Embed Size (px)
Citation preview
SPECIALISSUE
Recent phylogeographic structure in awidespread ‘weedy’ Neotropical treespecies, Cordia alliodora (Boraginaceae)
Paul D. Rymer1,2*, Christopher W. Dick3,4, Giovanni G. Vendramin5,
Anna Buonamici5 and David Boshier1
1Department of Plant Sciences, University of
Oxford, Oxford OX1 3RB, UK, 2Hawkesbury
Institute for the Environment, University of
Western Sydney, Richmond, NSW 2753,
Australia, 3Department of Ecology and
Evolutionary Biology and Herbarium,
University of Michigan, Ann Arbor, MI 48109-
1048, USA, 4Smithsonian Tropical Research
Institute, PO Box 0843-03092, Balboa, Ancon,
Republic of Panama, 5Istituto di Genetica
Vegetale, Consiglio Nazionale delle Ricerche,
50019 Sesto Fiorentino (Firenze), Italy
*Correspondence: Paul D. Rymer, Hawkesbury
Institute for the Environment, University of
Western Sydney, Locked Bag 1797, Penrith,
NSW 2751, Australia.
E-mail: [email protected]
ABSTRACT
Aim Although hundreds of tree species have broad geographic ranges in the
Neotropics, little is known about how such widespread species attained disjunct
distributions around mountain, ocean and xeric barriers. Here, we examine the
phylogeographic structure of a widespread and economically important tree, Cordia
alliodora, to: (1) test the roles of vicariance and dispersal in establishing major range
disjunctions, (2) determine which geographic regions and/or habitats contain the
highest levels of genetic diversity, and (3) infer the geographic origin of the species.
Location Twenty-five countries in Central and South America, and the West
Indies.
Methods Chloroplast simple sequence repeats (cpSSR; eight loci) were assayed
in 67 populations (240 individuals) sampled from the full geographic range of C.
alliodora. Chloroplast (trnH–psbA) and nuclear (internal transcribed spacer, ITS)
DNA sequences were sampled from a geographically representative subset.
Genetic structure was determined with samova, structure and haplotype
networks. Analysis of molecular variance (AMOVA) and rarefaction analyses were
used to compare regional haplotype diversity and differentiation.
Results Although the ITS region was polymorphic it revealed limited
phylogeographic structure, and trnH–psbA was monomorphic. However,
structure analysis of cpSSR variation recovered three broad demes spanning
Central America (Deme 1), the Greater Antilles and the Choco (Deme 2), and the
Lesser Antilles and cis-Andean South America (Deme 3). samova showed two
predominant demes (Deme 1 + 2 and Deme 3). The greatest haplotype diversity
was detected east of the Andes, while significantly more genetic variation was
partitioned among trans-Andean populations. Populations experiencing high
precipitation seasonality (dry ecotype) had greater levels of genetic variation.
Main conclusions Cordia alliodora displayed weak cis- and trans-Andean
phylogeographic structure based on DNA sequence data, indicative of historical
dispersal around this barrier and genetic exchange across its broad range. The
cpSSR data revealed phylogeographic structure corresponding to three
biogeographic zones. Patterns of genetic diversity are indicative of an origin in
the seasonally dry habitats of South America. Therefore, C. alliodora fits the
disperser hypothesis for widespread Neotropical species. Dispersal is evident in
the West Indies and the northern Andean cordilleras. The dry ecotype harbours
genetic variation that is likely to represent the source for the establishment of
populations under future warmer and drier climatic scenarios.
Keywords
Amazon Basin, Andes Mountains, Neotropics, phylogeography, samova,
structure, tropical trees, vicariance.
Journal of Biogeography (J. Biogeogr.) (2013) 40, 693–706
ª 2012 Blackwell Publishing Ltd http://wileyonlinelibrary.com/journal/jbi 693doi:10.1111/j.1365-2699.2012.02727.x
INTRODUCTION
The Neotropical region contains the greatest diversity of tree
species in the world (Fine & Ree, 2006). While most of this tree
diversity is concentrated in the lowland rain forests of the
Amazon Basin, the forests of Central America, the Brazilian
Atlantic, the Choco and the West Indies also contain many
endemic tree species and/or genetically distinct geographic
populations. All of these Neotropical regions share a subset of
widely distributed species, which form an ‘oligarchy’ of species
that account for a large proportion of the Neotropical forest
biomass (Pitman et al., 2001). The broad geographic distribu-
tion of these widespread species raises biogeographic ques-
tions. For example, how and when did they attain disjunct
distributions around barriers such as the Andean cordilleras?
From where did these species originate and spread?
Gentry (1982) proposed a hypothesis to explain the relation-
ship between Central American and Amazonian forests. Based
on extensive botanical experience, Gentry (1982) noted that
Central American forests were relatively species-poor and often
harboured the single widespread species of diverse Amazonian
tree genera. Thus he viewed Central American forests as a sink
for ‘weedy’ elements of the Amazonian flora. This idea is
supported by other historical and biogeographic factors,
importantly the more extensive drying of the Central American
landscape during the Pleistocene, coupled with the smaller land
area available as refugia for species-rich forests (Pennington
et al., 2000). The characteristics of weedy species, namely of
being fast-growing, ecological generalists able to disperse over
long distances, would allow them to traverse geographic barriers
and xeric habitats (Dick et al., 2007).
Vicariance is an alternative hypothesis to Gentry’s (1982)
weedy dispersal hypothesis, explaining the broad geographic
distribution of species across physical barriers, namely the
Andean cordilleras, and has been documented for some rain
forest tree species (Dick et al., 2003a). Phylogeography
provides a means to evaluate these alternative hypotheses
through an exploration of the distribution of genetic variation
within and among regional floras. An important distinction to
be made is that vicariant populations pre-date the emergence
of the barrier dividing them, whereas weedy dispersers
established in Central America after the uplift of the Andean
cordilleras (2–5 million years ago, Ma; Gregory-Wodzicki,
2000). Vicariance would leave a genetic signature of indepen-
dent regions of diversity with little exchange, while the
variation in Central America would represent a subset of the
variation in South America under Gentry’s hypothesis. Previ-
ous studies have provided support for both vicariance and
dispersal scenarios in both wet and dry forests (Dick et al.,
2007; Dick & Heuertz, 2008; Pennington et al., 2009).
A phylogeographic study of the kapok tree, Ceiba pentandra
(Malvaceae), for example, found broadly shared nuclear
(internal transcribed spacer region, ITS) and chloroplast
DNA haplotypes across Central America, the Amazon Basin,
the Guiana Shield and tropical West Africa (Dick et al., 2007).
The low level of nucleotide variation was evidence of recent
dispersal from the Amazon Basin across the northern Andean
cordilleras and from the Atlantic Ocean to Africa (Dick et al.,
2007). Ceiba pentandra is a giant tree (up to 60 m in height)
with tiny wind-dispersed seeds and buoyant fruit capsules; it
grows quickly (up to 3 m year)1 as a seedling), and colonizes
open areas. The genus is most diverse in the Amazon region,
and hence C. pentandra follows the model of Gentry’s (1982)
dispersal scenario.
A contrasting biogeographic history was found for Symphonia
globulifera (Clusiaceae), a tree of mature rain forests that
occurs in sympatry with Ceiba pentrandra in all major
Neotropical forests and in Africa (Dick et al., 2003b; Dick &
Heuertz, 2008). As Symphonia globulifera is the only Symphonia
species that occurs in the Neotropics, the genus-specific fossil
pollen provides an outline of the biogeographic history (Dick
& Heuertz, 2008). Fossil and molecular data indicate that
Symphonia reached the Neotropics by oceanic dispersal from
Africa in the Miocene and colonized the West Indies and
Central America before the Andes became a major barrier for
lowland forests. It shows strong phylogeographic structure,
with nuclear and chloroplast DNA sequence haplotype
networks containing divergent radiations for Central and
South America (Dick & Heuertz, 2008). Symphonia globulifera
does not have the attributes of a weedy species (it is a slow-
growing, shade-tolerant tree of mature rain forests, with
animal-dispersed seeds) and it fits the vicariance hypothesis.
Highly polymorphic genetic markers, such as nuclear
microsatellites, have been useful in uncovering genetic varia-
tion, potentially reflecting long-term vegetation histories.
Gentry’s (1982) hypothesis of the Amazon origin of wide-
spread Neotropical tree species leads to the prediction that the
area of geographic origin (Amazonia) should maintain higher
levels of genetic variation than the colonized region (Central
America). A few recent studies have compared genetic
variation from Central American and Amazonian forests. Dick
& Heuertz (2008) found greater within-population variation in
South America for Symphonia globulifera. Other studies,
however, have found no difference [Simarouba amara (Sima-
roubaceae), Hardesty et al., 2010] or lower diversity within
South American populations [Swietenia macrophylla (Melia-
ceae), Lemes et al., 2010]. Apart from differences in sampling,
these conflicting patterns may be explained by different life
history characteristics and geographic origins of the species.
The present study focuses on ‘laurel’, Cordia alliodora (Ruiz
& Pav.) Oken (Boraginaceae), to test aspects of Gentry’s (1982)
hypothesis, including recent dispersal versus vicariance history,
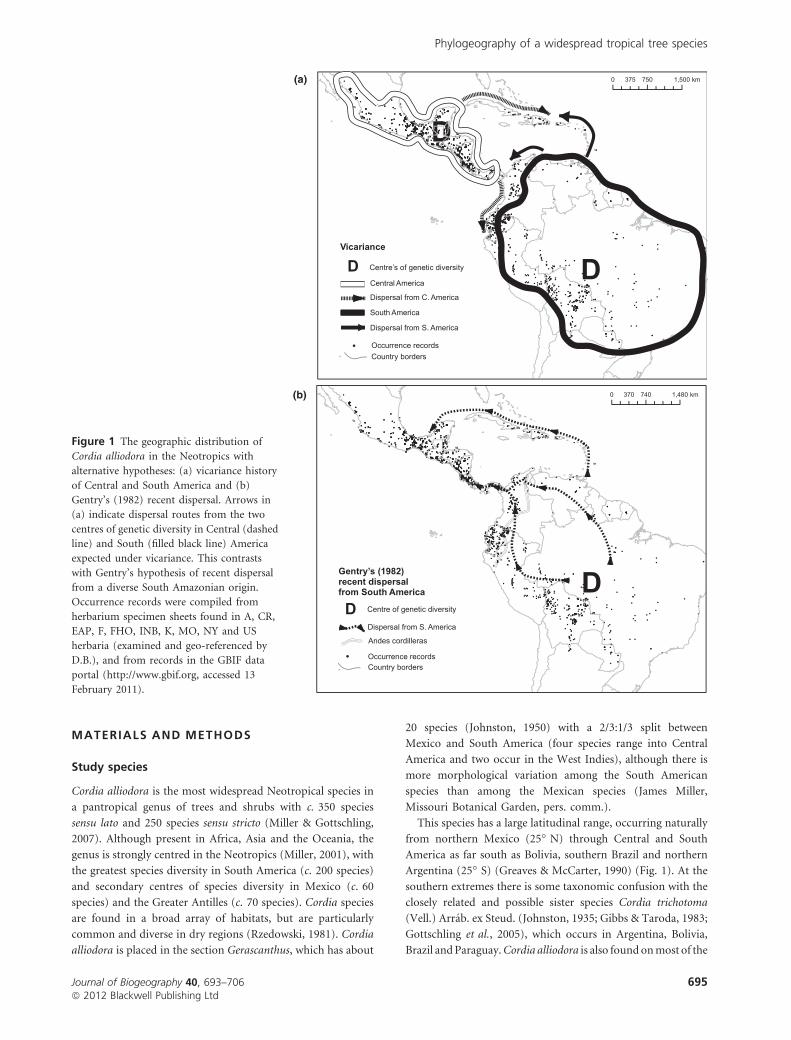
and South American versus Central American origins (Fig. 1).
Cordia alliodora displays the life history characteristics of a
‘weedy’ species, being fast-growing, able to colonize available
habitat, and able to disperse over long distances. The main
objectives were to: (1) assess the range-wide phylogeographic
structure of C. alliodora in relation to major dispersal barriers,
(2) compare levels of genetic variation within and among
major geographic regions, and (3) test for relationships
between significant genetic groupings (demes) and wet/dry-
zone ecotypes.
P. D. Rymer et al.
694 Journal of Biogeography 40, 693–706ª 2012 Blackwell Publishing Ltd
MATERIALS AND METHODS
Study species
Cordia alliodora is the most widespread Neotropical species in
a pantropical genus of trees and shrubs with c. 350 species
sensu lato and 250 species sensu stricto (Miller & Gottschling,
2007). Although present in Africa, Asia and the Oceania, the
genus is strongly centred in the Neotropics (Miller, 2001), with
the greatest species diversity in South America (c. 200 species)
and secondary centres of species diversity in Mexico (c. 60
species) and the Greater Antilles (c. 70 species). Cordia species
are found in a broad array of habitats, but are particularly
common and diverse in dry regions (Rzedowski, 1981). Cordia
alliodora is placed in the section Gerascanthus, which has about
20 species (Johnston, 1950) with a 2/3:1/3 split between
Mexico and South America (four species range into Central
America and two occur in the West Indies), although there is
more morphological variation among the South American
species than among the Mexican species (James Miller,
Missouri Botanical Garden, pers. comm.).
This species has a large latitudinal range, occurring naturally
from northern Mexico (25� N) through Central and South
America as far south as Bolivia, southern Brazil and northern
Argentina (25� S) (Greaves & McCarter, 1990) (Fig. 1). At the
southern extremes there is some taxonomic confusion with the
closely related and possible sister species Cordia trichotoma
(Vell.) Arrab. ex Steud. (Johnston, 1935; Gibbs & Taroda, 1983;
Gottschling et al., 2005), which occurs in Argentina, Bolivia,
Brazil and Paraguay. Cordia alliodora is also found on most of the
D
Dispersal from S. America
D Centre of genetic diversity
D Centre’s of genetic diversity
Central America
Dispersal from C. America
South America
Dispersal from S. America
Vicariance
Gentry’s (1982) recent dispersalfrom South America
Country bordersOccurrence records
Andes cordilleras
Country bordersOccurrence records
0 740 1,480370 km
(a)
(b)
0 750 1,500375 km
D
D
Figure 1 The geographic distribution of
Cordia alliodora in the Neotropics with
alternative hypotheses: (a) vicariance history
of Central and South America and (b)
Gentry’s (1982) recent dispersal. Arrows in
(a) indicate dispersal routes from the two
centres of genetic diversity in Central (dashed
line) and South (filled black line) America
expected under vicariance. This contrasts
with Gentry’s hypothesis of recent dispersal
from a diverse South Amazonian origin.
Occurrence records were compiled from
herbarium specimen sheets found in A, CR,
EAP, F, FHO, INB, K, MO, NY and US
herbaria (examined and geo-referenced by
D.B.), and from records in the GBIF data
portal (http://www.gbif.org, accessed 13
February 2011).
Phylogeography of a widespread tropical tree species
Journal of Biogeography 40, 693–706 695ª 2012 Blackwell Publishing Ltd
Caribbean Islands from Cuba to Trinidad, but is almost certainly
not native to Jamaica (Johnston, 1950). Throughout this
geographic range, it occurs under a wide variety of ecological
conditions, varying from very wet (up to 6000 mm precipitation
per year) to seasonally dry (as little as 800 mm precipitation and
a 7-month dry season per year), and from sea level to as high as
2000 m a.s.l. in Colombia (Greaves & McCarter, 1990).
Cordia alliodora is hermaphroditic, insect-pollinated and out-
crossed. It is also highly valued for its timber (Boshier et al.,
1995). It is a prolific seeder and regenerates easily, often being
found following forest clearance as pure stands of varying
densities. It is considered to be a long-lived pioneer or gap
species, and is not common in mature wet forest. It is moderately
fire-resistant and able to compete in the dry forest, where both
crown competition and species diversity are more restricted. In
lowland humid tropical regions, C. alliodora is generally tall and
thin with a narrow, open crown. In seasonally dry deciduous and
semi-deciduous forest, it is smaller and more poorly formed
than in moist forests, rarely reaching more than 20 m in height
and 30 cm d.b.h. (diameter at breast height) (Greaves &
McCarter, 1990; Chase et al., 1995). Results from an interna-
tional field trial, comparing the performance of dry- and wet-
zone Central American populations (ecotypes) in various
tropical countries, found significant heritability of ecotypic
variation (Boshier, 1984). Populations from areas with a
pronounced dry season germinated more quickly, initially
showed more vigorous seedling growth, with a longer primary
root, and flowered at a younger age than did wet-zone
populations (Boshier, 1984; Boshier & Henson, 1997). In
general, however, populations from the wet Caribbean
watershed showed the best survival, growth and form in tropical
regions (Boshier & Henson, 1997; Sebbenn et al., 2007).
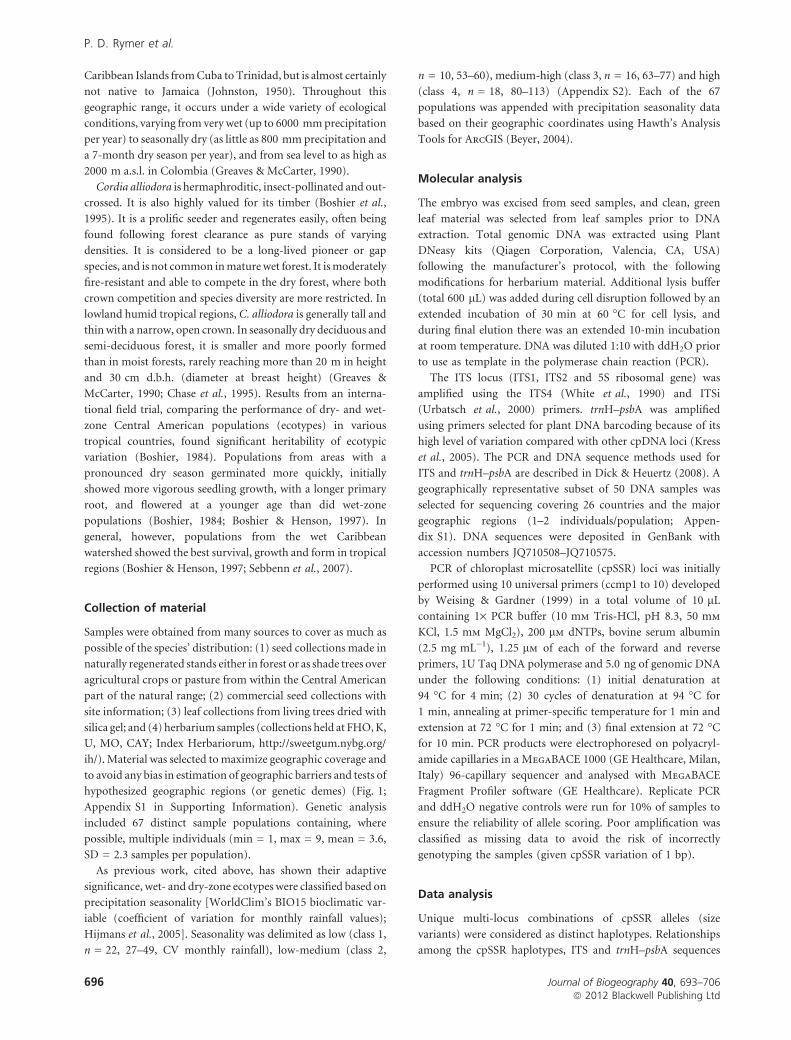
Collection of material
Samples were obtained from many sources to cover as much as
possible of the species’ distribution: (1) seed collections made in
naturally regenerated stands either in forest or as shade trees over
agricultural crops or pasture from within the Central American
part of the natural range; (2) commercial seed collections with
site information; (3) leaf collections from living trees dried with
silica gel; and (4) herbarium samples (collections held at FHO, K,
U, MO, CAY; Index Herbariorum, http://sweetgum.nybg.org/
ih/). Material was selected to maximize geographic coverage and
to avoid any bias in estimation of geographic barriers and tests of
hypothesized geographic regions (or genetic demes) (Fig. 1;
Appendix S1 in Supporting Information). Genetic analysis
included 67 distinct sample populations containing, where
possible, multiple individuals (min = 1, max = 9, mean = 3.6,
SD = 2.3 samples per population).
As previous work, cited above, has shown their adaptive
significance, wet- and dry-zone ecotypes were classified based on
precipitation seasonality [WorldClim’s BIO15 bioclimatic var-
iable (coefficient of variation for monthly rainfall values);
Hijmans et al., 2005]. Seasonality was delimited as low (class 1,
n = 22, 27–49, CV monthly rainfall), low-medium (class 2,
n = 10, 53–60), medium-high (class 3, n = 16, 63–77) and high
(class 4, n = 18, 80–113) (Appendix S2). Each of the 67
populations was appended with precipitation seasonality data
based on their geographic coordinates using Hawth’s Analysis
Tools for ArcGIS (Beyer, 2004).
Molecular analysis
The embryo was excised from seed samples, and clean, green
leaf material was selected from leaf samples prior to DNA
extraction. Total genomic DNA was extracted using Plant
DNeasy kits (Qiagen Corporation, Valencia, CA, USA)
following the manufacturer’s protocol, with the following
modifications for herbarium material. Additional lysis buffer
(total 600 lL) was added during cell disruption followed by an
extended incubation of 30 min at 60 �C for cell lysis, and
during final elution there was an extended 10-min incubation
at room temperature. DNA was diluted 1:10 with ddH2O prior
to use as template in the polymerase chain reaction (PCR).
The ITS locus (ITS1, ITS2 and 5S ribosomal gene) was
amplified using the ITS4 (White et al., 1990) and ITSi
(Urbatsch et al., 2000) primers. trnH–psbA was amplified
using primers selected for plant DNA barcoding because of its
high level of variation compared with other cpDNA loci (Kress
et al., 2005). The PCR and DNA sequence methods used for
ITS and trnH–psbA are described in Dick & Heuertz (2008). A
geographically representative subset of 50 DNA samples was
selected for sequencing covering 26 countries and the major
geographic regions (1–2 individuals/population; Appen-
dix S1). DNA sequences were deposited in GenBank with
accession numbers JQ710508–JQ710575.
PCR of chloroplast microsatellite (cpSSR) loci was initially
performed using 10 universal primers (ccmp1 to 10) developed
by Weising & Gardner (1999) in a total volume of 10 lL
containing 1· PCR buffer (10 mm Tris-HCl, pH 8.3, 50 mm
KCl, 1.5 mm MgCl2), 200 lm dNTPs, bovine serum albumin
(2.5 mg mL)1), 1.25 lm of each of the forward and reverse
primers, 1U Taq DNA polymerase and 5.0 ng of genomic DNA
under the following conditions: (1) initial denaturation at
94 �C for 4 min; (2) 30 cycles of denaturation at 94 �C for
1 min, annealing at primer-specific temperature for 1 min and
extension at 72 �C for 1 min; and (3) final extension at 72 �C
for 10 min. PCR products were electrophoresed on polyacryl-
amide capillaries in a MegaBACE 1000 (GE Healthcare, Milan,
Italy) 96-capillary sequencer and analysed with MegaBACE
Fragment Profiler software (GE Healthcare). Replicate PCR
and ddH2O negative controls were run for 10% of samples to
ensure the reliability of allele scoring. Poor amplification was
classified as missing data to avoid the risk of incorrectly
genotyping the samples (given cpSSR variation of 1 bp).
Data analysis
Unique multi-locus combinations of cpSSR alleles (size
variants) were considered as distinct haplotypes. Relationships
among the cpSSR haplotypes, ITS and trnH–psbA sequences
P. D. Rymer et al.
696 Journal of Biogeography 40, 693–706ª 2012 Blackwell Publishing Ltd
were inferred using median-joining (Bandelt et al., 1999) and
reduced-median network analysis (Bandelt et al., 1995) imple-
mented in Network (version 4.6.0) software (http://
www.fluxus-engineering.com/). Haplotypes were plotted on a
geographic map and labelled on networks based on the genetic
structure analysis.
Spatial structuring of variation at chloroplast loci was examined
using spatial analysis of molecular variance (samova; Dupanloup
et al., 2002), considering values of K (phylogroup number)
between 1 and 10, using 100 initial conditions for each run and the
sum of squared size differences as a measure of molecular distance.
Because of low sample sizes, genetic diversity could not be
estimated for all populations (15 populations had only a single
sample). To create population groups, individuals within geo-
graphic regions were pooled based on the distribution of
haplotypes (Figs 2 & 3). The samova analysis was re-run for 17
population groups [n = 6–27, mean (SD) = 14.1 (6.5) from 2–6
sampled populations] with the median geographic coordinates
(Appendices S1 and S2).
Individuals were assigned to genetic clusters using struc-
ture 2.3.3 (Pritchard et al., 2000), assuming genetic admix-
ture and correlated allele frequencies. The parameter K was
varied from 1 to 10, with five simulations run for each value of
K [initial burn-in period of 1 · 105, followed by 1 · 105
Markov chain Monte Carlo (MCMC) steps]. The optimal
value of K was determined using the DK statistic (Evanno
et al., 2005), which is the second-order rate of change in the
likelihood of K (performed in structure harvester 0.6.5;
Earl, 2011). The inferred ancestry of individuals for the
optimal K demes was calculated for each population averaged
across six independent runs.
The isolation-by-distance model (Wright, 1943) was tested
using a Mantel test (Mantel, 1967) in genalex 6.3 (Peakall &
Smouse, 2006). The analysis was based on the cpSSR haplotype
Euclidean genetic distance for individuals and pairwise line-
arized PhiPT values for population groups against Euclidean
geographic distance and log(1+ geographic distance) across the
entire distribution, and separately for geographic regions and
genetic demes (determined from the consensus of the samova
and structure analyses). The significance of the observed
value was determined against 999 permutations in genalex.
Estimates of genetic diversity were calculated in genalex 6.3
for population groups, geographic regions (Central America,
Caribbean, South America west of the Andes, South America:
Fig. 1), genetic demes (based on samova and structure), and
rainfall-zone ecotypes (based on precipitation seasonality).
Estimates of genetic diversity include: number of different
alleles (Na), number of effective alleles [Ne = 1/(1 – He)],
Shannon’s information index (I = )P
pi ln p1), diversity (h;
Nei’s diversity statistic; Nei, 1978) and unbiased diversity (uh;
Nei’s unbiased diversity statistic; Lynch & Milligan, 1994),
where He is the expected heterozygosity and pi is the frequency
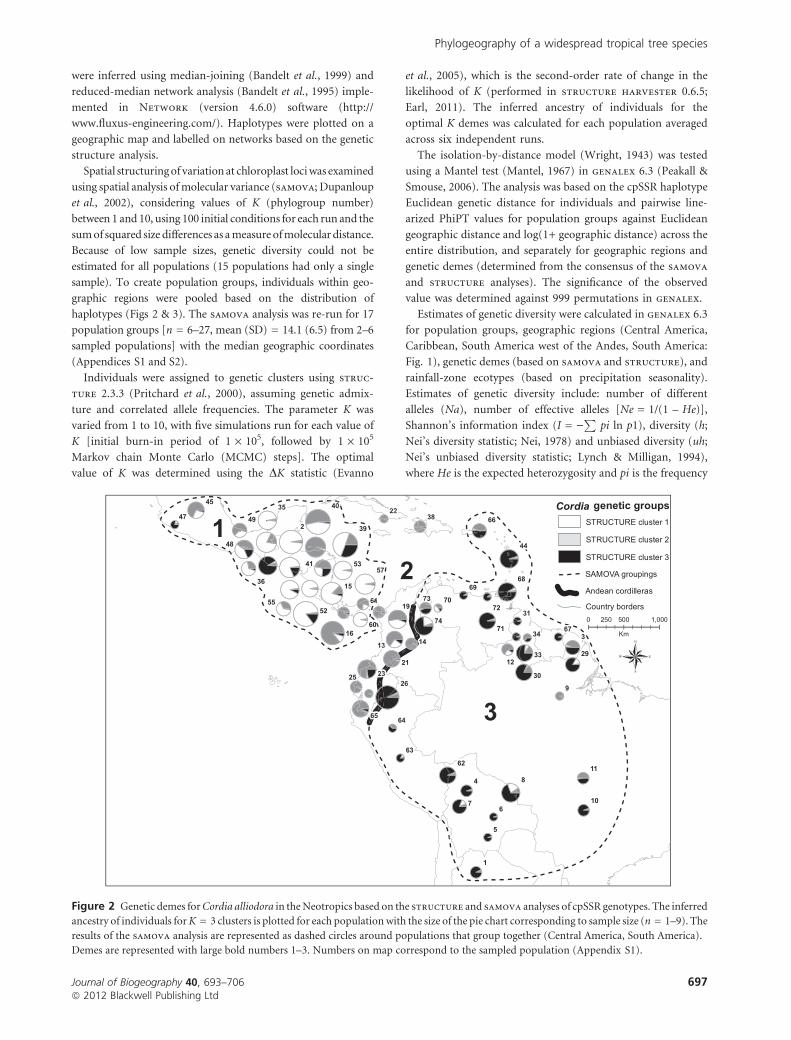
Figure 2 Genetic demes for Cordia alliodora in the Neotropics based on the structure and samova analyses of cpSSR genotypes. The inferred
ancestry of individuals for K = 3 clusters is plotted for each population with the size of the pie chart corresponding to sample size (n = 1–9). The
results of the samova analysis are represented as dashed circles around populations that group together (Central America, South America).
Demes are represented with large bold numbers 1–3. Numbers on map correspond to the sampled population (Appendix S1).
Phylogeography of a widespread tropical tree species
Journal of Biogeography 40, 693–706 697ª 2012 Blackwell Publishing Ltd
of the ith allele. fstat 2.9.3 was used to test for significance
among groupings for diversity estimates (Ne, h and uh) based
on 1000 permutations (Goudet, 1995). Rarefaction analysis was
conducted to facilitate the comparison of haplotype diversity in
geographic regions and genetic demes with different sample
sizes. Haplotype diversity was estimated for cpSSR haplotypes
for population groups, geographic regions, genetic demes and
rainfall-zone ecotypes in the program rarefact.for (Krebs,
1989). Mann–Whitney U-tests were conducted based on a
random standardized sample of haplotypes from geographic
regions, rainfall groups and genetic demes.
Partitioning of genetic variation within and among population
groups was tested for geographic regions, rainfall groups, and
genetic demes separately by analysis of molecular variance
(AMOVA; Excoffier et al., 1992) using genalex 6.3. The signif-
icance of the fixation index was tested with 999 permutations.
RESULTS
Chloroplast microsatellite genetic structure
The structure analysis revealed significant genetic structure,
with K = 3 as the most likely number of genetic clusters (DK
statistic 58.2) and with consistency among runs (ln probability
of data n = 6, mean = )582.6, SD = 6.1, range = )590.5 to
)572.7). The proportional genetic composition of populations
is shown in Appendix S1 and plotted in Fig. 2. structure
cluster 1 is predominantly in Central America, cluster 3 is east
of the Andes in South America, while cluster 2 is intermediate
west of the Andes and in the Caribbean (Fig. 2).
Two regional groupings, cis- and trans-American, were
suggested from the samova analysis as being the most
significant (RST = 0.639 (K = 2) > RST = 0.615 (K = 3), where
RST is the proportion of the genetic variation partitioned
among groupings). The split between the two groupings
corresponds to the northern Andean cordilleras, indicating
that it is a major barrier to genetic exchange (Fig. 2). Further
subdivision, up to K = 5 (RST = 0.595), maintained the core
cis- and trans-American demes, only splitting off intermediate
populations west of the Andes and in the Caribbean (Fig. 2).
These samova groupings have good correspondence with
the structure clusters and are here after referred to as Deme
1 (Central America), Deme 2 (Choco and the Caribbean),
Deme 1 + 2 (trans-Andes and Caribbean) and Deme 3 (cis-
Andes). Admixture was low among the three demes based on
the structure analysis (mean value of alpha < 0.06 across six
runs). structure did, however, reveal areas of significant
mixing adjacent to geographic barriers, notably north and
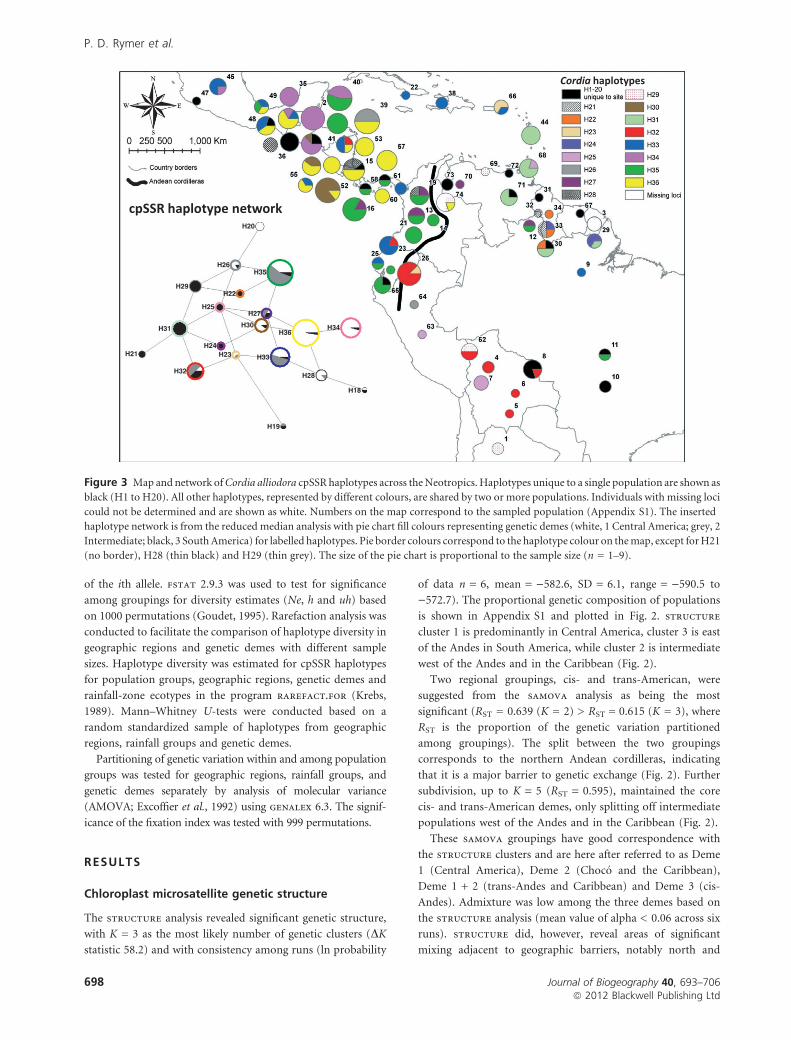
H20
H26H35
H29H22
H25H27
H30H31
H21H24
H23
H32
H33
H19
H28
H18
H34H36
Figure 3 Map and network of Cordia alliodora cpSSR haplotypes across the Neotropics. Haplotypes unique to a single population are shown as
black (H1 to H20). All other haplotypes, represented by different colours, are shared by two or more populations. Individuals with missing loci
could not be determined and are shown as white. Numbers on the map correspond to the sampled population (Appendix S1). The inserted
haplotype network is from the reduced median analysis with pie chart fill colours representing genetic demes (white, 1 Central America; grey, 2
Intermediate; black, 3 South America) for labelled haplotypes. Pie border colours correspond to the haplotype colour on the map, except for H21
(no border), H28 (thin black) and H29 (thin grey). The size of the pie chart is proportional to the sample size (n = 1–9).
P. D. Rymer et al.
698 Journal of Biogeography 40, 693–706ª 2012 Blackwell Publishing Ltd
south of the Andes barrier and in Puerto Rico. Other areas
could be indicative of long-distance dispersal events (e.g.
populations 9 and 12 in northern Brazil assigned to Deme 1
based on shared haplotypes) or further partitioning of the
deme (populations 37 and 47 in Guatemala and Mexico with
unique haplotypes but assigned to Deme 3) (Figs 2 & 3).
The distribution of cpSSR haplotypes shows local and
regional spatial clustering (Fig. 3). Haplotypes H1 to H20 were
unique to single populations. Of the 16 haplotypes that were
detected in more than one population, 10 (H21, H22, H23,
H24, H25, H28, H29, H31, H30, H34) were confined to demes
either side of the samova major barrier (four and six
haplotypes in Demes 1 + 2 and 3, respectively), and six
(H26, H27, H32, H33, H35, H36) were distributed across the
Andes, being found in Central and South America (Table 1;
Figs 2 & 3). Within Deme 1 + 2, two haplotypes were
restricted to Central America (H30, H34), H23 was restricted
to the Caribbean, and H28 was shared in Central America and
South America west of the Andes (Table 1). In cis-Andean
South America (Deme 3), four haplotypes were found north-
east of the Amazon River (H21, H22, H24, H31), while two
were distributed across the Amazon region (H25, H29)
(Table 1; Fig. 3; Appendix S1).
The median-joining network showed 61 links among
haplotypes (data not shown). The network had 11 terminal
haplotypes and 8 haplotypes with two links, while the
remaining haplotypes had several links (six links to H27 and
H36; seven links to H25 and H31). Reticulate evolution is
pronounced in the reduced-median network of cpSSR hapl-
otypes; however, it is simplified sufficiently to show the pattern
of haplotype partitioning among demes (Fig. 3 insert). The
relationship among haplotypes in the network shows geo-
graphic structure in north-east South America and the Lesser
Antilles (H21–H31–H25 and H24) and in Central America
(H34–H36–H30 and H28). Widespread haplotypes appear as
intermediates connecting cis- and trans-Andean America
(H27, H32, H35) (Fig. 3 insert).
Significant isolation-by-distance was detected among the
entire sample of cpSSR haplotypes from Central and South
American traversing the Andes and West Indies (Mantel test
n = 240, R2 = 0.168, P = 0.001). In contrast, isolation-
by-distance within geographic regions (and genetic demes)
explained only c. 1% of the variation and significance was
marginal (Mantel test Deme 1 n = 128, R2 = 0.008, P = 0.028;
Deme 2 n = 43, R2 = 0.012, P = 0.092; Deme 3 n = 69,
R2 = 0.012, P = 0.027). The Mantel test was not significant
for any of the comparisons based on the 17 population groups
(P > 0.1).
Genetic variation within geographic and
environmental groups
Thirty-six cpSSR haplotypes were found in 67 populations
(n = 240 samples) for eight chloroplast loci (ccmp 1 to 7 and
10; ccmp 8 and 9 were not variable). The estimates of genetic
variation within population groups were in the following
ranges: effective number of alleles (Ne) from 1.03 to 1.82
(mean ± 1 SE, 1.29 ± 0.04); Shannon’s information index (I)
from 0.04 to 0.57 (0.24 ± 0.03); Nei’s unbiased diversity (uh)
from 0.03 to 0.40 (0.16 ± 0.02); and percentage polymorphic
loci (%P) from 12.5 to 62.5% (38.2 ± 4.2%) (Appendix S3).
The greatest haplotype diversity was detected east of the
Andes (standardized n = 40 individuals, mean ± SD: Deme
1 + 2 = 11.1 ± 1.4; Deme 3 = 18.1 ± 1.6; Mann–Whitney U,
d.f. = 38, P < 0.001). Overall, the total and unique numbers of
haplotypes were also greatest east of the Andes (Deme
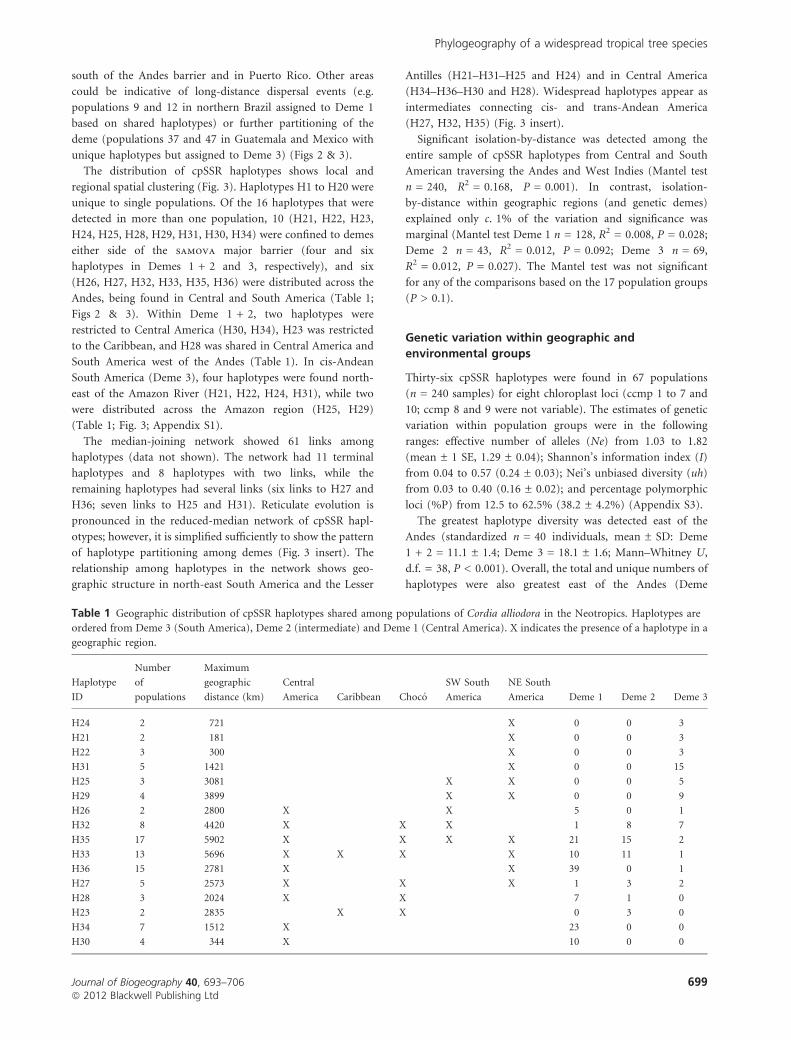
Table 1 Geographic distribution of cpSSR haplotypes shared among populations of Cordia alliodora in the Neotropics. Haplotypes are
ordered from Deme 3 (South America), Deme 2 (intermediate) and Deme 1 (Central America). X indicates the presence of a haplotype in a
geographic region.
Haplotype
ID
Number
of
populations
Maximum
geographic
distance (km)
Central
America Caribbean Choco
SW South
America
NE South
America Deme 1 Deme 2 Deme 3
H24 2 721 X 0 0 3
H21 2 181 X 0 0 3
H22 3 300 X 0 0 3
H31 5 1421 X 0 0 15
H25 3 3081 X X 0 0 5
H29 4 3899 X X 0 0 9
H26 2 2800 X X 5 0 1
H32 8 4420 X X X 1 8 7
H35 17 5902 X X X X 21 15 2
H33 13 5696 X X X X 10 11 1
H36 15 2781 X X 39 0 1
H27 5 2573 X X X 1 3 2
H28 3 2024 X X 7 1 0
H23 2 2835 X X 0 3 0
H34 7 1512 X 23 0 0
H30 4 344 X 10 0 0
Phylogeography of a widespread tropical tree species
Journal of Biogeography 40, 693–706 699ª 2012 Blackwell Publishing Ltd
1 + 2 = 18 and 12; Deme 3 = 24 and 18), despite their being
sampled from fewer individuals and populations (Deme
1 + 2 = 170 and 38; Deme 3 = 69 and 29).
The genetic demes did not differ significantly in the amount
of variation they contained (fstat permutation P > 0.1)
(Appendix S3). Levels of variation tended to be lower in the
intermediate regions, west of the Andes (west Columbia and
Ecuador, east Panama) and in the Caribbean (Cuba, Haiti),
and highest in south-west South America (Argentina, Bolivia,
Peru). Central America (Mexico to west Panama) and north-
east South America (French Guiana, Martinique, Venezuela)
had intermediate levels of variation (Appendix S3).
A significant amount of genetic variation partitioned among
trans- and cis-Andean America (AMOVA 29.4% of variation
partitioned among Deme 1 + 2 and Deme 3). Splitting the
trans-Andean grouping into its Central America (Deme 1) and
Intermediate (Deme 2) components did not increase the
amount of variation partitioned among demes (AMOVA
28.8% among Deme 1, Deme 2 and Deme 3) (Table 2).
Separate analyses of trans- and cis-Andean America revealed
more than four times as much variation among Deme 1 and
Deme 2 (17.8%) than among south-east and north-west South
America (4.4%), while more than twice as much variation was
partitioned among population groups in trans-Andean Amer-
ica (Deme 1 and Deme 2, 28.1%; south-east and north-west
South America, 11.6%) (Table 2). The analyses of genetic
demes conducted separately confirmed that Deme 1 had
significantly more genetic variation partitioned among popu-
lation groups than Deme 3 (AMOVA 39.8% and 14.2%,
respectively), with correspondingly less variation within pop-
ulation groups (Table 2).
Populations in the dry zone, characterized by high season-
ality of precipitation, had greater haplotype diversity than wet
ecotypes [standardized n = 50 individuals, mean ± SD: high
(class 1) = 17.94 ± 2.08; low (class 4) = 15.96 ± 0.88]. The
pattern differed among demes, with significantly greater
haplotype diversity found in the dry zone within Deme
1 + 2 (n = 30: high = 9.95 ± 1.42; low = 5.71 ± 0.49; Mann–
Whitney U, d.f. = 28, P < 0.01) and no difference within
Deme 3 (n = 20: high = 11.76 ± 1.62; low = 12.79 ± 0.79).
This pattern is reflected in all other metrics, with genetic
variation greater for dry-zone ecotypes (Appendix S3); how-
ever, the difference among seasonality classes is not significant
(fstat permutation P > 0.1).
Genetic variation among populations with different precip-
itation seasonality did not significantly differ over the entire
distribution (AMOVA 4%, Nei’s distance high to low season-
ality, 0.029). Contrasting patterns were detected for trans- and
cis-Andean regions. Within Deme 1, seasonality explained 15%
of the variation among populations, while only 2% of the
variation was explained within Deme 3 (Nei’s distance high to
low seasonality, 0.068 and 0.000, respectively). Appendix S2
shows the rainfall seasonality across the distribution of
C. alliodora.
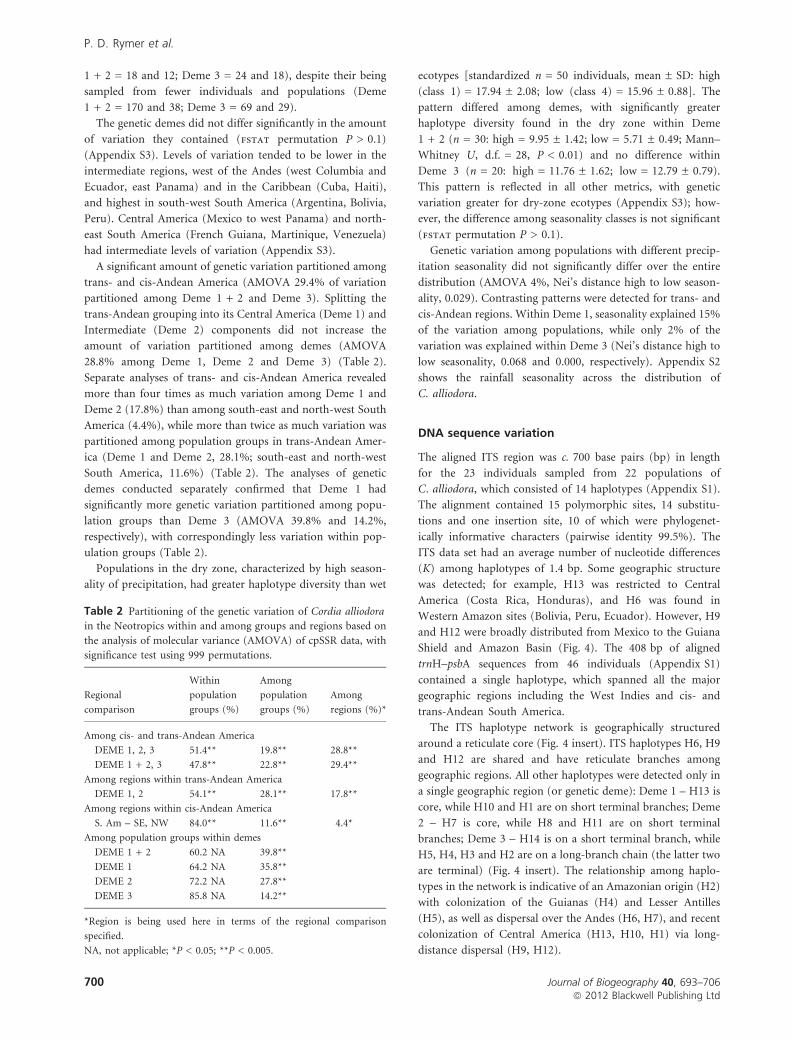
DNA sequence variation
The aligned ITS region was c. 700 base pairs (bp) in length
for the 23 individuals sampled from 22 populations of
C. alliodora, which consisted of 14 haplotypes (Appendix S1).
The alignment contained 15 polymorphic sites, 14 substitu-
tions and one insertion site, 10 of which were phylogenet-
ically informative characters (pairwise identity 99.5%). The
ITS data set had an average number of nucleotide differences
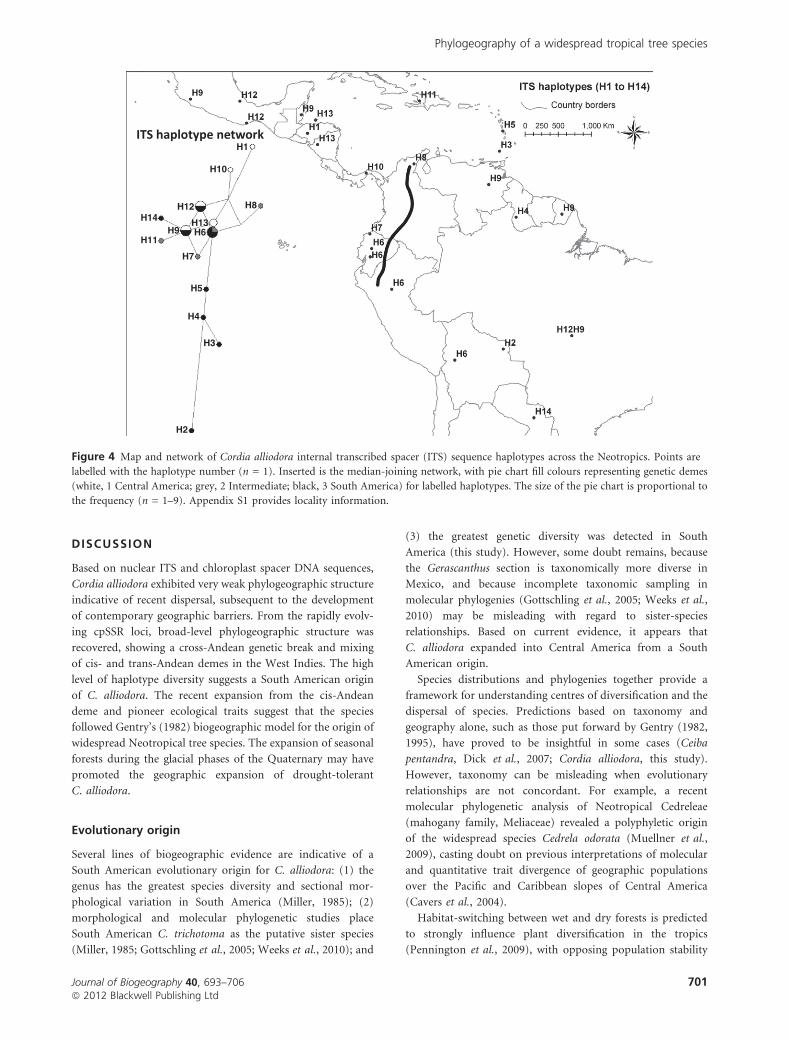
(K) among haplotypes of 1.4 bp. Some geographic structure
was detected; for example, H13 was restricted to Central
America (Costa Rica, Honduras), and H6 was found in
Western Amazon sites (Bolivia, Peru, Ecuador). However, H9
and H12 were broadly distributed from Mexico to the Guiana
Shield and Amazon Basin (Fig. 4). The 408 bp of aligned
trnH–psbA sequences from 46 individuals (Appendix S1)
contained a single haplotype, which spanned all the major
geographic regions including the West Indies and cis- and
trans-Andean South America.
The ITS haplotype network is geographically structured
around a reticulate core (Fig. 4 insert). ITS haplotypes H6, H9
and H12 are shared and have reticulate branches among
geographic regions. All other haplotypes were detected only in
a single geographic region (or genetic deme): Deme 1 – H13 is
core, while H10 and H1 are on short terminal branches; Deme
2 – H7 is core, while H8 and H11 are on short terminal
branches; Deme 3 – H14 is on a short terminal branch, while
H5, H4, H3 and H2 are on a long-branch chain (the latter two
are terminal) (Fig. 4 insert). The relationship among haplo-
types in the network is indicative of an Amazonian origin (H2)
with colonization of the Guianas (H4) and Lesser Antilles
(H5), as well as dispersal over the Andes (H6, H7), and recent
colonization of Central America (H13, H10, H1) via long-
distance dispersal (H9, H12).
Table 2 Partitioning of the genetic variation of Cordia alliodora
in the Neotropics within and among groups and regions based on
the analysis of molecular variance (AMOVA) of cpSSR data, with
significance test using 999 permutations.
Regional
comparison
Within
population
groups (%)
Among
population
groups (%)
Among
regions (%)*
Among cis- and trans-Andean America
DEME 1, 2, 3 51.4** 19.8** 28.8**
DEME 1 + 2, 3 47.8** 22.8** 29.4**
Among regions within trans-Andean America
DEME 1, 2 54.1** 28.1** 17.8**
Among regions within cis-Andean America
S. Am – SE, NW 84.0** 11.6** 4.4*
Among population groups within demes
DEME 1 + 2 60.2 NA 39.8**
DEME 1 64.2 NA 35.8**
DEME 2 72.2 NA 27.8**
DEME 3 85.8 NA 14.2**
*Region is being used here in terms of the regional comparison
specified.
NA, not applicable; *P < 0.05; **P < 0.005.
P. D. Rymer et al.
700 Journal of Biogeography 40, 693–706ª 2012 Blackwell Publishing Ltd
DISCUSSION
Based on nuclear ITS and chloroplast spacer DNA sequences,
Cordia alliodora exhibited very weak phylogeographic structure
indicative of recent dispersal, subsequent to the development
of contemporary geographic barriers. From the rapidly evolv-
ing cpSSR loci, broad-level phylogeographic structure was
recovered, showing a cross-Andean genetic break and mixing
of cis- and trans-Andean demes in the West Indies. The high
level of haplotype diversity suggests a South American origin
of C. alliodora. The recent expansion from the cis-Andean
deme and pioneer ecological traits suggest that the species
followed Gentry’s (1982) biogeographic model for the origin of
widespread Neotropical tree species. The expansion of seasonal
forests during the glacial phases of the Quaternary may have
promoted the geographic expansion of drought-tolerant
C. alliodora.
Evolutionary origin
Several lines of biogeographic evidence are indicative of a
South American evolutionary origin for C. alliodora: (1) the
genus has the greatest species diversity and sectional mor-
phological variation in South America (Miller, 1985); (2)
morphological and molecular phylogenetic studies place
South American C. trichotoma as the putative sister species
(Miller, 1985; Gottschling et al., 2005; Weeks et al., 2010); and
(3) the greatest genetic diversity was detected in South
America (this study). However, some doubt remains, because
the Gerascanthus section is taxonomically more diverse in
Mexico, and because incomplete taxonomic sampling in
molecular phylogenies (Gottschling et al., 2005; Weeks et al.,
2010) may be misleading with regard to sister-species
relationships. Based on current evidence, it appears that
C. alliodora expanded into Central America from a South
American origin.
Species distributions and phylogenies together provide a
framework for understanding centres of diversification and the
dispersal of species. Predictions based on taxonomy and
geography alone, such as those put forward by Gentry (1982,
1995), have proved to be insightful in some cases (Ceiba
pentandra, Dick et al., 2007; Cordia alliodora, this study).
However, taxonomy can be misleading when evolutionary
relationships are not concordant. For example, a recent
molecular phylogenetic analysis of Neotropical Cedreleae
(mahogany family, Meliaceae) revealed a polyphyletic origin
of the widespread species Cedrela odorata (Muellner et al.,
2009), casting doubt on previous interpretations of molecular
and quantitative trait divergence of geographic populations
over the Pacific and Caribbean slopes of Central America
(Cavers et al., 2004).
Habitat-switching between wet and dry forests is predicted
to strongly influence plant diversification in the tropics
(Pennington et al., 2009), with opposing population stability
H1
H10
H12H14
H11H9 H6
H7
H5
H4
H3
H2
H13
H8
Figure 4 Map and network of Cordia alliodora internal transcribed spacer (ITS) sequence haplotypes across the Neotropics. Points are
labelled with the haplotype number (n = 1). Inserted is the median-joining network, with pie chart fill colours representing genetic demes
(white, 1 Central America; grey, 2 Intermediate; black, 3 South America) for labelled haplotypes. The size of the pie chart is proportional to
the frequency (n = 1–9). Appendix S1 provides locality information.
Phylogeography of a widespread tropical tree species
Journal of Biogeography 40, 693–706 701ª 2012 Blackwell Publishing Ltd
and connectivity in wet and dry ecosystems. The wet Amazon
Basin represents a centre of diversity for lowland trees (Fine &
Ree, 2006), often with sparse or patchily distributed popula-
tions in a large, continuous, area (Hubbell et al., 2008). This
contrasts with patchily distributed seasonally dry forests, which
often maintain large local populations of relatively fewer
species (Pennington et al., 2009). The genus Cordia is most
species-rich and abundant in seasonally dry forests (Miller,
1985), where C. alliodora also maintains abundant popula-
tions. Combined with the knowledge that sister species often
occupy the same geographic nucleus in seasonally dry forests
(Pennington et al., 2009), we hypothesize that C. alliodora
originated in these forests rather than in the wet forests of the
Amazon Basin.
Cross-Andean divergence
The central and northern Andean cordilleras (in Ecuador,
Colombia, Venezuela) form the largest continental geographic
barrier within the range of C. alliodora, and are nearly
impassable for lowland rain forest plants. At points where
moist forest abuts the Andes, the lowest mountain passes are
c. 2000 m a.s.l. (e.g. the portal of the Magdalena valley in
Colombia where C. alliodora occurs). The northernmost points
that reach lowlands in Venezuela are surrounded by xeric
habitat (llanos region), which impedes dispersal by moist
forest species. The northern Andes are the youngest cordilleras,
of Pliocene origin (c. 3–5 Ma) (Hoorn et al., 2010). Of these,
the youngest, the Merida cordillera in Venezuela, is thought to
have become a barrier for lowland species near the Pliocene/
Pleistocene boundary (c. 2.6 Ma) (Brumfield & Capparella,
1996). The uplift of the tropical Andes coincided roughly with
the closure of the Panama Isthmus (c. 3.1 Ma) and the Great
American Biotic Interchange (GABI) (Simpson, 1940) and
preceded the major climate fluctuations that characterized the
Quaternary (2.6 Ma to present), raising the question of
whether vicariance histories or recent dispersal events best
explain the current distribution of widespread Neotropical
trees.
A handful of studies have examined the genetic divergence
of cis- and trans-Andean populations of lowland trees, using
DNA sequences (Dick et al., 2003b, 2007; Dick & Heuertz,
2008), nuclear microsatellite-based tests of phylogeographic
structure (Hardesty et al., 2010), or cpSSR variation (Lemes
et al., 2010). While most studies found the strongest range-
wide phylogeographic break at the Andes disjunction, Ceiba
pentandra was unusual in having shared cpDNA and ITS
haplotypes across the range, indicative of recent dispersal
(Dick et al., 2007). Based on molecular clock analyses using the
full range of published evolutionary rates for ITS, Dick et al.
(2007) concluded that haplotypes shared across the Andes were
most likely the result of dispersal rather than vicariance. Cordia
alliodora parallels Ceiba pentandra in having cross-Andean ITS
and cpDNA haplotypes. In Cordia alliodora, at least two
widespread ITS haplotypes range from Mexico to the Amazon
Basin, and six cpSSR haplotypes traverse the Andes, while the
cpDNA sequence locus is monomorphic across the full
Neotropical range, indicative of historical gene flow across or
around the Andes.
Dispersal, growth and water-tolerance life history traits are
important determinants of historical genetic exchange, as the
cross-Andean barrier is composed partly of xeric habitat.
Notably in the llanos region around the northern limits of the
Andes, where lowland migration might otherwise be possible.
Like Ceiba pentandra, Cordia alliodora is wind-dispersed, fast-
growing and drought-tolerant, facilitating migration around
the Andes through seasonally dry forests on the Pacific and
Atlantic coasts. In contrast, animal-dispersed trees that are
relegated to moist forests, such as Symphonia globulifera and
Simarouba amara, display strong cross-Andean genetic diver-
gence, as well as highly differentiated regional populations
(Dick & Heuertz, 2008; Hardesty et al., 2010). We predict that
other drought-tolerant, abiotically dispersed tree species will
show a similar weak phylogeographic structure indicative of
relatively recent range expansion. This prediction is analogous
to a relationship reported in widespread Neotropical bird
species, in that the deepest cross-Andean phylogeographic
divergence is found in forest-dependent understorey birds
rather than in birds found in open habitats (Burney &
Brumfield, 2009).
In contrast to the DNA sequence data, the cpSSR haplotypes
show regional patterns of phylogeographic structure and a
strong genetic break across the Andes. This suggests that the
gene flow leading to the cross-Andean distribution of
C. alliodora was historical and that seed dispersal has since been
partially disrupted. The cpSSR haplotypes showed two major
demes, cis- and trans-Andean, with evidence of local structure
within and mixing among demes (Figs 2 & 3). While the highly
reticulate cpSSR haplotype network may be partly attributable
to homoplasy, it is in line with DNA sequence analyses
suggesting incomplete and recent population divergence.
Impact of climate and habitat
Given the drier nature of South and Central America during
the Pleistocene (Prance, 1974), C. alliodora would have been
able to spread throughout the region in seasonally dry forest.
The small, wind-dispersed seed of C. alliodora makes it
particularly effective for colonizing and spreading, more so
than for the other species in the Gerascanthus section. As the
Neotropical lowlands became wetter during the Holocene,
C. alliodora may have become restricted to seasonal forest
refugia, as has been suggested for other seasonal forest
taxa (Pennington et al., 2000). Under selection pressure,
C. alliodora may have adapted to the wetter climate, but it
probably suffered a reduction in range and abundance in
undisturbed lowland wet forest.
Physiological and quantitative trait differences among wet
and dry ecotypes are indicative of adaptive divergence under
opposing selection regimes. A physiological study by Choat
et al. (2007) found that Cordia species growing at drier sites
were more resistant to embolism than those growing at moister
P. D. Rymer et al.
702 Journal of Biogeography 40, 693–706ª 2012 Blackwell Publishing Ltd
sites. The same pattern was observed for populations of
C. alliodora, which had a high hydraulic capacity (Choat et al.,
2007). Significant differences in quantitative characters (e.g.
height, volume, form) between wet- and dry-zone ecotypes
have been confirmed in provenance trials (Boshier, 1984;
Boshier & Henson, 1997; Sebbenn et al., 2007). Dry-zone
ecotypes had greater seedling establishment and initial growth
rates in wet and dry sites (Boshier, 1984; Boshier & Henson,
1997; Sebbenn et al., 2007). Genetic diversity was also found to
be greatest in dry-zone ecotypes in Central America (eight
allozyme loci, Chase et al., 1995; eight cpSSR loci, this study),
suggesting that genotypic adjustment in vulnerability to water
stress could contribute to the ability of C. alliodora to compete
across a broad environmental niche. Further investigation is
warranted to investigate the genetic signature of selection
through the application of water-stress candidate genes
(Audigeos et al., 2010) or population genomic approaches
(Rymer et al., 2010; Andolfatto et al., 2011).
Seedsourcing
The sourcing of seed for successful forestry and native
regeneration projects remains challenging throughout the
world. This is especially true for widespread Neotropical trees,
owing to the lack of ecological and evolutionary understand-
ing, and poor communication with local stake-holders. Cordia
alliodora is an important timber tree species throughout much
of its distribution (Boshier et al., 1995), where seedsourcing
has been ad hoc, in some cases, leading to poor outcomes in
plantations. Wet-zone ecotypes have been selected based on
tree form (Boshier & Henson, 1997); however, physiological
(Choat et al., 2007), molecular (Chase et al., 1995; this study)
and quantitative genetic (Boshier, 1984) studies indicate that
dry-zone ecotypes may have a greater capacity to initially
establish, grow and survive under drought conditions. This
may become acute under future climatic scenarios of warming
and drying in the Neotropics (Cowling et al., 2004; Malhi &
Phillips, 2004). Furthermore, the movement of seeds among
genetic demes is likely to have consequences for plantation
success, as well as potentially altering the evolutionary
trajectory of cis- and trans-Andean demes. The tracking of
seed and timber among regions may be enhanced through the
utilization of cpSSR genotyping, being variable at the level of
populations/regions, maternally inherited (Tnah et al., 2009),
and easily amplified from degraded DNA sources (such as
wood). The tracking of cpSSR haplotypes in C. alliodora may
assist in the maintenance of genetic resources and in reducing
illegal logging from reserves.
CONCLUSIONS
The density and evenness of sampling across Central America,
the Greater and Lesser Antilles, and South America has enabled
this study to exclude alternative hypotheses (isolation-by-
distance and vicariance) to conclude that the Andes is a
contemporary barrier to genetic exchange among cis- and
trans-Andean populations. However, the wide ecological niche
of C. alliodora has allowed it to disperse around this major
barrier and across the West Indies, where two genetic demes
come together. The greater genetic variation found in dry-zone
ecotypes may be indicative of genotypes restricted to this
ancestral habitat type. There is supporting evidence that these
populations may have more resilience to anthropogenic
climate change. Further experimental and population genomic
approaches will be fruitful in determining this potential.
ACKNOWLEDGEMENTS
This work was funded by the EC (FP6-2002-INCO-DEV-1).
We are grateful to the entire Seedsource consortium for
providing support for this project. Special thanks to Stephen
Cavers and two anonymous referees for intellectual contribu-
tions. This work would not have been possible without field
collections from Renato Valencia and Justin Stead, and
without access to herbarium material (FHO, K, U, MO,
CAY) for DNA samples. Sarah Rendell and Christina Vinson
provided laboratory assistance. C.D. acknowledges laboratory
assistance from Saji Abraham, and National Science Founda-
tion funding (DEB 0640379).
REFERENCES
Andolfatto, P., Davison, D., Erezyilmaz, D., Hu, T.T., Mast, J.,
Sunayama-Morita, T. & Stern, D.L. (2011) Multiplexed
shotgun genotyping for rapid and efficient genetic mapping.
Genome Research, 21, 610–617.
Audigeos, D., Buonamici, A., Belkadi, L., Rymer, P., Boshier,
D., Scotti-Saintagne, C., Vendramin, G.G. & Scotti, I. (2010)
Aquaporins in the wild: natural genetic diversity and selec-
tive pressure in the PIP gene family in five Neotropical tree
species. BMC Evolutionary Biology, 10, 202.
Bandelt, H.J., Forster, P. & Rohl, A. (1999) Median-joining
networks for inferring intraspecific phylogenies. Molecular
Biology and Evolution, 16, 37–48.
Bandelt, H.J., Forster, P., Sykes, B.C. & Richards, M.B. (1995)
Mitochondrial portraits of human populations using med-
ian networks. Genetics, 141, 743–753.
Beyer, H.L. (2004) Hawth’s analysis tools for ArcGIS. Available
at: http://www.spatialecology.com/htools (accessed 10 June
2011).
Boshier, D.H. (1984) The international provenance trial of
Cordia alliodora (R & P) Oken in Costa Rica. Provenance
and genetic improvement strategies in tropical forest trees (ed.
by R.D. Barnes and G.L. Gibson), pp. 168–185. Common-
wealth Forestry Institute, Oxford, and Forest Research
Center, Harare.
Boshier, D.H., Chase, M.R. & Bawa, K.S. (1995) Population
genetics of Cordia alliodora (Boraginaceae), a neotropical
tree. 3. Gene flow, neighborhood, and population sub-
structure. American Journal of Botany, 82, 484–490.
Boshier, D.H. & Henson, M. (1997) Cordia alliodora: genetics
and tree improvement. Genetic variation (ed. by D.H.
Phylogeography of a widespread tropical tree species
Journal of Biogeography 40, 693–706 703ª 2012 Blackwell Publishing Ltd
Boshier and A.T. Lamb), pp. 39–65. Oxford Forestry Insti-
tute, Oxford.
Brumfield, R.T. & Capparella, A.P. (1996) Historical diversifica-
tion of birds in northwestern South America: a molecular per-
spectiveontheroleofvicariantevents.Evolution,50,1607–1624.
Burney, C.W. & Brumfield, R.T. (2009) Ecology predicts levels
of genetic differentiation in Neotropical birds. The American
Naturalist, 174, 358–368.
Cavers, S., Navarro, C. & Lowe, A.J. (2004) Targeting genetic
resource conservation in widespread species: a case study of
Cedrela odorata L. Forest Ecology and Management, 197,
285–294.
Chase, M.R., Boshier, D.H. & Bawa, K.S. (1995) Population
genetics of Cordia alliodora (Boraginaceae), a neotropical
tree. 1. Genetic variation in natural populations. American
Journal of Botany, 82, 468–475.
Choat, B., Sack, L. & Holbrook, N.M. (2007) Diversity of
hydraulic traits in nine Cordia species growing in tropical
forests with contrasting precipitation. New Phytologist, 175,
686–698.
Cowling, S.A., Betts, R.A., Cox, P.M., Ettwein, V.J., Jones,
C.D., Maslin, M.A. & Spall, S.A. (2004) Contrasting simu-
lated past and future responses of the Amazonian forest to
atmospheric change. Philosophical Transactions of the Royal
Society B: Biological Sciences, 359, 539–547.
Dick, C.W., Abdul-Salim, K. & Bermingham, E. (2003b)
Molecular systematics reveals cryptic Tertiary diversification
of a widespread tropical rainforest tree. The American Nat-
uralist, 162, 691–703.
Dick, C.W., Bermingham, E., Lemes, M.R. & Gribel, R. (2007)
Extreme long-distance dispersal of the lowland tropical
rainforest tree Ceiba pentandra L. (Malvaceae) in Africa and
the Neotropics. Molecular Ecology, 16, 3039–3049.
Dick, C.W., Etchelecu, G. & Austerlitz, F. (2003a) Pollen dis-
persal of tropical trees (Dinizia excelsa: Fabaceae) by native
insects and African honeybees in pristine and fragmented
Amazonian rainforest. Molecular Ecology, 12, 753–764.
Dick, C.W. & Heuertz, M. (2008) The complex biogeographic
history of a widespread tropical tree species. Evolution, 62,
2760–2774.
Dupanloup, I., Schneider, S. & Excoffier, L. (2002) A simulated
annealing approach to define the genetic structure of pop-
ulations. Molecular Ecology, 11, 2571–2581.
Earl, D.A. (2011) Structure Harvester v0.6.5. Available at:
http://users.soe.ucsc.edu/~dearl/software/structureHarvest-
er/ (accessed 30 May 2011).
Evanno, G., Regnaut, S. & Goudet, J. (2005) Detecting the
number of clusters of individuals using the software struc-
ture: a simulation study. Molecular Ecology, 14, 2611–2620.
Excoffier, L., Smouse, P.E. & Quattro, J.M. (1992) Analysis of
molecular variance inferred from metric distances among
DNA haplotypes: application to human mitochondrial DNA
restriction data. Genetics, 131, 479–491.
Fine, P.V.A. & Ree, R.H. (2006) Evidence for a time-integrated
species–area effect on the latitudinal gradient in tree diver-
sity. The American Naturalist, 168, 796–804.
Gentry, A.H. (1982) Neotropical floristic diversity: phyto-
geographical connections between Central and South
America. Pleistocene climatic fluctuations or an accident of
Andean orogeny? Annals of the Missouri Botanical Garden,
69, 557–593.
Gentry, A.H. (1995) Diversity and floristic composition of
Neotropical dry forests. Seasonally dry tropical forests (ed. by
S.H. Bullock, H.A. Mooney and E. Medina), pp. 146–190.
Cambridge University Press, Cambridge.
Gibbs, P. & Taroda, N. (1983) Heterostyly in the Cordia alli-
odora–C. trichotoma complex in Brazil. Revista Brasileira de
Botanica, 6, 1–10.
Gottschling, M., Miller, J.S., Weigend, M. & Hilger, H.H.
(2005) Congruence of a phylogeny of Cordiaceae (Boragi-
nales) inferred from ITS1 sequence data with morphology,
ecology, and biogeography. Annals of the Missouri Botanical
Garden, 92, 425–437.
Goudet, J. (1995) FSTAT (version 1.2): a computer program to
calculate F-statistics. Journal of Heredity, 86, 485–486.
Greaves, A. & McCarter, P.S. (1990) Cordia alliodora: a
promising tree for tropical agroforestry. Oxford Forestry
Institute, Oxford.
Gregory-Wodzicki, K.M. (2000) Uplift history of the Central
and Northern Andes: a review. Geological Society of America
Bulletin, 112, 1091–1105.
Hardesty, B.D., Dick, C.W., Hamrick, J.L., Degen, B., Hubbell,
S.P. & Bermingham, E. (2010) Geographic influence on genetic
structure in the widespread Neotropical tree Simarouba amara
(Simaroubaceae). Tropical Plant Biology, 3, 28–39.
Hijmans, R.J., Cameron, S.E., Parra, J.L., Jones, P.G. & Jarvis,
A. (2005) Very high resolution interpolated climate surfaces
for global land areas. International Journal of Climatology,
25, 1965–1978.
Hoorn, C., Wesselingh, F.P., ter Steege, H., Bermudez, M.A.,
Mora, A., Sevink, J., Sanmartın, I., Sanchez-Meseguer, A.,
Anderson, C.L., Figueiredo, J.P., Jaramillo, C., Riff, D.,
Negri, F.R., Hooghiemstra, H., Lundberg, J., Stadler, T.,
Sarkinen, T. & Antonelli, A. (2010) Amazonia through time:
Andean uplift, climate change, landscape evolution, and
biodiversity. Science, 330, 927–931.
Hubbell, S.P., He, F., Condit, R., Borda-de-Agua, L., Kellner, J.
& ter Steege, H. (2008) How many tree species are there in
the Amazon and how many of them will go extinct? Pro-
ceedings of the National Academy of Sciences USA, 105,
11498–11504.
Johnston, I.M. (1935) Studies in the Boraginaceae XI. (1) The
species of Tournefortia and Esserschmidtia in the Old World.
(2) Notes on Brand’s treatment of Cryptantha. (3) New or
otherwise noteworthy species. Journal of the Arnold Arbo-
retum, 16, 145–205.
Johnston, I.M. (1950) Studies in the Boraginaceae XIX. 1.
Noteworthy species from tropical America. 2. Cordia section
Gerascanthus in Mexico and Central America. Journal of the
Arnold Arboretum, 31, 172–187.
Krebs, C.J. (1989) Ecological methodology. Harper & Row, New
York.
P. D. Rymer et al.
704 Journal of Biogeography 40, 693–706ª 2012 Blackwell Publishing Ltd
Kress, W.J., Wurdack, K.J., Zimmer, E.A., Weigt, L.A. & Jan-
zen, D.H. (2005) Use of DNA barcodes to identify flowering
plants. Proceedings of the National Academy of Sciences USA,
102, 8369–8374.
Lemes, M., Dick, C., Navarro, C., Lowe, A., Cavers, S. & Gribel,
R. (2010) Chloroplast DNA microsatellites reveal contrast-
ing phylogeographic structure in mahogany (Swietenia
macrophylla King, Meliaceae) from Amazonia and Central
America. Tropical Plant Biology, 3, 40–49.
Lynch, M. & Milligan, B.G. (1994) Analysis of population genetic
structure with RAPD markers. Molecular Ecology, 3, 91–99.
Malhi, Y. & Phillips, O.L. (2004) Tropical forests and global
atmospheric change: a synthesis. Philosophical Transactions
of the Royal Society B: Biological Sciences, 359, 549–555.
Mantel, N. (1967) The detection of disease clustering and a
generalized regression approach. Cancer Research, 27, 209–220.
Miller, J.S. (1985) Systematics of the genus Cordia (Boragina-
ceae) in Mexico and Central America. University Saint Louis,
St Louis, MO.
Miller, J.S. (2001) New Boraginaceae from Tropical America 4:
three new species of Cordia from South America. Novon, 11,
421–428.
Miller, J.S. & Gottschling, M. (2007) Generic classification in
the Cordiaceae (Boraginales): resurrection of the genus
Varronia P. Br. Taxon, 56, 163–169.
Muellner, A.N., Pennington, T.D. & Chase, M.W. (2009)
Molecular phylogenetics of Neotropical Cedreleae (mahog-
any family, Meliaceae) based on nuclear and plastid DNA
sequences reveal multiple origins of ‘‘Cedrela odorata’’.
Molecular Phylogenetics and Evolution, 52, 461–469.
Nei, M. (1978) Estimation of average heterozygosity and
genetic distance from a small number of individuals.
Genetics, 89, 583–590.
Peakall, R. & Smouse, P.E. (2006) genalex 6: genetic analysis
in Excel. Population genetic software for teaching and
research. Molecular Ecology Notes, 6, 288–295.
Pennington, R.T., Prado, D.E. & Pendry, C.A. (2000) Neo-
tropical seasonally dry forests and Quaternary vegetation
changes. Journal of Biogeography, 27, 261–273.
Pennington, R.T., Lavin, M. & Oliveira-Filho, A. (2009)
Woody plant diversity, evolution, and ecology in the
tropics: perspectives from seasonally dry tropical forests.
Annual Review of Ecology, Evolution, and Systematics, 40,
437–457.
Pitman, N.C.A., Terborgh, J., Silman, M.R., Nunez, P.V., Neill,
D.A., Ceron, C.R., Palacios, W.A. & Aulestia, M. (2001)
Dominance and distribution of tree species in upper Ama-
zonian terra firme forests. Ecology, 82, 2101–2117.
Prance, G.T. (1974) Phytogeographic support for the theory of
Pleistocene forest refuges in the Amazon Basin, based on
evidence from distribution patterns in Caryocaraceae,
Chrysobalanaceae, Dichapetalaceae and Lecythidaceae. Acta
Amazonica, 3, 5–28.
Pritchard, J.K., Stephens, M. & Donnelly, P. (2000) Inference
of population structure using multilocus genotype data.
Genetics, 155, 945–959.
Rymer, P.D., Manning, J.C., Goldblatt, P., Powell, M.P. &
Savolainen, V. (2010) Evidence of recent and continuous
speciation in a biodiversity hotspot: a population genetic
approach in southern African gladioli (Gladiolus; Iridaceae).
Molecular Ecology, 19, 4765–4782.
Rzedowski, J. (1981) Vegetacion de Mexico. Limusa, Mexico.
Sebbenn, A.M., Boshier, D.H., Freitas, M.L.M., Zanatto,
A.C.S., Sato, A.S., Ettori, L.C. & Moraes, E. (2007) Results of
an international provenance trial of Cordia alliodora in Sao
Paulo, Brazil at five and 23 years of age. Silvae Genetica, 56,
110–117.
Simpson, G.G. (1940) Mammals and land bridges. Journal of
the Washington Academy of Sciences, 30, 137–163.
Tnah, L.H., Lee, S.L., Ng, K.K.S., Tani, N., Bhassu, S. & Oth-
man, R.Y. (2009) Geographical traceability of an important
tropical timber (Neobalanocarpus heimii) inferred from
chloroplast DNA. Forest Ecology and Management, 258,
1918–1923.
Urbatsch, L.E., Baldwin, B.G. & Donoghue, M.J. (2000) Phy-
logeny of the coneflowers and relatives (Heliantheae:
Asteraceae) based in nuclear rDNA internal transcribed
spacer (ITS) sequences and chloroplast DNA restriction site
data. Systematic Botany, 25, 539–565.
Weeks, A., Baird, K.E. & McMullen, C.K. (2010) Origin
and evolution of endemic Galapagos Varronia species
(Cordiaceae). Molecular Phylogenetics and Evolution, 57,
948–954.
Weising, K. & Gardner, R.C. (1999) A set of conserved PCR
primers for the analysis of simple sequence repeat poly-
morphisms in chloroplast genomes of dicotyledonous
angiosperms. Genome, 42, 9–19.
White, T.J., Bruns, T., Lee, S. & Taylor, J. (1990) Amplification
and direct sequencing of fungal ribosomal RNA genes for
phylogenetics. PCR protocols: a guide to methods and appli-
cation (ed. by M. Innis, D. Gelfand, J. Sninsky and T.
White), pp. 315–322. Academic Press, San Diego, CA.
Wright, S. (1943) Isolation by distance. Genetics, 28, 114–138.
SUPPORTING INFORMATION
Additional Supporting Information may be found in the
online version of this article:
Appendix S1 Tables of cpSRR sampling, genetic clustering
and haplotypes, and sampling for DNA sequence analyses.
Appendix S2 Figures of rainfall seasonality and sampled
populations and population groups.
Appendix S3 Tables of cpSRR estimated diversity for pop-
ulation groups, geographic regions, genetic clusters and rainfall
seasonality.
As a service to our authors and readers, this journal provides
supporting information supplied by the authors. Such mate-
rials are peer-reviewed and may be re-organized for online
delivery, but are not copy-edited or typeset. Technical support
issues arising from supporting information (other than
missing files) should be addressed to the authors.
Phylogeography of a widespread tropical tree species
Journal of Biogeography 40, 693–706 705ª 2012 Blackwell Publishing Ltd
BIOSKETCH
Paul Rymer’s research interests are in understanding the evolutionary ecology of native populations and their capacity to respond
to changing environments. He combines classical and novel ecological and molecular techniques to explore plant mating patterns,
hybridization and local adaptation, and how these factors drive and erode species diversity.
The authors worked together as part of the SEEDSOURCE consortium that aims to provide best-practice policies for sourcing tree
germplasm for use within a range of degraded landscapes, in order to ensure the use of the best-adapted material that maximizes
production without eroding genetic and ecosystem diversity and long-term adaptive potential.
Author contributions: P.R. and C.D. carried out the DNA work, genetic analysis and writing; G.V. and A.B. generated the cpSSR data
set and preliminary analyses and provided revision of the manuscript; D.B. initiated this project, and provided samples and expert
guidance on the biological system and writing. All authors read and approved the final manuscript.
Editor: Malte Ebach
This Special Issue was motivated by research undertaken by partners in the SEEDSOURCE consortium (http://www.seed-
source.net), a collaborative project funded by the European Commission under FP6. The project aimed to establish the evolutionary
basis and geographic distribution of genetic variation in a range of important Neotropical tree species, for better sourcing and
control of germplasm and forest conservation.
P. D. Rymer et al.
706 Journal of Biogeography 40, 693–706ª 2012 Blackwell Publishing Ltd


