Embed Size (px)
Citation preview

Risk Assessment of Norovirus on Shellfish from
Indonesian Fish Markets
By
Radestya Triwibowo
B.Sc. Aquatic Resource Management
Padjadjaran University, Indonesia, 2005
Submitted in fulfilment of the requirements for the Doctor of Philosophy
University of Tasmania, October, 2019

i
Declaration of Originality
"This thesis contains no material which has been accepted for a degree or diploma by the University
or any other institution, except by way of background information and duly acknowledged in the
thesis, and to the best of my knowledge and belief no material previously published or written by
another person except where due acknowledgement is made in the text of the thesis, nor does the
thesis contain any material that infringes copyright.”
Radestya Triwibowo October 2019
Authority of Access
This thesis may be made available for loan and limited copying in accordance with the Copyright Act
1968.
Radestya Triwibowo October 2019
ii
Statement of Co-Authorship
This thesis comprises of work that has been prepared to be submitted to journals. Information for
each chapter is provided in the section of communications arising from this thesis.
The following people and institutions contributed to the publication and preparation of the work
undertaken as part of this thesis:
Radestya Triwibowo, Tasmanian Institute of Agriculture, University of Tasmania (Candidate)
Tom Ross, Tasmanian Institute of Agriculture, University of Tasmania (Supervisor)
Shane M. Powell, Tasmanian Institute of Agriculture, University of Tasmania (Co-Supervisor)
Chawalit Kocharunchitt, Tasmanian Institute of Agriculture, University of Tasmania (Co-Supervisor)

Communication Arising from this Thesis
Prepared paper for publications
Triwibowo, R., Powell, S., Kocharunchitt, C., and Ross, T. Improving molecular quantification of viable
MS2 bacteriophage: a Norovirus surrogate for inactivation studies.
Journal article in preparation.
Author 1 contributed 70% (designed the experiment, optimized the improved method, conducted
laboratory analysis, analysed the data and wrote the manuscript), author 2, 3 and 4 each
contributed 10% (provided suggestion for the experimental design, contributed to the development
of molecular method and provided input for the manuscript).
We the undersigned agree with the above stated "proportion of work undertaken" for the above
prepared peer-reviewed manuscript contribute to this thesis.
Signed
(Prof. Tom Ross)
Primary Supervisor
Tasmanian Institute of Agriculture
University of Tasmania
Date: February 27th, 2019
(Prof. Holger Meinke)
Director
Tasmanian Institute of Agriculture
University of Tasmania
iii

iv
Presentations from this thesis
1. Triwibowo, R., Powell, S., Kocharunchitt, C., and Ross, T. 2016. Improving quantification of MS2
bacteriophage: a norovirus surrogate. 4th Asia-Pacific International Food Safety Conference & 7th
Asian Conference on Food and Nutrition Safety, October 11 – 13, 2016, Penang, Malaysia.
(Poster presentation).
2. Triwibowo, R., Ross, T., Powell, S., and Kocharunchitt, C. 2017. The application of enzymatic pre-
treatment to improve PCR assay quantification of NoV surrogate. The Australian Society for
Microbiology (ASM) Conference, July 2 – 5, 2017, Hobart, Australia. (Oral presentation)
3. Triwibowo, R., Kocharunchitt, C., Powell, S., and Ross, T. 2018. Prevalence of norovirus (NoV) GII
in shellfish from Indonesian fish markets. The New Zealand Institute of Food Science and
Technology (NZIFST) Annual Conference, July 3 – 5, 2018, Hamilton, New Zealand. (Poster
presentation).

v
Acknowledgment
I would like to express my deep gratitude to the following people who contributed to this thesis and
supported me along the way.
First and foremost, I would like to thank my supervisors Prof. Tom Ross, Dr. Shane Powell and Dr.
Chawalit ‘Jay’ Kocharunchitt of the Tasmanian Institute of Agriculture (TIA) for sharing their
extensive knowledge and experience on food microbiology and food safety with me. I deeply thank
them for the countless time they spent to guide my research, for their patient and understanding,
and for their support in every aspect of my PhD journey.
I thank the director of the Research and Development Centre for Marine and Fisheries Product
Processing and Biotechnology (RDCMFPPB), the Indonesian Ministry of Marine Affairs and Fisheries,
Prof. Hari Eko Irianto as well as the former directors, Prof. Agus Heri Purnomo and Ir. Nugroho Aji,
MSi for their support during my study. To my fellow research scientists at the fisheries safety
research group; and to Research Professor Dr. Endang Sri Heruwati who inspire me to keep learning
on new things. Many thanks to the technical and non-technical staffs of Microbiology and
Biotechnology Laboratories at the RDCMFPPB; Mr. Budi, Mr Iksan Darmawan, Ms Anggi Musvita.
I would also like to acknowledge the Australia Awards Scholarship (AAS) and TIA scholarship that
provided financial support during my study.
I had great pleasure to work with Mr. Adam Smolenski and Ms. Sharee McCammon of the Molecular
Laboratory, the Central Science Laboratory (CSL). I thank them for their kind assistance during my
laboratory work. I thank Ms. Michelle Williams, Mr. Anthony Baker, Ms. Lauri Parkinson and Ms.
Joanne Pagnon of TIA Microbiology Research Laboratory for their support throughout the years.
My sincere gratitude to Honorary Professor, Dr. David Ratkowsky of TIA for his guidance and insight
on mathematic and statistics; and to Prof. John Bowman of the Centre of Food Safety and Innovation
(CFSI) for his ideas and suggestions about my research as well as his support on the technical
matters of my laboratory work. It has been an honour for me to know them in person.
I would like to extend my appreciation to the members of CFSI, TIA. Prof. Mark Tamplin, Prof.
Thomas McMeekin, Dr. Mandeep Kaur, Dr. Ross Corkrey, Dr. Alieta Eyles, Dr. Lyndall Mellefont. And
to the other PhD candidates at CFSI, Ms. Akhikun Nahar, Ms. Fera Roswita Dewi, Ms. Kaniz Mohsina,
Mr. Kayode Adu, Mr. Tai Gardner, Dr. Tuflikha Putri, Ms. Vongai Dakwa, Mr. Zachary Block; as well as
my PhD office-mates Ms. Elya Richardson, Ms. Gail Gnoinski, Mr. Ha Duong-Nam, Mr. Sohail Ayyaz,
and Mr. Quang Truong. From these people, I learned enormous experience that comes from
different perspectives and backgrounds.

vi
My study at the University of Tasmania will not be as smooth without assistance from the former
and current graduate research coordinators; A/Prof. Aduli Malau-Aduli, A/Prof. Calum Wilson and
Dr. Lana Shabala, as well as the research development advisor, Ms. Brooke Vanderlaan. I also thank
Mr. Christopher Dillon, Ms. Andrea Riseley, Ms. Kathleen Hinds, and Ms. Sharmila Prajit of the UTAS
International Scholarship Officer; Ms. Chantal Woodhams, Ms. Amanda Winter and Ms. Tina Bailey
of TIA; Ms. Morag Porteous and Mrs. Louise Oxley of UTAS Student Learning; Ms. Heather Mitchell
as the research librarian; who provided academic and technical supports throughout my study.
Thanks should also go to my friends at the TUU Moslem Society, the Tasmanian Indonesian Student
Association and my fishing buddies (Aswardi, Purwadi, Alba, Arie, Andika, Andrew, Wajiran) who
made my stay in Hobart more fun and memorable.
I deeply thank my parents and my parents-in-law, Meidy Hermawan, Bambang Widjoseno,
Rumartiatun, Ghozali, Suliyati, for their advice, endless supports and prayers. I am very blessed to
have continuous supports from my brothers and sisters, Ratih, Anung, Dipto, Ratri, Yuntha, Uci, Sita,
Ami, Puput, Hendra, Tria, Anis, Anas, as well as from my nieces and nephews.
Finally, yet importantly, I want to thank my wife, Novalia Rachmawati, the best companion in this
PhD journey and the best partner to share my ideas about work and life adventure. She deserves my
deepest gratitude for her patience, love and prayers during our past, present and future journey.

vii
Table of Content
Declaration of Originality .............................................................................................................. i
Statement of Co-Authorship ......................................................................................................... ii
Communication Arising from this Thesis ...................................................................................... iii
Acknowledgment ......................................................................................................................... v
Table of Content ........................................................................................................................ vii
List of Figures ............................................................................................................................. xii
List of Tables .............................................................................................................................. xv
List of Abbreviations ................................................................................................................. xvii
Abstract ..................................................................................................................................... xx
Chapter 1. Literature review .................................................................................................... 1
1.1. Introduction .................................................................................................................................. 1
1.1.1. Human enteric viruses .......................................................................................................... 3
1.1.2. Human norovirus .................................................................................................................. 5
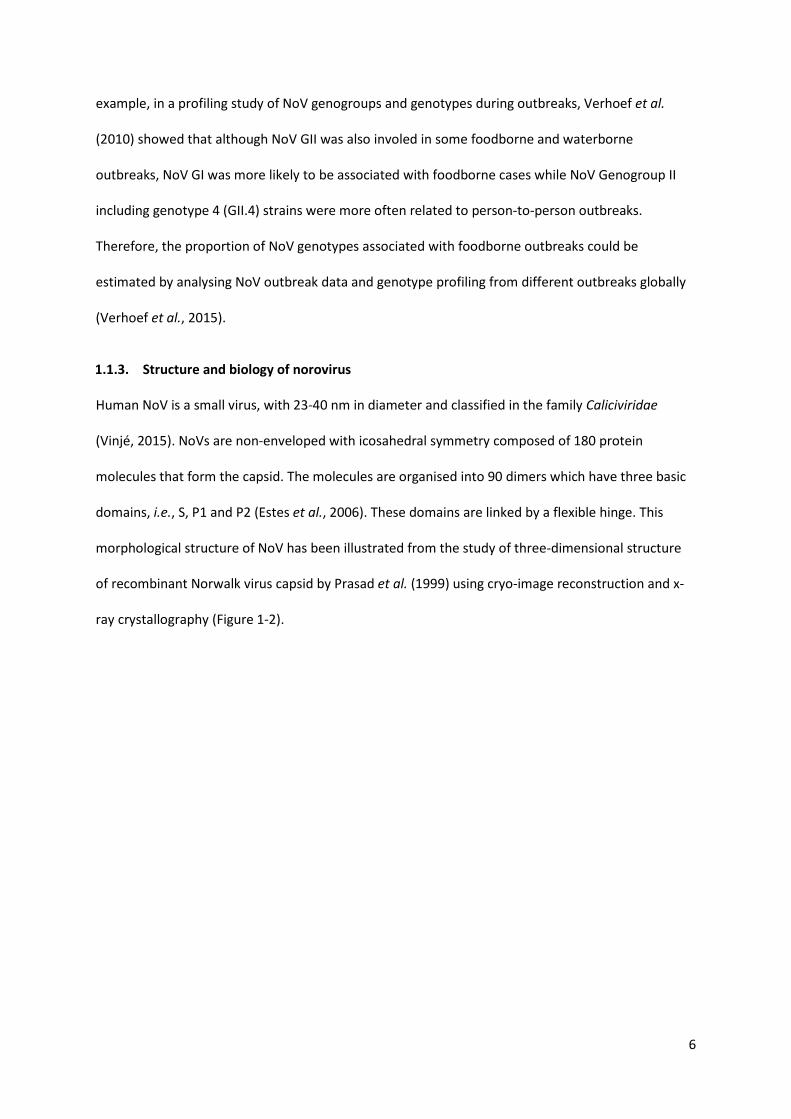
1.1.3. Structure and biology of norovirus ....................................................................................... 6
1.1.4. Foodborne norovirus related diseases ................................................................................. 9
1.1.5. NoV in shellfish ................................................................................................................... 10
1.2. Bivalve molluscan shellfish ......................................................................................................... 10
1.2.1. Biology of shellfish .............................................................................................................. 10
1.2.2. Shellfish production ............................................................................................................ 11
1.2.3. Shellfish in Indonesia .......................................................................................................... 12
1.3. Detection and quantification methods for noroviruses ............................................................. 15
viii
1.3.1. Primer sequences for detection, genotyping and quantification of NoV by RT-qPCR ....... 16
1.3.2. Sample pre-treatment in NoV inactivation studies to differentiate infectious/non-
infectious viruses ................................................................................................................ 20
1.4. Inactivation of human NoV in shellfish ....................................................................................... 22
1.4.1. NoV inactivation studies using surrogates ......................................................................... 22
1.4.2. Chlorination ........................................................................................................................ 24
1.4.3. High temperature treatment .............................................................................................. 25
1.4.4. Mathematical modelling on virus inactivation ................................................................... 25
1.5. Risk assessment of human NoV in shellfish ................................................................................ 29
1.6. Thesis objectives ......................................................................................................................... 29
Chapter 2. Improving molecular quantification of infectious MS2 bacteriophage: A norovirus
surrogate for inactivation studies ................................................................................... 31
2.1. Introduction ................................................................................................................................ 31
2.2. Materials and methods ............................................................................................................... 33
2.2.1. MS2 bacteriophage stock production................................................................................. 33
2.2.2. Quantification of MS2 ......................................................................................................... 34
2.2.2.1. Plaque assay .................................................................................................................. 34
2.2.2.2. RT-qPCR development ................................................................................................... 34
2.2.3. Preliminary experiment ...................................................................................................... 36
2.2.4. Development of pre-treatment for RT-qPCR ...................................................................... 37
2.2.5. Application of pre-treatment RT-qPCR for inactivation studies ......................................... 37
2.3. Results ......................................................................................................................................... 38
2.3.1. The correlation between plaque assay and RT-qPCR ......................................................... 38
2.3.2. Effect of different pre-treatments on the quantification of mixtures of infectious and non-
infectious MS2 .................................................................................................................... 39
2.3.3. The application of RT-qPCR with pre-treatment in inactivation study ............................... 42
2.4. Discussion ................................................................................................................................... 44
ix
2.5. Conclusions ................................................................................................................................. 49
Chapter 3. Thermal inactivation kinetics of Human norovirus and MS2 bacteriophage in
buffered media and bioaccumulated Tasmanian Blue Mussel (Mytilus galloprovincialis) . 50
3.1. Introduction ................................................................................................................................ 50
3.2. Materials and methods ............................................................................................................... 52
3.2.1. NoV stock preparation ........................................................................................................ 52
3.2.2. MS2 bacteriophage stock production................................................................................. 53
3.2.3. Bioaccumulation in mussels ............................................................................................... 53
3.2.4. Thermal inactivation in buffered media ............................................................................. 54
3.2.5. Thermal inactivation in mussel matrix ............................................................................... 56
3.2.6. Enumeration of NoV and MS2 ............................................................................................ 56
3.2.6.1. Virus concentration ....................................................................................................... 56
3.2.6.2. Enzymatic pre-treatment prior to RNA extraction ........................................................ 57
3.2.6.3. Quantification of infectious NoV by RT-qPCR assay ...................................................... 57
3.2.6.4. Quantification of infectious MS2 by plaque assay ........................................................ 58
3.2.7. Modelling of thermal inactivation kinetics ......................................................................... 58
3.2.8. Statistical analysis ............................................................................................................... 59
3.3. Results ......................................................................................................................................... 60
3.3.1. Bioaccumulation of NoV and MS2 in mussel ...................................................................... 60
3.3.2. Thermal inactivation of NoV and MS2 ................................................................................ 61
3.3.3. Model fitting and comparison ............................................................................................ 61
3.3.4. The z curves of NoV and MS2 thermal inactivation............................................................ 67
3.4. Discussion ................................................................................................................................... 71
3.5. Conclusions ................................................................................................................................. 74
Chapter 4. Chlorine dioxide inactivation of NoV and MS2 in buffered media and artificially
contaminated Tasmanian Blue Mussels (Mytilus galloprovincialis) tissue ........................ 76

x
4.1. Introduction ................................................................................................................................ 76
4.2. Materials and methods ............................................................................................................... 79
4.2.1. Mussels preparation and artificial contamination. ............................................................ 79
4.2.2. Chlorine dioxide treatments ............................................................................................... 79
4.2.3. Analysis of ClO2 residue by Palintest kit ............................................................................. 81
4.2.4. Virus and bacteriophage purification ................................................................................. 81
4.2.5. Enumeration of MS2 by plaque assay ................................................................................ 81
4.2.6. Virus pre-treatment and RNA extraction ............................................................................ 81
4.2.7. Enumeration of NoV by RT-qPCR ........................................................................................ 81
4.2.8. Modelling and statistical analysis of ClO2 inactivation kinetics .......................................... 82
4.3. Results ......................................................................................................................................... 83
4.3.1. ClO2 decay in buffered media and mussel matrix .............................................................. 83
4.3.2. The efficacy of ClO2 treatment on NoV and MS2 in buffered media ................................. 85
4.3.3. The efficacy of ClO2 treatment on NoV and MS2 in mussel matrix .................................... 87
4.4. Discussion ................................................................................................................................... 90
4.5. Conclusion .................................................................................................................................. 94
Chapter 5. Risk assessment of NoV GII in shellfish from Indonesian fish markets .................... 96
5.1. Introduction ................................................................................................................................ 96
5.2. Materials and methods ............................................................................................................... 98
5.2.1. Sample collection from Indonesian fish markets in Jakarta and Panimbang. .................... 98
5.2.2. Viral extraction and purification from shellfish digestive tissues ..................................... 100
5.2.3. Plaque assay method to determine viral extraction efficiency ........................................ 100
5.2.4. RNase pre-treatment and RNA extraction ........................................................................ 100
5.2.5. Enumeration of NoV by RT-qPCR ...................................................................................... 101
5.2.6. Statistical analysis ............................................................................................................. 102
5.2.7. Genotyping ....................................................................................................................... 102

xi
5.2.8. Quantitative risk assessment of NoV in shellfish from Indonesian markets .................... 103
5.3. Results ....................................................................................................................................... 106
5.3.1. NoV exposure from shellfish from Indonesian fish markets ............................................ 106
5.3.1.1. The efficiency of virus extraction and RNase pre-treatment process ......................... 107
5.3.1.2. NoV prevalence and enumeration in the shellfish from Indonesian fish markets ...... 108
5.3.2. Genotyping of NoV GII isolated from contaminated shellfish .......................................... 109
5.4. Discussion ................................................................................................................................. 110
5.4.1. Prevalence and contamination levels of NoV in shellfish from Indonesian fish markets 110
5.4.2. Quantitative Risk Assessment of NoV in Shellfish from Indonesian markets ................... 112
5.4.2.1. Hazard identification ................................................................................................... 112
5.4.2.2. Exposure assessment ................................................................................................... 113
5.4.2.3. Hazard characterisation ............................................................................................... 115
5.4.2.4. Risk characterisation .................................................................................................... 118
5.4.2.5. Limitations of the risk assessment and future recommendations .............................. 120
5.5. Conclusion ................................................................................................................................ 123
Chapter 6. General discussion and conclusions ..................................................................... 124
6.1. General discussion .................................................................................................................... 124
6.2. Conclusion ................................................................................................................................ 133
Bibliography ............................................................................................................................ 135

xii
List of Figures
Figure 1-1. Immuno-electron micrograph of NoV in stool samples (reproduced from Kapikian et al.
(1972)). ....................................................................................................................................... 5
Figure 1-2. Illustration of cryo-image reconstruction (A) and x-ray crystallography (B) of recombinant
Norwalk virus capsid structure; and three ribbon-protein domains (C) (reproduced from
Prasad et al. (1999)). ................................................................................................................... 7
Figure 1-3. The NoV genome (reproduced from Karst et al. (2014)). ..................................................... 8
Figure 1-4. Schematic representation of the NoV genome representing five regions frequently used
for detection and genotyping study (reproduced from Mattison et al. (2009)). ....................... 8
Figure 1-5. Shellfish from Bivalvia Class (reproduced from Gosling (2015)) ........................................ 11
Figure 1-6. Indonesia shellfish production from 2002-2011 (reproduced from FAO (2015)) .............. 13
Figure 1-7. The target sequences of ORF 1, ORF1-ORF2 junction and ORF2 for the detection of NoV GI
and GII genogroups (reproduced from Stals et al. (2012b)). .................................................... 16
Figure 2-1. Melt curve analysis of the standard and samples (A); and standard curve MS2 plasmid
from RT-qPCR assay generated from Rotor Gene 3000 (B) ...................................................... 38
Figure 2-2. The linear correlation between plaque assay and RT-qPCR on the quantification of
infectious MS2 .......................................................................................................................... 39
Figure 2-3. Comparison of RT-qPCR with no pre-treatment (■) and the plaque assay (▧) on the
quantification of infectious MS2 after heat treatment at 72°C (A) and chlorination with 0.5
ppm of ClO2 (B) with LOQ of RT-qPCR (―) and plaque assay (- -). ........................................... 40
Figure 2-4. Quantification of heat-inactivated MS2 with and without enzyme (RNase+RNasin, RNase
or TaqI) pre-treatment analysed by RT-qPCR(■) and plaque assay (▧) with LOQ of RT-qPCR
(―) and plaque assay (- -). ........................................................................................................ 41

xiii
Figure 2-5. MS2 inactivation by heat treatment at 72°C over 40 min as analysed by RT-qPCR without
(☐) or with RNase+RNasin pre-treatment () compared to the plaque assay () with LOQ of
RT-qPCR (―) and plaque assay (- -). ......................................................................................... 43
Figure 2-6. MS2 inactivation by exposure to different concentration of chlorine dioxide for 5 min at
25°C, analysed by RT-qPCR without (□) or with RNase+RNasin treatment (■) and plaque
assay (). ................................................................................................................................. 43
Figure 3-1. Acclimatisation and bioaccumulation process of Tasmanian Blue Mussel (Mytilus
galloprovincialis) ....................................................................................................................... 55
Figure 3-2. Thermal inactivation curves of NoV at 60 (A); 72 (B) and 90°C (C) in buffered media fitted
with Log linear-tailing (…), Weibull ( ̶ ̶ ̶ ) and Biphasic ( —) model. .................................... 63
Figure 3-3. Thermal inactivation curves of MS2 at 60 (A); 72 (B) and 90°C (C) in buffered media fitted
with Log linear-tailing (…), Weibull ( ̶ ̶ ̶ ), Weibull-tailing ( ̶ · ̶ ) and Biphasic ( —) model. 64
Figure 3-4. Thermal inactivation curves of NoV at 60 (A); 72 (B) and 90°C (C) in mussel matrix fitted
with Log linear-tailing (…), Weibull ( ̶ ̶ ̶ ) , Weibull-tailing ( ̶ · ̶ ) and Biphasic ( —) model.
.................................................................................................................................................. 65
Figure 3-5. Thermal inactivation curves of MS2 at 60 (A); 72 (B) and 90°C (C) in mussel matrix fitted
with Log linear-tailing (…), Log linear-shoulder-tailing (xxx), Weibull-tailing ( ̶ · ̶ ), Two-
mixed Weibull (═), Biphasic (—) and Biphasic-shoulder (○○○) model .............................. 66
Figure 3-6. Predicted general z curves in buffered media (—) and mussel matrix (…) of NoV (A) and
MS2 (B) in buffer (▲) and mussel matrix (□) at different temperatures. .............................. 70
Figure 3-7. Predicted specific z curves in buffered media (—) and mussel matrix (…)of NoV (A) and
MS2 (B) in buffer (▲) and mussel matrix (□) at different temperatures. .............................. 71

xiv
Figure 4-1. The observed () and predicted (---) values of ClO2 residue (C) (from (a) 10, (b) 20, and
(c) 40 ppm treatment at 20°C for different exposure times in buffered media. ..................... 84
Figure 4-2. The observed () and predicted (---) values of ClO2 residue (C) from (a) 10, (b) 20, and (c)
40 ppm treatment at 20°C for different exposure times in mussel matrix. ............................. 85
Figure 4-3. The log reductions (Log10(N/N0)) curves of NoV in the buffered media fitted using Hom
(…), Weibull (---), and Biphasic model (—) treated with 10 (▲), 20 (○), and 40 (◆)ppm ClO2
for different exposure times ..................................................................................................... 87
Figure 4-4. The log reductions (Log10(N/N0)) curves of MS2 in the buffered media fitted using Hom
(…), Weibull (---), and Biphasic model (—) treated with 10 (▲), 20 (○), and 40 (◆) ppm ClO2
for different exposure times ..................................................................................................... 87
Figure 4-5. The log reductions (Log10(N/N0)) curves of NoV in the mussel fitted using Hom (…),
Weibull (---), and Biphasic model (—) treated with 10 (▲), 20 (○), and 40 (◆) ppm ClO2 for
different exposure times .......................................................................................................... 88
Figure 4-6. The log reductions (Log10(N/N0))curves of MS2 in the mussel fitted using Hom (…),
Weibull (---), and Biphasic model (—) treated with 10 (▲), 20 (○), and 40 (◆) ppm ClO2 for
different exposure times .......................................................................................................... 89
Figure 5-1. Shellfish sampling locations in Jakarta and Panimbang ..................................................... 99
Figure 5-2. Shellfish species collected from Indonesian fish markets ................................................ 107
Figure 5-3. Phylogenetic tree of NoV GII detected from contaminated samples of Indonesian shellfish
................................................................................................................................................ 110
xv
List of Tables
Table 1-1. Standard quality for live shellfish and its processed products for direct consumption
(MMAF Indonesia, 2004) .......................................................................................................... 15
Table 1-2. Set of primer sequences for detection (D), genotyping (G) and quantification (Q)of NoV GI
and GII by RT PCR assay ............................................................................................................ 17
Table 3-1. Contact times of thermal inactivation at different temperatures. ...................................... 56
Table 3-2. The concentration of NoV and MS2 in seawater and mussel after bioaccumulation process
for 12 and 24 h.......................................................................................................................... 60
Table 3-3. The predicted time to log reduction at D, 2D and 4D and the calculated RMSE values from
the thermal inactivation curves of NoV in different matrices fitted by Log Linear, Weibull and
Biphasic models. ....................................................................................................................... 68
Table 3-4. The predicted time to log reduction at D, 2D and 4D and the calculated RMSE values from
the thermal inactivation curves of MS2 in different matrices fitted by Log Linear, Weibull and
Biphasic models. ....................................................................................................................... 68
Table 4-1. Exposure time of ClO2 treatment at different concentrations ............................................ 80
Table 4-2. The RMSE and R2 values of the ClO2 inactivation models of Hom, Weibull and Biphasic ... 86
Table 4-3. The average of observed maximum reduction of NoV and MS2 treated by ClO2 exposed for
certain periods .......................................................................................................................... 90
Table 5-1. The parameter utilised in the risk assessment to estimate the dose per serving, the
probability of illness and the number of NoV cases per year ................................................ 105
Table 5-2. The numbers of shellfish samples from Jakarta and Panimbang fish markets in 2016 and
2017 ........................................................................................................................................ 106
Table 5-3. The average extraction efficiency of MS2 as a control per batch...................................... 107

xvi
Table 5-4. NoV prevalence in the shellfish samples from Indonesian fish markets according to species
................................................................................................................................................ 108
Table 5-5. NoV prevalence in the shellfish samples from Indonesian fish markets according to
sampling sites ......................................................................................................................... 108
Table 5-6. NoV concentration in contaminated shellfish at traditional markets in Jakarta according to
species .................................................................................................................................... 109
Table 5-7. Assumptions on the proportion of shellfish cooked by different methods ....................... 115
Table 5-8. Input parameters for the deterministic QRA to estimate the risk of NoV in shellfish from
Indonesian fish markets.......................................................................................................... 117
Table 5-9. The NoV-illness cases per year estimated based on the assumption of the most common
shellfish cooking methods in Indonesia with the worst-cases scenario ................................. 119
Table 5-10. The estimated and reported attack rate of enteric virus due to shellfish consumption in
different scenario in one-year period ..................................................................................... 120

xvii
List of Abbreviations
ASP Amnesic Shellfish Poison
BIOHAZ Biological Hazard
Bps Base pairs
BSN Badan Standarisasi Nasional [National Standardization Agency of Indonesia]
CaCl2 Calcium Chloride
CFU Colony Forming Unit
ClO2 Chlorine dioxide
Ct value Cycle threshold value of real-time PCR
ddH2O Double-distilled water
DEPC Diethyl Pyrocarbonate
DT Digestive tissues
D value Time required to a log10 reduction (min)
E. coli Escherichia coli
EFSA European Food Safety Authority
FAO Food Agriculture Organization of United Nations
FAOSTAT FAO Statistic database
FCV Feline Calicivirus
GHP Good Handling Practices
GMP Good Manufacturing Practices
GII Genogroups II
HAV Hepatitis A Virus
HBGAs Histo-Blood Group Antigens
HEV Hepatitis E Virus
HPP High Pressure Processing

xviii
ISC RT-qPCR In Situ Capture Reverse Transcription Quantitative Polymerase Chain Reaction
Kb Kilobases
LAMP Loop-Mediated Isothermal Amplification
LB Lactose Broth
LTFC Long-Term Facilities Care
MIQE Minimum Information for publication of Quantitative Real-Time PCR Experiments
MMAF Ministry of Marine Affairs and Fisheries of Republic Indonesia
MNV Murine Norovirus
MPN Most Probable Number
MS2 MS2 bacteriophage
NoV Norovirus
ORF Open Reading Frames
P1 Protruding 1 domain of viral protein
P2 Protruding 2 domain of viral protein
PCR Polymerase Chain Reaction
PFU Plaque Forming Unit
PGM-MB Porcine Gastric Mucin-conjugated Magnetic Beads
PMA Propidium Monoazide
PMAxxTM Improved version of PMA by Biotium®
PSP Paralytic Shellfish Poison
P (value) Probability value or significance
PV Poliovirus
QMFSRA Quantitative Microbial Food Safety Risk Assessment
QMRA Quantitative Microbial Risk Assessment
R2 The coefficient of determination

xix
RdRp RNA-dependent RNA polymerase
RMSE Root Mean Square Error
RNA Ribonucleic Acid
RNase Ribonuclease
RNasin Ribonuclease Inhibitor
RT-qPCR Reverse Transcription Quantitative Polymerase Chain Reaction
S Shell domain of viral protein
SaV Sapovirus
SMV Snow Mountain Virus
SNI Standar Nasional Indonesia [Indonesian National Standard]
SSOP Sanitation Standard Operational Procedure
TaqI a restriction enzyme isolated from the bacterium Thermus aquaticus
TE Tris EDTA
TIA Tasmanian Institute of Agriculture
TuV Tulane Virus
UV Ultra Violet
VLPs Virus-like particles
VP1 Viral Protein of major capsid
VP2 Viral Protein of minor capsid
VPg Viral Protein genome-linked
WWF Word Wide Fund for Nature
z value Changes in temperature needed to produce 90% change in the reduction rate (D value)

xx
Abstract
Norovirus (NoV) infection is estimated to cause almost 20% of acute gastroenteritis cases
worldwide. Infants, the elderly and the immunocompromised are those most susceptible to NoV
infection. NoV is known to be persistent in the environment for long periods (60-80 days at 25°C), is
infectious at low doses (at 8 – 2,800 viral particles), can be shed at high concentration (up to 109-1011
viral copies per gram faeces of infected person), and is mainly transmitted through the faecal-oral
route. Therefore, a small amount of NoV contamination in the environment, water or food can cause
large outbreaks.
Shellfish, in particular, are susceptible to NoV contamination because they filter large amounts of
water and accumulate different types of suspended particles including bacteria and viruses when
grown or harvested from contaminated areas. In Indonesia, some shellfish growing and harvesting
areas are located close to estuaries which can be contaminated by untreated domestic sewage
effluent, especially during flood incidents. Even though shellfish in Indonesia are mostly consumed
cooked, inadequate cooking and cross-contamination during food preparation steps can lead to NoV
contamination in the prepared meal.
Risk assessment of NoV, especially in shellfish from Indonesian markets, remains challenging due to
the lack of prevalence data, no recorded NoV outbreaks caused by shellfish consumption, and the
lack of knowledge of the efficacy of post-processing steps including handling and cooking based on
consumer behaviour in Indonesia. Boiling, stir-frying and steaming are the most common cooking
practise of shellfish in Indonesia which can reduce the NoV contamination. In case the shellfish is
being consumed as a raw or fresh product, the use of disinfectant such as Chlorine Dioxide (ClO2) to
reduce the viral contamination or to prevent cross-contamination during post harvesting or handling
is a potential risk management strategy. In addition, standard quantification assays for NoV based on
the cell-culture system are as yet unavailable. Therefore, NoV studies rely on molecular based
methods such as Reverse Transcription Polymerase Chain Reaction (RT-PCR).

xxi
This project optimised a Reverse Transcription Quantitative Polymerase Chain Reaction (RT-qPCR)
method to obtain prevalence data on NoV in shellfish from Indonesian markets and further utilised a
NoV surrogate (MS2 bacteriophage, ‘MS2’) for inactivation studies, to fill those data gaps. The
results provided better understanding of NoV prevalence and survival and could be used to predict
the risk of NoV contamination in shellfish from Indonesian markets.
The first aim of this thesis was to evaluate the application of RT-qPCR after pre-treatment with
enzymes because current methods quantify both infectious and non-infectious viral particles and
may over-estimate the risk of viral infections, especially in the inactivation and prevalence studies.
Therefore, sample pre-treatments are required to differentiate the infectious from non-infectious
viral RNA.
MS2, a cultivable NoV surrogate was used in this study. RT-qPCR after pre-treatment with RNase
followed by RNasin showed better performance than RNase alone or TaqI in the elimination of the
RNA from inactivated MS2 and produced a comparable result to the plaque assay. This modified RT-
qPCR method was shown to be applicable for the quantification of infectious MS2 after inactivation
treatment by heat or ClO2, producing comparable results to plaque assays.
The next aim of this thesis was to compare the inactivation kinetics of NoV and MS2 treated by
heating and ClO2 in buffered media (PBS solution) and the shellfish matrix, as the NoV surrogates
may have different inactivation kinetics compared to NoV. The efficacy of both inactivation methods
was also determined.
To provide artificial contamination of NoV and MS2 in the mussel for heat treatment studies,
bioaccumulation process of the viruses in Tasmanian Blue Mussel (Mytilus galloprovincialis) was
done to mimic the actual virus transmission routes in shellfish. While for ClO2 treatment studies, the
mussels were artificially contaminated by dipping the tissue in solutions of NoV and MS2 for 30 min
to represent the cross-contamination process. NoV and MS2 in buffered media and bioaccumulated
mussel were heated at 60, 72 and 90° C at various times. The evaluation of NoV and MS2

xxii
inactivation kinetics showed that the Weibull model performed better in estimating the survival of
NoV and MS2 in buffered media, while the Biphasic model provided better estimation of virus
survival in mussel matrix. The D values of NoV were generally higher than MS2 in both buffered
medium and mussel matrix, showing a higher resistance of NoV towards heat treatment.
Furthermore, for all temperatures, inactivation of both viruses in mussel matrix required a longer
time to achieve 1 log10 reduction compared to inactivation in buffered media.
The efficacy of chlorine dioxide (ClO2) to inactivate NoV and MS2 in buffered media and artificially-
contaminated mussel was studied using ClO2 at 10, 20 and 40 ppm with various exposure times at
25°C. The result showed that 40 ppm ClO2 treatment reduced NoV and MS2 more significantly in
both buffered media and mussel matrix than 10 and 20 ppm treatments. In general, the virus
reduction was higher in buffered media than in mussel matrix for all ClO2 treatments. For example,
the reduction of MS2 in buffered media treated with 40 ppm ClO2 for 200 min resulted in > 6 log10
PFU/ml reduction, while in mussel matrix the same treatment only reduced MS2 by < 3 log10 PFU/g.
At the same treatment, NoV in buffered media were reduced for more than 3 log10 copies/ml, while
only 2.36 log10 copies/g reduction was observed in mussel matrix. The inactivation of ClO2 of both
viruses in buffered media and mussel matrix was equally well described using the quasi-mechanistic
Hom model or the Weibull model.
The first prevalence data for NoV GII in shellfish in Indonesia are presented in this thesis. The data
are for three shellfish species i.e. Green Mussel (Perna viridis), Blood Cockle (Anadara granosa) and
Oriental Hard Clam (Meretrix lusoria), that are commonly consumed in Indonesia. Shellfish were
sampled from four fish markets in Jakarta and Panimbang, Indonesia, in July 2016 and 2017. The
NoV from extracted digestive tissue (DT) of shellfish was enumerated using the enzymatic pre-
treated RT-qPCR developed in this study. NoV GII was detected in 11 out of 171 samples with
contamination levels from 1.43 to 3.55 log10 copies/g DT. The NoV GII prevalence in Green Mussels
was 10%, which was higher than the prevalence in Oriental Hard Clam (7.14%) and Blood Cockle

xxiii
(2.9%). All NoV-contaminated shellfish were collected from traditional fish markets (Muara Kamal
and Cilincing) harvested from Jakarta Bay.
Due to the paucity of relevant data, a deterministic approach was used to estimate the risk of illness
due to the consumption of NoV contaminated shellfish from Indonesian markets. In the worst-case
scenario where the level of contamination is 8.98 x 10³ log10 copies/g DT, boiling for more than 30
min during cooking step can significantly reduce the estimated NoV outbreaks due to shellfish
consumption.
Based on the results from the inactivation studies, both inactivation treatments (heat and ClO2) can
be used as control measures to reduce NoV contamination in shellfish. Even though MS2 was more
susceptible to heat treatment than NoV, the use of this surrogate in those studies has provided a
better understanding on inactivation kinetics and tailing phenomenon in both treatments. Together
with the data of NoV exposure or prevalence in shellfish from the markets, the result from the
inactivation studies was used to develop a risk assessment that can assist in risk management.
These data provided scientific evidence which can be applied to improve the quality and safety of
shellfish production and provide consumer protection from NoV infection in Indonesia. The findings
from this study also emphasised the need for regular surveillance in the polluted growing or
harvesting areas such as Jakarta Bay, and the application of proper cooking or disinfection to reduce
the risks of NoV gastroenteritis from consumption of the contaminated shellfish.

1
Chapter 1. Literature review
1.1. Introduction
Foodborne disease outbreaks cause serious health problems and are an economic burden in every
country. (WHO, 2013) estimated that 2.2 million people die each year due to foodborne and
waterborne outbreaks around the world. Many epidemiological studies of foodborne pathogens
have shown that bacteria and viruses have the potential to cause serious foodborne illness in
humans (Bartsch et al., 2016; Pires et al., 2015; Scallan et al., 2015). In the United States of America
they are responsible for 9.4 million episodes of foodborne illnesses per year (Scallan et al., 2011),
caused 112,000 DALYs (disability-adjusted life years) (Scallan et al., 2015) and associated with an
economic loss of US$10-83 billion per year (Nyachuba, 2010). Diarrhoea and vomiting are the most
noticeable symptoms caused by pathogenic foodborne microbes and potentially generate the
secondary transmission of the disease through faecal/fomites-oral route and person-to-person
transmission (Verhoef et al., 2015).
Among these causative agents, enteric viruses have been associated with high numbers of
gastroenteritis outbreaks in infants and the elderly especially at hospital, child care and long term
facilities care (LTFC) (Barclay et al., 2014; Bernard et al., 2014; Nic Fhogartaigh & Dance, 2013). Some
enteric viruses such as norovirus (NoV) and hepatitis A virus (HAV) have been found in aquatic
environments and thus contaminate shellfish (La Bella et al., 2016) and water used for food
processing and irrigation (Cook & Richards, 2013). These viruses can generate outbreaks as they can
be transmitted with relatively low ‘infectious dose’ through food or water to humans, or directly
from person-to-person (Atmar et al., 2014; Bitler et al., 2013; Hall et al., 2011). Enteric viruses are
commonly shed in high numbers in faeces and transferred to fomites in contact with the infected
patients, e.g.: NoV levels have been reported to range from 105 to 109 viruses/g faeces (Teunis et al.,
2015) and HAV up to 109 viruses/g faeces (Kotwal & Cannon, 2014; Tjon et al., 2006).

2
Although enteric viruses are mostly transmitted person-to-person, food and water are also potential
sources of contamination leading to many foodborne outbreaks. Various foods have been reported
to be contaminated by viruses and associated with outbreaks, including deli sandwiches (Daniels et
al., 2000), salad and produce (Gallimore et al., 2005; Mesquita & Nascimento, 2009; White et al.,
1986), raspberries (Le Guyader et al., 2004), frozen strawberries (Hutin et al., 1999), and shellfish
(Kohn et al., 1995; Le Guyader et al., 2006; Morse et al., 1986). Other studies also found that
contaminated water is responsible for many gastroenteritis outbreaks caused by enteric viruses
(Beller et al., 1997; Kukkula et al., 1999) indicating the use of contaminated water for irrigation,
aquaculture or drinking purposes. In Australia, outbreaks of HAV occurred in several states during
2009 caused by the consumption of semi dried tomatoes (Donnan et al., 2012), while in 2013 NoV
outbreaks were reported in Tasmania associated with the consumption of oysters (Lodo et al.,
2014).
Viruses have different structures and behaviours from bacteria. In general, viruses are more than 10
times smaller in size than bacteria with diameters ranging from 25 to 400 nm. Because of their small
size, most viruses cannot be observed under the light microscope. Viruses are unable to reproduce
and perform metabolic process without their host cell (i.e. specific cell type that they can infect and
in which they can proliferate). Most of them have a crystalline structure based on a protein shell
called a ‘capsid’ which encloses the DNA or RNA for replication and accessing the host cell (Madigan
et al., 2015; Panno, 2011; Prasad et al., 1999). Therefore, because of their relatively simple
structure, and particularly the absence of a membrane (i.e., ‘non-enveloped’ virus) some viruses
including human NoV, rotavirus and HAV are more resistant than bacteria from treatments such as
chlorination, UV and filtration during conventional wastewater treatment (Corrêa et al., 2012; Duizer
et al., 2004; Rzeżutka & Cook, 2004). Unlike the pathogenic bacteria, however, viruses are unable to
replicate themselves in the environment due to the lack of a host cell. Therefore, the number of
viruses will not increase after shedding from an infected individual and the public health risk will not
increase over time as the product moves through the supply chain.

3
This literature review introduces background information on epidemiology, biology, detection,
inactivation, and risk assessment of NoV in food. In addition, information about human enteric
viruses relevant to food and shellfish consumption is described to emphasize the importance of
human NoV in foods and foodborne outbreaks worldwide.
1.1.1. Human enteric viruses
Enteric viruses that are commonly associated with foodborne and waterborne outbreaks belong to
the families Adenoviridae (human adenoviruses serotype 40 and 41), Astroviridae (human astrovirus
types 1 to 8), Caliciviridae (NoV & sapoviruses), Picornaviridae (aichi viruses, enteroviruses and HAV),
Reoviridae (rotaviruses) (Bányai et al., 2018; Fong & Lipp, 2005; Le Guyader et al., 2008; Oude
Munnink & Van der Hoek, 2016; Thomas et al., 2013). Of these families, Caliciviridae, Picornaviridae
and Reoviridae are mostly found in faeces and fomites from infected people during gastroenteritis
outbreaks. Caliciviridae and Picornaviridae families have a similar morphology and structure, i.e.,
icosahedral, a non-enveloped RNA virus and similar genome configurations (King et al., 2011).
Enteric viruses contaminate food and water through two ways: i) inadequately treated human and
animal sewage that contaminates food and water environments and ii) direct contact of food and
water with a food handler who has infected by the virus (Gallimore et al., 2005; Maunula & Von
Bonsdorff, 2014; Tuladhar et al., 2013).
Numerous food and waterborne outbreaks have been caused by enteric viruses such as NoV, HAV,
hepatitis E (HEV), rotavirus, astrovirus and sapovirus (SAV). In USA, Scallan et al. (2011) estimated
that 59% (5.51 million of a total of 9.4 million) of cases of foodborne illnesses were caused by
viruses. Among these viruses, NoV has been estimated as the major cause of viral foodborne illness
in USA comprising at least 99% (5.46 million) of the cases, while other enteric viruses compose only
less than 1% from the total cases (Scallan et al., 2011). In addition, other studies have also reported
the contribution of enteric viruses to foodborne cases worldwide, such as NoV, aichiviruses,
rotaviruses, SaV, enteroviruses, astroviruses, and HEV, in Japan (Iritani et al., 2014; Miyashita et al.,

4
2012; Shibata et al., 2015; Usuku et al., 2008), SaV ini Puerto Rico (Hassan-Ríos et al., 2013), NoV,
rotaviruses and SaVs in Northern Arabian Gulf (Gallimore et al., 2005), NoV in Sweden, (Hedlund et
al., 2000), HAV in the Netherlands and Australia (Donnan et al., 2012; Fournet et al., 2012) and NoV,
rotaviruses, and HAV in the USA (Fletcher et al., 2000; Hutin et al., 1999; Noel et al., 1997).
In general, the numbers of viral foodborne cases caused by non-NoV are lower than NoV. This is
probably due to several reasons. Firstly, some enteric viruses remain unreported and not necessarily
diagnosed as causative of foodborne cases by general practitioners (Maunula & Von Bonsdorff,
2014). Secondly, the availability of vaccines for several enteric viruses such as rotavirus, HAV and
HEV may reduce or prevent outbreaks (Nelson et al., 2014; Van Herck et al., 2011; Yen et al., 2011).
Thirdly, some viruses such as rotavirus and adenoviruses are childhood disease (Amaral et al., 2015),
thus child vaccination program provides a sufficient host-immunity to the viral infection (Braeckman
et al., 2012). Lastly, NoV is also known to be persistent in the environment and has a low ‘infectious
dose’, at 18-2,800 viral particles (Rodríguez-Lázaro et al., 2012; Teunis et al., 2008). Combined with
high shedding rates of NoV from infected humans, a single infected individual has a potential to
transmit and infect hundreds of thousands of people (Pringle et al., 2015). Therefore, the low
‘infectious dose’ and high shedding rate are presumably the main reasons that NoV is the major
enteric virus associated with outbreaks.
As a consequence, NoV is an important issue to be addressed by food safety researchers and health
authorities in many countries. Many studies have assessed the risk for consuming food and water
contaminated by NoV such as produce (Barker, 2014; Bouwknegt et al., 2015; Laura et al., 2012;
Mok et al., 2014), shellfish (Croci et al., 2007; Suffredini et al., 2014) and drinking water (Masago et
al., 2006). Although the NoV can now be cultured in vivo using stem cell-derived from human
enteroids (Ettayebi et al., 2016), however, this cell culture system is still unsuitable as a robust
quantification assay for NoV (Ettayebi et al., 2016). Thus, it hampers the development of inactivation
models and risk assessment studies. Therefore the use of cultivable NoV surrogates for inactivation
studies such as murine norovirus (MNV) (Bozkurt et al., 2014b), feline calicivirus (FCV) (Buckow et

5
al., 2008), virus-like particles (VLPs) (Feng et al., 2011; Koromyslova et al., 2015) and MS2
bacteriophage (MS2) (Bae & Schwab, 2008; D'Souza & Su, 2010) could be alternatives even though
their genetic structures are different from human NoV.
1.1.2. Human norovirus
NoV, previously known as Norwalk-like virus (Figure 1-1), causes almost 20% of human
gastroenteritis outbreak cases worldwide (Ahmed et al., 2014; Karst et al., 2015). There are three
genogroups of NoV (GI, GII and GIV) associated with human gastroenteritis outbreaks (Karst et al.,
2015; Zheng et al., 2006). These genogroups are further divided into 33 genotypes based on amino
acid sequence diversity in the complete VP1 capsid protein, with 9 genotypes in GI, 22 genotypes in
GII and 2 genotypes in GIV (Vinjé, 2015). Of these, only GI and GII genogroups, known as human
NoV, are frequently found as contaminants in food and have caused human gastroenteritis through
the faecal-oral route (Scallan et al., 2011; Torok, 2013; Yu et al., 2015), especially in raw or uncooked
shellfish (Li et al., 2014).
Figure 1-1. Immuno-electron micrograph of NoV in stool samples (reproduced from Kapikian et al. (1972)).
Each NoV genogroup has been reported to be specific with respect to binding capability to the host
(Tan & Jiang, 2007), environmental persistence (Seitz et al., 2011; Verhaelen et al., 2013) and
removal or elimination responses (Cook et al., 2016; da Silva et al., 2007). These differences may
influence the epidemiological patterns (Matthews et al., 2012), the distribution in the environment
(Hoa et al., 2013) and transmission to the host, especially to humans (Vega et al., 2014). For
6
example, in a profiling study of NoV genogroups and genotypes during outbreaks, Verhoef et al.
(2010) showed that although NoV GII was also involed in some foodborne and waterborne
outbreaks, NoV GI was more likely to be associated with foodborne cases while NoV Genogroup II
including genotype 4 (GII.4) strains were more often related to person-to-person outbreaks.
Therefore, the proportion of NoV genotypes associated with foodborne outbreaks could be
estimated by analysing NoV outbreak data and genotype profiling from different outbreaks globally
(Verhoef et al., 2015).
1.1.3. Structure and biology of norovirus
Human NoV is a small virus, with 23-40 nm in diameter and classified in the family Caliciviridae
(Vinjé, 2015). NoVs are non-enveloped with icosahedral symmetry composed of 180 protein
molecules that form the capsid. The molecules are organised into 90 dimers which have three basic
domains, i.e., S, P1 and P2 (Estes et al., 2006). These domains are linked by a flexible hinge. This
morphological structure of NoV has been illustrated from the study of three-dimensional structure
of recombinant Norwalk virus capsid by Prasad et al. (1999) using cryo-image reconstruction and x-
ray crystallography (Figure 1-2).

7
[A] [B]
[C]
Figure 1-2. Illustration of cryo-image reconstruction (A) and x-ray crystallography (B) of recombinant Norwalk virus capsid structure; and three ribbon-protein domains (C) (reproduced from Prasad et al.
(1999)).
The genome of human NoV is composed of single-stranded, positive-sense RNA of approximately 7.6
kb length and containing 3 open reading frames (ORFs): ORF1, ORF2 and ORF3 (Atmar et al., 2018).
The ORF1 is translated to encode a polyprotein containing six to seven non-structural proteins,
including the VPg and the viral RNA-dependent RNA polymerase (RdRp), while the ORF2 and ORF3
are translated from sub-genomic RNA to form two structural proteins during viral replication, the
major (VP1) and the minor (VP2) capsid (Karst et al., 2014; Karst et al., 2015; Thorne & Goodfellow,
2014) (Figure 1-3). Generally, the genetic diversity of human NoV is determined from the variability
of RdRp and VP1 gene (Kroneman et al., 2013; Stals et al., 2012a; Vinjé et al., 2004; Zheng et al.,
2006).

8
Figure 1-3. The NoV genome (reproduced from Karst et al. (2014)).
The ORF1 and ORF2 sequences contain five genomic regions (A, B, C, D and E) that have become the
most interesting sequences for detection and genotyping studies (Kroneman et al., 2013; Stals et al.,
2012b). These five genomic regions are considered as the most conserved region for GI and GII
genogroups (Jothikumar et al., 2005; Kageyama et al., 2003; Loisy et al., 2005; Vinjé et al., 2004), and
are widely used for NoV genotyping purpose following single and dual-nomenclature system
(Kroneman et al., 2013). Among these, the B and C regions are now commonly used for detection of
NoV than theother regions (Le Guyader et al., 2009; Trujillo et al., 2006; Vinjé, 2015). The A and B
regions are located at the ORF1 encoding RNA polymerase/RdRp, while region C, D and E are located
at the ORF1-ORF2 junction and ORF2 encoding VP1 capsid protein, (Figure 1-4) (Mattison et al.,
2009).
Figure 1-4. Schematic representation of the NoV genome representing five regions frequently used for detection and genotyping study (reproduced from Mattison et al. (2009)).

9
1.1.4. Foodborne norovirus related diseases
A comprehensive study of NoV epidemiology from 1999-2012 by Verhoef et al. (2015) reported that
person-to-person transmission is the main source of NoV outbreaks and almost 14% of all NoV
outbreaks are associated with food as a source of exposure, while the other sources are water and
environment. GII.4 was the major causative genotype of NoV outbreaks worldwide being responsible
for at least 62% of total NoV cases (Siebenga et al., 2009). This is probably due to the emergence of
new variant GII.4 strains every year replacing the previous dominant strains of NoV GII.4 (not other
endemic strains) (Siebenga et al., 2009). The high mutation frequency of this strain enhances their
ability to bind a wider range of histo-blood group antigens (HBGAs) (White, 2014).
Based on its rapid evolution and immunogenetic response, GII.4 viruses are able to cause
gastroenteritis outbreaks in susceptible populations through person-to-person and environmental
transmission (Eden et al., 2013; Lindesmith et al., 2012). Non-GII.4 genotypes such as GI.3, GI.6, GI.7,
GII.3, GII.6, and GII.12 are more resistant to mutation and only cause gastroenteritis outbreaks via
food and water transmission route (Vega et al., 2014; White, 2014). Accordingly, several studies
have suggested that these genotypes were more consistently the causative agents of waterborne
and foodborne outbreaks rather than person-to-person route (Matthews et al., 2012; Vega et al.,
2014; Verhoef et al., 2010).
Among the various types of food, produce and shellfish are more susceptible to NoV contamination.
Many studies reported that NoV outbreaks were associated with the consumption of contaminated
ready-to-eat food such as oyster, clam (Huppatz et al., 2008; Lodo et al., 2014; Morse et al., 1986;
Westrell et al., 2010) and fresh produce (Daniels et al., 2000; Gallimore et al., 2005; Mesquita &
Nascimento, 2009; Rajko-Nenow et al., 2014). These foods have been indicated to sometimes be
grown in, irrigated with and/or processed with NoV-contaminated water, and because they are
usually eaten without a proper cooking step, these represent a potential route of human exposure
to NoV.

10
1.1.5. NoV in shellfish
NoVs have been reported to be introduced to water environment by the sewage overflows
(Rodríguez et al., 2012) and contaminated marine water (Wyn-Jones et al., 2011; Yang et al., 2012),
urban catchments water and estuarine bay (Aw et al., 2009). Due to the presence and persistence of
NoV in the water (Cook et al., 2016), shellfish, as a filter feeder animal, are more susceptible to
contamination than other seafood products (Lees, 2000). NoV contamination in shellfish has been
reported from markets worldwide, such as France (Loutreul et al., 2014), Thailand (Kittigul et al.,
2016), Italy (Terio et al., 2010) and Australia (Symes et al., 2007). Other studies have also reported
the presence of NoV in shellfish harvested from Portugal (Mesquita et al., 2011), UK (Lowther et al.,
2012), Italy (Croci et al., 2007), France (Le Guyader et al., 2009), the Netherlands (Boxman et al.,
2006), Australia (Brake et al., 2014), Japan (Maekawa et al., 2007) and India (Umesha et al., 2008).
Although the contamination has been widely reported, the risk assessment of NoV in shellfish is still
rare and partially performed, especially in Asian countries. In Indonesia particularly, the NoV
prevalence in shellfish from Indonesian fish markets or harvesting area is not yet available.
Consequently, acquiring knowledge for risk assessment of NoV in shellfish has become important to
provide better understanding of NoV outbreaks worldwide including in Indonesia to aid the
development of preventive strategies against future outbreaks.
1.2. Bivalve molluscan shellfish
1.2.1. Biology of shellfish
Bivalve molluscs are soft bodied animals that belong to the Bivalve class. The soft bodies are
protected by two opposed shell valves composed of calcium carbonate. This class is the second
largest class within the molluscs and consists of 7,500 species. Generally, species identification of
bivalves is based on their colour, shape and marking on the shell. More than 80% of bivalves live in
the ocean and these organisms are important element of marine and freshwater habitats (Gosling,

11
2003, 2015). Some of these bivalves including mussels, oysters, scallops and clams (Figure 1-5) are
also called as ‘shellfish’ in aquaculture and fishery studies.
Figure 1-5. Shellfish from Bivalvia Class (reproduced from Gosling (2015))
Shellfish are highly modified molluscs, including modification of the gill function to entrap food
particles from the aqueous environment. It enables shellfish to feed efficiently in aqueous
environments. This feeding system, known as ‘filter feeding’, is the most efficient system of ciliary
feeding in sea animals (Gosling, 2003). Shellfish are able to filter large volumes of water from their
environment and accumulate different types of suspended food particles, and pathogenic bacteria
and viruses (Le Guyader et al., 2013; Lees, 2000), in their gills. Moreover, these accumulated viruses
are concentrated in DT by HBGA-like for carbohydrate ligand molecules which may enhance the
bioaccumulation process (Maalouf et al., 2011). Hence many studies have proposed that DT can be
used for detection, quantification and isolation of NoV from shellfish.
1.2.2. Shellfish production
There are five major groups of bivalve molluscs which are commonly consumed by humans and
grown/harvested and sold commercially: mussels, oysters, scallops, clams and cockles. In 2010,

12
world shellfish production was 10% of the total global fisheries production, with 14.6 million tons of
production. 12.9 million ton of this production originated from aquaculture activities, consisting of
38% clams, cockles and ark shells; 35% oysters; 14% mussels and 13% scallops. The high demand for
shellfish in the global market, at US$ 2.1 billion in 2009, triggered high production of shellfish
worldwide. Scallops were the most important shellfish species in international markets and
accounted for 46% of the total shellfish production (Karunasagar, 2014). However, the increasing
scale of shellfish production should be matched by increasing the public awareness about the risk of
raw shellfish consumption.
1.2.3. Shellfish in Indonesia
As shown in Figure 1-6, a statistical report from Food Agriculture Organization (FAO) (2015) showed
that, during the period 2007 to 2010, shellfish production in Indonesia increased rapidly from 10,000
to 70,000 metric tonnes. In 2011, the proportion of shellfish consumption was only around 15% of
total shellfish production, while the rest was utilised for non-consumption purposes such as pearl
oyster. Up to 2007 the trend of shellfish consumption in Indonesia was relatively stable with the
average of 10,000 metric tonnes per year (FAO, 2015). Shellfish consumed in Indonesia are mainly
produced from aquaculture activities including fresh, brackish and marine water (Nurdjana, 2006).
The major commodities are Green Mussel (Perna viridis), Oriental Hard Clams (Meretrix lusiora),
Bamboo Clam (Ensis directus), Blood Cockle (Anadara granosa), and Feather Cockle (Anadara
antiquata).

13
Figure 1-6. Indonesia shellfish production from 2002-2011 (reproduced from FAO (2015))
People in Indonesia usually consume cooked shellfish, such as boiled, steamed or fried. Eating raw
shellfish, such as oysters, has not been widely introduced. It has started to be advertised in restaurants
in several big cities such as Jakarta, Surabaya and Denpasar, especially for tourists or ‘foreigners’. In
this case, the oyster’s quality is strictly controlled, and the raw materials are mostly imported from
Eastern Asian countries such as Taiwan, Korea and Japan that employ shellfish sanitation programs.
Decree of the Indonesian Minister of MAF no. KEP.17/MEN/2004 regulates the Indonesian shellfish
sanitation system and aims to ensure the production of safe shellfish from Indonesia for local and
export markets. The regulation assists different parties that play roles in the shellfish production
system, including the shellfish farmers, processors, distributors, and the competent authorities who
monitor and control the application of sanitation system. The central and local competent
authorities are responsible for conducting monitoring and routine surveillance on the application of
the Sanitation Standard Operational Procedure (SSOP), Good Manufacturing Practices (GMP), Good
Hygienic Practices (GHP), as well as the integrated quality management program based on HACCP, in
every aspect of the shellfish production system. The authorities are also responsible for laboratory
-
10,000
20,000
30,000
40,000
50,000
60,000
70,000
80,000
2000 2001 2002 2003 2004 2005 2006 2007 2008 2009 2010 2011
Prod
uctio
n (m
etrix
ton)
Year
Consumption
Non Consumption

14
testing to ensure the shellfish conformity with safety and quality requirements set in the Indonesian
National Standard (SNI) No. 3460.1; 3460.2; and 3460.3 (BSN, 2009).
The sanitation system also includes regulation for the shellfish farms across Indonesian waters. The
farm’s locations are regularly assessed, then the water qualities are recorded and routinely
monitored to determine the suitability of the locations to be used to grow the shellfish. Based on the
microbiological quality of the water and the possibility of pollution in the area due to the natural
cause and anthropogenic activities, the shellfish growing areas are classified into permissible areas,
permissible areas with certain condition, limited areas and off-limit areas. Shellfish farming activities
are prohibited in the off-limit areas. These areas are characterised by a high level of faecal
contamination, an exceeding level of PSP toxin, or the areas that have not been assessed for the
sanitation compliance.
Another part of the Indonesian shellfish sanitary system relates with the post-processing activities,
such as handling, collection, processing and distribution. For live shellfish, the transportation and
distribution should be done in a temperature-controlled vehicle, to avoid the shellfish quality loss
and their survival. Furthermore, a repeat circulation system with sterilised water may be used for
depuration purposes. The standard quality and safety requirements set in the decree for live
shellfish and its processed products for direct consumption are presented in Table 1-1.

15
Table 1-1. Standard quality for live shellfish and its processed products for direct consumption (MMAF Indonesia, 2004)
Parameters Requirement Method of analysis Visual characteristics Eggshells clean from manure, giving reaction
to knock, contain normal intravulval liquid Visual observation
Faecal coliform/Eschericia coli
Coliform < 300 MPN/100 g and E. coli < 230 MPN/100 g of shellfish meat, based on 5 tubes
Most Probable Number (3 dilutions)
Salmonella Absence in 25 g of shellfish meat
Total PSP content Must not exceed 80 µg/100 g of shellfish meat Bioassay test
PSP (diarrhetic shellfish poisoning)
Negative Bioassay test
ASP (amnestic shellfish poisoning)
Must not exceed 20 µg/100 g of domoic acid HPLC
Mercury (Hg) Must not exceed 0.5 mg/kg Lead (Pb) Maximum of 1.5 mg/kg Cadmium (Cd) Maximum of 1 mg/kg
1.3. Detection and quantification methods for noroviruses
To improve the safety of shellfish in the European countries, the European Food Safety Authority
(EFSA) has published a scientific opinion that contains recommendations to the European Council for
the establishment of regulations to control NoV contamination in oysters. One of the
recommendations is to investigate the levels of NoV contamination in shellfish which requires a
suitable method of identification and quantification (EFSA Panel on Biological Hazards (BIOHAZ),
2012). Accordingly, many studies have detected and quantified NoV in shellfish, in water as well as
sewage using methods such as conventional RT-PCR (Baert et al., 2007; Kageyama et al., 2003;
Kojima et al., 2002; Vinjé et al., 2004), RT-qPCR (Greening & Hewitt, 2008; Le Guyader et al., 2009;
Suffredini et al., 2014), enzyme-based colorimetric assay (Batule et al., 2018), immunoassay and
LAMP.
Among these methods, RT-qPCR has become a gold standard assay for both detection and
quantification (ISO, 2013; ISO, 2017), and it is widely used in NoV quantification studies (Kirby &
Iturriza-Gómara, 2012; Le Guyader et al., 2006; Vinjé, 2015). However, RT-qPCR may fail to

16
distinguish between infectious and non-infectious viruses in the sample because the assay will
quantify the RNA from both infectious and non-infectious viral particles. This drawback can lead to
misinterpretation of viral inactivation data for food quality control (Ceuppens et al., 2014). As a
consequence, sample pre-treatments to differentiate infectious from non-infectious viral RNA and
modification of RT-qPCR methods are required to provide a better analysis.
1.3.1. Primer sequences for detection, genotyping and quantification of NoV by RT-qPCR
Since the beginning of 2000’s, the use of both conventional and RT-qPCR methods to detect NoV has
increased rapidly. Many highly sensitive primer sets have been designed to detect both NoV GI and
GII such as in food, environmental and clinical samples as shown in Table 1-2. Most of the primers
target the sequences of ORF1, ORF1-ORF2 junction and ORF2 (GenBank accession no. X86557, nt
4997 to 5108) for GII detection, and sequences from the ORF1-ORF2 junction and ORF2 (GenBank
accession no. M87661, nt 5271 to 5385) for GI detection, (Figure 1-7), and only few primers target
different sequences of ORF2 in region D of GI (nt 5354 to 6914) and GII (nt 6432 to 6684) (Kong et
al., 2015; Vinjé et al., 2004).
Figure 1-7. The target sequences of ORF 1, ORF1-ORF2 junction and ORF2 for the detection of NoV GI
and GII genogroups (reproduced from Stals et al. (2012b)).

17
Table 1-2. Set of primer sequences for detection (D), genotyping (G) and quantification (Q)of NoV GI and GII by RT PCR assay
NoV Geno-group
Primer Sequences Polar-ity
Melting Temp (°C)
Product Length
(bp) Location
Type of assay*
(D/G/Q)1,2 References
GI G1SKF 5'-CTG CCC GAA TTY GTA AAT GA-3' + 49.7 329 ORF1-ORF2 junction & ORF 2 D/G1,2 (Kojima et al., 2002)
G1SKR 5'-CCA ACC CAR CCA TTR TAC A-3' - 51.1 329 ORF1-ORF2 junction & ORF 2 D/G1,2 (Kojima et al., 2002)
COG1F 5'-CGY TGG ATG CGN TTY CAT GA-3' + 55.9 84 ORF1-ORF2 junction Q1,2 (Kageyama et al., 2003)
COG1R 5'-CTT AGA CGC CAT CAT CAT TYA C-3' - 53 84 ORF1-ORF2 junction Q1,2 (Kageyama et al., 2003)
G1FFa 5'-ATH GAA CGY CAA ATY TTC TGG AC-3' + 55.3 596 ORF1-ORF2 junction & ORF 2 G1,2 (Kageyama et al., 2004)
G1FFb 5'-ATH GAA AGA CAA ATC TAC TGG AC-3' + 51.7 596 ORF1-ORF2 junction & ORF 2 G1,2 (Kageyama et al., 2004)
G1FFc 5'-ATH GAR AGR CAR CTN TGG TGG AC-3' + 60.6 596 ORF1-ORF2 junction & ORF 2 G1,2 (Kageyama et al., 2004)
G1SKR 5'-CCA ACC CAR CCA TTR TAC A-3' - 51.1 596 ORF1-ORF2 junction & ORF 2 G1,2 (Kageyama et al., 2004)
Cap A 5'-GGC WGT TCC CAC AGG CTT-3' + 54.2 177 ORF2 G1 (Vinjé et al., 2004)
Cap B1 5'-TAT GTT GAC CCT GAT AC-3' - 57.6 177 ORF2 G1 (Vinjé et al., 2004)
Cap B2 5'-TAT GTI GAY CCW GAC AC-3' - 59.1 177 ORF2 G1 (Vinjé et al., 2004)
NIFG1F 5'-ATG TTC CGC TGG ATG CG-3' + 55.9 92 ORF1-ORF2 junction Q1,2 (Miura et al., 2013)
QNIF4 5'-CGC TGG TAG CGN TTC CAT-3' + 55 86 ORF1-ORF2 junction Q1,2 (da Silva et al., 2007)
NV1LCR 5'-CCT TAG ACG CCA TCA TCA TTT AC-3' - 56 86 ORF1-ORF2 junction Q1,2 (Svraka et al., 2007)
NKIF 5'-GTA AAT GAT GAT GGC GTC TAA-3' + 50.3 305-314 ORF2 D/G1 (Kong et al., 2015)
NKI-F2 5'-GAT GGC GTC TAA GGA CGC-3' + 55.8 305-314 ORF2 D/G1 (Kong et al., 2015)
NKIR 5'-ACC CAD CCA TTR TAC ATY TG-3' - 50.8 305-314 ORF2 D/G1 (Kong et al., 2015)
MON 432 5’-TGG ACI CGY GGI CCY AAY CA-3’ + 57.2 213 ORF1 D/G1,2 (Richards et al., 2004)
MON 434 5’GAA SCG CAT CCA RCG GAA CAT-3’ - 56.3 213 ORF1 D/G1,2 (Morillo et al., 2012)

18
Table 1-2. Continued… NoV
Geno-group
Primer Sequences Polar-ity
Melting Temp (°C)
Product Length (bp) Location
Type of assay*
(D/G/Q)1,2 References
GII G2SKF 5'-CNT GGG AGG GCG ATC GCA A-3' + 57.6 343 ORF1 & ORF2 D/G1,2 (Kojima et al., 2002)
G2SKR 5'-CCR CCN GCA TRH CCR TTR TAC AT-3' - 62.4 343 ORF1 & ORF2 D/G1,2 (Kojima et al., 2002)
G2FBa 5'-GGH CCM BMD TTY TAC AGC AA-3' + 57.9 479 ORF1 & ORF2 Q1,2 (Kageyama et al., 2004)
G2FBb 5'-GGH CCM BMD TTY TAC AAG AA-3' + 55.9 479 ORF1 & ORF2 Q1,2 (Kageyama et al., 2004)
G2FBc 5'-GGH CCM BMD TTY TAC ARN AA-3' + 57.9 479 ORF1 & ORF2 Q1,2 (Kageyama et al., 2004)
G2SKR 5'-CCR CCN GCA TRH CCR TTR TAC AT-3' - 62.4 479 ORF1 & ORF2 D/G1,2 (Kageyama et al., 2003;
Kojima et al., 2002)
Cap C 5'-CCT TYC CAK WTC CCA YGG-3' + 54.2 253 ORF2 G1 (Vinjé et al., 2004)
Cap D1 5'-TGT CTR STC CCC CAG GAA TG-3' - 57.6 253 ORF2 G1 (Vinjé et al., 2004)
Cap D3 5'-TGY CTY ITI CCH CAR GAA TGG-3' - 59.1 253 ORF2 G1 (Vinjé et al., 2004)
COG2F 5'-CAR GAR BCN ATG TTY AGR TGG ATG AG-3' + 57.6 97 ORF1-ORF2 junction Q1,2 (Kageyama et al., 2003)
QNIF2 5'-ATG TTC AGR TGG ATG AGR TTC TCW GA-3' + 57.4 88 ORF1-ORF2 junction Q1,2 (Loisy et al., 2005)
JJV2F 5'-CAA GAG TCA ATG TTT AGG TGG ATG AG-3' + 55.6 97 ORF1-ORF2 junction D/Q1,2 (Boxman et al., 2009;
Jothikumar et al., 2005)
COG2R 5'-TCG ACG CCA TCT TCA TTC ACA-3' - 56.6 97 ORF1-ORF2 junction D/Q1,2 (Jothikumar et al., 2005;
Kageyama et al., 2003)
NVG2flux1 5'-ATG TTY AGR TGG ATG AGR TTY TC-3' + 55.3 88 ORF1-ORF2 junction Q1 (Nordgren et al., 2008)
NVG2flux2 5'-GGG AGG GCG ATC GCA ATC T-3' + 55.4 51 ORF1-ORF2 junction Q1 (Bucardo et al., 2017)
MON 431 5’-TGG ACI AGR GGI CCY AAY CA-3’ + 54.9 213 ORF1 D/G1,2 (Richards et al., 2004)
MON 433 5’GAA YCT CAT CCA YCT GAA CAT-3’ - 52.4 213 ORF1 D/G1,2 (Morillo et al., 2012)
Note: * (D=detection; G=genotyping; Q=quantification assay) 1 Primer has been used in the PCR assay for clinical samples 2 Primer has been used in the PCR assay for various food matrices including shellfish samples

19
The ORF1 and ORF1-ORF2 junction encoding both RdRp and major capsid (V1) is a sufficiently
conserved region for NoV GI and GII detection (Kageyama et al., 2003; Stals et al., 2012b). Therefore,
the use of primers designed from these sequences were able to detect 95-99% of GII genogroups
from confirmed positive samples with sensitivity from <10 to 104 genomic copies (Kojima et al.,
2002; Vinjé et al., 2004) but in some cases, these primers are less able to detect emerging variants of
GII.4 genotypes (Stals et al., 2012b). To improve the detection of these new variants there is a need
to design or develop new primer sets from different sequence regions based on new strains isolated
and identified from new outbreaks.
Based on the reverse transcription reaction prior to PCR assay, there are two types of RT-qPCR
method, i.e., one and two-step RT-qPCR. Both methods are comparable in terms of specificity,
efficiency and reliability. Although, two-step RT-qPCR has been commonly applied in NoV
quantification for clinical and food samples, the one-step method could be a promising method for
routine analysis because it is quicker, easier, and less expensive (Al-Shanti et al., 2009; Kirby &
Iturriza-Gómara, 2012). In addition, the use of a single reaction tube in the one-step method could
minimise sample cross-contamination, and the consequences of inaccurate pipetting during the
reverse transcription (Hanaki et al., 2014; Vinjé, 2015). Therefore, one-step RT-qPCR has been
applied for standard quantification of NoV (ISO, 2013; ISO, 2017), such as in inactivation and
surrogate studies in shellfish, water and faecal samples (Coudray-Meunier et al., 2015; Fuentes et
al., 2014; Jothikumar et al., 2005; Miura et al., 2013).
A method which can detect multiple NoV genogroups (GI, GII and GIV) simultaneously has been
developed using multiplex RT-qPCR and it has been suggested to be useful for the rapid screening of
NoV in food and water (Miura et al., 2013). However, single RT-qPCR produces a better sensitivity
than multiplex, especially when detecting low numbers of NoV, probably due to the use of more
probes (Niwa et al., 2014) and the number of genomes to be amplified (Stals et al., 2009) by
multiplex RT-qPCR. Furthermore, single RT-qPCR is more suitable to be used than multiplex assays in
inactivation studies where only one NoV genogroups is being studied at a time.

20
1.3.2. Sample pre-treatment in NoV inactivation studies to differentiate infectious/non-
infectious viruses
Published risk assessment studies on NoV in produce and ready-to-eat food (Bouwknegt et al., 2015;
Mokhtari & Jaykus, 2009; Stals et al., 2015), drinking water and environment (Masago et al., 2006;
Mok et al., 2014; Victoria et al., 2010) and shellfish products (Ventrone et al., 2013) have quantified
both infectious and non-infectious viruses without differentiation. Since only infectious particles of
NoV can infect humans, the number of quantified viral particles in those studies might not represent
the amount of infectious virus in the samples.
In recent years, the application of a pre-treatment step prior to RT-qPCR assay has been widely
studied to quantify infectious norovirus (Gyawali et al., 2019; Knight et al., 2012). The infectivity of
virus can be determined by its genom stability or capsid integrity (Knight et al., 2012). Thus, the
mechanism of pre-treatment step is based on two different processes, i.e., the capability of the
specific substances and chemical to disrupt the genom of infectious viral particles (damaged capsid),
or to bind the infectious viral particles (undamaged capsid and genom) (Knight et al., 2012).
Pre-treatments with photoactivable dyes (propidium monoazide (PMA), PMAxxTM, PEMAXTM and
EMA) (Gyawali & Hewitt, 2018; Kim & Ko, 2012; Oristo et al., 2018; Parshionikar et al., 2010), Porcine
Gastric Mucin (PGM) (Li et al., 2013; Ye et al., 2014), in situ capture (Wang et al., 2014) and RNase
(Richards et al., 2012; Ronnqvist et al., 2013) prior to RT-qPCR assay have been applied to evaluate
the efficacy of NoV inactivation treatment by quantifying the infectious NoV. The use of RT-qPCR
pre-treated with RNase are, to date, the most reliable and promising methods to be applied because
they are more efficient and economically affordable than the other methods.
RNase is known to be effective as a pre-treatment to quantify infectious viral particles of NoV
surrogates such as MNV, MS2 and HAV (Nuanualsuwan & Cliver, 2003; Rodríguez et al., 2009). It is
able to distinguish infectious and non-infectious viral particles through the evaluation of capsid and
cell membrane integrity during nucleic acid extraction prior to RT-qPCR assay (Soto-Munoz et al.,

21
2014; Yang & Griffiths, 2014). The basic principle of this pre-treatment is the degradation of RNA
from inactive bacteria and non-infectious viruses which lack of cell membrane or viral capsid
integrity, respectively (Knight et al., 2012).
However, the efficacy of RNase to degrade viral RNA depends on the different inactivation methods
and target viruses in the assay. For example, RNase was more effective when used as a pre-
treatment for measuring infectious viral particles treated by UV than high temperature due to
different in the mechanism of genomic structure degradation by the different treatments
(Bhattacharya et al., 2004). In addition, an inactivation study of human NoV which is previously
known as a snow mountain virus (SMV), reported that RNase is less effective than PMA (Escudero-
Abarca et al., 2014). Each virus has different capsid structure and ionic strength, thus they have
different capabilities to survive changes in temperature, pH and ionic strength in the suspension
during inactivation experiments (Knight et al., 2012).
Another alternative enzyme group that has potential to be used as pre-treatment are restriction
enzymes (REs). Molloy and Symons (1980) reported the ability of eight REs to cleave DNA in an RNA-
DNA substrate and amongst them, HaeIII and TaqI have also been shown to cleave the RNA strand of
this heteroduplex substrate. A further study by Murray et al. (2010) identified the cut-site or
sequence-specific site of TaqI enzyme to cleave DNA and RNA strands as T/CGA, while other REs also
identified to have similar ability were AvaII (cut site G/GWCC, W=A or T), AvrII (cut site C/CTAGG)
and BanI (cut site G/GYRCC, Y=C or T, R=A or G). That study also showed that these enzymes cleave
RNA-DNA and DNA-DNA substrate at the same phosphodiester bonds. However, the efficiency of
these enzymes to hydrolyse RNA strands from heteroduplex substrates is at least two orders of
magnitude less than the hydrolysis of DNA from homoduplex (DNA-DNA) substrate. Despite this,
there is the potential for using TaqI as a pre-treatment enzyme prior to RNA extraction to eliminate
free RNA from non-infectious viruses. Study to evaluate the efficacy of this enzyme as a pre-
treatment prior RT-qPCR is necessary, especially for the viral quantification in water, faecal, food
matrices including shellfish as there is no available data about its efficacy until now.

22
1.4. Inactivation of human NoV in shellfish
Apart from the NoV quantification method development that has been described above, many
studies have also investigated the treatment to reduce or eliminate NoV using depuration (Polo et
al., 2014), high pressure processing (HPP) (Ye et al., 2014), high temperature (Ahmed et al., 2013;
Escudero-Abarca et al., 2014; Ettayebi et al., 2016; Li et al., 2013; Wang & Tian, 2014), electron
beam and gamma irradiation (Feng et al., 2011; Praveen et al., 2013), 70% ethanol, UV, chlorine and
other chemical sanitisers (Belliot et al., 2008; Costantini et al., 2018; D'Souza & Su, 2010; Ronnqvist
et al., 2013). Some of these treatments, such as UV and application of disinfectants might be
ineffective to eliminate viral particles bioaccumulated inside the shellfish because the treatments
cannot penetrate the viral particles inside the tissue. High temperature is considered as the best
treatments which resulted in a higher log reduction of viral particles either in artificially
contaminated shellfish or in buffered media (Araud et al., 2016; Bozkurt et al., 2014b; Kingsley et al.,
2014). In addition, chlorine-based compounds also caused high reduction of infectious viral particles
(D'Souza & Su, 2010), thus it can be applied as a potential disinfectant or sanitizer agent to reduce
viral particles which contaminated food by cross-contamination during processing and handling (FAO
& WHO, 2009). Since shellfish in Indonesia is commonly consumed in a cooked form, the application
of high temperature treatment may not affect the consumer preference. During post-harvest step,
the retailers in Indonesian generally wash the tissue or the whole body of shellfish using clean water
or water containing disinfectant (WWF-Indonesia, 2015). Therefore, high temperature treatment
and chlorine-based disinfectants could be the most effective way to reduce and to eliminate NoV in
naturally-contaminated and in cross-contaminated shellfish from Indonesian fish markets,
respectively.
1.4.1. NoV inactivation studies using surrogates
Despite the significant impact of NoV in foodborne disease, the major limitation to the study of this
virus is its uncultivable nature (Cannon et al., 2006; Patel et al., 2008). To overcome this, some

23
studies on NoV inactivation have proposed the use of a cultivable NoV surrogate such as FCV,
murine noroviruses (MNV-1), tulane virus (TuV) or MS2 (Cromeans et al., 2014; Farkas et al., 2010;
Flannery et al., 2013; Kingsley et al., 2007) which share or have similar biochemical and genetic
properties to NoV (Jiang et al., 1993; Kniel, 2014; Wobus et al., 2006). These surrogates are amongst
the most common surrogates used in inactivation studies of NoV in different environments, such as
water, seafood and produce (Bae & Schwab, 2008; Belliot et al., 2008; Bozkurt et al., 2014b; Cannon
et al., 2006; Dawson et al., 2005). Since the proposed viral surrogates can be grown in a cell system
or small animals (Baert et al., 2008; Wobus et al., 2006), they can be used in routine clinical assays
(Kniel, 2014). However, the presence of less structural variations in surrogates compared to the NoV
necessitates the use of multiple surrogates in one study (Kniel, 2014).
Bacteriophages are a group of viruses that infect bacterial cells and share common physical,
biological and chemical characteristics with some mammalian viral pathogens. When viable host is
absent in an environment, bacteriophage cannot replicate themselves. Moreover, their host
specificity is limited to bacteria which means they can only infect bacteria and not mammalian cells,
so they do not pose a risk for humans. Also, they are cheap and generally easy to maintain in the
laboratory (Tufenkji & Emelko, 2011). Therefore, bacteriophage, such as MS2, has been used as NoV
surrogates in studies of enteric viruses.
MS2 is a ssRNA bacteriophage with capsid and known as one of the simplest viruses (Tufenkji &
Emelko, 2011). Compared to other types of phage, MS2 is the most robust model virus to be used in
a viral aerosol study and produced similar results when detected using qPCR and plaque assay
(Turgeon et al., 2014). These properties support the use of MS2 in inactivation and removal studies
of NoV in different types of food including water (Bae & Schwab, 2008; Hornstra et al., 2011), fresh
produce (Dawson et al., 2005), pork (Brandsma et al., 2012) and shellfish (Love et al., 2010).

24
1.4.2. Chlorination
For many years, chlorination, also known as “chlorine-containing disinfectants” treatment (FAO &
WHO, 2009), has been known as an effective treatment to reduce the number of pathogenic
bacteria and viruses in contaminated food. Sodium hypochlorite (NaClO2) as an oxidizing agent is
widely used as a disinfectant in food processing plants because it is cheap and easily applied
(Fonseca, 2006). Moreover, another less harmful chlorine-containing compound such as chlorine
dioxide (ClO2) treatment can be an alternative as it has been legally approved in the US for use as an
anti-microbial agent in food processing (Gómez-López et al., 2009).
Chlorine is a strong oxidizing compound which is able to destroy viral RNA (O'Brien & Newman,
1979) and bacterial cell membranes (Venkobachar et al., 1977). At an appropriate level, this
compound can be directly added into water for drinking (Kitajima et al., 2010) and washing raw food
products such as vegetable (Singh et al., 2002), fruit (Chen & Zhu, 2011) and poultry carcasses (Nagel
et al., 2013; Sarjit & Dykes, 2015) to reduce the level of pathogenic viruses and bacteria.
In NoV inactivation studies, chlorination has successfully reduced the number of the virus (Kim et al.,
2012; Kingsley et al., 2014; Kitajima et al., 2010). These studies reported that chlorination of 0.5
(free chlorine), 189 and 5,000 (total chlorine) ppm were able to reduce NoV by 3.64, 4.14 and 5.26
log10 respectively. In contrast with those studies, a study by Duizer et al. (2004) suggested that 300
ppm total chlorine was ineffective to reduce the number of NoV in the suspension. Factors that may
contribute to the chlorination efficacy are pH, temperature and the presence of organic matter
during inactivation (Hirneisen et al., 2010; Kingsley et al., 2014; Morino et al., 2009; Tung et al.,
2013). As the RT-PCR assay, which may not be able to distinguish between infectious and non-
infectious virus was been used in this study, the different efficacy of chlorination to reduce NoV
might be result of overestimation of infectious NoV.

25
1.4.3. High temperature treatment
The use of high temperature treatment (also known as ’heat treatment’) to inactivate
microorganisms is widely used food preservation technique. In the food industry, there are four
types of heat treatment: pasteurisation, sterilisation, canning and blanching (Teixeira, 2015). In the
meat and fish industries, sterilisation and canning are the most popular treatments. The study of
high temperature treatment in shellfish industries has been done since 30 years ago by Millard et al.
(1987). That study evaluated double boiling or cooking at 85-100°C to inactivate HAV and poliovirus
(PV) during shellfish processing. Using a radioimmunofocus assay, this method was successfully
confirmed to inactivate both viruses. Another study by Hewitt and Greening (2006) also confirmed
the efficacy of heating at 90°C for 90 s to inactivate viral particles in mussel.
More recent studies showed that high temperature treatments ranging from 50-80°C for 0.21-20
min exposure were able to reduce NoV and other NoV surrogates in shellfish (Araud et al., 2016;
Bozkurt et al., 2014b; Croci et al., 2012). Other studies also showed the ability of high temperature
to reduce NoV and its surrogates in different matrixes, such as berries (Butot et al., 2009), water and
milk (Hewitt & Greening, 2006) and PBS (Li et al., 2012; Topping et al., 2009; Wang & Tian, 2014).
However, the efficacy of heat treatment to reduce the NoV depends on the temperature, time
exposure, type of matrix and the initial titers of virus used in the experiments (Arthur & Gibson,
2015). Also NoV shows less susceptible to heat treatment than their surrogates (Knight et al., 2016),
therefore the use of the most heat-resistant surrogate is considered (Arthur & Gibson, 2015).
1.4.4. Mathematical modelling on virus inactivation
In the microbial inactivation, changes in the environment due to high temperature or mild
inactivation treatment such as chlorination, may lead to a log-linear reduction of cell numbers or a
shouldering and tailing expressions (Tamplin, 2005). In the linear phase the decimal reduction time
(D value) is defined as the reduction rate or the time needed to inactivate 90% of the initial

26
population, while, the z value is defined as the changes in temperature needed to produce 90%
change in the reduction rate (D value) (Barer, 2012; Tamplin, 2005).
Predictive modelling in food microbiology is used to describe the growth, survival, inactivation as
well as the metabolic activities of the microorganisms (Buchanan & Whiting, 1997). It can be
categorised based on different approaches, such as the microbial responses toward certain
treatment (growth, survival, and inactivation model), mechanistic or empirical model, and the three-
tier classification (primary, secondary, and tertiary model). A mechanistic model relies on an a priori
knowledge of different factors that influence the behaviour of microorganisms, while an empirical
model uses experimental data from different sets of conditions (Buchanan & Whiting, 1997; Caffi et
al., 2007). Furthermore, Buchanan (1993) defined the three-tier classification of model as follows,
i.e. a primary model that mathematically describes the microbial responses (growth or survival)
towards certain conditions as a factor of time, a secondary model that further describes the effect of
environmental factors on the microbial growth and survival; and a tertiary model that combines
primary and secondary models into a computer program or software.
The empirical model has been widely used in the modelling of microbial inactivation, including viral
inactivation. The first-order kinetic model is a simple linear model assuming that the levels of
cells/virus survival during treatment decrease exponentially over time of exposure. A survival curve
is obtained by plotting the logarithmic number of survival cells/viruses against the lethal dose
received and it is independent to the size of the original population (Barer, 2012). The first-order
kinetic model has been used in studies to predict the effect of thermal processing (Buckow et al.,
2008; Deboosere et al., 2004a; Isbarn et al., 2007; Pecson et al., 2009) and other mild treatments
including HPP (Isbarn et al., 2007) and chlorination (Thurston-Enriquez et al., 2003, 2005) on viral
inactivation. The first-order kinetic model can be described in Equation 1-1 and 1-2 (Erkmen &
Bozoglu, 2016; IFT, 2000; Moats, 1971), and the D value can be calculated from the slope value of
linear regression (Equation 1-3), as below :

27
𝑑𝑑𝑑𝑑𝑑𝑑𝑑𝑑
= −𝑘𝑘𝑘𝑘 Equation 1-1.
ln � 𝑑𝑑𝑑𝑑0� = −𝑘𝑘𝑘𝑘 Equation 1-2.
D = −1𝑠𝑠 Equation 1-3.
where:
𝑑𝑑𝑑𝑑𝑑𝑑𝑑𝑑
= the rate of viral death
N = the number of virus (PFU/ml) at time (t)
N0 = initial number of virus (PFU/ml)
t = time (h or min)
k = inactivation rate constant
D = 1 log10 reduction (h or min) at time (t)
s = slope of linear regression
This model assumes that each bacterial cell/virus has equal resistance towards the treatments, thus
the death from inactivation occurs to each bacterial cell (Erkmen & Bozoglu, 2016; Moats, 1971).
However, the first-order kinetic theory does not take into account the initial lag in the death rate
(Moats, 1971), while some viral inactivation studies showed that the viral survival curves have
shouldering and tailing phenomena on the beginning and end of the curve (Araud et al., 2016; Chen
et al., 2005; Sigstam et al., 2014). The shouldering and/or tailing phenomena usually occur when
using a high concentration of initial cells and/or at mild heat or lower temperature treatment
(Geeraerd et al., 2000; Tamplin, 2005), or when a subpopulation of virus is resistant to the
disinfectant (Sigstam et al., 2014) or have a low probability of lethal hit by a water molecule during
thermal inactivation (Casolari, 1998). Therefore, the viral inactivation curves often do not follow the
linear model assumptions. In this case, the non-linear models such as Weibull and biphasic models
are used (Araud et al., 2016; Bozkurt et al., 2014b; Sigstam et al., 2014).
The Weibull model, in particular, has successfully estimated virus survival from different treatments.
For example, inactivation of HAV in buffered cell culture treated with HPP (Grove et al., 2009), MNV-

28
1 treated with HPP (Kingsley et al., 2007), HAV in heat-treated oyster (Lee et al., 2015), HAV in
heated blue mussel homogenate (Bozkurt et al., 2014b), HAV, TV, MNV-1 and RV in heated oyster
tissue (Araud et al., 2016), and FCV in pressurised and heated culture media (Chen et al., 2005). In
some of those studies, the Weibull was compared with the linear (first order kinetic) model and was
observed to perform better. The Weibull model is described by the following equation:
𝑙𝑙𝑙𝑙𝑙𝑙 𝑑𝑑𝑑𝑑0
= −𝑏𝑏𝑘𝑘𝑛𝑛 Equation1-4.
where:
N = the number of virus (PFU/ml) at time (t)
N0 = initial number of virus (PFU/ml)
b = the slope factor
t = time (h or min)
n = the scale factor
This model assumes that viral inactivation occurs as probabilities and that the inactivation curve is
the cumulative form of distribution of lethal events (Erkmen & Bozoglu, 2016; Kingsley et al., 2006).
When applying the Weibull model, the D value is usually determined from the linear portion of the
curve (Chen et al., 2005).
Another non-linear model that commonly used to describe the inactivation model of bacteria or
virus is biphasic model (Cerf, 1977; de Roda Husman et al., 2009). This model is based an assumption
that two subpopulation of cells/virus having different levels of resistance to treatments are present
in the bacterial/virus population during inactivation (Cerf, 1977; Humpheson et al., 1998). Therefore,
this model produces two linear curves representing the survival of each subpopulation over the time
exposure thus generate two D value, i.e., D initial and D tailing. The D values of this model can be
generated from both linear regression equation. The Biphasic model (derived from Cerf (1977)) is
described by following equation (Geeraerd et al., 2005):

29
𝑙𝑙𝑙𝑙𝑙𝑙10(𝑘𝑘) = 𝑙𝑙𝑙𝑙𝑙𝑙10(𝑘𝑘0) + 𝑙𝑙𝑙𝑙𝑙𝑙10�𝑓𝑓. 𝑒𝑒−𝑘𝑘𝑚𝑚𝑚𝑚𝑚𝑚1.𝑑𝑑 + (1 − 𝑓𝑓). 𝑒𝑒−𝑘𝑘𝑚𝑚𝑚𝑚𝑚𝑚2.𝑑𝑑� Equation 1-5.
where:
N = the number of virus (PFU/ml or copies/ml) at time (t)
N0 = initial number of virus (PFU/ml or copies/ml)
t = time (h or min)
f = fraction of the initial population in major subpopulation
kmax1 and kmax2 = specific inactivation rate of two population (phase 1 and phase 2, respectively)
1.5. Risk assessment of human NoV in shellfish
Studies on method development and inactivation treatments of NoV have been widely investigated,
however risk assessment of the virus in food and shellfish which comprehensively incorporates these
studies are still limited. For instance, the available risk assessment studies used RT-qPCR method
without pre-treatment which is unable to distinguish between infectious and non-infectious NoV
(Bouwknegt et al., 2015; Masago et al., 2006; Mok et al., 2014; Stals et al., 2015; Suffredini et al.,
2014). Hence, the level of exposure and prevalence data produced from these studies may not
represent the real risk exposure of NoV. Therefore, combining the modified detection methods
which can differentiate infectious and non-infectious virus together with inactivation treatments will
enhance the risk prediction in a risk assessment study.
In addition, published risk assessment studies of NoV have been conducted for developed countries
such as European countries, Japan, and Australia (Bouwknegt et al., 2015; Masago et al., 2006; Stals
et al., 2011; Suffredini et al., 2014), which in general have different shellfish eating behaviour
compared to people in Indonesia.
1.6. Thesis objectives
As the consumption of shellfish continues to increase in Indonesia, the development of an accurate
risk assessment, using a reliable quantification method of NoV and based on the specific eating

30
behaviour of shellfish in Indonesia, is needed to estimate the exposure and risk of NoV in shellfish in
Indonesia.
The overall objective of this research is to estimate the risk of NoV which might contaminate
shellfish in Indonesian fish markets. By applying RT-qPCR with enzyme pre-treatment in NoV
inactivation studies and in NoV prevalence study, a more comprehensive risk assessment will be
developed. There are four aims which contribute to this thesis:
1. To evaluate the application of RT-qPCR pre-treated with enzymes for NoV inactivation
studies.
2. To compare the inactivation kinetic of NoV and its surrogate (MS2 bacteriophage)
treated by heating and chlorine dioxide.
3. To determine the efficacy of high temperature treatment on NoV and MS2 reduction in
buffer and in bioaccumulated-shellfish (inside the tissue).
4. To determine the efficacy of chlorine dioxide as disinfectant to reduce NoV and MS2 in
buffer and in artificially-contaminated shellfish (in the surface)
5. To determine the NoV prevalence in raw shellfish from Indonesian fish markets.
The risk assessment will provide scientific-based recommendations for the Indonesian government
and the related stakeholders. The recommendations can be applied to improve the quality and
safety of shellfish industries as well as provide consumer protection from foodborne outbreaks
related to NoV.

31
Chapter 2. Improving molecular quantification of infectious MS2
bacteriophage: A norovirus surrogate for inactivation studies
2.1. Introduction
NoV is considered to be one of the major causes of foodborne disease globally causing almost 20%
of all cases of acute gastroenteritis worldwide (Ahmed et al., 2014; Karst et al., 2015), or an
estimated 120 million diarrhoeal cases and 5,000 deaths globally in 2010 (Havelaar et al., 2015),
mostly in developing nations. In USA, NoV is estimated to cause 5.46 million foodborne diseases
each year (Scallan et al., 2011). NoV transmission to humans is predominantly by person to person,
followed by food and environmental transmission (Glass et al., 2009; Verhoef et al., 2015). Shellfish,
soft berries and leafy salads are food types that commonly associated with NoV contamination in
food (FAO & WHO, 2008).
A major limitation to study NoV is the difficulty to quantify the viral particles using the previously
developed cell culture system (Cannon et al., 2006; Ettayebi et al., 2016; Patel et al., 2008).
Consequently, RT-qPCR has become a standard diagnostic tool or reference method for NoV
detection and quantification (Glass et al., 2009; ISO, 2013; ISO, 2017; Ushijima et al., 2014).
However, the RT-qPCR assays that are available for detection of total nucleic acid, cannot distinguish
between infectious and non-infectious NoV (Knight et al., 2012): the ribonucleic acid (RNA) from
non-infectious virus remains detectable but undistinguishable by PCR assay even though the virus
has lost its infectivity (Richards, 1999). Therefore, NoV quantification by RT-qPCR assay could over-
estimate the abundance of NoV and hence the risk of illness to humans from NoV in contaminated
food, water or environmental samples.
As previously described in section 1.3 and 1.3.2, many studies have investigated the application of
pre-treatment step to improve the quantification of infectious viral particles and the utilization of
viral surrogates to evaluate its efficacy. For example, RNase is reported to be effective as a pre-

32
treatment in RT-qPCR to quantify only infectious viral particles of NoV (Richards et al., 2012) and its
surrogates such as MNV (Ronnqvist et al., 2013), FCV and HAV (Nuanualsuwan & Cliver, 2002).
However, the efficacy of the RNase pre-treatment appears to depend on the type of virus
inactivation process, especially under harsh inactivation conditions (Pecson et al., 2009; Topping et
al., 2009). From those studies, RNase pre-treatment significantly reduced the amplification of RNA
from non-infectious viral particles by heat treatment. Without further inactivation of RNase
following the pre-treatment, however, RNase may remain in the sample during extraction resulting
in the degradation of RNA from infectious viral particles. This may contribute to under-estimation of
viral abundance by PCR assay.
The strategies to overcome this problem are to eliminate and to inactivate residual RNase activity,
for example, by using of guanidinium thiocyanate and 2-mercaptoethanol during nucleic acid
extraction (Chomczynski & Sacchi, 2006); or adding an RNase inhibitor (RNasin) (Nuanualsuwan &
Cliver, 2002; Yang & Griffiths, 2014); or heating the samples (Johnson, 1996) prior to nucleic acid
extraction. However, heating the samples prior to RNA extraction is not common practice as it may
affect the RNA integrity (Brisco & Morley, 2012) and that results in inaccurate quantification of the
PCR assay. As an alternative to RNase as pre-treatment, the use of different enzymes such as
restriction enzymes is being considered, mainly because the application of these enzymes is cheaper
than RNase+RNasin and safer than the application of 2-mercaptoethanol during nucleic acid
extraction. Molloy and Symons (1980) and Murray et al. (2010) showed that some restriction
enzymes such as HaeIII and TaqI were able to cleave DNA and RNA strands. Hence these enzymes
have potential to be used to disrupt free genomic RNA from inactivated viral particles.
Some authors have proposed the use of cultivable NoV surrogates such as FCV and TV (Cromeans et
al., 2014; Farkas et al., 2010), MNV (Cromeans et al., 2014; Kingsley et al., 2007), FRNA
bacteriophages (Flannery et al., 2013; Hartard et al., 2016) and MS2 bacteriophage (MS2) (Hornstra
et al., 2011) to explore NoV inactivation kinetics. MS2, belongs to genus Levivirus of family

33
Leviviridae, and is a non-harmful cultivable virus which has a similar structure to NoV and has been
frequently used as a NoV surrogate (Brié et al., 2016; Hornstra et al., 2011; Sherchan et al., 2014;
Turgeon et al., 2014). Therefore, the use of MS2 as a NoV surrogate together with the application of
enzymatic pre-treatments, such as RNases and TaqI, could be a promising approach for
quantification methods and for inactivation studies of NoV.
In this study, we examined the performance of an RT-qPCR method with RNase and TaqI pre-
treatments to quantify MS2 bacteriophage as a NoV surrogate and to demonstrate the use of these
methods for the quantification of the NoV surrogate after high temperature and chlorine dioxide
(ClO2) treatments.
2.2. Materials and methods
2.2.1. MS2 bacteriophage stock production
MS2 bacteriophage (MS2) was cultivated as previously described by Bae and Schwab (2008) with the
following modification. MS2 (ATCC® 15597-B1™) purchased from In Vitro Technologies (Australia)
was inoculated into host E. coli strain K12 (culture collection of Tasmanian Institute of Agriculture) at
a ratio of approximately 107 PFU of MS2 per 1010 CFU of E. coli cells in 100 ml of Luria-Bertani (LB)
broth (Oxoid, UK; CM0996) containing 10 mM added calcium chloride (CaCl2) (Sigma Aldrich, USA)
and 0.1% glycine (Sigma Aldrich, USA). The mixture was incubated at 37°C with continuous shaking
for 8 to 12 h until bacterial lysis occurred. Ten ml of chloroform (Sigma Aldrich, USA) was then added
to the suspension and incubated for a further 10 min at 37°C. The culture was then centrifuged at
5,000 x g for 10 min to remove E. coli cells and cell debris, and the virus-containing supernatant was
recovered as MS2 stock. The MS2 stock was serially filtered through 0.45 and 0.22 µm pore-size low-
protein-binding membrane filters (Millipore, Germany) and stored at -80°C. The concentration of
MS2 in the stock was determined as described in Section 2.2. The plaque assays and RT-qPCR results
of infectious MS2 stocks at concentrations from 100 to 107 PFU/µl were compared and analysed by

34
linear regression using Microsoft Excel® (Microsoft, USA), to determine the correlation coefficient
(R2 value).
2.2.2. Quantification of MS2
2.2.2.1. Plaque assay
MS2 were quantified using a double layer agar method (EPA, 2001) with modification, using E. coli
strain K12 as the host strain and LB+ as the culture media. In brief, 3 ml aliquots of semi-solid LB+
agar (LB broth containing 0.7% (w/w) agar, 10 mM CaCl2 and 0.1% glycine) were pre-warmed at 45°C
in a shaking water bath. Then, 100 µl of exponential phase E. coli, containing approximately 106-7
CFU/ml, was added as a host. One hundred µl of serially diluted MS2 stock were added to the pre-
warmed semi-solid LB+ agar (~ 45°C) and then poured into pre-warmed (~ 45°C) 90 mm Petri plates
containing solid LB+ agar (LB broth + 1.5 % (w/w) agar + 10 mM CaCl2 + 0.1% glycine). After 18-24 h of
incubation at 37°C, MS2 were quantified by counting the semi-transparent plaques formed on the
LB+ agar plates. This assay only quantified the presence of MS2 between 2 to 200 PFU per plate.
Therefore, the theoretical limit of quantification (LOQ) of this assay is 2 PFU per 100 µl of sample
that is equivalent to 1.30 log10 PFU/ml.
2.2.2.2. RT-qPCR development
a. Plasmid and standard production
For absolute quantification, a plasmid standard was constructed by cloning nucleotides from 1470 to
2000 of MS2 sequences (GenBank accession no. NC_001417) as previously described by Gentilomi
et al. (2008), with the TOPO II Kit (Invitrogen, USA). The fragment produced had 531 bps length.
Plasmid was purified using a plasmid purification kit (MO BIO, Australia) following the
manufacturer’s recommended procedures and quantified using a Nano Drop 8000 (Thermo
Scientific, USA). Plasmid was linearized by PCR using M13 primers provided with the TOPO II Kit
(Invitrogen, USA). The PCR product had a length of approximately 774 bps encompassing 243 bps of
original M13 sites plus 531 bps of inserted MS2 gene. The product was then purified using a PCR

35
purification kit (MO BIO, Australia) and quantified using a Fragment Analyzer™ (Advanced Analytical
Technology Inc., USA). Standard concentrations for each plasmid used were 10,000,000; 1,000,000;
100,000; 10,000; 1,000; 100; 10; and 1 copies per µl. Copy number of the linearized plasmid was
calculated using Equation 2-1.
Number of copies (molecules) = X ng*6.02221 x 10²³ molecules/mole(N*660 g/mole)*1 x 109ng/g
Equation 2-1
Where:
X = amount of amplicon (ng)
N = length of dsDNA amplicon
660 g/mole = average mass of 1 bp dsDNA
b. RNA extraction
Genomic RNA was extracted from liquid samples of MS2 by the acid-guanidinium thiocyanate-
phenol-chloroform method of Chomczynski and Sacchi (2006) with modifications. Specifically, two
hundred µl of liquid sample were mixed with 1 ml denaturing solution (containing 4M guanidinium
thiocyanate, 25 mM sodium citrate pH 7.0, 0.5% N-laurosylsarcosine and 0.1M 2-mercaptoethanol)
and gently shaken for 15 sec. Then 0.1 ml of 2M sodium acetate pH 4.0, 1 ml of water-saturated
phenol, 0.2 ml of chloroform/isoamyl alcohol (49:1) were added and the tubes were shaken
vigorously for 10 sec. The samples were incubated at 4°C for 15 min and centrifuged for 20 min at
10,000 x g at 4°C. The aqueous phase was transferred to new microtubes containing 1 ml of cold
isopropanol (approximately -20°C) (Sigma Aldrich, USA) and incubated at -20°C for at least 1 h. The
RNA pellet was precipitated by centrifugation for 20 min at 10,000 x g at 4°C. After discarding the
supernatant, cold 70% ethanol (approximately -20°C) was added to the pellet and centrifuged for 10
min at 10,000 x g at 4°C. The supernatant was removed from the tubes to isolate the RNA pellet.
After air drying the pellet for 10 min at room temperature (15-25°C), the RNA was dissolved in 50 µl
of DEPC-treated Tris-EDTA (TE) buffer pH 7.2.

36
c. Quantification of MS2 with one-step RT-qPCR
RT-qPCR was conducted using PowerSYBR® Green RNA-to-CT™1-Step Kit (Applied Biosystem, USA)
on a Rotor Gene 3000 (Corbett Research, Australia). Primers used in this assay were designed from
MS2 sequences for nucleotides 1733 – 1804 f (GenBank accession no. NC_001417) analysed using
Primer-BLAST NCBI software. The primer sequences were 5’-GCCGGCCATTCAAACATGAG-3’
(forward) and 5’-CGAGAGAAAGATCGCGAGGAA-3’ (reverse).
PCR thermal condition were as follows: initial holding at 48°C for 30 min and 95° for 10 min;
followed by 45 cycles of denaturation at 95°C for 15 sec; annealing at 55°C for 30 sec; elongation at
72°C for 1 min and final extension at 72°C for 7 min (Gentilomi et al., 2008). The length of the PCR
product amplified from this assay was 92bp. To assess the specificity of PCR product, negative
controls using RNA from bacteria and melt curve assays were conducted following the
recommended procedures for the Rotor Gene 3000 (Corbett Research, Australia).
2.2.3. Preliminary experiment
This preliminary experiment was done in triplicate to confirm the efficacy of RT-qPCR without
enzymatic pre-treatment in MS2 inactivation by heating and chlorination. MS2 suspension was heat-
treated at 72° or treated with 0.5 ppm of chlorine dioxide (ClO2) (Zychem, Australia). For high
temperature treatment, MS2 stocks were heated at 72°C using the methods described by
Nuanualsuwan and Cliver (2002) with modification. In brief, MS2 stocks were added to the pre-
heated (72°C) 2 ml microtubes containing 900 µl PBS to a final concentration of 1010 PFU/ml. The
samples were heated at 72°C for 15, 30, and 60 min in a water bath. The ClO2 treatment was
performed in a 25°C water bath. Appropriate volumes of 10 ppm ClO2 were added to 900 µl MS2 in
PBS stocks (1010 PFU/ml) to reach final concentrations of 0.5 ppm ClO2 and incubated for 15, 30 and
60 min. After incubation, 10 µl of 1% (w/v) sodium thiosulfate was added to the samples which were
incubated for another 10 min to neutralise the oxidising effect of ClO2. Samples from both heat and

37
chlorine dioxide treatments were analysed for MS2 both by plaque assay and RT-qPCR performed as
described in Sections 2.2.2.1 and 2.2.2.2, respectively.
2.2.4. Development of pre-treatment for RT-qPCR
Ten ml of MS2 suspension at a final concentration of 107 - 108 PFU/ml was heat–inactivated at 60°C
for 120 min. This treatment was done to obtain two sub-populations of viruses i.e., infectious and
non-infectious viruses so that, RNA from non-infectious viral particles was present in the suspension.
The heated MS2 were pre-treated with RNase, RNase followed by RNasin (RNase+RNasin), or TaqI
enzyme. All enzymatic pre-treatments and no pre-treatment (control) were done in triplicate. The
RNase+RNasin pre-treatment was carried out as described by Yang and Griffiths (2014) but modified
by adding a 4 µl aliquot containing 10 mg/ml of RNase A (Sigma Aldrich, Germany) to 150 µl of virus
extract and incubating at 35°C for 30 min. Then, 10 µl of RNasin (40 units/µl) (Promega, USA) was
added to the sample and incubated for 30 min at 37°C. For the TaqI pre-treatment, 10 µl of TaqI
enzyme (20 units/µl; NEB, USA) was added to 150 µl aliquots of virus extract and incubated at 60°C
for 30 min. Three control treatments were included: unheated MS2 without pre-treatment,
unheated MS2 with RNase+RNasin pre-treatment and heated MS2 without enzyme pre-treatment.
MS2 RNA was extracted and assayed in triplicate as described in Section 2.2. Results were analysed
using Analysis of Variance (ANOVA) and Tukey Test post-hoc analysis by SigmaPlot 12.0 Version
(Systat Software, USA).
2.2.5. Application of pre-treatment RT-qPCR for inactivation studies
High temperature or chlorination treatments were applied to MS2 suspensions in the inactivation
study. The heat treatments were carried out as previously described in section 2.2.3, with
modification of time exposure. MS2 stock was added to the pre-heated 2 ml microtubes containing
900 µl PBS to a final concentration of 108 PFU/ml. The samples were heated at 72°C for 2.5, 5, 10, 20
and 40 min in a water bath. The ClO2 treatment was performed in a 25°C water bath. Appropriate
volumes of 100 ppm ClO2 were added to the 108 PFU/ml MS2 in PBS stocks to reach final

38
concentrations of 1, 2, 4, 8 and 16 ppm ClO2. After 5 min of incubation, 10µl of 1% (w/v) sodium
thiosulfate was added to the samples and incubated for another 10 min to neutralise the oxidising
effect of chlorine dioxide. The infectious MS2 from both inactivation treatments were assayed in
triplicate by plaque assay and the modified RT-qPCR as described in Sections 2.2 and 2.3. Prior to
nucleic acid extraction, all samples (including control, heated and chlorine dioxide treated samples)
were pre-treated using RNase followed by RNasin.
2.3. Results
2.3.1. The correlation between plaque assay and RT-qPCR
The melt curve analysis showed that the RT-qPCR reaction generated a single peak. Moreover, the
genomic RNA from the negative control was not amplified during the PCR reaction. This indicates
that the assay only amplified the specific target gene of MS2 and that no non-specific amplification
was detected (Figure 2-1A).
Figure 2-1. Melt curve analysis of the standard and samples (A); and standard curve MS2 plasmid from RT-qPCR assay generated from Rotor Gene 3000 (B)
To quantify the MS2 bacteriophage by RT-qPCR, a standard curve was generated from the linearized
MS2 plasmid at concentrations from 100 to 107copies/µl. The RT-qPCR was found to be less sensitive
than the plaque assay with a limit of quantification (LOQ) of 4.46 copies/reaction or 4.46 copies/25
y = -3.39x + 30.01R² = 1.00
Eff.= 0.98535
0
5
10
15
20
25
30
35
-1 0 1 2 3 4 5 6 7
Ct V
alue
Concentration (log copies/µL)
(B)(A)
*Ct value: a fractional number of cycles where the PCR kinetic curve reaches a user or program-defined threshold amount of fluorescence (Schefe et al., 2006).

39
µl (≈ 2.25 log10 copies/ml), while the theoretical LOQ of plaque assay is 1.30 log10 PFU/ml. The
calculated PCR efficiency of the assay was 98% with a slope value of -3.39 and a high correlation of
R2=1.00 (Figure 2-1B).
The correlation between the RT-qPCR and plaque assay were evaluated using only infectious MS2
from unheated stock culture. A high correlation (R2=0.9978, P<0.001) with a slope value of 0.9938
and an intercept value of -0.13 was obtained (Figure 2-2). From the regression equation, the result
from RT-qPCR can be extrapolated to PFU/µl of MS2 where 1 log10 copies/µl is equal to 1.14 log10
PFU/µl.
Figure 2-2. The linear correlation between plaque assay and RT-qPCR on the quantification of infectious MS2
2.3.2. Effect of different pre-treatments on the quantification of mixtures of infectious and non-
infectious MS2
In the preliminary study, MS2 was treated with high temperature and ClO2 to obtain a mixture of
both infectious and non-infectious MS2. The result from plaque assays showed that heating at 72°C
for 15 to 60 min reduced the level of infectious MS2 by 4-9 log10 PFU/ml (Figure 2-3A), while ClO2 at
a concentration of 0.5 ppm from 15 to 60 min had no significant (P>0.05) effect on MS2 reduction
(Figure 2-3B). In comparison to the plaque assay, the result of RT-qPCR without pre-treatment prior
y = 0.9938x - 0.13R² = 0.9978P<0.0001
0
1
2
3
4
5
6
7
8
0 2 4 6 8
RT-q
PCR
(log 1
0co
pies
/ul)
Plaque Assay(log10 PFU/µl)

40
to nucleic acid extraction showed over-quantification of the infectious MS2 after heating at 72°C for
15-60 min. The RT-qPCR result was approximately 1-6 log10 PFU/ml higher than the plaque assay
after the heat-treatment (Figure 2-3A), while after the ClO2 treatment the RT-qPCR assay showed a
similar result to plaque assay (Figure 2-3B).
Figure 2-3. Comparison of RT-qPCR with no pre-treatment (■) and the plaque assay (▧) on the quantification of infectious MS2 after heat treatment at 72°C (A) and chlorination with 0.5 ppm of
ClO2 (B) with LOQ of RT-qPCR (―) and plaque assay (- -).
0
2
4
6
8
10
NoTreatment
72°C 15 min 72°C 30 min 72°C 60 min0
2
4
6
8
10
RT-q
PCR
Assa
ylo
g co
pies
/ml
Treatments
Plaq
ue A
ssay
log
PFU
/ml
(A)
0
2
4
6
8
10
0
2
4
6
8
10
15 min 30 min 60 min
No Treatment 0.5 ppm ClO2
Plaq
ue A
ssay
log
PFU
/ml
RT-q
PCR
log
copi
es/m
l
Treatments
(B)

41
To try to prevent the over-quantification of infectious MS2 by the RT-qPCR assay due to the
presence of genome fragments from non-infectious viruses, enzymatic pre-treatment with RNase,
RNase+RNasin or TaqI was applied prior to RNA extraction. MS2 that had been pre-treated with
RNase, RNase+RNasin or TaqI were analysed using both RT-qPCR and plaque assays. The result of RT-
qPCR pre-treated with RNase+RNasin produced no significant difference (P>0.05) compared to
plaque assays for the quantification of infectious MS2 the heat treatment (Figure 2-4). In contrast,
the RT-qPCR pre-treated either with RNase alone or TaqI produced a significantly different (P<0.001)
result compared to the plaque assay in the quantification of infectious MS2the heat treatment.
Figure 2-4. Quantification of heat-inactivated MS2 with and without enzyme (RNase+RNasin, RNase or TaqI) pre-treatment analysed by RT-qPCR(■) and plaque assay (▧) with LOQ of RT-qPCR (―) and
plaque assay (- -).
Even though the RNase pre-treatment was able to reduce the over-quantification of RT-qPCR, it
under-estimated the number of infectious MS2 by 1.5 log10 PFU/ml compared to the plaque assay
result. Moreover, TaqI pre-treatment slightly reduced the over-quantification of infectious MS2 by
0
2
4
6
8
10
0
2
4
6
8
10
No Pre-Treatment
RNAse +RNAsin Taq I No Pre-Treatment
RNAse +RNAsin RNAse Taq I
Unheated Heated 60°C for 120 min
Plaq
ue A
ssay
log
PFU
/ml
RT-q
PCR
log
copi
es/m
l
Treatments

42
RT-qPCR assay but it still over-estimated the infectious viral particles by 3 log10 PFU/ml. Therefore,
RNase alone and TaqI pre-treatment were not applied in the subsequent inactivation studies.
To evaluate whether the enzymatic pre-treatment affects MS2 propagation, the plaque assay results
of unheated MS2 with RNase+RNasin and TaqI pre-treatment were compared to unheated MS2
without enzymatic pre-treatment (as a control). The plaque assay result showed no significant
difference (P>0.05) between the RNase+RNasin pre-treatment and the control (Figure 2-4). In
contrast, the plaque assay result of MS2 pre-treated with TaqI showed a significant difference
(P<0.001) to the control. The TaqI pre-treatment slightly reduced the number of infectious MS2 by
0.92 log10 PFU/ml.
2.3.3. The application of RT-qPCR with pre-treatment in inactivation study
In the inactivation study, MS2 was treated with heat or chlorination. Since, from the initial study,
exposure to ClO2 at 0.5 ppm did not inactivate MS2, higher concentrations of ClO2 were used in the
subsequent inactivation study. Heat treatment at 72°C (Figure 2-5) and chlorination with 1 – 16 ppm
ClO2 for 5 min (Figure 2-6) were able to inactivate MS2. The result from plaque assay and RT-qPCR
with pre-treatment showed that heating at 72°C for 40 min reduced the number of MS2 up to 5.57
log10 PFU/ml and 4.81 log10 copies/ml, respectively. Furthermore, the chlorine dioxide treatment for
5 min up to 16 ppm showed the reduction of up to 3.46 log10 PFU/ml and 3.46 log10 copies/ml,
respectively. However, the result of RT-qPCR without pre-treatment showed that both heating at
72°C for up to 40 min and chlorine dioxide treatment for 5 min up to 16 ppm resulted in no MS2
reduction.

43
Figure 2-5. MS2 inactivation by heat treatment at 72°C over 40 min as analysed by RT-qPCR without (☐) or with RNase+RNasin pre-treatment () compared to the plaque assay () with LOQ of RT-
qPCR (―) and plaque assay (- -).
Figure 2-6. MS2 inactivation by exposure to different concentration of chlorine dioxide for 5 min at 25°C, analysed by RT-qPCR without (□) or with RNase+RNasin treatment (■) and plaque assay ().
0
2
4
6
8
0
2
4
6
8
0 2 4 6 8 10 12 14 16
Plaq
ue A
ssay
log
PFU
/ml
RT-q
PCR
log
copi
es/m
l
Chlorine Dioxide (ppm) for 5 min at 25°C
(B)

44
2.4. Discussion
Although human NoV can now be cultured in vivo using stem cell-derived human enteroids (Ettayebi
et al., 2016) and can be used to qualitatively evaluate the efficacy of disinfectants for NoV
inactivation (Costantini et al., 2018), however the development of culture-based assay as a simple,
cheap and robust NoV quantification assay remains challenging (Jones et al., 2015). As a solution,
the molecular-based methods, such as RT-qPCR have been widely developed and proposed as the
detection and quantification assay of NoV (Jones et al., 2015; Kirby & Iturriza-Gómara, 2012;
Lowther et al., 2019; Vinjé, 2015). However, the inability of RT-qPCR to distinguish between
infectious and non-infectious viral particles is the major limitation of this assay. RT-qPCR without
sample pre-treatment may detect and quantify the total nucleic acid from both infectious and non-
infectious viral particles, but only infectious NoV particles are able to infect humans and associated
with a risk of human illness. Not knowing the real number of infectious viruses in a mixture of
infectious and non-infectious virus may lead to overestimation of NoV and lead to inappropriate
decisions regarding the risk management of human NoV.
Accordingly, a cultivable NoV surrogate such as MS2 bacteriophage can be used to evaluate the
efficacy of RT-qPCR to quantify infectious viral particles by comparing the calculated number of
copies of viral particles to the plaque assay in which only infectious viral particles are being
quantified. In our studies, the efficacy of RT-qPCR (without pre-treatment) to quantify infectious
viral particles from non-inactivated MS2 stock was evaluated by comparing the RT-qPCR to plaque
assay results. The RT-qPCR gave comparable results and high correlation (R2=0.9994 (P<0.001) with
a slope value of 0.9938 and intercept value of 0.12997) to the plaque assay for the quantification of
infectious viral particles (Figure 2-2). The LOQ of RT-qPCR method used in this study was 4.46
copies/reaction or 4.46 copies/25 µl. This result was comparable to RT-qPCR assay from Rolfe et al.
(2007); Dreier et al. (2005); and O'Connell et al. (2006) where the LOQ were 2 copies/25 µl, 44.9, and
200 copies/20 µl, respectively.

45
However, the RT-qPCR failed to quantify the number of infectious MS2 particles surviving high
temperature treatment for different durations when compared with the plaque assay results. The
numbers of MS2 genomes were constant for all treatments when quantified by RT-qPCR but
declined when enumerated by plaque assay (Figure 2-3). This indicates that the quantification of
infectious viral particles after heat treatment was over-quantified by RT-qPCR without pre-treatment
compared to the plaque assay. In agreement with our result, other studies also reported no
correlation between the numbers of genomic copies detected with RT-qPCR (without pre-treatment
prior to RNA extraction) and the number of infectious viral particles detected by plaque assay after
an inactivation treatment, such as heat (>72°C), chlorination or other type of disinfectant (Baert et
al., 2008; Belliot et al., 2008; Escudero-Abarca et al., 2014; Fraisse et al., 2011), but positive
correlation on the viral quantification were observed between RT-qPCR with pre-treatments (using
RNase or PMA/EMA) and plaque assay results (Escudero-Abarca et al., 2014; Leifels et al., 2015;
Parshionikar et al., 2010). However, the efficacy of pre-treatment prior to RNA extraction may vary
depends on type of virus, matrix types, inactivation treatments and RNA extraction procedure. For
example, pre-treatment using PMA was effective to measure infectious poliovirus surviving from
heat treatment, but less effective for NoV (Parshionikar et al., 2010). None of these studies used
MS2 as a NoV surrogate, but instead used MNV, FCV, PV or HAV. Therefore, the present results
together with those observed in other studies confirm that RT-qPCR without pre-treatment prior to
nucleic acid extraction is insufficient to estimate the levels of infectious viral particles, especially
when applied to particular inactivation treatments.
In our study, enzymatic pre-treatment prior to nucleic acid extraction was used to eliminate free
genomic RNA from the non-infectious MS2 viral particles. The RT-qPCR and plaque assay results of
infectious MS2 in the inactivation experiments showed that the over-quantification of infectious
MS2 from heat treatment can be reduced with the application of RNase or RNase+RNasin prior to
RNA extraction (Figure 2-4). This is because RNase degrades the RNA from non-infectious viral
particles that lack capsid protection, so that only RNA from infectious MS2 was quantified by the RT-

46
qPCR. When MS2 is exposed to 72°C for 10 min, the protein capsid is disrupted (Pecson et al., 2009)
and so the RNA genome from the damaged virus becomes accessible to RNase (Brié et al., 2016).
The ability of RNase to degrade viral genome integrity also depends on the inactivation method and
target viruses used in the assay (Knight et al., 2012; Pecson et al., 2009). For example, in their
inactivation study of HAV, Bhattacharya et al. (2004) showed that the use of RNase as a pre-
treatment in RT-PCR was more effective for UV inactivated samples than when it was used with heat
treated samples.
However, RNases may remain active at low temperature and pH, and continue to degrade RNA
released from infectious viral particles during the nucleic acid extraction and preparation for PCR
assay. For instance, during purification of RNase A from bovine pancreas by a classical procedure,
the enzyme remained stable and active under low temperature and pH (Raines, 1998). Therefore,
the application of RNase as pre-treatment without further inactivation of this enzyme prior to RNA
extraction may result in under-estimation of infectious viral particles. As shown in our enzymatic
pre-treatment studies, the application of RNase without further inactivation by RNasin in RT-qPCR
assay under-estimated the number of infectious MS2 the heat treatment compared to
RNase+RNasin pre-treatment (Figure 2-4).
Furthermore, RT-qPCR with RNase+RNasin pre-treatment also showed similar trend to the plaque
assay result. This indicates that RNase+RNasin pre-treatment can be used to reduce the over-
estimation of infectious MS2 after exposure to high temperature (Figure 2-5) or chlorine dioxide
treatment (Figure 2-6). Our results confirm the observation of Nuanualsuwan and Cliver (2002) that
the RNase is able to eliminate the over-estimation of infectious NoV surrogates such as HAV, vaccine
PV 1 and FCV from UV, chlorine and 72°C inactivation.
RNasin is a protein that inhibits RNA by binding with high affinity to, and blocking the active site of
RNase (Kobe & Deisenhofer, 1996). The addition of RNasin therefore helps to prevent RNA
degradation by residual RNase (Nuanualsuwan & Cliver, 2002; Yang & Griffiths, 2014), which might

47
result in under-estimation of the infectious MS2. In our study, RNasin was used along with the
application of RNase as pre-treatment prior to nucleic acid extraction. Results from the RT-qPCR
showed that the significant difference (P<0.001) between RNase with and without subsequent
RNasin treatment was observed (Figure 2-4). Moreover, no significant difference (P<0.001) was
observed in plaque assay results between RNase+RNasin pre-treatment and no pre-treatment (as a
control). These indicated that the enzymatic pre-treatment of RNase followed by RNasin might not
injure the infectious MS2 or might not interfere the propagation of infectious MS2 into the host cell.
Thus, RNase+RNasin is potentially to be applied as a pre-treatment prior to nucleic acid extraction
for the RT-qPCR assay to enumerate the infectious virus from the inactivation.
As an alternative to RNase+RNasin, we evaluated the use of restriction endonucleases such as TaqI
as a pre-treatment. This class of enzyme is cheaper than RNase and simpler to use because they
provide a one-step pre-treatment rather than the two-step RNase then RNasin protocol. To the best
of our knowledge, however, the use of TaqI as a pre-treatment has not been widely reported. Our
RT-qPCR results showed that the use of TaqI reduced the over-estimation of MS2 by 1 log10
copies/ml; however, in comparison with the plaque assay, it still overestimated the amount of
infectious virus by approximately 3 log10 PFU/ml. In addition, the results of the plaque assay after
this pre-treatment indicates that either TaqI may affect the lysogenic cycle of MS2 into the host cell
(E. coli strain K12) or incubation at 60°C for 30 min may inactivate MS2 as the number of MS2 were
approximately 1 log10 PFU/ml lower than in the control (without pre-treatment) (Figure 2-4). As a
result, the use of TaqI as a pre-treatment may not be as useful as RNase, and further optimisation is
needed before applying this enzyme in future studies.
High temperature has been shown to be an effective treatment to reduce the number of infectious
NoV and its surrogates including MS2 either in the foods, shellfish, water or culture medium (Araud
et al., 2016; Bozkurt et al., 2014b; Brié et al., 2016; Buckow et al., 2008; Mormann et al., 2010;
Tuladhar et al., 2012). It works by changing the structure of the capsid protein of the viruses (Baert
et al., 2008; Nuanualsuwan & Cliver, 2003), and potentially jeopardising RNA integrity, which may

48
affect their ability to initiate the infectious process (Cliver, 2009). We also observed that heat
inactivation at 72°C for 20 to 40 min was effective and reduced the number of MS2 by 5-5.5 log10
PFU/ml (Figure 2-5). Moreover, heating at 76.6°C for 2 min has been suggested as the minimum
temperature to eliminate 4-5 log10 copies/reaction of NoV by heat inactivation modelling (Beller et
al., 1997; Topping et al., 2009). Therefore, the application of heat treatment in food preparation
such as steaming, boiling and cooking might be an effective method to eliminate enteric viruses
including NoV in food.
Oxidative chemical substances such as chlorine and ClO2 are alternative disinfectants to inactivate
enteric virus on food contact surfaces (Feliciano et al., 2012; Kim et al., 2012) and in uncooked food
(Predmore & Li, 2011). Chlorine dioxide causes oxidative damage to the RNA genome and reacts
with the capsid protein thus preventing virus attachment to the host cell (Li et al., 2004). A study
from Hornstra et al. (2011) confirmed that the application of 0.5 ppm ClO2 using a reactor was
sufficient to inactivate MS2 by up to 5 log10 unit after an exposure time of at least 20 min. This
contrasts with our preliminary study using the plaque assay that found that the application of 0.5
ppm ClO2 for 15-60 min did not inactivate MS2. This difference was probably due to the use of a
reactor in the previous study which maintains the concentration of ClO2 constant during the
treatment. When higher concentrations of ClO2, up to 16 ppm for 5 min, were applied in our
inactivation studies, ClO2 inactivated MS2 by up to 3 log10 PFU/ml (Figure 2-6). The different
inactivation efficacy between our preliminary and inactivation studies may be due to the tailing
phenomenon which occurs during chlorine or ClO2 inactivation processes (Hornstra et al., 2011;
Sigstam et al., 2014); therefore the concentration of ClO2 is not linearly correlated with the viral
inactivation.
Our inactivation studies showed that both heat and ClO2 treatment have the potential to be applied
to eliminate and to reduce viral particles that may contaminate food, water or food contact surfaces.
The use of ClO2 might be a good alternative disinfectant to eliminate or to reduce the viruses that
are transmitted to food via the secondary transmission such as contaminated water or infected-

49
person hand during food handling, but might be ineffective to eliminate NoV inside the shellfish
tissue, which originates from the natural contamination. This ClO2 treatments can be done by
dipping, washing or cleaning processes when it is not possible to use heat treatment for uncooked
food products such as raw oysters, fresh fruits and vegetables.
2.5. Conclusions
In this study, the quantification of MS2 bacteriophage (as a NoV surrogate) after exposure to heat or
chlorine dioxide using RT-qPCR without RNase pre-treatment overestimated the number of
infectious viruses, while RT-qPCR with RNase-only pre-treatment underestimated the number of
infectious viruses. Hence, the use of RNasin as a complimentary step after RNase pre-treatment is
required for the RT-qPCR assay to produce a comparable result to a plaque assay in the
quantification of infectious viral particles. The results of the present study, therefore, demonstrate
the potential for using such an approach to more accurately determine the infectious viral particles
of “uncultivable” virus where the viral capsid integrity is the object of inactivation, such as NoV
surviving from inactivation by heat or chlorine dioxide. This pre-treatment might not be suitable to
determine surviving viral particles from inactivation by UV or irradiation where the viral genome
integrity is the object of inactivation.

50
Chapter 3. Thermal inactivation kinetics of Human norovirus and MS2
bacteriophage in buffered media and bioaccumulated Tasmanian Blue
Mussel (Mytilus galloprovincialis)
3.1. Introduction
NoV is one of the most prominent foodborne viruses that cause enteritic disease (Koopmans et al.,
2008) and is frequently related to consumption of virus-contaminated shellfish (Le Guyader et al.,
2010). There are numerous outbreak reports of NoV contamination from shellfish in U.S.A. (Berg et
al., 2000; Kohn et al., 1995), European countries (Le Guyader et al., 2006; Westrell et al., 2010),
Australia (Webby et al., 2007), and Singapore (Ng et al., 2005). Although most of the outbreaks
caused by NoV were associated with the consumption of raw oysters, undercooked shellfish also
contributed to outbreaks (Alfano-Sobsey et al., 2012; Richards, 2006). When cooking is applied,
temperature and holding time play important roles during cooking, and are considered as critical
points in reducing the incidence of NoV-foodborne cases.
In countries where shellfish is consumed as a cooked meal, the application of thermal inactivation by
heating can greatly reduce the risk of gastrointestinal disease, without concerning the change of
organoleptic quality. Thermal inactivation is considered as one of the most effective treatments to
reduce the number of enteric viruses that contaminated food and drinking water (Bertrand et al.,
2012). There is high variability in the efficacy of this treatment, which depends on the matrix types
and sizes, the virus species or strains, detection or quantification methods (Bertrand et al., 2012;
Bozkurt et al., 2015b) and holding time (Arthur & Gibson, 2015). As expected, inactivation rates at
≥50°C are faster than at <50°C (Bertrand et al., 2012), hence, heating at ≥50°C has potential to be
applied in food processing to reduce the risk of NoV infection.
Studies of heat inactivation of enteric viruses have been initiated since 1960’s (Heberling & Cheever,
1960). However, determining the heat inactivation kinetics of viruses such as NoV , SaV, and HEV

51
remains challenging (Bozkurt et al., 2015b; Koopmans & Duizer, 2004; Randazzo et al., 2018) due to
the absence of an effective and robust cell culture-based system as a standard quantification
method (Harrison & DiCaprio, 2018; Oka et al., 2015). Consequently, molecular-based method such
as PCR, and the culturable surrogates that have a similar structure to the targeted viruses, have been
commonly applied in heat inactivation studies (Flannery et al., 2014; Randazzo et al., 2018; Richards,
2012). Since the inactivation kinetics of these surrogates is varied, thus, a study comparing the
inactivation kinetics between the actual virus and a surrogate would be beneficial to reduce
underestimation or overestimation of the inactivation kinetics.
In the last few decades, several mathematical models have been used to describe the viral
inactivation kinetics and to evaluate the efficacy of thermal inactivation in reducing enteric viruses in
food and water (Deboosere et al., 2004b; Deboosere et al., 2010; Kauppinen & Miettinen, 2017;
Romero et al., 2011) or their surrogates (Bozkurt et al., 2013, 2014a; Hewitt et al., 2009). Linear and
non-linear regression models have been applied to describe and to predict the inactivation kinetics
in these studies. First-order kinetic and log-logistic equations were widely used as linear models to
generate D and z values for thermal inactivation of enteric viruses, while Weibull and Biphasic
models were used to describe more complex inactivation kinetics (Araud et al., 2016; Bertrand et al.,
2012; Seo et al., 2012; Tuladhar et al., 2012). Although some of studies have explored both model
types (linear and non-linear) to determine the thermal inactivation kinetics, there are few studies on
heat inactivation kinetics of human NoV and its surrogates which incorporate or compare both
models.
In this study, a pre-treatment RT-qPCR was used as a quantification method for NoV during the heat
inactivation study. Pre-treatment RT-qPCR has been used in some studies to enumerate NoV in the
sample that contains both infectious and non-infectious viruses. The use of substances such as EMA,
PMA/PMAXX, proteinase K and RNase as a pre-treatment in RT-qPCR has been shown to reduce the
overestimation of infectious viral particles (Barbeau et al., 2005; Karim et al., 2015; Nuanualsuwan &
Cliver, 2002; Oristo et al., 2018). Also, MS2 bacteriophage has been proposed as a surrogate for NoV

52
inactivation studies because of its structural similarity with NoV, and because it is easy to handle and
cheap (Tufenkji & Emelko, 2011). To the best of the candidate’s knowledge, there is no study that
has evaluated the heat inactivation kinetics of MS2 and infectious NoV (which was quantified by pre-
treatment RT-qPCR) using both linear and non-linear model approaches.
The purposes of the present study were to evaluate and to compare thermal inactivation kinetics of
NoV and its surrogate (MS2) in buffered media and Tasmanian Blue Mussel (Mytilus
galloprovincialis) matrix utilising different models (i.e. the log linear, Weibull and Biphasic model).
Mussels were artificially contaminated by the bioaccumulation process to mimic the actual condition
of enteric virus’s transmission routes in shellfish. Viruses in buffered media and contaminated-
mussel were treated with different temperatures and holding times.
3.2. Materials and methods
3.2.1. NoV stock preparation
Eight fresh faecal specimens containing NoV genogrup II genotype 4 (GII.4) were provided by the
Hobart Pathology, Hobart, Tasmania. These samples were previously determined to be NoV-positive
by an immunochromatographic test using Rida®Quick (Biopharm AG, Gemany) (Bruggink et al., 2011;
Bruins et al., 2010; Kirby et al., 2010). All samples were prepared as previously described by Trujillo
et al. (2006) with some modifications, described here. In brief, 1 g of faecal/stool or 1 ml of watery
stool was suspended in 9 ml of PBS (Phosphate Buffered Saline) that was previously prepared in
diethyl pyrocarbonate-treated water, yielding a 10% suspension. The suspension was then added to
5 ml chloroform and vigorously shaken for 30 sec. The virus was then separated from the organic
matter by centrifugation at 10,000 x g for 10 min at 4°C. The upper aqueous phase was transferred
to new, sterile, 50 ml plastic tubes and serially filtered through 0.45 and 0.22 µm pore-size low-
protein-binding membrane filters (Millipore, USA). The virus stock was stored at -80°C for
subsequent studies. RT-qPCR assay with enzyme pre-treatment was performed to determine the
NoV concentration on the virus stock. The specific primers COG2R and QINF2 were used to quantify

53
the NoV GII.4 because of their specificity and sensitivity (International Organization for
Standardization, 2013; Loisy et al., 2005; Miura et al., 2013). Virus stocks with concentration of >109
genomic copies per ml were used for inactivation studies.
3.2.2. MS2 bacteriophage stock production
MS2 bacteriophage (MS2) was produced as previously described in Section 2.2.1. of this thesis. The
concentration of infectious MS2 in the stock was confirmed by a double layer agar method (EPA,
2001). The concentration of infectious MS2 was expected to be between 1011 to 1012 PFU/ml.
3.2.3. Bioaccumulation in mussels
Five kilograms of live Tasmanian Blue Mussel (Mytilus galloprovincialis) were purchased from a
single local supplier in Tasmania and kept at <10°C during transportation. Three individual mussels
per batch (1 batch equal to 1 kg mussel) were randomly picked and analysed by RT-qPCR and plaque
assay to detect the presence of MS2 and NoV as natural contaminants. In the screening step,
naturally contaminated batches of mussels (with MS2 or NoV) and mussels with broken shells were
not used for the bioaccumulation study. None of the mussel batches were naturally contaminated by
NoV and MS2.
Only four kilograms of mussels (50-60 individual mussels/kg/batches) were obtained from the
screening step, and then were acclimated for 24 h in an aquarium (40 x 25 x 50 cm) using 20 l of
sterile artificial seawater with continuous aeration. After the acclimatisation, 100 live mussels were
selected for the bioaccumulation process. The mussels were laid on a monolayer disposal in 10 l of
sterile artificial sea water (containing 2% of sea salt) which was contaminated with NoV and MS2
stock. The final concentration of NoV and MS2 in the aquarium seawater was approximately 107 -108
copies/ml and 108-109 PFU/ml, respectively. To optimize the bioaccumulation process in the DT of
mussels, 10 ml of concentrated phytoplankton (Reef PhytoplanktonTM, Australia) was added to the
seawater. The bioaccumulation process was conducted for 12 and 24 h at 10 ± 4°C, under similar
condition to the acclimatisation step. After bioaccumulation process, all mussels were dipped in 20 l

54
sterile seawater for 5 min to remove contaminated-water from the mussel body. Three individual
mussels were dissected to take out the tissue. The mussel tissues were washed with sterile saline
water (ddH2O+0.9% NaCl), extracted and then analysed using RT-qPCR and/or plaque assay to
quantify the NoV and MS2 concentration. Each mussel tissue was weighed and recorded prior to
sample extraction. The bioaccumulation process is presented in Figure 3-1.
3.2.4. Thermal inactivation in buffered media
The temperature of buffered media (PBS) in 15 ml plastic tubes was equilibrated by heat pre-
treatment for 10 min at 60, 72 and 90°C for thermal treatments, or at 20°C for controls. NoV and
MS2 stocks were added to make final concentrations of approximately 107 copies/ml and 108
PFU/ml, respectively. The suspensions were heated using water bath at 60±1°C for 15, 30, 60, 120
and 240 min; 72±1°C for 2.5, 5, 10, 20 and 40 min; and 90±1°C for 1, 2.5, 5, 10, and 20 min. Each
treatment was done in triplicates. Thermocouple Tecpel 319® (Taiwan) with 4-channel wired probes
were used to confirm the actual temperature in the tubes during treatment. After each incubation
time, samples were taken from water bath and kept in a freezer at -20°C for further analysis.

55
Figure 3-1. Acclimatisation and bioaccumulation process of Tasmanian Blue Mussel (Mytilus galloprovincialis)
Stock
3 mussels analyse RT-qPCR & Plaque assay
4 kg mussel (200-240 pcs) acclimatisation 24 h at 10±4°C
Bucket + 5 kg live mussels
2 kg mussels/ 10 litre artificial sea water
100 ml of NoV and MS stock
Phytoplankton concentrate
10±4°C
Plaque assay
12 & 24 h bioaccumulation process
Sampling for RT-qPCR & Plaque assay

56
3.2.5. Thermal inactivation in mussel matrix
The thermal inactivation treatments were done in triplicate in water baths at 60, 72 and 90°±1C.
Previously, forty five of 30 ml of PBS solution in 50 ml plastic tubes were pre-heated at certain
temperatures (for 30 min) to equilibrate the thermal condition. The PBS solution was used as a
buffer media in this study to avoid a viral aggregation due to changes in the environment before the
heat treatment. Two pieces of bioaccumulated-mussels tissue (approximately 10-14 g) were then
added to each suspension/tube and heated for specified contact times as shown in Table 3-1. After
each incubation period, five grams of mussels were removed from the water bath and transferred to
a freezer at -20°C before subsequent concentration and purification steps.
Table 3-1. Contact times of thermal inactivation at different temperatures.
Treatments Replication Contact Time (Min)
Control (No Heating/±20°C) 3 0
60°C 3 15; 30; 60; 120; and 240
72°C 3 2.5; 5; 10; 20; and 40
90°C 3 1; 2.5; 5; 10; and 20
3.2.6. Enumeration of NoV and MS2
3.2.6.1. Virus concentration
Viruses were isolated and concentrated form the mussel samples following the procedure of Lewis
and Metcalf (1988) and Mullendore et al. (2001), with modifications. In brief, 5 g of whole mussel
tissue were homogenized by shaking at 250 rpm with 1:6 (w/v) 10% tryptose phosphate broth (TPB)
in 0.05 M glycine (pH 9.0) for 30 min at 4°C. Seven ml of supernatant was transferred into new 15 ml
plastic tubes, 5 ml of chloroform was added, and centrifuged at 10,000 x g for 10 min at 4°C. The
upper aqueous phase was transferred into 7 ml of 16% PEG 6000 (Sigma Aldrich, USA) and 0.6 M
NaCl (pH 6.5), and was shaken at 250 rpm for 12 h at 4°C. The resulting suspension was centrifuged
at 10,000 x g for 30 min at 4°C. The PEG-containing supernatant was discarded, and the pellet was

57
suspended in 1 ml PBS, pH 7.5 sonicated for 30 s, shaken for 20 min at 250 rpm. The suspension was
re-purified by adding an equal volume of chloroform, and centrifuged at 10,000 x g for 10 min at
4°C. The upper aqueous phase was then transferred into new 2 ml micro tube and stored at -20°C.
3.2.6.2. Enzymatic pre-treatment prior to RNA extraction
Prior to nucleic acid extraction, heat treated, as well as control samples, were enzymatically pre-
treated as previously described in Section 2.2.4. of this thesis. Subsequently, RNA in samples was
extracted by the acid-guanidinium thiocyanate-phenol-chloroform method of Chomczynski and
Sacchi (2006), with modification, as previously described in Section 2.2.2.2.b. of this thesis.
3.2.6.3. Quantification of infectious NoV by RT-qPCR assay
For NoV GII assay, the RT-qPCR was performed as previously described by Jothikumar et al. (2005)
with modifications using PowerSYBR® Green RNA-to-CT™1-Step Kit (Applied Biosystem, USA) on the
Rotor-Gene Q (Qiagen, Germany). JJV2F and COG2R primers were used as forward and reverse
primers, respectively. In the final mixture, the RT-qPCR reaction contained 5 µl of RNA template, 0.5
µl of each primer (final concentration of 250 nM), 10 µl of 2x PowerSYBR® Green buffer, 0.2 µl RT-
Taq enzyme, and DNase/RNase-free purified-water to make a final volume of 20 µl. The mixture was
then subjected to a one-step assay by using the following amplification conditions: (i) RT for 30 min
at 48°C, (ii) 10 min at 95°C to activate Taq polymerase, and (iii) 45 cycles of 10 s at 94°C, 20 s at 55°C,
and 15 s at 72°C. To develop a standard for enumeration of NoV GII, a plasmid was constructed by
cloning nucleotides from 4830-5285 of GII.4 Lordsdale NoV sequences (GenBank accession no.
X86557) from isolated NoV. The 475 bps plasmid fragment encompassed 97 bps of RT-qPCR product
sequences. The plasmid was purified and serially diluted in free DNase/RNase purified-water. To
assess the specificity of PCR products, negative controls using RNA from E. coli K12 bacteria and MS2
was used, and the melt curve analysis were performed following the procedures from the Rotor-
Gene Q® (Qiagen, Germany).

58
3.2.6.4. Quantification of infectious MS2 by plaque assay
The infectious MS2 was quantified by plaque assay as described in Section 2.2.2.2.a of this thesis.
3.2.7. Modelling of thermal inactivation kinetics
Three different models i.e. log linear (first-order kinetic), Weibull and Biphasic, were compared to
obtain the best fitted survival curve of NoV and MS2. The first-order kinetic model is written as
follows (Geeraerd et al., 2000):
𝑙𝑙𝑙𝑙𝑙𝑙 � 𝑑𝑑𝑑𝑑0� = − 𝑑𝑑
𝐷𝐷 or 𝑙𝑙𝑙𝑙𝑙𝑙10(𝑘𝑘) = 𝑙𝑙𝑙𝑙𝑙𝑙10 (𝑘𝑘0) − 𝑘𝑘𝑚𝑚𝑚𝑚𝑚𝑚.𝑑𝑑
𝑙𝑙𝑛𝑛(10) (Equation 3-1)
In the cases of shoulder and/or tailing phenomenon, the modified log-linear model with shoulder
and/or tailing can be applied to fit the curves. The modified model proposed by Geeraerd et al.
(2000) is written as follows.
𝑑𝑑𝑑𝑑𝑑𝑑𝑑𝑑
= −𝑘𝑘𝑘𝑘𝑘𝑘𝑘𝑘.𝑘𝑘. � 11+𝐶𝐶𝑐𝑐
� . �1 − 𝑑𝑑𝑟𝑟𝑟𝑟𝑟𝑟𝑑𝑑� (Equation 3-2)
where N is the number of viruses survived after heat treatment and No is the initial population of
viruses. MS2 population was described in PFU/ml, while NoV was quantified in copies/ml. t is the
exposure time (min), kmax is the first order inactivation constant [1/min] and D (decimal reduction
time) is the time required to eliminate 90% of the population (min). Herein, Cc is related to the
physiological state of cells or viruses [-], and Nres is the residual population density (PFU/ml or
copies/ml).
The Weibull model equation proposed by Mafart et al. (2002) is described as follows:
𝑙𝑙𝑙𝑙𝑙𝑙 � 𝑑𝑑𝑑𝑑0� = −�𝑑𝑑
𝛿𝛿�𝑝𝑝
or 𝑛𝑛 = �𝑑𝑑𝛿𝛿�𝑝𝑝
(Equation 3-3)

59
The modified Weibull model which describes concave, convex or linear curves followed by tailing can
be used to fit data with tailing phenomenon. The model was proposed by Albert and Mafart (2005)
and can be written as follows:
l𝑙𝑙𝑙𝑙10(𝑘𝑘) = 𝐿𝐿𝑙𝑙𝑙𝑙10 �(𝑘𝑘0 − 𝑘𝑘𝑟𝑟𝑟𝑟𝑠𝑠). 10�−�𝑡𝑡𝛿𝛿�𝑝𝑝� + 𝑘𝑘𝑟𝑟𝑟𝑟𝑠𝑠� (Equation 3-4)
where δ is the time to first decimal reduction, p is a shape parameter, and n represents the decimal
reduction ratio. The value of δ is not equal to the conventional D value. Therefore, n can be used to
calculate log10 reductions (D), from which 1D can be calculated as n=1, or 2D equal to n=2.
The biphasic model equation (Geeraerd et al., 2005; Schielke et al., 2011) can be generated from
Cerf (1977), as described below:
𝑙𝑙𝑙𝑙𝑙𝑙(𝑘𝑘) = 𝑙𝑙𝑙𝑙𝑙𝑙(𝑘𝑘0) + 𝑙𝑙𝑙𝑙𝑙𝑙�𝑓𝑓. 𝑒𝑒−𝑘𝑘𝑚𝑚𝑚𝑚𝑚𝑚1.𝑑𝑑 + (1 − 𝑓𝑓). 𝑒𝑒−𝑘𝑘𝑚𝑚𝑚𝑚𝑚𝑚2.𝑑𝑑� (Equation 3-5)
where f is the fraction of initial population in a major subpopulation, kmax1 and kmax2 is specific
inactivation rate (1/time unit) at phase 1 (Initial) and 2 (Tailing), respectively.
Curves were fitted to those three models using GInaFiT for Microsoft Excel (Geeraerd et al., 2005).
The 2D, 4D and D Initial values were calculated using Solver® Add-in of Microsoft 365 (Microsoft
Corp).
3.2.8. Statistical analysis
The models were evaluated for the best fit by comparing the Root Mean Square Error (RMSE) and
the coefficient of determination (R2) value for the various models. To measure goodness-of-fit, the
RMSE was used for both linear and non-linear models (Ratkowsky, 2004), while the R2 was only used
for linear models. The RMSE and R2 values were calculated using Microsoft Excel® software. The
RMSE and R2 equation are described below:

60
𝑅𝑅𝑅𝑅𝑅𝑅𝑅𝑅 = �Σ(𝑝𝑝𝑟𝑟𝑟𝑟𝑑𝑑𝑝𝑝𝑝𝑝𝑑𝑑𝑟𝑟𝑑𝑑−𝑜𝑜𝑜𝑜𝑠𝑠𝑟𝑟𝑟𝑟𝑜𝑜𝑟𝑟𝑑𝑑)2
𝑛𝑛 − 𝑝𝑝 (Equation 3-6)
𝑅𝑅2 = 𝑛𝑛(∑𝑚𝑚𝑥𝑥)−(∑𝑚𝑚)(∑𝑥𝑥)�[𝑛𝑛∑𝑚𝑚2−(∑𝑚𝑚)2][𝑛𝑛∑𝑥𝑥2−(∑𝑥𝑥)2]
(Equation 3-7)
where n is the number of observations and p is the number of parameters to be estimated. The value
of x presents the independent variables (temperature), while y presents the dependent variables
(observed values).
3.3. Results
3.3.1. Bioaccumulation of NoV and MS2 in mussel
The preliminary screening confirmed that there were undetectable levels of NoV or MS2 in batches
of mussel used in the bioaccumulation study. Four batches of mussels (Approximately 50-60
mussels/batch) were acclimated for 24 h. During 12 and 24 h of bioaccumulation process, the mussel
was contaminated by NoV at 6.64 and 6.61 log10 copies/g and MS2 at 7.80 and 7.57 log10 PFU/g,
respectively. There were no significant differences (p>0.05) in viral concentration in mussels that
were subjected to bioaccumulation for 12 or 24 h for either virus as shown in Table 3-2. However,
unopened shells were observed in the mussels (<10%) after 24 h bioaccumulation process which
may indicate dead or inactive mussels. Therefore, only mussels from the 12 h of bioaccumulation
were used for inactivation studies to reduce the variability of initial concentration of NoV or MS2.
Table 3-2. The concentration of NoV and MS2 in seawater and mussel after bioaccumulation process for 12 and 24 h.
Virus Seawater
(24 h) Unit
Mussel Unit
12 h 24 h
NoV 7.67 ± 0.05 log10 copies/ml 6.64 ± 0.17a 6.06 ± 0.63a log10 copies/g
MS2 8.12 ± 0.24 log10 PFU/ml 7.80 ± 0.03b 7.57 ± 0.27b log10 PFU/g
*The same letter in the same row denotes no significant differences (p>0.05)

61
3.3.2. Thermal inactivation of NoV and MS2
To determine the thermal inactivation kinetics of NoV and MS2 in buffered media and mussel
matrix, the virus stock and bioaccumulated-mussels were exposed to heat treatment at 60, 72 and
90±1°C for defined periods. The concentration of infectious NoV and MS2 after heating in both
matrices, expressed as log10 copies/g or copies/ml and log10 PFU/g or PFU/ml, were plotted against
the contact time (min) at each temperature as shown in Figure 3-2 to 3-5. The average initial
concentrations of NoV in buffer and mussels were 6.26 ± 0.16 log10 copies/ml and 6.64 ± 0.17 log10
copies/g, respectively. While the MS2 initial concentrations were 7.89 ± 0.07 log10 PFU/ml in buffer
and 7.80 ± 0.03 log10 PFU/g in mussel matrix.
The average of NoV reduction in buffered media by heating at 60°C for 240 min, 72°C for 40 min and
90°C for 20 min were 2.81, 2.96 and 3.88 log10 reductions respectively, while the inactivation in
mussel matrix were 2.85, 3.08 and 3.58 log10 reductions at the end of treatment. Furthermore, the
inactivation of MS2 at 60, 72 and 90°C in buffered media and mussel matrix resulted in 4.93, 6.73
and 7.09 and 4.64, 5.42 and 6.35 log10 reductions, respectively. Apparently, based on the log
reductions trends after the treatment, MS2 were more susceptible to heat treatment than NoV in
both buffered media and mussel matrix at each heating temperature. For example, the average of
MS2 reduction in buffered media by heating at 72°C for 10 min resulted in 4.74 log10 reductions, two
logs higher than the reductions of NoV from similar treatment, which was only 2.03 log10 reduction.
Moreover, similar treatment in the mussel matrix reduced MS2 by 3.30 log10 reductions in average,
while only 2.35 log10 reductions were observed from NoV.
3.3.3. Model fitting and comparison
Linear and non-linear models (see Section 3.2.7.) were used to describe the inactivation kinetics and
the times required to a log10 reduction (D value) of NoV and MS2 due to thermal inactivation over
the time. The data of infectious NoV and MS2 over time during heat treatments at 60, 72 and 90±1°C
were fitted using log linear, Weibull and Biphasic models. Since the observed survival of NoV and

62
MS2 data showed a tailing and/or shoulder phenomenon (Figure 3-2 to 3-5), the models were
calculated by modified equations that included terms for tailing and/or shoulders (see Section 3.2.8).
RMSE and/or R2 were used to compare linear and non-linear models, and were also used to
determine the best predicted 2D (time to 100-fold reduction) and 4D (time to 10,000 fold reduction)
values. During the model fitting, the unmodified log linear model produced a lower coefficient of
determination (R2) compared to the log linear model with tailing and/or shoulder (data not shown),
therefore only the modified (with tailing and/or shoulder) log linear model was used for model
comparison.
In general, Weibull (without tailing) and Biphasic models presented better predictions of thermal
inactivation kinetics in both matrices for both viruses, as shown on Table 3-3 and 3-4. Some
inactivation curves were better fitted by Weibull-tailing or Log linear-tailing model than Weibull or
Biphasic, especially to predict the infectious viruses in the full duration of the treatment. However,
with the assumption that viruses will not survive from heating for extended periods, Weibull-tailing
and Log linear-tailing models failed to predict the infectious viruses for extended periods (outside of
the full duration of the treatment), because of a constant survival of viruses after certain exposure
time (Figure 3-2 to 3-5). Moreover, based on these observations, Weibull (without tailing) was better
to predict the infectious viruses from heat treatment in the buffered media, while Biphasic
performed better to predict the virus survival in the mussel matrix.
By visually comparing the observed data to the fitted curves of each model, the log linear with tailing
model underestimated and/or overestimated the observed infectious population of NoV and MS2,
especially at initial contact time (t=0) and the end of treatment, while the Weibull or Biphasic
models presented better predictions (Figure 3-2 to 3-5). These subjective evaluations were
consistent with curve fitting analyses (Table 3-3 and 3-4) where the RMSE value of the log linear-
tailing model were always higher than the Weibull or Biphasic, except for NoV heated at 60°C in
mussel matrix.

63
Figure 3-2. Thermal inactivation curves of NoV at 60 (A); 72 (B) and 90°C (C) in buffered media fitted with Log linear-tailing (…), Weibull ( ̶ ̶ ̶) and Biphasic ( —) model.
0
1
2
3
4
5
6
7
0 50 100 150 200 250
Log 1
0(N
)(log
cop
ies/
ml)
Time (min)
(A)
0
1
2
3
4
5
6
7
0 50 100 150 200 250
Log 1
0(N
)(log
cop
ies/
ml)
Time (min)
(B)
0
1
2
3
4
5
6
7
0 50 100 150 200 250
Log 1
0(N
) (lo
g co
pies
/ml)
Time (min)
(C)
*LOQ = 2.40 log10 copies/ml

64
Figure 3-3. Thermal inactivation curves of MS2 at 60 (A); 72 (B) and 90°C (C) in buffered media fitted with Log linear-tailing (…), Weibull ( ̶ ̶ ̶), Weibull-tailing ( ̶ · ̶ ) and Biphasic ( —) model.
0
1
2
3
4
5
6
7
8
9
0 50 100 150 200 250
Log 1
0(N
)(log
PFU
/ml)
Time (min)
(A)
0
1
2
3
4
5
6
7
8
0 50 100 150 200 250
Log 1
0(N
)(log
PFU
/ml)
Time (min)
(B)
0
1
2
3
4
5
6
7
8
0 50 100 150 200 250
Log 1
0(N
)(log
PFU
/ml)
Time (min)
(C)
*LOQ = 0.70 log10 PFU/ml (---)
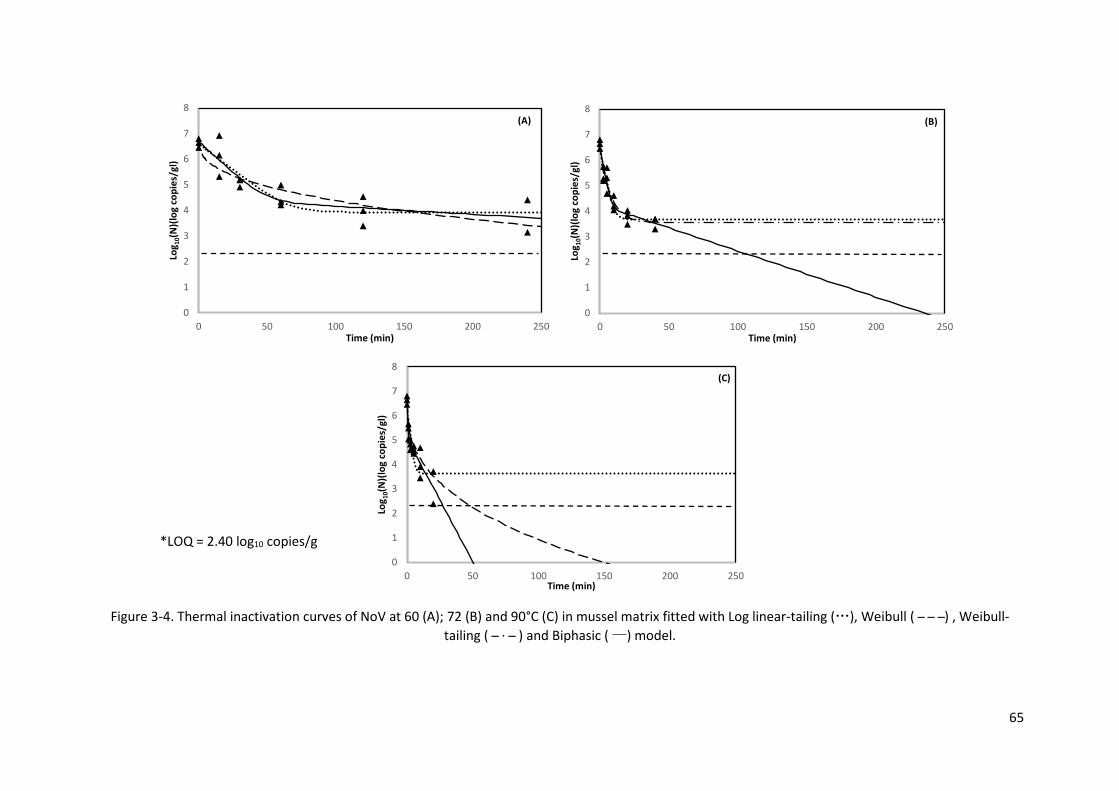
65
Figure 3-4. Thermal inactivation curves of NoV at 60 (A); 72 (B) and 90°C (C) in mussel matrix fitted with Log linear-tailing (…), Weibull ( ̶ ̶ ̶) , Weibull-tailing ( ̶ · ̶ ) and Biphasic ( —) model.
0
1
2
3
4
5
6
7
8
0 50 100 150 200 250
Log 1
0(N
)(log
cop
ies/
gl)
Time (min)
(A)
0
1
2
3
4
5
6
7
8
0 50 100 150 200 250
Log 1
0(N
)(log
cop
ies/
gl)
Time (min)
(B)
0
1
2
3
4
5
6
7
8
0 50 100 150 200 250
Log 1
0(N
)(log
cop
ies/
gl)
Time (min)
(C)
*LOQ = 2.40 log10 copies/g

66
Figure 3-5. Thermal inactivation curves of MS2 at 60 (A); 72 (B) and 90°C (C) in mussel matrix fitted with Log linear-tailing (…), Log linear-shoulder-tailing (xxx), Weibull-tailing ( ̶ · ̶ ), Two-mixed Weibull (═), Biphasic (—) and Biphasic-shoulder (○○○) model
0
1
2
3
4
5
6
7
8
0 50 100 150 200 250
Log 1
0(N
)(log
cop
ies/
gl)
Time (min)
(A)
0
1
2
3
4
5
6
7
8
0 50 100 150 200 250
Log 1
0(N
)(log
cop
ies/
gl)
Time (min)
(B)
0
1
2
3
4
5
6
7
8
0 50 100 150 200 250
Log 1
0(N
)(log
cop
ies/
gl)
Time (min)
(C)
*LOQ = 0.70 log10 PFU/g (---)

67
3.3.4. The z curves of NoV and MS2 thermal inactivation.
The calculated D, 2D and 4D values from each thermal inactivation model of NoV and MS2 in
buffered media and mussel matrix are presented in Table 3-3 and 3-4. The calculated D values from
the best fitted of three models (which has the lowest RMSE for non-linear models or the closest
coefficient of determination (R2) to 1 for linear models) (Table 3-3 and 3-4) were plotted against the
temperature of the treatment to generate a general secondary model (z curves) of thermal
inactivation (Figure 3-6). For comparison to the general z curves, specific secondary models of
Biphasic (Figure 3-7 and 3-8) were derived from D values of Biphasic model only.
In general, the modified Log linear and Weibull with tailing models were failed to calculate the 4D
values from thermal inactivation of NoV but were successful for MS2. As expected in this study, the
fastest time to reduce 4 log concentrations (4D value) of the viruses in buffered media and mussel
matrix were observed from heating at 90°C for less than 1 min.

68
Table 3-3. The predicted time to log reduction at D, 2D and 4D and the calculated RMSE values from the thermal inactivation curves of NoV in different matrices fitted by Log Linear, Weibull and Biphasic models.
Initial Conc. Matrix Temp.
(°C)
Model fitting Log Linear Weibull Biphasic
Time to log reduction (mins) RMSE Curves
Time to log reduction (mins) RMSE Curves
Time to log reduction (mins) RMSE Curves
D 2D 4D D (n=1) 2D 4D D(Dinitial) 2D 4D
6.27 ± 0.16 log
copies/ml
Buffered Media
60 30.83 84.29 n/a 0.405 Tailing 15.04 93.04 575.80 0.296 Normal 16.75 101.43 399.85 0.301 Normal 72 4.71 10.32 n/a 0.415 Tailing 1.28 11.45 102.98 0.172 Normal 2.25 12.05 60.21 0.218 Normal 90 2.29 4.68 n/a 0.541 Tailing 0.24 2.27 21.54 0.303 Normal 0.57 1.50 19.91 0.352 Normal
6.64 ± 0.17 log
copies/g Mussel
60 24.74 51.46 n/a 0.511 Tailing 11.09 66.14 393.11 0.587 Normal 20.68 45.39 573.05 0.519 Normal 72 4.27 8.88 n/a 0.359 Tailing 2.06 7.89 n/a 0.313 Tailing 3.66 8.10 99.73 0.356 Normal 90 2.58 5.50 n/a 0.590 Tailing 1.21 7.18 42.58 0.485 Normal 0.77 4.19 24.01 0.397 Normal
Note: The D value predicted from the best fitted models (with the lowest RMSE value) were written in bold and used to create z curves.
Table 3-4. The predicted time to log reduction at D, 2D and 4D and the calculated RMSE values from the thermal inactivation curves of MS2 in different matrices fitted by Log Linear, Weibull and Biphasic models.
Initial Conc. Matrix Temp. (°C)
Model fitting Log Linear Weibull Biphasic
Time to log reduction (mins) RMSE Curves Time to log reduction
(mins) RMSE Curves Time to log reduction (mins) RMSE Curves
D 2D 4D D (n=1) 2D 4D D(Dinitial) 2D 4D
7.89 ± 0.07 log PFU/ml
Buffered Media
60 21.13 42.43 n/a 0.564 Tailing 6.41 31.06 150.34 0.237 Normal 10.43 22.04 153.69 0.127 Normal 72 1.35 2.63 5.39 0.692 Tailing 0.39 1.61 6.78 0.290 Tailing 1.29 2.58 5.27 0.394 Normal 90 1.08 2.16 4.32 0.593 Tailing 0.04 0.31 2.67 0.482 Normal 0.36 1.43 2.91 0.574 Normal
7.80 ± 0.03 log PFU/g Mussel
60 39.61 67.93 125.89 0.114 Shoulder-tailing 39.01 66.32 142.13 0.117 Double-
Weibull 40.40 65.16 139.70 0.102 Shoulder
72 2.92 5.82 12.09 0.579 Tailing 1.05 4.25 17.23 0.421 Tailing 1.97 3.99 17.80 0.228 Normal 90 1.15 2.30 4.64 0.549 Tailing 0.16 0.82 4.11 0.245 Tailing 0.76 1.52 3.33 0.338 Normal
Note: The D value predicted from the best fitted models (with the lowest RMSE value) were written in bold and used to create z curves.

69
The general z curves (Figure 3-6) showed that temperature and matrix type affected the D values of
NoV and MS2. The intercept values of the curves (calculated from the log linear regression curves) in
mussel matrix was always higher than in buffered media for both NoV and MS2 (data not shown). In
addition, the predicted D values in buffered medium were constantly lower than in mussel matrix at
temperature more than 50°C by a constant proportion (Figure 3-6). The D values of NoV were
generally higher than MS2 in both buffered medium and mussel matrix, for each temperature
studied. Furthermore, when the best fitted models were used to predict the D, 2D and 4D values,
the inactivation in mussel matrix required more time, except for MS2 in mussel heated at 60°C
(Table 3-3 and 3-4), showing that the NoV and MS2 were more susceptible to heat treatment in
buffered media than in mussel. A similar trend was also observed from the specific z curves (Figure
3-7) generated from the D values of the Biphasic model, where NoV has higher predicted D values
than MS2, and thermal inactivation in mussel required more time than in buffered medium, at each
temperature studied.

70
Figure 3-6. Predicted general z curves in buffered media (—) and mussel matrix (…) of NoV (A) and MS2 (B) in buffer (▲) and mussel matrix (□) at different temperatures.
Under the assumption that the matrix effect is constant for each temperature, the calculated D
values of MS2 was better predicted by the general z curves (Figure 3-6), while for the NoV, the
calculated D values from the Biphasic model (Figure 3-7) produced a better prediction.
y = 35214e-0.135x
R² = 0.9507
y = 12440e-0.111x
R² = 0.8765
0.0
0.1
1.0
10.0
100.0
0 20 40 60 80 100
Tim
es re
quire
d to
a lo
g 10
redu
ctio
n (m
in)
Temp (°C)
(A)
y = 415134e-0.183x
R² = 0.9554
y = 1E+06e-0.18x
R² = 0.9711
0.0
0.1
1.0
10.0
100.0
0 20 40 60 80 100
Tim
es re
quire
d to
a lo
g 10
redu
ctio
n (m
in)
Temp (°C)
(B)

71
Figure 3-7. Predicted specific z curves in buffered media (—) and mussel matrix (…)of NoV (A) and
MS2 (B) in buffer (▲) and mussel matrix (□) at different temperatures.
3.4. Discussion
Enteric viruses that caused foodborne diseases are often linked to three categories of food, i.e. filter
feeder shellfish (bivalve mollusc), raw products contaminated with water containing viruses, and
meals or foods prepared by infected food handler (Deboosere et al., 2004b). Thermal inactivation
including cooking, pasteurization, sterilisation, canning and blanching has been widely applied in
food production systems to reduce or eliminate pathogenic bacteria and viruses (Bertrand et al.,
2012; Richards et al., 2010; Teixeira, 2015), thus the determination of D and z values became key
ybuffer = 9367.2e-0.11x
R² = 0.951
ymussel = 11384e-0.108x
R² = 0.9792
0.0
0.1
1.0
10.0
100.0
0 25 50 75 100
Tim
es re
quire
d to
a lo
g 10
redu
ctio
n (m
in)
Temp (°C)
(A)
y = 5352.4e-0.109x
R² = 0.9367
y = 44461e-0.126x
R² = 0.843
0.0
0.1
1.0
10.0
100.0
0 25 50 75 100
Tim
es re
quire
d to
a lo
g 10
redu
ctio
n (m
in)
Temp (°C)
(B)
72
elements in measuring heat resistance of microorganism during thermal inactivation process
(Holdsworth et al., 2016; Van Asselt & Zwietering, 2006). In the past 40 years, thermal inactivation
has been evaluated for its efficacy to reduce HAV, rotavirus, PV and, NoV and its surrogates in
shellfish (Abad et al., 1997; Araud et al., 2016; Bozkurt et al., 2014b; DiGirolamo et al., 1970; Hewitt
& Greening, 2006; Millard et al., 1987). However, the use of predictive modelling to predict the D
values of the virus in thermal inactivation studies especially in shellfish has just started in the 2010’s
(Araud et al., 2016; Bozkurt et al., 2015a; Bozkurt et al., 2014b; Park & Ha, 2015; Park et al., 2014).
None of these studies, however, were directly compared the predicted D values of NoV and its
surrogate, and/or utilised MS2 as NoV surrogate for the inactivation studies.
Predictive inactivation models of NoV and MS2 as its surrogate in different temperatures and
matrices were evaluated in this study. The heat treatment at 60, 72 and 90°C mimicked to cooking
process of stir-frying, steaming and boiling, respectively. By utilising both linear and non-linear
models to fit the viral inactivation curves in this study, the survival data of both viruses during
thermal treatment appeared to be best fitted by Weibull or Biphasic than the log linear. This finding
is in agreement with some previous studies (Araud et al., 2016; Bozkurt et al., 2013, 2014a) which
suggested that Weibull or Biphasic model produced a better fit of thermal inactivation kinetics of
NoV and its surrogate, with lower RMSE values than the linear model. Although the Weibull model
was appropriate to present the thermal inactivation curves, however this model was unsuccessfully
to predict a complete NoV elimination for extended contact time (outside the full duration of the
treatment) in both matrices. Thus in this study, only the Biphasic model can be used to predict the
required time to complete elimination of NoV. Based on the predicted inactivation curves from
Biphasic model (Figure 3-2 and 3-4), for example, a complete elimination of NoV in buffered media
and mussel matrix can be achieved after heating at 90°C for approximately 40 and 50 min,
respectively.
This present study observed the tailing phenomenon in all curves generated from the inactivation
data in both matrices (Figure 3-2 to 3-5). Similar observations were shown from the previous viral

73
inactivation studies in suspension or shellfish matrix (Araud et al., 2016; Bozkurt et al., 2013; Bozkurt
et al., 2015a; Escudero-Abarca et al., 2014; Tuladhar et al., 2012), where tailing phenomenon was
present during thermal inactivation. This phenomenon can be hypothesised due to the presence of
subpopulations that have a different response toward thermal treatment. The tailing can be caused
by the slow reduction of a subpopulation, such as the aggregated viral fraction (Langlet et al., 2007;
Tuladhar et al., 2012) or the protected viral particles attached inside the tissue that were more
resistant than other subpopulations outside the tissue towards environmental changes due to high
content of fat and protein in the tissue (Bidawid et al., 2000). Viral aggregation is potentially
occurred due to the changes of the environmental conditions (such as the presence of salts, cationic
polymers or suspended organic matters) (Gerba & Betancourt, 2017). Hence, it is worth noting that
the use both an aggregated and non-aggregated viral particle in the future studies of inactivation by
heat treatment is necessary.
The suitability of MS2 as a NoV surrogate for thermal inactivation study was evaluated in this study
by comparing the D, 2D, 4D as well as the z values of NoV and MS2 predicted from the best fitted of
three models (Log linear, Weibull and Biphasic). As observed, NoV was generally more resistance to
heat than MS2 in both matrices. NoV presented higher z values as well as the D, 2D and 4D values
than MS2 in each heating treatment, except for 60°C treatment in mussel (Table 3-3 and 3-4). For
example, the z values of NoV and MS2 from thermal inactivation in mussel were 20.75° and 12.79 °C,
respectively, and the D values of NoV and MS2 in buffered media at 72°C were 1.28 and 0.39 min,
respectively. These observations show evidences that MS2 may not suitable to be used as NoV
surrogate to describe the heat resistance of NoV toward thermal inactivation in buffered medium.
However, when comparing these results with result from other studies, the thermal resistance of
MS2 in suspension at 72°C was similar to HAV (Hewitt et al., 2009), but higher than FCV and MNV-1
(Bozkurt et al., 2014a; Cannon et al., 2006). The predicted D value of MS2 from this study was 0.39
min, while the D values of HAV, FCV and MNV-1 at 72°C were ≤0.30, between 0.10 to 0.12 and 0.09
to 0.17 min, respectively. Hence, MS2 is more relevant to represent the heat-resistance of HAV than

74
NoV towards thermal inactivation in the suspension, and is potentially to be used as a HAV
surrogate.
This present study also evaluates the matrix effect on thermal inactivation by comparing the D, 2D
and 4D values of the viruses, predicted from the best fitted of three models in buffered media and
bioaccumulated mussel. The differences in thermal resistance of NoV or MS2 in buffered media and
in mussels were observed in this study. The D, 2D and 4D values of NoV or MS2 in mussel matrix
were higher than in buffered media, except for the D values of MS2 in mussel at 60°C treatment
(Table 3-3 and 3-4) where shoulder phenomenon was observed during the first 70 min of contact
time (Figure 3-5 A). The time differences to obtain certain log reductions of the virus in buffered
media and mussels indicates the occurrence of matrix effect during thermal inactivation, in which
NoV or MS2 were more resistance to heat in complex than in simple matrix. This finding is in
consistency with result from previous study by Park and colleagues (2014), the virus (MNV-1) was
more resistance to heat in complex matrix (dried mussels) than in the simple matrix (culture
medium/suspension) at 60, 85 and 100°C treatment which was shown by the higher D values in
dried mussels than in suspension. Moreover, similar trend was also observed from a study by Croci
and colleagues (2012), where the number of infectious of NoV and FCV from heating at 80°C for 3 to
15 min were higher in complex matrix (spiked mussels) than in simple matrix (viral suspension).
Possible explanation for this matrix effect is that the mussel contains protein and fat which could
protect the viral particle from the heat (Bozkurt et al., 2014b) and prevent viral aggregation (Croci et
al., 2012).
3.5. Conclusions
Overall, this study presents tailing phenomena during thermal inactivation of NoV and MS2, which
due to the occurrence of heat-resistant subpopulation. Thus, non-linear models (Weibull and
Biphasic) were more appropriate than linear model (log linear) to describe the inactivation kinetics
of both viruses. The Biphasic model was also more suitable than Weibull to predict virus survival for

75
extended contact times (outside the full duration of the treatment), when two or four log reductions
are considered as the thermal inactivation objective. The thermal inactivation kinetics were affected
by different matrices, where complex matrix such as mussel provided higher protection for the viral
particles against heat treatment than the simple matrix (buffered media). It is worth noting that MS2
can be used as NoV surrogate to describe this phenomenon, but caution should be taken when
extrapolating the MS2 inactivation kinetics for NoV inactivation studies because MS2 is less resistant
than NoV toward thermal treatment.

76
Chapter 4. Chlorine dioxide inactivation of NoV and MS2 in buffered media
and artificially contaminated Tasmanian Blue Mussels (Mytilus
galloprovincialis) tissue
4.1. Introduction
Consumption of raw or improperly cooked shellfish has been identified as a major cause of of NoV
infection (Alfano-Sobsey et al., 2012; Maunula & Von Bonsdorff, 2014). Bitler et al. (2013) suggested
that the attack rate (which is defined as the number of cases per 100,000 persons exposed to NoV
contaminated food) in shellfish was the highest amongst other type of foods (produce and ready to
eat foods). Food in general are contaminated by NoV through different routes, such as contact with
infected food handlers or cross-contamination during food processing (Hall et al., 2012); or contact
with NoV-contaminated water at their harvesting/growing sites during production (Bellou et al.,
2013; Polo et al., 2015; Rodríguez-Lázaro et al., 2012). While contamination of NoV into water
environment can be caused by several factors, such as sewage leak, surface contamination due to
heavy rainfall or flooding, water treatment (chlorination) failure and water system breakdown
(Maunula, 2007). Therefore, the use of untreated contaminated-water for food processing and
handling could contribute to NoV contamination in food.
In the case of potentially transmission of NoV during the food processing, the implementation of
GHP and the application of disinfectants and sanitizers play important role in reducing the
contamination (Barker et al., 2004; Boxman, 2013). Many studies have highlighted the potential
application of disinfectants to reduce viral contamination during food processing and to be used as a
cleaning agent for the processing facilities, particularly using NoV surrogates (D'Souza & Su, 2010;
Feliciano et al., 2012; Fraisse et al., 2011; Grove et al., 2015; Malik & Goyal, 2006; Takahashi et al.,
2011). Among other disinfectants, these studies showed that chlorine-containing compounds such

77
as sodium hypochlorite, chloramines and chlorine dioxide (ClO2) have effectively reduced viral
contamination.
Chlorine-containing compounds have been considered and reviewed by the expert panels of
FAO/WHO as potential disinfectants used in food production and processing globally (FAO & WHO,
2009) and have been widely used as disinfectants in the cleaning and sanitation steps of seafood
processing (Huss, 1994). For instance, chlorine (one of these compounds) is a common disinfectant
added into water which is used for different purposes, including to wash the fish, to make the ice for
chilling the fish, to thaw the frozen fish or to cool the canned fish after retorting (FAO & WHO,
2000). Hypochlorite is also used to decontaminate containers and table surface in the fish processing
industry in Indonesia with concentration ranges from 20 to 100 mg/l of total chlorine (FAO & WHO,
2009). From Indonesia perspective, the use of chlorinated-water in fish production lines in Indonesia
is regulated through the Decree of Ministry of Marine and Fisheries Affairs (MMAF) KEP
01/MEN/2002 about the Intensive Quality Management System of Fishery Product (MMAF
Indonesia, 2002), where chlorine can be added into water as a disinfectant for washing purpose at
the maximum of 10 mg/l of total chlorine (MMAF Indonesia, 2002). Moreover, the free chlorine
residue in the water to be used in fish processing should not exceed 5 mg/l (Ministry of Health
Indonesia, 2010).
The efficacy of chlorine-containing compounds to inactivate and to reduce enteric virus such as NoV
and its surrogates (e.g., FCV, MS2 phage, MNV and PV-1), has been investigated and evaluated
(Feliciano et al., 2012; Kim et al., 2012; Kitajima et al., 2010; Montazeri et al., 2017; Rachmadi et al.,
2018; Sigstam et al., 2014; Tung et al., 2013). Results from these studies showed that the difference
in disinfectants efficacies to reduce and to inactivate viruses were observed. The variability in the
disinfectant efficacies of those studies were being influenced by some parameters used during the
inactivation, such as: the differences in mode of inactivation, types and concentration of the
disinfectant, contact time and virus species.

78
Another factor that may influence the disinfection efficacy is the differences in disinfection decay
rate (k’ values) (Haas & Joffe, 1994; Shin & Sobsey, 2008) which occurs when different types of
chlorine-containing compounds (such as hypochlorite, chloramines and ClO2) and different modes of
inactivation that are being used (Gómez-López et al., 2009). The efficacy of chlorine-containing
compounds as disinfectant is also influenced by pH, temperature and the presence of organic matter
(Hirneisen et al., 2010; Kingsley et al., 2014; Morino et al., 2009; Tung et al., 2013).
In particular, previous studies that evaluated the efficacy ClO2 to reduce the NoV and its surrogates
were only performed in suspension or buffered media, produce or fruit matrices and in hard
surfaces, and rarely compared it with meat matrix, especially shellfish (Girard et al., 2016; Kingsley et
al., 2018; Lim et al., 2010; Montazeri et al., 2017; Morino et al., 2009; Yeap et al., 2016). Compared
to the matrices used in those studies, shellfish has different composition of both organic and
inorganic compounds. As a consequence, the application of ClO2 as disinfectant in the shellfish
matrix may represent a different efficacy than the result from the previous studies on chlorine-
containing compounds disinfection. Hence, investigating the efficacy of ClO2 as disinfectant in
shellfish matrix is required.
The efficacy of the treatment is commonly assessed by calculating the concentration of ClO2 over the
time (C) and the decay rate (k’) values using the first-order kinetic, and followed by predicting the
inactivation kinetics using the Hom model (Haas & Joffe, 1994; Hornstra et al., 2011). This approach
has been widely used to calculate the efficacy of chlorination as well as ClO2 treatment to reduce
microbial and viral contamination in water treatments (Cromeans et al., 2010; Haas & Joffe, 1994;
Hornstra et al., 2011; Jacangelo et al., 2002; Kahler et al., 2010; Murphy et al., 2014). Another
model such as the modified biphasic can also be used for the comparison of the inactivation kinetic
and to describe the tailing phenomenon during the ClO2 inactivation in drinking water (Hornstra et
al., 2011).

79
In our study, the efficacy of ClO2 treatment to reduce NoV and MS2 bacteriophage were evaluated in
both buffered media and artificially-contaminated mussel. Pre-treatment RT-qPCR was used to
enumerate the infectious NoV from the treatment, while plaque assay method was used for the
quantification of MS2. In the same ClO2 treatment, the reliability of MS2 bacteriophage as a NoV
surrogate was also assessed by comparing the inactivation kinetic of both viruses in the same matrix,
while the matrix effect was evaluated by comparing inactivation kinetic of the virus in buffered
media and mussel. The quasi-mechanistic Hom, Weibull and Biphasic model were used to calculate
the inactivation kinetics of both viruses during the treatment, while the first-order kinetic equation
was used to determine the decay rate of ClO2.
4.2. Materials and methods
4.2.1. Mussels preparation and artificial contamination.
Five kilograms of live Tasmanian Blue Mussel (Mytilus galloprovincialis) were purchased from a
single local fish market/supplier. Mussel acclimatisation and depuration were done as described in
Section 3.2.3 for 6 h and by changing the sterilized sea water every 2 h. One hundred pieces of tissue
mussels were taken out from the shells and were pre-washed with sterile saline water (0.3% NaCl) at
4°C. Artificial contamination of the mussel was done by dipping the tissue in NoV and MS2 solutions
at a final concentration of approximately 108 copies/ml and 108 PFU/ml, respectively, for 30 min. The
tissues were then drained for 60 min at 4°C to remove the excessive solution. The dipping method
was done to provide NoV contamination at the shellfish tissue surface (not inside the tissue) which
mimicked the process of viral cross-contamination by secondary transmission.
4.2.2. Chlorine dioxide treatments
Chlorine dioxide (ClO2) stocks (5,000 ppm) were prepared following procedure from Cleanoxide®
(NaturalWater Solutions, Australia) by mixing 1 part of solution A and 9 part of solution B. The
mixture was shaken for 15 s and stored at a dark glass bottle for 8-10 h in 4°C to complete the

80
reaction. The concentration of total ClO2 stock was determined by the DPD-based method (Palin,
1957) using the Palintest Chlorometer ClO2+ Kit (Palintest, Australia). This kit was able to quantify
only chlorine dioxide in the sample. The ClO2 stock was serially diluted to make 250; 500; and 1,000
ppm of working solutions. The ClO2 treatments were performed in two different matrices i.e.,
buffered medium (PBS) and mussel matrices at different ClO2 concentration (10; 20 and 40 ppm) for
certain period of times as shown in Table 4-1. The treatment of each concentration in both matrices
were done in triplicate and carried out in 50 ml plastic tube incubated at water bath to maintain the
temperature at 20°C. For the treatment in buffered media, tube containing 45 ml of PBS-ClO2
suspension were prepared by adding the ClO2 working solutions into the 40 ml PBS solution in the
tube to obtain the final concentrations of 10; 20; and 40 ± 1 ppm. A five ml of virus stock containing
NoV and MS2 at concentration of 107 copies/ml and 108 PFU/ml, respectively, were added into the
tubes. The concentration of ClO2 was measured immediately following procedure from the
manufacture (Palin Test Kit, Australia) after certain exposure time (Table. 4-1). For the ClO2
treatment in mussel matrix, 5 g of contaminated-mussel was dipped into the plastic tube containing
45 ml ddH2O-ClO2 and exposed to the treatment for certain periods of time, as shown in Table 4-1.
After each exposure time, the ClO2 concentration was measured immediately, and the mussels were
transferred to a new tube and added with 1 ml of 10% sodium thiosulfate to inactivate the
remaining ClO2. The sample was then concentrated and purified as described in Section 4.2.4.
Table 4-1. Exposure time of ClO2 treatment at different concentrations
ClO2 concentration (ppm)
Σ treatment tubes Exposure time (min)
Buffered medium Mussel
0 (Initial/No treatment) 3 3 0 10 21 21 1; 10; 20; 30; 40; 50; and 60 20 21 21 1; 10; 20; 40; 60; 80; and 100 40 21 21 1; 20; 40; 80; 120; 160; and 200
81
4.2.3. Analysis of ClO2 residue by Palintest kit
The remaining ClO2 in the suspension after each exposure time was quantified using the Palintest Kit
(Australia) according to the manufacturer’s instructions without any modifications.
4.2.4. Virus and bacteriophage purification
The infectious viruses from the treatment in mussel matrix were purified following the procedure of
Lewis and Metcalf (1988) and Mullendore et al. (2001), with modifications as previously described in
Section 3.2.6.1 of this thesis, while the infectious viruses in buffered media were directly processed
for subsequent plaque assay (for MS2) or pre-treatment and RNA extraction (for NoV) without the
purification step.
4.2.5. Enumeration of MS2 by plaque assay
The infectious MS2 from the treatment was enumerated using a double layer agar method (EPA,
2001), with modifications, as previously described in Section 2.2.2.2.a of this thesis.
4.2.6. Virus pre-treatment and RNA extraction
Prior to nucleic acid extraction, the purified sample was pre-treated using RNase as previously
described in Section 2.2.4 of this thesis. Subsequently, RNA samples was extracted using method of
Chomczynski and Sacchi (2006), with modifications, as previously described in Section 2.2.2.2.b of
this thesis
4.2.7. Enumeration of NoV by RT-qPCR
For the enumeration of infectious NoV GII, the RT-qPCR were performed using method of
Jothikumar et al. (2005) with modifications as previously described in Section 3.2.6.3 of this thesis.

82
4.2.8. Modelling and statistical analysis of ClO2 inactivation kinetics
As described from previous study by Haas and Joffe (1994), the decay rate of ClO2 during inactivation
process was calculated using a first-order kinetic equation as follows.
𝐶𝐶 = 𝐶𝐶0𝑒𝑒−𝑘𝑘′𝑑𝑑 (Equation 4-1)
where C and C0 are ClO2 residue (mg/l) at time t and time 1 min (closest measurement to time zero),
respectively, and k’ is the first-order ClO2 decay rate constant (min-1). The k’ value for each
experiment were calculated using the Solver function in Microsoft Excel 365 (Microsoft Corp).
The infectious NoV and MS2 from each treatment were fitted into Hom, Weibull and Biphasic
models. The Hom model equation as previously described by Thurston-Enriquez et al. (2003) and
Haas and Joffe (1994) is written as follows.
𝐿𝐿𝑛𝑛 � 𝑑𝑑𝑑𝑑0� = −𝑘𝑘𝐶𝐶0𝑘𝑘𝑚𝑚 𝑘𝑘 �1 − 𝑒𝑒(−𝑛𝑛𝑘𝑘′𝑑𝑑/𝑚𝑚)/(𝑛𝑛𝑘𝑘′𝑘𝑘/𝑘𝑘)� (Equation 4-2)
where Ln (N/N0) is the natural log of the survival ratio of virus (number of viruses remaining at time t
(N) divided by the average of initial number of viruses without treatment (N0)). The k value is the
Hom inactivation rate constant, n is the dilution coefficient, and m is an empirical constant that
describes the deviation from ideal Chick-Watson kinetics (Sigstam et al., 2014). The Solver function
in Microsoft Excel 365 (Microsoft Corp.) was used to determine the values for each model’s
coefficients by minimising the sum of squares of the difference between the observed and predicted
of natural log reduction over the time (Ln(N/N0)) for viral inactivation with the same virus and
matrix. Inactivation curves of NoV and MS2 (log reduction over the time (min) (Log10(N/N0)) were
also calculated and created using Microsoft Excel 365 (Microsoft Corp.).
Weibull (Eqn. 3-3) and Biphasic model (Eqn. 3-5) previously described in Section 3.2.7 were used to
predict the log reduction value over the time (Log10(N/N0)) for each experiment with the same virus
and matrix. The inactivation curves of the models were fitted and calculated using GInaFiT for
Microsoft Excel (Geeraerd et al., 2005). The coefficient of determination (R2) was used to evaluate

83
the predicted C values compared to the observed, while the Root Mean Square Error (RMSE) values
was used to measure the goodness-of-fit of the decay rate and the inactivation models.
The single factor of Analysis of Variance (ANOVA) was carried out to calculate the differences of the
calculated k’ rate and the observed log10 reductions of NoV and MS2 using Real Statistics Add-ins for
Microsoft Excel 365 (Microsoft Corp).
4.3. Results
4.3.1. ClO2 decay in buffered media and mussel matrix
The residue of chlorine dioxide (ClO2) (at pH 6.9 ± 0.2) of each treatment at 20 ± 1°C over the
inactivation period in buffered media is shown in Figure 4-1. The ClO2 residue analysis was done
using Palintest kit with the detection limit (LOD) of 0.02 ppm. The residue values were plotted
against the exposure time to produce ClO2 decay curves. In general, ClO2 concentration decreased
over time during the treatment. These curves were then fitted using the first-order kinetics model to
calculate the initial concentration residue (C0) and the decay rate (k’) of ClO2. The calculated (C0) in
the solution at 1 min exposure (the closest measurement to time zero) were 8.40, 19.25 and 30.13
ppm for treatment with 10, 20 and 40 ppm, respectively. The k’ of ClO2 during treatment were
varied between 0.052 to 0.056 min-1, with the average of 0.053 ± 0.023 min-1. The R2 between the
observed and the predicted C values for 10; 20; and 40 ppm treatment were above 95% for each
treatment with the RMSE values of 0.516; 0.834; and 2.338, respectively.

84
Figure 4-1. The observed () and predicted (---) values of ClO2 residue (C) (from (a) 10, (b) 20, and (c) 40 ppm treatment at 20°C for different exposure times in buffered media.
Figure 4-2 describes the effect of mussel matrix on ClO2 concentration over the time. A decrease in
ClO2 concentration was observed in all cases, similar to the apparent effects in the buffered media.
However, the ClO2 decay in mussel matrix showed higher k’ value than in the buffered media. The
average k’ rate in mussel (0.080 ± 0.0024 min-1) was significantly higher (p<0.01) than in buffered
media (0.053 ± 0.0023 min-1). Moreover, the observed initial ClO2 concentrations (C0) of 10, 20 and
40 ppm treatment in mussel matrix (7.40, 12.51 and 17.86 ppm, respectively) were lower than in
buffered media. Similar observation to the ClO2 decay curves in buffered media, the R2 values
between observed and predicted C in those three curves (10; 20 and 40 ppm) in mussel matrix were
more than 95% with the RMSE value of 0.513, 0.606, and 1.335, respectively. In addition, the
observed residue values of ClO2 from all treatments in both matrices (buffered media and mussel)
after 60 min exposure were less than 5 ppm.
0
2
4
6
8
10
0 10 20 30 40 50 60
ClO
2re
sidu
e (p
pm)
Contact Time (min)
C=8.401e-0.051872t
R2 =0.964RMSE = 0.516
(a)
0
5
10
15
20
25
0 20 40 60 80 100
ClO
2re
sidu
e (p
pm)
Contact Time (min)
C=19.255e-0.05156t
R2 =0.982RMSE = 0.834
(b)
0
5
10
15
20
25
30
35
0 40 80 120 160 200
ClO
2re
sidu
e (p
pm)
Contact Time (min)
C=30.128e-0.05569t
R2 =0.964RMSE = 2.338
(c)

85
Figure 4-2. The observed () and predicted (---) values of ClO2 residue (C) from (a) 10, (b) 20, and (c) 40 ppm treatment at 20°C for different exposure times in mussel matrix.
4.3.2. The efficacy of ClO2 treatment on NoV and MS2 in buffered media
The infectious NoV in buffered media treated with different concentrations of ClO2 at 20 ± 1°C were
enumerated using pre-treatment RT-qPCR assay with LOQ at 250 copies/ml (2.40 log10 copies/ml). To
calculate the reductions of MS2, the infectious MS2 in buffered media after exposure to ClO2
treatment were analysed using plaque assay (LOQ at 20 PFU/ml). The observed log10 reductions of
the viruses (log10(N/N0)) were plotted against the contact times to generate inactivation curves. In
general, the viral inactivation curves observed in this study showed a tailing shape, thus non-linear
models were better to describe the viral inactivation by ClO2. The inactivation curves of NoV and
MS2 in buffered media fitted using non-linear models i.e., Hom, Weibull and Biphasic models were
shown in Figure 4-3 and 4-4. Since the Hom model produced the reductions in natural logarithm
value (Ln(N/N0)), therefore the value of log reductions (log10(N/N0)) was obtained by extrapolating
the value of Ln(N/N0) using Microsoft Solver Add-in.
0
2
4
6
8
0 10 20 30 40 50 60
ClO
2re
sidu
e (p
pm)
Contact Time (min)
C=7.398e-0.08135t
R2 =0.955RMSE = 0.51253
(a)
0
2
4
6
8
10
12
14
0 20 40 60 80
ClO
2re
sidu
e (p
pm)
Contact Time (min)
C=12.5076e-0.08037t
R2 =0.984RMSE = 0.606
(b)
0
5
10
15
20
25
30
0 40 80 120 160 200
ClO
2re
sidu
e (p
pm)
Contact Time (min)
C=17.857e-0.0768t
R2 =0.976RMSE = 1.335
(c)

86
Table 4-2. The RMSE and R2 values of the ClO2 inactivation models of Hom, Weibull and Biphasic
Matrix Virus Initial viral conc. (N0)
ClO2 (ppm) Inactivation model
Hom Weibull Biphasic RMSE R² RMSE R² RMSE R²
Buffered media
NoV 6.39 ± 0.20 log10 copies/ml
10 0.121 0.922 0.131 0.922 0.123 0.935 20 0.316 0.793 0.349 0.789 0.324 0.830 40 0.451 0.856 0.511 0.852 0.473 0.884
MS2 7.37 ± 0.11 log10 PFU/ml
10 0.128 0.960 0.139 0.959 0.142 0.960 20 0.330 0.922 0.369 0.917 0.305 0.946 40 0.397 0.955 0.722 0.871 0.355 0.971
Mussel
NoV 6.59 ± 0.44 log10 copies/g
10 0.145 0.725 0.193 0.582 0.161 0.725 20 0.261 0.641 0.283 0.640 0.273 0.685 40 0.213 0.830 0.232 0.827 0.223 0.848
MS2 6.40 ± 0.07 log10 PFU/g
10 0.172 0.784 0.195 0.761 0.177 0.813 20 0.139 0.945 0.192 0.907 0.136 0.956 40 0.211 0.895 0.261 0.861 0.212 0.913
Note: The RMSE values written in bold indicate the lowest RMSE produced by the best-fitted model.
Hom’s showed the lowest RMSE values amongst the other models in predicting the log10 reductions
value of NoV for each treatment (Table 4-2), thus these predicted log reductions values of Hom’s
were used to describe the treatment efficacy in NoV. The highest NoV reduction predicted in
buffered media treated with ClO2 for 60 min was observed from the 40 ppm ClO2 with 3.05 log10
reductions, while treatment at 10 and 20 ppm were predicted to reduce NoV numbers by 1.61 and
2.38 log10 reductions, respectively. In contrast with the NoV inactivation data, Biphasic model was
observed as the best fitted model (giving the lowest RMSE values) to predict the log10 reductions of
MS2 inactivated by 20 and 40 ppm ClO2 in buffered media (Table 4-2.), while Hom only gave the best
prediction at 10 ppm treatment. Hence, the predicted log10 reductions of MS2 in 20 and 40 ppm
treatment were calculated using Biphasic model, while the predicted log10 reductions of 10 ppm
treatment was calculated using Hom model. Compared to NoV, similar observation was shown on
the efficacy of ClO2 treatment, where the higher ClO2 concentration produced the higher value of
estimated log reductions. However, MS2 were more susceptible towards ClO2 treatment, where the
log10 reductions of MS2 in the same treatment for the same time exposure were higher than NoV.
The predicted reductions of MS2 in 10, 20 and 40 ppm were 2.46, 4.02 and 5.18 log10 reductions,
respectively.

87
Figure 4-3. The log reductions (Log10(N/N0)) curves of NoV in the buffered media fitted using Hom (…), Weibull (---), and Biphasic model (—) treated with 10 (▲), 20 (○), and 40 (◆)ppm ClO2 for
different exposure times
Figure 4-4. The log reductions (Log10(N/N0)) curves of MS2 in the buffered media fitted using Hom (…), Weibull (---), and Biphasic model (—) treated with 10 (▲), 20 (○), and 40 (◆) ppm ClO2 for
different exposure times
4.3.3. The efficacy of ClO2 treatment on NoV and MS2 in mussel matrix
The viral inactivation curves by ClO2 in the mussel matrix are presented in Figure 4-5 and 4-6. In the
mussel matrix experiment, Hom model produced better prediction on the viral reduction treated
-4.5
-4
-3.5
-3
-2.5
-2
-1.5
-1
-0.5
0
0 40 80 120 160 200
Log 1
0(N
/N0)
Time (Min)
-7
-6
-5
-4
-3
-2
-1
0
0 40 80 120 160 200
Log 1
0(N
/N0)
Time (Min)

88
with 10, 20 and 40 ppm ClO2 than Weibull or Biphasic model, except for MS2 treated with 20 ppm
ClO2 (where the biphasic was the best-fitted model for this treatment) (Table 4-2). The predicted
reduction values of NoV in mussel treated with 10, 20 and 40 ppm of ClO2 for 60 min were 1.14, 1.38
and 1.43 log10 reductions, respectively. These values were lower than the MS2 reductions toward
similar treatments, except in the 10 ppm treatment. The MS2 reduction treated with ClO2 at
concentration of 10, 20 and 40 ppm for 60 min were 1.09, 1.66 and 1.72 log10 reductions.
Figure 4-5. The log reductions (Log10(N/N0)) curves of NoV in the mussel fitted using Hom (…), Weibull (---), and Biphasic model (—) treated with 10 (▲), 20 (○), and 40 (◆) ppm ClO2 for
different exposure times
Although the predicted log10 reductions of NoV was slightly higher than MS2 in the 10 ppm
treatment for 60 min in mussel matrix, however, the result from analysis of variance (ANOVA)
showed that there were no significant differences (P>0.05) between the average of observed log10
reductions of NoV (≈1.07 ± 0.07 log10 reductions) and MS2 (≈1.08 ± 0.12). From the observed data,
the maximum reduction of NoV and MS2 in mussel matrix were achieved by treated using 40 ppm
ClO2 for 200 min. The average of NoV and MS2 reductions observed from these treatments were
1.94 ± 0.33 and 2.17 ± 0.19 log10 reductions, respectively (Figure 4-5). In overall, MS2 were more
susceptible than NoV toward ClO2 treatment in the mussel matrix which were similar to the
-3
-2.5
-2
-1.5
-1
-0.5
0
0 40 80 120 160 200
Log 1
0(N
/N0)
Time (Min)
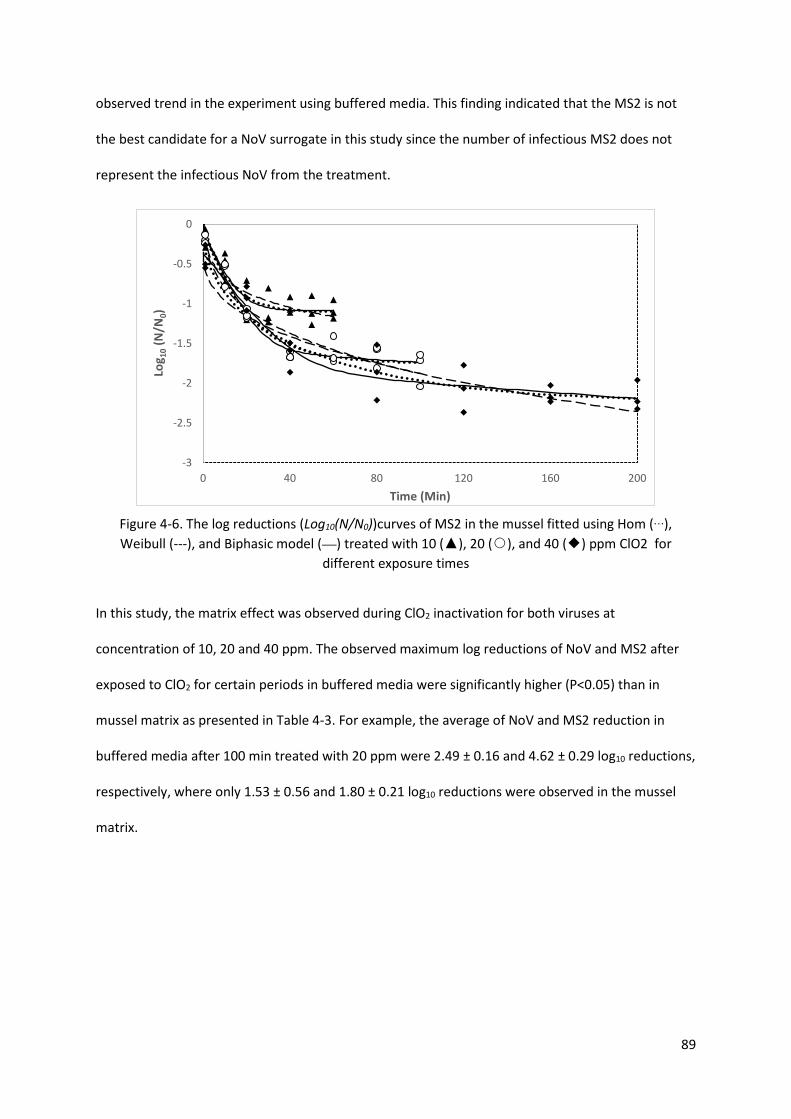
89
observed trend in the experiment using buffered media. This finding indicated that the MS2 is not
the best candidate for a NoV surrogate in this study since the number of infectious MS2 does not
represent the infectious NoV from the treatment.
Figure 4-6. The log reductions (Log10(N/N0))curves of MS2 in the mussel fitted using Hom (…), Weibull (---), and Biphasic model (—) treated with 10 (▲), 20 (○), and 40 (◆) ppm ClO2 for
different exposure times
In this study, the matrix effect was observed during ClO2 inactivation for both viruses at
concentration of 10, 20 and 40 ppm. The observed maximum log reductions of NoV and MS2 after
exposed to ClO2 for certain periods in buffered media were significantly higher (P<0.05) than in
mussel matrix as presented in Table 4-3. For example, the average of NoV and MS2 reduction in
buffered media after 100 min treated with 20 ppm were 2.49 ± 0.16 and 4.62 ± 0.29 log10 reductions,
respectively, where only 1.53 ± 0.56 and 1.80 ± 0.21 log10 reductions were observed in the mussel
matrix.
-3
-2.5
-2
-1.5
-1
-0.5
0
0 40 80 120 160 200
Log 1
0(N
/N0)
Time (Min)

90
Table 4-3. The average of observed maximum reduction of NoV and MS2 treated by ClO2 exposed for certain periods
Virus Treatment The average of log10(N/N0)
(log10 reductions) Buffered Media Mussel
NoV 10 ppm for 60 min 1.60 ± 0.25a 1.07 ± 0.07b 20 ppm for 100 min 2.49 ± 0.16a 1.53 ± 0.56b 40 ppm for 120 min* 3.76 ± 0.35a 1.65 ± 0.23b
MS2 10 ppm for 60 min 2.49 ± 0.16a 1.08 ± 0.12b 20 ppm for 100 min 4.62 ± 0.29a 1.80 ± 0.21b 40 ppm for 200 min 6.08 ± 0.01a 2.17 ± 0.19b
Note: *The exposure time of 120 min was used in the 40 ppm treatment, as some missing data was observed in the exposure of 160 and 200 min
The same letter in the same row denotes no significant differences (p>0.05)
4.4. Discussion
The likelihood of viral transmission to human from the ingestion of food contaminated by enteric
viruses were reported from some foodborne outbreaks. Although the major sources of enteric viral
contamination in food originated from the main transmission route where the food has been
directly contacted with faecal-contaminated water (Bellou et al., 2013), for example in the NoV or
HAV contamination in shellfish, some types of food have been reported to be contaminated by
enteric viruses through secondary transmission via cross-contamination during food handling.
Findings from previous studies showed that some enteric viruses and their surrogate can be
transmitted into the food through the contact with food handlers’ hand, washing water and the
equipment during handling and processing in fresh produce, fruit and ready-to-eat meals (Dalton et
al., 1996; Grove et al., 2015; Holvoet et al., 2014; Maunula et al., 2013; Schmid et al., 2007). During
the viral cross-contamination in food, viral particles were commonly attached in the food surfaces
(Todd et al., 2009), thus this contamination can be reduced or eliminated by the application of
disinfectant in washing step. In addition, the use of disinfectants as control strategies in GHP and
GMP regime have been widely applied in food industries, including for fisheries product (FAO &
WHO, 2009).

91
In fish processing industries, ClO2 is generally used to improve the application of hygienic practices,
rather than in the decontamination procedure (FAO & WHO, 2009). The efficacy of this compound to
reduce the level of pathogenic bacteria has been studied in oyster (Shin et al., 2004) and other
seafood products (salmon, grouper, scallops, and shrimps) (Kim et al., 1999) as well as in
antimicrobial ice used in fish processing (Wang et al., 2010). These studies suggested that ClO2 can
be used as an effective bacterial disinfectant in fish and oyster with the minimum concentration of
20 ppm. However, studies that evaluate the efficacy of this compound against viral contamination in
seafood are still limited. Hence in the current study, the efficacy of ClO2 treatment with various
concentration from 10 to 40 ppm was evaluated to reduce NoV in buffered medium and mussel
matrix.
As previously described in Chapter 1 and 2, NoV is the most common cause of NoV infection and the
challenge to cultivate this virus makes it difficult to perform the quantification using a cell culture
system. Therefore, the used of cultivable surrogates such as MNV, FCV and MS2 have been widely
proposed to overcome this problem and to understand the inactivation mechanism of NoV. In this
study, the efficacy of ClO2 (at 20 ± 1°C with pH 6.9 ± 0.2) to reduce NoV and MS2 using identical
experiment condition in two different matrices (buffered media and mussel) was evaluated and
compared. The experiment in mussel matrix was designed to understand the efficacy of ClO2 to
reduce viral particles contaminated the mussel in which cross-contamination scenario was applied,
hence the artificial contamination of the virus in this study was performed by dipping the mussel’s
tissue into viral stock.
Results from this current study showed that the decay of ClO2 in both matrices was observed during
viral inactivation. The ClO2 decay rates were constant following the model of first-order-kinetic with
the R2 values of >95% in all concentrations observed. The matrix effect in ClO2 decay was also
observed in the inactivation of both viruses (NoV and MS2) where the ClO2 decay rate in mussel was
faster than in buffered media (solution). The possible explanation of this matrix effect is that the
mussel tissue contains more organic and inorganic compounds than the buffered media. Thus the

92
available chlorine including ClO2 were being consumed faster for oxidation, addition and
electrophilic substitution reactions of these compounds (Deborde & von Gunten, 2008) in the
mussel matrix than in buffered media. To maintain the ClO2 concentration during inactivation
treatment, a closed reactor (pump) as used by (Sigstam et al., 2014) can be suggested in future
inactivation experiment in both matrices.
The virucidal effects of ClO2 (as disinfectant) in NoV and MS2 were investigated in this study. In viral
inactivation studies using disinfectants, a temporary inactivation could occur due to a reversible
change in the virus conformation, while damage on the capsid protein and/or nucleic acid may
resulted in the permanent inactivation of the virus (Thurman & Gerba, 1988).The efficacy of ClO2 to
inactivate viral particles varied depend on the virus species as well as the matrix used in the
experiment. In general, MS2 was more susceptible than NoV towards ClO2 treatment especially in
buffered media. The discrepancies in the effectivity for viral inactivation by chlorine-containing
compounds were also observed from previous studies when different viruses were used for the
identical treatment in their studies (D'Souza & Su, 2010; Duizer et al., 2004; Dunkin et al., 2017;
Kitajima et al., 2010; Montazeri et al., 2017; Shin & Sobsey, 2008; Sigstam et al., 2013). Generally,
the virus stability depends on the capsid structure to provide protection from environmental stress
(Hirneisen et al., 2010; Nuanualsuwan & Cliver, 2003), thus different capsid structure has different
mechanisms toward environmental stress which affect their persistence in the environment and
their sensitivity to disinfectants (Cook et al., 2016; da Silva et al., 2007; Seitz et al., 2011; Verhaelen
et al., 2013).
It is worth noting that each virus species or strain has a different structure of capsid protein and
genome, thus it has a different response toward disinfectant such as chlorine-containing compounds
(Sigstam et al., 2013; Wigginton et al., 2012). In addition, from the extensive investigation of the
viral inactivation mechanism using MS2, Wigginton and colleagues (2012) suggested that even the
same virus species may have different susceptibilities toward environmental stress. As consequence,
the observation from the current study together with those previous studies that highlighted the

93
differences in susceptibility of NoV and MS2 toward ClO2 raise a concern about the compatibility of
MS2 as NoV surrogate. Caution must be considered when utilising inactivation kinetic data of MS2
for NoV inactivation by ClO2.
The inactivation curves of NoV and MS2 in buffered media and mussel matrices from this study
showed tailing phenomena. Further investigation of this phenomenon is important since its
occurrence might indicate incomplete inactivation of the targeted microorganisms (Sigstam et al.,
2014). The tailing phenomena of inactivation curves could be explained by the consumption of ClO2
over exposure time, as suggested by other studies (Lim et al., 2010; Sigstam et al., 2014). This
condition was particularly supported by the ClO2 decay rate observed from the current study, which
showed similar pattern as the inactivation curves. Another possible explanation of the tailing
phenomena is the occurrence of mixed population with different susceptibilities against ClO2.
Hornstra et al. (2011) advised that certain attachment process to particles or different disinfectant
reactions that occur during treatment might instigate the presence of subpopulation within the
original MS2 population. Furthermore, viral aggregation or viral clumping in the suspension was also
proposed as a condition which could lead to the tailing phenomena (Thurman & Gerba, 1988). Viral
aggregation could inhibit the effect of disinfectant because the consumption of disinfectant in the
outer layer of viruses which leave only smaller concentration of disinfectant to react with the viruses
in the inner layer (Mattle et al., 2011). Thus, viruses in the inner layer will be inactivated slower than
the outer part. This aggregation is often referred as a protective mechanism of core virion against
disinfectant. Besides, quantification of each single non-infectious viral particle is not possible to be
done in the aggregated virus, thus the number of infectious virus appears constant (Sigstam et al.,
2014) and observed as tails.
Based on the evaluation of ClO2 efficacy to inactivate NoV in the current study, this compound was
able to reduce NoV in the simple (buffered media) and complex matrix (mussel). Nevertheless, the
direct application of ClO2 to reduce NoV contamination in mussel matrix might not provide sufficient
reductions when the reduction objective of a treatment is set at more than 2 log10 reductions. Using

94
disinfectant solution might be sufficient to eliminate microbial contamination at the food surface,
however it might be ineffective to remove the virus that have penetrated inside the food matrix
(Richards, 2001), such as a natural viral contamination in shellfish through the bioaccumulation
process. Therefore, it can be suggested that ClO2 is more suitable to be used as disinfectant to
reduce viral contamination in the surface of matrix, for example: in the water used for washing the
food handler’s hand and cleaning the processing equipment, and washing or cleaning the surface of
raw shellfish.
The highest NoV reduction in this study was achieved from 40 ppm ClO2 after 120 min treatment in
buffered media and mussel matrix, with the ClO2 residue of less than 2 ppm. This ClO2 concentration
used in this study were within the range of concentration considered (5-100 ppm) by the FAO/WHO
expert meeting to rinse, wash, thaw, transport and stored fish products (FAO & WHO, 2009).
Moreover, the recommended ClO2 residue as disinfectant for these purposes by Food and Drug
Administration of the United States (USFDA) (CFR 173.300) is less than 3 ppm (USFDA, 2018).
The current legislation on the shellfish sanitary program in Indonesia controlled the used of chlorine
in fish processing (MMAF Indonesia, 2002), while such regulation for ClO2 has not available yet.
Therefore, results from this current study can be used as input for future assessment of ClO2 as
disinfectant in fish processing practices especially for stakeholders and government in Indonesia,
since this method could be used as a control strategy in shellfish processing to prevent any potential
secondary contamination of NoV.
4.5. Conclusion
ClO2 can be used as a candidate disinfectant in the processing of fishery product. At a concentration
of 40 ppm for 120 mins treatment, ClO2 gave 3.76 ± 0.35 log10 reduction of NoV in buffered media
but only 1.65 ± 0.23 log10 reduction was obtained in mussel matrix. Thus, this disinfectant is more
suitable to be used as a washing or cleaning sanitizer which could prevent secondary and cross-
contamination of NoV during handling and processing.

95
Furthermore, MS2 was more susceptible than NoV towards chlorination, however the used of this
surrogate is recommended to understand the kinetic mechanism of NoV in the inactivation studies.
Future studies could be improved by using a closed reactor to control the ClO2 concentration during
treatment and by using different type of surrogates.

96
Chapter 5. Risk assessment of NoV GII in shellfish from Indonesian fish
markets
5.1. Introduction
Genogroup I and II of NoV are known as human NoV and are food contaminants that can cause
human gastroenteritis (Lees, 2000; Scallan et al., 2011; Torok, 2013). NoV are the etiologic agents
responsible for 68% of acute gastroenteritis outbreaks from 1999 to 2010 in the US (Hall et al.,
2013). Verhoef et al. (2015) studied worldwide infections due to NoV from 1999 to 2012, and
reported that almost 14% of all the outbreaks are associated with food as a primary source of
exposure (with other common sources including sewage contamination and exposure in child care
centres, aged care homes, and cruise ships). An epidemiological study of gastroenteritis outbreaks in
Europe from 1995 to 2000 (Lopman et al., 2003) found that NoV, especially NoV genogroup II (NoV
GII) was the major causative agent of all non-bacterial outbreaks of human gastroenteritis. Such
studies demonstrate that NoV is an important source of human gastroenteritis outbreaks in many
countries.
In general, enteric viral contamination of foods occurs via the following routes of transmission:
direct contamination from human sewage and faeces/fomites, indirect contamination from infected
food handlers (also known as person-to-person contamination) and through zoonotic transmission
which involve animals (FAO & WHO, 2008; Verhoef et al., 2015). To elaborate, following an
outbreak, the infectious viral particles that were shed in the faeces or vomit of the infected person
can be transmitted back to the environment, especially in the water (Montazeri et al., 2015). These
suspended viral particles can remain in the water for several days to weeks while maintaining the
same level of infectivity (Brake et al., 2018). Therefore, aquatic organisms such as shellfish, which
tend to remain in the same contaminated water and filter the water to obtain food, are likely to be
the most susceptible to accumulation of viruses (Lees, 2000; Montazeri et al., 2015).

97
The presence of NoV in shellfish from different markets, restaurants and harvesting areas in Asia
(Kittigul et al., 2016; Maekawa et al., 2007; Umesha et al., 2008), Europe (Boxman et al., 2006; Croci
et al., 2007; Le Guyader et al., 2009; Li et al., 2014; Loutreul et al., 2014; Lowther et al., 2010;
Lowther et al., 2012; Mesquita et al., 2011; Terio et al., 2010), the USA (Montazeri et al., 2015), and
Australia (Brake et al., 2014; Symes et al., 2007) has been reported. The presence of NoV in shellfish
has also been directly related to gastroenteritis outbreaks (Huppatz et al., 2008; Symes et al., 2007).
These reports emphasise the need to develop Quantitative Microbiological Risk Assessments
(QMRA) for NoV as a valuable tool to estimate, and optimally manage, human health risks associated
with the consumption of NoV-contaminated shellfish.
Shellfish are one of the most commonly consumed fisheries products in Indonesia. Generally,
shellfish in Indonesia are consumed in cooked condition such as boiled, steamed or stir-fried and are
mussels, clams or cockles. The Indonesian government recommends that shellfish in markets are
cooked to open the shell, before sale to consumers (BSN, 2009). When Indonesian consumers buy
raw (un-cooked) shellfish from the market, the pre-cooking step to open the shell is commonly done
at home before they cook the shellfish.(Anonymous, 2018) The consumption of raw shellfish such as
oysters has not yet become popular in Indonesia. In 2013, mollusc (including shellfish) production in
Indonesia reached 60,471 tonnes per year, with 23,611 tonnes are intended for domestic
consumption (FAO, 2015), while the major commodities being Green Mussels (Perna viridis), Clams
(Meretrix spp.) and Cockle (Anadara spp.) (Directorate General of Fisheries, 1999; Murdinah, 2009;
Setyono, 2007; WWF-Indonesia, 2015). These shellfish were mainly produced from growing areas in
fresh, brackish and marine water (Nurdjana, 2006). Some of the farming and harvesting sites are
located in bays and coastal waters close to human settlements, such as in Jakarta Bay, Lampung Bay
(Ali et al., 2015; Ferdinan, 2017; Noor, 2014; Sulvina, 2018) and Brebes (Prasetya et al., 2010; Rejeki
et al., 2016). As a result, some growing areas might be exposed to domestic sewage including faecal
pollution and therefore vulnerable to NoV contamination. Hence, there is a need to assess the risk,
e.g., the potential number of gastroenteritis cases due to the consumption of contaminated-shellfish

98
by enteric viruses (especially NoV) from Indonesian fish markets to determine risk management
needs and options.
To ensure the quality and safety of shellfish harvested from growing areas, the Indonesian
government initiated a program in 2004 to undertake routine monitoring and surveillance of water
and shellfish quality in some shellfish growing areas (MMAF, 2004). Following this regulation, the
Indonesian government also issued a standard for processing for frozen (peeled) shellfish (SNI 3460-
2009) which consists of 11 handling steps (including the pre-cooking step). The pre-cooking step is
defined as a method to open the shellfish shell by placing the shellfish in boiling water until the
shells open and then cooling it immediately in clean water at maximum temperature of 5°C (BSN,
2009).
Although the microbiological quality of the water and shellfish are monitored, only faecal coliforms
are used as a faecal pollution indicator. No tests for enteric viruses are performed during this routine
monitoring. Therefore, information and data on enteric virus contamination (especially NoV) in
shellfish from Indonesian fish markets is unavailable. It is, thus, difficult to estimate the NoV risk
associated with shellfish consumption in Indonesia.
This study aimed to provide NoV prevalence data in shellfish obtained from Indonesian markets,
especially from Jakarta and Panimbang fish markets, and to develop a risk assessment for human
consumers from NoV in this commodity. This information can be used by the relevant competent
authority in Indonesia to develop regulations to ensure the safety and quality of shellfish in
Indonesian markets.
5.2. Materials and methods
5.2.1. Sample collection from Indonesian fish markets in Jakarta and Panimbang.
Shellfish samples were collected from fish markets in two different cities, i.e. Jakarta and
Panimbang. In Jakarta, shellfish were purchased from two “traditional” fish markets (Cilincing and
Muara Kamal) and one “modern” fish market (Everfresh), as shown in the map in Figure 5-1. In

99
Panimbang, shellfish were purchased from one traditional fish market. The term “modern market”
describes a hygienic fish market that follows the standard sanitation practices as defined by
regulations of the Indonesian Ministry of Marine Affairs and Fisheries (MMAF) (MMAF, 2017), while
the term “traditional” market describes a fish market that has not applied those standard hygienic
practices yet.
All shellfish purchased from traditional markets in Jakarta were harvested from Jakarta Bay, while
shellfish from Panimbang fish market were harvested locally from Panimbang and Labuan (Banten
Bay). However, samples from Everfresh fish market were supplied domestically and harvested from
other local farming sites in Indonesia (apart from Jakarta, Panimbang and Labuan).
Figure 5-1. Shellfish sampling locations in Jakarta and Panimbang
Triplicate individual samples of each shellfish species from each market were collected at three
times within three weeks in July 2016 and 2017. The DT were aseptically removed from the shellfish
samples and stored at -20°C. Viral particles were concentrated using PEG and pre-treated using
RNase enzyme as detailed in Section 5.2.2, below. The ribonucleic acids of the viruses were
extracted using Trizol (Invitrogen, USA) combined with the spin column method (Yaffe et al., 2012)
with modifications (described in Section 5.2.2), and preserved using 70% ethanol and transported to

100
the University of Tasmania within 2-3 days for further purification. The samples were kept at -20°C
during transportation.
5.2.2. Viral extraction and purification from shellfish digestive tissues
Viral particles were concentrated following protocols modified from Lewis and Metcalf (1988);
Mullendore et al. (2001). Briefly, two grams of shellfish DT were inoculated with 100 µl of
approximately 108 PFU/ml MS2 (as a process control to determine viral extraction efficacy) and
homogenized in a Waring blender for 30 s at high speed with 1:4 (wt/vol) 10% tryptose phosphate
broth (TPB) in 0.05 M glycine (pH 9.0). The suspension was then shaken at 250 rpm for 30 min at 4°C,
and centrifuged at 5,000 x g for 5 min. The remaining DT were collected and stored at -20°C for
further viral re-extraction (if the viral extraction efficiency of the sample was less than 10%). The
subsequent concentration steps were performed as previously described (Section 3.2.6) except that
for the final step of viral purification the pellet was re-suspended in 200 µl PBS, pH 7.5.
5.2.3. Plaque assay method to determine viral extraction efficiency
A hundred µl of the virus sample was analysed using plaque assay as previously described (Section
2.2.2) to determine the viral extraction efficiency. The viral extraction efficiency can be calculated as
the percentage of the number of MS2 after extraction divided by total added MS2 to the sample
before extraction. Following the approach of Le Guyader et al. (2009) only virus samples with a viral
(MS2) extraction efficiency more than 10% were used for further enzymatic pre-treatment and RNA
extraction as described in Section 5.2.4, below. Any virus sample with less than 10% extraction
efficacy was re-extracted following the previous procedure (Section 5.2.2).
5.2.4. RNase pre-treatment and RNA extraction
The viral suspension was subjected to RNase pre-treatment as previously described (Section 2.2.4).
The ribonucleic acid was extracted by guanidine-phenol-chloroform (Chomczynski & Sacchi, 2006)
followed by the spin column method (Yaffe et al., 2012) with modifications, as follows. In brief, 100
µl viral suspensions isolated from shellfish samples were mixed with 1 ml Trizol reagent in 1.5 ml

101
microtubes. Two hundred µl of chloroform:isoamylalcohol (24:1 v/v) was then added to the sample
and mixed up and down for 15 sec. The suspension was centrifuged at 12,000 x g for 10 min at 4°C
and the aqueous phase was then transferred to new microtubes containing 500 µl isopropanol and
10 µl of 1mg/ml glycogen (Sigma Aldrich, USA). This sample was incubated for 2 hours at -20 °C and
then centrifuged 12,000 x g for 10 min at 4°C. The supernatant was discarded, and the pellet was
dissolved in 350 µl GuSHCl buffer. The suspension was then added to an equal volume of 70%
ethanol, mixed well and stored at -20°C. In subsequent extraction steps, the mixture was transferred
to a spin column (Qiagen, Germany) and centrifuged at 8,000 x g for 30 s at 4°C. The eluate was
discarded, and the column was washed three times: once with 500 μl 3 M Na-acetate and then twice
with 500 μl 70% ethanol to remove salts. Between and after washes, the column was centrifuged at
8,000 x g for 30 s at 4°C and the eluate collected and discarded. The column was ‘dried’ by
centrifugation at 7,000 x g for 2 min at 4°C. For elution of the RNA from the column, 50 μl of DEPC-
treated water at 60°C were added directly to the column membrane, incubated for 2 min at room
temperature and centrifuged at 8,000 x g for 2 min at 4°C. The eluate, containing the nucleic acid,
was kept and stored at -70°C.
5.2.5. Enumeration of NoV by RT-qPCR
Due to unavailability of GI standard plasmid in Tasmanian Institute of Agriculture (TIA) laboratory,
only NoV GII assay was performed using RT-qPCR protocols previously described (Section 3.2.6.3)
and was done in duplicate per sample as confirmation step to avoid a false positive and negative
result. The negative result is defined as a sample with NoV concentration below the LOD value. Only
the highest NoV concentration from each positive sample was used for further study. The LOD and
LOQ of this assay were determined following MIQE guidelines for real-time PCR assay (Bustin et al.,
2009) and suggestion by Forootan et al. (2017).

102
5.2.6. Statistical analysis
A chi-squared test was used to analyse whether the different sources and species influenced the
amount of NoV contamination in the shellfish, while Analysis of Variance (ANOVA) and the Duncan
Test were used to assess the significance of differences in NoV contamination level among species.
These calculations were performed using Microsoft Excel and Real Statistics Resource Pack add-in,
and SigmaPlot ver.12.5 (Systat Software Inc., UK).
5.2.7. Genotyping
The genotype of all NoV GII (i.e., samples > LOD) detected from the shellfish samples was
determined by sequencing using a CEQTM 8000 Genetic Analysis (Beckman Coulter System, USA) at
the Molecular Laboratory of the Central Science Laboratory, University of Tasmania. Sequences of
NoV GII ORF1-ORF2 junction region were amplified by RT-nested PCR as previously described by
Kageyama et al. (2003) using G2FB and G2SKR as forward and reverse primers, respectively. The
alternative primer sequences in this study, i.e., NOV-G2-BP-F (5'-GCC CCA ATC ATG AAG ACC CA-3’)
as forward and NOV-G2-BP-R (5'-CAC CTG GAG CGT TTC TAG GG-3') as reverse primers, were
designed using Primer-BLAST NCBI that amplify 475 bps sequence of RdRp and capsid genes (nt
sequence from 4,830 to 5,304 bps which cover ORF 1 region, ORF1-ORF2 junction and ORF 2 region).
These primers used when the PCR product could not be amplified using Kageyama’s method due to
primer mismatch with the RNA template especially in ORF1 region. The PCR products from the gel
electrophoresis were purified using a QIAquick Gel Extraction Kit (Qiagen, Germany) and sequenced
using GenomeLab DTCS – Quick Kit (Beckman Coulter, USA) according to the manufacturer’s
instructions. Sequences were analysed and corrected using BioEdit Alignment Editor (Hall, 1999).
The sequences of PCR products were aligned with the published sequences from Gen Bank database
using the NCBI-BLAST (Basic Local Alignment Search Tool) available at
https://blast.ncbi.nlm.nih.gov/Blast.cgi. Phylogenetic analysis was performed using MEGA 6
software (Tamura et al., 2013).

103
5.2.8. Quantitative risk assessment of NoV in shellfish from Indonesian markets
A risk assessment (RA) was performed following the principles and guidelines for microbiological risk
assessment (MRA) established by the Codex Alimentarius Commission (CAC), including a structural
approach that consists of hazard identification, hazard characterization, exposure assessment and
risk characterisation (FAO & WHO, 2001). A point-estimate model that determining some “worst-
case” scenarios was used to develop the risk assessment. This model employs a single number of
each data set which is used as an input in the risk calculation (Lammerding & McKellar, 2004;
Zwietering & Nauta, 2007), for example mean of prevalence, highest level of contamination or
average of shellfish consumption. This deterministic approach is a suitable model for developing the
quantitative risk assessment of NoV in shellfish from Indonesian fish markets due to the paucity of
some Indonesian data inputs such as NoV outbreak cases, incidences of NoV illness associated with
shellfish consumption, and the proportion of shellfish species consumed by the Indonesian
population. The data for NoV inactivation by thermal inactivation (Chapter 3 of this thesis) was used
to calculate the potential NoV reduction after handling and cooking of the commodities.
The current regulation concerning processing of frozen shellfish in Indonesia (SNI 3460-2009)
requires boiling the shellfish in the boiled water until the shells open (assumed as heating at 90-
100°C for approximately 3-4 min) (Hewitt & Greening, 2006)), before the shellfish can be sold in the
market (BSN, 2009). This pre-cooking method is considered in this study, and its effectiveness to
reduce the risk of illness is estimated and compared with the non-pre-cooking method.
To estimate the risk of NoV, the dose per shellfish serving for different marketed shellfish (pre-
cooked or non-pre-cooked) and various formats of shellfish consumed (i.e., boiled, steamed and stir-
fried) per consumer were calculated using Equation 5-1 and 5-2. These equations were developed in
this study based on the combination of previous dose equations from Tenuis and colleagues (1997)
and Pintó and colleagues (2009), and were adjusted with the variety of assumptions and the worst-
case scenarios used in this study (for details see Table 5-1). The calculated dose was then used to
estimate the probability of illness (P*ill) per consumer according to the exponential model as
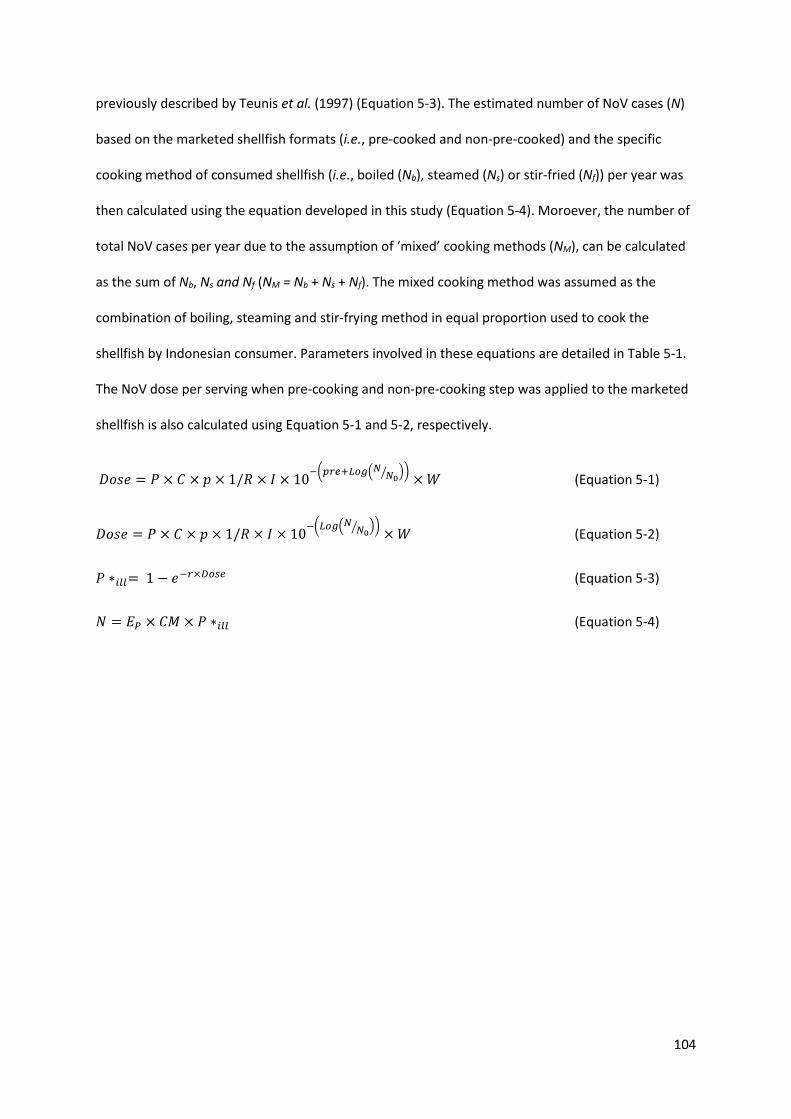
104
previously described by Teunis et al. (1997) (Equation 5-3). The estimated number of NoV cases (N)
based on the marketed shellfish formats (i.e., pre-cooked and non-pre-cooked) and the specific
cooking method of consumed shellfish (i.e., boiled (Nb), steamed (Ns) or stir-fried (Nf)) per year was
then calculated using the equation developed in this study (Equation 5-4). Moroever, the number of
total NoV cases per year due to the assumption of ‘mixed’ cooking methods (NM), can be calculated
as the sum of Nb, Ns and Nf (NM = Nb + Ns + Nf). The mixed cooking method was assumed as the
combination of boiling, steaming and stir-frying method in equal proportion used to cook the
shellfish by Indonesian consumer. Parameters involved in these equations are detailed in Table 5-1.
The NoV dose per serving when pre-cooking and non-pre-cooking step was applied to the marketed
shellfish is also calculated using Equation 5-1 and 5-2, respectively.
𝐷𝐷𝑙𝑙𝐷𝐷𝑒𝑒 = 𝑃𝑃 × 𝐶𝐶 × 𝑝𝑝 × 1/𝑅𝑅 × 𝐼𝐼 × 10−�𝑝𝑝𝑟𝑟𝑟𝑟+𝐿𝐿𝑜𝑜𝐿𝐿�𝑑𝑑𝑑𝑑0� �� × 𝑊𝑊 (Equation 5-1)
𝐷𝐷𝑙𝑙𝐷𝐷𝑒𝑒 = 𝑃𝑃 × 𝐶𝐶 × 𝑝𝑝 × 1/𝑅𝑅 × 𝐼𝐼 × 10−�𝐿𝐿𝑜𝑜𝐿𝐿�𝑑𝑑𝑑𝑑0� �� × 𝑊𝑊 (Equation 5-2)
𝑃𝑃 ∗𝑝𝑝𝑙𝑙𝑙𝑙= 1 − 𝑒𝑒−𝑟𝑟×𝐷𝐷𝑜𝑜𝑠𝑠𝑟𝑟 (Equation 5-3)
𝑘𝑘 = 𝑅𝑅𝑃𝑃 × 𝐶𝐶𝑅𝑅 × 𝑃𝑃 ∗𝑝𝑝𝑙𝑙𝑙𝑙 (Equation 5-4)

105
Table 5-1. The parameter utilised in the risk assessment to estimate the dose per serving, the probability of illness and the number of NoV cases per year
Parameter Description Unit Reference Note
P The prevalence of NoV in shellfish from Indonesian fish markets % This study The average prevalence (as worst-
case scenario)
C The highest NoV concentration in the contaminated DT shellfish copies/g DT This study The maximum NoV concentration
(as worst-case scenario)
p The proportion of DT from the total weight of shellfish tissue % (Grodzki et al., 2014) The maximum proportion (as
worst-case scenario)
R The average recovery of the extraction method % This study The minimum value (as worst-case scenario)
I Proportion of infective viral particles among the detected viruses % This study The maximum proportion (as
worst-case scenario)
pre The viral log reduction due to the pre-cooking step Log10 reductions (Hewitt & Greening, 2006) The minimum value of viral log10 reductions (as worst-case scenario)
Log(N/N0) The log reduction of NoV by thermal inactivation processes that mimic the food processing styles (i.e., boiling, steaming and stir-frying)
Log10 reductions Chapter 3 of this thesis Log(N/N0) of NoV at 60, 72 and 90°C treatment was applied
W The average of shellfish consumption portion per consumer gram (Makmur et al., 2014)
r The dose response of NoV illness viral particle or genomic copies (Teunis et al., 2008)
Pop The total population of Indonesia of the year people (BPS-Statistics Indonesia, 2018)
SC The average of shellfish consumption per capita in Indonesia of the year gram (BPS-Statistics Indonesia,
2018; FAO, 2015)
Con The annual of total shellfish consumed in Indonesia gram This study (Con=Pop x SC)
S The expected (potential) contaminated servings servings This study (S= (P x Con)/W)
CM The proportion of shellfish consumption based on the consumption format % This study Assumption – no relevant data
available

106
5.3. Results
5.3.1. NoV exposure from shellfish from Indonesian fish markets
Ninety shellfish samples including Green Mussel, Blood Cockle and Oriental Hard Clam (Figure 5-2),
were collected in 2016 and a further 81 samples were collected in 2017, from four different
Indonesian fish markets in Jakarta and Panimbang, i.e., Cilincing, Kamal, Everfresh and Panimbang
market. Some species, e.g., Oriental Hard Clam and Green Mussel, were not available for sampling in
Everfresh and Panimbang market as detailed in Table 5-2.
Table 5-2. The numbers of shellfish samples from Jakarta and Panimbang fish markets in 2016 and 2017
Sampling site
Market Year
Σ samples (per species) Σ samples (per site per
year) Name Type Oriental Hard Clam
Blood Cockle
Green Mussel
Jakarta Cilincing Traditional 2016 9 9 9 27
2017 9 9 9 27
Kamal Traditional 2016 9 9 9 27
2017 9 9 9 27
Everfresh Modern 2016 n/a 9 9 18
2017 n/a 9 9 18 Panimbang Panimbang Traditional 2016 6 6 6 18 2017 n/a 9 n/a 9
Total 42 69 60 171 *Note: n/a =not available in the market at the time of sampling

107
Green Mussels (Perna viridis) Blood cockles (Anadara granosa)
Oriental Hard Clams (Meretrix lusiora)
Figure 5-2. Shellfish species collected from Indonesian fish markets
5.3.1.1. The efficiency of virus extraction and RNase pre-treatment process
To evaluate the efficiency of the virus extraction process from DT samples, MS2 was added as a
process control. The average extraction efficiency was analysed by comparing the calculated number
of MS2 (PFU/g) in the virus samples added before and those enumerated after the viral extraction
(% recovery). Following each market sampling in 2016 and 2017 (Section 5.2.1), three individual
samples from the approximately 30 samples were randomly picked and analysed by plaque assay to
evaluate the efficiency of viral extraction. The average efficiency of this extraction procedure and
RNase pre-treatment varied between 17.70 and 30.35% per batch (Table 5-3).
Table 5-3. The average extraction efficiency of MS2 as a control per batch
Batch No. Week Year
Recovery (%) Average
1 1 2016 30.35 ± 17.70 2 2 2016 31.06 ± 15.53 3 3 2016 27.01 ± 11.50 4 1 2017 21.87 ± 10.28 5 2 2017 17.70 ± 9.18 6 3 2017 24.33 ± 9.53

108
5.3.1.2. NoV prevalence and enumeration in the shellfish from Indonesian fish markets
Positive samples were defined as shellfish that were contaminated with NoV at a concentration
above the limit of detection (LOD) (10 copies/g or 1 log10 copies/g DT) with no non-specific
amplification products (as determined by melt curves analysis in the RT-qPCR). The average
proportion of positive DT in Blood Cockles, Oriental Hard Clams and Green Mussels varied between 5
to 10% of total tissue weight (data not shown). The average NoV prevalence in shellfish from 2016
and 2017 sampling periods was 5.55% and 7.41%, respectively. The highest prevalence of NoV GII
was found in Green Mussels (10%), followed by Oriental Hard Clams (7.14%) and Blood Cockles
(2.9%) (Table 5-4), and all of the positive samples (>LOD) originated from “traditional” fish markets
in Jakarta (Table 5-5). No positive samples were detected in the Clam samples in 2016, but 3 positive
samples were found in 2017. The chi-square analysis showed that the NoV prevalence between
shellfish species was not significantly different (P>0.05) (Table 5-4) but was significantly different
between market sources (P<0.05) (Table 5-5).
Table 5-4. NoV prevalence in the shellfish samples from Indonesian fish markets according to species
Species Year (Positive/Total Samples)
Total Prevalence (%) 2016 2017
Oriental Hard Clam (Meretrix lusoria) 0/24 3/18 3/42 7.14a
Blood Cockle (Anadara granosa) 1/33 1/36 2/69 2.90a
Green Mussel (Perna viridis) 4/33 2/27 6/60 10a
*The same letter in the same column denotes no significant differences (P>0.05)
Table 5-5. NoV prevalence in the shellfish samples from Indonesian fish markets according to sampling sites
Sampling sites Market type Year (Positive/Total Samples)
Total Prevalence (%) 2016 2017
Jakarta Traditional 5/54 6/54 11/108 10.19a
Modern 0/18 0/18 0/36 0b
Panimbang Traditional 0/18 0/9 0/27 0b
*The same letter in the same column denotes no significant differences (P>0.05)

109
The concentrations of NoV (GII) in the contaminated shellfish collected in 2016 and 2017 are
presented in Table 5-6. The LOQ of this assay is 20 copies/g or 1.3 log10 copies/g DT. The level of NoV
contamination in Oriental Hard Clam species was higher and significantly different (P<0.05) to Blood
Cockle and Green Mussels, however, there was no significant difference (P>0.05) between cockles
and mussels.
Table 5-6. NoV concentration in contaminated shellfish at traditional markets in Jakarta according to species
Species NoV (log10 copies/g DT)
For each positive sample Average
Oriental Hard Clam (Meretrix lusoria)
2.71
3.14±0.70a 2.78
3.95
Blood Cockle (Anadara granosa)
1.60 1.89±0.41b
2.18
Green Mussel
(Perna viridis)
1.43
2.07±0.51b
1.54
1.92
2.48
2.48
2.57
*LOQ of RT-qPCR is 1.30 log10 copies/g sample. The same letters in the same column denotes no significant differences (P>0.05)
5.3.2. Genotyping of NoV GII isolated from contaminated shellfish
A total of eleven NoV-positive samples were analysed for genotyping study. Samples were amplified
by a conventional RT PCR using G2FB and G2SKR primers following the method of Kageyama et al.
(2003) to produce 479 bps fragment. Only one of 11 samples was successfully amplified (with cDNA
concentration of <25 ng/µl), and was later identified as genotype GII.4 (sample C2C3) (Figure 5-3).
The alternative primers designed in this study were used to amplify the fragment from the ORF1,
ORF1-ORF2 junction and ORF3 regions from the remaining positive samples that could not be

110
amplified by Kageyama’s method. Using these primers, another sample (K3C2) produced a 475 bp
fragment (with cDNA concentration of <25 ng/µl) and was also identified as genotype GII.4 (Figure 5-
3). In both genotyping processes, instead of applying cloning step, two primers from each PCR
method (Kageyama’s and alternative method) were used in the sequencing process to avoid noisy
area or poor sequences resolution due to a possible mixture of RNA from other GII strains in the
sample.
Figure 5-3. Phylogenetic tree of NoV GII detected from contaminated samples of Indonesian shellfish
5.4. Discussion
5.4.1. Prevalence and contamination levels of NoV in shellfish from Indonesian fish markets
This study presents the first data of NoV GII prevalence and contamination levels in some shellfish
species commonly purchased from Indonesian fish markets in Jakarta and Panimbang for human
consumption. The sampling sites were selected based on the market types (modern and traditional)
as well as the source of the marketed shellfish.
NoV GII.4_Dresden174/pUS-NorII/1997_AY741811.1
NoV GII.4_Osaka1/2007_AB541319.1
NoV GII.4_Farmington_Hills/2002_AY502023.1
NoV GII.4_Hunter504D/04O_DQ078814.2
NoV GII.4_Orange/NSW001P/2008_GQ845367.2
NoV GII.4_JB-15/KOR/2008_HQ009513.1
NoV GII.4 Huzhou_NS16439
NoV GII.4_Sydney_2012_isolate_15011203
NoV GII.4_isolate_Novosibirsk/NS16-A262/2016
Sample_1_Green Mussel_C2C3
Sample_5_Green Mussel_K3C2
NoV GII.6_strain_groundwater/GII-6/Deagu/2015/KR
NoV GII.3_strain_Hu/GII.3/AH15076/2015/CHN
NoV GII.2_isolate_Hu/GII.2/Tainan/16-7/2017/TW
NoV GII.5_strain_Hu/GII.5/GG(02169)/2010/KOR
NoV GII.21_GL02LP3
NoV GII.17_GL07LP6
NoV GII.1_isolate_Hu/GII.1/GM50/2017/CHN
0.05

111
Shellfish from three traditional markets in Jakarta included shellfish harvested from more polluted
environments (Jakarta Bay), while shellfish from Panimbang (Banten Bay) market represented
shellfish from less polluted areas. As shown from the results of this study, the highest NoV
prevalence was found in Green Mussels from traditional markets in Jakarta. NoV was also found in
other types of shellfish from these markets but was not found in shellfish from Panimbang market,
which are mainly procured from Banten Bay. Banten Bay has been proposed by the Indonesian
MMAF as a potentially safer alternative to the shellfish growing sites in Jakarta Bay (Andriyanto,
2018) which are heavily exposed to industrial and domestic sewage (Dsikowitzky et al., 2016; Siregar
et al., 2016).
NoV GII.4 were identified from Green Mussels in this study. Genogroup GII, and especially GII.4, are
the most common cause of human gastroenteritis outbreaks (Bernard et al., 2014; Bull et al., 2006;
White, 2014). Thus, these findings emphasize the importance of regular monitoring and surveillance
of NoV in shellfish products. Although regular monitoring and surveillance is carried out by local and
national Indonesian authorities to ensure the safety and quality of shellfish in Indonesian markets,
information on NoV prevalence remains limited. The Indonesian government has mainly focused on
monitoring of biotoxins, heavy metals and bacterial contamination in shellfish products (MMAF,
2004), in which only the faecal coliform test was used as an indicator of faecal contamination in the
growing areas (BPLHD, 2015). If the results of routine monitoring indicate high levels of faecal
coliform contamination (> 300 MPN faecal coliforms/100 ml) in the water, and further laboratory
tests confirm these observations, the authorized agency is required to perform an evaluation of the
particular area and, as appropriate, the area will be declared as “off-limits” and no shellfish growing
and harvesting can be done in this area until the water quality improves and meets the requirements
(MMAF, 2004).
The use of faecal coliforms as an indicator for faecal contamination may not an effective approach to
assess NoV contamination of shellfish or harvesting sites. While the faecal coliform test can
effectively indicate enteric bacterial pathogens in shellfish and its production areas (Suffredini et al.,

112
2014), it is less accurate to assess enteric virus contamination in the shellfish or viral dispersal in
sewage-contaminated water (Brake et al., 2018; Lee et al., 2013; Winterbourn et al., 2016).
5.4.2. Quantitative Risk Assessment of NoV in Shellfish from Indonesian markets
A Quantitative Microbiological Food Safety Risk Assessment (QMFSRA) utilising the NoV prevalence
and contamination levels data from this study was performed with different assumptions, including
‘worst-case scenarios’, (as described in Table 5-1) to provide scientific information on the risk of NoV
infections due to the consumption of shellfish in Indonesia. The QMFSRA was performed using a
deterministic approach following the guidance and example of the risk evaluation of viruses in
oysters in UK (ICMSF, 2018) and a model of HAV in shellfish (Pintó et al., 2009), with modifications to
the input parameters used for the risk calculations. The risk assessment in this study employed
various assumptions such as the application of a pre-cooking step to raw shellfish and also
considered the consumer behaviour toward shellfish cooking and consumption in Indonesia, where
the shellfish are usually consumed in the cooked form, i.e., after being boiled, stir-fried or steamed.
These pre-cooking and cooking practises could potentially eliminate or greatly reduce the
possibilities of NoV contamination in the final shellfish product. Hence the data on NoV thermal
inactivation (which mimics those cooking processes) from the Chapter 3 of this thesis were
integrated into the risk characterization.
5.4.2.1. Hazard identification
Occurrences of NoV in food as well as reported cases of NoV infection due to the consumption of
contaminated food in some developed countries have been well-reported (Lopman et al., 2003;
Scallan et al., 2011). In some developing countries such as Indonesia, however, foodborne
outbreaks caused by NoV are undocumented or underreported. The available published data on NoV
infections in some developing countries are limited to NoV prevalence from symptomatic and
asymptomatic patients such as in African (Armah et al., 2006; Ayukekbong et al., 2014), South
American (Bucardo et al., 2017; Fumian et al., 2016; García et al., 2006), and Asian countries

113
including Indonesia (Nguyen et al., 2007; Sai et al., 2013; Subekti et al., 2002a; Subekti et al., 2002b;
Utsumi et al., 2017). In Indonesia, prevalence of NoV in patient stool samples varied between 2.7 to
20.6% (Subekti et al., 2002a; Utsumi et al., 2017). Although some NoV infections were recorded from
the patient, the information about the source of these infections were not available.
According to FAO data, mollusc (including shellfish) production in Indonesia increased from 53,684
to 60,471 metric tonnes in the period of 2010 to 2013 (FAO, 2015). However, some of the shellfish
growing and harvesting areas in Indonesia, such as Jakarta Bay, are located close to estuaries and
likely to be contaminated by domestic sewage from the surrounding settlement (Dsikowitzky et al.,
2016). As described earlier (Section 1.1.5), shellfish are highly susceptible to microbial
contamination, including viruses, due to their filter feeding behaviour (Le Guyader et al., 2013; Lees,
2000). Since NoV are highly persistent in the water environment (Brake et al., 2018; Cook et al.,
2016), shellfish grown in NoV contaminated areas are at high risk of being contaminated by NoV.
Current Indonesian national standards for shellfish products sold in the market provide guidelines on
safety and quality requirements as well as handling and processing of frozen (SNI 3460.1 to 3: 2009)
and canned shellfish (SNI 3919.1-3:2009). However, related regulations for fresh shellfish do not
exist, although this product is often sold fresh to consumers. Moreover, these regulations do not
consider viruses as potential microbial contaminants for raw material intended for frozen and
canned products.
5.4.2.2. Exposure assessment
Section 5.3.2. detailed the NoV prevalence from shellfish sold in Indonesian markets. A total of 171
samples were collected from four markets in Jakarta (Special Capital Region of Jakarta Province) and
Panimbang (West Java Province) in 2016 and 2017 (Table 5-2). As presented in Table 5-4 and Table
5-5, the average NoV prevalence was 6.48% and all positive shellfish were originated from
traditional markets in Jakarta. The shellfish sold in these markets are more likely to be grown in, or
harvested from, Jakarta Bay which has experienced environmental stress due to high loads of solid

114
waste and wastewater from the surrounding households and industries from the city of Jakarta
(Dsikowitzky et al., 2016). Most of the wastewater is only partially treated or untreated and collects
into 13 rivers and canals which empty into Jakarta Bay (Nur et al., 2001).
Shellfish consumption data were estimated from the data of FAOSTAT (FAO, 2015) and the
Indonesian Ministry of Health (Indonesian Ministry of Health, 2014). FAOSTAT estimated that the
total domestic supply of molluscs intended for consumption in Indonesia in 2013 was 23,611 tonnes
(FAO, 2015). Furthermore, the national food consumption survey in Indonesia in 2014 suggested
that the number of consumer consuming squid and shellfish per year was 1.1% of the total
population (Indonesian Ministry of Health, 2014). This survey used a cross sectional design and was
conducted in every province in Indonesia. Consumer food intake during the last 24 h was recorded
from 191,524 participants from 51,127 households.
The average amount of shellfish consumed per serving is estimated as 185.29 g, derived from a
study in Cilincing, North Jakarta (Makmur et al., 2014). This survey involved 200 participants with
inclusion criteria as those who consume shellfish.
In the current study, due to unavailability of recorded or published data on the consumption of raw
shellfish in Indonesia, the proportion of shellfish consumed by Indonesian consumer was estimated
based on assumptions of different shellfish cooking methods. The most common cooking practices
of shellfish in Indonesia are boiling, steaming and stir-frying (Murdinah, 2009; Panjaitan et al., 2018;
Wongso & Tobing, 2012). Because there is lack of information and data about the proportion of the
different shellfish cooking methods, further assumptions were made on these proportions in this
current study (Table 5-7) to assess the importance of those assumptions on the risk estimates.

115
Table 5-7. Assumptions on the proportion of shellfish cooked by different methods
Assumptions Percentage of cooking methods (%)
Boiling (90-100°C for 30 min)
Steaming (72°C for 15 min)
Stir-frying (60°C for 30 min)
1 100 0 0
2 0 100 0
3 0 0 100
4 (“mixed”) 33.3 33.3 33.3
The above proportions of cooking methods were estimated based on the antimicrobial potency of
each cooking method as well as the “mixed” method (assumption 4) to reduce NoV contamination in
the shellfish, thus the relative efficacy of different cooking method to reduce the risk of NoV cases
can be determined.
5.4.2.3. Hazard characterisation
Since specific studies on the dose response of Indonesian consumers (patients) to NoV exposure are
not yet available, the probability of infection in this study was calculated using the dose response
model developed by Teunis et al. (2008), while the NoV concentration and the serving size estimates
were provided in Table 5-6 and Section 5.4.2.2, respectively. Teunis’s model was derived from the
infectivity of NoV in human challenge studies, where the lD50 was estimated to be 1 million particles
or viral copies (ICMSF, 2018). The probability of illnesses due to the consumption of NoV
contaminated shellfish was estimated using a simple exponential model (Teunis et al., 1997).
To coordinate the available data with the required input values in this quantitative approach, several
assumptions were made. The NoV contamination level was analysed from the shellfish DT, which
comprise approximately 10% (assumed as the maximum proportion) of total shellfish tissue weight
(Grodzki et al., 2014). Although a previous study showed that the majority of the viral particles were
accumulated in the DT and were not homogenously distributed in other shellfish organs (McLeod et
al., 2009), however some other studies confirmed that viral particles were not only accumulated in
the shellfish DT but also in other organs such as gills, adductor muscle and haemolymph cell

116
(Maalouf et al., 2010). Therefore, in this study the viral particles were assumed to be distributed not
only in the DT but also in other organs, as a worst-case scenario. This approach was applied to avoid
an underestimation of the dose calculated. The conversion factor (p) of 10%, which was obtained as
the proportion of digestive tissue from the total weight of shellfish tissue was used to calculate the
dose. The highest level of NoV contamination in shellfish from this study (8,980 copies/g DT before
adjustment by correction factor of recovery rate (R)) was also chosen as the worst-case scenario in
this risk assessment. Moreover, as there is no data available on the proportion of shellfish
consumption based on different species of shellfish, it was assumed that the population consumed
similar proportions of each shellfish species. A further assumption about the total shellfish (bivalve
molluscan shellfish) consumption was also made, since the FAO data on the total domestic supply
was calculated for molluscs in general (includes bivalve molluscan and other molluscs without shell).
All the required data and information to calculate the risk estimate are presented in Table 5-7.

117
Table 5-8. Input parameters for the deterministic QRA to estimate the risk of NoV in shellfish from Indonesian fish markets
Parameter Values Reference(s) Note
P 6.48% Chapter 5 (Section 5.3.1) of this thesis Assumed at the average of annual prevalence
C 8,980 copies/g DT Chapter 5 (Section 5.3.1) of this thesis Worst-cases scenario
p 10% (Grodzki et al., 2014) Assumed at max. proportion
R 17.70% Chapter 5 (Section 5.3.1) of this thesis Worst-cases scenario
I 100% Chapter 5 (Section 5.4.2) of this thesis Worst-cases scenario
pre 2 (Hewitt & Greening, 2006) Worst-cases scenario
Log(N/N0) 4 (at 90°C for 30 min); 3 (at 72°C for 30 min); and 1 (at 60°C for 30 min) Chapter 3 (Section 3.3.4) of this thesis
W 185.9 g (Makmur et al., 2014)
r 1/1,000,000 copies or viral genomic (Teunis et al., 2008); (ICMSF, 2018)
Pop 248,800,000 (BPS-Statistics Indonesia, 2018)
SC 94.9 g (BPS-Statistics Indonesia, 2018; FAOSTAT, 2015)
Con 23,611,120,000 g - Calculated
S 8,230,234.41 servings - Calculated
CM Boiling; steaming; and stir-frying* - Assumed Note:*The details on the assumption of cooking methods proportion were described in Table 5-7

118
5.4.2.4. Risk characterisation
Based on the thermal inactivation data from this thesis (Section 3.3.4) the reduction of NoV by a
cooking process such as boiling at 90-100°C for 30 min, steaming at 70-80°C for 30 min or stir-frying
at 60°C for 30 min were predicted to be at least 4, 3 and 1 log10 reductions, respectively. These log
reductions values of NoV in shellfish matrix due to thermal inactivation that mimicked the assumed
cooking process were estimated using a Biphasic (non-linear) model. In addition, the result from
previous study showed that >2 log10 viral reductions were achieved by boiling until the shell opens
(90°C for 3-4 min) (Hewitt & Greening, 2006). This value (2 log10 reductions) was used to determine
the minimum viral reduction achieved by the pre-cooking step (i.e., the worst-case). All of the viral
reduction values were then incorporated with the NoV annual prevalence and concentration data,
the average mass of shellfish consumed by the Indonesian population, the recovery rate of the
quantification method, the proportion of DT from the total shellfish body weight and the proportion
of virus infectivity in the sample, to estimate the doses of NoV per serve of shellfish (Equation 5-1
and 5-2).
By multiplying the estimated average probability of illnesses (P*ill) with the potential contaminated
servings, the annual NoV incidences based on the various assumptions of the most common shellfish
cooking methods in Indonesia with the worst-case scenarios were estimated. The results are
presented in Table 5-9. The annual attack rates of NoV (number of NoV-illness cases per 100,000
inhabitants per year) due to contaminated-shellfish consumption in Indonesia are presented in Table
5-10. These attack rates depend on the assumptions in the application of pre-cooking step of pre-
marketed shellfish as well as the cooking methods. For instance, when the pre-cooking step (boiling
at 90-100°C for 3-4 min) was incorporated into the risk calculation, the attack rates of each cooking
methods were, as expected, 100-fold lower than without a pre-cooking step (Table 5-10). It can be
explained because, from the results from previous studies (Hewitt & Greening, 2006), pre-cooking by
boiling at 90-100°C for-3-4 min to open the shell reduces NoV particles by at least 2 log10.

119
Table 5-9. The NoV-illness cases per year estimated based on the assumption of the most common shellfish cooking methods in Indonesia with the worst-cases scenario
Assumption on shellfish cooking method No of cases Without pre-cooking
All shellfish cooked by boiling (90-100°C for 30 min) 780 All shellfish cooked by steaming (70-80°C for 30 min) 7,800 All shellfish cooked by stir-frying (60-70°C for 30 min) 741,000 Shellfish cooked by mixed method1 250,000
With pre-cooking2 All shellfish cooked by boiling (90-100°C for 30 min) 7.8 All shellfish cooked by steaming (70-80°C for 30 min) 78 All shellfish cooked by stir-frying (60-70°C for 30 min) 7,800 Shellfish cooked by mixed method1 2,600
Note: 1The mixed method was assumed as mixed cooking practices consist of boiling, steaming and stir-frying in equal proportion (33.33% of each cooking method) 2The standard handling procedures of pre-marketed raw or frozen peeled shellfish published by Indonesian government which utilise boiling step (boiling at 90-100°C for 3-4 mins) to open the shell
Results from previous studies by Pintó et al. (2009), which estimate the risk of enteric viruses in
shellfish products in Spain and the documented enteric viruses outbreaks due to shellfish
consumption by Suffredini et al. (2014) were compared to the results from this study. The estimated
NoV attack rates in Indonesia assumed without pre-cooking step were higher than those reports, but
when including the pre-cooking application, the rates were comparable to those estimates in Spain
and Italy (Table 5-10). However, the estimated NoV attack rates in Indonesia were lower than the
attack rate from the recorded HAV cases in China during the outbreaks in 1988 (Halliday et al., 1991)
or from the estimated NoV cases example in UK due to raw shellfish consumption (ICMSF, 2018).

120
Table 5-10. The estimated and reported attack rate of enteric virus due to shellfish consumption in different scenario in one-year period
Scenario Attack rate (per 100,000 person) Note
This study
No pre-cooking + boiling only 0.31 Estimated No pre-cooking + steaming only 3.09 Estimated No pre-cooking + stir-frying only 295.43 Estimated No pre-cooking + mixed cooking 99.61 Estimated Pre-cooking + boiling only 0.0031 Estimated Pre-cooking + steaming only 0.031 Estimated Pre-cooking + stir-frying only 3.09 Estimated Pre-cooking + mixed cooking 1.04 Estimated
Other studies
No cooking (Pintó et al., 2009) 0.66-0.91 Estimated Lightly cooking (Pintó et al., 2009) 0.05-0.43 Estimated Well cooking (Pintó et al., 2009 0.01-0.21 Estimated Raw consumption (in UK)* 3,000 Estimated example High pressure process (in UK)* 3.08 Estimated example HAV prevalence studies (in Peru) (Pintó et al., 2009) 3.30-13.30 Estimated Italia outbreaks in 2008 (Suffredini et al., 2014) 2.5 Reported China outbreaks in 1988 (Halliday et al., 1991) 4,083 Reported Note*: Example of risk estimation of NoV cases in UK (ICMSF, 2018)
5.4.2.5. Limitations of the risk assessment and future recommendations
The estimated risk of illnesses and the attack rates due to the consumption of NoV-contaminated
shellfish in Indonesia were different from other outbreak estimates due to enteric viruses which
used a similar risk estimation approach (ICMSF, 2018; Pintó et al., 2009), especially when the pre-
cooking method was not considered. These differences could be due to the various assumptions and
the worst-case scenarios that were used in this current study. In the calculation of virus dose per
serving, this study assumed that the proportion of DT from the total weight of shellfish tissue was
10% (Table 5-1) because the NoV concentration was calculated only from the sample’s DT, while the
study of Pintó et al. (2009) did not use this correction factor and assumed that the level of HAV
contamination in the shellfish DT represented the contamination throughout the flesh of the
individual shellfish. Furthermore, because of the unavailability of an in-vitro assay method to
evaluate the infectivity of the NoV in this study, NoV quantified by RT-qPCR with enzymatic pre-
treatment were assumed as infectious viral particles in the risk estimation. If an in-culturo assay

121
becomes available as a standard method to quantify the levels of infectious NoV (such as HAV
quantification assay), the current risk assessment may be improved.
The worst-case scenarios used in this study were made to accommodate data gaps on shellfish
consumption and preparation methods in Indonesia. Based on the prevalence study, the highest
NoV contamination was found in Clams (Table 5-6). Thus, to generate the maximum risk estimate, it
was assumed that all shellfish consumers in Indonesia only consume Clams. Following this
assumption, the highest concentration of NoV in Clams (8,980 copies/g DT) was used in the risk
calculation. In addition, the lowest recovery average was also used in the risk calculation to develop
a worst-case risk estimation.
To resolve these data gaps and refine the risk estimates and potential risk management solutions,
more detailed studies on the volume of different shellfish species consumed by Indonesian
consumer is necessary to follow up the National Food Consumption Survey (SKMI) conducted by the
Ministry of Health. In addition, to get more representative information on the NoV prevalence in
shellfish from Indonesian markets, further studies or surveys should also be carried out in other
Indonesian fish markets. To properly identify the origin of shellfish contamination, direct sampling of
waters from the shellfish growing areas is also suggested. This could also provide information on the
actual level of NoV in shellfish due to faecal-oral transmission (natural contamination).
The current risk assessment focussed on the efficacy of heat treatment as a potential control
measure to reduce NoV contamination in shellfish. The pre-cooking practice, which was proposed by
the Indonesian government for frozen (peeled) shellfish (SNI 3460:2009), was included as an
assumption in the risk calculation. This processing step is intended to open the shellfish shell (BSN,
2009). As shown in Table 5-10, assuming that the pre-cooking step was applied with a further
cooking method, the number of estimated NoV cases as well as the attack rates per year due to
shellfish consumption can be reduced to 100-fold. For example, pre-cooking before boiling reduced

122
the estimated cases of illness due to the consumption of NoV-contaminated shellfish from 780 cases
(without pre-cooking) to 7.80 cases (with pre-cooking) per year. This standard processing supports
conclusions from a previous study (Hewitt & Greening, 2006) and guidelines from Codex
Alimentarius Commission (CAC) on the general principles of food hygiene to control viruses in food
(FAO & WHO, 2012) where boiling the shellfish at minimum 3 min resulted in increasing internal
temperature of the shellfish to a minimum of 90°C, and maintaining this internal temperature for
minimum 90 s was recommended to inactivate viruses in most foods.
Following the different methods of cooking that are generally done by shellfish consumers in
Indonesia (Table 5-10), pre-cooked shellfish with further boiling have the lowest risk of residual NoV
contamination in the final product, while the highest-risk product is estimated to be stir-fried
shellfish without pre-cooking. This observation showed that although NoV was found in shellfish sold
in traditional markets in Jakarta, the current processing practices of the consumer will reduce the
NoV contamination in the product. Furthermore, reduction levels are dependent upon the different
cooking methods. It can be suggested that consumer should pre-cook their shellfish before further
cooking and that boiling is preferable to other cooking methods to reduce the level of NoV
contamination. It is also suggested that pre-cooking of raw shellfish should be done in the processing
facilities before the product is sold, particularly for shellfish harvested from polluted sites such as
Jakarta Bay.
However, if the consumption of raw shellfish, such as oysters, becomes popular in Indonesia in the
future, the risk of illnesses due to shellfish consumption might increase beyond the estimates
provided in this study, especially if the shellfish are harvested from polluted sites such as Jakarta
Bay. In this scenario, the pre-cooking practices and cooking methods will not be applied, thus the
risk of NoV infection will need to be re-calculated but would be expected to be tens-of-times higher
per serving. In the absence of cooking steps, the quality assurance of this product from farm to fork
will need to be well-monitored and controlled, e.g., when the shellfish growing/harvesting sites are

123
determined as “off-limit” by the competent authorities, following the sites’ closure, the products are
not allowed to be harvested and marketed.
5.5. Conclusion
Frequent NoV contamination was observed in shellfish obtained from traditional markets in Jakarta,
which most likely are harvested from Jakarta Bay. Findings from the risk assessment presented as
part of this study emphasized the value of implementing pre-cooking practices by producers and
consumers, to reduce the level of NoV contamination in the shellfish, thus reducing the estimated
risk of illness. Furthermore, based on the set of assumptions and scenarios in this risk assessment
study, different cooking methods (i.e., boiling, steaming and stir-frying) affects the number of
estimated the risk of NoV cases and the attack rates, with the shellfish boiled for 30 minutes having
the lowest risk product of NoV contamination, and of causing illness to consumers.

124
Chapter 6. General discussion and conclusions
6.1. General discussion
As reviewed in Chapter 1 (Section 1.1), NoV remains the leading causative agent of viral
gastroenteritis outbreaks, and subsequent health and economic losses worldwide. Most of the
outbreaks are caused by person-to-person and faecal-to-oral transmission through water and
environmental contamination, whereas some of the outbreaks were associated with consumption of
NoV-contaminated food (Glass et al., 2009; Verhoef et al., 2015). NoV can be introduced into water
via sewage overflows or contaminated water from the surroundings (Aw et al., 2009; Rodríguez et
al., 2012; Wyn-Jones et al., 2011; Yang et al., 2012). Hence, raw or fresh food such as shellfish,
produce and fruit which are grown or harvested, irrigated, handled and processed with NoV-
contaminated water have become the most common source of food-borne NoV infection.
Moreover, food that is prepared and handled by NoV-infected persons (both symptomatic and
asymptomatic) can also contribute to the NoV infection.
Compared to other aquatic animals, shellfish are more susceptible to NoV contamination, due to
their filter feeding behaviour which enables them to accumulate different types of suspended
particles from their aqueous environment, including bacteria and virus (Lees, 2000). An increasing
trend in shellfish consumption and production in Indonesia has been documented since the early
2000’s. The source of Indonesian shellfish is mainly from domestic production by shellfish farming or
wild catch (FAO, 2015). Some of the harvesting sites have been heavily contaminated with sewage
overflow from the rivers, such as Jakarta Bay (Dsikowitzky et al., 2016). Currently, shellfish species
harvested and caught from the Jakarta Bay (i.e., Green Mussel, Blood Cockle and Hard Clam) are
commonly found in the traditional fish markets close to Jakarta Bay (i.e., Cilincing and Muara Kamal).
It is, therefore, likely that these shellfish are being contaminated by faecal sewage containing enteric
viruses including NoV.

125
Generally, shellfish in Indonesia are cooked before consumption, however, the risk of NoV
contamination might remain due to inadequate cooking of the contaminated shellfish, secondary
transmission route through cross-contamination between shellfish during washing steps or
contamination from an infected food handler. However, a risk assessment of NoV from shellfish in
Indonesian fish market is not yet available, hence, there is a need to develop this risk assessment
especially for shellfish from traditional fish markets (i.e., Jakarta and Panimbang). Such a food safety
risk assessment will provide the competent authorities in Indonesia (both local and central
government) with information about the estimated magnitude of risk due to consumption of NoV-
contaminated shellfish as well as potential control strategies for NoV foodborne cases.
The EFSA recommended investigation of NoV levels in shellfish products following several incidents
of foodborne NoV illnesses related to the consumption of raw shellfish, using robust methods for
NoV identification and quantification (EFSA Panel on Biological Hazards (BIOHAZ), 2012). However,
these efforts remain challenging because a standard quantification assay based on the cell-culture
system as a robust quantification method is currently unavailable. As a consequence, a molecular-
based method such as RT-qPCR has been used as the gold standard assay for detection and
quantification of NoV (ISO, 2013, 2017; Kirby & Iturriza-Gómara, 2012; Vinjé, 2015). One of the
limitations of using RT-qPCR in the quantitative analysis is the inability of this method to distinguish
between infectious and non-infectious viral particles (Knight et al., 2012; Richards, 1999) which
could lead to overestimation of NoV and the related risks and provided inaccurate information for
the decision making process.
Chapter 2 of this thesis addressed the above issue by proposing enzymatic pre-treatment to improve
the ability of RT-qPCR to differentiate the infectious from non-infectious viral RNA using MS2
bacteriophage (MS2) as a cultivable NoV surrogate. The results showed that the performance of RT-
qPCR without enzymatic pre-treatment was comparable to the plaque assay method only for
quantification of non-heated MS2 (presumed only infectious viruses were present), but was not
comparable for the quantification of infectious MS2 after heat treatment where both infectious and

126
non-infectious viral particles were present. In addition, by comparing the result of RT-qPCR with the
culture-based method (plaque assay), the application of RNase as enzymatic pre-treatment was able
to reduce the overestimation of “infectious” viral particles that survive from the treatment. The
ability of RNase to reduce the overestimation of the infectious viral particles can be explained by its
ability to degrade the RNA from non-infectious viral particles lacking capsid protein (Brié et al., 2016;
Pecson et al., 2009), and thus only to quantify RNA from infectious viral particles.
However, without a further step to inactivate RNase by RNasin treatment during the enzymatic pre-
treatment in this study, underestimation of the infectious viral particles was observed using RT-qPCR
assay. The finding of this study showed that the application of RNase followed by RNasin prior to
RNA extraction were able to reduce the overestimation of infectious MS2 from heat treatment
which is confirmed by the comparable results obtained from the RT-qPCR method (with enzymatic
pre-treatment) compared to the plaque assay. Hence, this RT-qPCR assay with enzymatic pre-
treatment (RNase followed by RNasin prior to RNA extraction) was proposed to enumerate
infectious viral particles from thermal or chlorination treatments, as described in Chapters 3 and 4.
This assay (pre-treatment RT-qPCR) was also used to in the prevalence study (Chapter 5).
Quantification using this assay was able to avoid over-estimation, thus provided reliable results on
the level of NoV in shellfish available at retail markets in Indonesia.
Based on the available records, most NoV outbreaks are related to the consumption of raw-
contaminated shellfish (Huppatz et al., 2008; Lodo et al., 2014; Morse et al., 1986; Westrell et al.,
2010), however undercooked shellfish is also reported to cause illnesses (Alfano-Sobsey et al., 2012;
Richards, 2006). To overcome this problem, thermal inactivation has been considered as one of the
most effective treatments to reduce or eliminate enteric virus contamination (Bertrand et al., 2012;
Richards et al., 2010; Teixeira, 2015). Heating the shellfish before consumption is an acceptable
approach in Indonesia, because the majority of shellfish consumers in Indonesia cook their shellfish

127
before eating, therefore the heat treatment is unlikely to affect their perception of organoleptic
quality of the final product.
The application of heat to inactivate NoV and MS2 in buffered media and artificially contaminated
mussel (Mytilus galloprovincialis) was evaluated in Chapter 3. The heat inactivation kinetics of the
two viruses were compared using linear (first-order kinetic) and non-linear (Weibull and Biphasic)
models. The heating temperatures explored, 60, 72 and 90°C for different contact times,
represented the cooking processes of stir-frying, steaming and boiling, as the most common cooking
practices of shellfish in Indonesia.
In general, tailing phenomena were observed in all inactivation curves of NoV and MS2 in both
matrices (buffered media and mussel matrix). These findings agree with the observations from
previous thermal inactivation studies (Araud et al., 2016; Bozkurt et al., 2013, 2014a) where there
were more heat-resistant subpopulations present during viral inactivation treatments. As a
consequence, the non-linear models (Weibull and Biphasic) which have lower RMSE values,
performed better in the prediction of thermal inactivation kinetics of the viruses than log-linear
models (first-order kinetic).
Although those non-linear models were appropriate to describe the thermal inactivation curves of
NoV and MS2 for the full duration of the treatment, only the Biphasic model was able to predict the
rates of NoV elimination in both matrices after an extended period. Hence, this model was used to
predict two and four log10 reduction (2D and 4D) of NoV in both matrices. When a non-linear model
is the best to describe the survival curves, the specific viral log10 reductions were best predicted by
direct calculation of determined values (such as 2D, 3D or 4D) from the equation rather than
multiplying the D values (1D) obtained from the models with the targeted log10 reductions (such as
2, 3 or 4) to avoid over or under-estimation. For instance, the time for 4 log10 reductions (4D)
calculated from the equation was not equal to the value of D values (1D) multiplies by 4 because the
responses were not log-linear. Thus, when a food safety objective is determined by the minimum

128
requirement of a specific log10 reductions during processing for risk elimination purposes, the use of
targeted D values (e.g., 2D, 3D or 4D) predicted by non-linear models could prevent the
overestimation of viral inactivation in cases where a tailing phenomenon is observed.
A difference in the efficacy of thermal inactivation against NoV and MS2 was observed in this study.
Overall, MS2 was more susceptible than NoV to heat treatment in both matrices (buffered media
and mussel matrix) and at temperatures between 60 and 90 °C and had higher z, D, 2D and 4D
values than NoV. It has been shown that the difference in viral resistance toward environmental
stress between virus species or even strains is determined by capsid protein and genomes structure
of the virus (Thurman & Gerba, 1988). Therefore, MS2 may not be a good candidate for NoV
surrogate in thermal inactivation studies. The efficacy of thermal inactivation is also influenced by
the matrix, i.e. both viruses were generally more resistant towards heat treatment in a complex
matrix (mussel), which is potentially due to the presence of protein and fat in the mussel that
protect the viral particles from heat (Bozkurt et al., 2014b; Croci et al., 2012).
Another source of NoV contamination in food, identified as secondary route of contamination, is
cross-contamination from food handlers or other contaminated products or equipment, which may
occur during harvesting, handling or processing (Bellou et al., 2013; Hall et al., 2012; Polo et al.,
2015; Rodríguez-Lázaro et al., 2012). In this case, the use of disinfectants such as chlorine to prevent
cross-contamination is recommended. The considered concentrations of ClO2 to be used as
disinfectant in water are between 5-100 ppm (FAO & WHO, 2009), while the USFDA recommended
the level of ClO2 residue is less than 3 ppm (CFR 173.300) (USFDA, 2018). To this end, Chapter 4
evaluated the efficacy of chlorine dioxide (ClO2) treatment at concentrations of 10, 20 and 40 ppm at
20 ± 1°C (pH 6.9 ± 2) with a range of contact times, to inactivate NoV and MS2 in buffered media and
mussel (Mytilus galloprovincialis) matrix. Hom, Weibull and Biphasic models were used to estimate
the log10 reduction of viral particles over time, while a first-order kinetic model was used to calculate
ClO2 decay rate. Overall, the viral reduction curves that were generated from the number of
infectious viral particles plotted against time exposure were better fitted by Hom than other models,

129
especially for NoV. For some MS2 treatments (20 and 40 ppm), the Biphasic model was the best to
predict MS2 reduction as a function of time. From the observed data, the highest concentration of
ClO2 (40 ppm) with the longest exposure (120 min) produces the highest log10 reduction of the viral
particles with the ClO2 residue <2 ppm in both matrices, thus this treatment has potential to be used
as disinfectant, as considered by the FAO/WHO (FAO & WHO, 2009) and to meet the minimum
residue required by the USFDA (USFDA, 2018).
A matrix effect was observed in the decay of ClO2, where the decay rate was higher in complex
(mussel) than in simple matrix (buffered media), presumably due to the presence of higher loads of
organic matter. As a consequence, the rate of viral reduction of NoV or MS2 was significantly higher
(P<0.05) in buffered media than in mussel matrix from identical treatments. In this study, the decay
of ClO2 over time was presumed to be one of the causes of the tailing phenomenon in all inactivation
curves predicted by the three models (Hom, Weibull and Biphasic). This assumption is in agreement
with the findings from previous studies (Thurston-Enriquez et al., 2003), where one of the factors
that contributed to the tailing phenomenon is the decrease of disinfectant concentration over the
time (Thurman & Gerba, 1988).
The results of the current study provide evidence that the efficacy of ClO2 treatment varies between
viruses. MS2 was generally more susceptible than NoV to ClO2 treatment in both matrices as MS2
obtained a higher log10 reduction than NoV for the same treatments at the same matrix. This
difference in viral response to disinfectant was similar to the viral response towards heat treatment,
which can be explained by the difference in viral protein structures as previously described (Sigstam
et al., 2013; Wigginton et al., 2012). Based on the observation in this thesis together with those
previous studies, MS2, which is less resistant toward heat and ClO2 treatment, may not be suitable as
a NoV surrogate to generate viral particles inactivation kinetics by these treatments. Thus, the use of
MS2 as surrogate in NoV inactivation studies should be performed with caution, to avoid
overestimation of the treatment efficacy. However, MS2 could be a useful enteric virus surrogate to

130
describe general trends and mechanisms of enteric viral inactivation studies, especially using heat
and ClO2 treatments.
As part of this study, a prevalence study of NoV in shellfish from Indonesian markets was conducted
in 2016 and 2017 (Chapter 5). The aims of this study were to specifically investigate the presence of
NoV and its level in the shellfish sold in two different places (Jakarta and Panimbang) and two
different market types (“traditional” and “modern”) to indicate the source of shellfish from less or
more polluted areas.
All NoV-contaminated shellfish observed in this study were collected from traditional markets in
Jakarta (Cilincing and Muara Kamal) that represented shellfish harvested from a polluted
environment (Jakarta Bay). The level of NoV concentration in the contaminated shellfish varied
between 1.43 to 3.95 log10 copies/g DT. By adjusting these values with the lowest average of
acceptable viral extraction efficiency (17.7%), the estimated NoV concentration were between 2.20
to 4.72 log10 copies/g DT. Furthermore, no NoV were detected in shellfish collected from Panimbang
fish market or from a modern market from Jakarta. Amongst different shellfish species, the highest
NoV prevalence was found in Green Mussel (Perna viridis). This finding might be correlated with the
fact that Green Mussel is the only species farmed in Jakarta Bay for over three decades, while other
species such as Blood Cockle and Oriental Hard Clam are wild- captured shellfish. Thus, Green
Mussel becomes the predominant shellfish species in the “traditional” markets and that are likely to
be more exposed to viral contamination than other species. In addition, both NoV purified from the
positive samples were identified as GII.4. This genotype (GII.4) has been reported worldwide as the
predominant strain in the NoV genogroup II (GII) that was responsible for many human NoV-
gastroenteritis outbreaks caused by either person-to-person transmission or food contamination
(Baert et al., 2009; Bernard et al., 2014; Bull et al., 2006; Fitzgerald et al., 2014; White, 2014; Zheng
et al., 2010).

131
Based on the Decree of the Indonesian Minister of MAF no. KEP.17/MEN/2004 (MMAF, 2004)
regarding the Indonesian shellfish sanitation system, shellfish farming activities are prohibited in
particular areas which have a high level of faecal contamination in the water (> 300 MPN
coliforms/100 ml) and an excessive level of PSP toxin in the shellfish (> 80µg/100 g of shellfish meat).
Such activities are also prohibited in areas that have not been assessed for the sanitation
compliance. Jakarta Bay plays important roles in different sectors, including the economic,
transportation, tourism and fishery sectors, however the Bay has been experiencing heavy pollution
from domestic and industrial activities in the surrounding areas (Arifin, 2004; Dsikowitzky et al.,
2016; Siregar et al., 2016). Therefore, the Indonesian MMAF has proposed Banten Bay as one of the
potential replacements for shellfish growing sites in Jakarta Bay (Andriyanto, 2018). Results from this
study which showed that NoV was not found in shellfish from Panimbang market (harvested from
Banten Bay which is considered a less polluted area), support this strategy.
Enteric viruses including NoV were not considered as potential microbial contaminants of raw or
frozen shellfish in the Indonesian shellfish sanitation system (MMAF, 2004) as well as in the standard
processing of frozen (SNI 3460.1 to 3: 2009) and canned shellfish (SNI 3919.1-3:2009)(BSN, 2009).
Moreover, regulations that contain minimum safety requirements specifically for viral contamination
parameter in fresh shellfish sold in Indonesia do not exist. Therefore, the quantitative microbial food
safety risk assessment (QMFSRA) to estimate the risk of NoV infection from consuming shellfish from
Indonesia, presented in Chapter 5, could provide science-based information to assist Indonesian
regulatory bodies to establish relevant regulations and develop a management control system for
NoV in shellfish.
In this study, a risk assessment of NoV in shellfish from Indonesian markets was performed to
estimate risks and to provide mitigation strategies. Since several data such as information on the
Indonesian NoV outbreak cases, incidences of NoV illness related to shellfish consumption in
Indonesia, and the proportion of shellfish species consumed by the Indonesian population, were not
available, a deterministic approach was used to develop the risk assessment. To estimate the risk of

132
NoV cases per year in Indonesia due to consumption of contaminated shellfish, some data from
previous studies and adjusted parameters (based on several assumptions and worst-case scenario)
were incorporated, while the data for NoV inactivation by thermal inactivation (Chapter 3 of this
thesis) was used to calculate the potential NoV reduction after handling and cooking of the
commodities.
The potential NoV-contaminated servings of shellfish per year in Indonesia were estimated as 8.17
million servings. The expected number of infections per year due to the consumption of NoV-
contaminated shellfish without pre-cooking step in Indonesia was estimated to be 100-folds higher
than the pre-cooked shellfish. This risk estimate was based on the assumed proportion of shellfish
cooking methods and the worst-case scenario i.e., the highest NoV contamination level, the lowest
average of extraction recovery and the highest prevalence data, were used as the input parameters.
By the non-pre-cooked following with mixed cooking method assumption and the worst-case
scenario, the estimated NoV attack rate (100 cases per 100.000 population) per year in this study
were higher than the estimated HAV attack rate in Spain (Pintó et al., 2009). The estimated attack
rate of HAV in Spain was calculated using an assumption of mixed format of shellfish consumption
(i.e., uncooked, lightly and well-cooked). However, when the pre-cooking was included in the
assumption in the risk calculation as an additional step before the different cooking method, the
estimate attack rates of NoV due to shellfish consumption in Indonesia was comparable to the
estimate of HAV attack rates in Spain (Pintó et al., 2009). Moreover, the estimated NoV attack rates
in the current study was lower than those of estimated NoV incidences in UK due to consumption of
contaminated raw shellfish (ICMSF, 2018) or the recorded enteric outbreak due to shellfish
consumption in China (Halliday et al., 1991). It is worth noting that when the pre-cooking is applied
before cooking step (with different methods i.e., boiling, steaming, stir-frying or “mixed”) by
consumer or frozen shellfish producer in Indonesia, this step could potentially reduce the incidences
of NoV outbreak due to shellfish consumption, and prevent the enteric viruses outbreak such as the
reported case in China (Halliday et al., 1991).

133
6.2. Conclusion
This thesis reported the application of RT-qPCR with enzymatic pre-treatment (RNase followed by
RNasin) as a reliable method to quantify infectious viral particles (NoV and MS2) for inactivation
studies in both buffered media and mussel matrix. The proposed method was also able to assist the
NoV quantification in the prevalence study, which were used to support the QMFSRA of NoV in
shellfish sold in fish markets in Indonesia. In general, MS2 has different resistance than NoV toward
heat and ClO2 treatment, thus this bacteriophage may not be the best candidate as a NoV surrogate
especially for inactivation studies. Results from the viral inactivation studies confirmed the presence
of a matrix effect and tailing phenomenon during the treatment. Hence, the non-linear model such
as Biphasic model is suggested as a robust model to be applied to predict and to calculate the
thermal inactivation kinetics, while Hom’s model is considered as the best model to predict ClO2
inactivation kinetics of the virus. The improved quantification method (RTqPCR with enzymatic pre-
treatment) could be used to minimise over or underestimation of NoV risk in shellfish, while in-vitro
assay has not been available as to quantify the infectious NoV. Understanding the kinetic of the
viruses could also support the evaluation of proposed control measures to reduce or to eliminate
NoV contamination. Further incorporation of these information into QMFSRA could finally
contribute to a better estimation of the risk NoV illnesses in a given population.
The prevalence study indicated the presence of NoV GII.4 in Green Mussel (Perna viridis) harvested
from Jakarta Bay. This genotype is also the most common cause of NoV infection worldwide, and this
highlights the importance of regular monitoring and surveillance of NoV in shellfish products (before
they are distributed) in addition to the well-established monitoring of biotoxin, heavy metals and
coliforms in these shellfish growing sites.
The risk assessment suggested that the application of heat treatment (boiling the pre-marketed
shellfish) can be used as a control measure to reduce the number of contaminated NoV, and thus
lower the risk of NoV infection. Besides, based on the evaluation of ClO2 efficacy to reduce viral

134
contamination, this substance could potentially be used as a disinfectant during shellfish handling
and processing to reduce NoV contamination from the secondary route (from infected food handler
and cross-contamination). However, further studies which incorporate results from the ClO2
inactivation study into the shellfish processing plan in Indonesia is needed to estimate the risk
reductions after application of this treatment.
To overcome the limitations from the current QMFSRA, scientific investigations on the NoV dose-
response relationship in Indonesia is needed. Furthermore, integrated approaches to collect and to
record information on the proportion of shellfish consumption format of the Indonesian consumers
could enhance the accuracy and validity of the NoV risk estimate. Despite the limitations in the risk
assessment of this study, this thesis provided science-based evidence which can be applied to
improve the management of the quality and safety of shellfish from food-borne NoV, in Indonesia
and especially from “traditional” markets in Jakarta.

135
Bibliography
Abad, F. X., Pinto, R. M., Gajardo, R., & Bosch, A. (1997). Viruses in mussels: Public health implications and depuration. J Food Prot, 60(6), 677-681. doi:https://dx.doi.org/10.4315/0362-028x-60.6.677
Ahmed, S. M., Hall, A. J., Robinson, A. E., Verhoef, L., Premkumar, P., Parashar, U. D., Koopmans, M., & Lopman, B. A. (2014). Global prevalence of norovirus in cases of gastroenteritis: A systematic review and meta-analysis. Lancet Infect Dis, 14(8), 725-730. doi:https://dx.doi.org/10.1016/s1473-3099(14)70767-4
Ahmed, S. M., Lopman, B. A., & Levy, K. (2013). A systematic review and meta-analysis of the global seasonality of norovirus. PLoS ONE, 8, e75922.
Al-Shanti, N., Saini, A., & Stewart, C. E. (2009). Two-step versus one-step RNA-to-C(T)™ 2-step and one-step RNA-to-C(T)™ 1-step: validity, sensitivity, and efficiency. J Bimol Tech, 20(3), 172-179.
Albert, I., & Mafart, P. (2005). A modified Weibull model for bacterial inactivation. Int J Food Microbiol, 100(1), 197-211. doi:https://dx.doi.org/10.1016/j.ijfoodmicro.2004.10.016
Alfano-Sobsey, E., Sweat, D., Hall, A., Breedlove, F., Rodriguez, R., Greene, S., Pierce, A., Sobsey, M., Davies, M., & Ledford, S. L. (2012). Norovirus outbreak associated with undercooked oysters and secondary household transmission. Epidemiol Infect, 140(02), 276-282. doi:https://dx.doi.org/doi:10.1017/S0950268811000665
Ali, M., Wijayanti, H., Maharani, Hudaidah, S., & Fornando, H. (2015). Land compatibility analysis in Pasaran Island Waters Lampung Province for Asian Green Mussel (Perna viridis) culture. [Analisis kesesuaian lahan di Perairan Pulau Pasaran Provinsi Lampung untuk budidaya Kerang Hijau (Perna viridis)]. Maspari Journal, 7(2), 57-64.
Amaral, M. S. C., Estevam, G. K., Penatti, M., Lafontaine, R., Lima, I. C. G., Spada, P. K. P., Gabbay, Y. B., & Matos, N. B. (2015). The prevalence of norovirus, astrovirus and adenovirus infections among hospitalised children with acute gastroenteritis in Porto Velho, state of Rondônia, western Brazilian Amazon. Memórias do Instituto Oswaldo Cruz, 110, 215-221.
Andriyanto, S. (2018). The valuable green mussel from Banten Bay [Kerang Hijau sang primadona dari Teluk Banten]. Retrieved 1 February, 2019, from https://kkp.go.id/brsdm/artikel/4122-kerang-hijau-sang-primadona-dari-teluk-banten
Anonymous. (2018). How to cook shellfish without losing the nutrition [Cara merebus kerang agar cepat terbuka tanpa mengurangi nutrisinya]. Retrieved 5 January, 2019, from

136
https://www.fimela.com/lifestyle-relationship/read/3812889/cara-merebus-kerang-agar-cepat-terbuka-tanpa-mengurangi-nutrisinya
Araud, E., DiCaprio, E., Ma, Y., Lou, F., Gao, Y., Kingsley, D., Hughes, J. H., & Li, J. (2016). Thermal inactivation of enteric viruses and bioaccumulation of enteric foodborne viruses in live oysters (Crassostrea virginica). Appl Environ Microbiol, 82(7), 2086-2099. doi:https://dx.doi.org/10.1128/aem.03573-15
Arifin, Z. (2004). Trend of coastal pollution in Jakarta Bay, Indonesia: Its implication for fishery and recreational activities. Paper presented at the Bilateral Workshop on Coastal Resources Exploration and Conservation, Bali.
Armah, G. E., Gallimore, C. I., Binka, F. N., Asmah, R. H., Green, J., Ugoji, U., Anto, F., Brown, D. W. G., & Gray, J. J. (2006). Characterisation of norovirus strains in rural Ghanaian children with acute diarrhoea. J Med Virol, 78(11), 1480-1485. doi:https://dx.doi.org/10.1002/jmv.20722
Arthur, S. E., & Gibson, K. E. (2015). Comparison of methods for evaluating the thermal stability of human enteric viruses. Food Environ Virol, 7(1), 14-26. doi:https://dx.doi.org/10.1007/s12560-014-9178-9
Atmar, R. L., Opekun, A. R., Gilger, M. A., Estes, M. K., Crawford, S. E., Neill, F. H., Ramani, S., Hill, H., Ferreira, J., & Graham, D. Y. (2014). Determination of the 50% human infectious dose for Norwalk virus. J Infect Dis, 209(7), 1016-1022. doi:https://dx.doi.org/10.1093/infdis/jit620
Atmar, R. L., Ramani, S., & Estes, M. K. (2018). Human noroviruses: recent advances in a 50-year history. Curr Opin Infect Dis, 31(5), 422-432. doi:https://dx.doi.org/10.1097/qco.0000000000000476
Aw, T. G., Gin, K. Y.-H., Ean Oon, L. L., Chen, E. X., & Woo, C. H. (2009). Prevalence and genotypes of human noroviruses in tropical urban surface waters and clinical samples in Singapore. Appl Environ Microbiol, 75(15), 4984-4992. doi:https://dx.doi.org/10.1128/aem.00489-09
Ayukekbong, J. A., Andersson, M. E., Vansarla, G., Tah, F., Nkuo-Akenji, T., Lindh, M., & Bergstrom, T. (2014). Monitoring of seasonality of norovirus and other enteric viruses in Cameroon by real-time PCR: An exploratory study. Epidemiol Infect, 142(7), 1393-1402. doi:https://dx.doi.org/10.1017/s095026881300232x
Bae, J., & Schwab, K. J. (2008). Evaluation of murine norovirus, feline calicivirus, poliovirus, and MS2 as surrogates for human norovirus in a model of viral persistence in surface water and groundwater. Appl Environ Microbiol, 74(2), 477-484. doi:https://dx.doi.org/10.1128/aem.02095-06
Baert, L., Uyttendaele, M., & Debevere, J. (2007). Evaluation of two viral extraction methods for the detection of human noroviruses in shellfish with conventional and real-time reverse

137
transcriptase PCR. Lett Appl Microbiol, 44(1), 106-111. doi:https://dx.doi.org/10.1111/j.1472-765X.2006.02047.x
Baert, L., Uyttendaele, M., Stals, A., Van Coillie, E., Dierick, K., Debevere, J., & Botteldoorn, N. (2009). Reported foodborne outbreaks due to noroviruses in Belgium: The link between food and patient investigations in an international context. Epidemiol Infect, 137(3), 316-325. doi:https://dx.doi.org/10.1017/S0950268808001830
Baert, L., Wobus, C. E., Van Coillie, E., Thackray, L. B., Debevere, J., & Uyttendaele, M. (2008). Detection of murine norovirus 1 by using plaque assay, transfection assay, and real-time Reverse Transcription-PCR before and after heat exposure. Appl Environ Microbiol, 74(2), 543-546. doi:https://dx.doi.org/10.1128/aem.01039-07
Bányai, K., Estes, M. K., Martella, V., & Parashar, U. D. (2018). Viral gastroenteritis. The Lancet, 392(10142), 175-186. doi:https://dx.doi.org/10.1016/S0140-6736(18)31128-0
Barbeau, B., Huffman, D., Mysore, C., Desjardins, R., Clément, B., & Prévost, M. (2005). Examination of discrete and counfounding effects of water quality parameters during the inactivation of MS2 phages and Bacillus subtilis spores with chlorine dioxide. J Environ Eng Sci, 4(2), 139-151. doi:https://dx.doi.org/10.1139/s04-050
Barclay, L., Park, G. W., Vega, E., Hall, A., Parashar, U., Vinjé, J., & Lopman, B. (2014). Infection control for norovirus. Clin Microbiol Infect, 20(8), 731-740. doi:https://dx.doi.org/10.1111/1469-0691.12674
Barer, M. R. (2012). Bacterial growth, physiology and death. In D. Greenwood, M. Barer, R. Slack & W. Irving (Eds.), Medical microbiology, A guide to microbial infections: Pathogenesis, immunity, laboratory investigation and control (8th ed.). Leicester, UK: Churchill Livingstone Elsevier.
Barker, J., Vipond, I. B., & Bloomfield, S. F. (2004). Effects of cleaning and disinfection in reducing the spread of norovirus contamination via environmental surfaces. J Hosp Infect, 58(1), 42-49. doi:https://dx.doi.org/10.1016/j.jhin.2004.04.021
Barker, S. F. (2014). Risk of norovirus gastroenteritis from consumption of vegetables irrigated with highly treated municipal wastewater-Evaluation of methods to estimate sewage quality. Risk Anal, 34(5), 803-817. doi:https://dx.doi.org/10.1111/risa.12138
Bartsch, S. M., Lopman, B. A., Ozawa, S., Hall, A. J., & Lee, B. Y. (2016). Global economic burden of norovirus gastroenteritis. PLoS ONE, 11(4), e0151219. doi:https://dx.doi.org/10.1371/journal.pone.0151219

138
Batule, B. S., Kim, S. U., Mun, H., Choi, C., Shim, W.-B., & Kim, M.-G. (2018). Colorimetric detection of norovirus in oyster samples through DNAzyme as a signaling probe. J Agric Food Chem, 66(11), 3003-3008. doi:https://dx.doi.org/10.1021/acs.jafc.7b05289
Beller, M., Ellis, A., Lee, S. H., Drebot, M. A., Jenkerson, S. A., Funk, E., Sobsey, M. D., Simmons, O. D., 3rd, Monroe, S. S., Ando, T., Noel, J., Petric, M., Middaugh, J. P., & Spika, J. S. (1997). Outbreak of viral gastroenteritis due to a contaminated well: International consequences. JAMA, 278(7), 563-568. doi:https://dx.doi.org/10.1001/jama.1997.03550070055038
Belliot, G., Lavaux, A., Souihel, D., Agnello, D., & Pothier, P. (2008). Use of murine norovirus as a surrogate to evaluate resistance of human norovirus to disinfectants. Appl Environ Microbiol, 74(10), 3315-3318. doi:https://dx.doi.org/10.1128/aem.02148-07
Bellou, M., Kokkinos, P., & Vantarakis, A. (2013). Shellfish-borne viral outbreaks: A systematic review. Food Environ Virol, 5(1), 13-23. doi:https://dx.doi.org/10.1007/s12560-012-9097-6
Berg, D. E., Kohn, M. A., Farley, T. A., & McFarland, L. M. (2000). Multi-state outbreaks of acute gastroenteritis traced to fecal-contaminated oysters harvested in Louisiana. J. Infect. Dis., 181(Supplement_2), S381-S386. doi:https://dx.doi.org/10.1086/315581
Bernard, H., Höhne, M., Niendorf, S., Altmann, D., & Stark, K. (2014). Epidemiology of norovirus gastroenteritis in Germany 2001–2009: Eight seasons of routine surveillance. Epidemiol Infect, 142(01), 63-74. doi:https://dx.doi.org/10.1017/S0950268813000435
Bertrand, I., Schijven, J. F., Sánchez, G., Wyn-Jones, P., Ottoson, J., Morin, T., Muscillo, M., Verani, M., Nasser, A., de Roda Husman, A. M., Myrmel, M., Sellwood, J., Cook, N., & Gantzer, C. (2012). The impact of temperature on the inactivation of enteric viruses in food and water: a review. J Appl Microbiol, 112(6), 1059. doi:https://dx.doi.org/10.1111/j.1365-2672.2012.05267.x
Bhattacharya, S. S., Kulka, M., Lampel, K. A., Cebula, T. A., & Goswami, B. B. (2004). Use of reverse transcription and PCR to discriminate between infectious and non-infectious hepatitis A virus. J Virol Methods, 116(2), 181-187. doi:https://dx.doi.org/10.1016/j.jviromet.2003.11.008
Bidawid, S., Farber, J. M., Sattar, S. A., & Hayward, S. (2000). Heat Inactivation of Hepatitis A Virus in Dairy Foods†. J Food Prot, 63(4), 522-528. doi:https://dx.doi.org/10.4315/0362-028x-63.4.522
Bitler, E. J., Matthews, J. E., Dickey, B. W., Eisenberg, J. N., & Leon, J. S. (2013). Norovirus outbreaks: a systematic review of commonly implicated transmission routes and vehicles. Epidemiol Infect, 141(8), 1563-1571. doi:https://dx.doi.org/10.1017/S095026881300006X

139
Bouwknegt, M., Verhaelen, K., Rzezutka, A., Kozyra, I., Maunula, L., von Bonsdorff, C. H., Vantarakis, A., Kokkinos, P., Petrovic, T., Lazic, S., Pavlik, I., Vasickova, P., Willems, K. A., Havelaar, A. H., Rutjes, S. A., & de Roda Husman, A. M. (2015). Quantitative farm-to-fork risk assessment model for norovirus and hepatitis A virus in European leafy green vegetable and berry fruit supply chains. Int J Food Microbiol, 198, 50-58. doi:https://dx.doi.org/10.1016/j.ijfoodmicro.2014.12.013
Boxman, I. L., Tilburg, J. J., Te Loeke, N. A., Vennema, H., Jonker, K., de Boer, E., & Koopmans, M. (2006). Detection of noroviruses in shellfish in the Netherlands. Int J Food Microbiol, 108(3), 391-396. doi:https://dx.doi.org/10.1016/j.ijfoodmicro.2006.01.002
Boxman, I. L. A. (2013). 11 - Viral contamination by food handlers and recommended procedural controls. In N. Cook (Ed.), Viruses in Food and Water (pp. 217-236): Woodhead Publishing. doi:http://dx.doi.org/10.1533/9780857098870.3.217
Boxman, I. L. A., Dijkman, R., Loeke, N. A. J. M. T., Hägele, G., Tilburg, J. J. H. C., Vennema, H., & Koopmans, M. (2009). Environmental swabs as a tool in norovirus outbreak investigation, including outbreaks on cruise ships. J Food Prot, 72(1), 111-119. doi:https://dx.doi.org/10.4315/0362-028x-72.1.111
Bozkurt, H., D'Souza, D. H., & Davidson, P. M. (2013). Determination of the thermal inactivation kinetics of the human norovirus surrogates, murine norovirus and feline calicivirus. J Food Prot, 76(1), 79-84. doi:https://dx.doi.org/10.4315/0362-028X.JFP-12-327
Bozkurt, H., D'Souza, D. H., & Davidson, P. M. (2014a). A comparison of the thermal inactivation kinetics of human norovirus surrogates and hepatitis A virus in buffered cell culture medium. Food Microbiol, 42, 212-217. doi:https://dx.doi.org/10.1016/j.fm.2014.04.002
Bozkurt, H., D'Souza, D. H., & Davidson, P. M. (2015a). Thermal inactivation kinetics of hepatitis A virus in homogenized clam meat (Mercenaria mercenaria). J Appl Microbiol, 119(3), 834-844. doi:https://dx.doi.org/doi:10.1111/jam.12892
Bozkurt, H., D'Souza, D. H., & Davidson, P. M. (2015b). Thermal inactivation of foodborne enteric viruses and their viral surrogates in foods. J Food Prot, 78(8), 1597-1617. doi:https://dx.doi.org/10.4315/0362-028x.Jfp-14-487
Bozkurt, H., Leiser, S., Davidson, P. M., & D'Souza, D. H. (2014b). Thermal inactivation kinetic modeling of human norovirus surrogates in Blue Mussel (Mytilus edulis) homogenate. Int J Food Microbiol, 172, 130-136. doi:https://dx.doi.org/10.1016/j.ijfoodmicro.2013.11.026
BPS-Statistics Indonesia. (2018). Statistical yearbook of Indonesia 2018 [Statistik Indonesia 2018]. Jakarta: BPS-Statistics Indonesia.

140
Braeckman, T., Van Herck, K., Meyer, N., Pirçon, J.-Y., Soriano-Gabarró, M., Heylen, E., Zeller, M., Azou, M., Capiau, H., De Koster, J., Maernoudt, A.-S., Raes, M., Verdonck, L., Verghote, M., Vergison, A., Matthijnssens, J., Van Ranst, M., & Van Damme, P. (2012). Effectiveness of rotavirus vaccination in prevention of hospital admissions for rotavirus gastroenteritis among young children in Belgium: case-control study. BMJ : British Medical Journal, 345, e4752. doi:https://dx.doi.org/10.1136/bmj.e4752
Brake, F., Kiermeier, A., Ross, T., Holds, G., Landinez, L., & McLeod, C. (2018). Spatial and temporal distribution of norovirus and E. coli in Sydney Rock Oysters following a sewage overflow into an estuary. Food Environ Virol. doi:https://dx.doi.org/10.1007/s12560-017-9313-5
Brake, F., Ross, T., Holds, G., Kiermeier, A., & McLeod, C. (2014). A survey of Australian Oysters for the presence of human noroviruses. Food Microbiol, 44, 264-270. doi:https://dx.doi.org/10.1016/j.fm.2014.06.012
Brandsma, S. R., Muehlhauser, V., & Jones, T. H. (2012). Survival of murine norovirus and F-RNA coliphage MS2 on pork during storage and retail display. Int J Food Microbiol, 159(3), 193-197. doi:https://dx.doi.org/10.1016/j.ijfoodmicro.2012.09.015
Brié, A., Bertrand, I., Meo, M., Boudaud, N., & Gantzer, C. (2016). The effect of heat on the physicochemical properties of bacteriophage MS2. Food Environ Virol, 1-11. doi:https://dx.doi.org/10.1007/s12560-016-9248-2
Brisco, M. J., & Morley, A. A. (2012). Quantification of RNA integrity and its use for measurement of transcript number. Nucleic Acids Res, 40(18), e144-e144. doi:https://dx.doi.org/10.1093/nar/gks588
Bruggink, L. D., Witlox, K. J., Sameer, R., Catton, M. G., & Marshall, J. A. (2011). Evaluation of the RIDA®QUICK immunochromatographic norovirus detection assay using specimens from Australian gastroenteritis incidents. J Virol Methods, 173(1), 121-126. doi:https://dx.doi.org/10.1016/j.jviromet.2011.01.017
Bruins, M. J., Wolfhagen, M. J. H. M., Schirm, J., & Ruijs, G. J. H. M. (2010). Evaluation of a rapid immunochromatographic test for the detection of norovirus in stool samples. Eur. J. Clin. Microbiol. Infect. Dis., 29(6), 741-743. doi:https://dx.doi.org/10.1007/s10096-010-0911-5
Bucardo, F., Reyes, Y., Becker-Dreps, S., Bowman, N., Gruber, J. F., Vinjé, J., Espinoza, F., Paniagua, M., Balmaseda, A., Svensson, L., & Nordgren, J. (2017). Pediatric norovirus GII.4 infections in Nicaragua, 1999–2015. Infect Genet Evol, 55, 305-312. doi:https://dx.doi.org/10.1016/j.meegid.2017.10.001
Buchanan, R. L. (1993). Predictive food microbiology. Trends Food Sci Technol, 4(1), 6-11. doi:https://dx.doi.org/10.1016/S0924-2244(05)80004-4

141
Buchanan, R. L., & Whiting, R. C. (1997). Concepts in predictive microbiology. Paper presented at the Reciprocal Meat Conference, Champaign, IL.
Buckow, R., Isbarn, S., Knorr, D., Heinz, V., & Lehmacher, A. (2008). Predictive model for inactivation of feline calicivirus, a norovirus surrogate, by heat and high hydrostatic pressure. Appl Environ Microbiol, 74(4), 1030-1038. doi:https://dx.doi.org/10.1128/AEM.01784-07
Bull, R. A., Tu, E. T. V., McIver, C. J., Rawlinson, W. D., & White, P. A. (2006). Emergence of a new norovirus genotype II.4 variant associated with global outbreaks of gastroenteritis. J Clin Microbiol, 44(2), 327-333. doi:https://dx.doi.org/10.1128/jcm.44.2.327-333.2006
Bustin, S., Benes, V., Garson, J., Hellemans, J., Huggett, J., Kubista, M., Mueller, R., Nolan, T., Pfaffl, M., Shipley, G., Vandesompele, J., & Wittwer, C. (2009). The MIQE guidelines: Minimum information for publication of quantitative real-time PCR experiments. Clinical Chemistry, 55, 611 - 622.
Butot, S., Putallaz, T., Amoroso, R., & Sánchez, G. (2009). Inactivation of enteric viruses in minimally processed berries and herbs. Appl Environ Microbiol, 75(12), 4155-4161. doi:https://dx.doi.org/10.1128/aem.00182-09
Caffi, T., Rossi, V., Cossu, A., & Fronteddu, F. (2007). Empirical vs. mechanistic models for primary infections of Plasmopara viticola*. EPPO Bulletin, 37(2), 261-271. doi:https://dx.doi.org/10.1111/j.1365-2338.2007.01120.x
Cannon, J. L., Papafragkou, E., Park, G. W., Osborne, J., Jaykus, L.-A., & Vinjé, J. (2006). Surrogates for the study of norovirus stability and inactivation in the environment: A comparison of murine norovirus and feline calicivirus. J Food Prot, 69(11), 2761-2765. doi:https://dx.doi.org/10.4315/0362-028X-69.11.2761
Casolari, A. (1998). Heat resistance of prions and food processing. Food Microbiol, 15(1), 59-63. doi:https://dx.doi.org/10.1006/fmic.1997.0141
Cerf, O. (1977). A review: Tailing of survival curves of bacterial spores. J Appl Bacteriol, 42(1), 1-19. doi:https://dx.doi.org/10.1111/j.1365-2672.1977.tb00665.x
Ceuppens, S., Li, D., Uyttendaele, M., Renault, P., Ross, P., Ranst, M. V., Cocolin, L., & Donaghy, J. (2014). Molecular methods in food safety microbiology: Interpretation and implications of nucleic acid detection. Compr Rev Food Sci Food Saf, 13(4), 551-577. doi:https://dx.doi.org/10.1111/1541-4337.12072
Chen, H., Hoover, D. G., & Kingsley, D. H. (2005). Temperature and treatment time influence high hydrostatic pressure inactivation of feline calicivirus, a norovirus surrogate. J Food Prot, 68(11), 2389-2394. doi:https://dx.doi.org/10.4315/0362-028X-68.11.2389

142
Chen, Z., & Zhu, C. (2011). Combined effects of aqueous chlorine dioxide and ultrasonic treatments on postharvest storage quality of plum fruit (Prunus salicina L.). Postharvest Biol Technol, 61(2–3), 117-123. doi:https://dx.doi.org/10.1016/j.postharvbio.2011.03.006
Chomczynski, P., & Sacchi, N. (2006). The single-step method of RNA isolation by acid guanidinium thiocyanate-phenol-chloroform extraction: twenty-something years on. Nat Protoc, 1(2), 581-585. doi:https://dx.doi.org/10.1038/nprot.2006.83
Cliver, D. O. (2009). Capsid and infectivity in virus detection. Food Environ Virol, 1(3-4), 123-128. doi:https://dx.doi.org/10.1007/s12560-009-9020-y
Cook, N., Knight, A., & Richards, G. P. (2016). Persistence and elimination of human norovirus in food and on food contact surfaces: A critical review. J Food Prot, 79(7), 1273-1294. doi:https://dx.doi.org/10.4315/0362-028X.JFP-15-570
Cook, N., & Richards, G. P. (2013). An introduction to food- and waterborne viral disease. In N. Cook (Ed.), Viruses in food and water (pp. 5-6). Cambridge, UK: Woodhead Publishing Limited. doi:http://dx.doi.org/10.1533/9780857098870.1.3
Corrêa, d. A. A., Souza, D., Moresco, V., Kleemann, C., Garcia, L., & Barardi, C. (2012). Stability of human enteric viruses in seawater samples from mollusc depuration tanks coupled with ultraviolet irradiation. J Appl Microbiol, 113(6), 1554-1563. doi:https://dx.doi.org/10.1111/jam.12010
Costantini, V., Morantz, E. K., Browne, H., Ettayebi, K., Zeng, X.-L., Atmar, R. L., Estes, M. K., & Vinjé, J. (2018). Human norovirus replication in human intestinal enteroids as model to evaluate virus inactivation. Emerg Infect Dis, 24(8), 1453-1464. doi:https://dx.doi.org/10.3201/eid2408.180126
Coudray-Meunier, C., Fraisse, A., Martin-Latil, S., Guillier, L., Delannoy, S., Fach, P., & Perelle, S. (2015). A comparative study of digital RT-PCR and RT-qPCR for quantification of hepatitis A virus and norovirus in lettuce and water samples. Int J Food Microbiol, 201(0), 17-26. doi:https://dx.doi.org/10.1016/j.ijfoodmicro.2015.02.006
Croci, L., Losio, M. N., Suffredini, E., Pavoni, E., Di Pasquale, S., Fallacara, F., & Arcangeli, G. (2007). Assessment of human enteric viruses in shellfish from the Northern Adriatic sea. Int J Food Microbiol, 114(2), 252-257. doi:https://dx.doi.org/10.1016/j.ijfoodmicro.2006.09.015
Croci, L., Suffredini, E., Di Pasquale, S., & Cozzi, L. (2012). Detection of norovirus and feline calicivirus in spiked molluscs subjected to heat treatments. Food Control, 25(1), 17-22. doi:https://dx.doi.org/10.1016/j.foodcont.2011.10.004
Cromeans, T., Park, G. W., Costantini, V., Lee, D., Wang, Q., Farkas, T., Lee, A., & Vinjé, J. (2014). Comprehensive comparison of cultivable norovirus surrogates in response to different
143
inactivation and disinfection treatments. Appl Environ Microbiol, 80(18), 5743-5751. doi:https://dx.doi.org/10.1128/aem.01532-14
Cromeans, T. L., Kahler, A. M., & Hill, V. R. (2010). Inactivation of adenoviruses, enteroviruses, and murine norovirus in water by free chlorine and monochloramine. Appl Environ Microbiol, 76(4), 1028-1033. doi:https://dx.doi.org/10.1128/aem.01342-09
D'Souza, D. H., & Su, X. (2010). Efficacy of chemical treatments against murine norovirus, feline calicivirus, and MS2 bacteriophage. Foodborne Pathog Dis, 7(3), 319-326. doi:https://dx.doi.org/10.1089/fpd.2009.0426
da Silva, A. K., Le Saux, J.-C., Parnaudeau, S., Pommepuy, M., Elimelech, M., & Le Guyader, F. S. (2007). Evaluation of removal of noroviruses during wastewater treatment, using Real-Time Reverse Transcription-PCR: Different behaviors of genogroups I and II. Appl Environ Microbiol, 73(24), 7891-7897. doi:https://dx.doi.org/10.1128/AEM.01428-07
Dalton, C. B., Haddix, A., Hoffman, R. E., & Mast, E. E. (1996). The cost of a food-borne outbreak of hepatitis A in Denver, Colo. Arch Intern Med, 156(9), 1013-1016. doi:https://dx.doi.org/10.1001/archinte.1996.00440090123012
Daniels, N. A., Bergmire-Sweat, D. A., Schwab, K. J., Hendricks, K. A., Reddy, S., Rowe, S. M., Fankhauser, R. L., Monroe, S. S., Atmar, R. L., Glass, R. I., & Mead, P. (2000). A foodborne outbreak of gastroenteritis associated with Norwalk-like viruses: First molecular traceback to deli sandwiches contaminated during preparation. J Infect Dis, 181(4), 1467-1470. doi:https://dx.doi.org/10.1086/315365
Dawson, D., Paish, A., Staffell, L., Seymour, I., & Appleton, H. (2005). Survival of viruses on fresh produce, using MS2 as a surrogate for norovirus. J Appl Microbiol, 98(1), 203-209. doi:https://dx.doi.org/10.1111/j.1365-2672.2004.02439.x
de Roda Husman, A. M., Lodder, W. J., Rutjes, S. A., Schijven, J. F., & Teunis, P. F. M. (2009). Long-term inactivation study of three enteroviruses in artificial surface and groundwaters, using PCR and cell culture. Appl Environ Microbiol, 75(4), 1050-1057. doi:https://dx.doi.org/10.1128/aem.01750-08
Deboosere, N., Legeay, O., Caudrelier, Y., & Lange, M. (2004a). Modelling effect of physical and chemical parameters on heat inactivation kinetics of hepatitis A virus in a fruit model system. Int J Food Microbiol, 93(1), 73-85. doi:https://dx.doi.org/10.1016/j.ijfoodmicro.2003.10.015
Deboosere, N., Legeay, O., Caudrelier, Y., & Lange, M. (2004b). Modelling effect of physical and chemical parameters on heat inactivation kinetics of hepatitis A virus in a fruit model system. Int J Food Microbiol, 93(1), 73-85. doi:https://dx.doi.org/10.1016/j.ijfoodmicro.2003.10.015

144
Deboosere, N., Pinon, A., Delobel, A., Temmam, S., Morin, T., Merle, G., Blaise-Boisseau, S., Perelle, S., & Vialette, M. (2010). A predictive microbiology approach for thermal inactivation of hepatitis A virus in acidified berries. Food Microbiol, 27(7), 962-967. doi:https://dx.doi.org/10.1016/j.fm.2010.05.018
Deborde, M., & von Gunten, U. (2008). Reactions of chlorine with inorganic and organic compounds during water treatment—kinetics and mechanisms: A critical review. Water Res, 42(1), 13-51. doi:https://dx.doi.org/10.1016/j.watres.2007.07.025
DiGirolamo, R., Liston, J., & Matches, J. R. (1970). Survival of virus in chilled, frozen, and processed oysters. Appl Microbiol, 20(1), 58-63.
Directorate General of Fisheries. (1999). Potency and distribution of marine fisheries resources in Indonesian waters [Potensi dan penyebaran sumberdaya ikan laut di perairan Indonesia]. Proyek Pengembangan dan Pemanfaatan Sumberdaya Perikanan Laut, Departemen Pertanian, Jakarta.
Donnan, E. J., Fielding, J. E., Gregory, J. E., Lalor, K., Rowe, S., Goldsmith, P., Antoniou, M., Fullerton, K. E., Knope, K., & Copland, J. G. (2012). A multistate outbreak of hepatitis A associated with semidried tomatoes in Australia, 2009. Clin Infect Dis, 54(6), 775-781. doi:https://dx.doi.org/10.1093/cid/cir949
Dreier, J., Stormer, M., & Kleesiek, K. (2005). Use of bacteriophage MS2 as an internal control in viral reverse transcription-PCR assays. J Clin Microbiol, 43(9), 4551-4557. doi:https://dx.doi.org/10.1128/jcm.43.9.4551-4557.2005
Dsikowitzky, L., Ferse, S., Schwarzbauer, J., Vogt, T. S., & Irianto, H. E. (2016). Impacts of megacities on tropical coastal ecosystems — The case of Jakarta, Indonesia. Mar Pollut Bull, 110(2), 621-623. doi:https://dx.doi.org/10.1016/j.marpolbul.2015.11.060
Duizer, E., Bijkerk, P., Rockx, B., de Groot, A., Twisk, F., & Koopmans, M. (2004). Inactivation of caliciviruses. Appl Environ Microbiol, 70(8), 4538-4543. doi:https://dx.doi.org/10.1128/aem.70.8.4538-4543.2004
Dunkin, N., Weng, S., Schwab, K. J., McQuarrie, J., Bell, K., & Jacangelo, J. G. (2017). Comparative Inactivation of murine norovirus and MS2 bacteriophage by peracetic acid and monochloramine in municipal secondary wastewater effluent. Environ Sci Technol, 51(5), 2972-2981. doi:https://dx.doi.org/10.1021/acs.est.6b05529
Eden, J.-S., Tanaka, M. M., Boni, M. F., Rawlinson, W. D., & White, P. A. (2013). Recombination within the pandemic norovirus GII.4 lineage. J Virol, 87(11), 6270-6282. doi:https://dx.doi.org/10.1128/jvi.03464-12

145
EFSA Panel on Biological Hazards (BIOHAZ). (2012). Scientific opinion on norovirus (NoV) in oysters: methods, limits and control options. European Food Safety Authority, 10(1), 1-39. doi:https://dx.doi.org/10.2903/j.efsa.2012.2500
Environmental Protection Agency. (2001). Method 1601 : male-specific (F+) and somatic coliphage in water by two-step enrichment procedure. Washington, D.C.: U.S. Environmental Protection Agency, Office of Water.
Erkmen, O., & Bozoglu, T. F. (2016). Food microbiology: Principles into practices (Vol. 1): John Wiley & Sons, Inc.
Escudero-Abarca, B. I., Rawsthorne, H., Goulter, R. M., Suh, S. H., & Jaykus, L. A. (2014). Molecular methods used to estimate thermal inactivation of a prototype human norovirus: more heat resistant than previously believed? Food Microbiol, 41, 91-95. doi:https://dx.doi.org/10.1016/j.fm.2014.01.009
Estes, M. K., Prasad, B. V., & Atmar, R. L. (2006). Noroviruses everywhere: Has something changed? Curr Opin Infect Dis, 19(5), 467-474. doi:https://dx.doi.org/10.1097/01.qco.0000244053.69253.3d
Ettayebi, K., Crawford, S. E., Murakami, K., Broughman, J. R., Karandikar, U., Tenge, V. R., Neill, F. H., Blutt, S. E., Zeng, X.-L., Qu, L., Kou, B., Opekun, A. R., Burrin, D., Graham, D. Y., Ramani, S., Atmar, R. L., & Estes, M. K. (2016). Replication of human noroviruses in stem cell–derived human enteroids. Science. doi:https://dx.doi.org/10.1126/science.aaf5211
Farkas, T., Cross, R. W., Hargitt, E., Lerche, N. W., Morrow, A. L., & Sestak, K. (2010). Genetic diversity and histo-blood group antigen interactions of rhesus enteric caliciviruses. J Virol, 84(17), 8617-8625. doi:https://dx.doi.org/10.1128/jvi.00630-10
Feliciano, L., Li, J., Lee, J., & Pascall, M. A. (2012). Efficacies of sodium hypochlorite and quaternary ammonium sanitizers for reduction of norovirus and selected bacteria during ware-washing operations. PLoS ONE, 7(12), e50273. doi:https://dx.doi.org/10.1371/journal.pone.0050273
Feng, K., Divers, E., Ma, Y., & Li, J. (2011). Inactivation of a human norovirus surrogate, human norovirus virus-like particles, and vesicular stomatitis virus by gamma irradiation. Appl Environ Microbiol, 77(10), 3507-3517. doi:https://dx.doi.org/10.1128/aem.00081-11
Ferdinan, D. (2017). Socio economic condition of Green Mussel fisherman in Pasaran Island East Teluk Betung Sub-district Bandar Lampung City 2016. [Kondisi sosial ekonomi nelayan Kerang Hijau di Pulau Pasaran Kecamatan Teluk Betung Timur Kota Bandar Lampung tahun 2016]. (Bachelor), Lampung University, Bandar Lampung.

146
Fitzgerald, T.-L. L., Zammit, A., Merritt, T. D., McLeod, C., Landinez, L. M., White, P. A., Munnoch, S. A., & Durrheim, D. N. (2014). An outbreak of norovirus genogroup II associated with New South Wales oysters. Commun Dis Intell Quart Rep, 38(4), E9-E15.
Flannery, J., Keaveney, S., Rajko-Nenow, P., O'Flaherty, V., & Doré, W. (2013). Norovirus and FRNA bacteriophage determined by RT-qPCR and infectious FRNA bacteriophage in wastewater and oysters. Water Res, 47(14), 5222-5231. doi:https://dx.doi.org/10.1016/j.watres.2013.06.008
Flannery, J., Rajko-Nenow, P., Winterbourn, J. B., Malham, S. K., & Jones, D. L. (2014). Effectiveness of cooking to reduce norovirus and infectious F-specific RNA bacteriophage concentrations in Mytilus edulis. J Appl Microbiol, 117(2), 564-571. doi:https://dx.doi.org/10.1111/jam.12534
Fletcher, M., Levy, M., & Griffin, D. (2000). Foodborne outbreak of group A rotavirus gastroenteritis among college students-District of Columbia, March-April 2000. Morb Mortal Wkly Rep, 49(50), 1131-1133. doi:https://dx.doi.org/10.1001/jama.285.4.405-JWR0124-4-1
Fong, T.-T., & Lipp, E. K. (2005). Enteric viruses of humans and animals in aquatic environments: Health risks, detection, and potential water quality assessment tools. Microbiol Mol Biol Rev, 69(2), 357-371. doi:https://dx.doi.org/10.1128/MMBR.69.2.357-371.2005
Fonseca, J. M. (2006). Postharvest handling and processing sources of microorganisms and impact of sanitizing procedures. In K. R. Matthews & M. P. Doyle (Eds.), Microbiology of Fresh Produce: American Society of Microbiology. doi:http://dx.doi.org/10.1128/9781555817527.ch4
Food Agriculture Organization. (2015). FAOSTAT. Retrieved from: http://faostat.fao.org/
Food and Agriculture Organization, & World Health Organization. (2000). Discussion paper on the use of chlorinated water (A. Reilly Ed.): FAO/WHO.
Food and Agriculture Organization, & World Health Organization. (2001). Codex alimentarius : Food hygiene basic text (Second ed.). Rome: FAO/WHO.
Food and Agriculture Organization, & World Health Organization. (2008). Viruses in food: scientific advice to support risk management activities. In M. Report (Ed.), Microbiological Risk Assessment Series (Vol. 13, pp. 53). Rome: FAO/WHO.
Food and Agriculture Organization, & World Health Organization. (2009). Benefits and risks of the use of chlorine-containing disinfectants in food production and food processing. In F. WHO (Ed.), Report of a Joint FAO/WHO Expert Meeting. Rome; Geneva: FAO ; WHO.

147
Food and Agriculture Organization, & World Health Organization. (2012). Guidelines on the application of general principles of food hygiene to the control of viruses in food. Retrieved from: www.fao.org/input/download/standards/13215/CXG_079e.pdf
Forootan, A., Sjöback, R., Björkman, J., Sjögreen, B., Linz, L., & Kubista, M. (2017). Methods to determine limit of detection and limit of quantification in quantitative real-time PCR (qPCR). Biomolecular detection and quantification, 12, 1-6. doi:https://dx.doi.org/10.1016/j.bdq.2017.04.001
Fournet, N., Baas, D., Van Pelt, W., Swaan, C., Ober, H., Isken, L., Cremer, J., Friesema, I., Vennema, H., & Boxman, I. (2012). Another possible food-borne outbreak of hepatitis A in the Netherlands indicated by two closely related molecular sequences, July to October 2011. Eurosurveillance, 17(6), 18-20.
Fraisse, A., Temmam, S., Deboosere, N., Guillier, L., Delobel, A., Maris, P., Vialette, M., Morin, T., & Perelle, S. (2011). Comparison of chlorine and peroxyacetic-based disinfectant to inactivate feline calicivirus, murine norovirus and hepatitis A virus on lettuce. Int J Food Microbiol, 151(1), 98-104. doi:https://dx.doi.org/10.1016/j.ijfoodmicro.2011.08.011
Fuentes, C., Guix, S., Pérez-Rodriguez, F. J., Fuster, N., Carol, M., Pintó, R. M., & Bosch, A. (2014). Standardized multiplex one-step qRT-PCR for hepatitis A virus, norovirus GI and GII quantification in bivalve mollusks and water. Food Microbiol, 40(0), 55-63. doi:https://dx.doi.org/10.1016/j.fm.2013.12.003
Fumian, T. M., da Silva Ribeiro de Andrade, J., Leite, J. P. G., & Miagostovich, M. P. (2016). Norovirus recombinant strains isolated from gastroenteritis outbreaks in Southern Brazil, 2004–2011. PLOS ONE, 11(4), e0145391. doi:https://dx.doi.org/10.1371/journal.pone.0145391
Gallimore, C. I., Pipkin, C., Shrimpton, H., Green, A. D., Pickford, Y., McCartney, C., Sutherland, G., Brown, D. W. G., & Gray, J. J. (2005). Detection of multiple enteric virus strains within a foodborne outbreak of gastroenteritis: an indication of the source of contamination. Epidemiol Infect, 133(01), 41-47. doi:https://dx.doi.org/10.1017/S0950268804003218
García, C., DuPont, H. L., Long, K. Z., Santos, J. I., & Ko, G. (2006). Asymptomatic Norovirus Infection in Mexican Children. J Clin Microbiol, 44(8), 2997-3000. doi:https://dx.doi.org/10.1128/jcm.00065-06
Geeraerd, A. H., Herremans, C. H., & Van Impe, J. F. (2000). Structural model requirements to describe microbial inactivation during a mild heat treatment. Int J Food Microbiol, 59(3), 185-209. doi:https://dx.doi.org/10.1016/S0168-1605(00)00362-7
Geeraerd, A. H., Valdramidis, V. P., & Van Impe, J. F. (2005). GInaFiT, a freeware tool to assess non-log-linear microbial survivor curves. Int J Food Microbiol, 102(1), 95-105. doi:https://dx.doi.org/10.1016/j.ijfoodmicro.2004.11.038

148
Gentilomi, G. A., Cricca, M., Luca, G. D., Sacchetti, R., & Zanetti, F. (2008). Rapid and sensitive detection of MS2 coliphages in wastewater samples by quantitative reverse transcriptase PCR. New Microbiol, 31(2), 273.
Gerba, C. P., & Betancourt, W. Q. (2017). Viral aggregation: Impact on virus behavior in the environment. Environ Sci Technol, 51(13), 7318-7325. doi:https://dx.doi.org/10.1021/acs.est.6b05835
Girard, M., Mattison, K., Fliss, I., & Jean, J. (2016). Efficacy of oxidizing disinfectants at inactivating murine norovirus on ready-to-eat foods. Int J Food Microbiol, 219, 7-11. doi:https://dx.doi.org/10.1016/j.ijfoodmicro.2015.11.015
Glass, R. I., Parashar, U. D., & Estes, M. K. (2009). Norovirus gastroenteritis. N Engl J Med, 361(18), 1776-1785. doi:https://dx.doi.org/10.1056/NEJMra0804575
Gómez-López, V. M., Rajkovic, A., Ragaert, P., Smigic, N., & Devlieghere, F. (2009). Chlorine dioxide for minimally processed produce preservation: a review. Trends Food Sci Technol, 20(1), 17-26. doi:https://dx.doi.org/10.1016/j.tifs.2008.09.005
Gosling, E. M. (2003). Bivalve molluscs : biology, ecology, and culture. Oxford; Malden, MA: Fishing News Books. doi:http://dx.doi.org/10.1002/9780470995532.fmatter
Gosling, E. M. (2015). Marine bivalve molluscs (Second ed.). Chichester, UK: John Wiley & Sons, Ltd. doi:http://dx.doi.org/10.1002/9781119045212
Greening, G., & Hewitt, J. (2008). Norovirus detection in shellfish using a rapid, sensitive virus recovery and Real-Time RT-PCR detection protocol. Food Anal Method, 1(2), 109-118. doi:https://dx.doi.org/10.1007/s12161-008-9018-3
Grodzki, M., Schaeffer, J., Piquet, J.-C., Le Saux, J.-C., Chevé, J., Ollivier, J., Le Pendu, J., & Le Guyader, F. S. (2014). Bioaccumulation efficiency, tissue distribution, and environmental occurrence of hepatitis E virus in bivalve shellfish from France. Appl Environ Microbiol, 80(14), 4269-4276.
Grove, S. F., Lee, A., Stewart, C. M., & Ross, T. (2009). Development of a high pressure processing inactivation model for hepatitis A virus. J Food Prot, 72(7), 1434-1442.
Grove, S. F., Suriyanarayanan, A., Puli, B., Zhao, H., Li, M., Li, D., Schaffner, D. W., & Lee, A. (2015). Norovirus cross-contamination during preparation of fresh produce. Int J Food Microbiol, 198, 43-49. doi:https://dx.doi.org/10.1016/j.ijfoodmicro.2014.12.023
Gyawali, P., & Hewitt, J. (2018). Detection of infectious noroviruses from wastewater and weawater using PEMAXTM treatment combined with RT-qPCR. Water, 10(7), 841.

149
Gyawali, P., KC, S., Beale, D. J., & Hewitt, J. (2019). Current and emerging technologies for the detection of norovirus from shellfish. Foods, 8(6), 187.
Haas, C. N., & Joffe, J. (1994). Disinfection under dynamic conditions: Modification of Hom's model for decay. Environ Sci Technol, 28(7), 1367-1369. doi:https://dx.doi.org/10.1021/es00056a028
Hall, A. J., Eisenbart, V. G., Etingue, A. L., Gould, L. H., Lopman, B. A., & Parashar, U. D. (2012). Epidemiology of foodborne norovirus outbreaks, United States, 2001-2008. Emerg Infect Dis, 18(10), 1566-1573. doi:https://dx.doi.org/10.3201/eid1810.120833
Hall, A. J., Vinjé, J., Lopman, B., Park, G. W., Yen, C., Gregoricus, N., & Parashar, U. (2011). Updated norovirus outbreak management and disease prevention guidelines. Atlanta, GA: U.S. Dept. of Health and Human Services, Centers for Disease Control and Prevention.
Hall, A. J., Wikswo, M. E., Manikonda, K., Roberts, V. A., Yoder, J. S., & Gould, L. H. (2013). Acute gastroenteritis surveillance through the national outbreak reporting system, United States. Emerg Infect Dis, 19(8), 1305. doi:https://dx.doi.org/10.3201/eid1908.130482
Hall, T. A. (1999). BioEdit: a user-friendly biological sequence alignment editor and analysis program for Windows 95/98/NT. Nucleic Acids Symp Ser, 41, 95-98.
Halliday, M. L., Kang, L.-Y., Zhou, T.-K., Hu, M.-D., Pan, Q.-C., Fu, T.-Y., Huang, Y.-S., & Hu, S.-L. (1991). An epidemic of hepatitis A attributable to the ingestion of raw clams in Shanghai, China. J. Infect. Dis., 164(u5), 852-859.
Hanaki, K.-I., Ike, F., Kajita, A., Yasuno, W., Yanagiba, M., Goto, M., Sakai, K., Ami, Y., & Kyuwa, S. (2014). A broadly reactive One-Step SYBR Green I Real-Time RT-PCR assay for rapid detection of murine norovirus. PLoS ONE, 9(5), e98108. doi:https://dx.doi.org/10.1371/journal.pone.0098108
Harrison, L. C., & DiCaprio, E. (2018). Hepatitis E virus: An emerging foodborne pathogen. Front Sust Food Syst, 2(14). doi:https://dx.doi.org/10.3389/fsufs.2018.00014
Hartard, C., Banas, S., Loutreul, J., Rincé, A., Benoit, F., Boudaud, N., & Gantzer, C. (2016). Relevance of F-specific RNA bacteriophages in assessing human norovirus risk in shellfish and environmental waters. Appl Environ Microbiol, 82(18), 5709-5719. doi:https://dx.doi.org/10.1128/aem.01528-16
Hassan-Ríos, E., Torres, P., Muñoz, E., Matos, C., Hall, A. J., Gregoricus, N., & Vinjé, J. (2013). Sapovirus gastroenteritis in preschool center, Puerto Rico, 2011. Emerg Infect Dis, 19(1), 174-175. doi:https://dx.doi.org/10.3201/eid1901.120690

150
Havelaar, A. H., Kirk, M. D., Torgerson, P. R., Gibb, H. J., Hald, T., Lake, R. J., Praet, N., Bellinger, D. C., de Silva, N. R., Gargouri, N., Speybroeck, N., Cawthorne, A., Mathers, C., Stein, C., Angulo, F. J., & Devleesschauwer, B. (2015). World Health Organization global estimates and regional comparisons of the burden of foodborne disease in 2010. PLoS Med, 12(12), e1001923. doi:https://dx.doi.org/10.1371/journal.pmed.1001923
Heberling, R. L., & Cheever, F. S. (1960). Enteric viruses of monkeys. Ann N Y Acad Sci, 85(3), 942-950. doi:https://dx.doi.org/10.1111/j.1749-6632.1960.tb50014.x
Hedlund, K. O., Rubilar-Abreu, E., & Svensson, L. (2000). Epidemiology of calicivirus infections in Sweden, 1994–1998. J Infect Dis, 181(Supplement 2), S275-S280. doi:https://dx.doi.org/10.1086/315585
Hewitt, J., & Greening, G. E. (2006). Effect of heat treatment on hepatitis A virus and norovirus in New Zealand greenshell mussels (Perna canaliculus) by quantitative real-time reverse transcription PCR and cell culture. J Food Prot, 69(9), 2217-2223. doi:https://dx.doi.org/10.4315/0362-028X-69.9.2217
Hewitt, J., Rivera-Aban, M., & Greening, G. E. (2009). Evaluation of murine norovirus as a surrogate for human norovirus and hepatitis A virus in heat inactivation studies. J Appl Microbiol, 107(1), 65-71. doi:https://dx.doi.org/10.1111/j.1365-2672.2009.04179.x
Hirneisen, K. A., Black, E. P., Cascarino, J. L., Fino, V. R., Hoover, D. G., & Kniel, K. E. (2010). Viral inactivation in foods: A review of traditional and novel food-processing technologies. Compr Rev Food Sci Food Saf, 9(1), 3-20. doi:https://dx.doi.org/10.1111/j.1541-4337.2009.00092.x
Hoa, T. T. N., Trainor, E., Nakagomi, T., Cunliffe, N. A., & Nakagomi, O. (2013). Molecular epidemiology of noroviruses associated with acute sporadic gastroenteritis in children: Global distribution of genogroups, genotypes and GII.4 variants. J Clin Virol, 56(3), 269-277. doi:https://dx.doi.org/10.1016/j.jcv.2012.11.011
Holdsworth, S. D., Simpson, R., & Ramirez, C. (2016). Fundamentals of thermal food processing. In C. Ramirez (Ed.), Thermal processing of packaged foods (Third ed., pp. 89-124). Switzerland: Springer International Publisihing AG. doi:http://dx.doi.org/10.1007/978-3-319-24904-9
Holvoet, K., De Keuckelaere, A., Sampers, I., Van Haute, S., Stals, A., & Uyttendaele, M. (2014). Quantitative study of cross-contamination with Escherichia coli, E. coli O157, MS2 phage and murine norovirus in a simulated fresh-cut lettuce wash process. Food Control, 37, 218-227. doi:https://dx.doi.org/10.1016/j.foodcont.2013.09.051
Hornstra, L. M., Smeets, P. W. M. H., & Medema, G. J. (2011). Inactivation of bacteriophage MS2 upon exposure to very low concentrations of chlorine dioxide. Water Res, 45(4), 1847-1855. doi:https://dx.doi.org/10.1016/j.watres.2010.11.041

151
Humpheson, L., Adams, M. R., Anderson, W. A., & Cole, M. B. (1998). Biphasic thermal inactivation kinetics in Salmonella enteritidis PT4. Appl Environ Microbiol, 64(2), 459-464.
Huppatz, C., Munnoch, S., Worgan, T., Merritt, T., Dolton, C., Kelly, P. M., & Durrheim, D. N. (2008). A norovirus outbreak associated with consumption of NSW oysters: Implications for quality assurance systems. Commun Dis Intell Quart Rep, 32(1), 87-91.
Huss, H. H. (1994). Cleaning and sanitation in seafood processing. Assurance of seafood quality. Rome: United Nations: The Food and Agriculture Organization (FAO) Fisheries tech.
Hutin, Y. J. F., Pool, V., Cramer, E. H., Nainan, O. V., Weth, J., Williams, I. T., Goldstein, S. T., Gensheimer, K. F., Bell, B. P., Shapiro, C. N., Alter, M. J., & Margolis, H. S. (1999). A multistate, foodborne outbreak of hepatitis A. N Engl J Med, 340(8), 595-602. doi:https://dx.doi.org/10.1056/NEJM199902253400802
Institute of Food Technologist. (2000). Kinetics of microbial inactivation for alternative food processing technologies.
International Commission on Microbiological Specifications for Foods. (2018). Viruses in oysters. In R. L. Buchanan (Ed.), Microorganisms in Foods (Second ed., Vol. 7, pp. 411-434). Cham, Switzerland: Springer. doi:http://dx.doi.org/10.1007/978-3-319-68460-4
International Organization for Standardization. (2013). ISO/TS 15216-1 2013: Microbiology of food and animal feed—Horizontal method for determination of hepatitis A virus and norovirus in food using real-time RT-PCR —Part 1: Method for quantification. Geneva: International Organization for Standardization.
International Organization for Standardization. (2017). ISO/TS 15216-1 2017: Microbiology of the food chain - Horizontal method for determination of hepatitis A virus and norovirus using real-time RT-PCR - Part 1: Method for quantification. Geneva.
Iritani, N., Kaida, A., Abe, N., Kubo, H., Sekiguchi, J., Yamamoto, S. P., Goto, K., Tanaka, T., & Noda, M. (2014). Detection and genetic characterization of human enteric viruses in oyster-associated gastroenteritis outbreaks between 2001 and 2012 in Osaka City, Japan. J Med Virol, 86(12), 2019-2025. doi:https://dx.doi.org/10.1002/jmv.23883
Isbarn, S., Buckow, R., Himmelreich, A., Lehmacher, A., & Heinz, V. (2007). Inactivation of avian influenza virus by heat and high hydrostatic pressure. J Food Prot, 70(3), 667-673. doi:https://dx.doi.org/10.4315/0362-028x-70.3.667
Jacangelo, J. G., Patania, N. L., Trussell, R. R., Haas, C. N., & Gerba, C. (2002). Inactivation of waterborne emerging pathogens by selected disinfectants: AWWA Research Foundation and American Water Works Association.

152
Jiang, X., Wang, M., Wang, K., & Estes, M. K. (1993). Sequence and genomic organization of Norwalk virus. Virology, 195(1), 51-61. doi:https://dx.doi.org/10.1006/viro.1993.1345
Johnson, M. (1996). Use of RNase I for the efficient elimination of RNA from DNA preparations and mismatch detection. Paper presented at the Epicentre Forum.
Jones, M. K., Grau, K. R., Costantini, V., Kolawole, A. O., de Graaf, M., Freiden, P., Graves, C. L., Koopmans, M., Wallet, S. M., Tibbetts, S. A., Schultz-Cherry, S., Wobus, C. E., Vinje, J., & Karst, S. M. (2015). Human norovirus culture in B cells. Nat Protoc, 10(12), 1939-1947. doi:https://dx.doi.org/10.1038/nprot.2015.121
Jothikumar, N., Lowther, J. A., Henshilwood, K., Lees, D. N., Hill, V. R., & Vinjé, J. (2005). Rapid and sensitive detection of noroviruses by using TaqMan-Based One-Step Reverse Transcription-PCR assays and application to naturally contaminated shellfish samples. Appl Environ Microbiol, 71(4), 1870-1875. doi:https://dx.doi.org/10.1128/aem.71.4.1870-1875.2005
Kageyama, T., Kojima, S., Shinohara, M., Uchida, K., Fukushi, S., Hoshino, F. B., Takeda, N., & Katayama, K. (2003). Broadly reactive and highly sensitive assay for norwalk-like viruses based on Real-Time Quantitative Reverse Transcription-PCR. J Clin Microbiol, 41(4), 1548-1557. doi:https://dx.doi.org/10.1128/JCM.41.4.1548-1557.2003
Kageyama, T., Shinohara, M., Uchida, K., Fukushi, S., Hoshino, F. B., Kojima, S., Takai, R., Oka, T., Takeda, N., & Katayama, K. (2004). Coexistence of multiple genotypes, including newly identified genotypes, in outbreaks of gastroenteritis due to norovirus in Japan. J Clin Microbiol, 42(7), 2988-2995. doi:https://dx.doi.org/10.1128/jcm.42.7.2988-2995.2004
Kahler, A. M., Cromeans, T. L., Roberts, J. M., & Hill, V. R. (2010). Effects of source water quality on chlorine inactivation of adenovirus, coxsackievirus, echovirus, and murine norovirus. Appl Environ Microbiol, 76(15), 5159-5164. doi:https://dx.doi.org/10.1128/aem.00869-10
Kapikian, A. Z., Wyatt, R. G., Dolin, R., Thornhill, T. S., Kalica, A. R., & Chanock, R. M. (1972). Visualization by immune electron microscopy of a 27-nm particle associated with acute infectious nonbacterial gastroenteritis. J Virol, 10(5), 1075-1081.
Karim, M. R., Fout, G. S., Johnson, C. H., White, K. M., & Parshionikar, S. U. (2015). Propidium monoazide reverse transcriptase PCR and RT-qPCR for detecting infectious enterovirus and norovirus. J Virol Methods, 219, 51-61. doi:https://dx.doi.org/10.1016/j.jviromet.2015.02.020
Karst, S. M., Wobus, C. E., Goodfellow, I. G., Green, K. Y., & Virgin, H. W. (2014). Advances in norovirus biology. Cell Host & Microbe, 15(6), 668-680. doi:https://dx.doi.org/10.1016/j.chom.2014.05.015

153
Karst, S. M., Zhu, S., & Goodfellow, I. G. (2015). The molecular pathology of noroviruses. J Pathol, 235(2), 206-216. doi:https://dx.doi.org/10.1002/path.4463
Karunasagar, I. (2014). Recent international efforts to improve bivalve molluscan shellfish safety. In G. Saufe (Ed.), Molluscan Shellfish Safety (pp. 1-14). Dordrecht: Springer. doi:http://dx.doi.org/10.1007/978-94-007-6588-7
Kauppinen, A., & Miettinen, I. (2017). Persistence of norovirus GII genome in drinking water and wastewater at different temperatures. Pathogens, 6(4), 48. doi:https://dx.doi.org/10.3390/pathogens6040048
Kim, J. M., Huang, T.-S., Marshall, M. R., & Wei, C.-I. (1999). Chlorine dioxide treatment of seafoods to reduce bacterial loads. J Food Sci, 64(6), 1089-1093. doi:https://dx.doi.org/10.1111/j.1365-2621.1999.tb12288.x
Kim, S.-W., Baek, S.-B., Ha, J.-H., Lee, M. H., Choi, C., & Ha, S.-D. (2012). Chlorine treatment to inactivate Norovirus on food contact surfaces. J Food Prot, 75(1), 184-188. doi:https://dx.doi.org/10.4315/0362-028X.JFP-11-243
Kim, S. Y., & Ko, G. (2012). Using propidium monoazide to distinguish between viable and nonviable bacteria, MS2 and murine norovirus. Lett Appl Microbiol, 55(3), 182. doi:https://dx.doi.org/10.1111/j.1472-765X.2012.03276.x
King, A. M. Q., Adams, M. J., Carstens, E. B., & Lefkowitz, E. J. (2011). Virus taxonomy ninth report of the international committee on taxonomy of viruses (Vol. 9). San Diego, CA, USA: Elsevier Science & Technology Books. doi:http://dx.doi.org/10.1016/B978-0-12-384684-6.00136-1
Kingsley, D. H., Guan, D., Hoover, D. G., & Chen, H. (2006). Inactivation of hepatitis A virus by high-pressure processing: The role of temperature and pressure oscillation. J Food Prot, 69(10), 2454-2459. doi:https://dx.doi.org/10.4315/0362-028x-69.10.2454
Kingsley, D. H., Holliman, D. R., Calci, K. R., Chen, H., & Flick, G. J. (2007). Inactivation of a norovirus by high-pressure processing. Appl Environ Microbiol, 73(2), 581-585. doi:https://dx.doi.org/10.1128/aem.02117-06
Kingsley, D. H., Pérez-Pérez, R. E., Niemira, B. A., & Fan, X. (2018). Evaluation of gaseous chlorine dioxide for the inactivation of tulane virus on blueberries. Int J Food Microbiol, 273, 28-32. doi:https://dx.doi.org/10.1016/j.ijfoodmicro.2018.01.024
Kingsley, D. H., Vincent, E. M., Meade, G. K., Watson, C. L., & Fan, X. (2014). Inactivation of human norovirus using chemical sanitizers. Int J Food Microbiol, 171, 94-99. doi:https://dx.doi.org/10.1016/j.ijfoodmicro.2013.11.018

154
Kirby, A., Gurgel, R. Q., Dove, W., Vieira, S. C. F., Cunliffe, N. A., & Cuevas, L. E. (2010). An evaluation of the RIDASCREEN and IDEIA enzyme immunoassays and the RIDAQUICK immunochromatographic test for the detection of norovirus in faecal specimens. J Clin Virol, 49(4), 254-257. doi:https://dx.doi.org/10.1016/j.jcv.2010.08.004
Kirby, A., & Iturriza-Gómara, M. (2012). Norovirus diagnostics: options, applications and interpretations. Expert Rev Anti Infect Ther, 10(4), 423-433. doi:https://dx.doi.org/10.1586/eri.12.21
Kitajima, M., Tohya, Y., Matsubara, K., Haramoto, E., Utagawa, E., & Katayama, H. (2010). Chlorine inactivation of human norovirus, murine norovirus and poliovirus in drinking water. Lett Appl Microbiol, 51(1), 119-121. doi:https://dx.doi.org/10.1111/j.1472-765X.2010.02869.x
Kittigul, L., Thamjaroen, A., Chiawchan, S., Chavalitshewinkoon-Petmitr, P., Pombubpa, K., & Diraphat, P. (2016). Prevalence and molecular genotyping of noroviruses in market oysters, mussels, and cockles in Bangkok, Thailand. Food Environ Virol, 8(2), 133-140. doi:https://dx.doi.org/10.1007/s12560-016-9228-6
Kniel, K. E. (2014). The makings of a good human norovirus surrogate. Curr Opin Virol, 4, 85-90. doi:https://dx.doi.org/10.1016/j.coviro.2014.01.002
Knight, A., Haines, J., Stals, A., Li, D., Uyttendaele, M., Knight, A., & Jaykus, L.-A. (2016). A systematic review of human norovirus survival reveals a greater persistence of human norovirus RT-qPCR signals compared to those of cultivable surrogate viruses. Int J Food Microbiol, 216, 40-49. doi:https://dx.doi.org/j.ijfoodmicro.2015.08.015
Knight, A., Li, D., Uyttendaele, M., & Jaykus, L.-A. (2012). A critical review of methods for detecting human noroviruses and predicting their infectivity. Crit Rev Microbiol, 39(3), 295-309. doi:https://dx.doi.org/10.3109/1040841X.2012.709820
Kobe, B., & Deisenhofer, J. (1996). Mechanism of ribonuclease inhibition by ribonuclease inhibitor protein based on the crystal structure of its complex with ribonuclease A. J Mol Biol, 264(5), 1028-1043. doi:https://dx.doi.org/10.1006/jmbi.1996.0694
Kohn, M. A., Farley, T. A., Ando, T., Curtis, M., Wilson, S. A., Jin, Q., Monroe, S. S., Baron, R. C., McFarland, L. M., & Glass, R. I. (1995). An outbreak of norwalk virus gastroenteritis associated with eating raw oysters: Implications for maintaining safe oyster beds. JAMA, 273(6), 466-471. doi:https://dx.doi.org/10.1001/jama.1995.03520300040034
Kojima, S., Kageyama, T., Fukushi, S., Hoshino, F. B., Shinohara, M., Uchida, K., Natori, K., Takeda, N., & Katayama, K. (2002). Genogroup-specific PCR primers for detection of Norwalk-like viruses. J Virol Methods, 100(1–2), 107-114. doi:https://dx.doi.org/10.1016/S0166-0934(01)00404-9

155
Kong, B.-H., Lee, S.-G., Han, S.-H., Jin, J.-Y., Jheong, W.-H., & Paik, S.-Y. (2015). Development of enhanced primer sets for detection of norovirus. Biomed Res Int, 2015, 9. doi:https://dx.doi.org/10.1155/2015/103052
Koopmans, M., & Duizer, E. (2004). Foodborne viruses: an emerging problem. Int J Food Microbiol, 90(1), 23-41. doi:https://dx.doi.org/10.1016/s0168-1605(03)00169-7
Koopmans, M. P. G., Cliver, D. O., & Bosch, A. (2008). Food-borne viruses Progress and Challenges. Washington DC - USA: ASM Press.
Koromyslova, A. D., White, P. A., & Hansman, G. S. (2015). Treatment of norovirus particles with citrate. Virology, 485, 199-204. doi:https://dx.doi.org/10.1016/j.virol.2015.07.009
Kotwal, G., & Cannon, J. L. (2014). Environmental persistence and transfer of enteric viruses. Curr Opin Virol, 4, 37-43. doi:https://dx.doi.org/10.1016/j.coviro.2013.12.003
Kroneman, A., Vega, E., Vennema, H., Vinjé, J., White, P., Hansman, G., Green, K., Martella, V., Katayama, K., & Koopmans, M. (2013). Proposal for a unified norovirus nomenclature and genotyping. Arch Virol, 158(10), 2059-2068. doi:https://dx.doi.org/10.1007/s00705-013-1708-5
Kukkula, M., Maunula, L., Silvennoinen, E., & von Bonsdorff, C.-H. (1999). Outbreak of viral gastroenteritis due to drinking water contaminated by Norwalk-like viruses. J Infect Dis, 180(6), 1771-1776. doi:https://dx.doi.org/10.1086/315145
La Bella, G., Martella, V., Basanisi, M. G., Nobili, G., Terio, V., & La Salandra, G. (2016). Food-borne viruses in shellfish: Investigation on norovirus and HAV presence in Apulia (SE Italy). Food Environ Virol, 1-8. doi:https://dx.doi.org/10.1007/s12560-016-9273-1
Lammerding, A. M., & McKellar, R. C. (2004). Predictive microbiology in quantitative risk assessment. In R. C. McKellar & X. Lu (Eds.), Modeling microbial responses in food (pp. 274-295). Boca Raton-Florida, USA: CRC.
Langlet, J., Gaboriaud, F., & Gantzer, C. (2007). Effects of pH on plaque forming unit counts and aggregation of MS2 bacteriophage. J Appl Microbiol, 103(5), 1632-1638. doi:https://dx.doi.org/10.1111/j.1365-2672.2007.03396.x
Laura, S., Irene, R., Roberta, B., Maria, G., Serena, S., Gabriella, D., & Carlo, E. (2012). Potential risk of norovirus infection due to the consumption of “Ready to Eat” food. Food Environ Virol, 4(3), 89-92. doi:https://dx.doi.org/10.1007/s12560-012-9081-1
Le Guyader, F. S., Bon, F., DeMedici, D., Parnaudeau, S., Bertone, A., Crudeli, S., Doyle, A., Zidane, M., Suffredini, E., Kohli, E., Maddalo, F., Monini, M., Gallay, A., Pommepuy, M., Pothier, P., &

156
Ruggeri, F. M. (2006). Detection of multiple noroviruses associated with an international gastroenteritis outbreak linked to oyster consumption. J Clin Microbiol, 44(11), 3878-3882. doi:https://dx.doi.org/10.1128/JCM.01327-06
Le Guyader, F. S., Krol, J., Ambert-Balay, K., Ruvoen-Clouet, N., Desaubliaux, B., Parnaudeau, S., Le Saux, J.-C., Ponge, A., Pothier, P., & Atmar, R. L. (2010). Comprehensive analysis of a norovirus-associated gastroenteritis outbreak, from the environment to the consumer. J Clin Microbiol, 48(3), 915-920.
Le Guyader, F. S., Le Saux, J.-C., Ambert-Balay, K., Krol, J., Serais, O., Parnaudeau, S., Giraudon, H., Delmas, G., Pommepuy, M., Pothier, P., & Atmar, R. L. (2008). Aichi virus, norovirus, astrovirus, enterovirus, and rotavirus involved in clinical cases from a French oyster-related gastroenteritis outbreak. J Clin Microbiol, 46(12), 4011-4017. doi:https://dx.doi.org/10.1128/jcm.01044-08
Le Guyader, F. S., Mittelholzer, C., Haugarreau, L., Hedlund, K.-O., Alsterlund, R., Pommepuy, M., & Svensson, L. (2004). Detection of noroviruses in raspberries associated with a gastroenteritis outbreak. Int J Food Microbiol, 97(2), 179-186. doi:https://dx.doi.org/10.1016/j.ijfoodmicro.2004.04.018
Le Guyader, F. S., Parnaudeau, S., Schaeffer, J., Bosch, A., Loisy, F., Pommepuy, M., & Atmar, R. L. (2009). Detection and quantification of noroviruses in shellfish. Appl Environ Microbiol, 75(3), 618-624. doi:https://dx.doi.org/10.1128/AEM.01507-08
Le Guyader, S., Atmar, R., Maalouf, H., & Le Pendu, J. (2013). Shellfish contamination by norovirus: strain selection based on ligand expression? Clin Virol, 41(1), 3-18.
Lee, G.-C., Jheong, W.-H., Kim, M.-j., Choi, D. H., & Baik, K.-H. (2013). A 5-year survey (2007–2011) of enteric viruses in Korean aquatic environments and the use of coliforms as viral indicators. Microbiol Immunol, 57(1), 46-53. doi:https://dx.doi.org/10.1111/j.1348-0421.2012.00515.x
Lee, S. J., Si, J., Yun, H. S., & Ko, G. (2015). Effect of temperature and relative humidity on the survival of foodborne viruses during food storage. Appl Environ Microbiol, 81(6), 2075-2081. doi:https://dx.doi.org/10.1128/aem.04093-14
Lees, D. (2000). Viruses and bivalve shellfish. Int J Food Microbiol, 59, 81-116. doi:https://dx.doi.org/10.1016/S0168-1605(00)00248-8
Leifels, M., Jurzik, L., Wilhelm, M., & Hamza, I. A. (2015). Use of ethidium monoazide and propidium monoazide to determine viral infectivity upon inactivation by heat, UV- exposure and chlorine. Int J Hyg Environ Health, 218(8), 686-693. doi:https://dx.doi.org/10.1016/j.ijheh.2015.02.003

157
Lewis, G. D., & Metcalf, T. G. (1988). Polyethylene glycol precipitation for recovery of pathogenic viruses, including hepatitis A virus and human rotavirus, from oyster, water, and sediment samples. Appl Environ Microbiol, 54(8), 1983-1988.
Li, D., Baert, L., Xia, M., Zhong, W., Van Coillie, E., Jiang, X., & Uyttendaele, M. (2012). Evaluation of methods measuring the capsid integrity and/or functions of noroviruses by heat inactivation. J Virol Methods, 181(1), 1-5. doi:https://dx.doi.org/10.1016/j.jviromet.2012.01.001
Li, D., Stals, A., Tang, Q., & Uyttendaele, M. (2014). Detection of noroviruses in shellfish and semiprocessed fishery products from a Belgian seafood company. J Food Prot, 77(8), 1342-1347. doi:https://dx.doi.org/10.4315/0362-028X.JFP-14-016
Li, J. W., Xin, Z. T., Wang, X. W., Zheng, J. L., & Chao, F. H. (2004). Mechanisms of inactivation of hepatitis A virus in water by chlorine dioxide. Water Res, 38(6), 1514-1519. doi:https://dx.doi.org/10.1016/j.watres.2003.12.021
Li, X., Chen, H., & Kingsley, D. H. (2013). The influence of temperature, pH, and water immersion on the high hydrostatic pressure inactivation of GI.1 and GII.4 human noroviruses. Int J Food Microbiol, 167(2), 138-143. doi:https://dx.doi.org/10.1016/j.ijfoodmicro.2013.08.020
Lim, M. Y., Kim, J.-M., & Ko, G. (2010). Disinfection kinetics of murine norovirus using chlorine and chlorine dioxide. Water Res, 44(10), 3243-3251. doi:https://dx.doi.org/10.1016/j.watres.2010.03.003
Lindesmith, L. C., Beltramello, M., Donaldson, E. F., Corti, D., Swanstrom, J., Debbink, K., Lanzavecchia, A., & Baric, R. S. (2012). Immunogenetic mechanisms driving norovirus GII.4 antigenic variation. PLOS Pathogens, 8(5), e1002705. doi:https://dx.doi.org/10.1371/journal.ppat.1002705
Lodo, K. L., Veitch, M. G. K., & Green, M. L. (2014). An outbreak of norovirus linked to oysters in Tasmania. Commun Dis Intell Quart Rep, 38(1), E16-E19.
Loisy, F., Atmar, R. L., Guillon, P., Le Cann, P., Pommepuy, M., & Le Guyader, F. S. (2005). Real-time RT-PCR for norovirus screening in shellfish. J Virol Methods, 123(1), 1-7. doi:https://dx.doi.org/10.1016/j.jviromet.2004.08.023
Lopman, B. A., Reacher, M. H., Duijnhoven, Y. v., Hanon, F.-X., Brown, D., & Koopmans, M. (2003). Viral gastroenteritis outbreaks in Europe, 1995–2000. Emerg Infect Dis, 9(1), 90-96. doi:https://dx.doi.org/10.3201/eid0901.020184
Loutreul, J., Cazeaux, C., Levert, D., Nicolas, A., Vautier, S., Le Sauvage, A. L., Perelle, S., & Morin, T. (2014). Prevalence of human noroviruses in frozen marketed shellfish, red fruits and fresh vegetables. Food Environ Virol, 6(3), 157-168. doi:https://dx.doi.org/10.1007/s12560-014-9150-8

158
Love, D. C., Lovelace, G. L., & Sobsey, M. D. (2010). Removal of Escherichia coli, Enterococcus fecalis, coliphage MS2, poliovirus, and hepatitis A virus from oysters (Crassostrea virginica) and hard shell clams (Mercinaria mercinaria) by depuration. Int J Food Microbiol, 143(3), 211-217. doi:https://dx.doi.org/10.1016/j.ijfoodmicro.2010.08.028
Lowther, J. A., Avant, J. M., Gizynski, K., Rangdale, R. E., & Lees, D. N. (2010). Comparison between Quantitative Real-Time Reverse Transcription PCR results for norovirus in oysters and self-reported gastroenteric illness in restaurant customers. J Food Prot, 73(2), 305-311. doi:https://dx.doi.org/10.4315/0362-028X-73.2.305
Lowther, J. A., Bosch, A., Butot, S., Ollivier, J., Mäde, D., Rutjes, S. A., Hardouin, G., Lombard, B., in't Veld, P., & Leclercq, A. (2019). Validation of EN ISO method 15216 - Part 1 – Quantification of hepatitis A virus and norovirus in food matrices. Int J Food Microbiol, 288, 82-90. doi:https://dx.doi.org/10.1016/j.ijfoodmicro.2017.11.014
Lowther, J. A., Gustar, N. E., Powell, A. L., Hartnell, R. E., & Lees, D. N. (2012). Two-year systematic study to assess norovirus contamination in oysters from commercial harvesting areas in the United Kingdom. Appl Environ Microbiol, 78(16), 5812-5817. doi:https://dx.doi.org/10.1128/AEM.01046-12
Maalouf, H., Schaeffer, J., Parnaudeau, S., Le Pendu, J., Atmar, R. L., Crawford, S. E., & Le Guyader, F. S. (2011). Strain-dependent norovirus bioaccumulation in oysters. Appl Environ Microbiol, 77(10), 3189-3196. doi:https://dx.doi.org/10.1128/aem.03010-10
Maalouf, H., Zakhour, M., Le Pendu, J., Le Saux, J.-C., Atmar, R. L., & Le Guyader, F. S. (2010). Distribution in tissue and seasonal variation of norovirus genogroup I and II ligands in oysters. Appl Environ Microbiol, 76(16), 5621-5630. doi:https://dx.doi.org/10.1128/aem.00148-10
Madigan, M., Martinko, J., Bender, K., Buckley, D., & Stahl, D. (2015). Brock biology of microorganisms (14th ed.). Boston, USA: Benjamin-Cummings Pub Co.
Maekawa, F., Miura, Y., Kato, A., Takahashi, K. G., & Muroga, K. (2007). Norovirus contamination in wild oysters and mussels in Shiogama Bay, Northeastern Japan. J Shell Res, 26(2), 365-370. doi:https://dx.doi.org/10.2983/0730-8000(2007)26[365:nciwoa]2.0.co;2
Mafart, P., Couvert, O., Gaillard, S., & Leguerinel, I. (2002). On calculating sterility in thermal preservation methods: application of the Weibull frequency distribution model. Int J Food Microbiol, 72(1), 107-113. doi:https://dx.doi.org/10.1016/S0168-1605(01)00624-9
Makmur, M., Moersidik, S. S., Wisnubroto, D. S., & Kusnoputranto, H. (2014). Consumer health risk assessment of green mussell containing saxitoxin in Cilincing, North Jakarta [Kajian risiko kesehatan konsumen kerang hijau yang mengandung saksitoksin di Cilincing, Jakarta Utara]. Jurnal Ekologi Kesehatan, 13(2), 165-178.

159
Malik, Y. S., & Goyal, S. M. (2006). Virucidal efficacy of sodium bicarbonate on a food contact surface against feline calicivirus, a norovirus surrogate. Int J Food Microbiol, 109(1–2), 160-163. doi:https://dx.doi.org/10.1016/j.ijfoodmicro.2005.08.033
Masago, Y., Katayama, H., Watanabe, T., Haramoto, E., Hashimoto, A., Omura, T., Hirata, T., & Ohgaki, S. (2006). Quantitative risk assessment of noroviruses in drinking water based on qualitative data in Japan†. Environ Sci Technol, 40(23), 7428-7433. doi:https://dx.doi.org/10.1021/es060348f
Matthews, J. E., Dickey, B. W., Miller, R. D., Felzer, J. R., Dawson, B. P., Lee, A. S., Rocks, J. J., Kiel, J., Montes, J. S., Moe, C. L., Eisenberg, J. N. S., & Leon, J. S. (2012). The epidemiology of published norovirus outbreaks: A review of risk factors associated with attack rate and genogroup. Epidemiol Infect, 140(07), 1161-1172. doi:https://dx.doi.org/10.1017/S0950268812000234
Mattison, K., Grudeski, E., Auk, B., Charest, H., Drews, S. J., Fritzinger, A., Gregoricus, N., Hayward, S., Houde, A., Lee, B. E., Pang, X. L., Wong, J., Booth, T. F., & Vinjé, J. (2009). Multicenter comparison of two norovirus ORF2-based genotyping protocols. J Clin Microbiol, 47(12), 3927-3932. doi:https://dx.doi.org/10.1128/jcm.00497-09
Mattle, M. J., Crouzy, B., Brennecke, M., R. Wigginton, K., Perona, P., & Kohn, T. (2011). Impact of virus aggregation on inactivation by peracetic acid and implications for other disinfectants. Environ Sci Technol, 45(18), 7710-7717. doi:https://dx.doi.org/10.1021/es201633s
Maunula, L. (2007). Waterborne norovirus outbreaks. Future Virol, 2(1), 101-112. doi:https://dx.doi.org/10.2217/17460794.2.1.101
Maunula, L., Kaupke, A., Vasickova, P., Söderberg, K., Kozyra, I., Lazic, S., van der Poel, W. H. M., Bouwknegt, M., Rutjes, S., Willems, K. A., Moloney, R., D'Agostino, M., de Roda Husman, A. M., von Bonsdorff, C.-H., Rzeżutka, A., Pavlik, I., Petrovic, T., & Cook, N. (2013). Tracing enteric viruses in the European berry fruit supply chain. Int J Food Microbiol, 167(2), 177-185. doi:https://dx.doi.org/10.1016/j.ijfoodmicro.2013.09.003
Maunula, L., & Von Bonsdorff, C.-H. (2014). Emerging and re-emerging enteric viruses causing multinational foodborne disease outbreaks. Future Virol, 9(3), 301-312. doi:https://dx.doi.org/10.2217/fvl.13.128
McLeod, C., Hay, B., Grant, C., Greening, G., & Day, D. (2009). Localization of norovirus and poliovirus in Pacific oysters. J Appl Microbiol, 106(4), 1220-1230. doi:https://dx.doi.org/10.1111/j.1365-2672.2008.04091.x
Mesquita, J. R., & Nascimento, M. S. J. (2009). A foodborne outbreak of norovirus gastroenteritis associated with a Christmas dinner in Porto, Portugal, December 2008. Euro surveillance, 14(41), 19355. http://europepmc.org/abstract/MED/19883537

160
Mesquita, J. R., Vaz, L., Cerqueira, S., Castilho, F., Santos, R., Monteiro, S., Manso, C. F., Romalde, J. L., & Nascimento, M. S. (2011). Norovirus, hepatitis A virus and enterovirus presence in shellfish from high quality harvesting areas in Portugal. Food Microbiol, 28(5), 936-941. doi:https://dx.doi.org/10.1016/j.fm.2011.01.005
Millard, J., Appleton, H., & Parry, J. V. (1987). Studies on heat inactivation of hepatitis A virus with special reference to shellfish: Part 1. Procedures for infection and recovery of virus from laboratory-maintained cockles. Epidemiol Infect, 98(3), 397-414. doi:https://dx.doi.org/10.1017/S0950268800062166
Ministry of Health Republic of Indonesia. (2010). 492/MENKES/PER/IV/2010 "Drinking Water Quality". Jakarta-Indonesia.
Ministry of Health Republic of Indonesia. (2014). Total diet study: Individual food consumption survey Indonesia 2014 [Studi diet total: Survei konsumsi makanan individu Indonesia 2014]. Jakarta: National Institute of Health Research and Development Publishing House.
Ministry of Marine Affairs and Fisheries Republic Indonesia. (2017). 22/PER-DJPDSPKP/2017 "Technical Guidelines for Managing Goverment Aid in Revitalisation and Development of Hygienic Fish Markets". Jakarta - Indonesia: Ministry of Marine Affairs and Fisheries Republic Indonesia.
Ministry of Marine Affairs and Fisheries Republic of Indonesia. (2002). KEP.01/MEN/2002 "Intensive Quality Management System of Fishery Product". Jakarta-Indonesia: Retrieved from http://hukum.unsrat.ac.id/men/menlaut_1_2002.htm.
Ministry of Marine Affairs and Fisheries Republic of Indonesia. (2004). KEP.17/MEN/2004 "Indonesian Shellfish Sanitation System". Jakarta-Indonesia: Republic of Indonesia Retrieved from https://www.informea.org/sites/default/files/legislation/ins48875.pdf.
Miura, T., Parnaudeau, S., Grodzki, M., Okabe, S., Atmar, R. L., & Le Guyader, F. S. (2013). Environmental detection of genogroup I, II, and IV noroviruses by using a generic Real-Time Reverse Transcription-PCR assay. Appl Environ Microbiol, 79(21), 6585-6592. doi:https://dx.doi.org/10.1128/AEM.02112-13
Miyashita, K., Kang, J. H., Saga, A., Takahashi, K., Shimamura, T., Yasumoto, A., Fukushima, H., Sogabe, S., Konishi, K., & Uchida, T. (2012). Three cases of acute or fulminant hepatitis E caused by ingestion of pork meat and entrails in Hokkaido, Japan: Zoonotic food‐borne transmission of hepatitis E virus and public health concerns. Hepatol Res, 42(9), 870-878. doi:https://dx.doi.org/10.1111/j.1872-034X.2012.01006.x
Moats, W. A. (1971). Kinetics of thermal death of bacteria. J Bacteriol, 105(1), 165-171.

161
Mok, H. F., Barker, S. F., & Hamilton, A. J. (2014). A probabilistic quantitative microbial risk assessment model of norovirus disease burden from wastewater irrigation of vegetables in Shepparton, Australia. Water Res, 54, 347-362. doi:https://dx.doi.org/10.1016/j.watres.2014.01.060
Mokhtari, A., & Jaykus, L. A. (2009). Quantitative exposure model for the transmission of norovirus in retail food preparation. Int J Food Microbiol, 133(1-2), 38-47. doi:https://dx.doi.org/10.1016/j.ijfoodmicro.2009.04.021
Molloy, P. L., & Symons, R. H. (1980). Cleavage of DNA.RNA hybrids by type II restriction enzymes. Nucleic Acids Res, 8(13), 2939-2946. doi:https://dx.doi.org/10.1093/nar/8.13.2939
Montazeri, N., Maite, M., Liu, D., Cormier, J., Landry, M., Shackleford, J., Lampila, L. E., Achberger, E. C., & Janes, M. E. (2015). Surveillance of enteric viruses and microbial indicators in the Eastern Oysters (Crassostrea virginica) and harvest waters along Louisiana Gulf Coast. J Food Sci, n/a-n/a. doi:https://dx.doi.org/10.1111/1750-3841.12871
Montazeri, N., Manuel, C., Moorman, E., Khatiwada, J. R., Williams, L. L., & Jaykus, L.-A. (2017). Virucidal activity of fogged chlorine dioxide- and hydrogen peroxide-based disinfectants against human norovirus and its surrogate, feline calicivirus, on hard-to-reach surfaces. Front Microbiol, 8(1031). doi:https://dx.doi.org/10.3389/fmicb.2017.01031
Morillo, S. G., Luchs, A., Cilli, A., & do Carmo Sampaio Tavares Timenetsky, M. (2012). Rapid detection of norovirus in naturally contaminated food: Foodborne gastroenteritis outbreak on a cruise ship in Brazil, 2010. Food Environ Virol, 4(3), 124-129. doi:https://dx.doi.org/10.1007/s12560-012-9085-x
Morino, H., Fukuda, T., Miura, T., Lee, C., Shibata, T., & Sanekata, T. (2009). Inactivation of feline calicivirus, a norovirus surrogate, by chlorine dioxide gas. Biocontrol Sci, 14(4), 147-153.
Mormann, S., Dabisch, M., & Becker, B. (2010). Effects of technological processes on the tenacity and inactivation of norovirus genogroup II in experimentally contaminated foods. Appl Environ Microbiol, 76(2), 536-545. doi:https://dx.doi.org/10.1128/aem.01797-09
Morse, D. L., Guzewich, J. J., Hanrahan, J. P., Stricof, R., Shayegani, M., Deibel, R., Grabau, J. C., Nowak, N. A., Herrmann, J. E., Cukor, G., & Blacklow, N. R. (1986). Widespread outbreaks of clam- and oyster-associated gastroenteritis. N Engl J Med, 314(11), 678-681. doi:https://dx.doi.org/10.1056/NEJM198603133141103
Mullendore, J. L., Sobsey, M. D., & Carol Shieh, Y. S. (2001). Improved method for the recovery of hepatitis A virus from oysters. J Virol Methods, 94(1), 25-35. doi:https://dx.doi.org/10.1016/S0166-0934(01)00263-4

162
Murdinah. (2009). The handling and diversification of green mussel’s products. Squalen, 4(2), 11. doi:https://dx.doi.org/10.15578/squalen.v4i2.149
Murphy, J. L., Haas, C. N., Arrowood, M. J., Hlavsa, M. C., Beach, M. J., & Hill, V. R. (2014). Efficacy of chlorine dioxide tablets on inactivation of Cryptosporidium Oocysts. Environ Sci Technol, 48(10), 5849-5856. doi:https://dx.doi.org/10.1021/es500644d
Murray, I. A., Stickel, S. K., & Roberts, R. J. (2010). Sequence-specific cleavage of RNA by Type II restriction enzymes. Nucleic Acids Res, 38(22), 8257-8268. doi:https://dx.doi.org/10.1093/nar/gkq702
Nagel, G. M., Bauermeister, L. J., Bratcher, C. L., Singh, M., & McKee, S. R. (2013). Salmonella and campylobacter reduction and quality characteristics of poultry carcasses treated with various antimicrobials in a post-chill immersion tank. Int J Food Microbiol, 165(3), 281-286. doi:https://dx.doi.org/10.1016/j.ijfoodmicro.2013.05.016
National Standarization Agency. (2009). Frozen shellfish Specification, Raw Material Requirements, and Handling and Processing of Shellfish (Vol. 3460). Jakarta, Indonesia: BSN.
Nelson, K. E., Shih, J. W., Zhang, J., Zhao, Q., Xia, N., Ticehurst, J. R., & Labrique, A. B. (2014). Hepatitis E vaccine to prevent morbidity and mortality during epidemics. Paper presented at the Open forum infectious diseases. doi:http://dx.doi.org/10.1093/ofid/ofu098
Ng, T. L., Chan, P. P., Phua, T. H., Loh, J. P., Yip, R., Wong, C., Liaw, C. W., Tan, B. H., Chiew, K. T., Chua, S. B., Lim, S., Ooi, P. L., Chew, S. K., & Goh, K. T. (2005). Oyster-associated outbreaks of norovirus gastroenteritis in Singapore. J Infect, 51(5), 413-418. doi:https://dx.doi.org/10.1016/j.jinf.2004.11.003
Nguyen, T. A., Khamrin, P., Takanashi, S., Le Hoang, P., Pham, L. D., Hoang, K. T., Satou, K., Masuoka, Y., Okitsu, S., & Ushijima, H. (2007). Evaluation of immunochromatography tests for detection of rotavirus and norovirus among vietnamese children with acute gastroenteritis and the emergence of a novel norovirus GII.4 variant. J Trop Pediatr, 53(4), 264-269. doi:https://dx.doi.org/10.1093/tropej/fmm021
Nic Fhogartaigh, C., & Dance, D. A. B. (2013). Bacterial gastroenteritis. Medicine, 41(12), 693-699. doi:https://dx.doi.org/10.1016/j.mpmed.2013.09.010
Niwa, S., Tsukagoshi, H., Ishioka, T., Sasaki, Y., Yoshizumi, M., Morita, Y., Kimura, H., & Kozawa, K. (2014). Triplex real-time polymerase chain reaction assay for detection and quantification of norovirus (GI and GII) and sapovirus. Microbiol Immunol, 58(1), 68-71. doi:https://dx.doi.org/10.1111/1348-0421.12107
Noel, J. S., Liu, B. L., Humphrey, C. D., Rodriguez, E. M., Lambden, P. R., Clarke, I. N., Dwyer, D. M., Ando, T., Glass, R. I., & Monroe, S. S. (1997). Parkville virus: A novel genetic variant of human

163
calicivirus in the Sapporo virus clade, associated with an outbreak of gastroenteritis in adults. J Med Virol, 52(2), 173-178. doi:https://dx.doi.org/10.1002/(SICI)1096-9071(199706)52:2<173::AID-JMV10>3.0.CO;2-M
Noor, N. M. (2014). Development prospect of Green Mussel (Perna viridis) cultivation in Pasaran Island, Bandar Lampung. [Prospek pengembangan usaha budidaya Kerang Hijau (Perna viridis) di Pulau Pasaran, Bandar Lampung]. Aquasains, 239-246.
Nordgren, J., Bucardo, F., Dienus, O., Svensson, L., & Lindgren, P.-E. (2008). Novel Light-Upon-Extension Real-Time PCR assays for detection and quantification of genogroup I and II noroviruses in clinical specimens. J Clin Microbiol, 46(1), 164-170. doi:https://dx.doi.org/10.1128/jcm.01316-07
Nuanualsuwan, S., & Cliver, D. O. (2002). Pretreatment to avoid positive RT-PCR results with inactivated viruses. J Virol Methods, 104(2), 217-225. doi:https://dx.doi.org/10.1016/S0166-0934(02)00089-7
Nuanualsuwan, S., & Cliver, D. O. (2003). Capsid functions of inactivated human picornaviruses and feline calicivirus. Appl Environ Microbiol, 69(1), 350-357. doi:https://dx.doi.org/10.1128/AEM.69.1.350-357.2003
Nur, Y., Fazi, S., Wirjoatmodjo, N., & Han, Q. (2001). Towards wise coastal management practice in a tropical megacity—Jakarta. Ocean Coast Manage, 44(5–6), 335-353. doi:https://dx.doi.org/10.1016/S0964-5691(01)00054-0
Nurdjana, M. L. (2006). Indonesian aquaculture development. Paper presented at the DGA, MMAF. The paper delivered on RCA International Workshop on Innovative Technologies for Eco-Friendly Fish Farm Management and Production of Safe Aquaculture Foods, Bali.
Nyachuba, D. G. (2010). Foodborne illness: Is it on the rise? Nutr Rev, 68(5), 257-269. doi:https://dx.doi.org/10.1111/j.1753-4887.2010.00286.x
O'Brien, R. T., & Newman, J. (1979). Structural and compositional changes associated with chlorine inactivation of polioviruses. Appl Environ Microbiol, 38(6), 1034-1039.
O'Connell, K. P., Bucher, J. R., Anderson, P. E., Cao, C. J., Khan, A. S., Gostomski, M. V., & Valdes, J. J. (2006). Real-Time fluorogenic reverse transcription-PCR assays for detection of bacteriophage MS2. Appl Environ Microbiol, 72(1), 478-483. doi:https://dx.doi.org/10.1128/aem.72.1.478-483.2006
Oka, T., Wang, Q., Katayama, K., & Saif, L. J. (2015). Comprehensive review of human sapoviruses. Clin Microbiol Rev, 28(1), 32-53. doi:https://dx.doi.org/10.1128/cmr.00011-14

164
Oristo, S., Lee, H.-J., & Maunula, L. (2018). Performance of pre-RT-qPCR treatments to discriminate infectious human rotaviruses and noroviruses from heat-inactivated viruses: applications of PMA/PMAxx, benzonase and RNase. J Appl Microbiol, 124(4), 1008-1016. doi:https://dx.doi.org/doi:10.1111/jam.13737
Oude Munnink, B. B., & Van der Hoek, L. (2016). Viruses causing gastroenteritis: The known, the new and those beyond. Viruses, 8(2), 42.
Palin, A. T. (1957). The determination of free and combined chlorine in water by the use of diethyl-p-phenylene Diamine. Journal (American Water Works Association), 49(7), 873-880.
Panjaitan, B. P., Edison, & Sari, N. I. (2018). The influence of differences cooking methods of cockle (Anadara granosa) on protein concentrate quality. Jurnal Online Mahasiswa 5.
Panno, J. (2011). Viruses : the origin and evolution of deadly pathogens. New York: Facts on File.
Park, S. Y., & Ha, S.-D. (2015). Thermal inactivation of hepatitis A virus in suspension and in dried mussels (Mytilus edulis). Int J Food Sci Technol, 50(3), 717-722. doi:https://dx.doi.org/doi:10.1111/ijfs.12674
Park, S. Y., Kim, S.-H., Ju, I.-S., Cho, J.-I., & Ha, S.-D. (2014). Thermal Inactivation of murine norovirus-1 in suspension and in dried mussels (Mytilus edulis). J Food Saf, 34(3), 193-198. doi:https://dx.doi.org/doi:10.1111/jfs.12113
Parshionikar, S., Laseke, I., & Fout, G. S. (2010). Use of propidium monoazide in reverse transcriptase PCR to distinguish between infectious and noninfectious enteric viruses in water samples. Appl Environ Microbiol, 76(13), 4318-4326. doi:https://dx.doi.org/10.1128/AEM.02800-09
Patel, M. M., Widdowson, M.-A., Glass, R. I., Akazawa, K., Vinjé, J., & Parashar, U. D. (2008). Systematic literature review of role of noroviruses in sporadic gastroenteritis. Emerg Infect Dis, 14(8), 1224-1231. doi:https://dx.doi.org/10.3201/eid1408.071114
Pecson, B. M., Martin, L. V., & Kohn, T. (2009). Quantitative PCR for determining the infectivity of bacteriophage MS2 upon inactivation by heat, UV-B radiation, and singlet oxygen: Advantages and limitations of an enzymatic treatment to reduce false-positive results. Appl Environ Microbiol, 75(17), 5544-5554. doi:https://dx.doi.org/10.1128/AEM.00425-09
Pintó, R. M., Costafreda, M. I., & Bosch, A. (2009). Risk assessment in shellfish-borne outbreaks of hepatitis A. Appl Environ Microbiol, 75(23), 7350-7355. doi:https://dx.doi.org/10.1128/aem.01177-09
Pires, S. M., Fischer-Walker, C. L., Lanata, C. F., Devleesschauwer, B., Hall, A. J., Kirk, M. D., Duarte, A. S. R., Black, R. E., & Angulo, F. J. (2015). Aetiology-specific estimates of the global and

165
regional incidence and mortality of diarrhoeal diseases commonly transmitted through food. PLoS ONE, 10(12), e0142927. doi:https://dx.doi.org/10.1371/journal.pone.0142927
Polo, D., Álvarez, C., Díez, J., Darriba, S., Longa, Á., & Romalde, J. L. (2014). Viral elimination during commercial depuration of shellfish. Food Control, 43, 206-212. doi:https://dx.doi.org/10.1016/j.foodcont.2014.03.022
Polo, D., Varela, M. F., & Romalde, J. L. (2015). Detection and quantification of hepatitis A virus and norovirus in Spanish authorized shellfish harvesting areas. Int J Food Microbiol, 193(0), 43-50. doi:https://dx.doi.org/10.1016/j.ijfoodmicro.2014.10.007
Prasad, B. V., Hardy, M. E., Dokland, T., Bella, J., Rossmann, M. G., & Estes, M. K. (1999). X-ray crystallographic structure of the Norwalk virus capsid. Science, 286(5438), 287-290. doi:https://dx.doi.org/10.1126/science.286.5438.287
Prasetya, J. D., Suprijanto, J., & Hutabarat, J. (2010). The potency of scallop (Amusium pleuronectes) in Brebes District Central Java. [Potensi Kerang Simping (Amusium pleuronectes) di Kabupaten Brebes Jawa Tengah]. Paper presented at the Seminar Nasional Tahunan VII Hasil Penelitian Perikanan dan Kelautan, Yogyakarta, Indonesia.
Praveen, C., Dancho, B. A., Kingsley, D. H., Calci, K. R., Meade, G. K., Mena, K. D., & Pillai, S. D. (2013). Susceptibility of murine norovirus and hepatitis A virus to electron beam irradiation in oysters and quantifying the reduction in potential infection risks. Appl Environ Microbiol, 79(12), 3796-3801. doi:https://dx.doi.org/10.1128/AEM.00347-13
Predmore, A., & Li, J. (2011). Enhanced removal of a human norovirus surrogate from fresh vegetables and fruits by a combination of surfactants and sanitizers. Appl Environ Microbiol, 77(14), 4829-4838. doi:https://dx.doi.org/10.1128/aem.00174-11
Pringle, K., Lopman, B., Vega, E., Vinje, J., Parashar, U. D., & Hall, A. J. (2015). Noroviruses: epidemiology, immunity and prospects for prevention. Future Microbiol, 10(1), 53-67. doi:https://dx.doi.org/10.2217/fmb.14.102
Rachmadi, A. T., Kitajima, M., Watanabe, K., Yaegashi, S., Serrana, J., Nakamura, A., Nakagomi, T., Nakagomi, O., Katayama, K., Okabe, S., & Sano, D. (2018). Free-Chlorine disinfection as a selection pressure on norovirus. Appl Environ Microbiol, 84(13), e00244-00218. doi:https://dx.doi.org/10.1128/aem.00244-18
Raines, R. T. (1998). Ribonuclease A. Chem Rev, 98(3), 1045-1066. doi:https://dx.doi.org/10.1021/cr960427h
Rajko-Nenow, P., Keaveney, S., Flannery, J., McIntyre, A., & DorÉ, W. (2014). Norovirus genotypes implicated in two oyster-related illness outbreaks in Ireland. Epidemiol Infect, 142(10), 2096-2104. doi:https://dx.doi.org/10.1017/S0950268813003014

166
Randazzo, W., Vasquez-García, A., Aznar, R., & Sánchez, G. (2018). Viability RT-qPCR to distinguish between HEV and HAV with intact and altered capsids. Front Microbiol, 9(1973). doi:https://dx.doi.org/10.3389/fmicb.2018.01973
Ratkowsky, D. A. (2004). Model fitting and uncertainty. In R. C. McKellar & X. Lu (Eds.), Modeling Microbial Responses in Foods (pp. 151-196). Boca Raton: CRC Press.
Rejeki, S., Ariyati, R. W., & Widowati, L. L. (2016). Application of integrated multi tropic aquaculture concept in an abraded brackish water pond. Jurnal Teknologi (Science & Engineering), 78(4-2), 227-232.
Richards, G. P. (1999). Limitations of molecular biological techniques for assessing the virological safety of foods. J Food Prot, 62(6), 691-697. doi:https://dx.doi.org/10.4315/0362-028x-62.6.691
Richards, G. P. (2001). Enteric virus contamination of foods through industrial practices: a primer on intervention strategies. J Ind Microbiol Biotechnol, 27(2), 117-125. doi:https://dx.doi.org/10.1038/sj.jim.7000095
Richards, G. P. (2006). Shellfish-Associated viral disease outbreaks. In S. M. Goyal (Ed.), Viruses in Foods (Food Microbiology and Food Safety ed.). Boston, MA: Springer.
Richards, G. P. (2012). Critical review of norovirus surrogates in food safety research: Rationale for considering volunteer studies. Food Environ Virol, 4(1), 6-13. doi:https://dx.doi.org/10.1007/s12560-011-9072-7
Richards, G. P., McLeod, C., & Le Guyader, F. (2010). Processing strategies to inactivate enteric viruses in shellfish. Food Environ Virol, 2(3), 183-193. doi:https://dx.doi.org/10.1007/s12560-010-9045-2
Richards, G. P., Watson, M. A., Fankhauser, R. L., & Monroe, S. S. (2004). Genogroup I and II Noroviruses Detected in Stool Samples by Real-Time Reverse Transcription-PCR Using Highly Degenerate Universal Primers. Appl Environ Microbiol, 70(12), 7179-7184. doi:https://dx.doi.org/10.1128/aem.70.12.7179-7184.2004
Richards, G. P., Watson, M. A., Meade, G. K., Hovan, G. L., & Kingsley, D. H. (2012). Resilience of norovirus GII.4 to freezing and thawing: Implications for virus infectivity. Food Environ Virol, 4(4), 192-197. doi:https://dx.doi.org/10.1007/s12560-012-9089-6
Rodríguez-Lázaro, D., Cook, N., Ruggeri, F. M., Sellwood, J., Nasser, A., Nascimento, M. S. J., D'Agostino, M., Santos, R., Saiz, J. C., Rzeżutka, A., Bosch, A., Gironés, R., Carducci, A., Muscillo, M., Kovač, K., Diez-Valcarce, M., Vantarakis, A., von Bonsdorff, C.-H., de Roda Husman, A. M., Hernández, M., & van der Poel, W. H. M. (2012). Virus hazards from food,

167
water and other contaminated environments. FEMS Microbiol Rev, 36(4), 786-814. doi:https://dx.doi.org/10.1111/j.1574-6976.2011.00306.x
Rodríguez, R. A., Gundy, P. M., Rijal, G. K., & Gerba, C. P. (2012). The Impact of combined sewage overflows on the viral contamination of receiving waters. Food Environ Virol, 4(1), 34-40. doi:https://dx.doi.org/10.1007/s12560-011-9076-3
Rodríguez, R. A., Pepper, I. L., & Gerba, C. P. (2009). Application of PCR-based methods to assess the infectivity of enteric viruses in environmental samples. Appl Environ Microbiol, 75(2), 297-307. doi:https://dx.doi.org/10.1128/AEM.01150-08
Rolfe, K. J., Parmar, S., Mururi, D., Wreghitt, T. G., Jalal, H., Zhang, H., & Curran, M. D. (2007). An internally controlled, one-step, real-time RT-PCR assay for norovirus detection and genogrouping. J Clin Virol, 39(4), 318-321. doi:https://dx.doi.org/10.1016/j.jcv.2007.05.005
Romero, O. C., Straub, A. P., Kohn, T., & Nguyen, T. H. (2011). Role of temperature and Suwannee River natural organic matter on inactivation kinetics of rotavirus and bacteriophage MS2 by solar irradiation. Environ Sci Technol, 45(24), 10385-10393. doi:https://dx.doi.org/10.1021/es202067f
Ronnqvist, M., Mikkela, A., Tuominen, P., Salo, S., & Maunula, L. (2013). Ultraviolet light inactivation of murine norovirus and human norovirus GII: PCR may overestimate the persistence of noroviruses even when combined with pre-PCR treatments. Food Environ Virol, 6, 48-57. doi:https://dx.doi.org/10.1007/s12560-013-9128-y
Rzeżutka, A., & Cook, N. (2004). Survival of human enteric viruses in the environment and food. FEMS Microbiol Rev, 28(4), 441-453. doi:https://dx.doi.org/10.1016/j.femsre.2004.02.001
Sai, L., Sun, J., Shao, L., Chen, S., Liu, H., & Ma, L. (2013). Epidemiology and clinical features of rotavirus and norovirus infection among children in Ji'nan, China. Virol J, 10, 302-302. doi:https://dx.doi.org/10.1186/1743-422X-10-302
Sarjit, A., & Dykes, G. A. (2015). Trisodium phosphate and sodium hypochlorite are more effective as antimicrobials against campylobacter and salmonella on duck as compared to chicken meat. Int J Food Microbiol, 203, 63-69. doi:https://dx.doi.org/10.1016/j.ijfoodmicro.2015.02.026
Scallan, E., Hoekstra, R. M., Angulo, F. J., Tauxe, R. V., Widdowson, M.-A., Roy, S. L., Jones, J. L., & Griffin, P. M. (2011). Foodborne illness acquired in the United States—Major pathogens. Emerg Infect Dis, 17(1), 7-15. doi:https://dx.doi.org/10.3201/eid1701.P11101
Scallan, E., Hoekstra, R. M., Mahon, B. E., Jones, T. F., & Griffin, P. M. (2015). An assessment of the human health impact of seven leading foodborne pathogens in the United States using disability adjusted life years. Epidemiol Infect, FirstView, 1-10. doi:https://dx.doi.org/doi:10.1017/S0950268814003185

168
Schefe, J. H., Lehmann, K. E., Buschmann, I. R., Unger, T., & Funke-Kaiser, H. (2006). Quantitative real-time RT-PCR data analysis: Current concepts and the novel “gene expression’s Ct difference” formula. J Mol Med, 84(11), 901-910. doi:https://dx.doi.org/10.1007/s00109-006-0097-6
Schielke, A., Filter, M., Appel, B., & Johne, R. (2011). Thermal stability of hepatitis E virus assessed by a molecular biological approach. Virol J, 8(1), 487. doi:https://dx.doi.org/10.1186/1743-422x-8-487
Schmid, D., Stüger, H. P., Lederer, I., Pichler, A.-M., Kainz-Arnfelser, G., Schreier, E., & Allerberger, F. (2007). A foodborne norovirus outbreak due to manually prepared salad, Austria 2006. Infection, 35(4), 232-239. doi:https://dx.doi.org/10.1007/s15010-007-6327-1
Seitz, S. R., Leon, J. S., Schwab, K. J., Lyon, G. M., Dowd, M., McDaniels, M., Abdulhafid, G., Fernandez, M. L., Lindesmith, L. C., Baric, R. S., & Moe, C. L. (2011). Norovirus infectivity in humans and persistence in water. Appl Environ Microbiol, 77(19), 6884-6888. doi:https://dx.doi.org/10.1128/aem.05806-11
Seo, K., Lee, J. E., Lim, M. Y., & Ko, G. (2012). Effect of temperature, pH, and NaCl on the inactivation kinetics of murine norovirus. J Food Prot, 75(3), 533-540. doi:https://dx.doi.org/10.4315/0362-028x.Jfp-11-199
Setyono, D. E. D. (2007). Prospect for development of mollusc aquaculture in Indonesia [Prospek usaha budidaya kekerangan di Indonesia]. Oseana, 32(1), 33-38.
Sherchan, S. P., Snyder, S. A., Gerba, C. P., & Pepper, I. L. (2014). Inactivation of MS2 coliphage by UV and hydrogen peroxide: Comparison by cultural and molecular methodologies. J Environ Sci Health A Tox Hazard Subst Environ Eng, 49(4), 397-403. doi:https://dx.doi.org/10.1080/10934529.2014.854607
Shibata, S., Sekizuka, T., Kodaira, A., Kuroda, M., Haga, K., Doan, Y. H., Takai-Todaka, R., Katayama, K., Wakita, T., Oka, T., & Hirata, H. (2015). Complete genome sequence of a Novel GV.2 Sapovirus strain, NGY-1, detected from a suspected foodborne gastroenteritis outbreak. Genome Announc, 3(1). doi:https://dx.doi.org/10.1128/genomeA.01553-14
Shin, G.-A., & Sobsey, M. D. (2008). Inactivation of norovirus by chlorine disinfection of water. Water Res, 42(17), 4562-4568. doi:https://dx.doi.org/10.1016/j.watres.2008.08.001
Shin, J. H., Chang, S., & Kang, D. H. (2004). Application of antimicrobial ice for reduction of foodborne pathogens (Escherichia coli O157:H7, Salmonella typhimurium, Listeria monocytogenes) on the surface of fish. J Appl Microbiol, 97(5), 916-922. doi:https://dx.doi.org/10.1111/j.1365-2672.2004.02343.x

169
Siebenga, J. J., Vennema, H., Zheng, D.-P., Vinjé, J., Lee, B. E., Pang, X.-L., Ho, E. C. M., Lim, W., Choudekar, A., Broor, S., Halperin, T., Rasool, N. B. G., Hewitt, J., Greening, G. E., Jin, M., Duan, Z.-J., Lucero, Y., O’Ryan, M., Hoehne, M., Schreier, E., Ratcliff, R. M., White, P. A., Iritani, N., Reuter, G., & Koopmans, M. (2009). Norovirus illness is a global problem: Emergence and spread of norovirus GII.4 variants, 2001–2007. J Infect Dis, 200(5), 802-812. doi:https://dx.doi.org/10.1086/605127
Sigstam, T., Gannon, G., Cascella, M., Pecson, B. M., Wigginton, K. R., & Kohn, T. (2013). Subtle differences in virus composition affect disinfection kinetics and mechanisms. Appl Environ Microbiol, 79(11), 3455-3467. doi:https://dx.doi.org/10.1128/aem.00663-13
Sigstam, T., Rohatschek, A., Zhong, Q., Brennecke, M., & Kohn, T. (2014). On the cause of the tailing phenomenon during virus disinfection by chlorine dioxide. Water Res, 48, 82-89. doi:https://dx.doi.org/10.1016/j.watres.2013.09.023
Singh, N., Singh, R. K., Bhunia, A. K., & Stroshine, R. L. (2002). Efficacy of chlorine dioxide, ozone, and thyme essential oil or a sequential washing in killing Escherichia coli O157:H7 on lettuce and baby carrots. LWT - Food Sci Technol, 35(8), 720-729. doi:https://dx.doi.org/10.1006/fstl.2002.0933
Siregar, T. H., Priyanto, N., Putri, A. K., Rachmawati, N., Triwibowo, R., Dsikowitzky, L., & Schwarzbauer, J. (2016). Spatial distribution and seasonal variation of the trace hazardous element contamination in Jakarta Bay, Indonesia. Mar Pollut Bull, 110(2), 634-646. doi:https://dx.doi.org/10.1016/j.marpolbul.2016.05.008
Soto-Munoz, L., Teixido, N., Usall, J., Vinas, I., Crespo-Sempere, A., & Torres, R. (2014). Development of PMA real-time PCR method to quantify viable cells of Pantoea agglomerans CPA-2, an antagonist to control the major postharvest diseases on oranges. Int J Food Microbiol, 180, 49-55. doi:https://dx.doi.org/10.1016/j.ijfoodmicro.2014.04.011
Stals, A., Baert, L., Botteldoorn, N., Werbrouck, H., Herman, L., Uyttendaele, M., & Van Coillie, E. (2009). Multiplex real-time RT-PCR for simultaneous detection of GI/GII noroviruses and murine norovirus 1. J Virol Methods, 161(2), 247-253. doi:https://dx.doi.org/10.1016/j.jviromet.2009.06.019
Stals, A., Baert, L., De Keuckelaere, A., Van Coillie, E., & Uyttendaele, M. (2011). Evaluation of a norovirus detection methodology for ready-to-eat foods. Int J Food Microbiol, 145(2–3), 420-425. doi:https://dx.doi.org/10.1016/j.ijfoodmicro.2011.01.013
Stals, A., Baert, L., Van Coillie, E., & Uyttendaele, M. (2012a). Extraction of food-borne viruses from food samples: A review. Int J Food Microbiol, 153(1–2), 1-9. doi:https://dx.doi.org/10.1016/j.ijfoodmicro.2011.10.014

170
Stals, A., Jacxsens, L., Baert, L., Van Coillie, E., & Uyttendaele, M. (2015). A quantitative exposure model simulating human norovirus transmission during preparation of deli sandwiches. Int J Food Microbiol, 196(0), 126-136. doi:https://dx.doi.org/10.1016/j.ijfoodmicro.2014.12.004
Stals, A., Mathijs, E., Baert, L., Botteldoorn, N., Denayer, S., Mauroy, A., Scipioni, A., Daube, G., Dierick, K., Herman, L., Van Coillie, E., Thiry, E., & Uyttendaele, M. (2012b). Molecular detection and genotyping of noroviruses. Food Environ Virol, 4(4), 153-167. doi:https://dx.doi.org/10.1007/s12560-012-9092-y
Subekti, D., Lesmana, M., Tjaniadi, P., Safari, N., Frazier, E., Simanjuntak, C., Komalarini, S., Taslim, J., Campbell, J. R., & Oyofo, B. A. (2002a). Incidence of Norwalk-like viruses, rotavirus and adenovirus infection in patients with acute gastroenteritis in Jakarta, Indonesia1. FEMS Immunol Med Microbiol, 33(1), 27-33. doi:https://dx.doi.org/10.1111/j.1574-695X.2002.tb00568.x
Subekti, D. S., Tjaniadi, P., Lesmana, M., Simanjuntak, C., Komalarini, S., Digdowirogo, H., Setiawan, B., Corwin, A. L., Campbell, J. R., Porter, K. R., & Oyofo, B. A. (2002b). Characterization of Norwalk-like virus associated with gastroenteritis in Indonesia*. J Med Virol, 67(2), 253-258. doi:https://dx.doi.org/10.1002/jmv.2215
Suffredini, E., Lanni, L., Arcangeli, G., Pepe, T., Mazzette, R., Ciccaglioni, G., & Croci, L. (2014). Qualitative and quantitative assessment of viral contamination in bivalve molluscs harvested in Italy. Int J Food Microbiol, 184(0), 21-26. doi:https://dx.doi.org/10.1016/j.ijfoodmicro.2014.02.026
Sulvina. (2018). Production analysisi of Green Mussel (Perna viridis) bussiness in Pasaran Island. [Analisis produksi usaha kerang hijau (Perna viridis) di Pulau Pasaran]. (Master), Lampung University, Bandar Lampung.
Svraka, S., Duizer, E., Vennema, H., de Bruin, E., van der Veer, B., Dorresteijn, B., & Koopmans, M. (2007). Etiological role of viruses in outbreaks of acute gastroenteritis in The Netherlands from 1994 through 2005. J Clin Microbiol, 45(5), 1389-1394. doi:https://dx.doi.org/10.1128/JCM.02305-06
Symes, S. J., Gunesekere, I. C., Marshall, J. A., & Wright, P. J. (2007). Norovirus mixed infection in an oyster-associated outbreak: an opportunity for recombination. Arch Virol, 152(6), 1075-1086. doi:https://dx.doi.org/10.1007/s00705-007-0938-9
Takahashi, H., Ohuchi, A., Miya, S., Izawa, Y., & Kimura, B. (2011). Effect of food residues on norovirus survival on stainless steel surfaces. PLOS ONE, 6(8), e21951. doi:https://dx.doi.org/10.1371/journal.pone.0021951

171
Tamplin, M. L. (2005). Modeling pathogen behavior in foods. In P. M. Fratamico, A. K. Bhunia & J. L. Smith (Eds.), Foodborne Pathogens: Microbiology and Molecular Biology (pp. 113-120). Norfolk, UK: Caister Academic Press.
Tamura, K., Stecher, G., Peterson, D., Filipski, A., & Kumar, S. (2013). MEGA6: Molecular Evolutionary Genetics Analysis version 6.0. Mol Biol Evol, 30(12), 2725-2729. doi:https://dx.doi.org/10.1093/molbev/mst197
Tan, M., & Jiang, X. (2007). Norovirus–host interaction: implications for disease control and prevention. Expert Rev Mol Med, 9(19), 1-22. doi:https://dx.doi.org/10.1017/S1462399407000348
Teixeira, A. A. (2015). Thermal food preservation techniques (Pasteurization, Sterilization, Canning and Blanching) Conventional and Advanced Food Processing Technologies (pp. 115-128): John Wiley & Sons, Ltd. doi:http://dx.doi.org/10.1002/9781118406281.ch6
Terio, V., Martella, V., Moschidou, P., Di Pinto, P., Tantillo, G., & Buonavoglia, C. (2010). Norovirus in retail shellfish. Food Microbiol, 27(1), 29-32. doi:https://dx.doi.org/10.1016/j.fm.2009.07.005
Teunis, P., Sukhrie, F., Vennema, H., Bogerman, J., Beersma, M., & Koopmans, M. (2015). Shedding of norovirus in symptomatic and asymptomatic infections. Epidemiol Infect, 143(08), 1710-1717. doi:https://dx.doi.org/10.1017/S095026881400274X
Teunis, P. F. M., Medema, G. J., Kruidenier, L., & Havelaar, A. H. (1997). Assessment of the risk of infection by cyptosporidium or giardia in drinking water from a surface water source. Water Res, 31(6), 1333-1346. doi:https://dx.doi.org/10.1016/S0043-1354(96)00387-9
Teunis, P. F. M., Moe, C. L., Liu, P., Miller, S. E., Lindesmith, L., Baric, R. S., Le Pendu, J., & Calderon, R. L. (2008). Norwalk virus: How infectious is it? J Med Virol, 80(8), 1468-1476. doi:https://dx.doi.org/10.1002/jmv.21237
The Regional Agency of Natural Environment Management (BPLHD). (2015). The status of regional natural environment of the Special Capital Region of Jakarta in 2015 (Status lingkungan hidup daerah Provinsi Daerah Khusus Ibukota Jakarta tahun 2015). Jakarta.
Thomas, M. K., Murray, R., Flockhart, L., Pintar, K., Pollari, F., Fazil, A., Nesbitt, A., & Marshall, B. (2013). Estimates of the burden of foodborne illness in Canada for 30 specified pathogens and unspecified agents, circa 2006. Foodborne Pathog Dis, 10(7), 639-648. doi:https://dx.doi.org/10.1089/fpd.2012.1389
Thorne, L. G., & Goodfellow, I. G. (2014). Norovirus gene expression and replication. J Gen Virol, 95(Pt 2), 278-291. doi:https://dx.doi.org/10.1099/vir.0.059634-0

172
Thurman, R. B., & Gerba, C. P. (1988). Molecular mechanisms of viral inactivation by water disinfectans. Adv Appl Microbiol, 33, 75-105. doi:https://dx.doi.org/10.1016/s0065-2164(08)70205-3
Thurston-Enriquez, J. A., Haas, C. N., Jacangelo, J., & Gerba, C. P. (2003). Chlorine Inactivation of adenovirus type 40 and feline calicivirus. Appl Environ Microbiol, 69(7), 3979.
Thurston-Enriquez, J. A., Haas, C. N., Jacangelo, J., & Gerba, C. P. (2005). Inactivation of enteric adenovirus and feline calicivirus by chlorine dioxide. Appl Environ Microbiol, 71(6), 3100-3105. doi:https://dx.doi.org/10.1128/aem.71.6.3100-3105.2005
Tjon, G. M. S., Coutinho, R. A., van den Hoek, A., Esman, S., Wijkmans, C. J., Hoebe, C. J. P. A., Wolters, B., Swaan, C., Geskus, R. B., Dukers, N., & Bruisten, S. M. (2006). High and persistent excretion of hepatitis A virus in immunocompetent patients. J Med Virol, 78(11), 1398-1405. doi:https://dx.doi.org/10.1002/jmv.20711
Todd, E. C. D., Greig, J. D., Bartleson, C. A., & Michaels, B. S. (2009). Outbreaks where food workers have been implicated in the spread of foodborne disease. Part 6. Transmission and survival of pathogens in the food processing and preparation environment. J Food Prot, 72(1), 202-219. doi:https://dx.doi.org/10.4315/0362-028x-72.1.202
Topping, J. R., Schnerr, H., Haines, J., Scott, M., Carter, M. J., Willcocks, M. M., Bellamy, K., Brown, D. W., Gray, J. J., Gallimore, C. I., & Knight, A. I. (2009). Temperature inactivation of feline calicivirus vaccine strain FCV F-9 in comparison with human noroviruses using an RNA exposure assay and reverse transcribed quantitative real-time polymerase chain reaction—A novel method for predicting virus infectivity. J Virol Methods, 156(1–2), 89-95. doi:https://dx.doi.org/10.1016/j.jviromet.2008.10.024
Torok, V. (2013). Review of foodborne viruses in shellfish and current detection methodologies (pp. 1-27): South Australian Research & Development Institute.
Trujillo, A. A., McCaustland, K. A., Zheng, D.-P., Hadley, L. A., Vaughn, G., Adams, S. M., Ando, T., Glass, R. I., & Monroe, S. S. (2006). Use of TaqMan Real-Time Reverse Transcription-PCR for rapid detection, quantification, and typing of norovirus. J Clin Microbiol, 44(4), 1405-1412. doi:https://dx.doi.org/10.1128/JCM.44.4.1405-1412.2006
Tufenkji, N., & Emelko, M. B. (2011). Fate and transport of microbial contaminants in groundwater Encyclopedia of Environmental Health (pp. 715-726). Burlington: Elsevier. doi:http://dx.doi.org/10.1016/B978-0-444-52272-6.00040-4
Tuladhar, E., Bouwknegt, M., Zwietering, M. H., Koopmans, M., & Duizer, E. (2012). Thermal stability of structurally different viruses with proven or potential relevance to food safety. J Appl Microbiol, 112(5), 1050. doi:https://dx.doi.org/10.1111/j.1365-2672.2012.05282.x

173
Tuladhar, E., Hazeleger, W. C., Koopmans, M., Zwietering, M. H., Duizer, E., & Beumer, R. R. (2013). Transfer of noroviruses between fingers and fomites and food products. Int J Food Microbiol, 167(3), 346-352. doi:https://dx.doi.org/10.1016/j.ijfoodmicro.2013.09.018
Tung, G., Macinga, D., Arbogast, J., & Jaykus, L.-A. (2013). Efficacy of commonly used disinfectants for inactivation of human noroviruses and their surrogates. J Food Prot, 76(7), 1210-1217. doi:https://dx.doi.org/10.4315/0362-028X.JFP-12-532
Turgeon, N., Toulouse, M.-J., Martel, B., Moineau, S., & Duchaine, C. (2014). Comparison of five bacteriophages as models for viral aerosol studies. Appl Environ Microbiol, 80(14), 4242-4250. doi:https://dx.doi.org/10.1128/aem.00767-14
Umesha, K. R., Bhavani, N. C., Venugopal, M. N., Karunasagar, I., Krohne, G., & Karunasagar, I. (2008). Prevalence of human pathogenic enteric viruses in bivalve molluscan shellfish and cultured shrimp in south west coast of India. Int J Food Microbiol, 122(3), 279-286. doi:https://dx.doi.org/10.1016/j.ijfoodmicro.2007.12.024
US Food and Drug Administration. (2018). Secondary direct food additives permitted in food for human consumption - Chlorine dioxide (CFR 173.300). Retrieved from https://www.accessdata.fda.gov/scripts/cdrh/cfdocs/cfcfr/cfrsearch.cfm?fr=173.300.
Ushijima, H., Fujimoto, T., Müller, W. E. G., & Hayakawa, S. (2014). Norovirus and foodborne disease: A review. Food Safety, 2(3), 37-54. doi:https://dx.doi.org/10.14252/foodsafetyfscj.2014027
Usuku, S., Kumazaki, M., Kitamura, K., Tochikubo, O., & Noguchi, Y. (2008). An outbreak of food-borne gastroenteritis due to sapovirus among junior high school students. Jpn J Infect Dis, 61, 438-441.
Utsumi, T., Lusida, M. I., Dinana, Z., Wahyuni, R. M., Yamani, L. N., Juniastuti, Soetjipto, Matsui, C., Deng, L., Abe, T., Doan, Y. H., Fujii, Y., Kimura, H., Katayama, K., & Shoji, I. (2017). Occurrence of norovirus infection in an asymptomatic population in Indonesia. Infect Genet Evol, 55, 1-7. doi:https://dx.doi.org/10.1016/j.meegid.2017.08.020
Van Asselt, E. D., & Zwietering, M. H. (2006). A systematic approach to determine global thermal inactivation parameters for various food pathogens. Int J Food Microbiol, 107(1), 73-82. doi:https://dx.doi.org/10.1016/j.ijfoodmicro.2005.08.014
Van Herck, K., Jacquet, J.-M., & Van Damme, P. (2011). Antibody persistence and immune memory in healthy adults following vaccination with a two-dose inactivated hepatitis A vaccine: Long-term follow-up at 15 years. J Med Virol, 83(11), 1885-1891. doi:https://dx.doi.org/10.1002/jmv.22200

174
Vega, E., Barclay, L., Gregoricus, N., Shirley, S. H., Lee, D., & Vinjé, J. (2014). Genotypic and epidemiologic trends of norovirus outbreaks in the United States, 2009 to 2013. J Clin Microbiol, 52(1), 147-155. doi:https://dx.doi.org/10.1128/jcm.02680-13
Venkobachar, C., Iyengar, L., & Prabhakara Rao, A. V. S. (1977). Mechanism of disinfection: Effect of chlorine on cell membrane functions. Water Res, 11(8), 727-729. doi:https://dx.doi.org/10.1016/0043-1354(77)90114-2
Ventrone, I., Schaeffer, J., Ollivier, J., Parnaudeau, S., Pepe, T., Le Pendu, J., & Le Guyader, F. S. (2013). Chronic or accidental exposure of oysters to norovirus: Is there any difference in contamination? J Food Prot, 76(3), 505. doi:https://dx.doi.org/10.4315/0362-028X.JFP-12-296
Verhaelen, K., Bouwknegt, M., Rutjes, S. A., & de Roda Husman, A. M. (2013). Persistence of human norovirus in reconstituted pesticides — Pesticide application as a possible source of viruses in fresh produce chains. Int J Food Microbiol, 160(3), 323-328. doi:https://dx.doi.org/10.1016/j.ijfoodmicro.2012.11.007
Verhoef, L., Hewitt, J., Barclay, L., Ahmed, S., Lake, R., Hall, A. J., Lopman, B., Kroneman, A., Vennema, H., Vinje, J., & Koopmans, M. (2015). Norovirus genotype profiles associated with foodborne transmission, 1999 - 2012. Emerg Infect Dis, 21(4), 592-599. doi:https://dx.doi.org/10.3201/eid2104.141073
Verhoef, L., Vennema, H., Van Pelt, W., Lees, D., Boshuizen, H., Henshilwood, K., & Koopmans, M. (2010). Use of norovirus genotype profiles to differentiate origins of foodborne outbreaks. Emerg Infect Dis, 16(4), 617-624. doi:https://dx.doi.org/10.3201/eid1604.090723
Victoria, M., Rigotto, C., Moresco, V., de Abreu Corrêa, A., Kolesnikovas, C., Leite, J. P. G., Miagostovich, M. P., & Barardi, C. R. M. (2010). Assessment of norovirus contamination in environmental samples from Florianópolis City, Southern Brazil. J Appl Microbiol, 109(1), 231-238. doi:https://dx.doi.org/10.1111/j.1365-2672.2009.04646.x
Vinjé, J. (2015). Advances in laboratory methods for detection and typing of norovirus. J Clin Microbiol, 53(2), 373-381. doi:https://dx.doi.org/10.1128/jcm.01535-14
Vinjé, J., Hamidjaja, R. A., & Sobsey, M. D. (2004). Development and application of a capsid VP1 (region D) based reverse transcription PCR assay for genotyping of genogroup I and II noroviruses. J Virol Methods, 116(2), 109-117. doi:https://dx.doi.org/10.1016/j.jviromet.2003.11.001
Wang, D., & Tian, P. (2014). Inactivation conditions for human norovirus measured by an in situ capture-qRT-PCR method. Int J Food Microbiol, 172, 76-82. doi:https://dx.doi.org/10.1016/j.ijfoodmicro.2013.11.027

175
Wang, D., Xu, S., Yang, D., Young, G. M., & Tian, P. (2014). New in situ capture Quantitative (Real-Time) Reverse Transcription-PCR method as an alternative approach for determining inactivation of Tulane Virus. Appl Environ Microbiol, 80(7), 2120-2124. doi:https://dx.doi.org/10.1128/AEM.04036-13
Wang, D., Zhang, D., Chen, W., Yu, S., & Shi, X. (2010). Retention of Vibrio parahaemolyticus in oyster tissues after chlorine dioxide treatment. Int J Food Microbiol, 137(1), 76-80. doi:https://dx.doi.org/10.1016/j.ijfoodmicro.2009.10.022
Webby, R. J., Carville, K. S., Kirk, M. D., Greening, G., Ratcliff, R. M., Crerar, S. K., Dempsey, K., Sarna, M., Stafford, R., Patel, M., & Hall, G. (2007). Internationally distributed frozen oyster meat causing multiple outbreaks of norovirus infection in Australia. Clin Infect Dis, 44(8), 1026-1031. doi:https://dx.doi.org/10.1086/512807
Westrell, T., Dusch, V., Ethelberg, S., Harris, J., Hjertqvist, M., Jourdan-da Silva, N., Koller, A., Lenglet, A., Lisby, M., & Vold, L. (2010). Norovirus outbreaks linked to oyster consumption in the United Kingdom, Norway, France, Sweden and Denmark, 2010. Eurosurveillance, 15(12), 8-11. doi:https://dx.doi.org/10.1074/jbc.M603313200
White, K., Osterholm, M., Mariotti, J., Korlath, J., Lawrence, D., Ristinen, T., & Greenberg, H. (1986). A foodborne outbreak of Norwalk virus gastroenteritis evidence for post-recovery transmission. Am J Epidemiol, 124(1), 120-126. doi:https://dx.doi.org/10.1093/oxfordjournals.aje.a114356
White, P. A. (2014). Evolution of norovirus. Clin Microbiol Infect, 20(8), 741-745. doi:https://dx.doi.org/10.1111/1469-0691.12746
Wigginton, K. R., Pecson, B. M., Sigstam, T., Bosshard, F., & Kohn, T. (2012). Virus inactivation mechanisms: Impact of disinfectants on virus function and structural integrity. Environ Sci Technol, 46(21), 12069-12078. doi:https://dx.doi.org/10.1021/es3029473
Winterbourn, J. B., Clements, K., Lowther, J. A., Malham, S. K., McDonald, J. E., & Jones, D. L. (2016). Use of Mytilus edulis biosentinels to investigate spatial patterns of norovirus and faecal indicator organism contamination around coastal sewage discharges. Water Res, 105, 241-250. doi:https://dx.doi.org/10.1016/j.watres.2016.09.002
Wobus, C. E., Thackray, L. B., & Virgin, H. W. (2006). Murine norovirus: A model system to study norovirus biology and pathogenesis. J Virol, 80(11), 5104-5112. doi:https://dx.doi.org/10.1128/jvi.02346-05
Wongso, W. W., & Tobing, H. A. (2012). Mini homestyle indonesian cooking: Tuttle Publishing.

176
World Health Organization. (2013). Advancing food safety initiatives: Strategic plan for food safety including foodborne zoonoses, 2013-2022. In A. F. S. Initiatives (Ed.), Advancing Food Safety Initiatives: World Health Organization.
WWF-Indonesia, F. T. (2015). Perikanan kerang, panduan penangkapan dan penanganan [Shellfish fisheries: Catching and handling practices] (Vol. 1). Jakarta: WWF-Indonesia.
Wyn-Jones, A. P., Carducci, A., Cook, N., D’Agostino, M., Divizia, M., Fleischer, J., Gantzer, C., Gawler, A., Girones, R., Höller, C., de Roda Husman, A. M., Kay, D., Kozyra, I., López-Pila, J., Muscillo, M., José Nascimento, M. S., Papageorgiou, G., Rutjes, S., Sellwood, J., Szewzyk, R., & Wyer, M. (2011). Surveillance of adenoviruses and noroviruses in European recreational waters. Water Res, 45(3), 1025-1038. doi:https://dx.doi.org/10.1016/j.watres.2010.10.015
Yaffe, H., Buxdorf, K., Shapira, I., Ein-Gedi, S., Moyal-Ben Zvi, M., Fridman, E., Moshelion, M., & Levy, M. (2012). LogSpin: a simple, economical and fast method for RNA isolation from infected or healthy plants and other eukaryotic tissues. BMC Research Notes, 5(1), 45. doi:https://dx.doi.org/10.1186/1756-0500-5-45
Yang, N., Qi, H., Wong, M. M. L., Wu, R. S. S., & Kong, R. Y. C. (2012). Prevalence and diversity of norovirus genogroups I and II in Hong Kong marine waters and detection by real-time PCR. Mar Pollut Bull, 64(1), 164-168. doi:https://dx.doi.org/10.1016/j.marpolbul.2011.10.037
Yang, Y., & Griffiths, M. W. (2014). Enzyme treatment Reverse Transcription-PCR to differentiate infectious and inactivated F-specific RNA phages. Appl Environ Microbiol, 80(11), 3334-3340. doi:https://dx.doi.org/10.1128/AEM.03964-13
Ye, M., Li, X., Kingsley, D. H., Jiang, X., & Chen, H. (2014). Inactivation of human norovirus in contaminated oysters and clams by high hydrostatic pressure. Appl Environ Microbiol, 80(7), 2248-2253. doi:https://dx.doi.org/10.1128/AEM.04260-13
Yeap, J. W., Kaur, S., Lou, F., DiCaprio, E., Morgan, M., Linton, R., & Li, J. (2016). Inactivation kinetics and mechanism of a human norovirus surrogate on stainless steel coupons via chlorine dioxide gas. Appl Environ Microbiol, 82(1), 116-123. doi:https://dx.doi.org/10.1128/aem.02489-15
Yen, C., Tate, J. E., Patel, M. M., Cortese, M. M., Lopman, B., Fleming, J., Lewis, K., Jiang, B., Gentsch, J. R., Steele, A. D., & Parashar, U. D. (2011). Rotavirus vaccines. Hum Vaccin Immunother, 7(12), 1282-1290. doi:https://dx.doi.org/10.4161/hv.7.12.18321
Yu, Y., Cai, H., Hu, L., Lei, R., Pan, Y., Yan, S., & Wang, Y. (2015). Molecular epidemiology of oyster-related human noroviruses and their global genetic diversity and temporal-geographical distribution from 1983 to 2014. Appl Environ Microbiol, 81(21), 7615-7624. doi:https://dx.doi.org/10.1128/aem.01729-15

177
Zheng, D.-P., Widdowson, M.-A., Glass, R. I., & Vinjé, J. (2010). Molecular epidemiology of genogroup II-genotype 4 noroviruses in the United States between 1994 and 2006. J Clin Microbiol, 48(1), 168-177. doi:https://dx.doi.org/10.1128/jcm.01622-09
Zheng, D. P., Ando, T., Fankhauser, R. L., Beard, R. S., Glass, R. I., & Monroe, S. S. (2006). Norovirus classification and proposed strain nomenclature. Virology, 346(2), 312-323. doi:https://dx.doi.org/10.1016/j.virol.2005.11.015
Zwietering, M., & Nauta, M. J. (2007). Predictive models in microbiological risk assessment. In S. Brul, S. v. Gerwen & M. Zwietering (Eds.), Modelling microorganisms in food (Vol. 110-125). Cambridge, England: Woodhead Publishing Limited.