Embed Size (px)
Citation preview

RESEARCH ARTICLE10.1002/2016GC006527
Reconciling mantle wedge thermal structure with arc lavathermobarometric determinations in oceanic subduction zonesAlexander Perrin1, Saskia Goes1, Julie Prytulak1, D. Rhodri Davies2, Cian Wilson3, andStephan Kramer1
1Department of Earth Science and Engineering, Imperial College London, London, UK, 2Research School of Earth Sciences,Australian National University, Canberra, Australian Capital Territory, Australia, 3Lamont-Doherty Earth Observatory,Columbia University, Palisades, New York, USA
Abstract Subduction zone mantle wedge temperatures impact plate interaction, melt generation, andchemical recycling. However, it has been challenging to reconcile geophysical and geochemical constraintson wedge thermal structure. Here we chemically determine the equilibration pressures and temperatures ofprimitive arc lavas from worldwide intraoceanic subduction zones and compare them to kinematicallydriven thermal wedge models. We find that equilibration pressures are typically located in the lithosphere,starting just below the Moho, and spanning a wide depth range of �25 km. Equilibration temperatures arehigh for these depths, averaging �13008C. We test for correlations with subduction parameters and findthat equilibration pressures correlate with upper plate age, indicating overriding lithosphere thickness playsa role in magma equilibration. We suggest that most, if not all, thermobarometric pressure and temperatureconditions reflect magmatic reequilibration at a mechanical boundary, rather than reflecting the conditionsof major melt generation. The magma reequilibration conditions are difficult to reconcile, to a first order,with any of the conditions predicted by our dynamic models, with the exception of subduction zones withvery young, thin upper plates. For most zones, a mechanism for substantially thinning the overriding plateis required. Most likely thinning is localized below the arc, as kinematic thinning above the wedge cornerwould lead to a hot fore arc, incompatible with fore-arc surface heat flow and seismic properties. Localizedsubarc thermal erosion is consistent with seismic imaging and exhumed arc structures. Furthermore, suchthermal erosion can serve as a weakness zone and affect subsequent plate evolution.
1. Introduction
Subduction zones are the location of the greatest mass and heat fluxes at Earth’s surface and, thus, are criti-cal to understanding a wide array of Earth processes. For example, subduction exerts primary control onore-deposit formation [e.g., Sillitoe, 2010; Wilkinson, 2013], the generation and growth of continental crust[Huene and Scholl, 1991; Taylor and McLennan, 1995], and the cycling of volatiles [e.g., van Keken et al., 2011;Peacock, 1990]. The mantle wedge is a key part of the subduction system, where magmas are generatedand transferred to the arc, likely instigated by volatile release from the downgoing plate [Tatsumi, 1986;Schmidt and Poli, 1998; Grove et al., 2012; Gill, 2012]. Furthermore, the mantle wedge plays a key role in thedynamic plate-mantle interaction and plate coupling [e.g., Billen and Gurnis, 2001; Arcay, 2012].
Magma genesis, transport and the position of the arc are affected by (Figure 1): (a) subducting plate condi-tions, (b) mantle wedge conditions, and (c) the upper plate. The relative importance of each of these factorsremains debated, with geochemical and geophysical studies providing independent constraints that sup-port various scenarios. We next discuss these constraints, in turn.
a. The thermal conditions of the subducting plate are critical in considering the link between arc volcanismand slab dehydration [e.g., Tatsumi, 1986; Grove et al., 2002]. The variation of slab temperatures with depth(i.e., with pressure) controls where dehydration reactions occur [Schmidt and Poli, 1998; van Keken et al.,2011]. The so-called thermal parameter, U, captures the slab temperature as a function of depth throughthe product of age, A, and subduction velocity, Vc, and dip, d, of the subducting plate, U5A Vc sind [McKen-zie, 1969; Syracuse et al., 2010]. This, in turn, provides the boundary condition for where volatile-inducedmagma genesis in the overlying wedge is possible [Gaetani et al., 1993; Schmidt and Poli, 1998].
Key Points:� Last equilibration pressures of
primitive lavas at oceanic arcs reflectreequilibration within the lithosphere� Lava equilibration pressures correlate
with and span the thickness of theupper plate� Equilibration temperatures require
localized thermal erosion of thelithosphere below the arcs
Supporting Information:� Supporting Information S1� Data Set S1
Correspondence to:A. Perrin,[email protected]
Citation:Perrin, A., S. Goes, J. Prytulak,D. R. Davies, C. Wilson, and S. Kramer(2016), Reconciling mantle wedgethermal structure with arc lavathermobarometric determinations inoceanic subduction zones, Geochem.Geophys. Geosyst., 17, doi:10.1002/2016GC006527.
Received 11 JUL 2016
Accepted 29 SEP 2016
Accepted article online 4 OCT 2016
VC 2016. The Authors.
This is an open access article under the
terms of the Creative Commons
Attribution License, which permits use,
distribution and reproduction in any
medium, provided the original work is
properly cited.
PERRIN ET AL. ARC THERMOBAROMETRY AND THERMAL MODELS 1
Geochemistry, Geophysics, Geosystems
PUBLICATIONS

Recent experimental studies on subducting sediment and slab compositions have proposed a suite ofchemical ‘‘geothermometers’’ which are designed to estimate subarc slab surface temperatures. In essence,geothermometers use the solubility of an accessory phase containing trace elements of interest as majorstructural components (e.g., Ce in allanite) to determine the temperature of the fluid coexisting with theaccessory phase. Hermann and Spandler [2007] suggested the use of K2O/H2O, while Klimm et al. [2008] sug-gested the use of LREE/Ti. Plank et al. [2009] provided a review of geothermometers and advocated the useof H2O/Ce in particular. Cooper et al. [2012] then used the H2O/Ce geothermometer and found a positivecorrelation of temperature estimates determined from H2O/Ce ratios measured in melt inclusions in primi-tive olivine from global subduction zones to slab surface temperatures derived from the numerical modelsof Syracuse et al. [2010]. This relationship suggests that the thermal state of the slab may be reflected in thecomposition of fluids released from the slab into the wedge and that the erupted magmas may ‘‘remember’’this signature.
Turner and Langmuir [2015a] compiled a global database of primitive arc magma chemistry, includingmajor elements, trace elements, and radiogenic isotopes. They confirmed the original observations of Plankand Langmuir [1988] that sodium and calcium contents of magmas normalized to 6 wt % MgO correlatewith the thickness of the arc crust. Turner and Langmuir [2015b] extended the major element findings tosuggest trace element ratio correlations (e.g., La/Yb and Zr/Ti) with crustal thickness as well as, arguably, theslab thermal parameter. Although Turner and Langmuir [2015b] prefer a model where the mantle wedgeprovides the dominant control, they were also able to recreate the chemical correlations with a modelwhere the chemistry of the erupted magmas is controlled by slab thermal structure and its effect on therelease of slab components. However, critically, they find that their chemical trends do not correlate withslab temperatures predicted by thermal models at the depth directly below the arc [Syracuse et al., 2010].Thus, it appears that although the slab controls fluid input into the mantle wedge, it may not be the maincontrolling factor for melt major and trace element composition and migration pathways [e.g., Grove et al.,2012; Schmidt and Poli, 2014; Turner et al., 2016].
b. Mantle wedge conditions likely influence how melts rise. One end-member model is that melt migratesas a fully distributed and reactive flux, for which the thermal conditions determine whether the meltreaches the upper plate before freezing [Grove et al., 2002, 2012]. Alternatively, more focused melt path-ways (or those of the released fluids that lead to melting) may be the result of a balance between themantle wedge’s flow regime, and resistance to melt ascent by permeability variations, which arisethrough thermally controlled variations in viscosity and compaction [Spiegelman and McKenzie, 1987;Sparks and Parmentier, 1991; Cagnioncle et al., 2007; Wilson et al., 2014]. Finally, it has been suggestedthat melts may rise in diapirs [Bremond d’Ars et al., 1995; Hall and Kincaid, 2001], which may containmetamorphic melange mixtures of low-density subducted components (sediments and hydrous crustalmaterial), hydrated mantle, and melts [e.g., Gerya and Yuen, 2003; Behn et al., 2011; Marschall and Schu-macher, 2012].
The wedge is likely to be the dominant location of melt formation. Several studies that compared pres-sure (P) and temperature (T) conditions inferred from melt inclusions with indicators of melt fraction are
Figure 1. Cartoon of corner flow within the mantle wedge, and possible locations of melt generation and equilibration. Pink lines show the flow paths of the mantle within the wedge,typical of the ‘‘corner flow’’ mechanism that is thought to be driven by the subducting plate. Mantle is drawn into the corner and erodes the lithosphere of the upper plate. Blue linesindicate fluid released from the slab/mantle that rises into the wedge. Red circles indicate the locations of melt generation or equilibration. Black arrows are the flow paths of the melt.Red triangles indicate the volcanic front. (a) Main magma generation near the slab surface, and subsequent rise to the volcanoes. (b) Main magma generation within the center of thewedge, and subsequent rise to the volcano. Figure 1c shows magma generation within the wedge, by either Figure 1a or Figure 1b, but with subsequent reequilibration with mantle dur-ing ascent. We use the following terminology in this scenario. The ‘‘source’’ is the mantle from which the magma initially forms. The ‘‘residue’’ is the source postmelting. The ‘‘host’’ is themantle with which the magma last reequilibrated.
Geochemistry, Geophysics, Geosystems 10.1002/2016GC006527
PERRIN ET AL. ARC THERMOBAROMETRY AND THERMAL MODELS 2
in general agreement that the derived P and T reflect primary melting conditions [Kelley et al., 2010; Wattet al., 2013]. These P, T conditions commonly correspond to the shallow wedge. In particular, the wedgecorner has been suggested as a location for melt formation, because the upper plate may be easily erod-ed due to the strain associated with the turning flow [e.g., Kelemen et al., 2003].
Turner and Langmuir’s [2015b] preferred model is one where melt compositions are primarily con-trolled by mantle wedge conditions. They proposed that arc crustal thickness (the subduction parameterwith which they found their strongest trends) is positively correlated with upper plate lithospheric thick-ness and, accordingly, wedge thermal structure and the depth range of melting. This model predicts afourfold difference in degree of melting, and consequently a fourfold primary meltwater content differ-ence, in subduction zones worldwide.
The mantle wedge’s thermal structure has also been proposed as a first-order control on the positionof the volcanic arc front [England and Katz, 2010; Grove et al., 2009]. Grove et al. [2009] proposed that thestability field of hydrous minerals (particularly chlorite) in the slab and mantle wedge largely controlwhere the arc forms, over a region that may span several 100 km from the wedge corner toward theback arc. England and Katz [2010] suggested that the region where anhydrous melting is possible in thewedge may control the focusing of volcanism along a narrow arc. According to their analytical models[England and Wilkins, 2004], wedge temperatures depend on a product of subduction velocity and thesine of slab dip, Vcsind. When Turner and Langmuir [2015b] add a dependence of magma compositionon Vcsind into their wedge models, this further improves data confluence. In contrast, including slab agedoes not lead to improvements in data matching. Thus, there is both geochemical and geophysical evi-dence that mantle wedge pressure-temperature conditions may exert an important control on magmageneration and transport.
c. Finally, it is important to consider the effect of the upper plate on mantle wedge thermal structure. Indetail, Turner and Langmuir [2015b] infer that the upper plate controls wedge structure and therebymelting conditions. In numerical models of thermal wedge structure there is a feedback between over-riding plate structure and wedge flow, where overriding plate thickness puts a constraint on underlyingwedge flow, but wedge flow can also erode the upper plate’s thermal boundary layer thus thinning it,particularly in the wedge corner [e.g., Kelemen et al., 2003; Arcay et al., 2005; Conder, 2005]. England andKatz [2010] propose that it is this interplay which leads to the focusing of melting below the arc. In theirmodel, the enhanced thinning of the upper plate above the wedge corner provides the location wherewedge conditions approach the dry solidus and hence the extent of melting is highest. They proposethat above this highest melt region, localized thermal erosion of the upper plate occurs to form the arc[England and Katz, 2010]. Others have suggested that upper plate stress state may in some zones (e.g.,Sumatra) exert the dominant control on arc position, which would hence be independent of wedgestructure [Pacey et al., 2013; Schmidt and Poli, 2014].
A number of previous studies have investigated the generation and transport of melts at arcs using theequilibration P, T conditions of primitive subduction zone melts. Most have yielded relatively high (mantlewedge like) T (1200–14008C) at low P (around 1 GPa), which is close to the Moho for continental arcs (seecompilation of data by Kelemen et al. [2003]), although some studies, in particular those using melt inclu-sions [e.g., Kelley et al., 2010; Plank and Forsyth, 2016], obtained similarly high temperatures at elevated pres-sures (2–4 GPa). A number of different interpretations have been proposed: (1) the high temperaturesreflect transient conditions associated with melts rising from the wedge [Elkins-Tanton et al., 2001; Ruscittoet al., 2010]; (2) the P, T conditions correspond to the wedge corner above which the overriding plate hasbeen substantially thinned by corner flow [Kelemen et al., 2003; Grove et al., 2012]; and (3) local thermalmodification of the lithosphere below the arc was suggested, similar to the model of England and Katz[2010], in order to reconcile petrological and geodynamical constraints for the conditions obtained fromtwo samples in the Aleutians and Mexico [Weaver et al., 2011].
Here we perform a global compilation of pressure and temperature conditions from major element ther-mobarometry of primitive mantle melts from intraoceanic subduction zones and compare these condi-tions with our subduction zone thermal models. We explore whether: (a) primitive melt P, T conditionsagree with wedge melting conditions in a global sense and (b) if P, T conditions correlate with any physi-cal subduction parameters that may provide insight to whether the subducting slab, the upper plate ormantle wedge’s thermal structure is the dominant control on magma generation and transport.
Geochemistry, Geophysics, Geosystems 10.1002/2016GC006527
PERRIN ET AL. ARC THERMOBAROMETRY AND THERMAL MODELS 3

2. Method
We focus on well characterized intraoceanic arcs (as defined in Syracuse et al. [2010]), with simple oceanicupper plates (Figure 2), to avoid complications arising from possible crustal contamination by thick conti-nental crust. These are Izu, Southern Marianas, Tonga, Kermadec, New Britain, the Lesser Antilles, and SouthSandwich. We also include the West-Central Aleutians, which is considered to be largely oceanic. Otherocean-ocean arcs, the Phillipines, Vanuatu, New Zealand, and Calabria, were not considered due to theircomplex tectonic history and/or partly continental upper plates.
For each of these zones, we use two independent methods for determining mantle P, T conditions belowthe arcs. The first (section 2.1) uses whole-rock major element chemistry of arc lavas and applies the ther-mobarometer developed by Lee et al. [2009] to obtain the P, T conditions of last equilibration with the man-tle. The second (section 2.2) employs kinematic numerical models, following the approach of Syracuse et al.[2010] and Le Voci et al. [2014] to predict thermal structures for each of the subduction zones from whichthe chemical data are obtained.
2.1. Thermobarometry2.1.1. Arc DatabaseArc lava compositions were compiled from the GEOROC database (http://georoc.mpchmainz.gwdg.de/georoc/). Because the thermobarometric calculation of Lee et al. [2009] is dependent on the major elementcomposition of the lavas, we choose to examine samples with MgO contents between 6 and 10 wt %, ratherthan compare those at a similar stage in their fractionation history (e.g., 6 wt % MgO), which is more appro-priate for evaluating broad differences in the trace element chemistry of magmatic sources [e.g., Turner andLangmuir, 2015a]. The lower bound of 6 wt % is to exclude lavas that have undergone extensive crystal frac-tionation, while the upper bound is to remove magmas that have likely accumulated mafic phases. Wewould ideally have set the lower bound higher (e.g., 8 wt % MgO), but lavas in subduction zones are morefractionated than in other tectonic settings, leading to a paucity of lavas with 8–10 wt % MgO. Data werenext individually analyzed for each subduction zone, to include only samples from the active arc front andexclude back arc, fore arc, and older lavas for which the current geometry of the subduction zone is notapplicable. Major and trace element geochemistry of lavas with 6–10 wt % was further scrutinized and sam-ples with a clear plume influence (e.g., Niuatoputapu, Tonga) were also excluded. We also excluded anysamples from studies predating 1975 (as in Turner and Langmuir [2015a]), and only those whose the majorelements had been analyzed by XRF or EMPA on glass, to ensure accurate SiO2 contents. The database is
West-Central Aleutians
Izu
SouthernMarianas
Tonga
Kermadec
NewBritain
LesserAntilles
SouthSandwich
Figure 2. Map of the intraoceanic trenches studied (in blue). Plate boundaries in light gray.
Geochemistry, Geophysics, Geosystems 10.1002/2016GC006527
PERRIN ET AL. ARC THERMOBAROMETRY AND THERMAL MODELS 4

included as Supporting Information. We compared with the database compiled by Turner and Langmuir[2015a] to test robustness of the results.2.1.2. Thermobarometric MethodWe apply the major element thermobarometer proposed by Lee et al. [2009] to our filtered database of arclava geochemistry. This thermobarometer has been used in the study of lava equilibration pressures andtemperatures across a range of tectonic settings, including subduction zones [Watt et al., 2013; Kelley et al.,2010; Weaver et al., 2011; Mullen and Weis, 2015], back arcs [Kelley et al., 2010; Lytle et al., 2012], the basinand range province [Plank and Forsyth, 2016], and mantle plumes [Konter and Becker, 2012].
An individual pressure and temperature condition for a lava sample is calculated as follows. The major ele-ment composition of a lava is specified, along with the primary H2O content, mantle Fe31/RFe, and hostMg#. It is assumed that the lava has undergone some olivine fractionation between the point it last equili-brated with the mantle and eruption. Olivine is added back to the composition, until the Mg# of the lava isin equilibrium with its assumed host mantle. When the primary magma composition has been estimated,the activity of SiO2 in the primary melt, which is sensitive to the equilibration pressure, is calculated. Tem-peratures are estimated based on Fe-Mg exchange, taking into account the effect of the specified watercontent [Lee et al., 2009].
The thermobarometer requires olivine and orthopyroxene to be multiply saturated in the magma sourceregion [Lee et al., 2009], which is a reasonable assumption in subduction zones, where the source is likely tobe modally similar to a depleted MORB mantle (DMM). The thermobarometer was calibrated using a largeexperimental database of basaltic liquids over pressures up to 7 GPa and temperatures of 1100–18008C.Uncertainties in P and T were estimated to be 60.2 GPa, and 30–508, respectively. Similar uncertaintieswere confirmed in a detailed experimental study of two lavas, one from the Aleutian and one from the Mex-ican volcanic arcs [Weaver et al., 2011]. Abers et al. [2014] found that the Lee et al. [2009] thermobarometeryielded temperature estimates that agreed within a few tens of degrees with estimates using Fe8 and Na8.
2.2. Numerical Model SetupFor each of the seven chosen subduction zones, we use plate geometry and velocities from Syracuse et al.[2010] to define a kinematically prescribed subducting plate. We then solve numerically for the consequentflow to a depth of 400 km in the overlying mantle wedge and below the subducting plate, as well as fortemperature throughout the whole domain. The Stokes and energy equations, assuming an incompressibleBousinessq formulation, are solved using the finite element, control-volume code fluidity [Davies et al.,2011; Kramer et al., 2012]. Full details of the methods as well as the reproduction of kinematic subductionbenchmarks of van Keken et al. [2008] can be found in Le Voci et al. [2014] and Davies et al. [2016].
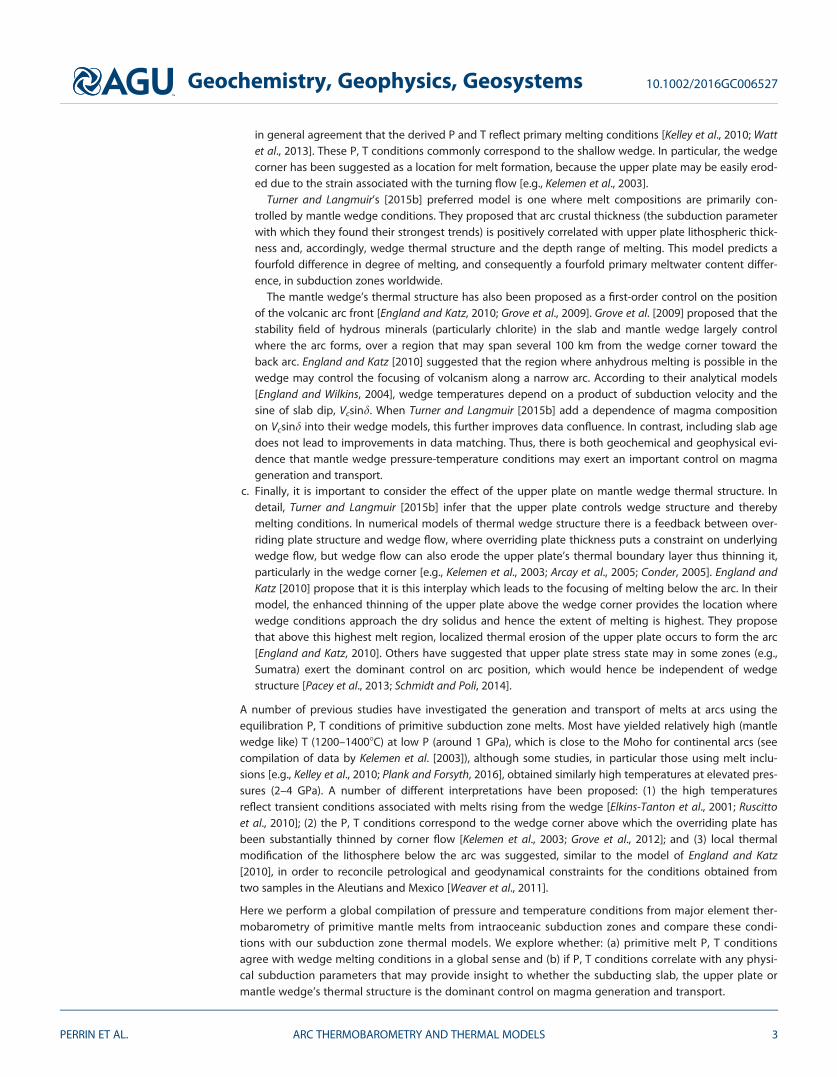
The model setup is similar to that of the models examined by Syracuse et al. [2010] (Figure 3). The top10 km of the subducting plate is set to the velocity of the subducting slab. As the subducting slab is coldand viscous, this top layer drags the rest of the slab that resides beneath it. The upper plate is given a zerovelocity down to a depth of 50 km in our reference setup (smaller depths are tested in a few cases). We alsoset velocities to zero in a small region below this fixed upper plate thickness, over a region 5 km thickdirectly above the subducting slab. This allows us to prescribe the depth to which full decoupling betweenthe slab and upper plate persists. Several previous studies [Wada and Wang, 2009; Syracuse et al., 2010] pre-ferred a decoupling depth of around 80 km as this leads to the formation of a cool fore-arc corner, mostconsistent with observations of low fore-arc surface heat flow and imaged seismic velocities and attenua-tion of the fore-arc mantle [e.g., Kincaid and Sacks, 1997; Hyndman and Peacock, 2003; Currie and Hyndman,2006; Rychert et al., 2008]. However, others preferred shallower depths [Kelemen et al., 2003] or depths thatevolved in response to thermal structure [Arcay et al., 2005; Arcay, 2012]. Our default decoupling depth is80 km, but as decoupling depth is one of the key parameters controlling wedge temperatures, we will dis-cuss how varying this depth affects thermal structure and compatibility between the thermal models andthe thermobarometric data.
Other mechanical boundary conditions imposed are stress-free sides below the two kinematically pre-scribed plates, as well as a stress-free base below the subducting plate. At the base of the model above theslab, an outflow velocity equal to that of the subducting plate is applied, to simulate the effect of thedeeper slab [see Le Voci et al., 2014]. This boundary always extends 100 km to the right of the slab, andtherefore the entire width of the model varies depending on the dip of the slab in each case, extending
Geochemistry, Geophysics, Geosystems 10.1002/2016GC006527
PERRIN ET AL. ARC THERMOBAROMETRY AND THERMAL MODELS 5
between 300 and 500 km oceanward from the trench. Temperature boundary conditions are 273 K on thetop, an error function commensurate with the incoming and overriding plate ages on the side, and zeroheatflux on the bottom boundary. Mantle potential temperature is set to 13508C [Courtier et al., 2007],although a hotter temperature of 14218C used by Syracuse et al. [2010] based on the plate model of Steinand Stein [1992] was also examined.
We assume a temperature, pressure, H2O-dependent composite diffusion- and dislocation-creep rheology,with the same parameters as Davies et al. [2016], for a damp mantle with a hydration of 1000 H/106Si (TableS1). All material parameters are as in Le Voci et al. [2014] and summarized in Table S1.
The initial temperature field is set to an error function according to the chosen downgoing and initial upperplate ages in the plates, and mantle potential temperature below. They are then run until the upper platereaches the thermal age as given in the Syracuse et al. [2010] database. The initial upper plate age is chosento allow the thermal structure of the downgoing plate to reach a quasi steady state. For example, in Tonga,to take a snapshot at the current upper plate age, we set the initial upper plate thermal structure accordingto a half-space cooling model with an age of 1 Myr. The model is then run and a snapshot of the thermalstructure is taken at 9 Myr, to provide an approximation of the 10 Myr upper plate age. The plate reachesthe base of the model after 2 Myr, and subsequently slab thermal structure stabilizes for another 7 Myr.Where the upper plate is very young, for example in New Britain where the age is 2 Myr [Syracuse et al.,2010], there is insufficient time for the thermal structure to develop and so we take a snapshot of the ther-mal structure at 8 Myr.
Other studies have preferred to analyze models when the wedge reaches a (quasi)steady state [e.g.,Syracuse et al., 2010]. Kelemen et al. [2003] report that time to steady state in their wedge models is 10 Myrfor the wedge corner and 100 Myr for the entire model, while Dumoulin et al. [2001] found similarly longtime scales for oceanic lithosphere to achieve a thermal equilibrium, i.e., time scales that exceed the age ofmany of the Pacific subduction zones. Syracuse et al. [2010] run their models for 20 Myr to approximate asteady state velocity field and then solve for the corresponding temperatures. Given the notably high tem-peratures at low pressures often obtained from thermobarometry, considering a snapshot of the thermalstructure at a time equal to the upper plate age rather than letting the upper plate cool to a steady state,increases the likelihood of reconciling thermal models and thermobarometric data. Furthermore, as summa-rized by Schmidt and Poli [2014], subduction zones are generally not in a steady state, as suggested by thelack of correlation between the parameters governing the thermal field within the wedge and the positionof the arc.
Figure 3. Model setup showing the grid used, color-coded according to the velocity conditions prescribed, and the boundary conditionsapplied. Velocities are prescribed in the top 10 km of the slab (cyan) and top 50 km of the upper plate (green), while they are solved for inthe wedge (orange) and below the slab (black). The geometry of the subducting plates is based on the analysis of Syracuse and Abers[2006]. We model the decoupling depth by prescribing a thin region (black area shown in inset, �5 km thick) of zero velocity above theslab. This extends to 80 km depth.
Geochemistry, Geophysics, Geosystems 10.1002/2016GC006527
PERRIN ET AL. ARC THERMOBAROMETRY AND THERMAL MODELS 6

3. Results: Major-Element Thermobarometry
3.1. Uncertainties in Thermobarometric CalculationsFigure 4 shows the thermobarometric P, T estimates obtained from filtered samples for all arcs in our data-base. We first discuss the sensitivity of calculated pressure and temperature to host rock composition (i.e.,Mg#), primary H2O content, and oxygen fugacity.3.1.1. Effect of Magmatic EvolutionThe thermobarometer corrects only for olivine fractionation, and thus fractionation of other phases couldaffect the calculated primary major element composition and subsequent pressure and temperature esti-mates. Lee et al. [2009] choose samples with >8.5 wt % MgO, to ensure that only olivine has fractionated.Arc lavas are typically more fractionated than those from other tectonic settings and, as noted previously,choosing this minimum MgO would dramatically reduce the number of the samples available for analysis. Aplot of equilibration pressure versus MgO for all MgO contents yields some sense of lower MgO lavas tend-ing to have lower calculated pressures in some subduction zones (Figure S1). However, this trend is mostpronounced in lavas with MgO <6 wt %. Although this uncertainty is likely negated by our filtering criteria,
Figure 4. Calculated magma equilibration P, T using the thermobarometer of Lee et al. [2009] for all arcs, in order of upper plate age, exploring uncertainty in primary melt H2O content(from 0 (red) to 8 (blue) wt %), Mg# of the host rock (filled symbol 5 0.9, hollow 5 0.92), and fO2 (0.1–0.2 as shown by red error bars, points plotted at 0.15). Each point represents the cal-culated P, T for one lava sample. For example, for the Tonga data set, the red filled symbols represent the P, T for all the lavas from the data set calculated assuming primary H2O 5 0 wt%, host Mg# 5 0.9, and fO2 5 0.15. The hollow symbols are the calculated P, T of the data set, assuming the same parameters, except for host Mg# 5 0.92. For comparison, we plot solidifrom Katz et al. [2003], crustal thicknesses from Clift and Vannucchi [2004], and slab surface depths below the arc, marked by an H, from Syracuse et al. [2010]. Red lines are adiabats forpotential temperatures of 1350 and 14508C.
Geochemistry, Geophysics, Geosystems 10.1002/2016GC006527
PERRIN ET AL. ARC THERMOBAROMETRY AND THERMAL MODELS 7

it is of interest to assess the magnitude of calculated pressure and temperature change induced by unac-counted crystal fractionation.
To ensure olivine only fractionation, Abers et al. [2014] based their sample choice on MgO-CaO and MgO-Al2O3 relationships, and this results in the inclusion of samples with <6 wt % MgO. The effects of ignoringpossible plagioclase and clinopyroxene fractionation were considered. Plagioclase fractionation caused aslight overestimate of SiO2 and MgO [Lee et al., 2009], leading to a slight overestimate of T and P. However,in water rich magmas typical of subduction zones, plagioclase crystallization is suppressed [e.g., Gaetaniet al., 1993], thus our filtering criteria of 6–10 wt % MgO makes it unlikely that our samples are affected bythis process. Ignoring clinopyroxene (cpx) fractionation results in an underestimate of SiO2 and an overesti-mate of MgO, resulting in a lower P and higher T estimate. Abers et al. [2014] quantified the effects of cpxfractionation by adding back cpx until the magma had 12 wt % CaO. Their cpx correction resulted in a tem-perature decrease of 108C and a pressure decrease of 0.05 GPa. Overall, a generous estimate of the uncer-tainty resulting from unaccounted fractionation of plagioclase and clinopyroxene in our filtered lavas is onthe order of (108C and 0.05 GPa, i.e., �2 km) and does not impact our interpretations.3.1.2. Effect of fO2
When magma composition is corrected for olivine fractionation, a partition coefficient dependent on theFe21 concentration and Mg# of the melt and mantle is used. This calculation is dependent upon the relativeamount of Fe21 to Fe31 in the primary magma (Fe31/RFe). The original Fe31/RFe is uncertain as the oxida-tion state of the mantle is strongly debated [e.g., Kelley and Cottrell, 2009; Lee et al., 2010]. Kelley and Cottrell[2009] suggest that the magmatic Fe31/RFe of subduction zones is more oxidized, with values in the regionof 0.18–0.32 (compared with 0.13–0.17 at ridges and 0.15–0.19 at back arcs). Lee et al. [2005, 2010] haveadvocated negligible difference in the oxidation state of the mantle beneath volcanic arcs and mid-oceanridges, and thus employed a value of 0.1 in their analysis of subduction zone lavas in Lee et al. [2009]. Aberset al. [2014] select specific values of Fe31/RFe for each of the arcs they consider. For example, in the Maria-nas, a value was selected for individual islands (ranging from 0.23 to 0.26) based on available data. In CostaRica and Nicaragua, where there is no available data, Abers et al. [2014] assume a ratio of 0.25. Kelley et al.[2010] assume a value of 0.25 for the Mariana arc. All else being equal, increasing Fe31/RFe to more oxidiz-ing conditions results in a decrease in estimated pressure and temperature (see Table 1). The symbols inFigure 4 are calculated with Fe31/RFe 5 0.15, with error bars depicting calculations at Fe31/RFe 5 0.1 and
Table 1. Effect of Altering H2O Content, Host Mg#, or Fe31/RFe on Selected Samples From Tonga (Chosen to Cover a Range of P, TSpace)a
Changing H2O Content From 0 to 8 wt %Host Mg# 5 0.91, Fe31/RFe 5 0.15
Sample Name Ave. P (GPa) P0–P8 (GPa) Ave. T (8C) T0–T8 (8C)
89T25 1 20.2 1306 148T052A 1.3 20.1 1324 150482-8-11 1.7 0 1357 162Average 1.3 20.1 1329 153
Altering Host Mg# From 0.90 to 0.92H2O Content 4 wt %, Fe31/RFe 5 0.15
Sample Name Ave. P (GPa) P0:92–P0:90 (GPa) Ave. T (8C) T0:92–T0:90 (8C)
89T25 1.1 0.5 1301 82T052A 1.4 0.5 1319 85482-8-11 1.7 0.7 1352 91Average 1.4 0.6 1324 86
Altering Fe31/RFe From 0.1 to 0.2Host Mg# 5 0.91, H2O Content 4 wt %
Sample Name Ave. P (GPa) P0:1–P0:2 (GPa) Ave. T (8C) T0:1–T0:2 (8C)
89T25 1 0.2 1297 42T052A 1.3 0.3 1316 44482-8-11 1.7 0.3 1348 47Average 1.4 0.3 1320 44
aUncertainties generally increase with increasing P and T.
Geochemistry, Geophysics, Geosystems 10.1002/2016GC006527
PERRIN ET AL. ARC THERMOBAROMETRY AND THERMAL MODELS 8

0.2. As the effect is relatively small (on the order of 0.2–0.3 GPa), and the oxidation state of subduction zonemantle is an area of much debate, we choose to set Fe31/RFe to 0.15 for all samples.3.1.3. Effect of Changes in Primary H2O ContentPrimary H2O contents of subduction zone magmas are thought to vary from dry (<1 wt %) to wet (>8 wt%) [Grove et al., 2002] (Figure 4). From worldwide melt inclusion data, however, the primary H2O concentra-tions are thought to be on average 4 wt % [Plank et al., 2013], which we assume when comparing models.The effect of H2O variation on equilibration conditions is shown in Table 1. Decreasing the assumed H2Ocontent has a relatively small effect on pressure. For a large water content variation from 8 to 0 wt %, pres-sure estimates change by up to 20.3 GPa for the lowest pressures [see also Lee et al., 2009] to less than20.1 GPa for pressures above 1 GPa. The effect on temperature estimates is more substantial and adecrease in water content from wet to dry increases the temperature by around 1508.3.1.4. Effect of ‘‘Host’’ CompositionThe Mg# (where Mg# 5 Mg/(Mg1Fe)) of the mantle ‘‘host’’ with which the magma last equilibrated is anunknown variable linked to the melt depletion history of the mantle source, with progressive depletionresulting in higher Mg#. For example, many studies suggest that the mantle wedge is more depleted thanthe source of MORB, perhaps due to melt depletion in the back arc [McCulloch and Gamble, 1991; Woodheadet al., 1993; Kimura and Yoshida, 2006]. The DMM1 composition [Wasylenki et al., 2003] which is equivalentto the depleted MORB mantle (DMM) with 10% melt removed, has Mg# �0.9. Given that it is highly unlikelythat arc lavas derive from a source with Mg# <0.9, Lee et al. [2009] initially explored a range of 0.9–0.92 forsubduction zones. Progressive host depletion as reflected in changing Mg# from 0.90 to 0.92 results in sig-nificantly higher calculated pressures (�0.5–0.7 GPa) and elevated temperatures (�80–908C) (Figure 4 andTable 1). Abers et al. [2014] assume a host Mg# of 0.9 for all three subduction zones they consider, but givelittle justification. Weaver et al. [2011] use SiO2 and TiO2 contents of oceanic arc magmas from five subduc-tion zones to argue that lavas from oceanic arcs equilibrate more often with a lherzolitic host rock(Mg# 5 0.9). Harzburgitic hosts (i.e., Mg#> 0.9) are possible, but more common in continental margin arcs.Given this uncertainty and previous work, we assume Mg# 5 0.9 as our reference value, but explore theeffect of using more depleted host compositions.3.1.5. SummaryOverall, temperature estimates are most sensitive to primary H2O content, while host Mg#, fO2, and mag-matic evolution (in order of importance) play a secondary role. In contrast, pressure is most affected by thechoice of host Mg#, with less sensitivity to fO2, H2O, and magmatic evolution.
3.2. Calculated Pressures and Temperatures3.2.1. Inferred P and T RangesWhile the range and average pressures vary in each subduction zone, a few distinct global characteristicsstand out, irrespective of the uncertainties discussed above. These are illustrated in Figure 4, by focusing ona set of pressure and temperature conditions with a single host rock composition (e.g., solid symbols) and 4wt % water (e.g., cyan symbols).
1. Most thermobarometric conditions lie at relatively low pressures which fall in a lithospheric depth rangefrom the Moho to 100 km depth, with an average for all zones of about 40 km depth.
2. A large range of pressures is obtained for each subduction zone (especially for Izu, where they span >2GPa, i.e., over 60 km). For all zones, the average pressure range is �0.8 GPa, corresponding to about 25 km.
3. Relatively high temperatures are obtained at shallow depths, all near the temperatures of a dry solidus.These temperatures are more like those expected in the central region of the mantle wedge, rather thanthose of a conductive lithosphere.
4. Compared to the range of temperatures expected in the upper plate and mantle wedge (from close tosurface temperatures near 08C to wedge temperatures of around 13508C), for a constant water content,the range of temperatures is narrow, generally only spanning 100–2008C.
5. For a constant water content, the P, T conditions approximately parallel the solidi, i.e., a trend steeperthan a conductive lithospheric geotherm, but less steep than either a mantle or a melt adiabat. This ismost apparent for the subduction zones where points span the largest pressure ranges (e.g., Figure 4g).This implies that the apparent degree of melting is relatively constant over the range of P, T conditionsin each zone. The geotherms defined by the P, T data are similar to those that are predicted from adia-batic melting models [e.g., Morgan, 2001], where latent heat extraction by melting leads to increasingly
Geochemistry, Geophysics, Geosystems 10.1002/2016GC006527
PERRIN ET AL. ARC THERMOBAROMETRY AND THERMAL MODELS 9

subadiabatic temperatures,along trends close to that ofthe solidus, as initially adia-batic mantle rises to shal-lower depths.
3.2.2. Trends WithSubduction ParametersNext we examine the covaria-tion of calculated P and T witha range of subduction zoneparameters. We tested correla-tions with upper plate age,upper plate crustal thickness,subduction velocity, subduct-ing plate dip, and subductingplate age (values taken fromSyracuse et al. [2010]), whichare the parameters controllingslab and/or the mantle wedge’sthermal structure (section 1).
The main pressure sensitivity inthe thermobarometric calcula-tions is host rock composition,which has a small enougheffect that it is not expected tomask primary differences inequilibration pressure.Although it is likely that thecomposition of the host rockvaries between zones, it is clearthat irrespective of assumedhost composition, the equilibra-tion depths are mostly locatedwithin the upper plate.
We find that equilibration pres-sures have negligible correlationwith parameters that controlslab thermal structure: slab dipand age, convergence velocity(Figure S3), or the combinationof these, the thermal parameter(Figure 5a).
The only parameter with whichthere is a significant pressure correlation, is upper plate age (Figure 5b). This includes strong positive corre-lations between the median, mean and range of the equilibration pressures and the upper plate age, of0.89, 0.91, and 0.91, respectively. We also note that the pressure range increase with upper plate age ismostly due to an increase in the maximum pressures sampled—the minimum pressure is relatively similarbetween subduction zones, and close to the base of the crust.
It is worth considering if the strong correlation with pressure range could simply be due to the fact that thezones with older upper plate ages have a larger number of samples meeting our filtering criteria. For exam-ple Izu is an outlier in terms of number of samples passing our filtering criteria (there are 120, almost doublethe second largest) and has the largest pressure range. To test this, pressure range is plotted versus thenumber of samples available, and returns only a moderate correlation (0.57, Figure S2 in Supporting
Figure 5. Pressure estimations assuming H2O content 5 4 wt %, host Mg# 5 0.9, Fe31/Fetotal 5 0.15 versus (a) arc thermal parameter and (b) upper plate age. Each cyan point isan individual sample pressure. Black markers are medians, and red error bars are standarddeviations for each arc data set. Note that the Lesser Antilles actually has an upper plateage of 50 Ma, but has been offset slightly to enable clearer viewing of data. The same istrue for the Southern Marianas (actual 25 Myr upper plate age) and South Sandwich (actual2 Myr upper plate age). While there is a poor correlation between the thermal parameterand various parameters of the P distribution (with mean: r 5 0.25, median: r 5 0.20, stan-dard deviation: r 5 0.38, range: r 5 0.40), there is a good correlation of P with upper plateage (with mean: r 5 0.91, median: r 5 0.89, standard deviation: r 5 0.83, range: r 5 0.91).
Geochemistry, Geophysics, Geosystems 10.1002/2016GC006527
PERRIN ET AL. ARC THERMOBAROMETRY AND THERMAL MODELS 10

Information). If Izu is excluded, the correlations remain strong (mean r 5 0.87, median r 5 0.84, standarddeviation r 5 0.73, and range r 5 0.88). Therefore, the number of samples does not exert a major control onthe correlation of upper plate age and equilibration pressure.
We use upper plate age as a proxy for upper plate thickness (as did Syracuse et al. [2010]). Although this isreasonable, there are significant uncertainties in oceanic upper plate thicknesses. The values for the upperplate age in Syracuse et al. [2010] are chosen as half the age of the oldest part of the plate. By the compari-son of age maps and seismic studies [M€uller et al., 2008; Wiens et al., 2006; Abers et al., 2014; Calvert, 2011], itis clear that the main trends in lithospheric thickness, in particular the order of the youngest, middle agesand oldest upper plates in our data set are probably robust. (a) Upper plate age increases from the Marianasto Izu, as well as from Tonga to Kermadec because the distance from the back-arc spreading center andage of activity increase in those directions. (b) The Antilles upper plate is one of the oldest (Cretaceous), butfurther affected by subsequent Eocene thinning (Grenada Basin) [Bouysse, 1988], so 50 m.y. is probably areasonable effective age. The Izu upper plate is partly relatively young, but contains large age gradientswith maximum ages up to 100 m.y. and may be affected by the collision of the arc with Honshu which alsoresults in a relatively thick crust [e.g., Calvert, 2011], so it too is at the high end of overriding plate thicknessrelative to the other zones we studied. (c) The Marianas upper plate is thicker and colder than Tonga’s[Wiens et al., 2006], making Marianas and Kermadec the middle range in ages. (d) Scotia has a very youngback arc and thin lithosphere [Wiens et al., 2006], and the New Britain back arc is similarly young (1–4 Ma)[Holm et al., 2016]. Tonga’s back arc is also young (most recent spreading from 7 to 0 Ma, older spreadingfrom 35 Ma) [Sdrolias and M€uller, 2006] and appears to be relatively hot [Wiens et al., 2006; Abers et al.,2014]. Thus, in spite of the uncertainties in lithospheric thickness, the order of the zones would be unlikelyto change significantly, and this is what yields the correlation between the pressure range and upper plateage.
Turner and Langmuir [2015b] inferred from their global data set that lithospheric thickness correlates withcrustal thickness. Such a correlation can be understood if both crust and lithosphere are affected by thesame tectonic or magmatic thickening or thinning processes [Turner et al., 2016; Karlstrom et al., 2014]. How-ever, we do not find a correlation of lava thermobarometric pressures with arc crustal thicknesses fromeither the Syracuse et al. [2010] or Turner and Langmuir [2015b] compilations (the latter is shown Figure S3).It is worth recognizing that crust and lithospheric thicknesses are also affected by distinct processes (likethermal and convective erosion of the lithosphere). Many of the zones we study, have been subject to mul-tiple episodes of back-arc rifting which cumulatively built the arc crust, but each time renewed much of theupper plate lithosphere. This may well explain why we find no correlation between crust and lithosphericthickness in our data set of intraoceanic subduction zones.
In contrast to the pressure estimates, equilibration temperature estimates are sensitive to primary watercontent and it is likely that that this varies significantly between and within zones [e.g., Turner and Langmuir,2015b; Plank et al., 2013], and hence trends with temperature may become obscured. Indeed, when anassumption of constant water content across all zones is employed, no meaningful trends emerge.3.2.3. Along-Arc VariationsSystematic variation in equilibration pressure range with upper plate age can be further illustrated by exam-ining the distribution of pressures along individual arcs. Figure 6 shows the variation along the Izu-SouthernMarianas and Tonga-Kermadec arc segments. The deepening of maximum pressures can be clearly seengoing from the younger upper plate in the southern Marianas to the older/thicker upper plate in Izu alongthe IBM trench (as shown by gray lines). Similarly, along the Tonga-Kermadec trench, the upper plate ageincreases southward as do the maximum pressures and the pressure ranges.
Figure 6 also showcases that although the overall trends are clearly distinguished both in averages (Figure5) and in along-arc sections, there is significant variability from island to island, even between nearbyislands, in both maximum pressure and range. For example, at Kao volcano in Tonga, located at 2208 south,there are lavas which sample pressures on average 0.7 GPa deeper than those from nearby Tofua volcano,despite being located only 10 km apart.
If we assume that the samples from Kao equilibrated with Mg# 0.9, and the samples from Tofua equilibratedwith Mg# 0.92 with all other parameters equal, then the pressures can be reconciled. Although it is notimpossible that such short-scale variations in mantle composition exist, sampling bias must also be
Geochemistry, Geophysics, Geosystems 10.1002/2016GC006527
PERRIN ET AL. ARC THERMOBAROMETRY AND THERMAL MODELS 11

considered. The number ofsamples at most islands issmall, usually <20, with someislands only having one ortwo analyses that meet ourfiltering criteria. Given theoverall large range of equili-bration pressures observed,caution needs to be exercisedwhen analyzing results from asingle volcano or island.
Similar short-scale variabilityis also seen in Izu at around338N. The pressures here varyby �1 GPa over 25 km sur-face distance at a constanthost Mg#. One sample in thesouthern part of this area,from the study of Taylor andNesbitt [1998], is from theisland of Hachijojima (whichis composed of two volca-noes, Nishiyama and Higa-shiyama), and records apressure of 1.5 GPa (at 0.9host Mg#). The samples withapparently larger equilibra-tion pressures, from thestudy of Ishizuka et al. [2008],
were dredged to the north of the island and are submarine samples that are part of a chain extending to theNW of Hachijojima, and also from Hachijo-kojima, a volcano to the west of Hachijojima. They conclude thatthe samples from the chain to the NW of Hachijojima and Hachijo-kojima are from the same primary magmasource as the Hachijojima volcano and are the result of lateral magma transport along arc within the crust.This indicates different depths of equilibration for magmas from the same source. Where there are a largenumber of samples available at an island, pressures over a range of �1 GPa can be sampled, reinforcing thenotion that short-scale pressure differences may be due to insufficient sample size at a particular location.3.2.4. Comparison With Turner and Langmuir Data SetThe only statistically significant trend in our analysis is that of equilibration pressure and upper plate age.To further test the robustness of this trend, we apply a similar analysis to the database compiled by Turnerand Langmuir [2015a], who used somewhat different criteria of sample age and quality in their selection.When compiling their database, Turner and Langmuir [2015a] selected samples with the aim to comparelavas that had experienced a similar level of fractionation, e.g., only considering samples with MgO contentbetween 5.5 and 6.5 wt %. Within this range, the amount of fractionation can affect major element concen-trations, and therefore the pressure estimated using the Lee et al. [2009], as shown in Figure S1. They addi-tionally filtered for Eu anomalies that indicate that samples had been affected by either plagioclasefractionation or mixing with an end-member which has undergone plagioclase fractionation (Eu anomaly<0.85) or plagioclase accumulation (Eu anomaly >1.1). Although, as discussed previously, we expect ourcalculated P, T to not be significantly affected by potential plagioclase fractionation, this more stringent fil-tering process could illuminate possible mixing or accumulation of plagioclase. We refiltered the Turner andLangmuir [2015a] database for samples with MgO contents between 6 and 10 wt %, and with an Eu anoma-ly in the range of 0.85–1.1, to enable comparison with our database.
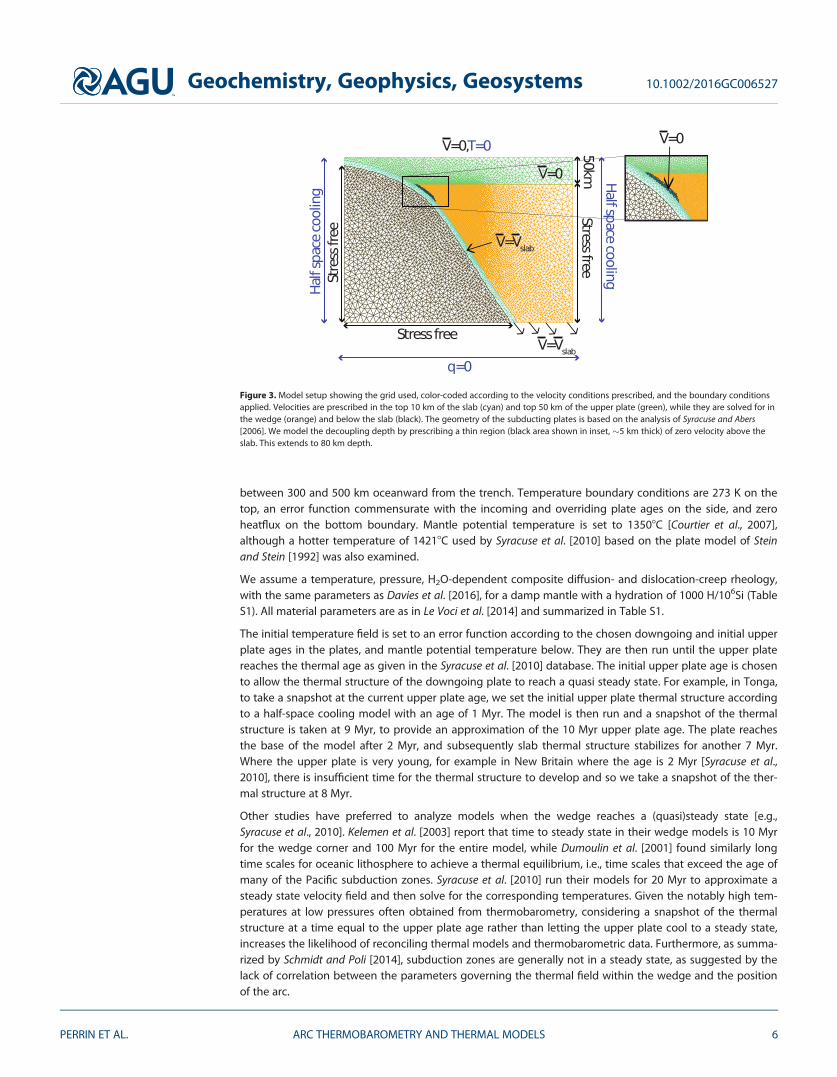
The relationship between pressure and upper plate age for the Turner and Langmuir [2015a] database isshown in Figure 7. Similar strong correlations are seen with median and mean pressures and upper plate
Figure 6. Along-arc pressure variations for the (a) Tonga-Kermadec and (b) Izu-Marianas arcs,calculated assuming 4 wt % H2O, Fe31/Fetotal 5 0.15, and at both host Mg# 5 0.9 andMg# 5 0.92. Islands labeled are those referred to in text. Gray lines are hand-drawn and illus-trate the change in the deepest pressure estimates along the arcs.
Geochemistry, Geophysics, Geosystems 10.1002/2016GC006527
PERRIN ET AL. ARC THERMOBAROMETRY AND THERMAL MODELS 12
age (0.73 and 0.75, respectively), althoughthe correlation with range is somewhatweaker, at 0.61, as is the correlationwith the standard deviation, 0.54. Simi-lar to the analyses with our database,no correlations are found with any oth-er subduction zone parameters (Sup-porting Information Figure S3).3.2.5. Comparison With PublishedContinental P, TIn the future, it would be useful toextend the analysis to continental arcs.A few have already been studied previ-ously. Kelemen et al. [2003] compiled P,T estimates from a few active arcs(including data points from Japan andCascadia), while Lee et al. [2009], Elkins-Tanton et al. [2001], Ruscitto et al.[2010], and Watt et al. [2013] compiledmore comprehensive data sets for Cas-cadia and the southern Chile VolcanicZone, respectively. In all cases, theyfind pressure estimates that rangefrom about the base of the Moho to1.5–2.5 GPa. Their temperature esti-mates are much higher than expected
for any continental geotherms and follow a trend that more or less parallels the solidus. Lithospheric thick-nesses in continental back-arc regions tend to be around 50–70 km [Currie and Hyndman, 2006], with thosefor Cascadia between 55 and 75 km [Currie and Hyndman, 2006], and those for Southern Chile between 60and 70 km [e.g., Currie and Hyndman, 2006; Hickey-Vargas et al., 2016], for distances <100 km from thetrench. Thus, the range of thermobarometric pressures overlaps and possibly extends slightly below theselithospheric thicknesses. From this limited set, it appears the available continental data reflect very similarconditions as those we find for our intraoceanic primitive arc lavas.
4. Discussion and Interpretation: Comparison With Numerical Models
It is clear from the analyses above as well as previous work [e.g., Kelemen et al., 2003; Ruscitto et al., 2010;Weaver et al., 2011; Watt et al., 2013], that the prevalence of elevated temperatures coupled to shallow pres-sures in petrologically determined P, T estimates is not straightforward to reconcile with predictions fromthermal models. We next evaluate the extent of disagreement between models and equilibration P, T condi-tions. Because of the apparent control that upper plate age has on equilibration pressures, we discussresults by using the cases of Tonga and the Lesser Antilles (Figure 8), which have upper plate ages of 10Myr (young) and 50 Myr (comparatively old), respectively. Models for all other zones are included in FigureS4 of Supporting Information.
For each subduction zone, we evaluate whether the P, T conditions inferred from thermobarometry corre-spond to numerically predicted conditions in the mantle wedge. We perform comparisons of thermal mod-els and thermobarometry for a range of host Mg# (0.90, 0.91, and 0.92), and primary H2O contents (0, 4, and8 wt %). Uncertainties stemming from assumed Fe31/RFe in thermobarometric calculations are used toassign error values of 60.15 GPa and 6228C to the petrologic PT conditions for this comparison.
Several studies of wedge models have documented that the main controls on wedge temperature are sub-duction velocity, slab dip, upper plate thickness, decoupling depth, and mantle temperature [van Kekenet al., 2002; Syracuse et al., 2010; Wada et al., 2008; Conder, 2005; England and Wilkins, 2004; Le Voci et al.,2014; Karlstrom et al., 2014; Turner et al., 2016]. The first two parameters are zone specific and well con-strained by data [Syracuse et al., 2010]. Upper plate thickness is also zone specific, but as discussed above
Figure 7. Same as Figure 5, but for the data set of Turner and Langmuir [2015a]:pressure estimations for primitive water content of 4 wt % H2O, host Mg# 5 0.9,Fe31/Fetotal 5 0.15 versus upper plate age. Each cyan point is an individual samplepressure. Black markers are medians, and red error bars are standard deviationsfor each arc data set. Note that the Lesser Antilles actually has an upper plate ageof 50 Myr, but has been offset slightly to enable clearer viewing of data. This isthe same for the Southern Marianas (actual 25 Myr upper plate age) and SouthSandwich (actual 2 Myr upper plate age). As with our data set, there is a signifi-cant correlation between upper plate age and the pressure distribution, withmean: r 5 0.75, median: r 50.73, standard deviation: r 5 0.54, range: r 5 0.61.
Geochemistry, Geophysics, Geosystems 10.1002/2016GC006527
PERRIN ET AL. ARC THERMOBAROMETRY AND THERMAL MODELS 13

less well constrained. Further-more, upper plate thicknessmay vary due to (a) dynamicinteraction with wedge flowand (b) inherited variations inplate thickness. The first pro-cess is incorporated in themodels and as a result upperplate thickness evolves withtime (i.e., until the zone-specific upper plate age isreached). This evolution isstrongly affected by thechoice of decoupling depth[Syracuse et al., 2010; Wadaet al., 2008; Conder, 2005].We start from a simple half-space cooling plate structureand do not consider anyinherited thickness variations,which have, for example, beenproposed to affect arc migra-tion [Karlstrom et al., 2014].However, the results willshow that the disagreementsbetween model structure andthermobarometric conditionsare more fundamental thancan be reconciled with inher-ited thickness variations. Wewill use the Tonga modelsto illustrate the effects ofdecoupling depth and man-tle temperature. Comparison
with the Antillean case and models for all the other zones clearly highlights the effect of platethickness.
4.1. TongaTonga has a very young upper plate age of 10 Myr and a rapid subduction velocity of 16.58 cm/yr. Mantlepotential temperatures have been inferred to vary from 1350 to 15008C in back-arc basins [Kelley et al.,2006] and have been proposed to be particularly high in the Lau Basin (14408C), possibly because of theproximity of the Samoan plume [Kelley et al., 2006; Nebel and Arculus, 2015]. We test (1) the reference mantlepotential temperature of 13508C as well as (2) a hotter wedge of 14218C (the temperature in the models ofSyracuse et al., 2010]). In addition, if decoupling is controlled by rheology [Arcay et al., 2005; Arcay, 2012], ashallower decoupling depth than the reference value of 80 km may be expected, so as an end-member, wealso test (3) a model where thickness of the fixed upper plate and the decoupling depth are set to 10 km.Note that previous studies [Syracuse et al., 2010; Wada et al., 2008] have shown that globally decouplingdepth can probably not vary much more than 65 or 10 km around 80 km depth, so this is indeed an end-member case. A summary of how many sample P, T conditions are reconciled in each model case for Tongais given in Table 2.
In the reference case (1), most sample P, T can only be reconciled if an extreme case of 8 wt % H2O and ahost 0.92 Mg# residue is assumed (i.e., the combined coolest and deepest possible temperatures and pres-sures for the sample set). The position of these P, T conditions on this model are shown in Figure 8a. It isimportant to note that no samples would match thermal model conditions if the models were run for 20
Figure 8. Reference thermal model cases (13508C potential temperature, 80 km decouplingdepth) for Tonga and the Lesser Antilles, and positions of sample P, T at Mg# 5 0.9, Fe31/Fetotal 5 0.15, and assumed H2O contents of 0 (red), 4 (green), and 8 wt % (blue), there wheresamples can be reconciled with model P, T structure within 0.15 GPa and 228C. The numbers inthe black boxes indicate the number of samples that can be reconciled with the model condi-tions out of the total number of samples, colored by assumed H2O content. The position of thearc is plotted as a red triangle. Dashed black line marks the crustal thickness below the arc fromClift and Vannucchi [2004]. Black lines are the slab surface coordinates, as given in Syracuse et al.[2010, Supporting Information]. Only the top-central part of the model domain is shown. In Tongathe upper plate is young enough for about half the samples with 8 wt % H2O to be plotted, whilenone of the sample P, T conditions can be found within the Lesser Antilles model.
Geochemistry, Geophysics, Geosystems 10.1002/2016GC006527
PERRIN ET AL. ARC THERMOBAROMETRY AND THERMAL MODELS 14

Myr to a quasi steady state [Kelemen et al., 2003; Syracuse et al., 2010]. H2O concentrations of 8 wt % arehigh compared with melt inclusion measurements from samples worldwide, and within Tonga specifically,where they vary from 2.9 to 4.9 wt % (six samples) [Plank et al., 2013].
The 14218C model case (2) is able to reconcile more sample P, T with model mantle temperatures at 4 wt %H2O, closer to measured melt inclusion values, although a heavily depleted host (Mg# 5 0.92) is stillrequired. If a constant H2O content is assumed, the temperature estimates of the samples fall within a rela-tively small temperature range and over a relatively large pressure range. These conditions are met at thepoint where the isotherms are close to vertical, at the boundary of the cold nose of the wedge. We notethat this lies approximately below the arc for a decoupling depth of 80 km.
To test the suggestion made by Kelemen et al. [2003] that erosion of the upper plate above the wedge cor-ner can account for the discrepancy between models and petrologic mantle P, T estimates from lavas, weexamine a model where we set the decoupling depth to 10 km, case (3). Such a shallow decoupling depthis indeed able to reconcile a significant number of sample P, T points, at both 4 and 8 wt % H2O. However,(i) this configuration allows wedge flow to erode into the overlying lithosphere close to the trench and (ii)the positions where sample P, T estimates can be reconciled are located 30–60 km trenchward from the arc,thus requiring a mechanism that would transport the magmas laterally before rising below the arc. Elevatedtemperatures beneath the fore arc, as predicted in this model, are inconsistent with observations of lowheat flow and low seismic attenuation, in addition to pervasive seismic indications of serpentinization andthe occasional occurrence of seismicity, which indicate that the fore-arc mantle is cold [Bostock et al., 2002;Rychert et al., 2008; Wada and Wang, 2009]. Although Kelemen et al. [2003] matched across-arc heat flowgradients with their models, they aligned models at the maximum heat flow, without using observed sub-duction zone geometries as a constraint. Our models, which utilize the subduction geometries of Syracuseet al. [2010], highlight the spatial discrepancy between maximum upper plate thinning and arc positions incases with a shallow decoupling depth, which lead to substantial upper plate thinning directly above thewedge corner.
In summary, if the Tonga wedge has elevated temperatures, and/or the upper plate is at the thin end of therange expected for this zone, then the sample P, T conditions may reflect mantle wedge conditions. Theposition of the magmatic equilibration conditions places them on the transition into the ‘‘cold nose’’ of themantle wedge, where isotherms are near vertical.
The predominantly shallow and hot pressure and temperature conditions we determine may representreequilibration conditions, perhaps at a rheological boundary near the base of the lithosphere and at thetransition from fore-arc corner to the wedge. If on the other hand, the conditions at Tonga reflect the loca-tion of primary melt generation, it would imply that the main melting conditions are only reached at depthsright below the upper plate.
4.2. Lesser AntillesIn contrast to Tonga, the Lesser Antilles has a relatively old (50 Myr) and, hence, thick upper plate, with sub-duction occurring at �1.75 cm/yr [Syracuse et al., 2010]. Figure 8b shows the thermal structure for the refer-ence case of the Lesser Antilles. The thick overriding lithosphere dictates that no sample P, T can bereconciled with the thermal model, regardless of assumed H2O content or host Mg#. There is no reason toassume the mantle would be exceptionally hot, but even extremely high (>15008C) temperatures wouldnot sufficiently thin the lithosphere and reconcile the petrologic sample P, T with the modeled structure.Only in the 10 km decoupling case, can some P, T conditions be reconciled with our model. However, similar
Table 2. Number of Sample P, T That Are Able To Be Reconciled for Each of the Three Model Cases for Tonga, Exploring Uncertainty inHost Mg# and H2O
Simulation Host Mg# 0 wt % H2O 4 wt % H2O 8 wt % H2O
(1) Reference 0.9 0/28 2/28 15/2813508C 0.92 0/28 6/28 28/28(2) Hotter 0.9 0/28 8/28 28/2814218C 0.92 0/28 28/28 28/28(3) 10 km 0.9 0/28 27/28 28/28decoupling 0.92 2/28 28/28 28/28
Geochemistry, Geophysics, Geosystems 10.1002/2016GC006527
PERRIN ET AL. ARC THERMOBAROMETRY AND THERMAL MODELS 15

to Tonga, this case has problems withthe position of the P, T points relative tothe position of the arc, and comparisonwith heat flow and seismic attenuationdata. A model snapshot at an earliertime of 20 Myr is also unable to recon-cile any P, T points.
Hence for the Antillean case, it is clearthat the sample P, T conditions do notrepresent the original source melt con-ditions, and must correspond to areequilibration at lithospheric depths.However, this reequilibration processdoes need to involve significant heat-ing of the lithosphere to be reconciledwith the high temperature estimatesfrom thermobarometry.
4.3. All ZonesConsidering all of our chosen subductionzones (Figure 4), results fall between thetwo end-member cases of Tonga andthe Antilles (Figure 8). Figure 9 summa-rizes the findings, illustrating the per-centage of the P, T points for each zonethat can be reconciled with modeledthermal structure for host Mg# 0.9 and0.92 and water content of 4 and 8 wt %.
For very young upper plates, most of the samples could plausibly represent primary mantle wedge conditions.However, the number of samples that can be reconciled decreases rapidly with increasing upper plate age andthickness, and is only about half for a 10 Myr upper plate like Tonga and zero for upper plates older than 20 Myr.
An intriguing aspect of the data is that thermobarometric conditions always require a near vertical isotherm(e.g., Figure 8), which is only found at the edge of the cold nose. While in the youngest upper-plate cases, P,T conditions may be reconcilable with such a position in the wedge at the edge of the cold nose, for olderplates localized thermal erosion below the arc is required to produce such steep isotherms over a widerange of pressures. Note that preexisting lithospheric thickness variations may also induce some steep gra-dients, but only over a limited depth range, and not necessarily involving thinning below the arc. Thus, ourdata suggests that lavas last reequilibrate near the base of, or inside, the mantle lithosphere, at strong gra-dients in viscosity.
4.4. Comparison With Melt-Inclusion P-T Conditions for MarianasOverall, thermobarometric pressures indicate that lavas equilibrate within the lithosphere, i.e., much shal-lower than most suggestions of magma-generation depth (Figure 1). In contrast to the whole-rock composi-tions we used, melt inclusions may capture more primitive melts. Indeed, such melt-inclusion data havebeen interpreted to represent original melting conditions at high pressure [Schiano, 2003; Le Voyer et al.,2010; Kelley et al., 2010]. We compare in Figure 10 our samples from the Marianas, with the melt inclusiondata for this arc of Kelley et al. [2010], who also used the Lee et al. [2009] thermobarometer to analyze theequilibration conditions using data on water content from the same melt inclusions.
The equilibration pressures of the melt inclusions of the Kelley et al. [2010] data set (which includes samplesfrom Shaw et al. [2008]) significantly overlap with the pressures of the data set presented here, with theexception of Guguan, where melt inclusion derived pressures are �0.5 GPa deeper than the whole-rocksamples of the data set of this study. And indeed, both data sets span a wide range of pressures, togetherranging from slightly less than 1–2.6 GPa.
Figure 9. Summary of percentage of samples from each subduction zone that areable to be reconciled with their respective model thermal outputs. Full symbolsare for an assumed host Mg# of 0.9, hollow symbols for 0.92. Cyan indicates anassumed primary H2O content of 4 wt %, blue is 8 wt %. In many cases no sam-ples can be reconciled irrespective of assumed conditions, and so symbols plot atthe same point on the x axis. In this case the symbol corresponding to the H2Oand Mg# which results in the P, T closest to the model temperatures is the onethat is shown.
Geochemistry, Geophysics, Geosystems 10.1002/2016GC006527
PERRIN ET AL. ARC THERMOBAROMETRY AND THERMAL MODELS 16

If we plot the P, T conditions ofthe Kelley et al. [2010] melt in-clusions on the Marianas ther-mal structure (Figure 11), moreof the melt inclusion pressuresand temperatures can be rec-onciled with the model condi-tions, but still only about 2/3 ofthe samples match, even whenassuming a high primary watercontent (8 wt %). If we assumean original water content of8 wt %, these points plot at thebase of the thermal litho-sphere, i.e., barely in the man-tle wedge. Only one to three ofthe largest pressures out of thetotal of 35 points correspondto depths that may fall below
the upper plate thermal boundary layer. Interestingly, most of the points in Kelley et al. [2010] follow asolidus-parallel trend, except a few of the deepest points which form a somewhat steeper, more adiabat-like trend, as would be compatible with a mantle provenance. Thus, it appears that only a few of the meltinclusions record primary melt conditions in the mantle wedge, while most of them reflect, as do thewhole-rock data, reequilibration during melt ascent through the lithosphere.
4.5. Localized ThermalErosion of the Upper PlateIt is clear that when models arerun to steady state or the upperplate is older than 20 Myr, ther-mobarometric P, T conditionscannot be easily reconciled withour current models of the mantlewedge’s thermal structure. Insuch cases, a mechanism forlocally eroding the lithosphere isrequired, such that hotter materi-al can be advected to shallowerdepths. As emphasized above,removing or substantially shal-lowing the decoupling depth isinconsistent with observationssuch as fore-arc heat flow andseismic structure of the wedgecorner [Kincaid and Sacks, 1997;Hyndman and Peacock, 2003;Currie and Hyndman, 2006;Rychert et al., 2008]. Small-scaleconvection, which is suppressedat the viscosities examined here-in, is able to thin the overridinglithosphere by up to 10 km[Wirth and Korenaga, 2012; LeVoci et al., 2014; Davies et al.,2016], but this is insufficient to
Figure 10. Comparison of the latitudinal variation in equilibration pressures inferred for theSouthern Marianas for our data set with the melt inclusion data of Kelley et al. [2010]. Theequilibration P, T of the samples from our database are estimated at both 0.9 and 0.92 Mg#.The melt-inclusion P show are those calculated by Kelley et al. [2010] in their paper, assum-ing host Mg# 5 0.9.
Figure 11. Comparison of Southern Marianas sample P, T with thermal model conditions(13508C, 80 km decoupling depth), for our (a) sample set and (b) the melt inclusion data setof Kelley et al. [2010]. Format of the figure is the same as Figure 8. We calculated P, T forboth data sets using host Mg# 5 0.9, Fe31/Fetotal 5 0.15, and assumed H2O contents of 0(red), 4 (green), and 8 wt % (blue). Figure format as in Figure 8, and as in that figure onlythe part of the model domain around the wedge corner is shown. The numbers in the blackboxes indicate the number of samples that can be reconciled with the model conditionsout of the total number of samples, colored by assumed H2O content. Even for the meltinclusion data, few samples plot within the convecting wedge.
Geochemistry, Geophysics, Geosystems 10.1002/2016GC006527
PERRIN ET AL. ARC THERMOBAROMETRY AND THERMAL MODELS 17

reconcile our P, T estimates, similarly to preexisting variations in lithospheric thickness [e.g., Karlstrom et al., 2014],which may span a somewhat larger depth range, but still not the whole depth of the lithosphere from the Mohodownward.
Alternatively, it has been suggested that the P, T conditions recorded by the lavas may represent transientconditions of migrating melts, rather than lithospheric temperatures, with the main argument for transientconditions being that such high Moho temperatures would result in extensive melting of the lower crust forwhich there is no evidence [e.g., Elkins-Tanton et al., 2001; Ruscitto et al., 2010]. However, Kelemen et al.[2003] refutes this argument and prefers a lower crustal composition that would not melt at Moho tempera-tures of 1200–14008C. Furthermore, the P, T trends delineated by the data are not like the melt adiabatsexpected for migrating melts. Nonetheless, could it be conceivable that the high T are reflecting a processby which magmas were generated at these temperatures and, after reaching a shallow depth, do not ther-mally equilibrate with the surroundings? This notion is problematic, as it is inconsistent with the basic pre-mise of the thermobarometer, which assumes chemical reequilibration of SiO2 [Lee et al., 2009]. Silicon hasa very low diffusion coefficient in basaltic magma (10210 m2/s in wet basaltic melts [Zhang et al., 2010]),about 4 orders of magnitude lower than thermal diffusivity (1026 m2/s [Turcotte and Schubert, 2014]), andso if SiO2 is able to chemically equilibrate, then the magmas must be in thermal equilibrium. If on the otherhand, the magmas were not fully chemically reequilibrated, then the recorded P, T conditions would be anoverestimate of the pressures, further increasing the discrepancy between thermal model and magma P, Tconditions. In this case, temperatures could also be an overestimate, however, the fact that magmas must,in part, have reequilibrated as they record lithospheric P conditions, indicates that the much more rapidthermal reequilibration was likely complete and hence high temperatures at lithospheric depths would stillbe required.
Hence, localized thermal modification of the lithosphere appears to be necessary to reconcile models andthermobarometric P, T conditions. As suggested by Weaver et al. [2011], the thermal erosion process pro-posed by England and Katz [2010] provides a viable mechanism. In this process, melts with water contentsranging from ‘‘anhydrous’’ (in England and Katz [2010] this refers to a mantle water content of 200–500ppm) to water saturated are generated. Melts generated within the anhydrous melting region, a relativelysmall region located within the corner of the wedge, follow the anhydrous solidi upward until they reachthe location of the shallowest anhydrous solidi. Once this point is reached, the melts heat the mantle/litho-sphere above, deflecting all solidi from anhydrous to wet upward. All melts subsequently produced followtheir respective solidi up to this thermally eroded part of the mantle, and then up through the lithosphereto form the arc. According to their model, the amount that the isotherms are deflected upward depends onthe ratio of heat transfer by the melt (i.e., melt flux) and conductive loss of heat through the lithosphere[England and Katz, 2010].
We apply the thermal erosion model of England and Katz [2010] to our thermal structures. Derivation ofequations that describe the process can be found in England and Katz [2010, Supporting Information]. Weuse the same input constants, except that we double the magma production rate to 8 3 1023 kg m21,which England and Katz [2010] acknowledge may be a more realistic value. We choose the 13008C isothermas the hottest one to be advected (rather than the 12008C one used in England and Katz [2010]) to allowerosion to affect the whole thermal boundary layer of our models. We assume that the region of meltadvection is 15 km wide and positioned directly below the arc, which is more or less there where the unper-turbed isotherms reach their shallowest depth, consistent with England and Katz’s [2010] hypothesis thatthis point (which corresponds to where the temperature approach the anhydrous solidus most closely) con-trols the location of the arc. Applying this to the reference model of the Lesser Antilles now allows 94% ofthe P, T points to be reconciled, at Mg# 5 0.9 and 8 wt % H2O, and 88% of the 36 points for Mg# 5 0.9 and4 wt % H2O (Figure 12), suggesting that this is indeed a viable mechanism.
A further advantage of a localized thermal erosion model is that it produces strong lateral strength gra-dients in the lithosphere over a broad range of depths. This provides a logical explanation for why we findpressures corresponding to broad depth ranges, and depth ranges that correlate with overriding plate age,i.e., thickness. Note that the data P, T trends are also consistent with such a local thermal erosion mecha-nism, as it will allow adiabatic melting to proceed upward over the whole depth range where the litho-sphere has been replaced by asthenospheric temperatures.
Geochemistry, Geophysics, Geosystems 10.1002/2016GC006527
PERRIN ET AL. ARC THERMOBAROMETRY AND THERMAL MODELS 18

4.6. Further Consequences ofThermal ErosionLocal thermal modification ofthe lithosphere is consistentwith seismic images document-ing localized low velocity andhigh attenuation (low-Q) zonesbelow several arcs that span thedepth range of the lithosphere[Zhao et al., 1994, 1997; Rychertet al., 2008]. Such signatureshave commonly been attributedto the presence of melt. Howev-er, bringing material of mantletemperatures to such shallowdepths is also an efficient way oflowering seismic velocities, dueto the increasing contribution ofanelasticity with decreasing depth[e.g., Goes et al., 2012]. Hence, our
results indicate that the seismic signature may well be a combination of high temperatures and the presenceof melt. Furthermore, the seismic signatures agree with a localized thermal effect rather than a larger-scaleupper plate thinning above the wedge corner, as was previously proposed by Kelemen et al. [2003].
Field observations of exhumed arcs are also consistent with the subarc mantle lithosphere being pervasivelyheated by intruded melts up to the base of the crust (see compilation and data by Kelemen et al. [2003] forthe Talkeetna, Alaska, and Kohistan, Pakistan exhumed arcs).
Finally, local thermal erosion of the lithosphere would also be expected to lead to lithospheric weakening.Formation of a localized zone of weakness below the arc is consistent with the observation that back-arcspreading often splits the previous arc, e.g., in Tonga and Marianas [Karig, 1970, 1971]. This same process ofmelt-related weakening has also been invoked to aid continental rifting, based on geophysical and surfaceobservations of the process in Afar [Ebinger and Casey, 2001; Buck, 2006].
5. Conclusions
We present a study of equilibration pressures and temperatures of intraoceanic subduction zone lavas andcompare these conditions with those predicted by kinematically driven models of the wedge’s flow regimeand thermal structure with geometries from Syracuse et al. [2010] for each subduction zone. We draw thefollowing conclusions:
1. Consistent with a number of previous studies of thermobarometric equilibration conditions of mantlemelts [Elkins-Tanton et al., 2001; Kelemen et al., 2003; Lee et al., 2009; Weaver et al., 2011] we find that forall intraoceanic arcs in our compilation, equilibration temperatures are relatively high (averaging�13008C) and pressures are relatively shallow (averaging �1.1 GPa).
2. We find that pressures span a large range in each arc, more or less comprising the full depth of the upperplate from the Moho to the thermal base of the lithosphere.
3. There are positive correlations of the mean, median, and range of equilibration pressures within each arcwith the age of the upper plate, consistent with an upper plate thickness control on the petrologic P, Tconditions.
4. The temperature conditions likely equate to lithospheric temperatures where the samples reequilibrated,as the thermobarometer requires chemical equilibration, which is many orders of magnitude slower thanthermal reequilibration, making it highly unlikely that these represent transient thermal conditions.
5. Pressures and temperatures can only be reconciled with wedge thermal models if the upper plate is thin(equivalent to an age of <10 Myr). Models with older upper plates (thicker lithospheres) are inconsistentwith sample pressures and temperatures.
Figure 12. Comparison of sample P, T with numerical model outputs (13508C, 80 km decou-pling depth) for the Lesser Antilles after the application of the thermal erosion process ofEngland and Katz [2010]. Format of the figure is the same as Figure 8. P, T estimates are forhost Mg# 5 0.9, Fe31/Fetotal 5 0.15, and assumed H2O contents of 0 (red), 4 (green), and8 wt % (blue). The numbers in the black boxes indicate the number of samples that can bereconciled with the model conditions out of the total number of samples, colored byassumed H2O content. Pentagons are plotted where a sample P, T can be found in the mod-el. Now the majority of samples at a water content of 8 wt % can be reconciled.
Geochemistry, Geophysics, Geosystems 10.1002/2016GC006527
PERRIN ET AL. ARC THERMOBAROMETRY AND THERMAL MODELS 19

6. A thermal erosion process, by which melts locally erode the lithosphere below the arc, as previously sug-gested by England and Katz [2010] to explain the focusing of volcanism along a linear arc, once appliedto the models, is able to reconcile the predicted thermal structure with the equilibration pressures andtemperatures inferred from the lavas. Such local weakening explains the wide range of equilibrationpressures all corresponding to high temperatures.
A consequence of the reequilibration process, which appears to be continuous from the mantle wedgethroughout the rise through the lithosphere, is that the lithosphere is locally warmed and weakened belowthe arc. In this process, the geotherms follow an adiabatic melting trend and the apparent melt fractionsstay relatively constant in the range 10–20%. There are potential implications of this reequilibration process.The chemical composition of the melts may be altered, and, as such, affect the interpretations of subduc-tion zone geochemistry. Trace element ratios are likely unaffected, as reequilibration with mineral assemb-lages that are similar to the mineral assemblages from which the magma first formed will have little effecton the ratios, however absolute major, minor and trace element concentrations may be affected. The lackof correlation of the reequilibration pressures with other subduction parameters, such as thermal parame-ter, does not preclude the possibility that these parameters could have a control on where these magmasare first generated, but information on this process would be lost in the reequilibration process.
ReferencesAbers, G., K. Fischer, G. Hirth, D. Wiens, T. Plank, B. Holtzman, C. McCarthy, and E. Gazel (2014), Reconciling mantle attenuation-
temperature relationships from seismology, petrology, and laboratory measurements, Geochem. Geophys. Geosyst., 15, 3521–3542, doi:10.1002/2014GC005444.
Arcay, D. (2012), Dynamics of interplate domain in subduction zones: Influence of rheological parameters and subducting plate age, SolidEarth, 3(2), 467–488.
Arcay, D., M. P. Doin, and E. Tric (2005), Numerical simulations of subduction zones: Effect of slab dehydration on the mantle wedge dynam-ics, Phys. Earth Planet. Inter., 149, 133–153, doi:10.1016/j.pepi.2004.08.020.
Behn, M. D., P. B. Kelemen, G. Hirth, B. R. Hacker, and H.-J. Massonne (2011), Diapirs as the source of the sediment signature in arc lavas,Nat. Geosci., 4(9), 641–646.
Billen, M. I., and M. Gurnis (2001), A low viscosity wedge in subduction zones, Earth Planet. Sci. Lett., 193(1–2), 227–236, doi:10.1016/S0012-821X(01)00482-4.
Bostock, M., R. Hyndman, S. Rondenay, and S. Peacock (2002), An inverted continental Moho and serpentinization of the forearc mantle,Nature, 417(6888), 536–538.
Bouysse, P. (1988), Opening of the Grenada back-arc basin and evolution of the Caribbean plate during the mesozoic and early paleogene,Tectonophysics, 149, 121–143, doi:10.1016/0040-1951(88)90122-9.
Bremond d’Ars, J., C. Jaupart, and R. S. J. Sparks (1995), Distribution of volcanoes in active margins, J. Geophys. Res., 100(B10), 20,421–20,432.
Buck, W. (2006), The role of magma in the development of the Afro-Arabian rift system, Geol. Soc. Spec Publ., 259(1), 43–54.Cagnioncle, A.-M., E. Parmentier, and L. T. Elkins-Tanton (2007), Effect of solid flow above a subducting slab on water distribution and melt-
ing at convergent plate boundaries, J. Geophys. Res., 112, B09402, doi:10.1029/2007JB004934.Calvert, A. J. (2011), The seismic structure of island arc crust, in Arc-Continent Collision, Front. Earth Sci., pp. 87–119, Springer-Verlag, Berlin.Clift, P., and P. Vannucchi (2004), Controls on tectonic accretion versus erosion in subduction zones: Implications for the origin and recy-
cling of the continental crust, Rev. Geophys., 42, RG2001, doi:10.1029/2003RG000127.Conder, J. A. (2005), A case for hot slab surface temperatures in numerical viscous flow models of subduction zones with an improved fault
zone parameterization, Phys. Earth Planet. Inter., 149(1), 155–164.Cooper, L. B., D. M. Ruscitto, T. Plank, P. J. Wallace, E. M. Syracuse, and C. E. Manning (2012), Global variations in H2O/Ce: 1. Slab surface tem-
peratures beneath volcanic arcs, Geochem. Geophys. Geosyst., 13, Q03024, doi:10.1029/2011GC003902.Courtier, A. M., et al. (2007), Correlation of seismic and petrologic thermometers suggests deep thermal anomalies beneath hotspots, Earth
Planet. Sci. Lett., 264(1), 308–316.Currie, C. A., and R. D. Hyndman (2006), The thermal structure of subduction zone back arcs, J. Geophys. Res., 111, B08404, doi:10.1029/
2005JB004024.Davies, D. R., C. R. Wilson, and S. C. Kramer (2011), Fluidity: A fully unstructured anisotropic adaptive mesh computational modeling frame-
work for geodynamics, Geochem. Geophys. Geosyst., 12, Q06001, doi:10.1029/2011GC003551.Davies, D. R., G. Le Voci, S. Goes, S. Kramer, and C. Wilson (2016), The mantle wedge’s transient 3-D flow regime and thermal structure, Geo-
chem. Geophys. Geosyst., 17, 78–100, doi:10.1002/2015GC006125.Dumoulin, C., M.-P. Doin, and L. Fleitout (2001), Numerical simulations of the cooling of an oceanic lithosphere above a convective mantle,
Phys. Earth Planet. Inter., 125(1), 45–64.Ebinger, C., and M. Casey (2001), Continental breakup in magmatic provinces: An Ethiopian example, Geology, 29(6), 527–530.Elkins-Tanton, L. T., T. L. Grove, and J. Donnelly-Nolan (2001), Hot, shallow mantle melting under the cascades volcanic arc, Geology, 29(7),
631–634.England, P., and C. Wilkins (2004), A simple analytical approximation to the temperature structure in subduction zones, Geophys. J. Int.,
159(3), 1138–1154.England, P. C., and R. F. Katz (2010), Melting above the anhydrous solidus controls the location of volcanic arcs, Nature, 467(7316),
700–703.Gaetani, G. A., T. L. Grove, and W. B. Bryan (1993), The influence of water on the petrogenesis of subduction-related igneous rocks, Nature,
365(6444), 332–334.
AcknowledgmentsWe thank Pierre Bouilhol, St�ephaneRondenay, and John Armitage fordiscussions and the Applied Modellingand Computation Group for supportwith Fluidity. We much appreciate thethoughtful and detailed reviews byLeif Karlstrom and Stephen Turner. A.P.was funded by a Janet Watsonfellowship from the department ofEarth Science and Engineering,Imperial College London, SG by theVoiLA project (NERC grant NE/K010743/1), D.R.D. and C.W. by NERCgrant NE/I024429/1, C.W. by NSF OCE-1358091, and D.R.D. by an ARC FutureFellowship (FT140101262).
Geochemistry, Geophysics, Geosystems 10.1002/2016GC006527
PERRIN ET AL. ARC THERMOBAROMETRY AND THERMAL MODELS 20

Gerya, T. V., and D. A. Yuen (2003), Rayleigh-Taylor instabilities from hydration and melting propel ‘‘cold plumes’’ at subduction zones,Earth Planet. Sci. Lett., 212, 47–62, doi:10.1016/S0012-821X(03)00265-6.
Gill, J. (2012), Orogenic Andesites and Plate Tectonics, vol. 16, Springer, Berlin.Goes, S., J. Armitage, N. Harmon, H. Smith, and R. Huismans (2012), Low seismic velocities below mid-ocean ridges: Attenuation versus
melt retention, J. Geophys. Res., 117, B12403, doi:10.1029/2012JB009637.Grove, T., S. Parman, S. Bowring, R. Price, and M. Baker (2002), The role of an H2O-rich fluid component in the generation of primitive basal-
tic andesites and andesites from the Mt. Shasta region, N California, Contrib. Mineral. Petrol., 142(4), 375–396.Grove, T. L., C. B. Till, E. Lev, N. Chatterjee, and E. Medard (2009), Kinematic variables and water transport control the formation and location
of arc volcanoes, Nature, 459, 694–697, doi:10.1038/nature08044.Grove, T. L., C. B. Till, and M. J. Krawczynski (2012), The role of H2O in subduction zone magmatism, Annu. Rev. Earth Planet. Sci., 40,
413–439.Hall, P. S., and C. Kincaid (2001), Diapiric flow at subduction zones: A recipe for rapid transport, Science, 292(5526), 2472–2475.Hermann, J., and C. J. Spandler (2007), Sediment melts at sub-arc depths: An experimental study, J. Petrol., 49(4), 717–740, doi:10.1093/
petrology/egm073.Hickey-Vargas, R., S. Holbik, D. Tormey, F. A. Frey, and H. M. Roa (2016), Basaltic rocks from the Andean Southern Volcanic Zone: Insights
from the comparison of along-strike and small-scale geochemical variations and their sources, Lithos, 258–259, 115–132, doi:10.1016/j.lithos.2016.04.014.
Holm, R. J., G. Rosenbaum, and S. W. Richards (2016), Post 8 ma reconstruction of Papua New Guinea and Solomon Islands: Microplate tec-tonics in a convergent plate boundary setting, Earth Sci. Rev., 156, 66–81, doi:10.1016/j.earscirev.2016.03.005.
Huene, R., and D. W. Scholl (1991), Observations at convergent margins concerning sediment subduction, subduction erosion, and thegrowth of continental crust, Rev. Geophys., 29(3), 279–316.
Hyndman, R. D., and S. M. Peacock (2003), Serpentinization of the forearc mantle, Earth Planet. Sci. Lett., 212(34), 417–432, doi:10.1016/S0012-821X(03)00263-2.
Ishizuka, O., N. Geshi, J. Itoh, Y. Kawanabe, and T. TuZino (2008), The magmatic plumbing of the submarine Hachijo NW volcanic chain,Hachijojima, Japan: Long-distance magma transport?, J. Geophys. Res., 113, B08S08, doi:10.1029/2007JB005325.
Karig, D. E. (1970), Ridges and basins of the Tonga-Kermadec island arc system, J. Geophys. Res., 75(2), 239–254.Karig, D. E. (1971), Origin and development of marginal basins in the western pacific, J. Geophys. Res., 76(11), 2542–2561.Karlstrom, L., C.-T. A. Lee, and M. Manga (2014), The role of magmatically driven lithospheric thickening on arc front migration, Geochem.
Geophys. Geosyst., 15, 2655–2675, doi:10.1002/2014GC005355.Katz, R. F., M. Spiegelman, and C. H. Langmuir (2003), A new parameterization of hydrous mantle melting, Geochem. Geophys. Geosyst., 4(9),
1073, doi:10.1029/2002GC000433.Kelemen, P. B., J. L. Rilling, E. Parmentier, L. Mehl, and B. R. Hacker (2003), Thermal structure due to solid-state flow in the mantle wedge
beneath arcs, in Inside the Subduction Factory, pp. 293–311, AGU, Washington, D. C.Kelley, K. A., and E. Cottrell (2009), Water and the oxidation state of subduction zone magmas, Science, 325(5940), 605–607.Kelley, K. A., T. Plank, T. L. Grove, E. M. Stolper, S. Newman, and E. Hauri (2006), Mantle melting as a function of water content beneath
back-arc basins, J. Geophys. Res., 111, B09208, doi:10.1029/2005JB003732.Kelley, K. A., T. Plank, S. Newman, E. M. Stolper, T. L. Grove, S. Parman, and E. H. Hauri (2010), Mantle melting as a function of water content
beneath the Mariana Arc, J. Petrol., 51(8), 1711–1738.Kimura, J.-I., and T. Yoshida (2006), Contributions of slab fluid, mantle wedge and crust to the origin of quaternary lavas in the NE Japan
arc, J. Petrol., 47(11), 2185–2232.Kincaid, C., and I. S. Sacks (1997), Thermal and dynamical evolution of the upper mantle in subduction zones, J. Geophys. Res., 102(B6),
12,295–12,315.Klimm, K., J. D. Blundy, and T. H. Green (2008), Trace element partitioning and accessory phase saturation during H2O-saturated melting of
basalt with implications for subduction zone chemical fluxes, J. Petrol., 49(3), 523–553.Konter, J. G., and T. W. Becker (2012), Shallow lithospheric contribution to mantle plumes revealed by integrating seismic and geochemical
data, Geochem. Geophys. Geosyst., 13, Q02004, doi:10.1029/2011GC003923.Kramer, S. C., C. R. Wilson, and D. R. Davies (2012), An implicit free surface algorithm for geodynamical simulations, Phys. Earth Planet. Inter.,
194, 25–37.Le Voci, G., D. R. Davies, S. Goes, S. C. Kramer, and C. R. Wilson (2014), A systematic 2-D investigation into the mantle wedge’s transient
flow regime and thermal structure: Complexities arising from a hydrated rheology and thermal buoyancy, Geochem. Geophys. Geosyst.,15, 28–51, doi:10.1002/2013GC005022.
Le Voyer, M., E. Rose-Koga, N. Shimizu, T. Grove, and P. Schiano (2010), Two contrasting H2O-rich components in primary melt inclusionsfrom Mount Shasta, J. Petrol., 51(7), 1571–1595.
Lee, C.-T. A., W. P. Leeman, D. Canil, and Z.-X. A. Li (2005), Similar V/Sc systematics in MORB and arc basalts: Implications for the oxygenfugacities of their mantle source regions, J. Petrol., 46(11), 2313–2336.
Lee, C.-T. A., P. Luffi, T. Plank, H. Dalton, and W. P. Leeman (2009), Constraints on the depths and temperatures of basaltic magma genera-tion on earth and other terrestrial planets using new thermobarometers for mafic magmas, Earth Planet. Sci. Lett., 279(1), 20–33.
Lee, C.-T. A., P. Luffi, V. Le Roux, R. Dasgupta, F. Albar�ede, and W. P. Leeman (2010), The redox state of arc mantle using Zn/Fe systematics,Nature, 468(7324), 681–685.
Lytle, M. L., K. A. Kelley, E. H. Hauri, J. B. Gill, D. Papia, and R. J. Arculus (2012), Tracing mantle sources and Samoan influence in the north-western Lau back-arc basin, Geochem. Geophys. Geosyst., 13, Q10019, doi:10.1029/2012GC004233.
Marschall, H. R., and J. C. Schumacher (2012), Arc magmas sourced from m�elange diapirs in subduction zones, Nat. Geosci., 5(12), 862–867,doi:10.1038/ngeo1634.
McCulloch, M. T., and J. Gamble (1991), Geochemical and geodynamical constraints on subduction zone magmatism, Earth Planet. Sci.Lett., 102(3), 358–374.
McKenzie, D. P. (1969), Speculations on the consequences and causes of plate motions, Geophys. J. Int., 18(1), 1–32.Morgan, J. P. (2001), Thermodynamics of pressure release melting of a veined plum pudding mantle, Geochem. Geophys. Geosyst., 2, 1001,
doi:10.1029/2000GC000049.Mullen, E. K., and D. Weis (2015), Evidence for trench-parallel mantle flow in the northern Cascade Arc from basalt geochemistry, Earth
Planet. Sci. Lett., 414, 100–107.M€uller, R. D., M. Sdrolias, C. Gaina, and W. R. Roest (2008), Age, spreading rates and spreading asymmetry of the world’s ocean crust, Geo-
chem. Geophys. Geosyst., 9, Q04006, doi:10.1029/2007GC001743.
Geochemistry, Geophysics, Geosystems 10.1002/2016GC006527
PERRIN ET AL. ARC THERMOBAROMETRY AND THERMAL MODELS 21

Nebel, O., and R. J. Arculus (2015), Selective ingress of a Samoan plume component into the northern Lau backarc basin, Nat. Commun., 6,Article 6554, doi:10.1038/ncomms7554.
Pacey, A., C. G. Macpherson, and K. J. McCaffrey (2013), Linear volcanic segments in the central Sunda Arc, Indonesia, identified usingHough transform analysis: implications for arc lithosphere control upon volcano distribution, Earth Planet. Sci. Lett., 369, 24–33.
Peacock, S. M. (1990), Fluid processes in subduction zones, Science, 248(4953), 329–337.Plank, T., and D. Forsyth (2016), Thermal structure and melting conditions in the mantle beneath the basin and range province from seis-
mology and petrology, Geochem. Geophys. Geosyst., 17, 1312–1338, doi:10.1002/2015GC006205.Plank, T., and C. H. Langmuir (1988), An evaluation of the global variations in the major element chemistry of arc basalts, Earth Planet. Sci.
Lett., 90(4), 349–370.Plank, T., L. B. Cooper, and C. E. Manning (2009), Emerging geothermometers for estimating slab surface temperatures, Nat. Geosci., 2(9),
611–615.Plank, T., K. A. Kelley, M. M. Zimmer, E. H. Hauri, and P. J. Wallace (2013), Why do mafic arc magmas contain 4wt% water on average?, Earth
Planet. Sci. Lett., 364, 168–179.Ruscitto, D., P. Wallace, E. Johnson, A. Kent, and I. Bindeman (2010), Volatile contents of mafic magmas from cinder cones in the Central
Oregon High Cascades: Implications for magma formation and mantle conditions in a hot arc, Earth Planet. Sci. Lett., 298(1), 153–161.Rychert, C. A., K. M. Fischer, G. A. Abers, T. Plank, E. Syracuse, J. M. Protti, V. Gonzalez, and W. Strauch (2008), Strong along-arc variations in
attenuation in the mantle wedge beneath Costa Rica and Nicaragua, Geochem. Geophys. Geosyst., 9, Q10S10, doi:10.1029/2008GC002040.
Schiano, P. (2003), Primitive mantle magmas recorded as silicate melt inclusions in igneous minerals, Earth Sci. Rev., 63(1), 121–144.Schmidt, M., and S. Poli (2014), Devolatilization during subduction, in The Crust, Treatise on Geochemistry, edited by H. D. Holland and
K. K. Turekian, 2nd ed., pp. 669–701, Elsevier, Oxford.Schmidt, M. W., and S. Poli (1998), Experimentally based water budgets for dehydrating slabs and consequences for arc magma genera-
tion, Earth Planet. Sci. Lett., 163(1), 361–379.Sdrolias, M., and R. D. M€uller (2006), Controls on back-arc basin formation, Geochem. Geophys. Geosyst., 7, Q04,016, doi:10.1029/
2005GC001090.Shaw, A., E. Hauri, T. Fischer, D. Hilton, and K. Kelley (2008), Hydrogen isotopes in Mariana arc melt inclusions: Implications for subduction
dehydration and the deep-earth water cycle, Earth Planet. Sci. Lett., 275(1), 138–145.Sillitoe, R. H. (2010), Porphyry copper systems, Econ. Geol., 105(1), 3–41.Sparks, D. W., and E. Parmentier (1991), Melt extraction from the mantle beneath spreading centers, Earth Planet. Sci. Lett., 105(4), 368–377.Spiegelman, M., and D. McKenzie (1987), Simple 2-D models for melt extraction at mid-ocean ridges and island arcs, Earth Planet. Sci. Lett.,
83(1), 137–152.Stein, C. A., and S. Stein (1992), A model for the global variation in oceanic depth and heat flow with lithospheric age, Nature, 359(6391),
123–129.Syracuse, E. M., and G. A. Abers (2006), Global compilation of variations in slab depth beneath arc volcanoes and implications, Geochem.
Geophys. Geosyst., 7, Q05017, doi:10.1029/2005GC001045.Syracuse, E. M., P. E. van Keken, and G. A. Abers (2010), The global range of subduction zone thermal models, Phys. Earth Planet. Inter.,
183(12), 73–90, doi:10.1016/j.pepi.2010.02.004.Tatsumi, Y. (1986), Formation of the volcanic front in subduction zones, Geophys. Res. Lett., 13(8), 717–720.Taylor, R. N., and R. W. Nesbitt (1998), Isotopic characteristics of subduction fluids in an intra-oceanic setting, Izu–Bonin Arc, Japan, Earth
Planet. Sci. Lett., 164(1), 79–98.Taylor, S. R., and S. M. McLennan (1995), The geochemical evolution of the continental crust, Rev. Geophys., 33(2), 241–265.Turcotte, D. L., and G. Schubert (2014), Geodynamics, Cambridge Univ. Press, Cambridge, U. K.Turner, S. J., and C. H. Langmuir (2015a), The global chemical systematics of arc front stratovolcanoes: Evaluating the role of crustal pro-
cesses, Earth Planet. Sci. Lett., 422, 182–193, doi:10.1016/j.epsl.2015.03.056.Turner, S. J., and C. H. Langmuir (2015b), What processes control the chemical compositions of arc front stratovolcanoes?, Geochem. Geo-
phys. Geosyst., 16, 1865–1893, doi:10.1002/2014GC005633.Turner, S. J., C. H. Langmuir, R. F. Katz, M. A. Dungan, and S. Escrig (2016), Parental arc magma compositions dominantly controlled by
mantle-wedge thermal structure, Nat. Geosci., 9, 772–776.van Keken, P. E., B. Kiefer, and S. M. Peacock (2002), High-resolution models of subduction zones: Implications for mineral dehydration
reactions and the transport of water into the deep mantle, Geochem. Geophys. Geosyst., 3(10), 1056, doi:10.1029/2001GC000256.van Keken, P. E., C. Currie, S. D. King, M. D. Behn, A. Cagnioncle, J. He, R. F. Katz, S.-C. Lin, E. M. Parmentier, M. Spiegelman, and K. Wang
(2008), A community benchmark for subduction zone modeling, Phys. Earth Planet. Inter., 171, 187–197, doi:10.1016/j.pepi.2008.04.015.
van Keken, P. E., B. R. Hacker, E. M. Syracuse, and G. A. Abers (2011), Subduction factory: 4. Depth-dependent flux of H2O from subductingslabs worldwide, J. Geophys. Res., 116, B01401, doi:10.1029/2010JB007922.
Wada, I., and K. Wang (2009), Common depth of slab-mantle decoupling: Reconciling diversity and uniformity of subduction zones, Geo-chem. Geophys. Geosyst., 10, Q10009, doi:10.1029/2009GC002570.
Wada, I., K. Wang, J. He, and R. D. Hyndman (2008), Weakening of the subduction interface and its effects on surface heat flow, slab dehy-dration, and mantle wedge serpentinization, J. Geophys. Res., 113, B04402, doi:10.1029/2007JB005190.
Wasylenki, L. E., M. B. Baker, A. J. Kent, and E. M. Stolper (2003), Near-solidus melting of the shallow upper mantle: Partial melting experi-ments on depleted peridotite, J. Petrol., 44(7), 1163–1191.
Watt, S. F., D. M. Pyle, T. A. Mather, and J. A. Naranjo (2013), Arc magma compositions controlled by linked thermal and chemical gradientsabove the subducting slab, Geophys. Res. Lett., 40, 2550–2556, doi:10.1002/grl.50513.
Weaver, S. L., P. J. Wallace, and A. D. Johnston (2011), A comparative study of continental vs. intraoceanic arc mantle melting: Experimen-tally determined phase relations of hydrous primitive melts, Earth Planet. Sci. Lett., 308(1), 97–106.
Wiens, D. A., K. A. Kelly, and T. Plank (2006), Mantle temperature variations beneath back-arc spreading centers inferred from seismology,petrology and bathymetry, Earth Planet. Sci. Lett., 248, 30–42, doi:10.1016/j.epsl.2006.04.011.
Wilkinson, J. J. (2013), Triggers for the formation of porphyry ore deposits in magmatic arcs, Nat. Geosci., 6(11), 917–925.Wilson, C. R., M. Spiegelman, P. E. van Keken, and B. R. Hacker (2014), Fluid flow in subduction zones: The role of solid rheology and com-
paction pressure, Earth Planet. Sci. Lett., 401, 261–274.Wirth, E. A., and J. Korenaga (2012), Small-scale convection in the subduction zone mantle wedge, Earth Planet. Sci. Lett., 357, 111–118.
Geochemistry, Geophysics, Geosystems 10.1002/2016GC006527
PERRIN ET AL. ARC THERMOBAROMETRY AND THERMAL MODELS 22

Woodhead, J., S. Eggins, and J. Gamble (1993), High field strength and transition element systematics in island arc and back-arc basinbasalts: Evidence for multi-phase melt extraction and a depleted mantle wedge, Earth Planet. Sci. Lett., 114(4), 491–504.
Zhang, Y., H. Ni, and Y. Chen (2010), Diffusion data in silicate melts, Rev. Mineral. Geochem., 72(1), 311–408.Zhao, D., A. Hasegawa, and H. Kanamori (1994), Deep structure of Japan subduction zone as derived from local, regional, and teleseismic
events, J. Geophys. Res., 99(B11), 22,313–22,329.Zhao, D., Y. Xu, D. A. Wiens, L. Dorman, J. Hildebrand, and S. Webb (1997), Depth extent of the Lau back-arc spreading center and its rela-
tion to subduction processes, Science, 278(5336), 254–257.
Geochemistry, Geophysics, Geosystems 10.1002/2016GC006527
PERRIN ET AL. ARC THERMOBAROMETRY AND THERMAL MODELS 23


