Embed Size (px)
Citation preview

1 23
Bulletin of VolcanologyOfficial Journal of the InternationalAssociation of Volcanology andChemistry of the Earth`s Interior(IAVCEI) ISSN 0258-8900 Bull VolcanolDOI 10.1007/s00445-012-0597-x
Lava balloons—peculiar products ofbasaltic submarine eruptions
Ulrich Kueppers, AlexanderR. L. Nichols, Vittorio Zanon, MarcelPotuzak & Jose M. R. Pacheco

1 23
Your article is protected by copyright and
all rights are held exclusively by Springer-
Verlag. This e-offprint is for personal use only
and shall not be self-archived in electronic
repositories. If you wish to self-archive your
work, please use the accepted author’s
version for posting to your own website or
your institution’s repository. You may further
deposit the accepted author’s version on a
funder’s repository at a funder’s request,
provided it is not made publicly available until
12 months after publication.

RESEARCH ARTICLE
Lava balloons—peculiar products of basalticsubmarine eruptions
Ulrich Kueppers & Alexander R. L. Nichols &
Vittorio Zanon & Marcel Potuzak & Jose M. R. Pacheco
Received: 30 December 2010 /Accepted: 25 March 2012# Springer-Verlag 2012
Abstract Between December 1998 and April 2001, a sub-marine basaltic eruption occurred west of Terceira Island,Azores (Portugal) in water depths between 300 and 1,000 m.Physical evidence for the eruption was provided by theperiodic occurrence of hot lava “balloons” floating on thesea surface. The balloons consisted of a large gas-filledcavity surrounded by a thin shell (a few centimetres thick).The shells of the collected balloons are composed of twolayers, termed the outer layer and the inner layer, defined bydifferent bubble number density, bubble sizes and crystalcontent. The inner layer is further divided into three sub-layers defined by more subtle differences in vesicularity.The outer layer is glassy, golden-coloured and highlyporous. It shows signs of fluidal deformation and late-stage extension cracks. Interstitial glass contains 0.29 wt%H2O and CO2 is below detection. Melt inclusions containup to 1.18 wt% H2O and 1,500 ppm CO2 (from different
inclusions). Cooling rates of the outermost glass of theouter layer are found to be as high as 1,259 K/s. Duringascent of low viscosity magma to the ocean floor, volatiles,dominated by CO2, exsolved from the magma (melt + crys-tals). The buoyancy of the vapour phase that accumulatedbelow a thin crust on lava ponded at the vent caused bulgingand ultimately cracking of the crust. This allowed largebubbles (central cavity) surrounded by a film of vesicularmagma (balloon shell) to leak into the water column. Oncontact with the seawater, the outermost part of the outerlayer of the shell hyperquenched. If an entirely closed shellwas produced during detachment, the trapped gas insideallowed buoyant rise. Only balloons with the right balanceof physical properties (e.g. size and bulk density) rose all theway to the sea surface.
Keywords Serreta Ridge . Azores . Submarine eruption .
Lava balloons . Physical volcanology . Cooling rate . Meltinclusion . Volatile content
Introduction
The most recent recorded eruption in the Azores archipelago(Portugal) occurred between 1998 and 2001 along the sub-marine Serreta Ridge, at water depths of 300–1,000 m, offthe western coast of Terceira Island. The Serreta Ridge ispart of the Terceira Rift, a hyper-slow, oblique spreadingaxis (Vogt and Jung 2004) that has a general NW–SEorientation and crosses Graciosa, Terceira and São MiguelIslands (Fig. 1a) and possibly intersects the Mid-AtlanticRidge at about 39° N. The Serreta eruption was notable forproducing ellipsoidal basaltic bodies that rose intact throughthe water column and floated on the surface of the sea. Theywere up to 3 m long and 1 m in diameter and most consisted
Editorial responsibility: J. McPhie
U. KueppersDepartment for Earth & Environmental Sciences,Ludwig-Maximilians-Universität (LMU),Munich, Germany
U. Kueppers (*) :V. Zanon : J. M. R. PachecoCentro de Vulcanologia e Avaliação de Riscos Geológicos(CVARG), Universidade dos Açores,Ponta Delgada, Azores, Portugale-mail: [email protected]
A. R. L. NicholsInstitute for Research on Earth Evolution (IFREE), Japan Agencyfor Marine Earth Science and Technology (JAMSTEC),Yokosuka, Japan
M. PotuzakScience and Technology Division, Corning Incorporated,Corning, USA
Bull VolcanolDOI 10.1007/s00445-012-0597-x
Author's personal copy

of a single gas-filled cavity surrounded by a shell of vesic-ular basalt only a few centimetres thick. They remainedfloating for several minutes. Owing to their morphologyand behaviour, they were termed “lava balloons” (Gasparet al. 2003).
Since the fifteenth century, more than a dozen submarineeruptions are known to have taken place around the islandsof the Azores archipelago (Weston 1964). However, there isno record of lava balloons having been produced in any ofthese eruptions. Worldwide, there have been only four othercases where basaltic balloon-type products have been ob-served forming during submarine eruptions: during the2011–2012 eruption (ongoing at the time of writing) southof El Hierro (Canary Islands, Spain), near Socorro Island,Mexico (Siebe et al. 1995), offshore of Pantelleria Island,Italy (Riccò 1892) and west of Hawai’i Island, USA (Mooreet al. 1985). In this study, we investigate the lava balloonsand fine suspended particles (<2 mm) produced during the1998–2001 Serreta eruption. We compare the Serreta bal-loons to the products of the aforementioned eruptions andreview the ideas proposed to explain the formation of lavaballoons. Then, by examining the morphology and compo-sition of the basaltic shell of the Serreta lava balloons, andthe rate at which the shell cooled, we present a model thatexplains the formation of the lava balloons during the sub-marine Serreta eruption.
The Serreta eruption and other basaltic submarineeruptions with floating eruption products
On 18 December 1998, fishermen reported white vapourrising from the sea surface approximately 10 km west ofTerceira above the Serreta Ridge (Fig. 1a,b). During a re-connaissance trip to the area in early January 1999 by
members of the Centro de Vulcanologia e Avaliação deRiscos Geológicos, several tens to a few hundred ellipsoidallava balloons were seen floating on the surface of the sea(Fig. 2a), providing evidence for an on-going submarineeruption. Each balloon was the source of a little white plumeof vapour and emitted a hissing noise while it remainedafloat (up to several minutes). The eruption continued untilearly 2001, during which the lava balloons appeared inter-mittently and in variable numbers. The periods when bal-loons appeared at the surface lasted for several days to a fewweeks and during at least one of those periods, large quan-tities of suspended volcanic particles discoloured the sea(Gaspar et al. 2003).
Volcanic rocks can only float in seawater (i.e. have a bulkdensity lower than that of the water) if: (1) they contain alarge fraction of pore space (approximately 60 vol%) and (2)this pore space is gas filled. In comparison to felsic erup-tions that produce floating pumice more frequently, subma-rine basaltic eruptions rarely erupt products that can float.Besides the Serreta eruption, we are aware of only four othersubmarine eruptions where basaltic products were observedfloating at the surface: (1) the 1877 eruption in KealakekuaBay on the western coast of Hawai’i Island, USA (Moore etal. 1985); (2) the 1891 eruption northwest of PantelleriaIsland, Italy (Riccò 1892); (3) the 1993 eruption west ofSocorro Island, Mexico (Siebe et al. 1995); and (4) the2011–2012 eruption south of El Hierro (Canary Islands,Spain). The last of these started in October 2011 and hasbeen characterised by the generation of two types of erup-tion products that have distinctly different floating times.The first type is characterised by a thin (~1 cm) envelope ofbasanitic lava around a core of white porous glass. The corehas been interpreted to be remelted ocean crust sediment(Troll et al. 2012). Samples of this type have mostly beenrecovered along the coast, implying a floating time longer
Fig. 1 a Map of the Azores Archipelago (Portugal) and TerceiraIsland. The thick black line crossing Graciosa, Terceira and São MiguelIslands represents the Terceira Rift. b Terceira Island and the surround-ing bathymetry (contour lines, 50, 100, 200, 500 and 1,000 m). The
1998–2001 eruption took place from vents along the submarine SerretaRidge, west of the island. The red oval indicates the locations ofballoons observed at the sea surface (Gaspar et al. 2003). The scalebar is 10 km
Bull Volcanol
Author's personal copy

than a few minutes. The second type was observed severaltimes (on 4, 26 and 27 November and intermittently thereafter)and sampled on 27 November (images, published by theSpanish Instituto Geographico Nacional, can be seen athttp://www.ign.es/ign/resources/volcanologia/Galeria_Fotos/GaleriaFotos.html). These samples appear to be remarkablysimilar to the Serreta and Pantelleria lava balloons in terms ofform and behaviour. As detailed descriptions of the El Hierrosamples are not yet available, these balloons will not be dis-cussed further in this paper. However, the Serreta and El Hierroeruptions suggest that lava balloon formation may be a morecommon feature of submarine eruptions than previously real-ised. Because balloons are ephemeral, chances that they will beobserved are generally very low.
Existing ideas about floating basaltic eruption products
Without any direct knowledge of conditions at the ventduring the eruption, possible models to explain the observedphenomena must be based on evidence gleaned from theanalysis of the eruptive products. In the case of the Serretaeruption, Gaspar et al. (2003, pages 205 and 210) hypoth-esised that the lava balloons were: (1) “the result of puffingup of gas under the plastic surface of lava at vent level […]
within or beneath submarine lava lakes. […] the segregationand accumulation of gas under a cooler lava crust […]would lead to the development of large gas bubbles […].At a critical point of accumulation, these large gas bubblescan form blisters that, in a subaqueous setting, detach fromthe vent as swollen lava balloons that rise by flotation(buoyancy)”; or (2) were formed “[…] during lava fountain-ing episodes […]”. During the 1993/1994 eruption offshoreSocorro, floating eruption products were observed abovetwo vents in water depths of 210 and 30 m. In contrast toSerreta, their cores were filled with reticulite and Siebe et al.(1995) proposed that “intermittent lava fountaining at afixed vent” produced “vesiculated scoria blocks rising tothe surface”. Riccò (1892) reported that the Pantelleria erup-tion in 1891 took place at water depths of 320 m andproduced balloons up to 1 m in length. These balloons werefound to consist of a black porous shell with a glassy surfaceand a central void (M. Calarco, personal communication),suggesting strong similarities with the Serreta balloons.Several balloons revealed an incandescent interior whenthey exploded at the sea surface. Riccò (1892) postulatedthat the entrapment and vaporisation of external water led tothe observed low bulk density that allowed the lava balloonsto float temporarily. The explosions of some of the balloonsat the surface were explained by internal overpressure.
Fig. 2 a A group of lavaballoons (~30) floating at thesea surface as seen in January1999, emitting white plumes ofsteam (balloon lengthapproximately 1 m). b Balloonfragment (looking into theinterior) showing the thin shell,with the outer layer (OL) andinner layer (IL) labelled, and thehollow interior. c Close-up ofthe shell showing the golden-coloured, glassy OL (top) andthe black IL and the complexporosity pattern across the shell.d The commonly smooth outerlayer is in places cut by exten-sion cracks (here 10 mm wide).e A folded shell includes cavi-ties in which the outer layer wasentirely preserved. The dashedwhite line indicates the outersurface of the outer layer. f Ascanned thin section of the en-tire shell showing the complexvesicle structure (outer layer istop left). Scale bars in b–f (inthe lower left corner) represent3 cm
Bull Volcanol
Author's personal copy

During the 1877 eruption in Kealakekua Bay, many “redhot” and “quite soft bombs” up to 60 cm, which weredescribed as “quite porous, brittle and light”, reached thesea surface (news article in the “Hawaiian Gazzette” of 28February 1877, reprinted by Moore et al. (1985)). Thiseruption took place along a WNW–ESE trending fissure inwater depths ranging from 20 to 300 m. The author of the“Hawaiian Gazzette” article noted that the samples resem-bled subaerial volcanic products, being “bubble rich, with aglassy coating”. To the best of our knowledge, further moredetailed descriptions of the 1877 samples do not currentlyexist.
Methods
We have used a threefold approach in order to test thehypotheses of Gaspar et al. (2003) and better constrain theconditions under which the lava balloons were producedduring the 1998–2001 Serreta eruption. We examined thephysical volcanology, geochemistry and calorimetric prop-erties of the balloon shells. All analyses were performed onsamples collected from the sea surface in January 1999(Figs. 1b and 2a). In addition, we investigated in detail thesurface morphology and internal features of the shell of thefew preserved balloons as well as more than 100 fragments(up to 50 cm, Fig. 2b–f).
The description of bubbles (size, number, and shape)and crystals (size and kind) was achieved through thinsection analysis. Whole-rock composition (Fig. 3) wasmeasured by inductively coupled plasma-mass spectrometry(ICP-MS). Approximately 1 kg of fragments from the shells
of various balloons was crushed to obtain a homogeneous andrepresentative sample of the magma erupted during this erup-tion. Further information can be found in Appendix 1. Exceptfor the fine particles, samples used for in situ geochemicalanalyses (including melt inclusion analysis) and calorimetrywere taken from a single shell fragment. Glass samples wereextracted at different distances from the exterior surface of thisshell fragment and the same chips were analysed by bothelectron microprobe and Fourier-transform infrared (FTIR)spectroscopy to examine whether there were any variationsin major elements and volatiles across the shell. In addition,one fine particle (0.8 mm) filtered from suspension in the seawas also analysed by FTIR spectroscopy, although owing tothe difficulty in sample preparation it could not be analysed byelectron microprobe.
Silicate melt inclusions (SMI) hosted by ferromagne-sian phases (olivine and clinopyroxene) were analysedby electron microprobe and FTIR spectroscopy in orderto determine how major (Fig. 4a,b) and volatile(Fig. 4c,d) elements evolved during magma ascent priorto eruption (Table 1). A piece of the shell fragment thatwas sampled for glass was crushed and sieved into a500–1,000 μm size fraction from which SMI-bearingcrystals could be picked. The SMI occur as isolated,small clusters or trails criss-crossing olivine crystals, oralong cleavage planes in clinopyroxene crystals. TheSMI chosen for analysis were isolated, apparentlyglassy, had a small shrinkage bubble (bubble volume/melt volume 0.04–0.06) and ranged in size from 36 to198 μm. The selected SMI did not show decrepitationfeatures. The compositions of the SMI have been affect-ed by variable amounts of post-entrapment crystallisa-tion of the host phase at the boundary between the SMIand the host crystal. Accordingly, the SMI compositionshave been corrected for post-entrapment crystallisation of ol-ivine (ranging from Fo82–84) or clinopyroxene (Wo43En48Fs9),depending on the host phase (Table 1). The correctedvalues are used in all subsequent figures and discussion,unless stated otherwise. The compositions of the hostcrystals were also analysed by electron microprobe (Table 2).In addition to conventional spot-FTIR analyses of theinclusions, FTIR spectroscopic images were collected todirectly compare volatiles in the SMI with those ingroundmass glass attached to the outside of the samecrystal (Fig. 5). Details of instrument settings for all thein situ geochemical analyses are provided in Appendices 2and 3.
Finally, cooling rates of samples from different layers inthe Serreta balloon shell (Fig. 6) and fine particles filteredfrom the sea above the eruption site were quantified bymeasuring the specific heat capacity (cp) of the glass acrossthe glass transition using a differential scanning calorimeter(Appendix 4).
Fig. 3 Total alkalis versus silica discrimination diagram (after Le Baset al. 1986). Coloured field shows compositions of samples from theisland of Terceira (Beier et al. 2008). The Serreta balloon shell whole-rock composition is indicated by the blue star. The boundary betweenalkaline and subalkaline series is from Macdonald (1968). Ba basalt,Ab alkaline basalt, Mu mugearite, Be benmoreite, Tr trachyte
Bull Volcanol
Author's personal copy

Physical volcanology
Gaspar et al. (2003) assumed that the vents were directlybelow the area where the balloons reached the surface, inwater depths of 300–1,000 m. An oceanographic surveyin 2008 attempted to better constrain the location of thevents with a remotely controlled vehicle, but was unsuc-cessful (A. Pimentel, personal communication). There-fore, at this time, we are unable to constrain the waterdepth at the eruption site to better than between 300 and1,000 m. The lava balloons that reached the surface andwere sampled intact are ellipsoidal in shape, up to 1 mlong and 40 cm in diameter. The balloons comprise alava shell a few centimetre in thickness (commonly lessthan 5 cm, Fig. 2b,c) that surrounds a single, large,empty cavity. In a few samples, we observe the entireshell to be strongly folded (Fig. 2e). Gaspar et al. (2003)subdivided the shell into two different layers, an outerand an inner layer on the basis of bubble number density,bubble size, crystal content and the presence of glass(Fig. 2c). They then further divided the inner layer intothree sublayers separated by gradual contacts and definedby differences in vesicularity. We continue to use thesedivisions in the following detailed description based onour hand specimen and thin section analysis.
The outer layer is golden-coloured (Fig. 2b–f), glassy andhas an average thickness of about 20 mm. It is characterisedby a high porosity (80–90 %). Bubble shapes change sig-nificantly over the outermost 2 mm, from high aspect ratiosat the surface (up to 5:1) to nearly spherical towards theinterior (up to 150 μm diameter). The outer layer is veryfragile and can easily detach from the inner layer. If theouter layer is preserved in its entirety (including the outer-most surface), the balloon surface appears very smooth,locally broken by extensional cracks (Fig. 2d); where theoutermost surface is missing, stretched bubbles are exposedand the surface texture is rather rough.
The inner layer is opaque and has a microcrystallinegroundmass. Inner layer 1 (in contact with the outerlayer) is black and highly porous (~65 %) with sphericalbubbles up to 1 mm in diameter. It grades continuouslyinto inner layer 2, which is dark grey and poorly vesic-ular (~25 %); bubbles are elongate along planes parallelto the long axis of the balloons. The innermost part ofthe shell (inner layer 3) is black and has a porosityranging from 40 to 50 %. Bubbles may be as large as1 cm in diameter. The surface facing the central largecavity is commonly covered in many irregularly distrib-uted, half-sphere-shaped depressions (<1 cm in depth anddiameter, Fig. 2b).
Fig. 4 Variations of a Al2O3 and b CaO versus MgO in lavaballoon shell interstitial glass and silicate melt inclusions (SMI).All analyses normalised to 100 %. Error bars show 1 SD frommultiple analyses per glass and inclusion. Dashed line definescrystallisation of olivine and clinopyroxene in proportions of3:1, solid line defines crystallisation of olivine, clinopyroxeneand plagioclase feldspar in the proportions of 1:2:5 after 6.6 %crystallisation of olivine and clinopyroxene. Tick marks defineincrements of 1 % where olivine and clinopyroxene are crystallis-ing, and 20 and 40 % crystallisation where olivine, clinopyroxene
and plagioclase are crystallising. Crystallisation paths were determinedbymass balance calculations starting from the least differentiated (highestMgO) inclusion and crystallising mineral compositions in equilibriumwith the melt at each step of the calculation. Relationships between cH2O(weight percent) versus CO2 (parts per million), and d H2O (weightpercent) versus S (parts per million), in lava balloon shell interstitial glassand SMI corrected for post-entrapment crystallisation. Of those SMI thatdo not contain CO2, only those with detection limits <100 ppm areplotted. Error bars show 1 SD from multiple analyses per glass andinclusion
Bull Volcanol
Author's personal copy

Tab
le1
Lavaballo
onshellinterstitialglassandsilicatemeltinclusion(SMI;original
andcorrectedforpo
st-entrapm
entcrystallisatio
n)major
elem
entandvo
latileelem
entcompo
sitio
ns,ho
stclinop
yrox
eneMg#andho
stolivineFo-contentandpressuresof
volatilesaturatio
n
Sam
ple
SRT01
SRT01
SRT01
SRT01
SRT01
SRT01
SRT01
SRT01
SRT01
SRT01
SRT01
SRT01
SRT01
SRT01
Distancea
017
2738
Hostcrystalb
cpx
olol
olol
olol
olol
olInclusionc
1–1
2–1
2–2
3–1
4–2
4–3
5–1
5–2
7–1
8–1
SiO
249.09(0.38)
48.95(0.17)
49.60(0.49)
49.08(0.22)
46.46(0.16)
49.91(0.21)
49.77(0.15)
47.95(0.17)
49.04(0.07)
49.28(0.10)
48.94(0.19)
48.59(0.28)
50.14(0.14)
48.19(0.20)
TiO
23.51
(0.10)
3.54
(0.08)
3.85
(0.28)
3.55
(0.05)
3.68
(0.09)
2.99
(0.08)
3.32
(0.14)
3.49
(0.06)
3.23
(0.06)
3.21
(0.09)
3.04
(0.11)
2.75
(0.06)
2.42
(0.05)
3.14
(0.05)
Al 2O3
14.70(0.15)
14.58(0.15)
13.80(0.95)
14.58(0.13)
15.42(0.09)
15.86(0.17)
16.95(0.25)
16.71(0.12)
17.03(0.03)
17.10(0.16)
16.00(0.08)
15.82(0.17)
16.05(0.07)
15.85(0.31)
Fe 2O3d
1.49
(0.02)
1.49
(0.03)
1.71
(0.11)
1.48
(0.03)
1.46
(0.01)
1.11
(0.02)
1.08
(0.04)
1.15
(0.01)
1.26
(0.01)
1.26
(0.01)
1.42
(0.01)
1.31
(0.01)
1.07
(0.02)
1.45
(0.02)
FeO
9.83
(0.10)
9.82
(0.18)
11.31(0.75)
9.74
(0.19)
9.64
(0.06)
7.33
(0.10)
7.15
(0.27)
7.60
(0.09)
8.34
(0.06)
8.33
(0.09)
9.34
(0.07)
8.66
(0.10)
7.04
(0.13)
9.57
(0.11)
MnO
0.18
(0.02)
0.18
(0.02)
0.23
(0.02)
0.18
(0.02)
0.16
(0.02)
0.13
(0.02)
0.13
(0.02)
0.12
(0.01)
0.16
(0.02)
0.17
(0.01)
0.17
(0.03)
0.15
(0.02)
0.12
(0.01)
0.18
(0.02)
MgO
5.89
(0.07)
5.81
(0.09)
5.28
(0.47)
5.82
(0.12)
7.04
(0.08)
5.72
(0.14)
3.69
(0.25)
6.14
(0.05)
5.61
(0.12)
5.20
(0.26)
5.89
(0.04)
5.45
(0.13)
5.94
(0.19)
5.69
(0.04)
NiO
0.01
(0.01)
0.00
(0.01)
0.00
(0.01)
0.01
(0.01)
0.01
(0.01)
0.02
(0.02)
0.02
(0.01)
0.01
(0.01)
0.00
(0.01)
0.02
(0.01)
0.02
(0.02)
0.01
(0.01)
0.02
(0.01)
0.02
(0.01)
CaO
10.84(0.04)
10.65(0.13)
10.10(0.81)
10.80(0.07)
10.67(0.06)
12.25(0.13)
12.91(0.14)
11.46(0.05)
10.65(0.05)
10.85(0.13)
11.16(0.05)
12.00(0.09)
11.99(0.07)
11.27(0.10)
Na 2O
3.12
(0.05)
3.11
(0.08)
2.69
(0.50)
3.08
(0.05)
2.73
(0.07)
2.81
(0.04)
2.63
(0.15)
2.81
(0.09)
3.23
(0.06)
3.23
(0.06)
2.98
(0.14)
2.90
(0.04)
3.02
(0.05)
3.19
(0.03)
K2O
0.85
(0.04)
0.86
(0.08)
1.42
(0.33)
0.81
(0.08)
0.64
(0.08)
0.42
(0.03)
0.53
(0.08)
0.81
(0.02)
0.82
(0.03)
0.76
(0.03)
0.65
(0.03)
0.59
(0.03)
0.51
(0.01)
0.73
(0.03)
H2O
0.29
(0.02)
0.31
(0.01)
0.27
(0.03)
0.32
(0.02)
0.83
(0.03)
0.89
(0.05)
0.70
(0.01)
0.90
(0.04)
1.23
(0.06)
0.97
(0.00)
0.44
(0.02)
0.29
(0.03)
0.85
(0.03)
0.41
(0.08)
CO2
nd(27)
nd(46)
nd(77)
nd(37)
1,606(236)
781(158)
nd(256)
919(116)
609(8)
528(0)
nd(103)
nd(84)
500(140)
205(67)
P2O5
0.43
(0.01)
0.42
(0.02)
0.47
(0.03)
0.42
(0.01)
0.46
(0.02)
0.43
(0.01)
0.68
(0.04)
0.37
(0.01)
0.43
(0.01)
0.43
(0.02)
0.31
(0.02)
0.29
(0.02)
0.24
(0.02)
0.35
(0.01)
Cr 2O3
0.03
(0.01)
0.04
(0.02)
0.02
(0.02)
0.03
(0.01)
0.01
(0.02)
0.03
(0.01)
0.04
(0.03)
0.03
(0.02)
0.01
(0.01)
0.04
(0.01)
0.04
(0.02)
0.04
(0.02)
0.02
(0.02)
0.04
(0.01)
SO3
0.09
(0.01)
0.08
(0.01)
0.11
(0.02)
0.09
(0.00)
0.44
(0.01)
0.26
(0.01)
0.26
(0.01)
0.29
(0.01)
0.26
(0.02)
0.27
(0.01)
0.18
(0.01)
0.17
(0.01)
0.23
(0.01)
0.26
(0.01)
ClO
20.05
(0.00)
0.05
(0.00)
0.08
(0.02)
0.05
(0.00)
0.05
(0.00)
0.03
(0.00)
0.04
(0.00)
0.05
(0.00)
0.04
(0.00)
0.04
(0.01)
0.04
(0.01)
0.03
(0.01)
0.03
(0.00)
0.05
(0.01)
Total
100.08
99.58
100.68
99.73
99.86
100.27
99.90
99.99
101.42
101.22
100.62
99.06
99.73
100.42
Mg#
51.65
51.34
45.43
51.59
56.54
58.18
47.93
59.03
54.50
52.64
52.91
52.86
60.05
51.47
Cl/K
0.07
0.07
0.07
0.07
0.10
0.10
0.09
0.08
0.07
0.07
0.08
0.07
0.07
0.08
Pbarse
910
811
1627
1686
451387
1423
1202
209
1123
344
HostMg#
orFo%
f84.90
83.75
83.75
83.85
82.28
82.28
83.30
83.30
84.50
82.64
%hostadd
6.7
3.1
8.4
2.7
4.1
5.3
7.2
6.7
2.6
7.4
Corrected
forpostentrapmentcrystallisatio
n1–
12–
12–
23–
14–2
4–3
5–1
5–2
7–1
8–1
SiO
247.25
49.60
48.94
47.74
48.67
48.79
48.28
48.00
49.87
47.56
TiO
23.53
2.90
3.04
3.40
3.10
3.04
2.83
2.56
2.36
2.91
Al 2O3
14.67
15.37
15.52
16.27
16.33
16.20
14.85
14.75
15.63
14.68
Fe 2O3†
1.43
1.08
0.99
1.12
1.21
1.20
1.31
1.22
1.04
1.34
FeO
9.40
7.57
7.81
7.80
8.68
8.77
9.79
9.13
7.23
10.05
MnO
0.15
0.13
0.14
0.12
0.16
0.17
0.17
0.16
0.12
0.18
MgO
7.75
6.93
7.15
7.18
7.20
7.27
8.69
8.10
6.97
8.55
NiO
0.01
0.02
0.04
0.02
0.01
0.03
0.04
0.03
0.02
0.04
CaO
11.43
11.88
11.84
11.16
10.22
10.28
10.37
11.20
11.68
10.46
Na 2O
2.57
2.72
2.41
2.74
3.10
3.06
2.77
2.70
2.94
2.95
K2O
0.60
0.41
0.48
0.79
0.79
0.72
0.60
0.55
0.50
0.68
H2O
0.78
0.87
0.64
0.87
1.18
0.92
0.41
0.27
0.82
0.38
Bull Volcanol
Author's personal copy

Tab
le1
(con
tinued)
Sam
ple
SRT01
SRT01
SRT01
SRT01
SRT01
SRT01
SRT01
SRT01
SRT01
SRT01
SRT01
SRT01
SRT01
SRT01
Distancea
017
2738
Hostcrystalb
cpx
olol
olol
olol
olol
olInclusionc
1–1
2–1
2–2
3–1
4–2
4–3
5–1
5–2
7–1
8–1
CO2
1500
757
nd895
583
500
ndnd
487
190
P2O5
0.43
0.41
0.63
0.36
0.41
0.41
0.29
0.27
0.23
0.33
Cr 2O3
0.02
0.03
0.04
0.03
0.01
0.04
0.04
0.04
0.02
0.04
SO3
0.41
0.25
0.23
0.28
0.25
0.25
0.17
0.15
0.23
0.24
ClO
20.04
0.03
0.03
0.05
0.04
0.04
0.04
0.03
0.03
0.04
Total
100.61
100.27
99.95
100.01
101.43
101.23
100.64
99.18
99.75
100.46
Mg#
59.51
61.99
61.99
62.13
59.65
59.65
61.28
61.28
63.20
60.26
Cl/K
0.09
0.10
0.09
0.08
0.07
0.07
0.08
0.07
0.07
0.08
Pbarse
1788
1636
371276
1210
1049
188
1092
267
The
analysed
glassandSMIcamefrom
onepieceof
theshell
aAllsamples
weretakenfrom
afolded,thinballo
onshell.The
numbersindicatethedistance
inmm
from
theexterior
surfaceof
itsou
terlayer.Sam
ple00
and17
weretakenfrom
theou
terlayer,
sample27
from
theinnerlayerandsample38
from
thefolded
surfacethat
was
facing
asm
allcavity.Sam
plenu
mbers
fortheSMIidentifytheho
stcrystalandinclusion,
respectiv
ely
bcpxandol
deno
teclinop
yrox
eneandolivine,respectiv
ely
cAllox
ides
arein
weigh
tpercent,except
CO2,which
isin
partspermillion
dFe 2O3calculated
usingFe3
+/∑Fe0
0.12
(Bézos
andHum
ler20
05).Valuesin
parenthesesarestandard
deviations
ofmultip
leanalyses
(for
major
elem
ents,atleast11
inglass,atleastfive
inthe
SMI,andforH2OandCO2,atleastthreein
glassandatleasttwoin
theSMI).n
ddeno
tesCO2was
belowthedetectionlim
it.The
detectionlim
itsarethevalues
notin
parenthesesin
theadjacent
column,
andwerecalculated
basedon
aFTIR-peakdetectionlim
itof
0.01
(3×backgrou
nd)andthethickn
essof
theanalysed
sample
eSaturationpressurescalculated
usingVolatileCalc(N
ewman
andLow
enstern20
02)
fAmou
ntof
hostcrystaladd
edto
theSMIcompo
sitio
nforinclusionandho
stto
bein
equilib
rium
.For
theSMIho
sted
inolivine,thiscalculationisbasedon
Fe-Mgpartition
ingandtheequilib
rium
relatio
nshipof
Ulm
er(198
9).F
ortheclinop
yrox
ene-ho
sted
SMI,equilib
rium
clinop
yrox
enewas
addedback
intotheliq
uidin0.01
wt%
increm
ents,startingfrom
theinclusioncompo
sitio
n,un
tilthe
liquidreachedequilib
rium
with
theho
stclinop
yrox
ene.These
calculations
wereperformed
usingPETROLOG
v.3.1.1.1(D
anyu
shevskyandPlechov
2011)
Bull Volcanol
Author's personal copy

Petrography and composition
The magma erupted during the 1998–2001 Serreta eruption ishypersthene-normative basalt with a weak alkaline affinity(Fig. 3). The average whole-rock composition of the collectedsamples plots on the trend exhibited by subaerial magmaserupted on Terceira (Self and Gunn 1976; Beier et al. 2008),indicating that Serreta Ridge is the submarine extension ofTerceira volcanism along the Terceira Rift (Fig. 1). Samplesare porphyritic and point-counting revealed a highly variablephenocryst content (4–36 vol%), consisting of plagioclase(≤24 vol%), followed by olivine (≤12 vol%) and scarce cli-nopyroxene (≤4 vol%), set in an intersertal to vitrophyricgroundmass. Plagioclase is present both as tabular, euhedraland highly resorbed anhedral phenocrysts and microphenoc-rysts. Most crystals are unzoned and have anorthite contents inthe range An77–85. Olivine is typically euhedral to subhedral,unzoned and contains melt inclusions. Forsterite contents ofthe olivine phenocrysts are fairly constant (Fo81–84). The rareclinopyroxene phenocrysts have augite to augitic–diopsidecomposition (Wo40–46En44–52Fs7–10) and variable Cr-content(0.1–1.05 wt%). The groundmass contains clinopyroxenewith diopside compositions (Wo45–50En38–44Fs11–14) that con-tain up to 1.05 wt% chromium. Oxide phenocrysts are absent,however Cr-spinel can be found included in olivine. Intersti-tial glass is present mainly in the outer layer where it isyellowish to orange and contains numerous tiny (<few micro-meters) skeletal microlites. The shift from glassy (outer layer)to an entirely crystalline (inner layer) groundmass occurs overa few millimetres. None of the samples show evidence ofhydrothermal alteration; all interstitial glass samples have a
Cl/K of 0.07 (Table 1), similar to that proposed for unalteredN-MORB by Michael and Cornell (1998).
The corrected major element compositions of the SMI areless evolved than those of the interstitial glass from acrossthe shell (Fig. 4a,b). The trends exhibited by the SMI areconsistent with olivine ± clinopyroxene crystallisation. Theinterstitial glass samples require the additional crystallisa-tion of plagioclase. We investigated four different samples:SRT01-00 and SRT01-17 from the outer layer, sampleSRT01-27 from the inner layer and sample SRT01-38 froma glassy surface resembling the outer layer but folded toform a small cavity in the balloon shell (Fig. 2e). The lasttwo digits of the sample number refer to the distance (inmillimetre) from the outer surface (Table 1). The composi-tion of interstitial glass in sample SRT01-27 indicates that ithas experienced the greatest extent of crystallisation, whichis consistent with its location in the crystalline inner layer ofthe shell, where cooling would have been slower and moretime was available for crystal nucleation and growth.
In terms of volatiles, the olivine-hosted SMI contain up to1.18 wt% H2O and 895 ppm CO2; a single clinopyroxene-hosted SMI contains 0.78 wt% H2O and 1500 ppm CO2
(Fig. 4c). In comparison, values of volatile content in glassyareas in the four samples from across the shell are much lower;H2O ranges between 0.27 and 0.32 wt% (mean of 0.29 wt%[1σ00.02]) and CO2 is below detection ([sample specific, butall <77 ppm], Table 1). The fine particle filtered from the seaabove the eruption site, which was not analysed for majorelements, contains 0.30 wt% H2O (1σ00.01) and CO2 is alsobelow detection (<59 ppm). Sulphur contents in the SMIcorrelate positively with their H2O (Fig. 4d) and CO2 contents
Table 2 Major element compositions of crystals hosting the analysed silicate melt inclusions. All oxides are in weight percent, values inparentheses are standard deviations of multiple analyses (at least 6)
Sample SRT01 SRT01 SRT01 SRT01 SRT01 SRT01 SRT01Host cpx ol ol ol ol ol olCrystal 1 2 3 4 5 7 8
SiO2 50.92 (0.44) 39.97 (0.22) 39.92 (0.16) 40.02 (0.13) 39.79 (0.38) 39.81 (0.11) 39.68 (0.21)
TiO2 0.93 (0.02) 0.01 (0.01) 0.02 (0.02) 0.02 (0.01) 0.01 (0.01) 0.02 (0.01) 0.03 (0.02)
Al2O3 4.14 (0.16) 0.04 (0.00) 0.03 (0.01) 0.04 (0.02) 0.04 (0.01) 0.04 (0.01) 0.03 (0.00)
FeO 5.23 (0.13) 14.99 (0.49) 14.99 (0.40) 16.51 (0.27) 15.51 (0.38) 14.37 (0.16) 16.12 (0.24)
MnO 0.11 (0.02) 0.18 (0.02) 0.18 (0.02) 0.21 (0.02) 0.19 (0.01) 0.18 (0.02) 0.20 (0.02)
MgO 16.49 (0.20) 44.72 (0.46) 45.02 (0.44) 44.24 (0.38) 44.74 (0.56) 45.45 (0.29) 44.40 (0.13)
NiO 0.03 (0.02) 0.27 (0.02) 0.28 (0.01) 0.19 (0.02) 0.28 (0.03) 0.30 (0.03) 0.22 (0.04)
CaO 20.95 (0.09) 0.23 (0.01) 0.22 (0.01) 0.21 (0.01) 0.23 (0.01) 0.25 (0.01) 0.24 (0.01)
Na2O 0.37 (0.03) 0.01 (0.02) 0.02 (0.02) 0.01 (0.01) 0.01 (0.01) 0.01 (0.01) 0.01 (0.01)
K2O 0.01 (0.00) 0.00 (0.01) 0.01 (0.01) 0.00 (0.00) 0.00 (0.01) 0.01 (0.01) 0.01 (0.01)
P2O5 0.01 (0.01) 0.02 (0.02) 0.01 (0.01) 0.03 (0.02) 0.02 (0.01) 0.03 (0.02) 0.01 (0.01)
Cr2O3 0.66 (0.09) 0.04 (0.03) 0.03 (0.02) 0.02 (0.02) 0.05 (0.03) 0.07 (0.03) 0.03 (0.03)
Total 99.86 100.49 100.73 101.49 100.87 100.53 100.96
Host Mg# or Fo % 84.90 83.75 83.85 82.28 83.30 84.50 82.64
Bull Volcanol
Author's personal copy

(not shown). FTIR spectroscopic images of the SMI andneighbouring interstitial glass outside the host crystal confirmthat whereas H2O and CO2 are present in the SMI, loweramounts of H2O and no CO2 can be detected in the interstitialglass (Fig. 5). The colour scale bars in Fig. 5 refer to absor-bance as it is difficult to account for the variation in the SMIthickness across the SMI. Thus, despite some of the thicknessat the SMI being the host crystal, these images show that theabsorbance of H2O and CO2 are higher in the area of the SMIthan in the areas of glass even though in the glassy areas theentire thickness is glass.
In summary, the major and volatile elements of the inter-stitial glass and SMI indicate a magmatic system in whichdegassing accompanied crystallisation, and that the SMI pre-serve an earlier less degassed, less evolved melt composition.
Cooling rates
We were able to determine the cooling rate for only threekinds of samples, (1) fine particles from the water column,(2) the “normal” outer layer (Fig. 2d) and (3) an unusualpart of the outer layer where the shell was strongly foldedand thereby preserved completely (Fig. 2e). Only thesethree sample types were glassy enough for the successfulmeasurement of heat capacity (cp); the entire inner layerwas found to be too crystalline. During initial heating, allmeasurable samples exhibited a clear trough in cp prior tothe glass transition peak. This pattern (Fig. 6a) has beenobserved previously in volcanic glass that quenched incontact with seawater and is commonly interpreted toreflect rapid quenching (Potuzak et al. 2008; Nichols et
Fig. 5 FTIR spectroscopic images of the distribution of volatile ab-sorbance in silicate melt inclusions (SMI) and interstitial glass sur-rounding the host crystal sampled from the balloon shell for the totalH2O peak and one of the peaks that form the CO3
2− doublet used tocalculate CO2 concentrations. Colour scale bars refer to absorbance.Notice that although H2O is present in both the SMI and the interstitialglass, CO2 is present only in the SMI. Also, the absorbance of the totalH2O-peak is greater in the SMI than in the interstitial glass, despite thefact that in the areas of the SMI, the thickness includes some crystal
whereas in the glass, the entire thickness is glass. As absorbancedepends on thickness, the lower intensities around the rims of theSMI reflect thinning of the SMI towards their edges. The crack inter-secting the crystal developed during sample preparation. SRT01 3-2(original uncorrected H2O and CO2 concentrations 0.93 wt% and747 ppm, respectively) was not exposed and therefore was not ana-lysed by electron microprobe and cannot be corrected for post-entrapment crystallisation. As a result, it is not included in the datasetused in this study. Scale bars indicate 100 μm
Bull Volcanol
Author's personal copy
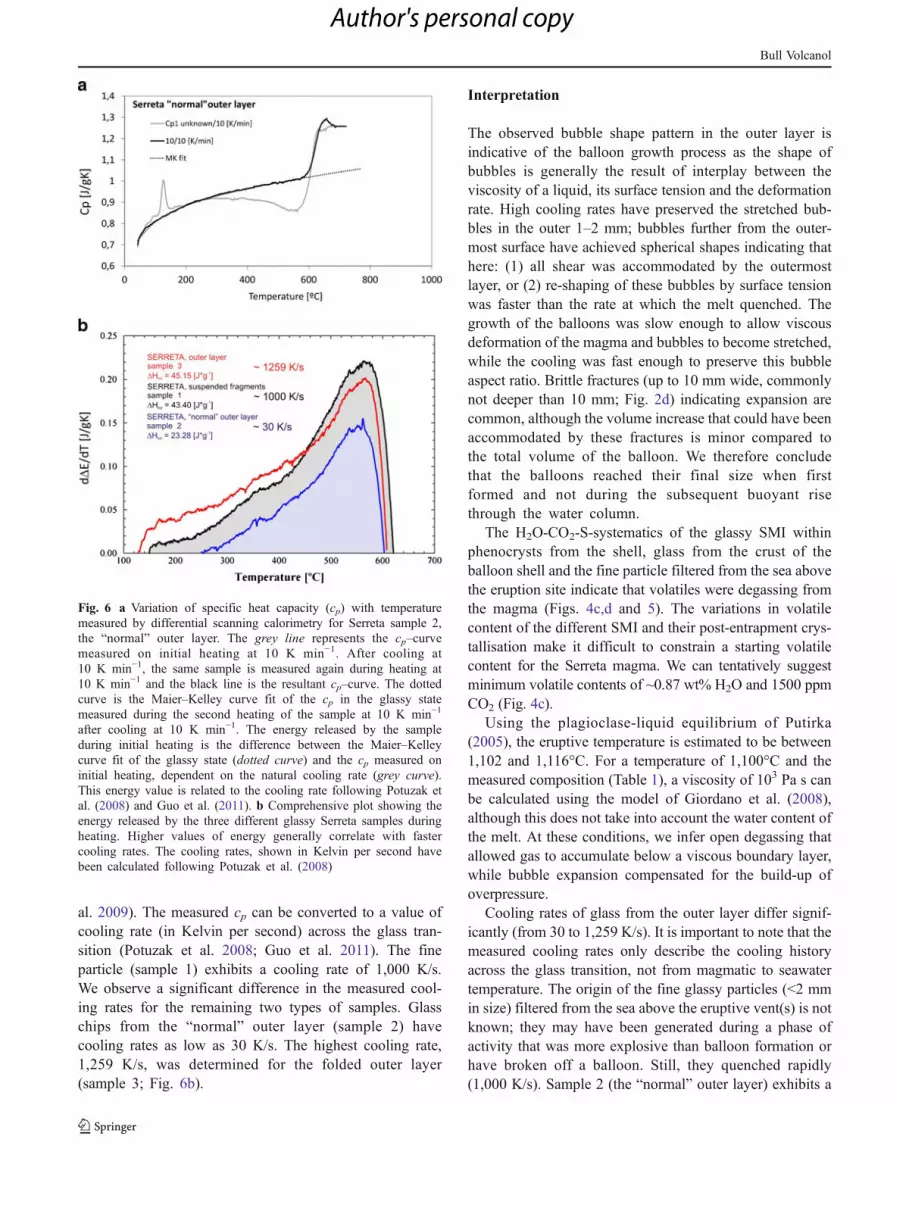
al. 2009). The measured cp can be converted to a value ofcooling rate (in Kelvin per second) across the glass tran-sition (Potuzak et al. 2008; Guo et al. 2011). The fineparticle (sample 1) exhibits a cooling rate of 1,000 K/s.We observe a significant difference in the measured cool-ing rates for the remaining two types of samples. Glasschips from the “normal” outer layer (sample 2) havecooling rates as low as 30 K/s. The highest cooling rate,1,259 K/s, was determined for the folded outer layer(sample 3; Fig. 6b).
Interpretation
The observed bubble shape pattern in the outer layer isindicative of the balloon growth process as the shape ofbubbles is generally the result of interplay between theviscosity of a liquid, its surface tension and the deformationrate. High cooling rates have preserved the stretched bub-bles in the outer 1–2 mm; bubbles further from the outer-most surface have achieved spherical shapes indicating thathere: (1) all shear was accommodated by the outermostlayer, or (2) re-shaping of these bubbles by surface tensionwas faster than the rate at which the melt quenched. Thegrowth of the balloons was slow enough to allow viscousdeformation of the magma and bubbles to become stretched,while the cooling was fast enough to preserve this bubbleaspect ratio. Brittle fractures (up to 10 mm wide, commonlynot deeper than 10 mm; Fig. 2d) indicating expansion arecommon, although the volume increase that could have beenaccommodated by these fractures is minor compared tothe total volume of the balloon. We therefore concludethat the balloons reached their final size when firstformed and not during the subsequent buoyant risethrough the water column.
The H2O-CO2-S-systematics of the glassy SMI withinphenocrysts from the shell, glass from the crust of theballoon shell and the fine particle filtered from the sea abovethe eruption site indicate that volatiles were degassing fromthe magma (Figs. 4c,d and 5). The variations in volatilecontent of the different SMI and their post-entrapment crys-tallisation make it difficult to constrain a starting volatilecontent for the Serreta magma. We can tentatively suggestminimum volatile contents of ~0.87 wt% H2O and 1500 ppmCO2 (Fig. 4c).
Using the plagioclase-liquid equilibrium of Putirka(2005), the eruptive temperature is estimated to be between1,102 and 1,116°C. For a temperature of 1,100°C and themeasured composition (Table 1), a viscosity of 103 Pa s canbe calculated using the model of Giordano et al. (2008),although this does not take into account the water content ofthe melt. At these conditions, we infer open degassing thatallowed gas to accumulate below a viscous boundary layer,while bubble expansion compensated for the build-up ofoverpressure.
Cooling rates of glass from the outer layer differ signif-icantly (from 30 to 1,259 K/s). It is important to note that themeasured cooling rates only describe the cooling historyacross the glass transition, not from magmatic to seawatertemperature. The origin of the fine glassy particles (<2 mmin size) filtered from the sea above the eruptive vent(s) is notknown; they may have been generated during a phase ofactivity that was more explosive than balloon formation orhave broken off a balloon. Still, they quenched rapidly(1,000 K/s). Sample 2 (the “normal” outer layer) exhibits a
Fig. 6 a Variation of specific heat capacity (cp) with temperaturemeasured by differential scanning calorimetry for Serreta sample 2,the “normal” outer layer. The grey line represents the cp–curvemeasured on initial heating at 10 K min−1. After cooling at10 K min−1, the same sample is measured again during heating at10 K min−1 and the black line is the resultant cp–curve. The dottedcurve is the Maier–Kelley curve fit of the cp in the glassy statemeasured during the second heating of the sample at 10 K min−1
after cooling at 10 K min−1. The energy released by the sampleduring initial heating is the difference between the Maier–Kelleycurve fit of the glassy state (dotted curve) and the cp measured oninitial heating, dependent on the natural cooling rate (grey curve).This energy value is related to the cooling rate following Potuzak etal. (2008) and Guo et al. (2011). b Comprehensive plot showing theenergy released by the three different glassy Serreta samples duringheating. Higher values of energy generally correlate with fastercooling rates. The cooling rates, shown in Kelvin per second havebeen calculated following Potuzak et al. (2008)
Bull Volcanol
Author's personal copy

cooling rate of 30 K/s, a low value compared to the othersamples. The highest value (1,259 K/s) was measured insample 3 in which the shell profile is strongly deformed andthe glassy outer layer faces a cavity in the shell (Fig. 2e). Weinterpret this shape to be a result of folding of the shellduring balloon formation. The large difference between thecooling rates measured for samples 2 and 3 can be explainedby the strong dependence of the cooling rate on the distancefrom the melt–seawater interface (e.g. Wilding et al. 2000).Both samples went through a comparable cooling history aswe assume that magmatic and seawater temperatures wereconstant. The several orders of magnitude faster cooling raterecorded by sample 3 is the result of the entire outer layerhaving been preserved lining the cavity in the shell where itwas protected from abrasion (during buoyant rise, floating,sampling, transport, storage, sample handling, sample prep-aration, etc.). In the case of the exposed “normal” outerlayer, the outermost part of the outer layer that cooled incontact with seawater has been lost as a result of one, or acombination, of these abrasion processes. This glass did notcool in direct contact with seawater and hence a slowercooling rate (30 K/s) was measured. These results showthe sensitivity of porous volcanic glass to cooling, and thelarge differences in cooling rate across the glass transitionthat neighbouring bubble walls may record. Accordingly,measuring the maximum cooling rate of volcanic glass maybe very difficult for porous samples, as losing one, or a few,of the bubble walls closest to the melt–seawater interfacewill greatly influence the results.
During buoyant rise, the hydrostatic pressure was de-creasing and the effective overpressure inside the detachedballoons was increasing. If the balloons had been gastight,the internal overpressure at the sea surface would have beenbetween 30 and 100 bar (equivalent to the inferred eruptiondepths of 300–1,000 m). A time series of images, taken lessthan 10 m below the sea surface by a remotely operatedvehicle, shows abundant gas bubbles rising directly next toballoons that existed for at least 5 s (period covered by theavailable images). These images indicate that the growingoverpressure during rise was being released by gas leakage.As H2O-rich gas would immediately condense in the water(and bubbles disappear), the gas phase inside the balloonsmost likely had a high concentration of CO2 and/or sulphurgases. The observed two-dimensional shapes of the bubblesin inner layer 2 suggest that the layer had a low permeabil-ity. Accordingly, gas loss was possible in two ways: (1)diffuse degassing (originating from the outer layer and innerlayer 1) all along the shell surface and (2) focussed degass-ing where a crack extending through the entire shell thick-ness reached the interior of the balloon.
The formation and survival of the balloons indicates thatthe interaction between the hot, bubble-rich magma and theseawater was not highly energetic. It has been shown that in
the case where lava is ponded above the vent, the latent heatof the magma below can create a setting in which the moltenlava is covered only by a relatively thin crust for an extend-ed period of time (Clague and Paduan 2009). This crust willdelay solidification. This situation involves two fluids (meltand seawater) that coexist (as separate phases) although theambient conditions would favour one of the liquids chang-ing state. Other examples of such behaviour are: (1) activemolten sulphur ponds (at >115°C) on the sea floor (W.Chadwick and N. Deardorff, personal communication, pub-lished on the NOAA webpage at http://oceanexplorer.noaa.gov/explorations/06fire/logs/may4/may4.html) that coexistwith seawater (at 4°C); and (2) lava flows on the sea floor(as observed, e.g. at West Mata volcano, see Cruise report athttp://oceanexplorer.noaa.gov/explorations/09laubasin/).
Model of lava balloon genesis
Hot basaltic magma rose to the sea floor at the Serreta Ridgeforming a submarine lava-filled conduit or lava lake onwhich only a relatively thin crust formed. It is important tonote that that magma erupted at Serreta does not haveexceptional geochemical or physical characteristics com-pared to other Azorean magmas (e.g. Self and Gunn 1976;Beier et al. 2006, 2008; Mattioli et al. 1997; Renzulli andSanti 2000). Convective processes led to constant rejuvena-tion of the lava crust, preventing it from thickening. Theoversaturation of volatiles in the rising magma generatedbubbles that could separate from the magma and rise faster.They eventually accumulated at a viscosity boundaryformed by, for example, a cool lava crust (Fig. 7a). Hereseparate bubbles coalesced. The buoyant forces of the gastrapped below the crust exerted stress causing the crust tobulge (Fig. 7b), allowing more gas bubbles to accumulateand coalesce. Based on bubble textures, it can be assumedthat the crust was deforming in a ductile way before solid-ifying. Ultimately, this led to brittle failure of the crust(Fig. 7c). Through the fractures that developed, a gas vol-ume surrounded by a film of vesicular magma leaked intothe water column. The film of magma quenched on contactwith seawater to form the shell (Fig. 7d). The balloon grewat the lava–water interface and if the shell and the gas itenveloped had a total bulk density less than 1,000 kg/m³, itdetached from the magma below. The generally low magmaviscosity and the resulting ductile deformation allowedsome balloons to close completely (Fig. 7e) and then risebuoyantly. The balloon shell was sometimes strongly folded(Fig. 2e), thereby preserving the entire shell stratigraphy.
This model refines the first scenario described by Gasparet al. (2003), who suggested a similar setting (ponded lava)and also hypothesised that volatiles degassing from themagma accumulated below a lava crust. However, our
Bull Volcanol
Author's personal copy

physical volcanology, volatile and cooling rate data placeadditional constraints on the balloon genesis model.
The smooth surface and elongate bubbles, with onlyminor brittle cracks, observed on the balloon shell suggestthat the shell deformed in a ductile manner as the balloonbegan to grow, indicating that the magma was above theglass transition, at least for a time, during balloon formation.Thus, the magma that formed the outermost part of theballoon shell must have first come into contact with seawa-ter during the formation of the balloon, and it was not part ofthe crust that formed on the lava ponded at the vent. Other-wise, it would have already quenched through the glasstransition owing to the efficiency of cooling on direct con-tact with seawater (Potuzak et al. 2008 and the hyperquenchrates recorded in this study for what is believed to be theoutermost surface of the balloon).
The complex stratigraphy of the balloon shell reflects thegradational changes in cooling rate. The outermost surfaceof the balloon shell hyperquenched (1,259 K/s) through the
glass transition and cooling rates dropping off steeply withdistance (30 K/s perhaps only a few bubble walls away). Inthe interior of the balloon shell, quench rates were slowenough that in some cases, incandescence was observedwhen the balloons were broken up during sampling. Theobserved bubble shapes in the inner layer represent a com-bination of bubble extension, bubble migration and coales-cence. The half sphere-shaped depressions in the surfacefacing the central void are relicts of popped bubbles. Thehyperquenching of the outer layer of the shell does notcontradict the proposed model of balloon formation. Weenvisage that most deformation (extension/folding) was ac-commodated along a small cross-sectional area of a growingballoon in a similar manner to the way in which pillow lavasform (along the “orange line” where molten lava is exposedto seawater). Only balloons with the right balance of phys-ical properties (size, bulk density, etc.) could rise all the wayto the sea surface. Balloon formation is possibly a morecommon feature than previously realised. Whether theyreach the surface depends critically on the water depth atthe vent.
The explosive disintegration of a few balloons on the seasurface was probably caused by the rapid infiltration of sea-water. At Serreta, such explosions did not occur frequently fortwo reasons. Firstly, as the balloon rose through the watercolumn and hydrostatic pressure decreased, there would havebeen a growing overpressure inside the balloon that forced gasout through any cracks and prevented seawater from enteringthe balloon. Escaping gas would also have prevented theballoons from becoming overpressurised during rise or uponreaching the sea surface. Secondly, while floating on the seasurface, the low permeability of the shell and/or constrictionof fractures slowed the infiltration of seawater. A bulk density<1,000 kg/m³ could be sustained for as long as the latent heatcould evaporate the infiltrating water to steam; escaping steamwas the source of little steam plumes and hissing noisesemanating from the balloons (Fig. 2a). As cooling continued,more and more water was able to infiltrate the balloon, leadingto an increase in its bulk density until it eventually sank,frequently breaking up.
It is unlikely that degassing of the inner layers intothe cavity caused significant balloon growth. The smallvolume of lava (e.g. in a spherical balloon 1 m indiameter with a 5-cm thick shell, the shell represents27 % of the overall volume) and the low residual volatilecontents in the glass of the shell mean that the shellwould not be able to provide enough gas to form thecavity. Bubble migration and coalescence continued inthe inner layers after balloon formation and account forthe observed differences in bubble textures. We concludethat there was no significant inflation of the balloonsduring their ascent through the water column. Afterballoon detachment, the outer layer of the shell was in
Fig. 7 a Bubble accumulation and coalescence below a viscous bound-ary layer exert stress on the lava crust, leading to b crust deformation andc break-up. dWhen lava oozes out through a fracture in the lava crust, theballoons form and grow. e In some cases, a completely closed balloon isformed. Due to its bulk density <1,000 kg/m³, buoyant rise in thewater column is possible. During formation, the shell may befolded, creating cavities where the entire shell stratigraphy can bepreserved. Stable balloons with the right physical properties (e.g.size and bulk density) for a given eruption depth could rise buoyantly tothe sea surface
Bull Volcanol
Author's personal copy

a solid state and any expansion would have led to ex-tension cracks (comparable to bread-crust bombs). Suchcracks are typically smaller than 10 mm wide indicatingthat any increase in balloon volume after detachment wasinsignificant (Fig. 2d). The crystallinity of the innerlayers and the texture of inner layer 3 indicate that thispart of the balloons was not in contact with seawaterduring balloon formation. Finally, we have found noevidence for the “re-juvenation” of the outer layer ofthe shell as a whole after detachment; elongate bubbles(indicating syn-quenching shearing) are found only in a<2 mm-thick zone of the outermost layer of the shell andsignificant petrographic differences exist between theouter and the inner layers. We infer that the observedshell stratigraphy was formed when the balloon formedat the ocean floor.
Overall, we consider the generation of lava balloons to bea rather low-energy process and envisage gas-driven infla-tion of vesicular lava at the crust of lava ponded above thevent. On the basis of the descriptions that exist of theballoon-producing eruption near Pantelleria (Riccò 1892)and the balloons themselves, it seems likely that the genesisof Serreta and Pantelleria balloons was very similar. Weassume that the main reason the balloons exploded at thesea surface during the eruption near Pantelleria was thatseawater quickly entered the balloons and flashed to steammore frequently. The floating products of the eruptions atSocorro and possibly also in Kealakekua Bay have differentmorphologies and textures from the Serreta balloons, sug-gesting that the physical state of the magma and/or theeruption processes were different.
Conclusions
Lava balloons observed floating at the sea surface ap-proximately 10 km west of Terceira Island (Azores)were the product of a submarine eruption at the SerretaRidge. The typically ellipsoidal balloons are hollowshells a few cm in thickness and have an alkali basaltcomposition. Assuming an eruptive temperature of 1,100°C,the viscosity of the basaltic melt was below 103 Pa sand allowed bubbles to separate from the melt and rise.These bubbles accumulated below a crust that hadformed on lava ponded at the vent, separating the mol-ten lava from the seawater. Any internal overpressurewas accommodated by bubble expansion and coales-cence. The crust was cracked by the stress exerted bythe accumulating gas. The internal textures of the bal-loon shell indicate that the balloons generally formedwhen one large bubble of gas surrounded by bubble-richlava oozed out through cracks in the crust. Above acritical size, balloons detached from the crust surface.
When this detachment led to a complete enclosure ofgas inside a lava shell, the balloons rose to the seasurface and provided direct evidence of this on-goingsubmarine eruption.
Acknowledgments The authors would like to thank Rui Coutinho(CVARG) for his swift actions that guaranteed sampling during thefirst phase of the eruption in 1999, Pedro Cerqueira (CVARG) forassistance during sample description and documentation and CatarinaPereira (CVARG) for preparing Fig. 1b. Further thanks are due to BillChadwick (OSU), Dave Clague (MBARI) and Nick Deardorff (Uni-versity of Oregon) for providing high-definition video footage andphotographs of submarine eruptions and eruption sites. We also thankFrank Trusdell (HVO) and Marilena Calarco (INGV) for informationon the eruptions in Kealakekua Bay and Pantelleria, respectively. Inaddition, Adriano Pimentel (CVARG) is acknowledged for sharingobservations made during the 2008 oceanographic survey on the SerretaRidge and Ed Llewellin (Durham University) for the insights he gave onfield experiments in Hawai’i. We thank Claus Siebe and an anonymousreferee for their thorough reviews that helped to improve this manuscript.We are indebted to the editor-in-charge, Jocelyn McPhie, for her detailedcomments on the revised manuscript.
Appendix 1
Whole-rock geochemistry
Rock powders were mixed with a flux of lithium metabo-rate and lithium tetraborate and fused in an inductionfurnace. The molten melt was poured into a solution of5 % nitric acid containing an internal standard, and mixedcontinuously until completely dissolved (~30 min). Thesamples were analysed to determine major element com-positions by ICP-MS at Activation Laboratories Ltd.,Ontario (Canada). The relative standard deviation for ma-jor elements was less than 5 %. Three blanks and fivecontrols were analysed per group of samples. Duplicateswere fused and analysed every 15 samples. The instru-ment was recalibrated after 40 samples. Calibration wasperformed using BHVO, BR, GH and DRN internationalrock standards. Analytical precision (2σ) for major elementswas about 1 %.
Appendix 2
Electron microprobe analysis
Glass, crystal phases, silicate melt inclusions (SMI) andtheir host crystals were analysed for major elements, plusS and Cl, by electron microprobe on a JEOL JXA-8800Superprobe at the Institute for Research on Earth Evolution(IFREE), Japan Agency for Marine Earth Science and Tech-nology (JAMSTEC). An accelerating voltage of 15 kV, a15 nA beam current, a defocused 3 μm spot size and ZAF
Bull Volcanol
Author's personal copy

correction procedures were used. Na and K were analysedfirst on their respective spectrometers for 10 s on the peakand 5 s on the background. Peak and background analysistimes for Si, Ti, Al, Fe, Mg and Ca were 20 and 10 s; forMn, Ni, Cr, P were 30 and 10 s; for S were 50 and 25 s’while for Cl, they were 240 and 120 s, respectively. Cali-brations and spectrometer drift during measurements werechecked by interspersing measurements on the secondarystandards VG-2 glass, Saint John’s Island olivine, and scap-olite amongst the sample measurements. To check for ho-mogeneity at least 11 analyses were collected on the glass, atleast three on selected crystals within the glassy samples, atleast five on the SMI and at least six on the host crystal.
Appendix 3
FTIR spectroscopy
H2O and CO2 contents were determined by FTIR spectros-copy using a Varian FTS Stingray 700 Micro Image Analy-ser spectrometer at IFREE, JAMSTEC following thetechniques of Nichols and Wysoczanski (2007). A UMA600 microscope, attached to the spectrometer bench, wasused to focus the beam on the area of interest. For the glassand fine particle spectra were collected over 512 scans witha beam size of 30×30 μm square, for the silicate meltinclusions (SMI) 1024 scans were collected mostly with abeam size of 20×20 μm, but some measurements wereconducted at 15×15, 25×25 and 25×15 μm. On each glasssample, at least five spots were analysed; while on the fineparticle, three spots were analysed to check for homogeneitywhile SMI were analysed from both sides. The concentra-tions of volatile species were calculated using the Beer–Lambert law (Stolper 1982). Peak heights (absorbance)above a linear baseline on spectra collected in transmittedlight were used to calculate volatile concentrations. To de-termine total H2O, the peak at ~3,500 cm−1, caused by theO–H fundamental stretching vibration, was used with amolar absorptivity coefficient of 63±5 l/mol cm (Dixon etal. 1988). CO2 concentrations were calculated from theaverage height of the peaks at ~1,515 and ~1,435 cm−1,caused by the asymmetric stretch of CO3
2− groups, with amolar absorptivity coefficient of 375±20 l/mol cm (Fine andStolper 1986). The bulk densities of glass, ash and SMIwere calculated on the basis of their major element compo-sition using the model of Lange and Carmichael (1987).Wafer thickness was determined using the frequency ofinterference fringes on spectra taken in reflected lightthrough exactly the same area as was analysed in transmittedlight. The SMI hosted in clinopyroxene was prepared so thatit was exposed on both sides and thus the thickness of the
inclusion equals the wafer thickness. However, some of theolivine-hosted SMI were prepared so that only one surfacewas exposed. In this case, the method described in Nicholsand Wysoczanski (2007) was followed to obtain inclusionthickness.
Spectroscopic images of areas 350×350 μm were mea-sured to compare the volatiles contained within the SMIwith those in glass attached to the outside of the samecrystal. The images were collected using a Varian Inc.Lancer focal plane array (FPA) camera attached to theUMA 600 microscope, set up to collect images across themid-IR spectral region, 6,000–400 cm−1. For more detaileddiscussions on imaging and the Lancer FPA camera, seeWysoczanski and Tani (2006) and Nichols and Wysoczanski(2007). For those SMI imaged, four spectra across theinclusion were used to add to the data collected by spotanalysis and check for volatile homogeneity in the inclusion.The procedures to calculate the volatile data from thesespectra are the same as those outlined above for the spotanalysis.
Appendix 4
Differential scanning calorimetry
The structure of glass is mostly compositionally dependantand a careful characterization of its properties reveals the P-T-tconditions at which it formed. The variation of specificheat capacity (cp) with temperature was measured using adifferential scanning calorimeter (DSC Netzsch® 404C atCorning Inc.). The cp–curve, reflecting the natural coolingrate, was recorded during the first heating scan at 10 K min−1.Subsequent repeated cooling and heating treatments, per-formed on the same sample, allowed further cp–curves to bemeasured at known P-T-t conditions. A mathematicalevaluation of the differences between the shape of the“natural” cp–curve and those measured under known experi-mental conditions, allows the natural cooling rate across theglass transition region to be quantified. A detailed descriptionof the measurement procedure and calibration, as well as theaccuracy of the technique, can be found in Potuzak et al.(2008) and Guo et al. (2011).
References
Beier C, Haase KM, Hansteen TH (2006) Magma evolution of the SeteCidades Volcano, São Miguel, Azores. J Petrol 47:1375–1411
Beier C, Haase KM, Abouchami W, Krienitz MS, Hauff F (2008)Magma genesis by rifting of oceanic lithosphere above anomalousmantle: Terceira Rift, Azores. Geochem Geophys Geosys 9:Q12013. doi:10.1029/2008GC002112
Bull Volcanol
Author's personal copy

Bézos A, Humler E (2005) The Fe3+/∑Fe ratios of MORB glasses andtheir implications for mantle melting. Geochim Cosmochim Acta69:711–725
Clague DA, Paduan JB (2009) Submarine basaltic volcanism. In: CousensB and Piercey SJ (eds) Submarine volcanism and mineralization:modern through ancient. Geological Association of Canada, ShortCourse 29–30 May 2008, Quebec City, Canada, pp. 41–60
Danyushevsky LV, Plechov P (2011) Petrolog3: integrated software formodelling crystallization processes. Geochem Geophys Geosys12:Q07021. doi:10.1029/2011GC003516
Dixon JE, Stolper E, Delaney JR (1988) Infrared spectroscopic meas-urements of CO2 and H2O in Juan de Fuca Ridge basaltic glasses.Earth Planet Sci Lett 90:87–104
Fine G, Stolper E (1986) Dissolved carbon dioxide in basaltic glasses:concentration and speciation. Earth Planet Sci Lett 76:263–278
Gaspar JL, Queiroz G, Pacheco JM, Ferreira T, Wallenstein N (2003)Basaltic lava balloons produced during the 1998–2001 SerretaSubmarine Ridge eruption (Azores). In: White J, Clague D,Smellie J (eds) Subaqueous explosive volcanism. AGUMonograph140:205–212
Giordano D, Russell JK, Dingwell DB (2008) Viscosity of magmaticliquids: a model. Earth Planet Sci Lett 271:123–134
Guo X, Potuzak M, Mauro JC, Allan DC, Kiczenski TC, Yue Y (2011)Unified approach for determining the enthalpic fictive tempera-ture of glasses with arbitrary thermal history. J Non-Cryst Sol357:3230–3236
Lange RA, Carmichael ISE (1987) Densities of Na2O-K2O-CaO-MgO-FeO-Fe2O3-Al2O3-TiO2-SiO2 liquids: New measurements andderived partial molar properties. Geochim Cosmochim Acta 51:2931–2946
Le Bas MJ, Le Maitre RW, Streckeisen A, Zanettin B (1986) Achemical classification of volcanic rocks based on the total alka-li–silica diagram. J Petrol 27:745–750
Macdonald GA (1968) Composition and origin of Hawaiian lavas.Geol Soc Am Mem 116:477–522
Mattioli M, Upton BGJ, Renzulli A (1997) Sub-volcanic crystallization atSete Cidades volcano, São Miguel, Azores, inferred from mafic andultramafic plutonic nodules. Mineral Petrolog 60(1–2):1–26
Michael PJ, Cornell WC (1998) Influence of spreading rate and magmasupply on crystallisation and assimilation beneath mid-oceanridges: Evidence from chlorine and major element chemistry ofmid-ocean ridge basalts. J Geophys Res 103:18325–18356
Moore JG, Fornari DJ, Clague DA (1985) Basalts from the 1877submarine eruption of Mauna Loa, Hawaii: New data on thevariation of the palagonization rate with temperature. US GeolSurv Bull 1663
Newman S, Lowenstern JB (2002) VolatileCalc: a silicate melt-H2O-CO2 solution model written in Visual Basic for excel. ComputGeosci 28:597–604
Nichols ARL, Wysoczanski RJ (2007) Using micro-FTIR spectrosco-py to measure volatile contents in small and unexposed inclusionshosted in olivine crystals. Chem Geol 242:371–384
Nichols ARL, Potuzak M, Dingwell DB (2009) Cooling rates ofbasaltic hyaloclastites and pillow lava glasses from the HSDP2drill core. Geochim Cosmochim Acta 73:1052–1066
Potuzak M, Nichols ARL, Dingwell DB, Clague DA (2008) Hyper-quenched volcanic glass from Loihi Seamount, Hawaii. EarthPlanet Sci Lett 270:54–62
Putirka KD (2005) Igneous thermometers and barometers based onplagioclase + liquid equilibria: tests of some existing models andnew calibrations. Am Min 90:336–346
Renzulli A, Santi P (2000) Two-stage fractionation history of the alkalibasalt-trachyte series of Sete Cidades volcano (São Miguel Island,Azores). Eur J Mineral 12:469–494
Riccò A (1892) Terremoti, sollevamento ed eruzione sottomarina aPantelleria nella seconda metà dell’ottobre 1891. Annali UfficioCentrale Meteorologico e Geodinamico 2: vol. XIV
Self S, Gunn BM (1976) Petrology, volume, and age relations ofalkaline and saturated peralkaline volcanics from Terceira,Azores. Contrib Mineral Petrol 54:293–313
Siebe C, Komorowski JC, Navarro C, McHone J, Delgado H, Cortes A(1995) Submarine eruption near Socorro Island, México: geo-chemistry and scanning electron microscopy studies of floatingscoria and reticulite. J Volcanol Geotherm Res 68:239–271
Stolper E (1982) Water in silicate glasses: an infrared spectroscopicstudy. Contrib Mineral Petrol 81:1–17
Troll VR, Klügel A, Longpré MA, Burchardt S, Deegan FM, CarracedoJC, Wiesmaier S, Kueppers U, Dahren B, Blythe LS, Hansteen TH,Freda C, Budd DA, Jolis EM, Jonsson E, Meade FC, Harris C, BergSE, Mancini L, Polacci M, Pedroza K (2012) Floating stones off ElHierro, Canary Islands: xenoliths of pre-island sedimentary origin inthe early products of the October 2011 eruption. Solid Earth 3:97–110, http://www.solid-earth.net/3/97/2012/se-3-97-2012.html
Ulmer P (1989) The dependence of the Fe2+-Mg cation-partitioningbetween olivine and basaltic liquid on pressure, temperature andcomposition: an experimental study to 30 kbars. Contrib MineralPetrol 101:261–273
Vogt PR, Jung WY (2004) The Terceira rift as hyper-slow, hotspot-dominated oblique spreading axis: a comparison with other slow-spreading plate boundaries. Earth Planet Sci Lett 218:77–90
Weston FS (1964) List of recorded volcanic eruptions in the Azoreswith brief reports. Bol Mus Lab Miner 10:3–18
Wilding M, Dingwell D, Batiza R, Wilson L (2000) Cooling rates ofhyaloclastites: applications of relaxation geospeedometry to un-dersea volcanic deposits. Bull Volcanol 61:527–536
Wysoczanski RJ, Tani K (2006) Spectroscopic FTIR imaging of waterspecies in silicic volcanic glasses and melt inclusions: an examplefrom the Izu-Bonin arc. J Volcanol Geotherm Res 156:302–314
Links to internet pages (in order of appearance)
http://www.ign.es/ign/resources/volcanologia/Galeria_Fotos/GaleriaFotos.html. Accessed on 28 Jan 2012
http://oceanexplorer.noaa.gov/explorations/06fire/logs/may4/may4.html.Accessed on 28 Jan 2012
http://oceanexplorer.noaa.gov/explorations/09laubasin/. Accessed on28 Jan 2012
Bull Volcanol
Author's personal copy


