Embed Size (px)
Citation preview

A&A 414, 245–259 (2004)DOI: 10.1051/0004-6361:20031580c© ESO 2004
Astronomy&
Astrophysics
The peculiar circumstellar environment of NGC 2024 IRS2
A. Lenorzer1, A. Bik1, A. de Koter1, S. E. Kurtz2, L. B. F. M. Waters1,3, L. Kaper1, C. E. Jones4, and T. R. Geballe5
1 Astronomical Institute “Anton Pannekoek”, Kruislaan 403, 1098 SJ Amsterdam, The Netherlands2 Instituto de Astronomıa, Universidad Nacional Autonoma de Mexico, Apdo. Postal 3-72, 58090 Morelia, Mich. Mexico3 Instituut voor Sterrenkunde, K.U. Leuven, Celestijnenlaan 200B, 3001 Heverlee, Belgium4 Department of Physics and Astronomy, The University of Western Ontario, London, Ontario,
Canada N6A 3K7 Gemini Observatory, 670 N. A’ohoku Place, Hilo, HI 96720, USA
Received 20 March 2003 / Accepted 2 October 2003
Abstract. We re-examine the nature of NGC 2024 IRS2 in light of the recent discovery of the late O-type star, IRS2b, located5′′ from IRS2. Using L-band spectroscopy, we set a lower limit of AV = 27.0 mag on the visual extinction towards IRS2.Arguments based on the nature of the circumstellar material, favor an AV of 31.5 mag. IRS2 is associated with the UCHregion G206.543–16.347 and the infrared source IRAS 05393–0156. We show that much of the mid-infrared emission towardsIRS2, as well as the far infrared emission peaking at ∼100 µm, do not originate in the direct surroundings of IRS2, but insteadfrom an extended molecular cloud. Using new K-, L- and L′-band spectroscopy and a comprehensive set of infrared and radiocontinuum measurements from the literature, we apply diagnostics based on the radio slope, the strength of the infrared hydro-gen recombination lines, and the presence of CO band-heads to constrain the nature and spatial distribution of the circumstellarmaterial of IRS2. Using simple gaseous and/or dust models of prescribed geometry, we find strong indications that the infraredflux originating in the circumstellar material of IRS2 is dominated by emission from a dense gaseous disk with a radius of about0.6 AU. At radio wavelengths the flux density distribution is best described by a stellar wind recombining at a radius of about100 AU. Although NGC 2024 IRS2 shares many similarities with BN-like objects, we do not find evidence for the presence ofa dust shell surrounding this object. Therefore, IRS2 is likely more evolved.
Key words. stars: circumstellar matter – early-type – individual: NGC 2024 IRS2 – infrared: stars
1. Introduction
NGC 2024 is one of the four major nebulae in the nearby gi-ant star forming complex Orion B. Located at about 363 pc(Brown et al. 1994) this nearby H region is particularly ac-tive in star formation and has therefore been extensively stud-ied at many wavelengths. The optical image of NGC 2024 (theFlame Nebula) shows a bright nebulosity with a central elon-gated obscuration in the north-south direction. The heavy ex-tinction renders most of the nebula unobservable, from the UVto about one micron.
The ionizing source of NGC 2024 was unknown until veryrecently (Bik et al. 2003), although numerous secondary in-dicators suggested that the dominant source must be a late-Omain-sequence star (e.g. Cesarsky 1977). The ionizing star wassearched for in the near-infrared where it was expected to bethe brightest source in NGC 2024. This led to the discovery ofIRS2 by Grasdalen (1974). IRS2 has been extensively studiedin the near-infrared (Jiang et al. 1984; Black & Willner 1984;Chalabaev & Lena 1986; Barnes et al. 1989; Nisini et al. 1994),
Send offprint requests to: A. Lenorzer,e-mail: [email protected]
although it was eventually recognized that it is incapable ofpowering the H region (e.g., Nisini et al. 1994). NGC 2024hosts the strong IRAS source 05393–0156 whose colors fulfillthe criteria of Ultra-Compact H (UCH) regions as definedby Wood & Churchwell (1989). Kurtz et al. (1994) and Walshet al. (1998) identified the compact radio source G206.543–16.347, 72.8 ′′ from the IRAS source, but coincident with IRS2.
The dominant ionizing source of NGC 2024 has recentlybeen identified as IRS2b. IRS2 is only 5′′ away from IRS2b,for which an extinction has been reliably determined (Bik et al.2003). We address the nature of the circumstellar material ofIRS2 in light of this discovery. If IRS2 is not the dominantsource of ionization of NGC 2024, what makes it so bright atinfrared wavelengths? Is the star surrounded by a dust shelland/or a circumstellar disk? Is IRS2 a massive young stellarobject, and if so, do we observe remnants from the star forma-tion process?
In this study, we make use of spectroscopic observa-tions obtained with The Very Large Telescope (VLT) andthe United Kingdom Infrared Telescope (UKIRT) and photo-metric measurements from the literature. The paper is orga-nized as follows: in Sect. 2 we describe the new spectroscopic

246 A. Lenorzer et al.: The peculiar circumstellar environment of NGC 2024 IRS2
Fig. 1. 2.08−2.18 µm spectrum of NGC 2024 IRS2 obtained withISAAC/VLT at R � 8000. Line identifications and properties are givenin Table 1.
observations. We present the flux density distribution in Sect. 3and propose a set of diagnostics to investigate the circumstellarmaterial of IRS2 in Sect. 4. We employ and discuss the meritsof three simple models to fit the observations in Sect. 5. Wesummarize our findings in Sect. 6.
2. Observations
2.1. Observations and data reduction
A 2.08−2.18 µm spectrum of IRS2, with a spectral resolvingpower R � 8000 and signal-to-noise ratio S/N ∼130, wasobtained using the Infrared Spectrometer And Array Camera(ISAAC) at the VLT on March 20, 2000. The spectrum wasreduced using standard procedures. Telluric absorption lineswere removed using the A2 V star HD 39908 observed underidentical sky conditions as IRS2. Over the wavelength range ofthe Brγ line, we substituted a spectrum of telluric features inplace of the standard spectrum, instead of interpolating acrossthe Brγ line of the standard star as is usually done. As we areinterested in the broad features in the line profile in IRS2, weprefer to have easily recognizable residuals from narrow tel-luric lines rather than broad residuals from the inaccurate re-moval of the broad Brγ line of the standard star.
L-band spectra of both IRS2 and IRS2b were obtainedusing ISAAC on February 22, 2002, with a resolving powerR � 1200. The response function was derived by dividing thespectrum of an A6 II star (HD 73634), observed under similarconditions, by a synthetic spectrum compiled from a model atmosphere with parameters Teff = 8100 K, log g = 2.76,and [Fe/H] = 0.00 (Decin, priv. comm.). The model assumesplane-parallel layers and solar abundances. For the syntheticspectrum calculations the atomic line list of Sauval (Decin2000) and the H-line list of Kurucz (1991) were used. For moredetails about the atmosphere models, see Decin et al. (2000)and Plez et al. (1992).
Fig. 2. 3.5−4.1 µm spectrum of NGC 2024 IRS2 obtained withCGS4/UKIRT at a resolving power of R ∼ 1500. Line identificationsand properties are given in Table 1.
The L′-band (3.5−4.1 µm) spectrum was obtainedon December 23, 2000 (UT), using the Cooled GratingSpectrometer 4 (CGS4; Mountain et al. 1990) on UKIRT.CGS4’s 40 l/mm grating was used in first order with the300 mm focal length camera and the 0.6′′ wide slit, giving anominal resolving power R ∼ 1500. The array was stepped toprovide two data points per resolution element. A signal-to-noise ratio of ∼100 was achieved on the continuum. We usedthe Starlink Figaro package for data reduction. Wavelength cal-ibration was done using the second order spectrum of an argonarc lamp. The spectrum was reduced using the F0 V standardBS 1474 and the spectrum of a star of the same spectral type ob-served at similar spectral resolution with the Short WavelengthSpectrometer (SWS, de Graauw et al. 1996) on the InfraredSpace Observatory (ISO, Kessler et al. 1996). We built a re-sponsivity curve by dividing the L′-band spectrum of the stan-dard star by the ISO spectrum of this F0 V star and used it toreduce the spectrum of IRS2.
2.2. Line properties and identifications
The 2.08−2.18 µm and 3.5−4.1 µm spectra of IRS2 are pre-sented in Figs. 1 and 2. The spectra only include emission lines,mainly from hydrogen. We identified two lines of Mg andpossibly one line of Fe at λ2.089 µm, one line of Mg atλ3.866 µm and one line of He at λ4.038 µm. The Mg andFe lines indicate the presence of very high density and fairlycool gas close to the star (e.g. Hamann & Simon 1987). The2.08−2.18 µm spectrum of IRS2 is similar to the spectra ofGroup 3 Be stars as proposed by Clark & Steele (2000), hav-ing spectral types in the range B1–B4. That group contains fivestars all showing Mg and Brγ in emission and no He ; fourof them also show Fe in emission. The He I 2.06 µm line,usually the strongest line in the K-band, is not covered in ourspectrum, but is not present in the K-band spectrum of IRS2 ob-tained by Thompson et al. (1981). The equivalent width (EW)

A. Lenorzer et al.: The peculiar circumstellar environment of NGC 2024 IRS2 247
Fig. 3. The 2.17 µm Brγ line of IRS2 obtained with VLT/ISAAC. Theline peaks at vlsr = 0 km s−1and has a wing extending ∼400 km s−1 tothe red side of the profile.
of the Brγ line is larger than 8 Å in all Group 3 stars, but issomewhat less in IRS2 (5.3 ± 0.1 Å).
The Mg , Pfγ and Humphreys series lines are fairlybroad with full widths at half maximum (FWHMs) of about400 km s−1. The Brackett lines are much narrower, with decon-volved FWHMs of 145 km s−1 for Brγ and 200 km s−1 for Brα.The values in Table 1 are not deconvolved by the instrumen-tal profile, but deconvolution has only a small effect except forBrα. The difference in FWHM between the Brackett and otherhydrogen lines is investigated further in Sect.4.2.
Previous near-infrared spectroscopic observations of re-combination lines in NGC 2024 IRS2 have been reported byThompson et al. (1981), Smith et al. (1984), Chalabaev & Lena(1986), Geballe et al. (1987), Maihara et al. (1990), and Nisiniet al. (1994). Both the line fluxes and line profiles have shownsignificant variations. Only small variations in the line fluxeswere observed between 1980 and 1989. In 1991, however, theline fluxes increase greatly (up to 10 times for Brα; Nisini et al.1994). The proportional increase was larger for Brα than forBrγ and Pfγ. The increase was followed by a decrease duringthe period 1992–1994. There have been no reported measure-ments of these lines since 1994.
High-resolution spectroscopy (R ∼ 10 000) by Smith et al.(1984) and Chalabaev & Lena (1986) showed that the peaksof the Brα, Pfγ, and Brγ lines were at velocities in the range20 < vlsr < 50 km s−1 and that the lines had extended blue-shifted wings. In 1992 all three lines peaked at vlsr = −25 km s−1
and had extended red-shifted wings (Nisini et al. 1994). Our2000 spectrum shows the peak of Brγ near vlsr = 0 km s−1 anda very extended wing on the red side of the profile (see Fig. 3).The widths of the lines, both at half maximum and at zero in-tensity (FWZI), are comparable in 1984, 1992 and 1993 andare about 100 and 250 km s−1, respectively. However, in 2000all three lines had much larger widths. The measured FWZI of∼600 km s−1 for the Brγ line is much larger than has previously
been seen in any of the lines. The large width is mainly due tothe red wing.
Both the ISAAC and UKIRT measurements are in smallerapertures than all previous observations. The narrower profilesmeasured by Smith et al. (1984), Chalabaev & Lena (1986)and Nisini et al. (1994) might result from a larger contribu-tion from extended gas with lower velocity dispersion. Our newhigh-resolution observations demonstrate that eight years afterthe outburst the lines have not returned to their pre-outburstwidth, shape, and peak velocity. Therefore we question if vlsr =
40 km s−1 is the actual systemic velocity for IRS2. We note thatthe extended molecular cloud of NGC 2024 has vlsr of 6 km s−1
in the region surrounding our program star (Krugel et al. 1982).IRS2 likely has a similar velocity. We do not pursue on thenature of the observed line variability as this requires consecu-tive observations on timescales much shorter than are available.This variability was already pointed out by Nisini et al. (1994),who also suggest several explanations for the line behaviourbetween 1981 and 1994.
3. The spectral energy distribution
In Fig. 4 we display the spectral energy distribution (SED) ofIRS2 from the near-infrared to the radio domain. The SED isbased on photometric data compiled from the literature plusspectra obtained using the SWS and LWS instruments on ISO.The interpretation of the plotted data is not straightforward, asmeasurements have been obtained with widely different aper-tures. We provide information on all data points in the fig-ure, including beam sizes, measured magnitudes and fluxes, aswell as the observational technique (when non-photometric) inTables 2–4 in the appendix.
3.1. Contribution of IRS2 to the observed spectralenergy distribution
Variations between different observations at the same wave-length can be noticed, the most striking being in the rangeof 3 to 30 µm. It is crucial to determine the dominant causeof these variations in order to measure the flux directly at-tributable to IRS2. The variations could be due to intrinsic vari-ability of IRS2, to the extended background, or to other dis-crete sources. The region surrounding IRS2 is far from emptyat infrared wavelengths (cf. Bik et al. 2003) and we thus ex-pect some dependence of the observed flux on aperture size.In the following we separately discuss four wavelength ranges:the near-infrared (1−10 µm), the mid-infrared (10−25 µm), thefar-infrared to sub-millimeter (25 µm−0.2 cm) and the radiodomain (0.2−6 cm).
Most of the near-infrared observations were made withbeam sizes less than or equal to 15′′; only the data observedby Frey et al. (1979) were obtained through a larger aper-ture (63′′). The aperture used by Grasdalen (1974) is notspecified, however the bolometer systems they used on the1.3m and 2.1m telescopes at Kitt Peak had aperture diame-ters less than 12′′ (Joyce, priv. comm.), the ones they usedlikely being smaller than 8.5′′ (Rieke, priv. comm.). Thefluxes observed through apertures less than or equal to 20′′

248 A. Lenorzer et al.: The peculiar circumstellar environment of NGC 2024 IRS2
Table 1. Wavelength, emission line equivalent width, full width at half maximum, and identification of the lines present in the 2.08−2.18 µmand the 3.5−4.1 µm spectra. The last columns list the spectral resolving power and beam size. Lines for which no measured quantities are givenrepresent uncertain identifications.
λ EW FWHM Identification R beam
(µm) (Å) (km s−1) (′′)
2.090 0.30 ± 0.06 117 Fe (3d64p–3d64s) 8000 0.6 × 0.9
2.138 0.6 ± 0.1 290 Mg (5s–5p) 8000 0.6 × 0.9
2.144 0.4 ± 0.1 320 Mg (5s–5p) 8000 0.6 × 0.9
2.166 5.3 ± 0.1 150 H (4–7) 8000 0.6 × 0.9
3.575 1.7 ± 0.3 389 H (6–21) 1500 0.6 × 1.8
3.608 1.3 ± 0.3 289 H (6–20) 1500 0.6 × 1.8
3.647 2.0 ± 0.3 337 H (6–19) 1500 0.6 × 1.8
3.694 2.3 ± 0.3 393 H (6–18) 1500 0.6 × 1.8
3.742 5.0 ± 0.3 470 H (5–8) 1500 0.6 × 1.8
3.750 3.0 ± 0.3 470 H (6–17) 1500 0.6 × 1.8
3.820 2.9 ± 0.3 460 H (6–16) 1500 0.6 × 1.8
3.866 ≤0.3 Mg (3s.4f–3s.5g) 1500 0.6 × 1.8
3.908 3.3 ± 0.3 470 H (6–15) 1500 0.6 × 1.8
4.021 3.5 ± 0.3 440 H (6–14) 1500 0.6 × 1.8
4.038 ≤0.3 He (1s.4d–1s.5f) 1500 0.6 × 1.8
4.052 14.5 ± 0.2 290 H (4–5) 1500 0.6 × 1.8
(including the ISO/SWS spectrum) do not show any trendwith aperture size. The higher values obtained by Nisini et al.(1994), which were observed with simultaneous line enhance-ment and shift, most likely originate from variations close toor in IRS2. The J-band measurement of Grasdalen (1974) isbrighter than other observations by 0.8 mag. It is difficult toattribute this value to source variability as it is the only bandaffected by this discrepancy. We conclude that IRS2 is the dom-inant source in the 1−10 µm region through aperture diametersless than or equal to 20′′.
The mid-infrared SED consists of four data sets. Grasdalen(1974) and Walsh et al. (2001) observed similar fluxes at∼10 µm through small apertures. The ISO/SWS flux is higherthan the other mid-IR values suggesting that IRS2 is not thedominant source in the mid-infrared within the 14 × 20′′ ISObeam. The IRAS fluxes are 20 and 600 times larger than theones of Grasdalen (1974) at 12 and 25 µm respectively, andare obtained through much larger apertures. Moreover, thereis a large offset of 72.8′′ between the position of IRS2 andIRAS 05393–0156; this IRAS point source has commonly beenassociated with IRS2 (e.g. Kurtz et al. 1994 or Walsh et al.1998), but is actually closer to FIR5 (Mezger et al. 1988),
supporting the view that IRS2 is not the dominant source inthe IRAS beam.
The IRS2 region has not been observed at far-infrared tosub-millimeter wavelengths with aperture sizes smaller than40′′. ISO/LWS observed three different sources between 43 and197 µm within NGC 2024: IRS2, FIR3 and FIR5. The beamsincluding IRS2 and FIR3 overlap by about 50% whereas thebeam of FIR5 has only a very small fraction in common withthe others. The three spectra are very similar suggesting that atthese wavelengths the emission is coming from the extendedsurroundings and not from individual sources (see Gianniniet al. 2000).
In the radio domain we only consider data obtained withinterferometers, i.e. with small beam sizes. After inspection ofthe original data, we feel that the 6 cm data point of Snell &Bally (1986; 2.8 mJy) is too low and that the 1.3 cm point(Gaume et al. 1992; 19 mJy) suffers from significant uncer-tainties. Recalibrated values are given in Table 3 together withother reported fluxes and VLA archival data. Data taken be-tween May 1994 and January 1995 all show similar flux lev-els. Observations by Kurtz in 1989 and by Walsh in 1994 bothshow smaller fluxes by about a factor of three to four. The flux

A. Lenorzer et al.: The peculiar circumstellar environment of NGC 2024 IRS2 249
Fig. 4. The spectral energy distribution of IRS2, compiled from published photometric data and ISO SWS/LWS spectra. Details concerningthese data are given in Tables 2–4. The high resolution ISO spectra (shown as continuous lines) are obtained in AOT6 mode. Open squaresdenote measurements made with apertures larger than 40′′; open circles indicate aperture sizes of 5–20′′; closed circles represent beam sizesless than 5′′. Most often, the error bars on the data are smaller than the symbol size. The subdivision in aperture size clearly shows that theemission bump peaking at about 100 µm is not due to the nearby circumstellar medium of IRS2, i.e. it is not associated with the system itselfbut must come from warm material in the vicinity of the star.
differences cannot be attributed to differences in beam size.Radio variability and spectral index is discussed in Sect 4.1.
We conclude that the bulk of the mid- and far-infrared emis-sion observed in large apertures and peaking at ∼100 µm isnot associated with the nearby circumstellar medium of IRS2,but arises from a more diffuse source. Therefore, one cannotuse the IRAS color-color criteria for UCH regions (Wood &Churchwell 1989) to conclude that IRS2 is a massive star sur-rounded by a dust cocoon. This weakness of the infrared crite-rion for UCH was already pointed out by Codella et al. (1994)and Ramesh & Sridharan (1997). Except for the shortest in-frared wavelengths, only small aperture observations (≤20′′)are relevant in probing the nature of IRS2 and its immediatecircumstellar environment. Large aperture measurements willnot be considered further in this paper.
3.2. Extinction
Estimates for the extinction towards IRS2 are very uncertainand range between AV = 12 and 32 mag (Thompson et al. 1981;Grasdalen 1974). The identification of IRS2b as the ionizingsource of the Flame Nebula, 5′′ away from IRS2 (Bik et al.2003), allows for the first time an independent determinationof the interstellar extinction caused by the elongated structureobscuring the center of NGC 2024. Applying the synthetic ex-tinction law of Cardelli et al. (1989), Bik et al. (2003) find anAV of 24 ± 0.5 mag towards IRS2b, taking RV = 5.5. Note thatthe value of RV is relevant for the absolute value of the extinc-tion, but has only a weak effect on the slope of the near-infraredspectrum. IRS2 and IRS2b are most likely located in the H region behind the cold obscuring dust bar and in front of awarm molecular cloud (Barnes et al. 1989). The 2.08−2.18 µm

250 A. Lenorzer et al.: The peculiar circumstellar environment of NGC 2024 IRS2
spectrum of IRS2b does not show any evidence of circumstel-lar extinction (Bik et al. 2003), implying that the obscuration isdominated by the cold foreground molecular cloud.
To compare the interstellar extinction towards IRS2 andIRS2b, we have inspected the strength of the 3.0 µm water iceabsorption seen towards both sources. Whittet et al. (1988) andTeixeira & Emerson (1999) present evidence for a linear rela-tion between the optical depth in the ice band and the visualextinction. The parameters of this relation is expected to de-pend on the physical and chemical properties of the interven-ing medium, and thus may vary from cloud to cloud. The mainuncertainty in the extinction determination is the uncertaintyin the continuum flux level near the ice feature. The top panelof Fig. 5 shows normalized L-band spectra of both IRS2 andIRS2b. The spectrum of IRS2 stops at 3.5 µm due to saturationeffects; that of IRS2b extends out to 4.0 µm. IRS2 has been ob-served by ISO/SWS. This allows a reliable determination of thecontinuum in our L-band spectrum, as the ISO spectrum coversa much broader wavelength interval. The normalization of thespectrum of IRS2b is problematic. First, the spectrum starts at2.9 µm, which is somewhat inside of the ice feature. Therefore,we cannot use the short wavelength side of the profile to de-fine the continuum. Second, just outside of the feature at thelong wavelength side the spectral slope shows a kink at about3.5 µm. We consider the two limiting cases: IRS2b1, in whichthe continuum is based on a slope measurement in the 3.4 to3.5 µm region, and IRS2b2, in which the continuum is derivedfrom the 3.5 to 4.0 µm interval. The lower panel of Fig. 5 showsthe ratio of the L-band spectra of IRS2 and IRS2b for these twocases.
For both normalizations the ice band absorption in IRS2 isfound to be stronger than in IRS2b, showing that more inter-stellar ice is present in the line of sight towards IRS2. UsingAV = 24 mag for IRS2b, we arrive at a propotional AV of 27(using IRS2b1) to 41 mag (using IRS2b2) for IRS2. If we re-quire an intrinsic spectral index of two, the upper limit can beadjusted down to AV = 36.5 mag (for RV = 5.5). We con-clude that the visual extinction towards IRS2 is between 27 and36.5 mag.
4. Diagnostic tools
We discuss a number of independent diagnostic methods thatmay help to constrain the geometry of the circumstellar mate-rial around IRS2. First, we use the radio slope to determine thegradient in the radial density structure. We compare this slopewith values typical for spherical outflows and disks. Second,we apply a technique developed by Lenorzer et al. (2002a) inwhich the flux ratio of lines in the L′-band are used to deter-mine whether the material is distributed in a spherically sym-metric or disk-like structure. Third, we briefly summarize theimportant observational and modeling findings made on COband-head emission about IRS2.
4.1. Radio slope
The radio observations are listed in Table 3 (in appendix) andplotted in Figs. 6 and 7. Discarding the problematic points
Fig. 5. The upper panel shows the 3.0 µm ice band in the normal-ized L-band spectra of IRS2b and IRS2, as well as the normalizedISO/SWS spectrum of IRS2 (shifted by −0.1). IRS2b is normalizedusing the slope of the 3.4 to 3.5 µm region (denoted IRS2b1) and ofthe 3.5 to 4.0 µm region (IRS2b2). The lower panel shows the ratioof the ice feature in IRS2 and in IRS2b, indicating that the extinctiontowards IRS2 is higher.
taken in 1981−83 (Snell & Bally 1986) and 1989 (Gaumeet al. 1992) (see Sect. 3), flux variations of up to about a fac-tor of three are observed on timescales of years, and varia-tions of roughly a factor of two on timescales of months. Dataprior to 1994 indicate relatively low flux densities, whereasthe 1994−1995 dataset suggests a significant brightening of thesource, followed by a possible relaxation in 2002. The nature ofthis variability is not understood, however it may suggest somesort of flaring event. The spectral indices α ≡ ∂ logFν/∂ log νderived from simultaneous measurements suffer from large un-certainties, but do not show a trend in time, nor do they dependon frequency base. Simultaneous observations yield spectral in-dices ranging from 0.75 to 1.33, with a weighted average ofα = 1.25 ± 0.06.
The radio spectral index can be used as a diagnostic of thedensity structure in a circumstellar medium. For a spherical,isothermal stellar wind that has reached its terminal velocity itcan be shown (Wright & Barlow 1975; Panagia & Felli 1975;Olnon 1975) that α = 2/3, neglecting a very modest depen-dence of the Gaunt factor on frequency. The observed slopesare somewhat steeper, suggesting either that the ionized regionis sharply bounded (Simon et al. 1983), or that the radial den-sity distribution ρ(r) ∝ r−m has a gradient steeper than thatfor a constant velocity wind, m = 2. For the wind model de-scribed in Sect. 5 with m = 2, two free parameters essentiallydetermine the radio spectrum: the electron density at the stel-lar surface and the recombining radius. Recent observations by
A. Lenorzer et al.: The peculiar circumstellar environment of NGC 2024 IRS2 251
Fig. 6. Radio observations of IRS2. Multi-frequency observations at asingle epoch are denoted by open circles. Squares represent non simul-taneous data. Recent observations by Rodrıguez (priv. comm.) resolv-ing the radio source are denoted by a filled star. Assuming a sphericalwind, these data are fitted by n0 = 1011 cm−3 and Rout = 145 AU.Data point obtained at other epochs yield roughly similar parame-ters: 1989 observations by Kurtz et al. (1994) imply the same n0
and Rout = 25 AU (dashed line); (1994) and (1995) data requiren0 = 2.5 × 1011 cm−3 and recombination at 42 AU (dotted line).
Rodrıguez (priv. comm.) have resolved the radio source, its di-ameter is 0.8′′ at 3.6 cm, corresponding to a radius of 145 AU.This outer radius and the flux measured by Rodrıguez requirean electron density of n0 = 1011 cm−3 (solid line in Fig. 6).Data obtained at different epochs are matched by roughly sim-ilar combinations of outer radius and n0 (see also Fig. 6).
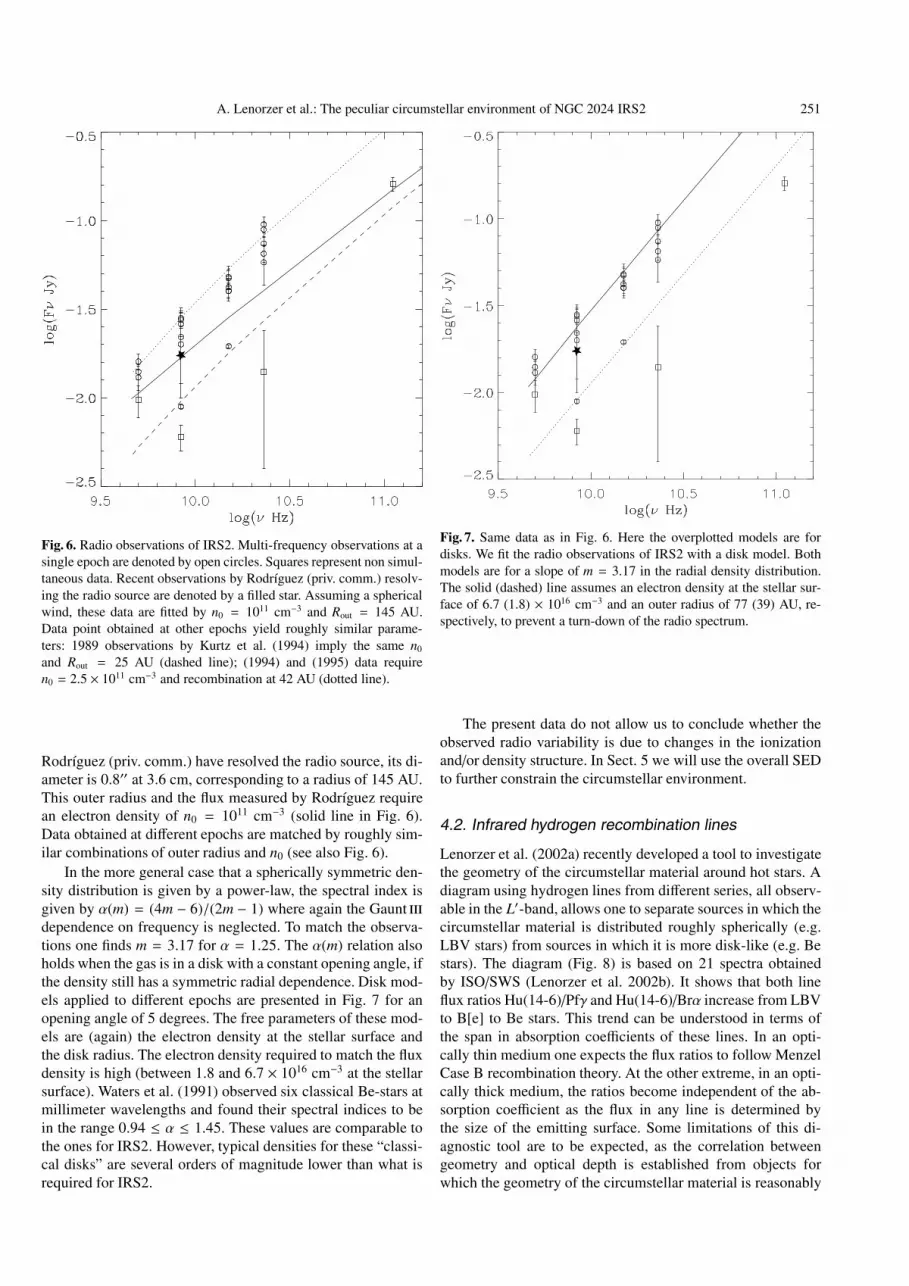
In the more general case that a spherically symmetric den-sity distribution is given by a power-law, the spectral index isgiven by α(m) = (4m − 6)/(2m − 1) where again the Gaunt dependence on frequency is neglected. To match the observa-tions one finds m = 3.17 for α = 1.25. The α(m) relation alsoholds when the gas is in a disk with a constant opening angle, ifthe density still has a symmetric radial dependence. Disk mod-els applied to different epochs are presented in Fig. 7 for anopening angle of 5 degrees. The free parameters of these mod-els are (again) the electron density at the stellar surface andthe disk radius. The electron density required to match the fluxdensity is high (between 1.8 and 6.7 × 1016 cm−3 at the stellarsurface). Waters et al. (1991) observed six classical Be-stars atmillimeter wavelengths and found their spectral indices to bein the range 0.94 ≤ α ≤ 1.45. These values are comparable tothe ones for IRS2. However, typical densities for these “classi-cal disks” are several orders of magnitude lower than what isrequired for IRS2.
Fig. 7. Same data as in Fig. 6. Here the overplotted models are fordisks. We fit the radio observations of IRS2 with a disk model. Bothmodels are for a slope of m = 3.17 in the radial density distribution.The solid (dashed) line assumes an electron density at the stellar sur-face of 6.7 (1.8) × 1016 cm−3 and an outer radius of 77 (39) AU, re-spectively, to prevent a turn-down of the radio spectrum.
The present data do not allow us to conclude whether theobserved radio variability is due to changes in the ionizationand/or density structure. In Sect. 5 we will use the overall SEDto further constrain the circumstellar environment.
4.2. Infrared hydrogen recombination lines
Lenorzer et al. (2002a) recently developed a tool to investigatethe geometry of the circumstellar material around hot stars. Adiagram using hydrogen lines from different series, all observ-able in the L′-band, allows one to separate sources in which thecircumstellar material is distributed roughly spherically (e.g.LBV stars) from sources in which it is more disk-like (e.g. Bestars). The diagram (Fig. 8) is based on 21 spectra obtainedby ISO/SWS (Lenorzer et al. 2002b). It shows that both lineflux ratios Hu(14-6)/Pfγ and Hu(14-6)/Brα increase from LBVto B[e] to Be stars. This trend can be understood in terms ofthe span in absorption coefficients of these lines. In an opti-cally thin medium one expects the flux ratios to follow MenzelCase B recombination theory. At the other extreme, in an opti-cally thick medium, the ratios become independent of the ab-sorption coefficient as the flux in any line is determined bythe size of the emitting surface. Some limitations of this di-agnostic tool are to be expected, as the correlation betweengeometry and optical depth is established from objects forwhich the geometry of the circumstellar material is reasonably

252 A. Lenorzer et al.: The peculiar circumstellar environment of NGC 2024 IRS2
Fig. 8. Hu(14-6)/Brα versus Hu(14-6)/Pfγ for hot stars observed withISO (Lenorzer et al. 2002b). The different classes of objects, LBVs(squares), B[e] stars (filled circles) and Be stars (open circles) are wellseparated. IRS2 is denoted by a filled square. The filled asterisk indi-cates the position of optically thick black-body emission; the stripedregion shows the range for Menzel case B recombination, includingcollisional de-excitation, for temperatures higher than 104 K. Line fluxratios are plotted in black; EW ratios in grey.
simple. Deriving the geometry of objects that might have multi-components and vary on short timescales is not trivial and re-quires additional diagnostics, e.g. the modeling of the line pro-files.
To investigate the effect of extinction the diagram includesthe line flux and EW ratios. The EW diagram is calibrated onthe line flux diagram such that P Cygni, which has negligibleextinction, is at the same location in both diagrams. Figure 8shows that IRS2 falls in the upper right part of the diagram,close to the B[e] star GG Car. This position indicates that itslines are predominantly formed in optically thick gas. This sit-uation likely arises in a disk-like geometry. The position of theline flux ratio of IRS2 corrected for an AV of 30 mag (Sect. 3.2)is also indicated in the figure. There is a close agreement be-tween the de-reddened line flux ratio and the EW ratio of IRS2.The large shift observed for B[e] stars is not predominantlycaused by extinction (all plotted sources have very moder-ate AV), but by a rising dust continuum reducing their spectral
indices. We conclude that the continuum of IRS2 is not affectedby a dust continuum strongly rising between 3.74 and 4.05 µm.
To further constrain the geometry of the circumstellar ma-terial, we investigate the line widths. The Humphreys lines aswell as the Pfγ line have FWHMs of about 400 km s−1; theS/N of the L′-band spectrum is too low to derive any trend inthe widths of these lines. The Brackett lines are narrower withFWHMs of about 200 km s−1 (Sect. 2.2), suggesting a differentline forming region for intrinsically stronger lines.
The ratio of the FWHMs of Pfγ and Brα is about 2.0. Fortypical Be stars like γ Cas, HR4621, κ Cma or in the B[e] starGG Car, close to the position of IRS2 in the diagram, this ratiolies between 1.1 and 1.3, whereas it is less than 1.0 for windsources like P Cyg. The fact that the Brackett lines are muchnarrower than the other hydrogen lines suggests that they havea significant contribution from low density gas close enough tothe star to be observed in our narrow-slit spectrum. The FWHMof this optically thin component can be estimated from thehigh-resolution spectrum of the Brγ line as ≤130 km s−1. Theinfrared recombination lines observed in IRS2 are mainly pro-duced in a high velocity (400 km s−1) optically thick medium,with a small contribution from a lower velocity (≤130 km s−1)optically thin medium. The high velocity contribution in itselfwould give IRS2 a position in Fig. 8 that is closer to the Bestars.
4.3. CO band-heads
CO band-head emission at 2.3 µm was first detected inNGC 2024/IRS2 by Geballe et al. (1987). Its presence attestsof the existence of high-density and warm molecular gas. COis largely dissociated at T >∼ 5000 K, while for T <∼ 2000 Kthe upper vibrational levels will not be excited frequently bycollisions. In addition to the proper temperature range, a den-sity of at least 1010 cm−3 is required to maintain the popula-tion of the excited vibrational levels, which radiatively decayrapidly via fundamental band transitions. The 2−0, 3−1, 4−2and 5−3 band-heads were observed by Geballe et al. at a reso-lution of ∼460 km s−1, insufficient to resolve the individual COlines. From the relative band-head intensities they estimated anexcitation temperature of about 4000 K. From the intensity ofthe 2−0 band-head they found a minimum area of the CO lineemitting region of 2.8× 1024 cm2, assuming that the lines closeto the band-heads are optically thick.
Chandler et al. (1993, 1993) observed the 2−0 band-headat high spectral resolution and proposed two models to ex-plain the observations: an accretion disk and a neutral wind.The accretion disk model requires an extinction in the K-band of about 4.4 mag, corresponding to AV ∼ 33.0 mag(for RV = 5.5). The best fit values in the case of a disk are:an inclination angle of 33 degrees (i.e. rather face on), andMacc = 5 ×10⁻⁷ M� yr−1. Assuming a stellar mass of 15 M� theemission arises between 60 and 180 R� where Keplerian veloc-ities are 130−220 km s−1. The wind model requires a mass-lossrate of about 10−5 M� yr−1 and maximum velocities of 100 to500 km s−1.

A. Lenorzer et al.: The peculiar circumstellar environment of NGC 2024 IRS2 253
5. Discussion
In this section we discuss three simple configurations that mayreproduce the observed SED and investigate their relevancebased on the diagnostic tools presented in Sect 4. We evalu-ate the contribution of emission from an ionised wind and disk,as well as that of dust. We end the section with a discussion onthe nature of IRS2.
For the emission from ionized gas we use a basicdisk model, consisting of isothermal hydrogen in LocalThermodynamic Equilibrium (LTE) and consider bound-freeand free-free emission. We assume the density distribution tobe a power-law, i.e.
ρ(r) = ρ0 (r/r0)−m or n(r) = n0 (r/r0)−m (1)
within the disk, where the density ρ and the electron density nhave the value ρ0 and n0 at the stellar surface. The disk hasa constant opening angle θ. The total bound-free and free-freeoptical depth for a beam passing the disk in the direction per-pendicular to the mid-plane is given by
τbf+ffν (T, r) = 2 κbf+ff
ν (T )∫ r×tan( θ2 )
0ρ(r)2 dz. (2)
It follows that in the part of the spectrum produced by a par-tially optically thick medium, the spectral index is given byα = (4m − 6)/(2m − 1) (see Waters 1986).
We adopt an opening angle of θ = 5 degrees, consistentwith the small opening angles derived from spectropolarimet-ric observations of gaseous disks around classical Be stars (e.g.Putman et al. 1996). Note that this parameter influences the fluxlevel similarly to ρ0. The adopted gas temperature is 10 000 K.The free parameters of this model are then the density at thestellar surface ρ0, the density gradient index m, and the outerradius of the disk Rdisk. The density parameter ρ0 fixes the to-tal flux while m determines the spectral index. The outer radiussets the wavelength at which the break occurs in the spectralindex. The spherical wind model is very similar to the diskmodel, except for the difference in geometry, and the use ofa fixed density gradient m = 2. We remark that for a densedisk the assumption of an isothermal medium is likely to breakdown, leading to lower temperatures in the midplane region asa result of self-shielding. This is not expected to change thepredicted disk energy distribution significantly as this is set byemission from the disk surface layers, which can be illuminateddirectly and therefore have a high temperature. Finally, dustemission, which cannot arise in the ionized region, is modeledas black-body emission at temperature Td.
There is very little known about the stellar content of IRS2.From radio observations of the compact radio source associatedwith IRS2, Kurtz et al. (1994) derive an ionizing source corre-sponding to a B3 V star. K-band spectroscopy is consistent withan early B star. In the following, we assume the central objectis a single early-B main-sequence star.
5.1. Model A: A gaseous disk
We first consider the case in which the entire spectral en-ergy distribution is produced by one gaseous component
(i.e., no dust). This model requires an interstellar extinctionhigh enough to account for the sharp turn down observed atnear-infrared wavelengths. This is achieved for AV ≥ 31.5 mag.After dereddening, the best fit to all data points yields a spectralslope α = 1.09, corresponding to a density gradient m = 2.7.The steep gradient favors a disk-like geometry. Matching theoverall flux level requires an electron density n0 = 1015 cm−3.The radio data do not show a break in the spectral index downto 6 cm, implying an outer radius of at least 100 AU. The bestfit model is plotted in the top panel of Fig. 9. The model corre-sponds to a hydrogen disk mass of Mdisk = 3.0 × 10⁻⁶ M� anda disk luminosity log (Ldisk/L�) = 4.6.
To investigate if such a very dense gaseous disk allowsthe excitation of CO band-heads, as is observed, we deter-mine self-consistently the temperature throughout the disk us-ing a technique developed by Millar & Marlborough (1998).This method adopts a Poeckert-Marlborough disk model as-suming hydrostatic equilibrium. The continuity equation fixesthe radial density gradient (see Marlborough 1969 and Poeckert& Marlborough 1978). The state of the gas is solved sub-ject to statistical and radiative equilibrium. The final result isa set of self-consistent temperatures. For additional details ofthe temperature calculation we refer to Millar & Marlborough(1998, 1999a, 1999b) and Millar et al. (2000).
The adopted parameters are n0 = 3.33 × 1014 cm−3 inthe equatorial plane at the stellar surface and a scale heightrising from 0.1 R at the stellar surface to 34.75 R at a ra-dial distance of 100 R. Note that this disk structure is some-what different from that of our simple model, but close enoughfor the qualitative purposes. Figure 10 shows the temperaturestructure calculated for a central star having Teff = 25 000 K,R = 10 R�, and log g = 3.67 (representative of a B1 Vstar). The global-average kinetic temperature of the disk gasis 13 700 ± 4000 K. The temperature at the surface of thedisk decreases from 15 000 K close to the star to 12 000 Kover most of the surface. Mid-way between disk surface andequatorial plane the temperature rises above that of the sur-face. At radial distances beyond 15 R the temperature reachesapproximately 17 000 K. In the equatorial plane however, thetemperature drops drastically at around 10 R from 20 000 to5000 K, decreasing outwards to 3000–4000 K. This is due toa large optical depth for photo-ionizing stellar radiation. Notethat our detailed temperature computation assumes a pure hy-drogen disk. Additional and more efficient cooling from metalsand molecules at these temperatures would likely result in evenlower temperatures. It is therefore plausible that the observedCO band-heads, representative of a 4000 K medium, originatefrom inside a dense gaseous disk. The observed CO emissiondoes not necessarily require the molecules to be shielded by adusty medium. The position of IRS2 in the line-flux ratio dia-gram (see Fig. 8) can be explained qualitatively with a massiveBe-like disk, the shape of the lines, however, require a morecomplex geometry.
Model A is fairly compatible with the diagnostic tools dis-cussed in Sect. 4, namely the observed radio slope, the infraredhydrogen recombination lines and CO band-heads, as well aswith the extinction determination. The main shortcoming ofthis model is that it overestimates the observed mid-infrared

254 A. Lenorzer et al.: The peculiar circumstellar environment of NGC 2024 IRS2
Fig. 9. Three models describing the circumstellar medium of IRS2. The central star is represented by a Kurucz model of Teff = 33 000 K andlog (L/L�) = 4.87 (solid line). The observations are denoted by circles Note that the observations are de-reddened using a lower extinction inthe middle panel (AV = 20 instead of 31.5 mag). From top to bottom: Model A: the dotted line is the disk model and the thick solid line is thesum of the stellar and disk contributions; Model B: the dotted line is the wind model, the dashed line is the dust model and the thick solid line isthe sum of the stellar, dust and wind contributions; Model C: the dotted line is the wind model, the dashed line is the disk model and the thicksolid line is the sum of the stellar, disk and wind contributions.
flux in the 8−20 micron range. Also, the disk luminosity isa sizeable fraction of the luminosity of a main sequence star(about 50%). For an active disk, i.e. a disk that has an extrasource of heating, (e.g. from accretion) this fraction would de-crease. To get a rough idea, for a star of 15 M� and an ac-cretion radius of 10 R�, the disk luminosity corresponds to anEddington accretion rate of the order of 10−3 M� yr−1. Suchaccretion rates may perhaps occur in hot molecular cores, butseem unrealistically high for IRS2.
5.2. Model B: A stellar wind and optically thin dust
In the model discussed above, we assumed that one componentis responsible for the entire SED. As can be seen from Fig. 9,Model A overestimates the mid-infrared flux. This wavelengthrange is also observed to have a spectral index of about 2, dif-ferent from the radio range. In Model B we ascribe much ofthe infrared continuum emission to a different origin than theradio emission, i.e. we assume the radio flux to originate in a

A. Lenorzer et al.: The peculiar circumstellar environment of NGC 2024 IRS2 255
0 10 20 30 40 50 60 70 80 90 1000
0.5
1
1.5
2
2.5
Tem
pera
ture
[104 K
]
Radial Position, [Stellar Radii]
Equatorial PlaneMid−wayUpper edge
Fig. 10. The temperature structure for a Poeckert-Marlborough diskwith n0 = 3.33 × 1014 cm−3 in the equatorial plane at the stellar sur-face. Temperature profiles for three different heights above the equato-rial plane are given. This calculation shows that CO band-head emis-sion may arise in a dense gaseous disk.
dense ionization bounded wind, while a dust shell gives rise tothe near- and mid-infrared flux.
In the middle panel of Fig. 9, we show a wind model withan electron density at the stellar surface of n0 = 1011 cm−3 andouter radius of 145 AU by a dotted line (cf. Sect. 4.1). The massof hydrogen contained in this wind is Mwind = 7.6 × 10⁻⁷ M�yielding a mass-loss rate of about M = 1.1 × 10⁻⁶ M� yr−1
(adopting a terminal wind velocity of 1000 km s−1). This mass-loss rate is about four times larger than predictions for early-Bmain-sequence stars by Vink et al. (2001). Assuming Baker &Menzel (1938) Case B, we find that the above wind densitystructure and outer (recombination) radius are appropriate fora B1 V star adopting ionizing fluxes by Panagia (1973).
We model the near-infrared part of the SED by a simpleblack-body. Strictly speaking, this is only allowed if the dustymedium is optically thick. However, for dust temperatures near1500 K (which are required; see below) dust extinction willbe dominated by species that have a rather grey extinction be-haviour at near-infrared wavelengths, such as carbon grains. Inthat case, the assumption of black-body emission also holdsfor an optically thin, isothermal dusty medium. The monotonicslope of the SED in the 5−20 µm region is quite insensitive toextinction and shows that if dust is to contribute, it must havea temperature higher than 1000 K. The highest dust evapora-tion temperatures are around 1500 K and result in a peak fluxdensity at 3.4 µm. To have the flux peak at this wavelength re-quires an AV of 20 mag; cooler dust requires less extinction.This extinction is less than the derived minimum extinctiontowards IRS2 of 27 mag. Any contribution to the extinctionby circumstellar dust only aggravates the problem. To mini-mize the extinction problem we model the dust emission us-ing a blackbody of 1500 K (see dashed line in middle panelof Fig. 9). The properties of the central star require this dustto be at about 240 stellar radii. The observed flux density atnear-infrared wavelengths then implies that this dust is opti-cally thin. The single temperature blackbody is slightly broaderthan the observed emission, a problem that cannot be solvedusing a temperature distribution to represent the dust as thatwould only broaden the emission further. A higher extinction(than AV = 20 mag) allows a broader intrinsic near- and mid-IR flux distribution. However, it would simultaneously shift the
peak emission towards shorter wavelengths. This would requiredust at temperatures in excess of 1500 K, which is not physical.
The near-infrared hydrogen recombination lines could, inprinciple, originate in a recombining wind with parameterssimilar to those derived above and an AV of 20 mag (Maiharaet al. 1990). The main problem of model B is that it is incom-patible with the minimum extinction of 27 mag towards IRS2.For this reason the optically thin hot dust model proposed byJiang et al. (1984) cannot be supported.
5.3. Model C: A wind plus a gaseous disk
Finally, we consider a model in which the radio emission orig-inates in a recombining wind, and the infrared component in agaseous disk. The wind component has the same characteristicsas in Model B. Matching the mid-infrared part of the SED witha gaseous disk requires an extinction of 31.5 mag, similar toModel A. The mid-infrared spectral index is close to α = 2, i.e.to the value expected for an optically thick isothermal mediumThe dereddened mid-IR observations can be fitted by a black-body of at least 5000 K, the flux level constraining the size (i.e.surface area) of this component. If the temperature is higher,the same extinction allows the near-infrared part of the SED tobe partially optically thin.
Lacking a constraint on the density gradient, we use m =2.0. We retain the disk geometry assuming an opening an-gle of 5 degrees and a temperature of 10 000 K. We obtainn0 = 1.8 × 1014 cm−3 and an outer radius of Rdisk = 140.0 R�.This component is plotted in the bottom panel of Fig. 9 witha dashed line. It corresponds to M disk = 2.5 × 10⁻⁷ M� and alog (L disk/L�) = 4.5.
The infrared recombination lines are easily explained bythis model. The broad optically thick portions of the lineswould originate in the disk and the optically thin contribu-tions would be produced in the outer wind. The CO band-heads likely originate from the equatorial plane and outer partof the disk, as the high densities and low temperatures (due tothe shielding) can provide the required physical conditions forthe existence of CO and for excitation of the band-heads (seeSect. 5.1). This location is also in agreement with results of COband-head modeling by Chandler et al. (1993) (see Sect. 4).
In conclusion, model C fulfills all the observational diag-nostics and fits the observations best. Similarly to model A,model C implies a disk luminosity that is comparable to thestellar luminosity of a B0 V star for which log (L disk/L�) =4.86 (Smith et al. 2002). In principle this is possible, thoughit implies that the total opening angle of the disk should be∼45 degrees. If we have underestimated the stellar luminositythen the disk could have a smaller opening angle. Alternatively,the disk could have an intrinsic energy source, e.g. as a result ofaccretion (cf. Sect. 5.1) providing (part of) the disk luminosity.
5.4. The nature of NGC 2024 IRS2
The location of IRS2 in the star-forming complex OrionB suggests it is a young object, perhaps even in a pre-main sequence stage of evolution. Objects similar to the

256 A. Lenorzer et al.: The peculiar circumstellar environment of NGC 2024 IRS2
Becklin-Neugebauer (BN) object in Orion, which reside incores of molecular clouds, have been proposed to representdeeply embedded massive YSOs. Therefore, we compare theproperties of IRS2 with those of BN-like objects (see Henning& Gurtler 1986 for a review).
Both IRS2 and the BN-like objects are very compactsources in the near- and mid-IR as well as in the radio, withsizes of about 10 to 100 AU. For an AV of 31.5 mag and theadopted distance of 363 pc, we find a minimum luminosityfor IRS2 of 104 L�, corresponding to a B0.5 V star. This is inreasonable agreement with that of the BN-like objects, whichhave integrated luminosities in the range of ∼103 to 104 L�.The near-IR hydrogen recombination lines in BN-like objects,like in IRS2, have extended wings (with FWHM of several hun-dreds of kilometers or more) and have flux ratios which are notconsistent with Case B recombination. Also, both the BN-likeobjects and IRS2 show CO band-heads, implying dense andwarm neutral gas. However, the BN-like objects show evidencefor an optically thick dust cocoon as well as for a cold molecu-lar surrounding. Both are absent in IRS2. Perhaps IRS2 is in asimilar evolutionary stage as the BN-like objects, but somehowhas its circumstellar cloud disrupted by another more evolvedsource (such as IRS2b). More likely, the star is more evolved.This would be supported by the apparent absence of dust in thesystem. If the disk in IRS2 would represent a remnant of thestellar formation process, one would expect dust to be presentas it is a constituent of the molecular cloud material that isaccreted.
6. Conclusion
We have investigated the near-infrared and radio sourceNGC 2024 IRS2/G206.543–16.347 focusing on K-, L′ and L-band spectroscopy and on a reconstruction of the spectral en-ergy distribution from near-IR to the radio wavelengths. Theprimary goal was to obtain better insight into the nature of thecentral star and its circumstellar medium. Simple models wereused to test a number of diagnostics, notably the slope and fluxlevel at radio wavelengths, the flux ratios of near-IR hydrogenlines, and the CO band-head emission.
Previously, IRS2 has been associated with the IRAS source05393–0156, and, on the basis of this was found to satisfy thecolor-color criteria for UCH regions. We show from beam-size arguments that the large infrared flux peaking around100 µmdoes not originate from a dusty cocoon confining theionized gas around IRS2, but rather from a background. This isconsistent with the offset of 72.8 between IRS2 and the IRASsource 05393–0156. Therefore, IRS2 may not be interpreted asa “cocoon” star, i.e. as the object usually depicted as an UCHregion.
To gain a better understanding of the nature of the circum-stellar medium we compared our observations with a number ofrelatively simple models: a dense gaseous disk; a stellar windplus a dust shell; and a stellar wind plus a gaseous disk. Thelast model fits the observational constraints best. New spec-tra and the models allow one to draw a number of conclusions
concerning the properties of the central star and of the ambientmedium of IRS2. These conclusions are:
1. Both the radio flux and the 2.08−2.18 µm spectrum are con-sistent with an early-B spectral type for the central star.
2. Based on a comparative study of the ice-band optical depthin IRS2 and in IRS2b the visual extinction towards IRS2 isconstrained to be between 27 and 36.5 mag, with a prefer-ence for an AV of 31.5 mag based on the shape of the SED.
3. The presence of dust cannot be completely excluded, al-though emission from dust cannot be the dominant sourceof radiation in the infrared. A Significant amount of dustcan only be present in the equatorial plane of an opticallythick gaseous disk, where it would be unable to contributemuch to the infrared spectrum.
4. The infrared recombination lines observed in IRS2 origi-nate for the most part in a high velocity (400 km s−1) op-tically thick medium, likely distributed in a disk, and tosome extent in a lower velocity (≤130 km s−1) optically thinmedium.
5. Mg and possibly Fe lines are observed, implying thepresence of a dense and warm medium with velocities ofabout (400 km s−1), similar to the hydrogen lines.
6. The CO band-head emission originates in a high density re-gion, where the temperature must drop to about 4000 K andwhere velocities are about 200 km s−1. For such relativelylow temperatures to arise close to the star requires shield-ing. We have shown that this shielding may be provided byhigh density gas located within some ten stellar radii fromthe star.
7. The radio data are best described by a stellar wind modelwith a mass-loss rate of 1.1 ×10⁻⁶ M� yr−1 recombining at145 AU. The radio emission is variable on short timescales(months), its spectral index might also vary. These varia-tions may be explained by changes in the ionization and/ordensity structure; however, non-thermal radiation cannot beexcluded.
8. The origin of the infrared SED is best described by a highdensity disk-like gaseous medium that is optically thick inthe mid-infrared and extends to about 15 R.
9. The luminosity emitted by the circumstellar material iscomparable to the total luminosity of an early-B main-sequence star. It is possible that either the star has a higherluminosity, which would be consistent with the high mass-loss rate derived from radio observations, or part of the lu-minosity is supplied by the disk e.g. through accretion.
Acknowledgements. We would like to thank the Observatory Staff ofUKIRT and of the VLT. We are grateful to L. Decin for her helpin the data reduction, to S. Hony and C. Neiner for useful and re-peated discussions. M. Marlborough and A. Sigut are acknowledgedfor their help with the temperature model. We thank R. Gaume forhis willingness to share the archival VLA data. UKIRT is operatedby the Joint Astronomy Centre on behalf of the UK Particle Physicsand Astronomy Research Council. TRG’s research is supported bythe Gemini Observatory, which is operated by the Association ofUniversities for Research in Astronomy on behalf of the internationalGemini partnership of Argentina, Australia, Brazil, Canada, Chile, theUnited Kingdom, and the United States of America.

A. Lenorzer et al.: The peculiar circumstellar environment of NGC 2024 IRS2 257
7. Appendix
Table 2. Small aperture data used to construct the spectral energy distribution: we list the observing date, frequency, wavelength, beam size,magnitude, flux, observational technique when not photometric, and reference.
Date ν λ Beam Magnitude Flux Tech Ref.
1012 Hz (µm) (′′) (Jy)
1976−77 326 0.92 ≥16.5 ≤0.001 (a) F79
1974 240 1.25 ≤12 10.80 ± 0.10 0.072 ± 0.007 G74
1982 240 1.25 10 11.64 ± 0.05 0.033 ± 0.002 B89
1986 240 1.25 15 11.57 ± 0.02 0.036 ± 0.001 C86
1991 240 1.25 15 10.56 ± 0.05 0.090 ± 0.004 N94
1999 240 1.25 0.7 × 0.7 11.02 ± 0.15 0.059 ± 0.008 (b) B03
1974 182 1.65 ≤12 7.32 ± 0.05 1.226 ± 0.056 G74
1982 182 1.65 10 7.38 ± 0.05 1.160 ± 0.053 B89
1986 182 1.65 15 7.38 ± 0.02 1.160 ± 0.021 C86
1991 182 1.65 15 6.53 ± 0.05 2.538 ± 0.117 N94
1974 136 2.20 ≤12 4.54 ± 0.05 10.423 ± 0.480 G74
1982 136 2.20 10 4.59 ± 0.05 9.954 ± 0.459 B89
1986 136 2.20 15 4.57 ± 0.02 10.139 ± 0.187 C86
1991 136 2.20 15 3.62 ± 0.05 24.322 ± 1.120 N94
1993 136 2.20 3.1 × 3.1 4.7 ± 0.2 8.995 ± 1.666 N94
1994 136 2.20 3.1 × 3.1 4.5 ± 0.2 10.814 ± 2.003 N94
1999 136 2.20 0.7 × 0.7 4.75 ± 0.1 8.590 ± 0.792 (b) B03
1997 86−115 2.6−3.5 14 × 20 25−35 (c) ISO
1974 100 3.00 ≤12 3.76 ± 0.05 13.115 ± 0.604 G74
1974 98.3 3.05 ≤12 4.08 ± 0.05 9.506 ± 0.438 G74
1974 88.2 3.40 ≤12 2.54 ± 0.05 32.779 ± 1.510 G74
1982 79.7 3.76 10 2.06 ± 0.05 42.973 ± 1.980 B89
1986 79.7 3.76 15 1.95 ± 0.04 47.554 ± 1.752 C86
1993 79.7 3.76 3.1 × 3.1 1.7 ± 0.2 59.867 ± 11.090 N94
1994 79.7 3.76 3.1 × 3.1 1.9 ± 0.2 49.796 ± 9.225 N94
1991 78.3 3.83 15 0.62 ± 0.05 156.809 ± 7.224 N94
1997 37.5−74.9 4.0−8.0 14 × 20 40−70 (c) ISO
1982 64.6 4.64 0.27 × 5 1.09 ± 0.03 72.489 ± 2.003 (d) J84
1986 62.5 4.80 15 1.20 ± 0.04 61.609 ± 2.270 C86
1974 62.5 4.80 ≤12 1.24 ± 0.05 59.380 ± 2.736 G74
1974 35.7 8.40 ≤12 0.80 ± 0.05 30.367 ± 1.399 G74
1974 29.4 10.2 ≤12 1.62 ± 0.05 9.552 ± 0.440 G74
1997 25.0−29.4 10.2−12.0 14 × 20 15−35 (c) ISO
1998 28.6 10.5 1.5 19.000 ± 1.000 W01
1974 26.8 11.2 ≤12 1.06 ± 0.05 13.119 ± 0.604 G74
1997 15.4−25.0 12−19.5 14 × 27 35−80 (c) ISO
1974 2.3.8 12.6 ≤12 0.54 ± 0.05 16.416 ± 0.756 G74
1974 1.5.0 20.0 ≤12 0.19 ± 0.04 7.925 ± 0.292 G74
1974 1.3.3 22.5 ≤12 0.09 ± 0.06 6.562 ± 0.363 G74
1986 0.231 1300 11 ≤0.2 (e) M88
1994 0.111 2700 8.2 × 7.7 0.1600 ± 0.0140 (e) W95
Tech: (a): photography; (b): narrow-band photometry; (c): spectroscopy; (d): speckle interferometry; (e): interferometry.Ref: G74: Grasdalen (1974); J84: Jiang et al. (1984); C86: Chalabaev & Lena (1986); S86: Snell & Bally (1986); B89: Barnes et al. (1989);
G92: Gaume et al. (1992); K94: Kurtz et al. (1994); N94: Nisini et al. (1994); W95: Wilson et al. (1995); W98: Walsh et al. (1998); W01:Walsh et al. (2001); B03: Bik et al. (2003); ISO: Infrared Space Observatory, obtained in AOT6 mode.

258 A. Lenorzer et al.: The peculiar circumstellar environment of NGC 2024 IRS2
Table 3. Small aperture interferometric data used to construct the spectral energy distribution at centimeter wavelengths. The listed quantitiesare the same as in Table 2.
Date ν λ Beam Flux RefGHz (cm) (′′) (mJy)
Aug. 1994 23 1.3 0.3 88.8 ± 8.9 VLAOct. 1994 23 1.3 0.9 74 ± 7 VLAJan. 1995 23 1.3 2.8 65 ± 7 VLAApr. 1995 23 1.3 2.8 58 ± 15 VLAAug. 1995 23 1.3 0.08 95 ± 10 VLANov. 1989 23 1.3 2.4 14.7 ± 10.0 G92Mar. 1989 15 2 0.5 19.5 ± 0.4 K94May. 1994 15 2 0.4 40 ± 5 VLAAug. 1994 15 2 0.4 47.2 ± 4.7 VLAOct. 1994 15 2 1.2 48 ± 5 VLAJan. 1995 15 2 3.9 48 ± 7 VLAApr. 1995 15 2 3.9 42 ± 5 VLAAug. 1995 15 2 0.14 40 ± 4.0 VLAMar. 1989 8.4 3.6 0.5 8.9 ± 0.2 K94
1994 8.4 3.6 1.0 6.0 ± 1.0 W98May. 1994 8.4 3.6 0.7 26 ± 4 VLAAug. 1994 8.4 3.6 0.7 27.5 ± 2.8 VLAOct. 1994 8.4 3.6 2.3 22 ± 10 VLAJan. 1995 8.4 3.6 8.4 20 ± 10 VLA
Aug. 1995 8.4 3.6 0.24 28.1 ± 2.8 VLAMar. 2002 8.4 3.6 0.24 17.4 ± 0.6 R02Nov. 1983 5 6 2.6 9.7 ± 2 S86May. 1994 5 6 1.2 13 ± 2 VLAAug. 1994 5 6 1.2 16 ± 1.6 VLAAug. 1995 5 6 0.4 14 ± 1.4 VLA
Ref: S86: Snell & Bally (1986); G92: Gaume et al. (1992); K94: Kurtz et al. (1994); R02: Rodrıguez (priv. comm. 2002); W98: Walsh et al.(1998); VLA: Very Large Array Archival Data.
Table 4. Large aperture data used to construct the spectral energy distribution: we list the same quantities as in Tables 2 and 3.
Date ν λ Beam Flux Tech Ref1012 Hz (µm) (′′) (Jy)
1976−77 136 2.20 62 144.76 ± 3.55 F791976−77 85.7 3.50 62 302.3 ± 3.55 F79
1983 25.0 12 45 × 270 284.4 ± 17.0 IRAS1983 12.0 25 45 × 276 4746 ± 570 IRAS1997 10.3−10.5 28.6−29 20 × 27 325−360 (c) ISO1997 7.89−10.3 29−38 20 × 33 520−940 (c) ISO
1981−83 7.50 40 49 1640 ± 410 T841997 1.52−6.97 43−197 84 5000−15000 (c) ISO
1981−83 5.00 60 49 3600 ± 1200 T841983 5.00 60 90 × 282 7894 ± 1200 IRAS
1981−83 3.00 100 49 3600 ± 1200 T841983 3.00 100 180 × 300 ≤35 330 IRAS
1981−83 1.87 160 49 1710 ± 570 T841985 0.857 350 90 95 ± 20 M881985 0.231 1300 90 22 ± 2 M88
(1) (c): spectroscopy(2) T84: Thronson et al. (1984); F79: Frey et al. (1979); M88: Mezger et al. (1988); IRAS: Infrared Astronomical Satellite; ISO: Infrared
Space Observatory.

A. Lenorzer et al.: The peculiar circumstellar environment of NGC 2024 IRS2 259
References
Baker, J. G., & Menzel, D. H. 1938, ApJ, 88, 52Barnes, P. J., Crutcher, R. M., Bieging, J. H., Storey, J. W. V., &
Willner, S. P. 1989, ApJ, 342, 883Bik, A., Lenorzer, A., Kaper, L., et al. 2003, A&A, 404, 249Black, J. H., & Willner, S. P. 1984, ApJ, 279, 673Brown, A. G. A., de Geus, E. J., & de Zeeuw, P. T. 1994, A&A, 289,
101Cardelli, J. A., Clayton, G. C., Mathis, J. S. 1989, ApJ, 345, 245Cesarsky, D. A. 1977, A&A, 54, 765Chalabaev, A. A., & Lena, P. 1986, A&A, 168, L7Chandler, C. J., Carlstrom, J. E., Scoville, N. Z., Dent, W. R. F., &
Geballe, T. R. 1993, ApJ, 412, L71Chandler, C. J., Carlstrom, J. E., Scoville, N. Z. 1995, ApJ, 446, 793Clark, J. S., & Steele, I. A. 2000, A&AS, 141, 65Codella, C., Felli, M., & Natale, V. 1994, A&A, 284, 233Decin, L. 2000, Ph.D. Thesis, 16Decin, L., Waelkens, C., Eriksson, K., et al. 2000, A&A, 364, 137Frey, A., Lemke, D., Thum, C., & Fahrbach, U. 1979, A&A, 74, 133Gaume, R. A., Johnston, K. J., & Wilson, T. L. 1992, ApJ, 388, 489Geballe, T. R., Smith, H. A., & Fischer, J. 1987a, BAAS, 19, 728Geballe, T. R., & Persson, S. E. 1987b, ApJ, 312, 297Giannini, T., Nisini, B., Lorenzetti, D., et al. 2000, A&A, 358, 310de Graauw, T., Haser, L. N., Beintema, D. A., et al. 1996, A&A, 315,
L49Grasdalen, G. L. 1974, ApJ, 193, 373Hamann, F., & Simon, M. 1987, ApJ, 318, 356Henning, Th., & Guertler, J. 1986, Ap&SS, 128, 199Jiang, D. R., Perrier, C., & Lena, P. 1984, A&A, 135, 249Kessler, M. F., Steinz, J. A., Anderegg, M. E., et al. 1996, A&A, 315,
L27Kruegel, E., Thum, C., Pankonin, V., & Martin-Pintado, J. 1982,
A&AS, 48, 345Kurtz, S., Churchwell, E., & Wood, D. O. S. 1994, ApJS, 91, 659Kurucz, R.L. 1991, in Stellar atmospheres: beyond classical models,
ed. L. Crivellari, I. Hubeny, & D. G. Hummer, NATO ASI Ser. C,341, 441
Lenorzer, A., de Koter, A., & Waters, L. B. F. M. 2002a, A&A, 386,L5
Lenorzer, A., Vandenbussche, B., Morris, P., et al. 2002b, A&A, 384,473
Maihara, T., Mizutani, K., & Suto, H. 1990, ApJ, 354, 549Marlborough, J. M. 1969, ApJ, 156, 135Mezger, P. G., Chini, R., Kreysa, E., Wink, J. E., & Salter, C. J. 1988,
A&A, 191, 44
Millar, C. E., & Marlborough, J. M. 1998, ApJ, 494, 715Millar, C. E., & Marlborough, J. M. 1999a, ApJ, 516, 276Millar, C. E., & Marlborough, J. M. 1999b, ApJ, 516, 280Millar, C. E., Sigut, T. A. A., & Marlborough, J. M. 2000, MNRAS,
312, 465Mountain, C. M., Robertson, D. J., Lee, T. J., et al. 1990, SPIE, 1235,
25Nisini, B., Smith, H. A., Fischer, J., & Geballe, T. R. 1994, A&A, 290,
463Olnon, F. M. 1975, A&A, 39, 217Panagia, N. 1973, AJ, 78, 929Panagia, N., Felli, M. 1975, A&A, 39, 1Plez, B., Brett, J. M., & Nordlund, A. 1992, A&A, 256, 551Poeckert, R., & Marlborough, J. M. 1978, ApJ, 220, 940Putman, M. E., Bjorkman, K. S., Wood, K., & Bjorkman, J. E. 1996,
A&AS, 188, 5708Ramesh, B., & Sridharan, T. K. 1997, MNRAS, 284, 1001Simon, M., Felli, M., Cassar, L., Fischer, J., & Massi, M. 1983, ApJ,
266, 623Smith, H. A., Fischer, J., Geballe, T. R., et al. 1984, in NASA Ames
Research Center Airborne Astron. Symp., 164Smith, L. J., Norris, R. P. F., & Crowther, P. 2002, MNRAS, 337, 1309Snell, R. L., & Bally, J. 1986, ApJ, 303, 683Teixeira, T. C., & Emerson, J. P. 1999, A&A, 351, 292Thompson, R. I., Thronson, H. A. Jr., & Campbell, B.G. 1981, ApJ,
249, 622Thronson, H. A., Lada, C. J., Schwartz, P. R., et al. 1984, ApJ, 280,
154Vink, J. S., de Koter, A., & Lamers, H. J. G. L. M. 2001, A&A, 369,
574Waters, L. B. F. M. 1986, A&A, 162, 121Waters, L. B. F. M., Marlborough, J. M., van der Veen, W. E. C.,
Taylor, A. R., & Dougherty, S. M. 1991, A&A, 244, 120Walsh, A. J., Burton, M. G., Hyland, A. R., & Robinson, G. 1998,
MNRAS, 301, 640Walsh, A. J., Bertoldi, F., Burton, M. G., & Nikola, T. 2001, MNRAS,
326, 36Whittet, D. C. B., Bode, M. F., Longmore, A. J., et al. 1988, MNRAS,
233, 321Wilson, T. L., Mehringer, D. M., & Dickel, H. R. 1995, A&A, 303,
840Wood, D. O. S., & Churchwell, Ed. 1989, ApJ, 340, 265Wright, A. E., & Barlow, M. H. 1975, MNRAS, 170, 41