Embed Size (px)
Citation preview

Recertification Notice of Intent (NO I) Hydrostatic Testing Discharge General Permit ARG670000
You must complete, certify, and sign this Recertification Notice oflntent (NOI) form and return it to the Department in order to continue permit coverage under the General Permit ARG670000. You must submit this form no later September 30,2013. Please keep a copy of this form for your records once completed and signed.
Permit Tracking Number: ARG670545 AFIN: 18-00120 Permittee Name: The Premcor Refining Group Inc.
If any changes need to be made to the information shown below, please update the new information in the corrections section below and/or attach documentation.
Facility Name: Facility Address:
Responsible Official: Responsible Official Email: Cognizant Official: Cognizant Official Email:
Current Information in ADEQ's Database West Memphis Terminal P.O. Box 696000 San Antonio, TX 78269-6000
-.£a il Htoslwt
Corrections, IfNeeded
1. Have you attached an updated disclosure statement? Yes or No ortf!!j) 2. Are the mailing and invoice addresses the same? ~r No If"~o" please provide
~ mv01ce address
Outfalls Currently Listed in ADEO's Database*
Outfall Latitude Longitude 001 35 ° 7 ' 44" 90° 10' 54"
0 ' " 0 ' " 0 ' " 0 ' "
* If a change to the above outfalls is needed, please be sure to provide the outfall number, coordinates, and an explanation of the required changes.
Additional Comments:
"I certifY under penalty of law that this document and all attachments were prepared under my direction or supervision in accordance with a system designed to assure that qualified personnel properly gather and evaluate the information submitted. Based on my inquiry of the person or persons who manage the system, or those persons directly responsible for gathering the information, the information submitted is, to the best of my knowledge and belief, true, accurate, and complete. I am aware that there are significant penalties for submitting false information, including the possibility of fme and imprisonment for knowing violations."
I certifY that I have read and will comply with all the requirements of the Hydrostatic Testing Discharge General Permit ARG670000.
Responsible Official Name: f..J:>bNE:.y ~ Responsible Official Title: \J r~c ... ~,.~~=::=eN _..
Responsible Official Signature: __ _ -~ Date:
----~-.~~--------------------------
Return the NOI form to the address below or send it electronically to: [email protected]
Water Division, General Permits Section Arkansas Department of Environmental Quality 5301 Northshore Drive North Little Rock, AR 72118-5317
ADEQ A R K A N S A S Department of Environmental Quality
June 26, 2013
~ucJ.ner~ The Premcor Refming Group Inc. P.O. Box 696000 San Antonio, TX 78269-6000
Re: Hydrostatic Testing Discharge General Permit Renewal ARG670000, West Memphis Terminal Permit Tracking Number, ARG670545, AFlN 18-00120
Dear Permittee:
This is a reminder that the Department has issued the renewal of Hydrostatic Testing Discharge General Permit (ARG670000) with an effective date of July 1, 2013. If you wish to continue permit coverage under this general permit after June 30, 2013, please complete and return the Recertification Notice of Intent (NO I) included on the back of this correspondence to the address at the bottom of the page or send it electronically to [email protected] NO LATER THAN September 30, 2013. If the facility will no longer be in operation after June 30, 2013 and you wish not to renew your coverage, you must submit a Notice of Termination (NOT) before the expiration date of June 30, 2013. Failure to submit an NOT could result in enforcement action.
Permittees who fail to make a written request to the Director to be covered by this general permit by September 30, 2013 will be operating without a permit which will be in violation of the Arkansas Water and Air Pollution Control Act (Ark. Code Ann.§ 8-4-101 et seq.), and the Clean Water Act (33 U.S.C. § 1251 et seq.).
A copy of the Permit, NOI, and the NOT forms can be obtained at the following website: http://www.adeg.state.ar.us/water/branch permits/general permits/default.htm
A copy of the latest version of the disclosure statement must be used which can be obtained at the following website: htto://www.adea.state.ar.us/dis~lQ$JJ!e stm!!p.Q_f
Please contact my staff Ms. Sarah Cousins or Ms. Jessica Temple of the General Permits Section at 501-682-0623 if you have any questions.
Sincerely,
John Bailey, P.E. . Permits Section Branch Manager Water Division
Enclosure: Recertification NOI
~ VALERO'
July 12, 2013
Arkansas Department of Environmental Quality Water Division, General Permits Section 5301 Northshore Drive North Little Rock, AR 72118-5317
RE: Recertification Notice of Intent (NOI)
CERTIFIED MAIL NO. 7012 3050 0002 1167 9613 RETURN RECEIPT REQUESTED
Hydrostatic Testing Discharge General Permit ARG670000 The Premcor Refining Group Inc. A Valero Company West Memphis Terminal AFIN: 18-00120 Permit Tracking No. ARG670545
Dear Sir or Madam:
Please find enclosed the signed Recertification Notice of Intent (NO!) form for Hydrostatic Testing Discharge General Permit ARG670000 for the above referenced facility.
If you have questions, please contact me at 210-345-4665 or by email at [email protected].
Sincerely,
John Tenison, PG Manager - HSE Pipelines & Terminals
Enclosure
One Valero Way· San Antonio, Texas 78249-1616 Post Office Box 696000 • San Antonio, Texas 78269-6000 ·Telephone (210) 345-2000
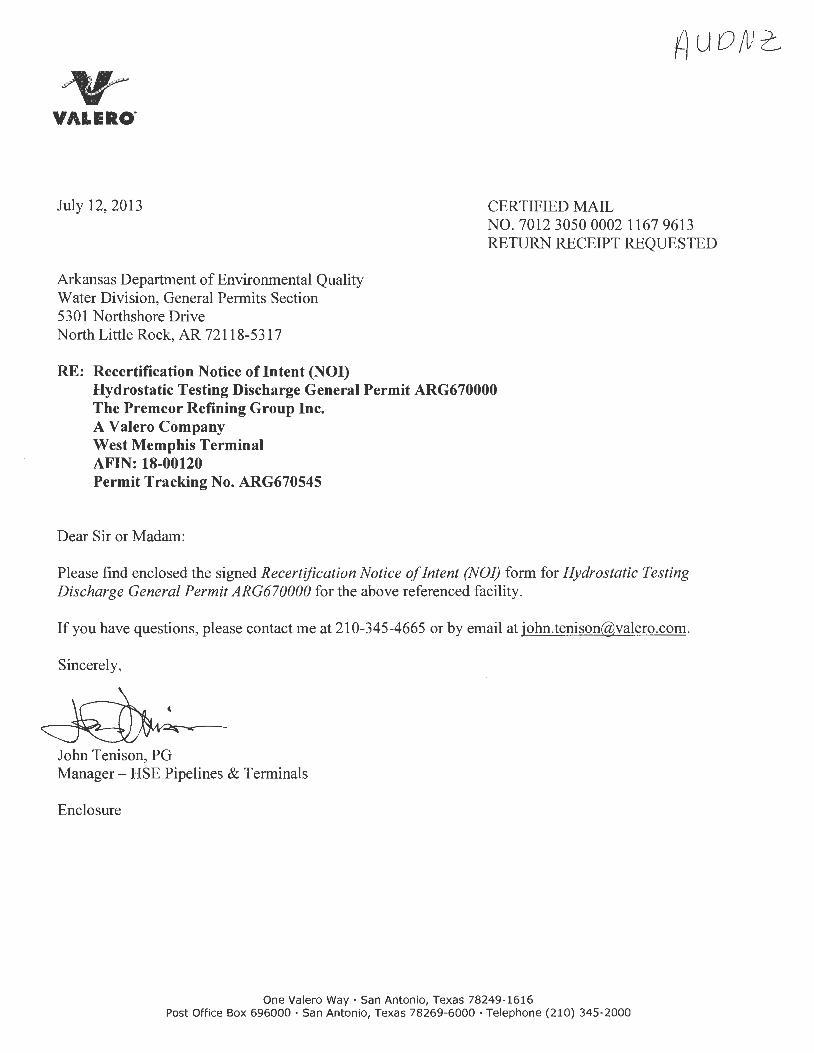
Arkansas Secretary of State Page 1 of 1
ARKANSAS
SECRETARY OF TATE ?"1aAL ~
Search Incorporations, Cooperatives, Banks and Insurance Companies
Printer Friendly Version
LLC Member information is now confidential per Act 865 of 2007
Use your browser's back button to return to the Search Results
Begin New Search
For service of process contact the Secretary of State's office.
Corporation Name
Fictitious Names
Filing#
Filing Type
Filed under Act
Status
Principal Address
Reg. Agent
Agent Address
Date Filed
Officers
Foreign Name
Foreign Address
State of Origin
Purchase a Certificate of Good
Standing for this Entity
THE PREMCOR REFINING GROUP INC.
VALERO WEST MEMPHIS TERMINAL
100104565
Foreign For Profit Corporation
For Bus Corp; 958 of 1987
Good Standing
THE CORPORATION COMPANY
124 WEST CAPITOL AVENUE SUITE 1900 LITTLE ROCK, AR 72201
05/21/1993
SEE FILE, Incorporator/Organizer VVLLIAM R. KLESSE , President JAY D. BROWNING , Secretary STEPHANIE A. DAVIS , Vice-President DONNA M. TITZMAN , Treasurer CLAYTON E. KILLINGER , Controller
N/A
1700 E. PUTNAM AVE., STE 400 OLD GREENVVCH, 06870
DE
Pay Franchise Tax for this corporation
http://www.sos.arkansas.gov/corps/search _ corps.php?DETAIL=l 07408&corp _type _id=&. .. 7/16/2013
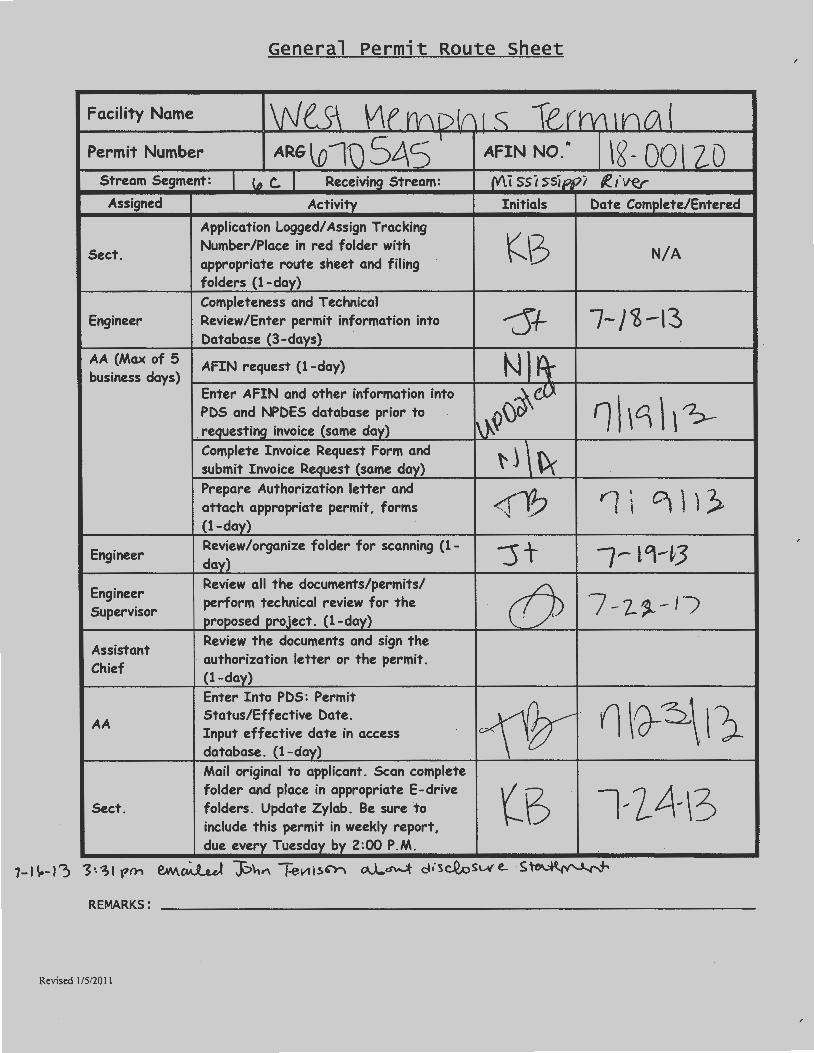
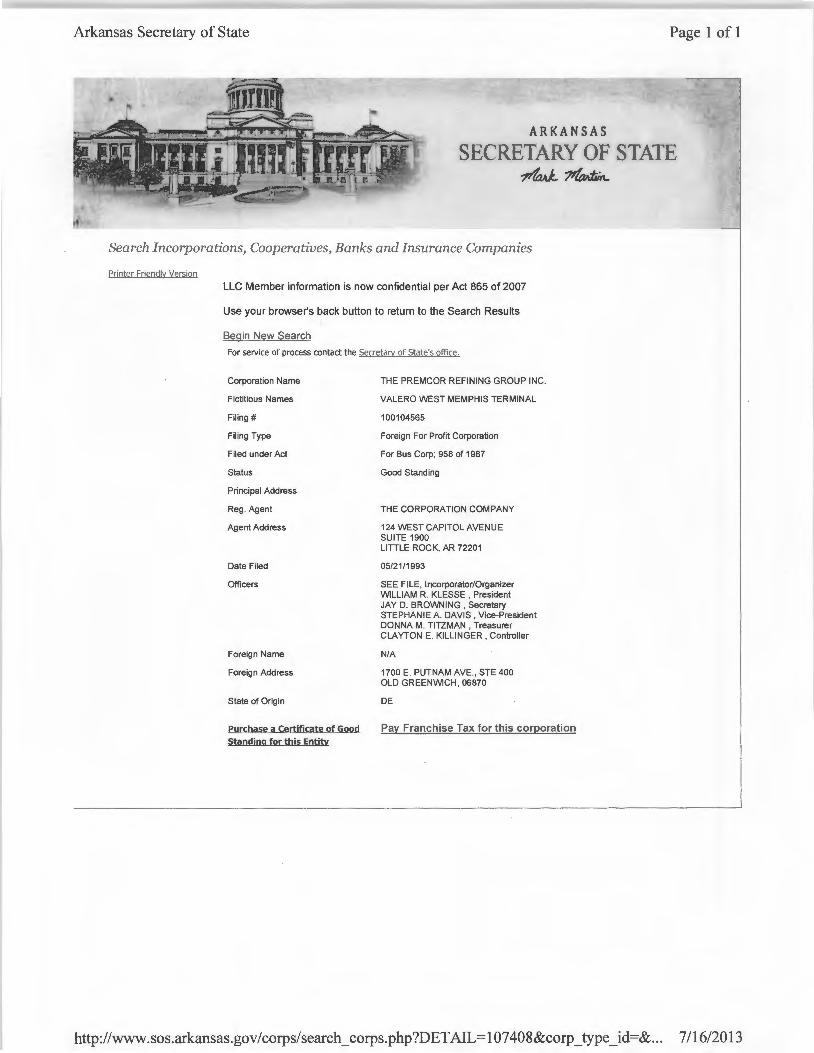
General Permit Route Sheet
Facility Name wu~ V\(rY\D(f11 S 1erm \nO\ ( Permit Number ARG \o1D SL\5 I AFIN NO ... \g- OOllD
Stream Segment: I u, c. I Receiving Stream: {V\i ssi 5Sippi f!.I'W(r
Assigned Activity Initials Date Complete/Entered
Application Logged/ Assign Tracking
KB Sect. Number/Place in red folder with N/A appropriate route sh-eet and filing folders (1-day) Completeness and Technical
~+ 7-/~-13 Engineer Review/Enter permit information into Database (3-days)
AA (Max of 5 AFIN request (1-day) N)rt business days) Enter AFIN and other information into ~f)) 'l\\C1\,>-PDS and NPDES data_base prior to
I~' . requesting invoice (same day) Complete Invoice Request Form and \v submit Invoice Request (same day) Prepare Authorization letter and attach appropriate permit, forms ~ (1-day)
Engineer Review/organize folder for scanning (1- :s+ 1- Lq-~3 day)
Engineer Review all the documents/permits/ v perform technical review for the '7 -z.~-1/ Supervisor proposed project. (1-day)
Assistant Review the documents and sign the
Chief authorization letter or the permit. (1-day) Enter Into PDS: Permit
~· (j \fd-~\11 AA Status/Effective Date . Input effective date in access database . (1-day) Mail original to applicant. Scan complete folder and place in appropriate E-drive
(3 l~ Ii\,\3 Sect. folders. Update Zylab . Be sure to include this permit in weekly report, due every Tuesday by 2:00P.M.
REMARKS:
Revised 1/5/20 II
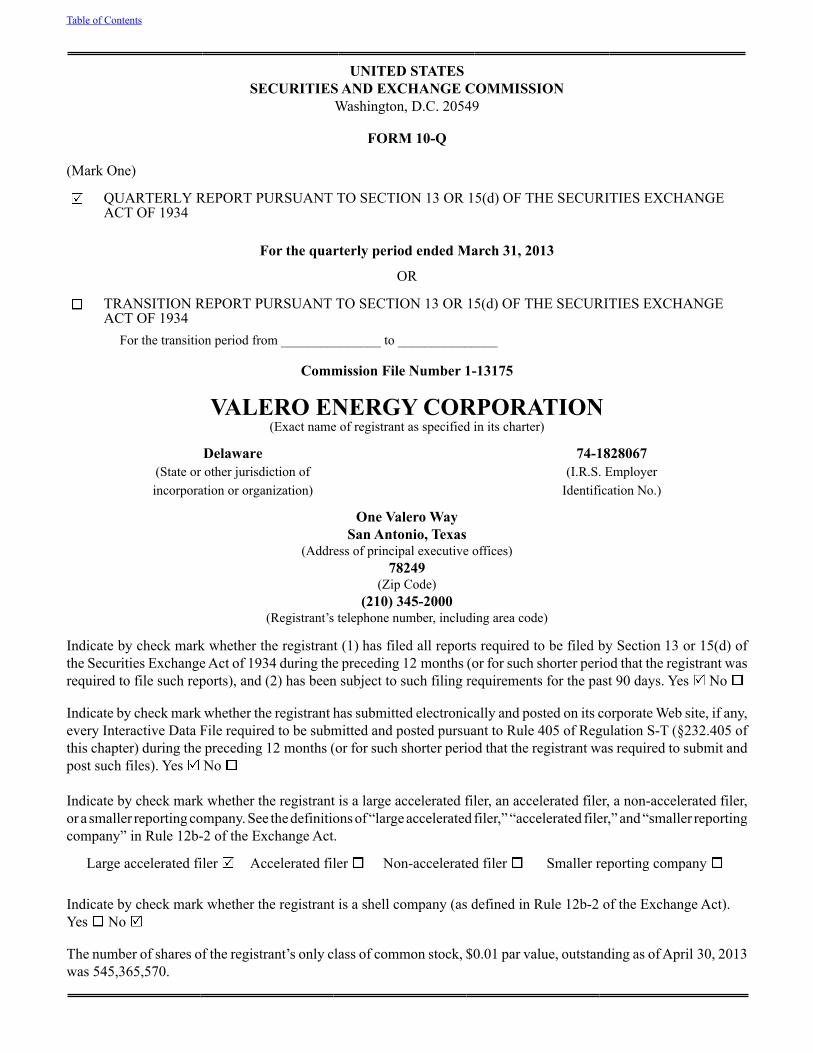
UNITED STATESSECURITIES AND EXCHANGE COMMISSION
Washington, D.C. 20549
FORM 10-Q
(Mark One)
QUARTERLY REPORT PURSUANT TO SECTION 13 OR 15(d) OF THE SECURITIES EXCHANGEACT OF 1934
For the quarterly period ended March 31, 2013
OR
TRANSITION REPORT PURSUANT TO SECTION 13 OR 15(d) OF THE SECURITIES EXCHANGEACT OF 1934
For the transition period from _______________ to _______________
Commission File Number 1-13175
VALERO ENERGY CORPORATION(Exact name of registrant as specified in its charter)
Delaware 74-1828067(State or other jurisdiction of (I.R.S. Employerincorporation or organization) Identification No.)
One Valero WaySan Antonio, Texas
(Address of principal executive offices)78249
(Zip Code)(210) 345-2000
(Registrant’s telephone number, including area code)
Indicate by check mark whether the registrant (1) has filed all reports required to be filed by Section 13 or 15(d) of the Securities Exchange Act of 1934 during the preceding 12 months (or for such shorter period that the registrant was required to file such reports), and (2) has been subject to such filing requirements for the past 90 days. Yes No
Indicate by check mark whether the registrant has submitted electronically and posted on its corporate Web site, if any, every Interactive Data File required to be submitted and posted pursuant to Rule 405 of Regulation S-T (§232.405 of this chapter) during the preceding 12 months (or for such shorter period that the registrant was required to submit and post such files). Yes No
Indicate by check mark whether the registrant is a large accelerated filer, an accelerated filer, a non-accelerated filer, or a smaller reporting company. See the definitions of “large accelerated filer,” “accelerated filer,” and “smaller reporting company” in Rule 12b-2 of the Exchange Act.
Large accelerated filer Accelerated filer Non-accelerated filer Smaller reporting company
Indicate by check mark whether the registrant is a shell company (as defined in Rule 12b-2 of the Exchange Act). Yes No
The number of shares of the registrant’s only class of common stock, $0.01 par value, outstanding as of April 30, 2013 was 545,365,570.
Table of Contents
i
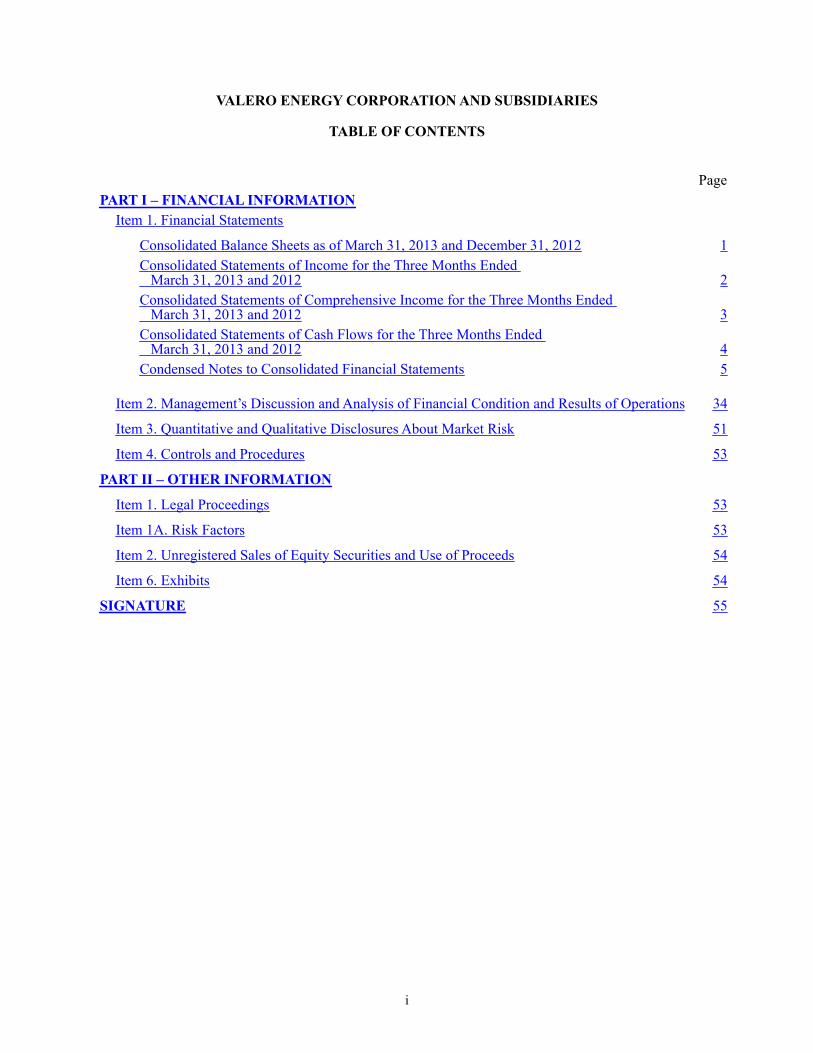
VALERO ENERGY CORPORATION AND SUBSIDIARIES
TABLE OF CONTENTS
Page
PART I – FINANCIAL INFORMATIONItem 1. Financial Statements
Consolidated Balance Sheets as of March 31, 2013 and December 31, 2012 1Consolidated Statements of Income for the Three Months Ended March 31, 2013 and 2012 2Consolidated Statements of Comprehensive Income for the Three Months Ended March 31, 2013 and 2012 3Consolidated Statements of Cash Flows for the Three Months Ended March 31, 2013 and 2012 4Condensed Notes to Consolidated Financial Statements 5
Item 2. Management’s Discussion and Analysis of Financial Condition and Results of Operations 34
Item 3. Quantitative and Qualitative Disclosures About Market Risk 51
Item 4. Controls and Procedures 53
PART II – OTHER INFORMATION
Item 1. Legal Proceedings 53
Item 1A. Risk Factors 53
Item 2. Unregistered Sales of Equity Securities and Use of Proceeds 54
Item 6. Exhibits 54
SIGNATURE 55
1
PART I – FINANCIAL INFORMATIONItem 1. Financial Statements
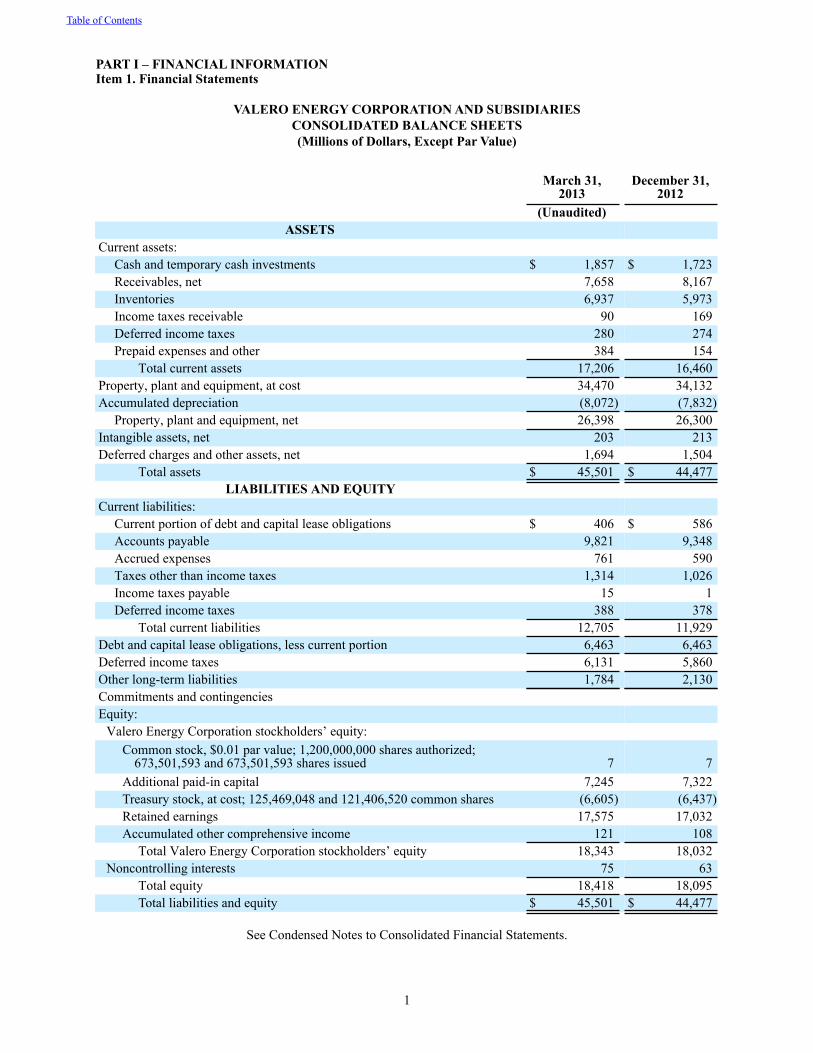
VALERO ENERGY CORPORATION AND SUBSIDIARIESCONSOLIDATED BALANCE SHEETS(Millions of Dollars, Except Par Value)
March 31,
2013December 31,
2012 (Unaudited)
ASSETS Current assets:
Cash and temporary cash investments $ 1,857 $ 1,723Receivables, net 7,658 8,167Inventories 6,937 5,973Income taxes receivable 90 169Deferred income taxes 280 274Prepaid expenses and other 384 154
Total current assets 17,206 16,460Property, plant and equipment, at cost 34,470 34,132Accumulated depreciation (8,072) (7,832)
Property, plant and equipment, net 26,398 26,300Intangible assets, net 203 213Deferred charges and other assets, net 1,694 1,504
Total assets $ 45,501 $ 44,477LIABILITIES AND EQUITY
Current liabilities: Current portion of debt and capital lease obligations $ 406 $ 586Accounts payable 9,821 9,348Accrued expenses 761 590Taxes other than income taxes 1,314 1,026Income taxes payable 15 1Deferred income taxes 388 378
Total current liabilities 12,705 11,929Debt and capital lease obligations, less current portion 6,463 6,463Deferred income taxes 6,131 5,860Other long-term liabilities 1,784 2,130Commitments and contingenciesEquity:
Valero Energy Corporation stockholders’ equity: Common stock, $0.01 par value; 1,200,000,000 shares authorized;
673,501,593 and 673,501,593 shares issued 7 7Additional paid-in capital 7,245 7,322Treasury stock, at cost; 125,469,048 and 121,406,520 common shares (6,605) (6,437)Retained earnings 17,575 17,032Accumulated other comprehensive income 121 108
Total Valero Energy Corporation stockholders’ equity 18,343 18,032Noncontrolling interests 75 63
Total equity 18,418 18,095Total liabilities and equity $ 45,501 $ 44,477
See Condensed Notes to Consolidated Financial Statements.
Table of Contents
2
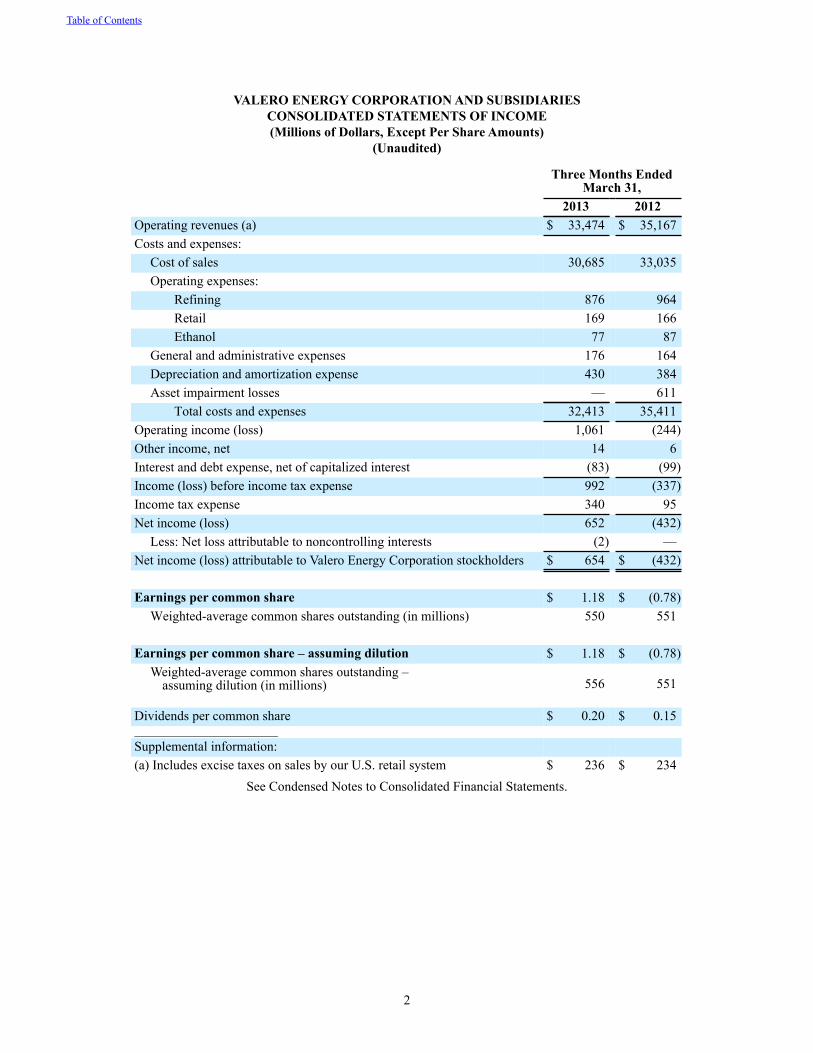
VALERO ENERGY CORPORATION AND SUBSIDIARIESCONSOLIDATED STATEMENTS OF INCOME(Millions of Dollars, Except Per Share Amounts)
(Unaudited)
Three Months EndedMarch 31,
2013 2012Operating revenues (a) $ 33,474 $ 35,167Costs and expenses:
Cost of sales 30,685 33,035Operating expenses:
Refining 876 964Retail 169 166Ethanol 77 87
General and administrative expenses 176 164Depreciation and amortization expense 430 384Asset impairment losses — 611
Total costs and expenses 32,413 35,411Operating income (loss) 1,061 (244)Other income, net 14 6Interest and debt expense, net of capitalized interest (83) (99)Income (loss) before income tax expense 992 (337)Income tax expense 340 95Net income (loss) 652 (432)
Less: Net loss attributable to noncontrolling interests (2) —Net income (loss) attributable to Valero Energy Corporation stockholders $ 654 $ (432)
Earnings per common share $ 1.18 $ (0.78)Weighted-average common shares outstanding (in millions) 550 551
Earnings per common share – assuming dilution $ 1.18 $ (0.78)Weighted-average common shares outstanding –
assuming dilution (in millions) 556 551
Dividends per common share $ 0.20 $ 0.15____________________________________
Supplemental information:(a) Includes excise taxes on sales by our U.S. retail system $ 236 $ 234
See Condensed Notes to Consolidated Financial Statements.
Table of Contents
3
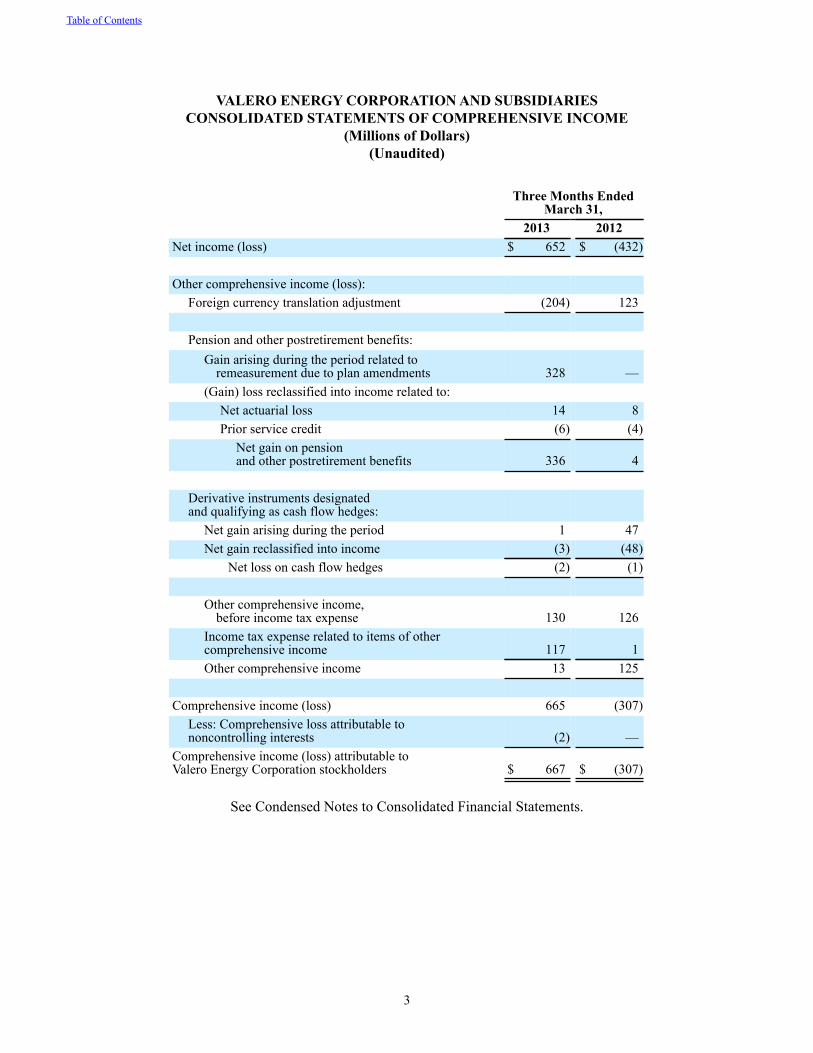
VALERO ENERGY CORPORATION AND SUBSIDIARIESCONSOLIDATED STATEMENTS OF COMPREHENSIVE INCOME
(Millions of Dollars)(Unaudited)
Three Months EndedMarch 31,
2013 2012Net income (loss) $ 652 $ (432)
Other comprehensive income (loss):Foreign currency translation adjustment (204) 123
Pension and other postretirement benefits:Gain arising during the period related to
remeasurement due to plan amendments 328 —(Gain) loss reclassified into income related to:
Net actuarial loss 14 8Prior service credit (6) (4)
Net gain on pensionand other postretirement benefits 336 4
Derivative instruments designatedand qualifying as cash flow hedges:
Net gain arising during the period 1 47Net gain reclassified into income (3) (48)
Net loss on cash flow hedges (2) (1)
Other comprehensive income,before income tax expense 130 126
Income tax expense related to items of othercomprehensive income 117 1Other comprehensive income 13 125
Comprehensive income (loss) 665 (307)Less: Comprehensive loss attributable tononcontrolling interests (2) —
Comprehensive income (loss) attributable toValero Energy Corporation stockholders $ 667 $ (307)
See Condensed Notes to Consolidated Financial Statements.
Table of Contents
4
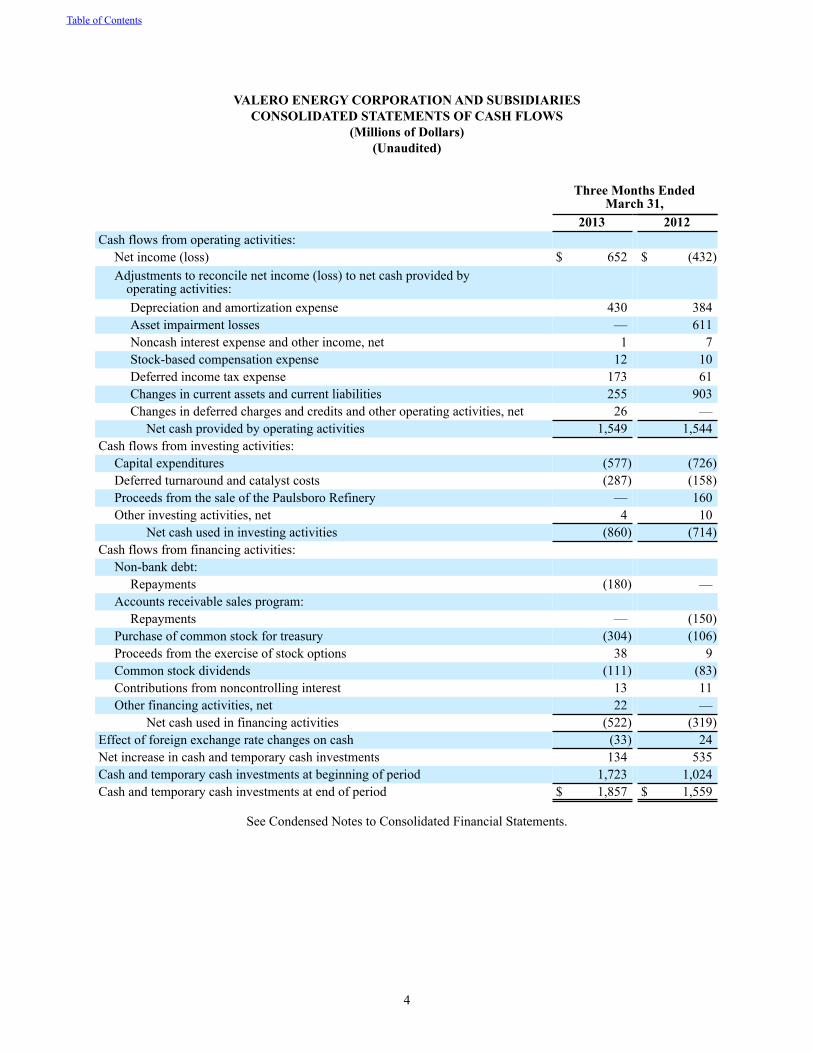
VALERO ENERGY CORPORATION AND SUBSIDIARIESCONSOLIDATED STATEMENTS OF CASH FLOWS
(Millions of Dollars)(Unaudited)
Three Months Ended
March 31, 2013 2012Cash flows from operating activities:
Net income (loss) $ 652 $ (432)Adjustments to reconcile net income (loss) to net cash provided by
operating activities: Depreciation and amortization expense 430 384Asset impairment losses — 611Noncash interest expense and other income, net 1 7Stock-based compensation expense 12 10Deferred income tax expense 173 61Changes in current assets and current liabilities 255 903Changes in deferred charges and credits and other operating activities, net 26 —
Net cash provided by operating activities 1,549 1,544Cash flows from investing activities:
Capital expenditures (577) (726)Deferred turnaround and catalyst costs (287) (158)Proceeds from the sale of the Paulsboro Refinery — 160Other investing activities, net 4 10
Net cash used in investing activities (860) (714)Cash flows from financing activities:
Non-bank debt: Repayments (180) —
Accounts receivable sales program: Repayments — (150)
Purchase of common stock for treasury (304) (106)Proceeds from the exercise of stock options 38 9Common stock dividends (111) (83)Contributions from noncontrolling interest 13 11Other financing activities, net 22 —
Net cash used in financing activities (522) (319)Effect of foreign exchange rate changes on cash (33) 24Net increase in cash and temporary cash investments 134 535Cash and temporary cash investments at beginning of period 1,723 1,024Cash and temporary cash investments at end of period $ 1,857 $ 1,559
See Condensed Notes to Consolidated Financial Statements.
Table of Contents
5
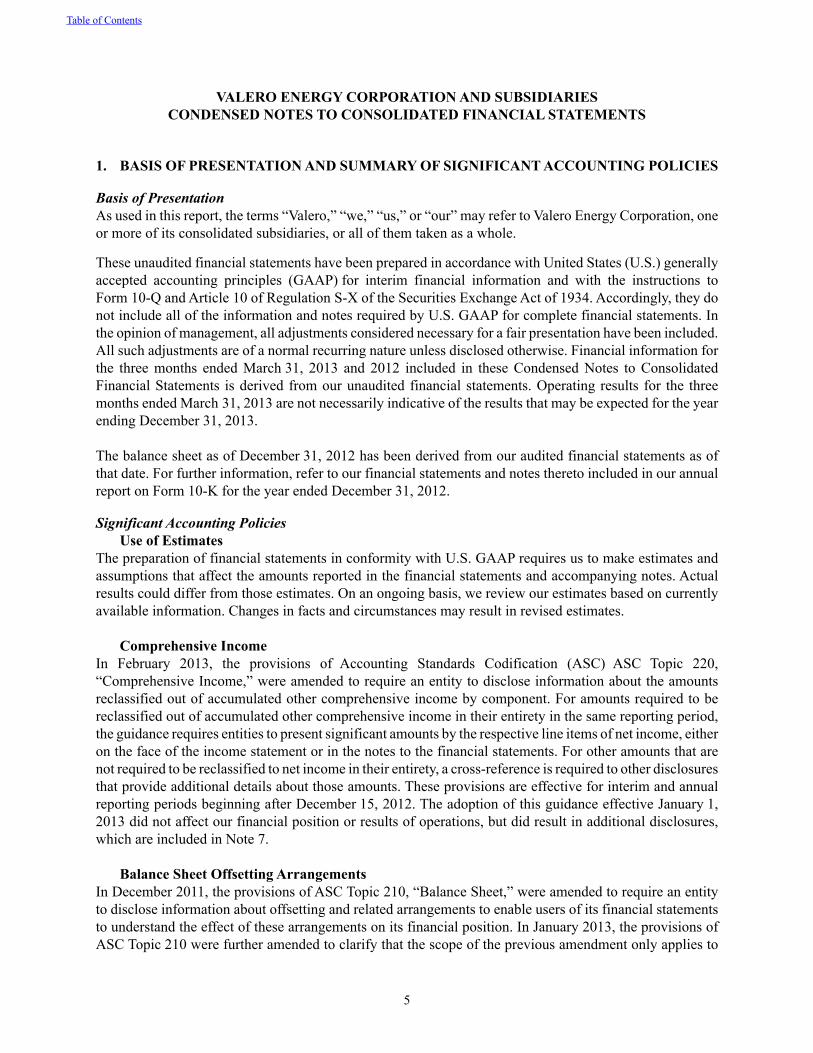
VALERO ENERGY CORPORATION AND SUBSIDIARIESCONDENSED NOTES TO CONSOLIDATED FINANCIAL STATEMENTS
1. BASIS OF PRESENTATION AND SUMMARY OF SIGNIFICANT ACCOUNTING POLICIES
Basis of PresentationAs used in this report, the terms “Valero,” “we,” “us,” or “our” may refer to Valero Energy Corporation, one or more of its consolidated subsidiaries, or all of them taken as a whole.
These unaudited financial statements have been prepared in accordance with United States (U.S.) generally accepted accounting principles (GAAP) for interim financial information and with the instructions to Form 10-Q and Article 10 of Regulation S-X of the Securities Exchange Act of 1934. Accordingly, they do not include all of the information and notes required by U.S. GAAP for complete financial statements. In the opinion of management, all adjustments considered necessary for a fair presentation have been included. All such adjustments are of a normal recurring nature unless disclosed otherwise. Financial information for the three months ended March 31, 2013 and 2012 included in these Condensed Notes to Consolidated Financial Statements is derived from our unaudited financial statements. Operating results for the three months ended March 31, 2013 are not necessarily indicative of the results that may be expected for the year ending December 31, 2013.
The balance sheet as of December 31, 2012 has been derived from our audited financial statements as of that date. For further information, refer to our financial statements and notes thereto included in our annual report on Form 10-K for the year ended December 31, 2012.
Significant Accounting PoliciesUse of Estimates
The preparation of financial statements in conformity with U.S. GAAP requires us to make estimates and assumptions that affect the amounts reported in the financial statements and accompanying notes. Actual results could differ from those estimates. On an ongoing basis, we review our estimates based on currently available information. Changes in facts and circumstances may result in revised estimates.
Comprehensive IncomeIn February 2013, the provisions of Accounting Standards Codification (ASC) ASC Topic 220, “Comprehensive Income,” were amended to require an entity to disclose information about the amounts reclassified out of accumulated other comprehensive income by component. For amounts required to be reclassified out of accumulated other comprehensive income in their entirety in the same reporting period, the guidance requires entities to present significant amounts by the respective line items of net income, either on the face of the income statement or in the notes to the financial statements. For other amounts that are not required to be reclassified to net income in their entirety, a cross-reference is required to other disclosures that provide additional details about those amounts. These provisions are effective for interim and annual reporting periods beginning after December 15, 2012. The adoption of this guidance effective January 1, 2013 did not affect our financial position or results of operations, but did result in additional disclosures, which are included in Note 7.
Balance Sheet Offsetting ArrangementsIn December 2011, the provisions of ASC Topic 210, “Balance Sheet,” were amended to require an entity to disclose information about offsetting and related arrangements to enable users of its financial statements to understand the effect of these arrangements on its financial position. In January 2013, the provisions of ASC Topic 210 were further amended to clarify that the scope of the previous amendment only applies to
Table of Contents
6
derivative instruments, including bifurcated derivatives, repurchase agreements and reverse repurchase agreements, and securities borrowing and securities lending transactions that are either eligible for offset in the balance sheet or are subject to an agreement similar to a master netting agreement. The guidance requires entities to disclose both gross information and net information about assets and liabilities within the scope of the amendment. These provisions are effective for interim and annual reporting periods beginning on or after January 1, 2013. The adoption of this guidance effective January 1, 2013 did not affect our financial position or results of operations, but did result in additional disclosures, which are included in Note 12.
OtherThe statement of cash flows for the three months ended March 31, 2012, which was included in our Form 10-Q for the quarterly period ended March 31, 2012, reflected an incorrect classification of $160 million in proceeds on a note receivable related to the sale of our Paulsboro Refinery in December 2010. We previously reflected such proceeds as a component of cash flows from operating activities rather than as a component of cash flows from investing activities. The statement of cash flows for the three months ended March 31, 2012 included in this Form 10-Q for the quarterly period ended March 31, 2013 has been corrected to properly reflect the classification of those proceeds.
2. SEPARATION OF RETAIL BUSINESS
On May 1, 2013, we completed the separation of our retail business, creating an independent public company named CST Brands, Inc. (CST). In accordance with a separation and distribution agreement, the separation occurred by way of a pro rata distribution of 80 percent of the outstanding shares of CST common stock to our stockholders on May 1, 2013. Each Valero stockholder received one share of CST common stock for every nine shares of Valero common stock held at the close of business on the record date of April 19, 2013. Fractional shares of CST common stock were not distributed, but instead were aggregated and sold in the open market at prevailing rates with net cash proceeds then distributed pro rata to each Valero stockholder who was entitled to receive fractional shares.
In connection with the separation, we received an aggregate of $1.05 billion in cash, consisting of $550 million from the issuance of short-term debt to a third-party financial institution on April 16, 2013 and $500 million distributed to us by CST on May 1, 2013. The cash distributed to us by CST was borrowed by CST on May 1, 2013 under its senior secured credit facility. See Note 5 for further discussion of that credit facility. Also on May 1, 2013, CST issued $550 million of its senior unsecured bonds to us, and we exchanged those bonds with the third-party financial institution in satisfaction of our short-term debt. Immediately prior to May 1, 2013, subsidiaries of CST held $315 million of cash, and CST retained that cash following the distribution on May 1, 2013. Approximately $265 million of the cash retained by CST resulted from a change in the payment terms from “due upon receipt” to “net 10” days on motor fuel purchased from us, and this change in payment terms was effective prior to May 1, 2013. The new payment terms are consistent with those offered by us to our other creditworthy retail distributors. Also in connection with the separation, we incurred a tax liability of approximately $220 million primarily related to the manner in which the transaction is treated for tax purposes in Canada, and most of these taxes will not be paid until the first half of 2014. Therefore the net cash we will receive as a result of the separation will be approximately $500 million. We expect to liquidate the remaining 20 percent of the outstanding shares of CST common stock that we own within 18 months.
Table of Contents
VALERO ENERGY CORPORATION AND SUBSIDIARIESCONDENSED NOTES TO CONSOLIDATED FINANCIAL STATEMENTS (Continued)
7
In order to effect the separation and provide a framework for our relationship with CST after the separation, we entered into various agreements with CST, including fuel supply agreements in the U.S. and Canada. The nature and significance of our post-separation participation in the supply of motor fuel to CST represents a continuation of activities with CST for accounting purposes. As such, the historical results of operations related to CST will not be reported by us as discontinued operations in our consolidated statements of income.
3. IMPAIRMENTS
Aruba RefineryIn March 2012, we suspended the operations of the Aruba Refinery because of its inability to generate positive cash flows on a sustained basis subsequent to its restart in January 2011 and the sensitivity of its profitability to sour crude oil differentials, which had narrowed significantly in the fourth quarter of 2011. Shortly thereafter, we received a non-binding offer to purchase the refinery for $350 million, plus working capital as of the closing date. Because of our decision to suspend the operations and the possibility of selling the refinery, we evaluated the refinery for potential impairment as of March 31, 2012 and concluded that it was impaired. We recognized an asset impairment loss of $595 million in March 2012. We did not, however, classify the Aruba Refinery as “held for sale” in our balance sheet because all of the accounting criteria required for that classification had not been met.
In September 2012, we decided to reorganize the Aruba Refinery into a crude oil and refined products terminal in response to the withdrawal of the non-binding offer to purchase the refinery. We bifurcated the idled crude oil processing units and related infrastructure (refining assets) from the terminal assets and evaluated the refining assets for potential impairment as of September 30, 2012. We concluded that the refining assets were impaired and recognized an asset impairment loss of $308 million in September 2012. We also recognized an asset impairment loss of $25 million related to materials and supplies inventories that supported the refining operations, resulting in a total asset impairment loss of $333 million that was recognized in September 2012 related to the Aruba Refinery. The terminal assets were not impaired.
We have continued to maintain the refining assets to allow them to be restarted and do not consider them to be abandoned. Therefore, we have not reflected the Aruba Refinery as a discontinued operation in our financial statements. It is possible, however, that we may abandon these assets in the future. Should we ultimately decide to abandon these assets, we may be required under our land lease agreement with the Government of Aruba to dismantle and remove the abandoned assets, which would require us to recognize an asset retirement obligation, that would be immediately charged to expense. We do not expect these amounts to be material to our financial position or results of operations.
The variation in the customary relationship between income tax expense and income before income tax expense for the three months ended March 31, 2012 was primarily due to not recognizing a tax benefit associated with the asset impairment loss of $595 million related to the Aruba Refinery as we do not expect to realize this tax benefit.
Cancelled Capital ProjectIn March 2012, we wrote down the carrying value of equipment associated with a permanently cancelled capital project at one of our refineries, resulting in an asset impairment loss of $16 million.
Table of Contents
VALERO ENERGY CORPORATION AND SUBSIDIARIESCONDENSED NOTES TO CONSOLIDATED FINANCIAL STATEMENTS (Continued)
8
4. INVENTORIES
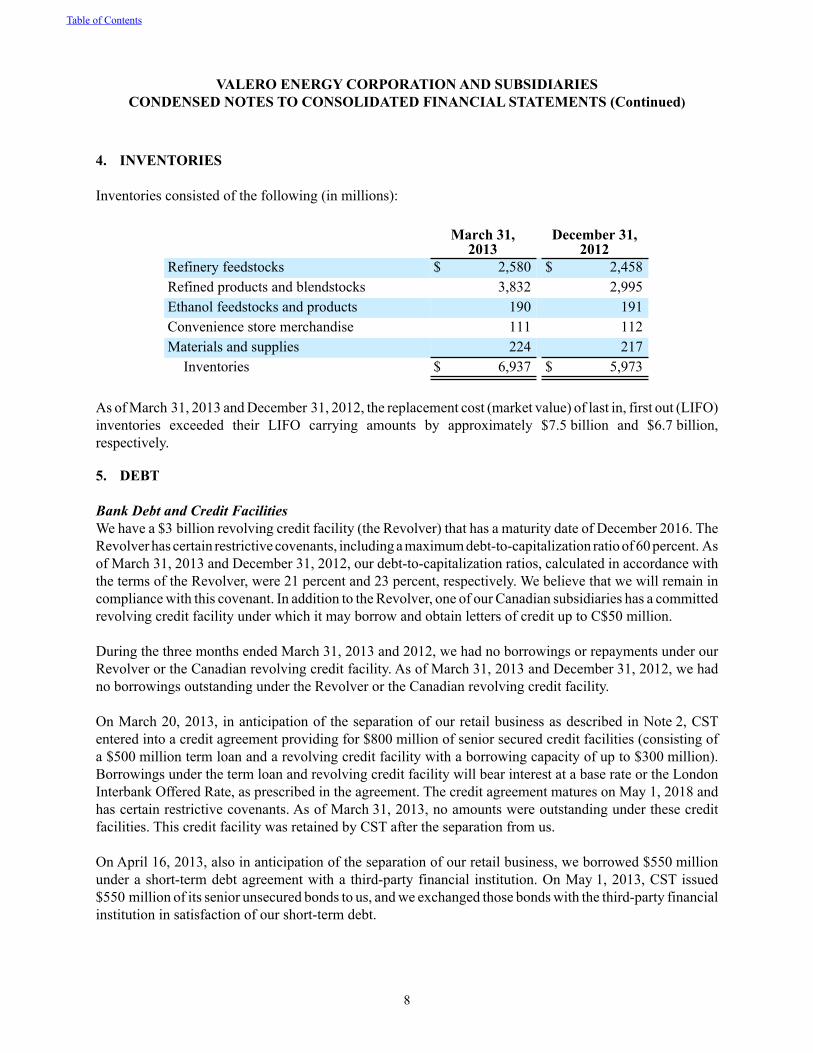
Inventories consisted of the following (in millions):
March 31,2013
December 31,2012
Refinery feedstocks $ 2,580 $ 2,458Refined products and blendstocks 3,832 2,995Ethanol feedstocks and products 190 191Convenience store merchandise 111 112Materials and supplies 224 217
Inventories $ 6,937 $ 5,973
As of March 31, 2013 and December 31, 2012, the replacement cost (market value) of last in, first out (LIFO) inventories exceeded their LIFO carrying amounts by approximately $7.5 billion and $6.7 billion, respectively.
5. DEBT
Bank Debt and Credit FacilitiesWe have a $3 billion revolving credit facility (the Revolver) that has a maturity date of December 2016. The Revolver has certain restrictive covenants, including a maximum debt-to-capitalization ratio of 60 percent. As of March 31, 2013 and December 31, 2012, our debt-to-capitalization ratios, calculated in accordance with the terms of the Revolver, were 21 percent and 23 percent, respectively. We believe that we will remain in compliance with this covenant. In addition to the Revolver, one of our Canadian subsidiaries has a committed revolving credit facility under which it may borrow and obtain letters of credit up to C$50 million.
During the three months ended March 31, 2013 and 2012, we had no borrowings or repayments under our Revolver or the Canadian revolving credit facility. As of March 31, 2013 and December 31, 2012, we had no borrowings outstanding under the Revolver or the Canadian revolving credit facility.
On March 20, 2013, in anticipation of the separation of our retail business as described in Note 2, CST entered into a credit agreement providing for $800 million of senior secured credit facilities (consisting of a $500 million term loan and a revolving credit facility with a borrowing capacity of up to $300 million). Borrowings under the term loan and revolving credit facility will bear interest at a base rate or the London Interbank Offered Rate, as prescribed in the agreement. The credit agreement matures on May 1, 2018 and has certain restrictive covenants. As of March 31, 2013, no amounts were outstanding under these credit facilities. This credit facility was retained by CST after the separation from us.
On April 16, 2013, also in anticipation of the separation of our retail business, we borrowed $550 million under a short-term debt agreement with a third-party financial institution. On May 1, 2013, CST issued $550 million of its senior unsecured bonds to us, and we exchanged those bonds with the third-party financial institution in satisfaction of our short-term debt.
Table of Contents
VALERO ENERGY CORPORATION AND SUBSIDIARIESCONDENSED NOTES TO CONSOLIDATED FINANCIAL STATEMENTS (Continued)
9
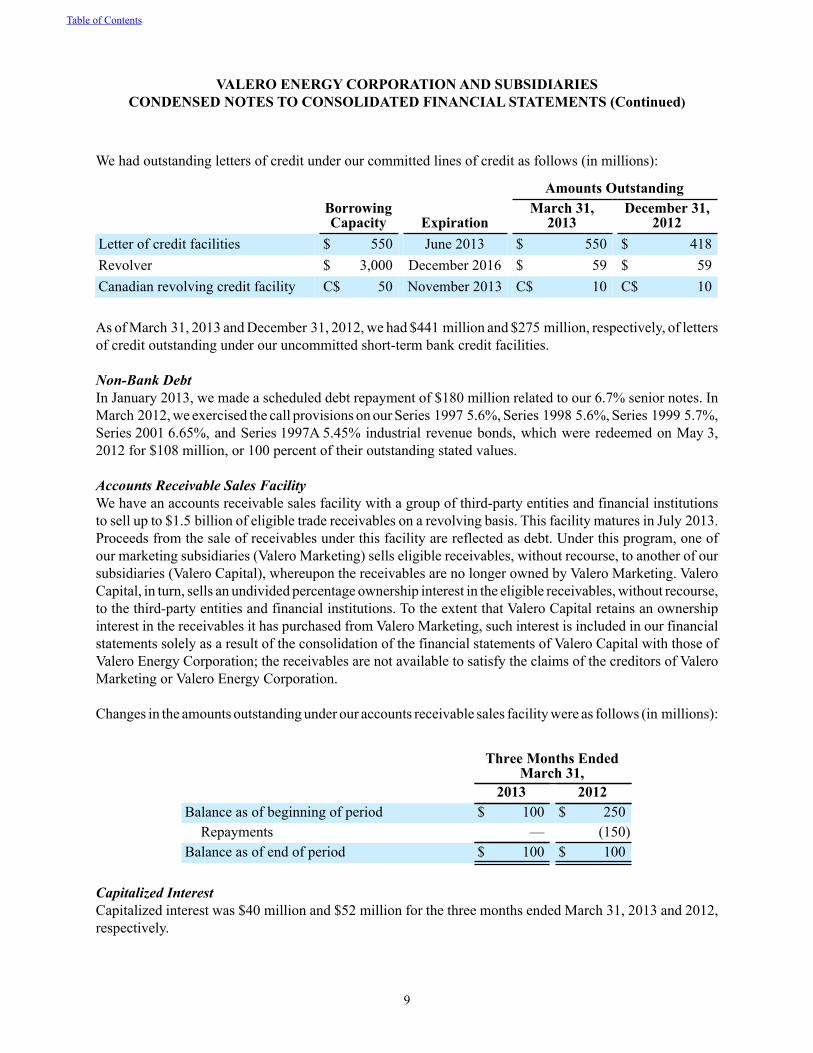
We had outstanding letters of credit under our committed lines of credit as follows (in millions):
Amounts OutstandingBorrowingCapacity Expiration
March 31,2013
December 31,2012
Letter of credit facilities $ 550 June 2013 $ 550 $ 418Revolver $ 3,000 December 2016 $ 59 $ 59Canadian revolving credit facility C$ 50 November 2013 C$ 10 C$ 10
As of March 31, 2013 and December 31, 2012, we had $441 million and $275 million, respectively, of letters of credit outstanding under our uncommitted short-term bank credit facilities.
Non-Bank Debt In January 2013, we made a scheduled debt repayment of $180 million related to our 6.7% senior notes. In March 2012, we exercised the call provisions on our Series 1997 5.6%, Series 1998 5.6%, Series 1999 5.7%, Series 2001 6.65%, and Series 1997A 5.45% industrial revenue bonds, which were redeemed on May 3, 2012 for $108 million, or 100 percent of their outstanding stated values.
Accounts Receivable Sales FacilityWe have an accounts receivable sales facility with a group of third-party entities and financial institutions to sell up to $1.5 billion of eligible trade receivables on a revolving basis. This facility matures in July 2013. Proceeds from the sale of receivables under this facility are reflected as debt. Under this program, one of our marketing subsidiaries (Valero Marketing) sells eligible receivables, without recourse, to another of our subsidiaries (Valero Capital), whereupon the receivables are no longer owned by Valero Marketing. Valero Capital, in turn, sells an undivided percentage ownership interest in the eligible receivables, without recourse, to the third-party entities and financial institutions. To the extent that Valero Capital retains an ownership interest in the receivables it has purchased from Valero Marketing, such interest is included in our financial statements solely as a result of the consolidation of the financial statements of Valero Capital with those of Valero Energy Corporation; the receivables are not available to satisfy the claims of the creditors of Valero Marketing or Valero Energy Corporation.
Changes in the amounts outstanding under our accounts receivable sales facility were as follows (in millions):
Three Months EndedMarch 31,
2013 2012Balance as of beginning of period $ 100 $ 250
Repayments — (150)Balance as of end of period $ 100 $ 100
Capitalized InterestCapitalized interest was $40 million and $52 million for the three months ended March 31, 2013 and 2012, respectively.
Table of Contents
VALERO ENERGY CORPORATION AND SUBSIDIARIESCONDENSED NOTES TO CONSOLIDATED FINANCIAL STATEMENTS (Continued)
10
6. COMMITMENTS AND CONTINGENCIES
Environmental MatterWe are involved, together with several other companies, in an environmental cleanup in the Village of Hartford, Illinois (the Village) and the adjacent shutdown refinery site, which we acquired as part of a prior acquisition. In cooperation with some of the other companies, we have been conducting initial mitigation and cleanup response pursuant to an administrative order issued by the U.S. Environmental Protection Agency (EPA). The EPA is seeking further cleanup obligations from us and other potentially responsible parties for the Village. In parallel with the Village cleanup, we are also in litigation with the State of Illinois Environmental Protection Agency and other potentially responsible parties relating to the remediation of the shutdown refinery site. In each of these matters, we have various defenses and rights for contribution from the other potentially responsible parties. We have accrued for our own expected contribution obligations. However, because of the unpredictable nature of these cleanups and the methodology for allocation of liabilities, it is reasonably possible that we could incur a loss in a range of $0 to $250 million in excess of the amount of our accrual to ultimately resolve these matters. Factors underlying this estimated range are expected to change from time to time, and actual results may vary significantly from this estimate.
Litigation MattersWe are party to claims and legal proceedings arising in the ordinary course of business. We have not recorded a loss contingency liability with respect to some of these matters because we have determined that it is remote that a loss has been incurred. For other matters, we have recorded a loss contingency liability where we have determined that it is probable that a loss has been incurred and that the loss is reasonably estimable. These loss contingency liabilities are not material to our financial position. We re-evaluate and update our loss contingency liabilities as matters progress over time, and we believe that any changes to the recorded liabilities will not be material to our financial position or results of operations.
One-Time Severance BenefitsAs described in Note 3, we decided to reorganize the Aruba Refinery into a crude oil and refined products terminal in September 2012 resulting in a decrease in required personnel for our operations in Aruba. We notified 495 employees in September 2012 of the termination of their employment effective November 15, 2012. Benefits to each terminated employee consisted primarily of a cash payment based on a formula that considers the employee’s current compensation and years of service, among other factors. We recognized a severance liability of $41 million in September 2012, which approximated fair value. We paid $31 million of these benefits in the fourth quarter of 2012 and we paid the remaining termination benefits of $10 million during the three months ended March 31, 2013.
Table of Contents
VALERO ENERGY CORPORATION AND SUBSIDIARIESCONDENSED NOTES TO CONSOLIDATED FINANCIAL STATEMENTS (Continued)
11
7. EQUITY
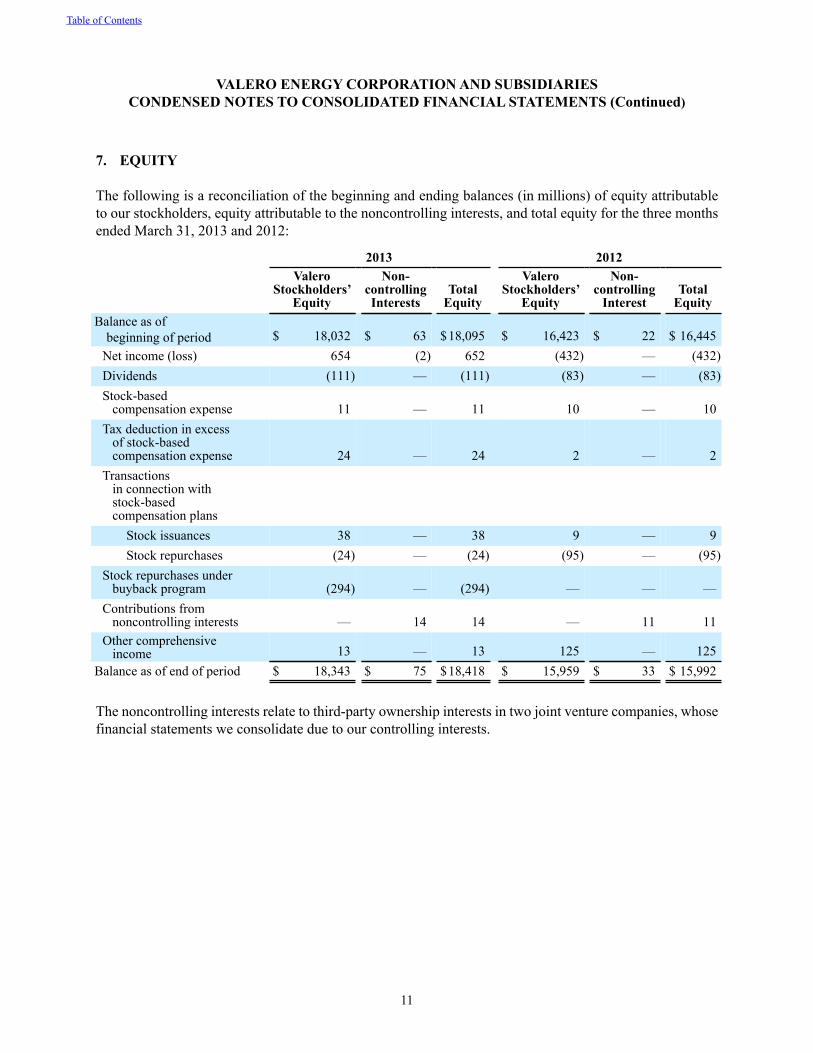
The following is a reconciliation of the beginning and ending balances (in millions) of equity attributable to our stockholders, equity attributable to the noncontrolling interests, and total equity for the three months ended March 31, 2013 and 2012:
2013 2012Valero
Stockholders’Equity
Non-controllingInterests
TotalEquity
ValeroStockholders’
Equity
Non-controlling
InterestTotal
EquityBalance as of
beginning of period $ 18,032 $ 63 $18,095 $ 16,423 $ 22 $ 16,445Net income (loss) 654 (2) 652 (432) — (432)Dividends (111) — (111) (83) — (83)Stock-based compensation expense 11 — 11 10 — 10Tax deduction in excess of stock-based compensation expense 24 — 24 2 — 2Transactions in connection with stock-based compensation plans
Stock issuances 38 — 38 9 — 9Stock repurchases (24) — (24) (95) — (95)
Stock repurchases under buyback program (294) — (294) — — —Contributions from noncontrolling interests — 14 14 — 11 11Other comprehensive income 13 — 13 125 — 125
Balance as of end of period $ 18,343 $ 75 $18,418 $ 15,959 $ 33 $ 15,992
The noncontrolling interests relate to third-party ownership interests in two joint venture companies, whose financial statements we consolidate due to our controlling interests.
Table of Contents
VALERO ENERGY CORPORATION AND SUBSIDIARIESCONDENSED NOTES TO CONSOLIDATED FINANCIAL STATEMENTS (Continued)
12
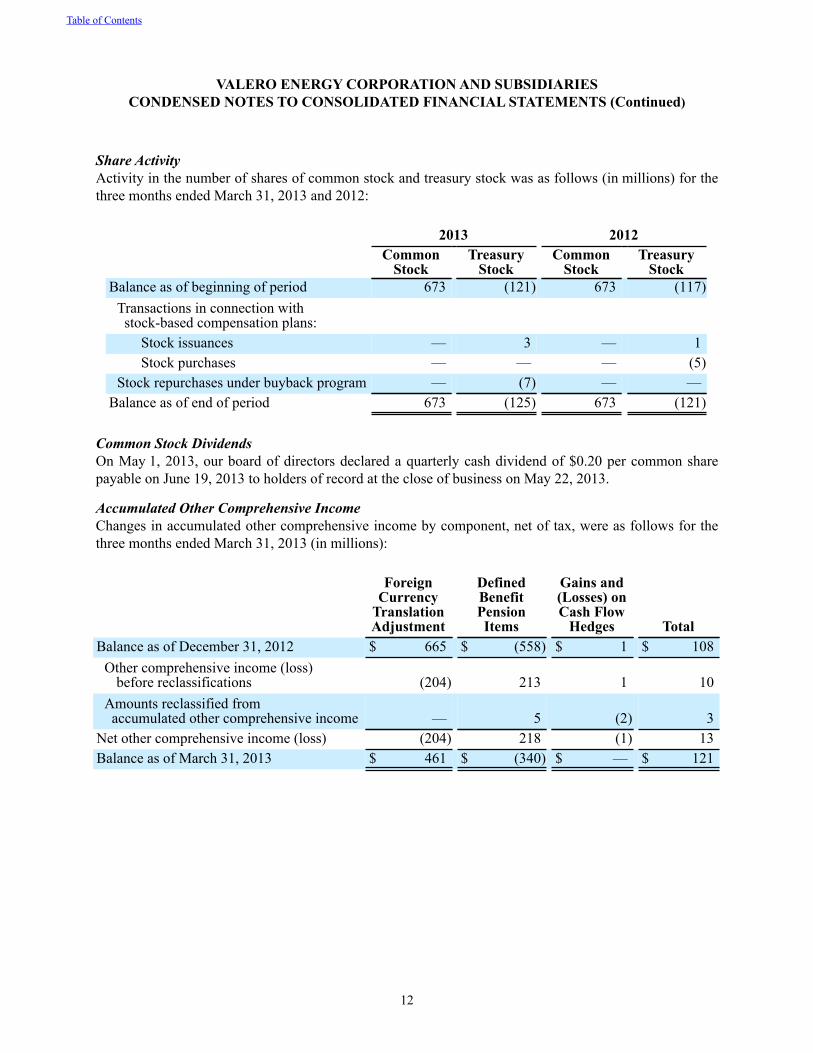
Share ActivityActivity in the number of shares of common stock and treasury stock was as follows (in millions) for the three months ended March 31, 2013 and 2012:
2013 2012Common
StockTreasury
StockCommon
StockTreasury
StockBalance as of beginning of period 673 (121) 673 (117)
Transactions in connection with stock-based compensation plans:
Stock issuances — 3 — 1Stock purchases — — — (5)
Stock repurchases under buyback program — (7) — —Balance as of end of period 673 (125) 673 (121)
Common Stock DividendsOn May 1, 2013, our board of directors declared a quarterly cash dividend of $0.20 per common share payable on June 19, 2013 to holders of record at the close of business on May 22, 2013.
Accumulated Other Comprehensive IncomeChanges in accumulated other comprehensive income by component, net of tax, were as follows for the three months ended March 31, 2013 (in millions):
ForeignCurrency
TranslationAdjustment
DefinedBenefitPensionItems
Gains and(Losses) onCash Flow
Hedges TotalBalance as of December 31, 2012 $ 665 $ (558) $ 1 $ 108
Other comprehensive income (loss)before reclassifications (204) 213 1 10
Amounts reclassified from accumulated other comprehensive income — 5 (2) 3
Net other comprehensive income (loss) (204) 218 (1) 13Balance as of March 31, 2013 $ 461 $ (340) $ — $ 121
Table of Contents
VALERO ENERGY CORPORATION AND SUBSIDIARIESCONDENSED NOTES TO CONSOLIDATED FINANCIAL STATEMENTS (Continued)
13
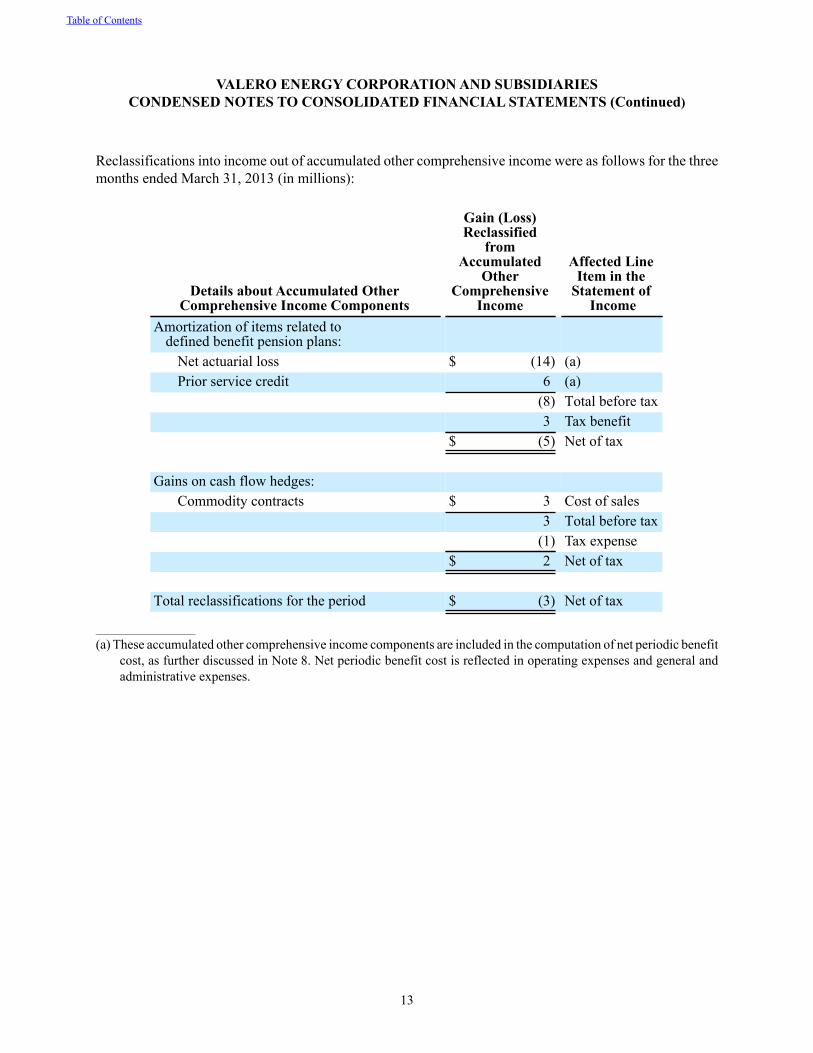
Reclassifications into income out of accumulated other comprehensive income were as follows for the three months ended March 31, 2013 (in millions):
Details about Accumulated OtherComprehensive Income Components
Gain (Loss)Reclassified
fromAccumulated
OtherComprehensive
Income
Affected LineItem in the
Statement of Income
Amortization of items related to defined benefit pension plans:
Net actuarial loss $ (14) (a)Prior service credit 6 (a)
(8) Total before tax3 Tax benefit
$ (5) Net of tax
Gains on cash flow hedges:Commodity contracts $ 3 Cost of sales
3 Total before tax(1) Tax expense
$ 2 Net of tax
Total reclassifications for the period $ (3) Net of tax
_________________________
(a) These accumulated other comprehensive income components are included in the computation of net periodic benefit cost, as further discussed in Note 8. Net periodic benefit cost is reflected in operating expenses and general and administrative expenses.
Table of Contents
VALERO ENERGY CORPORATION AND SUBSIDIARIESCONDENSED NOTES TO CONSOLIDATED FINANCIAL STATEMENTS (Continued)
14
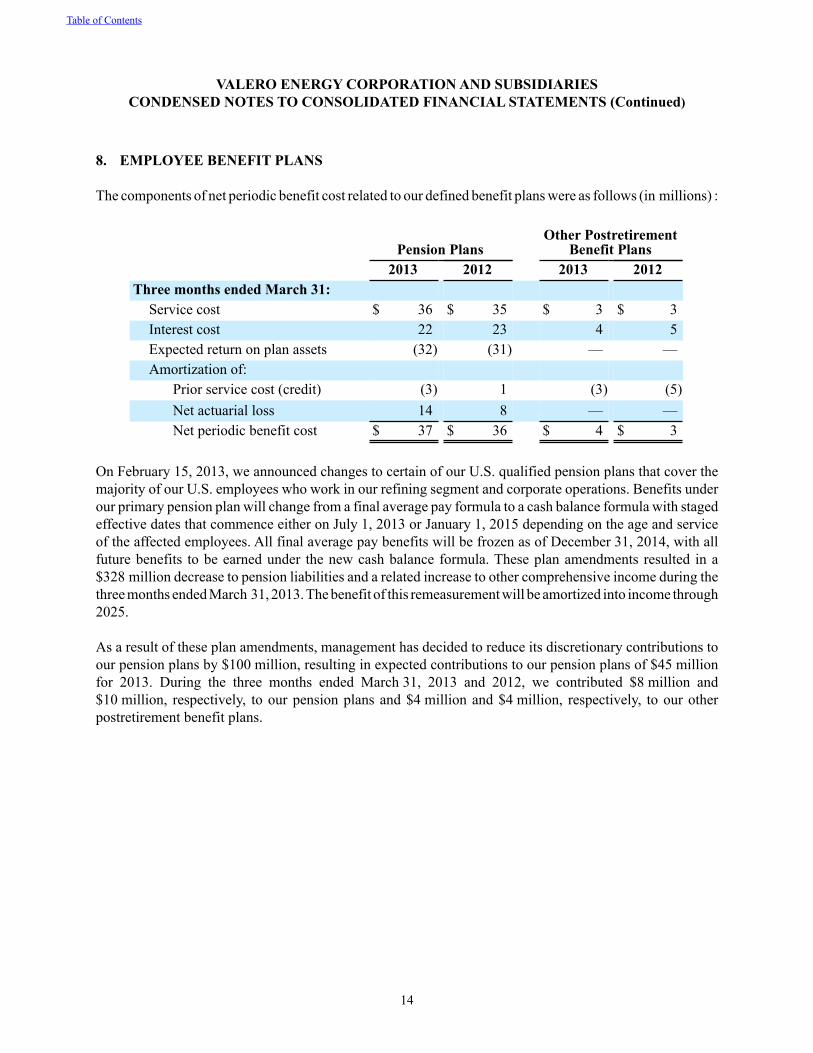
8. EMPLOYEE BENEFIT PLANS
The components of net periodic benefit cost related to our defined benefit plans were as follows (in millions) :
Pension PlansOther Postretirement
Benefit Plans 2013 2012 2013 2012Three months ended March 31:
Service cost $ 36 $ 35 $ 3 $ 3Interest cost 22 23 4 5Expected return on plan assets (32) (31) — —Amortization of:
Prior service cost (credit) (3) 1 (3) (5)Net actuarial loss 14 8 — —Net periodic benefit cost $ 37 $ 36 $ 4 $ 3
On February 15, 2013, we announced changes to certain of our U.S. qualified pension plans that cover the majority of our U.S. employees who work in our refining segment and corporate operations. Benefits under our primary pension plan will change from a final average pay formula to a cash balance formula with staged effective dates that commence either on July 1, 2013 or January 1, 2015 depending on the age and service of the affected employees. All final average pay benefits will be frozen as of December 31, 2014, with all future benefits to be earned under the new cash balance formula. These plan amendments resulted in a $328 million decrease to pension liabilities and a related increase to other comprehensive income during the three months ended March 31, 2013. The benefit of this remeasurement will be amortized into income through 2025.
As a result of these plan amendments, management has decided to reduce its discretionary contributions to our pension plans by $100 million, resulting in expected contributions to our pension plans of $45 million for 2013. During the three months ended March 31, 2013 and 2012, we contributed $8 million and $10 million, respectively, to our pension plans and $4 million and $4 million, respectively, to our other postretirement benefit plans.
Table of Contents
VALERO ENERGY CORPORATION AND SUBSIDIARIESCONDENSED NOTES TO CONSOLIDATED FINANCIAL STATEMENTS (Continued)
15
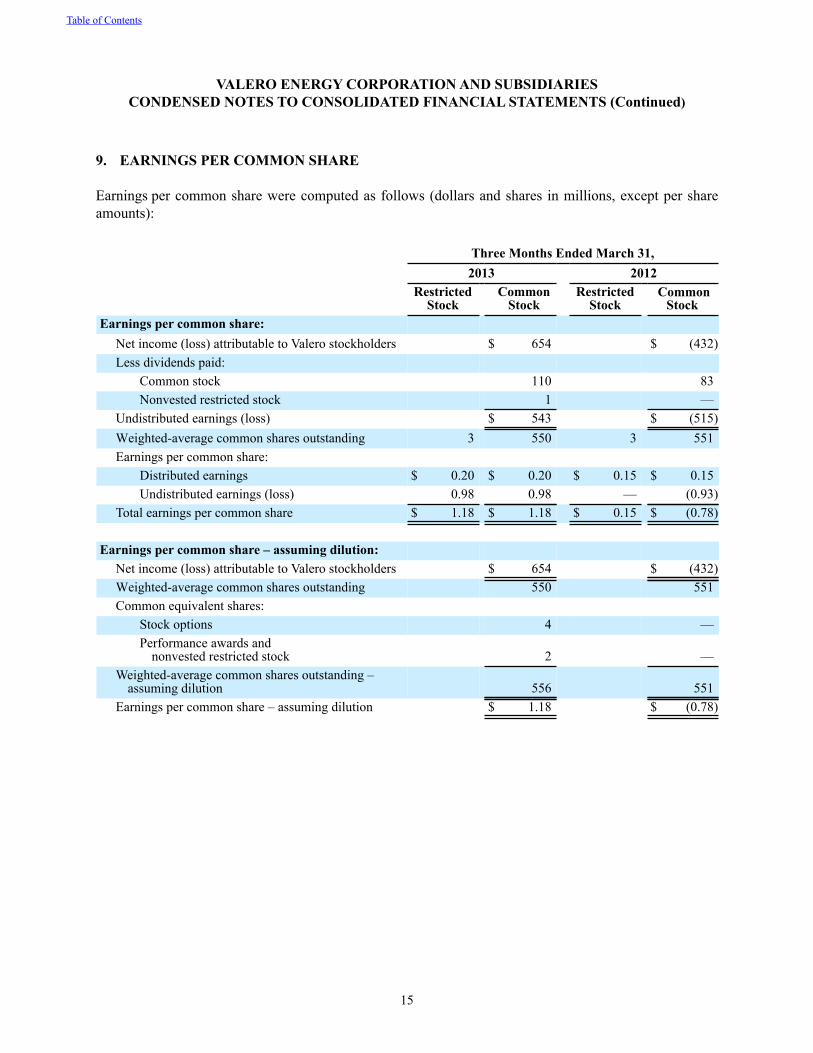
9. EARNINGS PER COMMON SHARE
Earnings per common share were computed as follows (dollars and shares in millions, except per share amounts):
Three Months Ended March 31,2013 2012
Restricted
StockCommon
Stock Restricted
Stock Common
StockEarnings per common share:
Net income (loss) attributable to Valero stockholders $ 654 $ (432)Less dividends paid:
Common stock 110 83Nonvested restricted stock 1 —
Undistributed earnings (loss) $ 543 $ (515)Weighted-average common shares outstanding 3 550 3 551Earnings per common share:
Distributed earnings $ 0.20 $ 0.20 $ 0.15 $ 0.15Undistributed earnings (loss) 0.98 0.98 — (0.93)
Total earnings per common share $ 1.18 $ 1.18 $ 0.15 $ (0.78)
Earnings per common share – assuming dilution:Net income (loss) attributable to Valero stockholders $ 654 $ (432)Weighted-average common shares outstanding 550 551Common equivalent shares:
Stock options 4 —Performance awards and
nonvested restricted stock 2 —Weighted-average common shares outstanding –
assuming dilution 556 551Earnings per common share – assuming dilution $ 1.18 $ (0.78)
Table of Contents
VALERO ENERGY CORPORATION AND SUBSIDIARIESCONDENSED NOTES TO CONSOLIDATED FINANCIAL STATEMENTS (Continued)
16
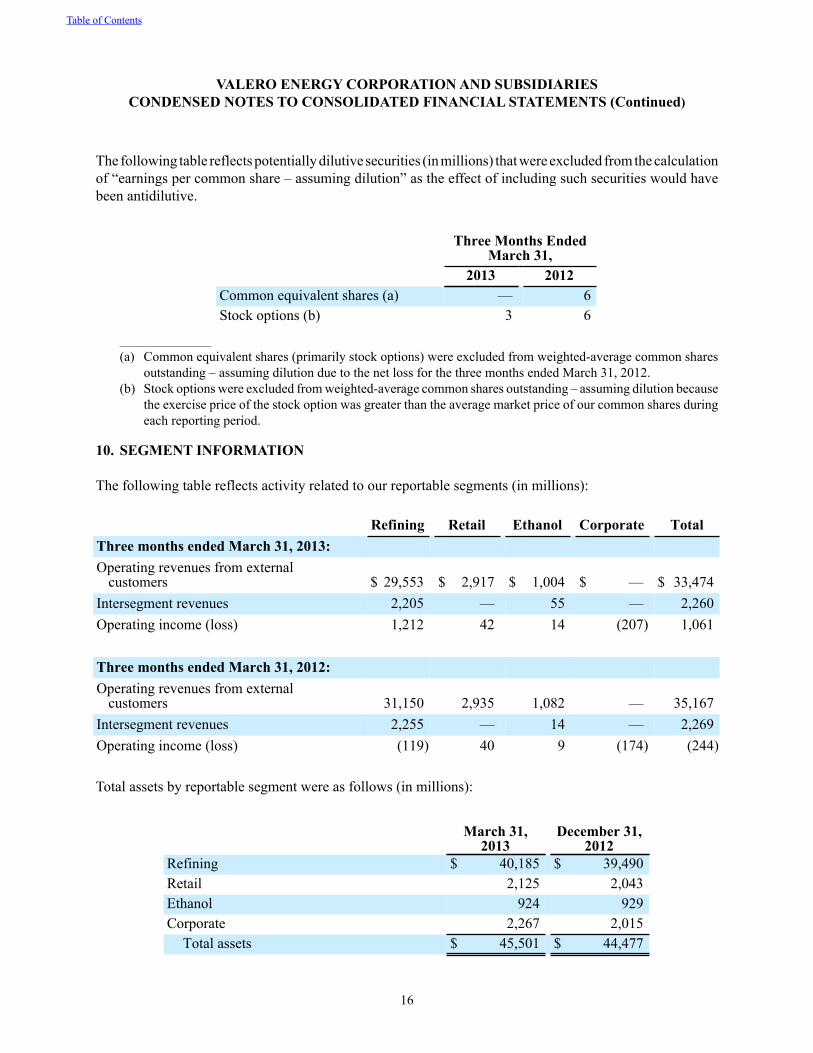
The following table reflects potentially dilutive securities (in millions) that were excluded from the calculation of “earnings per common share – assuming dilution” as the effect of including such securities would have been antidilutive.
Three Months EndedMarch 31,
2013 2012Common equivalent shares (a) — 6Stock options (b) 3 6
_______________________
(a) Common equivalent shares (primarily stock options) were excluded from weighted-average common shares outstanding – assuming dilution due to the net loss for the three months ended March 31, 2012.
(b) Stock options were excluded from weighted-average common shares outstanding – assuming dilution because the exercise price of the stock option was greater than the average market price of our common shares during each reporting period.
10. SEGMENT INFORMATION
The following table reflects activity related to our reportable segments (in millions):
Refining Retail Ethanol Corporate TotalThree months ended March 31, 2013:Operating revenues from external
customers $ 29,553 $ 2,917 $ 1,004 $ — $ 33,474Intersegment revenues 2,205 — 55 — 2,260Operating income (loss) 1,212 42 14 (207) 1,061
Three months ended March 31, 2012:Operating revenues from external
customers 31,150 2,935 1,082 — 35,167Intersegment revenues 2,255 — 14 — 2,269Operating income (loss) (119) 40 9 (174) (244)
Total assets by reportable segment were as follows (in millions):
March 31,
2013December 31,
2012Refining $ 40,185 $ 39,490Retail 2,125 2,043Ethanol 924 929Corporate 2,267 2,015
Total assets $ 45,501 $ 44,477
Table of Contents
VALERO ENERGY CORPORATION AND SUBSIDIARIESCONDENSED NOTES TO CONSOLIDATED FINANCIAL STATEMENTS (Continued)
17
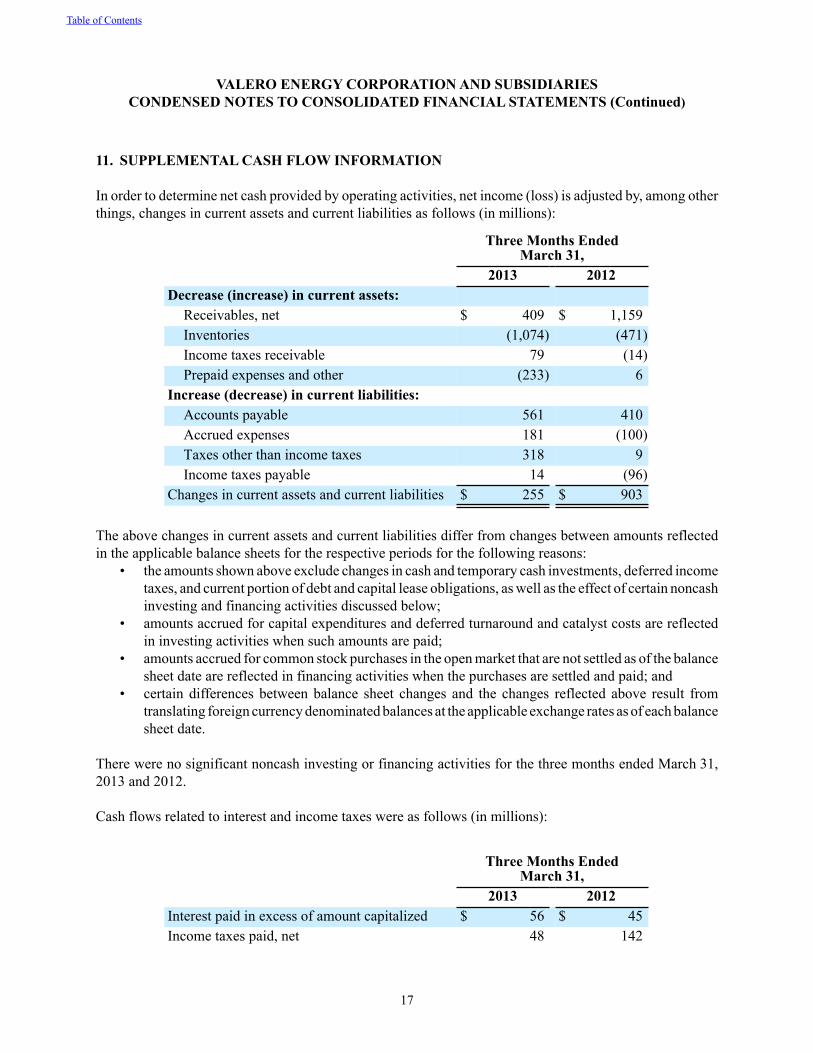
11. SUPPLEMENTAL CASH FLOW INFORMATION
In order to determine net cash provided by operating activities, net income (loss) is adjusted by, among other things, changes in current assets and current liabilities as follows (in millions):
Three Months EndedMarch 31,
2013 2012Decrease (increase) in current assets:
Receivables, net $ 409 $ 1,159Inventories (1,074) (471)Income taxes receivable 79 (14)Prepaid expenses and other (233) 6
Increase (decrease) in current liabilities:Accounts payable 561 410Accrued expenses 181 (100)Taxes other than income taxes 318 9Income taxes payable 14 (96)
Changes in current assets and current liabilities $ 255 $ 903
The above changes in current assets and current liabilities differ from changes between amounts reflected in the applicable balance sheets for the respective periods for the following reasons:
• the amounts shown above exclude changes in cash and temporary cash investments, deferred income taxes, and current portion of debt and capital lease obligations, as well as the effect of certain noncash investing and financing activities discussed below;
• amounts accrued for capital expenditures and deferred turnaround and catalyst costs are reflected in investing activities when such amounts are paid;
• amounts accrued for common stock purchases in the open market that are not settled as of the balance sheet date are reflected in financing activities when the purchases are settled and paid; and
• certain differences between balance sheet changes and the changes reflected above result from translating foreign currency denominated balances at the applicable exchange rates as of each balance sheet date.
There were no significant noncash investing or financing activities for the three months ended March 31, 2013 and 2012.
Cash flows related to interest and income taxes were as follows (in millions):
Three Months EndedMarch 31,
2013 2012Interest paid in excess of amount capitalized $ 56 $ 45Income taxes paid, net 48 142
Table of Contents
VALERO ENERGY CORPORATION AND SUBSIDIARIESCONDENSED NOTES TO CONSOLIDATED FINANCIAL STATEMENTS (Continued)
18
12. FAIR VALUE MEASUREMENTS
GeneralGAAP requires that certain financial instruments, such as derivative instruments, be recognized at their fair values in our balance sheets. However, other financial instruments, such as debt obligations, are not required to be recognized at their fair values, but GAAP provides an option to elect fair value accounting for these instruments. GAAP requires the disclosure of the fair values of all financial instruments, regardless of whether they are recognized at their fair values or carrying amounts in our balance sheets. For financial instruments recognized at fair value, GAAP requires the disclosure of their fair values by type of instrument, along with other information, including changes in the fair values of certain financial instruments recognized in income or other comprehensive income, and this information is provided below under “Recurring Fair Value Measurements.” For financial instruments not recognized at fair value, the disclosure of their fair values is provided below under “Other Financial Instruments.”
Nonfinancial assets, such as property, plant and equipment, and nonfinancial liabilities are recognized at their carrying amounts in our balance sheets. GAAP does not permit nonfinancial assets and liabilities to be remeasured at their fair values. However, GAAP requires the remeasurement of such assets and liabilities to their fair values upon the occurrence of certain events, such as the impairment of property, plant and equipment. In addition, if such an event occurs, GAAP requires the disclosure of the fair value of the asset or liability along with other information, including the gain or loss recognized in income in the period the remeasurement occurred. This information is provided below under “Nonrecurring Fair Value Measurements.”
GAAP provides a framework for measuring fair value and establishes a three-level fair value hierarchy that prioritizes inputs to valuation techniques based on the degree to which objective prices in external active markets are available to measure fair value. Following is a description of each of the levels of the fair value hierarchy.
• Level 1 - Observable inputs, such as unadjusted quoted prices in active markets for identical assets or liabilities.
• Level 2 - Inputs other than quoted prices included within Level 1 that are observable for the asset or liability, either directly or indirectly. These include quoted prices for similar assets or liabilities in active markets and quoted prices for identical or similar assets or liabilities in markets that are not active.
• Level 3 - Unobservable inputs for the asset or liability for which there is little, if any, market activity at the measurement date. Unobservable inputs reflect our own assumptions about what market participants would use to price the asset or liability. The inputs are developed based on the best information available in the circumstances, which might include occasional market quotes or sales of similar instruments or our own financial data such as internally developed pricing models, discounted cash flow methodologies, as well as instruments for which the fair value determination requires significant judgment.
The financial instruments and nonfinancial assets and liabilities included in our disclosure of recurring and nonrecurring fair value measurements are categorized according to the fair value hierarchy based on the inputs used to measure their fair values.
Table of Contents
VALERO ENERGY CORPORATION AND SUBSIDIARIESCONDENSED NOTES TO CONSOLIDATED FINANCIAL STATEMENTS (Continued)
19
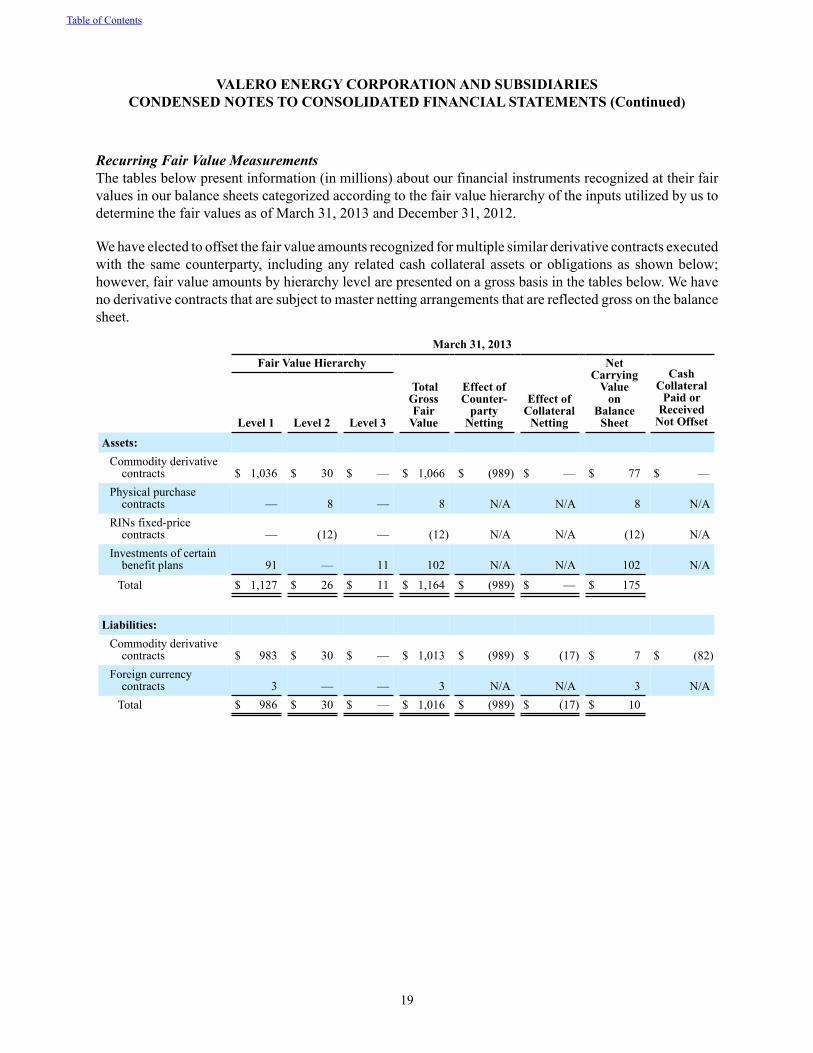
Recurring Fair Value MeasurementsThe tables below present information (in millions) about our financial instruments recognized at their fair values in our balance sheets categorized according to the fair value hierarchy of the inputs utilized by us to determine the fair values as of March 31, 2013 and December 31, 2012.
We have elected to offset the fair value amounts recognized for multiple similar derivative contracts executed with the same counterparty, including any related cash collateral assets or obligations as shown below; however, fair value amounts by hierarchy level are presented on a gross basis in the tables below. We have no derivative contracts that are subject to master netting arrangements that are reflected gross on the balance sheet.
March 31, 2013Fair Value Hierarchy
TotalGrossFair
Value
Effect ofCounter-
partyNetting
Effect ofCollateral
Netting
NetCarrying
Valueon
BalanceSheet
CashCollateral
Paid or Received
Not Offset Level 1 Level 2 Level 3
Assets:Commodity derivative
contracts $ 1,036 $ 30 $ — $ 1,066 $ (989) $ — $ 77 $ —Physical purchase
contracts — 8 — 8 N/A N/A 8 N/ARINs fixed-price
contracts — (12) — (12) N/A N/A (12) N/AInvestments of certain
benefit plans 91 — 11 102 N/A N/A 102 N/A
Total $ 1,127 $ 26 $ 11 $ 1,164 $ (989) $ — $ 175
Liabilities:Commodity derivative
contracts $ 983 $ 30 $ — $ 1,013 $ (989) $ (17) $ 7 $ (82)Foreign currency
contracts 3 — — 3 N/A N/A 3 N/ATotal $ 986 $ 30 $ — $ 1,016 $ (989) $ (17) $ 10
Table of Contents
VALERO ENERGY CORPORATION AND SUBSIDIARIESCONDENSED NOTES TO CONSOLIDATED FINANCIAL STATEMENTS (Continued)
20
December 31, 2012Fair Value Hierarchy
TotalGrossFair
Value
Effect ofCounter-
partyNetting
Effect ofCollateral
Netting
NetCarrying
Valueon
BalanceSheet
CashCollateral
Paid orReceived
Not Offset Level 1 Level 2 Level 3
Assets:Commodity derivative
contracts $ 1,143 $ 60 $ — $ 1,203 $ (1,189) $ — $ 14 $ —Physical purchase
contracts — 11 — 11 N/A N/A 11 N/AInvestments of certain
benefit plans 87 — 11 98 N/A N/A 98 N/A
Foreign currencycontracts 1 — — 1 N/A N/A 1 N/A
Total $ 1,231 $ 71 $ 11 $ 1,313 $ (1,189) $ — $ 124
Liabilities:Commodity derivative
contracts $ 1,138 $ 70 $ — $ 1,208 $ (1,189) $ (13) $ 6 $ (114)Biofuels blending
obligation — 10 — 10 N/A N/A 10 N/AForeign currency
contracts 1 — — 1 N/A N/A 1 N/ATotal $ 1,139 $ 80 $ — $ 1,219 $ (1,189) $ (13) $ 17
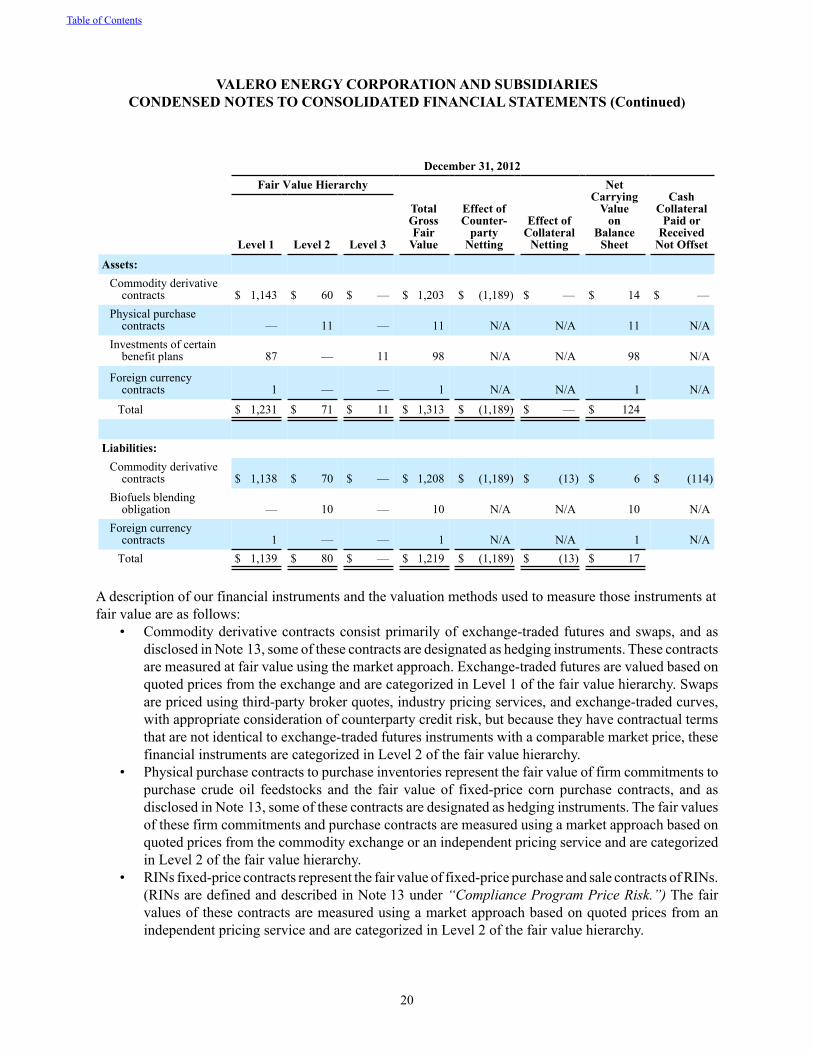
A description of our financial instruments and the valuation methods used to measure those instruments at fair value are as follows:
• Commodity derivative contracts consist primarily of exchange-traded futures and swaps, and as disclosed in Note 13, some of these contracts are designated as hedging instruments. These contracts are measured at fair value using the market approach. Exchange-traded futures are valued based on quoted prices from the exchange and are categorized in Level 1 of the fair value hierarchy. Swaps are priced using third-party broker quotes, industry pricing services, and exchange-traded curves, with appropriate consideration of counterparty credit risk, but because they have contractual terms that are not identical to exchange-traded futures instruments with a comparable market price, these financial instruments are categorized in Level 2 of the fair value hierarchy.
• Physical purchase contracts to purchase inventories represent the fair value of firm commitments to purchase crude oil feedstocks and the fair value of fixed-price corn purchase contracts, and as disclosed in Note 13, some of these contracts are designated as hedging instruments. The fair values of these firm commitments and purchase contracts are measured using a market approach based on quoted prices from the commodity exchange or an independent pricing service and are categorized in Level 2 of the fair value hierarchy.
• RINs fixed-price contracts represent the fair value of fixed-price purchase and sale contracts of RINs. (RINs are defined and described in Note 13 under “Compliance Program Price Risk.”) The fair values of these contracts are measured using a market approach based on quoted prices from an independent pricing service and are categorized in Level 2 of the fair value hierarchy.
Table of Contents
VALERO ENERGY CORPORATION AND SUBSIDIARIESCONDENSED NOTES TO CONSOLIDATED FINANCIAL STATEMENTS (Continued)
21
• Investments of certain benefit plans consist of investment securities held by trusts for the purpose of satisfying a portion of our obligations under certain U.S. nonqualified benefit plans. The assets categorized in Level 1 of the fair value hierarchy are measured at fair value using a market approach based on quoted prices from national securities exchanges. The assets categorized in Level 3 of the fair value hierarchy represent insurance contracts, the fair value of which is provided by the insurer.
• Foreign currency contracts consist of foreign currency exchange and purchase contracts entered into by our international operations to manage our exposure to exchange rate fluctuations on transactions denominated in currencies other than the local (functional) currencies of those operations. These contracts are valued based on quoted prices from the exchange and are categorized in Level 1 of the fair value hierarchy.
• Our biofuels blending obligation represents a liability for the purchase of RINs and RTFCs, as defined and described in Note 13 under “Compliance Program Price Risk,” to satisfy our obligation to blend biofuels into the products we produce. Our obligation is based on our deficiency in RINs and RTFCs and the price of these instruments as of the balance sheet date. Our obligation is categorized in Level 2 of the fair value hierarchy and is measured at fair value using the market approach based on quoted prices from an independent pricing service.
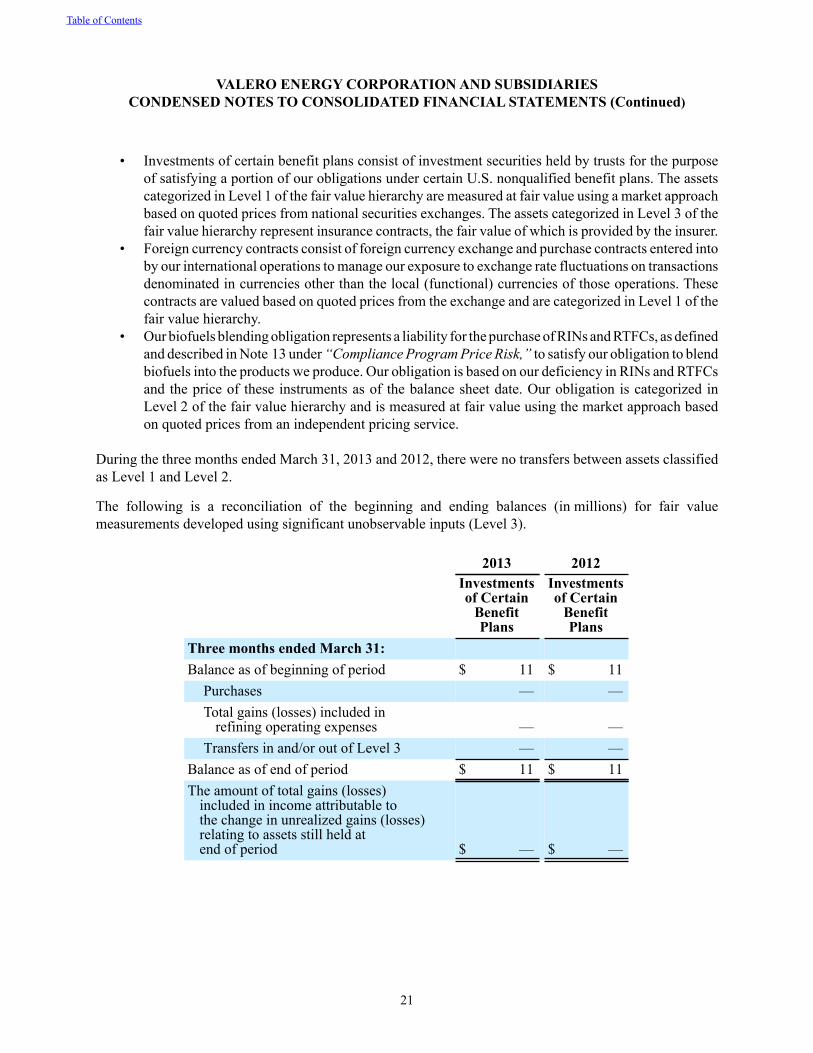
During the three months ended March 31, 2013 and 2012, there were no transfers between assets classified as Level 1 and Level 2.
The following is a reconciliation of the beginning and ending balances (in millions) for fair value measurements developed using significant unobservable inputs (Level 3).
2013 2012Investmentsof Certain
BenefitPlans
Investmentsof Certain
BenefitPlans
Three months ended March 31:Balance as of beginning of period $ 11 $ 11
Purchases — —Total gains (losses) included in
refining operating expenses — —Transfers in and/or out of Level 3 — —
Balance as of end of period $ 11 $ 11The amount of total gains (losses)
included in income attributable tothe change in unrealized gains (losses)relating to assets still held atend of period $ — $ —
Table of Contents
VALERO ENERGY CORPORATION AND SUBSIDIARIESCONDENSED NOTES TO CONSOLIDATED FINANCIAL STATEMENTS (Continued)
22
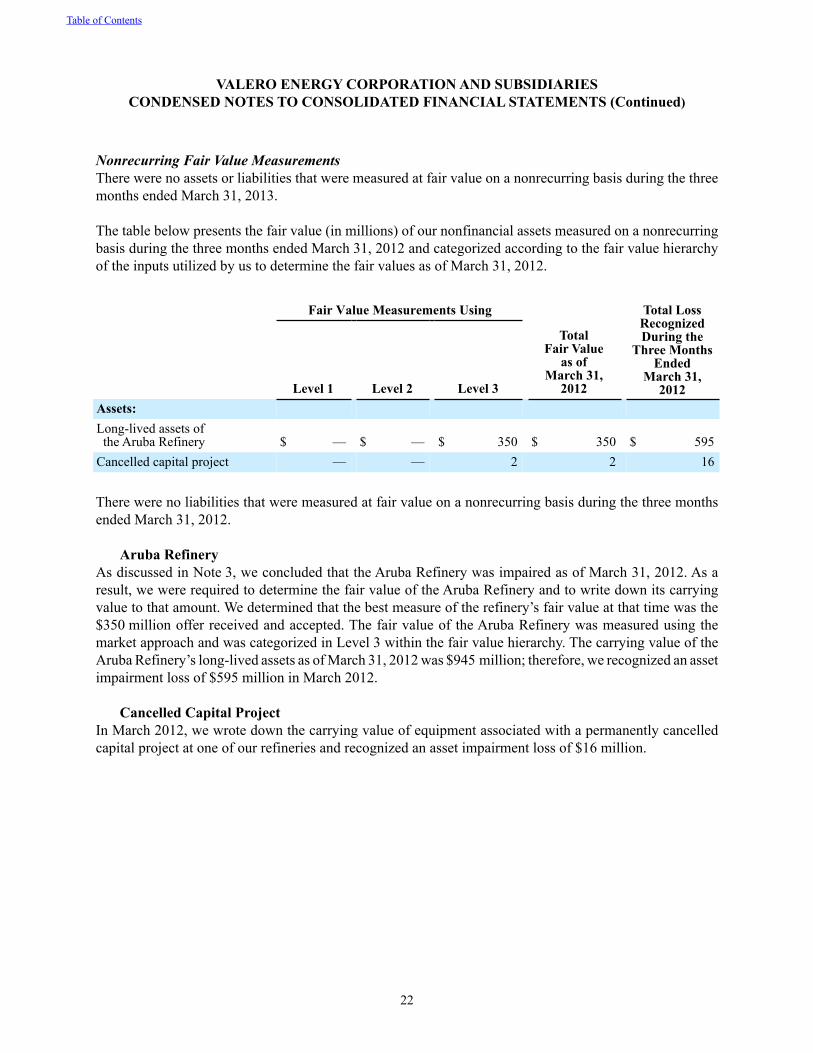
Nonrecurring Fair Value MeasurementsThere were no assets or liabilities that were measured at fair value on a nonrecurring basis during the three months ended March 31, 2013.
The table below presents the fair value (in millions) of our nonfinancial assets measured on a nonrecurring basis during the three months ended March 31, 2012 and categorized according to the fair value hierarchy of the inputs utilized by us to determine the fair values as of March 31, 2012.
Fair Value Measurements Using Total LossRecognizedDuring the
Three Months Ended
March 31,2012Level 1 Level 2 Level 3
TotalFair Value
as of March 31,
2012Assets:Long-lived assets of the Aruba Refinery $ — $ — $ 350 $ 350 $ 595Cancelled capital project — — 2 2 16
There were no liabilities that were measured at fair value on a nonrecurring basis during the three months ended March 31, 2012.
Aruba RefineryAs discussed in Note 3, we concluded that the Aruba Refinery was impaired as of March 31, 2012. As a result, we were required to determine the fair value of the Aruba Refinery and to write down its carrying value to that amount. We determined that the best measure of the refinery’s fair value at that time was the $350 million offer received and accepted. The fair value of the Aruba Refinery was measured using the market approach and was categorized in Level 3 within the fair value hierarchy. The carrying value of the Aruba Refinery’s long-lived assets as of March 31, 2012 was $945 million; therefore, we recognized an asset impairment loss of $595 million in March 2012.
Cancelled Capital ProjectIn March 2012, we wrote down the carrying value of equipment associated with a permanently cancelled capital project at one of our refineries and recognized an asset impairment loss of $16 million.
Table of Contents
VALERO ENERGY CORPORATION AND SUBSIDIARIESCONDENSED NOTES TO CONSOLIDATED FINANCIAL STATEMENTS (Continued)
23
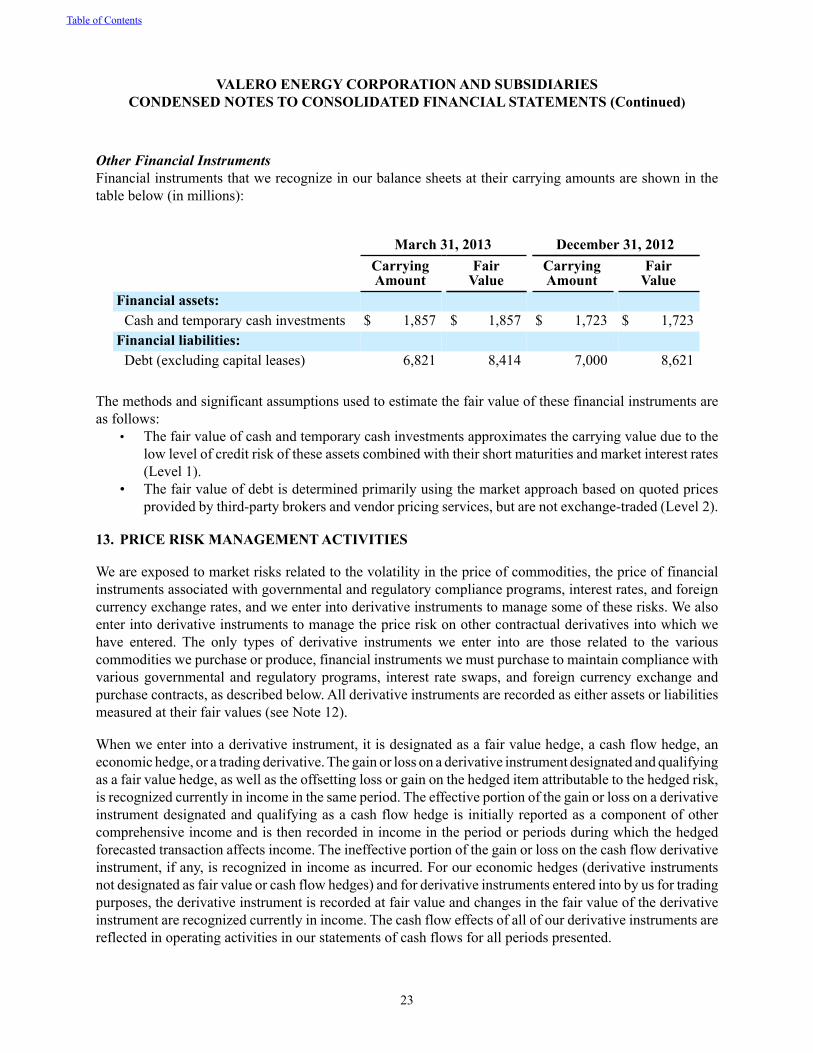
Other Financial InstrumentsFinancial instruments that we recognize in our balance sheets at their carrying amounts are shown in the table below (in millions):
March 31, 2013 December 31, 2012CarryingAmount
FairValue
CarryingAmount
FairValue
Financial assets:Cash and temporary cash investments $ 1,857 $ 1,857 $ 1,723 $ 1,723
Financial liabilities:Debt (excluding capital leases) 6,821 8,414 7,000 8,621
The methods and significant assumptions used to estimate the fair value of these financial instruments are as follows:
• The fair value of cash and temporary cash investments approximates the carrying value due to the low level of credit risk of these assets combined with their short maturities and market interest rates (Level 1).
• The fair value of debt is determined primarily using the market approach based on quoted prices provided by third-party brokers and vendor pricing services, but are not exchange-traded (Level 2).
13. PRICE RISK MANAGEMENT ACTIVITIES
We are exposed to market risks related to the volatility in the price of commodities, the price of financial instruments associated with governmental and regulatory compliance programs, interest rates, and foreign currency exchange rates, and we enter into derivative instruments to manage some of these risks. We also enter into derivative instruments to manage the price risk on other contractual derivatives into which we have entered. The only types of derivative instruments we enter into are those related to the various commodities we purchase or produce, financial instruments we must purchase to maintain compliance with various governmental and regulatory programs, interest rate swaps, and foreign currency exchange and purchase contracts, as described below. All derivative instruments are recorded as either assets or liabilities measured at their fair values (see Note 12).
When we enter into a derivative instrument, it is designated as a fair value hedge, a cash flow hedge, an economic hedge, or a trading derivative. The gain or loss on a derivative instrument designated and qualifying as a fair value hedge, as well as the offsetting loss or gain on the hedged item attributable to the hedged risk, is recognized currently in income in the same period. The effective portion of the gain or loss on a derivative instrument designated and qualifying as a cash flow hedge is initially reported as a component of other comprehensive income and is then recorded in income in the period or periods during which the hedged forecasted transaction affects income. The ineffective portion of the gain or loss on the cash flow derivative instrument, if any, is recognized in income as incurred. For our economic hedges (derivative instruments not designated as fair value or cash flow hedges) and for derivative instruments entered into by us for trading purposes, the derivative instrument is recorded at fair value and changes in the fair value of the derivative instrument are recognized currently in income. The cash flow effects of all of our derivative instruments are reflected in operating activities in our statements of cash flows for all periods presented.
Table of Contents
VALERO ENERGY CORPORATION AND SUBSIDIARIESCONDENSED NOTES TO CONSOLIDATED FINANCIAL STATEMENTS (Continued)
24
Commodity Price RiskWe are exposed to market risks related to the volatility in the price of crude oil, refined products (primarily gasoline and distillate), grain (primarily corn), and natural gas used in our operations. To reduce the impact of price volatility on our results of operations and cash flows, we use commodity derivative instruments, including futures, swaps, and options. We use the futures markets for the available liquidity, which provides greater flexibility in transacting our hedging and trading operations. We use swaps primarily to manage our price exposure. Our positions in commodity derivative instruments are monitored and managed on a daily basis by a risk control group to ensure compliance with our stated risk management policy that has been approved by our board of directors.
For risk management purposes, we use fair value hedges, cash flow hedges, and economic hedges. In addition to the use of derivative instruments to manage commodity price risk, we also enter into certain commodity derivative instruments for trading purposes. Our objective for entering into each type of hedge or trading derivative is described below.
Table of Contents
VALERO ENERGY CORPORATION AND SUBSIDIARIESCONDENSED NOTES TO CONSOLIDATED FINANCIAL STATEMENTS (Continued)
25
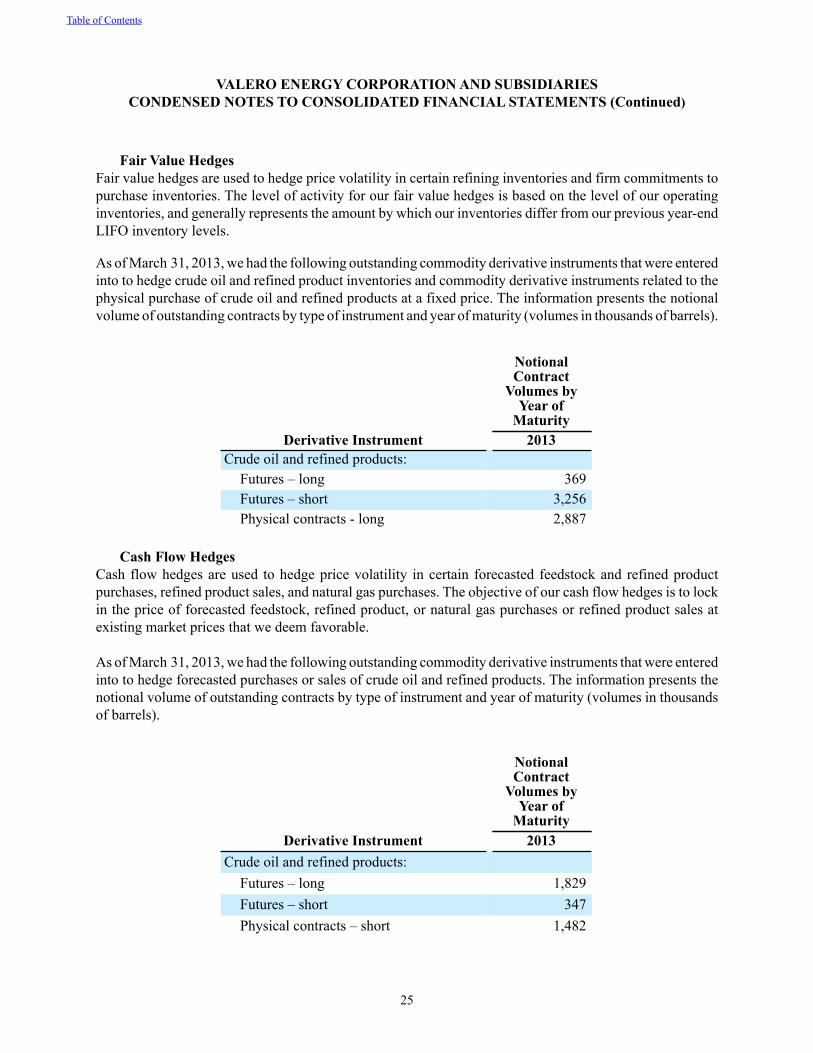
Fair Value HedgesFair value hedges are used to hedge price volatility in certain refining inventories and firm commitments to purchase inventories. The level of activity for our fair value hedges is based on the level of our operating inventories, and generally represents the amount by which our inventories differ from our previous year-end LIFO inventory levels.
As of March 31, 2013, we had the following outstanding commodity derivative instruments that were entered into to hedge crude oil and refined product inventories and commodity derivative instruments related to the physical purchase of crude oil and refined products at a fixed price. The information presents the notional volume of outstanding contracts by type of instrument and year of maturity (volumes in thousands of barrels).
NotionalContract
Volumes byYear of
MaturityDerivative Instrument 2013
Crude oil and refined products: Futures – long 369Futures – short 3,256Physical contracts - long 2,887
Cash Flow HedgesCash flow hedges are used to hedge price volatility in certain forecasted feedstock and refined product purchases, refined product sales, and natural gas purchases. The objective of our cash flow hedges is to lock in the price of forecasted feedstock, refined product, or natural gas purchases or refined product sales at existing market prices that we deem favorable.
As of March 31, 2013, we had the following outstanding commodity derivative instruments that were entered into to hedge forecasted purchases or sales of crude oil and refined products. The information presents the notional volume of outstanding contracts by type of instrument and year of maturity (volumes in thousands of barrels).
NotionalContract
Volumes byYear of
MaturityDerivative Instrument 2013
Crude oil and refined products:Futures – long 1,829Futures – short 347Physical contracts – short 1,482
Table of Contents
VALERO ENERGY CORPORATION AND SUBSIDIARIESCONDENSED NOTES TO CONSOLIDATED FINANCIAL STATEMENTS (Continued)
26
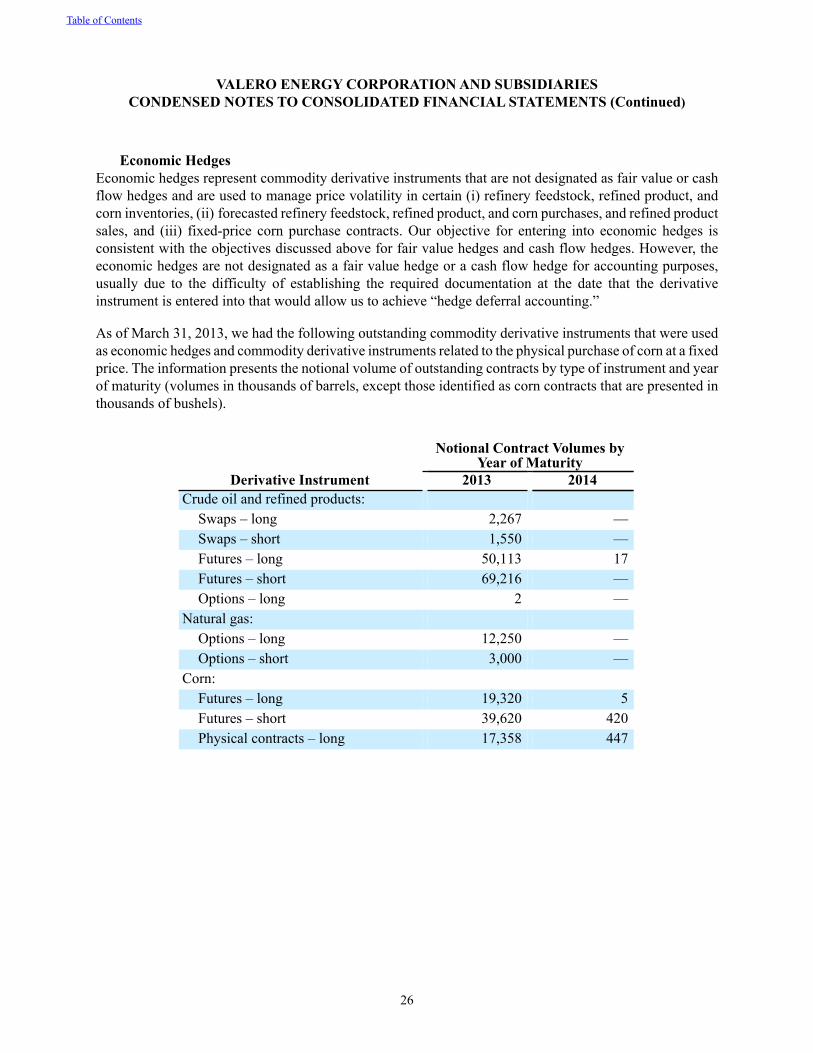
Economic HedgesEconomic hedges represent commodity derivative instruments that are not designated as fair value or cash flow hedges and are used to manage price volatility in certain (i) refinery feedstock, refined product, and corn inventories, (ii) forecasted refinery feedstock, refined product, and corn purchases, and refined product sales, and (iii) fixed-price corn purchase contracts. Our objective for entering into economic hedges is consistent with the objectives discussed above for fair value hedges and cash flow hedges. However, the economic hedges are not designated as a fair value hedge or a cash flow hedge for accounting purposes, usually due to the difficulty of establishing the required documentation at the date that the derivative instrument is entered into that would allow us to achieve “hedge deferral accounting.”
As of March 31, 2013, we had the following outstanding commodity derivative instruments that were used as economic hedges and commodity derivative instruments related to the physical purchase of corn at a fixed price. The information presents the notional volume of outstanding contracts by type of instrument and year of maturity (volumes in thousands of barrels, except those identified as corn contracts that are presented in thousands of bushels).
Notional Contract Volumes by
Year of MaturityDerivative Instrument 2013 2014
Crude oil and refined products:Swaps – long 2,267 —Swaps – short 1,550 —Futures – long 50,113 17Futures – short 69,216 —Options – long 2 —
Natural gas:Options – long 12,250 —Options – short 3,000 —
Corn:Futures – long 19,320 5Futures – short 39,620 420Physical contracts – long 17,358 447
Table of Contents
VALERO ENERGY CORPORATION AND SUBSIDIARIESCONDENSED NOTES TO CONSOLIDATED FINANCIAL STATEMENTS (Continued)
27
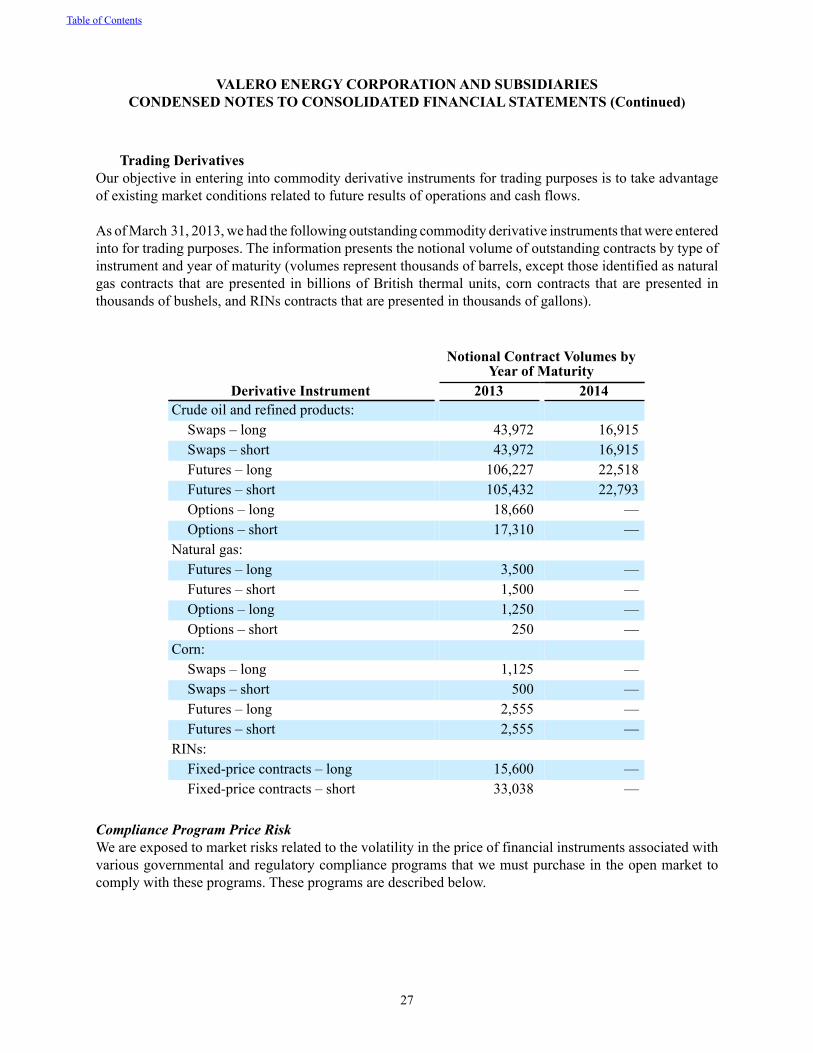
Trading DerivativesOur objective in entering into commodity derivative instruments for trading purposes is to take advantage of existing market conditions related to future results of operations and cash flows.
As of March 31, 2013, we had the following outstanding commodity derivative instruments that were entered into for trading purposes. The information presents the notional volume of outstanding contracts by type of instrument and year of maturity (volumes represent thousands of barrels, except those identified as natural gas contracts that are presented in billions of British thermal units, corn contracts that are presented in thousands of bushels, and RINs contracts that are presented in thousands of gallons).
Notional Contract Volumes by
Year of MaturityDerivative Instrument 2013 2014
Crude oil and refined products:Swaps – long 43,972 16,915Swaps – short 43,972 16,915Futures – long 106,227 22,518Futures – short 105,432 22,793Options – long 18,660 —Options – short 17,310 —
Natural gas:Futures – long 3,500 —Futures – short 1,500 —Options – long 1,250 —Options – short 250 —
Corn:Swaps – long 1,125 —Swaps – short 500 —Futures – long 2,555 —Futures – short 2,555 —
RINs:Fixed-price contracts – long 15,600 —Fixed-price contracts – short 33,038 —
Compliance Program Price RiskWe are exposed to market risks related to the volatility in the price of financial instruments associated with various governmental and regulatory compliance programs that we must purchase in the open market to comply with these programs. These programs are described below.
Table of Contents
VALERO ENERGY CORPORATION AND SUBSIDIARIESCONDENSED NOTES TO CONSOLIDATED FINANCIAL STATEMENTS (Continued)
28
Obligation to Blend BiofuelsWe are obligated to blend biofuels into the products we produce in most of the countries in which we operate, and these countries set annual quotas for the percentage of biofuels that must be blended into the motor fuels consumed in these countries. As a producer of motor fuels from petroleum, we are obligated to blend biofuels into the products we produce at a rate that is at least equal to the applicable quota. To the degree we are unable to blend at the applicable rate in the U.S. and the United Kingdom (U.K.), we must purchase Renewable Identification Numbers (RINs) in the U.S. and Renewable Transport Fuel Certificates (RTFCs) in the U.K., and as such, we are exposed to the volatility in the market price of these financial instruments. We have not entered into derivative instruments to manage this risk, but we purchase RINs and RTFCs when the price of these instruments is deemed favorable. During the three months ended March 31, 2013, we purchased a portion of our expected obligation for 2013 due to rising RINs prices. The cost of meeting our obligations under this compliance program was $130 million and $67 million for the three months ended March 31, 2013 and 2012, respectively. These amounts are reflected in cost of sales.
Maintaining Minimum Inventory QuantitiesIn the U.K., we are required to maintain a minimum quantity of crude oil and refined products as a reserve against shortages or interruptions in the supply of these products. To the degree we decide not to physically hold the minimum quantity of crude oil and refined products, we must purchase Compulsory Stock Obligation (CSO) tickets from other suppliers of refined products in the U.K. or other European Union (EU) member countries, and we make economic decisions as to the cost of maintaining certain quantities of crude oil and refined products versus the cost of purchasing CSO tickets. We have not entered into derivative instruments to manage the price volatility of CSO tickets. For the three months ended March 31, 2013, costs incurred to meet our obligations under this compliance program were immaterial. For the three months ended March 31, 2012, the cost of purchasing CSO tickets to help meet our obligations under this compliance program was $2 million, which was reflected in cost of sales.
Emission AllowancesOur Pembroke Refinery is subject to a maximum amount of carbon dioxide that it can emit each year under the EU Emissions Trading Scheme. Under this cap-and-trade program, we purchase emission allowances on the open market for the difference between the amount of carbon dioxide emitted and the maximum amount allowed under the program. Therefore, we are exposed to the volatility in the market price of these allowances. For the three months ended March 31, 2013, no costs were incurred to meet our obligation under this compliance program. For the three months ended March 31, 2012, the cost of meeting our obligation under this compliance program was $1 million, which was reflected in refining operating expenses.
We enter into derivative instruments (futures) to reduce the impact of this risk on our results of operations and cash flows. Our positions in these derivative instruments are monitored and managed on a daily basis by a risk control group to ensure compliance with our stated risk management policy that has been approved by our board of directors. As of March 31, 2013 and December 31, 2012, we had no futures contracts outstanding related to this compliance program. For the three months ended March 31, 2012, the loss recognized in income on these derivative instruments designated as economic hedges was immaterial and therefore not separately presented in the table below under “Effect of Derivative Instruments on Income and Other Comprehensive Income.”
Table of Contents
VALERO ENERGY CORPORATION AND SUBSIDIARIESCONDENSED NOTES TO CONSOLIDATED FINANCIAL STATEMENTS (Continued)
29
Interest Rate RiskOur primary market risk exposure for changes in interest rates relates to our debt obligations. We manage our exposure to changing interest rates through the use of a combination of fixed-rate and floating-rate debt. In addition, at times we have used interest rate swap agreements to manage our fixed to floating interest rate position by converting certain fixed-rate debt to floating-rate debt. We had no interest rate derivative instruments outstanding as of March 31, 2013 or December 31, 2012, or during the three months ended March 31, 2013 and 2012.
Foreign Currency RiskWe are exposed to exchange rate fluctuations on transactions entered into by our international operations that are denominated in currencies other than the local (functional) currencies of those operations. To manage our exposure to these exchange rate fluctuations, we use foreign currency exchange and purchase contracts. These contracts are not designated as hedging instruments for accounting purposes, and therefore they are classified as economic hedges. As of March 31, 2013, we had commitments to purchase $576 million of U.S. dollars. These commitments matured on or before April 30, 2013, resulting in an immaterial loss in the second quarter of 2013.
Table of Contents
VALERO ENERGY CORPORATION AND SUBSIDIARIESCONDENSED NOTES TO CONSOLIDATED FINANCIAL STATEMENTS (Continued)
30
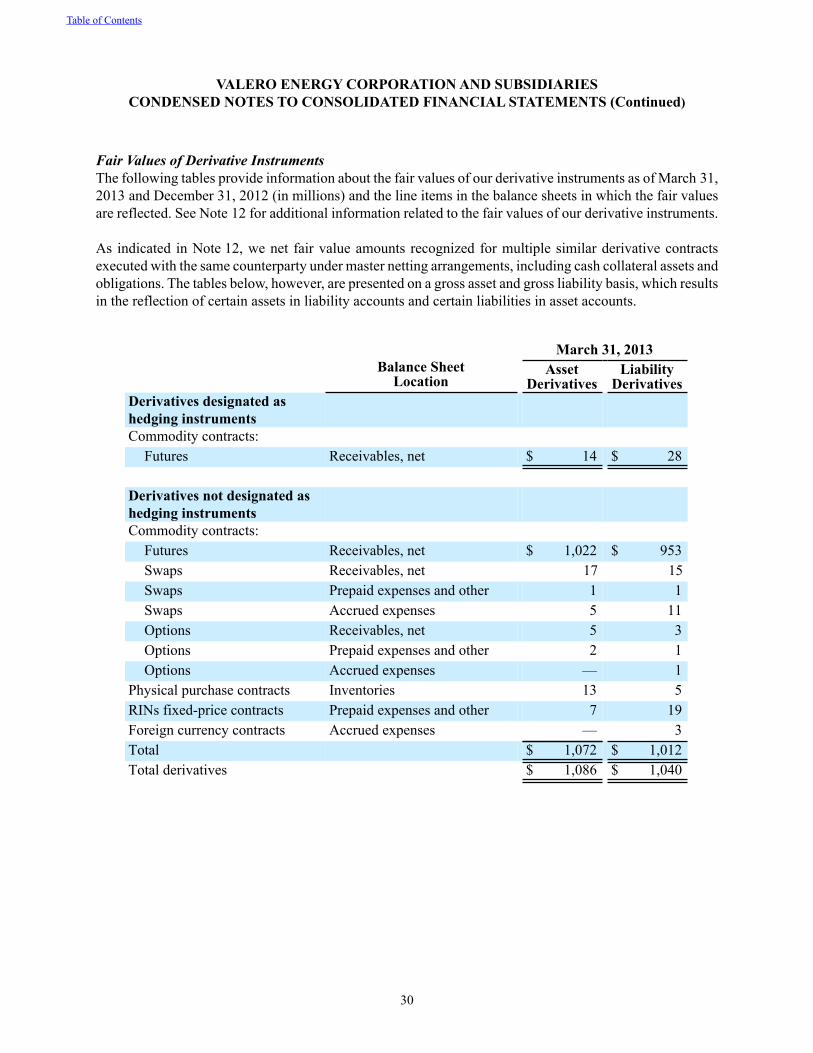
Fair Values of Derivative InstrumentsThe following tables provide information about the fair values of our derivative instruments as of March 31, 2013 and December 31, 2012 (in millions) and the line items in the balance sheets in which the fair values are reflected. See Note 12 for additional information related to the fair values of our derivative instruments.
As indicated in Note 12, we net fair value amounts recognized for multiple similar derivative contracts executed with the same counterparty under master netting arrangements, including cash collateral assets and obligations. The tables below, however, are presented on a gross asset and gross liability basis, which results in the reflection of certain assets in liability accounts and certain liabilities in asset accounts.
Balance SheetLocation
March 31, 2013Asset
DerivativesLiability
DerivativesDerivatives designated as hedging instrumentsCommodity contracts:
Futures Receivables, net $ 14 $ 28
Derivatives not designated as hedging instrumentsCommodity contracts:
Futures Receivables, net $ 1,022 $ 953Swaps Receivables, net 17 15Swaps Prepaid expenses and other 1 1Swaps Accrued expenses 5 11Options Receivables, net 5 3Options Prepaid expenses and other 2 1Options Accrued expenses — 1
Physical purchase contracts Inventories 13 5RINs fixed-price contracts Prepaid expenses and other 7 19Foreign currency contracts Accrued expenses — 3Total $ 1,072 $ 1,012Total derivatives $ 1,086 $ 1,040
Table of Contents
VALERO ENERGY CORPORATION AND SUBSIDIARIESCONDENSED NOTES TO CONSOLIDATED FINANCIAL STATEMENTS (Continued)
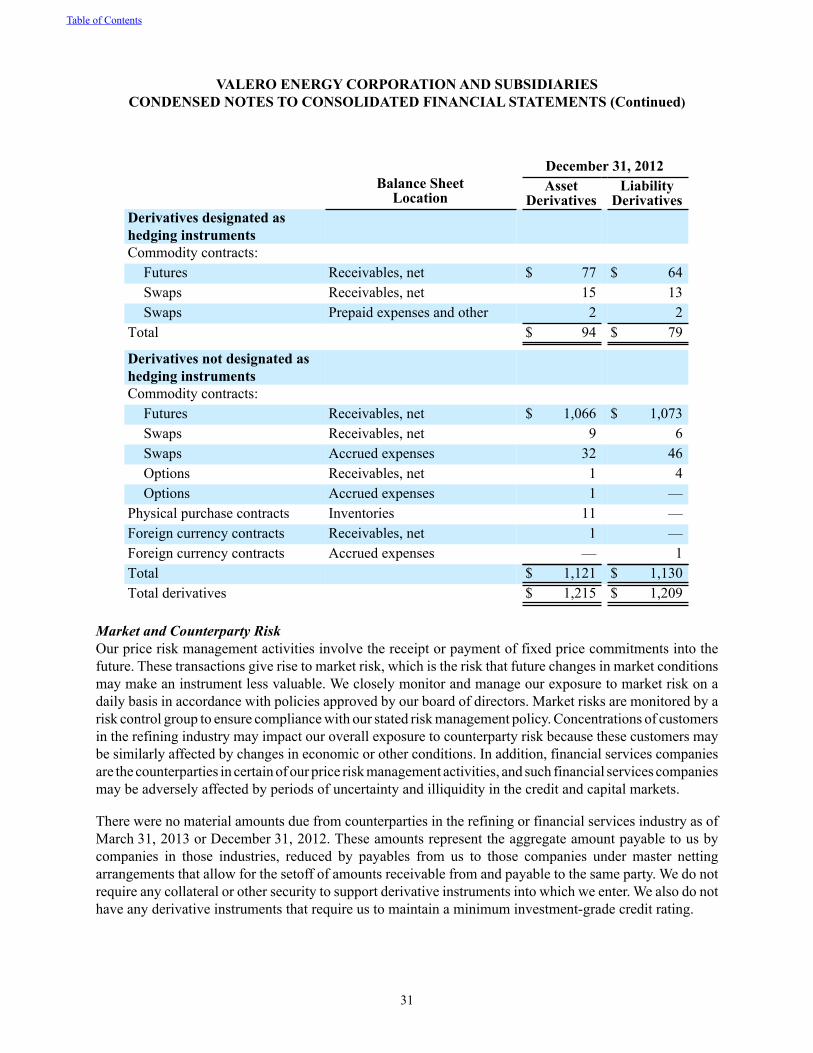
31
Balance SheetLocation
December 31, 2012Asset
DerivativesLiability
DerivativesDerivatives designated as hedging instrumentsCommodity contracts:
Futures Receivables, net $ 77 $ 64Swaps Receivables, net 15 13Swaps Prepaid expenses and other 2 2
Total $ 94 $ 79
Derivatives not designated as hedging instrumentsCommodity contracts:
Futures Receivables, net $ 1,066 $ 1,073Swaps Receivables, net 9 6Swaps Accrued expenses 32 46Options Receivables, net 1 4Options Accrued expenses 1 —
Physical purchase contracts Inventories 11 —Foreign currency contracts Receivables, net 1 —Foreign currency contracts Accrued expenses — 1Total $ 1,121 $ 1,130Total derivatives $ 1,215 $ 1,209
Market and Counterparty RiskOur price risk management activities involve the receipt or payment of fixed price commitments into the future. These transactions give rise to market risk, which is the risk that future changes in market conditions may make an instrument less valuable. We closely monitor and manage our exposure to market risk on a daily basis in accordance with policies approved by our board of directors. Market risks are monitored by a risk control group to ensure compliance with our stated risk management policy. Concentrations of customers in the refining industry may impact our overall exposure to counterparty risk because these customers may be similarly affected by changes in economic or other conditions. In addition, financial services companies are the counterparties in certain of our price risk management activities, and such financial services companies may be adversely affected by periods of uncertainty and illiquidity in the credit and capital markets.
There were no material amounts due from counterparties in the refining or financial services industry as of March 31, 2013 or December 31, 2012. These amounts represent the aggregate amount payable to us by companies in those industries, reduced by payables from us to those companies under master netting arrangements that allow for the setoff of amounts receivable from and payable to the same party. We do not require any collateral or other security to support derivative instruments into which we enter. We also do not have any derivative instruments that require us to maintain a minimum investment-grade credit rating.
Table of Contents
VALERO ENERGY CORPORATION AND SUBSIDIARIESCONDENSED NOTES TO CONSOLIDATED FINANCIAL STATEMENTS (Continued)
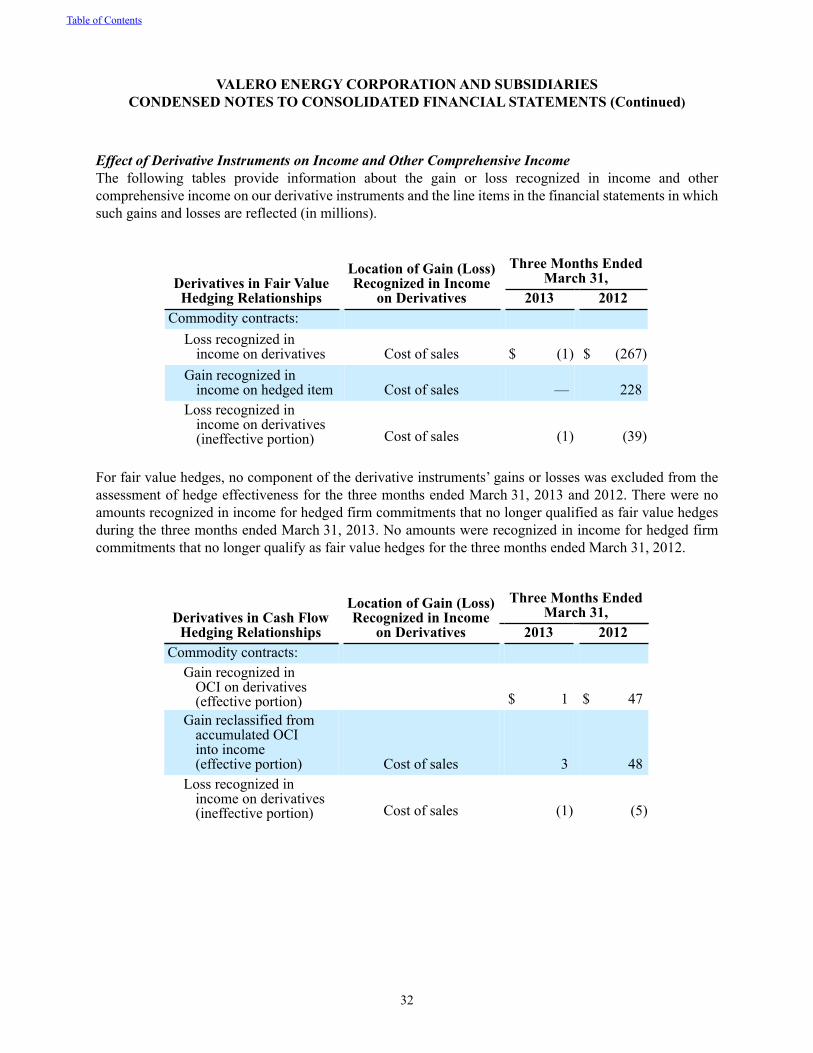
32
Effect of Derivative Instruments on Income and Other Comprehensive IncomeThe following tables provide information about the gain or loss recognized in income and other comprehensive income on our derivative instruments and the line items in the financial statements in which such gains and losses are reflected (in millions).
Derivatives in Fair ValueHedging Relationships
Location of Gain (Loss)Recognized in Income
on Derivatives
Three Months EndedMarch 31,
2013 2012Commodity contracts:
Loss recognized inincome on derivatives Cost of sales $ (1) $ (267)
Gain recognized inincome on hedged item Cost of sales — 228
Loss recognized inincome on derivatives(ineffective portion) Cost of sales (1) (39)
For fair value hedges, no component of the derivative instruments’ gains or losses was excluded from the assessment of hedge effectiveness for the three months ended March 31, 2013 and 2012. There were no amounts recognized in income for hedged firm commitments that no longer qualified as fair value hedges during the three months ended March 31, 2013. No amounts were recognized in income for hedged firm commitments that no longer qualify as fair value hedges for the three months ended March 31, 2012.
Derivatives in Cash FlowHedging Relationships
Location of Gain (Loss)Recognized in Income
on Derivatives
Three Months EndedMarch 31,
2013 2012Commodity contracts:
Gain recognized inOCI on derivatives(effective portion) $ 1 $ 47
Gain reclassified from accumulated OCI into income (effective portion) Cost of sales 3 48
Loss recognized inincome on derivatives(ineffective portion) Cost of sales (1) (5)
Table of Contents
VALERO ENERGY CORPORATION AND SUBSIDIARIESCONDENSED NOTES TO CONSOLIDATED FINANCIAL STATEMENTS (Continued)
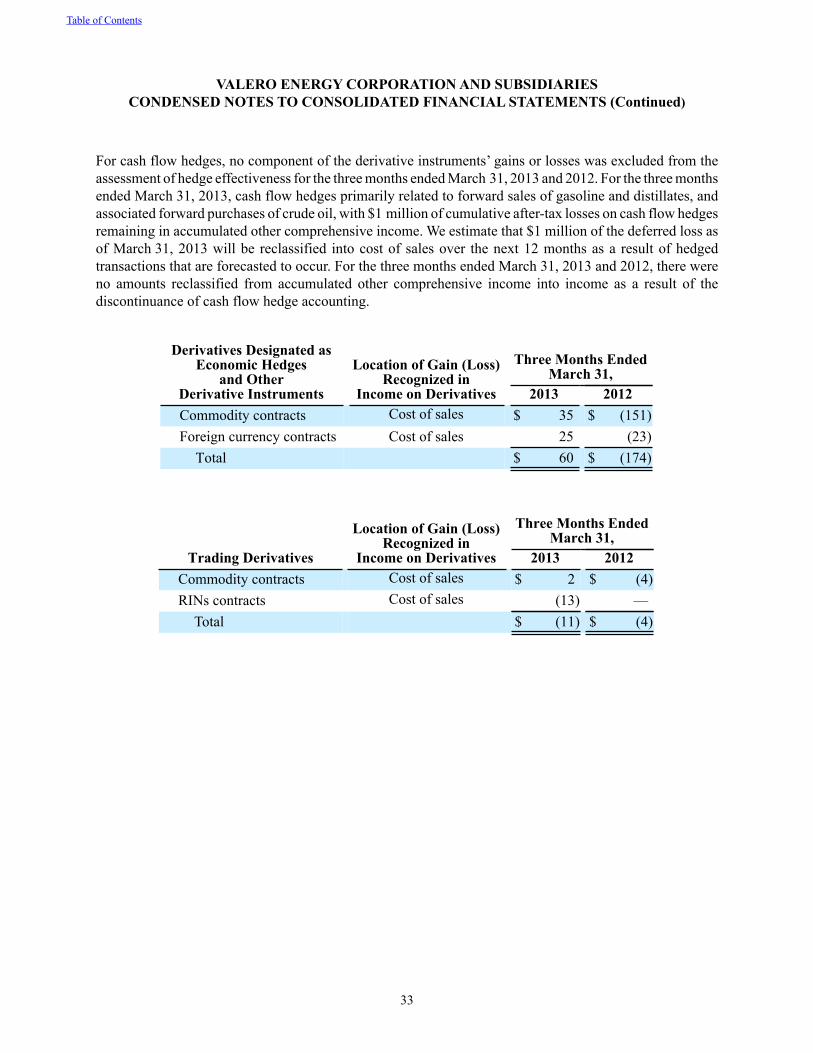
33
For cash flow hedges, no component of the derivative instruments’ gains or losses was excluded from the assessment of hedge effectiveness for the three months ended March 31, 2013 and 2012. For the three months ended March 31, 2013, cash flow hedges primarily related to forward sales of gasoline and distillates, and associated forward purchases of crude oil, with $1 million of cumulative after-tax losses on cash flow hedges remaining in accumulated other comprehensive income. We estimate that $1 million of the deferred loss as of March 31, 2013 will be reclassified into cost of sales over the next 12 months as a result of hedged transactions that are forecasted to occur. For the three months ended March 31, 2013 and 2012, there were no amounts reclassified from accumulated other comprehensive income into income as a result of the discontinuance of cash flow hedge accounting.
Derivatives Designated as Economic Hedges
and OtherDerivative Instruments
Location of Gain (Loss)Recognized in
Income on Derivatives
Three Months EndedMarch 31,
2013 2012Commodity contracts Cost of sales $ 35 $ (151)Foreign currency contracts Cost of sales 25 (23)
Total $ 60 $ (174)
Trading Derivatives
Location of Gain (Loss)Recognized in
Income on Derivatives
Three Months EndedMarch 31,
2013 2012Commodity contracts Cost of sales $ 2 $ (4)RINs contracts Cost of sales (13) —
Total $ (11) $ (4)
Table of Contents
VALERO ENERGY CORPORATION AND SUBSIDIARIESCONDENSED NOTES TO CONSOLIDATED FINANCIAL STATEMENTS (Continued)
34
Item 2. Management’s Discussion and Analysis of Financial Condition and Results of Operations
CAUTIONARY STATEMENT FOR THE PURPOSE OF SAFE HARBOR PROVISIONS OF THE PRIVATE SECURITIES LITIGATION REFORM ACT OF 1995This Form 10-Q, including without limitation our discussion below under the heading “OVERVIEW AND OUTLOOK,” includes forward-looking statements within the meaning of Section 27A of the Securities Act of 1933 and Section 21E of the Securities Exchange Act of 1934. You can identify our forward-looking statements by the words “anticipate,” “believe,” “expect,” “plan,” “intend,” “estimate,” “project,” “projection,” “predict,” “budget,” “forecast,” “goal,” “guidance,” “target,” “could,” “should,” “may,” and similar expressions.
These forward-looking statements include, among other things, statements regarding:
• future refining margins, including gasoline and distillate margins;• future retail margins, including gasoline, diesel, home heating oil, and convenience store merchandise
margins;• future ethanol margins;• expectations regarding feedstock costs, including crude oil differentials, and operating expenses;• anticipated levels of crude oil and refined product inventories;• our anticipated level of capital investments, including deferred refinery turnaround and catalyst costs
and capital expenditures for environmental and other purposes, and the effect of those capital investments on our results of operations;
• anticipated trends in the supply of and demand for crude oil and other feedstocks and refined products globally and in the regions where we operate;
• expectations regarding environmental, tax, and other regulatory initiatives; and• the effect of general economic and other conditions on refining, retail, and ethanol industry
fundamentals.
We based our forward-looking statements on our current expectations, estimates, and projections about ourselves and our industry. We caution that these statements are not guarantees of future performance and involve risks, uncertainties, and assumptions that we cannot predict. In addition, we based many of these forward-looking statements on assumptions about future events that may prove to be inaccurate. Accordingly, our actual results may differ materially from the future performance that we have expressed or forecast in the forward-looking statements. Differences between actual results and any future performance suggested in these forward-looking statements could result from a variety of factors, including the following:
• acts of terrorism aimed at either our facilities or other facilities that could impair our ability to produce or transport refined products or receive feedstocks;
• political and economic conditions in nations that produce crude oil or consume refined products;• demand for, and supplies of, refined products such as gasoline, diesel fuel, jet fuel, home heating
oil, petrochemicals, and ethanol;• demand for, and supplies of, crude oil and other feedstocks;• the ability of the members of the Organization of Petroleum Exporting Countries (OPEC) to agree
on and to maintain crude oil price and production controls;• the level of consumer demand, including seasonal fluctuations;• refinery overcapacity or undercapacity;• our ability to successfully integrate any acquired businesses into our operations;• the actions taken by competitors, including both pricing and adjustments to refining capacity in
response to market conditions;
Table of Contents
35
• the level of competitors’ imports into markets that we supply;• accidents, unscheduled shutdowns, or other catastrophes affecting our refineries, machinery,
pipelines, equipment, and information systems, or those of our suppliers or customers;• changes in the cost or availability of transportation for feedstocks and refined products;• the price, availability, and acceptance of alternative fuels and alternative-fuel vehicles;• the levels of government subsidies for ethanol and other alternative fuels;• delay of, cancellation of, or failure to implement planned capital projects and realize the various
assumptions and benefits projected for such projects or cost overruns in constructing such planned capital projects;
• earthquakes, hurricanes, tornadoes, and irregular weather, which can unforeseeably affect the price or availability of natural gas, crude oil, grain and other feedstocks, and refined products and ethanol;
• rulings, judgments, or settlements in litigation or other legal or regulatory matters, including unexpected environmental remediation costs, in excess of any reserves or insurance coverage;
• legislative or regulatory action, including the introduction or enactment of legislation or rulemakings by governmental authorities, including tax and environmental regulations, such as those to be implemented under the California Global Warming Solutions Act (also known as AB 32) and the United States (U.S.) Environmental Protection Agency’s (EPA) regulation of greenhouse gases, which may adversely affect our business or operations;
• changes in the credit ratings assigned to our debt securities and trade credit;• changes in currency exchange rates, including the value of the Canadian dollar, the pound sterling,
and the euro relative to the U.S. dollar; and• overall economic conditions, including the stability and liquidity of financial markets.
Any one of these factors, or a combination of these factors, could materially affect our future results of operations and whether any forward-looking statements ultimately prove to be accurate. Our forward-looking statements are not guarantees of future performance, and actual results and future performance may differ materially from those suggested in any forward-looking statements. We do not intend to update these statements unless we are required by the securities laws to do so.
All subsequent written and oral forward-looking statements attributable to us or persons acting on our behalf are expressly qualified in their entirety by the foregoing. We undertake no obligation to publicly release any revisions to any such forward-looking statements that may be made to reflect events or circumstances after the date of this report or to reflect the occurrence of unanticipated events.
Table of Contents
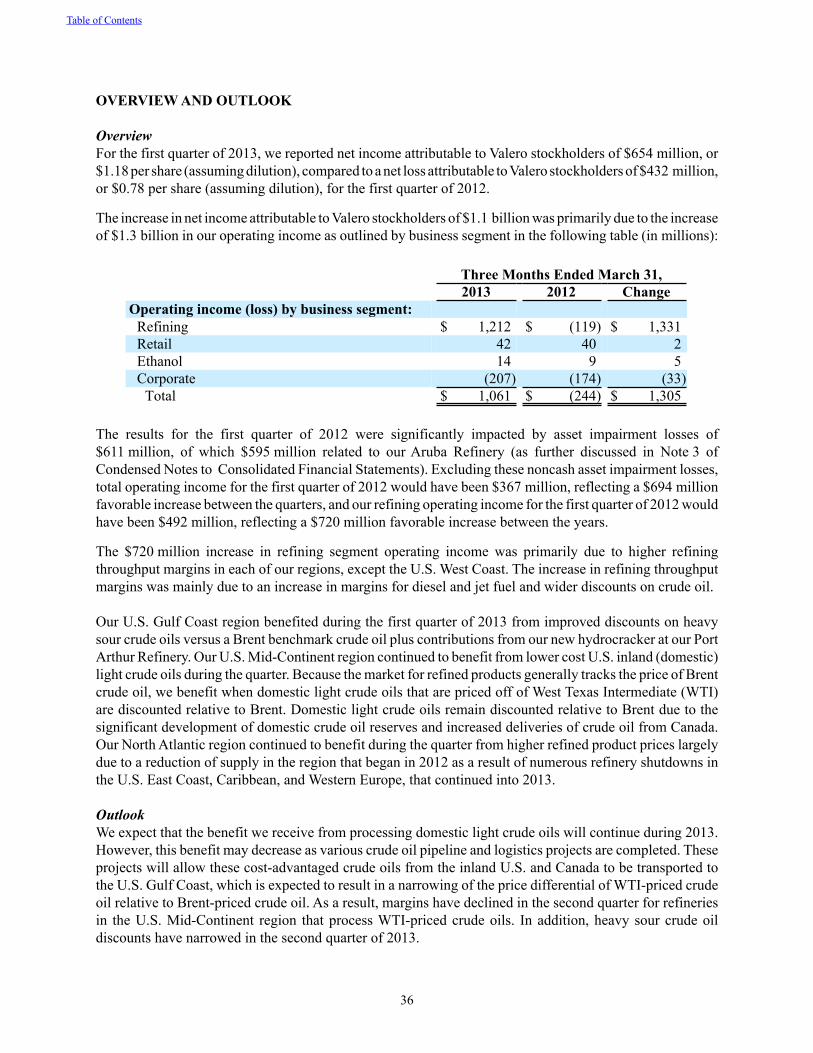
36
OVERVIEW AND OUTLOOK
OverviewFor the first quarter of 2013, we reported net income attributable to Valero stockholders of $654 million, or $1.18 per share (assuming dilution), compared to a net loss attributable to Valero stockholders of $432 million, or $0.78 per share (assuming dilution), for the first quarter of 2012.
The increase in net income attributable to Valero stockholders of $1.1 billion was primarily due to the increase of $1.3 billion in our operating income as outlined by business segment in the following table (in millions):
Three Months Ended March 31,2013 2012 Change
Operating income (loss) by business segment:Refining $ 1,212 $ (119) $ 1,331Retail 42 40 2Ethanol 14 9 5Corporate (207) (174) (33)
Total $ 1,061 $ (244) $ 1,305
The results for the first quarter of 2012 were significantly impacted by asset impairment losses of $611 million, of which $595 million related to our Aruba Refinery (as further discussed in Note 3 of Condensed Notes to Consolidated Financial Statements). Excluding these noncash asset impairment losses, total operating income for the first quarter of 2012 would have been $367 million, reflecting a $694 million favorable increase between the quarters, and our refining operating income for the first quarter of 2012 would have been $492 million, reflecting a $720 million favorable increase between the years.
The $720 million increase in refining segment operating income was primarily due to higher refining throughput margins in each of our regions, except the U.S. West Coast. The increase in refining throughput margins was mainly due to an increase in margins for diesel and jet fuel and wider discounts on crude oil.
Our U.S. Gulf Coast region benefited during the first quarter of 2013 from improved discounts on heavy sour crude oils versus a Brent benchmark crude oil plus contributions from our new hydrocracker at our Port Arthur Refinery. Our U.S. Mid-Continent region continued to benefit from lower cost U.S. inland (domestic) light crude oils during the quarter. Because the market for refined products generally tracks the price of Brent crude oil, we benefit when domestic light crude oils that are priced off of West Texas Intermediate (WTI) are discounted relative to Brent. Domestic light crude oils remain discounted relative to Brent due to the significant development of domestic crude oil reserves and increased deliveries of crude oil from Canada. Our North Atlantic region continued to benefit during the quarter from higher refined product prices largely due to a reduction of supply in the region that began in 2012 as a result of numerous refinery shutdowns in the U.S. East Coast, Caribbean, and Western Europe, that continued into 2013.
OutlookWe expect that the benefit we receive from processing domestic light crude oils will continue during 2013. However, this benefit may decrease as various crude oil pipeline and logistics projects are completed. These projects will allow these cost-advantaged crude oils from the inland U.S. and Canada to be transported to the U.S. Gulf Coast, which is expected to result in a narrowing of the price differential of WTI-priced crude oil relative to Brent-priced crude oil. As a result, margins have declined in the second quarter for refineries in the U.S. Mid-Continent region that process WTI-priced crude oils. In addition, heavy sour crude oil discounts have narrowed in the second quarter of 2013.
Table of Contents
37
Our investment strategy focuses on three areas — logistics, processing cost-advantaged crude oil, and distillates-focused hydrocracking. In order to take advantage of the significant growth in crude oil production in the U.S. and Canada, we are investing in more logistics projects in order to transport these discounted crude oils to our refineries and to increase our ability to export products. For example, during the first quarter of 2013, we ordered 2,500 additional rail cars and invested in other logistics assets. Since much of the new production is light crude oil, we are investing at certain of our refineries to increase the front-end flexibility to process more volumes of these cost-advantaged crude oils. Our other growth investments focus on completing our hydrocracker projects to produce more diesel and jet fuel. We expect the hydrocracker at our St. Charles Refinery to commence operations late in the second quarter of 2013.
Recent refinery closures in the U.S. East Coast, Caribbean, and Western Europe and additional closures expected to occur in the industry combined with poor reliability and low utilization in Latin American refineries create opportunities for competitive refineries to export quality products at higher margins. However, some marginally profitable refineries may continue to be operated, which could negatively impact refined product margins.
Turnaround activity continues in the second quarter of 2013 with work at our Meraux and McKee Refineries plus a plant-wide turnaround planned for two months at our Quebec City Refinery.
Thus far in the second quarter of 2013, ethanol margins have improved primarily due to declining corn prices. We expect a continued modest improvement in ethanol margins throughout 2013 relative to those in 2012.
Energy markets and margins are volatile, and we expect them to continue to be volatile in the near to mid-term. Due to our obligation to blend biofuels into the products we produce in most of the countries in which we operate, and our inability to blend biofuels at the applicable rate in the U.S., we must purchase Renewable Identification Numbers (RINs) in the U.S. and are therefore exposed to the volatility in the market price of these financial instruments. During the first quarter of 2013, we purchased a portion of our expected obligation for 2013 due to rising RINs prices. As further discussed in Note 13 of Condensed Notes to Consolidated Financial Statements, the cost of meeting our obligations under this compliance program was $130 million for the first quarter of 2013. We estimate that the cost of meeting our obligation for the full year of 2013 is between $500 million and $750 million based on recent RINs prices and our estimate of the expected RINs purchase requirement.
On May 1, 2013, we completed the separation of our retail business, creating an independent public company named CST Brands, Inc. (CST). This transaction is more fully discussed in Note 2 of Condensed Notes to Consolidated Financial Statements.
During 2012, we announced that we were evaluating a master limited partnership for our growing portfolio of logistics assets. We expect to continue to evaluate this strategy during the second half of 2013.
Table of Contents
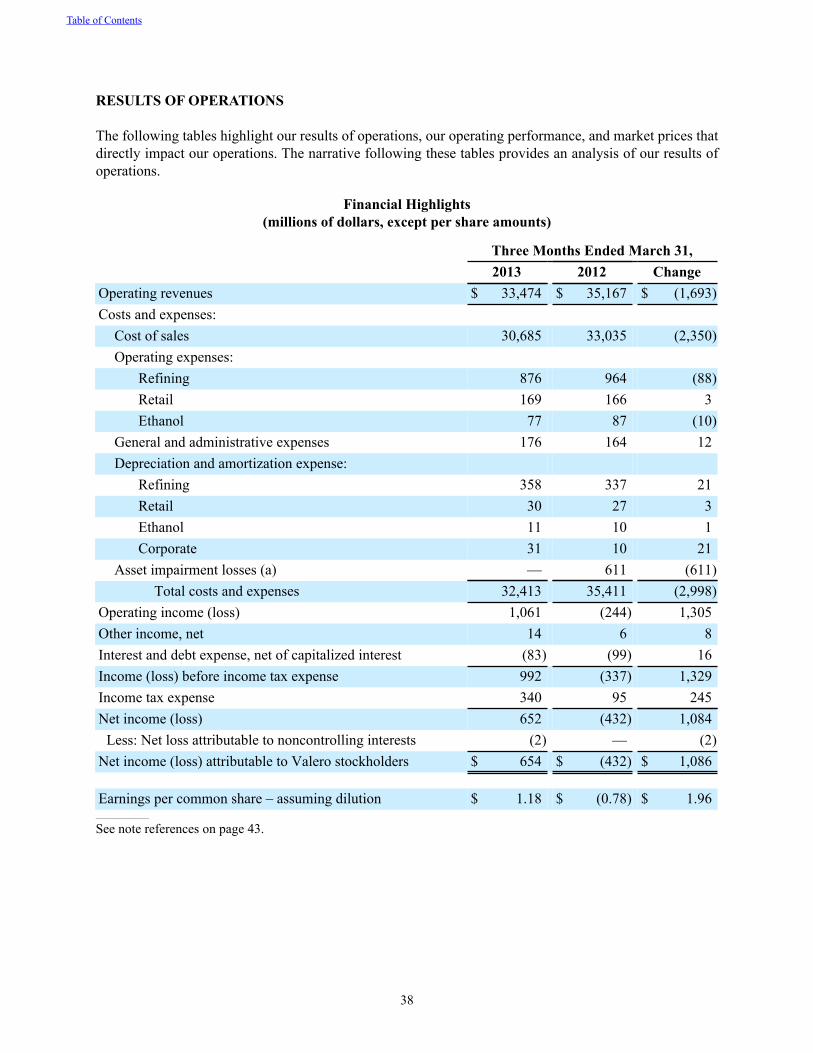
38
RESULTS OF OPERATIONS
The following tables highlight our results of operations, our operating performance, and market prices that directly impact our operations. The narrative following these tables provides an analysis of our results of operations.
Financial Highlights (millions of dollars, except per share amounts)
Three Months Ended March 31, 2013 2012 ChangeOperating revenues $ 33,474 $ 35,167 $ (1,693)Costs and expenses:
Cost of sales 30,685 33,035 (2,350)Operating expenses:
Refining 876 964 (88)Retail 169 166 3Ethanol 77 87 (10)
General and administrative expenses 176 164 12Depreciation and amortization expense:
Refining 358 337 21Retail 30 27 3Ethanol 11 10 1Corporate 31 10 21
Asset impairment losses (a) — 611 (611)Total costs and expenses 32,413 35,411 (2,998)
Operating income (loss) 1,061 (244) 1,305Other income, net 14 6 8Interest and debt expense, net of capitalized interest (83) (99) 16Income (loss) before income tax expense 992 (337) 1,329Income tax expense 340 95 245Net income (loss) 652 (432) 1,084
Less: Net loss attributable to noncontrolling interests (2) — (2)Net income (loss) attributable to Valero stockholders $ 654 $ (432) $ 1,086
Earnings per common share – assuming dilution $ 1.18 $ (0.78) $ 1.96________________
See note references on page 43.
Table of Contents
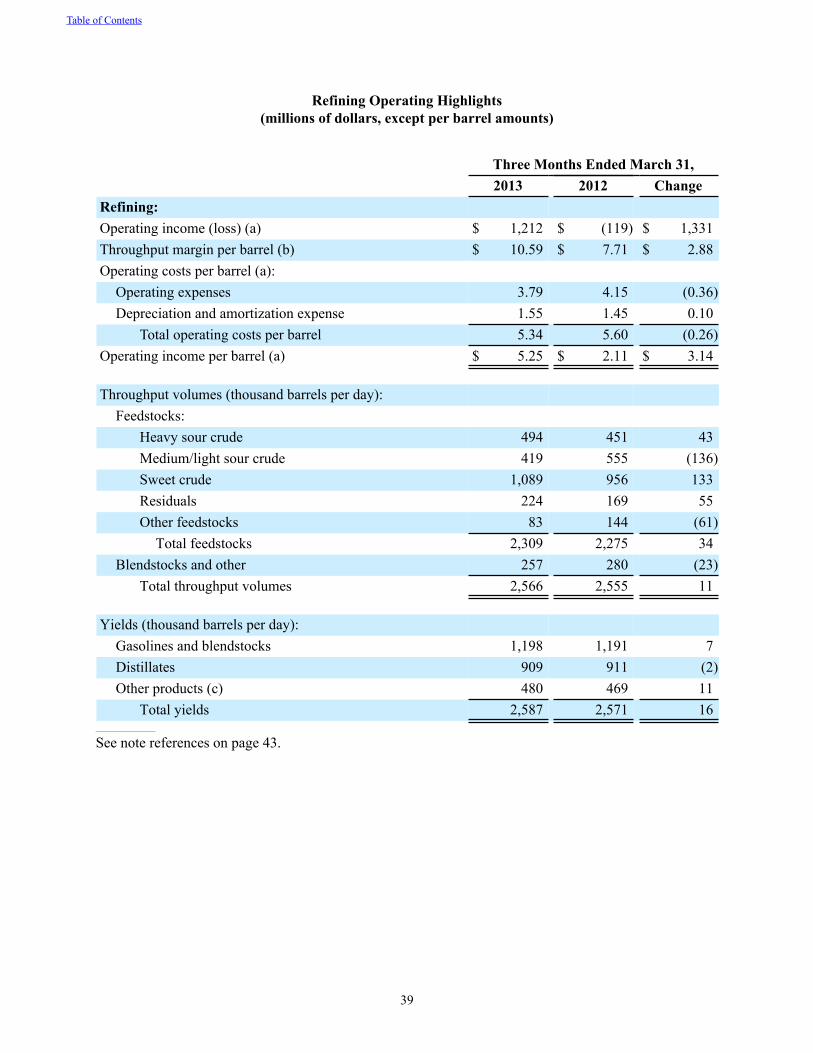
39
Refining Operating Highlights(millions of dollars, except per barrel amounts)
Three Months Ended March 31, 2013 2012 ChangeRefining: Operating income (loss) (a) $ 1,212 $ (119) $ 1,331Throughput margin per barrel (b) $ 10.59 $ 7.71 $ 2.88Operating costs per barrel (a):
Operating expenses 3.79 4.15 (0.36)Depreciation and amortization expense 1.55 1.45 0.10
Total operating costs per barrel 5.34 5.60 (0.26)Operating income per barrel (a) $ 5.25 $ 2.11 $ 3.14
Throughput volumes (thousand barrels per day): Feedstocks:
Heavy sour crude 494 451 43Medium/light sour crude 419 555 (136)Sweet crude 1,089 956 133Residuals 224 169 55Other feedstocks 83 144 (61)
Total feedstocks 2,309 2,275 34Blendstocks and other 257 280 (23)
Total throughput volumes 2,566 2,555 11
Yields (thousand barrels per day): Gasolines and blendstocks 1,198 1,191 7Distillates 909 911 (2)Other products (c) 480 469 11
Total yields 2,587 2,571 16_______________
See note references on page 43.
Table of Contents
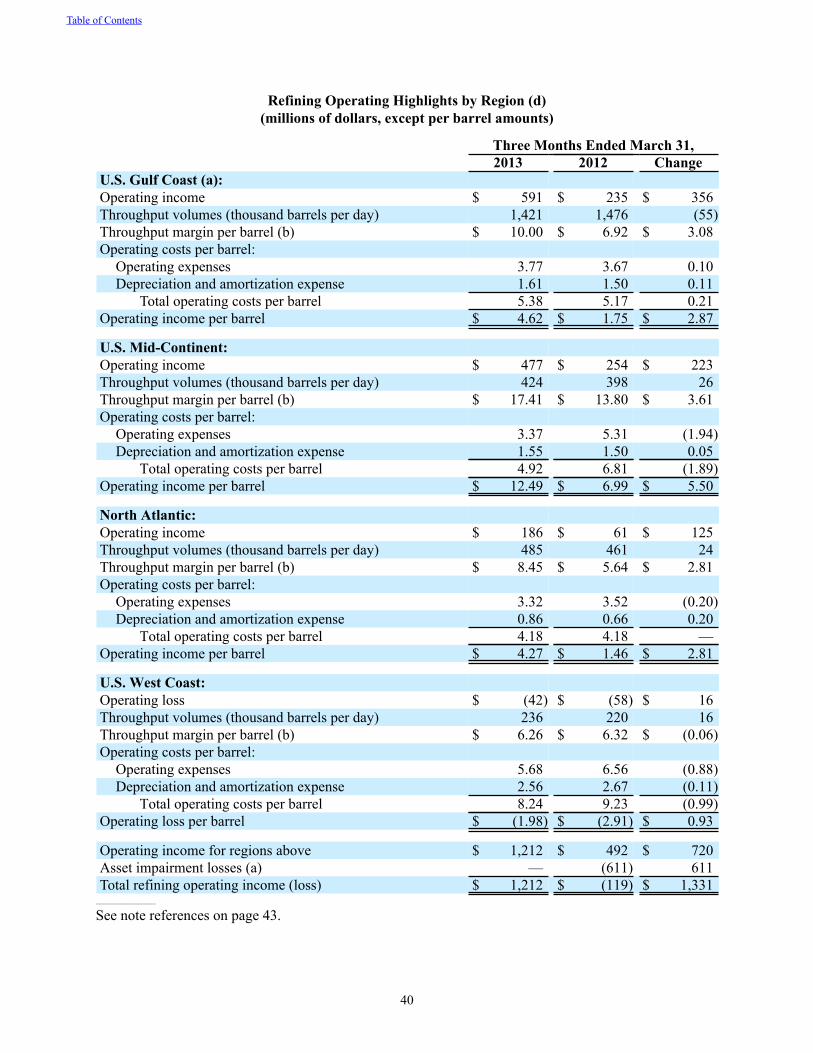
40
Refining Operating Highlights by Region (d)(millions of dollars, except per barrel amounts)
Three Months Ended March 31,2013 2012 Change
U.S. Gulf Coast (a):Operating income $ 591 $ 235 $ 356Throughput volumes (thousand barrels per day) 1,421 1,476 (55)Throughput margin per barrel (b) $ 10.00 $ 6.92 $ 3.08Operating costs per barrel:
Operating expenses 3.77 3.67 0.10Depreciation and amortization expense 1.61 1.50 0.11
Total operating costs per barrel 5.38 5.17 0.21Operating income per barrel $ 4.62 $ 1.75 $ 2.87
U.S. Mid-Continent:Operating income $ 477 $ 254 $ 223Throughput volumes (thousand barrels per day) 424 398 26Throughput margin per barrel (b) $ 17.41 $ 13.80 $ 3.61Operating costs per barrel:
Operating expenses 3.37 5.31 (1.94)Depreciation and amortization expense 1.55 1.50 0.05
Total operating costs per barrel 4.92 6.81 (1.89)Operating income per barrel $ 12.49 $ 6.99 $ 5.50
North Atlantic:Operating income $ 186 $ 61 $ 125Throughput volumes (thousand barrels per day) 485 461 24Throughput margin per barrel (b) $ 8.45 $ 5.64 $ 2.81Operating costs per barrel:
Operating expenses 3.32 3.52 (0.20)Depreciation and amortization expense 0.86 0.66 0.20
Total operating costs per barrel 4.18 4.18 —Operating income per barrel $ 4.27 $ 1.46 $ 2.81
U.S. West Coast:Operating loss $ (42) $ (58) $ 16Throughput volumes (thousand barrels per day) 236 220 16Throughput margin per barrel (b) $ 6.26 $ 6.32 $ (0.06)Operating costs per barrel:
Operating expenses 5.68 6.56 (0.88)Depreciation and amortization expense 2.56 2.67 (0.11)
Total operating costs per barrel 8.24 9.23 (0.99)Operating loss per barrel $ (1.98) $ (2.91) $ 0.93
Operating income for regions above $ 1,212 $ 492 $ 720Asset impairment losses (a) — (611) 611Total refining operating income (loss) $ 1,212 $ (119) $ 1,331
_______________
See note references on page 43.
Table of Contents
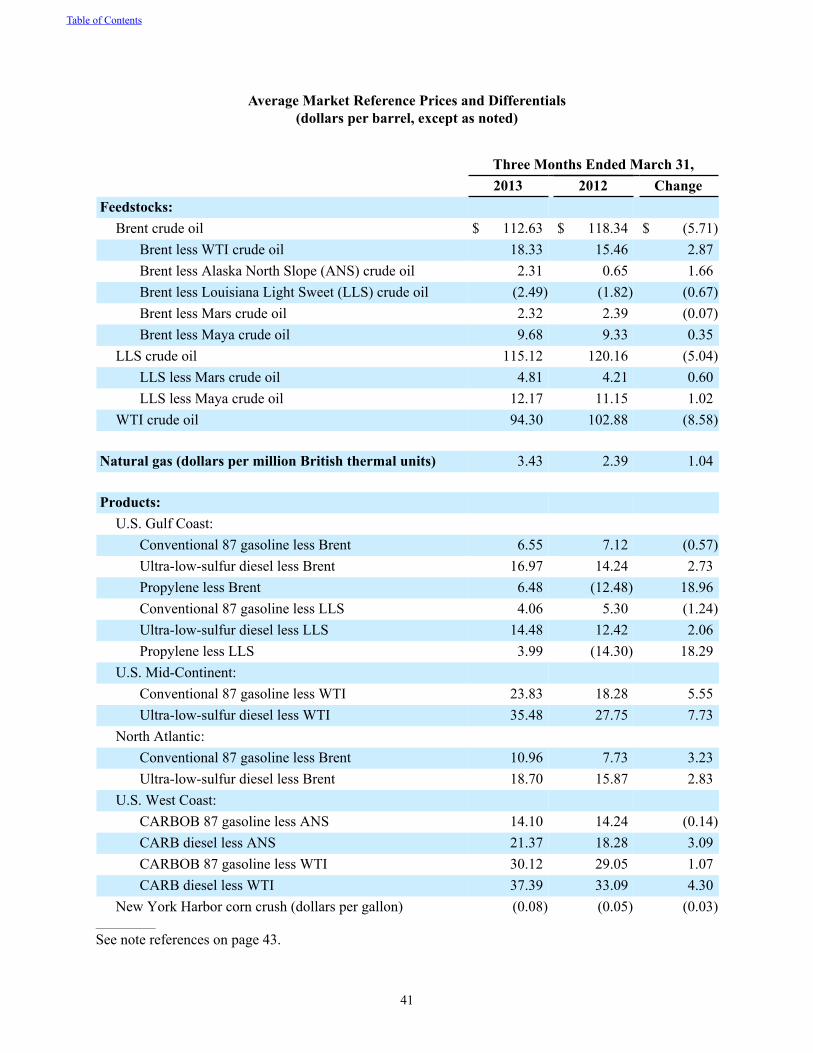
41
Average Market Reference Prices and Differentials(dollars per barrel, except as noted)
Three Months Ended March 31, 2013 2012 ChangeFeedstocks:
Brent crude oil $ 112.63 $ 118.34 $ (5.71)Brent less WTI crude oil 18.33 15.46 2.87Brent less Alaska North Slope (ANS) crude oil 2.31 0.65 1.66Brent less Louisiana Light Sweet (LLS) crude oil (2.49) (1.82) (0.67)Brent less Mars crude oil 2.32 2.39 (0.07)Brent less Maya crude oil 9.68 9.33 0.35
LLS crude oil 115.12 120.16 (5.04)LLS less Mars crude oil 4.81 4.21 0.60LLS less Maya crude oil 12.17 11.15 1.02
WTI crude oil 94.30 102.88 (8.58)
Natural gas (dollars per million British thermal units) 3.43 2.39 1.04
Products: U.S. Gulf Coast:
Conventional 87 gasoline less Brent 6.55 7.12 (0.57)Ultra-low-sulfur diesel less Brent 16.97 14.24 2.73Propylene less Brent 6.48 (12.48) 18.96Conventional 87 gasoline less LLS 4.06 5.30 (1.24)Ultra-low-sulfur diesel less LLS 14.48 12.42 2.06Propylene less LLS 3.99 (14.30) 18.29
U.S. Mid-Continent: Conventional 87 gasoline less WTI 23.83 18.28 5.55Ultra-low-sulfur diesel less WTI 35.48 27.75 7.73
North Atlantic: Conventional 87 gasoline less Brent 10.96 7.73 3.23Ultra-low-sulfur diesel less Brent 18.70 15.87 2.83
U.S. West Coast: CARBOB 87 gasoline less ANS 14.10 14.24 (0.14)CARB diesel less ANS 21.37 18.28 3.09CARBOB 87 gasoline less WTI 30.12 29.05 1.07CARB diesel less WTI 37.39 33.09 4.30
New York Harbor corn crush (dollars per gallon) (0.08) (0.05) (0.03)_______________
See note references on page 43.
Table of Contents
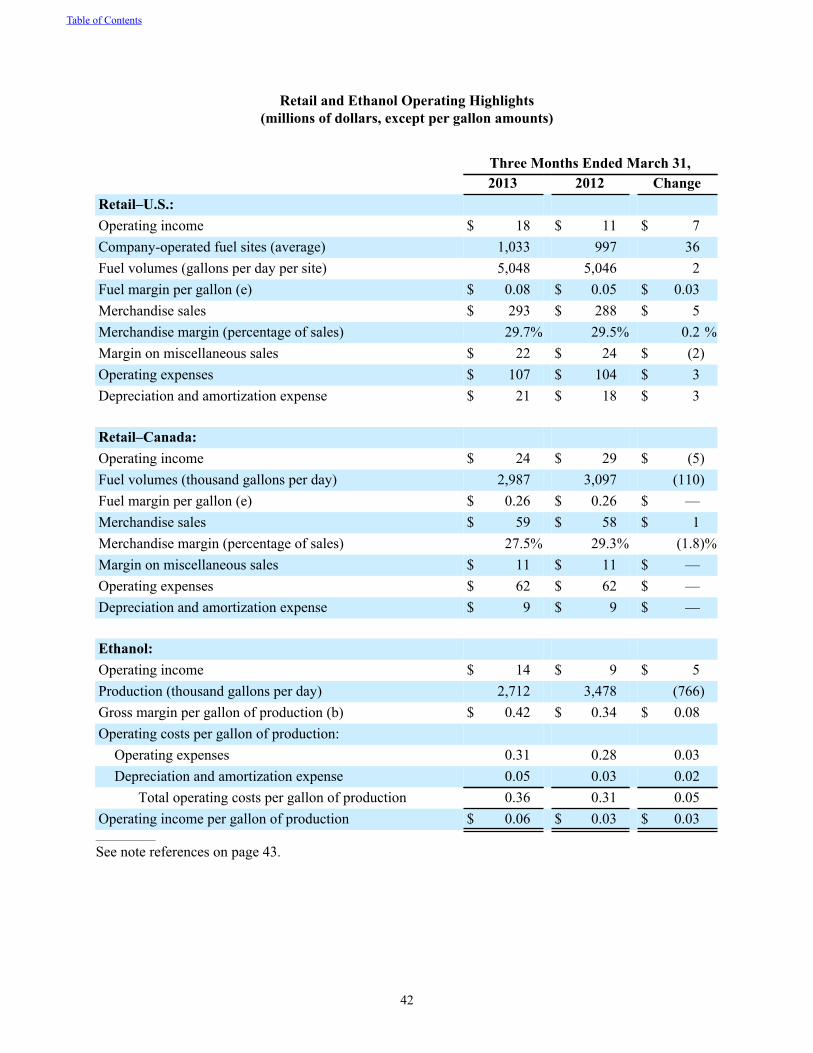
42
Retail and Ethanol Operating Highlights(millions of dollars, except per gallon amounts)
Three Months Ended March 31, 2013 2012 ChangeRetail–U.S.: Operating income $ 18 $ 11 $ 7Company-operated fuel sites (average) 1,033 997 36Fuel volumes (gallons per day per site) 5,048 5,046 2Fuel margin per gallon (e) $ 0.08 $ 0.05 $ 0.03Merchandise sales $ 293 $ 288 $ 5Merchandise margin (percentage of sales) 29.7% 29.5% 0.2 %Margin on miscellaneous sales $ 22 $ 24 $ (2)Operating expenses $ 107 $ 104 $ 3Depreciation and amortization expense $ 21 $ 18 $ 3
Retail–Canada: Operating income $ 24 $ 29 $ (5)Fuel volumes (thousand gallons per day) 2,987 3,097 (110)Fuel margin per gallon (e) $ 0.26 $ 0.26 $ —Merchandise sales $ 59 $ 58 $ 1Merchandise margin (percentage of sales) 27.5% 29.3% (1.8)%Margin on miscellaneous sales $ 11 $ 11 $ —Operating expenses $ 62 $ 62 $ —Depreciation and amortization expense $ 9 $ 9 $ —
Ethanol: Operating income $ 14 $ 9 $ 5Production (thousand gallons per day) 2,712 3,478 (766)Gross margin per gallon of production (b) $ 0.42 $ 0.34 $ 0.08Operating costs per gallon of production:
Operating expenses 0.31 0.28 0.03Depreciation and amortization expense 0.05 0.03 0.02
Total operating costs per gallon of production 0.36 0.31 0.05Operating income per gallon of production $ 0.06 $ 0.03 $ 0.03
_______________
See note references on page 43.
Table of Contents
43
The following notes relate to references on pages 38 through 42.(a) Asset impairment losses for the three months ended March 31, 2012 include a $595 million loss on the write down of the Aruba
Refinery and a $16 million loss related to equipment associated with a permanently cancelled capital project at another refinery.
The asset impairment loss related to the Aruba Refinery resulted from our decision in March 2012 to suspend refining operations at the refinery. Subsequently, in September 2012, we suspended refining operations indefinitely and reorganized the refinery into a crude oil and refined projects terminal; however, we continue to maintain the refining assets to allow them to be restarted and do not consider them abandoned.
The total asset impairment loss of $611 million ($605 million after taxes) is reflected in refining segment operating loss for the three months ended March 31, 2012, but it is excluded from operating costs per barrel and operating income per barrel for the refining segment and U.S. Gulf Coast region.
(b) Throughput margin per barrel represents operating revenues less cost of sales of our refining segment divided by throughput volumes. Gross margin per gallon of production represents operating revenues less cost of sales of our ethanol segment divided by production volumes.
(c) Other products primarily include petrochemicals, gas oils, No. 6 fuel oil, petroleum coke, sulfur, and asphalt.(d) The regions reflected herein contain the following refineries: the U.S. Gulf Coast region includes the Aruba, Corpus Christi
East, Corpus Christi West, Houston, Meraux, Port Arthur, St. Charles, Texas City, and Three Rivers Refineries; the U.S. Mid-Continent region includes the Ardmore, McKee, and Memphis Refineries; the North Atlantic region includes the Pembroke and Quebec City Refineries; and the U.S.West Coast region includes the Benicia and Wilmington Refineries.
(e) Fuel margin per gallon is presented net of credit card fees.
GeneralOperating revenues decreased 5 percent (or $1.7 billion) for the first quarter of 2013 compared to the first quarter of 2012 primarily as a result of lower average refined product prices between the two periods related to our refining segment operations. Operating income and income before income tax expense each increased $1.3 billion for the first quarter of 2013 compared to amounts reported for the first quarter of 2012 due to a $1.3 billion increase in refining segment operating income, a $2 million increase in retail segment operating income, and a $5 million increase in ethanol segment operating income, which are discussed below.
RefiningRefining segment operating income increased $1.3 billion from an operating loss of $119 million for the first quarter of 2012 to operating income of $1.2 billion for the first quarter of 2013. The $1.3 billion increase in operating income was impacted by the $611 million asset impairment loss in the first quarter of 2012 primarily related to our Aruba Refinery. (See Note 3 of Condensed Notes to Consolidated Financial Statements for further discussion of the impairment losses.) Excluding the prior year asset impairment losses, refining segment operating income increased $720 million primarily due to a $653 million increase in refining margin and an $88 million decrease in operating expenses.
The increase in our refining margin of $653 million (a $2.88 per barrel increase, or 37 percent) in the first quarter of 2013 as compared to the first quarter of 2012 resulted from margin improvements generated by our U.S. Gulf Coast, U.S. Mid-Continent, and North Atlantic regions, which experienced increases in refining margin of $350 million (a $3.08 per barrel increase), $165 million (a $3.61 per barrel increase), and $132 millions (a $2.81 per barrel increase), respectively. The increase in refining margin was mainly due to an increase in margins for diesel and jet fuel and wider discounts on crude oils.
The $350 million increase in refining margin in the U.S. Gulf Coast was primarily the result of a $0.35 per barrel increase in the discount between the price of Maya crude oil and other heavy sour crude oils that price at a discount to Maya versus Brent crude oil. Brent crude oil is the type of crude oil used by the market to set the price of refined products, but certain of our refineries in the U.S. Gulf Coast region process heavy sour crude oils like Maya and Maya-type crude oils; therefore, the increase in the price discount between Maya-type crude oils versus Brent crude oil had a positive impact to our refining margin in this region. Maya-type crude oil discounts improved due to additional availability of these crude oils in the U.S. Gulf
Table of Contents
44
Coast. The U.S. Gulf Coast region also benefited from strong diesel and jet fuel margins during the first quarter of 2013. The ultra-low-sulfur diesel margin versus Brent crude oil increased by $2.73 per barrel in the U.S. Gulf Coast region as compared to the first quarter of 2012 due to refinery closures in the Atlantic Basin, which tightened refining industry fundamentals in the U.S. Gulf Coast region. In addition, our new hydrocracker at our Port Arthur Refinery contributed to our strong performance in the U.S. Gulf Coast region for the first quarter of 2013.
The $165 million increase in refining margin in the U.S. Mid-Continent region was largely due to improved gasoline and distillate margins of approximately $120 million in that region in the first quarter of 2013 compared to the first quarter of 2012. For example, the U.S. Mid-Continent benchmark reference margins for conventional 87 gasoline and ultra-low-sulfur diesel, a type of distillate, increased first quarter 2013 over first quarter 2012 by $5.55 per barrel and $7.73 per barrel, respectively, and these increases are due to wider discounts on domestic light crude oils and stronger gasoline and diesel margins during the first quarter of 2013 compared to the first quarter of 2012. The discount between the price of WTI crude oil versus Brent crude oil improved $2.87 per barrel and improved refining margin by approximately $60 million. WTI crude oil priced at a discount to Brent crude oil of $18.33 per barrel during the first quarter of 2013 compared to a discount of $15.46 per barrel for the first quarter of 2012. These significant discounts are due to increases in crude oil production within the U.S. Mid-Continent region and increased deliveries of crude oil from Canada into that region, coupled with the inability to transport significant quantities of that crude oil to other regions of the country. Gasoline and diesel margins were relatively weak during the first quarter of 2012 and returned to more normal levels during the first quarter of 2013. The relatively weak margins during the first quarter of 2012 were attributed to higher industry utilization rates in the U.S. Mid-Continent region and relatively low turnarounds.
The $132 million increase in refining margin in the North Atlantic region was also due to improved gasoline and distillate margins in that region in the first quarter of 2013 compared to the first quarter of 2012. For example, the North Atlantic benchmark reference margins for conventional 87 gasoline and ultra-low-sulfur diesel increased first quarter 2013 over first quarter 2012 by $3.23 per barrel and $2.83 per barrel, respectively, and these increases were due largely to a reduction in the supply of refined products, which resulted from the continued shutdown of refineries in the U.S. East Coast, Caribbean, and Western Europe.
The decrease of $88 million in refining operating expenses discussed above was primarily due to a $42 million decrease in operating expenses incurred by the Aruba Refinery, whose operations were suspended in March 2012. The remaining decrease in refining operating expenses of $46 million was primarily due to a $59 million decrease in maintenance expenses due to higher maintenance activities in the first quarter of 2012, a $48 million decrease in insurance and other expense primarily due to a $32 million decrease in insurance reserves related to the favorable settlement of a lawsuit, and a $10 million decrease in catalyst and chemical costs due to lower-cost catalysts used in certain of our fluid catalytic cracking units, partially offset by a $61 million increase in energy costs related to higher natural gas costs, and a $14 million increase in employee-related expenses due to higher compensation expense and increased employee benefit costs.
RetailRetail segment operating income was $42 million for the first quarter of 2013 compared to $40 million for the first quarter of 2012. This 5 percent (or $2 million) increase was primarily due to a $13 million increase in fuel margin from our U.S. retail operations, partially offset by a $4 million decrease in fuel margin from our Canadian retail operations and a $3 million increase both in operating expenses and depreciation and amortization in our U.S. retail operations.
Table of Contents
45
Our U.S. retail fuel margin improved during the first quarter of 2013 due to increased fuel volumes sold as a result of more retail sites combined with improved fuel margin per gallon as wholesale motor fuel prices were lower during the first quarter of 2013 as compared to the first quarter of 2012. The Canadian retail fuel margin in the first quarter of 2013 was impacted by a decline in fuel volumes sold as a result of fewer retail sites combined with a decline in the fuel margin per gallon, which was due to pricing pressure from our competitors during the quarter.
EthanolEthanol segment operating income was $14 million for the first quarter of 2013 compared to $9 million for the first quarter of 2012. The $5 million increase in operating income was primarily due to a $10 million decrease in operating expense due to lower ethanol production, partially offset by a $4 million decrease in gross margin.
The gross margin decreased primarily due to higher corn prices relative to the average selling price of ethanol between the quarters. The increase in average corn prices from the first quarter of 2012 to the first quarter of 2013 was primarily caused by the drought in corn-producing regions of the U.S. Mid-Continent that began in the second quarter of 2012, which negatively impacted gross margin by $0.28 per gallon. The impact of higher corn prices was partially offset by an increase in the average selling price of ethanol between the comparable periods which favorably impacted gross margin per gallon by $0.24 per gallon.
In addition, ethanol production decreased 766,000 gallons per day between the comparable periods as three plants that were idled during 2012 did not restart production until late in the first quarter of 2013. The reduction in operating expenses during the first quarter of 2013 was primarily due to a $7 million decrease in chemicals expense and a $3 million decrease in maintenance expenses compared to the first quarter of 2012 resulting from the lower production during the first quarter of 2013.
Corporate Expenses and OtherGeneral and administrative expenses increased $12 million from the first quarter of 2012 to the first quarter of 2013 primarily due to a $5 million increase related to environmental reserves and $4 million for professional fees incurred related to the separation of our retail business. The increase in corporate depreciation and amortization expense was primarily due to $20 million of losses incurred on the sale of certain corporate property.
“Interest and debt expense, net of capitalized interest” for the first quarter of 2013 decreased $16 million from the first quarter of 2012. This decrease was primarily due to a $13 million favorable impact from the decrease in average borrowings and a $12 million write-off of unamortized debt discounts related to the early redemption of certain industrial revenue bonds in the first quarter of 2012, partially offset by a $12 million decrease in capitalized interest due to a corresponding decrease in capital expenditures between the quarters.
Income tax expense increased $245 million from the first quarter of 2012 to the first quarter of 2013 mainly as a result of higher income before income tax expense. However, the variation in the customary relationship between income tax expense and income before income tax expense for the first quarter of 2012 was primarily due to not recognizing the tax benefits associated with the asset impairment loss of $595 million related to the Aruba Refinery as we did not expect to realize a tax benefit from these losses.
Table of Contents
46
LIQUIDITY AND CAPITAL RESOURCES
Cash Flows for the Three Months Ended March 31, 2013 and 2012 Net cash provided by operating activities for the first three months of 2013 of $1.5 billion was generated primarily from operating income discussed above under “RESULTS OF OPERATIONS” combined with favorable changes in current assets and current liabilities. Net cash provided by operating activities for the first three months of 2012 was also 1.5 billion and was generated from operating income excluding the asset impairment losses combined with favorable changes in current assets and current liabilities. The changes in cash provided by or used in working capital during the first three months of 2013 and 2012 are shown in Note 11 of Condensed Notes to Consolidated Financial Statements.
The net cash provided by operating activities during the first three months of 2013 were used mainly to:• fund $864 million of capital expenditures and deferred turnaround and catalyst costs;• make scheduled long-term note repayments of $180 million;• purchase common stock for treasury of $304 million;• pay common stock dividends of $111 million; and• increase available cash on hand by $134 million.
The net cash provided by operating activities during the first three months of 2012 combined with $160 million of proceeds on a note receivable related to the sale of the Paulsboro Refinery were used mainly to:
• fund $884 million of capital expenditures and deferred turnaround and catalyst costs;• make a repayment under our accounts receivable sales facility of $150 million;• purchase common stock for treasury of $106 million;• pay common stock dividends of $83 million; and• increase available cash on hand by $535 million.
Capital InvestmentsOur operations, especially those of our refining segment, are highly capital intensive. Each of our refineries comprises a large base of property assets, consisting of a series of interconnected, highly integrated and interdependent crude oil processing facilities and supporting logistical infrastructure (Units), and these Units are improved continuously. The cost of improvements, which consist of the addition of new Units and betterments of existing Units, can be significant. We have historically acquired our refineries at amounts significantly below their replacement costs, whereas our improvements are made at full replacement value. As such, the costs for improving our refinery assets increase over time and are significant in relation to the amounts we paid to acquire our refineries. We plan for these improvements by developing a multi-year capital program that is updated and revised based on changing internal and external factors.
We make improvements to our refineries in order to maintain and enhance their operating reliability, to meet environmental obligations with respect to reducing emissions and removing prohibited elements from the products we produce, or to enhance their profitability. Reliability and environmental improvements generally do not increase the throughput capacities of our refineries. Improvements that enhance refinery profitability may increase throughput capacity, but many of these improvements allow our refineries to process higher volumes of sour crude oil, which lowers our feedstock costs, and enables us to refine crude oil into products with higher market values. Therefore, many of our improvements do not increase throughput capacity significantly.
Table of Contents
47
During the three months ended March 31, 2013, we expended $577 million for capital expenditures and $287 million for deferred turnaround and catalyst costs. Capital expenditures for the three months ended March 31, 2013 included $15 million of costs related to environmental projects.
For 2013, we expect to incur approximately $2.2 billion for capital investments (approximately $100 million of which is for environmental projects) and $650 million for deferred turnaround and catalyst costs. The capital expenditure estimate excludes expenditures related to strategic business acquisitions. We continuously evaluate our capital budget and make changes as conditions warrant.
Contractual ObligationsAs of March 31, 2013, our contractual obligations included debt, capital lease obligations, operating leases, purchase obligations, and other long-term liabilities.
During the three months ended March 31, 2013, we had no material changes outside the ordinary course of our business with respect to our debt, capital lease obligations, operating leases, purchase obligations, or other long-term liabilities.
On March 20, 2013, in anticipation of the separation, CST entered into a credit agreement providing for $800 million of senior secured credit facilities (consisting of a $500 million term loan and a revolving credit facility with a borrowing capacity of up to $300 million). Borrowings under the term loan and revolving credit facility bear interest at a base rate or LIBOR rate as prescribed in the agreement. The credit agreement matures on May 1, 2018 and has certain restrictive covenants. As of March 31, 2013, no amounts were outstanding under these credit facilities. This credit facility was retained by CST after the separation from us.
We intend to make a scheduled debt repayment of $300 million related to our 4.75% notes that mature in June 2013.
We have an accounts receivable sales facility with a group of third-party entities and financial institutions to sell eligible trade receivables on a revolving basis up to $1.5 billion, which matures in July 2013. We anticipate that we will be able to renew this facility prior to its expiration in July 2013.
Our debt and financing agreements do not have rating agency triggers that would automatically require us to post additional collateral. However, in the event of certain downgrades of our senior unsecured debt to below investment grade ratings by Moody’s Investors Service, Standard & Poor’s Ratings Services, and Fitch Ratings, the cost of borrowings under some of our bank credit facilities and other arrangements would increase. All of our ratings on our senior unsecured debt are at or above investment grade level as follows:
Rating Agency RatingStandard & Poor’s Ratings Services BBB (negative outlook)Moody’s Investors Service Baa2 (stable outlook)Fitch Ratings BBB (stable outlook)
We cannot provide assurance that these ratings will remain in effect for any given period of time or that one or more of these ratings will not be lowered or withdrawn entirely by a rating agency. We note that these credit ratings are not recommendations to buy, sell, or hold our securities and may be revised or withdrawn at any time by the rating agency. Each rating should be evaluated independently of any other rating. Any
Table of Contents
48
future reduction below investment grade or withdrawal of one or more of our credit ratings could have a material adverse impact on our ability to obtain short- and long-term financing and the cost of such financings.
Other Commercial CommitmentsAs of March 31, 2013, we had outstanding letters of credit under our committed lines of credit as follows (in millions):
BorrowingCapacity Expiration
OutstandingLetters of
CreditLetter of credit facilities $ 550 June 2013 $ 550Revolving credit facility $ 3,000 December 2016 $ 59Canadian revolving credit facility C$ 50 November 2013 C$ 10
As of March 31, 2013, we had no amounts borrowed under our revolving credit facilities. The letters of credit outstanding as of March 31, 2013 expire during 2013 and 2014. We anticipate that we will be able to renew the $550 million letter of credit facilities prior to their expiration in June 2013.
Other Matters Impacting Liquidity and Capital ResourcesPension Plan Funded Status
We have $30 million of minimum required contributions during 2013 to one of our international pension plans that have minimum funding requirements.
In February 2013, we announced amendments to certain of our pension plans that will reduce our benefit costs and obligations for 2013 and future years, as further discussed in Note 8 of Condensed Notes to Consolidated Financial Statements. As a result of these plan amendments, management has decided to reduce its discretionary contributions to our pension plans by $100 million, resulting in expected contributions to our pension plans of $45 million for 2013. In addition, we plan to contribute approximately $21 million to our other postretirement plans during 2013.
Stock Purchase ProgramsAs of March 31, 2013, we have approvals under common stock purchase programs to purchase approximately $3.0 billion of our common stock.
Environmental MattersOur operations are subject to extensive environmental regulations by governmental authorities relating to the discharge of materials into the environment, waste management, pollution prevention measures, greenhouse gas emissions, and characteristics and composition of gasolines and distillates. Because environmental laws and regulations are becoming more complex and stringent and new environmental laws and regulations are continuously being enacted or proposed, the level of future expenditures required for environmental matters could increase in the future. In addition, any major upgrades in any of our operating facilities could require material additional expenditures to comply with environmental laws and regulations. See Note 6 of Condensed Notes to Consolidated Financial Statements for a further discussion of our environmental matters.
Tax MattersAs of March 31, 2013, the Internal Revenue Service (IRS) has ongoing tax audits related to our U.S. federal tax returns from 2002 through 2009. We have received Revenue Agent Reports on our tax years for 2002
Table of Contents
49
through 2007, and we are vigorously contesting certain tax positions and assertions from the IRS. We have made significant progress during the three months ended March 31, 2013 in resolving certain of these matters with the IRS, but settlement agreements have not yet been reached. We are continuing to work with the IRS to resolve these matters and we believe that they will be resolved for amounts consistent with the recorded amounts of unrecognized tax benefits associated with these matters. As of March 31, 2013, the total amount of unrecognized tax benefits reflected in “other long-term liabilities” in our balance sheet was $389 million, and this amount did not change significantly during the three months ended March 31, 2013. We do not believe that settlement agreements will be finalized and that cash will be paid to the IRS in connection with such settlements within the next 12 months, but the complexity of these matters makes it difficult to predict the timing of their resolution. As such, no amount of total unrecognized tax benefits has been reflected as a current liability in our balance sheet as of March 31, 2013. Should we ultimately settle for amounts consistent with our estimates, we believe that we will have sufficient cash on hand at that time to make such payments.
Cash Held by Our International SubsidiariesWe operate in countries outside the U.S. through subsidiaries incorporated in these countries, and the earnings of these subsidiaries are taxed by the countries in which they are incorporated. We intend to reinvest these earnings indefinitely in our international operations even though we are not restricted from repatriating such earnings to the U.S. in the form of cash dividends. Should we decide to repatriate such earnings, we would incur and pay taxes on the amounts repatriated. In addition, such repatriation could cause us to record deferred tax expense that could significantly impact our results of operations. We believe, however, that a substantial portion of our international cash can be returned to the U.S. without significant tax consequences through means other than a repatriation of earnings. As of March 31, 2013, $1.2 billion of our cash and temporary cash investments was held by our international subsidiaries.
Financial Regulatory ReformIn July 2010, President Obama signed into law the Dodd-Frank Wall Street Reform and Consumer Protection Act (Wall Street Reform Act). Key provisions of the Wall Street Reform Act create new statutory requirements that require most derivative instruments to be traded on exchanges and routed through clearinghouses, as well as impose new recordkeeping and reporting responsibilities on market participants. While certain final rules implementing the Wall Street Reform Act became effective in the fourth quarter of 2012, others continue to become effective in 2013 and 2014. Although we cannot predict the ultimate impact of these rules which may result in higher clearing costs and more reporting requirements with respect to our derivative activities, we believe they will not have a material impact on our financial position, results of operations, or liquidity.
Concentration of CustomersOur refining and marketing operations have a concentration of customers in the refining industry and customers who are refined product wholesalers and retailers. These concentrations of customers may impact our overall exposure to credit risk, either positively or negatively, in that these customers may be similarly affected by changes in economic or other conditions. However, we believe that our portfolio of accounts receivable is sufficiently diversified to the extent necessary to minimize potential credit risk. Historically, we have not had any significant problems collecting our accounts receivable.
Sources of LiquidityWe believe that we have sufficient funds from operations and, to the extent necessary, from borrowings under our credit facilities, to fund our ongoing operating requirements. We expect that, to the extent necessary, we can raise additional funds from time to time through equity or debt financings in the public and private capital markets or the arrangement of additional credit facilities. However, there can be no assurances regarding the availability of any future financings or additional credit facilities or whether such financings or additional credit facilities can be made available on terms that are acceptable to us.
Table of Contents
50
CRITICAL ACCOUNTING POLICIES
The preparation of financial statements in accordance with U. S. generally accepted accounting principles requires us to make estimates and assumptions that affect the amounts reported in our financial statements and accompanying notes. Actual results could differ from those estimates. Our critical accounting policies are disclosed in our annual report on Form 10-K for the year ended December 31, 2012.
Table of Contents
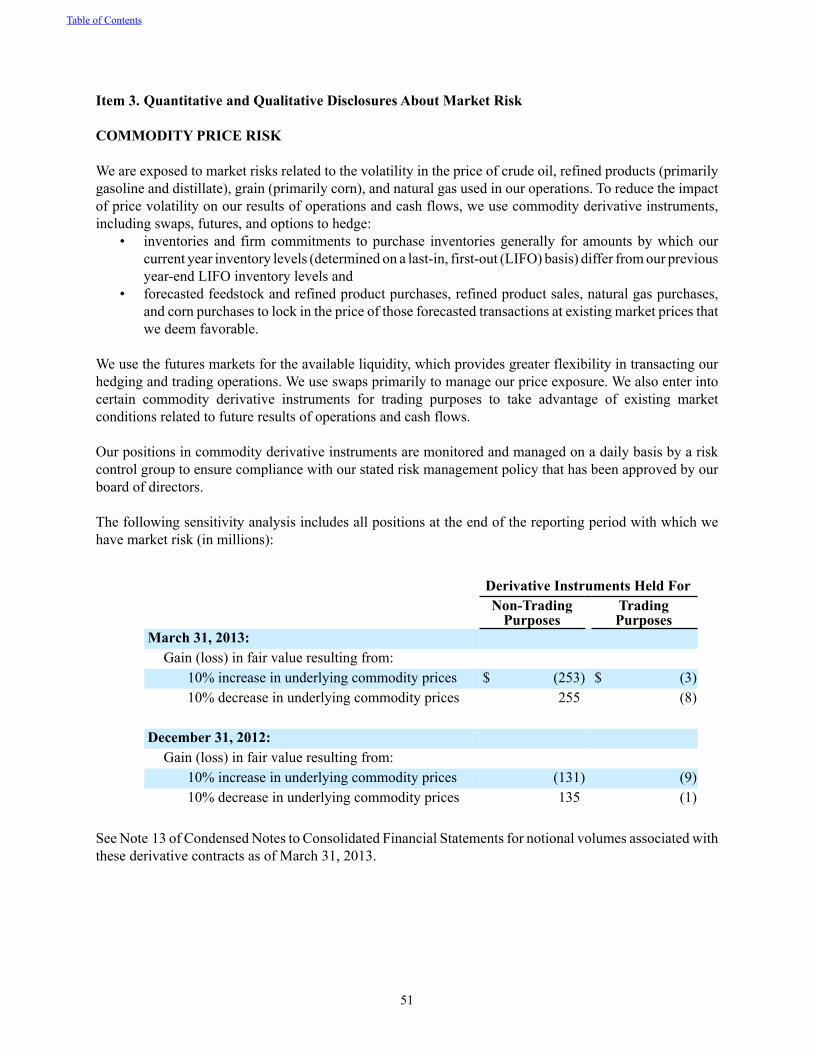
51
Item 3. Quantitative and Qualitative Disclosures About Market Risk
COMMODITY PRICE RISK
We are exposed to market risks related to the volatility in the price of crude oil, refined products (primarily gasoline and distillate), grain (primarily corn), and natural gas used in our operations. To reduce the impact of price volatility on our results of operations and cash flows, we use commodity derivative instruments, including swaps, futures, and options to hedge:
• inventories and firm commitments to purchase inventories generally for amounts by which our current year inventory levels (determined on a last-in, first-out (LIFO) basis) differ from our previous year-end LIFO inventory levels and
• forecasted feedstock and refined product purchases, refined product sales, natural gas purchases, and corn purchases to lock in the price of those forecasted transactions at existing market prices that we deem favorable.
We use the futures markets for the available liquidity, which provides greater flexibility in transacting our hedging and trading operations. We use swaps primarily to manage our price exposure. We also enter into certain commodity derivative instruments for trading purposes to take advantage of existing market conditions related to future results of operations and cash flows.
Our positions in commodity derivative instruments are monitored and managed on a daily basis by a risk control group to ensure compliance with our stated risk management policy that has been approved by our board of directors.
The following sensitivity analysis includes all positions at the end of the reporting period with which we have market risk (in millions):
Derivative Instruments Held For
Non-Trading
PurposesTradingPurposes
March 31, 2013: Gain (loss) in fair value resulting from:
10% increase in underlying commodity prices $ (253) $ (3)10% decrease in underlying commodity prices 255 (8)
December 31, 2012: Gain (loss) in fair value resulting from:
10% increase in underlying commodity prices (131) (9)10% decrease in underlying commodity prices 135 (1)
See Note 13 of Condensed Notes to Consolidated Financial Statements for notional volumes associated with these derivative contracts as of March 31, 2013.
Table of Contents
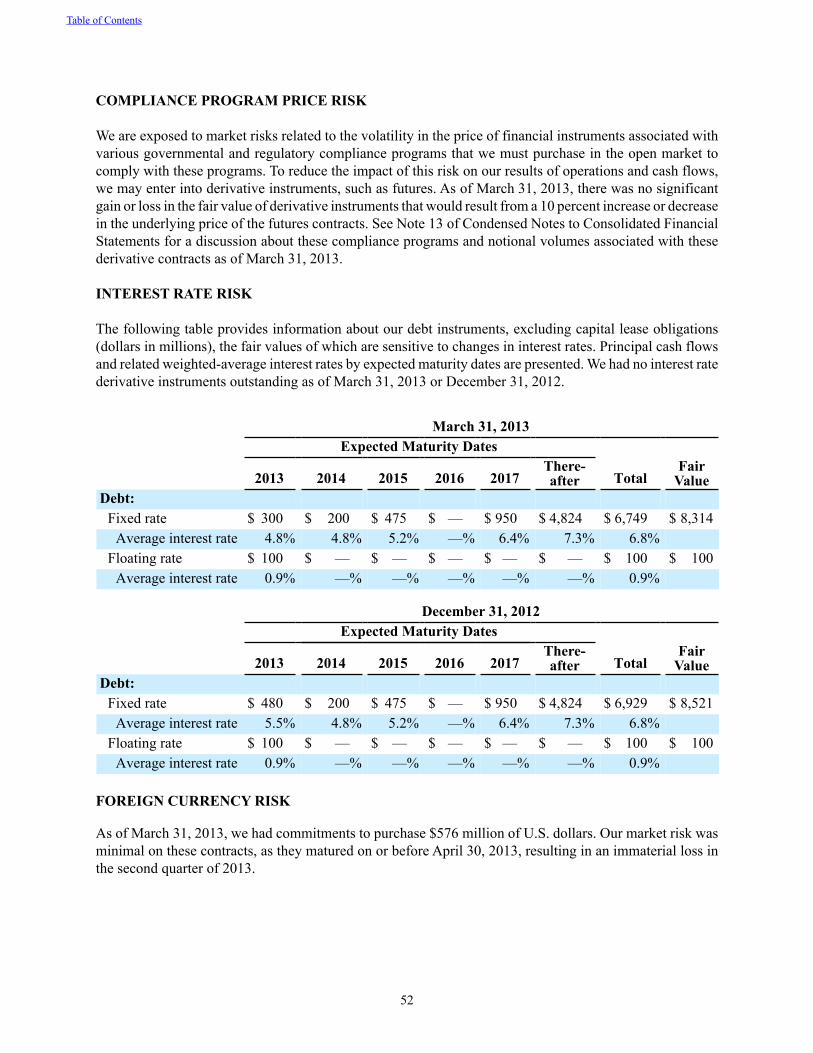
52
COMPLIANCE PROGRAM PRICE RISK
We are exposed to market risks related to the volatility in the price of financial instruments associated with various governmental and regulatory compliance programs that we must purchase in the open market to comply with these programs. To reduce the impact of this risk on our results of operations and cash flows, we may enter into derivative instruments, such as futures. As of March 31, 2013, there was no significant gain or loss in the fair value of derivative instruments that would result from a 10 percent increase or decrease in the underlying price of the futures contracts. See Note 13 of Condensed Notes to Consolidated Financial Statements for a discussion about these compliance programs and notional volumes associated with these derivative contracts as of March 31, 2013.
INTEREST RATE RISK
The following table provides information about our debt instruments, excluding capital lease obligations (dollars in millions), the fair values of which are sensitive to changes in interest rates. Principal cash flows and related weighted-average interest rates by expected maturity dates are presented. We had no interest rate derivative instruments outstanding as of March 31, 2013 or December 31, 2012.
March 31, 2013Expected Maturity Dates
2013 2014 2015 2016 2017There-after Total
FairValue
Debt:Fixed rate $ 300 $ 200 $ 475 $ — $ 950 $ 4,824 $ 6,749 $ 8,314
Average interest rate 4.8% 4.8% 5.2% —% 6.4% 7.3% 6.8%Floating rate $ 100 $ — $ — $ — $ — $ — $ 100 $ 100
Average interest rate 0.9% —% —% —% —% —% 0.9%
December 31, 2012Expected Maturity Dates
2013 2014 2015 2016 2017There-after Total
FairValue
Debt:Fixed rate $ 480 $ 200 $ 475 $ — $ 950 $ 4,824 $ 6,929 $ 8,521
Average interest rate 5.5% 4.8% 5.2% —% 6.4% 7.3% 6.8%Floating rate $ 100 $ — $ — $ — $ — $ — $ 100 $ 100
Average interest rate 0.9% —% —% —% —% —% 0.9%
FOREIGN CURRENCY RISK
As of March 31, 2013, we had commitments to purchase $576 million of U.S. dollars. Our market risk was minimal on these contracts, as they matured on or before April 30, 2013, resulting in an immaterial loss in the second quarter of 2013.
Table of Contents
53
Item 4. Controls and Procedures
(a) Evaluation of disclosure controls and procedures.
Our management has evaluated, with the participation of our principal executive officer and principal financial officer, the effectiveness of our disclosure controls and procedures (as defined in Rule 13a-15(e) under the Securities Exchange Act of 1934) as of the end of the period covered by this report, and has concluded that our disclosure controls and procedures were effective as of March 31, 2013.
(b) Changes in internal control over financial reporting.
There has been no change in our internal control over financial reporting that occurred during our last fiscal quarter that has materially affected, or is reasonably likely to materially affect, our internal control over financial reporting.
PART II – OTHER INFORMATION
Item 1. Legal Proceedings
The information below describes new proceedings or material developments in proceedings that we previously reported in our annual report on Form 10-K for the year ended December 31, 2012.
LitigationWe hereby incorporate by reference into this Item our disclosures made in Part I, Item 1 of this Report included in Note 6 of Condensed Notes to Consolidated Financial Statements under the caption “Litigation Matters.”
Item 1A. Risk FactorsThere have been no material changes from the risk factors disclosed in our annual report on Form 10-K for the year ended December 31, 2012.
Table of Contents
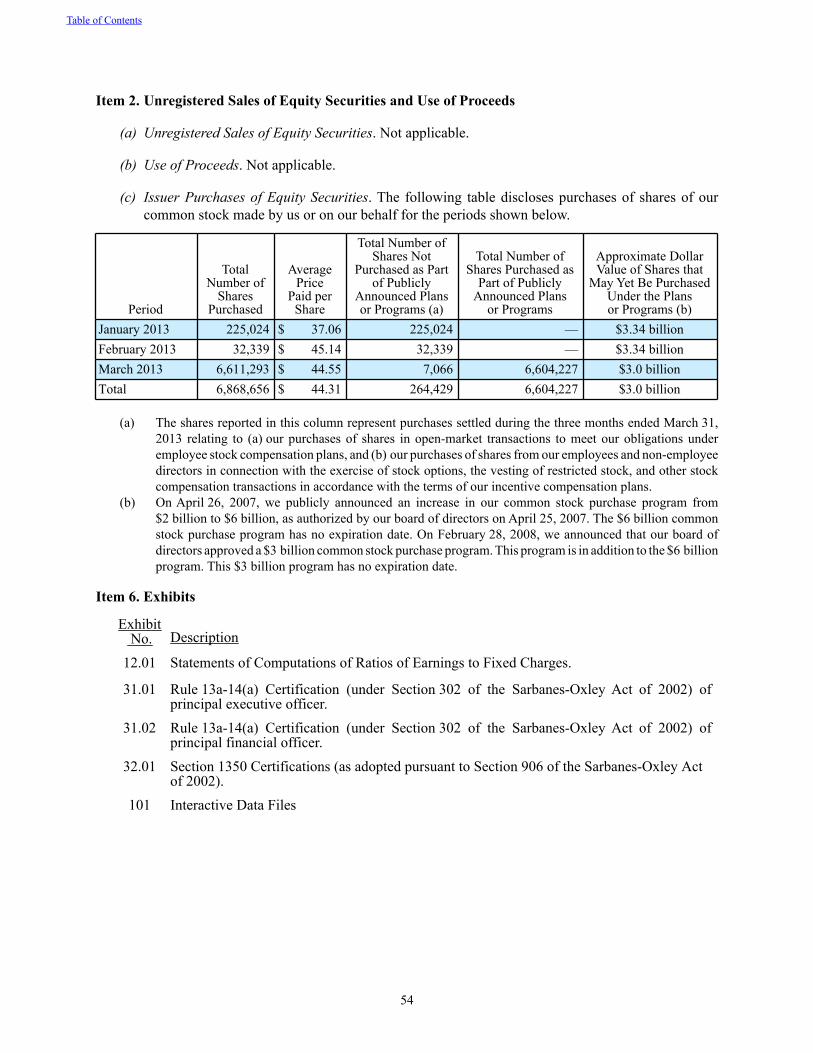
54
Item 2. Unregistered Sales of Equity Securities and Use of Proceeds
(a) Unregistered Sales of Equity Securities. Not applicable.
(b) Use of Proceeds. Not applicable.
(c) Issuer Purchases of Equity Securities. The following table discloses purchases of shares of our common stock made by us or on our behalf for the periods shown below.
Period
TotalNumber of
SharesPurchased
AveragePrice
Paid perShare
Total Number ofShares Not
Purchased as Partof Publicly
Announced Plansor Programs (a)
Total Number ofShares Purchased as
Part of PubliclyAnnounced Plans
or Programs
Approximate DollarValue of Shares that
May Yet Be PurchasedUnder the Plansor Programs (b)
January 2013 225,024 $ 37.06 225,024 — $3.34 billionFebruary 2013 32,339 $ 45.14 32,339 — $3.34 billionMarch 2013 6,611,293 $ 44.55 7,066 6,604,227 $3.0 billionTotal 6,868,656 $ 44.31 264,429 6,604,227 $3.0 billion
(a) The shares reported in this column represent purchases settled during the three months ended March 31, 2013 relating to (a) our purchases of shares in open-market transactions to meet our obligations under employee stock compensation plans, and (b) our purchases of shares from our employees and non-employee directors in connection with the exercise of stock options, the vesting of restricted stock, and other stock compensation transactions in accordance with the terms of our incentive compensation plans.
(b) On April 26, 2007, we publicly announced an increase in our common stock purchase program from $2 billion to $6 billion, as authorized by our board of directors on April 25, 2007. The $6 billion common stock purchase program has no expiration date. On February 28, 2008, we announced that our board of directors approved a $3 billion common stock purchase program. This program is in addition to the $6 billion program. This $3 billion program has no expiration date.
Item 6. Exhibits
Exhibit No. Description
12.01 Statements of Computations of Ratios of Earnings to Fixed Charges.
31.01 Rule 13a-14(a) Certification (under Section 302 of the Sarbanes-Oxley Act of 2002) of principal executive officer.
31.02 Rule 13a-14(a) Certification (under Section 302 of the Sarbanes-Oxley Act of 2002) of principal financial officer.
32.01 Section 1350 Certifications (as adopted pursuant to Section 906 of the Sarbanes-Oxley Actof 2002).
101 Interactive Data Files
Table of Contents
55
SIGNATURE
Pursuant to the requirements of the Securities Exchange Act of 1934, the registrant has duly caused this report to be signed on its behalf by the undersigned, thereunto duly authorized.
VALERO ENERGY CORPORATION
(Registrant)
By: /s/ Michael S. Ciskowski Michael S. Ciskowski
Executive Vice President andChief Financial Officer
(Duly Authorized Officer and PrincipalFinancial and Accounting Officer)
Date: May 8, 2013
Table of Contents
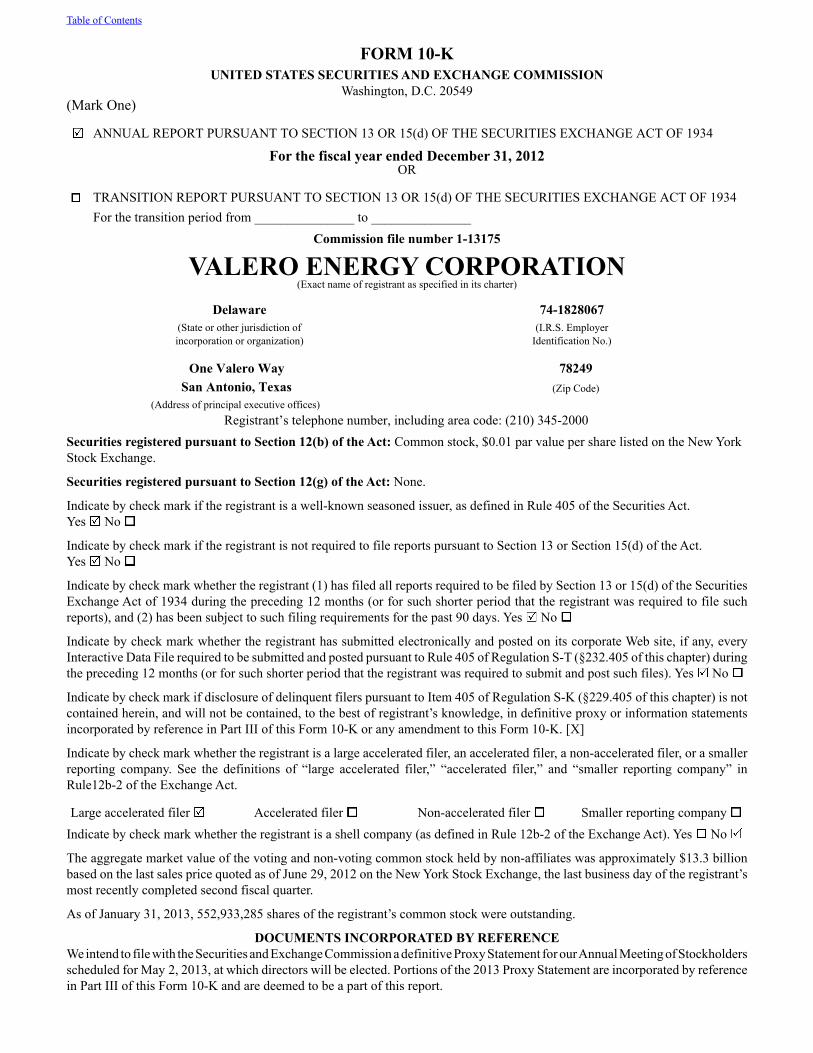
FORM 10-KUNITED STATES SECURITIES AND EXCHANGE COMMISSION
Washington, D.C. 20549(Mark One)
ANNUAL REPORT PURSUANT TO SECTION 13 OR 15(d) OF THE SECURITIES EXCHANGE ACT OF 1934
For the fiscal year ended December 31, 2012 OR
TRANSITION REPORT PURSUANT TO SECTION 13 OR 15(d) OF THE SECURITIES EXCHANGE ACT OF 1934For the transition period from _______________ to _______________
Commission file number 1-13175
VALERO ENERGY CORPORATION(Exact name of registrant as specified in its charter)
Delaware 74-1828067(State or other jurisdiction of (I.R.S. Employerincorporation or organization) Identification No.)
One Valero Way 78249San Antonio, Texas (Zip Code)
(Address of principal executive offices)Registrant’s telephone number, including area code: (210) 345-2000
Securities registered pursuant to Section 12(b) of the Act: Common stock, $0.01 par value per share listed on the New York Stock Exchange.
Securities registered pursuant to Section 12(g) of the Act: None.
Indicate by check mark if the registrant is a well-known seasoned issuer, as defined in Rule 405 of the Securities Act.Yes No
Indicate by check mark if the registrant is not required to file reports pursuant to Section 13 or Section 15(d) of the Act.Yes No
Indicate by check mark whether the registrant (1) has filed all reports required to be filed by Section 13 or 15(d) of the Securities Exchange Act of 1934 during the preceding 12 months (or for such shorter period that the registrant was required to file such reports), and (2) has been subject to such filing requirements for the past 90 days. Yes No
Indicate by check mark whether the registrant has submitted electronically and posted on its corporate Web site, if any, every Interactive Data File required to be submitted and posted pursuant to Rule 405 of Regulation S-T (§232.405 of this chapter) during the preceding 12 months (or for such shorter period that the registrant was required to submit and post such files). Yes No
Indicate by check mark if disclosure of delinquent filers pursuant to Item 405 of Regulation S-K (§229.405 of this chapter) is not contained herein, and will not be contained, to the best of registrant’s knowledge, in definitive proxy or information statements incorporated by reference in Part III of this Form 10-K or any amendment to this Form 10-K. [X]
Indicate by check mark whether the registrant is a large accelerated filer, an accelerated filer, a non-accelerated filer, or a smaller reporting company. See the definitions of “large accelerated filer,” “accelerated filer,” and “smaller reporting company” in Rule12b-2 of the Exchange Act.
Large accelerated filer Accelerated filer Non-accelerated filer Smaller reporting company Indicate by check mark whether the registrant is a shell company (as defined in Rule 12b-2 of the Exchange Act). Yes No
The aggregate market value of the voting and non-voting common stock held by non-affiliates was approximately $13.3 billion based on the last sales price quoted as of June 29, 2012 on the New York Stock Exchange, the last business day of the registrant’s most recently completed second fiscal quarter.
As of January 31, 2013, 552,933,285 shares of the registrant’s common stock were outstanding.
DOCUMENTS INCORPORATED BY REFERENCEWe intend to file with the Securities and Exchange Commission a definitive Proxy Statement for our Annual Meeting of Stockholders scheduled for May 2, 2013, at which directors will be elected. Portions of the 2013 Proxy Statement are incorporated by reference in Part III of this Form 10-K and are deemed to be a part of this report.
Table of Contents
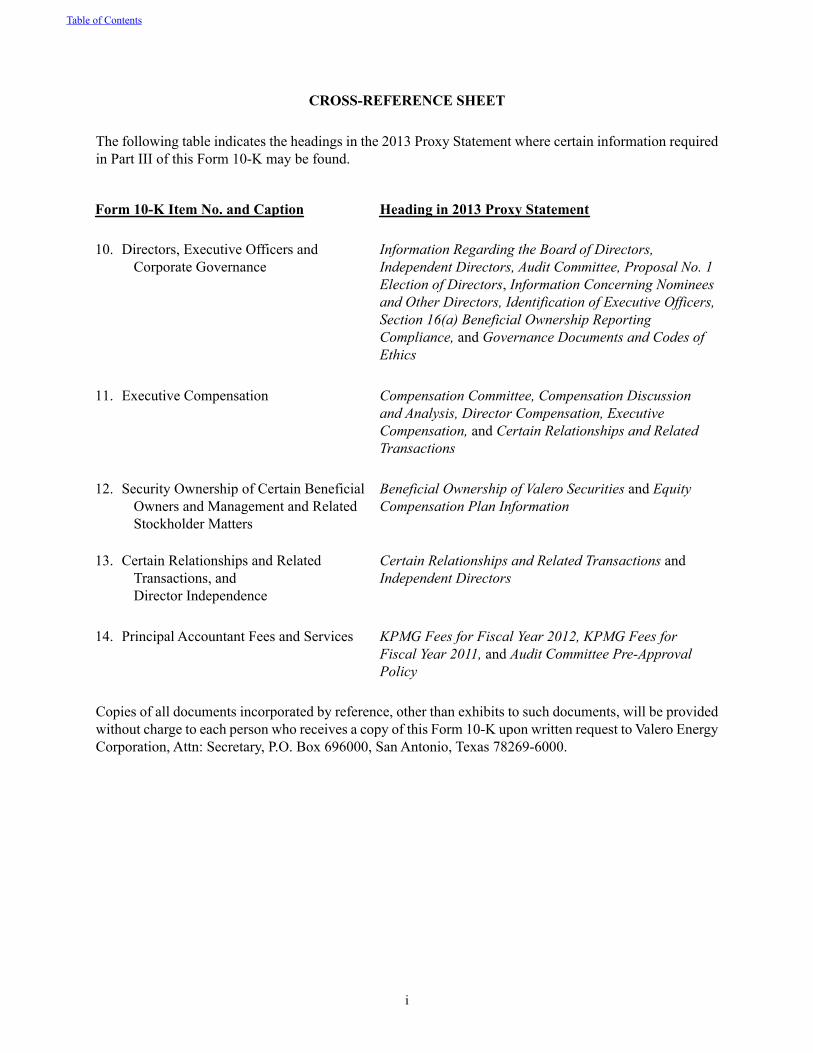
i
CROSS-REFERENCE SHEET
The following table indicates the headings in the 2013 Proxy Statement where certain information required in Part III of this Form 10-K may be found.
Form 10-K Item No. and Caption Heading in 2013 Proxy Statement
10. Directors, Executive Officers and Corporate Governance
Information Regarding the Board of Directors, Independent Directors, Audit Committee, Proposal No. 1 Election of Directors, Information Concerning Nominees and Other Directors, Identification of Executive Officers, Section 16(a) Beneficial Ownership Reporting Compliance, and Governance Documents and Codes of Ethics
11. Executive Compensation Compensation Committee, Compensation Discussion and Analysis, Director Compensation, Executive Compensation, and Certain Relationships and Related Transactions
12. Security Ownership of Certain BeneficialOwners and Management and RelatedStockholder Matters
Beneficial Ownership of Valero Securities and Equity Compensation Plan Information
13. Certain Relationships and RelatedTransactions, and Director Independence
Certain Relationships and Related Transactions and Independent Directors
14. Principal Accountant Fees and Services KPMG Fees for Fiscal Year 2012, KPMG Fees for Fiscal Year 2011, and Audit Committee Pre-Approval Policy
Copies of all documents incorporated by reference, other than exhibits to such documents, will be provided without charge to each person who receives a copy of this Form 10-K upon written request to Valero Energy Corporation, Attn: Secretary, P.O. Box 696000, San Antonio, Texas 78269-6000.
Table of Contents
ii
CONTENTS
PAGE
Item 11. Executive CompensationItem 12. Security Ownership of Certain Beneficial Owners and Management
and Related Stockholder MattersItem 13. Certain Relationships and Related Transactions, and Director IndependenceItem 14. Principal Accountant Fees and Services
PART IItems 1., 1A., & 2. Business, Risk Factors, and Properties 1
Segments 2Valero’s Operations 3Risk Factors 13Environmental Matters 19Properties 19
Item 1B. Unresolved Staff Comments 19Item 3. Legal Proceedings 20Item 4. Mine Safety Disclosures 21
PART IIItem 5. Market for Registrant’s Common Equity, Related Stockholder Matters, and
Issuer Purchases of Equity Securities 22Item 6. Selected Financial Data 25Item 7. Management’s Discussion and Analysis of Financial Condition and Results
of Operations 26Item 7A. Quantitative and Qualitative Disclosures About Market Risk 56Item 8. Financial Statements and Supplementary Data 58Item 9. Changes in and Disagreements with Accountants on Accounting and
Financial Disclosure 137Item 9A. Controls and Procedures 137Item 9B. Other Information 137
PART IIIItem 10. Directors, Executive Officers and Corporate Governance 138
138
138138138
PART IVItem 15. Exhibits and Financial Statement Schedules 138
Signature 142
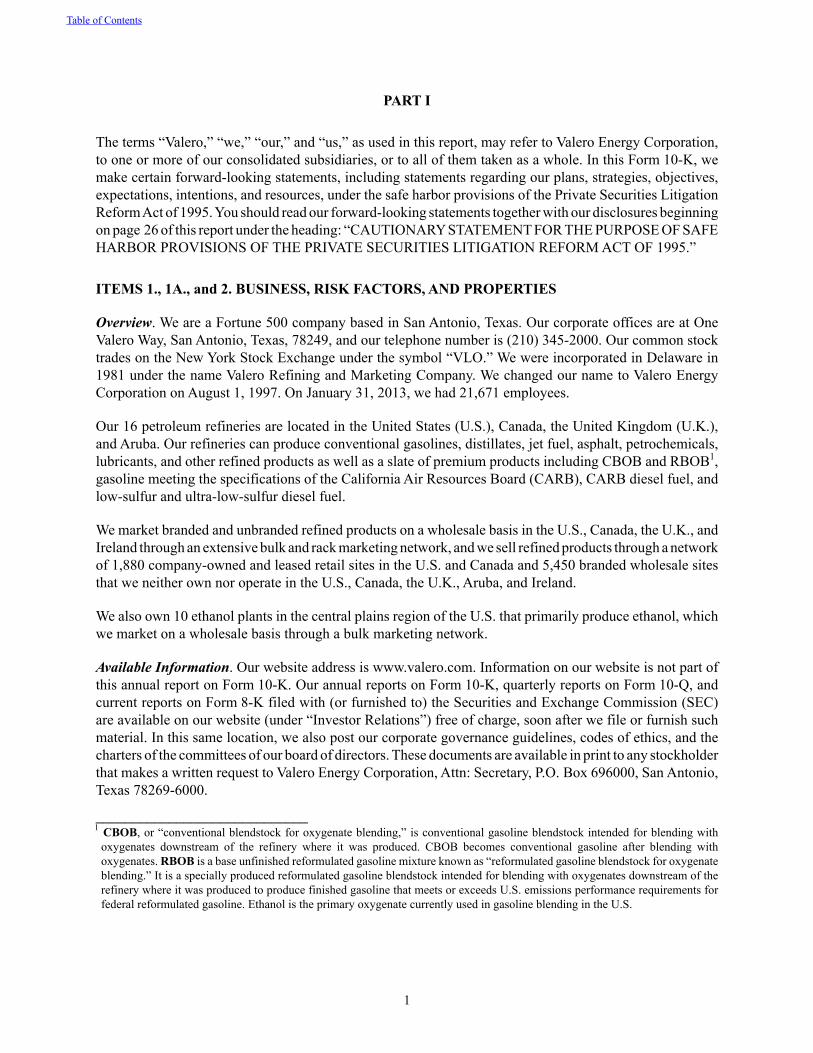
1
PART I
The terms “Valero,” “we,” “our,” and “us,” as used in this report, may refer to Valero Energy Corporation, to one or more of our consolidated subsidiaries, or to all of them taken as a whole. In this Form 10-K, we make certain forward-looking statements, including statements regarding our plans, strategies, objectives, expectations, intentions, and resources, under the safe harbor provisions of the Private Securities Litigation Reform Act of 1995. You should read our forward-looking statements together with our disclosures beginning on page 26 of this report under the heading: “CAUTIONARY STATEMENT FOR THE PURPOSE OF SAFE HARBOR PROVISIONS OF THE PRIVATE SECURITIES LITIGATION REFORM ACT OF 1995.”
ITEMS 1., 1A., and 2. BUSINESS, RISK FACTORS, AND PROPERTIES
Overview. We are a Fortune 500 company based in San Antonio, Texas. Our corporate offices are at One Valero Way, San Antonio, Texas, 78249, and our telephone number is (210) 345-2000. Our common stock trades on the New York Stock Exchange under the symbol “VLO.” We were incorporated in Delaware in 1981 under the name Valero Refining and Marketing Company. We changed our name to Valero Energy Corporation on August 1, 1997. On January 31, 2013, we had 21,671 employees.
Our 16 petroleum refineries are located in the United States (U.S.), Canada, the United Kingdom (U.K.), and Aruba. Our refineries can produce conventional gasolines, distillates, jet fuel, asphalt, petrochemicals, lubricants, and other refined products as well as a slate of premium products including CBOB and RBOB1, gasoline meeting the specifications of the California Air Resources Board (CARB), CARB diesel fuel, and low-sulfur and ultra-low-sulfur diesel fuel.
We market branded and unbranded refined products on a wholesale basis in the U.S., Canada, the U.K., and Ireland through an extensive bulk and rack marketing network, and we sell refined products through a network of 1,880 company-owned and leased retail sites in the U.S. and Canada and 5,450 branded wholesale sites that we neither own nor operate in the U.S., Canada, the U.K., Aruba, and Ireland.
We also own 10 ethanol plants in the central plains region of the U.S. that primarily produce ethanol, which we market on a wholesale basis through a bulk marketing network.
Available Information. Our website address is www.valero.com. Information on our website is not part of this annual report on Form 10-K. Our annual reports on Form 10-K, quarterly reports on Form 10-Q, and current reports on Form 8-K filed with (or furnished to) the Securities and Exchange Commission (SEC) are available on our website (under “Investor Relations”) free of charge, soon after we file or furnish such material. In this same location, we also post our corporate governance guidelines, codes of ethics, and the charters of the committees of our board of directors. These documents are available in print to any stockholder that makes a written request to Valero Energy Corporation, Attn: Secretary, P.O. Box 696000, San Antonio, Texas 78269-6000.
_____________________________1 CBOB, or “conventional blendstock for oxygenate blending,” is conventional gasoline blendstock intended for blending with
oxygenates downstream of the refinery where it was produced. CBOB becomes conventional gasoline after blending with oxygenates. RBOB is a base unfinished reformulated gasoline mixture known as “reformulated gasoline blendstock for oxygenate blending.” It is a specially produced reformulated gasoline blendstock intended for blending with oxygenates downstream of the refinery where it was produced to produce finished gasoline that meets or exceeds U.S. emissions performance requirements for federal reformulated gasoline. Ethanol is the primary oxygenate currently used in gasoline blending in the U.S.
Table of Contents
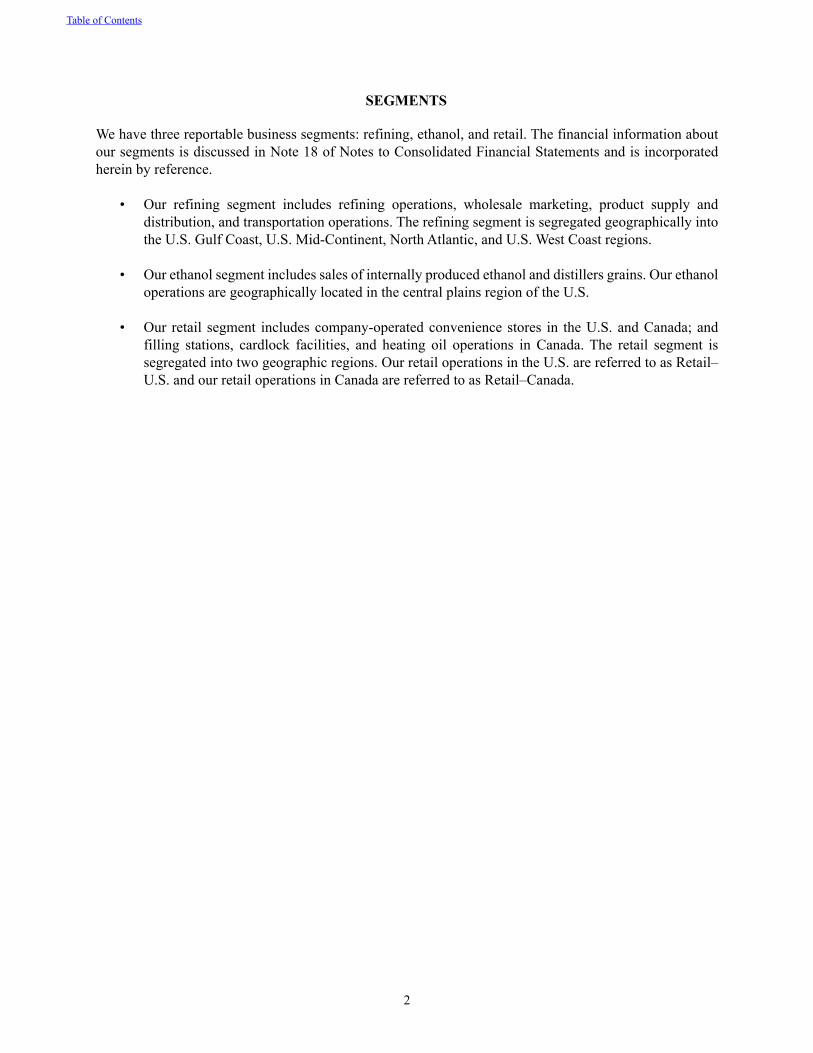
2
SEGMENTS
We have three reportable business segments: refining, ethanol, and retail. The financial information about our segments is discussed in Note 18 of Notes to Consolidated Financial Statements and is incorporated herein by reference.
• Our refining segment includes refining operations, wholesale marketing, product supply and distribution, and transportation operations. The refining segment is segregated geographically into the U.S. Gulf Coast, U.S. Mid-Continent, North Atlantic, and U.S. West Coast regions.
• Our ethanol segment includes sales of internally produced ethanol and distillers grains. Our ethanol operations are geographically located in the central plains region of the U.S.
• Our retail segment includes company-operated convenience stores in the U.S. and Canada; and filling stations, cardlock facilities, and heating oil operations in Canada. The retail segment is segregated into two geographic regions. Our retail operations in the U.S. are referred to as Retail–U.S. and our retail operations in Canada are referred to as Retail–Canada.
Table of Contents
3
VALERO’S OPERATIONS
REFINING
On December 31, 2012, our refining operations included 16 refineries in the U.S., Canada, the U.K., and Aruba, with a combined total throughput capacity of approximately 3.0 million barrels per day (BPD). The following table presents the locations of these refineries and their approximate feedstock throughput capacities as of December 31, 2012.
Refinery Location
Throughput Capacity (a)
(BPD)U.S. Gulf Coast:
Corpus Christi (b) Texas 325,000Port Arthur Texas 310,000St. Charles Louisiana 270,000Texas City Texas 245,000Aruba (c) Aruba 235,000Houston Texas 160,000Meraux Louisiana 135,000Three Rivers Texas 100,000
1,780,000
U.S. Mid-Continent:Memphis Tennessee 195,000McKee Texas 170,000Ardmore Oklahoma 90,000
455,000
North Atlantic:Pembroke Wales, U.K. 270,000Quebec City Quebec, Canada 235,000
505,000
U.S. West Coast:Benicia California 170,000Wilmington California 135,000
305,000Total 3,045,000
(a) “Throughput capacity” represents estimated capacity for processing crude oil, intermediates, and other feedstocks. Total estimated crude oil capacity is approximately 2.6 million BPD.
(b) Represents the combined capacities of two refineries – the Corpus Christi East and Corpus Christi West Refineries.
(c) The operations of the Aruba Refinery were suspended in March 2012. For further discussion of this matter, see Note 4 in Notes to Consolidated Financial Statements.
Table of Contents
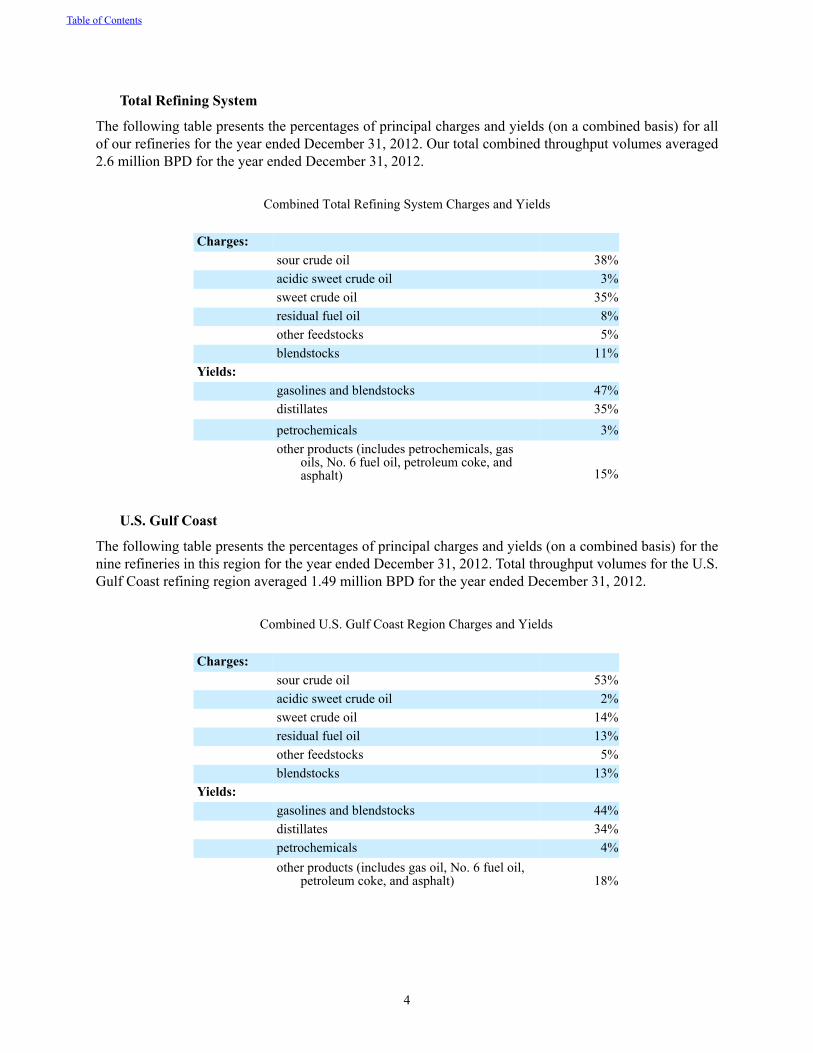
4
Total Refining System
The following table presents the percentages of principal charges and yields (on a combined basis) for all of our refineries for the year ended December 31, 2012. Our total combined throughput volumes averaged 2.6 million BPD for the year ended December 31, 2012.
Combined Total Refining System Charges and Yields
Charges:sour crude oil 38%acidic sweet crude oil 3%sweet crude oil 35%residual fuel oil 8%other feedstocks 5%blendstocks 11%
Yields:gasolines and blendstocks 47%distillates 35%petrochemicals 3%other products (includes petrochemicals, gas
oils, No. 6 fuel oil, petroleum coke, andasphalt) 15%
U.S. Gulf Coast
The following table presents the percentages of principal charges and yields (on a combined basis) for the nine refineries in this region for the year ended December 31, 2012. Total throughput volumes for the U.S. Gulf Coast refining region averaged 1.49 million BPD for the year ended December 31, 2012.
Combined U.S. Gulf Coast Region Charges and Yields
Charges:sour crude oil 53%acidic sweet crude oil 2%sweet crude oil 14%residual fuel oil 13%other feedstocks 5%blendstocks 13%
Yields:gasolines and blendstocks 44%distillates 34%petrochemicals 4%other products (includes gas oil, No. 6 fuel oil,
petroleum coke, and asphalt) 18%
Table of Contents
5
Corpus Christi East and West Refineries. Our Corpus Christi East and West Refineries are located on the Texas Gulf Coast along the Corpus Christi Ship Channel. The East Refinery processes sour crude oil into conventional gasoline, diesel, jet fuel, asphalt, aromatics, and other light products. The West Refinery specializes in processing primarily sour crude oil and residual fuel oil into premium products such as RBOB. The East and West Refineries allow for the transfer of various feedstocks and blending components between the two refineries and the sharing of resources. The refineries typically receive and deliver feedstocks and products by tanker and barge via deepwater docking facilities along the Corpus Christi Ship Channel. Three truck racks with a total of 16 bays service local markets for gasoline, diesel, jet fuels, liquefied petroleum gases, and asphalt. Finished products are distributed across the refineries’ docks into ships or barges, and are transported via third-party pipelines to the Colonial, Explorer, Valley, and other major pipelines.
Port Arthur Refinery. Our Port Arthur Refinery is located on the Texas Gulf Coast approximately 90 miles east of Houston. The refinery processes primarily heavy sour crude oils and other feedstocks into gasoline, diesel, jet fuel, petrochemicals, intermediates, petroleum coke, and sulfur. In 2012, we completed construction of a 57,000 BPD hydrocracker at this refinery, expanding the refinery’s yield of distillates. The refinery receives crude oil over marine docks and through crude oil pipelines, and has access to the Sunoco and Oiltanking terminals at Nederland, Texas. Finished products are distributed into the Colonial, Explorer, and TEPPCO pipelines and across the refinery docks into ships or barges.
St. Charles Refinery. Our St. Charles Refinery is located approximately 15 miles from New Orleans along the Mississippi River. The refinery processes sour crude oils and other feedstocks into gasoline, distillates, and other light products. In 2012, we continued construction on a planned 60,000 BPD hydrocracker at this refinery, which is expected to be completed in the second quarter of 2013. The refinery receives crude oil over five marine docks and has access to the Louisiana Offshore Oil Port where it can receive crude oil through a 24-inch pipeline. Finished products can be shipped over these docks or through the Colonial pipeline network for distribution to the eastern U.S.
Texas City Refinery. Our Texas City Refinery is located southeast of Houston on the Texas City Ship Channel. The refinery processes sour crude oils into a wide slate of products. The refinery receives and delivers its feedstocks and products by ship and barge via deepwater docking facilities along the Texas City Ship Channel and uses the Colonial, Explorer, and TEPPCO pipelines for distribution of its products.
Houston Refinery. Our Houston Refinery is located on the Houston Ship Channel. It processes a mix of crude oils and intermediate oils into reformulated gasoline and distillates. The refinery receives its feedstocks via interstate crude pipelines, tankers at deepwater docking facilities along the Houston Ship Channel and interconnecting pipelines with the Texas City Refinery. It delivers its products through major refined-product pipelines, including the Colonial, Explorer, Orion, and TEPPCO pipelines.
Meraux Refinery. Our Meraux Refinery is located in St. Bernard Parish southeast of New Orleans. The refinery processes primarily medium sour crude oils into gasoline, distillates, and other light products. The refinery receives crude oil at its marine dock and has access to the Louisiana Offshore Oil Port where it can receive crude oil via the Clovelly-Alliance-Meraux pipeline system. Finished products can be shipped from the refinery’s dock or through the Colonial pipeline network for distribution to the eastern U.S. The Meraux Refinery is located about 40 miles from our St. Charles Refinery, allowing for integration of feedstocks and refined product blending.
Table of Contents
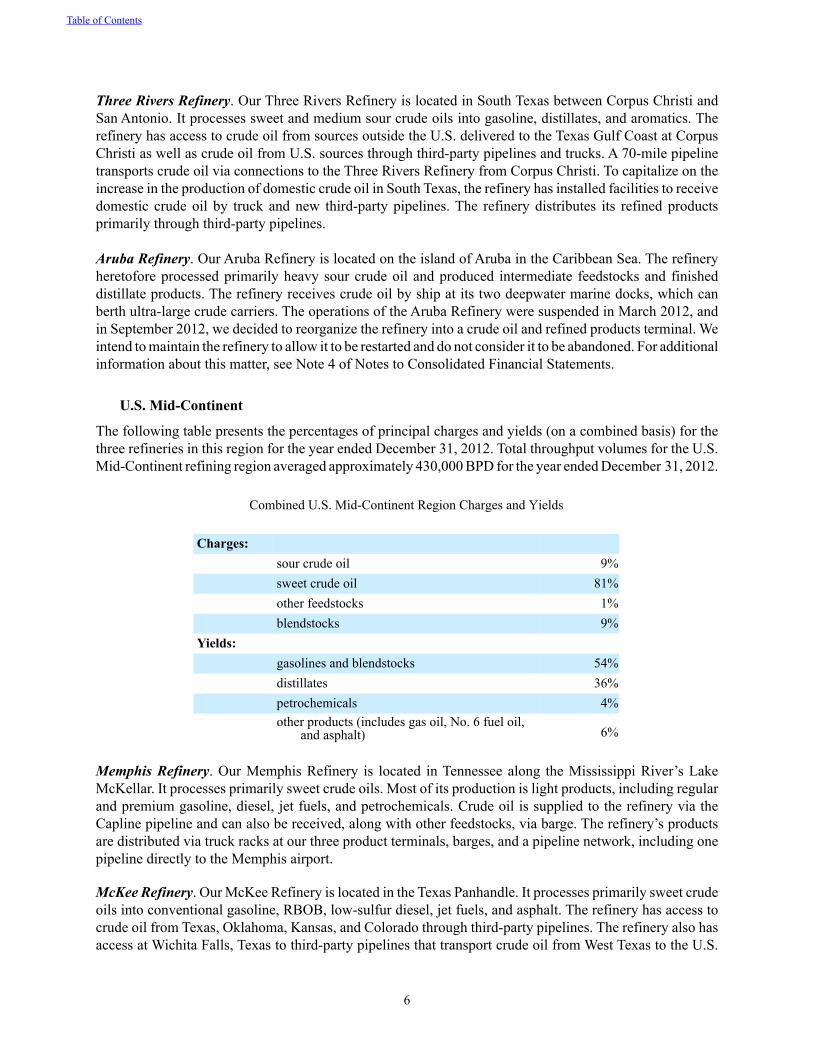
6
Three Rivers Refinery. Our Three Rivers Refinery is located in South Texas between Corpus Christi and San Antonio. It processes sweet and medium sour crude oils into gasoline, distillates, and aromatics. The refinery has access to crude oil from sources outside the U.S. delivered to the Texas Gulf Coast at Corpus Christi as well as crude oil from U.S. sources through third-party pipelines and trucks. A 70-mile pipeline transports crude oil via connections to the Three Rivers Refinery from Corpus Christi. To capitalize on the increase in the production of domestic crude oil in South Texas, the refinery has installed facilities to receive domestic crude oil by truck and new third-party pipelines. The refinery distributes its refined products primarily through third-party pipelines.
Aruba Refinery. Our Aruba Refinery is located on the island of Aruba in the Caribbean Sea. The refinery heretofore processed primarily heavy sour crude oil and produced intermediate feedstocks and finished distillate products. The refinery receives crude oil by ship at its two deepwater marine docks, which can berth ultra-large crude carriers. The operations of the Aruba Refinery were suspended in March 2012, and in September 2012, we decided to reorganize the refinery into a crude oil and refined products terminal. We intend to maintain the refinery to allow it to be restarted and do not consider it to be abandoned. For additional information about this matter, see Note 4 of Notes to Consolidated Financial Statements.
U.S. Mid-Continent
The following table presents the percentages of principal charges and yields (on a combined basis) for the three refineries in this region for the year ended December 31, 2012. Total throughput volumes for the U.S. Mid-Continent refining region averaged approximately 430,000 BPD for the year ended December 31, 2012.
Combined U.S. Mid-Continent Region Charges and Yields
Charges:sour crude oil 9%sweet crude oil 81%other feedstocks 1%blendstocks 9%
Yields:gasolines and blendstocks 54%distillates 36%petrochemicals 4%other products (includes gas oil, No. 6 fuel oil,
and asphalt) 6%
Memphis Refinery. Our Memphis Refinery is located in Tennessee along the Mississippi River’s Lake McKellar. It processes primarily sweet crude oils. Most of its production is light products, including regular and premium gasoline, diesel, jet fuels, and petrochemicals. Crude oil is supplied to the refinery via the Capline pipeline and can also be received, along with other feedstocks, via barge. The refinery’s products are distributed via truck racks at our three product terminals, barges, and a pipeline network, including one pipeline directly to the Memphis airport.
McKee Refinery. Our McKee Refinery is located in the Texas Panhandle. It processes primarily sweet crude oils into conventional gasoline, RBOB, low-sulfur diesel, jet fuels, and asphalt. The refinery has access to crude oil from Texas, Oklahoma, Kansas, and Colorado through third-party pipelines. The refinery also has access at Wichita Falls, Texas to third-party pipelines that transport crude oil from West Texas to the U.S.
Table of Contents
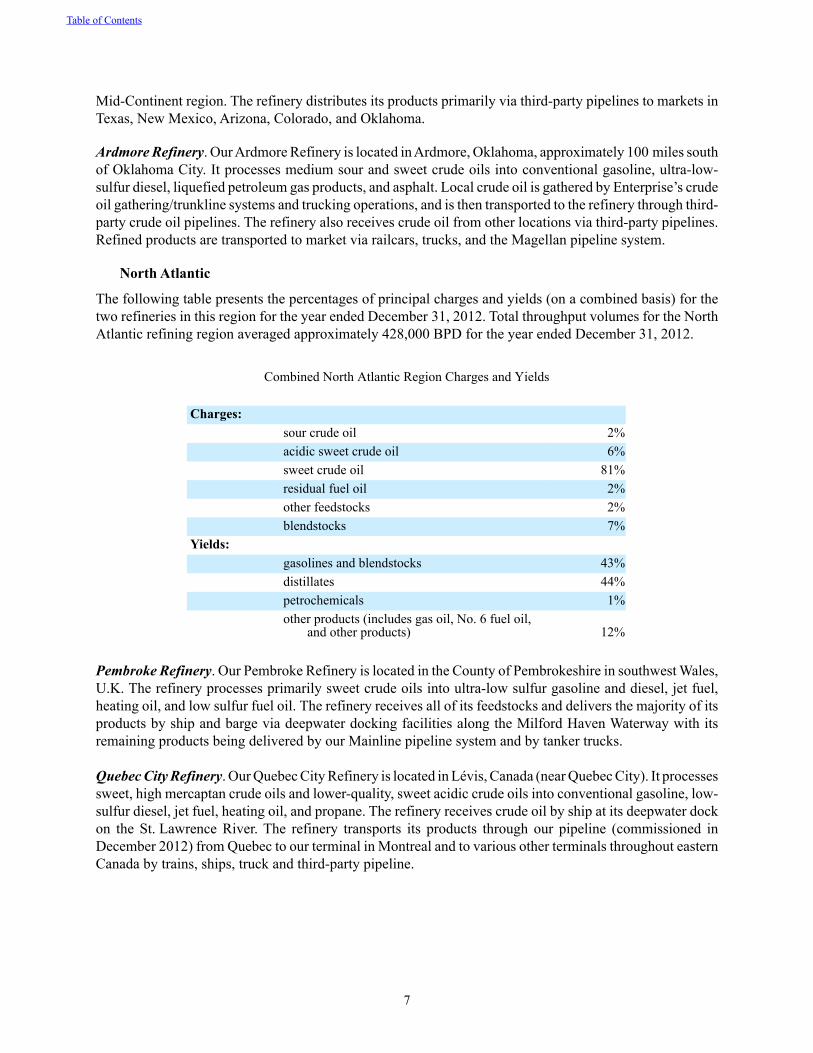
7
Mid-Continent region. The refinery distributes its products primarily via third-party pipelines to markets in Texas, New Mexico, Arizona, Colorado, and Oklahoma.
Ardmore Refinery. Our Ardmore Refinery is located in Ardmore, Oklahoma, approximately 100 miles south of Oklahoma City. It processes medium sour and sweet crude oils into conventional gasoline, ultra-low-sulfur diesel, liquefied petroleum gas products, and asphalt. Local crude oil is gathered by Enterprise’s crude oil gathering/trunkline systems and trucking operations, and is then transported to the refinery through third-party crude oil pipelines. The refinery also receives crude oil from other locations via third-party pipelines. Refined products are transported to market via railcars, trucks, and the Magellan pipeline system.
North Atlantic
The following table presents the percentages of principal charges and yields (on a combined basis) for the two refineries in this region for the year ended December 31, 2012. Total throughput volumes for the North Atlantic refining region averaged approximately 428,000 BPD for the year ended December 31, 2012.
Combined North Atlantic Region Charges and Yields
Charges:sour crude oil 2%acidic sweet crude oil 6%sweet crude oil 81%residual fuel oil 2%other feedstocks 2%blendstocks 7%
Yields:gasolines and blendstocks 43%distillates 44%petrochemicals 1%other products (includes gas oil, No. 6 fuel oil,
and other products) 12%
Pembroke Refinery. Our Pembroke Refinery is located in the County of Pembrokeshire in southwest Wales, U.K. The refinery processes primarily sweet crude oils into ultra-low sulfur gasoline and diesel, jet fuel, heating oil, and low sulfur fuel oil. The refinery receives all of its feedstocks and delivers the majority of its products by ship and barge via deepwater docking facilities along the Milford Haven Waterway with its remaining products being delivered by our Mainline pipeline system and by tanker trucks.
Quebec City Refinery. Our Quebec City Refinery is located in Lévis, Canada (near Quebec City). It processes sweet, high mercaptan crude oils and lower-quality, sweet acidic crude oils into conventional gasoline, low-sulfur diesel, jet fuel, heating oil, and propane. The refinery receives crude oil by ship at its deepwater dock on the St. Lawrence River. The refinery transports its products through our pipeline (commissioned in December 2012) from Quebec to our terminal in Montreal and to various other terminals throughout eastern Canada by trains, ships, truck and third-party pipeline.
Table of Contents
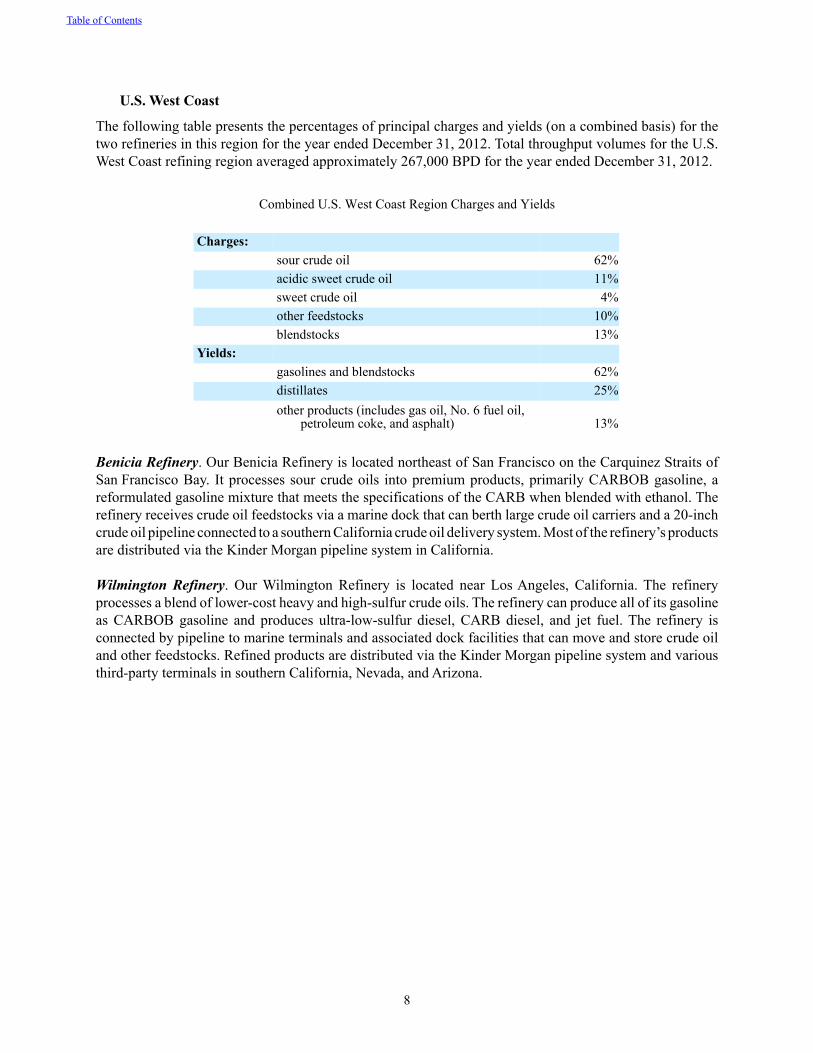
8
U.S. West Coast
The following table presents the percentages of principal charges and yields (on a combined basis) for the two refineries in this region for the year ended December 31, 2012. Total throughput volumes for the U.S. West Coast refining region averaged approximately 267,000 BPD for the year ended December 31, 2012.
Combined U.S. West Coast Region Charges and Yields
Charges:sour crude oil 62%acidic sweet crude oil 11%sweet crude oil 4%other feedstocks 10%blendstocks 13%
Yields:gasolines and blendstocks 62%distillates 25%other products (includes gas oil, No. 6 fuel oil,
petroleum coke, and asphalt) 13%
Benicia Refinery. Our Benicia Refinery is located northeast of San Francisco on the Carquinez Straits of San Francisco Bay. It processes sour crude oils into premium products, primarily CARBOB gasoline, a reformulated gasoline mixture that meets the specifications of the CARB when blended with ethanol. The refinery receives crude oil feedstocks via a marine dock that can berth large crude oil carriers and a 20-inch crude oil pipeline connected to a southern California crude oil delivery system. Most of the refinery’s products are distributed via the Kinder Morgan pipeline system in California.
Wilmington Refinery. Our Wilmington Refinery is located near Los Angeles, California. The refinery processes a blend of lower-cost heavy and high-sulfur crude oils. The refinery can produce all of its gasoline as CARBOB gasoline and produces ultra-low-sulfur diesel, CARB diesel, and jet fuel. The refinery is connected by pipeline to marine terminals and associated dock facilities that can move and store crude oil and other feedstocks. Refined products are distributed via the Kinder Morgan pipeline system and various third-party terminals in southern California, Nevada, and Arizona.
Table of Contents
9
Feedstock Supply
Approximately 77 percent of our current crude oil feedstock requirements are purchased through term contracts while the remaining requirements are generally purchased on the spot market. Our term supply agreements include arrangements to purchase feedstocks at market-related prices directly or indirectly from various national oil companies as well as international and U.S. oil companies. The contracts generally permit the parties to amend the contracts (or terminate them), effective as of the next scheduled renewal date, by giving the other party proper notice within a prescribed period of time (e.g., 60 days, 6 months) before expiration of the current term. The majority of the crude oil purchased under our term contracts is purchased at the producer’s official stated price (i.e., the “market” price established by the seller for all purchasers) and not at a negotiated price specific to us.
The U.S. network of crude oil pipelines and terminals allows us to acquire crude oil from producing leases, crude oil trading centers, and ships delivering cargoes of crude oil. Our Pembroke and Quebec City Refineries rely on crude oil that is delivered to the refineries’ dock facilities by ship.
In 2012, our refining business benefited from processing sweet crude oils sourced from the inland U.S. This development is discussed further in Item 7, “Management’s Discussion and Analysis of Financial Condition and Results of Operations” under the caption “Outlook.”
Refining Segment Sales
Overview
Our refining segment includes sales of refined products in both the wholesale rack and bulk markets. These sales include refined products that are manufactured in our refining operations as well as refined products purchased or received on exchange from third parties. Most of our refineries have access to marine transportation facilities and interconnect with common-carrier pipeline systems, allowing us to sell products in the U.S., Canada, the U.K., and other countries. No customer accounted for more than 10 percent of our total operating revenues in 2012.
Wholesale Marketing
We market branded and unbranded refined products on a wholesale basis through an extensive rack marketing network. The principal purchasers of our refined products from terminal truck racks are wholesalers, distributors, retailers, and truck-delivered end users throughout the U.S., the U.K., and Ireland.
The majority of our rack volume is sold through unbranded channels. The remainder is sold to distributors and dealers that are members of the Valero-brand family that operate approximately 4,450 branded sites in the U.S. and approximately 1,000 branded sites in the U.K. and Ireland. These sites are independently owned and are supplied by us under multi-year contracts. For wholesale branded sites, we promote our Valero®, Beacon®, and Shamrock® brands in the U.S., and the Texaco® brand in the U.K. and Ireland.
Bulk Sales and Trading
We sell a significant portion of our gasoline and distillate production through bulk sales channels in U.S. and international markets. Our bulk sales are made to various oil companies and traders as well as certain bulk end-users such as railroads, airlines, and utilities. Our bulk sales are transported primarily by pipeline, barges, and tankers to major tank farms and trading hubs.
We also enter into refined product exchange and purchase agreements. These agreements help minimize transportation costs, optimize refinery utilization, balance refined product availability, broaden geographic
Table of Contents
10
distribution, and provide access to markets not connected to our refined-product pipeline systems. Exchange agreements provide for the delivery of refined products by us to unaffiliated companies at our and third-parties’ terminals in exchange for delivery of a similar amount of refined products to us by these unaffiliated companies at specified locations. Purchase agreements involve our purchase of refined products from third parties with delivery occurring at specified locations.
Specialty Products
We sell a variety of other products produced at our refineries, which we refer to collectively as “Specialty Products.” Our Specialty Products include asphalt, lube oils, natural gas liquids (NGLs), petroleum coke, petrochemicals, and sulfur.
• We produce asphalt at five of our refineries. Our asphalt products are sold for use in road construction, road repair, and roofing applications through a network of refinery and terminal loading racks.
• We produce naphthenic oils at one of our refineries suitable for a wide variety of lubricant and process applications.
• NGLs produced at our refineries include butane, isobutane, and propane. These products can be used for gasoline blending, home heating, and petrochemical plant feedstocks.
• We are a significant producer of petroleum coke, supplying primarily power generation customers and cement manufacturers. Petroleum coke is used largely as a substitute for coal.
• We produce and market a number of commodity petrochemicals including aromatics (benzene, toluene, and xylene) and two grades of propylene. Aromatics and propylenes are sold to customers in the chemical industry for further processing into such products as paints, plastics, and adhesives.
• We are a large producer of sulfur with sales primarily to customers in the agricultural sector. Sulfur is used in manufacturing fertilizer.
Table of Contents
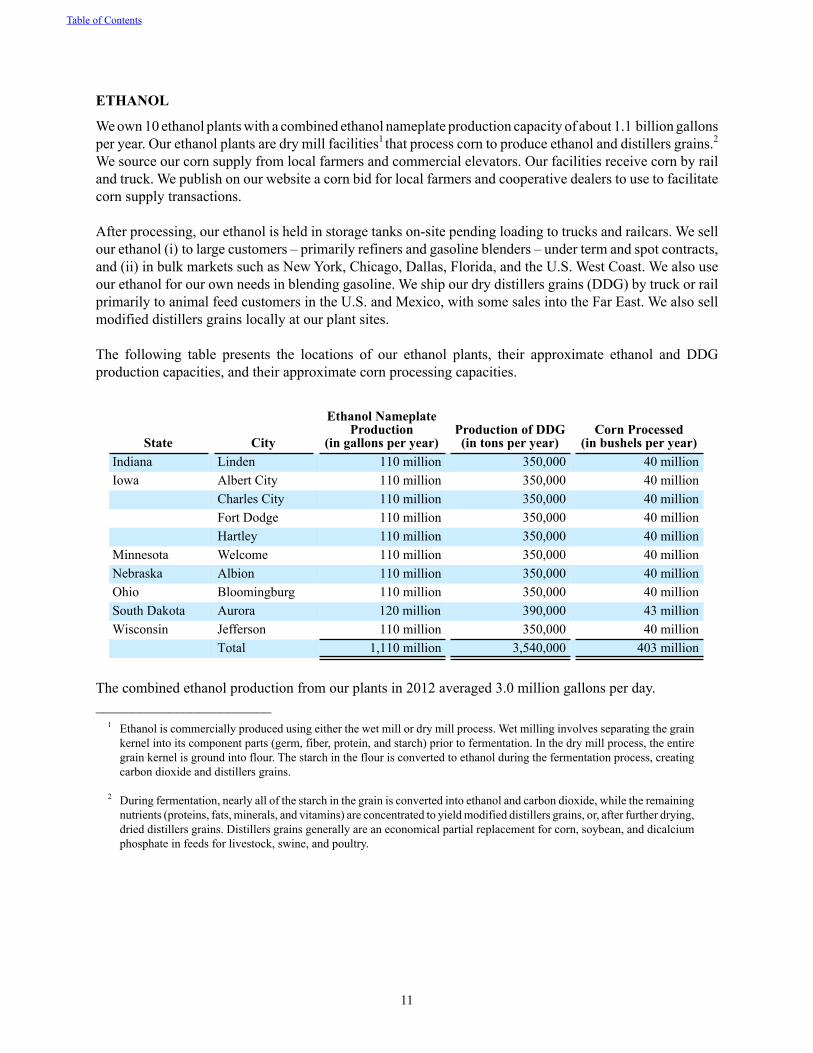
11
ETHANOL
We own 10 ethanol plants with a combined ethanol nameplate production capacity of about 1.1 billion gallons per year. Our ethanol plants are dry mill facilities1 that process corn to produce ethanol and distillers grains.2
We source our corn supply from local farmers and commercial elevators. Our facilities receive corn by rail and truck. We publish on our website a corn bid for local farmers and cooperative dealers to use to facilitate corn supply transactions.
After processing, our ethanol is held in storage tanks on-site pending loading to trucks and railcars. We sell our ethanol (i) to large customers – primarily refiners and gasoline blenders – under term and spot contracts, and (ii) in bulk markets such as New York, Chicago, Dallas, Florida, and the U.S. West Coast. We also use our ethanol for our own needs in blending gasoline. We ship our dry distillers grains (DDG) by truck or rail primarily to animal feed customers in the U.S. and Mexico, with some sales into the Far East. We also sell modified distillers grains locally at our plant sites.
The following table presents the locations of our ethanol plants, their approximate ethanol and DDG production capacities, and their approximate corn processing capacities.
State City
Ethanol Nameplate Production
(in gallons per year)Production of DDG(in tons per year)
Corn Processed(in bushels per year)
Indiana Linden 110 million 350,000 40 millionIowa Albert City 110 million 350,000 40 million
Charles City 110 million 350,000 40 millionFort Dodge 110 million 350,000 40 millionHartley 110 million 350,000 40 million
Minnesota Welcome 110 million 350,000 40 millionNebraska Albion 110 million 350,000 40 millionOhio Bloomingburg 110 million 350,000 40 millionSouth Dakota Aurora 120 million 390,000 43 millionWisconsin Jefferson 110 million 350,000 40 million
Total 1,110 million 3,540,000 403 million
The combined ethanol production from our plants in 2012 averaged 3.0 million gallons per day.________________________
1 Ethanol is commercially produced using either the wet mill or dry mill process. Wet milling involves separating the grain kernel into its component parts (germ, fiber, protein, and starch) prior to fermentation. In the dry mill process, the entire grain kernel is ground into flour. The starch in the flour is converted to ethanol during the fermentation process, creating carbon dioxide and distillers grains.
2 During fermentation, nearly all of the starch in the grain is converted into ethanol and carbon dioxide, while the remaining nutrients (proteins, fats, minerals, and vitamins) are concentrated to yield modified distillers grains, or, after further drying, dried distillers grains. Distillers grains generally are an economical partial replacement for corn, soybean, and dicalcium phosphate in feeds for livestock, swine, and poultry.
Table of Contents
12
RETAIL
Our retail segment operations include:
• the sale of motor fuel at convenience stores, filling stations, and cardlocks;• the sale of convenience merchandise items and services at our convenience stores; and• the sale of heating oil to residential customers and heating oil and motor fuel to small commercial
customers.
We are one of the largest independent retailers of motor fuel in the central and southwest U.S. and eastern Canada. Our retail operations are segregated geographically into two groups: Retail–U.S. and Retail–Canada.
We plan to separate our retail business under a new company named CST Brands, Inc. (CST). CST is a wholly owned subsidiary of Valero Energy Corporation. The separation is planned by way of a pro rata distribution of 80 percent of the outstanding shares of CST common stock to Valero stockholders. For a further discussion of the planned separation, see Item 7, “Management’s Discussion and Analysis of Financial Condition and Results of Operations” under the caption “Outlook.”
Retail–U.S.
Sales in Retail–U.S. represent sales of motor fuel and convenience merchandise items and services through our company-operated convenience stores. For the year ended December 31, 2012, total sales of motor fuel through Retail–U.S.’s sites averaged 122,583 BPD. In addition to motor fuel, our company-operated stores sell convenience-type items, such as tobacco products, beer, snacks and beverages, and fast foods. Our stores also offer services such as ATM access, money orders, lottery tickets, car wash facilities, air and water, and video rentals. On December 31, 2012, we had 1,032 company-operated convenience stores in Retail–U.S. (of which 833 were owned and 199 were leased). Our company-operated convenience stores are operated primarily under the Corner Store® brand name. Motor fuel sold in our Retail–U.S. stores are sold primarily under the Valero® brand.
Retail–Canada
Sales in Retail–Canada include:
• the sale of motor fuel and convenience merchandise items through our company-operated convenience stores and cardlocks,
• the sale of motor fuel through filling stations owned and operated by independent dealers or agents where we retain title to the motor fuel and sell it directly to our customers, and
• the sale of heating oil to residential and small commercial customers.
Retail–Canada includes retail operations in eastern Canada where we are a major supplier of motor fuel serving Quebec, Ontario, Newfoundland and Labrador, Nova Scotia, New Brunswick, and Prince Edward Island. For the year ended December 31, 2012, total retail sales of motor fuel through Retail–Canada averaged approximately 68,100 BPD. Motor fuel is sold under the Ultramar® brand through a network of 848 retail sites throughout eastern Canada. On December 31, 2012, we owned or leased 261 convenience stores in Retail–Canada and sold motor fuel through 507 filling stations. In addition, Retail–Canada operates 80 cardlocks, which are card- or key-activated, self-service, unattended filling stations that allow commercial, trucking, and governmental fleets to buy motor fuel 24 hours a day. Retail–Canada operations also include the sale of heating oil to residential customers and heating oil and motor fuel to small commercial customers in eastern Canada. Our heating oil business is seasonal to the extent of increased demand for heating oil during the winter.
Table of Contents
13
RISK FACTORS
Risk Factors Related to Our Business
Our financial results are affected by volatile refining margins, which are dependent upon factors beyond our control.
Our financial results are primarily affected by the relationship, or margin, between refined product prices and the prices for crude oil and other feedstocks. Our cost to acquire feedstocks and the price at which we can ultimately sell refined products depend upon several factors beyond our control, including regional and global supply of and demand for crude oil, gasoline, diesel, and other feedstocks and refined products. These in turn depend on, among other things, the availability and quantity of imports, the production levels of U.S. and international suppliers, levels of refined product inventories, productivity and growth (or the lack thereof) of U.S. and global economies, U.S. relationships with foreign governments, political affairs, and the extent of governmental regulation. Historically, refining margins have been volatile, and we believe they will continue to be volatile in the future.
Economic turmoil and political unrest or hostilities, including the threat of future terrorist attacks, could affect the economies of the U.S. and other countries. Lower levels of economic activity could result in declines in energy consumption, including declines in the demand for and consumption of our refined products, which could cause our revenues and margins to decline and limit our future growth prospects.
Refining margins are also significantly impacted by additional refinery conversion capacity through the expansion of existing refineries or the construction of new refineries. Worldwide refining capacity expansions may result in refining production capability exceeding refined product demand, which would have an adverse effect on refining margins.
A significant portion of our profitability is derived from the ability to purchase and process crude oil feedstocks that historically have been cheaper than benchmark crude oils, such as Louisiana Light Sweet (LLS) and Brent crude oils. These crude oil feedstock differentials vary significantly depending on overall economic conditions and trends and conditions within the markets for crude oil and refined products, and they could decline in the future, which would have a negative impact on our results of operations.
Uncertainty and illiquidity in credit and capital markets can impair our ability to obtain credit and financing on acceptable terms, and can adversely affect the financial strength of our business partners.
Our ability to obtain credit and capital depends in large measure on capital markets and liquidity factors that we do not control. Our ability to access credit and capital markets may be restricted at a time when we would like, or need, to access those markets, which could have an impact on our flexibility to react to changing economic and business conditions. In addition, the cost and availability of debt and equity financing may be adversely impacted by unstable or illiquid market conditions. Protracted uncertainty and illiquidity in these markets also could have an adverse impact on our lenders, commodity hedging counterparties, or our customers, causing them to fail to meet their obligations to us. In addition, decreased returns on pension fund assets may also materially increase our pension funding requirements.
Our access to credit and capital markets also depends on the credit ratings assigned to our debt by independent credit rating agencies. We currently maintain investment-grade ratings by Standard & Poor’s Ratings Services (S&P), Moody’s Investors Service (Moody’s), and Fitch Ratings (Fitch) on our senior unsecured debt. (Ratings from credit agencies are not recommendations to buy, sell, or hold our securities. Each rating should be evaluated independently of any other rating.) We cannot provide assurance that any of our current ratings
Table of Contents
14
will remain in effect for any given period of time or that a rating will not be lowered or withdrawn entirely by a rating agency if, in its judgment, circumstances so warrant. Specifically, if S&P, Moody’s, or Fitch were to downgrade our long-term rating, particularly below investment grade, our borrowing costs would increase, which could adversely affect our ability to attract potential investors and our funding sources could decrease. In addition, we may not be able to obtain favorable credit terms from our suppliers or they may require us to provide collateral, letters of credit, or other forms of security which would increase our operating costs. As a result, a downgrade below investment grade in our credit ratings could have a material adverse impact on our financial position, results of operations, and liquidity.
From time to time, our cash needs may exceed our internally generated cash flow, and our business could be materially and adversely affected if we were unable to obtain necessary funds from financing activities. From time to time, we may need to supplement our cash generated from operations with proceeds from financing activities. We have existing revolving credit facilities, committed letter of credit facilities, and an accounts receivable sales facility to provide us with available financing to meet our ongoing cash needs. In addition, we rely on the counterparties to our derivative instruments to fund their obligations under such arrangements. Uncertainty and illiquidity in financial markets may materially impact the ability of the participating financial institutions and other counterparties to fund their commitments to us under our various financing facilities or our derivative instruments, which could have a material adverse effect on our financial position, results of operations, and liquidity.
Compliance with and changes in environmental laws, including proposed climate change laws and regulations, could adversely affect our performance.
The principal environmental risks associated with our operations are emissions into the air and releases into the soil, surface water, or groundwater. Our operations are subject to extensive environmental laws and regulations, including those relating to the discharge of materials into the environment, waste management, pollution prevention measures, greenhouse gas emissions, and characteristics and composition of gasoline and diesel fuels. Certain of these laws and regulations could impose obligations to conduct assessment or remediation efforts at our facilities as well as at formerly owned properties or third-party sites where we have taken wastes for disposal or where our wastes have migrated. Environmental laws and regulations also may impose liability on us for the conduct of third parties, or for actions that complied with applicable requirements when taken, regardless of negligence or fault. If we violate or fail to comply with these laws and regulations, we could be fined or otherwise sanctioned.
Because environmental laws and regulations are becoming more stringent and new environmental laws and regulations are continuously being enacted or proposed, such as those relating to greenhouse gas emissions and climate change, the level of expenditures required for environmental matters could increase in the future. Current and future legislative action and regulatory initiatives could result in changes to operating permits, material changes in operations, increased capital expenditures and operating costs, increased costs of the goods we sell, and decreased demand for our products that cannot be assessed with certainty at this time. We may be required to make expenditures to modify operations or install pollution control equipment that could materially and adversely affect our business, financial condition, results of operations, and liquidity. For example, in 2012, the U.S. Environmental Protection Agency (EPA) proposed more stringent requirements for refinery air emissions through revisions to existing New Source Performance Standards and National Emission Standards for Hazardous Air Pollutants. The EPA also issued final amendments to Subpart Ja of the New Source Performance Standards, which included revisions to certain emission limits, monitoring requirements, fuel gas concentration limits, and waste gas flow limits for process heaters and flares. In addition, the EPA has, in recent years, adopted final rules making more stringent the National
Table of Contents
15
Ambient Air Quality Standards (NAAQS) for ozone, sulfur dioxide and nitrogen dioxide, and the EPA is considering further revisions to the NAAQS. Emerging rules and permitting requirements implementing these revised standards may require us to install more stringent controls at our facilities, which may result in increased capital expenditures. Governmental restrictions on greenhouse gas emissions – including so-called “cap-and-trade” programs targeted at reducing carbon dioxide emissions – could result in material increased compliance costs, additional operating restrictions for our business, and an increase in the cost of, and reduction in demand for, the products we produce, which could have a material adverse effect on our financial position, results of operations, and liquidity.
Disruption of our ability to obtain crude oil could adversely affect our operations.
A significant portion of our feedstock requirements is satisfied through supplies originating in the Middle East, Africa, Asia, North America, and South America. We are, therefore, subject to the political, geographic, and economic risks attendant to doing business with suppliers located in, and supplies originating from, these areas. If one or more of our supply contracts were terminated, or if political events disrupt our traditional crude oil supply, we believe that adequate alternative supplies of crude oil would be available, but it is possible that we would be unable to find alternative sources of supply. If we are unable to obtain adequate crude oil volumes or are able to obtain such volumes only at unfavorable prices, our results of operations could be materially adversely affected, including reduced sales volumes of refined products or reduced margins as a result of higher crude oil costs.
In addition, the U.S. government can prevent or restrict us from doing business in or with other countries. These restrictions, and those of other governments, could limit our ability to gain access to business opportunities in various countries. Actions by both the U.S. and other countries have affected our operations in the past and will continue to do so in the future.
We are subject to interruptions of supply and increased costs as a result of our reliance on third-party transportation of crude oil and refined products.
We often use the services of third parties to transport feedstocks and refined products to and from our facilities. If we experience prolonged interruptions of supply or increases in costs to deliver refined products to market, or if the ability of the pipelines or vessels to transport feedstocks or refined products is disrupted because of weather events, accidents, governmental regulations, or third-party actions, it could have a material adverse effect on our financial position, results of operations, and liquidity.
Competitors that produce their own supply of feedstocks, have more extensive retail sites, have greater financial resources, or provide alternative energy sources may have a competitive advantage.
The refining and marketing industry is highly competitive with respect to both feedstock supply and refined product markets. We compete with many companies for available supplies of crude oil and other feedstocks and for sites for our refined products. We do not produce any of our crude oil feedstocks and, following the proposed separation of our retail business, will not have a company-owned retail network. Many of our competitors, however, obtain a significant portion of their feedstocks from company-owned production and some have extensive retail sites. Such competitors are at times able to offset losses from refining operations with profits from producing or retailing operations, and may be better positioned to withstand periods of depressed refining margins or feedstock shortages.
Table of Contents
16
Some of our competitors also have materially greater financial and other resources than we have. Such competitors have a greater ability to bear the economic risks inherent in all phases of our industry. In addition, we compete with other industries that provide alternative means to satisfy the energy and fuel requirements of our industrial, commercial, and individual consumers.
A significant interruption in one or more of our refineries or our information technology systems could adversely affect our business.
Our refineries are our principal operating assets. As a result, our operations could be subject to significant interruption if one or more of our refineries were to experience a major accident or mechanical failure, encounter work stoppages relating to organized labor issues, be damaged by severe weather or other natural or man-made disaster, such as an act of terrorism, or otherwise be forced to shut down. If any refinery were to experience an interruption in operations, earnings from the refinery could be materially adversely affected (to the extent not recoverable through insurance) because of lost production and repair costs. Significant interruptions in our refining system could also lead to increased volatility in prices for crude oil feedstocks and refined products, and could increase instability in the financial and insurance markets, making it more difficult for us to access capital and to obtain insurance coverage that we consider adequate.
In addition, our information technology systems and network infrastructure may be subject to unauthorized access or attack, which could result in a loss of sensitive business information, systems interruption, or the disruption of our business operations. There can be no assurance that our infrastructure protection technologies and disaster recovery plans can prevent a technology systems breach or systems failure, which could have a material adverse effect on our financial position or results of operations.
We are subject to operational risks and our insurance may not be sufficient to cover all potential losses arising from operating hazards. Failure by one or more insurers to honor its coverage commitments for an insured event could materially and adversely affect our financial position, results of operations, and liquidity.
Our refining and marketing operations are subject to various hazards common to the industry, including explosions, fires, toxic emissions, maritime hazards, and natural catastrophes. As protection against these hazards, we maintain insurance coverage against some, but not all, such potential losses and liabilities. We may not be able to maintain or obtain insurance of the type and amount we desire at reasonable rates. As a result of market conditions, premiums and deductibles for certain of our insurance policies could increase substantially. In some instances, certain insurance could become unavailable or available only for reduced amounts of coverage. For example, coverage for hurricane damage is very limited, and coverage for terrorism risks includes very broad exclusions. If we were to incur a significant liability for which we were not fully insured, it could have a material adverse effect on our financial position.
Our insurance program includes a number of insurance carriers. Significant disruptions in financial markets could lead to a deterioration in the financial condition of many financial institutions, including insurance companies. We can make no assurances that we will be able to obtain the full amount of our insurance coverage for insured events.
Compliance with and changes in tax laws could adversely affect our performance.
We are subject to extensive tax liabilities imposed by multiple jurisdictions, including income taxes, indirect taxes (excise/duty, sales/use, gross receipts, and value-added taxes), payroll taxes, franchise taxes,
Table of Contents
17
withholding taxes, and ad valorem taxes. New tax laws and regulations and changes in existing tax laws and regulations are continuously being enacted or proposed that could result in increased expenditures for tax liabilities in the future. Many of these liabilities are subject to periodic audits by the respective taxing authority. Subsequent changes to our tax liabilities as a result of these audits may subject us to interest and penalties.
We may incur losses as a result of our forward-contract activities and derivative transactions.
We currently use commodity derivative instruments, and we expect to continue their use in the future. If the instruments we use to hedge our exposure to various types of risk are not effective, we may incur losses.
Risk Factors Related to the Planned Separation of our Retail Business
Risks associated with the separation of CST.
Our planned separation of CST is subject to a number of risks, including the following:
Risk of Non-Consummation. Although we expect to distribute 80 percent of the shares of CST common stock to Valero stockholders, the distribution remains subject to conditions, including, but not limited to: (i) the SEC having declared effective CST’s registration statement on Form 10; (ii) the receipt of a private letter ruling from the Internal Revenue Service (IRS) to the effect that the distribution, together with certain related transactions, will qualify as a reorganization for U.S. federal income tax purposes under Sections 355 and 368(a)(1)(D) of the Internal Revenue Code of 1986, as amended (Code); and (iii) the receipt of an opinion from a nationally recognized investment banking firm or other authority confirming the solvency and financial viability of CST after the distribution. There can be no assurance that any or all of these conditions will be met and that the distribution will be completed in the manner currently contemplated, or at all. In addition, the fulfillment of these conditions does not create any obligations on our part to effect the distribution, and our board of directors has reserved the right, in its sole discretion, to abandon, modify, or change the terms of the distribution.
Risks of Not Obtaining Benefits from the Separation. We and CST may not realize some or all of the benefits we expect from the separation in the time frame currently contemplated, or at all.
Risks Relating to Less Diversification. If the distribution is completed, our diversification of revenue sources will diminish due to the separation of CST from our other businesses, and it is possible that our results of operations, cash flows, working capital and financing requirements may be subject to increased volatility as a result.
Risks Relating to Taxes. We are seeking a private letter ruling from the IRS substantially to the effect that, for U.S. federal income tax purposes, the distribution of 80 percent of the shares of CST common stock, except for cash received in lieu of fractional shares, will qualify as tax-free under Sections 355 and 361 of the Code, and that certain internal transactions undertaken in anticipation of the distribution will qualify for favorable treatment. Notwithstanding the private letter ruling, the IRS could determine on audit that the distribution or the internal transactions should be treated as taxable transactions if it determines that any of the facts, assumptions, representations, or undertakings we or CST have made or provided to the IRS is not correct, or that the distribution or the internal transactions should be taxable for other reasons, including as a result of a significant change in stock or asset ownership after the distribution. If the distribution ultimately is determined to be taxable, we and/or our stockholders that are subject to U.S. federal income tax could incur significant U.S. federal income tax liabilities.
Table of Contents
18
Risks Relating to Post-Separation Share Value. Until the market has fully analyzed the value of our company after the distribution, we may experience more stock price volatility than usual. In addition, it is possible that the combined trading prices of our common stock and CST common stock immediately after the distribution will be less than the trading price of shares of our common stock immediately before the distribution.
Our minority investment in CST will be subject to certain risks and uncertainties and we may not be able to capture the full benefits from this investment.
After the distribution, we expect to retain 20 percent of the outstanding shares of CST common stock. As with any investment in a publicly traded company, our investment in CST will be subject to certain risks and uncertainties, which are disclosed in more detail in CST’s filings with the SEC. In addition, in connection with the separation, we will agree, and will grant to CST a proxy, to vote all of the shares of CST common stock that we retain in proportion to the votes cast by CST’s other stockholders. As a result, after the distribution, we may be required to vote our shares of CST common stock in a manner that is contrary to the manner we would otherwise have voted such shares.
We currently plan to dispose of all of the shares of CST common stock we will retain after the distribution through one or more exchanges for our indebtedness outstanding at the time of such exchange. We expect that pursuant to the private letter ruling we are seeking from the IRS in connection with the distribution, we will be required to dispose of any shares we do not dispose of pursuant to such exchanges as soon as practicable and consistent with our reasons for retaining such shares, but in no event later than five years after the distribution in connection with the separation. As a result, we may be required to sell some or all of our retained shares of CST common stock at a time when we might not otherwise choose to do so, and any such disposition in the public market, or the perception that such dispositions could occur, could adversely affect prevailing market prices for CST common stock and/or the value or the terms of such disposition.
Table of Contents
19
ENVIRONMENTAL MATTERS
We incorporate by reference into this Item the environmental disclosures contained in the following sections of this report:
• Item 1 under the caption “Risk Factors – Compliance with and changes in environmental laws, including proposed climate change laws and regulations, could adversely affect our performance,”
• Item 3, “Legal Proceedings” under the caption “Environmental Enforcement Matters,” and• Item 8, “Financial Statements and Supplementary Data” in Note 10 of Notes to Consolidated
Financial Statements under the caption “Environmental Liabilities” and Note 12 of Notes to Consolidated Financial Statements under the caption “Environmental Matters.”
Capital Expenditures Attributable to Compliance with Environmental Regulations. In 2012, our capital expenditures attributable to compliance with environmental regulations were $135 million, and are currently estimated to be $100 million for 2013 and $70 million for 2014. The estimates for 2013 and 2014 do not include amounts related to capital investments at our facilities that management has deemed to be strategic investments. These amounts could materially change as a result of governmental and regulatory actions.
PROPERTIES
Our principal properties are described above under the caption “Valero’s Operations,” and that information is incorporated herein by reference. We also own feedstock and refined product storage and transportation facilities in various locations. We believe that our properties and facilities are generally adequate for our operations and that our facilities are maintained in a good state of repair. As of December 31, 2012, we were the lessee under a number of cancelable and noncancelable leases for certain properties. Our leases are discussed more fully in Notes 11 and 12 of Notes to Consolidated Financial Statements.
Our patents relating to our refining operations are not material to us as a whole. The trademarks and tradenames under which we conduct our retail and branded wholesale business – including Valero®, Diamond Shamrock®, Shamrock®, Ultramar®, Beacon®, Texaco®, Corner Store®, and Stop N Go® – and other trademarks employed in the marketing of petroleum products are integral to our wholesale and retail marketing operations.
ITEM 1B. UNRESOLVED STAFF COMMENTS
None.
Table of Contents
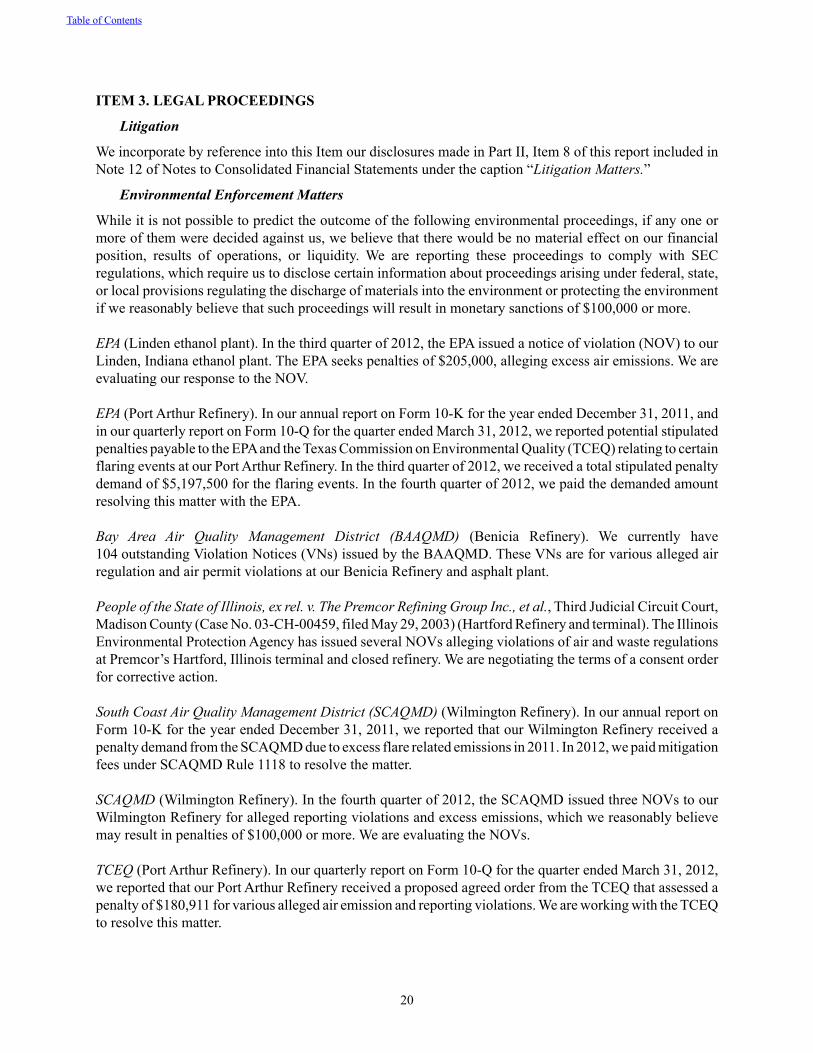
20
ITEM 3. LEGAL PROCEEDINGS
Litigation
We incorporate by reference into this Item our disclosures made in Part II, Item 8 of this report included in Note 12 of Notes to Consolidated Financial Statements under the caption “Litigation Matters.”
Environmental Enforcement Matters
While it is not possible to predict the outcome of the following environmental proceedings, if any one or more of them were decided against us, we believe that there would be no material effect on our financial position, results of operations, or liquidity. We are reporting these proceedings to comply with SEC regulations, which require us to disclose certain information about proceedings arising under federal, state, or local provisions regulating the discharge of materials into the environment or protecting the environment if we reasonably believe that such proceedings will result in monetary sanctions of $100,000 or more.
EPA (Linden ethanol plant). In the third quarter of 2012, the EPA issued a notice of violation (NOV) to our Linden, Indiana ethanol plant. The EPA seeks penalties of $205,000, alleging excess air emissions. We are evaluating our response to the NOV.
EPA (Port Arthur Refinery). In our annual report on Form 10-K for the year ended December 31, 2011, and in our quarterly report on Form 10-Q for the quarter ended March 31, 2012, we reported potential stipulated penalties payable to the EPA and the Texas Commission on Environmental Quality (TCEQ) relating to certain flaring events at our Port Arthur Refinery. In the third quarter of 2012, we received a total stipulated penalty demand of $5,197,500 for the flaring events. In the fourth quarter of 2012, we paid the demanded amount resolving this matter with the EPA.
Bay Area Air Quality Management District (BAAQMD) (Benicia Refinery). We currently have 104 outstanding Violation Notices (VNs) issued by the BAAQMD. These VNs are for various alleged air regulation and air permit violations at our Benicia Refinery and asphalt plant.
People of the State of Illinois, ex rel. v. The Premcor Refining Group Inc., et al., Third Judicial Circuit Court, Madison County (Case No. 03-CH-00459, filed May 29, 2003) (Hartford Refinery and terminal). The Illinois Environmental Protection Agency has issued several NOVs alleging violations of air and waste regulations at Premcor’s Hartford, Illinois terminal and closed refinery. We are negotiating the terms of a consent order for corrective action.
South Coast Air Quality Management District (SCAQMD) (Wilmington Refinery). In our annual report on Form 10-K for the year ended December 31, 2011, we reported that our Wilmington Refinery received a penalty demand from the SCAQMD due to excess flare related emissions in 2011. In 2012, we paid mitigation fees under SCAQMD Rule 1118 to resolve the matter.
SCAQMD (Wilmington Refinery). In the fourth quarter of 2012, the SCAQMD issued three NOVs to our Wilmington Refinery for alleged reporting violations and excess emissions, which we reasonably believe may result in penalties of $100,000 or more. We are evaluating the NOVs.
TCEQ (Port Arthur Refinery). In our quarterly report on Form 10-Q for the quarter ended March 31, 2012, we reported that our Port Arthur Refinery received a proposed agreed order from the TCEQ that assessed a penalty of $180,911 for various alleged air emission and reporting violations. We are working with the TCEQ to resolve this matter.
Table of Contents
21
TCEQ (Port Arthur Refinery). In the fourth quarter of 2012, the TCEQ issued a Notice of Enforcement (NOE) for unauthorized flare emissions. We are evaluating the NOE. Potential stipulated penalties under our EPA §114 Clean Air Act Consent Decree for these three incidents are expected to be $166,000 if the EPA issues a stipulated penalty demand letter for these events.
ITEM 4. MINE SAFETY DISCLOSURES
None.
Table of Contents
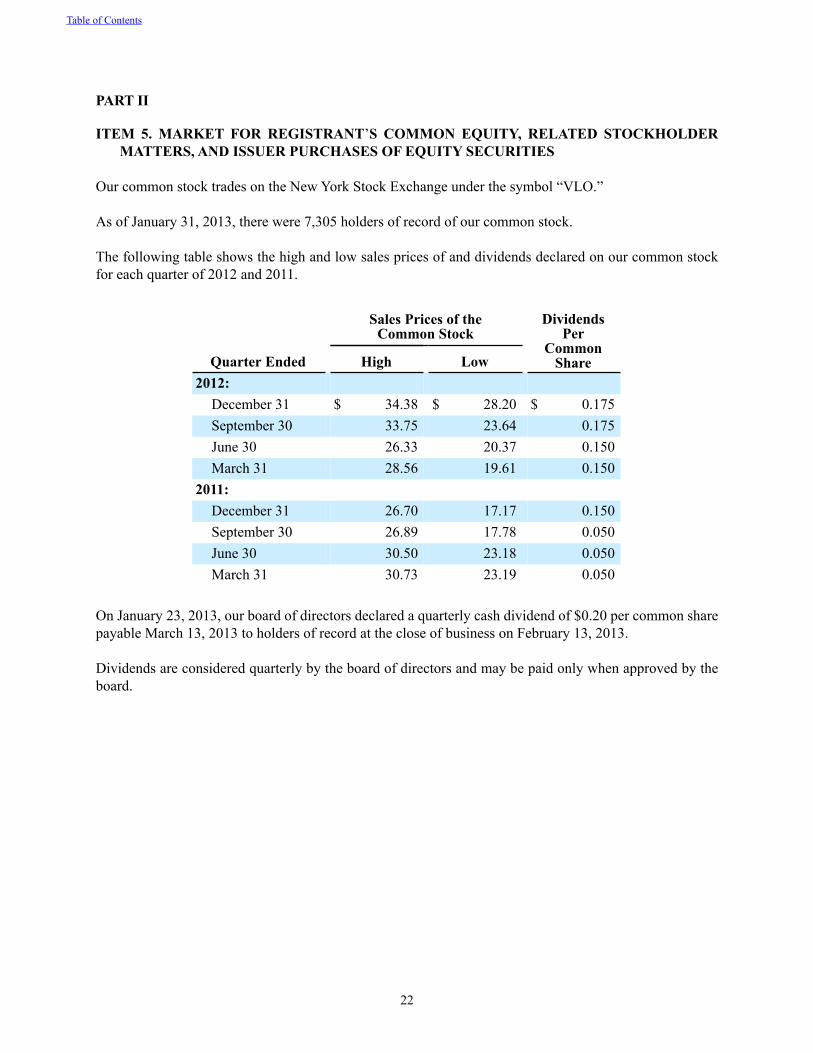
22
PART II
ITEM 5. MARKET FOR REGISTRANT’S COMMON EQUITY, RELATED STOCKHOLDER MATTERS, AND ISSUER PURCHASES OF EQUITY SECURITIES
Our common stock trades on the New York Stock Exchange under the symbol “VLO.”
As of January 31, 2013, there were 7,305 holders of record of our common stock.
The following table shows the high and low sales prices of and dividends declared on our common stock for each quarter of 2012 and 2011.
Sales Prices of theCommon Stock
DividendsPer
CommonShareQuarter Ended High Low
2012:December 31 $ 34.38 $ 28.20 $ 0.175September 30 33.75 23.64 0.175June 30 26.33 20.37 0.150March 31 28.56 19.61 0.150
2011:December 31 26.70 17.17 0.150September 30 26.89 17.78 0.050June 30 30.50 23.18 0.050March 31 30.73 23.19 0.050
On January 23, 2013, our board of directors declared a quarterly cash dividend of $0.20 per common share payable March 13, 2013 to holders of record at the close of business on February 13, 2013.
Dividends are considered quarterly by the board of directors and may be paid only when approved by the board.
Table of Contents
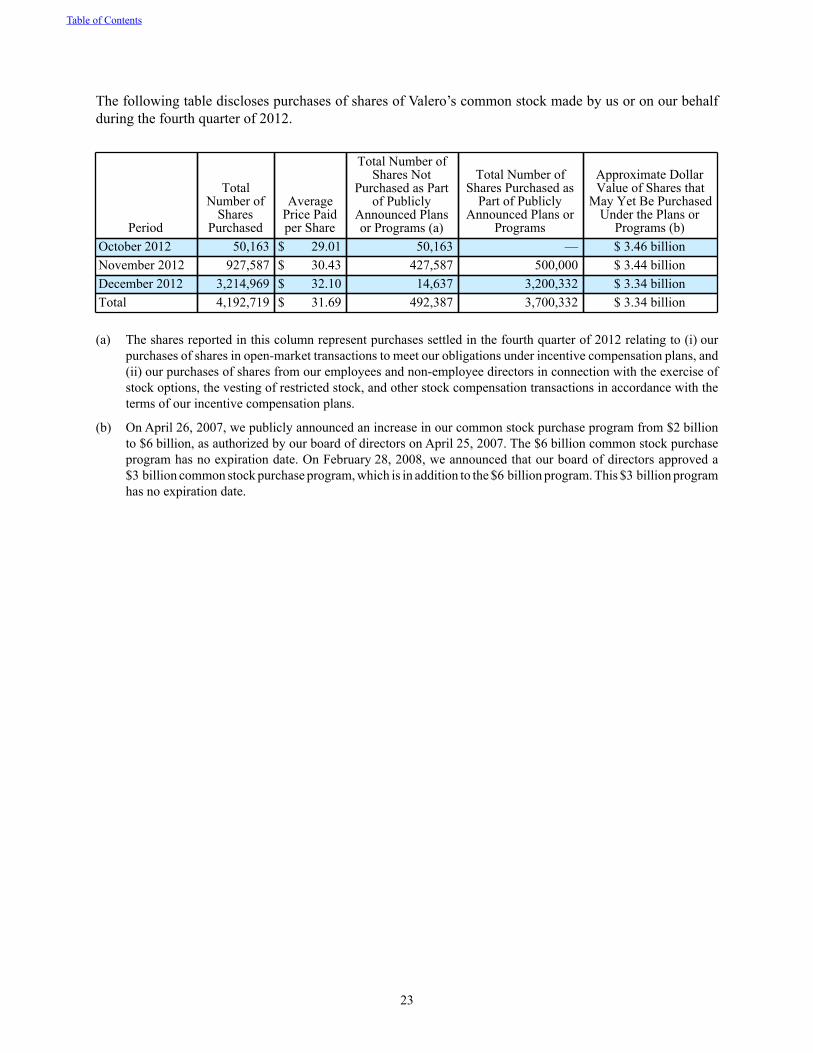
23
The following table discloses purchases of shares of Valero’s common stock made by us or on our behalf during the fourth quarter of 2012.
Period
TotalNumber of
SharesPurchased
AveragePrice Paidper Share
Total Number ofShares Not
Purchased as Partof Publicly
Announced Plansor Programs (a)
Total Number ofShares Purchased as
Part of PubliclyAnnounced Plans or
Programs
Approximate DollarValue of Shares that
May Yet Be PurchasedUnder the Plans or
Programs (b)October 2012 50,163 $ 29.01 50,163 — $ 3.46 billionNovember 2012 927,587 $ 30.43 427,587 500,000 $ 3.44 billionDecember 2012 3,214,969 $ 32.10 14,637 3,200,332 $ 3.34 billionTotal 4,192,719 $ 31.69 492,387 3,700,332 $ 3.34 billion
(a) The shares reported in this column represent purchases settled in the fourth quarter of 2012 relating to (i) our purchases of shares in open-market transactions to meet our obligations under incentive compensation plans, and (ii) our purchases of shares from our employees and non-employee directors in connection with the exercise of stock options, the vesting of restricted stock, and other stock compensation transactions in accordance with the terms of our incentive compensation plans.
(b) On April 26, 2007, we publicly announced an increase in our common stock purchase program from $2 billion to $6 billion, as authorized by our board of directors on April 25, 2007. The $6 billion common stock purchase program has no expiration date. On February 28, 2008, we announced that our board of directors approved a $3 billion common stock purchase program, which is in addition to the $6 billion program. This $3 billion program has no expiration date.
Table of Contents
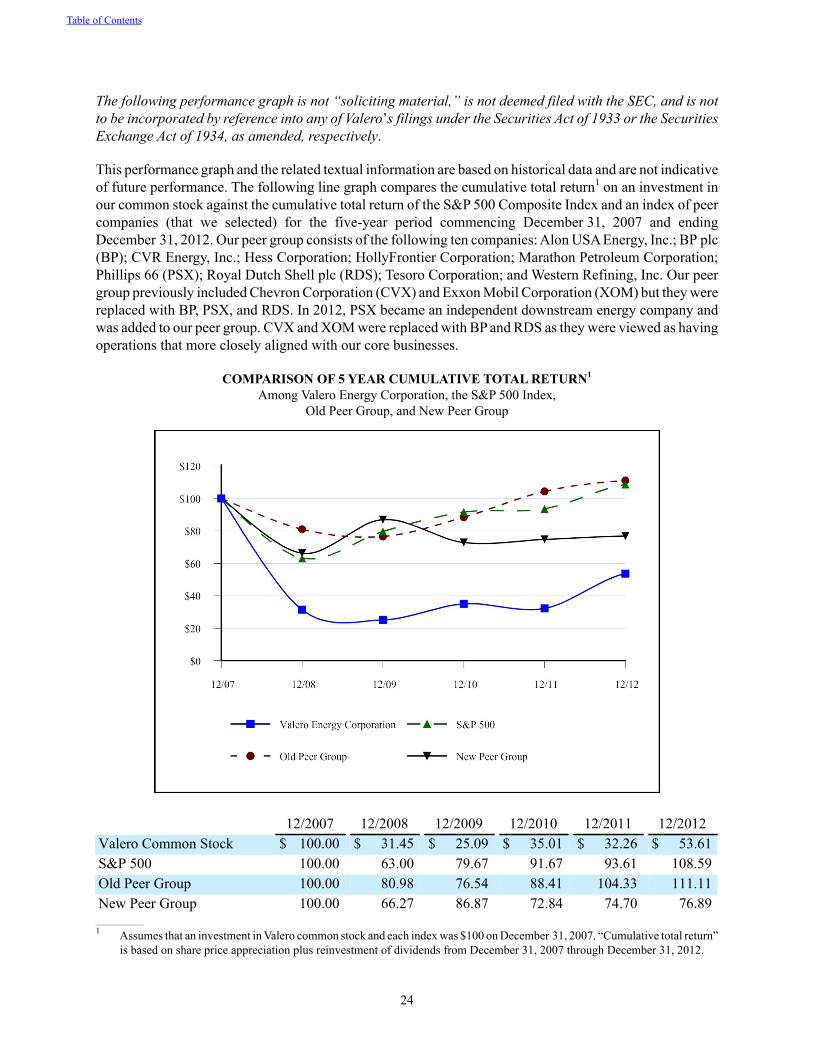
24
The following performance graph is not “soliciting material,” is not deemed filed with the SEC, and is not to be incorporated by reference into any of Valero’s filings under the Securities Act of 1933 or the Securities Exchange Act of 1934, as amended, respectively.
This performance graph and the related textual information are based on historical data and are not indicative of future performance. The following line graph compares the cumulative total return1 on an investment in our common stock against the cumulative total return of the S&P 500 Composite Index and an index of peer companies (that we selected) for the five-year period commencing December 31, 2007 and ending December 31, 2012. Our peer group consists of the following ten companies: Alon USA Energy, Inc.; BP plc (BP); CVR Energy, Inc.; Hess Corporation; HollyFrontier Corporation; Marathon Petroleum Corporation; Phillips 66 (PSX); Royal Dutch Shell plc (RDS); Tesoro Corporation; and Western Refining, Inc. Our peer group previously included Chevron Corporation (CVX) and Exxon Mobil Corporation (XOM) but they were replaced with BP, PSX, and RDS. In 2012, PSX became an independent downstream energy company and was added to our peer group. CVX and XOM were replaced with BP and RDS as they were viewed as having operations that more closely aligned with our core businesses.
COMPARISON OF 5 YEAR CUMULATIVE TOTAL RETURN1
Among Valero Energy Corporation, the S&P 500 Index,Old Peer Group, and New Peer Group
12/2007 12/2008 12/2009 12/2010 12/2011 12/2012Valero Common Stock $ 100.00 $ 31.45 $ 25.09 $ 35.01 $ 32.26 $ 53.61S&P 500 100.00 63.00 79.67 91.67 93.61 108.59Old Peer Group 100.00 80.98 76.54 88.41 104.33 111.11New Peer Group 100.00 66.27 86.87 72.84 74.70 76.89
____________1 Assumes that an investment in Valero common stock and each index was $100 on December 31, 2007. “Cumulative total return”
is based on share price appreciation plus reinvestment of dividends from December 31, 2007 through December 31, 2012.
Table of Contents
25
ITEM 6. SELECTED FINANCIAL DATA
The selected financial data for the five-year period ended December 31, 2012 was derived from our audited financial statements. The following table should be read together with Item 7, “Management’s Discussion and Analysis of Financial Condition and Results of Operations” and with the historical financial statements and accompanying notes included in Item 8, “Financial Statements and Supplementary Data.”
The following summaries are in millions of dollars, except for per share amounts:
Year Ended December 31,2012 (a) 2011 (b) 2010 (c) 2009 (c) 2008
Operating revenues $ 139,250 $ 125,987 $ 82,233 $ 64,599 $ 106,676Income (loss) from continuing operations 2,080 2,096 923 (273) (1,154)Earnings per common
share from continuingoperations – assuming dilution 3.75 3.69 1.62 (0.50) (2.20)
Dividends per common share 0.65 0.30 0.20 0.60 0.57Total assets 44,477 42,783 37,621 35,572 34,417Debt and capital lease
obligations, less current portion 6,463 6,732 7,515 7,163 6,264___________________________
(a) The operations of the Aruba Refinery were suspended in March 2012, as further described in Note 4 in Notes to Consolidated Financial Statements.
(b) We acquired the Meraux Refinery on October 1, 2011 and the Pembroke Refinery on August 1, 2011. The information presented for 2011 includes the results of operations from these acquisitions commencing on their respective acquisition dates.
(c) We acquired three ethanol plants in the first quarter of 2010 and seven ethanol plants in the second quarter of 2009. The information presented for 2010 and 2009 includes the results of operations of these plants commencing on their respective acquisition dates.
Table of Contents
26
ITEM 7. MANAGEMENT’S DISCUSSION AND ANALYSIS OF FINANCIAL CONDITION AND RESULTS OF OPERATIONS
The following review of our results of operations and financial condition should be read in conjunction with Items 1, 1A, and 2, “Business, Risk Factors, and Properties,” and Item 8, “Financial Statements and Supplementary Data,” included in this report.
CAUTIONARY STATEMENT FOR THE PURPOSE OF SAFE HARBOR PROVISIONS OF THE PRIVATE SECURITIES LITIGATION REFORM ACT OF 1995
This report, including without limitation our disclosures below under the heading “OVERVIEW AND OUTLOOK,” includes forward-looking statements within the meaning of Section 27A of the Securities Act of 1933 and Section 21E of the Securities Exchange Act of 1934. You can identify our forward-looking statements by the words “anticipate,” “believe,” “expect,” “plan,” “intend,” “estimate,” “project,” “projection,” “predict,” “budget,” “forecast,” “goal,” “guidance,” “target,” “could,” “should,” “may,” and similar expressions.
These forward-looking statements include, among other things, statements regarding:
• future refining margins, including gasoline and distillate margins;• future retail margins, including gasoline, diesel, heating oil, and convenience store merchandise
margins;• future ethanol margins;• expectations regarding feedstock costs, including crude oil differentials, and operating expenses;• anticipated levels of crude oil and refined product inventories;• our anticipated level of capital investments, including deferred refinery turnaround and catalyst costs
and capital expenditures for environmental and other purposes, and the effect of these capital investments on our results of operations;
• anticipated trends in the supply of and demand for crude oil and other feedstocks and refined products globally and in the regions where we operate;
• expectations regarding environmental, tax, and other regulatory initiatives; and• the effect of general economic and other conditions on refining, retail, and ethanol industry
fundamentals.
We based our forward-looking statements on our current expectations, estimates, and projections about ourselves and our industry. We caution that these statements are not guarantees of future performance and involve risks, uncertainties, and assumptions that we cannot predict. In addition, we based many of these forward-looking statements on assumptions about future events that may prove to be inaccurate. Accordingly, our actual results may differ materially from the future performance that we have expressed or forecast in the forward-looking statements. Differences between actual results and any future performance suggested in these forward-looking statements could result from a variety of factors, including the following:
• acts of terrorism aimed at either our facilities or other facilities that could impair our ability to produce or transport refined products or receive feedstocks;
• political and economic conditions in nations that produce crude oil or consume refined products;• demand for, and supplies of, refined products such as gasoline, diesel fuel, jet fuel, heating oil,
petrochemicals, and ethanol;• demand for, and supplies of, crude oil and other feedstocks;
Table of Contents
27
• the ability of the members of the Organization of Petroleum Exporting Countries (OPEC) to agree on and to maintain crude oil price and production controls;
• the level of consumer demand, including seasonal fluctuations;• refinery overcapacity or undercapacity;• our ability to successfully integrate any acquired businesses into our operations;• the actions taken by competitors, including both pricing and adjustments to refining capacity in
response to market conditions;• the level of competitors’ imports into markets that we supply;• accidents, unscheduled shutdowns, or other catastrophes affecting our refineries, machinery,
pipelines, equipment, and information systems, or those of our suppliers or customers;• changes in the cost or availability of transportation for feedstocks and refined products;• the price, availability, and acceptance of alternative fuels and alternative-fuel vehicles;• the levels of government subsidies for ethanol and other alternative fuels;• delay of, cancellation of, or failure to implement planned capital projects and realize the various
assumptions and benefits projected for such projects or cost overruns in constructing such planned capital projects;
• earthquakes, hurricanes, tornadoes, and irregular weather, which can unforeseeably affect the price or availability of natural gas, crude oil, grain and other feedstocks, and refined products and ethanol;
• rulings, judgments, or settlements in litigation or other legal or regulatory matters, including unexpected environmental remediation costs, in excess of any reserves or insurance coverage;
• legislative or regulatory action, including the introduction or enactment of legislation or rulemakings by governmental authorities, including tax and environmental regulations, such as those to be implemented under the California Global Warming Solutions Act (also known as AB 32) and the EPA’s regulation of greenhouse gases, which may adversely affect our business or operations;
• changes in the credit ratings assigned to our debt securities and trade credit;• changes in currency exchange rates, including the value of the Canadian dollar, the pound sterling,
and the euro relative to the U.S. dollar; • overall economic conditions, including the stability and liquidity of financial markets; and• other factors generally described in the “Risk Factors” section included in Items 1, 1A, and 2,
“Business, Risk Factors, and Properties” in this report.
Any one of these factors, or a combination of these factors, could materially affect our future results of operations and whether any forward-looking statements ultimately prove to be accurate. Our forward-looking statements are not guarantees of future performance, and actual results and future performance may differ materially from those suggested in any forward-looking statements. We do not intend to update these statements unless we are required by the securities laws to do so.
All subsequent written and oral forward-looking statements attributable to us or persons acting on our behalf are expressly qualified in their entirety by the foregoing. We undertake no obligation to publicly release any revisions to any such forward-looking statements that may be made to reflect events or circumstances after the date of this report or to reflect the occurrence of unanticipated events.
Table of Contents
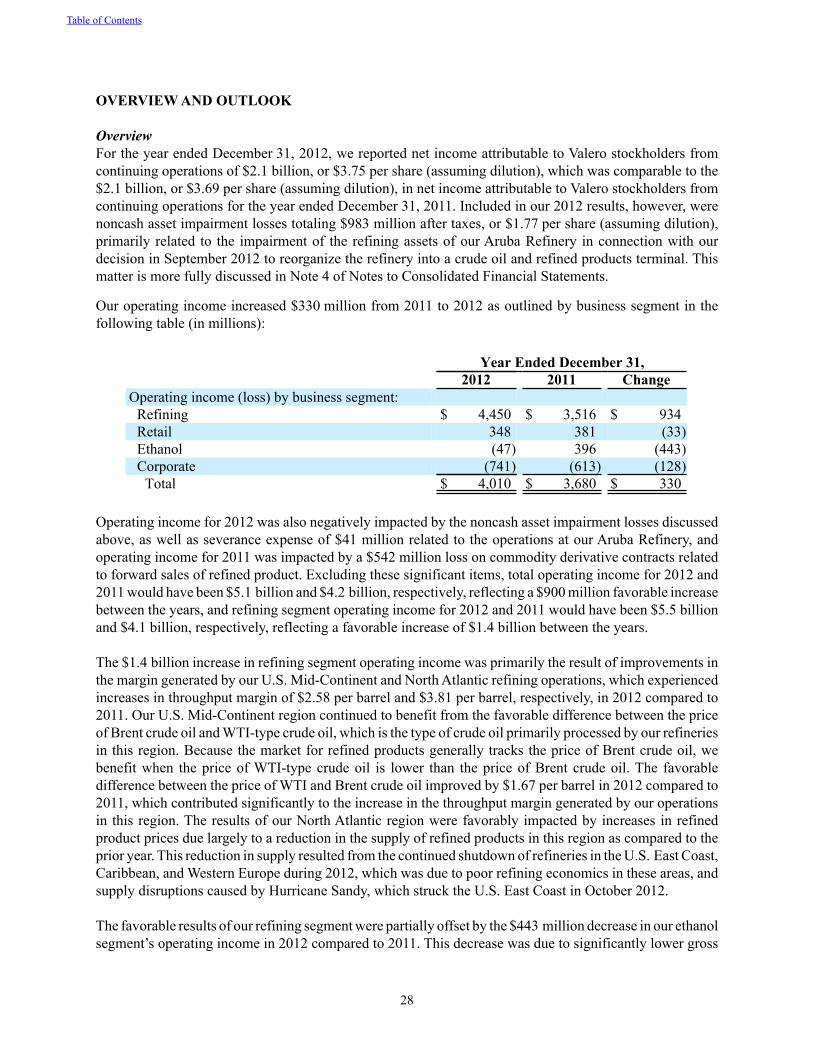
28
OVERVIEW AND OUTLOOK
OverviewFor the year ended December 31, 2012, we reported net income attributable to Valero stockholders from continuing operations of $2.1 billion, or $3.75 per share (assuming dilution), which was comparable to the $2.1 billion, or $3.69 per share (assuming dilution), in net income attributable to Valero stockholders from continuing operations for the year ended December 31, 2011. Included in our 2012 results, however, were noncash asset impairment losses totaling $983 million after taxes, or $1.77 per share (assuming dilution), primarily related to the impairment of the refining assets of our Aruba Refinery in connection with our decision in September 2012 to reorganize the refinery into a crude oil and refined products terminal. This matter is more fully discussed in Note 4 of Notes to Consolidated Financial Statements.
Our operating income increased $330 million from 2011 to 2012 as outlined by business segment in the following table (in millions):
Year Ended December 31,2012 2011 Change
Operating income (loss) by business segment:Refining $ 4,450 $ 3,516 $ 934Retail 348 381 (33)Ethanol (47) 396 (443)Corporate (741) (613) (128)
Total $ 4,010 $ 3,680 $ 330
Operating income for 2012 was also negatively impacted by the noncash asset impairment losses discussed above, as well as severance expense of $41 million related to the operations at our Aruba Refinery, and operating income for 2011 was impacted by a $542 million loss on commodity derivative contracts related to forward sales of refined product. Excluding these significant items, total operating income for 2012 and 2011 would have been $5.1 billion and $4.2 billion, respectively, reflecting a $900 million favorable increase between the years, and refining segment operating income for 2012 and 2011 would have been $5.5 billion and $4.1 billion, respectively, reflecting a favorable increase of $1.4 billion between the years.
The $1.4 billion increase in refining segment operating income was primarily the result of improvements in the margin generated by our U.S. Mid-Continent and North Atlantic refining operations, which experienced increases in throughput margin of $2.58 per barrel and $3.81 per barrel, respectively, in 2012 compared to 2011. Our U.S. Mid-Continent region continued to benefit from the favorable difference between the price of Brent crude oil and WTI-type crude oil, which is the type of crude oil primarily processed by our refineries in this region. Because the market for refined products generally tracks the price of Brent crude oil, we benefit when the price of WTI-type crude oil is lower than the price of Brent crude oil. The favorable difference between the price of WTI and Brent crude oil improved by $1.67 per barrel in 2012 compared to 2011, which contributed significantly to the increase in the throughput margin generated by our operations in this region. The results of our North Atlantic region were favorably impacted by increases in refined product prices due largely to a reduction in the supply of refined products in this region as compared to the prior year. This reduction in supply resulted from the continued shutdown of refineries in the U.S. East Coast, Caribbean, and Western Europe during 2012, which was due to poor refining economics in these areas, and supply disruptions caused by Hurricane Sandy, which struck the U.S. East Coast in October 2012.
The favorable results of our refining segment were partially offset by the $443 million decrease in our ethanol segment’s operating income in 2012 compared to 2011. This decrease was due to significantly lower gross
Table of Contents
29
margins in 2012 caused by a combination of high corn prices and an oversupply of ethanol in the market. The increase in corn prices in 2012 was largely due to the severe drought experienced in grain producing regions of the U.S. in 2012, and the oversupply of ethanol inventories was largely attributable to lower exports of ethanol to Europe and increased imports of ethanol from Brazil.
OutlookThroughout 2011 and 2012, our refining business benefited from processing sweet crude oils sourced from the inland U.S., such as WTI crude oil, due to the favorable difference between the price of this type of crude oil and the price of a benchmark sweet crude oil, such as Brent crude oil. Historically, the price of WTI-type crude oil has closely approximated Brent crude oil, but due to the significant development of crude oil reserves within the U.S. Mid-Continent region and increased deliveries of crude oil from Canada into the U.S. Mid-Continent region, the increased supply of WTI crude oil has resulted in WTI crude oil being priced at a significant discount to Brent crude oil. This benefit, however, may decline as various crude oil pipeline and logistics projects are completed. These projects will allow cost-advantaged crude oils from the inland U.S. and Canada to be transported to the U.S. Gulf Coast region, which is expected to result in a narrowing of the price differential of WTI-priced crude oils relative to Brent-priced crude oils. As a result, the margins for refined products for refiners that process WTI-priced crude oils may decline.
Continued refinery closures in the U.S. East Coast, Caribbean, and Western Europe and additional closures expected to occur in the industry combined with poor reliability and low utilization in Latin American refineries create opportunities for competitive refineries to export quality products at higher margins. However, some marginally profitable refineries may continue to be operated, which could negatively impact refined product margins.
Thus far in the first quarter of 2013, ethanol margins have improved, but the improvement is not significant and the margins remain far below those experienced in 2011. We expect a continued modest improvement in ethanol margins throughout 2013 relative to those in 2012.
Energy markets and margins are volatile, and we expect them to continue to be volatile in the near to mid-term.
We continue to make progress in the separation of our retail business under a new company named CST Brands, Inc. The separation is planned by way of a pro rata distribution of 80 percent of the outstanding shares of CST common stock to Valero stockholders. The distribution is expected to take place in the second quarter of 2013, assuming a favorable private letter ruling from the IRS and clearance of all comments from the SEC relating to CST’s registration statement on Form 10. When the distribution occurs, we expect to receive approximately $1.1 billion of cash and incur a tax liability of approximately $230 million. We also expect to liquidate the remaining 20 percent of CST outstanding shares within 18 months of the distribution. Details of the separation and distribution are provided in filings with the SEC by CST.
Table of Contents
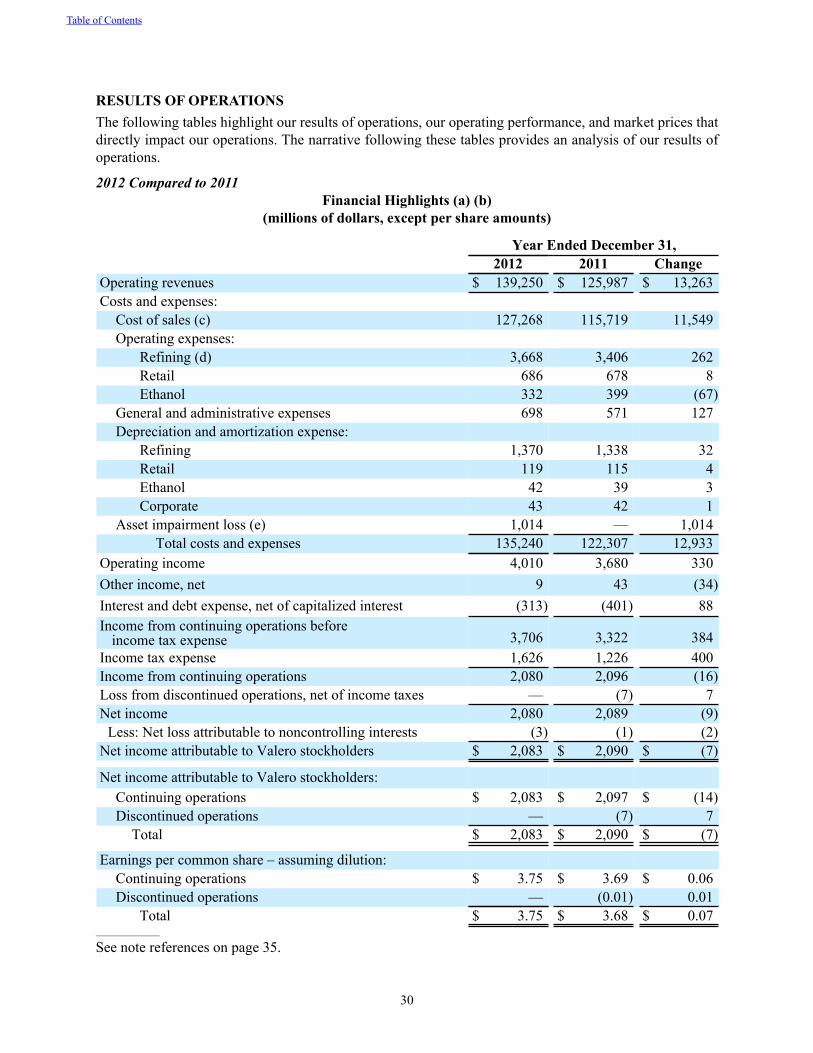
30
RESULTS OF OPERATIONSThe following tables highlight our results of operations, our operating performance, and market prices that directly impact our operations. The narrative following these tables provides an analysis of our results of operations.
2012 Compared to 2011 Financial Highlights (a) (b)
(millions of dollars, except per share amounts)
Year Ended December 31,2012 2011 Change
Operating revenues $ 139,250 $ 125,987 $ 13,263Costs and expenses:
Cost of sales (c) 127,268 115,719 11,549Operating expenses:
Refining (d) 3,668 3,406 262Retail 686 678 8Ethanol 332 399 (67)
General and administrative expenses 698 571 127Depreciation and amortization expense:
Refining 1,370 1,338 32Retail 119 115 4Ethanol 42 39 3Corporate 43 42 1
Asset impairment loss (e) 1,014 — 1,014Total costs and expenses 135,240 122,307 12,933
Operating income 4,010 3,680 330Other income, net 9 43 (34)Interest and debt expense, net of capitalized interest (313) (401) 88Income from continuing operations before
income tax expense 3,706 3,322 384Income tax expense 1,626 1,226 400Income from continuing operations 2,080 2,096 (16)Loss from discontinued operations, net of income taxes — (7) 7Net income 2,080 2,089 (9)
Less: Net loss attributable to noncontrolling interests (3) (1) (2)Net income attributable to Valero stockholders $ 2,083 $ 2,090 $ (7)
Net income attributable to Valero stockholders:Continuing operations $ 2,083 $ 2,097 $ (14)Discontinued operations — (7) 7
Total $ 2,083 $ 2,090 $ (7)
Earnings per common share – assuming dilution:Continuing operations $ 3.75 $ 3.69 $ 0.06Discontinued operations — (0.01) 0.01
Total $ 3.75 $ 3.68 $ 0.07________________
See note references on page 35.
Table of Contents
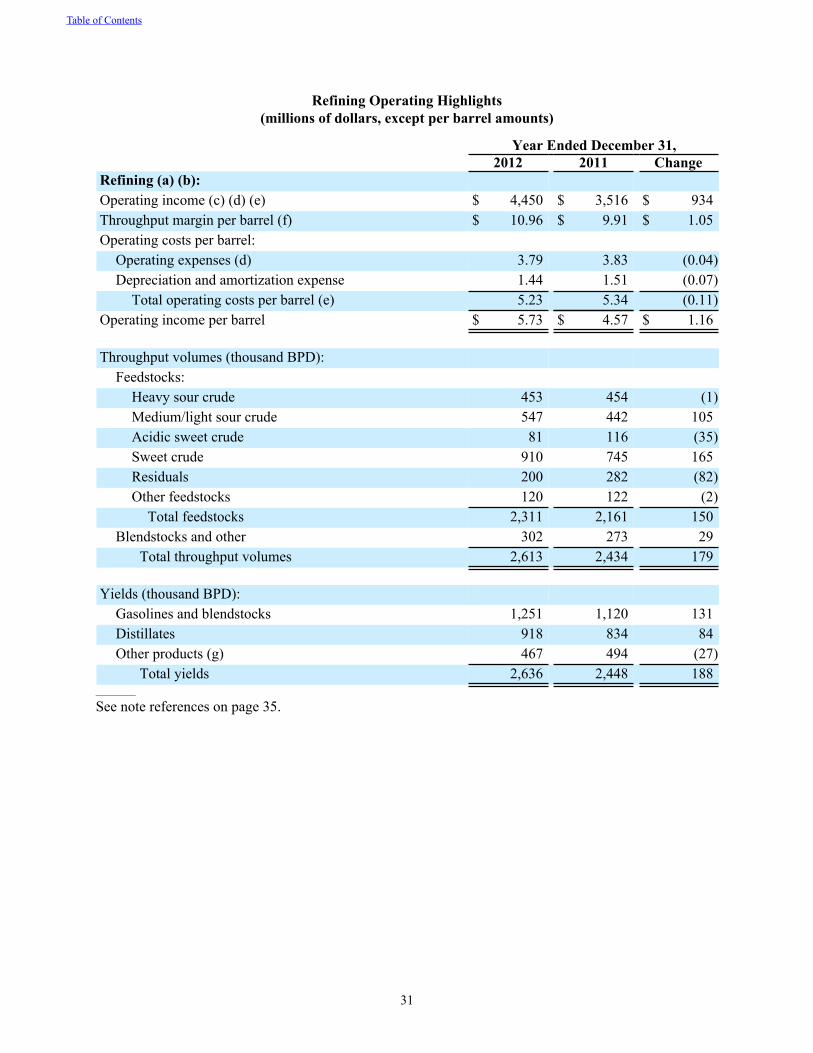
31
Refining Operating Highlights(millions of dollars, except per barrel amounts)
Year Ended December 31,2012 2011 Change
Refining (a) (b):Operating income (c) (d) (e) $ 4,450 $ 3,516 $ 934Throughput margin per barrel (f) $ 10.96 $ 9.91 $ 1.05Operating costs per barrel:
Operating expenses (d) 3.79 3.83 (0.04)Depreciation and amortization expense 1.44 1.51 (0.07)
Total operating costs per barrel (e) 5.23 5.34 (0.11)Operating income per barrel $ 5.73 $ 4.57 $ 1.16
Throughput volumes (thousand BPD):Feedstocks:
Heavy sour crude 453 454 (1)Medium/light sour crude 547 442 105Acidic sweet crude 81 116 (35)Sweet crude 910 745 165Residuals 200 282 (82)Other feedstocks 120 122 (2)
Total feedstocks 2,311 2,161 150Blendstocks and other 302 273 29
Total throughput volumes 2,613 2,434 179
Yields (thousand BPD):Gasolines and blendstocks 1,251 1,120 131Distillates 918 834 84Other products (g) 467 494 (27)
Total yields 2,636 2,448 188__________
See note references on page 35.
Table of Contents
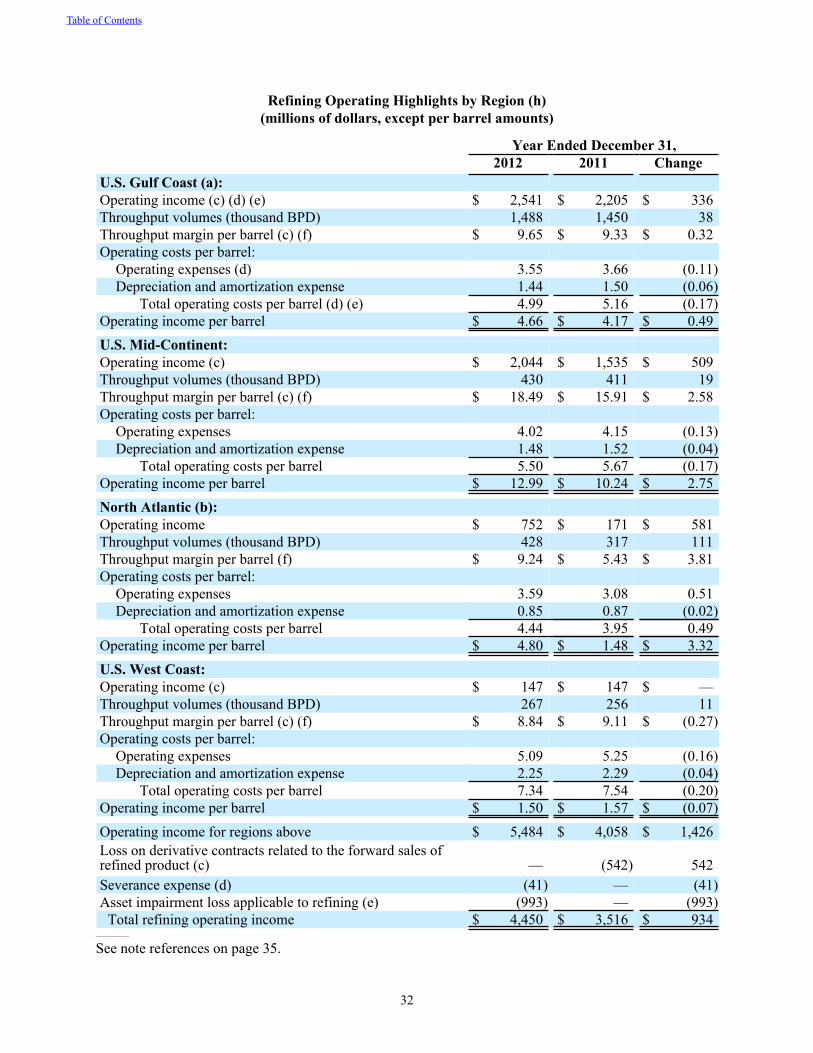
32
Refining Operating Highlights by Region (h)(millions of dollars, except per barrel amounts)
Year Ended December 31, 2012 2011 ChangeU.S. Gulf Coast (a):Operating income (c) (d) (e) $ 2,541 $ 2,205 $ 336Throughput volumes (thousand BPD) 1,488 1,450 38Throughput margin per barrel (c) (f) $ 9.65 $ 9.33 $ 0.32Operating costs per barrel:
Operating expenses (d) 3.55 3.66 (0.11)Depreciation and amortization expense 1.44 1.50 (0.06)
Total operating costs per barrel (d) (e) 4.99 5.16 (0.17)Operating income per barrel $ 4.66 $ 4.17 $ 0.49U.S. Mid-Continent:Operating income (c) $ 2,044 $ 1,535 $ 509Throughput volumes (thousand BPD) 430 411 19Throughput margin per barrel (c) (f) $ 18.49 $ 15.91 $ 2.58Operating costs per barrel:
Operating expenses 4.02 4.15 (0.13)Depreciation and amortization expense 1.48 1.52 (0.04)
Total operating costs per barrel 5.50 5.67 (0.17)Operating income per barrel $ 12.99 $ 10.24 $ 2.75North Atlantic (b):Operating income $ 752 $ 171 $ 581Throughput volumes (thousand BPD) 428 317 111Throughput margin per barrel (f) $ 9.24 $ 5.43 $ 3.81Operating costs per barrel:
Operating expenses 3.59 3.08 0.51Depreciation and amortization expense 0.85 0.87 (0.02)
Total operating costs per barrel 4.44 3.95 0.49Operating income per barrel $ 4.80 $ 1.48 $ 3.32U.S. West Coast:Operating income (c) $ 147 $ 147 $ —Throughput volumes (thousand BPD) 267 256 11Throughput margin per barrel (c) (f) $ 8.84 $ 9.11 $ (0.27)Operating costs per barrel:
Operating expenses 5.09 5.25 (0.16)Depreciation and amortization expense 2.25 2.29 (0.04)
Total operating costs per barrel 7.34 7.54 (0.20)Operating income per barrel $ 1.50 $ 1.57 $ (0.07)Operating income for regions above $ 5,484 $ 4,058 $ 1,426Loss on derivative contracts related to the forward sales of refined product (c) — (542) 542Severance expense (d) (41) — (41)Asset impairment loss applicable to refining (e) (993) — (993)
Total refining operating income $ 4,450 $ 3,516 $ 934__________
See note references on page 35.
Table of Contents
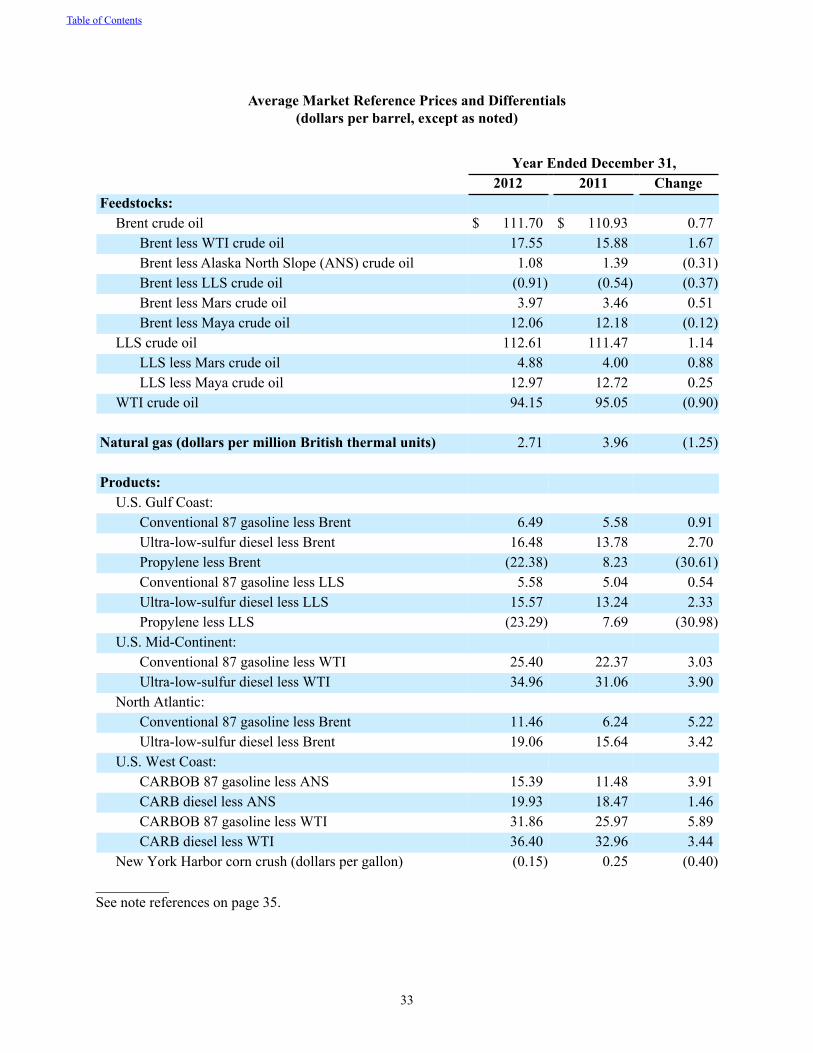
33
Average Market Reference Prices and Differentials(dollars per barrel, except as noted)
Year Ended December 31, 2012 2011 ChangeFeedstocks:
Brent crude oil $ 111.70 $ 110.93 0.77Brent less WTI crude oil 17.55 15.88 1.67Brent less Alaska North Slope (ANS) crude oil 1.08 1.39 (0.31)Brent less LLS crude oil (0.91) (0.54) (0.37)Brent less Mars crude oil 3.97 3.46 0.51Brent less Maya crude oil 12.06 12.18 (0.12)
LLS crude oil 112.61 111.47 1.14LLS less Mars crude oil 4.88 4.00 0.88LLS less Maya crude oil 12.97 12.72 0.25
WTI crude oil 94.15 95.05 (0.90)
Natural gas (dollars per million British thermal units) 2.71 3.96 (1.25)
Products: U.S. Gulf Coast:
Conventional 87 gasoline less Brent 6.49 5.58 0.91Ultra-low-sulfur diesel less Brent 16.48 13.78 2.70Propylene less Brent (22.38) 8.23 (30.61)Conventional 87 gasoline less LLS 5.58 5.04 0.54Ultra-low-sulfur diesel less LLS 15.57 13.24 2.33Propylene less LLS (23.29) 7.69 (30.98)
U.S. Mid-Continent: Conventional 87 gasoline less WTI 25.40 22.37 3.03Ultra-low-sulfur diesel less WTI 34.96 31.06 3.90
North Atlantic: Conventional 87 gasoline less Brent 11.46 6.24 5.22Ultra-low-sulfur diesel less Brent 19.06 15.64 3.42
U.S. West Coast: CARBOB 87 gasoline less ANS 15.39 11.48 3.91CARB diesel less ANS 19.93 18.47 1.46CARBOB 87 gasoline less WTI 31.86 25.97 5.89CARB diesel less WTI 36.40 32.96 3.44
New York Harbor corn crush (dollars per gallon) (0.15) 0.25 (0.40)__________See note references on page 35.
Table of Contents

34
Retail and Ethanol Operating Highlights(millions of dollars, except per gallon amounts)
Year Ended December 31,2012 2011 Change
Retail–U.S.: Operating income (e) $ 240 $ 213 $ 27Company-operated fuel sites (average) 1,013 994 19Fuel volumes (gallons per day per site) 5,083 5,060 23Fuel margin per gallon $ 0.162 $ 0.144 $ 0.018Merchandise sales $ 1,239 $ 1,223 $ 16Merchandise margin (percentage of sales) 29.7% 28.7% 1.0 %Margin on miscellaneous sales $ 89 $ 88 $ 1Operating expenses $ 434 $ 416 $ 18Depreciation and amortization expense $ 77 $ 77 $ —Asset impairment loss (e) $ 12 $ — $ 12
Retail–Canada: Operating income (e) $ 108 $ 168 $ (60)Fuel volumes (thousand gallons per day) 3,096 3,195 (99)Fuel margin per gallon $ 0.258 $ 0.299 $ (0.041)Merchandise sales $ 257 $ 261 $ (4)Merchandise margin (percentage of sales) 29.0% 29.4% (0.4)%Margin on miscellaneous sales $ 44 $ 43 $ 1Operating expenses $ 252 $ 262 $ (10)Depreciation and amortization expense $ 42 $ 38 $ 4Asset impairment loss (e) $ 9 $ — $ 9
Ethanol: Operating income (loss) $ (47) $ 396 $ (443)Ethanol production (thousand gallons per day) 2,967 3,352 (385)Gross margin per gallon of production (f) $ 0.30 $ 0.68 $ (0.38)Operating costs per gallon of production:
Operating expenses 0.30 0.33 (0.03)Depreciation and amortization expense 0.04 0.03 0.01
Total operating costs per gallon of production 0.34 0.36 (0.02)Operating income (loss) per gallon of production $ (0.04) $ 0.32 $ (0.36)
__________
See note references on page 35.
Table of Contents
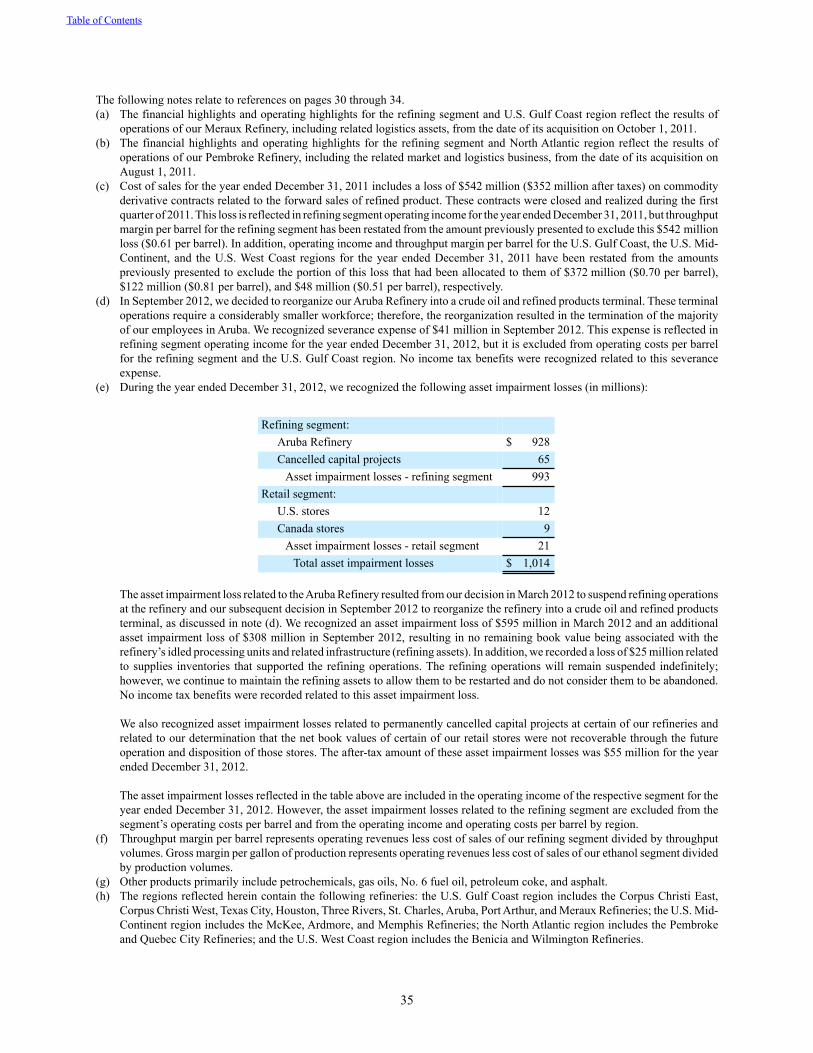
35
The following notes relate to references on pages 30 through 34.(a) The financial highlights and operating highlights for the refining segment and U.S. Gulf Coast region reflect the results of
operations of our Meraux Refinery, including related logistics assets, from the date of its acquisition on October 1, 2011.(b) The financial highlights and operating highlights for the refining segment and North Atlantic region reflect the results of
operations of our Pembroke Refinery, including the related market and logistics business, from the date of its acquisition on August 1, 2011.
(c) Cost of sales for the year ended December 31, 2011 includes a loss of $542 million ($352 million after taxes) on commodity derivative contracts related to the forward sales of refined product. These contracts were closed and realized during the first quarter of 2011. This loss is reflected in refining segment operating income for the year ended December 31, 2011, but throughput margin per barrel for the refining segment has been restated from the amount previously presented to exclude this $542 million loss ($0.61 per barrel). In addition, operating income and throughput margin per barrel for the U.S. Gulf Coast, the U.S. Mid-Continent, and the U.S. West Coast regions for the year ended December 31, 2011 have been restated from the amounts previously presented to exclude the portion of this loss that had been allocated to them of $372 million ($0.70 per barrel), $122 million ($0.81 per barrel), and $48 million ($0.51 per barrel), respectively.
(d) In September 2012, we decided to reorganize our Aruba Refinery into a crude oil and refined products terminal. These terminal operations require a considerably smaller workforce; therefore, the reorganization resulted in the termination of the majority of our employees in Aruba. We recognized severance expense of $41 million in September 2012. This expense is reflected in refining segment operating income for the year ended December 31, 2012, but it is excluded from operating costs per barrel for the refining segment and the U.S. Gulf Coast region. No income tax benefits were recognized related to this severance expense.
(e) During the year ended December 31, 2012, we recognized the following asset impairment losses (in millions):
Refining segment:Aruba Refinery $ 928Cancelled capital projects 65
Asset impairment losses - refining segment 993Retail segment:
U.S. stores 12Canada stores 9
Asset impairment losses - retail segment 21Total asset impairment losses $ 1,014
The asset impairment loss related to the Aruba Refinery resulted from our decision in March 2012 to suspend refining operations at the refinery and our subsequent decision in September 2012 to reorganize the refinery into a crude oil and refined products terminal, as discussed in note (d). We recognized an asset impairment loss of $595 million in March 2012 and an additional asset impairment loss of $308 million in September 2012, resulting in no remaining book value being associated with the refinery’s idled processing units and related infrastructure (refining assets). In addition, we recorded a loss of $25 million related to supplies inventories that supported the refining operations. The refining operations will remain suspended indefinitely; however, we continue to maintain the refining assets to allow them to be restarted and do not consider them to be abandoned. No income tax benefits were recorded related to this asset impairment loss.
We also recognized asset impairment losses related to permanently cancelled capital projects at certain of our refineries and related to our determination that the net book values of certain of our retail stores were not recoverable through the future operation and disposition of those stores. The after-tax amount of these asset impairment losses was $55 million for the year ended December 31, 2012.
The asset impairment losses reflected in the table above are included in the operating income of the respective segment for the year ended December 31, 2012. However, the asset impairment losses related to the refining segment are excluded from the segment’s operating costs per barrel and from the operating income and operating costs per barrel by region.
(f) Throughput margin per barrel represents operating revenues less cost of sales of our refining segment divided by throughput volumes. Gross margin per gallon of production represents operating revenues less cost of sales of our ethanol segment divided by production volumes.
(g) Other products primarily include petrochemicals, gas oils, No. 6 fuel oil, petroleum coke, and asphalt.(h) The regions reflected herein contain the following refineries: the U.S. Gulf Coast region includes the Corpus Christi East,
Corpus Christi West, Texas City, Houston, Three Rivers, St. Charles, Aruba, Port Arthur, and Meraux Refineries; the U.S. Mid-Continent region includes the McKee, Ardmore, and Memphis Refineries; the North Atlantic region includes the Pembroke and Quebec City Refineries; and the U.S. West Coast region includes the Benicia and Wilmington Refineries.
Table of Contents
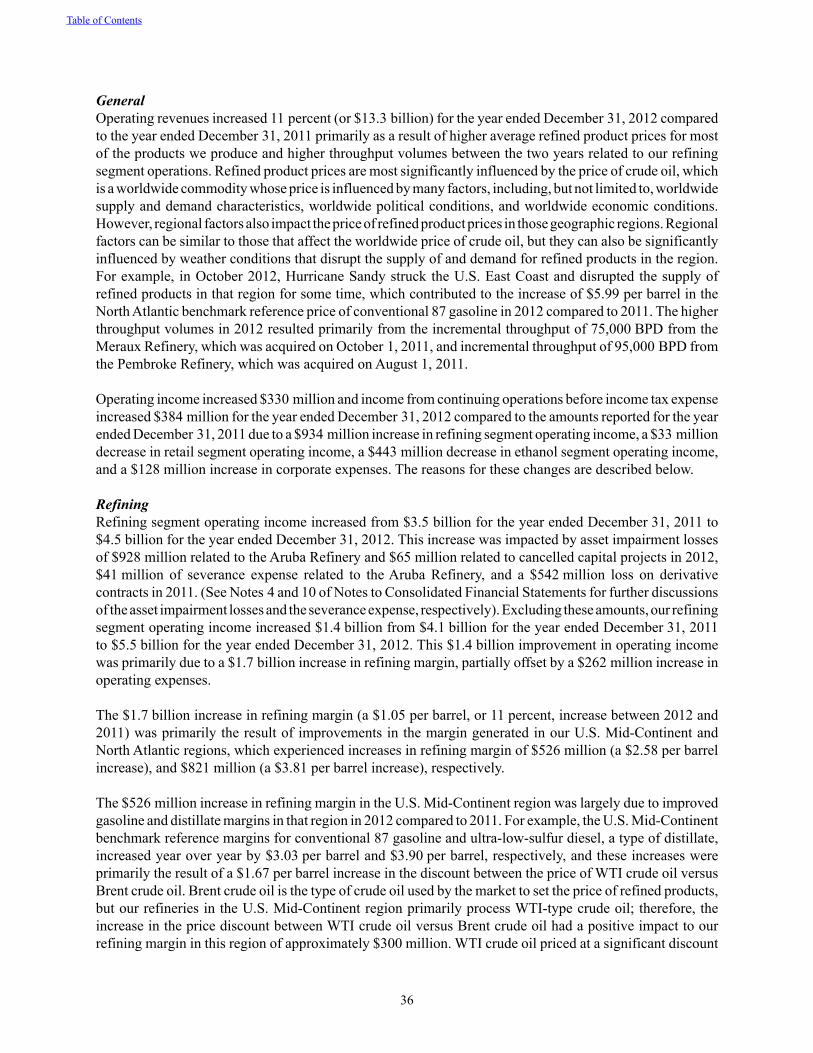
36
GeneralOperating revenues increased 11 percent (or $13.3 billion) for the year ended December 31, 2012 compared to the year ended December 31, 2011 primarily as a result of higher average refined product prices for most of the products we produce and higher throughput volumes between the two years related to our refining segment operations. Refined product prices are most significantly influenced by the price of crude oil, which is a worldwide commodity whose price is influenced by many factors, including, but not limited to, worldwide supply and demand characteristics, worldwide political conditions, and worldwide economic conditions. However, regional factors also impact the price of refined product prices in those geographic regions. Regional factors can be similar to those that affect the worldwide price of crude oil, but they can also be significantly influenced by weather conditions that disrupt the supply of and demand for refined products in the region. For example, in October 2012, Hurricane Sandy struck the U.S. East Coast and disrupted the supply of refined products in that region for some time, which contributed to the increase of $5.99 per barrel in the North Atlantic benchmark reference price of conventional 87 gasoline in 2012 compared to 2011. The higher throughput volumes in 2012 resulted primarily from the incremental throughput of 75,000 BPD from the Meraux Refinery, which was acquired on October 1, 2011, and incremental throughput of 95,000 BPD from the Pembroke Refinery, which was acquired on August 1, 2011.
Operating income increased $330 million and income from continuing operations before income tax expense increased $384 million for the year ended December 31, 2012 compared to the amounts reported for the year ended December 31, 2011 due to a $934 million increase in refining segment operating income, a $33 million decrease in retail segment operating income, a $443 million decrease in ethanol segment operating income, and a $128 million increase in corporate expenses. The reasons for these changes are described below.
RefiningRefining segment operating income increased from $3.5 billion for the year ended December 31, 2011 to $4.5 billion for the year ended December 31, 2012. This increase was impacted by asset impairment losses of $928 million related to the Aruba Refinery and $65 million related to cancelled capital projects in 2012, $41 million of severance expense related to the Aruba Refinery, and a $542 million loss on derivative contracts in 2011. (See Notes 4 and 10 of Notes to Consolidated Financial Statements for further discussions of the asset impairment losses and the severance expense, respectively). Excluding these amounts, our refining segment operating income increased $1.4 billion from $4.1 billion for the year ended December 31, 2011 to $5.5 billion for the year ended December 31, 2012. This $1.4 billion improvement in operating income was primarily due to a $1.7 billion increase in refining margin, partially offset by a $262 million increase in operating expenses.
The $1.7 billion increase in refining margin (a $1.05 per barrel, or 11 percent, increase between 2012 and 2011) was primarily the result of improvements in the margin generated in our U.S. Mid-Continent and North Atlantic regions, which experienced increases in refining margin of $526 million (a $2.58 per barrel increase), and $821 million (a $3.81 per barrel increase), respectively.
The $526 million increase in refining margin in the U.S. Mid-Continent region was largely due to improved gasoline and distillate margins in that region in 2012 compared to 2011. For example, the U.S. Mid-Continent benchmark reference margins for conventional 87 gasoline and ultra-low-sulfur diesel, a type of distillate, increased year over year by $3.03 per barrel and $3.90 per barrel, respectively, and these increases were primarily the result of a $1.67 per barrel increase in the discount between the price of WTI crude oil versus Brent crude oil. Brent crude oil is the type of crude oil used by the market to set the price of refined products, but our refineries in the U.S. Mid-Continent region primarily process WTI-type crude oil; therefore, the increase in the price discount between WTI crude oil versus Brent crude oil had a positive impact to our refining margin in this region of approximately $300 million. WTI crude oil priced at a significant discount
Table of Contents
37
to Brent crude oil during 2012 because of increases in crude oil reserves within the U.S. Mid-Continent region and increased deliveries of crude oil from Canada into that region, coupled with the inability to transport significant quantities of that crude oil to refineries in other regions of the country. As discussed in “OVERVIEW AND OUTLOOK.” we believe these conditions to remain in the near term; however, we believe the discount will begin to narrow as crude oil pipeline and logistics projects are completed and other forms of transportation are obtained, such as rail cars, to enable significant quantities of WTI-type crude oil to be transported to other regions.
The $821 million increase in refining margin in the North Atlantic region was also due to improved gasoline and distillate margins in that region in 2012 compared to 2011. For example, the North Atlantic benchmark reference margins for conventional 87 gasoline and ultra-low-sulfur diesel increased year over year by $5.22 per barrel and $3.42 per barrel, respectively, and these increases were due largely to a reduction in the supply of refined products, which resulted from the continued shutdown of refineries in the U.S. East Coast, Caribbean, and Western Europe during 2012, and supply disruptions caused by Hurricane Sandy, which struck the U.S. East Coast in October 2012.
The increase of $262 million in operating expenses discussed above was primarily due to an increase of $123 million in operating expenses of the Meraux Refinery, an increase of $214 million in operating expenses incurred by the Pembroke Refinery, and a decrease of $123 million in operating expenses incurred by the Aruba Refinery. We acquired the Pembroke Refinery on August 1, 2011 and the Meraux Refinery on October 1, 2011; therefore, operating expenses for 2011 only reflected five months of operating expenses of the Pembroke Refinery and three months of operating expenses of the Meraux Refinery. In addition, in March 2012, we suspended the operations of the Aruba Refinery, which resulted in a significant decrease in operating expenses related to that refinery in 2012. The remaining increase in operating expenses of $48 million was primarily due to an increase of $31 million in employee-related expenses due to higher compensation expense related to merit increases and promotions and higher expenses for employee benefit costs, an increase of $9 million in catalyst and chemical costs due to higher prices of rare earth metals used in our fluid catalytic cracking units, an increase of $61 million in ad valorem taxes and insurance expense due to increased insurance reserves in 2012 combined with a nonrecurring favorable ad valorem tax adjustment in 2011, and a decrease of $63 million in energy costs due to lower natural gas prices. Even though operating expenses increased year over year, operating expenses per barrel in 2012 were comparable to 2011 due to the incremental throughput of 179,000 BPD, which primarily resulted from the incremental throughput of the Pembroke and Meraux Refineries discussed above.
RetailRetail operating income was $348 million for the year ended December 31, 2012 compared to $381 million for the year ended December 31, 2011. This 9 percent (or $33 million) decrease was primarily due to a $21 million noncash asset impairment loss related to certain convenience stores (see Note 4 of Notes to Consolidated Financial Statements), a $56 million decrease in fuel margin from our Canadian retail operations, and a $41 million increase in fuel margin in our U.S. retail operations.
The Canadian retail fuel margin for 2012 was impacted by a decline in fuel volumes sold as a result of fewer retail sites combined with a decline in the fuel margin per gallon, which was due to pricing pressure from our competitors and changes in wholesale motor fuel prices during the year. Our U.S. retail fuel margin improved during 2012 due to increased fuel volumes sold as a result of more retail sites combined with improved fuel margin per gallon as wholesale motor fuel prices peaked in March 2012 and declined throughout the remainder of the year.
Table of Contents
38
EthanolEthanol segment operating loss was $47 million for the year ended December 31, 2012 compared to operating income of $396 million for the year ended December 31, 2011. This decrease of $443 million was primarily due to a $507 million decrease in gross margin, partially offset by a $67 million decrease in operating expenses.
The decrease in gross margin was due to a 56 percent decrease in the gross margin per gallon of ethanol production (a $0.38 per gallon decrease between the comparable periods) primarily due to lower ethanol prices in 2012 versus 2011. Ethanol prices during 2012 were pressured by a surplus of ethanol supply due to reduced demand for ethanol associated with the decline in gasoline demand in the U.S., lower exports of ethanol to Europe, and increased imports of ethanol from Brazil. In addition, ethanol production decreased 385,000 gallons per day between the comparable periods due to lower utilization rates at our ethanol plants during 2012. The reduction in operating expenses was due primarily to a $57 million decrease in energy costs resulting from decreased consumption because of the lower utilization rates previously discussed, combined with lower natural gas prices versus the comparable period of 2011.
Corporate Expenses and OtherGeneral and administrative expenses increased $127 million for the year ended December 31, 2012 compared to the year ended December 31, 2011 due to $58 million in administrative costs related to our European operations, which we acquired on August 1, 2011, a $23 million increase in employee benefits expense (primarily related to increased costs for medical and retirement benefits), and favorable legal settlements of $47 million in 2011, which did not recur in 2012.
“Other income, net” for the year ended December 31, 2012 decreased $34 million from the year ended December 31, 2011 due to an increase of $15 million of foreign currency transaction losses, an $11 million reduction in interest income due to the collection of a note receivable from PBF Holdings LLC in February 2012, and a $7 million reduction in bank interest income due to lower levels of temporary cash investments during 2012 as compared to the prior year.
“Interest and debt expense, net of capitalized interest” for the year ended December 31, 2012 decreased $88 million from the year ended December 31, 2011. This decrease is primarily due to an increase of $69 million in capitalized interest related to an increase in capital expenditures between the years and a $33 million favorable impact from the decrease in average borrowings, partially offset by a $12 million write-off of unamortized debt discounts related to the early redemption of certain industrial revenue bonds in the first quarter of 2012.
Income tax expense for the year ended December 31, 2012 increased $400 million from the year ended December 31, 2011 partially as a result of higher operating income in 2012. The variation in the customary relationship between income tax expense and income from continuing operations before income tax expense for the year ended December 31, 2012 was primarily due to not recognizing the tax benefits associated with the asset impairment loss of $928 million and the severance expense of $41 million related to the Aruba Refinery as we do not expect to realize a tax benefit from these losses.
Table of Contents
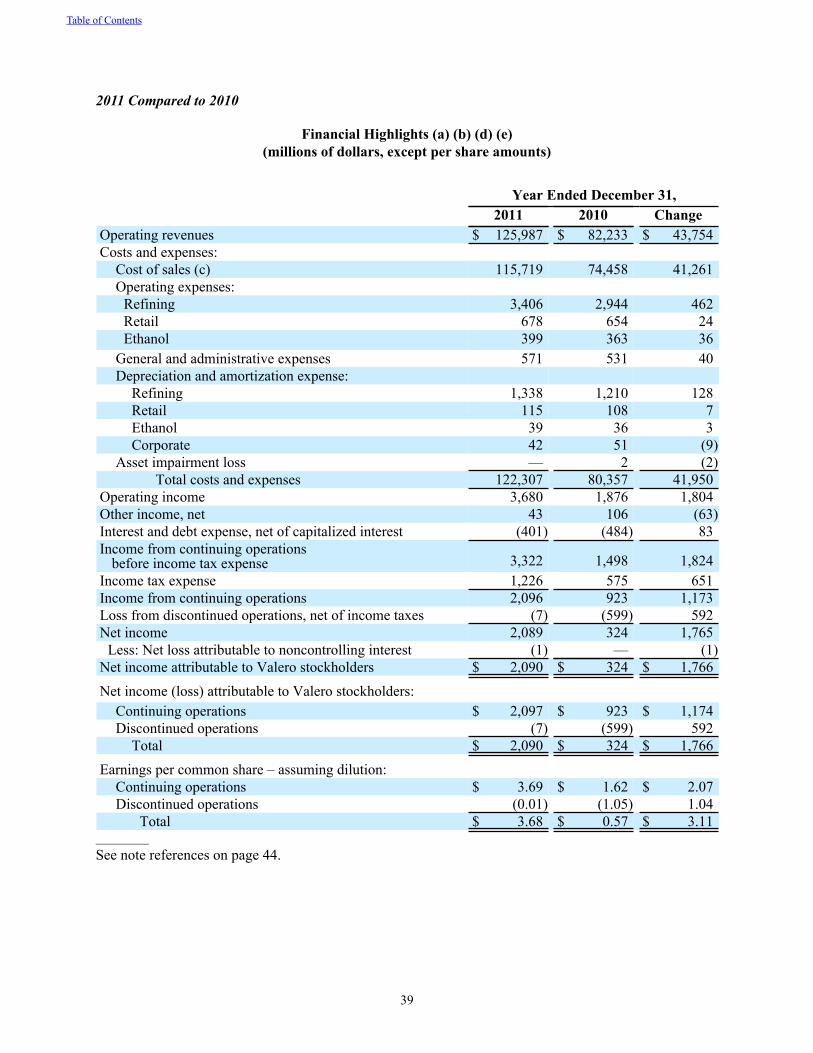
39
2011 Compared to 2010
Financial Highlights (a) (b) (d) (e)(millions of dollars, except per share amounts)
Year Ended December 31, 2011 2010 ChangeOperating revenues $ 125,987 $ 82,233 $ 43,754Costs and expenses:
Cost of sales (c) 115,719 74,458 41,261Operating expenses:
Refining 3,406 2,944 462Retail 678 654 24Ethanol 399 363 36
General and administrative expenses 571 531 40Depreciation and amortization expense:
Refining 1,338 1,210 128Retail 115 108 7Ethanol 39 36 3Corporate 42 51 (9)
Asset impairment loss — 2 (2)Total costs and expenses 122,307 80,357 41,950
Operating income 3,680 1,876 1,804Other income, net 43 106 (63)Interest and debt expense, net of capitalized interest (401) (484) 83Income from continuing operations
before income tax expense 3,322 1,498 1,824Income tax expense 1,226 575 651Income from continuing operations 2,096 923 1,173Loss from discontinued operations, net of income taxes (7) (599) 592Net income 2,089 324 1,765
Less: Net loss attributable to noncontrolling interest (1) — (1)Net income attributable to Valero stockholders $ 2,090 $ 324 $ 1,766Net income (loss) attributable to Valero stockholders:
Continuing operations $ 2,097 $ 923 $ 1,174Discontinued operations (7) (599) 592
Total $ 2,090 $ 324 $ 1,766Earnings per common share – assuming dilution:
Continuing operations $ 3.69 $ 1.62 $ 2.07Discontinued operations (0.01) (1.05) 1.04
Total $ 3.68 $ 0.57 $ 3.11__________
See note references on page 44.
Table of Contents
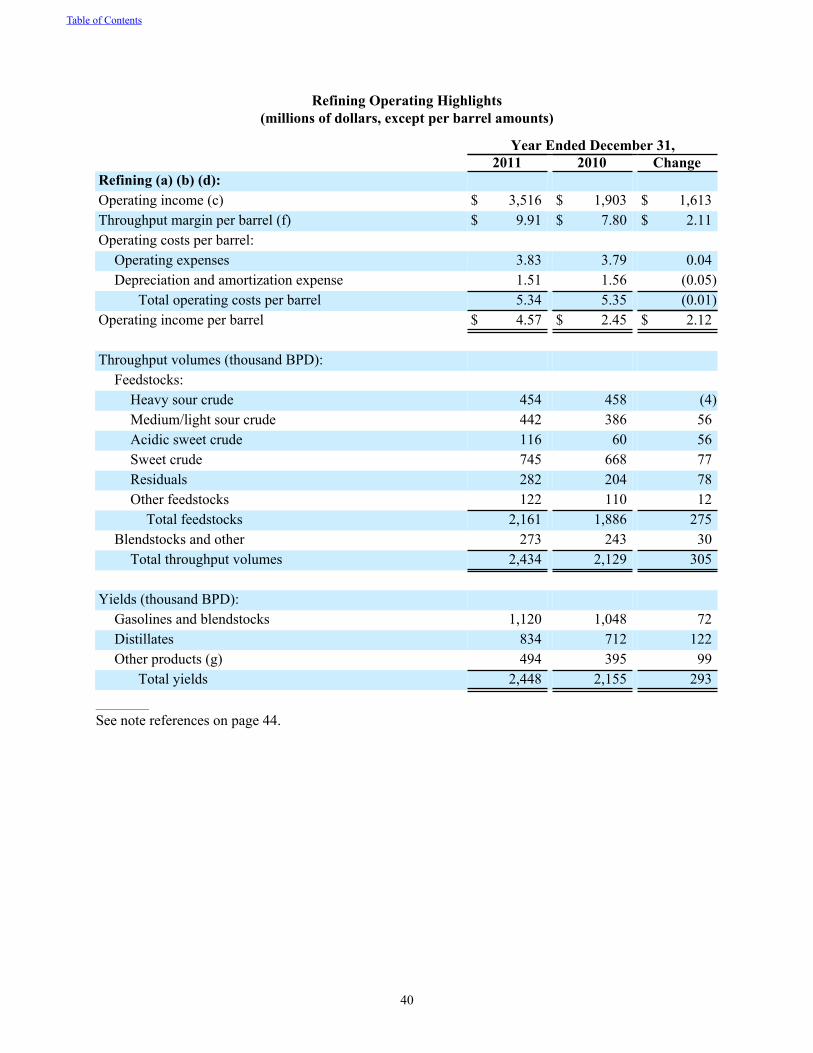
40
Refining Operating Highlights(millions of dollars, except per barrel amounts)
Year Ended December 31,2011 2010 Change
Refining (a) (b) (d): Operating income (c) $ 3,516 $ 1,903 $ 1,613Throughput margin per barrel (f) $ 9.91 $ 7.80 $ 2.11Operating costs per barrel:
Operating expenses 3.83 3.79 0.04Depreciation and amortization expense 1.51 1.56 (0.05)
Total operating costs per barrel 5.34 5.35 (0.01)Operating income per barrel $ 4.57 $ 2.45 $ 2.12
Throughput volumes (thousand BPD): Feedstocks:
Heavy sour crude 454 458 (4)Medium/light sour crude 442 386 56Acidic sweet crude 116 60 56Sweet crude 745 668 77Residuals 282 204 78Other feedstocks 122 110 12
Total feedstocks 2,161 1,886 275Blendstocks and other 273 243 30
Total throughput volumes 2,434 2,129 305
Yields (thousand BPD): Gasolines and blendstocks 1,120 1,048 72Distillates 834 712 122Other products (g) 494 395 99
Total yields 2,448 2,155 293
__________
See note references on page 44.
Table of Contents
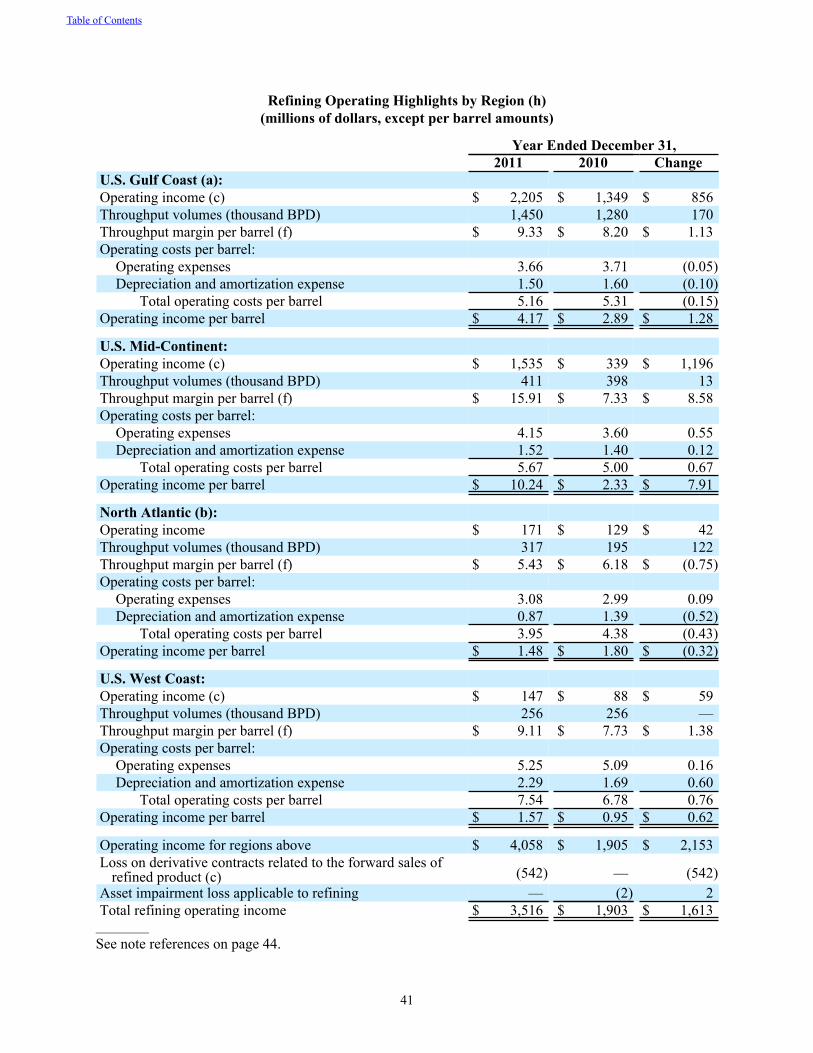
41
Refining Operating Highlights by Region (h)(millions of dollars, except per barrel amounts)
Year Ended December 31,2011 2010 Change
U.S. Gulf Coast (a):Operating income (c) $ 2,205 $ 1,349 $ 856Throughput volumes (thousand BPD) 1,450 1,280 170Throughput margin per barrel (f) $ 9.33 $ 8.20 $ 1.13Operating costs per barrel:
Operating expenses 3.66 3.71 (0.05)Depreciation and amortization expense 1.50 1.60 (0.10)
Total operating costs per barrel 5.16 5.31 (0.15)Operating income per barrel $ 4.17 $ 2.89 $ 1.28
U.S. Mid-Continent:Operating income (c) $ 1,535 $ 339 $ 1,196Throughput volumes (thousand BPD) 411 398 13Throughput margin per barrel (f) $ 15.91 $ 7.33 $ 8.58Operating costs per barrel:
Operating expenses 4.15 3.60 0.55Depreciation and amortization expense 1.52 1.40 0.12
Total operating costs per barrel 5.67 5.00 0.67Operating income per barrel $ 10.24 $ 2.33 $ 7.91
North Atlantic (b):Operating income $ 171 $ 129 $ 42Throughput volumes (thousand BPD) 317 195 122Throughput margin per barrel (f) $ 5.43 $ 6.18 $ (0.75)Operating costs per barrel:
Operating expenses 3.08 2.99 0.09Depreciation and amortization expense 0.87 1.39 (0.52)
Total operating costs per barrel 3.95 4.38 (0.43)Operating income per barrel $ 1.48 $ 1.80 $ (0.32)
U.S. West Coast:Operating income (c) $ 147 $ 88 $ 59Throughput volumes (thousand BPD) 256 256 —Throughput margin per barrel (f) $ 9.11 $ 7.73 $ 1.38Operating costs per barrel:
Operating expenses 5.25 5.09 0.16Depreciation and amortization expense 2.29 1.69 0.60
Total operating costs per barrel 7.54 6.78 0.76Operating income per barrel $ 1.57 $ 0.95 $ 0.62
Operating income for regions above $ 4,058 $ 1,905 $ 2,153Loss on derivative contracts related to the forward sales of
refined product (c) (542) — (542)Asset impairment loss applicable to refining — (2) 2Total refining operating income $ 3,516 $ 1,903 $ 1,613
__________
See note references on page 44.
Table of Contents
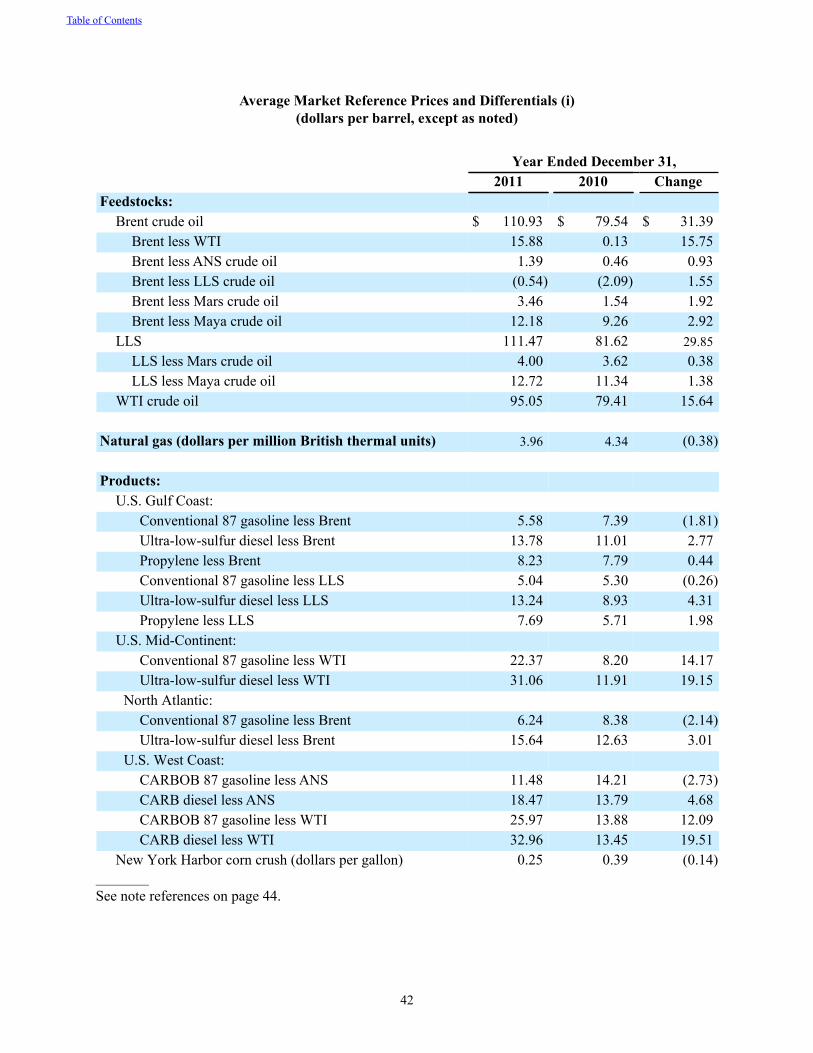
42
Average Market Reference Prices and Differentials (i)(dollars per barrel, except as noted)
Year Ended December 31, 2011 2010 ChangeFeedstocks:
Brent crude oil $ 110.93 $ 79.54 $ 31.39Brent less WTI 15.88 0.13 15.75Brent less ANS crude oil 1.39 0.46 0.93Brent less LLS crude oil (0.54) (2.09) 1.55Brent less Mars crude oil 3.46 1.54 1.92Brent less Maya crude oil 12.18 9.26 2.92
LLS 111.47 81.62 29.85LLS less Mars crude oil 4.00 3.62 0.38LLS less Maya crude oil 12.72 11.34 1.38
WTI crude oil 95.05 79.41 15.64
Natural gas (dollars per million British thermal units) 3.96 4.34 (0.38)
Products: U.S. Gulf Coast:
Conventional 87 gasoline less Brent 5.58 7.39 (1.81)Ultra-low-sulfur diesel less Brent 13.78 11.01 2.77Propylene less Brent 8.23 7.79 0.44Conventional 87 gasoline less LLS 5.04 5.30 (0.26)Ultra-low-sulfur diesel less LLS 13.24 8.93 4.31Propylene less LLS 7.69 5.71 1.98
U.S. Mid-Continent:Conventional 87 gasoline less WTI 22.37 8.20 14.17Ultra-low-sulfur diesel less WTI 31.06 11.91 19.15
North Atlantic:Conventional 87 gasoline less Brent 6.24 8.38 (2.14)Ultra-low-sulfur diesel less Brent 15.64 12.63 3.01
U.S. West Coast:CARBOB 87 gasoline less ANS 11.48 14.21 (2.73)CARB diesel less ANS 18.47 13.79 4.68CARBOB 87 gasoline less WTI 25.97 13.88 12.09CARB diesel less WTI 32.96 13.45 19.51
New York Harbor corn crush (dollars per gallon) 0.25 0.39 (0.14)__________
See note references on page 44.
Table of Contents
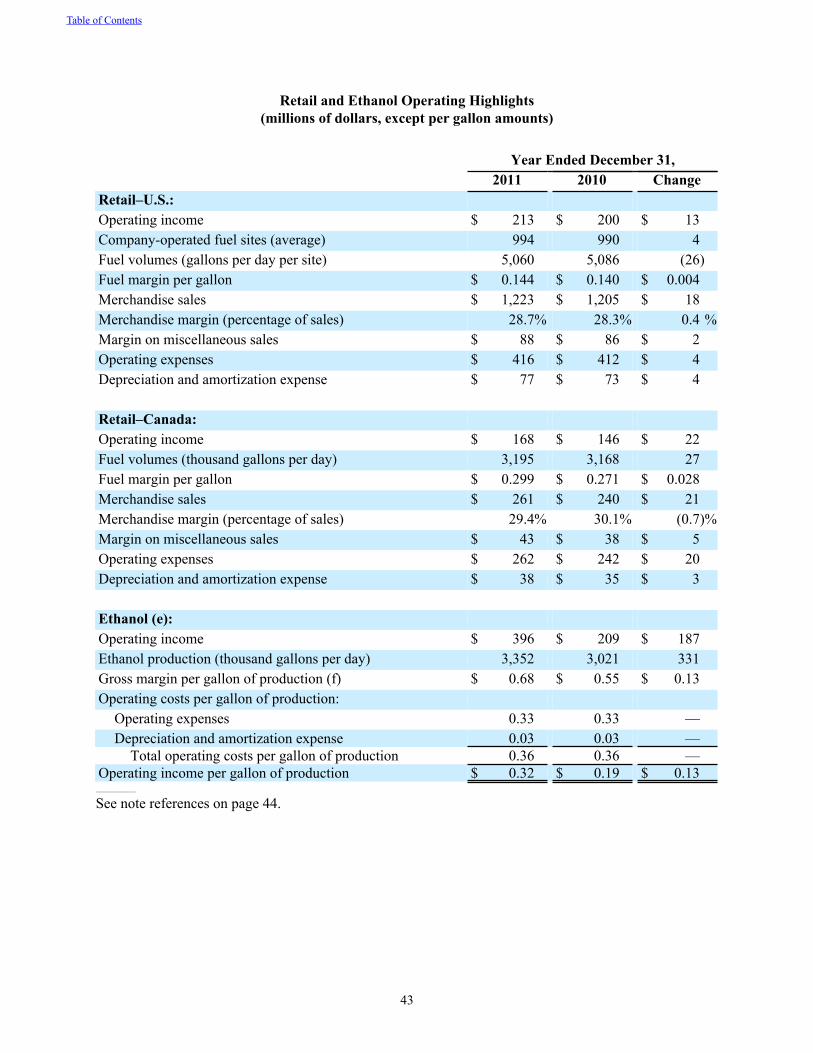
43
Retail and Ethanol Operating Highlights(millions of dollars, except per gallon amounts)
Year Ended December 31,2011 2010 Change
Retail–U.S.: Operating income $ 213 $ 200 $ 13Company-operated fuel sites (average) 994 990 4Fuel volumes (gallons per day per site) 5,060 5,086 (26)Fuel margin per gallon $ 0.144 $ 0.140 $ 0.004Merchandise sales $ 1,223 $ 1,205 $ 18Merchandise margin (percentage of sales) 28.7% 28.3% 0.4 %Margin on miscellaneous sales $ 88 $ 86 $ 2Operating expenses $ 416 $ 412 $ 4Depreciation and amortization expense $ 77 $ 73 $ 4
Retail–Canada:Operating income $ 168 $ 146 $ 22Fuel volumes (thousand gallons per day) 3,195 3,168 27Fuel margin per gallon $ 0.299 $ 0.271 $ 0.028Merchandise sales $ 261 $ 240 $ 21Merchandise margin (percentage of sales) 29.4% 30.1% (0.7)%Margin on miscellaneous sales $ 43 $ 38 $ 5Operating expenses $ 262 $ 242 $ 20Depreciation and amortization expense $ 38 $ 35 $ 3
Ethanol (e):Operating income $ 396 $ 209 $ 187Ethanol production (thousand gallons per day) 3,352 3,021 331Gross margin per gallon of production (f) $ 0.68 $ 0.55 $ 0.13Operating costs per gallon of production:
Operating expenses 0.33 0.33 —Depreciation and amortization expense 0.03 0.03 —
Total operating costs per gallon of production 0.36 0.36 —Operating income per gallon of production $ 0.32 $ 0.19 $ 0.13
__________
See note references on page 44.
Table of Contents
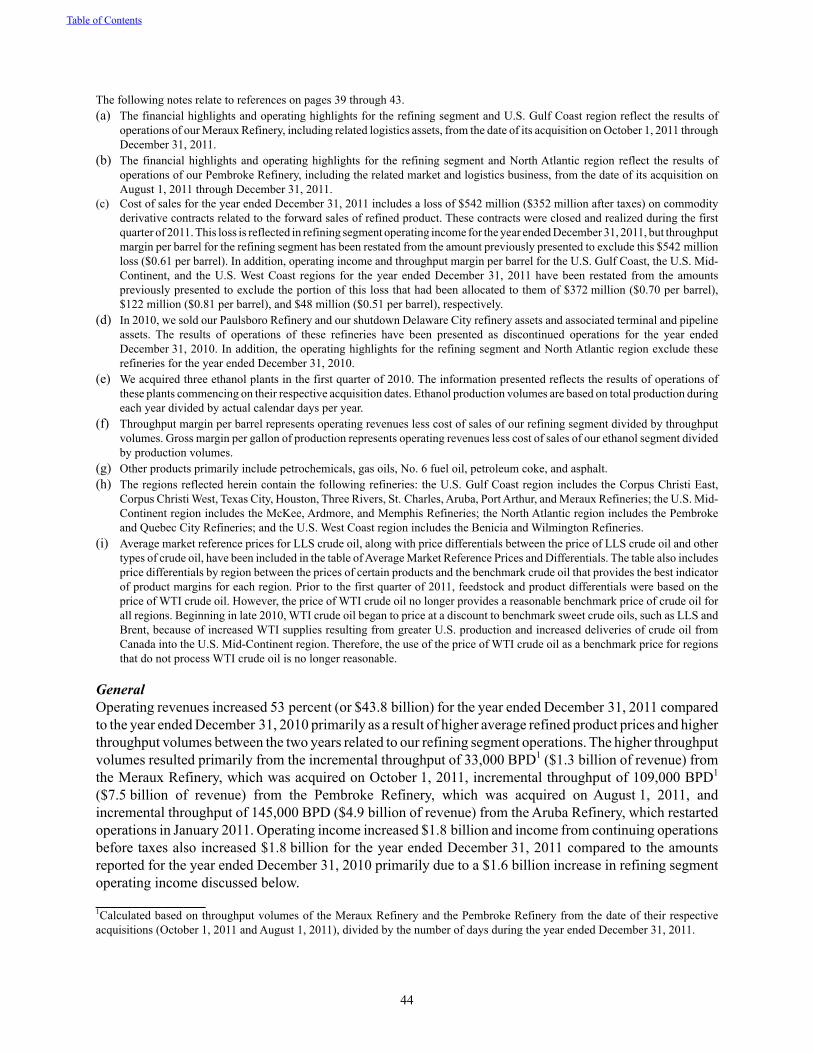
44
The following notes relate to references on pages 39 through 43.(a) The financial highlights and operating highlights for the refining segment and U.S. Gulf Coast region reflect the results of
operations of our Meraux Refinery, including related logistics assets, from the date of its acquisition on October 1, 2011 through December 31, 2011.
(b) The financial highlights and operating highlights for the refining segment and North Atlantic region reflect the results of operations of our Pembroke Refinery, including the related market and logistics business, from the date of its acquisition on August 1, 2011 through December 31, 2011.
(c) Cost of sales for the year ended December 31, 2011 includes a loss of $542 million ($352 million after taxes) on commodity derivative contracts related to the forward sales of refined product. These contracts were closed and realized during the first quarter of 2011. This loss is reflected in refining segment operating income for the year ended December 31, 2011, but throughput margin per barrel for the refining segment has been restated from the amount previously presented to exclude this $542 million loss ($0.61 per barrel). In addition, operating income and throughput margin per barrel for the U.S. Gulf Coast, the U.S. Mid-Continent, and the U.S. West Coast regions for the year ended December 31, 2011 have been restated from the amounts previously presented to exclude the portion of this loss that had been allocated to them of $372 million ($0.70 per barrel), $122 million ($0.81 per barrel), and $48 million ($0.51 per barrel), respectively.
(d) In 2010, we sold our Paulsboro Refinery and our shutdown Delaware City refinery assets and associated terminal and pipeline assets. The results of operations of these refineries have been presented as discontinued operations for the year ended December 31, 2010. In addition, the operating highlights for the refining segment and North Atlantic region exclude these refineries for the year ended December 31, 2010.
(e) We acquired three ethanol plants in the first quarter of 2010. The information presented reflects the results of operations of these plants commencing on their respective acquisition dates. Ethanol production volumes are based on total production during each year divided by actual calendar days per year.
(f) Throughput margin per barrel represents operating revenues less cost of sales of our refining segment divided by throughput volumes. Gross margin per gallon of production represents operating revenues less cost of sales of our ethanol segment divided by production volumes.
(g) Other products primarily include petrochemicals, gas oils, No. 6 fuel oil, petroleum coke, and asphalt.(h) The regions reflected herein contain the following refineries: the U.S. Gulf Coast region includes the Corpus Christi East,
Corpus Christi West, Texas City, Houston, Three Rivers, St. Charles, Aruba, Port Arthur, and Meraux Refineries; the U.S. Mid-Continent region includes the McKee, Ardmore, and Memphis Refineries; the North Atlantic region includes the Pembroke and Quebec City Refineries; and the U.S. West Coast region includes the Benicia and Wilmington Refineries.
(i) Average market reference prices for LLS crude oil, along with price differentials between the price of LLS crude oil and other types of crude oil, have been included in the table of Average Market Reference Prices and Differentials. The table also includes price differentials by region between the prices of certain products and the benchmark crude oil that provides the best indicator of product margins for each region. Prior to the first quarter of 2011, feedstock and product differentials were based on the price of WTI crude oil. However, the price of WTI crude oil no longer provides a reasonable benchmark price of crude oil for all regions. Beginning in late 2010, WTI crude oil began to price at a discount to benchmark sweet crude oils, such as LLS and Brent, because of increased WTI supplies resulting from greater U.S. production and increased deliveries of crude oil from Canada into the U.S. Mid-Continent region. Therefore, the use of the price of WTI crude oil as a benchmark price for regions that do not process WTI crude oil is no longer reasonable.
GeneralOperating revenues increased 53 percent (or $43.8 billion) for the year ended December 31, 2011 compared to the year ended December 31, 2010 primarily as a result of higher average refined product prices and higher throughput volumes between the two years related to our refining segment operations. The higher throughput volumes resulted primarily from the incremental throughput of 33,000 BPD1 ($1.3 billion of revenue) from the Meraux Refinery, which was acquired on October 1, 2011, incremental throughput of 109,000 BPD1 ($7.5 billion of revenue) from the Pembroke Refinery, which was acquired on August 1, 2011, and incremental throughput of 145,000 BPD ($4.9 billion of revenue) from the Aruba Refinery, which restarted operations in January 2011. Operating income increased $1.8 billion and income from continuing operations before taxes also increased $1.8 billion for the year ended December 31, 2011 compared to the amounts reported for the year ended December 31, 2010 primarily due to a $1.6 billion increase in refining segment operating income discussed below._______________1Calculated based on throughput volumes of the Meraux Refinery and the Pembroke Refinery from the date of their respective acquisitions (October 1, 2011 and August 1, 2011), divided by the number of days during the year ended December 31, 2011.
Table of Contents
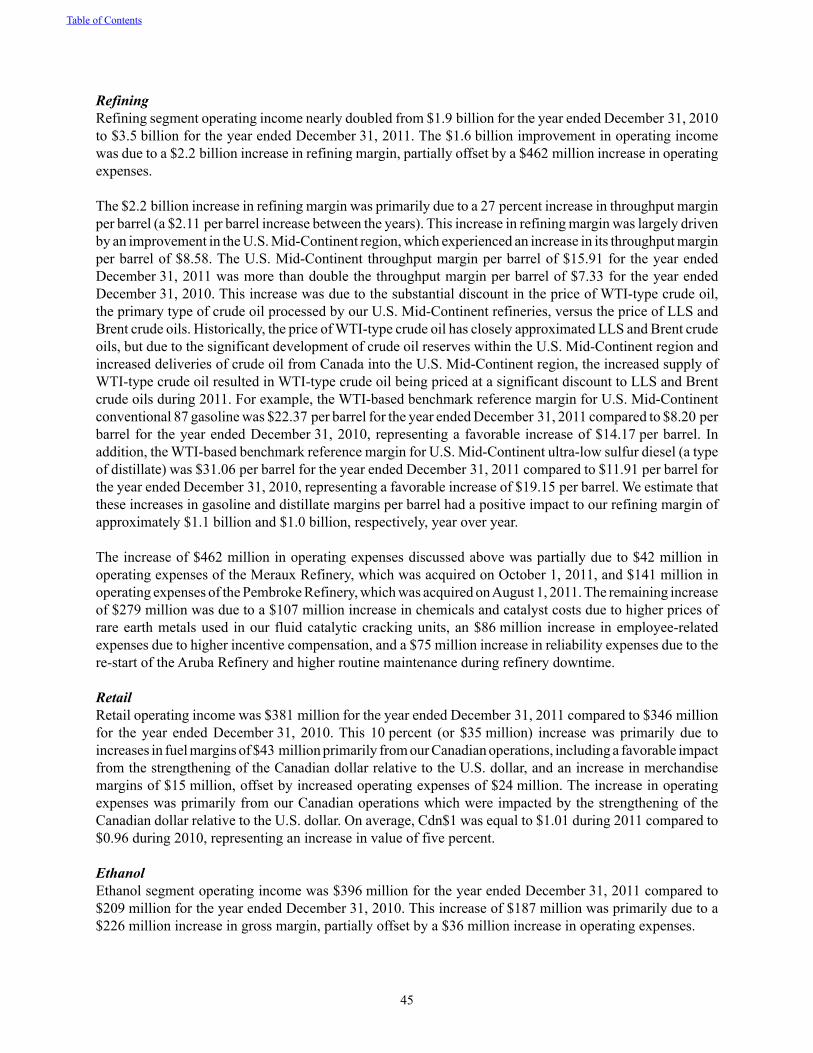
45
RefiningRefining segment operating income nearly doubled from $1.9 billion for the year ended December 31, 2010 to $3.5 billion for the year ended December 31, 2011. The $1.6 billion improvement in operating income was due to a $2.2 billion increase in refining margin, partially offset by a $462 million increase in operating expenses.
The $2.2 billion increase in refining margin was primarily due to a 27 percent increase in throughput margin per barrel (a $2.11 per barrel increase between the years). This increase in refining margin was largely driven by an improvement in the U.S. Mid-Continent region, which experienced an increase in its throughput margin per barrel of $8.58. The U.S. Mid-Continent throughput margin per barrel of $15.91 for the year ended December 31, 2011 was more than double the throughput margin per barrel of $7.33 for the year ended December 31, 2010. This increase was due to the substantial discount in the price of WTI-type crude oil, the primary type of crude oil processed by our U.S. Mid-Continent refineries, versus the price of LLS and Brent crude oils. Historically, the price of WTI-type crude oil has closely approximated LLS and Brent crude oils, but due to the significant development of crude oil reserves within the U.S. Mid-Continent region and increased deliveries of crude oil from Canada into the U.S. Mid-Continent region, the increased supply of WTI-type crude oil resulted in WTI-type crude oil being priced at a significant discount to LLS and Brent crude oils during 2011. For example, the WTI-based benchmark reference margin for U.S. Mid-Continent conventional 87 gasoline was $22.37 per barrel for the year ended December 31, 2011 compared to $8.20 per barrel for the year ended December 31, 2010, representing a favorable increase of $14.17 per barrel. In addition, the WTI-based benchmark reference margin for U.S. Mid-Continent ultra-low sulfur diesel (a type of distillate) was $31.06 per barrel for the year ended December 31, 2011 compared to $11.91 per barrel for the year ended December 31, 2010, representing a favorable increase of $19.15 per barrel. We estimate that these increases in gasoline and distillate margins per barrel had a positive impact to our refining margin of approximately $1.1 billion and $1.0 billion, respectively, year over year.
The increase of $462 million in operating expenses discussed above was partially due to $42 million in operating expenses of the Meraux Refinery, which was acquired on October 1, 2011, and $141 million in operating expenses of the Pembroke Refinery, which was acquired on August 1, 2011. The remaining increase of $279 million was due to a $107 million increase in chemicals and catalyst costs due to higher prices of rare earth metals used in our fluid catalytic cracking units, an $86 million increase in employee-related expenses due to higher incentive compensation, and a $75 million increase in reliability expenses due to the re-start of the Aruba Refinery and higher routine maintenance during refinery downtime.
RetailRetail operating income was $381 million for the year ended December 31, 2011 compared to $346 million for the year ended December 31, 2010. This 10 percent (or $35 million) increase was primarily due to increases in fuel margins of $43 million primarily from our Canadian operations, including a favorable impact from the strengthening of the Canadian dollar relative to the U.S. dollar, and an increase in merchandise margins of $15 million, offset by increased operating expenses of $24 million. The increase in operating expenses was primarily from our Canadian operations which were impacted by the strengthening of the Canadian dollar relative to the U.S. dollar. On average, Cdn$1 was equal to $1.01 during 2011 compared to $0.96 during 2010, representing an increase in value of five percent.
EthanolEthanol segment operating income was $396 million for the year ended December 31, 2011 compared to $209 million for the year ended December 31, 2010. This increase of $187 million was primarily due to a $226 million increase in gross margin, partially offset by a $36 million increase in operating expenses.
Table of Contents
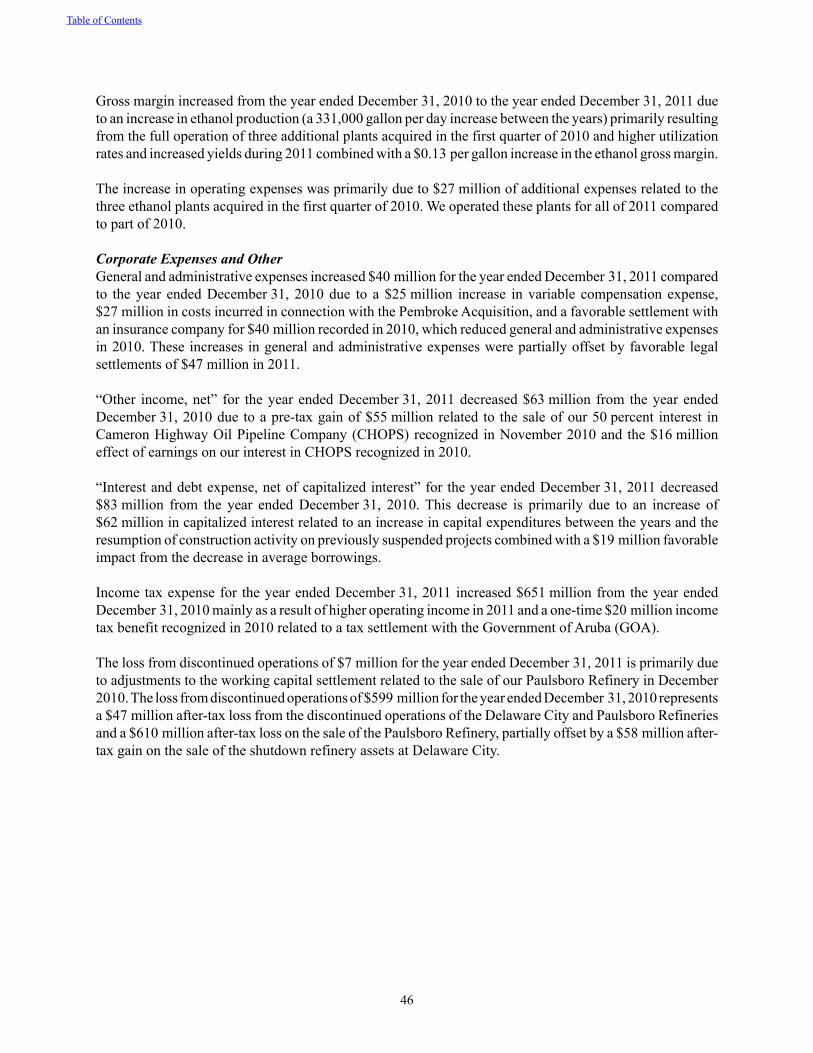
46
Gross margin increased from the year ended December 31, 2010 to the year ended December 31, 2011 due to an increase in ethanol production (a 331,000 gallon per day increase between the years) primarily resulting from the full operation of three additional plants acquired in the first quarter of 2010 and higher utilization rates and increased yields during 2011 combined with a $0.13 per gallon increase in the ethanol gross margin.
The increase in operating expenses was primarily due to $27 million of additional expenses related to the three ethanol plants acquired in the first quarter of 2010. We operated these plants for all of 2011 compared to part of 2010.
Corporate Expenses and OtherGeneral and administrative expenses increased $40 million for the year ended December 31, 2011 compared to the year ended December 31, 2010 due to a $25 million increase in variable compensation expense, $27 million in costs incurred in connection with the Pembroke Acquisition, and a favorable settlement with an insurance company for $40 million recorded in 2010, which reduced general and administrative expenses in 2010. These increases in general and administrative expenses were partially offset by favorable legal settlements of $47 million in 2011.
“Other income, net” for the year ended December 31, 2011 decreased $63 million from the year ended December 31, 2010 due to a pre-tax gain of $55 million related to the sale of our 50 percent interest in Cameron Highway Oil Pipeline Company (CHOPS) recognized in November 2010 and the $16 million effect of earnings on our interest in CHOPS recognized in 2010.
“Interest and debt expense, net of capitalized interest” for the year ended December 31, 2011 decreased $83 million from the year ended December 31, 2010. This decrease is primarily due to an increase of $62 million in capitalized interest related to an increase in capital expenditures between the years and the resumption of construction activity on previously suspended projects combined with a $19 million favorable impact from the decrease in average borrowings.
Income tax expense for the year ended December 31, 2011 increased $651 million from the year ended December 31, 2010 mainly as a result of higher operating income in 2011 and a one-time $20 million income tax benefit recognized in 2010 related to a tax settlement with the Government of Aruba (GOA).
The loss from discontinued operations of $7 million for the year ended December 31, 2011 is primarily due to adjustments to the working capital settlement related to the sale of our Paulsboro Refinery in December 2010. The loss from discontinued operations of $599 million for the year ended December 31, 2010 represents a $47 million after-tax loss from the discontinued operations of the Delaware City and Paulsboro Refineries and a $610 million after-tax loss on the sale of the Paulsboro Refinery, partially offset by a $58 million after-tax gain on the sale of the shutdown refinery assets at Delaware City.
Table of Contents
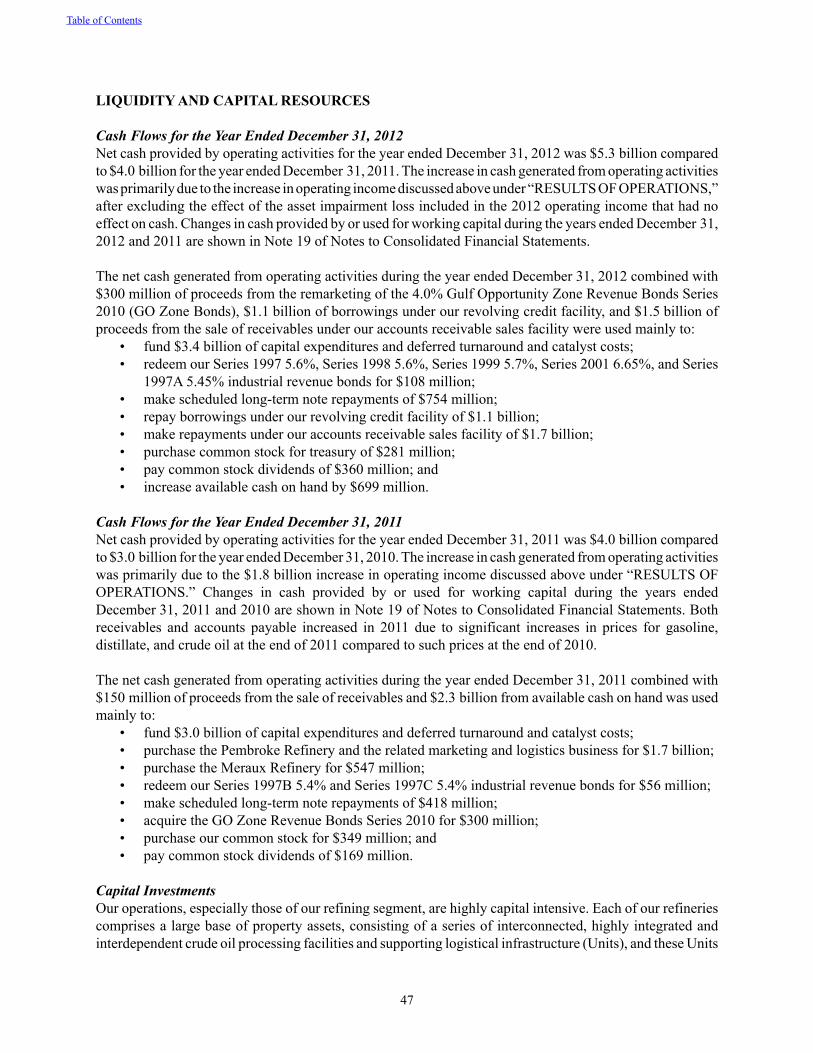
47
LIQUIDITY AND CAPITAL RESOURCES
Cash Flows for the Year Ended December 31, 2012Net cash provided by operating activities for the year ended December 31, 2012 was $5.3 billion compared to $4.0 billion for the year ended December 31, 2011. The increase in cash generated from operating activities was primarily due to the increase in operating income discussed above under “RESULTS OF OPERATIONS,” after excluding the effect of the asset impairment loss included in the 2012 operating income that had no effect on cash. Changes in cash provided by or used for working capital during the years ended December 31, 2012 and 2011 are shown in Note 19 of Notes to Consolidated Financial Statements.
The net cash generated from operating activities during the year ended December 31, 2012 combined with $300 million of proceeds from the remarketing of the 4.0% Gulf Opportunity Zone Revenue Bonds Series 2010 (GO Zone Bonds), $1.1 billion of borrowings under our revolving credit facility, and $1.5 billion of proceeds from the sale of receivables under our accounts receivable sales facility were used mainly to:
• fund $3.4 billion of capital expenditures and deferred turnaround and catalyst costs;• redeem our Series 1997 5.6%, Series 1998 5.6%, Series 1999 5.7%, Series 2001 6.65%, and Series
1997A 5.45% industrial revenue bonds for $108 million;• make scheduled long-term note repayments of $754 million;• repay borrowings under our revolving credit facility of $1.1 billion;• make repayments under our accounts receivable sales facility of $1.7 billion;• purchase common stock for treasury of $281 million;• pay common stock dividends of $360 million; and• increase available cash on hand by $699 million.
Cash Flows for the Year Ended December 31, 2011Net cash provided by operating activities for the year ended December 31, 2011 was $4.0 billion compared to $3.0 billion for the year ended December 31, 2010. The increase in cash generated from operating activities was primarily due to the $1.8 billion increase in operating income discussed above under “RESULTS OF OPERATIONS.” Changes in cash provided by or used for working capital during the years ended December 31, 2011 and 2010 are shown in Note 19 of Notes to Consolidated Financial Statements. Both receivables and accounts payable increased in 2011 due to significant increases in prices for gasoline, distillate, and crude oil at the end of 2011 compared to such prices at the end of 2010.
The net cash generated from operating activities during the year ended December 31, 2011 combined with $150 million of proceeds from the sale of receivables and $2.3 billion from available cash on hand was used mainly to:
• fund $3.0 billion of capital expenditures and deferred turnaround and catalyst costs;• purchase the Pembroke Refinery and the related marketing and logistics business for $1.7 billion;• purchase the Meraux Refinery for $547 million;• redeem our Series 1997B 5.4% and Series 1997C 5.4% industrial revenue bonds for $56 million;• make scheduled long-term note repayments of $418 million;• acquire the GO Zone Revenue Bonds Series 2010 for $300 million;• purchase our common stock for $349 million; and• pay common stock dividends of $169 million.
Capital InvestmentsOur operations, especially those of our refining segment, are highly capital intensive. Each of our refineries comprises a large base of property assets, consisting of a series of interconnected, highly integrated and interdependent crude oil processing facilities and supporting logistical infrastructure (Units), and these Units
Table of Contents
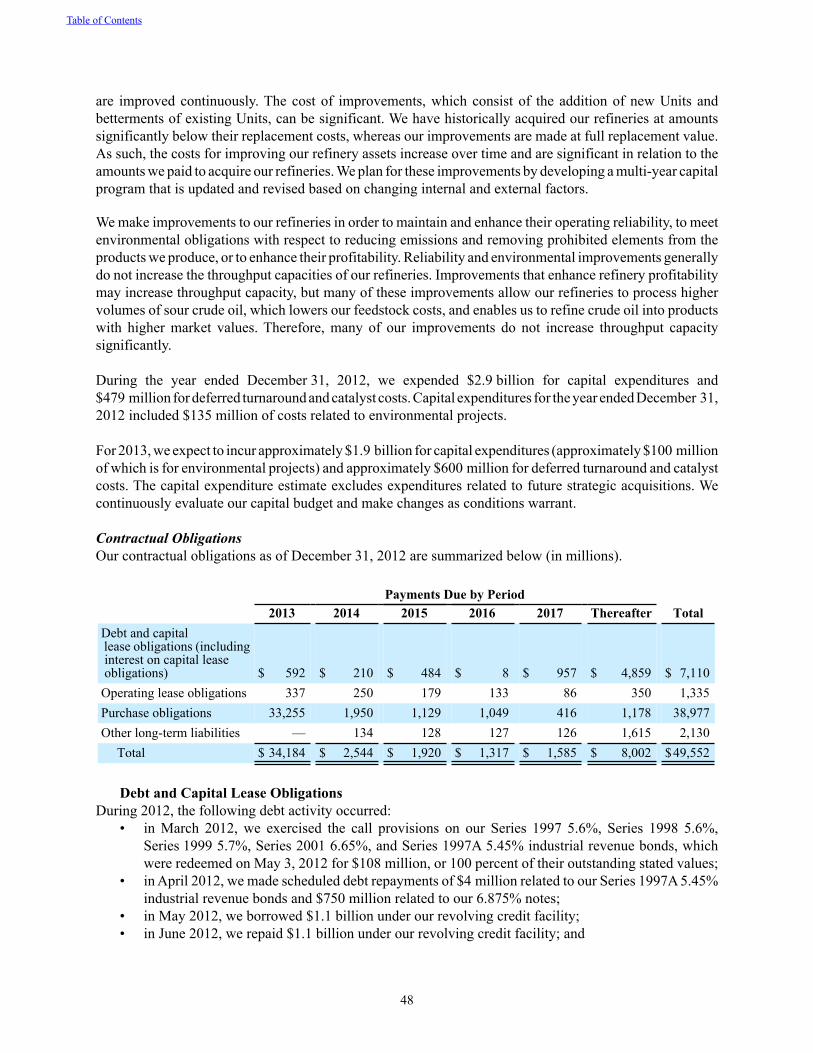
48
are improved continuously. The cost of improvements, which consist of the addition of new Units and betterments of existing Units, can be significant. We have historically acquired our refineries at amounts significantly below their replacement costs, whereas our improvements are made at full replacement value. As such, the costs for improving our refinery assets increase over time and are significant in relation to the amounts we paid to acquire our refineries. We plan for these improvements by developing a multi-year capital program that is updated and revised based on changing internal and external factors.
We make improvements to our refineries in order to maintain and enhance their operating reliability, to meet environmental obligations with respect to reducing emissions and removing prohibited elements from the products we produce, or to enhance their profitability. Reliability and environmental improvements generally do not increase the throughput capacities of our refineries. Improvements that enhance refinery profitability may increase throughput capacity, but many of these improvements allow our refineries to process higher volumes of sour crude oil, which lowers our feedstock costs, and enables us to refine crude oil into products with higher market values. Therefore, many of our improvements do not increase throughput capacity significantly.
During the year ended December 31, 2012, we expended $2.9 billion for capital expenditures and $479 million for deferred turnaround and catalyst costs. Capital expenditures for the year ended December 31, 2012 included $135 million of costs related to environmental projects.
For 2013, we expect to incur approximately $1.9 billion for capital expenditures (approximately $100 million of which is for environmental projects) and approximately $600 million for deferred turnaround and catalyst costs. The capital expenditure estimate excludes expenditures related to future strategic acquisitions. We continuously evaluate our capital budget and make changes as conditions warrant.
Contractual ObligationsOur contractual obligations as of December 31, 2012 are summarized below (in millions).
Payments Due by Period2013 2014 2015 2016 2017 Thereafter Total
Debt and capital lease obligations (including interest on capital lease obligations) $ 592 $ 210 $ 484 $ 8 $ 957 $ 4,859 $ 7,110Operating lease obligations 337 250 179 133 86 350 1,335Purchase obligations 33,255 1,950 1,129 1,049 416 1,178 38,977Other long-term liabilities — 134 128 127 126 1,615 2,130
Total $ 34,184 $ 2,544 $ 1,920 $ 1,317 $ 1,585 $ 8,002 $49,552
Debt and Capital Lease ObligationsDuring 2012, the following debt activity occurred:
• in March 2012, we exercised the call provisions on our Series 1997 5.6%, Series 1998 5.6%, Series 1999 5.7%, Series 2001 6.65%, and Series 1997A 5.45% industrial revenue bonds, which were redeemed on May 3, 2012 for $108 million, or 100 percent of their outstanding stated values;
• in April 2012, we made scheduled debt repayments of $4 million related to our Series 1997A 5.45% industrial revenue bonds and $750 million related to our 6.875% notes;
• in May 2012, we borrowed $1.1 billion under our revolving credit facility;• in June 2012, we repaid $1.1 billion under our revolving credit facility; and
Table of Contents
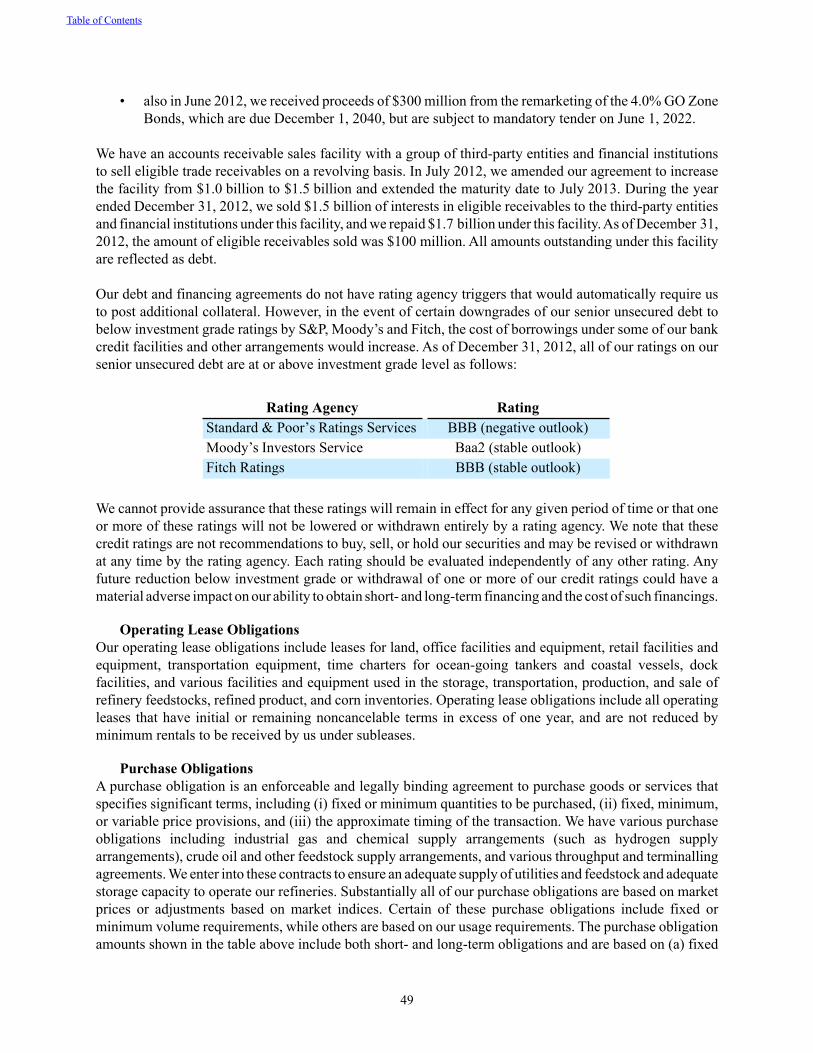
49
• also in June 2012, we received proceeds of $300 million from the remarketing of the 4.0% GO Zone Bonds, which are due December 1, 2040, but are subject to mandatory tender on June 1, 2022.
We have an accounts receivable sales facility with a group of third-party entities and financial institutions to sell eligible trade receivables on a revolving basis. In July 2012, we amended our agreement to increase the facility from $1.0 billion to $1.5 billion and extended the maturity date to July 2013. During the year ended December 31, 2012, we sold $1.5 billion of interests in eligible receivables to the third-party entities and financial institutions under this facility, and we repaid $1.7 billion under this facility. As of December 31, 2012, the amount of eligible receivables sold was $100 million. All amounts outstanding under this facility are reflected as debt.
Our debt and financing agreements do not have rating agency triggers that would automatically require us to post additional collateral. However, in the event of certain downgrades of our senior unsecured debt to below investment grade ratings by S&P, Moody’s and Fitch, the cost of borrowings under some of our bank credit facilities and other arrangements would increase. As of December 31, 2012, all of our ratings on our senior unsecured debt are at or above investment grade level as follows:
Rating Agency RatingStandard & Poor’s Ratings Services BBB (negative outlook)Moody’s Investors Service Baa2 (stable outlook)Fitch Ratings BBB (stable outlook)
We cannot provide assurance that these ratings will remain in effect for any given period of time or that one or more of these ratings will not be lowered or withdrawn entirely by a rating agency. We note that these credit ratings are not recommendations to buy, sell, or hold our securities and may be revised or withdrawn at any time by the rating agency. Each rating should be evaluated independently of any other rating. Any future reduction below investment grade or withdrawal of one or more of our credit ratings could have a material adverse impact on our ability to obtain short- and long-term financing and the cost of such financings.
Operating Lease ObligationsOur operating lease obligations include leases for land, office facilities and equipment, retail facilities and equipment, transportation equipment, time charters for ocean-going tankers and coastal vessels, dock facilities, and various facilities and equipment used in the storage, transportation, production, and sale of refinery feedstocks, refined product, and corn inventories. Operating lease obligations include all operating leases that have initial or remaining noncancelable terms in excess of one year, and are not reduced by minimum rentals to be received by us under subleases.
Purchase ObligationsA purchase obligation is an enforceable and legally binding agreement to purchase goods or services that specifies significant terms, including (i) fixed or minimum quantities to be purchased, (ii) fixed, minimum, or variable price provisions, and (iii) the approximate timing of the transaction. We have various purchase obligations including industrial gas and chemical supply arrangements (such as hydrogen supply arrangements), crude oil and other feedstock supply arrangements, and various throughput and terminalling agreements. We enter into these contracts to ensure an adequate supply of utilities and feedstock and adequate storage capacity to operate our refineries. Substantially all of our purchase obligations are based on market prices or adjustments based on market indices. Certain of these purchase obligations include fixed or minimum volume requirements, while others are based on our usage requirements. The purchase obligation amounts shown in the table above include both short- and long-term obligations and are based on (a) fixed
Table of Contents
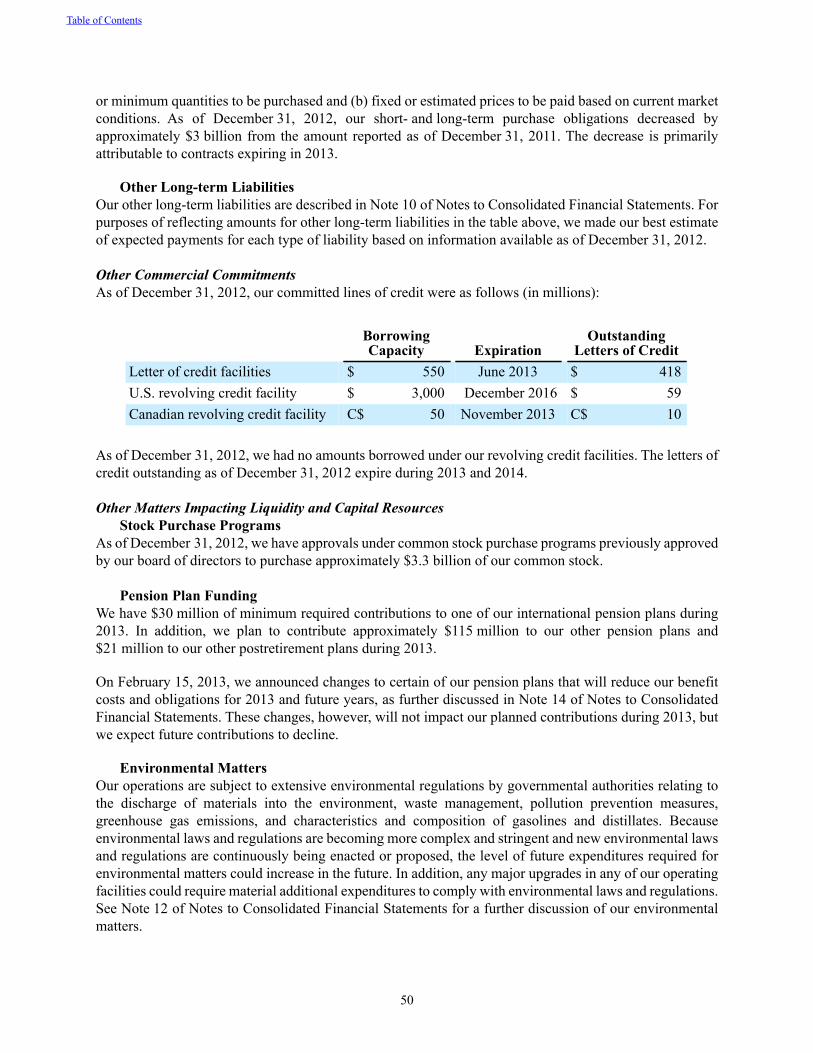
50
or minimum quantities to be purchased and (b) fixed or estimated prices to be paid based on current market conditions. As of December 31, 2012, our short- and long-term purchase obligations decreased by approximately $3 billion from the amount reported as of December 31, 2011. The decrease is primarily attributable to contracts expiring in 2013.
Other Long-term LiabilitiesOur other long-term liabilities are described in Note 10 of Notes to Consolidated Financial Statements. For purposes of reflecting amounts for other long-term liabilities in the table above, we made our best estimate of expected payments for each type of liability based on information available as of December 31, 2012.
Other Commercial CommitmentsAs of December 31, 2012, our committed lines of credit were as follows (in millions):
BorrowingCapacity Expiration
OutstandingLetters of Credit
Letter of credit facilities $ 550 June 2013 $ 418U.S. revolving credit facility $ 3,000 December 2016 $ 59Canadian revolving credit facility C$ 50 November 2013 C$ 10
As of December 31, 2012, we had no amounts borrowed under our revolving credit facilities. The letters of credit outstanding as of December 31, 2012 expire during 2013 and 2014.
Other Matters Impacting Liquidity and Capital ResourcesStock Purchase Programs
As of December 31, 2012, we have approvals under common stock purchase programs previously approved by our board of directors to purchase approximately $3.3 billion of our common stock.
Pension Plan FundingWe have $30 million of minimum required contributions to one of our international pension plans during 2013. In addition, we plan to contribute approximately $115 million to our other pension plans and $21 million to our other postretirement plans during 2013.
On February 15, 2013, we announced changes to certain of our pension plans that will reduce our benefit costs and obligations for 2013 and future years, as further discussed in Note 14 of Notes to Consolidated Financial Statements. These changes, however, will not impact our planned contributions during 2013, but we expect future contributions to decline.
Environmental MattersOur operations are subject to extensive environmental regulations by governmental authorities relating to the discharge of materials into the environment, waste management, pollution prevention measures, greenhouse gas emissions, and characteristics and composition of gasolines and distillates. Because environmental laws and regulations are becoming more complex and stringent and new environmental laws and regulations are continuously being enacted or proposed, the level of future expenditures required for environmental matters could increase in the future. In addition, any major upgrades in any of our operating facilities could require material additional expenditures to comply with environmental laws and regulations. See Note 12 of Notes to Consolidated Financial Statements for a further discussion of our environmental matters.
Table of Contents
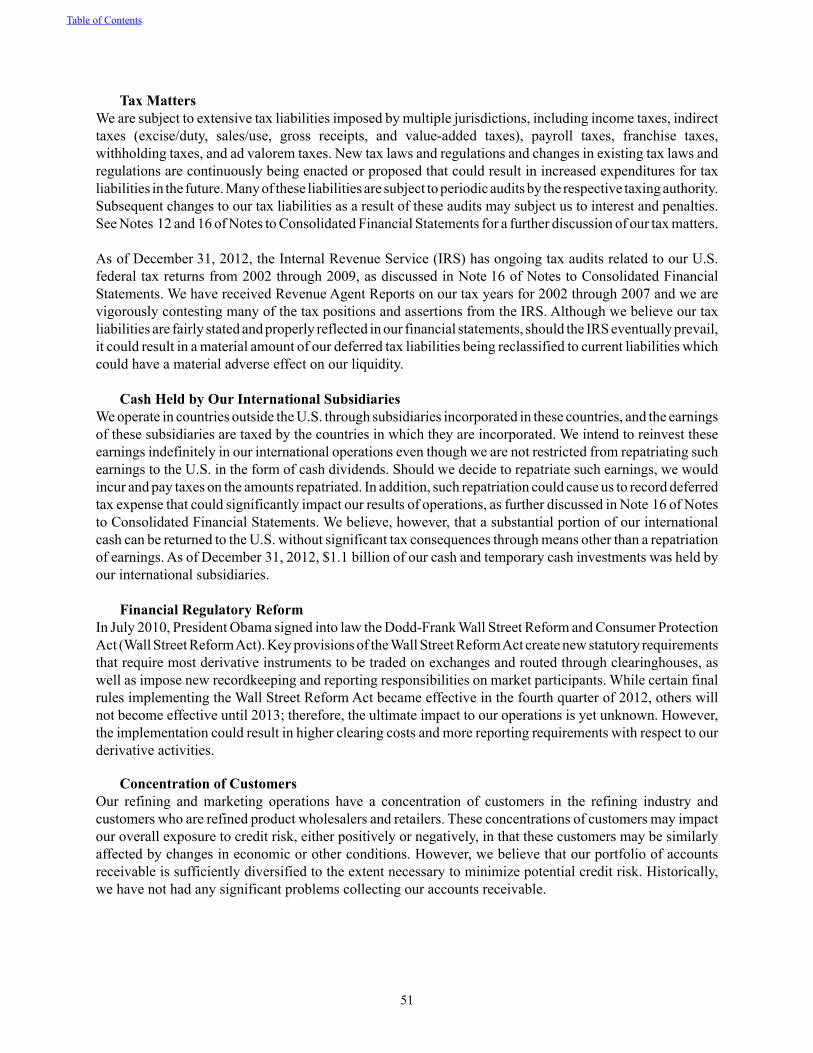
51
Tax MattersWe are subject to extensive tax liabilities imposed by multiple jurisdictions, including income taxes, indirect taxes (excise/duty, sales/use, gross receipts, and value-added taxes), payroll taxes, franchise taxes, withholding taxes, and ad valorem taxes. New tax laws and regulations and changes in existing tax laws and regulations are continuously being enacted or proposed that could result in increased expenditures for tax liabilities in the future. Many of these liabilities are subject to periodic audits by the respective taxing authority. Subsequent changes to our tax liabilities as a result of these audits may subject us to interest and penalties. See Notes 12 and 16 of Notes to Consolidated Financial Statements for a further discussion of our tax matters.
As of December 31, 2012, the Internal Revenue Service (IRS) has ongoing tax audits related to our U.S. federal tax returns from 2002 through 2009, as discussed in Note 16 of Notes to Consolidated Financial Statements. We have received Revenue Agent Reports on our tax years for 2002 through 2007 and we are vigorously contesting many of the tax positions and assertions from the IRS. Although we believe our tax liabilities are fairly stated and properly reflected in our financial statements, should the IRS eventually prevail, it could result in a material amount of our deferred tax liabilities being reclassified to current liabilities which could have a material adverse effect on our liquidity.
Cash Held by Our International SubsidiariesWe operate in countries outside the U.S. through subsidiaries incorporated in these countries, and the earnings of these subsidiaries are taxed by the countries in which they are incorporated. We intend to reinvest these earnings indefinitely in our international operations even though we are not restricted from repatriating such earnings to the U.S. in the form of cash dividends. Should we decide to repatriate such earnings, we would incur and pay taxes on the amounts repatriated. In addition, such repatriation could cause us to record deferred tax expense that could significantly impact our results of operations, as further discussed in Note 16 of Notes to Consolidated Financial Statements. We believe, however, that a substantial portion of our international cash can be returned to the U.S. without significant tax consequences through means other than a repatriation of earnings. As of December 31, 2012, $1.1 billion of our cash and temporary cash investments was held by our international subsidiaries.
Financial Regulatory ReformIn July 2010, President Obama signed into law the Dodd-Frank Wall Street Reform and Consumer Protection Act (Wall Street Reform Act). Key provisions of the Wall Street Reform Act create new statutory requirements that require most derivative instruments to be traded on exchanges and routed through clearinghouses, as well as impose new recordkeeping and reporting responsibilities on market participants. While certain final rules implementing the Wall Street Reform Act became effective in the fourth quarter of 2012, others will not become effective until 2013; therefore, the ultimate impact to our operations is yet unknown. However, the implementation could result in higher clearing costs and more reporting requirements with respect to our derivative activities.
Concentration of CustomersOur refining and marketing operations have a concentration of customers in the refining industry and customers who are refined product wholesalers and retailers. These concentrations of customers may impact our overall exposure to credit risk, either positively or negatively, in that these customers may be similarly affected by changes in economic or other conditions. However, we believe that our portfolio of accounts receivable is sufficiently diversified to the extent necessary to minimize potential credit risk. Historically, we have not had any significant problems collecting our accounts receivable.
Table of Contents
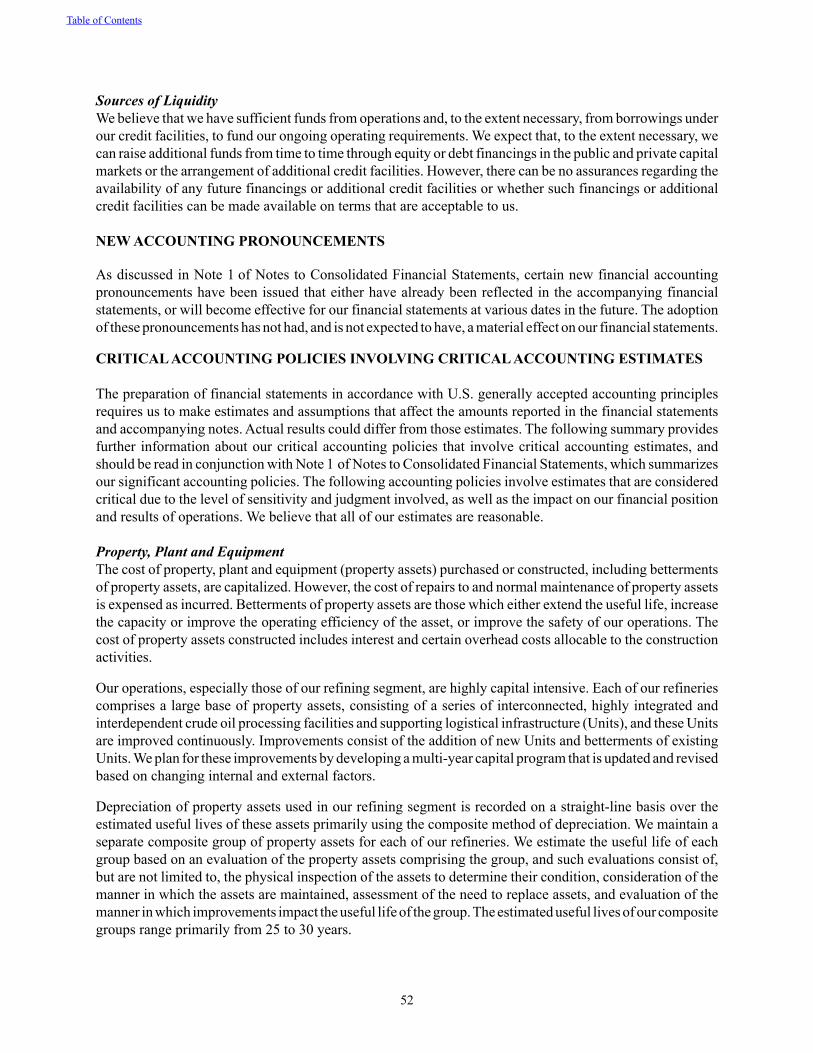
52
Sources of LiquidityWe believe that we have sufficient funds from operations and, to the extent necessary, from borrowings under our credit facilities, to fund our ongoing operating requirements. We expect that, to the extent necessary, we can raise additional funds from time to time through equity or debt financings in the public and private capital markets or the arrangement of additional credit facilities. However, there can be no assurances regarding the availability of any future financings or additional credit facilities or whether such financings or additional credit facilities can be made available on terms that are acceptable to us.
NEW ACCOUNTING PRONOUNCEMENTS
As discussed in Note 1 of Notes to Consolidated Financial Statements, certain new financial accounting pronouncements have been issued that either have already been reflected in the accompanying financial statements, or will become effective for our financial statements at various dates in the future. The adoption of these pronouncements has not had, and is not expected to have, a material effect on our financial statements.
CRITICAL ACCOUNTING POLICIES INVOLVING CRITICAL ACCOUNTING ESTIMATES
The preparation of financial statements in accordance with U.S. generally accepted accounting principles requires us to make estimates and assumptions that affect the amounts reported in the financial statements and accompanying notes. Actual results could differ from those estimates. The following summary provides further information about our critical accounting policies that involve critical accounting estimates, and should be read in conjunction with Note 1 of Notes to Consolidated Financial Statements, which summarizes our significant accounting policies. The following accounting policies involve estimates that are considered critical due to the level of sensitivity and judgment involved, as well as the impact on our financial position and results of operations. We believe that all of our estimates are reasonable.
Property, Plant and EquipmentThe cost of property, plant and equipment (property assets) purchased or constructed, including betterments of property assets, are capitalized. However, the cost of repairs to and normal maintenance of property assets is expensed as incurred. Betterments of property assets are those which either extend the useful life, increase the capacity or improve the operating efficiency of the asset, or improve the safety of our operations. The cost of property assets constructed includes interest and certain overhead costs allocable to the construction activities.
Our operations, especially those of our refining segment, are highly capital intensive. Each of our refineries comprises a large base of property assets, consisting of a series of interconnected, highly integrated and interdependent crude oil processing facilities and supporting logistical infrastructure (Units), and these Units are improved continuously. Improvements consist of the addition of new Units and betterments of existing Units. We plan for these improvements by developing a multi-year capital program that is updated and revised based on changing internal and external factors.
Depreciation of property assets used in our refining segment is recorded on a straight-line basis over the estimated useful lives of these assets primarily using the composite method of depreciation. We maintain a separate composite group of property assets for each of our refineries. We estimate the useful life of each group based on an evaluation of the property assets comprising the group, and such evaluations consist of, but are not limited to, the physical inspection of the assets to determine their condition, consideration of the manner in which the assets are maintained, assessment of the need to replace assets, and evaluation of the manner in which improvements impact the useful life of the group. The estimated useful lives of our composite groups range primarily from 25 to 30 years.
Table of Contents
53
Under the composite method of depreciation, the cost of an improvement is added to the composite group to which it relates and is depreciated over that group’s estimated useful life. We design improvements to our refineries in accordance with engineering specifications, design standards and practices accepted in our industry, and these improvements have design lives consistent with our estimated useful lives. Therefore, we believe the use of the group life to depreciate the cost of improvements made to the group is reasonable because the estimated useful life of each improvement is consistent with that of the group. It should be noted, however, that factors such as competition, regulation, or environmental matters could cause us to change our estimates, thus impacting depreciation expense in the future.
Also under the composite method of depreciation, the historical cost of a minor property asset (net of salvage value) that is retired or replaced is charged to accumulated depreciation and no gain or loss is recognized in income. However, a gain or loss is recognized in income for a major property asset that is retired, replaced or sold and for an abnormal disposition of a property asset (primarily involuntary conversions). Gains and losses are reflected in depreciation and amortization expense, unless such amounts are reported separately due to materiality.
Impairment of AssetsLong-lived assets, which include property, plant and equipment, intangible assets, and refinery turnaround and catalyst costs, are tested for recoverability whenever events or changes in circumstances indicate that the carrying amount of the asset may not be recoverable. An impairment loss should be recognized if the carrying amount of the asset exceeds its fair value.
In order to test for recoverability, we must make estimates of projected cash flows related to the asset being evaluated, which include, but are not limited to, assumptions about the use or disposition of the asset, its estimated remaining life, and future expenditures necessary to maintain its existing service potential. In order to determine fair value, management must make certain estimates and assumptions including, among other things, an assessment of market conditions, projected cash flows, investment rates, interest/equity rates, and growth rates, that could significantly impact the fair value of the asset being tested for impairment. Our impairment evaluations are based on assumptions that we deem to be reasonable. Providing sensitivity analyses if other assumptions were used in performing the impairment evaluations is not practicable due to the significant number of assumptions involved in the estimates. See Note 4 of Notes to Consolidated Financial Statements for a further discussion of our asset impairment analysis and certain losses resulting from those analyses.
We evaluate our equity method investments for impairment when there is evidence that we may not be able to recover the carrying amount of our investments or the investee is unable to sustain an earnings capacity that justifies the carrying amount. A loss in the value of an investment that is other than a temporary decline is recognized currently in earnings, and is based on the difference between the estimated current fair value of the investment and its carrying amount.
Environmental MattersOur operations are subject to extensive environmental regulations by governmental authorities relating primarily to the discharge of materials into the environment, waste management, and pollution prevention measures. Future legislative action and regulatory initiatives, as discussed in Note 12 of Notes to Consolidated Financial Statements could result in changes to required operating permits, additional remedial actions, or increased capital expenditures and operating costs that cannot be assessed with certainty at this time.
Accruals for environmental liabilities are based on best estimates of probable undiscounted future costs over a 20-year time period using currently available technology and applying current regulations, as well as our
Table of Contents
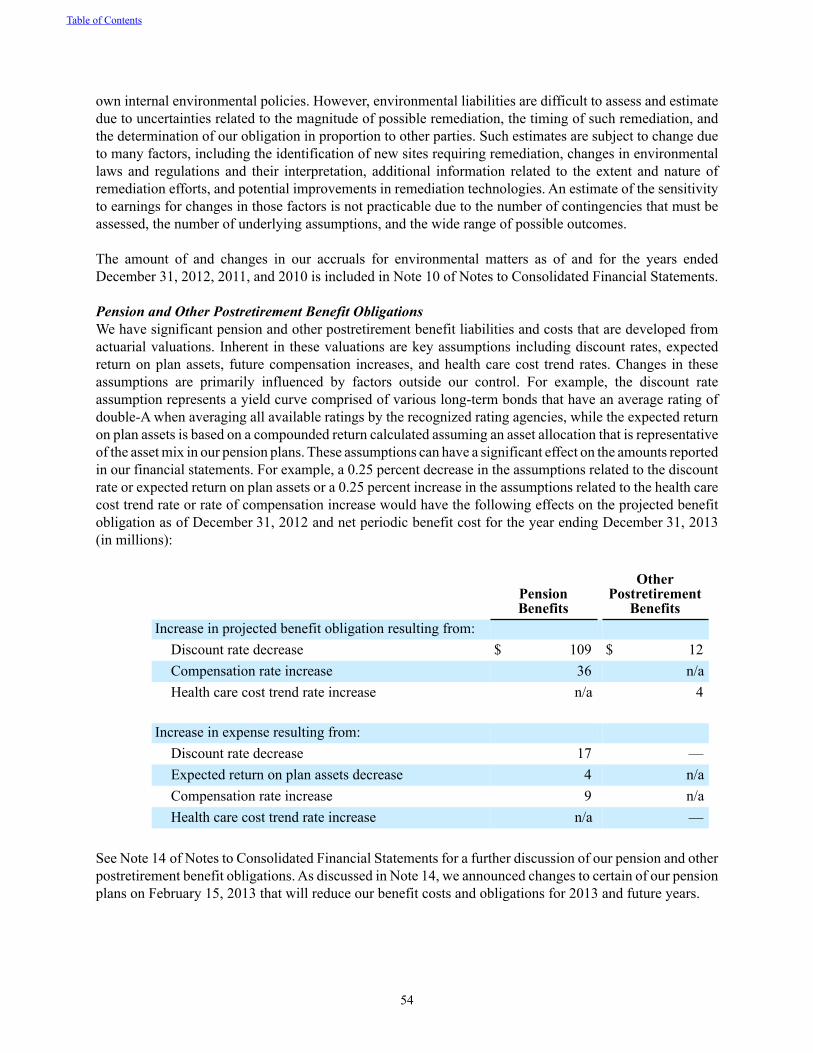
54
own internal environmental policies. However, environmental liabilities are difficult to assess and estimate due to uncertainties related to the magnitude of possible remediation, the timing of such remediation, and the determination of our obligation in proportion to other parties. Such estimates are subject to change due to many factors, including the identification of new sites requiring remediation, changes in environmental laws and regulations and their interpretation, additional information related to the extent and nature of remediation efforts, and potential improvements in remediation technologies. An estimate of the sensitivity to earnings for changes in those factors is not practicable due to the number of contingencies that must be assessed, the number of underlying assumptions, and the wide range of possible outcomes.
The amount of and changes in our accruals for environmental matters as of and for the years ended December 31, 2012, 2011, and 2010 is included in Note 10 of Notes to Consolidated Financial Statements.
Pension and Other Postretirement Benefit ObligationsWe have significant pension and other postretirement benefit liabilities and costs that are developed from actuarial valuations. Inherent in these valuations are key assumptions including discount rates, expected return on plan assets, future compensation increases, and health care cost trend rates. Changes in these assumptions are primarily influenced by factors outside our control. For example, the discount rate assumption represents a yield curve comprised of various long-term bonds that have an average rating of double-A when averaging all available ratings by the recognized rating agencies, while the expected return on plan assets is based on a compounded return calculated assuming an asset allocation that is representative of the asset mix in our pension plans. These assumptions can have a significant effect on the amounts reported in our financial statements. For example, a 0.25 percent decrease in the assumptions related to the discount rate or expected return on plan assets or a 0.25 percent increase in the assumptions related to the health care cost trend rate or rate of compensation increase would have the following effects on the projected benefit obligation as of December 31, 2012 and net periodic benefit cost for the year ending December 31, 2013 (in millions):
Pension Benefits
OtherPostretirement
BenefitsIncrease in projected benefit obligation resulting from:
Discount rate decrease $ 109 $ 12Compensation rate increase 36 n/aHealth care cost trend rate increase n/a 4
Increase in expense resulting from:Discount rate decrease 17 —Expected return on plan assets decrease 4 n/aCompensation rate increase 9 n/aHealth care cost trend rate increase n/a —
See Note 14 of Notes to Consolidated Financial Statements for a further discussion of our pension and other postretirement benefit obligations. As discussed in Note 14, we announced changes to certain of our pension plans on February 15, 2013 that will reduce our benefit costs and obligations for 2013 and future years.
Table of Contents
55
Tax MattersWe record tax liabilities based on our assessment of existing tax laws and regulations. A contingent loss related to an indirect tax claim is recorded if the loss is both probable and estimable. The recording of our tax liabilities requires significant judgments and estimates. Actual tax liabilities can vary from our estimates for a variety of reasons, including different interpretations of tax laws and regulations and different assessments of the amount of tax due. In addition, in determining our income tax provision, we must assess the likelihood that our deferred tax assets, primarily consisting of net operating loss and tax credit carryforwards, will be recovered through future taxable income. Significant judgment is required in estimating the amount of valuation allowance, if any, that should be recorded against those deferred income tax assets. If our actual results of operations differ from such estimates or our estimates of future taxable income change, the valuation allowance may need to be revised. However, an estimate of the sensitivity to earnings that would result from changes in the assumptions and estimates used in determining our tax liabilities is not practicable due to the number of assumptions and tax laws involved, the various potential interpretations of the tax laws, and the wide range of possible outcomes. See Notes 12 and 16 of Notes to Consolidated Financial Statements for a further discussion of our tax liabilities.
Legal MattersA variety of claims have been made against us in various lawsuits. We record a liability related to a loss contingency attributable to such legal matters if we determine that it is probable that a loss has been incurred and that the loss is reasonably estimable. The recording of such liabilities requires judgments and estimates, the results of which can vary significantly from actual litigation results due to differing interpretations of relevant law and differing opinions regarding the degree of potential liability and the assessment of reasonable damages. However, an estimate of the sensitivity to earnings if other assumptions were used in recording our legal liabilities is not practicable due to the number of contingencies that must be assessed and the wide range of reasonably possible outcomes, both in terms of the probability of loss and the estimates of such loss.
Table of Contents
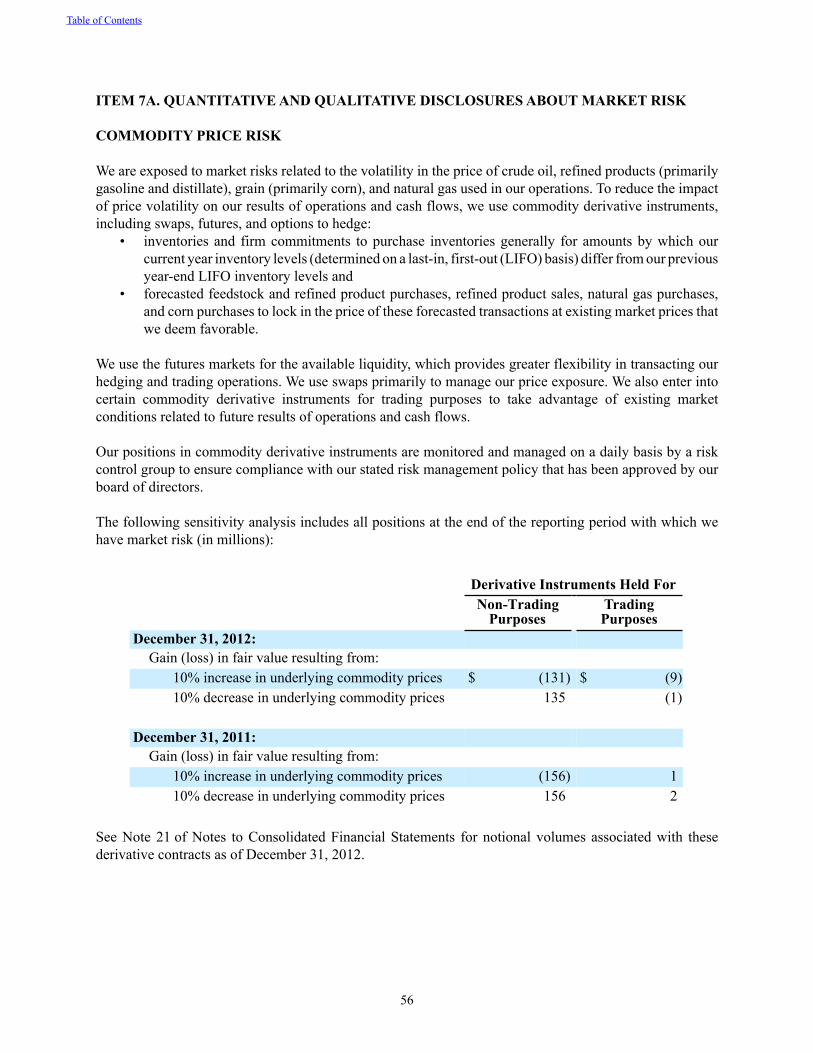
56
ITEM 7A. QUANTITATIVE AND QUALITATIVE DISCLOSURES ABOUT MARKET RISK
COMMODITY PRICE RISK
We are exposed to market risks related to the volatility in the price of crude oil, refined products (primarily gasoline and distillate), grain (primarily corn), and natural gas used in our operations. To reduce the impact of price volatility on our results of operations and cash flows, we use commodity derivative instruments, including swaps, futures, and options to hedge:
• inventories and firm commitments to purchase inventories generally for amounts by which our current year inventory levels (determined on a last-in, first-out (LIFO) basis) differ from our previous year-end LIFO inventory levels and
• forecasted feedstock and refined product purchases, refined product sales, natural gas purchases, and corn purchases to lock in the price of these forecasted transactions at existing market prices that we deem favorable.
We use the futures markets for the available liquidity, which provides greater flexibility in transacting our hedging and trading operations. We use swaps primarily to manage our price exposure. We also enter into certain commodity derivative instruments for trading purposes to take advantage of existing market conditions related to future results of operations and cash flows.
Our positions in commodity derivative instruments are monitored and managed on a daily basis by a risk control group to ensure compliance with our stated risk management policy that has been approved by our board of directors.
The following sensitivity analysis includes all positions at the end of the reporting period with which we have market risk (in millions):
Derivative Instruments Held ForNon-Trading
PurposesTradingPurposes
December 31, 2012:Gain (loss) in fair value resulting from:
10% increase in underlying commodity prices $ (131) $ (9)10% decrease in underlying commodity prices 135 (1)
December 31, 2011:Gain (loss) in fair value resulting from:
10% increase in underlying commodity prices (156) 110% decrease in underlying commodity prices 156 2
See Note 21 of Notes to Consolidated Financial Statements for notional volumes associated with these derivative contracts as of December 31, 2012.
Table of Contents
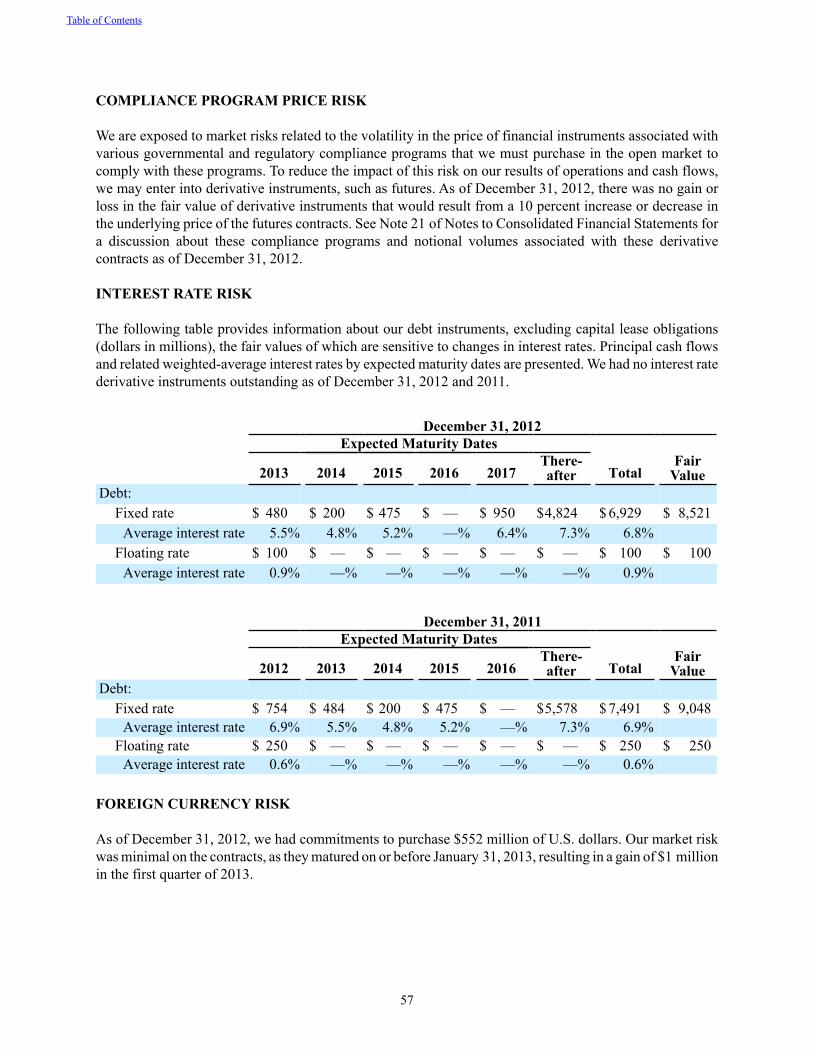
57
COMPLIANCE PROGRAM PRICE RISK
We are exposed to market risks related to the volatility in the price of financial instruments associated withvarious governmental and regulatory compliance programs that we must purchase in the open market to comply with these programs. To reduce the impact of this risk on our results of operations and cash flows, we may enter into derivative instruments, such as futures. As of December 31, 2012, there was no gain or loss in the fair value of derivative instruments that would result from a 10 percent increase or decrease in the underlying price of the futures contracts. See Note 21 of Notes to Consolidated Financial Statements for a discussion about these compliance programs and notional volumes associated with these derivative contracts as of December 31, 2012.
INTEREST RATE RISK
The following table provides information about our debt instruments, excluding capital lease obligations (dollars in millions), the fair values of which are sensitive to changes in interest rates. Principal cash flows and related weighted-average interest rates by expected maturity dates are presented. We had no interest rate derivative instruments outstanding as of December 31, 2012 and 2011.
December 31, 2012Expected Maturity Dates
2013 2014 2015 2016 2017There-after Total
FairValue
Debt:Fixed rate $ 480 $ 200 $ 475 $ — $ 950 $4,824 $ 6,929 $ 8,521
Average interest rate 5.5% 4.8% 5.2% —% 6.4% 7.3% 6.8%Floating rate $ 100 $ — $ — $ — $ — $ — $ 100 $ 100
Average interest rate 0.9% —% —% —% —% —% 0.9%
December 31, 2011Expected Maturity Dates
2012 2013 2014 2015 2016There-after Total
FairValue
Debt:Fixed rate $ 754 $ 484 $ 200 $ 475 $ — $5,578 $ 7,491 $ 9,048
Average interest rate 6.9% 5.5% 4.8% 5.2% —% 7.3% 6.9%Floating rate $ 250 $ — $ — $ — $ — $ — $ 250 $ 250
Average interest rate 0.6% —% —% —% —% —% 0.6%
FOREIGN CURRENCY RISK
As of December 31, 2012, we had commitments to purchase $552 million of U.S. dollars. Our market risk was minimal on the contracts, as they matured on or before January 31, 2013, resulting in a gain of $1 million in the first quarter of 2013.
Table of Contents
58
ITEM 8. FINANCIAL STATEMENTS AND SUPPLEMENTARY DATA
MANAGEMENT’S REPORT ON INTERNAL CONTROL OVER FINANCIAL REPORTING
Our management is responsible for establishing and maintaining adequate “internal control over financial reporting” (as defined in Rule 13a-15(f) under the Securities Exchange Act of 1934) for Valero. Our management evaluated the effectiveness of Valero’s internal control over financial reporting as of December 31, 2012. In its evaluation, management used the criteria established in Internal Control – Integrated Framework issued by the Committee of Sponsoring Organizations of the Treadway Commission (COSO). Management believes that as of December 31, 2012, our internal control over financial reporting was effective based on those criteria.
Our independent registered public accounting firm has issued an attestation report on the effectiveness of our internal control over financial reporting, which begins on page 60 of this report.
Table of Contents
59
REPORT OF INDEPENDENT REGISTERED PUBLIC ACCOUNTING FIRM
The Board of Directors and Stockholdersof Valero Energy Corporation and subsidiaries:
We have audited the accompanying consolidated balance sheets of Valero Energy Corporation and subsidiaries (the Company) as of December 31, 2012 and 2011, and the related consolidated statements of income, comprehensive income, equity, and cash flows for each of the years in the three-year period ended December 31, 2012. These consolidated financial statements are the responsibility of the Company’s management. Our responsibility is to express an opinion on these consolidated financial statements based on our audits.
We conducted our audits in accordance with the standards of the Public Company Accounting Oversight Board (United States) (the PCAOB). Those standards require that we plan and perform the audit to obtain reasonable assurance about whether the financial statements are free of material misstatement. An audit includes examining, on a test basis, evidence supporting the amounts and disclosures in the financial statements. An audit also includes assessing the accounting principles used and significant estimates made by management, as well as evaluating the overall financial statement presentation. We believe that our audits provide a reasonable basis for our opinion.
In our opinion, the consolidated financial statements referred to above present fairly, in all material respects, the financial position of Valero Energy Corporation and subsidiaries as of December 31, 2012 and 2011, and the results of their operations and their cash flows for each of the years in the three-year period ended December 31, 2012, in conformity with U.S. generally accepted accounting principles.
We also have audited, in accordance with the standards of the PCAOB, the Company’s internal control over financial reporting as of December 31, 2012, based on criteria established in Internal Control – Integrated Framework issued by the Committee of Sponsoring Organizations of the Treadway Commission, and our report dated February 28, 2013 expressed an unqualified opinion on the effectiveness of the Company’s internal control over financial reporting.
/s/ KPMG LLP
San Antonio, TexasFebruary 28, 2013
Table of Contents
60
REPORT OF INDEPENDENT REGISTERED PUBLIC ACCOUNTING FIRM
The Board of Directors and Stockholdersof Valero Energy Corporation and subsidiaries:
We have audited Valero Energy Corporation and subsidiaries’ (the Company’s) internal control over financial reporting as of December 31, 2012, based on criteria established in Internal Control – Integrated Framework issued by the Committee of Sponsoring Organizations of the Treadway Commission (COSO). The Company’s management is responsible for maintaining effective internal control over financial reporting and for its assessment of the effectiveness of internal control over financial reporting, included in the accompanying Management’s Report on Internal Control over Financial Reporting. Our responsibility is to express an opinion on the Company’s internal control over financial reporting based on our audit.
We conducted our audit in accordance with the standards of the Public Company Accounting Oversight Board (United States) (the PCAOB). Those standards require that we plan and perform the audit to obtain reasonable assurance about whether effective internal control over financial reporting was maintained in all material respects. Our audit included obtaining an understanding of internal control over financial reporting, assessing the risk that a material weakness exists, and testing and evaluating the design and operating effectiveness of internal control based on the assessed risk. Our audit also included performing such other procedures as we considered necessary in the circumstances. We believe that our audit provides a reasonable basis for our opinion.
A company’s internal control over financial reporting is a process designed to provide reasonable assurance regarding the reliability of financial reporting and the preparation of financial statements for external purposes in accordance with generally accepted accounting principles. A company’s internal control over financial reporting includes those policies and procedures that (1) pertain to the maintenance of records that, in reasonable detail, accurately and fairly reflect the transactions and dispositions of the assets of the company; (2) provide reasonable assurance that transactions are recorded as necessary to permit preparation of financial statements in accordance with generally accepted accounting principles, and that receipts and expenditures of the company are being made only in accordance with authorizations of management and directors of the company; and (3) provide reasonable assurance regarding prevention or timely detection of unauthorized acquisition, use, or disposition of the company’s assets that could have a material effect on the financial statements.
Because of its inherent limitations, internal control over financial reporting may not prevent or detect misstatements. Also, projections of any evaluation of effectiveness to future periods are subject to the risk that controls may become inadequate because of changes in conditions, or that the degree of compliance with the policies or procedures may deteriorate.
In our opinion, Valero Energy Corporation and subsidiaries maintained, in all material respects, effective internal control over financial reporting as of December 31, 2012, based on criteria established in Internal Control – Integrated Framework issued by COSO.
Table of Contents
61
We also have audited, in accordance with the standards of the PCAOB, the consolidated balance sheets of Valero Energy Corporation and subsidiaries as of December 31, 2012 and 2011, and the related consolidated statements of income, comprehensive income, equity, and cash flows for each of the years in the three-year period ended December 31, 2012, and our report dated February 28, 2013 expressed an unqualified opinion on those consolidated financial statements.
/s/ KPMG LLP
San Antonio, TexasFebruary 28, 2013
Table of Contents
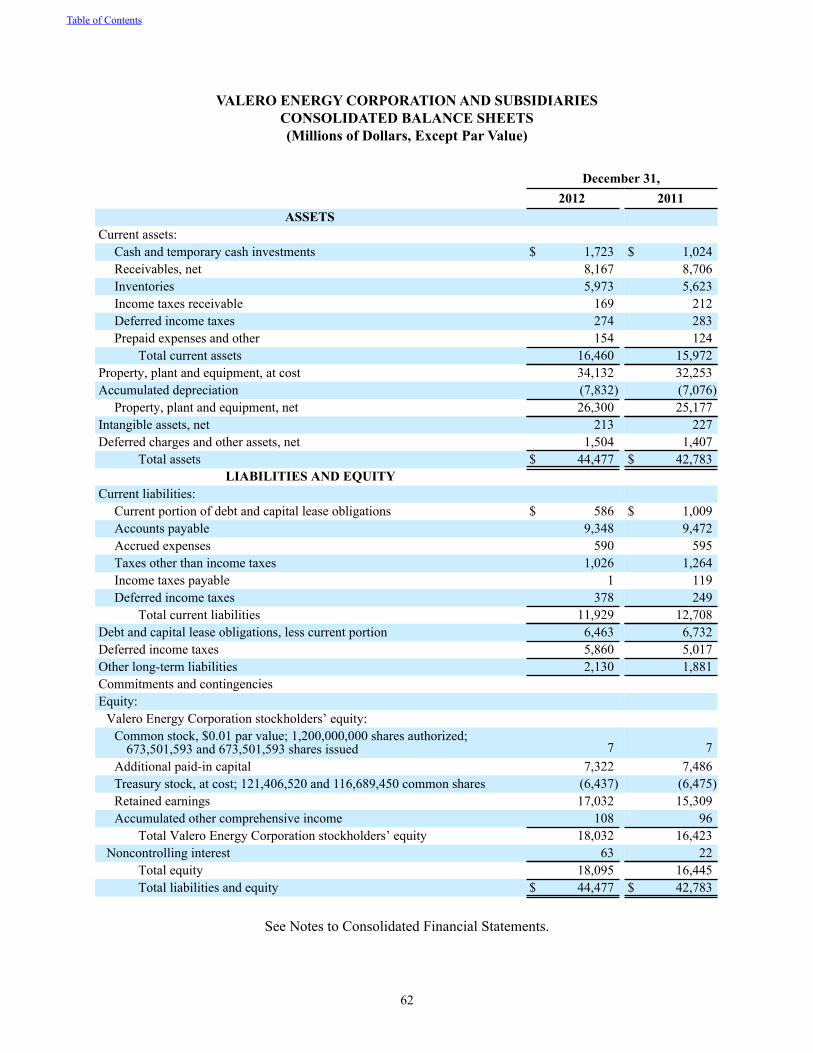
62
VALERO ENERGY CORPORATION AND SUBSIDIARIESCONSOLIDATED BALANCE SHEETS(Millions of Dollars, Except Par Value)
December 31, 2012 2011
ASSETS Current assets:
Cash and temporary cash investments $ 1,723 $ 1,024Receivables, net 8,167 8,706Inventories 5,973 5,623Income taxes receivable 169 212Deferred income taxes 274 283Prepaid expenses and other 154 124
Total current assets 16,460 15,972Property, plant and equipment, at cost 34,132 32,253Accumulated depreciation (7,832) (7,076)
Property, plant and equipment, net 26,300 25,177Intangible assets, net 213 227Deferred charges and other assets, net 1,504 1,407
Total assets $ 44,477 $ 42,783LIABILITIES AND EQUITY
Current liabilities: Current portion of debt and capital lease obligations $ 586 $ 1,009Accounts payable 9,348 9,472Accrued expenses 590 595Taxes other than income taxes 1,026 1,264Income taxes payable 1 119Deferred income taxes 378 249
Total current liabilities 11,929 12,708Debt and capital lease obligations, less current portion 6,463 6,732Deferred income taxes 5,860 5,017Other long-term liabilities 2,130 1,881Commitments and contingenciesEquity:
Valero Energy Corporation stockholders’ equity: Common stock, $0.01 par value; 1,200,000,000 shares authorized;
673,501,593 and 673,501,593 shares issued 7 7Additional paid-in capital 7,322 7,486Treasury stock, at cost; 121,406,520 and 116,689,450 common shares (6,437) (6,475)Retained earnings 17,032 15,309Accumulated other comprehensive income 108 96
Total Valero Energy Corporation stockholders’ equity 18,032 16,423Noncontrolling interest 63 22
Total equity 18,095 16,445Total liabilities and equity $ 44,477 $ 42,783
See Notes to Consolidated Financial Statements.
Table of Contents
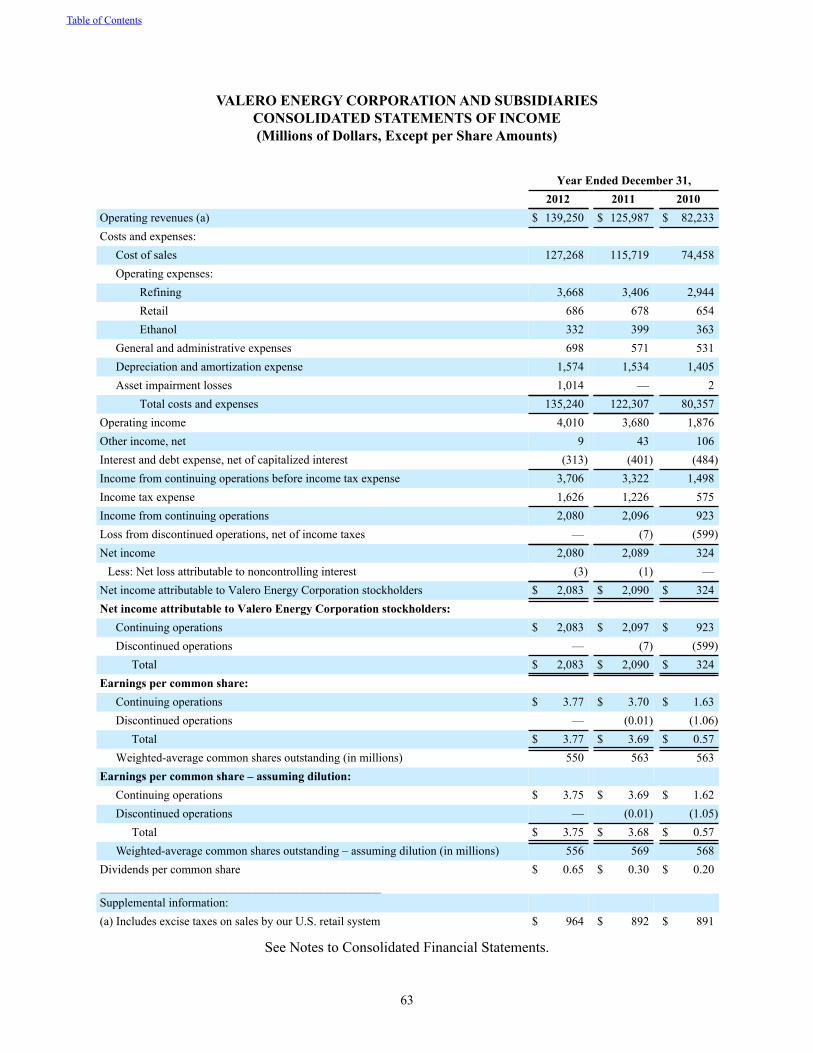
63
VALERO ENERGY CORPORATION AND SUBSIDIARIESCONSOLIDATED STATEMENTS OF INCOME(Millions of Dollars, Except per Share Amounts)
Year Ended December 31, 2012 2011 2010Operating revenues (a) $ 139,250 $ 125,987 $ 82,233Costs and expenses:
Cost of sales 127,268 115,719 74,458Operating expenses:
Refining 3,668 3,406 2,944Retail 686 678 654Ethanol 332 399 363
General and administrative expenses 698 571 531Depreciation and amortization expense 1,574 1,534 1,405Asset impairment losses 1,014 — 2
Total costs and expenses 135,240 122,307 80,357Operating income 4,010 3,680 1,876Other income, net 9 43 106Interest and debt expense, net of capitalized interest (313) (401) (484)Income from continuing operations before income tax expense 3,706 3,322 1,498Income tax expense 1,626 1,226 575Income from continuing operations 2,080 2,096 923Loss from discontinued operations, net of income taxes — (7) (599)Net income 2,080 2,089 324
Less: Net loss attributable to noncontrolling interest (3) (1) —Net income attributable to Valero Energy Corporation stockholders $ 2,083 $ 2,090 $ 324Net income attributable to Valero Energy Corporation stockholders:
Continuing operations $ 2,083 $ 2,097 $ 923Discontinued operations — (7) (599)
Total $ 2,083 $ 2,090 $ 324Earnings per common share:
Continuing operations $ 3.77 $ 3.70 $ 1.63Discontinued operations — (0.01) (1.06)
Total $ 3.77 $ 3.69 $ 0.57Weighted-average common shares outstanding (in millions) 550 563 563
Earnings per common share – assuming dilution: Continuing operations $ 3.75 $ 3.69 $ 1.62Discontinued operations — (0.01) (1.05)
Total $ 3.75 $ 3.68 $ 0.57Weighted-average common shares outstanding – assuming dilution (in millions) 556 569 568
Dividends per common share $ 0.65 $ 0.30 $ 0.20_______________________________________________Supplemental information:(a) Includes excise taxes on sales by our U.S. retail system $ 964 $ 892 $ 891
See Notes to Consolidated Financial Statements.
Table of Contents
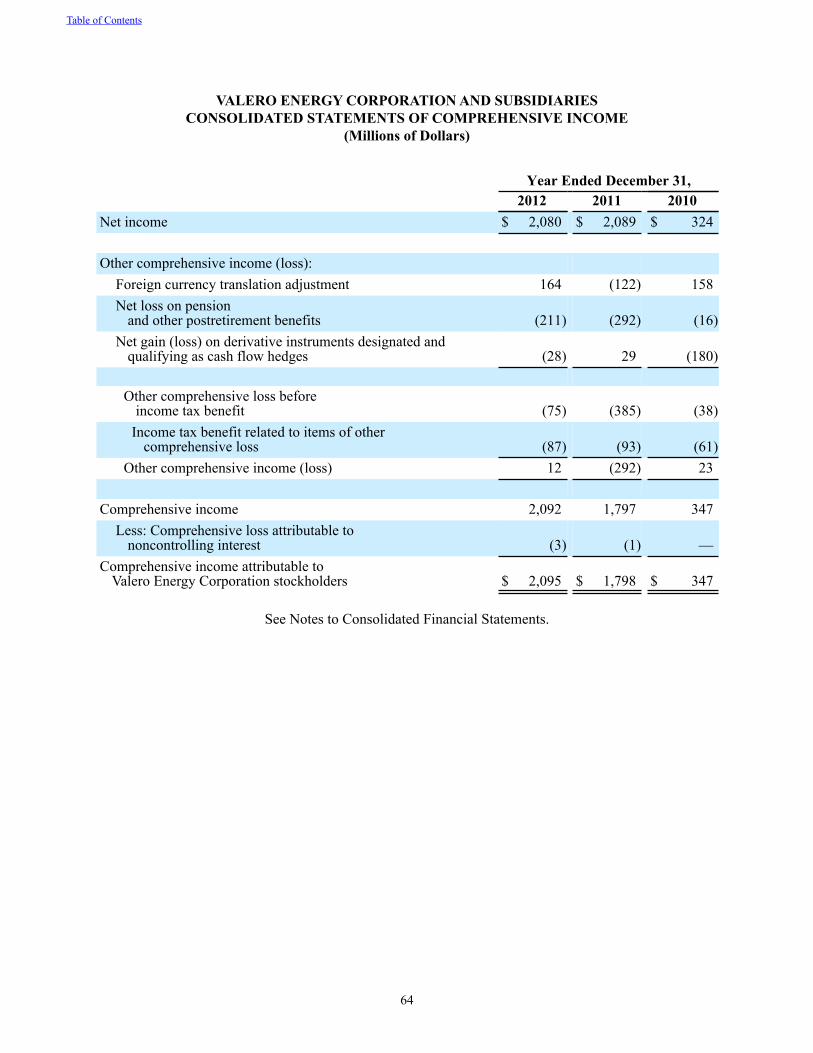
64
VALERO ENERGY CORPORATION AND SUBSIDIARIESCONSOLIDATED STATEMENTS OF COMPREHENSIVE INCOME
(Millions of Dollars)
Year Ended December 31, 2012 2011 2010Net income $ 2,080 $ 2,089 $ 324
Other comprehensive income (loss):
Foreign currency translation adjustment 164 (122) 158Net loss on pension
and other postretirement benefits (211) (292) (16)Net gain (loss) on derivative instruments designated and
qualifying as cash flow hedges (28) 29 (180)
Other comprehensive loss beforeincome tax benefit (75) (385) (38)
Income tax benefit related to items of othercomprehensive loss (87) (93) (61)
Other comprehensive income (loss) 12 (292) 23
Comprehensive income 2,092 1,797 347Less: Comprehensive loss attributable to
noncontrolling interest (3) (1) —Comprehensive income attributable to
Valero Energy Corporation stockholders $ 2,095 $ 1,798 $ 347
See Notes to Consolidated Financial Statements.
Table of Contents
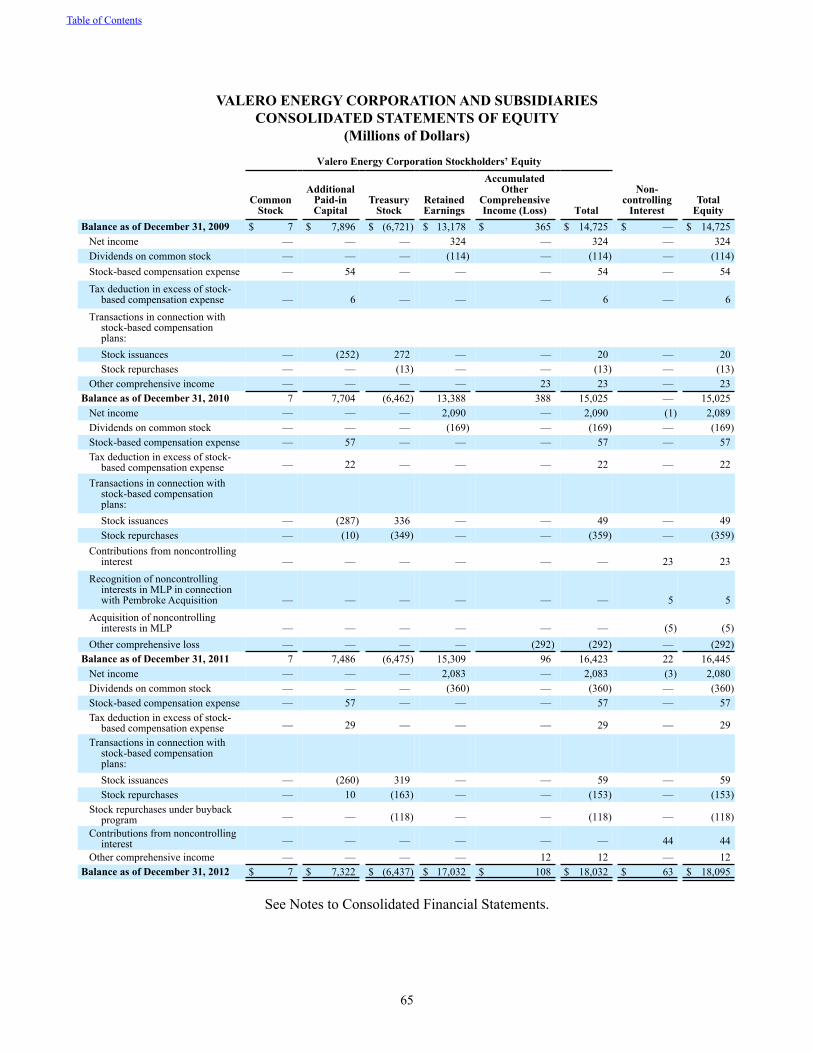
65
VALERO ENERGY CORPORATION AND SUBSIDIARIESCONSOLIDATED STATEMENTS OF EQUITY
(Millions of Dollars)
Valero Energy Corporation Stockholders’ Equity
CommonStock
AdditionalPaid-inCapital
TreasuryStock
RetainedEarnings
AccumulatedOther
ComprehensiveIncome (Loss) Total
Non-controlling
InterestTotal
EquityBalance as of December 31, 2009 $ 7 $ 7,896 $ (6,721) $ 13,178 $ 365 $ 14,725 $ — $ 14,725
Net income — — — 324 — 324 — 324Dividends on common stock — — — (114) — (114) — (114)Stock-based compensation expense — 54 — — — 54 — 54Tax deduction in excess of stock-
based compensation expense — 6 — — — 6 — 6Transactions in connection with
stock-based compensationplans:Stock issuances — (252) 272 — — 20 — 20Stock repurchases — — (13) — — (13) — (13)
Other comprehensive income — — — — 23 23 — 23Balance as of December 31, 2010 7 7,704 (6,462) 13,388 388 15,025 — 15,025
Net income — — — 2,090 — 2,090 (1) 2,089Dividends on common stock — — — (169) — (169) — (169)Stock-based compensation expense — 57 — — — 57 — 57Tax deduction in excess of stock-
based compensation expense — 22 — — — 22 — 22
Transactions in connection withstock-based compensationplans:Stock issuances — (287) 336 — — 49 — 49Stock repurchases — (10) (349) — — (359) — (359)
Contributions from noncontrolling interest — — — — — — 23 23
Recognition of noncontrolling interests in MLP in connection with Pembroke Acquisition — — — — — — 5 5
Acquisition of noncontrollinginterests in MLP — — — — — — (5) (5)
Other comprehensive loss — — — — (292) (292) — (292)Balance as of December 31, 2011 7 7,486 (6,475) 15,309 96 16,423 22 16,445
Net income — — — 2,083 — 2,083 (3) 2,080Dividends on common stock — — — (360) — (360) — (360)Stock-based compensation expense — 57 — — — 57 — 57Tax deduction in excess of stock-
based compensation expense — 29 — — — 29 — 29Transactions in connection with
stock-based compensationplans:Stock issuances — (260) 319 — — 59 — 59Stock repurchases — 10 (163) — — (153) — (153)
Stock repurchases under buyback program — — (118) — — (118) — (118)
Contributions from noncontrollinginterest — — — — — — 44 44
Other comprehensive income — — — — 12 12 — 12Balance as of December 31, 2012 $ 7 $ 7,322 $ (6,437) $ 17,032 $ 108 $ 18,032 $ 63 $ 18,095
See Notes to Consolidated Financial Statements.
Table of Contents
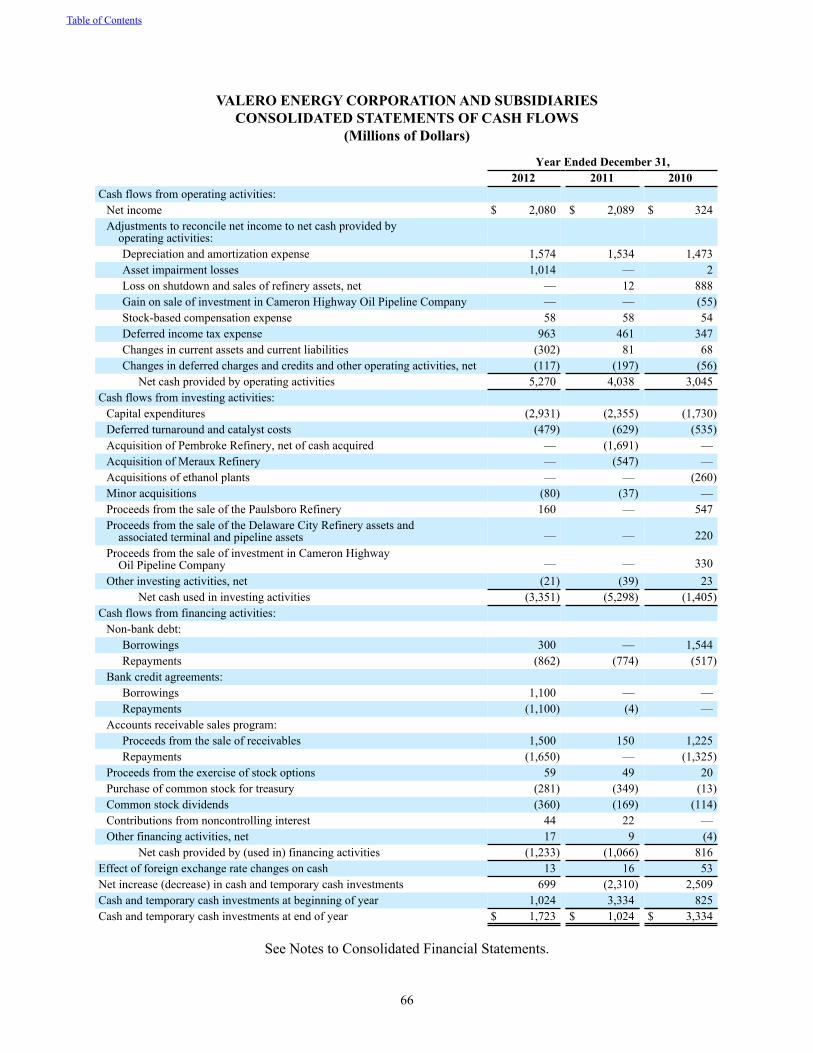
66
VALERO ENERGY CORPORATION AND SUBSIDIARIESCONSOLIDATED STATEMENTS OF CASH FLOWS
(Millions of Dollars)
Year Ended December 31,2012 2011 2010
Cash flows from operating activities:Net income $ 2,080 $ 2,089 $ 324Adjustments to reconcile net income to net cash provided by
operating activities:Depreciation and amortization expense 1,574 1,534 1,473Asset impairment losses 1,014 — 2Loss on shutdown and sales of refinery assets, net — 12 888Gain on sale of investment in Cameron Highway Oil Pipeline Company — — (55)Stock-based compensation expense 58 58 54Deferred income tax expense 963 461 347Changes in current assets and current liabilities (302) 81 68Changes in deferred charges and credits and other operating activities, net (117) (197) (56)
Net cash provided by operating activities 5,270 4,038 3,045Cash flows from investing activities:
Capital expenditures (2,931) (2,355) (1,730)Deferred turnaround and catalyst costs (479) (629) (535)Acquisition of Pembroke Refinery, net of cash acquired — (1,691) —Acquisition of Meraux Refinery — (547) —Acquisitions of ethanol plants — — (260)Minor acquisitions (80) (37) —Proceeds from the sale of the Paulsboro Refinery 160 — 547Proceeds from the sale of the Delaware City Refinery assets and
associated terminal and pipeline assets — — 220Proceeds from the sale of investment in Cameron Highway
Oil Pipeline Company — — 330Other investing activities, net (21) (39) 23
Net cash used in investing activities (3,351) (5,298) (1,405)Cash flows from financing activities:
Non-bank debt:Borrowings 300 — 1,544Repayments (862) (774) (517)
Bank credit agreements:Borrowings 1,100 — —Repayments (1,100) (4) —
Accounts receivable sales program:Proceeds from the sale of receivables 1,500 150 1,225Repayments (1,650) — (1,325)
Proceeds from the exercise of stock options 59 49 20Purchase of common stock for treasury (281) (349) (13)Common stock dividends (360) (169) (114)Contributions from noncontrolling interest 44 22 —Other financing activities, net 17 9 (4)
Net cash provided by (used in) financing activities (1,233) (1,066) 816Effect of foreign exchange rate changes on cash 13 16 53Net increase (decrease) in cash and temporary cash investments 699 (2,310) 2,509Cash and temporary cash investments at beginning of year 1,024 3,334 825Cash and temporary cash investments at end of year $ 1,723 $ 1,024 $ 3,334
See Notes to Consolidated Financial Statements.
Table of Contents
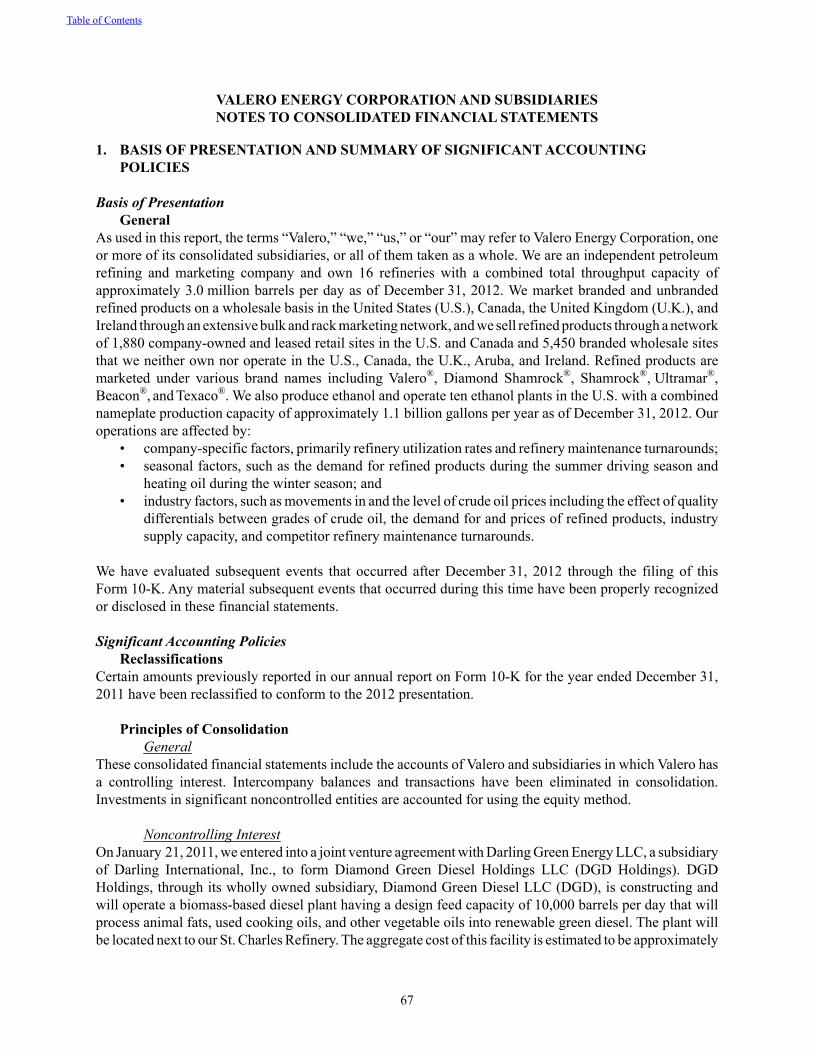
67
VALERO ENERGY CORPORATION AND SUBSIDIARIESNOTES TO CONSOLIDATED FINANCIAL STATEMENTS
1. BASIS OF PRESENTATION AND SUMMARY OF SIGNIFICANT ACCOUNTING POLICIES
Basis of Presentation General
As used in this report, the terms “Valero,” “we,” “us,” or “our” may refer to Valero Energy Corporation, one or more of its consolidated subsidiaries, or all of them taken as a whole. We are an independent petroleum refining and marketing company and own 16 refineries with a combined total throughput capacity of approximately 3.0 million barrels per day as of December 31, 2012. We market branded and unbranded refined products on a wholesale basis in the United States (U.S.), Canada, the United Kingdom (U.K.), and Ireland through an extensive bulk and rack marketing network, and we sell refined products through a network of 1,880 company-owned and leased retail sites in the U.S. and Canada and 5,450 branded wholesale sites that we neither own nor operate in the U.S., Canada, the U.K., Aruba, and Ireland. Refined products are marketed under various brand names including Valero®, Diamond Shamrock®, Shamrock®, Ultramar®, Beacon®, and Texaco®. We also produce ethanol and operate ten ethanol plants in the U.S. with a combined nameplate production capacity of approximately 1.1 billion gallons per year as of December 31, 2012. Our operations are affected by:
• company-specific factors, primarily refinery utilization rates and refinery maintenance turnarounds;• seasonal factors, such as the demand for refined products during the summer driving season and
heating oil during the winter season; and• industry factors, such as movements in and the level of crude oil prices including the effect of quality
differentials between grades of crude oil, the demand for and prices of refined products, industry supply capacity, and competitor refinery maintenance turnarounds.
We have evaluated subsequent events that occurred after December 31, 2012 through the filing of this Form 10-K. Any material subsequent events that occurred during this time have been properly recognized or disclosed in these financial statements.
Significant Accounting PoliciesReclassifications
Certain amounts previously reported in our annual report on Form 10-K for the year ended December 31, 2011 have been reclassified to conform to the 2012 presentation.
Principles of Consolidation General
These consolidated financial statements include the accounts of Valero and subsidiaries in which Valero has a controlling interest. Intercompany balances and transactions have been eliminated in consolidation. Investments in significant noncontrolled entities are accounted for using the equity method.
Noncontrolling InterestOn January 21, 2011, we entered into a joint venture agreement with Darling Green Energy LLC, a subsidiary of Darling International, Inc., to form Diamond Green Diesel Holdings LLC (DGD Holdings). DGD Holdings, through its wholly owned subsidiary, Diamond Green Diesel LLC (DGD), is constructing and will operate a biomass-based diesel plant having a design feed capacity of 10,000 barrels per day that will process animal fats, used cooking oils, and other vegetable oils into renewable green diesel. The plant will be located next to our St. Charles Refinery. The aggregate cost of this facility is estimated to be approximately
Table of Contents
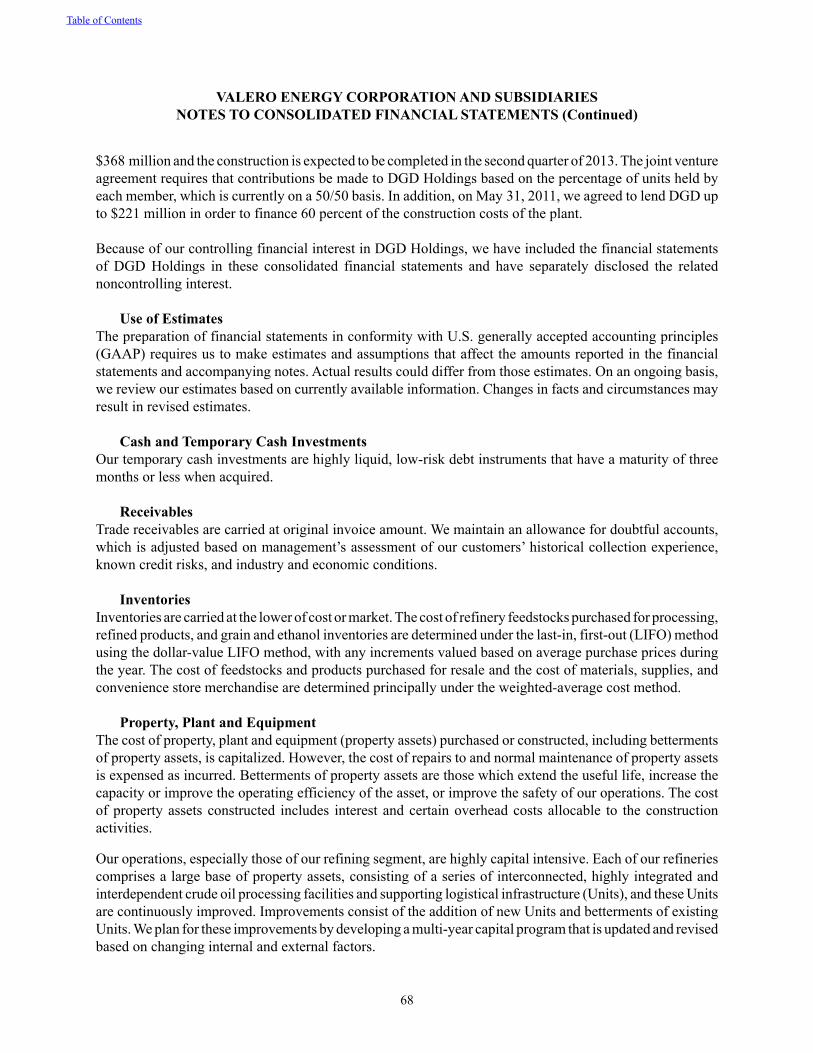
68
$368 million and the construction is expected to be completed in the second quarter of 2013. The joint venture agreement requires that contributions be made to DGD Holdings based on the percentage of units held by each member, which is currently on a 50/50 basis. In addition, on May 31, 2011, we agreed to lend DGD up to $221 million in order to finance 60 percent of the construction costs of the plant.
Because of our controlling financial interest in DGD Holdings, we have included the financial statements of DGD Holdings in these consolidated financial statements and have separately disclosed the related noncontrolling interest.
Use of EstimatesThe preparation of financial statements in conformity with U.S. generally accepted accounting principles (GAAP) requires us to make estimates and assumptions that affect the amounts reported in the financial statements and accompanying notes. Actual results could differ from those estimates. On an ongoing basis, we review our estimates based on currently available information. Changes in facts and circumstances may result in revised estimates.
Cash and Temporary Cash InvestmentsOur temporary cash investments are highly liquid, low-risk debt instruments that have a maturity of three months or less when acquired.
ReceivablesTrade receivables are carried at original invoice amount. We maintain an allowance for doubtful accounts, which is adjusted based on management’s assessment of our customers’ historical collection experience, known credit risks, and industry and economic conditions.
InventoriesInventories are carried at the lower of cost or market. The cost of refinery feedstocks purchased for processing, refined products, and grain and ethanol inventories are determined under the last-in, first-out (LIFO) method using the dollar-value LIFO method, with any increments valued based on average purchase prices during the year. The cost of feedstocks and products purchased for resale and the cost of materials, supplies, and convenience store merchandise are determined principally under the weighted-average cost method.
Property, Plant and EquipmentThe cost of property, plant and equipment (property assets) purchased or constructed, including betterments of property assets, is capitalized. However, the cost of repairs to and normal maintenance of property assets is expensed as incurred. Betterments of property assets are those which extend the useful life, increase the capacity or improve the operating efficiency of the asset, or improve the safety of our operations. The cost of property assets constructed includes interest and certain overhead costs allocable to the construction activities.
Our operations, especially those of our refining segment, are highly capital intensive. Each of our refineries comprises a large base of property assets, consisting of a series of interconnected, highly integrated and interdependent crude oil processing facilities and supporting logistical infrastructure (Units), and these Units are continuously improved. Improvements consist of the addition of new Units and betterments of existing Units. We plan for these improvements by developing a multi-year capital program that is updated and revised based on changing internal and external factors.
Table of Contents
VALERO ENERGY CORPORATION AND SUBSIDIARIESNOTES TO CONSOLIDATED FINANCIAL STATEMENTS (Continued)
69
Depreciation of property assets used in our refining segment is recorded on a straight-line basis over the estimated useful lives of these assets primarily using the composite method of depreciation. We maintain a separate composite group of property assets for each of our refineries. We estimate the useful life of each group based on an evaluation of the property assets comprising the group, and such evaluations consist of, but are not limited to, the physical inspection of the assets to determine their condition, consideration of the manner in which the assets are maintained, assessment of the need to replace assets, and evaluation of the manner in which improvements impact the useful life of the group. The estimated useful lives of our composite groups range primarily from 25 to 30 years.
Under the composite method of depreciation, the cost of an improvement is added to the composite group to which it relates and is depreciated over that group’s estimated useful life. We design improvements to our refineries in accordance with engineering specifications, design standards and practices accepted in our industry, and these improvements have design lives consistent with our estimated useful lives. Therefore, we believe the use of the group life to depreciate the cost of improvements made to the group is reasonable because the estimated useful life of each improvement is consistent with that of the group. It should be noted, however, that factors such as competition, regulation, or environmental matters could cause us to change our estimates, thus impacting depreciation expense in the future.
Also under the composite method of depreciation, the historical cost of a minor property asset (net of salvage value) that is retired or replaced is charged to accumulated depreciation and no gain or loss is recognized in income. However, a gain or loss is recognized in income for a major property asset that is retired, replaced or sold and for an abnormal disposition of a property asset (primarily involuntary conversions). Gains and losses are reflected in depreciation and amortization expense, unless such amounts are reported separately due to materiality.
Depreciation of property assets used in our retail and ethanol segments is recorded on a straight-line basis over the estimated useful lives of the related assets. Leasehold improvements and assets acquired under capital leases are amortized using the straight-line method over the shorter of the lease term or the estimated useful life of the related asset.
Deferred Charges and Other Assets“Deferred charges and other assets, net” include the following:
• turnaround costs, which are incurred in connection with planned major maintenance activities at our refineries and ethanol plants and which are deferred when incurred and amortized on a straight-line basis over the period of time estimated to lapse until the next turnaround occurs;
• fixed-bed catalyst costs, representing the cost of catalyst that is changed out at periodic intervals when the quality of the catalyst has deteriorated beyond its prescribed function, which are deferred when incurred and amortized on a straight-line basis over the estimated useful life of the specific catalyst;
• investments in entities that we do not control; and• other noncurrent assets such as convenience store dealer incentive programs, investments of certain
benefit plans (related primarily to certain U.S. nonqualified defined benefit plans whose plan assets are not protected from our creditors and therefore cannot be reflected as a reduction from our obligations under those pension plans), debt issuance costs, and various other costs.
Table of Contents
VALERO ENERGY CORPORATION AND SUBSIDIARIESNOTES TO CONSOLIDATED FINANCIAL STATEMENTS (Continued)
70
Impairment of AssetsLong-lived assets, which include property, plant and equipment, intangible assets, and refinery turnaround and catalysts costs, are tested for recoverability whenever events or changes in circumstances indicate that the carrying amount of the asset may not be recoverable. A long-lived asset is not recoverable if its carrying amount exceeds the sum of the undiscounted cash flows expected to result from its use and eventual disposition. If a long-lived asset is not recoverable, an impairment loss is recognized for the amount by which the carrying amount of the long-lived asset exceeds its fair value, with fair value determined based on discounted estimated net cash flows or other appropriate methods. See Note 4 for our impairment analysis of our long-lived assets.
We evaluate our equity method investments for impairment when there is evidence that we may not be able to recover the carrying amount of our investments or the investee is unable to sustain an earnings capacity that justifies the carrying amount. A loss in the value of an investment that is other than a temporary decline is recognized currently in income, and is based on the difference between the estimated current fair value of the investment and its carrying amount.
Environmental MattersLiabilities for future remediation costs are recorded when environmental assessments from governmental regulatory agencies and/or remedial efforts are probable and the costs can be reasonably estimated. Other than for assessments, the timing and magnitude of these accruals generally are based on the completion of investigations or other studies or a commitment to a formal plan of action. Environmental liabilities are based on best estimates of probable undiscounted future costs over a 20-year time period using currently available technology and applying current regulations, as well as our own internal environmental policies, without establishing a range of loss for these liabilities. Environmental liabilities are difficult to assess and estimate due to uncertainties related to the magnitude of possible remediation, the timing of such remediation, and the determination of our obligation in proportion to other parties. Such estimates are subject to change due to many factors, including the identification of new sites requiring remediation, changes in environmental laws and regulations and their interpretation, additional information related to the extent and nature of remediation efforts, and potential improvements in remediation technologies. Amounts recorded for environmental liabilities have not been reduced by possible recoveries from third parties.
Asset Retirement ObligationsWe record a liability, which is referred to as an asset retirement obligation, at fair value for the estimated cost to retire a tangible long-lived asset at the time we incur that liability, which is generally when the asset is purchased, constructed, or leased. We record the liability when we have a legal obligation to incur costs to retire the asset and when a reasonable estimate of the fair value of the liability can be made. If a reasonable estimate cannot be made at the time the liability is incurred, we record the liability when sufficient information is available to estimate the liability’s fair value.
Foreign Currency TranslationThe functional currency of each of our international operations is generally the respective local currency, which includes the Canadian dollar, the Aruban florin, the pound sterling, and the euro. Balance sheet accounts are translated into U.S. dollars using exchange rates in effect as of the balance sheet date. Revenue and expense accounts are translated using the weighted-average exchange rates during the year presented. Foreign currency translation adjustments are recorded as a component of accumulated other comprehensive income.
Table of Contents
VALERO ENERGY CORPORATION AND SUBSIDIARIESNOTES TO CONSOLIDATED FINANCIAL STATEMENTS (Continued)
71
Revenue RecognitionRevenues for products sold by the refining, retail, and ethanol segments are recorded upon delivery of the products to our customers, which is the point at which title to the products is transferred, and when payment has either been received or collection is reasonably assured.
We present excise taxes on sales by our U.S. retail system on a gross basis with supplemental information regarding the amount of such taxes included in revenues provided in a footnote on the face of the statements of income. All other excise taxes are presented on a net basis.
We enter into certain purchase and sale arrangements with the same counterparty that are deemed to be made in contemplation of one another. We combine these transactions and, as a result, revenues and cost of sales are not recognized in connection with these arrangements. We also enter into refined product exchange transactions to fulfill sales contracts with our customers by accessing refined products in markets where we do not operate our own refineries. These refined product exchanges are accounted for as exchanges of non-monetary assets, and no revenues are recorded on these transactions.
Product Shipping and Handling CostsCosts incurred for shipping and handling of products are included in cost of sales.
Stock-Based CompensationCompensation expense for our share-based compensation plans is based on the fair value of the awards granted and is recognized in income on a straight-line basis over the requisite service period of each award. For new grants that have retirement-eligibility provisions, we use the non-substantive vesting period approach, under which compensation cost is recognized immediately for awards granted to retirement-eligible employees or over the period from the grant date to the date retirement eligibility is achieved if that date is expected to occur during the nominal vesting period.
Income TaxesIncome taxes are accounted for under the asset and liability method. Under this method, deferred tax assets and liabilities are recognized for the future tax consequences attributable to differences between the financial statement carrying amounts of existing assets and liabilities and their respective tax bases. Deferred amounts are measured using enacted tax rates expected to apply to taxable income in the year those temporary differences are expected to be recovered or settled.
We have elected to classify any interest expense and penalties related to the underpayment of income taxes in income tax expense.
Earnings per Common ShareEarnings per common share is computed by dividing net income by the weighted-average number of common shares outstanding for the year. Participating share-based payment awards, including shares of restricted stock granted under certain of our stock-based compensation plans, are included in the computation of basic earnings per share using the two-class method. Earnings per common share – assuming dilution reflects the potential dilution arising from our outstanding stock options and nonvested shares granted to employees in connection with our stock-based compensation plans. Potentially dilutive securities are excluded from the
Table of Contents
VALERO ENERGY CORPORATION AND SUBSIDIARIESNOTES TO CONSOLIDATED FINANCIAL STATEMENTS (Continued)
72
computation of earnings per common share – assuming dilution when the effect of including such shares would be antidilutive.
Financial InstrumentsOur financial instruments include cash and temporary cash investments, receivables, payables, debt, capital lease obligations, commodity derivative contracts, and foreign currency derivative contracts. The estimated fair values of these financial instruments approximate their carrying amounts, except for certain debt as discussed in Note 20.
Derivatives and HedgingAll derivative instruments are recorded in the balance sheet as either assets or liabilities measured at their fair values. When we enter into a derivative instrument, it is designated as a fair value hedge, a cash flow hedge, an economic hedge, or a trading derivative. The gain or loss on a derivative instrument designated and qualifying as a fair value hedge, as well as the offsetting loss or gain on the hedged item attributable to the hedged risk, are recognized currently in income in the same period. The effective portion of the gain or loss on a derivative instrument designated and qualifying as a cash flow hedge is initially reported as a component of other comprehensive income and is then recorded in income in the period or periods during which the hedged forecasted transaction affects income. The ineffective portion of the gain or loss on the cash flow derivative instrument, if any, is recognized in income as incurred. For our economic hedging relationships (derivative instruments not designated as fair value or cash flow hedges) and for derivative instruments entered into for trading purposes, the derivative instrument is recorded at fair value and changes in the fair value of the derivative instrument are recognized currently in income. The cash flow effects of all of our derivative instruments are reflected in operating activities in the statements of cash flows.
New Accounting PronouncementsIn December 2011, the provisions of Accounting Standards Codification (ASC) Topic 210, “Balance Sheet,” were amended to require an entity to disclose information about offsetting and related arrangements to enable users of its financial statements to understand the effect of these arrangements on its financial position. In January 2013, the provisions of ASC Topic 210 were further amended to clarify that the scope of the previous amendment only applies to derivative instruments, including separated bifurcated derivatives, repurchase agreements and reverse repurchase agreements, and securities borrowing and securities lending transactions that are either eligible for offset in the balance sheet or are subject to an agreement similar to a master netting agreement. The guidance requires entities to disclose both gross information and net information about assets and liabilities within the scope of the amendment. These provisions are effective for interim and annual reporting periods beginning on or after January 1, 2013. The adoption of this guidance effective January 1, 2013 will not affect our financial position or results of operations, but will result in additional disclosures.
In February 2013, the provisions of ASC Topic 220, “Comprehensive Income,” were amended to require an entity to disclose information about the amounts reclassified out of accumulated other comprehensive income by component. For amounts required to be reclassified out of accumulated other comprehensive income in their entirety in the same reporting period, the guidance requires entities to present significant amounts by the respective line items of net income, either on the face of the income statement or in the notes to the financial statements. For other amounts that are not required to be reclassified to net income in their entirety, a cross-reference is required to other disclosures that provide additional details about those amounts. These provisions are effective for annual reporting periods beginning after December 15, 2012. The adoption of
Table of Contents
VALERO ENERGY CORPORATION AND SUBSIDIARIESNOTES TO CONSOLIDATED FINANCIAL STATEMENTS (Continued)
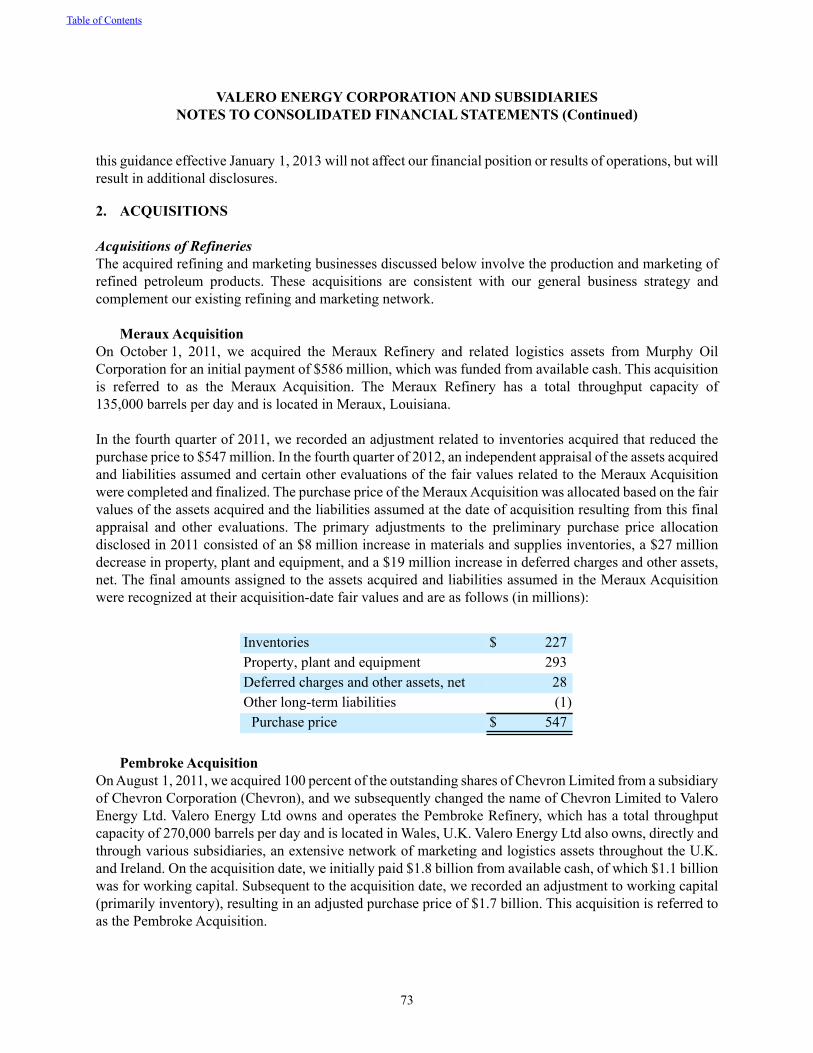
73
this guidance effective January 1, 2013 will not affect our financial position or results of operations, but will result in additional disclosures.
2. ACQUISITIONS
Acquisitions of RefineriesThe acquired refining and marketing businesses discussed below involve the production and marketing of refined petroleum products. These acquisitions are consistent with our general business strategy and complement our existing refining and marketing network.
Meraux AcquisitionOn October 1, 2011, we acquired the Meraux Refinery and related logistics assets from Murphy Oil Corporation for an initial payment of $586 million, which was funded from available cash. This acquisition is referred to as the Meraux Acquisition. The Meraux Refinery has a total throughput capacity of 135,000 barrels per day and is located in Meraux, Louisiana.
In the fourth quarter of 2011, we recorded an adjustment related to inventories acquired that reduced the purchase price to $547 million. In the fourth quarter of 2012, an independent appraisal of the assets acquired and liabilities assumed and certain other evaluations of the fair values related to the Meraux Acquisition were completed and finalized. The purchase price of the Meraux Acquisition was allocated based on the fair values of the assets acquired and the liabilities assumed at the date of acquisition resulting from this final appraisal and other evaluations. The primary adjustments to the preliminary purchase price allocation disclosed in 2011 consisted of an $8 million increase in materials and supplies inventories, a $27 million decrease in property, plant and equipment, and a $19 million increase in deferred charges and other assets, net. The final amounts assigned to the assets acquired and liabilities assumed in the Meraux Acquisition were recognized at their acquisition-date fair values and are as follows (in millions):
Inventories $ 227Property, plant and equipment 293Deferred charges and other assets, net 28Other long-term liabilities (1)
Purchase price $ 547
Pembroke AcquisitionOn August 1, 2011, we acquired 100 percent of the outstanding shares of Chevron Limited from a subsidiary of Chevron Corporation (Chevron), and we subsequently changed the name of Chevron Limited to Valero Energy Ltd. Valero Energy Ltd owns and operates the Pembroke Refinery, which has a total throughput capacity of 270,000 barrels per day and is located in Wales, U.K. Valero Energy Ltd also owns, directly and through various subsidiaries, an extensive network of marketing and logistics assets throughout the U.K. and Ireland. On the acquisition date, we initially paid $1.8 billion from available cash, of which $1.1 billion was for working capital. Subsequent to the acquisition date, we recorded an adjustment to working capital (primarily inventory), resulting in an adjusted purchase price of $1.7 billion. This acquisition is referred to as the Pembroke Acquisition.
Table of Contents
VALERO ENERGY CORPORATION AND SUBSIDIARIESNOTES TO CONSOLIDATED FINANCIAL STATEMENTS (Continued)
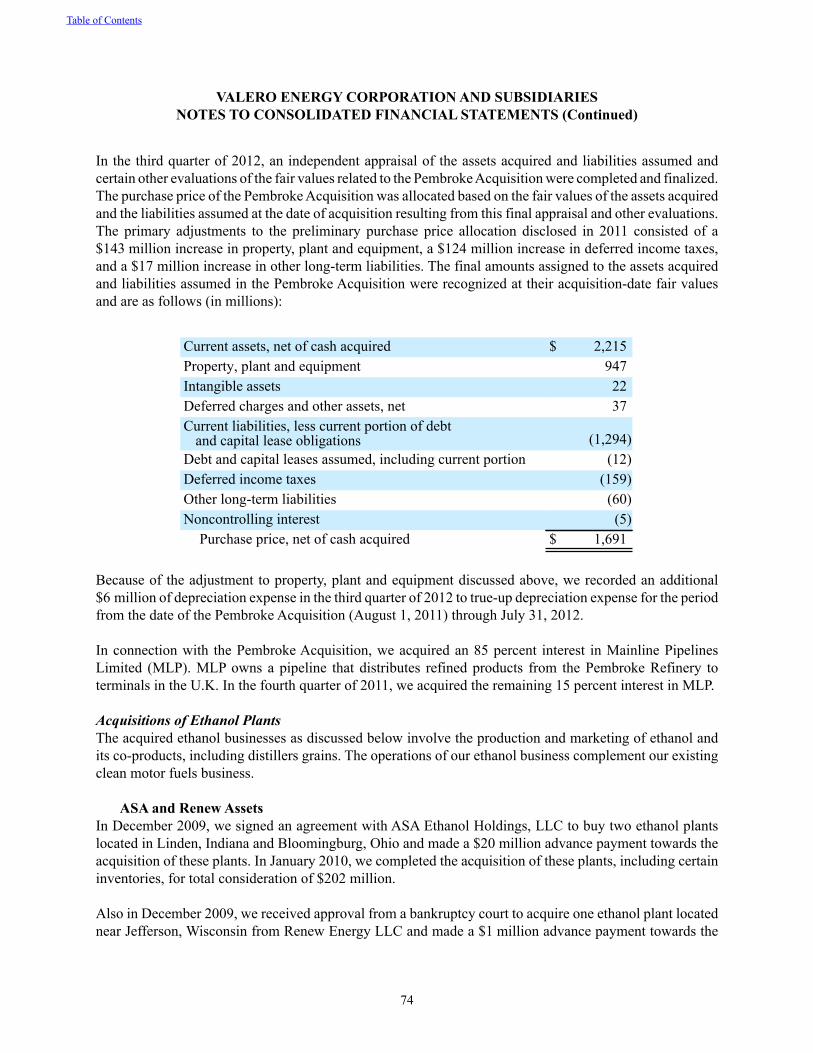
74
In the third quarter of 2012, an independent appraisal of the assets acquired and liabilities assumed and certain other evaluations of the fair values related to the Pembroke Acquisition were completed and finalized. The purchase price of the Pembroke Acquisition was allocated based on the fair values of the assets acquired and the liabilities assumed at the date of acquisition resulting from this final appraisal and other evaluations. The primary adjustments to the preliminary purchase price allocation disclosed in 2011 consisted of a $143 million increase in property, plant and equipment, a $124 million increase in deferred income taxes, and a $17 million increase in other long-term liabilities. The final amounts assigned to the assets acquired and liabilities assumed in the Pembroke Acquisition were recognized at their acquisition-date fair values and are as follows (in millions):
Current assets, net of cash acquired $ 2,215Property, plant and equipment 947Intangible assets 22Deferred charges and other assets, net 37Current liabilities, less current portion of debt
and capital lease obligations (1,294)Debt and capital leases assumed, including current portion (12)Deferred income taxes (159)Other long-term liabilities (60)Noncontrolling interest (5)
Purchase price, net of cash acquired $ 1,691
Because of the adjustment to property, plant and equipment discussed above, we recorded an additional $6 million of depreciation expense in the third quarter of 2012 to true-up depreciation expense for the period from the date of the Pembroke Acquisition (August 1, 2011) through July 31, 2012.
In connection with the Pembroke Acquisition, we acquired an 85 percent interest in Mainline Pipelines Limited (MLP). MLP owns a pipeline that distributes refined products from the Pembroke Refinery to terminals in the U.K. In the fourth quarter of 2011, we acquired the remaining 15 percent interest in MLP.
Acquisitions of Ethanol PlantsThe acquired ethanol businesses as discussed below involve the production and marketing of ethanol and its co-products, including distillers grains. The operations of our ethanol business complement our existing clean motor fuels business.
ASA and Renew AssetsIn December 2009, we signed an agreement with ASA Ethanol Holdings, LLC to buy two ethanol plants located in Linden, Indiana and Bloomingburg, Ohio and made a $20 million advance payment towards the acquisition of these plants. In January 2010, we completed the acquisition of these plants, including certain inventories, for total consideration of $202 million.
Also in December 2009, we received approval from a bankruptcy court to acquire one ethanol plant located near Jefferson, Wisconsin from Renew Energy LLC and made a $1 million advance payment towards the
Table of Contents
VALERO ENERGY CORPORATION AND SUBSIDIARIESNOTES TO CONSOLIDATED FINANCIAL STATEMENTS (Continued)
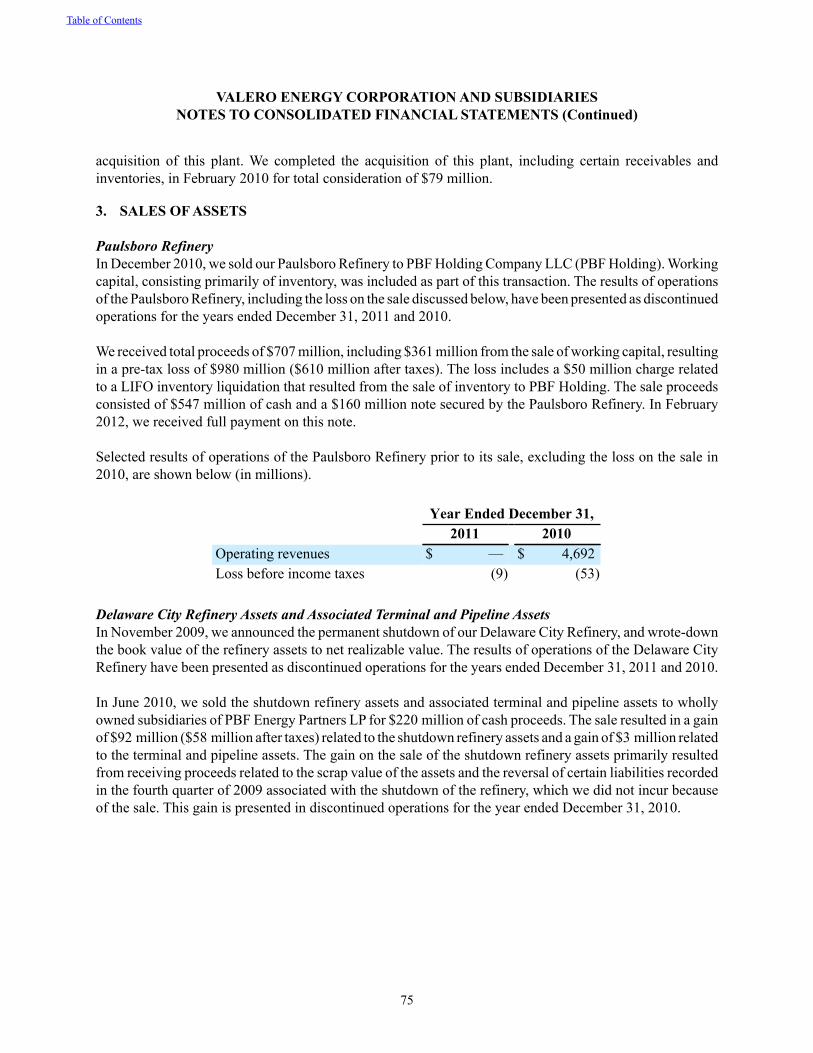
75
acquisition of this plant. We completed the acquisition of this plant, including certain receivables and inventories, in February 2010 for total consideration of $79 million.
3. SALES OF ASSETS
Paulsboro RefineryIn December 2010, we sold our Paulsboro Refinery to PBF Holding Company LLC (PBF Holding). Working capital, consisting primarily of inventory, was included as part of this transaction. The results of operations of the Paulsboro Refinery, including the loss on the sale discussed below, have been presented as discontinued operations for the years ended December 31, 2011 and 2010.
We received total proceeds of $707 million, including $361 million from the sale of working capital, resulting in a pre-tax loss of $980 million ($610 million after taxes). The loss includes a $50 million charge related to a LIFO inventory liquidation that resulted from the sale of inventory to PBF Holding. The sale proceeds consisted of $547 million of cash and a $160 million note secured by the Paulsboro Refinery. In February 2012, we received full payment on this note.
Selected results of operations of the Paulsboro Refinery prior to its sale, excluding the loss on the sale in 2010, are shown below (in millions).
Year Ended December 31,2011 2010
Operating revenues $ — $ 4,692Loss before income taxes (9) (53)
Delaware City Refinery Assets and Associated Terminal and Pipeline AssetsIn November 2009, we announced the permanent shutdown of our Delaware City Refinery, and wrote-down the book value of the refinery assets to net realizable value. The results of operations of the Delaware City Refinery have been presented as discontinued operations for the years ended December 31, 2011 and 2010.
In June 2010, we sold the shutdown refinery assets and associated terminal and pipeline assets to wholly owned subsidiaries of PBF Energy Partners LP for $220 million of cash proceeds. The sale resulted in a gain of $92 million ($58 million after taxes) related to the shutdown refinery assets and a gain of $3 million related to the terminal and pipeline assets. The gain on the sale of the shutdown refinery assets primarily resulted from receiving proceeds related to the scrap value of the assets and the reversal of certain liabilities recorded in the fourth quarter of 2009 associated with the shutdown of the refinery, which we did not incur because of the sale. This gain is presented in discontinued operations for the year ended December 31, 2010.
Table of Contents
VALERO ENERGY CORPORATION AND SUBSIDIARIESNOTES TO CONSOLIDATED FINANCIAL STATEMENTS (Continued)
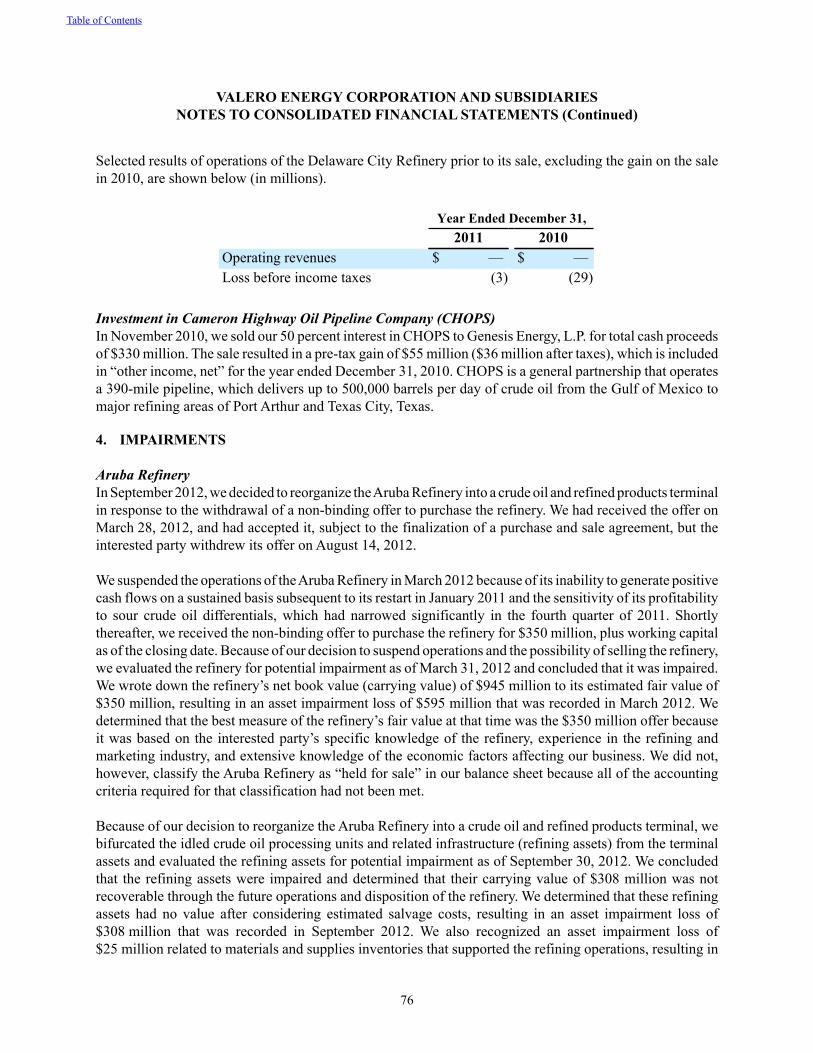
76
Selected results of operations of the Delaware City Refinery prior to its sale, excluding the gain on the sale in 2010, are shown below (in millions).
Year Ended December 31,2011 2010
Operating revenues $ — $ —Loss before income taxes (3) (29)
Investment in Cameron Highway Oil Pipeline Company (CHOPS)In November 2010, we sold our 50 percent interest in CHOPS to Genesis Energy, L.P. for total cash proceeds of $330 million. The sale resulted in a pre-tax gain of $55 million ($36 million after taxes), which is included in “other income, net” for the year ended December 31, 2010. CHOPS is a general partnership that operates a 390-mile pipeline, which delivers up to 500,000 barrels per day of crude oil from the Gulf of Mexico to major refining areas of Port Arthur and Texas City, Texas.
4. IMPAIRMENTS
Aruba RefineryIn September 2012, we decided to reorganize the Aruba Refinery into a crude oil and refined products terminal in response to the withdrawal of a non-binding offer to purchase the refinery. We had received the offer on March 28, 2012, and had accepted it, subject to the finalization of a purchase and sale agreement, but the interested party withdrew its offer on August 14, 2012.
We suspended the operations of the Aruba Refinery in March 2012 because of its inability to generate positive cash flows on a sustained basis subsequent to its restart in January 2011 and the sensitivity of its profitability to sour crude oil differentials, which had narrowed significantly in the fourth quarter of 2011. Shortly thereafter, we received the non-binding offer to purchase the refinery for $350 million, plus working capital as of the closing date. Because of our decision to suspend operations and the possibility of selling the refinery, we evaluated the refinery for potential impairment as of March 31, 2012 and concluded that it was impaired. We wrote down the refinery’s net book value (carrying value) of $945 million to its estimated fair value of $350 million, resulting in an asset impairment loss of $595 million that was recorded in March 2012. We determined that the best measure of the refinery’s fair value at that time was the $350 million offer because it was based on the interested party’s specific knowledge of the refinery, experience in the refining and marketing industry, and extensive knowledge of the economic factors affecting our business. We did not, however, classify the Aruba Refinery as “held for sale” in our balance sheet because all of the accounting criteria required for that classification had not been met.
Because of our decision to reorganize the Aruba Refinery into a crude oil and refined products terminal, we bifurcated the idled crude oil processing units and related infrastructure (refining assets) from the terminal assets and evaluated the refining assets for potential impairment as of September 30, 2012. We concluded that the refining assets were impaired and determined that their carrying value of $308 million was not recoverable through the future operations and disposition of the refinery. We determined that these refining assets had no value after considering estimated salvage costs, resulting in an asset impairment loss of $308 million that was recorded in September 2012. We also recognized an asset impairment loss of $25 million related to materials and supplies inventories that supported the refining operations, resulting in
Table of Contents
VALERO ENERGY CORPORATION AND SUBSIDIARIESNOTES TO CONSOLIDATED FINANCIAL STATEMENTS (Continued)
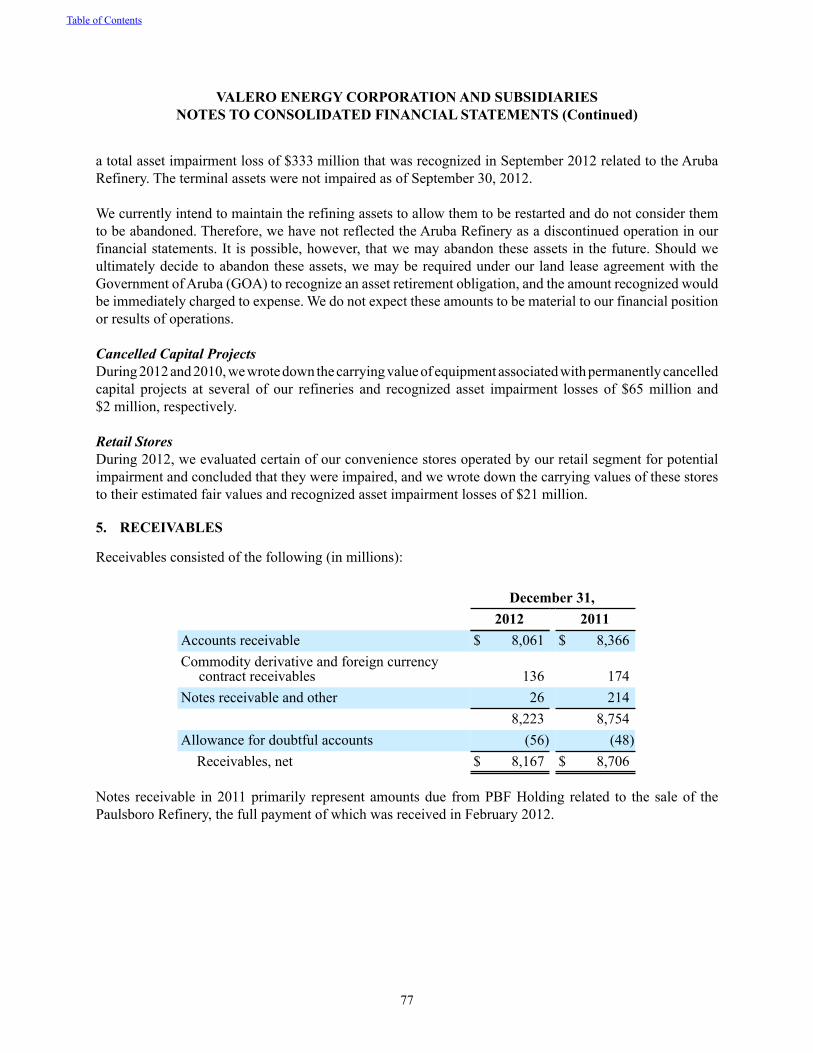
77
a total asset impairment loss of $333 million that was recognized in September 2012 related to the Aruba Refinery. The terminal assets were not impaired as of September 30, 2012.
We currently intend to maintain the refining assets to allow them to be restarted and do not consider them to be abandoned. Therefore, we have not reflected the Aruba Refinery as a discontinued operation in our financial statements. It is possible, however, that we may abandon these assets in the future. Should we ultimately decide to abandon these assets, we may be required under our land lease agreement with the Government of Aruba (GOA) to recognize an asset retirement obligation, and the amount recognized would be immediately charged to expense. We do not expect these amounts to be material to our financial position or results of operations.
Cancelled Capital ProjectsDuring 2012 and 2010, we wrote down the carrying value of equipment associated with permanently cancelled capital projects at several of our refineries and recognized asset impairment losses of $65 million and $2 million, respectively.
Retail StoresDuring 2012, we evaluated certain of our convenience stores operated by our retail segment for potential impairment and concluded that they were impaired, and we wrote down the carrying values of these stores to their estimated fair values and recognized asset impairment losses of $21 million.
5. RECEIVABLES
Receivables consisted of the following (in millions):
December 31,2012 2011
Accounts receivable $ 8,061 $ 8,366Commodity derivative and foreign currency
contract receivables 136 174Notes receivable and other 26 214
8,223 8,754Allowance for doubtful accounts (56) (48)
Receivables, net $ 8,167 $ 8,706
Notes receivable in 2011 primarily represent amounts due from PBF Holding related to the sale of the Paulsboro Refinery, the full payment of which was received in February 2012.
Table of Contents
VALERO ENERGY CORPORATION AND SUBSIDIARIESNOTES TO CONSOLIDATED FINANCIAL STATEMENTS (Continued)
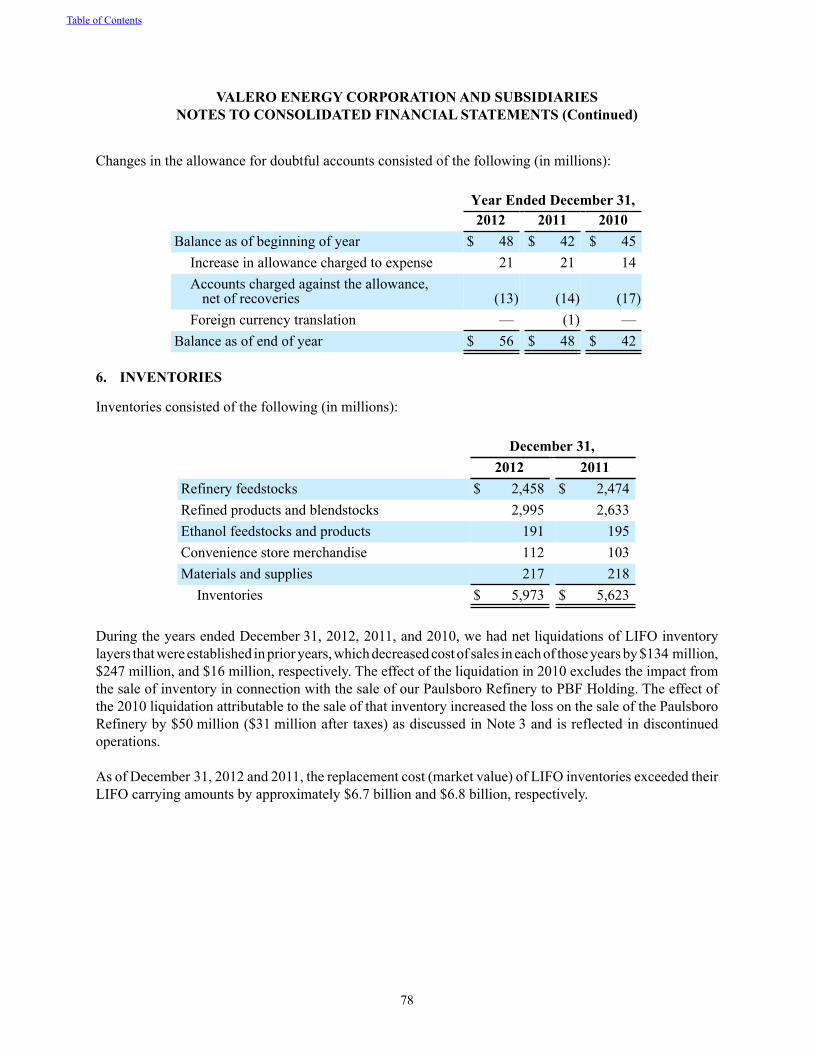
78
Changes in the allowance for doubtful accounts consisted of the following (in millions):
Year Ended December 31,2012 2011 2010
Balance as of beginning of year $ 48 $ 42 $ 45Increase in allowance charged to expense 21 21 14Accounts charged against the allowance,
net of recoveries (13) (14) (17)Foreign currency translation — (1) —
Balance as of end of year $ 56 $ 48 $ 42
6. INVENTORIES
Inventories consisted of the following (in millions):
December 31, 2012 2011Refinery feedstocks $ 2,458 $ 2,474Refined products and blendstocks 2,995 2,633Ethanol feedstocks and products 191 195Convenience store merchandise 112 103Materials and supplies 217 218
Inventories $ 5,973 $ 5,623
During the years ended December 31, 2012, 2011, and 2010, we had net liquidations of LIFO inventory layers that were established in prior years, which decreased cost of sales in each of those years by $134 million, $247 million, and $16 million, respectively. The effect of the liquidation in 2010 excludes the impact from the sale of inventory in connection with the sale of our Paulsboro Refinery to PBF Holding. The effect of the 2010 liquidation attributable to the sale of that inventory increased the loss on the sale of the Paulsboro Refinery by $50 million ($31 million after taxes) as discussed in Note 3 and is reflected in discontinued operations.
As of December 31, 2012 and 2011, the replacement cost (market value) of LIFO inventories exceeded their LIFO carrying amounts by approximately $6.7 billion and $6.8 billion, respectively.
Table of Contents
VALERO ENERGY CORPORATION AND SUBSIDIARIESNOTES TO CONSOLIDATED FINANCIAL STATEMENTS (Continued)
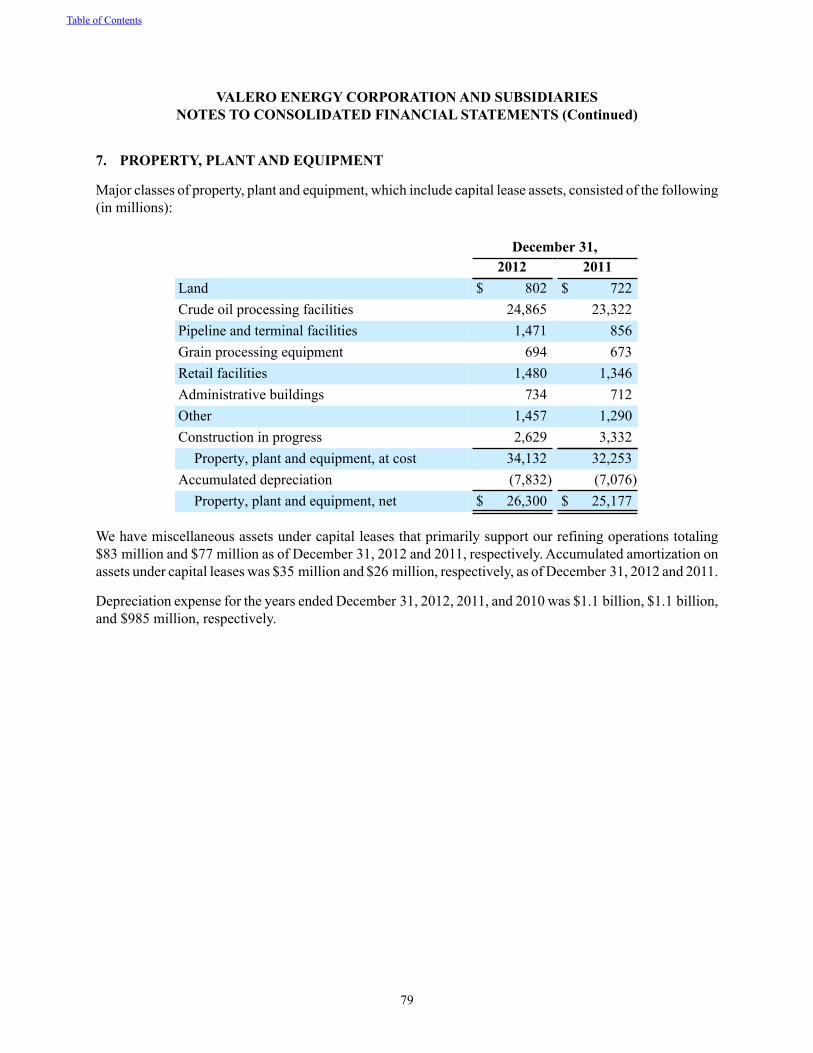
79
7. PROPERTY, PLANT AND EQUIPMENT
Major classes of property, plant and equipment, which include capital lease assets, consisted of the following (in millions):
December 31,2012 2011
Land $ 802 $ 722Crude oil processing facilities 24,865 23,322Pipeline and terminal facilities 1,471 856Grain processing equipment 694 673Retail facilities 1,480 1,346Administrative buildings 734 712Other 1,457 1,290Construction in progress 2,629 3,332
Property, plant and equipment, at cost 34,132 32,253Accumulated depreciation (7,832) (7,076)
Property, plant and equipment, net $ 26,300 $ 25,177
We have miscellaneous assets under capital leases that primarily support our refining operations totaling $83 million and $77 million as of December 31, 2012 and 2011, respectively. Accumulated amortization on assets under capital leases was $35 million and $26 million, respectively, as of December 31, 2012 and 2011.
Depreciation expense for the years ended December 31, 2012, 2011, and 2010 was $1.1 billion, $1.1 billion, and $985 million, respectively.
Table of Contents
VALERO ENERGY CORPORATION AND SUBSIDIARIESNOTES TO CONSOLIDATED FINANCIAL STATEMENTS (Continued)
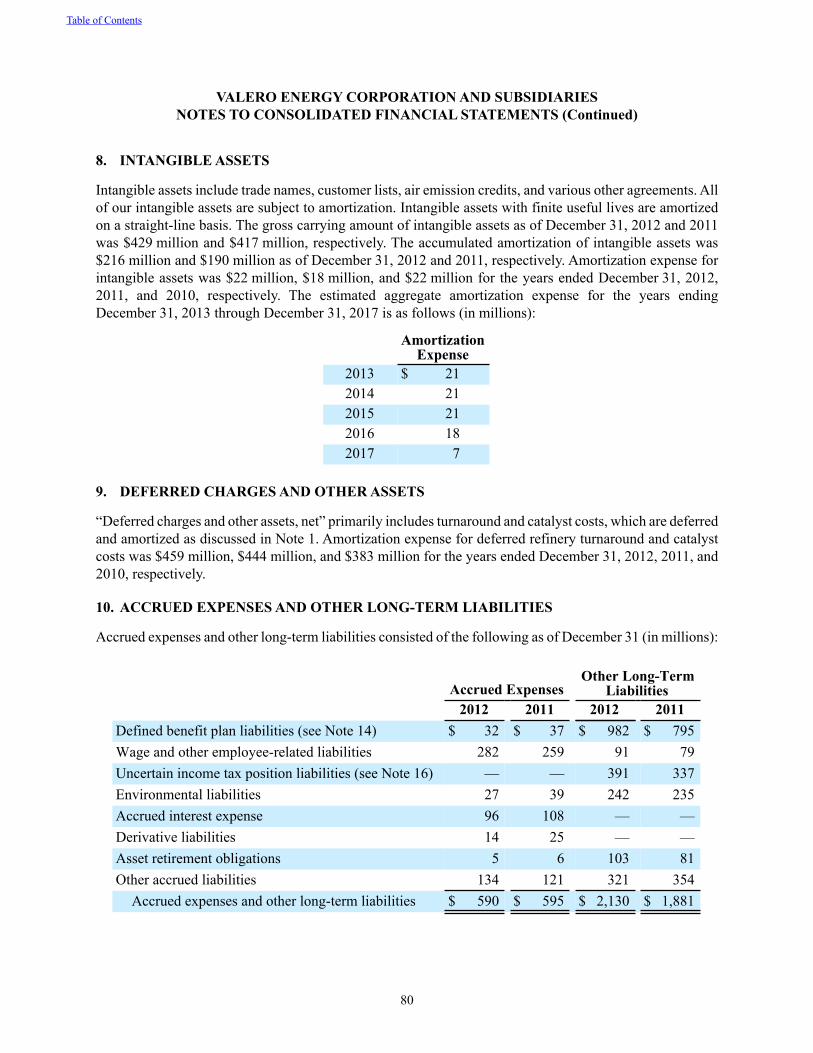
80
8. INTANGIBLE ASSETS
Intangible assets include trade names, customer lists, air emission credits, and various other agreements. All of our intangible assets are subject to amortization. Intangible assets with finite useful lives are amortized on a straight-line basis. The gross carrying amount of intangible assets as of December 31, 2012 and 2011 was $429 million and $417 million, respectively. The accumulated amortization of intangible assets was $216 million and $190 million as of December 31, 2012 and 2011, respectively. Amortization expense for intangible assets was $22 million, $18 million, and $22 million for the years ended December 31, 2012, 2011, and 2010, respectively. The estimated aggregate amortization expense for the years ending December 31, 2013 through December 31, 2017 is as follows (in millions):
AmortizationExpense
2013 $ 212014 212015 212016 182017 7
9. DEFERRED CHARGES AND OTHER ASSETS
“Deferred charges and other assets, net” primarily includes turnaround and catalyst costs, which are deferred and amortized as discussed in Note 1. Amortization expense for deferred refinery turnaround and catalyst costs was $459 million, $444 million, and $383 million for the years ended December 31, 2012, 2011, and 2010, respectively.
10. ACCRUED EXPENSES AND OTHER LONG-TERM LIABILITIES
Accrued expenses and other long-term liabilities consisted of the following as of December 31 (in millions):
Accrued ExpensesOther Long-Term
Liabilities2012 2011 2012 2011
Defined benefit plan liabilities (see Note 14) $ 32 $ 37 $ 982 $ 795Wage and other employee-related liabilities 282 259 91 79Uncertain income tax position liabilities (see Note 16) — — 391 337Environmental liabilities 27 39 242 235Accrued interest expense 96 108 — —Derivative liabilities 14 25 — —Asset retirement obligations 5 6 103 81Other accrued liabilities 134 121 321 354
Accrued expenses and other long-term liabilities $ 590 $ 595 $ 2,130 $ 1,881
Table of Contents
VALERO ENERGY CORPORATION AND SUBSIDIARIESNOTES TO CONSOLIDATED FINANCIAL STATEMENTS (Continued)
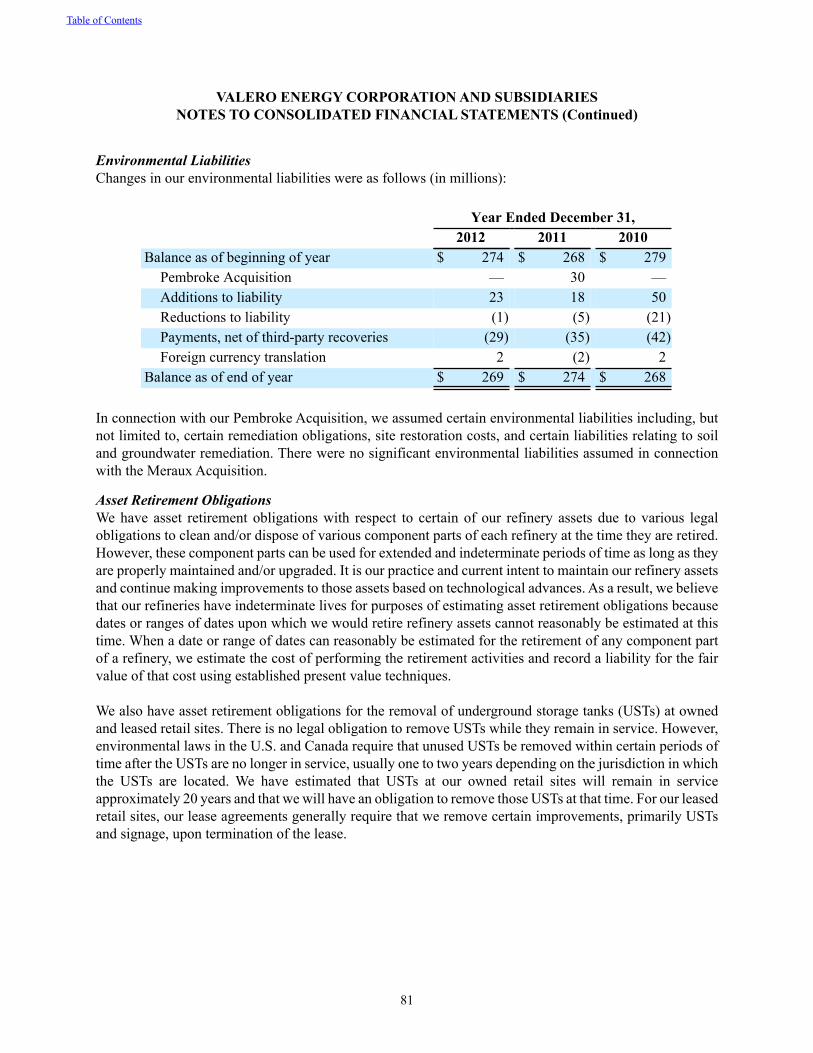
81
Environmental LiabilitiesChanges in our environmental liabilities were as follows (in millions):
Year Ended December 31,2012 2011 2010
Balance as of beginning of year $ 274 $ 268 $ 279Pembroke Acquisition — 30 —Additions to liability 23 18 50Reductions to liability (1) (5) (21)Payments, net of third-party recoveries (29) (35) (42)Foreign currency translation 2 (2) 2
Balance as of end of year $ 269 $ 274 $ 268
In connection with our Pembroke Acquisition, we assumed certain environmental liabilities including, but not limited to, certain remediation obligations, site restoration costs, and certain liabilities relating to soil and groundwater remediation. There were no significant environmental liabilities assumed in connection with the Meraux Acquisition.
Asset Retirement ObligationsWe have asset retirement obligations with respect to certain of our refinery assets due to various legal obligations to clean and/or dispose of various component parts of each refinery at the time they are retired. However, these component parts can be used for extended and indeterminate periods of time as long as they are properly maintained and/or upgraded. It is our practice and current intent to maintain our refinery assets and continue making improvements to those assets based on technological advances. As a result, we believe that our refineries have indeterminate lives for purposes of estimating asset retirement obligations because dates or ranges of dates upon which we would retire refinery assets cannot reasonably be estimated at this time. When a date or range of dates can reasonably be estimated for the retirement of any component part of a refinery, we estimate the cost of performing the retirement activities and record a liability for the fair value of that cost using established present value techniques.
We also have asset retirement obligations for the removal of underground storage tanks (USTs) at owned and leased retail sites. There is no legal obligation to remove USTs while they remain in service. However, environmental laws in the U.S. and Canada require that unused USTs be removed within certain periods of time after the USTs are no longer in service, usually one to two years depending on the jurisdiction in which the USTs are located. We have estimated that USTs at our owned retail sites will remain in service approximately 20 years and that we will have an obligation to remove those USTs at that time. For our leased retail sites, our lease agreements generally require that we remove certain improvements, primarily USTs and signage, upon termination of the lease.
Table of Contents
VALERO ENERGY CORPORATION AND SUBSIDIARIESNOTES TO CONSOLIDATED FINANCIAL STATEMENTS (Continued)
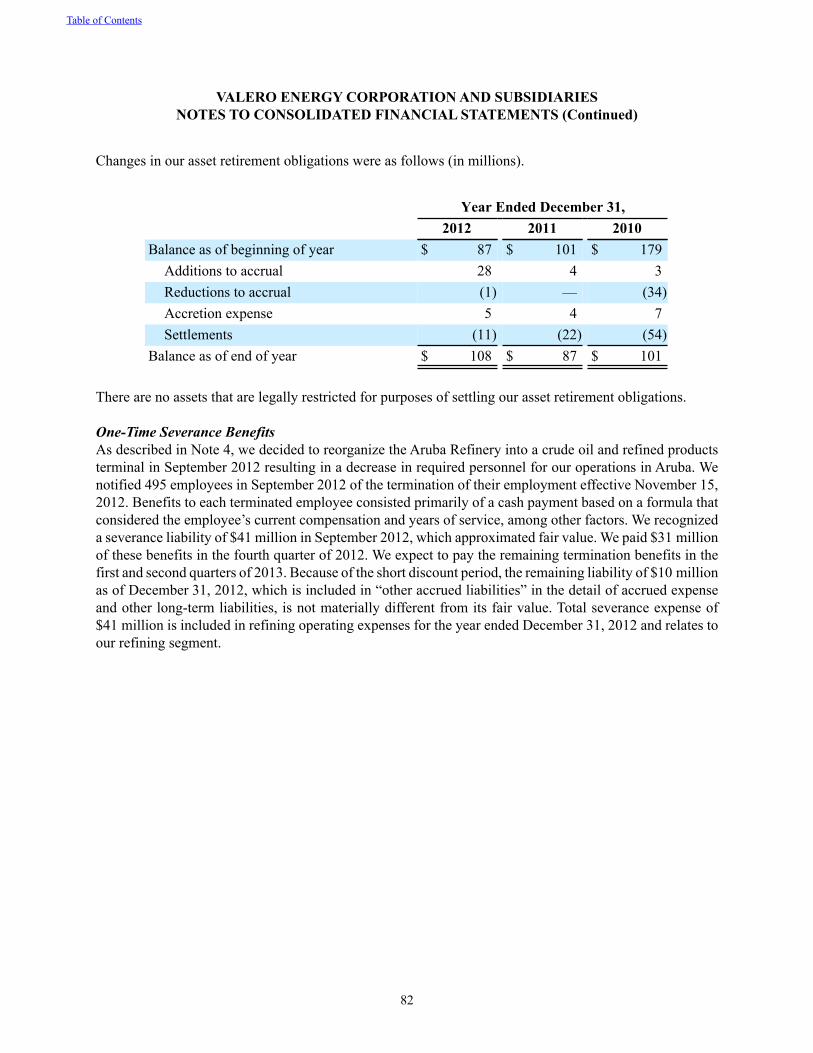
82
Changes in our asset retirement obligations were as follows (in millions).
Year Ended December 31,2012 2011 2010
Balance as of beginning of year $ 87 $ 101 $ 179Additions to accrual 28 4 3Reductions to accrual (1) — (34)Accretion expense 5 4 7Settlements (11) (22) (54)
Balance as of end of year $ 108 $ 87 $ 101
There are no assets that are legally restricted for purposes of settling our asset retirement obligations.
One-Time Severance BenefitsAs described in Note 4, we decided to reorganize the Aruba Refinery into a crude oil and refined products terminal in September 2012 resulting in a decrease in required personnel for our operations in Aruba. We notified 495 employees in September 2012 of the termination of their employment effective November 15, 2012. Benefits to each terminated employee consisted primarily of a cash payment based on a formula that considered the employee’s current compensation and years of service, among other factors. We recognized a severance liability of $41 million in September 2012, which approximated fair value. We paid $31 million of these benefits in the fourth quarter of 2012. We expect to pay the remaining termination benefits in the first and second quarters of 2013. Because of the short discount period, the remaining liability of $10 million as of December 31, 2012, which is included in “other accrued liabilities” in the detail of accrued expense and other long-term liabilities, is not materially different from its fair value. Total severance expense of $41 million is included in refining operating expenses for the year ended December 31, 2012 and relates to our refining segment.
Table of Contents
VALERO ENERGY CORPORATION AND SUBSIDIARIESNOTES TO CONSOLIDATED FINANCIAL STATEMENTS (Continued)
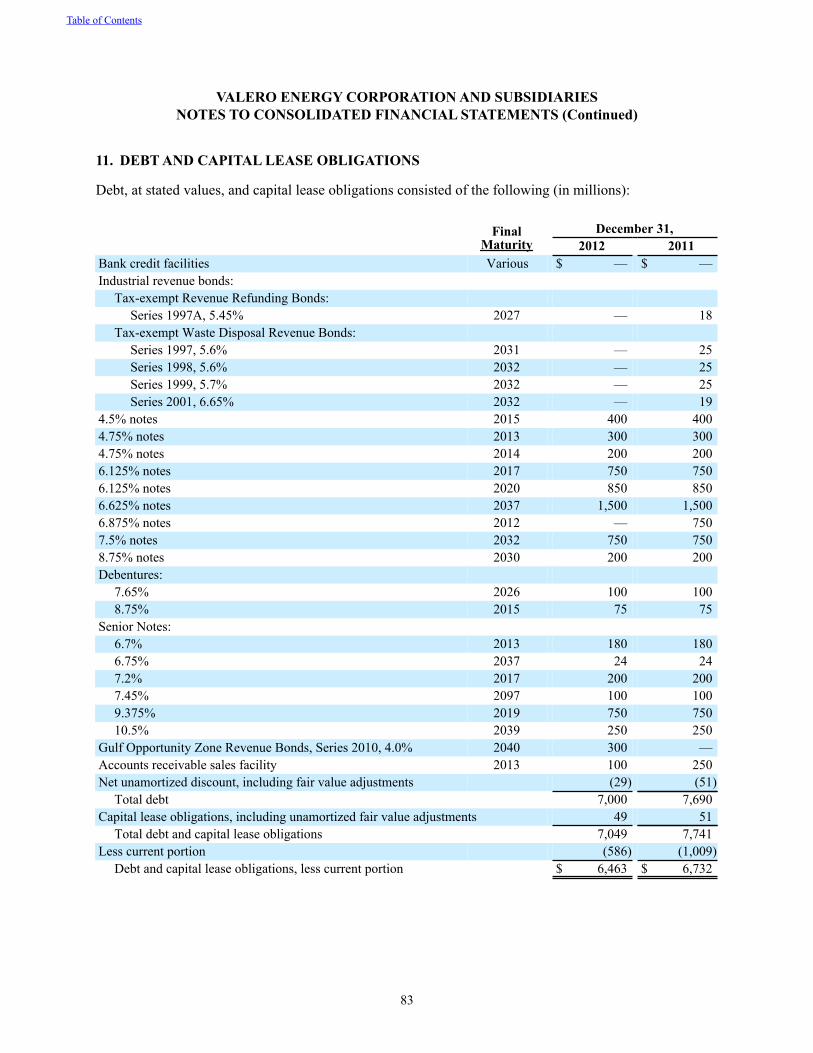
83
11. DEBT AND CAPITAL LEASE OBLIGATIONS
Debt, at stated values, and capital lease obligations consisted of the following (in millions):
FinalMaturity
December 31,2012 2011
Bank credit facilities Various $ — $ —Industrial revenue bonds:
Tax-exempt Revenue Refunding Bonds:Series 1997A, 5.45% 2027 — 18
Tax-exempt Waste Disposal Revenue Bonds:Series 1997, 5.6% 2031 — 25Series 1998, 5.6% 2032 — 25Series 1999, 5.7% 2032 — 25Series 2001, 6.65% 2032 — 19
4.5% notes 2015 400 4004.75% notes 2013 300 3004.75% notes 2014 200 2006.125% notes 2017 750 7506.125% notes 2020 850 8506.625% notes 2037 1,500 1,5006.875% notes 2012 — 7507.5% notes 2032 750 7508.75% notes 2030 200 200Debentures:
7.65% 2026 100 1008.75% 2015 75 75
Senior Notes:6.7% 2013 180 1806.75% 2037 24 247.2% 2017 200 2007.45% 2097 100 1009.375% 2019 750 75010.5% 2039 250 250
Gulf Opportunity Zone Revenue Bonds, Series 2010, 4.0% 2040 300 —Accounts receivable sales facility 2013 100 250Net unamortized discount, including fair value adjustments (29) (51)
Total debt 7,000 7,690Capital lease obligations, including unamortized fair value adjustments 49 51
Total debt and capital lease obligations 7,049 7,741Less current portion (586) (1,009)
Debt and capital lease obligations, less current portion $ 6,463 $ 6,732
Table of Contents
VALERO ENERGY CORPORATION AND SUBSIDIARIESNOTES TO CONSOLIDATED FINANCIAL STATEMENTS (Continued)
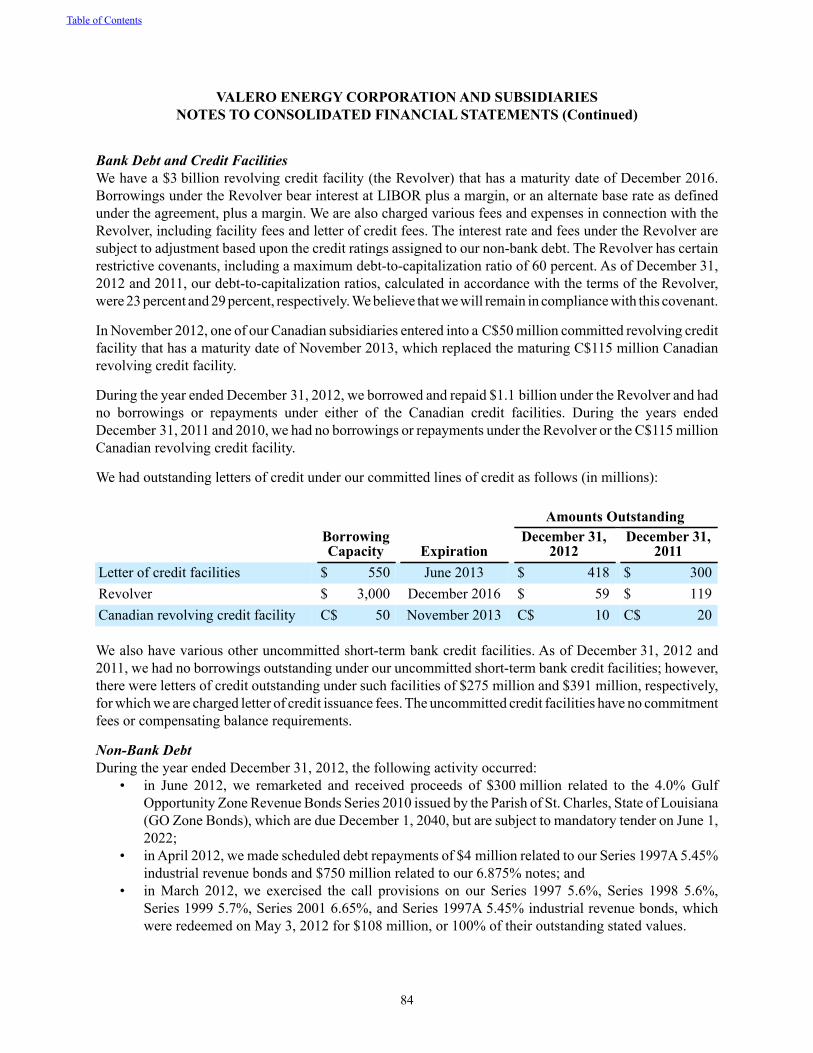
84
Bank Debt and Credit FacilitiesWe have a $3 billion revolving credit facility (the Revolver) that has a maturity date of December 2016. Borrowings under the Revolver bear interest at LIBOR plus a margin, or an alternate base rate as defined under the agreement, plus a margin. We are also charged various fees and expenses in connection with the Revolver, including facility fees and letter of credit fees. The interest rate and fees under the Revolver are subject to adjustment based upon the credit ratings assigned to our non-bank debt. The Revolver has certain restrictive covenants, including a maximum debt-to-capitalization ratio of 60 percent. As of December 31, 2012 and 2011, our debt-to-capitalization ratios, calculated in accordance with the terms of the Revolver, were 23 percent and 29 percent, respectively. We believe that we will remain in compliance with this covenant.
In November 2012, one of our Canadian subsidiaries entered into a C$50 million committed revolving credit facility that has a maturity date of November 2013, which replaced the maturing C$115 million Canadian revolving credit facility.
During the year ended December 31, 2012, we borrowed and repaid $1.1 billion under the Revolver and had no borrowings or repayments under either of the Canadian credit facilities. During the years ended December 31, 2011 and 2010, we had no borrowings or repayments under the Revolver or the C$115 million Canadian revolving credit facility.
We had outstanding letters of credit under our committed lines of credit as follows (in millions):
Amounts OutstandingBorrowingCapacity Expiration
December 31,2012
December 31,2011
Letter of credit facilities $ 550 June 2013 $ 418 $ 300Revolver $ 3,000 December 2016 $ 59 $ 119Canadian revolving credit facility C$ 50 November 2013 C$ 10 C$ 20
We also have various other uncommitted short-term bank credit facilities. As of December 31, 2012 and 2011, we had no borrowings outstanding under our uncommitted short-term bank credit facilities; however, there were letters of credit outstanding under such facilities of $275 million and $391 million, respectively, for which we are charged letter of credit issuance fees. The uncommitted credit facilities have no commitment fees or compensating balance requirements.
Non-Bank DebtDuring the year ended December 31, 2012, the following activity occurred:
• in June 2012, we remarketed and received proceeds of $300 million related to the 4.0% Gulf Opportunity Zone Revenue Bonds Series 2010 issued by the Parish of St. Charles, State of Louisiana (GO Zone Bonds), which are due December 1, 2040, but are subject to mandatory tender on June 1, 2022;
• in April 2012, we made scheduled debt repayments of $4 million related to our Series 1997A 5.45% industrial revenue bonds and $750 million related to our 6.875% notes; and
• in March 2012, we exercised the call provisions on our Series 1997 5.6%, Series 1998 5.6%, Series 1999 5.7%, Series 2001 6.65%, and Series 1997A 5.45% industrial revenue bonds, which were redeemed on May 3, 2012 for $108 million, or 100% of their outstanding stated values.
Table of Contents
VALERO ENERGY CORPORATION AND SUBSIDIARIESNOTES TO CONSOLIDATED FINANCIAL STATEMENTS (Continued)
85
During the year ended December 31, 2011, the following activity occurred:• in December 2011, we redeemed our Series 1997B 5.4% and Series 1997C 5.4% industrial revenue
bonds for $56 million, or 100% of their stated values;• in May 2011, we made a scheduled debt repayment of $200 million related to our 6.125% senior
notes;• in April 2011, we made scheduled debt repayments of $8 million related to our Series 1997A 5.45%,
Series 1997B 5.4%, and Series 1997C 5.4% industrial revenue bonds;• in February 2011, we made a scheduled debt repayment of $210 million related to our 6.75% senior
notes; and• in February 2011, we paid $300 million to acquire the GO Zone Bonds, which were subject to
mandatory tender. These bonds were remarketed in June 2012, as previously discussed.
During the year ended December 31, 2010, the following activity occurred:• in December 2010, the Parish of St. Charles, State of Louisiana (Issuer) issued GO Zone Bonds
totaling $300 million, with a maturity date of December 1, 2040. The GO Zone Bonds initially bore interest at a weekly rate with interest payable monthly, commencing January 5, 2011. Pursuant to a financing agreement, the Issuer lent the proceeds of the sale of the GO Zone Bonds to us to finance a portion of the construction costs of a hydrocracker project at our St. Charles Refinery. We received proceeds of $300 million. Under the financing agreement, we were obligated to pay the Issuer amounts sufficient for the Issuer to pay principal and interest on the GO Zone Bonds;
• in June 2010, we made a scheduled debt repayment of $25 million related to our 7.25% debentures;• in May 2010, we redeemed our 6.75% senior notes with a maturity date of May 1, 2014 for
$190 million, or 102.25% of stated value;• in April 2010, we made scheduled debt repayments of $8 million related to our Series 1997A 5.45%,
Series 1997B 5.4%, and Series 1997C 5.4% industrial revenue bonds;• in March 2010, we redeemed our 7.5% senior notes with a maturity date of June 15, 2015 for
$294 million, or 102.5% of stated value; and• in February 2010, we issued $400 million of 4.5% notes due February 1, 2015 and $850 million of
6.125% notes due in February 1, 2020 for total net proceeds of $1.2 billion.
Accounts Receivable Sales FacilityWe have an accounts receivable sales facility with a group of third-party entities and financial institutions to sell eligible trade receivables on a revolving basis. In July 2012, we amended our agreement to increase the facility from $1.0 billion to $1.5 billion and extended the maturity date to July 2013. Under this program, one of our marketing subsidiaries (Valero Marketing) sells eligible receivables, without recourse, to another of our subsidiaries (Valero Capital), whereupon the receivables are no longer owned by Valero Marketing. Valero Capital, in turn, sells an undivided percentage ownership interest in the eligible receivables, without recourse, to the third-party entities and financial institutions. To the extent that Valero Capital retains an ownership interest in the receivables it has purchased from Valero Marketing, such interest is included in our financial statements solely as a result of the consolidation of the financial statements of Valero Capital with those of Valero Energy Corporation; the receivables are not available to satisfy the claims of the creditors of Valero Marketing or Valero Energy Corporation.
As of December 31, 2012 and 2011, $3.2 billion and $3.3 billion, respectively, of our accounts receivable composed the designated pool of accounts receivable included in the program. All amounts outstanding
Table of Contents
VALERO ENERGY CORPORATION AND SUBSIDIARIESNOTES TO CONSOLIDATED FINANCIAL STATEMENTS (Continued)
86
under the accounts receivable sales facility are reflected as debt on our balance sheets and proceeds and repayments are reflected as cash flows from financing activities on the statements of cash flows. Changes in the amounts outstanding under our accounts receivable sales facility were as follows (in millions):
Year Ended December 31,2012 2011 2010
Balance as of beginning of year $ 250 $ 100 $ 200Proceeds from the sale of receivables 1,500 150 1,225Repayments (1,650) — (1,325)
Balance as of end of year $ 100 $ 250 $ 100
Capitalized InterestFor the years ended December 31, 2012, 2011, and 2010, capitalized interest was $221 million, $152 million, and $90 million, respectively.
Other DisclosuresIn addition to the maximum debt-to-capitalization ratio applicable to the Revolver discussed above under “Bank Credit Facilities,” our bank credit facilities and other debt arrangements contain various customary restrictive covenants, including cross-default and cross-acceleration clauses.
Principal payments on our debt obligations and future minimum rentals on capital lease obligations as of December 31, 2012 were as follows (in millions):
Debt
CapitalLease
Obligations2013 $ 580 $ 122014 200 102015 475 92016 — 82017 950 7Thereafter 4,824 35Net unamortized discount
and fair value adjustments (29) —Less interest expense — (32)
Total $ 7,000 $ 49
Table of Contents
VALERO ENERGY CORPORATION AND SUBSIDIARIESNOTES TO CONSOLIDATED FINANCIAL STATEMENTS (Continued)
87
12. COMMITMENTS AND CONTINGENCIES
Operating LeasesWe have long-term operating lease commitments for land, office facilities and equipment, retail facilities and related equipment, transportation equipment, time charters for ocean-going tankers and coastal vessels, dock facilities, and various facilities and equipment used in the storage, transportation, production, and sale of refinery feedstocks, refined product and corn inventories.
Certain leases for processing equipment and feedstock and refined product storage facilities provide for various contingent payments based on, among other things, throughput volumes in excess of a base amount. Certain leases for vessels contain renewal options and escalation clauses, which vary by charter, and provisions for the payment of chartering fees, which either vary based on usage or provide for payments, in addition to established minimums, that are contingent on usage. Leases for convenience stores may also include provisions for contingent rental payments based on sales volumes. In most cases, we expect that in the normal course of business, our leases will be renewed or replaced by other leases.
As of December 31, 2012, our future minimum rentals and minimum rentals to be received under subleases for leases having initial or remaining noncancelable lease terms in excess of one year were as follows (in millions):
2013 $ 3372014 2502015 1792016 1332017 86Thereafter 350
Total minimum rental payments $ 1,335Minimum rentals to be receivedunder subleases $ 30
Rental expense was as follows (in millions):
Year Ended December 31,2012 2011 2010
Minimum rental expense $ 508 $ 523 $ 485Contingent rental expense 23 23 23
Total rental expense 531 546 508Less sublease rental income (2) (2) (3)
Net rental expense $ 529 $ 544 $ 505
Table of Contents
VALERO ENERGY CORPORATION AND SUBSIDIARIESNOTES TO CONSOLIDATED FINANCIAL STATEMENTS (Continued)
88
Purchase ObligationsWe have various purchase obligations under certain industrial gas and chemical supply arrangements (such as hydrogen supply arrangements), crude oil and other feedstock supply arrangements, and various throughput and terminalling agreements. We enter into these contracts to ensure an adequate supply of utilities and feedstock and adequate storage capacity to operate our refineries. Substantially all of our purchase obligations are based on market prices or adjustments based on market indices. Certain of these purchase obligations include fixed or minimum volume requirements, while others are based on our usage requirements. None of these obligations are associated with suppliers’ financing arrangements. These purchase obligations are not reflected as liabilities.
Environmental MattersHartford Matters
We are involved, together with several other companies, in an environmental cleanup in the Village of Hartford, Illinois (the Village) and the adjacent shutdown refinery site, which we acquired as part of a prior acquisition. In cooperation with some of the other companies, we have been conducting initial mitigation and cleanup response pursuant to an administrative order issued by the U.S. Environmental Protection Agency (EPA). The EPA is seeking further cleanup obligations from us and other potentially responsible parties for the Village. In parallel with the Village cleanup, we are also in litigation with the State of Illinois Environmental Protection Agency and other potentially responsible parties relating to the remediation of the shutdown refinery site. In each of these matters, we have various defenses and rights for contribution from the other potentially responsible parties. We have accrued for our own expected contribution obligations. However, because of the unpredictable nature of these cleanups and the methodology for allocation of liabilities, it is reasonably possible that we could incur a loss in a range of $0 to $250 million in excess of the amount of our accrual to ultimately resolve these matters. Factors underlying this estimated range are expected to change from time to time, and actual results may vary significantly from this estimate.
Regulation of Greenhouse GasesThe EPA began regulating greenhouse gases on January 2, 2011, under the Clean Air Act Amendments of 1990 (Clean Air Act). Any new construction or material expansions will require that, among other things, a greenhouse gas permit be issued at either or both the state or federal level in accordance with the Clean Air Act regulations, and we will be required to undertake a technology review to determine appropriate controls to be implemented with the project in order to reduce greenhouse gas emissions. The determination would be on a case by case basis, and the EPA has provided only general guidance on which controls will be required or delegated to the states through State Implementation Plans.
Furthermore, the EPA is currently developing refinery-specific greenhouse gas regulations and performance standards that are expected to impose, on new and modified operations, greenhouse gas emission limits and/or technology requirements. These control requirements may affect a wide range of refinery operations but have not yet been delineated. Any such controls, however, could result in material increased compliance costs, additional operating restrictions for our business, and an increase in the cost of the products we produce, which could have a material adverse effect on our financial position, results of operations, and liquidity.
Certain states and foreign governments have pursued regulation of greenhouse gases independent of the EPA. For example, the California Global Warming Solutions Act, also known as AB 32, directs the California Air Resources Board (CARB) to develop and issue regulations to reduce greenhouse gas emissions in
Table of Contents
VALERO ENERGY CORPORATION AND SUBSIDIARIESNOTES TO CONSOLIDATED FINANCIAL STATEMENTS (Continued)
89
California to 1990 levels by 2020. CARB has issued a variety of regulations aimed at reaching this goal, including a Low Carbon Fuel Standard (LCFS) as well as a statewide cap-and-trade program.
• The LCFS was scheduled to become effective in 2011, but rulings by the U.S. District Court have stayed enforcement of the LCFS until certain legal challenges to the LCFS have been resolved. Most notably, the court determined that the LCFS violates the Commerce Clause of the U.S. Constitution to the extent that the standard discriminates against out-of-state crude oils and corn ethanol. CARB appealed the lower court’s ruling to the U.S. Court of Appeals for the Ninth Circuit (Ninth Circuit Court), which lifted the stay on April 23, 2012. The Ninth Circuit Court heard arguments on the merits of the appeal in October 2012. We await the Ninth Circuit Court’s final ruling on the merits.
• The California statewide cap-and-trade program became effective in 2012, with the auctioning of emission credits commencing in the fourth quarter of 2012. Initially, the program will apply only to stationary sources of greenhouse gases (e.g., refinery and power plant greenhouse gas emissions). Greenhouse gas emissions from fuels that we sell in California will be covered by the program beginning in 2015. We anticipate that free allocations of credits will be available in the early years of the program, but we expect that compliance costs will increase significantly beginning in 2015, when transportation fuels are included in the program.
• Complying with AB 32, including the LCFS and the cap-and-trade program, could result in material increased compliance costs for us, increased capital expenditures, increased operating costs, and additional operating restrictions for our business, resulting in an increase in the cost of, and decreases in the demand for, the products we produce. To the degree we are unable to recover these increased costs, these matters could have a material adverse effect on our financial position, results of operations, and liquidity.
Texas Permitting MattersThe EPA has disapproved certain permitting programs of the Texas Commission on Environmental Quality (TCEQ) that historically have streamlined the environmental permitting process or provided greater operational flexibility in Texas. For example, the EPA disapproved the TCEQ flexible permit program and pollution control standard permit, thus requiring the conversion of flexible permits to a more conventional permitting program and precluding the prompt authorization of pollution control equipment. The Fifth Circuit Court of Appeals overturned the EPA’s disapproval of the flexible permit program and pollution control standard permit and directed the EPA to reconsider them consistent with the court’s decision. In other instances, the EPA’s decisions have been initially upheld and others are still pending before the courts. Regardless of the EPA’s response to the courts’ various rulings, further litigation is probable.
The EPA has also objected to numerous Title V permits in Texas and other states, including permits at our Port Arthur, Texas City, Meraux, Corpus Christi East, and McKee Refineries. Environmental activist groups have filed notices of intent to sue the EPA, seeking to require the EPA to assume control of these permits from the TCEQ. Finally, as part of its regulation of greenhouse gases discussed above, the EPA has federalized the permitting of greenhouse gas emissions in Texas. This creates a dual permitting structure that must be navigated for material projects in Texas. All of these developments have created substantial uncertainty regarding existing and future permitting. Because of this uncertainty, we are unable to determine the costs or effects of the EPA’s actions on our permitting activity. The greenhouse gas permitting regime and the EPA’s disruption of the Texas permitting system could result in material increased compliance costs for us, increased capital expenditures, increased operating costs, and additional operating restrictions for our
Table of Contents
VALERO ENERGY CORPORATION AND SUBSIDIARIESNOTES TO CONSOLIDATED FINANCIAL STATEMENTS (Continued)
90
business, resulting in an increase in the cost of, and decreases in the demand for, the products we produce, which could have a material adverse effect on our financial position, results of operations, and liquidity.
Litigation MattersWe are party to claims and legal proceedings arising in the ordinary course of business. We have not recorded a loss contingency liability with respect to some of these matters because we have determined that it is remote that a loss has been incurred. For other matters, we have recorded a loss contingency liability where we have determined that it is probable that a loss has been incurred and that the loss is reasonably estimable. These loss contingency liabilities are not material to our financial position. We re-evaluate and update our loss contingency liabilities as matters progress over time, and we believe that any changes to the recorded liabilities will not be material to our financial position, results of operations, or liquidity.
Tax MattersGeneral
We are subject to extensive tax liabilities imposed by multiple jurisdictions, including income taxes, indirect taxes (excise/duty, sales/use, gross receipts, and value-added taxes), payroll taxes, franchise taxes, withholding taxes, and ad valorem taxes. New tax laws and regulations and changes in existing tax laws and regulations are continuously being enacted or proposed that could result in increased expenditures for tax liabilities in the future. Many of these liabilities are subject to periodic audits by the respective taxing authority. Subsequent changes to our tax liabilities as a result of these audits may subject us to interest and penalties.
IRS AuditsAs of December 31, 2012, the Internal Revenue Service (IRS) has ongoing tax audits related to our U.S. federal tax returns from 2002 through 2009, as discussed in Note 16. We have received Revenue Agent Reports on our tax years for 2002 through 2007 and we are vigorously contesting many of the tax positions and assertions from the IRS. Although we believe our tax liabilities are fairly stated and properly reflected in our financial statements, should the IRS eventually prevail, it could result in a material amount of our deferred tax liabilities being reclassified to current liabilities which could have a material adverse effect on our liquidity.
ArubaEffective June 1, 2010, the GOA enacted a new tax regime applicable to refinery and terminal operations in Aruba. Under the new tax regime, we are subject to a profit tax rate of 7 percent and a dividend withholding tax rate of zero percent. In addition, all imports and exports are exempt from turnover tax and throughput fees. Beginning June 1, 2012, we are required to make a minimum annual tax payment of $10 million (payable in equal quarterly installments), with the ability to carry forward any excess tax prepayments to future tax years.
The new tax regime was the result of a settlement agreement that we and the GOA entered into on February 24, 2010 to settle a lengthy and complicated tax dispute between the parties. On May 30, 2010, the Aruban Parliament adopted several laws that implemented the provisions of the settlement agreement, which became effective June 1, 2010. Pursuant to the terms of the settlement agreement, we relinquished certain provisions of a previous tax holiday regime. On June 4, 2010, we made a payment to the GOA of $118 million (primarily from restricted cash held in escrow) in consideration of a full release of all tax claims prior to June 1, 2010.
Table of Contents
VALERO ENERGY CORPORATION AND SUBSIDIARIESNOTES TO CONSOLIDATED FINANCIAL STATEMENTS (Continued)
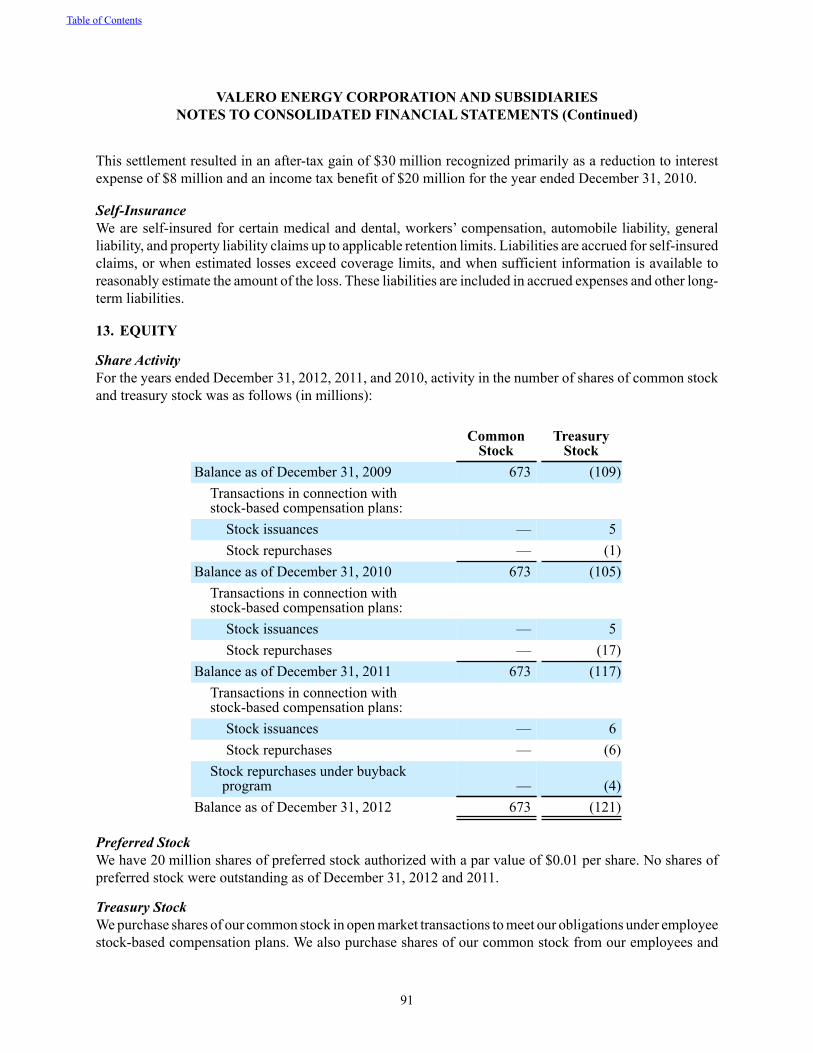
91
This settlement resulted in an after-tax gain of $30 million recognized primarily as a reduction to interest expense of $8 million and an income tax benefit of $20 million for the year ended December 31, 2010.
Self-InsuranceWe are self-insured for certain medical and dental, workers’ compensation, automobile liability, general liability, and property liability claims up to applicable retention limits. Liabilities are accrued for self-insured claims, or when estimated losses exceed coverage limits, and when sufficient information is available to reasonably estimate the amount of the loss. These liabilities are included in accrued expenses and other long-term liabilities.
13. EQUITY
Share ActivityFor the years ended December 31, 2012, 2011, and 2010, activity in the number of shares of common stock and treasury stock was as follows (in millions):
CommonStock
TreasuryStock
Balance as of December 31, 2009 673 (109)Transactions in connection withstock-based compensation plans:
Stock issuances — 5Stock repurchases — (1)
Balance as of December 31, 2010 673 (105)Transactions in connection withstock-based compensation plans:
Stock issuances — 5Stock repurchases — (17)
Balance as of December 31, 2011 673 (117)Transactions in connection withstock-based compensation plans:
Stock issuances — 6Stock repurchases — (6)
Stock repurchases under buyback program — (4)
Balance as of December 31, 2012 673 (121)
Preferred StockWe have 20 million shares of preferred stock authorized with a par value of $0.01 per share. No shares of preferred stock were outstanding as of December 31, 2012 and 2011.
Treasury StockWe purchase shares of our common stock in open market transactions to meet our obligations under employee stock-based compensation plans. We also purchase shares of our common stock from our employees and
Table of Contents
VALERO ENERGY CORPORATION AND SUBSIDIARIESNOTES TO CONSOLIDATED FINANCIAL STATEMENTS (Continued)
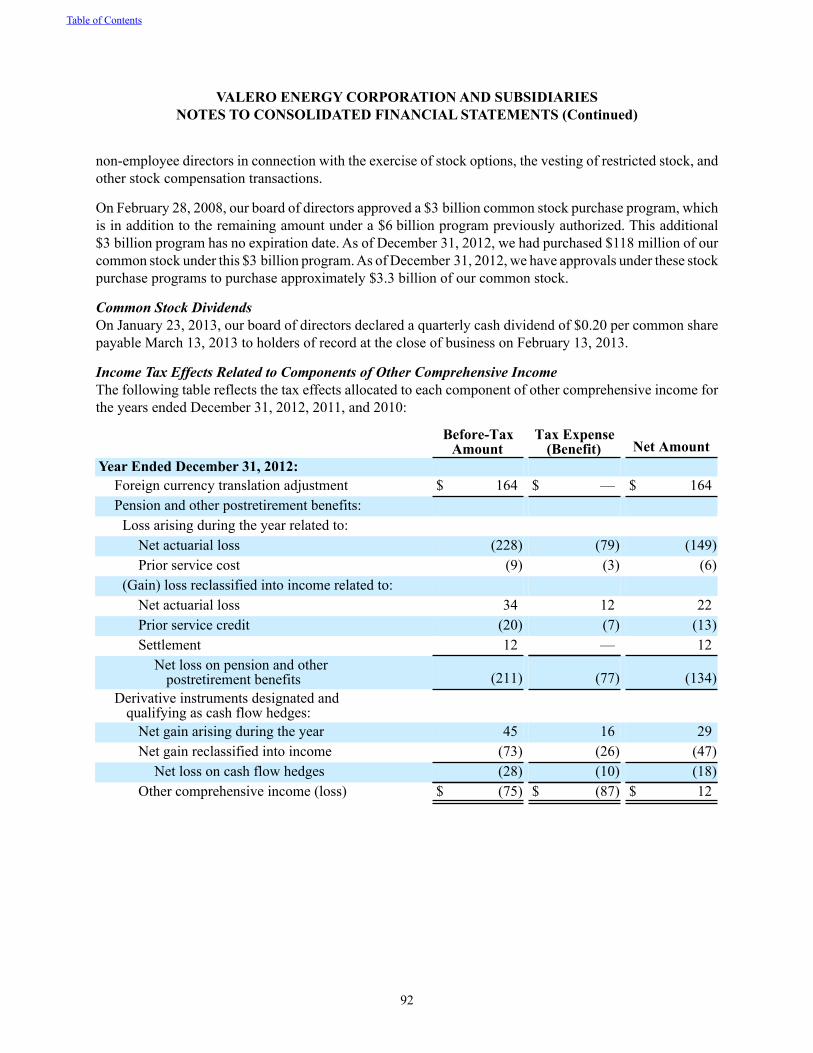
92
non-employee directors in connection with the exercise of stock options, the vesting of restricted stock, and other stock compensation transactions.
On February 28, 2008, our board of directors approved a $3 billion common stock purchase program, which is in addition to the remaining amount under a $6 billion program previously authorized. This additional $3 billion program has no expiration date. As of December 31, 2012, we had purchased $118 million of our common stock under this $3 billion program. As of December 31, 2012, we have approvals under these stock purchase programs to purchase approximately $3.3 billion of our common stock.
Common Stock DividendsOn January 23, 2013, our board of directors declared a quarterly cash dividend of $0.20 per common share payable March 13, 2013 to holders of record at the close of business on February 13, 2013.
Income Tax Effects Related to Components of Other Comprehensive IncomeThe following table reflects the tax effects allocated to each component of other comprehensive income for the years ended December 31, 2012, 2011, and 2010:
Before-TaxAmount
Tax Expense(Benefit) Net Amount
Year Ended December 31, 2012:Foreign currency translation adjustment $ 164 $ — $ 164Pension and other postretirement benefits:
Loss arising during the year related to:Net actuarial loss (228) (79) (149)Prior service cost (9) (3) (6)
(Gain) loss reclassified into income related to:Net actuarial loss 34 12 22Prior service credit (20) (7) (13)Settlement 12 — 12
Net loss on pension and otherpostretirement benefits (211) (77) (134)
Derivative instruments designated andqualifying as cash flow hedges:
Net gain arising during the year 45 16 29Net gain reclassified into income (73) (26) (47)
Net loss on cash flow hedges (28) (10) (18)Other comprehensive income (loss) $ (75) $ (87) $ 12
Table of Contents
VALERO ENERGY CORPORATION AND SUBSIDIARIESNOTES TO CONSOLIDATED FINANCIAL STATEMENTS (Continued)
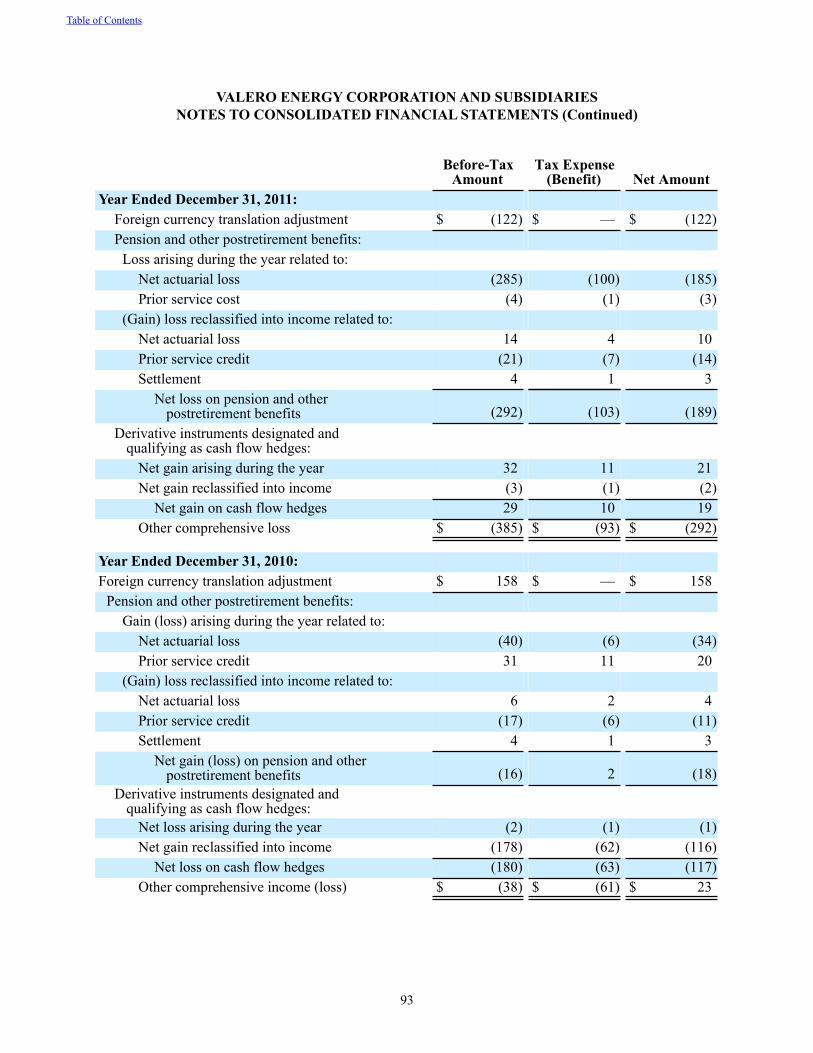
93
Before-TaxAmount
Tax Expense(Benefit) Net Amount
Year Ended December 31, 2011:Foreign currency translation adjustment $ (122) $ — $ (122)Pension and other postretirement benefits:
Loss arising during the year related to:Net actuarial loss (285) (100) (185)Prior service cost (4) (1) (3)
(Gain) loss reclassified into income related to:Net actuarial loss 14 4 10Prior service credit (21) (7) (14)Settlement 4 1 3
Net loss on pension and otherpostretirement benefits (292) (103) (189)
Derivative instruments designated andqualifying as cash flow hedges:
Net gain arising during the year 32 11 21Net gain reclassified into income (3) (1) (2)
Net gain on cash flow hedges 29 10 19Other comprehensive loss $ (385) $ (93) $ (292)
Year Ended December 31, 2010:Foreign currency translation adjustment $ 158 $ — $ 158
Pension and other postretirement benefits: Gain (loss) arising during the year related to:
Net actuarial loss (40) (6) (34)Prior service credit 31 11 20
(Gain) loss reclassified into income related to:Net actuarial loss 6 2 4Prior service credit (17) (6) (11)Settlement 4 1 3
Net gain (loss) on pension and other postretirement benefits (16) 2 (18)
Derivative instruments designated andqualifying as cash flow hedges:
Net loss arising during the year (2) (1) (1)Net gain reclassified into income (178) (62) (116)
Net loss on cash flow hedges (180) (63) (117)Other comprehensive income (loss) $ (38) $ (61) $ 23
Table of Contents
VALERO ENERGY CORPORATION AND SUBSIDIARIESNOTES TO CONSOLIDATED FINANCIAL STATEMENTS (Continued)
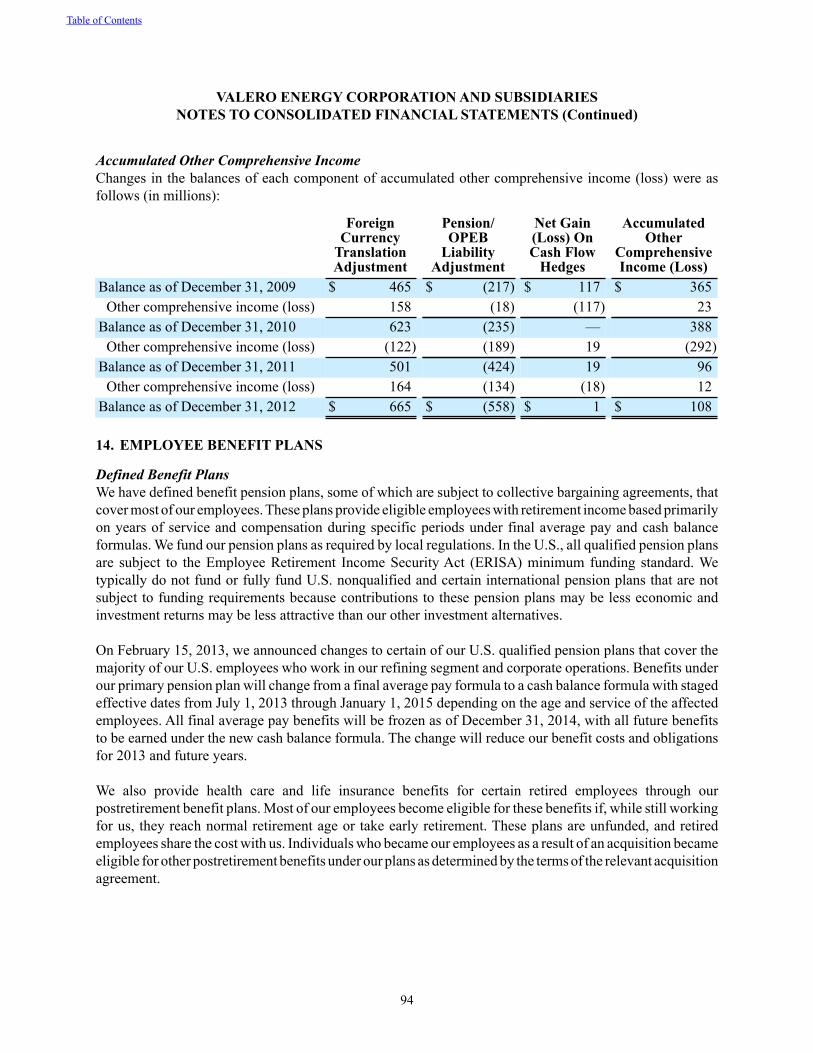
94
Accumulated Other Comprehensive IncomeChanges in the balances of each component of accumulated other comprehensive income (loss) were as follows (in millions):
ForeignCurrency
TranslationAdjustment
Pension/OPEB
LiabilityAdjustment
Net Gain(Loss) OnCash Flow
Hedges
AccumulatedOther
ComprehensiveIncome (Loss)
Balance as of December 31, 2009 $ 465 $ (217) $ 117 $ 365Other comprehensive income (loss) 158 (18) (117) 23
Balance as of December 31, 2010 623 (235) — 388Other comprehensive income (loss) (122) (189) 19 (292)
Balance as of December 31, 2011 501 (424) 19 96Other comprehensive income (loss) 164 (134) (18) 12
Balance as of December 31, 2012 $ 665 $ (558) $ 1 $ 108
14. EMPLOYEE BENEFIT PLANS
Defined Benefit PlansWe have defined benefit pension plans, some of which are subject to collective bargaining agreements, that cover most of our employees. These plans provide eligible employees with retirement income based primarily on years of service and compensation during specific periods under final average pay and cash balance formulas. We fund our pension plans as required by local regulations. In the U.S., all qualified pension plans are subject to the Employee Retirement Income Security Act (ERISA) minimum funding standard. We typically do not fund or fully fund U.S. nonqualified and certain international pension plans that are not subject to funding requirements because contributions to these pension plans may be less economic and investment returns may be less attractive than our other investment alternatives.
On February 15, 2013, we announced changes to certain of our U.S. qualified pension plans that cover the majority of our U.S. employees who work in our refining segment and corporate operations. Benefits under our primary pension plan will change from a final average pay formula to a cash balance formula with staged effective dates from July 1, 2013 through January 1, 2015 depending on the age and service of the affected employees. All final average pay benefits will be frozen as of December 31, 2014, with all future benefits to be earned under the new cash balance formula. The change will reduce our benefit costs and obligations for 2013 and future years.
We also provide health care and life insurance benefits for certain retired employees through our postretirement benefit plans. Most of our employees become eligible for these benefits if, while still working for us, they reach normal retirement age or take early retirement. These plans are unfunded, and retired employees share the cost with us. Individuals who became our employees as a result of an acquisition became eligible for other postretirement benefits under our plans as determined by the terms of the relevant acquisition agreement.
Table of Contents
VALERO ENERGY CORPORATION AND SUBSIDIARIESNOTES TO CONSOLIDATED FINANCIAL STATEMENTS (Continued)
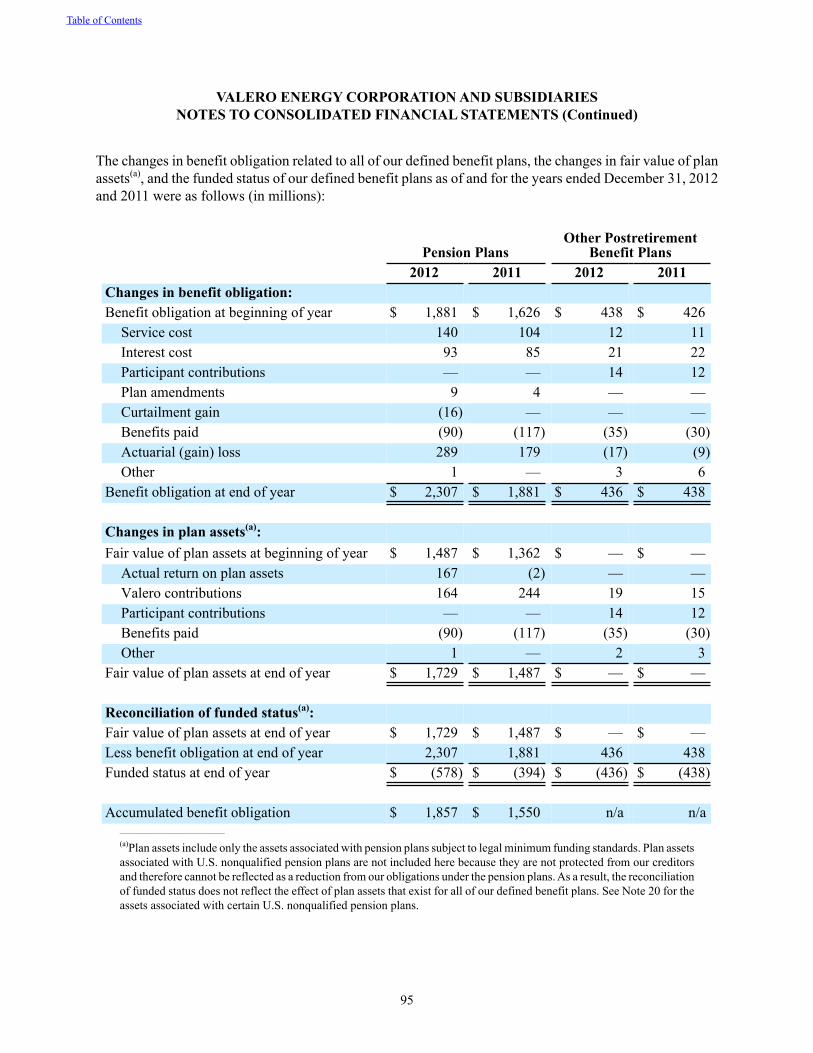
95
The changes in benefit obligation related to all of our defined benefit plans, the changes in fair value of plan assets(a), and the funded status of our defined benefit plans as of and for the years ended December 31, 2012 and 2011 were as follows (in millions):
Pension PlansOther Postretirement
Benefit Plans2012 2011 2012 2011
Changes in benefit obligation:Benefit obligation at beginning of year $ 1,881 $ 1,626 $ 438 $ 426
Service cost 140 104 12 11Interest cost 93 85 21 22Participant contributions — — 14 12Plan amendments 9 4 — —Curtailment gain (16) — — —Benefits paid (90) (117) (35) (30)Actuarial (gain) loss 289 179 (17) (9)Other 1 — 3 6
Benefit obligation at end of year $ 2,307 $ 1,881 $ 436 $ 438
Changes in plan assets(a):Fair value of plan assets at beginning of year $ 1,487 $ 1,362 $ — $ —
Actual return on plan assets 167 (2) — —Valero contributions 164 244 19 15Participant contributions — — 14 12Benefits paid (90) (117) (35) (30)Other 1 — 2 3
Fair value of plan assets at end of year $ 1,729 $ 1,487 $ — $ —
Reconciliation of funded status(a):Fair value of plan assets at end of year $ 1,729 $ 1,487 $ — $ —Less benefit obligation at end of year 2,307 1,881 436 438Funded status at end of year $ (578) $ (394) $ (436) $ (438)
Accumulated benefit obligation $ 1,857 $ 1,550 n/a n/a___________________________
(a)Plan assets include only the assets associated with pension plans subject to legal minimum funding standards. Plan assets associated with U.S. nonqualified pension plans are not included here because they are not protected from our creditors and therefore cannot be reflected as a reduction from our obligations under the pension plans. As a result, the reconciliation of funded status does not reflect the effect of plan assets that exist for all of our defined benefit plans. See Note 20 for the assets associated with certain U.S. nonqualified pension plans.
Table of Contents
VALERO ENERGY CORPORATION AND SUBSIDIARIESNOTES TO CONSOLIDATED FINANCIAL STATEMENTS (Continued)
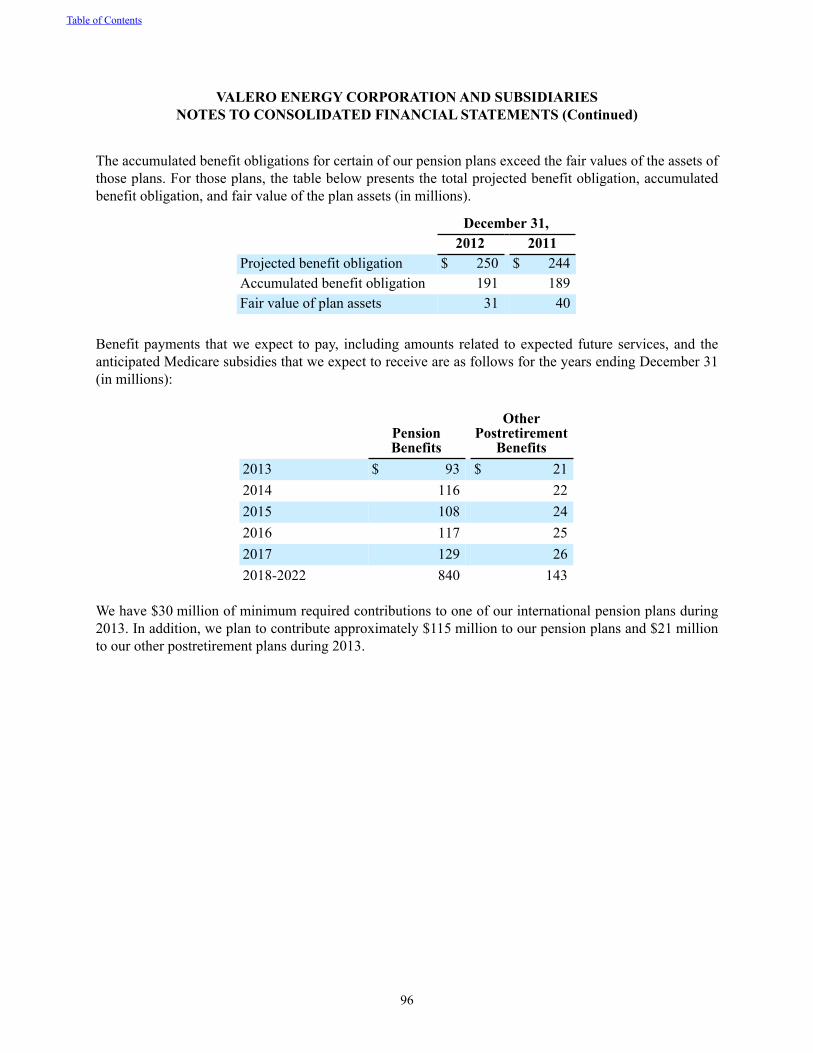
96
The accumulated benefit obligations for certain of our pension plans exceed the fair values of the assets of those plans. For those plans, the table below presents the total projected benefit obligation, accumulated benefit obligation, and fair value of the plan assets (in millions).
December 31,2012 2011
Projected benefit obligation $ 250 $ 244Accumulated benefit obligation 191 189Fair value of plan assets 31 40
Benefit payments that we expect to pay, including amounts related to expected future services, and the anticipated Medicare subsidies that we expect to receive are as follows for the years ending December 31 (in millions):
PensionBenefits
OtherPostretirement
Benefits2013 $ 93 $ 212014 116 222015 108 242016 117 252017 129 262018-2022 840 143
We have $30 million of minimum required contributions to one of our international pension plans during 2013. In addition, we plan to contribute approximately $115 million to our pension plans and $21 million to our other postretirement plans during 2013.
Table of Contents
VALERO ENERGY CORPORATION AND SUBSIDIARIESNOTES TO CONSOLIDATED FINANCIAL STATEMENTS (Continued)
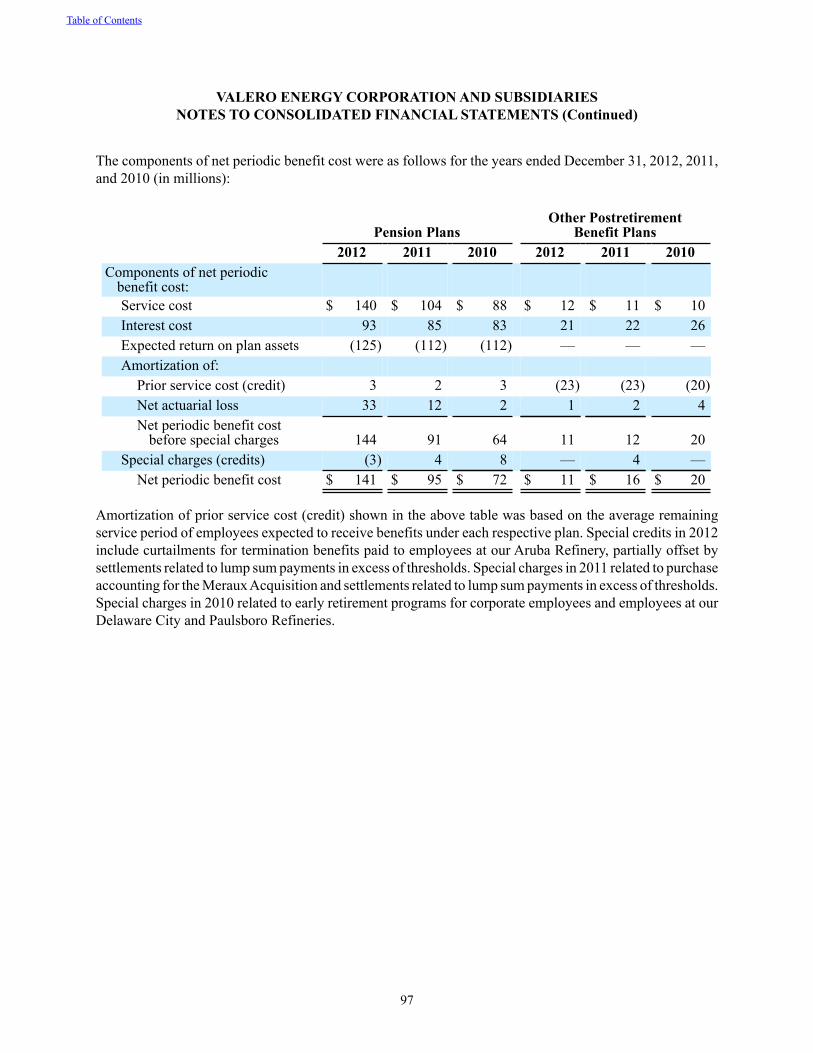
97
The components of net periodic benefit cost were as follows for the years ended December 31, 2012, 2011, and 2010 (in millions):
Pension PlansOther Postretirement
Benefit Plans2012 2011 2010 2012 2011 2010
Components of net periodic benefit cost:Service cost $ 140 $ 104 $ 88 $ 12 $ 11 $ 10Interest cost 93 85 83 21 22 26Expected return on plan assets (125) (112) (112) — — —Amortization of:
Prior service cost (credit) 3 2 3 (23) (23) (20)Net actuarial loss 33 12 2 1 2 4Net periodic benefit cost
before special charges 144 91 64 11 12 20Special charges (credits) (3) 4 8 — 4 —
Net periodic benefit cost $ 141 $ 95 $ 72 $ 11 $ 16 $ 20
Amortization of prior service cost (credit) shown in the above table was based on the average remaining service period of employees expected to receive benefits under each respective plan. Special credits in 2012 include curtailments for termination benefits paid to employees at our Aruba Refinery, partially offset by settlements related to lump sum payments in excess of thresholds. Special charges in 2011 related to purchase accounting for the Meraux Acquisition and settlements related to lump sum payments in excess of thresholds. Special charges in 2010 related to early retirement programs for corporate employees and employees at our Delaware City and Paulsboro Refineries.
Table of Contents
VALERO ENERGY CORPORATION AND SUBSIDIARIESNOTES TO CONSOLIDATED FINANCIAL STATEMENTS (Continued)
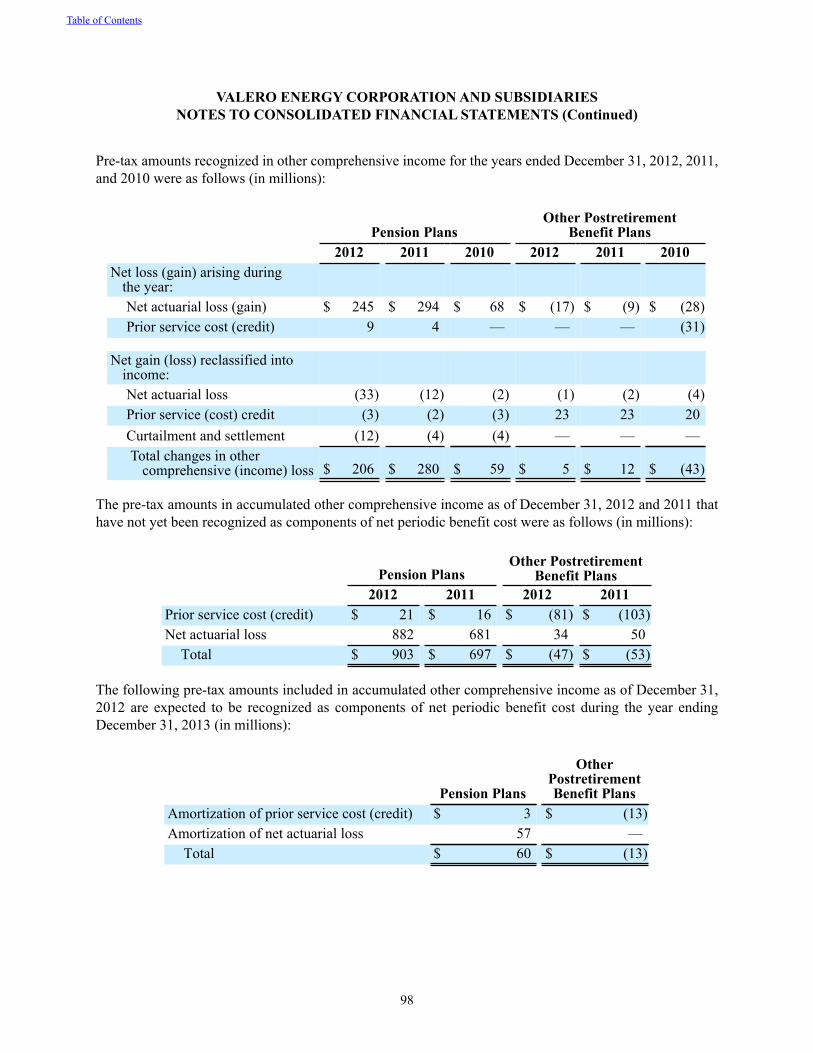
98
Pre-tax amounts recognized in other comprehensive income for the years ended December 31, 2012, 2011, and 2010 were as follows (in millions):
Pension PlansOther Postretirement
Benefit Plans2012 2011 2010 2012 2011 2010
Net loss (gain) arising during the year:Net actuarial loss (gain) $ 245 $ 294 $ 68 $ (17) $ (9) $ (28)Prior service cost (credit) 9 4 — — — (31)
Net gain (loss) reclassified intoincome:Net actuarial loss (33) (12) (2) (1) (2) (4)Prior service (cost) credit (3) (2) (3) 23 23 20Curtailment and settlement (12) (4) (4) — — —Total changes in other
comprehensive (income) loss $ 206 $ 280 $ 59 $ 5 $ 12 $ (43)
The pre-tax amounts in accumulated other comprehensive income as of December 31, 2012 and 2011 that have not yet been recognized as components of net periodic benefit cost were as follows (in millions):
Pension PlansOther Postretirement
Benefit Plans2012 2011 2012 2011
Prior service cost (credit) $ 21 $ 16 $ (81) $ (103)Net actuarial loss 882 681 34 50
Total $ 903 $ 697 $ (47) $ (53)
The following pre-tax amounts included in accumulated other comprehensive income as of December 31, 2012 are expected to be recognized as components of net periodic benefit cost during the year ending December 31, 2013 (in millions):
Pension Plans
OtherPostretirementBenefit Plans
Amortization of prior service cost (credit) $ 3 $ (13)Amortization of net actuarial loss 57 —
Total $ 60 $ (13)
Table of Contents
VALERO ENERGY CORPORATION AND SUBSIDIARIESNOTES TO CONSOLIDATED FINANCIAL STATEMENTS (Continued)
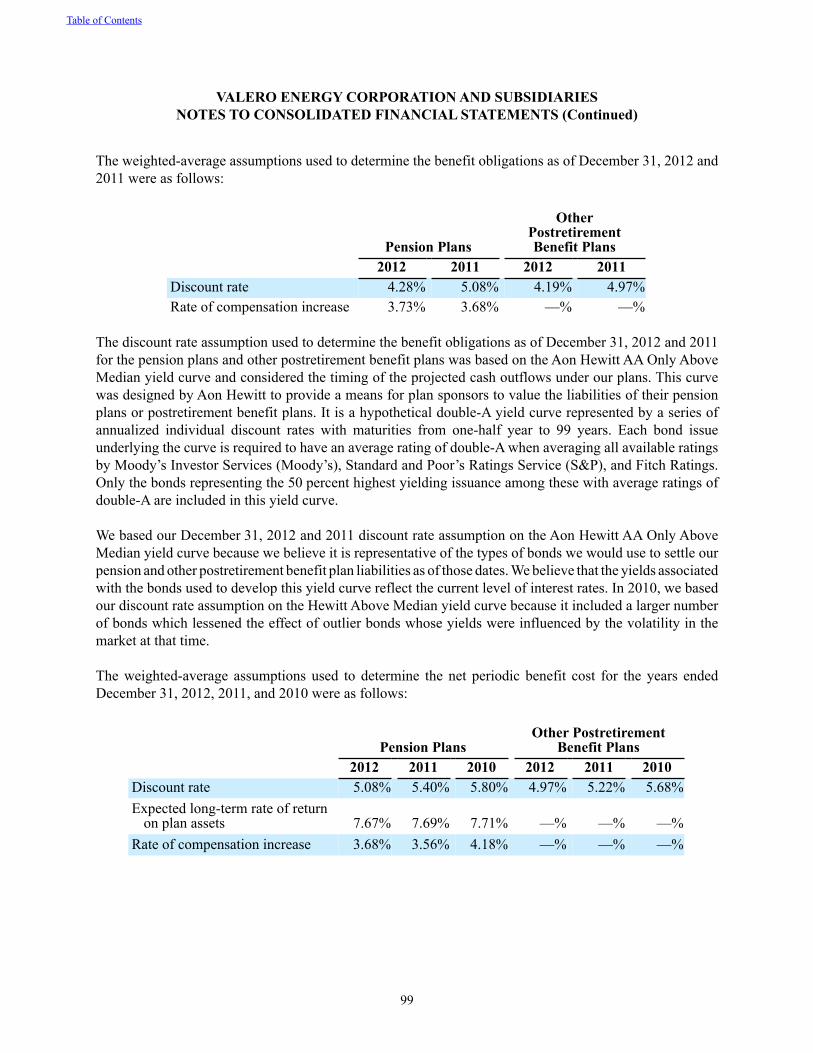
99
The weighted-average assumptions used to determine the benefit obligations as of December 31, 2012 and 2011 were as follows:
Pension Plans
OtherPostretirementBenefit Plans
2012 2011 2012 2011Discount rate 4.28% 5.08% 4.19% 4.97%Rate of compensation increase 3.73% 3.68% —% —%
The discount rate assumption used to determine the benefit obligations as of December 31, 2012 and 2011 for the pension plans and other postretirement benefit plans was based on the Aon Hewitt AA Only Above Median yield curve and considered the timing of the projected cash outflows under our plans. This curve was designed by Aon Hewitt to provide a means for plan sponsors to value the liabilities of their pension plans or postretirement benefit plans. It is a hypothetical double-A yield curve represented by a series of annualized individual discount rates with maturities from one-half year to 99 years. Each bond issue underlying the curve is required to have an average rating of double-A when averaging all available ratings by Moody’s Investor Services (Moody’s), Standard and Poor’s Ratings Service (S&P), and Fitch Ratings. Only the bonds representing the 50 percent highest yielding issuance among these with average ratings of double-A are included in this yield curve.
We based our December 31, 2012 and 2011 discount rate assumption on the Aon Hewitt AA Only Above Median yield curve because we believe it is representative of the types of bonds we would use to settle our pension and other postretirement benefit plan liabilities as of those dates. We believe that the yields associated with the bonds used to develop this yield curve reflect the current level of interest rates. In 2010, we based our discount rate assumption on the Hewitt Above Median yield curve because it included a larger number of bonds which lessened the effect of outlier bonds whose yields were influenced by the volatility in the market at that time.
The weighted-average assumptions used to determine the net periodic benefit cost for the years ended December 31, 2012, 2011, and 2010 were as follows:
Pension PlansOther Postretirement
Benefit Plans2012 2011 2010 2012 2011 2010
Discount rate 5.08% 5.40% 5.80% 4.97% 5.22% 5.68%Expected long-term rate of return
on plan assets 7.67% 7.69% 7.71% —% —% —%Rate of compensation increase 3.68% 3.56% 4.18% —% —% —%
Table of Contents
VALERO ENERGY CORPORATION AND SUBSIDIARIESNOTES TO CONSOLIDATED FINANCIAL STATEMENTS (Continued)
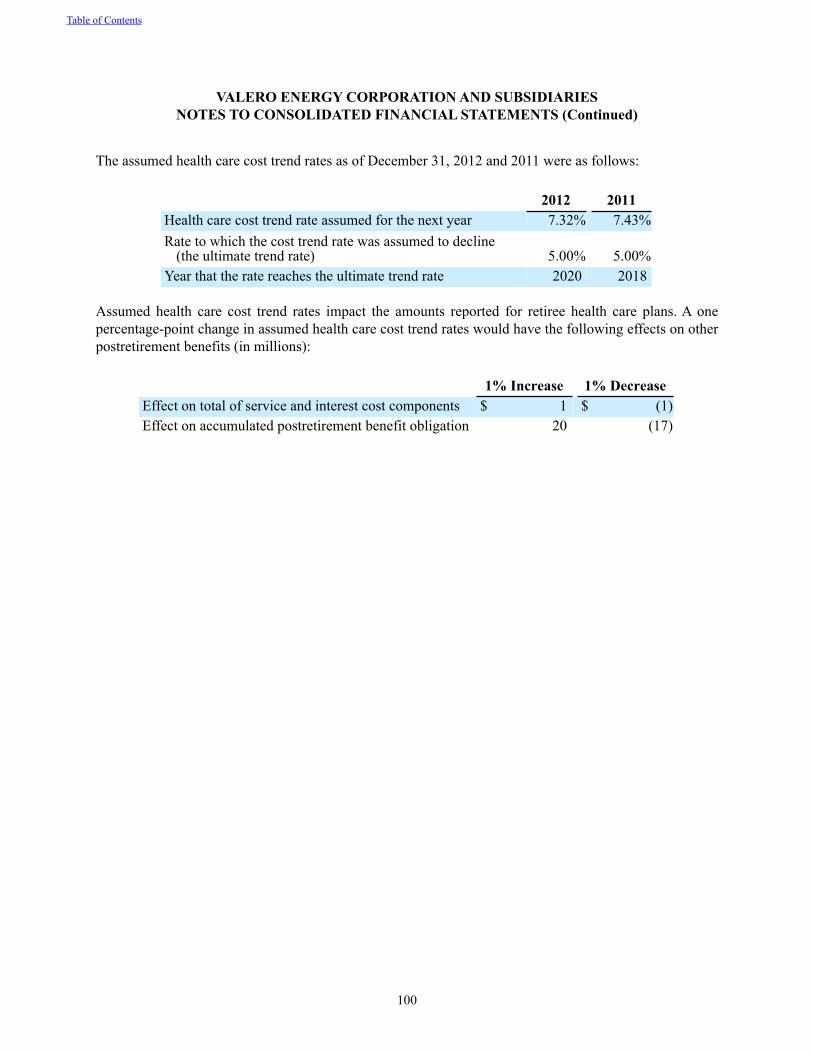
100
The assumed health care cost trend rates as of December 31, 2012 and 2011 were as follows:
2012 2011Health care cost trend rate assumed for the next year 7.32% 7.43%Rate to which the cost trend rate was assumed to decline
(the ultimate trend rate) 5.00% 5.00%Year that the rate reaches the ultimate trend rate 2020 2018
Assumed health care cost trend rates impact the amounts reported for retiree health care plans. A one percentage-point change in assumed health care cost trend rates would have the following effects on other postretirement benefits (in millions):
1% Increase 1% DecreaseEffect on total of service and interest cost components $ 1 $ (1)Effect on accumulated postretirement benefit obligation 20 (17)
Table of Contents
VALERO ENERGY CORPORATION AND SUBSIDIARIESNOTES TO CONSOLIDATED FINANCIAL STATEMENTS (Continued)
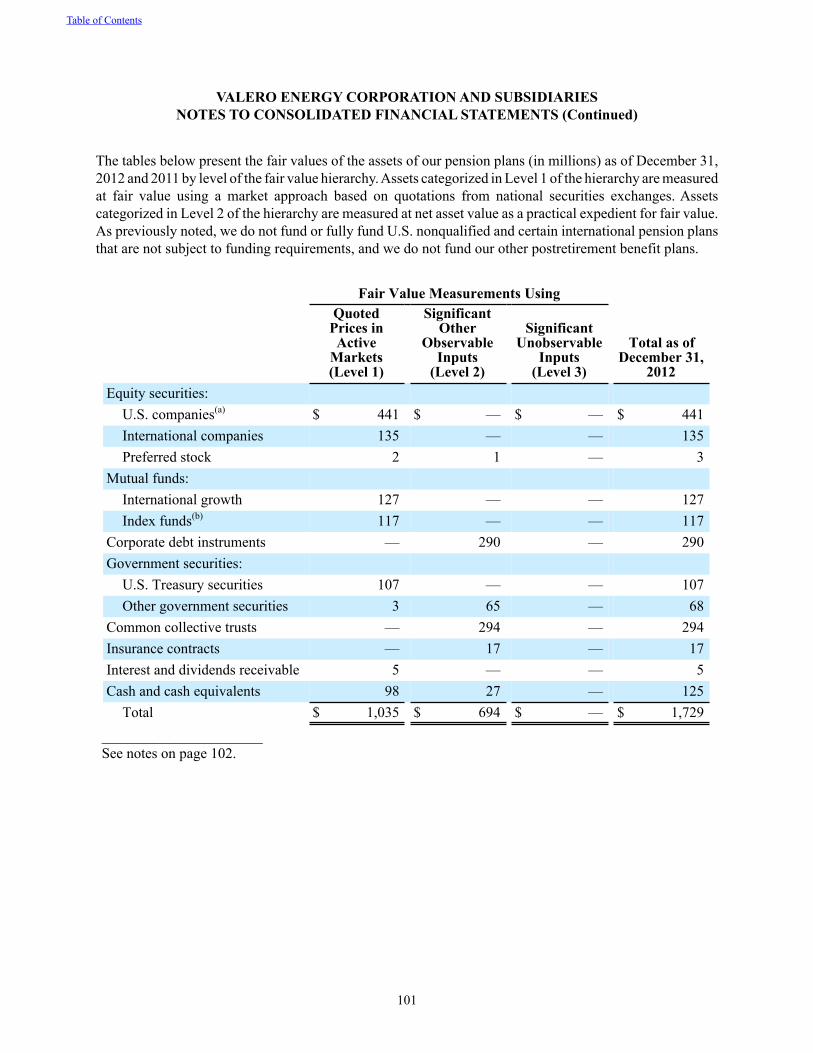
101
The tables below present the fair values of the assets of our pension plans (in millions) as of December 31, 2012 and 2011 by level of the fair value hierarchy. Assets categorized in Level 1 of the hierarchy are measured at fair value using a market approach based on quotations from national securities exchanges. Assets categorized in Level 2 of the hierarchy are measured at net asset value as a practical expedient for fair value. As previously noted, we do not fund or fully fund U.S. nonqualified and certain international pension plans that are not subject to funding requirements, and we do not fund our other postretirement benefit plans.
Fair Value Measurements UsingQuoted
Prices inActive
Markets (Level 1)
SignificantOther
ObservableInputs
(Level 2)
SignificantUnobservable
Inputs (Level 3)
Total as ofDecember 31,
2012Equity securities:
U.S. companies(a) $ 441 $ — $ — $ 441International companies 135 — — 135Preferred stock 2 1 — 3
Mutual funds:International growth 127 — — 127Index funds(b) 117 — — 117
Corporate debt instruments — 290 — 290Government securities:
U.S. Treasury securities 107 — — 107Other government securities 3 65 — 68
Common collective trusts — 294 — 294Insurance contracts — 17 — 17Interest and dividends receivable 5 — — 5Cash and cash equivalents 98 27 — 125
Total $ 1,035 $ 694 $ — $ 1,729______________________See notes on page 102.
Table of Contents
VALERO ENERGY CORPORATION AND SUBSIDIARIESNOTES TO CONSOLIDATED FINANCIAL STATEMENTS (Continued)
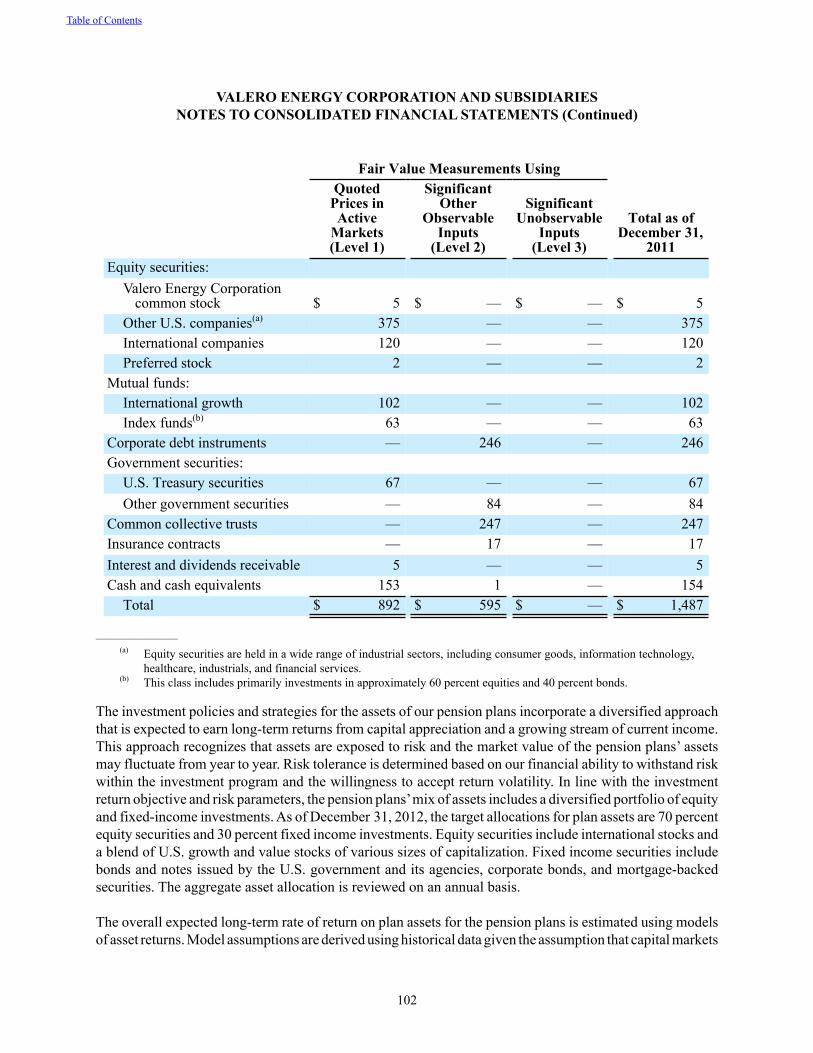
102
Fair Value Measurements UsingQuoted
Prices inActive
Markets(Level 1)
SignificantOther
ObservableInputs
(Level 2)
SignificantUnobservable
Inputs(Level 3)
Total as ofDecember 31,
2011Equity securities:
Valero Energy Corporation common stock $ 5 $ — $ — $ 5
Other U.S. companies(a) 375 — — 375International companies 120 — — 120Preferred stock 2 — — 2
Mutual funds:International growth 102 — — 102Index funds(b) 63 — — 63
Corporate debt instruments — 246 — 246Government securities:
U.S. Treasury securities 67 — — 67Other government securities — 84 — 84
Common collective trusts — 247 — 247Insurance contracts — 17 — 17Interest and dividends receivable 5 — — 5Cash and cash equivalents 153 1 — 154
Total $ 892 $ 595 $ — $ 1,487
___________________
(a) Equity securities are held in a wide range of industrial sectors, including consumer goods, information technology, healthcare, industrials, and financial services.
(b) This class includes primarily investments in approximately 60 percent equities and 40 percent bonds.
The investment policies and strategies for the assets of our pension plans incorporate a diversified approach that is expected to earn long-term returns from capital appreciation and a growing stream of current income. This approach recognizes that assets are exposed to risk and the market value of the pension plans’ assets may fluctuate from year to year. Risk tolerance is determined based on our financial ability to withstand risk within the investment program and the willingness to accept return volatility. In line with the investment return objective and risk parameters, the pension plans’ mix of assets includes a diversified portfolio of equity and fixed-income investments. As of December 31, 2012, the target allocations for plan assets are 70 percent equity securities and 30 percent fixed income investments. Equity securities include international stocks and a blend of U.S. growth and value stocks of various sizes of capitalization. Fixed income securities include bonds and notes issued by the U.S. government and its agencies, corporate bonds, and mortgage-backed securities. The aggregate asset allocation is reviewed on an annual basis.
The overall expected long-term rate of return on plan assets for the pension plans is estimated using models of asset returns. Model assumptions are derived using historical data given the assumption that capital markets
Table of Contents
VALERO ENERGY CORPORATION AND SUBSIDIARIESNOTES TO CONSOLIDATED FINANCIAL STATEMENTS (Continued)
103
are informationally efficient. Three methods are used to derive the long-term expected returns for each asset class. Because each method has distinct advantages and disadvantages and differing results, an equal weighted average of the methods’ results is used.
Defined Contribution PlansWe have defined contribution plans that cover substantially most of our employees. Our contributions to these plans are based on employees’ compensation and/or a partial match of employee contributions to the plans. Our contributions to these defined contribution plans were $61 million, $59 million, and $57 million for the years ended December 31, 2012, 2011, and 2010, respectively.
15. STOCK-BASED COMPENSATION
We have various fixed and performance-based stock compensation plans under which awards have been granted, which are summarized as follows:
• The 2011 Omnibus Stock Incentive Plan (the OSIP) authorizes the grant of various stock and stock-based awards to our employees and our non-employee directors. Awards available under the OSIP include options to purchase shares of common stock, performance awards that vest upon the achievement of an objective performance goal, stock appreciation rights, and restricted stock that vests over a period determined by our compensation committee. The OSIP was approved by our stockholders on April 28, 2011. As of December 31, 2012, 17,178,084 shares of our common stock remained available to be awarded under the OSIP.
• Prior to the approval of the OSIP by our stockholders, most of the equity awards granted to our employees and non-employee directors were made under our 2005 Omnibus Stock Incentive Plan. Prior awards granted under this plan included options to purchase shares of common stock, performance awards that vest upon the achievement of an objective performance goal, and restricted stock that vests over a period determined by our compensation committee. No additional grants may be awarded under this plan.
• The Restricted Stock Plan for Non-Employee Directors authorized an annual grant of our common stock valued at $160,000 to each non-employee director. Vesting generally occurred based on the number of grants received as follows: (i) initial grants to vest in three equal annual installments, (ii) second grants to vest one-third on the first anniversary of the grant date and the remaining two-thirds on the second anniversary of the grant date, and (iii) all grants thereafter to vest 100 percent on the first anniversary of the grant date. During 2012, the final grants of available shares under this plan were awarded and no additional grants may be awarded under this plan. Prospective grants to our non-employee directors will be made under the OSIP, with vesting to occur in annual one-third increments over three years.
• The 2003 Employee Stock Incentive Plan authorizes the grant of various stock and stock-related awards to employees and prospective employees. Awards include options to purchase shares of common stock, performance awards that vest upon the achievement of an objective performance goal, stock appreciation rights, and restricted stock that vests over a period determined by our compensation committee. As of December 31, 2012, 1,914,877 shares of our common stock remained available to be awarded under this plan.
• In addition, we maintained other stock option and incentive plans under which previously granted equity awards remain outstanding. No additional grants may be awarded under these plans.
Each of our stock-based compensation arrangements is discussed below.
Table of Contents
VALERO ENERGY CORPORATION AND SUBSIDIARIESNOTES TO CONSOLIDATED FINANCIAL STATEMENTS (Continued)
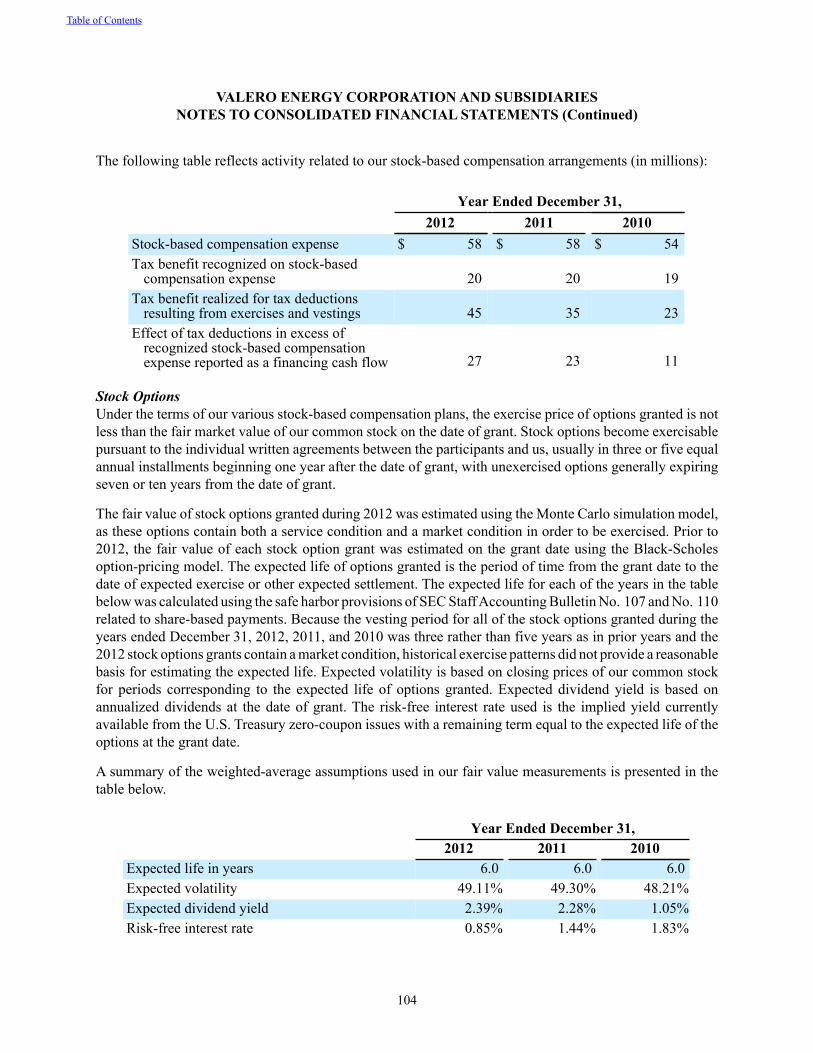
104
The following table reflects activity related to our stock-based compensation arrangements (in millions):
Year Ended December 31,2012 2011 2010
Stock-based compensation expense $ 58 $ 58 $ 54Tax benefit recognized on stock-based
compensation expense 20 20 19Tax benefit realized for tax deductions
resulting from exercises and vestings 45 35 23Effect of tax deductions in excess of
recognized stock-based compensationexpense reported as a financing cash flow 27 23 11
Stock OptionsUnder the terms of our various stock-based compensation plans, the exercise price of options granted is not less than the fair market value of our common stock on the date of grant. Stock options become exercisable pursuant to the individual written agreements between the participants and us, usually in three or five equal annual installments beginning one year after the date of grant, with unexercised options generally expiring seven or ten years from the date of grant.
The fair value of stock options granted during 2012 was estimated using the Monte Carlo simulation model, as these options contain both a service condition and a market condition in order to be exercised. Prior to 2012, the fair value of each stock option grant was estimated on the grant date using the Black-Scholes option-pricing model. The expected life of options granted is the period of time from the grant date to the date of expected exercise or other expected settlement. The expected life for each of the years in the table below was calculated using the safe harbor provisions of SEC Staff Accounting Bulletin No. 107 and No. 110 related to share-based payments. Because the vesting period for all of the stock options granted during the years ended December 31, 2012, 2011, and 2010 was three rather than five years as in prior years and the 2012 stock options grants contain a market condition, historical exercise patterns did not provide a reasonable basis for estimating the expected life. Expected volatility is based on closing prices of our common stock for periods corresponding to the expected life of options granted. Expected dividend yield is based on annualized dividends at the date of grant. The risk-free interest rate used is the implied yield currently available from the U.S. Treasury zero-coupon issues with a remaining term equal to the expected life of the options at the grant date.
A summary of the weighted-average assumptions used in our fair value measurements is presented in the table below.
Year Ended December 31,2012 2011 2010
Expected life in years 6.0 6.0 6.0Expected volatility 49.11% 49.30% 48.21%Expected dividend yield 2.39% 2.28% 1.05%Risk-free interest rate 0.85% 1.44% 1.83%
Table of Contents
VALERO ENERGY CORPORATION AND SUBSIDIARIESNOTES TO CONSOLIDATED FINANCIAL STATEMENTS (Continued)
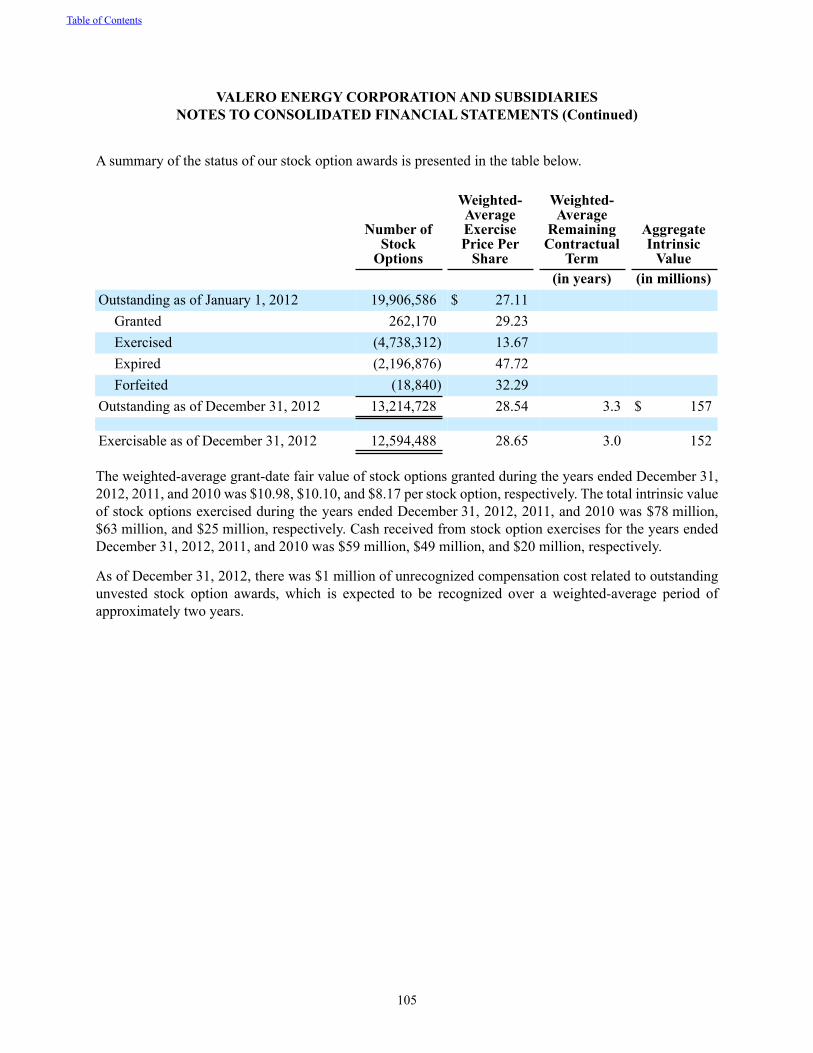
105
A summary of the status of our stock option awards is presented in the table below.
Number ofStock
Options
Weighted-AverageExercisePrice Per
Share
Weighted-Average
RemainingContractual
Term
AggregateIntrinsic
Value(in years) (in millions)
Outstanding as of January 1, 2012 19,906,586 $ 27.11Granted 262,170 29.23Exercised (4,738,312) 13.67Expired (2,196,876) 47.72Forfeited (18,840) 32.29
Outstanding as of December 31, 2012 13,214,728 28.54 3.3 $ 157
Exercisable as of December 31, 2012 12,594,488 28.65 3.0 152
The weighted-average grant-date fair value of stock options granted during the years ended December 31, 2012, 2011, and 2010 was $10.98, $10.10, and $8.17 per stock option, respectively. The total intrinsic value of stock options exercised during the years ended December 31, 2012, 2011, and 2010 was $78 million, $63 million, and $25 million, respectively. Cash received from stock option exercises for the years ended December 31, 2012, 2011, and 2010 was $59 million, $49 million, and $20 million, respectively.
As of December 31, 2012, there was $1 million of unrecognized compensation cost related to outstanding unvested stock option awards, which is expected to be recognized over a weighted-average period of approximately two years.
Table of Contents
VALERO ENERGY CORPORATION AND SUBSIDIARIESNOTES TO CONSOLIDATED FINANCIAL STATEMENTS (Continued)
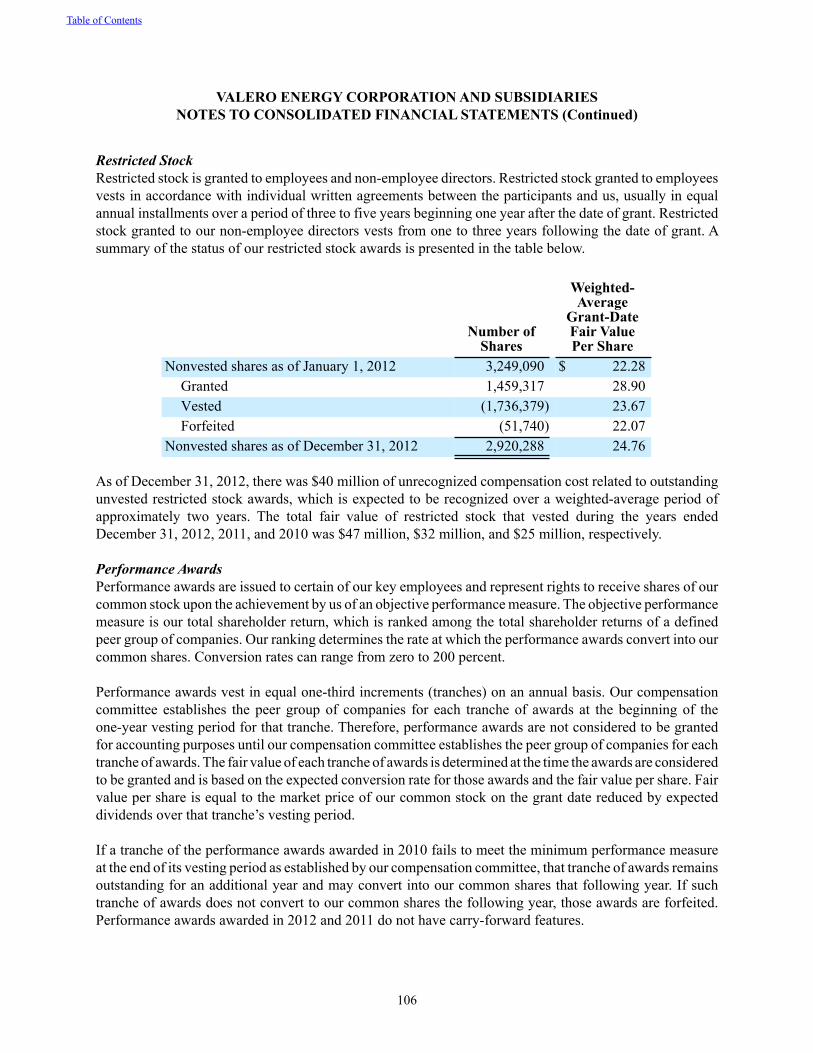
106
Restricted StockRestricted stock is granted to employees and non-employee directors. Restricted stock granted to employees vests in accordance with individual written agreements between the participants and us, usually in equal annual installments over a period of three to five years beginning one year after the date of grant. Restricted stock granted to our non-employee directors vests from one to three years following the date of grant. A summary of the status of our restricted stock awards is presented in the table below.
Number ofShares
Weighted-Average
Grant-DateFair ValuePer Share
Nonvested shares as of January 1, 2012 3,249,090 $ 22.28Granted 1,459,317 28.90Vested (1,736,379) 23.67Forfeited (51,740) 22.07
Nonvested shares as of December 31, 2012 2,920,288 24.76
As of December 31, 2012, there was $40 million of unrecognized compensation cost related to outstanding unvested restricted stock awards, which is expected to be recognized over a weighted-average period of approximately two years. The total fair value of restricted stock that vested during the years ended December 31, 2012, 2011, and 2010 was $47 million, $32 million, and $25 million, respectively.
Performance AwardsPerformance awards are issued to certain of our key employees and represent rights to receive shares of our common stock upon the achievement by us of an objective performance measure. The objective performance measure is our total shareholder return, which is ranked among the total shareholder returns of a defined peer group of companies. Our ranking determines the rate at which the performance awards convert into our common shares. Conversion rates can range from zero to 200 percent.
Performance awards vest in equal one-third increments (tranches) on an annual basis. Our compensation committee establishes the peer group of companies for each tranche of awards at the beginning of the one-year vesting period for that tranche. Therefore, performance awards are not considered to be granted for accounting purposes until our compensation committee establishes the peer group of companies for each tranche of awards. The fair value of each tranche of awards is determined at the time the awards are considered to be granted and is based on the expected conversion rate for those awards and the fair value per share. Fair value per share is equal to the market price of our common stock on the grant date reduced by expected dividends over that tranche’s vesting period.
If a tranche of the performance awards awarded in 2010 fails to meet the minimum performance measure at the end of its vesting period as established by our compensation committee, that tranche of awards remains outstanding for an additional year and may convert into our common shares that following year. If such tranche of awards does not convert to our common shares the following year, those awards are forfeited. Performance awards awarded in 2012 and 2011 do not have carry-forward features.
Table of Contents
VALERO ENERGY CORPORATION AND SUBSIDIARIESNOTES TO CONSOLIDATED FINANCIAL STATEMENTS (Continued)
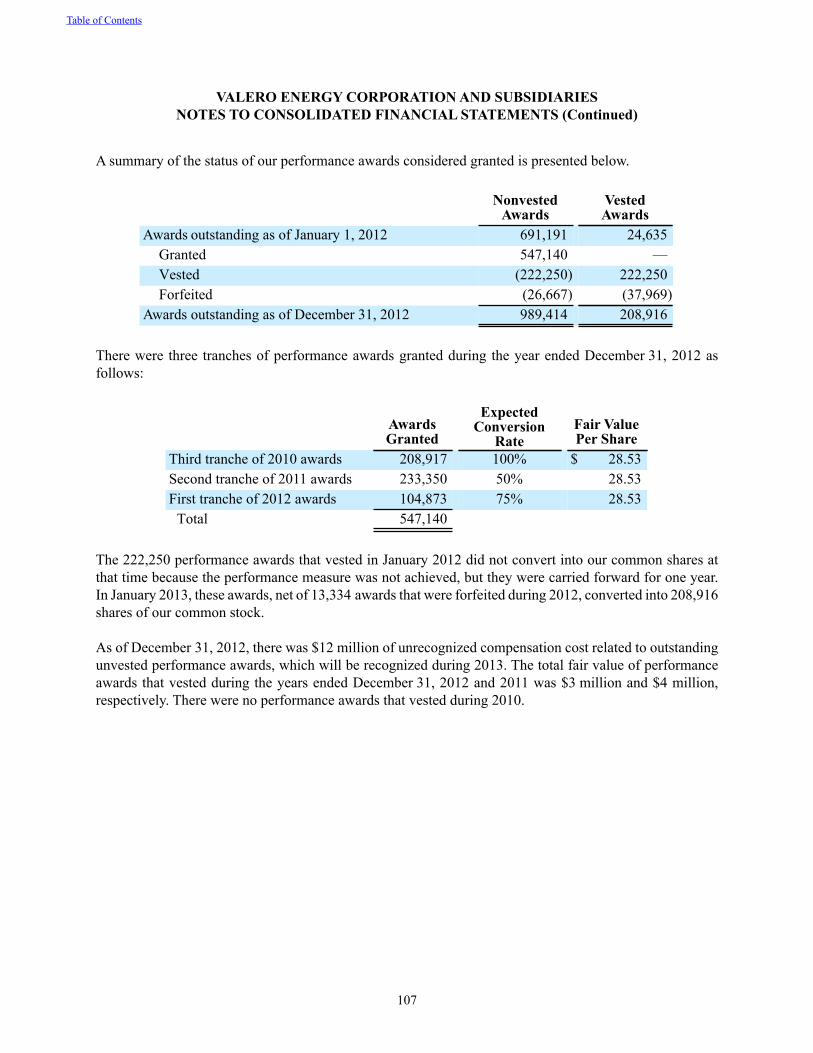
107
A summary of the status of our performance awards considered granted is presented below.
NonvestedAwards
VestedAwards
Awards outstanding as of January 1, 2012 691,191 24,635Granted 547,140 —Vested (222,250) 222,250Forfeited (26,667) (37,969)
Awards outstanding as of December 31, 2012 989,414 208,916
There were three tranches of performance awards granted during the year ended December 31, 2012 as follows:
AwardsGranted
ExpectedConversion
RateFair ValuePer Share
Third tranche of 2010 awards 208,917 100% $ 28.53Second tranche of 2011 awards 233,350 50% 28.53First tranche of 2012 awards 104,873 75% 28.53
Total 547,140
The 222,250 performance awards that vested in January 2012 did not convert into our common shares at that time because the performance measure was not achieved, but they were carried forward for one year. In January 2013, these awards, net of 13,334 awards that were forfeited during 2012, converted into 208,916 shares of our common stock.
As of December 31, 2012, there was $12 million of unrecognized compensation cost related to outstanding unvested performance awards, which will be recognized during 2013. The total fair value of performance awards that vested during the years ended December 31, 2012 and 2011 was $3 million and $4 million, respectively. There were no performance awards that vested during 2010.
Table of Contents
VALERO ENERGY CORPORATION AND SUBSIDIARIESNOTES TO CONSOLIDATED FINANCIAL STATEMENTS (Continued)
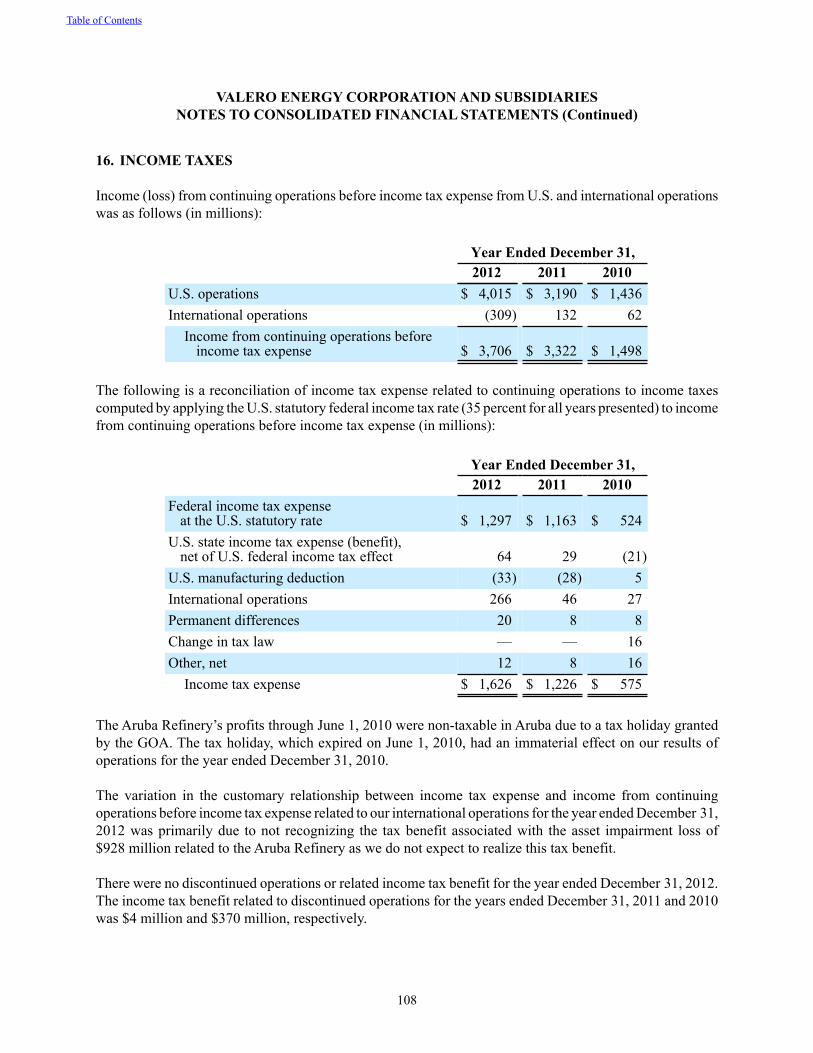
108
16. INCOME TAXES
Income (loss) from continuing operations before income tax expense from U.S. and international operations was as follows (in millions):
Year Ended December 31,2012 2011 2010
U.S. operations $ 4,015 $ 3,190 $ 1,436International operations (309) 132 62
Income from continuing operations beforeincome tax expense $ 3,706 $ 3,322 $ 1,498
The following is a reconciliation of income tax expense related to continuing operations to income taxes computed by applying the U.S. statutory federal income tax rate (35 percent for all years presented) to income from continuing operations before income tax expense (in millions):
Year Ended December 31,2012 2011 2010
Federal income tax expenseat the U.S. statutory rate $ 1,297 $ 1,163 $ 524
U.S. state income tax expense (benefit),net of U.S. federal income tax effect 64 29 (21)
U.S. manufacturing deduction (33) (28) 5International operations 266 46 27Permanent differences 20 8 8Change in tax law — — 16Other, net 12 8 16
Income tax expense $ 1,626 $ 1,226 $ 575
The Aruba Refinery’s profits through June 1, 2010 were non-taxable in Aruba due to a tax holiday granted by the GOA. The tax holiday, which expired on June 1, 2010, had an immaterial effect on our results of operations for the year ended December 31, 2010.
The variation in the customary relationship between income tax expense and income from continuing operations before income tax expense related to our international operations for the year ended December 31, 2012 was primarily due to not recognizing the tax benefit associated with the asset impairment loss of $928 million related to the Aruba Refinery as we do not expect to realize this tax benefit.
There were no discontinued operations or related income tax benefit for the year ended December 31, 2012. The income tax benefit related to discontinued operations for the years ended December 31, 2011 and 2010 was $4 million and $370 million, respectively.
Table of Contents
VALERO ENERGY CORPORATION AND SUBSIDIARIESNOTES TO CONSOLIDATED FINANCIAL STATEMENTS (Continued)
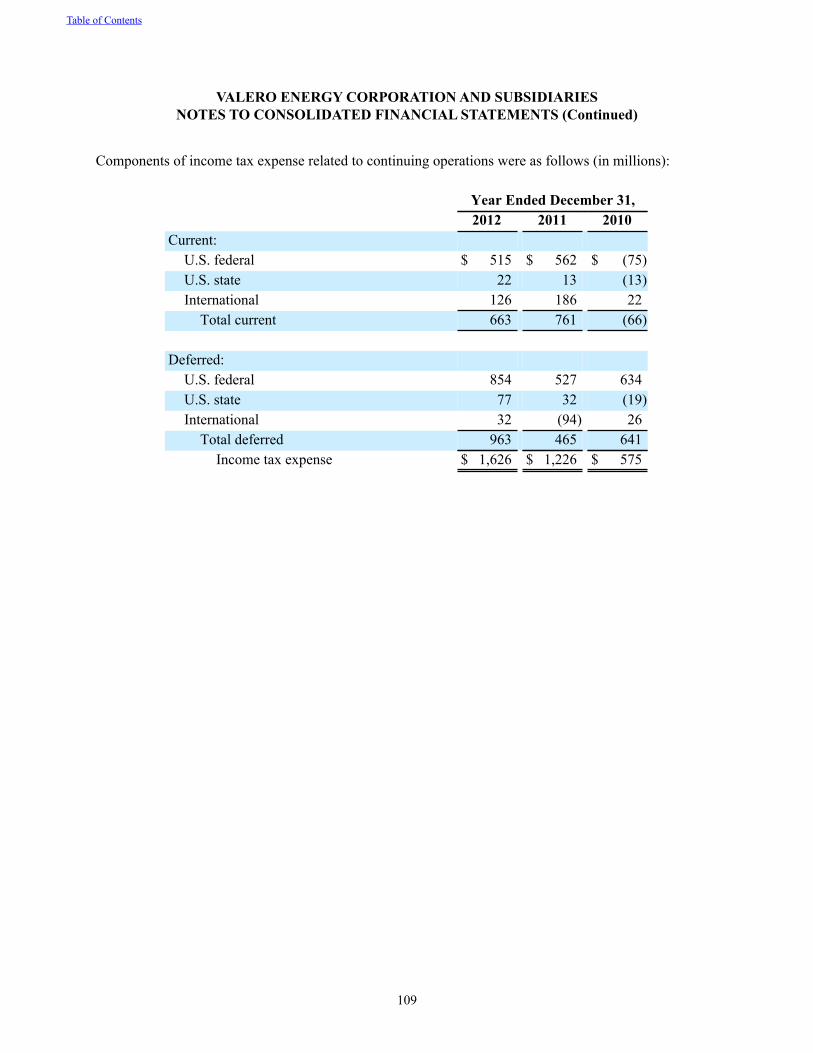
109
Components of income tax expense related to continuing operations were as follows (in millions):
Year Ended December 31,2012 2011 2010
Current:U.S. federal $ 515 $ 562 $ (75)U.S. state 22 13 (13)International 126 186 22
Total current 663 761 (66)
Deferred:U.S. federal 854 527 634U.S. state 77 32 (19)International 32 (94) 26
Total deferred 963 465 641Income tax expense $ 1,626 $ 1,226 $ 575
Table of Contents
VALERO ENERGY CORPORATION AND SUBSIDIARIESNOTES TO CONSOLIDATED FINANCIAL STATEMENTS (Continued)
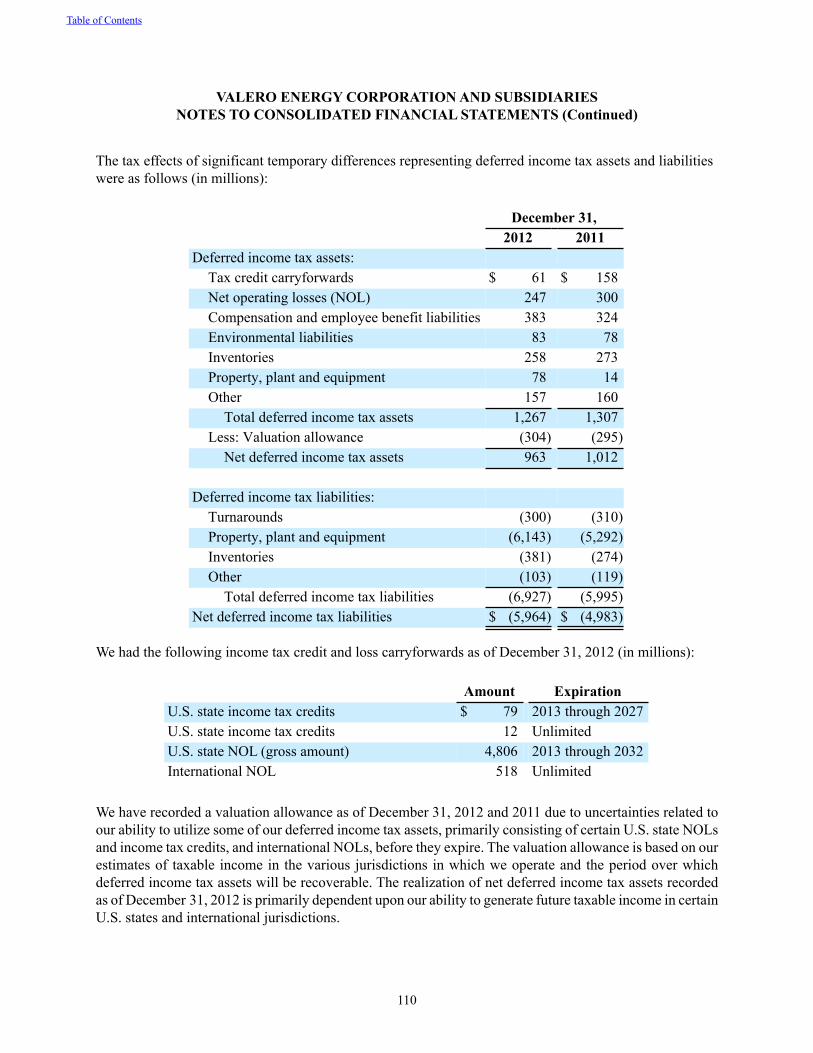
110
The tax effects of significant temporary differences representing deferred income tax assets and liabilities were as follows (in millions):
December 31,2012 2011
Deferred income tax assets:Tax credit carryforwards $ 61 $ 158Net operating losses (NOL) 247 300Compensation and employee benefit liabilities 383 324Environmental liabilities 83 78Inventories 258 273Property, plant and equipment 78 14Other 157 160
Total deferred income tax assets 1,267 1,307Less: Valuation allowance (304) (295)
Net deferred income tax assets 963 1,012
Deferred income tax liabilities:Turnarounds (300) (310)Property, plant and equipment (6,143) (5,292)Inventories (381) (274)Other (103) (119)
Total deferred income tax liabilities (6,927) (5,995)Net deferred income tax liabilities $ (5,964) $ (4,983)
We had the following income tax credit and loss carryforwards as of December 31, 2012 (in millions):
Amount ExpirationU.S. state income tax credits $ 79 2013 through 2027U.S. state income tax credits 12 UnlimitedU.S. state NOL (gross amount) 4,806 2013 through 2032International NOL 518 Unlimited
We have recorded a valuation allowance as of December 31, 2012 and 2011 due to uncertainties related to our ability to utilize some of our deferred income tax assets, primarily consisting of certain U.S. state NOLs and income tax credits, and international NOLs, before they expire. The valuation allowance is based on our estimates of taxable income in the various jurisdictions in which we operate and the period over which deferred income tax assets will be recoverable. The realization of net deferred income tax assets recorded as of December 31, 2012 is primarily dependent upon our ability to generate future taxable income in certain U.S. states and international jurisdictions.
Table of Contents
VALERO ENERGY CORPORATION AND SUBSIDIARIESNOTES TO CONSOLIDATED FINANCIAL STATEMENTS (Continued)
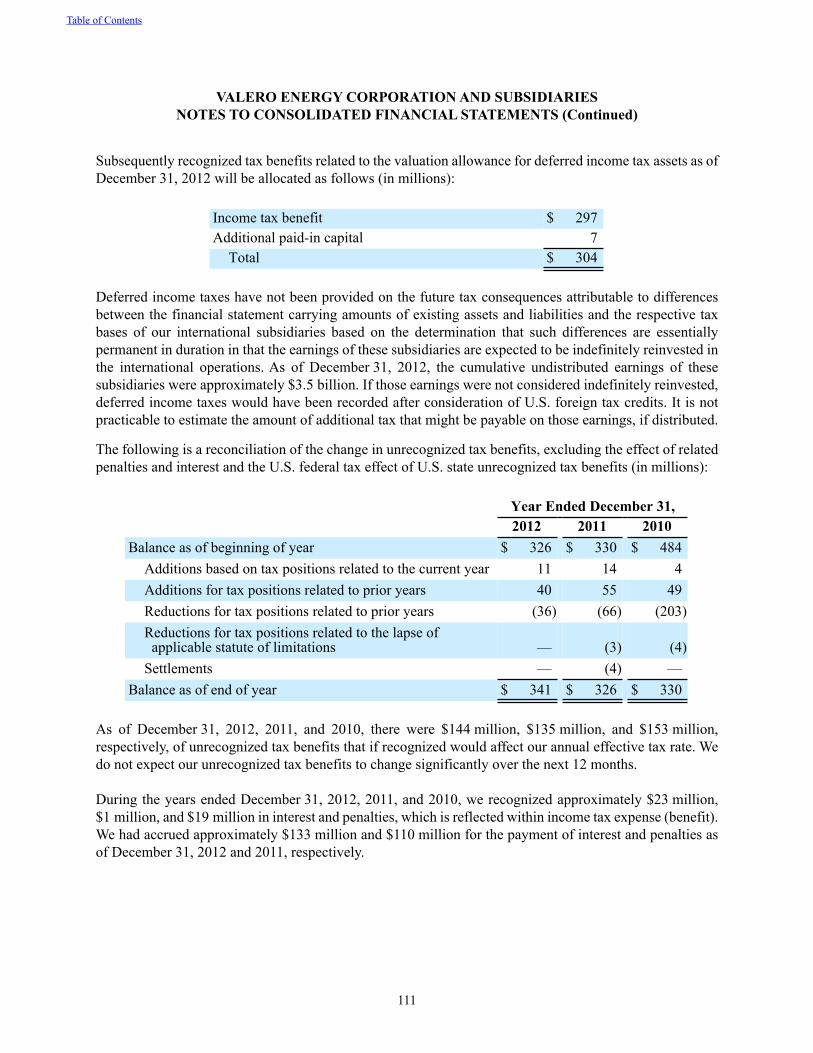
111
Subsequently recognized tax benefits related to the valuation allowance for deferred income tax assets as of December 31, 2012 will be allocated as follows (in millions):
Income tax benefit $ 297Additional paid-in capital 7
Total $ 304
Deferred income taxes have not been provided on the future tax consequences attributable to differences between the financial statement carrying amounts of existing assets and liabilities and the respective tax bases of our international subsidiaries based on the determination that such differences are essentially permanent in duration in that the earnings of these subsidiaries are expected to be indefinitely reinvested in the international operations. As of December 31, 2012, the cumulative undistributed earnings of these subsidiaries were approximately $3.5 billion. If those earnings were not considered indefinitely reinvested, deferred income taxes would have been recorded after consideration of U.S. foreign tax credits. It is not practicable to estimate the amount of additional tax that might be payable on those earnings, if distributed.
The following is a reconciliation of the change in unrecognized tax benefits, excluding the effect of related penalties and interest and the U.S. federal tax effect of U.S. state unrecognized tax benefits (in millions):
Year Ended December 31,2012 2011 2010
Balance as of beginning of year $ 326 $ 330 $ 484Additions based on tax positions related to the current year 11 14 4Additions for tax positions related to prior years 40 55 49Reductions for tax positions related to prior years (36) (66) (203)Reductions for tax positions related to the lapse of applicable statute of limitations — (3) (4)Settlements — (4) —
Balance as of end of year $ 341 $ 326 $ 330
As of December 31, 2012, 2011, and 2010, there were $144 million, $135 million, and $153 million, respectively, of unrecognized tax benefits that if recognized would affect our annual effective tax rate. We do not expect our unrecognized tax benefits to change significantly over the next 12 months.
During the years ended December 31, 2012, 2011, and 2010, we recognized approximately $23 million, $1 million, and $19 million in interest and penalties, which is reflected within income tax expense (benefit). We had accrued approximately $133 million and $110 million for the payment of interest and penalties as of December 31, 2012 and 2011, respectively.
Table of Contents
VALERO ENERGY CORPORATION AND SUBSIDIARIESNOTES TO CONSOLIDATED FINANCIAL STATEMENTS (Continued)
112
Our tax years for 2002 through 2009 and Premcor Inc.’s separate tax years for 2004 and 2005 are currently under examination by the IRS. Premcor Inc. was merged into Valero effect September 1, 2005. The IRS has proposed adjustments to our taxable income for certain open years. We are protesting the proposed adjustments and do not expect that the ultimate disposition of these adjustments will result in a material change to our financial position, results of operations, or liquidity; however, as discussed in Note 12, should the IRS eventually prevail, it could result in a material amount of our deferred tax liabilities being reclassified to current liabilities, which could have a material adverse effect on our liquidity. We believe that adequate provisions for income taxes have been reflected in our financial statements.
Table of Contents
VALERO ENERGY CORPORATION AND SUBSIDIARIESNOTES TO CONSOLIDATED FINANCIAL STATEMENTS (Continued)
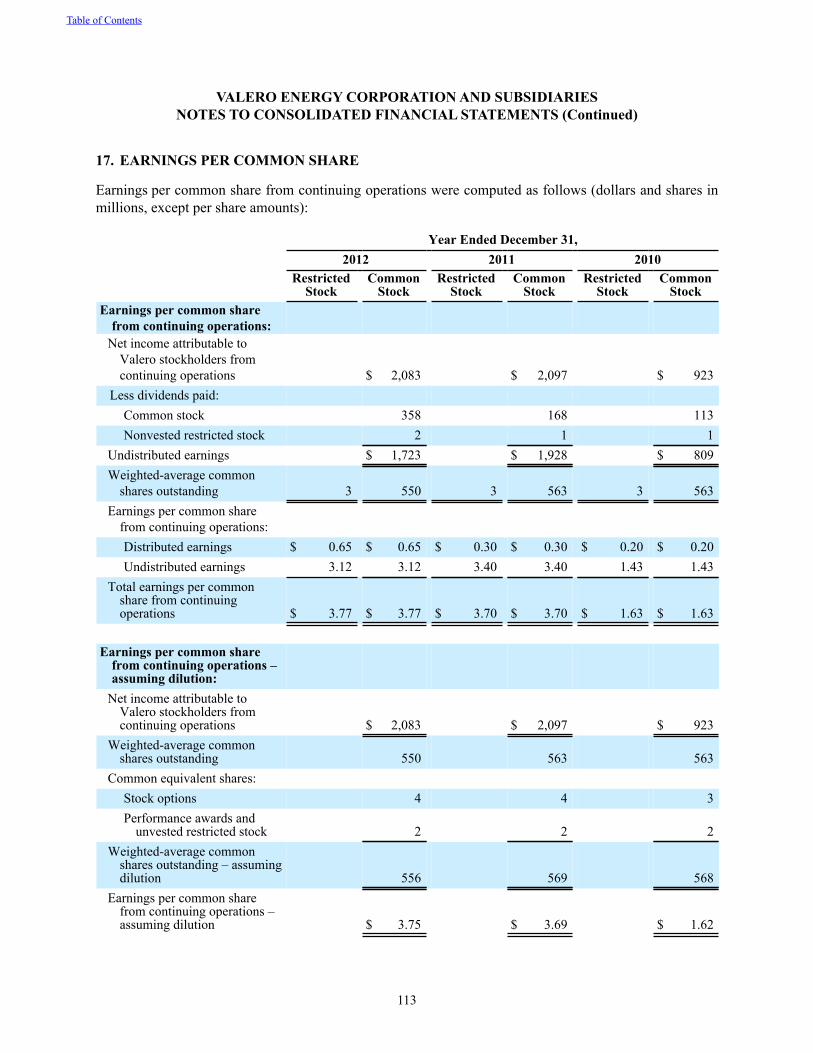
113
17. EARNINGS PER COMMON SHARE
Earnings per common share from continuing operations were computed as follows (dollars and shares in millions, except per share amounts):
Year Ended December 31, 2012 2011 2010
Restricted
StockCommon
Stock Restricted
Stock Common
StockRestricted
Stock Common
StockEarnings per common share
from continuing operations: Net income attributable to
Valero stockholders fromcontinuing operations $ 2,083 $ 2,097 $ 923
Less dividends paid: Common stock 358 168 113Nonvested restricted stock 2 1 1
Undistributed earnings $ 1,723 $ 1,928 $ 809Weighted-average common
shares outstanding 3 550 3 563 3 563Earnings per common share
from continuing operations:Distributed earnings $ 0.65 $ 0.65 $ 0.30 $ 0.30 $ 0.20 $ 0.20Undistributed earnings 3.12 3.12 3.40 3.40 1.43 1.43
Total earnings per commonshare from continuingoperations $ 3.77 $ 3.77 $ 3.70 $ 3.70 $ 1.63 $ 1.63
Earnings per common sharefrom continuing operations –assuming dilution:
Net income attributable toValero stockholders fromcontinuing operations $ 2,083 $ 2,097 $ 923
Weighted-average commonshares outstanding 550 563 563
Common equivalent shares: Stock options 4 4 3Performance awards and
unvested restricted stock 2 2 2Weighted-average common
shares outstanding – assumingdilution 556 569 568
Earnings per common sharefrom continuing operations –assuming dilution $ 3.75 $ 3.69 $ 1.62
Table of Contents
VALERO ENERGY CORPORATION AND SUBSIDIARIESNOTES TO CONSOLIDATED FINANCIAL STATEMENTS (Continued)
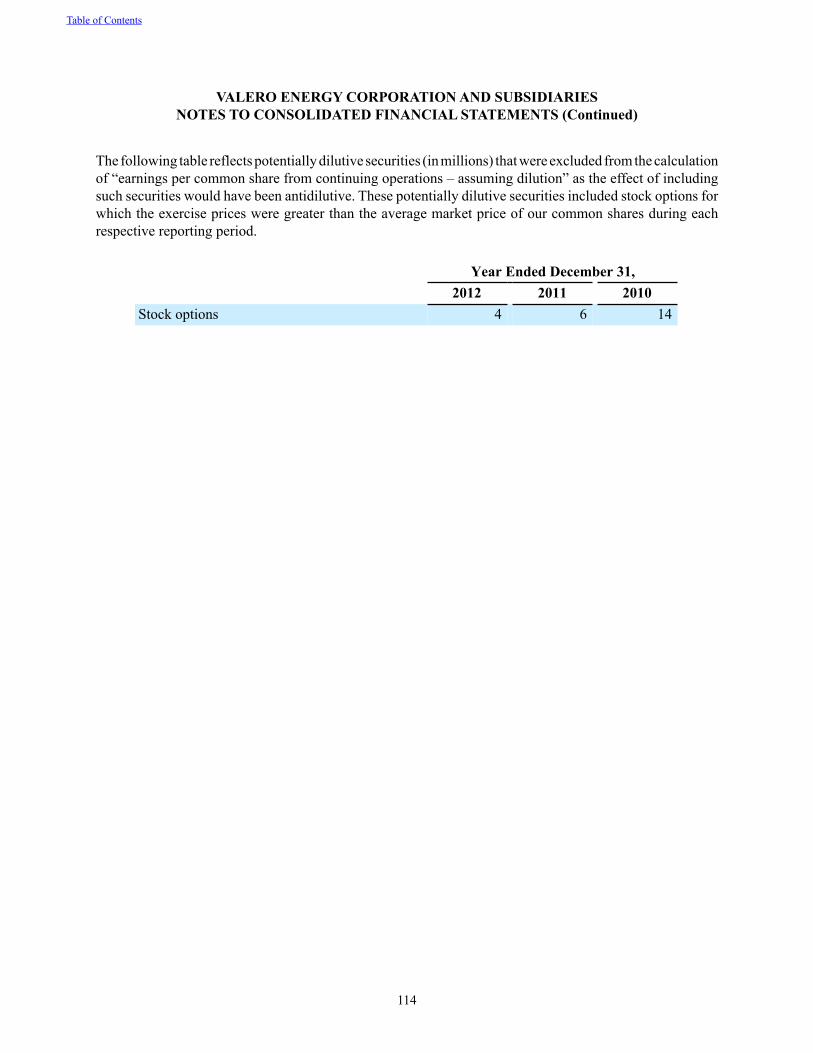
114
The following table reflects potentially dilutive securities (in millions) that were excluded from the calculation of “earnings per common share from continuing operations – assuming dilution” as the effect of including such securities would have been antidilutive. These potentially dilutive securities included stock options for which the exercise prices were greater than the average market price of our common shares during each respective reporting period.
Year Ended December 31, 2012 2011 2010Stock options 4 6 14
Table of Contents
VALERO ENERGY CORPORATION AND SUBSIDIARIESNOTES TO CONSOLIDATED FINANCIAL STATEMENTS (Continued)
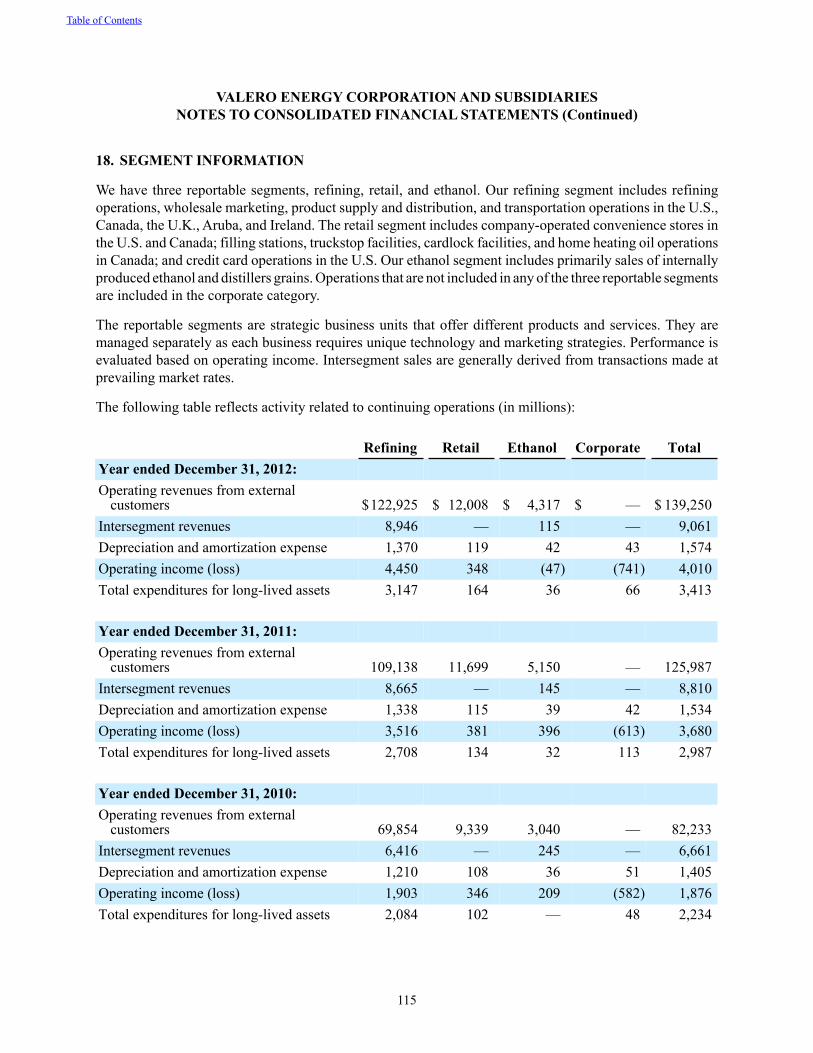
115
18. SEGMENT INFORMATION
We have three reportable segments, refining, retail, and ethanol. Our refining segment includes refining operations, wholesale marketing, product supply and distribution, and transportation operations in the U.S., Canada, the U.K., Aruba, and Ireland. The retail segment includes company-operated convenience stores in the U.S. and Canada; filling stations, truckstop facilities, cardlock facilities, and home heating oil operations in Canada; and credit card operations in the U.S. Our ethanol segment includes primarily sales of internally produced ethanol and distillers grains. Operations that are not included in any of the three reportable segments are included in the corporate category.
The reportable segments are strategic business units that offer different products and services. They are managed separately as each business requires unique technology and marketing strategies. Performance is evaluated based on operating income. Intersegment sales are generally derived from transactions made at prevailing market rates.
The following table reflects activity related to continuing operations (in millions):
Refining Retail Ethanol Corporate TotalYear ended December 31, 2012:Operating revenues from external
customers $122,925 $ 12,008 $ 4,317 $ — $ 139,250Intersegment revenues 8,946 — 115 — 9,061Depreciation and amortization expense 1,370 119 42 43 1,574Operating income (loss) 4,450 348 (47) (741) 4,010Total expenditures for long-lived assets 3,147 164 36 66 3,413
Year ended December 31, 2011:Operating revenues from external
customers 109,138 11,699 5,150 — 125,987Intersegment revenues 8,665 — 145 — 8,810Depreciation and amortization expense 1,338 115 39 42 1,534Operating income (loss) 3,516 381 396 (613) 3,680Total expenditures for long-lived assets 2,708 134 32 113 2,987
Year ended December 31, 2010:Operating revenues from external
customers 69,854 9,339 3,040 — 82,233Intersegment revenues 6,416 — 245 — 6,661Depreciation and amortization expense 1,210 108 36 51 1,405Operating income (loss) 1,903 346 209 (582) 1,876Total expenditures for long-lived assets 2,084 102 — 48 2,234
Table of Contents
VALERO ENERGY CORPORATION AND SUBSIDIARIESNOTES TO CONSOLIDATED FINANCIAL STATEMENTS (Continued)
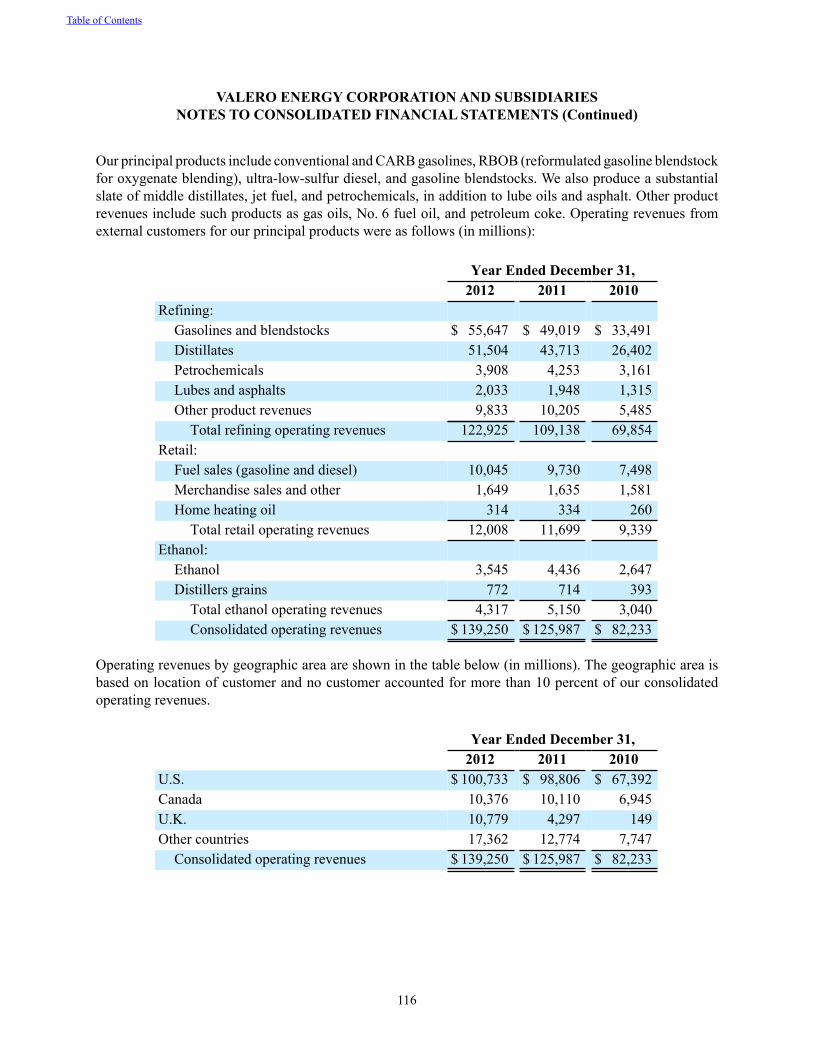
116
Our principal products include conventional and CARB gasolines, RBOB (reformulated gasoline blendstock for oxygenate blending), ultra-low-sulfur diesel, and gasoline blendstocks. We also produce a substantial slate of middle distillates, jet fuel, and petrochemicals, in addition to lube oils and asphalt. Other product revenues include such products as gas oils, No. 6 fuel oil, and petroleum coke. Operating revenues from external customers for our principal products were as follows (in millions):
Year Ended December 31,2012 2011 2010
Refining:Gasolines and blendstocks $ 55,647 $ 49,019 $ 33,491Distillates 51,504 43,713 26,402Petrochemicals 3,908 4,253 3,161Lubes and asphalts 2,033 1,948 1,315Other product revenues 9,833 10,205 5,485
Total refining operating revenues 122,925 109,138 69,854Retail:
Fuel sales (gasoline and diesel) 10,045 9,730 7,498Merchandise sales and other 1,649 1,635 1,581Home heating oil 314 334 260
Total retail operating revenues 12,008 11,699 9,339Ethanol:
Ethanol 3,545 4,436 2,647Distillers grains 772 714 393
Total ethanol operating revenues 4,317 5,150 3,040Consolidated operating revenues $ 139,250 $ 125,987 $ 82,233
Operating revenues by geographic area are shown in the table below (in millions). The geographic area is based on location of customer and no customer accounted for more than 10 percent of our consolidated operating revenues.
Year Ended December 31,2012 2011 2010
U.S. $ 100,733 $ 98,806 $ 67,392Canada 10,376 10,110 6,945U.K. 10,779 4,297 149Other countries 17,362 12,774 7,747
Consolidated operating revenues $ 139,250 $ 125,987 $ 82,233
Table of Contents
VALERO ENERGY CORPORATION AND SUBSIDIARIESNOTES TO CONSOLIDATED FINANCIAL STATEMENTS (Continued)
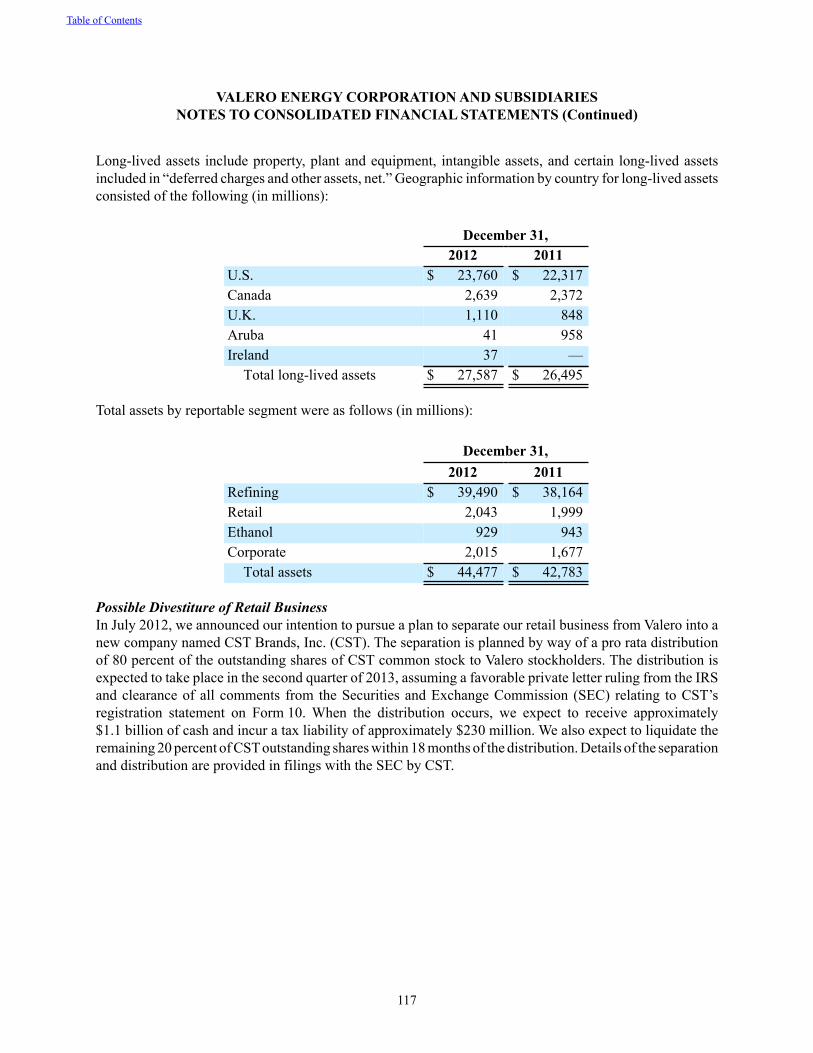
117
Long-lived assets include property, plant and equipment, intangible assets, and certain long-lived assets included in “deferred charges and other assets, net.” Geographic information by country for long-lived assets consisted of the following (in millions):
December 31,2012 2011
U.S. $ 23,760 $ 22,317Canada 2,639 2,372U.K. 1,110 848Aruba 41 958Ireland 37 —
Total long-lived assets $ 27,587 $ 26,495
Total assets by reportable segment were as follows (in millions):
December 31, 2012 2011Refining $ 39,490 $ 38,164Retail 2,043 1,999Ethanol 929 943Corporate 2,015 1,677
Total assets $ 44,477 $ 42,783
Possible Divestiture of Retail BusinessIn July 2012, we announced our intention to pursue a plan to separate our retail business from Valero into a new company named CST Brands, Inc. (CST). The separation is planned by way of a pro rata distribution of 80 percent of the outstanding shares of CST common stock to Valero stockholders. The distribution is expected to take place in the second quarter of 2013, assuming a favorable private letter ruling from the IRS and clearance of all comments from the Securities and Exchange Commission (SEC) relating to CST’s registration statement on Form 10. When the distribution occurs, we expect to receive approximately $1.1 billion of cash and incur a tax liability of approximately $230 million. We also expect to liquidate the remaining 20 percent of CST outstanding shares within 18 months of the distribution. Details of the separation and distribution are provided in filings with the SEC by CST.
Table of Contents
VALERO ENERGY CORPORATION AND SUBSIDIARIESNOTES TO CONSOLIDATED FINANCIAL STATEMENTS (Continued)
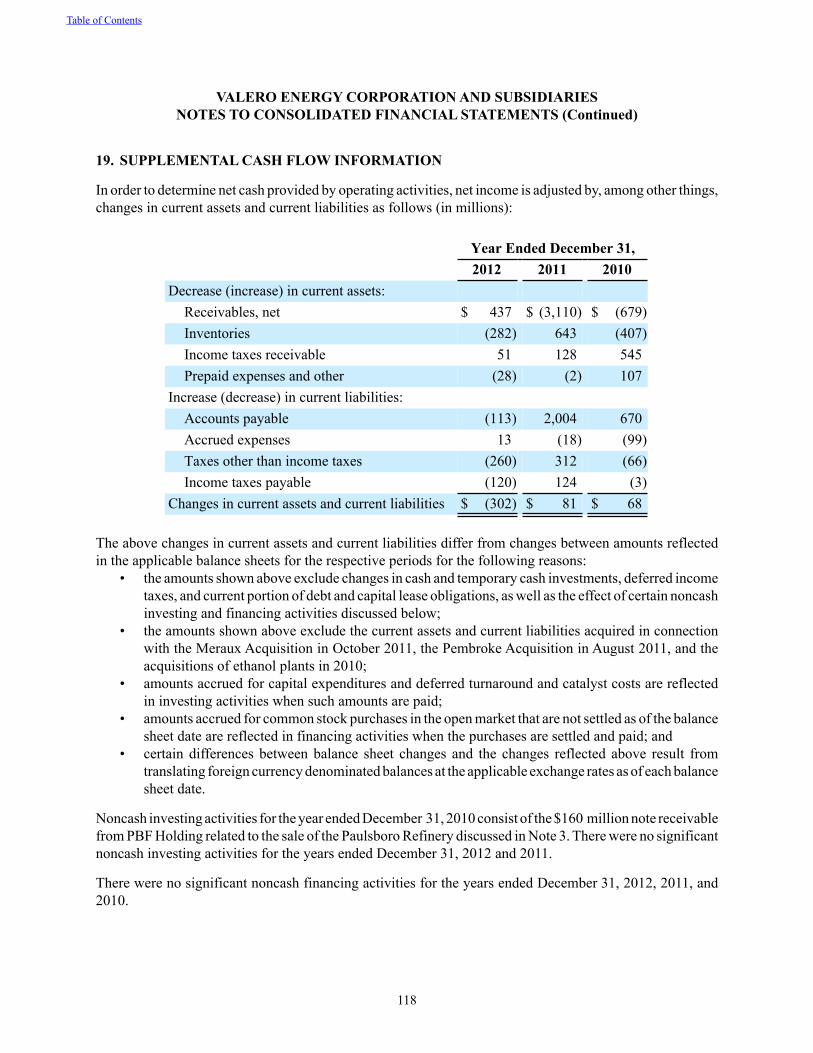
118
19. SUPPLEMENTAL CASH FLOW INFORMATION
In order to determine net cash provided by operating activities, net income is adjusted by, among other things, changes in current assets and current liabilities as follows (in millions):
Year Ended December 31, 2012 2011 2010Decrease (increase) in current assets:
Receivables, net $ 437 $ (3,110) $ (679)Inventories (282) 643 (407)Income taxes receivable 51 128 545Prepaid expenses and other (28) (2) 107
Increase (decrease) in current liabilities:Accounts payable (113) 2,004 670Accrued expenses 13 (18) (99)Taxes other than income taxes (260) 312 (66)Income taxes payable (120) 124 (3)
Changes in current assets and current liabilities $ (302) $ 81 $ 68
The above changes in current assets and current liabilities differ from changes between amounts reflected in the applicable balance sheets for the respective periods for the following reasons:
• the amounts shown above exclude changes in cash and temporary cash investments, deferred income taxes, and current portion of debt and capital lease obligations, as well as the effect of certain noncash investing and financing activities discussed below;
• the amounts shown above exclude the current assets and current liabilities acquired in connection with the Meraux Acquisition in October 2011, the Pembroke Acquisition in August 2011, and the acquisitions of ethanol plants in 2010;
• amounts accrued for capital expenditures and deferred turnaround and catalyst costs are reflected in investing activities when such amounts are paid;
• amounts accrued for common stock purchases in the open market that are not settled as of the balance sheet date are reflected in financing activities when the purchases are settled and paid; and
• certain differences between balance sheet changes and the changes reflected above result from translating foreign currency denominated balances at the applicable exchange rates as of each balance sheet date.
Noncash investing activities for the year ended December 31, 2010 consist of the $160 million note receivable from PBF Holding related to the sale of the Paulsboro Refinery discussed in Note 3. There were no significant noncash investing activities for the years ended December 31, 2012 and 2011.
There were no significant noncash financing activities for the years ended December 31, 2012, 2011, and 2010.
Table of Contents
VALERO ENERGY CORPORATION AND SUBSIDIARIESNOTES TO CONSOLIDATED FINANCIAL STATEMENTS (Continued)
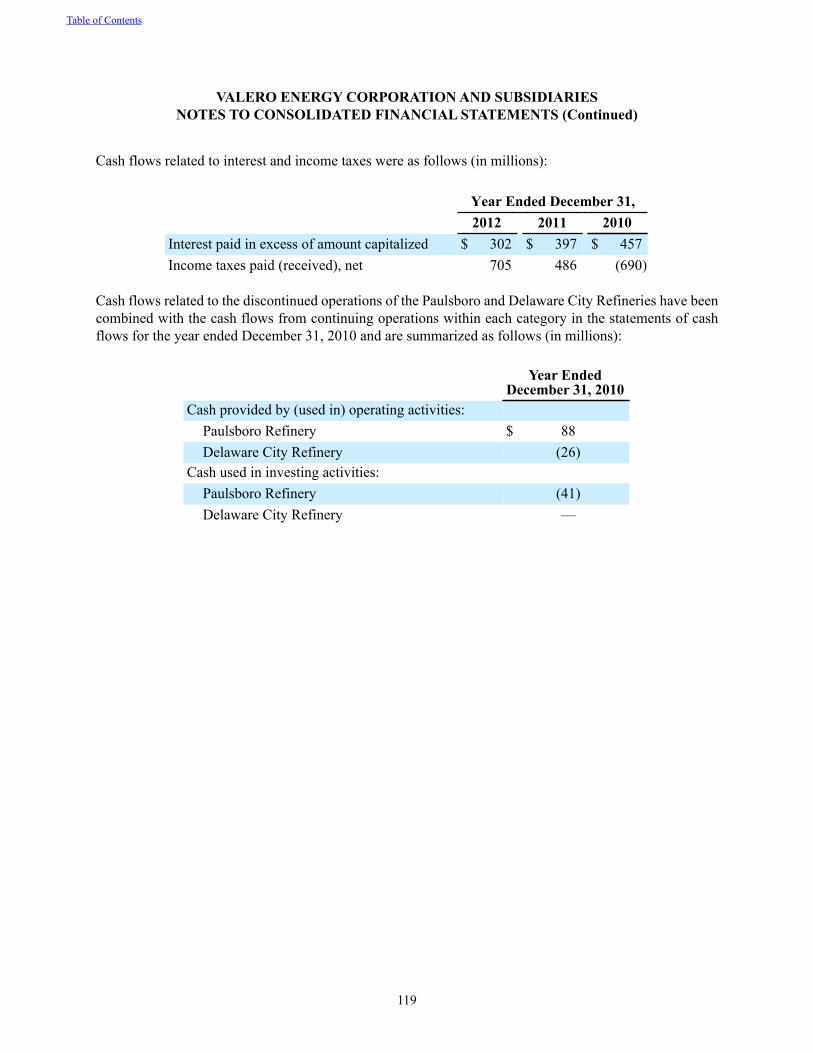
119
Cash flows related to interest and income taxes were as follows (in millions):
Year Ended December 31, 2012 2011 2010Interest paid in excess of amount capitalized $ 302 $ 397 $ 457Income taxes paid (received), net 705 486 (690)
Cash flows related to the discontinued operations of the Paulsboro and Delaware City Refineries have been combined with the cash flows from continuing operations within each category in the statements of cash flows for the year ended December 31, 2010 and are summarized as follows (in millions):
Year Ended
December 31, 2010Cash provided by (used in) operating activities:
Paulsboro Refinery $ 88Delaware City Refinery (26)
Cash used in investing activities:Paulsboro Refinery (41)Delaware City Refinery —
Table of Contents
VALERO ENERGY CORPORATION AND SUBSIDIARIESNOTES TO CONSOLIDATED FINANCIAL STATEMENTS (Continued)
120
20. FAIR VALUE MEASUREMENTS
GeneralGAAP requires that certain financial instruments, such as derivative instruments, be recognized at their fair values in our balance sheets. However, other financial instruments, such as debt obligations, are not required to be recognized at their fair values, but GAAP provides an option to elect fair value accounting for these instruments. GAAP requires the disclosure of the fair values of all financial instruments, regardless of whether they are recognized at their fair values or carrying amounts in our balance sheets. For financial instruments recognized at fair value, GAAP requires the disclosure of their fair values by type of instrument, along with other information, including changes in the fair values of certain financial instruments recognized in income or other comprehensive income, and this information is provided below under “Recurring Fair Value Measurements.” For financial instruments not recognized at fair value, the disclosure of their fair values is provided below under “Other Financial Instruments.”
Nonfinancial assets, such as property, plant and equipment, and nonfinancial liabilities are recognized at their carrying amounts in our balance sheets. GAAP does not permit nonfinancial assets and liabilities to be remeasured at their fair values. However, GAAP requires the remeasurement of such assets and liabilities to their fair values upon the occurrence of certain events, such as the impairment of property, plant and equipment. In addition, if such an event occurs, GAAP requires the disclosure of the fair value of the asset or liability along with other information, including the gain or loss recognized in income in the period the remeasurement occurred. This information is provided below under “Nonrecurring Fair Value Measurements.”
GAAP provides a framework for measuring fair value and establishes a three-level fair value hierarchy that prioritizes inputs to valuation techniques based on the degree to which objective prices in external active markets are available to measure fair value. Following is a description of each of the levels of the fair value hierarchy.
• Level 1 - Observable inputs, such as unadjusted quoted prices in active markets for identical assets or liabilities.
• Level 2 - Inputs other than quoted prices included within Level 1 that are observable for the asset or liability, either directly or indirectly. These include quoted prices for similar assets or liabilities in active markets and quoted prices for identical or similar assets or liabilities in markets that are not active.
• Level 3 - Unobservable inputs for the asset or liability for which there is little, if any, market activity at the measurement date. Unobservable inputs reflect our own assumptions about what market participants would use to price the asset or liability. The inputs are developed based on the best information available in the circumstances, which might include occasional market quotes or sales of similar instruments or our own financial data such as internally developed pricing models, discounted cash flow methodologies, as well as instruments for which the fair value determination requires significant judgment.
The financial instruments and nonfinancial assets and liabilities included in our disclosure of recurring and nonrecurring fair value measurements are categorized according to the fair value hierarchy based on the inputs used to measure their fair values.
Table of Contents
VALERO ENERGY CORPORATION AND SUBSIDIARIESNOTES TO CONSOLIDATED FINANCIAL STATEMENTS (Continued)
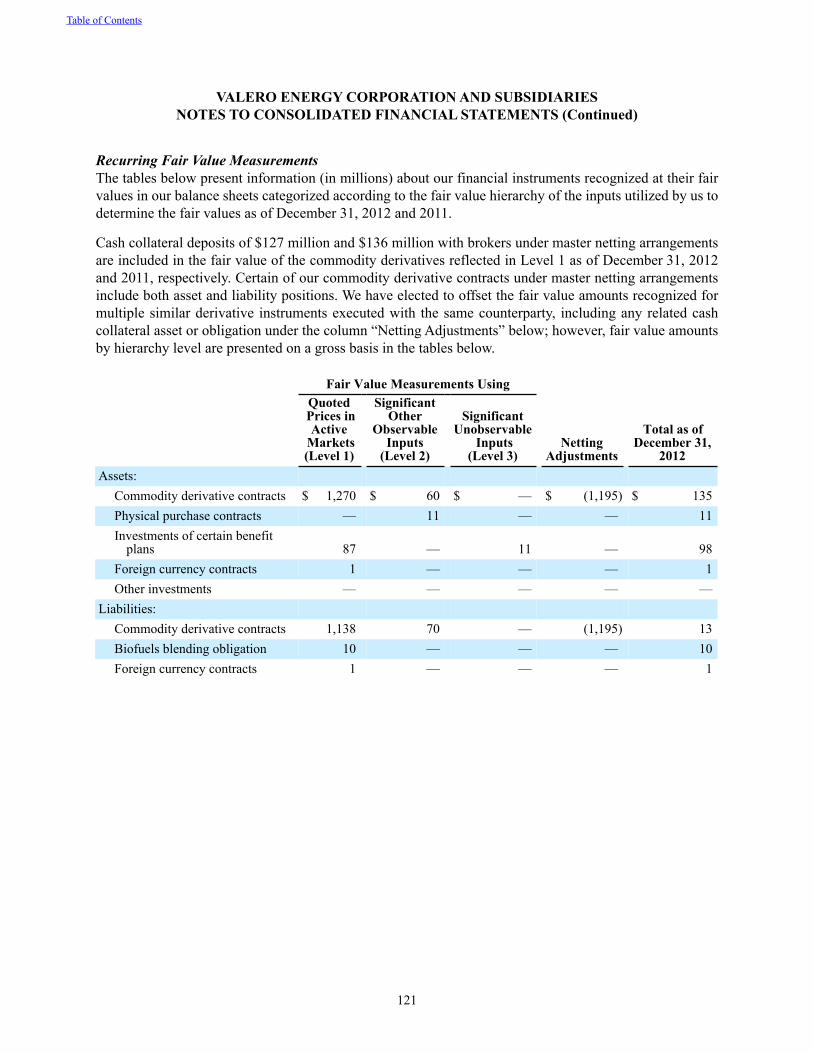
121
Recurring Fair Value MeasurementsThe tables below present information (in millions) about our financial instruments recognized at their fair values in our balance sheets categorized according to the fair value hierarchy of the inputs utilized by us to determine the fair values as of December 31, 2012 and 2011.
Cash collateral deposits of $127 million and $136 million with brokers under master netting arrangements are included in the fair value of the commodity derivatives reflected in Level 1 as of December 31, 2012 and 2011, respectively. Certain of our commodity derivative contracts under master netting arrangements include both asset and liability positions. We have elected to offset the fair value amounts recognized for multiple similar derivative instruments executed with the same counterparty, including any related cash collateral asset or obligation under the column “Netting Adjustments” below; however, fair value amounts by hierarchy level are presented on a gross basis in the tables below.
Fair Value Measurements Using
Quoted Prices in
Active Markets(Level 1)
SignificantOther
ObservableInputs
(Level 2)
SignificantUnobservable
Inputs(Level 3)
NettingAdjustments
Total as ofDecember 31,
2012Assets:
Commodity derivative contracts $ 1,270 $ 60 $ — $ (1,195) $ 135Physical purchase contracts — 11 — — 11Investments of certain benefit
plans 87 — 11 — 98Foreign currency contracts 1 — — — 1Other investments — — — — —
Liabilities: Commodity derivative contracts 1,138 70 — (1,195) 13Biofuels blending obligation 10 — — — 10Foreign currency contracts 1 — — — 1
Table of Contents
VALERO ENERGY CORPORATION AND SUBSIDIARIESNOTES TO CONSOLIDATED FINANCIAL STATEMENTS (Continued)
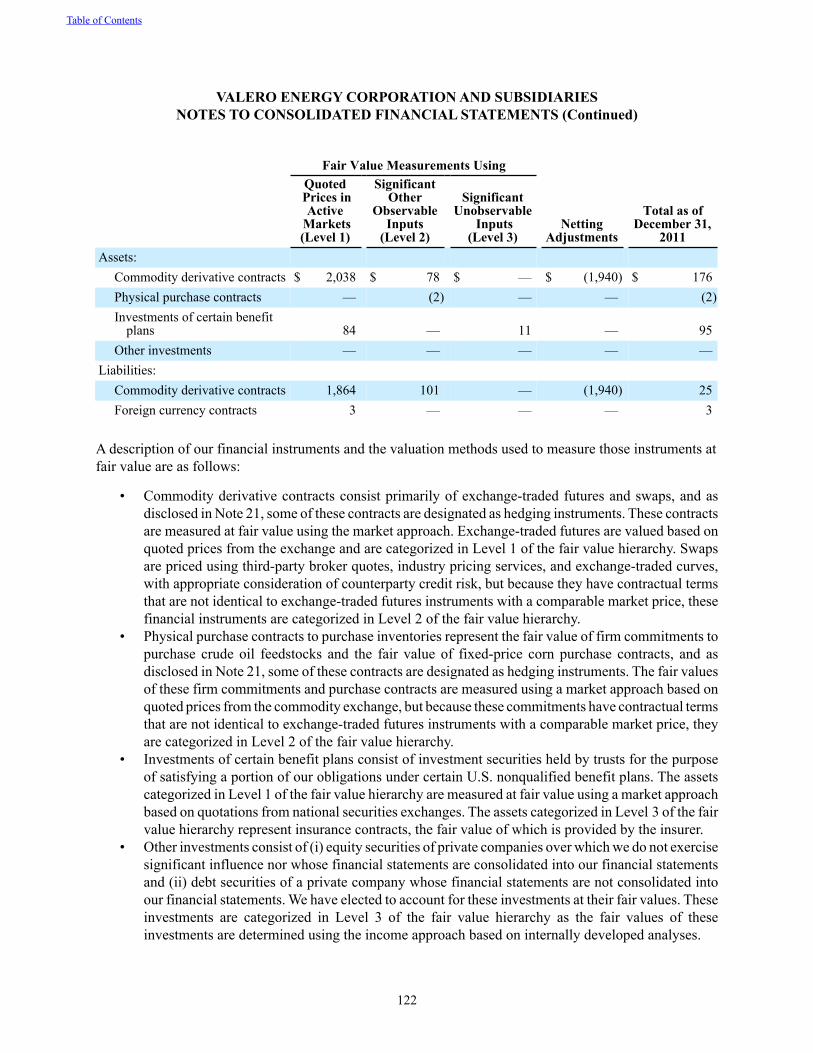
122
Fair Value Measurements Using
Quoted Prices in
Active Markets(Level 1)
SignificantOther
ObservableInputs
(Level 2)
SignificantUnobservable
Inputs(Level 3)
NettingAdjustments
Total as ofDecember 31,
2011Assets:
Commodity derivative contracts $ 2,038 $ 78 $ — $ (1,940) $ 176Physical purchase contracts — (2) — — (2)Investments of certain benefit
plans 84 — 11 — 95Other investments — — — — —
Liabilities: Commodity derivative contracts 1,864 101 — (1,940) 25Foreign currency contracts 3 — — — 3
A description of our financial instruments and the valuation methods used to measure those instruments at fair value are as follows:
• Commodity derivative contracts consist primarily of exchange-traded futures and swaps, and as disclosed in Note 21, some of these contracts are designated as hedging instruments. These contracts are measured at fair value using the market approach. Exchange-traded futures are valued based on quoted prices from the exchange and are categorized in Level 1 of the fair value hierarchy. Swaps are priced using third-party broker quotes, industry pricing services, and exchange-traded curves, with appropriate consideration of counterparty credit risk, but because they have contractual terms that are not identical to exchange-traded futures instruments with a comparable market price, these financial instruments are categorized in Level 2 of the fair value hierarchy.
• Physical purchase contracts to purchase inventories represent the fair value of firm commitments to purchase crude oil feedstocks and the fair value of fixed-price corn purchase contracts, and as disclosed in Note 21, some of these contracts are designated as hedging instruments. The fair values of these firm commitments and purchase contracts are measured using a market approach based on quoted prices from the commodity exchange, but because these commitments have contractual terms that are not identical to exchange-traded futures instruments with a comparable market price, they are categorized in Level 2 of the fair value hierarchy.
• Investments of certain benefit plans consist of investment securities held by trusts for the purpose of satisfying a portion of our obligations under certain U.S. nonqualified benefit plans. The assets categorized in Level 1 of the fair value hierarchy are measured at fair value using a market approach based on quotations from national securities exchanges. The assets categorized in Level 3 of the fair value hierarchy represent insurance contracts, the fair value of which is provided by the insurer.
• Other investments consist of (i) equity securities of private companies over which we do not exercise significant influence nor whose financial statements are consolidated into our financial statements and (ii) debt securities of a private company whose financial statements are not consolidated into our financial statements. We have elected to account for these investments at their fair values. These investments are categorized in Level 3 of the fair value hierarchy as the fair values of these investments are determined using the income approach based on internally developed analyses.
Table of Contents
VALERO ENERGY CORPORATION AND SUBSIDIARIESNOTES TO CONSOLIDATED FINANCIAL STATEMENTS (Continued)
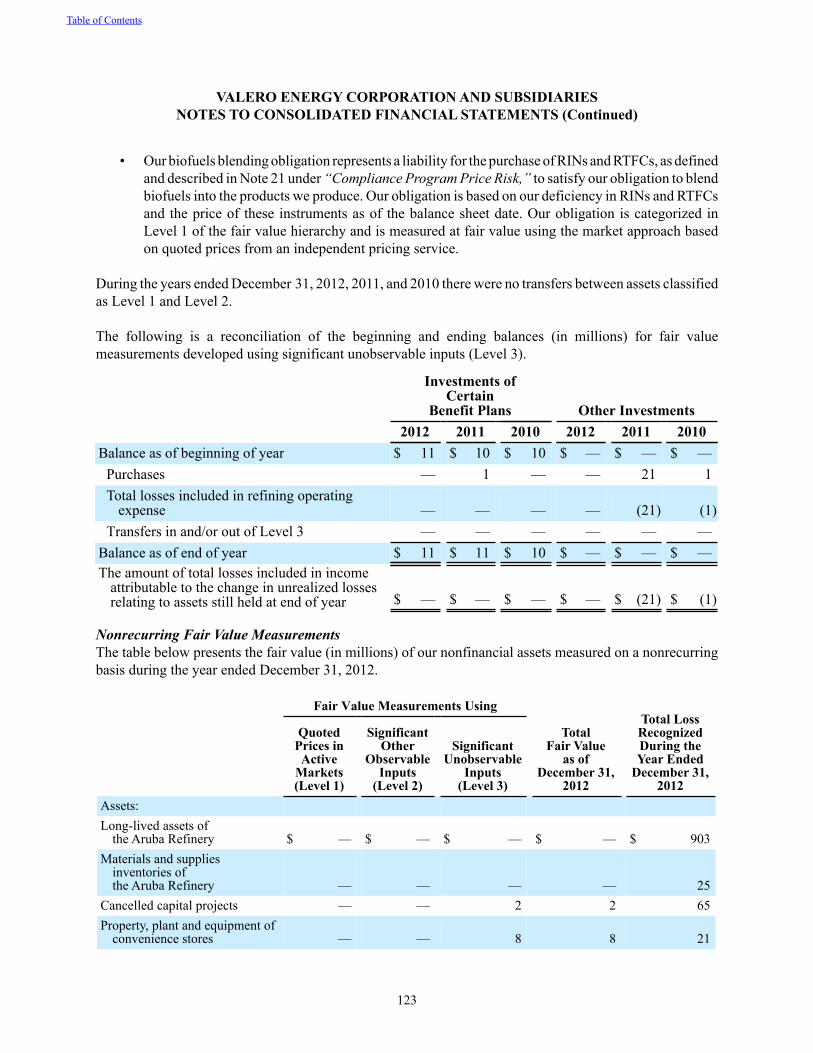
123
• Our biofuels blending obligation represents a liability for the purchase of RINs and RTFCs, as defined and described in Note 21 under “Compliance Program Price Risk,” to satisfy our obligation to blend biofuels into the products we produce. Our obligation is based on our deficiency in RINs and RTFCs and the price of these instruments as of the balance sheet date. Our obligation is categorized in Level 1 of the fair value hierarchy and is measured at fair value using the market approach based on quoted prices from an independent pricing service.
During the years ended December 31, 2012, 2011, and 2010 there were no transfers between assets classified as Level 1 and Level 2.
The following is a reconciliation of the beginning and ending balances (in millions) for fair value measurements developed using significant unobservable inputs (Level 3).
Investments ofCertain
Benefit Plans Other Investments 2012 2011 2010 2012 2011 2010Balance as of beginning of year $ 11 $ 10 $ 10 $ — $ — $ —
Purchases — 1 — — 21 1Total losses included in refining operating
expense — — — — (21) (1)Transfers in and/or out of Level 3 — — — — — —
Balance as of end of year $ 11 $ 11 $ 10 $ — $ — $ —The amount of total losses included in income
attributable to the change in unrealized lossesrelating to assets still held at end of year $ — $ — $ — $ — $ (21) $ (1)
Nonrecurring Fair Value MeasurementsThe table below presents the fair value (in millions) of our nonfinancial assets measured on a nonrecurring basis during the year ended December 31, 2012.
Fair Value Measurements UsingTotal LossRecognizedDuring theYear Ended
December 31,2012
QuotedPrices inActive
Markets(Level 1)
SignificantOther
ObservableInputs
(Level 2)
SignificantUnobservable
Inputs(Level 3)
TotalFair Value
as of December 31,
2012Assets: Long-lived assets of
the Aruba Refinery $ — $ — $ — $ — $ 903Materials and supplies
inventories ofthe Aruba Refinery — — — — 25
Cancelled capital projects — — 2 2 65Property, plant and equipment of
convenience stores — — 8 8 21
Table of Contents
VALERO ENERGY CORPORATION AND SUBSIDIARIESNOTES TO CONSOLIDATED FINANCIAL STATEMENTS (Continued)
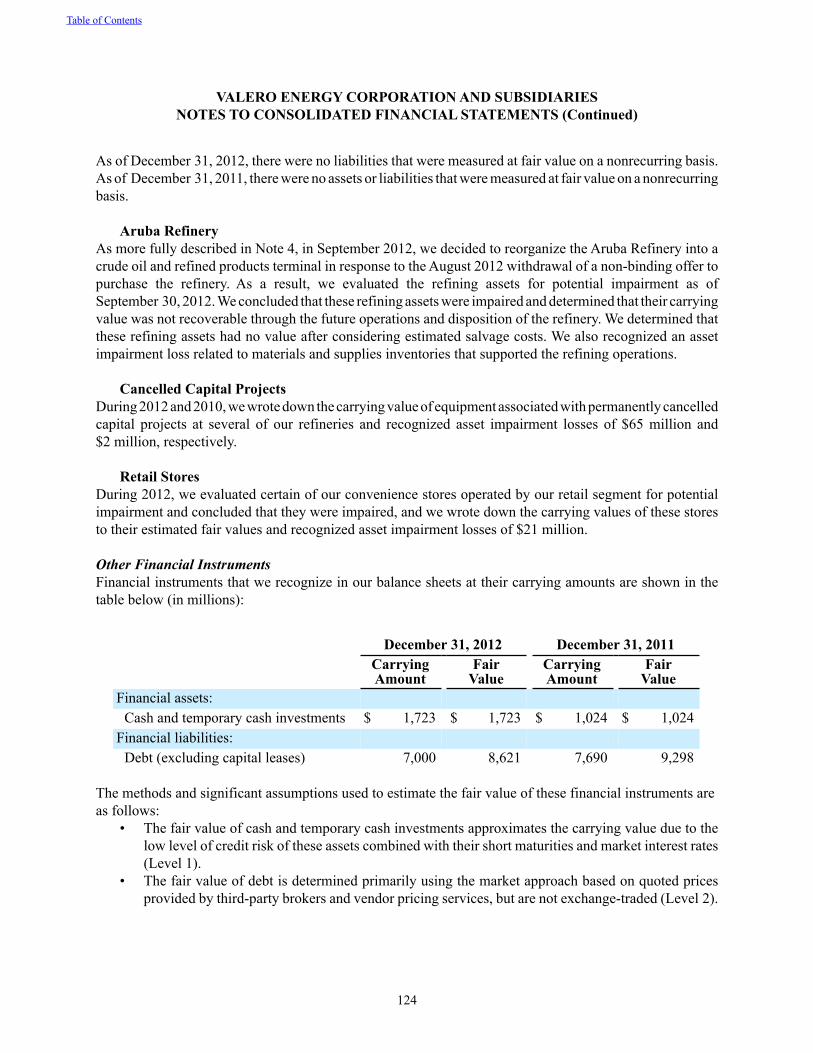
124
As of December 31, 2012, there were no liabilities that were measured at fair value on a nonrecurring basis. As of December 31, 2011, there were no assets or liabilities that were measured at fair value on a nonrecurring basis.
Aruba RefineryAs more fully described in Note 4, in September 2012, we decided to reorganize the Aruba Refinery into a crude oil and refined products terminal in response to the August 2012 withdrawal of a non-binding offer to purchase the refinery. As a result, we evaluated the refining assets for potential impairment as of September 30, 2012. We concluded that these refining assets were impaired and determined that their carrying value was not recoverable through the future operations and disposition of the refinery. We determined that these refining assets had no value after considering estimated salvage costs. We also recognized an asset impairment loss related to materials and supplies inventories that supported the refining operations.
Cancelled Capital ProjectsDuring 2012 and 2010, we wrote down the carrying value of equipment associated with permanently cancelled capital projects at several of our refineries and recognized asset impairment losses of $65 million and $2 million, respectively.
Retail StoresDuring 2012, we evaluated certain of our convenience stores operated by our retail segment for potential impairment and concluded that they were impaired, and we wrote down the carrying values of these stores to their estimated fair values and recognized asset impairment losses of $21 million.
Other Financial InstrumentsFinancial instruments that we recognize in our balance sheets at their carrying amounts are shown in the table below (in millions):
December 31, 2012 December 31, 2011CarryingAmount
FairValue
CarryingAmount
FairValue
Financial assets:Cash and temporary cash investments $ 1,723 $ 1,723 $ 1,024 $ 1,024
Financial liabilities:Debt (excluding capital leases) 7,000 8,621 7,690 9,298
The methods and significant assumptions used to estimate the fair value of these financial instruments are as follows:
• The fair value of cash and temporary cash investments approximates the carrying value due to the low level of credit risk of these assets combined with their short maturities and market interest rates (Level 1).
• The fair value of debt is determined primarily using the market approach based on quoted prices provided by third-party brokers and vendor pricing services, but are not exchange-traded (Level 2).
Table of Contents
VALERO ENERGY CORPORATION AND SUBSIDIARIESNOTES TO CONSOLIDATED FINANCIAL STATEMENTS (Continued)
125
21. PRICE RISK MANAGEMENT ACTIVITIES
We are exposed to market risks related to the volatility in the price of commodities, the price of financial instruments associated with governmental and regulatory compliance programs, interest rates, and foreign currency exchange rates, and we enter into derivative instruments to manage some of these risks. We also enter into derivative instruments to manage the price risk on other contractual derivatives into which we have entered. The only types of derivative instruments we enter into are those related to the various commodities we purchase or produce, financial instruments we must purchase to maintain compliance with various governmental and regulatory programs, interest rate swaps, and foreign currency exchange and purchase contracts, as described below. All derivative instruments are recorded as either assets or liabilities measured at their fair values (see Note 20).
When we enter into a derivative instrument, it is designated as a fair value hedge, a cash flow hedge, an economic hedge, or a trading derivative. The gain or loss on a derivative instrument designated and qualifying as a fair value hedge, as well as the offsetting loss or gain on the hedged item attributable to the hedged risk, is recognized currently in income in the same period. The effective portion of the gain or loss on a derivative instrument designated and qualifying as a cash flow hedge is initially reported as a component of other comprehensive income and is then recorded in income in the period or periods during which the hedged forecasted transaction affects income. The ineffective portion of the gain or loss on the cash flow derivative instrument, if any, is recognized in income as incurred. For our economic hedges (derivative instruments not designated as fair value or cash flow hedges) and for derivative instruments entered into by us for trading purposes, the derivative instrument is recorded at fair value and changes in the fair value of the derivative instrument are recognized currently in income. The cash flow effects of all of our derivative instruments are reflected in operating activities in our statements of cash flows for all periods presented.
Table of Contents
VALERO ENERGY CORPORATION AND SUBSIDIARIESNOTES TO CONSOLIDATED FINANCIAL STATEMENTS (Continued)
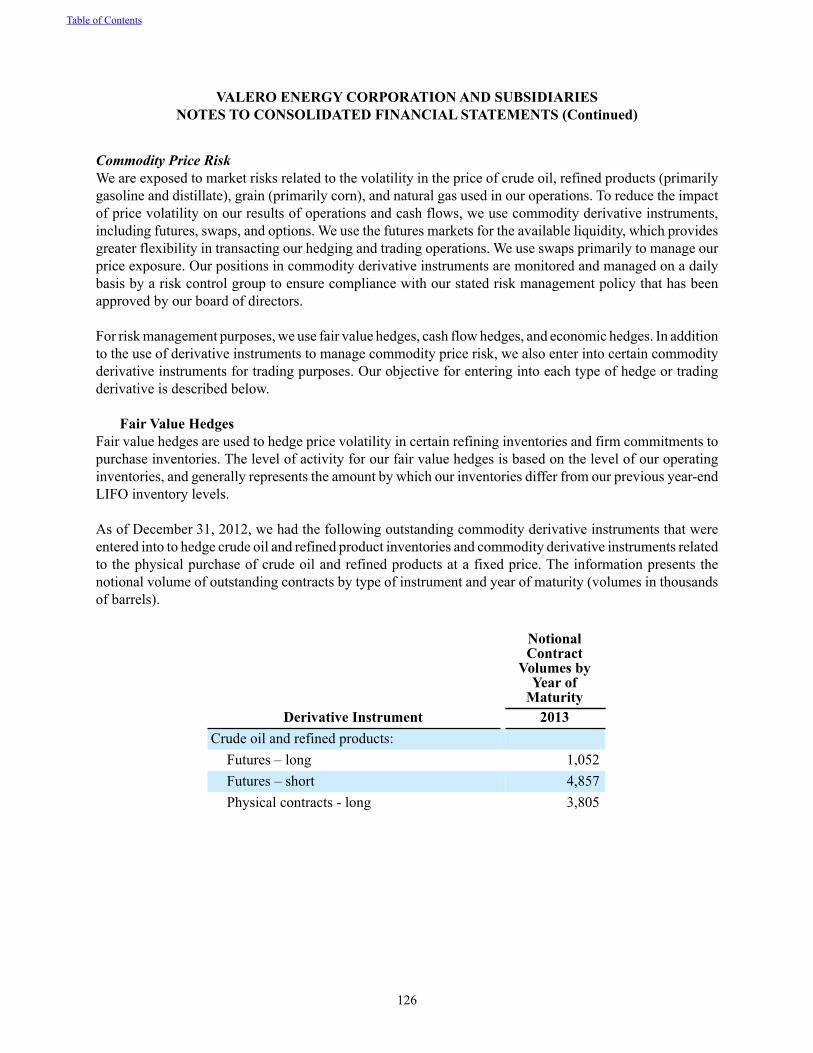
126
Commodity Price RiskWe are exposed to market risks related to the volatility in the price of crude oil, refined products (primarily gasoline and distillate), grain (primarily corn), and natural gas used in our operations. To reduce the impact of price volatility on our results of operations and cash flows, we use commodity derivative instruments, including futures, swaps, and options. We use the futures markets for the available liquidity, which provides greater flexibility in transacting our hedging and trading operations. We use swaps primarily to manage our price exposure. Our positions in commodity derivative instruments are monitored and managed on a daily basis by a risk control group to ensure compliance with our stated risk management policy that has been approved by our board of directors.
For risk management purposes, we use fair value hedges, cash flow hedges, and economic hedges. In addition to the use of derivative instruments to manage commodity price risk, we also enter into certain commodity derivative instruments for trading purposes. Our objective for entering into each type of hedge or trading derivative is described below.
Fair Value HedgesFair value hedges are used to hedge price volatility in certain refining inventories and firm commitments to purchase inventories. The level of activity for our fair value hedges is based on the level of our operating inventories, and generally represents the amount by which our inventories differ from our previous year-end LIFO inventory levels.
As of December 31, 2012, we had the following outstanding commodity derivative instruments that were entered into to hedge crude oil and refined product inventories and commodity derivative instruments related to the physical purchase of crude oil and refined products at a fixed price. The information presents the notional volume of outstanding contracts by type of instrument and year of maturity (volumes in thousands of barrels).
NotionalContract
Volumes byYear of
MaturityDerivative Instrument 2013
Crude oil and refined products: Futures – long 1,052Futures – short 4,857Physical contracts - long 3,805
Table of Contents
VALERO ENERGY CORPORATION AND SUBSIDIARIESNOTES TO CONSOLIDATED FINANCIAL STATEMENTS (Continued)
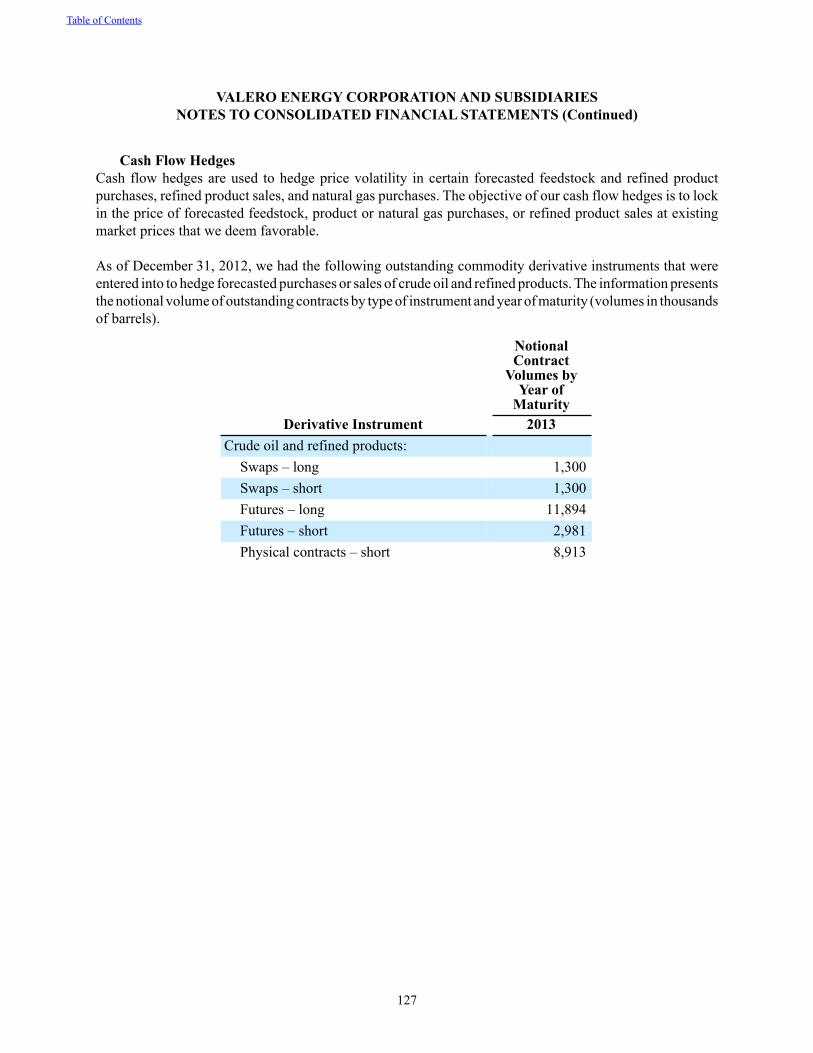
127
Cash Flow HedgesCash flow hedges are used to hedge price volatility in certain forecasted feedstock and refined product purchases, refined product sales, and natural gas purchases. The objective of our cash flow hedges is to lock in the price of forecasted feedstock, product or natural gas purchases, or refined product sales at existing market prices that we deem favorable.
As of December 31, 2012, we had the following outstanding commodity derivative instruments that were entered into to hedge forecasted purchases or sales of crude oil and refined products. The information presents the notional volume of outstanding contracts by type of instrument and year of maturity (volumes in thousands of barrels).
NotionalContract
Volumes byYear of
MaturityDerivative Instrument 2013
Crude oil and refined products:Swaps – long 1,300Swaps – short 1,300Futures – long 11,894Futures – short 2,981Physical contracts – short 8,913
Table of Contents
VALERO ENERGY CORPORATION AND SUBSIDIARIESNOTES TO CONSOLIDATED FINANCIAL STATEMENTS (Continued)
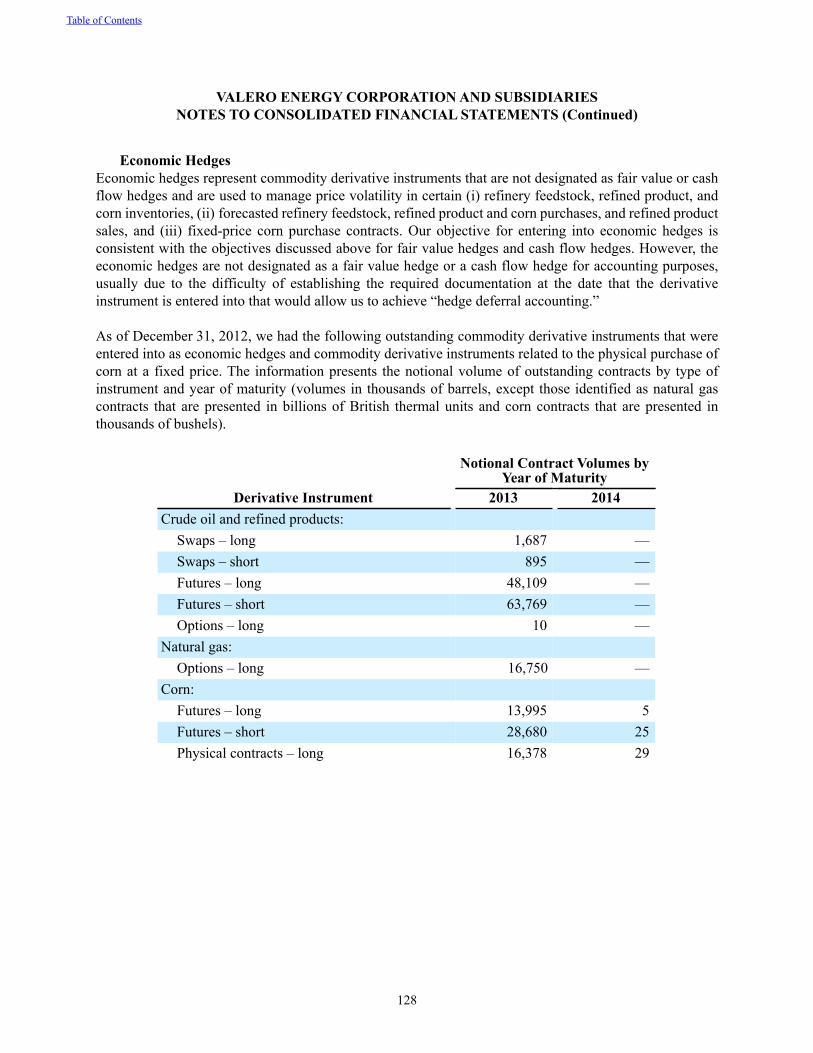
128
Economic HedgesEconomic hedges represent commodity derivative instruments that are not designated as fair value or cash flow hedges and are used to manage price volatility in certain (i) refinery feedstock, refined product, and corn inventories, (ii) forecasted refinery feedstock, refined product and corn purchases, and refined product sales, and (iii) fixed-price corn purchase contracts. Our objective for entering into economic hedges is consistent with the objectives discussed above for fair value hedges and cash flow hedges. However, the economic hedges are not designated as a fair value hedge or a cash flow hedge for accounting purposes, usually due to the difficulty of establishing the required documentation at the date that the derivative instrument is entered into that would allow us to achieve “hedge deferral accounting.”
As of December 31, 2012, we had the following outstanding commodity derivative instruments that were entered into as economic hedges and commodity derivative instruments related to the physical purchase of corn at a fixed price. The information presents the notional volume of outstanding contracts by type of instrument and year of maturity (volumes in thousands of barrels, except those identified as natural gas contracts that are presented in billions of British thermal units and corn contracts that are presented in thousands of bushels).
Notional Contract Volumes byYear of Maturity
Derivative Instrument 2013 2014Crude oil and refined products:
Swaps – long 1,687 —Swaps – short 895 —Futures – long 48,109 —Futures – short 63,769 —Options – long 10 —
Natural gas:Options – long 16,750 —
Corn:Futures – long 13,995 5Futures – short 28,680 25Physical contracts – long 16,378 29
Table of Contents
VALERO ENERGY CORPORATION AND SUBSIDIARIESNOTES TO CONSOLIDATED FINANCIAL STATEMENTS (Continued)
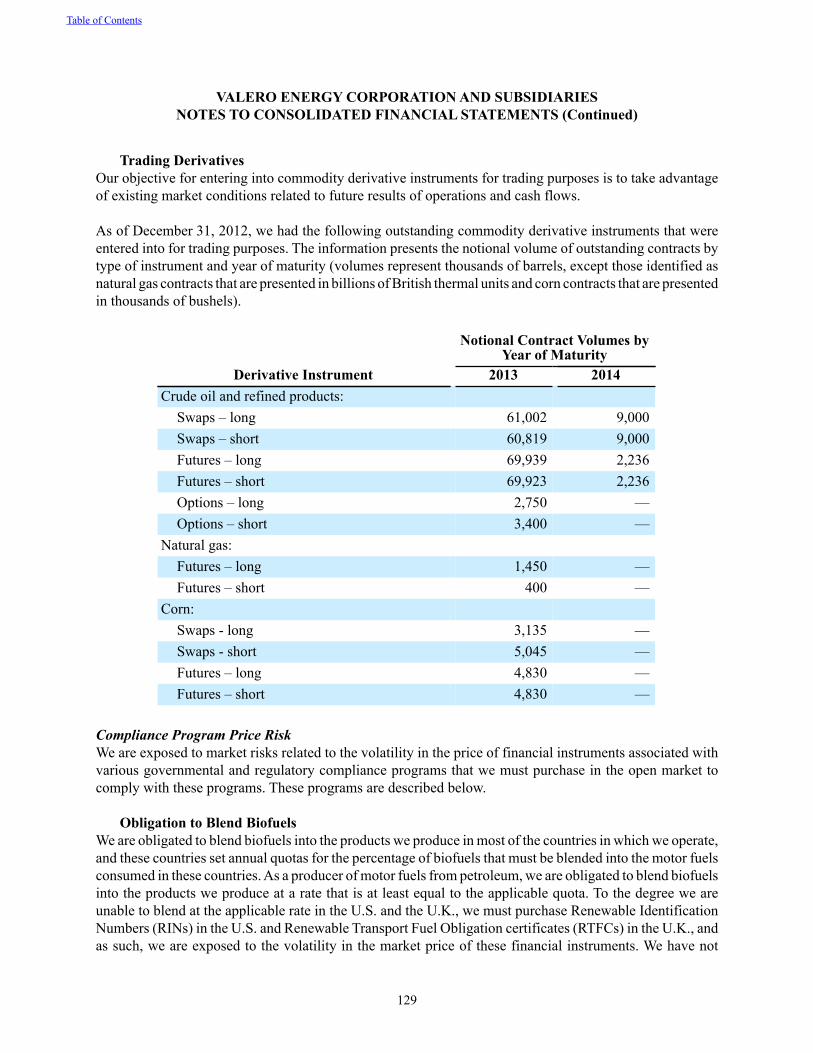
129
Trading DerivativesOur objective for entering into commodity derivative instruments for trading purposes is to take advantage of existing market conditions related to future results of operations and cash flows.
As of December 31, 2012, we had the following outstanding commodity derivative instruments that were entered into for trading purposes. The information presents the notional volume of outstanding contracts by type of instrument and year of maturity (volumes represent thousands of barrels, except those identified as natural gas contracts that are presented in billions of British thermal units and corn contracts that are presented in thousands of bushels).
Notional Contract Volumes byYear of Maturity
Derivative Instrument 2013 2014Crude oil and refined products:
Swaps – long 61,002 9,000Swaps – short 60,819 9,000Futures – long 69,939 2,236Futures – short 69,923 2,236Options – long 2,750 —Options – short 3,400 —
Natural gas:Futures – long 1,450 —Futures – short 400 —
Corn:Swaps - long 3,135 —Swaps - short 5,045 —Futures – long 4,830 —Futures – short 4,830 —
Compliance Program Price RiskWe are exposed to market risks related to the volatility in the price of financial instruments associated with various governmental and regulatory compliance programs that we must purchase in the open market to comply with these programs. These programs are described below.
Obligation to Blend BiofuelsWe are obligated to blend biofuels into the products we produce in most of the countries in which we operate, and these countries set annual quotas for the percentage of biofuels that must be blended into the motor fuels consumed in these countries. As a producer of motor fuels from petroleum, we are obligated to blend biofuels into the products we produce at a rate that is at least equal to the applicable quota. To the degree we are unable to blend at the applicable rate in the U.S. and the U.K., we must purchase Renewable Identification Numbers (RINs) in the U.S. and Renewable Transport Fuel Obligation certificates (RTFCs) in the U.K., and as such, we are exposed to the volatility in the market price of these financial instruments. We have not
Table of Contents
VALERO ENERGY CORPORATION AND SUBSIDIARIESNOTES TO CONSOLIDATED FINANCIAL STATEMENTS (Continued)
130
entered into derivative instruments to manage this risk, but we purchase RINs and RTFCs when the price of these instruments is deemed favorable. For the years ended December 31, 2012, 2011, and 2010, the cost of meeting our obligations under these compliance programs was $250 million, $231 million, and $66 million, respectively, and these amounts are reflected in cost of sales.
Maintaining Minimum Inventory QuantitiesIn the U.K., we are required to maintain a minimum quantity of crude oil and refined products as a reserve against shortages or interruptions in the supply of these products. To the degree we decide not to physically hold the minimum quantity of crude oil and refined products, we must purchase Compulsory Stock Obligation (CSO) tickets from other suppliers of refined products in the U.K. or other European Union (EU) member countries, and we make economic decisions as to the cost of maintaining certain quantities of crude oil and refined products versus the cost of purchasing CSO tickets. We have not entered into derivative instruments to manage the price volatility of CSO tickets. For the years ended December 31, 2012 and 2011, the cost of purchasing CSO tickets to help meet our obligations under this compliance program was $8 million and $4 million, respectively, and these amounts were reflected in cost of sales. We had no obligations under this compliance program prior to completing the Pembroke Acquisition in 2011.
Emission AllowancesOur Pembroke Refinery is subject to a maximum amount of carbon dioxide that it can emit each year under the EU Emissions Trading Scheme. Under this cap-and-trade program, we purchase emission allowances on the open market for the difference between the amount of carbon dioxide emitted and the maximum amount allowed under the program. Therefore, we are exposed to the volatility in the market price of these allowances. For the years ended December 31, 2012 and 2011, the cost of meeting our obligation under this compliance program was immaterial. We had no obligations under this compliance program prior to completing the Pembroke Acquisition in 2011.
We enter into derivative instruments (futures) to reduce the impact of this risk on our results of operations and cash flows. Our positions in these derivative instruments are monitored and managed on a daily basis by a risk control group to ensure compliance with our stated risk management policy that has been approved by our board of directors. As of December 31, 2012, we had no futures contracts outstanding related to this compliance program. As of December 31, 2011, we had purchased futures contracts – long for 68,000 metric tons of EU emission allowances that were entered into as economic hedges. As of December 31, 2011, the fair value of these futures contracts was immaterial and therefore not separately presented in the table below under “Fair Values of Derivative Instruments.” For the year ended December 31, 2011, the loss recognized in income on these derivative instruments designated as economic hedges was also immaterial and therefore not separately presented in the table below under “Effect of Derivative Instruments on Statements of Income and Other Comprehensive Income.”
Interest Rate RiskOur primary market risk exposure for changes in interest rates relates to our debt obligations. We manage our exposure to changing interest rates through the use of a combination of fixed-rate and floating-rate debt. In addition, at times we have used interest rate swap agreements to manage our fixed to floating interest rate position by converting certain fixed-rate debt to floating-rate debt. We had no interest rate derivative instruments outstanding as of December 31, 2012 and 2011, or during the years ended December 31, 2012, 2011, or 2010.
Table of Contents
VALERO ENERGY CORPORATION AND SUBSIDIARIESNOTES TO CONSOLIDATED FINANCIAL STATEMENTS (Continued)
131
Foreign Currency RiskWe are exposed to exchange rate fluctuations on transactions entered into by our international operations that are denominated in currencies other than the local (functional) currencies of these operations. To manage our exposure to these exchange rate fluctuations, we use foreign currency exchange and purchase contracts. These contracts are not designated as hedging instruments for accounting purposes, and therefore they are classified as economic hedges. As of December 31, 2012, we had commitments to purchase $552 million of U.S. dollars. These commitments matured on or before January 31, 2013 resulting in a gain of $1 million in the first quarter of 2013.
Table of Contents
VALERO ENERGY CORPORATION AND SUBSIDIARIESNOTES TO CONSOLIDATED FINANCIAL STATEMENTS (Continued)
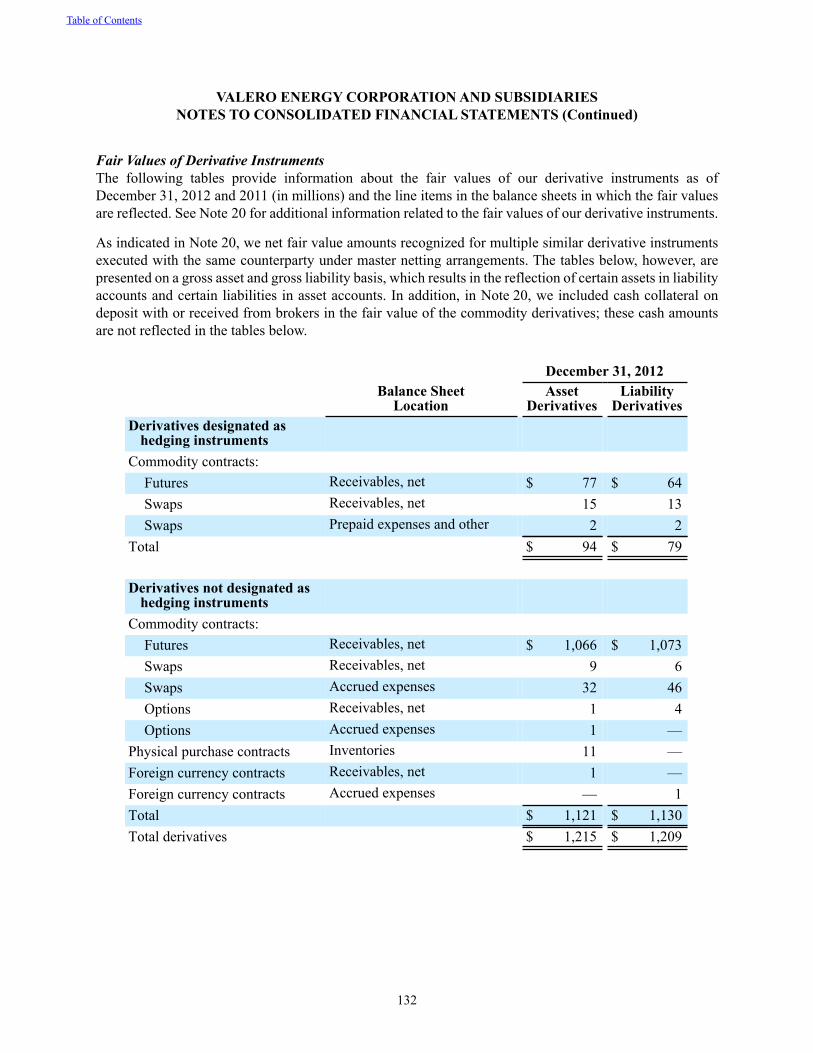
132
Fair Values of Derivative InstrumentsThe following tables provide information about the fair values of our derivative instruments as of December 31, 2012 and 2011 (in millions) and the line items in the balance sheets in which the fair values are reflected. See Note 20 for additional information related to the fair values of our derivative instruments.
As indicated in Note 20, we net fair value amounts recognized for multiple similar derivative instruments executed with the same counterparty under master netting arrangements. The tables below, however, are presented on a gross asset and gross liability basis, which results in the reflection of certain assets in liability accounts and certain liabilities in asset accounts. In addition, in Note 20, we included cash collateral on deposit with or received from brokers in the fair value of the commodity derivatives; these cash amounts are not reflected in the tables below.
Balance SheetLocation
December 31, 2012Asset
Derivatives Liability
Derivatives Derivatives designated as
hedging instrumentsCommodity contracts:
Futures Receivables, net $ 77 $ 64Swaps Receivables, net 15 13Swaps Prepaid expenses and other 2 2
Total $ 94 $ 79
Derivatives not designated ashedging instruments
Commodity contracts:Futures Receivables, net $ 1,066 $ 1,073Swaps Receivables, net 9 6Swaps Accrued expenses 32 46Options Receivables, net 1 4Options Accrued expenses 1 —
Physical purchase contracts Inventories 11 —Foreign currency contracts Receivables, net 1 —Foreign currency contracts Accrued expenses — 1Total $ 1,121 $ 1,130Total derivatives $ 1,215 $ 1,209
Table of Contents
VALERO ENERGY CORPORATION AND SUBSIDIARIESNOTES TO CONSOLIDATED FINANCIAL STATEMENTS (Continued)
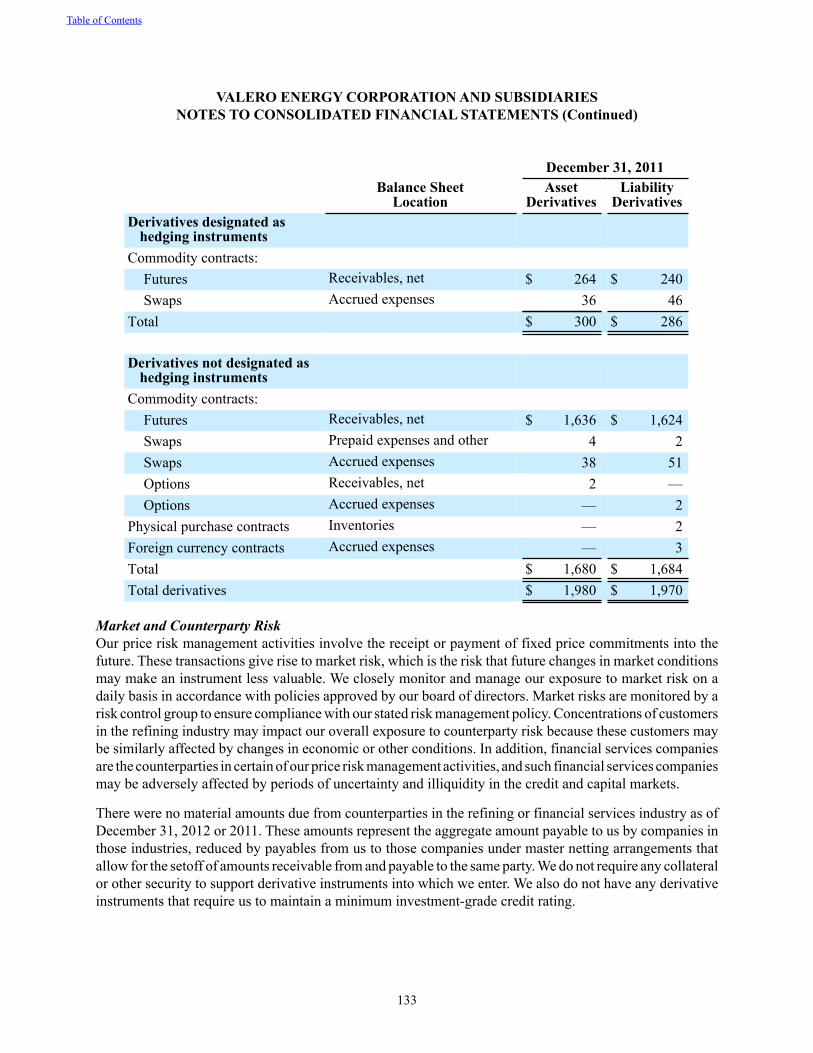
133
Balance Sheet
Location
December 31, 2011
Asset
Derivatives Liability
Derivatives Derivatives designated as
hedging instruments
Commodity contracts:
Futures Receivables, net $ 264 $ 240Swaps Accrued expenses 36 46
Total $ 300 $ 286
Derivatives not designated ashedging instruments
Commodity contracts: Futures Receivables, net $ 1,636 $ 1,624Swaps Prepaid expenses and other 4 2Swaps Accrued expenses 38 51Options Receivables, net 2 —Options Accrued expenses — 2
Physical purchase contracts Inventories — 2Foreign currency contracts Accrued expenses — 3Total $ 1,680 $ 1,684Total derivatives $ 1,980 $ 1,970
Market and Counterparty RiskOur price risk management activities involve the receipt or payment of fixed price commitments into the future. These transactions give rise to market risk, which is the risk that future changes in market conditions may make an instrument less valuable. We closely monitor and manage our exposure to market risk on a daily basis in accordance with policies approved by our board of directors. Market risks are monitored by a risk control group to ensure compliance with our stated risk management policy. Concentrations of customers in the refining industry may impact our overall exposure to counterparty risk because these customers may be similarly affected by changes in economic or other conditions. In addition, financial services companies are the counterparties in certain of our price risk management activities, and such financial services companies may be adversely affected by periods of uncertainty and illiquidity in the credit and capital markets.
There were no material amounts due from counterparties in the refining or financial services industry as of December 31, 2012 or 2011. These amounts represent the aggregate amount payable to us by companies in those industries, reduced by payables from us to those companies under master netting arrangements that allow for the setoff of amounts receivable from and payable to the same party. We do not require any collateral or other security to support derivative instruments into which we enter. We also do not have any derivative instruments that require us to maintain a minimum investment-grade credit rating.
Table of Contents
VALERO ENERGY CORPORATION AND SUBSIDIARIESNOTES TO CONSOLIDATED FINANCIAL STATEMENTS (Continued)
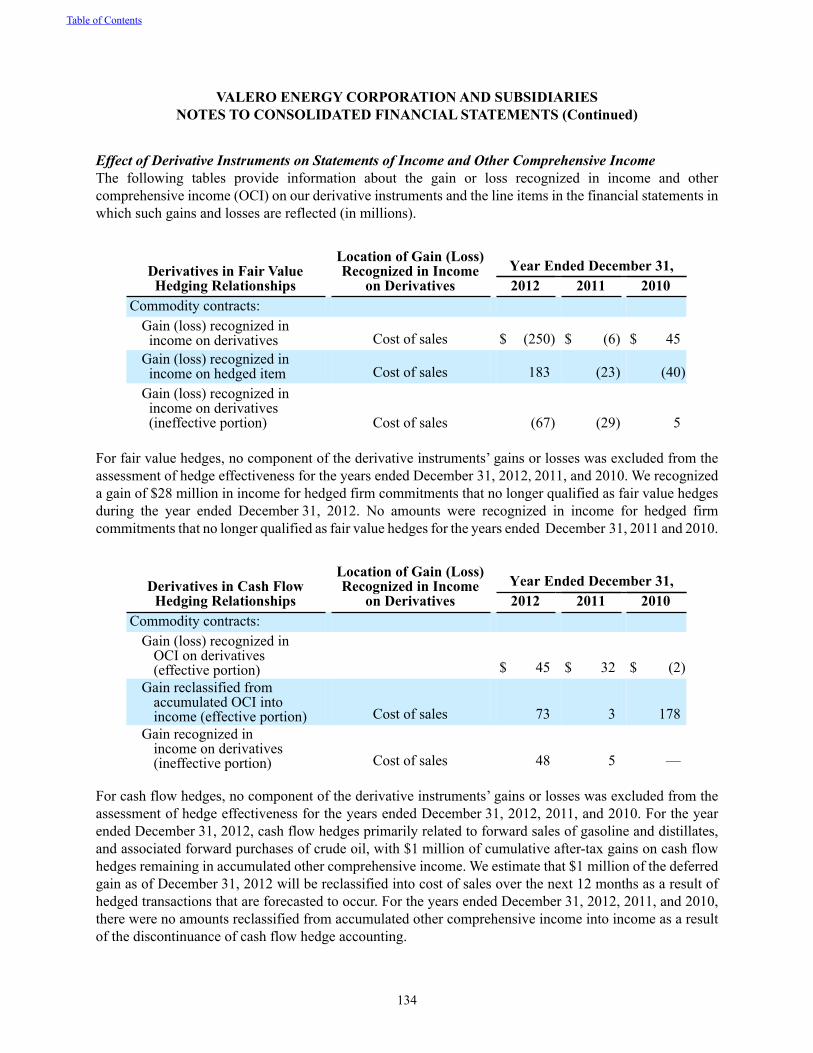
134
Effect of Derivative Instruments on Statements of Income and Other Comprehensive IncomeThe following tables provide information about the gain or loss recognized in income and other comprehensive income (OCI) on our derivative instruments and the line items in the financial statements in which such gains and losses are reflected (in millions).
Derivatives in Fair ValueHedging Relationships
Location of Gain (Loss)Recognized in Income
on DerivativesYear Ended December 31,2012 2011 2010
Commodity contracts:Gain (loss) recognized in income on derivatives Cost of sales $ (250) $ (6) $ 45Gain (loss) recognized in income on hedged item Cost of sales 183 (23) (40)Gain (loss) recognized in income on derivatives (ineffective portion) Cost of sales (67) (29) 5
For fair value hedges, no component of the derivative instruments’ gains or losses was excluded from the assessment of hedge effectiveness for the years ended December 31, 2012, 2011, and 2010. We recognized a gain of $28 million in income for hedged firm commitments that no longer qualified as fair value hedges during the year ended December 31, 2012. No amounts were recognized in income for hedged firm commitments that no longer qualified as fair value hedges for the years ended December 31, 2011 and 2010.
Derivatives in Cash FlowHedging Relationships
Location of Gain (Loss)Recognized in Income
on DerivativesYear Ended December 31,2012 2011 2010
Commodity contracts:Gain (loss) recognized in
OCI on derivatives(effective portion) $ 45 $ 32 $ (2)
Gain reclassified fromaccumulated OCI intoincome (effective portion) Cost of sales 73 3 178
Gain recognized inincome on derivatives(ineffective portion) Cost of sales 48 5 —
For cash flow hedges, no component of the derivative instruments’ gains or losses was excluded from the assessment of hedge effectiveness for the years ended December 31, 2012, 2011, and 2010. For the year ended December 31, 2012, cash flow hedges primarily related to forward sales of gasoline and distillates, and associated forward purchases of crude oil, with $1 million of cumulative after-tax gains on cash flow hedges remaining in accumulated other comprehensive income. We estimate that $1 million of the deferred gain as of December 31, 2012 will be reclassified into cost of sales over the next 12 months as a result of hedged transactions that are forecasted to occur. For the years ended December 31, 2012, 2011, and 2010, there were no amounts reclassified from accumulated other comprehensive income into income as a result of the discontinuance of cash flow hedge accounting.
Table of Contents
VALERO ENERGY CORPORATION AND SUBSIDIARIESNOTES TO CONSOLIDATED FINANCIAL STATEMENTS (Continued)
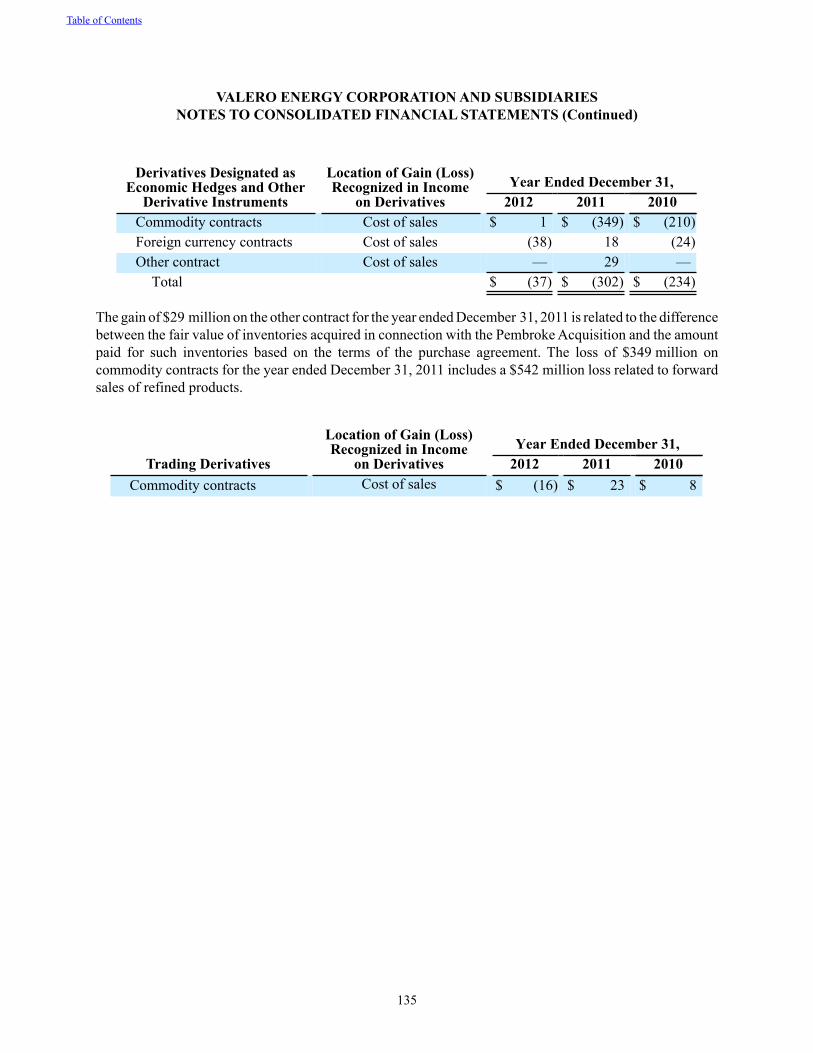
135
Derivatives Designated as Economic Hedges and Other
Derivative Instruments
Location of Gain (Loss)Recognized in Income
on DerivativesYear Ended December 31,
2012 2011 2010Commodity contracts Cost of sales $ 1 $ (349) $ (210)Foreign currency contracts Cost of sales (38) 18 (24)Other contract Cost of sales — 29 —
Total $ (37) $ (302) $ (234)
The gain of $29 million on the other contract for the year ended December 31, 2011 is related to the difference between the fair value of inventories acquired in connection with the Pembroke Acquisition and the amount paid for such inventories based on the terms of the purchase agreement. The loss of $349 million on commodity contracts for the year ended December 31, 2011 includes a $542 million loss related to forward sales of refined products.
Trading Derivatives
Location of Gain (Loss)Recognized in Income
on DerivativesYear Ended December 31,
2012 2011 2010Commodity contracts Cost of sales $ (16) $ 23 $ 8
Table of Contents
VALERO ENERGY CORPORATION AND SUBSIDIARIESNOTES TO CONSOLIDATED FINANCIAL STATEMENTS (Continued)
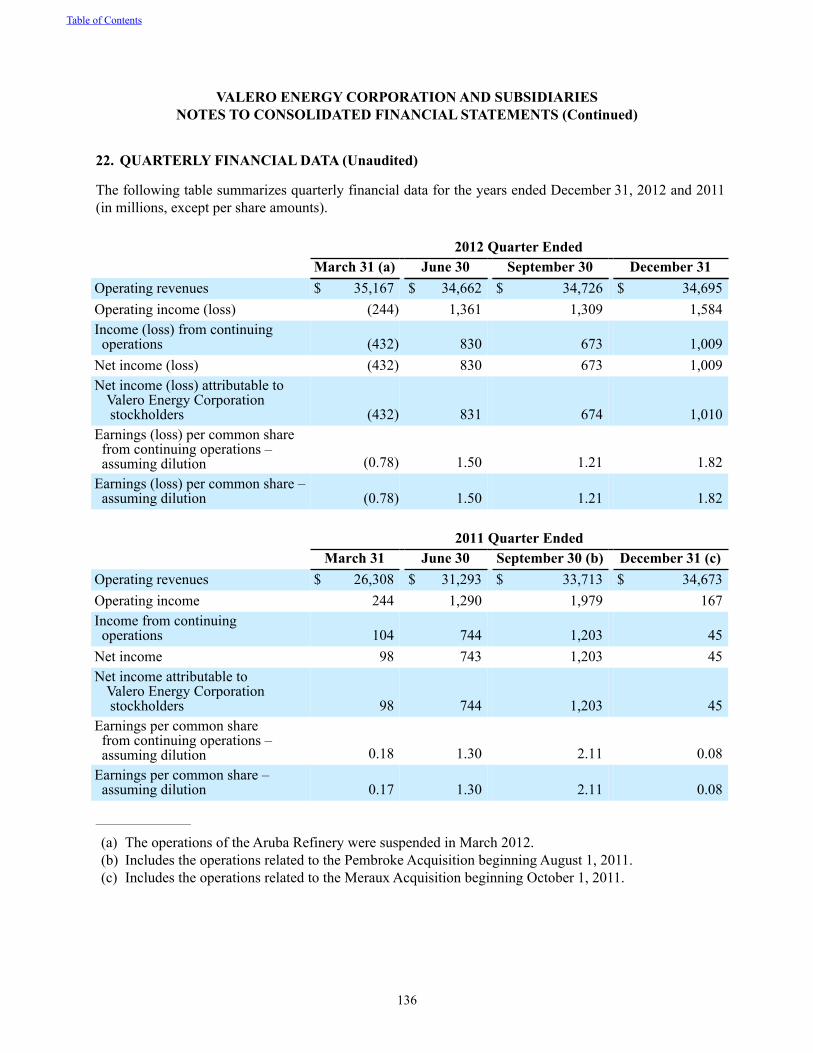
136
22. QUARTERLY FINANCIAL DATA (Unaudited)
The following table summarizes quarterly financial data for the years ended December 31, 2012 and 2011 (in millions, except per share amounts).
2012 Quarter EndedMarch 31 (a) June 30 September 30 December 31
Operating revenues $ 35,167 $ 34,662 $ 34,726 $ 34,695Operating income (loss) (244) 1,361 1,309 1,584Income (loss) from continuing operations (432) 830 673 1,009Net income (loss) (432) 830 673 1,009Net income (loss) attributable to
Valero Energy Corporation stockholders (432) 831 674 1,010
Earnings (loss) per common share from continuing operations – assuming dilution (0.78) 1.50 1.21 1.82Earnings (loss) per common share – assuming dilution (0.78) 1.50 1.21 1.82
2011 Quarter EndedMarch 31 June 30 September 30 (b) December 31 (c)
Operating revenues $ 26,308 $ 31,293 $ 33,713 $ 34,673Operating income 244 1,290 1,979 167Income from continuing operations 104 744 1,203 45Net income 98 743 1,203 45Net income attributable to
Valero Energy Corporation stockholders 98 744 1,203 45
Earnings per common share from continuing operations – assuming dilution 0.18 1.30 2.11 0.08Earnings per common share – assuming dilution 0.17 1.30 2.11 0.08
____________________
(a) The operations of the Aruba Refinery were suspended in March 2012.(b) Includes the operations related to the Pembroke Acquisition beginning August 1, 2011.(c) Includes the operations related to the Meraux Acquisition beginning October 1, 2011.
Table of Contents
VALERO ENERGY CORPORATION AND SUBSIDIARIESNOTES TO CONSOLIDATED FINANCIAL STATEMENTS (Continued)
137
ITEM 9. CHANGES IN AND DISAGREEMENTS WITH ACCOUNTANTS ON ACCOUNTING AND FINANCIAL DISCLOSURE
None.
ITEM 9A. CONTROLS AND PROCEDURES
Disclosure Controls and Procedures. Our management has evaluated, with the participation of our principal executive officer and principal financial officer, the effectiveness of our disclosure controls and procedures (as defined in Rule 13a-15(e) under the Securities Exchange Act of 1934) as of the end of the period covered by this report, and has concluded that our disclosure controls and procedures were effective as of December 31, 2012.
Internal Control over Financial Reporting.
(a) Management’s Report on Internal Control over Financial Reporting.
The management report on Valero’s internal control over financial reporting required by Item 9A appears in Item 8 on page 58 of this report, and is incorporated herein by reference.
(b) Attestation Report of the Independent Registered Public Accounting Firm.
KPMG LLP’s report on Valero’s internal control over financial reporting appears in Item 8 beginning on page 60 of this report, and is incorporated herein by reference.
(c) Changes in Internal Control over Financial Reporting.
There has been no change in our internal control over financial reporting that occurred during our last fiscal quarter that has materially affected, or is reasonably likely to materially affect, our internal control over financial reporting.
ITEM 9B. OTHER INFORMATION
None.
Table of Contents
138
PART IIIITEMS 10-14.
The information required by Items 10 through 14 of Form 10-K is incorporated herein by reference to the definitive proxy statement for our 2013 annual meeting of stockholders. We will file the proxy statement with the SEC before March 31, 2013.
PART IV
ITEM 15. EXHIBITS AND FINANCIAL STATEMENT SCHEDULES
(a) 1. Financial Statements. The following consolidated financial statements of Valero Energy Corporation and its subsidiaries are included in Part II, Item 8 of this Form 10-K:
Page
2. Financial Statement Schedules and Other Financial Information. No financial statement schedules are submitted because either they are inapplicable or because the required information is included in the consolidated financial statements or notes thereto.
3. Exhibits. Filed as part of this Form 10-K are the following exhibits:
3.01 -- Amended and Restated Certificate of Incorporation of Valero Energy Corporation, formerly known as Valero Refining and Marketing Company - incorporated by reference to Exhibit 3.1 to Valero’s Registration Statement on Form S-1 (SEC File No. 333-27013) filed May 13, 1997.
3.02 -- Certificate of Amendment (effective July 31, 1997) to Restated Certificate of Incorporation of Valero Energy Corporation - incorporated by reference to Exhibit 3.02 to Valero’s Annual Report on Form 10-K for the year ended December 31, 2003 (SEC File No. 1-13175).
3.03 -- Certificate of Merger of Ultramar Diamond Shamrock Corporation with and into Valero Energy Corporation dated December 31, 2001 - incorporated by reference to Exhibit 3.03 to Valero’s Annual Report on Form 10-K for the year ended December 31, 2003 (SEC File No. 1-13175).
3.04 -- Amendment (effective December 31, 2001) to Restated Certificate of Incorporation of Valero Energy Corporation - incorporated by reference to Exhibit 3.1 to Valero’s Current Report on Form 8-K dated December 31, 2001, and filed January 11, 2002 (SEC File No. 1-13175).
3.05 -- Second Certificate of Amendment (effective September 17, 2004) to Restated Certificate of Incorporation of Valero Energy Corporation - incorporated by reference to Exhibit 3.04 to Valero’s Quarterly Report on Form 10-Q for the quarter ended September 30, 2004 (SEC File No. 1-13175).
Table of Contents
Management’s report on internal control over financial reporting 58Reports of independent registered public accounting firm 59Consolidated balance sheets as of December 31, 2012 and 2011 62Consolidated statements of income for the years ended December 31, 2012, 2011, and 2010 63Consolidated statements of comprehensive income for the years ended December 31, 2012, 2011, and 2010 64Consolidated statements of equity for the years ended December 31, 2012, 2011, and 2010 65Consolidated statements of cash flows for the years ended December 31, 2012, 2011, and 2010 66Notes to consolidated financial statements 67
139
3.06 -- Certificate of Merger of Premcor Inc. with and into Valero Energy Corporation effective September 1, 2005 - incorporated by reference to Exhibit 2.01 to Valero’s Quarterly Report on Form 10-Q for the quarter ended September 30, 2005 (SEC File No. 1-13175).
3.07 -- Third Certificate of Amendment (effective December 2, 2005) to Restated Certificate of Incorporation of Valero Energy Corporation - incorporated by reference to Exhibit 3.07 to Valero’s Annual Report on Form 10-K for the year ended December 31, 2005 (SEC File No. 1-13175).
3.08 -- Fourth Certificate of Amendment (effective May 24, 2011) to Restated Certificate of Incorporation of Valero Energy Corporation - incorporated by reference to Exhibit 4.8 to Valero’s Current Report on Form 8-K dated and filed May 24, 2011 (SEC File No. 1-13175).
*3.09 -- Amended and Restated Bylaws of Valero Energy Corporation.
4.01 -- Indenture dated as of December 12, 1997 between Valero Energy Corporation and The Bank of New York - incorporated by reference to Exhibit 3.4 to Valero’s Registration Statement on Form S-3 (SEC File No. 333-56599) filed June 11, 1998.
4.02 -- First Supplemental Indenture dated as of June 28, 2000 between Valero Energy Corporation and The Bank of New York (including Form of 7 3/4% Senior Deferrable Note due 2005) - incorporated by reference to Exhibit 4.6 to Valero’s Current Report on Form 8-K dated June 28, 2000, and filed June 30, 2000 (SEC File No. 1-13175).
4.03 -- Indenture (Senior Indenture) dated as of June 18, 2004 between Valero Energy Corporation and Bank of New York - incorporated by reference to Exhibit 4.7 to Valero’s Registration Statement on Form S-3 (SEC File No. 333-116668) filed June 21, 2004.
4.04 -- Form of Indenture related to subordinated debt securities - incorporated by reference to Exhibit 4.8 to Valero’s Registration Statement on Form S-3 (SEC File No. 333-116668) filed June 21, 2004.
4.05 -- Specimen Certificate of Common Stock - incorporated by reference to Exhibit 4.1 to Valero’s Registration Statement on Form S-3 (SEC File No. 333-116668) filed June 21, 2004.
+10.01 -- Valero Energy Corporation Annual Bonus Plan, amended and restated as of July 29, 2009 - incorporated by reference to Exhibit 10.01 to Valero’s Current Report on Form 8-K dated July 29, 2009, and filed August 4, 2009 (SEC File No. 1-13175).
+10.02 -- Valero Energy Corporation Annual Incentive Plan for Named Executive Officers - incorporated by reference to Exhibit 10.01 to Valero’s Current Report on Form 8-K dated February 22, 2012, and filed February 27, 2012 (SEC File No. 1-13175).
+10.03 -- Valero Energy Corporation 2005 Omnibus Stock Incentive Plan, amended and restated as of October 1, 2005 - incorporated by reference to Exhibit 10.02 to Valero’s Annual Report on Form 10-K for the year ended December 31, 2009 (SEC File No. 1-13175).
+10.04 -- Valero Energy Corporation 2011 Omnibus Stock Incentive Plan - incorporated by reference to Appendix A to Valero’s Definitive Proxy Statement on Schedule 14A for the 2011 annual meeting of stockholders, filed March 18, 2011 (SEC File No. 1-13175).
+10.05 -- Valero Energy Corporation Deferred Compensation Plan, amended and restated as of January 1, 2008 - incorporated by reference to Exhibit 10.04 to Valero’s Annual Report on Form 10-K for the year ended December 31, 2008 (SEC File No. 1-13175).
+10.06 -- Form of Elective Deferral Agreement pursuant to the Valero Energy Corporation Deferred Compensation Plan - incorporated by reference to Exhibit 10.05 to Valero’s Annual Report on Form 10-K for the year ended December 31, 2011 (SEC File No. 1-13175).
+10.07 -- Form of Investment Election Form pursuant to the Valero Energy Corporation Deferred Compensation Plan - incorporated by reference to Exhibit 10.06 to Valero’s Annual Report on Form 10-K for the year ended December 31, 2011 (SEC File No. 1-13175).
+10.08 -- Form of Distribution Election Form pursuant to the Valero Energy Corporation Deferred Compensation Plan - incorporated by reference to Exhibit 10.07 to Valero’s Annual Report on Form 10-K for the year ended December 31, 2011 (SEC File No. 1-13175).
Table of Contents
140
+10.09 -- Valero Energy Corporation Amended and Restated Supplemental Executive Retirement Plan, amended and restated as of November 10, 2008 - incorporated by reference to Exhibit 10.08 to Valero’s Annual Report on Form 10-K for the year ended December 31, 2008 (SEC File No. 1-13175).
+10.10 -- Valero Energy Corporation Excess Pension Plan, as amended and restated effective December 31, 2011 - incorporated by reference to Exhibit 10.10 to Valero’s Annual Report on Form 10-K for the year ended December 31, 2011 (SEC File No. 1-13175).
+10.11 -- Valero Energy Corporation Restricted Stock Plan for Non-Employee Directors, as amended and restated July 11, 2007 - incorporated by reference to Exhibit 10.02 to Valero’s Current Report on Form 8-K/A dated July 11, 2007, and filed September 18, 2007 (SEC File No. 1-13175).
+10.12 -- Form of Indemnity Agreement between Valero Energy Corporation (formerly known as Valero Refining and Marketing Company) and certain officers and directors - incorporated by reference to Exhibit 10.8 to Valero’s Registration Statement on Form S-1 (SEC File No. 333-27013) filed May 13, 1997.
+10.13 -- Schedule of Indemnity Agreements - incorporated by reference to Exhibit 10.14 to Valero’s Annual Report on Form 10-K for the year ended December 31, 2011 (SEC File No. 1-13175).
+10.14 -- Change of Control Severance Agreement (Tier I) dated January 18, 2007, between Valero Energy Corporation and William R. Klesse - incorporated by reference to Exhibit 10.15 to Valero’s Annual Report on Form 10-K for the year ended December 31, 2011 (SEC File No. 1-13175).
+10.15 -- Schedule of Change of Control Severance Agreements (Tier I) - incorporated by reference to Exhibit 10.16 to Valero’s Annual Report on Form 10-K for the year ended December 31, 2011 (SEC File No. 1-13175).
+10.16 -- Change of Control Severance Agreement (Tier II) dated March 15, 2007, between Valero Energy Corporation and Kimberly S. Bowers - incorporated by reference to Exhibit 10.17 to Valero’s Annual Report on Form 10-K for the year ended December 31, 2011 (SEC File No. 1-13175).
*+10.17 -- Form of Amendment to Change of Control Severance Agreements (to eliminate excise tax gross-up benefit).
*+10.18 -- Schedule of Amendments to Change of Control Severance Agreements.
+10.19 -- Form of Performance Award Agreement pursuant to the Valero Energy Corporation 2011 Omnibus Stock Incentive Plan - incorporated by reference to Exhibit 10.19 to Valero’s Annual Report on Form 10-K for the year ended December 31, 2011 (SEC File No. 1-13175).
+10.20 -- Form of Stock Option Agreement pursuant to the Valero Energy Corporation 2011 Omnibus Stock Incentive Plan - incorporated by reference to Exhibit 10.21 to Valero’s Annual Report on Form 10-K for the year ended December 31, 2011 (SEC File No. 1-13175).
*+10.21 -- Form of Performance Stock Option Agreement pursuant to the Valero Energy Corporation 2011 Omnibus Stock Incentive Plan.
+10.22 -- Form of Stock Option Agreement pursuant to the Valero Energy Corporation Non-Employee Director Stock Option Plan - incorporated by reference to Exhibit 10.04 to Valero’s Quarterly Report on Form 10-Q for the quarter ended September 30, 2006 (SEC File No. 1-13175).
+10.23 -- Form of Restricted Stock Agreement pursuant to the Valero Energy Corporation 2005 Omnibus Stock Incentive Plan - incorporated by reference to Exhibit 10.02 to Valero’s Quarterly Report on Form 10-Q for the quarter ended September 30, 2005 (SEC File No. 1-13175).
+10.24 -- Form of Restricted Stock Agreement (with acceleration feature) pursuant to the Valero Energy Corporation 2011 Omnibus Stock Incentive Plan - incorporated by reference to Exhibit 10.24 to Valero’s Annual Report on Form 10-K for the year ended December 31, 2011 (SEC File No. 1-13175).
*+10.25 -- Form of Restricted Stock Agreement (without acceleration feature) pursuant to the Valero Energy Corporation 2011 Omnibus Stock Incentive Plan.
Table of Contents
141
+10.26 -- Form of Restricted Stock Agreement pursuant to the Valero Energy Corporation Restricted Stock Plan for Non-Employee Directors - incorporated by reference to Exhibit 10.03 to Valero’s Quarterly Report on Form 10-Q for the quarter ended September 30, 2006 (SEC File No. 1-13175).
10.27 -- $3,000,000,000 5-Year Amended and Restated Revolving Credit Agreement, dated as of December 5, 2011, among Valero Energy Corporation, as Borrower; JPMorgan Chase Bank, N.A., as Administrative Agent; and the lenders named therein - incorporated by reference to Exhibit 10.26 to Valero’s Annual Report on Form 10-K for the year ended December 31, 2011 (SEC File No. 1-13175).
*12.01 -- Statements of Computations of Ratios of Earnings to Fixed Charges.
14.01 -- Code of Ethics for Senior Financial Officers - incorporated by reference to Exhibit 14.01 to Valero’s Annual Report on Form 10-K for the year ended December 31, 2003 (SEC File No. 1-13175).
*21.01 -- Valero Energy Corporation subsidiaries.
*23.01 -- Consent of KPMG LLP dated February 28, 2013.
*24.01 -- Power of Attorney dated February 28, 2013 (on the signature page of this Form 10-K).
*31.01 -- Rule 13a-14(a) Certification (under Section 302 of the Sarbanes-Oxley Act of 2002) of principal executive officer.
*31.02 -- Rule 13a-14(a) Certification (under Section 302 of the Sarbanes-Oxley Act of 2002) of principal financial officer.
*32.01 -- Section 1350 Certifications (under Section 906 of the Sarbanes-Oxley Act of 2002).
99.01 -- Audit Committee Pre-Approval Policy - incorporated by reference to Exhibit 99.01 to Valero’s Annual Report on Form 10-K for the year ended December 31, 2011 (SEC File No. 1-13175).
**101 -- Interactive Data Files
______________
* Filed herewith.
+ Identifies management contracts or compensatory plans or arrangements required to be filed as an exhibit hereto.
** Submitted electronically herewith.
Copies of exhibits filed with this Form 10-K may be obtained by stockholders of record at a charge of $0.15 per page, minimum $5.00 each request. Direct inquiries to Valero Energy Corporation, Attn: Secretary, P.O. Box 696000, San Antonio, Texas 78269-6000.
Pursuant to paragraph 601(b)(4)(iii)(A) of Regulation S-K, the registrant has omitted from the foregoing listing of exhibits, and hereby agrees to furnish to the SEC upon its request, copies of certain instruments, each relating to debt not exceeding 10 percent of the total assets of the registrant and its subsidiaries on a consolidated basis.
Table of Contents
142
SIGNATUREPursuant to the requirements of Section 13 or 15(d) of the Securities Exchange Act of 1934, the registrant has duly caused this report to be signed on its behalf by the undersigned, thereunto duly authorized.
VALERO ENERGY CORPORATION(Registrant)
By: /s/ William R. Klesse
(William R. Klesse)Chief Executive Officer and
Chairman of the Board
Date: February 28, 2013
Table of Contents
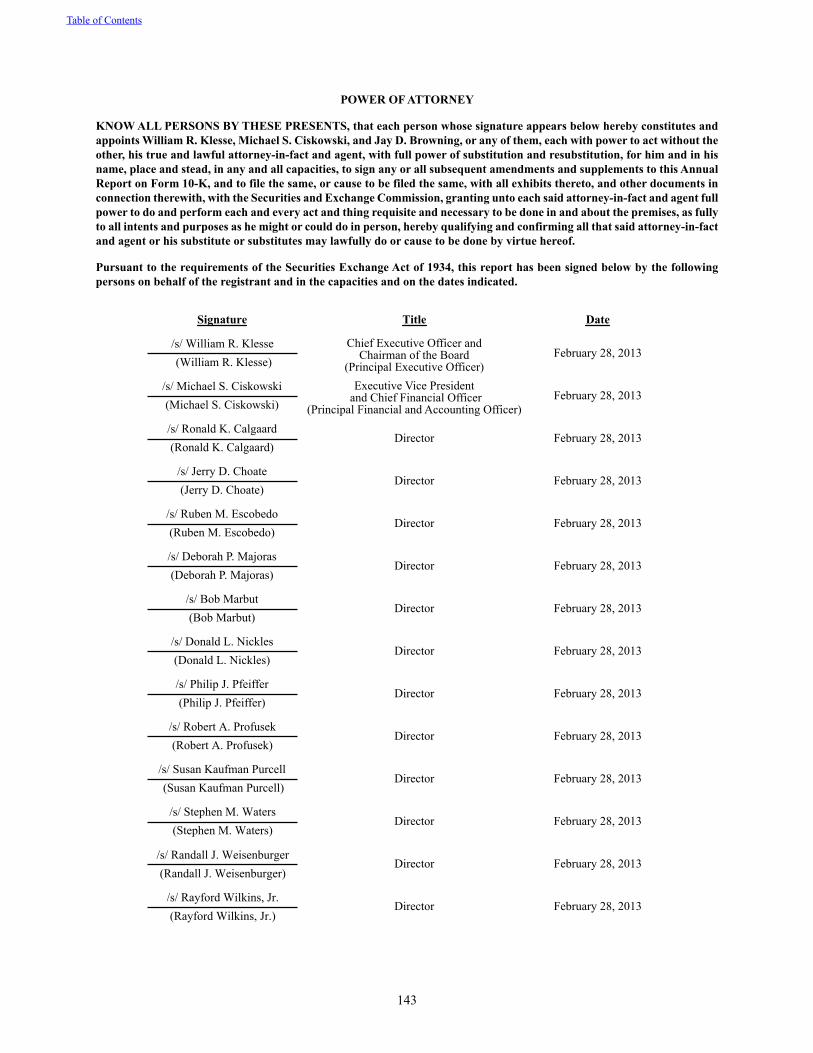
143
POWER OF ATTORNEY
KNOW ALL PERSONS BY THESE PRESENTS, that each person whose signature appears below hereby constitutes and appoints William R. Klesse, Michael S. Ciskowski, and Jay D. Browning, or any of them, each with power to act without the other, his true and lawful attorney-in-fact and agent, with full power of substitution and resubstitution, for him and in his name, place and stead, in any and all capacities, to sign any or all subsequent amendments and supplements to this Annual Report on Form 10-K, and to file the same, or cause to be filed the same, with all exhibits thereto, and other documents in connection therewith, with the Securities and Exchange Commission, granting unto each said attorney-in-fact and agent full power to do and perform each and every act and thing requisite and necessary to be done in and about the premises, as fully to all intents and purposes as he might or could do in person, hereby qualifying and confirming all that said attorney-in-fact and agent or his substitute or substitutes may lawfully do or cause to be done by virtue hereof.
Pursuant to the requirements of the Securities Exchange Act of 1934, this report has been signed below by the following persons on behalf of the registrant and in the capacities and on the dates indicated.
Signature Title Date
/s/ William R. Klesse Chief Executive Officer andChairman of the Board
(Principal Executive Officer)February 28, 2013
(William R. Klesse)
/s/ Michael S. Ciskowski Executive Vice President and Chief Financial Officer
(Principal Financial and Accounting Officer)February 28, 2013
(Michael S. Ciskowski)
/s/ Ronald K. CalgaardDirector February 28, 2013
(Ronald K. Calgaard)
/s/ Jerry D. ChoateDirector February 28, 2013
(Jerry D. Choate)
/s/ Ruben M. EscobedoDirector February 28, 2013
(Ruben M. Escobedo)
/s/ Deborah P. MajorasDirector February 28, 2013
(Deborah P. Majoras)
/s/ Bob MarbutDirector February 28, 2013
(Bob Marbut)
/s/ Donald L. NicklesDirector February 28, 2013
(Donald L. Nickles)
/s/ Philip J. PfeifferDirector February 28, 2013
(Philip J. Pfeiffer)
/s/ Robert A. ProfusekDirector February 28, 2013
(Robert A. Profusek)
/s/ Susan Kaufman PurcellDirector February 28, 2013
(Susan Kaufman Purcell)
/s/ Stephen M. WatersDirector February 28, 2013
(Stephen M. Waters)
/s/ Randall J. WeisenburgerDirector February 28, 2013
(Randall J. Weisenburger)
/s/ Rayford Wilkins, Jr.Director February 28, 2013
(Rayford Wilkins, Jr.)
Table of Contents