Embed Size (px)
Citation preview
1 23
Food Analytical Methods ISSN 1936-9751 Food Anal. MethodsDOI 10.1007/s12161-013-9708-3
Rapid Quantification of SoyasaponinsI and βg in Italian Lentils by High-Performance Liquid Chromatography(HPLC)–Tandem Mass Spectrometry (MS/MS)Pilar Vila Donat, Giovanni Caprioli,Paolo Conti, Filippo Maggi, MassimoRicciutelli, Elisabetta Torregiani, SauroVittori, et al.
1 23
Your article is protected by copyright and all
rights are held exclusively by Springer Science
+Business Media New York. This e-offprint is
for personal use only and shall not be self-
archived in electronic repositories. If you wish
to self-archive your article, please use the
accepted manuscript version for posting on
your own website. You may further deposit
the accepted manuscript version in any
repository, provided it is only made publicly
available 12 months after official publication
or later and provided acknowledgement is
given to the original source of publication
and a link is inserted to the published article
on Springer's website. The link must be
accompanied by the following text: "The final
publication is available at link.springer.com”.
Rapid Quantification of Soyasaponins I and βg in ItalianLentils by High-Performance Liquid Chromatography(HPLC)–Tandem Mass Spectrometry (MS/MS)
Pilar Vila Donat & Giovanni Caprioli & Paolo Conti &Filippo Maggi & Massimo Ricciutelli &Elisabetta Torregiani & Sauro Vittori & Gianni Sagratini
Received: 9 August 2013 /Accepted: 20 August 2013# Springer Science+Business Media New York 2013
Abstract In this work, an innovative and fast analyticalmethod for the quantification of soyasaponins I and βg inlentils has been developed. Samples were extracted using70 % aqueous ethanol at room temperature and then injectedinto a high-performance liquid chromatography–tandemmassspectrometry system. The correlation coefficients of calibra-tion curves of the analyzed compounds were ≥0.9997. Therecoveries obtained by spiking the lentil samples with a stan-dard mixture of soyasaponins I and βg at 50 and 100 mg l−1
were in the range of 96–101 and 98–103 %, respectively. Thevalidated method was applied to the analysis of 30 lentilsamples from central Italy. Soyasaponins I and βg were pres-ent in these lentils in concentrations that ranged from 54 to226 mg kg−1 and from 436 to 1,272 mg kg−1, respectively.Our data indicated that lentils cultivated in fields at interme-diate altitudes (1,142–1,387 m) showed the highest levels ofsoyasaponins, a finding confirmed by principal componentanalysis.
Keywords Lentils . Soyasaponins . Cholesterol lowercompounds . HPLC-MS/MS
AbbreviationsHPLC-MS/MS
High-performance liquid chromatography–tandem mass spectrometry
SPE Solid-phase extraction
UV UltravioletESI Electrospray ionization
Introduction
Lentils (Lens culinaris Medik), belonging to the family ofFabaceae, are one of the major cool-season food legumesgrown in many parts of the world (Cubero 1981; Caprioliet al. 2010). They are considered a healthy food because oftheir nutritional properties, as they contain dietary fiber, folate,vitamins A, C, B1, B2, and B6, and minerals (Ca, P, Fe, Mg,K) (Cervera 2002), as well as essential amino acids such asisoleucine and lysine (Messina 1997). To create a mixture thatpossesses an excellent protein balance with high biologicalvalue, lentils are often mixed with cereals like rice (EuropeanAssociation for Grain Legume Research 2011; EuropeanFood Information Council (EUFIC) 2013; Friedman 1996).A recent paper suggested that lentils contain nutritionallysignificant amounts of dietary fiber as prebiotic carbohydratesand that a 100-g serving of lentils may provide over 13 gof prebiotics (Johnson et al. 2013). Lentils are considereda primary dietary source of food saponins, especiallysoyasaponins I and βg, components of dietary fiber, bothbelonging to the group B of the soyasaponin family, havinga single glycosylation site on two different aglycons (Ruizet al. 1996).
Saponins are bioactive compounds that have beendemonstrated to possess multiple health-promoting prop-erties, such as reduction of cholesterol levels (Lee et al.2005). The soyasaponins in lentils, mainly soyasaponinI (soyasaponin βb) and soyasaponin βg (also calledsoyasaponin VI), are able to decrease plasma cholesterol
Pilar Vila Donat and Giovanni Caprioli equally contributed to this work.
P. V. Donat :G. Caprioli : P. Conti : F. Maggi :M. Ricciutelli :E. Torregiani : S. Vittori :G. Sagratini (*)School of Pharmacy, University of Camerino, Via Sant’ Agostino 1,62032 Camerino, Italye-mail: [email protected]
Food Anal. MethodsDOI 10.1007/s12161-013-9708-3
Author's personal copy
levels; this happens directly by inhibiting absorption ofcholesterol from the small intestine or indirectly byinhibiting the reabsorption of bile acid. Reduced entryof cholesterol or bile acids into the enterohepatic circu-lation results in the stimulation of cholesterol synthesismainly by the liver (Sagratini et al. 2013; Decroos et al. 2006).Soyasaponin βg (C54H84O21) contains the DDMP group (2,3-dihydro-2,5-dihydroxy-6-methyl-4-pyrone), a thermolabilegroup, at the C-22 position and may be the natural precursorof soyasaponin I (C48H78O18). The difficulty in accuratelyquantifying soyasaponins in legumes is tied to the challengeof isolating authentic standards from soybean, especiallythe thermolabile DDMP-containing soyasaponins likesoyasaponin βg (Sagratini et al. 2009; Hu et al. 2002; Linand Wang 2004a).
Several analytical methods have been proposed for thequantification of soyasaponins in a complex matrix such asfood. Ruiz et al. quantified soyasaponins in lentils using high-performance liquid chromatography (HPLC) and ultraviolet(UV) absorption (Ruiz et al. 1996), and Hu et al. used HPLC-UV detection to analyze the soyasaponin content of 46 soy-bean varieties (Hu et al. 2002). Lin et al. proposed a methodfor quantifying soyasaponin of group B in soybean by usingHPLC coupled to evaporative light-scattering detection(ELSD) (Lin and Wang 2004b). Mass spectrometry (MS)coupled to HPLC was used for monitoring soyasaponin Iduring human fecal metabolism (Hu et al. 2004) and forstudying the soyasaponin Ab metabolites in human fecalmicroflora (Chang et al. 2010). Moreover, Fuzzati et al. stud-ied the saponins contained in soybean flour extracts by aHPLC–thermospray mass spectrometry method (Fuzzatiet al. 1997), while Jin et al. proposed a HPLC-MS (ion trap)method for analyzing soyasaponins in soybeans by monitor-ing the extracted ions of each compound (Jin et al. 2006). Inour labs, a solid-phase extraction (SPE)–HPLC-MS (singlequadrupole) method was developed to quantify soyasaponinsin lentils and in legumes and to study the bioaccessibility byusing an in vitro digestion model (Sagratini et al. 2013;Sagratini et al. 2009). Although the SPE step is usefulfor purifying the sample, it is time-consuming and cancompromise the stability of thermolabile molecules likesoyasaponins.
The aim of the present work was to develop a new,selective, and fast analytical procedure for the quantifi-cation of soyasaponins I and βg in lentils using a HPLC-MS/MS technique. With this method, we have eliminatedthe pre-purification step (SPE) and, through the use of atriple quadrupole as mass analyzer, have enhanced thespecificity and sensitivity compared to previous HPLC-MS published methods. This method was applied to theanalysis of 30 samples of lentils from central Italy. Tothe best of our knowledge, no similar publications areavailable in the literature.
Materials and Methods
Materials and Standards
Pure standards of soyasaponins I and βg, used as referencecompounds, were both purchased from Tauto Biotech Co.(Zhangjiang High-Tech Park, Shanghai, P.R. China) and iso-lated according to the procedure developed in our laboratory.Individual stock solutions were prepared by dissolving 5 mgof these standards in 5 ml of methanol and were stored inglass-stoppered bottles at 4 °C. Standard working solutions, atvarious concentrations, were prepared when needed by appro-priate dilution with methanol of stock solution aliquots.HPLC-grade methanol, ethanol, and acetonitrile were pur-chased from Sigma-Aldrich (Milano, Italy), and HPLC-grade acetic acid 99–100 % was from J.T. Baker B.V. (De-venter, Holland). Deionized water (<18 MΩ cm resistivity)was obtained from a Milli-Q SP Reagent Water System(Millipore, Bedford, MA, USA). All solvents and solutionswere filtered through 0.45-μm PTFE filter from Supelco(Bellofonte, PA, USA) before use. The octadecyl-functionalized silica gel for gravity column chromatographywas supplied by Sigma-Aldrich (Steinheim, Germany).
Sample Collection
Soybean samples needed for the isolation of soyasaponinswere bought in a local market in the town of Camerino. The30 samples of lentils were provided by local producers ofcentral Italy, in particular from Camerino (MC), Fiastra(MC), Capriglia (MC), Castelsantangelo sul Nera (MC),Colfiorito (PG), Castelluccio di Norcia (PG), Visso (MC),and Montecavallo (MC). These areas are situated in the Ap-ennineMountains between theMarche and Umbria regions, ataltitudes ranging from 648 to 1,551m, and share a very similarclimate. Samples were collected in 2011.
Sample Preparation
One gram of finely ground lentil seeds was extracted for 3 hunder magnetic stirring, with 10 ml of 70 % aqueous ethanolat room temperature. The mixture was then filtered undervacuum, and the solution was directly injected in HPLC-MS/MS without further concentration.
HPLC-MS/MS Analysis
The separation of soyasaponins was achieved on a Gemini C18
analytical column (150×4.6 mm i.d., 5 μm) fromPhenomenex (Cheshire, UK). The mobile phase for LC-MS/MS analyses was a mixture of (A) water with 0.25 % aceticacid (v /v ) and (B) methanol with 0.25 % acetic acid (v /v )flowing at 1 ml/min in isocratic conditions: 20 % A and 80 %
Food Anal. Methods
Author's personal copy
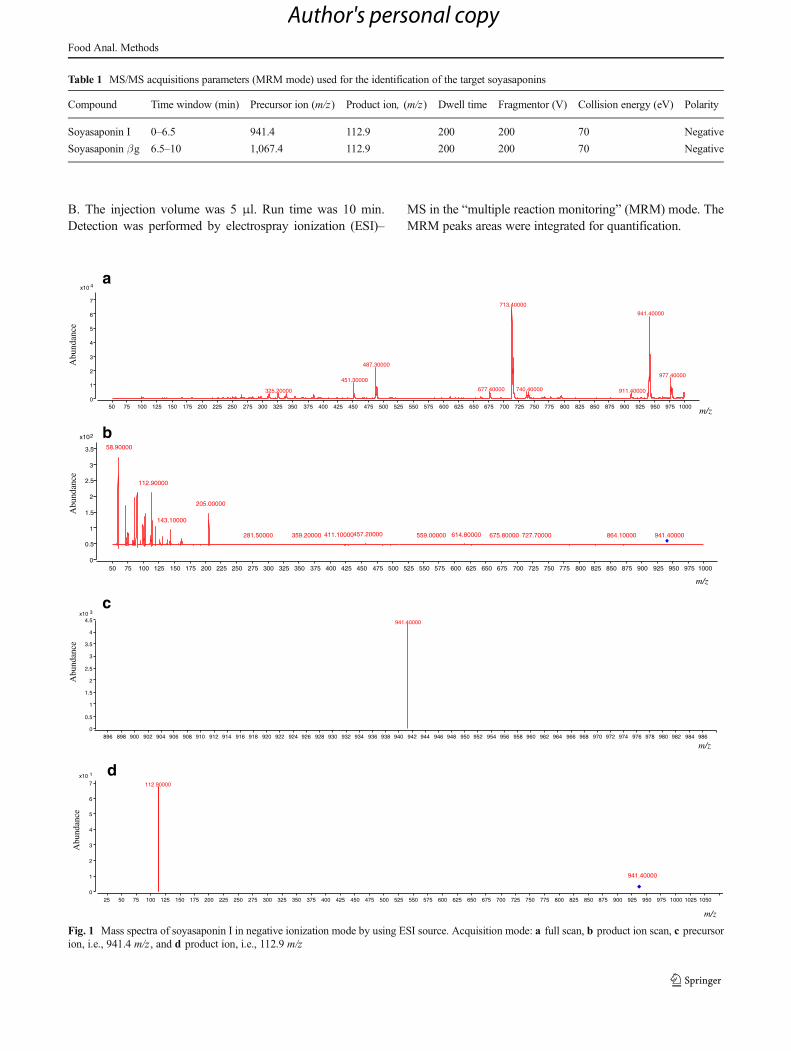
B. The injection volume was 5 μl. Run time was 10 min.Detection was performed by electrospray ionization (ESI)–
MS in the “multiple reaction monitoring” (MRM) mode. TheMRM peaks areas were integrated for quantification.
Table 1 MS/MS acquisitions parameters (MRM mode) used for the identification of the target soyasaponins
Compound Time window (min) Precursor ion (m/z) Product ion, (m/z) Dwell time Fragmentor (V) Collision energy (eV) Polarity
Soyasaponin I 0–6.5 941.4 112.9 200 200 70 Negative
Soyasaponin βg 6.5–10 1,067.4 112.9 200 200 70 Negative
4x10
0
1
2
3
4
5
6
7713.40000
941.40000
487.30000
977.40000451.30000
740.40000677.40000 911.40000325.20000
50 75 100 125 150 175 200 225 250 275 300 325 350 375 400 425 450 475 500 525 550 575 600 625 650 675 700 725 750 775 800 825 850 875 900 925 950 975 1000
a
Abu
ndan
ce
m/z
2x10
0
0.5
1
1.5
2
2.5
3
3.5 58.90000
112.90000
205.00000
143.10000
457.20000 614.80000411.10000 941.40000359.20000 559.00000 727.70000281.50000 675.80000 864.10000
50 75 100 125 150 175 200 225 250 275 300 325 350 375 400 425 450 475 500 525 550 575 600 625 650 675 700 725 750 775 800 825 850 875 900 925 950 975 1000
b
Abu
ndan
ce
m/z
3x10
0
0.5
1
1.5
2
2.5
3
3.5
4
4.5 941.40000
896 898 900 902 904 906 908 910 912 914 916 918 920 922 924 926 928 930 932 934 936 938 940 942 944 946 948 950 952 954 956 958 960 962 964 966 968 970 972 974 976 978 980 982 984 986
c
Abu
ndan
ce
m/z
1x10
0
1
2
3
4
5
6
7 112.90000
25 50 75 100 125 150 175 200 225 250 275 300 325 350 375 400 425 450 475 500 525 550 575 600 625 650 675 700 725 750 775 800 825 850 875 900 925 950 975 1000 1025 1050
941.40000
d
Abu
ndan
ce
m/z
Fig. 1 Mass spectra of soyasaponin I in negative ionization mode by using ESI source. Acquisition mode: a full scan, b product ion scan, c precursorion, i.e., 941.4 m/z, and d product ion, i.e., 112.9 m/z
Food Anal. Methods
Author's personal copy
LC-MS/MS studies were performed using an Agilent 1290Infinity Series and a Triple Quadrupole 6420 from AgilentTechnology (Santa Clara, CA, USA) equipped with an ESIsource operating in negative ionization mode.
Optimization of the LC-MS/MS conditions was carried outby varying them in flow injection analysis (FIA) of theanalytes (5 μl of 50 μg ml−1 individual standard solutions).Operating ESI conditions were as follows: gas temperature350 °C, nebulizer gas 60 psi, drying gas (nitrogen) flow rate13 ml min−1, and capillary voltage 4,000 V. The MS/MSacquisition parameters (MRM mode) used for the quantifica-tion of the target compounds are provided in Table 1. The ESIinterface and mass spectrometer parameters were optimized toobtain maximum sensitivity.
Multivariate Analysis
To reveal the relationship among 30 different lentil samplesalong the altitudinal gradient, the composition data matrix (2variables×30 samples) was analyzed using principal compo-nent analysis (PCA) with STATISTICA 7.1 software (StatSoftItalia srl, 2005, www.statsoft.it). The two-dimensional PCA
biplot, including both the altitudes of lentil samples and thecontent of soyasaponins, was generated.
Results and Discussion
HPLC-MS/MS Method
For both compounds, the precursor ion was the base peak ofthe mass spectrum corresponding to the deprotonated mole-cule [M-H+]−, i.e., the ion 941.4m/z for soyasaponin I and theion 1,067.4 m/z for soyasaponin βg (Table 1). Each precursorion was then subjected to MS/MS experiments by testingvarious values of fragmentor and collision energy and choos-ing finally 200 V (fragmentor) and 70 eV (collision energy).The selected product ion for both soyasaponins was the frag-ment 112.9 m/z. As an example, Fig. 1 reports the massspectra of soyasaponin I corresponding to different acquisitionmodes of triple quadrupole, i.e., (a) full scan, (b) product ionscan, (c) precursor ion, and (d) product ion. In particular, in themass spectra in Fig. 1c, d, one can see the ions selected for thetransition of soyasaponin I.
12.5
x102
0
0.6
1
1.6
2
2.6
3
3.6
4
0.5 1 1.5 2 2.5 3 3.5 4 4.5 5 5.5 6 6.5 7 7.5 8 8.5 9 9.5 10 10.5 11 11.5 12
Soyasaponin I
Soyasaponin g
Abu
ndan
ce
min
X10 2
0
0.4
1
1.4
2
2.4
3
3.4
4
4.4
0.5 1 1.5 2 2.5 3 3.5 4 4.5 5 5.5 6 6.5 7 7.5 8 8.5 9 9.5 10 10.5 11 11.5 12
Soyasaponin I
Soyasaponin g
Abu
ndan
ce
min
a
b
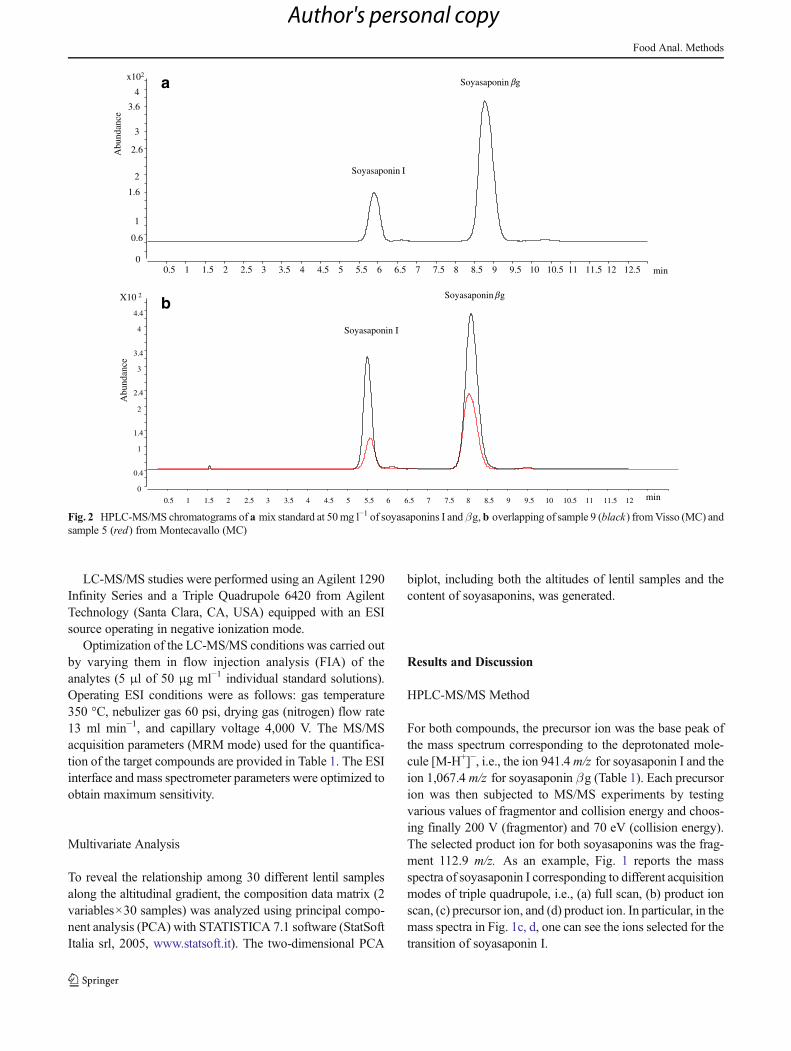
Fig. 2 HPLC-MS/MS chromatograms of a mix standard at 50mg l−1 of soyasaponins I and βg, b overlapping of sample 9 (black) fromVisso (MC) andsample 5 (red) from Montecavallo (MC)
Food Anal. Methods
Author's personal copy
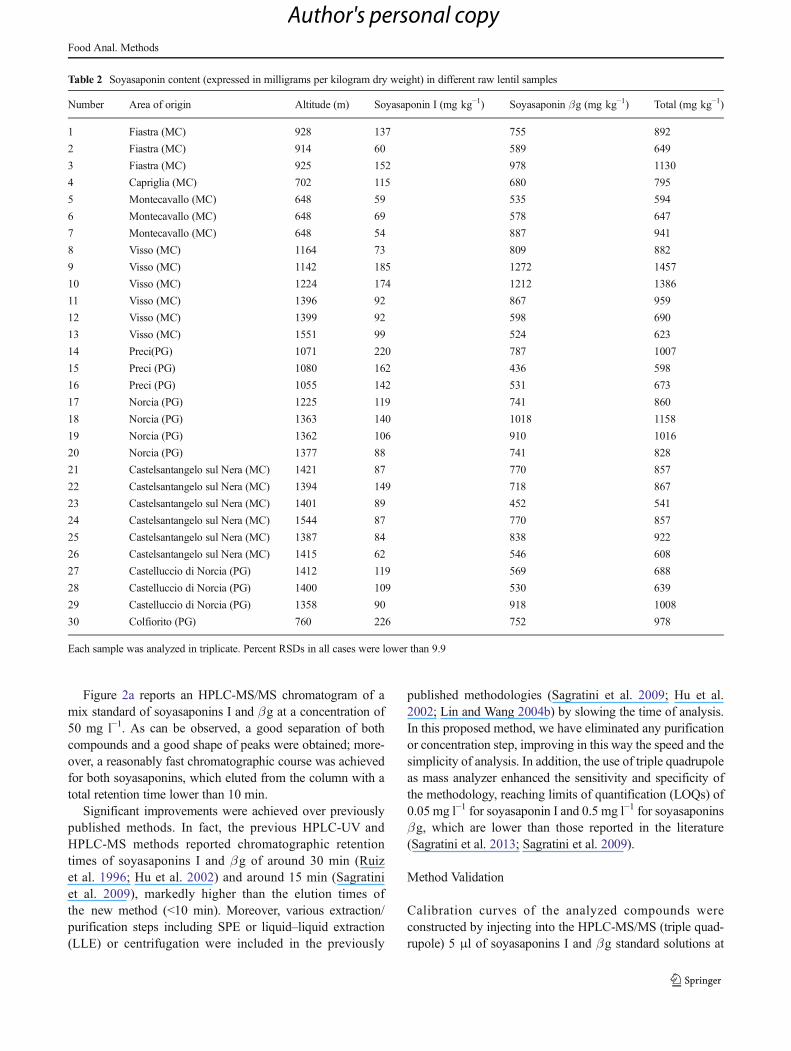
Figure 2a reports an HPLC-MS/MS chromatogram of amix standard of soyasaponins I and βg at a concentration of50 mg l−1. As can be observed, a good separation of bothcompounds and a good shape of peaks were obtained; more-over, a reasonably fast chromatographic course was achievedfor both soyasaponins, which eluted from the column with atotal retention time lower than 10 min.
Significant improvements were achieved over previouslypublished methods. In fact, the previous HPLC-UV andHPLC-MS methods reported chromatographic retentiontimes of soyasaponins I and βg of around 30 min (Ruizet al. 1996; Hu et al. 2002) and around 15 min (Sagratiniet al. 2009), markedly higher than the elution times ofthe new method (<10 min). Moreover, various extraction/purification steps including SPE or liquid–liquid extraction(LLE) or centrifugation were included in the previously
published methodologies (Sagratini et al. 2009; Hu et al.2002; Lin and Wang 2004b) by slowing the time of analysis.In this proposed method, we have eliminated any purificationor concentration step, improving in this way the speed and thesimplicity of analysis. In addition, the use of triple quadrupoleas mass analyzer enhanced the sensitivity and specificity ofthe methodology, reaching limits of quantification (LOQs) of0.05 mg l−1 for soyasaponin I and 0.5 mg l−1 for soyasaponinsβg, which are lower than those reported in the literature(Sagratini et al. 2013; Sagratini et al. 2009).
Method Validation
Calibration curves of the analyzed compounds wereconstructed by injecting into the HPLC-MS/MS (triple quad-rupole) 5 μl of soyasaponins I and βg standard solutions at
Table 2 Soyasaponin content (expressed in milligrams per kilogram dry weight) in different raw lentil samples
Number Area of origin Altitude (m) Soyasaponin I (mg kg−1) Soyasaponin βg (mg kg−1) Total (mg kg−1)
1 Fiastra (MC) 928 137 755 892
2 Fiastra (MC) 914 60 589 649
3 Fiastra (MC) 925 152 978 1130
4 Capriglia (MC) 702 115 680 795
5 Montecavallo (MC) 648 59 535 594
6 Montecavallo (MC) 648 69 578 647
7 Montecavallo (MC) 648 54 887 941
8 Visso (MC) 1164 73 809 882
9 Visso (MC) 1142 185 1272 1457
10 Visso (MC) 1224 174 1212 1386
11 Visso (MC) 1396 92 867 959
12 Visso (MC) 1399 92 598 690
13 Visso (MC) 1551 99 524 623
14 Preci(PG) 1071 220 787 1007
15 Preci (PG) 1080 162 436 598
16 Preci (PG) 1055 142 531 673
17 Norcia (PG) 1225 119 741 860
18 Norcia (PG) 1363 140 1018 1158
19 Norcia (PG) 1362 106 910 1016
20 Norcia (PG) 1377 88 741 828
21 Castelsantangelo sul Nera (MC) 1421 87 770 857
22 Castelsantangelo sul Nera (MC) 1394 149 718 867
23 Castelsantangelo sul Nera (MC) 1401 89 452 541
24 Castelsantangelo sul Nera (MC) 1544 87 770 857
25 Castelsantangelo sul Nera (MC) 1387 84 838 922
26 Castelsantangelo sul Nera (MC) 1415 62 546 608
27 Castelluccio di Norcia (PG) 1412 119 569 688
28 Castelluccio di Norcia (PG) 1400 109 530 639
29 Castelluccio di Norcia (PG) 1358 90 918 1008
30 Colfiorito (PG) 760 226 752 978
Each sample was analyzed in triplicate. Percent RSDs in all cases were lower than 9.9
Food Anal. Methods
Author's personal copy
seven different concentrations: 0.5, 1, 5, 10, 15, 30, and50 mg l−1. The correlation coefficients of calibration curvesof the analyzed compounds were ≥0.9997. Five replicates foreach concentration were performed over the course of 10 days,and the relative standard deviations (RSDs) ranged from 0.5 to1.1 % for run-to-run precision and from 1.8 to 5.6 % for day-to-day precision. The recoveries obtained by spiking the lentilsamples with a standard mixture of soyasaponins I and βg at50 and 100 mg l−1 were in the range of 96–101 and 98–103%,respectively. The repeatability of the method, evaluated fivetimes, was expressed as percent RSDs, lower than 9.2 % in allcases. Limits of detection (LODs) and LOQs were estimatedon the basis of 3:1 and 10:1 signal-to-noise ratios obtainedwith standards containing the compounds of interest at lowconcentration levels. The LODs for soyasaponins I and βgwere 0.01 and 0.1 mg l−1 (0.2–2 ng), respectively. The LOQsfor soyasaponins I and βg were 0.05 and 0.5 mg l−1 (1–10 ng),respectively, which are lower than those reported in the liter-ature (Sagratini et al. 2013; Sagratini et al. 2009).
Quantifications of Soyasaponins I and βg in Italian LentilSeeds
We used and then applied the analytical method using HPLCcoupled to MS/MS that we developed and validated to deter-mine soyasaponins I and βg to the analysis of 30 samples oflentils from central Italy. In particular, the samples of lentilswere purchased from farmers directly involved in the produc-tion of lentils in various areas of the Marches and Umbriaregions (central Italy). The altitude of the fields where thelentils were grown ranged from 648 to 1,551 m above sealevel. The analytical data from all analyzed samples are
reported in Table 2, which provides the number of thesamples, area of origin, altitude, content of soyasaponin I,soyasaponin βg, and total soyasaponin expressed in milli-grams per kilogram. The quantification of both soyasaponinswas obtained by comparing the peak areas of compoundsidentified in the extracts of lentil samples with those of purestandards.
Soyasaponins I and βg were present in lentils in concen-trations that ranged from 54 to 226 mg kg−1 and from 436 to1,272 mg kg−1, respectively. Total content of soyasaponinsranged from 541 to 1,457 mg kg−1.
Samples 9 and 10, both from Visso (MC), displayedthe highest content of total soyasaponins (1,457 and1,386 mg kg−1, respectively) and of soyasaponin βg (1,272and 1,212 mg kg−1, respectively). However, also samples 3,14, 18, 19, and 29 showed a total amount higher than1,000 mg kg−1 and corresponding high levels of soyasaponinβg. Sample 30 from Colfiorito (PG) showed the highestquantity of soyasaponin I, while sample 7 from Montacavallo(MC) had the lowest content of soyasaponin I.
Sample 23 from Castelsantangelo sul Nera (MC) showedthe lowest level of total soyasaponin content, while sample 15from Preci (PG) showed the lowest level of soyasaponin βg(436 mg kg−1).
Figure 2b shows the overlapping of sample 9 (black) fromVisso (MC) and sample 5 (red) from Montecavallo (MC).
The average content of soyasaponin I, soyasaponin βg, andtotal soyasaponins in the 30 lentil samples analyzed were115, 744, and 858 mg kg−1, respectively. In each sample,the content of soyasaponin βg was higher than that ofsoyasaponin I, in line with our previously published work(Sagratini et al. 2013).
S I
S βg
-20 0 20 40 60 80 100 120 140 160 180 200 220 240
PC 1 : 96.04%
-50
0
50
100
150
200
250
PC
2 :
3.9
6%928
914
925702
648648
648
1164
11421224
1396
13991551
1071
1080
1055
1225 1363
13621377
1394
1401
13871415
14121400
1358
760
-600 -400 -200 0 200 400 600 800 1000
PC 1: 96.04%
-150
-100
-50
0
50
100
150
200
PC
2:
3.96
%
a b
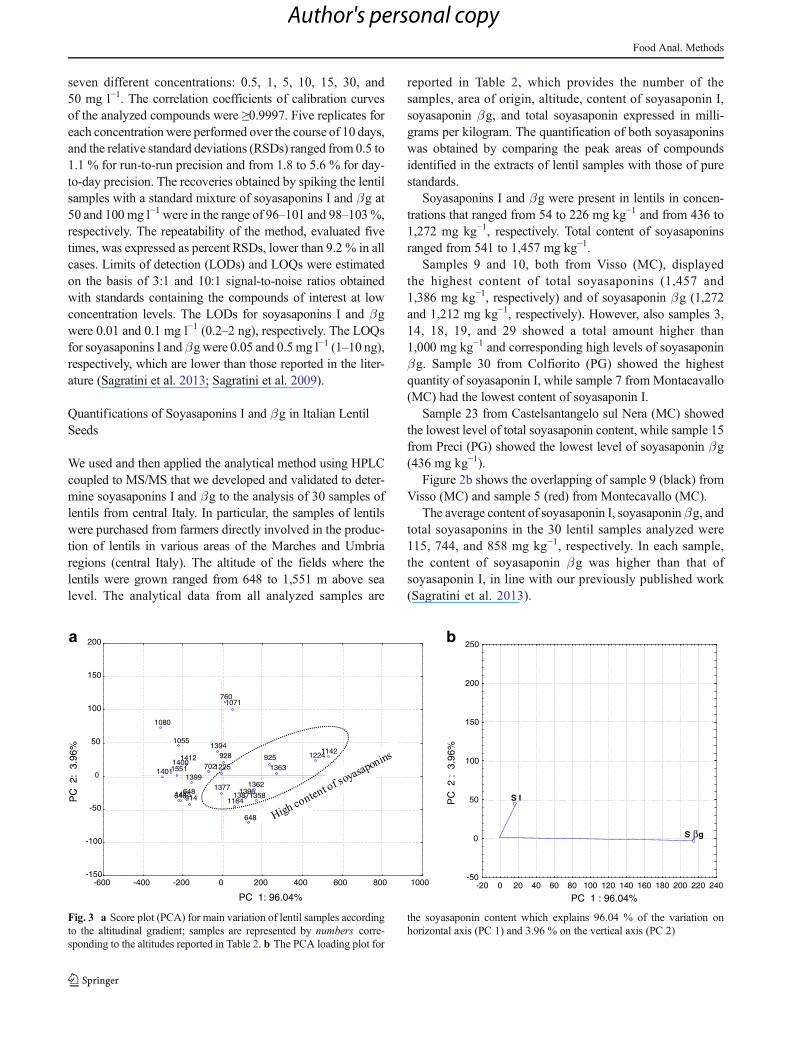
Fig. 3 a Score plot (PCA) for main variation of lentil samples accordingto the altitudinal gradient; samples are represented by numbers corre-sponding to the altitudes reported in Table 2. b The PCA loading plot for
the soyasaponin content which explains 96.04 % of the variation onhorizontal axis (PC 1) and 3.96 % on the vertical axis (PC 2)
Food Anal. Methods
Author's personal copy
Some differences in soyasaponin content seem to be relatedto altitude. Lentil samples 8–13 (six samples) from Visso(MC), cultivated on average at 1,312 m, showed a mean totalsoyasaponin content of 999 mg kg−1. A very similar situationis seen in lentil samples 17–20 (four samples) from the Norcia(PG) area, where the average altitude of fields was 1,331 m:the mean total soyasaponin content was 965 mg kg−1.
Nevertheless, lentil samples 21–26 (six samples) fromfields in Castelsantangelo sul Nera (MC) with an averagealtitude of 1,427 m (the highest average level) displayed thelowest concentrations with a mean total soyasaponin contentof 775 mg kg−1. The total concentration of soyasaponins wasalso low in lentils cultivated at 648 and 702m, in areas such asMontecavallo (MC) and Capriglia (MC); the lentil seeds fromthese altitudes showed a mean total soyasaponin content of727 and 795 mg kg−1, respectively.
Our data indicated that samples cultivated in fields atintermediate altitudes (1,142–1,387 m) showed the highestlevels of soyasaponins, while lentils cultivated in lands atan altitude higher than 1,387 m such as Castelsantangelosul Nera or lower than 1,142 m such as Montecavallodisplayed a low level of soyasaponins. These data were con-firmed by the PCA analysis shown in Fig. 3 and described inthe next paragraph.
PCA Analysis
Figure 3 shows the 2-D graphical representations of principalcomponent analysis of the lentil samples analyzed. The vari-ability of data was generated mostly (96.4%) by the content ofsoyasaponin βg, which in turn influenced the total content ofsoyasaponins in the lentil samples (Fig. 3b). Samples on theright side of the PCA score plot (Fig. 3a), from altitudesbetween 1,142 and 1,387 m above sea level, were stronglycorrelated with soyasaponin βg showing the highest levels ofthis compound. On the other hand, samples from the highest(above ~1,400 m) and the lowest (below ~1,100 m) altitudeswere those on the left side of the PCA score plot (Fig. 3a) andseem to be negatively correlated with the levels of totalsoyasaponins. In conclusion, multivariate analysis identifiedan altitudinal range (1,142–1,387 m above sea level) at whichlentil samples showed the highest levels of soyasaponins βgand, hence, of total soyasaponin. These molecules could be avalid taxonomic tool for classifying the varieties of lentilsbasing on their different concentrations.
Conclusions
In this work, a new analytical method that uses HPLC-MS/MS (triple quadrupole as mass analyzer) to determinesoyasaponins I and βg in lentils was developed. The describedmethod provided several advantages over other published
methods, including rapid quantification and avoidance ofpurification steps. The validated method was applied to theanalysis of 30 samples of Italian lentils. Results showed thatsoyasaponins I and βg are present in lentils in concentrationsthat ranged from 54 to 226 mg kg−1 and from 436 to1,272 mg kg−1, respectively. Moreover, it is interesting to notethat samples cultivated in fields at intermediate altitudes(1,142–1,387 m) showed the highest levels of soyasaponins.These results were confirmed by PCA analysis.
Acknowledgments We are grateful to the farmers and producers oflentils that kindly provided the samples and to the Italian Ministry ofResearch (project PRIN 2009W2MZ88) for the economic support. Wewould like to thank Sheila Beatty for editing the English usage of themanuscript.
Conflict of Interest Pilar Vila Donat declares that she has no conflict ofinterest. Giovanni Caprioli declares that he has no conflict of interest.Paolo Conti declares that he has no conflict of interest. Filippo Maggideclares that he has no conflict of interest. Massimo Ricciutelli declaresthat he has no conflict of interest. Elisabetta Torregiani declares that shehas no conflict of interest. Sauro Vittori declares that he has no conflict ofinterest. Gianni Sagratini declares that he has no conflict of interest. Thisarticle does not contain any studies with human or animal subjects.
References
Caprioli G, Cristalli G, Ragazzi E, Molin L, Ricciutelli M, Sagratini G,Seraglia R, ZuoY,Vittori S (2010)A preliminarymatrix-assisted laserdesorption/ionization time-of-flight approach for the characterizationof Italian lentils varieties. Rapid Commun Mass Spectrom 24:2843
Cervera RP (2002) Food composition and nutrition tables. University ofBarcelona, Barcelona
Chang SY, Han MJ, John E-H, Kim D-H (2010) Liquid chromatography/mass spectrometry-based structural analysis of soyasaponin Abmetabolites by human fecal microflora. J Pharm Biomed 52:752
Cubero JI (1981) Origin, taxonomy and domestication. In: Webb, C.,Hawtin, G. (eds) Lentils. Commonwealth Agricultural Bureaux,Slough, 15
Decroos K, Vincken JP, Koningsveld GA, GruppenH, VerstraeteW (2006)Preparative chromatographic purification and surfactant properties ofindividual soyasaponins from soy hypocotyls. Food Chem 101:324
European Association for Grain Legume Research (2011). Grainlegumes. The magazine of the European Association for GrainLegume Research. Issue 57, p 25. http://www.legumefutures.de/images/Grain_legumes_57_Lentils.pdf. Accessed 20 May 2013
European Food Information Council (EUFIC) (2013) http://www.eufic.org/article/it/expid/NOZIONI-FONDAMENTALI-PROTEINE/.Accessed 20 May 2013
Friedman M (1996) Nutritional value of proteins from different fromsources. A review. J Agric Food Chem 44:6
Fuzzati N, Pace R, Papeo G, Peterlongo F (1997) Identification ofsoyasaponins by liquid chromatography-thermospray mass spec-trometry. J Chromatogr A 777:233
Hu J, Lee SO, Hendrich S,Murphy PA (2002) Quantification of the groupB soyasaponins by high-performance liquid chromatography. JAgric Food Chem 50:2587
Hu J, Zheng YL, Hyde W, Hendrich S, Murphy PA (2004) Human fecalmetabolism of soyasaponin I. J Agric Food Chem 52:2689
Food Anal. Methods
Author's personal copy
Jin M, Yang Y, Su B, Ren Q (2006) Rapid quantification and characteriza-tion of soyasaponins by high-performance liquid chromatographycoupledwith electrospraymass spectrometry. J ChromatogrA 1108:31
Johnson CR, Thavarajah D, Combs GF Jr, Thavarajah P (2013) Lentil(Lens culinaris L.): a prebiotic-rich whole food legume. Food ResInt 51:107
Lee SO, Simons AL, Murphy PA, Hendrich S (2005) Soyasaponinslowered plasma cholesterol and increased fecal bile acids in femalegolden Syrian hamsters. Exp Biol Med 230:472
Lin J, Wang C (2004a) An analytical method for soy soyasaponins byHPLC/ELSD. J Food Sci 69:456
Lin J, Wang C (2004b) An analytical method for soy saponins by HPLC/ELSD. J Food Sci 69(6):456
Messina MJ (1997) Legumes and soybeans: overview of their nutritionalprofiles and health effects. Am J Clin Nutr 70:439
Ruiz RG, Price KR, Arthur AE, Rose ME, Rhodes MJC, Fenwick RG(1996) Effect of soaking and cooking on the saponin content andcomposition of chickpeas (Cicer arietinum ) and lentils (Lensculinaris). J Agric Food Chem 44:1526
Sagratini G, Zuo Y, Caprioli G, Cristalli G, Giardinà D, Maggi F, MolinL, Ricciutelli M, Traldi P, Vittori S (2009) Quantification ofsoyasaponins I and βg in Italian lentil seeds by solid phase extrac-tion (SPE) and high-performance liquid chromatography-mass spec-trometry (HPLC-MS). J Agric Food Chem 57:11226
Sagratini G, Caprioli G, Maggi F, Font G, Giardinà D, Mañes J, Meca G,Ricciutelli M, Sirocchi V, Torregiani E, Vittori S (2013) Determina-tion of soyasaponins I and βg in raw and cooked legumes by phasesolid extraction (SPE) coupled to liquid chromatography (LC)-massspectrometry (MS) and assessment of their bioaccessibility by anin vitro digestion model. J Agric Food Chem 61:1702
Food Anal. Methods
Author's personal copy


