Embed Size (px)
Citation preview

Analytica Chimica Acta 567 (2006) 39–47
Analysis of perchlorate in foods and beverages by ion chromatographycoupled with tandem mass spectrometry (IC-ESI-MS/MS)
Houssain El Aribi a,∗, Yves J.C. Le Blanc a, Stephen Antonsen b, Takeo Sakuma a
a Applied Biosystems/MDS Sciex, 71 Four Valley Drive, Concord, Ont., Canada L4K 4V8b Dionex Canada Ltd., 1540 Cornwall Road, Oakville, Ont., Canada L6J 7W5
Received 6 January 2006; received in revised form 2 March 2006; accepted 3 March 2006Available online 18 April 2006
Abstract
A new IC-ESI-MS/MS method, with simple sample preparation procedure, has been developed for quantification and confirmation of perchlorate(ClO4
−) anions in water, fresh and canned food, wine and beer samples at low part-per-trillion (ng l−1) levels. To the best of our knowledge, this isthe first time an analytical method is used for determination of perchlorate in wine and beer samples. The IC-ESI-MS/MS instrumentation consistedof an ICS-2500 ion chromatography (IC) system coupled to either an API 2000TM or an API 3200TM mass spectrometer. The IC-ESI-MS/MSshcootOo©
K
1
ia[spdtdnePr
0d
ystem was optimized to monitor two pairs of precursor and fragment ion transitions, i.e., multiple reaction monitoring (MRM). All samplesad oxygen-18 isotope labeled perchlorate internal standard (ISTD) added prior to extraction. Chlorine isotope ratio (35Cl/37Cl) was used as aonfirmation tool. The transition of 35Cl16O4
− (m/z 98.9) into 35Cl16O3− (m/z 82.9) was monitored for quantifying the main analyte; the transition
f 37Cl16O4− (m/z 100.9) into 37Cl16O3
− (m/z 84.9) was monitored for examining a proper isotopic abundance ratio of 35Cl/37Cl; and the transitionf 35Cl18O4
− (m/z 107.0) into 35Cl18O3− (m/z 89.0) was monitored for quantifying the internal standard. The minimum detection limit (MDL) for
his method in de-ionized water is 5 ng l−1 (ppt) using the API 2000TM mass spectrometer and 0.5 ng l−1 using the API 3200TM mass spectrometer.ver 350 food and beverage samples were analyzed mostly in triplicate. Except for four, all samples were found to contain measurable amountsf perchlorate. The levels found ranged from 5 ng l−1 to 463.5 ± 6.36 �g kg−1 using MRM 98.9 → 82.9 and 100 �l injection.
2006 Elsevier B.V. All rights reserved.
eywords: Perchlorate; Produce; Wine; Beer; IC; ESI-MS/MS
. Introduction
Perchlorate became a well-publicized environmental contam-nant in the spring of 1997, when the US EPA developed annalytical method with a quantification level at 4 �g l−1 (ppb)1]. Perchlorate exists in the form of ammonium, sodium, potas-ium and other metal salts in nature and also as man-maderoducts. Naturally occurring perchlorate is found in nitrateeposits in Chile [2]. One major source of this environmen-al contamination is the manufacture or improper storage orisposal of ammonium perchlorate used as a primary compo-ent of solid propellant for rockets, missiles, fireworks [3–5], orxplosives in various military munitions and air bag inflators [6].erchlorate salts dissolve readily in water, and because perchlo-ate anion adheres poorly to mineral surfaces, it can spread in
∗ Corresponding author. Tel.: +1 905 660 9006x2367; fax: +1 905 660 2605.E-mail address: [email protected] (H. El Aribi).
waterways. Perchlorate is believed to be relatively inert in typicalground and surface water and therefore, such contamination maypersist for a long time. Since April 1997, perchlorate has beenfound in over 500 drinking water supplies in at least 20 states,serving well over 20 million people in the USA. In February2005, the National Academy of Science (NAS) recommendeda perchlorate reference dose (RfD) of 0.0007 mg kg−1 per dayor 49 �g per day for a 70 kg adult. This RfD was adopted byEPA, and based on 2 liters of drinking water consumption perday by a 70 kg adult. This translates to a drinking water equiv-alent of 24.5 �g l−1 (49 �g perchlorate per 2 liters of water or24.5 �g per liter or 24.5 �g l−1) [7]. Perchlorate has been alsofound in food products [8–10], soils [11], milk [12], fertilizers[13], plants [14] and in human urine [15]. To our knowledge,there are no extant data on perchlorate in wine and beer.
Perchlorate contamination is a concern for several reasons.First, there are uncertainties in the toxicological database thatis used to address the potential of perchlorate to affect humanhealth effects when present at low levels in drinking water,
003-2670/$ – see front matter © 2006 Elsevier B.V. All rights reserved.oi:10.1016/j.aca.2006.03.012

40 H. El Aribi et al. / Analytica Chimica Acta 567 (2006) 39–47
beverages and food products. Perchlorate may modify thy-roid function by competitively inhibiting iodide uptake [16],which could lead to metabolic problems in adults and anoma-lous development in children. Additionally, the actual extent ofperchlorate occurrence in ground and surface waters and othermedia (soils or plant and animal tissues) is unknown—a prob-lem compounded by analytical limitations. This has resultedin a proliferation of analytical methods to support the mea-surement of perchlorate in the environment with the endgoal of determining its threat to eco-systems and humanhealth.
Several methods have been published for the analysis of per-chlorate from low �g l−1 to high mg l−1 (ppm) range [3,4]. How-ever, ion chromatography (IC) is, presently, the most commonsystem for its determination in water samples. Until recently, USEPA Method 314.1 “Determination of Perchlorate in DrinkingWater Using Ion Chromatography” [17] was the only approvedmethod. With conductivity detection, the IC method can quantifyperchlorate down to ∼1 �g l−1 using a 100 �l injection [18–21].Although the IC method with conductivity detection has beenwidely used for the determination of trace levels of perchlorateion in water, chromatographic retention times are not consid-ered to be a unique identifier and often cannot be used in legalproceedings without another confirmatory testing [3,4]. Conduc-tivity detection lack selectivity and could lead to the reportingof false positives [22]. Single quadrupole mass spectrometry(tEotvfa9tirtaic[crmslio(tgearf
limit because of the reduction in chemical noise, especially invery complex matrices, when compared with the conductivitydetector. For example, the transition of 35Cl16O4
− (m/z 98.9)into 35Cl16O3
− (m/z 82.9) was monitored for quantifying themain analyte; 37Cl16O4
− (m/z 100.9) into 37Cl16O3− (m/z 84.9)
was monitored for examining a proper isotopic abundance ratioof 35Cl/37Cl; and another transition of 35Cl18O4
− (m/z 107.0)into 35Cl18O4
− (m/z 89.0) was monitored for quantifying theinternal standard (ISTD). Our results showed that the variationof the calculated amounts of perchlorate from the two differenttransitions is less than 5%. In this work, the levels of per-chlorate in the samples are determined using multiple reactionmonitoring (MRM) 98.9 → 82.9 and 100 �l injection. To con-firm the presence of perchlorate, the 82.9/84.9 peak area countratio should be between 2.2 and 3.3. This ratio is derived fromthe natural abundance of chlorine-35 and chlorine-37 isotopes[29].
Recently, we assisted US EPA in developing Method 332.0“Determination of perchlorate in Drinking Water by Ion Chro-matography with Suppressed Conductivity and ElectrosprayIonization Mass Spectrometry” [30]. This method relies on anIC separation and suppression of the IC eluent followed by eithermass spectrometry (MS) or tandem mass spectrometry (MS/MS)for detection and quantitation. We have applied this analyticalapproach to determine the amount of perchlorate in various foodproducts, e.g., fresh/canned fruits and vegetables, milk, alco-hpti2iwW
2
2
wfw1fI1Ipa
2
mt
MS) has been coupled to chromatography for the determina-ion and quantification of sulfate and perchlorate [5,12,23,24].ven with mass selectivity, this approach requires some levelf chromatographic separation for appropriate quantification ofhe two species. Others have relied on the use of elevated coneoltages to induce fragmentation of the perchlorate at the inter-ace prior to mass analysis. In this method, the fragment ionst m/z 82.9 and 84.9 (originating from the perchlorate at m/z8.9 and 100.9, respectively) are monitored and used for quan-ification. Although this approach could be successfully used,t is susceptible to matrix interferences if chromatography iselaxed in order to increase throughput, because the fragmenta-ion occurs in a non-selective way at the source prior to massnalysis. To increase the selectivity of perchlorate analysis, var-ous approaches were used; formation of selective associativeomplexes of perchlorate with organic and other substances24,25], ion pair liquid–liquid extraction [5], stable associationomplex formation [26], and electrospray—high-field asymmet-ic waveform ion mobility spectrometry/MS (ESI-FAIMS/MS)ethod [27]. Though most of these approaches improve the
electivity of the perchlorate detection, they either resulted in aower sample throughput as a result of sample preparation or lim-ted to less complex matrix samples. Here we proposed the usef ion chromatography coupled to tandem mass spectrometryIC-MS/MS) to significantly improve selectivity in the detec-ion of perchlorate, thus enabling faster throughput and a moreeneric approach for various matrices. Tandem mass spectrom-try (MS/MS) offers more selective detection than conductivitynd single quadrupole MS in that it monitors the mass-to-chargeatio (m/z) transition of the precursor analyte ion into a uniqueragment ion [28]. In addition, MS/MS offers a better detection
olic and non-alcoholic beverages, baby foods and other foodroducts that have been harvested or processed in many parts ofhe world and were purchased in local grocery and liquor storesn the greater Toronto area, Ontario, Canada between January005 and February 2006. For the fresh food products, the origins determined based on the stores description. Some samplesere purchased overseas and brought back by our coworkers.e wish to report these results here.
. Experimental method
.1. Reagents and standards
De-ionized water, Type I reagent-grade, 18 M� cm resistanceas produced in house; acetonitrile, HPLC grade was purchased
rom J.T. Baker; sodium perchlorate, 99% ACS reagent-gradeas purchased from Sigma–Aldrich Canada (cat. no. 41,024-); sodium perchlorate, internal standard, 1 mg l−1 was obtainedrom Dionex California (P/N 062923). The sodium perchlorateSTD is enriched with 18O and the base mass peaks are m/z07/109. The relative abundance of m/z 98.9 and 100.9 in theSTD is less than 0.1%. For the quantification of trace-levelerchlorate, the recommended concentration in each standardnd sample is 1 �g l−1.
.2. Sample preparation
The procedure described in [8,9] was modified. The presentethod is simpler, less expensive, and less time-consuming than
he earlier extraction procedures.

H. El Aribi et al. / Analytica Chimica Acta 567 (2006) 39–47 41
2.2.1. WaterDrinking water (tap and bottled) samples were analyzed with-
out preparation. Waste water samples were filtered.
2.2.2. Fruits and vegetablesBulk samples were first cut into small, 1–2 cm pieces and
chopped in a food processor. Samples were prepared by weigh-ing 10 ± 0.10 g of each food samples into separate 50 ml dispos-able polypropylene centrifuge tubes. 20 ml of de-ionized waterwas added.
2.2.3. Milk products5 ± 0.05 ml of each sample was pipetted into separate 50 ml
disposable polypropylene centrifuge tubes. 5 ml of de-ionizedwater and 20 ml of acetonitrile were added.
2.2.4. Wines, beers and other beveragesSample solutions were prepared by pipetting 5 ± 0.05 ml of
each samples into separate 50 ml polypropylene conical tube.Twenty-five milliliters of de-ionized water was added.
For all sample types, after mixing the sample and water, cen-trifuge tubes were capped and shaken with a Vortex-Genie®
for 1 min. The tubes containing the test portion were then cen-trifuged at 9500 rpm for 30 min at room temperature. The sam-ples were then filtered with a 0.2-�m pore size nylon-meshsIsbwttsavmis
2
2
1
2
SeC
Analyst® 1.4.1 software is featured with analyst access object(AAO), which allows integration of other hardware to be con-trolled by analyst. This integration can be achieved by a com-panion software such as DCMS link that can facilitate control ofDionex chromatography instruments from the third-party massspectrometry software.
2.3.2. Columns
1. Dionex IonPac® AS16, 250 mm × 2 mm i.d.; guard column:IonPac® AG16, 50 mm × 2 mm i.d.
2. Dionex IonPac® AS20, 250 mm × 2 mm i.d.; guard column:IonPac® AG20, 50 mm × 2 mm i.d.
2.3.3. Eluent90% acetonitrile + 10% water; AXP-MS flow rate:
0.3 ml min−1; analytical flow rate: 0.3 ml min−1; IC oventemperature: 28 ◦C; matrix diversion time: 2–9 min; injectionvolume: 100 �l.
This methodology includes an on-line diversion valve (“MDvalve” in the diagram, Fig. 1), located inside the LC30, to divertmatrix ions to waste early in the method. Matrix diversion isa technique that uses a valve to divert non-analyte chromato-graphic peaks to the waste, thereby avoiding possible contam-ination of downstream system components. In most cases, thistechnique eliminates the need to perform off-line matrix elim-ittcpptmstbcmdaethat
yringe filter. All samples have the 18-O labeled perchlorateSTD added prior to extraction. Assuming a total volume ofample extract is 10 ml, the final concentration of ISTD wille 1 �g l−1. The use of a stable isotope-labeled ISTD is aell-accepted methodology for accurate, long-term quantifica-
ion in chromatography–mass spectrometry methods. Becausehe ISTD and analyte are chemically indistinguishable, the twopecies have the same behavior in the analytical method andre affected in the same way by chemical and instrumentalariations. The ISTD is used for relative retention time confir-ation and monitoring instrument performance. In electrospray
onization, sample dilution is typically used to minimize ionuppression without increasing analytical cost and complexity.
.3. Equipment
.3.1. Ion chromatography systems
. ICS-2500 quaternary proportioned gradient pumping sys-tem consisting of a Dionex GS50 pump, EG50 eluent gen-erator, AS50 auto-sampler, CD25 A conductivity detector,shielded conductivity cell, LC30 chromatography oven withrear-loading Rheodyne injection valve (100-�l loop), Rheo-dyne 6-port valve for matrix diversion, static mixing “Tee”(Upchurch).
. ICS-2000 isocratic pumping system with integrated conduc-tivity detection, AS50 auto-sampler.
uppressor: ASRS® MS, 2 mm, external water, 50 mA; GS50luent: 45 mM KOH. Dionex AXP-MS auxiliary pump,hromeleon® 6.6, 6.7 and DCMS link software were used.
nation sample preparation. The diversion is performed duringhe normal analytical run (the first 9 min) so that no additionalime is required. An auxiliary pump (AXP-MS) supplies post-olumn solvent to the MS during the divert time. The auxiliaryump (“AXP-MS” in the diagram, Fig. 1) is used to sup-ly the LC/MS/MS systems with 90% acetonitrile + 10% waterhroughout the run. The addition of this solvent through the static
ixer improves the electrospray process and provides a betterensitivity than 100% water-based run. The column effluent ishen switched to combine with post-column solvent about 2 minefore perchlorate elutes so that the aqueous analytical streamombines with the solvent stream before entering the MS. Thisixing occurs inside a static mixing Tee (“static mixer” in the
iagram, Fig. 1) with a frit inside to aid mixing. An eluent gener-tor is used to produce high purity potassium hydroxide (KOH)luent and an electrolytic suppressor (“ASRS® suppressor” inhe diagram, Fig. 1) is used to replace metallic cations withydronium ions [H3O]+ prior to entering the detector. Althoughguard column (“Guard” in the diagram, Fig. 1) is used to protect
he analytical column and to extend its lifetime, a gradient step
Fig. 1. Schematic diagram of the method.

42 H. El Aribi et al. / Analytica Chimica Acta 567 (2006) 39–47
to a higher concentration of KOH after the elution of perchlo-rate anion is used and was found to be a necessary step. This isfor the purpose of removing the majority of strongly retainedcompounds present in the injected samples more quickly. Abuildup of retained material over time in the column will even-tually degrade column performance and can be minimized bythis gradient operation. The gradient step to the higher KOHconcentration provides conditioning of the column to allow forsubsequent fast equilibration to starting conditions and stablebaseline. This step was mainly used in the case of analysis ofwine samples.
2.3.4. Mass spectrometers
1. Applied Biosystems–MDS SCIEX API 3200TM triplequadrupole system equipped with a Turbo VTM IonSprayTM
source with the following operational parameters: sourcetemperature, 590 ◦C; polarity, negative ion mode; CurtainGasTM, 10.0 psi; gas supply 1, 60 psi; gas supply 2, 70 psi;ion spray voltage, −4200 V; collision gas thickness, setting7; declustering potential, −50 V; focusing potential, −300 V;entrance potential, −10 V; collision energy, −35 V; collisionexit potential, −2 V.
2. Applied Biosystems–MDS SCIEX API 2000TM triplequadrupole system equipped with a TurboIonSpray® sourcewith the following operational parameters: source tem-
3
tM(11fmbttmta
lcdm
Table 1Accuracy and precision in de-ionized (DI) water and synthetic reagent (SR)water fortified with 1000 mg l−1 each of chloride (Cl−), carbonate (CO3
2−) andsulfate (SO4
2−)
Matrix Perchlorate spike(�g l−1)
n Mean recovery (%) R.S.D. (%)
DI water 0.015 7 102 8.5DI water 0.03 7 103 3.4DI water 0.1 7 95.3 1.8DI water 0.5 7 101 1.1DI water 5 7 102 0.7DI water 40 7 99.8 0.3SR water 0.5 7 101 5.2SR water 5 7 102 0.9
and triplicate injections, the correlation coefficients for the cal-ibration curves were 0.9998 and 0.9999 using a linear fit and1/x weighting factor for the 98.9 → 82.9 and 100.9 → 84.9 tran-sitions, respectively. These data show that quantification couldbe performed with good linearity and sensitivity. The measuredisotopic ratios of 35Cl to 37Cl varies from 2.68 to 3.2.
The accuracy and precision of this analytical method weremeasured based on seven replicates laboratory fortified blanksin both de-ionized (DI) water and synthetic reagent (SR) watercontaining various concentrations of chloride, carbonate and sul-fate. The results of these analyses are shown in Table 1. Theaccuracy and the precision were measured as the mean percentrecovery and as the relative standard deviation (R.S.D.), respec-tively. The perchlorate had a relative recovery of 95–103% witha R.S.D. of 0.3–8.5%.
Using MRM transition 98.9 → 82.9 and 100 �l injection vol-ume, the minimum detection limit (MDL) for this method inde-ionized water are 5 and 0.5 ng l−1 for API 2000TM and API3200TM, respectively. The MDLs were defined as the level atwhich the analyte signal to peak-to-peak noise (S/N) is 3:1 forthe transition 98.9 → 82.9.
3.1. Water samples
Fig. 2 shows the MRM chromatograms for analysis of bot-t −1
psdf
c1fiwfTl3
sw
perature, 500 ◦C; polarity, negative ion mode; CurtainGasTM, 30.0 psi; gas supply 1, 50 psi; gas supply 2, 75 psi;ion spray voltage, −4500 V; collision gas thickness, 6;declustering potential, −50 V; focusing potential, −300 V;entrance potential, −10 V; collision energy, −35 V; colli-sion exit potential, −13.5 V. MRM transitions: 98.9 → 82.9,100.9 → 84.9 and 107.0 → 89.0; dwell time, 150 ms; run-time, 15 min. We used Analyst® 1.4.1 software to acquireand reduce data.
. Results and discussion
Multiple reaction monitoring mode was used to quan-ify perchlorate anion in food and beverage samples. The
RM transitions that were monitored are: 35Cl16O4−
m/z 98.9) → 35Cl16O3− (m/z 82.9), 37Cl16O4
− (m/z00.9) → 37Cl16O3
− (m/z 84.9) and 35Cl18O4− (m/z
07.0) → 35Cl18O3− (m/z 89.0) (the first transition is used
or quantitation and the second is used for confirmation). Theeasured isotopic ratio of 35Cl to 37Cl and the comparison
etween standard and sample areas ratios were used to confirmhe presence of perchlorate and to determine any interferencehat may cause systematic error in detection. In addition,
ethod blanks were analyzed between each sample to verifyhat the measured levels of perchlorate are not a measurementrtifact.
From the list of wine and beer samples, those with the lowestevel of perchlorate were used to establish calibration curves,overing the range from 0.001 to 10.0 �g l−1 perchlorate (10ifferent concentrations). This was done to mimic potentialatrix effects. Using 1 �g l−1 O-18 labeled perchlorate ISTD
led water from Portugal spiked with 1 �g l O-18 labelederchlorate ISTD. The chromatograms B and C show adequateignals for both transitions and no significant interferences wereetected. The chromatogram A observed for ISTD is a responserom 1 �g l−1 solution added to the water samples.
Using 10 different concentrations, in triplicate injections,overing a range from 0.005 to 5.0 �g l−1 perchlorate and�g l−1 O-18 labeled perchlorate ISTD, the correlation coef-cients of the two calibration curves in the de-ionized waterere 0.999 and 1.000 using a linear fit and 1/x weighting factor
or the 98.9 → 82.9 and 100.9 → 84.9 transitions, respectively.hese data show that quantification can be performed with good
inearity and sensitivity. The measured isotopic ratios of 35Cl to7Cl varies from 2.73 to 3.2.
Table 2 summarizes perchlorate levels found in the wateramples originated from many parts of the world. More than 50ater samples have been analyzed using ICS-2500/API 2000TM

H. El Aribi et al. / Analytica Chimica Acta 567 (2006) 39–47 43
Fig. 2. IC-MS/MS chromatograms of bottled water from Portugal spiked with 1 �g l−1 of perchlorate standard and 1 �g l−1 O-18 label-internal standard. (A) MRM:35Cl18O4
− (m/z 107.0) → 35Cl18O3− (m/z 89.0); (B) MRM: 37Cl16O4
− (m/z 100.9) → 37Cl16O3− (m/z 84.9); (C) MRM: 35Cl16O4
− (m/z 98.9) → 35Cl16O3− (m/z
82.9).
system. Most of these samples are from Canada and they allcontain measurable amounts of perchlorate, except for three bot-tled water samples; one from Portugal and two from Canada.These three samples showed the perchlorate level below thedetection limit (5 ng l−1) of the ICS-2500/API 2000TM system.For all the samples analyzed in triplicate, the measured iso-topic ratios of 35Cl to 37Cl varies from 2.67 to 3.3 with anaverage of 2.93 ± 0.17. Based on the samples analyzed, tapwaters from Canada and China showed, on average, the low-est level of perchlorate. Tap water from Las Vegas, USA with2.983 ± 0.021 �g l−1 showed the highest level of perchlorate. Abottled water sample from Portugal, showed the highest level ofall the water samples at 5.098 ± 0.040 �g l−1.
A comparison between the level of perchlorate before andafter filtration of tap water samples, using either a householdwater filter or the reversed osmosis system, is shown in Table 3.These data clearly demonstrate that at least when new, these fil-ters effectively removed most of the perchlorate from the water.
3.2. Produce samples
Table 4 summarizes perchlorate levels found in food prod-ucts. The perchlorate values are averages of duplicate or tripli-cate measurement. A more detailed supplementary Table 4s is
given in the electronic supplementary information with detailson the type of the food analyzed, individual analytical data andstandard deviations for individual samples. All of the tested foodsamples contained measurable amounts of perchlorate and themeasured isotopic ratios of 35Cl to 37Cl varied from 2.67 to 3.23with an average of 3.07 ± 0.08.
From the level of perchlorate found in the same type of foodproducts such as red tomatoes, oranges and grapes, it is interest-ing to note that only certain agricultural areas indicated a strongpresence of perchlorate in produces. The perchlorate thereforemost likely originated in the water or the soil in which theywere grown. If perchlorate was not present in the soil, it waslikely introduced into the produce when they were irrigated withperchlorate-containing water or fertilized with perchlorate con-taining fertilizer. Perchlorate in water used for food processingmight also be a source of contamination in food products.
Based on this limited sample survey (a few samples ofeach food) our analysis showed that products from State ofCalifornia and some Latin American countries such as Chile,Costa Rica, Guatemala and Mexico had higher levels of per-chlorate. Cantaloupe from Guatemala measured the highest at463.50 ± 6.364 �g kg−1. Foods from Canada and China showedthe lowest level of perchlorate. Food products from Europeshowed relatively low level of perchlorate; however, grape leaves

44 H. El Aribi et al. / Analytica Chimica Acta 567 (2006) 39–47
Table 2Concentrations of perchlorate found in various water samples
Water sample City, province, country Perchloratea (�g l−1)
Tap Ajax, Ontario, Canada 0.168 ± 0.004Tap Brantford, Ontario, Canada 0.040 ± 0.002Tap Brooklin, Ontario, Canada 0.106 ± 0.002Tap Quebec, Quebec, Canada 0.016 ± 0.000Tap Montreal, Quebec, Canada 0.047 ± 0.001Tap Thoronhill, Ontario, Canada 0.063 ± 0.001Tap Winnipeg, Manitoba, Canada 0.067 ± 0.000Tap Beijing, China 0.035 ± 0.000Tap Porto, Portugal 0.041 ± 0.003Tap Las Vegas, Nevada, USA 2.983 ± 0.021Tap Reston, Virginia, USA 0.162 ± 0.000Tap Sunnyvale, California, USA 0.072 ± 0.000Bottled France 0.092 ± 0.002Bottled India 0.105 ± 0.001Bottled India 0.134 ± 0.004Bottled Germany 0.198 ± 0.032Bottled Ontario, Canada 0.067 ± 0.002Bottled Portugal 0.093 ± 0.002Bottled Porto, Portugal 5.098 ± 0.040Bottled Portugal NDBottled Toronto, Ontario, Canada NDBottled Winnipeg, Manitoba, Canada NDWaste Sunnyvale, California, USA 1.753 ± 0.006
ND, not detected.a Average of triplicates ± standard deviation.
from Turkey at 6.195 ± 0.064 �g kg−1 and mushrooms fromPoland at 5.670 ± 0.255 �g kg−1 were amoung the highest.Oranges from Cyprus (0.079 ± 0.007 �g kg−1) had the lowestamount of perchlorate among the food, fruits, and vegetablesoriginated from Europe.
A comparison between level of perchlorate in rawasparagus (39.900 ± 0.424 �g kg−1) and cooked asparagus(24.345 ± 0.955 �g kg−1) clearly showed that perchlorate cansurvive in food even after processing at a high temperature.
In the US, the lower Colorado River is known to have hadperchlorate contamination. It is used to irrigate 1.4 million acresof cropland in the States of California and Arizona. A study bythe Environmental Working Group reported that about one infive winter lettuce samples that were irrigated by the ColoradoRiver system showed perchlorate levels averaging four times
Table 3Concentrations of perchlorate found in various water samples before and afterfiltration
Water sample City, province, country Perchloratea (�g l−1)
Tap Aurora, Ontario, Canada 0.089 ± 0.001Filtered Aurora, Ontario, Canada 0.012 ± 0.001Tap Concord, Ontario, Canada 0.075 ± 0.001Filtered Concord, Ontario, Canada 0.005 ± 0.000Tap Nobelton, Ontario, Canada 0.035 ± 0.001Filtered Nobelton, Ontario, Canada 0.012 ± 0.001TFTF
Table 4Concentration level of perchlorate found in produce samplesa
Country of origin(number of samples analyzed)
Perchlorate (�g kg−1)
Low High Median
Brazil (1) – – 2.657Canada (5) 0.088 0.329 0.217Chile (3) 21.98 145.65 23.11China (5) 0.058 0.149 0.093Columbia (1) – – 2.432Costa Rica (2) 1.023 151.65 76.34Cuba (1) – – 0.047Cyprus (1) – – 0.076Dominican Republic (1) – – 0.153Ecuador (1) – – 0.299Guatemala (4) 0.752 463.5 169.698Holland (1) – – 0.197Israel (1) – – 0.599Italy (3) 0.369 2.795 2.221Japan (1) – – 0.721Jamaica (1) – – 0.112Mexico (4) 0.289 62.8 39.9Morocco (1) – – 0.446Peru (1) – – 0.164Poland (1) – – 5.67South Africa (1) – – 0.938South Korea (1) – – 0.219Spain (1) – – 2.952Taiwan (1) – – 0.407Turkey (1) – – 6.195UK (1) – – 0.589USA (8) 0.094 19.29 0.252
a A more detailed supplementary Table 4s is given in electronic supplementaryinformation with individual analytical data and standard deviations for individualsamples.
the EPA’s draft safety standard. The level of perchorate reportedby the FDA in green lettuces from State of California rangedfrom 1.0 to 21.7 �g kg−1 [9]. In the present work, the amount ofperchlorate found in green lettuce from State of California was6.630 ± 0.042 �g kg−1.
3.3. Wine samples
Seventy-seven samples of ice, sparkling, red, rose and whitetable wine originating from many parts of the world were ana-lyzed. The ages of these wines varied from 1 to 16 years. Thealcohol contents varied from 10 to 15%. Most of the wine sam-ples analyzed in the present study are from Canada, USA, Franceand Chile but from different producers. All samples analyzedcontained measurable amounts of perchlorate.
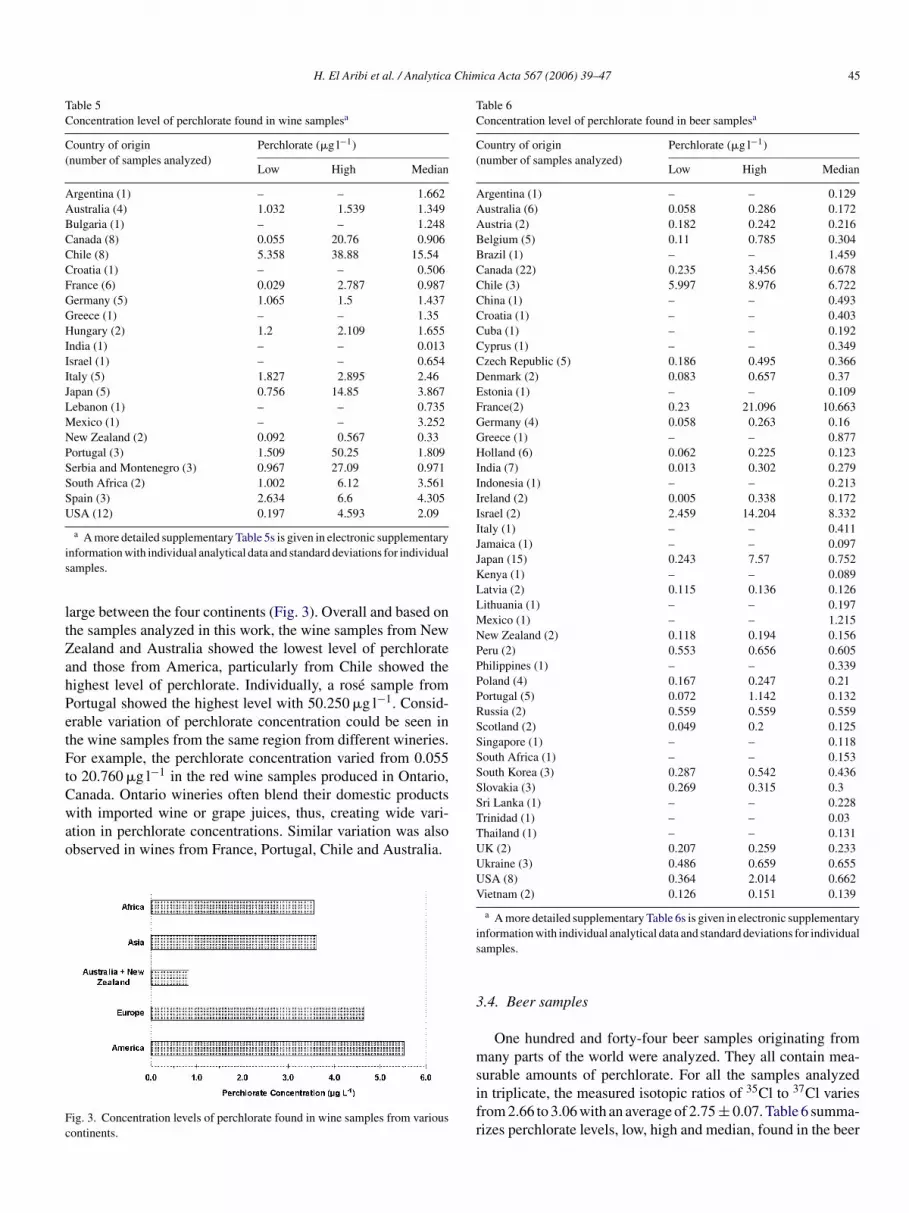
Table 5 summarizes perchlorate levels (low, high and median)found in the wine samples from various countries. A moredetailed supplementary Table 5s is given in the electronic supple-mentary information with details on the type of wine analyzed,individual analytical data and standard deviations for individualsamples. For all the samples analyzed, the measured isotopicratios of 35Cl to 37Cl varied from 2.64 to 3.19 with an average of2.78 ± 0.18. The present data shows that the level of perchloratefound in the wine samples varied significantly between coun-tries on the same continent, however, this variation is not very
ap Richmond Hill, Ontario, Canada 0.072 ± 0.001iltered Richmond Hill, Ontario, Canada 0.005 ± 0.000ap Toronto, Ontario, Canada 0.061 ± 0.001iltered Toronto, Ontario, Canada 0.005 ± 0.000
a Average of triplicates ± standard deviation.
H. El Aribi et al. / Analytica Chimica Acta 567 (2006) 39–47 45
Table 5Concentration level of perchlorate found in wine samplesa
Country of origin(number of samples analyzed)
Perchlorate (�g l−1)
Low High Median
Argentina (1) – – 1.662Australia (4) 1.032 1.539 1.349Bulgaria (1) – – 1.248Canada (8) 0.055 20.76 0.906Chile (8) 5.358 38.88 15.54Croatia (1) – – 0.506France (6) 0.029 2.787 0.987Germany (5) 1.065 1.5 1.437Greece (1) – – 1.35Hungary (2) 1.2 2.109 1.655India (1) – – 0.013Israel (1) – – 0.654Italy (5) 1.827 2.895 2.46Japan (5) 0.756 14.85 3.867Lebanon (1) – – 0.735Mexico (1) – – 3.252New Zealand (2) 0.092 0.567 0.33Portugal (3) 1.509 50.25 1.809Serbia and Montenegro (3) 0.967 27.09 0.971South Africa (2) 1.002 6.12 3.561Spain (3) 2.634 6.6 4.305USA (12) 0.197 4.593 2.09
a A more detailed supplementary Table 5s is given in electronic supplementaryinformation with individual analytical data and standard deviations for individualsamples.
large between the four continents (Fig. 3). Overall and based onthe samples analyzed in this work, the wine samples from NewZealand and Australia showed the lowest level of perchlorateand those from America, particularly from Chile showed thehighest level of perchlorate. Individually, a rose sample fromPortugal showed the highest level with 50.250 �g l−1. Consid-erable variation of perchlorate concentration could be seen inthe wine samples from the same region from different wineries.For example, the perchlorate concentration varied from 0.055to 20.760 �g l−1 in the red wine samples produced in Ontario,Canada. Ontario wineries often blend their domestic productswith imported wine or grape juices, thus, creating wide vari-ation in perchlorate concentrations. Similar variation was alsoobserved in wines from France, Portugal, Chile and Australia.
Fc
Table 6Concentration level of perchlorate found in beer samplesa
Country of origin(number of samples analyzed)
Perchlorate (�g l−1)
Low High Median
Argentina (1) – – 0.129Australia (6) 0.058 0.286 0.172Austria (2) 0.182 0.242 0.216Belgium (5) 0.11 0.785 0.304Brazil (1) – – 1.459Canada (22) 0.235 3.456 0.678Chile (3) 5.997 8.976 6.722China (1) – – 0.493Croatia (1) – – 0.403Cuba (1) – – 0.192Cyprus (1) – – 0.349Czech Republic (5) 0.186 0.495 0.366Denmark (2) 0.083 0.657 0.37Estonia (1) – – 0.109France(2) 0.23 21.096 10.663Germany (4) 0.058 0.263 0.16Greece (1) – – 0.877Holland (6) 0.062 0.225 0.123India (7) 0.013 0.302 0.279Indonesia (1) – – 0.213Ireland (2) 0.005 0.338 0.172Israel (2) 2.459 14.204 8.332Italy (1) – – 0.411Jamaica (1) – – 0.097Japan (15) 0.243 7.57 0.752Kenya (1) – – 0.089Latvia (2) 0.115 0.136 0.126Lithuania (1) – – 0.197Mexico (1) – – 1.215New Zealand (2) 0.118 0.194 0.156Peru (2) 0.553 0.656 0.605Philippines (1) – – 0.339Poland (4) 0.167 0.247 0.21Portugal (5) 0.072 1.142 0.132Russia (2) 0.559 0.559 0.559Scotland (2) 0.049 0.2 0.125Singapore (1) – – 0.118South Africa (1) – – 0.153South Korea (3) 0.287 0.542 0.436Slovakia (3) 0.269 0.315 0.3Sri Lanka (1) – – 0.228Trinidad (1) – – 0.03Thailand (1) – – 0.131UK (2) 0.207 0.259 0.233Ukraine (3) 0.486 0.659 0.655USA (8) 0.364 2.014 0.662Vietnam (2) 0.126 0.151 0.139
a A more detailed supplementary Table 6s is given in electronic supplementaryinformation with individual analytical data and standard deviations for individualsamples.
3.4. Beer samples
One hundred and forty-four beer samples originating frommany parts of the world were analyzed. They all contain mea-surable amounts of perchlorate. For all the samples analyzedin triplicate, the measured isotopic ratios of 35Cl to 37Cl variesfrom 2.66 to 3.06 with an average of 2.75 ± 0.07. Table 6 summa-rizes perchlorate levels, low, high and median, found in the beer
ig. 3. Concentration levels of perchlorate found in wine samples from variousontinents.

46 H. El Aribi et al. / Analytica Chimica Acta 567 (2006) 39–47
Table 7Concentrations of perchlorate found in various beverage products
Beverage Country of origin Perchloratea (�g l−1)
Sugar cane rum Brazil 0.065 ± 0.007Milk (1%) Canada 4.795 ± 0.038Milk (baby formula) Canada 1.245 ± 0.057Whisky England 0.089 ± 0.008Canned iced tea Hawaii 0.785 ± 0.002Ciacobazzi Italy 1.707 ± 0.002Canned barley tea Japan NDSake Japan 0.103 ± 0.007Plum wine Japan 0.296 ± 0.018Canned aloevera drink Malaysia 1.185 ± 0.020Canned fruit juice Singapore 0.021 ± 0.001Canned fruit–vege juice Singapore 0.543 ± 0.002
ND, not detected.a Average of triplicates ± standard deviation.
samples from various countries. A more detailed supplementaryTable 6s is given in electronic supplementary information withindividual analytical data and standard deviations for individualsamples. These concentration values are averages of triplicatemeasurement. The data indicate that the level of perchlorate,found in the beer samples, varied significantly between coun-tries on the same continent and between continents. In general,the beer samples from Europe and Asia showed, on the average,the lowest level of perchlorate, with the exception of one samplefrom France and one from Japan. Beer from Latvia, Vietnam,Holland and Germany showed, on the average, the lowest levelof perchlorate. A beer samples from France and another fromIsrael had the highest level of perchlorate. However, due to thelimited sample size, it is difficult to say if these are isolated casesor common occurrence in those regions.
3.5. Other beverages samples
Table 7 summarizes perchlorate levels found in beverages.The perchlorate values are averages of triplicate measurement.The measured isotopic ratios of 35Cl to 37Cl varies from 2.67 to3.15 with an average of 3.02 ± 0.11. All of the tested samplescontained measurable amounts of perchlorate except for a canbarley tea from Japan. The level of perchlorate in this sample wasbelow the detection limit (5 ng l−1) of the ICS-2500/API 2000TM
system. A 1% milk sample from Canada showed a high levelorf
4
fmosKMo
in food and beverages products. This present method clearlyimproved the analytical capabilities for the detection perchloratein complex samples at the sub-ppb level. These detection limitare significantly lower than previously reported values when ICis used with conductivity detection.
Though the main emphasis of the present work was to demon-strate the analytical capabilities of IC-ESI-MSMS with variousmatrices, our data also showed that perchlorate is omnipresentin food and beverages samples, worldwide. The variation of per-chlorate concentration from different continents, countries andeven producers within the same region adds an additional dimen-sion to the complexity of human exposure to perchlorate. Sincethere are uncertainties in the toxicological database that is usedto address the potential of perchlorate to produce human healtheffects when present at low levels in drinking water, some ofthe levels of perchlorate found in the present study are rela-tively high and it could be of health concern when consideringall dietary sources. We hope that the simplicity, robustness andsensitivity of the IC-ESI-MSMS method proposed in this workwill facilitate further work in this complex field.
Acknowledgements
The authors wish to thank colleagues at Applied Biosys-tems/MDS SCIEX for donation and procurement of variouss
Gtb
A
i
R
[
f perchlorate at 4.795 ± 0.038 �g l−1. The level of perchlorateeported by the FDA in 1% milk from State of California rangedrom 4.0 to 8.33 �g l−1 [9].
. Conclusion
The present approach with the IC-ESI-MS/MS system isound to be a robust, specific and sensitive method for the deter-ination of perchlorate in food and beverages samples. The use
f O-18 labeled perchlorate as internal standard and matrix diver-ion technique with a gradient step to a higher concentration ofOH provided accurate quantification of perchlorate. The use ofS/MS to monitor the 35Cl/37Cl ratios improved the specificity
f this method and data reliability in perchlorate determination
amples examined in this work.Trademarks: API 3200, Turbo V, IonSpray and Curtain
as are trademarks; Analyst and TurboIonSpray are registeredrademarks of Applied Biosystems/MDS Sciex, a joint ventureetween Applera Corporation and MDS Inc.
ppendix A. Supplementary data
Supplementary data associated with this article can be found,n the online version, at doi:10.1016/j.aca.2006.03.012.
eferences
[1] Perchlorate Environmental Contamination: Toxicological Review andRisk Characterization (2002 External Review Draft). http://cfpub.epa.gov/ncea/cfm/recordisplav.cfm?deid=24002.
[2] E.T. Urbansky, S.K. Brown, M.L. Magnuson, C.A. Kelty, Environ. Pol-lut. 112 (2001) 299–302.
[3] E.T. Urbansky, Biorem. J. 2 (1998) 81–95.[4] E.T. Urbansky, M.R. Anchock, J. Environ. Manage. 56 (1999) 79–81.[5] M.L. Magnuson, E.T. Urbansky, C.A. Kelty, Anal. Chem. 72 (2000)
25–29.[6] U.S. Environmental Protection Agency: Federal Facilities Restora-
tion and Reuse: Perchlorate. http://www.epa.gov/fedfac/documents/perchlorate.htm.
[7] Organic Consumers Association. http://www.organicconsumers.org/perchlorate.htm, http://www.organicconsumers.org/foodsafety/perchlorate022205.cfm.
[8] A.J. Krynitsky, R.A. Niemann, D.A. Nortrup, Anal. Chem. 76 (2004)5518–5522.
[9] U.S. Food and Drug Administration, Center for Food Safetyand Applied Nutrition, Exploratory Data on Perchlorate in Food.http://www.cfsan.fda.gov/∼dms/clo4data.html.
10] C.A. Sanchez, K.S. Crump, R.I. Krieger, N.R. Khandaker, J.P. Gibbs,Environ. Sci. Technol. 39 (2005) 9391–9397.

H. El Aribi et al. / Analytica Chimica Acta 567 (2006) 39–47 47
[11] P. Winkler, M. Minteer, J. Willey, Anal. Chem. 76 (2004) 469–473.[12] A.B. Kirk, E.E. Smith, K. Tian, T.A. Anderson, P.K. Dasgupta, Environ.
Sci. Technol. 37 (2003) 4979–4981.[13] S. Susarla, T.W. Collette, A.W. Garrison, S.C. McCutcheon, Environ.
Sci. Technol. 33 (1999) 3469–3472.[14] J.J. Ellington, N.L. Wolfe, A.W. Garrison, J.J. Evans, J.K. Avants, Q.
Teng, Environ. Sci. Technol. 35 (2001) 3213–3218.[15] L. Valentin-Blasini, J.P. Mauldin, D. Maple, B.C. Blount, Anal. Chem.
77 (2005) 2475–2481.[16] M.A. Greer, G. Goodman, R.C. Pleus, S.E. Greer, Environ. Health Per-
spect. 110 (2002) 927–937.[17] Method 314.1, Determination of Perchlorate in Drinking Water Using
In Line Column Concentration/Matrix Elimination Ion Chromatogra-phy With Suppressed Conductivity Detection, Revision 1, May 2005.http://www.epa.gov/OGWDW/methods/pdfs/method 314 1.pdf.
[18] Dionex Corporation, Determination of Low Concentrations of Perchlo-rate in Drinking and Ground Waters Using Ion Chromatography, Appli-cation Note 134, Sunnyvale, CA.
[19] Dionex Corporation, Determination of Perchlorate in Drinking Water byIon Chromatography, Application Update 145, Sunnyvale, CA.
[20] Dionex Corporation, Determination of Perchlorate in Drinking WaterUsing Reagent-Free Ion Chromatography, Application Update 148, Sun-nyvale, CA.
[21] H.S. Okamoto, D.K. Rishi, W.R. Steeber, F.J. Baumann, S.K. Perera, J.Am. Water Works Assoc. 91 (1990) 72–84.
[22] E.T. Urbansky, T.W. Collette, J. Environ. Monit. 3 (2001) 454–462.
[23] E.A. Dodds, J.M. Kennish, F.A. von Hippel, R. Bernhardt, M.E. Hines,Anal. Bioanal. Chem. 379 (5–6) (2004) 881–887.
[24] P.K. Martinelango, J.L. Anderson, P.K. Dasgupta, D.W. Armstrong, R.S.Al-Horr, R.W. Slingsby, Anal. Chem. 77 (2005) 4829–4835.
[25] M.L. Magnuson, E.T. Urbansky, D. Freeman, C.J. Jefks, Anal. At. Spec-trom. 14 (1999) 1861–1866.
[26] C.J. Koester, H.R. Beller, R.U. Halden, Environ. Sci. Technol. 34 (2000)1862–1864.
[27] E. Ells, D.A. Barnett, R.W. Purves, R. Guevremont, J. Environ. Monit.2 (2000) 393–397.
[28] R. Roehl, R.W. Slingsby, N. Avdalovic, P.E. Jackson, J. Chromatogr. A956 (2002) 245–254.
[29] G.G. Hawley, The Condensed Chemical Dictionary, 10th ed., Van Nos-trand Reinhold Company Inc., New York, 1981.
[30] U.S. EPA Method 332.0, Determination of Perchlorate in DrinkingWater by Ion Chromatography with Suppressed Conductivity and Elec-trospray Ionization Mass Spectrometry. http://www.epa.gov/nerlcwww/rn332 0.pdf.