Embed Size (px)
Citation preview
EBI Consulting environmental | engineering | due diligence
21 B Street .
Burlington, MA 01803 .
Tel: (781) 273.2500 .
Fax: (781) 273.3311
RADIO FREQUENCY FCC REGULATORY COMPLIANCE MAXIMUM PERMISSIBLE EXPOSURE (MPE) ASSESSMENT
Sprint Existing Facility
Site ID: CT43XC822
Glastonbury Nextel
2577 Main Street Glastonbury, CT 06033
May 27, 2014
EBI Project Number: 62143112
EBI Consulting environmental | engineering | due diligence
21 B Street .
Burlington, MA 01803 .
Tel: (781) 273.2500 .
Fax: (781) 273.3311
May 27, 2014
Sprint
Attn: RF Engineering Manager
1 International Boulevard, Suite 800
Mahwah, NJ 07495
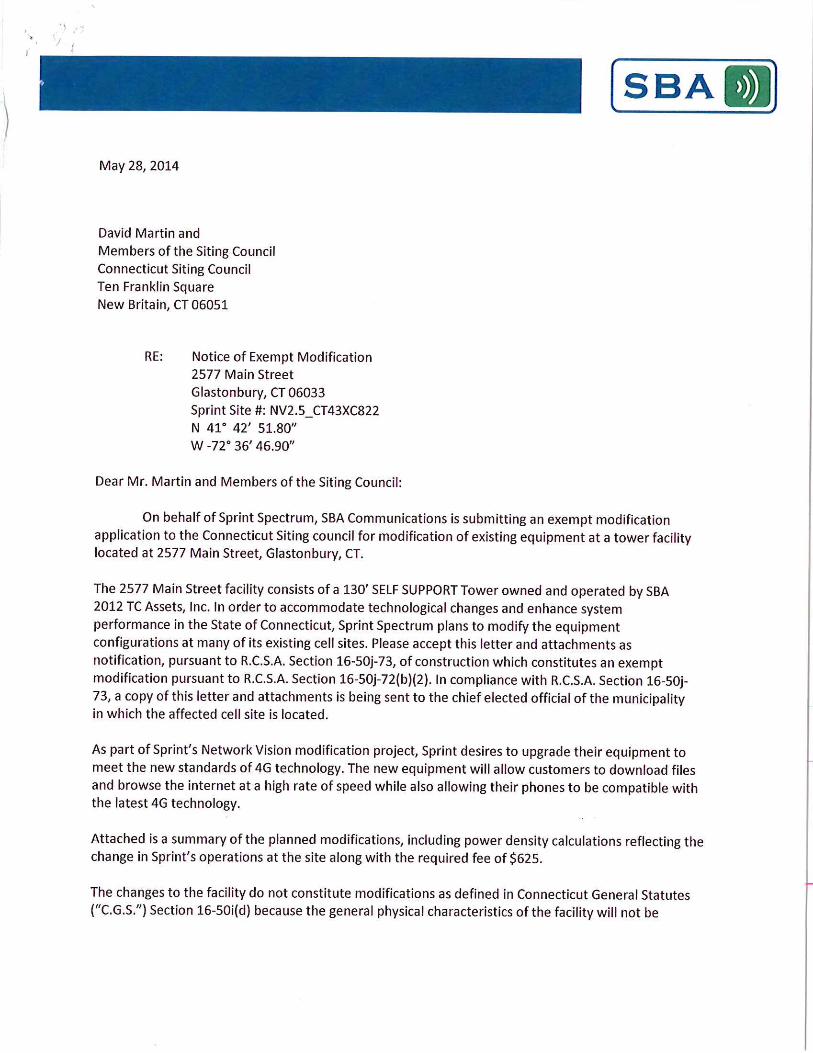
Re: Radio Frequency Maximum Permissible Exposure (MPE) Assessment for Site:
CT43XC822 - Glastonbury Nextel
Site Total: 68.02% - MPE% in full compliance
EBI Consulting was directed to analyze the proposed upgrades to the existing Sprint facility located at
2577 Main Street, Glastonbury, CT, for the purpose of determining whether the radio frequency (RF)
exposure levels from the proposed Sprint equipment upgrades on this property are within specified federal
limits.
All information used in this report was analyzed as a percentage of current Maximum Permissible
Exposure (% MPE) as listed in the FCC OET Bulletin 65 Edition 97-01and ANSI/IEEE Std C95.1. The
FCC regulates Maximum Permissible Exposure in units of microwatts per square centimeter (µW/cm2).
The number of µW/cm2 calculated at each sample point is called the power density. The exposure limit
for power density varies depending upon the frequencies being utilized. Wireless Carriers and Paging
Services use different frequency bands each with different exposure limits, therefore it is necessary to
report results and limits in terms of percent MPE rather than power density.
All results were compared to the FCC (Federal Communications Commission) radio frequency exposure
rules, 47 CFR 1.1307(b)(1) – (b)(3), to determine compliance with the Maximum Permissible Exposure
(MPE) limits for General Population/Uncontrolled environments as defined below.
General population/uncontrolled exposure limits apply to situations in which the general public may be
exposed or in which persons who are exposed as a consequence of their employment may not be made
fully aware of the potential for exposure or cannot exercise control over their exposure. Therefore,
members of the general public would always be considered under this category when exposure is not
employment related, for example, in the case of a telecommunications tower that exposes persons in a
nearby residential area.
Public exposure to radio frequencies is regulated and enforced in units of microwatts per square
centimeter (µW/cm2). The general population exposure limit for the cellular band (850 MHz Band) is
approximately 567 µW/cm2, and the general population exposure limit for the 1900 MHz and 2500 MHz
bands is 1000 µW/cm2. Because each carrier will be using different frequency bands, and each frequency
band has different exposure limits, it is necessary to report percent of MPE rather than power density.
EBI Consulting environmental | engineering | due diligence
21 B Street .
Burlington, MA 01803 .
Tel: (781) 273.2500 .
Fax: (781) 273.3311
Occupational/controlled exposure limits apply to situations in which persons are exposed as a
consequence of their employment and in which those persons who are exposed have been made fully
aware of the potential for exposure and can exercise control over their exposure. Occupational/controlled
exposure limits also apply where exposure is of a transient nature as a result of incidental passage through
a location where exposure levels may be above general population/uncontrolled limits (see below), as
long as the exposed person has been made fully aware of the potential for exposure and can exercise
control over his or her exposure by leaving the area or by some other appropriate means.
Additional details can be found in FCC OET 65.
CALCULATIONS
Calculations were done for the proposed upgrades to the existing Sprint Wireless antenna facility located
at 2577 Main Street, Glastonbury, CT, using the equipment information listed below. All calculations
were performed per the specifications under FCC OET 65. All calculations were performed assuming a
lobe representing the maximum gain of the antenna per the antenna manufactures supplied specifications,
minus 10 dB, was focused at the base of the tower. For this report the sample point is the top of a 6 foot
person standing at the base of the tower.
For all calculations, all emissions were calculated using the following assumptions:
1) 4 channels in the 1900 MHz Band were considered for each sector of the proposed
installation.
2) 1 channel in the 800 MHz Band was considered for each sector of the proposed installation
3) 2 channels in the 2500 MHz Band were considered for each sector of the proposed
installation.
4) All radios at the proposed installation were considered to be running at full power and were
uncombined in their RF transmissions paths per carrier prescribed configuration. Per FCC
OET Bulletin No. 65 - Edition 97-01 recommendations to achieve the maximum anticipated
value at each sample point, all power levels emitting from the proposed antenna installation
are increased by a factor of 2.56 to account for possible in-phase reflections from the
surrounding environment. This is rarely the case, and if so, is never continuous.
5) For the following calculations the sample point was the top of a six foot person standing at
the base of the tower. The maximum gain of the antenna per the antenna manufactures
supplied specifications minus 10 dB was used in this direction. This value is a very
conservative estimate as gain reductions for these particular antennas are typically much
higher in this direction.
EBI Consulting environmental | engineering | due diligence
21 B Street .
Burlington, MA 01803 .
Tel: (781) 273.2500 .
Fax: (781) 273.3311
6) The antennas used in this modeling are the RFS APXVSPP18-C-A20, the Powerwave P40-
16-XLPP-RR-A and the RFS APXVTMM-C-120. This is based on feedback from the carrier
with regards to anticipated antenna selection. The RFS APXVSPP18-C-A20 has a 15.9 dBd
gain value at its main lobe at 1900 MHz and 13.4 dBd at its main lobe for 850 MHz. The
Powerwave P40-16-XLPP-RR-A has a 15.9 dBd gain value at its main lobe at 1900 MHz and
14.2 dBd at its main lobe for 850 MHz. The RFS APXVTMM-C-120 has a 15.9 dBd gain
value at its main lobe at 2500 MHz. The maximum gain of the antenna per the antenna
manufactures supplied specifications, minus 10 dB, was used for all calculations. This value
is a very conservative estimate as gain reductions for these particular antennas are typically
much higher in this direction.
7) The antenna mounting height centerline for the proposed antennas is 118.5feet above ground
level (AGL) for the 1900MHz / 850 MHz antennas and 120 feet above ground level (AGL)
for the 2500 MHz antennas.
8) Emissions values for additional carriers were taken from the Connecticut Siting Council
active database. Values in this database are provided by the individual carriers themselves.
All calculation were done with respect to uncontrolled / general public threshold limits
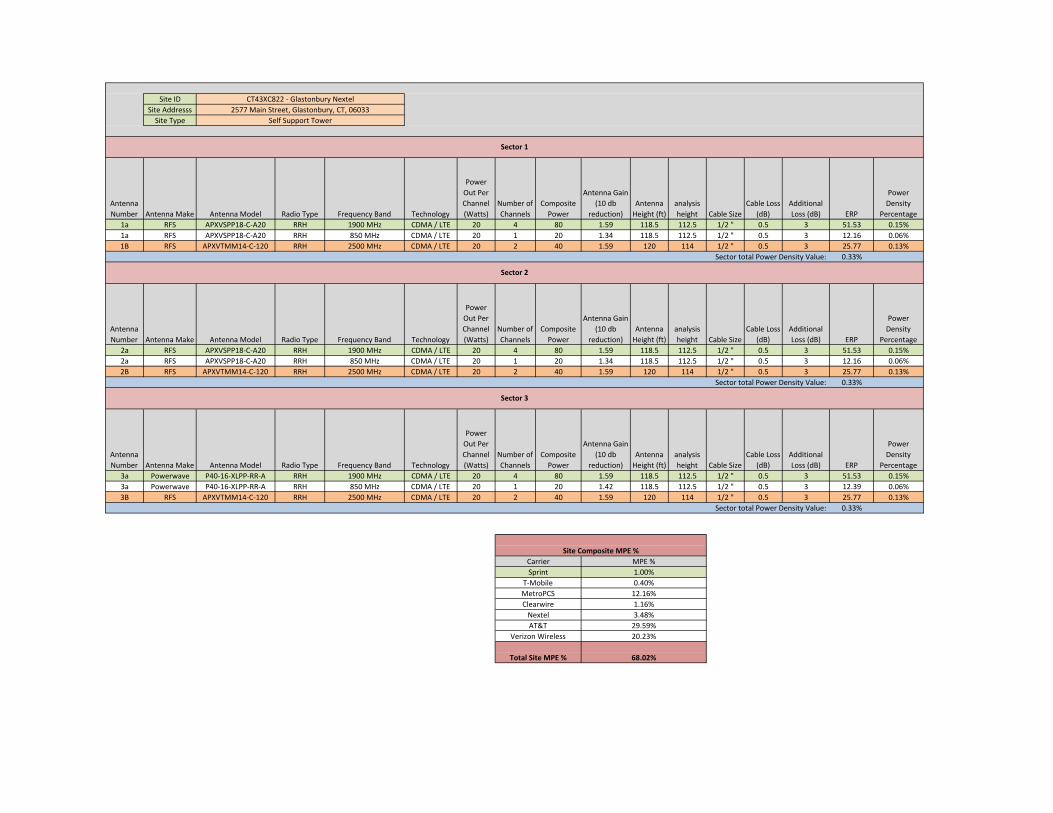
Site ID
Site Addresss
Site Type
Antenna
Number Antenna Make Antenna Model Radio Type Frequency Band Technology
Power
Out Per
Channel
(Watts)
Number of
Channels
Composite
Power
Antenna Gain
(10 db
reduction)
Antenna
Height (ft)
analysis
height Cable Size
Cable Loss
(dB)
Additional
Loss (dB) ERP
Power
Density
Percentage
1a RFS APXVSPP18-C-A20 RRH 1900 MHz CDMA / LTE 20 4 80 1.59 118.5 112.5 1/2 " 0.5 3 51.53 0.15%
1a RFS APXVSPP18-C-A20 RRH 850 MHz CDMA / LTE 20 1 20 1.34 118.5 112.5 1/2 " 0.5 3 12.16 0.06%
1B RFS APXVTMM14-C-120 RRH 2500 MHz CDMA / LTE 20 2 40 1.59 120 114 1/2 " 0.5 3 25.77 0.13%
0.33%
Antenna
Number Antenna Make Antenna Model Radio Type Frequency Band Technology
Power
Out Per
Channel
(Watts)
Number of
Channels
Composite
Power
Antenna Gain
(10 db
reduction)
Antenna
Height (ft)
analysis
height Cable Size
Cable Loss
(dB)
Additional
Loss (dB) ERP
Power
Density
Percentage
2a RFS APXVSPP18-C-A20 RRH 1900 MHz CDMA / LTE 20 4 80 1.59 118.5 112.5 1/2 " 0.5 3 51.53 0.15%
2a RFS APXVSPP18-C-A20 RRH 850 MHz CDMA / LTE 20 1 20 1.34 118.5 112.5 1/2 " 0.5 3 12.16 0.06%
2B RFS APXVTMM14-C-120 RRH 2500 MHz CDMA / LTE 20 2 40 1.59 120 114 1/2 " 0.5 3 25.77 0.13%
0.33%
Antenna
Number Antenna Make Antenna Model Radio Type Frequency Band Technology
Power
Out Per
Channel
(Watts)
Number of
Channels
Composite
Power
Antenna Gain
(10 db
reduction)
Antenna
Height (ft)
analysis
height Cable Size
Cable Loss
(dB)
Additional
Loss (dB) ERP
Power
Density
Percentage
3a Powerwave P40-16-XLPP-RR-A RRH 1900 MHz CDMA / LTE 20 4 80 1.59 118.5 112.5 1/2 " 0.5 3 51.53 0.15%
3a Powerwave P40-16-XLPP-RR-A RRH 850 MHz CDMA / LTE 20 1 20 1.42 118.5 112.5 1/2 " 0.5 3 12.39 0.06%
3B RFS APXVTMM14-C-120 RRH 2500 MHz CDMA / LTE 20 2 40 1.59 120 114 1/2 " 0.5 3 25.77 0.13%
0.33%
AT&T 29.59%
Verizon Wireless 20.23%
Sector total Power Density Value:
Site Composite MPE %
Total Site MPE % 68.02%
12.16%
1.16%
MPE %
1.00%
0.40%
Clearwire
Carrier
Sprint
T-Mobile
Sector 1
Sector 2
Sector 3
2577 Main Street, Glastonbury, CT, 06033
CT43XC822 - Glastonbury Nextel
Self Support Tower
Sector total Power Density Value:
Sector total Power Density Value:
MetroPCS
Nextel 3.48%
EBI Consulting environmental | engineering | due diligence
21 B Street .
Burlington, MA 01803 .
Tel: (781) 273.2500 .
Fax: (781) 273.3311
Summary
All calculations performed for this analysis yielded results that were well within the allowable limits for
general public Maximum Permissible Exposure (MPE) to radio frequency energy.
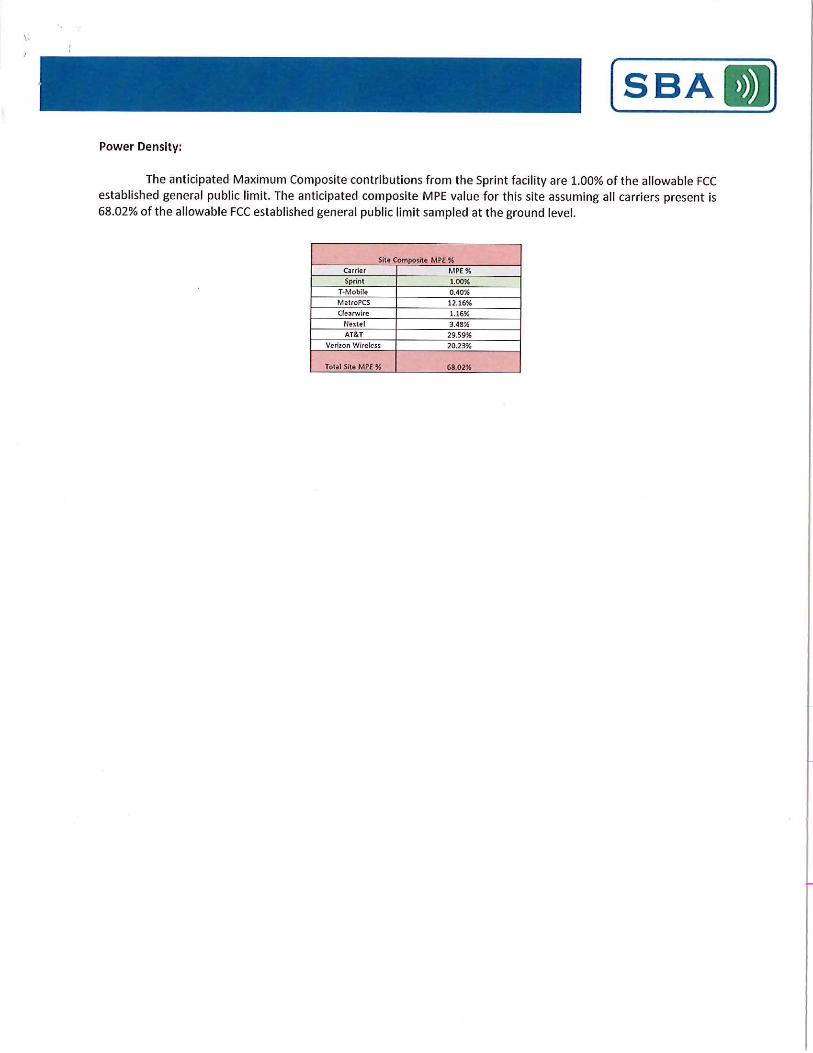
The anticipated Maximum Composite contributions from the Sprint facility are 1.00% (0.33% from
sector 1, 0.33% from sector 2 and 0.33% from sector 3) of the allowable FCC established general
public limit considering all three sectors simultaneously sampled at the ground level.
The anticipated composite MPE value for this site assuming all carriers present is 68.02% of the
allowable FCC established general public limit sampled at 6 feet above ground level. This total composite
site value is based upon MPE values listed in the Connecticut Siting Council database for existing carrier
emissions.
FCC guidelines state that if a site is found to be out of compliance (over allowable thresholds), that
carriers over a 5% contribution to the composite value will require measures to bring the site into
compliance. For this facility, the composite values calculated were well within the allowable 100%
threshold standard per the federal government.
Scott Heffernan
RF Engineering Director
EBI Consulting
21 B Street
Burlington, MA 01803
FDH Engineering, Inc., 6521 Meridien Drive Raleigh, NC 27616, Ph. 919.755.1012
Document No. ENG-RPT-502S Revision Date: 07/05/11
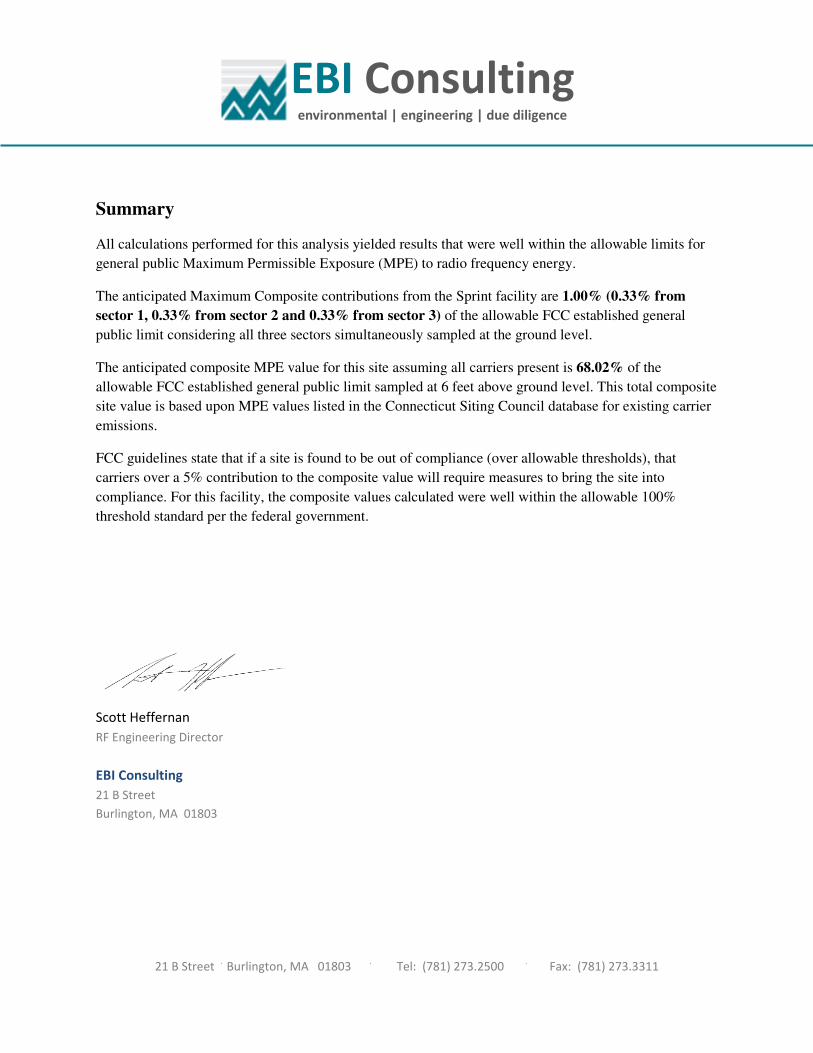
Structural Analysis for SBA Network Services, Inc.
130' Self-Support Tower
SBA Site Name: Glastonbury-Main St
SBA Site ID: CT46126-A-03 Sprint Site ID: CT43XC822
FDH Project Number 1462HD1400
Analysis Results
Tower Components 90.1 % Sufficient
Foundation 68.8 % Sufficient
Prepared By: Reviewed By:
Diana Tang, EIT Project Engineer
Bradley R. Newman, PE Senior Engineer
CT PE License No. 29630
FDH Engineering, Inc.
6521 Meridien Drive Raleigh, NC 27616
(919) 755-1012 [email protected]
April 10, 2014
Prepared pursuant to TIA/EIA-222-F Structural Standards for Steel Antenna Towers and Antenna Supporting Structures & 2005 Connecticut Building Code
Structural Analysis ReportSBA Network Services, Inc.
SBA Site ID: CT46126-A-03April 10, 2014
Document No. ENG-RPT-502S Revision Date: 06/17/112
TABLE OF CONTENTS
EXECUTIVE SUMMARY ................................................................................................................................................................3
Conclusions ................................................................................................................................................................................3
Recommendations......................................................................................................................................................................3
APPURTENANCE LISTING ...........................................................................................................................................................4
RESULTS........................................................................................................................................................................................5
GENERAL COMMENTS.................................................................................................................................................................8
LIMITATIONS..................................................................................................................................................................................8
APPENDIX ......................................................................................................................................................................................9
Structural Analysis Report SBA Network Services, Inc.
SBA Site ID: CT46126-A-03 April 10, 2014
Document No. ENG-RPT-502S Revision Date: 06/17/11 3
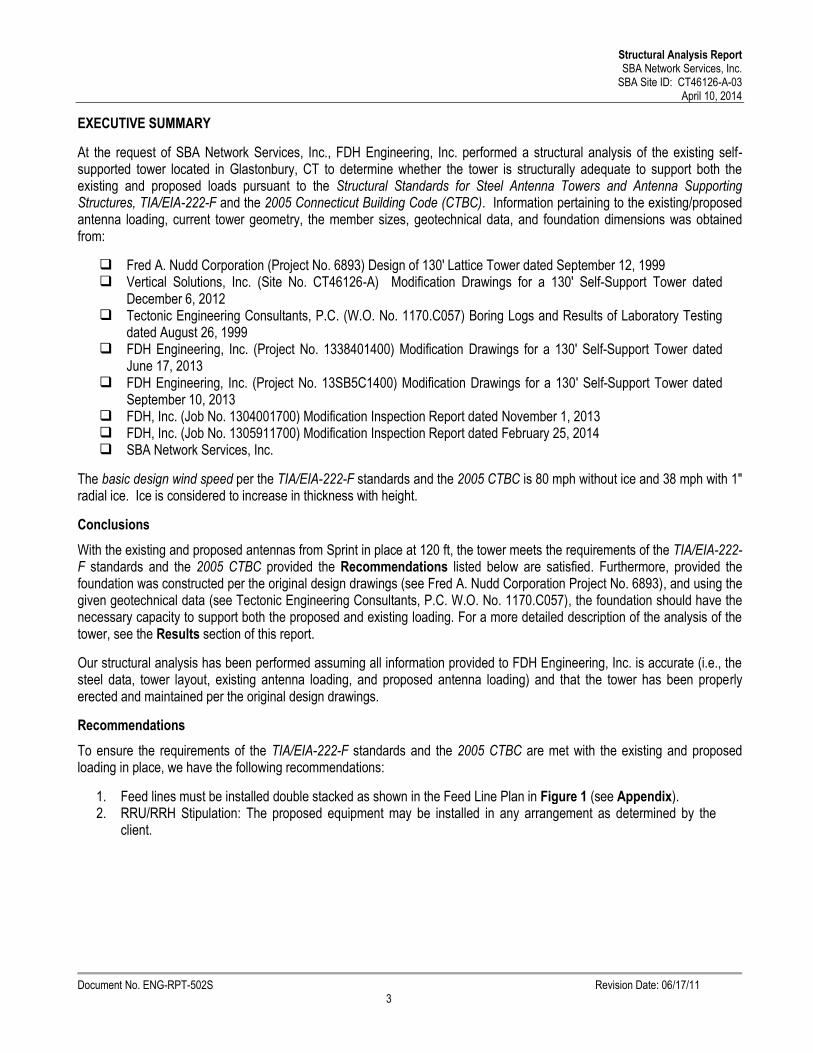
EXECUTIVE SUMMARY
At the request of SBA Network Services, Inc., FDH Engineering, Inc. performed a structural analysis of the existing self-supported tower located in Glastonbury, CT to determine whether the tower is structurally adequate to support both the existing and proposed loads pursuant to the Structural Standards for Steel Antenna Towers and Antenna Supporting Structures, TIA/EIA-222-F and the 2005 Connecticut Building Code (CTBC). Information pertaining to the existing/proposed antenna loading, current tower geometry, the member sizes, geotechnical data, and foundation dimensions was obtained from:
Fred A. Nudd Corporation (Project No. 6893) Design of 130' Lattice Tower dated September 12, 1999 Vertical Solutions, Inc. (Site No. CT46126-A) Modification Drawings for a 130' Self-Support Tower dated
December 6, 2012 Tectonic Engineering Consultants, P.C. (W.O. No. 1170.C057) Boring Logs and Results of Laboratory Testing
dated August 26, 1999 FDH Engineering, Inc. (Project No. 1338401400) Modification Drawings for a 130' Self-Support Tower dated
June 17, 2013 FDH Engineering, Inc. (Project No. 13SB5C1400) Modification Drawings for a 130' Self-Support Tower dated
September 10, 2013 FDH, Inc. (Job No. 1304001700) Modification Inspection Report dated November 1, 2013 FDH, Inc. (Job No. 1305911700) Modification Inspection Report dated February 25, 2014 SBA Network Services, Inc.
The basic design wind speed per the TIA/EIA-222-F standards and the 2005 CTBC is 80 mph without ice and 38 mph with 1" radial ice. Ice is considered to increase in thickness with height.
Conclusions
With the existing and proposed antennas from Sprint in place at 120 ft, the tower meets the requirements of the TIA/EIA-222-F standards and the 2005 CTBC provided the Recommendations listed below are satisfied. Furthermore, provided the foundation was constructed per the original design drawings (see Fred A. Nudd Corporation Project No. 6893), and using the given geotechnical data (see Tectonic Engineering Consultants, P.C. W.O. No. 1170.C057), the foundation should have the necessary capacity to support both the proposed and existing loading. For a more detailed description of the analysis of the tower, see the Results section of this report.
Our structural analysis has been performed assuming all information provided to FDH Engineering, Inc. is accurate (i.e., the steel data, tower layout, existing antenna loading, and proposed antenna loading) and that the tower has been properly erected and maintained per the original design drawings.
Recommendations
To ensure the requirements of the TIA/EIA-222-F standards and the 2005 CTBC are met with the existing and proposed loading in place, we have the following recommendations:
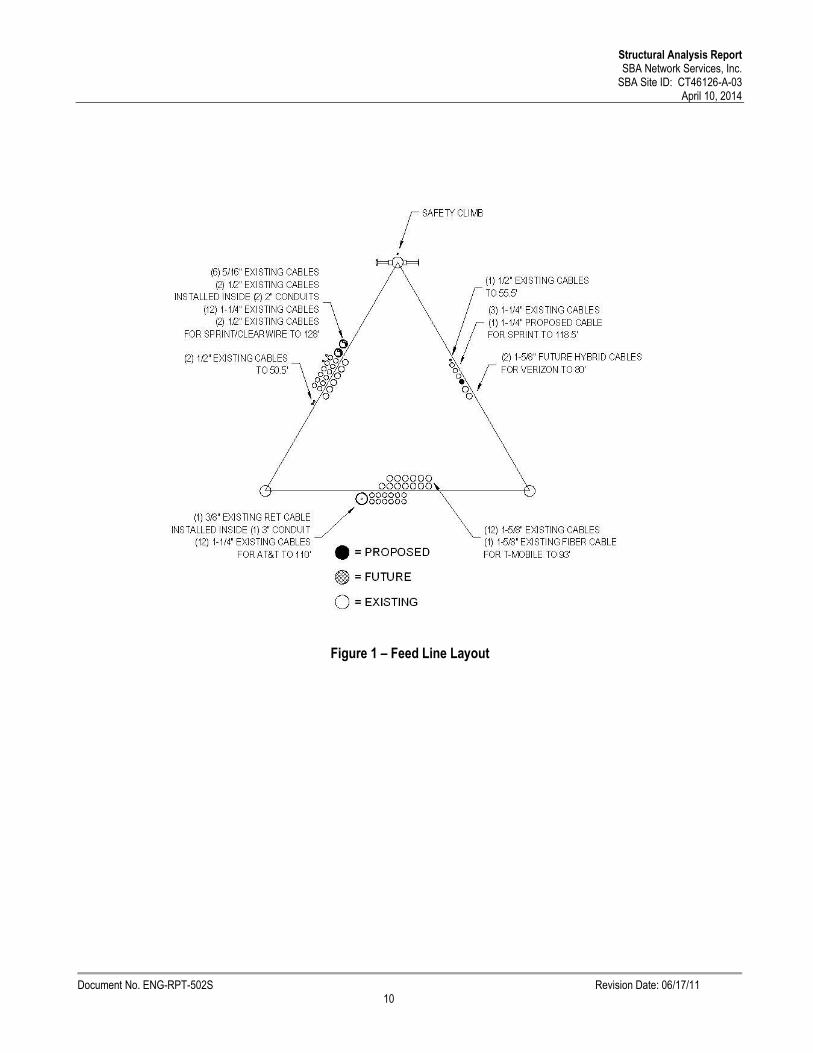
1. Feed lines must be installed double stacked as shown in the Feed Line Plan in Figure 1 (see Appendix). 2. RRU/RRH Stipulation: The proposed equipment may be installed in any arrangement as determined by the
client.
Structural Analysis Report SBA Network Services, Inc.
SBA Site ID: CT46126-A-03 April 10, 2014
Document No. ENG-RPT-502S Revision Date: 06/17/11 4
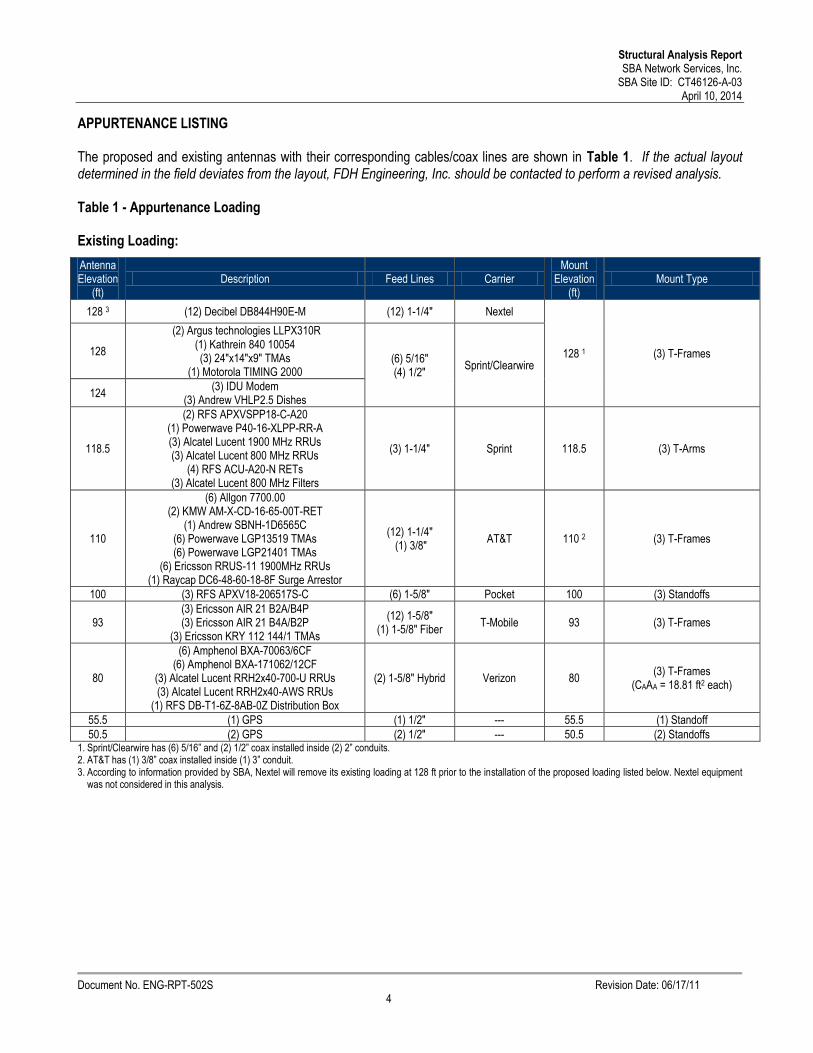
APPURTENANCE LISTING The proposed and existing antennas with their corresponding cables/coax lines are shown in Table 1. If the actual layout determined in the field deviates from the layout, FDH Engineering, Inc. should be contacted to perform a revised analysis. Table 1 - Appurtenance Loading Existing Loading:
Antenna Elevation
(ft) Description Feed Lines Carrier
Mount Elevation
(ft) Mount Type
128 3 (12) Decibel DB844H90E-M (12) 1-1/4" Nextel
128 1 (3) T-Frames 128
(2) Argus technologies LLPX310R (1) Kathrein 840 10054 (3) 24"x14"x9" TMAs
(1) Motorola TIMING 2000 (6) 5/16" (4) 1/2"
Sprint/Clearwire
124 (3) IDU Modem
(3) Andrew VHLP2.5 Dishes
118.5
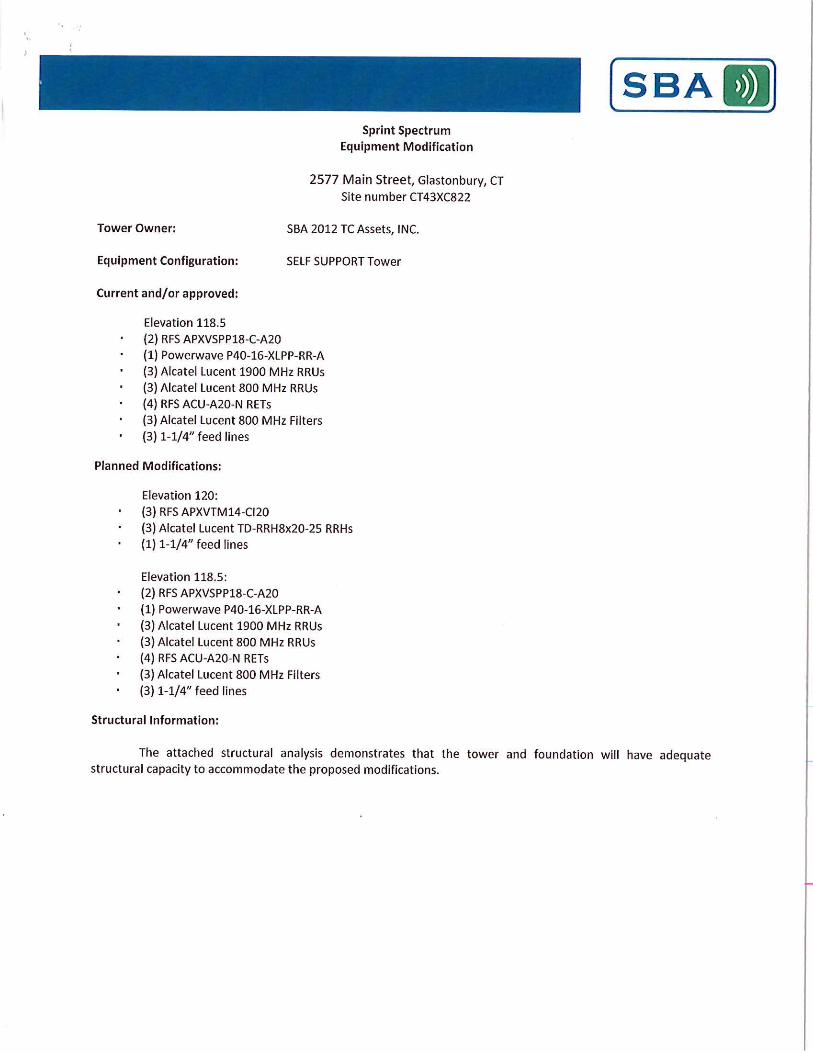
(2) RFS APXVSPP18-C-A20 (1) Powerwave P40-16-XLPP-RR-A (3) Alcatel Lucent 1900 MHz RRUs (3) Alcatel Lucent 800 MHz RRUs
(4) RFS ACU-A20-N RETs (3) Alcatel Lucent 800 MHz Filters
(3) 1-1/4" Sprint 118.5 (3) T-Arms
110
(6) Allgon 7700.00 (2) KMW AM-X-CD-16-65-00T-RET
(1) Andrew SBNH-1D6565C (6) Powerwave LGP13519 TMAs (6) Powerwave LGP21401 TMAs
(6) Ericsson RRUS-11 1900MHz RRUs (1) Raycap DC6-48-60-18-8F Surge Arrestor
(12) 1-1/4" (1) 3/8"
AT&T 110 2 (3) T-Frames
100 (3) RFS APXV18-206517S-C (6) 1-5/8" Pocket 100 (3) Standoffs
93 (3) Ericsson AIR 21 B2A/B4P (3) Ericsson AIR 21 B4A/B2P
(3) Ericsson KRY 112 144/1 TMAs
(12) 1-5/8" (1) 1-5/8" Fiber
T-Mobile 93 (3) T-Frames
80
(6) Amphenol BXA-70063/6CF (6) Amphenol BXA-171062/12CF
(3) Alcatel Lucent RRH2x40-700-U RRUs (3) Alcatel Lucent RRH2x40-AWS RRUs
(1) RFS DB-T1-6Z-8AB-0Z Distribution Box
(2) 1-5/8" Hybrid Verizon 80 (3) T-Frames
(CAAA = 18.81 ft2 each)
55.5 (1) GPS (1) 1/2" --- 55.5 (1) Standoff
50.5 (2) GPS (2) 1/2" --- 50.5 (2) Standoffs 1. Sprint/Clearwire has (6) 5/16” and (2) 1/2” coax installed inside (2) 2” conduits. 2. AT&T has (1) 3/8” coax installed inside (1) 3” conduit. 3. According to information provided by SBA, Nextel will remove its existing loading at 128 ft prior to the installation of the proposed loading listed below. Nextel equipment
was not considered in this analysis.
Structural Analysis Report SBA Network Services, Inc.
SBA Site ID: CT46126-A-03 April 10, 2014
Document No. ENG-RPT-502S Revision Date: 06/17/11 5
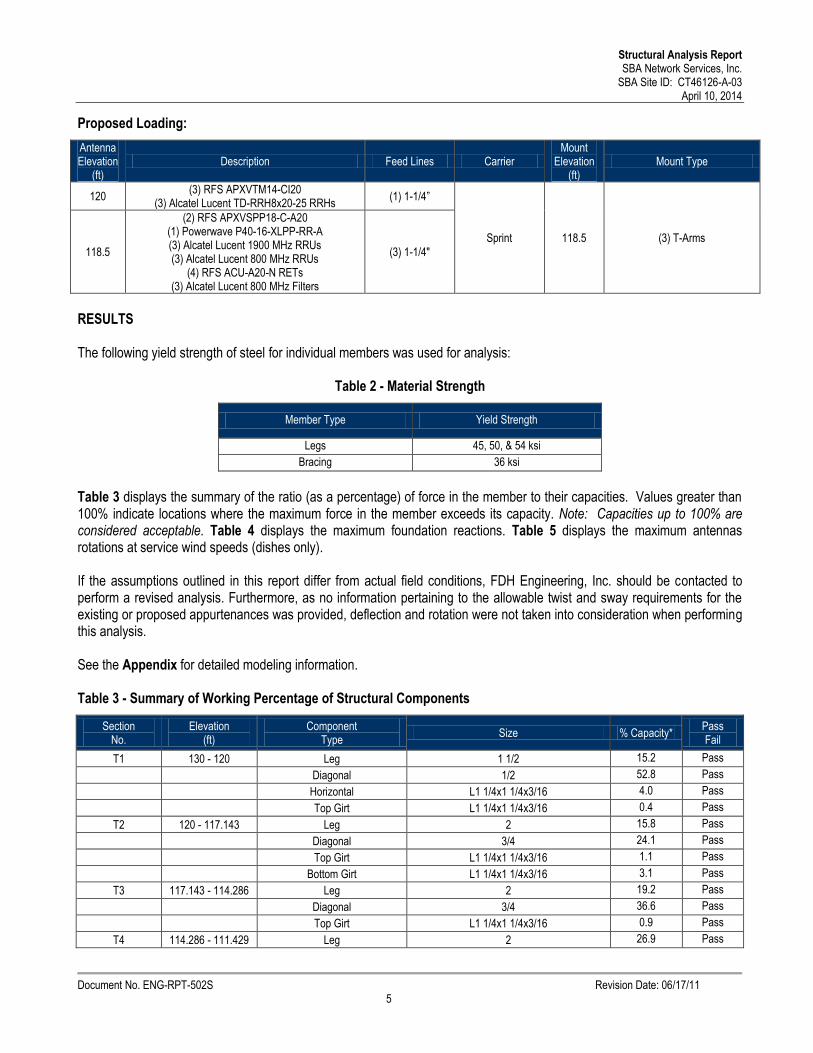
Proposed Loading:
Antenna Elevation
(ft) Description Feed Lines Carrier
Mount Elevation
(ft) Mount Type
120 (3) RFS APXVTM14-CI20
(3) Alcatel Lucent TD-RRH8x20-25 RRHs (1) 1-1/4”
Sprint 118.5 (3) T-Arms
118.5
(2) RFS APXVSPP18-C-A20 (1) Powerwave P40-16-XLPP-RR-A (3) Alcatel Lucent 1900 MHz RRUs (3) Alcatel Lucent 800 MHz RRUs
(4) RFS ACU-A20-N RETs (3) Alcatel Lucent 800 MHz Filters
(3) 1-1/4"
RESULTS The following yield strength of steel for individual members was used for analysis:
Table 2 - Material Strength
Member Type Yield Strength
Legs 45, 50, & 54 ksi
Bracing 36 ksi
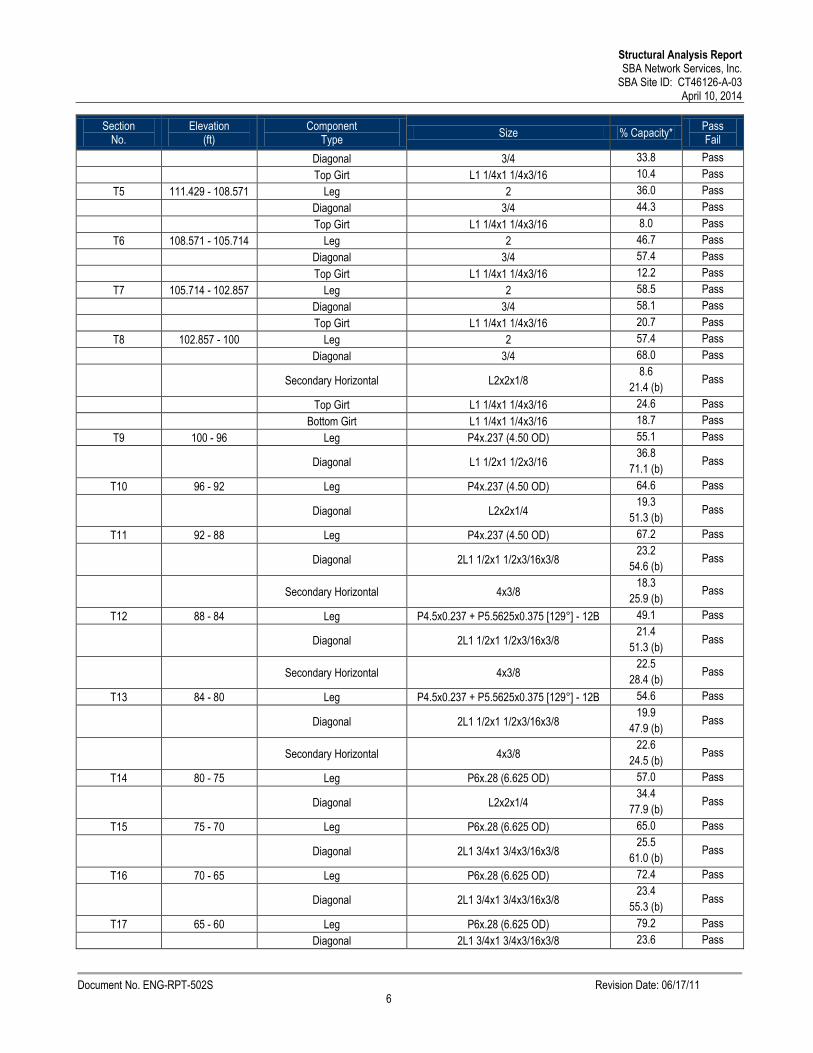
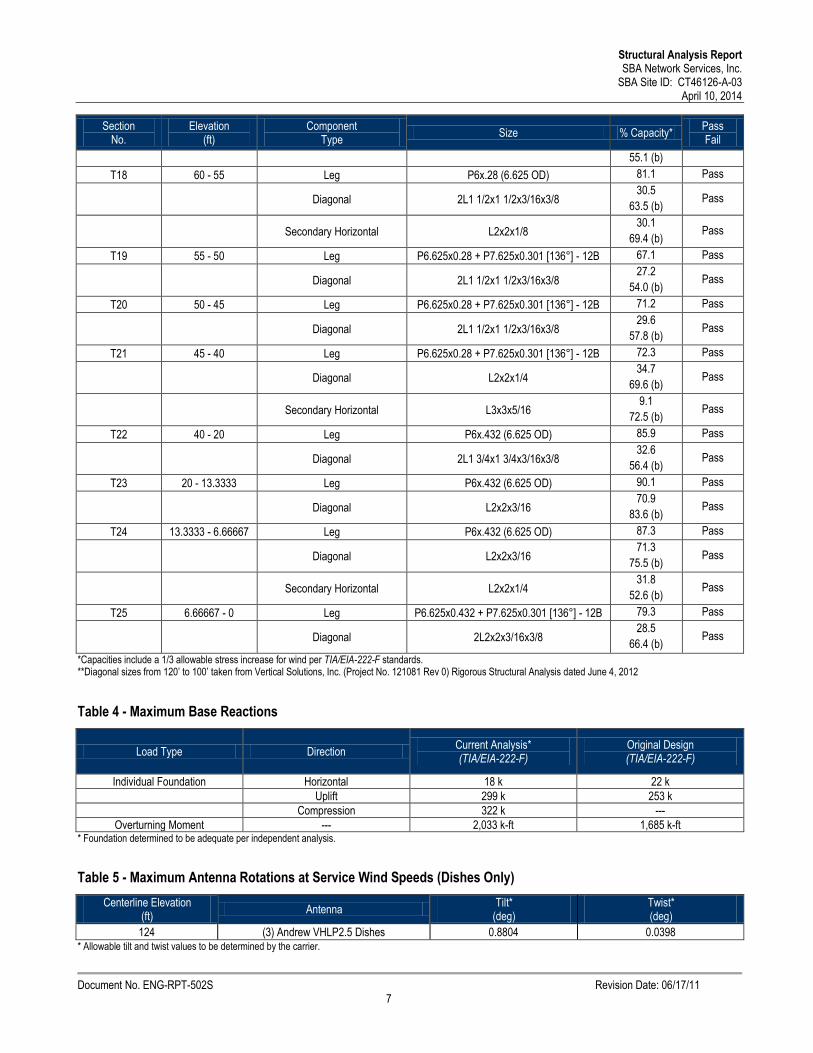
Table 3 displays the summary of the ratio (as a percentage) of force in the member to their capacities. Values greater than 100% indicate locations where the maximum force in the member exceeds its capacity. Note: Capacities up to 100% are considered acceptable. Table 4 displays the maximum foundation reactions. Table 5 displays the maximum antennas rotations at service wind speeds (dishes only). If the assumptions outlined in this report differ from actual field conditions, FDH Engineering, Inc. should be contacted to perform a revised analysis. Furthermore, as no information pertaining to the allowable twist and sway requirements for the existing or proposed appurtenances was provided, deflection and rotation were not taken into consideration when performing this analysis. See the Appendix for detailed modeling information. Table 3 - Summary of Working Percentage of Structural Components
Section No.
Elevation (ft)
Component Type
Size % Capacity* Pass Fail
T1 130 - 120 Leg 1 1/2 15.2 Pass
Diagonal 1/2 52.8 Pass
Horizontal L1 1/4x1 1/4x3/16 4.0 Pass
Top Girt L1 1/4x1 1/4x3/16 0.4 Pass
T2 120 - 117.143 Leg 2 15.8 Pass
Diagonal 3/4 24.1 Pass
Top Girt L1 1/4x1 1/4x3/16 1.1 Pass
Bottom Girt L1 1/4x1 1/4x3/16 3.1 Pass
T3 117.143 - 114.286 Leg 2 19.2 Pass
Diagonal 3/4 36.6 Pass
Top Girt L1 1/4x1 1/4x3/16 0.9 Pass
T4 114.286 - 111.429 Leg 2 26.9 Pass
Structural Analysis Report SBA Network Services, Inc.
SBA Site ID: CT46126-A-03 April 10, 2014
Document No. ENG-RPT-502S Revision Date: 06/17/11 6
Section No.
Elevation (ft)
Component Type
Size % Capacity* Pass Fail
Diagonal 3/4 33.8 Pass
Top Girt L1 1/4x1 1/4x3/16 10.4 Pass
T5 111.429 - 108.571 Leg 2 36.0 Pass
Diagonal 3/4 44.3 Pass
Top Girt L1 1/4x1 1/4x3/16 8.0 Pass
T6 108.571 - 105.714 Leg 2 46.7 Pass
Diagonal 3/4 57.4 Pass
Top Girt L1 1/4x1 1/4x3/16 12.2 Pass
T7 105.714 - 102.857 Leg 2 58.5 Pass
Diagonal 3/4 58.1 Pass
Top Girt L1 1/4x1 1/4x3/16 20.7 Pass
T8 102.857 - 100 Leg 2 57.4 Pass
Diagonal 3/4 68.0 Pass
Secondary Horizontal L2x2x1/8 8.6
21.4 (b) Pass
Top Girt L1 1/4x1 1/4x3/16 24.6 Pass
Bottom Girt L1 1/4x1 1/4x3/16 18.7 Pass
T9 100 - 96 Leg P4x.237 (4.50 OD) 55.1 Pass
Diagonal L1 1/2x1 1/2x3/16 36.8
71.1 (b) Pass
T10 96 - 92 Leg P4x.237 (4.50 OD) 64.6 Pass
Diagonal L2x2x1/4 19.3
51.3 (b) Pass
T11 92 - 88 Leg P4x.237 (4.50 OD) 67.2 Pass
Diagonal 2L1 1/2x1 1/2x3/16x3/8 23.2
54.6 (b) Pass
Secondary Horizontal 4x3/8 18.3
25.9 (b) Pass
T12 88 - 84 Leg P4.5x0.237 + P5.5625x0.375 [129°] - 12B 49.1 Pass
Diagonal 2L1 1/2x1 1/2x3/16x3/8 21.4
51.3 (b) Pass
Secondary Horizontal 4x3/8 22.5
28.4 (b) Pass
T13 84 - 80 Leg P4.5x0.237 + P5.5625x0.375 [129°] - 12B 54.6 Pass
Diagonal 2L1 1/2x1 1/2x3/16x3/8 19.9
47.9 (b) Pass
Secondary Horizontal 4x3/8 22.6
24.5 (b) Pass
T14 80 - 75 Leg P6x.28 (6.625 OD) 57.0 Pass
Diagonal L2x2x1/4 34.4
77.9 (b) Pass
T15 75 - 70 Leg P6x.28 (6.625 OD) 65.0 Pass
Diagonal 2L1 3/4x1 3/4x3/16x3/8 25.5
61.0 (b) Pass
T16 70 - 65 Leg P6x.28 (6.625 OD) 72.4 Pass
Diagonal 2L1 3/4x1 3/4x3/16x3/8 23.4
55.3 (b) Pass
T17 65 - 60 Leg P6x.28 (6.625 OD) 79.2 Pass
Diagonal 2L1 3/4x1 3/4x3/16x3/8 23.6 Pass
Structural Analysis Report SBA Network Services, Inc.
SBA Site ID: CT46126-A-03 April 10, 2014
Document No. ENG-RPT-502S Revision Date: 06/17/11 7
Section No.
Elevation (ft)
Component Type
Size % Capacity* Pass Fail
55.1 (b)
T18 60 - 55 Leg P6x.28 (6.625 OD) 81.1 Pass
Diagonal 2L1 1/2x1 1/2x3/16x3/8 30.5
63.5 (b) Pass
Secondary Horizontal L2x2x1/8 30.1
69.4 (b) Pass
T19 55 - 50 Leg P6.625x0.28 + P7.625x0.301 [136°] - 12B 67.1 Pass
Diagonal 2L1 1/2x1 1/2x3/16x3/8 27.2
54.0 (b) Pass
T20 50 - 45 Leg P6.625x0.28 + P7.625x0.301 [136°] - 12B 71.2 Pass
Diagonal 2L1 1/2x1 1/2x3/16x3/8 29.6
57.8 (b) Pass
T21 45 - 40 Leg P6.625x0.28 + P7.625x0.301 [136°] - 12B 72.3 Pass
Diagonal L2x2x1/4 34.7
69.6 (b) Pass
Secondary Horizontal L3x3x5/16 9.1
72.5 (b) Pass
T22 40 - 20 Leg P6x.432 (6.625 OD) 85.9 Pass
Diagonal 2L1 3/4x1 3/4x3/16x3/8 32.6
56.4 (b) Pass
T23 20 - 13.3333 Leg P6x.432 (6.625 OD) 90.1 Pass
Diagonal L2x2x3/16 70.9
83.6 (b) Pass
T24 13.3333 - 6.66667 Leg P6x.432 (6.625 OD) 87.3 Pass
Diagonal L2x2x3/16 71.3
75.5 (b) Pass
Secondary Horizontal L2x2x1/4 31.8
52.6 (b) Pass
T25 6.66667 - 0 Leg P6.625x0.432 + P7.625x0.301 [136°] - 12B 79.3 Pass
Diagonal 2L2x2x3/16x3/8 28.5
66.4 (b) Pass
*Capacities include a 1/3 allowable stress increase for wind per TIA/EIA-222-F standards. **Diagonal sizes from 120’ to 100’ taken from Vertical Solutions, Inc. (Project No. 121081 Rev 0) Rigorous Structural Analysis dated June 4, 2012
Table 4 - Maximum Base Reactions
Load Type Direction Current Analysis* (TIA/EIA-222-F)
Original Design (TIA/EIA-222-F)
Individual Foundation Horizontal 18 k 22 k
Uplift 299 k 253 k
Compression 322 k ---
Overturning Moment --- 2,033 k-ft 1,685 k-ft * Foundation determined to be adequate per independent analysis.
Table 5 - Maximum Antenna Rotations at Service Wind Speeds (Dishes Only)
Centerline Elevation (ft)
Antenna Tilt*
(deg) Twist* (deg)
124 (3) Andrew VHLP2.5 Dishes 0.8804 0.0398 * Allowable tilt and twist values to be determined by the carrier.
Structural Analysis Report SBA Network Services, Inc.
SBA Site ID: CT46126-A-03 April 10, 2014
Document No. ENG-RPT-502S Revision Date: 06/17/11 8
GENERAL COMMENTS
This engineering analysis is based upon the theoretical capacity of the structure. It is not a condition assessment of the tower and its foundation. It is the responsibility of SBA Network Services, Inc. to verify that the tower modeled and analyzed is the correct structure (with accurate antenna loading information) modeled. If there are substantial modifications to be made or the assumptions made in this analysis are not accurate, FDH Engineering, Inc. should be notified immediately to perform a revised analysis. LIMITATIONS All opinions and conclusions are considered accurate to a reasonable degree of engineering certainty based upon the evidence available at the time of this report. All opinions and conclusions are subject to revision based upon receipt of new or additional/updated information. All services are provided exercising a level of care and diligence equivalent to the standard and care of our profession. No other warranty or guarantee, expressed or implied, is offered. Our services are confidential in nature and we will not release this report to any other party without the client’s consent. The use of this engineering work is limited to the express purpose for which it was commissioned and it may not be reused, copied, or distributed for any other purpose without the written consent of FDH Engineering, Inc.
Structural Analysis Report SBA Network Services, Inc.
SBA Site ID: CT46126-A-03 April 10, 2014
Document No. ENG-RPT-502S Revision Date: 06/17/11 9
APPENDIX
Structural Analysis Report SBA Network Services, Inc.
SBA Site ID: CT46126-A-03 April 10, 2014
Document No. ENG-RPT-502S Revision Date: 06/17/11 10
Figure 1 – Feed Line Layout
Tower Analysis
FDH Engineering, Inc.6521 Meridien Drive
Raleigh, North Carolina 27616Phone: (919) 755-1012
FAX: (919) 755-1031
Job:Glastonbury-Main St, CT46126-A-03
Project: 1462HD1400Client: SBA Network Services, Inc. Drawn by: DTang App'd:
Code: TIA/EIA-222-F Date: 04/10/14 Scale: NTSPath:
\\fdh-irvine\FDH-Irvine\Projects\2014 Effective - Client Jobs\SBANET_SBA Network Services, Inc\CT\CT46126-A_Glastonbury\1462HD1400\Analysis\Wind\Glastonbury, CT46126-A-03.eri
Dwg No. E-1
130.0 ft
120.0 ft
117.1 ft
114.3 ft
111.4 ft
108.6 ft
105.7 ft
102.9 ft
100.0 ft
96.0 ft
92.0 ft
88.0 ft
84.0 ft
80.0 ft
75.0 ft
70.0 ft
65.0 ft
60.0 ft
55.0 ft
50.0 ft
45.0 ft
40.0 ft
20.0 ft
13.3 ft
6.7 ft
0.0 ft
Section
T1
T2
T3
T4
T5
T6
T7
T8
T9
T10
T11
T12
T13
T14
T15
T16
T17
T18
T19
T20
T21
T22
T23
T24
T25
Legs
SR
11/2
SR
2P
4x.2
37
(4.5
0O
D)
AP
6x.2
8(6
.625
OD
)B
P6x.4
32
(6.6
25
OD
)C
Leg
Gra
de
A570-4
5A
500M
-54
A572-5
0A
500M
-54
A572-5
0A
500M
-54
A572-5
0
Dia
gonals
SR
1/2
SR
3/4
DE
2L1
1/2
x1
1/2
x3/1
6x3/8
L2x2x1/4
2L1
3/4
x1
3/4
x3/1
6x3/8
2L1
1/2
x1
1/2
x3/1
6x3/8
L2x2x1/4
2L1
3/4
x1
3/4
x3/1
6x3/8
L2x2x3/1
6F
Dia
gonalG
rade
A36
Top
Girts
L1
1/4
x1
1/4
x3/1
6N
.A.
Bott
om
Girts
N.A
.G
N.A
.G
N.A
.
Horizonta
lsL1
1/4
x1
1/4
x3/1
6N
.A.
Sec.
Horizonta
lsN
.A.
HN
.A.
4x3/8
N.A
.L2x2x1/8
N.A
.L3x3x5/1
6N
.A.
L2x2x1/4
N.A
.
Face
Wid
th(f
t)2.5
2.7
2.9
3.1
3.3
3.5
3.7
54
4.2
54.5
4.7
55
5.2
55.5
6.5
6.8
3333
7.1
6667
7.5
#P
anels
@(f
t)4
@2.5
2@
2.7
7381
5@
2.8
5714
5@
48
@5
6@
6.6
6667
Weig
ht
(K)
0.3
0.1
0.1
0.1
0.1
0.1
0.1
0.2
0.2
0.2
0.3
0.4
0.4
0.4
0.4
0.4
0.5
0.5
0.6
0.6
0.7
2.4
0.7
0.8
1.0
11.7
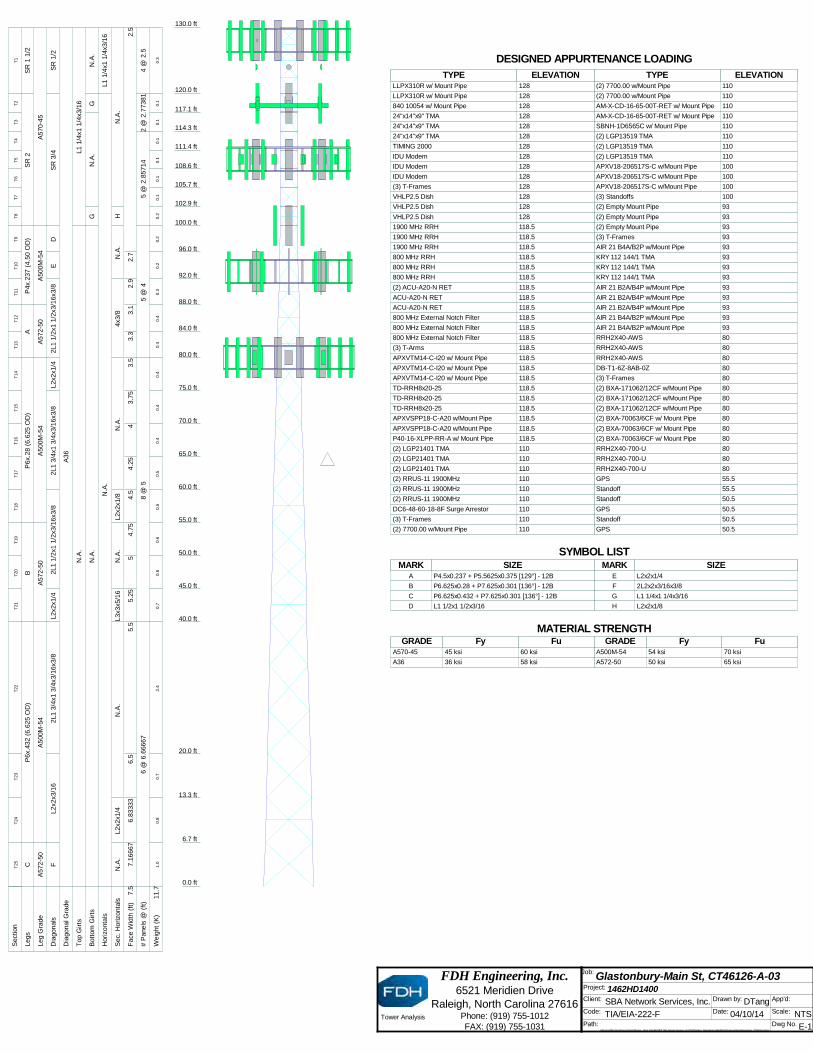
LLPX310R w/ Mount Pipe 128LLPX310R w/ Mount Pipe 128840 10054 w/ Mount Pipe 12824"x14"x9" TMA 12824"x14"x9" TMA 12824"x14"x9" TMA 128TIMING 2000 128IDU Modem 128IDU Modem 128IDU Modem 128(3) T-Frames 128VHLP2.5 Dish 128VHLP2.5 Dish 128VHLP2.5 Dish 1281900 MHz RRH 118.51900 MHz RRH 118.51900 MHz RRH 118.5800 MHz RRH 118.5800 MHz RRH 118.5800 MHz RRH 118.5(2) ACU-A20-N RET 118.5ACU-A20-N RET 118.5ACU-A20-N RET 118.5800 MHz External Notch Filter 118.5800 MHz External Notch Filter 118.5800 MHz External Notch Filter 118.5(3) T-Arms 118.5APXVTM14-C-I20 w/ Mount Pipe 118.5APXVTM14-C-I20 w/ Mount Pipe 118.5APXVTM14-C-I20 w/ Mount Pipe 118.5TD-RRH8x20-25 118.5TD-RRH8x20-25 118.5TD-RRH8x20-25 118.5APXVSPP18-C-A20 w/Mount Pipe 118.5APXVSPP18-C-A20 w/Mount Pipe 118.5P40-16-XLPP-RR-A w/ Mount Pipe 118.5(2) LGP21401 TMA 110(2) LGP21401 TMA 110(2) LGP21401 TMA 110(2) RRUS-11 1900MHz 110(2) RRUS-11 1900MHz 110(2) RRUS-11 1900MHz 110DC6-48-60-18-8F Surge Arrestor 110(3) T-Frames 110(2) 7700.00 w/Mount Pipe 110(2) 7700.00 w/Mount Pipe 110(2) 7700.00 w/Mount Pipe 110AM-X-CD-16-65-00T-RET w/ Mount Pipe 110AM-X-CD-16-65-00T-RET w/ Mount Pipe 110SBNH-1D6565C w/ Mount Pipe 110(2) LGP13519 TMA 110(2) LGP13519 TMA 110(2) LGP13519 TMA 110APXV18-206517S-C w/Mount Pipe 100APXV18-206517S-C w/Mount Pipe 100APXV18-206517S-C w/Mount Pipe 100(3) Standoffs 100(2) Empty Mount Pipe 93(2) Empty Mount Pipe 93(2) Empty Mount Pipe 93(3) T-Frames 93AIR 21 B4A/B2P w/Mount Pipe 93KRY 112 144/1 TMA 93KRY 112 144/1 TMA 93KRY 112 144/1 TMA 93AIR 21 B2A/B4P w/Mount Pipe 93AIR 21 B2A/B4P w/Mount Pipe 93AIR 21 B2A/B4P w/Mount Pipe 93AIR 21 B4A/B2P w/Mount Pipe 93AIR 21 B4A/B2P w/Mount Pipe 93RRH2X40-AWS 80RRH2X40-AWS 80RRH2X40-AWS 80DB-T1-6Z-8AB-0Z 80(3) T-Frames 80(2) BXA-171062/12CF w/Mount Pipe 80(2) BXA-171062/12CF w/Mount Pipe 80(2) BXA-171062/12CF w/Mount Pipe 80(2) BXA-70063/6CF w/ Mount Pipe 80(2) BXA-70063/6CF w/ Mount Pipe 80(2) BXA-70063/6CF w/ Mount Pipe 80RRH2X40-700-U 80RRH2X40-700-U 80RRH2X40-700-U 80GPS 55.5Standoff 55.5Standoff 50.5GPS 50.5Standoff 50.5GPS 50.5DESIGNED APPURTENANCE LOADING
TYPE TYPEELEVATION ELEVATIONLLPX310R w/ Mount Pipe 128
LLPX310R w/ Mount Pipe 128
840 10054 w/ Mount Pipe 128
24"x14"x9" TMA 128
24"x14"x9" TMA 128
24"x14"x9" TMA 128
TIMING 2000 128
IDU Modem 128
IDU Modem 128
IDU Modem 128
(3) T-Frames 128
VHLP2.5 Dish 128
VHLP2.5 Dish 128
VHLP2.5 Dish 128
1900 MHz RRH 118.5
1900 MHz RRH 118.5
1900 MHz RRH 118.5
800 MHz RRH 118.5
800 MHz RRH 118.5
800 MHz RRH 118.5
(2) ACU-A20-N RET 118.5
ACU-A20-N RET 118.5
ACU-A20-N RET 118.5
800 MHz External Notch Filter 118.5
800 MHz External Notch Filter 118.5
800 MHz External Notch Filter 118.5
(3) T-Arms 118.5
APXVTM14-C-I20 w/ Mount Pipe 118.5
APXVTM14-C-I20 w/ Mount Pipe 118.5
APXVTM14-C-I20 w/ Mount Pipe 118.5
TD-RRH8x20-25 118.5
TD-RRH8x20-25 118.5
TD-RRH8x20-25 118.5
APXVSPP18-C-A20 w/Mount Pipe 118.5
APXVSPP18-C-A20 w/Mount Pipe 118.5
P40-16-XLPP-RR-A w/ Mount Pipe 118.5
(2) LGP21401 TMA 110
(2) LGP21401 TMA 110
(2) LGP21401 TMA 110
(2) RRUS-11 1900MHz 110
(2) RRUS-11 1900MHz 110
(2) RRUS-11 1900MHz 110
DC6-48-60-18-8F Surge Arrestor 110
(3) T-Frames 110
(2) 7700.00 w/Mount Pipe 110
(2) 7700.00 w/Mount Pipe 110
(2) 7700.00 w/Mount Pipe 110
AM-X-CD-16-65-00T-RET w/ Mount Pipe 110
AM-X-CD-16-65-00T-RET w/ Mount Pipe 110
SBNH-1D6565C w/ Mount Pipe 110
(2) LGP13519 TMA 110
(2) LGP13519 TMA 110
(2) LGP13519 TMA 110
APXV18-206517S-C w/Mount Pipe 100
APXV18-206517S-C w/Mount Pipe 100
APXV18-206517S-C w/Mount Pipe 100
(3) Standoffs 100
(2) Empty Mount Pipe 93
(2) Empty Mount Pipe 93
(2) Empty Mount Pipe 93
(3) T-Frames 93
AIR 21 B4A/B2P w/Mount Pipe 93
KRY 112 144/1 TMA 93
KRY 112 144/1 TMA 93
KRY 112 144/1 TMA 93
AIR 21 B2A/B4P w/Mount Pipe 93
AIR 21 B2A/B4P w/Mount Pipe 93
AIR 21 B2A/B4P w/Mount Pipe 93
AIR 21 B4A/B2P w/Mount Pipe 93
AIR 21 B4A/B2P w/Mount Pipe 93
RRH2X40-AWS 80
RRH2X40-AWS 80
RRH2X40-AWS 80
DB-T1-6Z-8AB-0Z 80
(3) T-Frames 80
(2) BXA-171062/12CF w/Mount Pipe 80
(2) BXA-171062/12CF w/Mount Pipe 80
(2) BXA-171062/12CF w/Mount Pipe 80
(2) BXA-70063/6CF w/ Mount Pipe 80
(2) BXA-70063/6CF w/ Mount Pipe 80
(2) BXA-70063/6CF w/ Mount Pipe 80
RRH2X40-700-U 80
RRH2X40-700-U 80
RRH2X40-700-U 80
GPS 55.5
Standoff 55.5
Standoff 50.5
GPS 50.5
Standoff 50.5
GPS 50.5
SYMBOL LISTMARK MARKSIZE SIZE
A P4.5x0.237 + P5.5625x0.375 [129°] - 12B
B P6.625x0.28 + P7.625x0.301 [136°] - 12B
C P6.625x0.432 + P7.625x0.301 [136°] - 12B
D L1 1/2x1 1/2x3/16
E L2x2x1/4
F 2L2x2x3/16x3/8
G L1 1/4x1 1/4x3/16
H L2x2x1/8
MATERIAL STRENGTHGRADE GRADEFy FyFu Fu
A570-45 45 ksi 60 ksi
A36 36 ksi 58 ksi
A500M-54 54 ksi 70 ksi
A572-50 50 ksi 65 ksi
Tower Analysis
FDH Engineering, Inc.6521 Meridien Drive
Raleigh, North Carolina 27616Phone: (919) 755-1012
FAX: (919) 755-1031
Job:Glastonbury-Main St, CT46126-A-03
Project: 1462HD1400Client: SBA Network Services, Inc. Drawn by: DTang App'd:
Code: TIA/EIA-222-F Date: 04/10/14 Scale: NTSPath:
\\fdh-irvine\FDH-Irvine\Projects\2014 Effective - Client Jobs\SBANET_SBA Network Services, Inc\CT\CT46126-A_Glastonbury\1462HD1400\Analysis\Wind\Glastonbury, CT46126-A-03.eri
Dwg No. E-1
130.0 ft
120.0 ft
117.1 ft
114.3 ft
111.4 ft
108.6 ft
105.7 ft
102.9 ft
100.0 ft
96.0 ft
92.0 ft
88.0 ft
84.0 ft
80.0 ft
75.0 ft
70.0 ft
65.0 ft
60.0 ft
55.0 ft
50.0 ft
45.0 ft
40.0 ft
20.0 ft
13.3 ft
6.7 ft
0.0 ft
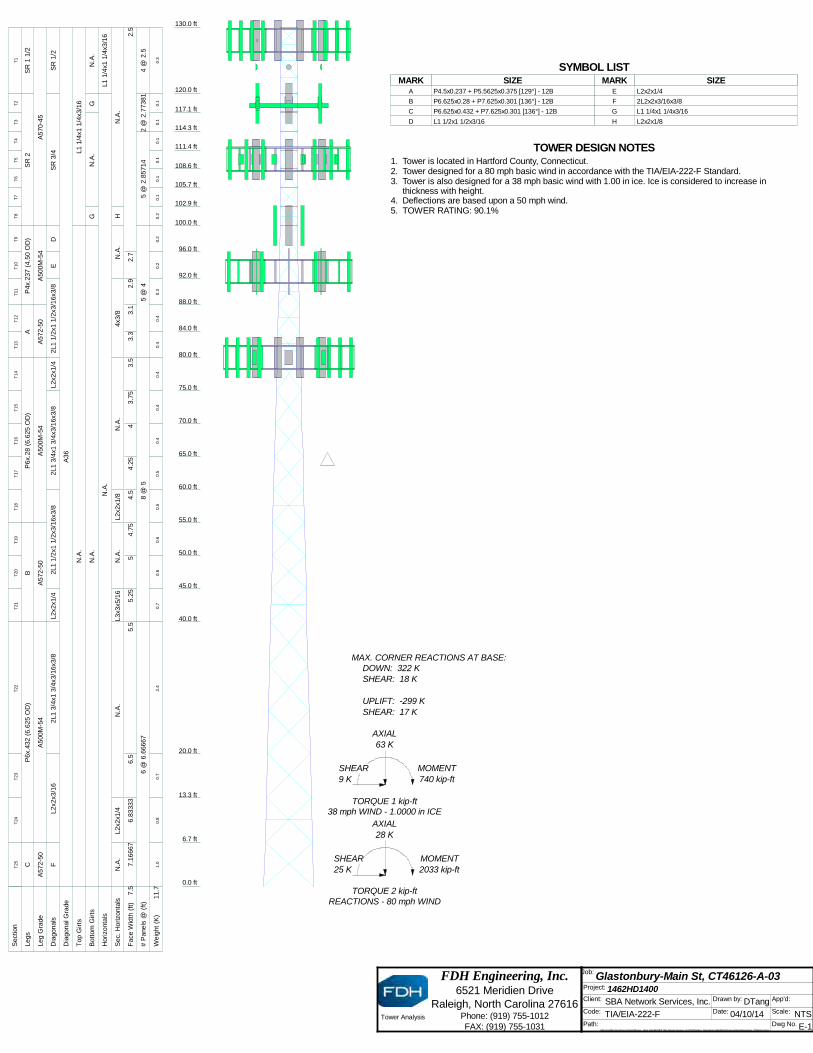
REACTIONS - 80 mph WINDTORQUE 2 kip-ft
25 KSHEAR
2033 kip-ftMOMENT
28 KAXIAL
38 mph WIND - 1.0000 in ICETORQUE 1 kip-ft
9 KSHEAR
740 kip-ftMOMENT
63 KAXIAL
SHEAR: 17 KUPLIFT: -299 K
SHEAR: 18 KDOWN: 322 K
MAX. CORNER REACTIONS AT BASE:
Section
T1
T2
T3
T4
T5
T6
T7
T8
T9
T10
T11
T12
T13
T14
T15
T16
T17
T18
T19
T20
T21
T22
T23
T24
T25
Legs
SR
11/2
SR
2P
4x.2
37
(4.5
0O
D)
AP
6x.2
8(6
.625
OD
)B
P6x.4
32
(6.6
25
OD
)C
Leg
Gra
de
A570-4
5A
500M
-54
A572-5
0A
500M
-54
A572-5
0A
500M
-54
A572-5
0
Dia
gonals
SR
1/2
SR
3/4
DE
2L1
1/2
x1
1/2
x3/1
6x3/8
L2x2x1/4
2L1
3/4
x1
3/4
x3/1
6x3/8
2L1
1/2
x1
1/2
x3/1
6x3/8
L2x2x1/4
2L1
3/4
x1
3/4
x3/1
6x3/8
L2x2x3/1
6F
Dia
gonalG
rade
A36
Top
Girts
L1
1/4
x1
1/4
x3/1
6N
.A.
Bott
om
Girts
N.A
.G
N.A
.G
N.A
.
Horizonta
lsL1
1/4
x1
1/4
x3/1
6N
.A.
Sec.
Horizonta
lsN
.A.
HN
.A.
4x3/8
N.A
.L2x2x1/8
N.A
.L3x3x5/1
6N
.A.
L2x2x1/4
N.A
.
Face
Wid
th(f
t)2.5
2.7
2.9
3.1
3.3
3.5
3.7
54
4.2
54.5
4.7
55
5.2
55.5
6.5
6.8
3333
7.1
6667
7.5
#P
anels
@(f
t)4
@2.5
2@
2.7
7381
5@
2.8
5714
5@
48
@5
6@
6.6
6667
Weig
ht
(K)
0.3
0.1
0.1
0.1
0.1
0.1
0.1
0.2
0.2
0.2
0.3
0.4
0.4
0.4
0.4
0.4
0.5
0.5
0.6
0.6
0.7
2.4
0.7
0.8
1.0
11.7
SYMBOL LISTMARK MARKSIZE SIZE
A P4.5x0.237 + P5.5625x0.375 [129°] - 12B
B P6.625x0.28 + P7.625x0.301 [136°] - 12B
C P6.625x0.432 + P7.625x0.301 [136°] - 12B
D L1 1/2x1 1/2x3/16
E L2x2x1/4
F 2L2x2x3/16x3/8
G L1 1/4x1 1/4x3/16
H L2x2x1/8
TOWER DESIGN NOTES1. Tower is located in Hartford County, Connecticut.2. Tower designed for a 80 mph basic wind in accordance with the TIA/EIA-222-F Standard.3. Tower is also designed for a 38 mph basic wind with 1.00 in ice. Ice is considered to increase in
thickness with height.4. Deflections are based upon a 50 mph wind.5. TOWER RATING: 90.1%
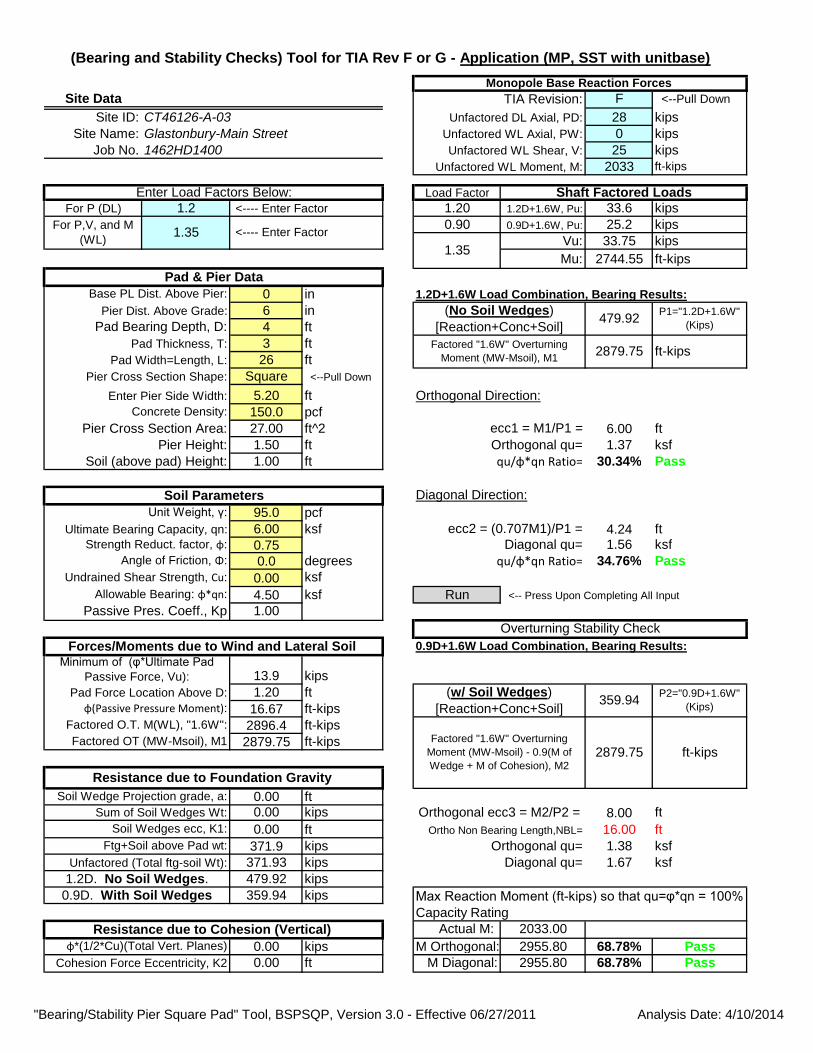
Site Data F <--Pull Down
Site ID: 28 kips
Site Name: 0 kips
Job No. 25 kips
2033 ft-kips
Load Factor
For P (DL) 1.2 1.20 1.2D+1.6W, Pu: 33.6 kips
0.90 0.9D+1.6W, Pu: 25.2 kips
Vu: 33.75 kips
Mu: 2744.55 ft-kips
0 in 1.2D+1.6W Load Combination, Bearing Results:
6 in
4 ft
3 ft
26 ft
Square <--Pull Down
5.20 ft Orthogonal Direction:
150.0 pcf
Pier Cross Section Area: 27.00 ft^2 6.00 ft
1.50 ft Orthogonal qu= 1.37 ksf
1.00 ft qu/φ*qn R atio= 30.34% Pass
Diagonal Direction:
95.0 pcf
6.00 ksf 4.24 ft
0.75 Diagonal qu= 1.56 ksf
0.0 degrees qu/φ*qn R atio= 34.76% Pass
0.00 ksf
4.50 ksf Run <-- Press Upon Completing All Input
Passive Pres. Coeff., Kp 1.00
0.9D+1.6W Load Combination, Bearing Results:
13.9 kips
1.20 ft
16.67 ft-kips
2896.4 ft-kips
2879.75 ft-kips
0.00 ft0.00 kips 8.00 ft
0.00 ft Ortho Non Bearing Length,NBL= 16.00 ft
371.9 kips Orthogonal qu= 1.38 ksf
371.93 kips Diagonal qu= 1.67 ksf
479.92 kips
359.94 kips
Actual M: 2033.00
0.00 kips M Orthogonal: 2955.80 68.78% Pass0.00 ft M Diagonal: 2955.80 68.78% Pass
Max Reaction Moment (ft-kips) so that qu=φ*qn = 100% Capacity Rating
1.35
Pad & Pier Data
Pad Bearing Depth, D:
Pier Height:
Pad Thickness, T:
Pad Width=Length, L:
Enter Pier Side Width:
Enter Load Factors Below:
Factored OT (MW-Msoil), M1
Undrained Shear Strength, Cu:
Unit Weight, γ:
Ultimate Bearing Capacity, qn:
Orthogonal ecc3 = M2/P2 =
Unfactored (Total ftg-soil Wt):
Soil Wedges ecc, K1:
Ftg+Soil above Pad wt:
(No Soil Wedges)
[Reaction+Conc+Soil]
P2="0.9D+1.6W"
(Kips)
Factored O.T. M(WL), "1.6W":
Strength Reduct. factor, φ :
Soil (above pad) Height:
Soil Parameters
Sum of Soil Wedges Wt:
0.9D. With Soil Wedges
Resistance due to Cohesion (Vertical)
Unfactored WL Shear, V:
Shaft Factored Loads
Base PL Dist. Above Pier:
<---- Enter Factor
Allowable Bearing: φ *qn:
ecc2 = (0.707M1)/P1 =
479.92P1="1.2D+1.6W"
(Kips)
φ*(1/2*Cu)(Total Vert. Planes)
Cohesion Force Eccentricity, K2
Concrete Density:
Forces/Moments due to Wind and Lateral SoilMinimum of (φ*Ultimate Pad
Passive Force, Vu):
Pad Force Location Above D:
1.2D. No Soil Wedges.
φ (P assive P ressure M om ent):
Resistance due to Foundation Gravity
Soil Wedge Projection grade, a:
TIA Revision:
Unfactored WL Moment, M:
Unfactored DL Axial, PD:
Pier Dist. Above Grade:
Factored "1.6W" Overturning
Moment (MW-Msoil), M1
CT46126-A-03Glastonbury-Main Street1462HD1400
For P,V, and M
(WL)
Unfactored WL Axial, PW:
(Bearing and Stability Checks) Tool for TIA Rev F or G - Application (MP, SST with unitbase)
<---- Enter Factor
359.94
Monopole Base Reaction Forces
Pier Cross Section Shape:
ft-kips
ecc1 = M1/P1 =
1.35
2879.75
Angle of Friction, Φ:
Overturning Stability Check
(w/ Soil Wedges)
[Reaction+Conc+Soil]
Factored "1.6W" Overturning
Moment (MW-Msoil) - 0.9(M of
Wedge + M of Cohesion), M2
2879.75 ft-kips
"Bearing/Stability Pier Square Pad" Tool, BSPSQP, Version 3.0 - Effective 06/27/2011 Analysis Date: 4/10/2014