Embed Size (px)
Citation preview
Annual Report on the
FINANCIAL STATUS OF CONNECTICUT’S SHORT TERM ACUTE CARE HOSPITALS
for Fiscal Year 2012
State of Connecticut
Department of Public Health Office of Health Care Access
September 2013

TABLE OF CONTENTS
Section 1: Executive Summary of FY 2012 Hospital Financial Performance ..................................... 1 Section 2: Statewide Hospital Health System Profile and Statewide Hospital Profile ...................... 19 Section 3: Individual Hospital Profiles William W. Backus Hospital .................................................................................................. 23 Bridgeport Hospital ............................................................................................................... 26 Bristol Hospital ...................................................................................................................... 29 Connecticut Children’s Medical Center ................................................................................. 32 Danbury Hospital .................................................................................................................. 35 Day Kimball Hospital ............................................................................................................. 38 John Dempsey Hospital ........................................................................................................ 41 Greenwich Hospital ............................................................................................................... 44 Griffin Hospital ...................................................................................................................... 47 Hartford Hospital ................................................................................................................... 50 Hospital of Central Connecticut ............................................................................................ 53 Charlotte Hungerford Hospital .............................................................................................. 56 Johnson Memorial Hospital .................................................................................................. 59 Lawrence & Memorial Hospital ............................................................................................. 62 Manchester Memorial Hospital ............................................................................................. 65 Middlesex Hospital ................................................................................................................ 68 MidState Medical Center ...................................................................................................... 71 Milford Hospital ..................................................................................................................... 74 New Milford Hospital ............................................................................................................. 77 Norwalk Hospital ................................................................................................................... 80 Rockville General Hospital .................................................................................................... 83 Saint Francis Hospital and Medical Center ........................................................................... 86 Saint Mary’s Hospital ............................................................................................................ 89 Saint Raphael, Hospital of ................................................................................................... 92 Saint Vincent’s Medical Center ............................................................................................. 95 Sharon Hospital……………………………………………………………………………………...98 Stamford Hospital ............................................................................................................... 101 Waterbury Hospital ............................................................................................................. 104 Windham Community Memorial Hospital ............................................................................ 107 Yale-New Haven Hospital ................................................................................................... 110 Section 4: Appendices Appendix A — Hospital Health System Statement of Operations Data ............................. 113 Appendix B — Hospital Health System Margin Data .......................................................... 114 Appendix C — Hospital Health System Operating Margins ............................................... 115 Appendix D — Hospital Health System Non Operating Margins ....................................... 116 Appendix E — Hospital Health System Total Margins ....................................................... 117 Appendix F — Hospital Health System Net Assets Data .................................................... 118 Appendix G — Hospital Health System Solvency Measures ............................................. 119 Appendix H — Hospital Health System Liquidity Measures ............................................... 120 Appendix I — Hospital Statement of Operations Data ....................................................... 121 Appendix J — Hospital Margin Data ................................................................................... 122 Appendix K — Hospital Operating Margins ....................................................................... 123 Appendix L — Hospital Non Operating Margins ................................................................ 124 Appendix M — Hospital Total Margins ............................................................................... 125 Appendix N — Hospital Net Assets Data ............................................................................ 126 Appendix O — Hospital Ratio of Cost to Charge Data ........................................................ 127 Appendix P — Hospital Solvency Ratios ............................................................................ 129 Appendix Q — Hospital Liquidity Ratios ............................................................................. 130 Appendix R — Hospital Uncompensated Care Data .......................................................... 131 Appendix S — Hospital Utilization Data .............................................................................. 132 Appendix T — Hospital Gross Revenue Payer Mix ............................................................ 133 Appendix U — Hospital Net Revenue Payer Mix ................................................................ 134 Appendix V — Hospital Discharges by Payer ..................................................................... 135 Appendix W — Hospital Case Mix Index by Payer ............................................................. 136 Appendix X — Hospital Emergency Department Visits ....................................................... 137 Appendix Y — Hospital Map ............................................................................................... 138 Appendix Z — Glossary of Terms ....................................................................................... 139
1
EXECUTIVE SUMMARY
Executive Summary
The Department of Public Health, Office of Health Care Access (OHCA) is
responsible for the collection, analysis and dissemination of acute care hospital
financial information. This report provides information related to the financial
stability of Connecticut’s acute care hospitals, as mandated in Section 19a-670 of
the Connecticut General Statutes. The report highlights Connecticut’s statewide
hospital trends and includes individual hospital profiles of financial performance.
The report is intended to provide information that will enhance knowledge of the
financial status of Connecticut’s hospitals.
The report identifies a number of key findings and trends:
In Fiscal Year (FY) 2012, Connecticut hospitals had a total gain from
operations of $513.6 million, a substantial increase (69%) from the previous
year's gain from operations.
In FY 2012, Connecticut hospitals earned $194.4 million in income from
non-operating sources of revenue, a very substantial increase (283%) from
the previous year's results.
In FY 2012, 83% of hospitals (25 of 30) achieved a positive total margin.
The average statewide total margin was 6.63% in FY 2012, a considerable
increase over the 3.63% average statewide total margin in FY 2011.
Six hospitals had negative five-year average total margins in FY 2012.
Total hospital net assets increased by $393 million to a total of $4.3 billion in
FY 2012.
Bad debts accounted for 64% of uncompensated care charges in FY 2012
while charity care accounted for nearly 36% compared to 63% and 37%,
respectively, for FY 2011.
Statewide uncompensated care charges totaled $663.5 million in FY 2012,
increasing $59.5 million or 10% over FY 2011 results.
Medicaid discharges continue to account for two out of every ten discharges.
The average occupancy rate for staffed beds statewide dropped slightly from
83% in FY 2011 to 81% in FY 2012, as did the statewide available bed
occupancy rate, which declined from 67% to 65%.
2
Introduction
The Department of Public Health, Office of Health Care Access (OHCA) is responsible
for the collection, analysis, and dissemination of acute care hospital financial
information. This report provides information related to the financial stability of
Connecticut’s 301 acute care hospitals, as mandated in Section 19a-670 of the
Connecticut General Statutes. The following narrative provides a summary of the
financial performance of Connecticut’s hospitals during Fiscal Year (FY) 20122 and
presents some key statewide hospital financial indicators.3
Connecticut state statutes and regulations4 require each short-term acute care general or
children’s hospital, whether the hospital is structured as for-profit or not-for-profit, to
annually submit financial and statistical information to OHCA. The primary source of
information in this report is hospital audited financial statements, which include balance
sheet and statement of operations information. This report also uses the annual hospital
filings submitted to OHCA, which include utilization statistics, uncompensated care data,
free bed funds and legal charts of corporate structure.5
The report highlights Connecticut’s statewide hospital trends, includes individual
hospital profiles of financial performance, and is intended to provide information that
will enhance knowledge of the financial status of Connecticut’s hospitals. While there are
numerous financial and operating indicators that provide a means to measure hospital
performance, this report focuses on ten measures – profitability, cost data, liquidity,
solvency, net assets, utilization, discharges by payer, case mix index by payer,
uncompensated care and emergency department visits – that are considered strong
indicators of the hospitals’ financial and operating strength.
EXECUTIVE SUMMARY
1During most of FY 2012, there were 30 acute care hospitals. However on 9/12/2012, Hospital of Saint Raphael closed as a separate acute care hospital and became a satellite location of Yale-New Haven Hospital. There are currently 29 acute care hospitals at the time of release of this report. 2For the purpose of filing fiscal year end results with OHCA, Connecticut’s acute care hospitals Fiscal Year 2012 began on October 1, 2011 and ended on September 30, 2012. 3OHCA used OPTUMInsight (formerly INGENIX) 2013, Almanac of Hospital Financial & Operating Indicators, A Comprehensive Benchmark of the Nation’s Hospitals, as the source for this report’s financial ratios. 4Sections 19a-644 and 19a-676, C.G.S and Section 19a-643-206 of the Regulations of Connecticut State Agencies. 5Some FY 2011 financial and statistical data elements previously reported have been updated by the hospitals. This updated information has been included to improve reporting accuracy and comparability of FY 2011 data elements to those reported by the hospitals for FY 2012.
3
Hospital Income and Financial Performance
Hospitals must be able to generate sufficient cash flow to pay for operations
and debt service, to provide a source of capital for facility needs and
strategic initiatives and to increase cash reserves. Net patient revenue
(NPR), the revenue generated from patient care, increased by 6.7% in FY
2012, slightly more than the 6.2% increase achieved in FY 2011.
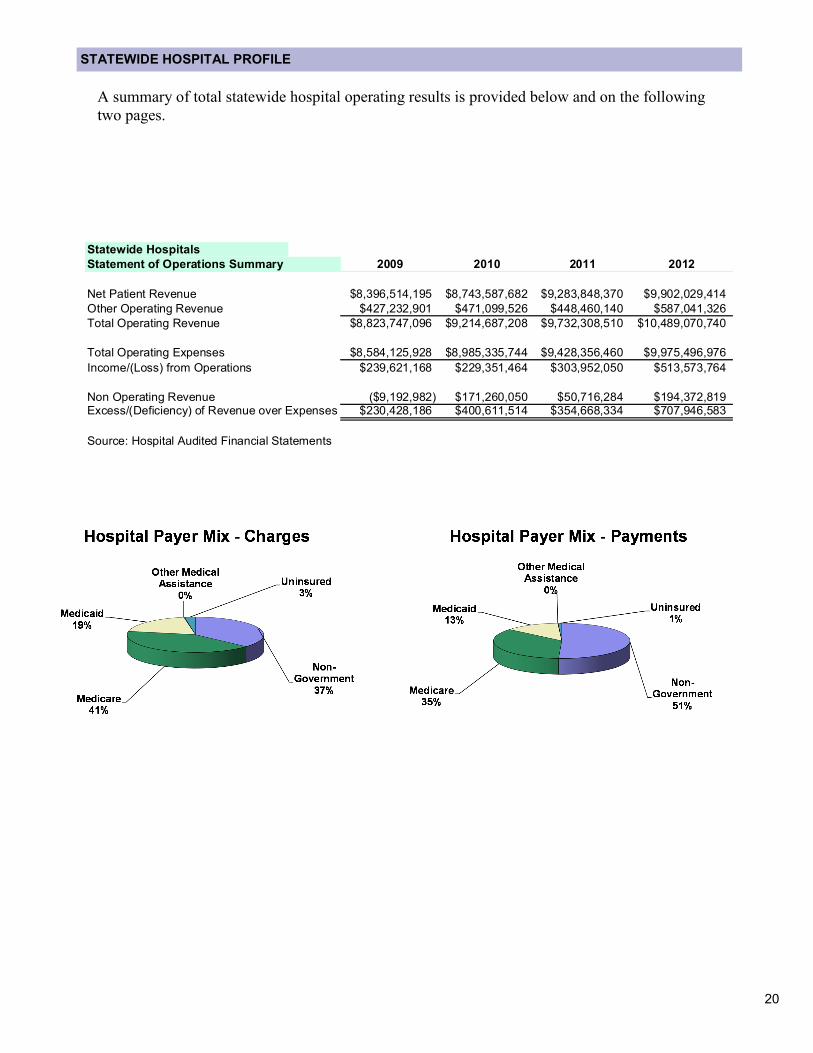
Statewide NPR was approximately $9.9 billion and accounted for 94% of
operating revenues. For FY 2012, nearly half (48%) of hospital net revenues
continued to be generated from governmental payers (Medicare, Medicaid,
CHAMPUS/TRICARE and Medical Assistance recipients), which also
accounted for the majority of discharges (66%).
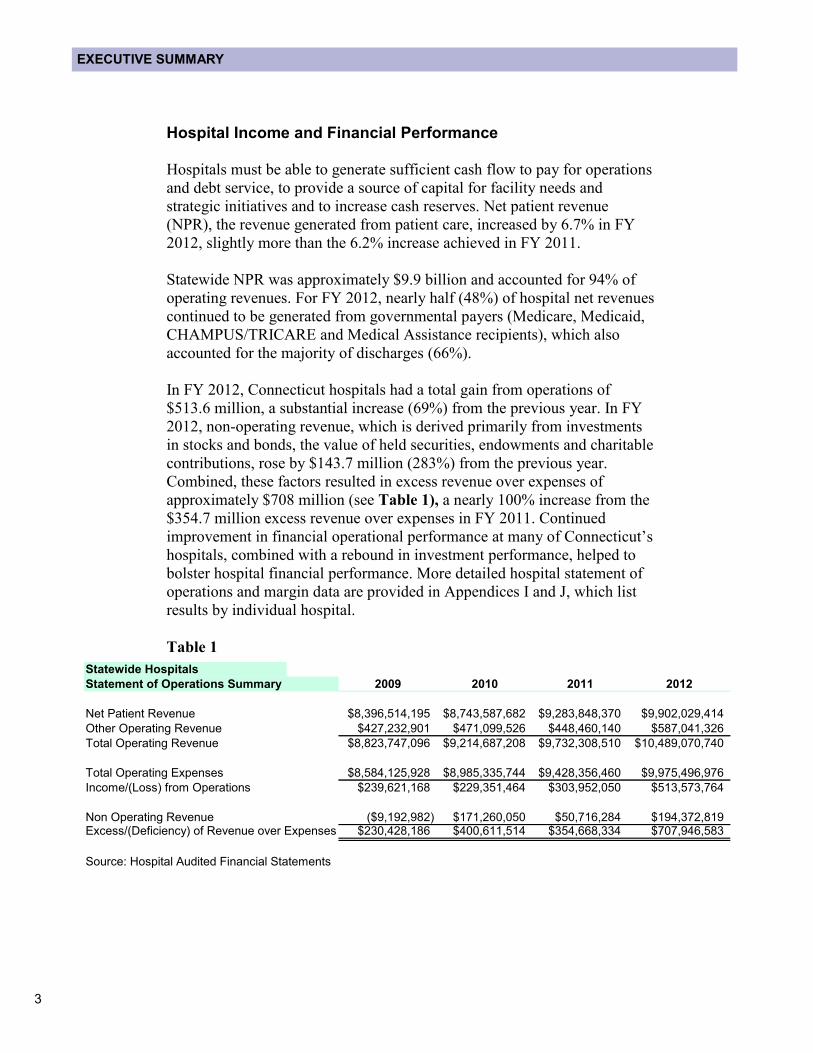
In FY 2012, Connecticut hospitals had a total gain from operations of
$513.6 million, a substantial increase (69%) from the previous year. In FY
2012, non-operating revenue, which is derived primarily from investments
in stocks and bonds, the value of held securities, endowments and charitable
contributions, rose by $143.7 million (283%) from the previous year.
Combined, these factors resulted in excess revenue over expenses of
approximately $708 million (see Table 1), a nearly 100% increase from the
$354.7 million excess revenue over expenses in FY 2011. Continued
improvement in financial operational performance at many of Connecticut’s
hospitals, combined with a rebound in investment performance, helped to
bolster hospital financial performance. More detailed hospital statement of
operations and margin data are provided in Appendices I and J, which list
results by individual hospital.
Table 1
EXECUTIVE SUMMARY
Statewide Hospitals
Statement of Operations Summary 2009 2010 2011 2012
Net Patient Revenue $8,396,514,195 $8,743,587,682 $9,283,848,370 $9,902,029,414
Other Operating Revenue $427,232,901 $471,099,526 $448,460,140 $587,041,326
Total Operating Revenue $8,823,747,096 $9,214,687,208 $9,732,308,510 $10,489,070,740
Total Operating Expenses $8,584,125,928 $8,985,335,744 $9,428,356,460 $9,975,496,976
Income/(Loss) from Operations $239,621,168 $229,351,464 $303,952,050 $513,573,764
Non Operating Revenue ($9,192,982) $171,260,050 $50,716,284 $194,372,819Excess/(Deficiency) of Revenue over Expenses $230,428,186 $400,611,514 $354,668,334 $707,946,583
Source: Hospital Audited Financial Statements
4
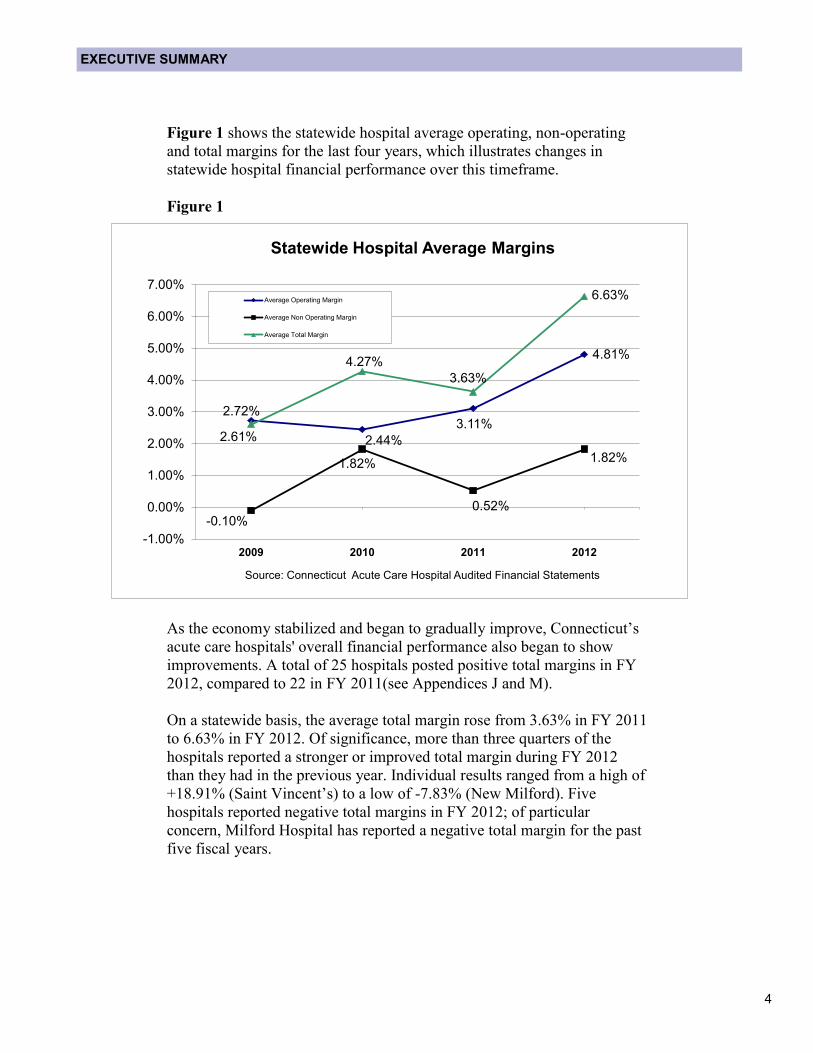
Figure 1 shows the statewide hospital average operating, non-operating
and total margins for the last four years, which illustrates changes in
statewide hospital financial performance over this timeframe.
Figure 1
As the economy stabilized and began to gradually improve, Connecticut’s
acute care hospitals' overall financial performance also began to show
improvements. A total of 25 hospitals posted positive total margins in FY
2012, compared to 22 in FY 2011(see Appendices J and M).
On a statewide basis, the average total margin rose from 3.63% in FY 2011
to 6.63% in FY 2012. Of significance, more than three quarters of the
hospitals reported a stronger or improved total margin during FY 2012
than they had in the previous year. Individual results ranged from a high of
+18.91% (Saint Vincent’s) to a low of -7.83% (New Milford). Five
hospitals reported negative total margins in FY 2012; of particular
concern, Milford Hospital has reported a negative total margin for the past
five fiscal years.
EXECUTIVE SUMMARY
2.72%
2.44%
3.11%
4.81%
-0.10%
1.82%
0.52%
1.82%
2.61%
4.27%
3.63%
6.63%
-1.00%
0.00%
1.00%
2.00%
3.00%
4.00%
5.00%
6.00%
7.00%
2009 2010 2011 2012
Source: Connecticut Acute Care Hospital Audited Financial Statements
Statewide Hospital Average Margins
Average Operating Margin
Average Non Operating Margin
Average Total Margin
5
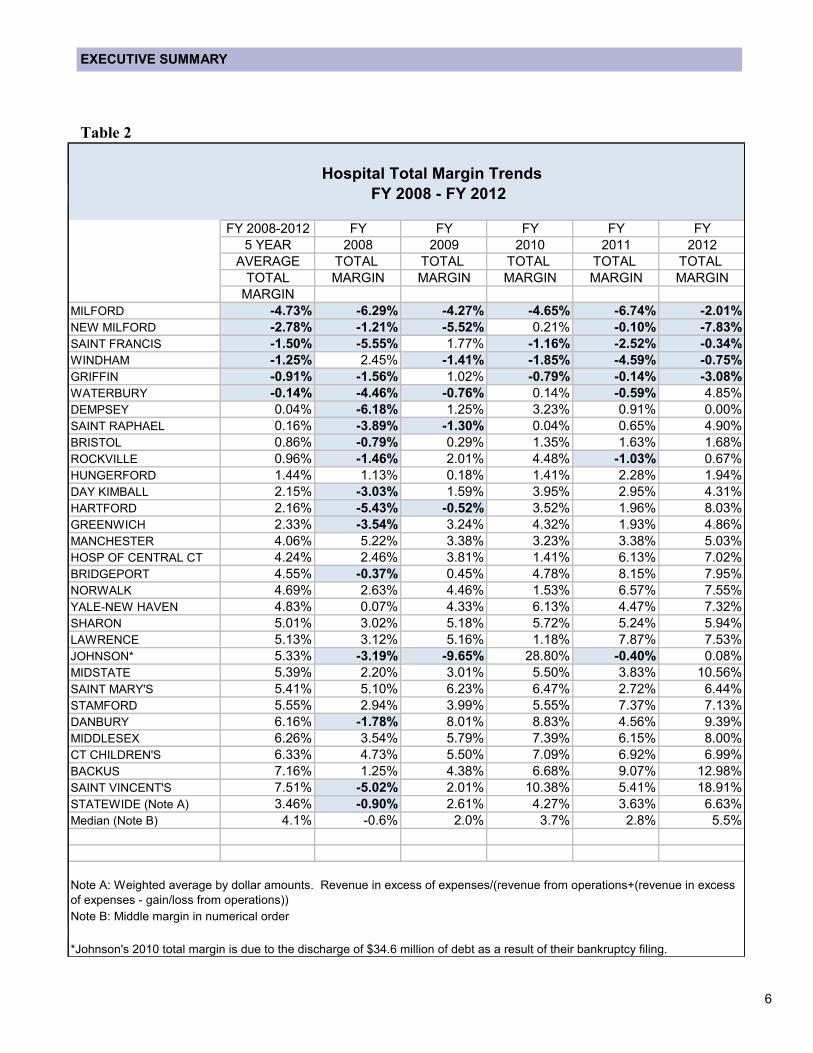
Five Year Financial Performance
Table 2 on the following page provides five-year weighted average
total margins for Connecticut’s 30 acute care hospitals. Hospitals
need to generate revenue in excess of expenses to remain profitable.
Over a period of several years, if losses occur due to expenses
exceeding revenues, it may be indicative of financial distress. Those
hospitals with a negative total margin are not receiving sufficient
revenue to pay all of their expenses and must use other sources of
funds such as cash reserves or the liquidation of assets to pay their
expenses. In addition, hospitals must earn sufficient income to make
improvements to facilities and equipment.
Listed below are key findings from Table 2 on the following page:
Six hospitals had negative five-year average total margins in FY
2012;
Five hospitals had negative total margins for at least four of the
five fiscal years reported (Milford, New Milford, Saint Francis,
Windham and Griffin);
There were 24 hospitals with positive five-year average total
margins;
Thirteen hospitals consistently sustained positive total margins in
each of the five years and seven hospitals had a positive total
margin in four of the five years;
Overall, the statewide five-year weighted average total margin for
FY 2008 through FY 2012 was 3.46%; and
There were 16 hospitals reporting a five year total margin greater
than the statewide average of 3.46%.
EXECUTIVE SUMMARY
6
Table 2
EXECUTIVE SUMMARY
Hospital Total Margin Trends
FY 2008 - FY 2012
FY 2008-2012 FY FY FY FY FY
5 YEAR 2008 2009 2010 2011 2012
AVERAGE TOTAL TOTAL TOTAL TOTAL TOTAL
TOTAL MARGIN MARGIN MARGIN MARGIN MARGIN
MARGIN
MILFORD -4.73% -6.29% -4.27% -4.65% -6.74% -2.01%
NEW MILFORD -2.78% -1.21% -5.52% 0.21% -0.10% -7.83%
SAINT FRANCIS -1.50% -5.55% 1.77% -1.16% -2.52% -0.34%
WINDHAM -1.25% 2.45% -1.41% -1.85% -4.59% -0.75%
GRIFFIN -0.91% -1.56% 1.02% -0.79% -0.14% -3.08%
WATERBURY -0.14% -4.46% -0.76% 0.14% -0.59% 4.85%
DEMPSEY 0.04% -6.18% 1.25% 3.23% 0.91% 0.00%
SAINT RAPHAEL 0.16% -3.89% -1.30% 0.04% 0.65% 4.90%
BRISTOL 0.86% -0.79% 0.29% 1.35% 1.63% 1.68%
ROCKVILLE 0.96% -1.46% 2.01% 4.48% -1.03% 0.67%
HUNGERFORD 1.44% 1.13% 0.18% 1.41% 2.28% 1.94%
DAY KIMBALL 2.15% -3.03% 1.59% 3.95% 2.95% 4.31%
HARTFORD 2.16% -5.43% -0.52% 3.52% 1.96% 8.03%
GREENWICH 2.33% -3.54% 3.24% 4.32% 1.93% 4.86%
MANCHESTER 4.06% 5.22% 3.38% 3.23% 3.38% 5.03%
HOSP OF CENTRAL CT 4.24% 2.46% 3.81% 1.41% 6.13% 7.02%
BRIDGEPORT 4.55% -0.37% 0.45% 4.78% 8.15% 7.95%
NORWALK 4.69% 2.63% 4.46% 1.53% 6.57% 7.55%
YALE-NEW HAVEN 4.83% 0.07% 4.33% 6.13% 4.47% 7.32%
SHARON 5.01% 3.02% 5.18% 5.72% 5.24% 5.94%
LAWRENCE 5.13% 3.12% 5.16% 1.18% 7.87% 7.53%
JOHNSON* 5.33% -3.19% -9.65% 28.80% -0.40% 0.08%
MIDSTATE 5.39% 2.20% 3.01% 5.50% 3.83% 10.56%
SAINT MARY'S 5.41% 5.10% 6.23% 6.47% 2.72% 6.44%
STAMFORD 5.55% 2.94% 3.99% 5.55% 7.37% 7.13%
DANBURY 6.16% -1.78% 8.01% 8.83% 4.56% 9.39%
MIDDLESEX 6.26% 3.54% 5.79% 7.39% 6.15% 8.00%
CT CHILDREN'S 6.33% 4.73% 5.50% 7.09% 6.92% 6.99%
BACKUS 7.16% 1.25% 4.38% 6.68% 9.07% 12.98%
SAINT VINCENT'S 7.51% -5.02% 2.01% 10.38% 5.41% 18.91%
STATEWIDE (Note A) 3.46% -0.90% 2.61% 4.27% 3.63% 6.63%
Median (Note B) 4.1% -0.6% 2.0% 3.7% 2.8% 5.5%
Note B: Middle margin in numerical order
*Johnson's 2010 total margin is due to the discharge of $34.6 million of debt as a result of their bankruptcy filing.
Note A: Weighted average by dollar amounts. Revenue in excess of expenses/(revenue from operations+(revenue in excess
of expenses - gain/loss from operations))
7
Balance Sheet Strength and Liquidity
Measuring balance sheet strength and liquidity can vary based on the ratios
and indicators used. Days cash on hand, a liquidity indicator that measures a
hospital’s average number of days of cash available to pay for expenses, rose
to 69 days in FY 2012, up from 58 days in FY 2011. A higher number of
days is favorable and indicates a greater ability to meet outstanding
obligations. Sixteen hospitals had an increase in their average number of days
cash on hand, while 14 hospitals had a decrease. Backus (159) and Lawrence
& Memorial (185) had the highest amounts and the lowest were Milford (3)
and CT Children’s (1), while Dempsey and Sharon each had no cash on
hand.6 More detailed data on specific hospital liquidity measures are
provided in Appendix Q.
The cash flow to total debt ratio, a solvency indicator used to measure future
debt repayment ability, rose from 21.2 to 27.0 over the year. A lower value is
considered unfavorable and may be indicative of future debt repayment
difficulties. The large increase in revenues over expenses for hospitals
statewide helped improve the ratio. In FY 2012, 23 hospitals had increases in
this ratio, while just seven had decreases. Hospital of Saint Raphael’s (76.9)
and Saint Vincent’s (88.9) had the highest ratios while Griffin (2.5) and New
Milford (-4.8) had the lowest ratios. More detailed data on specific hospital
solvency measures are provided in Appendix P.
Total statewide hospital net assets were $4.26 billion in FY 2012, an increase
of $393 million (10%) from FY 2011. Primary factors affecting total net
assets include changes in unrealized gains and losses, a hospital’s excess or
deficiency of revenue over expenses, monetary transfers to or from a hospital
affiliate, pension and post retirement-related changes, and net assets released
from restrictions and used for operating purposes. In FY 2012, there were 23
hospitals that experienced net asset increases and only seven hospitals with
net asset decreases: Hospital of Central CT, Charlotte Hungerford, Milford,
New Milford, Rockville, Saint Francis, and Windham. More detailed data on
specific hospital net assets totals is provided in Appendix N.
EXECUTIVE SUMMARY
6Dempsey and Sharon reported no cash on hand because the amount of outstanding checks exceeded the hospitals’ cash balance. According to the notes to Dempsey's audited financial statements, in accordance with State Statute, it can borrow from the State up to 90% of its net patient receivables, contract and other receivables to fund operations. According to the notes to the audited financial statements for Sharon Hospital Holding Company, Inc. (hospital parent), it participates in its overall system parent corporation's cash management system, which provides cash to the hospital parent as outstanding checks clear the bank.
8
Financial Status of Hospital Health Systems
The corporate systems within which Connecticut hospitals operate had
results similar to the individual hospitals this past year. The hospital
corporate systems, which include hospital parent corporations and all
subsidiaries, had mostly positive results in FY 2012. The 25 hospital
health systems7 in Connecticut had revenue in excess of expenses of
$628 million in FY 2012, an increase of $207.8 million or 49% from the
previous fiscal year. This resulted in a statewide average total margin of
5.08% for the hospital corporate systems, an increase from the 3.70%
earned in FY 2011.
Total margins in FY 2012 ranged from a high of 17% (Saint Vincent’s
Health Services Corporation) to a low of -4.3% (Griffin Health Services
Corporation). There were 15 health systems that reported an increase in
total margin over the year and just four health systems that reported a
negative total margin (Griffin Health Services Corporation, Johnson
Memorial Medical Center, Inc., Milford Health & Medical, Inc. and
Sharon Hospital Holding Company, Inc.), a decrease from ten health
systems with a negative total margin in FY 2011. More detailed health
system statement of operations and margin data are provided in
Appendix A and B.
Hospital corporate systems also experienced stable liquidity levels on a
statewide average. The statewide days of cash on hand for hospital
parent corporations and their subsidiaries rose to 77 days in FY 2012
from 64 days in FY 2011. Health system cash flow to total debt rose to
24.0 from 21.6 in FY 2011. The total net assets of hospital corporate
systems8 increased to $4.96 billion in FY 2012 from $4.47 billion over
the year, an increase of 11% or almost $500 million from FY 2011.
Detailed data on specific health system liquidity and solvency
measures, in addition to net asset data, are provided in Appendices F, G,
and H.
EXECUTIVE SUMMARY
7See Appendices A-H for a listing of the 25 hospital parent corporations. A number of these parent corporations are affiliated with each other, such as Bridgeport Hospital and Healthcare Services, Inc. and Yale-New Haven Network Corporation. 8The financial results of a hospital system include each hospital’s parent corporation, the hospital itself and any other subsidiaries under the hospital parent organization. Therefore, the statewide hospital systems’ net assets of $4.96 billion in FY 2012 includes the statewide hospitals’ nets assets for FY 2012.
9
Utilization Indicators
Utilization measures provide additional information essential to understanding hospital
performance. Significant fluctuations of patient volume or length of stay, for example, can
enhance or detract from a hospital’s financial performance. Appendix S of this report
provides a snapshot view of the hospitals' utilization statistics for the past fiscal year.
The number of statewide inpatient discharges continued its downward trend, decreasing
slightly from 426,388 in FY 2011 to 418,068 in FY 2012 (-0.2%), resulting in 8,320 fewer
inpatient discharges. Although the downward trend has continued, the rate at which it
decreased has consistently declined for each of the past several years. The majority of
hospitals (21) experienced declines in patient volume similar to the statewide total, most
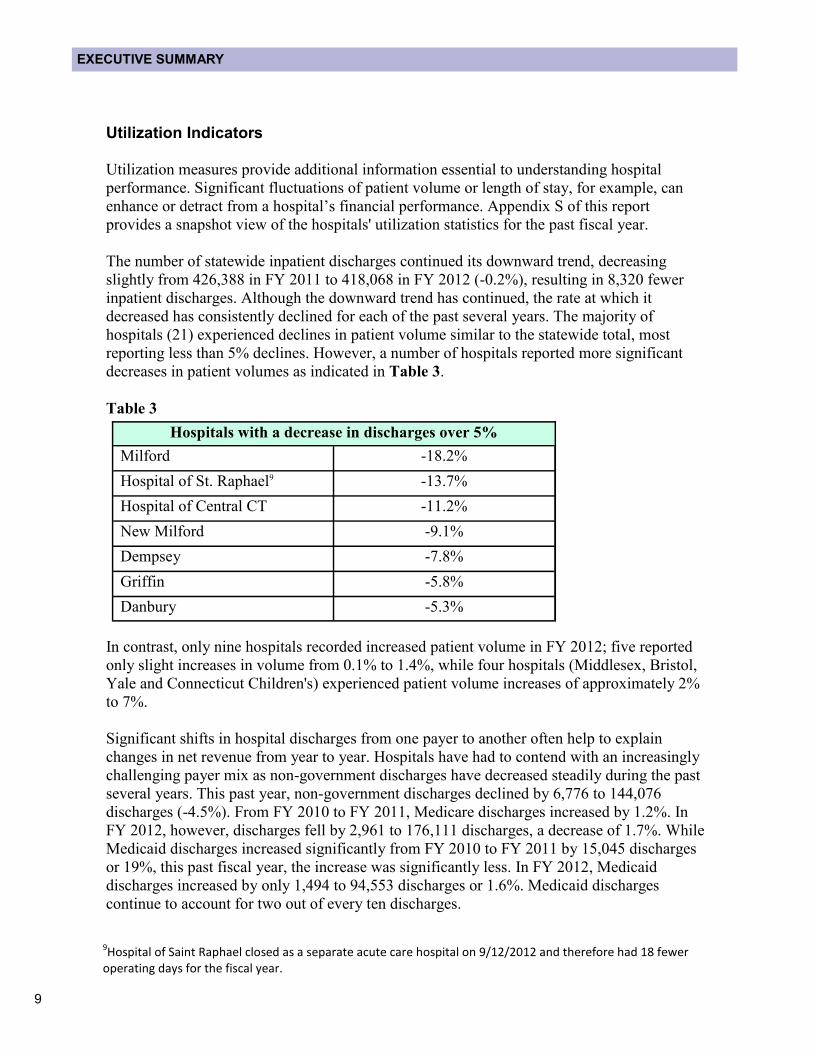
reporting less than 5% declines. However, a number of hospitals reported more significant
decreases in patient volumes as indicated in Table 3.
Table 3
In contrast, only nine hospitals recorded increased patient volume in FY 2012; five reported
only slight increases in volume from 0.1% to 1.4%, while four hospitals (Middlesex, Bristol,
Yale and Connecticut Children's) experienced patient volume increases of approximately 2%
to 7%.
Significant shifts in hospital discharges from one payer to another often help to explain
changes in net revenue from year to year. Hospitals have had to contend with an increasingly
challenging payer mix as non-government discharges have decreased steadily during the past
several years. This past year, non-government discharges declined by 6,776 to 144,076
discharges (-4.5%). From FY 2010 to FY 2011, Medicare discharges increased by 1.2%. In
FY 2012, however, discharges fell by 2,961 to 176,111 discharges, a decrease of 1.7%. While
Medicaid discharges increased significantly from FY 2010 to FY 2011 by 15,045 discharges
or 19%, this past fiscal year, the increase was significantly less. In FY 2012, Medicaid
discharges increased by only 1,494 to 94,553 discharges or 1.6%. Medicaid discharges
continue to account for two out of every ten discharges.
EXECUTIVE SUMMARY
9Hospital of Saint Raphael closed as a separate acute care hospital on 9/12/2012 and therefore had 18 fewer operating days for the fiscal year.
Hospitals with a decrease in discharges over 5%
Milford -18.2%
Hospital of St. Raphael9 -13.7%
Hospital of Central CT -11.2%
New Milford -9.1%
Dempsey -7.8%
Griffin -5.8%
Danbury -5.3%
10
Similar to statewide discharges, total patient days decreased slightly (42,662
or -2.1%) from 2,077,013 in FY 2011 to 2,034,351 in FY 2012. More
hospitals (21) reported a decline in patient days than those hospitals (9)
reporting increases. The number of hospitals reporting a decline increased
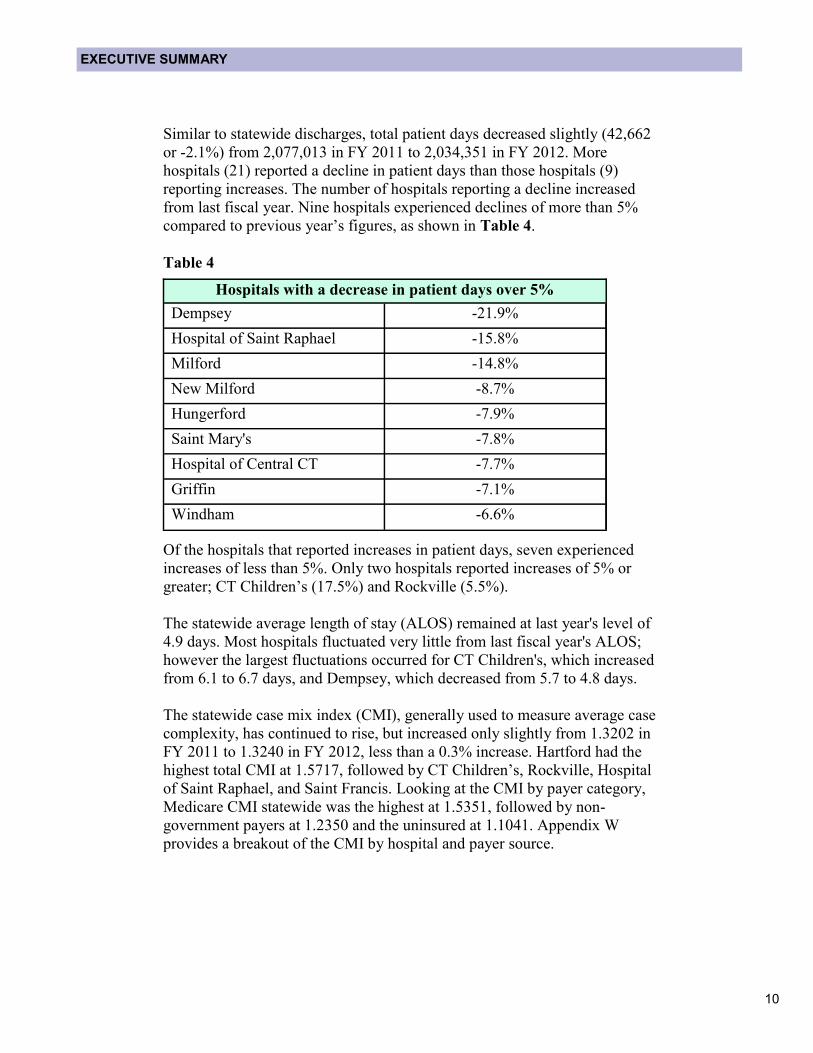
from last fiscal year. Nine hospitals experienced declines of more than 5%
compared to previous year’s figures, as shown in Table 4.
Table 4
Of the hospitals that reported increases in patient days, seven experienced
increases of less than 5%. Only two hospitals reported increases of 5% or
greater; CT Children’s (17.5%) and Rockville (5.5%).
The statewide average length of stay (ALOS) remained at last year's level of
4.9 days. Most hospitals fluctuated very little from last fiscal year's ALOS;
however the largest fluctuations occurred for CT Children's, which increased
from 6.1 to 6.7 days, and Dempsey, which decreased from 5.7 to 4.8 days.
The statewide case mix index (CMI), generally used to measure average case
complexity, has continued to rise, but increased only slightly from 1.3202 in
FY 2011 to 1.3240 in FY 2012, less than a 0.3% increase. Hartford had the
highest total CMI at 1.5717, followed by CT Children’s, Rockville, Hospital
of Saint Raphael, and Saint Francis. Looking at the CMI by payer category,
Medicare CMI statewide was the highest at 1.5351, followed by non-
government payers at 1.2350 and the uninsured at 1.1041. Appendix W
provides a breakout of the CMI by hospital and payer source.
EXECUTIVE SUMMARY
Hospitals with a decrease in patient days over 5%
Dempsey -21.9%
Hospital of Saint Raphael -15.8%
Milford -14.8%
New Milford -8.7%
Hungerford -7.9%
Saint Mary's -7.8%
Hospital of Central CT -7.7%
Griffin -7.1%
Windham -6.6%
11
Statewide emergency department (ED) utilization increased at a greater rate than the
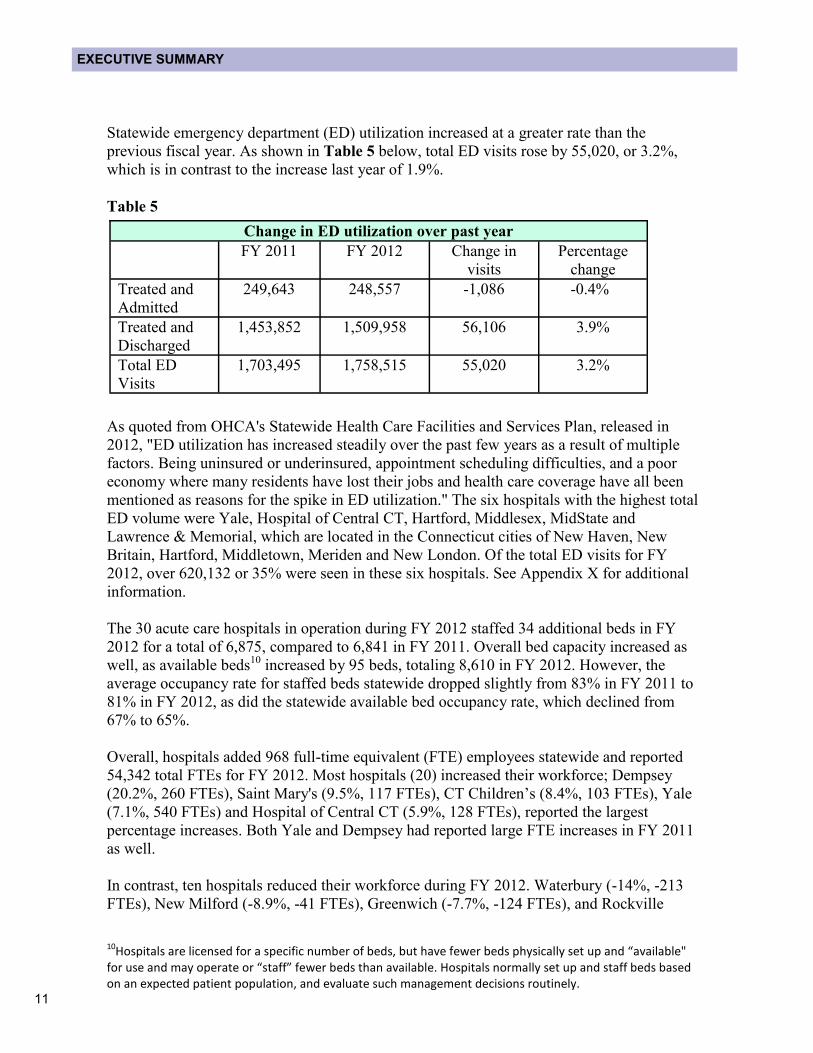
previous fiscal year. As shown in Table 5 below, total ED visits rose by 55,020, or 3.2%,
which is in contrast to the increase last year of 1.9%.
Table 5
As quoted from OHCA's Statewide Health Care Facilities and Services Plan, released in
2012, "ED utilization has increased steadily over the past few years as a result of multiple
factors. Being uninsured or underinsured, appointment scheduling difficulties, and a poor
economy where many residents have lost their jobs and health care coverage have all been
mentioned as reasons for the spike in ED utilization." The six hospitals with the highest total
ED volume were Yale, Hospital of Central CT, Hartford, Middlesex, MidState and
Lawrence & Memorial, which are located in the Connecticut cities of New Haven, New
Britain, Hartford, Middletown, Meriden and New London. Of the total ED visits for FY
2012, over 620,132 or 35% were seen in these six hospitals. See Appendix X for additional
information.
The 30 acute care hospitals in operation during FY 2012 staffed 34 additional beds in FY
2012 for a total of 6,875, compared to 6,841 in FY 2011. Overall bed capacity increased as
well, as available beds10 increased by 95 beds, totaling 8,610 in FY 2012. However, the
average occupancy rate for staffed beds statewide dropped slightly from 83% in FY 2011 to
81% in FY 2012, as did the statewide available bed occupancy rate, which declined from
67% to 65%.
Overall, hospitals added 968 full-time equivalent (FTE) employees statewide and reported
54,342 total FTEs for FY 2012. Most hospitals (20) increased their workforce; Dempsey
(20.2%, 260 FTEs), Saint Mary's (9.5%, 117 FTEs), CT Children’s (8.4%, 103 FTEs), Yale
(7.1%, 540 FTEs) and Hospital of Central CT (5.9%, 128 FTEs), reported the largest
percentage increases. Both Yale and Dempsey had reported large FTE increases in FY 2011
as well.
In contrast, ten hospitals reduced their workforce during FY 2012. Waterbury (-14%, -213
FTEs), New Milford (-8.9%, -41 FTEs), Greenwich (-7.7%, -124 FTEs), and Rockville
EXECUTIVE SUMMARY
Change in ED utilization over past year
FY 2011 FY 2012 Change in
visits
Percentage
change
Treated and
Admitted
249,643 248,557 -1,086 -0.4%
Treated and
Discharged
1,453,852 1,509,958 56,106 3.9%
Total ED
Visits
1,703,495 1,758,515 55,020 3.2%
10Hospitals are licensed for a specific number of beds, but have fewer beds physically set up and “available" for use and may operate or “staff” fewer beds than available. Hospitals normally set up and staff beds based on an expected patient population, and evaluate such management decisions routinely.
12
(-7.0%, -29 FTEs) reported the largest percentage decreases. Last year, the largest percentage
decrease was Rockville, decreasing 4.2% of FTEs.
Uncompensated Care
By law, all emergent, non-elective patients at Connecticut’s hospitals must be treated,
regardless of their ability to pay. Uncompensated care (UC) represents health care provided by
hospitals to patients that will not be reimbursed. There are two levels of uncompensated care,
charity care and bad debts. Charity care occurs when the hospital knows in advance that the
care provided will not be reimbursed. Bad debts are incurred after the service has been
provided, with no forewarning of non-payment. Bad debts accounted for 64% of
uncompensated care charges in FY 2012, while charity care accounted for nearly 36%.
Uncompensated care costs (UCC) are the costs hospitals incur providing care for which no
payment was received from the patient or insurer. Hospital charges include the actual cost of
care plus a mark-up to generate additional income. This additional income is used by hospitals
to recoup fixed costs, generate funds for future investment and to maintain profitability.
Uncompensated care costs are calculated from hospital charges and attempt to remove the
additional mark-up to determine the “true cost” of care.
Statewide uncompensated care charges totaled $663.5 million in FY 2012, an increase of $59.5
million or 9.8% more than in FY 2011. Accordingly, statewide uncompensated care cost
increased by $11.5 million (5.2%) in FY 2012 and accounted for 2.3% of total expenses.
The Uncompensated Care Disproportionate Share Hospital (UCP DSH) Program is a joint
federal/state program that was established to financially assist hospitals with their
uncompensated and undercompensated care. Undercompensated care generally refers to
government programs, like Medicaid, which tend to provide lower rates of reimbursement. The
UCP DSH Program provides supplemental reimbursement to help offset these shortfalls and
helps hospitals continue in their role as safety nets to patients with limited access to health
care.
Based on the state budget for the SFY 2012 and 2013 biennium and actions to date by the
General Assembly and the Department of Social Services, the Medicaid State Plan was
amended to end the current UCP DSH program, effective June 30, 2011. Effective July 1,
2011, a new program was implemented that makes payments to qualifying private acute care
hospitals in proportion to their overall uncompensated costs for inpatient and outpatient
hospital services. In FY 2012 the new DSH (SPA-State Plan Amendment) Program distributed
approximately $268.5 million to the hospitals
According to the American Hospital Association,11 U.S. hospitals uncompensated care costs
have risen steadily from $31.2 billion in 2006 to $41.1 billion in 2011 (32% increase), and
account for 5.9 % of total expenses.
EXECUTIVE SUMMARY
11American Hospital Association, Uncompensated Hospital Care Cost Fact Sheet, January 2013; accessed at the Web: http://www.aha.org/content/13/1-2013-uncompensated-care-fs.pdf .
13
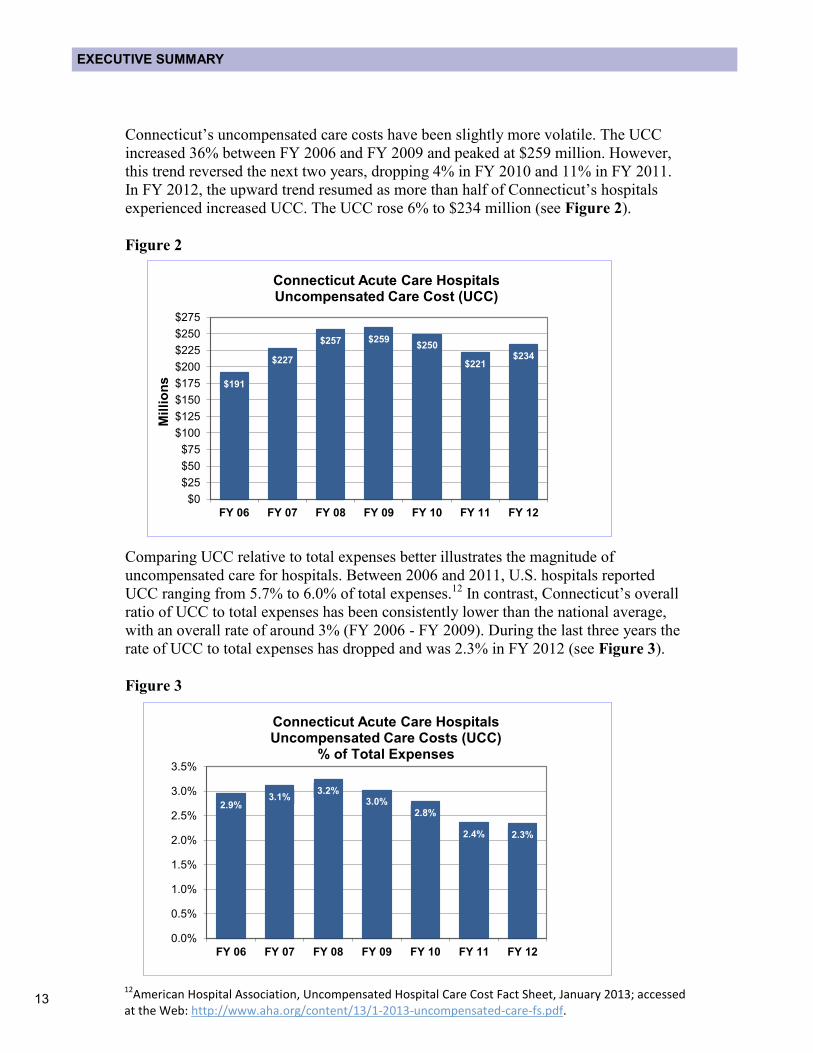
Connecticut’s uncompensated care costs have been slightly more volatile. The UCC
increased 36% between FY 2006 and FY 2009 and peaked at $259 million. However,
this trend reversed the next two years, dropping 4% in FY 2010 and 11% in FY 2011.
In FY 2012, the upward trend resumed as more than half of Connecticut’s hospitals
experienced increased UCC. The UCC rose 6% to $234 million (see Figure 2).
Figure 2
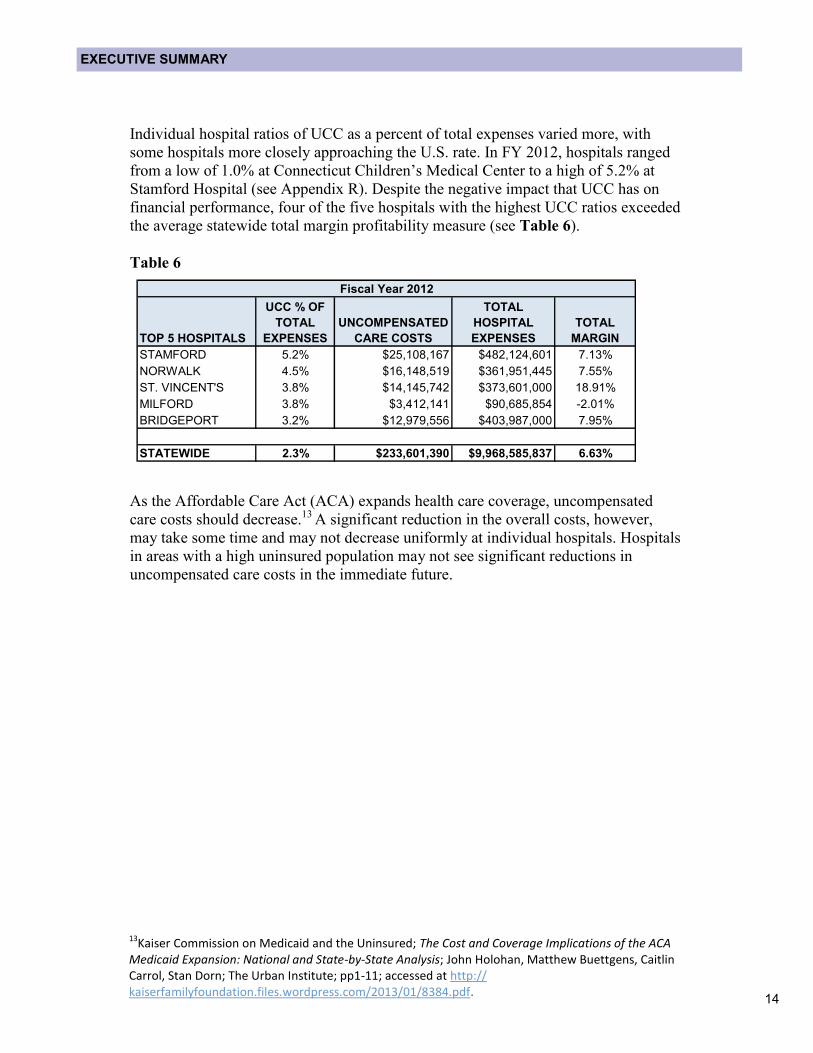
Comparing UCC relative to total expenses better illustrates the magnitude of
uncompensated care for hospitals. Between 2006 and 2011, U.S. hospitals reported
UCC ranging from 5.7% to 6.0% of total expenses.12 In contrast, Connecticut’s overall
ratio of UCC to total expenses has been consistently lower than the national average,
with an overall rate of around 3% (FY 2006 - FY 2009). During the last three years the
rate of UCC to total expenses has dropped and was 2.3% in FY 2012 (see Figure 3).
Figure 3
EXECUTIVE SUMMARY
$191
$227
$257 $259 $250
$221 $234
$0
$25
$50
$75
$100
$125
$150
$175
$200
$225
$250
$275
FY 06 FY 07 FY 08 FY 09 FY 10 FY 11 FY 12
Mil
lio
ns
Connecticut Acute Care HospitalsUncompensated Care Cost (UCC)
12American Hospital Association, Uncompensated Hospital Care Cost Fact Sheet, January 2013; accessed at the Web: http://www.aha.org/content/13/1-2013-uncompensated-care-fs.pdf.
2.9%3.1%
3.2%3.0%
2.8%
2.4% 2.3%
0.0%
0.5%
1.0%
1.5%
2.0%
2.5%
3.0%
3.5%
FY 06 FY 07 FY 08 FY 09 FY 10 FY 11 FY 12
Connecticut Acute Care HospitalsUncompensated Care Costs (UCC)
% of Total Expenses
14
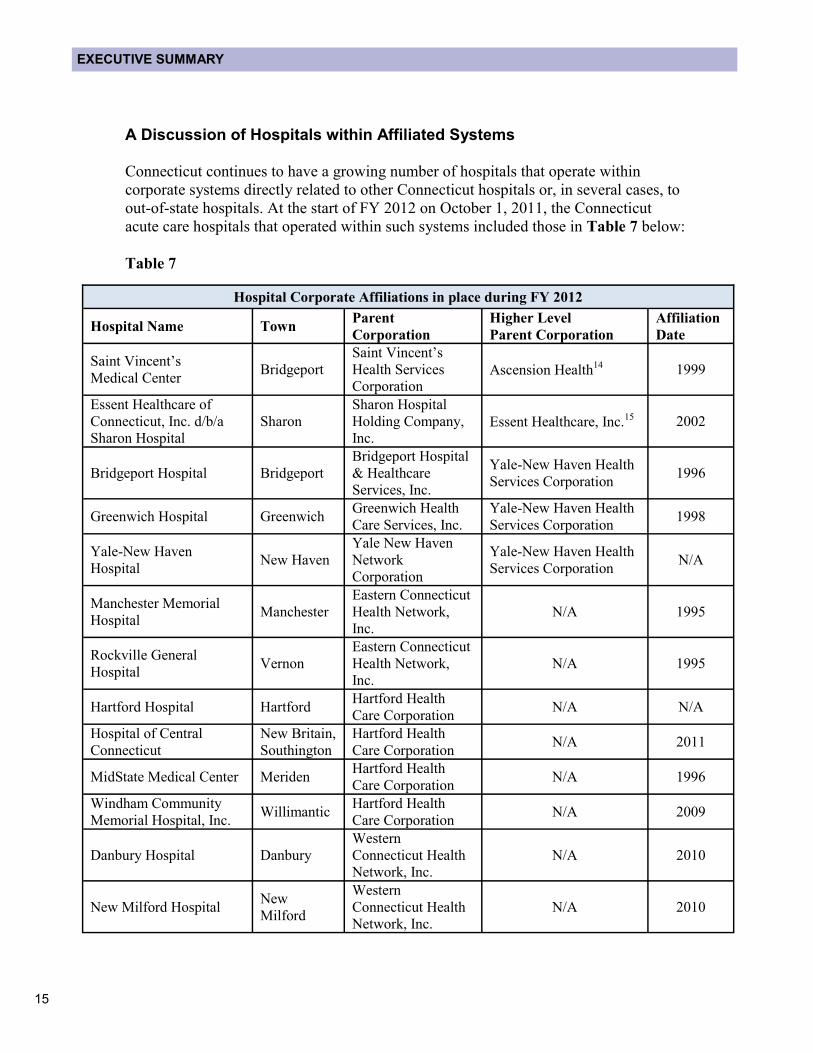
Individual hospital ratios of UCC as a percent of total expenses varied more, with
some hospitals more closely approaching the U.S. rate. In FY 2012, hospitals ranged
from a low of 1.0% at Connecticut Children’s Medical Center to a high of 5.2% at
Stamford Hospital (see Appendix R). Despite the negative impact that UCC has on
financial performance, four of the five hospitals with the highest UCC ratios exceeded
the average statewide total margin profitability measure (see Table 6).
Table 6
As the Affordable Care Act (ACA) expands health care coverage, uncompensated
care costs should decrease.13 A significant reduction in the overall costs, however,
may take some time and may not decrease uniformly at individual hospitals. Hospitals
in areas with a high uninsured population may not see significant reductions in
uncompensated care costs in the immediate future.
EXECUTIVE SUMMARY
STAMFORD 5.2% $25,108,167 $482,124,601 7.13%
NORWALK 4.5% $16,148,519 $361,951,445 7.55%
ST. VINCENT'S 3.8% $14,145,742 $373,601,000 18.91%
MILFORD 3.8% $3,412,141 $90,685,854 -2.01%
BRIDGEPORT 3.2% $12,979,556 $403,987,000 7.95%
STATEWIDE 2.3% $233,601,390 $9,968,585,837 6.63%
TOP 5 HOSPITALS
UNCOMPENSATED
CARE COSTS
TOTAL
HOSPITAL
EXPENSES
UCC % OF
TOTAL
EXPENSES
TOTAL
MARGIN
Fiscal Year 2012
13Kaiser Commission on Medicaid and the Uninsured; The Cost and Coverage Implications of the ACA Medicaid Expansion: National and State-by-State Analysis; John Holohan, Matthew Buettgens, Caitlin Carrol, Stan Dorn; The Urban Institute; pp1-11; accessed at http://kaiserfamilyfoundation.files.wordpress.com/2013/01/8384.pdf.
15
A Discussion of Hospitals within Affiliated Systems
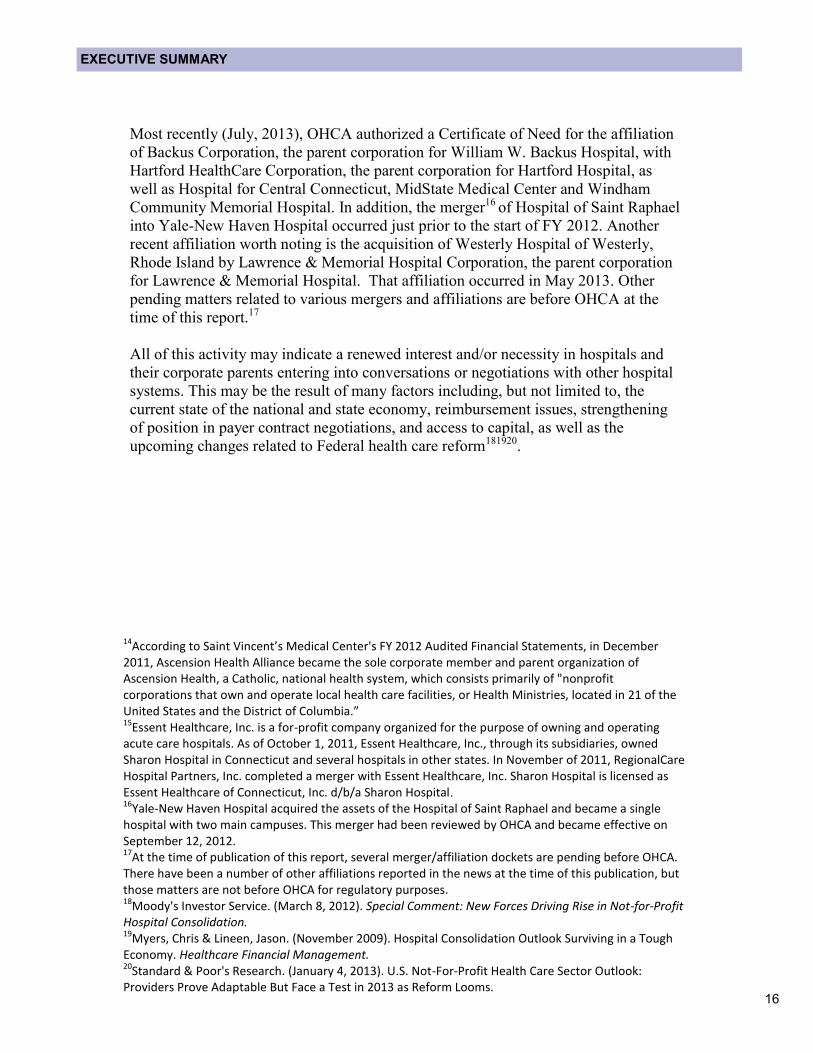
Connecticut continues to have a growing number of hospitals that operate within
corporate systems directly related to other Connecticut hospitals or, in several cases, to
out-of-state hospitals. At the start of FY 2012 on October 1, 2011, the Connecticut
acute care hospitals that operated within such systems included those in Table 7 below:
Table 7
EXECUTIVE SUMMARY
Hospital Corporate Affiliations in place during FY 2012
Hospital Name Town Parent
Corporation
Higher Level Parent Corporation
Affiliation Date
Saint Vincent’s
Medical Center Bridgeport
Saint Vincent’s
Health Services
Corporation
Ascension Health14 1999
Essent Healthcare of
Connecticut, Inc. d/b/a
Sharon Hospital
Sharon
Sharon Hospital
Holding Company,
Inc. Essent Healthcare, Inc.15
2002
Bridgeport Hospital Bridgeport
Bridgeport Hospital
& Healthcare
Services, Inc.
Yale-New Haven Health
Services Corporation 1996
Greenwich Hospital Greenwich Greenwich Health
Care Services, Inc.
Yale-New Haven Health
Services Corporation 1998
Yale-New Haven
Hospital New Haven
Yale New Haven
Network
Corporation
Yale-New Haven Health
Services Corporation N/A
Manchester Memorial
Hospital Manchester
Eastern Connecticut
Health Network,
Inc.
N/A 1995
Rockville General
Hospital Vernon
Eastern Connecticut
Health Network,
Inc.
N/A 1995
Hartford Hospital Hartford Hartford Health
Care Corporation N/A N/A
Hospital of Central
Connecticut
New Britain, Southington
Hartford Health
Care Corporation N/A 2011
MidState Medical Center Meriden Hartford Health
Care Corporation N/A 1996
Windham Community
Memorial Hospital, Inc. Willimantic
Hartford Health
Care Corporation N/A 2009
Danbury Hospital Danbury
Western
Connecticut Health
Network, Inc.
N/A 2010
New Milford Hospital New
Milford
Western
Connecticut Health
Network, Inc.
N/A 2010
16
14According to Saint Vincent’s Medical Center's FY 2012 Audited Financial Statements, in December 2011, Ascension Health Alliance became the sole corporate member and parent organization of Ascension Health, a Catholic, national health system, which consists primarily of "nonprofit corporations that own and operate local health care facilities, or Health Ministries, located in 21 of the United States and the District of Columbia.” 15Essent Healthcare, Inc. is a for-profit company organized for the purpose of owning and operating acute care hospitals. As of October 1, 2011, Essent Healthcare, Inc., through its subsidiaries, owned Sharon Hospital in Connecticut and several hospitals in other states. In November of 2011, RegionalCare Hospital Partners, Inc. completed a merger with Essent Healthcare, Inc. Sharon Hospital is licensed as Essent Healthcare of Connecticut, Inc. d/b/a Sharon Hospital. 16Yale-New Haven Hospital acquired the assets of the Hospital of Saint Raphael and became a single hospital with two main campuses. This merger had been reviewed by OHCA and became effective on September 12, 2012. 17At the time of publication of this report, several merger/affiliation dockets are pending before OHCA. There have been a number of other affiliations reported in the news at the time of this publication, but those matters are not before OHCA for regulatory purposes. 18Moody's Investor Service. (March 8, 2012). Special Comment: New Forces Driving Rise in Not-for-Profit Hospital Consolidation. 19Myers, Chris & Lineen, Jason. (November 2009). Hospital Consolidation Outlook Surviving in a Tough Economy. Healthcare Financial Management. 20Standard & Poor's Research. (January 4, 2013). U.S. Not-For-Profit Health Care Sector Outlook: Providers Prove Adaptable But Face a Test in 2013 as Reform Looms.
Most recently (July, 2013), OHCA authorized a Certificate of Need for the affiliation
of Backus Corporation, the parent corporation for William W. Backus Hospital, with
Hartford HealthCare Corporation, the parent corporation for Hartford Hospital, as
well as Hospital for Central Connecticut, MidState Medical Center and Windham
Community Memorial Hospital. In addition, the merger16 of Hospital of Saint Raphael
into Yale-New Haven Hospital occurred just prior to the start of FY 2012. Another
recent affiliation worth noting is the acquisition of Westerly Hospital of Westerly,
Rhode Island by Lawrence & Memorial Hospital Corporation, the parent corporation
for Lawrence & Memorial Hospital. That affiliation occurred in May 2013. Other
pending matters related to various mergers and affiliations are before OHCA at the
time of this report.17
All of this activity may indicate a renewed interest and/or necessity in hospitals and
their corporate parents entering into conversations or negotiations with other hospital
systems. This may be the result of many factors including, but not limited to, the
current state of the national and state economy, reimbursement issues, strengthening
of position in payer contract negotiations, and access to capital, as well as the
upcoming changes related to Federal health care reform181920.
EXECUTIVE SUMMARY
17
Implications of Federal Health Care Reform on Acute Care Hospitals in Connecticut
This report is released within the context of federal health care reform legislation
passed in 2010, which has the potential to dramatically change the health care
landscape in the coming years.21 A central premise of the reform package is improved
access to quality care for all Americans. The many complex provisions of health care
reform that will be rolled out this coming year and over the next several years are likely
to change where and how people access care and the reimbursement system for such
care, thereby potentially affecting the financial status of many of Connecticut’s
hospitals, as well as the corporate systems within which they operate.
An area that may continue to affect many of Connecticut's hospitals in the near future is
the implementation of the Hospital Readmission Reduction Program, which requires
the Centers for Medicare and Medicaid Services (CMS) to reduce payments to certain
hospitals with excess readmissions (patients readmitted within 30 days), effective for
discharges on or after October 1, 2012.22
As discussed in OHCA's Statewide Health Care Facilities and Services Plan, the
Affordable Care Act (ACA) establishes a new set of requirements for hospitals to
maintain their tax-exempt status in order to ensure that non-profit hospitals continue to
provide community benefit. The ACA requires non-profit hospitals to conduct a
community needs assessment every three years, to adopt implementation strategies to
meet identified community health needs, and to work with others to determine
community health needs and take action to meet those needs.23
This report focuses on the actual financial results of hospitals during Fiscal Year 2012
and therefore does not project the potential effect of federal health care reform on
individual hospitals within the State or on the acute care hospital system as a whole. It
will be critical to monitor Connecticut’s acute care hospitals' utilization and financial
results to understand federal health care reform’s effect on the financial status of these
safety net providers. Financial stability reports in the coming years may well reflect
changes made to, or initiated by, Connecticut’s hospitals as a result of or influenced by
federal reform efforts.
EXECUTIVE SUMMARY
21Connecticut's new health insurance exchange marketplace, called Access Health CT, will begin enrollment in October 2013 with provision of coverage beginning in January 2014. 22Information is from CMS's Readmission Reduction Program webpage. Accessed on 8/23/2013 at http://cms.gov/Medicare/Medicare-Fee-for-Service-Payment/AcuteInpatientPPS/Readmissions-Reduction-Program.html. 23Full discussion at Chapter 2, Section 1 Health Care Reform, Subsection 2 Community Benefit on page 12 - 13 of Statewide Health Care Facilities and Services Plan, OHCA, 2012.
18
Individual Hospital Data
The following sections provide an aggregate statewide profile of hospital parent
corporations and aggregate statewide profile of hospital summary totals for both
financial and statistical indicators. In addition, individual hospital profiles are
presented for each of Connecticut’s thirty acute care hospitals. The final section of
this report contains detailed appendices by hospital parent corporation and by hospital
as identified in the table of contents. Unless otherwise indicated, the sources of data
used in these sections are the OHCA Hospital Reporting System (HRS) and the
hospitals’ annual filings to OHCA.
EXECUTIVE SUMMARY
19
STATEWIDE HOSPITAL HEALTH SYSTEM PROFILE
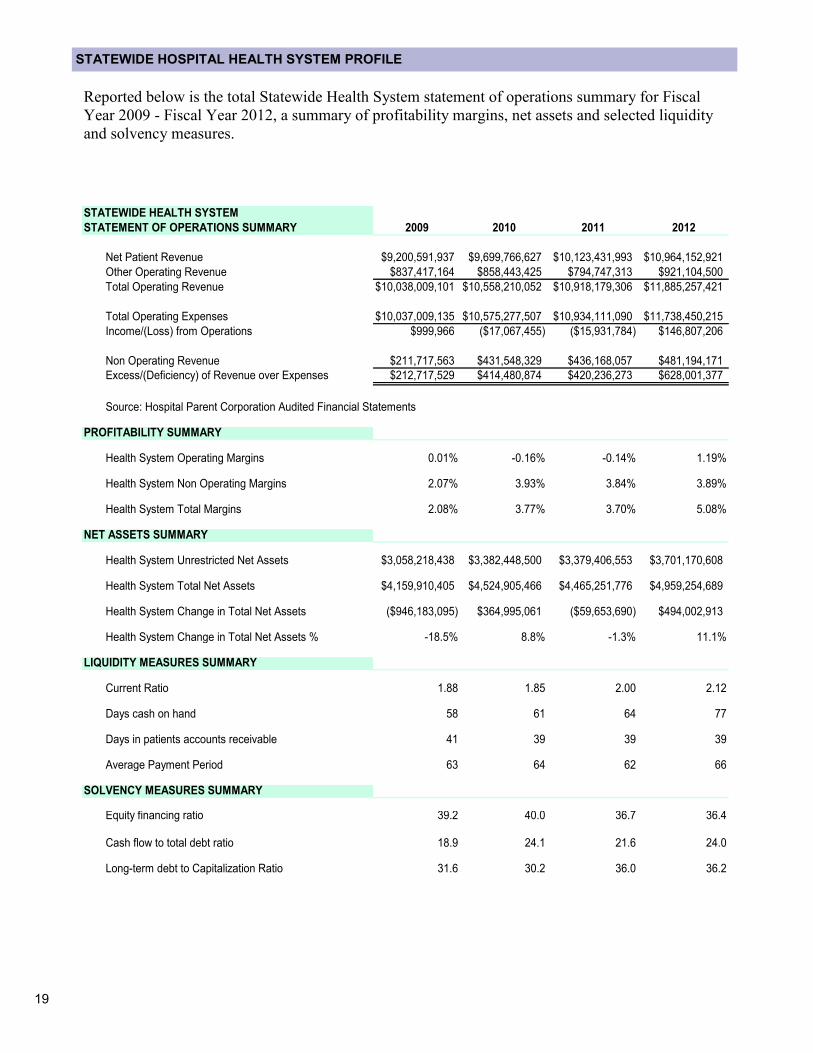
Reported below is the total Statewide Health System statement of operations summary for Fiscal
Year 2009 - Fiscal Year 2012, a summary of profitability margins, net assets and selected liquidity
and solvency measures.
STATEWIDE HEALTH SYSTEM
STATEMENT OF OPERATIONS SUMMARY 2009 2010 2011 2012
Net Patient Revenue $9,200,591,937 $9,699,766,627 $10,123,431,993 $10,964,152,921
Other Operating Revenue $837,417,164 $858,443,425 $794,747,313 $921,104,500
Total Operating Revenue $10,038,009,101 $10,558,210,052 $10,918,179,306 $11,885,257,421
Total Operating Expenses $10,037,009,135 $10,575,277,507 $10,934,111,090 $11,738,450,215
Income/(Loss) from Operations $999,966 ($17,067,455) ($15,931,784) $146,807,206
Non Operating Revenue $211,717,563 $431,548,329 $436,168,057 $481,194,171
Excess/(Deficiency) of Revenue over Expenses $212,717,529 $414,480,874 $420,236,273 $628,001,377
Source: Hospital Parent Corporation Audited Financial Statements
PROFITABILITY SUMMARY
Health System Operating Margins 0.01% -0.16% -0.14% 1.19%
Health System Non Operating Margins 2.07% 3.93% 3.84% 3.89%
Health System Total Margins 2.08% 3.77% 3.70% 5.08%
NET ASSETS SUMMARY
Health System Unrestricted Net Assets $3,058,218,438 $3,382,448,500 $3,379,406,553 $3,701,170,608
Health System Total Net Assets $4,159,910,405 $4,524,905,466 $4,465,251,776 $4,959,254,689
Health System Change in Total Net Assets ($946,183,095) $364,995,061 ($59,653,690) $494,002,913
Health System Change in Total Net Assets % -18.5% 8.8% -1.3% 11.1%
LIQUIDITY MEASURES SUMMARY
Current Ratio 1.88 1.85 2.00 2.12
Days cash on hand 58 61 64 77
Days in patients accounts receivable 41 39 39 39
Average Payment Period 63 64 62 66
SOLVENCY MEASURES SUMMARY
Equity financing ratio 39.2 40.0 36.7 36.4
Cash flow to total debt ratio 18.9 24.1 21.6 24.0
Long-term debt to Capitalization Ratio 31.6 30.2 36.0 36.2
20
STATEWIDE HOSPITAL PROFILE
A summary of total statewide hospital operating results is provided below and on the following
two pages.
Statewide Hospitals
Statement of Operations Summary 2009 2010 2011 2012
Net Patient Revenue $8,396,514,195 $8,743,587,682 $9,283,848,370 $9,902,029,414
Other Operating Revenue $427,232,901 $471,099,526 $448,460,140 $587,041,326
Total Operating Revenue $8,823,747,096 $9,214,687,208 $9,732,308,510 $10,489,070,740
Total Operating Expenses $8,584,125,928 $8,985,335,744 $9,428,356,460 $9,975,496,976
Income/(Loss) from Operations $239,621,168 $229,351,464 $303,952,050 $513,573,764
Non Operating Revenue ($9,192,982) $171,260,050 $50,716,284 $194,372,819Excess/(Deficiency) of Revenue over Expenses $230,428,186 $400,611,514 $354,668,334 $707,946,583
Source: Hospital Audited Financial Statements
21
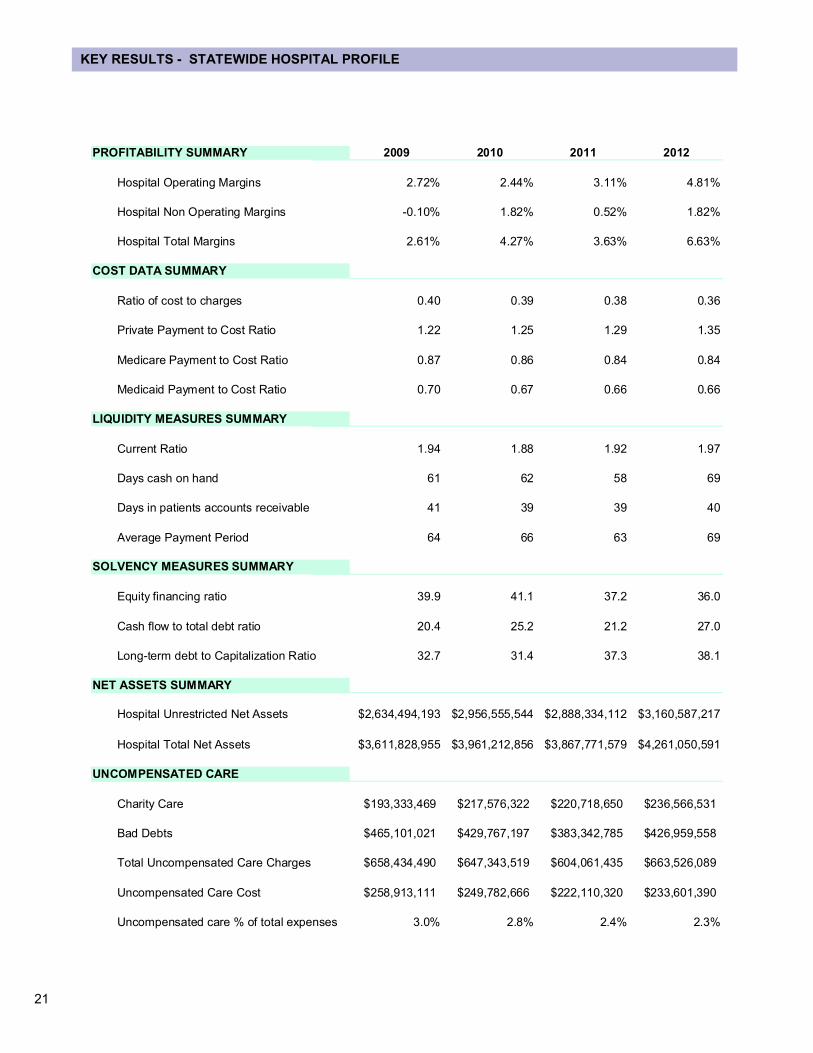
KEY RESULTS - STATEWIDE HOSPITAL PROFILE
PROFITABILITY SUMMARY 2009 2010 2011 2012
Hospital Operating Margins 2.72% 2.44% 3.11% 4.81%
Hospital Non Operating Margins -0.10% 1.82% 0.52% 1.82%
Hospital Total Margins 2.61% 4.27% 3.63% 6.63%
COST DATA SUMMARY
Ratio of cost to charges 0.40 0.39 0.38 0.36
Private Payment to Cost Ratio 1.22 1.25 1.29 1.35
Medicare Payment to Cost Ratio 0.87 0.86 0.84 0.84
Medicaid Payment to Cost Ratio 0.70 0.67 0.66 0.66
LIQUIDITY MEASURES SUMMARY
Current Ratio 1.94 1.88 1.92 1.97
Days cash on hand 61 62 58 69
Days in patients accounts receivable 41 39 39 40
Average Payment Period 64 66 63 69
SOLVENCY MEASURES SUMMARY
Equity financing ratio 39.9 41.1 37.2 36.0
Cash flow to total debt ratio 20.4 25.2 21.2 27.0
Long-term debt to Capitalization Ratio 32.7 31.4 37.3 38.1
NET ASSETS SUMMARY
Hospital Unrestricted Net Assets $2,634,494,193 $2,956,555,544 $2,888,334,112 $3,160,587,217
Hospital Total Net Assets $3,611,828,955 $3,961,212,856 $3,867,771,579 $4,261,050,591
UNCOMPENSATED CARE
Charity Care $193,333,469 $217,576,322 $220,718,650 $236,566,531
Bad Debts $465,101,021 $429,767,197 $383,342,785 $426,959,558
Total Uncompensated Care Charges $658,434,490 $647,343,519 $604,061,435 $663,526,089
Uncompensated Care Cost $258,913,111 $249,782,666 $222,110,320 $233,601,390
Uncompensated care % of total expenses 3.0% 2.8% 2.4% 2.3%
22
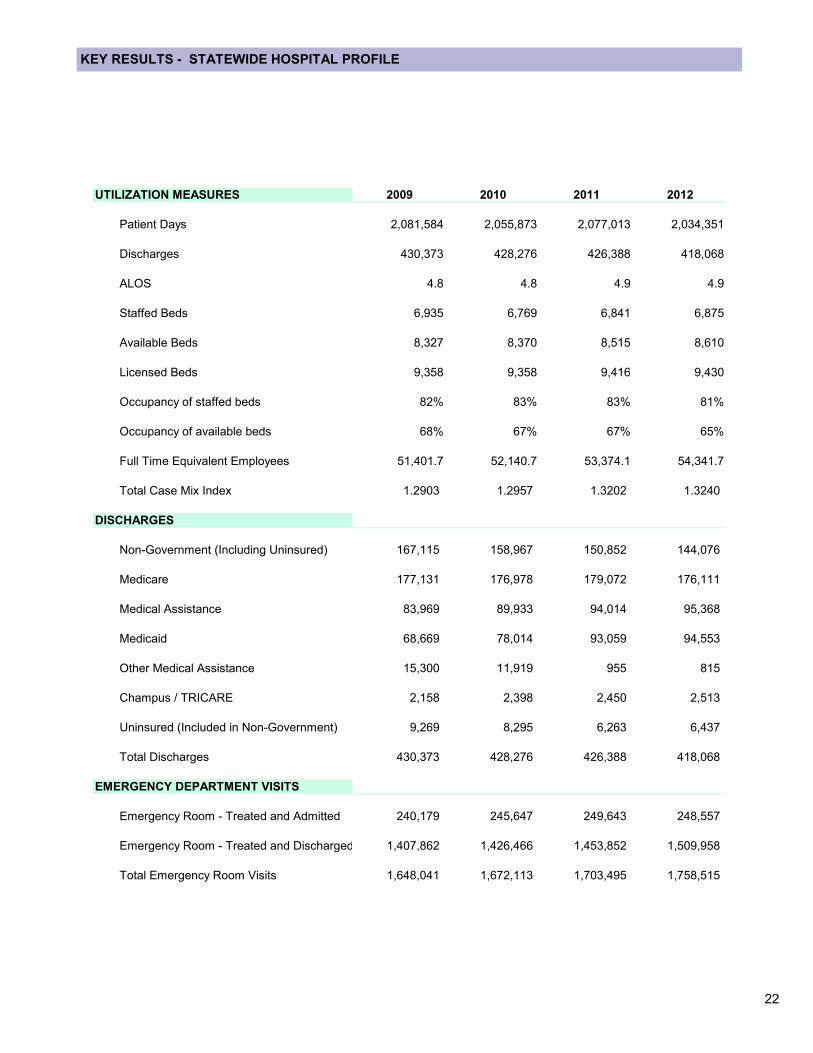
KEY RESULTS - STATEWIDE HOSPITAL PROFILE
UTILIZATION MEASURES 2009 2010 2011 2012
Patient Days 2,081,584 2,055,873 2,077,013 2,034,351
Discharges 430,373 428,276 426,388 418,068
ALOS 4.8 4.8 4.9 4.9
Staffed Beds 6,935 6,769 6,841 6,875
Available Beds 8,327 8,370 8,515 8,610
Licensed Beds 9,358 9,358 9,416 9,430
Occupancy of staffed beds 82% 83% 83% 81%
Occupancy of available beds 68% 67% 67% 65%
Full Time Equivalent Employees 51,401.7 52,140.7 53,374.1 54,341.7
Total Case Mix Index 1.2903 1.2957 1.3202 1.3240
DISCHARGES
Non-Government (Including Uninsured) 167,115 158,967 150,852 144,076
Medicare 177,131 176,978 179,072 176,111
Medical Assistance 83,969 89,933 94,014 95,368
Medicaid 68,669 78,014 93,059 94,553
Other Medical Assistance 15,300 11,919 955 815
Champus / TRICARE 2,158 2,398 2,450 2,513
Uninsured (Included in Non-Government) 9,269 8,295 6,263 6,437
Total Discharges 430,373 428,276 426,388 418,068
EMERGENCY DEPARTMENT VISITS
Emergency Room - Treated and Admitted 240,179 245,647 249,643 248,557
Emergency Room - Treated and Discharged 1,407,862 1,426,466 1,453,852 1,509,958
Total Emergency Room Visits 1,648,041 1,672,113 1,703,495 1,758,515
23
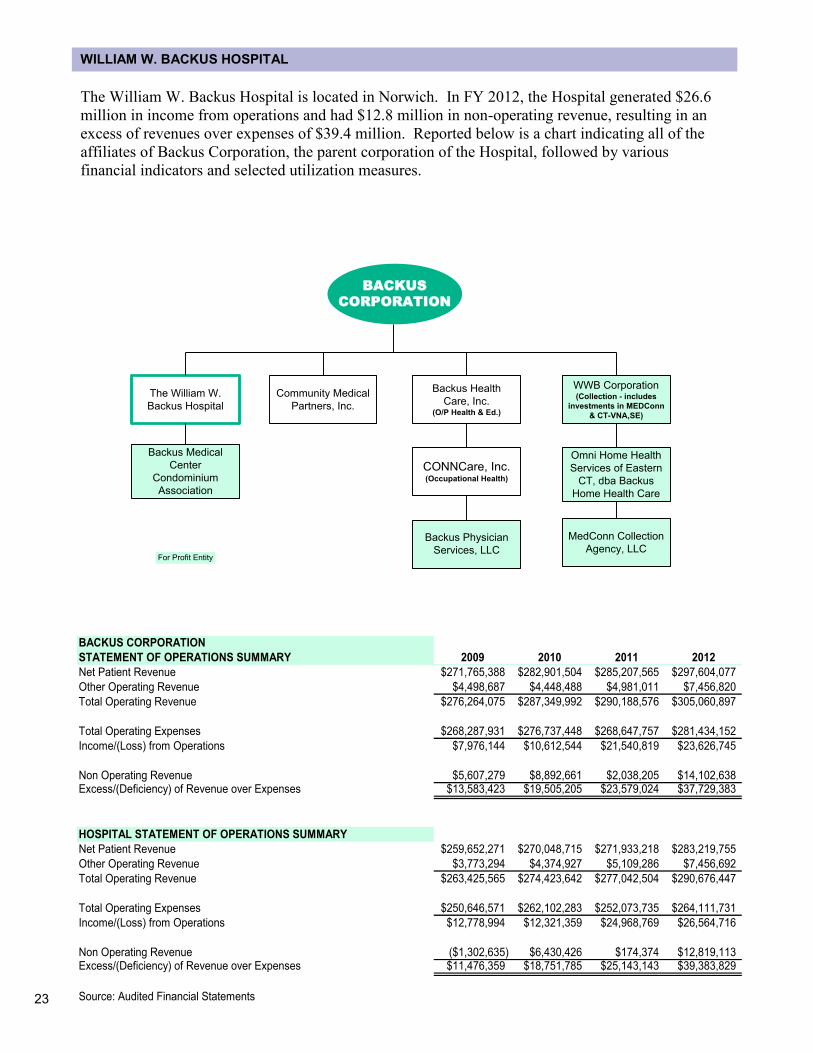
The William W. Backus Hospital is located in Norwich. In FY 2012, the Hospital generated $26.6
million in income from operations and had $12.8 million in non-operating revenue, resulting in an
excess of revenues over expenses of $39.4 million. Reported below is a chart indicating all of the
affiliates of Backus Corporation, the parent corporation of the Hospital, followed by various
financial indicators and selected utilization measures.
WILLIAM W. BACKUS HOSPITAL
The William W.
Backus Hospital
Backus Health
Care, Inc.(O/P Health & Ed.)
WWB Corporation(Collection - includes
investments in MEDConn
& CT-VNA,SE)
Backus Medical
Center
Condominium
Association
CONNCare, Inc.(Occupational Health)
For Profit Entity
Omni Home Health
Services of Eastern
CT, dba Backus
Home Health Care
Community Medical
Partners, Inc.
Backus Physician
Services, LLC
BACKUS
CORPORATION
MedConn Collection
Agency, LLC
BACKUS CORPORATION
STATEMENT OF OPERATIONS SUMMARY 2009 2010 2011 2012
Net Patient Revenue $271,765,388 $282,901,504 $285,207,565 $297,604,077
Other Operating Revenue $4,498,687 $4,448,488 $4,981,011 $7,456,820
Total Operating Revenue $276,264,075 $287,349,992 $290,188,576 $305,060,897
Total Operating Expenses $268,287,931 $276,737,448 $268,647,757 $281,434,152
Income/(Loss) from Operations $7,976,144 $10,612,544 $21,540,819 $23,626,745
Non Operating Revenue $5,607,279 $8,892,661 $2,038,205 $14,102,638Excess/(Deficiency) of Revenue over Expenses $13,583,423 $19,505,205 $23,579,024 $37,729,383
HOSPITAL STATEMENT OF OPERATIONS SUMMARY
Net Patient Revenue $259,652,271 $270,048,715 $271,933,218 $283,219,755
Other Operating Revenue $3,773,294 $4,374,927 $5,109,286 $7,456,692
Total Operating Revenue $263,425,565 $274,423,642 $277,042,504 $290,676,447
Total Operating Expenses $250,646,571 $262,102,283 $252,073,735 $264,111,731
Income/(Loss) from Operations $12,778,994 $12,321,359 $24,968,769 $26,564,716
Non Operating Revenue ($1,302,635) $6,430,426 $174,374 $12,819,113Excess/(Deficiency) of Revenue over Expenses $11,476,359 $18,751,785 $25,143,143 $39,383,829
Source: Audited Financial Statements

24
KEY RESULTS - WILLIAM W. BACKUS HOSPITAL
Statewide
PROFITABILITY SUMMARY 2009 2010 2011 2012 Avg. 2012
Hospital Operating Margins 4.88% 4.39% 9.01% 8.75% 4.81%
Hospital Non Operating Margins -0.50% 2.29% 0.06% 4.22% 1.82%
Hospital Total Margins 4.38% 6.68% 9.07% 12.98% 6.63%
COST DATA SUMMARY
Ratio of cost to charges 0.44 0.44 0.41 0.42 0.36
Private Payment to Cost Ratio 1.41 1.42 1.53 1.53 1.35
Medicare Payment to Cost Ratio 0.73 0.77 0.82 0.88 0.84
Medicaid Payment to Cost Ratio 0.62 0.61 0.62 0.57 0.66
LIQUIDITY MEASURES SUMMARY
Current Ratio 3.69 3.90 4.14 4.99 1.97
Days cash on hand 90 108 145 159 69
Days in patients accounts receivable 48 38 37 40 40
Average Payment Period 46 45 51 46 69
SOLVENCY MEASURES SUMMARY
Equity financing ratio 36.1 47.4 45.3 50.4 36.0
Cash flow to total debt ratio 30.4 38.3 44.1 59.8 27.0
Long-term debt to Capitalization Ratio 36.2 28.9 27.8 24.7 38.1
NET ASSETS SUMMARY
Hospital Unrestricted Net Assets $102,294,307 $147,348,055 $153,327,362 $187,197,385
Hospital Total Net Assets $112,603,569 $158,925,018 $162,176,033 $197,844,044
UNCOMPENSATED CARE
Charity Care $6,641,717 $6,321,367 $4,672,730 $5,341,790
Bad Debts $17,093,520 $14,508,284 $12,690,606 $8,089,246
Total Uncompensated Care Charges $23,735,237 $20,829,651 $17,363,336 $13,431,036
Uncompensated Care Cost $10,540,405 $9,257,065 $7,184,927 $5,694,063
Uncompensated care % of total expenses 4.2% 3.5% 2.9% 2.2%
Note: Financial measures noted in green are favorable compared to the statewide average while financial measures
noted in red are unfavorable compared to the statewide average. In some cases, the 2012 amount and the statewide
average show the same amount. The red and green formatting is based on additional decimal spaces that are not
shown.
25
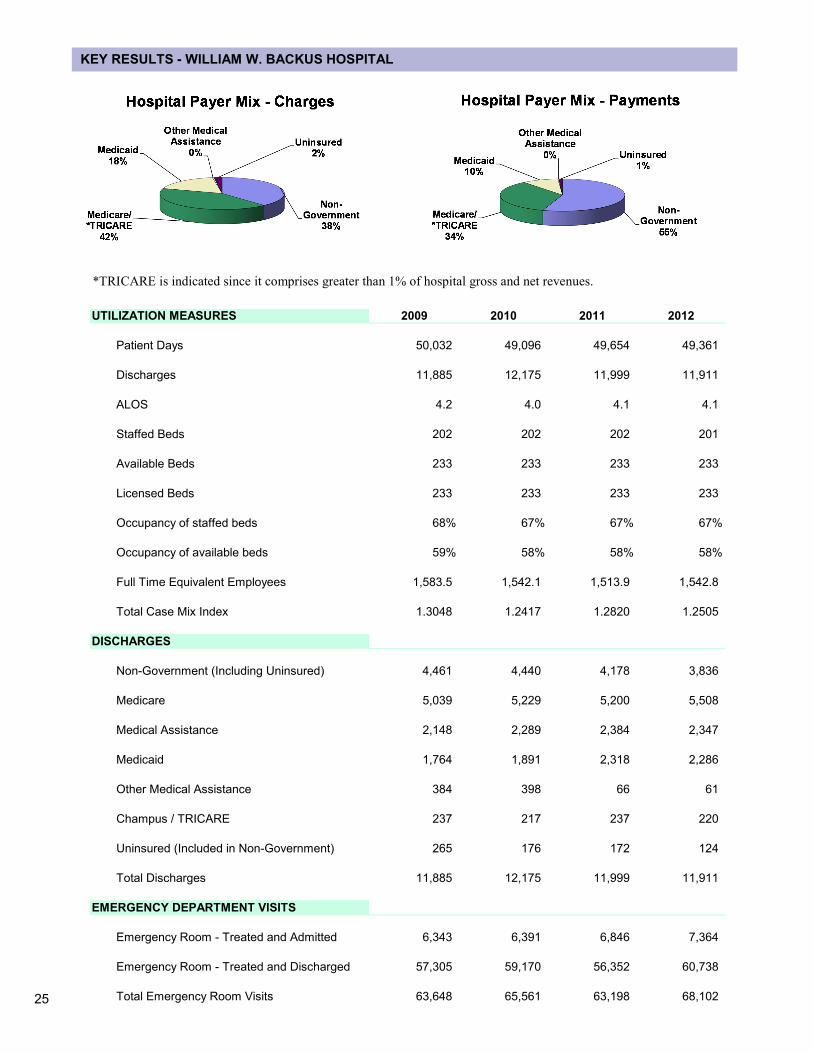
KEY RESULTS - WILLIAM W. BACKUS HOSPITAL
*TRICARE is indicated since it comprises greater than 1% of hospital gross and net revenues.
UTILIZATION MEASURES 2009 2010 2011 2012
Patient Days 50,032 49,096 49,654 49,361
Discharges 11,885 12,175 11,999 11,911
ALOS 4.2 4.0 4.1 4.1
Staffed Beds 202 202 202 201
Available Beds 233 233 233 233
Licensed Beds 233 233 233 233
Occupancy of staffed beds 68% 67% 67% 67%
Occupancy of available beds 59% 58% 58% 58%
Full Time Equivalent Employees 1,583.5 1,542.1 1,513.9 1,542.8
Total Case Mix Index 1.3048 1.2417 1.2820 1.2505
DISCHARGES
Non-Government (Including Uninsured) 4,461 4,440 4,178 3,836
Medicare 5,039 5,229 5,200 5,508
Medical Assistance 2,148 2,289 2,384 2,347
Medicaid 1,764 1,891 2,318 2,286
Other Medical Assistance 384 398 66 61
Champus / TRICARE 237 217 237 220
Uninsured (Included in Non-Government) 265 176 172 124
Total Discharges 11,885 12,175 11,999 11,911
EMERGENCY DEPARTMENT VISITS
Emergency Room - Treated and Admitted 6,343 6,391 6,846 7,364
Emergency Room - Treated and Discharged 57,305 59,170 56,352 60,738
Total Emergency Room Visits 63,648 65,561 63,198 68,102
26
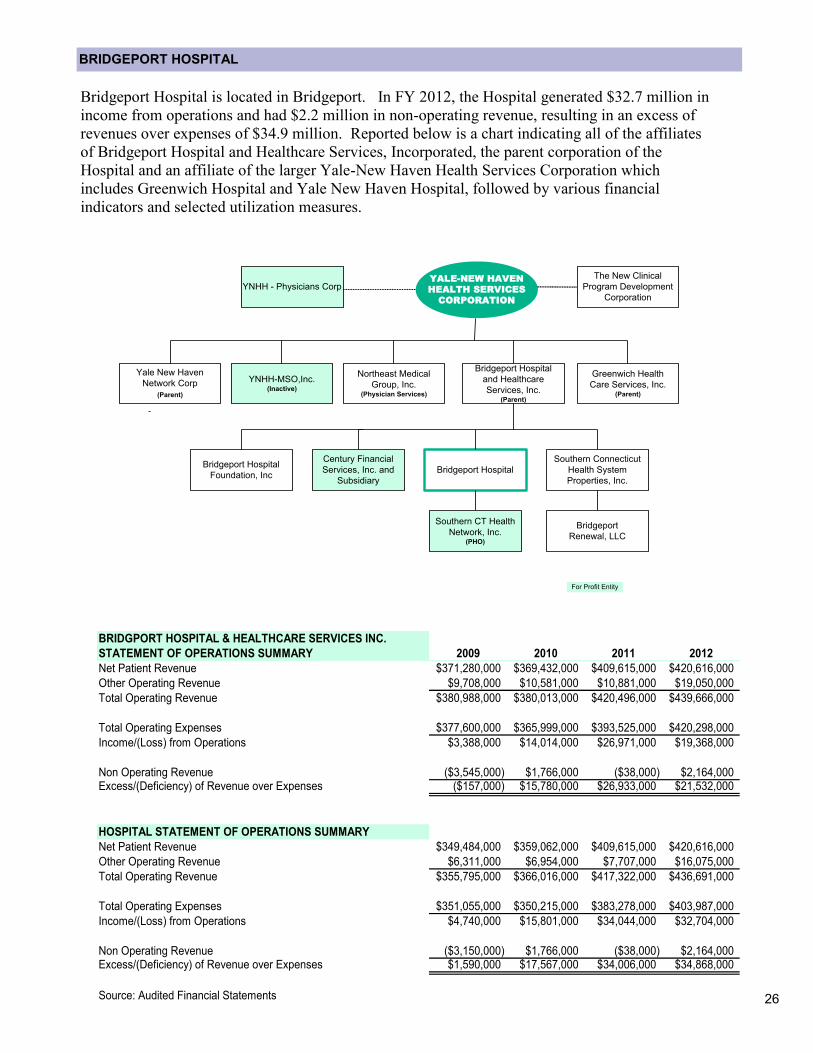
BRIDGEPORT HOSPITAL
Bridgeport Hospital is located in Bridgeport. In FY 2012, the Hospital generated $32.7 million in
income from operations and had $2.2 million in non-operating revenue, resulting in an excess of
revenues over expenses of $34.9 million. Reported below is a chart indicating all of the affiliates
of Bridgeport Hospital and Healthcare Services, Incorporated, the parent corporation of the
Hospital and an affiliate of the larger Yale-New Haven Health Services Corporation which
includes Greenwich Hospital and Yale New Haven Hospital, followed by various financial
indicators and selected utilization measures.
Yale New Haven
Network Corp
(Parent)
Bridgeport Hospital
and Healthcare
Services, Inc.(Parent)
Greenwich Health
Care Services, Inc.(Parent)
Bridgeport HospitalBridgeport Hospital
Foundation, Inc
Southern Connecticut
Health System
Properties, Inc.
YALE-NEW HAVEN
HEALTH SERVICES
CORPORATION
For Profit Entity
Southern CT Health
Network, Inc.(PHO)
Century Financial
Services, Inc. and
Subsidiary
YNHH-MSO,Inc.(Inactive)
YNHH - Physicians Corp
Bridgeport
Renewal, LLC
The New Clinical
Program Development
Corporation
Northeast Medical
Group, Inc.(Physician Services)
BRIDGPORT HOSPITAL & HEALTHCARE SERVICES INC.
STATEMENT OF OPERATIONS SUMMARY 2009 2010 2011 2012
Net Patient Revenue $371,280,000 $369,432,000 $409,615,000 $420,616,000
Other Operating Revenue $9,708,000 $10,581,000 $10,881,000 $19,050,000
Total Operating Revenue $380,988,000 $380,013,000 $420,496,000 $439,666,000
Total Operating Expenses $377,600,000 $365,999,000 $393,525,000 $420,298,000
Income/(Loss) from Operations $3,388,000 $14,014,000 $26,971,000 $19,368,000
Non Operating Revenue ($3,545,000) $1,766,000 ($38,000) $2,164,000Excess/(Deficiency) of Revenue over Expenses ($157,000) $15,780,000 $26,933,000 $21,532,000
HOSPITAL STATEMENT OF OPERATIONS SUMMARY
Net Patient Revenue $349,484,000 $359,062,000 $409,615,000 $420,616,000
Other Operating Revenue $6,311,000 $6,954,000 $7,707,000 $16,075,000
Total Operating Revenue $355,795,000 $366,016,000 $417,322,000 $436,691,000
Total Operating Expenses $351,055,000 $350,215,000 $383,278,000 $403,987,000
Income/(Loss) from Operations $4,740,000 $15,801,000 $34,044,000 $32,704,000
Non Operating Revenue ($3,150,000) $1,766,000 ($38,000) $2,164,000Excess/(Deficiency) of Revenue over Expenses $1,590,000 $17,567,000 $34,006,000 $34,868,000
Source: Audited Financial Statements

27
KEY RESULTS - BRIDGEPORT HOSPITAL
Note: Financial measures noted in green are favorable compared to the statewide average while financial measures
noted in red are unfavorable compared to the statewide average. In some cases, the 2012 amount and the statewide
average show the same amount. The red and green formatting is based on additional decimal spaces that are not
shown.
Statewide
PROFITABILITY SUMMARY 2009 2010 2011 2012 Avg. 2012
Hospital Operating Margins 1.34% 4.30% 8.16% 7.45% 4.81%
Hospital Non Operating Margins -0.89% 0.48% -0.01% 0.49% 1.82%
Hospital Total Margins 0.45% 4.78% 8.15% 7.95% 6.63%
COST DATA SUMMARY
Ratio of cost to charges 0.32 0.29 0.29 0.29 0.36
Private Payment to Cost Ratio 1.22 1.39 1.44 1.41 1.35
Medicare Payment to Cost Ratio 1.02 0.95 0.98 0.98 0.84
Medicaid Payment to Cost Ratio 0.77 0.72 0.74 0.74 0.66
LIQUIDITY MEASURES SUMMARY
Current Ratio 1.63 1.95 1.79 1.60 1.97
Days cash on hand 36 68 56 54 69
Days in patients accounts receivable 36 28 36 37 40
Average Payment Period 51 57 62 77 69
SOLVENCY MEASURES SUMMARY
Equity financing ratio 32.0 34.6 36.2 31.6 36.0
Cash flow to total debt ratio 21.3 35.6 46.3 42.9 27.0
Long-term debt to Capitalization Ratio 36.1 31.4 29.5 27.8 38.1
NET ASSETS SUMMARY
Hospital Unrestricted Net Assets $49,998,000 $62,529,000 $74,736,000 $74,554,000
Hospital Total Net Assets $88,852,000 $103,099,000 $118,814,000 $123,258,000
UNCOMPENSATED CARE
Charity Care $15,999,852 $12,024,692 $13,664,086 $14,777,279
Bad Debts $32,293,223 $25,581,567 $28,215,688 $30,026,844
Total Uncompensated Care Charges $48,293,075 $37,606,259 $41,879,774 $44,804,123
Uncompensated Care Cost $15,245,620 $11,054,283 $12,285,910 $12,979,556
Uncompensated care % of total expenses 4.3% 3.2% 3.2% 3.2%
28
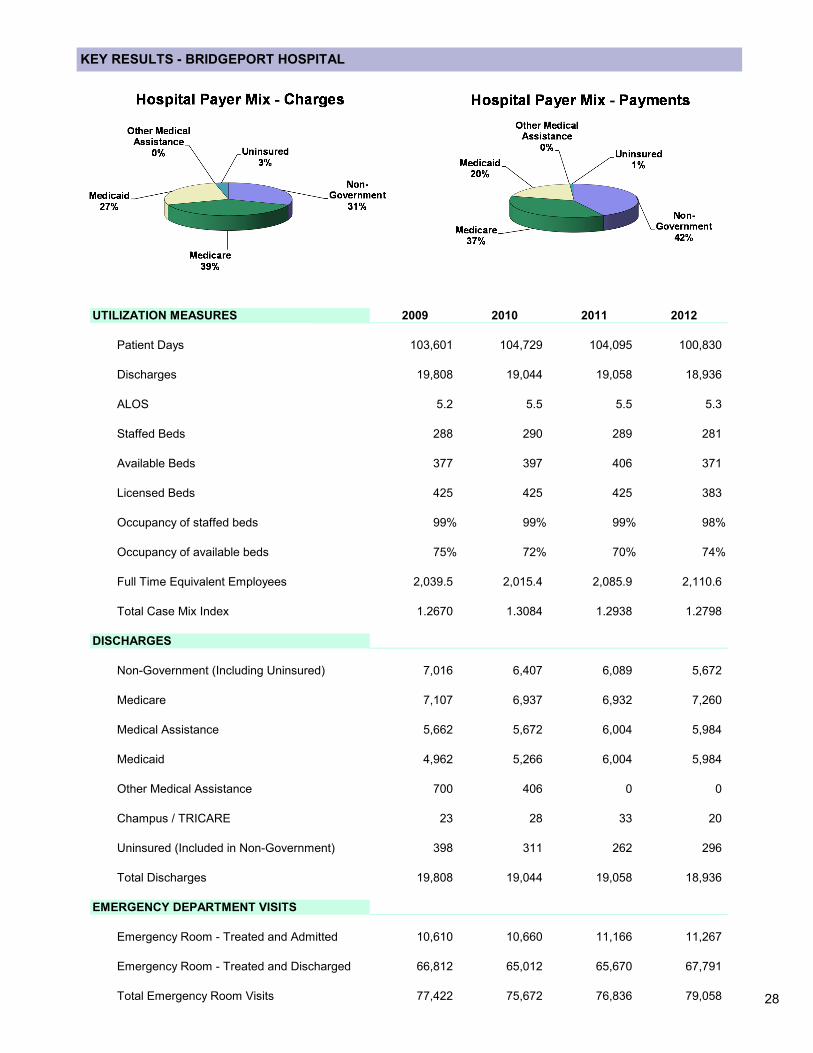
KEY RESULTS - BRIDGEPORT HOSPITAL
UTILIZATION MEASURES 2009 2010 2011 2012
Patient Days 103,601 104,729 104,095 100,830
Discharges 19,808 19,044 19,058 18,936
ALOS 5.2 5.5 5.5 5.3
Staffed Beds 288 290 289 281
Available Beds 377 397 406 371
Licensed Beds 425 425 425 383
Occupancy of staffed beds 99% 99% 99% 98%
Occupancy of available beds 75% 72% 70% 74%
Full Time Equivalent Employees 2,039.5 2,015.4 2,085.9 2,110.6
Total Case Mix Index 1.2670 1.3084 1.2938 1.2798
DISCHARGES
Non-Government (Including Uninsured) 7,016 6,407 6,089 5,672
Medicare 7,107 6,937 6,932 7,260
Medical Assistance 5,662 5,672 6,004 5,984
Medicaid 4,962 5,266 6,004 5,984
Other Medical Assistance 700 406 0 0
Champus / TRICARE 23 28 33 20
Uninsured (Included in Non-Government) 398 311 262 296
Total Discharges 19,808 19,044 19,058 18,936
EMERGENCY DEPARTMENT VISITS
Emergency Room - Treated and Admitted 10,610 10,660 11,166 11,267
Emergency Room - Treated and Discharged 66,812 65,012 65,670 67,791
Total Emergency Room Visits 77,422 75,672 76,836 79,058
29
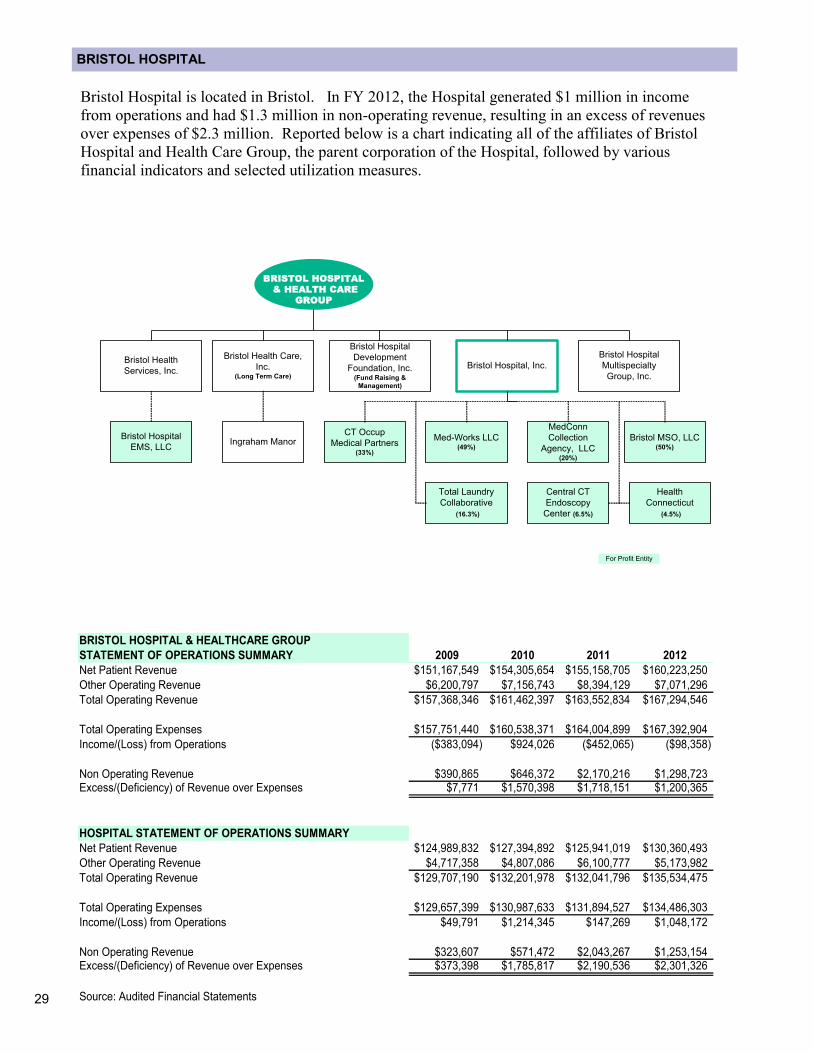
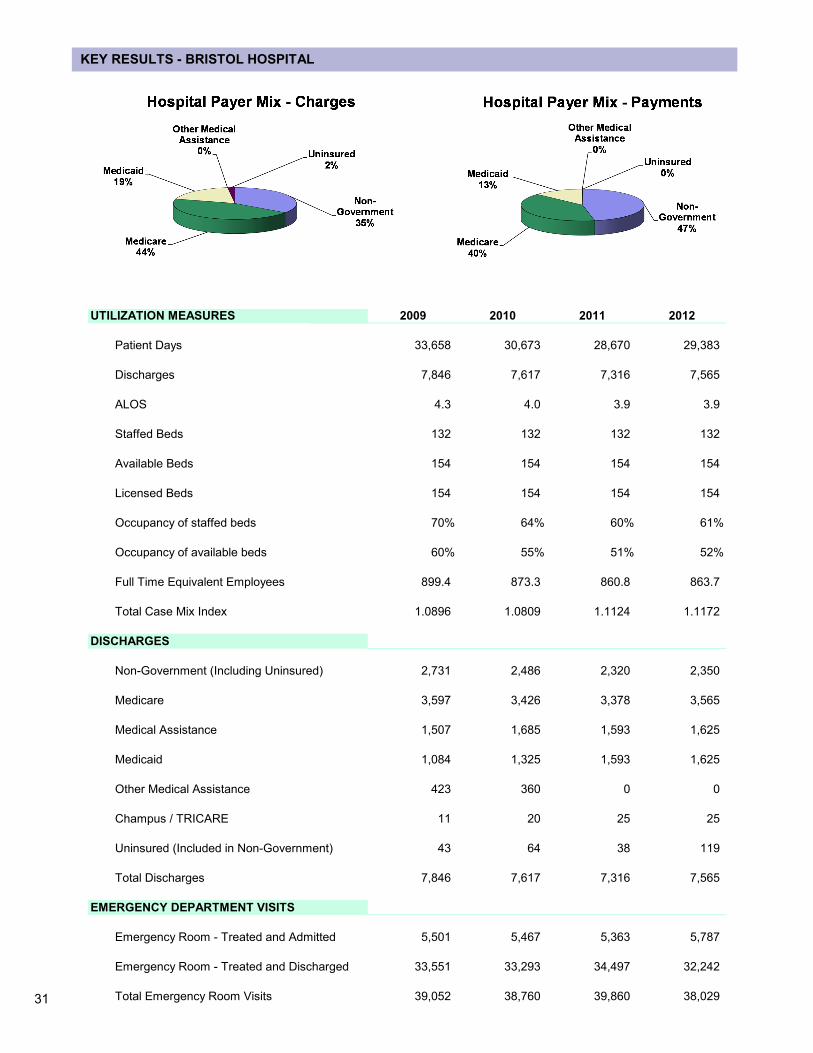
BRISTOL HOSPITAL
Bristol Hospital is located in Bristol. In FY 2012, the Hospital generated $1 million in income
from operations and had $1.3 million in non-operating revenue, resulting in an excess of revenues
over expenses of $2.3 million. Reported below is a chart indicating all of the affiliates of Bristol
Hospital and Health Care Group, the parent corporation of the Hospital, followed by various
financial indicators and selected utilization measures.
BRISTOL HOSPITAL & HEALTHCARE GROUP
STATEMENT OF OPERATIONS SUMMARY 2009 2010 2011 2012
Net Patient Revenue $151,167,549 $154,305,654 $155,158,705 $160,223,250
Other Operating Revenue $6,200,797 $7,156,743 $8,394,129 $7,071,296
Total Operating Revenue $157,368,346 $161,462,397 $163,552,834 $167,294,546
Total Operating Expenses $157,751,440 $160,538,371 $164,004,899 $167,392,904
Income/(Loss) from Operations ($383,094) $924,026 ($452,065) ($98,358)
Non Operating Revenue $390,865 $646,372 $2,170,216 $1,298,723Excess/(Deficiency) of Revenue over Expenses $7,771 $1,570,398 $1,718,151 $1,200,365
HOSPITAL STATEMENT OF OPERATIONS SUMMARY
Net Patient Revenue $124,989,832 $127,394,892 $125,941,019 $130,360,493
Other Operating Revenue $4,717,358 $4,807,086 $6,100,777 $5,173,982
Total Operating Revenue $129,707,190 $132,201,978 $132,041,796 $135,534,475
Total Operating Expenses $129,657,399 $130,987,633 $131,894,527 $134,486,303
Income/(Loss) from Operations $49,791 $1,214,345 $147,269 $1,048,172
Non Operating Revenue $323,607 $571,472 $2,043,267 $1,253,154Excess/(Deficiency) of Revenue over Expenses $373,398 $1,785,817 $2,190,536 $2,301,326
Source: Audited Financial Statements
Bristol Health Care,
Inc.(Long Term Care)
Bristol Hospital
Development
Foundation, Inc.(Fund Raising &
Management)
Bristol Hospital, Inc.
BRISTOL HOSPITAL
& HEALTH CARE
GROUP
For Profit Entity
Med-Works LLC(49%)
Bristol MSO, LLC(50%)
MedConn
Collection
Agency, LLC(20%)
Bristol Health
Services, Inc.
CT Occup
Medical Partners(33%)
Health
Connecticut
(4.5%)
Central CT
Endoscopy
Center (6.5%)
Total Laundry
Collaborative
(16.3%)
Bristol Hospital
EMS, LLCIngraham Manor
Bristol Hospital
Multispecialty
Group, Inc.
30
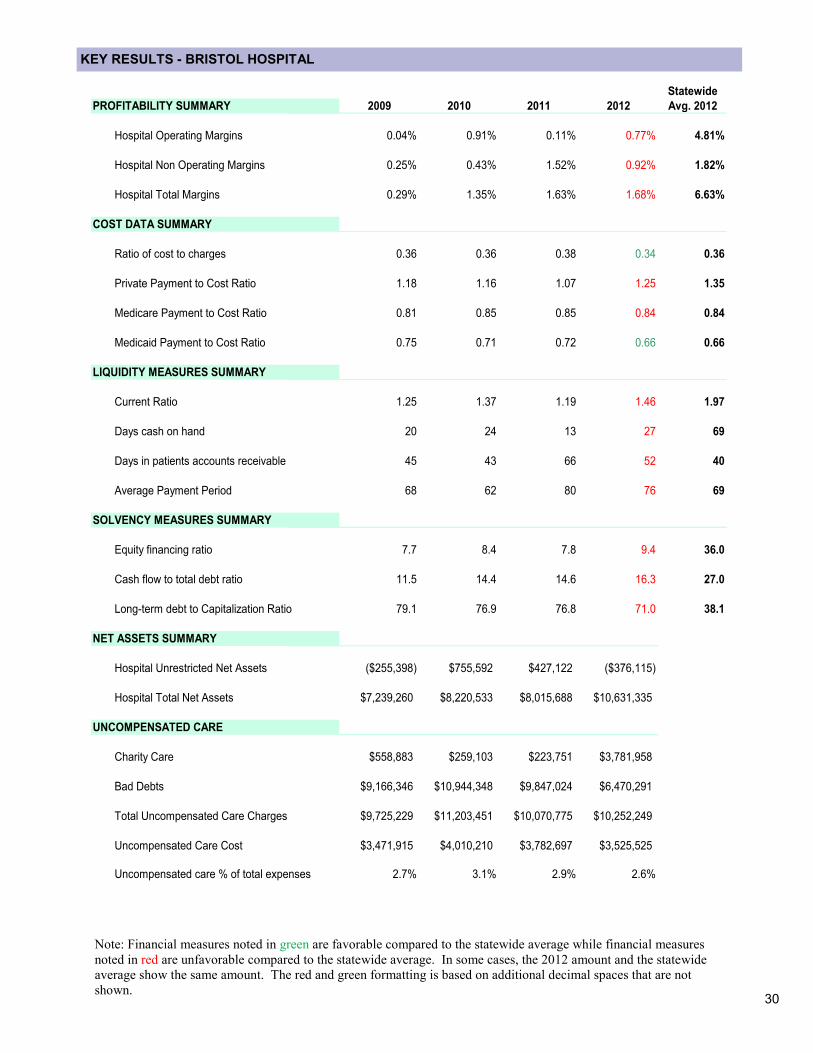
KEY RESULTS - BRISTOL HOSPITAL
Note: Financial measures noted in green are favorable compared to the statewide average while financial measures
noted in red are unfavorable compared to the statewide average. In some cases, the 2012 amount and the statewide
average show the same amount. The red and green formatting is based on additional decimal spaces that are not
shown.
Statewide
PROFITABILITY SUMMARY 2009 2010 2011 2012 Avg. 2012
Hospital Operating Margins 0.04% 0.91% 0.11% 0.77% 4.81%
Hospital Non Operating Margins 0.25% 0.43% 1.52% 0.92% 1.82%
Hospital Total Margins 0.29% 1.35% 1.63% 1.68% 6.63%
COST DATA SUMMARY
Ratio of cost to charges 0.36 0.36 0.38 0.34 0.36
Private Payment to Cost Ratio 1.18 1.16 1.07 1.25 1.35
Medicare Payment to Cost Ratio 0.81 0.85 0.85 0.84 0.84
Medicaid Payment to Cost Ratio 0.75 0.71 0.72 0.66 0.66
LIQUIDITY MEASURES SUMMARY
Current Ratio 1.25 1.37 1.19 1.46 1.97
Days cash on hand 20 24 13 27 69
Days in patients accounts receivable 45 43 66 52 40
Average Payment Period 68 62 80 76 69
SOLVENCY MEASURES SUMMARY
Equity financing ratio 7.7 8.4 7.8 9.4 36.0
Cash flow to total debt ratio 11.5 14.4 14.6 16.3 27.0
Long-term debt to Capitalization Ratio 79.1 76.9 76.8 71.0 38.1
NET ASSETS SUMMARY
Hospital Unrestricted Net Assets ($255,398) $755,592 $427,122 ($376,115)
Hospital Total Net Assets $7,239,260 $8,220,533 $8,015,688 $10,631,335
UNCOMPENSATED CARE
Charity Care $558,883 $259,103 $223,751 $3,781,958
Bad Debts $9,166,346 $10,944,348 $9,847,024 $6,470,291
Total Uncompensated Care Charges $9,725,229 $11,203,451 $10,070,775 $10,252,249
Uncompensated Care Cost $3,471,915 $4,010,210 $3,782,697 $3,525,525
Uncompensated care % of total expenses 2.7% 3.1% 2.9% 2.6%
31
KEY RESULTS - BRISTOL HOSPITAL
UTILIZATION MEASURES 2009 2010 2011 2012
Patient Days 33,658 30,673 28,670 29,383
Discharges 7,846 7,617 7,316 7,565
ALOS 4.3 4.0 3.9 3.9
Staffed Beds 132 132 132 132
Available Beds 154 154 154 154
Licensed Beds 154 154 154 154
Occupancy of staffed beds 70% 64% 60% 61%
Occupancy of available beds 60% 55% 51% 52%
Full Time Equivalent Employees 899.4 873.3 860.8 863.7
Total Case Mix Index 1.0896 1.0809 1.1124 1.1172
DISCHARGES
Non-Government (Including Uninsured) 2,731 2,486 2,320 2,350
Medicare 3,597 3,426 3,378 3,565
Medical Assistance 1,507 1,685 1,593 1,625
Medicaid 1,084 1,325 1,593 1,625
Other Medical Assistance 423 360 0 0
Champus / TRICARE 11 20 25 25
Uninsured (Included in Non-Government) 43 64 38 119
Total Discharges 7,846 7,617 7,316 7,565
EMERGENCY DEPARTMENT VISITS
Emergency Room - Treated and Admitted 5,501 5,467 5,363 5,787
Emergency Room - Treated and Discharged 33,551 33,293 34,497 32,242
Total Emergency Room Visits 39,052 38,760 39,860 38,029
32
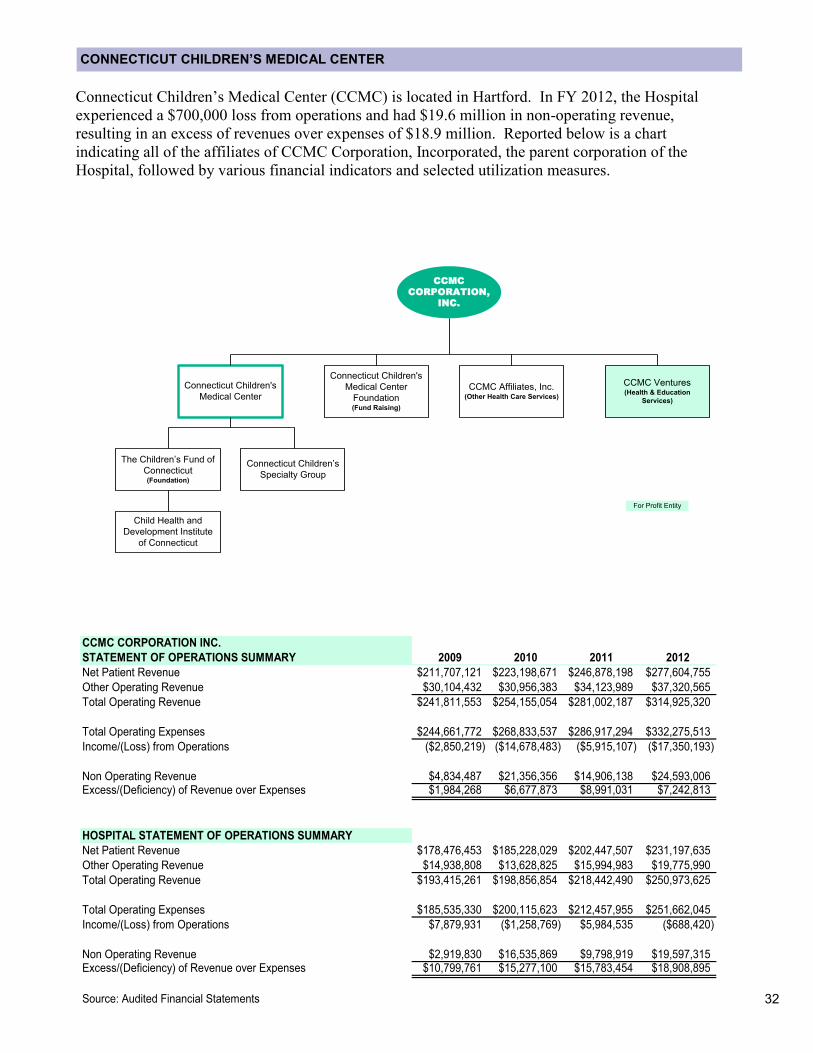
Connecticut Children’s Medical Center (CCMC) is located in Hartford. In FY 2012, the Hospital
experienced a $700,000 loss from operations and had $19.6 million in non-operating revenue,
resulting in an excess of revenues over expenses of $18.9 million. Reported below is a chart
indicating all of the affiliates of CCMC Corporation, Incorporated, the parent corporation of the
Hospital, followed by various financial indicators and selected utilization measures.
CONNECTICUT CHILDREN’S MEDICAL CENTER
Connecticut Children's
Medical Center
Connecticut Children's
Medical Center
Foundation(Fund Raising)
CCMC Affiliates, Inc.(Other Health Care Services)
CCMC Ventures(Health & Education
Services)
CCMC
CORPORATION,
INC.
For Profit Entity
The Children’s Fund of
Connecticut(Foundation)
Connecticut Children’s
Specialty Group
Child Health and
Development Institute
of Connecticut
CCMC CORPORATION INC.
STATEMENT OF OPERATIONS SUMMARY 2009 2010 2011 2012
Net Patient Revenue $211,707,121 $223,198,671 $246,878,198 $277,604,755
Other Operating Revenue $30,104,432 $30,956,383 $34,123,989 $37,320,565
Total Operating Revenue $241,811,553 $254,155,054 $281,002,187 $314,925,320
Total Operating Expenses $244,661,772 $268,833,537 $286,917,294 $332,275,513
Income/(Loss) from Operations ($2,850,219) ($14,678,483) ($5,915,107) ($17,350,193)
Non Operating Revenue $4,834,487 $21,356,356 $14,906,138 $24,593,006Excess/(Deficiency) of Revenue over Expenses $1,984,268 $6,677,873 $8,991,031 $7,242,813
HOSPITAL STATEMENT OF OPERATIONS SUMMARY
Net Patient Revenue $178,476,453 $185,228,029 $202,447,507 $231,197,635
Other Operating Revenue $14,938,808 $13,628,825 $15,994,983 $19,775,990
Total Operating Revenue $193,415,261 $198,856,854 $218,442,490 $250,973,625
Total Operating Expenses $185,535,330 $200,115,623 $212,457,955 $251,662,045
Income/(Loss) from Operations $7,879,931 ($1,258,769) $5,984,535 ($688,420)
Non Operating Revenue $2,919,830 $16,535,869 $9,798,919 $19,597,315Excess/(Deficiency) of Revenue over Expenses $10,799,761 $15,277,100 $15,783,454 $18,908,895
Source: Audited Financial Statements
33
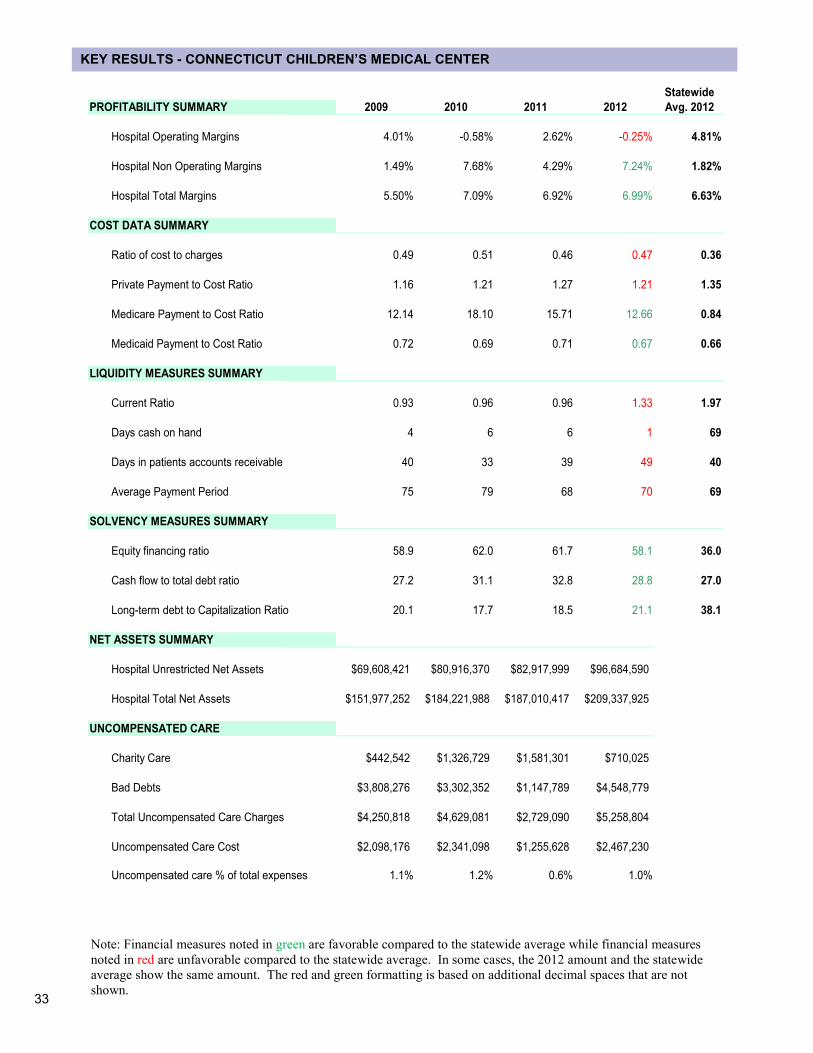
KEY RESULTS - CONNECTICUT CHILDREN’S MEDICAL CENTER
Note: Financial measures noted in green are favorable compared to the statewide average while financial measures
noted in red are unfavorable compared to the statewide average. In some cases, the 2012 amount and the statewide
average show the same amount. The red and green formatting is based on additional decimal spaces that are not
shown.
Statewide
PROFITABILITY SUMMARY 2009 2010 2011 2012 Avg. 2012
Hospital Operating Margins 4.01% -0.58% 2.62% -0.25% 4.81%
Hospital Non Operating Margins 1.49% 7.68% 4.29% 7.24% 1.82%
Hospital Total Margins 5.50% 7.09% 6.92% 6.99% 6.63%
COST DATA SUMMARY
Ratio of cost to charges 0.49 0.51 0.46 0.47 0.36
Private Payment to Cost Ratio 1.16 1.21 1.27 1.21 1.35
Medicare Payment to Cost Ratio 12.14 18.10 15.71 12.66 0.84
Medicaid Payment to Cost Ratio 0.72 0.69 0.71 0.67 0.66
LIQUIDITY MEASURES SUMMARY
Current Ratio 0.93 0.96 0.96 1.33 1.97
Days cash on hand 4 6 6 1 69
Days in patients accounts receivable 40 33 39 49 40
Average Payment Period 75 79 68 70 69
SOLVENCY MEASURES SUMMARY
Equity financing ratio 58.9 62.0 61.7 58.1 36.0
Cash flow to total debt ratio 27.2 31.1 32.8 28.8 27.0
Long-term debt to Capitalization Ratio 20.1 17.7 18.5 21.1 38.1
NET ASSETS SUMMARY
Hospital Unrestricted Net Assets $69,608,421 $80,916,370 $82,917,999 $96,684,590
Hospital Total Net Assets $151,977,252 $184,221,988 $187,010,417 $209,337,925
UNCOMPENSATED CARE
Charity Care $442,542 $1,326,729 $1,581,301 $710,025
Bad Debts $3,808,276 $3,302,352 $1,147,789 $4,548,779
Total Uncompensated Care Charges $4,250,818 $4,629,081 $2,729,090 $5,258,804
Uncompensated Care Cost $2,098,176 $2,341,098 $1,255,628 $2,467,230
Uncompensated care % of total expenses 1.1% 1.2% 0.6% 1.0%
34
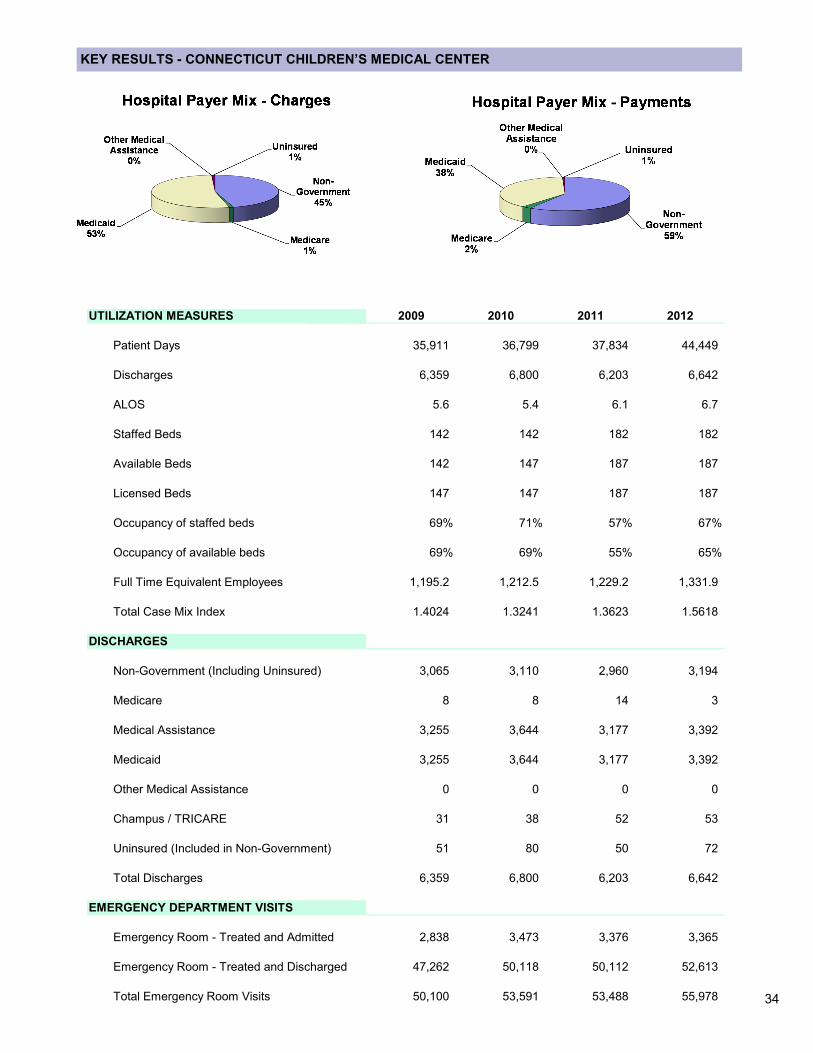
KEY RESULTS - CONNECTICUT CHILDREN’S MEDICAL CENTER
UTILIZATION MEASURES 2009 2010 2011 2012
Patient Days 35,911 36,799 37,834 44,449
Discharges 6,359 6,800 6,203 6,642
ALOS 5.6 5.4 6.1 6.7
Staffed Beds 142 142 182 182
Available Beds 142 147 187 187
Licensed Beds 147 147 187 187
Occupancy of staffed beds 69% 71% 57% 67%
Occupancy of available beds 69% 69% 55% 65%
Full Time Equivalent Employees 1,195.2 1,212.5 1,229.2 1,331.9
Total Case Mix Index 1.4024 1.3241 1.3623 1.5618
DISCHARGES
Non-Government (Including Uninsured) 3,065 3,110 2,960 3,194
Medicare 8 8 14 3
Medical Assistance 3,255 3,644 3,177 3,392
Medicaid 3,255 3,644 3,177 3,392
Other Medical Assistance 0 0 0 0
Champus / TRICARE 31 38 52 53
Uninsured (Included in Non-Government) 51 80 50 72
Total Discharges 6,359 6,800 6,203 6,642
EMERGENCY DEPARTMENT VISITS
Emergency Room - Treated and Admitted 2,838 3,473 3,376 3,365
Emergency Room - Treated and Discharged 47,262 50,118 50,112 52,613
Total Emergency Room Visits 50,100 53,591 53,488 55,978
35
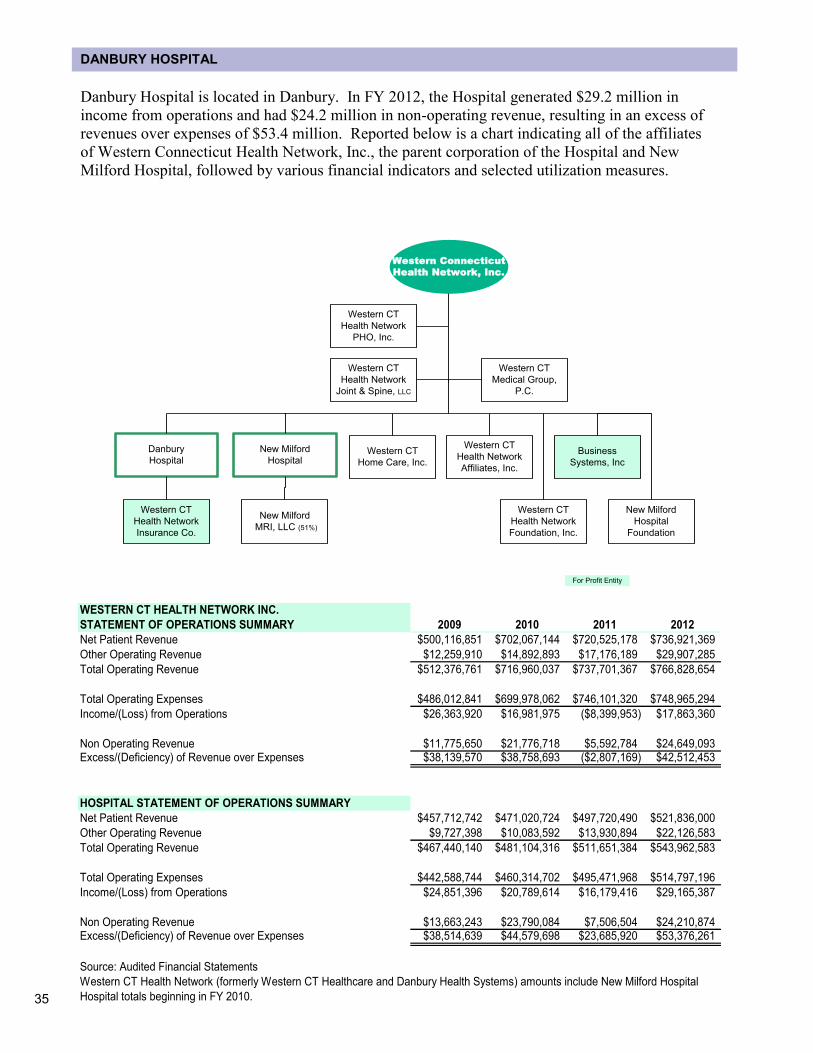
DANBURY HOSPITAL
Danbury Hospital is located in Danbury. In FY 2012, the Hospital generated $29.2 million in
income from operations and had $24.2 million in non-operating revenue, resulting in an excess of
revenues over expenses of $53.4 million. Reported below is a chart indicating all of the affiliates
of Western Connecticut Health Network, Inc., the parent corporation of the Hospital and New
Milford Hospital, followed by various financial indicators and selected utilization measures.
Business
Systems, Inc
For Profit Entity
Western Connecticut
Health Network, Inc.
Western CT
Home Care, Inc.
Danbury
Hospital
New Milford
Hospital
Foundation
Western CT
Health Network
Affiliates, Inc.
New Milford
Hospital
Western CT
Health Network
Insurance Co.
New Milford
MRI, LLC (51%)
Western CT
Medical Group,
P.C.
Western CT
Health Network
Joint & Spine, LLC
Western CT
Health Network
Foundation, Inc.
Western CT
Health Network
PHO, Inc.
WESTERN CT HEALTH NETWORK INC.
STATEMENT OF OPERATIONS SUMMARY 2009 2010 2011 2012
Net Patient Revenue $500,116,851 $702,067,144 $720,525,178 $736,921,369
Other Operating Revenue $12,259,910 $14,892,893 $17,176,189 $29,907,285
Total Operating Revenue $512,376,761 $716,960,037 $737,701,367 $766,828,654
Total Operating Expenses $486,012,841 $699,978,062 $746,101,320 $748,965,294
Income/(Loss) from Operations $26,363,920 $16,981,975 ($8,399,953) $17,863,360
Non Operating Revenue $11,775,650 $21,776,718 $5,592,784 $24,649,093Excess/(Deficiency) of Revenue over Expenses $38,139,570 $38,758,693 ($2,807,169) $42,512,453
HOSPITAL STATEMENT OF OPERATIONS SUMMARY
Net Patient Revenue $457,712,742 $471,020,724 $497,720,490 $521,836,000
Other Operating Revenue $9,727,398 $10,083,592 $13,930,894 $22,126,583
Total Operating Revenue $467,440,140 $481,104,316 $511,651,384 $543,962,583
Total Operating Expenses $442,588,744 $460,314,702 $495,471,968 $514,797,196
Income/(Loss) from Operations $24,851,396 $20,789,614 $16,179,416 $29,165,387
Non Operating Revenue $13,663,243 $23,790,084 $7,506,504 $24,210,874Excess/(Deficiency) of Revenue over Expenses $38,514,639 $44,579,698 $23,685,920 $53,376,261
Source: Audited Financial Statements
Western CT Health Network (formerly Western CT Healthcare and Danbury Health Systems) amounts include New Milford Hospital
Hospital totals beginning in FY 2010.
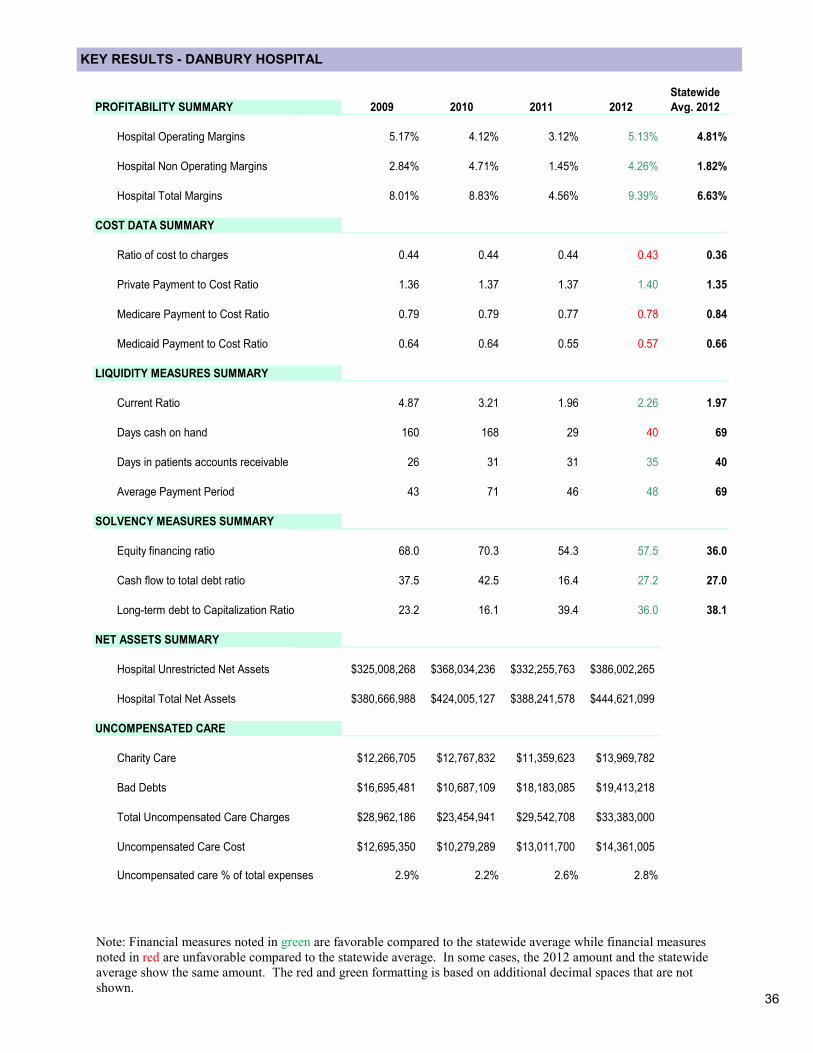
36
KEY RESULTS - DANBURY HOSPITAL
Note: Financial measures noted in green are favorable compared to the statewide average while financial measures
noted in red are unfavorable compared to the statewide average. In some cases, the 2012 amount and the statewide
average show the same amount. The red and green formatting is based on additional decimal spaces that are not
shown.
Statewide
PROFITABILITY SUMMARY 2009 2010 2011 2012 Avg. 2012
Hospital Operating Margins 5.17% 4.12% 3.12% 5.13% 4.81%
Hospital Non Operating Margins 2.84% 4.71% 1.45% 4.26% 1.82%
Hospital Total Margins 8.01% 8.83% 4.56% 9.39% 6.63%
COST DATA SUMMARY
Ratio of cost to charges 0.44 0.44 0.44 0.43 0.36
Private Payment to Cost Ratio 1.36 1.37 1.37 1.40 1.35
Medicare Payment to Cost Ratio 0.79 0.79 0.77 0.78 0.84
Medicaid Payment to Cost Ratio 0.64 0.64 0.55 0.57 0.66
LIQUIDITY MEASURES SUMMARY
Current Ratio 4.87 3.21 1.96 2.26 1.97
Days cash on hand 160 168 29 40 69
Days in patients accounts receivable 26 31 31 35 40
Average Payment Period 43 71 46 48 69
SOLVENCY MEASURES SUMMARY
Equity financing ratio 68.0 70.3 54.3 57.5 36.0
Cash flow to total debt ratio 37.5 42.5 16.4 27.2 27.0
Long-term debt to Capitalization Ratio 23.2 16.1 39.4 36.0 38.1
NET ASSETS SUMMARY
Hospital Unrestricted Net Assets $325,008,268 $368,034,236 $332,255,763 $386,002,265
Hospital Total Net Assets $380,666,988 $424,005,127 $388,241,578 $444,621,099
UNCOMPENSATED CARE
Charity Care $12,266,705 $12,767,832 $11,359,623 $13,969,782
Bad Debts $16,695,481 $10,687,109 $18,183,085 $19,413,218
Total Uncompensated Care Charges $28,962,186 $23,454,941 $29,542,708 $33,383,000
Uncompensated Care Cost $12,695,350 $10,279,289 $13,011,700 $14,361,005
Uncompensated care % of total expenses 2.9% 2.2% 2.6% 2.8%
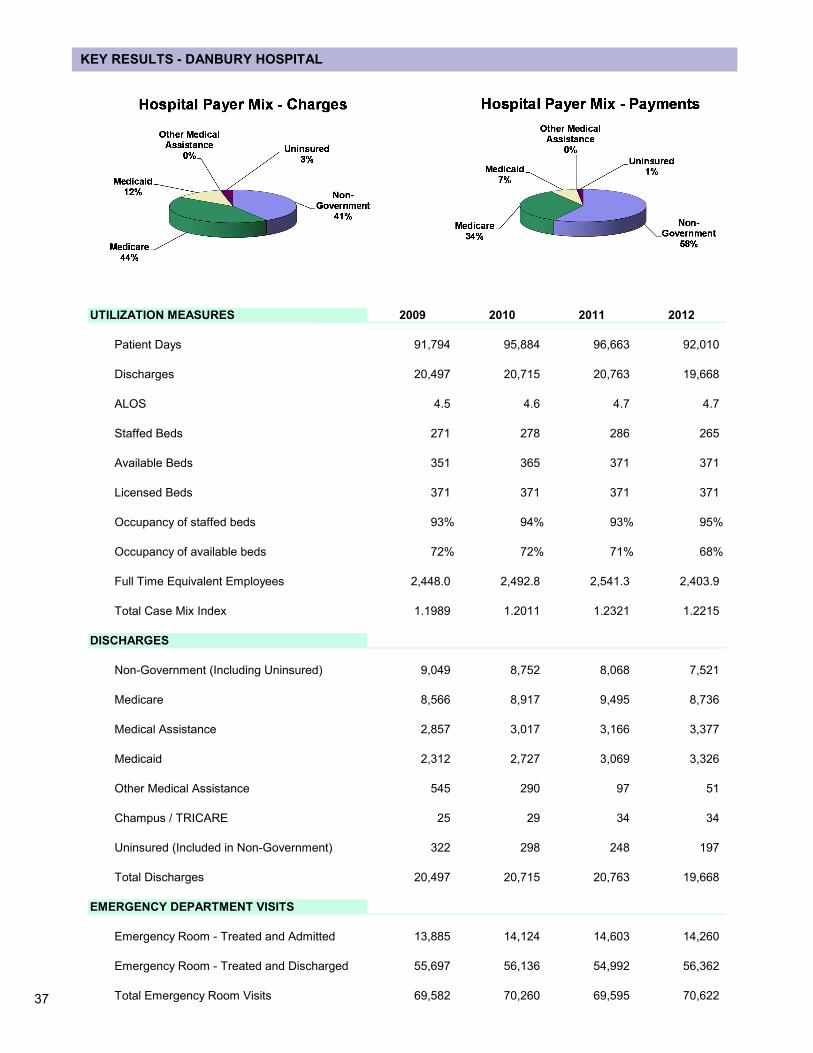
37
KEY RESULTS - DANBURY HOSPITAL
UTILIZATION MEASURES 2009 2010 2011 2012
Patient Days 91,794 95,884 96,663 92,010
Discharges 20,497 20,715 20,763 19,668
ALOS 4.5 4.6 4.7 4.7
Staffed Beds 271 278 286 265
Available Beds 351 365 371 371
Licensed Beds 371 371 371 371
Occupancy of staffed beds 93% 94% 93% 95%
Occupancy of available beds 72% 72% 71% 68%
Full Time Equivalent Employees 2,448.0 2,492.8 2,541.3 2,403.9
Total Case Mix Index 1.1989 1.2011 1.2321 1.2215
DISCHARGES
Non-Government (Including Uninsured) 9,049 8,752 8,068 7,521
Medicare 8,566 8,917 9,495 8,736
Medical Assistance 2,857 3,017 3,166 3,377
Medicaid 2,312 2,727 3,069 3,326
Other Medical Assistance 545 290 97 51
Champus / TRICARE 25 29 34 34
Uninsured (Included in Non-Government) 322 298 248 197
Total Discharges 20,497 20,715 20,763 19,668
EMERGENCY DEPARTMENT VISITS
Emergency Room - Treated and Admitted 13,885 14,124 14,603 14,260
Emergency Room - Treated and Discharged 55,697 56,136 54,992 56,362
Total Emergency Room Visits 69,582 70,260 69,595 70,622
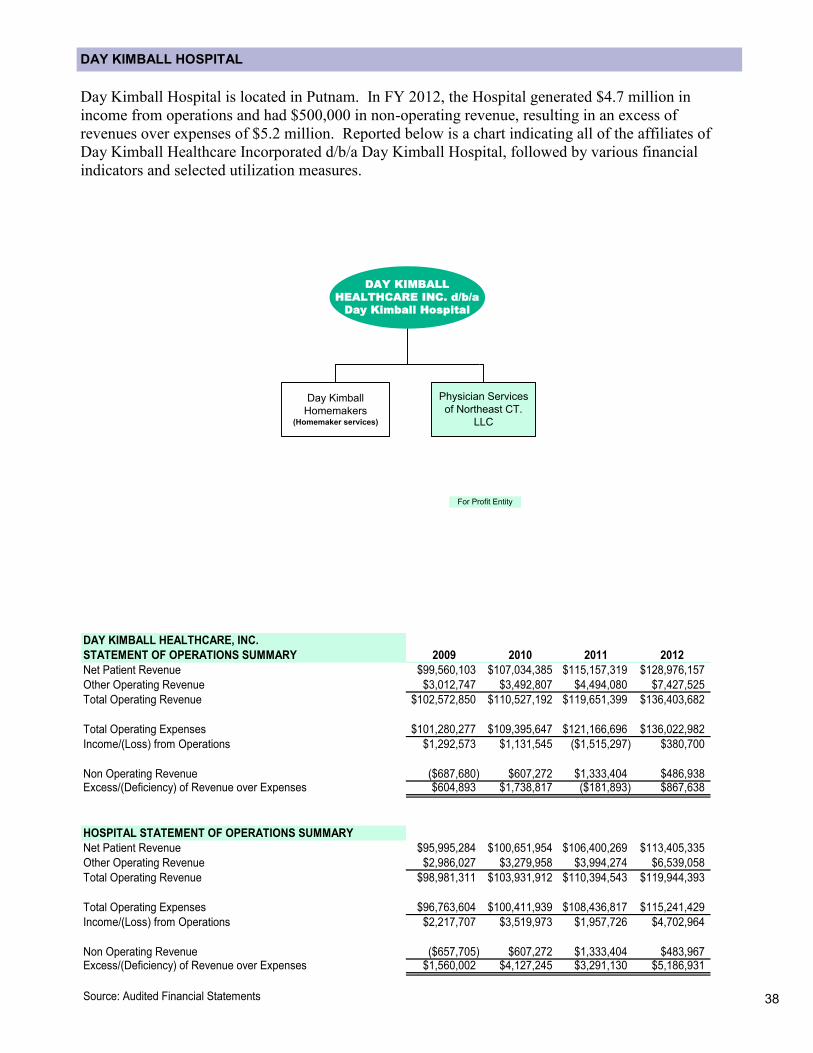
38
Day Kimball Hospital is located in Putnam. In FY 2012, the Hospital generated $4.7 million in
income from operations and had $500,000 in non-operating revenue, resulting in an excess of
revenues over expenses of $5.2 million. Reported below is a chart indicating all of the affiliates of
Day Kimball Healthcare Incorporated d/b/a Day Kimball Hospital, followed by various financial
indicators and selected utilization measures.
DAY KIMBALL HOSPITAL
Day Kimball
Homemakers(Homemaker services)
DAY KIMBALL
HEALTHCARE INC. d/b/a
Day Kimball Hospital
Physician Services
of Northeast CT.
LLC
For Profit Entity
DAY KIMBALL HEALTHCARE, INC.
STATEMENT OF OPERATIONS SUMMARY 2009 2010 2011 2012
Net Patient Revenue $99,560,103 $107,034,385 $115,157,319 $128,976,157
Other Operating Revenue $3,012,747 $3,492,807 $4,494,080 $7,427,525
Total Operating Revenue $102,572,850 $110,527,192 $119,651,399 $136,403,682
Total Operating Expenses $101,280,277 $109,395,647 $121,166,696 $136,022,982
Income/(Loss) from Operations $1,292,573 $1,131,545 ($1,515,297) $380,700
Non Operating Revenue ($687,680) $607,272 $1,333,404 $486,938Excess/(Deficiency) of Revenue over Expenses $604,893 $1,738,817 ($181,893) $867,638
HOSPITAL STATEMENT OF OPERATIONS SUMMARY
Net Patient Revenue $95,995,284 $100,651,954 $106,400,269 $113,405,335
Other Operating Revenue $2,986,027 $3,279,958 $3,994,274 $6,539,058
Total Operating Revenue $98,981,311 $103,931,912 $110,394,543 $119,944,393
Total Operating Expenses $96,763,604 $100,411,939 $108,436,817 $115,241,429
Income/(Loss) from Operations $2,217,707 $3,519,973 $1,957,726 $4,702,964
Non Operating Revenue ($657,705) $607,272 $1,333,404 $483,967Excess/(Deficiency) of Revenue over Expenses $1,560,002 $4,127,245 $3,291,130 $5,186,931
Source: Audited Financial Statements
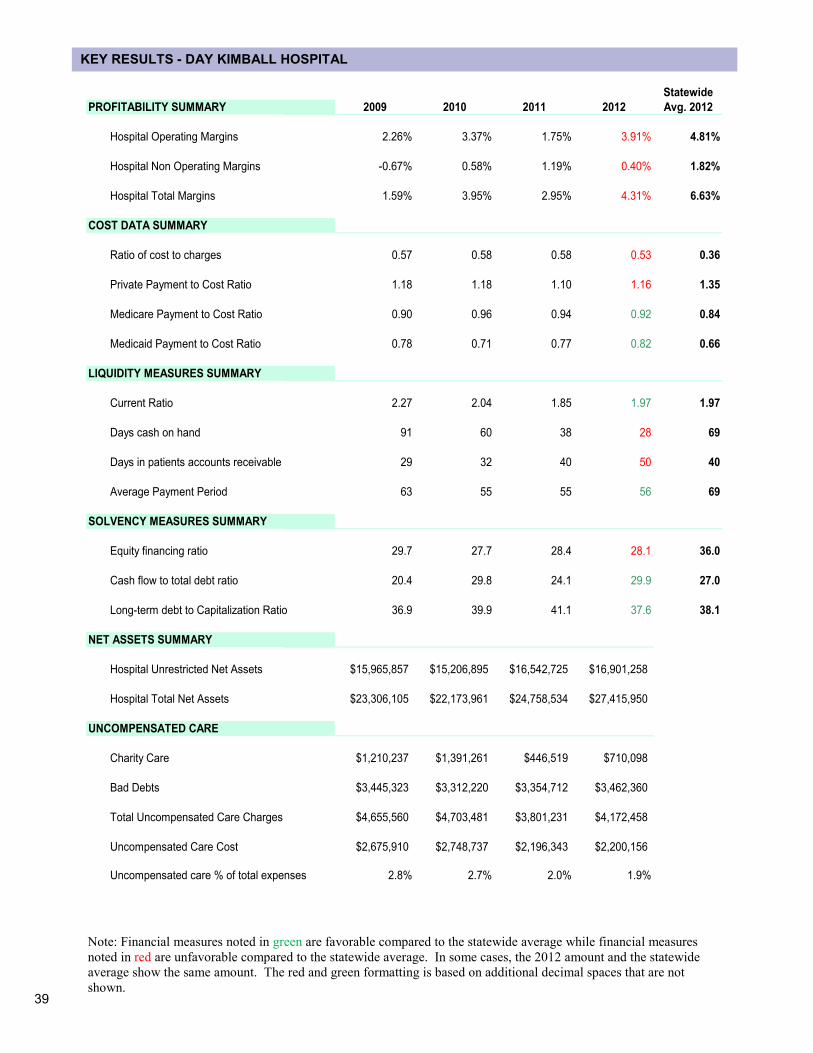
39
KEY RESULTS - DAY KIMBALL HOSPITAL
Note: Financial measures noted in green are favorable compared to the statewide average while financial measures
noted in red are unfavorable compared to the statewide average. In some cases, the 2012 amount and the statewide
average show the same amount. The red and green formatting is based on additional decimal spaces that are not
shown.
Statewide
PROFITABILITY SUMMARY 2009 2010 2011 2012 Avg. 2012
Hospital Operating Margins 2.26% 3.37% 1.75% 3.91% 4.81%
Hospital Non Operating Margins -0.67% 0.58% 1.19% 0.40% 1.82%
Hospital Total Margins 1.59% 3.95% 2.95% 4.31% 6.63%
COST DATA SUMMARY
Ratio of cost to charges 0.57 0.58 0.58 0.53 0.36
Private Payment to Cost Ratio 1.18 1.18 1.10 1.16 1.35
Medicare Payment to Cost Ratio 0.90 0.96 0.94 0.92 0.84
Medicaid Payment to Cost Ratio 0.78 0.71 0.77 0.82 0.66
LIQUIDITY MEASURES SUMMARY
Current Ratio 2.27 2.04 1.85 1.97 1.97
Days cash on hand 91 60 38 28 69
Days in patients accounts receivable 29 32 40 50 40
Average Payment Period 63 55 55 56 69
SOLVENCY MEASURES SUMMARY
Equity financing ratio 29.7 27.7 28.4 28.1 36.0
Cash flow to total debt ratio 20.4 29.8 24.1 29.9 27.0
Long-term debt to Capitalization Ratio 36.9 39.9 41.1 37.6 38.1
NET ASSETS SUMMARY
Hospital Unrestricted Net Assets $15,965,857 $15,206,895 $16,542,725 $16,901,258
Hospital Total Net Assets $23,306,105 $22,173,961 $24,758,534 $27,415,950
UNCOMPENSATED CARE
Charity Care $1,210,237 $1,391,261 $446,519 $710,098
Bad Debts $3,445,323 $3,312,220 $3,354,712 $3,462,360
Total Uncompensated Care Charges $4,655,560 $4,703,481 $3,801,231 $4,172,458
Uncompensated Care Cost $2,675,910 $2,748,737 $2,196,343 $2,200,156
Uncompensated care % of total expenses 2.8% 2.7% 2.0% 1.9%
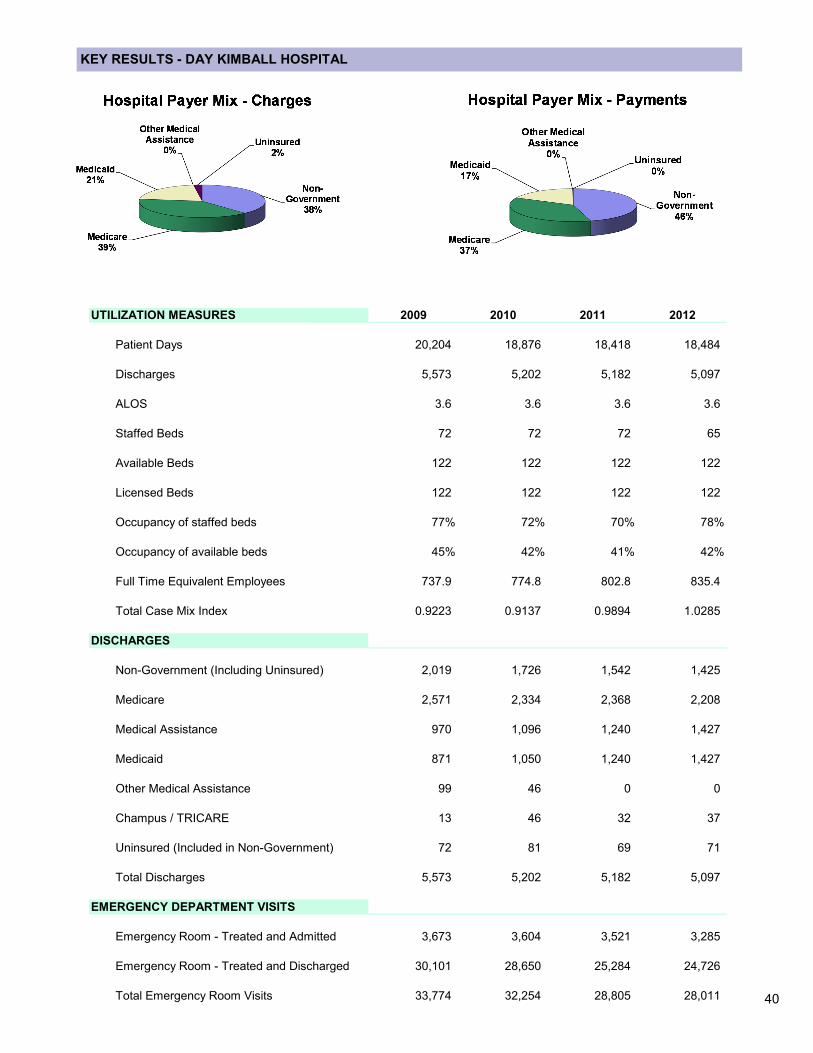
40
KEY RESULTS - DAY KIMBALL HOSPITAL
UTILIZATION MEASURES 2009 2010 2011 2012
Patient Days 20,204 18,876 18,418 18,484
Discharges 5,573 5,202 5,182 5,097
ALOS 3.6 3.6 3.6 3.6
Staffed Beds 72 72 72 65
Available Beds 122 122 122 122
Licensed Beds 122 122 122 122
Occupancy of staffed beds 77% 72% 70% 78%
Occupancy of available beds 45% 42% 41% 42%
Full Time Equivalent Employees 737.9 774.8 802.8 835.4
Total Case Mix Index 0.9223 0.9137 0.9894 1.0285
DISCHARGES
Non-Government (Including Uninsured) 2,019 1,726 1,542 1,425
Medicare 2,571 2,334 2,368 2,208
Medical Assistance 970 1,096 1,240 1,427
Medicaid 871 1,050 1,240 1,427
Other Medical Assistance 99 46 0 0
Champus / TRICARE 13 46 32 37
Uninsured (Included in Non-Government) 72 81 69 71
Total Discharges 5,573 5,202 5,182 5,097
EMERGENCY DEPARTMENT VISITS
Emergency Room - Treated and Admitted 3,673 3,604 3,521 3,285
Emergency Room - Treated and Discharged 30,101 28,650 25,284 24,726
Total Emergency Room Visits 33,774 32,254 28,805 28,011
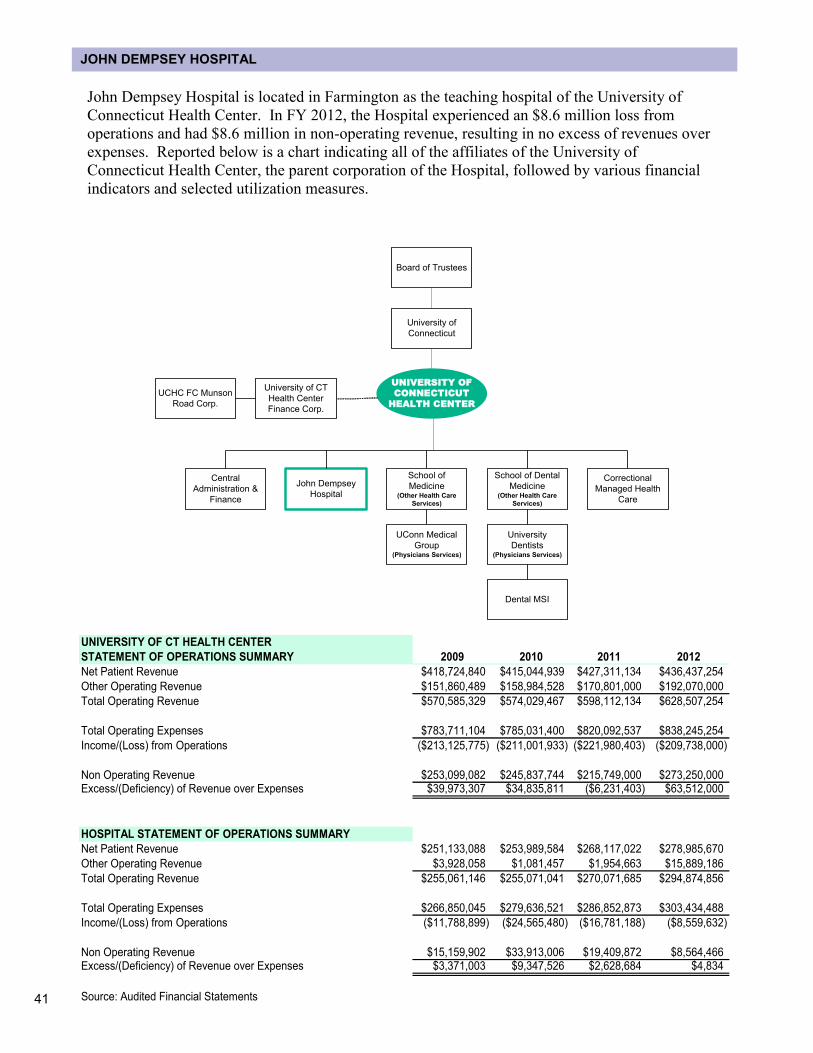
41
John Dempsey Hospital is located in Farmington as the teaching hospital of the University of
Connecticut Health Center. In FY 2012, the Hospital experienced an $8.6 million loss from
operations and had $8.6 million in non-operating revenue, resulting in no excess of revenues over
expenses. Reported below is a chart indicating all of the affiliates of the University of
Connecticut Health Center, the parent corporation of the Hospital, followed by various financial
indicators and selected utilization measures.
JOHN DEMPSEY HOSPITAL
UNIVERSITY OF CT HEALTH CENTER
STATEMENT OF OPERATIONS SUMMARY 2009 2010 2011 2012
Net Patient Revenue $418,724,840 $415,044,939 $427,311,134 $436,437,254
Other Operating Revenue $151,860,489 $158,984,528 $170,801,000 $192,070,000
Total Operating Revenue $570,585,329 $574,029,467 $598,112,134 $628,507,254
Total Operating Expenses $783,711,104 $785,031,400 $820,092,537 $838,245,254
Income/(Loss) from Operations ($213,125,775) ($211,001,933) ($221,980,403) ($209,738,000)
Non Operating Revenue $253,099,082 $245,837,744 $215,749,000 $273,250,000Excess/(Deficiency) of Revenue over Expenses $39,973,307 $34,835,811 ($6,231,403) $63,512,000
HOSPITAL STATEMENT OF OPERATIONS SUMMARY
Net Patient Revenue $251,133,088 $253,989,584 $268,117,022 $278,985,670
Other Operating Revenue $3,928,058 $1,081,457 $1,954,663 $15,889,186
Total Operating Revenue $255,061,146 $255,071,041 $270,071,685 $294,874,856
Total Operating Expenses $266,850,045 $279,636,521 $286,852,873 $303,434,488
Income/(Loss) from Operations ($11,788,899) ($24,565,480) ($16,781,188) ($8,559,632)
Non Operating Revenue $15,159,902 $33,913,006 $19,409,872 $8,564,466Excess/(Deficiency) of Revenue over Expenses $3,371,003 $9,347,526 $2,628,684 $4,834
Source: Audited Financial Statements
University of
Connecticut
Board of Trustees
John Dempsey
Hospital
School of
Medicine(Other Health Care
Services)
School of Dental
Medicine(Other Health Care
Services)
University
Dentists(Physicians Services)
UNIVERSITY OF
CONNECTICUT
HEALTH CENTER
Central
Administration &
Finance
Correctional
Managed Health
Care
UConn Medical
Group(Physicians Services)
University of CT
Health Center
Finance Corp.
Dental MSI
UCHC FC Munson
Road Corp.
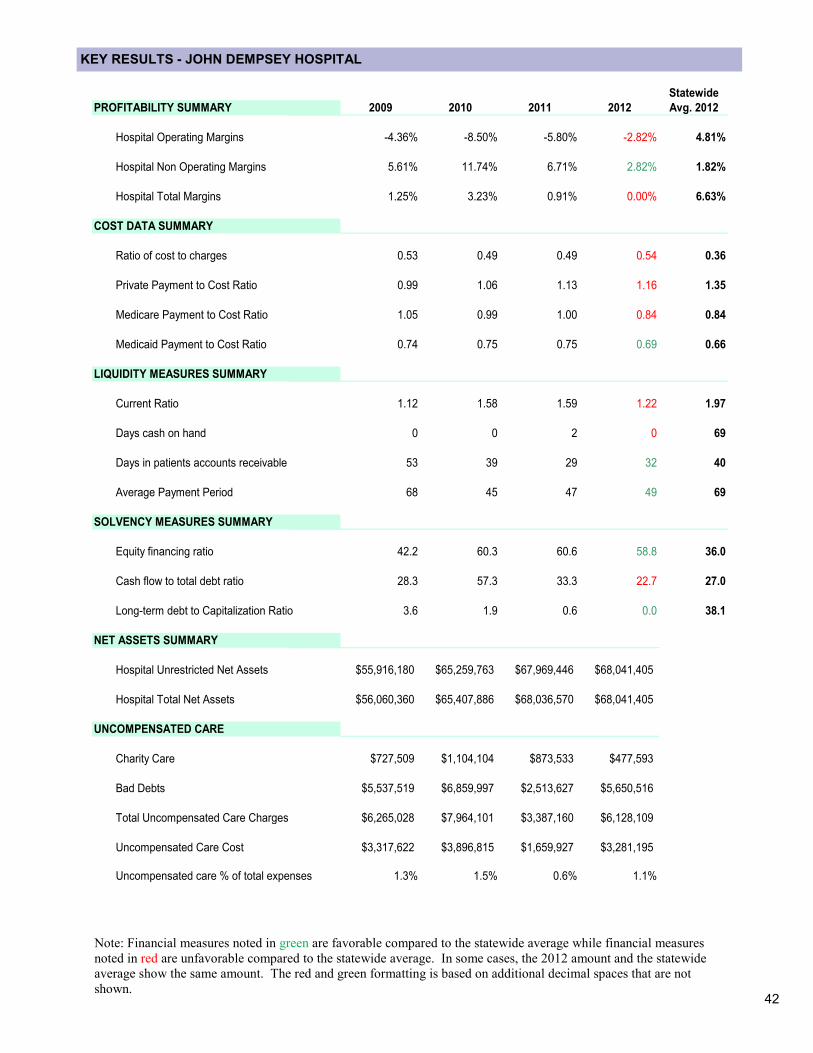
42
KEY RESULTS - JOHN DEMPSEY HOSPITAL
Note: Financial measures noted in green are favorable compared to the statewide average while financial measures
noted in red are unfavorable compared to the statewide average. In some cases, the 2012 amount and the statewide
average show the same amount. The red and green formatting is based on additional decimal spaces that are not
shown.
Statewide
PROFITABILITY SUMMARY 2009 2010 2011 2012 Avg. 2012
Hospital Operating Margins -4.36% -8.50% -5.80% -2.82% 4.81%
Hospital Non Operating Margins 5.61% 11.74% 6.71% 2.82% 1.82%
Hospital Total Margins 1.25% 3.23% 0.91% 0.00% 6.63%
COST DATA SUMMARY
Ratio of cost to charges 0.53 0.49 0.49 0.54 0.36
Private Payment to Cost Ratio 0.99 1.06 1.13 1.16 1.35
Medicare Payment to Cost Ratio 1.05 0.99 1.00 0.84 0.84
Medicaid Payment to Cost Ratio 0.74 0.75 0.75 0.69 0.66
LIQUIDITY MEASURES SUMMARY
Current Ratio 1.12 1.58 1.59 1.22 1.97
Days cash on hand 0 0 2 0 69
Days in patients accounts receivable 53 39 29 32 40
Average Payment Period 68 45 47 49 69
SOLVENCY MEASURES SUMMARY
Equity financing ratio 42.2 60.3 60.6 58.8 36.0
Cash flow to total debt ratio 28.3 57.3 33.3 22.7 27.0
Long-term debt to Capitalization Ratio 3.6 1.9 0.6 0.0 38.1
NET ASSETS SUMMARY
Hospital Unrestricted Net Assets $55,916,180 $65,259,763 $67,969,446 $68,041,405
Hospital Total Net Assets $56,060,360 $65,407,886 $68,036,570 $68,041,405
UNCOMPENSATED CARE
Charity Care $727,509 $1,104,104 $873,533 $477,593
Bad Debts $5,537,519 $6,859,997 $2,513,627 $5,650,516
Total Uncompensated Care Charges $6,265,028 $7,964,101 $3,387,160 $6,128,109
Uncompensated Care Cost $3,317,622 $3,896,815 $1,659,927 $3,281,195
Uncompensated care % of total expenses 1.3% 1.5% 0.6% 1.1%
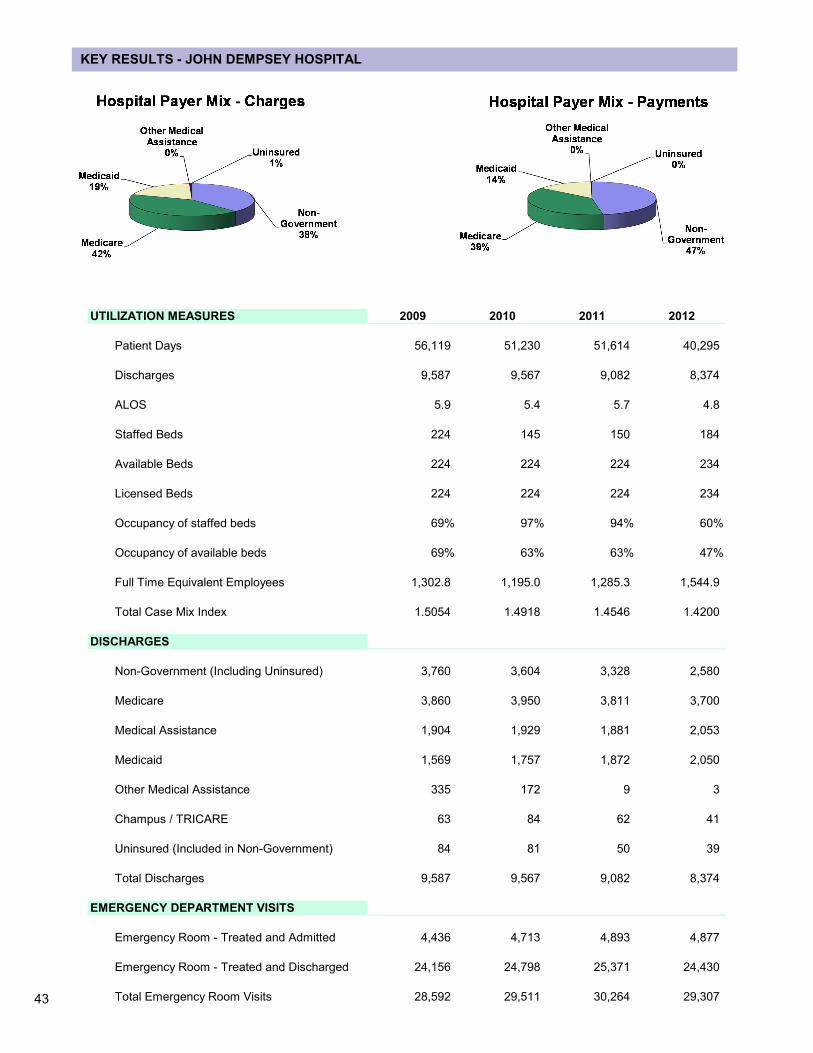
43
KEY RESULTS - JOHN DEMPSEY HOSPITAL
UTILIZATION MEASURES 2009 2010 2011 2012
Patient Days 56,119 51,230 51,614 40,295
Discharges 9,587 9,567 9,082 8,374
ALOS 5.9 5.4 5.7 4.8
Staffed Beds 224 145 150 184
Available Beds 224 224 224 234
Licensed Beds 224 224 224 234
Occupancy of staffed beds 69% 97% 94% 60%
Occupancy of available beds 69% 63% 63% 47%
Full Time Equivalent Employees 1,302.8 1,195.0 1,285.3 1,544.9
Total Case Mix Index 1.5054 1.4918 1.4546 1.4200
DISCHARGES
Non-Government (Including Uninsured) 3,760 3,604 3,328 2,580
Medicare 3,860 3,950 3,811 3,700
Medical Assistance 1,904 1,929 1,881 2,053
Medicaid 1,569 1,757 1,872 2,050
Other Medical Assistance 335 172 9 3
Champus / TRICARE 63 84 62 41
Uninsured (Included in Non-Government) 84 81 50 39
Total Discharges 9,587 9,567 9,082 8,374
EMERGENCY DEPARTMENT VISITS
Emergency Room - Treated and Admitted 4,436 4,713 4,893 4,877
Emergency Room - Treated and Discharged 24,156 24,798 25,371 24,430
Total Emergency Room Visits 28,592 29,511 30,264 29,307
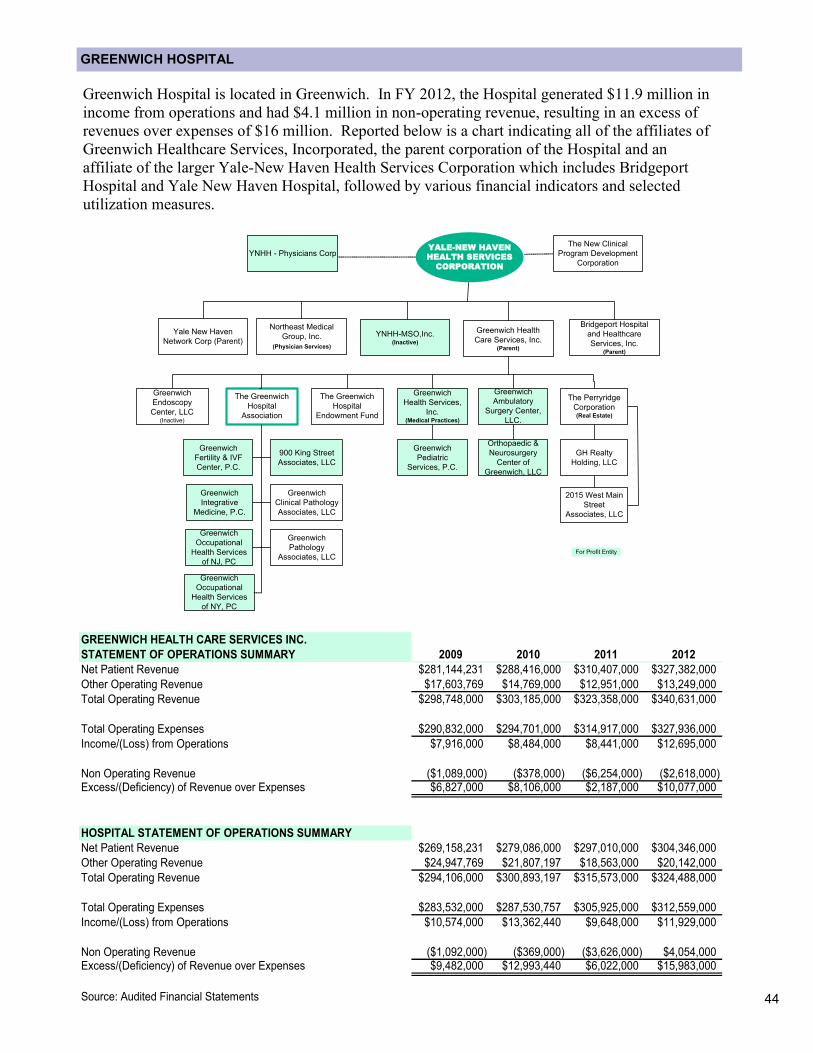
44
GREENWICH HOSPITAL
Greenwich Hospital is located in Greenwich. In FY 2012, the Hospital generated $11.9 million in
income from operations and had $4.1 million in non-operating revenue, resulting in an excess of
revenues over expenses of $16 million. Reported below is a chart indicating all of the affiliates of
Greenwich Healthcare Services, Incorporated, the parent corporation of the Hospital and an
affiliate of the larger Yale-New Haven Health Services Corporation which includes Bridgeport
Hospital and Yale New Haven Hospital, followed by various financial indicators and selected
utilization measures.
Northeast Medical
Group, Inc.
(Physician Services)
Bridgeport Hospital
and Healthcare
Services, Inc.(Parent)
Greenwich Health
Care Services, Inc.(Parent)
The Greenwich
Hospital
Association
Greenwich
Health Services,
Inc.(Medical Practices)
The Greenwich
Hospital
Endowment Fund
YALE-NEW HAVEN
HEALTH SERVICES
CORPORATION
For Profit Entity
YNHH-MSO,Inc.(Inactive)
YNHH - Physicians Corp
GH Realty
Holding, LLC
Greenwich
Fertility & IVF
Center, P.C.
Greenwich
Integrative
Medicine, P.C.
Greenwich
Occupational
Health Services
of NJ, PC
Greenwich
Pediatric
Services, P.C.
Greenwich
Ambulatory
Surgery Center,
LLC.
The New Clinical
Program Development
Corporation
Yale New Haven
Network Corp (Parent)
900 King Street
Associates, LLC
Greenwich
Clinical Pathology
Associates, LLC
Greenwich
Pathology
Associates, LLC
The Perryridge
Corporation(Real Estate)
2015 West Main
Street
Associates, LLC
Greenwich
Endoscopy
Center, LLC(Inactive)
Orthopaedic &
Neurosurgery
Center of
Greenwich, LLC
Greenwich
Occupational
Health Services
of NY, PC
GREENWICH HEALTH CARE SERVICES INC.
STATEMENT OF OPERATIONS SUMMARY 2009 2010 2011 2012
Net Patient Revenue $281,144,231 $288,416,000 $310,407,000 $327,382,000
Other Operating Revenue $17,603,769 $14,769,000 $12,951,000 $13,249,000
Total Operating Revenue $298,748,000 $303,185,000 $323,358,000 $340,631,000
Total Operating Expenses $290,832,000 $294,701,000 $314,917,000 $327,936,000
Income/(Loss) from Operations $7,916,000 $8,484,000 $8,441,000 $12,695,000
Non Operating Revenue ($1,089,000) ($378,000) ($6,254,000) ($2,618,000)Excess/(Deficiency) of Revenue over Expenses $6,827,000 $8,106,000 $2,187,000 $10,077,000
HOSPITAL STATEMENT OF OPERATIONS SUMMARY
Net Patient Revenue $269,158,231 $279,086,000 $297,010,000 $304,346,000
Other Operating Revenue $24,947,769 $21,807,197 $18,563,000 $20,142,000
Total Operating Revenue $294,106,000 $300,893,197 $315,573,000 $324,488,000
Total Operating Expenses $283,532,000 $287,530,757 $305,925,000 $312,559,000
Income/(Loss) from Operations $10,574,000 $13,362,440 $9,648,000 $11,929,000
Non Operating Revenue ($1,092,000) ($369,000) ($3,626,000) $4,054,000Excess/(Deficiency) of Revenue over Expenses $9,482,000 $12,993,440 $6,022,000 $15,983,000
Source: Audited Financial Statements
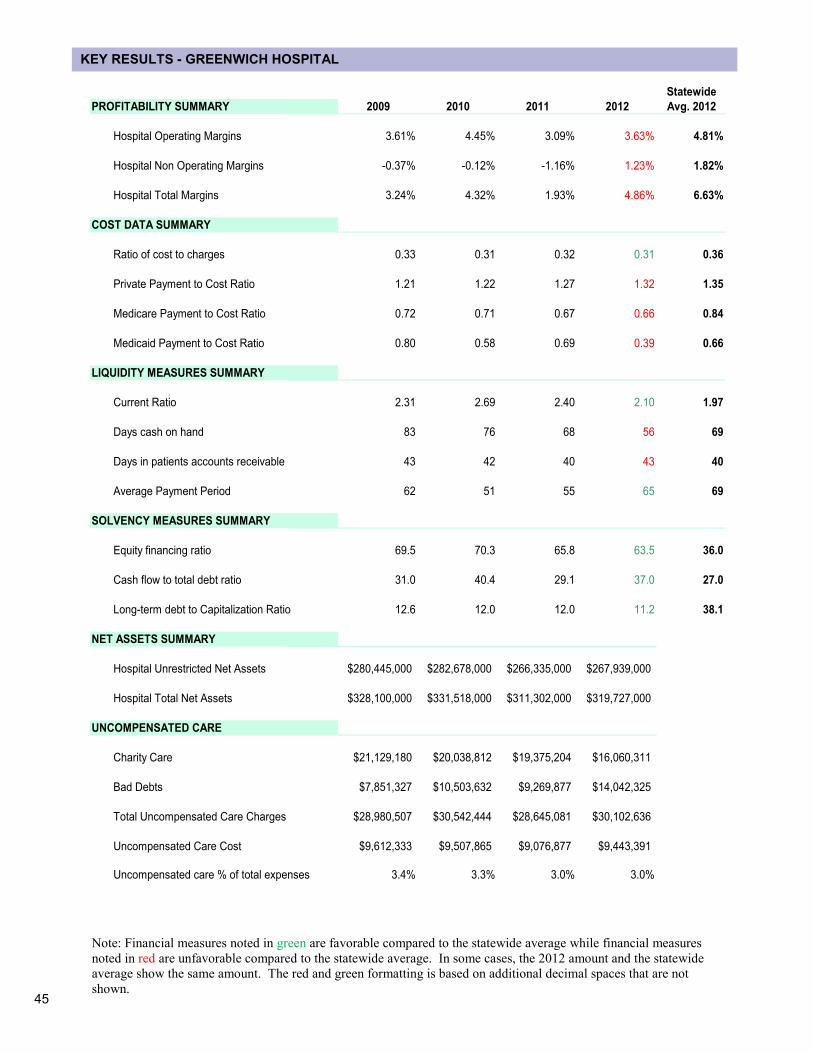
45
KEY RESULTS - GREENWICH HOSPITAL
Note: Financial measures noted in green are favorable compared to the statewide average while financial measures
noted in red are unfavorable compared to the statewide average. In some cases, the 2012 amount and the statewide
average show the same amount. The red and green formatting is based on additional decimal spaces that are not
shown.
Statewide
PROFITABILITY SUMMARY 2009 2010 2011 2012 Avg. 2012
Hospital Operating Margins 3.61% 4.45% 3.09% 3.63% 4.81%
Hospital Non Operating Margins -0.37% -0.12% -1.16% 1.23% 1.82%
Hospital Total Margins 3.24% 4.32% 1.93% 4.86% 6.63%
COST DATA SUMMARY
Ratio of cost to charges 0.33 0.31 0.32 0.31 0.36
Private Payment to Cost Ratio 1.21 1.22 1.27 1.32 1.35
Medicare Payment to Cost Ratio 0.72 0.71 0.67 0.66 0.84
Medicaid Payment to Cost Ratio 0.80 0.58 0.69 0.39 0.66
LIQUIDITY MEASURES SUMMARY
Current Ratio 2.31 2.69 2.40 2.10 1.97
Days cash on hand 83 76 68 56 69
Days in patients accounts receivable 43 42 40 43 40
Average Payment Period 62 51 55 65 69
SOLVENCY MEASURES SUMMARY
Equity financing ratio 69.5 70.3 65.8 63.5 36.0
Cash flow to total debt ratio 31.0 40.4 29.1 37.0 27.0
Long-term debt to Capitalization Ratio 12.6 12.0 12.0 11.2 38.1
NET ASSETS SUMMARY
Hospital Unrestricted Net Assets $280,445,000 $282,678,000 $266,335,000 $267,939,000
Hospital Total Net Assets $328,100,000 $331,518,000 $311,302,000 $319,727,000
UNCOMPENSATED CARE
Charity Care $21,129,180 $20,038,812 $19,375,204 $16,060,311
Bad Debts $7,851,327 $10,503,632 $9,269,877 $14,042,325
Total Uncompensated Care Charges $28,980,507 $30,542,444 $28,645,081 $30,102,636
Uncompensated Care Cost $9,612,333 $9,507,865 $9,076,877 $9,443,391
Uncompensated care % of total expenses 3.4% 3.3% 3.0% 3.0%
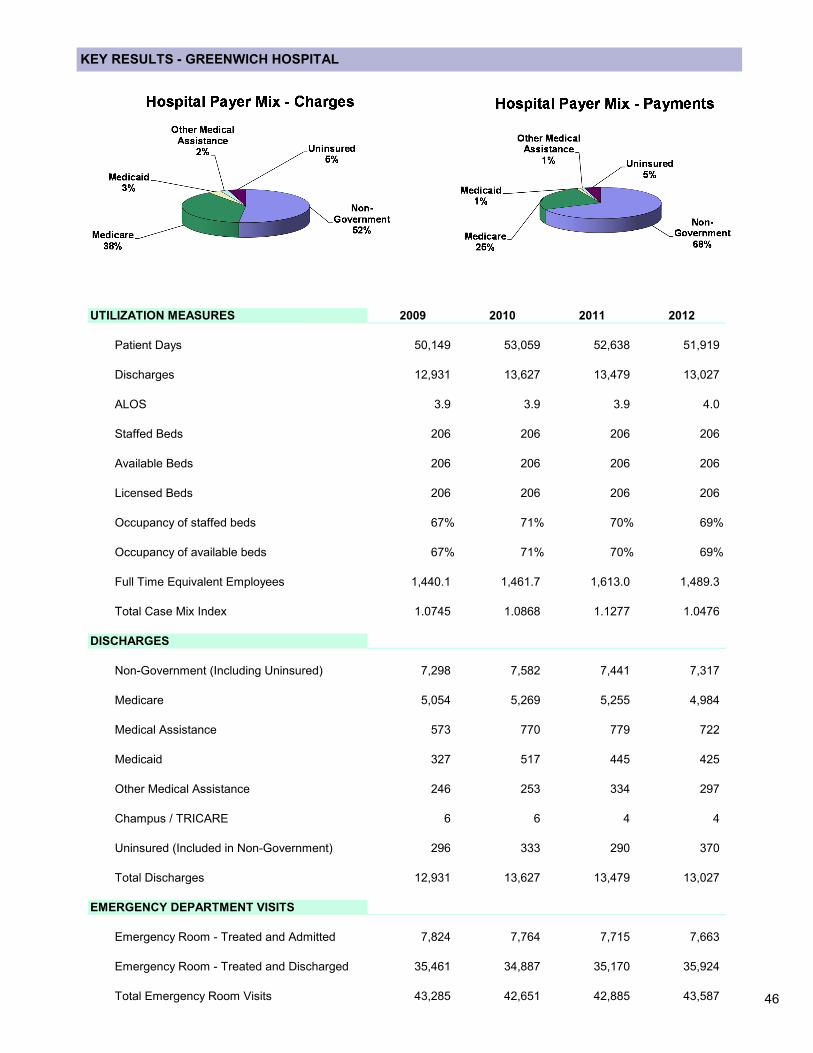
46
KEY RESULTS - GREENWICH HOSPITAL
UTILIZATION MEASURES 2009 2010 2011 2012
Patient Days 50,149 53,059 52,638 51,919
Discharges 12,931 13,627 13,479 13,027
ALOS 3.9 3.9 3.9 4.0
Staffed Beds 206 206 206 206
Available Beds 206 206 206 206
Licensed Beds 206 206 206 206
Occupancy of staffed beds 67% 71% 70% 69%
Occupancy of available beds 67% 71% 70% 69%
Full Time Equivalent Employees 1,440.1 1,461.7 1,613.0 1,489.3
Total Case Mix Index 1.0745 1.0868 1.1277 1.0476
DISCHARGES
Non-Government (Including Uninsured) 7,298 7,582 7,441 7,317
Medicare 5,054 5,269 5,255 4,984
Medical Assistance 573 770 779 722
Medicaid 327 517 445 425
Other Medical Assistance 246 253 334 297
Champus / TRICARE 6 6 4 4
Uninsured (Included in Non-Government) 296 333 290 370
Total Discharges 12,931 13,627 13,479 13,027
EMERGENCY DEPARTMENT VISITS
Emergency Room - Treated and Admitted 7,824 7,764 7,715 7,663
Emergency Room - Treated and Discharged 35,461 34,887 35,170 35,924
Total Emergency Room Visits 43,285 42,651 42,885 43,587
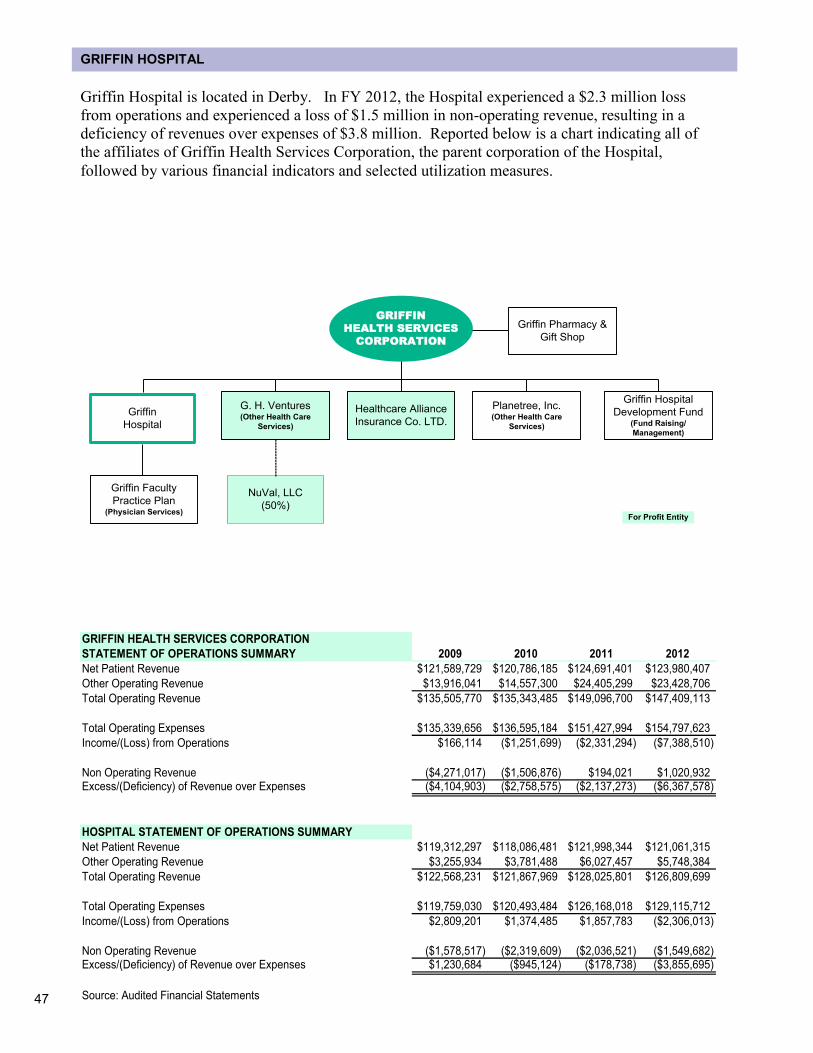
47
GRIFFIN HOSPITAL
Griffin Hospital is located in Derby. In FY 2012, the Hospital experienced a $2.3 million loss
from operations and experienced a loss of $1.5 million in non-operating revenue, resulting in a
deficiency of revenues over expenses of $3.8 million. Reported below is a chart indicating all of
the affiliates of Griffin Health Services Corporation, the parent corporation of the Hospital,
followed by various financial indicators and selected utilization measures.
GRIFFIN HEALTH SERVICES CORPORATION
STATEMENT OF OPERATIONS SUMMARY 2009 2010 2011 2012
Net Patient Revenue $121,589,729 $120,786,185 $124,691,401 $123,980,407
Other Operating Revenue $13,916,041 $14,557,300 $24,405,299 $23,428,706
Total Operating Revenue $135,505,770 $135,343,485 $149,096,700 $147,409,113
Total Operating Expenses $135,339,656 $136,595,184 $151,427,994 $154,797,623
Income/(Loss) from Operations $166,114 ($1,251,699) ($2,331,294) ($7,388,510)
Non Operating Revenue ($4,271,017) ($1,506,876) $194,021 $1,020,932Excess/(Deficiency) of Revenue over Expenses ($4,104,903) ($2,758,575) ($2,137,273) ($6,367,578)
HOSPITAL STATEMENT OF OPERATIONS SUMMARY
Net Patient Revenue $119,312,297 $118,086,481 $121,998,344 $121,061,315
Other Operating Revenue $3,255,934 $3,781,488 $6,027,457 $5,748,384
Total Operating Revenue $122,568,231 $121,867,969 $128,025,801 $126,809,699
Total Operating Expenses $119,759,030 $120,493,484 $126,168,018 $129,115,712
Income/(Loss) from Operations $2,809,201 $1,374,485 $1,857,783 ($2,306,013)
Non Operating Revenue ($1,578,517) ($2,319,609) ($2,036,521) ($1,549,682)Excess/(Deficiency) of Revenue over Expenses $1,230,684 ($945,124) ($178,738) ($3,855,695)
Source: Audited Financial Statements
Griffin Hospital
Development Fund(Fund Raising/
Management)
G. H. Ventures(Other Health Care
Services)
Griffin
Hospital
Healthcare Alliance
Insurance Co. LTD.
Planetree, Inc.(Other Health Care
Services)
GRIFFIN
HEALTH SERVICES
CORPORATION
For Profit Entity
Griffin Faculty
Practice Plan(Physician Services)
Griffin Pharmacy &
Gift Shop
NuVal, LLC
(50%)
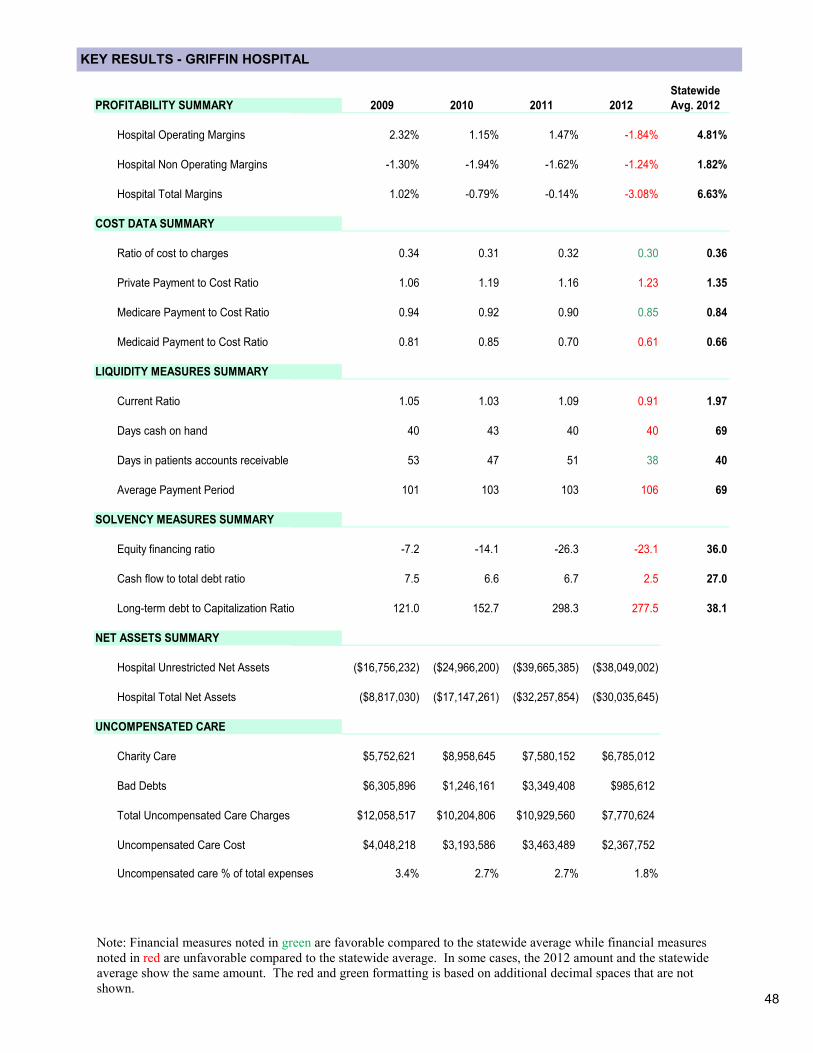
48
KEY RESULTS - GRIFFIN HOSPITAL
Note: Financial measures noted in green are favorable compared to the statewide average while financial measures
noted in red are unfavorable compared to the statewide average. In some cases, the 2012 amount and the statewide
average show the same amount. The red and green formatting is based on additional decimal spaces that are not
shown.
Statewide
PROFITABILITY SUMMARY 2009 2010 2011 2012 Avg. 2012
Hospital Operating Margins 2.32% 1.15% 1.47% -1.84% 4.81%
Hospital Non Operating Margins -1.30% -1.94% -1.62% -1.24% 1.82%
Hospital Total Margins 1.02% -0.79% -0.14% -3.08% 6.63%
COST DATA SUMMARY
Ratio of cost to charges 0.34 0.31 0.32 0.30 0.36
Private Payment to Cost Ratio 1.06 1.19 1.16 1.23 1.35
Medicare Payment to Cost Ratio 0.94 0.92 0.90 0.85 0.84
Medicaid Payment to Cost Ratio 0.81 0.85 0.70 0.61 0.66
LIQUIDITY MEASURES SUMMARY
Current Ratio 1.05 1.03 1.09 0.91 1.97
Days cash on hand 40 43 40 40 69
Days in patients accounts receivable 53 47 51 38 40
Average Payment Period 101 103 103 106 69
SOLVENCY MEASURES SUMMARY
Equity financing ratio -7.2 -14.1 -26.3 -23.1 36.0
Cash flow to total debt ratio 7.5 6.6 6.7 2.5 27.0
Long-term debt to Capitalization Ratio 121.0 152.7 298.3 277.5 38.1
NET ASSETS SUMMARY
Hospital Unrestricted Net Assets ($16,756,232) ($24,966,200) ($39,665,385) ($38,049,002)
Hospital Total Net Assets ($8,817,030) ($17,147,261) ($32,257,854) ($30,035,645)
UNCOMPENSATED CARE
Charity Care $5,752,621 $8,958,645 $7,580,152 $6,785,012
Bad Debts $6,305,896 $1,246,161 $3,349,408 $985,612
Total Uncompensated Care Charges $12,058,517 $10,204,806 $10,929,560 $7,770,624
Uncompensated Care Cost $4,048,218 $3,193,586 $3,463,489 $2,367,752
Uncompensated care % of total expenses 3.4% 2.7% 2.7% 1.8%
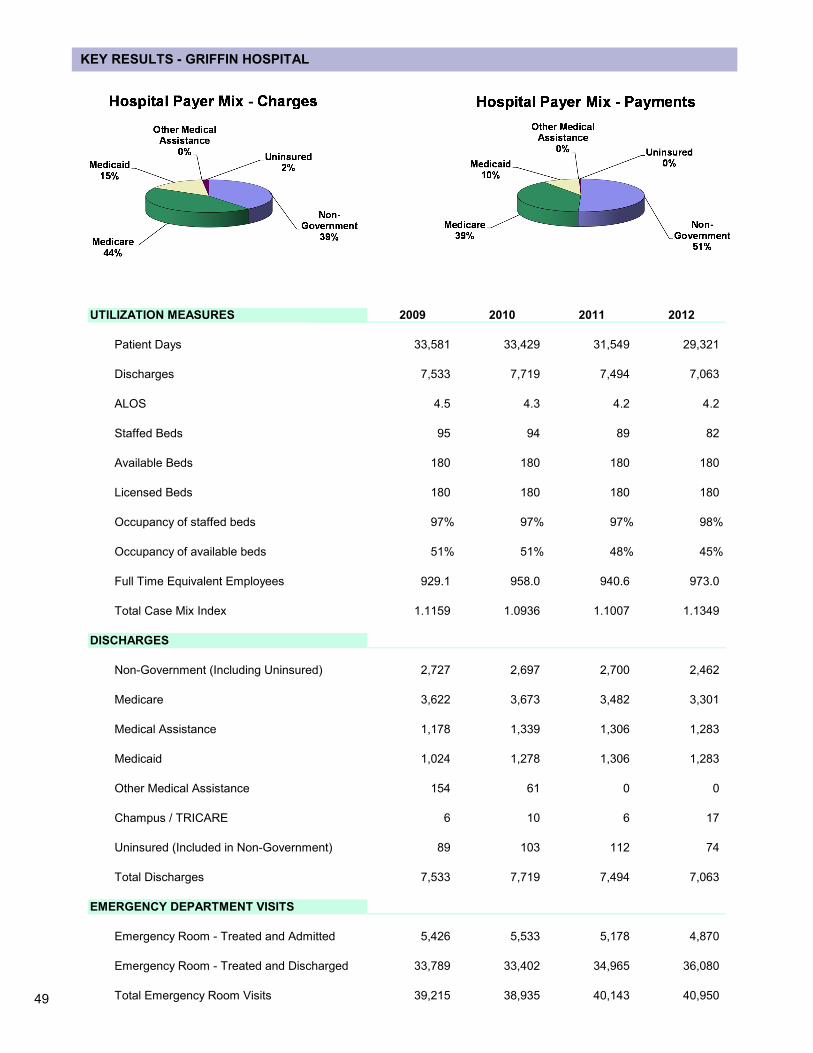
49
KEY RESULTS - GRIFFIN HOSPITAL
UTILIZATION MEASURES 2009 2010 2011 2012
Patient Days 33,581 33,429 31,549 29,321
Discharges 7,533 7,719 7,494 7,063
ALOS 4.5 4.3 4.2 4.2
Staffed Beds 95 94 89 82
Available Beds 180 180 180 180
Licensed Beds 180 180 180 180
Occupancy of staffed beds 97% 97% 97% 98%
Occupancy of available beds 51% 51% 48% 45%
Full Time Equivalent Employees 929.1 958.0 940.6 973.0
Total Case Mix Index 1.1159 1.0936 1.1007 1.1349
DISCHARGES
Non-Government (Including Uninsured) 2,727 2,697 2,700 2,462
Medicare 3,622 3,673 3,482 3,301
Medical Assistance 1,178 1,339 1,306 1,283
Medicaid 1,024 1,278 1,306 1,283
Other Medical Assistance 154 61 0 0
Champus / TRICARE 6 10 6 17
Uninsured (Included in Non-Government) 89 103 112 74
Total Discharges 7,533 7,719 7,494 7,063
EMERGENCY DEPARTMENT VISITS
Emergency Room - Treated and Admitted 5,426 5,533 5,178 4,870
Emergency Room - Treated and Discharged 33,789 33,402 34,965 36,080
Total Emergency Room Visits 39,215 38,935 40,143 40,950
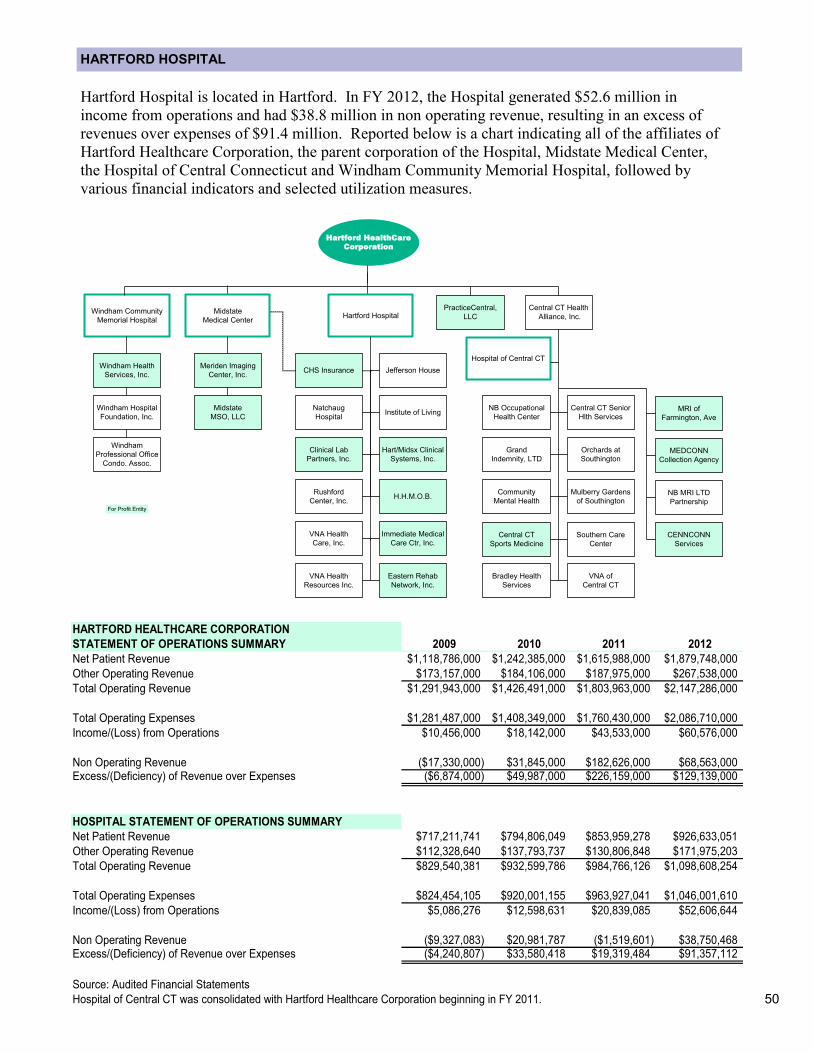
50
HARTFORD HOSPITAL
Hartford Hospital is located in Hartford. In FY 2012, the Hospital generated $52.6 million in
income from operations and had $38.8 million in non operating revenue, resulting in an excess of
revenues over expenses of $91.4 million. Reported below is a chart indicating all of the affiliates of
Hartford Healthcare Corporation, the parent corporation of the Hospital, Midstate Medical Center,
the Hospital of Central Connecticut and Windham Community Memorial Hospital, followed by
various financial indicators and selected utilization measures.
Hartford HealthCare
Corporation
For Profit Entity
Hospital of Central CT
Hartford HospitalMidstate
Medical Center
Midstate
MSO, LLC
Meriden Imaging
Center, Inc.
Windham Hospital
Foundation, Inc.
Windham
Professional Office
Condo. Assoc.
Windham Health
Services, Inc.
Windham Community
Memorial Hospital
Natchaug
Hospital
Clinical Lab
Partners, Inc.
Rushford
Center, Inc.H.H.M.O.B.
Immediate Medical
Care Ctr, Inc.
Eastern Rehab
Network, Inc.
Jefferson House
Institute of Living
Hart/Midsx Clinical
Systems, Inc.
VNA Health
Care, Inc.
VNA Health
Resources Inc.
CHS Insurance
Grand
Indemnity, LTD
Community
Mental Health
Central CT
Sports Medicine
Bradley Health
Services
CENNCONN
Services
MEDCONN
Collection Agency
MRI of
Farmington, Ave
VNA of
Central CT
Southern Care
Center
Central CT Senior
Hlth Services
Mulberry Gardens
of Southington
Orchards at
Southington
NB MRI LTD
Partnership
NB Occupational
Health Center
Central CT Health
Alliance, Inc.
PracticeCentral,
LLC
HARTFORD HEALTHCARE CORPORATION
STATEMENT OF OPERATIONS SUMMARY 2009 2010 2011 2012
Net Patient Revenue $1,118,786,000 $1,242,385,000 $1,615,988,000 $1,879,748,000
Other Operating Revenue $173,157,000 $184,106,000 $187,975,000 $267,538,000
Total Operating Revenue $1,291,943,000 $1,426,491,000 $1,803,963,000 $2,147,286,000
Total Operating Expenses $1,281,487,000 $1,408,349,000 $1,760,430,000 $2,086,710,000
Income/(Loss) from Operations $10,456,000 $18,142,000 $43,533,000 $60,576,000
Non Operating Revenue ($17,330,000) $31,845,000 $182,626,000 $68,563,000Excess/(Deficiency) of Revenue over Expenses ($6,874,000) $49,987,000 $226,159,000 $129,139,000
HOSPITAL STATEMENT OF OPERATIONS SUMMARY
Net Patient Revenue $717,211,741 $794,806,049 $853,959,278 $926,633,051
Other Operating Revenue $112,328,640 $137,793,737 $130,806,848 $171,975,203
Total Operating Revenue $829,540,381 $932,599,786 $984,766,126 $1,098,608,254
Total Operating Expenses $824,454,105 $920,001,155 $963,927,041 $1,046,001,610
Income/(Loss) from Operations $5,086,276 $12,598,631 $20,839,085 $52,606,644
Non Operating Revenue ($9,327,083) $20,981,787 ($1,519,601) $38,750,468Excess/(Deficiency) of Revenue over Expenses ($4,240,807) $33,580,418 $19,319,484 $91,357,112
Source: Audited Financial Statements
Hospital of Central CT was consolidated with Hartford Healthcare Corporation beginning in FY 2011.
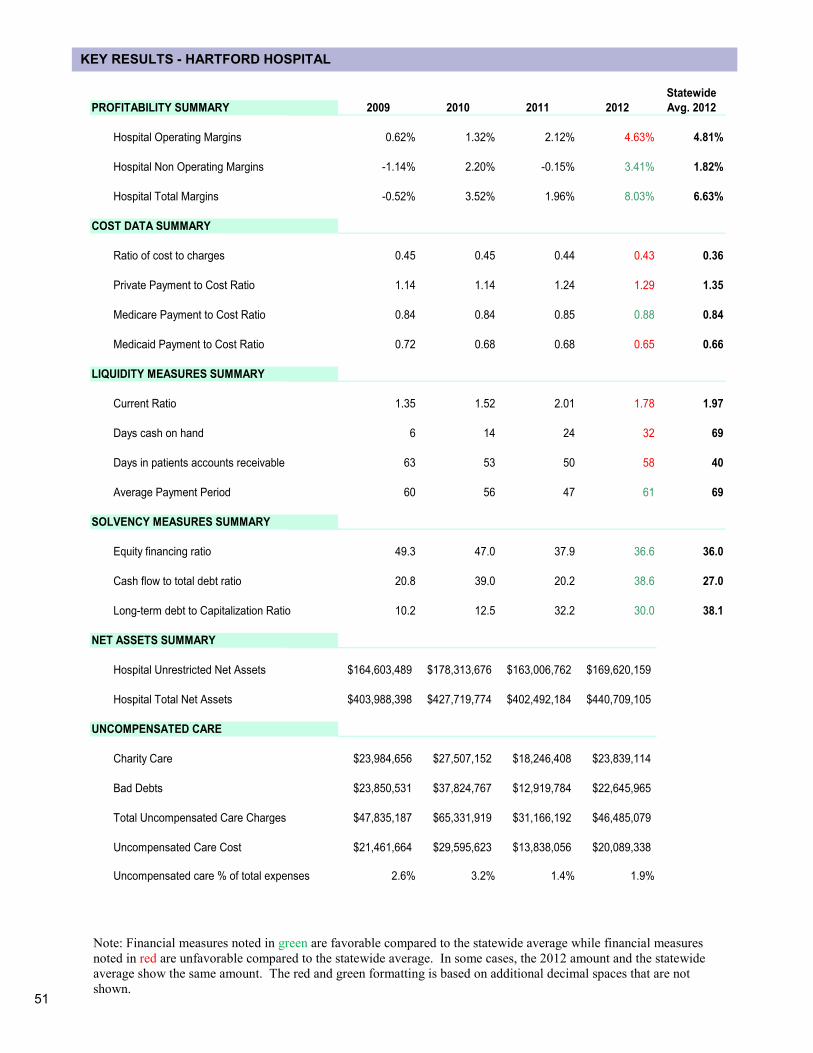
51
KEY RESULTS - HARTFORD HOSPITAL
Note: Financial measures noted in green are favorable compared to the statewide average while financial measures
noted in red are unfavorable compared to the statewide average. In some cases, the 2012 amount and the statewide
average show the same amount. The red and green formatting is based on additional decimal spaces that are not
shown.
Statewide
PROFITABILITY SUMMARY 2009 2010 2011 2012 Avg. 2012
Hospital Operating Margins 0.62% 1.32% 2.12% 4.63% 4.81%
Hospital Non Operating Margins -1.14% 2.20% -0.15% 3.41% 1.82%
Hospital Total Margins -0.52% 3.52% 1.96% 8.03% 6.63%
COST DATA SUMMARY
Ratio of cost to charges 0.45 0.45 0.44 0.43 0.36
Private Payment to Cost Ratio 1.14 1.14 1.24 1.29 1.35
Medicare Payment to Cost Ratio 0.84 0.84 0.85 0.88 0.84
Medicaid Payment to Cost Ratio 0.72 0.68 0.68 0.65 0.66
LIQUIDITY MEASURES SUMMARY
Current Ratio 1.35 1.52 2.01 1.78 1.97
Days cash on hand 6 14 24 32 69
Days in patients accounts receivable 63 53 50 58 40
Average Payment Period 60 56 47 61 69
SOLVENCY MEASURES SUMMARY
Equity financing ratio 49.3 47.0 37.9 36.6 36.0
Cash flow to total debt ratio 20.8 39.0 20.2 38.6 27.0
Long-term debt to Capitalization Ratio 10.2 12.5 32.2 30.0 38.1
NET ASSETS SUMMARY
Hospital Unrestricted Net Assets $164,603,489 $178,313,676 $163,006,762 $169,620,159
Hospital Total Net Assets $403,988,398 $427,719,774 $402,492,184 $440,709,105
UNCOMPENSATED CARE
Charity Care $23,984,656 $27,507,152 $18,246,408 $23,839,114
Bad Debts $23,850,531 $37,824,767 $12,919,784 $22,645,965
Total Uncompensated Care Charges $47,835,187 $65,331,919 $31,166,192 $46,485,079
Uncompensated Care Cost $21,461,664 $29,595,623 $13,838,056 $20,089,338
Uncompensated care % of total expenses 2.6% 3.2% 1.4% 1.9%
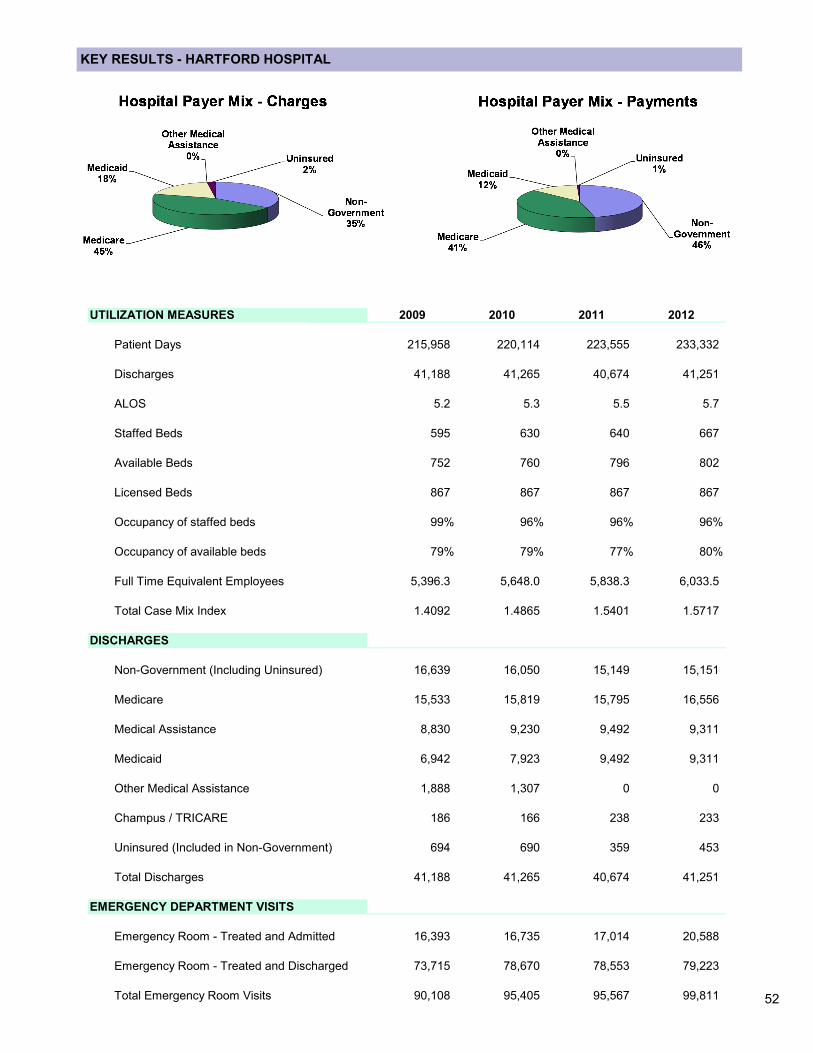
52
KEY RESULTS - HARTFORD HOSPITAL
UTILIZATION MEASURES 2009 2010 2011 2012
Patient Days 215,958 220,114 223,555 233,332
Discharges 41,188 41,265 40,674 41,251
ALOS 5.2 5.3 5.5 5.7
Staffed Beds 595 630 640 667
Available Beds 752 760 796 802
Licensed Beds 867 867 867 867
Occupancy of staffed beds 99% 96% 96% 96%
Occupancy of available beds 79% 79% 77% 80%
Full Time Equivalent Employees 5,396.3 5,648.0 5,838.3 6,033.5
Total Case Mix Index 1.4092 1.4865 1.5401 1.5717
DISCHARGES
Non-Government (Including Uninsured) 16,639 16,050 15,149 15,151
Medicare 15,533 15,819 15,795 16,556
Medical Assistance 8,830 9,230 9,492 9,311
Medicaid 6,942 7,923 9,492 9,311
Other Medical Assistance 1,888 1,307 0 0
Champus / TRICARE 186 166 238 233
Uninsured (Included in Non-Government) 694 690 359 453
Total Discharges 41,188 41,265 40,674 41,251
EMERGENCY DEPARTMENT VISITS
Emergency Room - Treated and Admitted 16,393 16,735 17,014 20,588
Emergency Room - Treated and Discharged 73,715 78,670 78,553 79,223
Total Emergency Room Visits 90,108 95,405 95,567 99,811
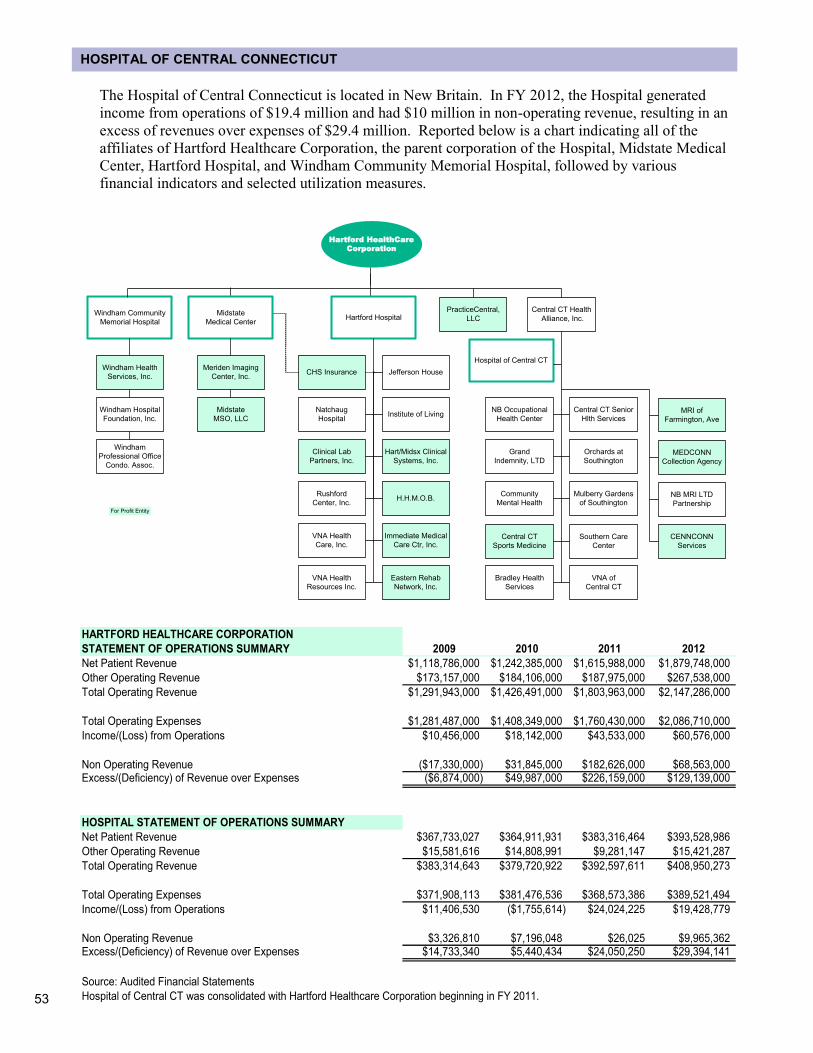
53
HOSPITAL OF CENTRAL CONNECTICUT
The Hospital of Central Connecticut is located in New Britain. In FY 2012, the Hospital generated
income from operations of $19.4 million and had $10 million in non-operating revenue, resulting in an
excess of revenues over expenses of $29.4 million. Reported below is a chart indicating all of the
affiliates of Hartford Healthcare Corporation, the parent corporation of the Hospital, Midstate Medical
Center, Hartford Hospital, and Windham Community Memorial Hospital, followed by various
financial indicators and selected utilization measures.
HARTFORD HEALTHCARE CORPORATION
STATEMENT OF OPERATIONS SUMMARY 2009 2010 2011 2012
Net Patient Revenue $1,118,786,000 $1,242,385,000 $1,615,988,000 $1,879,748,000
Other Operating Revenue $173,157,000 $184,106,000 $187,975,000 $267,538,000
Total Operating Revenue $1,291,943,000 $1,426,491,000 $1,803,963,000 $2,147,286,000
Total Operating Expenses $1,281,487,000 $1,408,349,000 $1,760,430,000 $2,086,710,000
Income/(Loss) from Operations $10,456,000 $18,142,000 $43,533,000 $60,576,000
Non Operating Revenue ($17,330,000) $31,845,000 $182,626,000 $68,563,000Excess/(Deficiency) of Revenue over Expenses ($6,874,000) $49,987,000 $226,159,000 $129,139,000
HOSPITAL STATEMENT OF OPERATIONS SUMMARY
Net Patient Revenue $367,733,027 $364,911,931 $383,316,464 $393,528,986
Other Operating Revenue $15,581,616 $14,808,991 $9,281,147 $15,421,287
Total Operating Revenue $383,314,643 $379,720,922 $392,597,611 $408,950,273
Total Operating Expenses $371,908,113 $381,476,536 $368,573,386 $389,521,494
Income/(Loss) from Operations $11,406,530 ($1,755,614) $24,024,225 $19,428,779
Non Operating Revenue $3,326,810 $7,196,048 $26,025 $9,965,362Excess/(Deficiency) of Revenue over Expenses $14,733,340 $5,440,434 $24,050,250 $29,394,141
Source: Audited Financial Statements
Hospital of Central CT was consolidated with Hartford Healthcare Corporation beginning in FY 2011.
Hartford HealthCare
Corporation
For Profit Entity
Hospital of Central CT
Hartford HospitalMidstate
Medical Center
Midstate
MSO, LLC
Meriden Imaging
Center, Inc.
Windham Hospital
Foundation, Inc.
Windham
Professional Office
Condo. Assoc.
Windham Health
Services, Inc.
Windham Community
Memorial Hospital
Natchaug
Hospital
Clinical Lab
Partners, Inc.
Rushford
Center, Inc.H.H.M.O.B.
Immediate Medical
Care Ctr, Inc.
Eastern Rehab
Network, Inc.
Jefferson House
Institute of Living
Hart/Midsx Clinical
Systems, Inc.
VNA Health
Care, Inc.
VNA Health
Resources Inc.
CHS Insurance
Grand
Indemnity, LTD
Community
Mental Health
Central CT
Sports Medicine
Bradley Health
Services
CENNCONN
Services
MEDCONN
Collection Agency
MRI of
Farmington, Ave
VNA of
Central CT
Southern Care
Center
Central CT Senior
Hlth Services
Mulberry Gardens
of Southington
Orchards at
Southington
NB MRI LTD
Partnership
NB Occupational
Health Center
Central CT Health
Alliance, Inc.
PracticeCentral,
LLC
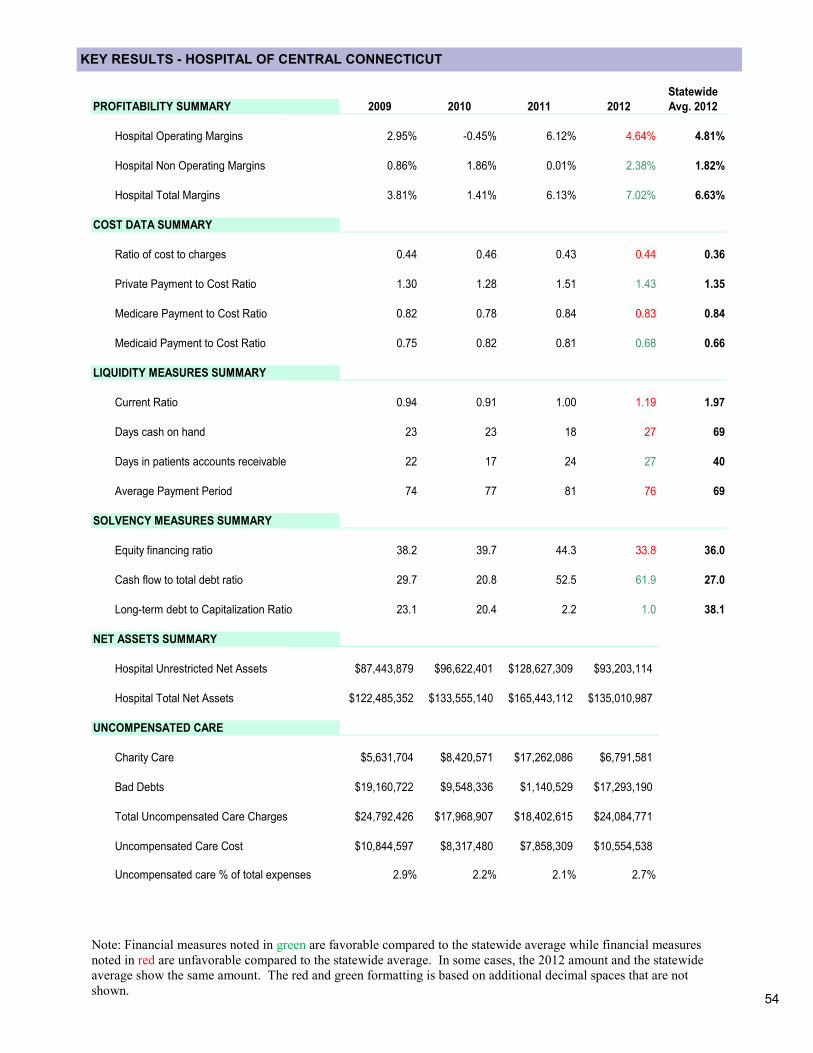
54
KEY RESULTS - HOSPITAL OF CENTRAL CONNECTICUT
Note: Financial measures noted in green are favorable compared to the statewide average while financial measures
noted in red are unfavorable compared to the statewide average. In some cases, the 2012 amount and the statewide
average show the same amount. The red and green formatting is based on additional decimal spaces that are not
shown.
Statewide
PROFITABILITY SUMMARY 2009 2010 2011 2012 Avg. 2012
Hospital Operating Margins 2.95% -0.45% 6.12% 4.64% 4.81%
Hospital Non Operating Margins 0.86% 1.86% 0.01% 2.38% 1.82%
Hospital Total Margins 3.81% 1.41% 6.13% 7.02% 6.63%
COST DATA SUMMARY
Ratio of cost to charges 0.44 0.46 0.43 0.44 0.36
Private Payment to Cost Ratio 1.30 1.28 1.51 1.43 1.35
Medicare Payment to Cost Ratio 0.82 0.78 0.84 0.83 0.84
Medicaid Payment to Cost Ratio 0.75 0.82 0.81 0.68 0.66
LIQUIDITY MEASURES SUMMARY
Current Ratio 0.94 0.91 1.00 1.19 1.97
Days cash on hand 23 23 18 27 69
Days in patients accounts receivable 22 17 24 27 40
Average Payment Period 74 77 81 76 69
SOLVENCY MEASURES SUMMARY
Equity financing ratio 38.2 39.7 44.3 33.8 36.0
Cash flow to total debt ratio 29.7 20.8 52.5 61.9 27.0
Long-term debt to Capitalization Ratio 23.1 20.4 2.2 1.0 38.1
NET ASSETS SUMMARY
Hospital Unrestricted Net Assets $87,443,879 $96,622,401 $128,627,309 $93,203,114
Hospital Total Net Assets $122,485,352 $133,555,140 $165,443,112 $135,010,987
UNCOMPENSATED CARE
Charity Care $5,631,704 $8,420,571 $17,262,086 $6,791,581
Bad Debts $19,160,722 $9,548,336 $1,140,529 $17,293,190
Total Uncompensated Care Charges $24,792,426 $17,968,907 $18,402,615 $24,084,771
Uncompensated Care Cost $10,844,597 $8,317,480 $7,858,309 $10,554,538
Uncompensated care % of total expenses 2.9% 2.2% 2.1% 2.7%
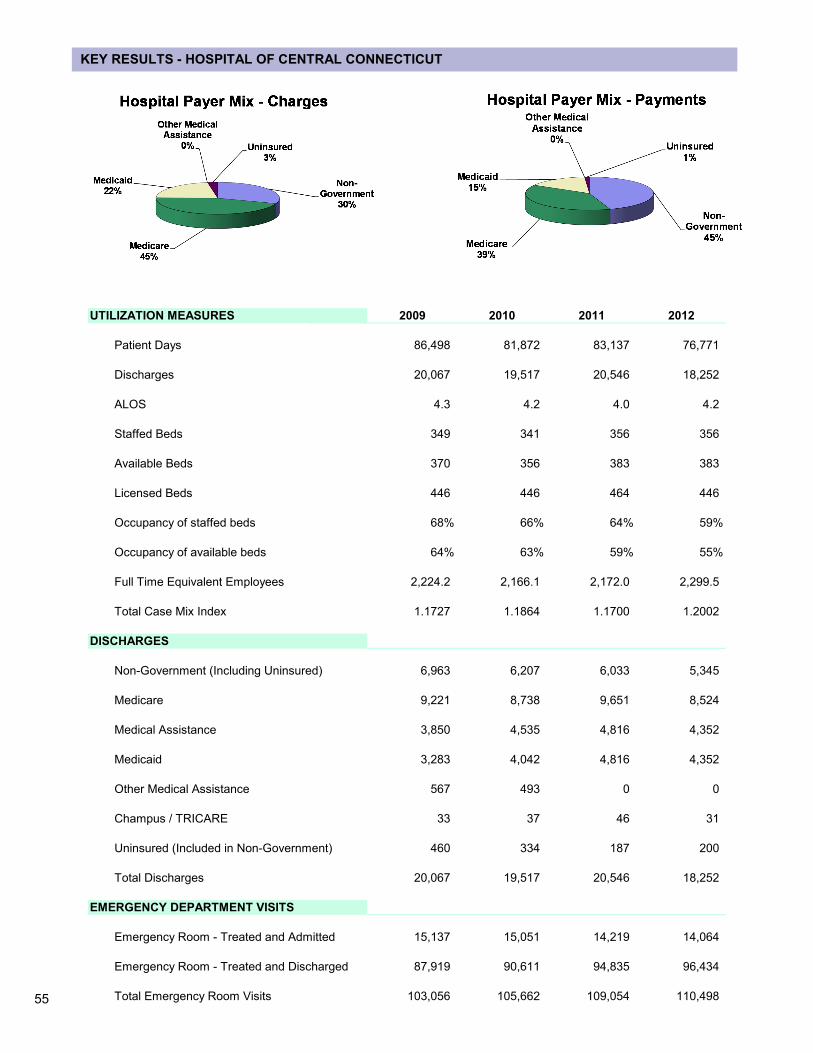
55
KEY RESULTS - HOSPITAL OF CENTRAL CONNECTICUT
UTILIZATION MEASURES 2009 2010 2011 2012
Patient Days 86,498 81,872 83,137 76,771
Discharges 20,067 19,517 20,546 18,252
ALOS 4.3 4.2 4.0 4.2
Staffed Beds 349 341 356 356
Available Beds 370 356 383 383
Licensed Beds 446 446 464 446
Occupancy of staffed beds 68% 66% 64% 59%
Occupancy of available beds 64% 63% 59% 55%
Full Time Equivalent Employees 2,224.2 2,166.1 2,172.0 2,299.5
Total Case Mix Index 1.1727 1.1864 1.1700 1.2002
DISCHARGES
Non-Government (Including Uninsured) 6,963 6,207 6,033 5,345
Medicare 9,221 8,738 9,651 8,524
Medical Assistance 3,850 4,535 4,816 4,352
Medicaid 3,283 4,042 4,816 4,352
Other Medical Assistance 567 493 0 0
Champus / TRICARE 33 37 46 31
Uninsured (Included in Non-Government) 460 334 187 200
Total Discharges 20,067 19,517 20,546 18,252
EMERGENCY DEPARTMENT VISITS
Emergency Room - Treated and Admitted 15,137 15,051 14,219 14,064
Emergency Room - Treated and Discharged 87,919 90,611 94,835 96,434
Total Emergency Room Visits 103,056 105,662 109,054 110,498
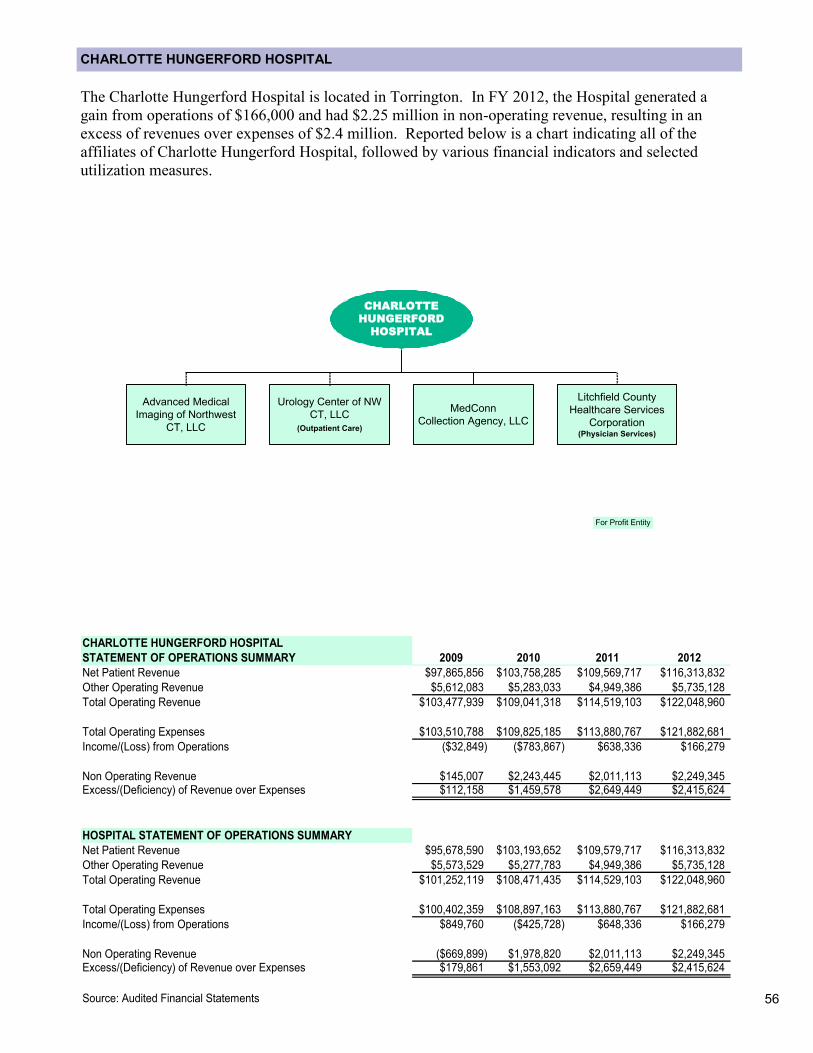
56
CHARLOTTE HUNGERFORD HOSPITAL
The Charlotte Hungerford Hospital is located in Torrington. In FY 2012, the Hospital generated a
gain from operations of $166,000 and had $2.25 million in non-operating revenue, resulting in an
excess of revenues over expenses of $2.4 million. Reported below is a chart indicating all of the
affiliates of Charlotte Hungerford Hospital, followed by various financial indicators and selected
utilization measures.
CHARLOTTE HUNGERFORD HOSPITAL
STATEMENT OF OPERATIONS SUMMARY 2009 2010 2011 2012
Net Patient Revenue $97,865,856 $103,758,285 $109,569,717 $116,313,832
Other Operating Revenue $5,612,083 $5,283,033 $4,949,386 $5,735,128
Total Operating Revenue $103,477,939 $109,041,318 $114,519,103 $122,048,960
Total Operating Expenses $103,510,788 $109,825,185 $113,880,767 $121,882,681
Income/(Loss) from Operations ($32,849) ($783,867) $638,336 $166,279
Non Operating Revenue $145,007 $2,243,445 $2,011,113 $2,249,345Excess/(Deficiency) of Revenue over Expenses $112,158 $1,459,578 $2,649,449 $2,415,624
HOSPITAL STATEMENT OF OPERATIONS SUMMARY
Net Patient Revenue $95,678,590 $103,193,652 $109,579,717 $116,313,832
Other Operating Revenue $5,573,529 $5,277,783 $4,949,386 $5,735,128
Total Operating Revenue $101,252,119 $108,471,435 $114,529,103 $122,048,960
Total Operating Expenses $100,402,359 $108,897,163 $113,880,767 $121,882,681
Income/(Loss) from Operations $849,760 ($425,728) $648,336 $166,279
Non Operating Revenue ($669,899) $1,978,820 $2,011,113 $2,249,345Excess/(Deficiency) of Revenue over Expenses $179,861 $1,553,092 $2,659,449 $2,415,624
Source: Audited Financial Statements
Urology Center of NW
CT, LLC
(Outpatient Care)
For Profit Entity
CHARLOTTE
HUNGERFORD
HOSPITAL
Advanced Medical
Imaging of Northwest
CT, LLC
Litchfield County
Healthcare Services
Corporation(Physician Services)
MedConn
Collection Agency, LLC
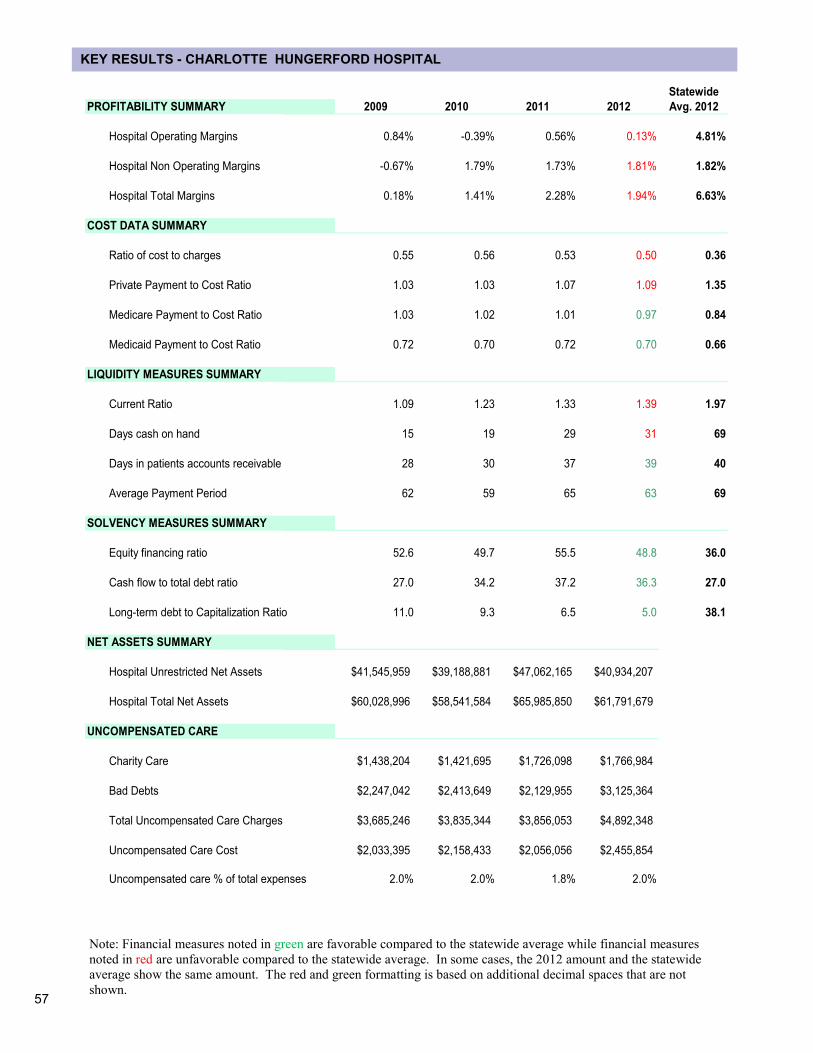
57
KEY RESULTS - CHARLOTTE HUNGERFORD HOSPITAL
Note: Financial measures noted in green are favorable compared to the statewide average while financial measures
noted in red are unfavorable compared to the statewide average. In some cases, the 2012 amount and the statewide
average show the same amount. The red and green formatting is based on additional decimal spaces that are not
shown.
Statewide
PROFITABILITY SUMMARY 2009 2010 2011 2012 Avg. 2012
Hospital Operating Margins 0.84% -0.39% 0.56% 0.13% 4.81%
Hospital Non Operating Margins -0.67% 1.79% 1.73% 1.81% 1.82%
Hospital Total Margins 0.18% 1.41% 2.28% 1.94% 6.63%
COST DATA SUMMARY
Ratio of cost to charges 0.55 0.56 0.53 0.50 0.36
Private Payment to Cost Ratio 1.03 1.03 1.07 1.09 1.35
Medicare Payment to Cost Ratio 1.03 1.02 1.01 0.97 0.84
Medicaid Payment to Cost Ratio 0.72 0.70 0.72 0.70 0.66
LIQUIDITY MEASURES SUMMARY
Current Ratio 1.09 1.23 1.33 1.39 1.97
Days cash on hand 15 19 29 31 69
Days in patients accounts receivable 28 30 37 39 40
Average Payment Period 62 59 65 63 69
SOLVENCY MEASURES SUMMARY
Equity financing ratio 52.6 49.7 55.5 48.8 36.0
Cash flow to total debt ratio 27.0 34.2 37.2 36.3 27.0
Long-term debt to Capitalization Ratio 11.0 9.3 6.5 5.0 38.1
NET ASSETS SUMMARY
Hospital Unrestricted Net Assets $41,545,959 $39,188,881 $47,062,165 $40,934,207
Hospital Total Net Assets $60,028,996 $58,541,584 $65,985,850 $61,791,679
UNCOMPENSATED CARE
Charity Care $1,438,204 $1,421,695 $1,726,098 $1,766,984
Bad Debts $2,247,042 $2,413,649 $2,129,955 $3,125,364
Total Uncompensated Care Charges $3,685,246 $3,835,344 $3,856,053 $4,892,348
Uncompensated Care Cost $2,033,395 $2,158,433 $2,056,056 $2,455,854
Uncompensated care % of total expenses 2.0% 2.0% 1.8% 2.0%
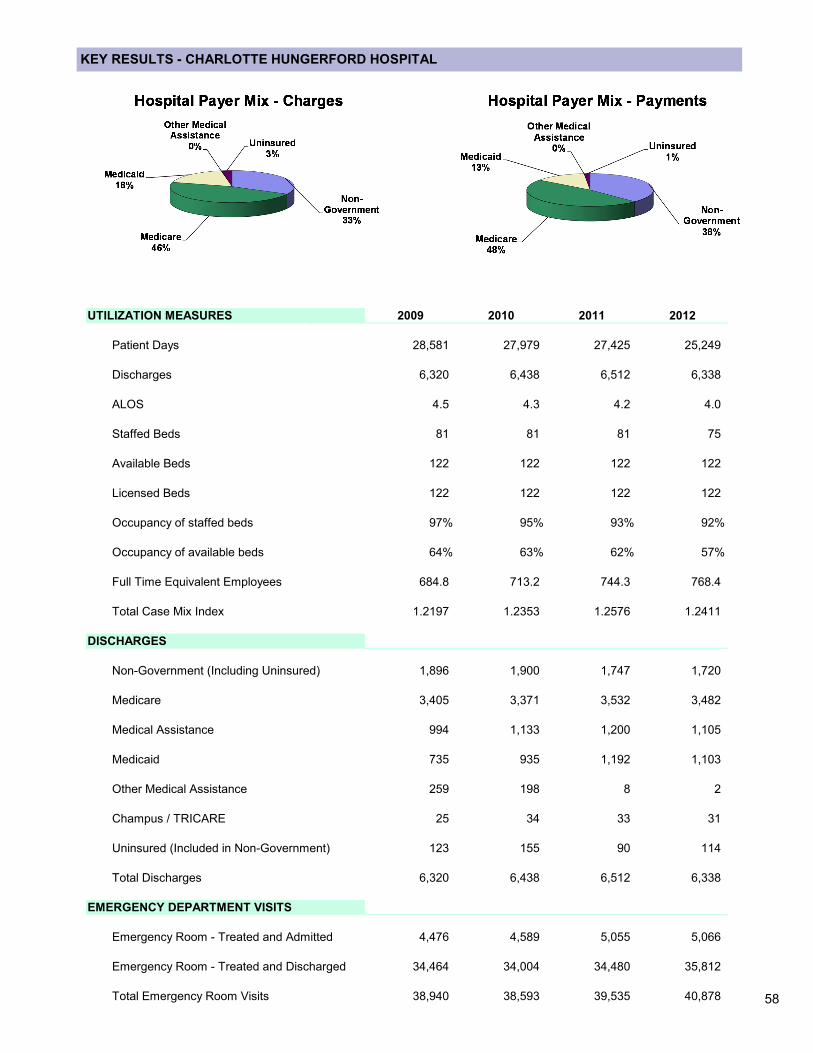
58
KEY RESULTS - CHARLOTTE HUNGERFORD HOSPITAL
UTILIZATION MEASURES 2009 2010 2011 2012
Patient Days 28,581 27,979 27,425 25,249
Discharges 6,320 6,438 6,512 6,338
ALOS 4.5 4.3 4.2 4.0
Staffed Beds 81 81 81 75
Available Beds 122 122 122 122
Licensed Beds 122 122 122 122
Occupancy of staffed beds 97% 95% 93% 92%
Occupancy of available beds 64% 63% 62% 57%
Full Time Equivalent Employees 684.8 713.2 744.3 768.4
Total Case Mix Index 1.2197 1.2353 1.2576 1.2411
DISCHARGES
Non-Government (Including Uninsured) 1,896 1,900 1,747 1,720
Medicare 3,405 3,371 3,532 3,482
Medical Assistance 994 1,133 1,200 1,105
Medicaid 735 935 1,192 1,103
Other Medical Assistance 259 198 8 2
Champus / TRICARE 25 34 33 31
Uninsured (Included in Non-Government) 123 155 90 114
Total Discharges 6,320 6,438 6,512 6,338
EMERGENCY DEPARTMENT VISITS
Emergency Room - Treated and Admitted 4,476 4,589 5,055 5,066
Emergency Room - Treated and Discharged 34,464 34,004 34,480 35,812
Total Emergency Room Visits 38,940 38,593 39,535 40,878
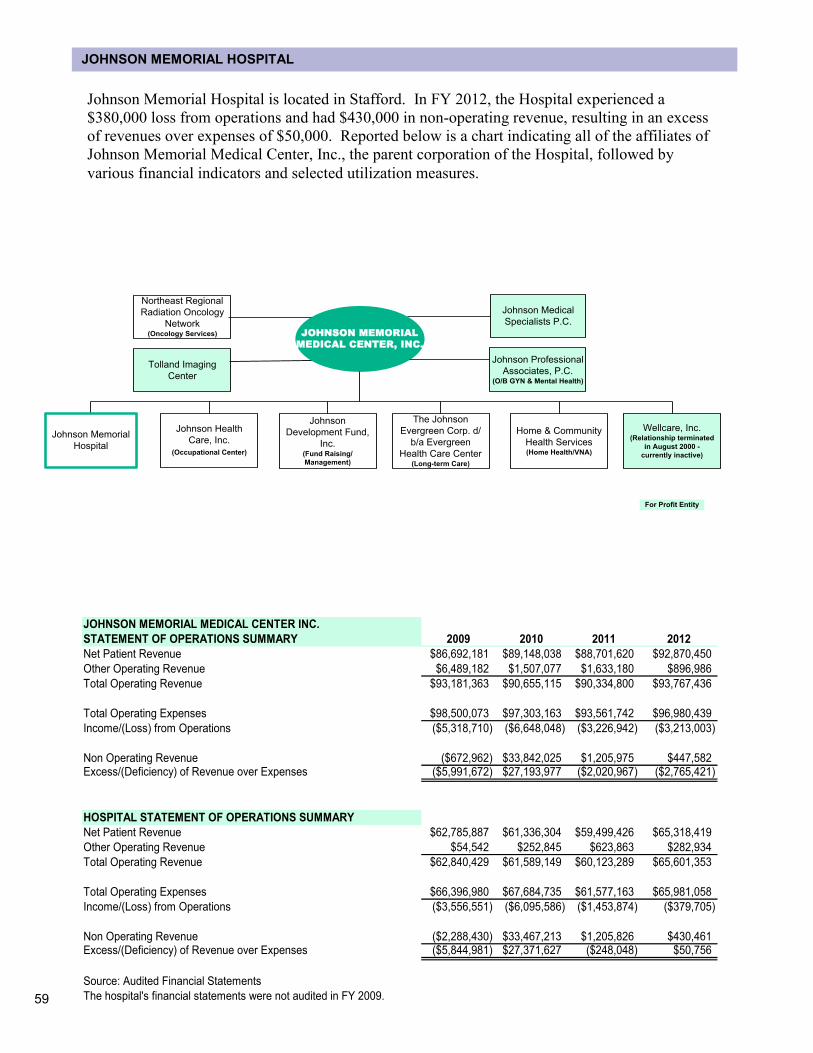
59
JOHNSON MEMORIAL HOSPITAL
Johnson Memorial Hospital is located in Stafford. In FY 2012, the Hospital experienced a
$380,000 loss from operations and had $430,000 in non-operating revenue, resulting in an excess
of revenues over expenses of $50,000. Reported below is a chart indicating all of the affiliates of
Johnson Memorial Medical Center, Inc., the parent corporation of the Hospital, followed by
various financial indicators and selected utilization measures.
Johnson Memorial
Hospital
Johnson Health
Care, Inc.
(Occupational Center)
Johnson
Development Fund,
Inc.(Fund Raising/
Management)
The Johnson
Evergreen Corp. d/
b/a Evergreen
Health Care Center(Long-term Care)
Home & Community
Health Services(Home Health/VNA)
Wellcare, Inc.(Relationship terminated
in August 2000 -
currently inactive)
JOHNSON MEMORIAL
MEDICAL CENTER, INC.
For Profit Entity
Johnson Professional
Associates, P.C.(O/B GYN & Mental Health)
Northeast Regional
Radiation Oncology
Network(Oncology Services)
Johnson Medical
Specialists P.C.
Tolland Imaging
Center
JOHNSON MEMORIAL MEDICAL CENTER INC.
STATEMENT OF OPERATIONS SUMMARY 2009 2010 2011 2012
Net Patient Revenue $86,692,181 $89,148,038 $88,701,620 $92,870,450
Other Operating Revenue $6,489,182 $1,507,077 $1,633,180 $896,986
Total Operating Revenue $93,181,363 $90,655,115 $90,334,800 $93,767,436
Total Operating Expenses $98,500,073 $97,303,163 $93,561,742 $96,980,439
Income/(Loss) from Operations ($5,318,710) ($6,648,048) ($3,226,942) ($3,213,003)
Non Operating Revenue ($672,962) $33,842,025 $1,205,975 $447,582Excess/(Deficiency) of Revenue over Expenses ($5,991,672) $27,193,977 ($2,020,967) ($2,765,421)
HOSPITAL STATEMENT OF OPERATIONS SUMMARY
Net Patient Revenue $62,785,887 $61,336,304 $59,499,426 $65,318,419
Other Operating Revenue $54,542 $252,845 $623,863 $282,934
Total Operating Revenue $62,840,429 $61,589,149 $60,123,289 $65,601,353
Total Operating Expenses $66,396,980 $67,684,735 $61,577,163 $65,981,058
Income/(Loss) from Operations ($3,556,551) ($6,095,586) ($1,453,874) ($379,705)
Non Operating Revenue ($2,288,430) $33,467,213 $1,205,826 $430,461Excess/(Deficiency) of Revenue over Expenses ($5,844,981) $27,371,627 ($248,048) $50,756
Source: Audited Financial Statements
The hospital's financial statements were not audited in FY 2009.
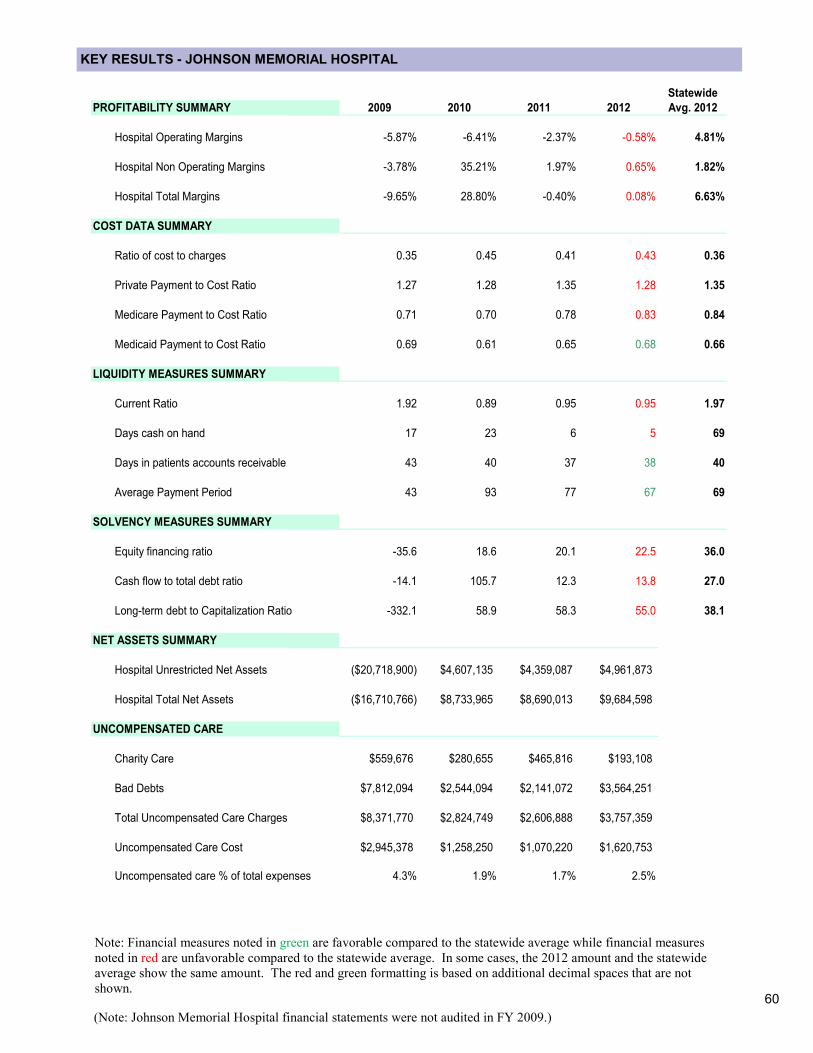
60
KEY RESULTS - JOHNSON MEMORIAL HOSPITAL
(Note: Johnson Memorial Hospital financial statements were not audited in FY 2009.)
Note: Financial measures noted in green are favorable compared to the statewide average while financial measures
noted in red are unfavorable compared to the statewide average. In some cases, the 2012 amount and the statewide
average show the same amount. The red and green formatting is based on additional decimal spaces that are not
shown.
Statewide
PROFITABILITY SUMMARY 2009 2010 2011 2012 Avg. 2012
Hospital Operating Margins -5.87% -6.41% -2.37% -0.58% 4.81%
Hospital Non Operating Margins -3.78% 35.21% 1.97% 0.65% 1.82%
Hospital Total Margins -9.65% 28.80% -0.40% 0.08% 6.63%
COST DATA SUMMARY
Ratio of cost to charges 0.35 0.45 0.41 0.43 0.36
Private Payment to Cost Ratio 1.27 1.28 1.35 1.28 1.35
Medicare Payment to Cost Ratio 0.71 0.70 0.78 0.83 0.84
Medicaid Payment to Cost Ratio 0.69 0.61 0.65 0.68 0.66
LIQUIDITY MEASURES SUMMARY
Current Ratio 1.92 0.89 0.95 0.95 1.97
Days cash on hand 17 23 6 5 69
Days in patients accounts receivable 43 40 37 38 40
Average Payment Period 43 93 77 67 69
SOLVENCY MEASURES SUMMARY
Equity financing ratio -35.6 18.6 20.1 22.5 36.0
Cash flow to total debt ratio -14.1 105.7 12.3 13.8 27.0
Long-term debt to Capitalization Ratio -332.1 58.9 58.3 55.0 38.1
NET ASSETS SUMMARY
Hospital Unrestricted Net Assets ($20,718,900) $4,607,135 $4,359,087 $4,961,873
Hospital Total Net Assets ($16,710,766) $8,733,965 $8,690,013 $9,684,598
UNCOMPENSATED CARE
Charity Care $559,676 $280,655 $465,816 $193,108
Bad Debts $7,812,094 $2,544,094 $2,141,072 $3,564,251
Total Uncompensated Care Charges $8,371,770 $2,824,749 $2,606,888 $3,757,359
Uncompensated Care Cost $2,945,378 $1,258,250 $1,070,220 $1,620,753
Uncompensated care % of total expenses 4.3% 1.9% 1.7% 2.5%
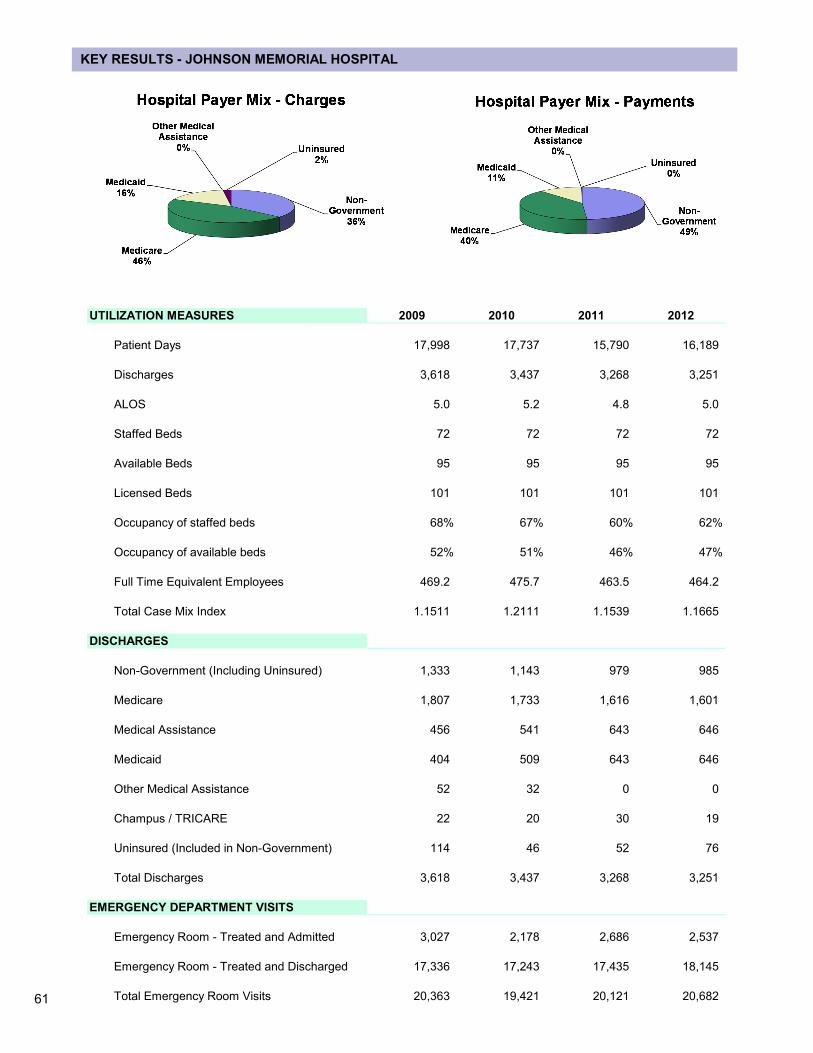
61
KEY RESULTS - JOHNSON MEMORIAL HOSPITAL
UTILIZATION MEASURES 2009 2010 2011 2012
Patient Days 17,998 17,737 15,790 16,189
Discharges 3,618 3,437 3,268 3,251
ALOS 5.0 5.2 4.8 5.0
Staffed Beds 72 72 72 72
Available Beds 95 95 95 95
Licensed Beds 101 101 101 101
Occupancy of staffed beds 68% 67% 60% 62%
Occupancy of available beds 52% 51% 46% 47%
Full Time Equivalent Employees 469.2 475.7 463.5 464.2
Total Case Mix Index 1.1511 1.2111 1.1539 1.1665
DISCHARGES
Non-Government (Including Uninsured) 1,333 1,143 979 985
Medicare 1,807 1,733 1,616 1,601
Medical Assistance 456 541 643 646
Medicaid 404 509 643 646
Other Medical Assistance 52 32 0 0
Champus / TRICARE 22 20 30 19
Uninsured (Included in Non-Government) 114 46 52 76
Total Discharges 3,618 3,437 3,268 3,251
EMERGENCY DEPARTMENT VISITS
Emergency Room - Treated and Admitted 3,027 2,178 2,686 2,537
Emergency Room - Treated and Discharged 17,336 17,243 17,435 18,145
Total Emergency Room Visits 20,363 19,421 20,121 20,682
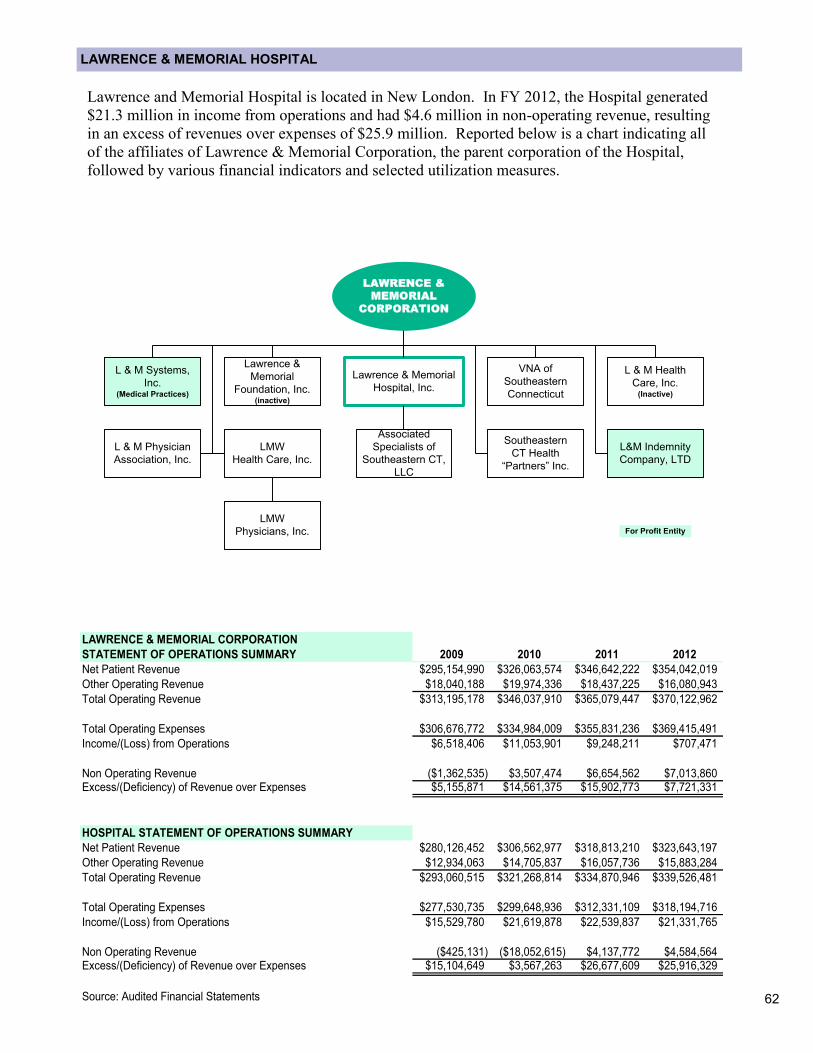
62
LAWRENCE & MEMORIAL HOSPITAL
Lawrence and Memorial Hospital is located in New London. In FY 2012, the Hospital generated
$21.3 million in income from operations and had $4.6 million in non-operating revenue, resulting
in an excess of revenues over expenses of $25.9 million. Reported below is a chart indicating all
of the affiliates of Lawrence & Memorial Corporation, the parent corporation of the Hospital,
followed by various financial indicators and selected utilization measures.
LAWRENCE & MEMORIAL CORPORATION
STATEMENT OF OPERATIONS SUMMARY 2009 2010 2011 2012
Net Patient Revenue $295,154,990 $326,063,574 $346,642,222 $354,042,019
Other Operating Revenue $18,040,188 $19,974,336 $18,437,225 $16,080,943
Total Operating Revenue $313,195,178 $346,037,910 $365,079,447 $370,122,962
Total Operating Expenses $306,676,772 $334,984,009 $355,831,236 $369,415,491
Income/(Loss) from Operations $6,518,406 $11,053,901 $9,248,211 $707,471
Non Operating Revenue ($1,362,535) $3,507,474 $6,654,562 $7,013,860Excess/(Deficiency) of Revenue over Expenses $5,155,871 $14,561,375 $15,902,773 $7,721,331
HOSPITAL STATEMENT OF OPERATIONS SUMMARY
Net Patient Revenue $280,126,452 $306,562,977 $318,813,210 $323,643,197
Other Operating Revenue $12,934,063 $14,705,837 $16,057,736 $15,883,284
Total Operating Revenue $293,060,515 $321,268,814 $334,870,946 $339,526,481
Total Operating Expenses $277,530,735 $299,648,936 $312,331,109 $318,194,716
Income/(Loss) from Operations $15,529,780 $21,619,878 $22,539,837 $21,331,765
Non Operating Revenue ($425,131) ($18,052,615) $4,137,772 $4,584,564Excess/(Deficiency) of Revenue over Expenses $15,104,649 $3,567,263 $26,677,609 $25,916,329
Source: Audited Financial Statements
Lawrence & Memorial
Hospital, Inc.
Lawrence &
Memorial
Foundation, Inc.(inactive)
L & M Systems,
Inc.(Medical Practices)
VNA of
Southeastern
Connecticut
L & M Health
Care, Inc.(Inactive)
LAWRENCE &
MEMORIAL
CORPORATION
For Profit Entity
Associated
Specialists of
Southeastern CT,
LLC
L & M Physician
Association, Inc.
Southeastern
CT Health
“Partners” Inc.
L&M Indemnity
Company, LTD
LMW
Health Care, Inc.
LMW
Physicians, Inc.
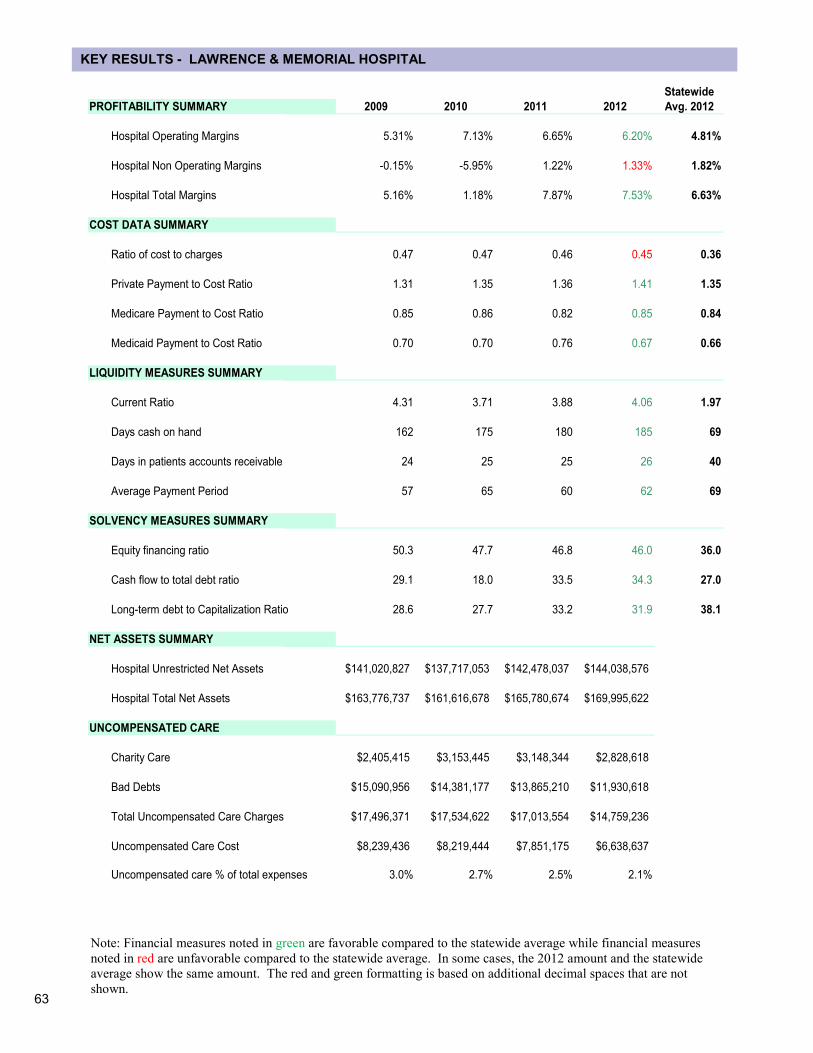
63
KEY RESULTS - LAWRENCE & MEMORIAL HOSPITAL
Note: Financial measures noted in green are favorable compared to the statewide average while financial measures
noted in red are unfavorable compared to the statewide average. In some cases, the 2012 amount and the statewide
average show the same amount. The red and green formatting is based on additional decimal spaces that are not
shown.
Statewide
PROFITABILITY SUMMARY 2009 2010 2011 2012 Avg. 2012
Hospital Operating Margins 5.31% 7.13% 6.65% 6.20% 4.81%
Hospital Non Operating Margins -0.15% -5.95% 1.22% 1.33% 1.82%
Hospital Total Margins 5.16% 1.18% 7.87% 7.53% 6.63%
COST DATA SUMMARY
Ratio of cost to charges 0.47 0.47 0.46 0.45 0.36
Private Payment to Cost Ratio 1.31 1.35 1.36 1.41 1.35
Medicare Payment to Cost Ratio 0.85 0.86 0.82 0.85 0.84
Medicaid Payment to Cost Ratio 0.70 0.70 0.76 0.67 0.66
LIQUIDITY MEASURES SUMMARY
Current Ratio 4.31 3.71 3.88 4.06 1.97
Days cash on hand 162 175 180 185 69
Days in patients accounts receivable 24 25 25 26 40
Average Payment Period 57 65 60 62 69
SOLVENCY MEASURES SUMMARY
Equity financing ratio 50.3 47.7 46.8 46.0 36.0
Cash flow to total debt ratio 29.1 18.0 33.5 34.3 27.0
Long-term debt to Capitalization Ratio 28.6 27.7 33.2 31.9 38.1
NET ASSETS SUMMARY
Hospital Unrestricted Net Assets $141,020,827 $137,717,053 $142,478,037 $144,038,576
Hospital Total Net Assets $163,776,737 $161,616,678 $165,780,674 $169,995,622
UNCOMPENSATED CARE
Charity Care $2,405,415 $3,153,445 $3,148,344 $2,828,618
Bad Debts $15,090,956 $14,381,177 $13,865,210 $11,930,618
Total Uncompensated Care Charges $17,496,371 $17,534,622 $17,013,554 $14,759,236
Uncompensated Care Cost $8,239,436 $8,219,444 $7,851,175 $6,638,637
Uncompensated care % of total expenses 3.0% 2.7% 2.5% 2.1%
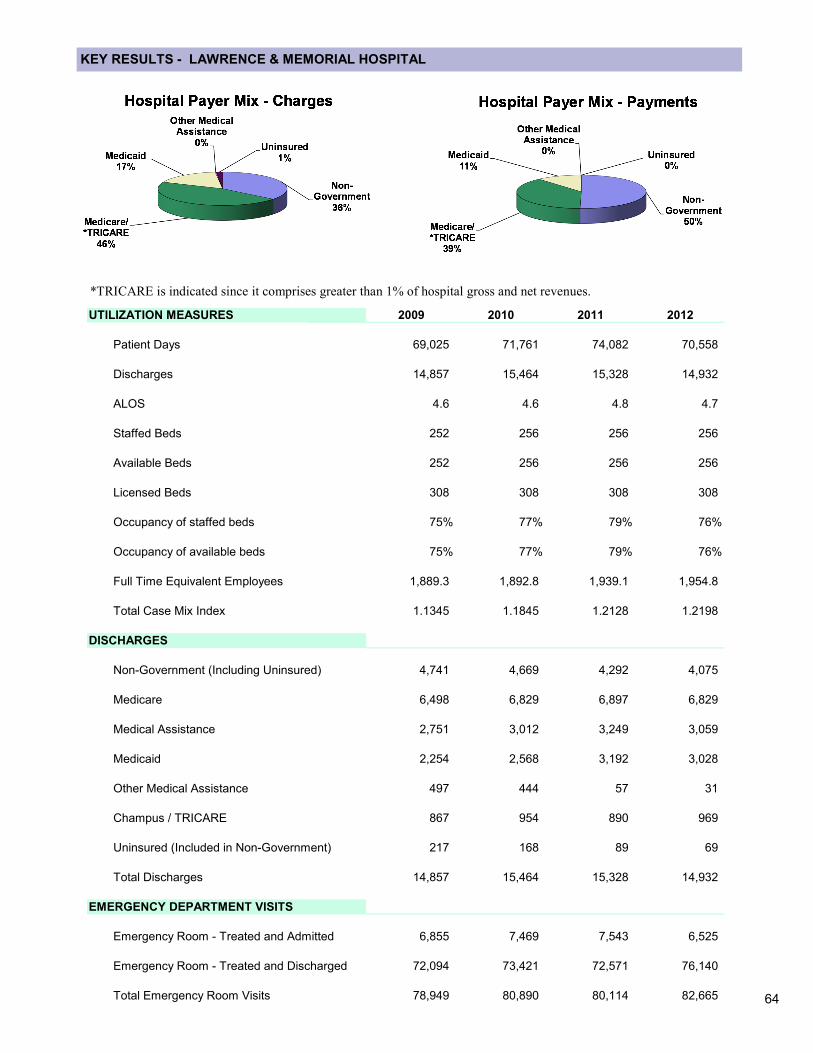
64
KEY RESULTS - LAWRENCE & MEMORIAL HOSPITAL
UTILIZATION MEASURES 2009 2010 2011 2012
Patient Days 69,025 71,761 74,082 70,558
Discharges 14,857 15,464 15,328 14,932
ALOS 4.6 4.6 4.8 4.7
Staffed Beds 252 256 256 256
Available Beds 252 256 256 256
Licensed Beds 308 308 308 308
Occupancy of staffed beds 75% 77% 79% 76%
Occupancy of available beds 75% 77% 79% 76%
Full Time Equivalent Employees 1,889.3 1,892.8 1,939.1 1,954.8
Total Case Mix Index 1.1345 1.1845 1.2128 1.2198
DISCHARGES
Non-Government (Including Uninsured) 4,741 4,669 4,292 4,075
Medicare 6,498 6,829 6,897 6,829
Medical Assistance 2,751 3,012 3,249 3,059
Medicaid 2,254 2,568 3,192 3,028
Other Medical Assistance 497 444 57 31
Champus / TRICARE 867 954 890 969
Uninsured (Included in Non-Government) 217 168 89 69
Total Discharges 14,857 15,464 15,328 14,932
EMERGENCY DEPARTMENT VISITS
Emergency Room - Treated and Admitted 6,855 7,469 7,543 6,525
Emergency Room - Treated and Discharged 72,094 73,421 72,571 76,140
Total Emergency Room Visits 78,949 80,890 80,114 82,665
*TRICARE is indicated since it comprises greater than 1% of hospital gross and net revenues.
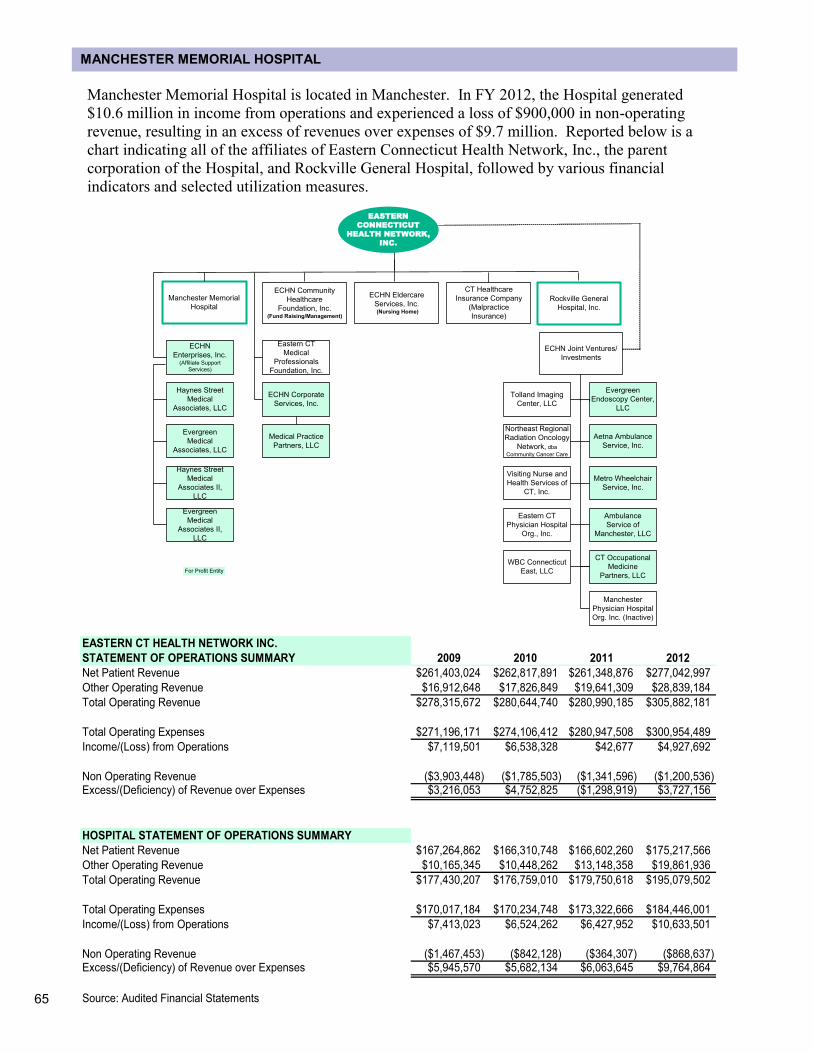
65
MANCHESTER MEMORIAL HOSPITAL
Manchester Memorial Hospital is located in Manchester. In FY 2012, the Hospital generated
$10.6 million in income from operations and experienced a loss of $900,000 in non-operating
revenue, resulting in an excess of revenues over expenses of $9.7 million. Reported below is a
chart indicating all of the affiliates of Eastern Connecticut Health Network, Inc., the parent
corporation of the Hospital, and Rockville General Hospital, followed by various financial
indicators and selected utilization measures.
Manchester Memorial
Hospital
ECHN Community
Healthcare
Foundation, Inc.(Fund Raising/Management)
ECHN Eldercare
Services, Inc. (Nursing Home)
EASTERN
CONNECTICUT
HEALTH NETWORK,
INC.
For Profit Entity
ECHN
Enterprises, Inc.(Affiliate Support
Services)
Rockville General
Hospital, Inc.
ECHN Joint Ventures/
Investments
CT Healthcare
Insurance Company
(Malpractice
Insurance)
Haynes Street
Medical
Associates, LLC
Haynes Street
Medical
Associates II,
LLC
Evergreen
Medical
Associates II,
LLC
Evergreen
Medical
Associates, LLC
Ambulance
Service of
Manchester, LLC
Metro Wheelchair
Service, Inc.
Aetna Ambulance
Service, Inc.
CT Occupational
Medicine
Partners, LLC
Evergreen
Endoscopy Center,
LLC
Visiting Nurse and
Health Services of
CT, Inc.
Northeast Regional
Radiation Oncology
Network, dba
Community Cancer Care
Tolland Imaging
Center, LLC
Eastern CT
Physician Hospital
Org., Inc.
WBC Connecticut
East, LLC
Medical Practice
Partners, LLC
Eastern CT
Medical
Professionals
Foundation, Inc.
ECHN Corporate
Services, Inc.
Manchester
Physician Hospital
Org. Inc. (Inactive)
EASTERN CT HEALTH NETWORK INC.
STATEMENT OF OPERATIONS SUMMARY 2009 2010 2011 2012
Net Patient Revenue $261,403,024 $262,817,891 $261,348,876 $277,042,997
Other Operating Revenue $16,912,648 $17,826,849 $19,641,309 $28,839,184
Total Operating Revenue $278,315,672 $280,644,740 $280,990,185 $305,882,181
Total Operating Expenses $271,196,171 $274,106,412 $280,947,508 $300,954,489
Income/(Loss) from Operations $7,119,501 $6,538,328 $42,677 $4,927,692
Non Operating Revenue ($3,903,448) ($1,785,503) ($1,341,596) ($1,200,536)Excess/(Deficiency) of Revenue over Expenses $3,216,053 $4,752,825 ($1,298,919) $3,727,156
HOSPITAL STATEMENT OF OPERATIONS SUMMARY
Net Patient Revenue $167,264,862 $166,310,748 $166,602,260 $175,217,566
Other Operating Revenue $10,165,345 $10,448,262 $13,148,358 $19,861,936
Total Operating Revenue $177,430,207 $176,759,010 $179,750,618 $195,079,502
Total Operating Expenses $170,017,184 $170,234,748 $173,322,666 $184,446,001
Income/(Loss) from Operations $7,413,023 $6,524,262 $6,427,952 $10,633,501
Non Operating Revenue ($1,467,453) ($842,128) ($364,307) ($868,637)Excess/(Deficiency) of Revenue over Expenses $5,945,570 $5,682,134 $6,063,645 $9,764,864
Source: Audited Financial Statements
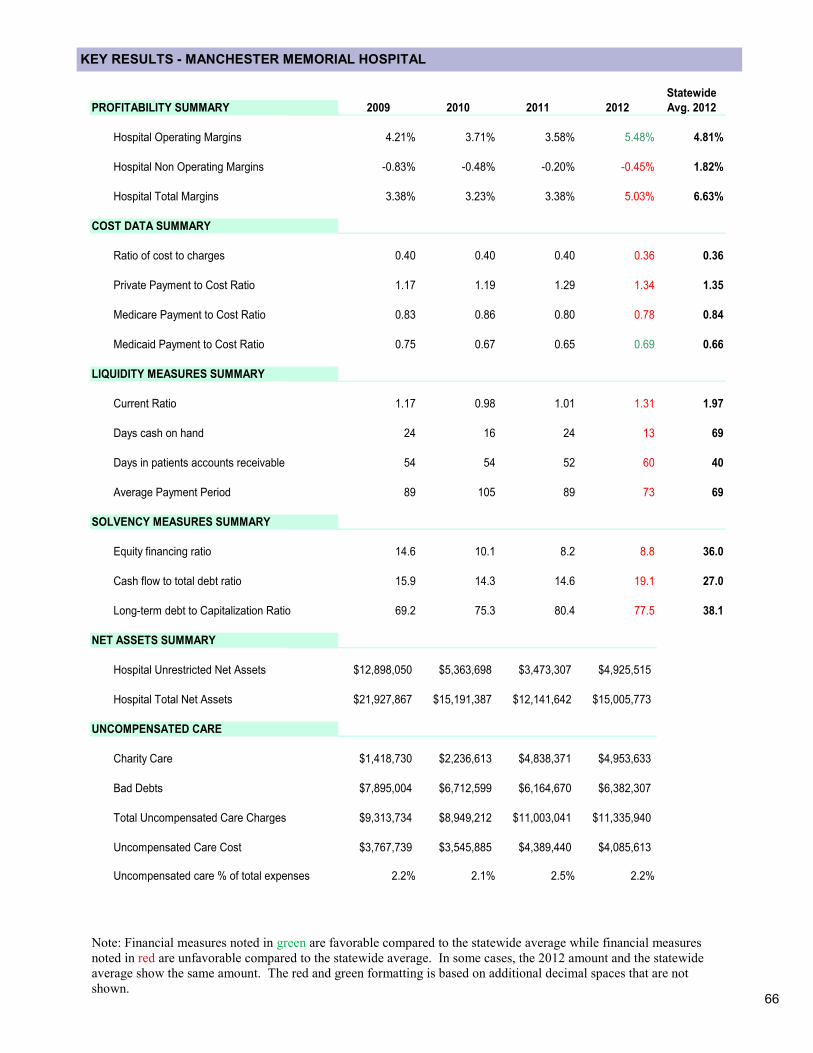
66
KEY RESULTS - MANCHESTER MEMORIAL HOSPITAL
Note: Financial measures noted in green are favorable compared to the statewide average while financial measures
noted in red are unfavorable compared to the statewide average. In some cases, the 2012 amount and the statewide
average show the same amount. The red and green formatting is based on additional decimal spaces that are not
shown.
Statewide
PROFITABILITY SUMMARY 2009 2010 2011 2012 Avg. 2012
Hospital Operating Margins 4.21% 3.71% 3.58% 5.48% 4.81%
Hospital Non Operating Margins -0.83% -0.48% -0.20% -0.45% 1.82%
Hospital Total Margins 3.38% 3.23% 3.38% 5.03% 6.63%
COST DATA SUMMARY
Ratio of cost to charges 0.40 0.40 0.40 0.36 0.36
Private Payment to Cost Ratio 1.17 1.19 1.29 1.34 1.35
Medicare Payment to Cost Ratio 0.83 0.86 0.80 0.78 0.84
Medicaid Payment to Cost Ratio 0.75 0.67 0.65 0.69 0.66
LIQUIDITY MEASURES SUMMARY
Current Ratio 1.17 0.98 1.01 1.31 1.97
Days cash on hand 24 16 24 13 69
Days in patients accounts receivable 54 54 52 60 40
Average Payment Period 89 105 89 73 69
SOLVENCY MEASURES SUMMARY
Equity financing ratio 14.6 10.1 8.2 8.8 36.0
Cash flow to total debt ratio 15.9 14.3 14.6 19.1 27.0
Long-term debt to Capitalization Ratio 69.2 75.3 80.4 77.5 38.1
NET ASSETS SUMMARY
Hospital Unrestricted Net Assets $12,898,050 $5,363,698 $3,473,307 $4,925,515
Hospital Total Net Assets $21,927,867 $15,191,387 $12,141,642 $15,005,773
UNCOMPENSATED CARE
Charity Care $1,418,730 $2,236,613 $4,838,371 $4,953,633
Bad Debts $7,895,004 $6,712,599 $6,164,670 $6,382,307
Total Uncompensated Care Charges $9,313,734 $8,949,212 $11,003,041 $11,335,940
Uncompensated Care Cost $3,767,739 $3,545,885 $4,389,440 $4,085,613
Uncompensated care % of total expenses 2.2% 2.1% 2.5% 2.2%

67
KEY RESULTS - MANCHESTER MEMORIAL HOSPITAL
UTILIZATION MEASURES 2009 2010 2011 2012
Patient Days 44,631 44,935 43,475 45,545
Discharges 8,989 9,109 9,281 8,831
ALOS 5.0 4.9 4.7 5.2
Staffed Beds 140 140 171 171
Available Beds 283 283 283 283
Licensed Beds 283 283 283 283
Occupancy of staffed beds 87% 88% 70% 73%
Occupancy of available beds 43% 44% 42% 44%
Full Time Equivalent Employees 1,155.3 1,146.9 1,138.9 1,075.8
Total Case Mix Index 1.2318 1.1816 1.1208 1.1529
DISCHARGES
Non-Government (Including Uninsured) 3,712 3,650 3,754 3,296
Medicare 3,770 3,774 3,626 3,537
Medical Assistance 1,488 1,651 1,854 1,957
Medicaid 1,166 1,295 1,854 1,957
Other Medical Assistance 322 356 0 0
Champus / TRICARE 19 34 47 41
Uninsured (Included in Non-Government) 182 185 216 182
Total Discharges 8,989 9,109 9,281 8,831
EMERGENCY DEPARTMENT VISITS
Emergency Room - Treated and Admitted 5,142 5,340 5,332 5,028
Emergency Room - Treated and Discharged 40,513 40,946 42,502 41,475
Total Emergency Room Visits 45,655 46,286 47,834 46,503
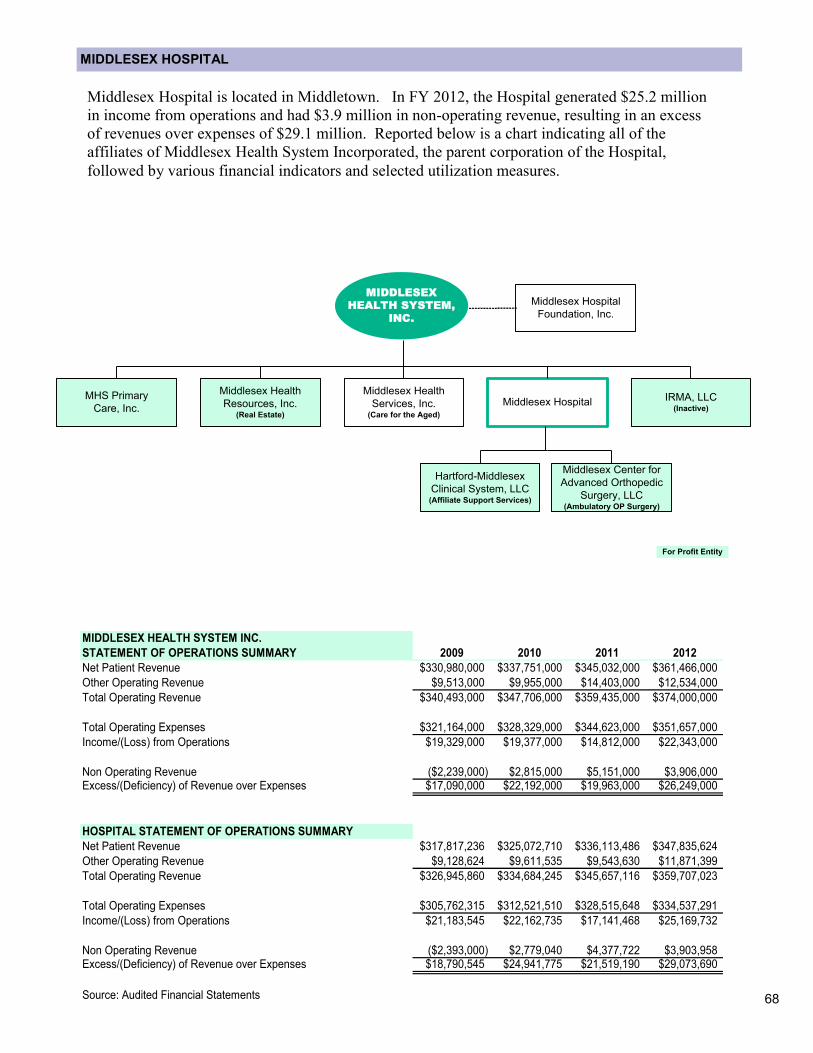
68
MIDDLESEX HOSPITAL
Middlesex Hospital is located in Middletown. In FY 2012, the Hospital generated $25.2 million
in income from operations and had $3.9 million in non-operating revenue, resulting in an excess
of revenues over expenses of $29.1 million. Reported below is a chart indicating all of the
affiliates of Middlesex Health System Incorporated, the parent corporation of the Hospital,
followed by various financial indicators and selected utilization measures.
MHS Primary
Care, Inc.IRMA, LLC
(Inactive)Middlesex Hospital
Middlesex Health
Resources, Inc.(Real Estate)
MIDDLESEX
HEALTH SYSTEM,
INC.
For Profit Entity
Hartford-Middlesex
Clinical System, LLC(Affiliate Support Services)
Middlesex Health
Services, Inc.(Care for the Aged)
Middlesex Center for
Advanced Orthopedic
Surgery, LLC(Ambulatory OP Surgery)
Middlesex Hospital
Foundation, Inc.
MIDDLESEX HEALTH SYSTEM INC.
STATEMENT OF OPERATIONS SUMMARY 2009 2010 2011 2012
Net Patient Revenue $330,980,000 $337,751,000 $345,032,000 $361,466,000
Other Operating Revenue $9,513,000 $9,955,000 $14,403,000 $12,534,000
Total Operating Revenue $340,493,000 $347,706,000 $359,435,000 $374,000,000
Total Operating Expenses $321,164,000 $328,329,000 $344,623,000 $351,657,000
Income/(Loss) from Operations $19,329,000 $19,377,000 $14,812,000 $22,343,000
Non Operating Revenue ($2,239,000) $2,815,000 $5,151,000 $3,906,000Excess/(Deficiency) of Revenue over Expenses $17,090,000 $22,192,000 $19,963,000 $26,249,000
HOSPITAL STATEMENT OF OPERATIONS SUMMARY
Net Patient Revenue $317,817,236 $325,072,710 $336,113,486 $347,835,624
Other Operating Revenue $9,128,624 $9,611,535 $9,543,630 $11,871,399
Total Operating Revenue $326,945,860 $334,684,245 $345,657,116 $359,707,023
Total Operating Expenses $305,762,315 $312,521,510 $328,515,648 $334,537,291
Income/(Loss) from Operations $21,183,545 $22,162,735 $17,141,468 $25,169,732
Non Operating Revenue ($2,393,000) $2,779,040 $4,377,722 $3,903,958Excess/(Deficiency) of Revenue over Expenses $18,790,545 $24,941,775 $21,519,190 $29,073,690
Source: Audited Financial Statements

69
KEY RESULTS - MIDDLESEX HOSPITAL
Note: Financial measures noted in green are favorable compared to the statewide average while financial measures
noted in red are unfavorable compared to the statewide average. In some cases, the 2012 amount and the statewide
average show the same amount. The red and green formatting is based on additional decimal spaces that are not
shown.
Statewide
PROFITABILITY SUMMARY 2009 2010 2011 2012 Avg. 2012
Hospital Operating Margins 6.53% 6.57% 4.90% 6.92% 4.81%
Hospital Non Operating Margins -0.74% 0.82% 1.25% 1.07% 1.82%
Hospital Total Margins 5.79% 7.39% 6.15% 8.00% 6.63%
COST DATA SUMMARY
Ratio of cost to charges 0.36 0.33 0.31 0.30 0.36
Private Payment to Cost Ratio 1.31 1.39 1.40 1.47 1.35
Medicare Payment to Cost Ratio 0.86 0.82 0.76 0.77 0.84
Medicaid Payment to Cost Ratio 0.67 0.84 0.75 0.66 0.66
LIQUIDITY MEASURES SUMMARY
Current Ratio 2.17 2.21 1.97 1.75 1.97
Days cash on hand 86 97 80 76 69
Days in patients accounts receivable 45 43 46 44 40
Average Payment Period 67 70 73 81 69
SOLVENCY MEASURES SUMMARY
Equity financing ratio 36.9 36.9 34.3 36.6 36.0
Cash flow to total debt ratio 30.5 36.9 33.9 38.0 27.0
Long-term debt to Capitalization Ratio 35.5 32.3 32.5 28.2 38.1
NET ASSETS SUMMARY
Hospital Unrestricted Net Assets $124,916,000 $131,224,000 $124,933,000 $144,992,000
Hospital Total Net Assets $138,110,000 $144,810,000 $138,072,000 $161,005,000
UNCOMPENSATED CARE
Charity Care $7,535,167 $9,520,361 $6,856,094 $7,509,399
Bad Debts $17,055,645 $11,858,436 $13,570,742 $12,199,395
Total Uncompensated Care Charges $24,590,812 $21,378,797 $20,426,836 $19,708,794
Uncompensated Care Cost $8,817,506 $7,061,633 $6,432,546 $5,829,532
Uncompensated care % of total expenses 2.9% 2.3% 2.0% 1.7%
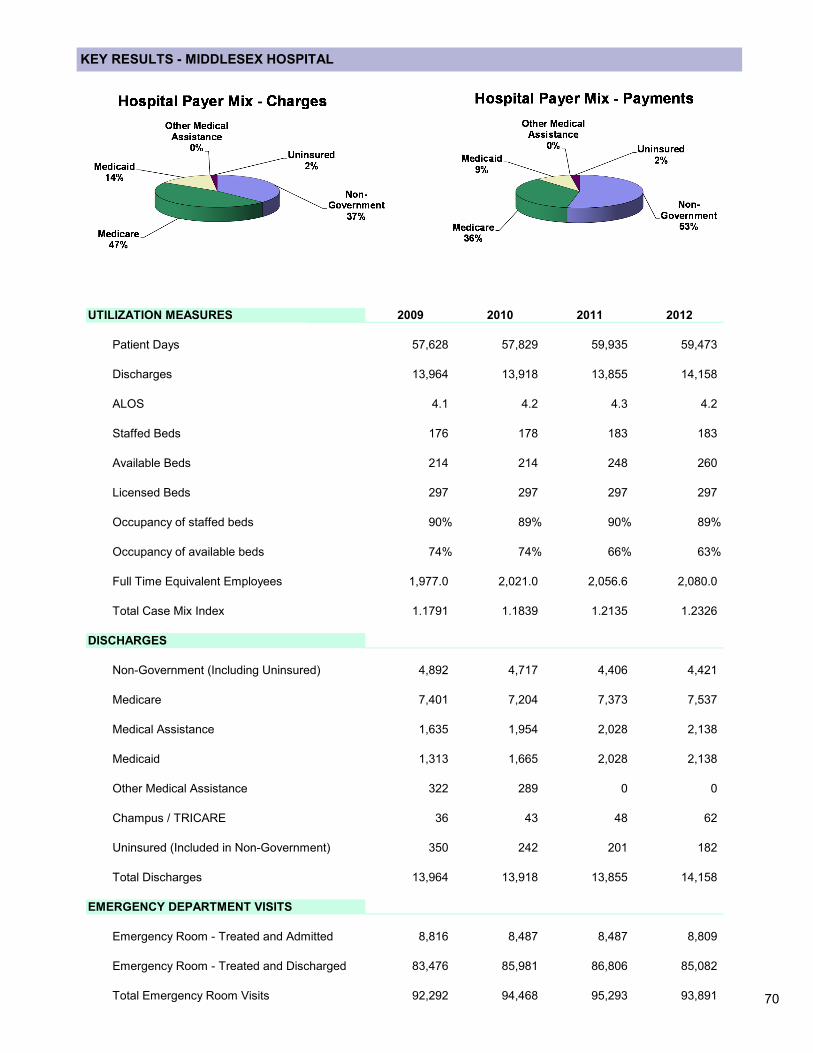
70
KEY RESULTS - MIDDLESEX HOSPITAL
UTILIZATION MEASURES 2009 2010 2011 2012
Patient Days 57,628 57,829 59,935 59,473
Discharges 13,964 13,918 13,855 14,158
ALOS 4.1 4.2 4.3 4.2
Staffed Beds 176 178 183 183
Available Beds 214 214 248 260
Licensed Beds 297 297 297 297
Occupancy of staffed beds 90% 89% 90% 89%
Occupancy of available beds 74% 74% 66% 63%
Full Time Equivalent Employees 1,977.0 2,021.0 2,056.6 2,080.0
Total Case Mix Index 1.1791 1.1839 1.2135 1.2326
DISCHARGES
Non-Government (Including Uninsured) 4,892 4,717 4,406 4,421
Medicare 7,401 7,204 7,373 7,537
Medical Assistance 1,635 1,954 2,028 2,138
Medicaid 1,313 1,665 2,028 2,138
Other Medical Assistance 322 289 0 0
Champus / TRICARE 36 43 48 62
Uninsured (Included in Non-Government) 350 242 201 182
Total Discharges 13,964 13,918 13,855 14,158
EMERGENCY DEPARTMENT VISITS
Emergency Room - Treated and Admitted 8,816 8,487 8,487 8,809
Emergency Room - Treated and Discharged 83,476 85,981 86,806 85,082
Total Emergency Room Visits 92,292 94,468 95,293 93,891
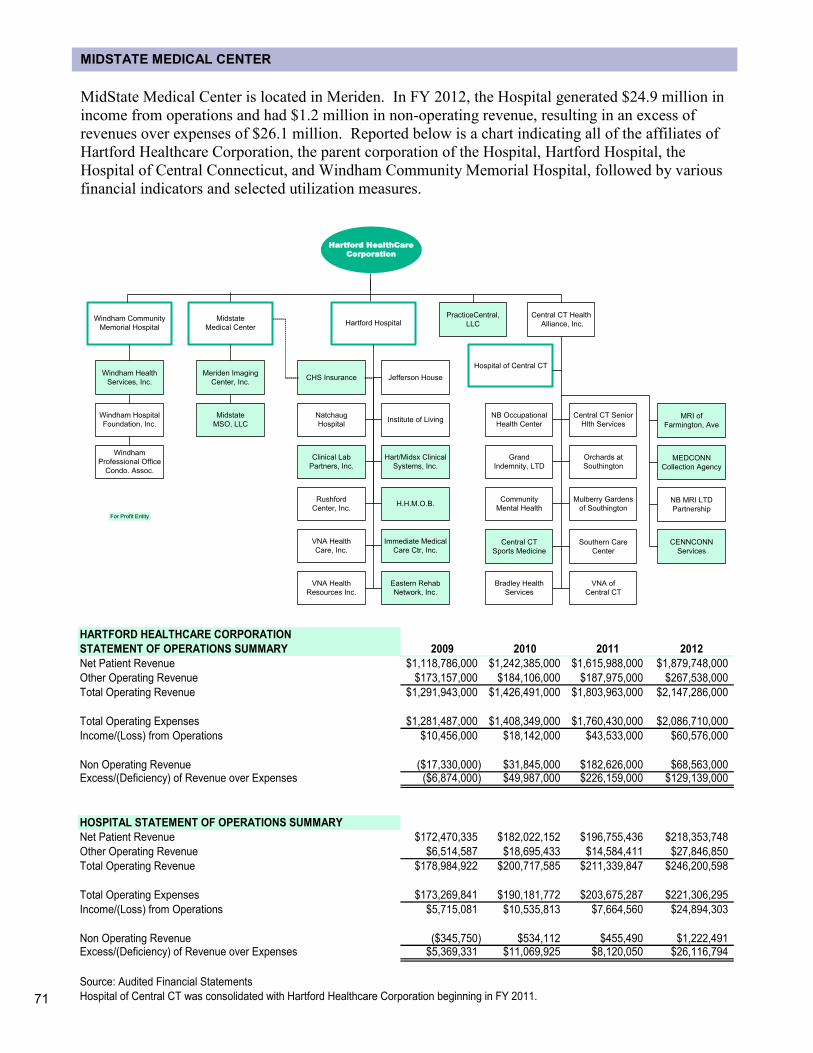
71
MIDSTATE MEDICAL CENTER
MidState Medical Center is located in Meriden. In FY 2012, the Hospital generated $24.9 million in
income from operations and had $1.2 million in non-operating revenue, resulting in an excess of
revenues over expenses of $26.1 million. Reported below is a chart indicating all of the affiliates of
Hartford Healthcare Corporation, the parent corporation of the Hospital, Hartford Hospital, the
Hospital of Central Connecticut, and Windham Community Memorial Hospital, followed by various
financial indicators and selected utilization measures.
Hartford HealthCare
Corporation
For Profit Entity
Hospital of Central CT
Hartford HospitalMidstate
Medical Center
Midstate
MSO, LLC
Meriden Imaging
Center, Inc.
Windham Hospital
Foundation, Inc.
Windham
Professional Office
Condo. Assoc.
Windham Health
Services, Inc.
Windham Community
Memorial Hospital
Natchaug
Hospital
Clinical Lab
Partners, Inc.
Rushford
Center, Inc.H.H.M.O.B.
Immediate Medical
Care Ctr, Inc.
Eastern Rehab
Network, Inc.
Jefferson House
Institute of Living
Hart/Midsx Clinical
Systems, Inc.
VNA Health
Care, Inc.
VNA Health
Resources Inc.
CHS Insurance
Grand
Indemnity, LTD
Community
Mental Health
Central CT
Sports Medicine
Bradley Health
Services
CENNCONN
Services
MEDCONN
Collection Agency
MRI of
Farmington, Ave
VNA of
Central CT
Southern Care
Center
Central CT Senior
Hlth Services
Mulberry Gardens
of Southington
Orchards at
Southington
NB MRI LTD
Partnership
NB Occupational
Health Center
Central CT Health
Alliance, Inc.
PracticeCentral,
LLC
HARTFORD HEALTHCARE CORPORATION
STATEMENT OF OPERATIONS SUMMARY 2009 2010 2011 2012
Net Patient Revenue $1,118,786,000 $1,242,385,000 $1,615,988,000 $1,879,748,000
Other Operating Revenue $173,157,000 $184,106,000 $187,975,000 $267,538,000
Total Operating Revenue $1,291,943,000 $1,426,491,000 $1,803,963,000 $2,147,286,000
Total Operating Expenses $1,281,487,000 $1,408,349,000 $1,760,430,000 $2,086,710,000
Income/(Loss) from Operations $10,456,000 $18,142,000 $43,533,000 $60,576,000
Non Operating Revenue ($17,330,000) $31,845,000 $182,626,000 $68,563,000Excess/(Deficiency) of Revenue over Expenses ($6,874,000) $49,987,000 $226,159,000 $129,139,000
HOSPITAL STATEMENT OF OPERATIONS SUMMARY
Net Patient Revenue $172,470,335 $182,022,152 $196,755,436 $218,353,748
Other Operating Revenue $6,514,587 $18,695,433 $14,584,411 $27,846,850
Total Operating Revenue $178,984,922 $200,717,585 $211,339,847 $246,200,598
Total Operating Expenses $173,269,841 $190,181,772 $203,675,287 $221,306,295
Income/(Loss) from Operations $5,715,081 $10,535,813 $7,664,560 $24,894,303
Non Operating Revenue ($345,750) $534,112 $455,490 $1,222,491Excess/(Deficiency) of Revenue over Expenses $5,369,331 $11,069,925 $8,120,050 $26,116,794
Source: Audited Financial Statements
Hospital of Central CT was consolidated with Hartford Healthcare Corporation beginning in FY 2011.
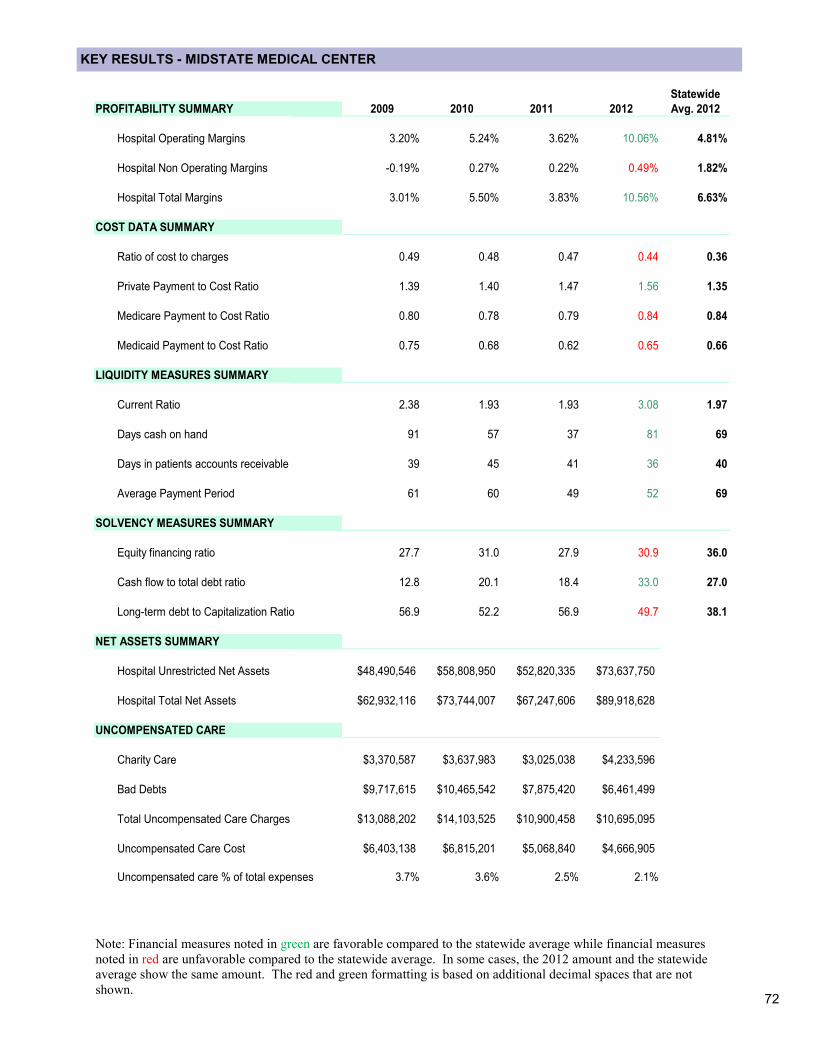
72
KEY RESULTS - MIDSTATE MEDICAL CENTER
Note: Financial measures noted in green are favorable compared to the statewide average while financial measures
noted in red are unfavorable compared to the statewide average. In some cases, the 2012 amount and the statewide
average show the same amount. The red and green formatting is based on additional decimal spaces that are not
shown.
Statewide
PROFITABILITY SUMMARY 2009 2010 2011 2012 Avg. 2012
Hospital Operating Margins 3.20% 5.24% 3.62% 10.06% 4.81%
Hospital Non Operating Margins -0.19% 0.27% 0.22% 0.49% 1.82%
Hospital Total Margins 3.01% 5.50% 3.83% 10.56% 6.63%
COST DATA SUMMARY
Ratio of cost to charges 0.49 0.48 0.47 0.44 0.36
Private Payment to Cost Ratio 1.39 1.40 1.47 1.56 1.35
Medicare Payment to Cost Ratio 0.80 0.78 0.79 0.84 0.84
Medicaid Payment to Cost Ratio 0.75 0.68 0.62 0.65 0.66
LIQUIDITY MEASURES SUMMARY
Current Ratio 2.38 1.93 1.93 3.08 1.97
Days cash on hand 91 57 37 81 69
Days in patients accounts receivable 39 45 41 36 40
Average Payment Period 61 60 49 52 69
SOLVENCY MEASURES SUMMARY
Equity financing ratio 27.7 31.0 27.9 30.9 36.0
Cash flow to total debt ratio 12.8 20.1 18.4 33.0 27.0
Long-term debt to Capitalization Ratio 56.9 52.2 56.9 49.7 38.1
NET ASSETS SUMMARY
Hospital Unrestricted Net Assets $48,490,546 $58,808,950 $52,820,335 $73,637,750
Hospital Total Net Assets $62,932,116 $73,744,007 $67,247,606 $89,918,628
UNCOMPENSATED CARE
Charity Care $3,370,587 $3,637,983 $3,025,038 $4,233,596
Bad Debts $9,717,615 $10,465,542 $7,875,420 $6,461,499
Total Uncompensated Care Charges $13,088,202 $14,103,525 $10,900,458 $10,695,095
Uncompensated Care Cost $6,403,138 $6,815,201 $5,068,840 $4,666,905
Uncompensated care % of total expenses 3.7% 3.6% 2.5% 2.1%
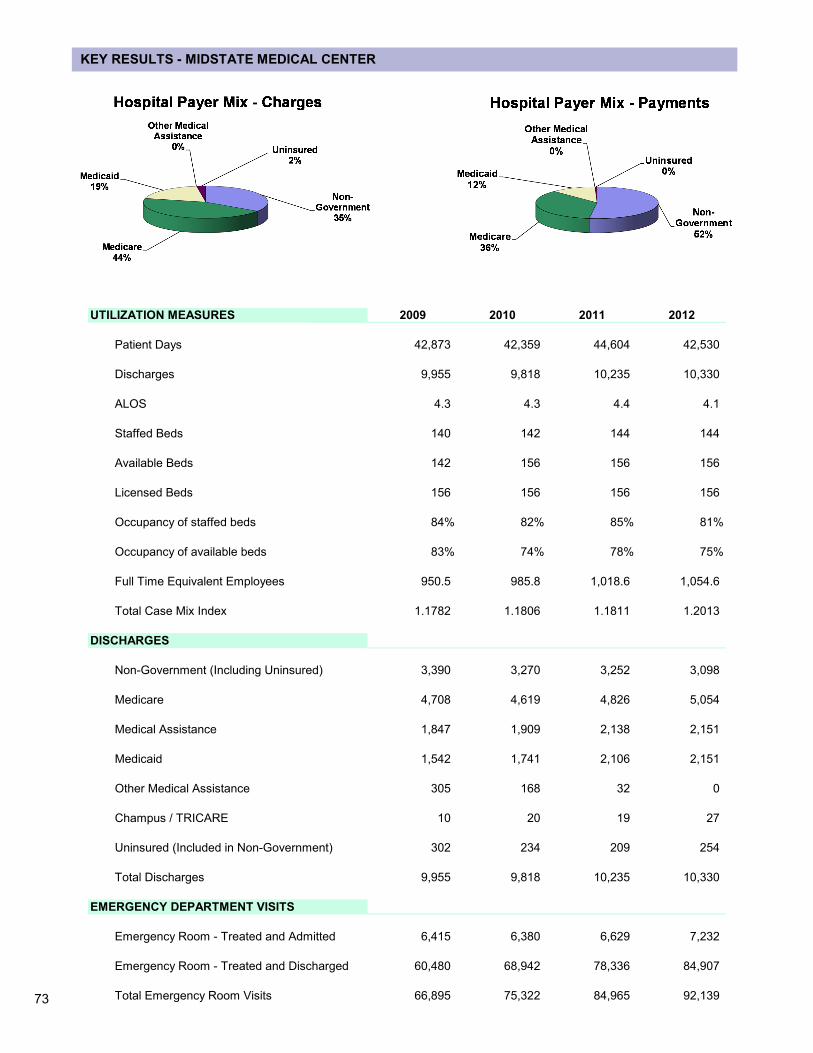
73
KEY RESULTS - MIDSTATE MEDICAL CENTER
UTILIZATION MEASURES 2009 2010 2011 2012
Patient Days 42,873 42,359 44,604 42,530
Discharges 9,955 9,818 10,235 10,330
ALOS 4.3 4.3 4.4 4.1
Staffed Beds 140 142 144 144
Available Beds 142 156 156 156
Licensed Beds 156 156 156 156
Occupancy of staffed beds 84% 82% 85% 81%
Occupancy of available beds 83% 74% 78% 75%
Full Time Equivalent Employees 950.5 985.8 1,018.6 1,054.6
Total Case Mix Index 1.1782 1.1806 1.1811 1.2013
DISCHARGES
Non-Government (Including Uninsured) 3,390 3,270 3,252 3,098
Medicare 4,708 4,619 4,826 5,054
Medical Assistance 1,847 1,909 2,138 2,151
Medicaid 1,542 1,741 2,106 2,151
Other Medical Assistance 305 168 32 0
Champus / TRICARE 10 20 19 27
Uninsured (Included in Non-Government) 302 234 209 254
Total Discharges 9,955 9,818 10,235 10,330
EMERGENCY DEPARTMENT VISITS
Emergency Room - Treated and Admitted 6,415 6,380 6,629 7,232
Emergency Room - Treated and Discharged 60,480 68,942 78,336 84,907
Total Emergency Room Visits 66,895 75,322 84,965 92,139
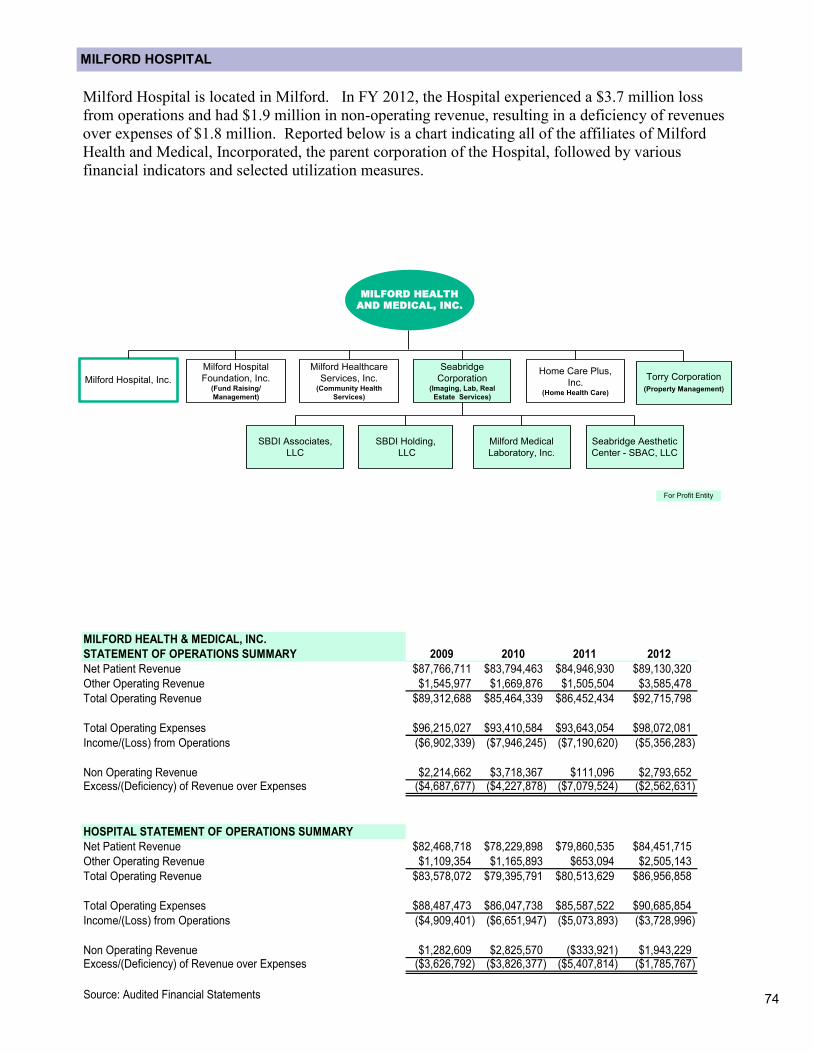
74
MILFORD HOSPITAL
Milford Hospital is located in Milford. In FY 2012, the Hospital experienced a $3.7 million loss
from operations and had $1.9 million in non-operating revenue, resulting in a deficiency of revenues
over expenses of $1.8 million. Reported below is a chart indicating all of the affiliates of Milford
Health and Medical, Incorporated, the parent corporation of the Hospital, followed by various
financial indicators and selected utilization measures.
Milford Healthcare
Services, Inc.(Community Health
Services)
Milford Hospital
Foundation, Inc.(Fund Raising/
Management)
Milford Hospital, Inc.
Seabridge
Corporation(Imaging, Lab, Real
Estate Services)
Home Care Plus,
Inc.(Home Health Care)
SBDI Holding,
LLC
MILFORD HEALTH
AND MEDICAL, INC.
For Profit Entity
Torry Corporation
(Property Management)
SBDI Associates,
LLC
Milford Medical
Laboratory, Inc.
Seabridge Aesthetic
Center - SBAC, LLC
MILFORD HEALTH & MEDICAL, INC.
STATEMENT OF OPERATIONS SUMMARY 2009 2010 2011 2012
Net Patient Revenue $87,766,711 $83,794,463 $84,946,930 $89,130,320
Other Operating Revenue $1,545,977 $1,669,876 $1,505,504 $3,585,478
Total Operating Revenue $89,312,688 $85,464,339 $86,452,434 $92,715,798
Total Operating Expenses $96,215,027 $93,410,584 $93,643,054 $98,072,081
Income/(Loss) from Operations ($6,902,339) ($7,946,245) ($7,190,620) ($5,356,283)
Non Operating Revenue $2,214,662 $3,718,367 $111,096 $2,793,652Excess/(Deficiency) of Revenue over Expenses ($4,687,677) ($4,227,878) ($7,079,524) ($2,562,631)
HOSPITAL STATEMENT OF OPERATIONS SUMMARY
Net Patient Revenue $82,468,718 $78,229,898 $79,860,535 $84,451,715
Other Operating Revenue $1,109,354 $1,165,893 $653,094 $2,505,143
Total Operating Revenue $83,578,072 $79,395,791 $80,513,629 $86,956,858
Total Operating Expenses $88,487,473 $86,047,738 $85,587,522 $90,685,854
Income/(Loss) from Operations ($4,909,401) ($6,651,947) ($5,073,893) ($3,728,996)
Non Operating Revenue $1,282,609 $2,825,570 ($333,921) $1,943,229Excess/(Deficiency) of Revenue over Expenses ($3,626,792) ($3,826,377) ($5,407,814) ($1,785,767)
Source: Audited Financial Statements

75
KEY RESULTS - MILFORD HOSPITAL
Note: Financial measures noted in green are favorable compared to the statewide average while financial measures
noted in red are unfavorable compared to the statewide average. In some cases, the 2012 amount and the statewide
average show the same amount. The red and green formatting is based on additional decimal spaces that are not
shown.
Statewide
PROFITABILITY SUMMARY 2009 2010 2011 2012 Avg. 2012
Hospital Operating Margins -5.79% -8.09% -6.33% -4.19% 4.81%
Hospital Non Operating Margins 1.51% 3.44% -0.42% 2.19% 1.82%
Hospital Total Margins -4.27% -4.65% -6.74% -2.01% 6.63%
COST DATA SUMMARY
Ratio of cost to charges 0.40 0.42 0.46 0.47 0.36
Private Payment to Cost Ratio 1.07 1.02 1.01 1.01 1.35
Medicare Payment to Cost Ratio 0.75 0.74 0.75 0.70 0.84
Medicaid Payment to Cost Ratio 0.53 0.54 0.56 0.56 0.66
LIQUIDITY MEASURES SUMMARY
Current Ratio 1.01 0.99 1.03 1.04 1.97
Days cash on hand 6 2 5 3 69
Days in patients accounts receivable 49 48 48 49 40
Average Payment Period 72 69 72 67 69
SOLVENCY MEASURES SUMMARY
Equity financing ratio 47.9 37.1 24.0 12.5 36.0
Cash flow to total debt ratio 1.8 -1.4 -12.9 6.2 27.0
Long-term debt to Capitalization Ratio 6.8 6.6 5.7 0.0 38.1
NET ASSETS SUMMARY
Hospital Unrestricted Net Assets $36,805,806 $25,485,476 $14,195,295 $5,927,259
Hospital Total Net Assets $38,098,899 $26,811,974 $15,495,219 $7,270,463
UNCOMPENSATED CARE
Charity Care $122,057 $299,029 $187,766 $192,533
Bad Debts $6,998,451 $6,738,669 $7,611,773 $7,028,914
Total Uncompensated Care Charges $7,120,508 $7,037,698 $7,799,539 $7,221,447
Uncompensated Care Cost $2,865,432 $2,952,944 $3,612,969 $3,412,141
Uncompensated care % of total expenses 3.2% 3.4% 4.2% 3.8%
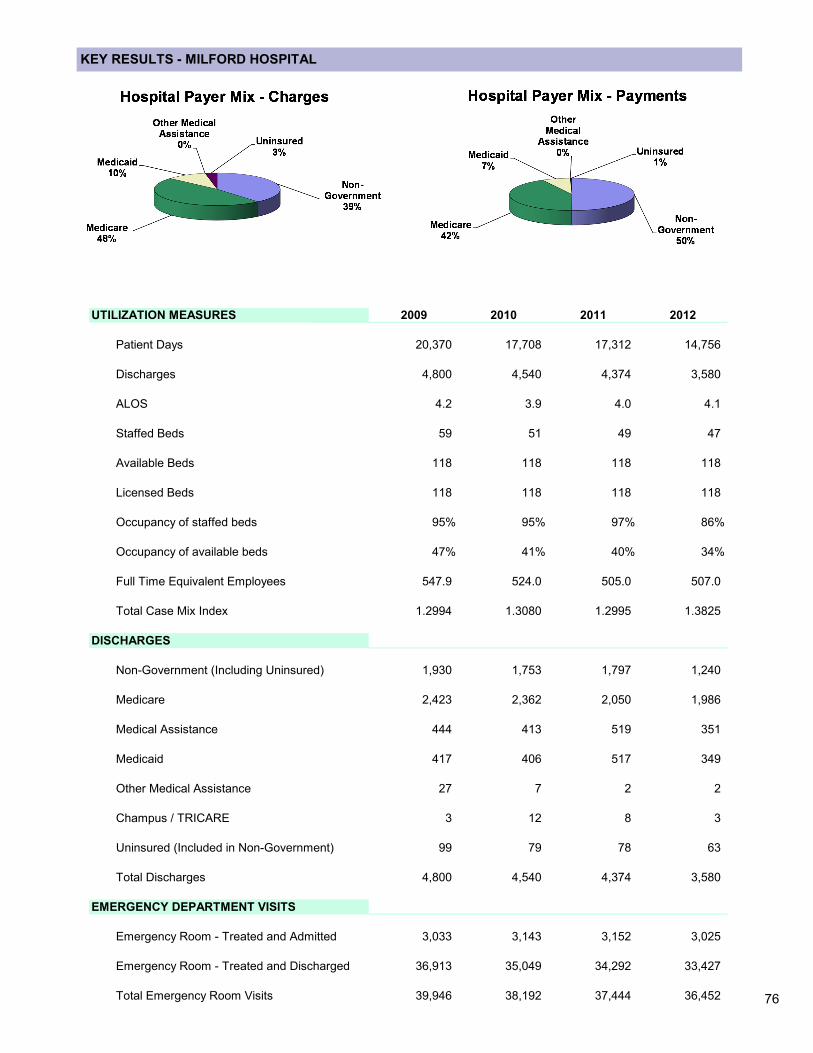
76
KEY RESULTS - MILFORD HOSPITAL
UTILIZATION MEASURES 2009 2010 2011 2012
Patient Days 20,370 17,708 17,312 14,756
Discharges 4,800 4,540 4,374 3,580
ALOS 4.2 3.9 4.0 4.1
Staffed Beds 59 51 49 47
Available Beds 118 118 118 118
Licensed Beds 118 118 118 118
Occupancy of staffed beds 95% 95% 97% 86%
Occupancy of available beds 47% 41% 40% 34%
Full Time Equivalent Employees 547.9 524.0 505.0 507.0
Total Case Mix Index 1.2994 1.3080 1.2995 1.3825
DISCHARGES
Non-Government (Including Uninsured) 1,930 1,753 1,797 1,240
Medicare 2,423 2,362 2,050 1,986
Medical Assistance 444 413 519 351
Medicaid 417 406 517 349
Other Medical Assistance 27 7 2 2
Champus / TRICARE 3 12 8 3
Uninsured (Included in Non-Government) 99 79 78 63
Total Discharges 4,800 4,540 4,374 3,580
EMERGENCY DEPARTMENT VISITS
Emergency Room - Treated and Admitted 3,033 3,143 3,152 3,025
Emergency Room - Treated and Discharged 36,913 35,049 34,292 33,427
Total Emergency Room Visits 39,946 38,192 37,444 36,452
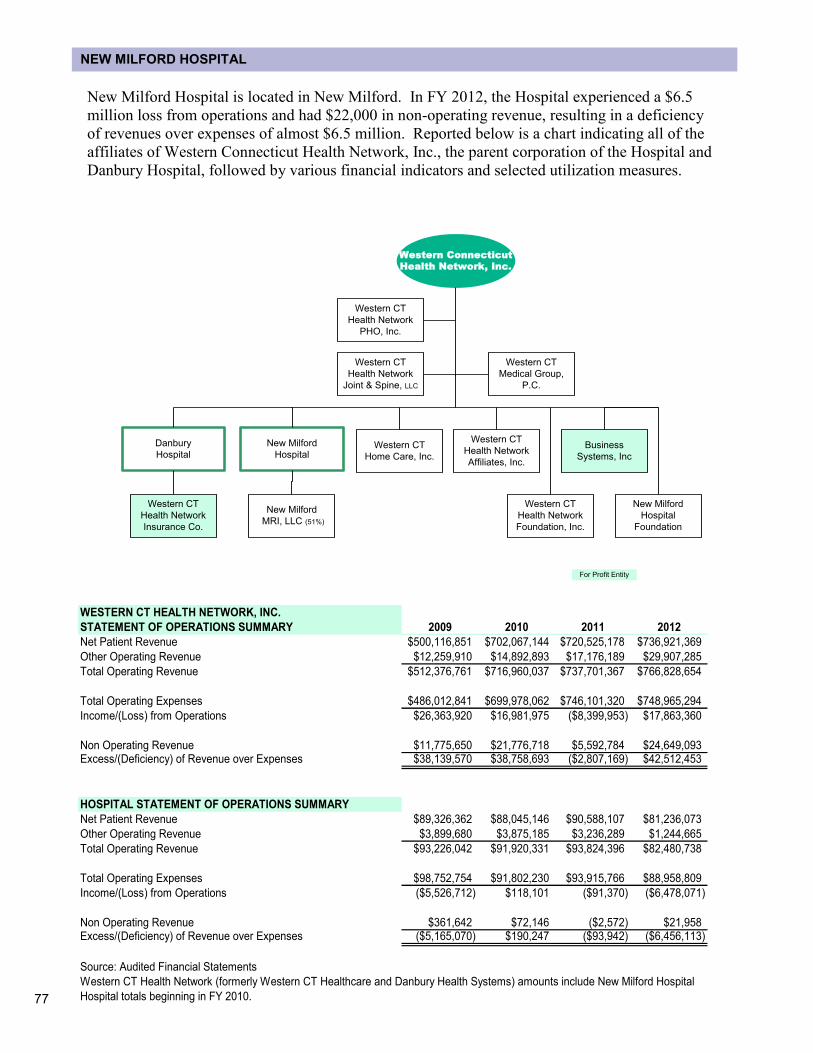
77
NEW MILFORD HOSPITAL
New Milford Hospital is located in New Milford. In FY 2012, the Hospital experienced a $6.5
million loss from operations and had $22,000 in non-operating revenue, resulting in a deficiency
of revenues over expenses of almost $6.5 million. Reported below is a chart indicating all of the
affiliates of Western Connecticut Health Network, Inc., the parent corporation of the Hospital and
Danbury Hospital, followed by various financial indicators and selected utilization measures.
Business
Systems, Inc
For Profit Entity
Western Connecticut
Health Network, Inc.
Western CT
Home Care, Inc.
Danbury
Hospital
New Milford
Hospital
Foundation
Western CT
Health Network
Affiliates, Inc.
New Milford
Hospital
Western CT
Health Network
Insurance Co.
New Milford
MRI, LLC (51%)
Western CT
Medical Group,
P.C.
Western CT
Health Network
Joint & Spine, LLC
Western CT
Health Network
Foundation, Inc.
Western CT
Health Network
PHO, Inc.
WESTERN CT HEALTH NETWORK, INC.
STATEMENT OF OPERATIONS SUMMARY 2009 2010 2011 2012
Net Patient Revenue $500,116,851 $702,067,144 $720,525,178 $736,921,369
Other Operating Revenue $12,259,910 $14,892,893 $17,176,189 $29,907,285
Total Operating Revenue $512,376,761 $716,960,037 $737,701,367 $766,828,654
Total Operating Expenses $486,012,841 $699,978,062 $746,101,320 $748,965,294
Income/(Loss) from Operations $26,363,920 $16,981,975 ($8,399,953) $17,863,360
Non Operating Revenue $11,775,650 $21,776,718 $5,592,784 $24,649,093Excess/(Deficiency) of Revenue over Expenses $38,139,570 $38,758,693 ($2,807,169) $42,512,453
HOSPITAL STATEMENT OF OPERATIONS SUMMARY
Net Patient Revenue $89,326,362 $88,045,146 $90,588,107 $81,236,073
Other Operating Revenue $3,899,680 $3,875,185 $3,236,289 $1,244,665
Total Operating Revenue $93,226,042 $91,920,331 $93,824,396 $82,480,738
Total Operating Expenses $98,752,754 $91,802,230 $93,915,766 $88,958,809
Income/(Loss) from Operations ($5,526,712) $118,101 ($91,370) ($6,478,071)
Non Operating Revenue $361,642 $72,146 ($2,572) $21,958Excess/(Deficiency) of Revenue over Expenses ($5,165,070) $190,247 ($93,942) ($6,456,113)
Source: Audited Financial Statements
Western CT Health Network (formerly Western CT Healthcare and Danbury Health Systems) amounts include New Milford Hospital
Hospital totals beginning in FY 2010.
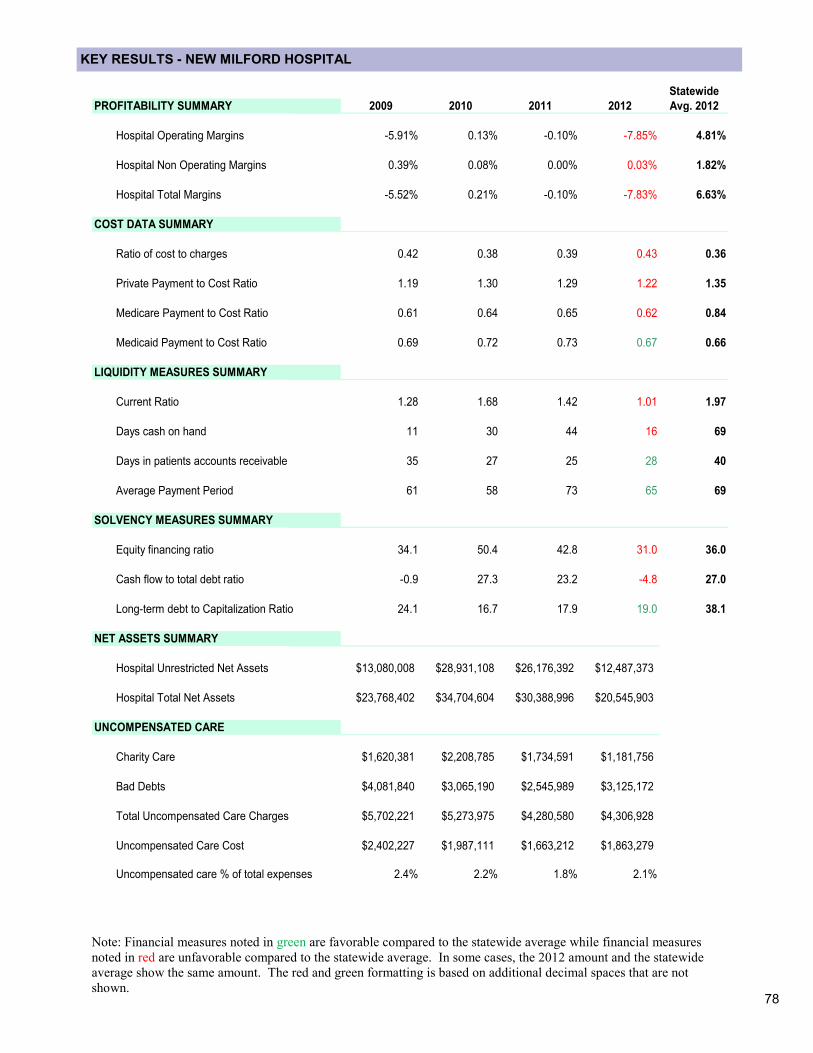
78
KEY RESULTS - NEW MILFORD HOSPITAL
Note: Financial measures noted in green are favorable compared to the statewide average while financial measures
noted in red are unfavorable compared to the statewide average. In some cases, the 2012 amount and the statewide
average show the same amount. The red and green formatting is based on additional decimal spaces that are not
shown.
Statewide
PROFITABILITY SUMMARY 2009 2010 2011 2012 Avg. 2012
Hospital Operating Margins -5.91% 0.13% -0.10% -7.85% 4.81%
Hospital Non Operating Margins 0.39% 0.08% 0.00% 0.03% 1.82%
Hospital Total Margins -5.52% 0.21% -0.10% -7.83% 6.63%
COST DATA SUMMARY
Ratio of cost to charges 0.42 0.38 0.39 0.43 0.36
Private Payment to Cost Ratio 1.19 1.30 1.29 1.22 1.35
Medicare Payment to Cost Ratio 0.61 0.64 0.65 0.62 0.84
Medicaid Payment to Cost Ratio 0.69 0.72 0.73 0.67 0.66
LIQUIDITY MEASURES SUMMARY
Current Ratio 1.28 1.68 1.42 1.01 1.97
Days cash on hand 11 30 44 16 69
Days in patients accounts receivable 35 27 25 28 40
Average Payment Period 61 58 73 65 69
SOLVENCY MEASURES SUMMARY
Equity financing ratio 34.1 50.4 42.8 31.0 36.0
Cash flow to total debt ratio -0.9 27.3 23.2 -4.8 27.0
Long-term debt to Capitalization Ratio 24.1 16.7 17.9 19.0 38.1
NET ASSETS SUMMARY
Hospital Unrestricted Net Assets $13,080,008 $28,931,108 $26,176,392 $12,487,373
Hospital Total Net Assets $23,768,402 $34,704,604 $30,388,996 $20,545,903
UNCOMPENSATED CARE
Charity Care $1,620,381 $2,208,785 $1,734,591 $1,181,756
Bad Debts $4,081,840 $3,065,190 $2,545,989 $3,125,172
Total Uncompensated Care Charges $5,702,221 $5,273,975 $4,280,580 $4,306,928
Uncompensated Care Cost $2,402,227 $1,987,111 $1,663,212 $1,863,279
Uncompensated care % of total expenses 2.4% 2.2% 1.8% 2.1%
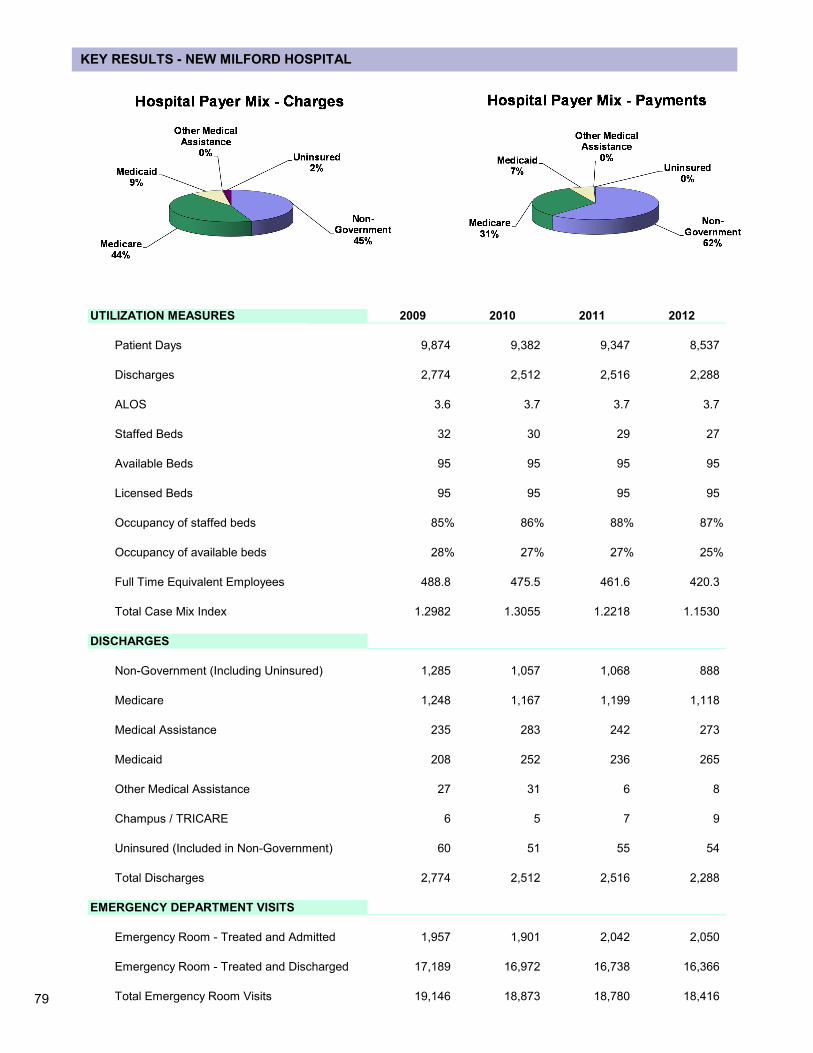
79
KEY RESULTS - NEW MILFORD HOSPITAL
UTILIZATION MEASURES 2009 2010 2011 2012
Patient Days 9,874 9,382 9,347 8,537
Discharges 2,774 2,512 2,516 2,288
ALOS 3.6 3.7 3.7 3.7
Staffed Beds 32 30 29 27
Available Beds 95 95 95 95
Licensed Beds 95 95 95 95
Occupancy of staffed beds 85% 86% 88% 87%
Occupancy of available beds 28% 27% 27% 25%
Full Time Equivalent Employees 488.8 475.5 461.6 420.3
Total Case Mix Index 1.2982 1.3055 1.2218 1.1530
DISCHARGES
Non-Government (Including Uninsured) 1,285 1,057 1,068 888
Medicare 1,248 1,167 1,199 1,118
Medical Assistance 235 283 242 273
Medicaid 208 252 236 265
Other Medical Assistance 27 31 6 8
Champus / TRICARE 6 5 7 9
Uninsured (Included in Non-Government) 60 51 55 54
Total Discharges 2,774 2,512 2,516 2,288
EMERGENCY DEPARTMENT VISITS
Emergency Room - Treated and Admitted 1,957 1,901 2,042 2,050
Emergency Room - Treated and Discharged 17,189 16,972 16,738 16,366
Total Emergency Room Visits 19,146 18,873 18,780 18,416
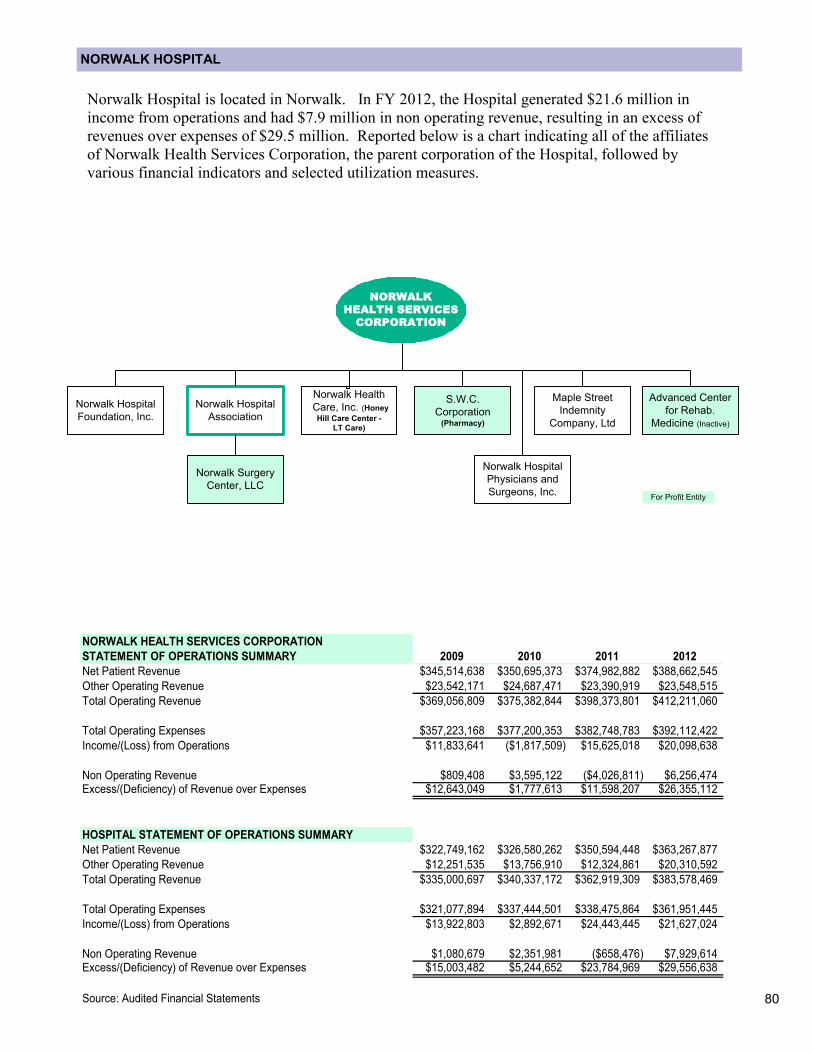
80
NORWALK HOSPITAL
Norwalk Hospital is located in Norwalk. In FY 2012, the Hospital generated $21.6 million in
income from operations and had $7.9 million in non operating revenue, resulting in an excess of
revenues over expenses of $29.5 million. Reported below is a chart indicating all of the affiliates
of Norwalk Health Services Corporation, the parent corporation of the Hospital, followed by
various financial indicators and selected utilization measures.
Norwalk Health
Care, Inc. (Honey
Hill Care Center -
LT Care)
Norwalk Hospital
Foundation, Inc.
Norwalk Hospital
Association
S.W.C.
Corporation(Pharmacy)
NORWALK
HEALTH SERVICES
CORPORATION
For Profit Entity
Maple Street
Indemnity
Company, Ltd
Norwalk Surgery
Center, LLC
Norwalk Hospital
Physicians and
Surgeons, Inc.
Advanced Center
for Rehab.
Medicine (Inactive)
NORWALK HEALTH SERVICES CORPORATION
STATEMENT OF OPERATIONS SUMMARY 2009 2010 2011 2012
Net Patient Revenue $345,514,638 $350,695,373 $374,982,882 $388,662,545
Other Operating Revenue $23,542,171 $24,687,471 $23,390,919 $23,548,515
Total Operating Revenue $369,056,809 $375,382,844 $398,373,801 $412,211,060
Total Operating Expenses $357,223,168 $377,200,353 $382,748,783 $392,112,422
Income/(Loss) from Operations $11,833,641 ($1,817,509) $15,625,018 $20,098,638
Non Operating Revenue $809,408 $3,595,122 ($4,026,811) $6,256,474Excess/(Deficiency) of Revenue over Expenses $12,643,049 $1,777,613 $11,598,207 $26,355,112
HOSPITAL STATEMENT OF OPERATIONS SUMMARY
Net Patient Revenue $322,749,162 $326,580,262 $350,594,448 $363,267,877
Other Operating Revenue $12,251,535 $13,756,910 $12,324,861 $20,310,592
Total Operating Revenue $335,000,697 $340,337,172 $362,919,309 $383,578,469
Total Operating Expenses $321,077,894 $337,444,501 $338,475,864 $361,951,445
Income/(Loss) from Operations $13,922,803 $2,892,671 $24,443,445 $21,627,024
Non Operating Revenue $1,080,679 $2,351,981 ($658,476) $7,929,614Excess/(Deficiency) of Revenue over Expenses $15,003,482 $5,244,652 $23,784,969 $29,556,638
Source: Audited Financial Statements

81
KEY RESULTS - NORWALK HOSPITAL
Note: Financial measures noted in green are favorable compared to the statewide average while financial measures
noted in red are unfavorable compared to the statewide average. In some cases, the 2012 amount and the statewide
average show the same amount. The red and green formatting is based on additional decimal spaces that are not
shown.
Statewide
PROFITABILITY SUMMARY 2009 2010 2011 2012 Avg. 2012
Hospital Operating Margins 4.14% 0.84% 6.75% 5.52% 4.81%
Hospital Non Operating Margins 0.32% 0.69% -0.18% 2.03% 1.82%
Hospital Total Margins 4.46% 1.53% 6.57% 7.55% 6.63%
COST DATA SUMMARY
Ratio of cost to charges 0.48 0.45 0.39 0.39 0.36
Private Payment to Cost Ratio 1.31 1.27 1.46 1.40 1.35
Medicare Payment to Cost Ratio 0.74 0.70 0.71 0.67 0.84
Medicaid Payment to Cost Ratio 0.60 0.58 0.65 0.69 0.66
LIQUIDITY MEASURES SUMMARY
Current Ratio 2.30 2.05 2.13 2.21 1.97
Days cash on hand 29 40 80 95 69
Days in patients accounts receivable 48 45 34 28 40
Average Payment Period 42 46 62 63 69
SOLVENCY MEASURES SUMMARY
Equity financing ratio 55.8 51.4 38.8 38.0 36.0
Cash flow to total debt ratio 63.7 45.4 38.3 44.7 27.0
Long-term debt to Capitalization Ratio 10.5 10.4 29.9 24.0 38.1
NET ASSETS SUMMARY
Hospital Unrestricted Net Assets $125,849,836 $111,900,976 $104,824,797 $123,000,420
Hospital Total Net Assets $148,919,922 $135,176,638 $135,696,801 $166,692,992
UNCOMPENSATED CARE
Charity Care $17,554,000 $18,026,000 $17,327,000 $17,929,000
Bad Debts $21,000,769 $23,255,695 $20,654,069 $23,530,477
Total Uncompensated Care Charges $38,554,769 $41,281,695 $37,981,069 $41,459,477
Uncompensated Care Cost $18,357,526 $18,455,851 $14,840,041 $16,148,519
Uncompensated care % of total expenses 5.7% 5.5% 4.4% 4.5%
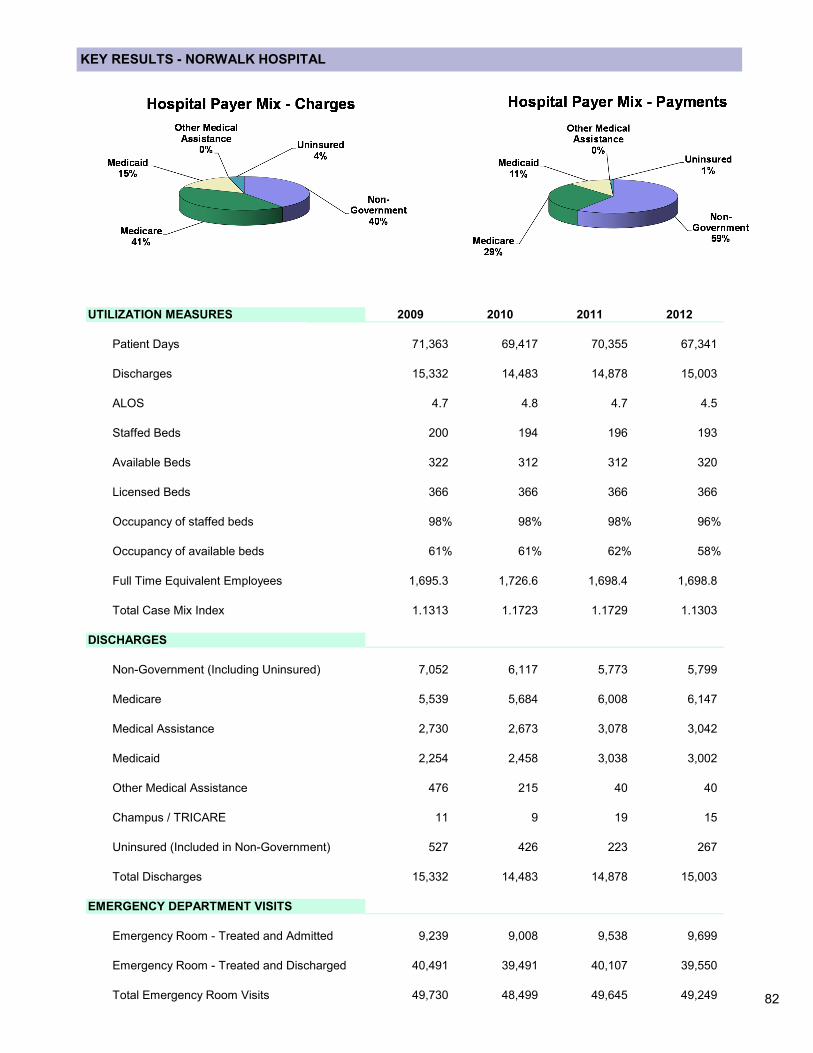
82
KEY RESULTS - NORWALK HOSPITAL
UTILIZATION MEASURES 2009 2010 2011 2012
Patient Days 71,363 69,417 70,355 67,341
Discharges 15,332 14,483 14,878 15,003
ALOS 4.7 4.8 4.7 4.5
Staffed Beds 200 194 196 193
Available Beds 322 312 312 320
Licensed Beds 366 366 366 366
Occupancy of staffed beds 98% 98% 98% 96%
Occupancy of available beds 61% 61% 62% 58%
Full Time Equivalent Employees 1,695.3 1,726.6 1,698.4 1,698.8
Total Case Mix Index 1.1313 1.1723 1.1729 1.1303
DISCHARGES
Non-Government (Including Uninsured) 7,052 6,117 5,773 5,799
Medicare 5,539 5,684 6,008 6,147
Medical Assistance 2,730 2,673 3,078 3,042
Medicaid 2,254 2,458 3,038 3,002
Other Medical Assistance 476 215 40 40
Champus / TRICARE 11 9 19 15
Uninsured (Included in Non-Government) 527 426 223 267
Total Discharges 15,332 14,483 14,878 15,003
EMERGENCY DEPARTMENT VISITS
Emergency Room - Treated and Admitted 9,239 9,008 9,538 9,699
Emergency Room - Treated and Discharged 40,491 39,491 40,107 39,550
Total Emergency Room Visits 49,730 48,499 49,645 49,249
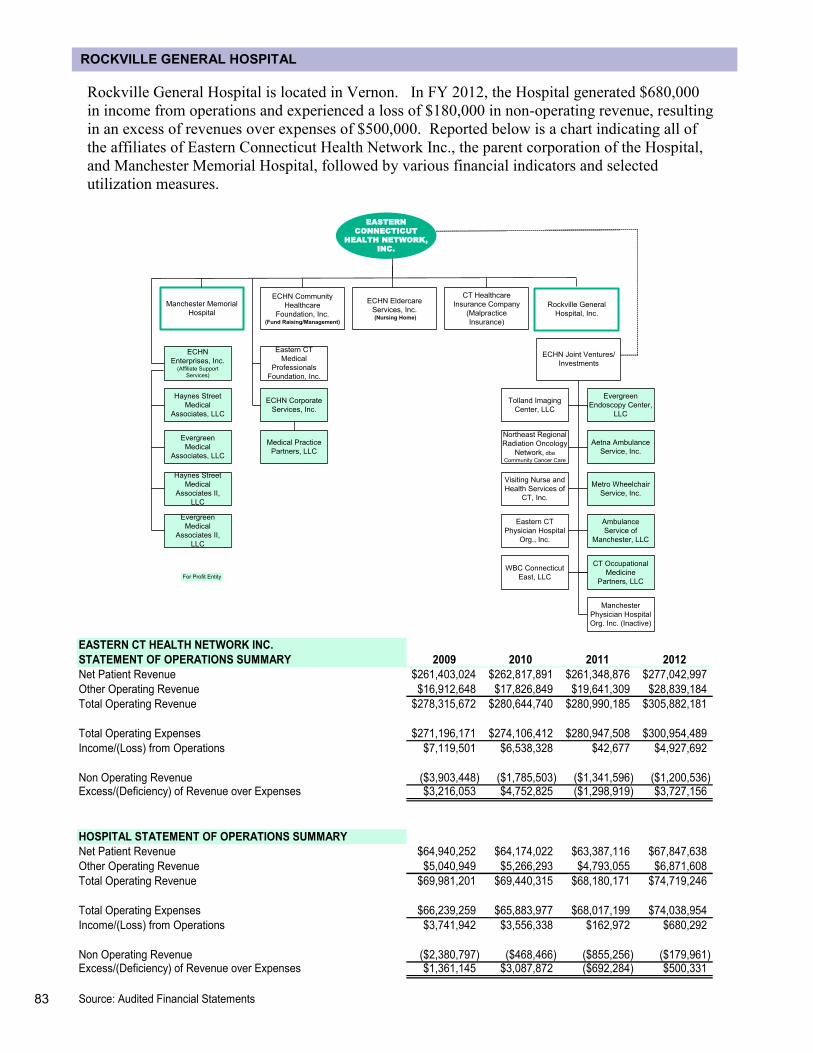
83
ROCKVILLE GENERAL HOSPITAL
Rockville General Hospital is located in Vernon. In FY 2012, the Hospital generated $680,000
in income from operations and experienced a loss of $180,000 in non-operating revenue, resulting
in an excess of revenues over expenses of $500,000. Reported below is a chart indicating all of
the affiliates of Eastern Connecticut Health Network Inc., the parent corporation of the Hospital,
and Manchester Memorial Hospital, followed by various financial indicators and selected
utilization measures.
Manchester Memorial
Hospital
ECHN Community
Healthcare
Foundation, Inc.(Fund Raising/Management)
ECHN Eldercare
Services, Inc. (Nursing Home)
EASTERN
CONNECTICUT
HEALTH NETWORK,
INC.
For Profit Entity
ECHN
Enterprises, Inc.(Affiliate Support
Services)
Rockville General
Hospital, Inc.
ECHN Joint Ventures/
Investments
CT Healthcare
Insurance Company
(Malpractice
Insurance)
Haynes Street
Medical
Associates, LLC
Haynes Street
Medical
Associates II,
LLC
Evergreen
Medical
Associates II,
LLC
Evergreen
Medical
Associates, LLC
Ambulance
Service of
Manchester, LLC
Metro Wheelchair
Service, Inc.
Aetna Ambulance
Service, Inc.
CT Occupational
Medicine
Partners, LLC
Evergreen
Endoscopy Center,
LLC
Visiting Nurse and
Health Services of
CT, Inc.
Northeast Regional
Radiation Oncology
Network, dba
Community Cancer Care
Tolland Imaging
Center, LLC
Eastern CT
Physician Hospital
Org., Inc.
WBC Connecticut
East, LLC
Medical Practice
Partners, LLC
Eastern CT
Medical
Professionals
Foundation, Inc.
ECHN Corporate
Services, Inc.
Manchester
Physician Hospital
Org. Inc. (Inactive)
EASTERN CT HEALTH NETWORK INC.
STATEMENT OF OPERATIONS SUMMARY 2009 2010 2011 2012
Net Patient Revenue $261,403,024 $262,817,891 $261,348,876 $277,042,997
Other Operating Revenue $16,912,648 $17,826,849 $19,641,309 $28,839,184
Total Operating Revenue $278,315,672 $280,644,740 $280,990,185 $305,882,181
Total Operating Expenses $271,196,171 $274,106,412 $280,947,508 $300,954,489
Income/(Loss) from Operations $7,119,501 $6,538,328 $42,677 $4,927,692
Non Operating Revenue ($3,903,448) ($1,785,503) ($1,341,596) ($1,200,536)Excess/(Deficiency) of Revenue over Expenses $3,216,053 $4,752,825 ($1,298,919) $3,727,156
HOSPITAL STATEMENT OF OPERATIONS SUMMARY
Net Patient Revenue $64,940,252 $64,174,022 $63,387,116 $67,847,638
Other Operating Revenue $5,040,949 $5,266,293 $4,793,055 $6,871,608
Total Operating Revenue $69,981,201 $69,440,315 $68,180,171 $74,719,246
Total Operating Expenses $66,239,259 $65,883,977 $68,017,199 $74,038,954
Income/(Loss) from Operations $3,741,942 $3,556,338 $162,972 $680,292
Non Operating Revenue ($2,380,797) ($468,466) ($855,256) ($179,961)Excess/(Deficiency) of Revenue over Expenses $1,361,145 $3,087,872 ($692,284) $500,331
Source: Audited Financial Statements
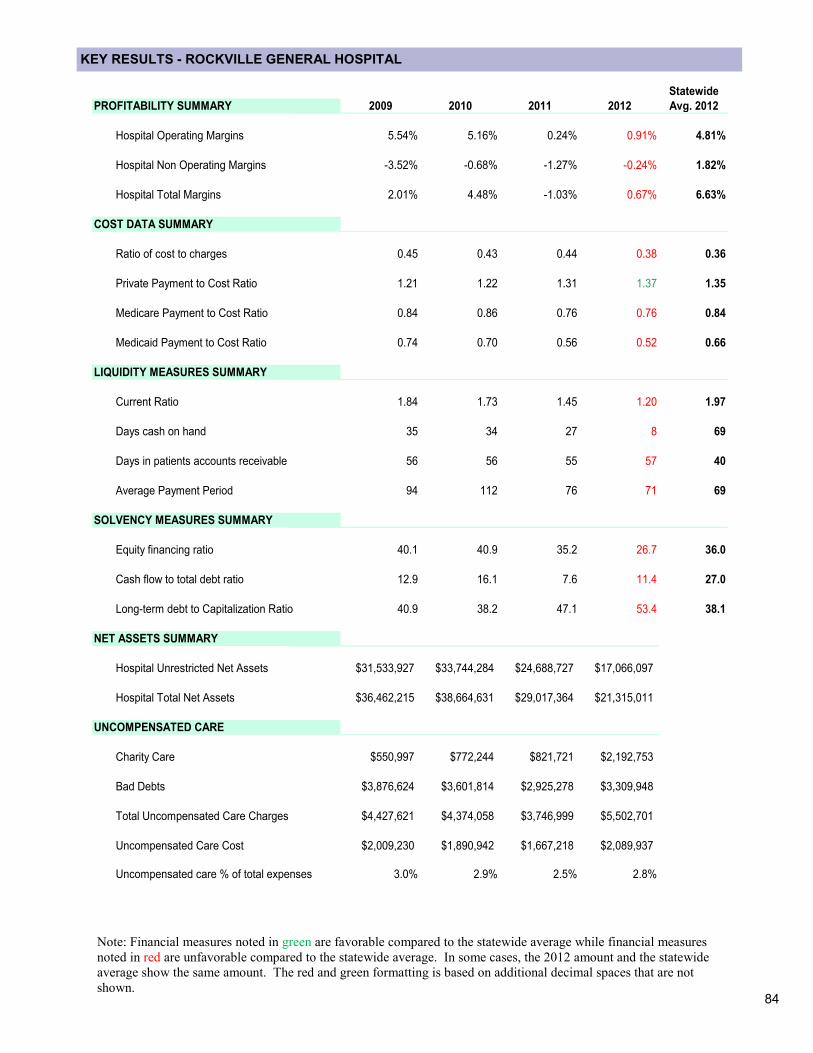
84
KEY RESULTS - ROCKVILLE GENERAL HOSPITAL
Note: Financial measures noted in green are favorable compared to the statewide average while financial measures
noted in red are unfavorable compared to the statewide average. In some cases, the 2012 amount and the statewide
average show the same amount. The red and green formatting is based on additional decimal spaces that are not
shown.
Statewide
PROFITABILITY SUMMARY 2009 2010 2011 2012 Avg. 2012
Hospital Operating Margins 5.54% 5.16% 0.24% 0.91% 4.81%
Hospital Non Operating Margins -3.52% -0.68% -1.27% -0.24% 1.82%
Hospital Total Margins 2.01% 4.48% -1.03% 0.67% 6.63%
COST DATA SUMMARY
Ratio of cost to charges 0.45 0.43 0.44 0.38 0.36
Private Payment to Cost Ratio 1.21 1.22 1.31 1.37 1.35
Medicare Payment to Cost Ratio 0.84 0.86 0.76 0.76 0.84
Medicaid Payment to Cost Ratio 0.74 0.70 0.56 0.52 0.66
LIQUIDITY MEASURES SUMMARY
Current Ratio 1.84 1.73 1.45 1.20 1.97
Days cash on hand 35 34 27 8 69
Days in patients accounts receivable 56 56 55 57 40
Average Payment Period 94 112 76 71 69
SOLVENCY MEASURES SUMMARY
Equity financing ratio 40.1 40.9 35.2 26.7 36.0
Cash flow to total debt ratio 12.9 16.1 7.6 11.4 27.0
Long-term debt to Capitalization Ratio 40.9 38.2 47.1 53.4 38.1
NET ASSETS SUMMARY
Hospital Unrestricted Net Assets $31,533,927 $33,744,284 $24,688,727 $17,066,097
Hospital Total Net Assets $36,462,215 $38,664,631 $29,017,364 $21,315,011
UNCOMPENSATED CARE
Charity Care $550,997 $772,244 $821,721 $2,192,753
Bad Debts $3,876,624 $3,601,814 $2,925,278 $3,309,948
Total Uncompensated Care Charges $4,427,621 $4,374,058 $3,746,999 $5,502,701
Uncompensated Care Cost $2,009,230 $1,890,942 $1,667,218 $2,089,937
Uncompensated care % of total expenses 3.0% 2.9% 2.5% 2.8%
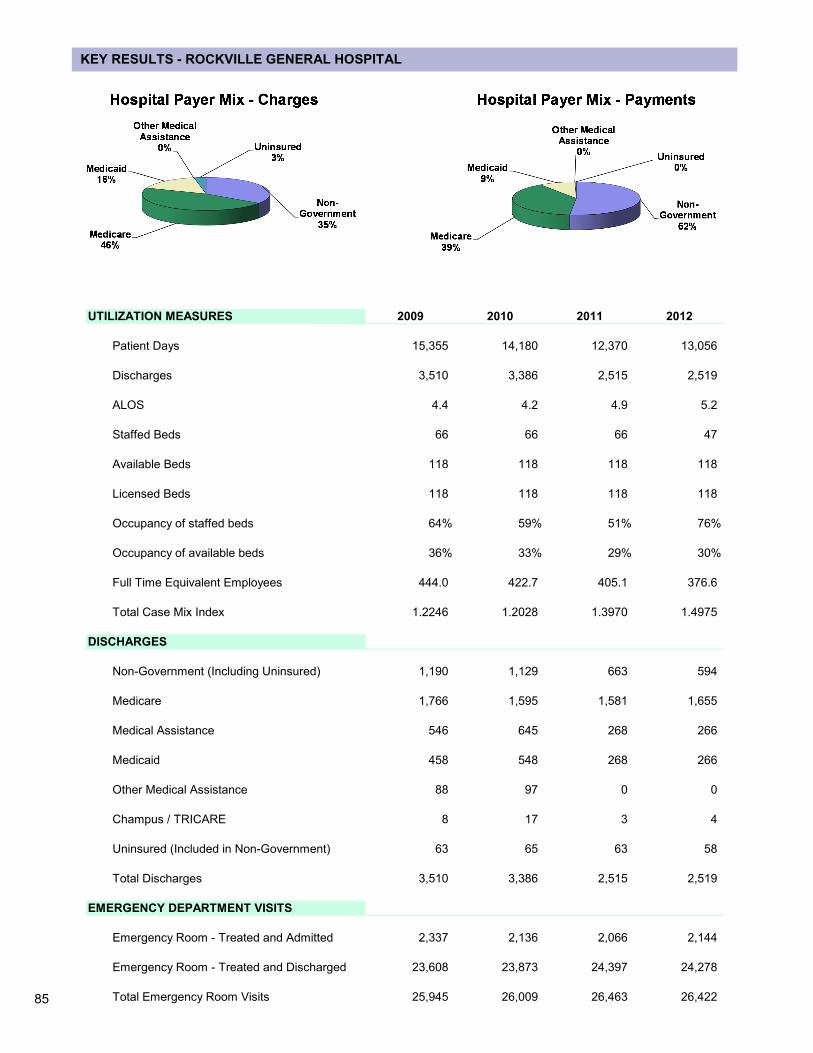
85
KEY RESULTS - ROCKVILLE GENERAL HOSPITAL
UTILIZATION MEASURES 2009 2010 2011 2012
Patient Days 15,355 14,180 12,370 13,056
Discharges 3,510 3,386 2,515 2,519
ALOS 4.4 4.2 4.9 5.2
Staffed Beds 66 66 66 47
Available Beds 118 118 118 118
Licensed Beds 118 118 118 118
Occupancy of staffed beds 64% 59% 51% 76%
Occupancy of available beds 36% 33% 29% 30%
Full Time Equivalent Employees 444.0 422.7 405.1 376.6
Total Case Mix Index 1.2246 1.2028 1.3970 1.4975
DISCHARGES
Non-Government (Including Uninsured) 1,190 1,129 663 594
Medicare 1,766 1,595 1,581 1,655
Medical Assistance 546 645 268 266
Medicaid 458 548 268 266
Other Medical Assistance 88 97 0 0
Champus / TRICARE 8 17 3 4
Uninsured (Included in Non-Government) 63 65 63 58
Total Discharges 3,510 3,386 2,515 2,519
EMERGENCY DEPARTMENT VISITS
Emergency Room - Treated and Admitted 2,337 2,136 2,066 2,144
Emergency Room - Treated and Discharged 23,608 23,873 24,397 24,278
Total Emergency Room Visits 25,945 26,009 26,463 26,422
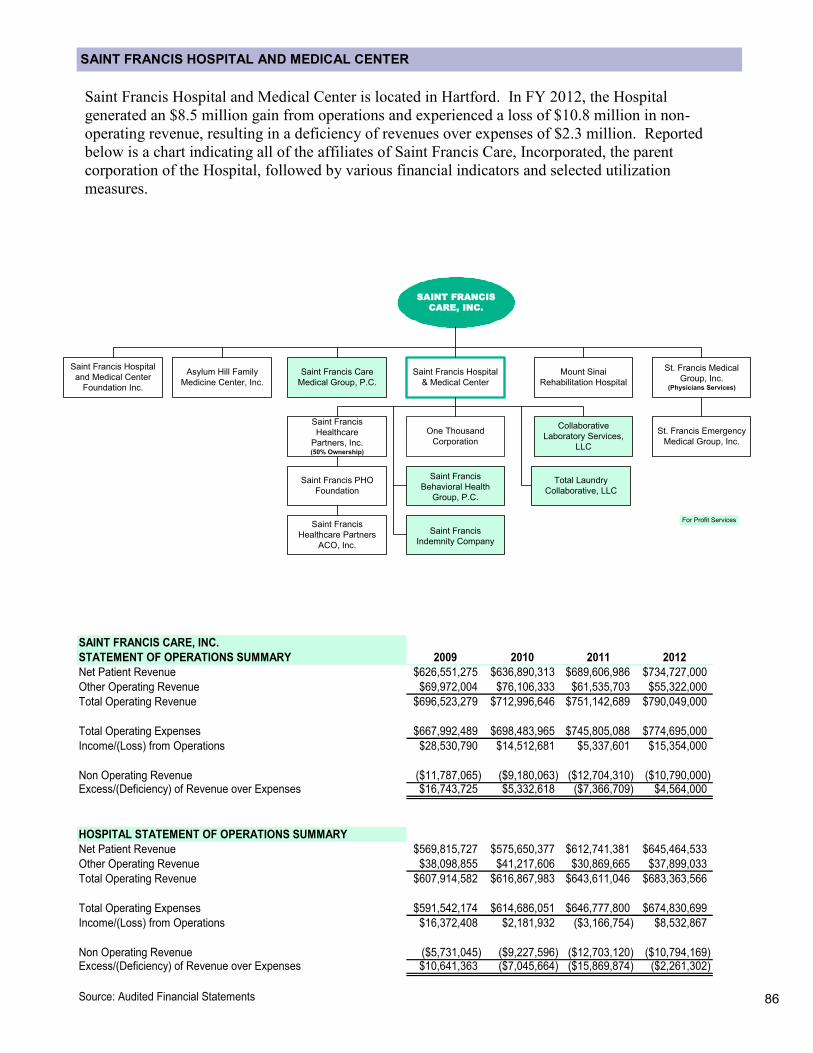
86
SAINT FRANCIS HOSPITAL AND MEDICAL CENTER
Saint Francis Hospital and Medical Center is located in Hartford. In FY 2012, the Hospital
generated an $8.5 million gain from operations and experienced a loss of $10.8 million in non-
operating revenue, resulting in a deficiency of revenues over expenses of $2.3 million. Reported
below is a chart indicating all of the affiliates of Saint Francis Care, Incorporated, the parent
corporation of the Hospital, followed by various financial indicators and selected utilization
measures.
Asylum Hill Family
Medicine Center, Inc.
Saint Francis Care
Medical Group, P.C.
Saint Francis Hospital
& Medical Center
Mount Sinai
Rehabilitation Hospital
St. Francis Medical
Group, Inc.(Physicians Services)
Saint Francis
Healthcare
Partners, Inc.(50% Ownership)
One Thousand
Corporation
Collaborative
Laboratory Services,
LLC
Saint Francis
Behavioral Health
Group, P.C.
SAINT FRANCIS
CARE, INC.
For Profit Services
Saint Francis Hospital
and Medical Center
Foundation Inc.
Saint Francis PHO
Foundation
Total Laundry
Collaborative, LLC
Saint Francis
Indemnity Company
Saint Francis
Healthcare Partners
ACO, Inc.
St. Francis Emergency
Medical Group, Inc.
SAINT FRANCIS CARE, INC.
STATEMENT OF OPERATIONS SUMMARY 2009 2010 2011 2012
Net Patient Revenue $626,551,275 $636,890,313 $689,606,986 $734,727,000
Other Operating Revenue $69,972,004 $76,106,333 $61,535,703 $55,322,000
Total Operating Revenue $696,523,279 $712,996,646 $751,142,689 $790,049,000
Total Operating Expenses $667,992,489 $698,483,965 $745,805,088 $774,695,000
Income/(Loss) from Operations $28,530,790 $14,512,681 $5,337,601 $15,354,000
Non Operating Revenue ($11,787,065) ($9,180,063) ($12,704,310) ($10,790,000)Excess/(Deficiency) of Revenue over Expenses $16,743,725 $5,332,618 ($7,366,709) $4,564,000
HOSPITAL STATEMENT OF OPERATIONS SUMMARY
Net Patient Revenue $569,815,727 $575,650,377 $612,741,381 $645,464,533
Other Operating Revenue $38,098,855 $41,217,606 $30,869,665 $37,899,033
Total Operating Revenue $607,914,582 $616,867,983 $643,611,046 $683,363,566
Total Operating Expenses $591,542,174 $614,686,051 $646,777,800 $674,830,699
Income/(Loss) from Operations $16,372,408 $2,181,932 ($3,166,754) $8,532,867
Non Operating Revenue ($5,731,045) ($9,227,596) ($12,703,120) ($10,794,169)Excess/(Deficiency) of Revenue over Expenses $10,641,363 ($7,045,664) ($15,869,874) ($2,261,302)
Source: Audited Financial Statements
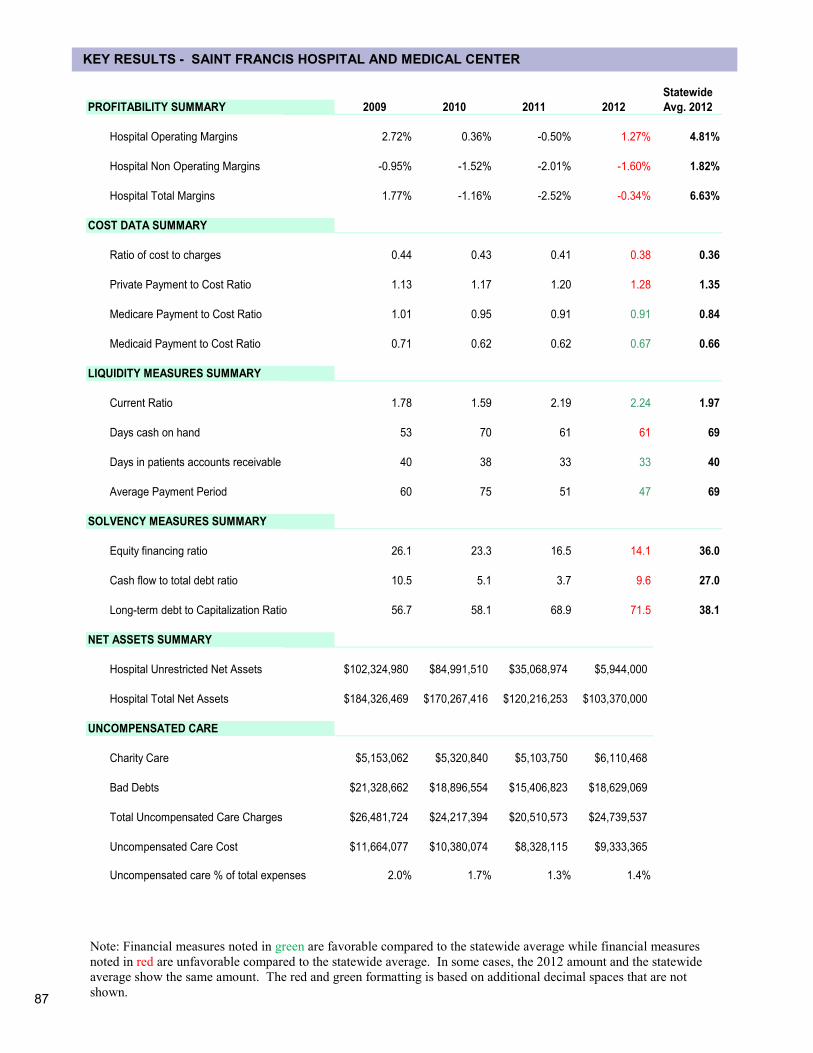
87
KEY RESULTS - SAINT FRANCIS HOSPITAL AND MEDICAL CENTER
Note: Financial measures noted in green are favorable compared to the statewide average while financial measures
noted in red are unfavorable compared to the statewide average. In some cases, the 2012 amount and the statewide
average show the same amount. The red and green formatting is based on additional decimal spaces that are not
shown.
Statewide
PROFITABILITY SUMMARY 2009 2010 2011 2012 Avg. 2012
Hospital Operating Margins 2.72% 0.36% -0.50% 1.27% 4.81%
Hospital Non Operating Margins -0.95% -1.52% -2.01% -1.60% 1.82%
Hospital Total Margins 1.77% -1.16% -2.52% -0.34% 6.63%
COST DATA SUMMARY
Ratio of cost to charges 0.44 0.43 0.41 0.38 0.36
Private Payment to Cost Ratio 1.13 1.17 1.20 1.28 1.35
Medicare Payment to Cost Ratio 1.01 0.95 0.91 0.91 0.84
Medicaid Payment to Cost Ratio 0.71 0.62 0.62 0.67 0.66
LIQUIDITY MEASURES SUMMARY
Current Ratio 1.78 1.59 2.19 2.24 1.97
Days cash on hand 53 70 61 61 69
Days in patients accounts receivable 40 38 33 33 40
Average Payment Period 60 75 51 47 69
SOLVENCY MEASURES SUMMARY
Equity financing ratio 26.1 23.3 16.5 14.1 36.0
Cash flow to total debt ratio 10.5 5.1 3.7 9.6 27.0
Long-term debt to Capitalization Ratio 56.7 58.1 68.9 71.5 38.1
NET ASSETS SUMMARY
Hospital Unrestricted Net Assets $102,324,980 $84,991,510 $35,068,974 $5,944,000
Hospital Total Net Assets $184,326,469 $170,267,416 $120,216,253 $103,370,000
UNCOMPENSATED CARE
Charity Care $5,153,062 $5,320,840 $5,103,750 $6,110,468
Bad Debts $21,328,662 $18,896,554 $15,406,823 $18,629,069
Total Uncompensated Care Charges $26,481,724 $24,217,394 $20,510,573 $24,739,537
Uncompensated Care Cost $11,664,077 $10,380,074 $8,328,115 $9,333,365
Uncompensated care % of total expenses 2.0% 1.7% 1.3% 1.4%
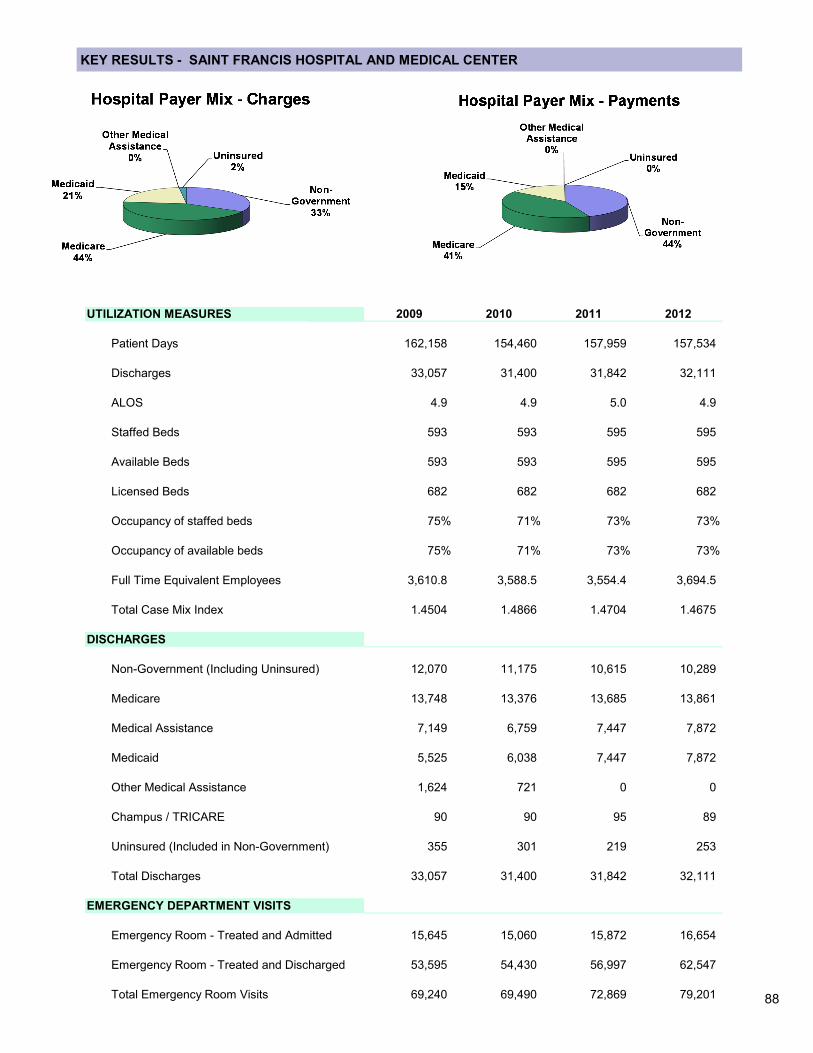
88
KEY RESULTS - SAINT FRANCIS HOSPITAL AND MEDICAL CENTER
UTILIZATION MEASURES 2009 2010 2011 2012
Patient Days 162,158 154,460 157,959 157,534
Discharges 33,057 31,400 31,842 32,111
ALOS 4.9 4.9 5.0 4.9
Staffed Beds 593 593 595 595
Available Beds 593 593 595 595
Licensed Beds 682 682 682 682
Occupancy of staffed beds 75% 71% 73% 73%
Occupancy of available beds 75% 71% 73% 73%
Full Time Equivalent Employees 3,610.8 3,588.5 3,554.4 3,694.5
Total Case Mix Index 1.4504 1.4866 1.4704 1.4675
DISCHARGES
Non-Government (Including Uninsured) 12,070 11,175 10,615 10,289
Medicare 13,748 13,376 13,685 13,861
Medical Assistance 7,149 6,759 7,447 7,872
Medicaid 5,525 6,038 7,447 7,872
Other Medical Assistance 1,624 721 0 0
Champus / TRICARE 90 90 95 89
Uninsured (Included in Non-Government) 355 301 219 253
Total Discharges 33,057 31,400 31,842 32,111
EMERGENCY DEPARTMENT VISITS
Emergency Room - Treated and Admitted 15,645 15,060 15,872 16,654
Emergency Room - Treated and Discharged 53,595 54,430 56,997 62,547
Total Emergency Room Visits 69,240 69,490 72,869 79,201
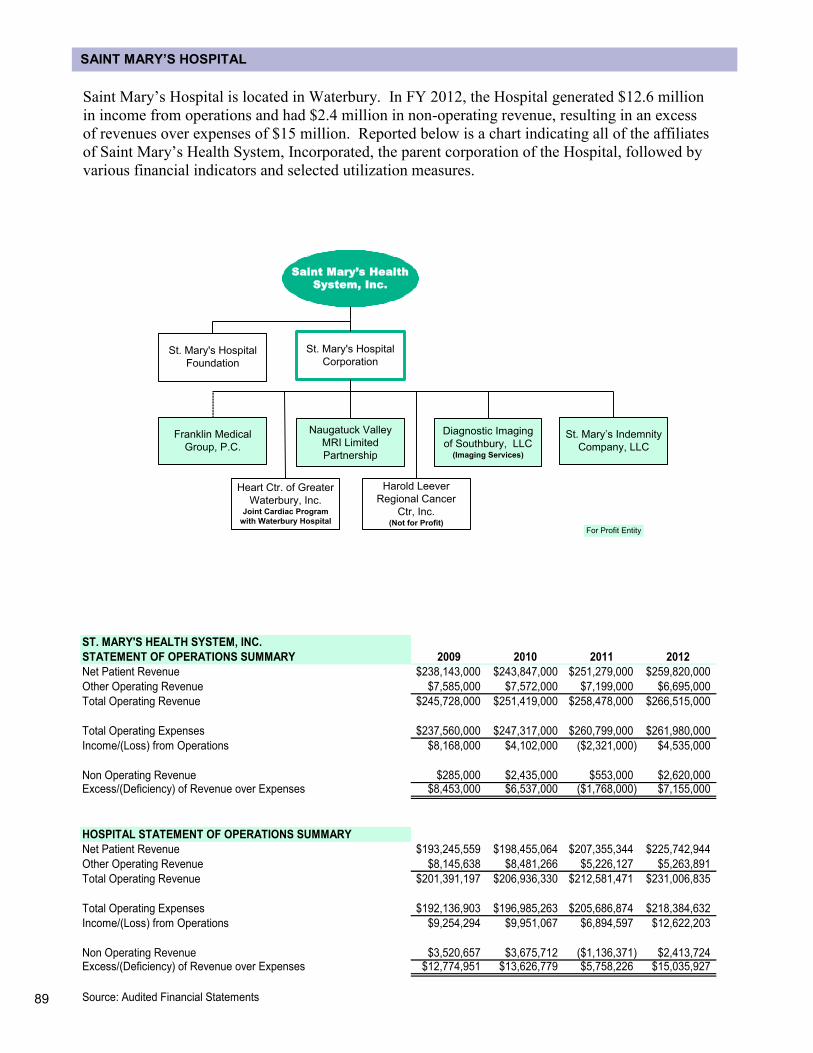
89
SAINT MARY’S HOSPITAL
Saint Mary’s Hospital is located in Waterbury. In FY 2012, the Hospital generated $12.6 million
in income from operations and had $2.4 million in non-operating revenue, resulting in an excess
of revenues over expenses of $15 million. Reported below is a chart indicating all of the affiliates
of Saint Mary’s Health System, Incorporated, the parent corporation of the Hospital, followed by
various financial indicators and selected utilization measures.
St. Mary's Hospital
Foundation
St. Mary's Hospital
Corporation
Naugatuck Valley
MRI Limited
Partnership
Saint Mary’s Health
System, Inc.
For Profit Entity
Diagnostic Imaging
of Southbury, LLC(Imaging Services)
Harold Leever
Regional Cancer
Ctr, Inc.(Not for Profit)
Franklin Medical
Group, P.C.
Heart Ctr. of Greater
Waterbury, Inc.Joint Cardiac Program
with Waterbury Hospital
St. Mary’s Indemnity
Company, LLC
ST. MARY'S HEALTH SYSTEM, INC.
STATEMENT OF OPERATIONS SUMMARY 2009 2010 2011 2012
Net Patient Revenue $238,143,000 $243,847,000 $251,279,000 $259,820,000
Other Operating Revenue $7,585,000 $7,572,000 $7,199,000 $6,695,000
Total Operating Revenue $245,728,000 $251,419,000 $258,478,000 $266,515,000
Total Operating Expenses $237,560,000 $247,317,000 $260,799,000 $261,980,000
Income/(Loss) from Operations $8,168,000 $4,102,000 ($2,321,000) $4,535,000
Non Operating Revenue $285,000 $2,435,000 $553,000 $2,620,000Excess/(Deficiency) of Revenue over Expenses $8,453,000 $6,537,000 ($1,768,000) $7,155,000
HOSPITAL STATEMENT OF OPERATIONS SUMMARY
Net Patient Revenue $193,245,559 $198,455,064 $207,355,344 $225,742,944
Other Operating Revenue $8,145,638 $8,481,266 $5,226,127 $5,263,891
Total Operating Revenue $201,391,197 $206,936,330 $212,581,471 $231,006,835
Total Operating Expenses $192,136,903 $196,985,263 $205,686,874 $218,384,632
Income/(Loss) from Operations $9,254,294 $9,951,067 $6,894,597 $12,622,203
Non Operating Revenue $3,520,657 $3,675,712 ($1,136,371) $2,413,724Excess/(Deficiency) of Revenue over Expenses $12,774,951 $13,626,779 $5,758,226 $15,035,927
Source: Audited Financial Statements

90
KEY RESULTS - SAINT MARY’S HOSPITAL
Note: Financial measures noted in green are favorable compared to the statewide average while financial measures
noted in red are unfavorable compared to the statewide average. In some cases, the 2012 amount and the statewide
average show the same amount. The red and green formatting is based on additional decimal spaces that are not
shown.
Statewide
PROFITABILITY SUMMARY 2009 2010 2011 2012 Avg. 2012
Hospital Operating Margins 4.52% 4.72% 3.26% 5.41% 4.81%
Hospital Non Operating Margins 1.72% 1.75% -0.54% 1.03% 1.82%
Hospital Total Margins 6.23% 6.47% 2.72% 6.44% 6.63%
COST DATA SUMMARY
Ratio of cost to charges 0.42 0.40 0.40 0.38 0.36
Private Payment to Cost Ratio 1.02 1.00 1.05 1.13 1.35
Medicare Payment to Cost Ratio 1.13 1.13 1.08 1.01 0.84
Medicaid Payment to Cost Ratio 0.65 0.65 0.67 0.77 0.66
LIQUIDITY MEASURES SUMMARY
Current Ratio 1.69 1.75 1.54 1.58 1.97
Days cash on hand 38 44 44 38 69
Days in patients accounts receivable 27 29 28 40 40
Average Payment Period 60 62 72 67 69
SOLVENCY MEASURES SUMMARY
Equity financing ratio 7.4 14.8 8.4 10.5 36.0
Cash flow to total debt ratio 34.8 36.4 21.3 39.7 27.0
Long-term debt to Capitalization Ratio 71.3 51.6 62.9 54.4 38.1
NET ASSETS SUMMARY
Hospital Unrestricted Net Assets ($4,907,594) $6,754,167 ($2,602,946) $72,000
Hospital Total Net Assets $11,261,310 $23,714,139 $13,626,171 $17,924,000
UNCOMPENSATED CARE
Charity Care $493,000 $1,043,954 $629,356 $384,059
Bad Debts $11,724,327 $11,904,617 $7,589,833 $10,501,359
Total Uncompensated Care Charges $12,217,327 $12,948,571 $8,219,189 $10,885,418
Uncompensated Care Cost $5,089,127 $5,210,770 $3,267,541 $4,104,368
Uncompensated care % of total expenses 2.6% 2.6% 1.6% 1.9%
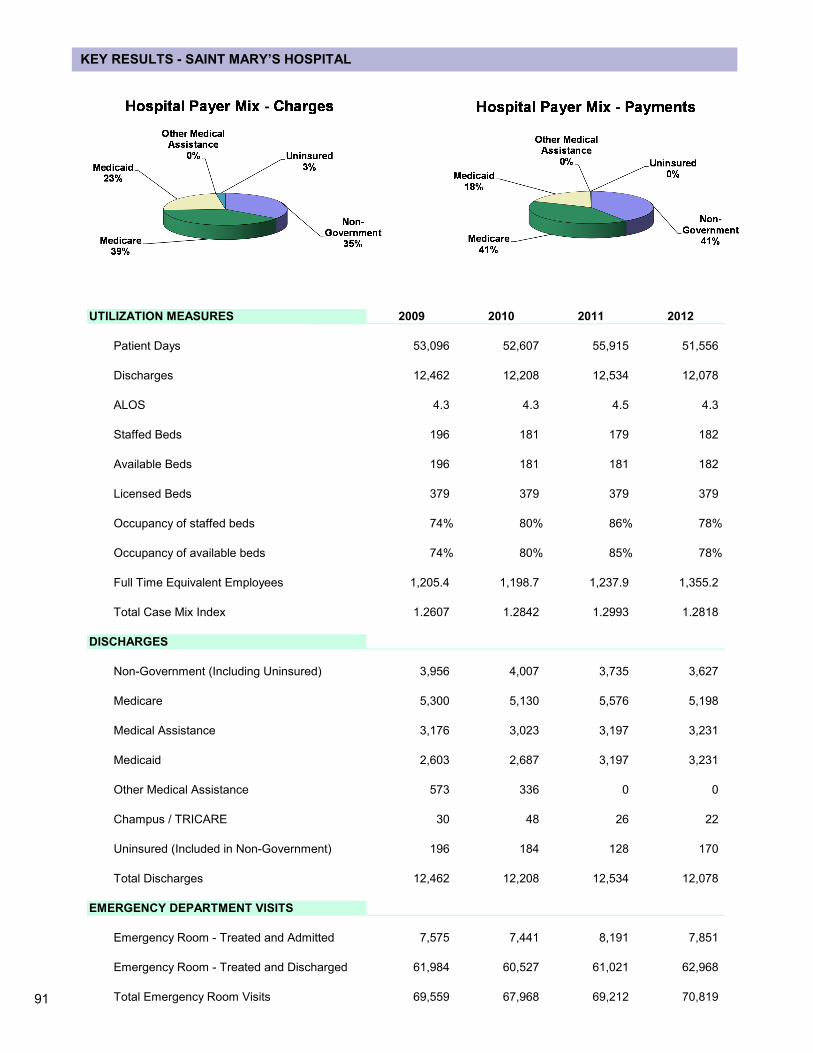
91
KEY RESULTS - SAINT MARY’S HOSPITAL
UTILIZATION MEASURES 2009 2010 2011 2012
Patient Days 53,096 52,607 55,915 51,556
Discharges 12,462 12,208 12,534 12,078
ALOS 4.3 4.3 4.5 4.3
Staffed Beds 196 181 179 182
Available Beds 196 181 181 182
Licensed Beds 379 379 379 379
Occupancy of staffed beds 74% 80% 86% 78%
Occupancy of available beds 74% 80% 85% 78%
Full Time Equivalent Employees 1,205.4 1,198.7 1,237.9 1,355.2
Total Case Mix Index 1.2607 1.2842 1.2993 1.2818
DISCHARGES
Non-Government (Including Uninsured) 3,956 4,007 3,735 3,627
Medicare 5,300 5,130 5,576 5,198
Medical Assistance 3,176 3,023 3,197 3,231
Medicaid 2,603 2,687 3,197 3,231
Other Medical Assistance 573 336 0 0
Champus / TRICARE 30 48 26 22
Uninsured (Included in Non-Government) 196 184 128 170
Total Discharges 12,462 12,208 12,534 12,078
EMERGENCY DEPARTMENT VISITS
Emergency Room - Treated and Admitted 7,575 7,441 8,191 7,851
Emergency Room - Treated and Discharged 61,984 60,527 61,021 62,968
Total Emergency Room Visits 69,559 67,968 69,212 70,819
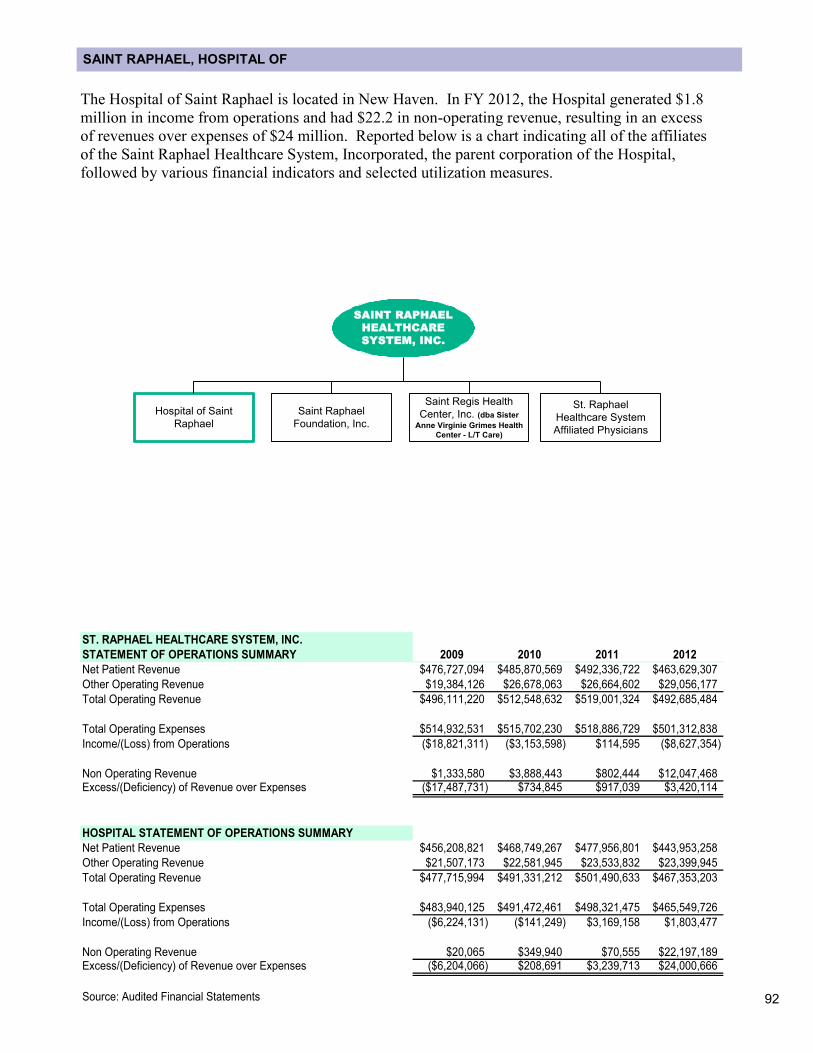
92
SAINT RAPHAEL, HOSPITAL OF
The Hospital of Saint Raphael is located in New Haven. In FY 2012, the Hospital generated $1.8
million in income from operations and had $22.2 in non-operating revenue, resulting in an excess
of revenues over expenses of $24 million. Reported below is a chart indicating all of the affiliates
of the Saint Raphael Healthcare System, Incorporated, the parent corporation of the Hospital,
followed by various financial indicators and selected utilization measures.
Hospital of Saint
Raphael
Saint Raphael
Foundation, Inc.
Saint Regis Health
Center, Inc. (dba Sister
Anne Virginie Grimes Health
Center - L/T Care)
SAINT RAPHAEL
HEALTHCARE
SYSTEM, INC.
St. Raphael
Healthcare System
Affiliated Physicians
ST. RAPHAEL HEALTHCARE SYSTEM, INC.
STATEMENT OF OPERATIONS SUMMARY 2009 2010 2011 2012
Net Patient Revenue $476,727,094 $485,870,569 $492,336,722 $463,629,307
Other Operating Revenue $19,384,126 $26,678,063 $26,664,602 $29,056,177
Total Operating Revenue $496,111,220 $512,548,632 $519,001,324 $492,685,484
Total Operating Expenses $514,932,531 $515,702,230 $518,886,729 $501,312,838
Income/(Loss) from Operations ($18,821,311) ($3,153,598) $114,595 ($8,627,354)
Non Operating Revenue $1,333,580 $3,888,443 $802,444 $12,047,468Excess/(Deficiency) of Revenue over Expenses ($17,487,731) $734,845 $917,039 $3,420,114
HOSPITAL STATEMENT OF OPERATIONS SUMMARY
Net Patient Revenue $456,208,821 $468,749,267 $477,956,801 $443,953,258
Other Operating Revenue $21,507,173 $22,581,945 $23,533,832 $23,399,945
Total Operating Revenue $477,715,994 $491,331,212 $501,490,633 $467,353,203
Total Operating Expenses $483,940,125 $491,472,461 $498,321,475 $465,549,726
Income/(Loss) from Operations ($6,224,131) ($141,249) $3,169,158 $1,803,477
Non Operating Revenue $20,065 $349,940 $70,555 $22,197,189Excess/(Deficiency) of Revenue over Expenses ($6,204,066) $208,691 $3,239,713 $24,000,666
Source: Audited Financial Statements

93
KEY RESULTS - SAINT RAPHAEL, HOSPITAL OF
Note: Financial measures noted in green are favorable compared to the statewide average while financial measures
noted in red are unfavorable compared to the statewide average. In some cases, the 2012 amount and the statewide
average show the same amount. The red and green formatting is based on additional decimal spaces that are not
shown.
Statewide
PROFITABILITY SUMMARY 2009 2010 2011 2012 Avg. 2012
Hospital Operating Margins -1.30% -0.03% 0.63% 0.37% 4.81%
Hospital Non Operating Margins 0.00% 0.07% 0.01% 4.53% 1.82%
Hospital Total Margins -1.30% 0.04% 0.65% 4.90% 6.63%
COST DATA SUMMARY
Ratio of cost to charges 0.39 0.38 0.36 0.36 0.36
Private Payment to Cost Ratio 1.16 1.22 1.25 1.35 1.35
Medicare Payment to Cost Ratio 0.87 0.86 0.85 0.84 0.84
Medicaid Payment to Cost Ratio 0.74 0.66 0.70 0.67 0.66
LIQUIDITY MEASURES SUMMARY
Current Ratio 0.68 0.72 0.68 2.79 1.97
Days cash on hand 16 11 21 75 69
Days in patients accounts receivable 45 41 34 21 40
Average Payment Period 113 102 98 39 69
SOLVENCY MEASURES SUMMARY
Equity financing ratio -11.9 -4.0 -19.7 7.1 36.0
Cash flow to total debt ratio 7.4 10.9 12.7 76.9 27.0
Long-term debt to Capitalization Ratio -11.6 -23.7 -1.4 0.0 38.1
NET ASSETS SUMMARY
Hospital Unrestricted Net Assets ($59,114,372) ($40,859,335) ($79,185,572) ($6,652,384)
Hospital Total Net Assets ($30,730,319) ($10,170,252) ($48,404,289) $11,366,084
UNCOMPENSATED CARE
Charity Care $4,656,971 $5,390,523 $5,784,587 $2,239,962
Bad Debts $20,632,999 $24,670,997 $22,840,000 $13,531,774
Total Uncompensated Care Charges $25,289,970 $30,061,520 $28,624,587 $15,771,736
Uncompensated Care Cost $9,742,216 $11,294,001 $10,244,765 $5,729,463
Uncompensated care % of total expenses 2.0% 2.3% 2.1% 1.2%
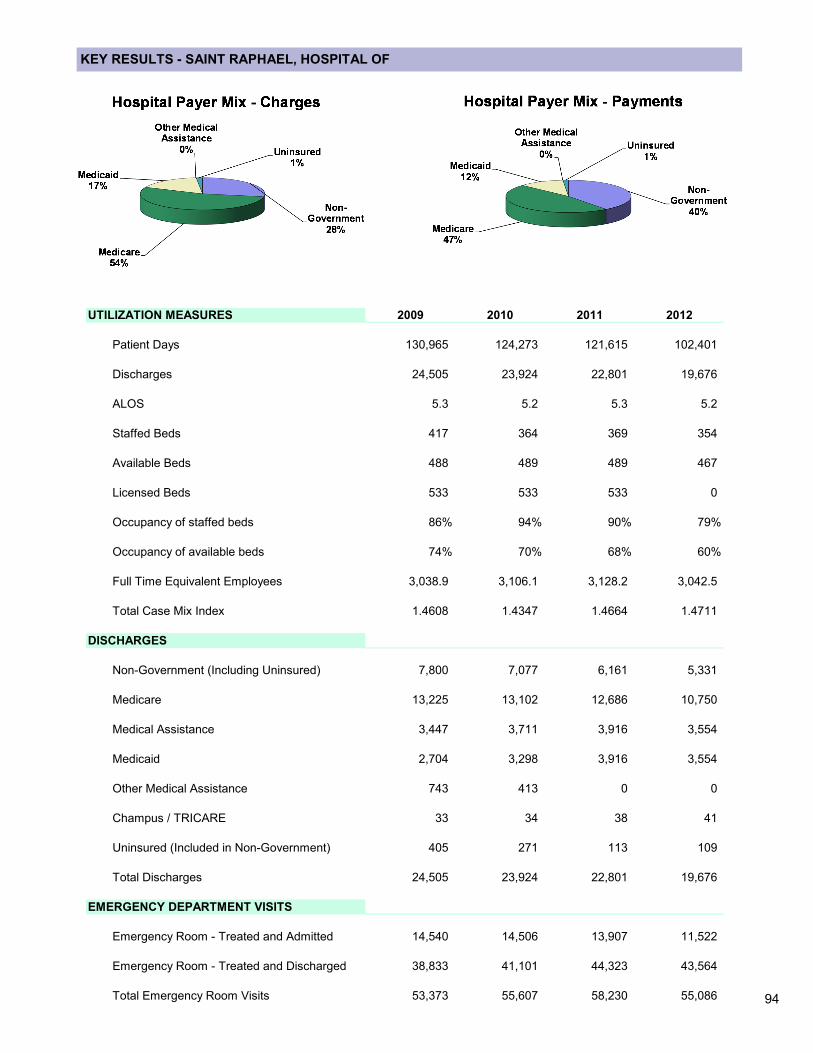
94
KEY RESULTS - SAINT RAPHAEL, HOSPITAL OF
UTILIZATION MEASURES 2009 2010 2011 2012
Patient Days 130,965 124,273 121,615 102,401
Discharges 24,505 23,924 22,801 19,676
ALOS 5.3 5.2 5.3 5.2
Staffed Beds 417 364 369 354
Available Beds 488 489 489 467
Licensed Beds 533 533 533 0
Occupancy of staffed beds 86% 94% 90% 79%
Occupancy of available beds 74% 70% 68% 60%
Full Time Equivalent Employees 3,038.9 3,106.1 3,128.2 3,042.5
Total Case Mix Index 1.4608 1.4347 1.4664 1.4711
DISCHARGES
Non-Government (Including Uninsured) 7,800 7,077 6,161 5,331
Medicare 13,225 13,102 12,686 10,750
Medical Assistance 3,447 3,711 3,916 3,554
Medicaid 2,704 3,298 3,916 3,554
Other Medical Assistance 743 413 0 0
Champus / TRICARE 33 34 38 41
Uninsured (Included in Non-Government) 405 271 113 109
Total Discharges 24,505 23,924 22,801 19,676
EMERGENCY DEPARTMENT VISITS
Emergency Room - Treated and Admitted 14,540 14,506 13,907 11,522
Emergency Room - Treated and Discharged 38,833 41,101 44,323 43,564
Total Emergency Room Visits 53,373 55,607 58,230 55,086
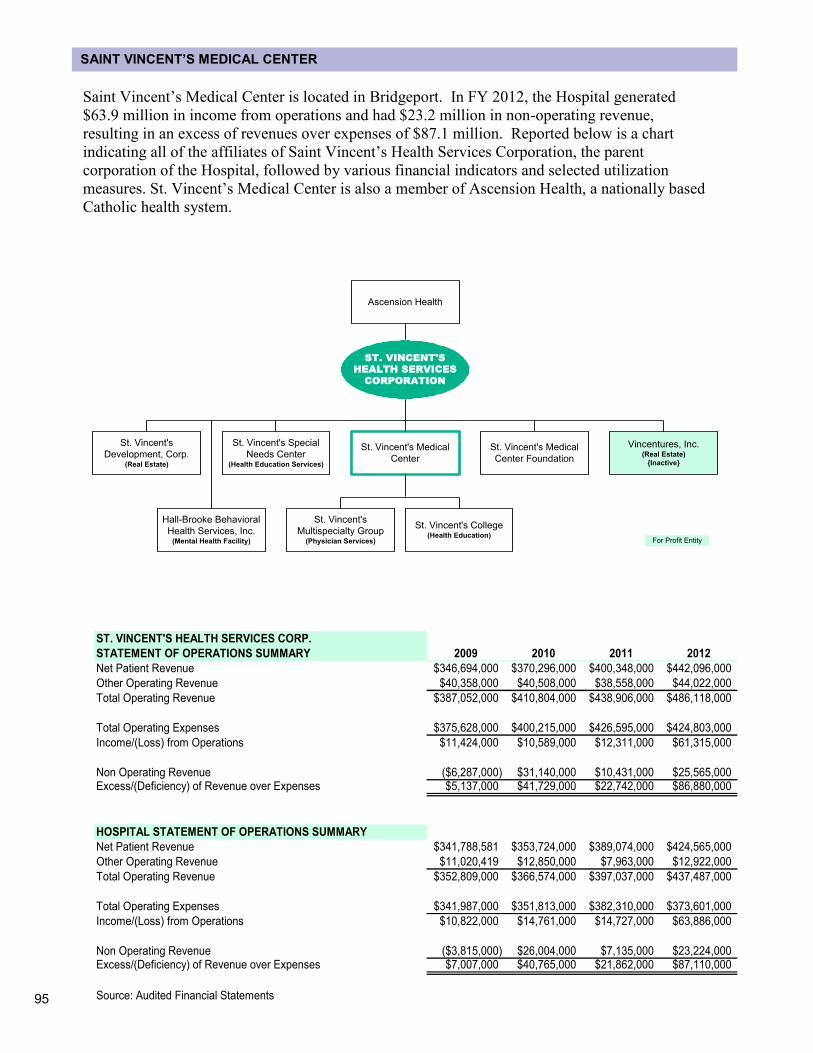
95
SAINT VINCENT’S MEDICAL CENTER
Saint Vincent’s Medical Center is located in Bridgeport. In FY 2012, the Hospital generated
$63.9 million in income from operations and had $23.2 million in non-operating revenue,
resulting in an excess of revenues over expenses of $87.1 million. Reported below is a chart
indicating all of the affiliates of Saint Vincent’s Health Services Corporation, the parent
corporation of the Hospital, followed by various financial indicators and selected utilization
measures. St. Vincent’s Medical Center is also a member of Ascension Health, a nationally based
Catholic health system.
St. Vincent's Medical
Center
St. Vincent's Special
Needs Center(Health Education Services)
St. Vincent's
Development, Corp.(Real Estate)
St. Vincent's Medical
Center Foundation
Vincentures, Inc.(Real Estate)
{Inactive}
Hall-Brooke Behavioral
Health Services, Inc.(Mental Health Facility)
St. Vincent's College(Health Education)
ST. VINCENT'S
HEALTH SERVICES
CORPORATION
For Profit Entity
Ascension Health
St. Vincent's
Multispecialty Group(Physician Services)
ST. VINCENT'S HEALTH SERVICES CORP.
STATEMENT OF OPERATIONS SUMMARY 2009 2010 2011 2012
Net Patient Revenue $346,694,000 $370,296,000 $400,348,000 $442,096,000
Other Operating Revenue $40,358,000 $40,508,000 $38,558,000 $44,022,000
Total Operating Revenue $387,052,000 $410,804,000 $438,906,000 $486,118,000
Total Operating Expenses $375,628,000 $400,215,000 $426,595,000 $424,803,000
Income/(Loss) from Operations $11,424,000 $10,589,000 $12,311,000 $61,315,000
Non Operating Revenue ($6,287,000) $31,140,000 $10,431,000 $25,565,000Excess/(Deficiency) of Revenue over Expenses $5,137,000 $41,729,000 $22,742,000 $86,880,000
HOSPITAL STATEMENT OF OPERATIONS SUMMARY
Net Patient Revenue $341,788,581 $353,724,000 $389,074,000 $424,565,000
Other Operating Revenue $11,020,419 $12,850,000 $7,963,000 $12,922,000
Total Operating Revenue $352,809,000 $366,574,000 $397,037,000 $437,487,000
Total Operating Expenses $341,987,000 $351,813,000 $382,310,000 $373,601,000
Income/(Loss) from Operations $10,822,000 $14,761,000 $14,727,000 $63,886,000
Non Operating Revenue ($3,815,000) $26,004,000 $7,135,000 $23,224,000Excess/(Deficiency) of Revenue over Expenses $7,007,000 $40,765,000 $21,862,000 $87,110,000
Source: Audited Financial Statements
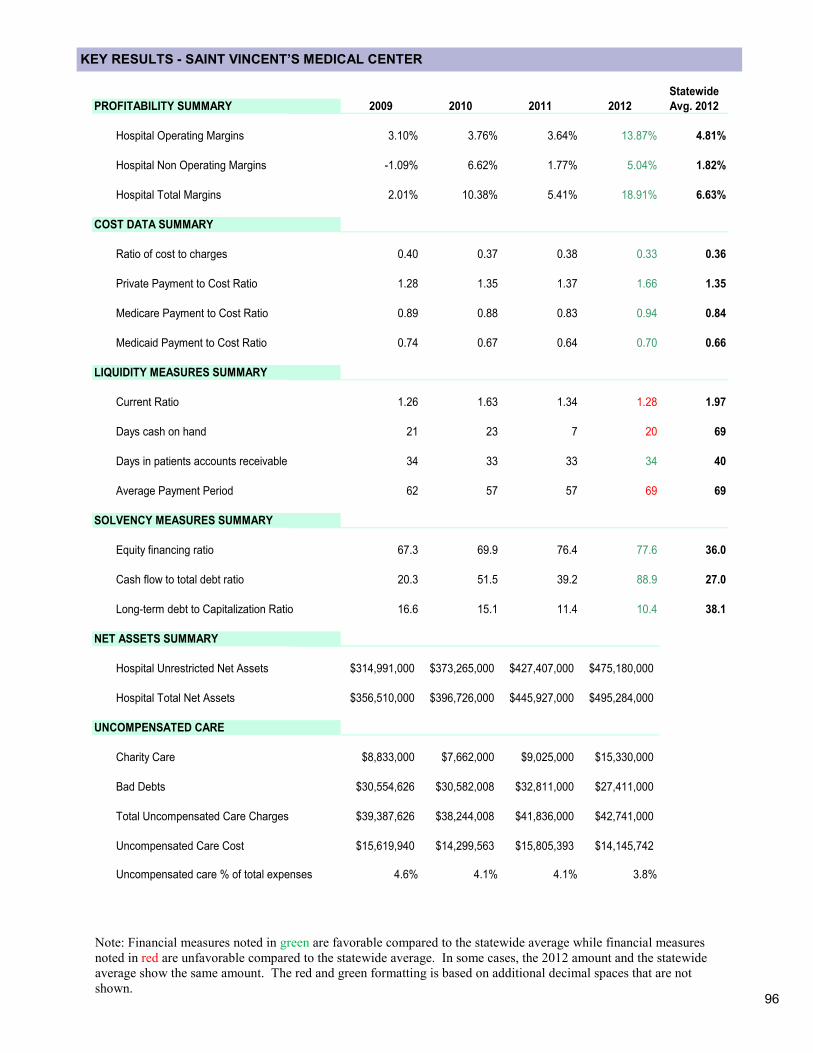
96
KEY RESULTS - SAINT VINCENT’S MEDICAL CENTER
Note: Financial measures noted in green are favorable compared to the statewide average while financial measures
noted in red are unfavorable compared to the statewide average. In some cases, the 2012 amount and the statewide
average show the same amount. The red and green formatting is based on additional decimal spaces that are not
shown.
Statewide
PROFITABILITY SUMMARY 2009 2010 2011 2012 Avg. 2012
Hospital Operating Margins 3.10% 3.76% 3.64% 13.87% 4.81%
Hospital Non Operating Margins -1.09% 6.62% 1.77% 5.04% 1.82%
Hospital Total Margins 2.01% 10.38% 5.41% 18.91% 6.63%
COST DATA SUMMARY
Ratio of cost to charges 0.40 0.37 0.38 0.33 0.36
Private Payment to Cost Ratio 1.28 1.35 1.37 1.66 1.35
Medicare Payment to Cost Ratio 0.89 0.88 0.83 0.94 0.84
Medicaid Payment to Cost Ratio 0.74 0.67 0.64 0.70 0.66
LIQUIDITY MEASURES SUMMARY
Current Ratio 1.26 1.63 1.34 1.28 1.97
Days cash on hand 21 23 7 20 69
Days in patients accounts receivable 34 33 33 34 40
Average Payment Period 62 57 57 69 69
SOLVENCY MEASURES SUMMARY
Equity financing ratio 67.3 69.9 76.4 77.6 36.0
Cash flow to total debt ratio 20.3 51.5 39.2 88.9 27.0
Long-term debt to Capitalization Ratio 16.6 15.1 11.4 10.4 38.1
NET ASSETS SUMMARY
Hospital Unrestricted Net Assets $314,991,000 $373,265,000 $427,407,000 $475,180,000
Hospital Total Net Assets $356,510,000 $396,726,000 $445,927,000 $495,284,000
UNCOMPENSATED CARE
Charity Care $8,833,000 $7,662,000 $9,025,000 $15,330,000
Bad Debts $30,554,626 $30,582,008 $32,811,000 $27,411,000
Total Uncompensated Care Charges $39,387,626 $38,244,008 $41,836,000 $42,741,000
Uncompensated Care Cost $15,619,940 $14,299,563 $15,805,393 $14,145,742
Uncompensated care % of total expenses 4.6% 4.1% 4.1% 3.8%
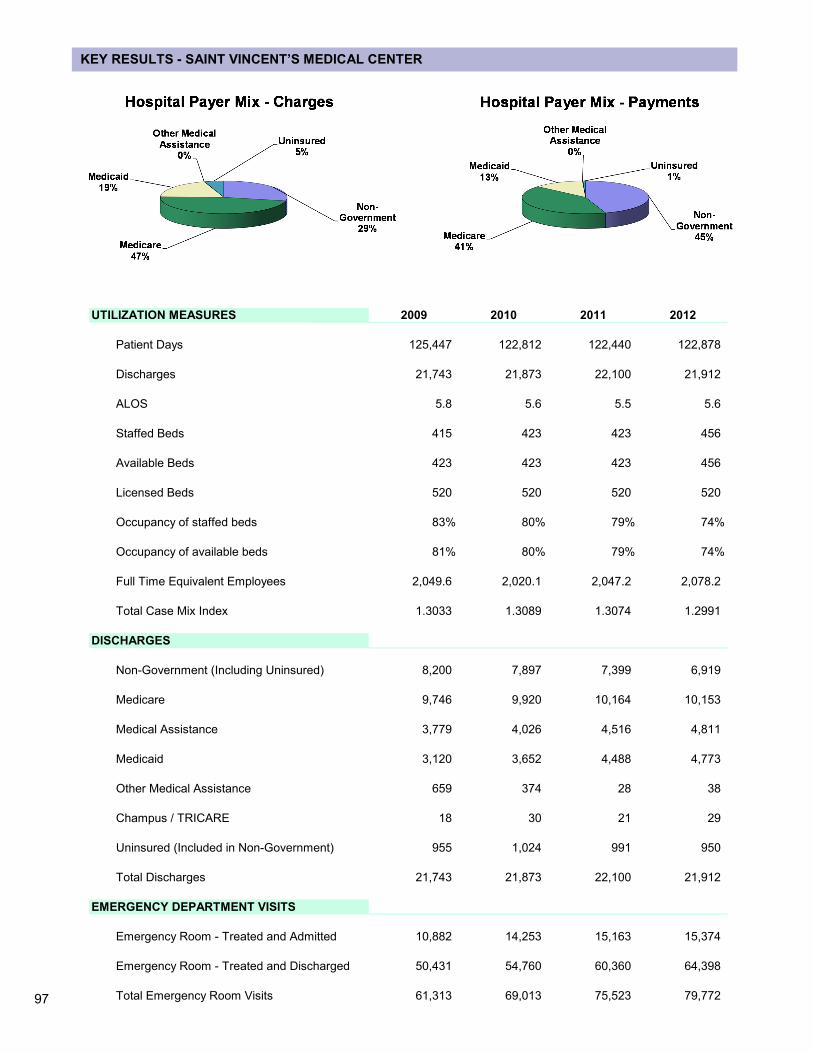
97
KEY RESULTS - SAINT VINCENT’S MEDICAL CENTER
UTILIZATION MEASURES 2009 2010 2011 2012
Patient Days 125,447 122,812 122,440 122,878
Discharges 21,743 21,873 22,100 21,912
ALOS 5.8 5.6 5.5 5.6
Staffed Beds 415 423 423 456
Available Beds 423 423 423 456
Licensed Beds 520 520 520 520
Occupancy of staffed beds 83% 80% 79% 74%
Occupancy of available beds 81% 80% 79% 74%
Full Time Equivalent Employees 2,049.6 2,020.1 2,047.2 2,078.2
Total Case Mix Index 1.3033 1.3089 1.3074 1.2991
DISCHARGES
Non-Government (Including Uninsured) 8,200 7,897 7,399 6,919
Medicare 9,746 9,920 10,164 10,153
Medical Assistance 3,779 4,026 4,516 4,811
Medicaid 3,120 3,652 4,488 4,773
Other Medical Assistance 659 374 28 38
Champus / TRICARE 18 30 21 29
Uninsured (Included in Non-Government) 955 1,024 991 950
Total Discharges 21,743 21,873 22,100 21,912
EMERGENCY DEPARTMENT VISITS
Emergency Room - Treated and Admitted 10,882 14,253 15,163 15,374
Emergency Room - Treated and Discharged 50,431 54,760 60,360 64,398
Total Emergency Room Visits 61,313 69,013 75,523 79,772
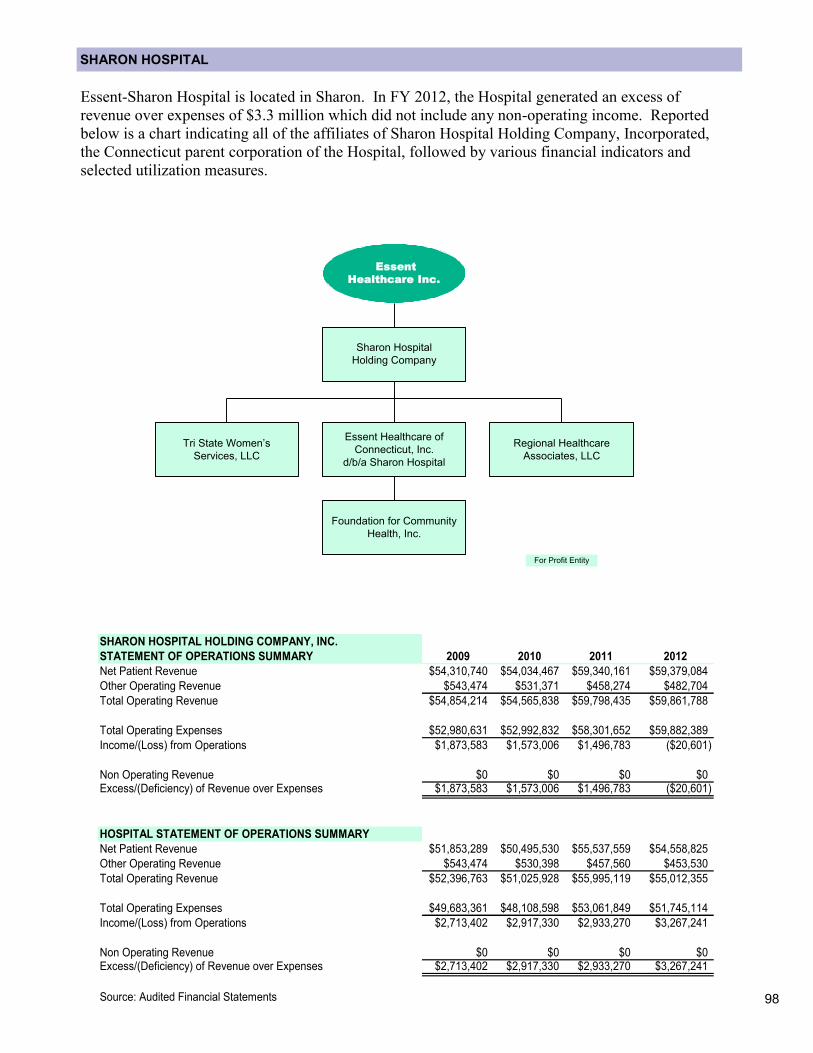
98
Essent-Sharon Hospital is located in Sharon. In FY 2012, the Hospital generated an excess of
revenue over expenses of $3.3 million which did not include any non-operating income. Reported
below is a chart indicating all of the affiliates of Sharon Hospital Holding Company, Incorporated,
the Connecticut parent corporation of the Hospital, followed by various financial indicators and
selected utilization measures.
Essent Healthcare of
Connecticut, Inc.
d/b/a Sharon Hospital
Essent
Healthcare Inc.
For Profit Entity
Sharon Hospital
Holding Company
Regional Healthcare
Associates, LLC
Foundation for Community
Health, Inc.
Tri State Women’s
Services, LLC
SHARON HOSPITAL
SHARON HOSPITAL HOLDING COMPANY, INC.
STATEMENT OF OPERATIONS SUMMARY 2009 2010 2011 2012
Net Patient Revenue $54,310,740 $54,034,467 $59,340,161 $59,379,084
Other Operating Revenue $543,474 $531,371 $458,274 $482,704
Total Operating Revenue $54,854,214 $54,565,838 $59,798,435 $59,861,788
Total Operating Expenses $52,980,631 $52,992,832 $58,301,652 $59,882,389
Income/(Loss) from Operations $1,873,583 $1,573,006 $1,496,783 ($20,601)
Non Operating Revenue $0 $0 $0 $0Excess/(Deficiency) of Revenue over Expenses $1,873,583 $1,573,006 $1,496,783 ($20,601)
HOSPITAL STATEMENT OF OPERATIONS SUMMARY
Net Patient Revenue $51,853,289 $50,495,530 $55,537,559 $54,558,825
Other Operating Revenue $543,474 $530,398 $457,560 $453,530
Total Operating Revenue $52,396,763 $51,025,928 $55,995,119 $55,012,355
Total Operating Expenses $49,683,361 $48,108,598 $53,061,849 $51,745,114
Income/(Loss) from Operations $2,713,402 $2,917,330 $2,933,270 $3,267,241
Non Operating Revenue $0 $0 $0 $0Excess/(Deficiency) of Revenue over Expenses $2,713,402 $2,917,330 $2,933,270 $3,267,241
Source: Audited Financial Statements

99
KEY RESULTS - SHARON HOSPITAL
Note: Financial measures noted in green are favorable compared to the statewide average while financial measures
noted in red are unfavorable compared to the statewide average. In some cases, the 2012 amount and the statewide
average show the same amount. The red and green formatting is based on additional decimal spaces that are not
shown.
Statewide
PROFITABILITY SUMMARY 2009 2010 2011 2012 Avg. 2012
Hospital Operating Margins 5.18% 5.72% 5.24% 5.94% 4.81%
Hospital Non Operating Margins 0.00% 0.00% 0.00% 0.00% 1.82%
Hospital Total Margins 5.18% 5.72% 5.24% 5.94% 6.63%
COST DATA SUMMARY
Ratio of cost to charges 0.43 0.40 0.41 0.37 0.36
Private Payment to Cost Ratio 1.18 1.26 1.19 1.25 1.35
Medicare Payment to Cost Ratio 0.89 0.90 0.91 0.92 0.84
Medicaid Payment to Cost Ratio 0.58 0.77 0.67 0.67 0.66
LIQUIDITY MEASURES SUMMARY
Current Ratio 1.52 1.51 1.37 1.78 1.97
Days cash on hand 0 0 0 0 69
Days in patients accounts receivable 41 40 42 46 40
Average Payment Period 55 50 51 39 69
SOLVENCY MEASURES SUMMARY
Equity financing ratio 25.7 29.9 33.6 52.9 36.0
Cash flow to total debt ratio 14.9 15.2 15.0 31.4 27.0
Long-term debt to Capitalization Ratio 68.8 64.8 60.6 37.5 38.1
NET ASSETS SUMMARY
Hospital Unrestricted Net Assets $15,453,591 $18,267,822 $21,632,914 $24,878,651
Hospital Total Net Assets $15,453,591 $18,267,822 $21,632,914 $24,878,651
UNCOMPENSATED CARE
Charity Care $430,330 $767,288 $942,411 $760,089
Bad Debts $2,953,540 $1,748,130 $3,537,228 $2,999,367
Total Uncompensated Care Charges $3,383,870 $2,515,418 $4,479,639 $3,759,456
Uncompensated Care Cost $1,461,984 $995,025 $1,825,630 $1,400,677
Uncompensated care % of total expenses 2.9% 2.1% 3.4% 2.7%
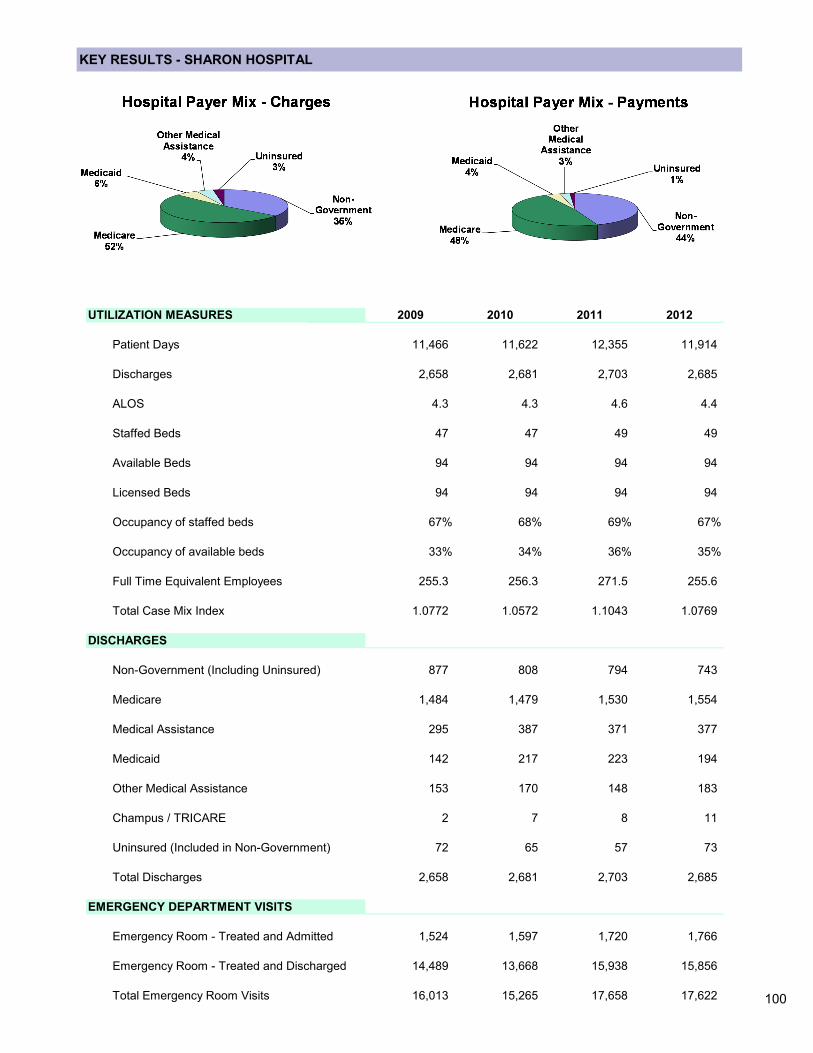
100
UTILIZATION MEASURES 2009 2010 2011 2012
Patient Days 11,466 11,622 12,355 11,914
Discharges 2,658 2,681 2,703 2,685
ALOS 4.3 4.3 4.6 4.4
Staffed Beds 47 47 49 49
Available Beds 94 94 94 94
Licensed Beds 94 94 94 94
Occupancy of staffed beds 67% 68% 69% 67%
Occupancy of available beds 33% 34% 36% 35%
Full Time Equivalent Employees 255.3 256.3 271.5 255.6
Total Case Mix Index 1.0772 1.0572 1.1043 1.0769
DISCHARGES
Non-Government (Including Uninsured) 877 808 794 743
Medicare 1,484 1,479 1,530 1,554
Medical Assistance 295 387 371 377
Medicaid 142 217 223 194
Other Medical Assistance 153 170 148 183
Champus / TRICARE 2 7 8 11
Uninsured (Included in Non-Government) 72 65 57 73
Total Discharges 2,658 2,681 2,703 2,685
EMERGENCY DEPARTMENT VISITS
Emergency Room - Treated and Admitted 1,524 1,597 1,720 1,766
Emergency Room - Treated and Discharged 14,489 13,668 15,938 15,856
Total Emergency Room Visits 16,013 15,265 17,658 17,622
KEY RESULTS - SHARON HOSPITAL
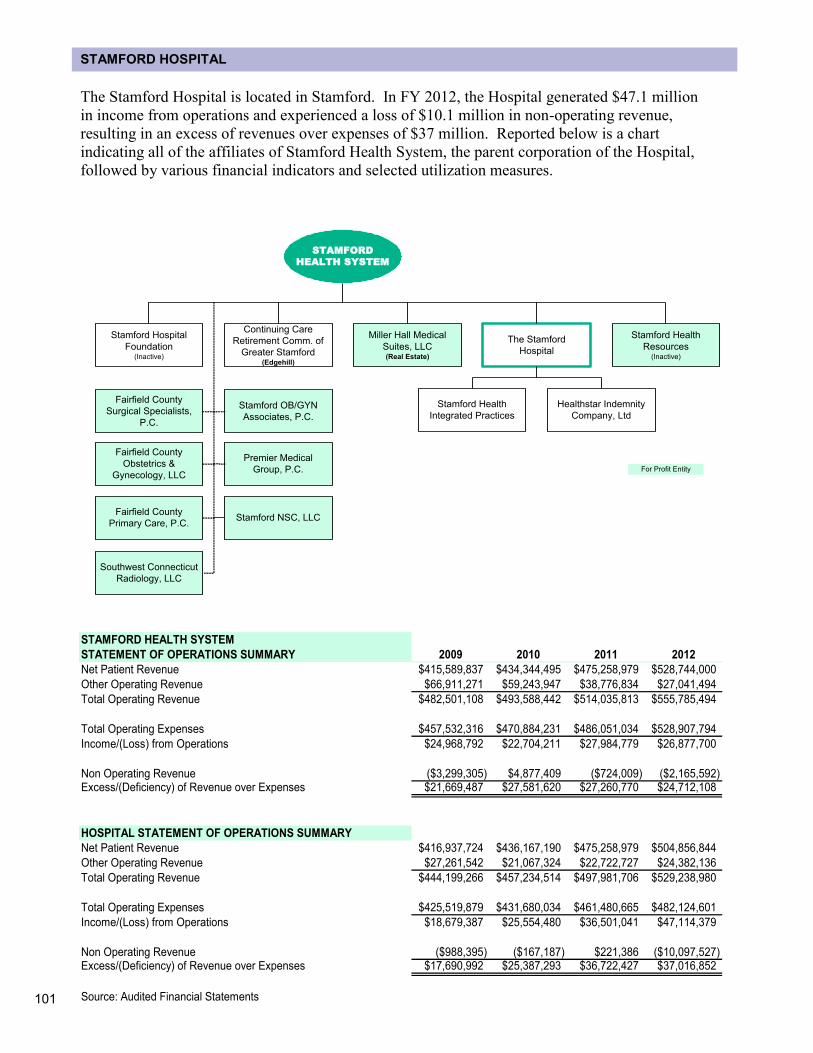
101
STAMFORD HOSPITAL
The Stamford Hospital is located in Stamford. In FY 2012, the Hospital generated $47.1 million
in income from operations and experienced a loss of $10.1 million in non-operating revenue,
resulting in an excess of revenues over expenses of $37 million. Reported below is a chart
indicating all of the affiliates of Stamford Health System, the parent corporation of the Hospital,
followed by various financial indicators and selected utilization measures.
The Stamford
Hospital
STAMFORD
HEALTH SYSTEM
For Profit Entity
Stamford Health
Integrated Practices
Healthstar Indemnity
Company, Ltd
Stamford Hospital
Foundation(Inactive)
Continuing Care
Retirement Comm. of
Greater Stamford(Edgehill)
Miller Hall Medical
Suites, LLC(Real Estate)
Stamford Health
Resources(Inactive)
Fairfield County
Surgical Specialists,
P.C.
Fairfield County
Obstetrics &
Gynecology, LLC
Fairfield County
Primary Care, P.C.
Stamford OB/GYN
Associates, P.C.
Premier Medical
Group, P.C.
Stamford NSC, LLC
Southwest Connecticut
Radiology, LLC
STAMFORD HEALTH SYSTEM
STATEMENT OF OPERATIONS SUMMARY 2009 2010 2011 2012
Net Patient Revenue $415,589,837 $434,344,495 $475,258,979 $528,744,000
Other Operating Revenue $66,911,271 $59,243,947 $38,776,834 $27,041,494
Total Operating Revenue $482,501,108 $493,588,442 $514,035,813 $555,785,494
Total Operating Expenses $457,532,316 $470,884,231 $486,051,034 $528,907,794
Income/(Loss) from Operations $24,968,792 $22,704,211 $27,984,779 $26,877,700
Non Operating Revenue ($3,299,305) $4,877,409 ($724,009) ($2,165,592)Excess/(Deficiency) of Revenue over Expenses $21,669,487 $27,581,620 $27,260,770 $24,712,108
HOSPITAL STATEMENT OF OPERATIONS SUMMARY
Net Patient Revenue $416,937,724 $436,167,190 $475,258,979 $504,856,844
Other Operating Revenue $27,261,542 $21,067,324 $22,722,727 $24,382,136
Total Operating Revenue $444,199,266 $457,234,514 $497,981,706 $529,238,980
Total Operating Expenses $425,519,879 $431,680,034 $461,480,665 $482,124,601
Income/(Loss) from Operations $18,679,387 $25,554,480 $36,501,041 $47,114,379
Non Operating Revenue ($988,395) ($167,187) $221,386 ($10,097,527)Excess/(Deficiency) of Revenue over Expenses $17,690,992 $25,387,293 $36,722,427 $37,016,852
Source: Audited Financial Statements

102
KEY RESULTS - STAMFORD HOSPITAL
Note: Financial measures noted in green are favorable compared to the statewide average while financial measures
noted in red are unfavorable compared to the statewide average. In some cases, the 2012 amount and the statewide
average show the same amount. The red and green formatting is based on additional decimal spaces that are not
shown.
Statewide
PROFITABILITY SUMMARY 2009 2010 2011 2012 Avg. 2012
Hospital Operating Margins 4.21% 5.59% 7.33% 9.08% 4.81%
Hospital Non Operating Margins -0.22% -0.04% 0.04% -1.95% 1.82%
Hospital Total Margins 3.99% 5.55% 7.37% 7.13% 6.63%
COST DATA SUMMARY
Ratio of cost to charges 0.36 0.33 0.31 0.29 0.36
Private Payment to Cost Ratio 1.32 1.37 1.43 1.49 1.35
Medicare Payment to Cost Ratio 0.63 0.65 0.61 0.64 0.84
Medicaid Payment to Cost Ratio 0.61 0.54 0.50 0.58 0.66
LIQUIDITY MEASURES SUMMARY
Current Ratio 1.18 1.72 1.91 1.80 1.97
Days cash on hand 9 45 68 79 69
Days in patients accounts receivable 43 43 44 43 40
Average Payment Period 59 61 69 82 69
SOLVENCY MEASURES SUMMARY
Equity financing ratio 20.3 25.5 28.3 20.2 36.0
Cash flow to total debt ratio 25.6 26.7 30.1 13.1 27.0
Long-term debt to Capitalization Ratio 60.9 54.3 49.0 70.2 38.1
NET ASSETS SUMMARY
Hospital Unrestricted Net Assets $42,615,000 $82,055,000 $108,504,000 $120,895,000
Hospital Total Net Assets $70,813,000 $109,583,000 $135,199,000 $161,014,000
UNCOMPENSATED CARE
Charity Care $11,909,791 $23,197,082 $27,344,589 $34,807,823
Bad Debts $47,934,677 $42,704,703 $46,972,113 $51,939,073
Total Uncompensated Care Charges $59,844,468 $65,901,785 $74,316,702 $86,746,896
Uncompensated Care Cost $21,570,630 $21,671,931 $23,111,558 $25,108,167
Uncompensated care % of total expenses 5.1% 5.0% 5.0% 5.2%
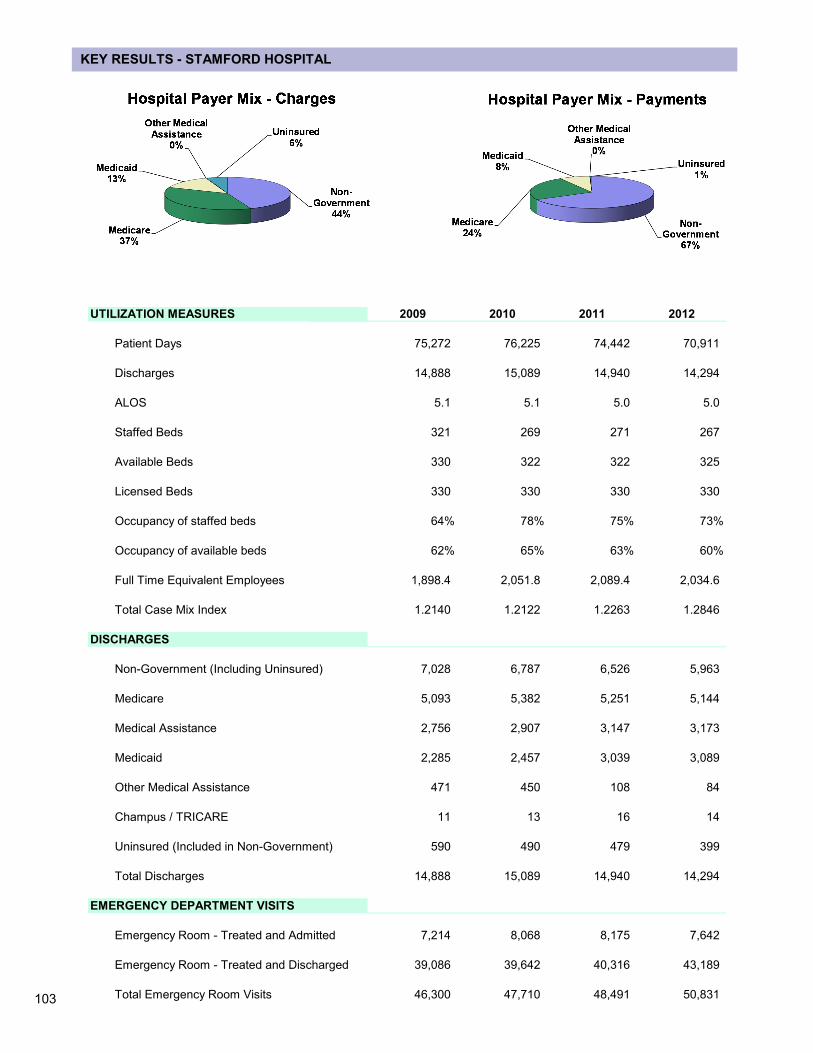
103
KEY RESULTS - STAMFORD HOSPITAL
UTILIZATION MEASURES 2009 2010 2011 2012
Patient Days 75,272 76,225 74,442 70,911
Discharges 14,888 15,089 14,940 14,294
ALOS 5.1 5.1 5.0 5.0
Staffed Beds 321 269 271 267
Available Beds 330 322 322 325
Licensed Beds 330 330 330 330
Occupancy of staffed beds 64% 78% 75% 73%
Occupancy of available beds 62% 65% 63% 60%
Full Time Equivalent Employees 1,898.4 2,051.8 2,089.4 2,034.6
Total Case Mix Index 1.2140 1.2122 1.2263 1.2846
DISCHARGES
Non-Government (Including Uninsured) 7,028 6,787 6,526 5,963
Medicare 5,093 5,382 5,251 5,144
Medical Assistance 2,756 2,907 3,147 3,173
Medicaid 2,285 2,457 3,039 3,089
Other Medical Assistance 471 450 108 84
Champus / TRICARE 11 13 16 14
Uninsured (Included in Non-Government) 590 490 479 399
Total Discharges 14,888 15,089 14,940 14,294
EMERGENCY DEPARTMENT VISITS
Emergency Room - Treated and Admitted 7,214 8,068 8,175 7,642
Emergency Room - Treated and Discharged 39,086 39,642 40,316 43,189
Total Emergency Room Visits 46,300 47,710 48,491 50,831
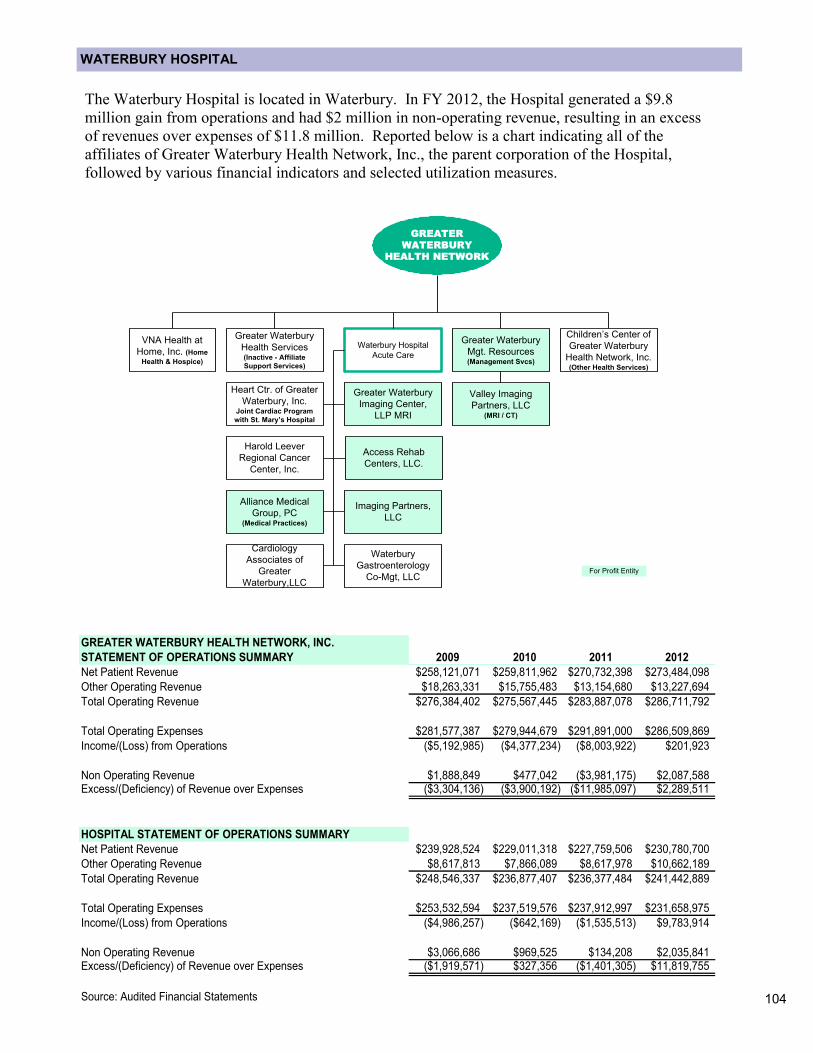
104
WATERBURY HOSPITAL
The Waterbury Hospital is located in Waterbury. In FY 2012, the Hospital generated a $9.8
million gain from operations and had $2 million in non-operating revenue, resulting in an excess
of revenues over expenses of $11.8 million. Reported below is a chart indicating all of the
affiliates of Greater Waterbury Health Network, Inc., the parent corporation of the Hospital,
followed by various financial indicators and selected utilization measures.
Alliance Medical
Group, PC(Medical Practices)
Greater Waterbury
Health Services(Inactive - Affiliate
Support Services)
Waterbury Hospital
Acute Care
Greater Waterbury
Mgt. Resources(Management Svcs)
Greater Waterbury
Imaging Center,
LLP MRI
Imaging Partners,
LLC
GREATER
WATERBURY
HEALTH NETWORK
For Profit Entity
VNA Health at
Home, Inc. (Home
Health & Hospice)
Valley Imaging
Partners, LLC(MRI / CT)
Harold Leever
Regional Cancer
Center, Inc.
Access Rehab
Centers, LLC.
Heart Ctr. of Greater
Waterbury, Inc.Joint Cardiac Program
with St. Mary’s Hospital
Children’s Center of
Greater Waterbury
Health Network, Inc.(Other Health Services)
Waterbury
Gastroenterology
Co-Mgt, LLC
Cardiology
Associates of
Greater
Waterbury,LLC
GREATER WATERBURY HEALTH NETWORK, INC.
STATEMENT OF OPERATIONS SUMMARY 2009 2010 2011 2012
Net Patient Revenue $258,121,071 $259,811,962 $270,732,398 $273,484,098
Other Operating Revenue $18,263,331 $15,755,483 $13,154,680 $13,227,694
Total Operating Revenue $276,384,402 $275,567,445 $283,887,078 $286,711,792
Total Operating Expenses $281,577,387 $279,944,679 $291,891,000 $286,509,869
Income/(Loss) from Operations ($5,192,985) ($4,377,234) ($8,003,922) $201,923
Non Operating Revenue $1,888,849 $477,042 ($3,981,175) $2,087,588Excess/(Deficiency) of Revenue over Expenses ($3,304,136) ($3,900,192) ($11,985,097) $2,289,511
HOSPITAL STATEMENT OF OPERATIONS SUMMARY
Net Patient Revenue $239,928,524 $229,011,318 $227,759,506 $230,780,700
Other Operating Revenue $8,617,813 $7,866,089 $8,617,978 $10,662,189
Total Operating Revenue $248,546,337 $236,877,407 $236,377,484 $241,442,889
Total Operating Expenses $253,532,594 $237,519,576 $237,912,997 $231,658,975
Income/(Loss) from Operations ($4,986,257) ($642,169) ($1,535,513) $9,783,914
Non Operating Revenue $3,066,686 $969,525 $134,208 $2,035,841Excess/(Deficiency) of Revenue over Expenses ($1,919,571) $327,356 ($1,401,305) $11,819,755
Source: Audited Financial Statements

105
KEY RESULTS – WATERBURY HOSPITAL
Note: Financial measures noted in green are favorable compared to the statewide average while financial measures
noted in red are unfavorable compared to the statewide average. In some cases, the 2012 amount and the statewide
average show the same amount. The red and green formatting is based on additional decimal spaces that are not
shown.
Statewide
PROFITABILITY SUMMARY 2009 2010 2011 2012 Avg. 2012
Hospital Operating Margins -1.98% -0.27% -0.65% 4.02% 4.81%
Hospital Non Operating Margins 1.22% 0.41% 0.06% 0.84% 1.82%
Hospital Total Margins -0.76% 0.14% -0.59% 4.85% 6.63%
COST DATA SUMMARY
Ratio of cost to charges 0.30 0.29 0.29 0.26 0.36
Private Payment to Cost Ratio 1.09 1.16 1.17 1.24 1.35
Medicare Payment to Cost Ratio 0.88 0.89 0.87 0.95 0.84
Medicaid Payment to Cost Ratio 0.68 0.62 0.65 0.57 0.66
LIQUIDITY MEASURES SUMMARY
Current Ratio 2.00 1.79 1.38 1.49 1.97
Days cash on hand 22 26 16 37 69
Days in patients accounts receivable 45 44 42 42 40
Average Payment Period 37 44 58 62 69
SOLVENCY MEASURES SUMMARY
Equity financing ratio 61.5 60.3 43.8 45.5 36.0
Cash flow to total debt ratio 16.3 21.0 10.7 31.2 27.0
Long-term debt to Capitalization Ratio 17.0 16.7 29.0 26.7 38.1
NET ASSETS SUMMARY
Hospital Unrestricted Net Assets $44,636,663 $40,084,846 $17,379,947 $18,516,310
Hospital Total Net Assets $93,058,584 $90,753,820 $63,988,676 $71,171,929
UNCOMPENSATED CARE
Charity Care $1,809,921 $1,910,845 $2,456,277 $1,389,352
Bad Debts $14,319,487 $14,985,815 $13,122,386 $10,435,502
Total Uncompensated Care Charges $16,129,408 $16,896,660 $15,578,663 $11,824,854
Uncompensated Care Cost $4,766,186 $4,856,677 $4,466,323 $3,064,711
Uncompensated care % of total expenses 1.9% 2.0% 1.9% 1.3%
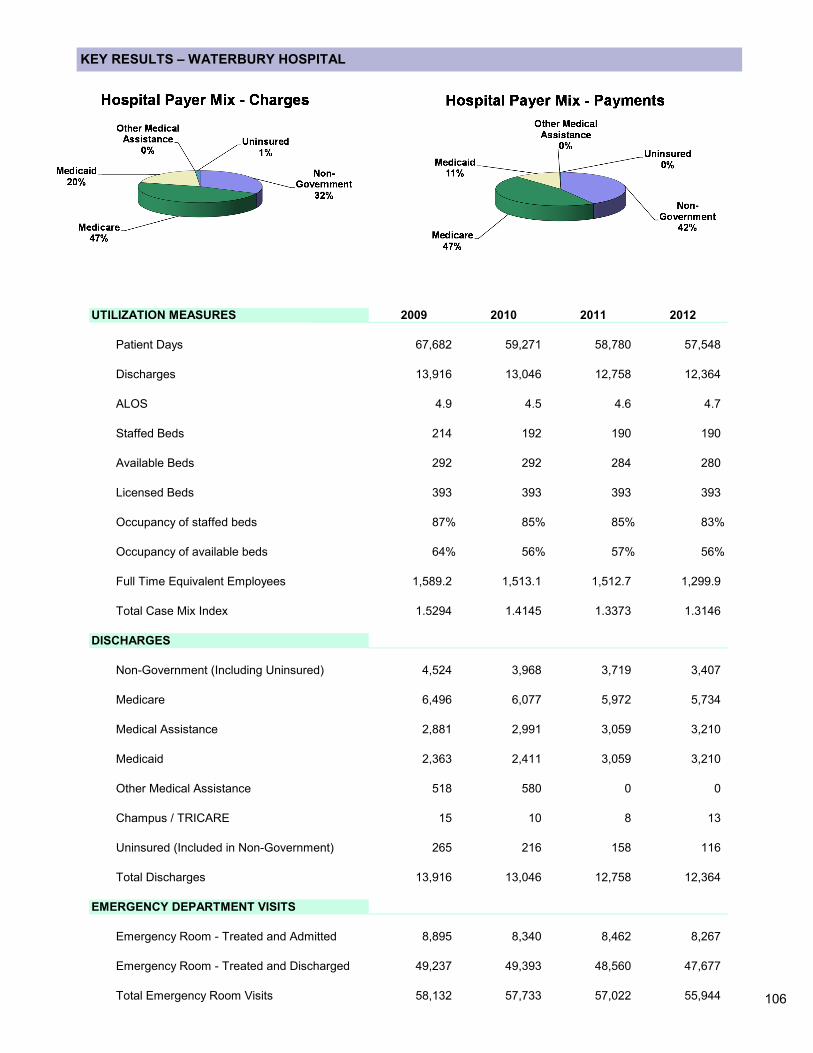
106
KEY RESULTS – WATERBURY HOSPITAL
UTILIZATION MEASURES 2009 2010 2011 2012
Patient Days 67,682 59,271 58,780 57,548
Discharges 13,916 13,046 12,758 12,364
ALOS 4.9 4.5 4.6 4.7
Staffed Beds 214 192 190 190
Available Beds 292 292 284 280
Licensed Beds 393 393 393 393
Occupancy of staffed beds 87% 85% 85% 83%
Occupancy of available beds 64% 56% 57% 56%
Full Time Equivalent Employees 1,589.2 1,513.1 1,512.7 1,299.9
Total Case Mix Index 1.5294 1.4145 1.3373 1.3146
DISCHARGES
Non-Government (Including Uninsured) 4,524 3,968 3,719 3,407
Medicare 6,496 6,077 5,972 5,734
Medical Assistance 2,881 2,991 3,059 3,210
Medicaid 2,363 2,411 3,059 3,210
Other Medical Assistance 518 580 0 0
Champus / TRICARE 15 10 8 13
Uninsured (Included in Non-Government) 265 216 158 116
Total Discharges 13,916 13,046 12,758 12,364
EMERGENCY DEPARTMENT VISITS
Emergency Room - Treated and Admitted 8,895 8,340 8,462 8,267
Emergency Room - Treated and Discharged 49,237 49,393 48,560 47,677
Total Emergency Room Visits 58,132 57,733 57,022 55,944
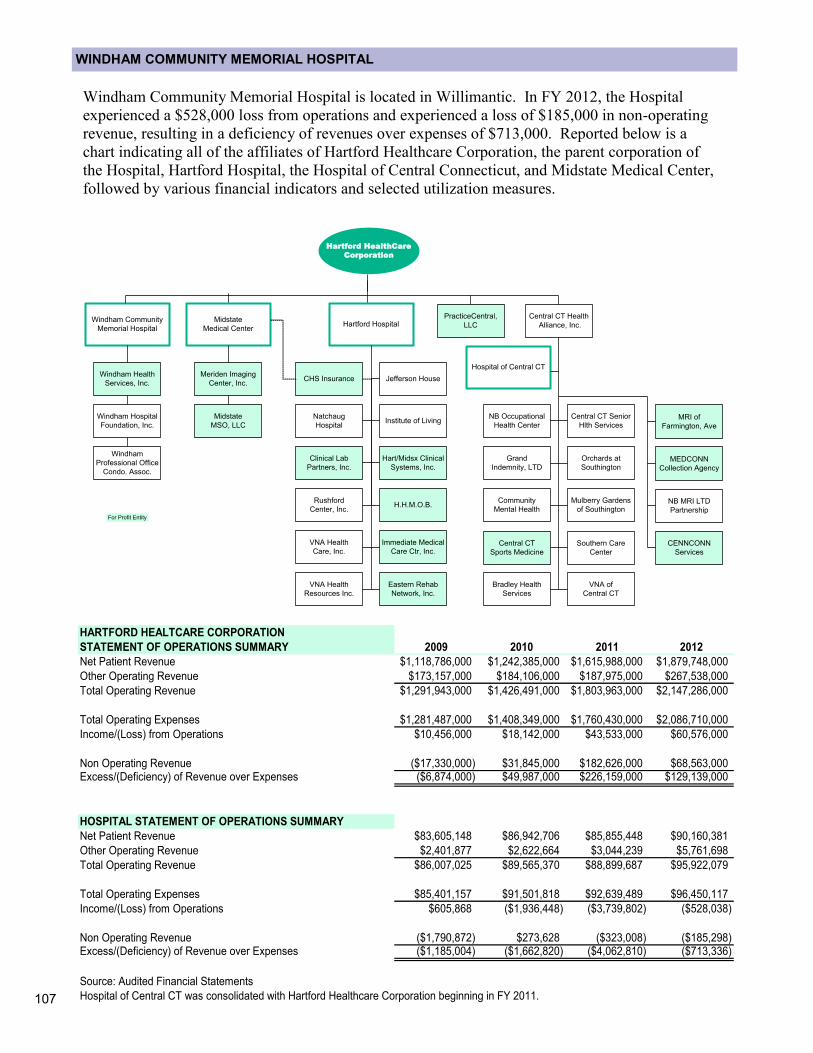
107
WINDHAM COMMUNITY MEMORIAL HOSPITAL
Windham Community Memorial Hospital is located in Willimantic. In FY 2012, the Hospital
experienced a $528,000 loss from operations and experienced a loss of $185,000 in non-operating
revenue, resulting in a deficiency of revenues over expenses of $713,000. Reported below is a
chart indicating all of the affiliates of Hartford Healthcare Corporation, the parent corporation of
the Hospital, Hartford Hospital, the Hospital of Central Connecticut, and Midstate Medical Center,
followed by various financial indicators and selected utilization measures.
HARTFORD HEALTCARE CORPORATION
STATEMENT OF OPERATIONS SUMMARY 2009 2010 2011 2012
Net Patient Revenue $1,118,786,000 $1,242,385,000 $1,615,988,000 $1,879,748,000
Other Operating Revenue $173,157,000 $184,106,000 $187,975,000 $267,538,000
Total Operating Revenue $1,291,943,000 $1,426,491,000 $1,803,963,000 $2,147,286,000
Total Operating Expenses $1,281,487,000 $1,408,349,000 $1,760,430,000 $2,086,710,000
Income/(Loss) from Operations $10,456,000 $18,142,000 $43,533,000 $60,576,000
Non Operating Revenue ($17,330,000) $31,845,000 $182,626,000 $68,563,000Excess/(Deficiency) of Revenue over Expenses ($6,874,000) $49,987,000 $226,159,000 $129,139,000
HOSPITAL STATEMENT OF OPERATIONS SUMMARY
Net Patient Revenue $83,605,148 $86,942,706 $85,855,448 $90,160,381
Other Operating Revenue $2,401,877 $2,622,664 $3,044,239 $5,761,698
Total Operating Revenue $86,007,025 $89,565,370 $88,899,687 $95,922,079
Total Operating Expenses $85,401,157 $91,501,818 $92,639,489 $96,450,117
Income/(Loss) from Operations $605,868 ($1,936,448) ($3,739,802) ($528,038)
Non Operating Revenue ($1,790,872) $273,628 ($323,008) ($185,298)Excess/(Deficiency) of Revenue over Expenses ($1,185,004) ($1,662,820) ($4,062,810) ($713,336)
Source: Audited Financial Statements
Hospital of Central CT was consolidated with Hartford Healthcare Corporation beginning in FY 2011.
Hartford HealthCare
Corporation
For Profit Entity
Hospital of Central CT
Hartford HospitalMidstate
Medical Center
Midstate
MSO, LLC
Meriden Imaging
Center, Inc.
Windham Hospital
Foundation, Inc.
Windham
Professional Office
Condo. Assoc.
Windham Health
Services, Inc.
Windham Community
Memorial Hospital
Natchaug
Hospital
Clinical Lab
Partners, Inc.
Rushford
Center, Inc.H.H.M.O.B.
Immediate Medical
Care Ctr, Inc.
Eastern Rehab
Network, Inc.
Jefferson House
Institute of Living
Hart/Midsx Clinical
Systems, Inc.
VNA Health
Care, Inc.
VNA Health
Resources Inc.
CHS Insurance
Grand
Indemnity, LTD
Community
Mental Health
Central CT
Sports Medicine
Bradley Health
Services
CENNCONN
Services
MEDCONN
Collection Agency
MRI of
Farmington, Ave
VNA of
Central CT
Southern Care
Center
Central CT Senior
Hlth Services
Mulberry Gardens
of Southington
Orchards at
Southington
NB MRI LTD
Partnership
NB Occupational
Health Center
Central CT Health
Alliance, Inc.
PracticeCentral,
LLC
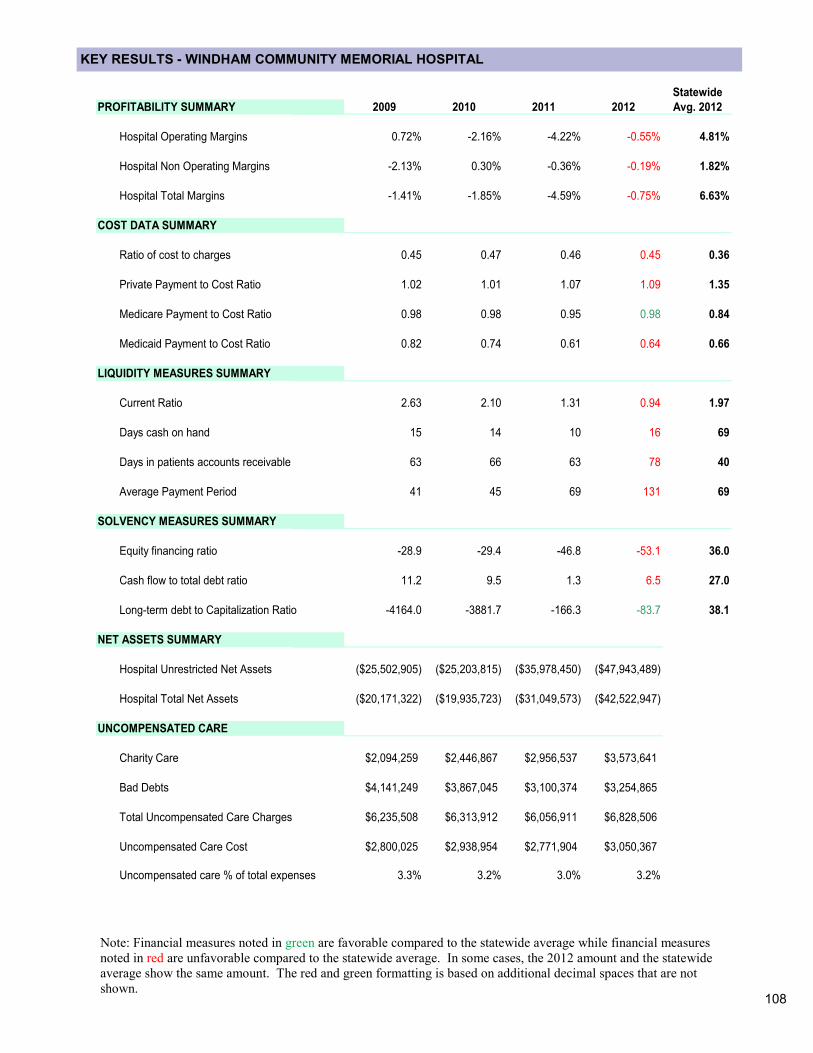
108
KEY RESULTS - WINDHAM COMMUNITY MEMORIAL HOSPITAL
Note: Financial measures noted in green are favorable compared to the statewide average while financial measures
noted in red are unfavorable compared to the statewide average. In some cases, the 2012 amount and the statewide
average show the same amount. The red and green formatting is based on additional decimal spaces that are not
shown.
Statewide
PROFITABILITY SUMMARY 2009 2010 2011 2012 Avg. 2012
Hospital Operating Margins 0.72% -2.16% -4.22% -0.55% 4.81%
Hospital Non Operating Margins -2.13% 0.30% -0.36% -0.19% 1.82%
Hospital Total Margins -1.41% -1.85% -4.59% -0.75% 6.63%
COST DATA SUMMARY
Ratio of cost to charges 0.45 0.47 0.46 0.45 0.36
Private Payment to Cost Ratio 1.02 1.01 1.07 1.09 1.35
Medicare Payment to Cost Ratio 0.98 0.98 0.95 0.98 0.84
Medicaid Payment to Cost Ratio 0.82 0.74 0.61 0.64 0.66
LIQUIDITY MEASURES SUMMARY
Current Ratio 2.63 2.10 1.31 0.94 1.97
Days cash on hand 15 14 10 16 69
Days in patients accounts receivable 63 66 63 78 40
Average Payment Period 41 45 69 131 69
SOLVENCY MEASURES SUMMARY
Equity financing ratio -28.9 -29.4 -46.8 -53.1 36.0
Cash flow to total debt ratio 11.2 9.5 1.3 6.5 27.0
Long-term debt to Capitalization Ratio -4164.0 -3881.7 -166.3 -83.7 38.1
NET ASSETS SUMMARY
Hospital Unrestricted Net Assets ($25,502,905) ($25,203,815) ($35,978,450) ($47,943,489)
Hospital Total Net Assets ($20,171,322) ($19,935,723) ($31,049,573) ($42,522,947)
UNCOMPENSATED CARE
Charity Care $2,094,259 $2,446,867 $2,956,537 $3,573,641
Bad Debts $4,141,249 $3,867,045 $3,100,374 $3,254,865
Total Uncompensated Care Charges $6,235,508 $6,313,912 $6,056,911 $6,828,506
Uncompensated Care Cost $2,800,025 $2,938,954 $2,771,904 $3,050,367
Uncompensated care % of total expenses 3.3% 3.2% 3.0% 3.2%
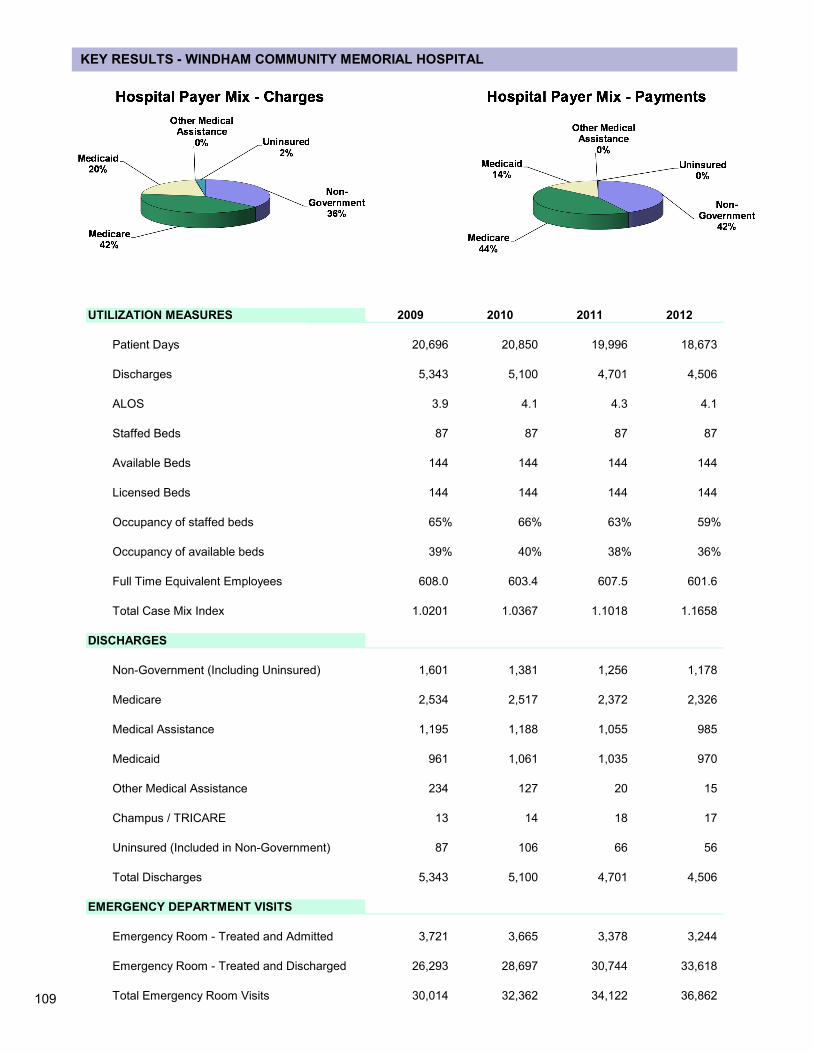
109
KEY RESULTS - WINDHAM COMMUNITY MEMORIAL HOSPITAL
UTILIZATION MEASURES 2009 2010 2011 2012
Patient Days 20,696 20,850 19,996 18,673
Discharges 5,343 5,100 4,701 4,506
ALOS 3.9 4.1 4.3 4.1
Staffed Beds 87 87 87 87
Available Beds 144 144 144 144
Licensed Beds 144 144 144 144
Occupancy of staffed beds 65% 66% 63% 59%
Occupancy of available beds 39% 40% 38% 36%
Full Time Equivalent Employees 608.0 603.4 607.5 601.6
Total Case Mix Index 1.0201 1.0367 1.1018 1.1658
DISCHARGES
Non-Government (Including Uninsured) 1,601 1,381 1,256 1,178
Medicare 2,534 2,517 2,372 2,326
Medical Assistance 1,195 1,188 1,055 985
Medicaid 961 1,061 1,035 970
Other Medical Assistance 234 127 20 15
Champus / TRICARE 13 14 18 17
Uninsured (Included in Non-Government) 87 106 66 56
Total Discharges 5,343 5,100 4,701 4,506
EMERGENCY DEPARTMENT VISITS
Emergency Room - Treated and Admitted 3,721 3,665 3,378 3,244
Emergency Room - Treated and Discharged 26,293 28,697 30,744 33,618
Total Emergency Room Visits 30,014 32,362 34,122 36,862
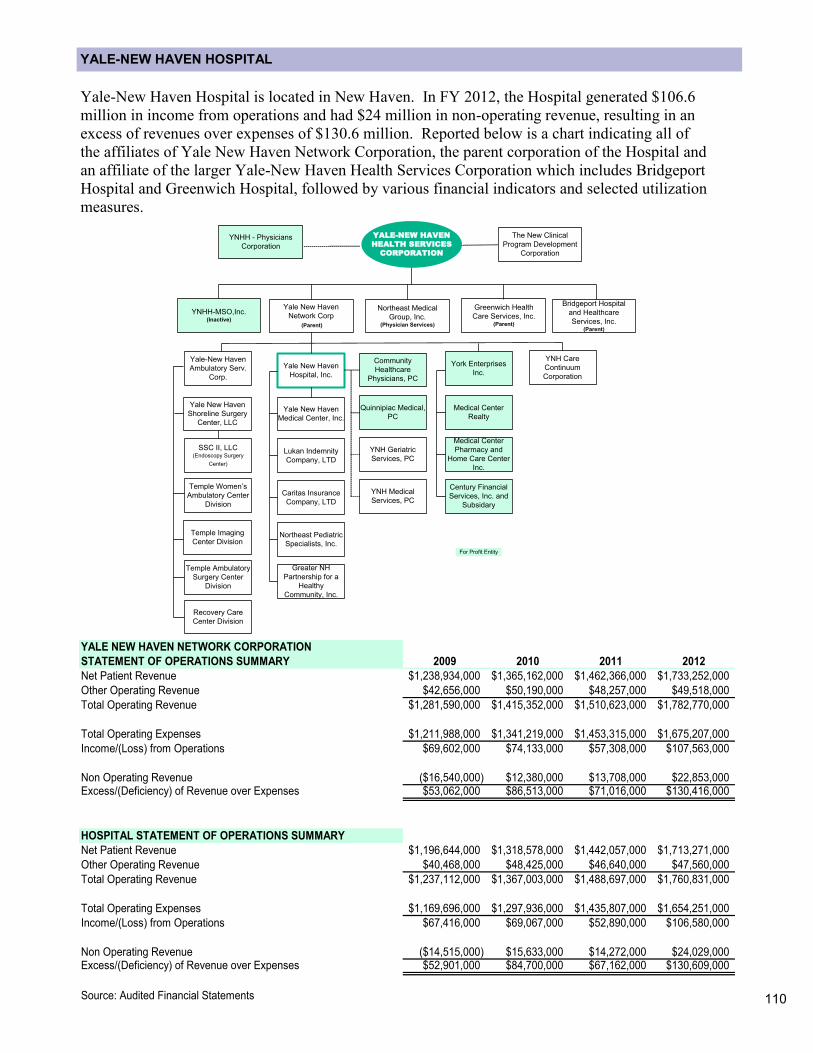
110
YALE-NEW HAVEN HOSPITAL
Yale-New Haven Hospital is located in New Haven. In FY 2012, the Hospital generated $106.6
million in income from operations and had $24 million in non-operating revenue, resulting in an
excess of revenues over expenses of $130.6 million. Reported below is a chart indicating all of
the affiliates of Yale New Haven Network Corporation, the parent corporation of the Hospital and
an affiliate of the larger Yale-New Haven Health Services Corporation which includes Bridgeport
Hospital and Greenwich Hospital, followed by various financial indicators and selected utilization
measures.
YALE NEW HAVEN NETWORK CORPORATION
STATEMENT OF OPERATIONS SUMMARY 2009 2010 2011 2012
Net Patient Revenue $1,238,934,000 $1,365,162,000 $1,462,366,000 $1,733,252,000
Other Operating Revenue $42,656,000 $50,190,000 $48,257,000 $49,518,000
Total Operating Revenue $1,281,590,000 $1,415,352,000 $1,510,623,000 $1,782,770,000
Total Operating Expenses $1,211,988,000 $1,341,219,000 $1,453,315,000 $1,675,207,000
Income/(Loss) from Operations $69,602,000 $74,133,000 $57,308,000 $107,563,000
Non Operating Revenue ($16,540,000) $12,380,000 $13,708,000 $22,853,000Excess/(Deficiency) of Revenue over Expenses $53,062,000 $86,513,000 $71,016,000 $130,416,000
HOSPITAL STATEMENT OF OPERATIONS SUMMARY
Net Patient Revenue $1,196,644,000 $1,318,578,000 $1,442,057,000 $1,713,271,000
Other Operating Revenue $40,468,000 $48,425,000 $46,640,000 $47,560,000
Total Operating Revenue $1,237,112,000 $1,367,003,000 $1,488,697,000 $1,760,831,000
Total Operating Expenses $1,169,696,000 $1,297,936,000 $1,435,807,000 $1,654,251,000
Income/(Loss) from Operations $67,416,000 $69,067,000 $52,890,000 $106,580,000
Non Operating Revenue ($14,515,000) $15,633,000 $14,272,000 $24,029,000Excess/(Deficiency) of Revenue over Expenses $52,901,000 $84,700,000 $67,162,000 $130,609,000
Source: Audited Financial Statements
Yale New Haven
Network Corp
(Parent)
Bridgeport Hospital
and Healthcare
Services, Inc.(Parent)
Greenwich Health
Care Services, Inc.(Parent)
YALE-NEW HAVEN
HEALTH SERVICES
CORPORATION
For Profit Entity
Yale-New Haven
Ambulatory Serv.
Corp.
Yale New Haven
Hospital, Inc.
Yale New Haven
Shoreline Surgery
Center, LLC
Temple Women’s
Ambulatory Center
Division
Temple Imaging
Center Division
Recovery Care
Center Division
York Enterprises
Inc.
Medical Center
Realty
Medical Center
Pharmacy and
Home Care Center
Inc.
Century Financial
Services, Inc. and
Subsidary
Yale New Haven
Medical Center, Inc.
YNHH-MSO,Inc.(Inactive)
YNHH - Physicians
Corporation
Community
Healthcare
Physicians, PC
Quinnipiac Medical,
PC
Temple Ambulatory
Surgery Center
Division
YNH Geriatric
Services, PC
YNH Medical
Services, PC
The New Clinical
Program Development
Corporation
SSC II, LLC(Endoscopy Surgery
Center)
Northeast Medical
Group, Inc.(Physician Services)
YNH Care
Continuum
Corporation
Lukan Indemnity
Company, LTD
Caritas Insurance
Company, LTD
Northeast Pediatric
Specialists, Inc.
Greater NH
Partnership for a
Healthy
Community, Inc.
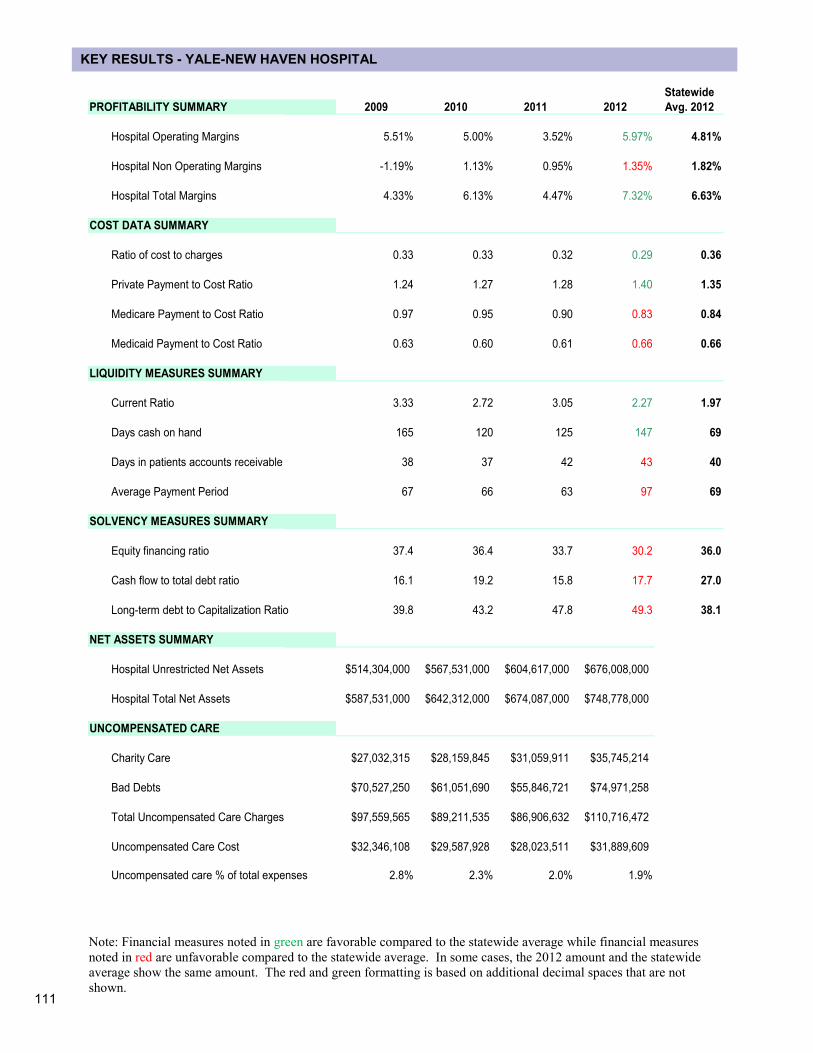
111
KEY RESULTS - YALE-NEW HAVEN HOSPITAL
Note: Financial measures noted in green are favorable compared to the statewide average while financial measures
noted in red are unfavorable compared to the statewide average. In some cases, the 2012 amount and the statewide
average show the same amount. The red and green formatting is based on additional decimal spaces that are not
shown.
Statewide
PROFITABILITY SUMMARY 2009 2010 2011 2012 Avg. 2012
Hospital Operating Margins 5.51% 5.00% 3.52% 5.97% 4.81%
Hospital Non Operating Margins -1.19% 1.13% 0.95% 1.35% 1.82%
Hospital Total Margins 4.33% 6.13% 4.47% 7.32% 6.63%
COST DATA SUMMARY
Ratio of cost to charges 0.33 0.33 0.32 0.29 0.36
Private Payment to Cost Ratio 1.24 1.27 1.28 1.40 1.35
Medicare Payment to Cost Ratio 0.97 0.95 0.90 0.83 0.84
Medicaid Payment to Cost Ratio 0.63 0.60 0.61 0.66 0.66
LIQUIDITY MEASURES SUMMARY
Current Ratio 3.33 2.72 3.05 2.27 1.97
Days cash on hand 165 120 125 147 69
Days in patients accounts receivable 38 37 42 43 40
Average Payment Period 67 66 63 97 69
SOLVENCY MEASURES SUMMARY
Equity financing ratio 37.4 36.4 33.7 30.2 36.0
Cash flow to total debt ratio 16.1 19.2 15.8 17.7 27.0
Long-term debt to Capitalization Ratio 39.8 43.2 47.8 49.3 38.1
NET ASSETS SUMMARY
Hospital Unrestricted Net Assets $514,304,000 $567,531,000 $604,617,000 $676,008,000
Hospital Total Net Assets $587,531,000 $642,312,000 $674,087,000 $748,778,000
UNCOMPENSATED CARE
Charity Care $27,032,315 $28,159,845 $31,059,911 $35,745,214
Bad Debts $70,527,250 $61,051,690 $55,846,721 $74,971,258
Total Uncompensated Care Charges $97,559,565 $89,211,535 $86,906,632 $110,716,472
Uncompensated Care Cost $32,346,108 $29,587,928 $28,023,511 $31,889,609
Uncompensated care % of total expenses 2.8% 2.3% 2.0% 1.9%
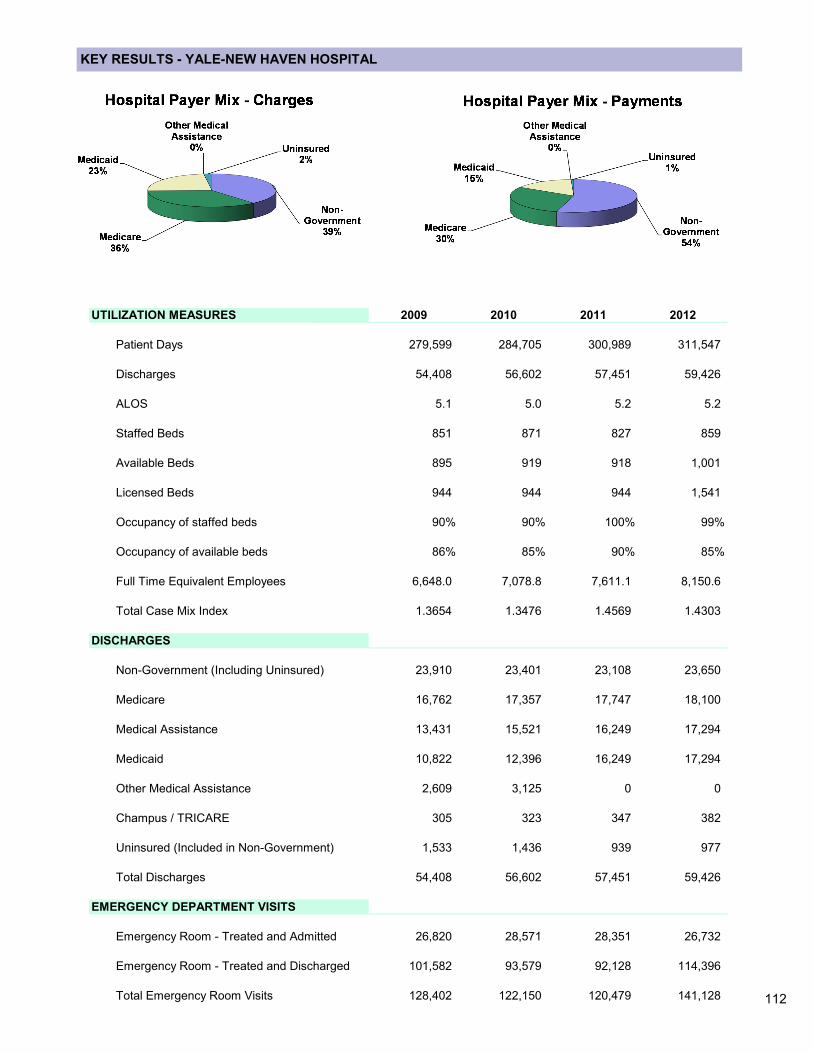
112
KEY RESULTS - YALE-NEW HAVEN HOSPITAL
UTILIZATION MEASURES 2009 2010 2011 2012
Patient Days 279,599 284,705 300,989 311,547
Discharges 54,408 56,602 57,451 59,426
ALOS 5.1 5.0 5.2 5.2
Staffed Beds 851 871 827 859
Available Beds 895 919 918 1,001
Licensed Beds 944 944 944 1,541
Occupancy of staffed beds 90% 90% 100% 99%
Occupancy of available beds 86% 85% 90% 85%
Full Time Equivalent Employees 6,648.0 7,078.8 7,611.1 8,150.6
Total Case Mix Index 1.3654 1.3476 1.4569 1.4303
DISCHARGES
Non-Government (Including Uninsured) 23,910 23,401 23,108 23,650
Medicare 16,762 17,357 17,747 18,100
Medical Assistance 13,431 15,521 16,249 17,294
Medicaid 10,822 12,396 16,249 17,294
Other Medical Assistance 2,609 3,125 0 0
Champus / TRICARE 305 323 347 382
Uninsured (Included in Non-Government) 1,533 1,436 939 977
Total Discharges 54,408 56,602 57,451 59,426
EMERGENCY DEPARTMENT VISITS
Emergency Room - Treated and Admitted 26,820 28,571 28,351 26,732
Emergency Room - Treated and Discharged 101,582 93,579 92,128 114,396
Total Emergency Room Visits 128,402 122,150 120,479 141,128
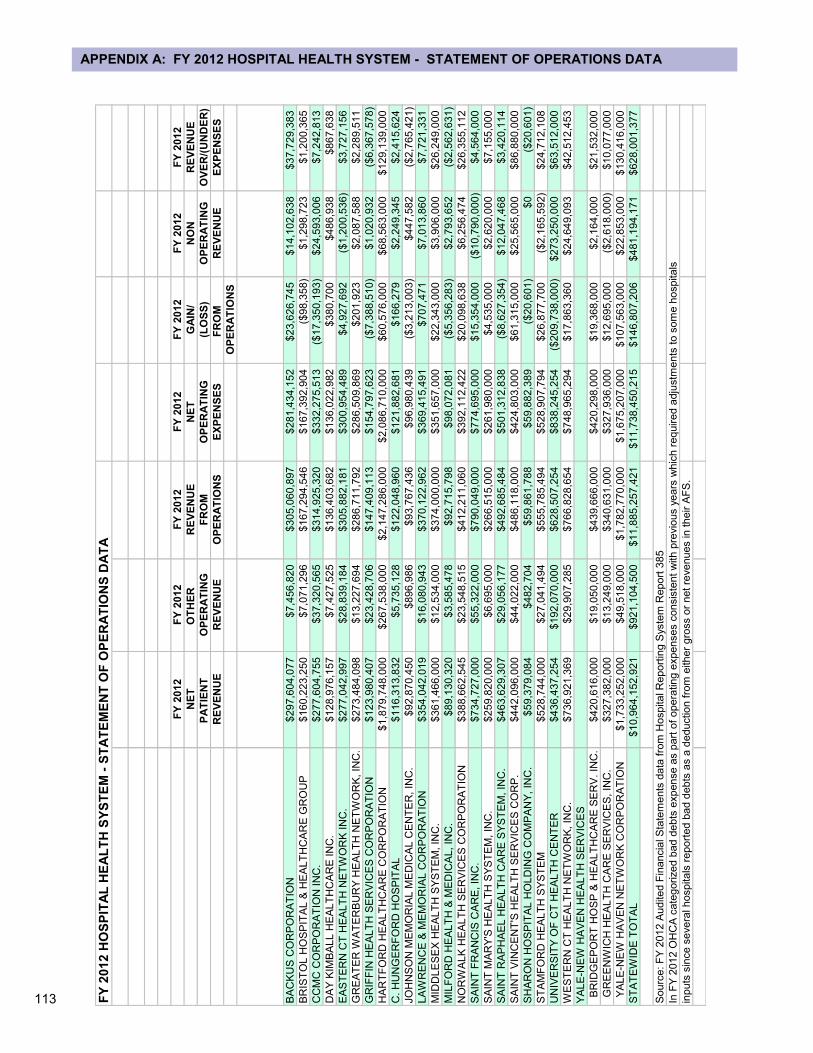
113
APPENDIX A: FY 2012 HOSPITAL HEALTH SYSTEM - STATEMENT OF OPERATIONS DATA
FY
20
12
HO
SP
ITA
L H
EA
LT
H S
YS
TE
M -
ST
AT
EM
EN
T O
F O
PE
RA
TIO
NS
DA
TA
FY
2012
FY
2012
FY
2012
FY
201
2F
Y 2
012
FY
2012
FY
2012
NE
TO
TH
ER
R
EV
EN
UE
NE
TG
AIN
/N
ON
RE
VE
NU
E
PA
TIE
NT
O
PE
RA
TIN
GF
RO
MO
PE
RA
TIN
G(L
OS
S)
OP
ER
AT
ING
OV
ER
/(U
ND
ER
)
RE
VE
NU
ER
EV
EN
UE
OP
ER
AT
ION
SE
XP
EN
SE
SF
RO
M
RE
VE
NU
EE
XP
EN
SE
S
OP
ER
AT
ION
S
BA
CK
US
CO
RP
OR
AT
ION
$297,6
04,0
77
$7,4
56,8
20
$305,0
60,8
97
$281,4
34,1
52
$23,6
26,7
45
$14,1
02,6
38
$37,7
29,3
83
BR
IST
OL H
OS
PIT
AL &
HE
ALT
HC
AR
E G
RO
UP
$160,2
23,2
50
$7,0
71,2
96
$167,2
94,5
46
$167,3
92,9
04
($98,3
58)
$1,2
98,7
23
$1,2
00,3
65
CC
MC
CO
RP
OR
AT
ION
IN
C.
$277,6
04,7
55
$37,3
20,5
65
$314,9
25,3
20
$332,2
75,5
13
($17,3
50,1
93)
$24,5
93,0
06
$7,2
42,8
13
DA
Y K
IMB
ALL H
EA
LT
HC
AR
E IN
C.
$128,9
76,1
57
$7,4
27,5
25
$136,4
03,6
82
$136,0
22,9
82
$380,7
00
$486,9
38
$867,6
38
EA
ST
ER
N C
T H
EA
LT
H N
ET
WO
RK
IN
C.
$277,0
42,9
97
$28,8
39,1
84
$305,8
82,1
81
$300,9
54,4
89
$4,9
27,6
92
($1,2
00,5
36)
$3,7
27,1
56
GR
EA
TE
R W
AT
ER
BU
RY
HE
AL
TH
NE
TW
OR
K, IN
C.
$273,4
84,0
98
$13,2
27,6
94
$286,7
11,7
92
$286,5
09,8
69
$201,9
23
$2,0
87,5
88
$2,2
89,5
11
GR
IFF
IN H
EA
LT
H S
ER
VIC
ES
CO
RP
OR
AT
ION
$123,9
80,4
07
$23,4
28,7
06
$147,4
09,1
13
$154,7
97,6
23
($7,3
88
,510)
$1,0
20,9
32
($6,3
67,5
78)
HA
RT
FO
RD
HE
ALT
HC
AR
E C
OR
PO
RA
TIO
N$1,8
79,7
48,0
00
$267,5
38,0
00
$2,1
47,2
86,0
00
$2,0
86,7
10,0
00
$60,5
76,0
00
$68,5
63,0
00
$129,1
39,0
00
C. H
UN
GE
RF
OR
D H
OS
PIT
AL
$116,3
13,8
32
$5,7
35,1
28
$122,0
48,9
60
$121,8
82,6
81
$166,2
79
$2,2
49,3
45
$2,4
15,6
24
JO
HN
SO
N M
EM
OR
IAL M
ED
ICA
L C
EN
TE
R, IN
C.
$92,8
70,4
50
$896,9
86
$93,7
67,4
36
$96,9
80,4
39
($3,2
13
,003)
$447,5
82
($2,7
65,4
21)
LA
WR
EN
CE
& M
EM
OR
IAL C
OR
PO
RA
TIO
N$354,0
42,0
19
$16,0
80,9
43
$370,1
22,9
62
$369,4
15,4
91
$707,4
71
$7,0
13,8
60
$7,7
21,3
31
MID
DLE
SE
X H
EA
LT
H S
YS
TE
M, IN
C.
$361,4
66,0
00
$12,5
34,0
00
$374,0
00,0
00
$351,6
57,0
00
$22,3
43,0
00
$3,9
06,0
00
$26,2
49,0
00
MIL
FO
RD
HE
ALT
H &
ME
DIC
AL, IN
C.
$89,1
30,3
20
$3,5
85,4
78
$92,7
15,7
98
$98,0
72,0
81
($5,3
56
,283)
$2,7
93,6
52
($2,5
62,6
31)
NO
RW
ALK
HE
ALT
H S
ER
VIC
ES
CO
RP
OR
AT
ION
$388,6
62,5
45
$23,5
48,5
15
$412,2
11,0
60
$392,1
12,4
22
$20,0
98,6
38
$6,2
56,4
74
$26,3
55,1
12
SA
INT
FR
AN
CIS
CA
RE
, IN
C.
$734,7
27,0
00
$55,3
22,0
00
$790,0
49,0
00
$774,6
95,0
00
$15,3
54,0
00
($10
,790,0
00)
$4,5
64,0
00
SA
INT
MA
RY
'S H
EA
LT
H S
YS
TE
M, IN
C.
$259,8
20,0
00
$6,6
95,0
00
$266,5
15,0
00
$261,9
80,0
00
$4,5
35,0
00
$2,6
20,0
00
$7,1
55,0
00
SA
INT
RA
PH
AE
L H
EA
LT
H C
AR
E S
YS
TE
M, IN
C.
$463,6
29,3
07
$29,0
56,1
77
$492,6
85,4
84
$501,3
12,8
38
($8,6
27
,354)
$12,0
47,4
68
$3,4
20,1
14
SA
INT
VIN
CE
NT
'S H
EA
LT
H S
ER
VIC
ES
CO
RP
.$442,0
96,0
00
$44,0
22,0
00
$486,1
18,0
00
$424,8
03,0
00
$61,3
15,0
00
$25,5
65,0
00
$86,8
80,0
00
SH
AR
ON
HO
SP
ITA
L H
OLD
ING
CO
MP
AN
Y, IN
C.
$59,3
79,0
84
$482,7
04
$59,8
61,7
88
$59,8
82,3
89
($20,6
01)
$0
($20,6
01)
ST
AM
FO
RD
HE
ALT
H S
YS
TE
M$528,7
44,0
00
$27,0
41,4
94
$555,7
85,4
94
$528,9
07,7
94
$26,8
77,7
00
($2,1
65,5
92)
$24,7
12,1
08
UN
IVE
RS
ITY
OF
CT
HE
ALT
H C
EN
TE
R$436,4
37,2
54
$192,0
70,0
00
$628,5
07,2
54
$838,2
45,2
54
($20
9,7
38
,000)
$273,2
50,0
00
$63,5
12,0
00
WE
ST
ER
N C
T H
EA
LT
H N
ET
WO
RK
, IN
C.
$736,9
21,3
69
$29,9
07,2
85
$766,8
28,6
54
$748,9
65,2
94
$17,8
63,3
60
$24,6
49,0
93
$42,5
12,4
53
YA
LE
-NE
W H
AV
EN
HE
ALT
H S
ER
VIC
ES
B
RID
GE
PO
RT
HO
SP
& H
EA
LT
HC
AR
E S
ER
V. IN
C.
$420,6
16,0
00
$19,0
50,0
00
$439,6
66,0
00
$420,2
98,0
00
$19,3
68,0
00
$2,1
64,0
00
$21,5
32,0
00
G
RE
EN
WIC
H H
EA
LT
H C
AR
E S
ER
VIC
ES
, IN
C.
$327,3
82,0
00
$13,2
49,0
00
$340,6
31,0
00
$327,9
36,0
00
$12,6
95,0
00
($2,6
18,0
00)
$10,0
77,0
00
Y
ALE
-NE
W H
AV
EN
NE
TW
OR
K C
OR
PO
RA
TIO
N$1,7
33,2
52,0
00
$49,5
18,0
00
$1,7
82,7
70,0
00
$1,6
75,2
07,0
00
$107,5
63,0
00
$22,8
53,0
00
$130,4
16,0
00
ST
AT
EW
IDE
TO
TA
L$10,9
64,1
52,9
21
$921,1
04,5
00
$11,8
85,2
57,4
21
$11,7
38,4
50,2
15
$146,8
07,2
06
$481,1
94,1
71
$628,0
01,3
77
Sourc
e: F
Y 2
012 A
udited F
ina
ncia
l S
tate
ments
data
fro
m H
ospital R
eport
ing S
yste
m R
eport
385
In F
Y 2
012 O
HC
A c
ate
gorized b
ad d
ebts
exp
ense
as p
art
of
opera
ting e
xpenses c
onsis
tent w
ith p
revio
us y
ears
whic
h r
eq
uired a
dju
stm
ents
to s
om
e h
osp
itals
inputs
sin
ce s
evera
l hospitals
report
ed
bad d
ebts
as a
deduction f
rom
either
gro
ss o
r net re
venues in their A
FS
.
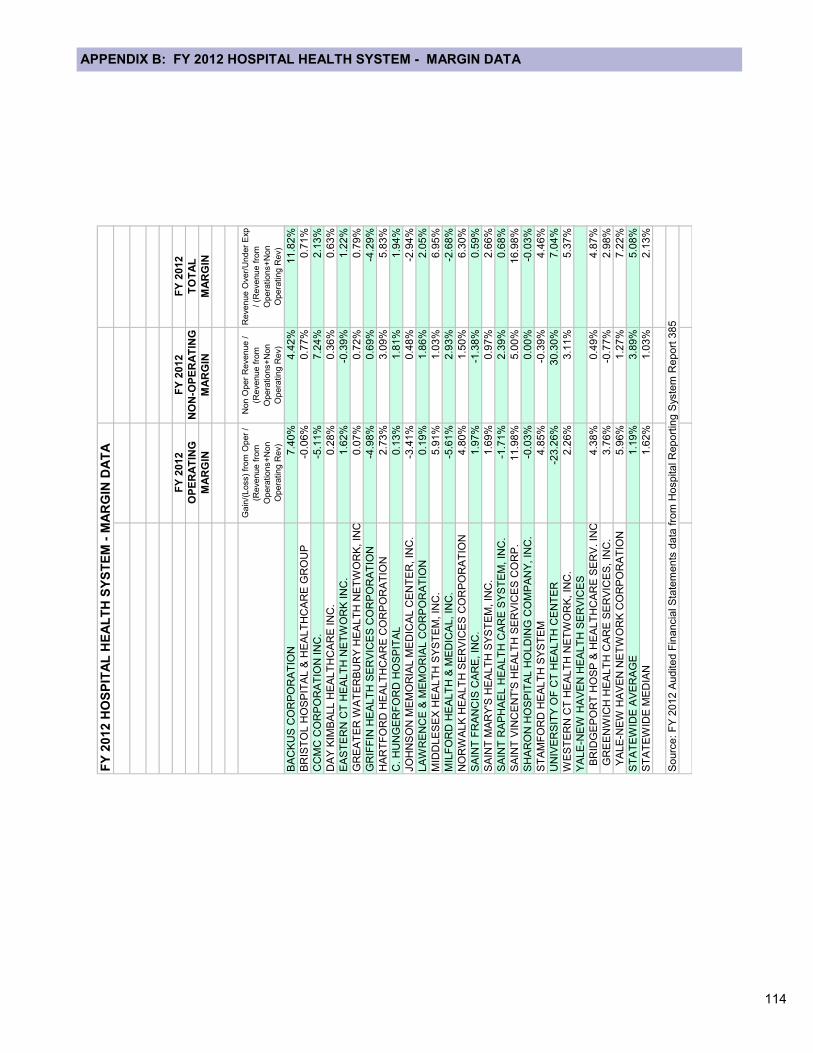
114
APPENDIX B: FY 2012 HOSPITAL HEALTH SYSTEM - MARGIN DATA
FY
20
12
HO
SP
ITA
L H
EA
LT
H S
YS
TE
M -
MA
RG
IN D
AT
A
FY
201
2F
Y 2
01
2F
Y 2
01
2
OP
ER
AT
ING
NO
N-O
PE
RA
TIN
GT
OT
AL
MA
RG
INM
AR
GIN
MA
RG
IN
Gain
/(Loss)
from
Oper
/
(Revenue f
rom
Opera
tio
ns+
Non
Opera
tin
g R
ev)
Non O
per
Revenue /
(Revenue f
rom
Opera
tio
ns+
Non
Opera
tin
g R
ev)
Revenue O
ver/
Under
Exp
/ (R
evenue f
rom
Opera
tio
ns+
Non
Opera
tin
g R
ev)
BA
CK
US
CO
RP
OR
AT
ION
7.4
0%
4.4
2%
11.8
2%
BR
IST
OL
HO
SP
ITA
L &
HE
AL
TH
CA
RE
GR
OU
P-0
.06
%0.7
7%
0.7
1%
CC
MC
CO
RP
OR
AT
ION
IN
C.
-5.1
1%
7.2
4%
2.1
3%
DA
Y K
IMB
AL
L H
EA
LT
HC
AR
E I
NC
.0.2
8%
0.3
6%
0.6
3%
EA
ST
ER
N C
T H
EA
LT
H N
ET
WO
RK
IN
C.
1.6
2%
-0.3
9%
1.2
2%
GR
EA
TE
R W
AT
ER
BU
RY
HE
AL
TH
NE
TW
OR
K,
INC
.0.0
7%
0.7
2%
0.7
9%
GR
IFF
IN H
EA
LT
H S
ER
VIC
ES
CO
RP
OR
AT
ION
-4.9
8%
0.6
9%
-4.2
9%
HA
RT
FO
RD
HE
AL
TH
CA
RE
CO
RP
OR
AT
ION
2.7
3%
3.0
9%
5.8
3%
C.
HU
NG
ER
FO
RD
HO
SP
ITA
L0.1
3%
1.8
1%
1.9
4%
JO
HN
SO
N M
EM
OR
IAL
ME
DIC
AL
CE
NT
ER
, IN
C.
-3.4
1%
0.4
8%
-2.9
4%
LA
WR
EN
CE
& M
EM
OR
IAL
CO
RP
OR
AT
ION
0.1
9%
1.8
6%
2.0
5%
MID
DL
ES
EX
HE
AL
TH
SY
ST
EM
, IN
C.
5.9
1%
1.0
3%
6.9
5%
MIL
FO
RD
HE
AL
TH
& M
ED
ICA
L, IN
C.
-5.6
1%
2.9
3%
-2.6
8%
NO
RW
AL
K H
EA
LT
H S
ER
VIC
ES
CO
RP
OR
AT
ION
4.8
0%
1.5
0%
6.3
0%
SA
INT
FR
AN
CIS
CA
RE
, IN
C.
1.9
7%
-1.3
8%
0.5
9%
SA
INT
MA
RY
'S H
EA
LT
H S
YS
TE
M, IN
C.
1.6
9%
0.9
7%
2.6
6%
SA
INT
RA
PH
AE
L H
EA
LT
H C
AR
E S
YS
TE
M, IN
C.
-1.7
1%
2.3
9%
0.6
8%
SA
INT
VIN
CE
NT
'S H
EA
LT
H S
ER
VIC
ES
CO
RP
.11.9
8%
5.0
0%
16.9
8%
SH
AR
ON
HO
SP
ITA
L H
OL
DIN
G C
OM
PA
NY
, IN
C.
-0.0
3%
0.0
0%
-0.0
3%
ST
AM
FO
RD
HE
AL
TH
SY
ST
EM
4.8
5%
-0.3
9%
4.4
6%
UN
IVE
RS
ITY
OF
CT
HE
AL
TH
CE
NT
ER
-23.2
6%
30.3
0%
7.0
4%
WE
ST
ER
N C
T H
EA
LT
H N
ET
WO
RK
, IN
C.
2.2
6%
3.1
1%
5.3
7%
YA
LE
-NE
W H
AV
EN
HE
AL
TH
SE
RV
ICE
S
B
RID
GE
PO
RT
HO
SP
& H
EA
LT
HC
AR
E S
ER
V.
INC
.4.3
8%
0.4
9%
4.8
7%
G
RE
EN
WIC
H H
EA
LT
H C
AR
E S
ER
VIC
ES
, IN
C.
3.7
6%
-0.7
7%
2.9
8%
Y
AL
E-N
EW
HA
VE
N N
ET
WO
RK
CO
RP
OR
AT
ION
5.9
6%
1.2
7%
7.2
2%
ST
AT
EW
IDE
AV
ER
AG
E1.1
9%
3.8
9%
5.0
8%
ST
AT
EW
IDE
ME
DIA
N1.6
2%
1.0
3%
2.1
3%
So
urc
e: F
Y 2
01
2 A
udite
d F
ina
ncia
l S
tate
me
nts
data
fro
m H
osp
ita
l R
epo
rtin
g S
yste
m R
eport
385
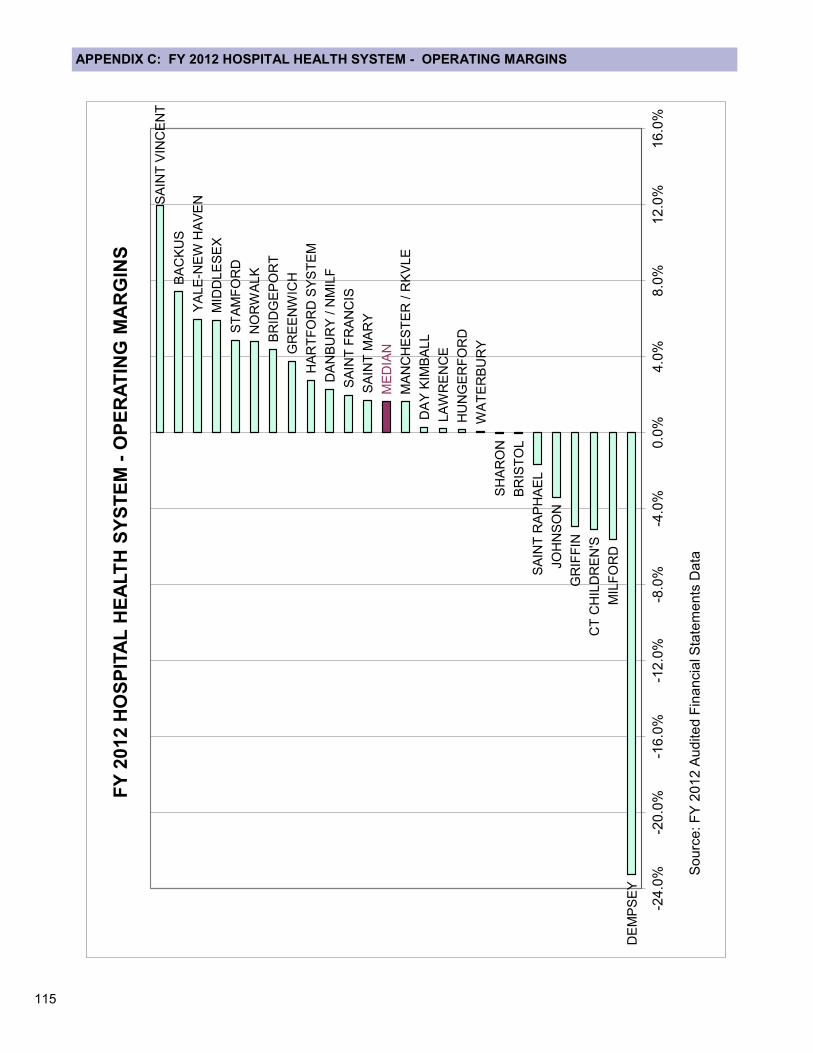
115
APPENDIX C: FY 2012 HOSPITAL HEALTH SYSTEM - OPERATING MARGINS
DE
MP
SE
Y
MIL
FO
RD
CT
CH
ILD
RE
N'S
GR
IFF
IN
JO
HN
SO
N
SA
INT
RA
PH
AE
L
BR
IST
OL
SH
AR
ON
WA
TE
RB
UR
Y
HU
NG
ER
FO
RD
LA
WR
EN
CE
DA
Y K
IMB
ALL
MA
NC
HE
ST
ER
/ R
KV
LE
ME
DIA
N
SA
INT
MA
RY
SA
INT
FR
AN
CIS
DA
NB
UR
Y /
NM
ILF
HA
RT
FO
RD
SY
ST
EM
GR
EE
NW
ICH
BR
IDG
EP
OR
T
NO
RW
ALK
ST
AM
FO
RD
MID
DLE
SE
X
YA
LE
-NE
W H
AV
EN
BA
CK
US
SA
INT
VIN
CE
NT
-24
.0%
-20
.0%
-16
.0%
-12
.0%
-8.0
%-4
.0%
0.0
%4.0
%8.0
%12
.0%
16
.0%
So
urc
e: F
Y 2
01
2 A
ud
ite
d F
ina
ncia
l Sta
tem
en
ts D
ata
FY
201
2 H
OS
PIT
AL
HE
ALT
H S
YS
TE
M -
OP
ER
AT
ING
MA
RG
INS
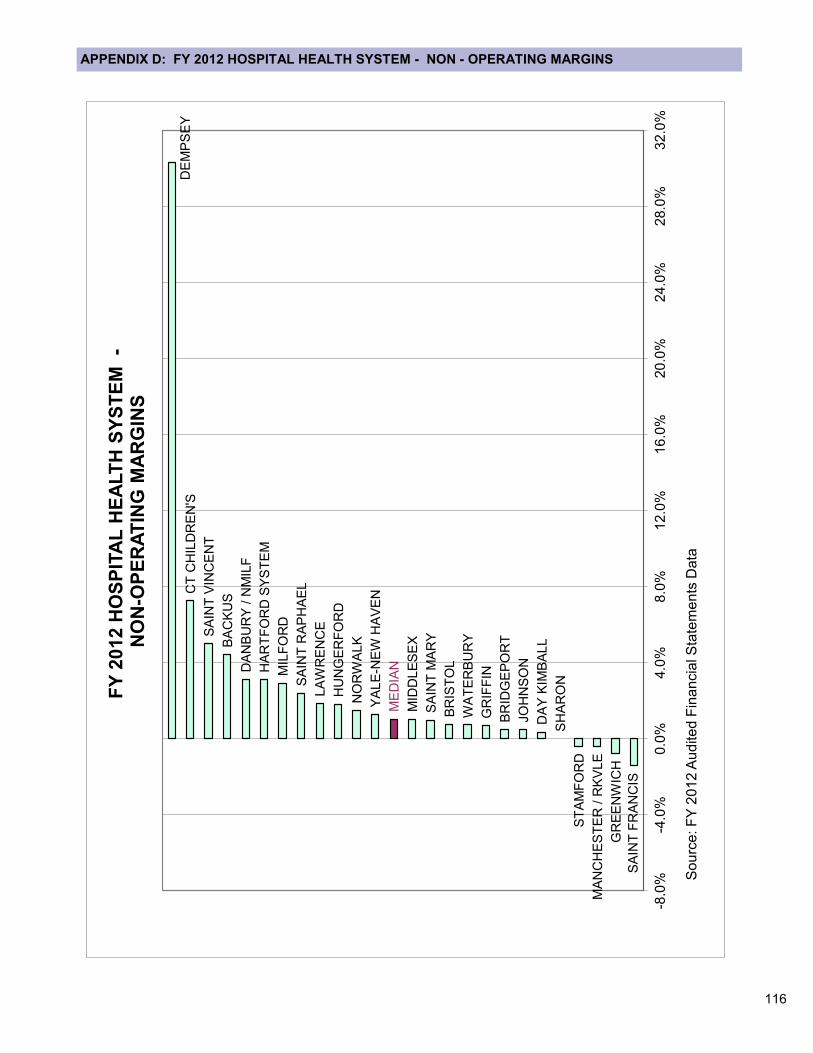
116
APPENDIX D: FY 2012 HOSPITAL HEALTH SYSTEM - NON - OPERATING MARGINS
SA
INT
FR
AN
CIS
GR
EE
NW
ICH
MA
NC
HE
ST
ER
/ R
KV
LE
ST
AM
FO
RD
SH
AR
ON
DA
Y K
IMB
ALL
JO
HN
SO
N
BR
IDG
EP
OR
T
GR
IFF
IN
WA
TE
RB
UR
Y
BR
IST
OL
SA
INT
MA
RY
MID
DLE
SE
X
ME
DIA
N
YA
LE
-NE
W H
AV
EN
NO
RW
ALK
HU
NG
ER
FO
RD
LA
WR
EN
CE
SA
INT
RA
PH
AE
L
MIL
FO
RD
HA
RT
FO
RD
SY
ST
EM
DA
NB
UR
Y /
NM
ILF
BA
CK
US
SA
INT
VIN
CE
NT
CT
CH
ILD
RE
N'S
DE
MP
SE
Y
-8.0
%-4
.0%
0.0
%4.0
%8.0
%12
.0%
16
.0%
20
.0%
24
.0%
28
.0%
32
.0%
So
urc
e: F
Y 2
01
2 A
ud
ite
d F
ina
ncia
l S
tate
me
nts
Da
ta
FY
20
12
HO
SP
ITA
L H
EA
LT
H S
YS
TE
M
-N
ON
-OP
ER
AT
ING
MA
RG
INS
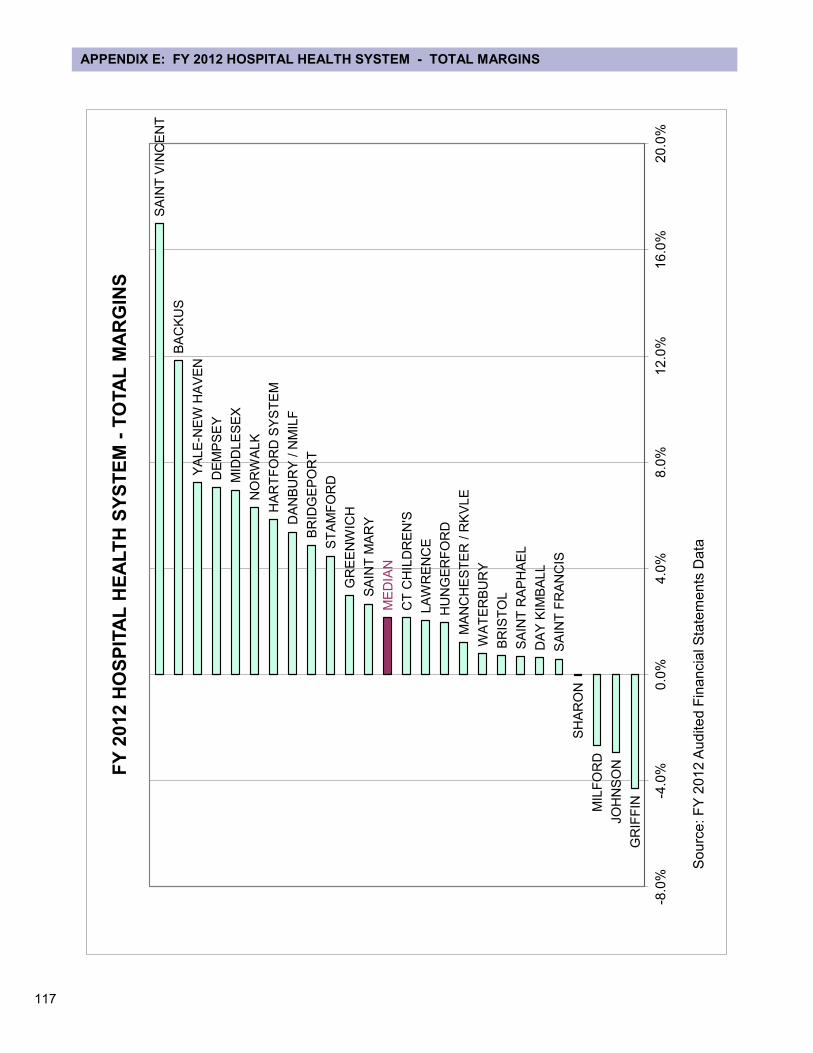
117
APPENDIX E: FY 2012 HOSPITAL HEALTH SYSTEM - TOTAL MARGINS
GR
IFF
IN
JO
HN
SO
N
MIL
FO
RD
SH
AR
ON
SA
INT
FR
AN
CIS
DA
Y K
IMB
ALL
SA
INT
RA
PH
AE
L
BR
IST
OL
WA
TE
RB
UR
Y
MA
NC
HE
ST
ER
/ R
KV
LE
HU
NG
ER
FO
RD
LA
WR
EN
CE
CT
CH
ILD
RE
N'S
ME
DIA
N
SA
INT
MA
RY
GR
EE
NW
ICH
ST
AM
FO
RD
BR
IDG
EP
OR
T
DA
NB
UR
Y /
NM
ILF
HA
RT
FO
RD
SY
ST
EM
NO
RW
ALK
MID
DLE
SE
X
DE
MP
SE
Y
YA
LE
-NE
W H
AV
EN
BA
CK
US
SA
INT
VIN
CE
NT
-8.0
%-4
.0%
0.0
%4.0
%8.0
%12
.0%
16
.0%
20
.0%
So
urc
e: F
Y 2
01
2 A
ud
ite
d F
ina
ncia
l S
tate
me
nts
Data
FY
20
12
HO
SP
ITA
L H
EA
LT
H S
YS
TE
M -
TO
TA
L M
AR
GIN
S
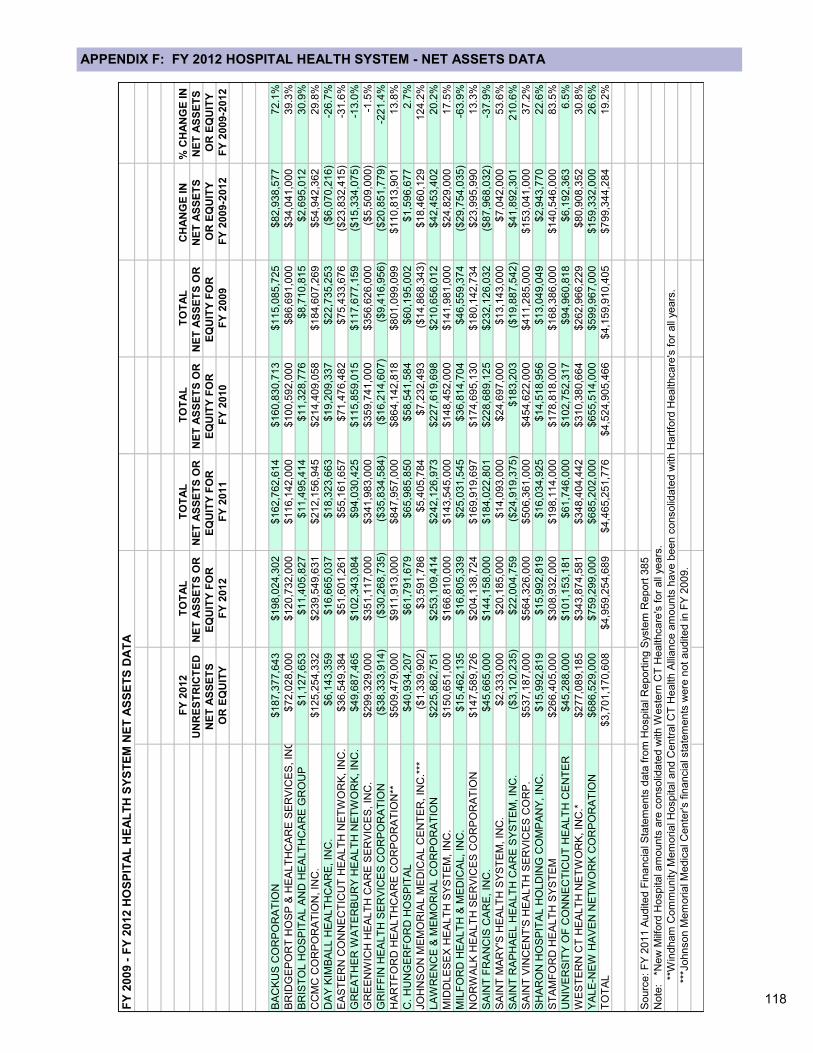
118
APPENDIX F: FY 2012 HOSPITAL HEALTH SYSTEM - NET ASSETS DATA
FY
200
9 -
FY
201
2 H
OS
PIT
AL
HE
AL
TH
SY
ST
EM
NE
T A
SS
ET
S D
AT
A
FY
2012
TO
TA
LT
OT
AL
TO
TA
LT
OT
AL
CH
AN
GE
IN
%
CH
AN
GE
IN
UN
RE
ST
RIC
TE
D
NE
T A
SS
ET
S O
R
NE
T A
SS
ET
S O
R
NE
T A
SS
ET
S O
R
NE
T A
SS
ET
S O
R
NE
T A
SS
ET
S
NE
T A
SS
ET
S
NE
T A
SS
ET
S
EQ
UIT
Y F
OR
E
QU
ITY
FO
R
EQ
UIT
Y F
OR
E
QU
ITY
FO
R
OR
EQ
UIT
YO
R E
QU
ITY
OR
EQ
UIT
YF
Y 2
012
FY
2011
FY
2010
FY
2009
FY
2009-2
012
FY
2009-2
012
BA
CK
US
CO
RP
OR
AT
ION
$187,3
77,6
43
$198,0
24,3
02
$162,7
62,6
14
$160,8
30,7
13
$115,0
85,7
25
$82,9
38,5
77
72.1
%
BR
IDG
EP
OR
T H
OS
P &
HE
ALT
HC
AR
E S
ER
VIC
ES
, IN
C.
$72,0
28,0
00
$120,7
32,0
00
$116,1
42,0
00
$100,5
92,0
00
$86,6
91,0
00
$34,0
41,0
00
39.3
%
BR
IST
OL H
OS
PIT
AL A
ND
HE
ALT
HC
AR
E G
RO
UP
$1,1
27,6
53
$11,4
05,8
27
$11,4
95,4
14
$11,3
28,7
76
$8,7
10,8
15
$2,6
95,0
12
30.9
%
CC
MC
CO
RP
OR
AT
ION
, IN
C.
$125,2
54,3
32
$239,5
49,6
31
$212,1
56,9
45
$214,4
09,0
58
$184,6
07,2
69
$54,9
42,3
62
29.8
%
DA
Y K
IMB
ALL H
EA
LT
HC
AR
E, IN
C.
$6,1
43,3
59
$16,6
65,0
37
$18,3
23,6
63
$19,2
09,3
37
$22,7
35,2
53
($6,0
70,2
16)
-26.7
%
EA
ST
ER
N C
ON
NE
CT
ICU
T H
EA
LT
H N
ET
WO
RK
, IN
C.
$36,5
49,3
84
$51,6
01,2
61
$55,1
61,6
57
$71,4
76,4
82
$75,4
33,6
76
($23,8
32,4
15)
-31.6
%
GR
EA
TH
ER
WA
TE
RB
UR
Y H
EA
LT
H N
ET
WO
RK
, IN
C.
$49,6
87,4
65
$102,3
43,0
84
$94,0
30,4
25
$115,8
59,0
15
$117,6
77,1
59
($15,3
34,0
75)
-13.0
%
GR
EE
NW
ICH
HE
ALT
H C
AR
E S
ER
VIC
ES
, IN
C.
$299,3
29,0
00
$351,1
17,0
00
$341,9
83,0
00
$359,7
41,0
00
$356,6
26,0
00
($5,5
09,0
00)
-1.5
%
GR
IFF
IN H
EA
LT
H S
ER
VIC
ES
CO
RP
OR
AT
ION
($38,3
33,9
14)
($30,2
68,7
35)
($35,8
34,5
84)
($16,2
14,6
07)
($9,4
16,9
56)
($20,8
51,7
79)
-221.4
%
HA
RT
FO
RD
HE
ALT
HC
AR
E C
OR
PO
RA
TIO
N**
$509,4
79,0
00
$911,9
13,0
00
$847,9
57,0
00
$864,1
42,8
18
$801,0
99,0
99
$110,8
13,9
01
13.8
%
C. H
UN
GE
RF
OR
D H
OS
PIT
AL
$40,9
34,2
07
$61,7
91,6
79
$65,9
85,8
50
$58,5
41,5
84
$60,1
95,0
02
$1,5
96,6
77
2.7
%
JO
HN
SO
N M
EM
OR
IAL M
ED
ICA
L C
EN
TE
R, IN
C.*
**($
1,3
39,9
02)
$3,5
91,7
86
$5,4
05,7
84
$7,2
32,4
93
($14,8
68,3
43)
$18,4
60,1
29
124.2
%
LA
WR
EN
CE
& M
EM
OR
IAL C
OR
PO
RA
TIO
N$225,8
62,7
51
$253,1
09,4
14
$242,1
26,9
73
$227,6
19,6
98
$210,6
56,0
12
$42,4
53,4
02
20.2
%
MID
DLE
SE
X H
EA
LT
H S
YS
TE
M, IN
C.
$150,6
51,0
00
$166,8
10,0
00
$143,5
45,0
00
$148,4
52,0
00
$141,9
81,0
00
$24,8
29,0
00
17.5
%
MIL
FO
RD
HE
ALT
H &
ME
DIC
AL, IN
C.
$15,4
62,1
35
$16,8
05,3
39
$25,0
31,5
45
$36,8
14,7
04
$46,5
59,3
74
($29,7
54,0
35)
-63.9
%
NO
RW
ALK
HE
ALT
H S
ER
VIC
ES
CO
RP
OR
AT
ION
$147,5
89,7
26
$204,1
38,7
24
$169,9
19,6
97
$174,6
95,1
30
$180,1
42,7
34
$23,9
95,9
90
13.3
%
SA
INT
FR
AN
CIS
CA
RE
, IN
C.
$45,6
65,0
00
$144,1
58,0
00
$184,0
22,8
01
$228,6
89,1
25
$232,1
26,0
32
($87,9
68,0
32)
-37.9
%
SA
INT
MA
RY
'S H
EA
LT
H S
YS
TE
M, IN
C.
$2,3
33,0
00
$20,1
85,0
00
$14,0
93,0
00
$24,6
97,0
00
$13,1
43,0
00
$7,0
42,0
00
53.6
%
SA
INT
RA
PH
AE
L H
EA
LT
H C
AR
E S
YS
TE
M, IN
C.
($3,1
20,2
35)
$22,0
04,7
59
($24,9
19,3
75)
$183,2
03
($19,8
87,5
42)
$41,8
92,3
01
210.6
%
SA
INT
VIN
CE
NT
'S H
EA
LT
H S
ER
VIC
ES
CO
RP
.$537,1
87,0
00
$564,3
26,0
00
$506,3
61,0
00
$454,6
22,0
00
$411,2
85,0
00
$153,0
41,0
00
37.2
%
SH
AR
ON
HO
SP
ITA
L H
OLD
ING
CO
MP
AN
Y, IN
C.
$15,9
92,8
19
$15,9
92,8
19
$16,0
34,9
25
$14,5
18,9
56
$13,0
49,0
49
$2,9
43,7
70
22.6
%
ST
AM
FO
RD
HE
ALT
H S
YS
TE
M$266,4
05,0
00
$308,9
32,0
00
$198,1
14,0
00
$178,8
18,0
00
$168,3
86,0
00
$140,5
46,0
00
83.5
%
UN
IVE
RS
ITY
OF
CO
NN
EC
TIC
UT
HE
ALT
H C
EN
TE
R$45,2
88,0
00
$101,1
53,1
81
$61,7
46,0
00
$102,7
52,3
17
$94,9
60,8
18
$6,1
92,3
63
6.5
%
WE
ST
ER
N C
T H
EA
LT
H N
ET
WO
RK
, IN
C.*
$277,0
89,1
85
$343,8
74,5
81
$348,4
04,4
42
$310,3
80,6
64
$262,9
66,2
29
$80,9
08,3
52
30.8
%
YA
LE
-NE
W H
AV
EN
NE
TW
OR
K C
OR
PO
RA
TIO
N$686,5
29,0
00
$759,2
99,0
00
$685,2
02,0
00
$655,5
14,0
00
$599,9
67,0
00
$159,3
32,0
00
26.6
%
TO
TA
L$3,7
01,1
70,6
08
$4,9
59,2
54,6
89
$4,4
65,2
51,7
76
$4,5
24,9
05,4
66
$4,1
59,9
10,4
05
$799,3
44,2
84
19.2
%
Sourc
e: F
Y 2
011 A
udited F
inancia
l S
tate
ments
data
fro
m H
ospital R
eport
ing S
yste
m R
eport
385
Note
: *N
ew
Milf
ord
Hospital am
ounts
are
consolid
ate
d w
ith W
este
rn C
T H
ealthcare
's f
or
all
years
.
**
Win
dham
Com
munity M
em
orial H
ospital and C
entr
al C
T H
ealth A
lliance a
mounts
have b
een c
onsolid
ate
d w
ith H
art
ford
Healthcare
's f
or
all
years
.
*
**Johnson M
em
orial M
edic
al C
ente
r's f
inancia
l sta
tem
ents
were
not audited in F
Y 2
009.
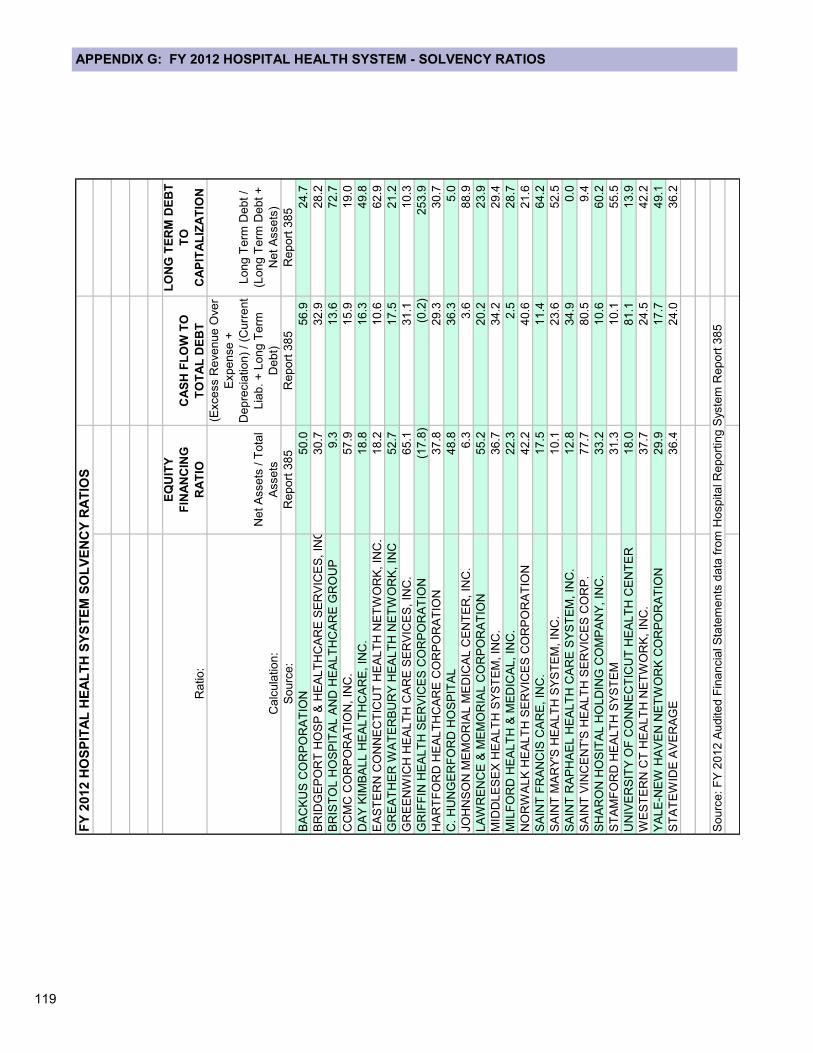
119
APPENDIX G: FY 2012 HOSPITAL HEALTH SYSTEM - SOLVENCY RATIOS
FY
201
2 H
OS
PIT
AL
HE
AL
TH
SY
ST
EM
SO
LV
EN
CY
RA
TIO
S
Ratio:
EQ
UIT
Y
FIN
AN
CIN
G
RA
TIO
CA
SH
FL
OW
TO
TO
TA
L D
EB
T
LO
NG
TE
RM
DE
BT
TO
CA
PIT
AL
IZA
TIO
N
Calc
ula
tion:
Net A
ssets
/ T
ota
l
Assets
(Excess R
evenue O
ver
Expen
se
+
Depre
cia
tion)
/ (C
urr
ent
Lia
b. +
Long T
erm
Debt)
Long T
erm
Debt /
(Long T
erm
De
bt +
Net
Asse
ts)
Sourc
e:
Report
385
Report
385
Re
port
385
BA
CK
US
CO
RP
OR
AT
ION
50.0
56.9
24.7
BR
IDG
EP
OR
T H
OS
P &
HE
ALT
HC
AR
E S
ER
VIC
ES
, IN
C.
30.7
32.9
28.2
BR
IST
OL H
OS
PIT
AL A
ND
HE
ALT
HC
AR
E G
RO
UP
9.3
13.6
72.7
CC
MC
CO
RP
OR
AT
ION
, IN
C.
57.9
15.9
19.0
DA
Y K
IMB
ALL H
EA
LT
HC
AR
E, IN
C.
18.8
16.3
49.8
EA
ST
ER
N C
ON
NE
CT
ICU
T H
EA
LT
H N
ET
WO
RK
, IN
C.
18.2
10.6
62.9
GR
EA
TH
ER
WA
TE
RB
UR
Y H
EA
LT
H N
ET
WO
RK
, IN
C52.7
17.5
21.2
GR
EE
NW
ICH
HE
ALT
H C
AR
E S
ER
VIC
ES
, IN
C.
65.1
31.1
10.3
GR
IFF
IN H
EA
LT
H S
ER
VIC
ES
CO
RP
OR
AT
ION
(17.8
)(0
.2)
253.9
HA
RT
FO
RD
HE
ALT
HC
AR
E C
OR
PO
RA
TIO
N37.8
29.3
30.7
C. H
UN
GE
RF
OR
D H
OS
PIT
AL
48.8
36.3
5.0
JO
HN
SO
N M
EM
OR
IAL M
ED
ICA
L C
EN
TE
R, IN
C.
6.3
3.6
88.9
LA
WR
EN
CE
& M
EM
OR
IAL C
OR
PO
RA
TIO
N55.2
20.2
23.9
MID
DLE
SE
X H
EA
LT
H S
YS
TE
M, IN
C.
36.7
34.2
29.4
MIL
FO
RD
HE
ALT
H &
ME
DIC
AL, IN
C.
22.3
2.5
28.7
NO
RW
ALK
HE
ALT
H S
ER
VIC
ES
CO
RP
OR
AT
ION
42.2
40.6
21.6
SA
INT
FR
AN
CIS
CA
RE
, IN
C.
17.5
11.4
64.2
SA
INT
MA
RY
'S H
EA
LT
H S
YS
TE
M, IN
C.
10.1
23.6
52.5
SA
INT
RA
PH
AE
L H
EA
LT
H C
AR
E S
YS
TE
M, IN
C.
12.8
34.9
0.0
SA
INT
VIN
CE
NT
'S H
EA
LT
H S
ER
VIC
ES
CO
RP
.77.7
80.5
9.4
SH
AR
ON
HO
SIT
AL H
OLD
ING
CO
MP
AN
Y, IN
C.
33.2
10.6
60.2
ST
AM
FO
RD
HE
ALT
H S
YS
TE
M31.3
10.1
55.5
UN
IVE
RS
ITY
OF
CO
NN
EC
TIC
UT
HE
ALT
H C
EN
TE
R18.0
81.1
13.9
WE
ST
ER
N C
T H
EA
LT
H N
ET
WO
RK
, IN
C.
37.7
24.5
42.2
YA
LE
-NE
W H
AV
EN
NE
TW
OR
K C
OR
PO
RA
TIO
N29.9
17.7
49.1
ST
AT
EW
IDE
AV
ER
AG
E36.4
24.0
36.2
Sourc
e: F
Y 2
012 A
udited F
inancia
l S
tate
ments
data
fro
m H
ospital R
eport
ing S
yste
m R
eport
385
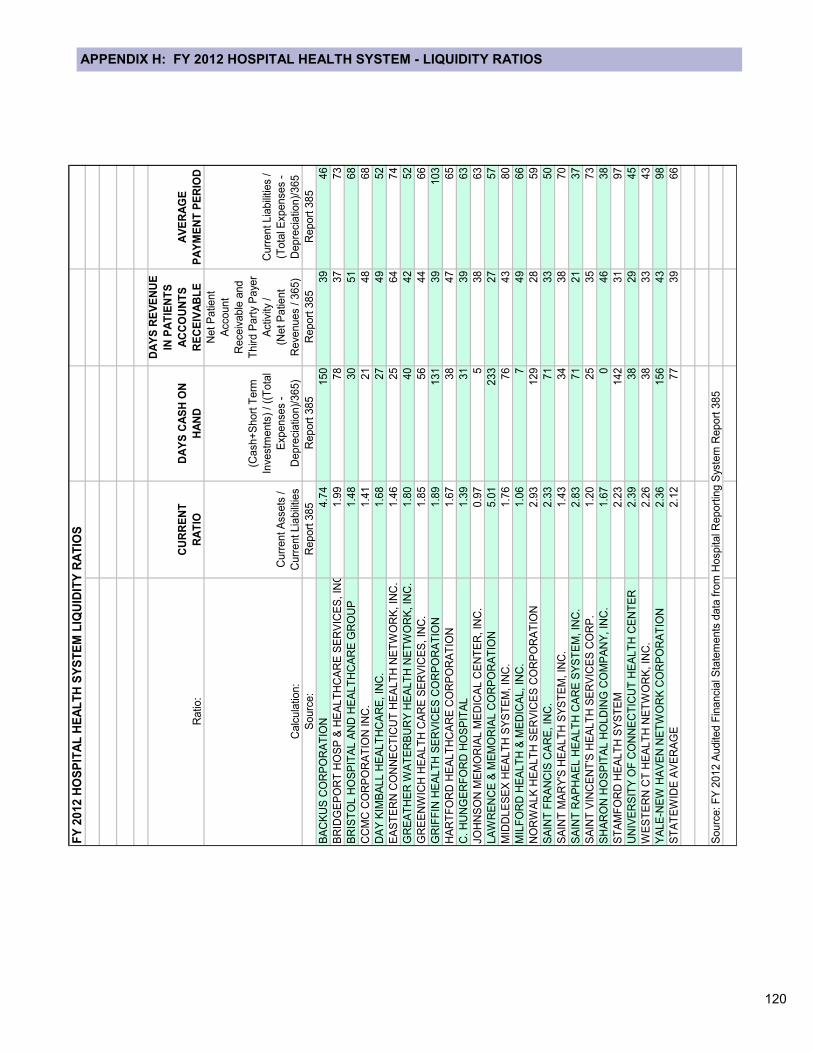
120
APPENDIX H: FY 2012 HOSPITAL HEALTH SYSTEM - LIQUIDITY RATIOS
FY
201
2 H
OS
PIT
AL
HE
AL
TH
SY
ST
EM
LIQ
UID
ITY
RA
TIO
S
Ra
tio:
CU
RR
EN
T
RA
TIO
DA
YS
CA
SH
ON
HA
ND
DA
YS
RE
VE
NU
E
IN P
AT
IEN
TS
AC
CO
UN
TS
RE
CE
IVA
BL
E
AV
ER
AG
E
PA
YM
EN
T P
ER
IOD
Ca
lcu
latio
n:
Cu
rre
nt
Asse
ts /
Cu
rre
nt
Lia
bili
ties
(Ca
sh
+S
hort
Te
rm
Inve
stm
ents
) /
((T
ota
l
Exp
en
se
s -
De
pre
cia
tion)/
365
)
Ne
t P
atie
nt
Acco
un
t
Re
ce
iva
ble
an
d
Th
ird
Pa
rty
Pa
yer
Activ
ity /
(Ne
t P
atie
nt
Re
venu
es /
36
5)
Cu
rre
nt
Lia
bili
ties /
(To
tal E
xp
en
se
s -
De
pre
cia
tion)/
365
So
urc
e:
Re
port
38
5R
ep
ort
38
5R
ep
ort
38
5R
ep
ort
38
5
BA
CK
US
CO
RP
OR
AT
ION
4.7
4
150
39
46
BR
IDG
EP
OR
T H
OS
P &
HE
AL
TH
CA
RE
SE
RV
ICE
S,
INC
.1.9
9
78
37
73
BR
IST
OL
HO
SP
ITA
L A
ND
HE
AL
TH
CA
RE
GR
OU
P1.4
8
30
51
68
CC
MC
CO
RP
OR
AT
ION
IN
C.
1.4
1
21
48
68
DA
Y K
IMB
AL
L H
EA
LT
HC
AR
E,
INC
.1.6
8
27
49
52
EA
ST
ER
N C
ON
NE
CT
ICU
T H
EA
LT
H N
ET
WO
RK
, IN
C.
1.4
6
25
64
74
GR
EA
TH
ER
WA
TE
RB
UR
Y H
EA
LT
H N
ET
WO
RK
, IN
C.
1.8
0
40
42
52
GR
EE
NW
ICH
HE
AL
TH
CA
RE
SE
RV
ICE
S,
INC
.1.8
5
56
44
66
GR
IFF
IN H
EA
LT
H S
ER
VIC
ES
CO
RP
OR
AT
ION
1.8
9
131
39
103
HA
RT
FO
RD
HE
AL
TH
CA
RE
CO
RP
OR
AT
ION
1.6
7
38
47
65
C.
HU
NG
ER
FO
RD
HO
SP
ITA
L1.3
9
31
39
63
JO
HN
SO
N M
EM
OR
IAL
ME
DIC
AL
CE
NT
ER
, IN
C.
0.9
7
5
38
63
LA
WR
EN
CE
& M
EM
OR
IAL
CO
RP
OR
AT
ION
5.0
1
233
27
57
MID
DL
ES
EX
HE
AL
TH
SY
ST
EM
, IN
C.
1.7
6
76
43
80
MIL
FO
RD
HE
AL
TH
& M
ED
ICA
L, IN
C.
1.0
6
7
49
66
NO
RW
AL
K H
EA
LT
H S
ER
VIC
ES
CO
RP
OR
AT
ION
2.9
3
129
28
59
SA
INT
FR
AN
CIS
CA
RE
, IN
C.
2.3
3
71
33
50
SA
INT
MA
RY
'S H
EA
LT
H S
YS
TE
M, IN
C.
1.4
3
34
38
70
SA
INT
RA
PH
AE
L H
EA
LT
H C
AR
E S
YS
TE
M, IN
C.
2.8
3
71
21
37
SA
INT
VIN
CE
NT
'S H
EA
LT
H S
ER
VIC
ES
CO
RP
.1.2
0
25
35
73
SH
AR
ON
HO
SP
ITA
L H
OL
DIN
G C
OM
PA
NY
, IN
C.
1.6
7
0
46
38
ST
AM
FO
RD
HE
AL
TH
SY
ST
EM
2.2
3
142
31
97
UN
IVE
RS
ITY
OF
CO
NN
EC
TIC
UT
HE
AL
TH
CE
NT
ER
2.3
9
38
29
45
WE
ST
ER
N C
T H
EA
LT
H N
ET
WO
RK
, IN
C.
2.2
6
38
33
43
YA
LE
-NE
W H
AV
EN
NE
TW
OR
K C
OR
PO
RA
TIO
N2.3
6
156
43
98
ST
AT
EW
IDE
AV
ER
AG
E2.1
2
77
39
66
So
urc
e: F
Y 2
01
2 A
udite
d F
ina
ncia
l Sta
tem
ents
data
fro
m H
osp
ital R
epo
rtin
g S
yste
m R
epo
rt 3
85
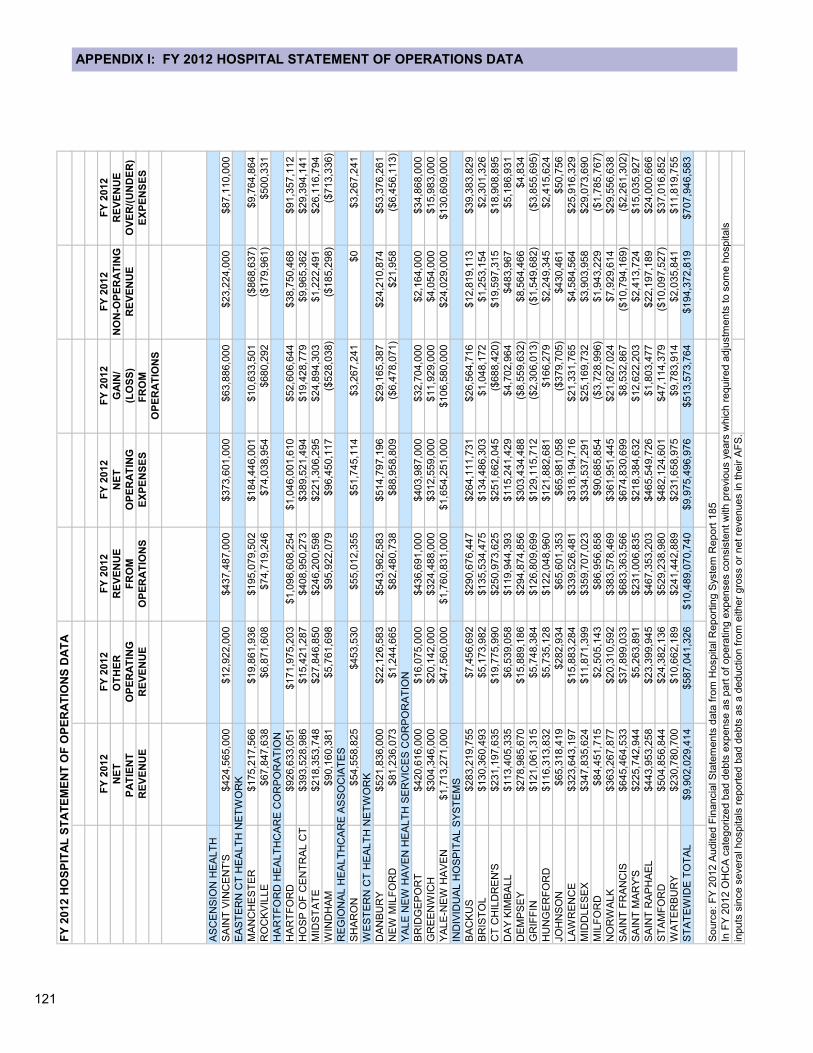
121
APPENDIX I: FY 2012 HOSPITAL STATEMENT OF OPERATIONS DATA F
Y 2
01
2 H
OS
PIT
AL
ST
AT
EM
EN
T O
F O
PE
RA
TIO
NS
DA
TA
FY
2012
FY
2012
FY
2012
FY
2012
FY
2012
FY
2012
FY
2012
NE
TO
TH
ER
R
EV
EN
UE
NE
TG
AIN
/N
ON
-OP
ER
AT
ING
RE
VE
NU
E
PA
TIE
NT
O
PE
RA
TIN
GF
RO
MO
PE
RA
TIN
G(L
OS
S)
RE
VE
NU
EO
VE
R/(
UN
DE
R)
RE
VE
NU
ER
EV
EN
UE
OP
ER
AT
ION
SE
XP
EN
SE
SF
RO
M
EX
PE
NS
ES
OP
ER
AT
ION
S
AS
CE
NS
ION
HE
ALT
H
SA
INT
VIN
CE
NT
'S$424,5
65,0
00
$12,9
22,0
00
$437,4
87,0
00
$373,6
01,0
00
$63,8
86,0
00
$23,2
24,0
00
$87,1
10,0
00
EA
ST
ER
N C
T H
EA
LT
H N
ET
WO
RK
MA
NC
HE
ST
ER
$175,2
17,5
66
$19,8
61,9
36
$195,0
79,5
02
$184,4
46,0
01
$10,6
33,5
01
($868,6
37)
$9,7
64,8
64
RO
CK
VIL
LE
$67,8
47,6
38
$6,8
71,6
08
$74,7
19,2
46
$74,0
38,9
54
$680,2
92
($179,9
61)
$500,3
31
HA
RT
FO
RD
HE
ALT
HC
AR
E C
OR
PO
RA
TIO
N
HA
RT
FO
RD
$926,6
33,0
51
$171,9
75,2
03
$1,0
98,6
08,2
54
$1,0
46,0
01,6
10
$52,6
06,6
44
$38,7
50,4
68
$91,3
57,1
12
HO
SP
OF
CE
NT
RA
L C
T$393,5
28,9
86
$15,4
21,2
87
$408,9
50,2
73
$389,5
21,4
94
$19,4
28,7
79
$9,9
65,3
62
$29,3
94,1
41
MID
ST
AT
E$218,3
53,7
48
$27,8
46,8
50
$246,2
00,5
98
$221,3
06,2
95
$24,8
94,3
03
$1,2
22,4
91
$26,1
16,7
94
WIN
DH
AM
$90,1
60,3
81
$5,7
61,6
98
$95,9
22,0
79
$96,4
50,1
17
($528,0
38)
($185,2
98)
($713,3
36)
RE
GIO
NA
L H
EA
LT
HC
AR
E A
SS
OC
IAT
ES
SH
AR
ON
$54,5
58,8
25
$453,5
30
$55,0
12,3
55
$51,7
45,1
14
$3,2
67,2
41
$0
$3,2
67,2
41
WE
ST
ER
N C
T H
EA
LT
H N
ET
WO
RK
DA
NB
UR
Y$521,8
36,0
00
$22,1
26,5
83
$543,9
62,5
83
$514,7
97,1
96
$29,1
65,3
87
$24,2
10,8
74
$53,3
76,2
61
NE
W M
ILF
OR
D$81,2
36,0
73
$1,2
44,6
65
$82,4
80,7
38
$88,9
58,8
09
($6,4
78,0
71)
$21,9
58
($6,4
56,1
13)
YA
LE
NE
W H
AV
EN
HE
ALT
H S
ER
VIC
ES
CO
RP
OR
AT
ION
BR
IDG
EP
OR
T$420,6
16,0
00
$16,0
75,0
00
$436,6
91,0
00
$403,9
87,0
00
$32,7
04,0
00
$2,1
64,0
00
$34,8
68,0
00
GR
EE
NW
ICH
$304,3
46,0
00
$20,1
42,0
00
$324,4
88,0
00
$312,5
59,0
00
$11,9
29,0
00
$4,0
54,0
00
$15,9
83,0
00
YA
LE
-NE
W H
AV
EN
$1,7
13,2
71,0
00
$47,5
60,0
00
$1,7
60,8
31,0
00
$1,6
54,2
51,0
00
$106,5
80,0
00
$24,0
29,0
00
$130,6
09,0
00
IND
IVID
UA
L H
OS
PIT
AL S
YS
TE
MS
BA
CK
US
$283,2
19,7
55
$7,4
56,6
92
$290,6
76,4
47
$264,1
11,7
31
$26,5
64,7
16
$12,8
19,1
13
$39,3
83,8
29
BR
IST
OL
$130,3
60,4
93
$5,1
73,9
82
$135,5
34,4
75
$134,4
86,3
03
$1,0
48,1
72
$1,2
53,1
54
$2,3
01,3
26
CT
CH
ILD
RE
N'S
$231,1
97,6
35
$19,7
75,9
90
$250,9
73,6
25
$251,6
62,0
45
($688,4
20)
$19,5
97,3
15
$18,9
08,8
95
DA
Y K
IMB
ALL
$113,4
05,3
35
$6,5
39,0
58
$119,9
44,3
93
$115,2
41,4
29
$4,7
02,9
64
$483,9
67
$5,1
86,9
31
DE
MP
SE
Y$278,9
85,6
70
$15,8
89,1
86
$294,8
74,8
56
$303,4
34,4
88
($8,5
59,6
32)
$8,5
64,4
66
$4,8
34
GR
IFF
IN$121,0
61,3
15
$5,7
48,3
84
$126,8
09,6
99
$129,1
15,7
12
($2,3
06,0
13)
($1,5
49,6
82)
($3,8
55,6
95)
HU
NG
ER
FO
RD
$116,3
13,8
32
$5,7
35,1
28
$122,0
48,9
60
$121,8
82,6
81
$166,2
79
$2,2
49,3
45
$2,4
15,6
24
JO
HN
SO
N$65,3
18,4
19
$282,9
34
$65,6
01,3
53
$65,9
81,0
58
($379,7
05)
$430,4
61
$50,7
56
LA
WR
EN
CE
$323,6
43,1
97
$15,8
83,2
84
$339,5
26,4
81
$318,1
94,7
16
$21,3
31,7
65
$4,5
84,5
64
$25,9
16,3
29
MID
DLE
SE
X$347,8
35,6
24
$11,8
71,3
99
$359,7
07,0
23
$334,5
37,2
91
$25,1
69,7
32
$3,9
03,9
58
$29,0
73,6
90
MIL
FO
RD
$84,4
51,7
15
$2,5
05,1
43
$86,9
56,8
58
$90,6
85,8
54
($3,7
28,9
96)
$1,9
43,2
29
($1,7
85,7
67)
NO
RW
ALK
$363,2
67,8
77
$20,3
10,5
92
$383,5
78,4
69
$361,9
51,4
45
$21,6
27,0
24
$7,9
29,6
14
$29,5
56,6
38
SA
INT
FR
AN
CIS
$645,4
64,5
33
$37,8
99,0
33
$683,3
63,5
66
$674,8
30,6
99
$8,5
32,8
67
($10,7
94,1
69)
($2,2
61,3
02)
SA
INT
MA
RY
'S$225,7
42,9
44
$5,2
63,8
91
$231,0
06,8
35
$218,3
84,6
32
$12,6
22,2
03
$2,4
13,7
24
$15,0
35,9
27
SA
INT
RA
PH
AE
L$443,9
53,2
58
$23,3
99,9
45
$467,3
53,2
03
$465,5
49,7
26
$1,8
03,4
77
$22,1
97,1
89
$24,0
00,6
66
ST
AM
FO
RD
$504,8
56,8
44
$24,3
82,1
36
$529,2
38,9
80
$482,1
24,6
01
$47,1
14,3
79
($10,0
97,5
27)
$37,0
16,8
52
WA
TE
RB
UR
Y$230,7
80,7
00
$10,6
62,1
89
$241,4
42,8
89
$231,6
58,9
75
$9,7
83,9
14
$2,0
35,8
41
$11,8
19,7
55
ST
AT
EW
IDE
TO
TA
L$9,9
02,0
29,4
14
$587,0
41,3
26
$10,4
89,0
70,7
40
$9,9
75,4
96,9
76
$513,5
73,7
64
$194,3
72,8
19
$707,9
46,5
83
Sourc
e: F
Y 2
012 A
udited F
inancia
l S
tate
ments
data
fro
m H
ospital R
eport
ing S
yste
m R
eport
185
In F
Y 2
012 O
HC
A c
ate
gorized b
ad d
ebts
expense a
s p
art
of
opera
ting e
xpenses c
onsis
tent w
ith p
revio
us y
ears
whic
h r
equired a
dju
stm
ents
to s
om
e h
ospitals
inputs
sin
ce s
evera
l hospitals
report
ed b
ad d
ebts
as a
deduction f
rom
either
gro
ss o
r net re
venues in their A
FS
.
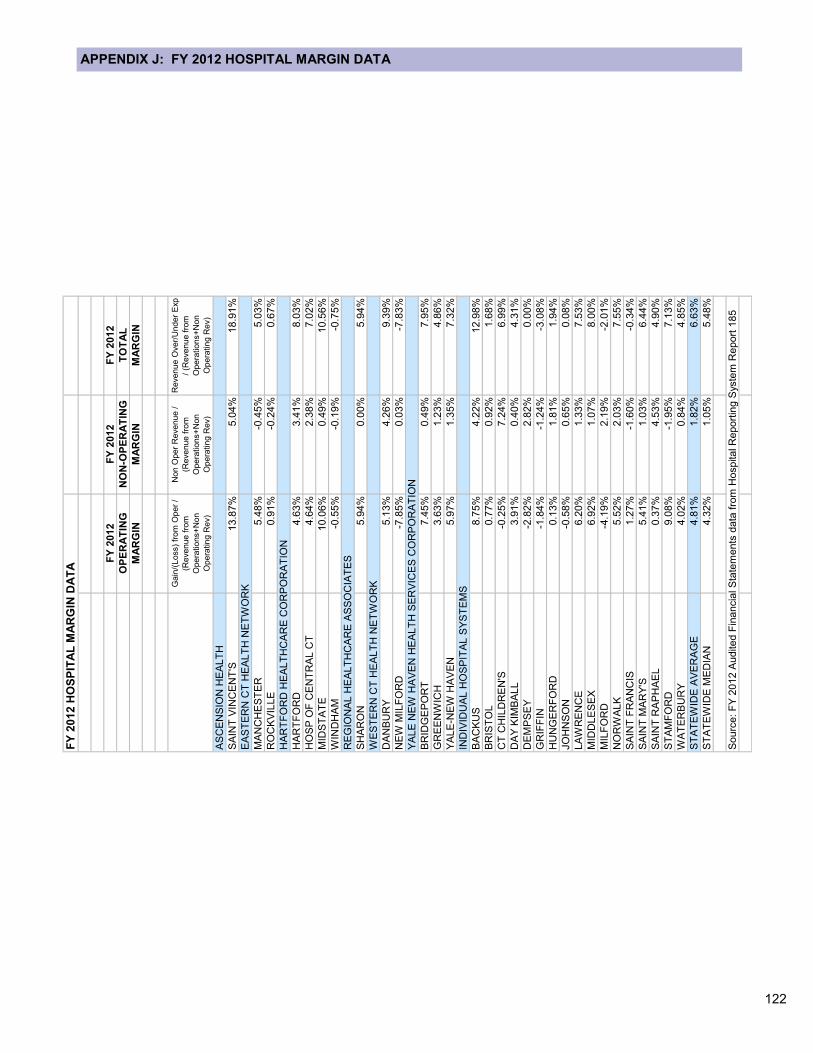
122
APPENDIX J: FY 2012 HOSPITAL MARGIN DATA F
Y 2
01
2 H
OS
PIT
AL
MA
RG
IN D
AT
A
FY
2012
FY
2012
FY
2012
OP
ER
AT
ING
NO
N-O
PE
RA
TIN
GT
OT
AL
MA
RG
INM
AR
GIN
MA
RG
IN
Gain
/(Loss)
from
Oper
/
(Revenue f
rom
Opera
tio
ns+
Non
Opera
tin
g R
ev)
Non O
per
Revenue /
(Revenue f
rom
Opera
tio
ns+
Non
Opera
tin
g R
ev)
Revenue O
ver/
Under
Exp
/ (R
evenue f
rom
Opera
tio
ns+
Non
Opera
tin
g R
ev)
AS
CE
NS
ION
HE
ALT
H
SA
INT
VIN
CE
NT
'S13.8
7%
5.0
4%
18.9
1%
EA
ST
ER
N C
T H
EA
LT
H N
ET
WO
RK
MA
NC
HE
ST
ER
5.4
8%
-0.4
5%
5.0
3%
RO
CK
VIL
LE
0.9
1%
-0.2
4%
0.6
7%
HA
RT
FO
RD
HE
ALT
HC
AR
E C
OR
PO
RA
TIO
N
HA
RT
FO
RD
4.6
3%
3.4
1%
8.0
3%
HO
SP
OF
CE
NT
RA
L C
T4.6
4%
2.3
8%
7.0
2%
MID
ST
AT
E10.0
6%
0.4
9%
10.5
6%
WIN
DH
AM
-0.5
5%
-0.1
9%
-0.7
5%
RE
GIO
NA
L H
EA
LT
HC
AR
E A
SS
OC
IAT
ES
SH
AR
ON
5.9
4%
0.0
0%
5.9
4%
WE
ST
ER
N C
T H
EA
LT
H N
ET
WO
RK
DA
NB
UR
Y5.1
3%
4.2
6%
9.3
9%
NE
W M
ILF
OR
D-7
.85%
0.0
3%
-7.8
3%
YA
LE
NE
W H
AV
EN
HE
ALT
H S
ER
VIC
ES
CO
RP
OR
AT
ION
BR
IDG
EP
OR
T7.4
5%
0.4
9%
7.9
5%
GR
EE
NW
ICH
3.6
3%
1.2
3%
4.8
6%
YA
LE
-NE
W H
AV
EN
5.9
7%
1.3
5%
7.3
2%
IND
IVID
UA
L H
OS
PIT
AL S
YS
TE
MS
BA
CK
US
8.7
5%
4.2
2%
12.9
8%
BR
IST
OL
0.7
7%
0.9
2%
1.6
8%
CT
CH
ILD
RE
N'S
-0.2
5%
7.2
4%
6.9
9%
DA
Y K
IMB
ALL
3.9
1%
0.4
0%
4.3
1%
DE
MP
SE
Y-2
.82%
2.8
2%
0.0
0%
GR
IFF
IN-1
.84%
-1.2
4%
-3.0
8%
HU
NG
ER
FO
RD
0.1
3%
1.8
1%
1.9
4%
JO
HN
SO
N-0
.58%
0.6
5%
0.0
8%
LA
WR
EN
CE
6.2
0%
1.3
3%
7.5
3%
MID
DLE
SE
X6.9
2%
1.0
7%
8.0
0%
MIL
FO
RD
-4.1
9%
2.1
9%
-2.0
1%
NO
RW
ALK
5.5
2%
2.0
3%
7.5
5%
SA
INT
FR
AN
CIS
1.2
7%
-1.6
0%
-0.3
4%
SA
INT
MA
RY
'S5.4
1%
1.0
3%
6.4
4%
SA
INT
RA
PH
AE
L0.3
7%
4.5
3%
4.9
0%
ST
AM
FO
RD
9.0
8%
-1.9
5%
7.1
3%
WA
TE
RB
UR
Y4.0
2%
0.8
4%
4.8
5%
ST
AT
EW
IDE
AV
ER
AG
E4.8
1%
1.8
2%
6.6
3%
ST
AT
EW
IDE
ME
DIA
N4.3
2%
1.0
5%
5.4
8%
Sourc
e: F
Y 2
012 A
udited F
inancia
l S
tate
ments
data
fro
m H
ospital R
eport
ing S
yste
m R
eport
185
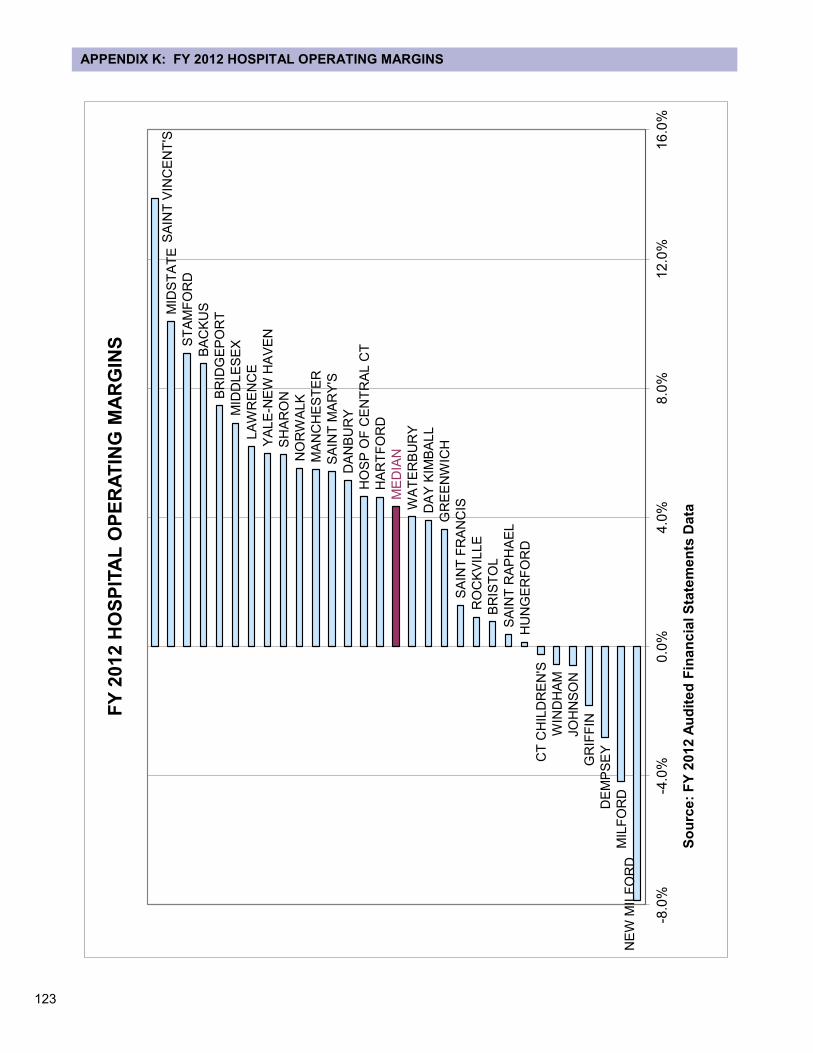
123
APPENDIX K: FY 2012 HOSPITAL OPERATING MARGINS
NE
W M
ILF
OR
DM
ILF
OR
D
DE
MP
SE
Y
GR
IFF
IN
JO
HN
SO
N
WIN
DH
AM
CT
CH
ILD
RE
N'S
HU
NG
ER
FO
RD
SA
INT
RA
PH
AE
L
BR
IST
OL
RO
CK
VIL
LE
SA
INT
FR
AN
CIS
GR
EE
NW
ICH
DA
Y K
IMB
ALL
WA
TE
RB
UR
Y
ME
DIA
N
HA
RT
FO
RD
HO
SP
OF
CE
NT
RA
L C
T
DA
NB
UR
Y
SA
INT
MA
RY
'S
MA
NC
HE
ST
ER
NO
RW
ALK
SH
AR
ON
YA
LE
-NE
W H
AV
EN
LA
WR
EN
CE
MID
DLE
SE
X
BR
IDG
EP
OR
T
BA
CK
US
ST
AM
FO
RD
MID
ST
AT
ES
AIN
T V
INC
EN
T'S
-8.0
%-4
.0%
0.0
%4.0
%8.0
%12
.0%
16
.0%
So
urc
e:
FY
20
12
Au
dit
ed
Fin
an
cia
l S
tate
me
nts
Da
ta
FY
20
12
HO
SP
ITA
L O
PE
RA
TIN
G M
AR
GIN
S
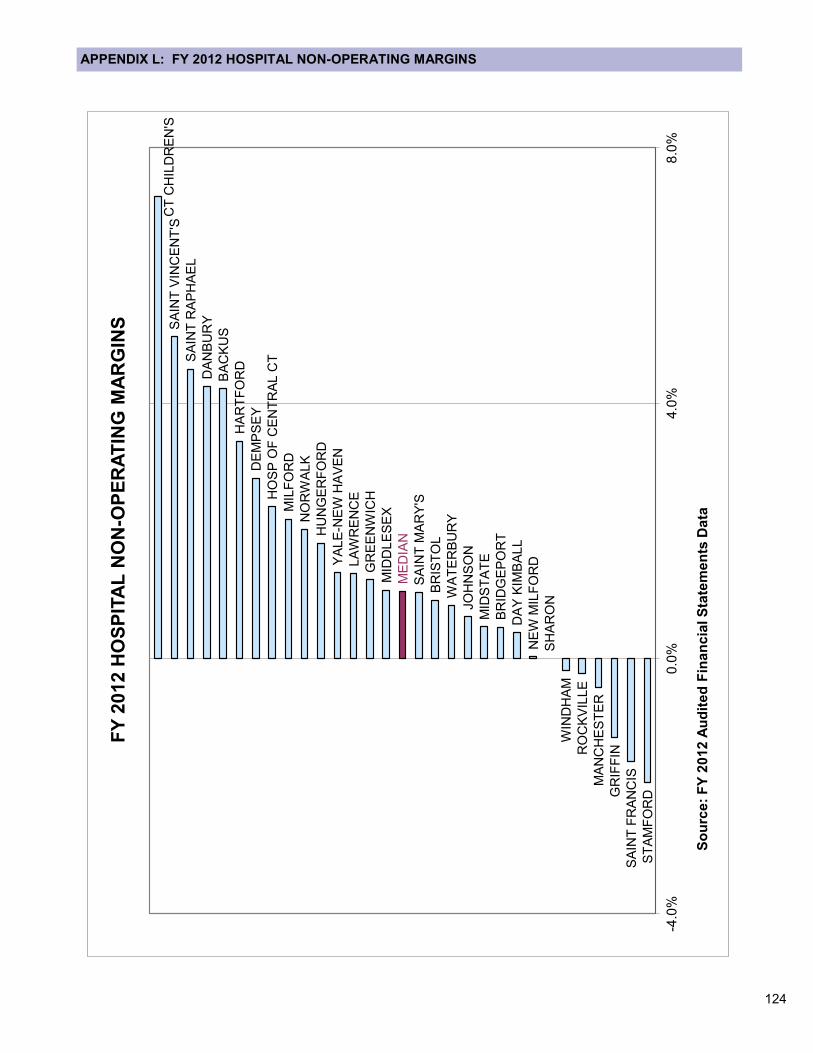
124
APPENDIX L: FY 2012 HOSPITAL NON-OPERATING MARGINS
ST
AM
FO
RD
SA
INT
FR
AN
CIS
GR
IFF
IN
MA
NC
HE
ST
ER
RO
CK
VIL
LE
WIN
DH
AM
SH
AR
ON
NE
W M
ILF
OR
D
DA
Y K
IMB
ALL
BR
IDG
EP
OR
T
MID
ST
AT
E
JO
HN
SO
N
WA
TE
RB
UR
Y
BR
IST
OL
SA
INT
MA
RY
'S
ME
DIA
N
MID
DLE
SE
X
GR
EE
NW
ICH
LA
WR
EN
CE
YA
LE
-NE
W H
AV
EN
HU
NG
ER
FO
RD
NO
RW
ALK
MIL
FO
RD
HO
SP
OF
CE
NT
RA
L C
T
DE
MP
SE
Y
HA
RT
FO
RD
BA
CK
US
DA
NB
UR
Y
SA
INT
RA
PH
AE
L
SA
INT
VIN
CE
NT
'SC
T C
HIL
DR
EN
'S
-4.0
%0.0
%4.0
%8.0
%
So
urc
e:
FY
20
12
Au
dit
ed
Fin
an
cia
l S
tate
me
nts
Da
ta
FY
20
12
HO
SP
ITA
L N
ON
-OP
ER
AT
ING
MA
RG
INS
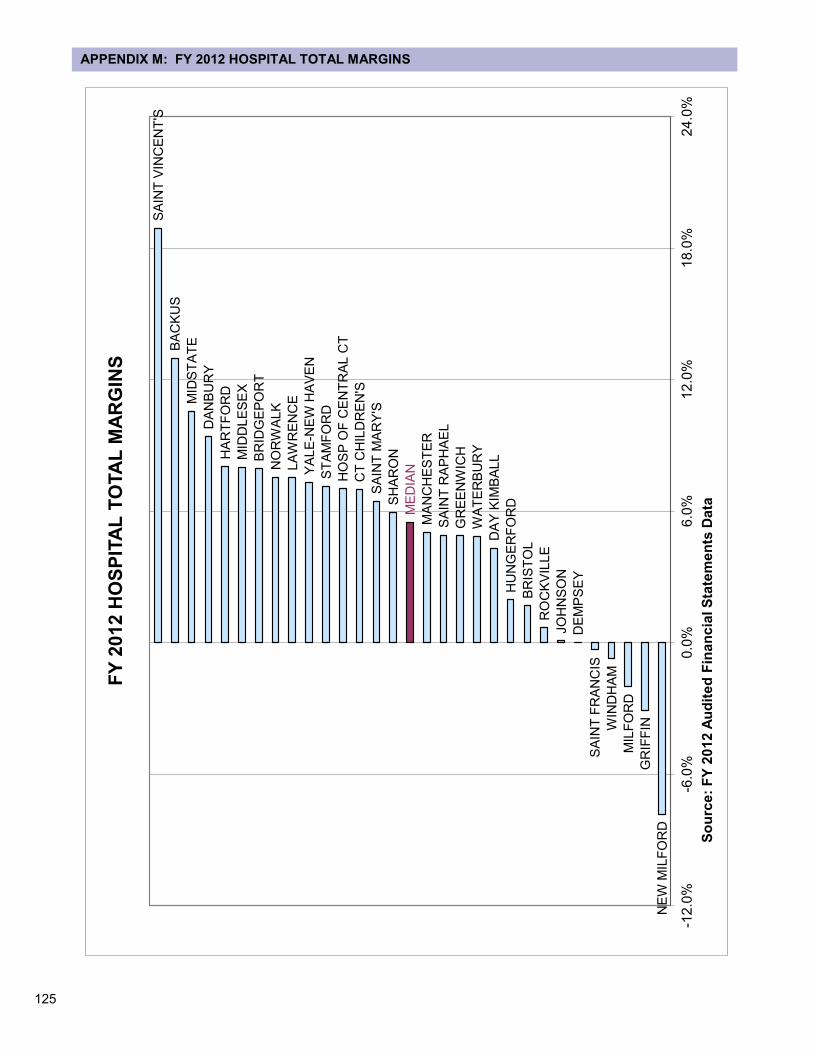
125
APPENDIX M: FY 2012 HOSPITAL TOTAL MARGINS
NE
W M
ILF
OR
D
GR
IFF
IN
MIL
FO
RD
WIN
DH
AM
SA
INT
FR
AN
CIS
DE
MP
SE
Y
JO
HN
SO
N
RO
CK
VIL
LE
BR
IST
OL
HU
NG
ER
FO
RD
DA
Y K
IMB
AL
L
WA
TE
RB
UR
Y
GR
EE
NW
ICH
SA
INT
RA
PH
AE
L
MA
NC
HE
ST
ER
ME
DIA
N
SH
AR
ON
SA
INT
MA
RY
'S
CT
CH
ILD
RE
N'S
HO
SP
OF
CE
NT
RA
L C
T
ST
AM
FO
RD
YA
LE
-NE
W H
AV
EN
LA
WR
EN
CE
NO
RW
AL
K
BR
IDG
EP
OR
T
MID
DL
ES
EX
HA
RT
FO
RD
DA
NB
UR
Y
MID
ST
AT
EBA
CK
US
SA
INT
VIN
CE
NT
'S
-12
.0%
-6.0
%0.0
%6.0
%12
.0%
18
.0%
24
.0%
So
urc
e:
FY
20
12
Au
dit
ed
Fin
an
cia
l S
tate
me
nts
Da
ta
FY
20
12
HO
SP
ITA
L T
OTA
L M
AR
GIN
S
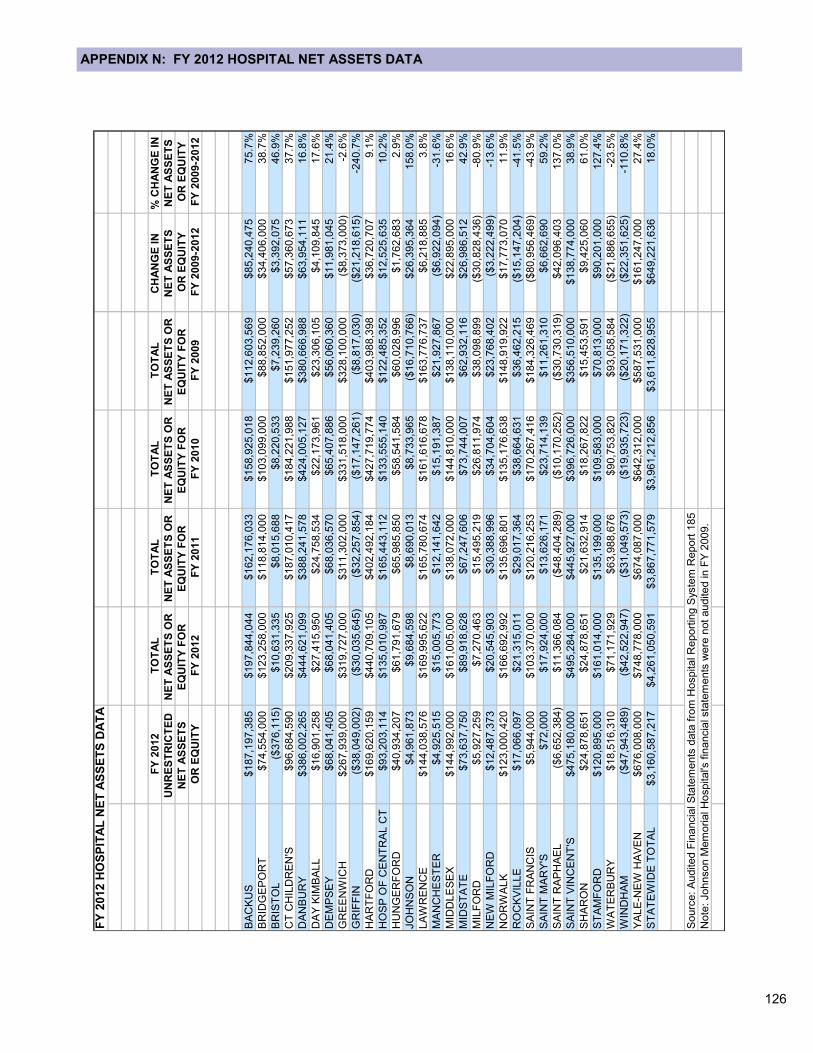
126
APPENDIX N: FY 2012 HOSPITAL NET ASSETS DATA
FY
201
2 H
OS
PIT
AL
NE
T A
SS
ET
S D
AT
A
FY
2012
TO
TA
LT
OT
AL
TO
TA
LT
OT
AL
CH
AN
GE
IN
%
CH
AN
GE
IN
UN
RE
ST
RIC
TE
D
NE
T A
SS
ET
S O
R
NE
T A
SS
ET
S O
R
NE
T A
SS
ET
S O
R
NE
T A
SS
ET
S O
R
NE
T A
SS
ET
S
NE
T A
SS
ET
S
NE
T A
SS
ET
S
EQ
UIT
Y F
OR
E
QU
ITY
FO
R
EQ
UIT
Y F
OR
E
QU
ITY
FO
R
OR
EQ
UIT
YO
R E
QU
ITY
OR
EQ
UIT
YF
Y 2
012
FY
2011
FY
2010
FY
2009
FY
2009-2
012
FY
2009-2
012
BA
CK
US
$187,1
97,3
85
$197,8
44,0
44
$162,1
76,0
33
$158,9
25,0
18
$112,6
03,5
69
$85,2
40,4
75
75.7
%
BR
IDG
EP
OR
T$74,5
54,0
00
$123,2
58,0
00
$118,8
14,0
00
$103,0
99,0
00
$88,8
52,0
00
$34,4
06,0
00
38.7
%
BR
IST
OL
($376,1
15)
$10,6
31,3
35
$8,0
15,6
88
$8,2
20,5
33
$7,2
39,2
60
$3,3
92,0
75
46.9
%
CT
CH
ILD
RE
N'S
$96,6
84,5
90
$209,3
37,9
25
$187,0
10,4
17
$184,2
21,9
88
$151,9
77,2
52
$57,3
60,6
73
37.7
%
DA
NB
UR
Y$386,0
02,2
65
$444,6
21,0
99
$388,2
41,5
78
$424,0
05,1
27
$380,6
66,9
88
$63,9
54,1
11
16.8
%
DA
Y K
IMB
ALL
$16,9
01,2
58
$27,4
15,9
50
$24,7
58,5
34
$22,1
73,9
61
$23,3
06,1
05
$4,1
09,8
45
17.6
%
DE
MP
SE
Y$68,0
41,4
05
$68,0
41,4
05
$68,0
36,5
70
$65,4
07,8
86
$56,0
60,3
60
$11,9
81,0
45
21.4
%
GR
EE
NW
ICH
$267,9
39,0
00
$319,7
27,0
00
$311,3
02,0
00
$331,5
18,0
00
$328,1
00,0
00
($8,3
73,0
00)
-2.6
%
GR
IFF
IN($
38,0
49,0
02)
($30,0
35,6
45)
($32,2
57,8
54)
($17,1
47,2
61)
($8,8
17,0
30)
($21,2
18,6
15)
-240.7
%
HA
RT
FO
RD
$169,6
20,1
59
$440,7
09,1
05
$402,4
92,1
84
$427,7
19,7
74
$403,9
88,3
98
$36,7
20,7
07
9.1
%
HO
SP
OF
CE
NT
RA
L C
T$93,2
03,1
14
$135,0
10,9
87
$165,4
43,1
12
$133,5
55,1
40
$122,4
85,3
52
$12,5
25,6
35
10.2
%
HU
NG
ER
FO
RD
$40,9
34,2
07
$61,7
91,6
79
$65,9
85,8
50
$58,5
41,5
84
$60,0
28,9
96
$1,7
62,6
83
2.9
%
JO
HN
SO
N$4,9
61,8
73
$9,6
84,5
98
$8,6
90,0
13
$8,7
33,9
65
($16,7
10,7
66)
$26,3
95,3
64
158.0
%
LA
WR
EN
CE
$144,0
38,5
76
$169,9
95,6
22
$165,7
80,6
74
$161,6
16,6
78
$163,7
76,7
37
$6,2
18,8
85
3.8
%
MA
NC
HE
ST
ER
$4,9
25,5
15
$15,0
05,7
73
$12,1
41,6
42
$15,1
91,3
87
$21,9
27,8
67
($6,9
22,0
94)
-31.6
%
MID
DLE
SE
X$144,9
92,0
00
$161,0
05,0
00
$138,0
72,0
00
$144,8
10,0
00
$138,1
10,0
00
$22,8
95,0
00
16.6
%
MID
ST
AT
E$73,6
37,7
50
$89,9
18,6
28
$67,2
47,6
06
$73,7
44,0
07
$62,9
32,1
16
$26,9
86,5
12
42.9
%
MIL
FO
RD
$5,9
27,2
59
$7,2
70,4
63
$15,4
95,2
19
$26,8
11,9
74
$38,0
98,8
99
($30,8
28,4
36)
-80.9
%
NE
W M
ILF
OR
D$12,4
87,3
73
$20,5
45,9
03
$30,3
88,9
96
$34,7
04,6
04
$23,7
68,4
02
($3,2
22,4
99)
-13.6
%
NO
RW
ALK
$123,0
00,4
20
$166,6
92,9
92
$135,6
96,8
01
$135,1
76,6
38
$148,9
19,9
22
$17,7
73,0
70
11.9
%
RO
CK
VIL
LE
$17,0
66,0
97
$21,3
15,0
11
$29,0
17,3
64
$38,6
64,6
31
$36,4
62,2
15
($15,1
47,2
04)
-41.5
%
SA
INT
FR
AN
CIS
$5,9
44,0
00
$103,3
70,0
00
$120,2
16,2
53
$170,2
67,4
16
$184,3
26,4
69
($80,9
56,4
69)
-43.9
%
SA
INT
MA
RY
'S$72,0
00
$17,9
24,0
00
$13,6
26,1
71
$23,7
14,1
39
$11,2
61,3
10
$6,6
62,6
90
59.2
%
SA
INT
RA
PH
AE
L($
6,6
52,3
84)
$11,3
66,0
84
($48,4
04,2
89)
($10,1
70,2
52)
($30,7
30,3
19)
$42,0
96,4
03
137.0
%
SA
INT
VIN
CE
NT
'S$475,1
80,0
00
$495,2
84,0
00
$445,9
27,0
00
$396,7
26,0
00
$356,5
10,0
00
$138,7
74,0
00
38.9
%
SH
AR
ON
$24,8
78,6
51
$24,8
78,6
51
$21,6
32,9
14
$18,2
67,8
22
$15,4
53,5
91
$9,4
25,0
60
61.0
%
ST
AM
FO
RD
$120,8
95,0
00
$161,0
14,0
00
$135,1
99,0
00
$109,5
83,0
00
$70,8
13,0
00
$90,2
01,0
00
127.4
%
WA
TE
RB
UR
Y$18,5
16,3
10
$71,1
71,9
29
$63,9
88,6
76
$90,7
53,8
20
$93,0
58,5
84
($21,8
86,6
55)
-23.5
%
WIN
DH
AM
($47,9
43,4
89)
($42,5
22,9
47)
($31,0
49,5
73)
($19,9
35,7
23)
($20,1
71,3
22)
($22,3
51,6
25)
-110.8
%
YA
LE
-NE
W H
AV
EN
$676,0
08,0
00
$748,7
78,0
00
$674,0
87,0
00
$642,3
12,0
00
$587,5
31,0
00
$161,2
47,0
00
27.4
%
ST
AT
EW
IDE
TO
TA
L$3,1
60,5
87,2
17
$4,2
61,0
50,5
91
$3,8
67,7
71,5
79
$3,9
61,2
12,8
56
$3,6
11,8
28,9
55
$649,2
21,6
36
18.0
%
Sourc
e: A
udited F
inancia
l S
tate
ments
data
fro
m H
ospital R
eport
ing S
yste
m R
eport
185
Note
: Johnson M
em
orial H
ospital's
fin
ancia
l sta
tem
ents
were
not audited in F
Y 2
009.
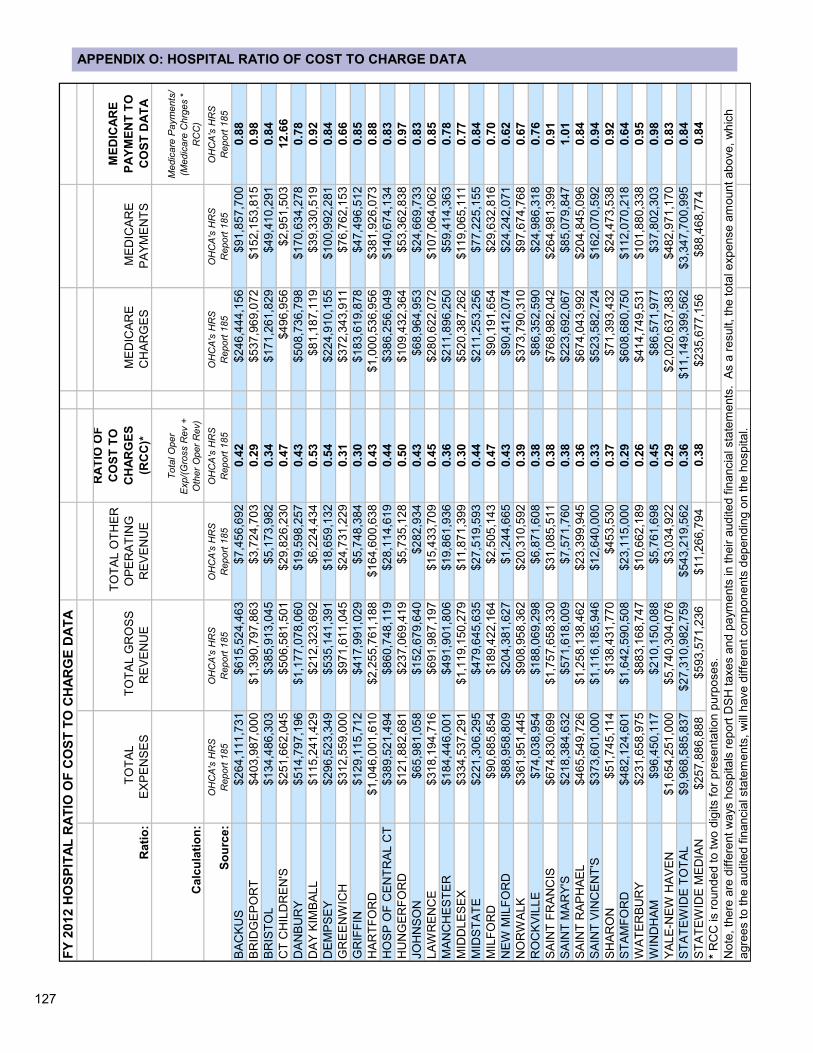
127
APPENDIX O: HOSPITAL RATIO OF COST TO CHARGE DATA F
Y 2
01
2 H
OS
PIT
AL
RA
TIO
OF
CO
ST
TO
CH
AR
GE
DA
TA
Rati
o:
TO
TA
L
EX
PE
NS
ES
TO
TA
L G
RO
SS
RE
VE
NU
E
TO
TA
L O
TH
ER
OP
ER
AT
ING
RE
VE
NU
E
RA
TIO
OF
CO
ST
TO
CH
AR
GE
S
(RC
C)*
ME
DIC
AR
E
CH
AR
GE
S
ME
DIC
AR
E
PA
YM
EN
TS
ME
DIC
AR
E
PA
YM
EN
T T
O
CO
ST
DA
TA
Calc
ula
tio
n:
Tota
l O
per
Exp/(
Gro
ss R
ev +
Oth
er
Oper
Rev)
Medic
are
Paym
ents
/
(Medic
are
Chrg
es *
RC
C)
So
urc
e:
OH
CA
's H
RS
Report
185
OH
CA
's H
RS
Report
185
OH
CA
's H
RS
Report
185
OH
CA
's H
RS
Report
185
OH
CA
's H
RS
Report
185
OH
CA
's H
RS
Report
185
OH
CA
's H
RS
Report
185
BA
CK
US
$264,1
11,7
31
$615,5
24,4
63
$7,4
56,6
92
0.4
2$246,4
44,1
56
$91,8
57,7
00
0.8
8
BR
IDG
EP
OR
T$403,9
87,0
00
$1,3
90,7
97,8
63
$3,7
24,7
03
0.2
9$537,9
69,0
72
$152,1
53,8
15
0.9
8
BR
IST
OL
$134,4
86,3
03
$385,9
13,0
45
$5,1
73,9
82
0.3
4$171,2
61,8
29
$49,4
10,2
91
0.8
4
CT
CH
ILD
RE
N'S
$251,6
62,0
45
$506,5
81,5
01
$29,8
26,2
30
0.4
7$496,9
56
$2,9
51,5
03
12.6
6
DA
NB
UR
Y$514,7
97,1
96
$1,1
77,0
78,0
60
$19,5
98,2
57
0.4
3$508,7
36,7
98
$170,6
34,2
78
0.7
8
DA
Y K
IMB
ALL
$115,2
41,4
29
$212,3
23,6
92
$6,2
24,4
34
0.5
3$81,1
87,1
19
$39,3
30,5
19
0.9
2
DE
MP
SE
Y$296,5
23,3
49
$535,1
41,3
91
$18,6
59,1
32
0.5
4$224,9
10,1
55
$100,9
92,2
81
0.8
4
GR
EE
NW
ICH
$312,5
59,0
00
$971,6
11,0
45
$24,7
31,2
29
0.3
1$372,3
43,9
11
$76,7
62,1
53
0.6
6
GR
IFF
IN$129,1
15,7
12
$417,9
91,0
29
$5,7
48,3
84
0.3
0$183,6
19,8
78
$47,4
96,5
12
0.8
5
HA
RT
FO
RD
$1,0
46,0
01,6
10
$2,2
55,7
61,1
88
$164,6
00,6
38
0.4
3$1,0
00,5
36,9
56
$381,9
26,0
73
0.8
8
HO
SP
OF
CE
NT
RA
L C
T$389,5
21,4
94
$860,7
48,1
19
$28,1
14,6
19
0.4
4$386,2
56,0
49
$140,6
74,1
34
0.8
3
HU
NG
ER
FO
RD
$121,8
82,6
81
$237,0
69,4
19
$5,7
35,1
28
0.5
0$109,4
32,3
64
$53,3
62,8
38
0.9
7
JO
HN
SO
N$65,9
81,0
58
$152,6
79,6
40
$282,9
34
0.4
3$68,9
64,9
53
$24,6
69,7
33
0.8
3
LA
WR
EN
CE
$318,1
94,7
16
$691,9
87,1
97
$15,4
33,7
09
0.4
5$280,6
22,0
72
$107,0
64,0
62
0.8
5
MA
NC
HE
ST
ER
$184,4
46,0
01
$491,9
01,8
06
$19,8
61,9
36
0.3
6$211,8
96,2
50
$59,4
14,3
63
0.7
8
MID
DLE
SE
X$334,5
37,2
91
$1,1
19,1
50,2
79
$11,8
71,3
99
0.3
0$520,3
87,2
62
$119,0
65,1
11
0.7
7
MID
ST
AT
E$221,3
06,2
95
$479,6
45,6
35
$27,5
19,5
93
0.4
4$211,2
53,2
56
$77,2
25,1
55
0.8
4
MIL
FO
RD
$90,6
85,8
54
$189,4
22,1
64
$2,5
05,1
43
0.4
7$90,1
91,6
54
$29,6
32,8
16
0.7
0
NE
W M
ILF
OR
D$88,9
58,8
09
$204,3
81,6
27
$1,2
44,6
65
0.4
3$90,4
12,0
74
$24,2
42,0
71
0.6
2
NO
RW
ALK
$361,9
51,4
45
$908,9
58,3
62
$20,3
10,5
92
0.3
9$373,7
90,3
10
$97,6
74,7
68
0.6
7
RO
CK
VIL
LE
$74,0
38,9
54
$188,0
69,2
98
$6,8
71,6
08
0.3
8$86,3
52,5
90
$24,9
86,3
18
0.7
6
SA
INT
FR
AN
CIS
$674,8
30,6
99
$1,7
57,6
58,3
30
$31,0
85,5
11
0.3
8$768,9
82,0
42
$264,9
81,3
99
0.9
1
SA
INT
MA
RY
'S$218,3
84,6
32
$571,6
18,0
09
$7,5
71,7
60
0.3
8$223,6
92,0
67
$85,0
79,8
47
1.0
1
SA
INT
RA
PH
AE
L$465,5
49,7
26
$1,2
58,1
38,4
62
$23,3
99,9
45
0.3
6$674,0
43,9
92
$204,8
45,0
96
0.8
4
SA
INT
VIN
CE
NT
'S$373,6
01,0
00
$1,1
16,1
85,9
46
$12,6
40,0
00
0.3
3$523,5
82,7
24
$162,0
70,5
92
0.9
4
SH
AR
ON
$51,7
45,1
14
$138,4
31,7
70
$453,5
30
0.3
7$71,3
93,4
32
$24,4
73,5
38
0.9
2
ST
AM
FO
RD
$482,1
24,6
01
$1,6
42,5
90,5
08
$23,1
15,0
00
0.2
9$608,6
80,7
50
$112,0
70,2
18
0.6
4
WA
TE
RB
UR
Y$231,6
58,9
75
$883,1
68,7
47
$10,6
62,1
89
0.2
6$414,7
49,5
31
$101,8
80,3
38
0.9
5
WIN
DH
AM
$96,4
50,1
17
$210,1
50,0
88
$5,7
61,6
98
0.4
5$86,5
71,9
77
$37,8
02,3
03
0.9
8
YA
LE
-NE
W H
AV
EN
$1,6
54,2
51,0
00
$5,7
40,3
04,0
76
$3,0
34,9
22
0.2
9$2,0
20,6
37,3
83
$482,9
71,1
70
0.8
3
ST
AT
EW
IDE
TO
TA
L$9,9
68,5
85,8
37
$27,3
10,9
82,7
59
$543,2
19,5
62
0.3
6$11,1
49,3
99,5
62
$3,3
47,7
00,9
95
0.8
4
ST
AT
EW
IDE
ME
DIA
N$257,8
86,8
88
$593,5
71,2
36
$11,2
66,7
94
0.3
8$235,6
77,1
56
$88,4
68,7
74
0.8
4
* R
CC
is r
ounded to tw
o d
igits f
or
pre
senta
tion p
urp
oses.
Note
, th
ere
are
diffe
rent w
ays
hospitals
report
DS
H taxes a
nd p
aym
ents
in their a
udited f
inancia
l sta
tem
ents
. A
s a
result, th
e tota
l expense a
mount above, w
hic
h
agre
es to the a
udited f
inancia
l sta
tem
ents
, w
ill h
ave d
iffe
rent com
ponents
dependin
g o
n the h
ospital.
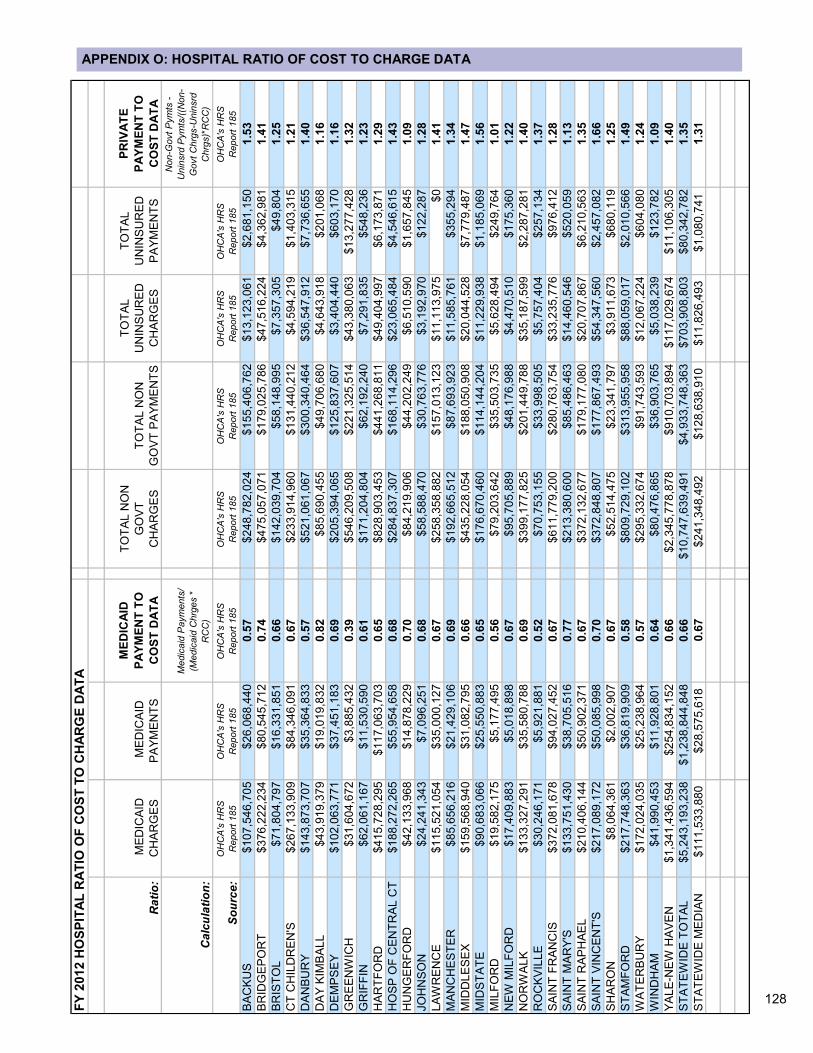
128
APPENDIX O: HOSPITAL RATIO OF COST TO CHARGE DATA
FY
2012 H
OS
PIT
AL
RA
TIO
OF
CO
ST
TO
CH
AR
GE
DA
TA
Ra
tio
:
ME
DIC
AID
CH
AR
GE
S
ME
DIC
AID
PA
YM
EN
TS
ME
DIC
AID
PA
YM
EN
T T
O
CO
ST
DA
TA
TO
TA
L N
ON
GO
VT
CH
AR
GE
S
TO
TA
L N
ON
GO
VT
PA
YM
EN
TS
TO
TA
L
UN
INS
UR
ED
CH
AR
GE
S
TO
TA
L
UN
INS
UR
ED
PA
YM
EN
TS
PR
IVA
TE
PA
YM
EN
T T
O
CO
ST
DA
TA
Ca
lcu
lati
on
:
Me
dic
aid
Paym
ents
/
(Me
dic
aid
Chrg
es *
RC
C)
Non-G
ovt
Pym
ts -
Unin
srd
Pym
ts/(
(Non-
Govt
Chrg
s-U
nin
srd
Chrg
s)*
RC
C)
So
urc
e:
OH
CA
's H
RS
Report
185
OH
CA
's H
RS
Report
185
OH
CA
's H
RS
Report
185
OH
CA
's H
RS
Report
185
OH
CA
's H
RS
Report
185
OH
CA
's H
RS
Report
185
OH
CA
's H
RS
Report
185
OH
CA
's H
RS
Report
185
BA
CK
US
$107,5
46,7
05
$26,0
68,4
40
0.5
7$248,7
82,0
24
$155,4
06,7
62
$13,1
23,0
61
$2,6
81,1
50
1.5
3
BR
IDG
EP
OR
T$376,2
22,2
34
$80,5
45,7
12
0.7
4$475,0
57,0
71
$179,0
25,7
86
$47,5
16,2
24
$4,3
62,9
81
1.4
1
BR
IST
OL
$71,8
04,7
97
$16,3
31,8
51
0.6
6$142,0
39,7
04
$58,1
48,9
95
$7,3
57,3
05
$49,8
04
1.2
5
CT
CH
ILD
RE
N'S
$267,1
33,9
09
$84,3
46,0
91
0.6
7$233,9
14,9
60
$131,4
40,2
12
$4,5
94,2
19
$1,4
03,3
15
1.2
1
DA
NB
UR
Y$143,8
73,7
07
$35,3
64,8
33
0.5
7$521,0
61,0
67
$300,3
40,4
64
$36,5
47,9
12
$7,7
36,6
55
1.4
0
DA
Y K
IMB
AL
L$43,9
19,3
79
$19,0
19,8
32
0.8
2$85,6
90,4
55
$49,7
06,6
80
$4,6
43,9
18
$201,0
68
1.1
6
DE
MP
SE
Y$102,0
63,7
71
$37,4
51,1
83
0.6
9$205,3
94,0
65
$125,8
37,6
07
$3,4
04,4
40
$603,1
70
1.1
6
GR
EE
NW
ICH
$31,6
04,6
72
$3,8
85,4
32
0.3
9$546,2
09,5
08
$221,3
25,5
14
$43,3
80,0
63
$13,2
77,4
28
1.3
2
GR
IFF
IN$62,0
61,1
67
$11,5
30,5
90
0.6
1$171,2
04,8
04
$62,1
92,2
40
$7,2
91,8
35
$548,2
36
1.2
3
HA
RT
FO
RD
$415,7
28,2
95
$117,0
63,7
03
0.6
5$828,9
03,4
53
$441,2
68,8
11
$49,4
04,9
97
$6,1
73,8
71
1.2
9
HO
SP
OF
CE
NT
RA
L C
T$188,2
72,2
65
$55,9
54,6
58
0.6
8$284,8
37,3
07
$168,1
14,2
96
$23,0
65,4
84
$4,5
46,6
15
1.4
3
HU
NG
ER
FO
RD
$42,1
33,9
68
$14,8
78,2
29
0.7
0$84,2
19,9
06
$44,2
02,2
49
$6,5
10,5
90
$1,6
57,8
45
1.0
9
JO
HN
SO
N$24,2
41,3
43
$7,0
96,2
51
0.6
8$58,5
88,4
70
$30,7
63,7
76
$3,1
92,9
70
$122,2
87
1.2
8
LA
WR
EN
CE
$115,5
21,0
54
$35,0
00,1
27
0.6
7$258,3
58,8
82
$157,0
13,1
23
$11,1
13,9
75
$0
1.4
1
MA
NC
HE
ST
ER
$85,6
56,2
16
$21,4
29,1
06
0.6
9$192,6
65,5
12
$87,6
93,9
23
$11,5
85,7
61
$355,2
94
1.3
4
MID
DL
ES
EX
$159,5
68,9
40
$31,0
82,7
95
0.6
6$435,2
28,0
54
$188,0
50,9
08
$20,0
44,5
28
$7,7
79,4
87
1.4
7
MID
ST
AT
E$90,6
83,0
66
$25,5
50,8
83
0.6
5$176,6
70,4
60
$114,1
44,2
04
$11,2
29,9
38
$1,1
85,0
69
1.5
6
MIL
FO
RD
$19,5
82,1
75
$5,1
77,4
95
0.5
6$79,2
03,6
42
$35,5
03,7
35
$5,6
28,4
94
$249,7
64
1.0
1
NE
W M
ILF
OR
D$17,4
09,8
83
$5,0
18,8
98
0.6
7$95,7
05,8
89
$48,1
76,9
88
$4,4
70,5
10
$175,3
60
1.2
2
NO
RW
AL
K$133,3
27,2
91
$35,5
80,7
88
0.6
9$399,1
77,8
25
$201,4
49,7
88
$35,1
87,5
99
$2,2
87,2
81
1.4
0
RO
CK
VIL
LE
$30,2
46,1
71
$5,9
21,8
81
0.5
2$70,7
53,1
55
$33,9
98,5
05
$5,7
57,4
04
$257,1
34
1.3
7
SA
INT
FR
AN
CIS
$372,0
81,6
78
$94,0
27,4
52
0.6
7$611,7
79,2
00
$280,7
63,7
54
$33,2
35,7
76
$976,4
12
1.2
8
SA
INT
MA
RY
'S$133,7
51,4
30
$38,7
05,5
16
0.7
7$213,3
80,6
00
$85,4
86,4
63
$14,4
60,5
46
$520,0
59
1.1
3
SA
INT
RA
PH
AE
L$210,4
06,1
44
$50,9
02,3
71
0.6
7$372,1
32,6
77
$179,1
77,0
80
$20,7
07,8
67
$6,2
10,5
63
1.3
5
SA
INT
VIN
CE
NT
'S$217,0
89,1
72
$50,0
85,9
98
0.7
0$372,8
48,8
07
$177,8
67,4
93
$54,3
47,5
60
$2,4
57,0
82
1.6
6
SH
AR
ON
$8,0
64,3
61
$2,0
02,9
07
0.6
7$52,5
14,4
75
$23,3
41,7
97
$3,9
11,6
73
$680,1
19
1.2
5
ST
AM
FO
RD
$217,7
48,3
63
$36,8
19,9
09
0.5
8$809,7
29,1
02
$313,9
55,9
58
$88,0
59,0
17
$2,0
10,5
66
1.4
9
WA
TE
RB
UR
Y$172,0
24,0
35
$25,2
38,9
64
0.5
7$295,3
32,6
74
$91,7
43,5
93
$12,0
67,2
24
$604,0
80
1.2
4
WIN
DH
AM
$41,9
90,4
53
$11,9
28,8
01
0.6
4$80,4
76,8
65
$36,9
03,7
65
$5,0
38,2
39
$123,7
82
1.0
9
YA
LE
-NE
W H
AV
EN
$1,3
41,4
36,5
94
$254,8
34,1
52
0.6
6$2,3
45,7
78,8
78
$910,7
03,8
94
$117,0
29,6
74
$11,1
06,3
05
1.4
0
ST
AT
EW
IDE
TO
TA
L$5,2
43,1
93,2
38
$1,2
38,8
44,8
48
0.6
6$10,7
47,6
39,4
91
$4,9
33,7
48,3
63
$703,9
08,8
03
$80,3
42,7
82
1.3
5
ST
AT
EW
IDE
ME
DIA
N$111,5
33,8
80
$28,5
75,6
18
0.6
7$241,3
48,4
92
$128,6
38,9
10
$11,8
26,4
93
$1,0
80,7
41
1.3
1
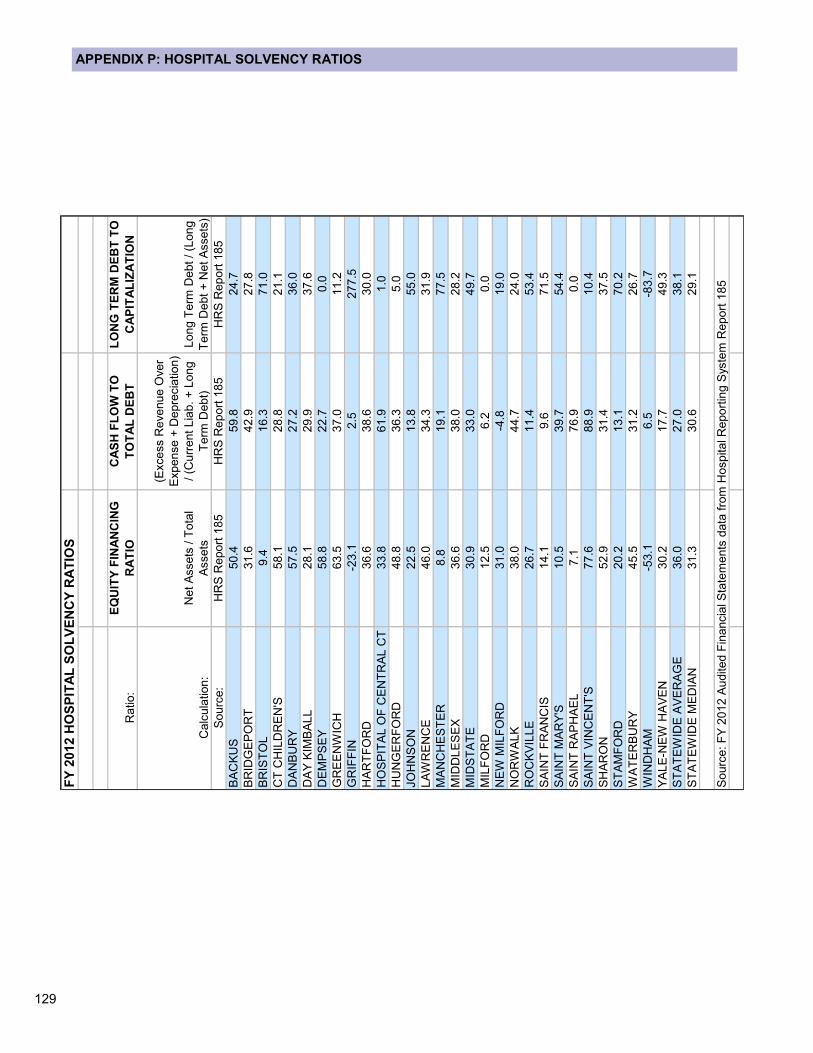
129
APPENDIX P: HOSPITAL SOLVENCY RATIOS F
Y 2
012 H
OS
PIT
AL
SO
LV
EN
CY
RA
TIO
S
Ratio:
EQ
UIT
Y F
INA
NC
ING
RA
TIO
CA
SH
FL
OW
TO
TO
TA
L D
EB
T
LO
NG
TE
RM
DE
BT
TO
CA
PIT
AL
IZA
TIO
N
Calc
ula
tion:
Net A
ssets
/ T
ota
l
Assets
(Excess R
evenue O
ver
Expense +
Depre
cia
tion)
/ (C
urr
ent Lia
b. +
Long
Term
Debt)
Long T
erm
Debt / (L
ong
Term
Debt +
Net A
ssets
)
Sourc
e:
HR
S R
eport
185
HR
S R
eport
185
HR
S R
eport
185
BA
CK
US
50.4
59.8
24.7
BR
IDG
EP
OR
T31.6
42.9
27.8
BR
IST
OL
9.4
16.3
71.0
CT
CH
ILD
RE
N'S
58.1
28.8
21.1
DA
NB
UR
Y57.5
27.2
36.0
DA
Y K
IMB
ALL
28.1
29.9
37.6
DE
MP
SE
Y58.8
22.7
0.0
GR
EE
NW
ICH
63.5
37.0
11.2
GR
IFF
IN-2
3.1
2.5
277.5
HA
RT
FO
RD
36.6
38.6
30.0
HO
SP
ITA
L O
F C
EN
TR
AL C
T33.8
61.9
1.0
HU
NG
ER
FO
RD
48.8
36.3
5.0
JO
HN
SO
N22.5
13.8
55.0
LA
WR
EN
CE
46.0
34.3
31.9
MA
NC
HE
ST
ER
8.8
19.1
77.5
MID
DLE
SE
X36.6
38.0
28.2
MID
ST
AT
E30.9
33.0
49.7
MIL
FO
RD
12.5
6.2
0.0
NE
W M
ILF
OR
D31.0
-4.8
19.0
NO
RW
ALK
38.0
44.7
24.0
RO
CK
VIL
LE
26.7
11.4
53.4
SA
INT
FR
AN
CIS
14.1
9.6
71.5
SA
INT
MA
RY
'S10.5
39.7
54.4
SA
INT
RA
PH
AE
L7.1
76.9
0.0
SA
INT
VIN
CE
NT
'S77.6
88.9
10.4
SH
AR
ON
52.9
31.4
37.5
ST
AM
FO
RD
20.2
13.1
70.2
WA
TE
RB
UR
Y45.5
31.2
26.7
WIN
DH
AM
-53.1
6.5
-83.7
YA
LE
-NE
W H
AV
EN
30.2
17.7
49.3
ST
AT
EW
IDE
AV
ER
AG
E36.0
27.0
38.1
ST
AT
EW
IDE
ME
DIA
N31.3
30.6
29.1
Sourc
e: F
Y 2
012 A
udited F
inancia
l S
tate
ments
data
fro
m H
ospital R
eport
ing S
yste
m R
eport
185
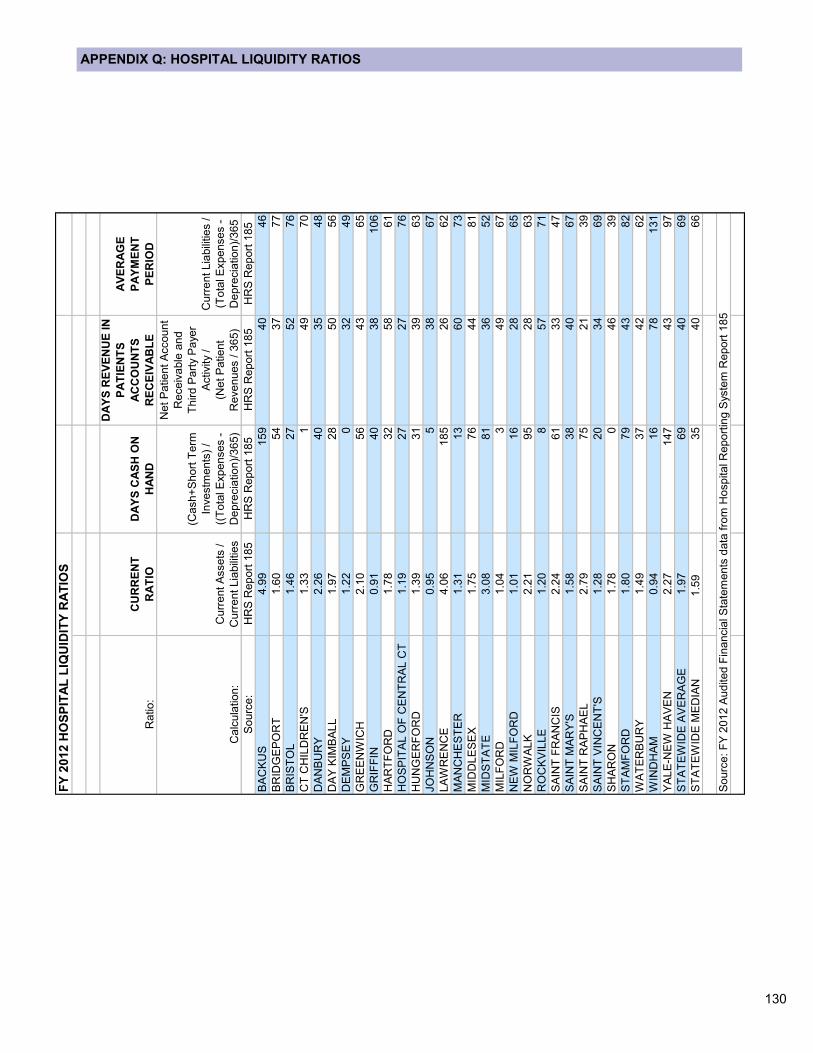
130
APPENDIX Q: HOSPITAL LIQUIDITY RATIOS F
Y 2
01
2 H
OS
PIT
AL
LIQ
UID
ITY
RA
TIO
S
Ratio:
CU
RR
EN
T
RA
TIO
DA
YS
CA
SH
ON
HA
ND
DA
YS
RE
VE
NU
E IN
PA
TIE
NT
S
AC
CO
UN
TS
RE
CE
IVA
BL
E
AV
ER
AG
E
PA
YM
EN
T
PE
RIO
D
Calc
ula
tion:
Curr
ent A
ssets
/
Curr
ent Lia
bili
ties
(Cash+
Short
Term
Investm
ents
) /
((T
ota
l E
xpenses -
De
pre
cia
tion)/
365)
Net
Patient A
cco
unt
Receiv
able
and
Third P
art
y P
aye
r
Activity
/
(Net
Patient
Revenues /
365)
Curr
ent
Lia
bili
ties /
(To
tal E
xp
ense
s -
De
pre
cia
tio
n)/
365
Sourc
e:
HR
S R
eport
185
HR
S R
eport
185
HR
S R
eport
18
5H
RS
Report
185
BA
CK
US
4.9
9159
40
46
BR
IDG
EP
OR
T1.6
054
37
77
BR
IST
OL
1.4
627
52
76
CT
CH
ILD
RE
N'S
1.3
31
49
70
DA
NB
UR
Y2.2
640
35
48
DA
Y K
IMB
ALL
1.9
728
50
56
DE
MP
SE
Y1.2
20
32
49
GR
EE
NW
ICH
2.1
056
43
65
GR
IFF
IN0.9
140
38
106
HA
RT
FO
RD
1.7
832
58
61
HO
SP
ITA
L O
F C
EN
TR
AL C
T1.1
927
27
76
HU
NG
ER
FO
RD
1.3
931
39
63
JO
HN
SO
N0.9
55
38
67
LA
WR
EN
CE
4.0
6185
26
62
MA
NC
HE
ST
ER
1.3
113
60
73
MID
DLE
SE
X1.7
576
44
81
MID
ST
AT
E3.0
881
36
52
MIL
FO
RD
1.0
43
49
67
NE
W M
ILF
OR
D1.0
116
28
65
NO
RW
ALK
2.2
195
28
63
RO
CK
VIL
LE
1.2
08
57
71
SA
INT
FR
AN
CIS
2.2
461
33
47
SA
INT
MA
RY
'S1.5
838
40
67
SA
INT
RA
PH
AE
L2.7
975
21
39
SA
INT
VIN
CE
NT
'S1.2
820
34
69
SH
AR
ON
1.7
80
46
39
ST
AM
FO
RD
1.8
079
43
82
WA
TE
RB
UR
Y1.4
937
42
62
WIN
DH
AM
0.9
416
78
131
YA
LE
-NE
W H
AV
EN
2.2
7147
43
97
ST
AT
EW
IDE
AV
ER
AG
E1.9
769
40
69
ST
AT
EW
IDE
ME
DIA
N1.5
935
40
66
Sourc
e: F
Y 2
012 A
udited F
ina
ncia
l S
tate
me
nts
data
fro
m H
ospital R
eport
ing S
yste
m R
epo
rt 1
85
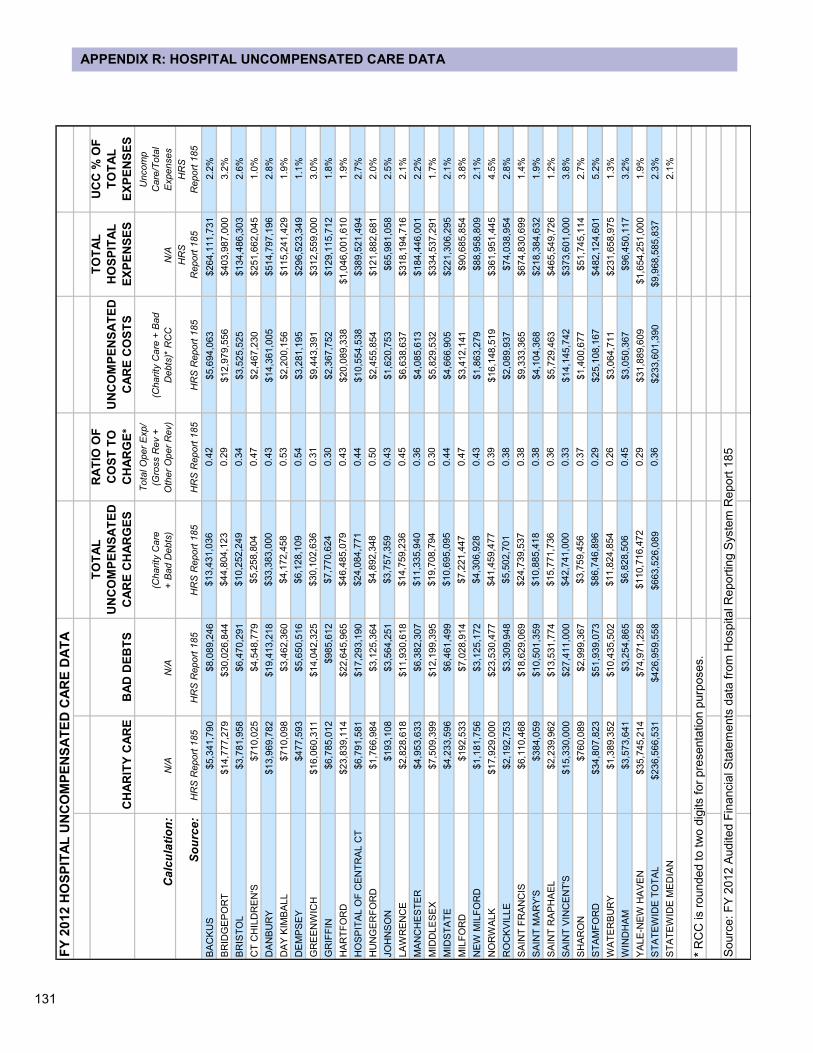
131
APPENDIX R: HOSPITAL UNCOMPENSATED CARE DATA F
Y 2
012 H
OS
PIT
AL
UN
CO
MP
EN
SA
TE
D C
AR
E D
AT
A
CH
AR
ITY
CA
RE
BA
D D
EB
TS
TO
TA
L
UN
CO
MP
EN
SA
TE
D
CA
RE
CH
AR
GE
S
RA
TIO
OF
CO
ST
TO
CH
AR
GE
*
UN
CO
MP
EN
SA
TE
D
CA
RE
CO
ST
S
TO
TA
L
HO
SP
ITA
L
EX
PE
NS
ES
UC
C %
OF
TO
TA
L
EX
PE
NS
ES
Ca
lcu
lati
on
:N
/AN
/A
(Charity
Care
+ B
ad D
ebts
)
Tota
l O
per
Exp/
(Gro
ss R
ev +
Oth
er
Oper
Rev)
(Charity
Care
+ B
ad
Debts
)* R
CC
N/A
Uncom
p
Care
/Tota
l
Expenses
So
urc
e:
HR
S R
eport
185
HR
S R
eport
185
HR
S R
eport
185
HR
S R
eport
185
HR
S R
eport
185
HR
S
Report
185
HR
S
Report
185
BA
CK
US
$5,3
41,7
90
$8,0
89,2
46
$13,4
31,0
36
0.4
2
$5,6
94,0
63
$264,1
11,7
31
2.2
%
BR
IDG
EP
OR
T$14,7
77,2
79
$30,0
26,8
44
$44,8
04,1
23
0.2
9
$12,9
79,5
56
$403,9
87,0
00
3.2
%
BR
IST
OL
$3,7
81,9
58
$6,4
70,2
91
$10,2
52,2
49
0.3
4
$3,5
25,5
25
$134,4
86,3
03
2.6
%
CT
CH
ILD
RE
N'S
$710,0
25
$4,5
48,7
79
$5,2
58,8
04
0.4
7
$2,4
67,2
30
$251,6
62,0
45
1.0
%
DA
NB
UR
Y$13,9
69,7
82
$19,4
13,2
18
$33,3
83,0
00
0.4
3
$14,3
61,0
05
$514,7
97,1
96
2.8
%
DA
Y K
IMB
ALL
$710,0
98
$3,4
62,3
60
$4,1
72,4
58
0.5
3
$2,2
00,1
56
$115,2
41,4
29
1.9
%
DE
MP
SE
Y$477,5
93
$5,6
50,5
16
$6,1
28,1
09
0.5
4
$3,2
81,1
95
$296,5
23,3
49
1.1
%
GR
EE
NW
ICH
$16,0
60,3
11
$14,0
42,3
25
$30,1
02,6
36
0.3
1
$9,4
43,3
91
$312,5
59,0
00
3.0
%
GR
IFF
IN$6,7
85,0
12
$985,6
12
$7,7
70,6
24
0.3
0
$2,3
67,7
52
$129,1
15,7
12
1.8
%
HA
RT
FO
RD
$23,8
39,1
14
$22,6
45,9
65
$46,4
85,0
79
0.4
3
$20,0
89,3
38
$1,0
46,0
01,6
10
1.9
%
HO
SP
ITA
L O
F C
EN
TR
AL C
T$6,7
91,5
81
$17,2
93,1
90
$24,0
84,7
71
0.4
4
$10,5
54,5
38
$389,5
21,4
94
2.7
%
HU
NG
ER
FO
RD
$1,7
66,9
84
$3,1
25,3
64
$4,8
92,3
48
0.5
0
$2,4
55,8
54
$121,8
82,6
81
2.0
%
JO
HN
SO
N$193,1
08
$3,5
64,2
51
$3,7
57,3
59
0.4
3
$1,6
20,7
53
$65,9
81,0
58
2.5
%
LA
WR
EN
CE
$2,8
28,6
18
$11,9
30,6
18
$14,7
59,2
36
0.4
5
$6,6
38,6
37
$318,1
94,7
16
2.1
%
MA
NC
HE
ST
ER
$4,9
53,6
33
$6,3
82,3
07
$11,3
35,9
40
0.3
6
$4,0
85,6
13
$184,4
46,0
01
2.2
%
MID
DLE
SE
X$7,5
09,3
99
$12,1
99,3
95
$19,7
08,7
94
0.3
0
$5,8
29,5
32
$334,5
37,2
91
1.7
%
MID
ST
AT
E$4,2
33,5
96
$6,4
61,4
99
$10,6
95,0
95
0.4
4
$4,6
66,9
05
$221,3
06,2
95
2.1
%
MIL
FO
RD
$192,5
33
$7,0
28,9
14
$7,2
21,4
47
0.4
7
$3,4
12,1
41
$90,6
85,8
54
3.8
%
NE
W M
ILF
OR
D$1,1
81,7
56
$3,1
25,1
72
$4,3
06,9
28
0.4
3
$1,8
63,2
79
$88,9
58,8
09
2.1
%
NO
RW
ALK
$17,9
29,0
00
$23,5
30,4
77
$41,4
59,4
77
0.3
9
$16,1
48,5
19
$361,9
51,4
45
4.5
%
RO
CK
VIL
LE
$2,1
92,7
53
$3,3
09,9
48
$5,5
02,7
01
0.3
8
$2,0
89,9
37
$74,0
38,9
54
2.8
%
SA
INT
FR
AN
CIS
$6,1
10,4
68
$18,6
29,0
69
$24,7
39,5
37
0.3
8
$9,3
33,3
65
$674,8
30,6
99
1.4
%
SA
INT
MA
RY
'S$384,0
59
$10,5
01,3
59
$10,8
85,4
18
0.3
8
$4,1
04,3
68
$218,3
84,6
32
1.9
%
SA
INT
RA
PH
AE
L$2,2
39,9
62
$13,5
31,7
74
$15,7
71,7
36
0.3
6
$5,7
29,4
63
$465,5
49,7
26
1.2
%
SA
INT
VIN
CE
NT
'S$15,3
30,0
00
$27,4
11,0
00
$42,7
41,0
00
0.3
3
$14,1
45,7
42
$373,6
01,0
00
3.8
%
SH
AR
ON
$760,0
89
$2,9
99,3
67
$3,7
59,4
56
0.3
7
$1,4
00,6
77
$51,7
45,1
14
2.7
%
ST
AM
FO
RD
$34,8
07,8
23
$51,9
39,0
73
$86,7
46,8
96
0.2
9
$25,1
08,1
67
$482,1
24,6
01
5.2
%
WA
TE
RB
UR
Y$1,3
89,3
52
$10,4
35,5
02
$11,8
24,8
54
0.2
6
$3,0
64,7
11
$231,6
58,9
75
1.3
%
WIN
DH
AM
$3,5
73,6
41
$3,2
54,8
65
$6,8
28,5
06
0.4
5
$3,0
50,3
67
$96,4
50,1
17
3.2
%
YA
LE
-NE
W H
AV
EN
$35,7
45,2
14
$74,9
71,2
58
$110,7
16,4
72
0.2
9
$31,8
89,6
09
$1,6
54,2
51,0
00
1.9
%
ST
AT
EW
IDE
TO
TA
L$236,5
66,5
31
$426,9
59,5
58
$663,5
26,0
89
0.3
6
$233,6
01,3
90
$9,9
68,5
85,8
37
2.3
%
ST
AT
EW
IDE
ME
DIA
N2.1
%
* R
CC
is r
oun
de
d t
o t
wo
dig
its f
or
pre
se
nta
tio
n p
urp
ose
s.
So
urc
e: F
Y 2
01
2 A
udite
d F
ina
ncia
l S
tate
me
nts
data
fro
m H
osp
ita
l R
epo
rtin
g S
yste
m R
epo
rt 1
85
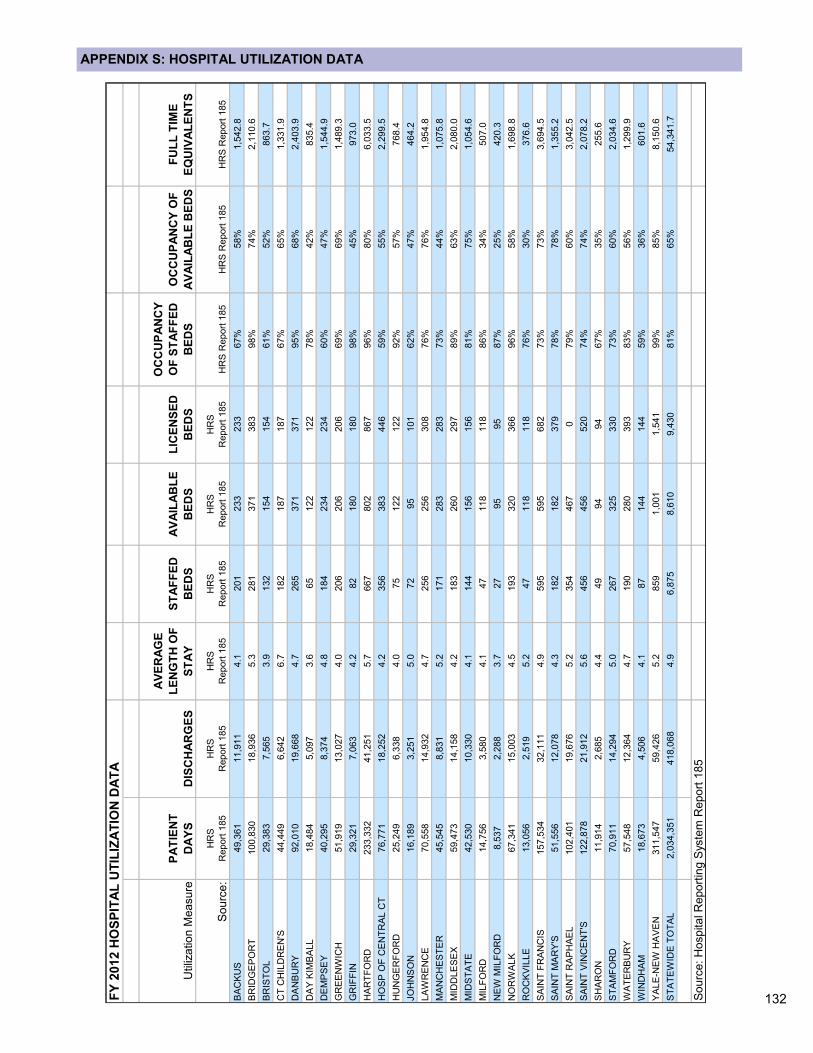
132
APPENDIX S: HOSPITAL UTILIZATION DATA
FY
201
2 H
OS
PIT
AL
UT
ILIZ
AT
ION
DA
TA
Utiliz
atio
n M
ea
su
re
PA
TIE
NT
DA
YS
DIS
CH
AR
GE
S
AV
ER
AG
E
LE
NG
TH
OF
ST
AY
ST
AF
FE
D
BE
DS
AV
AIL
AB
LE
BE
DS
LIC
EN
SE
D
BE
DS
OC
CU
PA
NC
Y
OF
ST
AF
FE
D
BE
DS
OC
CU
PA
NC
Y O
F
AV
AIL
AB
LE
BE
DS
FU
LL
TIM
E
EQ
UIV
AL
EN
TS
So
urc
e:
HR
S
Report
185
HR
S
Report
185
HR
S
Report
185
HR
S
Report
185
HR
S
Report
185
HR
S
Report
185
HR
S R
eport
185
HR
S R
eport
185
HR
S R
eport
185
BA
CK
US
49,3
61
11,9
11
4.1
201
233
233
67%
58%
1,5
42.8
BR
IDG
EP
OR
T100,8
30
18,9
36
5.3
281
371
383
98%
74%
2,1
10.6
BR
IST
OL
29,3
83
7,5
65
3.9
132
154
154
61%
52%
863.7
CT
CH
ILD
RE
N'S
44,4
49
6,6
42
6.7
182
187
187
67%
65%
1,3
31.9
DA
NB
UR
Y92,0
10
19,6
68
4.7
265
371
371
95%
68%
2,4
03.9
DA
Y K
IMB
ALL
18,4
84
5,0
97
3.6
65
122
122
78%
42%
835.4
DE
MP
SE
Y40,2
95
8,3
74
4.8
184
234
234
60%
47%
1,5
44.9
GR
EE
NW
ICH
51,9
19
13,0
27
4.0
206
206
206
69%
69%
1,4
89.3
GR
IFF
IN29,3
21
7,0
63
4.2
82
180
180
98%
45%
973.0
HA
RT
FO
RD
233,3
32
41,2
51
5.7
667
802
867
96%
80%
6,0
33.5
HO
SP
OF
CE
NT
RA
L C
T76,7
71
18,2
52
4.2
356
383
446
59%
55%
2,2
99.5
HU
NG
ER
FO
RD
25,2
49
6,3
38
4.0
75
122
122
92%
57%
768.4
JO
HN
SO
N16,1
89
3,2
51
5.0
72
95
101
62%
47%
464.2
LA
WR
EN
CE
70,5
58
14,9
32
4.7
256
256
308
76%
76%
1,9
54.8
MA
NC
HE
ST
ER
45,5
45
8,8
31
5.2
171
283
283
73%
44%
1,0
75.8
MID
DLE
SE
X59,4
73
14,1
58
4.2
183
260
297
89%
63%
2,0
80.0
MID
ST
AT
E42,5
30
10,3
30
4.1
144
156
156
81%
75%
1,0
54.6
MIL
FO
RD
14,7
56
3,5
80
4.1
47
118
118
86%
34%
507.0
NE
W M
ILF
OR
D8,5
37
2,2
88
3.7
27
95
95
87%
25%
420.3
NO
RW
ALK
67,3
41
15,0
03
4.5
193
320
366
96%
58%
1,6
98.8
RO
CK
VIL
LE
13,0
56
2,5
19
5.2
47
118
118
76%
30%
376.6
SA
INT
FR
AN
CIS
157,5
34
32,1
11
4.9
595
595
682
73%
73%
3,6
94.5
SA
INT
MA
RY
'S51,5
56
12,0
78
4.3
182
182
379
78%
78%
1,3
55.2
SA
INT
RA
PH
AE
L102,4
01
19,6
76
5.2
354
467
079%
60%
3,0
42.5
SA
INT
VIN
CE
NT
'S122,8
78
21,9
12
5.6
456
456
520
74%
74%
2,0
78.2
SH
AR
ON
11,9
14
2,6
85
4.4
49
94
94
67%
35%
255.6
ST
AM
FO
RD
70,9
11
14,2
94
5.0
267
325
330
73%
60%
2,0
34.6
WA
TE
RB
UR
Y57,5
48
12,3
64
4.7
190
280
393
83%
56%
1,2
99.9
WIN
DH
AM
18,6
73
4,5
06
4.1
87
144
144
59%
36%
601.6
YA
LE
-NE
W H
AV
EN
311,5
47
59,4
26
5.2
859
1,0
01
1,5
41
99%
85%
8,1
50.6
ST
AT
EW
IDE
TO
TA
L2,0
34,3
51
418,0
68
4.9
6,8
75
8,6
10
9,4
30
81%
65%
54,3
41.7
So
urc
e: H
osp
ita
l R
epo
rtin
g S
yste
m R
epo
rt 1
85
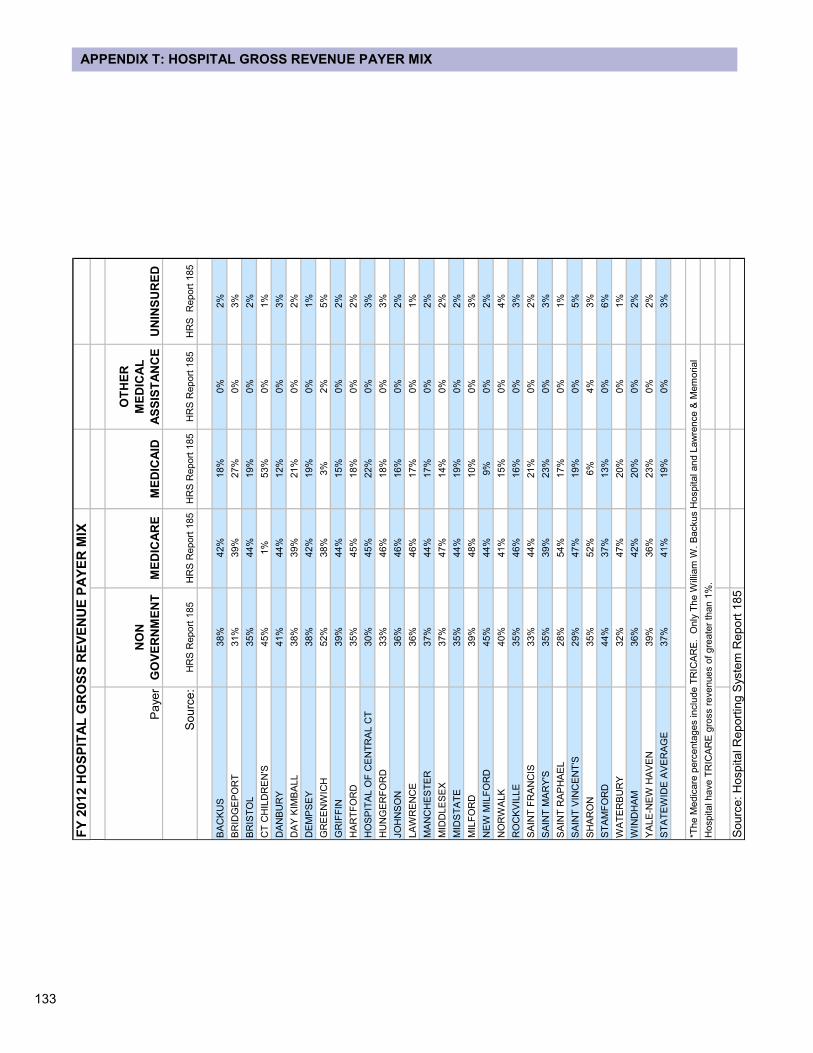
133
APPENDIX T: HOSPITAL GROSS REVENUE PAYER MIX
FY
2012 H
OS
PIT
AL
GR
OS
S R
EV
EN
UE
PA
YE
R M
IX
Paye
r
NO
N
GO
VE
RN
ME
NT
ME
DIC
AR
EM
ED
ICA
ID
OT
HE
R
ME
DIC
AL
AS
SIS
TA
NC
EU
NIN
SU
RE
D
Sourc
e:
HR
S R
eport
185
HR
S R
eport
185
HR
S R
eport
185
HR
S R
eport
185
HR
S
Report
185
BA
CK
US
38%
42%
18%
0%
2%
BR
IDG
EP
OR
T31%
39%
27%
0%
3%
BR
IST
OL
35%
44%
19%
0%
2%
CT
CH
ILD
RE
N'S
45%
1%
53%
0%
1%
DA
NB
UR
Y41%
44%
12%
0%
3%
DA
Y K
IMB
ALL
38%
39%
21%
0%
2%
DE
MP
SE
Y38%
42%
19%
0%
1%
GR
EE
NW
ICH
52%
38%
3%
2%
5%
GR
IFF
IN39%
44%
15%
0%
2%
HA
RT
FO
RD
35%
45%
18%
0%
2%
HO
SP
ITA
L O
F C
EN
TR
AL C
T30%
45%
22%
0%
3%
HU
NG
ER
FO
RD
33%
46%
18%
0%
3%
JO
HN
SO
N36%
46%
16%
0%
2%
LA
WR
EN
CE
36%
46%
17%
0%
1%
MA
NC
HE
ST
ER
37%
44%
17%
0%
2%
MID
DLE
SE
X37%
47%
14%
0%
2%
MID
ST
AT
E35%
44%
19%
0%
2%
MIL
FO
RD
39%
48%
10%
0%
3%
NE
W M
ILF
OR
D45%
44%
9%
0%
2%
NO
RW
ALK
40%
41%
15%
0%
4%
RO
CK
VIL
LE
35%
46%
16%
0%
3%
SA
INT
FR
AN
CIS
33%
44%
21%
0%
2%
SA
INT
MA
RY
'S35%
39%
23%
0%
3%
SA
INT
RA
PH
AE
L28%
54%
17%
0%
1%
SA
INT
VIN
CE
NT
'S29%
47%
19%
0%
5%
SH
AR
ON
35%
52%
6%
4%
3%
ST
AM
FO
RD
44%
37%
13%
0%
6%
WA
TE
RB
UR
Y32%
47%
20%
0%
1%
WIN
DH
AM
36%
42%
20%
0%
2%
YA
LE
-NE
W H
AV
EN
39%
36%
23%
0%
2%
ST
AT
EW
IDE
AV
ER
AG
E37%
41%
19%
0%
3%
*The M
edic
are
perc
enta
ges in
clu
de T
RIC
AR
E.
Only
Th
e W
illia
m W
. B
ackus H
ospital and L
aw
rence &
Mem
oria
l
Hospital have T
RIC
AR
E g
ross r
evenues o
f gre
ate
r th
an 1
%.
Sourc
e: H
ospital R
eport
ing S
yste
m R
eport
185
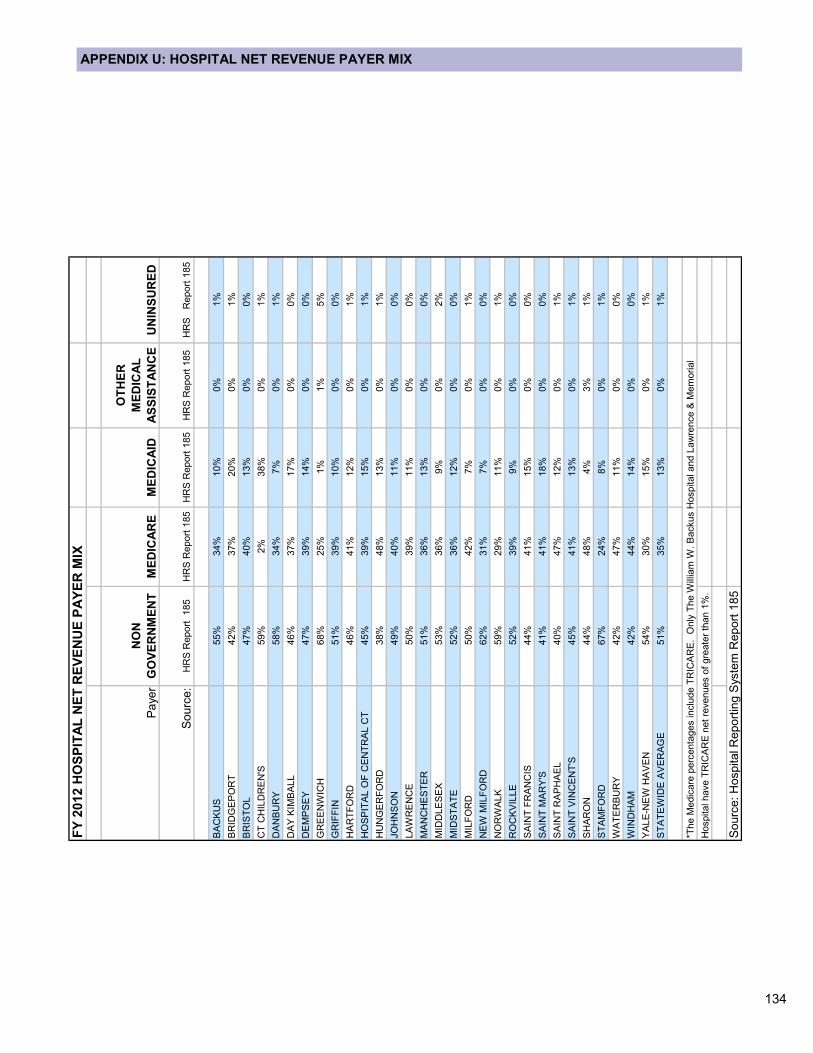
134
APPENDIX U: HOSPITAL NET REVENUE PAYER MIX
FY
2012 H
OS
PIT
AL
NE
T R
EV
EN
UE
PA
YE
R M
IX
Pa
yer
NO
N
GO
VE
RN
ME
NT
ME
DIC
AR
EM
ED
ICA
ID
OT
HE
R
ME
DIC
AL
AS
SIS
TA
NC
EU
NIN
SU
RE
D
So
urc
e:
HR
S R
eport
185
HR
S R
eport
185
HR
S R
eport
185
HR
S R
eport
185
HR
S
Report
185
BA
CK
US
55%
34%
10%
0%
1%
BR
IDG
EP
OR
T42%
37%
20%
0%
1%
BR
IST
OL
47%
40%
13%
0%
0%
CT
CH
ILD
RE
N'S
59%
2%
38%
0%
1%
DA
NB
UR
Y58%
34%
7%
0%
1%
DA
Y K
IMB
ALL
46%
37%
17%
0%
0%
DE
MP
SE
Y47%
39%
14%
0%
0%
GR
EE
NW
ICH
68%
25%
1%
1%
5%
GR
IFF
IN51%
39%
10%
0%
0%
HA
RT
FO
RD
46%
41%
12%
0%
1%
HO
SP
ITA
L O
F C
EN
TR
AL C
T45%
39%
15%
0%
1%
HU
NG
ER
FO
RD
38%
48%
13%
0%
1%
JO
HN
SO
N49%
40%
11%
0%
0%
LA
WR
EN
CE
50%
39%
11%
0%
0%
MA
NC
HE
ST
ER
51%
36%
13%
0%
0%
MID
DLE
SE
X53%
36%
9%
0%
2%
MID
ST
AT
E52%
36%
12%
0%
0%
MIL
FO
RD
50%
42%
7%
0%
1%
NE
W M
ILF
OR
D62%
31%
7%
0%
0%
NO
RW
ALK
59%
29%
11%
0%
1%
RO
CK
VIL
LE
52%
39%
9%
0%
0%
SA
INT
FR
AN
CIS
44%
41%
15%
0%
0%
SA
INT
MA
RY
'S41%
41%
18%
0%
0%
SA
INT
RA
PH
AE
L40%
47%
12%
0%
1%
SA
INT
VIN
CE
NT
'S45%
41%
13%
0%
1%
SH
AR
ON
44%
48%
4%
3%
1%
ST
AM
FO
RD
67%
24%
8%
0%
1%
WA
TE
RB
UR
Y42%
47%
11%
0%
0%
WIN
DH
AM
42%
44%
14%
0%
0%
YA
LE
-NE
W H
AV
EN
54%
30%
15%
0%
1%
ST
AT
EW
IDE
AV
ER
AG
E51%
35%
13%
0%
1%
*The M
edic
are
perc
enta
ges inclu
de T
RIC
AR
E.
Only
The W
illia
m W
. B
ackus H
ospital and L
aw
rence &
Mem
orial
Hospital have T
RIC
AR
E n
et
revenues o
f gre
ate
r th
an 1
%.
So
urc
e: H
osp
ita
l R
epo
rtin
g S
yste
m R
epo
rt 1
85
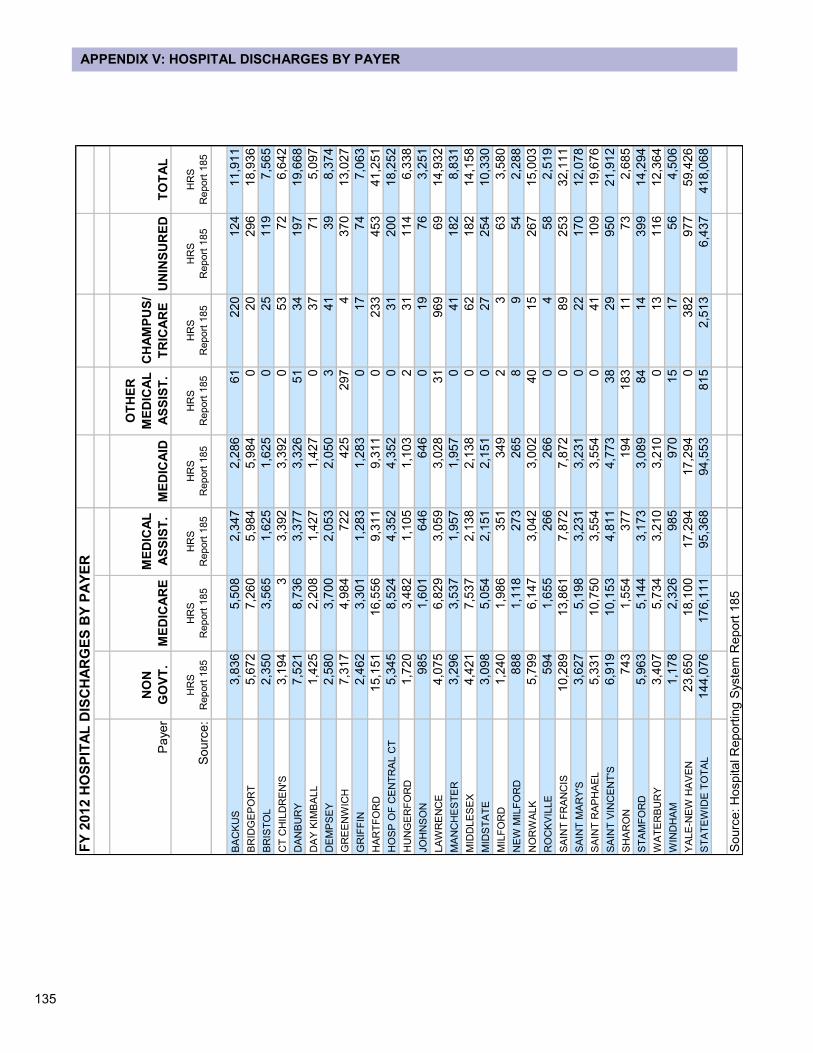
135
APPENDIX V: HOSPITAL DISCHARGES BY PAYER
FY
2012 H
OS
PIT
AL
DIS
CH
AR
GE
S B
Y P
AY
ER
Paye
r
NO
N
GO
VT
.M
ED
ICA
RE
ME
DIC
AL
AS
SIS
T.
ME
DIC
AID
OT
HE
R
ME
DIC
AL
AS
SIS
T.
CH
AM
PU
S/
TR
ICA
RE
UN
INS
UR
ED
TO
TA
L
Sourc
e:
HR
S
Report
185
HR
S
Report
185
HR
S
Report
185
HR
S
Report
185
HR
S
Report
185
HR
S
Report
185
HR
S
Report
185
HR
S
Report
185
BA
CK
US
3,8
36
5,5
08
2,3
47
2,2
86
61
220
124
11,9
11
BR
IDG
EP
OR
T5,6
72
7,2
60
5,9
84
5,9
84
020
296
18,9
36
BR
IST
OL
2,3
50
3,5
65
1,6
25
1,6
25
025
119
7,5
65
CT
CH
ILD
RE
N'S
3,1
94
33,3
92
3,3
92
053
72
6,6
42
DA
NB
UR
Y7,5
21
8,7
36
3,3
77
3,3
26
51
34
197
19,6
68
DA
Y K
IMB
ALL
1,4
25
2,2
08
1,4
27
1,4
27
037
71
5,0
97
DE
MP
SE
Y2,5
80
3,7
00
2,0
53
2,0
50
341
39
8,3
74
GR
EE
NW
ICH
7,3
17
4,9
84
722
425
297
4370
13,0
27
GR
IFF
IN2,4
62
3,3
01
1,2
83
1,2
83
017
74
7,0
63
HA
RT
FO
RD
15,1
51
16,5
56
9,3
11
9,3
11
0233
453
41,2
51
HO
SP
OF
CE
NT
RA
L C
T5,3
45
8,5
24
4,3
52
4,3
52
031
200
18,2
52
HU
NG
ER
FO
RD
1,7
20
3,4
82
1,1
05
1,1
03
231
114
6,3
38
JO
HN
SO
N985
1,6
01
646
646
019
76
3,2
51
LA
WR
EN
CE
4,0
75
6,8
29
3,0
59
3,0
28
31
969
69
14,9
32
MA
NC
HE
ST
ER
3,2
96
3,5
37
1,9
57
1,9
57
041
182
8,8
31
MID
DLE
SE
X4,4
21
7,5
37
2,1
38
2,1
38
062
182
14,1
58
MID
ST
AT
E3,0
98
5,0
54
2,1
51
2,1
51
027
254
10,3
30
MIL
FO
RD
1,2
40
1,9
86
351
349
23
63
3,5
80
NE
W M
ILF
OR
D888
1,1
18
273
265
89
54
2,2
88
NO
RW
ALK
5,7
99
6,1
47
3,0
42
3,0
02
40
15
267
15,0
03
RO
CK
VIL
LE
594
1,6
55
266
266
04
58
2,5
19
SA
INT
FR
AN
CIS
10,2
89
13,8
61
7,8
72
7,8
72
089
253
32,1
11
SA
INT
MA
RY
'S3,6
27
5,1
98
3,2
31
3,2
31
022
170
12,0
78
SA
INT
RA
PH
AE
L5,3
31
10,7
50
3,5
54
3,5
54
041
109
19,6
76
SA
INT
VIN
CE
NT
'S6,9
19
10,1
53
4,8
11
4,7
73
38
29
950
21,9
12
SH
AR
ON
743
1,5
54
377
194
183
11
73
2,6
85
ST
AM
FO
RD
5,9
63
5,1
44
3,1
73
3,0
89
84
14
399
14,2
94
WA
TE
RB
UR
Y3,4
07
5,7
34
3,2
10
3,2
10
013
116
12,3
64
WIN
DH
AM
1,1
78
2,3
26
985
970
15
17
56
4,5
06
YA
LE
-NE
W H
AV
EN
23,6
50
18,1
00
17,2
94
17,2
94
0382
977
59,4
26
ST
AT
EW
IDE
TO
TA
L144,0
76
176,1
11
95,3
68
94,5
53
815
2,5
13
6,4
37
418,0
68
Sourc
e: H
ospital R
eport
ing S
yste
m R
eport
185
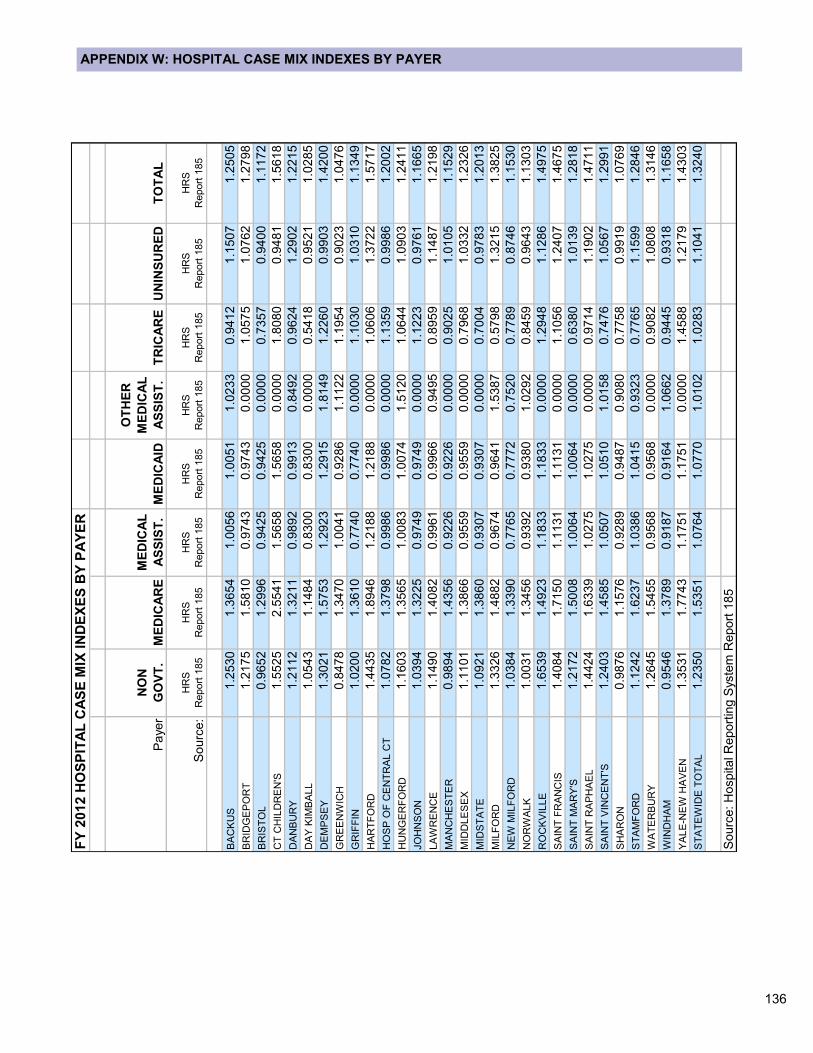
136
APPENDIX W: HOSPITAL CASE MIX INDEXES BY PAYER
FY
2012 H
OS
PIT
AL
CA
SE
MIX
IN
DE
XE
S B
Y P
AY
ER
Pa
yer
NO
N
GO
VT
.M
ED
ICA
RE
ME
DIC
AL
AS
SIS
T.
ME
DIC
AID
OT
HE
R
ME
DIC
AL
AS
SIS
T.
TR
ICA
RE
UN
INS
UR
ED
TO
TA
L
So
urc
e:
HR
S
Report
185
HR
S
Report
185
HR
S
Report
185
HR
S
Report
185
HR
S
Report
185
HR
S
Report
185
HR
S
Report
185
HR
S
Report
185
BA
CK
US
1.2
530
1.3
654
1.0
056
1.0
051
1.0
233
0.9
412
1.1
507
1.2
505
BR
IDG
EP
OR
T1.2
175
1.5
810
0.9
743
0.9
743
0.0
000
1.0
575
1.0
762
1.2
798
BR
IST
OL
0.9
652
1.2
996
0.9
425
0.9
425
0.0
000
0.7
357
0.9
400
1.1
172
CT
CH
ILD
RE
N'S
1.5
525
2.5
541
1.5
658
1.5
658
0.0
000
1.8
080
0.9
481
1.5
618
DA
NB
UR
Y1.2
112
1.3
211
0.9
892
0.9
913
0.8
492
0.9
624
1.2
902
1.2
215
DA
Y K
IMB
ALL
1.0
543
1.1
484
0.8
300
0.8
300
0.0
000
0.5
418
0.9
521
1.0
285
DE
MP
SE
Y1.3
021
1.5
753
1.2
923
1.2
915
1.8
149
1.2
260
0.9
903
1.4
200
GR
EE
NW
ICH
0.8
478
1.3
470
1.0
041
0.9
286
1.1
122
1.1
954
0.9
023
1.0
476
GR
IFF
IN1.0
200
1.3
610
0.7
740
0.7
740
0.0
000
1.1
030
1.0
310
1.1
349
HA
RT
FO
RD
1.4
435
1.8
946
1.2
188
1.2
188
0.0
000
1.0
606
1.3
722
1.5
717
HO
SP
OF
CE
NT
RA
L C
T1.0
782
1.3
798
0.9
986
0.9
986
0.0
000
1.1
359
0.9
986
1.2
002
HU
NG
ER
FO
RD
1.1
603
1.3
565
1.0
083
1.0
074
1.5
120
1.0
644
1.0
903
1.2
411
JO
HN
SO
N1.0
394
1.3
225
0.9
749
0.9
749
0.0
000
1.1
223
0.9
761
1.1
665
LA
WR
EN
CE
1.1
490
1.4
082
0.9
961
0.9
966
0.9
495
0.8
959
1.1
487
1.2
198
MA
NC
HE
ST
ER
0.9
894
1.4
356
0.9
226
0.9
226
0.0
000
0.9
025
1.0
105
1.1
529
MID
DLE
SE
X1.1
101
1.3
866
0.9
559
0.9
559
0.0
000
0.7
968
1.0
332
1.2
326
MID
ST
AT
E1.0
921
1.3
860
0.9
307
0.9
307
0.0
000
0.7
004
0.9
783
1.2
013
MIL
FO
RD
1.3
326
1.4
882
0.9
674
0.9
641
1.5
387
0.5
798
1.3
215
1.3
825
NE
W M
ILF
OR
D1.0
384
1.3
390
0.7
765
0.7
772
0.7
520
0.7
789
0.8
746
1.1
530
NO
RW
ALK
1.0
031
1.3
456
0.9
392
0.9
380
1.0
292
0.8
459
0.9
643
1.1
303
RO
CK
VIL
LE
1.6
539
1.4
923
1.1
833
1.1
833
0.0
000
1.2
948
1.1
286
1.4
975
SA
INT
FR
AN
CIS
1.4
084
1.7
150
1.1
131
1.1
131
0.0
000
1.1
056
1.2
407
1.4
675
SA
INT
MA
RY
'S1.2
172
1.5
008
1.0
064
1.0
064
0.0
000
0.6
380
1.0
139
1.2
818
SA
INT
RA
PH
AE
L1.4
424
1.6
339
1.0
275
1.0
275
0.0
000
0.9
714
1.1
902
1.4
711
SA
INT
VIN
CE
NT
'S1.2
403
1.4
585
1.0
507
1.0
510
1.0
158
0.7
476
1.0
567
1.2
991
SH
AR
ON
0.9
876
1.1
576
0.9
289
0.9
487
0.9
080
0.7
758
0.9
919
1.0
769
ST
AM
FO
RD
1.1
242
1.6
237
1.0
386
1.0
415
0.9
323
0.7
765
1.1
599
1.2
846
WA
TE
RB
UR
Y1.2
645
1.5
455
0.9
568
0.9
568
0.0
000
0.9
082
1.0
808
1.3
146
WIN
DH
AM
0.9
546
1.3
789
0.9
187
0.9
164
1.0
662
0.9
445
0.9
318
1.1
658
YA
LE
-NE
W H
AV
EN
1.3
531
1.7
743
1.1
751
1.1
751
0.0
000
1.4
588
1.2
179
1.4
303
ST
AT
EW
IDE
TO
TA
L1.2
350
1.5
351
1.0
764
1.0
770
1.0
102
1.0
283
1.1
041
1.3
240
So
urc
e: H
osp
ita
l R
epo
rtin
g S
yste
m R
epo
rt 1
85

137
APPENDIX X: HOSPITAL EMERGENCY DEPARTMENT VISITS
FY
201
2 E
ME
RG
EN
CY
DE
PA
RT
ME
NT
VIS
ITS
EM
ER
GE
NC
Y R
OO
M -
TR
EA
TE
D A
ND
AD
MIT
TE
D
EM
ER
GE
NC
Y R
OO
M -
TR
EA
TE
D A
ND
DIS
CH
AR
GE
D
TO
TA
L E
ME
RG
EN
CY
RO
OM
VIS
ITS
Sourc
e:
HR
S R
eport
185
HR
S R
eport
185
HR
S R
eport
185
BA
CK
US
7,3
64
60,7
38
68,1
02
BR
IDG
EP
OR
T11,2
67
67,7
91
79,0
58
BR
IST
OL
5,7
87
32,2
42
38,0
29
CT
CH
ILD
RE
N'S
3,3
65
52,6
13
55,9
78
DA
NB
UR
Y14,2
60
56,3
62
70,6
22
DA
Y K
IMB
ALL
3,2
85
24,7
26
28,0
11
DE
MP
SE
Y4,8
77
24,4
30
29,3
07
GR
EE
NW
ICH
7,6
63
35,9
24
43,5
87
GR
IFF
IN4,8
70
36,0
80
40,9
50
HA
RT
FO
RD
20,5
88
79,2
23
99,8
11
HO
SP
ITA
L O
F C
EN
TR
AL C
T14,0
64
96,4
34
110,4
98
HU
NG
ER
FO
RD
5,0
66
35,8
12
40,8
78
JO
HN
SO
N2,5
37
18,1
45
20,6
82
LA
WR
EN
CE
6,5
25
76,1
40
82,6
65
MA
NC
HE
ST
ER
5,0
28
41,4
75
46,5
03
MID
DLE
SE
X8,8
09
85,0
82
93,8
91
MID
ST
AT
E7,2
32
84,9
07
92,1
39
MIL
FO
RD
3,0
25
33,4
27
36,4
52
NE
W M
ILF
OR
D2,0
50
16,3
66
18,4
16
NO
RW
ALK
9,6
99
39,5
50
49,2
49
RO
CK
VIL
LE
2,1
44
24,2
78
26,4
22
SA
INT
FR
AN
CIS
16,6
54
62,5
47
79,2
01
SA
INT
MA
RY
'S7,8
51
62,9
68
70,8
19
SA
INT
RA
PH
AE
L11,5
22
43,5
64
55,0
86
SA
INT
VIN
CE
NT
'S15,3
74
64,3
98
79,7
72
SH
AR
ON
1,7
66
15,8
56
17,6
22
ST
AM
FO
RD
7,6
42
43,1
89
50,8
31
WA
TE
RB
UR
Y8,2
67
47,6
77
55,9
44
WIN
DH
AM
3,2
44
33,6
18
36,8
62
YA
LE
-NE
W H
AV
EN
26,7
32
114,3
96
141,1
28
ST
AT
EW
IDE
TO
TA
L248,5
57
1,5
09,9
58
1,7
58,5
15
Sourc
e: H
ospital R
eport
ing S
yste
m R
eport
185
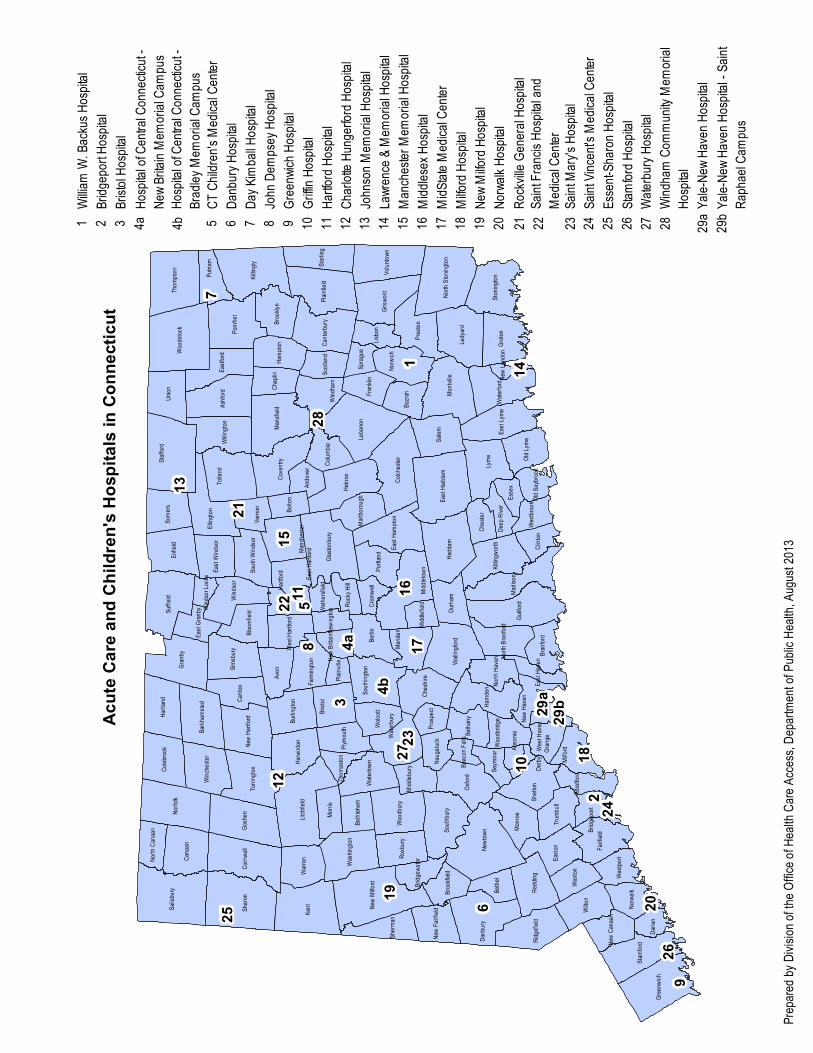
1Wil
liam W
. Back
us Ho
spital
2Bri
dgepor
t Hosp
ital3
Bristo
l Hosp
ital4a
Hospi
tal of C
entral
Conne
cticut -
Ne
w Brita
in Mem
orial C
ampus
4bHo
spital
of Cent
ral Co
nnectic
ut -
Bradle
y Mem
orial C
ampus
5CT
Childr
en's M
edical
Cente
r6
Danbu
ry Hosp
ital7
Day K
imball
Hospi
tal8
John D
empse
y Hosp
ital9
Greenw
ich Ho
spital
10Gri
ffin Ho
spital
11Ha
rtford
Hospi
tal12
Charlo
tte Hu
ngerfor
d Hosp
ital13
Johnso
n Mem
orial H
ospital
14Law
rence
& Mem
orial H
ospital
15Ma
nchest
er Me
morial
Hospi
tal16
Middle
sex Ho
spital
17Mid
State M
edical
Cente
r18
Milford
Hospi
tal19
New M
ilford
Hospi
tal20
Norwa
lk Hosp
ital21
Rockv
ille Ge
neral H
ospital
22Sa
int Fra
ncis H
ospital
and
Medic
al Cent
er23
Saint
Mary's
Hospi
tal24
Saint
Vincen
t's Me
dical C
enter
25Ess
ent-Sh
aron H
ospital
26Sta
mford
Hospi
tal27
Waterb
ury Ho
spital
28Win
dham
Comm
unity M
emoria
l Ho
spital
29aYa
le-New
Haven
Hospi
tal29b
Yale-N
ew Ha
ven Ho
spital
- Sain
t Ra
phael C
ampus
Acute
Car
e and
Chil
dren
's Ho
spita
ls in
Conn
ectic
ut
Prepar
ed by
Divisio
n of th
e Offic
e of H
ealth C
are Ac
cess, D
epartm
ent of
Public
Health
, Augu
st 2013
29a
20
23
22 11
9
8
7
6
5
3
2
1
28
27
26
2521
24
19
18
1716
15
14
13
12
10
4a
4b
29b
KentSh
aron
Staffor
d
Killing
ly
Norfo
lkSa
lisbury
Litchfie
ld
Newto
wn
Lebano
n
Lyme
Guilfo
rd
Goshe
n
Suffie
ldGra
nbyWo
odstoc
k
Tollan
d
Hadda
m
New M
ilford
Cornw
all
Danbu
ry
Pomfr
etAsh
ford
Union
Hebro
n
Montv
ille
Enfiel
d
Oxfor
dLed
yard
Groton
Mansf
ield
Berlin
Plainfi
eld
Salem
Colch
ester
Thomp
son
Avon
Greenw
ich
Wilton
Glasto
nbury
Madis
on
Bristo
l
Coven
try
Grisw
old
Canaa
n
Stamfo
rd
Shelto
n
East H
addam
Presto
n
Easto
n
Hartla
nd
Ellingt
on
Torring
ton
Hamd
en
South
bury
Reddi
ng
Fairfie
ld
Volun
town
Windso
r
Middle
town
Warre
n
Some
rs
Chesh
ire
Stonin
gton
Simsbu
ry
Cante
rbury
Norwi
ch
Wallin
gford
Woodb
ury
Sterlin
g
Water
ford
Eastfo
rd
Ridgef
ield
Canto
n
Monro
e
Willing
ton
Milfor
d
Brookl
yn
East L
yme
North
Stoni
ngton
Washi
ngton
Coleb
rook
Roxbu
ry
Killing
worth
Harwi
nton
South
ington
Winche
ster
Burlin
gton
Morris
Durha
m
Meride
n
Windha
m
Barkh
amste
d
Portla
nd
New H
artfor
d
Bozra
h
Wolco
tt
Norwa
lk
Hamp
ton
Water
town
Westo
n
Trumb
ull
Bethe
l
Putna
m
East H
ampto
n
Betha
ny
Old Ly
me
Chapl
in
Sherm
an
Branfo
rd
Farmin
gton
Lisbon
Bloom
field
Verno
n
Frankl
in
Plymo
uth
Clinton
Orange
Bolton
Colum
bia
Westp
ort
Scotlan
d
Chest
er
Brookf
ield
East W
indsor
South
Wind
sor
Essex
Darien
New F
airfield
Ando
ver
Marlbo
rough
Bethle
hem
Middle
bury
North
Haven
Seym
our
New H
aven
Prospe
ct
Sprag
ue
Woodb
ridge
Nauga
tuck
Westb
rook
East G
ranby
North
Canaa
n
Cromw
ell
Rocky
Hill
Deep
River
Plainv
ille
Water
bury
Manch
ester
Hartfo
rd
Stratfo
rd
North
Branf
ord
New C
anaan
West H
artfor
d
Bridge
port
Bridge
water
East H
artfor
d
Newin
gton
Middle
field
Old Sa
ybrook
New B
ritain
East H
aven
Thoma
ston
Wethe
rsfield
West H
aven
Derby
Anson
ia
Beaco
n Falls
Windso
r Lock
s
New L
ondon
139
APPENDIX Z: GLOSSARY OF TERMS
Average Payment Period: the average number of
days that are required to meet current liabilities. A
lower number of days is favorable, since it
indicates a more favorable liquidity position.
Bad Debts: the income lost to the hospital
because patients who were billed and from whom
payment was expected did not pay amounts owed
to the hospital for services provided. Bad debts net
of recoveries will result in bad debt expense, if
after reasonable collection efforts are made, the
hospital determines that the accounts are
uncollectible.
Case Mix Index: the arithmetic mean of the
Medicare diagnosis related group case weights
assigned to each inpatient discharge for a hospital
during the fiscal year. The case mix index is
calculated by dividing the hospital’s total case mix
adjusted discharges by the hospital’s actual
number of discharges for the fiscal year.
Cash Flow to Total Debt Ratio: an indicator of
potential future debt repayment difficulty or
insolvency. It is calculated by dividing excess of
revenues over expenses plus depreciation by
current liabilities plus long term debt. A decrease
in the value of the ratio may indicate a future debt
repayment problem.
Charity Care: the difference between the
hospital’s published charges and the amount of
reimbursement received for services provided to
patients from whom reimbursement was not
expected. Charity care does not include bad debts,
courtesy discounts, contractual allowances, self
pay discounts, and charges for health care services
provided to employees.
Current Ratio: the measure of the number of
dollars held in current assets per dollar of current
liabilities. High values imply a good ability to pay
short term obligations and low values imply a
lesser ability.
Days Cash on Hand: the average number of days
of cash available to pay for expenses that is
maintained in cash accounts. A higher number is
favorable, since it indicates a greater ability to
meet outstanding obligations.
Days in Patients Accounts Receivable: the
average number of days in collection that patient
accounts receivables remain outstanding. A lower
number is favorable, since it indicates good
collection practices that result in sufficient cash
flow and infrequent short-term financing.
Disproportionate Share Hospital (DSH)
Program Payments: payments that provide
financial assistance to hospitals that serve a large
number of low-income patients, such as the
uninsured or people on Medicaid.
Equity Financing Ratio: the ratio related to
capital structure that indicates the percentage of
net assets to total assets. A higher ratio is more
favorable, since it indicates utilization of a higher
level of equity and a lower level of debt financing
in acquiring plant and equipment assets.
Excess / (Deficiency) of Revenue over Expenses:
the difference between the sum of total operating
revenue and non-operating revenue less total
operating expenses that results in an excess or
deficiency of total revenue.
Gross Patient Revenue – total gross patient
charges for all patient services before deductions
for allowances, charity care and other deductions.
Hospital Parent Corporation: the hospital’s
corporate holding company that controls through
its governing body a hospital and the hospital’s
affiliates, as presented on the legal chart of
corporate structure.
Income / (Loss) from Operations: the difference
between total operating revenue and total operating
expenses that results in a financial gain or loss
from operating activities.
Long-Term Debt to Capitalization Ratio: the
measure of the proportion of Long-Term Debt in a
capital structure. A lower proportion or percentage
is desirable because it allows for obtaining of more
favorable terms (i.e., lower interest rates) when
borrowing.
Medicaid: the federal and state health insurance
program established under Title 19 of the Social
Security Act to provide medical assistance on
behalf of families with dependent children and for
aged, blind or disabled whose income and
resources are insufficient to meet the costs of
necessary medical services and which is
administered by the Department of Social Services.
Medical Assistance: the programs for medical
assistance provided under the Medicaid program,
including the HUSKY Plan, Part A, or (B) any
140
APPENDIX Z: GLOSSARY OF TERMS
other state-funded medical assistance program,
including the HUSKY Plan, Part B.
Medicare: the federal health insurance program
for the aged and disabled.
Net Assets: the residual amount of total assets
after all current and long-term liabilities (including
long-term debt) are deducted. Also referred to as
ownership equity.
Net Patient Revenue: the total gross revenue
from patient charges less contractual allowances,
less the difference between government charges
and government payments, less charity care and
less any other allowances.
Non Governmental: any commercial or private
payer and includes but isn’t limited to managed
care organizations, health maintenance
organizations, and preferred provider
organizations.
Non-Operating Margin: the ratio related to
profitability indicating the percentage of non-
operating revenue to total revenue. A higher
positive ratio indicates more favorable results.
Non-Operating Revenue: the unrestricted
revenue not directly derived from providing patient
services but obtained from either investment
income or philanthropic and non-philanthropic
sources.
Operating Expenses: the expenses necessary to
maintain regular operating functions and to carry
out ongoing activities.
Operating Margin: the ratio related to
profitability indicating the percentage of income or
loss from operations to total revenue. A higher
positive ratio indicates more favorable operating
results.
Operating Revenue: the total of net patient
revenue from reimbursement of patient services by
government and non-government payers plus other
operating revenue.
Other Medical Assistance: the difference
between Medical Assistance and Medicaid.
Other Operating Revenue: the non-patient
service operating revenue that is obtained from
operating activities but is accounted for separately
from patient service revenues. Other operating
revenue includes revenues restricted by a donor or
grantor for operating purposes, and also net assets
released from restrictions.
Payer Mix: the proportion of each government or
non-government payer’s reimbursement to the
hospital’s total reimbursement for patient services.
Payer mix is derived by determining the amount
of total gross patient revenue or total net patient
revenue that the hospital receives from each
government and non-government payer.
Payment to Cost Ratio: the ratio that indicates
the percentage above or below cost that a hospital
is reimbursed by a government or non-government
payer. A ratio that is higher than 1.00 is favorable,
since it indicates reimbursement by a payer that is
greater than the cost of providing patient services.
A ratio that is less than 1.00 is unfavorable, since it
indicates reimbursement by a payer that is less than
the cost of providing patient services.
Ratio of Cost to Charges: the ratio that indicates
the percentage of total operating expense to the
total of gross patient charges plus other operating
revenue. A lower ratio is more favorable, since it
indicates a greater difference between the cost and
charges billed for providing patient services.
Total Margin: the ratio related to profitability
indicating the percentage of income or loss from
operations and non-operating revenue to total
revenue. A higher positive ratio indicates more
favorable results.
Uncompensated Care: the total amount of the
hospital’s charity care and bad debts resulting from
unreimbursed patient services that are determined
by using the hospital’s published charges and
consistent with the hospital’s policies regarding
charity care and bad debts.
Uncompensated Care Cost: the total amount of
the hospital’s charity care and bad debts at charges
multiplied by the hospital’s ratio of cost to charges.
Uninsured: individuals with no health insurance
for the hospital services provided.
Unrestricted Net Assets: the amount of net assets
that is not restricted by donors or by a board of
directors as to their use.


410 Capitol Avenue MS#13HCA
PO Box 340308 Hartford, CT 06134
Phone: 860-418-7001 800-797-9688
Fax: 860-418-7053
www.ct.gov/dph
Commissioner Jewel Mullen, MD, MPH, MPA