Embed Size (px)
Citation preview
OFFICE OF POLICY AND MANAGEMENT
OFFICE OF THE SECRETARY Melissa McCaw, Secretary
Amy Tibor, Executive Secretary
Sandra (Fae) Brown- Brewton, Undersecretary
Anne Foley, Undersecretary
Jonathan Harris, Undersecretary
Marc Pelka, Undersecretary
David Wilkinson, Undersecretary
BUDGET AND FINANCIAL MANAGEMENT DIVISION Paul Potamianos, Executive Budget Officer
Gregory Messner, Assistant Executive Budget Officer
Marisa Lindsay, Secretary 1
GENERAL GOVERNMENT HEALTH & HUMAN SERVICES
Patti Maroney, Section Director Judith Dowd, Section Director
John Jaramillo, Principal Budget Specialist Susan Eccleston, Principal Budget Specialist
Matthew LaFayette, Budget Analyst Magdalena Lekarczyk, Budget Specialist
Christopher LeMay, Principal Budget Specialist Shelly Maynes, Budget Specialist
Melissa Yeich, Principal Budget Specialist Joan Soulsby, Principal Budget Specialist
ECONOMICS, CAPITAL, AND REVENUE FORECASTING APPLICATION DEVELOPMENT & SUPPORT,
Thomas Fiore, Section Director STATE WORKFORCE BENEFITS,
Steven Kitowicz, Principal Budget Specialist LABOR ISSUES, AND STATEWIDE TOPICS
Matthew Pellowski, Budget Specialist Alvin Dean, Jr., Information Technology Analyst 1
Manisha Srivastava, Budget Specialist Karen Nolen, Principal Budget Specialist
Brian Tassinari, Budget Specialist
EDUCATION AND WORKFORCE PROGRAMS OTHER ACKNOWLEDGEMENTS
Kerry Kelley, Section Director Susan Weisselberg, Senior Policy Advisor
Jessica Cabanillas, Principal Budget Specialist Kelly Sinko, Policy Development Coordinator
Leah Grenier, Principal Budget Specialist Mohit Agrawal, Executive Assistant
Michael Izadi, Budget Analyst Chris McClure, Executive Assistant
Kathy Taylor, Fiscal Administrative Officer
Gareth Bye, Policy and Legislative Advisor

TABLE OF CONTENTS
I
PAGE
INTRODUCTION ................................................................................................................................................................ 1
SECTION A: FINANCIAL SUMMARY
Governor’s Budget Plan ................................................................................................................................................. A-1
Summary of Expenditure Growth .................................................................................................................................. A-2
Summary of Appropriation Changes ............................................................................................................................. A-2
Budget Reserve Fund Projections .................................................................................................................................. A-3
Spending Cap Calculations ............................................................................................................................................. A-4
Explanation of Major Changes, FY 2020 and FY 2021 ................................................................................................... A-5
Summary of Proposed FY 2020 General Fund Appropriation Changes ......................................................................... A-6
Summary of Proposed FY 2021 General Fund Appropriation Changes ......................................................................... A-7
Summary of General Fund Revenue Recommendations ............................................................................................... A-8
General Fund Revenues ................................................................................................................................................. A-10
General Fund – Sources of Revenue (Pie Charts) .......................................................................................................... A-12
General Fund – FY 2020 Appropriations by Function of Government and Major Object (Bar Charts) ......................... A-13
General Fund – FY 2021 Appropriations by Function of Government and Major Object (Bar Charts) ......................... A-14
Special Transportation Fund – Statement of Financial Condition ................................................................................. A-15
Special Transportation Fund Revenues ......................................................................................................................... A-16
Summary of Proposed Appropriation Changes – Special Transportation Fund ............................................................ A-17
Special Transportation Fund – Sources of Revenue and FY 2020 Appropriations (Pie and Bar Charts) ........................ A-18
Special Transportation Fund – Sources of Revenue and FY 2021 Appropriations (Pie and Bar Charts) ........................ A-19
Summary of Principal and Interest on General Fund Debt Outstanding ....................................................................... A-20
Summary of Principal and Interest on Special Tax Obligation Debt Outstanding ......................................................... A-21
Financial Position of the State – Major Operating Funds .............................................................................................. A-22
Expenditures, Requests and Recommended Appropriations .......................................................................................... A-26
Full Time Position Summary – Appropriated Funds ...................................................................................................... A-59
Estimated Costs of Major Fringe Benefits by Agency .................................................................................................... A-62
SECTION B: BUDGET SUMMARY
OPERATING BUDGET
Legislative ...................................................................................................................................................................... B-1
General Government ..................................................................................................................................................... B-5
Regulation and Protection ............................................................................................................................................. B-22
Conservation and Development .................................................................................................................................... B-35
Health and Hospitals ...................................................................................................................................................... B-44
Transportation ............................................................................................................................................................... B-53
Human Services ............................................................................................................................................................. B-55
Education ....................................................................................................................................................................... B-62
Corrections .................................................................................................................................................................... B-73
TABLE OF CONTENTS
II
Judicial ........................................................................................................................................................................... B-77
Non Functional .............................................................................................................................................................. B-80
SECTION C: PROPOSED APPROPRIATIONS ........................................................................................ C-1
SECTION D: CAPITAL PROGRAM
Capital Program 2005-2021 ........................................................................................................................................... D-1
Federal Tax Law ............................................................................................................................................................. D-2
Statutory Debt Limit ...................................................................................................................................................... D-2
Summary of Recommended Capital Program ............................................................................................................... D-3
Summary of Financing ................................................................................................................................................... D-3
Agency Detail ................................................................................................................................................................. D-4
SECTION E: MUNICIPAL AID
Payments To Or On Behalf Of Local Governments ........................................................................................................ E-1
Bonds Authorized for Payment To Or On Behalf Of Local Governments ...................................................................... E-3
Statutory Formula Grants .............................................................................................................................................. E-4
Summary Descriptions ............................................................................................................................................. E-5
Town Listing ............................................................................................................................................................. E-17
INDEX ............................................................................................................................................................................................ F-1

INTRODUCTION

Governor Lamont’s February 20, 2019 Budget Proposal For the FY 2020 – FY 2021 Biennium
A Path Forward
Introduction
Connecticut is poised for success. We have more residents employed in the private sector than at any point in our state’s history. We have companies pushing the boundaries of their industries and we are one of the most innovative states in the country. We are home to 17 Fortune 500 companies across many sectors of the economy and have established the fertile environment that makes us a leader in productivity and venture capital investment. The state has abundant diversity and a highly educated and talented workforce, fed by our great schools, which will continue to foster jobs for the new economy. Right now, our businesses, residents, and the state are benefitting from the strong performance of the economy. Our unemployment rate is 4.0 percent and consumer confidence is high. As a result, our revenue collections for FY 2019 are exceeding expectations. For the fiscal year due to end on June 30, 2019, we are projecting an operating surplus of more than $516 million which does not include the almost $650 million we project will be deposited in the Rainy Day Fund thanks to the volatility cap instituted a few years ago. If those projections hold, we could deposit almost $800 million into our reserves this year and end the year with a Rainy Day Fund balance of nearly $2.0 billion, while still reserving an additional $380 million to allow for the long-term restructuring of the Teachers’ Retirement System. However, we cannot allow the fact that we are expecting a surplus and the likelihood of a significant deposit to the Rainy Day Fund to lull us into a false sense of security and sap the urgency we need to confront our fiscal crisis head-on. We are facing multi-billion dollar shortfalls over the next several years as the gap between spending and revenue projections is ever-widening. This is due, in part, to expiring baseline revenue, and budget practices that make unrealistic tax cuts and shifts to other funds or expenditure promises into the future with no real prospect of delivering and without a financial plan to do so. Such promises would force large spending programs to come on-budget outside of the current biennium. But, these deficits are also a result of fixed costs, like pensions and debt service, and generous social programs that are growing at a faster rate than our overall revenue. For example, the state’s contribution to its state employees’ and teachers’ retirement systems accounts for approximately 13 percent of all General Fund spending – twice the percentage from just ten years ago. Much of the increase is due to recent efforts to reverse decades of underfunding that has resulted in billions in unfunded pension liabilities. The state has taken significant steps to address the trajectory of contributions to the State Employees’ Retirement System, but the Teachers’ Retirement System continues to be funded in a way that could result in dramatic additional increases over the next decade. Action is required to align fixed cost growth with the rate of growth of our revenues.
1
In addition, while we grapple with aligning our spending and revenue, we must do so with an economy that, despite its current strength, has been slow to recover from the Great Recession that began more than a decade ago. Connecticut continues to experience net out-migration. In fact, over the prior four fiscal years, out-migration was sufficient to cancel out any population growth, resulting in population declines in those years. Furthermore, Connecticut still has not recovered the full percentage of total jobs lost since the recession. The jobs we have gained are primarily in industries that pay less than $50,000 per year or between $50,000 and $80,000. For those higher-wage industries that pay more than $80,000 per year, the state is still at a net loss. This has lessened our revenue collections over the past decade, coupled with increased demand for services, and stagnant home prices, forcing our municipalities to re-evaluate their own budget forecasts. This situation is going to require that we tackle these challenges while maintaining the assets that make our state so wonderful. Doing so will require a new approach, one where we will not simply focus on the near-term and create instability in the future. We will need to make the difficult choices; taking care of the present, but with a keen understanding of how those decisions will impact the next decade – not only the next year or two. We will need to be comprehensive in our approach, inquisitive about new ideas, focused on bipartisanship, and supportive of ideas that will stimulate growth. Put simply, the menu of options are not easy choices to achieving balance and staying within the confines of the spending cap for this biennium. We must reduce expenditures to stay within the spending cap and those reductions are getting more and more difficult to absorb. Further, we cannot continue to go to the well of increasing tax rates, as it impeding our economic growth and has contributed to people moving from our great state. A new path forward means we are going to have to seriously address the state’s fixed costs, which will, in some cases, yield positive budget results many years from now and with only limited benefit in the present. However, these changes must be made now so we can begin bending the arc on these costs that are annually crowding out discretionary spending and have historically forced tax increases. Proverbially, the best time to plant a tree was twenty years ago, and the second best time is right now. This budget proposal attempts to plant a tree. Governor Lamont took office in January facing a General Fund budget gap of more than $1.5 billion in FY 2020 and $2.2 billion in FY 2021. That gap is the result of fixed costs that are outpacing growth in the state’s revenues, economic growth that has lagged our neighboring states and the nation, a revenue structure in need of modernization, significant growth in fixed costs, and past budgetary choices that focused on short-term approaches rather than structural fixes. Governor Lamont is proposing an all funds budget of $21.2 billion for FY 2020, an increase of 2.0 percent over FY 2019, and $21.9 billion for FY 2021, 3.4 percent above the recommended level for FY 2020. The Governor’s recommended budget includes structural reforms, efficiencies, and changes to the tax code that will result in balanced operations. Proposed changes to revenues total $1,281.5 million in FY 2020 and $1,760.4 million in FY 2021 (before factoring in the impact
2
of the revenue cap), and expenditure requirements are reduced by nearly $270 million in FY 2020 and more than $480 million in FY 2021. While difficult decisions had to be made, the Governor’s vision produces a recommended budget that is balanced and compliant with all spending and revenue caps in each year of the upcoming biennium. The Economy Our state’s economy continues to expand and is projected to do so over the upcoming biennium, absent a national recession. As of December 2018, our unemployment rate stands at 4.0 percent, the lowest rate in over 16 years. Far more residents are working today than just a few short years ago and housing continues on its long road to recovery. However, these positive trends mask underlying areas of concern. Foremost, the overall economic output of our state’s residents remains 10.4 percent below its pre-recession peak and stands at levels that existed in 2005, 13 years ago. In addition, as of December 2018, the state has only regained 93.5 percent of the 119,100 jobs lost since the last employment peak of 1,713,300 jobs in March of 2008, and remains 0.5 percent below that peak. Connecticut is one of only three states, including West Virginia and Wyoming, not to have regained all the jobs lost while the country as a whole stands at 8.6 percent above its pre-recession employment peak. Median housing prices reflect this economic performance and remain 9.9 percent below their pre-recession peak. This degradation of our state’s economic performance does not bode well for the long-term vitality of our state, or the ability of our state’s budget to pay for state services. More broadly, the national economic expansion as of February has entered its 116th month and is currently the second longest expansion since the end of World War II. Typical expansions have lasted, on average, approximately 60 months. Later this year, the current expansion will surpass the 120th month record of the 1990s expansion. So although the current expansion is noteworthy, it is not typical and as a nation we are more likely closer to the end of this economic expansion than we are to its beginning. Therefore, the state should prepare itself for the possibility that some period of lower economic growth looms over the horizon.
3
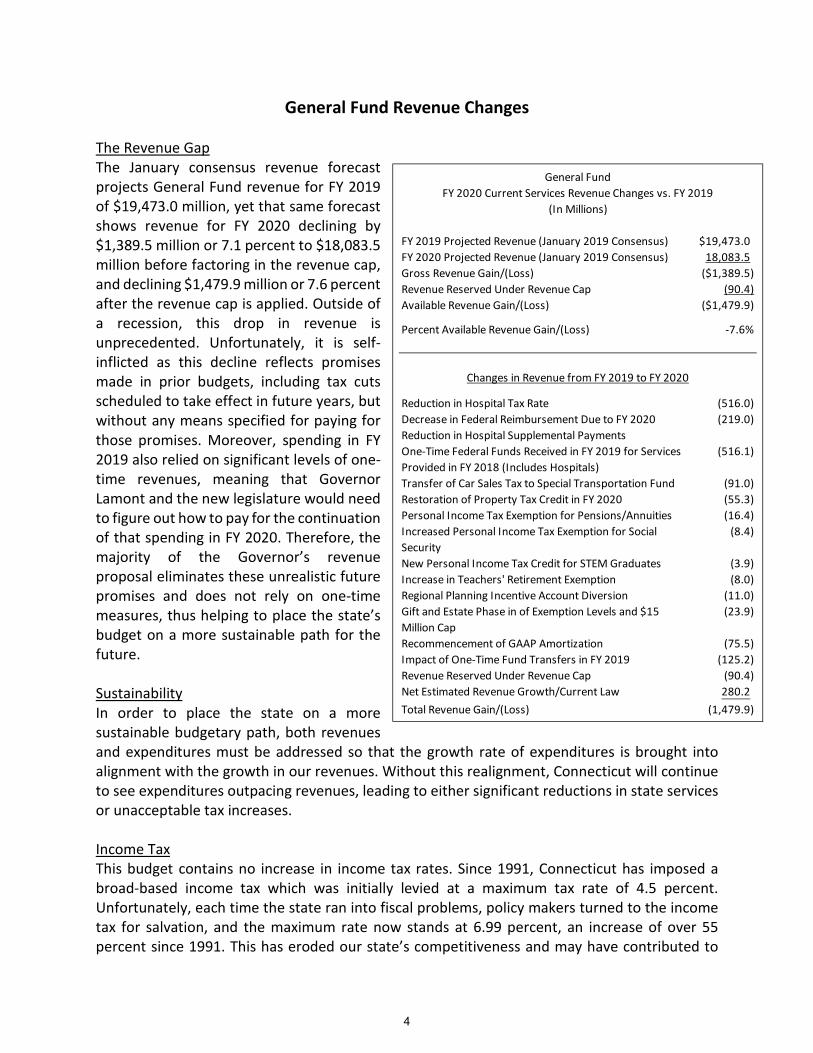
General Fund Revenue Changes The Revenue Gap The January consensus revenue forecast projects General Fund revenue for FY 2019 of $19,473.0 million, yet that same forecast shows revenue for FY 2020 declining by $1,389.5 million or 7.1 percent to $18,083.5 million before factoring in the revenue cap, and declining $1,479.9 million or 7.6 percent after the revenue cap is applied. Outside of a recession, this drop in revenue is unprecedented. Unfortunately, it is self-inflicted as this decline reflects promises made in prior budgets, including tax cuts scheduled to take effect in future years, but without any means specified for paying for those promises. Moreover, spending in FY 2019 also relied on significant levels of one-time revenues, meaning that Governor Lamont and the new legislature would need to figure out how to pay for the continuation of that spending in FY 2020. Therefore, the majority of the Governor’s revenue proposal eliminates these unrealistic future promises and does not rely on one-time measures, thus helping to place the state’s budget on a more sustainable path for the future. Sustainability In order to place the state on a more sustainable budgetary path, both revenues and expenditures must be addressed so that the growth rate of expenditures is brought into alignment with the growth in our revenues. Without this realignment, Connecticut will continue to see expenditures outpacing revenues, leading to either significant reductions in state services or unacceptable tax increases. Income Tax This budget contains no increase in income tax rates. Since 1991, Connecticut has imposed a broad-based income tax which was initially levied at a maximum tax rate of 4.5 percent. Unfortunately, each time the state ran into fiscal problems, policy makers turned to the income tax for salvation, and the maximum rate now stands at 6.99 percent, an increase of over 55 percent since 1991. This has eroded our state’s competitiveness and may have contributed to
FY 2019 Projected Revenue (January 2019 Consensus) $19,473.0FY 2020 Projected Revenue (January 2019 Consensus) 18,083.5Gross Revenue Gain/(Loss) ($1,389.5)Revenue Reserved Under Revenue Cap (90.4)Available Revenue Gain/(Loss) ($1,479.9)
Percent Available Revenue Gain/(Loss) -7.6%
Reduction in Hospital Tax Rate (516.0)Decrease in Federal Reimbursement Due to FY 2020 Reduction in Hospital Supplemental Payments
(219.0)
One-Time Federal Funds Received in FY 2019 for Services Provided in FY 2018 (Includes Hospitals)
(516.1)
Transfer of Car Sales Tax to Special Transportation Fund (91.0)Restoration of Property Tax Credit in FY 2020 (55.3)Personal Income Tax Exemption for Pensions/Annuities (16.4)Increased Personal Income Tax Exemption for Social Security
(8.4)
New Personal Income Tax Credit for STEM Graduates (3.9)Increase in Teachers' Retirement Exemption (8.0)Regional Planning Incentive Account Diversion (11.0)Gift and Estate Phase in of Exemption Levels and $15 Million Cap
(23.9)
Recommencement of GAAP Amortization (75.5)Impact of One-Time Fund Transfers in FY 2019 (125.2)Revenue Reserved Under Revenue Cap (90.4)Net Estimated Revenue Growth/Current Law 280.2Total Revenue Gain/(Loss) (1,479.9)
General Fund
(In Millions)FY 2020 Current Services Revenue Changes vs. FY 2019
Changes in Revenue from FY 2019 to FY 2020
4
the relocation decisions of some of our residents. The Governor’s budget proposal refuses to turn to this well-worn and detrimental solution. Sales Tax This budget does not increase the general sales tax rate, but it does modernize the sales tax code. For too long, Connecticut has selected winners and losers with respect to which goods and services are subject to sales tax. No more. We are eliminating exemptions and bringing our tax code into the 21st century by extending the sales tax broadly to services, which make up a growing share of the economy. Specifically, since 1950 services have grown from 39 percent to 69 percent of personal consumption, which has led to a significant reduction in the sales tax base. This budget pursues a broad expansion of the sales tax based on the following principles:
• All purchases for final consumption by households should be subject to the sales tax, with a few exceptions for basic needs including food, prescription drugs, health, and education services. These exemptions ensure that the burden of the sales tax is not concentrated on lower-income households.
• Goods and services are to be taxed equally. Equal tax treatment ensures relative prices
are held harmless by the state tax structure, and thus does not encourage the purchase of certain items in lieu of others.
• Business-to-business transactions are exempt from further taxation under the proposed sales tax expansion. As noted by the 2015 State Tax Panel and by the Council on State Taxation, a sales tax on business inputs is an additional cost of doing business in the state, which companies attempt to pass on to their customers. Businesses selling in regional or national markets are less able to pass on the added cost to out-of-state customers, increasing the likelihood of reducing their investment and employment in the state. Moreover, businesses would be encouraged to self-provide business services rather than purchasing from more efficient service providers, thereby decreasing economic competitiveness – and particularly hurting small businesses. Finally, sales tax on business inputs increases pyramiding, whereby sales tax is applied at various stages of production, and the effective sales tax rate would thus exceed the statutory rate.
In combination with the ruling by the U.S. Supreme Court in Wayfair, Inc. v. South Dakota, which upholds the ability of the Department of Revenue Services (DRS) to collect sales and use tax on online retailers, this budget levels the playing field and effectuates equal tax treatment. Sales taxes are a stable, consistent revenue source, and the reforms proposed in this budget will position the state for budget stability over the coming years. Business Taxes While the Governor’s proposal asks businesses to contribute to the budget solution, it does so with an eye towards minimizing the impact on Connecticut’s employers and providing them with a level of certainty moving forward. First and foremost, the Governor is proposing to eliminate
5
the unpopular $250 business entity tax in 2019. The cost of eliminating this tax is partially defrayed by increasing the Secretary of the State’s annual filing fee for pass-through entities currently paying the tax from $20 to $100. This change provides both financial and administrative relief to Connecticut’s small employers. The Governor is also proposing making the 10 percent surcharge on the tax liability of corporations with more than $100 million in gross revenue permanent. Setting the surcharge at a permanent level provides businesses with certainty and does not create an out-year deficit by making promises the state cannot afford. A surcharge of 10 percent to 25 percent has been levied on businesses in most income years since 2003. Finally, the Governor’s proposal caps the use of all corporate tax credits at 50.01 percent of liability and does not make unattainable promises in future years, such as eliminating a planned new tax credit for brownfields and the practice of issuing unlimited-life tax credits under the Research and Development (R&D) tax credit program. Tax Policy to Promote a Healthier Future In order to promote a healthier future, especially for our state’s youth, the Governor has proposed several important policy changes. First, the Governor proposes raising the age for the purchase of cigarettes and other tobacco products, including electronic cigarettes, from 18 to 21. The Centers for Disease Control and Prevention (CDC) has noted that 9 out of 10 cigarette smokers try their first cigarette by age 18. Raising the age will greatly reduce lifelong smoker rates and help to combat future health issues. While this will result in a revenue loss for the state, it is the right thing to do. Second, the Governor’s proposal creates a new 75 percent wholesale tax on electronic cigarette liquids. This new tax will level the playing field for tobacco products and will bring electronic cigarettes in parity with the taxes placed on cigarettes. It has been proven that placing taxes on tobacco products reduces tobacco consumption, and this same logic can be applied to electronic cigarette products. Third, the Governor’s proposal imposes a 1.5 cent per ounce tax on beverages with added sugars, including soda, juice and sports drinks, to discourage consumption of nutritionally “empty” calories, a significant contributor to a number of chronic diseases. Seven cities across the country have a tax on sugary beverages; Connecticut will be the first to implement this change on a state level, and will lead the way on improving health disparities and outcomes, ultimately leading to better life quality, while reducing healthcare costs. Tax Policy to Promote a Better Environment This proposal takes several steps to reduce the state’s carbon footprint to ensure future generations are not paying for past generations’ pollution. The Governor’s proposal places a new 5 cent bottle deposit on 50 milliliter liquor bottles to help combat wasteful litter throughout our state. In addition, a new 25 cent bottle deposit will be added to liquor bottles and wine bottles. Broken glass contaminates the state’s recycling waste stream, hurting the state’s environmental goals. In fact, only a small amount of glass is actually
6
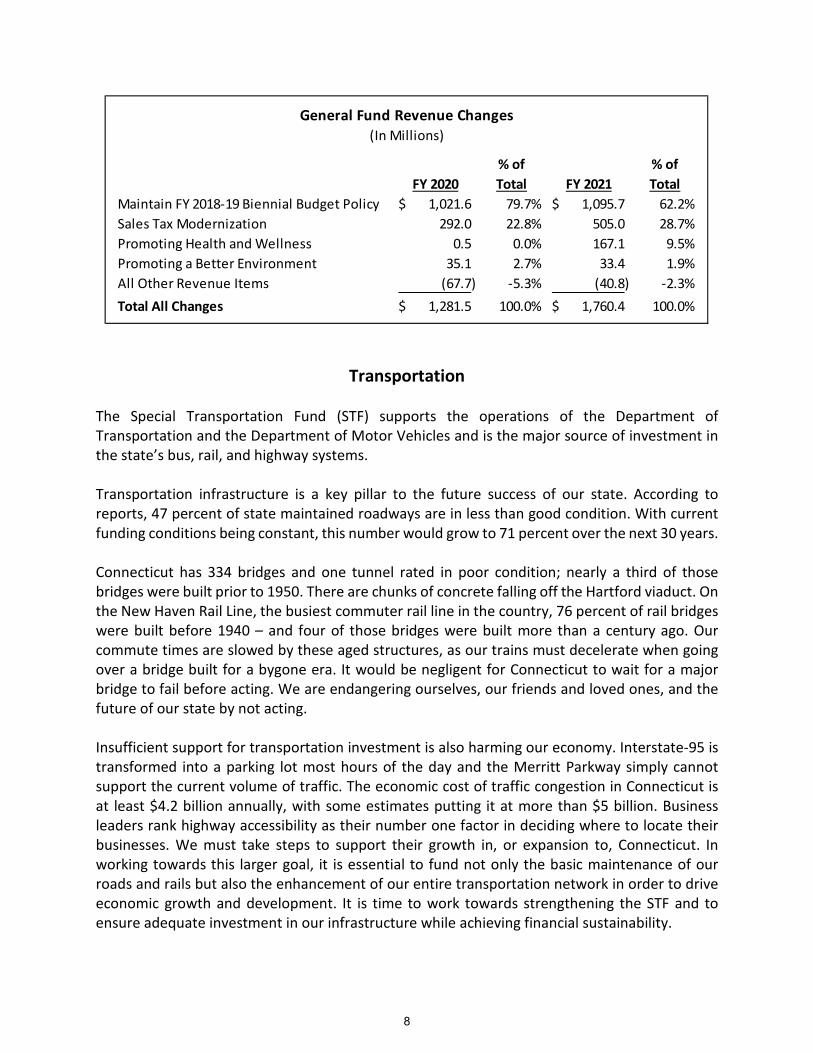
recycled, and that comes at a great cost to our state’s sorting facilities. In contrast, nearly 80 percent of glass is recycled through the current bottle deposit program at a much lower cost to our state. Americans use approximately 100 billion plastic bags per year, with an average use time of 12 minutes. An estimated one billion bags are used in Connecticut, and the recycling rate is approximately five percent. Plastic bags can take up to 1,000 years to decompose, and 80 percent of marine debris comes from land-based waste. In addition to the toxins resulting from the breakdown of plastics that pollute our oceans, marine life often mistake plastic bags for food, leading to an estimated 100,000 marine animals killed annually. To combat the ill-effects of human plastic consumption, this budget proposes a fee on non-compostable plastic bags at ten cents per plastic bag. Out-year revenue estimates assume declining usage of such bags due to the proposed new tax. Targeted Tax Relief The Governor’s budget proposal includes some important targeted tax relief. As discussed above, the Governor is proposing to eliminate the $250 Business Entity Tax. In addition, the Governor is proposing to eliminate the state’s gift tax, as Connecticut is the only state in the nation to have such a tax. In order to prevent any tax avoidance measures due to its elimination, the proposed law would institute a three-year look-back period for any gifts given in contemplation of death. The budget proposal also extends from six months to nine months the estate tax filing deadline to align our state’s due dates with those of the federal government so that taxpayers are not inadvertently out of compliance with state law thinking the two deadlines were similar. The budget also maintains the scheduled phase-in of the federal exemption level under the estate tax as planned for in law by January 1, 2023. Finally, the Governor’s budget allows for the full restoration of the $200 property tax that had been limited to seniors and those with dependents in the previous biennium. Summary of Revenue Changes The Governor’s recommended budget increases General Fund revenues from the current services baseline by $1,281.5 million in FY 2020 and $1,760.4 million in FY 2021. Approximately 80 percent of those changes in FY 2020 and over 62 percent of those changes in FY 2021 reflect continuation of current policies and undoing unrealistic tax cut promises. In total, true net new General Fund revenues total $253.5 million in FY 2020 and $651.5 million in FY 2021.
7
Transportation The Special Transportation Fund (STF) supports the operations of the Department of Transportation and the Department of Motor Vehicles and is the major source of investment in the state’s bus, rail, and highway systems. Transportation infrastructure is a key pillar to the future success of our state. According to reports, 47 percent of state maintained roadways are in less than good condition. With current funding conditions being constant, this number would grow to 71 percent over the next 30 years. Connecticut has 334 bridges and one tunnel rated in poor condition; nearly a third of those bridges were built prior to 1950. There are chunks of concrete falling off the Hartford viaduct. On the New Haven Rail Line, the busiest commuter rail line in the country, 76 percent of rail bridges were built before 1940 – and four of those bridges were built more than a century ago. Our commute times are slowed by these aged structures, as our trains must decelerate when going over a bridge built for a bygone era. It would be negligent for Connecticut to wait for a major bridge to fail before acting. We are endangering ourselves, our friends and loved ones, and the future of our state by not acting. Insufficient support for transportation investment is also harming our economy. Interstate-95 is transformed into a parking lot most hours of the day and the Merritt Parkway simply cannot support the current volume of traffic. The economic cost of traffic congestion in Connecticut is at least $4.2 billion annually, with some estimates putting it at more than $5 billion. Business leaders rank highway accessibility as their number one factor in deciding where to locate their businesses. We must take steps to support their growth in, or expansion to, Connecticut. In working towards this larger goal, it is essential to fund not only the basic maintenance of our roads and rails but also the enhancement of our entire transportation network in order to drive economic growth and development. It is time to work towards strengthening the STF and to ensure adequate investment in our infrastructure while achieving financial sustainability.
General Fund Revenue Changes(In Millions)
% of % ofFY 2020 Total FY 2021 Total
Maintain FY 2018-19 Biennial Budget Policy 1,021.6$ 79.7% 1,095.7$ 62.2%Sales Tax Modernization 292.0 22.8% 505.0 28.7%Promoting Health and Wellness 0.5 0.0% 167.1 9.5%Promoting a Better Environment 35.1 2.7% 33.4 1.9%All Other Revenue Items (67.7) -5.3% (40.8) -2.3%Total All Changes 1,281.5$ 100.0% 1,760.4$ 100.0%
8
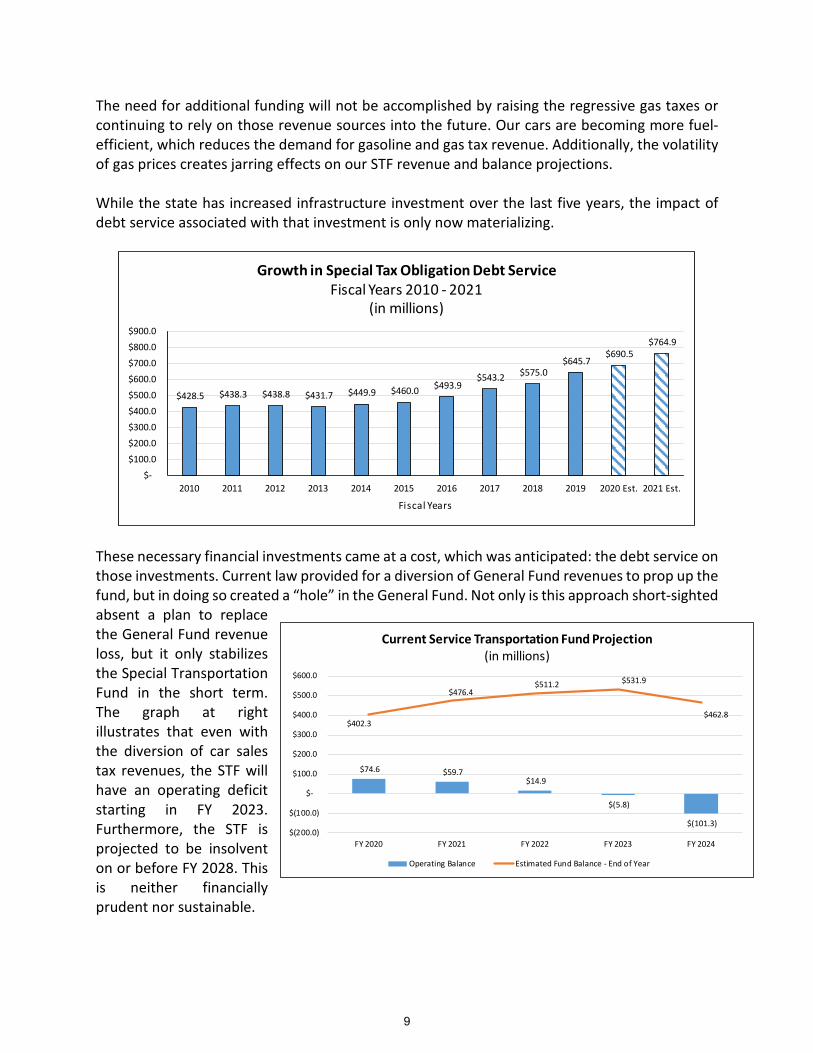
The need for additional funding will not be accomplished by raising the regressive gas taxes or continuing to rely on those revenue sources into the future. Our cars are becoming more fuel-efficient, which reduces the demand for gasoline and gas tax revenue. Additionally, the volatility of gas prices creates jarring effects on our STF revenue and balance projections. While the state has increased infrastructure investment over the last five years, the impact of debt service associated with that investment is only now materializing.
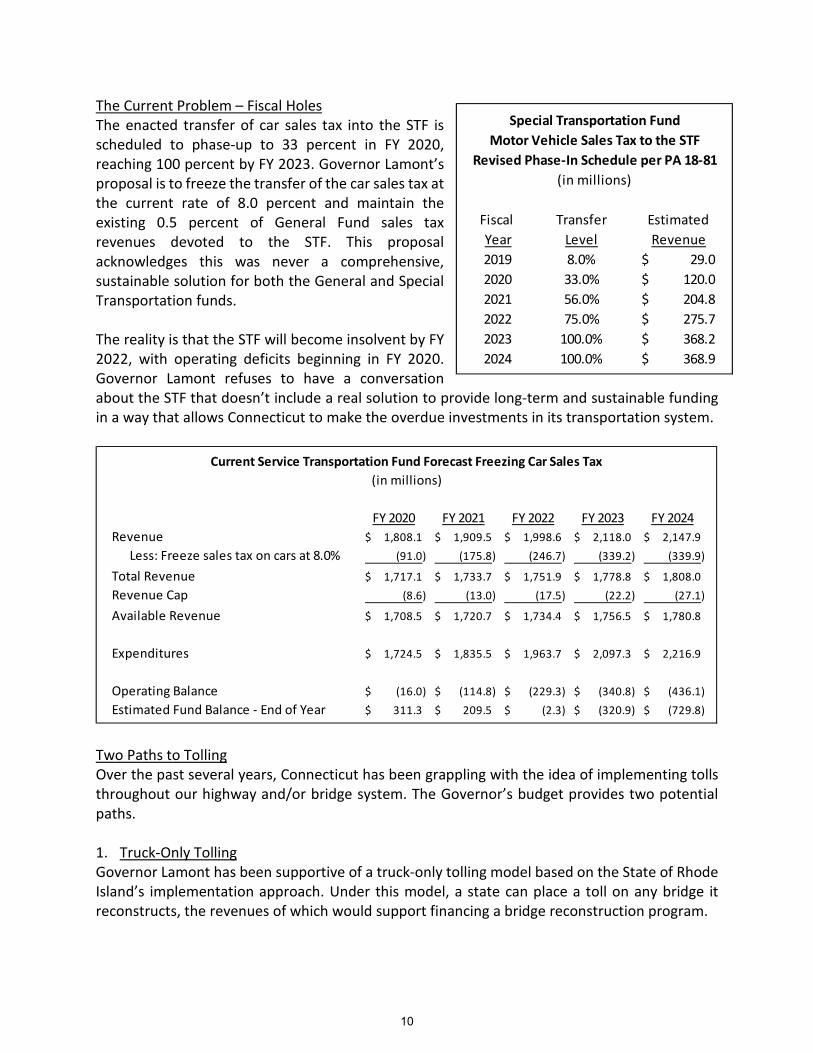
These necessary financial investments came at a cost, which was anticipated: the debt service on those investments. Current law provided for a diversion of General Fund revenues to prop up the fund, but in doing so created a “hole” in the General Fund. Not only is this approach short-sighted absent a plan to replace the General Fund revenue loss, but it only stabilizes the Special Transportation Fund in the short term. The graph at right illustrates that even with the diversion of car sales tax revenues, the STF will have an operating deficit starting in FY 2023. Furthermore, the STF is projected to be insolvent on or before FY 2028. This is neither financially prudent nor sustainable.
$428.5 $438.3 $438.8 $431.7 $449.9 $460.0 $493.9 $543.2 $575.0
$645.7 $690.5
$764.9
$-
$100.0
$200.0
$300.0
$400.0
$500.0
$600.0
$700.0
$800.0
$900.0
2010 2011 2012 2013 2014 2015 2016 2017 2018 2019 2020 Est. 2021 Est.
Fiscal Years
Growth in Special Tax Obligation Debt ServiceFiscal Years 2010 - 2021
(in millions)
$74.6 $59.7 $14.9
$(5.8)
$(101.3)
$402.3
$476.4 $511.2 $531.9
$462.8
$(200.0)
$(100.0)
$-
$100.0
$200.0
$300.0
$400.0
$500.0
$600.0
FY 2020 FY 2021 FY 2022 FY 2023 FY 2024
Current Service Transportation Fund Projection(in millions)
Operating Balance Estimated Fund Balance - End of Year
9
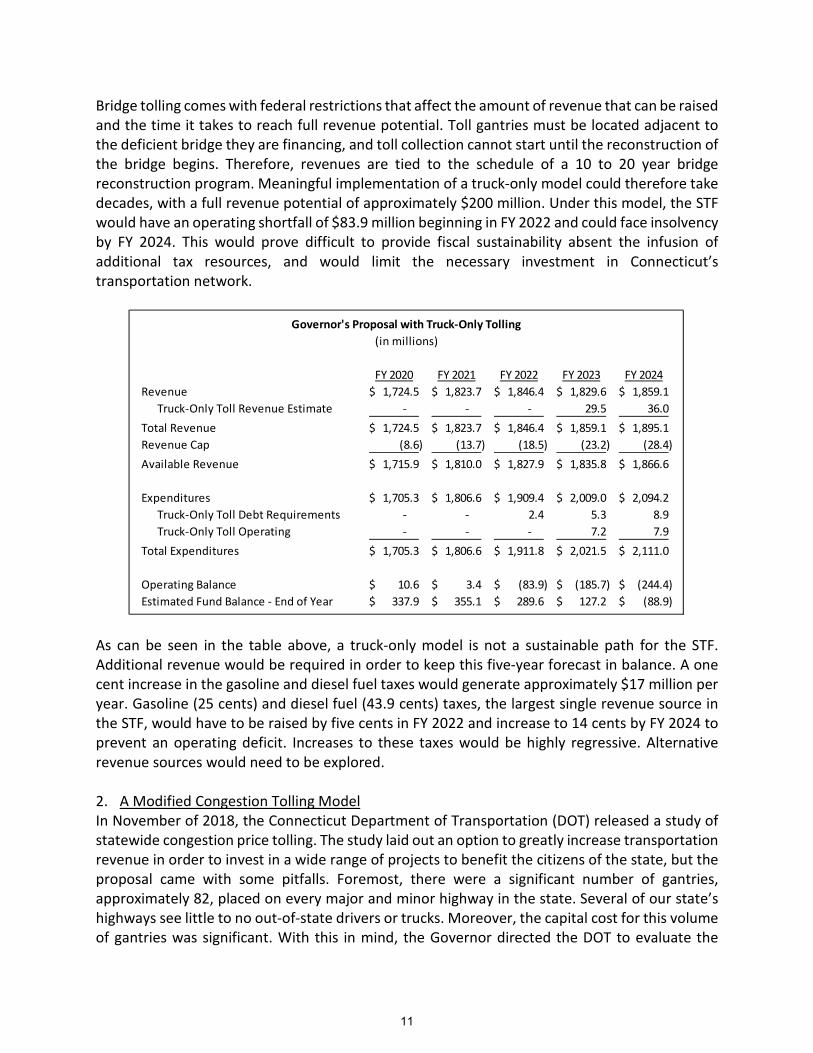
The Current Problem – Fiscal Holes The enacted transfer of car sales tax into the STF is scheduled to phase-up to 33 percent in FY 2020, reaching 100 percent by FY 2023. Governor Lamont’s proposal is to freeze the transfer of the car sales tax at the current rate of 8.0 percent and maintain the existing 0.5 percent of General Fund sales tax revenues devoted to the STF. This proposal acknowledges this was never a comprehensive, sustainable solution for both the General and Special Transportation funds. The reality is that the STF will become insolvent by FY 2022, with operating deficits beginning in FY 2020. Governor Lamont refuses to have a conversation about the STF that doesn’t include a real solution to provide long-term and sustainable funding in a way that allows Connecticut to make the overdue investments in its transportation system.
Two Paths to Tolling Over the past several years, Connecticut has been grappling with the idea of implementing tolls throughout our highway and/or bridge system. The Governor’s budget provides two potential paths. 1. Truck-Only Tolling Governor Lamont has been supportive of a truck-only tolling model based on the State of Rhode Island’s implementation approach. Under this model, a state can place a toll on any bridge it reconstructs, the revenues of which would support financing a bridge reconstruction program.
Current Service Transportation Fund Forecast Freezing Car Sales Tax(in millions)
FY 2020 FY 2021 FY 2022 FY 2023 FY 2024Revenue 1,808.1$ 1,909.5$ 1,998.6$ 2,118.0$ 2,147.9$
Less: Freeze sales tax on cars at 8.0% (91.0) (175.8) (246.7) (339.2) (339.9)
Total Revenue 1,717.1$ 1,733.7$ 1,751.9$ 1,778.8$ 1,808.0$ Revenue Cap (8.6) (13.0) (17.5) (22.2) (27.1)
Available Revenue 1,708.5$ 1,720.7$ 1,734.4$ 1,756.5$ 1,780.8$
Expenditures 1,724.5$ 1,835.5$ 1,963.7$ 2,097.3$ 2,216.9$
Operating Balance (16.0)$ (114.8)$ (229.3)$ (340.8)$ (436.1)$ Estimated Fund Balance - End of Year 311.3$ 209.5$ (2.3)$ (320.9)$ (729.8)$
Special Transportation FundMotor Vehicle Sales Tax to the STF
Revised Phase-In Schedule per PA 18-81(in millions)
Fiscal Transfer EstimatedYear Level Revenue2019 8.0% 29.0$ 2020 33.0% 120.0$ 2021 56.0% 204.8$ 2022 75.0% 275.7$ 2023 100.0% 368.2$ 2024 100.0% 368.9$
10
Bridge tolling comes with federal restrictions that affect the amount of revenue that can be raised and the time it takes to reach full revenue potential. Toll gantries must be located adjacent to the deficient bridge they are financing, and toll collection cannot start until the reconstruction of the bridge begins. Therefore, revenues are tied to the schedule of a 10 to 20 year bridge reconstruction program. Meaningful implementation of a truck-only model could therefore take decades, with a full revenue potential of approximately $200 million. Under this model, the STF would have an operating shortfall of $83.9 million beginning in FY 2022 and could face insolvency by FY 2024. This would prove difficult to provide fiscal sustainability absent the infusion of additional tax resources, and would limit the necessary investment in Connecticut’s transportation network.
As can be seen in the table above, a truck-only model is not a sustainable path for the STF. Additional revenue would be required in order to keep this five-year forecast in balance. A one cent increase in the gasoline and diesel fuel taxes would generate approximately $17 million per year. Gasoline (25 cents) and diesel fuel (43.9 cents) taxes, the largest single revenue source in the STF, would have to be raised by five cents in FY 2022 and increase to 14 cents by FY 2024 to prevent an operating deficit. Increases to these taxes would be highly regressive. Alternative revenue sources would need to be explored. 2. A Modified Congestion Tolling Model In November of 2018, the Connecticut Department of Transportation (DOT) released a study of statewide congestion price tolling. The study laid out an option to greatly increase transportation revenue in order to invest in a wide range of projects to benefit the citizens of the state, but the proposal came with some pitfalls. Foremost, there were a significant number of gantries, approximately 82, placed on every major and minor highway in the state. Several of our state’s highways see little to no out-of-state drivers or trucks. Moreover, the capital cost for this volume of gantries was significant. With this in mind, the Governor directed the DOT to evaluate the
Governor's Proposal with Truck-Only Tolling(in millions)
FY 2020 FY 2021 FY 2022 FY 2023 FY 2024Revenue 1,724.5$ 1,823.7$ 1,846.4$ 1,829.6$ 1,859.1$
Truck-Only Toll Revenue Estimate - - - 29.5 36.0 Total Revenue 1,724.5$ 1,823.7$ 1,846.4$ 1,859.1$ 1,895.1$ Revenue Cap (8.6) (13.7) (18.5) (23.2) (28.4) Available Revenue 1,715.9$ 1,810.0$ 1,827.9$ 1,835.8$ 1,866.6$
Expenditures 1,705.3$ 1,806.6$ 1,909.4$ 2,009.0$ 2,094.2$ Truck-Only Toll Debt Requirements - - 2.4 5.3 8.9 Truck-Only Toll Operating - - - 7.2 7.9
Total Expenditures 1,705.3$ 1,806.6$ 1,911.8$ 2,021.5$ 2,111.0$
Operating Balance 10.6$ 3.4$ (83.9)$ (185.7)$ (244.4)$ Estimated Fund Balance - End of Year 337.9$ 355.1$ 289.6$ 127.2$ (88.9)$
11
statewide tolling option and find ways to reduce the scope without impairing the state’s ability to make the necessary investments in its transportation infrastructure. A new modified congestion tolling option that reduces some of the original drawbacks could include the following:
1. Limit gantries to just Interstates 84, 91, 95 and Route 15, a reduction of statewide gantries by 35 percent, from 82 gantries to 53.
2. Shift a larger share of the burden to out-of-state drivers who are currently not paying their fair share for using our state’s highways. DOT estimates that the amount of out-of-state revenue could increase to almost 50 percent. Interstates 95, 84, and 91 all carry a higher proportion of out-of-state traffic than other state routes. This higher percentage combined with some increases in Connecticut resident discounts and adjustments to the toll rate structure could get close to the 50 percent goal.
3. Start initial toll operations in FY 2023 with full implementation by 2025. 4. Provide a reduced rate (of at least 30 percent) to holders of a Connecticut EZPass. 5. Reduce costs by reducing the number of gantries without sacrificing a significant amount
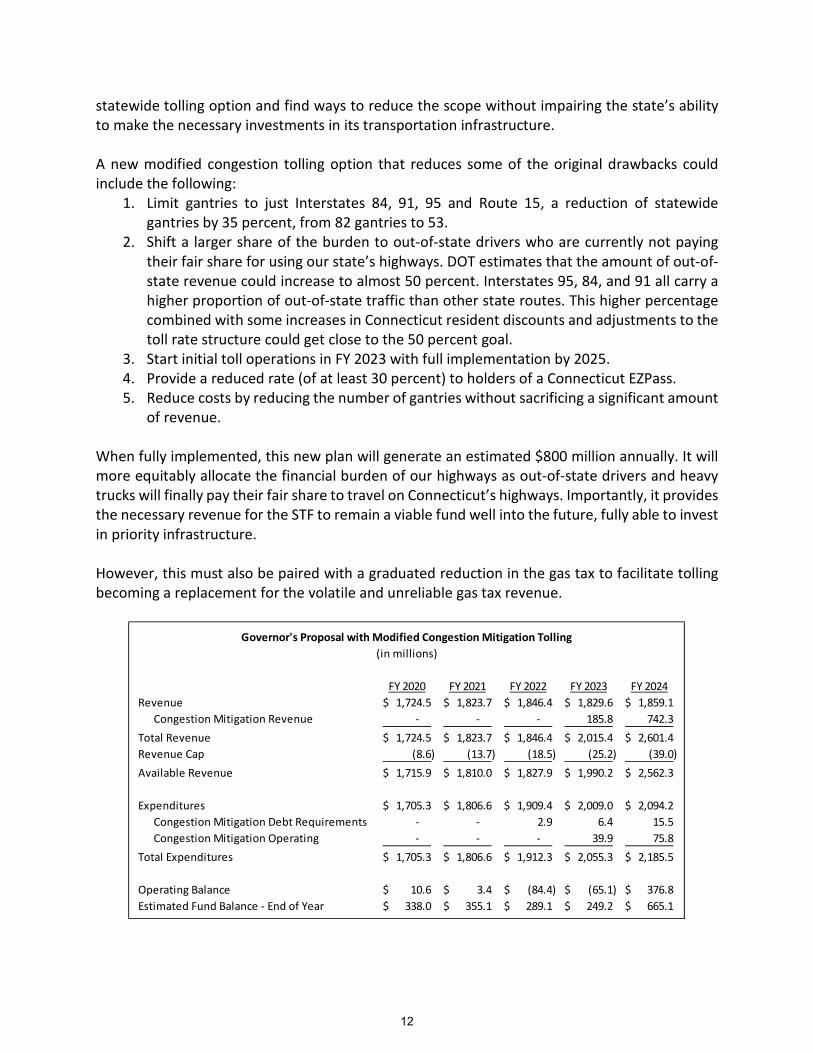
of revenue. When fully implemented, this new plan will generate an estimated $800 million annually. It will more equitably allocate the financial burden of our highways as out-of-state drivers and heavy trucks will finally pay their fair share to travel on Connecticut’s highways. Importantly, it provides the necessary revenue for the STF to remain a viable fund well into the future, fully able to invest in priority infrastructure. However, this must also be paired with a graduated reduction in the gas tax to facilitate tolling becoming a replacement for the volatile and unreliable gas tax revenue.
Governor's Proposal with Modified Congestion Mitigation Tolling(in millions)
FY 2020 FY 2021 FY 2022 FY 2023 FY 2024Revenue 1,724.5$ 1,823.7$ 1,846.4$ 1,829.6$ 1,859.1$
Congestion Mitigation Revenue - - - 185.8 742.3 Total Revenue 1,724.5$ 1,823.7$ 1,846.4$ 2,015.4$ 2,601.4$ Revenue Cap (8.6) (13.7) (18.5) (25.2) (39.0) Available Revenue 1,715.9$ 1,810.0$ 1,827.9$ 1,990.2$ 2,562.3$
Expenditures 1,705.3$ 1,806.6$ 1,909.4$ 2,009.0$ 2,094.2$ Congestion Mitigation Debt Requirements - - 2.9 6.4 15.5 Congestion Mitigation Operating - - - 39.9 75.8
Total Expenditures 1,705.3$ 1,806.6$ 1,912.3$ 2,055.3$ 2,185.5$
Operating Balance 10.6$ 3.4$ (84.4)$ (65.1)$ 376.8$ Estimated Fund Balance - End of Year 338.0$ 355.1$ 289.1$ 249.2$ 665.1$
12
A Sustainable Approach is Required The simple fact is that our aging transportation infrastructure is in need of massive investment. There is no doubt our transportation fund will require additional revenues in the very near future if we are to continue basic maintenance, not to mention a significant upgrade of our system. By enacting the Governor’s proposals, a strengthened STF will contribute to Connecticut’s economic future by delivering the following transportation upgrades: Speeding up our rail service from Hartford to New Haven, to Stamford and NYC, with more frequent service to Waterbury and New London, with easier access to Bradley Airport and an upgraded Tweed Airport opening up central Connecticut for regional air service – all the while moving some drivers from the car to the rail, incenting trucks to drive at off peak hours. These transportation upgrades are the building blocks of our economic future. We can no longer continue to ignore one of our most important economic assets and must take action now to ensure that the necessary investments are fully financed. The Governor presents these two options to begin an open dialogue with the legislature and Connecticut’s residents and stakeholders. All of us must act decisively and prudently in shaping a sustainable path forward that will push our transportation infrastructure into the 21st century. We cannot wait for a catastrophe before acting.
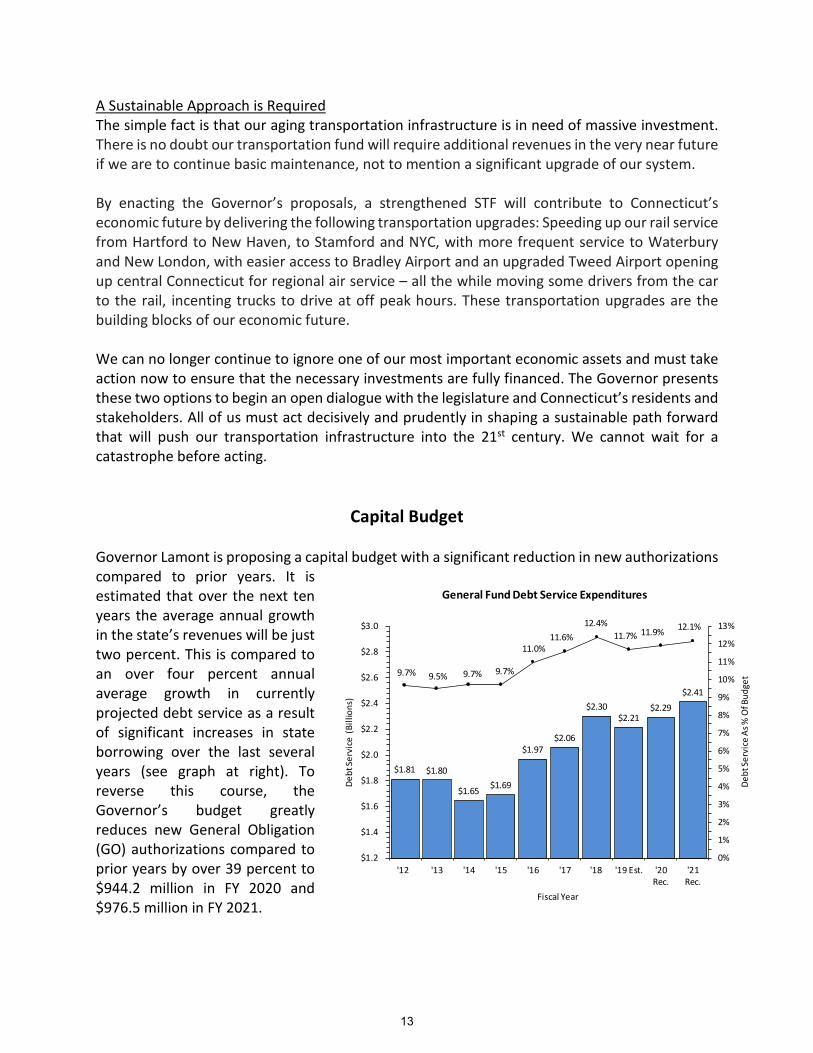
Capital Budget Governor Lamont is proposing a capital budget with a significant reduction in new authorizations compared to prior years. It is estimated that over the next ten years the average annual growth in the state’s revenues will be just two percent. This is compared to an over four percent annual average growth in currently projected debt service as a result of significant increases in state borrowing over the last several years (see graph at right). To reverse this course, the Governor’s budget greatly reduces new General Obligation (GO) authorizations compared to prior years by over 39 percent to $944.2 million in FY 2020 and $976.5 million in FY 2021.
$1.81 $1.80
$1.65 $1.69
$1.97 $2.06
$2.30 $2.21
$2.29 $2.41
9.7% 9.5% 9.7% 9.7%
11.0%11.6%
12.4%11.7% 11.9% 12.1%
0%
1%
2%
3%
4%
5%
6%
7%
8%
9%
10%
11%
12%
13%
$1.2
$1.4
$1.6
$1.8
$2.0
$2.2
$2.4
$2.6
$2.8
$3.0
'12 '13 '14 '15 '16 '17 '18 '19 Est. '20Rec.
'21Rec.
Debt
Serv
ice
As %
Of B
udge
t
Debt
Serv
ice
(Bill
ions
)
Fiscal Year
General Fund Debt Service Expenditures
13
These reductions will help to achieve long-term debt service savings. The Governor will ensure that new levels of debt spending will be reduced to more closely match the growth in revenues. He will hold spending to maintain an issuance schedule of $1.6 billion per fiscal year, a reduction in debt issuance of over 15 percent compared to the average of the last five years.
Average Annual Recommended Authorizations (in millions)
Fiscal GO STO Years Authorizations Authorizations
2012 through 2019 $ 1,587.1 $ 790.0 2020 through 2021 $ 960.3 $ 779.5
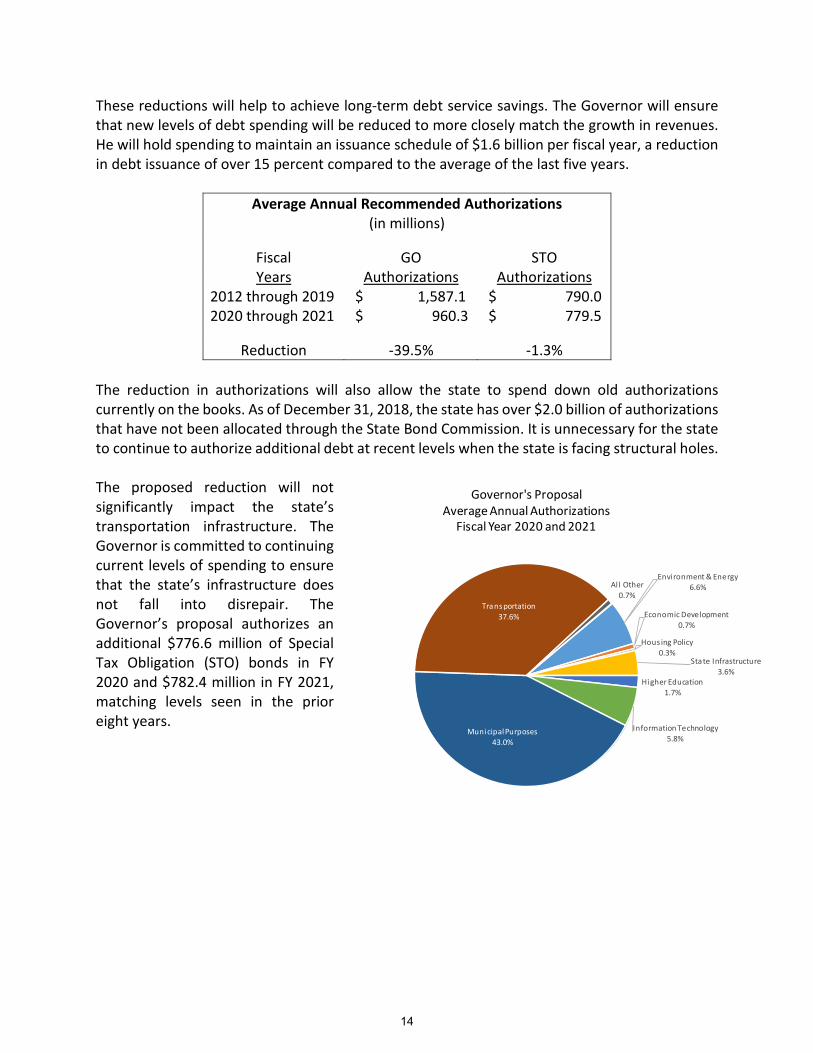
Reduction -39.5% -1.3% The reduction in authorizations will also allow the state to spend down old authorizations currently on the books. As of December 31, 2018, the state has over $2.0 billion of authorizations that have not been allocated through the State Bond Commission. It is unnecessary for the state to continue to authorize additional debt at recent levels when the state is facing structural holes. The proposed reduction will not significantly impact the state’s transportation infrastructure. The Governor is committed to continuing current levels of spending to ensure that the state’s infrastructure does not fall into disrepair. The Governor’s proposal authorizes an additional $776.6 million of Special Tax Obligation (STO) bonds in FY 2020 and $782.4 million in FY 2021, matching levels seen in the prior eight years.
Environment & Energy6.6%
Economic Development0.7%
Hous ing Policy0.3%
State Infrastructure3.6%
Higher Education1.7%
Information Technology5.8%
Municipal Purposes43.0%
Transportation37.6%
Al l Other0.7%
Governor's ProposalAverage Annual Authorizations
Fiscal Year 2020 and 2021
14
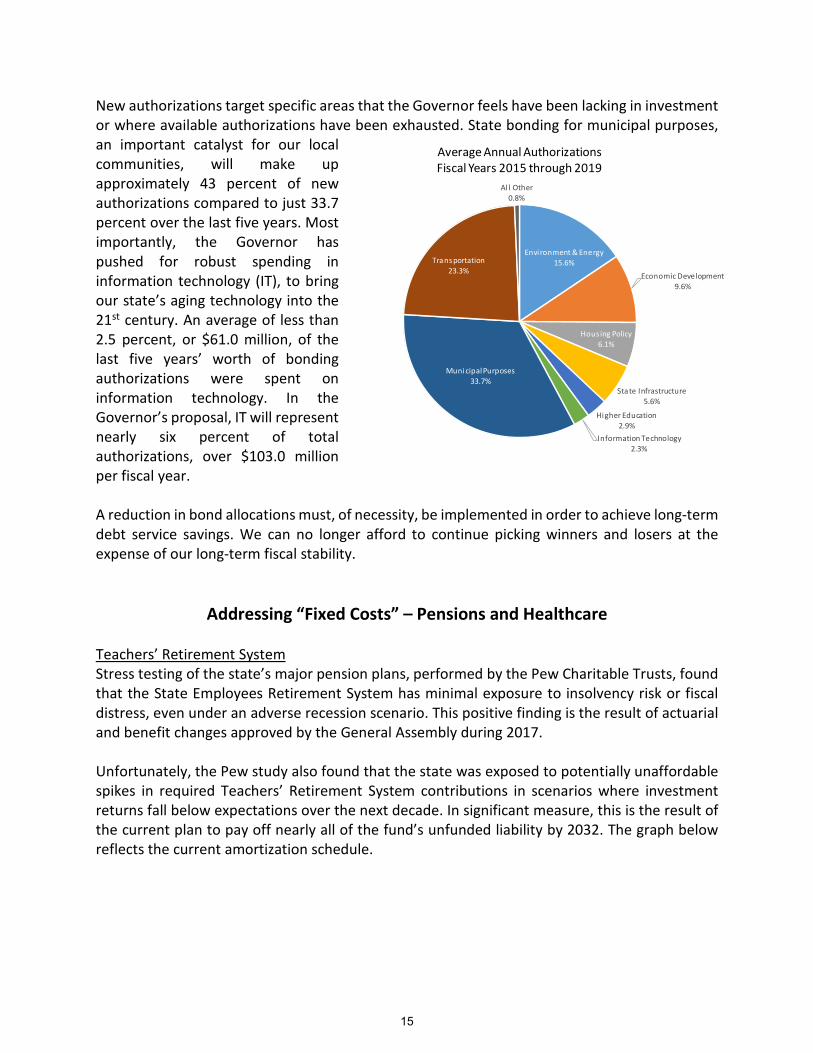
New authorizations target specific areas that the Governor feels have been lacking in investment or where available authorizations have been exhausted. State bonding for municipal purposes, an important catalyst for our local communities, will make up approximately 43 percent of new authorizations compared to just 33.7 percent over the last five years. Most importantly, the Governor has pushed for robust spending in information technology (IT), to bring our state’s aging technology into the 21st century. An average of less than 2.5 percent, or $61.0 million, of the last five years’ worth of bonding authorizations were spent on information technology. In the Governor’s proposal, IT will represent nearly six percent of total authorizations, over $103.0 million per fiscal year. A reduction in bond allocations must, of necessity, be implemented in order to achieve long-term debt service savings. We can no longer afford to continue picking winners and losers at the expense of our long-term fiscal stability.
Addressing “Fixed Costs” – Pensions and Healthcare Teachers’ Retirement System Stress testing of the state’s major pension plans, performed by the Pew Charitable Trusts, found that the State Employees Retirement System has minimal exposure to insolvency risk or fiscal distress, even under an adverse recession scenario. This positive finding is the result of actuarial and benefit changes approved by the General Assembly during 2017. Unfortunately, the Pew study also found that the state was exposed to potentially unaffordable spikes in required Teachers’ Retirement System contributions in scenarios where investment returns fall below expectations over the next decade. In significant measure, this is the result of the current plan to pay off nearly all of the fund’s unfunded liability by 2032. The graph below reflects the current amortization schedule.
Environment & Energy15.6%
Economic Development9.6%
Hous ing Policy6.1%
State Infrastructure5.6%
Higher Education2.9%
Information Technology2.3%
Municipal Purposes33.7%
Transportation23.3%
Al l Other0.8%
Average Annual AuthorizationsFiscal Years 2015 through 2019
15
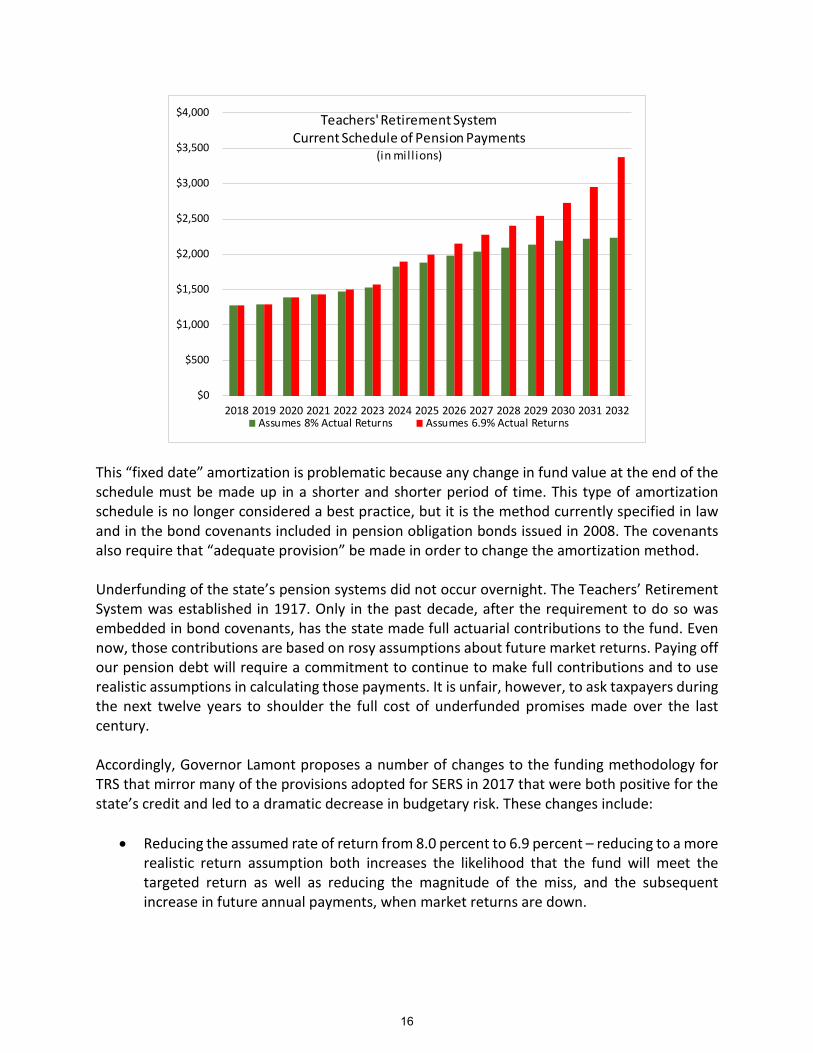
This “fixed date” amortization is problematic because any change in fund value at the end of the schedule must be made up in a shorter and shorter period of time. This type of amortization schedule is no longer considered a best practice, but it is the method currently specified in law and in the bond covenants included in pension obligation bonds issued in 2008. The covenants also require that “adequate provision” be made in order to change the amortization method. Underfunding of the state’s pension systems did not occur overnight. The Teachers’ Retirement System was established in 1917. Only in the past decade, after the requirement to do so was embedded in bond covenants, has the state made full actuarial contributions to the fund. Even now, those contributions are based on rosy assumptions about future market returns. Paying off our pension debt will require a commitment to continue to make full contributions and to use realistic assumptions in calculating those payments. It is unfair, however, to ask taxpayers during the next twelve years to shoulder the full cost of underfunded promises made over the last century. Accordingly, Governor Lamont proposes a number of changes to the funding methodology for TRS that mirror many of the provisions adopted for SERS in 2017 that were both positive for the state’s credit and led to a dramatic decrease in budgetary risk. These changes include:
• Reducing the assumed rate of return from 8.0 percent to 6.9 percent – reducing to a more realistic return assumption both increases the likelihood that the fund will meet the targeted return as well as reducing the magnitude of the miss, and the subsequent increase in future annual payments, when market returns are down.
$0
$500
$1,000
$1,500
$2,000
$2,500
$3,000
$3,500
$4,000
2018 2019 2020 2021 2022 2023 2024 2025 2026 2027 2028 2029 2030 2031 2032
Teachers' Retirement SystemCurrent Schedule of Pension Payments
(in mill ions)
Assumes 8% Actual Returns Assumes 6.9% Actual Returns
16
• Re-amortizing the unfunded liability over a new 30-year period – allows the impact of adopting realistic assumptions to be spread-out over a longer period.
• Transitioning from level percent of payroll to level dollar amortization – the current funding methodology assumes the state’s ability to pay-off the unfunded liability can increase by 3.25 percent per year, which results in increasing debt payments throughout the amortization period. A more conservative approach is to make level payments over the entire amortization period. A five-year transition period will limit the short-term fiscal impact of this change.
The Governor proposes making these changes while remaining fully compliant with the 2008 pension obligation bond covenants, including the requirement that the state continue to make the full actuarially determined employer contribution to the fund. These changes serve to strengthen the pension system and the state’s finances. A key component of this proposal is the establishment of a Teachers’ Retirement Fund Bonds Capital Reserve Fund in order to meet the “adequate provision” requirement of the 2008 pension obligation bonds. Funding of the reserve fund would be accomplished by appropriating $380.9 million of the FY 2019 General Fund surplus for this purpose. The $380.9 million threshold represents the maximum annual debt service for the pension obligation bonds. Under this plan, the state will continue to pay its debt service requirements on-time for the pension obligation bonds. However, in the event that the reserve fund is ever needed to cover a debt service payment, the debt service is further backed by a requirement that replenishment of the capital reserve fund would occur via a direct transfer of lottery receipts. In addition to changes in funding methodology, the Governor proposes two changes to benefit design where the current plan is more generous than most other plans.
• TRS members are required to contribute seven percent of their pay to the fund. These member contributions earn interest and are returned to the member in the event that the member dies before receiving a certain amount of pension benefits. The amount of interest that is currently credited to these member accounts is an outlier in comparison to other public pension plans, where the average assumption is 3.6 percent. In many plans, including SERS, no interest at all is credited. Going forward, the Governor proposes that the Teachers’ Retirement Board set the credited interest percentage at a more reasonable cap of four percent.
• The second proposed change concerns how member accounts are reduced as pension
benefits are received. In most pension plans, member accounts are reduced dollar-for-dollar for retirement payments received. Currently TRS member accounts are only reduced by 25 percent of benefits received; the Governor proposes increasing that factor to 50 percent.
These two changes do not affect the calculated annual benefit amount for any TRS member, but result in a significant reduction in plan liability.
17
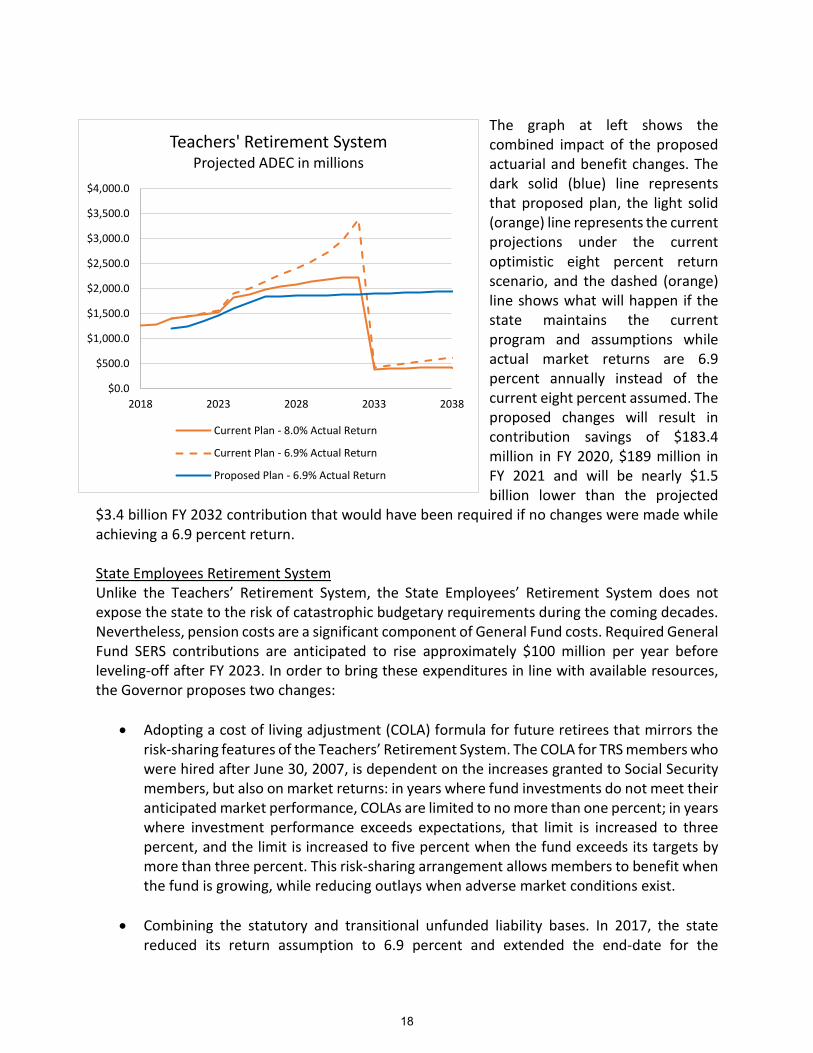
The graph at left shows the combined impact of the proposed actuarial and benefit changes. The dark solid (blue) line represents that proposed plan, the light solid (orange) line represents the current projections under the current optimistic eight percent return scenario, and the dashed (orange) line shows what will happen if the state maintains the current program and assumptions while actual market returns are 6.9 percent annually instead of the current eight percent assumed. The proposed changes will result in contribution savings of $183.4 million in FY 2020, $189 million in FY 2021 and will be nearly $1.5 billion lower than the projected
$3.4 billion FY 2032 contribution that would have been required if no changes were made while achieving a 6.9 percent return. State Employees Retirement System Unlike the Teachers’ Retirement System, the State Employees’ Retirement System does not expose the state to the risk of catastrophic budgetary requirements during the coming decades. Nevertheless, pension costs are a significant component of General Fund costs. Required General Fund SERS contributions are anticipated to rise approximately $100 million per year before leveling-off after FY 2023. In order to bring these expenditures in line with available resources, the Governor proposes two changes:
• Adopting a cost of living adjustment (COLA) formula for future retirees that mirrors the risk-sharing features of the Teachers’ Retirement System. The COLA for TRS members who were hired after June 30, 2007, is dependent on the increases granted to Social Security members, but also on market returns: in years where fund investments do not meet their anticipated market performance, COLAs are limited to no more than one percent; in years where investment performance exceeds expectations, that limit is increased to three percent, and the limit is increased to five percent when the fund exceeds its targets by more than three percent. This risk-sharing arrangement allows members to benefit when the fund is growing, while reducing outlays when adverse market conditions exist.
• Combining the statutory and transitional unfunded liability bases. In 2017, the state
reduced its return assumption to 6.9 percent and extended the end-date for the
$0.0
$500.0
$1,000.0
$1,500.0
$2,000.0
$2,500.0
$3,000.0
$3,500.0
$4,000.0
2018 2023 2028 2033 2038
Teachers' Retirement SystemProjected ADEC in millions
Current Plan - 8.0% Actual Return
Current Plan - 6.9% Actual Return
Proposed Plan - 6.9% Actual Return
18
amortization for about 4/5ths of the outstanding unfunded liability—the transitional base—from 2032 to 2046. The Governor proposes combining the remaining 1/5th of unfunded liability—the statutory base—with the transitional base that is scheduled to be repaid by 2046.
• The Governor is also proposing to eliminate mileage allowances from being counted toward pensions for legislators. This step, while relatively small from a budgetary standpoint, will demonstrate to Connecticut’s taxpayers that the state’s policymakers lead by example.
Together, these changes will reduce General Fund budget requirements by $131.9 million in FY 2020 and $141.8 million in FY 2021. Active and Retiree Healthcare The State of Connecticut provides healthcare coverage for approximately 47,000 active employees and 50,000 retirees. One hundred percent of retiree costs and approximately 73 percent of active employee costs are borne by the General Fund and totaled more than $1.33 billion in FY 2019. Healthcare is also one of the major cost drivers of the General Fund budget – current services projections reflect a $235 million increase by the end of the biennium. Fee-for-service payments to providers for services rendered account for the vast majority of the cost of the state employee plan, well over 95 percent. Payments across providers vary significantly. For example, average costs paid by the plan for knee replacement surgery range from a low of approximately $24,000 at one hospital to a high of more than $50,000 at another. The more than two-fold difference in cost bears no relationship to quality. Patients receiving knee replacements from the lower-cost hospital in the example above are less likely to experience an adverse event than the high-cost hospital. The Governor’s budget proposes, in coordination with the Office of the State Comptroller, to limit the variation in price the state employee plan will pay for such services by setting a ceiling on the maximum price the state health plan will pay for such services. The maximum price will be set as a percentage above the Medicare payment rate. The state continues to make progress in developing a greater partnership with members to improve health outcomes and reduce costs. Programs like the Health Enhancement Program (HEP), introduced in 2011, have significantly improved the percentage of plan participants who receive age appropriate preventive care and screenings while improving outcomes and reducing overall costs. More recently, the state has introduced a “Smart Shopper” program and a “Site of Service” program that encourage participants to utilize high-quality, lower-cost providers. The programs seek to improve outcomes for participants and reduce costs for the plan by giving plan participants a financial incentive to select high-quality low-cost providers for select services. The Governor’s budget builds upon these existing efforts by expanding programs that promote healthy behaviors and encourage participants to make informed provider choices. The budget envisions an expansion of wellness programs available to state employees as well as adding
19
services and geographies for which state employees will be eligible for rewards when choosing high-quality low-cost providers under the Smart Shopper program. In total, the Governor’s proposed General Fund budget includes $50 million in savings in FY 2020 and $135 million by FY 2021 for these initiatives combined. Savings equate to 3.75 percent of projected FY 2020 costs and 8.6 percent of projected FY 2021 costs. Components of the Governor’s proposed changes to SERS and healthcare will require discussion with, and the agreement of, the state’s unionized workforce, and to that end a dialogue has begun.
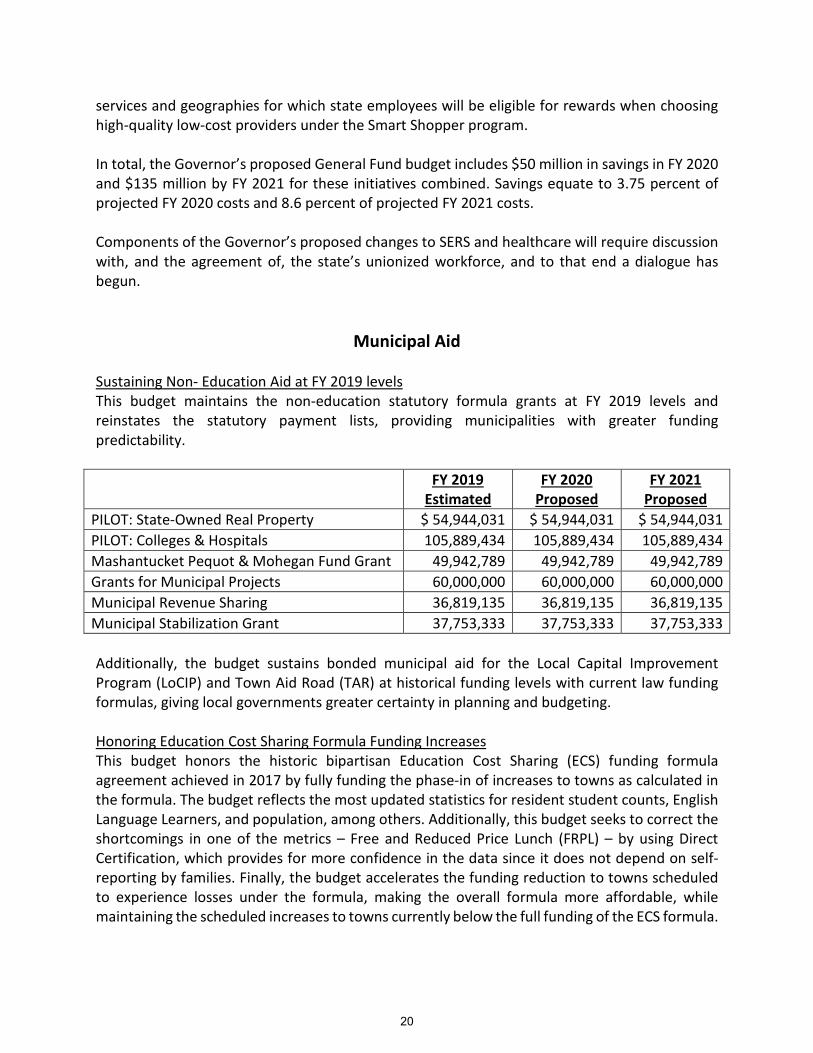
Municipal Aid Sustaining Non- Education Aid at FY 2019 levels This budget maintains the non-education statutory formula grants at FY 2019 levels and reinstates the statutory payment lists, providing municipalities with greater funding predictability.
FY 2019
Estimated FY 2020
Proposed FY 2021
Proposed PILOT: State-Owned Real Property $ 54,944,031 $ 54,944,031 $ 54,944,031 PILOT: Colleges & Hospitals 105,889,434 105,889,434 105,889,434 Mashantucket Pequot & Mohegan Fund Grant 49,942,789 49,942,789 49,942,789 Grants for Municipal Projects 60,000,000 60,000,000 60,000,000 Municipal Revenue Sharing 36,819,135 36,819,135 36,819,135 Municipal Stabilization Grant 37,753,333 37,753,333 37,753,333
Additionally, the budget sustains bonded municipal aid for the Local Capital Improvement Program (LoCIP) and Town Aid Road (TAR) at historical funding levels with current law funding formulas, giving local governments greater certainty in planning and budgeting. Honoring Education Cost Sharing Formula Funding Increases This budget honors the historic bipartisan Education Cost Sharing (ECS) funding formula agreement achieved in 2017 by fully funding the phase-in of increases to towns as calculated in the formula. The budget reflects the most updated statistics for resident student counts, English Language Learners, and population, among others. Additionally, this budget seeks to correct the shortcomings in one of the metrics – Free and Reduced Price Lunch (FRPL) – by using Direct Certification, which provides for more confidence in the data since it does not depend on self-reporting by families. Finally, the budget accelerates the funding reduction to towns scheduled to experience losses under the formula, making the overall formula more affordable, while maintaining the scheduled increases to towns currently below the full funding of the ECS formula.
20
This budget provides relief to municipalities from “Minimum Budget Requirements” (MBR) for those districts that plan and implement school consolidations and shared service arrangements with other entities. Local and regional boards of education may apply to the Commissioner of Education for a reduction in their MBR in a phased approach over a three-year period. If the cooperative arrangement ceases during this three-year period, the amount of reduction taken must be restored in the following year’s appropriation. This budget also provides MBR relief of up to 50 percent of the respective ECS increase in FY 2020 or FY 2021 in acknowledgement of the rising fixed costs that districts and municipalities face in funding their current educational program. Honoring Our Commitments to Education and Minority Teacher Recruitment The Governor’s proposal builds on existing efforts that are already part of the budget, including:
• $262,500 in each year under the Department of Education to aid schools in recruiting minority teachers; and
• $320,134 in the Office of Higher Education for Minority Teachers Incentives which assists
minority students pursuing careers in education. The budget provides new capital authorizations to the Connecticut Housing Finance Authority to administer a down payment assistance program as an additional way to keep our minority teachers in Connecticut. This authorization, combined with broadened certification reciprocity with other states, will bolster Connecticut’s efforts to attract teacher talent from out of state, making it available to those who have graduated from a Historically Black College or University (HBCU) or Hispanic Serving Institution (HSI). Sharing the Normal Costs for Teachers’ Retirement with Municipalities The budget re-frames the relationship with towns for the normal costs of the Teachers’ Retirement System (TRS) by acknowledging that wages negotiated at the local level have a bearing on teacher pension costs. Under the new proposal, each municipality or local board of education (excluding those designated as Distressed Municipalities by the Department of Economic and Community Development) will remit at least 25 percent of the normal cost (only) paid on its behalf by the state. To reflect the relationship between negotiated wages and pension liabilities, towns with higher average pensionable salaries will contribute an additional percentage of their normal cost equal to their marginal percentage above the statewide median salary. To maintain this new intergovernmental relationship without placing a heavy burden on struggling towns and cities, distressed municipalities will contribute only five percent of their associated normal cost. Previous proposals sought to make municipalities responsible for a portion of the unfunded liability of the underfunded Teachers’ Retirement System. That is not fair – municipalities should not be penalized for bad decisions in the past for which they had no control. The approach in this budget ensures that municipalities have “skin in the game” and share the responsibility for funding the normal cost based on decisions made at the local level.
21
Working Collaboratively with School Districts to Reduce the Costs Funding for education is among the largest expenditures at both the state and local level. Education Cost Sharing grants represent over 10 percent of the General Fund budget. It is in our mutual interest to work together to ensure the provision of the highest quality education, in the most cost effective manner possible – so that no student is left behind and the achievement gap is closed. Governor Lamont’s budget establishes a School Services and Redistricting Commission to engage stakeholders in a thoughtful and structured process which will achieve greater economies of scale and yield savings at the local level beginning this year and continuing for several years. Small local school districts that choose to have inefficient governance structures, and too many expensive superintendents, can no longer expect the state to bear the costs of these decisions. Under this budget, a small local district’s decision to retain rather than share a superintendent may result in a reduction in a district’s ECS grant, after July 1, 2020. The sharing of superintendents, staff, and services will be developed more broadly by the Commission, and will result in cost savings and possible redistricting. Moreover, the Commission will be working in consultation with the Advisory Council on Intergovernmental Relations (ACIR) so that all stakeholders are involved in developing and implementing shared services and related measures. Additionally, the budget invests in special education by funding staff at the Department of Education to work with stakeholders on improving the provision of special education services to students, enhancing cooperative arrangements for those services, and establishing “Centers of Excellence.” By working more creatively with local districts, we can build greater capacity to provide special education services that can be shared among districts, giving students greater opportunities and reducing local special education costs. There will be more training on social-emotional learning, trauma-informed instruction and behavior management strategies. Also, the Department of Education will work with the Department of Administrative Services on improving facilities for those services and the Centers for Excellence. School construction will be more sharply focused on these needs and those of distressed municipalities. Maintaining Commitment to Care 4 Kids Funding This budget will allow the Office of Early Childhood to achieve compliance with federal requirements for the use of Child Care Development Funds, which include rate increases, background checks and graduated phase out when a family’s income increases beyond the current level of 50 percent of state median income. It will also provide more accountability and better federal reporting by more accurately portraying actual state funding requirements rather than the current method of appropriating state General Fund dollars for costs that can be directly funded with federal Child Care Development Funds. The last time Care 4 Kids subsidies for center-based providers were increased was FY 2014. Subsidies for family child care providers were increased pursuant to the collective bargaining contract from FY 2014 through FY 2017. Working Together to Reduce the Costs of Local Government Connecticut’s Balkanized map of 169 municipalities, numerous overlapping local and regional bodies and territories, and a state government that often provides more service delivery than many other states, has led to a fragmented intergovernmental financing system. This budget is
22
the first step in unraveling and restructuring our governance to make it more efficient, cost-effective and to provide higher quality services. To accomplish this we finally take on the massive task of identifying the issues, gathering effective data and creating plans to change our map by empowering the Advisory Commission on Intergovernmental Relations to analyze and create annual work plans to move our state forward. The creation of the best data requires transparency and communication among all levels of our government. This budget makes it easier to detect municipalities that are in the early stages of fiscal distress, and refer them to the Municipal Finance Advisory Commission. The budget re-invigorates the Advisory Commission on Intergovernmental Relations and seeks to work collaboratively on local shared services, to make local governments more efficient and yield property tax relief to Connecticut’s citizens. The budget directs $250,000 from the Municipal Reimbursement and Revenue Account to promote and facilitate the implementation of shared or regional services, makes grants from the Regional Performance Incentive Account to the Regional Councils of Government and consults with the School Services and Redistricting Commission on expanded opportunities. Each COG will establish a regional assessment division that will be responsible for collecting and processing certain data for each municipality within its region with 15,000 parcels or less (146 municipalities), and later towns will conduct five-year revaluations through five regional revaluation zones. By July 1, 2022 those 146 municipalities should have consolidated their assessment and tax collection offices for the tasks that are not performed regionally. Municipalities that choose to have inefficient local property tax assessment and tax collection structures can no longer expect the state to provide the same level of funding and will face penalties in their Local Capital Improvement (LoCIP) and Mashantucket Pequot and Mohegan grants. Sustaining the Commitment to Housing Governor Lamont’s budget maintains funding for various housing programs, including rental assistance and emergency shelters. The investment in housing programs has been instrumental in Connecticut’s efforts to effectively end chronic homelessness for veterans and successfully matching chronically homeless individuals with housing. The budget also provides increased support for the Subsidized Assisted Living Project. Increases in debt service costs are funded to ensure low-income seniors remain in community-based housing settings rather than more costly nursing home care. Governor Lamont continues the commitment to the Money Follows the Person initiative by providing funding for rental assistance vouchers that support additional transitions for individuals who are exiting institutional care. Through this initiative, individuals are returned to the community setting, while avoiding unnecessary, costly nursing home and other institutional placements.
23
Continuing to Invest in Connecticut Governor Lamont’s budget maintains funding for arts and tourism programs. In Connecticut, tourism is a $14 billion economic driver that supports thousands of jobs statewide. The budget maintains over $4 million to market Connecticut as a premier destination for tourism and business growth under the Statewide Marketing program. Additionally, the budget maintains funding to support grants to arts and tourism entities throughout the region. Becoming a Leader in Effective Workforce Development The budget also invests in Connecticut’s future by positioning the state as a leader in effective workforce development efforts. This begins with supporting towns in their effort to provide every student with a high-quality K-12 education that lays the foundation for a lifetime of success, continues as students move through our excellent state college and university system, and culminates in our agencies’ collaborative approach to scaling the programs that have proven most successful in preparing the people of Connecticut with the skills they need and our businesses need to thrive in a 21st-century economy. Throughout that pipeline, the state is committed to working in partnership with employers whose dedication to building a workforce suitable to the state’s many thriving industry clusters provides the opportunity to deliver workforce development programs that result in meaningful employment and a dedicated, skilled, credentialed workforce. Those programs include the Connecticut Department of Labor’s successful Eastern Connecticut Manufacturing Pipeline (over $900,000 in each year of the biennium), a portable and flexible model driven by employer need that can be adapted to accommodate other industries and implemented in additional regions of the state; the Platform to Employment ($1.75 million in each year of the biennium), which helps upskill long-term job-seekers and has a job placement rate of over 84 percent; and nationally recognized pre-apprenticeship and apprenticeship certification programs that are customized by employers and aligned with academic institutions throughout the state to prepare youth from both traditional and alternative education programs for meaningful employment. Economic Development Governor Lamont recognizes the need to transform the state’s economic development strategy to better position the state to recruit and support businesses. To that end, the Governor re-invigorated the state’s economic development and workforce development through new leadership and public private partnership. The innovative partnership, known as the Partnership to Advance the Connecticut of Tomorrow (PACT), between the Department of Economic and Community Development and the nonprofit Connecticut Economic Resource Center, Inc., will strengthen the state’s ability to actively recruit new businesses while supporting, promoting and advocating for existing businesses. Maintaining Funding for Higher Education Despite the significant fiscal challenges facing the state, this budget sustains and grows the commitment to higher education. The budget funds the public higher education system block
24
grant and fringe benefit funding at FY 2019 levels plus funding increases for negotiated collective bargaining costs, and phases in the final year of the Bioscience Connecticut initiative at the University of Connecticut Health Center. The budget also sustains appropriations of $16.2 million for community colleges and $13.5 million at the UConn Health Center to support fringe benefits outside of the state’s General Fund. Governor Lamont believes in continuing the investments in higher education as it grows the economy, contributes to the vitality of the state, and builds the workforce of tomorrow. Additionally, the Governor is concerned about the accessibility and affordability of higher education for all Connecticut’s students. That is why he maintained funding for the Roberta J. Willis Scholarship program which provides need and need-merit based student financial aid to Connecticut students attending public and private colleges.
Criminal Justice and Public Safety Initiatives Governor Lamont is including policies, investments, and strategies in his budget intended to further Connecticut’s falling crime, arrest, and recidivism trends. To that end, the state will make its criminal justice system more equitable, data-driven and effective for its residents. Pursuing that goal will help both victims recover from crime and people who have completed their sentences return to the community as full, taxpaying members of society. There are six areas in the Governor’s budget highlighting his commitment to criminal justice. First, the proposed budget empowers the Department of Emergency Services and Public Protection to begin executing a strategy to address attrition in the ranks of the Connecticut State Police. The Governor’s budget provides approximately $1.25 million to recruit, train, and outfit a large trooper class in FY 2020, with the goal of over one hundred recruits on day one and graduating 80 to 90 new state troopers. Second, there’s a need to increase fairness in the parole revocation process and reduce the high cost to the corrections system of parole violations. Beginning in FY 2020, the Governor’s budget includes approximately $250,000 in funding for the Office of the Chief Public Defender to hire four staff for a pilot project to provide appointed counsel at parole violation hearings. In addition, Governor Lamont calls on agencies and stakeholders to collaborate in analyzing the best available parole violation data, identify factors contributing to returns to prison, and develop strategies and approaches to lower recidivism. Rather than spend more on the use of costly prison beds to respond to recidivism, efforts should focus on how to reduce parole revocations. Third, to fund the Governor’s strategy to address the opioid epidemic, $2 million and $6 million are recommended in FY 2020 (effective March 1, 2020) and FY 2021, respectively, to expand medication-assisted treatment, which is shown to be clinically effective in fighting opioid withdrawal and helping reduce relapse in our correctional facilities. Fifty-two percent of people in Connecticut who died of a drug overdose had at one point been in a correctional facility. This investment will help promote both a safer environment for corrections officers and greater recovery among people in prison with opioid use disorders.
25
Fourth, investments are recommended to help people overcome barriers to securing a second chance. Funding in the amount of $92,520 is provided to the Department of Transportation in each year of the biennium to provide 60-day bus passes for people needing them during reentry. Also, the budget recommends $230,000 in both years of the biennium for the Department of Correction (DOC) to provide state identification cards for all people leaving prison. Having valid identification and reliable transportation will help people returning to the community secure work, stable housing, and mental health and substance addiction treatment. Fifth, the budget recommends continued support for a case management system for prosecutors as well as $8.9 million in new capital funding for the Criminal Justice Information System (CJIS). CJIS’ Connecticut Information Sharing System enables credentialed criminal justice professionals to share electronic information instantly, benefitting everyone from law enforcement to the Board of Pardons and Paroles. Prosecutors should not have to rely on paper files in buckets in courtrooms to carry out their crucial role as gatekeepers of the criminal justice system. With the increase in available data, legislation is being proposed to include prosecutorial data in efforts to understand trends at the front end of the system. This information will help expand data-driven prosecutorial decision-making and increase communities’ confidence that there will be greater transparency in our criminal justice system. Sixth, the Governor recommends closing four housing units in DOC in order to right-size Connecticut’s prison capacity to meet current need, resulting in $3.9 million in savings. These efficiency savings will be realized by closing prison units and buildings that are underutilized or have become inefficient to maintain. The department will safely and securely move inmates to other buildings or units within a facility or to another facility in order to reduce space that requires posting custody staff. This will allow the department to redeploy correctional staff to vacant posts that are covered with overtime, resulting in savings. In addition to reducing staffed space, the Governor is proposing overtime savings of $6.3 million in DOC, which can be achieved by maintaining an efficient balance of staffing of custody posts and management of policies pertaining to overtime rules. Juvenile Justice Policy and Oversight Committee and Child Advocate Recommendations The Governor’s budget includes funding in DOC to address recommendations of the Juvenile Justice Policy and Oversight Committee and the Office of the Child Advocate. Research shows that all youth in custody are at risk for suicide and the deeper youth move into the correctional system, the higher the risk for self-harm and suicidal behaviors. Governor Lamont is providing funding of $86,000 for a professional mental health resource counselor in DOC to focus on suicide prevention for juveniles in the system. Additionally, the Governor is providing one-time funding of $75,000 for DOC to develop and deliver a training curriculum for Manson Youth Institute corrections officers and staff on providing developmentally-appropriate programs, services, and behavioral management to the juvenile population. The training curriculum will be modeled after the one delivered to TRUE (Truthfulness, Respectfulness, Understanding, and Elevating) Unit corrections officers and staff.
26
Health and Human Services Governor Lamont’s budget maintains important commitments to serve individuals who rely on the state for care and supports the providers of those services. A total of $46.2 million in new funding over the biennium will support increased caseload needs in the Department of Developmental Services (DDS). Specifically, it will fund day programs for high school graduates (324 in FY 2020 and 369 in FY 2021); individuals aging out of residential placements in the Department of Children and Families (DCF) or Local Education Authorities (LEAs) (112 in FY 2020 and 79 in FY 2021), and individuals transitioning to the community under the Money Follows the Person (MFP) program (39 in FY 2020 and 15 in FY 2021). The funding also supports residential placements for individuals aging out of DCF or LEAs (77 in FY 2020 and 67 in FY 2021), and individuals transitioning to the community under the MFP program from institutional settings, including Southbury Training School, or court-ordered placements (65 in FY 2020 and 53 in FY 2021). Additionally, the Governor continued support for the MFP program within the Department of Mental Health and Addiction Services (DMHAS) by funding 45 new placements in FY 2020 and 48 new placements in FY 2021. In addition, the Governor was able to maintain and annualize funding in DDS to address critical needs and to transition individuals who would otherwise languish in emergency departments by supporting services such as: six step up/step down beds designed to divert individuals in crisis and in need of behavioral stabilization from emergency department settings; a state-operated respite center open seven days per week specializing in crisis respite and reunification/reintegration work; and an enhanced Individual and Family Support team that will focus on rapid response for more than 3,700 individuals and families experiencing crisis in community-based settings by providing behavioral supports, case management, speech therapy and other services. The budget also includes funding in FY 2021 to support 70 new supportive housing units anticipated to come online during late FY 2020. These units will expand the continuum of residential services for DDS consumers serving individuals with intellectual disability and autism spectrum disorder by supporting individuals in their own apartments with wraparound services such as in-home supports, case management and rental assistance. The budget also annualizes FY 2019 cost of living adjustments (COLAs) for private providers and Medicaid rate increases. This included the minimum wage increases and 5 percent private provider COLAs required under Special Act 18-5 for employees in DDS private provider organizations at an annualized cost of approximately $58 million and the annualization of one percent COLAs required under Public Act 18-81 for private providers in DMHAS, DCF, DSS, DORS, DOC, DPH, and DOH, as well as OEC and the Judicial Department’s Court Support Services Division at a value of approximately $6 million. Additionally, $6 million in annualized funding is provided over the biennium to support the cost of anticipated increases in the state’s minimum wage for employees in the state’s private provider agencies. An additional $10.6 million in Medicaid funding ($21.3 million for providers after factoring in the federal share) is recommended to annualize FY 2019 Medicaid rate increases for nursing homes, intermediate care facilities for individuals with intellectual disabilities, waiver services and certain
27
home health services. The Governor also provides funding in DSS and DDS totaling $6.9 million over the biennium to support collective bargaining increases for personal care attendants. The budget also includes $9.1 million in net funding for the Department of Children and Families to honor the state’s commitment to the 2017 Revised Juan F. Exit Plan by adequately supporting community-based programming to address service needs in order to implement the Exit Plan’s outcome measures. Additionally, $4.1 million is recommended to maintain important clinical interventions and other services utilized by non-delinquent youth following the reallocation of juvenile justice funding by the legislature to the Judicial Branch, further enabling the department to meet Juan F. requirements. The Governor is also committed to supporting new initiatives to invest in the health of Connecticut’s residents. Funding of $4.5 million in FY 2020 and $8.8 million in FY 2021 is provided to expand the state’s childhood vaccine program in order to provide additional nationally recommended vaccines at significantly reduced cost. Two new vaccines will be available to insured children through this universal access program in FY 2020 – rotavirus and serogroup B meningococcal. Expanding the provision of influenza vaccine to children through age eighteen will commence in FY 2021. With the addition of the rotavirus vaccine, the state’s childhood immunization program will cover all of the sixteen vaccines currently recommended by the Centers for Disease Control and Prevention (CDC). Combatting the Opioid Crisis The recently-enacted federal SUPPORT Act to address the opioid crisis provides 100 percent federal funding to states for specific activities, including upgrades and enhancements to the state prescription monitoring program (PMP). The Office of Health Strategy and the Department of Consumer Protection are coordinating the preparation of funding requests to allow collection and production of specific quality metrics regarding opioids, PMP data sharing between contiguous states, and data sharing between the PMP and Medicaid. In addition, Governor Lamont is submitting a legislative proposal to enhance Connecticut’s response to the opioid crisis by reducing the likelihood of misuse of prescription opioids, facilitating oversight of opioid prescriptions, providing for early identification of pharmacies that may be engaging in questionable practices, and ensuring access to life-saving opioid antagonists. Funding in the amount of $500,000 has been included in the Department of Social Services’ budget to support consultant services to assist DSS, DMHAS, DCF, DOC and OPM in examining various methodologies, including a section 1115 demonstration project, to develop and implement a plan to address gaps in the state’s treatment of substance use disorder. Operational Efficiencies This budget leverages non-profit expertise by converting certain DMHAS state-run services to non-profit operations while honoring collective bargaining agreements and maintaining bed capacity. The initiative challenges the department’s leadership to invest in high quality and
28
efficient community solutions while achieving $2.3 million in savings in FY 2020 and $4.3 million in FY 2021. Additional operational efficiencies will be achieved under DCF through the creation of a central transportation unit, revising the process by which court-ordered evaluations are procured, applying new technologies to the management of employee overtime, procuring case management for children and families voluntarily receiving departmental services, and adding intensive care coordination services to the differential response system. Aggregate net savings of $4.6 million in FY 2020 and $8.4 million in FY 2021 are associated with these initiatives. Department of Social Services Governor Lamont’s budget maintains income eligibility for the Medicare Savings Program (MSP), which will remain the highest in the country. Recognizing that Connecticut is one of only eight states that does not have an asset test, the Governor is proposing to reinstitute the asset test similar to what was in place prior to FY 2010. With this change, Connecticut will join the 40 states with an asset test that is equal to the federal minimum (currently, $7,560 for singles and $11,340 for couples). Consistent with federal rules, countable resources include money in a checking or savings account, stocks and bonds. An individual’s home, one car, a burial plot, up to $1,500 in a burial account, household and personal items will be excluded. To avoid excessive administrative costs, the asset test will be effective July 1, 2020, in order that the asset verification system is in place prior to implementation. This proposal will reduce state Medicaid expenditures in FY 2021 by $10.5 million ($21.0 million after factoring in the federal share). These savings figures reflect the state’s share of Medicaid expenditures, which cover the costs of deductibles, coinsurance and copayments under the Qualified Medicare Beneficiary program, which is by far the largest of the three components of MSP. In addition, because Medicare premiums are covered through the diversion of Medicaid revenue, less revenue will need to be diverted to cover these costs, resulting in additional revenue of $16.0 million in FY 2021. In total, after factoring in staffing and systems costs, this proposal will result in net savings to the state of $25.6 million in FY 2021. To help reduce future costs, the Governor’s budget also includes funding to implement a CDC-recognized diabetes prevention program for HUSKY Health members. This is a national evidence-based program that has been proven to help individuals reduce their risk of developing type 2 diabetes through lifestyle coaching on lowering calories, increasing physical activity, self-monitoring, maintaining healthy behaviors, and handling psychological, social, and motivational challenges. This initiative is expected to reduce the state’s share of Medicaid expenses in FY 2021 by $520,000 ($1.3 million after factoring in the federal share). Building off of Connecticut’s successful managed fee-for-service framework, the Governor’s budget reflects continued efforts to achieve cost savings under the Medicaid program. In conjunction with national consultants, a joint review of the Medicaid program identified additional areas for potential savings. Following the completion of this work, the Department of Social Services developed a number of proposals that will result in cost savings. These include a focus on utilization management, program integrity, rebalancing of long-term services and
29
supports, pharmacy rebate optimization, value-based payments, and linking payments to social determinants of health. The state’s share of Medicaid expenditures is reduced by:
• $3.4 million in FY 2020 and $11.8 million in FY 2021 by strengthening utilization management (e.g., requiring confirmation of medical necessity of services that may be over-utilized or for which there are appropriate alternatives) based on a review of other states and payers ($8.5 million in FY 2020 and $29.5 million in FY 2021 after factoring in the federal share of Medicaid expenditures);
• $6.4 million in FY 2020 and $7.3 million in FY 2021 by providing further support of program
integrity efforts ($16.1 million in FY 2020 and $18.3 million in FY 2021 after factoring in the federal share);
• $480,000 in FY 2020 and $4.7 million in FY 2021 by strengthening rebalancing efforts under Money Follows the Person, beyond the 529 transitions already assumed in DSS in each year of the biennium, by supporting 800 additional transitions to the community in the second year of the biennium ($1.0 million in FY 2020 and $9.5 million in FY 2021 after factoring in the federal share);
• $3.5 million in FY 2021 by exploring additional opportunities to increase the department’s pharmacy purchasing power by expanding upon efforts to work with other states to leverage lower prices and increased rebates ($8.8 million in FY 2021 after factoring in the federal share);
• $580,000 in FY 2020 and $3.1 million in FY 2021 by implementing a Medicaid supportive housing benefit for up to 850 Medicaid recipients who have experienced homelessness and whose average Medicaid costs exceed $40,000 per year ($2.7 million in FY 2020 and $13.9 million in FY 2021 after factoring in the federal share);
• $2.4 million in FY 2020 and $2.9 million in FY 2021 by reducing excess nursing home capacity through the rebasing of nursing home rates and eliminating “stop loss” provisions for homes with very low occupancy or very low federal quality measure scores ($4.9 million in FY 2020 and $5.8 million in FY 2021 after factoring in the federal share);
• $2.0 million in FY 2020 and $2.4 million in FY 2021 by instituting a value-based component to certain hospital payments such that readmissions within 30 days after discharge for a related diagnosis will be subject to a readmission payment adjustment of 15 percent ($6.1 million in FY 2020 and $7.3 million in FY 2021 after factoring in the federal share);
• $500,000 in FY 2020 and $1.8 million in FY 2021 by expanding step therapy to additional drug classes with drugs for the treatment of atopic dermatitis, rheumatoid arthritis, plaque psoriasis and inflammatory bowel disease to be reviewed ($1.5 million in FY 2020 and $5.6 million in FY 2021 after factoring in the federal share); and
30
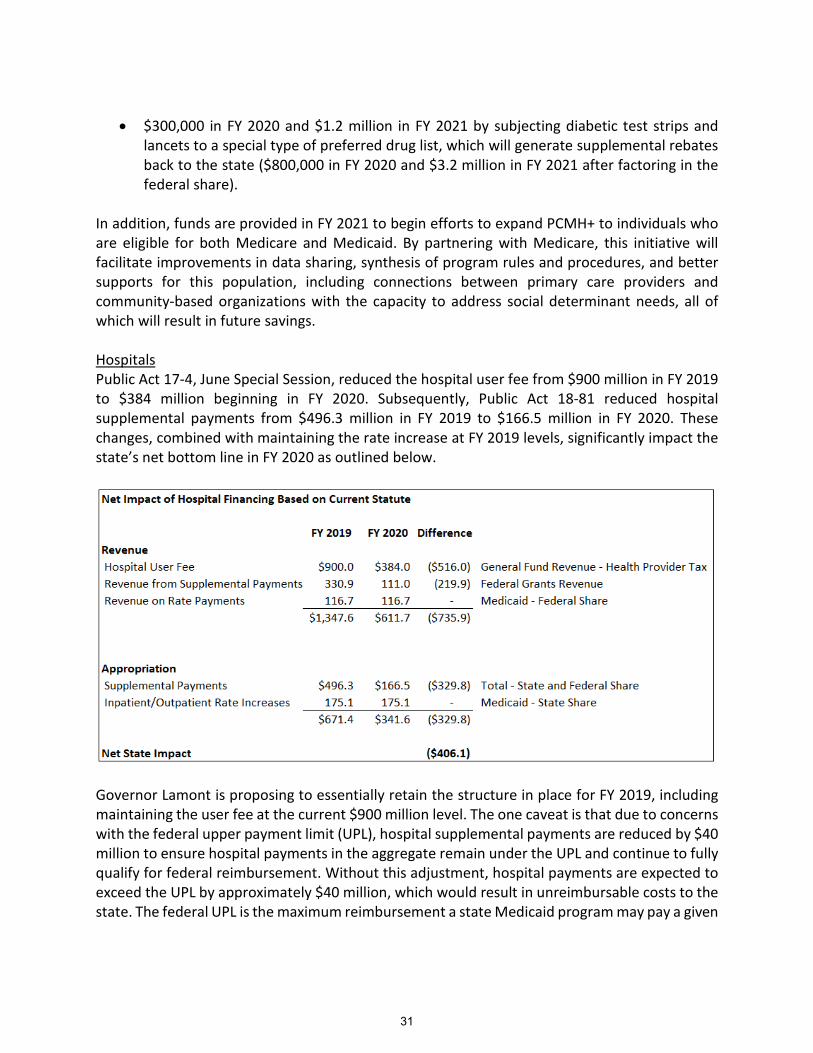
• $300,000 in FY 2020 and $1.2 million in FY 2021 by subjecting diabetic test strips and
lancets to a special type of preferred drug list, which will generate supplemental rebates back to the state ($800,000 in FY 2020 and $3.2 million in FY 2021 after factoring in the federal share).
In addition, funds are provided in FY 2021 to begin efforts to expand PCMH+ to individuals who are eligible for both Medicare and Medicaid. By partnering with Medicare, this initiative will facilitate improvements in data sharing, synthesis of program rules and procedures, and better supports for this population, including connections between primary care providers and community-based organizations with the capacity to address social determinant needs, all of which will result in future savings. Hospitals Public Act 17-4, June Special Session, reduced the hospital user fee from $900 million in FY 2019 to $384 million beginning in FY 2020. Subsequently, Public Act 18-81 reduced hospital supplemental payments from $496.3 million in FY 2019 to $166.5 million in FY 2020. These changes, combined with maintaining the rate increase at FY 2019 levels, significantly impact the state’s net bottom line in FY 2020 as outlined below.
Governor Lamont is proposing to essentially retain the structure in place for FY 2019, including maintaining the user fee at the current $900 million level. The one caveat is that due to concerns with the federal upper payment limit (UPL), hospital supplemental payments are reduced by $40 million to ensure hospital payments in the aggregate remain under the UPL and continue to fully qualify for federal reimbursement. Without this adjustment, hospital payments are expected to exceed the UPL by approximately $40 million, which would result in unreimbursable costs to the state. The federal UPL is the maximum reimbursement a state Medicaid program may pay a given
31
provider type in the aggregate and can vary each year as it is based on what Medicare would have paid for the same services.
Other Initiatives Pursuing Opportunities to Drive Efficiencies in State Operations The Governor is adamant that the state pursue efficiencies in state operations. This budget reflects cost reductions in many areas. As noted earlier, efforts in Medicaid and other health and human services programs include expanding long-term care rebalancing efforts, leveraging pharmacy purchasing power, and focusing on utilization management and program integrity (net state savings of $13.1 million in FY 2020, and $33.1 million in FY 2021); shifting certain state-operated services to nonprofit providers ($2.3 million in FY 2020, and $4.3 million in FY 2021); in the criminal justice area by closing unneeded or outmoded prison facilities ($3.9 million in each year of the biennium), and through many smaller cost saving measures in a variety of other agencies ($4.6 million in FY 2020 and $8.9 million in FY 2021). Additionally, efforts to reduce overtime, including through reassignment of staff and use of technology, such as automated scheduling systems, are expected to generate savings of $13.3 million in each year of the biennium. Making Investments to Improve Service Delivery – Digital Front Door Connecticut residents and businesses deserve seamless interactions with an efficient, evidence-based government. This budget invests in a new digital and performance agenda that will put Connecticut on a path to become one of the nation’s most user-friendly, cost-effective, data-informed, results-driven states. The investment includes the following components:
• Leverages the new Chief Operating Officer (COO) within the Office of the Governor to focus on instilling private-sector discipline and customer focus to the mission of government. The cross-agency performance management system will introduce clear priorities, set high standards, and align agency efforts around the important issues residents care about most, like jobs and the economy, family and child success, transportation, and community vitality – breaking down silos to deliver unified services to our customers.
• Reduces costs and improves taxpayer experiences by creating a Connecticut Digital Service. Every year, residents become more comfortable with online and mobile technology. Housed within the Department of Administrative Services (DAS), the Governor is adding $2 million in FY 2020 and $4.4 million in FY 2021 for staffing and the new digital service that will work with agencies to move their interactions with businesses and residents to the cloud, as well as across agencies to provide a digital one-stop-shop for people starting a business, accessing support during a family crisis, or seeking stability
32
through training and employment. The budget also envisions evaluating cost-saving opportunities to digital procurement to avoid the common challenge across states of purchasing over-priced, underperforming IT systems. Finally, it begins to modernize Connecticut’s digital workforce to support more rapid forms of technology delivery.
• Makes government more efficient and more responsive by unleashing evidence-based
responses to our biggest challenges. The purpose of state programs is to achieve better outcomes as a result of public investment. From workforce development to opioid response, Connecticut’s state and local governments devote billions of dollars to improving lives. By investing in digital services and improved analytics capacity, the budget proposes to use existing state data to understand the results being achieved today and identify opportunities to improve, scale effective programs and, where appropriate, achieve savings by reforming or eliminating ineffective efforts.
The Lamont Administration’s modest investments in this lean digital and performance agenda will strengthen Connecticut, enabling the state to more efficiently manage resources and be more responsive to residents. By bringing these business-minded approaches to government, the Lamont Administration can achieve measurably better results for the public. Governor Lamont understands the simplest and most cost-effective way to improve interactions with the Department of Motor Vehicles (DMV) is to reduce interactions with the DMV. That is why the Governor’s legislative package includes a proposal to extend the time between drivers’ license renewals from six years to eight years, and the time between registrations from two years to three years. In addition, the Governor will work to thoughtfully implement an option for residents to “skip a trip” between renewals by renewing their license online. These initiatives will cut down on residents’ trips to the DMV, and help to shorten the wait time when they do need to visit. Supporting Working Families Through Paid Family Medical Leave and Increasing the Minimum Wage Our society has built-in inequities in families’ ability to care for themselves and loved ones. Whereby middle- and upper-income individuals working for large employers are more likely to have access to paid family medical leave (PFML), only about six percent of low-income workers do. This budget proposes a framework for equalizing the ability of both men and women to take time to bond with a new child, and to care for themselves or a family member. In addition to improved health outcomes, PFML also makes business sense. Workers who have access to paid leave tend to return to work after a child’s birth, reducing business turnover costs and in some instances costs to the state for public assistance. Businesses will be able to offer this benefit to their employees at no fiscal cost; Connecticut’s PFML program will be funded via a payroll tax on employees of approximately 0.5 percent, which will raise an estimated $400 million annually. The payroll tax will be effective July 1, 2020 to fund system development and ramp up operations, with benefit payments beginning in FY 2022.
33
Governor Lamont’s budget also proposes recommendations made by the Connecticut Commission on Fiscal Stability and Economic Growth to phase-in an increase in the minimum wage to $15 over four years. Doing so may provide Connecticut’s families the economic stability they need to rise up out of poverty and decrease their need for state assistance or subsidies. Also, many families often work multiple jobs to provide for their families and increasing the minimum wage will allow them more time to spend with their loved ones. The minimum wage would increase from $10.10 to $11.25 in January 2020, followed by an increase of $1.25 every year until it reaches $15 per hour in 2023, the same year as Massachusetts reaches that threshold. Providing Additional Regulatory Resources for the Department of Consumer Protection The Governor’s budget includes approximately $190,000 in additional funding for each year of the biennium for the Department of Consumer Protection to hire 2.5 additional staff for the regulation and enforcement of palliative use of marijuana, the cottage foods industry and homemaker companions. Developing a State-Licensed Industrial Hemp Program The 2018 federal Farm Bill legalized industrial hemp and allows states to submit a plan and apply for primary regulatory authority over the production of hemp in their state. Governor Lamont is providing three positions and funding of $136,000 in the Department of Agriculture to develop and regulate a state industrial hemp program. In addition, one lab technician position is provided to the Agricultural Experiment Station to conduct testing of the hemp being grown to ensure compliance of mandated restrictions on the product. This is an economic development opportunity for agricultural producers in Connecticut, a sector that represents $4 billion in economic impact to the state each year, and employs about 22,000 people. Governor Lamont is solidifying his commitment to economic development and agriculture by investing in this new opportunity. Offshore Wind Energy Governor Lamont’s legislative package includes a proposal to allow the Department of Energy and Environmental Protection, in consultation with the Office of Consumer Counsel and the Procurement Manager at the Public Utilities Regulatory Authority, to conduct a solicitation of providers of energy from offshore wind facilities. This will allow Connecticut the opportunity to take advantage of new offshore wind developments off the New England coast to increase the amount of clean energy supported by the state.
Conclusion The baseline for budget development—the consensus revenue estimate released on January 15, 2019, plus estimated expenditures for the biennium before policy changes—results in a General Fund gap of more than $1.5 billion for FY 2020 and $2.2 billion for FY 2021. The Governor’s recommended budget resolves this imbalance primarily through increases in available revenue of $1,275.1 million in FY 2020 and $1,747.2 million in FY 2021, and net reductions in expenditure
34
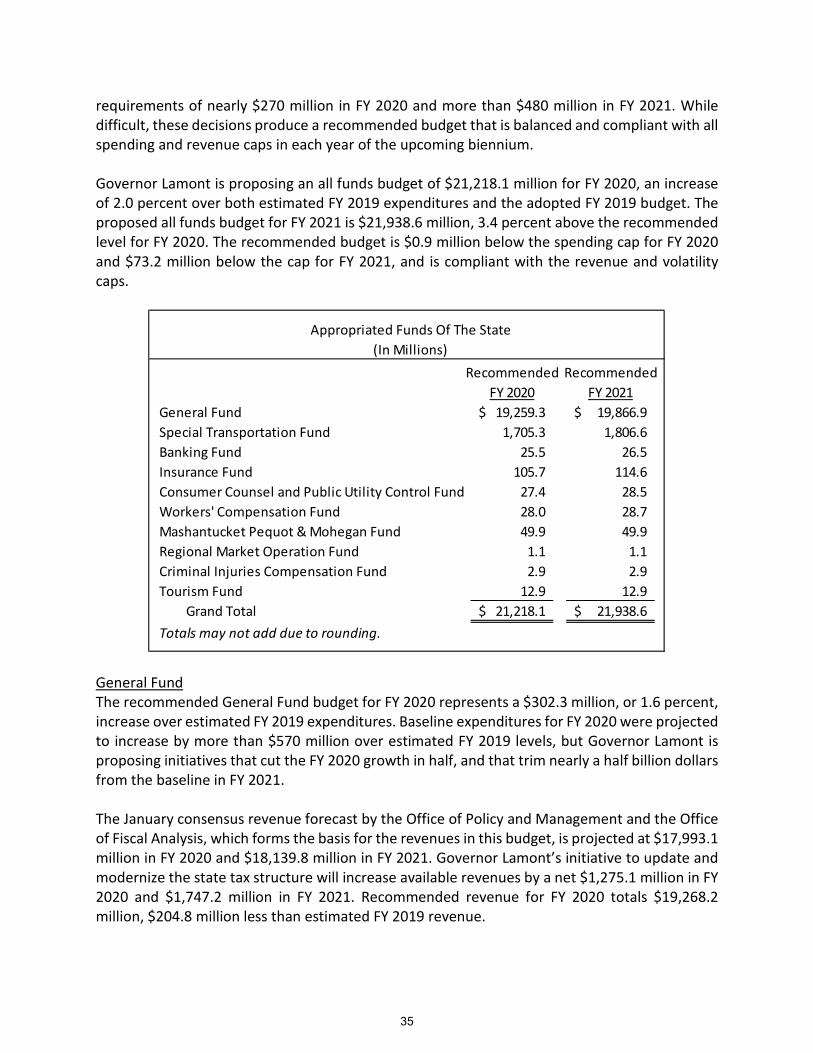
requirements of nearly $270 million in FY 2020 and more than $480 million in FY 2021. While difficult, these decisions produce a recommended budget that is balanced and compliant with all spending and revenue caps in each year of the upcoming biennium. Governor Lamont is proposing an all funds budget of $21,218.1 million for FY 2020, an increase of 2.0 percent over both estimated FY 2019 expenditures and the adopted FY 2019 budget. The proposed all funds budget for FY 2021 is $21,938.6 million, 3.4 percent above the recommended level for FY 2020. The recommended budget is $0.9 million below the spending cap for FY 2020 and $73.2 million below the cap for FY 2021, and is compliant with the revenue and volatility caps.
General Fund The recommended General Fund budget for FY 2020 represents a $302.3 million, or 1.6 percent, increase over estimated FY 2019 expenditures. Baseline expenditures for FY 2020 were projected to increase by more than $570 million over estimated FY 2019 levels, but Governor Lamont is proposing initiatives that cut the FY 2020 growth in half, and that trim nearly a half billion dollars from the baseline in FY 2021. The January consensus revenue forecast by the Office of Policy and Management and the Office of Fiscal Analysis, which forms the basis for the revenues in this budget, is projected at $17,993.1 million in FY 2020 and $18,139.8 million in FY 2021. Governor Lamont’s initiative to update and modernize the state tax structure will increase available revenues by a net $1,275.1 million in FY 2020 and $1,747.2 million in FY 2021. Recommended revenue for FY 2020 totals $19,268.2 million, $204.8 million less than estimated FY 2019 revenue.
Appropriated Funds Of The State(In Millions)
Recommended RecommendedFY 2020 FY 2021
General Fund 19,259.3$ 19,866.9$ Special Transportation Fund 1,705.3 1,806.6 Banking Fund 25.5 26.5 Insurance Fund 105.7 114.6 Consumer Counsel and Public Utility Control Fund 27.4 28.5 Workers' Compensation Fund 28.0 28.7 Mashantucket Pequot & Mohegan Fund 49.9 49.9 Regional Market Operation Fund 1.1 1.1 Criminal Injuries Compensation Fund 2.9 2.9 Tourism Fund 12.9 12.9 Grand Total 21,218.1$ 21,938.6$ Totals may not add due to rounding.
35
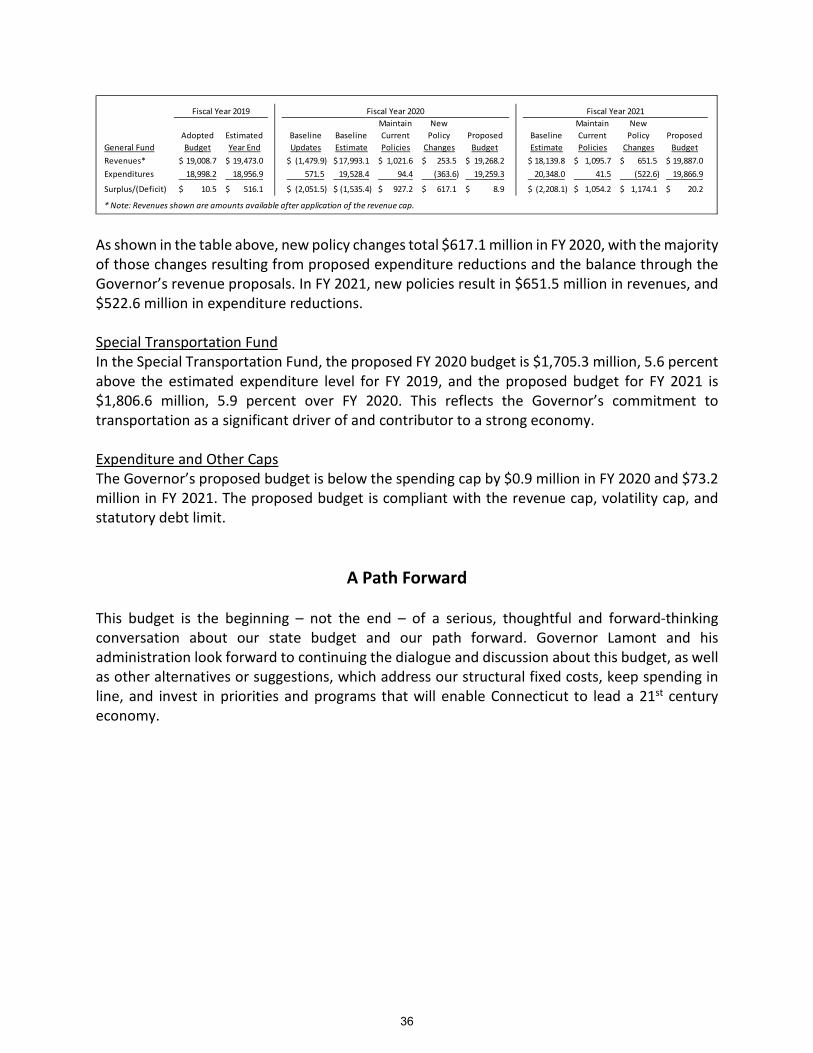
As shown in the table above, new policy changes total $617.1 million in FY 2020, with the majority of those changes resulting from proposed expenditure reductions and the balance through the Governor’s revenue proposals. In FY 2021, new policies result in $651.5 million in revenues, and $522.6 million in expenditure reductions. Special Transportation Fund In the Special Transportation Fund, the proposed FY 2020 budget is $1,705.3 million, 5.6 percent above the estimated expenditure level for FY 2019, and the proposed budget for FY 2021 is $1,806.6 million, 5.9 percent over FY 2020. This reflects the Governor’s commitment to transportation as a significant driver of and contributor to a strong economy. Expenditure and Other Caps The Governor’s proposed budget is below the spending cap by $0.9 million in FY 2020 and $73.2 million in FY 2021. The proposed budget is compliant with the revenue cap, volatility cap, and statutory debt limit.
A Path Forward This budget is the beginning – not the end – of a serious, thoughtful and forward-thinking conversation about our state budget and our path forward. Governor Lamont and his administration look forward to continuing the dialogue and discussion about this budget, as well as other alternatives or suggestions, which address our structural fixed costs, keep spending in line, and invest in priorities and programs that will enable Connecticut to lead a 21st century economy.
Maintain New Maintain NewAdopted Estimated Baseline Baseline Current Policy Proposed Baseline Current Policy Proposed
General Fund Budget Year End Updates Estimate Policies Changes Budget Estimate Policies Changes BudgetRevenues* 19,008.7$ 19,473.0$ (1,479.9)$ 17,993.1$ 1,021.6$ 253.5$ 19,268.2$ 18,139.8$ 1,095.7$ 651.5$ 19,887.0$ Expenditures 18,998.2 18,956.9 571.5 19,528.4 94.4 (363.6) 19,259.3 20,348.0 41.5 (522.6) 19,866.9
Surplus/(Deficit) 10.5$ 516.1$ (2,051.5)$ (1,535.4)$ 927.2$ 617.1$ 8.9$ (2,208.1)$ 1,054.2$ 1,174.1$ 20.2$
* Note: Revenues shown are amounts available after application of the revenue cap.
Fiscal Year 2019 Fiscal Year 2020 Fiscal Year 2021
36
SECTION A
FINANCIAL SUMMARY

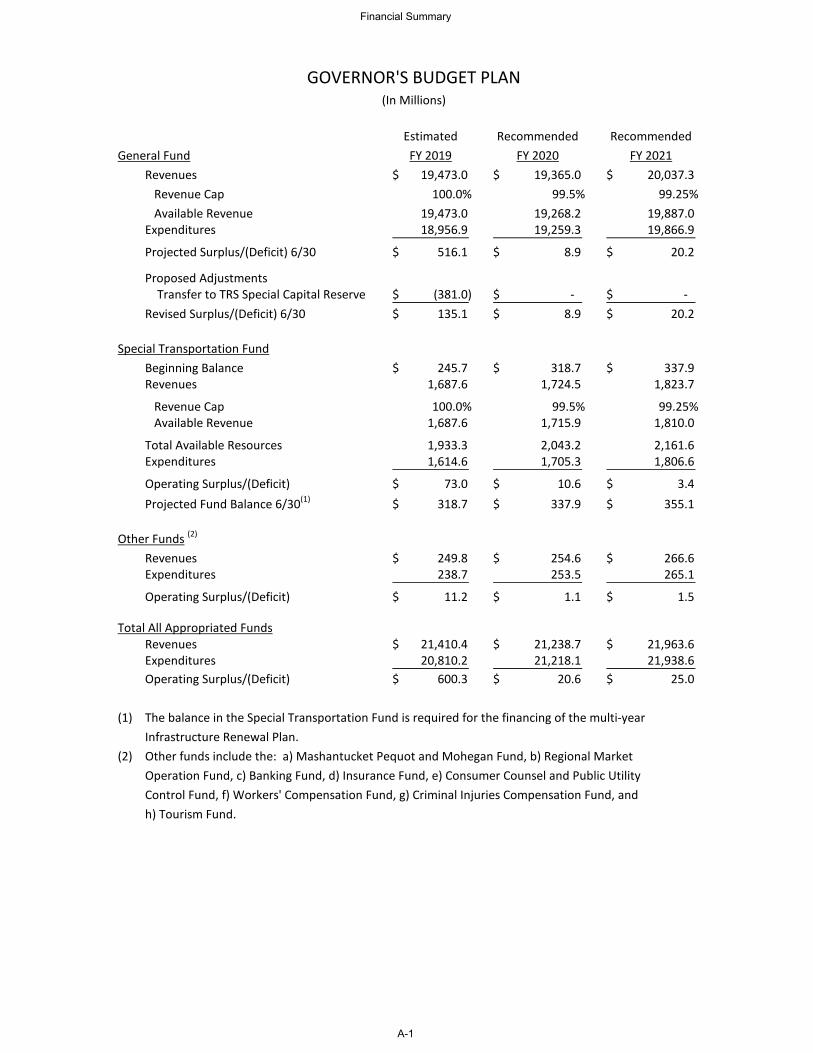
Estimated Recommended RecommendedGeneral Fund FY 2019 FY 2020 FY 2021
Revenues 19,473.0$ 19,365.0$ 20,037.3$ Revenue Cap 100.0% 99.5% 99.25% Available Revenue 19,473.0 19,268.2 19,887.0 Expenditures 18,956.9 19,259.3 19,866.9
Projected Surplus/(Deficit) 6/30 516.1$ 8.9$ 20.2$
Proposed Adjustments Transfer to TRS Special Capital Reserve (381.0)$ -$ -$ Revised Surplus/(Deficit) 6/30 135.1$ 8.9$ 20.2$
Special Transportation FundBeginning Balance 245.7$ 318.7$ 337.9$ Revenues 1,687.6 1,724.5 1,823.7
Revenue Cap 100.0% 99.5% 99.25% Available Revenue 1,687.6 1,715.9 1,810.0
Total Available Resources 1,933.3 2,043.2 2,161.6 Expenditures 1,614.6 1,705.3 1,806.6
Operating Surplus/(Deficit) 73.0$ 10.6$ 3.4$ Projected Fund Balance 6/30(1) 318.7$ 337.9$ 355.1$
Other Funds (2)
Revenues 249.8$ 254.6$ 266.6$ Expenditures 238.7 253.5 265.1
Operating Surplus/(Deficit) 11.2$ 1.1$ 1.5$
Total All Appropriated FundsRevenues 21,410.4$ 21,238.7$ 21,963.6$ Expenditures 20,810.2 21,218.1 21,938.6 Operating Surplus/(Deficit) 600.3$ 20.6$ 25.0$
(1) The balance in the Special Transportation Fund is required for the financing of the multi-yearInfrastructure Renewal Plan.
(2) Other funds include the: a) Mashantucket Pequot and Mohegan Fund, b) Regional MarketOperation Fund, c) Banking Fund, d) Insurance Fund, e) Consumer Counsel and Public Utility Control Fund, f) Workers' Compensation Fund, g) Criminal Injuries Compensation Fund, andh) Tourism Fund.
GOVERNOR'S BUDGET PLAN(In Millions)
Financial Summary
A-1
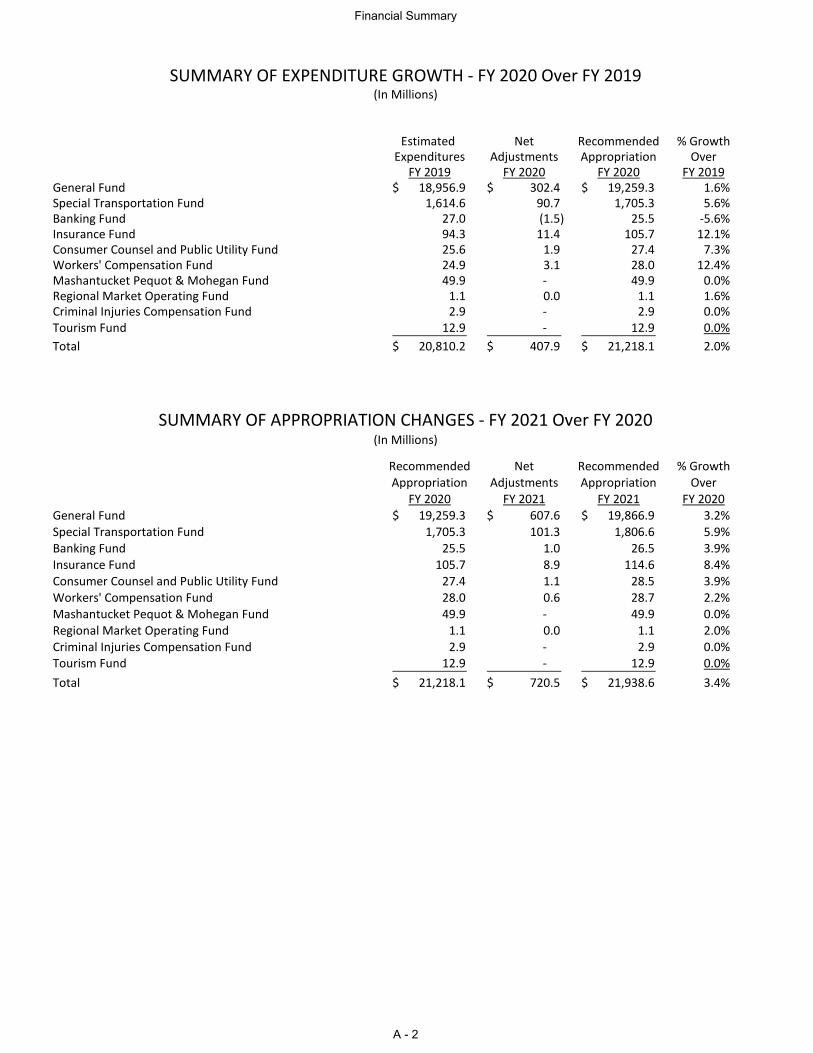
Estimated Net Recommended % GrowthExpenditures Adjustments Appropriation Over
FY 2019 FY 2020 FY 2020 FY 2019General Fund 18,956.9$ 302.4$ 19,259.3$ 1.6%Special Transportation Fund 1,614.6 90.7 1,705.3 5.6%Banking Fund 27.0 (1.5) 25.5 -5.6%Insurance Fund 94.3 11.4 105.7 12.1%Consumer Counsel and Public Utility Fund 25.6 1.9 27.4 7.3%Workers' Compensation Fund 24.9 3.1 28.0 12.4%Mashantucket Pequot & Mohegan Fund 49.9 - 49.9 0.0%Regional Market Operating Fund 1.1 0.0 1.1 1.6%Criminal Injuries Compensation Fund 2.9 - 2.9 0.0%Tourism Fund 12.9 - 12.9 0.0%Total 20,810.2$ 407.9$ 21,218.1$ 2.0%
Recommended Net Recommended % GrowthAppropriation Adjustments Appropriation Over
FY 2020 FY 2021 FY 2021 FY 2020General Fund 19,259.3$ 607.6$ 19,866.9$ 3.2%Special Transportation Fund 1,705.3 101.3 1,806.6 5.9%Banking Fund 25.5 1.0 26.5 3.9%Insurance Fund 105.7 8.9 114.6 8.4%Consumer Counsel and Public Utility Fund 27.4 1.1 28.5 3.9%Workers' Compensation Fund 28.0 0.6 28.7 2.2%Mashantucket Pequot & Mohegan Fund 49.9 - 49.9 0.0%Regional Market Operating Fund 1.1 0.0 1.1 2.0%Criminal Injuries Compensation Fund 2.9 - 2.9 0.0%Tourism Fund 12.9 - 12.9 0.0%Total 21,218.1$ 720.5$ 21,938.6$ 3.4%
SUMMARY OF APPROPRIATION CHANGES - FY 2021 Over FY 2020(In Millions)
SUMMARY OF EXPENDITURE GROWTH - FY 2020 Over FY 2019(In Millions)
Financial Summary
A - 2
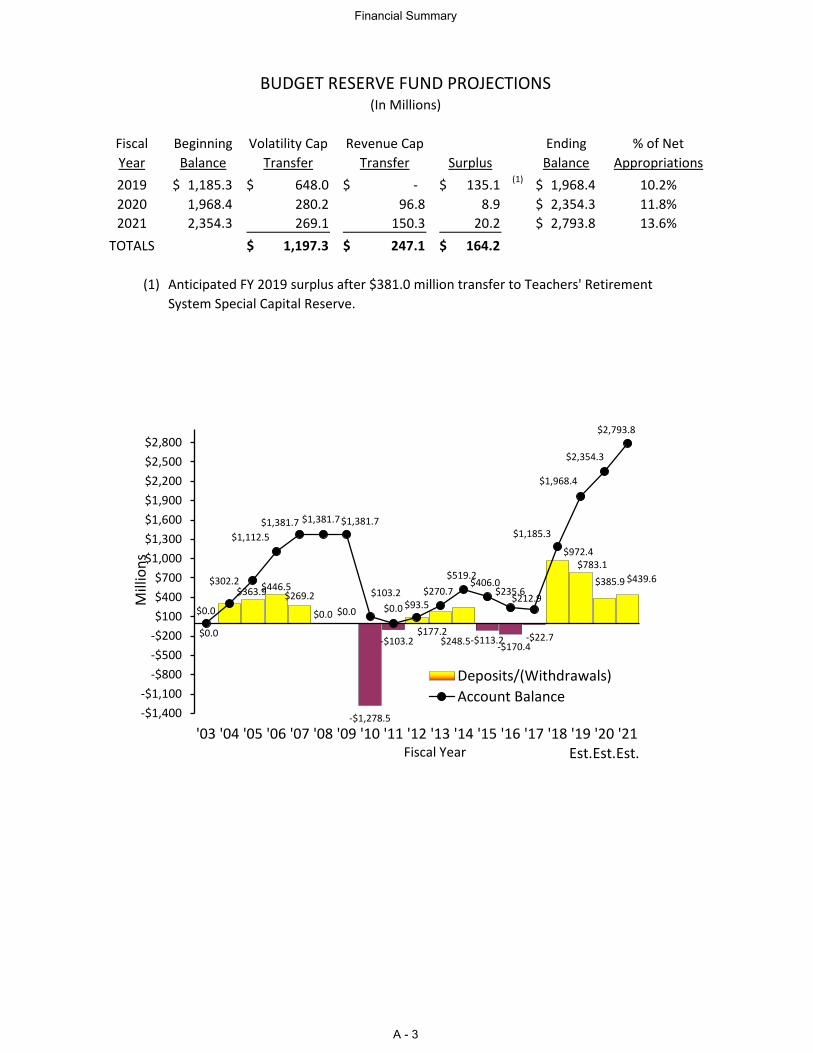
BUDGET RESERVE FUND PROJECTIONS(In Millions)
Fiscal Beginning Volatility Cap Revenue Cap Ending % of NetYear Balance Transfer Transfer Surplus Balance Appropriations2019 1,185.3$ 648.0$ -$ 135.1$ (1) 1,968.4$ 10.2%2020 1,968.4 280.2 96.8 8.9 2,354.3$ 11.8%2021 2,354.3 269.1 150.3 20.2 2,793.8$ 13.6%
TOTALS 1,197.3$ 247.1$ 164.2$
(1) Anticipated FY 2019 surplus after $381.0 million transfer to Teachers' RetirementSystem Special Capital Reserve.
$0.0
$302.2$363.9$446.5
$269.2
$0.0 $0.0
-$1,278.5
-$103.2
$93.5
$177.2$248.5-$113.2-$170.4
-$22.7
$972.4$783.1
$385.9 $439.6
$0.0
$1,112.5$1,381.7 $1,381.7$1,381.7
$103.2$0.0
$270.7$519.2
$406.0$235.6
$212.9
$1,185.3
$1,968.4
$2,354.3
$2,793.8
-$1,400-$1,100
-$800-$500-$200$100$400$700
$1,000$1,300$1,600$1,900$2,200$2,500$2,800
'03 '04 '05 '06 '07 '08 '09 '10 '11 '12 '13 '14 '15 '16 '17 '18 '19Est.
'20Est.
'21Est.
Mill
ions
Fiscal Year
Deposits/(Withdrawals)Account Balance
Financial Summary
A - 3
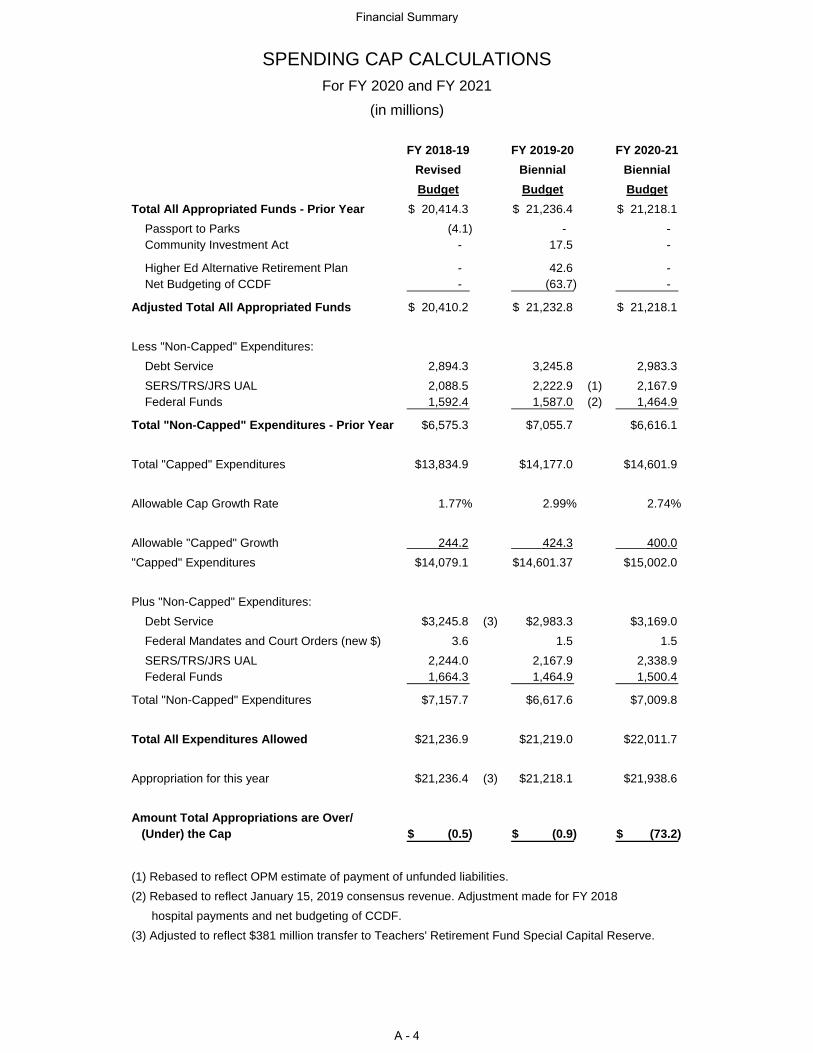
SPENDING CAP CALCULATIONSFor FY 2020 and FY 2021
(in millions)
FY 2018-19 FY 2019-20 FY 2020-21
Revised Biennial Biennial
Budget Budget Budget
Total All Appropriated Funds - Prior Year 20,414.3$ 21,236.4$ 21,218.1$ Passport to Parks (4.1) - - Community Investment Act - 17.5 -
Higher Ed Alternative Retirement Plan - 42.6 - Net Budgeting of CCDF - (63.7) -
Adjusted Total All Appropriated Funds 20,410.2$ 21,232.8$ 21,218.1$
Less "Non-Capped" Expenditures:Debt Service 2,894.3 3,245.8 2,983.3 SERS/TRS/JRS UAL 2,088.5 2,222.9 (1) 2,167.9 Federal Funds 1,592.4 1,587.0 (2) 1,464.9
Total "Non-Capped" Expenditures - Prior Year $6,575.3 $7,055.7 $6,616.1
Total "Capped" Expenditures $13,834.9 $14,177.0 $14,601.9
Allowable Cap Growth Rate 1.77% 2.99% 2.74%
Allowable "Capped" Growth 244.2 424.3 400.0 "Capped" Expenditures $14,079.1 $14,601.37 $15,002.0
Plus "Non-Capped" Expenditures:Debt Service $3,245.8 (3) $2,983.3 $3,169.0Federal Mandates and Court Orders (new $) 3.6 1.5 1.5 SERS/TRS/JRS UAL 2,244.0 2,167.9 2,338.9 Federal Funds 1,664.3 1,464.9 1,500.4
Total "Non-Capped" Expenditures $7,157.7 $6,617.6 $7,009.8
Total All Expenditures Allowed $21,236.9 $21,219.0 $22,011.7
Appropriation for this year $21,236.4 (3) $21,218.1 $21,938.6
Amount Total Appropriations are Over/
(Under) the Cap (0.5)$ (0.9)$ (73.2)$
(1) Rebased to reflect OPM estimate of payment of unfunded liabilities.(2) Rebased to reflect January 15, 2019 consensus revenue. Adjustment made for FY 2018 hospital payments and net budgeting of CCDF.(3) Adjusted to reflect $381 million transfer to Teachers' Retirement Fund Special Capital Reserve.
Financial Summary
A - 4
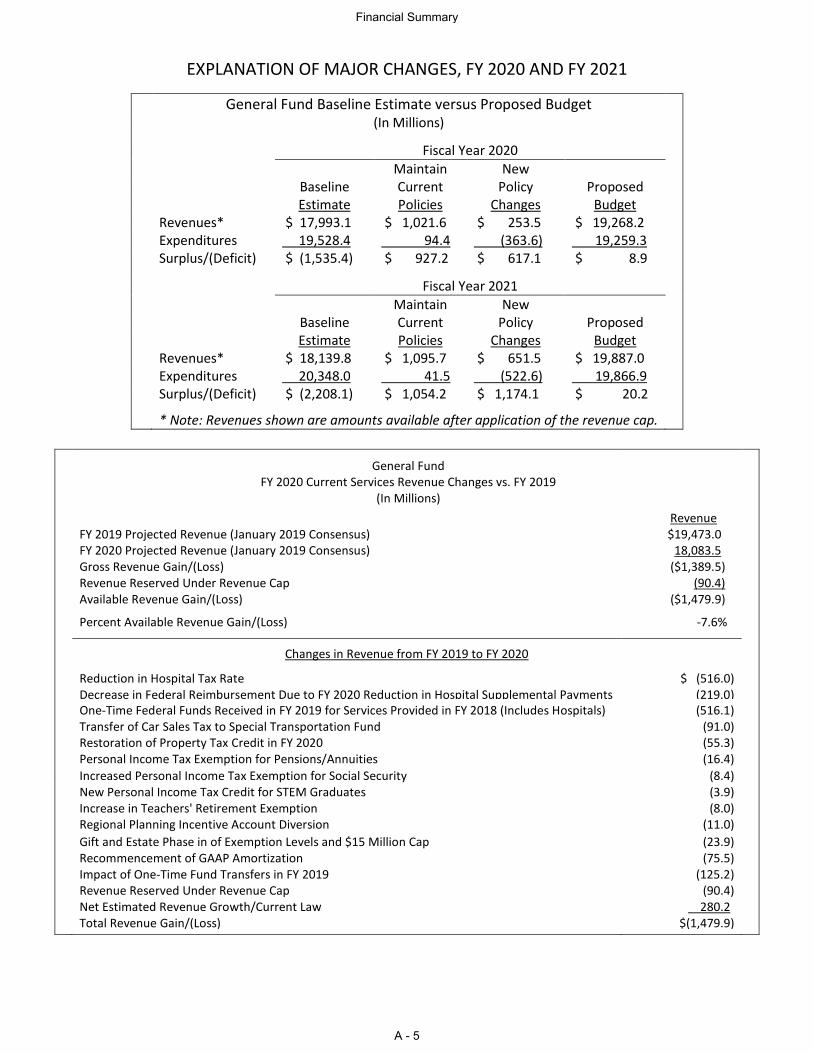
EXPLANATION OF MAJOR CHANGES, FY 2020 AND FY 2021
General Fund FY 2020 Current Services Revenue Changes vs. FY 2019 (In Millions) Revenue FY 2019 Projected Revenue (January 2019 Consensus) $19,473.0 FY 2020 Projected Revenue (January 2019 Consensus) 18,083.5 Gross Revenue Gain/(Loss) ($1,389.5) Revenue Reserved Under Revenue Cap (90.4) Available Revenue Gain/(Loss) ($1,479.9) Percent Available Revenue Gain/(Loss) -7.6%
Changes in Revenue from FY 2019 to FY 2020
Reduction in Hospital Tax Rate $ (516.0) Decrease in Federal Reimbursement Due to FY 2020 Reduction in Hospital Supplemental Payments (219.0) One-Time Federal Funds Received in FY 2019 for Services Provided in FY 2018 (Includes Hospitals) (516.1) Transfer of Car Sales Tax to Special Transportation Fund (91.0) Restoration of Property Tax Credit in FY 2020 (55.3) Personal Income Tax Exemption for Pensions/Annuities (16.4) Increased Personal Income Tax Exemption for Social Security (8.4) New Personal Income Tax Credit for STEM Graduates (3.9) Increase in Teachers' Retirement Exemption (8.0) Regional Planning Incentive Account Diversion (11.0) Gift and Estate Phase in of Exemption Levels and $15 Million Cap (23.9) Recommencement of GAAP Amortization (75.5) Impact of One-Time Fund Transfers in FY 2019 (125.2) Revenue Reserved Under Revenue Cap (90.4) Net Estimated Revenue Growth/Current Law 280.2 Total Revenue Gain/(Loss) $(1,479.9)
General Fund Baseline Estimate versus Proposed Budget (In Millions) Fiscal Year 2020 Maintain New Baseline Current Policy Proposed Estimate Policies Changes Budget Revenues* $ 17,993.1 $ 1,021.6 $ 253.5 $ 19,268.2 Expenditures 19,528.4 94.4 (363.6) 19,259.3 Surplus/(Deficit) $ (1,535.4) $ 927.2 $ 617.1 $ 8.9 Fiscal Year 2021 Maintain New Baseline Current Policy Proposed Estimate Policies Changes Budget Revenues* $ 18,139.8 $ 1,095.7 $ 651.5 $ 19,887.0 Expenditures 20,348.0 41.5 (522.6) 19,866.9 Surplus/(Deficit) $ (2,208.1) $ 1,054.2 $ 1,174.1 $ 20.2 * Note: Revenues shown are amounts available after application of the revenue cap.
Financial Summary
A - 5
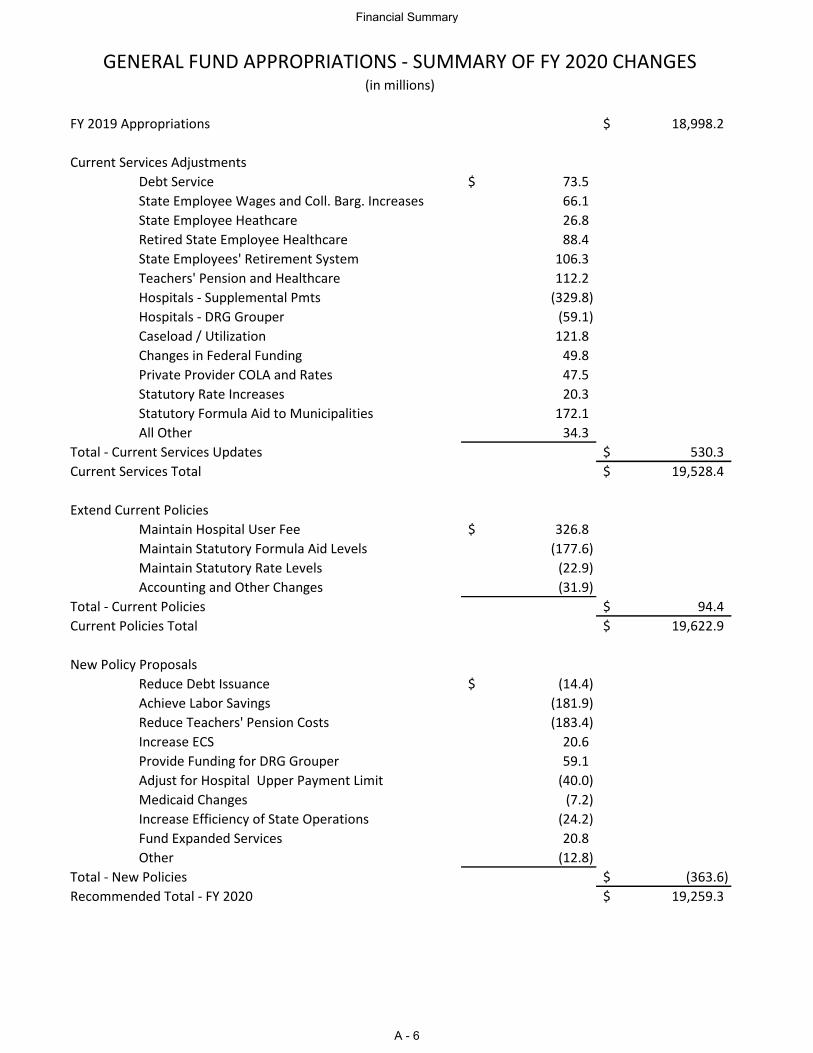
FY 2019 Appropriations 18,998.2$
Current Services Adjustments
Debt Service 73.5$
State Employee Wages and Coll. Barg. Increases 66.1
State Employee Heathcare 26.8
Retired State Employee Healthcare 88.4
State Employees' Retirement System 106.3
Teachers' Pension and Healthcare 112.2
Hospitals - Supplemental Pmts (329.8)
Hospitals - DRG Grouper (59.1)
Caseload / Utilization 121.8
Changes in Federal Funding 49.8
Private Provider COLA and Rates 47.5
Statutory Rate Increases 20.3
Statutory Formula Aid to Municipalities 172.1
All Other 34.3
Total - Current Services Updates 530.3$
Current Services Total 19,528.4$
Extend Current Policies
Maintain Hospital User Fee 326.8$
Maintain Statutory Formula Aid Levels (177.6)
Maintain Statutory Rate Levels (22.9)
Accounting and Other Changes (31.9)
Total - Current Policies 94.4$
Current Policies Total 19,622.9$
New Policy Proposals
Reduce Debt Issuance (14.4)$
Achieve Labor Savings (181.9)
Reduce Teachers' Pension Costs (183.4)
Increase ECS 20.6
Provide Funding for DRG Grouper 59.1
Adjust for Hospital Upper Payment Limit (40.0)
Medicaid Changes (7.2)
Increase Efficiency of State Operations (24.2)
Fund Expanded Services 20.8
Other (12.8)
Total - New Policies (363.6)$
Recommended Total - FY 2020 19,259.3$
GENERAL FUND APPROPRIATIONS - SUMMARY OF FY 2020 CHANGES(in millions)
Financial Summary
A - 6
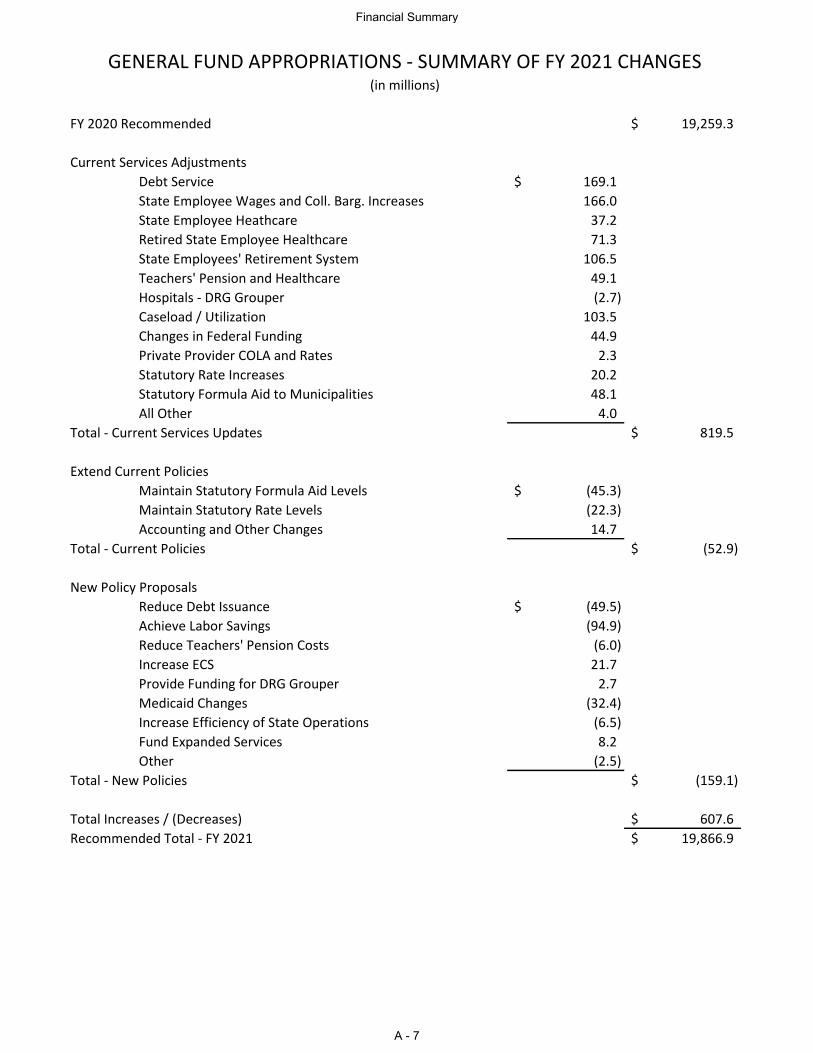
FY 2020 Recommended 19,259.3$
Current Services Adjustments
Debt Service 169.1$
State Employee Wages and Coll. Barg. Increases 166.0
State Employee Heathcare 37.2
Retired State Employee Healthcare 71.3
State Employees' Retirement System 106.5
Teachers' Pension and Healthcare 49.1
Hospitals - DRG Grouper (2.7)
Caseload / Utilization 103.5
Changes in Federal Funding 44.9
Private Provider COLA and Rates 2.3
Statutory Rate Increases 20.2
Statutory Formula Aid to Municipalities 48.1
All Other 4.0
Total - Current Services Updates 819.5$
Extend Current Policies
Maintain Statutory Formula Aid Levels (45.3)$
Maintain Statutory Rate Levels (22.3)
Accounting and Other Changes 14.7
Total - Current Policies (52.9)$
New Policy Proposals
Reduce Debt Issuance (49.5)$
Achieve Labor Savings (94.9)
Reduce Teachers' Pension Costs (6.0)
Increase ECS 21.7
Provide Funding for DRG Grouper 2.7
Medicaid Changes (32.4)
Increase Efficiency of State Operations (6.5)
Fund Expanded Services 8.2
Other (2.5)
Total - New Policies (159.1)$
Total Increases / (Decreases) 607.6$
Recommended Total - FY 2021 19,866.9$
(in millions)
GENERAL FUND APPROPRIATIONS - SUMMARY OF FY 2021 CHANGES
Financial Summary
A - 7
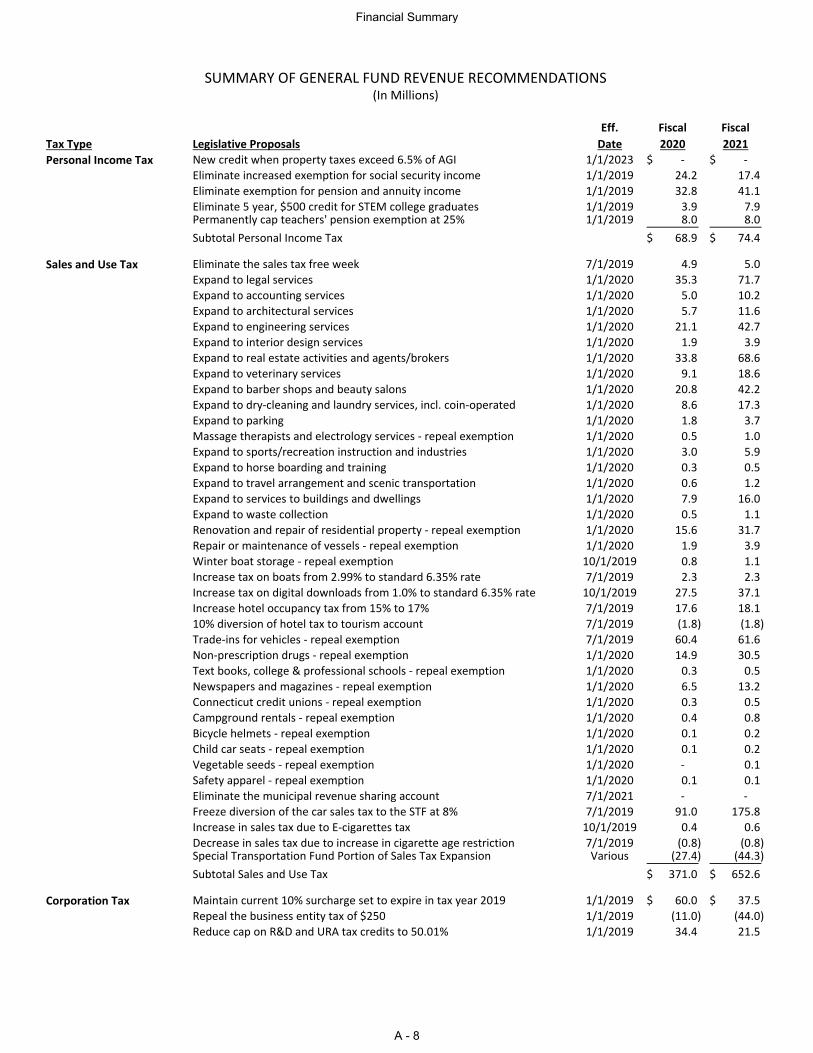
SUMMARY OF GENERAL FUND REVENUE RECOMMENDATIONS(In Millions)
Eff. Fiscal Fiscal
Tax Type Legislative Proposals Date 2020 2021
Personal Income Tax New credit when property taxes exceed 6.5% of AGI 1/1/2023 -$ -$
Eliminate increased exemption for social security income 1/1/2019 24.2 17.4
Eliminate exemption for pension and annuity income 1/1/2019 32.8 41.1
Eliminate 5 year, $500 credit for STEM college graduates 1/1/2019 3.9 7.9 Permanently cap teachers' pension exemption at 25% 1/1/2019 8.0 8.0
Subtotal Personal Income Tax 68.9$ 74.4$
Sales and Use Tax Eliminate the sales tax free week 7/1/2019 4.9 5.0
Expand to legal services 1/1/2020 35.3 71.7
Expand to accounting services 1/1/2020 5.0 10.2
Expand to architectural services 1/1/2020 5.7 11.6
Expand to engineering services 1/1/2020 21.1 42.7
Expand to interior design services 1/1/2020 1.9 3.9
Expand to real estate activities and agents/brokers 1/1/2020 33.8 68.6
Expand to veterinary services 1/1/2020 9.1 18.6
Expand to barber shops and beauty salons 1/1/2020 20.8 42.2
Expand to dry-cleaning and laundry services, incl. coin-operated 1/1/2020 8.6 17.3
Expand to parking 1/1/2020 1.8 3.7
Massage therapists and electrology services - repeal exemption 1/1/2020 0.5 1.0
Expand to sports/recreation instruction and industries 1/1/2020 3.0 5.9
Expand to horse boarding and training 1/1/2020 0.3 0.5
Expand to travel arrangement and scenic transportation 1/1/2020 0.6 1.2
Expand to services to buildings and dwellings 1/1/2020 7.9 16.0
Expand to waste collection 1/1/2020 0.5 1.1
Renovation and repair of residential property - repeal exemption 1/1/2020 15.6 31.7
Repair or maintenance of vessels - repeal exemption 1/1/2020 1.9 3.9
Winter boat storage - repeal exemption 10/1/2019 0.8 1.1
Increase tax on boats from 2.99% to standard 6.35% rate 7/1/2019 2.3 2.3
Increase tax on digital downloads from 1.0% to standard 6.35% rate 10/1/2019 27.5 37.1
Increase hotel occupancy tax from 15% to 17% 7/1/2019 17.6 18.1
10% diversion of hotel tax to tourism account 7/1/2019 (1.8) (1.8)
Trade-ins for vehicles - repeal exemption 7/1/2019 60.4 61.6
Non-prescription drugs - repeal exemption 1/1/2020 14.9 30.5
Text books, college & professional schools - repeal exemption 1/1/2020 0.3 0.5
Newspapers and magazines - repeal exemption 1/1/2020 6.5 13.2
Connecticut credit unions - repeal exemption 1/1/2020 0.3 0.5
Campground rentals - repeal exemption 1/1/2020 0.4 0.8
Bicycle helmets - repeal exemption 1/1/2020 0.1 0.2
Child car seats - repeal exemption 1/1/2020 0.1 0.2
Vegetable seeds - repeal exemption 1/1/2020 - 0.1
Safety apparel - repeal exemption 1/1/2020 0.1 0.1
Eliminate the municipal revenue sharing account 7/1/2021 - -
Freeze diversion of the car sales tax to the STF at 8% 7/1/2019 91.0 175.8
Increase in sales tax due to E-cigarettes tax 10/1/2019 0.4 0.6
Decrease in sales tax due to increase in cigarette age restriction 7/1/2019 (0.8) (0.8) Special Transportation Fund Portion of Sales Tax Expansion Various (27.4) (44.3)
Subtotal Sales and Use Tax 371.0$ 652.6$
Corporation Tax Maintain current 10% surcharge set to expire in tax year 2019 1/1/2019 60.0$ 37.5$
Repeal the business entity tax of $250 1/1/2019 (11.0) (44.0)
Reduce cap on R&D and URA tax credits to 50.01% 1/1/2019 34.4 21.5
Financial Summary
A - 8
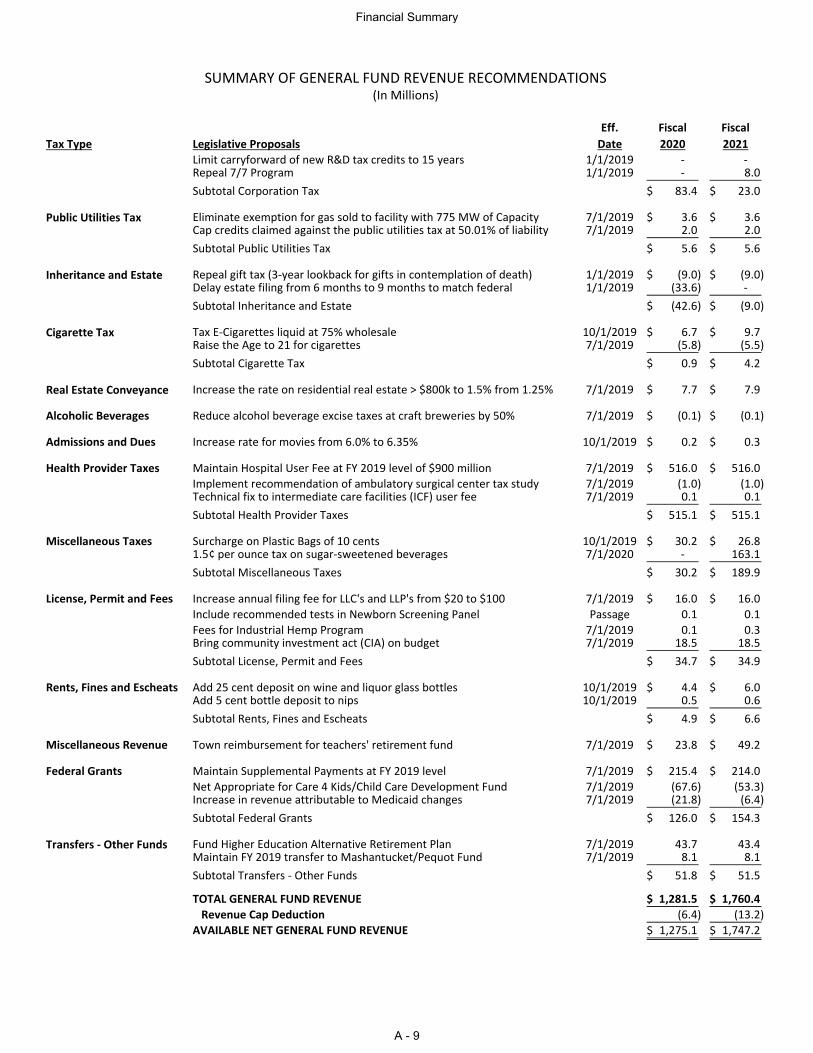
SUMMARY OF GENERAL FUND REVENUE RECOMMENDATIONS(In Millions)
Eff. Fiscal Fiscal
Tax Type Legislative Proposals Date 2020 2021
Limit carryforward of new R&D tax credits to 15 years 1/1/2019 - - Repeal 7/7 Program 1/1/2019 - 8.0
Subtotal Corporation Tax 83.4$ 23.0$
Public Utilities Tax Eliminate exemption for gas sold to facility with 775 MW of Capacity 7/1/2019 3.6$ 3.6$ Cap credits claimed against the public utilities tax at 50.01% of liability 7/1/2019 2.0 2.0
Subtotal Public Utilities Tax 5.6$ 5.6$
Inheritance and Estate Repeal gift tax (3-year lookback for gifts in contemplation of death) 1/1/2019 (9.0)$ (9.0)$ Delay estate filing from 6 months to 9 months to match federal 1/1/2019 (33.6) -
Subtotal Inheritance and Estate (42.6)$ (9.0)$
Cigarette Tax Tax E-Cigarettes liquid at 75% wholesale 10/1/2019 6.7$ 9.7$ Raise the Age to 21 for cigarettes 7/1/2019 (5.8) (5.5)
Subtotal Cigarette Tax 0.9$ 4.2$
Real Estate Conveyance Increase the rate on residential real estate > $800k to 1.5% from 1.25% 7/1/2019 7.7$ 7.9$
Alcoholic Beverages Reduce alcohol beverage excise taxes at craft breweries by 50% 7/1/2019 (0.1)$ (0.1)$
Admissions and Dues Increase rate for movies from 6.0% to 6.35% 10/1/2019 0.2$ 0.3$
Health Provider Taxes Maintain Hospital User Fee at FY 2019 level of $900 million 7/1/2019 516.0$ 516.0$
Implement recommendation of ambulatory surgical center tax study 7/1/2019 (1.0) (1.0) Technical fix to intermediate care facilities (ICF) user fee 7/1/2019 0.1 0.1
Subtotal Health Provider Taxes 515.1$ 515.1$
Miscellaneous Taxes Surcharge on Plastic Bags of 10 cents 10/1/2019 30.2$ 26.8$ 1.5¢ per ounce tax on sugar-sweetened beverages 7/1/2020 - 163.1
Subtotal Miscellaneous Taxes 30.2$ 189.9$
License, Permit and Fees Increase annual filing fee for LLC's and LLP's from $20 to $100 7/1/2019 16.0$ 16.0$
Include recommended tests in Newborn Screening Panel Passage 0.1 0.1
Fees for Industrial Hemp Program 7/1/2019 0.1 0.3 Bring community investment act (CIA) on budget 7/1/2019 18.5 18.5
Subtotal License, Permit and Fees 34.7$ 34.9$
Rents, Fines and Escheats Add 25 cent deposit on wine and liquor glass bottles 10/1/2019 4.4$ 6.0$ Add 5 cent bottle deposit to nips 10/1/2019 0.5 0.6
Subtotal Rents, Fines and Escheats 4.9$ 6.6$
Miscellaneous Revenue Town reimbursement for teachers' retirement fund 7/1/2019 23.8$ 49.2$
Federal Grants Maintain Supplemental Payments at FY 2019 level 7/1/2019 215.4$ 214.0$
Net Appropriate for Care 4 Kids/Child Care Development Fund 7/1/2019 (67.6) (53.3) Increase in revenue attributable to Medicaid changes 7/1/2019 (21.8) (6.4)
Subtotal Federal Grants 126.0$ 154.3$
Transfers - Other Funds Fund Higher Education Alternative Retirement Plan 7/1/2019 43.7 43.4 Maintain FY 2019 transfer to Mashantucket/Pequot Fund 7/1/2019 8.1 8.1
Subtotal Transfers - Other Funds 51.8$ 51.5$
TOTAL GENERAL FUND REVENUE 1,281.5$ 1,760.4$
Revenue Cap Deduction (6.4) (13.2)
AVAILABLE NET GENERAL FUND REVENUE 1,275.1$ 1,747.2$
Financial Summary
A - 9
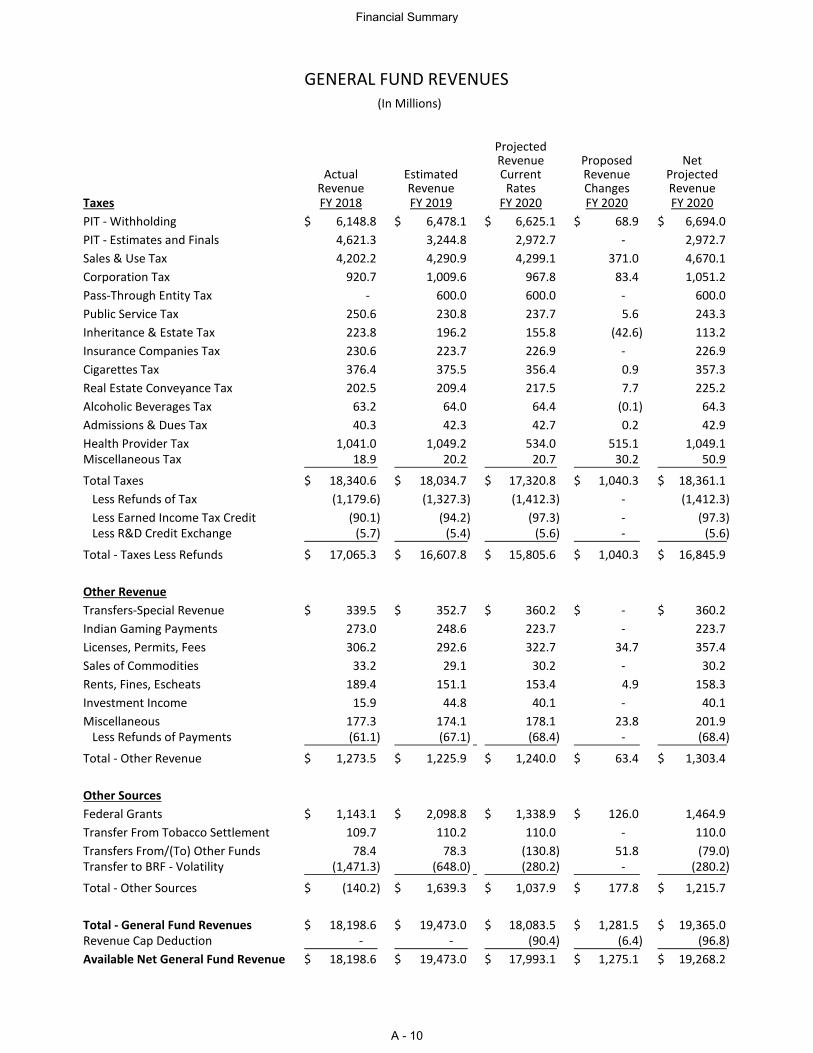
ProjectedRevenue Proposed Net
Actual Estimated Current Revenue ProjectedRevenue Revenue Rates Changes Revenue
Taxes FY 2018 FY 2019 FY 2020 FY 2020 FY 2020
PIT - Withholding 6,148.8$ 6,478.1$ 6,625.1$ 68.9$ 6,694.0$
PIT - Estimates and Finals 4,621.3 3,244.8 2,972.7 - 2,972.7
Sales & Use Tax 4,202.2 4,290.9 4,299.1 371.0 4,670.1
Corporation Tax 920.7 1,009.6 967.8 83.4 1,051.2
Pass-Through Entity Tax - 600.0 600.0 - 600.0
Public Service Tax 250.6 230.8 237.7 5.6 243.3
Inheritance & Estate Tax 223.8 196.2 155.8 (42.6) 113.2
Insurance Companies Tax 230.6 223.7 226.9 - 226.9
Cigarettes Tax 376.4 375.5 356.4 0.9 357.3
Real Estate Conveyance Tax 202.5 209.4 217.5 7.7 225.2
Alcoholic Beverages Tax 63.2 64.0 64.4 (0.1) 64.3
Admissions & Dues Tax 40.3 42.3 42.7 0.2 42.9
Health Provider Tax 1,041.0 1,049.2 534.0 515.1 1,049.1 Miscellaneous Tax 18.9 20.2 20.7 30.2 50.9
Total Taxes 18,340.6$ 18,034.7$ 17,320.8$ 1,040.3$ 18,361.1$
Less Refunds of Tax (1,179.6) (1,327.3) (1,412.3) - (1,412.3)
Less Earned Income Tax Credit (90.1) (94.2) (97.3) - (97.3) Less R&D Credit Exchange (5.7) (5.4) (5.6) - (5.6)
Total - Taxes Less Refunds 17,065.3$ 16,607.8$ 15,805.6$ 1,040.3$ 16,845.9$
Other Revenue
Transfers-Special Revenue 339.5$ 352.7$ 360.2$ -$ 360.2$
Indian Gaming Payments 273.0 248.6 223.7 - 223.7
Licenses, Permits, Fees 306.2 292.6 322.7 34.7 357.4
Sales of Commodities 33.2 29.1 30.2 - 30.2
Rents, Fines, Escheats 189.4 151.1 153.4 4.9 158.3
Investment Income 15.9 44.8 40.1 - 40.1
Miscellaneous 177.3 174.1 178.1 23.8 201.9 Less Refunds of Payments (61.1) (67.1) (68.4) - (68.4)
Total - Other Revenue 1,273.5$ 1,225.9$ 1,240.0$ 63.4$ 1,303.4$
Other Sources
Federal Grants 1,143.1$ 2,098.8$ 1,338.9$ 126.0$ 1,464.9
Transfer From Tobacco Settlement 109.7 110.2 110.0 - 110.0
Transfers From/(To) Other Funds 78.4 78.3 (130.8) 51.8 (79.0) Transfer to BRF - Volatility (1,471.3) (648.0) (280.2) - (280.2)
Total - Other Sources (140.2)$ 1,639.3$ 1,037.9$ 177.8$ 1,215.7$
Total - General Fund Revenues 18,198.6$ 19,473.0$ 18,083.5$ 1,281.5$ 19,365.0$ Revenue Cap Deduction - - (90.4) (6.4) (96.8)
Available Net General Fund Revenue 18,198.6$ 19,473.0$ 17,993.1$ 1,275.1$ 19,268.2$
GENERAL FUND REVENUES (In Millions)
Financial Summary
A - 10
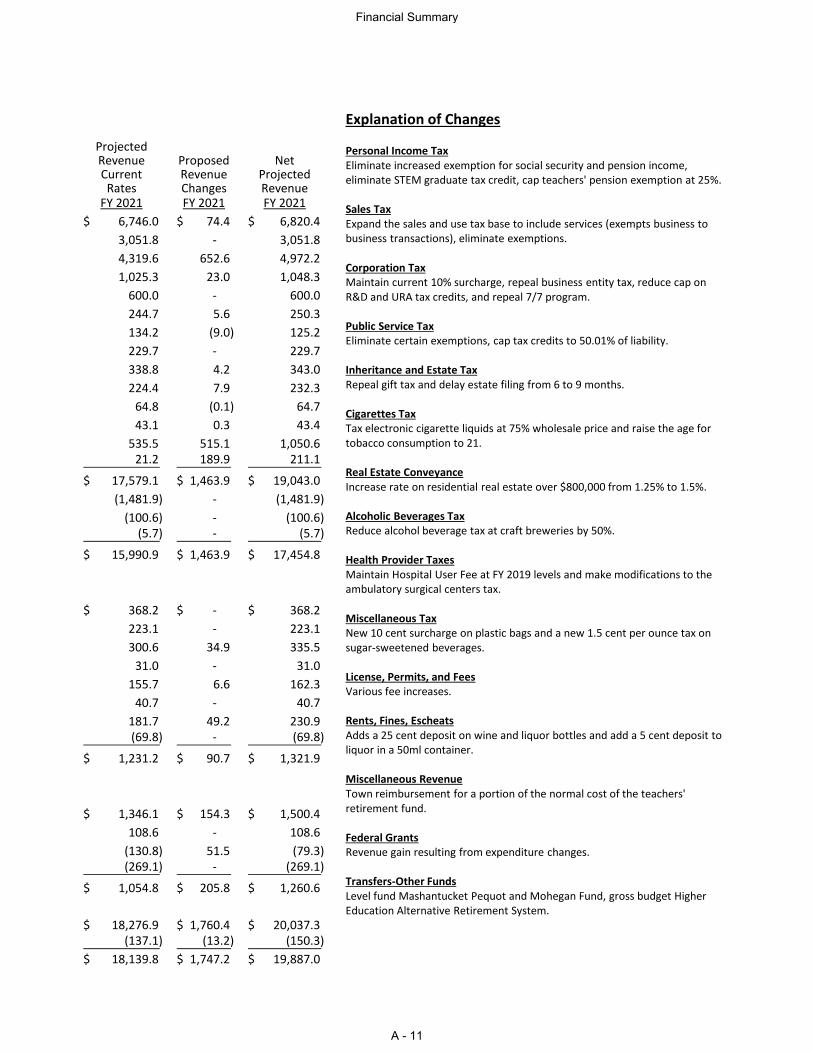
ProjectedRevenue Proposed NetCurrent Revenue ProjectedRates Changes Revenue
FY 2021 FY 2021 FY 2021
6,746.0$ 74.4$ 6,820.4$
3,051.8 - 3,051.8
4,319.6 652.6 4,972.2
1,025.3 23.0 1,048.3
600.0 - 600.0
244.7 5.6 250.3
134.2 (9.0) 125.2
229.7 - 229.7
338.8 4.2 343.0
224.4 7.9 232.3
64.8 (0.1) 64.7
43.1 0.3 43.4
535.5 515.1 1,050.6 21.2 189.9 211.1
17,579.1$ 1,463.9$ 19,043.0$
(1,481.9) - (1,481.9)
(100.6) - (100.6) (5.7) - (5.7)
15,990.9$ 1,463.9$ 17,454.8$
368.2$ -$ 368.2$
223.1 - 223.1
300.6 34.9 335.5
31.0 - 31.0
155.7 6.6 162.3
40.7 - 40.7
181.7 49.2 230.9 (69.8) - (69.8)
1,231.2$ 90.7$ 1,321.9$
1,346.1$ 154.3$ 1,500.4$
108.6 - 108.6
(130.8) 51.5 (79.3) (269.1) - (269.1)
1,054.8$ 205.8$ 1,260.6$
18,276.9$ 1,760.4$ 20,037.3$ (137.1) (13.2) (150.3)
18,139.8$ 1,747.2$ 19,887.0$
Explanation of Changes
Personal Income TaxEliminate increased exemption for social security and pension income, eliminate STEM graduate tax credit, cap teachers' pension exemption at 25%.
Sales Tax Expand the sales and use tax base to include services (exempts business to business transactions), eliminate exemptions.
Corporation Tax Maintain current 10% surcharge, repeal business entity tax, reduce cap on R&D and URA tax credits, and repeal 7/7 program.
Public Service TaxEliminate certain exemptions, cap tax credits to 50.01% of liability.
Inheritance and Estate Tax Repeal gift tax and delay estate filing from 6 to 9 months.
Cigarettes TaxTax electronic cigarette liquids at 75% wholesale price and raise the age for tobacco consumption to 21.
Real Estate ConveyanceIncrease rate on residential real estate over $800,000 from 1.25% to 1.5%.
Alcoholic Beverages Tax Reduce alcohol beverage tax at craft breweries by 50%.
Health Provider TaxesMaintain Hospital User Fee at FY 2019 levels and make modifications to the ambulatory surgical centers tax.
Miscellaneous TaxNew 10 cent surcharge on plastic bags and a new 1.5 cent per ounce tax on sugar-sweetened beverages.
License, Permits, and Fees Various fee increases.
Rents, Fines, EscheatsAdds a 25 cent deposit on wine and liquor bottles and add a 5 cent deposit to liquor in a 50ml container.
Miscellaneous Revenue Town reimbursement for a portion of the normal cost of the teachers' retirement fund.
Federal Grants Revenue gain resulting from expenditure changes.
Transfers-Other FundsLevel fund Mashantucket Pequot and Mohegan Fund, gross budget Higher Education Alternative Retirement System.
Financial Summary
A - 11
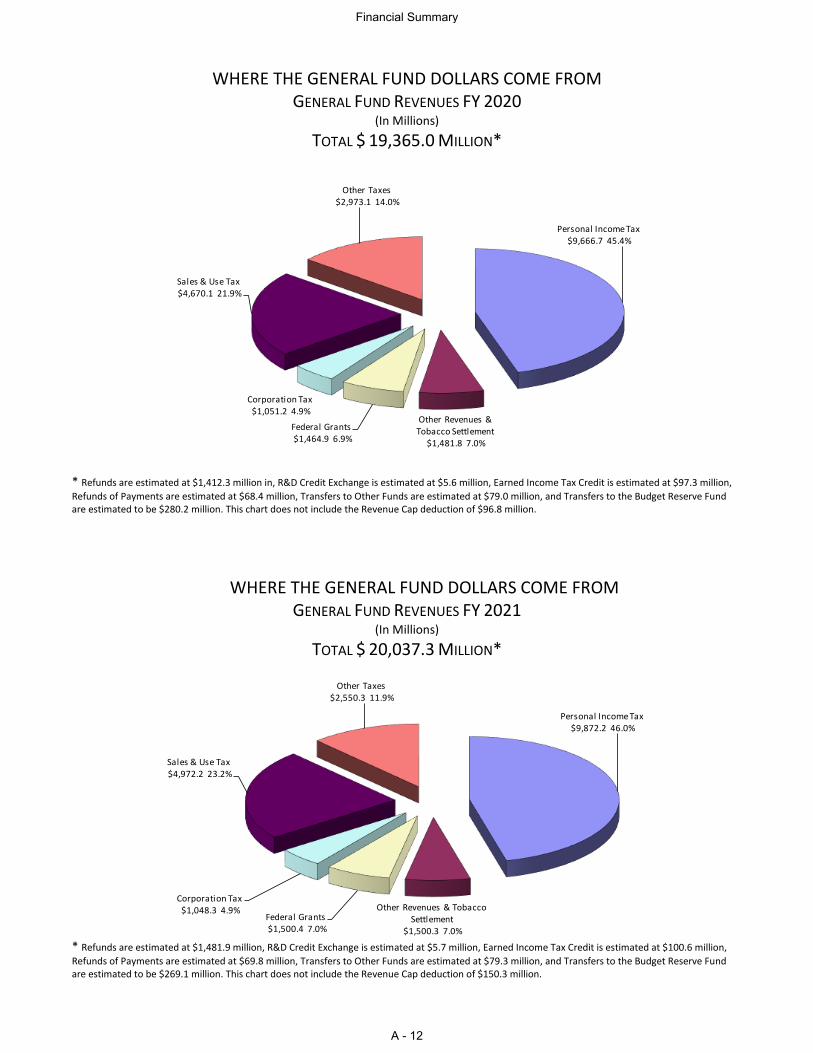
WHERE THE GENERAL FUND DOLLARS COME FROM GENERAL FUND REVENUES FY 2020
(In Millions)
TOTAL $ 19,365.0 MILLION*
Personal Income Tax$9,666.7 45.4%
Other Revenues & Tobacco Settlement
$1,481.8 7.0%
Federal Grants$1,464.9 6.9%
Corporation Tax$1,051.2 4.9%
Sales & Use Tax$4,670.1 21.9%
Other Taxes$2,973.1 14.0%
* Refunds are estimated at $1,412.3 million in, R&D Credit Exchange is estimated at $5.6 million, Earned Income Tax Credit is estimated at $97.3 million,
Refunds of Payments are estimated at $68.4 million, Transfers to Other Funds are estimated at $79.0 million, and Transfers to the Budget Reserve Fund are estimated to be $280.2 million. This chart does not include the Revenue Cap deduction of $96.8 million.
WHERE THE GENERAL FUND DOLLARS COME FROM GENERAL FUND REVENUES FY 2021
(In Millions)
TOTAL $ 20,037.3 MILLION*
Personal Income Tax$9,872.2 46.0%
Other Revenues & Tobacco Settlement
$1,500.3 7.0%
Federal Grants$1,500.4 7.0%
Corporation Tax$1,048.3 4.9%
Sales & Use Tax$4,972.2 23.2%
Other Taxes$2,550.3 11.9%
* Refunds are estimated at $1,481.9 million, R&D Credit Exchange is estimated at $5.7 million, Earned Income Tax Credit is estimated at $100.6 million,
Refunds of Payments are estimated at $69.8 million, Transfers to Other Funds are estimated at $79.3 million, and Transfers to the Budget Reserve Fund are estimated to be $269.1 million. This chart does not include the Revenue Cap deduction of $150.3 million.
Financial Summary
A - 12
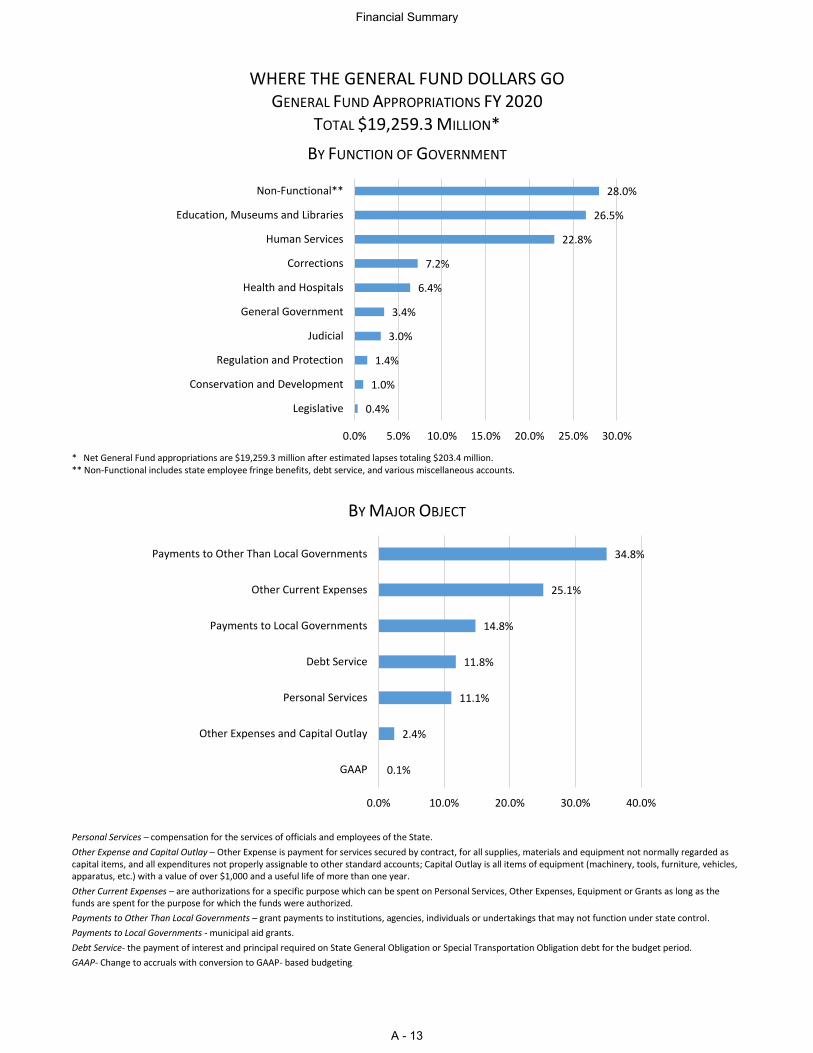
WHERE THE GENERAL FUND DOLLARS GO GENERAL FUND APPROPRIATIONS FY 2020
TOTAL $19,259.3 MILLION*
BY FUNCTION OF GOVERNMENT
* Net General Fund appropriations are $19,259.3 million after estimated lapses totaling $203.4 million. ** Non-Functional includes state employee fringe benefits, debt service, and various miscellaneous accounts.
BY MAJOR OBJECT
Personal Services – compensation for the services of officials and employees of the State.
Other Expense and Capital Outlay – Other Expense is payment for services secured by contract, for all supplies, materials and equipment not normally regarded as capital items, and all expenditures not properly assignable to other standard accounts; Capital Outlay is all items of equipment (machinery, tools, furniture, vehicles, apparatus, etc.) with a value of over $1,000 and a useful life of more than one year.
Other Current Expenses – are authorizations for a specific purpose which can be spent on Personal Services, Other Expenses, Equipment or Grants as long as the funds are spent for the purpose for which the funds were authorized.
Payments to Other Than Local Governments – grant payments to institutions, agencies, individuals or undertakings that may not function under state control.
Payments to Local Governments - municipal aid grants.
Debt Service- the payment of interest and principal required on State General Obligation or Special Transportation Obligation debt for the budget period.
GAAP- Change to accruals with conversion to GAAP- based budgeting.
0.4%
1.0%
1.4%
3.0%
3.4%
6.4%
7.2%
22.8%
26.5%
28.0%
0.0% 5.0% 10.0% 15.0% 20.0% 25.0% 30.0%
Legislative
Conservation and Development
Regulation and Protection
Judicial
General Government
Health and Hospitals
Corrections
Human Services
Education, Museums and Libraries
Non-Functional**
0.1%
2.4%
11.1%
11.8%
14.8%
25.1%
34.8%
0.0% 10.0% 20.0% 30.0% 40.0%
GAAP
Other Expenses and Capital Outlay
Personal Services
Debt Service
Payments to Local Governments
Other Current Expenses
Payments to Other Than Local Governments
Financial Summary
A - 13
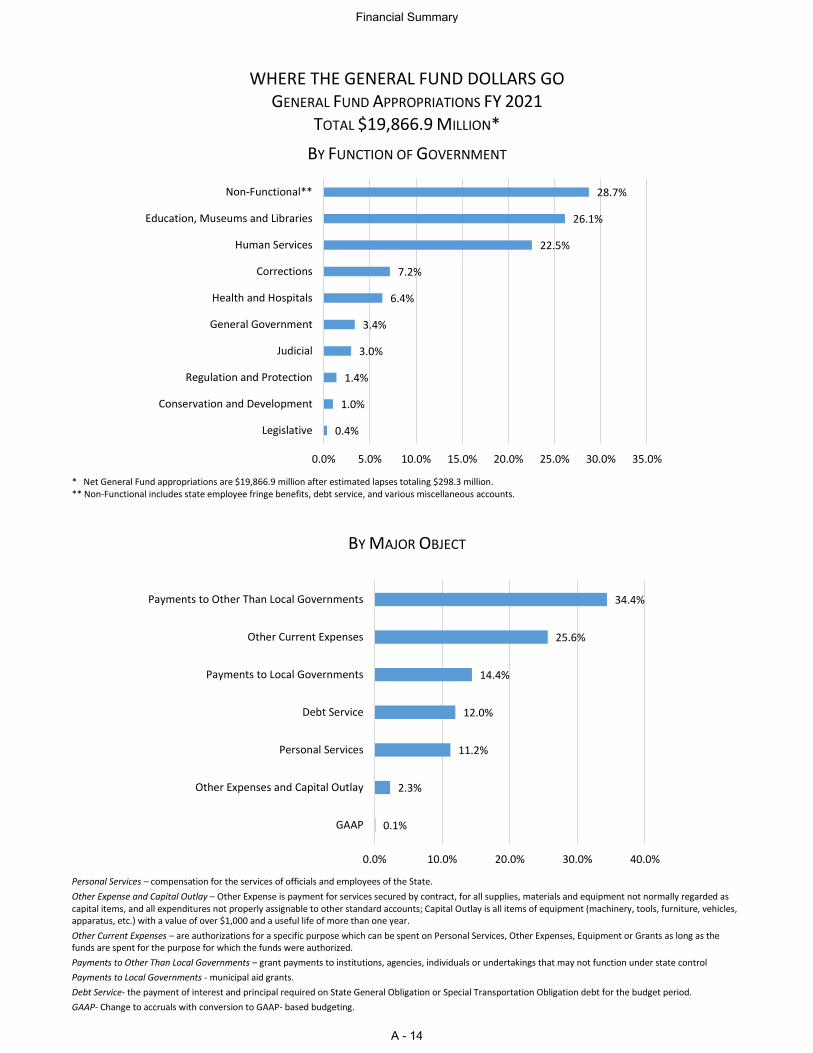
WHERE THE GENERAL FUND DOLLARS GO GENERAL FUND APPROPRIATIONS FY 2021
TOTAL $19,866.9 MILLION*
BY FUNCTION OF GOVERNMENT
* Net General Fund appropriations are $19,866.9 million after estimated lapses totaling $298.3 million. ** Non-Functional includes state employee fringe benefits, debt service, and various miscellaneous accounts.
BY MAJOR OBJECT
Personal Services – compensation for the services of officials and employees of the State.
Other Expense and Capital Outlay – Other Expense is payment for services secured by contract, for all supplies, materials and equipment not normally regarded as capital items, and all expenditures not properly assignable to other standard accounts; Capital Outlay is all items of equipment (machinery, tools, furniture, vehicles, apparatus, etc.) with a value of over $1,000 and a useful life of more than one year.
Other Current Expenses – are authorizations for a specific purpose which can be spent on Personal Services, Other Expenses, Equipment or Grants as long as the funds are spent for the purpose for which the funds were authorized.
Payments to Other Than Local Governments – grant payments to institutions, agencies, individuals or undertakings that may not function under state control
Payments to Local Governments - municipal aid grants.
Debt Service- the payment of interest and principal required on State General Obligation or Special Transportation Obligation debt for the budget period.
GAAP- Change to accruals with conversion to GAAP- based budgeting.
0.4%
1.0%
1.4%
3.0%
3.4%
6.4%
7.2%
22.5%
26.1%
28.7%
0.0% 5.0% 10.0% 15.0% 20.0% 25.0% 30.0% 35.0%
Legislative
Conservation and Development
Regulation and Protection
Judicial
General Government
Health and Hospitals
Corrections
Human Services
Education, Museums and Libraries
Non-Functional**
0.1%
2.3%
11.2%
12.0%
14.4%
25.6%
34.4%
0.0% 10.0% 20.0% 30.0% 40.0%
GAAP
Other Expenses and Capital Outlay
Personal Services
Debt Service
Payments to Local Governments
Other Current Expenses
Payments to Other Than Local Governments
Financial Summary
A - 14
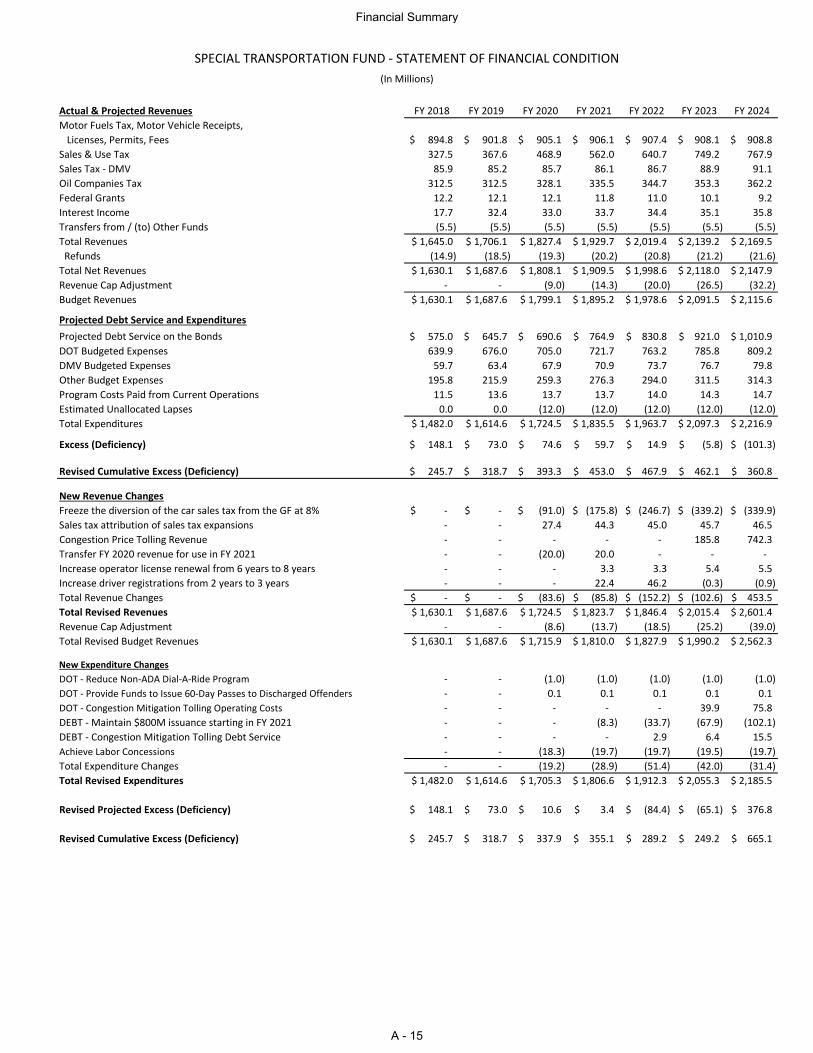
SPECIAL TRANSPORTATION FUND - STATEMENT OF FINANCIAL CONDITION
(In Millions)
Actual & Projected Revenues FY 2018 FY 2019 FY 2020 FY 2021 FY 2022 FY 2023 FY 2024
Motor Fuels Tax, Motor Vehicle Receipts,
Licenses, Permits, Fees 894.8$ 901.8$ 905.1$ 906.1$ 907.4$ 908.1$ 908.8$
Sales & Use Tax 327.5 367.6 468.9 562.0 640.7 749.2 767.9
Sales Tax - DMV 85.9 85.2 85.7 86.1 86.7 88.9 91.1
Oil Companies Tax 312.5 312.5 328.1 335.5 344.7 353.3 362.2
Federal Grants 12.2 12.1 12.1 11.8 11.0 10.1 9.2
Interest Income 17.7 32.4 33.0 33.7 34.4 35.1 35.8
Transfers from / (to) Other Funds (5.5) (5.5) (5.5) (5.5) (5.5) (5.5) (5.5)
Total Revenues 1,645.0$ 1,706.1$ 1,827.4$ 1,929.7$ 2,019.4$ 2,139.2$ 2,169.5$
Refunds (14.9) (18.5) (19.3) (20.2) (20.8) (21.2) (21.6)
Total Net Revenues 1,630.1$ 1,687.6$ 1,808.1$ 1,909.5$ 1,998.6$ 2,118.0$ 2,147.9$
Revenue Cap Adjustment - - (9.0) (14.3) (20.0) (26.5) (32.2)
Budget Revenues 1,630.1$ 1,687.6$ 1,799.1$ 1,895.2$ 1,978.6$ 2,091.5$ 2,115.6$
Projected Debt Service and Expenditures
Projected Debt Service on the Bonds 575.0$ 645.7$ 690.6$ 764.9$ 830.8$ 921.0$ 1,010.9$
DOT Budgeted Expenses 639.9 676.0 705.0 721.7 763.2 785.8 809.2
DMV Budgeted Expenses 59.7 63.4 67.9 70.9 73.7 76.7 79.8
Other Budget Expenses 195.8 215.9 259.3 276.3 294.0 311.5 314.3
Program Costs Paid from Current Operations 11.5 13.6 13.7 13.7 14.0 14.3 14.7
Estimated Unallocated Lapses 0.0 0.0 (12.0) (12.0) (12.0) (12.0) (12.0)
Total Expenditures 1,482.0$ 1,614.6$ 1,724.5$ 1,835.5$ 1,963.7$ 2,097.3$ 2,216.9$
Excess (Deficiency) 148.1$ 73.0$ 74.6$ 59.7$ 14.9$ (5.8)$ (101.3)$
Revised Cumulative Excess (Deficiency) 245.7$ 318.7$ 393.3$ 453.0$ 467.9$ 462.1$ 360.8$
New Revenue Changes
Freeze the diversion of the car sales tax from the GF at 8% -$ -$ (91.0)$ (175.8)$ (246.7)$ (339.2)$ (339.9)$
Sales tax attribution of sales tax expansions - - 27.4 44.3 45.0 45.7 46.5
Congestion Price Tolling Revenue - - - - - 185.8 742.3
Transfer FY 2020 revenue for use in FY 2021 - - (20.0) 20.0 - - -
Increase operator license renewal from 6 years to 8 years - - - 3.3 3.3 5.4 5.5
Increase driver registrations from 2 years to 3 years - - - 22.4 46.2 (0.3) (0.9)
Total Revenue Changes -$ -$ (83.6)$ (85.8)$ (152.2)$ (102.6)$ 453.5$
Total Revised Revenues 1,630.1$ 1,687.6$ 1,724.5$ 1,823.7$ 1,846.4$ 2,015.4$ 2,601.4$
Revenue Cap Adjustment - - (8.6) (13.7) (18.5) (25.2) (39.0)
Total Revised Budget Revenues 1,630.1$ 1,687.6$ 1,715.9$ 1,810.0$ 1,827.9$ 1,990.2$ 2,562.3$
New Expenditure Changes
DOT - Reduce Non-ADA Dial-A-Ride Program - - (1.0) (1.0) (1.0) (1.0) (1.0)
DOT - Provide Funds to Issue 60-Day Passes to Discharged Offenders - - 0.1 0.1 0.1 0.1 0.1
DOT - Congestion Mitigation Tolling Operating Costs - - - - - 39.9 75.8
DEBT - Maintain $800M issuance starting in FY 2021 - - - (8.3) (33.7) (67.9) (102.1)
DEBT - Congestion Mitigation Tolling Debt Service - - - - 2.9 6.4 15.5
Achieve Labor Concessions - - (18.3) (19.7) (19.7) (19.5) (19.7)
Total Expenditure Changes - - (19.2) (28.9) (51.4) (42.0) (31.4)
Total Revised Expenditures 1,482.0$ 1,614.6$ 1,705.3$ 1,806.6$ 1,912.3$ 2,055.3$ 2,185.5$
Revised Projected Excess (Deficiency) 148.1$ 73.0$ 10.6$ 3.4$ (84.4)$ (65.1)$ 376.8$
Revised Cumulative Excess (Deficiency) 245.7$ 318.7$ 337.9$ 355.1$ 289.2$ 249.2$ 665.1$
Financial Summary
A - 15
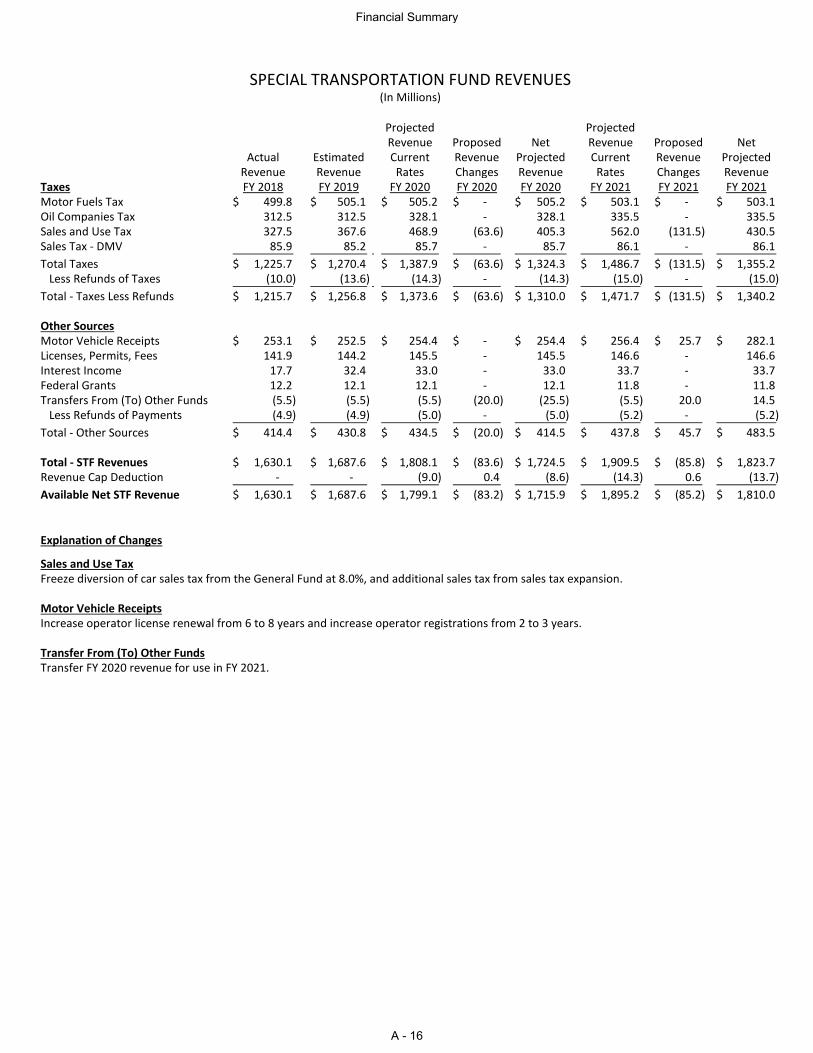
Projected ProjectedRevenue Proposed Net Revenue Proposed Net
Actual Estimated Current Revenue Projected Current Revenue ProjectedRevenue Revenue Rates Changes Revenue Rates Changes Revenue
Taxes FY 2018 FY 2019 FY 2020 FY 2020 FY 2020 FY 2021 FY 2021 FY 2021Motor Fuels Tax 499.8$ 505.1$ 505.2$ -$ 505.2$ 503.1$ -$ 503.1$ Oil Companies Tax 312.5 312.5 328.1 - 328.1 335.5 - 335.5 Sales and Use Tax 327.5 367.6 468.9 (63.6) 405.3 562.0 (131.5) 430.5 Sales Tax - DMV 85.9 85.2 85.7 - 85.7 86.1 - 86.1
Total Taxes 1,225.7$ 1,270.4$ 1,387.9$ (63.6)$ 1,324.3$ 1,486.7$ (131.5)$ 1,355.2$ Less Refunds of Taxes (10.0) (13.6) (14.3) - (14.3) (15.0) - (15.0)
Total - Taxes Less Refunds 1,215.7$ 1,256.8$ 1,373.6$ (63.6)$ 1,310.0$ 1,471.7$ (131.5)$ 1,340.2$
Other SourcesMotor Vehicle Receipts 253.1$ 252.5$ 254.4$ -$ 254.4$ 256.4$ 25.7$ 282.1$ Licenses, Permits, Fees 141.9 144.2 145.5 - 145.5 146.6 - 146.6 Interest Income 17.7 32.4 33.0 - 33.0 33.7 - 33.7 Federal Grants 12.2 12.1 12.1 - 12.1 11.8 - 11.8 Transfers From (To) Other Funds (5.5) (5.5) (5.5) (20.0) (25.5) (5.5) 20.0 14.5 Less Refunds of Payments (4.9) (4.9) (5.0) - (5.0) (5.2) - (5.2)
Total - Other Sources 414.4$ 430.8$ 434.5$ (20.0)$ 414.5$ 437.8$ 45.7$ 483.5$
Total - STF Revenues 1,630.1$ 1,687.6$ 1,808.1$ (83.6)$ 1,724.5$ 1,909.5$ (85.8)$ 1,823.7$ Revenue Cap Deduction - - (9.0) 0.4 (8.6) (14.3) 0.6 (13.7)
Available Net STF Revenue 1,630.1$ 1,687.6$ 1,799.1$ (83.2)$ 1,715.9$ 1,895.2$ (85.2)$ 1,810.0$
Explanation of Changes
Sales and Use TaxFreeze diversion of car sales tax from the General Fund at 8.0%, and additional sales tax from sales tax expansion.
Motor Vehicle ReceiptsIncrease operator license renewal from 6 to 8 years and increase operator registrations from 2 to 3 years.
Transfer From (To) Other FundsTransfer FY 2020 revenue for use in FY 2021.
SPECIAL TRANSPORTATION FUND REVENUES(In Millions)
Financial Summary
A - 16
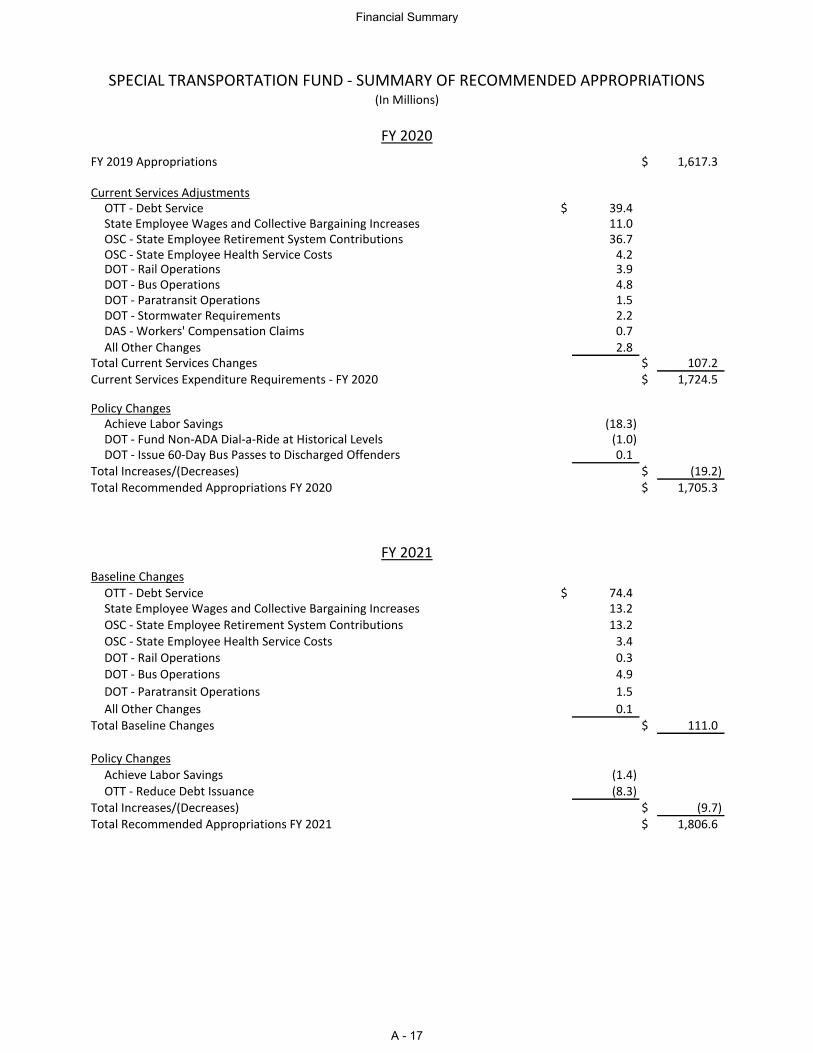
FY 2019 Appropriations $ 1,617.3
Current Services AdjustmentsOTT - Debt Service $ 39.4State Employee Wages and Collective Bargaining Increases 11.0OSC - State Employee Retirement System Contributions 36.7OSC - State Employee Health Service Costs 4.2DOT - Rail Operations 3.9DOT - Bus Operations 4.8DOT - Paratransit Operations 1.5DOT - Stormwater Requirements 2.2DAS - Workers' Compensation Claims 0.7All Other Changes 2.8
Total Current Services Changes $ 107.2Current Services Expenditure Requirements - FY 2020 $ 1,724.5
Policy ChangesAchieve Labor Savings (18.3) DOT - Fund Non-ADA Dial-a-Ride at Historical Levels (1.0) DOT - Issue 60-Day Bus Passes to Discharged Offenders 0.1
Total Increases/(Decreases) $ (19.2)Total Recommended Appropriations FY 2020 $ 1,705.3
Baseline ChangesOTT - Debt Service $ 74.4State Employee Wages and Collective Bargaining Increases 13.2OSC - State Employee Retirement System Contributions 13.2OSC - State Employee Health Service Costs 3.4DOT - Rail Operations 0.3DOT - Bus Operations 4.9
DOT - Paratransit Operations 1.5
All Other Changes 0.1Total Baseline Changes $ 111.0
Policy ChangesAchieve Labor Savings (1.4)OTT - Reduce Debt Issuance (8.3)
Total Increases/(Decreases) $ (9.7)Total Recommended Appropriations FY 2021 $ 1,806.6
SPECIAL TRANSPORTATION FUND - SUMMARY OF RECOMMENDED APPROPRIATIONS(In Millions)
FY 2020
FY 2021
Financial Summary
A - 17
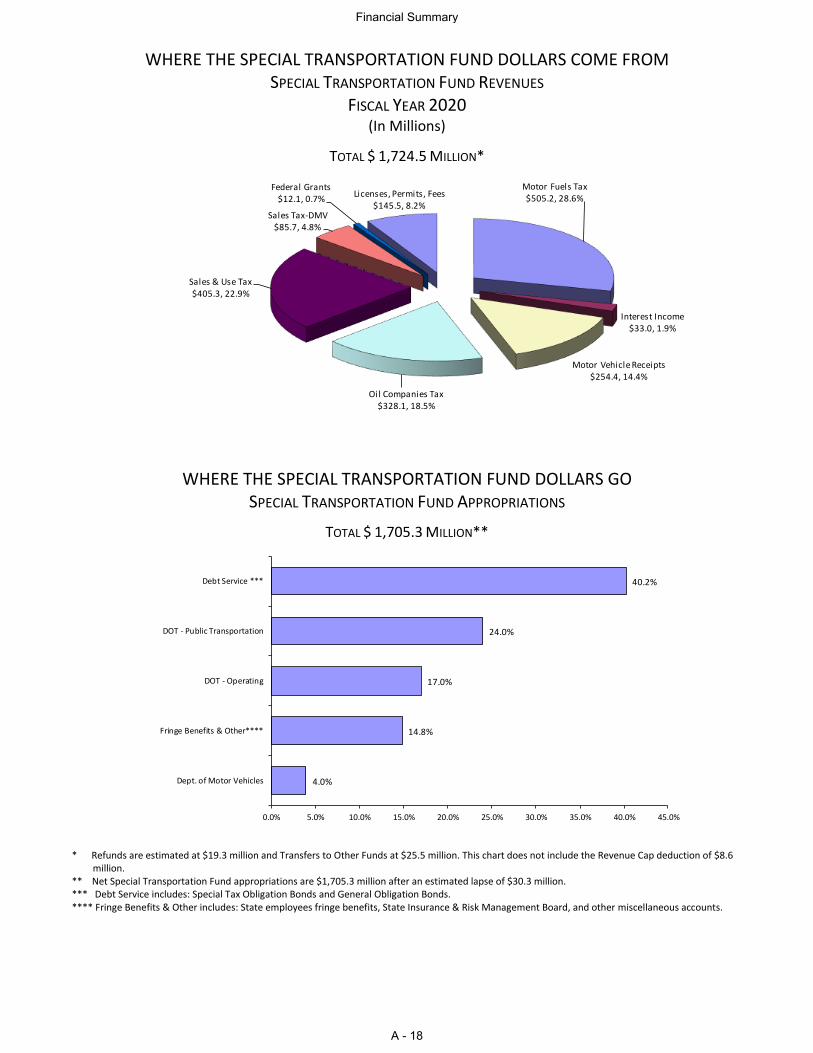
WHERE THE SPECIAL TRANSPORTATION FUND DOLLARS COME FROM SPECIAL TRANSPORTATION FUND REVENUES
FISCAL YEAR 2020 (In Millions)
TOTAL $ 1,724.5 MILLION*
Motor Fuels Tax$505.2, 28.6%
Interest Income $33.0, 1.9%
Motor Vehicle Receipts$254.4, 14.4%
Oil Companies Tax$328.1, 18.5%
Sales & Use Tax$405.3, 22.9%
Sales Tax-DMV$85.7, 4.8%
Federal Grants$12.1, 0.7%
Licenses, Permits, Fees$145.5, 8.2%
WHERE THE SPECIAL TRANSPORTATION FUND DOLLARS GO SPECIAL TRANSPORTATION FUND APPROPRIATIONS
TOTAL $ 1,705.3 MILLION**
4.0%
14.8%
17.0%
24.0%
40.2%
0.0% 5.0% 10.0% 15.0% 20.0% 25.0% 30.0% 35.0% 40.0% 45.0%
Dept. of Motor Vehicles
Fringe Benefits & Other****
DOT - Operating
DOT - Public Transportation
Debt Service ***
* Refunds are estimated at $19.3 million and Transfers to Other Funds at $25.5 million. This chart does not include the Revenue Cap deduction of $8.6 million.
** Net Special Transportation Fund appropriations are $1,705.3 million after an estimated lapse of $30.3 million. *** Debt Service includes: Special Tax Obligation Bonds and General Obligation Bonds. **** Fringe Benefits & Other includes: State employees fringe benefits, State Insurance & Risk Management Board, and other miscellaneous accounts.
Financial Summary
A - 18
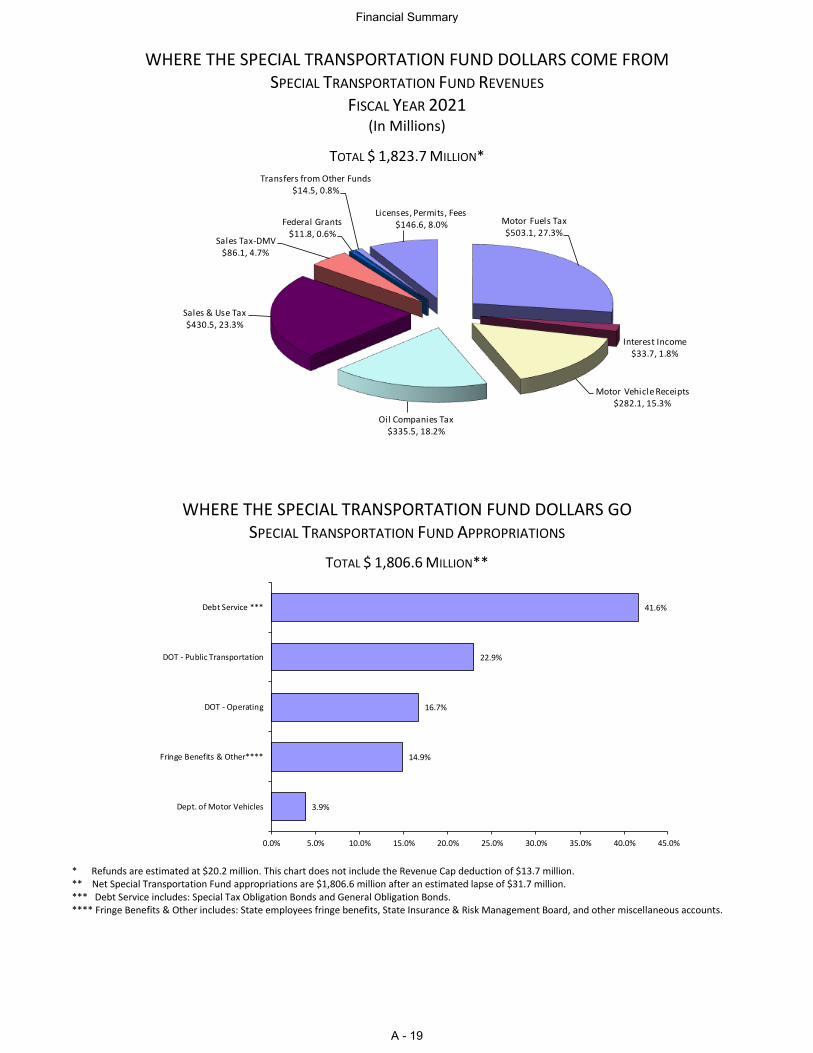
WHERE THE SPECIAL TRANSPORTATION FUND DOLLARS COME FROM SPECIAL TRANSPORTATION FUND REVENUES
FISCAL YEAR 2021 (In Millions)
TOTAL $ 1,823.7 MILLION*
Motor Fuels Tax$503.1, 27.3%
Interest Income $33.7, 1.8%
Motor Vehicle Receipts$282.1, 15.3%
Oil Companies Tax$335.5, 18.2%
Sales & Use Tax$430.5, 23.3%
Sales Tax-DMV$86.1, 4.7%
Federal Grants$11.8, 0.6%
Transfers from Other Funds$14.5, 0.8%
Licenses, Permits, Fees$146.6, 8.0%
WHERE THE SPECIAL TRANSPORTATION FUND DOLLARS GO SPECIAL TRANSPORTATION FUND APPROPRIATIONS
TOTAL $ 1,806.6 MILLION**
3.9%
14.9%
16.7%
22.9%
41.6%
0.0% 5.0% 10.0% 15.0% 20.0% 25.0% 30.0% 35.0% 40.0% 45.0%
Dept. of Motor Vehicles
Fringe Benefits & Other****
DOT - Operating
DOT - Public Transportation
Debt Service ***
* Refunds are estimated at $20.2 million. This chart does not include the Revenue Cap deduction of $13.7 million. ** Net Special Transportation Fund appropriations are $1,806.6 million after an estimated lapse of $31.7 million. *** Debt Service includes: Special Tax Obligation Bonds and General Obligation Bonds. **** Fringe Benefits & Other includes: State employees fringe benefits, State Insurance & Risk Management Board, and other miscellaneous accounts.
Financial Summary
A - 19
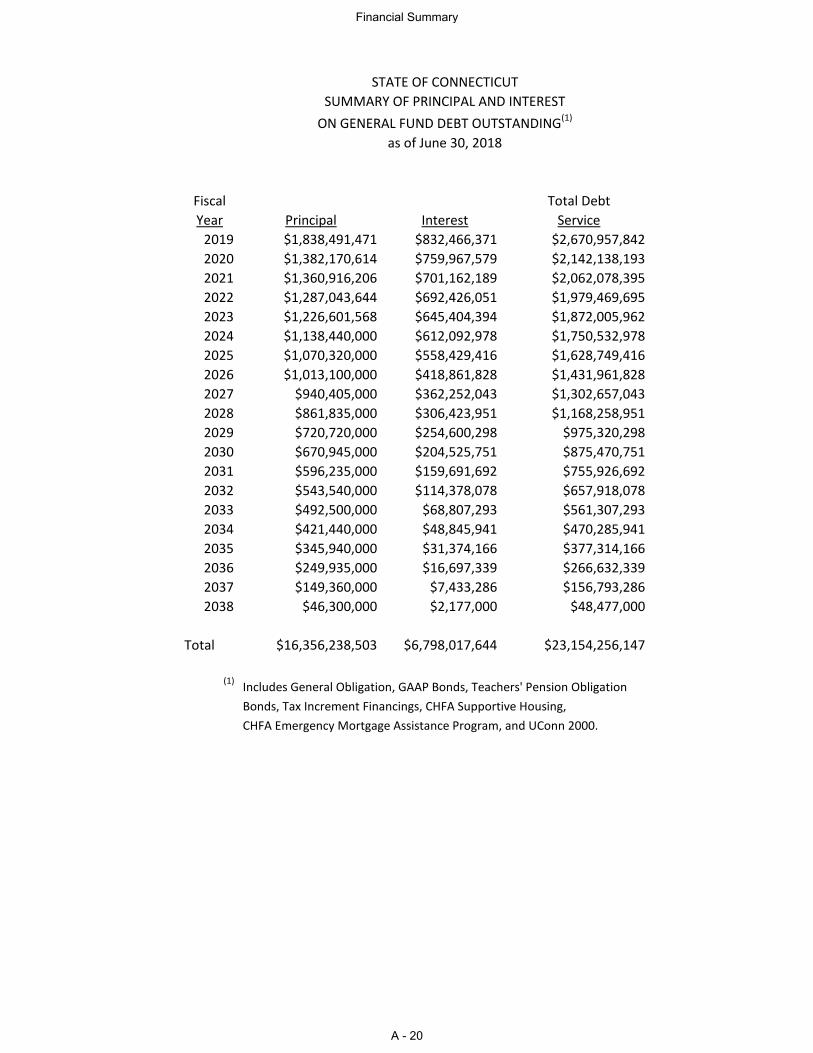
STATE OF CONNECTICUT
SUMMARY OF PRINCIPAL AND INTEREST
ON GENERAL FUND DEBT OUTSTANDING(1)
as of June 30, 2018
Fiscal Total Debt
Year Principal Interest Service
2019 $1,838,491,471 $832,466,371 $2,670,957,842
2020 $1,382,170,614 $759,967,579 $2,142,138,193
2021 $1,360,916,206 $701,162,189 $2,062,078,395
2022 $1,287,043,644 $692,426,051 $1,979,469,695
2023 $1,226,601,568 $645,404,394 $1,872,005,962
2024 $1,138,440,000 $612,092,978 $1,750,532,978
2025 $1,070,320,000 $558,429,416 $1,628,749,416
2026 $1,013,100,000 $418,861,828 $1,431,961,828
2027 $940,405,000 $362,252,043 $1,302,657,043
2028 $861,835,000 $306,423,951 $1,168,258,951
2029 $720,720,000 $254,600,298 $975,320,298
2030 $670,945,000 $204,525,751 $875,470,751
2031 $596,235,000 $159,691,692 $755,926,692
2032 $543,540,000 $114,378,078 $657,918,078
2033 $492,500,000 $68,807,293 $561,307,293
2034 $421,440,000 $48,845,941 $470,285,941
2035 $345,940,000 $31,374,166 $377,314,166
2036 $249,935,000 $16,697,339 $266,632,339
2037 $149,360,000 $7,433,286 $156,793,286
2038 $46,300,000 $2,177,000 $48,477,000
Total $16,356,238,503 $6,798,017,644 $23,154,256,147
(1)Includes General Obligation, GAAP Bonds, Teachers' Pension Obligation
Bonds, Tax Increment Financings, CHFA Supportive Housing,
CHFA Emergency Mortgage Assistance Program, and UConn 2000.
Financial Summary
A - 20
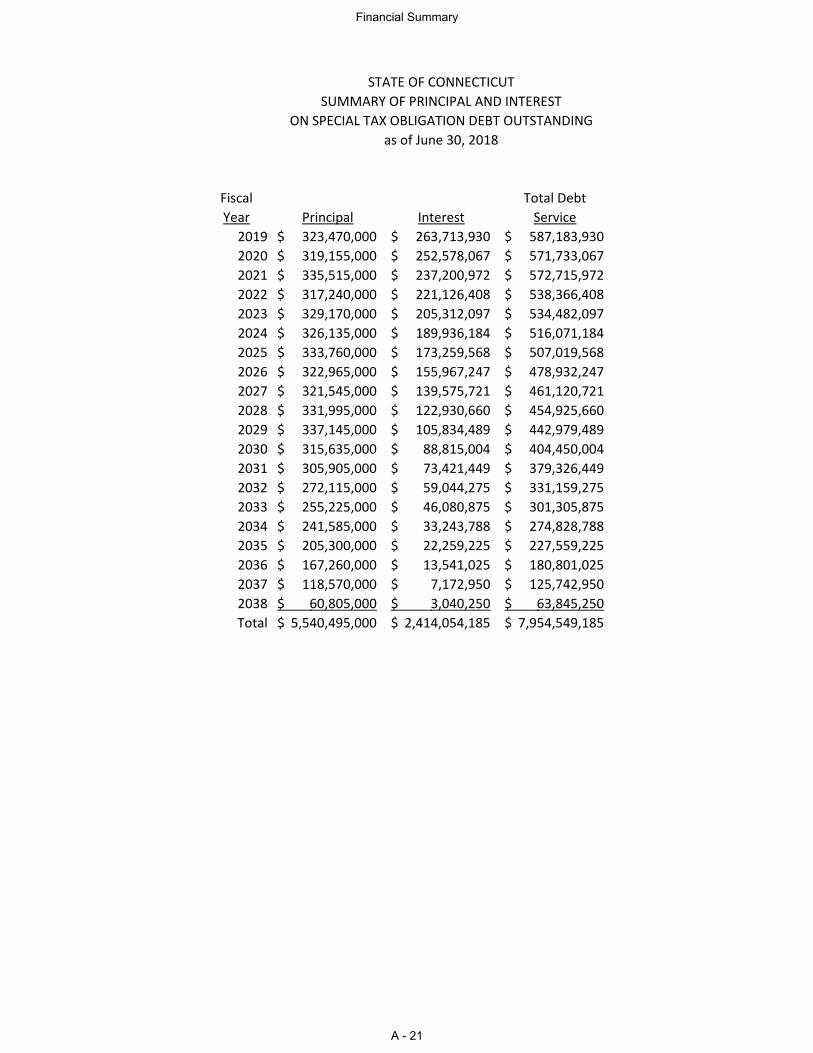
STATE OF CONNECTICUT
SUMMARY OF PRINCIPAL AND INTEREST
ON SPECIAL TAX OBLIGATION DEBT OUTSTANDING
as of June 30, 2018
Fiscal Total Debt
Year Principal Interest Service
2019 323,470,000$ 263,713,930$ 587,183,930$
2020 319,155,000$ 252,578,067$ 571,733,067$
2021 335,515,000$ 237,200,972$ 572,715,972$
2022 317,240,000$ 221,126,408$ 538,366,408$
2023 329,170,000$ 205,312,097$ 534,482,097$
2024 326,135,000$ 189,936,184$ 516,071,184$
2025 333,760,000$ 173,259,568$ 507,019,568$
2026 322,965,000$ 155,967,247$ 478,932,247$
2027 321,545,000$ 139,575,721$ 461,120,721$
2028 331,995,000$ 122,930,660$ 454,925,660$
2029 337,145,000$ 105,834,489$ 442,979,489$
2030 315,635,000$ 88,815,004$ 404,450,004$
2031 305,905,000$ 73,421,449$ 379,326,449$
2032 272,115,000$ 59,044,275$ 331,159,275$
2033 255,225,000$ 46,080,875$ 301,305,875$
2034 241,585,000$ 33,243,788$ 274,828,788$
2035 205,300,000$ 22,259,225$ 227,559,225$
2036 167,260,000$ 13,541,025$ 180,801,025$
2037 118,570,000$ 7,172,950$ 125,742,950$
2038 60,805,000$ 3,040,250$ 63,845,250$
Total 5,540,495,000$ 2,414,054,185$ 7,954,549,185$
Financial Summary
A - 21
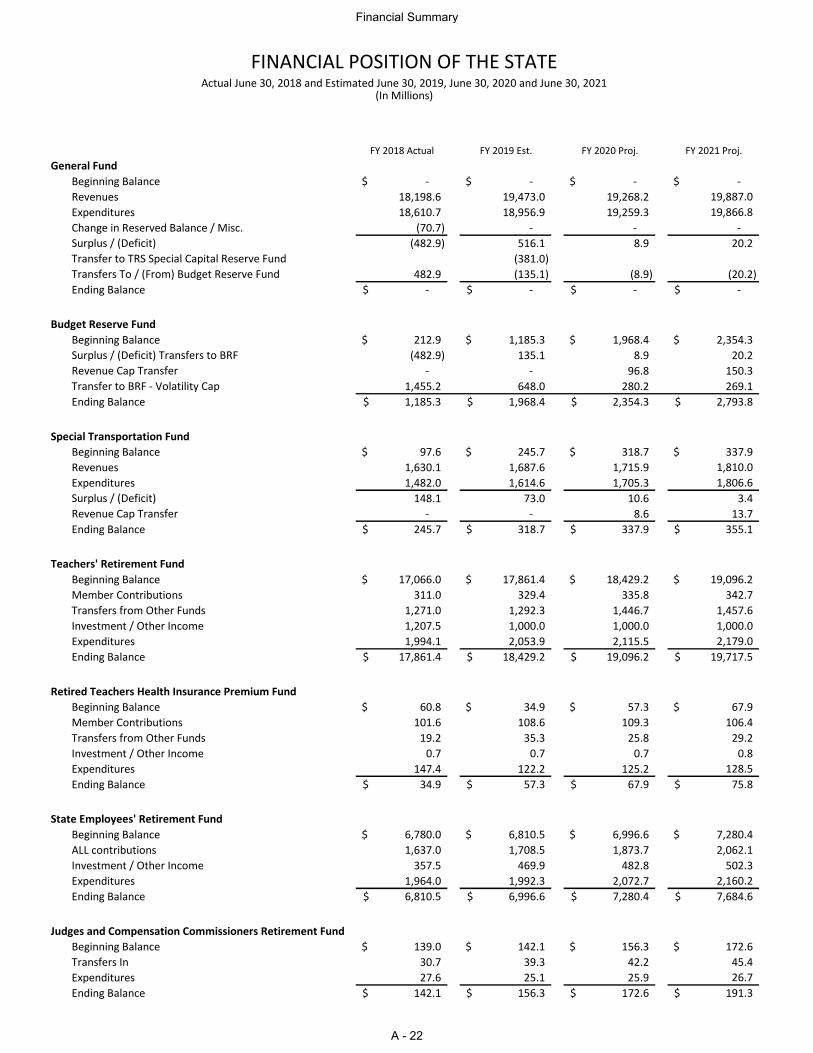
FY 2018 Actual FY 2019 Est. FY 2020 Proj. FY 2021 Proj.
General Fund
Beginning Balance -$ -$ -$ -$
Revenues 18,198.6 19,473.0 19,268.2 19,887.0
Expenditures 18,610.7 18,956.9 19,259.3 19,866.8
Change in Reserved Balance / Misc. (70.7) - - -
Surplus / (Deficit) (482.9) 516.1 8.9 20.2
Transfer to TRS Special Capital Reserve Fund (381.0)
Transfers To / (From) Budget Reserve Fund 482.9 (135.1) (8.9) (20.2)
Ending Balance -$ -$ -$ -$
Budget Reserve Fund
Beginning Balance 212.9$ 1,185.3$ 1,968.4$ 2,354.3$
Surplus / (Deficit) Transfers to BRF (482.9) 135.1 8.9 20.2
Revenue Cap Transfer - - 96.8 150.3
Transfer to BRF - Volatility Cap 1,455.2 648.0 280.2 269.1
Ending Balance 1,185.3$ 1,968.4$ 2,354.3$ 2,793.8$
Special Transportation Fund
Beginning Balance 97.6$ 245.7$ 318.7$ 337.9$
Revenues 1,630.1 1,687.6 1,715.9 1,810.0
Expenditures 1,482.0 1,614.6 1,705.3 1,806.6
Surplus / (Deficit) 148.1 73.0 10.6 3.4
Revenue Cap Transfer - - 8.6 13.7
Ending Balance 245.7$ 318.7$ 337.9$ 355.1$
Teachers' Retirement Fund
Beginning Balance 17,066.0$ 17,861.4$ 18,429.2$ 19,096.2$
Member Contributions 311.0 329.4 335.8 342.7
Transfers from Other Funds 1,271.0 1,292.3 1,446.7 1,457.6
Investment / Other Income 1,207.5 1,000.0 1,000.0 1,000.0
Expenditures 1,994.1 2,053.9 2,115.5 2,179.0
Ending Balance 17,861.4$ 18,429.2$ 19,096.2$ 19,717.5$
Retired Teachers Health Insurance Premium Fund
Beginning Balance 60.8$ 34.9$ 57.3$ 67.9$
Member Contributions 101.6 108.6 109.3 106.4
Transfers from Other Funds 19.2 35.3 25.8 29.2
Investment / Other Income 0.7 0.7 0.7 0.8
Expenditures 147.4 122.2 125.2 128.5
Ending Balance 34.9$ 57.3$ 67.9$ 75.8$
State Employees' Retirement Fund
Beginning Balance 6,780.0$ 6,810.5$ 6,996.6$ 7,280.4$
ALL contributions 1,637.0 1,708.5 1,873.7 2,062.1
Investment / Other Income 357.5 469.9 482.8 502.3
Expenditures 1,964.0 1,992.3 2,072.7 2,160.2
Ending Balance 6,810.5$ 6,996.6$ 7,280.4$ 7,684.6$
Judges and Compensation Commissioners Retirement Fund
Beginning Balance 139.0$ 142.1$ 156.3$ 172.6$
Transfers In 30.7 39.3 42.2 45.4
Expenditures 27.6 25.1 25.9 26.7
Ending Balance 142.1$ 156.3$ 172.6$ 191.3$
FINANCIAL POSITION OF THE STATEActual June 30, 2018 and Estimated June 30, 2019, June 30, 2020 and June 30, 2021
(In Millions)
Financial Summary
A - 22
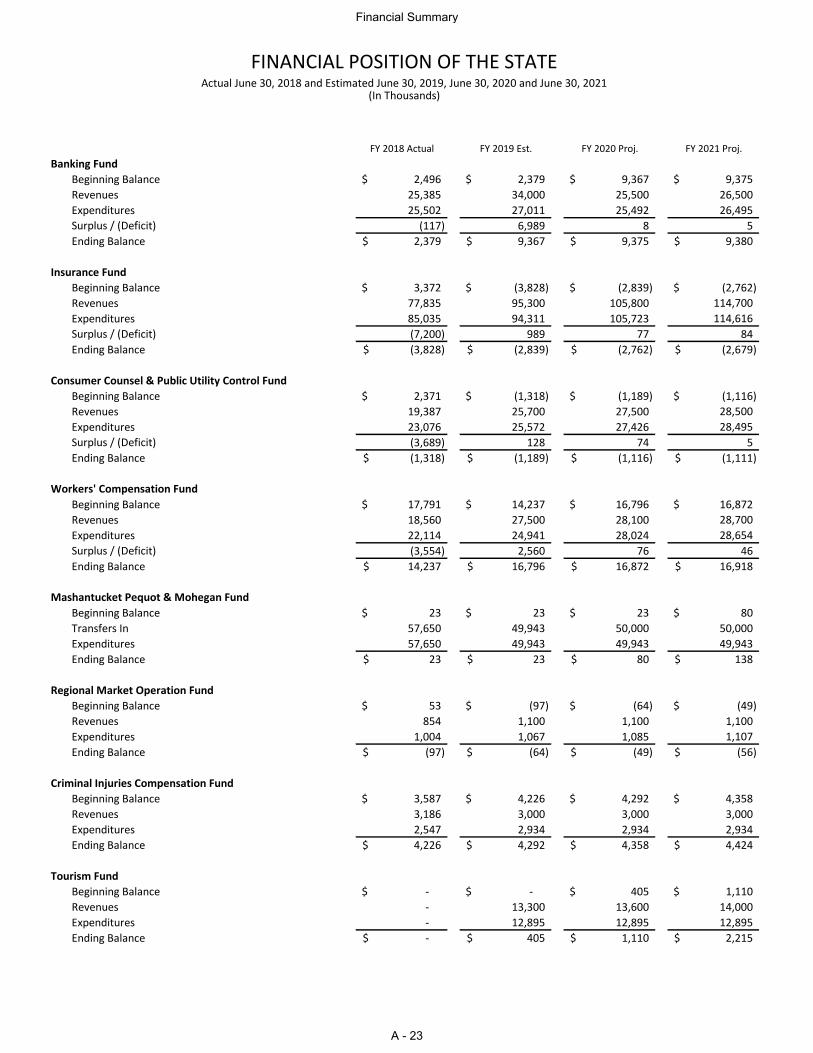
FY 2018 Actual FY 2019 Est. FY 2020 Proj. FY 2021 Proj.
Banking Fund
Beginning Balance 2,496$ 2,379$ 9,367$ 9,375$
Revenues 25,385 34,000 25,500 26,500
Expenditures 25,502 27,011 25,492 26,495
Surplus / (Deficit) (117) 6,989 8 5
Ending Balance 2,379$ 9,367$ 9,375$ 9,380$
Insurance Fund
Beginning Balance 3,372$ (3,828)$ (2,839)$ (2,762)$
Revenues 77,835 95,300 105,800 114,700
Expenditures 85,035 94,311 105,723 114,616
Surplus / (Deficit) (7,200) 989 77 84
Ending Balance (3,828)$ (2,839)$ (2,762)$ (2,679)$
Consumer Counsel & Public Utility Control Fund
Beginning Balance 2,371$ (1,318)$ (1,189)$ (1,116)$
Revenues 19,387 25,700 27,500 28,500
Expenditures 23,076 25,572 27,426 28,495
Surplus / (Deficit) (3,689) 128 74 5
Ending Balance (1,318)$ (1,189)$ (1,116)$ (1,111)$
Workers' Compensation Fund
Beginning Balance 17,791$ 14,237$ 16,796$ 16,872$
Revenues 18,560 27,500 28,100 28,700
Expenditures 22,114 24,941 28,024 28,654
Surplus / (Deficit) (3,554) 2,560 76 46
Ending Balance 14,237$ 16,796$ 16,872$ 16,918$
Mashantucket Pequot & Mohegan Fund
Beginning Balance 23$ 23$ 23$ 80$
Transfers In 57,650 49,943 50,000 50,000
Expenditures 57,650 49,943 49,943 49,943
Ending Balance 23$ 23$ 80$ 138$
Regional Market Operation Fund
Beginning Balance 53$ (97)$ (64)$ (49)$
Revenues 854 1,100 1,100 1,100
Expenditures 1,004 1,067 1,085 1,107
Ending Balance (97)$ (64)$ (49)$ (56)$
Criminal Injuries Compensation Fund
Beginning Balance 3,587$ 4,226$ 4,292$ 4,358$
Revenues 3,186 3,000 3,000 3,000
Expenditures 2,547 2,934 2,934 2,934
Ending Balance 4,226$ 4,292$ 4,358$ 4,424$
Tourism Fund
Beginning Balance -$ -$ 405$ 1,110$
Revenues - 13,300 13,600 14,000
Expenditures - 12,895 12,895 12,895
Ending Balance -$ 405$ 1,110$ 2,215$
FINANCIAL POSITION OF THE STATEActual June 30, 2018 and Estimated June 30, 2019, June 30, 2020 and June 30, 2021
(In Thousands)
Financial Summary
A - 23
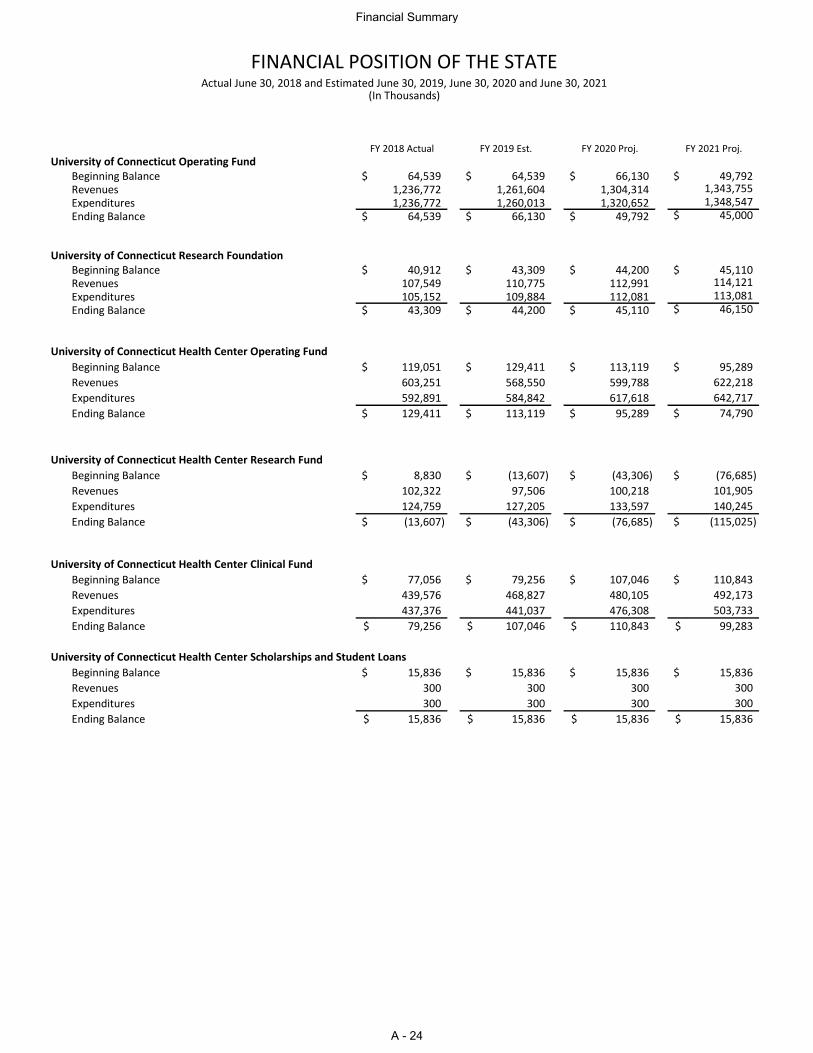
FY 2018 Actual FY 2019 Est. FY 2020 Proj. FY 2021 Proj.
University of Connecticut Operating FundBeginning Balance 64,539$ 64,539$ 66,130$ 49,792$ Revenues 1,236,772 1,261,604 1,304,314 1,343,755 Expenditures 1,236,772 1,260,013 1,320,652 1,348,547 Ending Balance 64,539$ 66,130$ 49,792$ 45,000$
University of Connecticut Research FoundationBeginning Balance 40,912$ 43,309$ 44,200$ 45,110$ Revenues 107,549 110,775 112,991 114,121 Expenditures 105,152 109,884 112,081 113,081 Ending Balance 43,309$ 44,200$ 45,110$ 46,150$
University of Connecticut Health Center Operating Fund
Beginning Balance 119,051$ 129,411$ 113,119$ 95,289$
Revenues 603,251 568,550 599,788 622,218
Expenditures 592,891 584,842 617,618 642,717
Ending Balance 129,411$ 113,119$ 95,289$ 74,790$
University of Connecticut Health Center Research Fund
Beginning Balance 8,830$ (13,607)$ (43,306)$ (76,685)$
Revenues 102,322 97,506 100,218 101,905
Expenditures 124,759 127,205 133,597 140,245
Ending Balance (13,607)$ (43,306)$ (76,685)$ (115,025)$
University of Connecticut Health Center Clinical Fund
Beginning Balance 77,056$ 79,256$ 107,046$ 110,843$
Revenues 439,576 468,827 480,105 492,173
Expenditures 437,376 441,037 476,308 503,733
Ending Balance 79,256$ 107,046$ 110,843$ 99,283$
University of Connecticut Health Center Scholarships and Student Loans
Beginning Balance 15,836$ 15,836$ 15,836$ 15,836$
Revenues 300 300 300 300
Expenditures 300 300 300 300
Ending Balance 15,836$ 15,836$ 15,836$ 15,836$
FINANCIAL POSITION OF THE STATEActual June 30, 2018 and Estimated June 30, 2019, June 30, 2020 and June 30, 2021
(In Thousands)
Financial Summary
A - 24
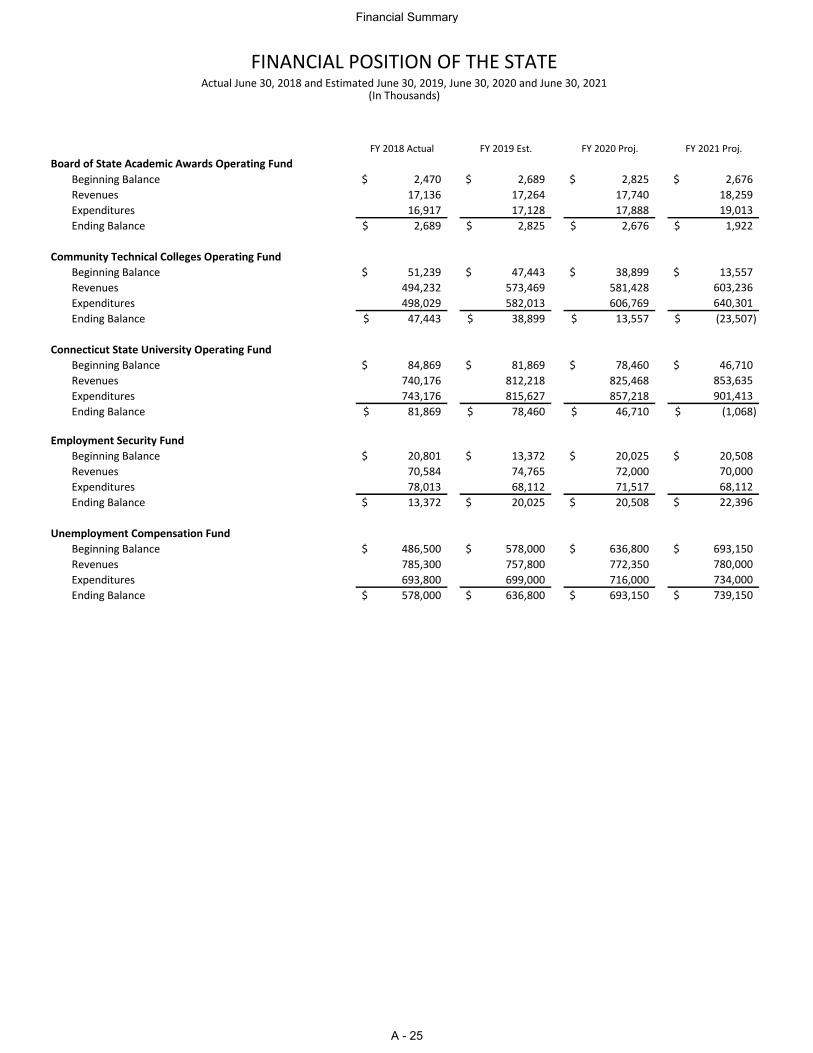
FY 2018 Actual FY 2019 Est. FY 2020 Proj. FY 2021 Proj.
Board of State Academic Awards Operating Fund
Beginning Balance 2,470$ 2,689$ 2,825$ 2,676$
Revenues 17,136 17,264 17,740 18,259
Expenditures 16,917 17,128 17,888 19,013
Ending Balance 2,689$ 2,825$ 2,676$ 1,922$
Community Technical Colleges Operating Fund
Beginning Balance 51,239$ 47,443$ 38,899$ 13,557$
Revenues 494,232 573,469 581,428 603,236
Expenditures 498,029 582,013 606,769 640,301
Ending Balance 47,443$ 38,899$ 13,557$ (23,507)$
Connecticut State University Operating Fund
Beginning Balance 84,869$ 81,869$ 78,460$ 46,710$
Revenues 740,176 812,218 825,468 853,635
Expenditures 743,176 815,627 857,218 901,413
Ending Balance 81,869$ 78,460$ 46,710$ (1,068)$
Employment Security Fund
Beginning Balance 20,801$ 13,372$ 20,025$ 20,508$
Revenues 70,584 74,765 72,000 70,000
Expenditures 78,013 68,112 71,517 68,112
Ending Balance 13,372$ 20,025$ 20,508$ 22,396$
Unemployment Compensation Fund
Beginning Balance 486,500$ 578,000$ 636,800$ 693,150$
Revenues 785,300 757,800 772,350 780,000
Expenditures 693,800 699,000 716,000 734,000
Ending Balance 578,000$ 636,800$ 693,150$ 739,150$
FINANCIAL POSITION OF THE STATEActual June 30, 2018 and Estimated June 30, 2019, June 30, 2020 and June 30, 2021
(In Thousands)
Financial Summary
A - 25
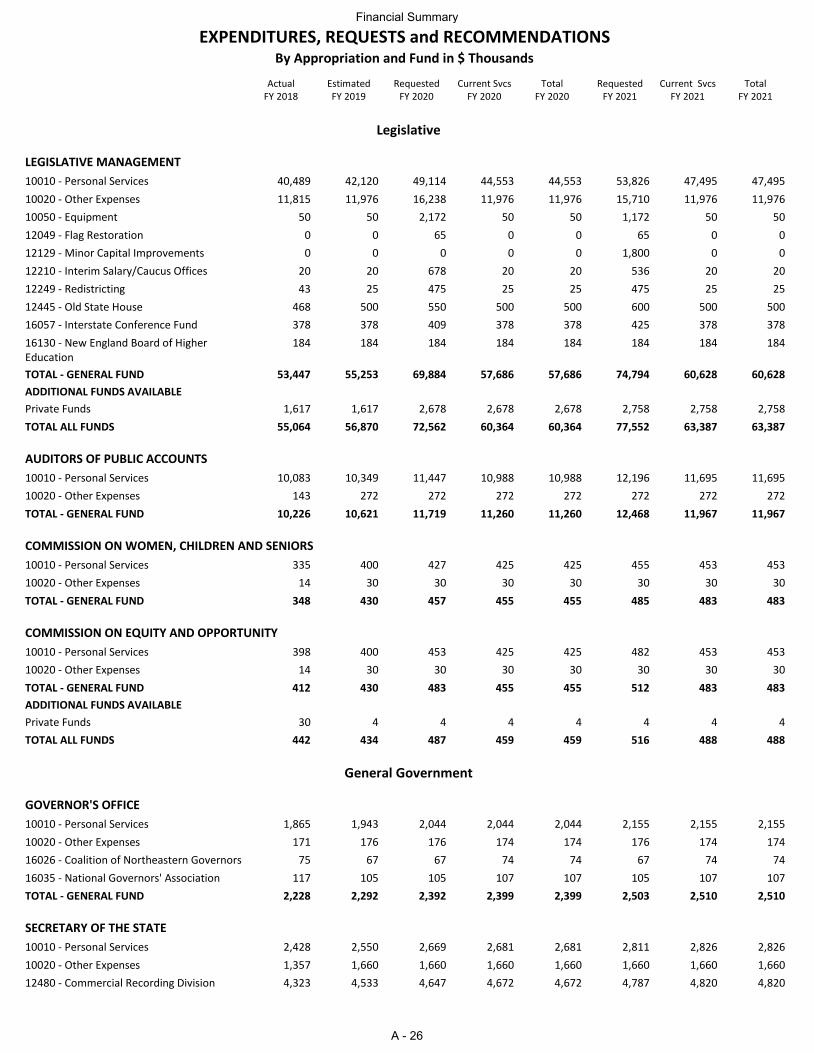
ActualFY 2018
EstimatedFY 2019
RequestedFY 2020
Current SvcsFY 2020
TotalFY 2020
RequestedFY 2021
Current SvcsFY 2021
TotalFY 2021
EXPENDITURES, REQUESTS and RECOMMENDATIONSBy Appropriation and Fund in $ Thousands
Legislative
LEGISLATIVE MANAGEMENT
10010 - Personal Services 40,489 42,120 49,114 44,553 44,553 53,826 47,495 47,495
10020 - Other Expenses 11,815 11,976 16,238 11,976 11,976 15,710 11,976 11,976
10050 - Equipment 50 50 2,172 50 50 1,172 50 50
12049 - Flag Restoration 0 0 65 0 0 65 0 0
12129 - Minor Capital Improvements 0 0 0 0 0 1,800 0 0
12210 - Interim Salary/Caucus Offices 20 20 678 20 20 536 20 20
12249 - Redistricting 43 25 475 25 25 475 25 25
12445 - Old State House 468 500 550 500 500 600 500 500
16057 - Interstate Conference Fund 378 378 409 378 378 425 378 378
16130 - New England Board of Higher Education
184 184 184 184 184 184 184 184
TOTAL - GENERAL FUND 53,447 55,253 69,884 57,686 57,686 74,794 60,628 60,628
ADDITIONAL FUNDS AVAILABLE
Private Funds 1,617 1,617 2,678 2,678 2,678 2,758 2,758 2,758
TOTAL ALL FUNDS 55,064 56,870 72,562 60,364 60,364 77,552 63,387 63,387
AUDITORS OF PUBLIC ACCOUNTS
10010 - Personal Services 10,083 10,349 11,447 10,988 10,988 12,196 11,695 11,695
10020 - Other Expenses 143 272 272 272 272 272 272 272
TOTAL - GENERAL FUND 10,226 10,621 11,719 11,260 11,260 12,468 11,967 11,967
COMMISSION ON WOMEN, CHILDREN AND SENIORS
10010 - Personal Services 335 400 427 425 425 455 453 453
10020 - Other Expenses 14 30 30 30 30 30 30 30
TOTAL - GENERAL FUND 348 430 457 455 455 485 483 483
COMMISSION ON EQUITY AND OPPORTUNITY
10010 - Personal Services 398 400 453 425 425 482 453 453
10020 - Other Expenses 14 30 30 30 30 30 30 30
TOTAL - GENERAL FUND 412 430 483 455 455 512 483 483
ADDITIONAL FUNDS AVAILABLE
Private Funds 30 4 4 4 4 4 4 4
TOTAL ALL FUNDS 442 434 487 459 459 516 488 488
General Government
GOVERNOR'S OFFICE
10010 - Personal Services 1,865 1,943 2,044 2,044 2,044 2,155 2,155 2,155
10020 - Other Expenses 171 176 176 174 174 176 174 174
16026 - Coalition of Northeastern Governors 75 67 67 74 74 67 74 74
16035 - National Governors' Association 117 105 105 107 107 105 107 107
TOTAL - GENERAL FUND 2,228 2,292 2,392 2,399 2,399 2,503 2,510 2,510
SECRETARY OF THE STATE
10010 - Personal Services 2,428 2,550 2,669 2,681 2,681 2,811 2,826 2,826
10020 - Other Expenses 1,357 1,660 1,660 1,660 1,660 1,660 1,660 1,660
12480 - Commercial Recording Division 4,323 4,533 4,647 4,672 4,672 4,787 4,820 4,820
Financial Summary
A - 26
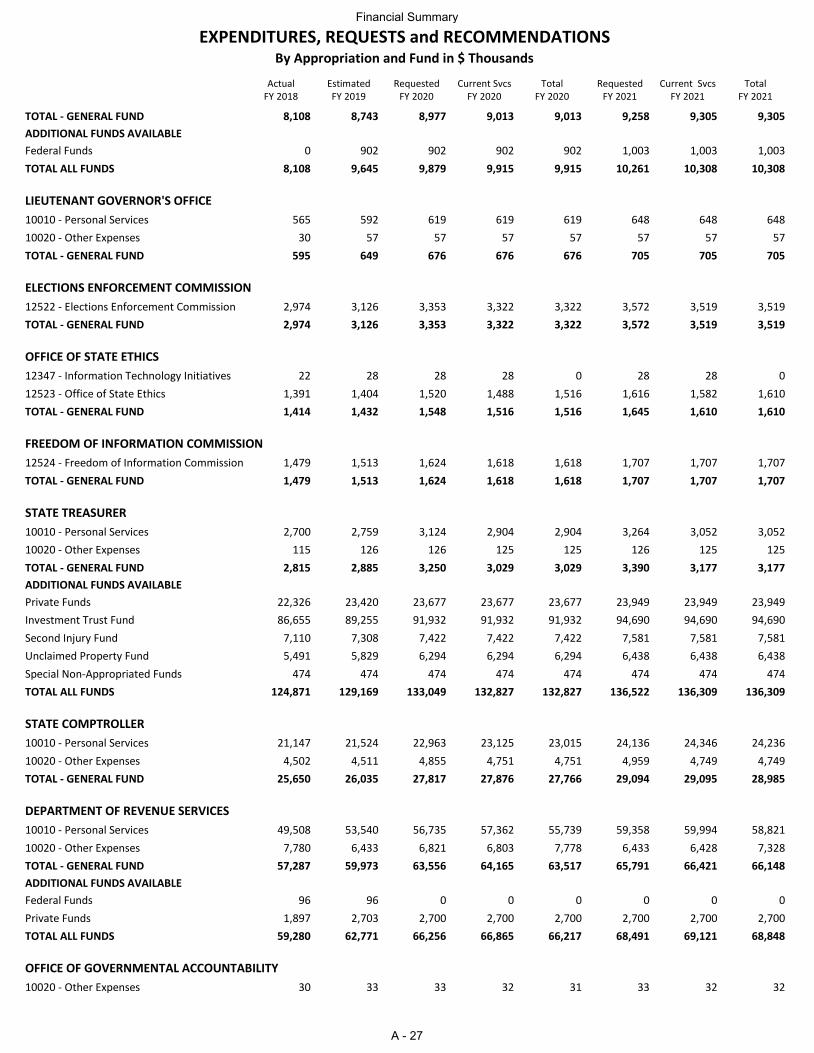
ActualFY 2018
EstimatedFY 2019
RequestedFY 2020
Current SvcsFY 2020
TotalFY 2020
RequestedFY 2021
Current SvcsFY 2021
TotalFY 2021
EXPENDITURES, REQUESTS and RECOMMENDATIONSBy Appropriation and Fund in $ Thousands
TOTAL - GENERAL FUND 8,108 8,743 8,977 9,013 9,013 9,258 9,305 9,305
ADDITIONAL FUNDS AVAILABLE
Federal Funds 0 902 902 902 902 1,003 1,003 1,003
TOTAL ALL FUNDS 8,108 9,645 9,879 9,915 9,915 10,261 10,308 10,308
LIEUTENANT GOVERNOR'S OFFICE
10010 - Personal Services 565 592 619 619 619 648 648 648
10020 - Other Expenses 30 57 57 57 57 57 57 57
TOTAL - GENERAL FUND 595 649 676 676 676 705 705 705
ELECTIONS ENFORCEMENT COMMISSION
12522 - Elections Enforcement Commission 2,974 3,126 3,353 3,322 3,322 3,572 3,519 3,519
TOTAL - GENERAL FUND 2,974 3,126 3,353 3,322 3,322 3,572 3,519 3,519
OFFICE OF STATE ETHICS
12347 - Information Technology Initiatives 22 28 28 28 0 28 28 0
12523 - Office of State Ethics 1,391 1,404 1,520 1,488 1,516 1,616 1,582 1,610
TOTAL - GENERAL FUND 1,414 1,432 1,548 1,516 1,516 1,645 1,610 1,610
FREEDOM OF INFORMATION COMMISSION
12524 - Freedom of Information Commission 1,479 1,513 1,624 1,618 1,618 1,707 1,707 1,707
TOTAL - GENERAL FUND 1,479 1,513 1,624 1,618 1,618 1,707 1,707 1,707
STATE TREASURER
10010 - Personal Services 2,700 2,759 3,124 2,904 2,904 3,264 3,052 3,052
10020 - Other Expenses 115 126 126 125 125 126 125 125
TOTAL - GENERAL FUND 2,815 2,885 3,250 3,029 3,029 3,390 3,177 3,177
ADDITIONAL FUNDS AVAILABLE
Private Funds 22,326 23,420 23,677 23,677 23,677 23,949 23,949 23,949
Investment Trust Fund 86,655 89,255 91,932 91,932 91,932 94,690 94,690 94,690
Second Injury Fund 7,110 7,308 7,422 7,422 7,422 7,581 7,581 7,581
Unclaimed Property Fund 5,491 5,829 6,294 6,294 6,294 6,438 6,438 6,438
Special Non-Appropriated Funds 474 474 474 474 474 474 474 474
TOTAL ALL FUNDS 124,871 129,169 133,049 132,827 132,827 136,522 136,309 136,309
STATE COMPTROLLER
10010 - Personal Services 21,147 21,524 22,963 23,125 23,015 24,136 24,346 24,236
10020 - Other Expenses 4,502 4,511 4,855 4,751 4,751 4,959 4,749 4,749
TOTAL - GENERAL FUND 25,650 26,035 27,817 27,876 27,766 29,094 29,095 28,985
DEPARTMENT OF REVENUE SERVICES
10010 - Personal Services 49,508 53,540 56,735 57,362 55,739 59,358 59,994 58,821
10020 - Other Expenses 7,780 6,433 6,821 6,803 7,778 6,433 6,428 7,328
TOTAL - GENERAL FUND 57,287 59,973 63,556 64,165 63,517 65,791 66,421 66,148
ADDITIONAL FUNDS AVAILABLE
Federal Funds 96 96 0 0 0 0 0 0
Private Funds 1,897 2,703 2,700 2,700 2,700 2,700 2,700 2,700
TOTAL ALL FUNDS 59,280 62,771 66,256 66,865 66,217 68,491 69,121 68,848
OFFICE OF GOVERNMENTAL ACCOUNTABILITY
10020 - Other Expenses 30 33 33 32 31 33 32 32
Financial Summary
A - 27
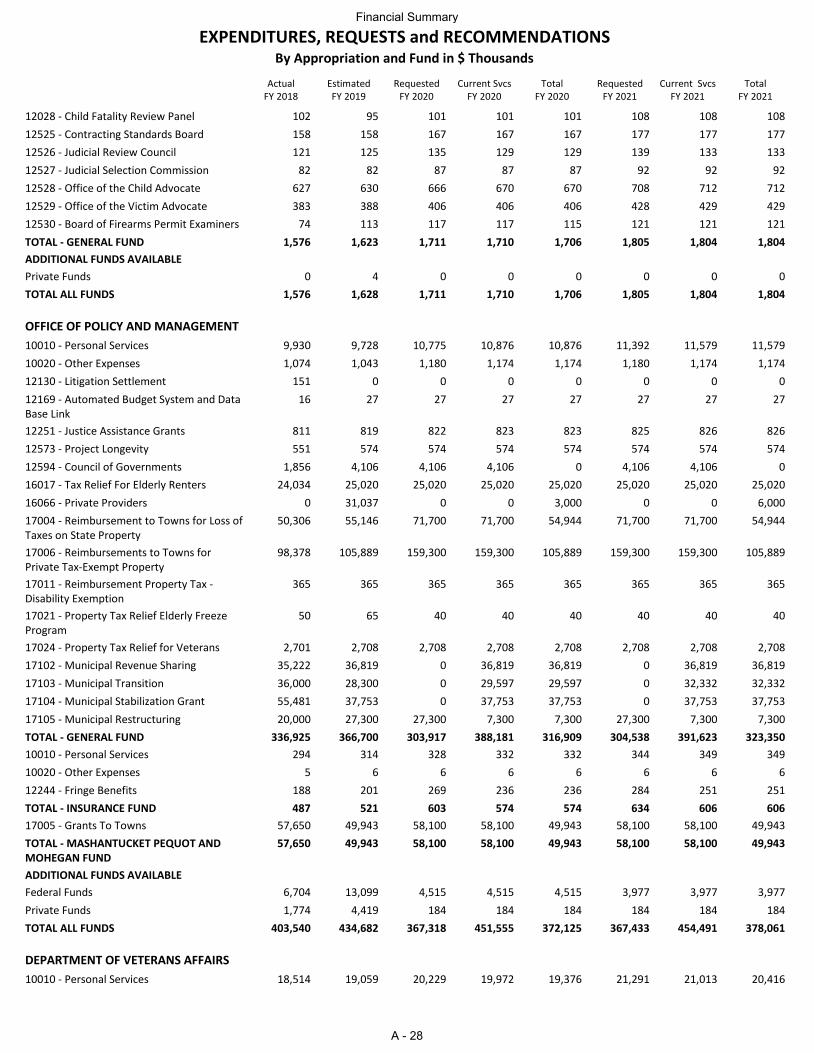
ActualFY 2018
EstimatedFY 2019
RequestedFY 2020
Current SvcsFY 2020
TotalFY 2020
RequestedFY 2021
Current SvcsFY 2021
TotalFY 2021
EXPENDITURES, REQUESTS and RECOMMENDATIONSBy Appropriation and Fund in $ Thousands
12028 - Child Fatality Review Panel 102 95 101 101 101 108 108 108
12525 - Contracting Standards Board 158 158 167 167 167 177 177 177
12526 - Judicial Review Council 121 125 135 129 129 139 133 133
12527 - Judicial Selection Commission 82 82 87 87 87 92 92 92
12528 - Office of the Child Advocate 627 630 666 670 670 708 712 712
12529 - Office of the Victim Advocate 383 388 406 406 406 428 429 429
12530 - Board of Firearms Permit Examiners 74 113 117 117 115 121 121 121
TOTAL - GENERAL FUND 1,576 1,623 1,711 1,710 1,706 1,805 1,804 1,804
ADDITIONAL FUNDS AVAILABLE
Private Funds 0 4 0 0 0 0 0 0
TOTAL ALL FUNDS 1,576 1,628 1,711 1,710 1,706 1,805 1,804 1,804
OFFICE OF POLICY AND MANAGEMENT
10010 - Personal Services 9,930 9,728 10,775 10,876 10,876 11,392 11,579 11,579
10020 - Other Expenses 1,074 1,043 1,180 1,174 1,174 1,180 1,174 1,174
12130 - Litigation Settlement 151 0 0 0 0 0 0 0
12169 - Automated Budget System and Data Base Link
16 27 27 27 27 27 27 27
12251 - Justice Assistance Grants 811 819 822 823 823 825 826 826
12573 - Project Longevity 551 574 574 574 574 574 574 574
12594 - Council of Governments 1,856 4,106 4,106 4,106 0 4,106 4,106 0
16017 - Tax Relief For Elderly Renters 24,034 25,020 25,020 25,020 25,020 25,020 25,020 25,020
16066 - Private Providers 0 31,037 0 0 3,000 0 0 6,000
17004 - Reimbursement to Towns for Loss of Taxes on State Property
50,306 55,146 71,700 71,700 54,944 71,700 71,700 54,944
17006 - Reimbursements to Towns for Private Tax-Exempt Property
98,378 105,889 159,300 159,300 105,889 159,300 159,300 105,889
17011 - Reimbursement Property Tax - Disability Exemption
365 365 365 365 365 365 365 365
17021 - Property Tax Relief Elderly Freeze Program
50 65 40 40 40 40 40 40
17024 - Property Tax Relief for Veterans 2,701 2,708 2,708 2,708 2,708 2,708 2,708 2,708
17102 - Municipal Revenue Sharing 35,222 36,819 0 36,819 36,819 0 36,819 36,819
17103 - Municipal Transition 36,000 28,300 0 29,597 29,597 0 32,332 32,332
17104 - Municipal Stabilization Grant 55,481 37,753 0 37,753 37,753 0 37,753 37,753
17105 - Municipal Restructuring 20,000 27,300 27,300 7,300 7,300 27,300 7,300 7,300
TOTAL - GENERAL FUND 336,925 366,700 303,917 388,181 316,909 304,538 391,623 323,350
10010 - Personal Services 294 314 328 332 332 344 349 349
10020 - Other Expenses 5 6 6 6 6 6 6 6
12244 - Fringe Benefits 188 201 269 236 236 284 251 251
TOTAL - INSURANCE FUND 487 521 603 574 574 634 606 606
17005 - Grants To Towns 57,650 49,943 58,100 58,100 49,943 58,100 58,100 49,943
TOTAL - MASHANTUCKET PEQUOT AND MOHEGAN FUND
57,650 49,943 58,100 58,100 49,943 58,100 58,100 49,943
ADDITIONAL FUNDS AVAILABLE
Federal Funds 6,704 13,099 4,515 4,515 4,515 3,977 3,977 3,977
Private Funds 1,774 4,419 184 184 184 184 184 184
TOTAL ALL FUNDS 403,540 434,682 367,318 451,555 372,125 367,433 454,491 378,061
DEPARTMENT OF VETERANS AFFAIRS
10010 - Personal Services 18,514 19,059 20,229 19,972 19,376 21,291 21,013 20,416
Financial Summary
A - 28
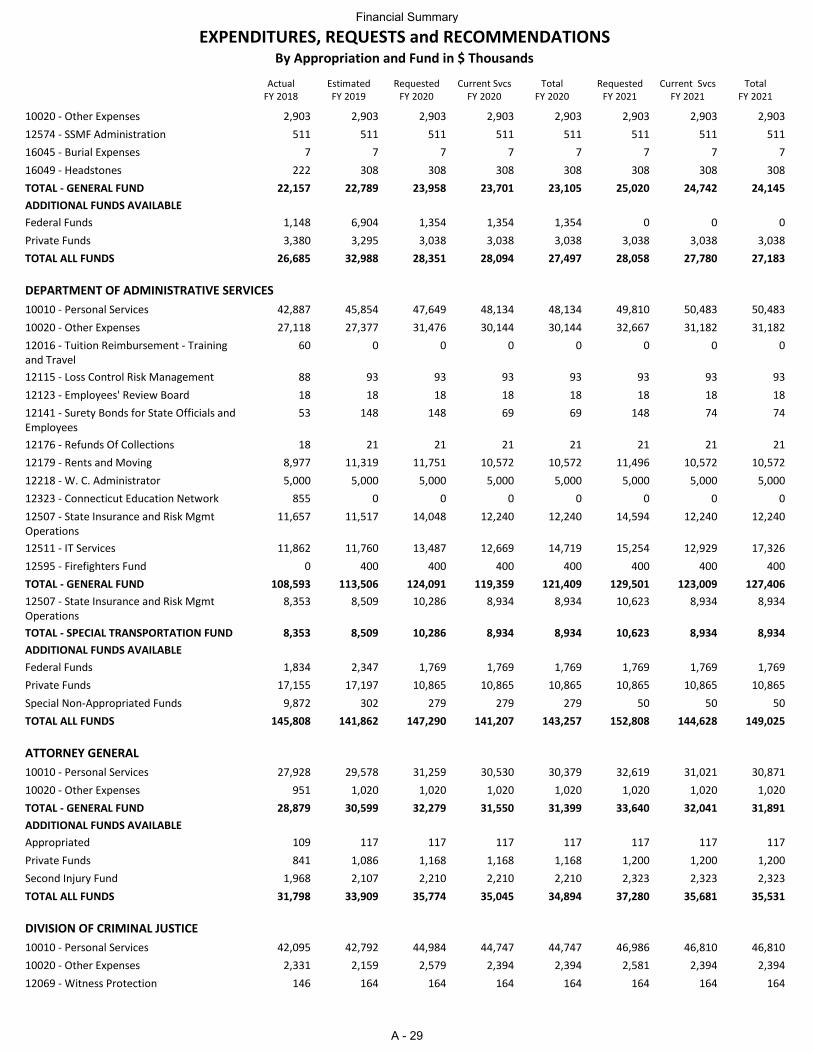
ActualFY 2018
EstimatedFY 2019
RequestedFY 2020
Current SvcsFY 2020
TotalFY 2020
RequestedFY 2021
Current SvcsFY 2021
TotalFY 2021
EXPENDITURES, REQUESTS and RECOMMENDATIONSBy Appropriation and Fund in $ Thousands
10020 - Other Expenses 2,903 2,903 2,903 2,903 2,903 2,903 2,903 2,903
12574 - SSMF Administration 511 511 511 511 511 511 511 511
16045 - Burial Expenses 7 7 7 7 7 7 7 7
16049 - Headstones 222 308 308 308 308 308 308 308
TOTAL - GENERAL FUND 22,157 22,789 23,958 23,701 23,105 25,020 24,742 24,145
ADDITIONAL FUNDS AVAILABLE
Federal Funds 1,148 6,904 1,354 1,354 1,354 0 0 0
Private Funds 3,380 3,295 3,038 3,038 3,038 3,038 3,038 3,038
TOTAL ALL FUNDS 26,685 32,988 28,351 28,094 27,497 28,058 27,780 27,183
DEPARTMENT OF ADMINISTRATIVE SERVICES
10010 - Personal Services 42,887 45,854 47,649 48,134 48,134 49,810 50,483 50,483
10020 - Other Expenses 27,118 27,377 31,476 30,144 30,144 32,667 31,182 31,182
12016 - Tuition Reimbursement - Training and Travel
60 0 0 0 0 0 0 0
12115 - Loss Control Risk Management 88 93 93 93 93 93 93 93
12123 - Employees' Review Board 18 18 18 18 18 18 18 18
12141 - Surety Bonds for State Officials and Employees
53 148 148 69 69 148 74 74
12176 - Refunds Of Collections 18 21 21 21 21 21 21 21
12179 - Rents and Moving 8,977 11,319 11,751 10,572 10,572 11,496 10,572 10,572
12218 - W. C. Administrator 5,000 5,000 5,000 5,000 5,000 5,000 5,000 5,000
12323 - Connecticut Education Network 855 0 0 0 0 0 0 0
12507 - State Insurance and Risk Mgmt Operations
11,657 11,517 14,048 12,240 12,240 14,594 12,240 12,240
12511 - IT Services 11,862 11,760 13,487 12,669 14,719 15,254 12,929 17,326
12595 - Firefighters Fund 0 400 400 400 400 400 400 400
TOTAL - GENERAL FUND 108,593 113,506 124,091 119,359 121,409 129,501 123,009 127,406
12507 - State Insurance and Risk Mgmt Operations
8,353 8,509 10,286 8,934 8,934 10,623 8,934 8,934
TOTAL - SPECIAL TRANSPORTATION FUND 8,353 8,509 10,286 8,934 8,934 10,623 8,934 8,934
ADDITIONAL FUNDS AVAILABLE
Federal Funds 1,834 2,347 1,769 1,769 1,769 1,769 1,769 1,769
Private Funds 17,155 17,197 10,865 10,865 10,865 10,865 10,865 10,865
Special Non-Appropriated Funds 9,872 302 279 279 279 50 50 50
TOTAL ALL FUNDS 145,808 141,862 147,290 141,207 143,257 152,808 144,628 149,025
ATTORNEY GENERAL
10010 - Personal Services 27,928 29,578 31,259 30,530 30,379 32,619 31,021 30,871
10020 - Other Expenses 951 1,020 1,020 1,020 1,020 1,020 1,020 1,020
TOTAL - GENERAL FUND 28,879 30,599 32,279 31,550 31,399 33,640 32,041 31,891
ADDITIONAL FUNDS AVAILABLE
Appropriated 109 117 117 117 117 117 117 117
Private Funds 841 1,086 1,168 1,168 1,168 1,200 1,200 1,200
Second Injury Fund 1,968 2,107 2,210 2,210 2,210 2,323 2,323 2,323
TOTAL ALL FUNDS 31,798 33,909 35,774 35,045 34,894 37,280 35,681 35,531
DIVISION OF CRIMINAL JUSTICE
10010 - Personal Services 42,095 42,792 44,984 44,747 44,747 46,986 46,810 46,810
10020 - Other Expenses 2,331 2,159 2,579 2,394 2,394 2,581 2,394 2,394
12069 - Witness Protection 146 164 164 164 164 164 164 164
Financial Summary
A - 29
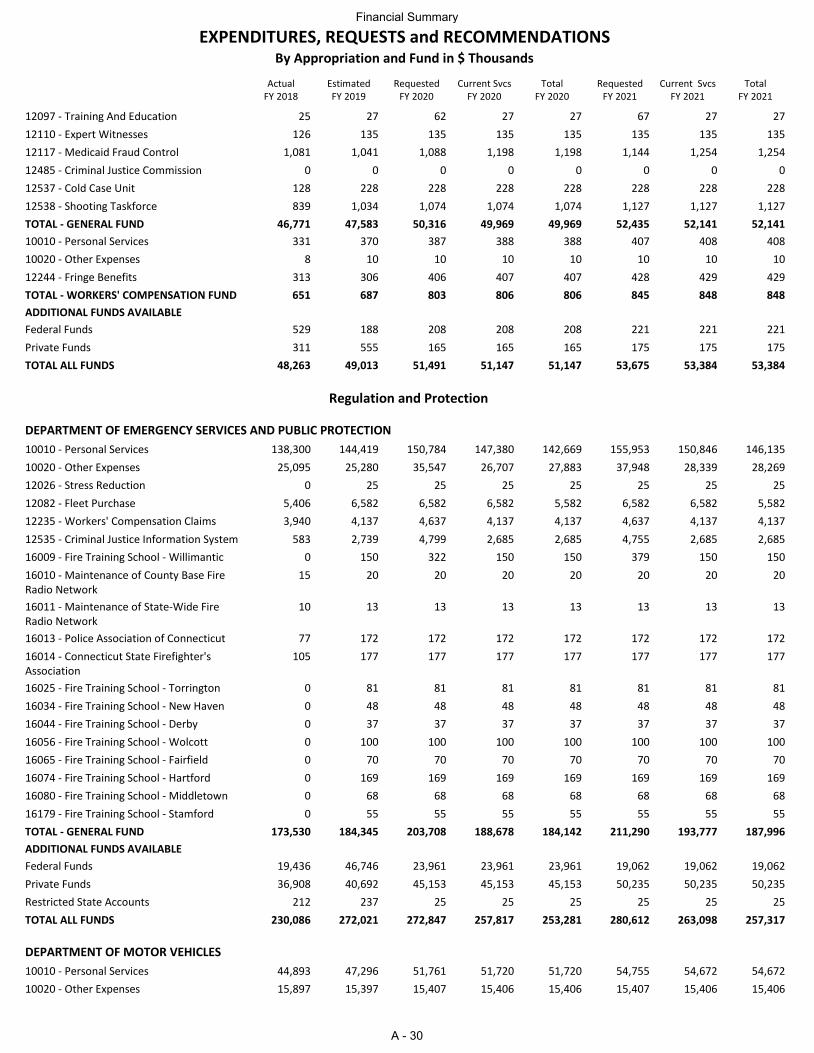
ActualFY 2018
EstimatedFY 2019
RequestedFY 2020
Current SvcsFY 2020
TotalFY 2020
RequestedFY 2021
Current SvcsFY 2021
TotalFY 2021
EXPENDITURES, REQUESTS and RECOMMENDATIONSBy Appropriation and Fund in $ Thousands
12097 - Training And Education 25 27 62 27 27 67 27 27
12110 - Expert Witnesses 126 135 135 135 135 135 135 135
12117 - Medicaid Fraud Control 1,081 1,041 1,088 1,198 1,198 1,144 1,254 1,254
12485 - Criminal Justice Commission 0 0 0 0 0 0 0 0
12537 - Cold Case Unit 128 228 228 228 228 228 228 228
12538 - Shooting Taskforce 839 1,034 1,074 1,074 1,074 1,127 1,127 1,127
TOTAL - GENERAL FUND 46,771 47,583 50,316 49,969 49,969 52,435 52,141 52,141
10010 - Personal Services 331 370 387 388 388 407 408 408
10020 - Other Expenses 8 10 10 10 10 10 10 10
12244 - Fringe Benefits 313 306 406 407 407 428 429 429
TOTAL - WORKERS' COMPENSATION FUND 651 687 803 806 806 845 848 848
ADDITIONAL FUNDS AVAILABLE
Federal Funds 529 188 208 208 208 221 221 221
Private Funds 311 555 165 165 165 175 175 175
TOTAL ALL FUNDS 48,263 49,013 51,491 51,147 51,147 53,675 53,384 53,384
Regulation and Protection
DEPARTMENT OF EMERGENCY SERVICES AND PUBLIC PROTECTION
10010 - Personal Services 138,300 144,419 150,784 147,380 142,669 155,953 150,846 146,135
10020 - Other Expenses 25,095 25,280 35,547 26,707 27,883 37,948 28,339 28,269
12026 - Stress Reduction 0 25 25 25 25 25 25 25
12082 - Fleet Purchase 5,406 6,582 6,582 6,582 5,582 6,582 6,582 5,582
12235 - Workers' Compensation Claims 3,940 4,137 4,637 4,137 4,137 4,637 4,137 4,137
12535 - Criminal Justice Information System 583 2,739 4,799 2,685 2,685 4,755 2,685 2,685
16009 - Fire Training School - Willimantic 0 150 322 150 150 379 150 150
16010 - Maintenance of County Base Fire Radio Network
15 20 20 20 20 20 20 20
16011 - Maintenance of State-Wide Fire Radio Network
10 13 13 13 13 13 13 13
16013 - Police Association of Connecticut 77 172 172 172 172 172 172 172
16014 - Connecticut State Firefighter's Association
105 177 177 177 177 177 177 177
16025 - Fire Training School - Torrington 0 81 81 81 81 81 81 81
16034 - Fire Training School - New Haven 0 48 48 48 48 48 48 48
16044 - Fire Training School - Derby 0 37 37 37 37 37 37 37
16056 - Fire Training School - Wolcott 0 100 100 100 100 100 100 100
16065 - Fire Training School - Fairfield 0 70 70 70 70 70 70 70
16074 - Fire Training School - Hartford 0 169 169 169 169 169 169 169
16080 - Fire Training School - Middletown 0 68 68 68 68 68 68 68
16179 - Fire Training School - Stamford 0 55 55 55 55 55 55 55
TOTAL - GENERAL FUND 173,530 184,345 203,708 188,678 184,142 211,290 193,777 187,996
ADDITIONAL FUNDS AVAILABLE
Federal Funds 19,436 46,746 23,961 23,961 23,961 19,062 19,062 19,062
Private Funds 36,908 40,692 45,153 45,153 45,153 50,235 50,235 50,235
Restricted State Accounts 212 237 25 25 25 25 25 25
TOTAL ALL FUNDS 230,086 272,021 272,847 257,817 253,281 280,612 263,098 257,317
DEPARTMENT OF MOTOR VEHICLES
10010 - Personal Services 44,893 47,296 51,761 51,720 51,720 54,755 54,672 54,672
10020 - Other Expenses 15,897 15,397 15,407 15,406 15,406 15,407 15,406 15,406
Financial Summary
A - 30
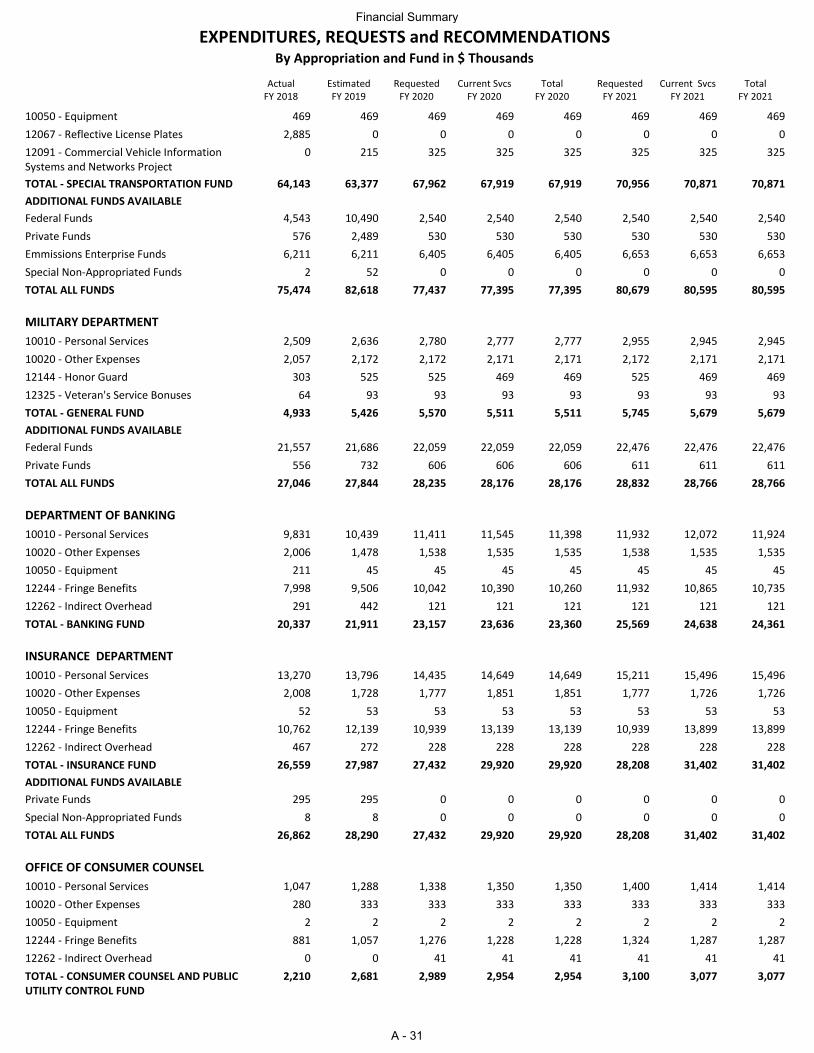
ActualFY 2018
EstimatedFY 2019
RequestedFY 2020
Current SvcsFY 2020
TotalFY 2020
RequestedFY 2021
Current SvcsFY 2021
TotalFY 2021
EXPENDITURES, REQUESTS and RECOMMENDATIONSBy Appropriation and Fund in $ Thousands
10050 - Equipment 469 469 469 469 469 469 469 469
12067 - Reflective License Plates 2,885 0 0 0 0 0 0 0
12091 - Commercial Vehicle Information Systems and Networks Project
0 215 325 325 325 325 325 325
TOTAL - SPECIAL TRANSPORTATION FUND 64,143 63,377 67,962 67,919 67,919 70,956 70,871 70,871
ADDITIONAL FUNDS AVAILABLE
Federal Funds 4,543 10,490 2,540 2,540 2,540 2,540 2,540 2,540
Private Funds 576 2,489 530 530 530 530 530 530
Emmissions Enterprise Funds 6,211 6,211 6,405 6,405 6,405 6,653 6,653 6,653
Special Non-Appropriated Funds 2 52 0 0 0 0 0 0
TOTAL ALL FUNDS 75,474 82,618 77,437 77,395 77,395 80,679 80,595 80,595
MILITARY DEPARTMENT
10010 - Personal Services 2,509 2,636 2,780 2,777 2,777 2,955 2,945 2,945
10020 - Other Expenses 2,057 2,172 2,172 2,171 2,171 2,172 2,171 2,171
12144 - Honor Guard 303 525 525 469 469 525 469 469
12325 - Veteran's Service Bonuses 64 93 93 93 93 93 93 93
TOTAL - GENERAL FUND 4,933 5,426 5,570 5,511 5,511 5,745 5,679 5,679
ADDITIONAL FUNDS AVAILABLE
Federal Funds 21,557 21,686 22,059 22,059 22,059 22,476 22,476 22,476
Private Funds 556 732 606 606 606 611 611 611
TOTAL ALL FUNDS 27,046 27,844 28,235 28,176 28,176 28,832 28,766 28,766
DEPARTMENT OF BANKING
10010 - Personal Services 9,831 10,439 11,411 11,545 11,398 11,932 12,072 11,924
10020 - Other Expenses 2,006 1,478 1,538 1,535 1,535 1,538 1,535 1,535
10050 - Equipment 211 45 45 45 45 45 45 45
12244 - Fringe Benefits 7,998 9,506 10,042 10,390 10,260 11,932 10,865 10,735
12262 - Indirect Overhead 291 442 121 121 121 121 121 121
TOTAL - BANKING FUND 20,337 21,911 23,157 23,636 23,360 25,569 24,638 24,361
INSURANCE DEPARTMENT
10010 - Personal Services 13,270 13,796 14,435 14,649 14,649 15,211 15,496 15,496
10020 - Other Expenses 2,008 1,728 1,777 1,851 1,851 1,777 1,726 1,726
10050 - Equipment 52 53 53 53 53 53 53 53
12244 - Fringe Benefits 10,762 12,139 10,939 13,139 13,139 10,939 13,899 13,899
12262 - Indirect Overhead 467 272 228 228 228 228 228 228
TOTAL - INSURANCE FUND 26,559 27,987 27,432 29,920 29,920 28,208 31,402 31,402
ADDITIONAL FUNDS AVAILABLE
Private Funds 295 295 0 0 0 0 0 0
Special Non-Appropriated Funds 8 8 0 0 0 0 0 0
TOTAL ALL FUNDS 26,862 28,290 27,432 29,920 29,920 28,208 31,402 31,402
OFFICE OF CONSUMER COUNSEL
10010 - Personal Services 1,047 1,288 1,338 1,350 1,350 1,400 1,414 1,414
10020 - Other Expenses 280 333 333 333 333 333 333 333
10050 - Equipment 2 2 2 2 2 2 2 2
12244 - Fringe Benefits 881 1,057 1,276 1,228 1,228 1,324 1,287 1,287
12262 - Indirect Overhead 0 0 41 41 41 41 41 41
TOTAL - CONSUMER COUNSEL AND PUBLIC UTILITY CONTROL FUND
2,210 2,681 2,989 2,954 2,954 3,100 3,077 3,077
Financial Summary
A - 31
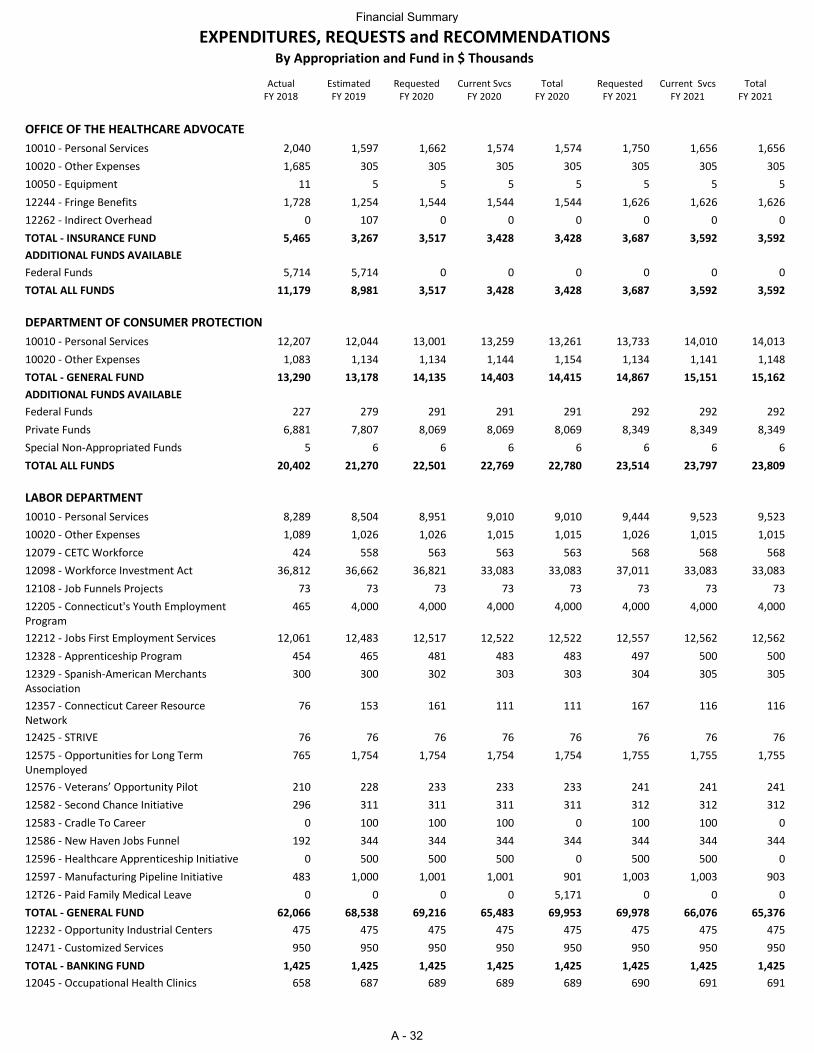
ActualFY 2018
EstimatedFY 2019
RequestedFY 2020
Current SvcsFY 2020
TotalFY 2020
RequestedFY 2021
Current SvcsFY 2021
TotalFY 2021
EXPENDITURES, REQUESTS and RECOMMENDATIONSBy Appropriation and Fund in $ Thousands
OFFICE OF THE HEALTHCARE ADVOCATE
10010 - Personal Services 2,040 1,597 1,662 1,574 1,574 1,750 1,656 1,656
10020 - Other Expenses 1,685 305 305 305 305 305 305 305
10050 - Equipment 11 5 5 5 5 5 5 5
12244 - Fringe Benefits 1,728 1,254 1,544 1,544 1,544 1,626 1,626 1,626
12262 - Indirect Overhead 0 107 0 0 0 0 0 0
TOTAL - INSURANCE FUND 5,465 3,267 3,517 3,428 3,428 3,687 3,592 3,592
ADDITIONAL FUNDS AVAILABLE
Federal Funds 5,714 5,714 0 0 0 0 0 0
TOTAL ALL FUNDS 11,179 8,981 3,517 3,428 3,428 3,687 3,592 3,592
DEPARTMENT OF CONSUMER PROTECTION
10010 - Personal Services 12,207 12,044 13,001 13,259 13,261 13,733 14,010 14,013
10020 - Other Expenses 1,083 1,134 1,134 1,144 1,154 1,134 1,141 1,148
TOTAL - GENERAL FUND 13,290 13,178 14,135 14,403 14,415 14,867 15,151 15,162
ADDITIONAL FUNDS AVAILABLE
Federal Funds 227 279 291 291 291 292 292 292
Private Funds 6,881 7,807 8,069 8,069 8,069 8,349 8,349 8,349
Special Non-Appropriated Funds 5 6 6 6 6 6 6 6
TOTAL ALL FUNDS 20,402 21,270 22,501 22,769 22,780 23,514 23,797 23,809
LABOR DEPARTMENT
10010 - Personal Services 8,289 8,504 8,951 9,010 9,010 9,444 9,523 9,523
10020 - Other Expenses 1,089 1,026 1,026 1,015 1,015 1,026 1,015 1,015
12079 - CETC Workforce 424 558 563 563 563 568 568 568
12098 - Workforce Investment Act 36,812 36,662 36,821 33,083 33,083 37,011 33,083 33,083
12108 - Job Funnels Projects 73 73 73 73 73 73 73 73
12205 - Connecticut's Youth Employment Program
465 4,000 4,000 4,000 4,000 4,000 4,000 4,000
12212 - Jobs First Employment Services 12,061 12,483 12,517 12,522 12,522 12,557 12,562 12,562
12328 - Apprenticeship Program 454 465 481 483 483 497 500 500
12329 - Spanish-American Merchants Association
300 300 302 303 303 304 305 305
12357 - Connecticut Career Resource Network
76 153 161 111 111 167 116 116
12425 - STRIVE 76 76 76 76 76 76 76 76
12575 - Opportunities for Long Term Unemployed
765 1,754 1,754 1,754 1,754 1,755 1,755 1,755
12576 - Veterans’ Opportunity Pilot 210 228 233 233 233 241 241 241
12582 - Second Chance Initiative 296 311 311 311 311 312 312 312
12583 - Cradle To Career 0 100 100 100 0 100 100 0
12586 - New Haven Jobs Funnel 192 344 344 344 344 344 344 344
12596 - Healthcare Apprenticeship Initiative 0 500 500 500 0 500 500 0
12597 - Manufacturing Pipeline Initiative 483 1,000 1,001 1,001 901 1,003 1,003 903
12T26 - Paid Family Medical Leave 0 0 0 0 5,171 0 0 0
TOTAL - GENERAL FUND 62,066 68,538 69,216 65,483 69,953 69,978 66,076 65,376
12232 - Opportunity Industrial Centers 475 475 475 475 475 475 475 475
12471 - Customized Services 950 950 950 950 950 950 950 950
TOTAL - BANKING FUND 1,425 1,425 1,425 1,425 1,425 1,425 1,425 1,425
12045 - Occupational Health Clinics 658 687 689 689 689 690 691 691
Financial Summary
A - 32
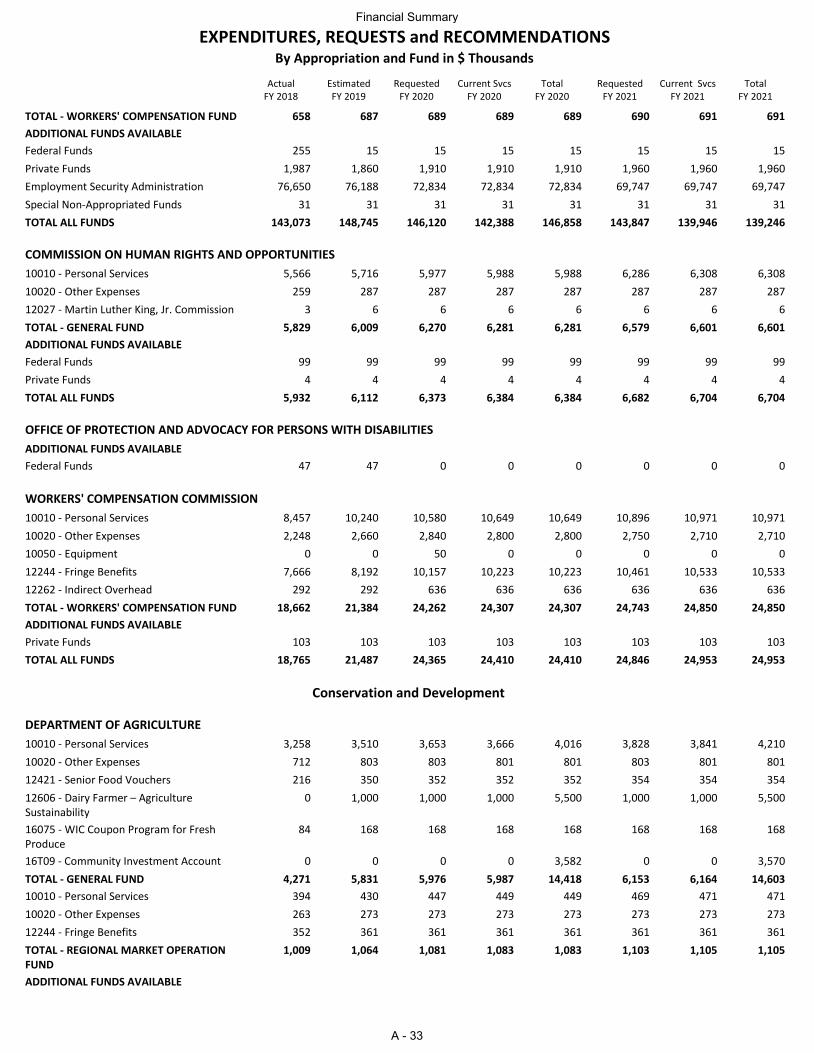
ActualFY 2018
EstimatedFY 2019
RequestedFY 2020
Current SvcsFY 2020
TotalFY 2020
RequestedFY 2021
Current SvcsFY 2021
TotalFY 2021
EXPENDITURES, REQUESTS and RECOMMENDATIONSBy Appropriation and Fund in $ Thousands
TOTAL - WORKERS' COMPENSATION FUND 658 687 689 689 689 690 691 691
ADDITIONAL FUNDS AVAILABLE
Federal Funds 255 15 15 15 15 15 15 15
Private Funds 1,987 1,860 1,910 1,910 1,910 1,960 1,960 1,960
Employment Security Administration 76,650 76,188 72,834 72,834 72,834 69,747 69,747 69,747
Special Non-Appropriated Funds 31 31 31 31 31 31 31 31
TOTAL ALL FUNDS 143,073 148,745 146,120 142,388 146,858 143,847 139,946 139,246
COMMISSION ON HUMAN RIGHTS AND OPPORTUNITIES
10010 - Personal Services 5,566 5,716 5,977 5,988 5,988 6,286 6,308 6,308
10020 - Other Expenses 259 287 287 287 287 287 287 287
12027 - Martin Luther King, Jr. Commission 3 6 6 6 6 6 6 6
TOTAL - GENERAL FUND 5,829 6,009 6,270 6,281 6,281 6,579 6,601 6,601
ADDITIONAL FUNDS AVAILABLE
Federal Funds 99 99 99 99 99 99 99 99
Private Funds 4 4 4 4 4 4 4 4
TOTAL ALL FUNDS 5,932 6,112 6,373 6,384 6,384 6,682 6,704 6,704
OFFICE OF PROTECTION AND ADVOCACY FOR PERSONS WITH DISABILITIES
ADDITIONAL FUNDS AVAILABLE
Federal Funds 47 47 0 0 0 0 0 0
WORKERS' COMPENSATION COMMISSION
10010 - Personal Services 8,457 10,240 10,580 10,649 10,649 10,896 10,971 10,971
10020 - Other Expenses 2,248 2,660 2,840 2,800 2,800 2,750 2,710 2,710
10050 - Equipment 0 0 50 0 0 0 0 0
12244 - Fringe Benefits 7,666 8,192 10,157 10,223 10,223 10,461 10,533 10,533
12262 - Indirect Overhead 292 292 636 636 636 636 636 636
TOTAL - WORKERS' COMPENSATION FUND 18,662 21,384 24,262 24,307 24,307 24,743 24,850 24,850
ADDITIONAL FUNDS AVAILABLE
Private Funds 103 103 103 103 103 103 103 103
TOTAL ALL FUNDS 18,765 21,487 24,365 24,410 24,410 24,846 24,953 24,953
Conservation and Development
DEPARTMENT OF AGRICULTURE
10010 - Personal Services 3,258 3,510 3,653 3,666 4,016 3,828 3,841 4,210
10020 - Other Expenses 712 803 803 801 801 803 801 801
12421 - Senior Food Vouchers 216 350 352 352 352 354 354 354
12606 - Dairy Farmer – Agriculture Sustainability
0 1,000 1,000 1,000 5,500 1,000 1,000 5,500
16075 - WIC Coupon Program for Fresh Produce
84 168 168 168 168 168 168 168
16T09 - Community Investment Account 0 0 0 0 3,582 0 0 3,570
TOTAL - GENERAL FUND 4,271 5,831 5,976 5,987 14,418 6,153 6,164 14,603
10010 - Personal Services 394 430 447 449 449 469 471 471
10020 - Other Expenses 263 273 273 273 273 273 273 273
12244 - Fringe Benefits 352 361 361 361 361 361 361 361
TOTAL - REGIONAL MARKET OPERATION FUND
1,009 1,064 1,081 1,083 1,083 1,103 1,105 1,105
ADDITIONAL FUNDS AVAILABLE
Financial Summary
A - 33
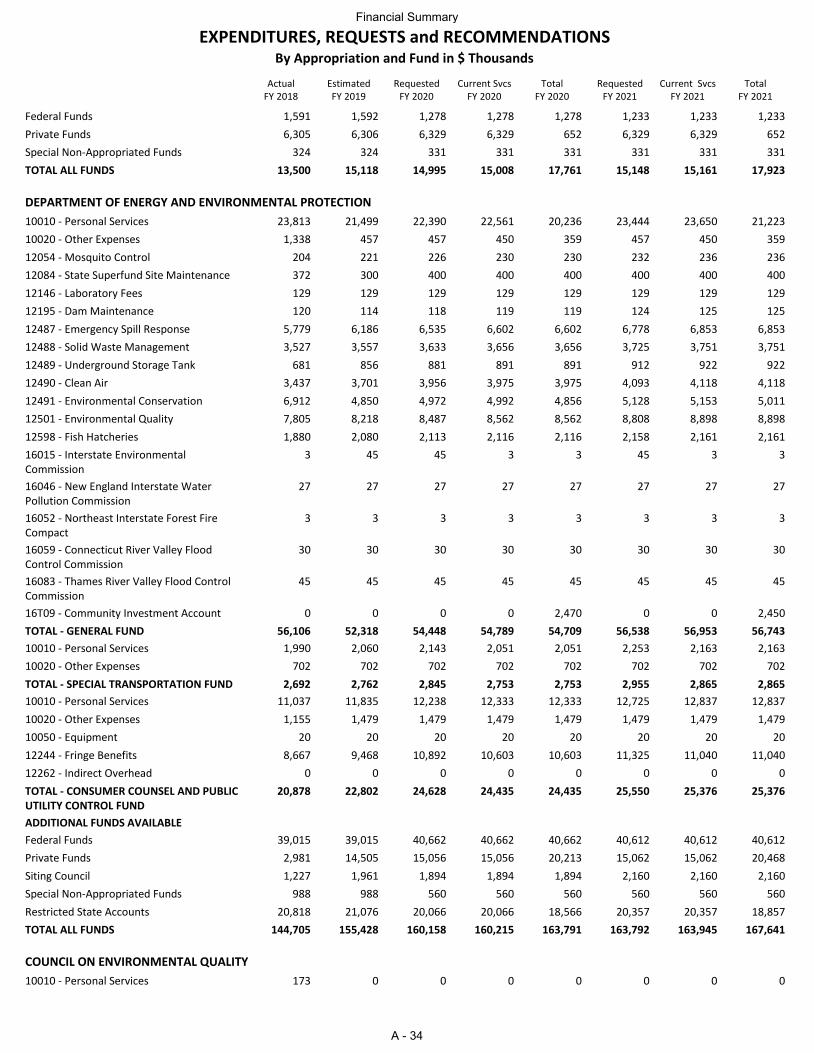
ActualFY 2018
EstimatedFY 2019
RequestedFY 2020
Current SvcsFY 2020
TotalFY 2020
RequestedFY 2021
Current SvcsFY 2021
TotalFY 2021
EXPENDITURES, REQUESTS and RECOMMENDATIONSBy Appropriation and Fund in $ Thousands
Federal Funds 1,591 1,592 1,278 1,278 1,278 1,233 1,233 1,233
Private Funds 6,305 6,306 6,329 6,329 652 6,329 6,329 652
Special Non-Appropriated Funds 324 324 331 331 331 331 331 331
TOTAL ALL FUNDS 13,500 15,118 14,995 15,008 17,761 15,148 15,161 17,923
DEPARTMENT OF ENERGY AND ENVIRONMENTAL PROTECTION
10010 - Personal Services 23,813 21,499 22,390 22,561 20,236 23,444 23,650 21,223
10020 - Other Expenses 1,338 457 457 450 359 457 450 359
12054 - Mosquito Control 204 221 226 230 230 232 236 236
12084 - State Superfund Site Maintenance 372 300 400 400 400 400 400 400
12146 - Laboratory Fees 129 129 129 129 129 129 129 129
12195 - Dam Maintenance 120 114 118 119 119 124 125 125
12487 - Emergency Spill Response 5,779 6,186 6,535 6,602 6,602 6,778 6,853 6,853
12488 - Solid Waste Management 3,527 3,557 3,633 3,656 3,656 3,725 3,751 3,751
12489 - Underground Storage Tank 681 856 881 891 891 912 922 922
12490 - Clean Air 3,437 3,701 3,956 3,975 3,975 4,093 4,118 4,118
12491 - Environmental Conservation 6,912 4,850 4,972 4,992 4,856 5,128 5,153 5,011
12501 - Environmental Quality 7,805 8,218 8,487 8,562 8,562 8,808 8,898 8,898
12598 - Fish Hatcheries 1,880 2,080 2,113 2,116 2,116 2,158 2,161 2,161
16015 - Interstate Environmental Commission
3 45 45 3 3 45 3 3
16046 - New England Interstate Water Pollution Commission
27 27 27 27 27 27 27 27
16052 - Northeast Interstate Forest Fire Compact
3 3 3 3 3 3 3 3
16059 - Connecticut River Valley Flood Control Commission
30 30 30 30 30 30 30 30
16083 - Thames River Valley Flood Control Commission
45 45 45 45 45 45 45 45
16T09 - Community Investment Account 0 0 0 0 2,470 0 0 2,450
TOTAL - GENERAL FUND 56,106 52,318 54,448 54,789 54,709 56,538 56,953 56,743
10010 - Personal Services 1,990 2,060 2,143 2,051 2,051 2,253 2,163 2,163
10020 - Other Expenses 702 702 702 702 702 702 702 702
TOTAL - SPECIAL TRANSPORTATION FUND 2,692 2,762 2,845 2,753 2,753 2,955 2,865 2,865
10010 - Personal Services 11,037 11,835 12,238 12,333 12,333 12,725 12,837 12,837
10020 - Other Expenses 1,155 1,479 1,479 1,479 1,479 1,479 1,479 1,479
10050 - Equipment 20 20 20 20 20 20 20 20
12244 - Fringe Benefits 8,667 9,468 10,892 10,603 10,603 11,325 11,040 11,040
12262 - Indirect Overhead 0 0 0 0 0 0 0 0
TOTAL - CONSUMER COUNSEL AND PUBLIC UTILITY CONTROL FUND
20,878 22,802 24,628 24,435 24,435 25,550 25,376 25,376
ADDITIONAL FUNDS AVAILABLE
Federal Funds 39,015 39,015 40,662 40,662 40,662 40,612 40,612 40,612
Private Funds 2,981 14,505 15,056 15,056 20,213 15,062 15,062 20,468
Siting Council 1,227 1,961 1,894 1,894 1,894 2,160 2,160 2,160
Special Non-Appropriated Funds 988 988 560 560 560 560 560 560
Restricted State Accounts 20,818 21,076 20,066 20,066 18,566 20,357 20,357 18,857
TOTAL ALL FUNDS 144,705 155,428 160,158 160,215 163,791 163,792 163,945 167,641
COUNCIL ON ENVIRONMENTAL QUALITY
10010 - Personal Services 173 0 0 0 0 0 0 0
Financial Summary
A - 34
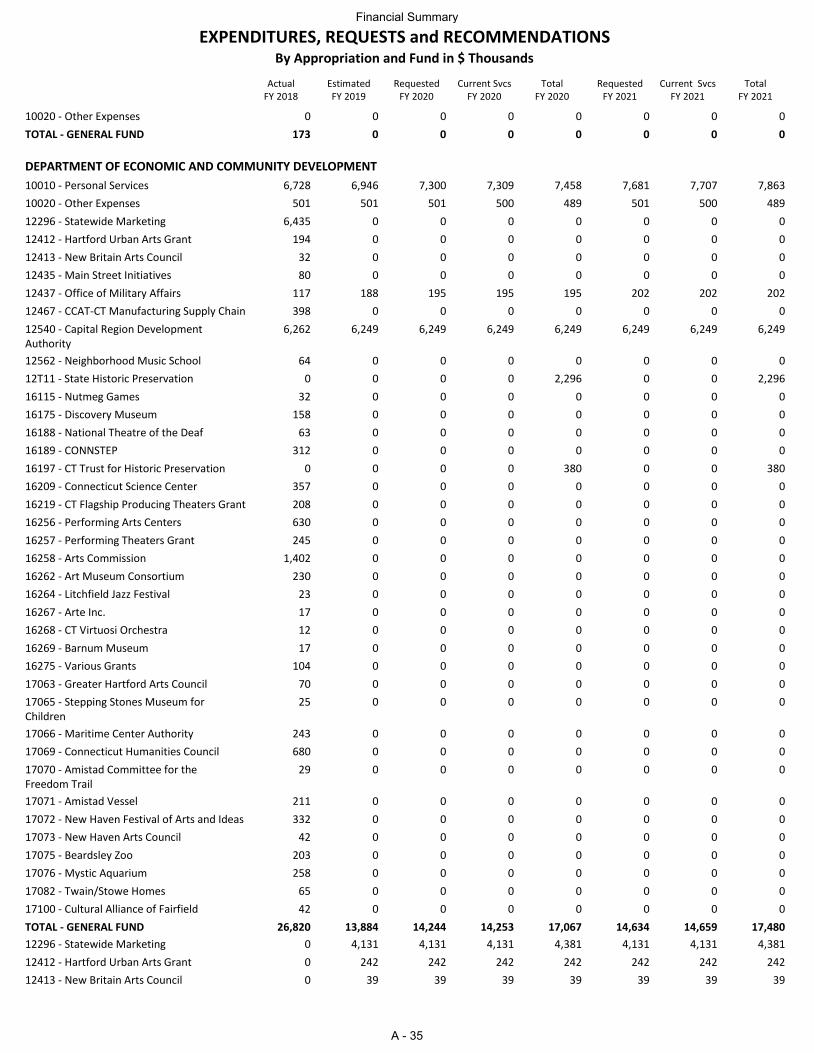
ActualFY 2018
EstimatedFY 2019
RequestedFY 2020
Current SvcsFY 2020
TotalFY 2020
RequestedFY 2021
Current SvcsFY 2021
TotalFY 2021
EXPENDITURES, REQUESTS and RECOMMENDATIONSBy Appropriation and Fund in $ Thousands
10020 - Other Expenses 0 0 0 0 0 0 0 0
TOTAL - GENERAL FUND 173 0 0 0 0 0 0 0
DEPARTMENT OF ECONOMIC AND COMMUNITY DEVELOPMENT
10010 - Personal Services 6,728 6,946 7,300 7,309 7,458 7,681 7,707 7,863
10020 - Other Expenses 501 501 501 500 489 501 500 489
12296 - Statewide Marketing 6,435 0 0 0 0 0 0 0
12412 - Hartford Urban Arts Grant 194 0 0 0 0 0 0 0
12413 - New Britain Arts Council 32 0 0 0 0 0 0 0
12435 - Main Street Initiatives 80 0 0 0 0 0 0 0
12437 - Office of Military Affairs 117 188 195 195 195 202 202 202
12467 - CCAT-CT Manufacturing Supply Chain 398 0 0 0 0 0 0 0
12540 - Capital Region Development Authority
6,262 6,249 6,249 6,249 6,249 6,249 6,249 6,249
12562 - Neighborhood Music School 64 0 0 0 0 0 0 0
12T11 - State Historic Preservation 0 0 0 0 2,296 0 0 2,296
16115 - Nutmeg Games 32 0 0 0 0 0 0 0
16175 - Discovery Museum 158 0 0 0 0 0 0 0
16188 - National Theatre of the Deaf 63 0 0 0 0 0 0 0
16189 - CONNSTEP 312 0 0 0 0 0 0 0
16197 - CT Trust for Historic Preservation 0 0 0 0 380 0 0 380
16209 - Connecticut Science Center 357 0 0 0 0 0 0 0
16219 - CT Flagship Producing Theaters Grant 208 0 0 0 0 0 0 0
16256 - Performing Arts Centers 630 0 0 0 0 0 0 0
16257 - Performing Theaters Grant 245 0 0 0 0 0 0 0
16258 - Arts Commission 1,402 0 0 0 0 0 0 0
16262 - Art Museum Consortium 230 0 0 0 0 0 0 0
16264 - Litchfield Jazz Festival 23 0 0 0 0 0 0 0
16267 - Arte Inc. 17 0 0 0 0 0 0 0
16268 - CT Virtuosi Orchestra 12 0 0 0 0 0 0 0
16269 - Barnum Museum 17 0 0 0 0 0 0 0
16275 - Various Grants 104 0 0 0 0 0 0 0
17063 - Greater Hartford Arts Council 70 0 0 0 0 0 0 0
17065 - Stepping Stones Museum for Children
25 0 0 0 0 0 0 0
17066 - Maritime Center Authority 243 0 0 0 0 0 0 0
17069 - Connecticut Humanities Council 680 0 0 0 0 0 0 0
17070 - Amistad Committee for the Freedom Trail
29 0 0 0 0 0 0 0
17071 - Amistad Vessel 211 0 0 0 0 0 0 0
17072 - New Haven Festival of Arts and Ideas 332 0 0 0 0 0 0 0
17073 - New Haven Arts Council 42 0 0 0 0 0 0 0
17075 - Beardsley Zoo 203 0 0 0 0 0 0 0
17076 - Mystic Aquarium 258 0 0 0 0 0 0 0
17082 - Twain/Stowe Homes 65 0 0 0 0 0 0 0
17100 - Cultural Alliance of Fairfield 42 0 0 0 0 0 0 0
TOTAL - GENERAL FUND 26,820 13,884 14,244 14,253 17,067 14,634 14,659 17,480
12296 - Statewide Marketing 0 4,131 4,131 4,131 4,381 4,131 4,131 4,381
12412 - Hartford Urban Arts Grant 0 242 242 242 242 242 242 242
12413 - New Britain Arts Council 0 39 39 39 39 39 39 39
Financial Summary
A - 35
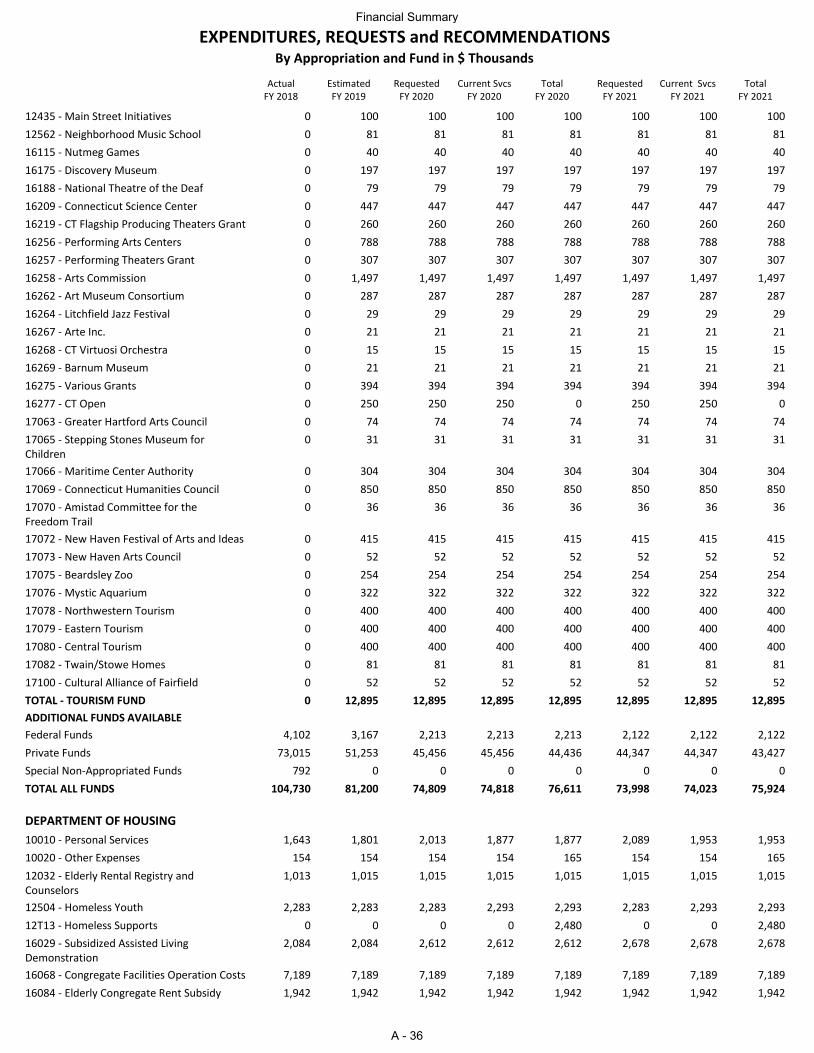
ActualFY 2018
EstimatedFY 2019
RequestedFY 2020
Current SvcsFY 2020
TotalFY 2020
RequestedFY 2021
Current SvcsFY 2021
TotalFY 2021
EXPENDITURES, REQUESTS and RECOMMENDATIONSBy Appropriation and Fund in $ Thousands
12435 - Main Street Initiatives 0 100 100 100 100 100 100 100
12562 - Neighborhood Music School 0 81 81 81 81 81 81 81
16115 - Nutmeg Games 0 40 40 40 40 40 40 40
16175 - Discovery Museum 0 197 197 197 197 197 197 197
16188 - National Theatre of the Deaf 0 79 79 79 79 79 79 79
16209 - Connecticut Science Center 0 447 447 447 447 447 447 447
16219 - CT Flagship Producing Theaters Grant 0 260 260 260 260 260 260 260
16256 - Performing Arts Centers 0 788 788 788 788 788 788 788
16257 - Performing Theaters Grant 0 307 307 307 307 307 307 307
16258 - Arts Commission 0 1,497 1,497 1,497 1,497 1,497 1,497 1,497
16262 - Art Museum Consortium 0 287 287 287 287 287 287 287
16264 - Litchfield Jazz Festival 0 29 29 29 29 29 29 29
16267 - Arte Inc. 0 21 21 21 21 21 21 21
16268 - CT Virtuosi Orchestra 0 15 15 15 15 15 15 15
16269 - Barnum Museum 0 21 21 21 21 21 21 21
16275 - Various Grants 0 394 394 394 394 394 394 394
16277 - CT Open 0 250 250 250 0 250 250 0
17063 - Greater Hartford Arts Council 0 74 74 74 74 74 74 74
17065 - Stepping Stones Museum for Children
0 31 31 31 31 31 31 31
17066 - Maritime Center Authority 0 304 304 304 304 304 304 304
17069 - Connecticut Humanities Council 0 850 850 850 850 850 850 850
17070 - Amistad Committee for the Freedom Trail
0 36 36 36 36 36 36 36
17072 - New Haven Festival of Arts and Ideas 0 415 415 415 415 415 415 415
17073 - New Haven Arts Council 0 52 52 52 52 52 52 52
17075 - Beardsley Zoo 0 254 254 254 254 254 254 254
17076 - Mystic Aquarium 0 322 322 322 322 322 322 322
17078 - Northwestern Tourism 0 400 400 400 400 400 400 400
17079 - Eastern Tourism 0 400 400 400 400 400 400 400
17080 - Central Tourism 0 400 400 400 400 400 400 400
17082 - Twain/Stowe Homes 0 81 81 81 81 81 81 81
17100 - Cultural Alliance of Fairfield 0 52 52 52 52 52 52 52
TOTAL - TOURISM FUND 0 12,895 12,895 12,895 12,895 12,895 12,895 12,895
ADDITIONAL FUNDS AVAILABLE
Federal Funds 4,102 3,167 2,213 2,213 2,213 2,122 2,122 2,122
Private Funds 73,015 51,253 45,456 45,456 44,436 44,347 44,347 43,427
Special Non-Appropriated Funds 792 0 0 0 0 0 0 0
TOTAL ALL FUNDS 104,730 81,200 74,809 74,818 76,611 73,998 74,023 75,924
DEPARTMENT OF HOUSING
10010 - Personal Services 1,643 1,801 2,013 1,877 1,877 2,089 1,953 1,953
10020 - Other Expenses 154 154 154 154 165 154 154 165
12032 - Elderly Rental Registry and Counselors
1,013 1,015 1,015 1,015 1,015 1,015 1,015 1,015
12504 - Homeless Youth 2,283 2,283 2,283 2,293 2,293 2,283 2,293 2,293
12T13 - Homeless Supports 0 0 0 0 2,480 0 0 2,480
16029 - Subsidized Assisted Living Demonstration
2,084 2,084 2,612 2,612 2,612 2,678 2,678 2,678
16068 - Congregate Facilities Operation Costs 7,189 7,189 7,189 7,189 7,189 7,189 7,189 7,189
16084 - Elderly Congregate Rent Subsidy 1,942 1,942 1,942 1,942 1,942 1,942 1,942 1,942
Financial Summary
A - 36
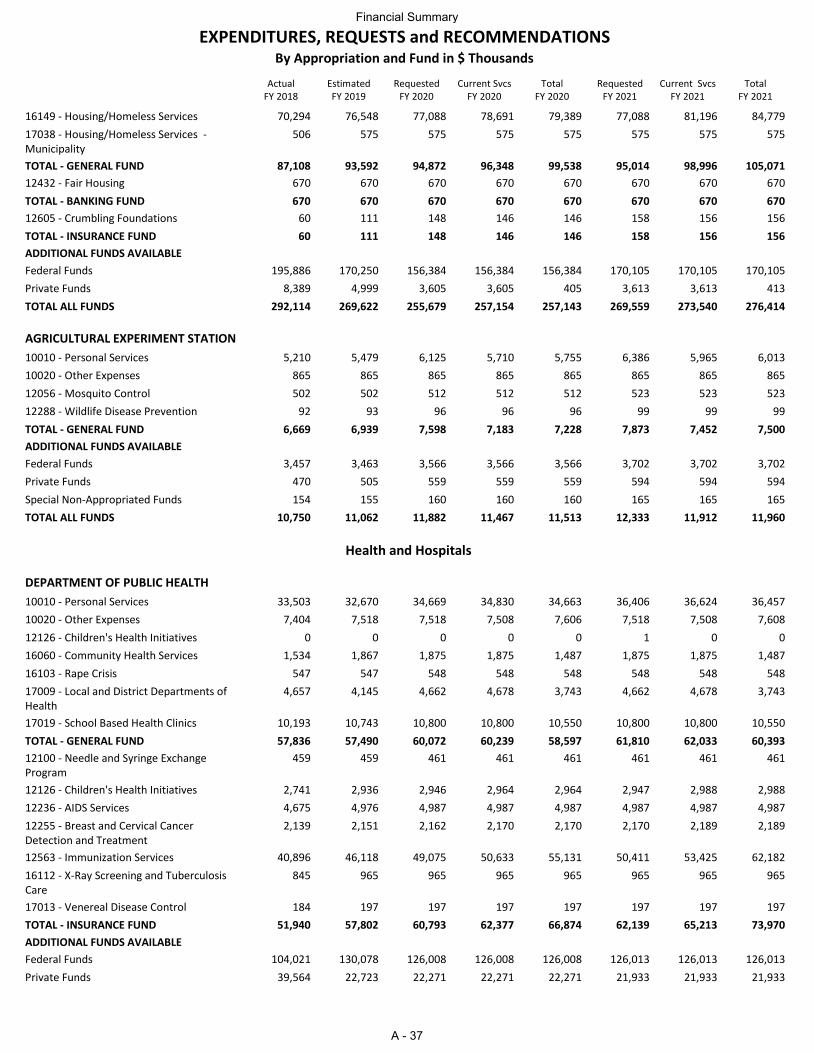
ActualFY 2018
EstimatedFY 2019
RequestedFY 2020
Current SvcsFY 2020
TotalFY 2020
RequestedFY 2021
Current SvcsFY 2021
TotalFY 2021
EXPENDITURES, REQUESTS and RECOMMENDATIONSBy Appropriation and Fund in $ Thousands
16149 - Housing/Homeless Services 70,294 76,548 77,088 78,691 79,389 77,088 81,196 84,779
17038 - Housing/Homeless Services - Municipality
506 575 575 575 575 575 575 575
TOTAL - GENERAL FUND 87,108 93,592 94,872 96,348 99,538 95,014 98,996 105,071
12432 - Fair Housing 670 670 670 670 670 670 670 670
TOTAL - BANKING FUND 670 670 670 670 670 670 670 670
12605 - Crumbling Foundations 60 111 148 146 146 158 156 156
TOTAL - INSURANCE FUND 60 111 148 146 146 158 156 156
ADDITIONAL FUNDS AVAILABLE
Federal Funds 195,886 170,250 156,384 156,384 156,384 170,105 170,105 170,105
Private Funds 8,389 4,999 3,605 3,605 405 3,613 3,613 413
TOTAL ALL FUNDS 292,114 269,622 255,679 257,154 257,143 269,559 273,540 276,414
AGRICULTURAL EXPERIMENT STATION
10010 - Personal Services 5,210 5,479 6,125 5,710 5,755 6,386 5,965 6,013
10020 - Other Expenses 865 865 865 865 865 865 865 865
12056 - Mosquito Control 502 502 512 512 512 523 523 523
12288 - Wildlife Disease Prevention 92 93 96 96 96 99 99 99
TOTAL - GENERAL FUND 6,669 6,939 7,598 7,183 7,228 7,873 7,452 7,500
ADDITIONAL FUNDS AVAILABLE
Federal Funds 3,457 3,463 3,566 3,566 3,566 3,702 3,702 3,702
Private Funds 470 505 559 559 559 594 594 594
Special Non-Appropriated Funds 154 155 160 160 160 165 165 165
TOTAL ALL FUNDS 10,750 11,062 11,882 11,467 11,513 12,333 11,912 11,960
Health and Hospitals
DEPARTMENT OF PUBLIC HEALTH
10010 - Personal Services 33,503 32,670 34,669 34,830 34,663 36,406 36,624 36,457
10020 - Other Expenses 7,404 7,518 7,518 7,508 7,606 7,518 7,508 7,608
12126 - Children's Health Initiatives 0 0 0 0 0 1 0 0
16060 - Community Health Services 1,534 1,867 1,875 1,875 1,487 1,875 1,875 1,487
16103 - Rape Crisis 547 547 548 548 548 548 548 548
17009 - Local and District Departments of Health
4,657 4,145 4,662 4,678 3,743 4,662 4,678 3,743
17019 - School Based Health Clinics 10,193 10,743 10,800 10,800 10,550 10,800 10,800 10,550
TOTAL - GENERAL FUND 57,836 57,490 60,072 60,239 58,597 61,810 62,033 60,393
12100 - Needle and Syringe Exchange Program
459 459 461 461 461 461 461 461
12126 - Children's Health Initiatives 2,741 2,936 2,946 2,964 2,964 2,947 2,988 2,988
12236 - AIDS Services 4,675 4,976 4,987 4,987 4,987 4,987 4,987 4,987
12255 - Breast and Cervical Cancer Detection and Treatment
2,139 2,151 2,162 2,170 2,170 2,170 2,189 2,189
12563 - Immunization Services 40,896 46,118 49,075 50,633 55,131 50,411 53,425 62,182
16112 - X-Ray Screening and Tuberculosis Care
845 965 965 965 965 965 965 965
17013 - Venereal Disease Control 184 197 197 197 197 197 197 197
TOTAL - INSURANCE FUND 51,940 57,802 60,793 62,377 66,874 62,139 65,213 73,970
ADDITIONAL FUNDS AVAILABLE
Federal Funds 104,021 130,078 126,008 126,008 126,008 126,013 126,013 126,013
Private Funds 39,564 22,723 22,271 22,271 22,271 21,933 21,933 21,933
Financial Summary
A - 37
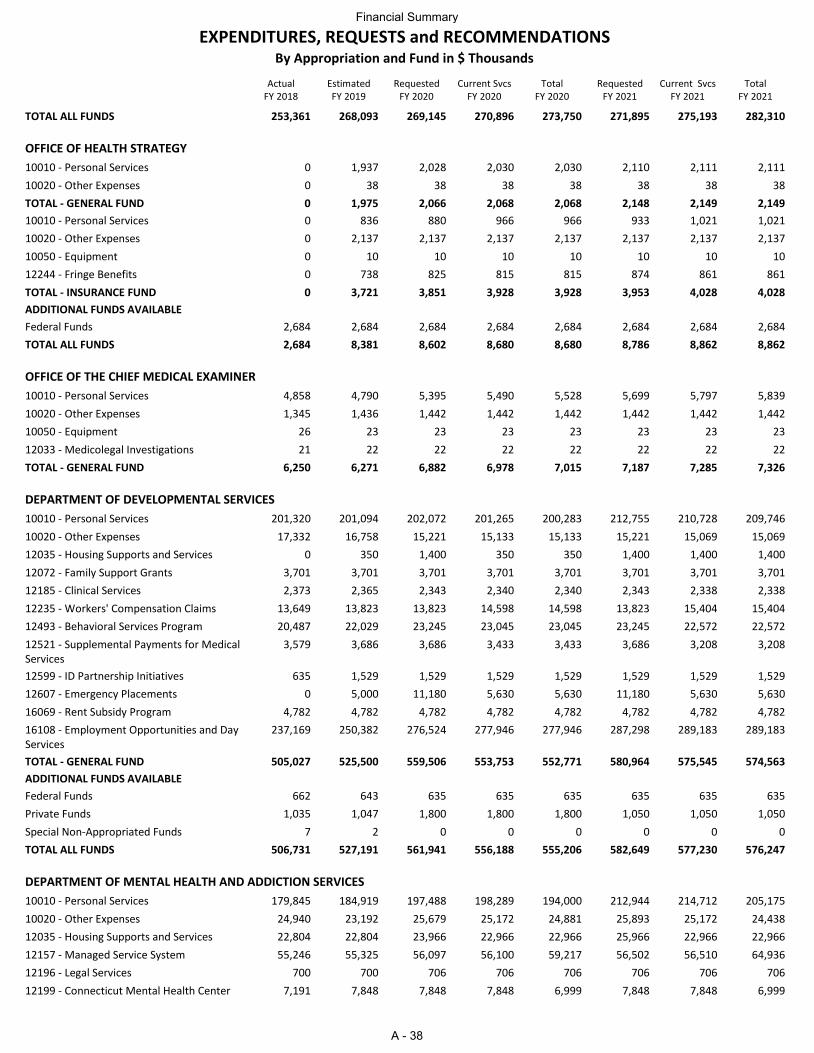
ActualFY 2018
EstimatedFY 2019
RequestedFY 2020
Current SvcsFY 2020
TotalFY 2020
RequestedFY 2021
Current SvcsFY 2021
TotalFY 2021
EXPENDITURES, REQUESTS and RECOMMENDATIONSBy Appropriation and Fund in $ Thousands
TOTAL ALL FUNDS 253,361 268,093 269,145 270,896 273,750 271,895 275,193 282,310
OFFICE OF HEALTH STRATEGY
10010 - Personal Services 0 1,937 2,028 2,030 2,030 2,110 2,111 2,111
10020 - Other Expenses 0 38 38 38 38 38 38 38
TOTAL - GENERAL FUND 0 1,975 2,066 2,068 2,068 2,148 2,149 2,149
10010 - Personal Services 0 836 880 966 966 933 1,021 1,021
10020 - Other Expenses 0 2,137 2,137 2,137 2,137 2,137 2,137 2,137
10050 - Equipment 0 10 10 10 10 10 10 10
12244 - Fringe Benefits 0 738 825 815 815 874 861 861
TOTAL - INSURANCE FUND 0 3,721 3,851 3,928 3,928 3,953 4,028 4,028
ADDITIONAL FUNDS AVAILABLE
Federal Funds 2,684 2,684 2,684 2,684 2,684 2,684 2,684 2,684
TOTAL ALL FUNDS 2,684 8,381 8,602 8,680 8,680 8,786 8,862 8,862
OFFICE OF THE CHIEF MEDICAL EXAMINER
10010 - Personal Services 4,858 4,790 5,395 5,490 5,528 5,699 5,797 5,839
10020 - Other Expenses 1,345 1,436 1,442 1,442 1,442 1,442 1,442 1,442
10050 - Equipment 26 23 23 23 23 23 23 23
12033 - Medicolegal Investigations 21 22 22 22 22 22 22 22
TOTAL - GENERAL FUND 6,250 6,271 6,882 6,978 7,015 7,187 7,285 7,326
DEPARTMENT OF DEVELOPMENTAL SERVICES
10010 - Personal Services 201,320 201,094 202,072 201,265 200,283 212,755 210,728 209,746
10020 - Other Expenses 17,332 16,758 15,221 15,133 15,133 15,221 15,069 15,069
12035 - Housing Supports and Services 0 350 1,400 350 350 1,400 1,400 1,400
12072 - Family Support Grants 3,701 3,701 3,701 3,701 3,701 3,701 3,701 3,701
12185 - Clinical Services 2,373 2,365 2,343 2,340 2,340 2,343 2,338 2,338
12235 - Workers' Compensation Claims 13,649 13,823 13,823 14,598 14,598 13,823 15,404 15,404
12493 - Behavioral Services Program 20,487 22,029 23,245 23,045 23,045 23,245 22,572 22,572
12521 - Supplemental Payments for Medical Services
3,579 3,686 3,686 3,433 3,433 3,686 3,208 3,208
12599 - ID Partnership Initiatives 635 1,529 1,529 1,529 1,529 1,529 1,529 1,529
12607 - Emergency Placements 0 5,000 11,180 5,630 5,630 11,180 5,630 5,630
16069 - Rent Subsidy Program 4,782 4,782 4,782 4,782 4,782 4,782 4,782 4,782
16108 - Employment Opportunities and Day Services
237,169 250,382 276,524 277,946 277,946 287,298 289,183 289,183
TOTAL - GENERAL FUND 505,027 525,500 559,506 553,753 552,771 580,964 575,545 574,563
ADDITIONAL FUNDS AVAILABLE
Federal Funds 662 643 635 635 635 635 635 635
Private Funds 1,035 1,047 1,800 1,800 1,800 1,050 1,050 1,050
Special Non-Appropriated Funds 7 2 0 0 0 0 0 0
TOTAL ALL FUNDS 506,731 527,191 561,941 556,188 555,206 582,649 577,230 576,247
DEPARTMENT OF MENTAL HEALTH AND ADDICTION SERVICES
10010 - Personal Services 179,845 184,919 197,488 198,289 194,000 212,944 214,712 205,175
10020 - Other Expenses 24,940 23,192 25,679 25,172 24,881 25,893 25,172 24,438
12035 - Housing Supports and Services 22,804 22,804 23,966 22,966 22,966 25,966 22,966 22,966
12157 - Managed Service System 55,246 55,325 56,097 56,100 59,217 56,502 56,510 64,936
12196 - Legal Services 700 700 706 706 706 706 706 706
12199 - Connecticut Mental Health Center 7,191 7,848 7,848 7,848 6,999 7,848 7,848 6,999
Financial Summary
A - 38
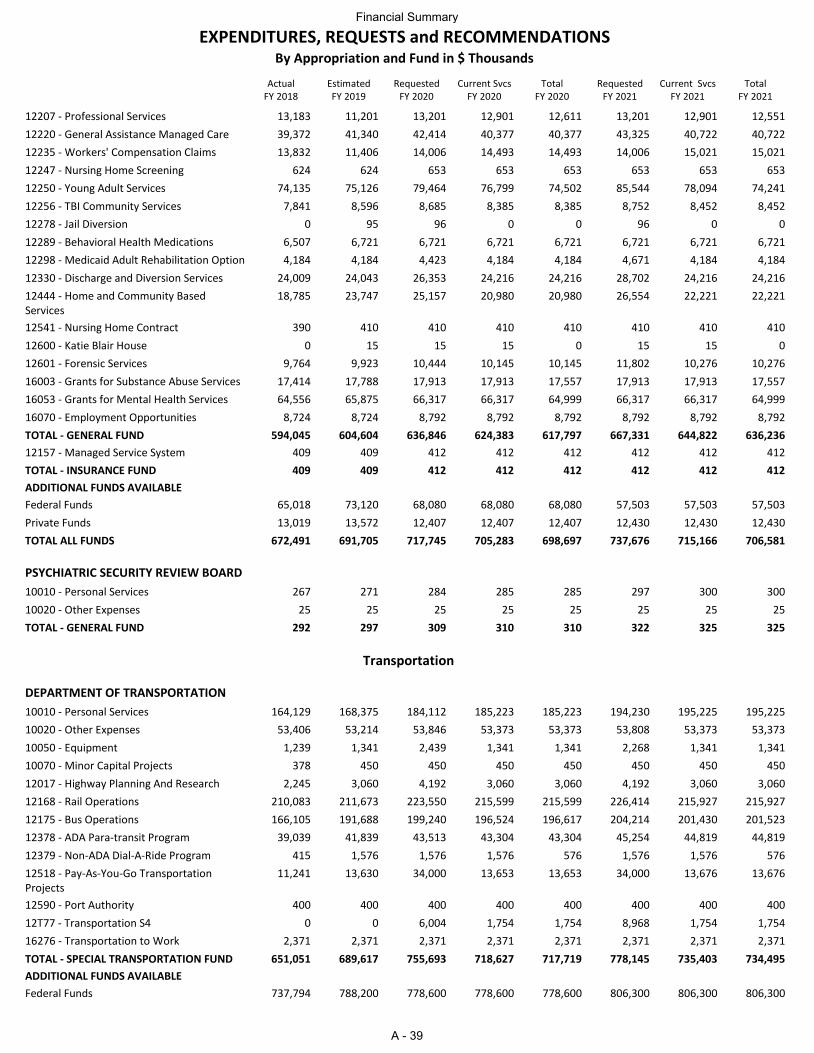
ActualFY 2018
EstimatedFY 2019
RequestedFY 2020
Current SvcsFY 2020
TotalFY 2020
RequestedFY 2021
Current SvcsFY 2021
TotalFY 2021
EXPENDITURES, REQUESTS and RECOMMENDATIONSBy Appropriation and Fund in $ Thousands
12207 - Professional Services 13,183 11,201 13,201 12,901 12,611 13,201 12,901 12,551
12220 - General Assistance Managed Care 39,372 41,340 42,414 40,377 40,377 43,325 40,722 40,722
12235 - Workers' Compensation Claims 13,832 11,406 14,006 14,493 14,493 14,006 15,021 15,021
12247 - Nursing Home Screening 624 624 653 653 653 653 653 653
12250 - Young Adult Services 74,135 75,126 79,464 76,799 74,502 85,544 78,094 74,241
12256 - TBI Community Services 7,841 8,596 8,685 8,385 8,385 8,752 8,452 8,452
12278 - Jail Diversion 0 95 96 0 0 96 0 0
12289 - Behavioral Health Medications 6,507 6,721 6,721 6,721 6,721 6,721 6,721 6,721
12298 - Medicaid Adult Rehabilitation Option 4,184 4,184 4,423 4,184 4,184 4,671 4,184 4,184
12330 - Discharge and Diversion Services 24,009 24,043 26,353 24,216 24,216 28,702 24,216 24,216
12444 - Home and Community Based Services
18,785 23,747 25,157 20,980 20,980 26,554 22,221 22,221
12541 - Nursing Home Contract 390 410 410 410 410 410 410 410
12600 - Katie Blair House 0 15 15 15 0 15 15 0
12601 - Forensic Services 9,764 9,923 10,444 10,145 10,145 11,802 10,276 10,276
16003 - Grants for Substance Abuse Services 17,414 17,788 17,913 17,913 17,557 17,913 17,913 17,557
16053 - Grants for Mental Health Services 64,556 65,875 66,317 66,317 64,999 66,317 66,317 64,999
16070 - Employment Opportunities 8,724 8,724 8,792 8,792 8,792 8,792 8,792 8,792
TOTAL - GENERAL FUND 594,045 604,604 636,846 624,383 617,797 667,331 644,822 636,236
12157 - Managed Service System 409 409 412 412 412 412 412 412
TOTAL - INSURANCE FUND 409 409 412 412 412 412 412 412
ADDITIONAL FUNDS AVAILABLE
Federal Funds 65,018 73,120 68,080 68,080 68,080 57,503 57,503 57,503
Private Funds 13,019 13,572 12,407 12,407 12,407 12,430 12,430 12,430
TOTAL ALL FUNDS 672,491 691,705 717,745 705,283 698,697 737,676 715,166 706,581
PSYCHIATRIC SECURITY REVIEW BOARD
10010 - Personal Services 267 271 284 285 285 297 300 300
10020 - Other Expenses 25 25 25 25 25 25 25 25
TOTAL - GENERAL FUND 292 297 309 310 310 322 325 325
Transportation
DEPARTMENT OF TRANSPORTATION
10010 - Personal Services 164,129 168,375 184,112 185,223 185,223 194,230 195,225 195,225
10020 - Other Expenses 53,406 53,214 53,846 53,373 53,373 53,808 53,373 53,373
10050 - Equipment 1,239 1,341 2,439 1,341 1,341 2,268 1,341 1,341
10070 - Minor Capital Projects 378 450 450 450 450 450 450 450
12017 - Highway Planning And Research 2,245 3,060 4,192 3,060 3,060 4,192 3,060 3,060
12168 - Rail Operations 210,083 211,673 223,550 215,599 215,599 226,414 215,927 215,927
12175 - Bus Operations 166,105 191,688 199,240 196,524 196,617 204,214 201,430 201,523
12378 - ADA Para-transit Program 39,039 41,839 43,513 43,304 43,304 45,254 44,819 44,819
12379 - Non-ADA Dial-A-Ride Program 415 1,576 1,576 1,576 576 1,576 1,576 576
12518 - Pay-As-You-Go Transportation Projects
11,241 13,630 34,000 13,653 13,653 34,000 13,676 13,676
12590 - Port Authority 400 400 400 400 400 400 400 400
12T77 - Transportation S4 0 0 6,004 1,754 1,754 8,968 1,754 1,754
16276 - Transportation to Work 2,371 2,371 2,371 2,371 2,371 2,371 2,371 2,371
TOTAL - SPECIAL TRANSPORTATION FUND 651,051 689,617 755,693 718,627 717,719 778,145 735,403 734,495
ADDITIONAL FUNDS AVAILABLE
Federal Funds 737,794 788,200 778,600 778,600 778,600 806,300 806,300 806,300
Financial Summary
A - 39
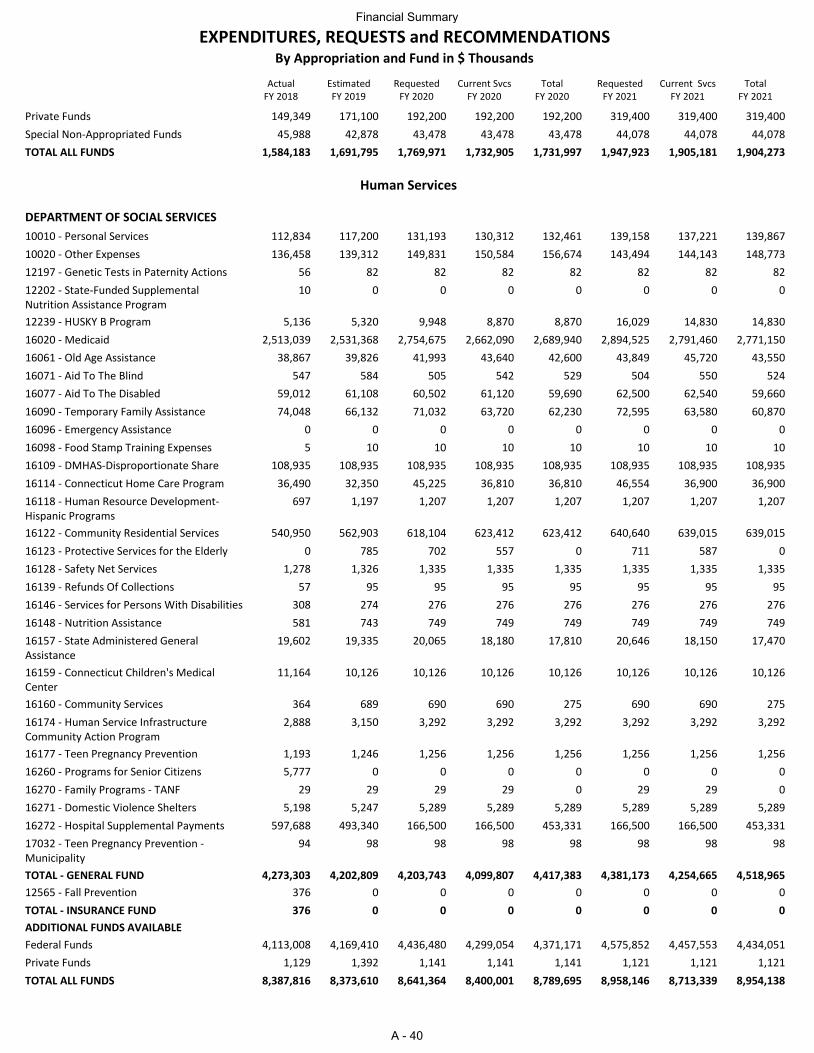
ActualFY 2018
EstimatedFY 2019
RequestedFY 2020
Current SvcsFY 2020
TotalFY 2020
RequestedFY 2021
Current SvcsFY 2021
TotalFY 2021
EXPENDITURES, REQUESTS and RECOMMENDATIONSBy Appropriation and Fund in $ Thousands
Private Funds 149,349 171,100 192,200 192,200 192,200 319,400 319,400 319,400
Special Non-Appropriated Funds 45,988 42,878 43,478 43,478 43,478 44,078 44,078 44,078
TOTAL ALL FUNDS 1,584,183 1,691,795 1,769,971 1,732,905 1,731,997 1,947,923 1,905,181 1,904,273
Human Services
DEPARTMENT OF SOCIAL SERVICES
10010 - Personal Services 112,834 117,200 131,193 130,312 132,461 139,158 137,221 139,867
10020 - Other Expenses 136,458 139,312 149,831 150,584 156,674 143,494 144,143 148,773
12197 - Genetic Tests in Paternity Actions 56 82 82 82 82 82 82 82
12202 - State-Funded Supplemental Nutrition Assistance Program
10 0 0 0 0 0 0 0
12239 - HUSKY B Program 5,136 5,320 9,948 8,870 8,870 16,029 14,830 14,830
16020 - Medicaid 2,513,039 2,531,368 2,754,675 2,662,090 2,689,940 2,894,525 2,791,460 2,771,150
16061 - Old Age Assistance 38,867 39,826 41,993 43,640 42,600 43,849 45,720 43,550
16071 - Aid To The Blind 547 584 505 542 529 504 550 524
16077 - Aid To The Disabled 59,012 61,108 60,502 61,120 59,690 62,500 62,540 59,660
16090 - Temporary Family Assistance 74,048 66,132 71,032 63,720 62,230 72,595 63,580 60,870
16096 - Emergency Assistance 0 0 0 0 0 0 0 0
16098 - Food Stamp Training Expenses 5 10 10 10 10 10 10 10
16109 - DMHAS-Disproportionate Share 108,935 108,935 108,935 108,935 108,935 108,935 108,935 108,935
16114 - Connecticut Home Care Program 36,490 32,350 45,225 36,810 36,810 46,554 36,900 36,900
16118 - Human Resource Development-Hispanic Programs
697 1,197 1,207 1,207 1,207 1,207 1,207 1,207
16122 - Community Residential Services 540,950 562,903 618,104 623,412 623,412 640,640 639,015 639,015
16123 - Protective Services for the Elderly 0 785 702 557 0 711 587 0
16128 - Safety Net Services 1,278 1,326 1,335 1,335 1,335 1,335 1,335 1,335
16139 - Refunds Of Collections 57 95 95 95 95 95 95 95
16146 - Services for Persons With Disabilities 308 274 276 276 276 276 276 276
16148 - Nutrition Assistance 581 743 749 749 749 749 749 749
16157 - State Administered General Assistance
19,602 19,335 20,065 18,180 17,810 20,646 18,150 17,470
16159 - Connecticut Children's Medical Center
11,164 10,126 10,126 10,126 10,126 10,126 10,126 10,126
16160 - Community Services 364 689 690 690 275 690 690 275
16174 - Human Service Infrastructure Community Action Program
2,888 3,150 3,292 3,292 3,292 3,292 3,292 3,292
16177 - Teen Pregnancy Prevention 1,193 1,246 1,256 1,256 1,256 1,256 1,256 1,256
16260 - Programs for Senior Citizens 5,777 0 0 0 0 0 0 0
16270 - Family Programs - TANF 29 29 29 29 0 29 29 0
16271 - Domestic Violence Shelters 5,198 5,247 5,289 5,289 5,289 5,289 5,289 5,289
16272 - Hospital Supplemental Payments 597,688 493,340 166,500 166,500 453,331 166,500 166,500 453,331
17032 - Teen Pregnancy Prevention - Municipality
94 98 98 98 98 98 98 98
TOTAL - GENERAL FUND 4,273,303 4,202,809 4,203,743 4,099,807 4,417,383 4,381,173 4,254,665 4,518,965
12565 - Fall Prevention 376 0 0 0 0 0 0 0
TOTAL - INSURANCE FUND 376 0 0 0 0 0 0 0
ADDITIONAL FUNDS AVAILABLE
Federal Funds 4,113,008 4,169,410 4,436,480 4,299,054 4,371,171 4,575,852 4,457,553 4,434,051
Private Funds 1,129 1,392 1,141 1,141 1,141 1,121 1,121 1,121
TOTAL ALL FUNDS 8,387,816 8,373,610 8,641,364 8,400,001 8,789,695 8,958,146 8,713,339 8,954,138
Financial Summary
A - 40
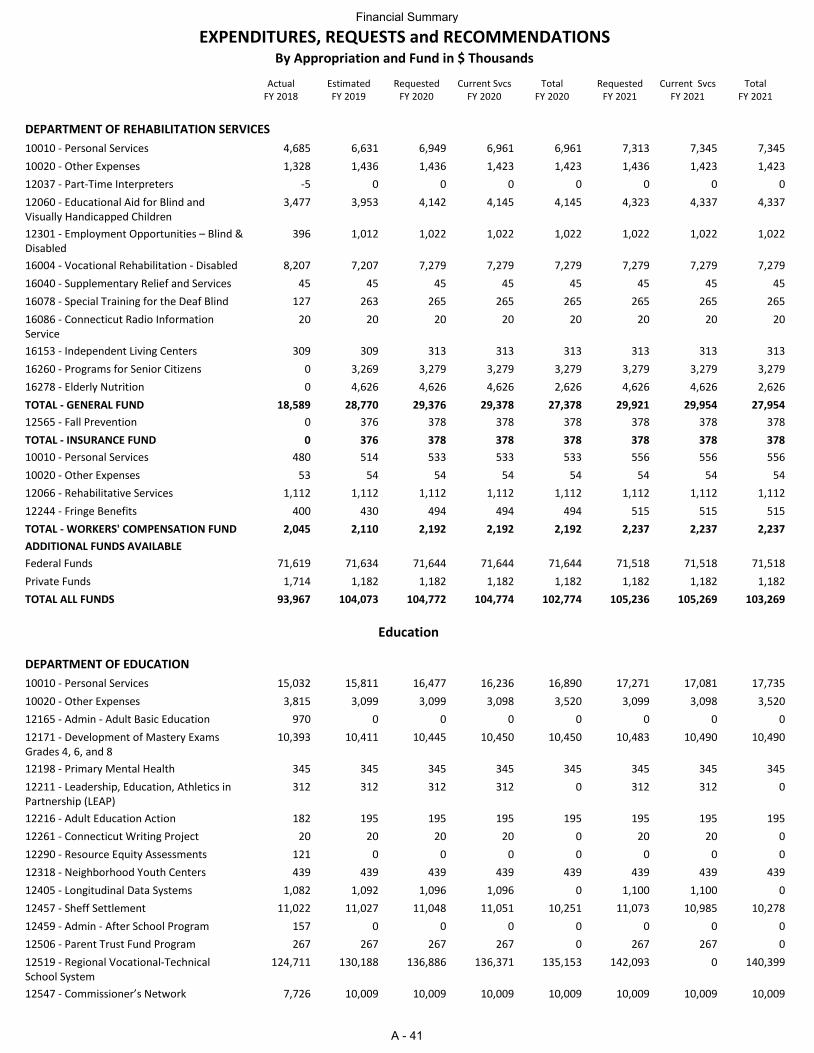
ActualFY 2018
EstimatedFY 2019
RequestedFY 2020
Current SvcsFY 2020
TotalFY 2020
RequestedFY 2021
Current SvcsFY 2021
TotalFY 2021
EXPENDITURES, REQUESTS and RECOMMENDATIONSBy Appropriation and Fund in $ Thousands
DEPARTMENT OF REHABILITATION SERVICES
10010 - Personal Services 4,685 6,631 6,949 6,961 6,961 7,313 7,345 7,345
10020 - Other Expenses 1,328 1,436 1,436 1,423 1,423 1,436 1,423 1,423
12037 - Part-Time Interpreters -5 0 0 0 0 0 0 0
12060 - Educational Aid for Blind and Visually Handicapped Children
3,477 3,953 4,142 4,145 4,145 4,323 4,337 4,337
12301 - Employment Opportunities – Blind & Disabled
396 1,012 1,022 1,022 1,022 1,022 1,022 1,022
16004 - Vocational Rehabilitation - Disabled 8,207 7,207 7,279 7,279 7,279 7,279 7,279 7,279
16040 - Supplementary Relief and Services 45 45 45 45 45 45 45 45
16078 - Special Training for the Deaf Blind 127 263 265 265 265 265 265 265
16086 - Connecticut Radio Information Service
20 20 20 20 20 20 20 20
16153 - Independent Living Centers 309 309 313 313 313 313 313 313
16260 - Programs for Senior Citizens 0 3,269 3,279 3,279 3,279 3,279 3,279 3,279
16278 - Elderly Nutrition 0 4,626 4,626 4,626 2,626 4,626 4,626 2,626
TOTAL - GENERAL FUND 18,589 28,770 29,376 29,378 27,378 29,921 29,954 27,954
12565 - Fall Prevention 0 376 378 378 378 378 378 378
TOTAL - INSURANCE FUND 0 376 378 378 378 378 378 378
10010 - Personal Services 480 514 533 533 533 556 556 556
10020 - Other Expenses 53 54 54 54 54 54 54 54
12066 - Rehabilitative Services 1,112 1,112 1,112 1,112 1,112 1,112 1,112 1,112
12244 - Fringe Benefits 400 430 494 494 494 515 515 515
TOTAL - WORKERS' COMPENSATION FUND 2,045 2,110 2,192 2,192 2,192 2,237 2,237 2,237
ADDITIONAL FUNDS AVAILABLE
Federal Funds 71,619 71,634 71,644 71,644 71,644 71,518 71,518 71,518
Private Funds 1,714 1,182 1,182 1,182 1,182 1,182 1,182 1,182
TOTAL ALL FUNDS 93,967 104,073 104,772 104,774 102,774 105,236 105,269 103,269
Education
DEPARTMENT OF EDUCATION
10010 - Personal Services 15,032 15,811 16,477 16,236 16,890 17,271 17,081 17,735
10020 - Other Expenses 3,815 3,099 3,099 3,098 3,520 3,099 3,098 3,520
12165 - Admin - Adult Basic Education 970 0 0 0 0 0 0 0
12171 - Development of Mastery Exams Grades 4, 6, and 8
10,393 10,411 10,445 10,450 10,450 10,483 10,490 10,490
12198 - Primary Mental Health 345 345 345 345 345 345 345 345
12211 - Leadership, Education, Athletics in Partnership (LEAP)
312 312 312 312 0 312 312 0
12216 - Adult Education Action 182 195 195 195 195 195 195 195
12261 - Connecticut Writing Project 20 20 20 20 0 20 20 0
12290 - Resource Equity Assessments 121 0 0 0 0 0 0 0
12318 - Neighborhood Youth Centers 439 439 439 439 439 439 439 439
12405 - Longitudinal Data Systems 1,082 1,092 1,096 1,096 0 1,100 1,100 0
12457 - Sheff Settlement 11,022 11,027 11,048 11,051 10,251 11,073 10,985 10,278
12459 - Admin - After School Program 157 0 0 0 0 0 0 0
12506 - Parent Trust Fund Program 267 267 267 267 0 267 267 0
12519 - Regional Vocational-Technical School System
124,711 130,188 136,886 136,371 135,153 142,093 0 140,399
12547 - Commissioner’s Network 7,726 10,009 10,009 10,009 10,009 10,009 10,009 10,009
Financial Summary
A - 41
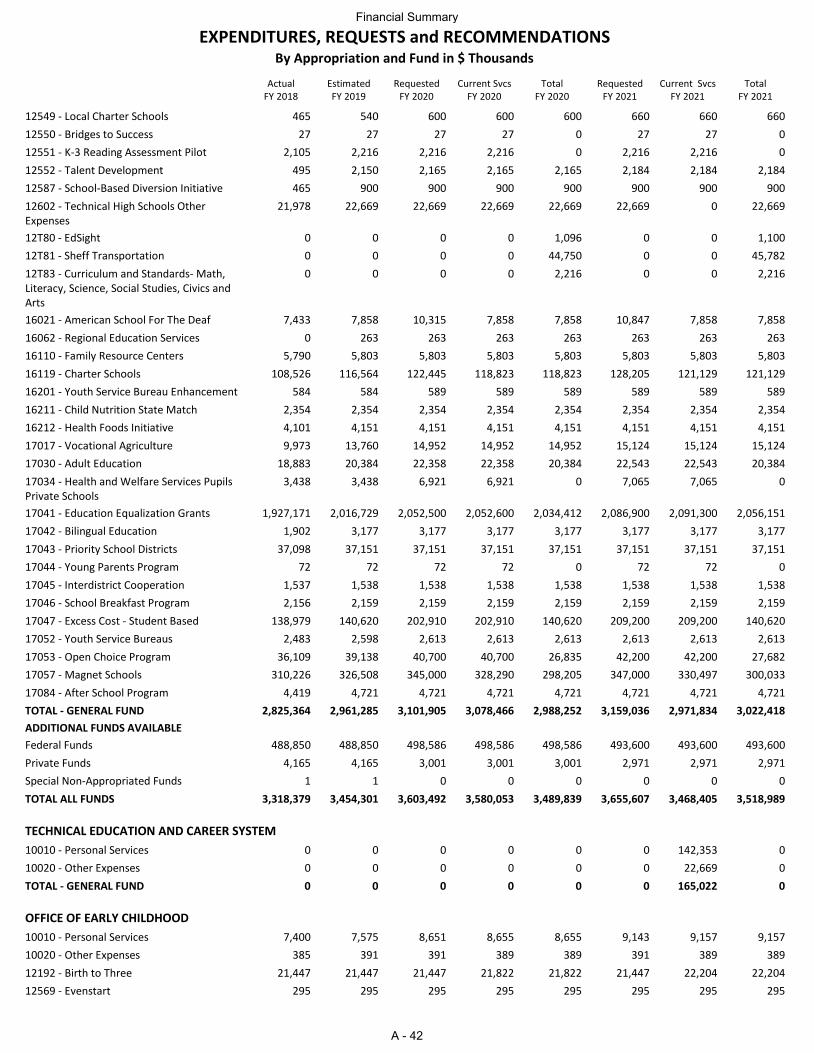
ActualFY 2018
EstimatedFY 2019
RequestedFY 2020
Current SvcsFY 2020
TotalFY 2020
RequestedFY 2021
Current SvcsFY 2021
TotalFY 2021
EXPENDITURES, REQUESTS and RECOMMENDATIONSBy Appropriation and Fund in $ Thousands
12549 - Local Charter Schools 465 540 600 600 600 660 660 660
12550 - Bridges to Success 27 27 27 27 0 27 27 0
12551 - K-3 Reading Assessment Pilot 2,105 2,216 2,216 2,216 0 2,216 2,216 0
12552 - Talent Development 495 2,150 2,165 2,165 2,165 2,184 2,184 2,184
12587 - School-Based Diversion Initiative 465 900 900 900 900 900 900 900
12602 - Technical High Schools Other Expenses
21,978 22,669 22,669 22,669 22,669 22,669 0 22,669
12T80 - EdSight 0 0 0 0 1,096 0 0 1,100
12T81 - Sheff Transportation 0 0 0 0 44,750 0 0 45,782
12T83 - Curriculum and Standards- Math, Literacy, Science, Social Studies, Civics and Arts
0 0 0 0 2,216 0 0 2,216
16021 - American School For The Deaf 7,433 7,858 10,315 7,858 7,858 10,847 7,858 7,858
16062 - Regional Education Services 0 263 263 263 263 263 263 263
16110 - Family Resource Centers 5,790 5,803 5,803 5,803 5,803 5,803 5,803 5,803
16119 - Charter Schools 108,526 116,564 122,445 118,823 118,823 128,205 121,129 121,129
16201 - Youth Service Bureau Enhancement 584 584 589 589 589 589 589 589
16211 - Child Nutrition State Match 2,354 2,354 2,354 2,354 2,354 2,354 2,354 2,354
16212 - Health Foods Initiative 4,101 4,151 4,151 4,151 4,151 4,151 4,151 4,151
17017 - Vocational Agriculture 9,973 13,760 14,952 14,952 14,952 15,124 15,124 15,124
17030 - Adult Education 18,883 20,384 22,358 22,358 20,384 22,543 22,543 20,384
17034 - Health and Welfare Services Pupils Private Schools
3,438 3,438 6,921 6,921 0 7,065 7,065 0
17041 - Education Equalization Grants 1,927,171 2,016,729 2,052,500 2,052,600 2,034,412 2,086,900 2,091,300 2,056,151
17042 - Bilingual Education 1,902 3,177 3,177 3,177 3,177 3,177 3,177 3,177
17043 - Priority School Districts 37,098 37,151 37,151 37,151 37,151 37,151 37,151 37,151
17044 - Young Parents Program 72 72 72 72 0 72 72 0
17045 - Interdistrict Cooperation 1,537 1,538 1,538 1,538 1,538 1,538 1,538 1,538
17046 - School Breakfast Program 2,156 2,159 2,159 2,159 2,159 2,159 2,159 2,159
17047 - Excess Cost - Student Based 138,979 140,620 202,910 202,910 140,620 209,200 209,200 140,620
17052 - Youth Service Bureaus 2,483 2,598 2,613 2,613 2,613 2,613 2,613 2,613
17053 - Open Choice Program 36,109 39,138 40,700 40,700 26,835 42,200 42,200 27,682
17057 - Magnet Schools 310,226 326,508 345,000 328,290 298,205 347,000 330,497 300,033
17084 - After School Program 4,419 4,721 4,721 4,721 4,721 4,721 4,721 4,721
TOTAL - GENERAL FUND 2,825,364 2,961,285 3,101,905 3,078,466 2,988,252 3,159,036 2,971,834 3,022,418
ADDITIONAL FUNDS AVAILABLE
Federal Funds 488,850 488,850 498,586 498,586 498,586 493,600 493,600 493,600
Private Funds 4,165 4,165 3,001 3,001 3,001 2,971 2,971 2,971
Special Non-Appropriated Funds 1 1 0 0 0 0 0 0
TOTAL ALL FUNDS 3,318,379 3,454,301 3,603,492 3,580,053 3,489,839 3,655,607 3,468,405 3,518,989
TECHNICAL EDUCATION AND CAREER SYSTEM
10010 - Personal Services 0 0 0 0 0 0 142,353 0
10020 - Other Expenses 0 0 0 0 0 0 22,669 0
TOTAL - GENERAL FUND 0 0 0 0 0 0 165,022 0
OFFICE OF EARLY CHILDHOOD
10010 - Personal Services 7,400 7,575 8,651 8,655 8,655 9,143 9,157 9,157
10020 - Other Expenses 385 391 391 389 389 391 389 389
12192 - Birth to Three 21,447 21,447 21,447 21,822 21,822 21,447 22,204 22,204
12569 - Evenstart 295 295 295 295 295 295 295 295
Financial Summary
A - 42
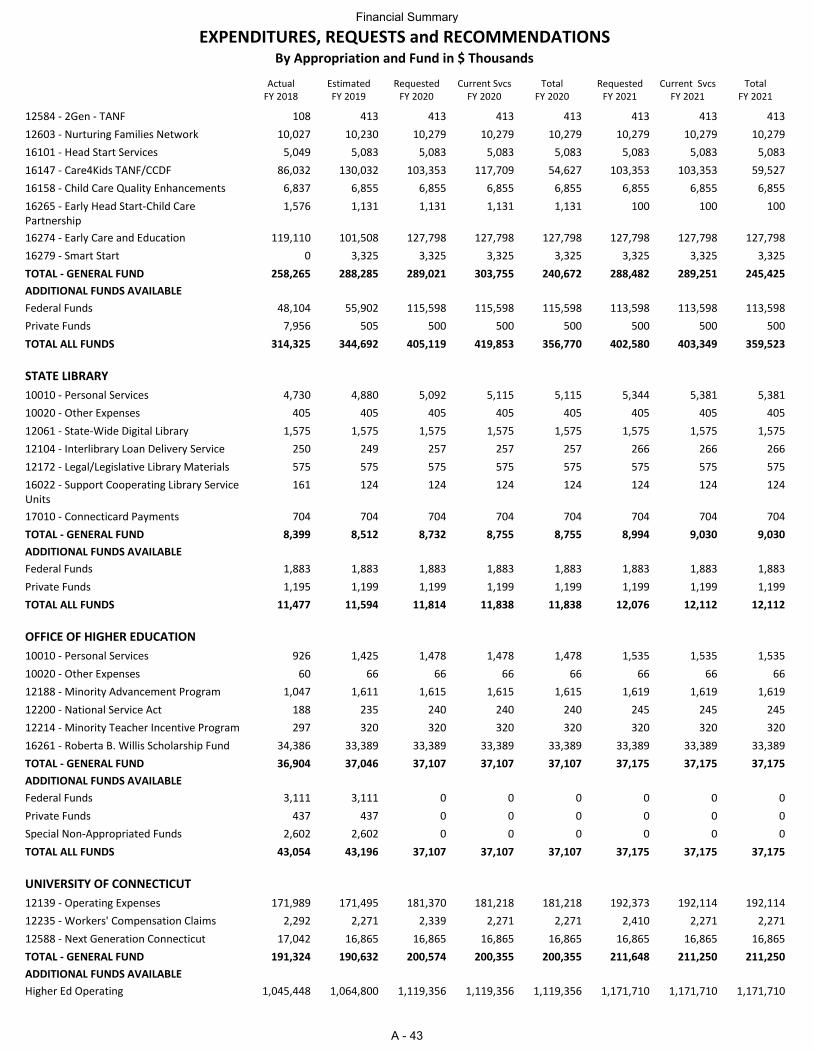
ActualFY 2018
EstimatedFY 2019
RequestedFY 2020
Current SvcsFY 2020
TotalFY 2020
RequestedFY 2021
Current SvcsFY 2021
TotalFY 2021
EXPENDITURES, REQUESTS and RECOMMENDATIONSBy Appropriation and Fund in $ Thousands
12584 - 2Gen - TANF 108 413 413 413 413 413 413 413
12603 - Nurturing Families Network 10,027 10,230 10,279 10,279 10,279 10,279 10,279 10,279
16101 - Head Start Services 5,049 5,083 5,083 5,083 5,083 5,083 5,083 5,083
16147 - Care4Kids TANF/CCDF 86,032 130,032 103,353 117,709 54,627 103,353 103,353 59,527
16158 - Child Care Quality Enhancements 6,837 6,855 6,855 6,855 6,855 6,855 6,855 6,855
16265 - Early Head Start-Child Care Partnership
1,576 1,131 1,131 1,131 1,131 100 100 100
16274 - Early Care and Education 119,110 101,508 127,798 127,798 127,798 127,798 127,798 127,798
16279 - Smart Start 0 3,325 3,325 3,325 3,325 3,325 3,325 3,325
TOTAL - GENERAL FUND 258,265 288,285 289,021 303,755 240,672 288,482 289,251 245,425
ADDITIONAL FUNDS AVAILABLE
Federal Funds 48,104 55,902 115,598 115,598 115,598 113,598 113,598 113,598
Private Funds 7,956 505 500 500 500 500 500 500
TOTAL ALL FUNDS 314,325 344,692 405,119 419,853 356,770 402,580 403,349 359,523
STATE LIBRARY
10010 - Personal Services 4,730 4,880 5,092 5,115 5,115 5,344 5,381 5,381
10020 - Other Expenses 405 405 405 405 405 405 405 405
12061 - State-Wide Digital Library 1,575 1,575 1,575 1,575 1,575 1,575 1,575 1,575
12104 - Interlibrary Loan Delivery Service 250 249 257 257 257 266 266 266
12172 - Legal/Legislative Library Materials 575 575 575 575 575 575 575 575
16022 - Support Cooperating Library Service Units
161 124 124 124 124 124 124 124
17010 - Connecticard Payments 704 704 704 704 704 704 704 704
TOTAL - GENERAL FUND 8,399 8,512 8,732 8,755 8,755 8,994 9,030 9,030
ADDITIONAL FUNDS AVAILABLE
Federal Funds 1,883 1,883 1,883 1,883 1,883 1,883 1,883 1,883
Private Funds 1,195 1,199 1,199 1,199 1,199 1,199 1,199 1,199
TOTAL ALL FUNDS 11,477 11,594 11,814 11,838 11,838 12,076 12,112 12,112
OFFICE OF HIGHER EDUCATION
10010 - Personal Services 926 1,425 1,478 1,478 1,478 1,535 1,535 1,535
10020 - Other Expenses 60 66 66 66 66 66 66 66
12188 - Minority Advancement Program 1,047 1,611 1,615 1,615 1,615 1,619 1,619 1,619
12200 - National Service Act 188 235 240 240 240 245 245 245
12214 - Minority Teacher Incentive Program 297 320 320 320 320 320 320 320
16261 - Roberta B. Willis Scholarship Fund 34,386 33,389 33,389 33,389 33,389 33,389 33,389 33,389
TOTAL - GENERAL FUND 36,904 37,046 37,107 37,107 37,107 37,175 37,175 37,175
ADDITIONAL FUNDS AVAILABLE
Federal Funds 3,111 3,111 0 0 0 0 0 0
Private Funds 437 437 0 0 0 0 0 0
Special Non-Appropriated Funds 2,602 2,602 0 0 0 0 0 0
TOTAL ALL FUNDS 43,054 43,196 37,107 37,107 37,107 37,175 37,175 37,175
UNIVERSITY OF CONNECTICUT
12139 - Operating Expenses 171,989 171,495 181,370 181,218 181,218 192,373 192,114 192,114
12235 - Workers' Compensation Claims 2,292 2,271 2,339 2,271 2,271 2,410 2,271 2,271
12588 - Next Generation Connecticut 17,042 16,865 16,865 16,865 16,865 16,865 16,865 16,865
TOTAL - GENERAL FUND 191,324 190,632 200,574 200,355 200,355 211,648 211,250 211,250
ADDITIONAL FUNDS AVAILABLE
Higher Ed Operating 1,045,448 1,064,800 1,119,356 1,119,356 1,119,356 1,171,710 1,171,710 1,171,710
Financial Summary
A - 43
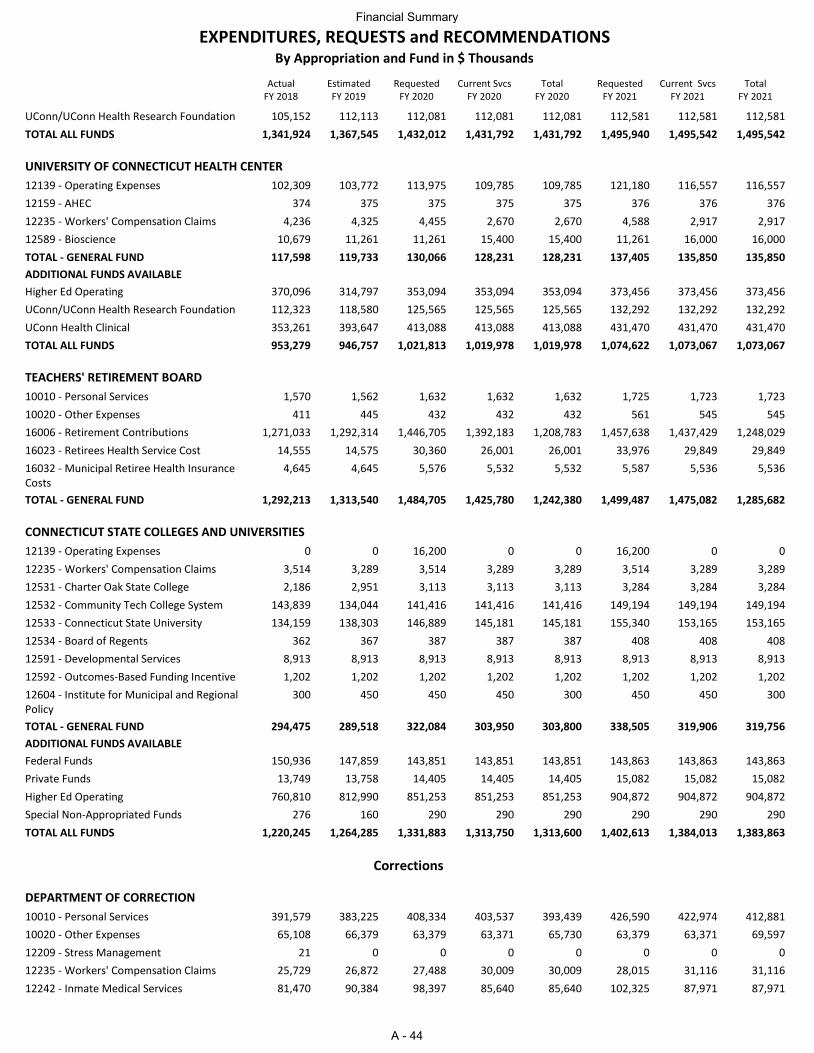
ActualFY 2018
EstimatedFY 2019
RequestedFY 2020
Current SvcsFY 2020
TotalFY 2020
RequestedFY 2021
Current SvcsFY 2021
TotalFY 2021
EXPENDITURES, REQUESTS and RECOMMENDATIONSBy Appropriation and Fund in $ Thousands
UConn/UConn Health Research Foundation 105,152 112,113 112,081 112,081 112,081 112,581 112,581 112,581
TOTAL ALL FUNDS 1,341,924 1,367,545 1,432,012 1,431,792 1,431,792 1,495,940 1,495,542 1,495,542
UNIVERSITY OF CONNECTICUT HEALTH CENTER
12139 - Operating Expenses 102,309 103,772 113,975 109,785 109,785 121,180 116,557 116,557
12159 - AHEC 374 375 375 375 375 376 376 376
12235 - Workers' Compensation Claims 4,236 4,325 4,455 2,670 2,670 4,588 2,917 2,917
12589 - Bioscience 10,679 11,261 11,261 15,400 15,400 11,261 16,000 16,000
TOTAL - GENERAL FUND 117,598 119,733 130,066 128,231 128,231 137,405 135,850 135,850
ADDITIONAL FUNDS AVAILABLE
Higher Ed Operating 370,096 314,797 353,094 353,094 353,094 373,456 373,456 373,456
UConn/UConn Health Research Foundation 112,323 118,580 125,565 125,565 125,565 132,292 132,292 132,292
UConn Health Clinical 353,261 393,647 413,088 413,088 413,088 431,470 431,470 431,470
TOTAL ALL FUNDS 953,279 946,757 1,021,813 1,019,978 1,019,978 1,074,622 1,073,067 1,073,067
TEACHERS' RETIREMENT BOARD
10010 - Personal Services 1,570 1,562 1,632 1,632 1,632 1,725 1,723 1,723
10020 - Other Expenses 411 445 432 432 432 561 545 545
16006 - Retirement Contributions 1,271,033 1,292,314 1,446,705 1,392,183 1,208,783 1,457,638 1,437,429 1,248,029
16023 - Retirees Health Service Cost 14,555 14,575 30,360 26,001 26,001 33,976 29,849 29,849
16032 - Municipal Retiree Health Insurance Costs
4,645 4,645 5,576 5,532 5,532 5,587 5,536 5,536
TOTAL - GENERAL FUND 1,292,213 1,313,540 1,484,705 1,425,780 1,242,380 1,499,487 1,475,082 1,285,682
CONNECTICUT STATE COLLEGES AND UNIVERSITIES
12139 - Operating Expenses 0 0 16,200 0 0 16,200 0 0
12235 - Workers' Compensation Claims 3,514 3,289 3,514 3,289 3,289 3,514 3,289 3,289
12531 - Charter Oak State College 2,186 2,951 3,113 3,113 3,113 3,284 3,284 3,284
12532 - Community Tech College System 143,839 134,044 141,416 141,416 141,416 149,194 149,194 149,194
12533 - Connecticut State University 134,159 138,303 146,889 145,181 145,181 155,340 153,165 153,165
12534 - Board of Regents 362 367 387 387 387 408 408 408
12591 - Developmental Services 8,913 8,913 8,913 8,913 8,913 8,913 8,913 8,913
12592 - Outcomes-Based Funding Incentive 1,202 1,202 1,202 1,202 1,202 1,202 1,202 1,202
12604 - Institute for Municipal and Regional Policy
300 450 450 450 300 450 450 300
TOTAL - GENERAL FUND 294,475 289,518 322,084 303,950 303,800 338,505 319,906 319,756
ADDITIONAL FUNDS AVAILABLE
Federal Funds 150,936 147,859 143,851 143,851 143,851 143,863 143,863 143,863
Private Funds 13,749 13,758 14,405 14,405 14,405 15,082 15,082 15,082
Higher Ed Operating 760,810 812,990 851,253 851,253 851,253 904,872 904,872 904,872
Special Non-Appropriated Funds 276 160 290 290 290 290 290 290
TOTAL ALL FUNDS 1,220,245 1,264,285 1,331,883 1,313,750 1,313,600 1,402,613 1,384,013 1,383,863
Corrections
DEPARTMENT OF CORRECTION
10010 - Personal Services 391,579 383,225 408,334 403,537 393,439 426,590 422,974 412,881
10020 - Other Expenses 65,108 66,379 63,379 63,371 65,730 63,379 63,371 69,597
12209 - Stress Management 21 0 0 0 0 0 0 0
12235 - Workers' Compensation Claims 25,729 26,872 27,488 30,009 30,009 28,015 31,116 31,116
12242 - Inmate Medical Services 81,470 90,384 98,397 85,640 85,640 102,325 87,971 87,971
Financial Summary
A - 44
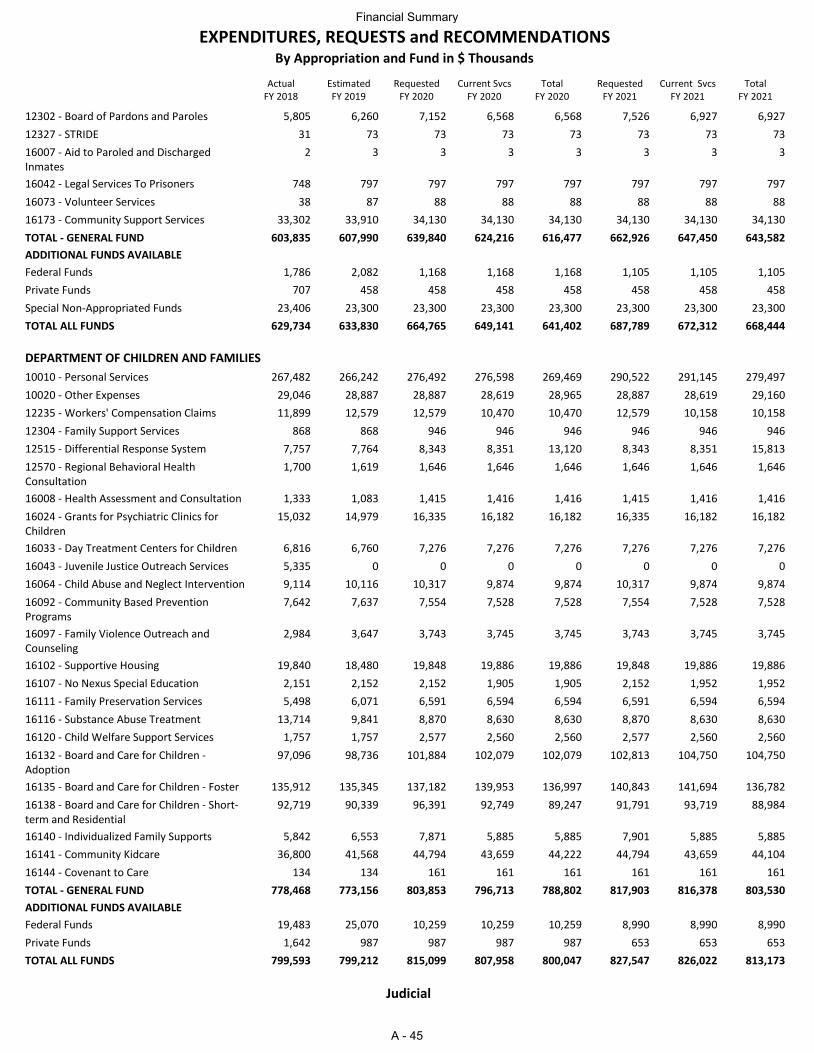
ActualFY 2018
EstimatedFY 2019
RequestedFY 2020
Current SvcsFY 2020
TotalFY 2020
RequestedFY 2021
Current SvcsFY 2021
TotalFY 2021
EXPENDITURES, REQUESTS and RECOMMENDATIONSBy Appropriation and Fund in $ Thousands
12302 - Board of Pardons and Paroles 5,805 6,260 7,152 6,568 6,568 7,526 6,927 6,927
12327 - STRIDE 31 73 73 73 73 73 73 73
16007 - Aid to Paroled and Discharged Inmates
2 3 3 3 3 3 3 3
16042 - Legal Services To Prisoners 748 797 797 797 797 797 797 797
16073 - Volunteer Services 38 87 88 88 88 88 88 88
16173 - Community Support Services 33,302 33,910 34,130 34,130 34,130 34,130 34,130 34,130
TOTAL - GENERAL FUND 603,835 607,990 639,840 624,216 616,477 662,926 647,450 643,582
ADDITIONAL FUNDS AVAILABLE
Federal Funds 1,786 2,082 1,168 1,168 1,168 1,105 1,105 1,105
Private Funds 707 458 458 458 458 458 458 458
Special Non-Appropriated Funds 23,406 23,300 23,300 23,300 23,300 23,300 23,300 23,300
TOTAL ALL FUNDS 629,734 633,830 664,765 649,141 641,402 687,789 672,312 668,444
DEPARTMENT OF CHILDREN AND FAMILIES
10010 - Personal Services 267,482 266,242 276,492 276,598 269,469 290,522 291,145 279,497
10020 - Other Expenses 29,046 28,887 28,887 28,619 28,965 28,887 28,619 29,160
12235 - Workers' Compensation Claims 11,899 12,579 12,579 10,470 10,470 12,579 10,158 10,158
12304 - Family Support Services 868 868 946 946 946 946 946 946
12515 - Differential Response System 7,757 7,764 8,343 8,351 13,120 8,343 8,351 15,813
12570 - Regional Behavioral Health Consultation
1,700 1,619 1,646 1,646 1,646 1,646 1,646 1,646
16008 - Health Assessment and Consultation 1,333 1,083 1,415 1,416 1,416 1,415 1,416 1,416
16024 - Grants for Psychiatric Clinics for Children
15,032 14,979 16,335 16,182 16,182 16,335 16,182 16,182
16033 - Day Treatment Centers for Children 6,816 6,760 7,276 7,276 7,276 7,276 7,276 7,276
16043 - Juvenile Justice Outreach Services 5,335 0 0 0 0 0 0 0
16064 - Child Abuse and Neglect Intervention 9,114 10,116 10,317 9,874 9,874 10,317 9,874 9,874
16092 - Community Based Prevention Programs
7,642 7,637 7,554 7,528 7,528 7,554 7,528 7,528
16097 - Family Violence Outreach and Counseling
2,984 3,647 3,743 3,745 3,745 3,743 3,745 3,745
16102 - Supportive Housing 19,840 18,480 19,848 19,886 19,886 19,848 19,886 19,886
16107 - No Nexus Special Education 2,151 2,152 2,152 1,905 1,905 2,152 1,952 1,952
16111 - Family Preservation Services 5,498 6,071 6,591 6,594 6,594 6,591 6,594 6,594
16116 - Substance Abuse Treatment 13,714 9,841 8,870 8,630 8,630 8,870 8,630 8,630
16120 - Child Welfare Support Services 1,757 1,757 2,577 2,560 2,560 2,577 2,560 2,560
16132 - Board and Care for Children - Adoption
97,096 98,736 101,884 102,079 102,079 102,813 104,750 104,750
16135 - Board and Care for Children - Foster 135,912 135,345 137,182 139,953 136,997 140,843 141,694 136,782
16138 - Board and Care for Children - Short-term and Residential
92,719 90,339 96,391 92,749 89,247 91,791 93,719 88,984
16140 - Individualized Family Supports 5,842 6,553 7,871 5,885 5,885 7,901 5,885 5,885
16141 - Community Kidcare 36,800 41,568 44,794 43,659 44,222 44,794 43,659 44,104
16144 - Covenant to Care 134 134 161 161 161 161 161 161
TOTAL - GENERAL FUND 778,468 773,156 803,853 796,713 788,802 817,903 816,378 803,530
ADDITIONAL FUNDS AVAILABLE
Federal Funds 19,483 25,070 10,259 10,259 10,259 8,990 8,990 8,990
Private Funds 1,642 987 987 987 987 653 653 653
TOTAL ALL FUNDS 799,593 799,212 815,099 807,958 800,047 827,547 826,022 813,173
Judicial
Financial Summary
A - 45
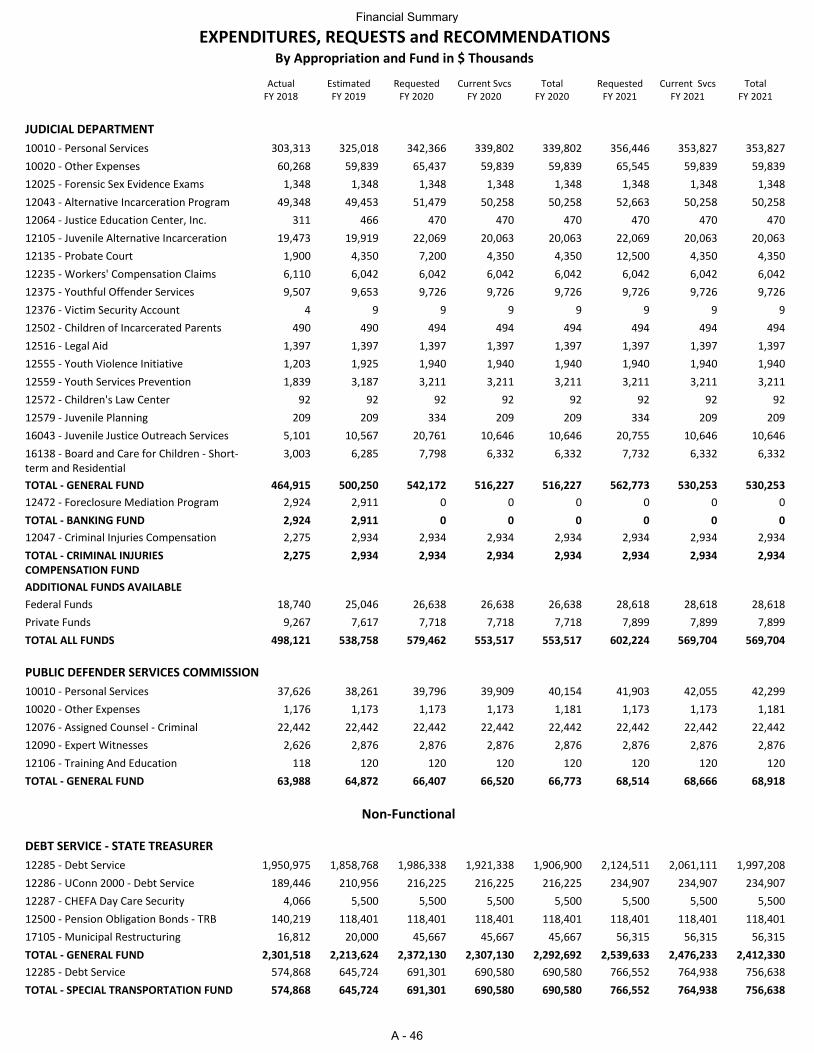
ActualFY 2018
EstimatedFY 2019
RequestedFY 2020
Current SvcsFY 2020
TotalFY 2020
RequestedFY 2021
Current SvcsFY 2021
TotalFY 2021
EXPENDITURES, REQUESTS and RECOMMENDATIONSBy Appropriation and Fund in $ Thousands
JUDICIAL DEPARTMENT
10010 - Personal Services 303,313 325,018 342,366 339,802 339,802 356,446 353,827 353,827
10020 - Other Expenses 60,268 59,839 65,437 59,839 59,839 65,545 59,839 59,839
12025 - Forensic Sex Evidence Exams 1,348 1,348 1,348 1,348 1,348 1,348 1,348 1,348
12043 - Alternative Incarceration Program 49,348 49,453 51,479 50,258 50,258 52,663 50,258 50,258
12064 - Justice Education Center, Inc. 311 466 470 470 470 470 470 470
12105 - Juvenile Alternative Incarceration 19,473 19,919 22,069 20,063 20,063 22,069 20,063 20,063
12135 - Probate Court 1,900 4,350 7,200 4,350 4,350 12,500 4,350 4,350
12235 - Workers' Compensation Claims 6,110 6,042 6,042 6,042 6,042 6,042 6,042 6,042
12375 - Youthful Offender Services 9,507 9,653 9,726 9,726 9,726 9,726 9,726 9,726
12376 - Victim Security Account 4 9 9 9 9 9 9 9
12502 - Children of Incarcerated Parents 490 490 494 494 494 494 494 494
12516 - Legal Aid 1,397 1,397 1,397 1,397 1,397 1,397 1,397 1,397
12555 - Youth Violence Initiative 1,203 1,925 1,940 1,940 1,940 1,940 1,940 1,940
12559 - Youth Services Prevention 1,839 3,187 3,211 3,211 3,211 3,211 3,211 3,211
12572 - Children's Law Center 92 92 92 92 92 92 92 92
12579 - Juvenile Planning 209 209 334 209 209 334 209 209
16043 - Juvenile Justice Outreach Services 5,101 10,567 20,761 10,646 10,646 20,755 10,646 10,646
16138 - Board and Care for Children - Short-term and Residential
3,003 6,285 7,798 6,332 6,332 7,732 6,332 6,332
TOTAL - GENERAL FUND 464,915 500,250 542,172 516,227 516,227 562,773 530,253 530,253
12472 - Foreclosure Mediation Program 2,924 2,911 0 0 0 0 0 0
TOTAL - BANKING FUND 2,924 2,911 0 0 0 0 0 0
12047 - Criminal Injuries Compensation 2,275 2,934 2,934 2,934 2,934 2,934 2,934 2,934
TOTAL - CRIMINAL INJURIES COMPENSATION FUND
2,275 2,934 2,934 2,934 2,934 2,934 2,934 2,934
ADDITIONAL FUNDS AVAILABLE
Federal Funds 18,740 25,046 26,638 26,638 26,638 28,618 28,618 28,618
Private Funds 9,267 7,617 7,718 7,718 7,718 7,899 7,899 7,899
TOTAL ALL FUNDS 498,121 538,758 579,462 553,517 553,517 602,224 569,704 569,704
PUBLIC DEFENDER SERVICES COMMISSION
10010 - Personal Services 37,626 38,261 39,796 39,909 40,154 41,903 42,055 42,299
10020 - Other Expenses 1,176 1,173 1,173 1,173 1,181 1,173 1,173 1,181
12076 - Assigned Counsel - Criminal 22,442 22,442 22,442 22,442 22,442 22,442 22,442 22,442
12090 - Expert Witnesses 2,626 2,876 2,876 2,876 2,876 2,876 2,876 2,876
12106 - Training And Education 118 120 120 120 120 120 120 120
TOTAL - GENERAL FUND 63,988 64,872 66,407 66,520 66,773 68,514 68,666 68,918
Non-Functional
DEBT SERVICE - STATE TREASURER
12285 - Debt Service 1,950,975 1,858,768 1,986,338 1,921,338 1,906,900 2,124,511 2,061,111 1,997,208
12286 - UConn 2000 - Debt Service 189,446 210,956 216,225 216,225 216,225 234,907 234,907 234,907
12287 - CHEFA Day Care Security 4,066 5,500 5,500 5,500 5,500 5,500 5,500 5,500
12500 - Pension Obligation Bonds - TRB 140,219 118,401 118,401 118,401 118,401 118,401 118,401 118,401
17105 - Municipal Restructuring 16,812 20,000 45,667 45,667 45,667 56,315 56,315 56,315
TOTAL - GENERAL FUND 2,301,518 2,213,624 2,372,130 2,307,130 2,292,692 2,539,633 2,476,233 2,412,330
12285 - Debt Service 574,868 645,724 691,301 690,580 690,580 766,552 764,938 756,638
TOTAL - SPECIAL TRANSPORTATION FUND 574,868 645,724 691,301 690,580 690,580 766,552 764,938 756,638
Financial Summary
A - 46
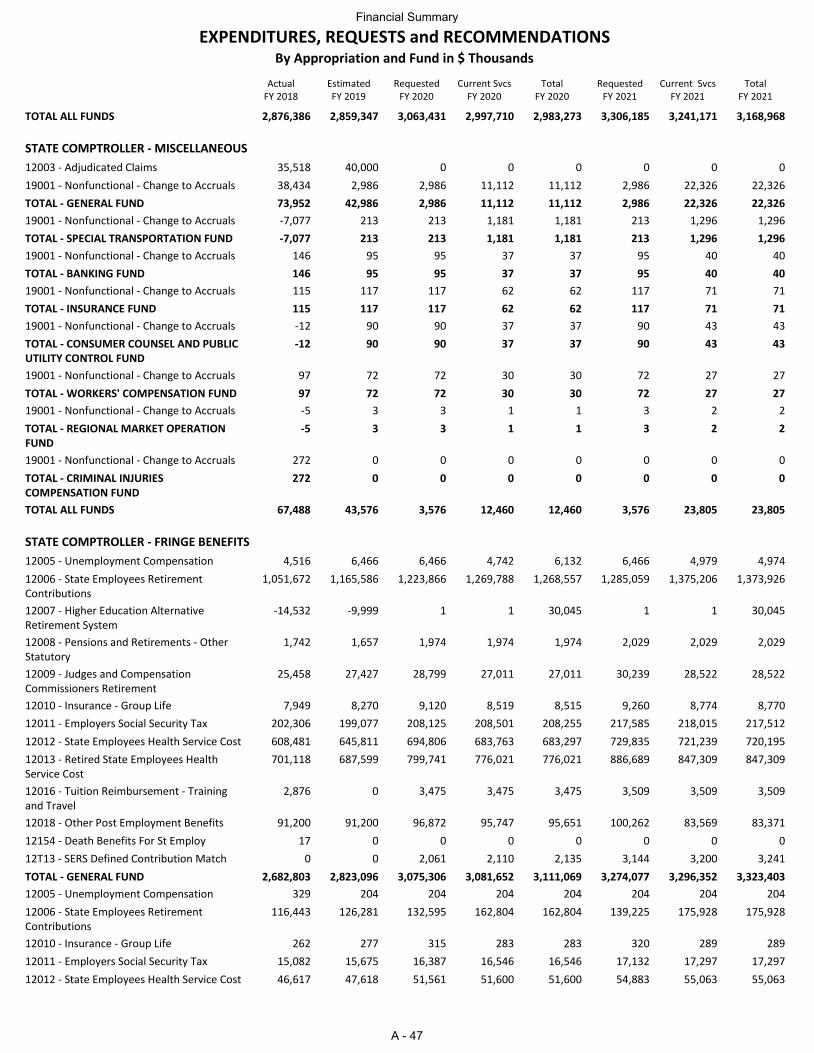
ActualFY 2018
EstimatedFY 2019
RequestedFY 2020
Current SvcsFY 2020
TotalFY 2020
RequestedFY 2021
Current SvcsFY 2021
TotalFY 2021
EXPENDITURES, REQUESTS and RECOMMENDATIONSBy Appropriation and Fund in $ Thousands
TOTAL ALL FUNDS 2,876,386 2,859,347 3,063,431 2,997,710 2,983,273 3,306,185 3,241,171 3,168,968
STATE COMPTROLLER - MISCELLANEOUS
12003 - Adjudicated Claims 35,518 40,000 0 0 0 0 0 0
19001 - Nonfunctional - Change to Accruals 38,434 2,986 2,986 11,112 11,112 2,986 22,326 22,326
TOTAL - GENERAL FUND 73,952 42,986 2,986 11,112 11,112 2,986 22,326 22,326
19001 - Nonfunctional - Change to Accruals -7,077 213 213 1,181 1,181 213 1,296 1,296
TOTAL - SPECIAL TRANSPORTATION FUND -7,077 213 213 1,181 1,181 213 1,296 1,296
19001 - Nonfunctional - Change to Accruals 146 95 95 37 37 95 40 40
TOTAL - BANKING FUND 146 95 95 37 37 95 40 40
19001 - Nonfunctional - Change to Accruals 115 117 117 62 62 117 71 71
TOTAL - INSURANCE FUND 115 117 117 62 62 117 71 71
19001 - Nonfunctional - Change to Accruals -12 90 90 37 37 90 43 43
TOTAL - CONSUMER COUNSEL AND PUBLIC UTILITY CONTROL FUND
-12 90 90 37 37 90 43 43
19001 - Nonfunctional - Change to Accruals 97 72 72 30 30 72 27 27
TOTAL - WORKERS' COMPENSATION FUND 97 72 72 30 30 72 27 27
19001 - Nonfunctional - Change to Accruals -5 3 3 1 1 3 2 2
TOTAL - REGIONAL MARKET OPERATION FUND
-5 3 3 1 1 3 2 2
19001 - Nonfunctional - Change to Accruals 272 0 0 0 0 0 0 0
TOTAL - CRIMINAL INJURIES COMPENSATION FUND
272 0 0 0 0 0 0 0
TOTAL ALL FUNDS 67,488 43,576 3,576 12,460 12,460 3,576 23,805 23,805
STATE COMPTROLLER - FRINGE BENEFITS
12005 - Unemployment Compensation 4,516 6,466 6,466 4,742 6,132 6,466 4,979 4,974
12006 - State Employees Retirement Contributions
1,051,672 1,165,586 1,223,866 1,269,788 1,268,557 1,285,059 1,375,206 1,373,926
12007 - Higher Education Alternative Retirement System
-14,532 -9,999 1 1 30,045 1 1 30,045
12008 - Pensions and Retirements - Other Statutory
1,742 1,657 1,974 1,974 1,974 2,029 2,029 2,029
12009 - Judges and Compensation Commissioners Retirement
25,458 27,427 28,799 27,011 27,011 30,239 28,522 28,522
12010 - Insurance - Group Life 7,949 8,270 9,120 8,519 8,515 9,260 8,774 8,770
12011 - Employers Social Security Tax 202,306 199,077 208,125 208,501 208,255 217,585 218,015 217,512
12012 - State Employees Health Service Cost 608,481 645,811 694,806 683,763 683,297 729,835 721,239 720,195
12013 - Retired State Employees Health Service Cost
701,118 687,599 799,741 776,021 776,021 886,689 847,309 847,309
12016 - Tuition Reimbursement - Training and Travel
2,876 0 3,475 3,475 3,475 3,509 3,509 3,509
12018 - Other Post Employment Benefits 91,200 91,200 96,872 95,747 95,651 100,262 83,569 83,371
12154 - Death Benefits For St Employ 17 0 0 0 0 0 0 0
12T13 - SERS Defined Contribution Match 0 0 2,061 2,110 2,135 3,144 3,200 3,241
TOTAL - GENERAL FUND 2,682,803 2,823,096 3,075,306 3,081,652 3,111,069 3,274,077 3,296,352 3,323,403
12005 - Unemployment Compensation 329 204 204 204 204 204 204 204
12006 - State Employees Retirement Contributions
116,443 126,281 132,595 162,804 162,804 139,225 175,928 175,928
12010 - Insurance - Group Life 262 277 315 283 283 320 289 289
12011 - Employers Social Security Tax 15,082 15,675 16,387 16,546 16,546 17,132 17,297 17,297
12012 - State Employees Health Service Cost 46,617 47,618 51,561 51,600 51,600 54,883 55,063 55,063
Financial Summary
A - 47
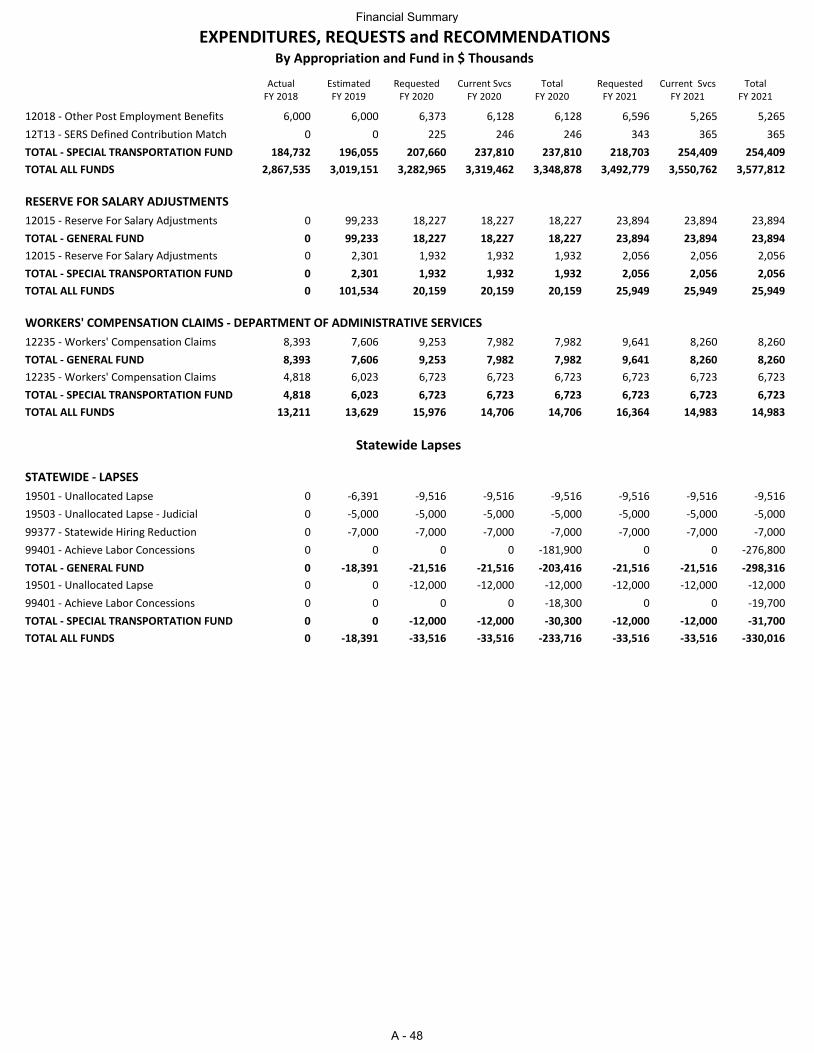
ActualFY 2018
EstimatedFY 2019
RequestedFY 2020
Current SvcsFY 2020
TotalFY 2020
RequestedFY 2021
Current SvcsFY 2021
TotalFY 2021
EXPENDITURES, REQUESTS and RECOMMENDATIONSBy Appropriation and Fund in $ Thousands
12018 - Other Post Employment Benefits 6,000 6,000 6,373 6,128 6,128 6,596 5,265 5,265
12T13 - SERS Defined Contribution Match 0 0 225 246 246 343 365 365
TOTAL - SPECIAL TRANSPORTATION FUND 184,732 196,055 207,660 237,810 237,810 218,703 254,409 254,409
TOTAL ALL FUNDS 2,867,535 3,019,151 3,282,965 3,319,462 3,348,878 3,492,779 3,550,762 3,577,812
RESERVE FOR SALARY ADJUSTMENTS
12015 - Reserve For Salary Adjustments 0 99,233 18,227 18,227 18,227 23,894 23,894 23,894
TOTAL - GENERAL FUND 0 99,233 18,227 18,227 18,227 23,894 23,894 23,894
12015 - Reserve For Salary Adjustments 0 2,301 1,932 1,932 1,932 2,056 2,056 2,056
TOTAL - SPECIAL TRANSPORTATION FUND 0 2,301 1,932 1,932 1,932 2,056 2,056 2,056
TOTAL ALL FUNDS 0 101,534 20,159 20,159 20,159 25,949 25,949 25,949
WORKERS' COMPENSATION CLAIMS - DEPARTMENT OF ADMINISTRATIVE SERVICES
12235 - Workers' Compensation Claims 8,393 7,606 9,253 7,982 7,982 9,641 8,260 8,260
TOTAL - GENERAL FUND 8,393 7,606 9,253 7,982 7,982 9,641 8,260 8,260
12235 - Workers' Compensation Claims 4,818 6,023 6,723 6,723 6,723 6,723 6,723 6,723
TOTAL - SPECIAL TRANSPORTATION FUND 4,818 6,023 6,723 6,723 6,723 6,723 6,723 6,723
TOTAL ALL FUNDS 13,211 13,629 15,976 14,706 14,706 16,364 14,983 14,983
Statewide Lapses
STATEWIDE - LAPSES
19501 - Unallocated Lapse 0 -6,391 -9,516 -9,516 -9,516 -9,516 -9,516 -9,516
19503 - Unallocated Lapse - Judicial 0 -5,000 -5,000 -5,000 -5,000 -5,000 -5,000 -5,000
99377 - Statewide Hiring Reduction 0 -7,000 -7,000 -7,000 -7,000 -7,000 -7,000 -7,000
99401 - Achieve Labor Concessions 0 0 0 0 -181,900 0 0 -276,800
TOTAL - GENERAL FUND 0 -18,391 -21,516 -21,516 -203,416 -21,516 -21,516 -298,316
19501 - Unallocated Lapse 0 0 -12,000 -12,000 -12,000 -12,000 -12,000 -12,000
99401 - Achieve Labor Concessions 0 0 0 0 -18,300 0 0 -19,700
TOTAL - SPECIAL TRANSPORTATION FUND 0 0 -12,000 -12,000 -30,300 -12,000 -12,000 -31,700
TOTAL ALL FUNDS 0 -18,391 -33,516 -33,516 -233,716 -33,516 -33,516 -330,016
Financial Summary
A - 48
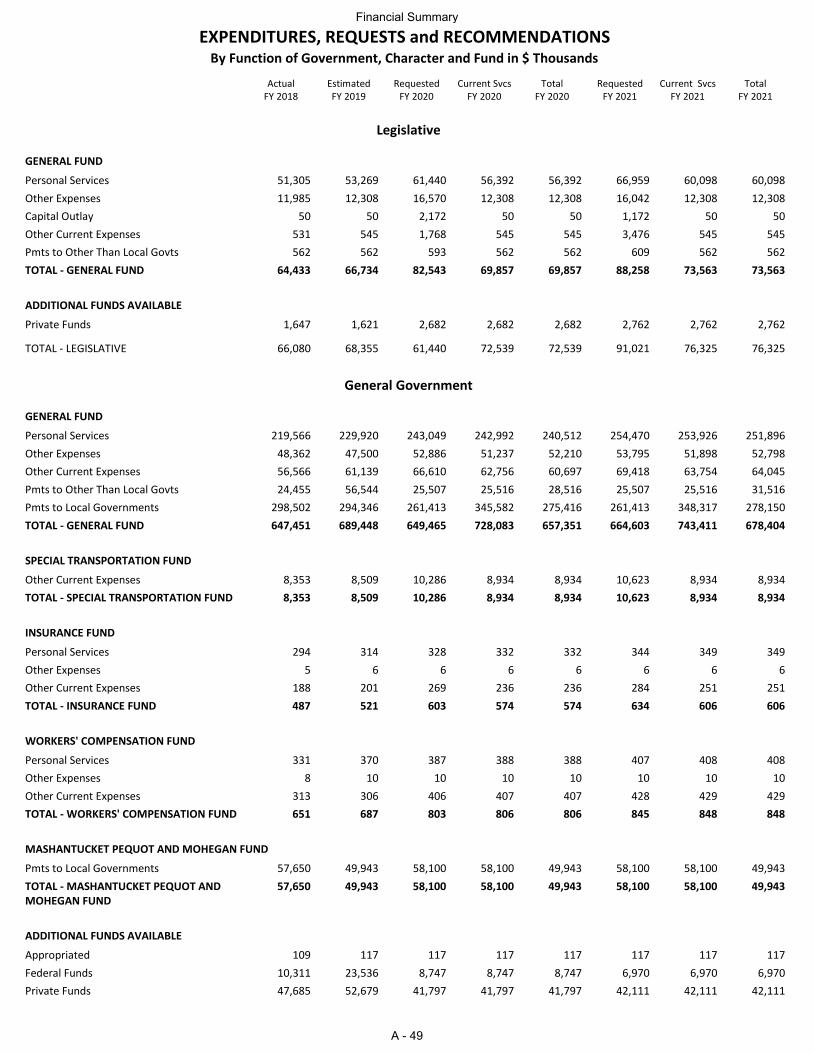
ActualFY 2018
EstimatedFY 2019
RequestedFY 2020
Current SvcsFY 2020
TotalFY 2020
RequestedFY 2021
Current SvcsFY 2021
TotalFY 2021
EXPENDITURES, REQUESTS and RECOMMENDATIONSBy Function of Government, Character and Fund in $ Thousands
Legislative
GENERAL FUND
Personal Services 51,305 53,269 61,440 56,392 56,392 66,959 60,098 60,098
Other Expenses 11,985 12,308 16,570 12,308 12,308 16,042 12,308 12,308
Capital Outlay 50 50 2,172 50 50 1,172 50 50
Other Current Expenses 531 545 1,768 545 545 3,476 545 545
Pmts to Other Than Local Govts 562 562 593 562 562 609 562 562
TOTAL - GENERAL FUND 64,433 66,734 82,543 69,857 69,857 88,258 73,563 73,563
ADDITIONAL FUNDS AVAILABLE
Private Funds 1,647 1,621 2,682 2,682 2,682 2,762 2,762 2,762
TOTAL - LEGISLATIVE 66,080 68,355 61,440 72,539 72,539 91,021 76,325 76,325
General Government
GENERAL FUND
Personal Services 219,566 229,920 243,049 242,992 240,512 254,470 253,926 251,896
Other Expenses 48,362 47,500 52,886 51,237 52,210 53,795 51,898 52,798
Other Current Expenses 56,566 61,139 66,610 62,756 60,697 69,418 63,754 64,045
Pmts to Other Than Local Govts 24,455 56,544 25,507 25,516 28,516 25,507 25,516 31,516
Pmts to Local Governments 298,502 294,346 261,413 345,582 275,416 261,413 348,317 278,150
TOTAL - GENERAL FUND 647,451 689,448 649,465 728,083 657,351 664,603 743,411 678,404
SPECIAL TRANSPORTATION FUND
Other Current Expenses 8,353 8,509 10,286 8,934 8,934 10,623 8,934 8,934
TOTAL - SPECIAL TRANSPORTATION FUND 8,353 8,509 10,286 8,934 8,934 10,623 8,934 8,934
INSURANCE FUND
Personal Services 294 314 328 332 332 344 349 349
Other Expenses 5 6 6 6 6 6 6 6
Other Current Expenses 188 201 269 236 236 284 251 251
TOTAL - INSURANCE FUND 487 521 603 574 574 634 606 606
WORKERS' COMPENSATION FUND
Personal Services 331 370 387 388 388 407 408 408
Other Expenses 8 10 10 10 10 10 10 10
Other Current Expenses 313 306 406 407 407 428 429 429
TOTAL - WORKERS' COMPENSATION FUND 651 687 803 806 806 845 848 848
MASHANTUCKET PEQUOT AND MOHEGAN FUND
Pmts to Local Governments 57,650 49,943 58,100 58,100 49,943 58,100 58,100 49,943
TOTAL - MASHANTUCKET PEQUOT AND MOHEGAN FUND
57,650 49,943 58,100 58,100 49,943 58,100 58,100 49,943
ADDITIONAL FUNDS AVAILABLE
Appropriated 109 117 117 117 117 117 117 117
Federal Funds 10,311 23,536 8,747 8,747 8,747 6,970 6,970 6,970
Private Funds 47,685 52,679 41,797 41,797 41,797 42,111 42,111 42,111
Financial Summary
A - 49
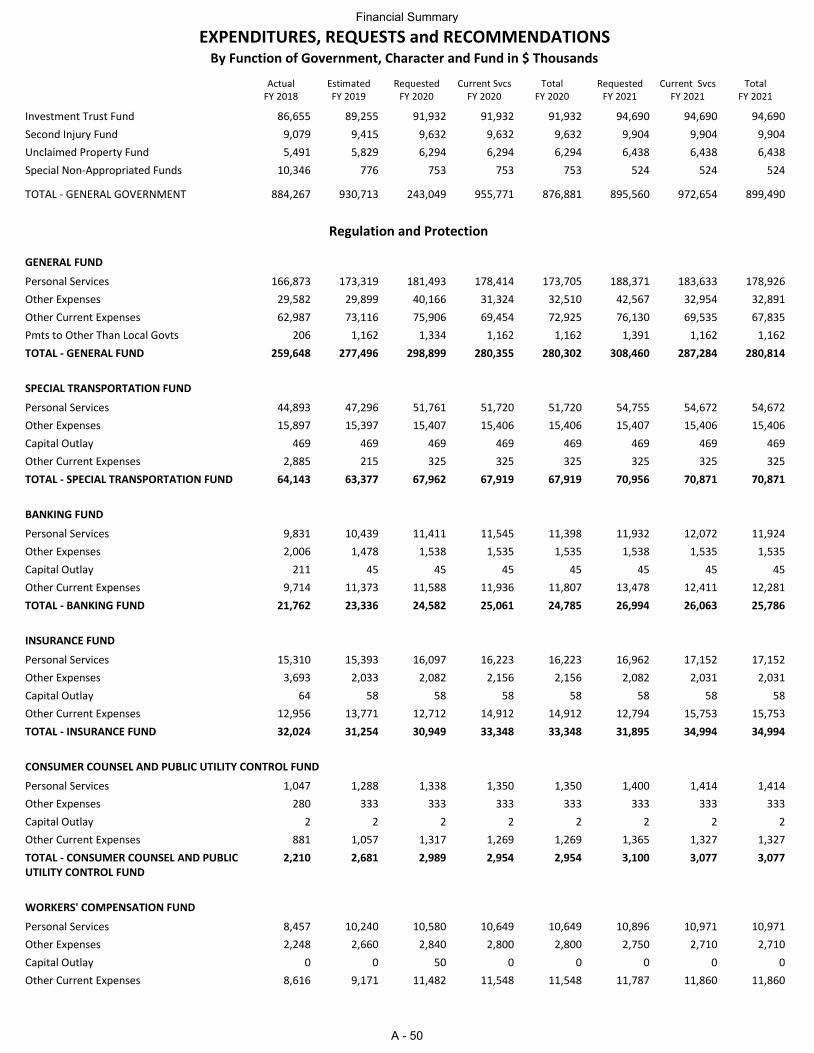
ActualFY 2018
EstimatedFY 2019
RequestedFY 2020
Current SvcsFY 2020
TotalFY 2020
RequestedFY 2021
Current SvcsFY 2021
TotalFY 2021
EXPENDITURES, REQUESTS and RECOMMENDATIONSBy Function of Government, Character and Fund in $ Thousands
Investment Trust Fund 86,655 89,255 91,932 91,932 91,932 94,690 94,690 94,690
Second Injury Fund 9,079 9,415 9,632 9,632 9,632 9,904 9,904 9,904
Unclaimed Property Fund 5,491 5,829 6,294 6,294 6,294 6,438 6,438 6,438
Special Non-Appropriated Funds 10,346 776 753 753 753 524 524 524
TOTAL - GENERAL GOVERNMENT 884,267 930,713 243,049 955,771 876,881 895,560 972,654 899,490
Regulation and Protection
GENERAL FUND
Personal Services 166,873 173,319 181,493 178,414 173,705 188,371 183,633 178,926
Other Expenses 29,582 29,899 40,166 31,324 32,510 42,567 32,954 32,891
Other Current Expenses 62,987 73,116 75,906 69,454 72,925 76,130 69,535 67,835
Pmts to Other Than Local Govts 206 1,162 1,334 1,162 1,162 1,391 1,162 1,162
TOTAL - GENERAL FUND 259,648 277,496 298,899 280,355 280,302 308,460 287,284 280,814
SPECIAL TRANSPORTATION FUND
Personal Services 44,893 47,296 51,761 51,720 51,720 54,755 54,672 54,672
Other Expenses 15,897 15,397 15,407 15,406 15,406 15,407 15,406 15,406
Capital Outlay 469 469 469 469 469 469 469 469
Other Current Expenses 2,885 215 325 325 325 325 325 325
TOTAL - SPECIAL TRANSPORTATION FUND 64,143 63,377 67,962 67,919 67,919 70,956 70,871 70,871
BANKING FUND
Personal Services 9,831 10,439 11,411 11,545 11,398 11,932 12,072 11,924
Other Expenses 2,006 1,478 1,538 1,535 1,535 1,538 1,535 1,535
Capital Outlay 211 45 45 45 45 45 45 45
Other Current Expenses 9,714 11,373 11,588 11,936 11,807 13,478 12,411 12,281
TOTAL - BANKING FUND 21,762 23,336 24,582 25,061 24,785 26,994 26,063 25,786
INSURANCE FUND
Personal Services 15,310 15,393 16,097 16,223 16,223 16,962 17,152 17,152
Other Expenses 3,693 2,033 2,082 2,156 2,156 2,082 2,031 2,031
Capital Outlay 64 58 58 58 58 58 58 58
Other Current Expenses 12,956 13,771 12,712 14,912 14,912 12,794 15,753 15,753
TOTAL - INSURANCE FUND 32,024 31,254 30,949 33,348 33,348 31,895 34,994 34,994
CONSUMER COUNSEL AND PUBLIC UTILITY CONTROL FUND
Personal Services 1,047 1,288 1,338 1,350 1,350 1,400 1,414 1,414
Other Expenses 280 333 333 333 333 333 333 333
Capital Outlay 2 2 2 2 2 2 2 2
Other Current Expenses 881 1,057 1,317 1,269 1,269 1,365 1,327 1,327
TOTAL - CONSUMER COUNSEL AND PUBLIC UTILITY CONTROL FUND
2,210 2,681 2,989 2,954 2,954 3,100 3,077 3,077
WORKERS' COMPENSATION FUND
Personal Services 8,457 10,240 10,580 10,649 10,649 10,896 10,971 10,971
Other Expenses 2,248 2,660 2,840 2,800 2,800 2,750 2,710 2,710
Capital Outlay 0 0 50 0 0 0 0 0
Other Current Expenses 8,616 9,171 11,482 11,548 11,548 11,787 11,860 11,860
Financial Summary
A - 50
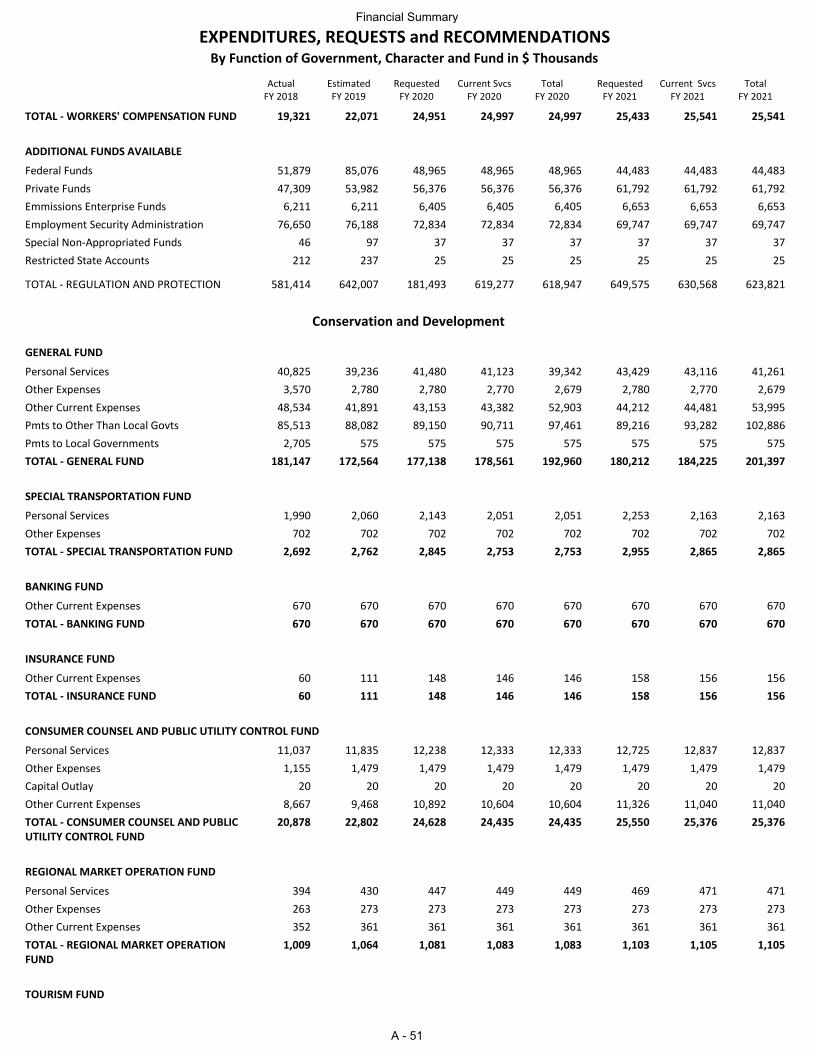
ActualFY 2018
EstimatedFY 2019
RequestedFY 2020
Current SvcsFY 2020
TotalFY 2020
RequestedFY 2021
Current SvcsFY 2021
TotalFY 2021
EXPENDITURES, REQUESTS and RECOMMENDATIONSBy Function of Government, Character and Fund in $ Thousands
TOTAL - WORKERS' COMPENSATION FUND 19,321 22,071 24,951 24,997 24,997 25,433 25,541 25,541
ADDITIONAL FUNDS AVAILABLE
Federal Funds 51,879 85,076 48,965 48,965 48,965 44,483 44,483 44,483
Private Funds 47,309 53,982 56,376 56,376 56,376 61,792 61,792 61,792
Emmissions Enterprise Funds 6,211 6,211 6,405 6,405 6,405 6,653 6,653 6,653
Employment Security Administration 76,650 76,188 72,834 72,834 72,834 69,747 69,747 69,747
Special Non-Appropriated Funds 46 97 37 37 37 37 37 37
Restricted State Accounts 212 237 25 25 25 25 25 25
TOTAL - REGULATION AND PROTECTION 581,414 642,007 181,493 619,277 618,947 649,575 630,568 623,821
Conservation and Development
GENERAL FUND
Personal Services 40,825 39,236 41,480 41,123 39,342 43,429 43,116 41,261
Other Expenses 3,570 2,780 2,780 2,770 2,679 2,780 2,770 2,679
Other Current Expenses 48,534 41,891 43,153 43,382 52,903 44,212 44,481 53,995
Pmts to Other Than Local Govts 85,513 88,082 89,150 90,711 97,461 89,216 93,282 102,886
Pmts to Local Governments 2,705 575 575 575 575 575 575 575
TOTAL - GENERAL FUND 181,147 172,564 177,138 178,561 192,960 180,212 184,225 201,397
SPECIAL TRANSPORTATION FUND
Personal Services 1,990 2,060 2,143 2,051 2,051 2,253 2,163 2,163
Other Expenses 702 702 702 702 702 702 702 702
TOTAL - SPECIAL TRANSPORTATION FUND 2,692 2,762 2,845 2,753 2,753 2,955 2,865 2,865
BANKING FUND
Other Current Expenses 670 670 670 670 670 670 670 670
TOTAL - BANKING FUND 670 670 670 670 670 670 670 670
INSURANCE FUND
Other Current Expenses 60 111 148 146 146 158 156 156
TOTAL - INSURANCE FUND 60 111 148 146 146 158 156 156
CONSUMER COUNSEL AND PUBLIC UTILITY CONTROL FUND
Personal Services 11,037 11,835 12,238 12,333 12,333 12,725 12,837 12,837
Other Expenses 1,155 1,479 1,479 1,479 1,479 1,479 1,479 1,479
Capital Outlay 20 20 20 20 20 20 20 20
Other Current Expenses 8,667 9,468 10,892 10,604 10,604 11,326 11,040 11,040
TOTAL - CONSUMER COUNSEL AND PUBLIC UTILITY CONTROL FUND
20,878 22,802 24,628 24,435 24,435 25,550 25,376 25,376
REGIONAL MARKET OPERATION FUND
Personal Services 394 430 447 449 449 469 471 471
Other Expenses 263 273 273 273 273 273 273 273
Other Current Expenses 352 361 361 361 361 361 361 361
TOTAL - REGIONAL MARKET OPERATION FUND
1,009 1,064 1,081 1,083 1,083 1,103 1,105 1,105
TOURISM FUND
Financial Summary
A - 51
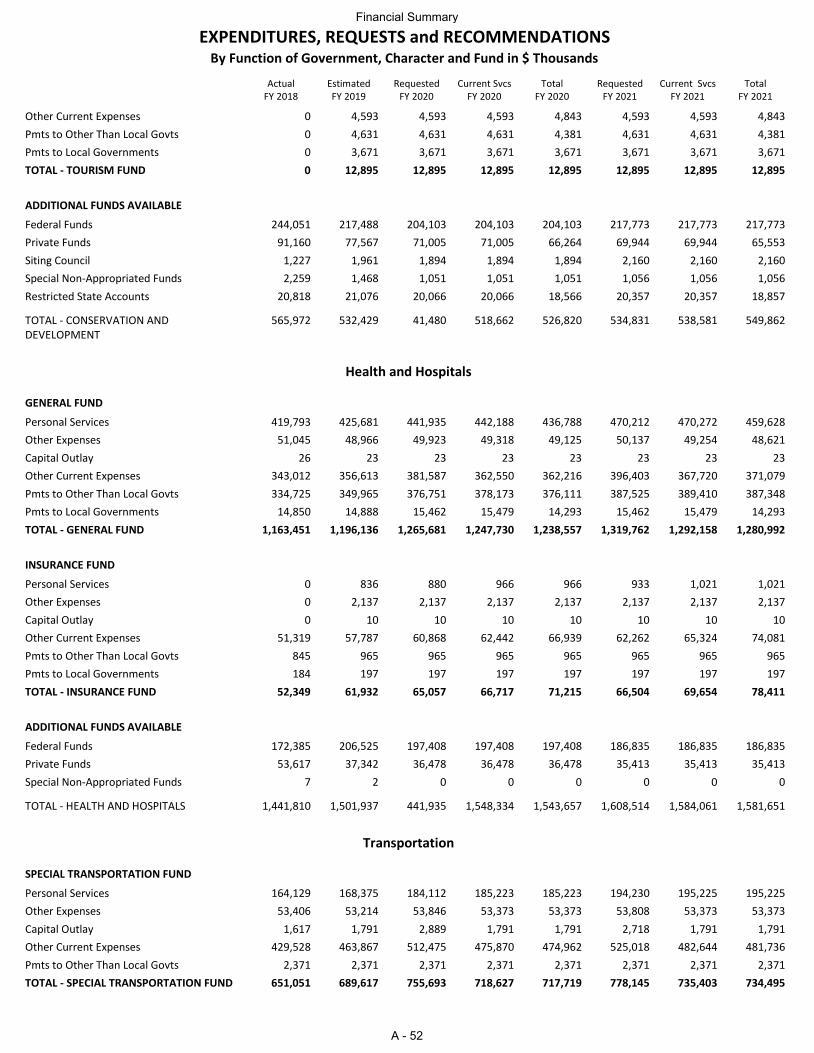
ActualFY 2018
EstimatedFY 2019
RequestedFY 2020
Current SvcsFY 2020
TotalFY 2020
RequestedFY 2021
Current SvcsFY 2021
TotalFY 2021
EXPENDITURES, REQUESTS and RECOMMENDATIONSBy Function of Government, Character and Fund in $ Thousands
Other Current Expenses 0 4,593 4,593 4,593 4,843 4,593 4,593 4,843
Pmts to Other Than Local Govts 0 4,631 4,631 4,631 4,381 4,631 4,631 4,381
Pmts to Local Governments 0 3,671 3,671 3,671 3,671 3,671 3,671 3,671
TOTAL - TOURISM FUND 0 12,895 12,895 12,895 12,895 12,895 12,895 12,895
ADDITIONAL FUNDS AVAILABLE
Federal Funds 244,051 217,488 204,103 204,103 204,103 217,773 217,773 217,773
Private Funds 91,160 77,567 71,005 71,005 66,264 69,944 69,944 65,553
Siting Council 1,227 1,961 1,894 1,894 1,894 2,160 2,160 2,160
Special Non-Appropriated Funds 2,259 1,468 1,051 1,051 1,051 1,056 1,056 1,056
Restricted State Accounts 20,818 21,076 20,066 20,066 18,566 20,357 20,357 18,857
TOTAL - CONSERVATION AND DEVELOPMENT
565,972 532,429 41,480 518,662 526,820 534,831 538,581 549,862
Health and Hospitals
GENERAL FUND
Personal Services 419,793 425,681 441,935 442,188 436,788 470,212 470,272 459,628
Other Expenses 51,045 48,966 49,923 49,318 49,125 50,137 49,254 48,621
Capital Outlay 26 23 23 23 23 23 23 23
Other Current Expenses 343,012 356,613 381,587 362,550 362,216 396,403 367,720 371,079
Pmts to Other Than Local Govts 334,725 349,965 376,751 378,173 376,111 387,525 389,410 387,348
Pmts to Local Governments 14,850 14,888 15,462 15,479 14,293 15,462 15,479 14,293
TOTAL - GENERAL FUND 1,163,451 1,196,136 1,265,681 1,247,730 1,238,557 1,319,762 1,292,158 1,280,992
INSURANCE FUND
Personal Services 0 836 880 966 966 933 1,021 1,021
Other Expenses 0 2,137 2,137 2,137 2,137 2,137 2,137 2,137
Capital Outlay 0 10 10 10 10 10 10 10
Other Current Expenses 51,319 57,787 60,868 62,442 66,939 62,262 65,324 74,081
Pmts to Other Than Local Govts 845 965 965 965 965 965 965 965
Pmts to Local Governments 184 197 197 197 197 197 197 197
TOTAL - INSURANCE FUND 52,349 61,932 65,057 66,717 71,215 66,504 69,654 78,411
ADDITIONAL FUNDS AVAILABLE
Federal Funds 172,385 206,525 197,408 197,408 197,408 186,835 186,835 186,835
Private Funds 53,617 37,342 36,478 36,478 36,478 35,413 35,413 35,413
Special Non-Appropriated Funds 7 2 0 0 0 0 0 0
TOTAL - HEALTH AND HOSPITALS 1,441,810 1,501,937 441,935 1,548,334 1,543,657 1,608,514 1,584,061 1,581,651
Transportation
SPECIAL TRANSPORTATION FUND
Personal Services 164,129 168,375 184,112 185,223 185,223 194,230 195,225 195,225
Other Expenses 53,406 53,214 53,846 53,373 53,373 53,808 53,373 53,373
Capital Outlay 1,617 1,791 2,889 1,791 1,791 2,718 1,791 1,791
Other Current Expenses 429,528 463,867 512,475 475,870 474,962 525,018 482,644 481,736
Pmts to Other Than Local Govts 2,371 2,371 2,371 2,371 2,371 2,371 2,371 2,371
TOTAL - SPECIAL TRANSPORTATION FUND 651,051 689,617 755,693 718,627 717,719 778,145 735,403 734,495
Financial Summary
A - 52
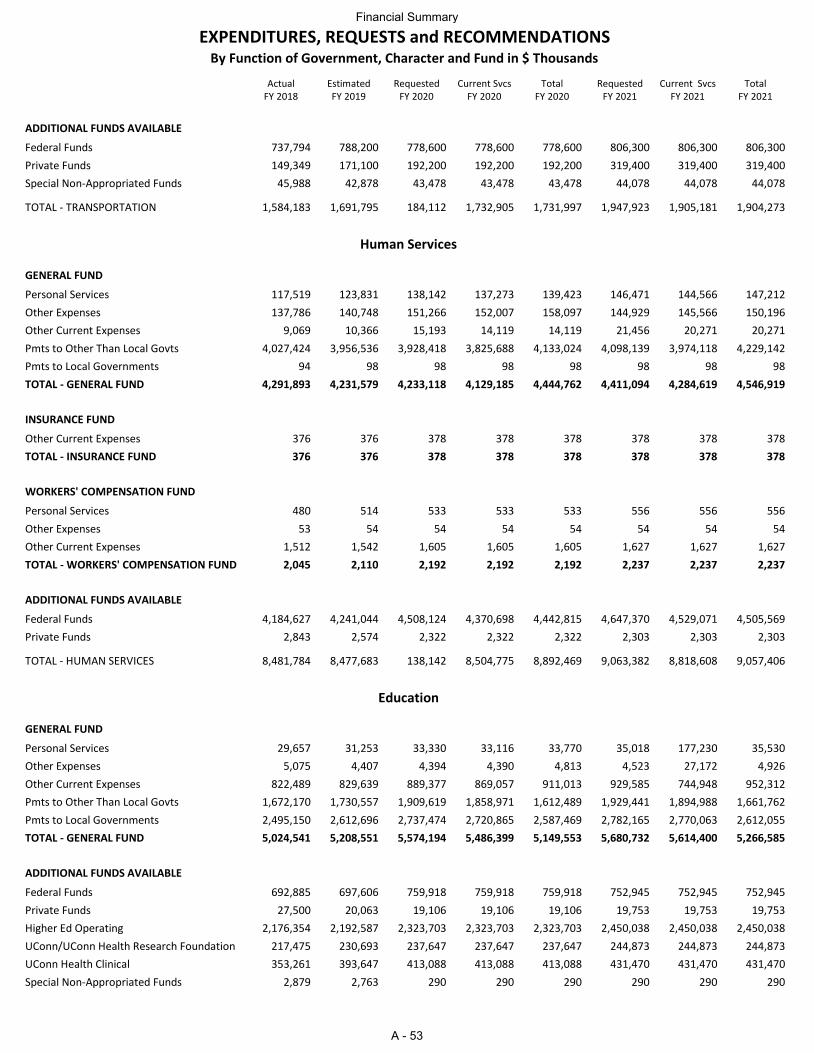
ActualFY 2018
EstimatedFY 2019
RequestedFY 2020
Current SvcsFY 2020
TotalFY 2020
RequestedFY 2021
Current SvcsFY 2021
TotalFY 2021
EXPENDITURES, REQUESTS and RECOMMENDATIONSBy Function of Government, Character and Fund in $ Thousands
ADDITIONAL FUNDS AVAILABLE
Federal Funds 737,794 788,200 778,600 778,600 778,600 806,300 806,300 806,300
Private Funds 149,349 171,100 192,200 192,200 192,200 319,400 319,400 319,400
Special Non-Appropriated Funds 45,988 42,878 43,478 43,478 43,478 44,078 44,078 44,078
TOTAL - TRANSPORTATION 1,584,183 1,691,795 184,112 1,732,905 1,731,997 1,947,923 1,905,181 1,904,273
Human Services
GENERAL FUND
Personal Services 117,519 123,831 138,142 137,273 139,423 146,471 144,566 147,212
Other Expenses 137,786 140,748 151,266 152,007 158,097 144,929 145,566 150,196
Other Current Expenses 9,069 10,366 15,193 14,119 14,119 21,456 20,271 20,271
Pmts to Other Than Local Govts 4,027,424 3,956,536 3,928,418 3,825,688 4,133,024 4,098,139 3,974,118 4,229,142
Pmts to Local Governments 94 98 98 98 98 98 98 98
TOTAL - GENERAL FUND 4,291,893 4,231,579 4,233,118 4,129,185 4,444,762 4,411,094 4,284,619 4,546,919
INSURANCE FUND
Other Current Expenses 376 376 378 378 378 378 378 378
TOTAL - INSURANCE FUND 376 376 378 378 378 378 378 378
WORKERS' COMPENSATION FUND
Personal Services 480 514 533 533 533 556 556 556
Other Expenses 53 54 54 54 54 54 54 54
Other Current Expenses 1,512 1,542 1,605 1,605 1,605 1,627 1,627 1,627
TOTAL - WORKERS' COMPENSATION FUND 2,045 2,110 2,192 2,192 2,192 2,237 2,237 2,237
ADDITIONAL FUNDS AVAILABLE
Federal Funds 4,184,627 4,241,044 4,508,124 4,370,698 4,442,815 4,647,370 4,529,071 4,505,569
Private Funds 2,843 2,574 2,322 2,322 2,322 2,303 2,303 2,303
TOTAL - HUMAN SERVICES 8,481,784 8,477,683 138,142 8,504,775 8,892,469 9,063,382 8,818,608 9,057,406
Education
GENERAL FUND
Personal Services 29,657 31,253 33,330 33,116 33,770 35,018 177,230 35,530
Other Expenses 5,075 4,407 4,394 4,390 4,813 4,523 27,172 4,926
Other Current Expenses 822,489 829,639 889,377 869,057 911,013 929,585 744,948 952,312
Pmts to Other Than Local Govts 1,672,170 1,730,557 1,909,619 1,858,971 1,612,489 1,929,441 1,894,988 1,661,762
Pmts to Local Governments 2,495,150 2,612,696 2,737,474 2,720,865 2,587,469 2,782,165 2,770,063 2,612,055
TOTAL - GENERAL FUND 5,024,541 5,208,551 5,574,194 5,486,399 5,149,553 5,680,732 5,614,400 5,266,585
ADDITIONAL FUNDS AVAILABLE
Federal Funds 692,885 697,606 759,918 759,918 759,918 752,945 752,945 752,945
Private Funds 27,500 20,063 19,106 19,106 19,106 19,753 19,753 19,753
Higher Ed Operating 2,176,354 2,192,587 2,323,703 2,323,703 2,323,703 2,450,038 2,450,038 2,450,038
UConn/UConn Health Research Foundation 217,475 230,693 237,647 237,647 237,647 244,873 244,873 244,873
UConn Health Clinical 353,261 393,647 413,088 413,088 413,088 431,470 431,470 431,470
Special Non-Appropriated Funds 2,879 2,763 290 290 290 290 290 290
Financial Summary
A - 53
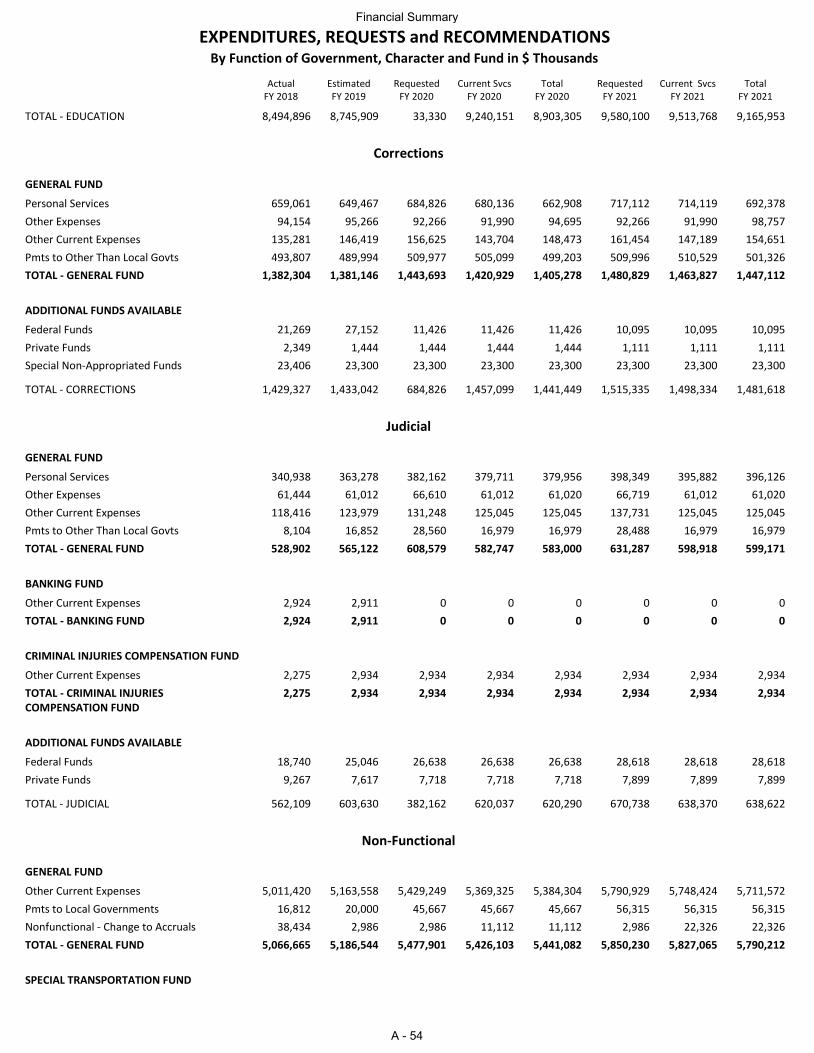
ActualFY 2018
EstimatedFY 2019
RequestedFY 2020
Current SvcsFY 2020
TotalFY 2020
RequestedFY 2021
Current SvcsFY 2021
TotalFY 2021
EXPENDITURES, REQUESTS and RECOMMENDATIONSBy Function of Government, Character and Fund in $ Thousands
TOTAL - EDUCATION 8,494,896 8,745,909 33,330 9,240,151 8,903,305 9,580,100 9,513,768 9,165,953
Corrections
GENERAL FUND
Personal Services 659,061 649,467 684,826 680,136 662,908 717,112 714,119 692,378
Other Expenses 94,154 95,266 92,266 91,990 94,695 92,266 91,990 98,757
Other Current Expenses 135,281 146,419 156,625 143,704 148,473 161,454 147,189 154,651
Pmts to Other Than Local Govts 493,807 489,994 509,977 505,099 499,203 509,996 510,529 501,326
TOTAL - GENERAL FUND 1,382,304 1,381,146 1,443,693 1,420,929 1,405,278 1,480,829 1,463,827 1,447,112
ADDITIONAL FUNDS AVAILABLE
Federal Funds 21,269 27,152 11,426 11,426 11,426 10,095 10,095 10,095
Private Funds 2,349 1,444 1,444 1,444 1,444 1,111 1,111 1,111
Special Non-Appropriated Funds 23,406 23,300 23,300 23,300 23,300 23,300 23,300 23,300
TOTAL - CORRECTIONS 1,429,327 1,433,042 684,826 1,457,099 1,441,449 1,515,335 1,498,334 1,481,618
Judicial
GENERAL FUND
Personal Services 340,938 363,278 382,162 379,711 379,956 398,349 395,882 396,126
Other Expenses 61,444 61,012 66,610 61,012 61,020 66,719 61,012 61,020
Other Current Expenses 118,416 123,979 131,248 125,045 125,045 137,731 125,045 125,045
Pmts to Other Than Local Govts 8,104 16,852 28,560 16,979 16,979 28,488 16,979 16,979
TOTAL - GENERAL FUND 528,902 565,122 608,579 582,747 583,000 631,287 598,918 599,171
BANKING FUND
Other Current Expenses 2,924 2,911 0 0 0 0 0 0
TOTAL - BANKING FUND 2,924 2,911 0 0 0 0 0 0
CRIMINAL INJURIES COMPENSATION FUND
Other Current Expenses 2,275 2,934 2,934 2,934 2,934 2,934 2,934 2,934
TOTAL - CRIMINAL INJURIES COMPENSATION FUND
2,275 2,934 2,934 2,934 2,934 2,934 2,934 2,934
ADDITIONAL FUNDS AVAILABLE
Federal Funds 18,740 25,046 26,638 26,638 26,638 28,618 28,618 28,618
Private Funds 9,267 7,617 7,718 7,718 7,718 7,899 7,899 7,899
TOTAL - JUDICIAL 562,109 603,630 382,162 620,037 620,290 670,738 638,370 638,622
Non-Functional
GENERAL FUND
Other Current Expenses 5,011,420 5,163,558 5,429,249 5,369,325 5,384,304 5,790,929 5,748,424 5,711,572
Pmts to Local Governments 16,812 20,000 45,667 45,667 45,667 56,315 56,315 56,315
Nonfunctional - Change to Accruals 38,434 2,986 2,986 11,112 11,112 2,986 22,326 22,326
TOTAL - GENERAL FUND 5,066,665 5,186,544 5,477,901 5,426,103 5,441,082 5,850,230 5,827,065 5,790,212
SPECIAL TRANSPORTATION FUND
Financial Summary
A - 54
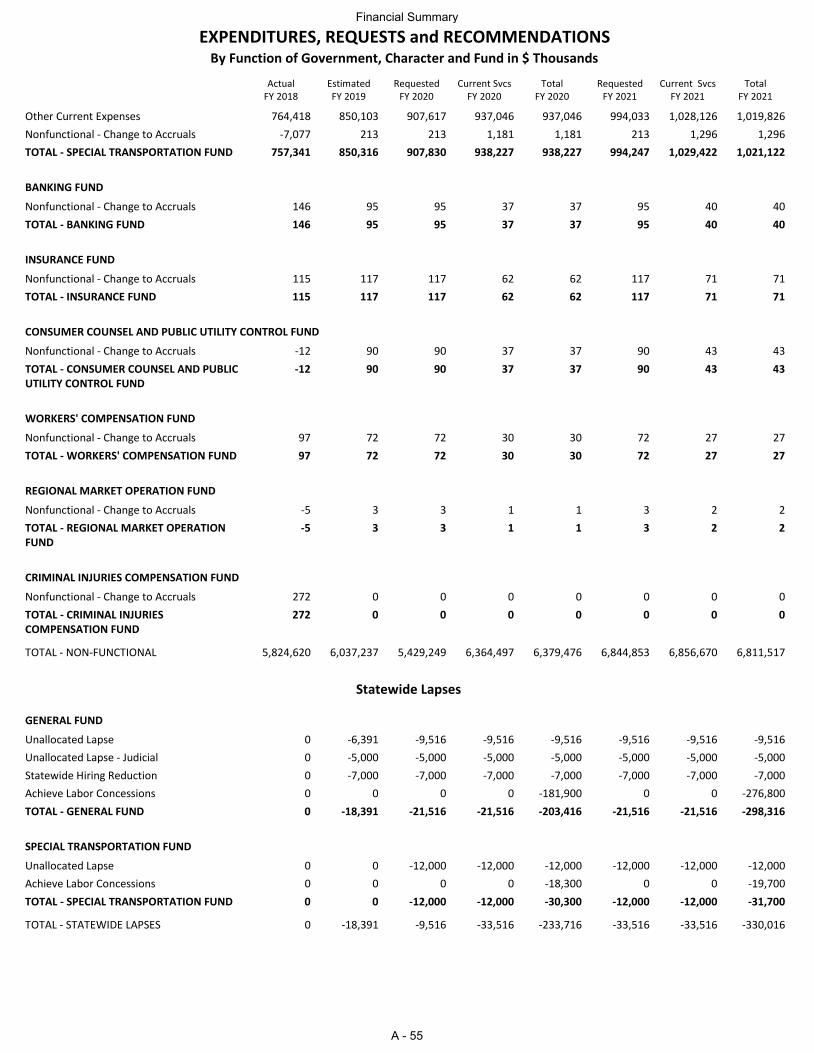
ActualFY 2018
EstimatedFY 2019
RequestedFY 2020
Current SvcsFY 2020
TotalFY 2020
RequestedFY 2021
Current SvcsFY 2021
TotalFY 2021
EXPENDITURES, REQUESTS and RECOMMENDATIONSBy Function of Government, Character and Fund in $ Thousands
Other Current Expenses 764,418 850,103 907,617 937,046 937,046 994,033 1,028,126 1,019,826
Nonfunctional - Change to Accruals -7,077 213 213 1,181 1,181 213 1,296 1,296
TOTAL - SPECIAL TRANSPORTATION FUND 757,341 850,316 907,830 938,227 938,227 994,247 1,029,422 1,021,122
BANKING FUND
Nonfunctional - Change to Accruals 146 95 95 37 37 95 40 40
TOTAL - BANKING FUND 146 95 95 37 37 95 40 40
INSURANCE FUND
Nonfunctional - Change to Accruals 115 117 117 62 62 117 71 71
TOTAL - INSURANCE FUND 115 117 117 62 62 117 71 71
CONSUMER COUNSEL AND PUBLIC UTILITY CONTROL FUND
Nonfunctional - Change to Accruals -12 90 90 37 37 90 43 43
TOTAL - CONSUMER COUNSEL AND PUBLIC UTILITY CONTROL FUND
-12 90 90 37 37 90 43 43
WORKERS' COMPENSATION FUND
Nonfunctional - Change to Accruals 97 72 72 30 30 72 27 27
TOTAL - WORKERS' COMPENSATION FUND 97 72 72 30 30 72 27 27
REGIONAL MARKET OPERATION FUND
Nonfunctional - Change to Accruals -5 3 3 1 1 3 2 2
TOTAL - REGIONAL MARKET OPERATION FUND
-5 3 3 1 1 3 2 2
CRIMINAL INJURIES COMPENSATION FUND
Nonfunctional - Change to Accruals 272 0 0 0 0 0 0 0
TOTAL - CRIMINAL INJURIES COMPENSATION FUND
272 0 0 0 0 0 0 0
TOTAL - NON-FUNCTIONAL 5,824,620 6,037,237 5,429,249 6,364,497 6,379,476 6,844,853 6,856,670 6,811,517
Statewide Lapses
GENERAL FUND
Unallocated Lapse 0 -6,391 -9,516 -9,516 -9,516 -9,516 -9,516 -9,516
Unallocated Lapse - Judicial 0 -5,000 -5,000 -5,000 -5,000 -5,000 -5,000 -5,000
Statewide Hiring Reduction 0 -7,000 -7,000 -7,000 -7,000 -7,000 -7,000 -7,000
Achieve Labor Concessions 0 0 0 0 -181,900 0 0 -276,800
TOTAL - GENERAL FUND 0 -18,391 -21,516 -21,516 -203,416 -21,516 -21,516 -298,316
SPECIAL TRANSPORTATION FUND
Unallocated Lapse 0 0 -12,000 -12,000 -12,000 -12,000 -12,000 -12,000
Achieve Labor Concessions 0 0 0 0 -18,300 0 0 -19,700
TOTAL - SPECIAL TRANSPORTATION FUND 0 0 -12,000 -12,000 -30,300 -12,000 -12,000 -31,700
TOTAL - STATEWIDE LAPSES 0 -18,391 -9,516 -33,516 -233,716 -33,516 -33,516 -330,016
Financial Summary
A - 55
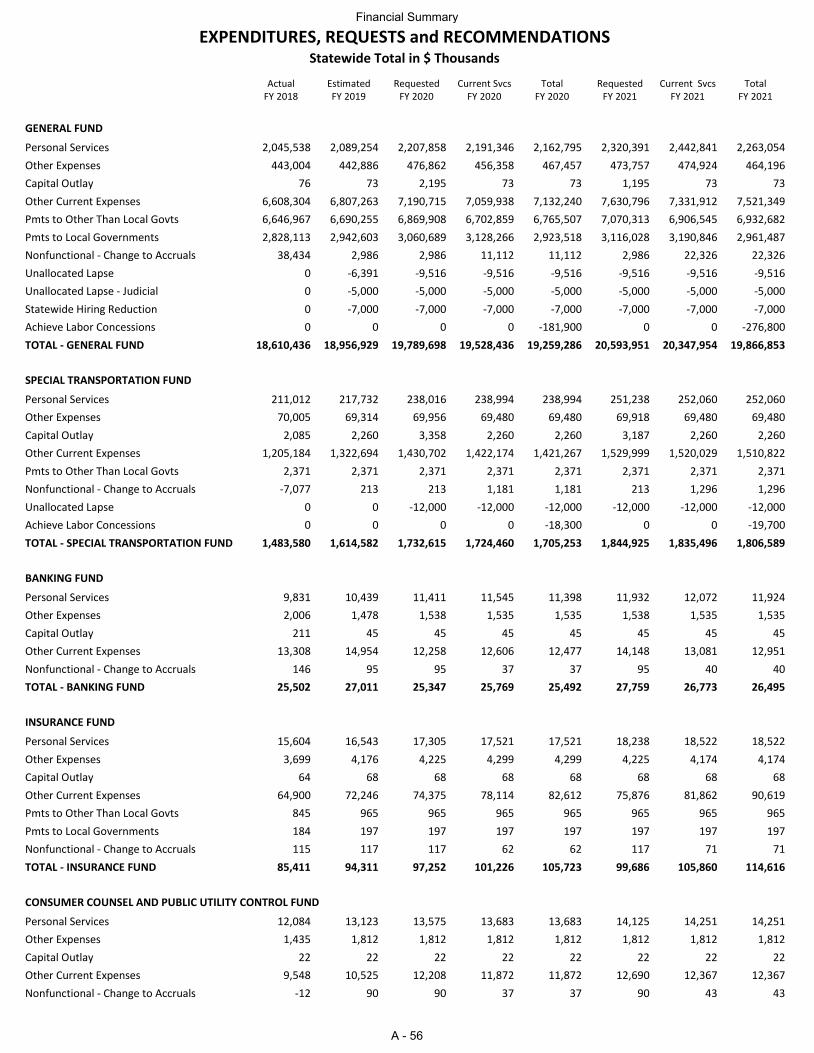
ActualFY 2018
EstimatedFY 2019
RequestedFY 2020
Current SvcsFY 2020
TotalFY 2020
RequestedFY 2021
Current SvcsFY 2021
TotalFY 2021
EXPENDITURES, REQUESTS and RECOMMENDATIONSStatewide Total in $ Thousands
GENERAL FUND
Personal Services 2,045,538 2,089,254 2,207,858 2,191,346 2,162,795 2,320,391 2,442,841 2,263,054
Other Expenses 443,004 442,886 476,862 456,358 467,457 473,757 474,924 464,196
Capital Outlay 76 73 2,195 73 73 1,195 73 73
Other Current Expenses 6,608,304 6,807,263 7,190,715 7,059,938 7,132,240 7,630,796 7,331,912 7,521,349
Pmts to Other Than Local Govts 6,646,967 6,690,255 6,869,908 6,702,859 6,765,507 7,070,313 6,906,545 6,932,682
Pmts to Local Governments 2,828,113 2,942,603 3,060,689 3,128,266 2,923,518 3,116,028 3,190,846 2,961,487
Nonfunctional - Change to Accruals 38,434 2,986 2,986 11,112 11,112 2,986 22,326 22,326
Unallocated Lapse 0 -6,391 -9,516 -9,516 -9,516 -9,516 -9,516 -9,516
Unallocated Lapse - Judicial 0 -5,000 -5,000 -5,000 -5,000 -5,000 -5,000 -5,000
Statewide Hiring Reduction 0 -7,000 -7,000 -7,000 -7,000 -7,000 -7,000 -7,000
Achieve Labor Concessions 0 0 0 0 -181,900 0 0 -276,800
TOTAL - GENERAL FUND 18,610,436 18,956,929 19,789,698 19,528,436 19,259,286 20,593,951 20,347,954 19,866,853
SPECIAL TRANSPORTATION FUND
Personal Services 211,012 217,732 238,016 238,994 238,994 251,238 252,060 252,060
Other Expenses 70,005 69,314 69,956 69,480 69,480 69,918 69,480 69,480
Capital Outlay 2,085 2,260 3,358 2,260 2,260 3,187 2,260 2,260
Other Current Expenses 1,205,184 1,322,694 1,430,702 1,422,174 1,421,267 1,529,999 1,520,029 1,510,822
Pmts to Other Than Local Govts 2,371 2,371 2,371 2,371 2,371 2,371 2,371 2,371
Nonfunctional - Change to Accruals -7,077 213 213 1,181 1,181 213 1,296 1,296
Unallocated Lapse 0 0 -12,000 -12,000 -12,000 -12,000 -12,000 -12,000
Achieve Labor Concessions 0 0 0 0 -18,300 0 0 -19,700
TOTAL - SPECIAL TRANSPORTATION FUND 1,483,580 1,614,582 1,732,615 1,724,460 1,705,253 1,844,925 1,835,496 1,806,589
BANKING FUND
Personal Services 9,831 10,439 11,411 11,545 11,398 11,932 12,072 11,924
Other Expenses 2,006 1,478 1,538 1,535 1,535 1,538 1,535 1,535
Capital Outlay 211 45 45 45 45 45 45 45
Other Current Expenses 13,308 14,954 12,258 12,606 12,477 14,148 13,081 12,951
Nonfunctional - Change to Accruals 146 95 95 37 37 95 40 40
TOTAL - BANKING FUND 25,502 27,011 25,347 25,769 25,492 27,759 26,773 26,495
INSURANCE FUND
Personal Services 15,604 16,543 17,305 17,521 17,521 18,238 18,522 18,522
Other Expenses 3,699 4,176 4,225 4,299 4,299 4,225 4,174 4,174
Capital Outlay 64 68 68 68 68 68 68 68
Other Current Expenses 64,900 72,246 74,375 78,114 82,612 75,876 81,862 90,619
Pmts to Other Than Local Govts 845 965 965 965 965 965 965 965
Pmts to Local Governments 184 197 197 197 197 197 197 197
Nonfunctional - Change to Accruals 115 117 117 62 62 117 71 71
TOTAL - INSURANCE FUND 85,411 94,311 97,252 101,226 105,723 99,686 105,860 114,616
CONSUMER COUNSEL AND PUBLIC UTILITY CONTROL FUND
Personal Services 12,084 13,123 13,575 13,683 13,683 14,125 14,251 14,251
Other Expenses 1,435 1,812 1,812 1,812 1,812 1,812 1,812 1,812
Capital Outlay 22 22 22 22 22 22 22 22
Other Current Expenses 9,548 10,525 12,208 11,872 11,872 12,690 12,367 12,367
Nonfunctional - Change to Accruals -12 90 90 37 37 90 43 43
Financial Summary
A - 56
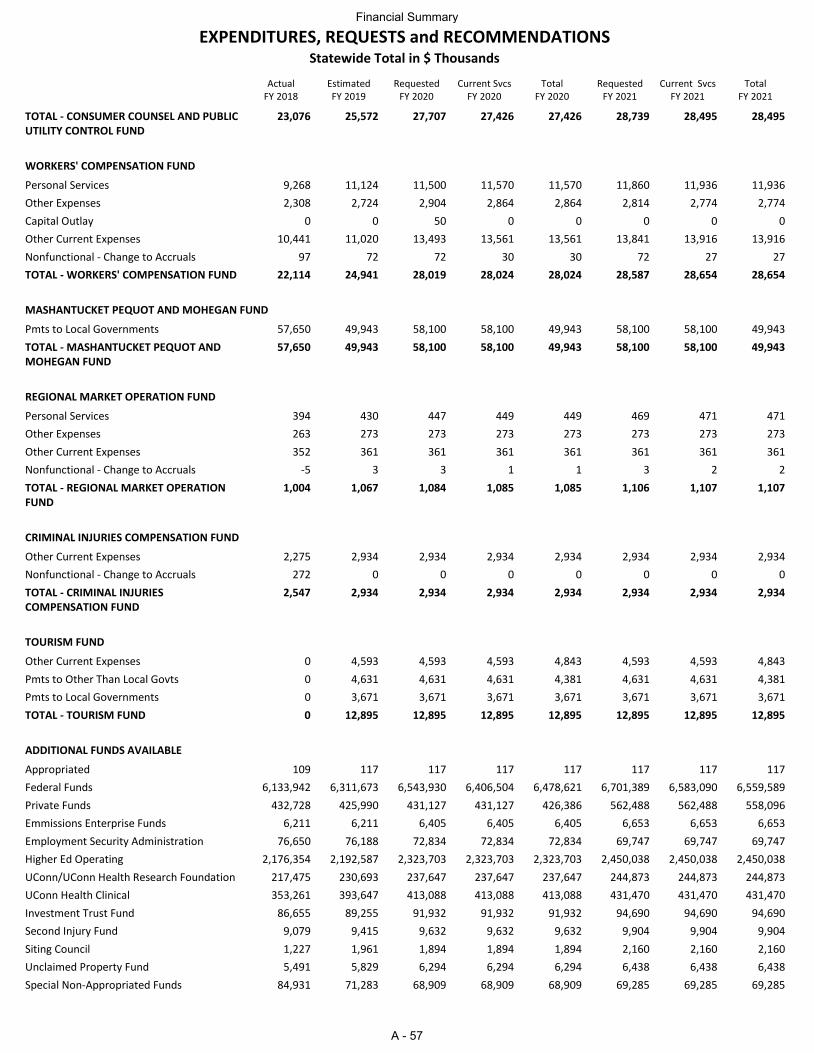
ActualFY 2018
EstimatedFY 2019
RequestedFY 2020
Current SvcsFY 2020
TotalFY 2020
RequestedFY 2021
Current SvcsFY 2021
TotalFY 2021
EXPENDITURES, REQUESTS and RECOMMENDATIONSStatewide Total in $ Thousands
TOTAL - CONSUMER COUNSEL AND PUBLIC UTILITY CONTROL FUND
23,076 25,572 27,707 27,426 27,426 28,739 28,495 28,495
WORKERS' COMPENSATION FUND
Personal Services 9,268 11,124 11,500 11,570 11,570 11,860 11,936 11,936
Other Expenses 2,308 2,724 2,904 2,864 2,864 2,814 2,774 2,774
Capital Outlay 0 0 50 0 0 0 0 0
Other Current Expenses 10,441 11,020 13,493 13,561 13,561 13,841 13,916 13,916
Nonfunctional - Change to Accruals 97 72 72 30 30 72 27 27
TOTAL - WORKERS' COMPENSATION FUND 22,114 24,941 28,019 28,024 28,024 28,587 28,654 28,654
MASHANTUCKET PEQUOT AND MOHEGAN FUND
Pmts to Local Governments 57,650 49,943 58,100 58,100 49,943 58,100 58,100 49,943
TOTAL - MASHANTUCKET PEQUOT AND MOHEGAN FUND
57,650 49,943 58,100 58,100 49,943 58,100 58,100 49,943
REGIONAL MARKET OPERATION FUND
Personal Services 394 430 447 449 449 469 471 471
Other Expenses 263 273 273 273 273 273 273 273
Other Current Expenses 352 361 361 361 361 361 361 361
Nonfunctional - Change to Accruals -5 3 3 1 1 3 2 2
TOTAL - REGIONAL MARKET OPERATION FUND
1,004 1,067 1,084 1,085 1,085 1,106 1,107 1,107
CRIMINAL INJURIES COMPENSATION FUND
Other Current Expenses 2,275 2,934 2,934 2,934 2,934 2,934 2,934 2,934
Nonfunctional - Change to Accruals 272 0 0 0 0 0 0 0
TOTAL - CRIMINAL INJURIES COMPENSATION FUND
2,547 2,934 2,934 2,934 2,934 2,934 2,934 2,934
TOURISM FUND
Other Current Expenses 0 4,593 4,593 4,593 4,843 4,593 4,593 4,843
Pmts to Other Than Local Govts 0 4,631 4,631 4,631 4,381 4,631 4,631 4,381
Pmts to Local Governments 0 3,671 3,671 3,671 3,671 3,671 3,671 3,671
TOTAL - TOURISM FUND 0 12,895 12,895 12,895 12,895 12,895 12,895 12,895
ADDITIONAL FUNDS AVAILABLE
Appropriated 109 117 117 117 117 117 117 117
Federal Funds 6,133,942 6,311,673 6,543,930 6,406,504 6,478,621 6,701,389 6,583,090 6,559,589
Private Funds 432,728 425,990 431,127 431,127 426,386 562,488 562,488 558,096
Emmissions Enterprise Funds 6,211 6,211 6,405 6,405 6,405 6,653 6,653 6,653
Employment Security Administration 76,650 76,188 72,834 72,834 72,834 69,747 69,747 69,747
Higher Ed Operating 2,176,354 2,192,587 2,323,703 2,323,703 2,323,703 2,450,038 2,450,038 2,450,038
UConn/UConn Health Research Foundation 217,475 230,693 237,647 237,647 237,647 244,873 244,873 244,873
UConn Health Clinical 353,261 393,647 413,088 413,088 413,088 431,470 431,470 431,470
Investment Trust Fund 86,655 89,255 91,932 91,932 91,932 94,690 94,690 94,690
Second Injury Fund 9,079 9,415 9,632 9,632 9,632 9,904 9,904 9,904
Siting Council 1,227 1,961 1,894 1,894 1,894 2,160 2,160 2,160
Unclaimed Property Fund 5,491 5,829 6,294 6,294 6,294 6,438 6,438 6,438
Special Non-Appropriated Funds 84,931 71,283 68,909 68,909 68,909 69,285 69,285 69,285
Financial Summary
A - 57
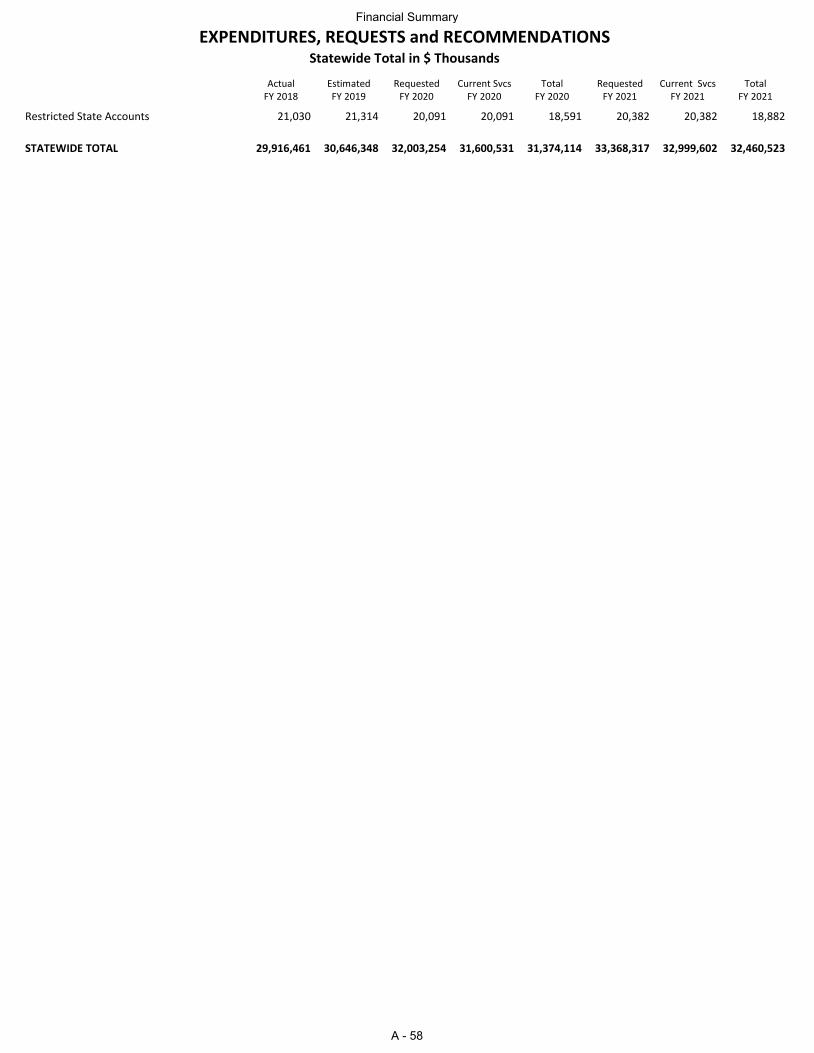
ActualFY 2018
EstimatedFY 2019
RequestedFY 2020
Current SvcsFY 2020
TotalFY 2020
RequestedFY 2021
Current SvcsFY 2021
TotalFY 2021
EXPENDITURES, REQUESTS and RECOMMENDATIONSStatewide Total in $ Thousands
Restricted State Accounts 21,030 21,314 20,091 20,091 18,591 20,382 20,382 18,882
STATEWIDE TOTAL 29,916,461 30,646,348 32,003,254 31,600,531 31,374,114 33,368,317 32,999,602 32,460,523
Financial Summary
A - 58
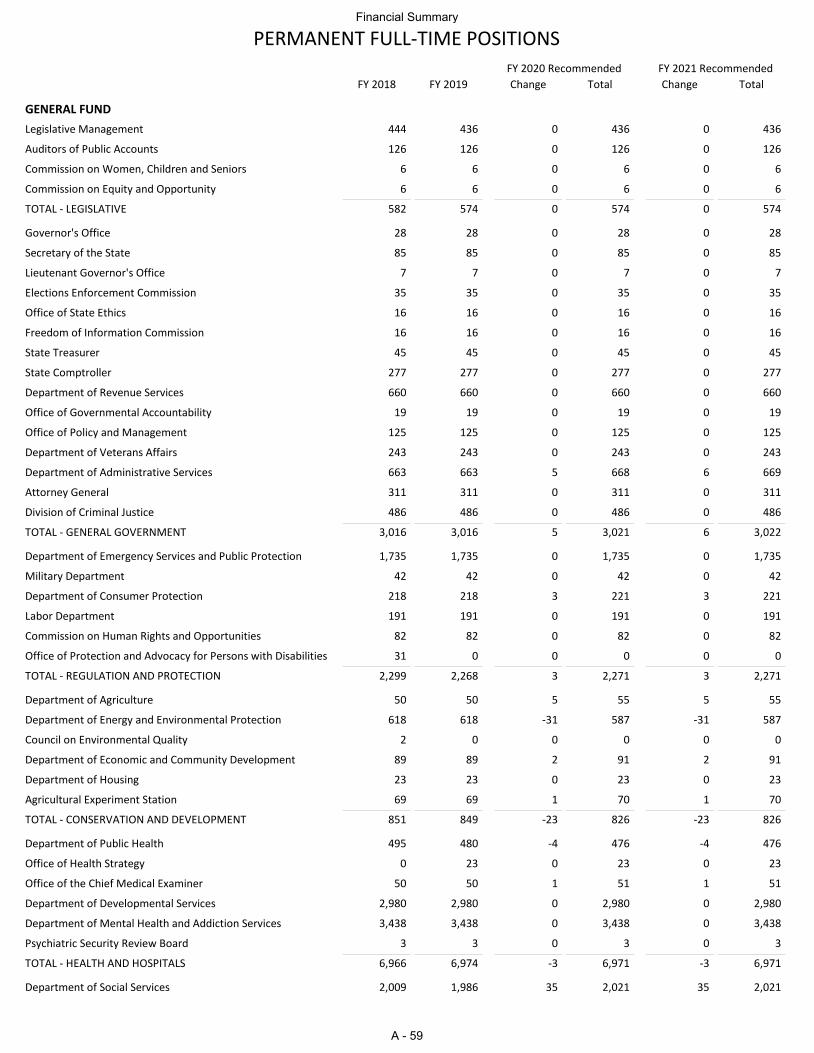
FY 2018 FY 2019 Change Total Change Total
FY 2020 Recommended FY 2021 Recommended
PERMANENT FULL-TIME POSITIONS
GENERAL FUND
Legislative Management 444 436 0 436 0 436
Auditors of Public Accounts 126 126 0 126 0 126
Commission on Women, Children and Seniors 6 6 0 6 0 6
Commission on Equity and Opportunity 6 6 0 6 0 6
TOTAL - LEGISLATIVE 582 574 0 574 0 574
Governor's Office 28 28 0 28 0 28
Secretary of the State 85 85 0 85 0 85
Lieutenant Governor's Office 7 7 0 7 0 7
Elections Enforcement Commission 35 35 0 35 0 35
Office of State Ethics 16 16 0 16 0 16
Freedom of Information Commission 16 16 0 16 0 16
State Treasurer 45 45 0 45 0 45
State Comptroller 277 277 0 277 0 277
Department of Revenue Services 660 660 0 660 0 660
Office of Governmental Accountability 19 19 0 19 0 19
Office of Policy and Management 125 125 0 125 0 125
Department of Veterans Affairs 243 243 0 243 0 243
Department of Administrative Services 663 663 5 668 6 669
Attorney General 311 311 0 311 0 311
Division of Criminal Justice 486 486 0 486 0 486
TOTAL - GENERAL GOVERNMENT 3,016 3,016 5 3,021 6 3,022
Department of Emergency Services and Public Protection 1,735 1,735 0 1,735 0 1,735
Military Department 42 42 0 42 0 42
Department of Consumer Protection 218 218 3 221 3 221
Labor Department 191 191 0 191 0 191
Commission on Human Rights and Opportunities 82 82 0 82 0 82
Office of Protection and Advocacy for Persons with Disabilities 31 0 0 0 0 0
TOTAL - REGULATION AND PROTECTION 2,299 2,268 3 2,271 3 2,271
Department of Agriculture 50 50 5 55 5 55
Department of Energy and Environmental Protection 618 618 -31 587 -31 587
Council on Environmental Quality 2 0 0 0 0 0
Department of Economic and Community Development 89 89 2 91 2 91
Department of Housing 23 23 0 23 0 23
Agricultural Experiment Station 69 69 1 70 1 70
TOTAL - CONSERVATION AND DEVELOPMENT 851 849 -23 826 -23 826
Department of Public Health 495 480 -4 476 -4 476
Office of Health Strategy 0 23 0 23 0 23
Office of the Chief Medical Examiner 50 50 1 51 1 51
Department of Developmental Services 2,980 2,980 0 2,980 0 2,980
Department of Mental Health and Addiction Services 3,438 3,438 0 3,438 0 3,438
Psychiatric Security Review Board 3 3 0 3 0 3
TOTAL - HEALTH AND HOSPITALS 6,966 6,974 -3 6,971 -3 6,971
Department of Social Services 2,009 1,986 35 2,021 35 2,021
Financial Summary
A - 59
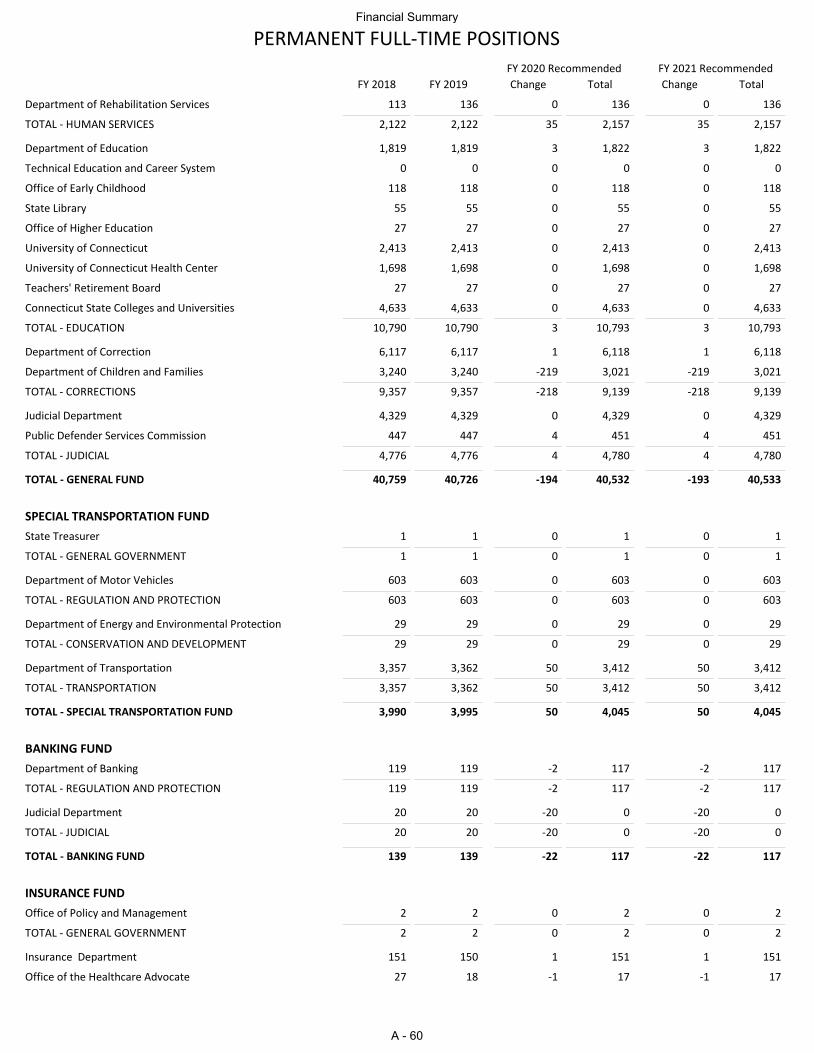
FY 2018 FY 2019 Change Total Change Total
FY 2020 Recommended FY 2021 Recommended
PERMANENT FULL-TIME POSITIONS
Department of Rehabilitation Services 113 136 0 136 0 136
TOTAL - HUMAN SERVICES 2,122 2,122 35 2,157 35 2,157
Department of Education 1,819 1,819 3 1,822 3 1,822
Technical Education and Career System 0 0 0 0 0 0
Office of Early Childhood 118 118 0 118 0 118
State Library 55 55 0 55 0 55
Office of Higher Education 27 27 0 27 0 27
University of Connecticut 2,413 2,413 0 2,413 0 2,413
University of Connecticut Health Center 1,698 1,698 0 1,698 0 1,698
Teachers' Retirement Board 27 27 0 27 0 27
Connecticut State Colleges and Universities 4,633 4,633 0 4,633 0 4,633
TOTAL - EDUCATION 10,790 10,790 3 10,793 3 10,793
Department of Correction 6,117 6,117 1 6,118 1 6,118
Department of Children and Families 3,240 3,240 -219 3,021 -219 3,021
TOTAL - CORRECTIONS 9,357 9,357 -218 9,139 -218 9,139
Judicial Department 4,329 4,329 0 4,329 0 4,329
Public Defender Services Commission 447 447 4 451 4 451
TOTAL - JUDICIAL 4,776 4,776 4 4,780 4 4,780
TOTAL - GENERAL FUND 40,759 40,726 -194 40,532 -193 40,533
SPECIAL TRANSPORTATION FUND
State Treasurer 1 1 0 1 0 1
TOTAL - GENERAL GOVERNMENT 1 1 0 1 0 1
Department of Motor Vehicles 603 603 0 603 0 603
TOTAL - REGULATION AND PROTECTION 603 603 0 603 0 603
Department of Energy and Environmental Protection 29 29 0 29 0 29
TOTAL - CONSERVATION AND DEVELOPMENT 29 29 0 29 0 29
Department of Transportation 3,357 3,362 50 3,412 50 3,412
TOTAL - TRANSPORTATION 3,357 3,362 50 3,412 50 3,412
TOTAL - SPECIAL TRANSPORTATION FUND 3,990 3,995 50 4,045 50 4,045
BANKING FUND
Department of Banking 119 119 -2 117 -2 117
TOTAL - REGULATION AND PROTECTION 119 119 -2 117 -2 117
Judicial Department 20 20 -20 0 -20 0
TOTAL - JUDICIAL 20 20 -20 0 -20 0
TOTAL - BANKING FUND 139 139 -22 117 -22 117
INSURANCE FUND
Office of Policy and Management 2 2 0 2 0 2
TOTAL - GENERAL GOVERNMENT 2 2 0 2 0 2
Insurance Department 151 150 1 151 1 151
Office of the Healthcare Advocate 27 18 -1 17 -1 17
Financial Summary
A - 60
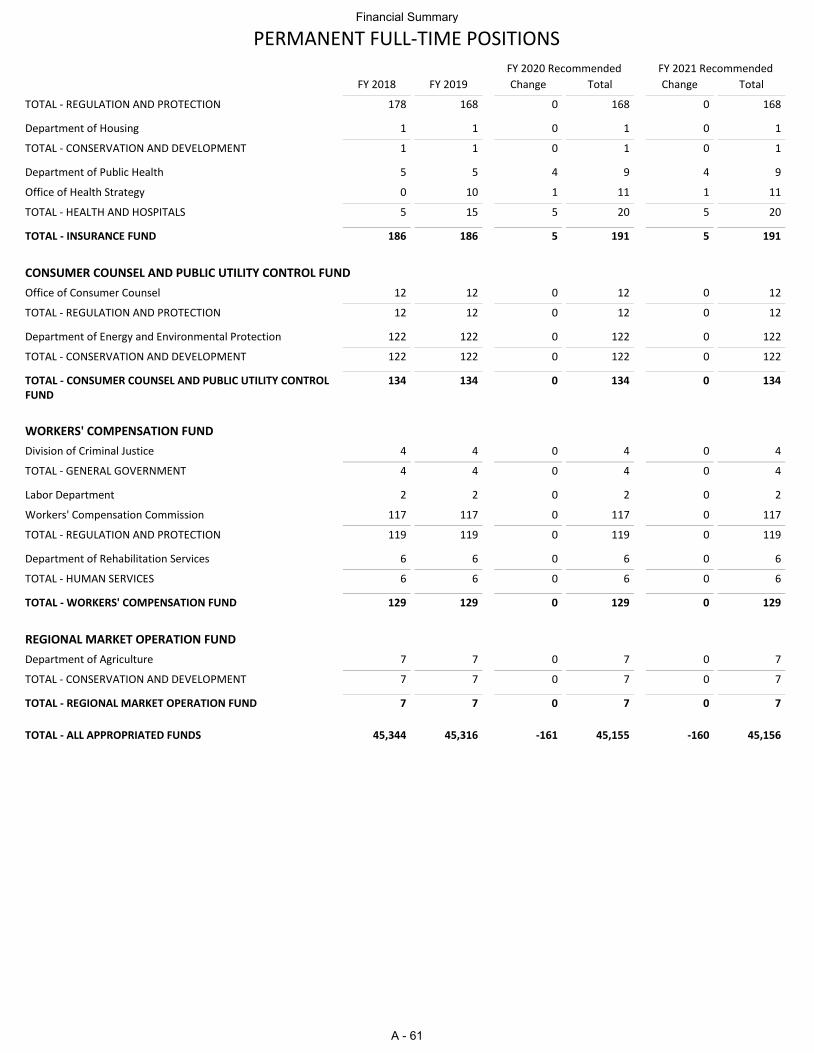
FY 2018 FY 2019 Change Total Change Total
FY 2020 Recommended FY 2021 Recommended
PERMANENT FULL-TIME POSITIONS
TOTAL - REGULATION AND PROTECTION 178 168 0 168 0 168
Department of Housing 1 1 0 1 0 1
TOTAL - CONSERVATION AND DEVELOPMENT 1 1 0 1 0 1
Department of Public Health 5 5 4 9 4 9
Office of Health Strategy 0 10 1 11 1 11
TOTAL - HEALTH AND HOSPITALS 5 15 5 20 5 20
TOTAL - INSURANCE FUND 186 186 5 191 5 191
CONSUMER COUNSEL AND PUBLIC UTILITY CONTROL FUND
Office of Consumer Counsel 12 12 0 12 0 12
TOTAL - REGULATION AND PROTECTION 12 12 0 12 0 12
Department of Energy and Environmental Protection 122 122 0 122 0 122
TOTAL - CONSERVATION AND DEVELOPMENT 122 122 0 122 0 122
TOTAL - CONSUMER COUNSEL AND PUBLIC UTILITY CONTROL FUND
134 134 0 134 0 134
WORKERS' COMPENSATION FUND
Division of Criminal Justice 4 4 0 4 0 4
TOTAL - GENERAL GOVERNMENT 4 4 0 4 0 4
Labor Department 2 2 0 2 0 2
Workers' Compensation Commission 117 117 0 117 0 117
TOTAL - REGULATION AND PROTECTION 119 119 0 119 0 119
Department of Rehabilitation Services 6 6 0 6 0 6
TOTAL - HUMAN SERVICES 6 6 0 6 0 6
TOTAL - WORKERS' COMPENSATION FUND 129 129 0 129 0 129
REGIONAL MARKET OPERATION FUND
Department of Agriculture 7 7 0 7 0 7
TOTAL - CONSERVATION AND DEVELOPMENT 7 7 0 7 0 7
TOTAL - REGIONAL MARKET OPERATION FUND 7 7 0 7 0 7
TOTAL - ALL APPROPRIATED FUNDS 45,344 45,316 -161 45,155 -160 45,156
Financial Summary
A - 61
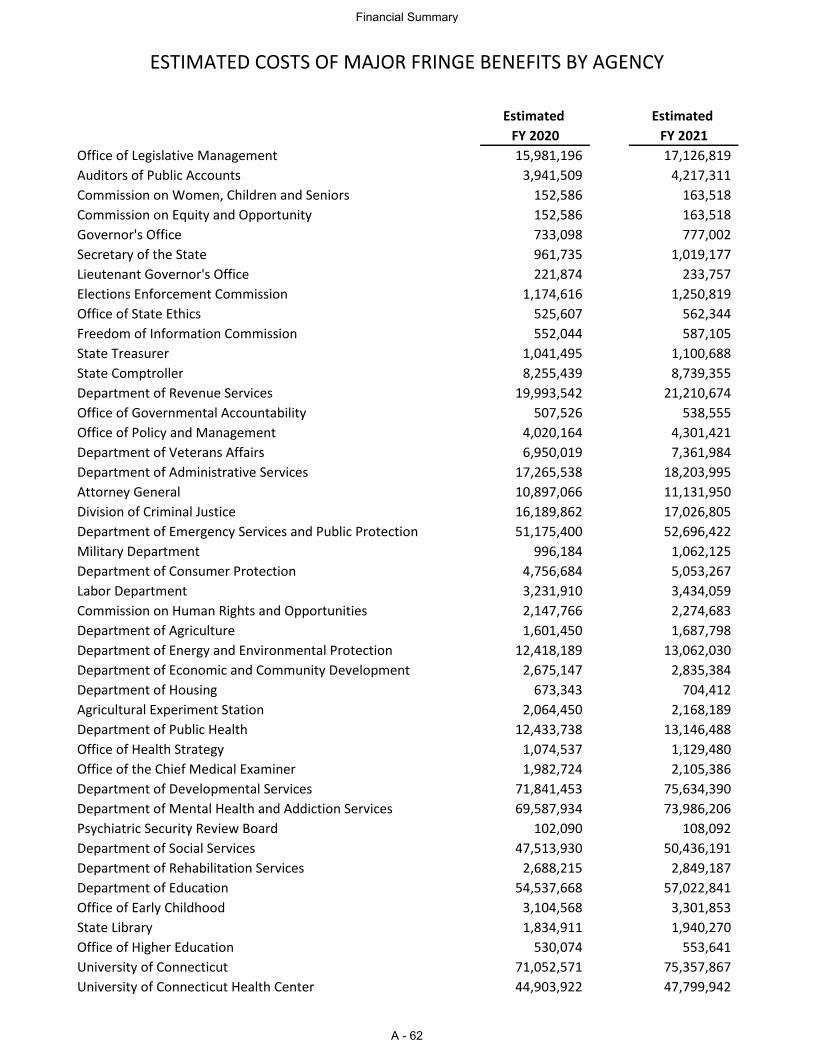
Estimated Estimated
FY 2020 FY 2021
Office of Legislative Management 15,981,196 17,126,819
Auditors of Public Accounts 3,941,509 4,217,311
Commission on Women, Children and Seniors 152,586 163,518
Commission on Equity and Opportunity 152,586 163,518
Governor's Office 733,098 777,002
Secretary of the State 961,735 1,019,177
Lieutenant Governor's Office 221,874 233,757
Elections Enforcement Commission 1,174,616 1,250,819
Office of State Ethics 525,607 562,344
Freedom of Information Commission 552,044 587,105
State Treasurer 1,041,495 1,100,688
State Comptroller 8,255,439 8,739,355
Department of Revenue Services 19,993,542 21,210,674
Office of Governmental Accountability 507,526 538,555
Office of Policy and Management 4,020,164 4,301,421
Department of Veterans Affairs 6,950,019 7,361,984
Department of Administrative Services 17,265,538 18,203,995
Attorney General 10,897,066 11,131,950
Division of Criminal Justice 16,189,862 17,026,805
Department of Emergency Services and Public Protection 51,175,400 52,696,422
Military Department 996,184 1,062,125
Department of Consumer Protection 4,756,684 5,053,267
Labor Department 3,231,910 3,434,059
Commission on Human Rights and Opportunities 2,147,766 2,274,683
Department of Agriculture 1,601,450 1,687,798
Department of Energy and Environmental Protection 12,418,189 13,062,030
Department of Economic and Community Development 2,675,147 2,835,384
Department of Housing 673,343 704,412
Agricultural Experiment Station 2,064,450 2,168,189
Department of Public Health 12,433,738 13,146,488
Office of Health Strategy 1,074,537 1,129,480
Office of the Chief Medical Examiner 1,982,724 2,105,386
Department of Developmental Services 71,841,453 75,634,390
Department of Mental Health and Addiction Services 69,587,934 73,986,206
Psychiatric Security Review Board 102,090 108,092
Department of Social Services 47,513,930 50,436,191
Department of Rehabilitation Services 2,688,215 2,849,187
Department of Education 54,537,668 57,022,841
Office of Early Childhood 3,104,568 3,301,853
State Library 1,834,911 1,940,270
Office of Higher Education 530,074 553,641
University of Connecticut 71,052,571 75,357,867
University of Connecticut Health Center 44,903,922 47,799,942
ESTIMATED COSTS OF MAJOR FRINGE BENEFITS BY AGENCY
Financial Summary
A - 62
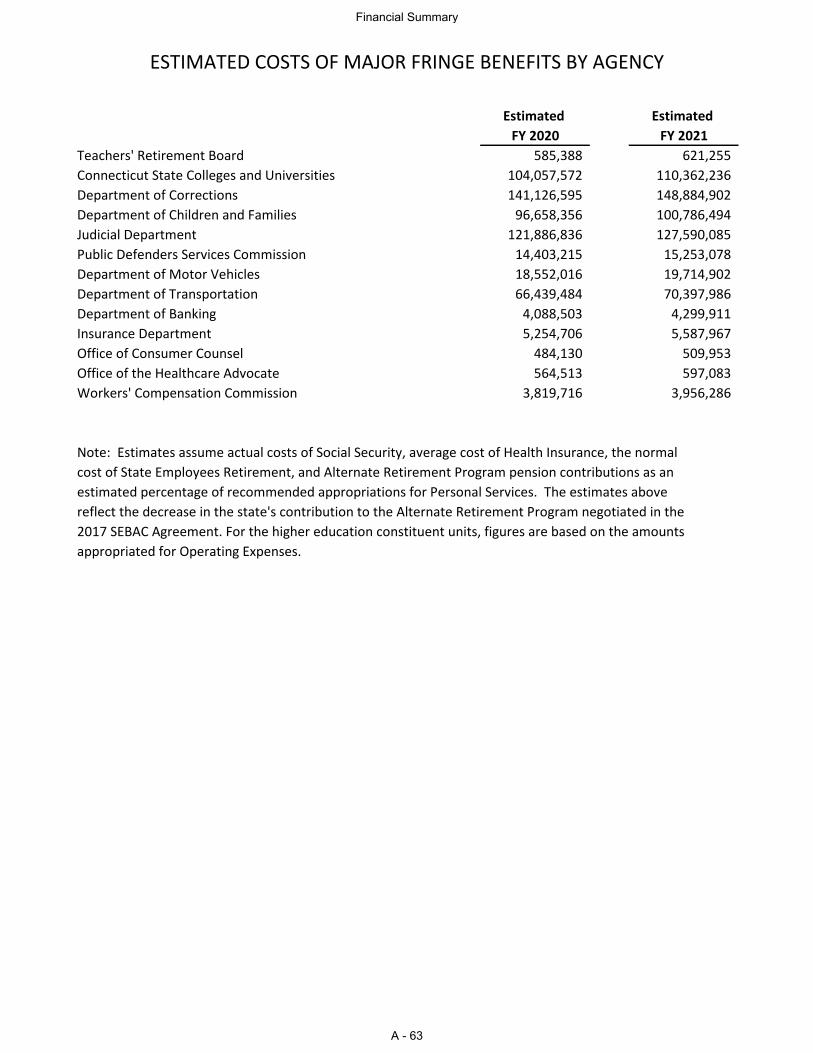
Estimated Estimated
FY 2020 FY 2021
ESTIMATED COSTS OF MAJOR FRINGE BENEFITS BY AGENCY
Teachers' Retirement Board 585,388 621,255
Connecticut State Colleges and Universities 104,057,572 110,362,236
Department of Corrections 141,126,595 148,884,902
Department of Children and Families 96,658,356 100,786,494
Judicial Department 121,886,836 127,590,085
Public Defenders Services Commission 14,403,215 15,253,078
Department of Motor Vehicles 18,552,016 19,714,902
Department of Transportation 66,439,484 70,397,986
Department of Banking 4,088,503 4,299,911
Insurance Department 5,254,706 5,587,967
Office of Consumer Counsel 484,130 509,953
Office of the Healthcare Advocate 564,513 597,083
Workers' Compensation Commission 3,819,716 3,956,286
Note: Estimates assume actual costs of Social Security, average cost of Health Insurance, the normal
cost of State Employees Retirement, and Alternate Retirement Program pension contributions as an
estimated percentage of recommended appropriations for Personal Services. The estimates above
reflect the decrease in the state's contribution to the Alternate Retirement Program negotiated in the
2017 SEBAC Agreement. For the higher education constituent units, figures are based on the amounts
appropriated for Operating Expenses.
Financial Summary
A - 63


SECTION B
BUDGET SUMMARY

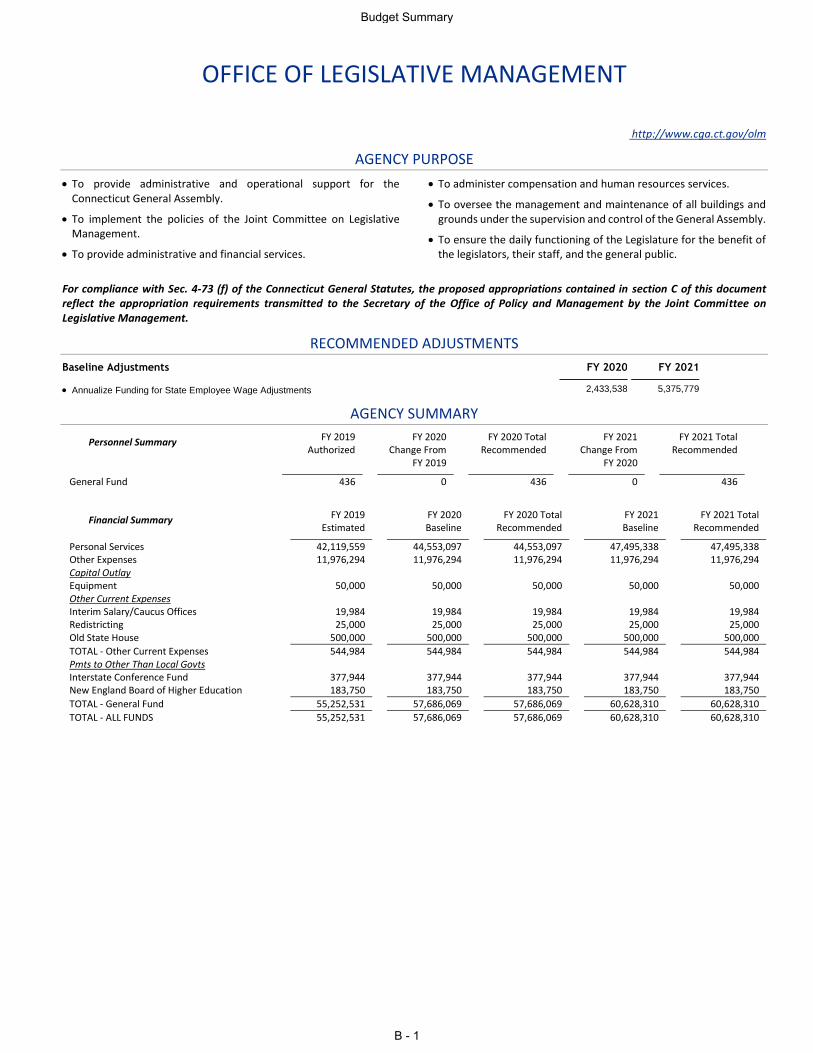
OFFICE OF LEGISLATIVE MANAGEMENT
http://www.cga.ct.gov/olm
AGENCY PURPOSE
To provide administrative and operational support for the Connecticut General Assembly.
To implement the policies of the Joint Committee on Legislative Management.
To provide administrative and financial services.
To administer compensation and human resources services.
To oversee the management and maintenance of all buildings and grounds under the supervision and control of the General Assembly.
To ensure the daily functioning of the Legislature for the benefit of the legislators, their staff, and the general public.
For compliance with Sec. 4-73 (f) of the Connecticut General Statutes, the proposed appropriations contained in section C of this document reflect the appropriation requirements transmitted to the Secretary of the Office of Policy and Management by the Joint Committee on Legislative Management.
RECOMMENDED ADJUSTMENTS
Baseline Adjustments FY 2020 FY 2021
Annualize Funding for State Employee Wage Adjustments 2,433,538 5,375,779
AGENCY SUMMARY
Personnel Summary FY 2019 Authorized
FY 2020 Change From
FY 2019
FY 2020 Total Recommended
FY 2021 Change From
FY 2020
FY 2021 Total Recommended
General Fund 436 0 436 0 436
Financial Summary FY 2019 Estimated
FY 2020 Baseline
FY 2020 Total Recommended
FY 2021 Baseline
FY 2021 Total Recommended
Personal Services 42,119,559 44,553,097 44,553,097 47,495,338 47,495,338 Other Expenses 11,976,294 11,976,294 11,976,294 11,976,294 11,976,294 Capital Outlay Equipment 50,000 50,000 50,000 50,000 50,000 Other Current Expenses Interim Salary/Caucus Offices 19,984 19,984 19,984 19,984 19,984 Redistricting 25,000 25,000 25,000 25,000 25,000 Old State House 500,000 500,000 500,000 500,000 500,000
TOTAL - Other Current Expenses 544,984 544,984 544,984 544,984 544,984 Pmts to Other Than Local Govts Interstate Conference Fund 377,944 377,944 377,944 377,944 377,944 New England Board of Higher Education 183,750 183,750 183,750 183,750 183,750
TOTAL - General Fund 55,252,531 57,686,069 57,686,069 60,628,310 60,628,310
TOTAL - ALL FUNDS 55,252,531 57,686,069 57,686,069 60,628,310 60,628,310
Budget Summary
B - 1
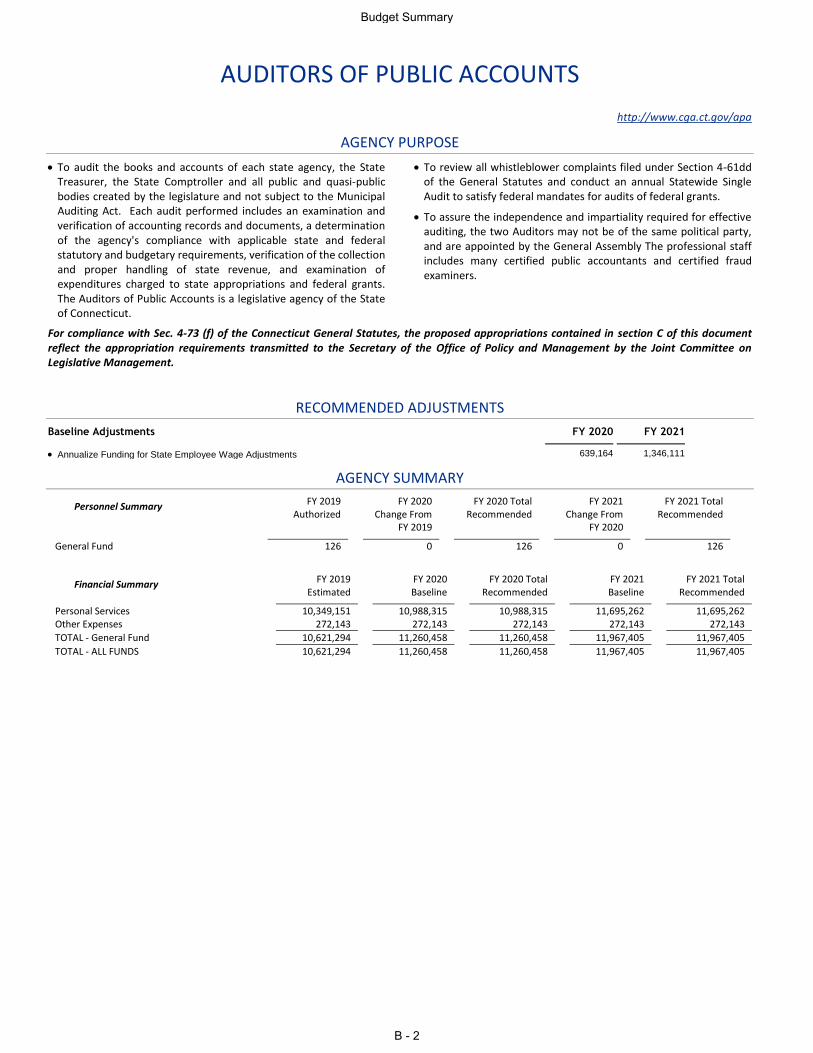
AUDITORS OF PUBLIC ACCOUNTS
http://www.cga.ct.gov/apa
AGENCY PURPOSE
To audit the books and accounts of each state agency, the State Treasurer, the State Comptroller and all public and quasi-public bodies created by the legislature and not subject to the Municipal Auditing Act. Each audit performed includes an examination and verification of accounting records and documents, a determination of the agency's compliance with applicable state and federal statutory and budgetary requirements, verification of the collection and proper handling of state revenue, and examination of expenditures charged to state appropriations and federal grants. The Auditors of Public Accounts is a legislative agency of the State of Connecticut.
To review all whistleblower complaints filed under Section 4-61dd of the General Statutes and conduct an annual Statewide Single Audit to satisfy federal mandates for audits of federal grants.
To assure the independence and impartiality required for effective auditing, the two Auditors may not be of the same political party, and are appointed by the General Assembly The professional staff includes many certified public accountants and certified fraud examiners.
For compliance with Sec. 4-73 (f) of the Connecticut General Statutes, the proposed appropriations contained in section C of this document reflect the appropriation requirements transmitted to the Secretary of the Office of Policy and Management by the Joint Committee on Legislative Management.
RECOMMENDED ADJUSTMENTS
Baseline Adjustments FY 2020 FY 2021
Annualize Funding for State Employee Wage Adjustments 639,164 1,346,111
AGENCY SUMMARY
Personnel Summary FY 2019 Authorized
FY 2020 Change From
FY 2019
FY 2020 Total Recommended
FY 2021 Change From
FY 2020
FY 2021 Total Recommended
General Fund 126 0 126 0 126
Financial Summary FY 2019 Estimated
FY 2020 Baseline
FY 2020 Total Recommended
FY 2021 Baseline
FY 2021 Total Recommended
Personal Services 10,349,151 10,988,315 10,988,315 11,695,262 11,695,262 Other Expenses 272,143 272,143 272,143 272,143 272,143
TOTAL - General Fund 10,621,294 11,260,458 11,260,458 11,967,405 11,967,405
TOTAL - ALL FUNDS 10,621,294 11,260,458 11,260,458 11,967,405 11,967,405
Budget Summary
B - 2
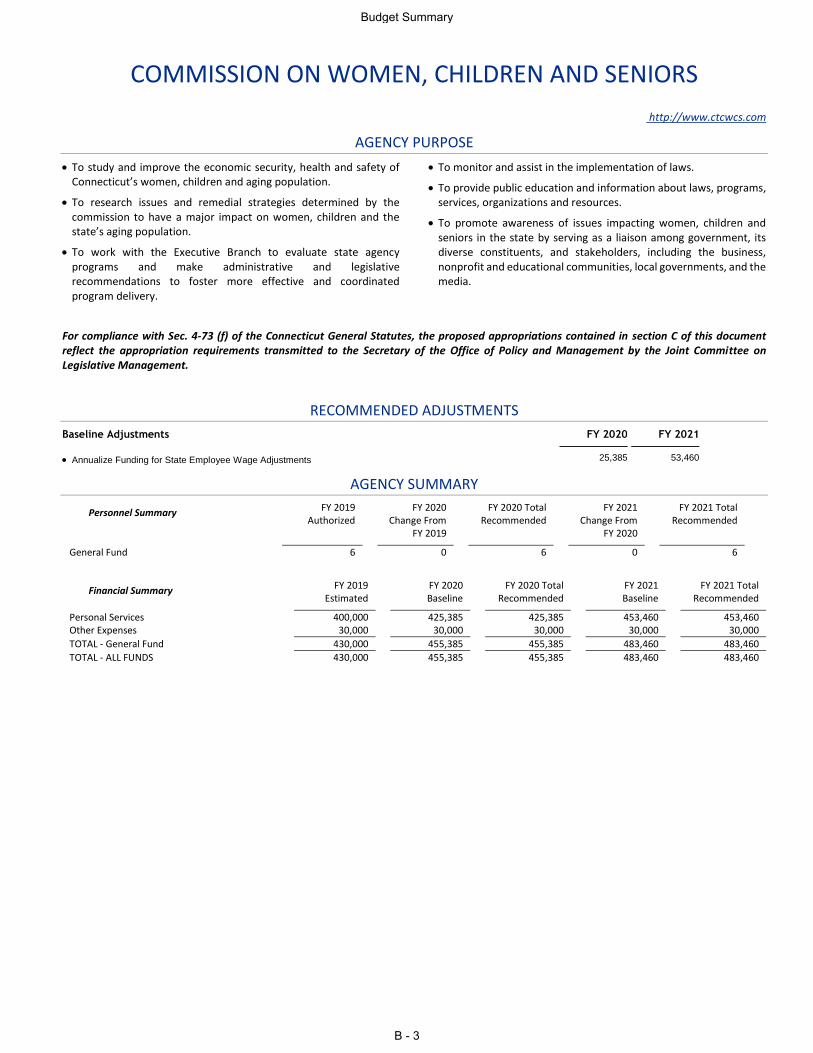
COMMISSION ON WOMEN, CHILDREN AND SENIORS
http://www.ctcwcs.com
AGENCY PURPOSE
To study and improve the economic security, health and safety of Connecticut’s women, children and aging population.
To research issues and remedial strategies determined by the commission to have a major impact on women, children and the state’s aging population.
To work with the Executive Branch to evaluate state agency programs and make administrative and legislative recommendations to foster more effective and coordinated program delivery.
To monitor and assist in the implementation of laws.
To provide public education and information about laws, programs, services, organizations and resources.
To promote awareness of issues impacting women, children and seniors in the state by serving as a liaison among government, its diverse constituents, and stakeholders, including the business, nonprofit and educational communities, local governments, and the media.
For compliance with Sec. 4-73 (f) of the Connecticut General Statutes, the proposed appropriations contained in section C of this document reflect the appropriation requirements transmitted to the Secretary of the Office of Policy and Management by the Joint Committee on Legislative Management.
RECOMMENDED ADJUSTMENTS
Baseline Adjustments FY 2020 FY 2021
Annualize Funding for State Employee Wage Adjustments 25,385 53,460
AGENCY SUMMARY
Personnel Summary FY 2019 Authorized
FY 2020 Change From
FY 2019
FY 2020 Total Recommended
FY 2021 Change From
FY 2020
FY 2021 Total Recommended
General Fund 6 0 6 0 6
Financial Summary FY 2019 Estimated
FY 2020 Baseline
FY 2020 Total Recommended
FY 2021 Baseline
FY 2021 Total Recommended
Personal Services 400,000 425,385 425,385 453,460 453,460 Other Expenses 30,000 30,000 30,000 30,000 30,000
TOTAL - General Fund 430,000 455,385 455,385 483,460 483,460
TOTAL - ALL FUNDS 430,000 455,385 455,385 483,460 483,460
Budget Summary
B - 3
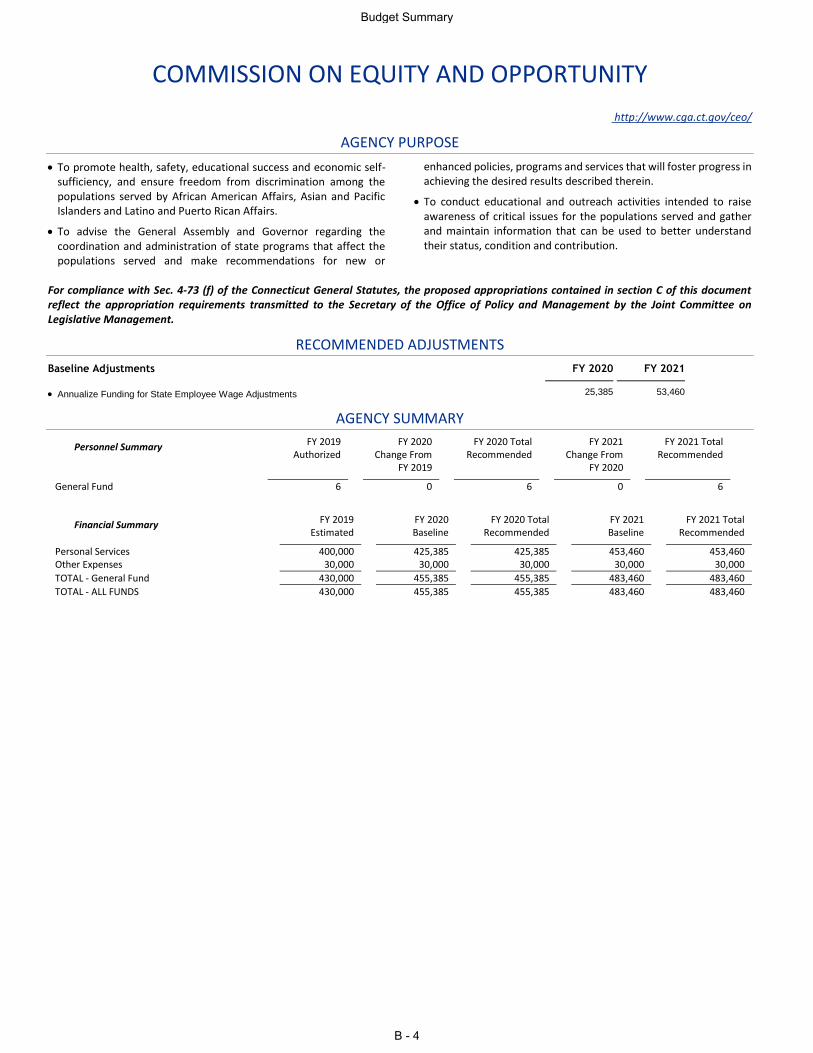
COMMISSION ON EQUITY AND OPPORTUNITY
http://www.cga.ct.gov/ceo/
AGENCY PURPOSE
To promote health, safety, educational success and economic self-sufficiency, and ensure freedom from discrimination among the populations served by African American Affairs, Asian and Pacific Islanders and Latino and Puerto Rican Affairs.
To advise the General Assembly and Governor regarding the coordination and administration of state programs that affect the populations served and make recommendations for new or
enhanced policies, programs and services that will foster progress in achieving the desired results described therein.
To conduct educational and outreach activities intended to raise awareness of critical issues for the populations served and gather and maintain information that can be used to better understand their status, condition and contribution.
For compliance with Sec. 4-73 (f) of the Connecticut General Statutes, the proposed appropriations contained in section C of this document reflect the appropriation requirements transmitted to the Secretary of the Office of Policy and Management by the Joint Committee on Legislative Management.
RECOMMENDED ADJUSTMENTS
Baseline Adjustments FY 2020 FY 2021
Annualize Funding for State Employee Wage Adjustments 25,385 53,460
AGENCY SUMMARY
Personnel Summary FY 2019 Authorized
FY 2020 Change From
FY 2019
FY 2020 Total Recommended
FY 2021 Change From
FY 2020
FY 2021 Total Recommended
General Fund 6 0 6 0 6
Financial Summary FY 2019 Estimated
FY 2020 Baseline
FY 2020 Total Recommended
FY 2021 Baseline
FY 2021 Total Recommended
Personal Services 400,000 425,385 425,385 453,460 453,460 Other Expenses 30,000 30,000 30,000 30,000 30,000
TOTAL - General Fund 430,000 455,385 455,385 483,460 483,460
TOTAL - ALL FUNDS 430,000 455,385 455,385 483,460 483,460
Budget Summary
B - 4
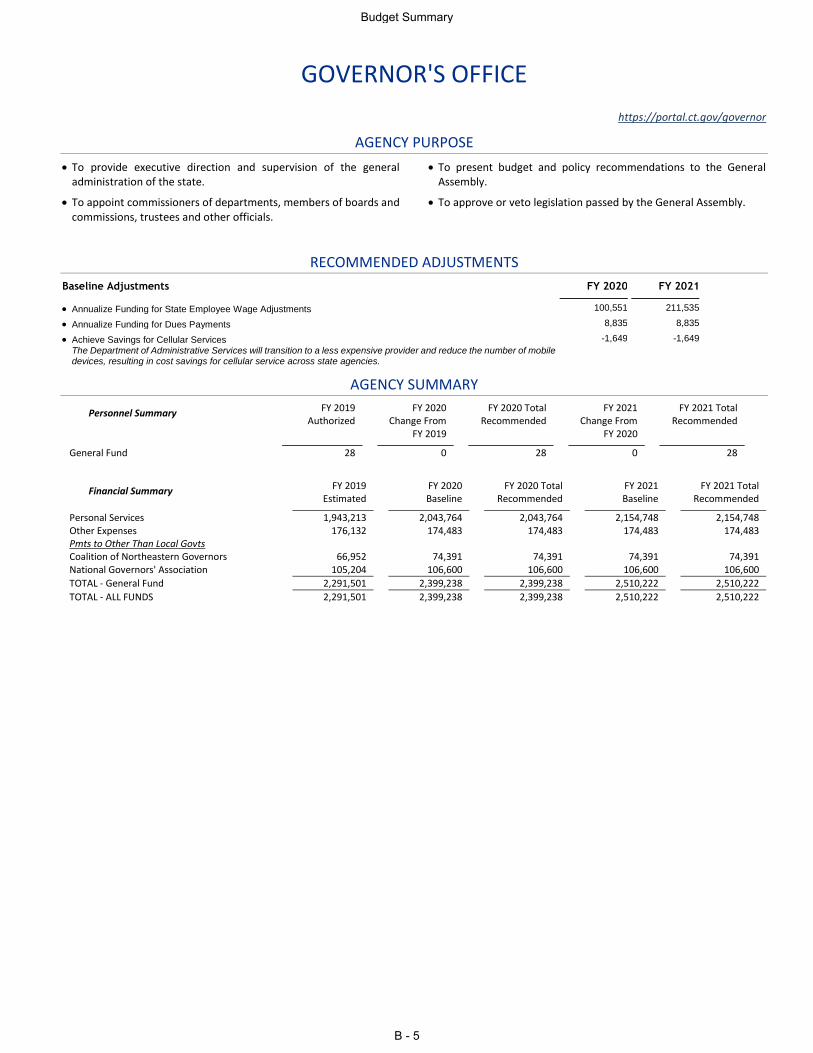
GOVERNOR'S OFFICE
https://portal.ct.gov/governor
AGENCY PURPOSE
To provide executive direction and supervision of the general administration of the state.
To appoint commissioners of departments, members of boards and commissions, trustees and other officials.
To present budget and policy recommendations to the General Assembly.
To approve or veto legislation passed by the General Assembly.
RECOMMENDED ADJUSTMENTS
Baseline Adjustments FY 2020 FY 2021
Annualize Funding for State Employee Wage Adjustments 100,551 211,535
Annualize Funding for Dues Payments 8,835 8,835
Achieve Savings for Cellular Services -1,649 -1,649 The Department of Administrative Services will transition to a less expensive provider and reduce the number of mobile devices, resulting in cost savings for cellular service across state agencies.
AGENCY SUMMARY
Personnel Summary FY 2019 Authorized
FY 2020 Change From
FY 2019
FY 2020 Total Recommended
FY 2021 Change From
FY 2020
FY 2021 Total Recommended
General Fund 28 0 28 0 28
Financial Summary FY 2019 Estimated
FY 2020 Baseline
FY 2020 Total Recommended
FY 2021 Baseline
FY 2021 Total Recommended
Personal Services 1,943,213 2,043,764 2,043,764 2,154,748 2,154,748 Other Expenses 176,132 174,483 174,483 174,483 174,483 Pmts to Other Than Local Govts Coalition of Northeastern Governors 66,952 74,391 74,391 74,391 74,391 National Governors' Association 105,204 106,600 106,600 106,600 106,600
TOTAL - General Fund 2,291,501 2,399,238 2,399,238 2,510,222 2,510,222
TOTAL - ALL FUNDS 2,291,501 2,399,238 2,399,238 2,510,222 2,510,222
Budget Summary
B - 5
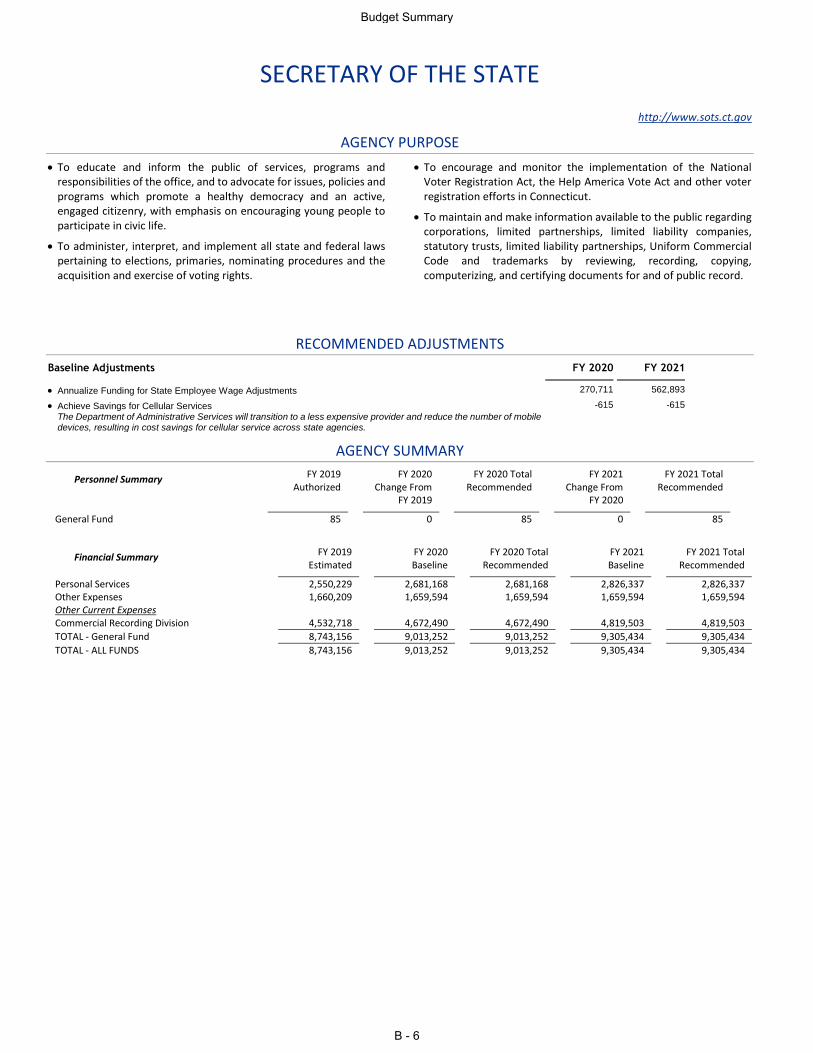
SECRETARY OF THE STATE
http://www.sots.ct.gov
AGENCY PURPOSE
To educate and inform the public of services, programs and responsibilities of the office, and to advocate for issues, policies and programs which promote a healthy democracy and an active, engaged citizenry, with emphasis on encouraging young people to participate in civic life.
To administer, interpret, and implement all state and federal laws pertaining to elections, primaries, nominating procedures and the acquisition and exercise of voting rights.
To encourage and monitor the implementation of the National Voter Registration Act, the Help America Vote Act and other voter registration efforts in Connecticut.
To maintain and make information available to the public regarding corporations, limited partnerships, limited liability companies, statutory trusts, limited liability partnerships, Uniform Commercial Code and trademarks by reviewing, recording, copying, computerizing, and certifying documents for and of public record.
RECOMMENDED ADJUSTMENTS
Baseline Adjustments FY 2020 FY 2021
Annualize Funding for State Employee Wage Adjustments 270,711 562,893
Achieve Savings for Cellular Services -615 -615 The Department of Administrative Services will transition to a less expensive provider and reduce the number of mobile devices, resulting in cost savings for cellular service across state agencies.
AGENCY SUMMARY
Personnel Summary FY 2019 Authorized
FY 2020 Change From
FY 2019
FY 2020 Total Recommended
FY 2021 Change From
FY 2020
FY 2021 Total Recommended
General Fund 85 0 85 0 85
Financial Summary FY 2019 Estimated
FY 2020 Baseline
FY 2020 Total Recommended
FY 2021 Baseline
FY 2021 Total Recommended
Personal Services 2,550,229 2,681,168 2,681,168 2,826,337 2,826,337 Other Expenses 1,660,209 1,659,594 1,659,594 1,659,594 1,659,594 Other Current Expenses Commercial Recording Division 4,532,718 4,672,490 4,672,490 4,819,503 4,819,503
TOTAL - General Fund 8,743,156 9,013,252 9,013,252 9,305,434 9,305,434
TOTAL - ALL FUNDS 8,743,156 9,013,252 9,013,252 9,305,434 9,305,434
Budget Summary
B - 6
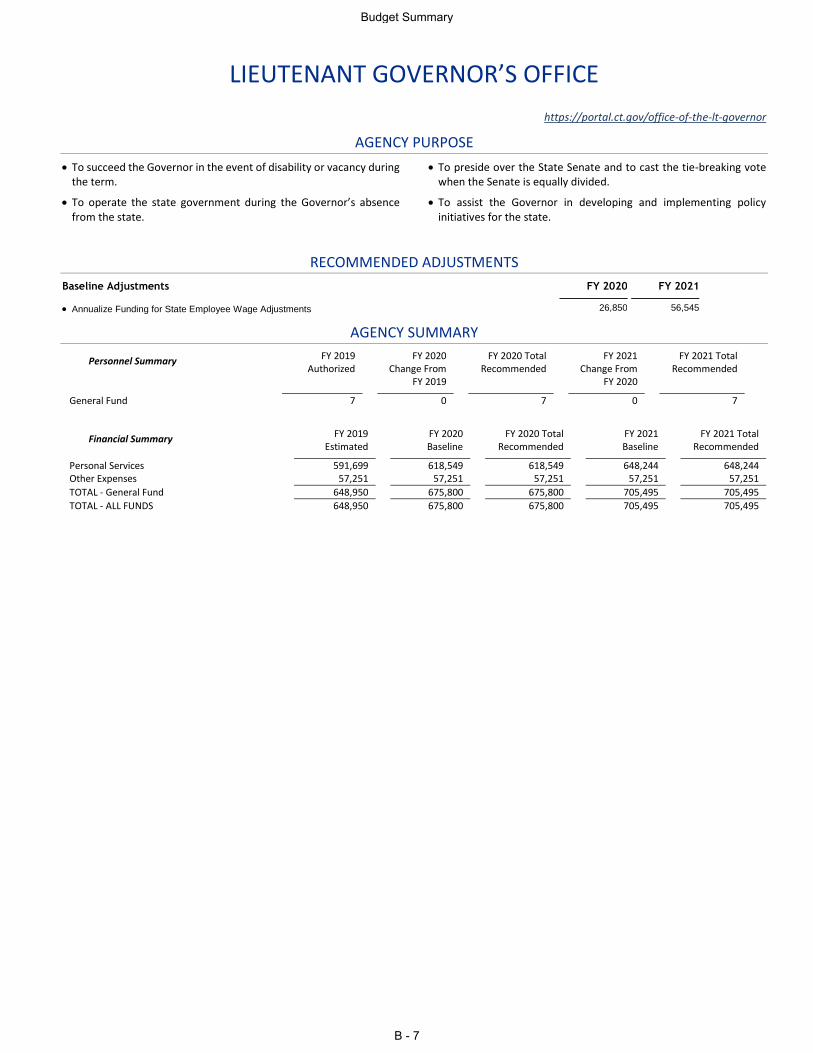
LIEUTENANT GOVERNOR’S OFFICE
https://portal.ct.gov/office-of-the-lt-governor
AGENCY PURPOSE
To succeed the Governor in the event of disability or vacancy during the term.
To operate the state government during the Governor’s absence from the state.
To preside over the State Senate and to cast the tie-breaking vote when the Senate is equally divided.
To assist the Governor in developing and implementing policy initiatives for the state.
RECOMMENDED ADJUSTMENTS
Baseline Adjustments FY 2020 FY 2021
Annualize Funding for State Employee Wage Adjustments 26,850 56,545
AGENCY SUMMARY
Personnel Summary FY 2019 Authorized
FY 2020 Change From
FY 2019
FY 2020 Total Recommended
FY 2021 Change From
FY 2020
FY 2021 Total Recommended
General Fund 7 0 7 0 7
Financial Summary FY 2019 Estimated
FY 2020 Baseline
FY 2020 Total Recommended
FY 2021 Baseline
FY 2021 Total Recommended
Personal Services 591,699 618,549 618,549 648,244 648,244 Other Expenses 57,251 57,251 57,251 57,251 57,251
TOTAL - General Fund 648,950 675,800 675,800 705,495 705,495
TOTAL - ALL FUNDS 648,950 675,800 675,800 705,495 705,495
Budget Summary
B - 7
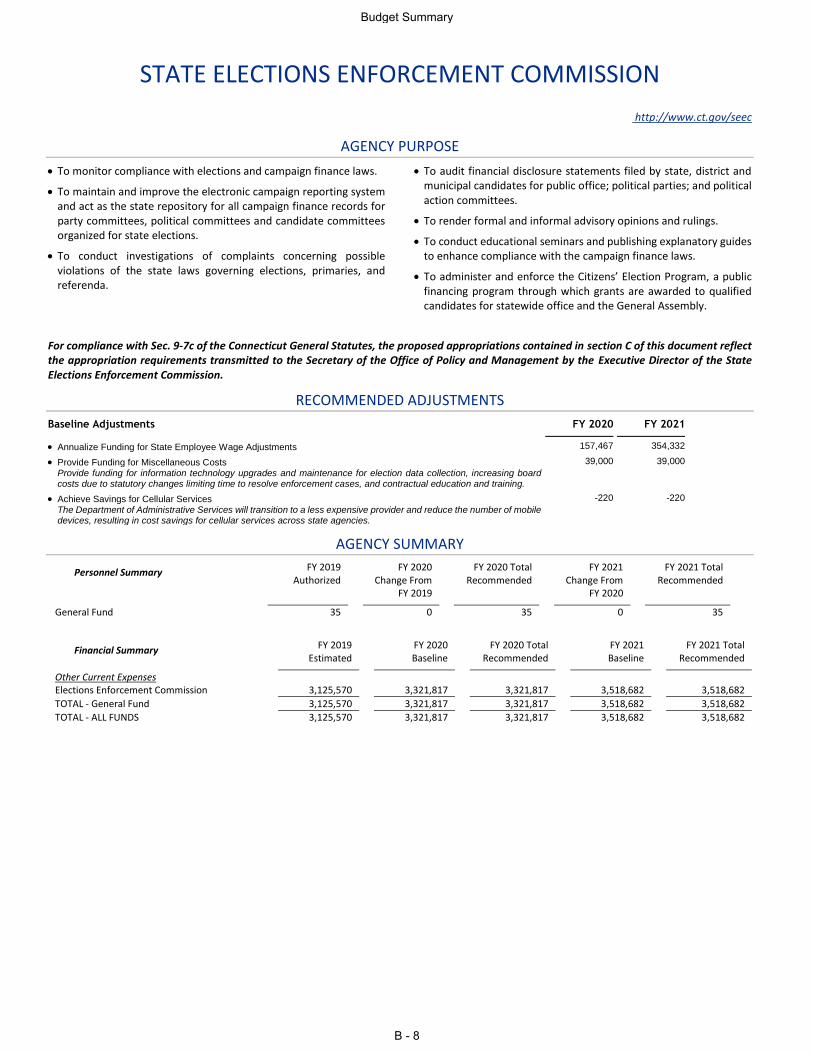
STATE ELECTIONS ENFORCEMENT COMMISSION
http://www.ct.gov/seec
AGENCY PURPOSE
To monitor compliance with elections and campaign finance laws.
To maintain and improve the electronic campaign reporting system and act as the state repository for all campaign finance records for party committees, political committees and candidate committees organized for state elections.
To conduct investigations of complaints concerning possible violations of the state laws governing elections, primaries, and referenda.
To audit financial disclosure statements filed by state, district and municipal candidates for public office; political parties; and political action committees.
To render formal and informal advisory opinions and rulings.
To conduct educational seminars and publishing explanatory guides to enhance compliance with the campaign finance laws.
To administer and enforce the Citizens’ Election Program, a public financing program through which grants are awarded to qualified candidates for statewide office and the General Assembly.
For compliance with Sec. 9-7c of the Connecticut General Statutes, the proposed appropriations contained in section C of this document reflect the appropriation requirements transmitted to the Secretary of the Office of Policy and Management by the Executive Director of the State Elections Enforcement Commission.
RECOMMENDED ADJUSTMENTS
Baseline Adjustments FY 2020 FY 2021
Annualize Funding for State Employee Wage Adjustments 157,467 354,332
Provide Funding for Miscellaneous Costs 39,000 39,000 Provide funding for information technology upgrades and maintenance for election data collection, increasing board costs due to statutory changes limiting time to resolve enforcement cases, and contractual education and training.
Achieve Savings for Cellular Services -220 -220 The Department of Administrative Services will transition to a less expensive provider and reduce the number of mobile devices, resulting in cost savings for cellular services across state agencies.
AGENCY SUMMARY
Personnel Summary FY 2019 Authorized
FY 2020 Change From
FY 2019
FY 2020 Total Recommended
FY 2021 Change From
FY 2020
FY 2021 Total Recommended
General Fund 35 0 35 0 35
Financial Summary FY 2019 Estimated
FY 2020 Baseline
FY 2020 Total Recommended
FY 2021 Baseline
FY 2021 Total Recommended
Other Current Expenses Elections Enforcement Commission 3,125,570 3,321,817 3,321,817 3,518,682 3,518,682
TOTAL - General Fund 3,125,570 3,321,817 3,321,817 3,518,682 3,518,682
TOTAL - ALL FUNDS 3,125,570 3,321,817 3,321,817 3,518,682 3,518,682
Budget Summary
B - 8
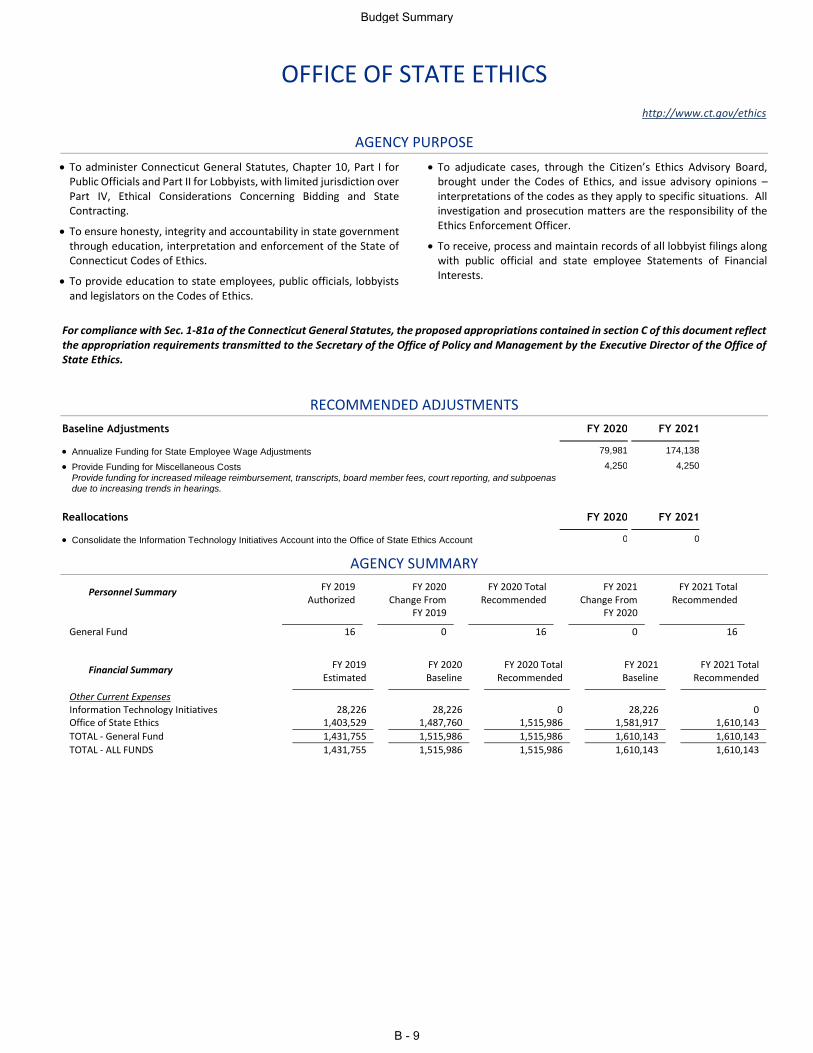
OFFICE OF STATE ETHICS
http://www.ct.gov/ethics
AGENCY PURPOSE
To administer Connecticut General Statutes, Chapter 10, Part I for Public Officials and Part II for Lobbyists, with limited jurisdiction over Part IV, Ethical Considerations Concerning Bidding and State Contracting.
To ensure honesty, integrity and accountability in state government through education, interpretation and enforcement of the State of Connecticut Codes of Ethics.
To provide education to state employees, public officials, lobbyists and legislators on the Codes of Ethics.
To adjudicate cases, through the Citizen’s Ethics Advisory Board, brought under the Codes of Ethics, and issue advisory opinions – interpretations of the codes as they apply to specific situations. All investigation and prosecution matters are the responsibility of the Ethics Enforcement Officer.
To receive, process and maintain records of all lobbyist filings along with public official and state employee Statements of Financial Interests.
For compliance with Sec. 1-81a of the Connecticut General Statutes, the proposed appropriations contained in section C of this document reflect the appropriation requirements transmitted to the Secretary of the Office of Policy and Management by the Executive Director of the Office of State Ethics.
RECOMMENDED ADJUSTMENTS
Baseline Adjustments FY 2020 FY 2021
Annualize Funding for State Employee Wage Adjustments 79,981 174,138
Provide Funding for Miscellaneous Costs 4,250 4,250 Provide funding for increased mileage reimbursement, transcripts, board member fees, court reporting, and subpoenas due to increasing trends in hearings.
Reallocations FY 2020 FY 2021
Consolidate the Information Technology Initiatives Account into the Office of State Ethics Account 0 0
AGENCY SUMMARY
Personnel Summary FY 2019 Authorized
FY 2020 Change From
FY 2019
FY 2020 Total Recommended
FY 2021 Change From
FY 2020
FY 2021 Total Recommended
General Fund 16 0 16 0 16
Financial Summary FY 2019 Estimated
FY 2020 Baseline
FY 2020 Total Recommended
FY 2021 Baseline
FY 2021 Total Recommended
Other Current Expenses Information Technology Initiatives 28,226 28,226 0 28,226 0 Office of State Ethics 1,403,529 1,487,760 1,515,986 1,581,917 1,610,143
TOTAL - General Fund 1,431,755 1,515,986 1,515,986 1,610,143 1,610,143
TOTAL - ALL FUNDS 1,431,755 1,515,986 1,515,986 1,610,143 1,610,143
Budget Summary
B - 9
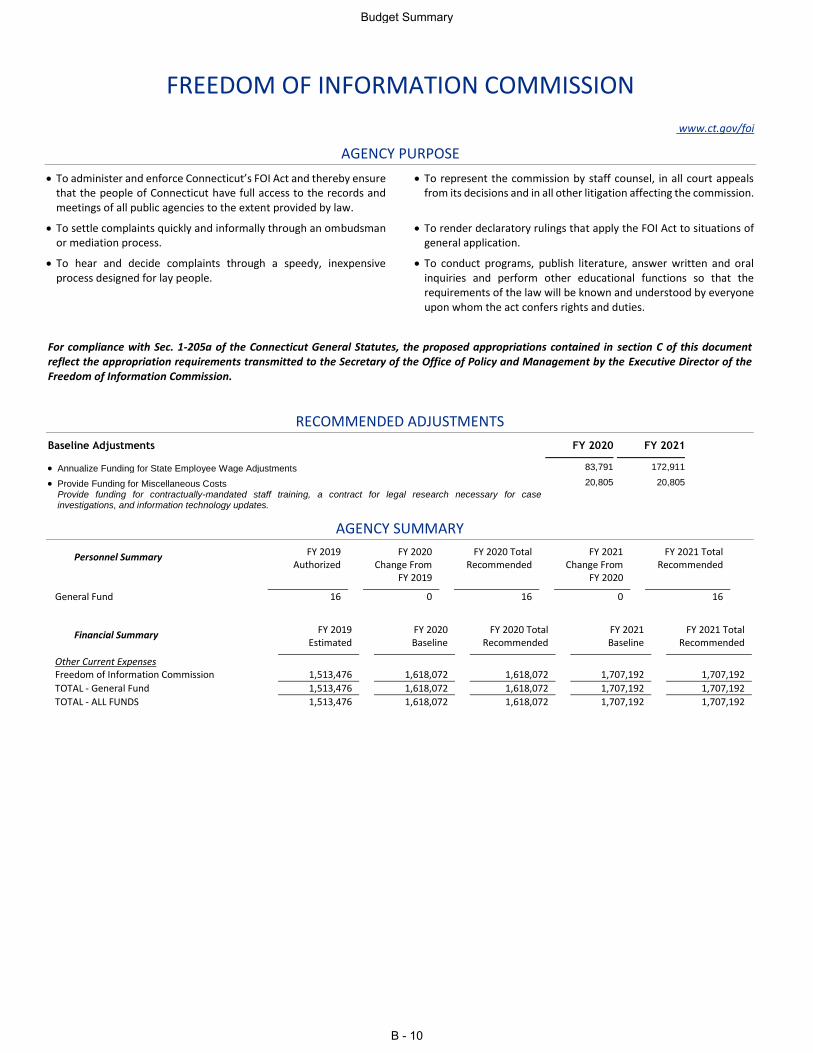
FREEDOM OF INFORMATION COMMISSION
www.ct.gov/foi
AGENCY PURPOSE
To administer and enforce Connecticut’s FOI Act and thereby ensure that the people of Connecticut have full access to the records and meetings of all public agencies to the extent provided by law.
To settle complaints quickly and informally through an ombudsman or mediation process.
To hear and decide complaints through a speedy, inexpensive process designed for lay people.
To represent the commission by staff counsel, in all court appeals from its decisions and in all other litigation affecting the commission.
To render declaratory rulings that apply the FOI Act to situations of general application.
To conduct programs, publish literature, answer written and oral inquiries and perform other educational functions so that the requirements of the law will be known and understood by everyone upon whom the act confers rights and duties.
For compliance with Sec. 1-205a of the Connecticut General Statutes, the proposed appropriations contained in section C of this document reflect the appropriation requirements transmitted to the Secretary of the Office of Policy and Management by the Executive Director of the Freedom of Information Commission.
RECOMMENDED ADJUSTMENTS
Baseline Adjustments FY 2020 FY 2021
Annualize Funding for State Employee Wage Adjustments 83,791 172,911
Provide Funding for Miscellaneous Costs 20,805 20,805 Provide funding for contractually-mandated staff training, a contract for legal research necessary for case investigations, and information technology updates.
AGENCY SUMMARY
Personnel Summary FY 2019 Authorized
FY 2020 Change From
FY 2019
FY 2020 Total Recommended
FY 2021 Change From
FY 2020
FY 2021 Total Recommended
General Fund 16 0 16 0 16
Financial Summary FY 2019 Estimated
FY 2020 Baseline
FY 2020 Total Recommended
FY 2021 Baseline
FY 2021 Total Recommended
Other Current Expenses Freedom of Information Commission 1,513,476 1,618,072 1,618,072 1,707,192 1,707,192
TOTAL - General Fund 1,513,476 1,618,072 1,618,072 1,707,192 1,707,192
TOTAL - ALL FUNDS 1,513,476 1,618,072 1,618,072 1,707,192 1,707,192
Budget Summary
B - 10
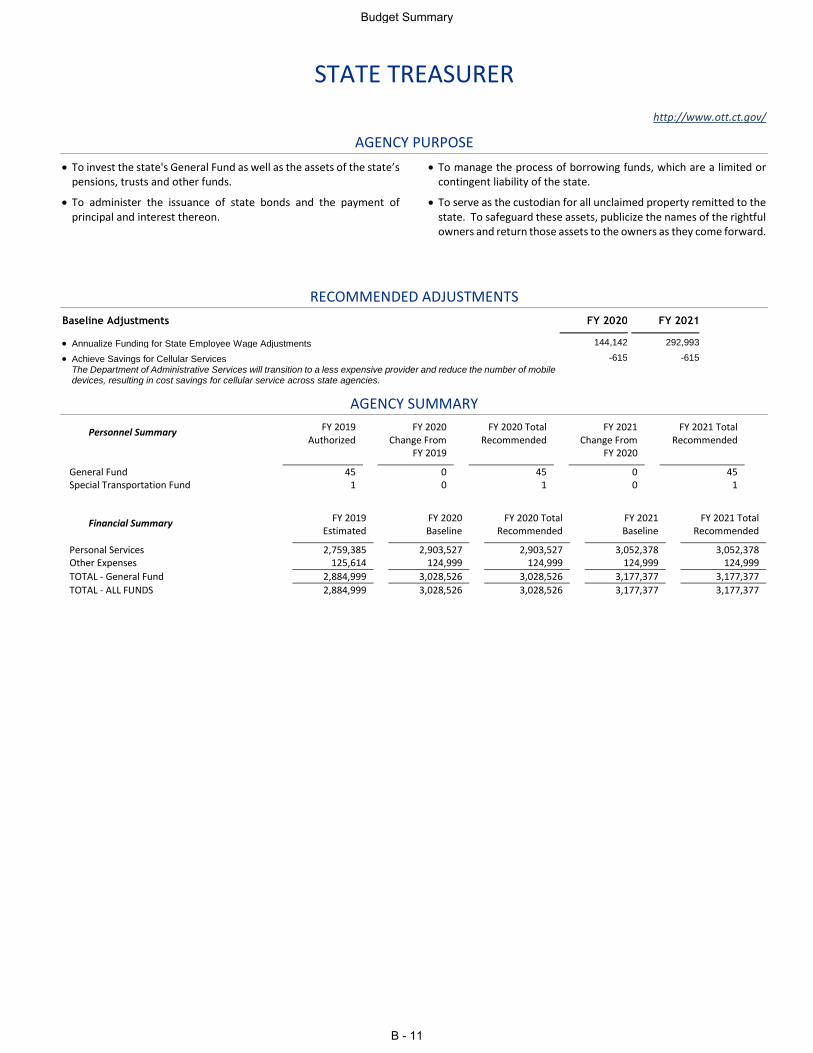
STATE TREASURER
http://www.ott.ct.gov/
AGENCY PURPOSE
To invest the state's General Fund as well as the assets of the state’s pensions, trusts and other funds.
To administer the issuance of state bonds and the payment of principal and interest thereon.
To manage the process of borrowing funds, which are a limited or contingent liability of the state.
To serve as the custodian for all unclaimed property remitted to the state. To safeguard these assets, publicize the names of the rightful owners and return those assets to the owners as they come forward.
RECOMMENDED ADJUSTMENTS
Baseline Adjustments FY 2020 FY 2021
Annualize Funding for State Employee Wage Adjustments 144,142 292,993
Achieve Savings for Cellular Services -615 -615 The Department of Administrative Services will transition to a less expensive provider and reduce the number of mobile devices, resulting in cost savings for cellular service across state agencies.
AGENCY SUMMARY
Personnel Summary FY 2019 Authorized
FY 2020 Change From
FY 2019
FY 2020 Total Recommended
FY 2021 Change From
FY 2020
FY 2021 Total Recommended
General Fund 45 0 45 0 45 Special Transportation Fund 1 0 1 0 1
Financial Summary FY 2019 Estimated
FY 2020 Baseline
FY 2020 Total Recommended
FY 2021 Baseline
FY 2021 Total Recommended
Personal Services 2,759,385 2,903,527 2,903,527 3,052,378 3,052,378 Other Expenses 125,614 124,999 124,999 124,999 124,999
TOTAL - General Fund 2,884,999 3,028,526 3,028,526 3,177,377 3,177,377
TOTAL - ALL FUNDS 2,884,999 3,028,526 3,028,526 3,177,377 3,177,377
Budget Summary
B - 11
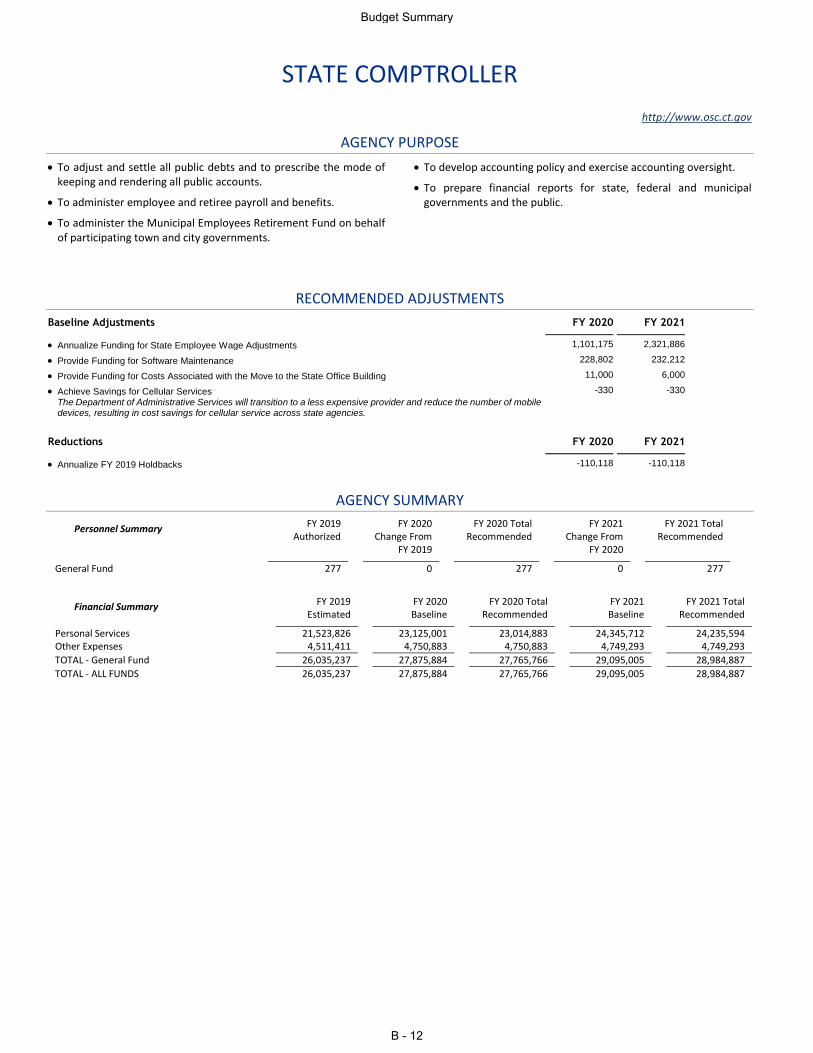
STATE COMPTROLLER
http://www.osc.ct.gov
AGENCY PURPOSE
To adjust and settle all public debts and to prescribe the mode of keeping and rendering all public accounts.
To administer employee and retiree payroll and benefits.
To administer the Municipal Employees Retirement Fund on behalf of participating town and city governments.
To develop accounting policy and exercise accounting oversight.
To prepare financial reports for state, federal and municipal governments and the public.
RECOMMENDED ADJUSTMENTS
Baseline Adjustments FY 2020 FY 2021
Annualize Funding for State Employee Wage Adjustments 1,101,175 2,321,886
Provide Funding for Software Maintenance 228,802 232,212
Provide Funding for Costs Associated with the Move to the State Office Building 11,000 6,000
Achieve Savings for Cellular Services -330 -330 The Department of Administrative Services will transition to a less expensive provider and reduce the number of mobile devices, resulting in cost savings for cellular service across state agencies.
Reductions FY 2020 FY 2021
Annualize FY 2019 Holdbacks -110,118 -110,118
AGENCY SUMMARY
Personnel Summary FY 2019 Authorized
FY 2020 Change From
FY 2019
FY 2020 Total Recommended
FY 2021 Change From
FY 2020
FY 2021 Total Recommended
General Fund 277 0 277 0 277
Financial Summary FY 2019 Estimated
FY 2020 Baseline
FY 2020 Total Recommended
FY 2021 Baseline
FY 2021 Total Recommended
Personal Services 21,523,826 23,125,001 23,014,883 24,345,712 24,235,594 Other Expenses 4,511,411 4,750,883 4,750,883 4,749,293 4,749,293
TOTAL - General Fund 26,035,237 27,875,884 27,765,766 29,095,005 28,984,887
TOTAL - ALL FUNDS 26,035,237 27,875,884 27,765,766 29,095,005 28,984,887
Budget Summary
B - 12
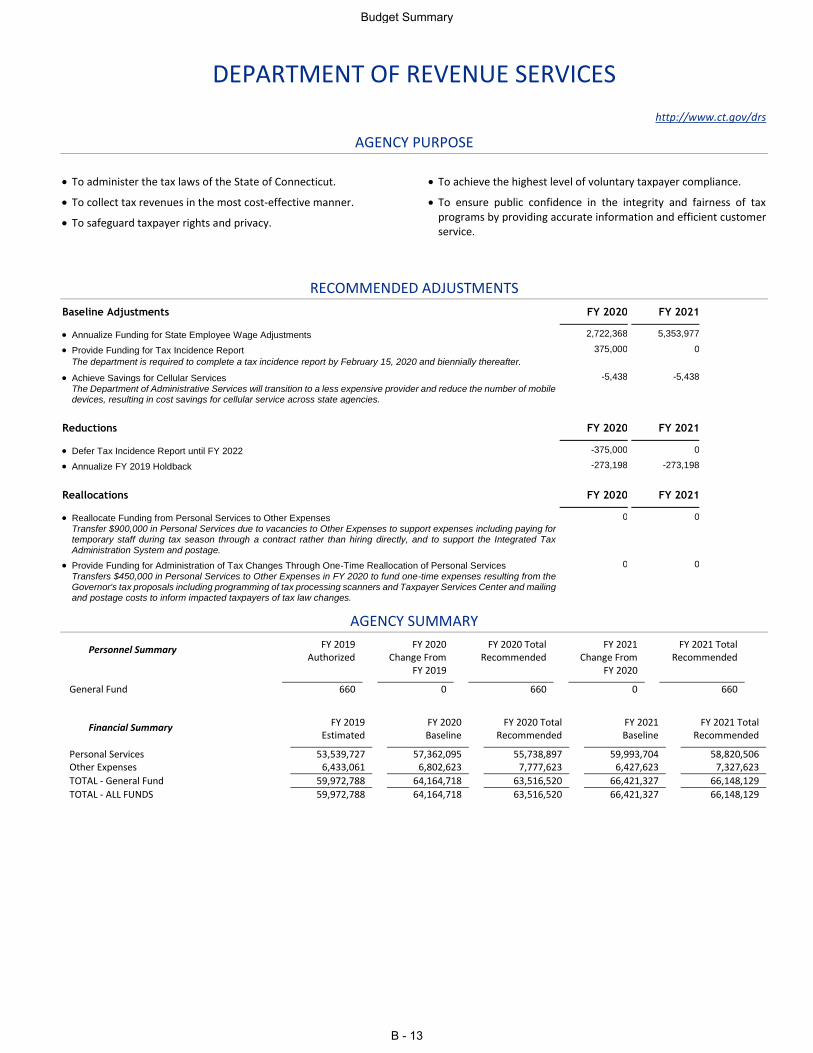
DEPARTMENT OF REVENUE SERVICES
http://www.ct.gov/drs
AGENCY PURPOSE
To administer the tax laws of the State of Connecticut.
To collect tax revenues in the most cost-effective manner.
To safeguard taxpayer rights and privacy.
To achieve the highest level of voluntary taxpayer compliance.
To ensure public confidence in the integrity and fairness of tax programs by providing accurate information and efficient customer service.
RECOMMENDED ADJUSTMENTS
Baseline Adjustments FY 2020 FY 2021
Annualize Funding for State Employee Wage Adjustments 2,722,368 5,353,977
Provide Funding for Tax Incidence Report 375,000 0
The department is required to complete a tax incidence report by February 15, 2020 and biennially thereafter.
Achieve Savings for Cellular Services -5,438 -5,438 The Department of Administrative Services will transition to a less expensive provider and reduce the number of mobile devices, resulting in cost savings for cellular service across state agencies.
Reductions FY 2020 FY 2021
Defer Tax Incidence Report until FY 2022 -375,000 0
Annualize FY 2019 Holdback -273,198 -273,198
Reallocations FY 2020 FY 2021
Reallocate Funding from Personal Services to Other Expenses 0 0 Transfer $900,000 in Personal Services due to vacancies to Other Expenses to support expenses including paying for temporary staff during tax season through a contract rather than hiring directly, and to support the Integrated Tax Administration System and postage.
Provide Funding for Administration of Tax Changes Through One-Time Reallocation of Personal Services 0 0 Transfers $450,000 in Personal Services to Other Expenses in FY 2020 to fund one-time expenses resulting from the Governor's tax proposals including programming of tax processing scanners and Taxpayer Services Center and mailing and postage costs to inform impacted taxpayers of tax law changes.
AGENCY SUMMARY
Personnel Summary FY 2019 Authorized
FY 2020 Change From
FY 2019
FY 2020 Total Recommended
FY 2021 Change From
FY 2020
FY 2021 Total Recommended
General Fund 660 0 660 0 660
Financial Summary FY 2019 Estimated
FY 2020 Baseline
FY 2020 Total Recommended
FY 2021 Baseline
FY 2021 Total Recommended
Personal Services 53,539,727 57,362,095 55,738,897 59,993,704 58,820,506 Other Expenses 6,433,061 6,802,623 7,777,623 6,427,623 7,327,623
TOTAL - General Fund 59,972,788 64,164,718 63,516,520 66,421,327 66,148,129
TOTAL - ALL FUNDS 59,972,788 64,164,718 63,516,520 66,421,327 66,148,129
Budget Summary
B - 13
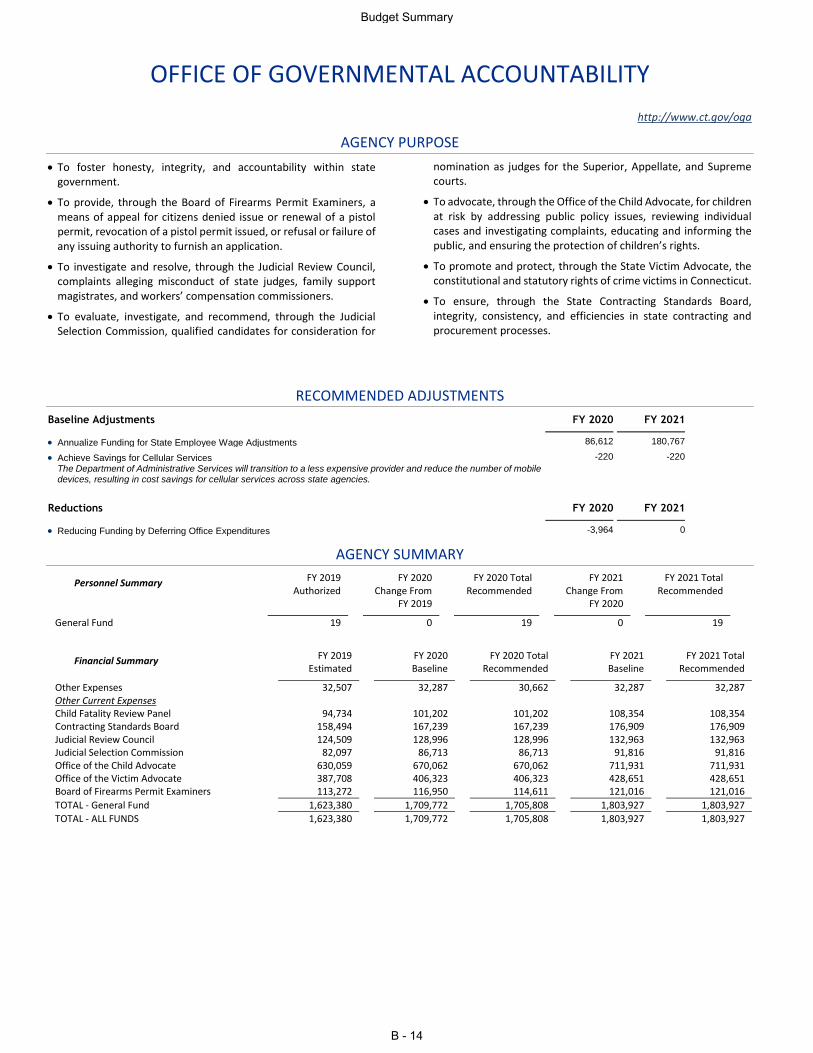
OFFICE OF GOVERNMENTAL ACCOUNTABILITY
http://www.ct.gov/oga
AGENCY PURPOSE
To foster honesty, integrity, and accountability within state government.
To provide, through the Board of Firearms Permit Examiners, a means of appeal for citizens denied issue or renewal of a pistol permit, revocation of a pistol permit issued, or refusal or failure of any issuing authority to furnish an application.
To investigate and resolve, through the Judicial Review Council, complaints alleging misconduct of state judges, family support magistrates, and workers’ compensation commissioners.
To evaluate, investigate, and recommend, through the Judicial Selection Commission, qualified candidates for consideration for
nomination as judges for the Superior, Appellate, and Supreme courts.
To advocate, through the Office of the Child Advocate, for children at risk by addressing public policy issues, reviewing individual cases and investigating complaints, educating and informing the public, and ensuring the protection of children’s rights.
To promote and protect, through the State Victim Advocate, the constitutional and statutory rights of crime victims in Connecticut.
To ensure, through the State Contracting Standards Board, integrity, consistency, and efficiencies in state contracting and procurement processes.
RECOMMENDED ADJUSTMENTS
Baseline Adjustments FY 2020 FY 2021
Annualize Funding for State Employee Wage Adjustments 86,612 180,767
Achieve Savings for Cellular Services -220 -220 The Department of Administrative Services will transition to a less expensive provider and reduce the number of mobile devices, resulting in cost savings for cellular services across state agencies.
Reductions FY 2020 FY 2021
Reducing Funding by Deferring Office Expenditures -3,964 0
AGENCY SUMMARY
Personnel Summary FY 2019 Authorized
FY 2020 Change From
FY 2019
FY 2020 Total Recommended
FY 2021 Change From
FY 2020
FY 2021 Total Recommended
General Fund 19 0 19 0 19
Financial Summary FY 2019 Estimated
FY 2020 Baseline
FY 2020 Total Recommended
FY 2021 Baseline
FY 2021 Total Recommended
Other Expenses 32,507 32,287 30,662 32,287 32,287 Other Current Expenses Child Fatality Review Panel 94,734 101,202 101,202 108,354 108,354 Contracting Standards Board 158,494 167,239 167,239 176,909 176,909 Judicial Review Council 124,509 128,996 128,996 132,963 132,963 Judicial Selection Commission 82,097 86,713 86,713 91,816 91,816 Office of the Child Advocate 630,059 670,062 670,062 711,931 711,931 Office of the Victim Advocate 387,708 406,323 406,323 428,651 428,651 Board of Firearms Permit Examiners 113,272 116,950 114,611 121,016 121,016
TOTAL - General Fund 1,623,380 1,709,772 1,705,808 1,803,927 1,803,927
TOTAL - ALL FUNDS 1,623,380 1,709,772 1,705,808 1,803,927 1,803,927
Budget Summary
B - 14
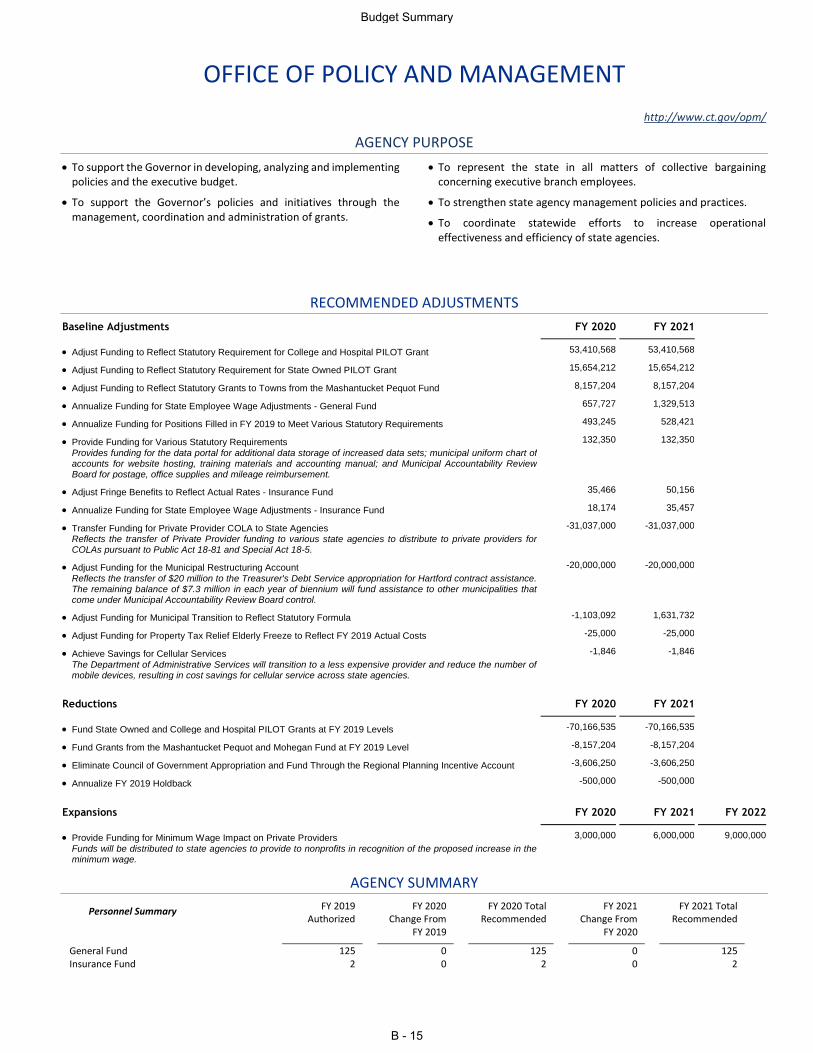
OFFICE OF POLICY AND MANAGEMENT
http://www.ct.gov/opm/
AGENCY PURPOSE
To support the Governor in developing, analyzing and implementing policies and the executive budget.
To support the Governor’s policies and initiatives through the management, coordination and administration of grants.
To represent the state in all matters of collective bargaining concerning executive branch employees.
To strengthen state agency management policies and practices.
To coordinate statewide efforts to increase operational effectiveness and efficiency of state agencies.
RECOMMENDED ADJUSTMENTS
Baseline Adjustments FY 2020 FY 2021
Adjust Funding to Reflect Statutory Requirement for College and Hospital PILOT Grant 53,410,568 53,410,568
Adjust Funding to Reflect Statutory Requirement for State Owned PILOT Grant 15,654,212 15,654,212
Adjust Funding to Reflect Statutory Grants to Towns from the Mashantucket Pequot Fund 8,157,204 8,157,204
Annualize Funding for State Employee Wage Adjustments - General Fund 657,727 1,329,513
Annualize Funding for Positions Filled in FY 2019 to Meet Various Statutory Requirements 493,245 528,421
Provide Funding for Various Statutory Requirements 132,350 132,350
Provides funding for the data portal for additional data storage of increased data sets; municipal uniform chart of accounts for website hosting, training materials and accounting manual; and Municipal Accountability Review Board for postage, office supplies and mileage reimbursement.
Adjust Fringe Benefits to Reflect Actual Rates - Insurance Fund 35,466 50,156
Annualize Funding for State Employee Wage Adjustments - Insurance Fund 18,174 35,457
Transfer Funding for Private Provider COLA to State Agencies -31,037,000 -31,037,000
Reflects the transfer of Private Provider funding to various state agencies to distribute to private providers for COLAs pursuant to Public Act 18-81 and Special Act 18-5.
Adjust Funding for the Municipal Restructuring Account -20,000,000 -20,000,000
Reflects the transfer of $20 million to the Treasurer's Debt Service appropriation for Hartford contract assistance. The remaining balance of $7.3 million in each year of biennium will fund assistance to other municipalities that come under Municipal Accountability Review Board control.
Adjust Funding for Municipal Transition to Reflect Statutory Formula -1,103,092 1,631,732
Adjust Funding for Property Tax Relief Elderly Freeze to Reflect FY 2019 Actual Costs -25,000 -25,000
Achieve Savings for Cellular Services -1,846 -1,846
The Department of Administrative Services will transition to a less expensive provider and reduce the number of mobile devices, resulting in cost savings for cellular service across state agencies.
Reductions FY 2020 FY 2021
Fund State Owned and College and Hospital PILOT Grants at FY 2019 Levels -70,166,535 -70,166,535
Fund Grants from the Mashantucket Pequot and Mohegan Fund at FY 2019 Level -8,157,204 -8,157,204
Eliminate Council of Government Appropriation and Fund Through the Regional Planning Incentive Account -3,606,250 -3,606,250
Annualize FY 2019 Holdback -500,000 -500,000
Expansions FY 2020 FY 2021 FY 2022
Provide Funding for Minimum Wage Impact on Private Providers 3,000,000 6,000,000 9,000,000
Funds will be distributed to state agencies to provide to nonprofits in recognition of the proposed increase in the minimum wage.
AGENCY SUMMARY
Personnel Summary FY 2019 Authorized
FY 2020 Change From
FY 2019
FY 2020 Total Recommended
FY 2021 Change From
FY 2020
FY 2021 Total Recommended
General Fund 125 0 125 0 125 Insurance Fund 2 0 2 0 2
Budget Summary
B - 15
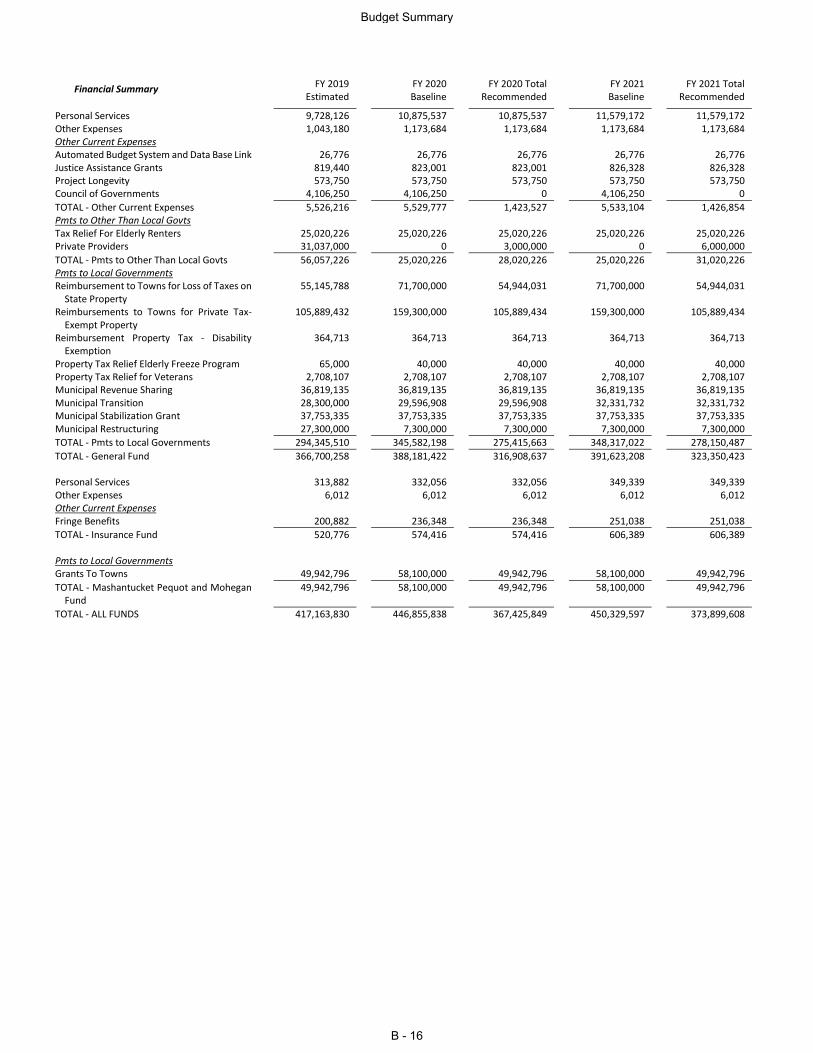
Financial Summary FY 2019 Estimated
FY 2020 Baseline
FY 2020 Total Recommended
FY 2021 Baseline
FY 2021 Total Recommended
Personal Services 9,728,126 10,875,537 10,875,537 11,579,172 11,579,172 Other Expenses 1,043,180 1,173,684 1,173,684 1,173,684 1,173,684 Other Current Expenses Automated Budget System and Data Base Link 26,776 26,776 26,776 26,776 26,776 Justice Assistance Grants 819,440 823,001 823,001 826,328 826,328 Project Longevity 573,750 573,750 573,750 573,750 573,750 Council of Governments 4,106,250 4,106,250 0 4,106,250 0
TOTAL - Other Current Expenses 5,526,216 5,529,777 1,423,527 5,533,104 1,426,854 Pmts to Other Than Local Govts Tax Relief For Elderly Renters 25,020,226 25,020,226 25,020,226 25,020,226 25,020,226 Private Providers 31,037,000 0 3,000,000 0 6,000,000
TOTAL - Pmts to Other Than Local Govts 56,057,226 25,020,226 28,020,226 25,020,226 31,020,226 Pmts to Local Governments Reimbursement to Towns for Loss of Taxes on
State Property 55,145,788 71,700,000 54,944,031 71,700,000 54,944,031
Reimbursements to Towns for Private Tax-Exempt Property
105,889,432 159,300,000 105,889,434 159,300,000 105,889,434
Reimbursement Property Tax - Disability Exemption
364,713 364,713 364,713 364,713 364,713
Property Tax Relief Elderly Freeze Program 65,000 40,000 40,000 40,000 40,000 Property Tax Relief for Veterans 2,708,107 2,708,107 2,708,107 2,708,107 2,708,107 Municipal Revenue Sharing 36,819,135 36,819,135 36,819,135 36,819,135 36,819,135 Municipal Transition 28,300,000 29,596,908 29,596,908 32,331,732 32,331,732 Municipal Stabilization Grant 37,753,335 37,753,335 37,753,335 37,753,335 37,753,335 Municipal Restructuring 27,300,000 7,300,000 7,300,000 7,300,000 7,300,000
TOTAL - Pmts to Local Governments 294,345,510 345,582,198 275,415,663 348,317,022 278,150,487
TOTAL - General Fund 366,700,258 388,181,422 316,908,637 391,623,208 323,350,423 Personal Services 313,882 332,056 332,056 349,339 349,339 Other Expenses 6,012 6,012 6,012 6,012 6,012 Other Current Expenses Fringe Benefits 200,882 236,348 236,348 251,038 251,038
TOTAL - Insurance Fund 520,776 574,416 574,416 606,389 606,389 Pmts to Local Governments Grants To Towns 49,942,796 58,100,000 49,942,796 58,100,000 49,942,796
TOTAL - Mashantucket Pequot and Mohegan Fund
49,942,796 58,100,000 49,942,796 58,100,000 49,942,796
TOTAL - ALL FUNDS 417,163,830 446,855,838 367,425,849 450,329,597 373,899,608
Budget Summary
B - 16
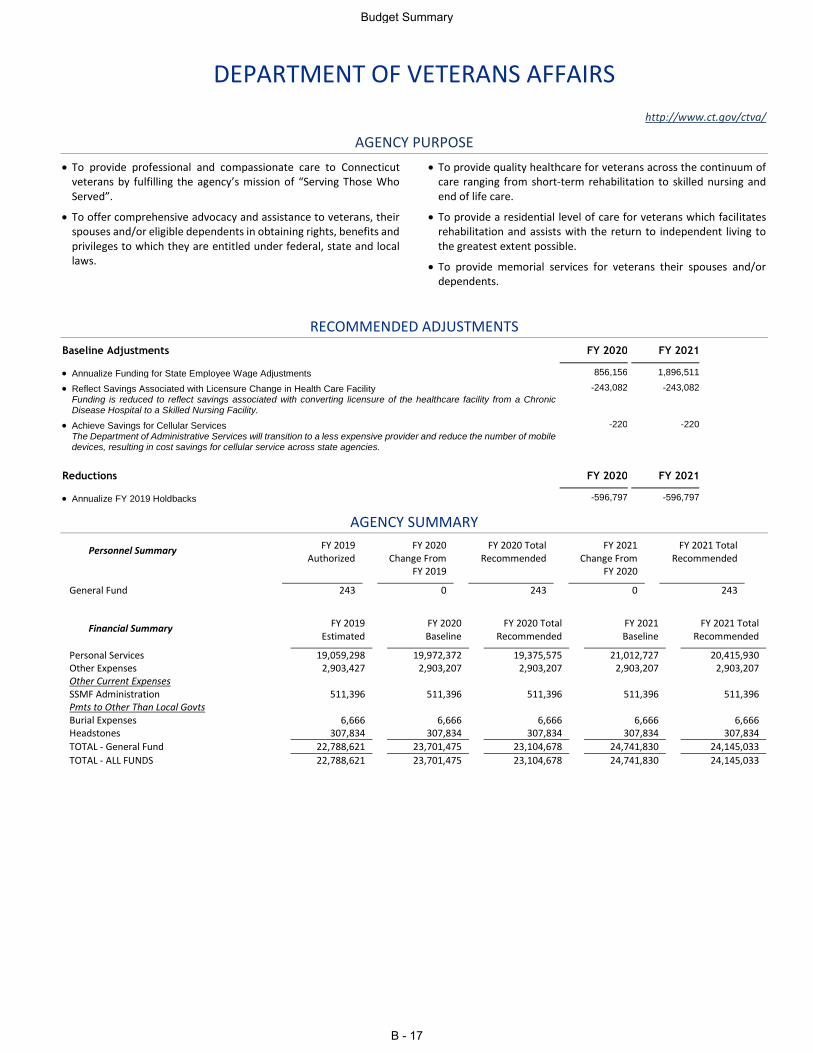
DEPARTMENT OF VETERANS AFFAIRS
http://www.ct.gov/ctva/
AGENCY PURPOSE
To provide professional and compassionate care to Connecticut veterans by fulfilling the agency’s mission of “Serving Those Who Served”.
To offer comprehensive advocacy and assistance to veterans, their spouses and/or eligible dependents in obtaining rights, benefits and privileges to which they are entitled under federal, state and local laws.
To provide quality healthcare for veterans across the continuum of care ranging from short-term rehabilitation to skilled nursing and end of life care.
To provide a residential level of care for veterans which facilitates rehabilitation and assists with the return to independent living to the greatest extent possible.
To provide memorial services for veterans their spouses and/or dependents.
RECOMMENDED ADJUSTMENTS
Baseline Adjustments FY 2020 FY 2021
Annualize Funding for State Employee Wage Adjustments 856,156 1,896,511
Reflect Savings Associated with Licensure Change in Health Care Facility -243,082 -243,082 Funding is reduced to reflect savings associated with converting licensure of the healthcare facility from a Chronic Disease Hospital to a Skilled Nursing Facility.
Achieve Savings for Cellular Services -220 -220 The Department of Administrative Services will transition to a less expensive provider and reduce the number of mobile devices, resulting in cost savings for cellular service across state agencies.
Reductions FY 2020 FY 2021
Annualize FY 2019 Holdbacks -596,797 -596,797
AGENCY SUMMARY
Personnel Summary FY 2019 Authorized
FY 2020 Change From
FY 2019
FY 2020 Total Recommended
FY 2021 Change From
FY 2020
FY 2021 Total Recommended
General Fund 243 0 243 0 243
Financial Summary FY 2019 Estimated
FY 2020 Baseline
FY 2020 Total Recommended
FY 2021 Baseline
FY 2021 Total Recommended
Personal Services 19,059,298 19,972,372 19,375,575 21,012,727 20,415,930 Other Expenses 2,903,427 2,903,207 2,903,207 2,903,207 2,903,207 Other Current Expenses SSMF Administration 511,396 511,396 511,396 511,396 511,396 Pmts to Other Than Local Govts Burial Expenses 6,666 6,666 6,666 6,666 6,666 Headstones 307,834 307,834 307,834 307,834 307,834
TOTAL - General Fund 22,788,621 23,701,475 23,104,678 24,741,830 24,145,033
TOTAL - ALL FUNDS 22,788,621 23,701,475 23,104,678 24,741,830 24,145,033
Budget Summary
B - 17
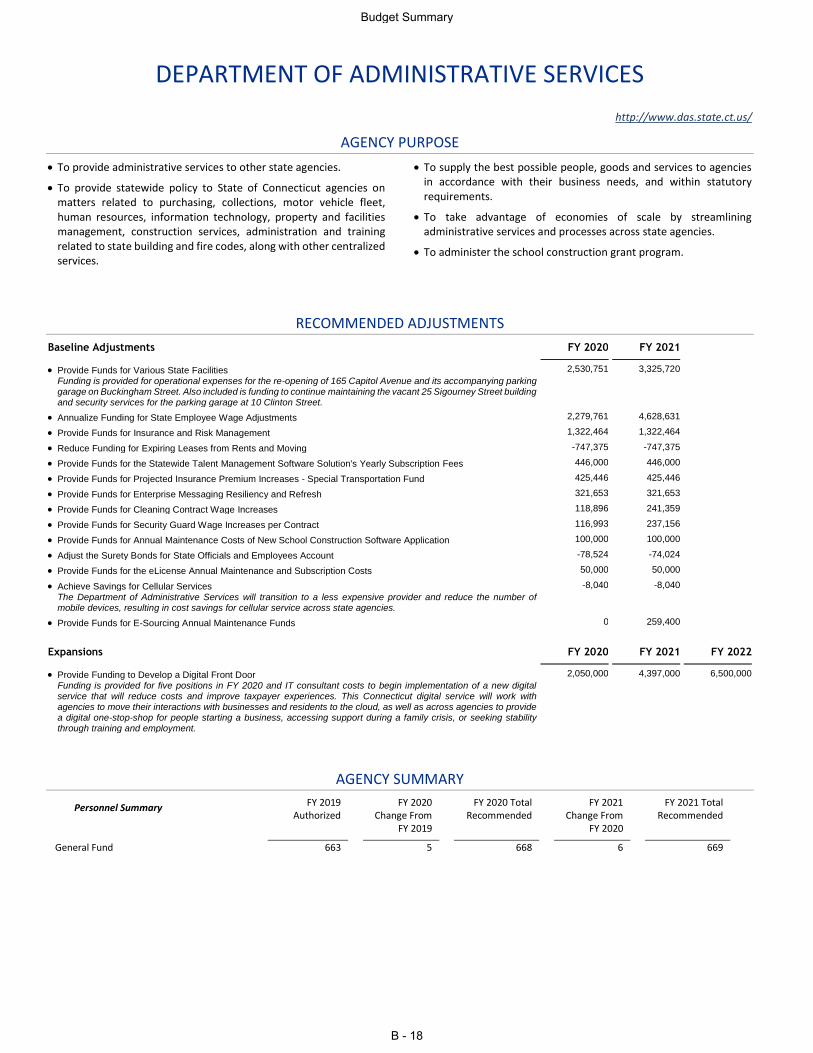
DEPARTMENT OF ADMINISTRATIVE SERVICES
http://www.das.state.ct.us/
AGENCY PURPOSE
To provide administrative services to other state agencies.
To provide statewide policy to State of Connecticut agencies on matters related to purchasing, collections, motor vehicle fleet, human resources, information technology, property and facilities management, construction services, administration and training related to state building and fire codes, along with other centralized services.
To supply the best possible people, goods and services to agencies in accordance with their business needs, and within statutory requirements.
To take advantage of economies of scale by streamlining administrative services and processes across state agencies.
To administer the school construction grant program.
RECOMMENDED ADJUSTMENTS
Baseline Adjustments FY 2020 FY 2021
Provide Funds for Various State Facilities 2,530,751 3,325,720 Funding is provided for operational expenses for the re-opening of 165 Capitol Avenue and its accompanying parking garage on Buckingham Street. Also included is funding to continue maintaining the vacant 25 Sigourney Street building and security services for the parking garage at 10 Clinton Street.
Annualize Funding for State Employee Wage Adjustments 2,279,761 4,628,631
Provide Funds for Insurance and Risk Management 1,322,464 1,322,464
Reduce Funding for Expiring Leases from Rents and Moving -747,375 -747,375
Provide Funds for the Statewide Talent Management Software Solution's Yearly Subscription Fees 446,000 446,000
Provide Funds for Projected Insurance Premium Increases - Special Transportation Fund 425,446 425,446
Provide Funds for Enterprise Messaging Resiliency and Refresh 321,653 321,653
Provide Funds for Cleaning Contract Wage Increases 118,896 241,359
Provide Funds for Security Guard Wage Increases per Contract 116,993 237,156
Provide Funds for Annual Maintenance Costs of New School Construction Software Application 100,000 100,000
Adjust the Surety Bonds for State Officials and Employees Account -78,524 -74,024
Provide Funds for the eLicense Annual Maintenance and Subscription Costs 50,000 50,000
Achieve Savings for Cellular Services -8,040 -8,040 The Department of Administrative Services will transition to a less expensive provider and reduce the number of mobile devices, resulting in cost savings for cellular service across state agencies.
Provide Funds for E-Sourcing Annual Maintenance Funds 0 259,400
Expansions FY 2020 FY 2021 FY 2022
Provide Funding to Develop a Digital Front Door 2,050,000 4,397,000 6,500,000 Funding is provided for five positions in FY 2020 and IT consultant costs to begin implementation of a new digital service that will reduce costs and improve taxpayer experiences. This Connecticut digital service will work with agencies to move their interactions with businesses and residents to the cloud, as well as across agencies to provide a digital one-stop-shop for people starting a business, accessing support during a family crisis, or seeking stability through training and employment.
AGENCY SUMMARY
Personnel Summary FY 2019 Authorized
FY 2020 Change From
FY 2019
FY 2020 Total Recommended
FY 2021 Change From
FY 2020
FY 2021 Total Recommended
General Fund 663 5 668 6 669
Budget Summary
B - 18
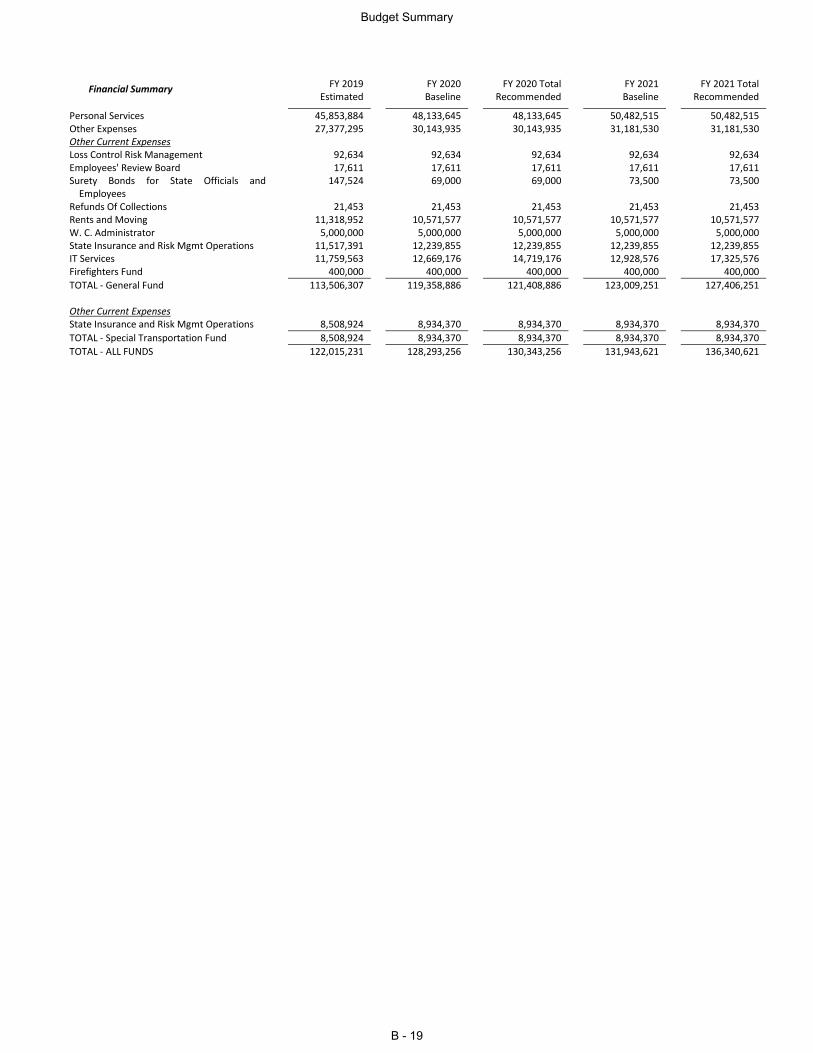
Financial Summary FY 2019 Estimated
FY 2020 Baseline
FY 2020 Total Recommended
FY 2021 Baseline
FY 2021 Total Recommended
Personal Services 45,853,884 48,133,645 48,133,645 50,482,515 50,482,515 Other Expenses 27,377,295 30,143,935 30,143,935 31,181,530 31,181,530 Other Current Expenses Loss Control Risk Management 92,634 92,634 92,634 92,634 92,634 Employees' Review Board 17,611 17,611 17,611 17,611 17,611 Surety Bonds for State Officials and
Employees 147,524 69,000 69,000 73,500 73,500
Refunds Of Collections 21,453 21,453 21,453 21,453 21,453 Rents and Moving 11,318,952 10,571,577 10,571,577 10,571,577 10,571,577 W. C. Administrator 5,000,000 5,000,000 5,000,000 5,000,000 5,000,000 State Insurance and Risk Mgmt Operations 11,517,391 12,239,855 12,239,855 12,239,855 12,239,855 IT Services 11,759,563 12,669,176 14,719,176 12,928,576 17,325,576 Firefighters Fund 400,000 400,000 400,000 400,000 400,000
TOTAL - General Fund 113,506,307 119,358,886 121,408,886 123,009,251 127,406,251 Other Current Expenses State Insurance and Risk Mgmt Operations 8,508,924 8,934,370 8,934,370 8,934,370 8,934,370
TOTAL - Special Transportation Fund 8,508,924 8,934,370 8,934,370 8,934,370 8,934,370
TOTAL - ALL FUNDS 122,015,231 128,293,256 130,343,256 131,943,621 136,340,621
Budget Summary
B - 19
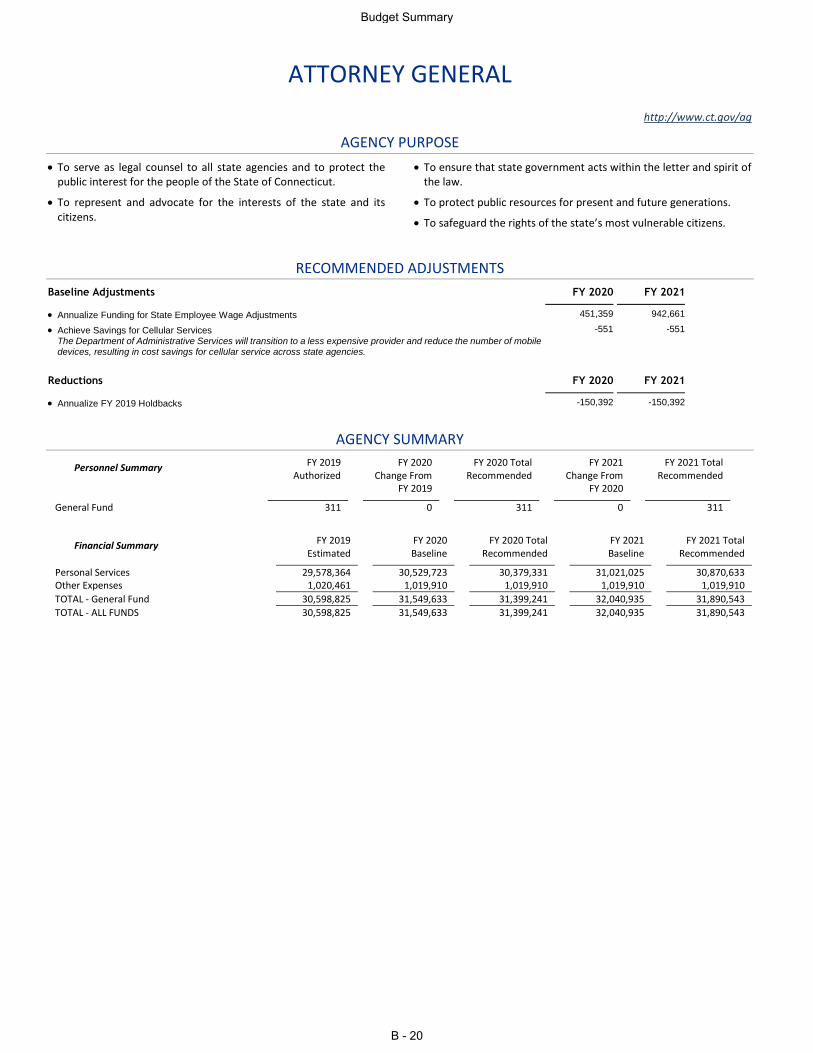
ATTORNEY GENERAL
http://www.ct.gov/ag
AGENCY PURPOSE
To serve as legal counsel to all state agencies and to protect the public interest for the people of the State of Connecticut.
To represent and advocate for the interests of the state and its citizens.
To ensure that state government acts within the letter and spirit of the law.
To protect public resources for present and future generations.
To safeguard the rights of the state’s most vulnerable citizens.
RECOMMENDED ADJUSTMENTS
Baseline Adjustments FY 2020 FY 2021
Annualize Funding for State Employee Wage Adjustments 451,359 942,661
Achieve Savings for Cellular Services -551 -551 The Department of Administrative Services will transition to a less expensive provider and reduce the number of mobile devices, resulting in cost savings for cellular service across state agencies.
Reductions FY 2020 FY 2021
Annualize FY 2019 Holdbacks -150,392 -150,392
AGENCY SUMMARY
Personnel Summary FY 2019 Authorized
FY 2020 Change From
FY 2019
FY 2020 Total Recommended
FY 2021 Change From
FY 2020
FY 2021 Total Recommended
General Fund 311 0 311 0 311
Financial Summary FY 2019 Estimated
FY 2020 Baseline
FY 2020 Total Recommended
FY 2021 Baseline
FY 2021 Total Recommended
Personal Services 29,578,364 30,529,723 30,379,331 31,021,025 30,870,633 Other Expenses 1,020,461 1,019,910 1,019,910 1,019,910 1,019,910
TOTAL - General Fund 30,598,825 31,549,633 31,399,241 32,040,935 31,890,543
TOTAL - ALL FUNDS 30,598,825 31,549,633 31,399,241 32,040,935 31,890,543
Budget Summary
B - 20
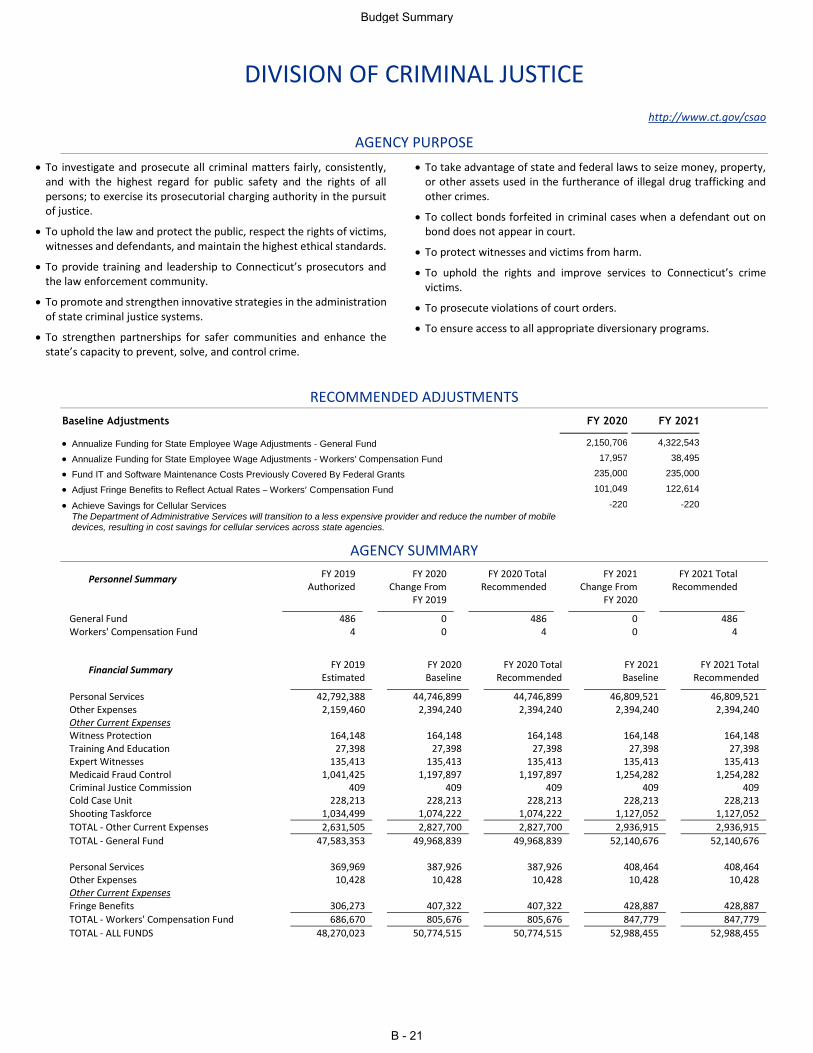
DIVISION OF CRIMINAL JUSTICE
http://www.ct.gov/csao
AGENCY PURPOSE
To investigate and prosecute all criminal matters fairly, consistently, and with the highest regard for public safety and the rights of all persons; to exercise its prosecutorial charging authority in the pursuit of justice.
To uphold the law and protect the public, respect the rights of victims, witnesses and defendants, and maintain the highest ethical standards.
To provide training and leadership to Connecticut’s prosecutors and the law enforcement community.
To promote and strengthen innovative strategies in the administration of state criminal justice systems.
To strengthen partnerships for safer communities and enhance the state’s capacity to prevent, solve, and control crime.
To take advantage of state and federal laws to seize money, property, or other assets used in the furtherance of illegal drug trafficking and other crimes.
To collect bonds forfeited in criminal cases when a defendant out on bond does not appear in court.
To protect witnesses and victims from harm.
To uphold the rights and improve services to Connecticut’s crime victims.
To prosecute violations of court orders.
To ensure access to all appropriate diversionary programs.
RECOMMENDED ADJUSTMENTS
Baseline Adjustments FY 2020 FY 2021
Annualize Funding for State Employee Wage Adjustments - General Fund 2,150,706 4,322,543
Annualize Funding for State Employee Wage Adjustments - Workers' Compensation Fund 17,957 38,495
Fund IT and Software Maintenance Costs Previously Covered By Federal Grants 235,000 235,000
Adjust Fringe Benefits to Reflect Actual Rates – Workers’ Compensation Fund 101,049 122,614
Achieve Savings for Cellular Services -220 -220 The Department of Administrative Services will transition to a less expensive provider and reduce the number of mobile devices, resulting in cost savings for cellular services across state agencies.
AGENCY SUMMARY
Personnel Summary FY 2019 Authorized
FY 2020 Change From
FY 2019
FY 2020 Total Recommended
FY 2021 Change From
FY 2020
FY 2021 Total Recommended
General Fund 486 0 486 0 486 Workers' Compensation Fund 4 0 4 0 4
Financial Summary FY 2019 Estimated
FY 2020 Baseline
FY 2020 Total Recommended
FY 2021 Baseline
FY 2021 Total Recommended
Personal Services 42,792,388 44,746,899 44,746,899 46,809,521 46,809,521 Other Expenses 2,159,460 2,394,240 2,394,240 2,394,240 2,394,240 Other Current Expenses Witness Protection 164,148 164,148 164,148 164,148 164,148 Training And Education 27,398 27,398 27,398 27,398 27,398 Expert Witnesses 135,413 135,413 135,413 135,413 135,413 Medicaid Fraud Control 1,041,425 1,197,897 1,197,897 1,254,282 1,254,282 Criminal Justice Commission 409 409 409 409 409 Cold Case Unit 228,213 228,213 228,213 228,213 228,213 Shooting Taskforce 1,034,499 1,074,222 1,074,222 1,127,052 1,127,052
TOTAL - Other Current Expenses 2,631,505 2,827,700 2,827,700 2,936,915 2,936,915
TOTAL - General Fund 47,583,353 49,968,839 49,968,839 52,140,676 52,140,676 Personal Services 369,969 387,926 387,926 408,464 408,464 Other Expenses 10,428 10,428 10,428 10,428 10,428 Other Current Expenses Fringe Benefits 306,273 407,322 407,322 428,887 428,887
TOTAL - Workers' Compensation Fund 686,670 805,676 805,676 847,779 847,779
TOTAL - ALL FUNDS 48,270,023 50,774,515 50,774,515 52,988,455 52,988,455
Budget Summary
B - 21
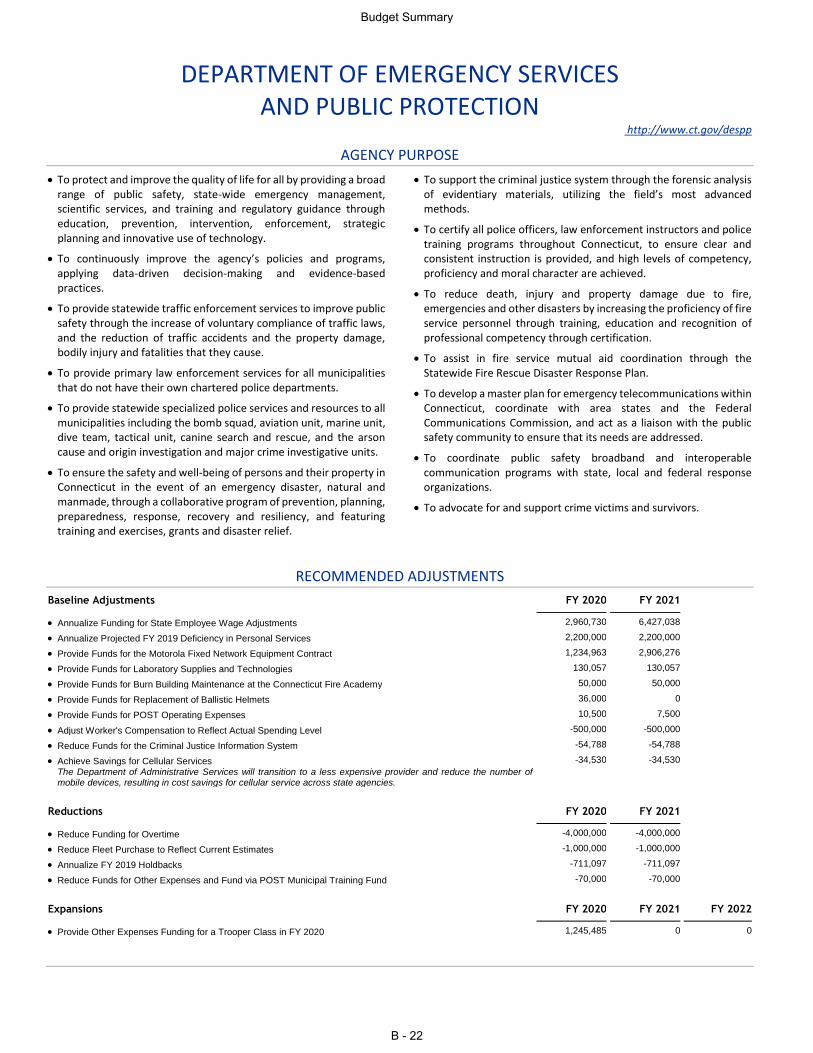
DEPARTMENT OF EMERGENCY SERVICES AND PUBLIC PROTECTION
http://www.ct.gov/despp
AGENCY PURPOSE
To protect and improve the quality of life for all by providing a broad range of public safety, state-wide emergency management, scientific services, and training and regulatory guidance through education, prevention, intervention, enforcement, strategic planning and innovative use of technology.
To continuously improve the agency’s policies and programs, applying data-driven decision-making and evidence-based practices.
To provide statewide traffic enforcement services to improve public safety through the increase of voluntary compliance of traffic laws, and the reduction of traffic accidents and the property damage, bodily injury and fatalities that they cause.
To provide primary law enforcement services for all municipalities that do not have their own chartered police departments.
To provide statewide specialized police services and resources to all municipalities including the bomb squad, aviation unit, marine unit, dive team, tactical unit, canine search and rescue, and the arson cause and origin investigation and major crime investigative units.
To ensure the safety and well-being of persons and their property in Connecticut in the event of an emergency disaster, natural and manmade, through a collaborative program of prevention, planning, preparedness, response, recovery and resiliency, and featuring training and exercises, grants and disaster relief.
To support the criminal justice system through the forensic analysis of evidentiary materials, utilizing the field’s most advanced methods.
To certify all police officers, law enforcement instructors and police training programs throughout Connecticut, to ensure clear and consistent instruction is provided, and high levels of competency, proficiency and moral character are achieved.
To reduce death, injury and property damage due to fire, emergencies and other disasters by increasing the proficiency of fire service personnel through training, education and recognition of professional competency through certification.
To assist in fire service mutual aid coordination through the Statewide Fire Rescue Disaster Response Plan.
To develop a master plan for emergency telecommunications within Connecticut, coordinate with area states and the Federal Communications Commission, and act as a liaison with the public safety community to ensure that its needs are addressed.
To coordinate public safety broadband and interoperable communication programs with state, local and federal response organizations.
To advocate for and support crime victims and survivors.
RECOMMENDED ADJUSTMENTS
Baseline Adjustments FY 2020 FY 2021
Annualize Funding for State Employee Wage Adjustments 2,960,730 6,427,038
Annualize Projected FY 2019 Deficiency in Personal Services 2,200,000 2,200,000
Provide Funds for the Motorola Fixed Network Equipment Contract 1,234,963 2,906,276
Provide Funds for Laboratory Supplies and Technologies 130,057 130,057
Provide Funds for Burn Building Maintenance at the Connecticut Fire Academy 50,000 50,000
Provide Funds for Replacement of Ballistic Helmets 36,000 0
Provide Funds for POST Operating Expenses 10,500 7,500
Adjust Worker's Compensation to Reflect Actual Spending Level -500,000 -500,000
Reduce Funds for the Criminal Justice Information System -54,788 -54,788
Achieve Savings for Cellular Services -34,530 -34,530 The Department of Administrative Services will transition to a less expensive provider and reduce the number of mobile devices, resulting in cost savings for cellular service across state agencies.
Reductions FY 2020 FY 2021
Reduce Funding for Overtime -4,000,000 -4,000,000
Reduce Fleet Purchase to Reflect Current Estimates -1,000,000 -1,000,000
Annualize FY 2019 Holdbacks -711,097 -711,097
Reduce Funds for Other Expenses and Fund via POST Municipal Training Fund -70,000 -70,000
Expansions FY 2020 FY 2021 FY 2022
Provide Other Expenses Funding for a Trooper Class in FY 2020 1,245,485 0 0
Budget Summary
B - 22
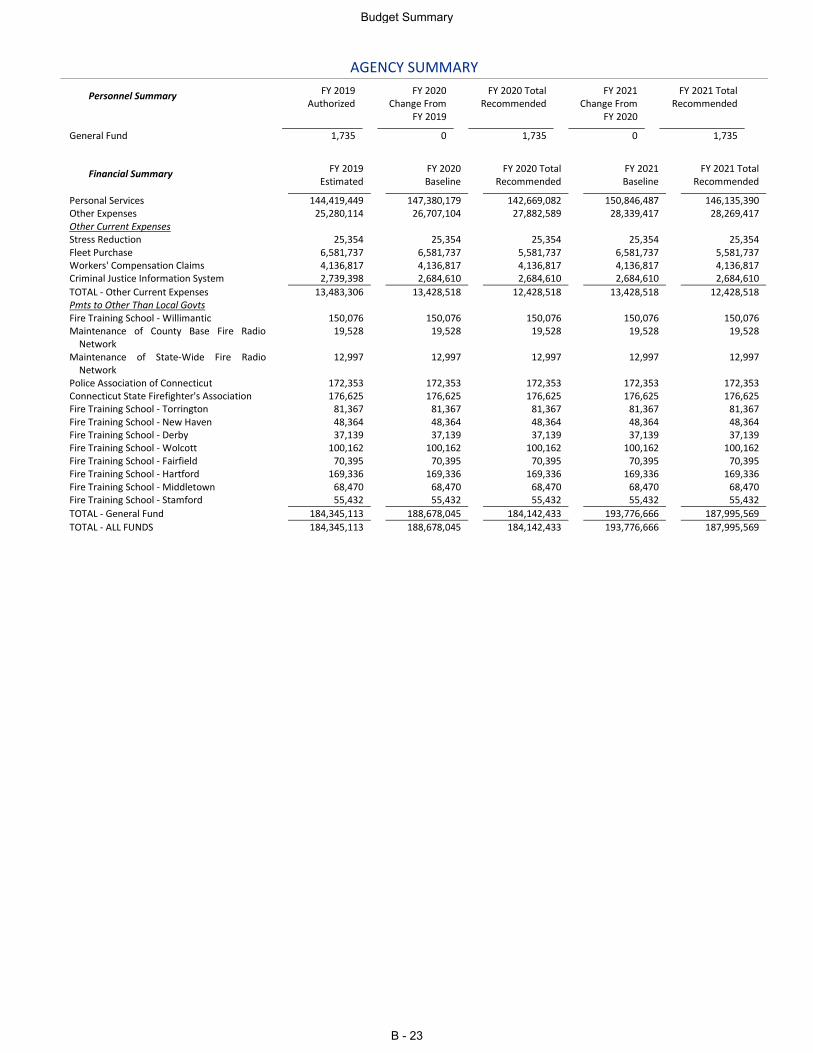
AGENCY SUMMARY
Personnel Summary FY 2019 Authorized
FY 2020 Change From
FY 2019
FY 2020 Total Recommended
FY 2021 Change From
FY 2020
FY 2021 Total Recommended
General Fund 1,735 0 1,735 0 1,735
Financial Summary FY 2019 Estimated
FY 2020 Baseline
FY 2020 Total Recommended
FY 2021 Baseline
FY 2021 Total Recommended
Personal Services 144,419,449 147,380,179 142,669,082 150,846,487 146,135,390 Other Expenses 25,280,114 26,707,104 27,882,589 28,339,417 28,269,417 Other Current Expenses Stress Reduction 25,354 25,354 25,354 25,354 25,354 Fleet Purchase 6,581,737 6,581,737 5,581,737 6,581,737 5,581,737 Workers' Compensation Claims 4,136,817 4,136,817 4,136,817 4,136,817 4,136,817 Criminal Justice Information System 2,739,398 2,684,610 2,684,610 2,684,610 2,684,610
TOTAL - Other Current Expenses 13,483,306 13,428,518 12,428,518 13,428,518 12,428,518 Pmts to Other Than Local Govts Fire Training School - Willimantic 150,076 150,076 150,076 150,076 150,076 Maintenance of County Base Fire Radio
Network 19,528 19,528 19,528 19,528 19,528
Maintenance of State-Wide Fire Radio Network
12,997 12,997 12,997 12,997 12,997
Police Association of Connecticut 172,353 172,353 172,353 172,353 172,353 Connecticut State Firefighter's Association 176,625 176,625 176,625 176,625 176,625 Fire Training School - Torrington 81,367 81,367 81,367 81,367 81,367 Fire Training School - New Haven 48,364 48,364 48,364 48,364 48,364 Fire Training School - Derby 37,139 37,139 37,139 37,139 37,139 Fire Training School - Wolcott 100,162 100,162 100,162 100,162 100,162 Fire Training School - Fairfield 70,395 70,395 70,395 70,395 70,395 Fire Training School - Hartford 169,336 169,336 169,336 169,336 169,336 Fire Training School - Middletown 68,470 68,470 68,470 68,470 68,470 Fire Training School - Stamford 55,432 55,432 55,432 55,432 55,432
TOTAL - General Fund 184,345,113 188,678,045 184,142,433 193,776,666 187,995,569
TOTAL - ALL FUNDS 184,345,113 188,678,045 184,142,433 193,776,666 187,995,569
Budget Summary
B - 23
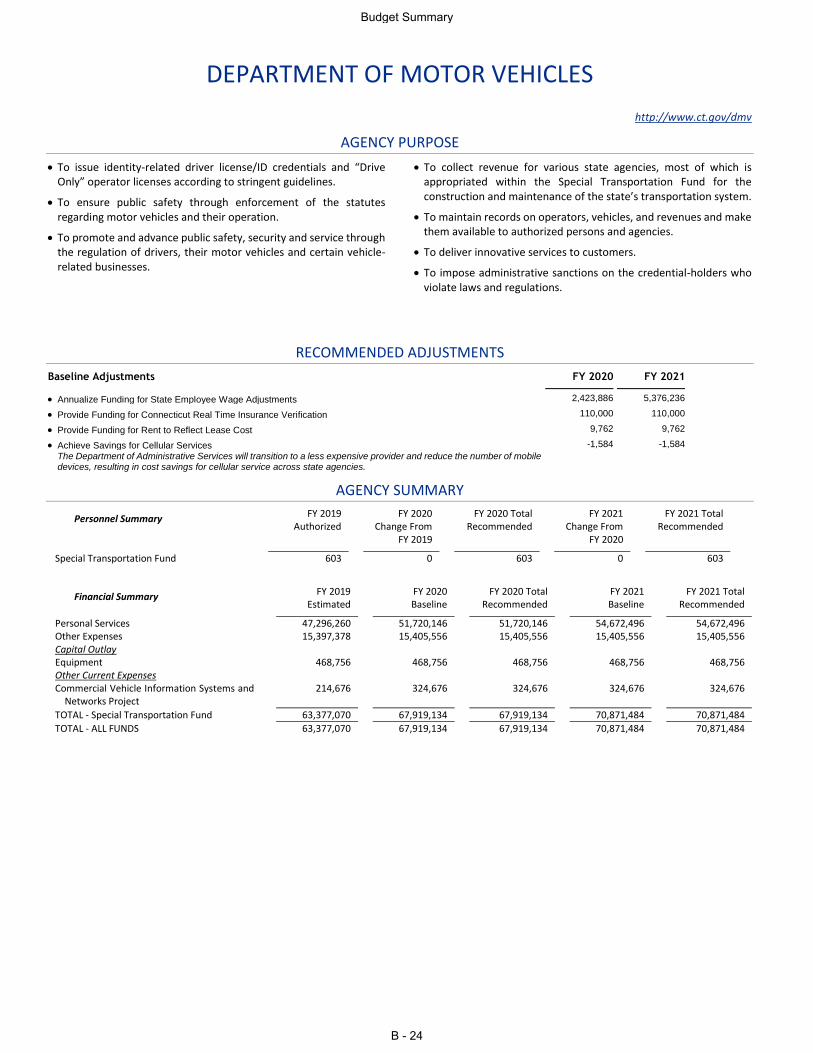
DEPARTMENT OF MOTOR VEHICLES
http://www.ct.gov/dmv
AGENCY PURPOSE
To issue identity-related driver license/ID credentials and “Drive Only” operator licenses according to stringent guidelines.
To ensure public safety through enforcement of the statutes regarding motor vehicles and their operation.
To promote and advance public safety, security and service through the regulation of drivers, their motor vehicles and certain vehicle-related businesses.
To collect revenue for various state agencies, most of which is appropriated within the Special Transportation Fund for the construction and maintenance of the state’s transportation system.
To maintain records on operators, vehicles, and revenues and make them available to authorized persons and agencies.
To deliver innovative services to customers.
To impose administrative sanctions on the credential-holders who violate laws and regulations.
RECOMMENDED ADJUSTMENTS
Baseline Adjustments FY 2020 FY 2021
Annualize Funding for State Employee Wage Adjustments 2,423,886 5,376,236
Provide Funding for Connecticut Real Time Insurance Verification 110,000 110,000
Provide Funding for Rent to Reflect Lease Cost 9,762 9,762
Achieve Savings for Cellular Services -1,584 -1,584 The Department of Administrative Services will transition to a less expensive provider and reduce the number of mobile devices, resulting in cost savings for cellular service across state agencies.
AGENCY SUMMARY
Personnel Summary FY 2019 Authorized
FY 2020 Change From
FY 2019
FY 2020 Total Recommended
FY 2021 Change From
FY 2020
FY 2021 Total Recommended
Special Transportation Fund 603 0 603 0 603
Financial Summary FY 2019 Estimated
FY 2020 Baseline
FY 2020 Total Recommended
FY 2021 Baseline
FY 2021 Total Recommended
Personal Services 47,296,260 51,720,146 51,720,146 54,672,496 54,672,496 Other Expenses 15,397,378 15,405,556 15,405,556 15,405,556 15,405,556 Capital Outlay Equipment 468,756 468,756 468,756 468,756 468,756 Other Current Expenses Commercial Vehicle Information Systems and
Networks Project 214,676 324,676 324,676 324,676 324,676
TOTAL - Special Transportation Fund 63,377,070 67,919,134 67,919,134 70,871,484 70,871,484
TOTAL - ALL FUNDS 63,377,070 67,919,134 67,919,134 70,871,484 70,871,484
Budget Summary
B - 24
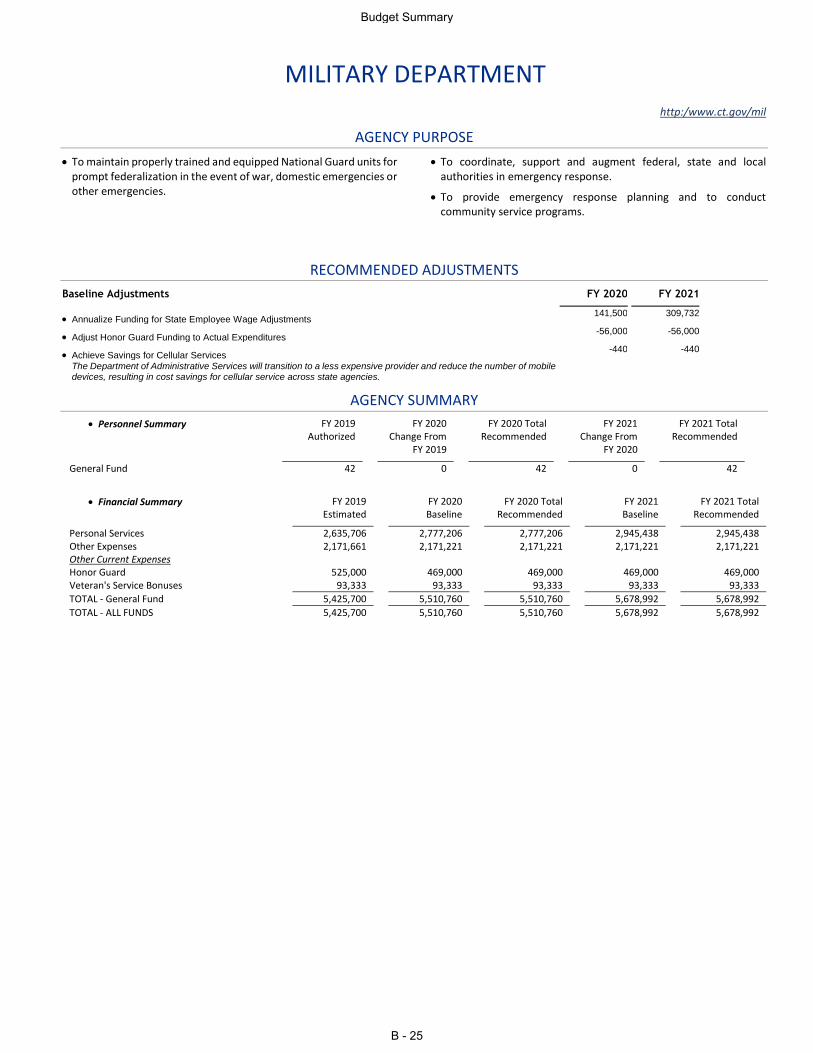
MILITARY DEPARTMENT
http:/www.ct.gov/mil
AGENCY PURPOSE
To maintain properly trained and equipped National Guard units for prompt federalization in the event of war, domestic emergencies or other emergencies.
To coordinate, support and augment federal, state and local authorities in emergency response.
To provide emergency response planning and to conduct community service programs.
RECOMMENDED ADJUSTMENTS
Baseline Adjustments FY 2020 FY 2021
Annualize Funding for State Employee Wage Adjustments 141,500 309,732
Adjust Honor Guard Funding to Actual Expenditures -56,000 -56,000
Achieve Savings for Cellular Services -440 -440
The Department of Administrative Services will transition to a less expensive provider and reduce the number of mobile devices, resulting in cost savings for cellular service across state agencies.
AGENCY SUMMARY
Personnel Summary FY 2019 Authorized
FY 2020 Change From
FY 2019
FY 2020 Total Recommended
FY 2021 Change From
FY 2020
FY 2021 Total Recommended
General Fund 42 0 42 0 42
Financial Summary FY 2019 Estimated
FY 2020 Baseline
FY 2020 Total Recommended
FY 2021 Baseline
FY 2021 Total Recommended
Personal Services 2,635,706 2,777,206 2,777,206 2,945,438 2,945,438 Other Expenses 2,171,661 2,171,221 2,171,221 2,171,221 2,171,221 Other Current Expenses Honor Guard 525,000 469,000 469,000 469,000 469,000 Veteran's Service Bonuses 93,333 93,333 93,333 93,333 93,333
TOTAL - General Fund 5,425,700 5,510,760 5,510,760 5,678,992 5,678,992
TOTAL - ALL FUNDS 5,425,700 5,510,760 5,510,760 5,678,992 5,678,992
Budget Summary
B - 25
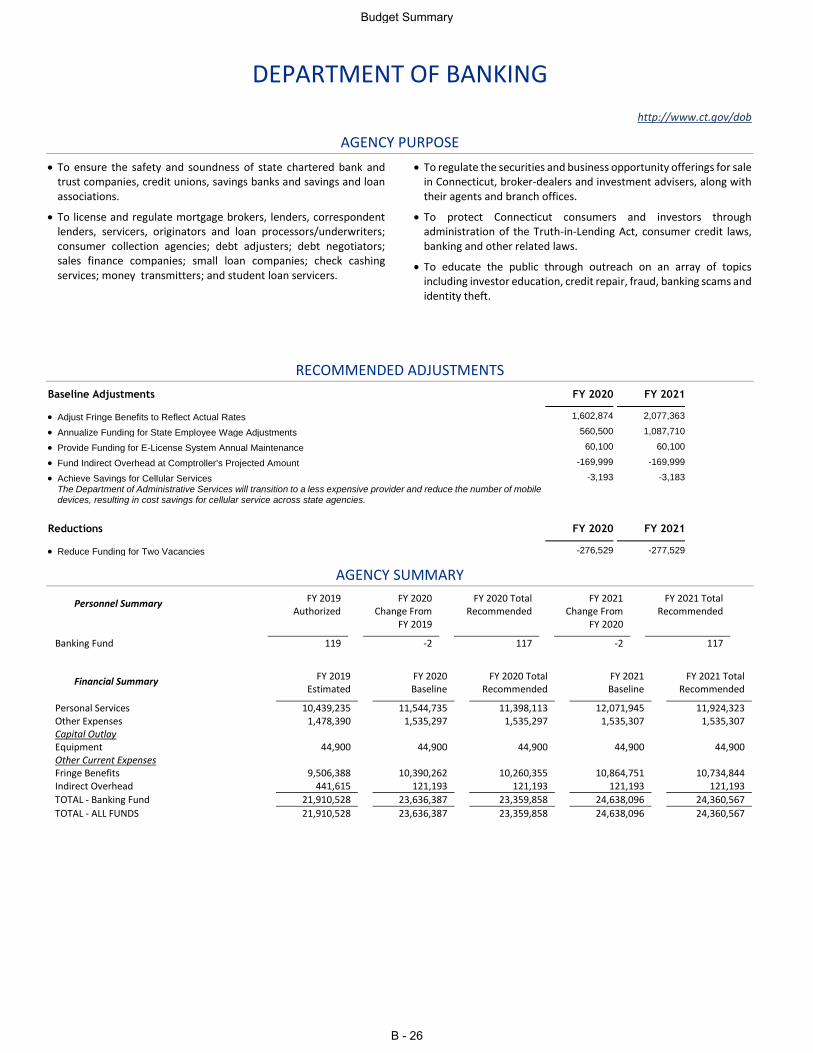
DEPARTMENT OF BANKING
http://www.ct.gov/dob
AGENCY PURPOSE
To ensure the safety and soundness of state chartered bank and trust companies, credit unions, savings banks and savings and loan associations.
To license and regulate mortgage brokers, lenders, correspondent lenders, servicers, originators and loan processors/underwriters; consumer collection agencies; debt adjusters; debt negotiators; sales finance companies; small loan companies; check cashing services; money transmitters; and student loan servicers.
To regulate the securities and business opportunity offerings for sale in Connecticut, broker-dealers and investment advisers, along with their agents and branch offices.
To protect Connecticut consumers and investors through administration of the Truth-in-Lending Act, consumer credit laws, banking and other related laws.
To educate the public through outreach on an array of topics including investor education, credit repair, fraud, banking scams and identity theft.
RECOMMENDED ADJUSTMENTS
Baseline Adjustments FY 2020 FY 2021
Adjust Fringe Benefits to Reflect Actual Rates 1,602,874 2,077,363
Annualize Funding for State Employee Wage Adjustments 560,500 1,087,710
Provide Funding for E-License System Annual Maintenance 60,100 60,100
Fund Indirect Overhead at Comptroller's Projected Amount -169,999 -169,999
Achieve Savings for Cellular Services -3,193 -3,183 The Department of Administrative Services will transition to a less expensive provider and reduce the number of mobile devices, resulting in cost savings for cellular service across state agencies.
Reductions FY 2020 FY 2021
Reduce Funding for Two Vacancies -276,529 -277,529
AGENCY SUMMARY
Personnel Summary FY 2019 Authorized
FY 2020 Change From
FY 2019
FY 2020 Total Recommended
FY 2021 Change From
FY 2020
FY 2021 Total Recommended
Banking Fund 119 -2 117 -2 117
Financial Summary FY 2019 Estimated
FY 2020 Baseline
FY 2020 Total Recommended
FY 2021 Baseline
FY 2021 Total Recommended
Personal Services 10,439,235 11,544,735 11,398,113 12,071,945 11,924,323 Other Expenses 1,478,390 1,535,297 1,535,297 1,535,307 1,535,307 Capital Outlay Equipment 44,900 44,900 44,900 44,900 44,900 Other Current Expenses Fringe Benefits 9,506,388 10,390,262 10,260,355 10,864,751 10,734,844 Indirect Overhead 441,615 121,193 121,193 121,193 121,193
TOTAL - Banking Fund 21,910,528 23,636,387 23,359,858 24,638,096 24,360,567
TOTAL - ALL FUNDS 21,910,528 23,636,387 23,359,858 24,638,096 24,360,567
Budget Summary
B - 26
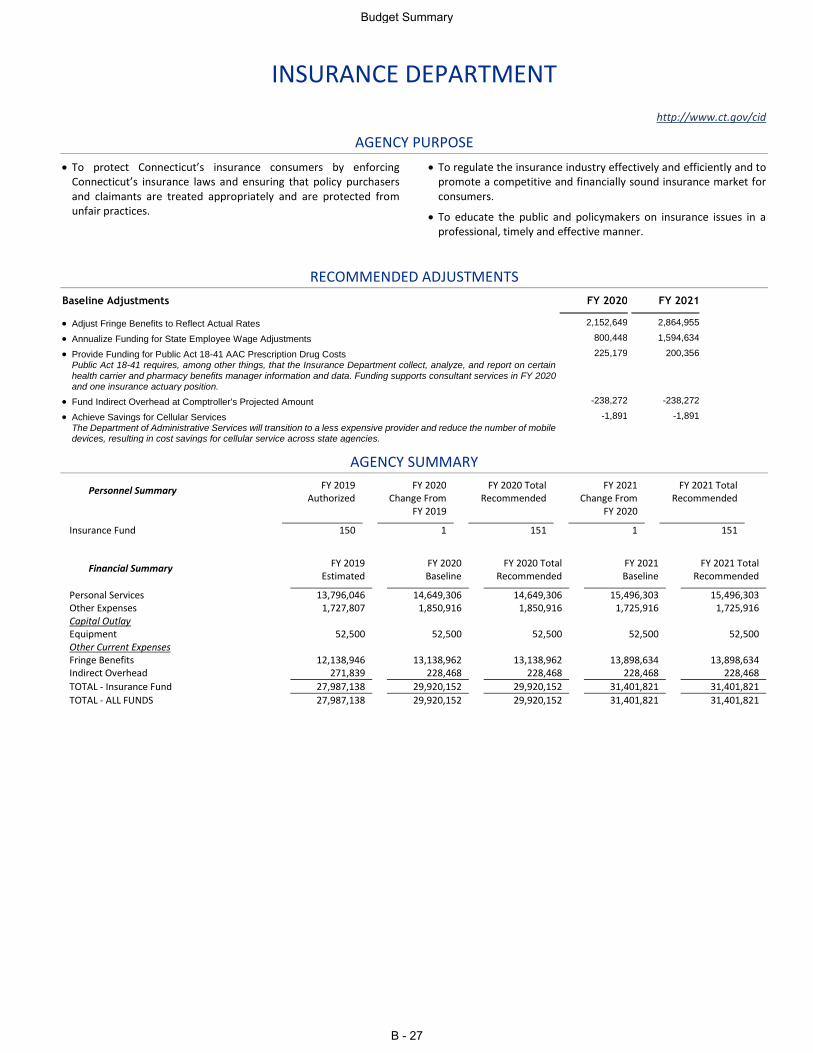
INSURANCE DEPARTMENT
http://www.ct.gov/cid
AGENCY PURPOSE
To protect Connecticut’s insurance consumers by enforcing Connecticut’s insurance laws and ensuring that policy purchasers and claimants are treated appropriately and are protected from unfair practices.
To regulate the insurance industry effectively and efficiently and to promote a competitive and financially sound insurance market for consumers.
To educate the public and policymakers on insurance issues in a professional, timely and effective manner.
RECOMMENDED ADJUSTMENTS
Baseline Adjustments FY 2020 FY 2021
Adjust Fringe Benefits to Reflect Actual Rates 2,152,649 2,864,955
Annualize Funding for State Employee Wage Adjustments 800,448 1,594,634
Provide Funding for Public Act 18-41 AAC Prescription Drug Costs 225,179 200,356 Public Act 18-41 requires, among other things, that the Insurance Department collect, analyze, and report on certain
health carrier and pharmacy benefits manager information and data. Funding supports consultant services in FY 2020 and one insurance actuary position.
Fund Indirect Overhead at Comptroller's Projected Amount -238,272 -238,272
Achieve Savings for Cellular Services -1,891 -1,891 The Department of Administrative Services will transition to a less expensive provider and reduce the number of mobile devices, resulting in cost savings for cellular service across state agencies.
AGENCY SUMMARY
Personnel Summary FY 2019 Authorized
FY 2020 Change From
FY 2019
FY 2020 Total Recommended
FY 2021 Change From
FY 2020
FY 2021 Total Recommended
Insurance Fund 150 1 151 1 151
Financial Summary FY 2019 Estimated
FY 2020 Baseline
FY 2020 Total Recommended
FY 2021 Baseline
FY 2021 Total Recommended
Personal Services 13,796,046 14,649,306 14,649,306 15,496,303 15,496,303 Other Expenses 1,727,807 1,850,916 1,850,916 1,725,916 1,725,916 Capital Outlay Equipment 52,500 52,500 52,500 52,500 52,500 Other Current Expenses Fringe Benefits 12,138,946 13,138,962 13,138,962 13,898,634 13,898,634 Indirect Overhead 271,839 228,468 228,468 228,468 228,468
TOTAL - Insurance Fund 27,987,138 29,920,152 29,920,152 31,401,821 31,401,821
TOTAL - ALL FUNDS 27,987,138 29,920,152 29,920,152 31,401,821 31,401,821
Budget Summary
B - 27
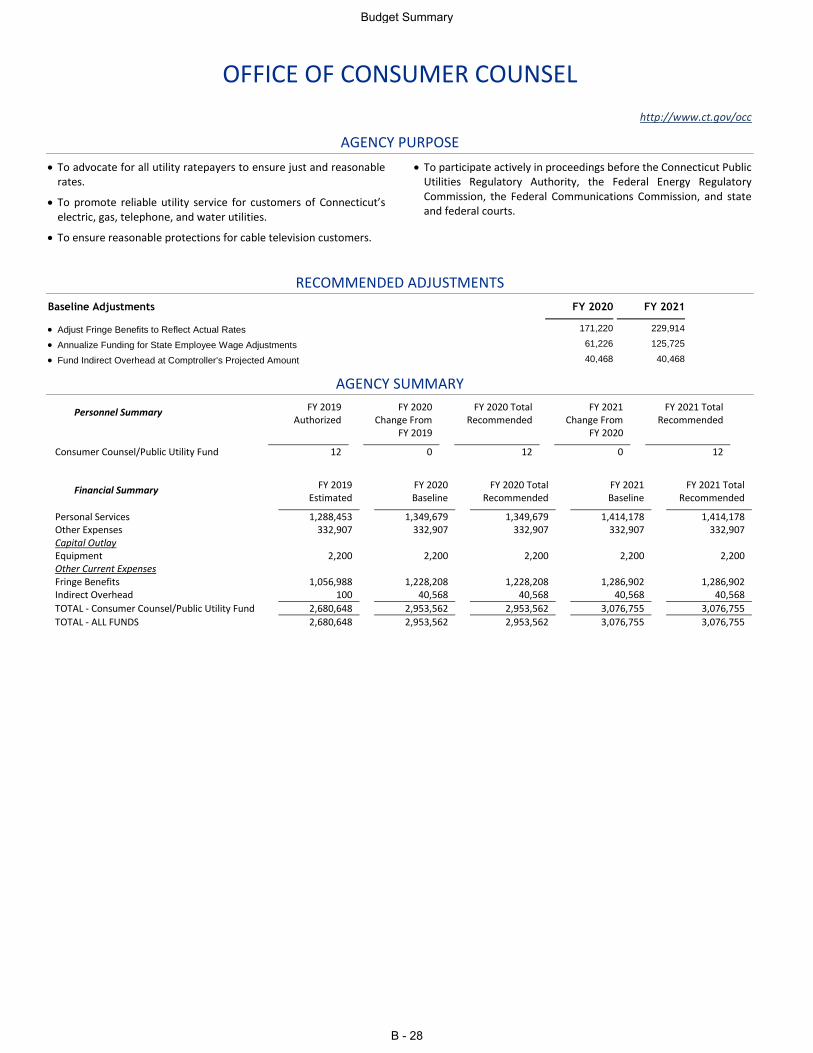
OFFICE OF CONSUMER COUNSEL
http://www.ct.gov/occ
AGENCY PURPOSE
To advocate for all utility ratepayers to ensure just and reasonable rates.
To promote reliable utility service for customers of Connecticut’s electric, gas, telephone, and water utilities.
To ensure reasonable protections for cable television customers.
To participate actively in proceedings before the Connecticut Public Utilities Regulatory Authority, the Federal Energy Regulatory Commission, the Federal Communications Commission, and state and federal courts.
RECOMMENDED ADJUSTMENTS
Baseline Adjustments FY 2020 FY 2021
Adjust Fringe Benefits to Reflect Actual Rates 171,220 229,914
Annualize Funding for State Employee Wage Adjustments 61,226 125,725
Fund Indirect Overhead at Comptroller's Projected Amount 40,468 40,468
AGENCY SUMMARY
Personnel Summary FY 2019 Authorized
FY 2020 Change From
FY 2019
FY 2020 Total Recommended
FY 2021 Change From
FY 2020
FY 2021 Total Recommended
Consumer Counsel/Public Utility Fund 12 0 12 0 12
Financial Summary FY 2019 Estimated
FY 2020 Baseline
FY 2020 Total Recommended
FY 2021 Baseline
FY 2021 Total Recommended
Personal Services 1,288,453 1,349,679 1,349,679 1,414,178 1,414,178 Other Expenses 332,907 332,907 332,907 332,907 332,907 Capital Outlay Equipment 2,200 2,200 2,200 2,200 2,200 Other Current Expenses Fringe Benefits 1,056,988 1,228,208 1,228,208 1,286,902 1,286,902 Indirect Overhead 100 40,568 40,568 40,568 40,568
TOTAL - Consumer Counsel/Public Utility Fund 2,680,648 2,953,562 2,953,562 3,076,755 3,076,755
TOTAL - ALL FUNDS 2,680,648 2,953,562 2,953,562 3,076,755 3,076,755
Budget Summary
B - 28
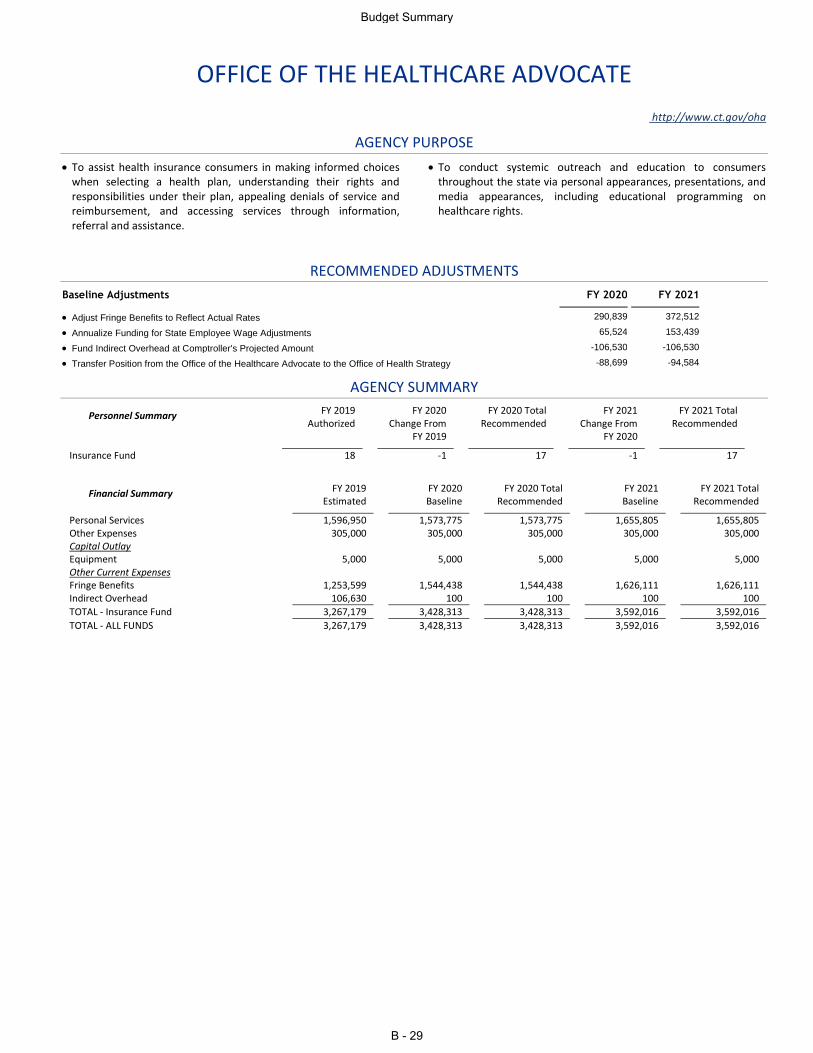
OFFICE OF THE HEALTHCARE ADVOCATE
http://www.ct.gov/oha
AGENCY PURPOSE
To assist health insurance consumers in making informed choices when selecting a health plan, understanding their rights and responsibilities under their plan, appealing denials of service and reimbursement, and accessing services through information, referral and assistance.
To conduct systemic outreach and education to consumers throughout the state via personal appearances, presentations, and media appearances, including educational programming on healthcare rights.
RECOMMENDED ADJUSTMENTS
Baseline Adjustments FY 2020 FY 2021
Adjust Fringe Benefits to Reflect Actual Rates 290,839 372,512
Annualize Funding for State Employee Wage Adjustments 65,524 153,439
Fund Indirect Overhead at Comptroller's Projected Amount -106,530 -106,530
Transfer Position from the Office of the Healthcare Advocate to the Office of Health Strategy -88,699 -94,584
AGENCY SUMMARY
Personnel Summary FY 2019 Authorized
FY 2020 Change From
FY 2019
FY 2020 Total Recommended
FY 2021 Change From
FY 2020
FY 2021 Total Recommended
Insurance Fund 18 -1 17 -1 17
Financial Summary FY 2019 Estimated
FY 2020 Baseline
FY 2020 Total Recommended
FY 2021 Baseline
FY 2021 Total Recommended
Personal Services 1,596,950 1,573,775 1,573,775 1,655,805 1,655,805 Other Expenses 305,000 305,000 305,000 305,000 305,000 Capital Outlay Equipment 5,000 5,000 5,000 5,000 5,000 Other Current Expenses Fringe Benefits 1,253,599 1,544,438 1,544,438 1,626,111 1,626,111 Indirect Overhead 106,630 100 100 100 100
TOTAL - Insurance Fund 3,267,179 3,428,313 3,428,313 3,592,016 3,592,016
TOTAL - ALL FUNDS 3,267,179 3,428,313 3,428,313 3,592,016 3,592,016
Budget Summary
B - 29
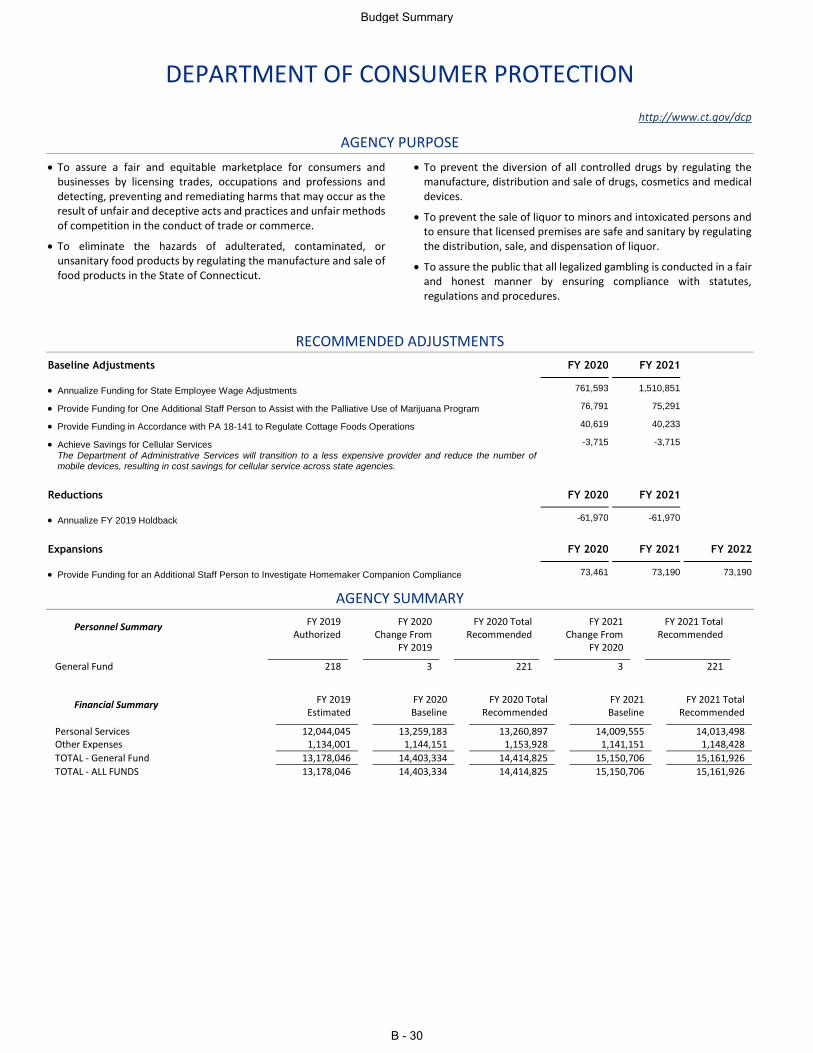
DEPARTMENT OF CONSUMER PROTECTION
http://www.ct.gov/dcp
AGENCY PURPOSE
To assure a fair and equitable marketplace for consumers and businesses by licensing trades, occupations and professions and detecting, preventing and remediating harms that may occur as the result of unfair and deceptive acts and practices and unfair methods of competition in the conduct of trade or commerce.
To eliminate the hazards of adulterated, contaminated, or unsanitary food products by regulating the manufacture and sale of food products in the State of Connecticut.
To prevent the diversion of all controlled drugs by regulating the manufacture, distribution and sale of drugs, cosmetics and medical devices.
To prevent the sale of liquor to minors and intoxicated persons and to ensure that licensed premises are safe and sanitary by regulating the distribution, sale, and dispensation of liquor.
To assure the public that all legalized gambling is conducted in a fair and honest manner by ensuring compliance with statutes, regulations and procedures.
RECOMMENDED ADJUSTMENTS
Baseline Adjustments FY 2020 FY 2021
Annualize Funding for State Employee Wage Adjustments 761,593 1,510,851
Provide Funding for One Additional Staff Person to Assist with the Palliative Use of Marijuana Program 76,791 75,291
Provide Funding in Accordance with PA 18-141 to Regulate Cottage Foods Operations 40,619 40,233
Achieve Savings for Cellular Services -3,715 -3,715
The Department of Administrative Services will transition to a less expensive provider and reduce the number of mobile devices, resulting in cost savings for cellular service across state agencies.
Reductions FY 2020 FY 2021
Annualize FY 2019 Holdback -61,970 -61,970
Expansions FY 2020 FY 2021 FY 2022
Provide Funding for an Additional Staff Person to Investigate Homemaker Companion Compliance 73,461 73,190 73,190
AGENCY SUMMARY
Personnel Summary FY 2019 Authorized
FY 2020 Change From
FY 2019
FY 2020 Total Recommended
FY 2021 Change From
FY 2020
FY 2021 Total Recommended
General Fund 218 3 221 3 221
Financial Summary FY 2019 Estimated
FY 2020 Baseline
FY 2020 Total Recommended
FY 2021 Baseline
FY 2021 Total Recommended
Personal Services 12,044,045 13,259,183 13,260,897 14,009,555 14,013,498 Other Expenses 1,134,001 1,144,151 1,153,928 1,141,151 1,148,428
TOTAL - General Fund 13,178,046 14,403,334 14,414,825 15,150,706 15,161,926
TOTAL - ALL FUNDS 13,178,046 14,403,334 14,414,825 15,150,706 15,161,926
Budget Summary
B - 30
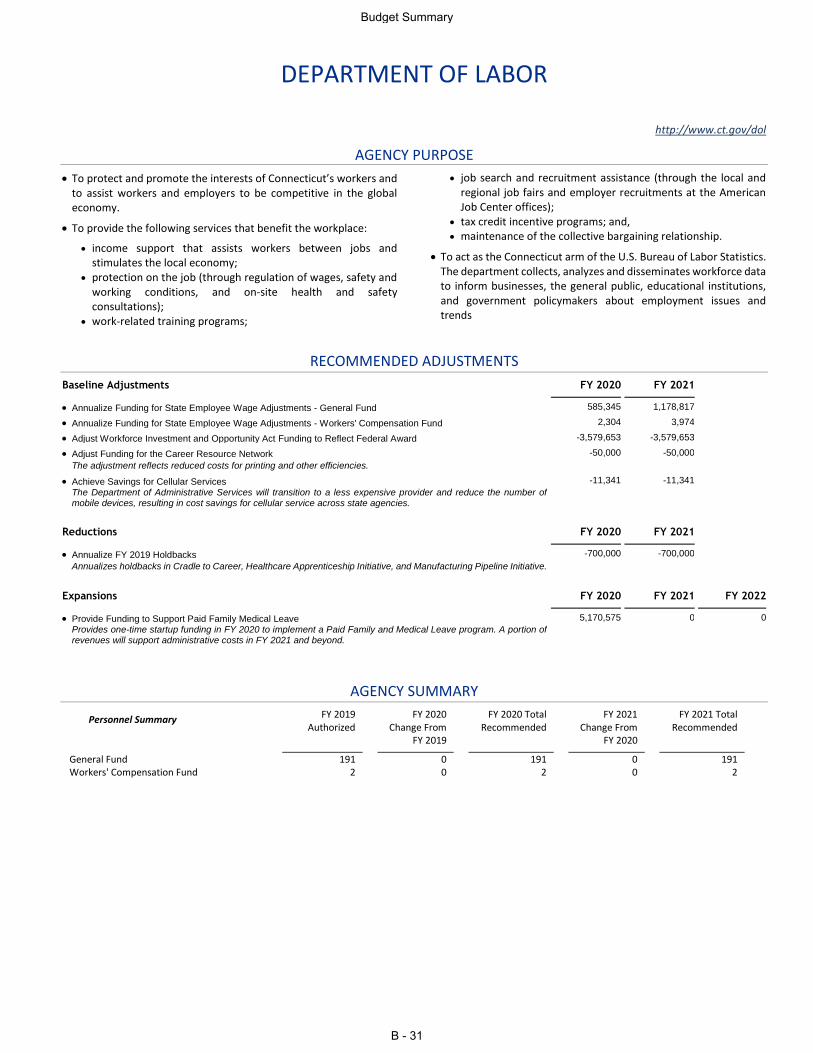
DEPARTMENT OF LABOR
http://www.ct.gov/dol
AGENCY PURPOSE
To protect and promote the interests of Connecticut’s workers and to assist workers and employers to be competitive in the global economy.
To provide the following services that benefit the workplace:
income support that assists workers between jobs and stimulates the local economy;
protection on the job (through regulation of wages, safety and working conditions, and on-site health and safety consultations);
work-related training programs;
job search and recruitment assistance (through the local and regional job fairs and employer recruitments at the American Job Center offices);
tax credit incentive programs; and, maintenance of the collective bargaining relationship.
To act as the Connecticut arm of the U.S. Bureau of Labor Statistics. The department collects, analyzes and disseminates workforce data to inform businesses, the general public, educational institutions, and government policymakers about employment issues and trends
RECOMMENDED ADJUSTMENTS
Baseline Adjustments FY 2020 FY 2021
Annualize Funding for State Employee Wage Adjustments - General Fund 585,345 1,178,817
Annualize Funding for State Employee Wage Adjustments - Workers' Compensation Fund 2,304 3,974
Adjust Workforce Investment and Opportunity Act Funding to Reflect Federal Award -3,579,653 -3,579,653
Adjust Funding for the Career Resource Network -50,000 -50,000
The adjustment reflects reduced costs for printing and other efficiencies.
Achieve Savings for Cellular Services -11,341 -11,341 The Department of Administrative Services will transition to a less expensive provider and reduce the number of mobile devices, resulting in cost savings for cellular service across state agencies.
Reductions FY 2020 FY 2021
Annualize FY 2019 Holdbacks -700,000 -700,000
Annualizes holdbacks in Cradle to Career, Healthcare Apprenticeship Initiative, and Manufacturing Pipeline Initiative.
Expansions FY 2020 FY 2021 FY 2022
Provide Funding to Support Paid Family Medical Leave 5,170,575 0 0 Provides one-time startup funding in FY 2020 to implement a Paid Family and Medical Leave program. A portion of revenues will support administrative costs in FY 2021 and beyond.
AGENCY SUMMARY
Personnel Summary FY 2019 Authorized
FY 2020 Change From
FY 2019
FY 2020 Total Recommended
FY 2021 Change From
FY 2020
FY 2021 Total Recommended
General Fund 191 0 191 0 191 Workers' Compensation Fund 2 0 2 0 2
Budget Summary
B - 31
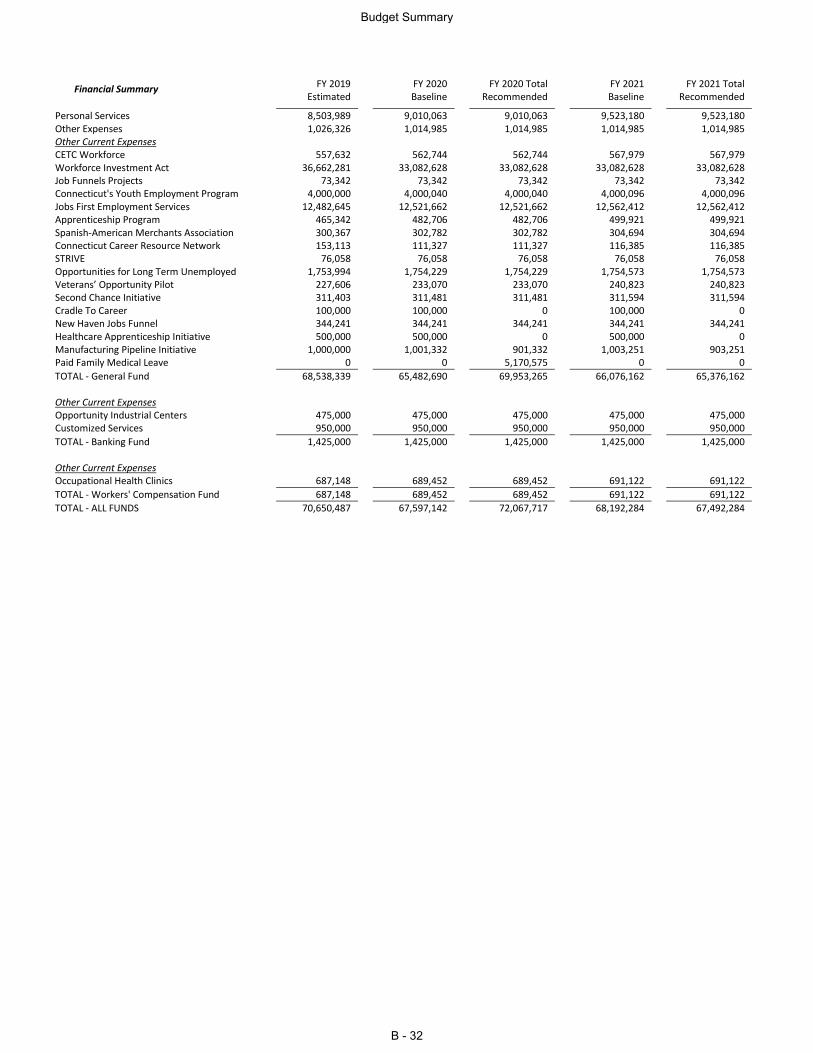
Financial Summary FY 2019 Estimated
FY 2020 Baseline
FY 2020 Total Recommended
FY 2021 Baseline
FY 2021 Total Recommended
Personal Services 8,503,989 9,010,063 9,010,063 9,523,180 9,523,180 Other Expenses 1,026,326 1,014,985 1,014,985 1,014,985 1,014,985 Other Current Expenses CETC Workforce 557,632 562,744 562,744 567,979 567,979 Workforce Investment Act 36,662,281 33,082,628 33,082,628 33,082,628 33,082,628 Job Funnels Projects 73,342 73,342 73,342 73,342 73,342 Connecticut's Youth Employment Program 4,000,000 4,000,040 4,000,040 4,000,096 4,000,096 Jobs First Employment Services 12,482,645 12,521,662 12,521,662 12,562,412 12,562,412 Apprenticeship Program 465,342 482,706 482,706 499,921 499,921 Spanish-American Merchants Association 300,367 302,782 302,782 304,694 304,694 Connecticut Career Resource Network 153,113 111,327 111,327 116,385 116,385 STRIVE 76,058 76,058 76,058 76,058 76,058 Opportunities for Long Term Unemployed 1,753,994 1,754,229 1,754,229 1,754,573 1,754,573 Veterans’ Opportunity Pilot 227,606 233,070 233,070 240,823 240,823 Second Chance Initiative 311,403 311,481 311,481 311,594 311,594 Cradle To Career 100,000 100,000 0 100,000 0 New Haven Jobs Funnel 344,241 344,241 344,241 344,241 344,241 Healthcare Apprenticeship Initiative 500,000 500,000 0 500,000 0 Manufacturing Pipeline Initiative 1,000,000 1,001,332 901,332 1,003,251 903,251 Paid Family Medical Leave 0 0 5,170,575 0 0
TOTAL - General Fund 68,538,339 65,482,690 69,953,265 66,076,162 65,376,162 Other Current Expenses Opportunity Industrial Centers 475,000 475,000 475,000 475,000 475,000 Customized Services 950,000 950,000 950,000 950,000 950,000
TOTAL - Banking Fund 1,425,000 1,425,000 1,425,000 1,425,000 1,425,000 Other Current Expenses Occupational Health Clinics 687,148 689,452 689,452 691,122 691,122
TOTAL - Workers' Compensation Fund 687,148 689,452 689,452 691,122 691,122
TOTAL - ALL FUNDS 70,650,487 67,597,142 72,067,717 68,192,284 67,492,284
Budget Summary
B - 32
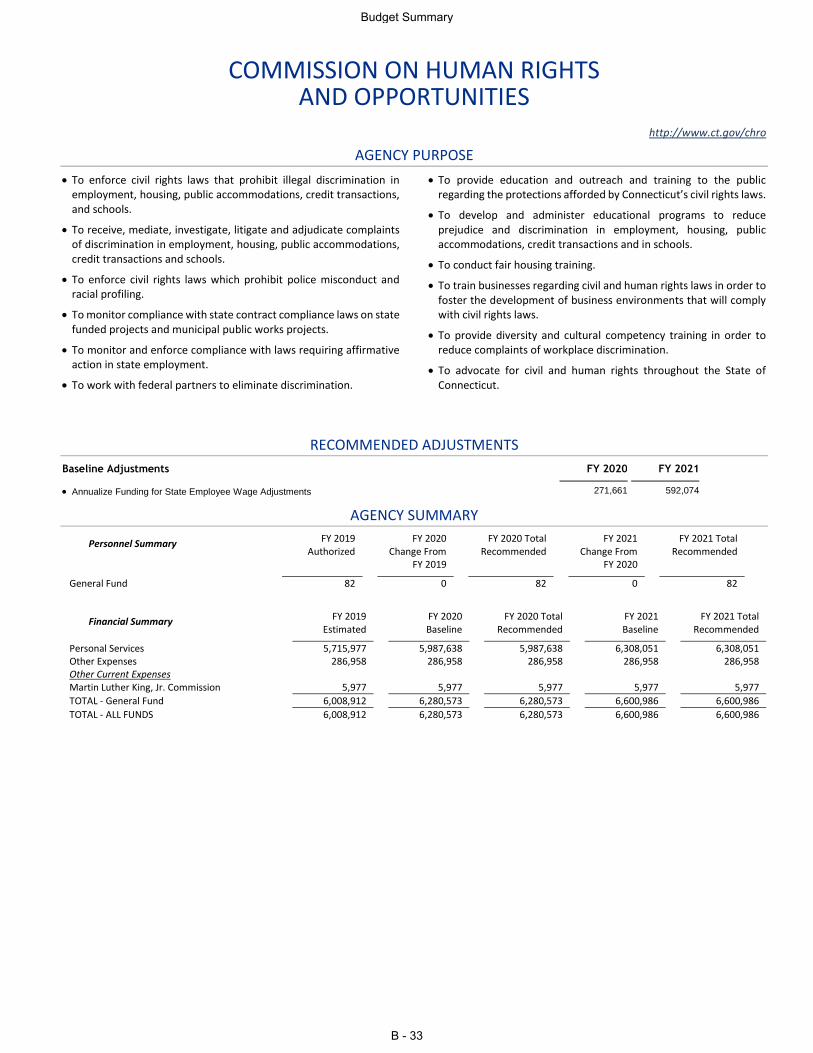
COMMISSION ON HUMAN RIGHTS AND OPPORTUNITIES
http://www.ct.gov/chro
AGENCY PURPOSE
To enforce civil rights laws that prohibit illegal discrimination in employment, housing, public accommodations, credit transactions, and schools.
To receive, mediate, investigate, litigate and adjudicate complaints of discrimination in employment, housing, public accommodations, credit transactions and schools.
To enforce civil rights laws which prohibit police misconduct and racial profiling.
To monitor compliance with state contract compliance laws on state funded projects and municipal public works projects.
To monitor and enforce compliance with laws requiring affirmative action in state employment.
To work with federal partners to eliminate discrimination.
To provide education and outreach and training to the public regarding the protections afforded by Connecticut’s civil rights laws.
To develop and administer educational programs to reduce prejudice and discrimination in employment, housing, public accommodations, credit transactions and in schools.
To conduct fair housing training.
To train businesses regarding civil and human rights laws in order to foster the development of business environments that will comply with civil rights laws.
To provide diversity and cultural competency training in order to reduce complaints of workplace discrimination.
To advocate for civil and human rights throughout the State of Connecticut.
RECOMMENDED ADJUSTMENTS
Baseline Adjustments FY 2020 FY 2021
Annualize Funding for State Employee Wage Adjustments 271,661 592,074
AGENCY SUMMARY
Personnel Summary FY 2019 Authorized
FY 2020 Change From
FY 2019
FY 2020 Total Recommended
FY 2021 Change From
FY 2020
FY 2021 Total Recommended
General Fund 82 0 82 0 82
Financial Summary FY 2019 Estimated
FY 2020 Baseline
FY 2020 Total Recommended
FY 2021 Baseline
FY 2021 Total Recommended
Personal Services 5,715,977 5,987,638 5,987,638 6,308,051 6,308,051 Other Expenses 286,958 286,958 286,958 286,958 286,958 Other Current Expenses Martin Luther King, Jr. Commission 5,977 5,977 5,977 5,977 5,977
TOTAL - General Fund 6,008,912 6,280,573 6,280,573 6,600,986 6,600,986
TOTAL - ALL FUNDS 6,008,912 6,280,573 6,280,573 6,600,986 6,600,986
Budget Summary
B - 33
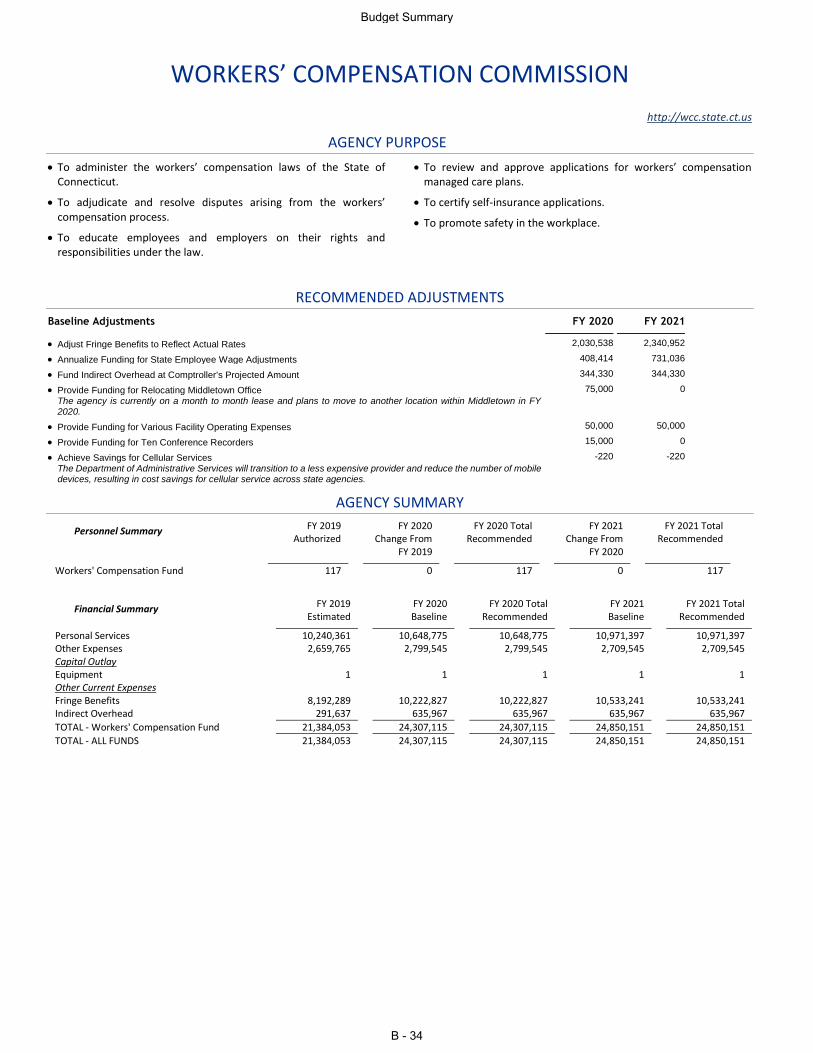
WORKERS’ COMPENSATION COMMISSION
http://wcc.state.ct.us
AGENCY PURPOSE
To administer the workers’ compensation laws of the State of Connecticut.
To adjudicate and resolve disputes arising from the workers’ compensation process.
To educate employees and employers on their rights and responsibilities under the law.
To review and approve applications for workers’ compensation managed care plans.
To certify self-insurance applications.
To promote safety in the workplace.
RECOMMENDED ADJUSTMENTS
Baseline Adjustments FY 2020 FY 2021
Adjust Fringe Benefits to Reflect Actual Rates 2,030,538 2,340,952
Annualize Funding for State Employee Wage Adjustments 408,414 731,036
Fund Indirect Overhead at Comptroller's Projected Amount 344,330 344,330
Provide Funding for Relocating Middletown Office 75,000 0 The agency is currently on a month to month lease and plans to move to another location within Middletown in FY 2020.
Provide Funding for Various Facility Operating Expenses 50,000 50,000
Provide Funding for Ten Conference Recorders 15,000 0
Achieve Savings for Cellular Services -220 -220 The Department of Administrative Services will transition to a less expensive provider and reduce the number of mobile devices, resulting in cost savings for cellular service across state agencies.
AGENCY SUMMARY
Personnel Summary FY 2019 Authorized
FY 2020 Change From
FY 2019
FY 2020 Total Recommended
FY 2021 Change From
FY 2020
FY 2021 Total Recommended
Workers' Compensation Fund 117 0 117 0 117
Financial Summary FY 2019 Estimated
FY 2020 Baseline
FY 2020 Total Recommended
FY 2021 Baseline
FY 2021 Total Recommended
Personal Services 10,240,361 10,648,775 10,648,775 10,971,397 10,971,397 Other Expenses 2,659,765 2,799,545 2,799,545 2,709,545 2,709,545 Capital Outlay Equipment 1 1 1 1 1 Other Current Expenses Fringe Benefits 8,192,289 10,222,827 10,222,827 10,533,241 10,533,241 Indirect Overhead 291,637 635,967 635,967 635,967 635,967
TOTAL - Workers' Compensation Fund 21,384,053 24,307,115 24,307,115 24,850,151 24,850,151
TOTAL - ALL FUNDS 21,384,053 24,307,115 24,307,115 24,850,151 24,850,151
Budget Summary
B - 34
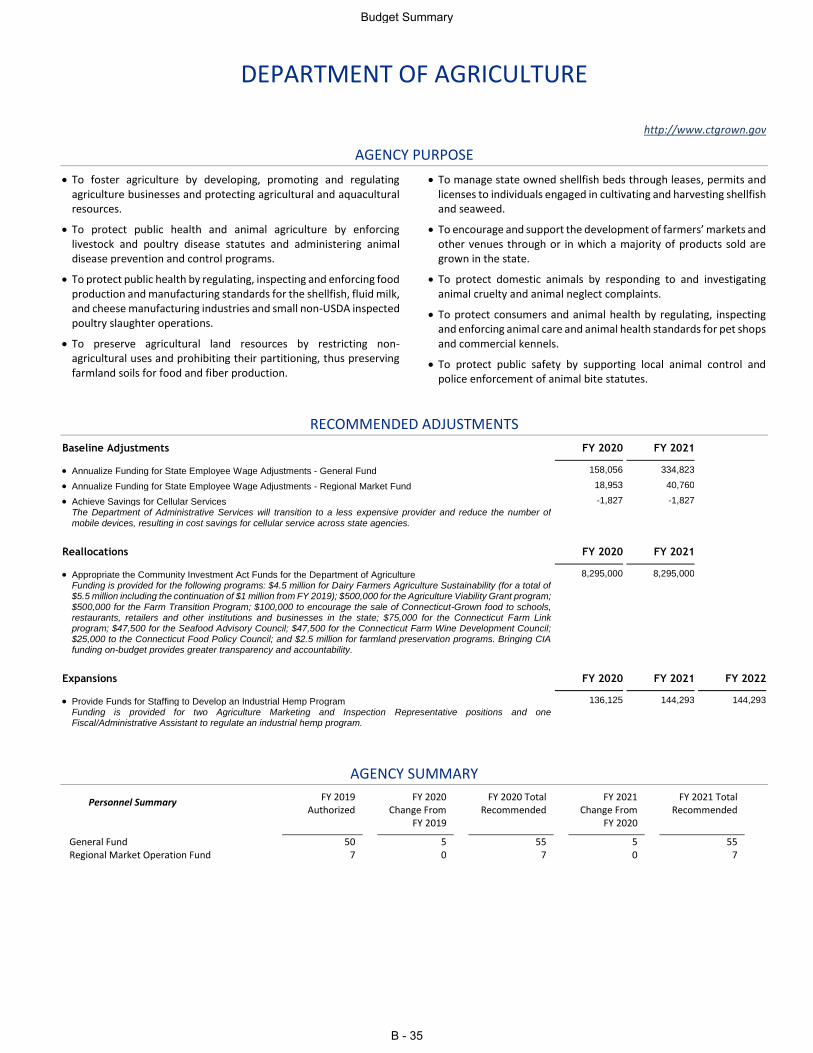
DEPARTMENT OF AGRICULTURE
http://www.ctgrown.gov
AGENCY PURPOSE
To foster agriculture by developing, promoting and regulating agriculture businesses and protecting agricultural and aquacultural resources.
To protect public health and animal agriculture by enforcing livestock and poultry disease statutes and administering animal disease prevention and control programs.
To protect public health by regulating, inspecting and enforcing food production and manufacturing standards for the shellfish, fluid milk, and cheese manufacturing industries and small non-USDA inspected poultry slaughter operations.
To preserve agricultural land resources by restricting non-agricultural uses and prohibiting their partitioning, thus preserving farmland soils for food and fiber production.
To manage state owned shellfish beds through leases, permits and licenses to individuals engaged in cultivating and harvesting shellfish and seaweed.
To encourage and support the development of farmers’ markets and other venues through or in which a majority of products sold are grown in the state.
To protect domestic animals by responding to and investigating animal cruelty and animal neglect complaints.
To protect consumers and animal health by regulating, inspecting and enforcing animal care and animal health standards for pet shops and commercial kennels.
To protect public safety by supporting local animal control and police enforcement of animal bite statutes.
RECOMMENDED ADJUSTMENTS
Baseline Adjustments FY 2020 FY 2021
Annualize Funding for State Employee Wage Adjustments - General Fund 158,056 334,823
Annualize Funding for State Employee Wage Adjustments - Regional Market Fund 18,953 40,760
Achieve Savings for Cellular Services -1,827 -1,827 The Department of Administrative Services will transition to a less expensive provider and reduce the number of
mobile devices, resulting in cost savings for cellular service across state agencies.
Reallocations FY 2020 FY 2021
Appropriate the Community Investment Act Funds for the Department of Agriculture 8,295,000 8,295,000 Funding is provided for the following programs: $4.5 million for Dairy Farmers Agriculture Sustainability (for a total of $5.5 million including the continuation of $1 million from FY 2019); $500,000 for the Agriculture Viability Grant program;
$500,000 for the Farm Transition Program; $100,000 to encourage the sale of Connecticut-Grown food to schools, restaurants, retailers and other institutions and businesses in the state; $75,000 for the Connecticut Farm Link program; $47,500 for the Seafood Advisory Council; $47,500 for the Connecticut Farm Wine Development Council; $25,000 to the Connecticut Food Policy Council; and $2.5 million for farmland preservation programs. Bringing CIA funding on-budget provides greater transparency and accountability.
Expansions FY 2020 FY 2021 FY 2022
Provide Funds for Staffing to Develop an Industrial Hemp Program 136,125 144,293 144,293 Funding is provided for two Agriculture Marketing and Inspection Representative positions and one Fiscal/Administrative Assistant to regulate an industrial hemp program.
AGENCY SUMMARY
Personnel Summary FY 2019 Authorized
FY 2020 Change From
FY 2019
FY 2020 Total Recommended
FY 2021 Change From
FY 2020
FY 2021 Total Recommended
General Fund 50 5 55 5 55 Regional Market Operation Fund 7 0 7 0 7
Budget Summary
B - 35
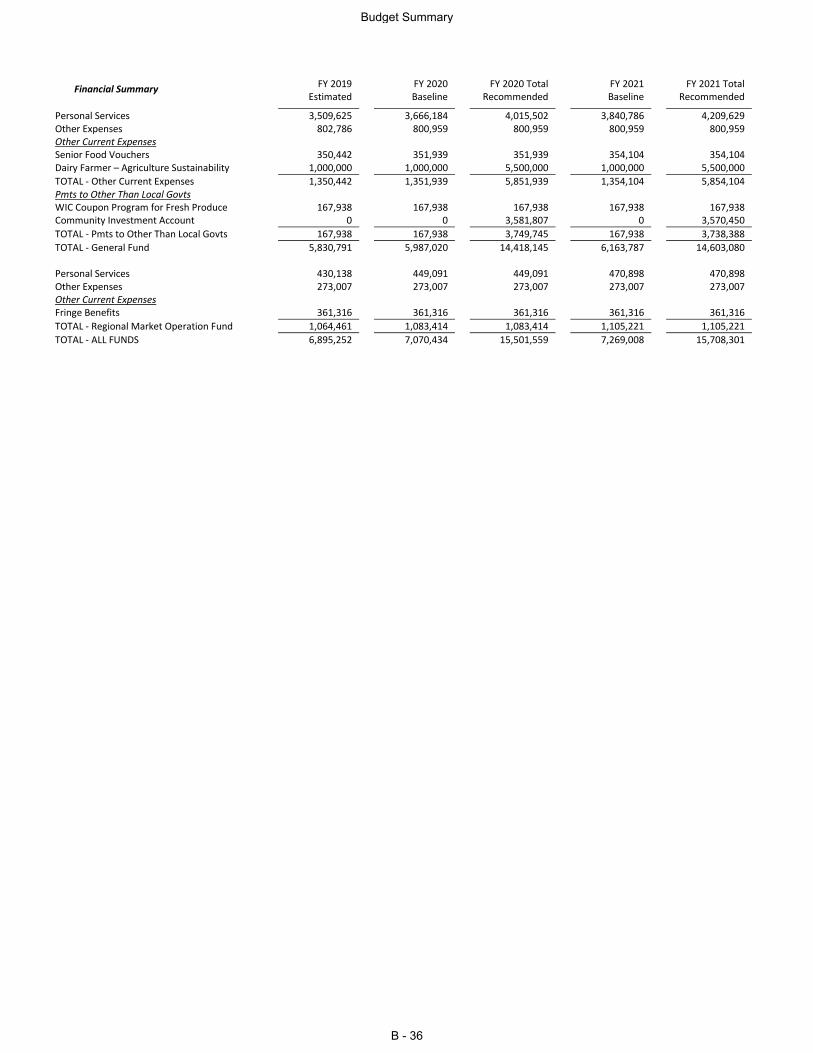
Financial Summary FY 2019 Estimated
FY 2020 Baseline
FY 2020 Total Recommended
FY 2021 Baseline
FY 2021 Total Recommended
Personal Services 3,509,625 3,666,184 4,015,502 3,840,786 4,209,629 Other Expenses 802,786 800,959 800,959 800,959 800,959 Other Current Expenses Senior Food Vouchers 350,442 351,939 351,939 354,104 354,104 Dairy Farmer – Agriculture Sustainability 1,000,000 1,000,000 5,500,000 1,000,000 5,500,000
TOTAL - Other Current Expenses 1,350,442 1,351,939 5,851,939 1,354,104 5,854,104 Pmts to Other Than Local Govts WIC Coupon Program for Fresh Produce 167,938 167,938 167,938 167,938 167,938 Community Investment Account 0 0 3,581,807 0 3,570,450
TOTAL - Pmts to Other Than Local Govts 167,938 167,938 3,749,745 167,938 3,738,388
TOTAL - General Fund 5,830,791 5,987,020 14,418,145 6,163,787 14,603,080 Personal Services 430,138 449,091 449,091 470,898 470,898 Other Expenses 273,007 273,007 273,007 273,007 273,007 Other Current Expenses Fringe Benefits 361,316 361,316 361,316 361,316 361,316
TOTAL - Regional Market Operation Fund 1,064,461 1,083,414 1,083,414 1,105,221 1,105,221
TOTAL - ALL FUNDS 6,895,252 7,070,434 15,501,559 7,269,008 15,708,301
Budget Summary
B - 36
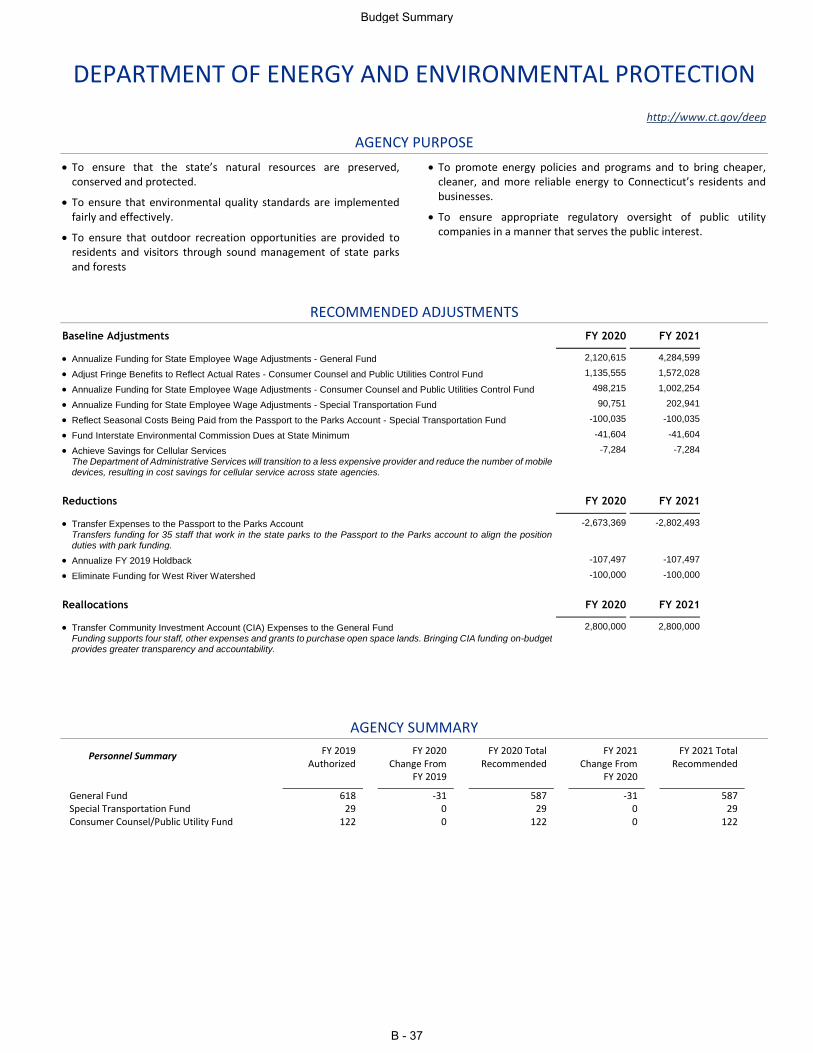
DEPARTMENT OF ENERGY AND ENVIRONMENTAL PROTECTION
http://www.ct.gov/deep
AGENCY PURPOSE
To ensure that the state’s natural resources are preserved, conserved and protected.
To ensure that environmental quality standards are implemented fairly and effectively.
To ensure that outdoor recreation opportunities are provided to residents and visitors through sound management of state parks and forests
To promote energy policies and programs and to bring cheaper, cleaner, and more reliable energy to Connecticut’s residents and businesses.
To ensure appropriate regulatory oversight of public utility companies in a manner that serves the public interest.
RECOMMENDED ADJUSTMENTS
Baseline Adjustments FY 2020 FY 2021
Annualize Funding for State Employee Wage Adjustments - General Fund 2,120,615 4,284,599
Adjust Fringe Benefits to Reflect Actual Rates - Consumer Counsel and Public Utilities Control Fund 1,135,555 1,572,028
Annualize Funding for State Employee Wage Adjustments - Consumer Counsel and Public Utilities Control Fund 498,215 1,002,254
Annualize Funding for State Employee Wage Adjustments - Special Transportation Fund 90,751 202,941
Reflect Seasonal Costs Being Paid from the Passport to the Parks Account - Special Transportation Fund -100,035 -100,035
Fund Interstate Environmental Commission Dues at State Minimum -41,604 -41,604
Achieve Savings for Cellular Services -7,284 -7,284 The Department of Administrative Services will transition to a less expensive provider and reduce the number of mobile devices, resulting in cost savings for cellular service across state agencies.
Reductions FY 2020 FY 2021
Transfer Expenses to the Passport to the Parks Account -2,673,369 -2,802,493 Transfers funding for 35 staff that work in the state parks to the Passport to the Parks account to align the position duties with park funding.
Annualize FY 2019 Holdback -107,497 -107,497
Eliminate Funding for West River Watershed -100,000 -100,000
Reallocations FY 2020 FY 2021
Transfer Community Investment Account (CIA) Expenses to the General Fund 2,800,000 2,800,000 Funding supports four staff, other expenses and grants to purchase open space lands. Bringing CIA funding on-budget provides greater transparency and accountability.
AGENCY SUMMARY
Personnel Summary FY 2019 Authorized
FY 2020 Change From
FY 2019
FY 2020 Total Recommended
FY 2021 Change From
FY 2020
FY 2021 Total Recommended
General Fund 618 -31 587 -31 587 Special Transportation Fund 29 0 29 0 29 Consumer Counsel/Public Utility Fund 122 0 122 0 122
Budget Summary
B - 37
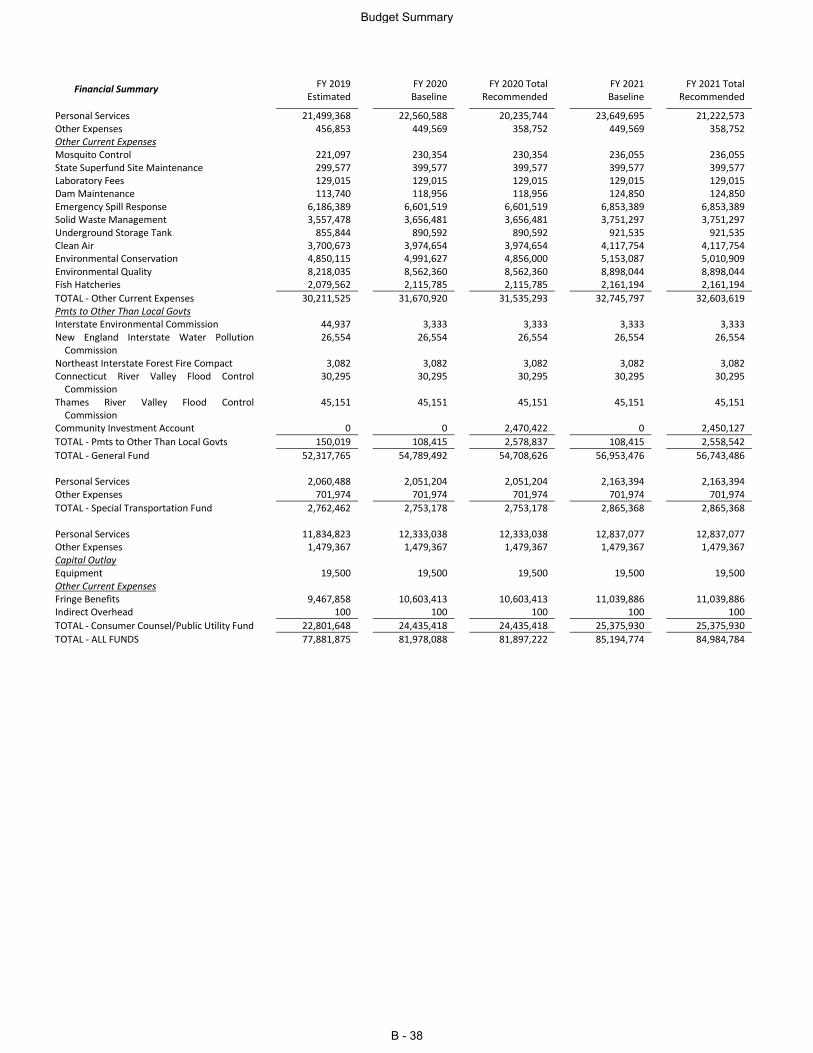
Financial Summary FY 2019 Estimated
FY 2020 Baseline
FY 2020 Total Recommended
FY 2021 Baseline
FY 2021 Total Recommended
Personal Services 21,499,368 22,560,588 20,235,744 23,649,695 21,222,573 Other Expenses 456,853 449,569 358,752 449,569 358,752 Other Current Expenses Mosquito Control 221,097 230,354 230,354 236,055 236,055 State Superfund Site Maintenance 299,577 399,577 399,577 399,577 399,577 Laboratory Fees 129,015 129,015 129,015 129,015 129,015 Dam Maintenance 113,740 118,956 118,956 124,850 124,850 Emergency Spill Response 6,186,389 6,601,519 6,601,519 6,853,389 6,853,389 Solid Waste Management 3,557,478 3,656,481 3,656,481 3,751,297 3,751,297 Underground Storage Tank 855,844 890,592 890,592 921,535 921,535 Clean Air 3,700,673 3,974,654 3,974,654 4,117,754 4,117,754 Environmental Conservation 4,850,115 4,991,627 4,856,000 5,153,087 5,010,909 Environmental Quality 8,218,035 8,562,360 8,562,360 8,898,044 8,898,044 Fish Hatcheries 2,079,562 2,115,785 2,115,785 2,161,194 2,161,194
TOTAL - Other Current Expenses 30,211,525 31,670,920 31,535,293 32,745,797 32,603,619 Pmts to Other Than Local Govts Interstate Environmental Commission 44,937 3,333 3,333 3,333 3,333 New England Interstate Water Pollution
Commission 26,554 26,554 26,554 26,554 26,554
Northeast Interstate Forest Fire Compact 3,082 3,082 3,082 3,082 3,082 Connecticut River Valley Flood Control
Commission 30,295 30,295 30,295 30,295 30,295
Thames River Valley Flood Control Commission
45,151 45,151 45,151 45,151 45,151
Community Investment Account 0 0 2,470,422 0 2,450,127
TOTAL - Pmts to Other Than Local Govts 150,019 108,415 2,578,837 108,415 2,558,542
TOTAL - General Fund 52,317,765 54,789,492 54,708,626 56,953,476 56,743,486 Personal Services 2,060,488 2,051,204 2,051,204 2,163,394 2,163,394 Other Expenses 701,974 701,974 701,974 701,974 701,974
TOTAL - Special Transportation Fund 2,762,462 2,753,178 2,753,178 2,865,368 2,865,368 Personal Services 11,834,823 12,333,038 12,333,038 12,837,077 12,837,077 Other Expenses 1,479,367 1,479,367 1,479,367 1,479,367 1,479,367 Capital Outlay Equipment 19,500 19,500 19,500 19,500 19,500 Other Current Expenses Fringe Benefits 9,467,858 10,603,413 10,603,413 11,039,886 11,039,886 Indirect Overhead 100 100 100 100 100
TOTAL - Consumer Counsel/Public Utility Fund 22,801,648 24,435,418 24,435,418 25,375,930 25,375,930
TOTAL - ALL FUNDS 77,881,875 81,978,088 81,897,222 85,194,774 84,984,784
Budget Summary
B - 38
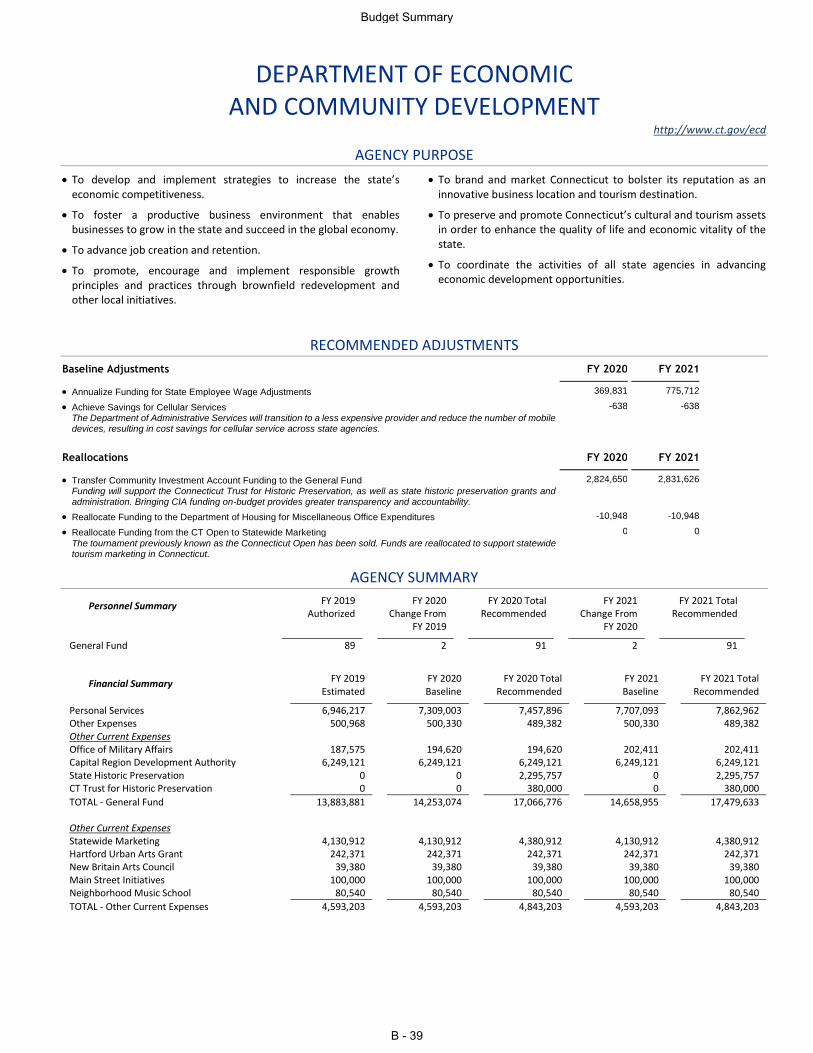
DEPARTMENT OF ECONOMIC AND COMMUNITY DEVELOPMENT
http://www.ct.gov/ecd
AGENCY PURPOSE
To develop and implement strategies to increase the state’s economic competitiveness.
To foster a productive business environment that enables businesses to grow in the state and succeed in the global economy.
To advance job creation and retention.
To promote, encourage and implement responsible growth principles and practices through brownfield redevelopment and other local initiatives.
To brand and market Connecticut to bolster its reputation as an innovative business location and tourism destination.
To preserve and promote Connecticut’s cultural and tourism assets in order to enhance the quality of life and economic vitality of the state.
To coordinate the activities of all state agencies in advancing economic development opportunities.
RECOMMENDED ADJUSTMENTS
Baseline Adjustments FY 2020 FY 2021
Annualize Funding for State Employee Wage Adjustments 369,831 775,712
Achieve Savings for Cellular Services -638 -638 The Department of Administrative Services will transition to a less expensive provider and reduce the number of mobile devices, resulting in cost savings for cellular service across state agencies.
Reallocations FY 2020 FY 2021
Transfer Community Investment Account Funding to the General Fund 2,824,650 2,831,626 Funding will support the Connecticut Trust for Historic Preservation, as well as state historic preservation grants and administration. Bringing CIA funding on-budget provides greater transparency and accountability.
Reallocate Funding to the Department of Housing for Miscellaneous Office Expenditures -10,948 -10,948
Reallocate Funding from the CT Open to Statewide Marketing 0 0 The tournament previously known as the Connecticut Open has been sold. Funds are reallocated to support statewide tourism marketing in Connecticut.
AGENCY SUMMARY
Personnel Summary FY 2019 Authorized
FY 2020 Change From
FY 2019
FY 2020 Total Recommended
FY 2021 Change From
FY 2020
FY 2021 Total Recommended
General Fund 89 2 91 2 91
Financial Summary FY 2019 Estimated
FY 2020 Baseline
FY 2020 Total Recommended
FY 2021 Baseline
FY 2021 Total Recommended
Personal Services 6,946,217 7,309,003 7,457,896 7,707,093 7,862,962 Other Expenses 500,968 500,330 489,382 500,330 489,382 Other Current Expenses Office of Military Affairs 187,575 194,620 194,620 202,411 202,411 Capital Region Development Authority 6,249,121 6,249,121 6,249,121 6,249,121 6,249,121 State Historic Preservation 0 0 2,295,757 0 2,295,757 CT Trust for Historic Preservation 0 0 380,000 0 380,000
TOTAL - General Fund 13,883,881 14,253,074 17,066,776 14,658,955 17,479,633 Other Current Expenses Statewide Marketing 4,130,912 4,130,912 4,380,912 4,130,912 4,380,912 Hartford Urban Arts Grant 242,371 242,371 242,371 242,371 242,371 New Britain Arts Council 39,380 39,380 39,380 39,380 39,380 Main Street Initiatives 100,000 100,000 100,000 100,000 100,000 Neighborhood Music School 80,540 80,540 80,540 80,540 80,540
TOTAL - Other Current Expenses 4,593,203 4,593,203 4,843,203 4,593,203 4,843,203
Budget Summary
B - 39
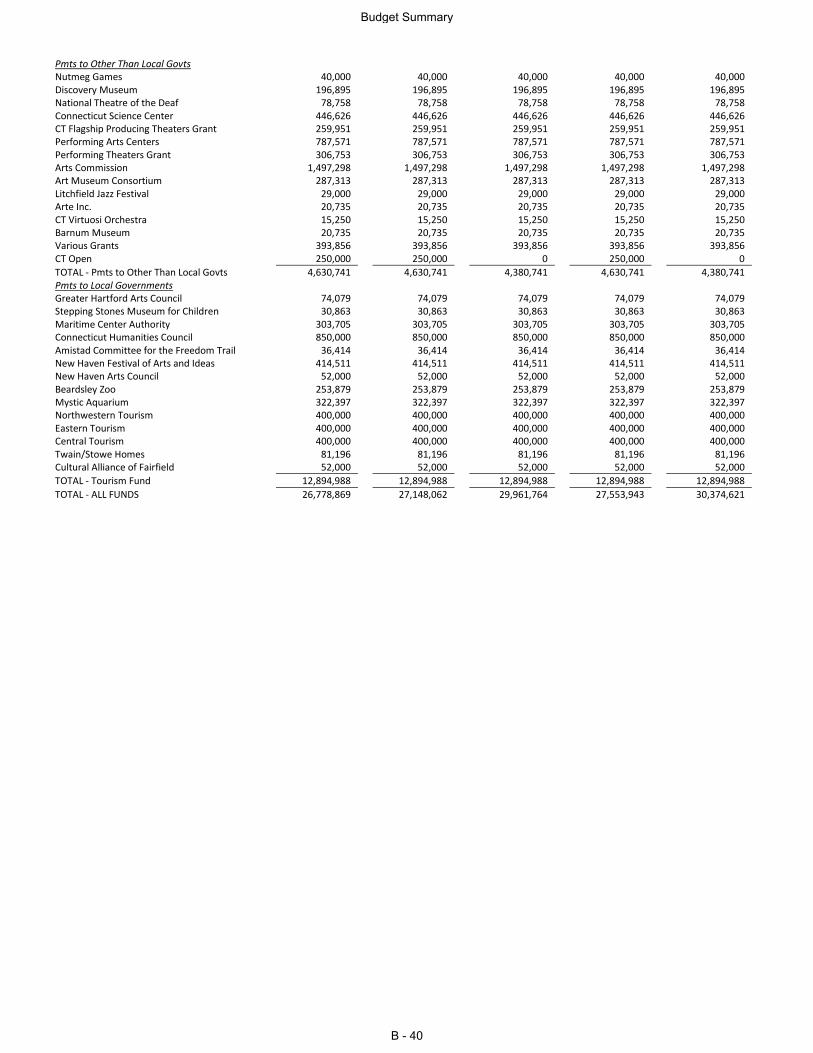
Pmts to Other Than Local Govts Nutmeg Games 40,000 40,000 40,000 40,000 40,000 Discovery Museum 196,895 196,895 196,895 196,895 196,895 National Theatre of the Deaf 78,758 78,758 78,758 78,758 78,758 Connecticut Science Center 446,626 446,626 446,626 446,626 446,626 CT Flagship Producing Theaters Grant 259,951 259,951 259,951 259,951 259,951 Performing Arts Centers 787,571 787,571 787,571 787,571 787,571 Performing Theaters Grant 306,753 306,753 306,753 306,753 306,753 Arts Commission 1,497,298 1,497,298 1,497,298 1,497,298 1,497,298 Art Museum Consortium 287,313 287,313 287,313 287,313 287,313 Litchfield Jazz Festival 29,000 29,000 29,000 29,000 29,000 Arte Inc. 20,735 20,735 20,735 20,735 20,735 CT Virtuosi Orchestra 15,250 15,250 15,250 15,250 15,250 Barnum Museum 20,735 20,735 20,735 20,735 20,735 Various Grants 393,856 393,856 393,856 393,856 393,856 CT Open 250,000 250,000 0 250,000 0
TOTAL - Pmts to Other Than Local Govts 4,630,741 4,630,741 4,380,741 4,630,741 4,380,741 Pmts to Local Governments Greater Hartford Arts Council 74,079 74,079 74,079 74,079 74,079 Stepping Stones Museum for Children 30,863 30,863 30,863 30,863 30,863 Maritime Center Authority 303,705 303,705 303,705 303,705 303,705 Connecticut Humanities Council 850,000 850,000 850,000 850,000 850,000 Amistad Committee for the Freedom Trail 36,414 36,414 36,414 36,414 36,414 New Haven Festival of Arts and Ideas 414,511 414,511 414,511 414,511 414,511 New Haven Arts Council 52,000 52,000 52,000 52,000 52,000 Beardsley Zoo 253,879 253,879 253,879 253,879 253,879 Mystic Aquarium 322,397 322,397 322,397 322,397 322,397 Northwestern Tourism 400,000 400,000 400,000 400,000 400,000 Eastern Tourism 400,000 400,000 400,000 400,000 400,000 Central Tourism 400,000 400,000 400,000 400,000 400,000 Twain/Stowe Homes 81,196 81,196 81,196 81,196 81,196 Cultural Alliance of Fairfield 52,000 52,000 52,000 52,000 52,000
TOTAL - Tourism Fund 12,894,988 12,894,988 12,894,988 12,894,988 12,894,988
TOTAL - ALL FUNDS 26,778,869 27,148,062 29,961,764 27,553,943 30,374,621
Budget Summary
B - 40
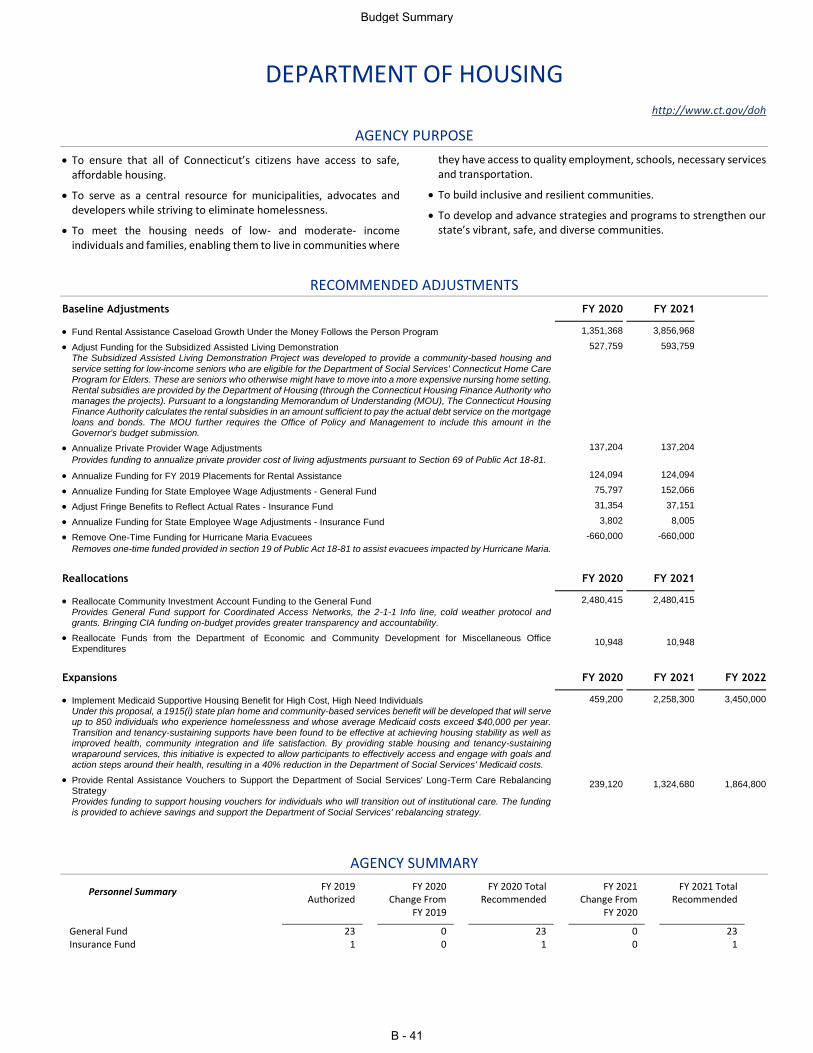
DEPARTMENT OF HOUSING
http://www.ct.gov/doh
AGENCY PURPOSE
To ensure that all of Connecticut’s citizens have access to safe, affordable housing.
To serve as a central resource for municipalities, advocates and developers while striving to eliminate homelessness.
To meet the housing needs of low- and moderate- income individuals and families, enabling them to live in communities where
they have access to quality employment, schools, necessary services and transportation.
To build inclusive and resilient communities.
To develop and advance strategies and programs to strengthen our state’s vibrant, safe, and diverse communities.
RECOMMENDED ADJUSTMENTS
Baseline Adjustments FY 2020 FY 2021
Fund Rental Assistance Caseload Growth Under the Money Follows the Person Program 1,351,368 3,856,968
Adjust Funding for the Subsidized Assisted Living Demonstration 527,759 593,759 The Subsidized Assisted Living Demonstration Project was developed to provide a community-based housing and
service setting for low-income seniors who are eligible for the Department of Social Services' Connecticut Home Care Program for Elders. These are seniors who otherwise might have to move into a more expensive nursing home setting. Rental subsidies are provided by the Department of Housing (through the Connecticut Housing Finance Authority who manages the projects). Pursuant to a longstanding Memorandum of Understanding (MOU), The Connecticut Housing Finance Authority calculates the rental subsidies in an amount sufficient to pay the actual debt service on the mortgage loans and bonds. The MOU further requires the Office of Policy and Management to include this amount in the Governor's budget submission.
Annualize Private Provider Wage Adjustments 137,204 137,204
Provides funding to annualize private provider cost of living adjustments pursuant to Section 69 of Public Act 18-81.
Annualize Funding for FY 2019 Placements for Rental Assistance 124,094 124,094
Annualize Funding for State Employee Wage Adjustments - General Fund 75,797 152,066
Adjust Fringe Benefits to Reflect Actual Rates - Insurance Fund 31,354 37,151
Annualize Funding for State Employee Wage Adjustments - Insurance Fund 3,802 8,005
Remove One-Time Funding for Hurricane Maria Evacuees -660,000 -660,000
Removes one-time funded provided in section 19 of Public Act 18-81 to assist evacuees impacted by Hurricane Maria.
Reallocations FY 2020 FY 2021
Reallocate Community Investment Account Funding to the General Fund 2,480,415 2,480,415 Provides General Fund support for Coordinated Access Networks, the 2-1-1 Info line, cold weather protocol and grants. Bringing CIA funding on-budget provides greater transparency and accountability.
Reallocate Funds from the Department of Economic and Community Development for Miscellaneous Office Expenditures
10,948 10,948
Expansions FY 2020 FY 2021 FY 2022
Implement Medicaid Supportive Housing Benefit for High Cost, High Need Individuals 459,200 2,258,300 3,450,000 Under this proposal, a 1915(i) state plan home and community-based services benefit will be developed that will serve up to 850 individuals who experience homelessness and whose average Medicaid costs exceed $40,000 per year. Transition and tenancy-sustaining supports have been found to be effective at achieving housing stability as well as improved health, community integration and life satisfaction. By providing stable housing and tenancy-sustaining wraparound services, this initiative is expected to allow participants to effectively access and engage with goals and action steps around their health, resulting in a 40% reduction in the Department of Social Services' Medicaid costs.
Provide Rental Assistance Vouchers to Support the Department of Social Services' Long-Term Care Rebalancing Strategy
239,120 1,324,680 1,864,800
Provides funding to support housing vouchers for individuals who will transition out of institutional care. The funding is provided to achieve savings and support the Department of Social Services' rebalancing strategy.
AGENCY SUMMARY
Personnel Summary FY 2019 Authorized
FY 2020 Change From
FY 2019
FY 2020 Total Recommended
FY 2021 Change From
FY 2020
FY 2021 Total Recommended
General Fund 23 0 23 0 23 Insurance Fund 1 0 1 0 1
Budget Summary
B - 41
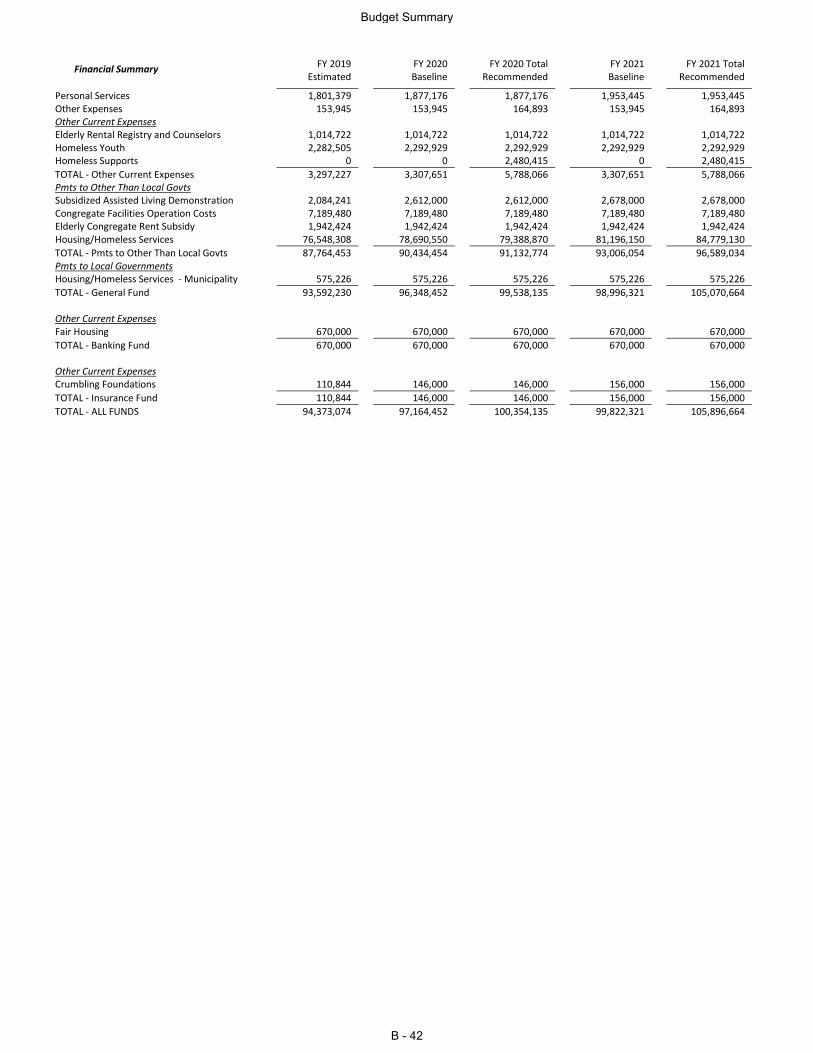
Financial Summary FY 2019 Estimated
FY 2020 Baseline
FY 2020 Total Recommended
FY 2021 Baseline
FY 2021 Total Recommended
Personal Services 1,801,379 1,877,176 1,877,176 1,953,445 1,953,445 Other Expenses 153,945 153,945 164,893 153,945 164,893 Other Current Expenses Elderly Rental Registry and Counselors 1,014,722 1,014,722 1,014,722 1,014,722 1,014,722 Homeless Youth 2,282,505 2,292,929 2,292,929 2,292,929 2,292,929 Homeless Supports 0 0 2,480,415 0 2,480,415
TOTAL - Other Current Expenses 3,297,227 3,307,651 5,788,066 3,307,651 5,788,066 Pmts to Other Than Local Govts Subsidized Assisted Living Demonstration 2,084,241 2,612,000 2,612,000 2,678,000 2,678,000 Congregate Facilities Operation Costs 7,189,480 7,189,480 7,189,480 7,189,480 7,189,480 Elderly Congregate Rent Subsidy 1,942,424 1,942,424 1,942,424 1,942,424 1,942,424 Housing/Homeless Services 76,548,308 78,690,550 79,388,870 81,196,150 84,779,130
TOTAL - Pmts to Other Than Local Govts 87,764,453 90,434,454 91,132,774 93,006,054 96,589,034 Pmts to Local Governments Housing/Homeless Services - Municipality 575,226 575,226 575,226 575,226 575,226
TOTAL - General Fund 93,592,230 96,348,452 99,538,135 98,996,321 105,070,664 Other Current Expenses Fair Housing 670,000 670,000 670,000 670,000 670,000
TOTAL - Banking Fund 670,000 670,000 670,000 670,000 670,000 Other Current Expenses Crumbling Foundations 110,844 146,000 146,000 156,000 156,000
TOTAL - Insurance Fund 110,844 146,000 146,000 156,000 156,000
TOTAL - ALL FUNDS 94,373,074 97,164,452 100,354,135 99,822,321 105,896,664
Budget Summary
B - 42
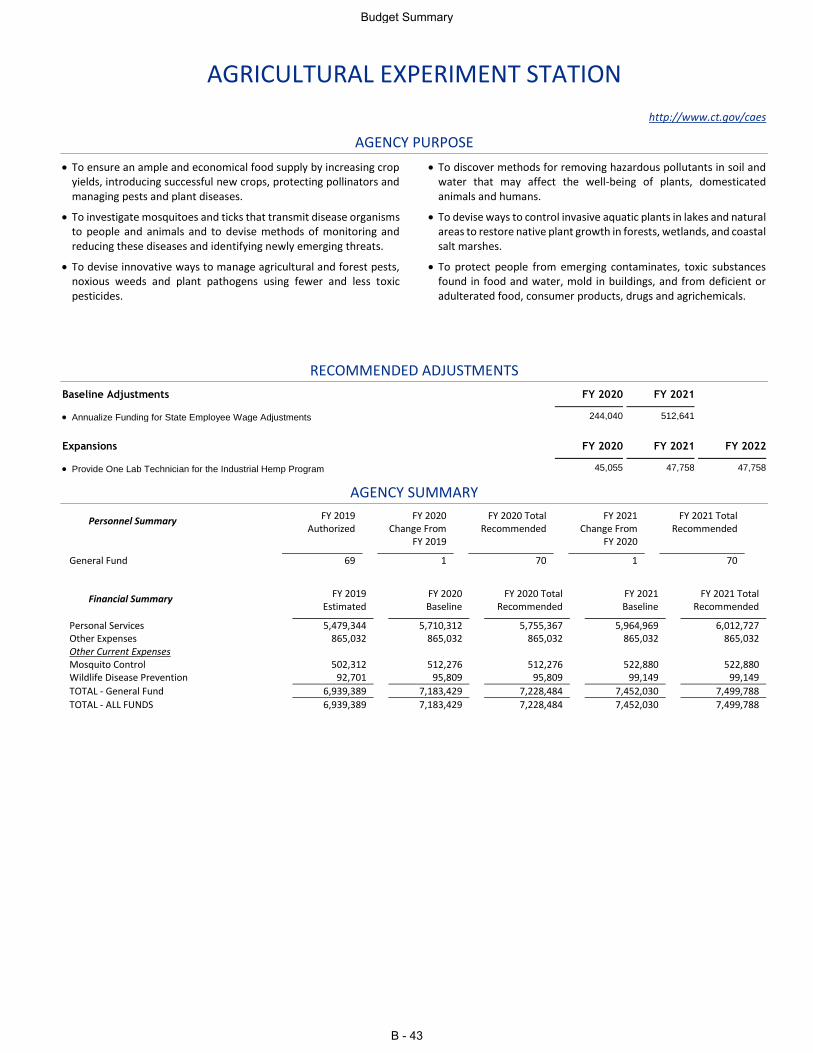
AGRICULTURAL EXPERIMENT STATION
http://www.ct.gov/caes
AGENCY PURPOSE
To ensure an ample and economical food supply by increasing crop yields, introducing successful new crops, protecting pollinators and managing pests and plant diseases.
To investigate mosquitoes and ticks that transmit disease organisms to people and animals and to devise methods of monitoring and reducing these diseases and identifying newly emerging threats.
To devise innovative ways to manage agricultural and forest pests, noxious weeds and plant pathogens using fewer and less toxic pesticides.
To discover methods for removing hazardous pollutants in soil and water that may affect the well-being of plants, domesticated animals and humans.
To devise ways to control invasive aquatic plants in lakes and natural areas to restore native plant growth in forests, wetlands, and coastal salt marshes.
To protect people from emerging contaminates, toxic substances found in food and water, mold in buildings, and from deficient or adulterated food, consumer products, drugs and agrichemicals.
RECOMMENDED ADJUSTMENTS
Baseline Adjustments FY 2020 FY 2021
Annualize Funding for State Employee Wage Adjustments 244,040 512,641
Expansions FY 2020 FY 2021 FY 2022
Provide One Lab Technician for the Industrial Hemp Program 45,055 47,758 47,758
AGENCY SUMMARY
Personnel Summary FY 2019 Authorized
FY 2020 Change From
FY 2019
FY 2020 Total Recommended
FY 2021 Change From
FY 2020
FY 2021 Total Recommended
General Fund 69 1 70 1 70
Financial Summary FY 2019 Estimated
FY 2020 Baseline
FY 2020 Total Recommended
FY 2021 Baseline
FY 2021 Total Recommended
Personal Services 5,479,344 5,710,312 5,755,367 5,964,969 6,012,727 Other Expenses 865,032 865,032 865,032 865,032 865,032 Other Current Expenses Mosquito Control 502,312 512,276 512,276 522,880 522,880 Wildlife Disease Prevention 92,701 95,809 95,809 99,149 99,149
TOTAL - General Fund 6,939,389 7,183,429 7,228,484 7,452,030 7,499,788
TOTAL - ALL FUNDS 6,939,389 7,183,429 7,228,484 7,452,030 7,499,788
Budget Summary
B - 43
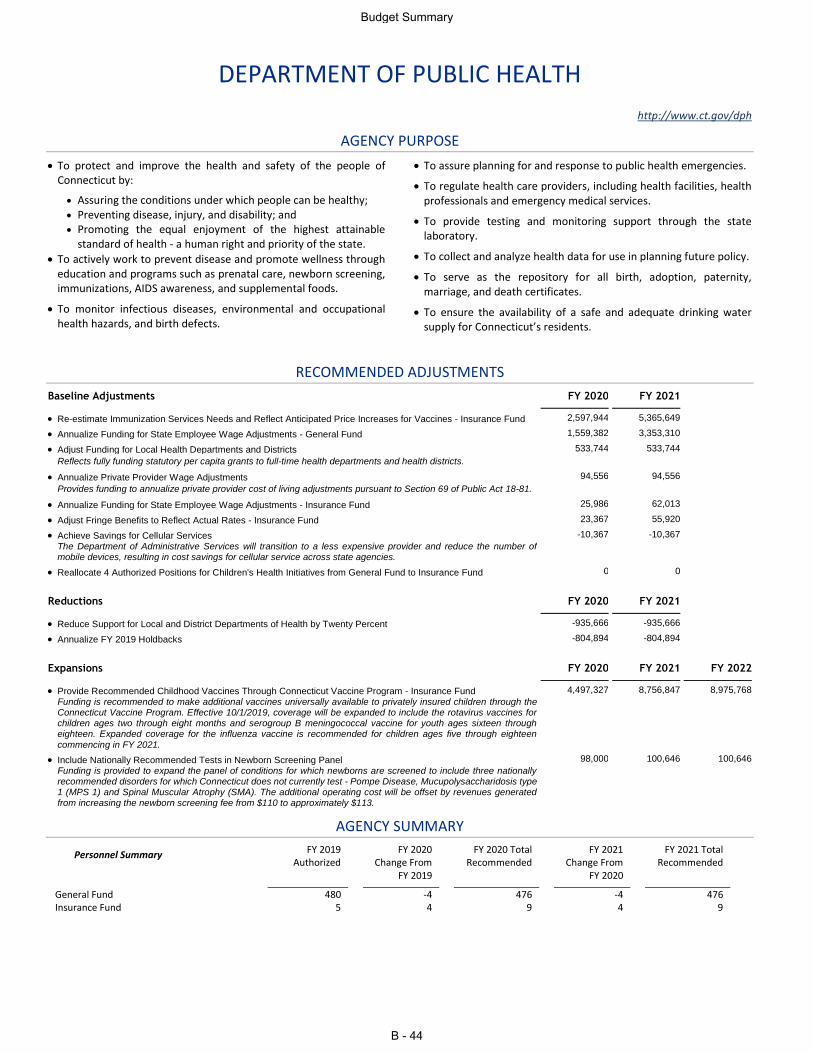
DEPARTMENT OF PUBLIC HEALTH
http://www.ct.gov/dph
AGENCY PURPOSE
To protect and improve the health and safety of the people of Connecticut by:
Assuring the conditions under which people can be healthy; Preventing disease, injury, and disability; and Promoting the equal enjoyment of the highest attainable
standard of health - a human right and priority of the state.
To actively work to prevent disease and promote wellness through education and programs such as prenatal care, newborn screening, immunizations, AIDS awareness, and supplemental foods.
To monitor infectious diseases, environmental and occupational health hazards, and birth defects.
To assure planning for and response to public health emergencies.
To regulate health care providers, including health facilities, health professionals and emergency medical services.
To provide testing and monitoring support through the state laboratory.
To collect and analyze health data for use in planning future policy.
To serve as the repository for all birth, adoption, paternity, marriage, and death certificates.
To ensure the availability of a safe and adequate drinking water supply for Connecticut’s residents.
RECOMMENDED ADJUSTMENTS
Baseline Adjustments FY 2020 FY 2021
Re-estimate Immunization Services Needs and Reflect Anticipated Price Increases for Vaccines - Insurance Fund 2,597,944 5,365,649
Annualize Funding for State Employee Wage Adjustments - General Fund 1,559,382 3,353,310
Adjust Funding for Local Health Departments and Districts 533,744 533,744
Reflects fully funding statutory per capita grants to full-time health departments and health districts.
Annualize Private Provider Wage Adjustments 94,556 94,556
Provides funding to annualize private provider cost of living adjustments pursuant to Section 69 of Public Act 18-81.
Annualize Funding for State Employee Wage Adjustments - Insurance Fund 25,986 62,013
Adjust Fringe Benefits to Reflect Actual Rates - Insurance Fund 23,367 55,920
Achieve Savings for Cellular Services -10,367 -10,367 The Department of Administrative Services will transition to a less expensive provider and reduce the number of mobile devices, resulting in cost savings for cellular service across state agencies.
Reallocate 4 Authorized Positions for Children's Health Initiatives from General Fund to Insurance Fund 0 0
Reductions FY 2020 FY 2021
Reduce Support for Local and District Departments of Health by Twenty Percent -935,666 -935,666
Annualize FY 2019 Holdbacks -804,894 -804,894
Expansions FY 2020 FY 2021 FY 2022
Provide Recommended Childhood Vaccines Through Connecticut Vaccine Program - Insurance Fund 4,497,327 8,756,847 8,975,768 Funding is recommended to make additional vaccines universally available to privately insured children through the Connecticut Vaccine Program. Effective 10/1/2019, coverage will be expanded to include the rotavirus vaccines for children ages two through eight months and serogroup B meningococcal vaccine for youth ages sixteen through eighteen. Expanded coverage for the influenza vaccine is recommended for children ages five through eighteen
commencing in FY 2021.
Include Nationally Recommended Tests in Newborn Screening Panel 98,000 100,646 100,646 Funding is provided to expand the panel of conditions for which newborns are screened to include three nationally recommended disorders for which Connecticut does not currently test - Pompe Disease, Mucupolysaccharidosis type 1 (MPS 1) and Spinal Muscular Atrophy (SMA). The additional operating cost will be offset by revenues generated from increasing the newborn screening fee from $110 to approximately $113.
AGENCY SUMMARY
Personnel Summary FY 2019 Authorized
FY 2020 Change From
FY 2019
FY 2020 Total Recommended
FY 2021 Change From
FY 2020
FY 2021 Total Recommended
General Fund 480 -4 476 -4 476 Insurance Fund 5 4 9 4 9
Budget Summary
B - 44
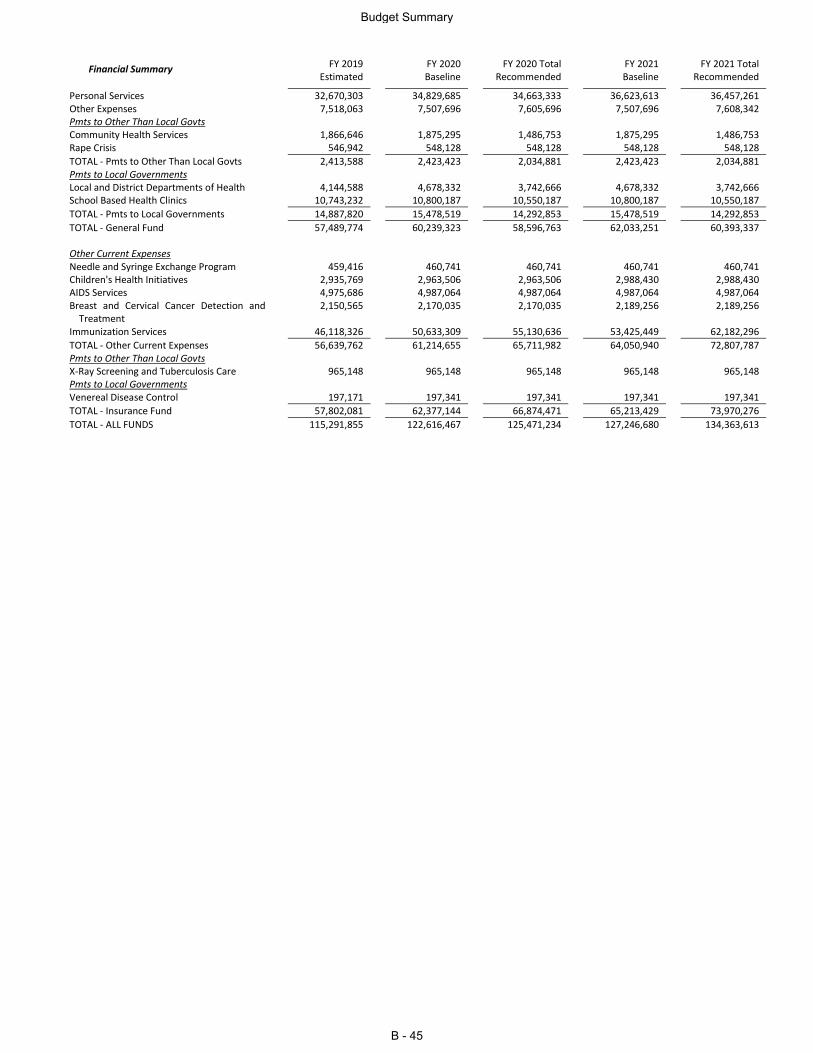
Financial Summary FY 2019 Estimated
FY 2020 Baseline
FY 2020 Total Recommended
FY 2021 Baseline
FY 2021 Total Recommended
Personal Services 32,670,303 34,829,685 34,663,333 36,623,613 36,457,261 Other Expenses 7,518,063 7,507,696 7,605,696 7,507,696 7,608,342 Pmts to Other Than Local Govts Community Health Services 1,866,646 1,875,295 1,486,753 1,875,295 1,486,753 Rape Crisis 546,942 548,128 548,128 548,128 548,128
TOTAL - Pmts to Other Than Local Govts 2,413,588 2,423,423 2,034,881 2,423,423 2,034,881 Pmts to Local Governments Local and District Departments of Health 4,144,588 4,678,332 3,742,666 4,678,332 3,742,666 School Based Health Clinics 10,743,232 10,800,187 10,550,187 10,800,187 10,550,187
TOTAL - Pmts to Local Governments 14,887,820 15,478,519 14,292,853 15,478,519 14,292,853
TOTAL - General Fund 57,489,774 60,239,323 58,596,763 62,033,251 60,393,337 Other Current Expenses Needle and Syringe Exchange Program 459,416 460,741 460,741 460,741 460,741 Children's Health Initiatives 2,935,769 2,963,506 2,963,506 2,988,430 2,988,430 AIDS Services 4,975,686 4,987,064 4,987,064 4,987,064 4,987,064 Breast and Cervical Cancer Detection and
Treatment 2,150,565 2,170,035 2,170,035 2,189,256 2,189,256
Immunization Services 46,118,326 50,633,309 55,130,636 53,425,449 62,182,296
TOTAL - Other Current Expenses 56,639,762 61,214,655 65,711,982 64,050,940 72,807,787 Pmts to Other Than Local Govts X-Ray Screening and Tuberculosis Care 965,148 965,148 965,148 965,148 965,148 Pmts to Local Governments Venereal Disease Control 197,171 197,341 197,341 197,341 197,341
TOTAL - Insurance Fund 57,802,081 62,377,144 66,874,471 65,213,429 73,970,276
TOTAL - ALL FUNDS 115,291,855 122,616,467 125,471,234 127,246,680 134,363,613
Budget Summary
B - 45
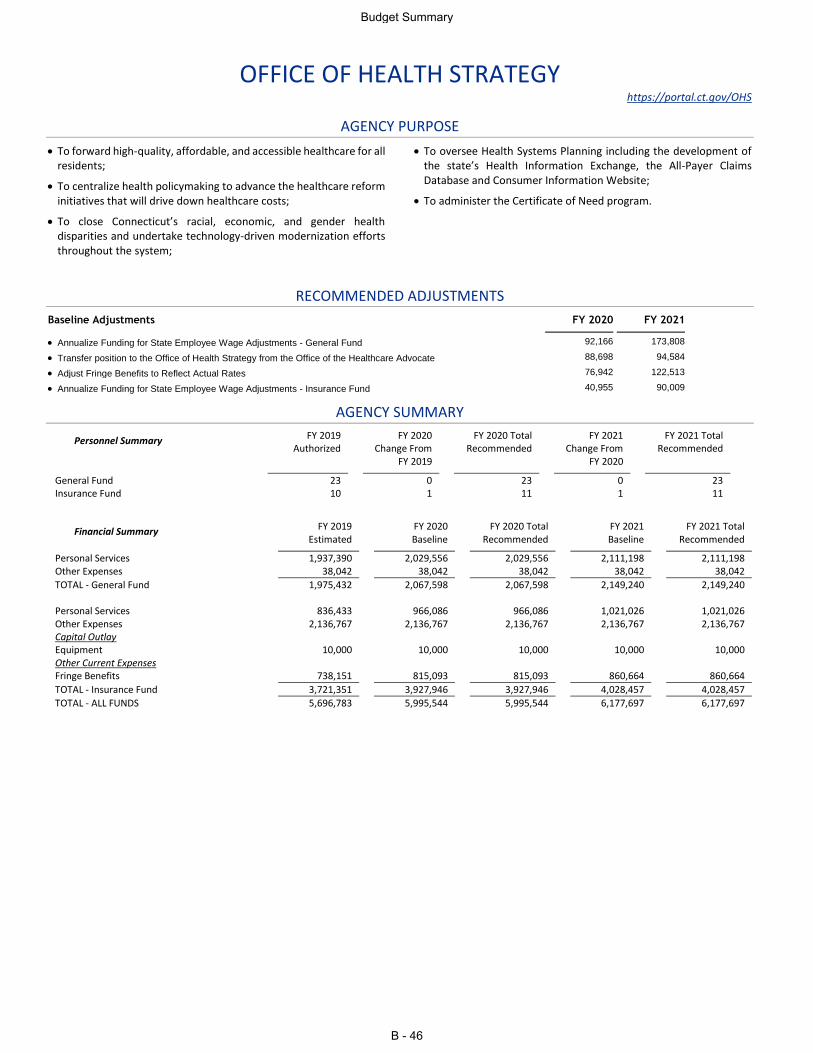
OFFICE OF HEALTH STRATEGY https://portal.ct.gov/OHS
AGENCY PURPOSE
To forward high-quality, affordable, and accessible healthcare for all residents;
To centralize health policymaking to advance the healthcare reform initiatives that will drive down healthcare costs;
To close Connecticut’s racial, economic, and gender health disparities and undertake technology-driven modernization efforts throughout the system;
To oversee Health Systems Planning including the development of the state’s Health Information Exchange, the All-Payer Claims Database and Consumer Information Website;
To administer the Certificate of Need program.
RECOMMENDED ADJUSTMENTS
Baseline Adjustments FY 2020 FY 2021
Annualize Funding for State Employee Wage Adjustments - General Fund 92,166 173,808
Transfer position to the Office of Health Strategy from the Office of the Healthcare Advocate 88,698 94,584
Adjust Fringe Benefits to Reflect Actual Rates 76,942 122,513
Annualize Funding for State Employee Wage Adjustments - Insurance Fund 40,955 90,009
AGENCY SUMMARY
Personnel Summary FY 2019 Authorized
FY 2020 Change From
FY 2019
FY 2020 Total Recommended
FY 2021 Change From
FY 2020
FY 2021 Total Recommended
General Fund 23 0 23 0 23 Insurance Fund 10 1 11 1 11
Financial Summary FY 2019 Estimated
FY 2020 Baseline
FY 2020 Total Recommended
FY 2021 Baseline
FY 2021 Total Recommended
Personal Services 1,937,390 2,029,556 2,029,556 2,111,198 2,111,198 Other Expenses 38,042 38,042 38,042 38,042 38,042
TOTAL - General Fund 1,975,432 2,067,598 2,067,598 2,149,240 2,149,240 Personal Services 836,433 966,086 966,086 1,021,026 1,021,026 Other Expenses 2,136,767 2,136,767 2,136,767 2,136,767 2,136,767 Capital Outlay Equipment 10,000 10,000 10,000 10,000 10,000 Other Current Expenses Fringe Benefits 738,151 815,093 815,093 860,664 860,664
TOTAL - Insurance Fund 3,721,351 3,927,946 3,927,946 4,028,457 4,028,457
TOTAL - ALL FUNDS 5,696,783 5,995,544 5,995,544 6,177,697 6,177,697
Budget Summary
B - 46
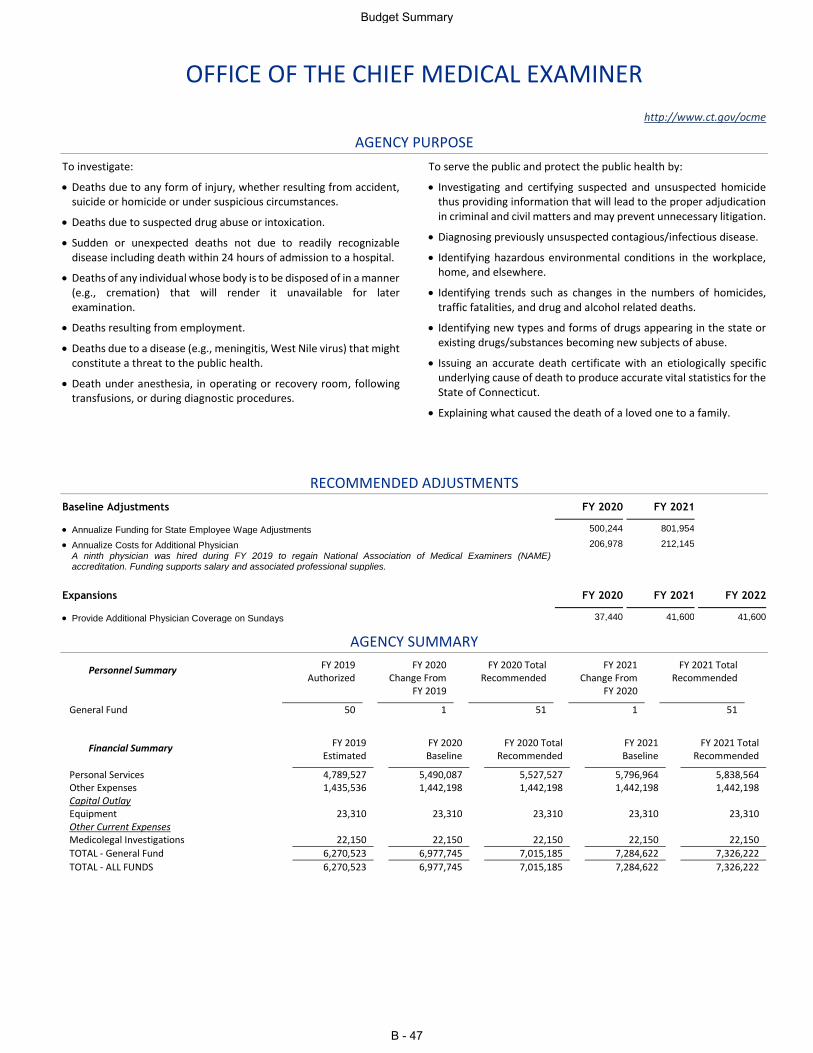
OFFICE OF THE CHIEF MEDICAL EXAMINER
http://www.ct.gov/ocme
AGENCY PURPOSE
To investigate:
Deaths due to any form of injury, whether resulting from accident, suicide or homicide or under suspicious circumstances.
Deaths due to suspected drug abuse or intoxication.
Sudden or unexpected deaths not due to readily recognizable disease including death within 24 hours of admission to a hospital.
Deaths of any individual whose body is to be disposed of in a manner (e.g., cremation) that will render it unavailable for later examination.
Deaths resulting from employment.
Deaths due to a disease (e.g., meningitis, West Nile virus) that might constitute a threat to the public health.
Death under anesthesia, in operating or recovery room, following transfusions, or during diagnostic procedures.
To serve the public and protect the public health by:
Investigating and certifying suspected and unsuspected homicide thus providing information that will lead to the proper adjudication in criminal and civil matters and may prevent unnecessary litigation.
Diagnosing previously unsuspected contagious/infectious disease.
Identifying hazardous environmental conditions in the workplace, home, and elsewhere.
Identifying trends such as changes in the numbers of homicides, traffic fatalities, and drug and alcohol related deaths.
Identifying new types and forms of drugs appearing in the state or existing drugs/substances becoming new subjects of abuse.
Issuing an accurate death certificate with an etiologically specific underlying cause of death to produce accurate vital statistics for the State of Connecticut.
Explaining what caused the death of a loved one to a family.
RECOMMENDED ADJUSTMENTS
Baseline Adjustments FY 2020 FY 2021
Annualize Funding for State Employee Wage Adjustments 500,244 801,954
Annualize Costs for Additional Physician 206,978 212,145 A ninth physician was hired during FY 2019 to regain National Association of Medical Examiners (NAME) accreditation. Funding supports salary and associated professional supplies.
Expansions FY 2020 FY 2021 FY 2022
Provide Additional Physician Coverage on Sundays 37,440 41,600 41,600
AGENCY SUMMARY
Personnel Summary FY 2019 Authorized
FY 2020 Change From
FY 2019
FY 2020 Total Recommended
FY 2021 Change From
FY 2020
FY 2021 Total Recommended
General Fund 50 1 51 1 51
Financial Summary FY 2019 Estimated
FY 2020 Baseline
FY 2020 Total Recommended
FY 2021 Baseline
FY 2021 Total Recommended
Personal Services 4,789,527 5,490,087 5,527,527 5,796,964 5,838,564 Other Expenses 1,435,536 1,442,198 1,442,198 1,442,198 1,442,198 Capital Outlay Equipment 23,310 23,310 23,310 23,310 23,310 Other Current Expenses Medicolegal Investigations 22,150 22,150 22,150 22,150 22,150
TOTAL - General Fund 6,270,523 6,977,745 7,015,185 7,284,622 7,326,222
TOTAL - ALL FUNDS 6,270,523 6,977,745 7,015,185 7,284,622 7,326,222
Budget Summary
B - 47
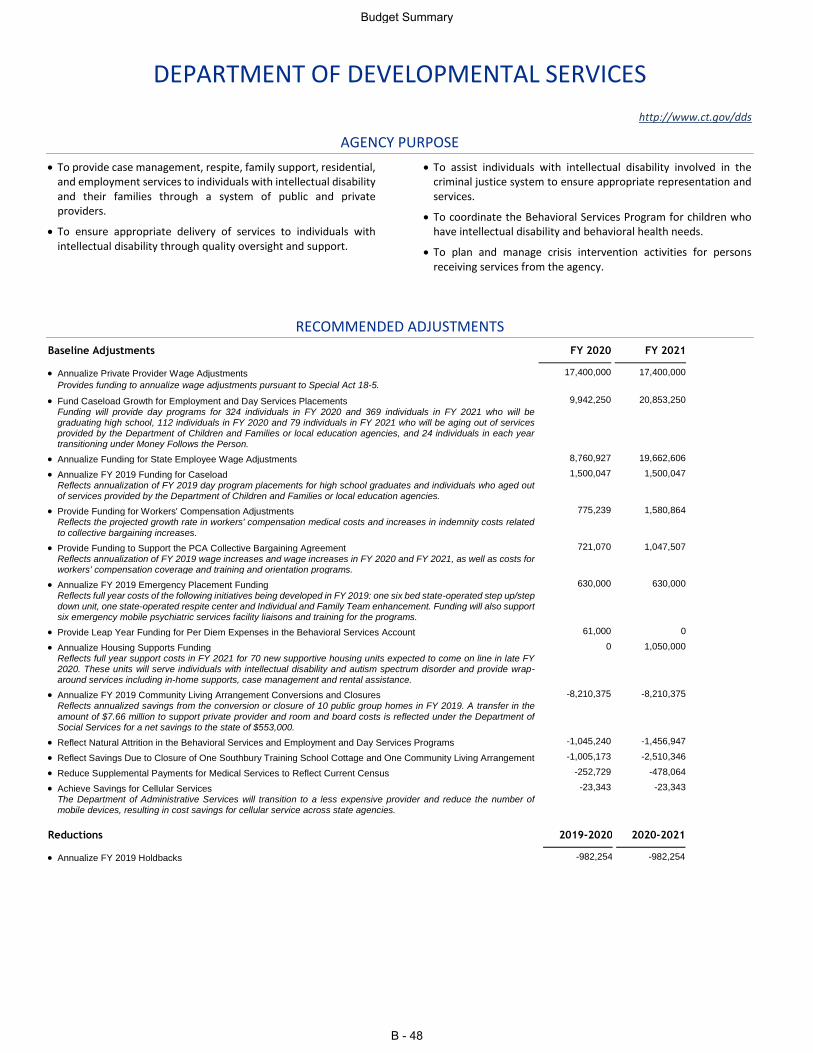
DEPARTMENT OF DEVELOPMENTAL SERVICES
http://www.ct.gov/dds
AGENCY PURPOSE
To provide case management, respite, family support, residential, and employment services to individuals with intellectual disability and their families through a system of public and private providers.
To ensure appropriate delivery of services to individuals with intellectual disability through quality oversight and support.
To assist individuals with intellectual disability involved in the criminal justice system to ensure appropriate representation and services.
To coordinate the Behavioral Services Program for children who have intellectual disability and behavioral health needs.
To plan and manage crisis intervention activities for persons receiving services from the agency.
RECOMMENDED ADJUSTMENTS
Baseline Adjustments FY 2020 FY 2021
Annualize Private Provider Wage Adjustments 17,400,000 17,400,000
Provides funding to annualize wage adjustments pursuant to Special Act 18-5.
Fund Caseload Growth for Employment and Day Services Placements 9,942,250 20,853,250 Funding will provide day programs for 324 individuals in FY 2020 and 369 individuals in FY 2021 who will be graduating high school, 112 individuals in FY 2020 and 79 individuals in FY 2021 who will be aging out of services provided by the Department of Children and Families or local education agencies, and 24 individuals in each year transitioning under Money Follows the Person.
Annualize Funding for State Employee Wage Adjustments 8,760,927 19,662,606
Annualize FY 2019 Funding for Caseload 1,500,047 1,500,047 Reflects annualization of FY 2019 day program placements for high school graduates and individuals who aged out of services provided by the Department of Children and Families or local education agencies.
Provide Funding for Workers' Compensation Adjustments 775,239 1,580,864 Reflects the projected growth rate in workers' compensation medical costs and increases in indemnity costs related
to collective bargaining increases.
Provide Funding to Support the PCA Collective Bargaining Agreement 721,070 1,047,507 Reflects annualization of FY 2019 wage increases and wage increases in FY 2020 and FY 2021, as well as costs for workers' compensation coverage and training and orientation programs.
Annualize FY 2019 Emergency Placement Funding 630,000 630,000 Reflects full year costs of the following initiatives being developed in FY 2019: one six bed state-operated step up/step down unit, one state-operated respite center and Individual and Family Team enhancement. Funding will also support six emergency mobile psychiatric services facility liaisons and training for the programs.
Provide Leap Year Funding for Per Diem Expenses in the Behavioral Services Account 61,000 0
Annualize Housing Supports Funding 0 1,050,000 Reflects full year support costs in FY 2021 for 70 new supportive housing units expected to come on line in late FY 2020. These units will serve individuals with intellectual disability and autism spectrum disorder and provide wrap-around services including in-home supports, case management and rental assistance.
Annualize FY 2019 Community Living Arrangement Conversions and Closures -8,210,375 -8,210,375 Reflects annualized savings from the conversion or closure of 10 public group homes in FY 2019. A transfer in the
amount of $7.66 million to support private provider and room and board costs is reflected under the Department of Social Services for a net savings to the state of $553,000.
Reflect Natural Attrition in the Behavioral Services and Employment and Day Services Programs -1,045,240 -1,456,947
Reflect Savings Due to Closure of One Southbury Training School Cottage and One Community Living Arrangement -1,005,173 -2,510,346
Reduce Supplemental Payments for Medical Services to Reflect Current Census -252,729 -478,064
Achieve Savings for Cellular Services -23,343 -23,343 The Department of Administrative Services will transition to a less expensive provider and reduce the number of mobile devices, resulting in cost savings for cellular service across state agencies.
Reductions 2019-2020 2020-2021
Annualize FY 2019 Holdbacks -982,254 -982,254
Budget Summary
B - 48
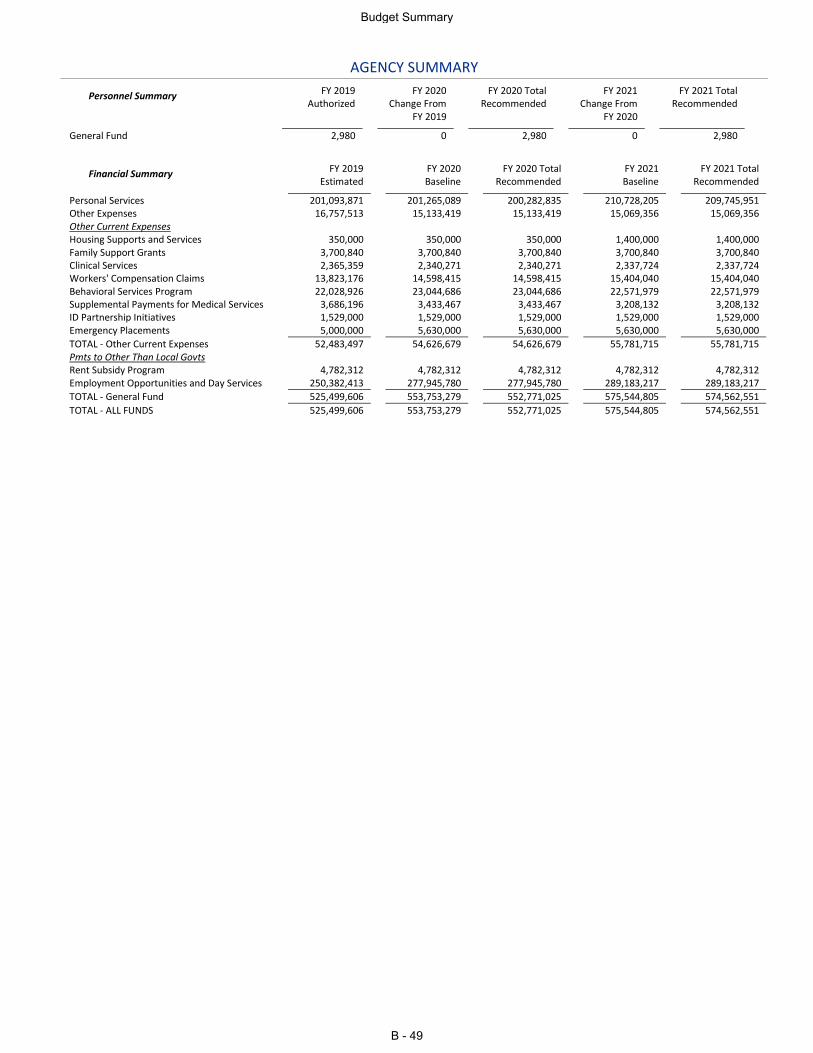
AGENCY SUMMARY
Personnel Summary FY 2019 Authorized
FY 2020 Change From
FY 2019
FY 2020 Total Recommended
FY 2021 Change From
FY 2020
FY 2021 Total Recommended
General Fund 2,980 0 2,980 0 2,980
Financial Summary FY 2019 Estimated
FY 2020 Baseline
FY 2020 Total Recommended
FY 2021 Baseline
FY 2021 Total Recommended
Personal Services 201,093,871 201,265,089 200,282,835 210,728,205 209,745,951 Other Expenses 16,757,513 15,133,419 15,133,419 15,069,356 15,069,356 Other Current Expenses Housing Supports and Services 350,000 350,000 350,000 1,400,000 1,400,000 Family Support Grants 3,700,840 3,700,840 3,700,840 3,700,840 3,700,840 Clinical Services 2,365,359 2,340,271 2,340,271 2,337,724 2,337,724 Workers' Compensation Claims 13,823,176 14,598,415 14,598,415 15,404,040 15,404,040 Behavioral Services Program 22,028,926 23,044,686 23,044,686 22,571,979 22,571,979 Supplemental Payments for Medical Services 3,686,196 3,433,467 3,433,467 3,208,132 3,208,132 ID Partnership Initiatives 1,529,000 1,529,000 1,529,000 1,529,000 1,529,000 Emergency Placements 5,000,000 5,630,000 5,630,000 5,630,000 5,630,000
TOTAL - Other Current Expenses 52,483,497 54,626,679 54,626,679 55,781,715 55,781,715 Pmts to Other Than Local Govts Rent Subsidy Program 4,782,312 4,782,312 4,782,312 4,782,312 4,782,312 Employment Opportunities and Day Services 250,382,413 277,945,780 277,945,780 289,183,217 289,183,217
TOTAL - General Fund 525,499,606 553,753,279 552,771,025 575,544,805 574,562,551
TOTAL - ALL FUNDS 525,499,606 553,753,279 552,771,025 575,544,805 574,562,551
Budget Summary
B - 49
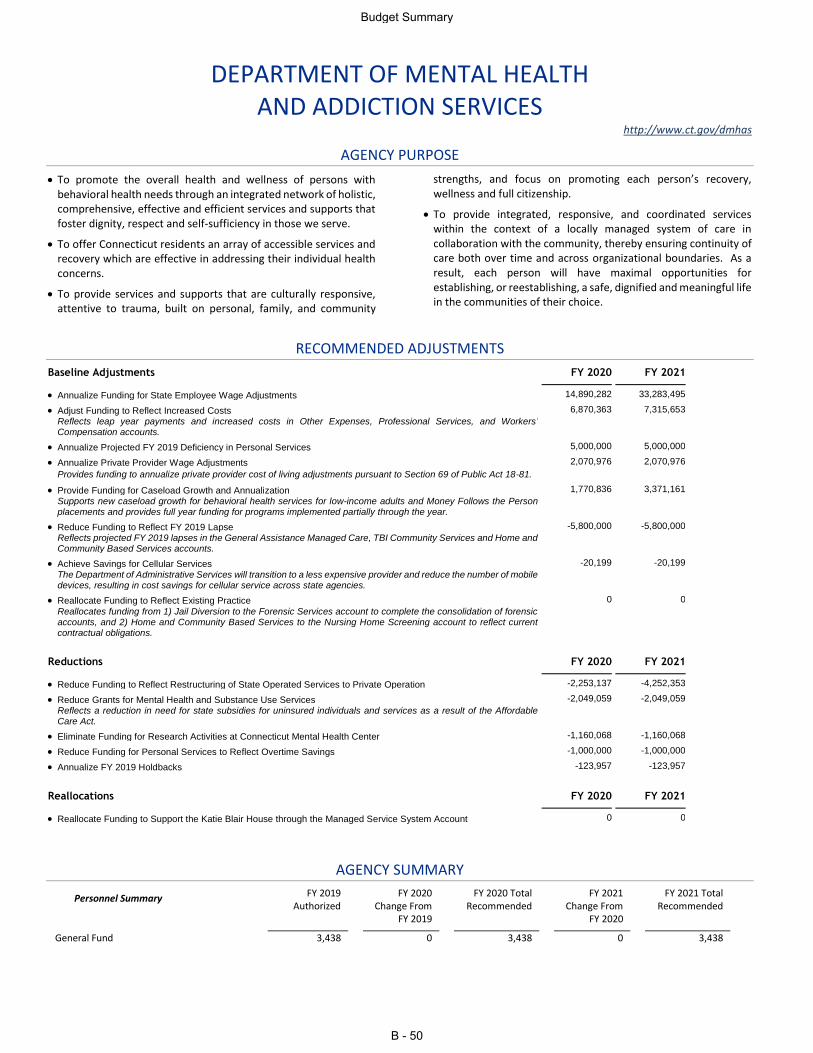
DEPARTMENT OF MENTAL HEALTH AND ADDICTION SERVICES
http://www.ct.gov/dmhas
AGENCY PURPOSE
To promote the overall health and wellness of persons with behavioral health needs through an integrated network of holistic, comprehensive, effective and efficient services and supports that foster dignity, respect and self-sufficiency in those we serve.
To offer Connecticut residents an array of accessible services and recovery which are effective in addressing their individual health concerns.
To provide services and supports that are culturally responsive, attentive to trauma, built on personal, family, and community
strengths, and focus on promoting each person’s recovery, wellness and full citizenship.
To provide integrated, responsive, and coordinated services within the context of a locally managed system of care in collaboration with the community, thereby ensuring continuity of care both over time and across organizational boundaries. As a result, each person will have maximal opportunities for establishing, or reestablishing, a safe, dignified and meaningful life in the communities of their choice.
RECOMMENDED ADJUSTMENTS
Baseline Adjustments FY 2020 FY 2021
Annualize Funding for State Employee Wage Adjustments 14,890,282 33,283,495
Adjust Funding to Reflect Increased Costs 6,870,363 7,315,653 Reflects leap year payments and increased costs in Other Expenses, Professional Services, and Workers’ Compensation accounts.
Annualize Projected FY 2019 Deficiency in Personal Services 5,000,000 5,000,000
Annualize Private Provider Wage Adjustments 2,070,976 2,070,976
Provides funding to annualize private provider cost of living adjustments pursuant to Section 69 of Public Act 18-81.
Provide Funding for Caseload Growth and Annualization 1,770,836 3,371,161 Supports new caseload growth for behavioral health services for low-income adults and Money Follows the Person placements and provides full year funding for programs implemented partially through the year.
Reduce Funding to Reflect FY 2019 Lapse -5,800,000 -5,800,000 Reflects projected FY 2019 lapses in the General Assistance Managed Care, TBI Community Services and Home and Community Based Services accounts.
Achieve Savings for Cellular Services -20,199 -20,199 The Department of Administrative Services will transition to a less expensive provider and reduce the number of mobile devices, resulting in cost savings for cellular service across state agencies.
Reallocate Funding to Reflect Existing Practice 0 0 Reallocates funding from 1) Jail Diversion to the Forensic Services account to complete the consolidation of forensic accounts, and 2) Home and Community Based Services to the Nursing Home Screening account to reflect current contractual obligations.
Reductions FY 2020 FY 2021
Reduce Funding to Reflect Restructuring of State Operated Services to Private Operation -2,253,137 -4,252,353
Reduce Grants for Mental Health and Substance Use Services -2,049,059 -2,049,059 Reflects a reduction in need for state subsidies for uninsured individuals and services as a result of the Affordable Care Act.
Eliminate Funding for Research Activities at Connecticut Mental Health Center -1,160,068 -1,160,068
Reduce Funding for Personal Services to Reflect Overtime Savings -1,000,000 -1,000,000
Annualize FY 2019 Holdbacks -123,957 -123,957
Reallocations FY 2020 FY 2021
Reallocate Funding to Support the Katie Blair House through the Managed Service System Account 0 0
AGENCY SUMMARY
Personnel Summary FY 2019 Authorized
FY 2020 Change From
FY 2019
FY 2020 Total Recommended
FY 2021 Change From
FY 2020
FY 2021 Total Recommended
General Fund 3,438 0 3,438 0 3,438
Budget Summary
B - 50
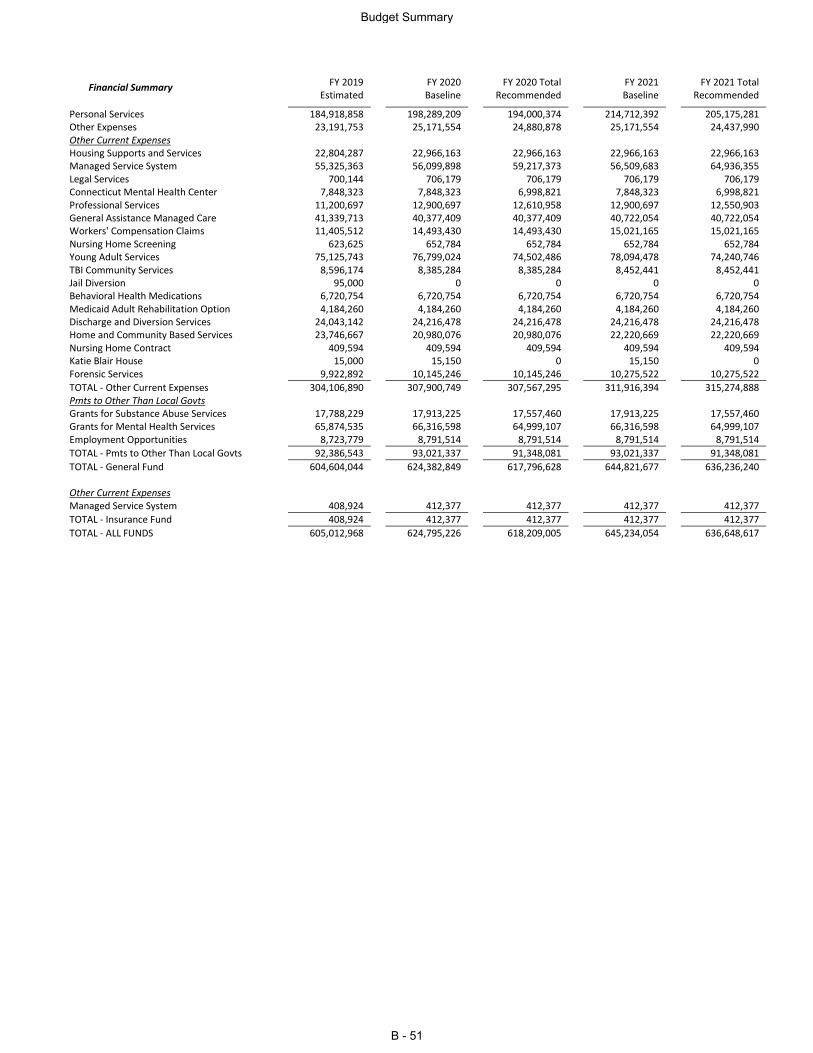
Financial Summary FY 2019 Estimated
FY 2020 Baseline
FY 2020 Total Recommended
FY 2021 Baseline
FY 2021 Total Recommended
Personal Services 184,918,858 198,289,209 194,000,374 214,712,392 205,175,281 Other Expenses 23,191,753 25,171,554 24,880,878 25,171,554 24,437,990 Other Current Expenses Housing Supports and Services 22,804,287 22,966,163 22,966,163 22,966,163 22,966,163 Managed Service System 55,325,363 56,099,898 59,217,373 56,509,683 64,936,355 Legal Services 700,144 706,179 706,179 706,179 706,179 Connecticut Mental Health Center 7,848,323 7,848,323 6,998,821 7,848,323 6,998,821 Professional Services 11,200,697 12,900,697 12,610,958 12,900,697 12,550,903 General Assistance Managed Care 41,339,713 40,377,409 40,377,409 40,722,054 40,722,054 Workers' Compensation Claims 11,405,512 14,493,430 14,493,430 15,021,165 15,021,165 Nursing Home Screening 623,625 652,784 652,784 652,784 652,784 Young Adult Services 75,125,743 76,799,024 74,502,486 78,094,478 74,240,746 TBI Community Services 8,596,174 8,385,284 8,385,284 8,452,441 8,452,441 Jail Diversion 95,000 0 0 0 0 Behavioral Health Medications 6,720,754 6,720,754 6,720,754 6,720,754 6,720,754 Medicaid Adult Rehabilitation Option 4,184,260 4,184,260 4,184,260 4,184,260 4,184,260 Discharge and Diversion Services 24,043,142 24,216,478 24,216,478 24,216,478 24,216,478 Home and Community Based Services 23,746,667 20,980,076 20,980,076 22,220,669 22,220,669 Nursing Home Contract 409,594 409,594 409,594 409,594 409,594 Katie Blair House 15,000 15,150 0 15,150 0 Forensic Services 9,922,892 10,145,246 10,145,246 10,275,522 10,275,522
TOTAL - Other Current Expenses 304,106,890 307,900,749 307,567,295 311,916,394 315,274,888 Pmts to Other Than Local Govts Grants for Substance Abuse Services 17,788,229 17,913,225 17,557,460 17,913,225 17,557,460 Grants for Mental Health Services 65,874,535 66,316,598 64,999,107 66,316,598 64,999,107 Employment Opportunities 8,723,779 8,791,514 8,791,514 8,791,514 8,791,514
TOTAL - Pmts to Other Than Local Govts 92,386,543 93,021,337 91,348,081 93,021,337 91,348,081
TOTAL - General Fund 604,604,044 624,382,849 617,796,628 644,821,677 636,236,240 Other Current Expenses Managed Service System 408,924 412,377 412,377 412,377 412,377
TOTAL - Insurance Fund 408,924 412,377 412,377 412,377 412,377
TOTAL - ALL FUNDS 605,012,968 624,795,226 618,209,005 645,234,054 636,648,617
Budget Summary
B - 51
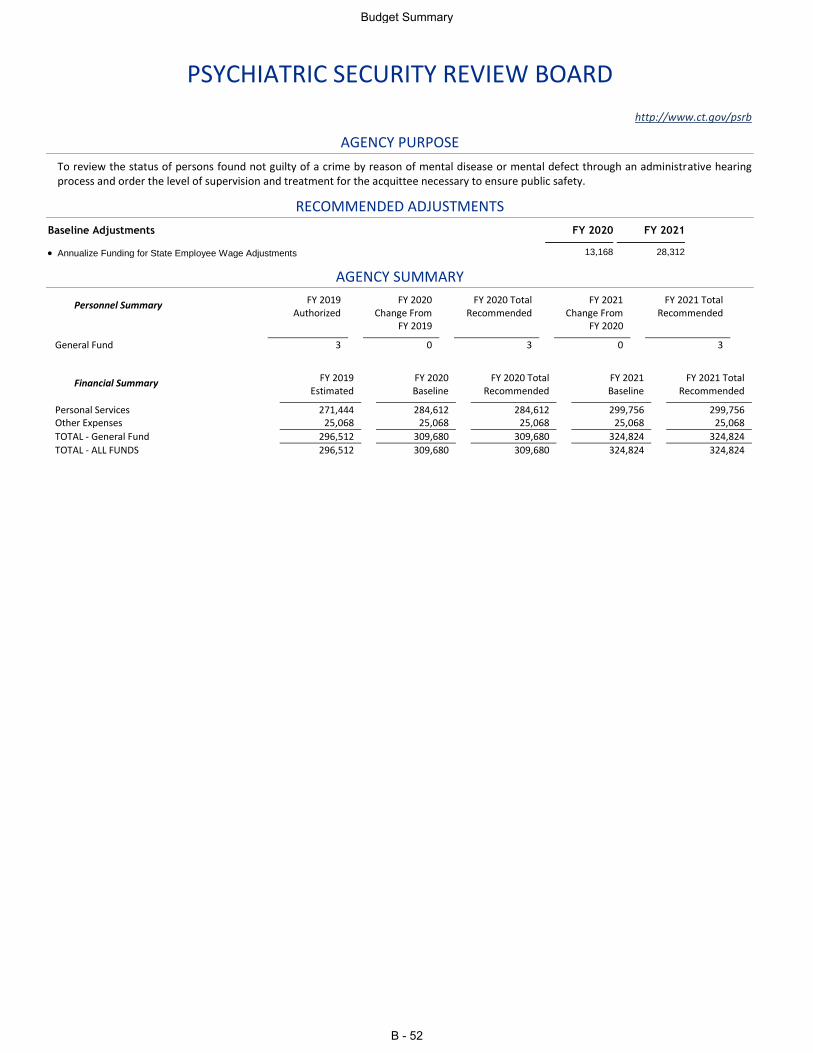
PSYCHIATRIC SECURITY REVIEW BOARD
http://www.ct.gov/psrb
AGENCY PURPOSE
To review the status of persons found not guilty of a crime by reason of mental disease or mental defect through an administrative hearing process and order the level of supervision and treatment for the acquittee necessary to ensure public safety.
RECOMMENDED ADJUSTMENTS
Baseline Adjustments FY 2020 FY 2021
Annualize Funding for State Employee Wage Adjustments 13,168 28,312
AGENCY SUMMARY
Personnel Summary FY 2019 Authorized
FY 2020 Change From
FY 2019
FY 2020 Total Recommended
FY 2021 Change From
FY 2020
FY 2021 Total Recommended
General Fund 3 0 3 0 3
Financial Summary FY 2019 Estimated
FY 2020 Baseline
FY 2020 Total Recommended
FY 2021 Baseline
FY 2021 Total Recommended
Personal Services 271,444 284,612 284,612 299,756 299,756 Other Expenses 25,068 25,068 25,068 25,068 25,068
TOTAL - General Fund 296,512 309,680 309,680 324,824 324,824
TOTAL - ALL FUNDS 296,512 309,680 309,680 324,824 324,824
Budget Summary
B - 52
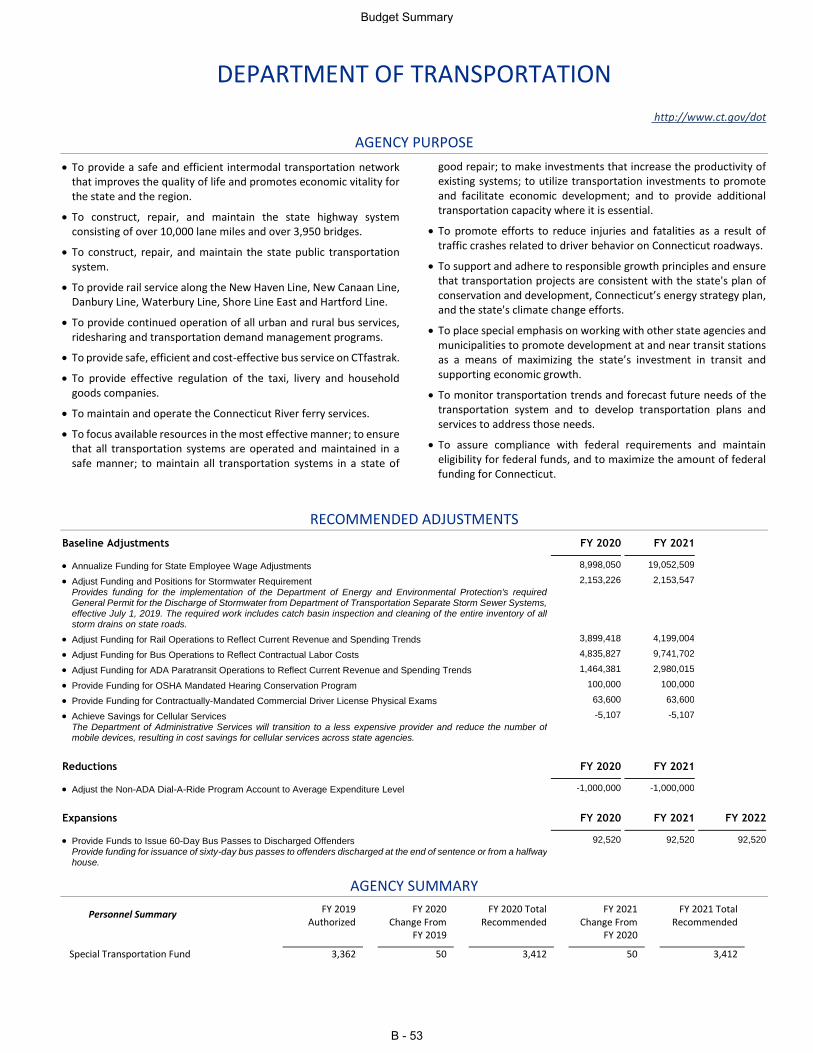
DEPARTMENT OF TRANSPORTATION
http://www.ct.gov/dot
AGENCY PURPOSE
To provide a safe and efficient intermodal transportation network that improves the quality of life and promotes economic vitality for the state and the region.
To construct, repair, and maintain the state highway system consisting of over 10,000 lane miles and over 3,950 bridges.
To construct, repair, and maintain the state public transportation system.
To provide rail service along the New Haven Line, New Canaan Line, Danbury Line, Waterbury Line, Shore Line East and Hartford Line.
To provide continued operation of all urban and rural bus services, ridesharing and transportation demand management programs.
To provide safe, efficient and cost-effective bus service on CTfastrak.
To provide effective regulation of the taxi, livery and household goods companies.
To maintain and operate the Connecticut River ferry services.
To focus available resources in the most effective manner; to ensure that all transportation systems are operated and maintained in a safe manner; to maintain all transportation systems in a state of
good repair; to make investments that increase the productivity of existing systems; to utilize transportation investments to promote and facilitate economic development; and to provide additional transportation capacity where it is essential.
To promote efforts to reduce injuries and fatalities as a result of traffic crashes related to driver behavior on Connecticut roadways.
To support and adhere to responsible growth principles and ensure that transportation projects are consistent with the state's plan of conservation and development, Connecticut’s energy strategy plan, and the state's climate change efforts.
To place special emphasis on working with other state agencies and municipalities to promote development at and near transit stations as a means of maximizing the state’s investment in transit and supporting economic growth.
To monitor transportation trends and forecast future needs of the transportation system and to develop transportation plans and services to address those needs.
To assure compliance with federal requirements and maintain eligibility for federal funds, and to maximize the amount of federal funding for Connecticut.
RECOMMENDED ADJUSTMENTS
Baseline Adjustments FY 2020 FY 2021
Annualize Funding for State Employee Wage Adjustments 8,998,050 19,052,509
Adjust Funding and Positions for Stormwater Requirement 2,153,226 2,153,547 Provides funding for the implementation of the Department of Energy and Environmental Protection's required General Permit for the Discharge of Stormwater from Department of Transportation Separate Storm Sewer Systems, effective July 1, 2019. The required work includes catch basin inspection and cleaning of the entire inventory of all storm drains on state roads.
Adjust Funding for Rail Operations to Reflect Current Revenue and Spending Trends 3,899,418 4,199,004
Adjust Funding for Bus Operations to Reflect Contractual Labor Costs 4,835,827 9,741,702
Adjust Funding for ADA Paratransit Operations to Reflect Current Revenue and Spending Trends 1,464,381 2,980,015
Provide Funding for OSHA Mandated Hearing Conservation Program 100,000 100,000
Provide Funding for Contractually-Mandated Commercial Driver License Physical Exams 63,600 63,600
Achieve Savings for Cellular Services -5,107 -5,107 The Department of Administrative Services will transition to a less expensive provider and reduce the number of mobile devices, resulting in cost savings for cellular services across state agencies.
Reductions FY 2020 FY 2021
Adjust the Non-ADA Dial-A-Ride Program Account to Average Expenditure Level -1,000,000 -1,000,000
Expansions FY 2020 FY 2021 FY 2022
Provide Funds to Issue 60-Day Bus Passes to Discharged Offenders 92,520 92,520 92,520 Provide funding for issuance of sixty-day bus passes to offenders discharged at the end of sentence or from a halfway house.
AGENCY SUMMARY
Personnel Summary FY 2019 Authorized
FY 2020 Change From
FY 2019
FY 2020 Total Recommended
FY 2021 Change From
FY 2020
FY 2021 Total Recommended
Special Transportation Fund 3,362 50 3,412 50 3,412
Budget Summary
B - 53
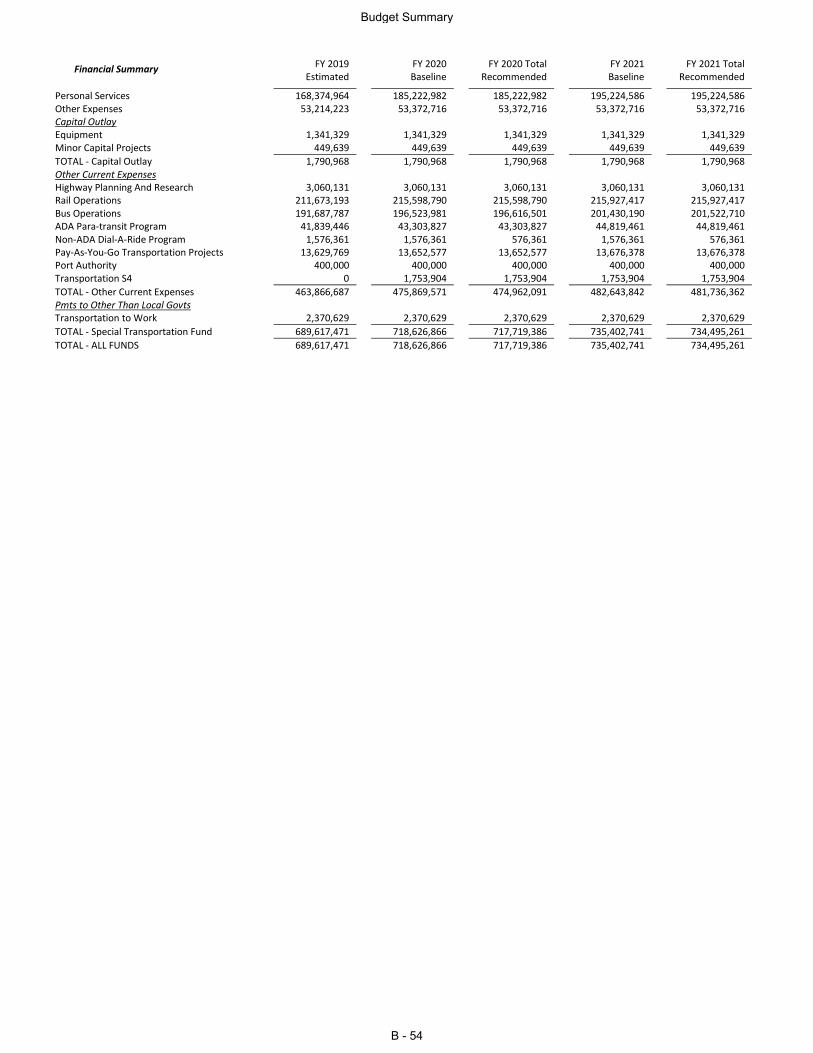
Financial Summary FY 2019 Estimated
FY 2020 Baseline
FY 2020 Total Recommended
FY 2021 Baseline
FY 2021 Total Recommended
Personal Services 168,374,964 185,222,982 185,222,982 195,224,586 195,224,586 Other Expenses 53,214,223 53,372,716 53,372,716 53,372,716 53,372,716 Capital Outlay Equipment 1,341,329 1,341,329 1,341,329 1,341,329 1,341,329 Minor Capital Projects 449,639 449,639 449,639 449,639 449,639
TOTAL - Capital Outlay 1,790,968 1,790,968 1,790,968 1,790,968 1,790,968 Other Current Expenses Highway Planning And Research 3,060,131 3,060,131 3,060,131 3,060,131 3,060,131 Rail Operations 211,673,193 215,598,790 215,598,790 215,927,417 215,927,417 Bus Operations 191,687,787 196,523,981 196,616,501 201,430,190 201,522,710 ADA Para-transit Program 41,839,446 43,303,827 43,303,827 44,819,461 44,819,461 Non-ADA Dial-A-Ride Program 1,576,361 1,576,361 576,361 1,576,361 576,361 Pay-As-You-Go Transportation Projects 13,629,769 13,652,577 13,652,577 13,676,378 13,676,378 Port Authority 400,000 400,000 400,000 400,000 400,000 Transportation S4 0 1,753,904 1,753,904 1,753,904 1,753,904
TOTAL - Other Current Expenses 463,866,687 475,869,571 474,962,091 482,643,842 481,736,362 Pmts to Other Than Local Govts Transportation to Work 2,370,629 2,370,629 2,370,629 2,370,629 2,370,629
TOTAL - Special Transportation Fund 689,617,471 718,626,866 717,719,386 735,402,741 734,495,261
TOTAL - ALL FUNDS 689,617,471 718,626,866 717,719,386 735,402,741 734,495,261
Budget Summary
B - 54
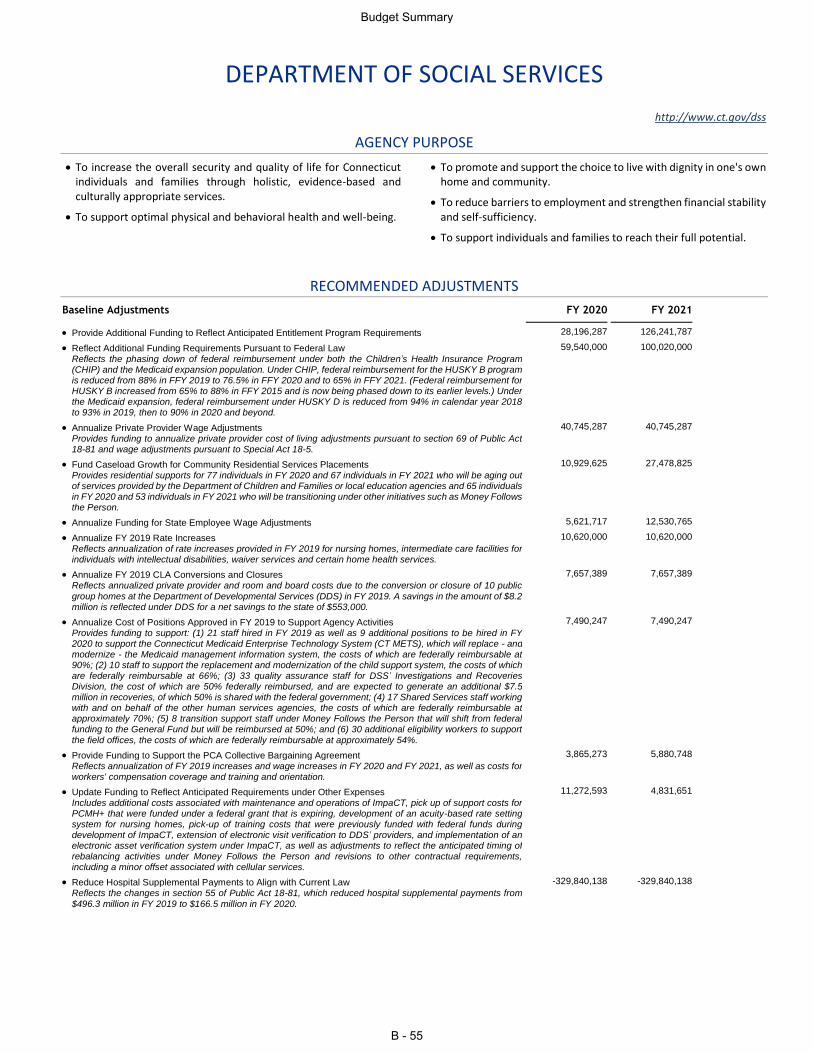
DEPARTMENT OF SOCIAL SERVICES
http://www.ct.gov/dss
AGENCY PURPOSE
To increase the overall security and quality of life for Connecticut individuals and families through holistic, evidence-based and culturally appropriate services.
To support optimal physical and behavioral health and well-being.
To promote and support the choice to live with dignity in one's own home and community.
To reduce barriers to employment and strengthen financial stability and self-sufficiency.
To support individuals and families to reach their full potential.
RECOMMENDED ADJUSTMENTS
Baseline Adjustments FY 2020 FY 2021
Provide Additional Funding to Reflect Anticipated Entitlement Program Requirements 28,196,287 126,241,787
Reflect Additional Funding Requirements Pursuant to Federal Law 59,540,000 100,020,000 Reflects the phasing down of federal reimbursement under both the Children’s Health Insurance Program (CHIP) and the Medicaid expansion population. Under CHIP, federal reimbursement for the HUSKY B program is reduced from 88% in FFY 2019 to 76.5% in FFY 2020 and to 65% in FFY 2021. (Federal reimbursement for HUSKY B increased from 65% to 88% in FFY 2015 and is now being phased down to its earlier levels.) Under the Medicaid expansion, federal reimbursement under HUSKY D is reduced from 94% in calendar year 2018 to 93% in 2019, then to 90% in 2020 and beyond.
Annualize Private Provider Wage Adjustments 40,745,287 40,745,287 Provides funding to annualize private provider cost of living adjustments pursuant to section 69 of Public Act 18-81 and wage adjustments pursuant to Special Act 18-5.
Fund Caseload Growth for Community Residential Services Placements 10,929,625 27,478,825 Provides residential supports for 77 individuals in FY 2020 and 67 individuals in FY 2021 who will be aging out of services provided by the Department of Children and Families or local education agencies and 65 individuals in FY 2020 and 53 individuals in FY 2021 who will be transitioning under other initiatives such as Money Follows the Person.
Annualize Funding for State Employee Wage Adjustments 5,621,717 12,530,765
Annualize FY 2019 Rate Increases 10,620,000 10,620,000 Reflects annualization of rate increases provided in FY 2019 for nursing homes, intermediate care facilities for individuals with intellectual disabilities, waiver services and certain home health services.
Annualize FY 2019 CLA Conversions and Closures 7,657,389 7,657,389 Reflects annualized private provider and room and board costs due to the conversion or closure of 10 public
group homes at the Department of Developmental Services (DDS) in FY 2019. A savings in the amount of $8.2 million is reflected under DDS for a net savings to the state of $553,000.
Annualize Cost of Positions Approved in FY 2019 to Support Agency Activities 7,490,247 7,490,247 Provides funding to support: (1) 21 staff hired in FY 2019 as well as 9 additional positions to be hired in FY 2020 to support the Connecticut Medicaid Enterprise Technology System (CT METS), which will replace - and modernize - the Medicaid management information system, the costs of which are federally reimbursable at 90%; (2) 10 staff to support the replacement and modernization of the child support system, the costs of which are federally reimbursable at 66%; (3) 33 quality assurance staff for DSS’ Investigations and Recoveries Division, the cost of which are 50% federally reimbursed, and are expected to generate an additional $7.5 million in recoveries, of which 50% is shared with the federal government; (4) 17 Shared Services staff working with and on behalf of the other human services agencies, the costs of which are federally reimbursable at approximately 70%; (5) 8 transition support staff under Money Follows the Person that will shift from federal funding to the General Fund but will be reimbursed at 50%; and (6) 30 additional eligibility workers to support
the field offices, the costs of which are federally reimbursable at approximately 54%.
Provide Funding to Support the PCA Collective Bargaining Agreement 3,865,273 5,880,748 Reflects annualization of FY 2019 increases and wage increases in FY 2020 and FY 2021, as well as costs for workers' compensation coverage and training and orientation.
Update Funding to Reflect Anticipated Requirements under Other Expenses 11,272,593 4,831,651 Includes additional costs associated with maintenance and operations of ImpaCT, pick up of support costs for PCMH+ that were funded under a federal grant that is expiring, development of an acuity-based rate setting system for nursing homes, pick-up of training costs that were previously funded with federal funds during development of ImpaCT, extension of electronic visit verification to DDS’ providers, and implementation of an electronic asset verification system under ImpaCT, as well as adjustments to reflect the anticipated timing of rebalancing activities under Money Follows the Person and revisions to other contractual requirements, including a minor offset associated with cellular services.
Reduce Hospital Supplemental Payments to Align with Current Law -329,840,138 -329,840,138 Reflects the changes in section 55 of Public Act 18-81, which reduced hospital supplemental payments from
$496.3 million in FY 2019 to $166.5 million in FY 2020.
Budget Summary
B - 55
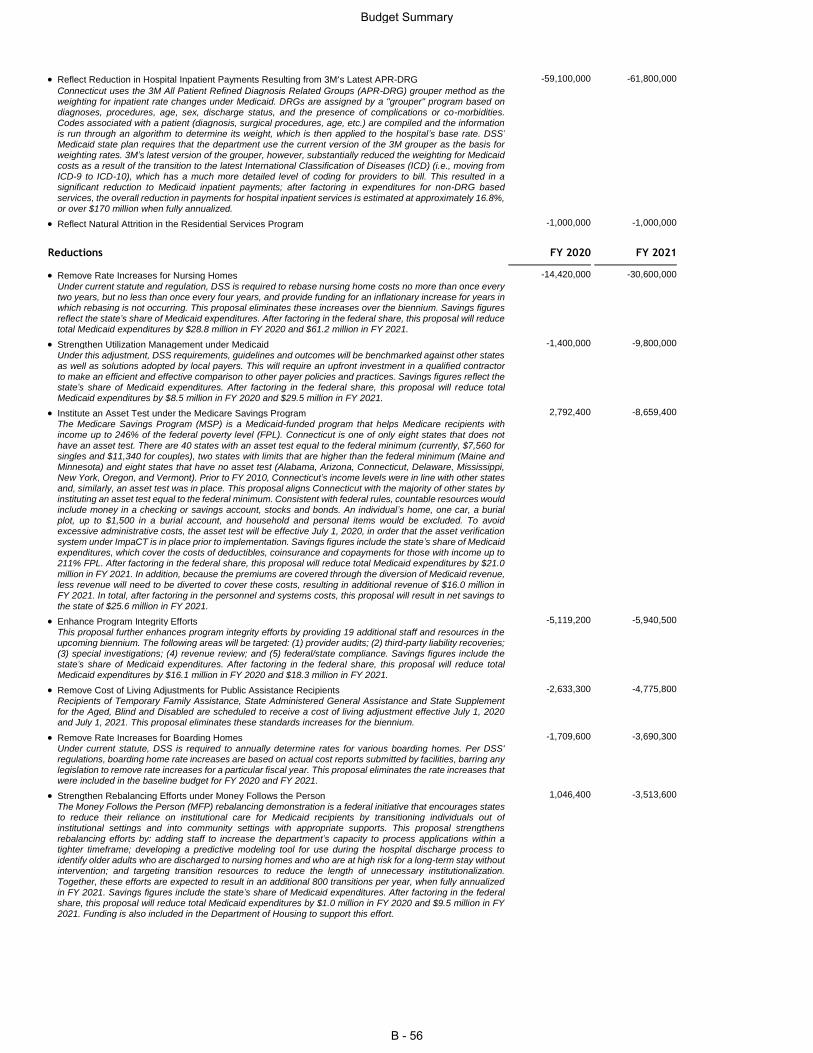
Reflect Reduction in Hospital Inpatient Payments Resulting from 3M’s Latest APR-DRG -59,100,000 -61,800,000
Connecticut uses the 3M All Patient Refined Diagnosis Related Groups (APR-DRG) grouper method as the weighting for inpatient rate changes under Medicaid. DRGs are assigned by a "grouper" program based on diagnoses, procedures, age, sex, discharge status, and the presence of complications or co-morbidities. Codes associated with a patient (diagnosis, surgical procedures, age, etc.) are compiled and the information is run through an algorithm to determine its weight, which is then applied to the hospital’s base rate. DSS’ Medicaid state plan requires that the department use the current version of the 3M grouper as the basis for weighting rates. 3M’s latest version of the grouper, however, substantially reduced the weighting for Medicaid costs as a result of the transition to the latest International Classification of Diseases (ICD) (i.e., moving from ICD-9 to ICD-10), which has a much more detailed level of coding for providers to bill. This resulted in a significant reduction to Medicaid inpatient payments; after factoring in expenditures for non-DRG based
services, the overall reduction in payments for hospital inpatient services is estimated at approximately 16.8%, or over $170 million when fully annualized.
Reflect Natural Attrition in the Residential Services Program -1,000,000 -1,000,000
Reductions FY 2020 FY 2021
Remove Rate Increases for Nursing Homes -14,420,000 -30,600,000 Under current statute and regulation, DSS is required to rebase nursing home costs no more than once every two years, but no less than once every four years, and provide funding for an inflationary increase for years in which rebasing is not occurring. This proposal eliminates these increases over the biennium. Savings figures reflect the state’s share of Medicaid expenditures. After factoring in the federal share, this proposal will reduce total Medicaid expenditures by $28.8 million in FY 2020 and $61.2 million in FY 2021.
Strengthen Utilization Management under Medicaid -1,400,000 -9,800,000 Under this adjustment, DSS requirements, guidelines and outcomes will be benchmarked against other states as well as solutions adopted by local payers. This will require an upfront investment in a qualified contractor to make an efficient and effective comparison to other payer policies and practices. Savings figures reflect the state’s share of Medicaid expenditures. After factoring in the federal share, this proposal will reduce total Medicaid expenditures by $8.5 million in FY 2020 and $29.5 million in FY 2021.
Institute an Asset Test under the Medicare Savings Program 2,792,400 -8,659,400 The Medicare Savings Program (MSP) is a Medicaid-funded program that helps Medicare recipients with income up to 246% of the federal poverty level (FPL). Connecticut is one of only eight states that does not
have an asset test. There are 40 states with an asset test equal to the federal minimum (currently, $7,560 for singles and $11,340 for couples), two states with limits that are higher than the federal minimum (Maine and Minnesota) and eight states that have no asset test (Alabama, Arizona, Connecticut, Delaware, Mississippi, New York, Oregon, and Vermont). Prior to FY 2010, Connecticut’s income levels were in line with other states and, similarly, an asset test was in place. This proposal aligns Connecticut with the majority of other states by instituting an asset test equal to the federal minimum. Consistent with federal rules, countable resources would include money in a checking or savings account, stocks and bonds. An individual’s home, one car, a burial plot, up to $1,500 in a burial account, and household and personal items would be excluded. To avoid excessive administrative costs, the asset test will be effective July 1, 2020, in order that the asset verification system under ImpaCT is in place prior to implementation. Savings figures include the state’s share of Medicaid expenditures, which cover the costs of deductibles, coinsurance and copayments for those with income up to 211% FPL. After factoring in the federal share, this proposal will reduce total Medicaid expenditures by $21.0
million in FY 2021. In addition, because the premiums are covered through the diversion of Medicaid revenue, less revenue will need to be diverted to cover these costs, resulting in additional revenue of $16.0 million in FY 2021. In total, after factoring in the personnel and systems costs, this proposal will result in net savings to the state of $25.6 million in FY 2021.
Enhance Program Integrity Efforts -5,119,200 -5,940,500 This proposal further enhances program integrity efforts by providing 19 additional staff and resources in the upcoming biennium. The following areas will be targeted: (1) provider audits; (2) third-party liability recoveries; (3) special investigations; (4) revenue review; and (5) federal/state compliance. Savings figures include the state’s share of Medicaid expenditures. After factoring in the federal share, this proposal will reduce total Medicaid expenditures by $16.1 million in FY 2020 and $18.3 million in FY 2021.
Remove Cost of Living Adjustments for Public Assistance Recipients -2,633,300 -4,775,800 Recipients of Temporary Family Assistance, State Administered General Assistance and State Supplement for the Aged, Blind and Disabled are scheduled to receive a cost of living adjustment effective July 1, 2020 and July 1, 2021. This proposal eliminates these standards increases for the biennium.
Remove Rate Increases for Boarding Homes -1,709,600 -3,690,300 Under current statute, DSS is required to annually determine rates for various boarding homes. Per DSS' regulations, boarding home rate increases are based on actual cost reports submitted by facilities, barring any legislation to remove rate increases for a particular fiscal year. This proposal eliminates the rate increases that were included in the baseline budget for FY 2020 and FY 2021.
Strengthen Rebalancing Efforts under Money Follows the Person 1,046,400 -3,513,600 The Money Follows the Person (MFP) rebalancing demonstration is a federal initiative that encourages states to reduce their reliance on institutional care for Medicaid recipients by transitioning individuals out of institutional settings and into community settings with appropriate supports. This proposal strengthens rebalancing efforts by: adding staff to increase the department’s capacity to process applications within a tighter timeframe; developing a predictive modeling tool for use during the hospital discharge process to identify older adults who are discharged to nursing homes and who are at high risk for a long-term stay without intervention; and targeting transition resources to reduce the length of unnecessary institutionalization.
Together, these efforts are expected to result in an additional 800 transitions per year, when fully annualized in FY 2021. Savings figures include the state’s share of Medicaid expenditures. After factoring in the federal share, this proposal will reduce total Medicaid expenditures by $1.0 million in FY 2020 and $9.5 million in FY 2021. Funding is also included in the Department of Housing to support this effort.
Budget Summary
B - 56
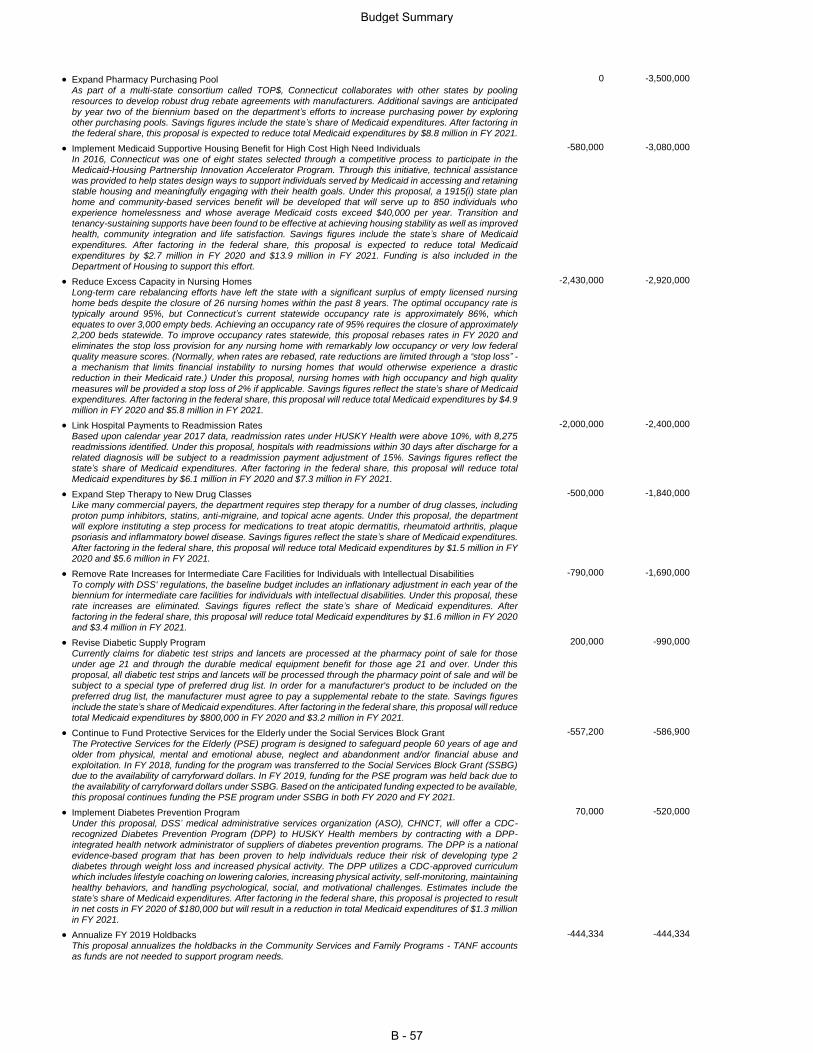
Expand Pharmacy Purchasing Pool 0 -3,500,000 As part of a multi-state consortium called TOP$, Connecticut collaborates with other states by pooling
resources to develop robust drug rebate agreements with manufacturers. Additional savings are anticipated by year two of the biennium based on the department’s efforts to increase purchasing power by exploring other purchasing pools. Savings figures include the state’s share of Medicaid expenditures. After factoring in the federal share, this proposal is expected to reduce total Medicaid expenditures by $8.8 million in FY 2021.
Implement Medicaid Supportive Housing Benefit for High Cost High Need Individuals -580,000 -3,080,000 In 2016, Connecticut was one of eight states selected through a competitive process to participate in the Medicaid-Housing Partnership Innovation Accelerator Program. Through this initiative, technical assistance was provided to help states design ways to support individuals served by Medicaid in accessing and retaining stable housing and meaningfully engaging with their health goals. Under this proposal, a 1915(i) state plan home and community-based services benefit will be developed that will serve up to 850 individuals who experience homelessness and whose average Medicaid costs exceed $40,000 per year. Transition and tenancy-sustaining supports have been found to be effective at achieving housing stability as well as improved health, community integration and life satisfaction. Savings figures include the state’s share of Medicaid
expenditures. After factoring in the federal share, this proposal is expected to reduce total Medicaid expenditures by $2.7 million in FY 2020 and $13.9 million in FY 2021. Funding is also included in the Department of Housing to support this effort.
Reduce Excess Capacity in Nursing Homes -2,430,000 -2,920,000 Long-term care rebalancing efforts have left the state with a significant surplus of empty licensed nursing home beds despite the closure of 26 nursing homes within the past 8 years. The optimal occupancy rate is typically around 95%, but Connecticut’s current statewide occupancy rate is approximately 86%, which equates to over 3,000 empty beds. Achieving an occupancy rate of 95% requires the closure of approximately 2,200 beds statewide. To improve occupancy rates statewide, this proposal rebases rates in FY 2020 and eliminates the stop loss provision for any nursing home with remarkably low occupancy or very low federal quality measure scores. (Normally, when rates are rebased, rate reductions are limited through a “stop loss” - a mechanism that limits financial instability to nursing homes that would otherwise experience a drastic reduction in their Medicaid rate.) Under this proposal, nursing homes with high occupancy and high quality
measures will be provided a stop loss of 2% if applicable. Savings figures reflect the state’s share of Medicaid expenditures. After factoring in the federal share, this proposal will reduce total Medicaid expenditures by $4.9 million in FY 2020 and $5.8 million in FY 2021.
Link Hospital Payments to Readmission Rates -2,000,000 -2,400,000 Based upon calendar year 2017 data, readmission rates under HUSKY Health were above 10%, with 8,275 readmissions identified. Under this proposal, hospitals with readmissions within 30 days after discharge for a related diagnosis will be subject to a readmission payment adjustment of 15%. Savings figures reflect the state’s share of Medicaid expenditures. After factoring in the federal share, this proposal will reduce total Medicaid expenditures by $6.1 million in FY 2020 and $7.3 million in FY 2021.
Expand Step Therapy to New Drug Classes -500,000 -1,840,000 Like many commercial payers, the department requires step therapy for a number of drug classes, including proton pump inhibitors, statins, anti-migraine, and topical acne agents. Under this proposal, the department will explore instituting a step process for medications to treat atopic dermatitis, rheumatoid arthritis, plaque psoriasis and inflammatory bowel disease. Savings figures reflect the state’s share of Medicaid expenditures.
After factoring in the federal share, this proposal will reduce total Medicaid expenditures by $1.5 million in FY 2020 and $5.6 million in FY 2021.
Remove Rate Increases for Intermediate Care Facilities for Individuals with Intellectual Disabilities -790,000 -1,690,000 To comply with DSS' regulations, the baseline budget includes an inflationary adjustment in each year of the biennium for intermediate care facilities for individuals with intellectual disabilities. Under this proposal, these rate increases are eliminated. Savings figures reflect the state’s share of Medicaid expenditures. After factoring in the federal share, this proposal will reduce total Medicaid expenditures by $1.6 million in FY 2020 and $3.4 million in FY 2021.
Revise Diabetic Supply Program 200,000 -990,000 Currently claims for diabetic test strips and lancets are processed at the pharmacy point of sale for those under age 21 and through the durable medical equipment benefit for those age 21 and over. Under this proposal, all diabetic test strips and lancets will be processed through the pharmacy point of sale and will be subject to a special type of preferred drug list. In order for a manufacturer's product to be included on the
preferred drug list, the manufacturer must agree to pay a supplemental rebate to the state. Savings figures include the state’s share of Medicaid expenditures. After factoring in the federal share, this proposal will reduce total Medicaid expenditures by $800,000 in FY 2020 and $3.2 million in FY 2021.
Continue to Fund Protective Services for the Elderly under the Social Services Block Grant -557,200 -586,900 The Protective Services for the Elderly (PSE) program is designed to safeguard people 60 years of age and older from physical, mental and emotional abuse, neglect and abandonment and/or financial abuse and exploitation. In FY 2018, funding for the program was transferred to the Social Services Block Grant (SSBG) due to the availability of carryforward dollars. In FY 2019, funding for the PSE program was held back due to the availability of carryforward dollars under SSBG. Based on the anticipated funding expected to be available, this proposal continues funding the PSE program under SSBG in both FY 2020 and FY 2021.
Implement Diabetes Prevention Program 70,000 -520,000 Under this proposal, DSS’ medical administrative services organization (ASO), CHNCT, will offer a CDC-recognized Diabetes Prevention Program (DPP) to HUSKY Health members by contracting with a DPP-integrated health network administrator of suppliers of diabetes prevention programs. The DPP is a national
evidence-based program that has been proven to help individuals reduce their risk of developing type 2 diabetes through weight loss and increased physical activity. The DPP utilizes a CDC-approved curriculum which includes lifestyle coaching on lowering calories, increasing physical activity, self-monitoring, maintaining healthy behaviors, and handling psychological, social, and motivational challenges. Estimates include the state’s share of Medicaid expenditures. After factoring in the federal share, this proposal is projected to result in net costs in FY 2020 of $180,000 but will result in a reduction in total Medicaid expenditures of $1.3 million in FY 2021.
Annualize FY 2019 Holdbacks -444,334 -444,334 This proposal annualizes the holdbacks in the Community Services and Family Programs - TANF accounts as funds are not needed to support program needs.
Budget Summary
B - 57
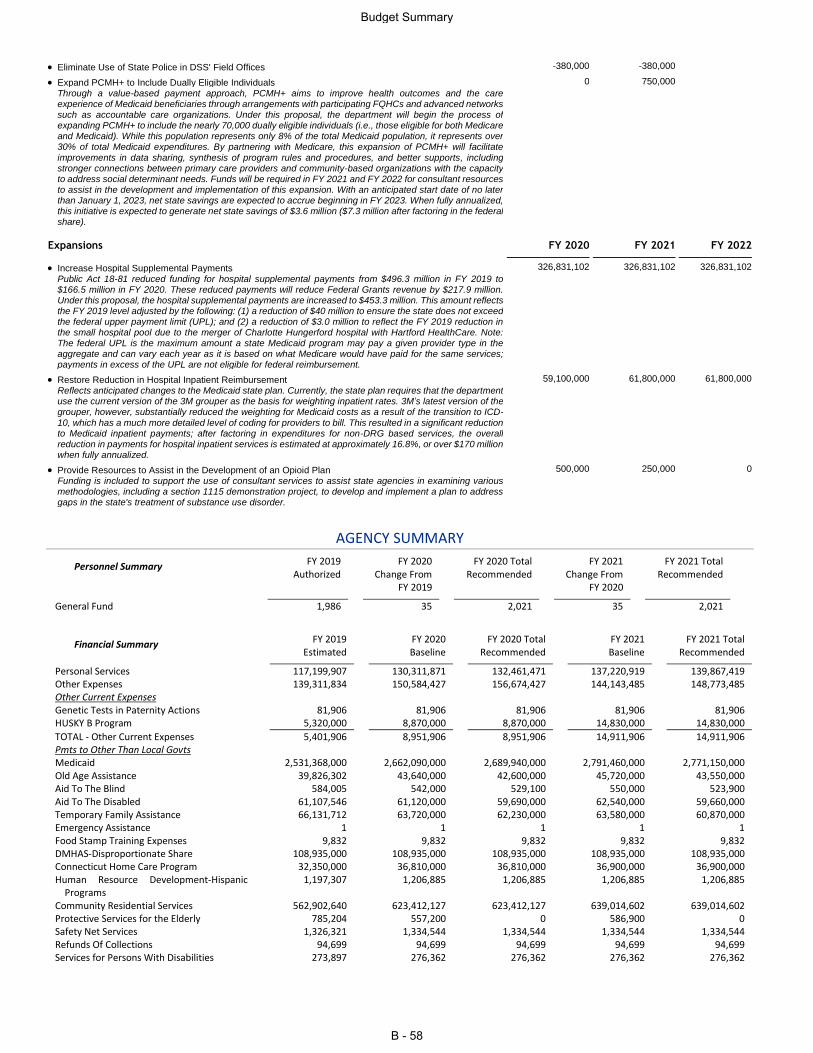
Eliminate Use of State Police in DSS' Field Offices -380,000 -380,000
Expand PCMH+ to Include Dually Eligible Individuals 0 750,000 Through a value-based payment approach, PCMH+ aims to improve health outcomes and the care experience of Medicaid beneficiaries through arrangements with participating FQHCs and advanced networks such as accountable care organizations. Under this proposal, the department will begin the process of expanding PCMH+ to include the nearly 70,000 dually eligible individuals (i.e., those eligible for both Medicare and Medicaid). While this population represents only 8% of the total Medicaid population, it represents over 30% of total Medicaid expenditures. By partnering with Medicare, this expansion of PCMH+ will facilitate
improvements in data sharing, synthesis of program rules and procedures, and better supports, including stronger connections between primary care providers and community-based organizations with the capacity to address social determinant needs. Funds will be required in FY 2021 and FY 2022 for consultant resources to assist in the development and implementation of this expansion. With an anticipated start date of no later than January 1, 2023, net state savings are expected to accrue beginning in FY 2023. When fully annualized, this initiative is expected to generate net state savings of $3.6 million ($7.3 million after factoring in the federal share).
Expansions FY 2020 FY 2021 FY 2022
Increase Hospital Supplemental Payments 326,831,102 326,831,102 326,831,102 Public Act 18-81 reduced funding for hospital supplemental payments from $496.3 million in FY 2019 to $166.5 million in FY 2020. These reduced payments will reduce Federal Grants revenue by $217.9 million. Under this proposal, the hospital supplemental payments are increased to $453.3 million. This amount reflects the FY 2019 level adjusted by the following: (1) a reduction of $40 million to ensure the state does not exceed the federal upper payment limit (UPL); and (2) a reduction of $3.0 million to reflect the FY 2019 reduction in the small hospital pool due to the merger of Charlotte Hungerford hospital with Hartford HealthCare. Note: The federal UPL is the maximum amount a state Medicaid program may pay a given provider type in the aggregate and can vary each year as it is based on what Medicare would have paid for the same services; payments in excess of the UPL are not eligible for federal reimbursement.
Restore Reduction in Hospital Inpatient Reimbursement 59,100,000 61,800,000 61,800,000 Reflects anticipated changes to the Medicaid state plan. Currently, the state plan requires that the department use the current version of the 3M grouper as the basis for weighting inpatient rates. 3M’s latest version of the grouper, however, substantially reduced the weighting for Medicaid costs as a result of the transition to ICD-
10, which has a much more detailed level of coding for providers to bill. This resulted in a significant reduction to Medicaid inpatient payments; after factoring in expenditures for non-DRG based services, the overall reduction in payments for hospital inpatient services is estimated at approximately 16.8%, or over $170 million when fully annualized.
Provide Resources to Assist in the Development of an Opioid Plan 500,000 250,000 0 Funding is included to support the use of consultant services to assist state agencies in examining various methodologies, including a section 1115 demonstration project, to develop and implement a plan to address gaps in the state's treatment of substance use disorder.
AGENCY SUMMARY
Personnel Summary FY 2019 Authorized
FY 2020 Change From
FY 2019
FY 2020 Total Recommended
FY 2021 Change From
FY 2020
FY 2021 Total Recommended
General Fund 1,986 35 2,021 35 2,021
Financial Summary FY 2019 Estimated
FY 2020 Baseline
FY 2020 Total Recommended
FY 2021 Baseline
FY 2021 Total Recommended
Personal Services 117,199,907 130,311,871 132,461,471 137,220,919 139,867,419 Other Expenses 139,311,834 150,584,427 156,674,427 144,143,485 148,773,485 Other Current Expenses Genetic Tests in Paternity Actions 81,906 81,906 81,906 81,906 81,906 HUSKY B Program 5,320,000 8,870,000 8,870,000 14,830,000 14,830,000
TOTAL - Other Current Expenses 5,401,906 8,951,906 8,951,906 14,911,906 14,911,906 Pmts to Other Than Local Govts Medicaid 2,531,368,000 2,662,090,000 2,689,940,000 2,791,460,000 2,771,150,000 Old Age Assistance 39,826,302 43,640,000 42,600,000 45,720,000 43,550,000 Aid To The Blind 584,005 542,000 529,100 550,000 523,900 Aid To The Disabled 61,107,546 61,120,000 59,690,000 62,540,000 59,660,000 Temporary Family Assistance 66,131,712 63,720,000 62,230,000 63,580,000 60,870,000 Emergency Assistance 1 1 1 1 1 Food Stamp Training Expenses 9,832 9,832 9,832 9,832 9,832 DMHAS-Disproportionate Share 108,935,000 108,935,000 108,935,000 108,935,000 108,935,000 Connecticut Home Care Program 32,350,000 36,810,000 36,810,000 36,900,000 36,900,000 Human Resource Development-Hispanic
Programs 1,197,307 1,206,885 1,206,885 1,206,885 1,206,885
Community Residential Services 562,902,640 623,412,127 623,412,127 639,014,602 639,014,602 Protective Services for the Elderly 785,204 557,200 0 586,900 0 Safety Net Services 1,326,321 1,334,544 1,334,544 1,334,544 1,334,544 Refunds Of Collections 94,699 94,699 94,699 94,699 94,699 Services for Persons With Disabilities 273,897 276,362 276,362 276,362 276,362
Budget Summary
B - 58
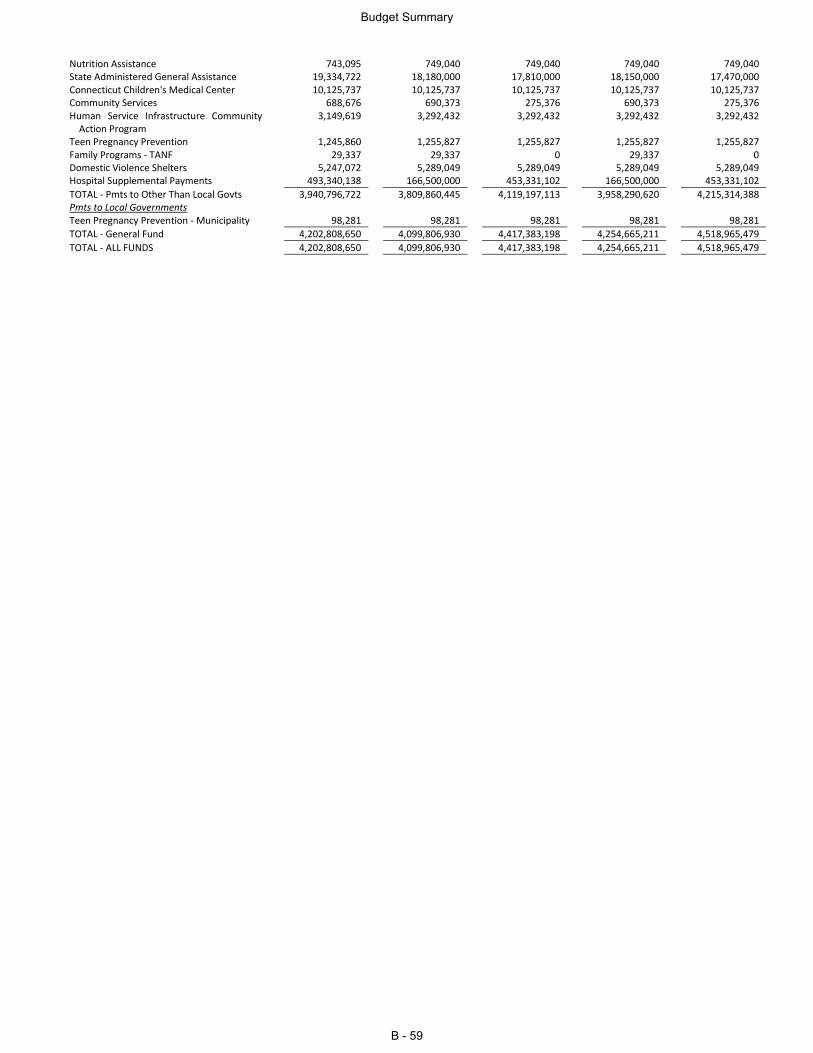
Nutrition Assistance 743,095 749,040 749,040 749,040 749,040 State Administered General Assistance 19,334,722 18,180,000 17,810,000 18,150,000 17,470,000 Connecticut Children's Medical Center 10,125,737 10,125,737 10,125,737 10,125,737 10,125,737 Community Services 688,676 690,373 275,376 690,373 275,376 Human Service Infrastructure Community
Action Program 3,149,619 3,292,432 3,292,432 3,292,432 3,292,432
Teen Pregnancy Prevention 1,245,860 1,255,827 1,255,827 1,255,827 1,255,827 Family Programs - TANF 29,337 29,337 0 29,337 0 Domestic Violence Shelters 5,247,072 5,289,049 5,289,049 5,289,049 5,289,049 Hospital Supplemental Payments 493,340,138 166,500,000 453,331,102 166,500,000 453,331,102
TOTAL - Pmts to Other Than Local Govts 3,940,796,722 3,809,860,445 4,119,197,113 3,958,290,620 4,215,314,388 Pmts to Local Governments Teen Pregnancy Prevention - Municipality 98,281 98,281 98,281 98,281 98,281
TOTAL - General Fund 4,202,808,650 4,099,806,930 4,417,383,198 4,254,665,211 4,518,965,479
TOTAL - ALL FUNDS 4,202,808,650 4,099,806,930 4,417,383,198 4,254,665,211 4,518,965,479
Budget Summary
B - 59
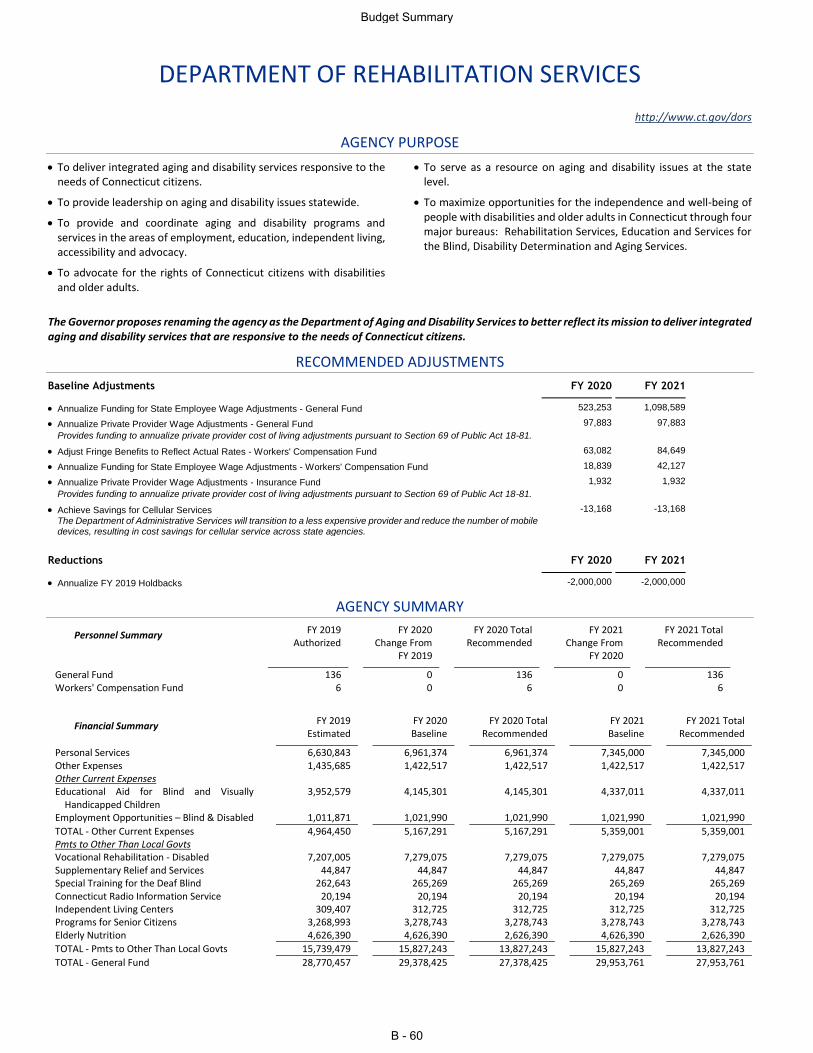
DEPARTMENT OF REHABILITATION SERVICES
http://www.ct.gov/dors
AGENCY PURPOSE
To deliver integrated aging and disability services responsive to the needs of Connecticut citizens.
To provide leadership on aging and disability issues statewide.
To provide and coordinate aging and disability programs and services in the areas of employment, education, independent living, accessibility and advocacy.
To advocate for the rights of Connecticut citizens with disabilities and older adults.
To serve as a resource on aging and disability issues at the state level.
To maximize opportunities for the independence and well-being of people with disabilities and older adults in Connecticut through four major bureaus: Rehabilitation Services, Education and Services for the Blind, Disability Determination and Aging Services.
The Governor proposes renaming the agency as the Department of Aging and Disability Services to better reflect its mission to deliver integrated aging and disability services that are responsive to the needs of Connecticut citizens.
RECOMMENDED ADJUSTMENTS
Baseline Adjustments FY 2020 FY 2021
Annualize Funding for State Employee Wage Adjustments - General Fund 523,253 1,098,589
Annualize Private Provider Wage Adjustments - General Fund 97,883 97,883
Provides funding to annualize private provider cost of living adjustments pursuant to Section 69 of Public Act 18-81.
Adjust Fringe Benefits to Reflect Actual Rates - Workers' Compensation Fund 63,082 84,649
Annualize Funding for State Employee Wage Adjustments - Workers' Compensation Fund 18,839 42,127
Annualize Private Provider Wage Adjustments - Insurance Fund 1,932 1,932
Provides funding to annualize private provider cost of living adjustments pursuant to Section 69 of Public Act 18-81.
Achieve Savings for Cellular Services -13,168 -13,168 The Department of Administrative Services will transition to a less expensive provider and reduce the number of mobile devices, resulting in cost savings for cellular service across state agencies.
Reductions FY 2020 FY 2021
Annualize FY 2019 Holdbacks -2,000,000 -2,000,000
AGENCY SUMMARY
Personnel Summary FY 2019 Authorized
FY 2020 Change From
FY 2019
FY 2020 Total Recommended
FY 2021 Change From
FY 2020
FY 2021 Total Recommended
General Fund 136 0 136 0 136 Workers' Compensation Fund 6 0 6 0 6
Financial Summary FY 2019 Estimated
FY 2020 Baseline
FY 2020 Total Recommended
FY 2021 Baseline
FY 2021 Total Recommended
Personal Services 6,630,843 6,961,374 6,961,374 7,345,000 7,345,000 Other Expenses 1,435,685 1,422,517 1,422,517 1,422,517 1,422,517 Other Current Expenses Educational Aid for Blind and Visually
Handicapped Children 3,952,579 4,145,301 4,145,301 4,337,011 4,337,011
Employment Opportunities – Blind & Disabled 1,011,871 1,021,990 1,021,990 1,021,990 1,021,990
TOTAL - Other Current Expenses 4,964,450 5,167,291 5,167,291 5,359,001 5,359,001 Pmts to Other Than Local Govts Vocational Rehabilitation - Disabled 7,207,005 7,279,075 7,279,075 7,279,075 7,279,075 Supplementary Relief and Services 44,847 44,847 44,847 44,847 44,847 Special Training for the Deaf Blind 262,643 265,269 265,269 265,269 265,269 Connecticut Radio Information Service 20,194 20,194 20,194 20,194 20,194 Independent Living Centers 309,407 312,725 312,725 312,725 312,725 Programs for Senior Citizens 3,268,993 3,278,743 3,278,743 3,278,743 3,278,743 Elderly Nutrition 4,626,390 4,626,390 2,626,390 4,626,390 2,626,390
TOTAL - Pmts to Other Than Local Govts 15,739,479 15,827,243 13,827,243 15,827,243 13,827,243
TOTAL - General Fund 28,770,457 29,378,425 27,378,425 29,953,761 27,953,761
Budget Summary
B - 60
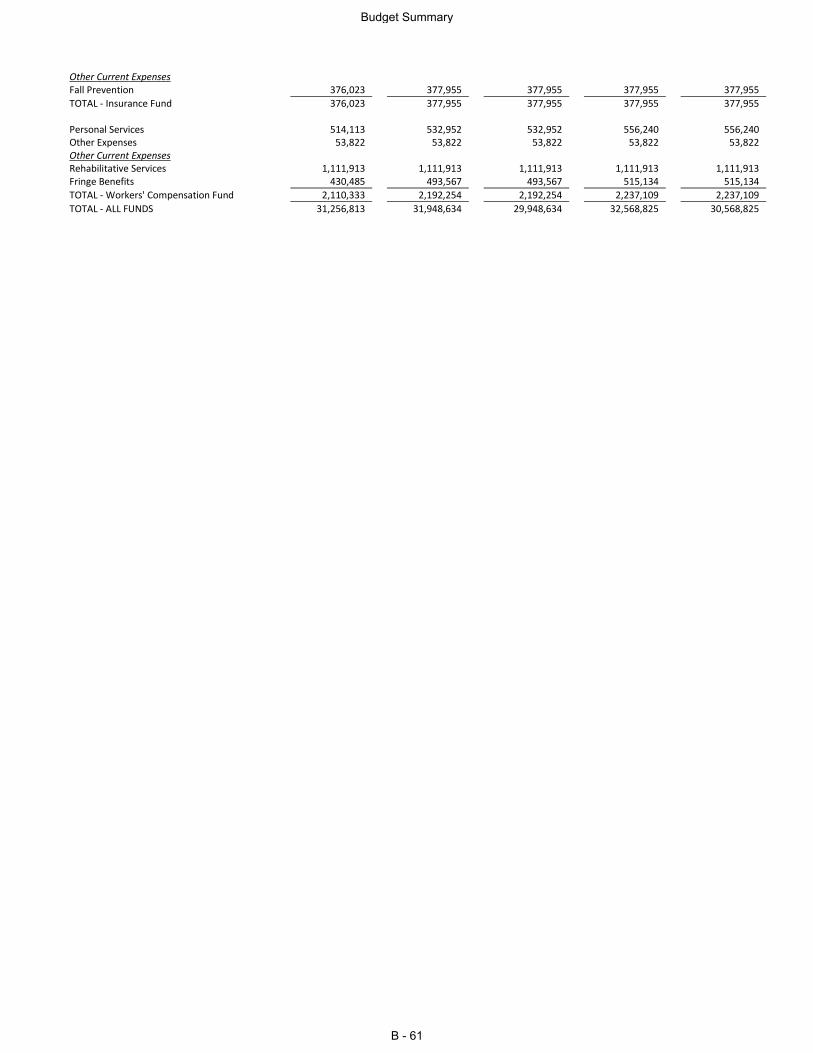
Other Current Expenses Fall Prevention 376,023 377,955 377,955 377,955 377,955
TOTAL - Insurance Fund 376,023 377,955 377,955 377,955 377,955 Personal Services 514,113 532,952 532,952 556,240 556,240 Other Expenses 53,822 53,822 53,822 53,822 53,822 Other Current Expenses Rehabilitative Services 1,111,913 1,111,913 1,111,913 1,111,913 1,111,913 Fringe Benefits 430,485 493,567 493,567 515,134 515,134
TOTAL - Workers' Compensation Fund 2,110,333 2,192,254 2,192,254 2,237,109 2,237,109
TOTAL - ALL FUNDS 31,256,813 31,948,634 29,948,634 32,568,825 30,568,825
Budget Summary
B - 61
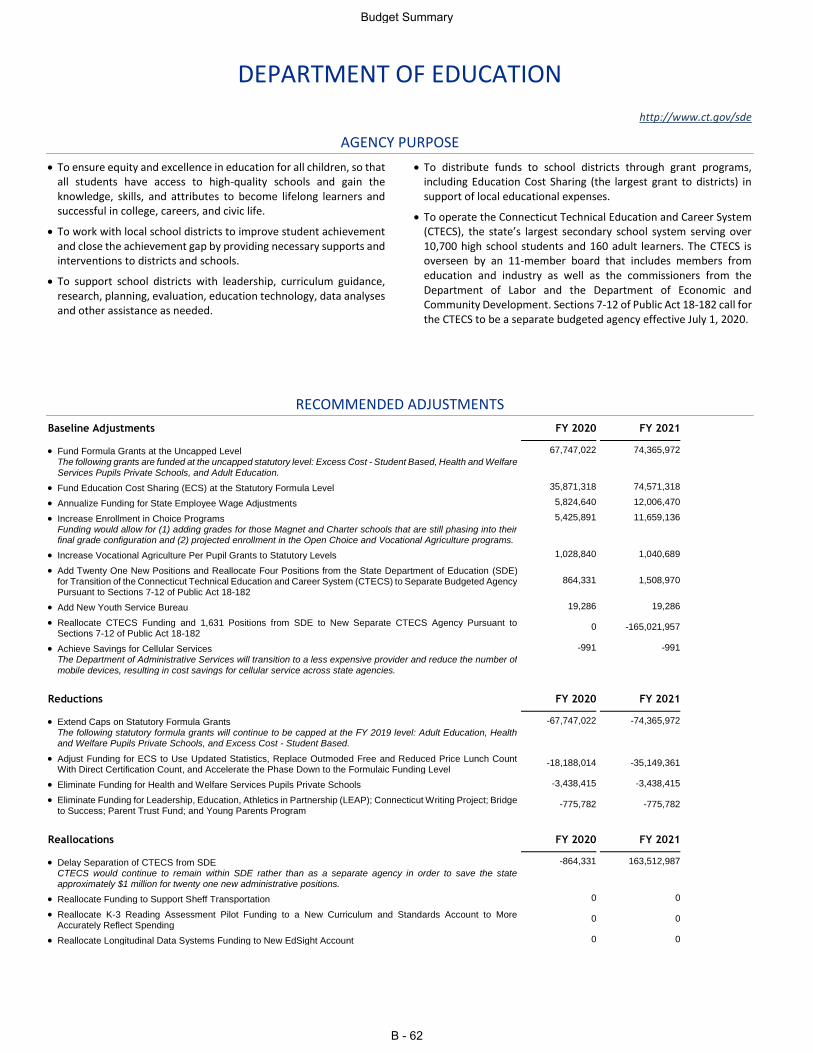
DEPARTMENT OF EDUCATION
http://www.ct.gov/sde
AGENCY PURPOSE
To ensure equity and excellence in education for all children, so that all students have access to high-quality schools and gain the knowledge, skills, and attributes to become lifelong learners and successful in college, careers, and civic life.
To work with local school districts to improve student achievement and close the achievement gap by providing necessary supports and interventions to districts and schools.
To support school districts with leadership, curriculum guidance, research, planning, evaluation, education technology, data analyses and other assistance as needed.
To distribute funds to school districts through grant programs, including Education Cost Sharing (the largest grant to districts) in support of local educational expenses.
To operate the Connecticut Technical Education and Career System (CTECS), the state’s largest secondary school system serving over 10,700 high school students and 160 adult learners. The CTECS is overseen by an 11-member board that includes members from education and industry as well as the commissioners from the Department of Labor and the Department of Economic and Community Development. Sections 7-12 of Public Act 18-182 call for the CTECS to be a separate budgeted agency effective July 1, 2020.
RECOMMENDED ADJUSTMENTS
Baseline Adjustments FY 2020 FY 2021
Fund Formula Grants at the Uncapped Level 67,747,022 74,365,972 The following grants are funded at the uncapped statutory level: Excess Cost - Student Based, Health and Welfare
Services Pupils Private Schools, and Adult Education.
Fund Education Cost Sharing (ECS) at the Statutory Formula Level 35,871,318 74,571,318
Annualize Funding for State Employee Wage Adjustments 5,824,640 12,006,470
Increase Enrollment in Choice Programs 5,425,891 11,659,136 Funding would allow for (1) adding grades for those Magnet and Charter schools that are still phasing into their final grade configuration and (2) projected enrollment in the Open Choice and Vocational Agriculture programs.
Increase Vocational Agriculture Per Pupil Grants to Statutory Levels 1,028,840 1,040,689
Add Twenty One New Positions and Reallocate Four Positions from the State Department of Education (SDE) for Transition of the Connecticut Technical Education and Career System (CTECS) to Separate Budgeted Agency Pursuant to Sections 7-12 of Public Act 18-182
864,331 1,508,970
Add New Youth Service Bureau 19,286 19,286
Reallocate CTECS Funding and 1,631 Positions from SDE to New Separate CTECS Agency Pursuant to Sections 7-12 of Public Act 18-182
0 -165,021,957
Achieve Savings for Cellular Services -991 -991 The Department of Administrative Services will transition to a less expensive provider and reduce the number of
mobile devices, resulting in cost savings for cellular service across state agencies.
Reductions FY 2020 FY 2021
Extend Caps on Statutory Formula Grants -67,747,022 -74,365,972 The following statutory formula grants will continue to be capped at the FY 2019 level: Adult Education, Health and Welfare Pupils Private Schools, and Excess Cost - Student Based.
Adjust Funding for ECS to Use Updated Statistics, Replace Outmoded Free and Reduced Price Lunch Count With Direct Certification Count, and Accelerate the Phase Down to the Formulaic Funding Level
-18,188,014 -35,149,361
Eliminate Funding for Health and Welfare Services Pupils Private Schools -3,438,415 -3,438,415
Eliminate Funding for Leadership, Education, Athletics in Partnership (LEAP); Connecticut Writing Project; Bridge to Success; Parent Trust Fund; and Young Parents Program
-775,782 -775,782
Reallocations FY 2020 FY 2021
Delay Separation of CTECS from SDE -864,331 163,512,987 CTECS would continue to remain within SDE rather than as a separate agency in order to save the state approximately $1 million for twenty one new administrative positions.
Reallocate Funding to Support Sheff Transportation 0 0
Reallocate K-3 Reading Assessment Pilot Funding to a New Curriculum and Standards Account to More Accurately Reflect Spending
0 0
Reallocate Longitudinal Data Systems Funding to New EdSight Account 0 0
Budget Summary
B - 62
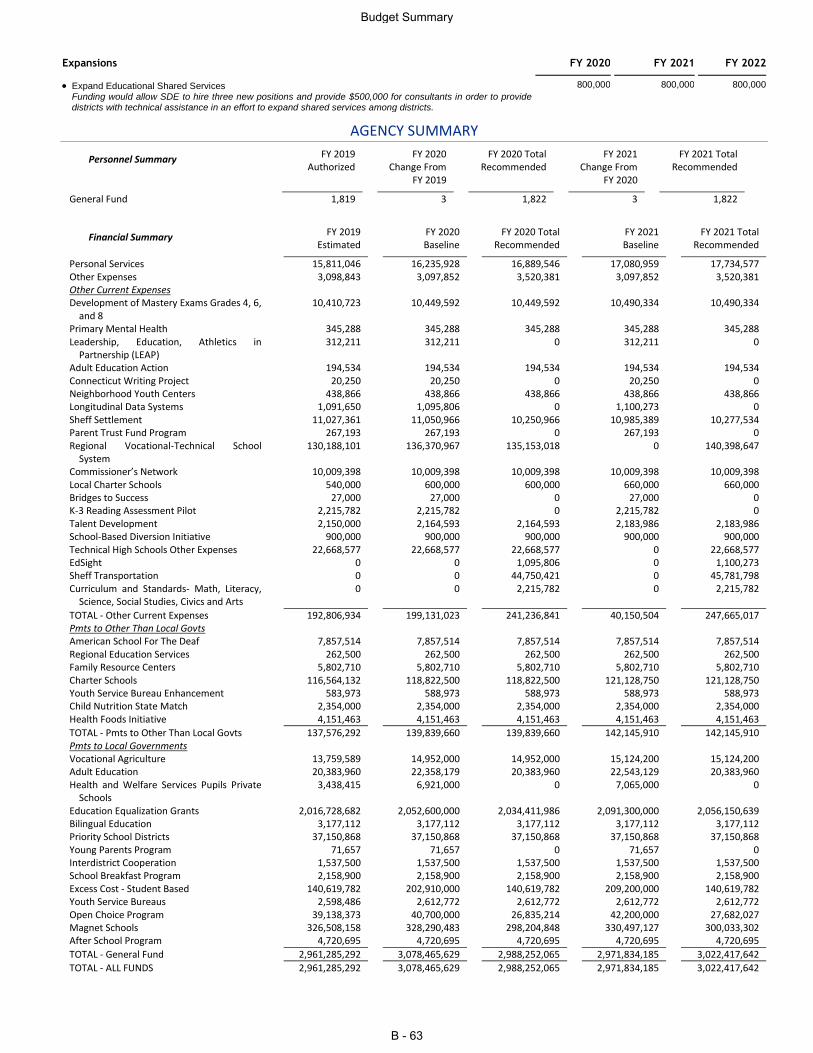
Expansions FY 2020 FY 2021 FY 2022
Expand Educational Shared Services 800,000 800,000 800,000 Funding would allow SDE to hire three new positions and provide $500,000 for consultants in order to provide districts with technical assistance in an effort to expand shared services among districts.
AGENCY SUMMARY
Personnel Summary FY 2019 Authorized
FY 2020 Change From
FY 2019
FY 2020 Total Recommended
FY 2021 Change From
FY 2020
FY 2021 Total Recommended
General Fund 1,819 3 1,822 3 1,822
Financial Summary FY 2019 Estimated
FY 2020 Baseline
FY 2020 Total Recommended
FY 2021 Baseline
FY 2021 Total Recommended
Personal Services 15,811,046 16,235,928 16,889,546 17,080,959 17,734,577 Other Expenses 3,098,843 3,097,852 3,520,381 3,097,852 3,520,381 Other Current Expenses Development of Mastery Exams Grades 4, 6,
and 8 10,410,723 10,449,592 10,449,592 10,490,334 10,490,334
Primary Mental Health 345,288 345,288 345,288 345,288 345,288 Leadership, Education, Athletics in
Partnership (LEAP) 312,211 312,211 0 312,211 0
Adult Education Action 194,534 194,534 194,534 194,534 194,534 Connecticut Writing Project 20,250 20,250 0 20,250 0 Neighborhood Youth Centers 438,866 438,866 438,866 438,866 438,866 Longitudinal Data Systems 1,091,650 1,095,806 0 1,100,273 0 Sheff Settlement 11,027,361 11,050,966 10,250,966 10,985,389 10,277,534 Parent Trust Fund Program 267,193 267,193 0 267,193 0 Regional Vocational-Technical School
System 130,188,101 136,370,967 135,153,018 0 140,398,647
Commissioner’s Network 10,009,398 10,009,398 10,009,398 10,009,398 10,009,398 Local Charter Schools 540,000 600,000 600,000 660,000 660,000 Bridges to Success 27,000 27,000 0 27,000 0 K-3 Reading Assessment Pilot 2,215,782 2,215,782 0 2,215,782 0 Talent Development 2,150,000 2,164,593 2,164,593 2,183,986 2,183,986 School-Based Diversion Initiative 900,000 900,000 900,000 900,000 900,000 Technical High Schools Other Expenses 22,668,577 22,668,577 22,668,577 0 22,668,577 EdSight 0 0 1,095,806 0 1,100,273 Sheff Transportation 0 0 44,750,421 0 45,781,798 Curriculum and Standards- Math, Literacy,
Science, Social Studies, Civics and Arts 0 0 2,215,782 0 2,215,782
TOTAL - Other Current Expenses 192,806,934 199,131,023 241,236,841 40,150,504 247,665,017 Pmts to Other Than Local Govts American School For The Deaf 7,857,514 7,857,514 7,857,514 7,857,514 7,857,514 Regional Education Services 262,500 262,500 262,500 262,500 262,500 Family Resource Centers 5,802,710 5,802,710 5,802,710 5,802,710 5,802,710 Charter Schools 116,564,132 118,822,500 118,822,500 121,128,750 121,128,750 Youth Service Bureau Enhancement 583,973 588,973 588,973 588,973 588,973 Child Nutrition State Match 2,354,000 2,354,000 2,354,000 2,354,000 2,354,000 Health Foods Initiative 4,151,463 4,151,463 4,151,463 4,151,463 4,151,463
TOTAL - Pmts to Other Than Local Govts 137,576,292 139,839,660 139,839,660 142,145,910 142,145,910 Pmts to Local Governments Vocational Agriculture 13,759,589 14,952,000 14,952,000 15,124,200 15,124,200 Adult Education 20,383,960 22,358,179 20,383,960 22,543,129 20,383,960 Health and Welfare Services Pupils Private
Schools 3,438,415 6,921,000 0 7,065,000 0
Education Equalization Grants 2,016,728,682 2,052,600,000 2,034,411,986 2,091,300,000 2,056,150,639 Bilingual Education 3,177,112 3,177,112 3,177,112 3,177,112 3,177,112 Priority School Districts 37,150,868 37,150,868 37,150,868 37,150,868 37,150,868 Young Parents Program 71,657 71,657 0 71,657 0 Interdistrict Cooperation 1,537,500 1,537,500 1,537,500 1,537,500 1,537,500 School Breakfast Program 2,158,900 2,158,900 2,158,900 2,158,900 2,158,900 Excess Cost - Student Based 140,619,782 202,910,000 140,619,782 209,200,000 140,619,782 Youth Service Bureaus 2,598,486 2,612,772 2,612,772 2,612,772 2,612,772 Open Choice Program 39,138,373 40,700,000 26,835,214 42,200,000 27,682,027 Magnet Schools 326,508,158 328,290,483 298,204,848 330,497,127 300,033,302 After School Program 4,720,695 4,720,695 4,720,695 4,720,695 4,720,695
TOTAL - General Fund 2,961,285,292 3,078,465,629 2,988,252,065 2,971,834,185 3,022,417,642
TOTAL - ALL FUNDS 2,961,285,292 3,078,465,629 2,988,252,065 2,971,834,185 3,022,417,642
Budget Summary
B - 63
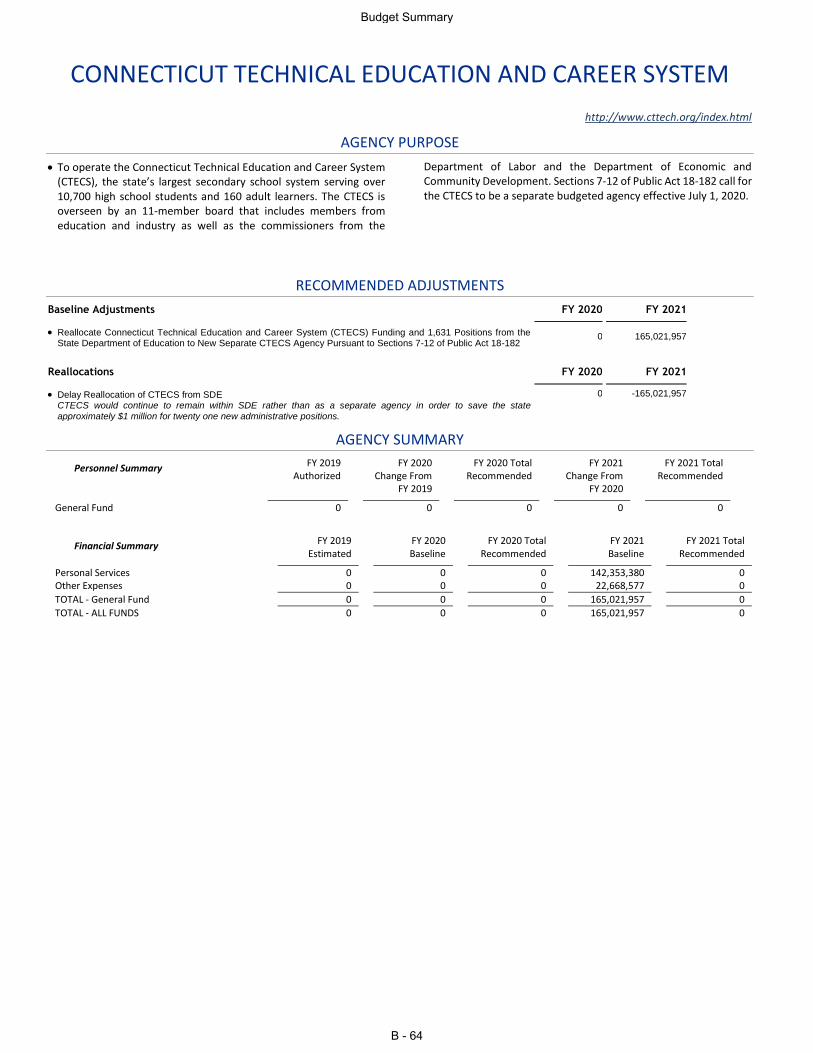
CONNECTICUT TECHNICAL EDUCATION AND CAREER SYSTEM
http://www.cttech.org/index.html
AGENCY PURPOSE
To operate the Connecticut Technical Education and Career System (CTECS), the state’s largest secondary school system serving over 10,700 high school students and 160 adult learners. The CTECS is overseen by an 11-member board that includes members from education and industry as well as the commissioners from the
Department of Labor and the Department of Economic and Community Development. Sections 7-12 of Public Act 18-182 call for the CTECS to be a separate budgeted agency effective July 1, 2020.
RECOMMENDED ADJUSTMENTS
Baseline Adjustments FY 2020 FY 2021
Reallocate Connecticut Technical Education and Career System (CTECS) Funding and 1,631 Positions from the State Department of Education to New Separate CTECS Agency Pursuant to Sections 7-12 of Public Act 18-182
0 165,021,957
Reallocations FY 2020 FY 2021
Delay Reallocation of CTECS from SDE 0 -165,021,957 CTECS would continue to remain within SDE rather than as a separate agency in order to save the state
approximately $1 million for twenty one new administrative positions.
AGENCY SUMMARY
Personnel Summary FY 2019 Authorized
FY 2020 Change From
FY 2019
FY 2020 Total Recommended
FY 2021 Change From
FY 2020
FY 2021 Total Recommended
General Fund 0 0 0 0 0
Financial Summary FY 2019 Estimated
FY 2020 Baseline
FY 2020 Total Recommended
FY 2021 Baseline
FY 2021 Total Recommended
Personal Services 0 0 0 142,353,380 0 Other Expenses 0 0 0 22,668,577 0
TOTAL - General Fund 0 0 0 165,021,957 0
TOTAL - ALL FUNDS 0 0 0 165,021,957 0
Budget Summary
B - 64
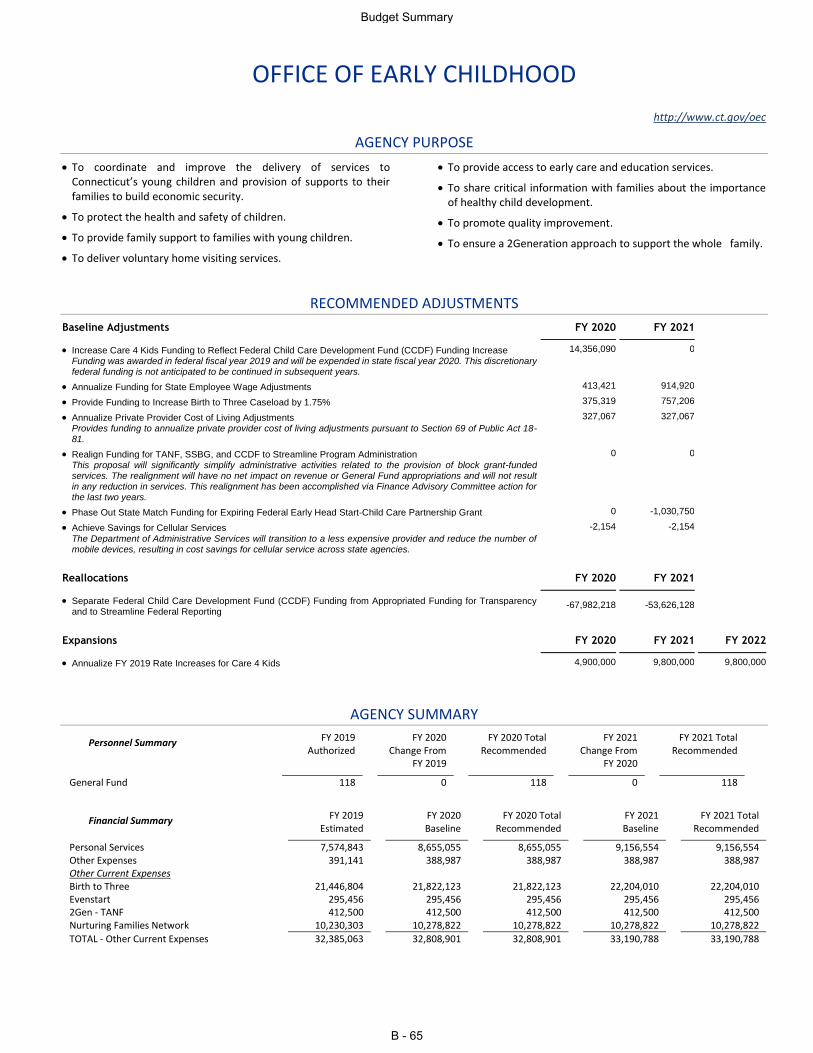
OFFICE OF EARLY CHILDHOOD
http://www.ct.gov/oec
AGENCY PURPOSE
To coordinate and improve the delivery of services to Connecticut’s young children and provision of supports to their families to build economic security.
To protect the health and safety of children.
To provide family support to families with young children.
To deliver voluntary home visiting services.
To provide access to early care and education services.
To share critical information with families about the importance of healthy child development.
To promote quality improvement.
To ensure a 2Generation approach to support the whole family.
RECOMMENDED ADJUSTMENTS
Baseline Adjustments FY 2020 FY 2021
Increase Care 4 Kids Funding to Reflect Federal Child Care Development Fund (CCDF) Funding Increase 14,356,090 0 Funding was awarded in federal fiscal year 2019 and will be expended in state fiscal year 2020. This discretionary federal funding is not anticipated to be continued in subsequent years.
Annualize Funding for State Employee Wage Adjustments 413,421 914,920
Provide Funding to Increase Birth to Three Caseload by 1.75% 375,319 757,206
Annualize Private Provider Cost of Living Adjustments 327,067 327,067 Provides funding to annualize private provider cost of living adjustments pursuant to Section 69 of Public Act 18-81.
Realign Funding for TANF, SSBG, and CCDF to Streamline Program Administration 0 0 This proposal will significantly simplify administrative activities related to the provision of block grant-funded services. The realignment will have no net impact on revenue or General Fund appropriations and will not result in any reduction in services. This realignment has been accomplished via Finance Advisory Committee action for the last two years.
Phase Out State Match Funding for Expiring Federal Early Head Start-Child Care Partnership Grant 0 -1,030,750
Achieve Savings for Cellular Services -2,154 -2,154 The Department of Administrative Services will transition to a less expensive provider and reduce the number of mobile devices, resulting in cost savings for cellular service across state agencies.
Reallocations FY 2020 FY 2021
Separate Federal Child Care Development Fund (CCDF) Funding from Appropriated Funding for Transparency and to Streamline Federal Reporting
-67,982,218 -53,626,128
Expansions FY 2020 FY 2021 FY 2022
Annualize FY 2019 Rate Increases for Care 4 Kids 4,900,000 9,800,000 9,800,000
AGENCY SUMMARY
Personnel Summary FY 2019 Authorized
FY 2020 Change From
FY 2019
FY 2020 Total Recommended
FY 2021 Change From
FY 2020
FY 2021 Total Recommended
General Fund 118 0 118 0 118
Financial Summary FY 2019 Estimated
FY 2020 Baseline
FY 2020 Total Recommended
FY 2021 Baseline
FY 2021 Total Recommended
Personal Services 7,574,843 8,655,055 8,655,055 9,156,554 9,156,554 Other Expenses 391,141 388,987 388,987 388,987 388,987 Other Current Expenses Birth to Three 21,446,804 21,822,123 21,822,123 22,204,010 22,204,010 Evenstart 295,456 295,456 295,456 295,456 295,456 2Gen - TANF 412,500 412,500 412,500 412,500 412,500 Nurturing Families Network 10,230,303 10,278,822 10,278,822 10,278,822 10,278,822
TOTAL - Other Current Expenses 32,385,063 32,808,901 32,808,901 33,190,788 33,190,788
Budget Summary
B - 65
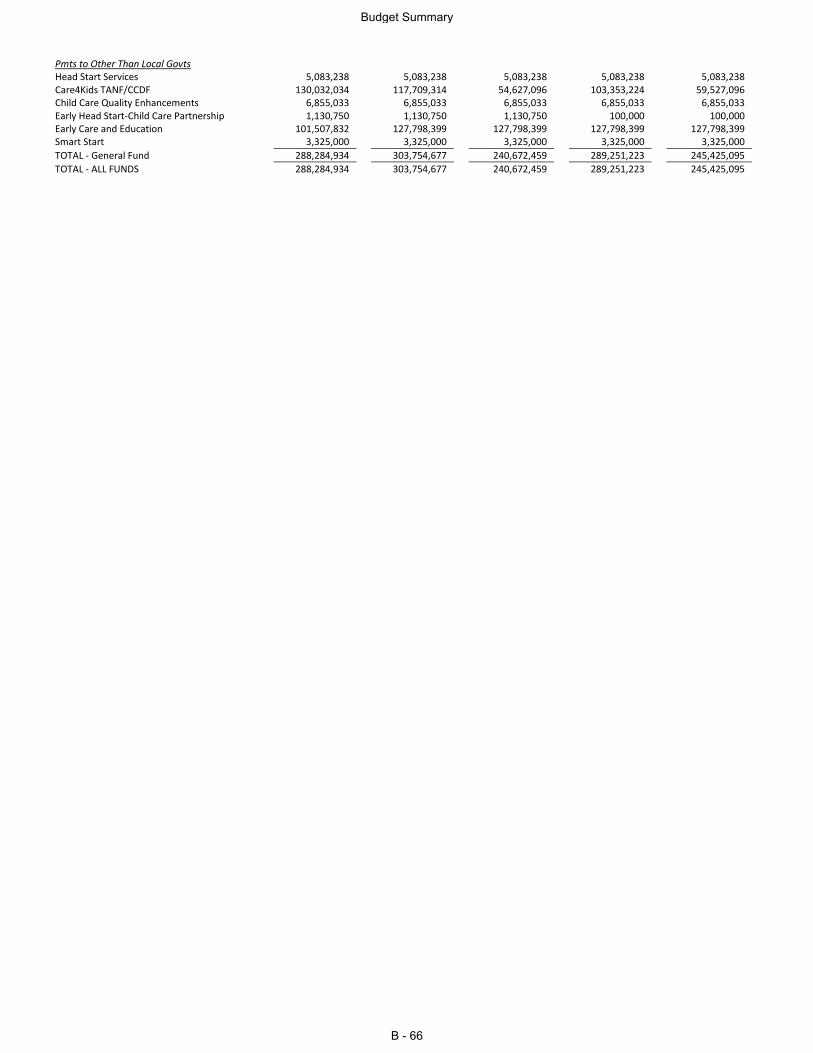
Pmts to Other Than Local Govts Head Start Services 5,083,238 5,083,238 5,083,238 5,083,238 5,083,238 Care4Kids TANF/CCDF 130,032,034 117,709,314 54,627,096 103,353,224 59,527,096 Child Care Quality Enhancements 6,855,033 6,855,033 6,855,033 6,855,033 6,855,033 Early Head Start-Child Care Partnership 1,130,750 1,130,750 1,130,750 100,000 100,000 Early Care and Education 101,507,832 127,798,399 127,798,399 127,798,399 127,798,399 Smart Start 3,325,000 3,325,000 3,325,000 3,325,000 3,325,000
TOTAL - General Fund 288,284,934 303,754,677 240,672,459 289,251,223 245,425,095
TOTAL - ALL FUNDS 288,284,934 303,754,677 240,672,459 289,251,223 245,425,095
Budget Summary
B - 66
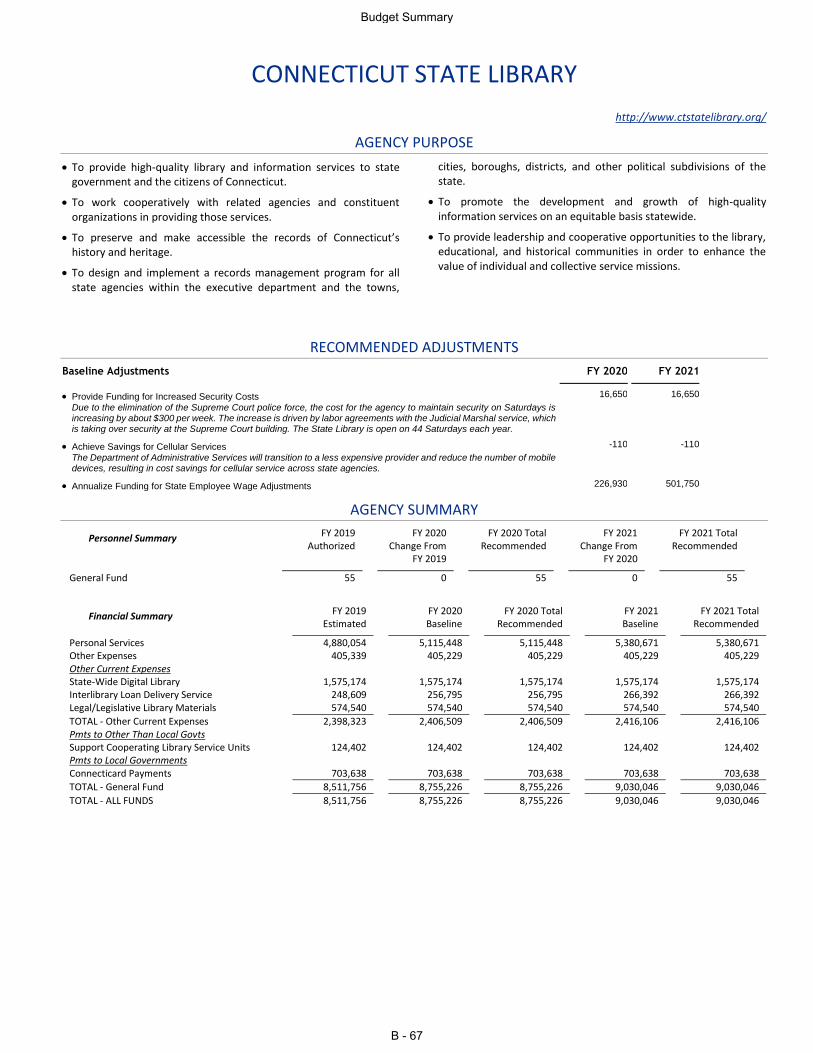
CONNECTICUT STATE LIBRARY
http://www.ctstatelibrary.org/
AGENCY PURPOSE
To provide high-quality library and information services to state government and the citizens of Connecticut.
To work cooperatively with related agencies and constituent organizations in providing those services.
To preserve and make accessible the records of Connecticut’s history and heritage.
To design and implement a records management program for all state agencies within the executive department and the towns,
cities, boroughs, districts, and other political subdivisions of the state.
To promote the development and growth of high-quality information services on an equitable basis statewide.
To provide leadership and cooperative opportunities to the library, educational, and historical communities in order to enhance the value of individual and collective service missions.
RECOMMENDED ADJUSTMENTS
Baseline Adjustments FY 2020 FY 2021
Provide Funding for Increased Security Costs 16,650 16,650
Due to the elimination of the Supreme Court police force, the cost for the agency to maintain security on Saturdays is increasing by about $300 per week. The increase is driven by labor agreements with the Judicial Marshal service, which is taking over security at the Supreme Court building. The State Library is open on 44 Saturdays each year.
Achieve Savings for Cellular Services -110 -110
The Department of Administrative Services will transition to a less expensive provider and reduce the number of mobile devices, resulting in cost savings for cellular service across state agencies.
Annualize Funding for State Employee Wage Adjustments 226,930 501,750
AGENCY SUMMARY
Personnel Summary FY 2019 Authorized
FY 2020 Change From
FY 2019
FY 2020 Total Recommended
FY 2021 Change From
FY 2020
FY 2021 Total Recommended
General Fund 55 0 55 0 55
Financial Summary FY 2019 Estimated
FY 2020 Baseline
FY 2020 Total Recommended
FY 2021 Baseline
FY 2021 Total Recommended
Personal Services 4,880,054 5,115,448 5,115,448 5,380,671 5,380,671 Other Expenses 405,339 405,229 405,229 405,229 405,229 Other Current Expenses State-Wide Digital Library 1,575,174 1,575,174 1,575,174 1,575,174 1,575,174 Interlibrary Loan Delivery Service 248,609 256,795 256,795 266,392 266,392 Legal/Legislative Library Materials 574,540 574,540 574,540 574,540 574,540
TOTAL - Other Current Expenses 2,398,323 2,406,509 2,406,509 2,416,106 2,416,106 Pmts to Other Than Local Govts Support Cooperating Library Service Units 124,402 124,402 124,402 124,402 124,402 Pmts to Local Governments Connecticard Payments 703,638 703,638 703,638 703,638 703,638
TOTAL - General Fund 8,511,756 8,755,226 8,755,226 9,030,046 9,030,046
TOTAL - ALL FUNDS 8,511,756 8,755,226 8,755,226 9,030,046 9,030,046
Budget Summary
B - 67
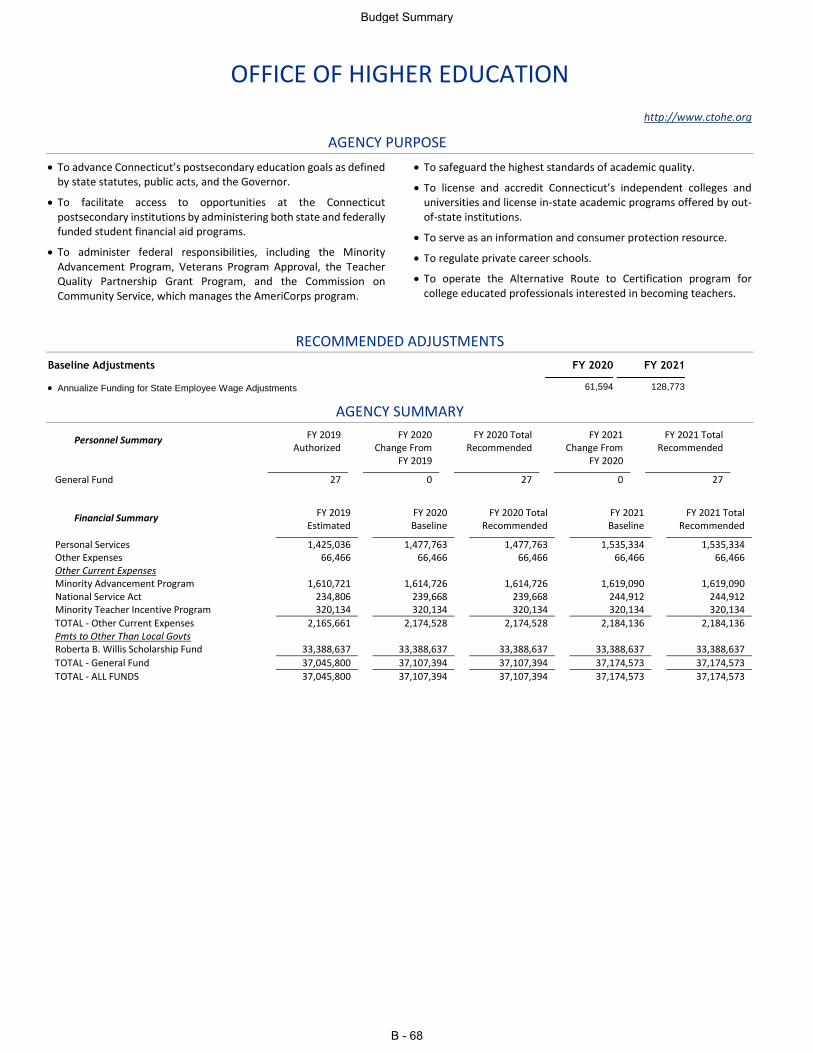
OFFICE OF HIGHER EDUCATION
http://www.ctohe.org
AGENCY PURPOSE
To advance Connecticut’s postsecondary education goals as defined by state statutes, public acts, and the Governor.
To facilitate access to opportunities at the Connecticut postsecondary institutions by administering both state and federally funded student financial aid programs.
To administer federal responsibilities, including the Minority Advancement Program, Veterans Program Approval, the Teacher Quality Partnership Grant Program, and the Commission on Community Service, which manages the AmeriCorps program.
To safeguard the highest standards of academic quality.
To license and accredit Connecticut’s independent colleges and universities and license in-state academic programs offered by out-of-state institutions.
To serve as an information and consumer protection resource.
To regulate private career schools.
To operate the Alternative Route to Certification program for college educated professionals interested in becoming teachers.
RECOMMENDED ADJUSTMENTS
Baseline Adjustments FY 2020 FY 2021
Annualize Funding for State Employee Wage Adjustments 61,594 128,773
AGENCY SUMMARY
Personnel Summary FY 2019 Authorized
FY 2020 Change From
FY 2019
FY 2020 Total Recommended
FY 2021 Change From
FY 2020
FY 2021 Total Recommended
General Fund 27 0 27 0 27
Financial Summary FY 2019 Estimated
FY 2020 Baseline
FY 2020 Total Recommended
FY 2021 Baseline
FY 2021 Total Recommended
Personal Services 1,425,036 1,477,763 1,477,763 1,535,334 1,535,334 Other Expenses 66,466 66,466 66,466 66,466 66,466 Other Current Expenses Minority Advancement Program 1,610,721 1,614,726 1,614,726 1,619,090 1,619,090 National Service Act 234,806 239,668 239,668 244,912 244,912 Minority Teacher Incentive Program 320,134 320,134 320,134 320,134 320,134
TOTAL - Other Current Expenses 2,165,661 2,174,528 2,174,528 2,184,136 2,184,136 Pmts to Other Than Local Govts Roberta B. Willis Scholarship Fund 33,388,637 33,388,637 33,388,637 33,388,637 33,388,637
TOTAL - General Fund 37,045,800 37,107,394 37,107,394 37,174,573 37,174,573
TOTAL - ALL FUNDS 37,045,800 37,107,394 37,107,394 37,174,573 37,174,573
Budget Summary
B - 68
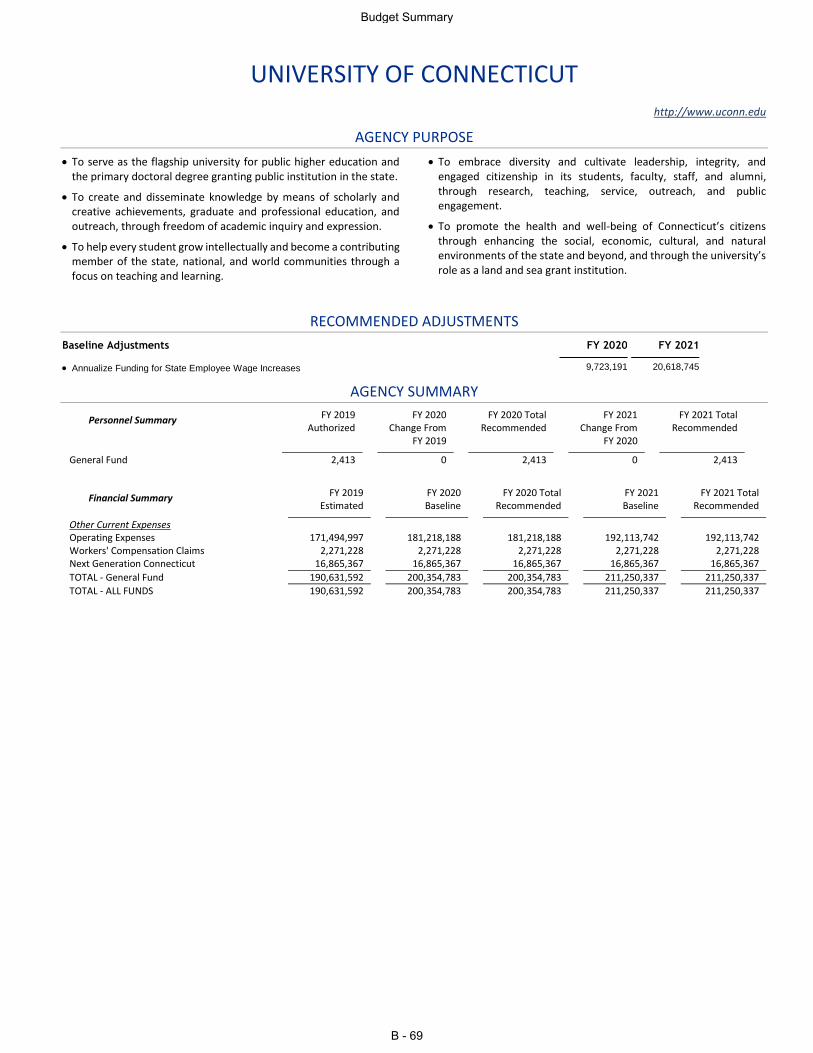
UNIVERSITY OF CONNECTICUT
http://www.uconn.edu
AGENCY PURPOSE
To serve as the flagship university for public higher education and the primary doctoral degree granting public institution in the state.
To create and disseminate knowledge by means of scholarly and creative achievements, graduate and professional education, and outreach, through freedom of academic inquiry and expression.
To help every student grow intellectually and become a contributing member of the state, national, and world communities through a focus on teaching and learning.
To embrace diversity and cultivate leadership, integrity, and engaged citizenship in its students, faculty, staff, and alumni, through research, teaching, service, outreach, and public engagement.
To promote the health and well-being of Connecticut’s citizens through enhancing the social, economic, cultural, and natural environments of the state and beyond, and through the university’s role as a land and sea grant institution.
RECOMMENDED ADJUSTMENTS
Baseline Adjustments FY 2020 FY 2021
Annualize Funding for State Employee Wage Increases 9,723,191 20,618,745
AGENCY SUMMARY
Personnel Summary FY 2019 Authorized
FY 2020 Change From
FY 2019
FY 2020 Total Recommended
FY 2021 Change From
FY 2020
FY 2021 Total Recommended
General Fund 2,413 0 2,413 0 2,413
Financial Summary FY 2019 Estimated
FY 2020 Baseline
FY 2020 Total Recommended
FY 2021 Baseline
FY 2021 Total Recommended
Other Current Expenses Operating Expenses 171,494,997 181,218,188 181,218,188 192,113,742 192,113,742 Workers' Compensation Claims 2,271,228 2,271,228 2,271,228 2,271,228 2,271,228 Next Generation Connecticut 16,865,367 16,865,367 16,865,367 16,865,367 16,865,367
TOTAL - General Fund 190,631,592 200,354,783 200,354,783 211,250,337 211,250,337
TOTAL - ALL FUNDS 190,631,592 200,354,783 200,354,783 211,250,337 211,250,337
Budget Summary
B - 69
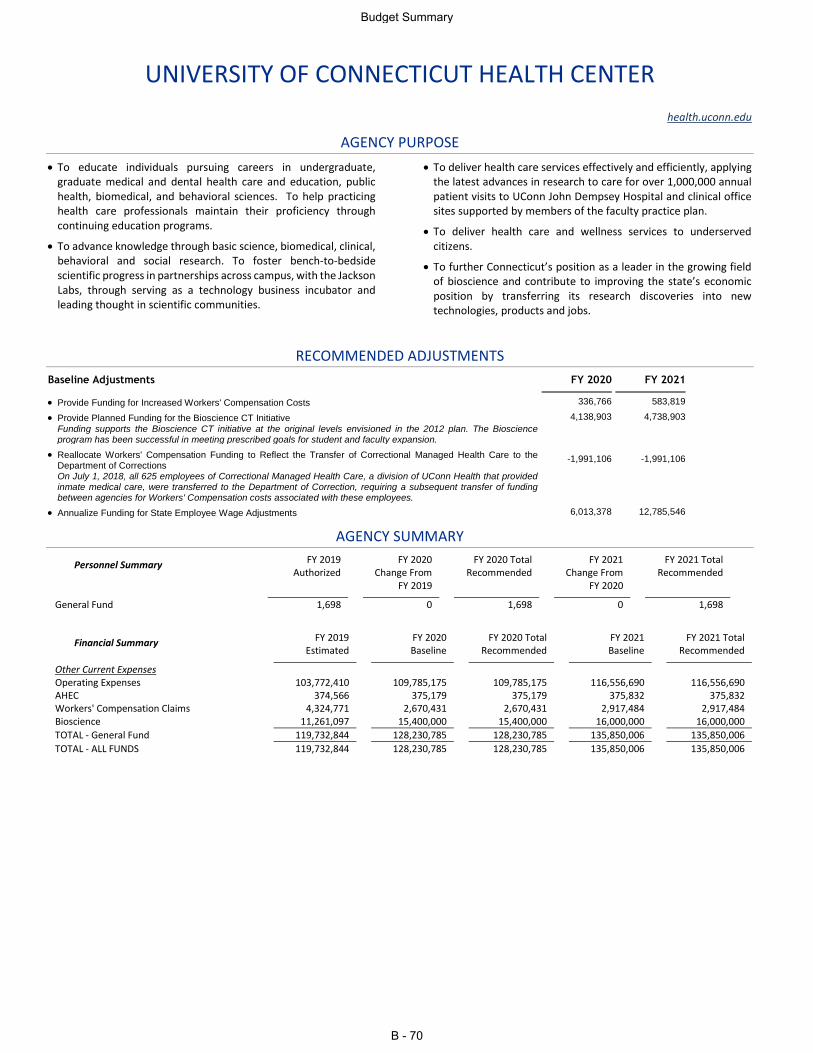
UNIVERSITY OF CONNECTICUT HEALTH CENTER
health.uconn.edu
AGENCY PURPOSE
To educate individuals pursuing careers in undergraduate, graduate medical and dental health care and education, public health, biomedical, and behavioral sciences. To help practicing health care professionals maintain their proficiency through continuing education programs.
To advance knowledge through basic science, biomedical, clinical, behavioral and social research. To foster bench-to-bedside scientific progress in partnerships across campus, with the Jackson Labs, through serving as a technology business incubator and leading thought in scientific communities.
To deliver health care services effectively and efficiently, applying the latest advances in research to care for over 1,000,000 annual patient visits to UConn John Dempsey Hospital and clinical office sites supported by members of the faculty practice plan.
To deliver health care and wellness services to underserved citizens.
To further Connecticut’s position as a leader in the growing field of bioscience and contribute to improving the state’s economic position by transferring its research discoveries into new technologies, products and jobs.
RECOMMENDED ADJUSTMENTS
Baseline Adjustments FY 2020 FY 2021
Provide Funding for Increased Workers' Compensation Costs 336,766 583,819
Provide Planned Funding for the Bioscience CT Initiative 4,138,903 4,738,903 Funding supports the Bioscience CT initiative at the original levels envisioned in the 2012 plan. The Bioscience program has been successful in meeting prescribed goals for student and faculty expansion.
Reallocate Workers' Compensation Funding to Reflect the Transfer of Correctional Managed Health Care to the Department of Corrections
-1,991,106 -1,991,106
On July 1, 2018, all 625 employees of Correctional Managed Health Care, a division of UConn Health that provided inmate medical care, were transferred to the Department of Correction, requiring a subsequent transfer of funding between agencies for Workers' Compensation costs associated with these employees.
Annualize Funding for State Employee Wage Adjustments 6,013,378 12,785,546
AGENCY SUMMARY
Personnel Summary FY 2019 Authorized
FY 2020 Change From
FY 2019
FY 2020 Total Recommended
FY 2021 Change From
FY 2020
FY 2021 Total Recommended
General Fund 1,698 0 1,698 0 1,698
Financial Summary FY 2019 Estimated
FY 2020 Baseline
FY 2020 Total Recommended
FY 2021 Baseline
FY 2021 Total Recommended
Other Current Expenses Operating Expenses 103,772,410 109,785,175 109,785,175 116,556,690 116,556,690 AHEC 374,566 375,179 375,179 375,832 375,832 Workers' Compensation Claims 4,324,771 2,670,431 2,670,431 2,917,484 2,917,484 Bioscience 11,261,097 15,400,000 15,400,000 16,000,000 16,000,000
TOTAL - General Fund 119,732,844 128,230,785 128,230,785 135,850,006 135,850,006
TOTAL - ALL FUNDS 119,732,844 128,230,785 128,230,785 135,850,006 135,850,006
Budget Summary
B - 70
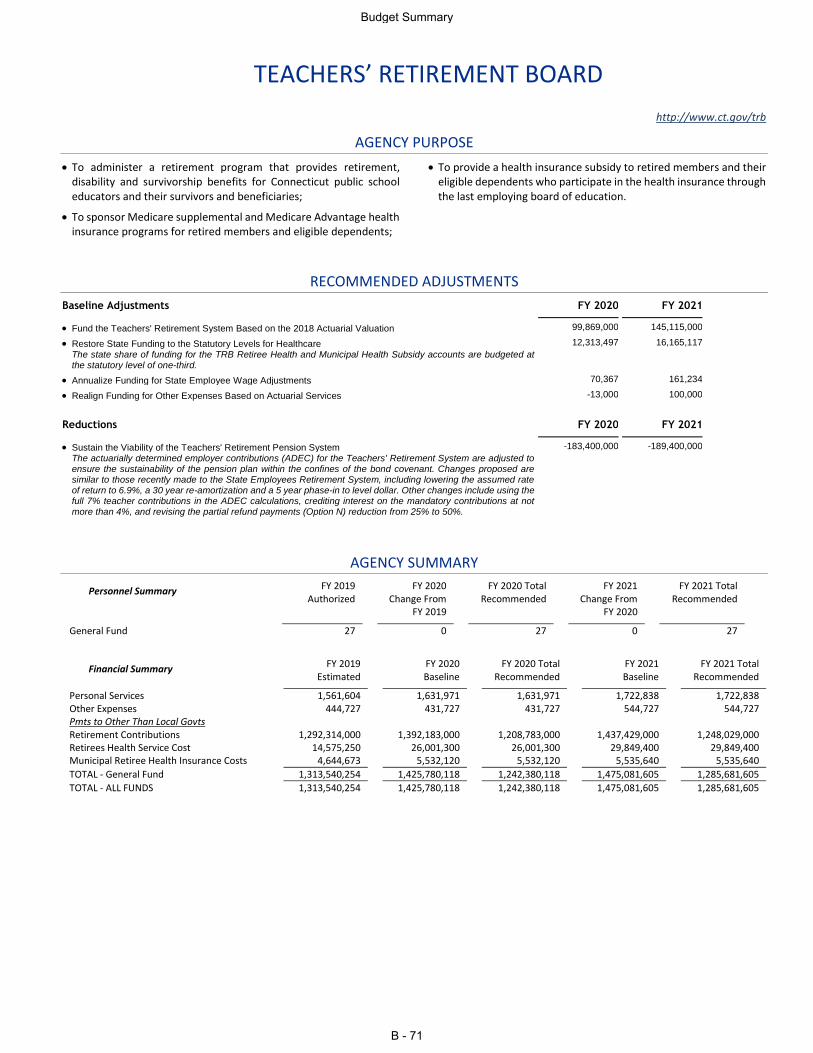
TEACHERS’ RETIREMENT BOARD
http://www.ct.gov/trb
AGENCY PURPOSE
To administer a retirement program that provides retirement, disability and survivorship benefits for Connecticut public school educators and their survivors and beneficiaries;
To sponsor Medicare supplemental and Medicare Advantage health insurance programs for retired members and eligible dependents;
To provide a health insurance subsidy to retired members and their eligible dependents who participate in the health insurance through the last employing board of education.
RECOMMENDED ADJUSTMENTS
Baseline Adjustments FY 2020 FY 2021
Fund the Teachers' Retirement System Based on the 2018 Actuarial Valuation 99,869,000 145,115,000
Restore State Funding to the Statutory Levels for Healthcare 12,313,497 16,165,117 The state share of funding for the TRB Retiree Health and Municipal Health Subsidy accounts are budgeted at the statutory level of one-third.
Annualize Funding for State Employee Wage Adjustments 70,367 161,234
Realign Funding for Other Expenses Based on Actuarial Services -13,000 100,000
Reductions FY 2020 FY 2021
Sustain the Viability of the Teachers' Retirement Pension System -183,400,000 -189,400,000 The actuarially determined employer contributions (ADEC) for the Teachers' Retirement System are adjusted to ensure the sustainability of the pension plan within the confines of the bond covenant. Changes proposed are similar to those recently made to the State Employees Retirement System, including lowering the assumed rate of return to 6.9%, a 30 year re-amortization and a 5 year phase-in to level dollar. Other changes include using the full 7% teacher contributions in the ADEC calculations, crediting interest on the mandatory contributions at not more than 4%, and revising the partial refund payments (Option N) reduction from 25% to 50%.
AGENCY SUMMARY
Personnel Summary FY 2019 Authorized
FY 2020 Change From
FY 2019
FY 2020 Total Recommended
FY 2021 Change From
FY 2020
FY 2021 Total Recommended
General Fund 27 0 27 0 27
Financial Summary FY 2019 Estimated
FY 2020 Baseline
FY 2020 Total Recommended
FY 2021 Baseline
FY 2021 Total Recommended
Personal Services 1,561,604 1,631,971 1,631,971 1,722,838 1,722,838 Other Expenses 444,727 431,727 431,727 544,727 544,727 Pmts to Other Than Local Govts Retirement Contributions 1,292,314,000 1,392,183,000 1,208,783,000 1,437,429,000 1,248,029,000 Retirees Health Service Cost 14,575,250 26,001,300 26,001,300 29,849,400 29,849,400 Municipal Retiree Health Insurance Costs 4,644,673 5,532,120 5,532,120 5,535,640 5,535,640
TOTAL - General Fund 1,313,540,254 1,425,780,118 1,242,380,118 1,475,081,605 1,285,681,605
TOTAL - ALL FUNDS 1,313,540,254 1,425,780,118 1,242,380,118 1,475,081,605 1,285,681,605
Budget Summary
B - 71
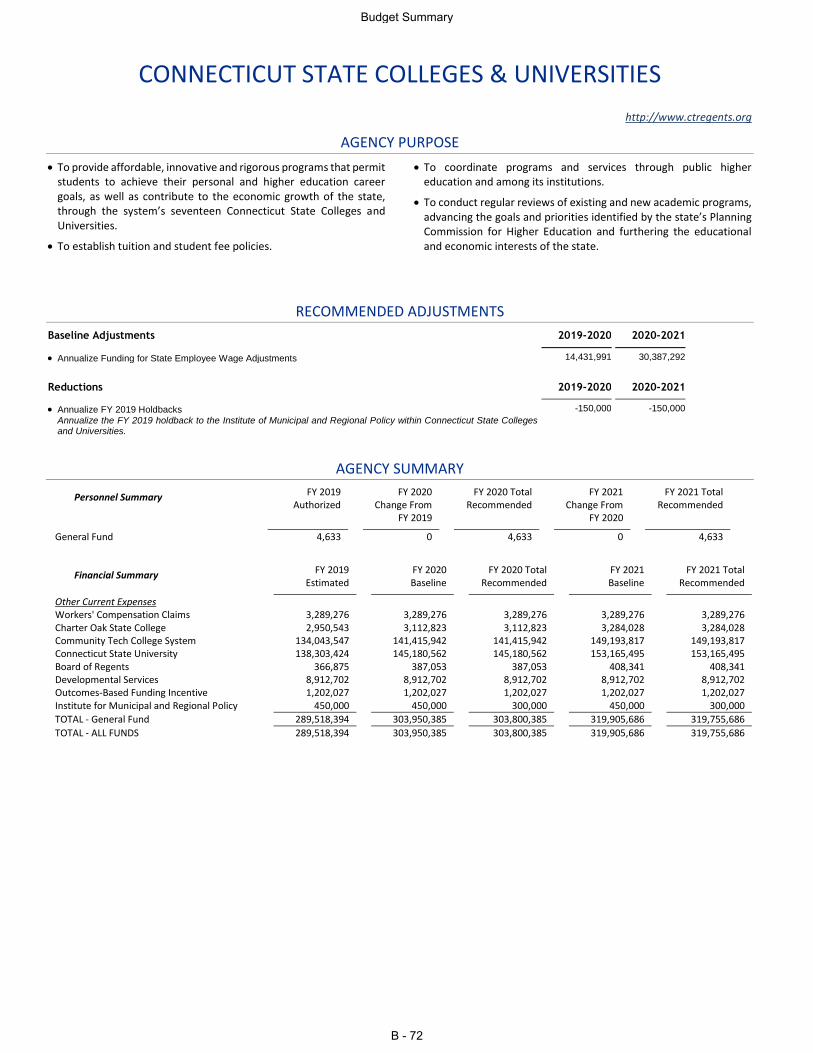
CONNECTICUT STATE COLLEGES & UNIVERSITIES
http://www.ctregents.org
AGENCY PURPOSE
To provide affordable, innovative and rigorous programs that permit students to achieve their personal and higher education career goals, as well as contribute to the economic growth of the state, through the system’s seventeen Connecticut State Colleges and Universities.
To establish tuition and student fee policies.
To coordinate programs and services through public higher education and among its institutions.
To conduct regular reviews of existing and new academic programs, advancing the goals and priorities identified by the state’s Planning Commission for Higher Education and furthering the educational and economic interests of the state.
RECOMMENDED ADJUSTMENTS
Baseline Adjustments 2019-2020 2020-2021
Annualize Funding for State Employee Wage Adjustments 14,431,991 30,387,292
Reductions 2019-2020 2020-2021
Annualize FY 2019 Holdbacks -150,000 -150,000 Annualize the FY 2019 holdback to the Institute of Municipal and Regional Policy within Connecticut State Colleges and Universities.
AGENCY SUMMARY
Personnel Summary FY 2019 Authorized
FY 2020 Change From
FY 2019
FY 2020 Total Recommended
FY 2021 Change From
FY 2020
FY 2021 Total Recommended
General Fund 4,633 0 4,633 0 4,633
Financial Summary FY 2019 Estimated
FY 2020 Baseline
FY 2020 Total Recommended
FY 2021 Baseline
FY 2021 Total Recommended
Other Current Expenses Workers' Compensation Claims 3,289,276 3,289,276 3,289,276 3,289,276 3,289,276 Charter Oak State College 2,950,543 3,112,823 3,112,823 3,284,028 3,284,028 Community Tech College System 134,043,547 141,415,942 141,415,942 149,193,817 149,193,817 Connecticut State University 138,303,424 145,180,562 145,180,562 153,165,495 153,165,495 Board of Regents 366,875 387,053 387,053 408,341 408,341 Developmental Services 8,912,702 8,912,702 8,912,702 8,912,702 8,912,702 Outcomes-Based Funding Incentive 1,202,027 1,202,027 1,202,027 1,202,027 1,202,027 Institute for Municipal and Regional Policy 450,000 450,000 300,000 450,000 300,000
TOTAL - General Fund 289,518,394 303,950,385 303,800,385 319,905,686 319,755,686
TOTAL - ALL FUNDS 289,518,394 303,950,385 303,800,385 319,905,686 319,755,686
Budget Summary
B - 72
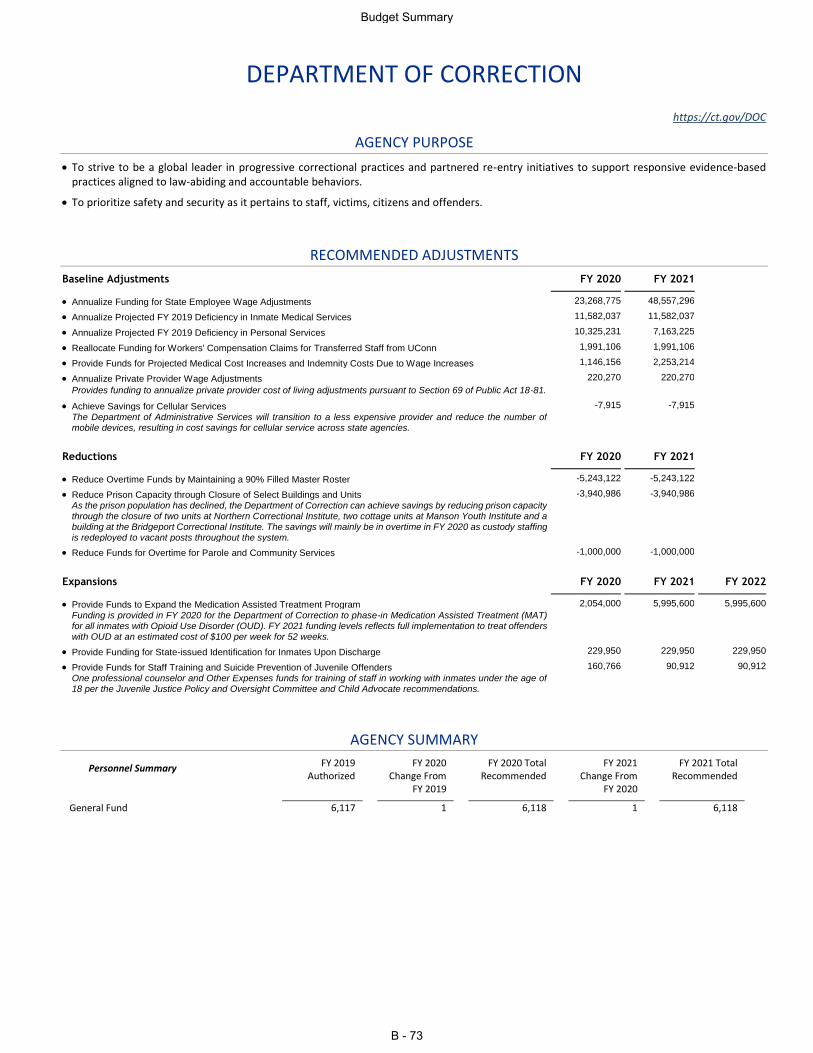
DEPARTMENT OF CORRECTION
https://ct.gov/DOC
AGENCY PURPOSE
To strive to be a global leader in progressive correctional practices and partnered re-entry initiatives to support responsive evidence-based practices aligned to law-abiding and accountable behaviors.
To prioritize safety and security as it pertains to staff, victims, citizens and offenders.
RECOMMENDED ADJUSTMENTS
Baseline Adjustments FY 2020 FY 2021
Annualize Funding for State Employee Wage Adjustments 23,268,775 48,557,296
Annualize Projected FY 2019 Deficiency in Inmate Medical Services 11,582,037 11,582,037
Annualize Projected FY 2019 Deficiency in Personal Services 10,325,231 7,163,225
Reallocate Funding for Workers' Compensation Claims for Transferred Staff from UConn 1,991,106 1,991,106
Provide Funds for Projected Medical Cost Increases and Indemnity Costs Due to Wage Increases 1,146,156 2,253,214
Annualize Private Provider Wage Adjustments 220,270 220,270
Provides funding to annualize private provider cost of living adjustments pursuant to Section 69 of Public Act 18-81.
Achieve Savings for Cellular Services -7,915 -7,915 The Department of Administrative Services will transition to a less expensive provider and reduce the number of mobile devices, resulting in cost savings for cellular service across state agencies.
Reductions FY 2020 FY 2021
Reduce Overtime Funds by Maintaining a 90% Filled Master Roster -5,243,122 -5,243,122
Reduce Prison Capacity through Closure of Select Buildings and Units -3,940,986 -3,940,986 As the prison population has declined, the Department of Correction can achieve savings by reducing prison capacity through the closure of two units at Northern Correctional Institute, two cottage units at Manson Youth Institute and a building at the Bridgeport Correctional Institute. The savings will mainly be in overtime in FY 2020 as custody staffing is redeployed to vacant posts throughout the system.
Reduce Funds for Overtime for Parole and Community Services -1,000,000 -1,000,000
Expansions FY 2020 FY 2021 FY 2022
Provide Funds to Expand the Medication Assisted Treatment Program 2,054,000 5,995,600 5,995,600 Funding is provided in FY 2020 for the Department of Correction to phase-in Medication Assisted Treatment (MAT) for all inmates with Opioid Use Disorder (OUD). FY 2021 funding levels reflects full implementation to treat offenders with OUD at an estimated cost of $100 per week for 52 weeks.
Provide Funding for State-issued Identification for Inmates Upon Discharge 229,950 229,950 229,950
Provide Funds for Staff Training and Suicide Prevention of Juvenile Offenders 160,766 90,912 90,912 One professional counselor and Other Expenses funds for training of staff in working with inmates under the age of 18 per the Juvenile Justice Policy and Oversight Committee and Child Advocate recommendations.
AGENCY SUMMARY
Personnel Summary FY 2019 Authorized
FY 2020 Change From
FY 2019
FY 2020 Total Recommended
FY 2021 Change From
FY 2020
FY 2021 Total Recommended
General Fund 6,117 1 6,118 1 6,118
Budget Summary
B - 73
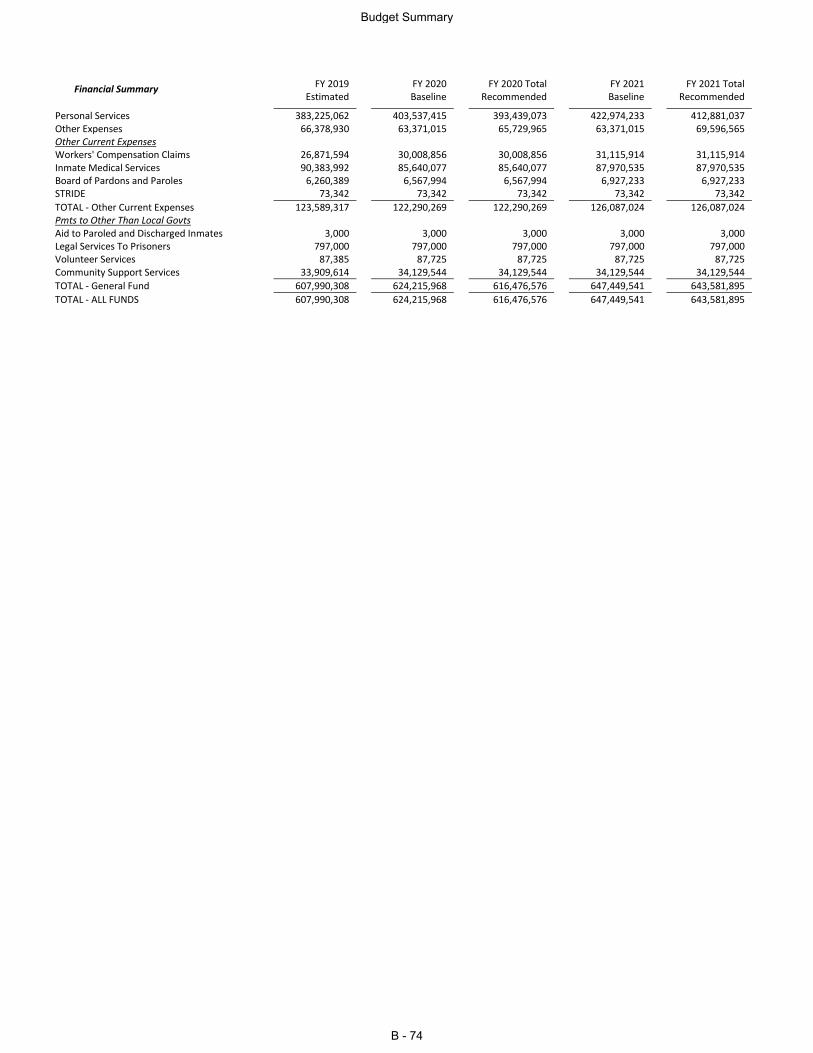
Financial Summary FY 2019 Estimated
FY 2020 Baseline
FY 2020 Total Recommended
FY 2021 Baseline
FY 2021 Total Recommended
Personal Services 383,225,062 403,537,415 393,439,073 422,974,233 412,881,037 Other Expenses 66,378,930 63,371,015 65,729,965 63,371,015 69,596,565 Other Current Expenses Workers' Compensation Claims 26,871,594 30,008,856 30,008,856 31,115,914 31,115,914 Inmate Medical Services 90,383,992 85,640,077 85,640,077 87,970,535 87,970,535 Board of Pardons and Paroles 6,260,389 6,567,994 6,567,994 6,927,233 6,927,233 STRIDE 73,342 73,342 73,342 73,342 73,342
TOTAL - Other Current Expenses 123,589,317 122,290,269 122,290,269 126,087,024 126,087,024 Pmts to Other Than Local Govts Aid to Paroled and Discharged Inmates 3,000 3,000 3,000 3,000 3,000 Legal Services To Prisoners 797,000 797,000 797,000 797,000 797,000 Volunteer Services 87,385 87,725 87,725 87,725 87,725 Community Support Services 33,909,614 34,129,544 34,129,544 34,129,544 34,129,544
TOTAL - General Fund 607,990,308 624,215,968 616,476,576 647,449,541 643,581,895
TOTAL - ALL FUNDS 607,990,308 624,215,968 616,476,576 647,449,541 643,581,895
Budget Summary
B - 74
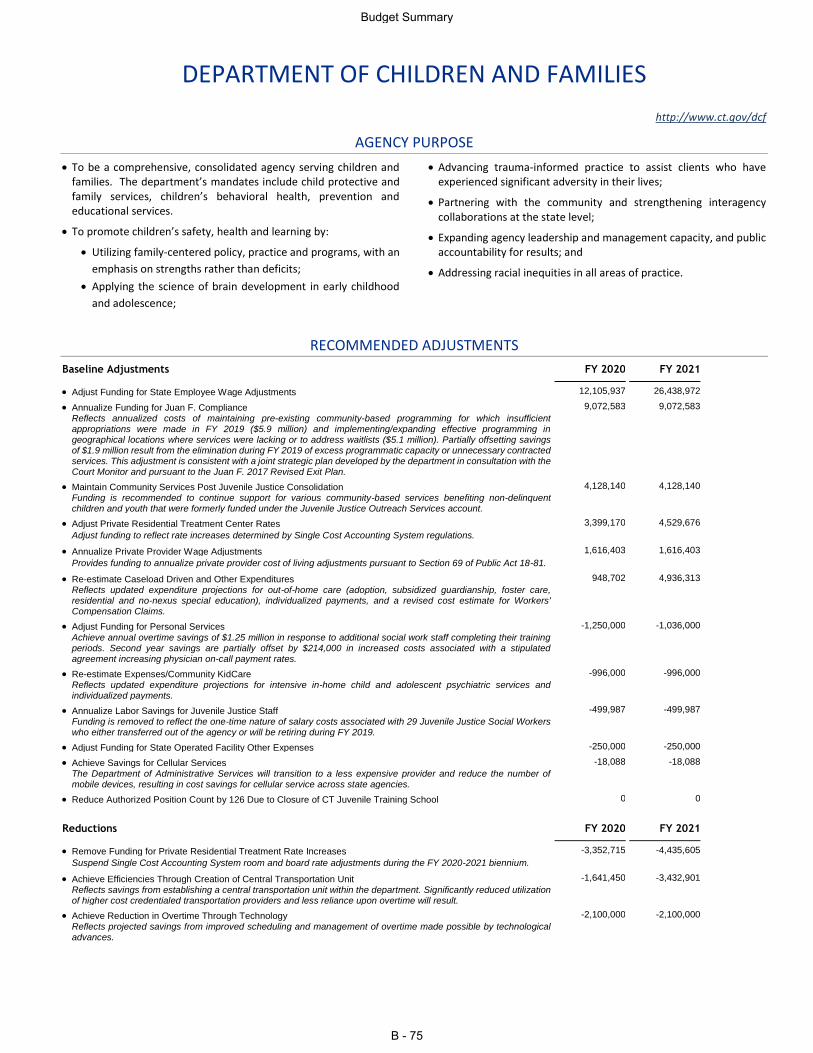
DEPARTMENT OF CHILDREN AND FAMILIES
http://www.ct.gov/dcf
AGENCY PURPOSE
To be a comprehensive, consolidated agency serving children and families. The department’s mandates include child protective and family services, children’s behavioral health, prevention and educational services.
To promote children’s safety, health and learning by:
Utilizing family-centered policy, practice and programs, with an
emphasis on strengths rather than deficits;
Applying the science of brain development in early childhood
and adolescence;
Advancing trauma-informed practice to assist clients who have experienced significant adversity in their lives;
Partnering with the community and strengthening interagency collaborations at the state level;
Expanding agency leadership and management capacity, and public accountability for results; and
Addressing racial inequities in all areas of practice.
RECOMMENDED ADJUSTMENTS
Baseline Adjustments FY 2020 FY 2021
Adjust Funding for State Employee Wage Adjustments 12,105,937 26,438,972
Annualize Funding for Juan F. Compliance 9,072,583 9,072,583 Reflects annualized costs of maintaining pre-existing community-based programming for which insufficient appropriations were made in FY 2019 ($5.9 million) and implementing/expanding effective programming in geographical locations where services were lacking or to address waitlists ($5.1 million). Partially offsetting savings of $1.9 million result from the elimination during FY 2019 of excess programmatic capacity or unnecessary contracted services. This adjustment is consistent with a joint strategic plan developed by the department in consultation with the Court Monitor and pursuant to the Juan F. 2017 Revised Exit Plan.
Maintain Community Services Post Juvenile Justice Consolidation 4,128,140 4,128,140 Funding is recommended to continue support for various community-based services benefiting non-delinquent children and youth that were formerly funded under the Juvenile Justice Outreach Services account.
Adjust Private Residential Treatment Center Rates 3,399,170 4,529,676
Adjust funding to reflect rate increases determined by Single Cost Accounting System regulations.
Annualize Private Provider Wage Adjustments 1,616,403 1,616,403
Provides funding to annualize private provider cost of living adjustments pursuant to Section 69 of Public Act 18-81.
Re-estimate Caseload Driven and Other Expenditures 948,702 4,936,313 Reflects updated expenditure projections for out-of-home care (adoption, subsidized guardianship, foster care, residential and no-nexus special education), individualized payments, and a revised cost estimate for Workers' Compensation Claims.
Adjust Funding for Personal Services -1,250,000 -1,036,000 Achieve annual overtime savings of $1.25 million in response to additional social work staff completing their training periods. Second year savings are partially offset by $214,000 in increased costs associated with a stipulated agreement increasing physician on-call payment rates.
Re-estimate Expenses/Community KidCare -996,000 -996,000 Reflects updated expenditure projections for intensive in-home child and adolescent psychiatric services and individualized payments.
Annualize Labor Savings for Juvenile Justice Staff -499,987 -499,987 Funding is removed to reflect the one-time nature of salary costs associated with 29 Juvenile Justice Social Workers who either transferred out of the agency or will be retiring during FY 2019.
Adjust Funding for State Operated Facility Other Expenses -250,000 -250,000
Achieve Savings for Cellular Services -18,088 -18,088 The Department of Administrative Services will transition to a less expensive provider and reduce the number of mobile devices, resulting in cost savings for cellular service across state agencies.
Reduce Authorized Position Count by 126 Due to Closure of CT Juvenile Training School 0 0
Reductions FY 2020 FY 2021
Remove Funding for Private Residential Treatment Rate Increases -3,352,715 -4,435,605
Suspend Single Cost Accounting System room and board rate adjustments during the FY 2020-2021 biennium.
Achieve Efficiencies Through Creation of Central Transportation Unit -1,641,450 -3,432,901 Reflects savings from establishing a central transportation unit within the department. Significantly reduced utilization of higher cost credentialed transportation providers and less reliance upon overtime will result.
Achieve Reduction in Overtime Through Technology -2,100,000 -2,100,000 Reflects projected savings from improved scheduling and management of overtime made possible by technological advances.
Budget Summary
B - 75
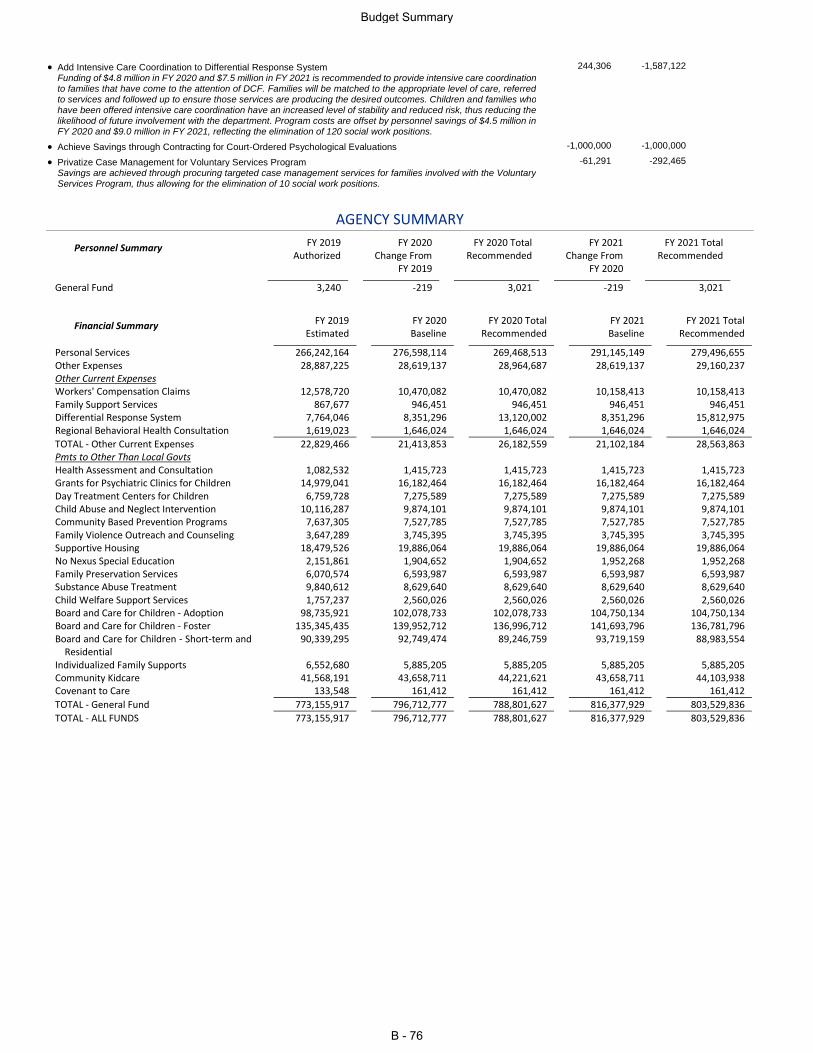
Add Intensive Care Coordination to Differential Response System 244,306 -1,587,122 Funding of $4.8 million in FY 2020 and $7.5 million in FY 2021 is recommended to provide intensive care coordination to families that have come to the attention of DCF. Families will be matched to the appropriate level of care, referred to services and followed up to ensure those services are producing the desired outcomes. Children and families who have been offered intensive care coordination have an increased level of stability and reduced risk, thus reducing the likelihood of future involvement with the department. Program costs are offset by personnel savings of $4.5 million in FY 2020 and $9.0 million in FY 2021, reflecting the elimination of 120 social work positions.
Achieve Savings through Contracting for Court-Ordered Psychological Evaluations -1,000,000 -1,000,000
Privatize Case Management for Voluntary Services Program -61,291 -292,465 Savings are achieved through procuring targeted case management services for families involved with the Voluntary Services Program, thus allowing for the elimination of 10 social work positions.
AGENCY SUMMARY
Personnel Summary FY 2019 Authorized
FY 2020 Change From
FY 2019
FY 2020 Total Recommended
FY 2021 Change From
FY 2020
FY 2021 Total Recommended
General Fund 3,240 -219 3,021 -219 3,021
Financial Summary FY 2019 Estimated
FY 2020 Baseline
FY 2020 Total Recommended
FY 2021 Baseline
FY 2021 Total Recommended
Personal Services 266,242,164 276,598,114 269,468,513 291,145,149 279,496,655 Other Expenses 28,887,225 28,619,137 28,964,687 28,619,137 29,160,237 Other Current Expenses Workers' Compensation Claims 12,578,720 10,470,082 10,470,082 10,158,413 10,158,413 Family Support Services 867,677 946,451 946,451 946,451 946,451 Differential Response System 7,764,046 8,351,296 13,120,002 8,351,296 15,812,975 Regional Behavioral Health Consultation 1,619,023 1,646,024 1,646,024 1,646,024 1,646,024
TOTAL - Other Current Expenses 22,829,466 21,413,853 26,182,559 21,102,184 28,563,863 Pmts to Other Than Local Govts Health Assessment and Consultation 1,082,532 1,415,723 1,415,723 1,415,723 1,415,723 Grants for Psychiatric Clinics for Children 14,979,041 16,182,464 16,182,464 16,182,464 16,182,464 Day Treatment Centers for Children 6,759,728 7,275,589 7,275,589 7,275,589 7,275,589 Child Abuse and Neglect Intervention 10,116,287 9,874,101 9,874,101 9,874,101 9,874,101 Community Based Prevention Programs 7,637,305 7,527,785 7,527,785 7,527,785 7,527,785 Family Violence Outreach and Counseling 3,647,289 3,745,395 3,745,395 3,745,395 3,745,395 Supportive Housing 18,479,526 19,886,064 19,886,064 19,886,064 19,886,064 No Nexus Special Education 2,151,861 1,904,652 1,904,652 1,952,268 1,952,268 Family Preservation Services 6,070,574 6,593,987 6,593,987 6,593,987 6,593,987 Substance Abuse Treatment 9,840,612 8,629,640 8,629,640 8,629,640 8,629,640 Child Welfare Support Services 1,757,237 2,560,026 2,560,026 2,560,026 2,560,026 Board and Care for Children - Adoption 98,735,921 102,078,733 102,078,733 104,750,134 104,750,134 Board and Care for Children - Foster 135,345,435 139,952,712 136,996,712 141,693,796 136,781,796 Board and Care for Children - Short-term and
Residential 90,339,295 92,749,474 89,246,759 93,719,159 88,983,554
Individualized Family Supports 6,552,680 5,885,205 5,885,205 5,885,205 5,885,205 Community Kidcare 41,568,191 43,658,711 44,221,621 43,658,711 44,103,938 Covenant to Care 133,548 161,412 161,412 161,412 161,412
TOTAL - General Fund 773,155,917 796,712,777 788,801,627 816,377,929 803,529,836
TOTAL - ALL FUNDS 773,155,917 796,712,777 788,801,627 816,377,929 803,529,836
Budget Summary
B - 76
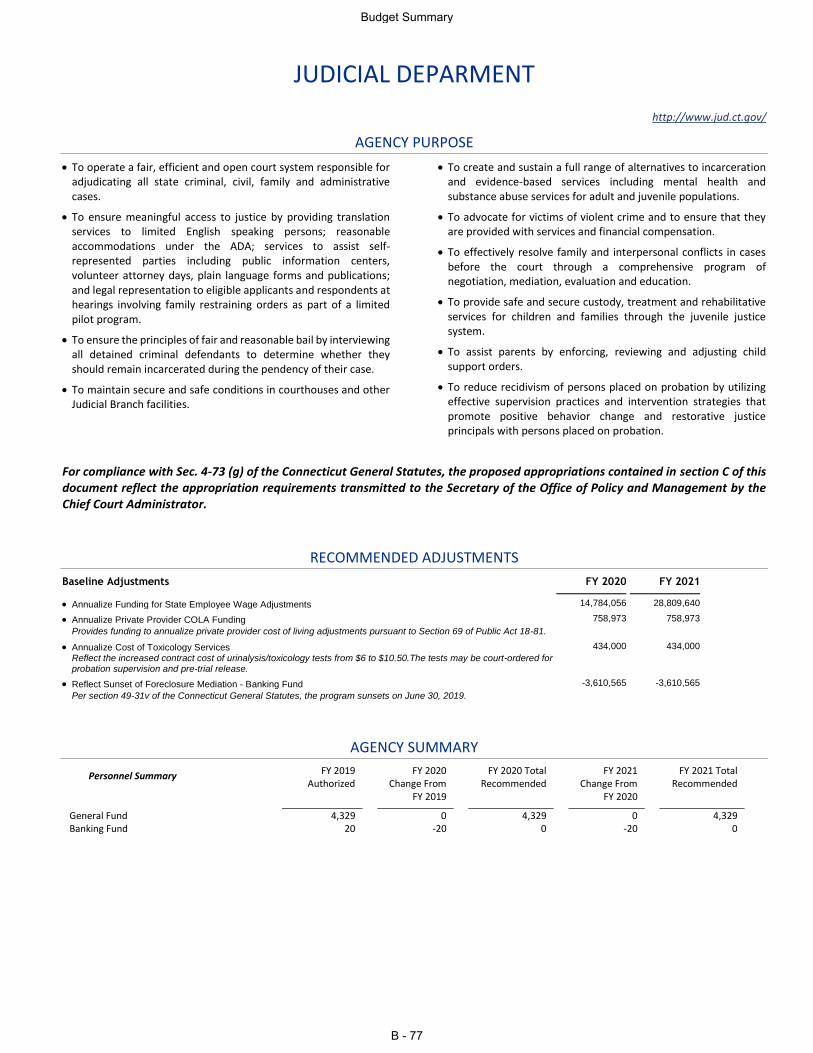
JUDICIAL DEPARMENT
http://www.jud.ct.gov/
AGENCY PURPOSE
To operate a fair, efficient and open court system responsible for adjudicating all state criminal, civil, family and administrative cases.
To ensure meaningful access to justice by providing translation services to limited English speaking persons; reasonable accommodations under the ADA; services to assist self-represented parties including public information centers, volunteer attorney days, plain language forms and publications; and legal representation to eligible applicants and respondents at hearings involving family restraining orders as part of a limited pilot program.
To ensure the principles of fair and reasonable bail by interviewing all detained criminal defendants to determine whether they should remain incarcerated during the pendency of their case.
To maintain secure and safe conditions in courthouses and other Judicial Branch facilities.
To create and sustain a full range of alternatives to incarceration and evidence-based services including mental health and substance abuse services for adult and juvenile populations.
To advocate for victims of violent crime and to ensure that they are provided with services and financial compensation.
To effectively resolve family and interpersonal conflicts in cases before the court through a comprehensive program of negotiation, mediation, evaluation and education.
To provide safe and secure custody, treatment and rehabilitative services for children and families through the juvenile justice system.
To assist parents by enforcing, reviewing and adjusting child support orders.
To reduce recidivism of persons placed on probation by utilizing effective supervision practices and intervention strategies that promote positive behavior change and restorative justice principals with persons placed on probation.
For compliance with Sec. 4-73 (g) of the Connecticut General Statutes, the proposed appropriations contained in section C of this document reflect the appropriation requirements transmitted to the Secretary of the Office of Policy and Management by the Chief Court Administrator.
RECOMMENDED ADJUSTMENTS
Baseline Adjustments FY 2020 FY 2021
Annualize Funding for State Employee Wage Adjustments 14,784,056 28,809,640
Annualize Private Provider COLA Funding 758,973 758,973
Provides funding to annualize private provider cost of living adjustments pursuant to Section 69 of Public Act 18-81.
Annualize Cost of Toxicology Services 434,000 434,000 Reflect the increased contract cost of urinalysis/toxicology tests from $6 to $10.50.The tests may be court-ordered for probation supervision and pre-trial release.
Reflect Sunset of Foreclosure Mediation - Banking Fund -3,610,565 -3,610,565
Per section 49-31v of the Connecticut General Statutes, the program sunsets on June 30, 2019.
AGENCY SUMMARY
Personnel Summary FY 2019 Authorized
FY 2020 Change From
FY 2019
FY 2020 Total Recommended
FY 2021 Change From
FY 2020
FY 2021 Total Recommended
General Fund 4,329 0 4,329 0 4,329 Banking Fund 20 -20 0 -20 0
Budget Summary
B - 77
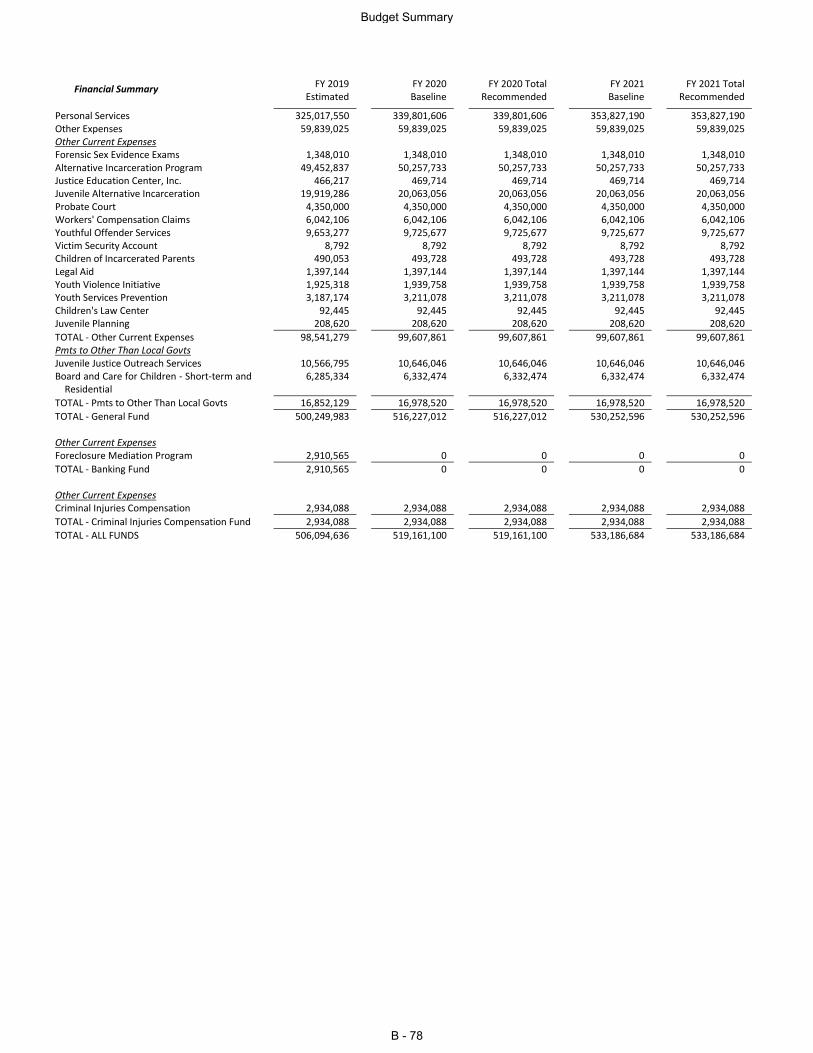
Financial Summary FY 2019 Estimated
FY 2020 Baseline
FY 2020 Total Recommended
FY 2021 Baseline
FY 2021 Total Recommended
Personal Services 325,017,550 339,801,606 339,801,606 353,827,190 353,827,190 Other Expenses 59,839,025 59,839,025 59,839,025 59,839,025 59,839,025 Other Current Expenses Forensic Sex Evidence Exams 1,348,010 1,348,010 1,348,010 1,348,010 1,348,010 Alternative Incarceration Program 49,452,837 50,257,733 50,257,733 50,257,733 50,257,733 Justice Education Center, Inc. 466,217 469,714 469,714 469,714 469,714 Juvenile Alternative Incarceration 19,919,286 20,063,056 20,063,056 20,063,056 20,063,056 Probate Court 4,350,000 4,350,000 4,350,000 4,350,000 4,350,000 Workers' Compensation Claims 6,042,106 6,042,106 6,042,106 6,042,106 6,042,106 Youthful Offender Services 9,653,277 9,725,677 9,725,677 9,725,677 9,725,677 Victim Security Account 8,792 8,792 8,792 8,792 8,792 Children of Incarcerated Parents 490,053 493,728 493,728 493,728 493,728 Legal Aid 1,397,144 1,397,144 1,397,144 1,397,144 1,397,144 Youth Violence Initiative 1,925,318 1,939,758 1,939,758 1,939,758 1,939,758 Youth Services Prevention 3,187,174 3,211,078 3,211,078 3,211,078 3,211,078 Children's Law Center 92,445 92,445 92,445 92,445 92,445 Juvenile Planning 208,620 208,620 208,620 208,620 208,620
TOTAL - Other Current Expenses 98,541,279 99,607,861 99,607,861 99,607,861 99,607,861 Pmts to Other Than Local Govts Juvenile Justice Outreach Services 10,566,795 10,646,046 10,646,046 10,646,046 10,646,046 Board and Care for Children - Short-term and
Residential 6,285,334 6,332,474 6,332,474 6,332,474 6,332,474
TOTAL - Pmts to Other Than Local Govts 16,852,129 16,978,520 16,978,520 16,978,520 16,978,520
TOTAL - General Fund 500,249,983 516,227,012 516,227,012 530,252,596 530,252,596 Other Current Expenses Foreclosure Mediation Program 2,910,565 0 0 0 0
TOTAL - Banking Fund 2,910,565 0 0 0 0 Other Current Expenses Criminal Injuries Compensation 2,934,088 2,934,088 2,934,088 2,934,088 2,934,088
TOTAL - Criminal Injuries Compensation Fund 2,934,088 2,934,088 2,934,088 2,934,088 2,934,088
TOTAL - ALL FUNDS 506,094,636 519,161,100 519,161,100 533,186,684 533,186,684
Budget Summary
B - 78
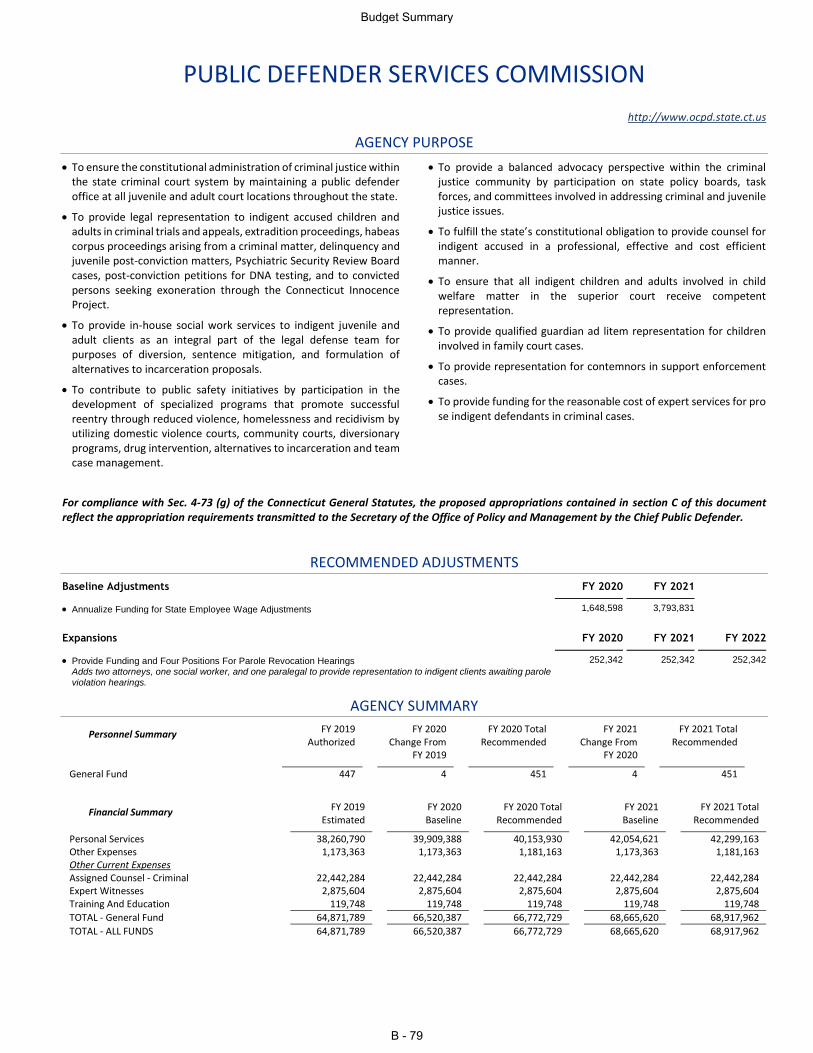
PUBLIC DEFENDER SERVICES COMMISSION
http://www.ocpd.state.ct.us
AGENCY PURPOSE
To ensure the constitutional administration of criminal justice within the state criminal court system by maintaining a public defender office at all juvenile and adult court locations throughout the state.
To provide legal representation to indigent accused children and adults in criminal trials and appeals, extradition proceedings, habeas corpus proceedings arising from a criminal matter, delinquency and juvenile post-conviction matters, Psychiatric Security Review Board cases, post-conviction petitions for DNA testing, and to convicted persons seeking exoneration through the Connecticut Innocence Project.
To provide in-house social work services to indigent juvenile and adult clients as an integral part of the legal defense team for purposes of diversion, sentence mitigation, and formulation of alternatives to incarceration proposals.
To contribute to public safety initiatives by participation in the development of specialized programs that promote successful reentry through reduced violence, homelessness and recidivism by utilizing domestic violence courts, community courts, diversionary programs, drug intervention, alternatives to incarceration and team case management.
To provide a balanced advocacy perspective within the criminal justice community by participation on state policy boards, task forces, and committees involved in addressing criminal and juvenile justice issues.
To fulfill the state’s constitutional obligation to provide counsel for indigent accused in a professional, effective and cost efficient manner.
To ensure that all indigent children and adults involved in child welfare matter in the superior court receive competent representation.
To provide qualified guardian ad litem representation for children involved in family court cases.
To provide representation for contemnors in support enforcement cases.
To provide funding for the reasonable cost of expert services for pro se indigent defendants in criminal cases.
For compliance with Sec. 4-73 (g) of the Connecticut General Statutes, the proposed appropriations contained in section C of this document reflect the appropriation requirements transmitted to the Secretary of the Office of Policy and Management by the Chief Public Defender.
RECOMMENDED ADJUSTMENTS
Baseline Adjustments FY 2020 FY 2021
Annualize Funding for State Employee Wage Adjustments 1,648,598 3,793,831
Expansions FY 2020 FY 2021 FY 2022
Provide Funding and Four Positions For Parole Revocation Hearings 252,342 252,342 252,342 Adds two attorneys, one social worker, and one paralegal to provide representation to indigent clients awaiting parole
violation hearings.
AGENCY SUMMARY
Personnel Summary FY 2019 Authorized
FY 2020 Change From
FY 2019
FY 2020 Total Recommended
FY 2021 Change From
FY 2020
FY 2021 Total Recommended
General Fund 447 4 451 4 451
Financial Summary FY 2019 Estimated
FY 2020 Baseline
FY 2020 Total Recommended
FY 2021 Baseline
FY 2021 Total Recommended
Personal Services 38,260,790 39,909,388 40,153,930 42,054,621 42,299,163 Other Expenses 1,173,363 1,173,363 1,181,163 1,173,363 1,181,163 Other Current Expenses Assigned Counsel - Criminal 22,442,284 22,442,284 22,442,284 22,442,284 22,442,284 Expert Witnesses 2,875,604 2,875,604 2,875,604 2,875,604 2,875,604 Training And Education 119,748 119,748 119,748 119,748 119,748
TOTAL - General Fund 64,871,789 66,520,387 66,772,729 68,665,620 68,917,962
TOTAL - ALL FUNDS 64,871,789 66,520,387 66,772,729 68,665,620 68,917,962
Budget Summary
B - 79
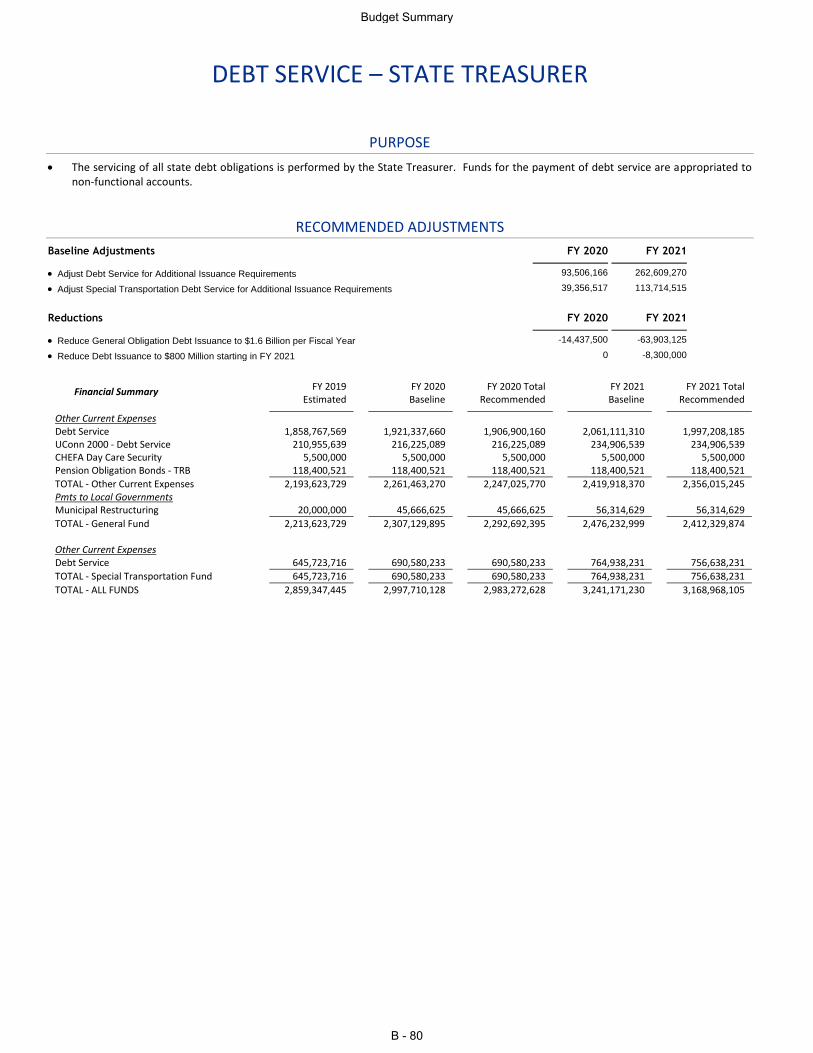
DEBT SERVICE – STATE TREASURER
PURPOSE
The servicing of all state debt obligations is performed by the State Treasurer. Funds for the payment of debt service are appropriated to non-functional accounts.
RECOMMENDED ADJUSTMENTS
Baseline Adjustments FY 2020 FY 2021
Adjust Debt Service for Additional Issuance Requirements 93,506,166 262,609,270
Adjust Special Transportation Debt Service for Additional Issuance Requirements 39,356,517 113,714,515
Reductions FY 2020 FY 2021
Reduce General Obligation Debt Issuance to $1.6 Billion per Fiscal Year -14,437,500 -63,903,125
Reduce Debt Issuance to $800 Million starting in FY 2021 0 -8,300,000
Financial Summary FY 2019 Estimated
FY 2020 Baseline
FY 2020 Total Recommended
FY 2021 Baseline
FY 2021 Total Recommended
Other Current Expenses Debt Service 1,858,767,569 1,921,337,660 1,906,900,160 2,061,111,310 1,997,208,185 UConn 2000 - Debt Service 210,955,639 216,225,089 216,225,089 234,906,539 234,906,539 CHEFA Day Care Security 5,500,000 5,500,000 5,500,000 5,500,000 5,500,000 Pension Obligation Bonds - TRB 118,400,521 118,400,521 118,400,521 118,400,521 118,400,521
TOTAL - Other Current Expenses 2,193,623,729 2,261,463,270 2,247,025,770 2,419,918,370 2,356,015,245 Pmts to Local Governments Municipal Restructuring 20,000,000 45,666,625 45,666,625 56,314,629 56,314,629
TOTAL - General Fund 2,213,623,729 2,307,129,895 2,292,692,395 2,476,232,999 2,412,329,874 Other Current Expenses Debt Service 645,723,716 690,580,233 690,580,233 764,938,231 756,638,231
TOTAL - Special Transportation Fund 645,723,716 690,580,233 690,580,233 764,938,231 756,638,231
TOTAL - ALL FUNDS 2,859,347,445 2,997,710,128 2,983,272,628 3,241,171,230 3,168,968,105
Budget Summary
B - 80
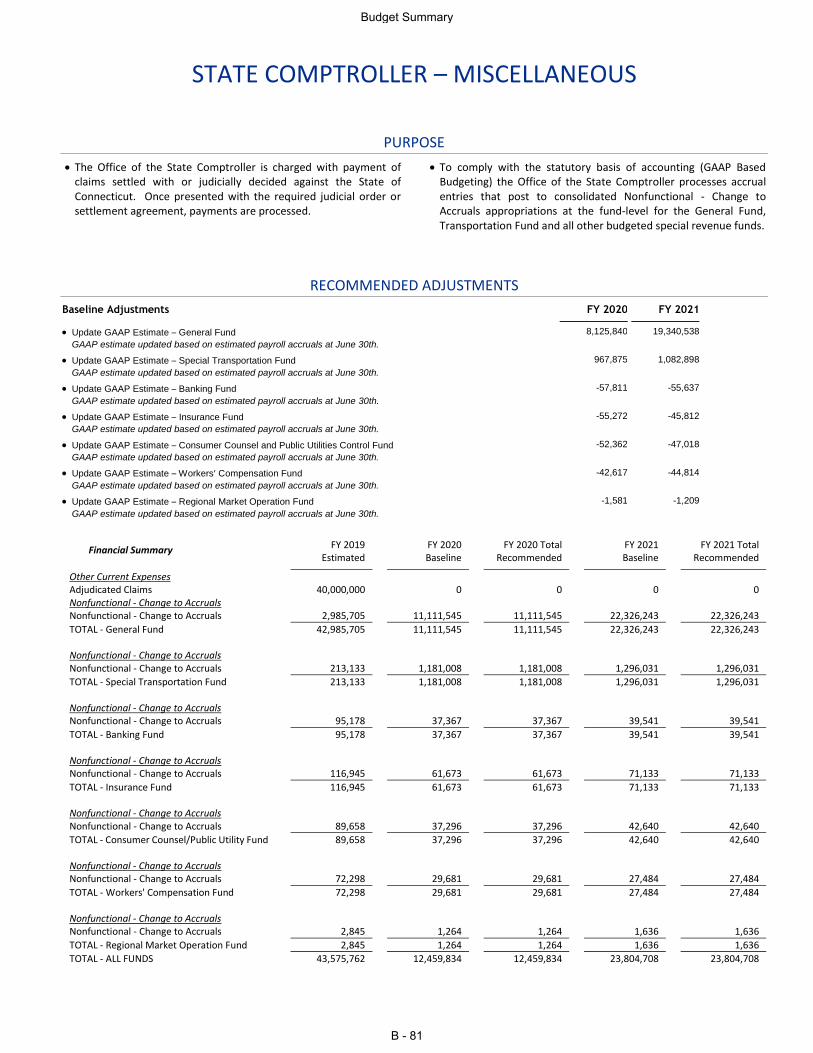
STATE COMPTROLLER – MISCELLANEOUS
PURPOSE
The Office of the State Comptroller is charged with payment of claims settled with or judicially decided against the State of Connecticut. Once presented with the required judicial order or settlement agreement, payments are processed.
To comply with the statutory basis of accounting (GAAP Based Budgeting) the Office of the State Comptroller processes accrual entries that post to consolidated Nonfunctional - Change to Accruals appropriations at the fund-level for the General Fund, Transportation Fund and all other budgeted special revenue funds.
RECOMMENDED ADJUSTMENTS
Baseline Adjustments FY 2020 FY 2021
Update GAAP Estimate – General Fund 8,125,840 19,340,538
GAAP estimate updated based on estimated payroll accruals at June 30th.
Update GAAP Estimate – Special Transportation Fund 967,875 1,082,898
GAAP estimate updated based on estimated payroll accruals at June 30th.
Update GAAP Estimate – Banking Fund -57,811 -55,637
GAAP estimate updated based on estimated payroll accruals at June 30th.
Update GAAP Estimate – Insurance Fund -55,272 -45,812
GAAP estimate updated based on estimated payroll accruals at June 30th.
Update GAAP Estimate – Consumer Counsel and Public Utilities Control Fund -52,362 -47,018
GAAP estimate updated based on estimated payroll accruals at June 30th.
Update GAAP Estimate – Workers’ Compensation Fund -42,617 -44,814
GAAP estimate updated based on estimated payroll accruals at June 30th.
Update GAAP Estimate – Regional Market Operation Fund -1,581 -1,209
GAAP estimate updated based on estimated payroll accruals at June 30th.
Financial Summary FY 2019 Estimated
FY 2020 Baseline
FY 2020 Total Recommended
FY 2021 Baseline
FY 2021 Total Recommended
Other Current Expenses Adjudicated Claims 40,000,000 0 0 0 0 Nonfunctional - Change to Accruals Nonfunctional - Change to Accruals 2,985,705 11,111,545 11,111,545 22,326,243 22,326,243
TOTAL - General Fund 42,985,705 11,111,545 11,111,545 22,326,243 22,326,243 Nonfunctional - Change to Accruals Nonfunctional - Change to Accruals 213,133 1,181,008 1,181,008 1,296,031 1,296,031
TOTAL - Special Transportation Fund 213,133 1,181,008 1,181,008 1,296,031 1,296,031 Nonfunctional - Change to Accruals Nonfunctional - Change to Accruals 95,178 37,367 37,367 39,541 39,541
TOTAL - Banking Fund 95,178 37,367 37,367 39,541 39,541 Nonfunctional - Change to Accruals Nonfunctional - Change to Accruals 116,945 61,673 61,673 71,133 71,133
TOTAL - Insurance Fund 116,945 61,673 61,673 71,133 71,133 Nonfunctional - Change to Accruals Nonfunctional - Change to Accruals 89,658 37,296 37,296 42,640 42,640
TOTAL - Consumer Counsel/Public Utility Fund 89,658 37,296 37,296 42,640 42,640 Nonfunctional - Change to Accruals Nonfunctional - Change to Accruals 72,298 29,681 29,681 27,484 27,484
TOTAL - Workers' Compensation Fund 72,298 29,681 29,681 27,484 27,484 Nonfunctional - Change to Accruals Nonfunctional - Change to Accruals 2,845 1,264 1,264 1,636 1,636
TOTAL - Regional Market Operation Fund 2,845 1,264 1,264 1,636 1,636
TOTAL - ALL FUNDS 43,575,762 12,459,834 12,459,834 23,804,708 23,804,708
Budget Summary
B - 81
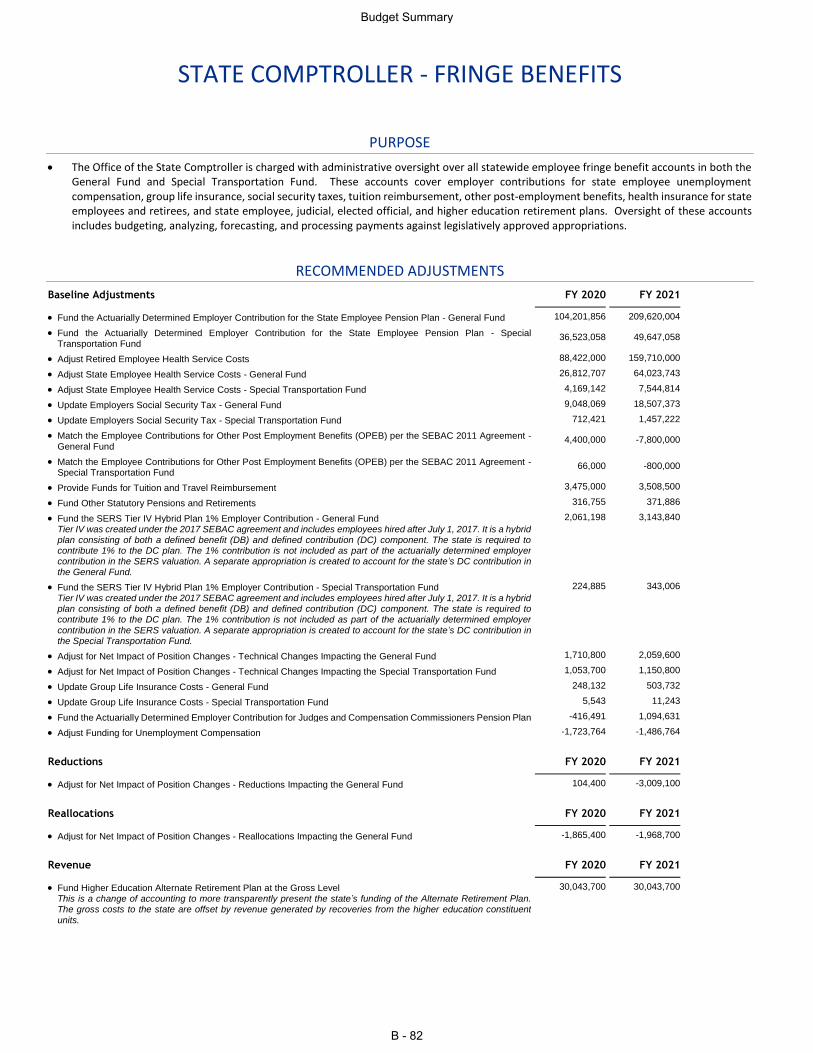
STATE COMPTROLLER - FRINGE BENEFITS
PURPOSE
The Office of the State Comptroller is charged with administrative oversight over all statewide employee fringe benefit accounts in both the General Fund and Special Transportation Fund. These accounts cover employer contributions for state employee unemployment compensation, group life insurance, social security taxes, tuition reimbursement, other post-employment benefits, health insurance for state employees and retirees, and state employee, judicial, elected official, and higher education retirement plans. Oversight of these accounts includes budgeting, analyzing, forecasting, and processing payments against legislatively approved appropriations.
RECOMMENDED ADJUSTMENTS
Baseline Adjustments FY 2020 FY 2021
Fund the Actuarially Determined Employer Contribution for the State Employee Pension Plan - General Fund 104,201,856 209,620,004
Fund the Actuarially Determined Employer Contribution for the State Employee Pension Plan - Special Transportation Fund
36,523,058 49,647,058
Adjust Retired Employee Health Service Costs 88,422,000 159,710,000
Adjust State Employee Health Service Costs - General Fund 26,812,707 64,023,743
Adjust State Employee Health Service Costs - Special Transportation Fund 4,169,142 7,544,814
Update Employers Social Security Tax - General Fund 9,048,069 18,507,373
Update Employers Social Security Tax - Special Transportation Fund 712,421 1,457,222
Match the Employee Contributions for Other Post Employment Benefits (OPEB) per the SEBAC 2011 Agreement - General Fund
4,400,000 -7,800,000
Match the Employee Contributions for Other Post Employment Benefits (OPEB) per the SEBAC 2011 Agreement - Special Transportation Fund
66,000 -800,000
Provide Funds for Tuition and Travel Reimbursement 3,475,000 3,508,500
Fund Other Statutory Pensions and Retirements 316,755 371,886
Fund the SERS Tier IV Hybrid Plan 1% Employer Contribution - General Fund 2,061,198 3,143,840 Tier IV was created under the 2017 SEBAC agreement and includes employees hired after July 1, 2017. It is a hybrid plan consisting of both a defined benefit (DB) and defined contribution (DC) component. The state is required to contribute 1% to the DC plan. The 1% contribution is not included as part of the actuarially determined employer contribution in the SERS valuation. A separate appropriation is created to account for the state’s DC contribution in the General Fund.
Fund the SERS Tier IV Hybrid Plan 1% Employer Contribution - Special Transportation Fund 224,885 343,006 Tier IV was created under the 2017 SEBAC agreement and includes employees hired after July 1, 2017. It is a hybrid plan consisting of both a defined benefit (DB) and defined contribution (DC) component. The state is required to contribute 1% to the DC plan. The 1% contribution is not included as part of the actuarially determined employer
contribution in the SERS valuation. A separate appropriation is created to account for the state’s DC contribution in the Special Transportation Fund.
Adjust for Net Impact of Position Changes - Technical Changes Impacting the General Fund 1,710,800 2,059,600
Adjust for Net Impact of Position Changes - Technical Changes Impacting the Special Transportation Fund 1,053,700 1,150,800
Update Group Life Insurance Costs - General Fund 248,132 503,732
Update Group Life Insurance Costs - Special Transportation Fund 5,543 11,243
Fund the Actuarially Determined Employer Contribution for Judges and Compensation Commissioners Pension Plan -416,491 1,094,631
Adjust Funding for Unemployment Compensation -1,723,764 -1,486,764
Reductions FY 2020 FY 2021
Adjust for Net Impact of Position Changes - Reductions Impacting the General Fund 104,400 -3,009,100
Reallocations FY 2020 FY 2021
Adjust for Net Impact of Position Changes - Reallocations Impacting the General Fund -1,865,400 -1,968,700
Revenue FY 2020 FY 2021
Fund Higher Education Alternate Retirement Plan at the Gross Level 30,043,700 30,043,700 This is a change of accounting to more transparently present the state’s funding of the Alternate Retirement Plan. The gross costs to the state are offset by revenue generated by recoveries from the higher education constituent
units.
Budget Summary
B - 82
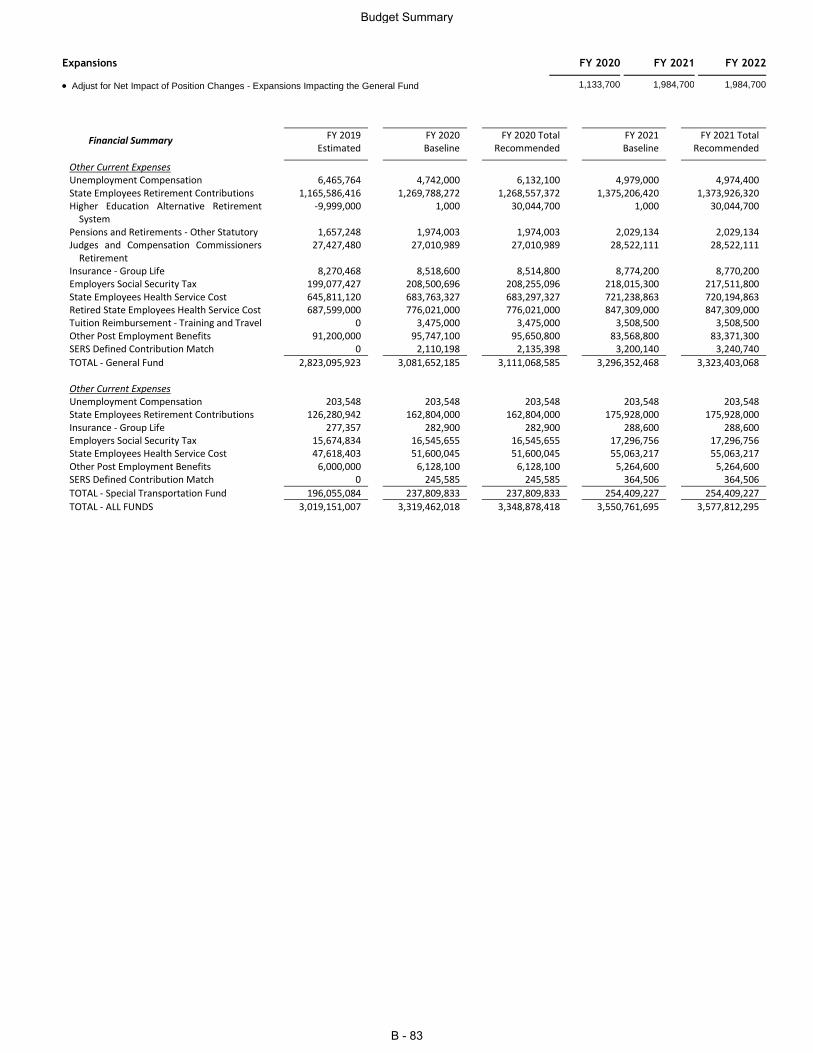
Expansions FY 2020 FY 2021 FY 2022
Adjust for Net Impact of Position Changes - Expansions Impacting the General Fund 1,133,700 1,984,700 1,984,700
Financial Summary FY 2019 Estimated
FY 2020 Baseline
FY 2020 Total Recommended
FY 2021 Baseline
FY 2021 Total Recommended
Other Current Expenses Unemployment Compensation 6,465,764 4,742,000 6,132,100 4,979,000 4,974,400 State Employees Retirement Contributions 1,165,586,416 1,269,788,272 1,268,557,372 1,375,206,420 1,373,926,320 Higher Education Alternative Retirement
System -9,999,000 1,000 30,044,700 1,000 30,044,700
Pensions and Retirements - Other Statutory 1,657,248 1,974,003 1,974,003 2,029,134 2,029,134 Judges and Compensation Commissioners
Retirement 27,427,480 27,010,989 27,010,989 28,522,111 28,522,111
Insurance - Group Life 8,270,468 8,518,600 8,514,800 8,774,200 8,770,200 Employers Social Security Tax 199,077,427 208,500,696 208,255,096 218,015,300 217,511,800 State Employees Health Service Cost 645,811,120 683,763,327 683,297,327 721,238,863 720,194,863 Retired State Employees Health Service Cost 687,599,000 776,021,000 776,021,000 847,309,000 847,309,000 Tuition Reimbursement - Training and Travel 0 3,475,000 3,475,000 3,508,500 3,508,500 Other Post Employment Benefits 91,200,000 95,747,100 95,650,800 83,568,800 83,371,300 SERS Defined Contribution Match 0 2,110,198 2,135,398 3,200,140 3,240,740
TOTAL - General Fund 2,823,095,923 3,081,652,185 3,111,068,585 3,296,352,468 3,323,403,068 Other Current Expenses Unemployment Compensation 203,548 203,548 203,548 203,548 203,548 State Employees Retirement Contributions 126,280,942 162,804,000 162,804,000 175,928,000 175,928,000 Insurance - Group Life 277,357 282,900 282,900 288,600 288,600 Employers Social Security Tax 15,674,834 16,545,655 16,545,655 17,296,756 17,296,756 State Employees Health Service Cost 47,618,403 51,600,045 51,600,045 55,063,217 55,063,217 Other Post Employment Benefits 6,000,000 6,128,100 6,128,100 5,264,600 5,264,600 SERS Defined Contribution Match 0 245,585 245,585 364,506 364,506
TOTAL - Special Transportation Fund 196,055,084 237,809,833 237,809,833 254,409,227 254,409,227
TOTAL - ALL FUNDS 3,019,151,007 3,319,462,018 3,348,878,418 3,550,761,695 3,577,812,295
Budget Summary
B - 83
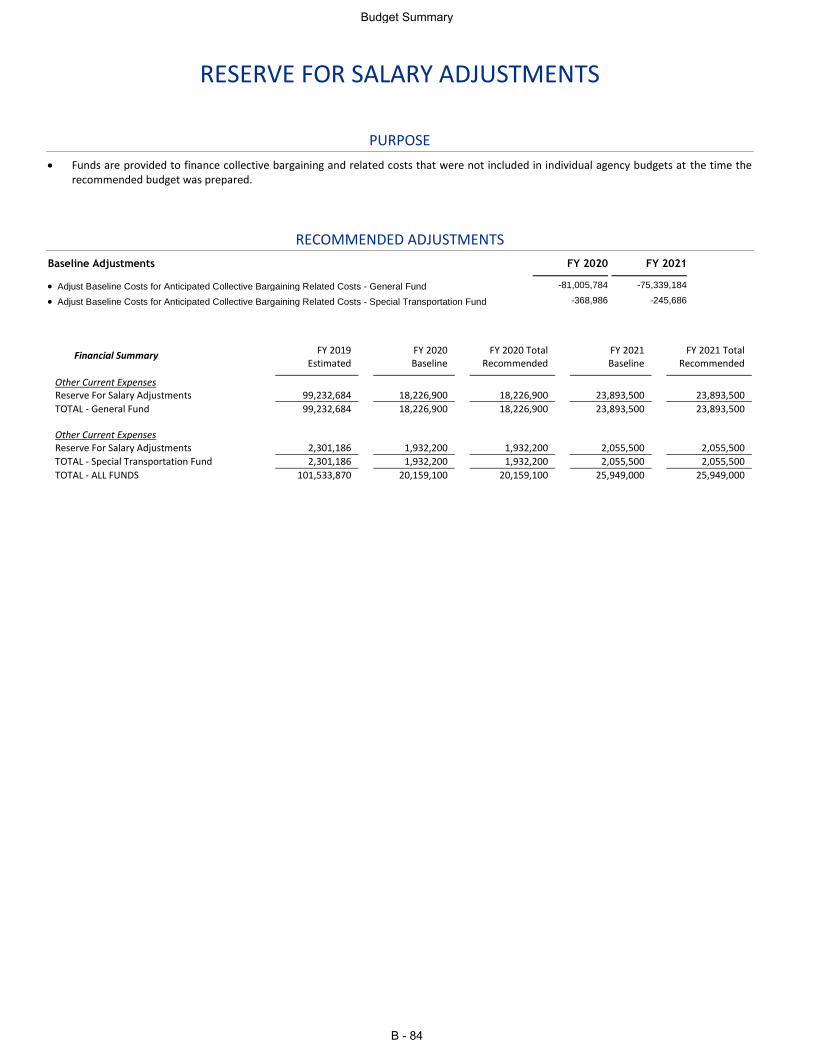
RESERVE FOR SALARY ADJUSTMENTS
PURPOSE
Funds are provided to finance collective bargaining and related costs that were not included in individual agency budgets at the time the recommended budget was prepared.
RECOMMENDED ADJUSTMENTS
Baseline Adjustments FY 2020 FY 2021
Adjust Baseline Costs for Anticipated Collective Bargaining Related Costs - General Fund -81,005,784 -75,339,184
Adjust Baseline Costs for Anticipated Collective Bargaining Related Costs - Special Transportation Fund -368,986 -245,686
Financial Summary FY 2019 Estimated
FY 2020 Baseline
FY 2020 Total Recommended
FY 2021 Baseline
FY 2021 Total Recommended
Other Current Expenses Reserve For Salary Adjustments 99,232,684 18,226,900 18,226,900 23,893,500 23,893,500
TOTAL - General Fund 99,232,684 18,226,900 18,226,900 23,893,500 23,893,500 Other Current Expenses Reserve For Salary Adjustments 2,301,186 1,932,200 1,932,200 2,055,500 2,055,500
TOTAL - Special Transportation Fund 2,301,186 1,932,200 1,932,200 2,055,500 2,055,500
TOTAL - ALL FUNDS 101,533,870 20,159,100 20,159,100 25,949,000 25,949,000
Budget Summary
B - 84
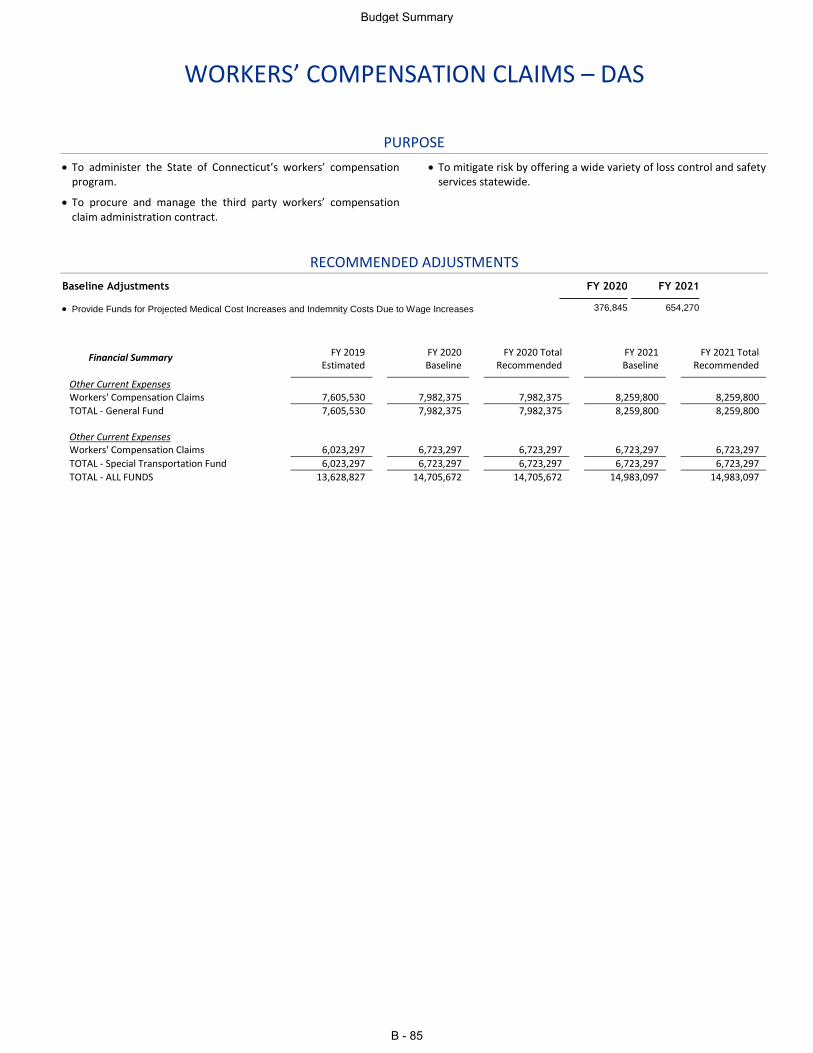
WORKERS’ COMPENSATION CLAIMS – DAS
PURPOSE
To administer the State of Connecticut’s workers’ compensation program.
To procure and manage the third party workers’ compensation claim administration contract.
To mitigate risk by offering a wide variety of loss control and safety services statewide.
RECOMMENDED ADJUSTMENTS
Baseline Adjustments FY 2020 FY 2021
Provide Funds for Projected Medical Cost Increases and Indemnity Costs Due to Wage Increases 376,845 654,270
Financial Summary FY 2019 Estimated
FY 2020 Baseline
FY 2020 Total Recommended
FY 2021 Baseline
FY 2021 Total Recommended
Other Current Expenses Workers' Compensation Claims 7,605,530 7,982,375 7,982,375 8,259,800 8,259,800
TOTAL - General Fund 7,605,530 7,982,375 7,982,375 8,259,800 8,259,800 Other Current Expenses Workers' Compensation Claims 6,023,297 6,723,297 6,723,297 6,723,297 6,723,297
TOTAL - Special Transportation Fund 6,023,297 6,723,297 6,723,297 6,723,297 6,723,297
TOTAL - ALL FUNDS 13,628,827 14,705,672 14,705,672 14,983,097 14,983,097
Budget Summary
B - 85

SECTION C
PROPOSED APPROPRIATIONS

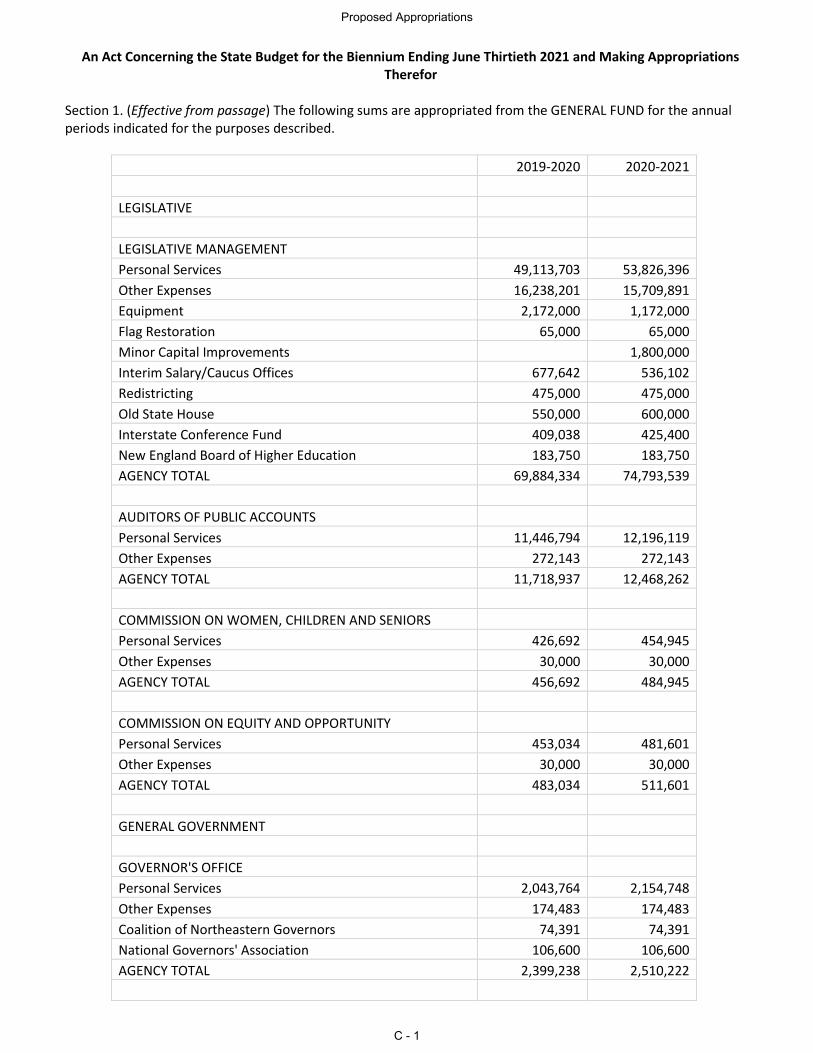
An Act Concerning the State Budget for the Biennium Ending June Thirtieth 2021 and Making Appropriations Therefor
Section 1. (Effective from passage) The following sums are appropriated from the GENERAL FUND for the annual periods indicated for the purposes described.
2019-2020 2020-2021
LEGISLATIVE
LEGISLATIVE MANAGEMENT
Personal Services 49,113,703 53,826,396
Other Expenses 16,238,201 15,709,891
Equipment 2,172,000 1,172,000
Flag Restoration 65,000 65,000
Minor Capital Improvements 1,800,000
Interim Salary/Caucus Offices 677,642 536,102
Redistricting 475,000 475,000
Old State House 550,000 600,000
Interstate Conference Fund 409,038 425,400
New England Board of Higher Education 183,750 183,750
AGENCY TOTAL 69,884,334 74,793,539
AUDITORS OF PUBLIC ACCOUNTS
Personal Services 11,446,794 12,196,119
Other Expenses 272,143 272,143
AGENCY TOTAL 11,718,937 12,468,262
COMMISSION ON WOMEN, CHILDREN AND SENIORS
Personal Services 426,692 454,945
Other Expenses 30,000 30,000
AGENCY TOTAL 456,692 484,945
COMMISSION ON EQUITY AND OPPORTUNITY
Personal Services 453,034 481,601
Other Expenses 30,000 30,000
AGENCY TOTAL 483,034 511,601
GENERAL GOVERNMENT
GOVERNOR'S OFFICE
Personal Services 2,043,764 2,154,748
Other Expenses 174,483 174,483
Coalition of Northeastern Governors 74,391 74,391
National Governors' Association 106,600 106,600
AGENCY TOTAL 2,399,238 2,510,222
Proposed Appropriations
C - 1
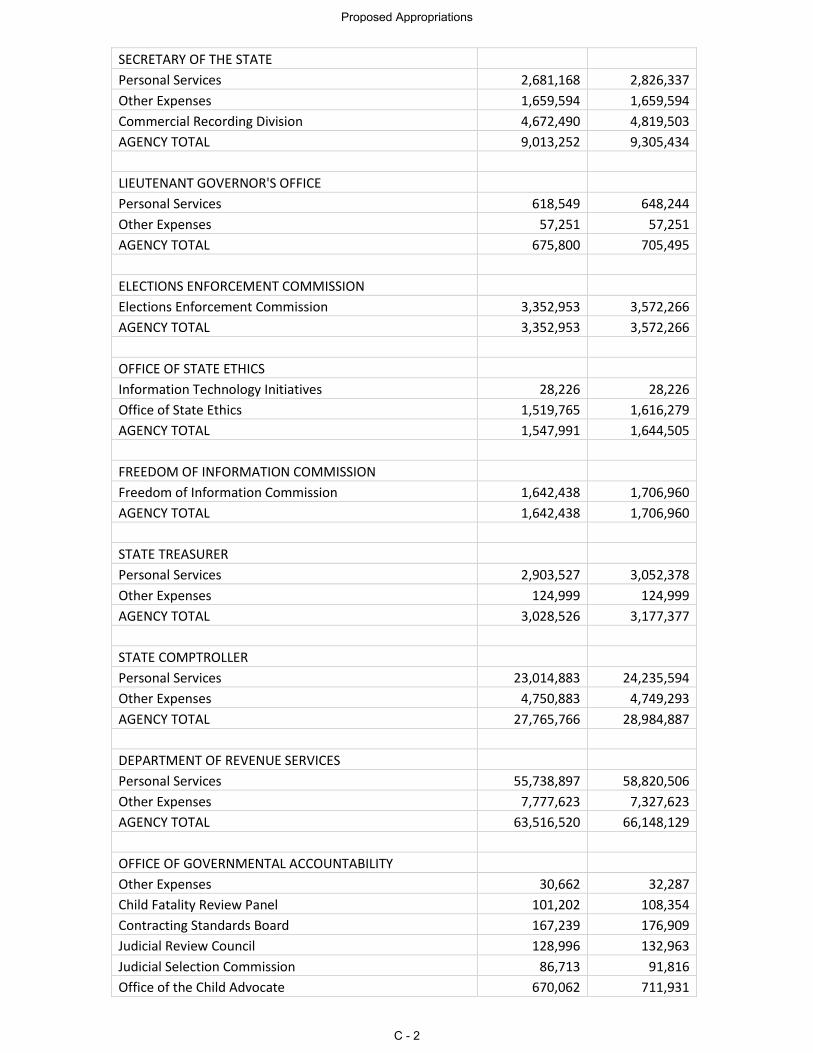
SECRETARY OF THE STATE
Personal Services 2,681,168 2,826,337
Other Expenses 1,659,594 1,659,594
Commercial Recording Division 4,672,490 4,819,503
AGENCY TOTAL 9,013,252 9,305,434
LIEUTENANT GOVERNOR'S OFFICE
Personal Services 618,549 648,244
Other Expenses 57,251 57,251
AGENCY TOTAL 675,800 705,495
ELECTIONS ENFORCEMENT COMMISSION
Elections Enforcement Commission 3,352,953 3,572,266
AGENCY TOTAL 3,352,953 3,572,266
OFFICE OF STATE ETHICS
Information Technology Initiatives 28,226 28,226
Office of State Ethics 1,519,765 1,616,279
AGENCY TOTAL 1,547,991 1,644,505
FREEDOM OF INFORMATION COMMISSION
Freedom of Information Commission 1,642,438 1,706,960
AGENCY TOTAL 1,642,438 1,706,960
STATE TREASURER
Personal Services 2,903,527 3,052,378
Other Expenses 124,999 124,999
AGENCY TOTAL 3,028,526 3,177,377
STATE COMPTROLLER
Personal Services 23,014,883 24,235,594
Other Expenses 4,750,883 4,749,293
AGENCY TOTAL 27,765,766 28,984,887
DEPARTMENT OF REVENUE SERVICES
Personal Services 55,738,897 58,820,506
Other Expenses 7,777,623 7,327,623
AGENCY TOTAL 63,516,520 66,148,129
OFFICE OF GOVERNMENTAL ACCOUNTABILITY
Other Expenses 30,662 32,287
Child Fatality Review Panel 101,202 108,354
Contracting Standards Board 167,239 176,909
Judicial Review Council 128,996 132,963
Judicial Selection Commission 86,713 91,816
Office of the Child Advocate 670,062 711,931
Proposed Appropriations
C - 2
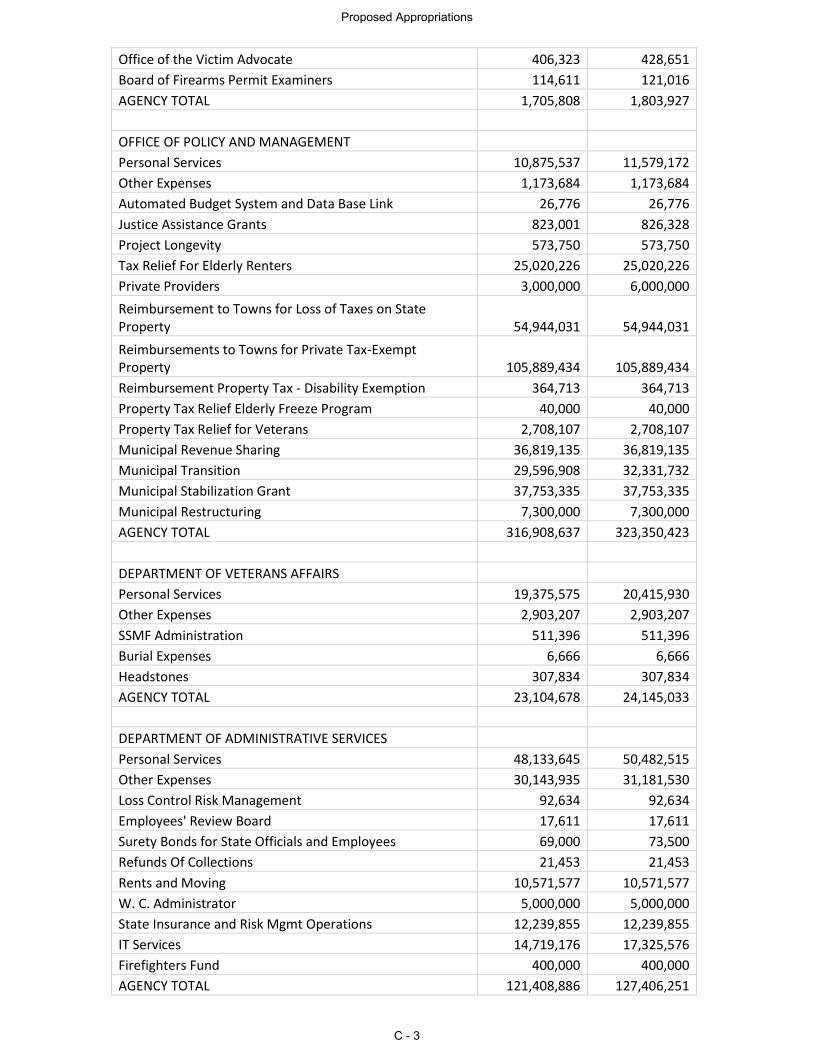
Office of the Victim Advocate 406,323 428,651
Board of Firearms Permit Examiners 114,611 121,016
AGENCY TOTAL 1,705,808 1,803,927
OFFICE OF POLICY AND MANAGEMENT
Personal Services 10,875,537 11,579,172
Other Expenses 1,173,684 1,173,684
Automated Budget System and Data Base Link 26,776 26,776
Justice Assistance Grants 823,001 826,328
Project Longevity 573,750 573,750
Tax Relief For Elderly Renters 25,020,226 25,020,226
Private Providers 3,000,000 6,000,000
Reimbursement to Towns for Loss of Taxes on State Property 54,944,031 54,944,031
Reimbursements to Towns for Private Tax-Exempt Property 105,889,434 105,889,434
Reimbursement Property Tax - Disability Exemption 364,713 364,713
Property Tax Relief Elderly Freeze Program 40,000 40,000
Property Tax Relief for Veterans 2,708,107 2,708,107
Municipal Revenue Sharing 36,819,135 36,819,135
Municipal Transition 29,596,908 32,331,732
Municipal Stabilization Grant 37,753,335 37,753,335
Municipal Restructuring 7,300,000 7,300,000
AGENCY TOTAL 316,908,637 323,350,423
DEPARTMENT OF VETERANS AFFAIRS
Personal Services 19,375,575 20,415,930
Other Expenses 2,903,207 2,903,207
SSMF Administration 511,396 511,396
Burial Expenses 6,666 6,666
Headstones 307,834 307,834
AGENCY TOTAL 23,104,678 24,145,033
DEPARTMENT OF ADMINISTRATIVE SERVICES
Personal Services 48,133,645 50,482,515
Other Expenses 30,143,935 31,181,530
Loss Control Risk Management 92,634 92,634
Employees' Review Board 17,611 17,611
Surety Bonds for State Officials and Employees 69,000 73,500
Refunds Of Collections 21,453 21,453
Rents and Moving 10,571,577 10,571,577
W. C. Administrator 5,000,000 5,000,000
State Insurance and Risk Mgmt Operations 12,239,855 12,239,855
IT Services 14,719,176 17,325,576
Firefighters Fund 400,000 400,000
AGENCY TOTAL 121,408,886 127,406,251
Proposed Appropriations
C - 3
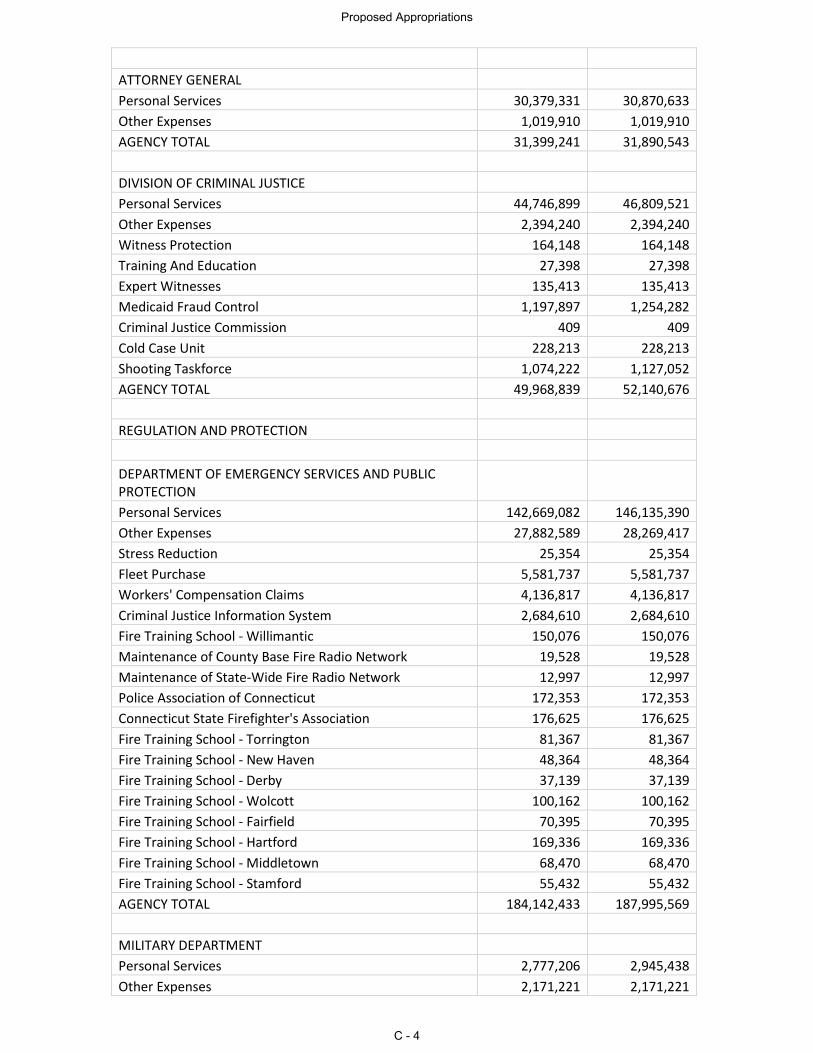
ATTORNEY GENERAL
Personal Services 30,379,331 30,870,633
Other Expenses 1,019,910 1,019,910
AGENCY TOTAL 31,399,241 31,890,543
DIVISION OF CRIMINAL JUSTICE
Personal Services 44,746,899 46,809,521
Other Expenses 2,394,240 2,394,240
Witness Protection 164,148 164,148
Training And Education 27,398 27,398
Expert Witnesses 135,413 135,413
Medicaid Fraud Control 1,197,897 1,254,282
Criminal Justice Commission 409 409
Cold Case Unit 228,213 228,213
Shooting Taskforce 1,074,222 1,127,052
AGENCY TOTAL 49,968,839 52,140,676
REGULATION AND PROTECTION
DEPARTMENT OF EMERGENCY SERVICES AND PUBLIC PROTECTION
Personal Services 142,669,082 146,135,390
Other Expenses 27,882,589 28,269,417
Stress Reduction 25,354 25,354
Fleet Purchase 5,581,737 5,581,737
Workers' Compensation Claims 4,136,817 4,136,817
Criminal Justice Information System 2,684,610 2,684,610
Fire Training School - Willimantic 150,076 150,076
Maintenance of County Base Fire Radio Network 19,528 19,528
Maintenance of State-Wide Fire Radio Network 12,997 12,997
Police Association of Connecticut 172,353 172,353
Connecticut State Firefighter's Association 176,625 176,625
Fire Training School - Torrington 81,367 81,367
Fire Training School - New Haven 48,364 48,364
Fire Training School - Derby 37,139 37,139
Fire Training School - Wolcott 100,162 100,162
Fire Training School - Fairfield 70,395 70,395
Fire Training School - Hartford 169,336 169,336
Fire Training School - Middletown 68,470 68,470
Fire Training School - Stamford 55,432 55,432
AGENCY TOTAL 184,142,433 187,995,569
MILITARY DEPARTMENT
Personal Services 2,777,206 2,945,438
Other Expenses 2,171,221 2,171,221
Proposed Appropriations
C - 4
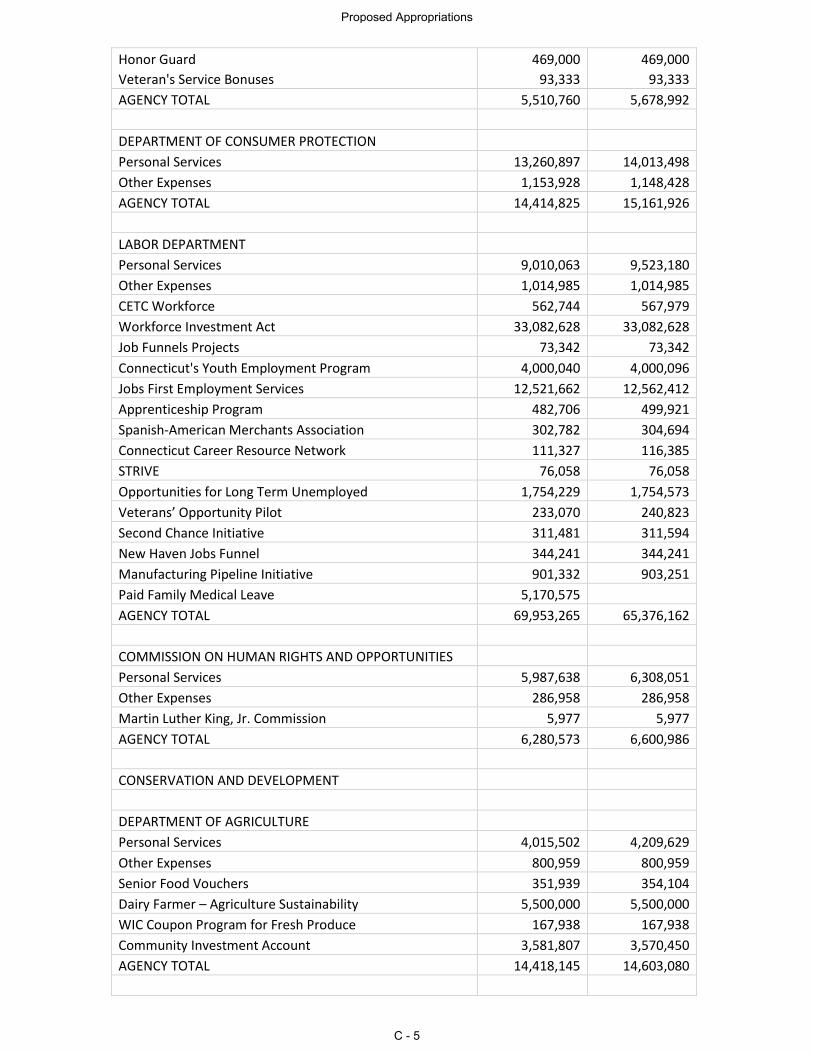
Honor Guard 469,000 469,000
Veteran's Service Bonuses 93,333 93,333
AGENCY TOTAL 5,510,760 5,678,992
DEPARTMENT OF CONSUMER PROTECTION
Personal Services 13,260,897 14,013,498
Other Expenses 1,153,928 1,148,428
AGENCY TOTAL 14,414,825 15,161,926
LABOR DEPARTMENT
Personal Services 9,010,063 9,523,180
Other Expenses 1,014,985 1,014,985
CETC Workforce 562,744 567,979
Workforce Investment Act 33,082,628 33,082,628
Job Funnels Projects 73,342 73,342
Connecticut's Youth Employment Program 4,000,040 4,000,096
Jobs First Employment Services 12,521,662 12,562,412
Apprenticeship Program 482,706 499,921
Spanish-American Merchants Association 302,782 304,694
Connecticut Career Resource Network 111,327 116,385
STRIVE 76,058 76,058
Opportunities for Long Term Unemployed 1,754,229 1,754,573
Veterans’ Opportunity Pilot 233,070 240,823
Second Chance Initiative 311,481 311,594
New Haven Jobs Funnel 344,241 344,241
Manufacturing Pipeline Initiative 901,332 903,251
Paid Family Medical Leave 5,170,575 AGENCY TOTAL 69,953,265 65,376,162
COMMISSION ON HUMAN RIGHTS AND OPPORTUNITIES
Personal Services 5,987,638 6,308,051
Other Expenses 286,958 286,958
Martin Luther King, Jr. Commission 5,977 5,977
AGENCY TOTAL 6,280,573 6,600,986
CONSERVATION AND DEVELOPMENT
DEPARTMENT OF AGRICULTURE
Personal Services 4,015,502 4,209,629
Other Expenses 800,959 800,959
Senior Food Vouchers 351,939 354,104
Dairy Farmer – Agriculture Sustainability 5,500,000 5,500,000
WIC Coupon Program for Fresh Produce 167,938 167,938
Community Investment Account 3,581,807 3,570,450
AGENCY TOTAL 14,418,145 14,603,080
Proposed Appropriations
C - 5
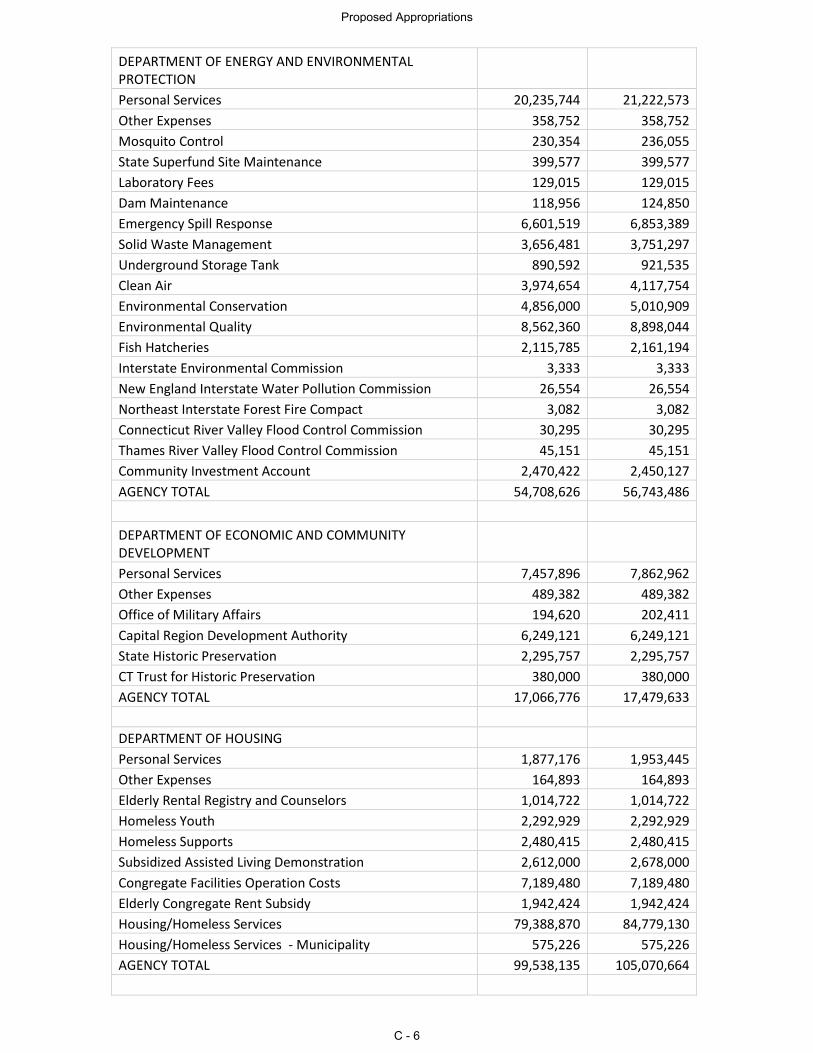
DEPARTMENT OF ENERGY AND ENVIRONMENTAL PROTECTION
Personal Services 20,235,744 21,222,573
Other Expenses 358,752 358,752
Mosquito Control 230,354 236,055
State Superfund Site Maintenance 399,577 399,577
Laboratory Fees 129,015 129,015
Dam Maintenance 118,956 124,850
Emergency Spill Response 6,601,519 6,853,389
Solid Waste Management 3,656,481 3,751,297
Underground Storage Tank 890,592 921,535
Clean Air 3,974,654 4,117,754
Environmental Conservation 4,856,000 5,010,909
Environmental Quality 8,562,360 8,898,044
Fish Hatcheries 2,115,785 2,161,194
Interstate Environmental Commission 3,333 3,333
New England Interstate Water Pollution Commission 26,554 26,554
Northeast Interstate Forest Fire Compact 3,082 3,082
Connecticut River Valley Flood Control Commission 30,295 30,295
Thames River Valley Flood Control Commission 45,151 45,151
Community Investment Account 2,470,422 2,450,127
AGENCY TOTAL 54,708,626 56,743,486
DEPARTMENT OF ECONOMIC AND COMMUNITY DEVELOPMENT
Personal Services 7,457,896 7,862,962
Other Expenses 489,382 489,382
Office of Military Affairs 194,620 202,411
Capital Region Development Authority 6,249,121 6,249,121
State Historic Preservation 2,295,757 2,295,757
CT Trust for Historic Preservation 380,000 380,000
AGENCY TOTAL 17,066,776 17,479,633
DEPARTMENT OF HOUSING
Personal Services 1,877,176 1,953,445
Other Expenses 164,893 164,893
Elderly Rental Registry and Counselors 1,014,722 1,014,722
Homeless Youth 2,292,929 2,292,929
Homeless Supports 2,480,415 2,480,415
Subsidized Assisted Living Demonstration 2,612,000 2,678,000
Congregate Facilities Operation Costs 7,189,480 7,189,480
Elderly Congregate Rent Subsidy 1,942,424 1,942,424
Housing/Homeless Services 79,388,870 84,779,130
Housing/Homeless Services - Municipality 575,226 575,226
AGENCY TOTAL 99,538,135 105,070,664
Proposed Appropriations
C - 6
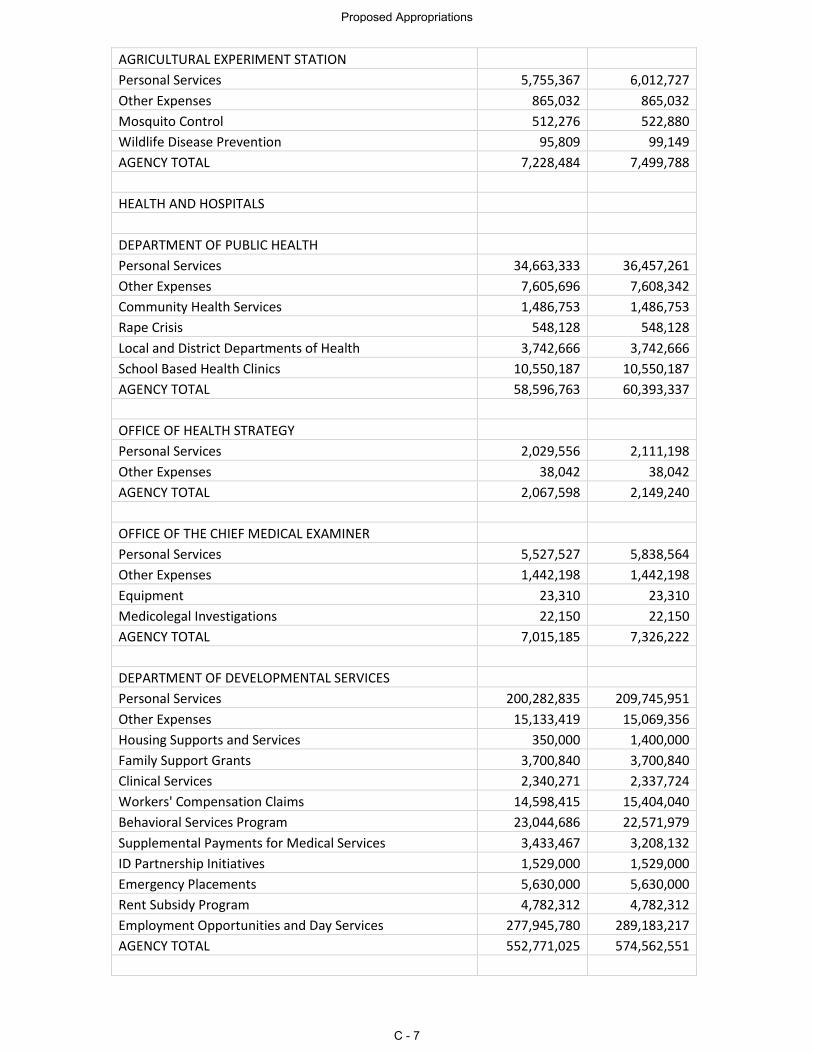
AGRICULTURAL EXPERIMENT STATION
Personal Services 5,755,367 6,012,727
Other Expenses 865,032 865,032
Mosquito Control 512,276 522,880
Wildlife Disease Prevention 95,809 99,149
AGENCY TOTAL 7,228,484 7,499,788
HEALTH AND HOSPITALS
DEPARTMENT OF PUBLIC HEALTH
Personal Services 34,663,333 36,457,261
Other Expenses 7,605,696 7,608,342
Community Health Services 1,486,753 1,486,753
Rape Crisis 548,128 548,128
Local and District Departments of Health 3,742,666 3,742,666
School Based Health Clinics 10,550,187 10,550,187
AGENCY TOTAL 58,596,763 60,393,337
OFFICE OF HEALTH STRATEGY
Personal Services 2,029,556 2,111,198
Other Expenses 38,042 38,042
AGENCY TOTAL 2,067,598 2,149,240
OFFICE OF THE CHIEF MEDICAL EXAMINER
Personal Services 5,527,527 5,838,564
Other Expenses 1,442,198 1,442,198
Equipment 23,310 23,310
Medicolegal Investigations 22,150 22,150
AGENCY TOTAL 7,015,185 7,326,222
DEPARTMENT OF DEVELOPMENTAL SERVICES
Personal Services 200,282,835 209,745,951
Other Expenses 15,133,419 15,069,356
Housing Supports and Services 350,000 1,400,000
Family Support Grants 3,700,840 3,700,840
Clinical Services 2,340,271 2,337,724
Workers' Compensation Claims 14,598,415 15,404,040
Behavioral Services Program 23,044,686 22,571,979
Supplemental Payments for Medical Services 3,433,467 3,208,132
ID Partnership Initiatives 1,529,000 1,529,000
Emergency Placements 5,630,000 5,630,000
Rent Subsidy Program 4,782,312 4,782,312
Employment Opportunities and Day Services 277,945,780 289,183,217
AGENCY TOTAL 552,771,025 574,562,551
Proposed Appropriations
C - 7
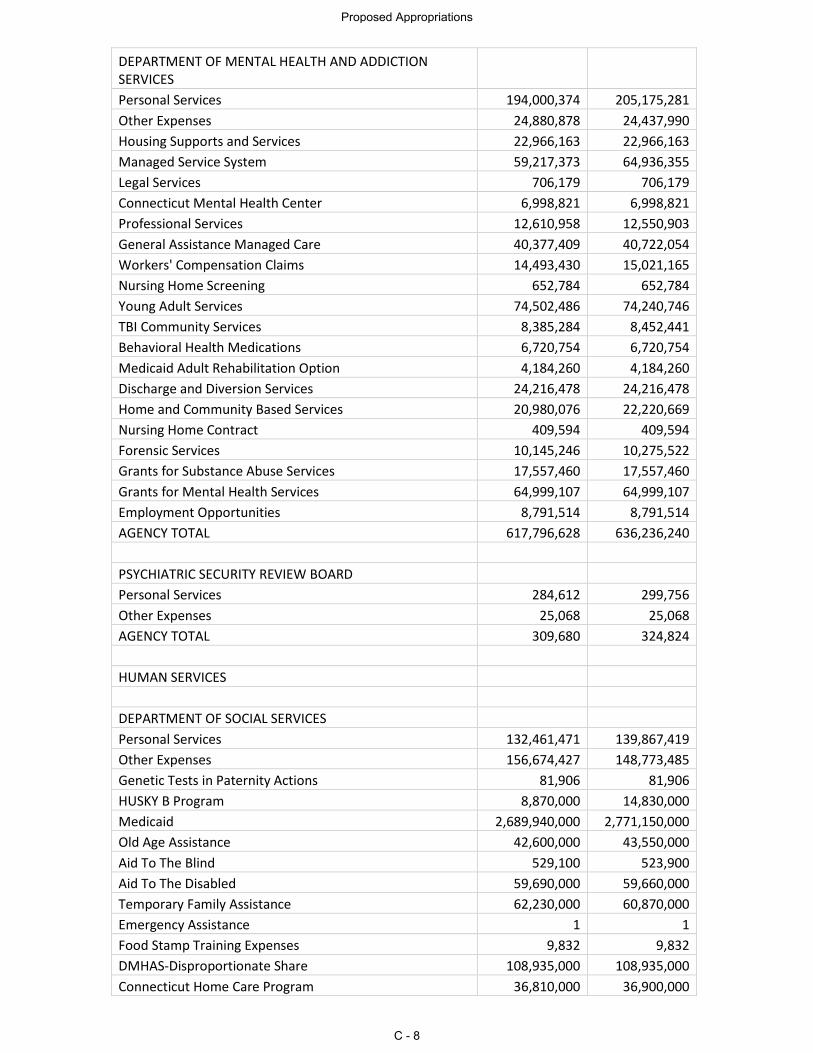
DEPARTMENT OF MENTAL HEALTH AND ADDICTION SERVICES
Personal Services 194,000,374 205,175,281
Other Expenses 24,880,878 24,437,990
Housing Supports and Services 22,966,163 22,966,163
Managed Service System 59,217,373 64,936,355
Legal Services 706,179 706,179
Connecticut Mental Health Center 6,998,821 6,998,821
Professional Services 12,610,958 12,550,903
General Assistance Managed Care 40,377,409 40,722,054
Workers' Compensation Claims 14,493,430 15,021,165
Nursing Home Screening 652,784 652,784
Young Adult Services 74,502,486 74,240,746
TBI Community Services 8,385,284 8,452,441
Behavioral Health Medications 6,720,754 6,720,754
Medicaid Adult Rehabilitation Option 4,184,260 4,184,260
Discharge and Diversion Services 24,216,478 24,216,478
Home and Community Based Services 20,980,076 22,220,669
Nursing Home Contract 409,594 409,594
Forensic Services 10,145,246 10,275,522
Grants for Substance Abuse Services 17,557,460 17,557,460
Grants for Mental Health Services 64,999,107 64,999,107
Employment Opportunities 8,791,514 8,791,514
AGENCY TOTAL 617,796,628 636,236,240
PSYCHIATRIC SECURITY REVIEW BOARD
Personal Services 284,612 299,756
Other Expenses 25,068 25,068
AGENCY TOTAL 309,680 324,824
HUMAN SERVICES
DEPARTMENT OF SOCIAL SERVICES
Personal Services 132,461,471 139,867,419
Other Expenses 156,674,427 148,773,485
Genetic Tests in Paternity Actions 81,906 81,906
HUSKY B Program 8,870,000 14,830,000
Medicaid 2,689,940,000 2,771,150,000
Old Age Assistance 42,600,000 43,550,000
Aid To The Blind 529,100 523,900
Aid To The Disabled 59,690,000 59,660,000
Temporary Family Assistance 62,230,000 60,870,000
Emergency Assistance 1 1
Food Stamp Training Expenses 9,832 9,832
DMHAS-Disproportionate Share 108,935,000 108,935,000
Connecticut Home Care Program 36,810,000 36,900,000
Proposed Appropriations
C - 8
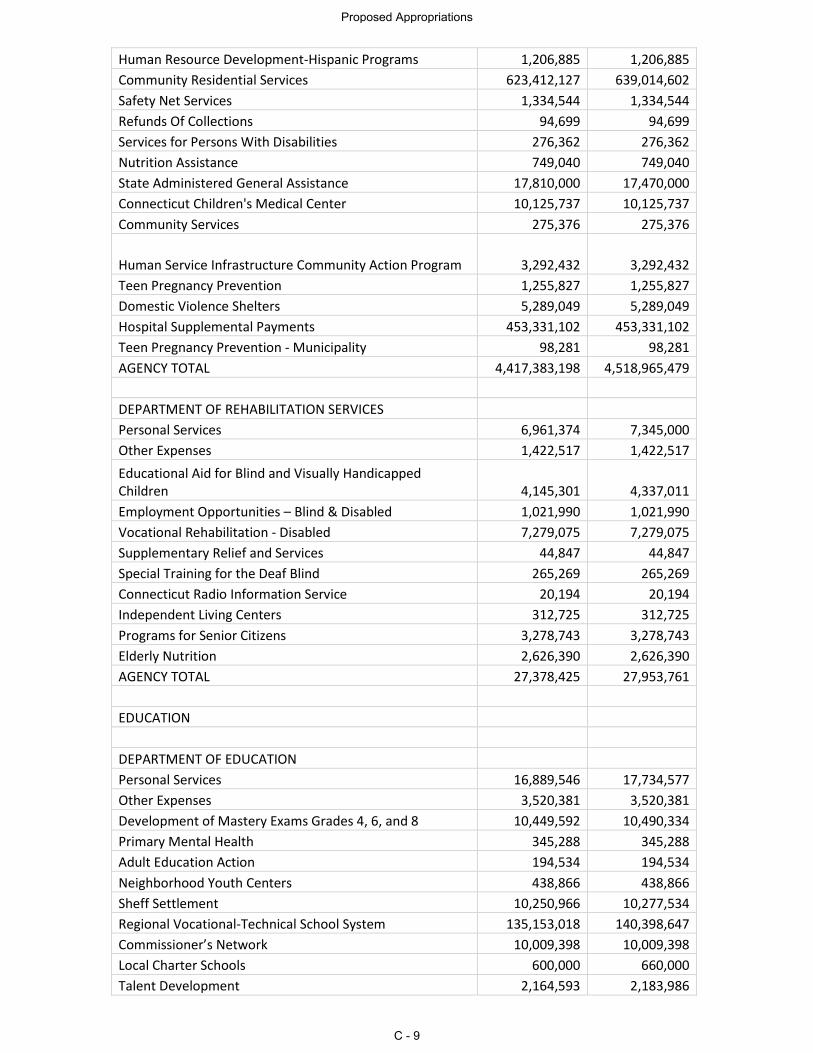
Human Resource Development-Hispanic Programs 1,206,885 1,206,885
Community Residential Services 623,412,127 639,014,602
Safety Net Services 1,334,544 1,334,544
Refunds Of Collections 94,699 94,699
Services for Persons With Disabilities 276,362 276,362
Nutrition Assistance 749,040 749,040
State Administered General Assistance 17,810,000 17,470,000
Connecticut Children's Medical Center 10,125,737 10,125,737
Community Services 275,376 275,376
Human Service Infrastructure Community Action Program 3,292,432 3,292,432
Teen Pregnancy Prevention 1,255,827 1,255,827
Domestic Violence Shelters 5,289,049 5,289,049
Hospital Supplemental Payments 453,331,102 453,331,102
Teen Pregnancy Prevention - Municipality 98,281 98,281
AGENCY TOTAL 4,417,383,198 4,518,965,479
DEPARTMENT OF REHABILITATION SERVICES
Personal Services 6,961,374 7,345,000
Other Expenses 1,422,517 1,422,517
Educational Aid for Blind and Visually Handicapped Children 4,145,301 4,337,011
Employment Opportunities – Blind & Disabled 1,021,990 1,021,990
Vocational Rehabilitation - Disabled 7,279,075 7,279,075
Supplementary Relief and Services 44,847 44,847
Special Training for the Deaf Blind 265,269 265,269
Connecticut Radio Information Service 20,194 20,194
Independent Living Centers 312,725 312,725
Programs for Senior Citizens 3,278,743 3,278,743
Elderly Nutrition 2,626,390 2,626,390
AGENCY TOTAL 27,378,425 27,953,761
EDUCATION
DEPARTMENT OF EDUCATION
Personal Services 16,889,546 17,734,577
Other Expenses 3,520,381 3,520,381
Development of Mastery Exams Grades 4, 6, and 8 10,449,592 10,490,334
Primary Mental Health 345,288 345,288
Adult Education Action 194,534 194,534
Neighborhood Youth Centers 438,866 438,866
Sheff Settlement 10,250,966 10,277,534
Regional Vocational-Technical School System 135,153,018 140,398,647
Commissioner’s Network 10,009,398 10,009,398
Local Charter Schools 600,000 660,000
Talent Development 2,164,593 2,183,986
Proposed Appropriations
C - 9
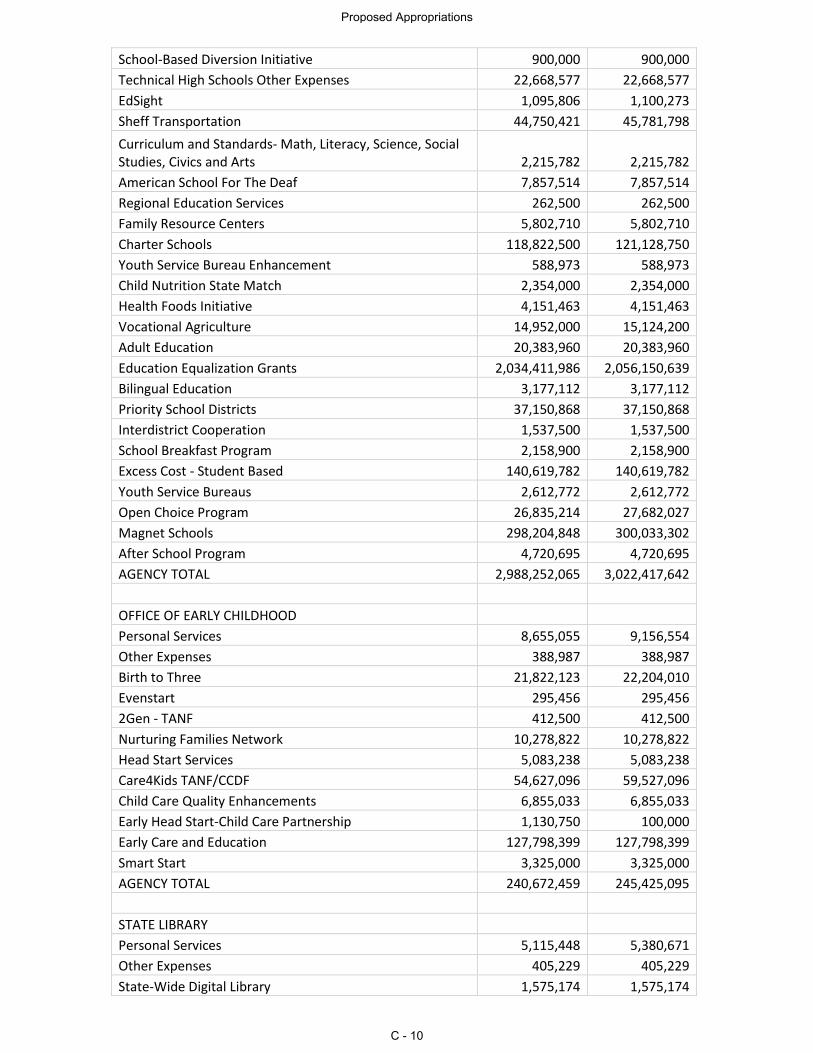
School-Based Diversion Initiative 900,000 900,000
Technical High Schools Other Expenses 22,668,577 22,668,577
EdSight 1,095,806 1,100,273
Sheff Transportation 44,750,421 45,781,798
Curriculum and Standards- Math, Literacy, Science, Social Studies, Civics and Arts 2,215,782 2,215,782
American School For The Deaf 7,857,514 7,857,514
Regional Education Services 262,500 262,500
Family Resource Centers 5,802,710 5,802,710
Charter Schools 118,822,500 121,128,750
Youth Service Bureau Enhancement 588,973 588,973
Child Nutrition State Match 2,354,000 2,354,000
Health Foods Initiative 4,151,463 4,151,463
Vocational Agriculture 14,952,000 15,124,200
Adult Education 20,383,960 20,383,960
Education Equalization Grants 2,034,411,986 2,056,150,639
Bilingual Education 3,177,112 3,177,112
Priority School Districts 37,150,868 37,150,868
Interdistrict Cooperation 1,537,500 1,537,500
School Breakfast Program 2,158,900 2,158,900
Excess Cost - Student Based 140,619,782 140,619,782
Youth Service Bureaus 2,612,772 2,612,772
Open Choice Program 26,835,214 27,682,027
Magnet Schools 298,204,848 300,033,302
After School Program 4,720,695 4,720,695
AGENCY TOTAL 2,988,252,065 3,022,417,642
OFFICE OF EARLY CHILDHOOD
Personal Services 8,655,055 9,156,554
Other Expenses 388,987 388,987
Birth to Three 21,822,123 22,204,010
Evenstart 295,456 295,456
2Gen - TANF 412,500 412,500
Nurturing Families Network 10,278,822 10,278,822
Head Start Services 5,083,238 5,083,238
Care4Kids TANF/CCDF 54,627,096 59,527,096
Child Care Quality Enhancements 6,855,033 6,855,033
Early Head Start-Child Care Partnership 1,130,750 100,000
Early Care and Education 127,798,399 127,798,399
Smart Start 3,325,000 3,325,000
AGENCY TOTAL 240,672,459 245,425,095
STATE LIBRARY
Personal Services 5,115,448 5,380,671
Other Expenses 405,229 405,229
State-Wide Digital Library 1,575,174 1,575,174
Proposed Appropriations
C - 10
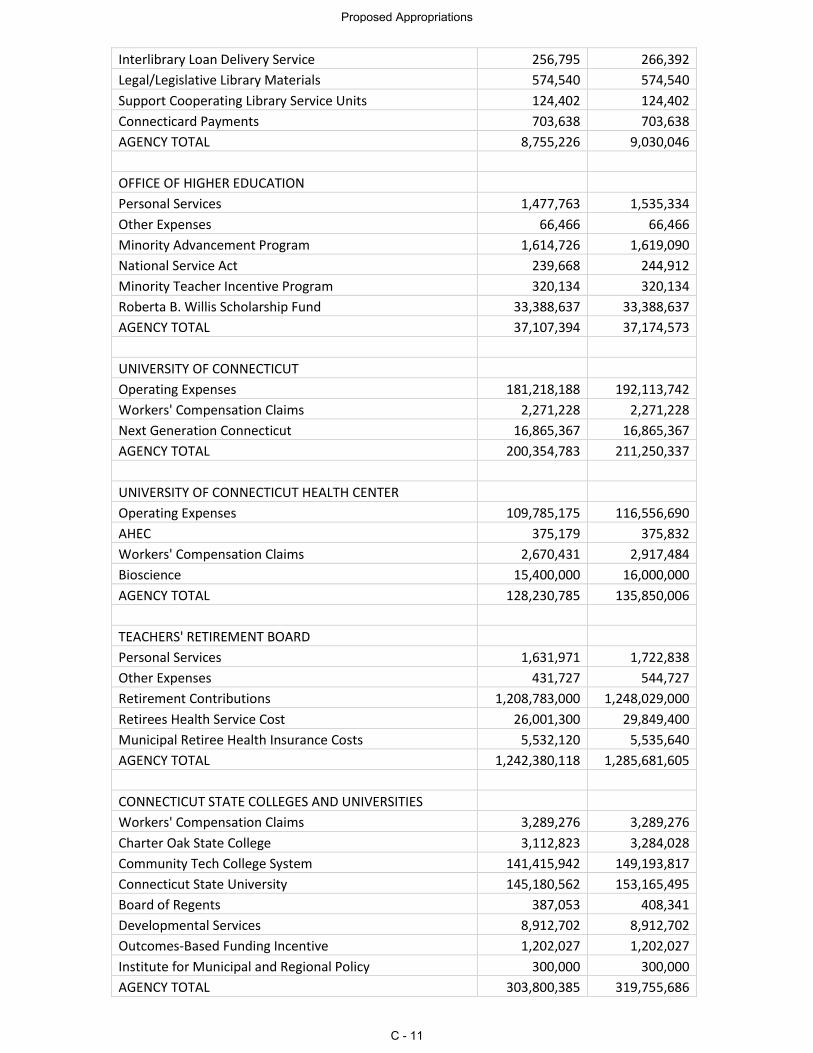
Interlibrary Loan Delivery Service 256,795 266,392
Legal/Legislative Library Materials 574,540 574,540
Support Cooperating Library Service Units 124,402 124,402
Connecticard Payments 703,638 703,638
AGENCY TOTAL 8,755,226 9,030,046
OFFICE OF HIGHER EDUCATION
Personal Services 1,477,763 1,535,334
Other Expenses 66,466 66,466
Minority Advancement Program 1,614,726 1,619,090
National Service Act 239,668 244,912
Minority Teacher Incentive Program 320,134 320,134
Roberta B. Willis Scholarship Fund 33,388,637 33,388,637
AGENCY TOTAL 37,107,394 37,174,573
UNIVERSITY OF CONNECTICUT
Operating Expenses 181,218,188 192,113,742
Workers' Compensation Claims 2,271,228 2,271,228
Next Generation Connecticut 16,865,367 16,865,367
AGENCY TOTAL 200,354,783 211,250,337
UNIVERSITY OF CONNECTICUT HEALTH CENTER
Operating Expenses 109,785,175 116,556,690
AHEC 375,179 375,832
Workers' Compensation Claims 2,670,431 2,917,484
Bioscience 15,400,000 16,000,000
AGENCY TOTAL 128,230,785 135,850,006
TEACHERS' RETIREMENT BOARD
Personal Services 1,631,971 1,722,838
Other Expenses 431,727 544,727
Retirement Contributions 1,208,783,000 1,248,029,000
Retirees Health Service Cost 26,001,300 29,849,400
Municipal Retiree Health Insurance Costs 5,532,120 5,535,640
AGENCY TOTAL 1,242,380,118 1,285,681,605
CONNECTICUT STATE COLLEGES AND UNIVERSITIES
Workers' Compensation Claims 3,289,276 3,289,276
Charter Oak State College 3,112,823 3,284,028
Community Tech College System 141,415,942 149,193,817
Connecticut State University 145,180,562 153,165,495
Board of Regents 387,053 408,341
Developmental Services 8,912,702 8,912,702
Outcomes-Based Funding Incentive 1,202,027 1,202,027
Institute for Municipal and Regional Policy 300,000 300,000
AGENCY TOTAL 303,800,385 319,755,686
Proposed Appropriations
C - 11
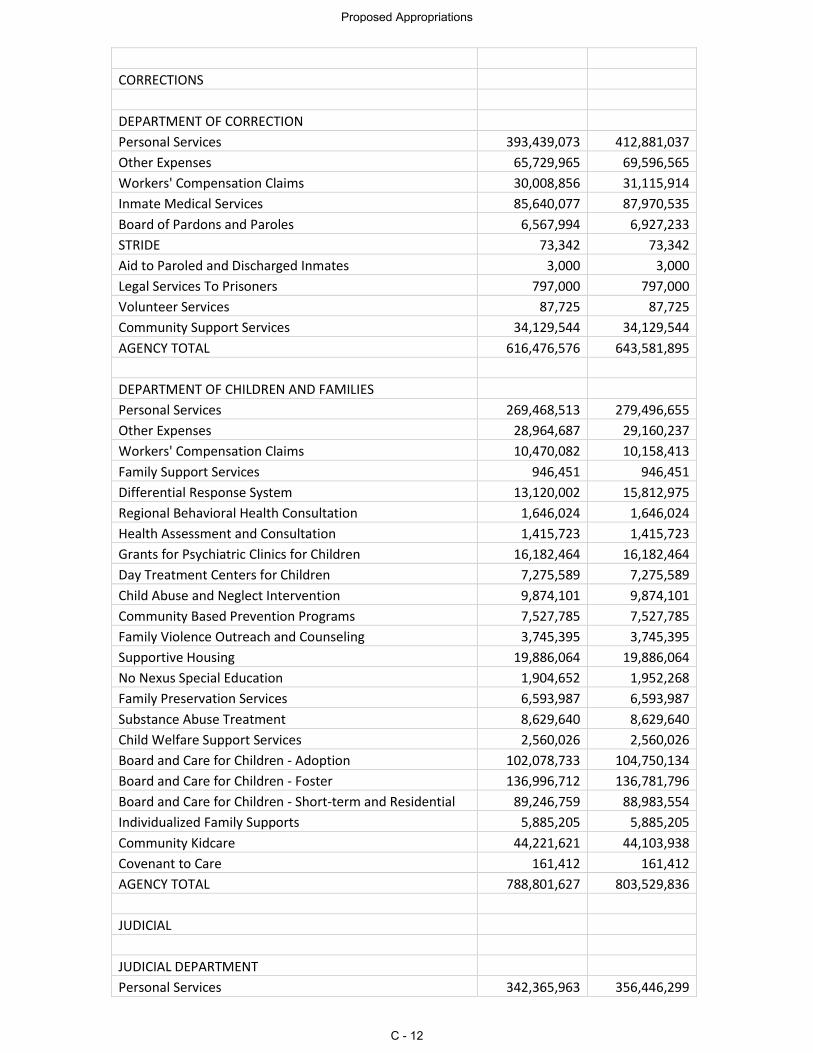
CORRECTIONS
DEPARTMENT OF CORRECTION
Personal Services 393,439,073 412,881,037
Other Expenses 65,729,965 69,596,565
Workers' Compensation Claims 30,008,856 31,115,914
Inmate Medical Services 85,640,077 87,970,535
Board of Pardons and Paroles 6,567,994 6,927,233
STRIDE 73,342 73,342
Aid to Paroled and Discharged Inmates 3,000 3,000
Legal Services To Prisoners 797,000 797,000
Volunteer Services 87,725 87,725
Community Support Services 34,129,544 34,129,544
AGENCY TOTAL 616,476,576 643,581,895
DEPARTMENT OF CHILDREN AND FAMILIES
Personal Services 269,468,513 279,496,655
Other Expenses 28,964,687 29,160,237
Workers' Compensation Claims 10,470,082 10,158,413
Family Support Services 946,451 946,451
Differential Response System 13,120,002 15,812,975
Regional Behavioral Health Consultation 1,646,024 1,646,024
Health Assessment and Consultation 1,415,723 1,415,723
Grants for Psychiatric Clinics for Children 16,182,464 16,182,464
Day Treatment Centers for Children 7,275,589 7,275,589
Child Abuse and Neglect Intervention 9,874,101 9,874,101
Community Based Prevention Programs 7,527,785 7,527,785
Family Violence Outreach and Counseling 3,745,395 3,745,395
Supportive Housing 19,886,064 19,886,064
No Nexus Special Education 1,904,652 1,952,268
Family Preservation Services 6,593,987 6,593,987
Substance Abuse Treatment 8,629,640 8,629,640
Child Welfare Support Services 2,560,026 2,560,026
Board and Care for Children - Adoption 102,078,733 104,750,134
Board and Care for Children - Foster 136,996,712 136,781,796
Board and Care for Children - Short-term and Residential 89,246,759 88,983,554
Individualized Family Supports 5,885,205 5,885,205
Community Kidcare 44,221,621 44,103,938
Covenant to Care 161,412 161,412
AGENCY TOTAL 788,801,627 803,529,836
JUDICIAL
JUDICIAL DEPARTMENT
Personal Services 342,365,963 356,446,299
Proposed Appropriations
C - 12
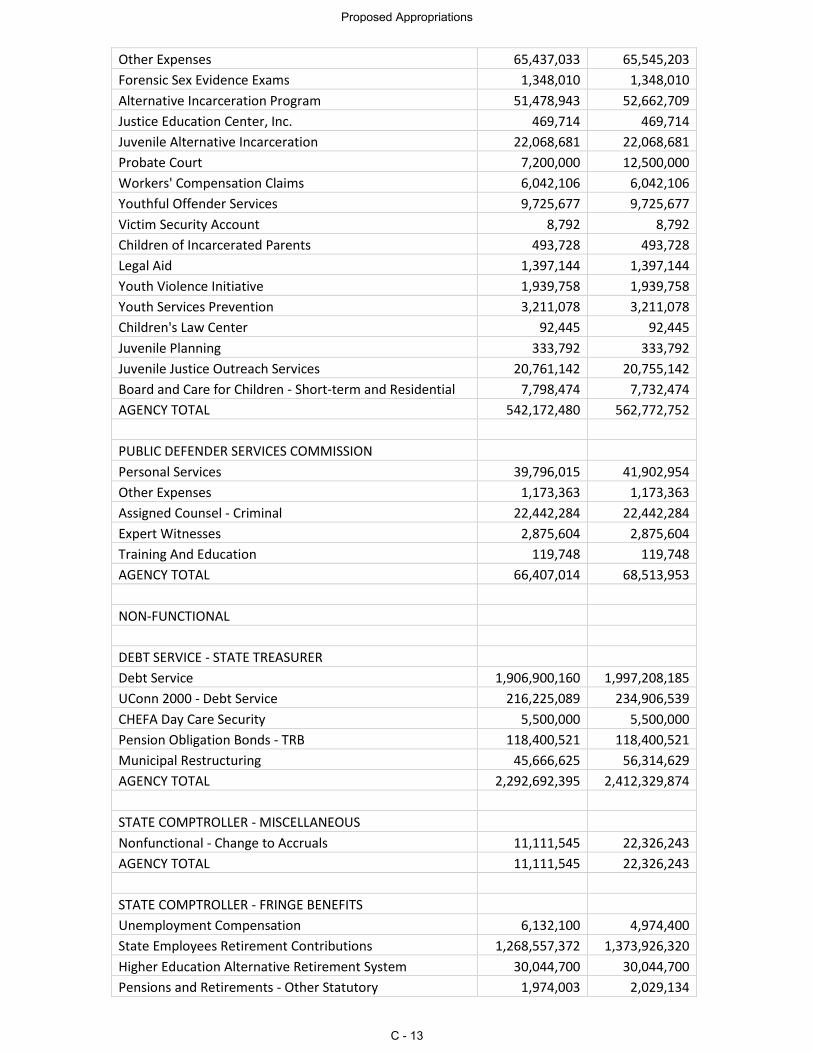
Other Expenses 65,437,033 65,545,203
Forensic Sex Evidence Exams 1,348,010 1,348,010
Alternative Incarceration Program 51,478,943 52,662,709
Justice Education Center, Inc. 469,714 469,714
Juvenile Alternative Incarceration 22,068,681 22,068,681
Probate Court 7,200,000 12,500,000
Workers' Compensation Claims 6,042,106 6,042,106
Youthful Offender Services 9,725,677 9,725,677
Victim Security Account 8,792 8,792
Children of Incarcerated Parents 493,728 493,728
Legal Aid 1,397,144 1,397,144
Youth Violence Initiative 1,939,758 1,939,758
Youth Services Prevention 3,211,078 3,211,078
Children's Law Center 92,445 92,445
Juvenile Planning 333,792 333,792
Juvenile Justice Outreach Services 20,761,142 20,755,142
Board and Care for Children - Short-term and Residential 7,798,474 7,732,474
AGENCY TOTAL 542,172,480 562,772,752
PUBLIC DEFENDER SERVICES COMMISSION
Personal Services 39,796,015 41,902,954
Other Expenses 1,173,363 1,173,363
Assigned Counsel - Criminal 22,442,284 22,442,284
Expert Witnesses 2,875,604 2,875,604
Training And Education 119,748 119,748
AGENCY TOTAL 66,407,014 68,513,953
NON-FUNCTIONAL
DEBT SERVICE - STATE TREASURER
Debt Service 1,906,900,160 1,997,208,185
UConn 2000 - Debt Service 216,225,089 234,906,539
CHEFA Day Care Security 5,500,000 5,500,000
Pension Obligation Bonds - TRB 118,400,521 118,400,521
Municipal Restructuring 45,666,625 56,314,629
AGENCY TOTAL 2,292,692,395 2,412,329,874
STATE COMPTROLLER - MISCELLANEOUS
Nonfunctional - Change to Accruals 11,111,545 22,326,243
AGENCY TOTAL 11,111,545 22,326,243
STATE COMPTROLLER - FRINGE BENEFITS
Unemployment Compensation 6,132,100 4,974,400
State Employees Retirement Contributions 1,268,557,372 1,373,926,320
Higher Education Alternative Retirement System 30,044,700 30,044,700
Pensions and Retirements - Other Statutory 1,974,003 2,029,134
Proposed Appropriations
C - 13
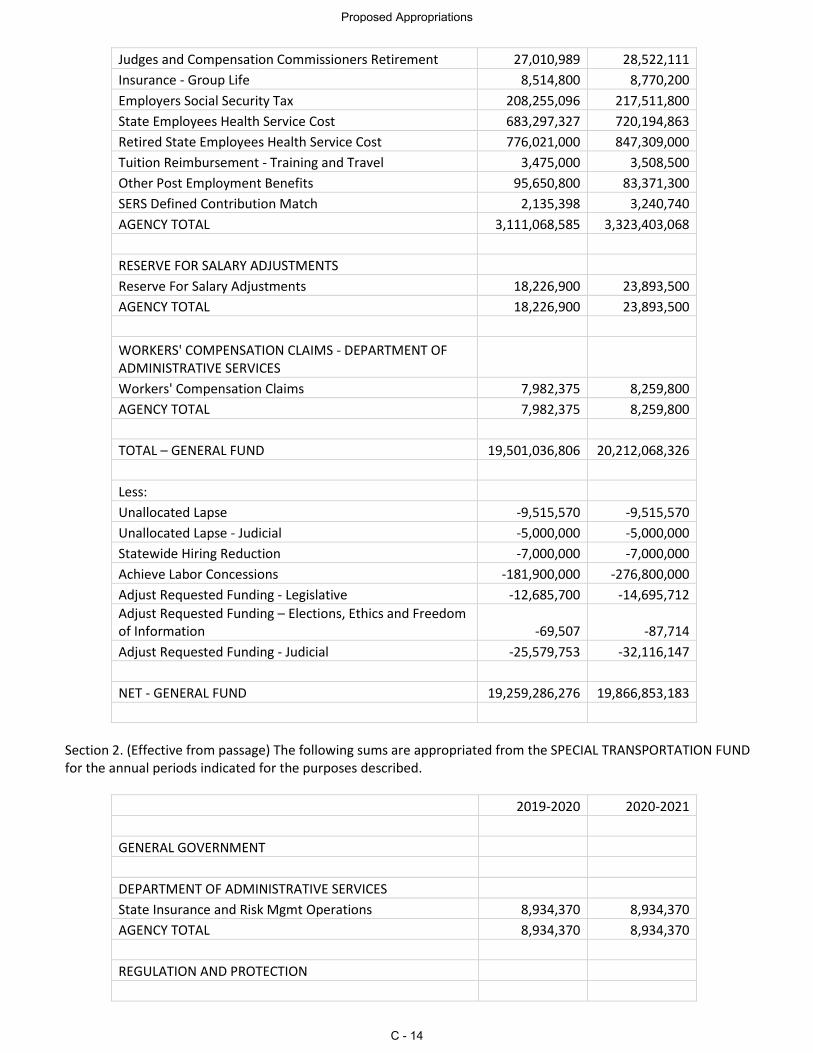
Judges and Compensation Commissioners Retirement 27,010,989 28,522,111
Insurance - Group Life 8,514,800 8,770,200
Employers Social Security Tax 208,255,096 217,511,800
State Employees Health Service Cost 683,297,327 720,194,863
Retired State Employees Health Service Cost 776,021,000 847,309,000
Tuition Reimbursement - Training and Travel 3,475,000 3,508,500
Other Post Employment Benefits 95,650,800 83,371,300
SERS Defined Contribution Match 2,135,398 3,240,740
AGENCY TOTAL 3,111,068,585 3,323,403,068
RESERVE FOR SALARY ADJUSTMENTS
Reserve For Salary Adjustments 18,226,900 23,893,500
AGENCY TOTAL 18,226,900 23,893,500
WORKERS' COMPENSATION CLAIMS - DEPARTMENT OF ADMINISTRATIVE SERVICES
Workers' Compensation Claims 7,982,375 8,259,800
AGENCY TOTAL 7,982,375 8,259,800
TOTAL – GENERAL FUND 19,501,036,806 20,212,068,326
Less:
Unallocated Lapse -9,515,570 -9,515,570
Unallocated Lapse - Judicial -5,000,000 -5,000,000
Statewide Hiring Reduction -7,000,000 -7,000,000
Achieve Labor Concessions -181,900,000 -276,800,000
Adjust Requested Funding - Legislative -12,685,700 -14,695,712
Adjust Requested Funding – Elections, Ethics and Freedom of Information -69,507 -87,714
Adjust Requested Funding - Judicial -25,579,753 -32,116,147
NET - GENERAL FUND 19,259,286,276 19,866,853,183
Section 2. (Effective from passage) The following sums are appropriated from the SPECIAL TRANSPORTATION FUND for the annual periods indicated for the purposes described.
2019-2020 2020-2021
GENERAL GOVERNMENT
DEPARTMENT OF ADMINISTRATIVE SERVICES
State Insurance and Risk Mgmt Operations 8,934,370 8,934,370
AGENCY TOTAL 8,934,370 8,934,370
REGULATION AND PROTECTION
Proposed Appropriations
C - 14
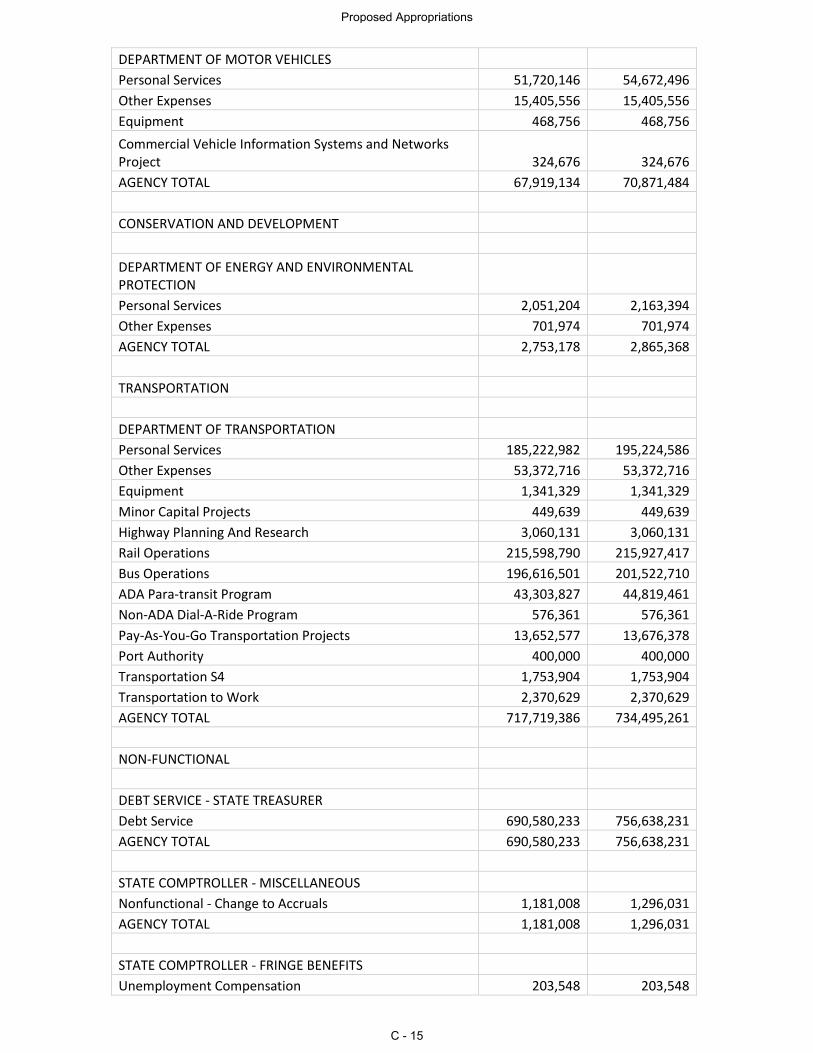
DEPARTMENT OF MOTOR VEHICLES
Personal Services 51,720,146 54,672,496
Other Expenses 15,405,556 15,405,556
Equipment 468,756 468,756
Commercial Vehicle Information Systems and Networks Project 324,676 324,676
AGENCY TOTAL 67,919,134 70,871,484
CONSERVATION AND DEVELOPMENT
DEPARTMENT OF ENERGY AND ENVIRONMENTAL PROTECTION
Personal Services 2,051,204 2,163,394
Other Expenses 701,974 701,974
AGENCY TOTAL 2,753,178 2,865,368
TRANSPORTATION
DEPARTMENT OF TRANSPORTATION
Personal Services 185,222,982 195,224,586
Other Expenses 53,372,716 53,372,716
Equipment 1,341,329 1,341,329
Minor Capital Projects 449,639 449,639
Highway Planning And Research 3,060,131 3,060,131
Rail Operations 215,598,790 215,927,417
Bus Operations 196,616,501 201,522,710
ADA Para-transit Program 43,303,827 44,819,461
Non-ADA Dial-A-Ride Program 576,361 576,361
Pay-As-You-Go Transportation Projects 13,652,577 13,676,378
Port Authority 400,000 400,000
Transportation S4 1,753,904 1,753,904
Transportation to Work 2,370,629 2,370,629
AGENCY TOTAL 717,719,386 734,495,261
NON-FUNCTIONAL
DEBT SERVICE - STATE TREASURER
Debt Service 690,580,233 756,638,231
AGENCY TOTAL 690,580,233 756,638,231
STATE COMPTROLLER - MISCELLANEOUS
Nonfunctional - Change to Accruals 1,181,008 1,296,031
AGENCY TOTAL 1,181,008 1,296,031
STATE COMPTROLLER - FRINGE BENEFITS
Unemployment Compensation 203,548 203,548
Proposed Appropriations
C - 15
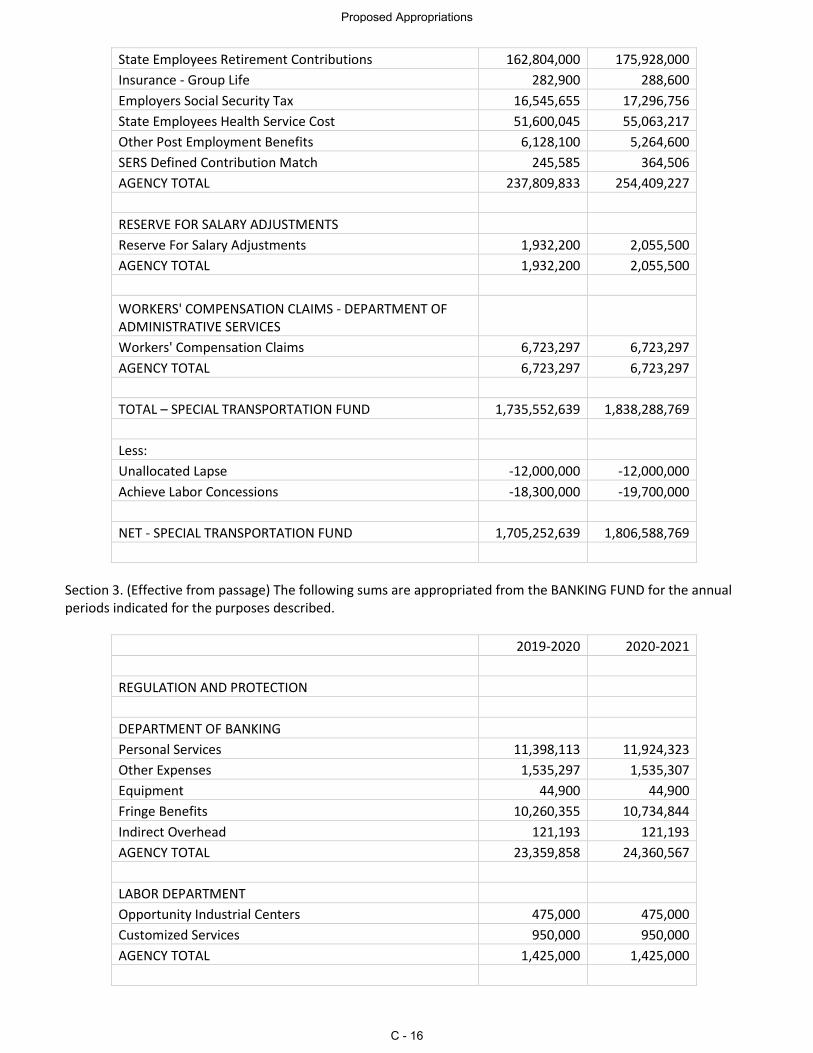
State Employees Retirement Contributions 162,804,000 175,928,000
Insurance - Group Life 282,900 288,600
Employers Social Security Tax 16,545,655 17,296,756
State Employees Health Service Cost 51,600,045 55,063,217
Other Post Employment Benefits 6,128,100 5,264,600
SERS Defined Contribution Match 245,585 364,506
AGENCY TOTAL 237,809,833 254,409,227
RESERVE FOR SALARY ADJUSTMENTS
Reserve For Salary Adjustments 1,932,200 2,055,500
AGENCY TOTAL 1,932,200 2,055,500
WORKERS' COMPENSATION CLAIMS - DEPARTMENT OF ADMINISTRATIVE SERVICES
Workers' Compensation Claims 6,723,297 6,723,297
AGENCY TOTAL 6,723,297 6,723,297
TOTAL – SPECIAL TRANSPORTATION FUND 1,735,552,639 1,838,288,769
Less:
Unallocated Lapse -12,000,000 -12,000,000
Achieve Labor Concessions -18,300,000 -19,700,000
NET - SPECIAL TRANSPORTATION FUND 1,705,252,639 1,806,588,769
Section 3. (Effective from passage) The following sums are appropriated from the BANKING FUND for the annual periods indicated for the purposes described.
2019-2020 2020-2021
REGULATION AND PROTECTION
DEPARTMENT OF BANKING
Personal Services 11,398,113 11,924,323
Other Expenses 1,535,297 1,535,307
Equipment 44,900 44,900
Fringe Benefits 10,260,355 10,734,844
Indirect Overhead 121,193 121,193
AGENCY TOTAL 23,359,858 24,360,567
LABOR DEPARTMENT
Opportunity Industrial Centers 475,000 475,000
Customized Services 950,000 950,000
AGENCY TOTAL 1,425,000 1,425,000
Proposed Appropriations
C - 16
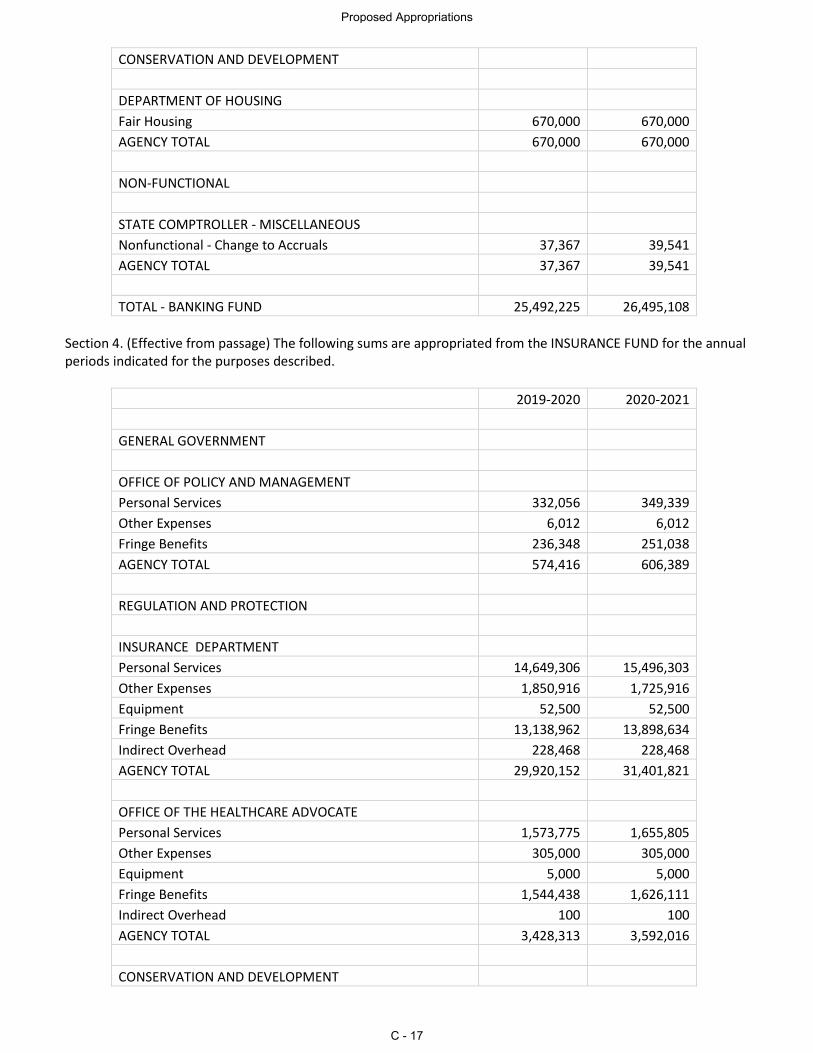
CONSERVATION AND DEVELOPMENT
DEPARTMENT OF HOUSING
Fair Housing 670,000 670,000
AGENCY TOTAL 670,000 670,000
NON-FUNCTIONAL
STATE COMPTROLLER - MISCELLANEOUS
Nonfunctional - Change to Accruals 37,367 39,541
AGENCY TOTAL 37,367 39,541
TOTAL - BANKING FUND 25,492,225 26,495,108
Section 4. (Effective from passage) The following sums are appropriated from the INSURANCE FUND for the annual periods indicated for the purposes described.
2019-2020 2020-2021
GENERAL GOVERNMENT
OFFICE OF POLICY AND MANAGEMENT
Personal Services 332,056 349,339
Other Expenses 6,012 6,012
Fringe Benefits 236,348 251,038
AGENCY TOTAL 574,416 606,389
REGULATION AND PROTECTION
INSURANCE DEPARTMENT
Personal Services 14,649,306 15,496,303
Other Expenses 1,850,916 1,725,916
Equipment 52,500 52,500
Fringe Benefits 13,138,962 13,898,634
Indirect Overhead 228,468 228,468
AGENCY TOTAL 29,920,152 31,401,821
OFFICE OF THE HEALTHCARE ADVOCATE
Personal Services 1,573,775 1,655,805
Other Expenses 305,000 305,000
Equipment 5,000 5,000
Fringe Benefits 1,544,438 1,626,111
Indirect Overhead 100 100
AGENCY TOTAL 3,428,313 3,592,016
CONSERVATION AND DEVELOPMENT
Proposed Appropriations
C - 17
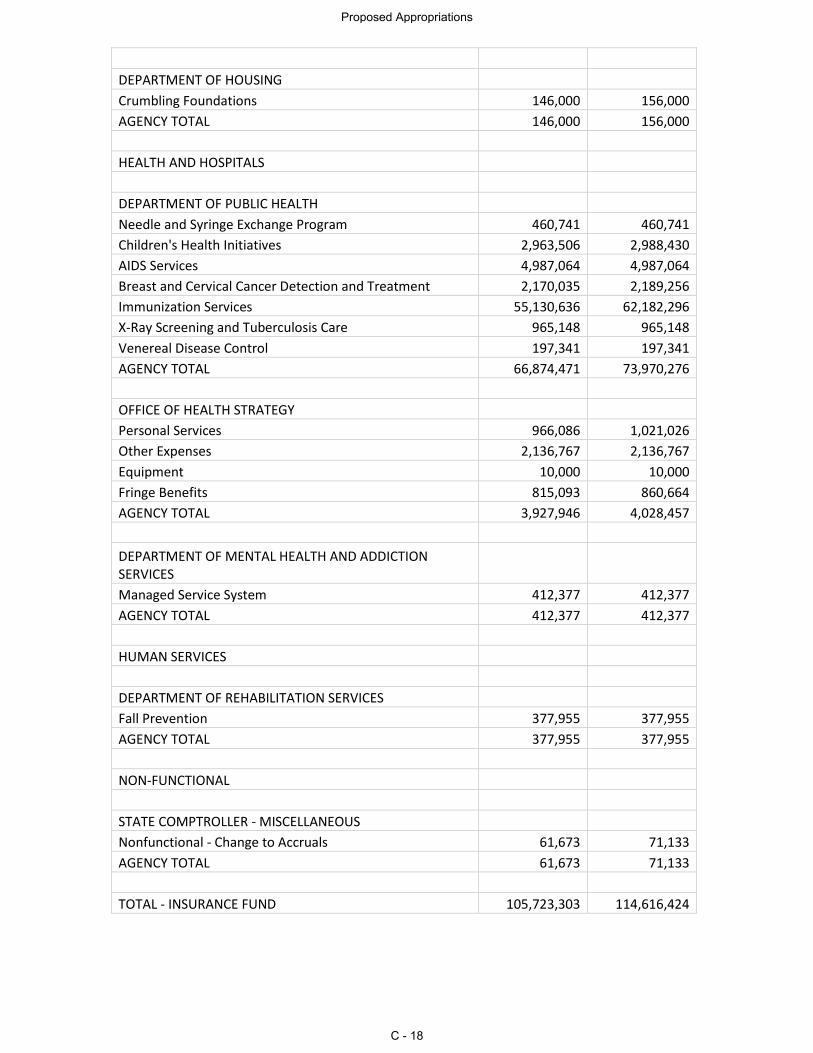
DEPARTMENT OF HOUSING
Crumbling Foundations 146,000 156,000
AGENCY TOTAL 146,000 156,000
HEALTH AND HOSPITALS
DEPARTMENT OF PUBLIC HEALTH
Needle and Syringe Exchange Program 460,741 460,741
Children's Health Initiatives 2,963,506 2,988,430
AIDS Services 4,987,064 4,987,064
Breast and Cervical Cancer Detection and Treatment 2,170,035 2,189,256
Immunization Services 55,130,636 62,182,296
X-Ray Screening and Tuberculosis Care 965,148 965,148
Venereal Disease Control 197,341 197,341
AGENCY TOTAL 66,874,471 73,970,276
OFFICE OF HEALTH STRATEGY
Personal Services 966,086 1,021,026
Other Expenses 2,136,767 2,136,767
Equipment 10,000 10,000
Fringe Benefits 815,093 860,664
AGENCY TOTAL 3,927,946 4,028,457
DEPARTMENT OF MENTAL HEALTH AND ADDICTION SERVICES
Managed Service System 412,377 412,377
AGENCY TOTAL 412,377 412,377
HUMAN SERVICES
DEPARTMENT OF REHABILITATION SERVICES
Fall Prevention 377,955 377,955
AGENCY TOTAL 377,955 377,955
NON-FUNCTIONAL
STATE COMPTROLLER - MISCELLANEOUS
Nonfunctional - Change to Accruals 61,673 71,133
AGENCY TOTAL 61,673 71,133
TOTAL - INSURANCE FUND 105,723,303 114,616,424
Proposed Appropriations
C - 18
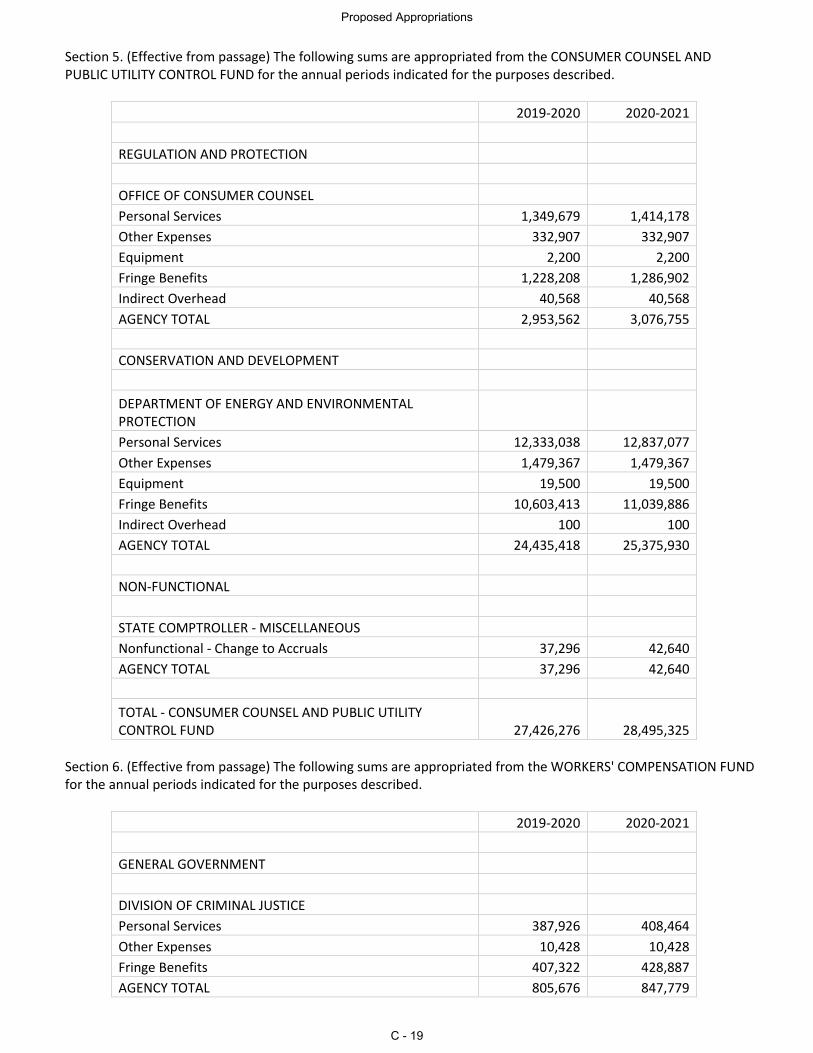
Section 5. (Effective from passage) The following sums are appropriated from the CONSUMER COUNSEL AND PUBLIC UTILITY CONTROL FUND for the annual periods indicated for the purposes described.
2019-2020 2020-2021
REGULATION AND PROTECTION
OFFICE OF CONSUMER COUNSEL
Personal Services 1,349,679 1,414,178
Other Expenses 332,907 332,907
Equipment 2,200 2,200
Fringe Benefits 1,228,208 1,286,902
Indirect Overhead 40,568 40,568
AGENCY TOTAL 2,953,562 3,076,755
CONSERVATION AND DEVELOPMENT
DEPARTMENT OF ENERGY AND ENVIRONMENTAL PROTECTION
Personal Services 12,333,038 12,837,077
Other Expenses 1,479,367 1,479,367
Equipment 19,500 19,500
Fringe Benefits 10,603,413 11,039,886
Indirect Overhead 100 100
AGENCY TOTAL 24,435,418 25,375,930
NON-FUNCTIONAL
STATE COMPTROLLER - MISCELLANEOUS
Nonfunctional - Change to Accruals 37,296 42,640
AGENCY TOTAL 37,296 42,640
TOTAL - CONSUMER COUNSEL AND PUBLIC UTILITY CONTROL FUND 27,426,276 28,495,325
Section 6. (Effective from passage) The following sums are appropriated from the WORKERS' COMPENSATION FUND for the annual periods indicated for the purposes described.
2019-2020 2020-2021
GENERAL GOVERNMENT
DIVISION OF CRIMINAL JUSTICE
Personal Services 387,926 408,464
Other Expenses 10,428 10,428
Fringe Benefits 407,322 428,887
AGENCY TOTAL 805,676 847,779
Proposed Appropriations
C - 19
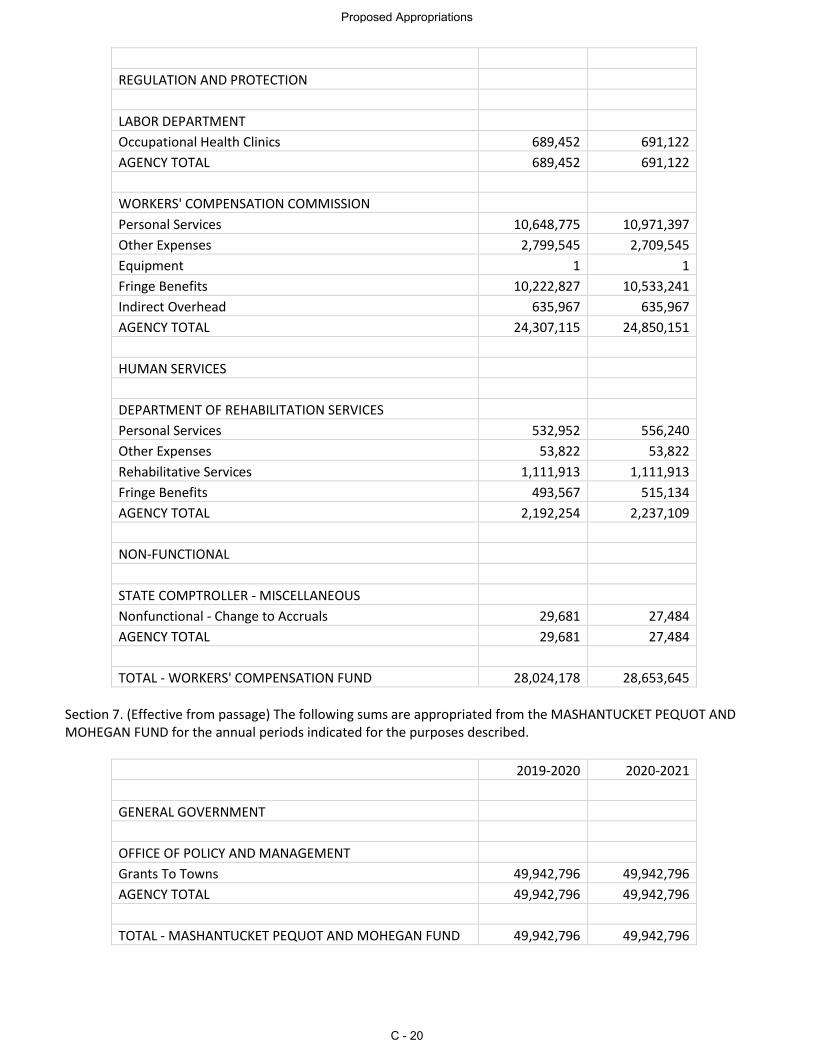
REGULATION AND PROTECTION
LABOR DEPARTMENT
Occupational Health Clinics 689,452 691,122
AGENCY TOTAL 689,452 691,122
WORKERS' COMPENSATION COMMISSION
Personal Services 10,648,775 10,971,397
Other Expenses 2,799,545 2,709,545
Equipment 1 1
Fringe Benefits 10,222,827 10,533,241
Indirect Overhead 635,967 635,967
AGENCY TOTAL 24,307,115 24,850,151
HUMAN SERVICES
DEPARTMENT OF REHABILITATION SERVICES
Personal Services 532,952 556,240
Other Expenses 53,822 53,822
Rehabilitative Services 1,111,913 1,111,913
Fringe Benefits 493,567 515,134
AGENCY TOTAL 2,192,254 2,237,109
NON-FUNCTIONAL
STATE COMPTROLLER - MISCELLANEOUS
Nonfunctional - Change to Accruals 29,681 27,484
AGENCY TOTAL 29,681 27,484
TOTAL - WORKERS' COMPENSATION FUND 28,024,178 28,653,645
Section 7. (Effective from passage) The following sums are appropriated from the MASHANTUCKET PEQUOT AND MOHEGAN FUND for the annual periods indicated for the purposes described.
2019-2020 2020-2021
GENERAL GOVERNMENT
OFFICE OF POLICY AND MANAGEMENT
Grants To Towns 49,942,796 49,942,796
AGENCY TOTAL 49,942,796 49,942,796
TOTAL - MASHANTUCKET PEQUOT AND MOHEGAN FUND 49,942,796 49,942,796
Proposed Appropriations
C - 20
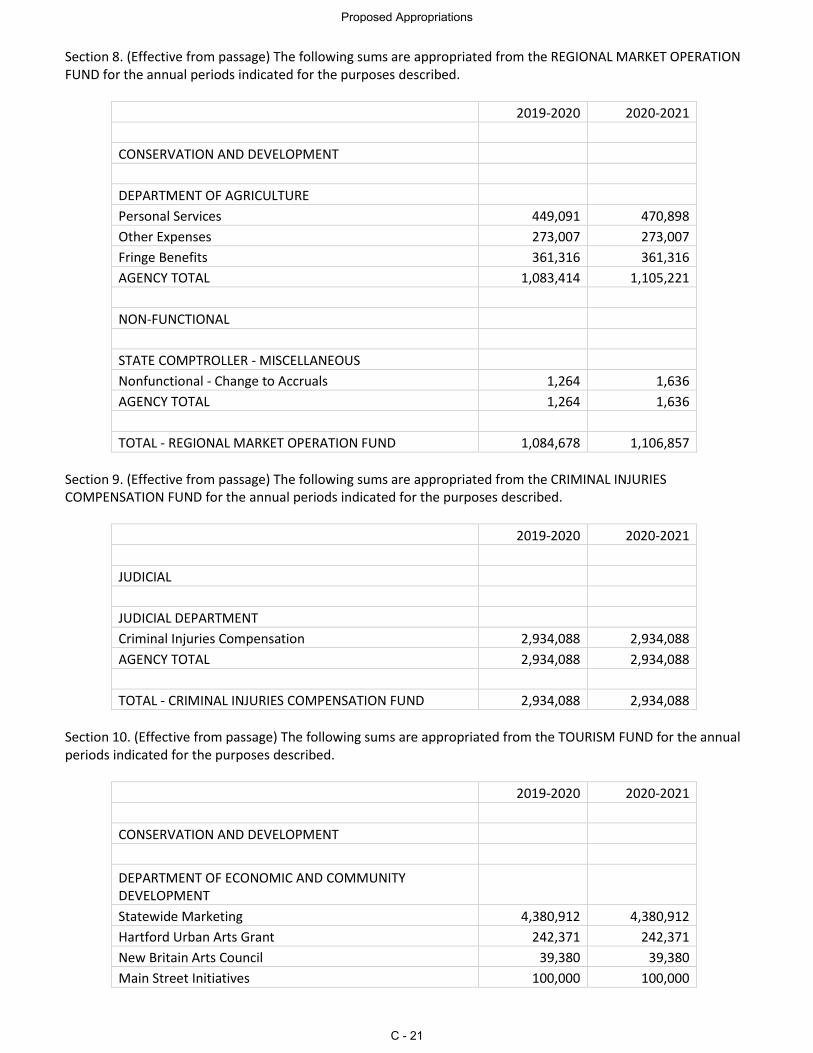
Section 8. (Effective from passage) The following sums are appropriated from the REGIONAL MARKET OPERATION FUND for the annual periods indicated for the purposes described.
2019-2020 2020-2021
CONSERVATION AND DEVELOPMENT
DEPARTMENT OF AGRICULTURE
Personal Services 449,091 470,898
Other Expenses 273,007 273,007
Fringe Benefits 361,316 361,316
AGENCY TOTAL 1,083,414 1,105,221
NON-FUNCTIONAL
STATE COMPTROLLER - MISCELLANEOUS
Nonfunctional - Change to Accruals 1,264 1,636
AGENCY TOTAL 1,264 1,636
TOTAL - REGIONAL MARKET OPERATION FUND 1,084,678 1,106,857
Section 9. (Effective from passage) The following sums are appropriated from the CRIMINAL INJURIES COMPENSATION FUND for the annual periods indicated for the purposes described.
2019-2020 2020-2021
JUDICIAL
JUDICIAL DEPARTMENT
Criminal Injuries Compensation 2,934,088 2,934,088
AGENCY TOTAL 2,934,088 2,934,088
TOTAL - CRIMINAL INJURIES COMPENSATION FUND 2,934,088 2,934,088
Section 10. (Effective from passage) The following sums are appropriated from the TOURISM FUND for the annual periods indicated for the purposes described.
2019-2020 2020-2021
CONSERVATION AND DEVELOPMENT
DEPARTMENT OF ECONOMIC AND COMMUNITY DEVELOPMENT
Statewide Marketing 4,380,912 4,380,912
Hartford Urban Arts Grant 242,371 242,371
New Britain Arts Council 39,380 39,380
Main Street Initiatives 100,000 100,000
Proposed Appropriations
C - 21
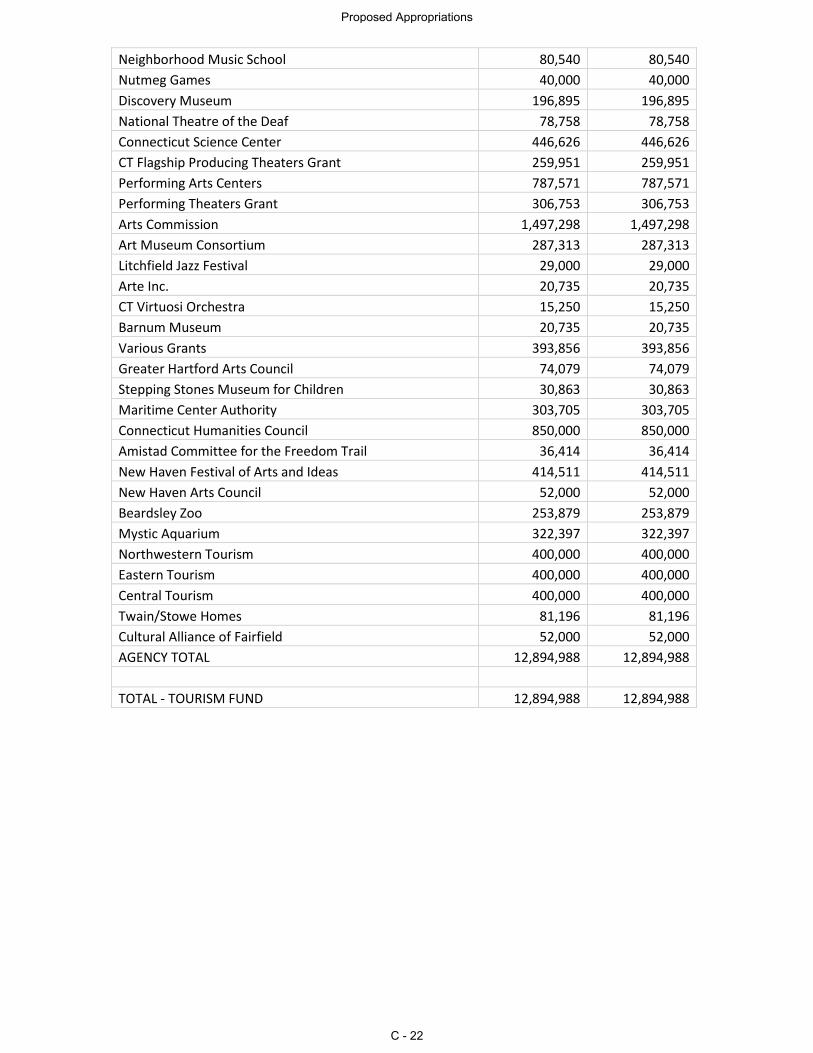
Neighborhood Music School 80,540 80,540
Nutmeg Games 40,000 40,000
Discovery Museum 196,895 196,895
National Theatre of the Deaf 78,758 78,758
Connecticut Science Center 446,626 446,626
CT Flagship Producing Theaters Grant 259,951 259,951
Performing Arts Centers 787,571 787,571
Performing Theaters Grant 306,753 306,753
Arts Commission 1,497,298 1,497,298
Art Museum Consortium 287,313 287,313
Litchfield Jazz Festival 29,000 29,000
Arte Inc. 20,735 20,735
CT Virtuosi Orchestra 15,250 15,250
Barnum Museum 20,735 20,735
Various Grants 393,856 393,856
Greater Hartford Arts Council 74,079 74,079
Stepping Stones Museum for Children 30,863 30,863
Maritime Center Authority 303,705 303,705
Connecticut Humanities Council 850,000 850,000
Amistad Committee for the Freedom Trail 36,414 36,414
New Haven Festival of Arts and Ideas 414,511 414,511
New Haven Arts Council 52,000 52,000
Beardsley Zoo 253,879 253,879
Mystic Aquarium 322,397 322,397
Northwestern Tourism 400,000 400,000
Eastern Tourism 400,000 400,000
Central Tourism 400,000 400,000
Twain/Stowe Homes 81,196 81,196
Cultural Alliance of Fairfield 52,000 52,000
AGENCY TOTAL 12,894,988 12,894,988
TOTAL - TOURISM FUND 12,894,988 12,894,988
Proposed Appropriations
C - 22
SECTION D
CAPITAL PROGRAM

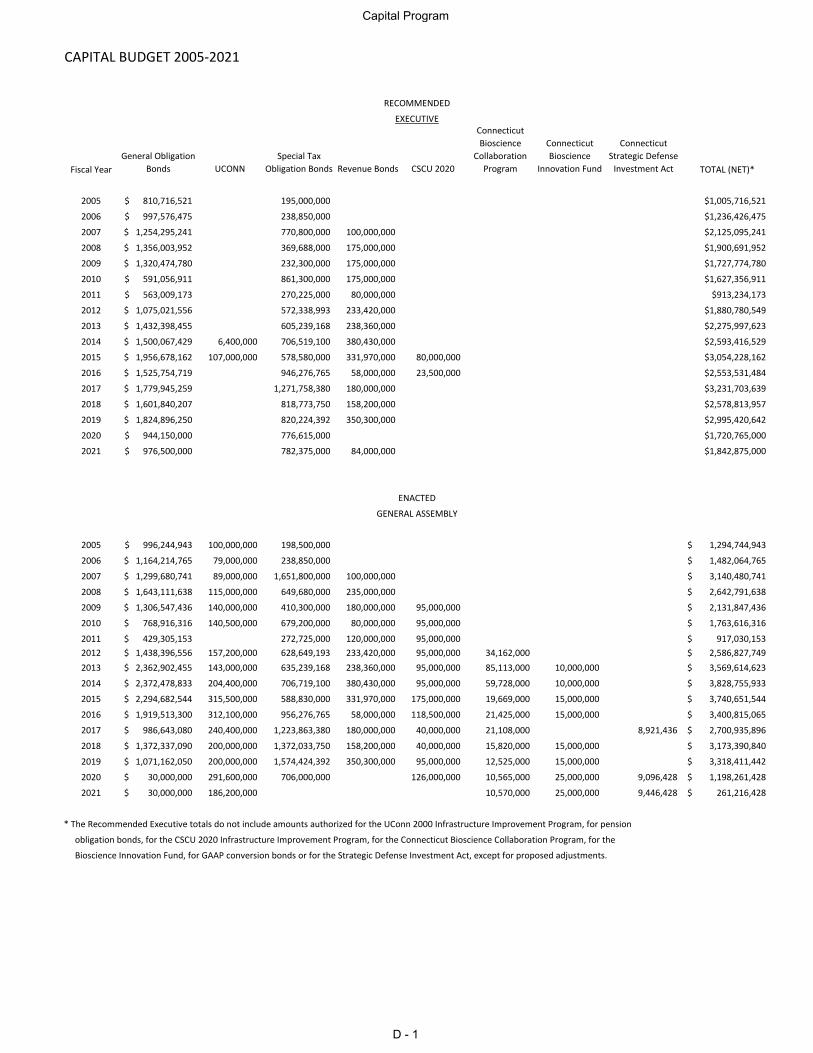
CAPITAL BUDGET 2005-2021
Fiscal YearGeneral Obligation
Bonds UCONNSpecial Tax
Obligation Bonds Revenue Bonds CSCU 2020
Connecticut Bioscience
Collaboration Program
Connecticut Bioscience
Innovation Fund
Connecticut Strategic Defense
Investment Act TOTAL (NET)*
2005 810,716,521$ 195,000,000 $1,005,716,521
2006 997,576,475$ 238,850,000 $1,236,426,475
2007 1,254,295,241$ 770,800,000 100,000,000 $2,125,095,241
2008 1,356,003,952$ 369,688,000 175,000,000 $1,900,691,952
2009 1,320,474,780$ 232,300,000 175,000,000 $1,727,774,780
2010 591,056,911$ 861,300,000 175,000,000 $1,627,356,911
2011 563,009,173$ 270,225,000 80,000,000 $913,234,173
2012 1,075,021,556$ 572,338,993 233,420,000 $1,880,780,549
2013 1,432,398,455$ 605,239,168 238,360,000 $2,275,997,623
2014 1,500,067,429$ 6,400,000 706,519,100 380,430,000 $2,593,416,529
2015 1,956,678,162$ 107,000,000 578,580,000 331,970,000 80,000,000 $3,054,228,162
2016 1,525,754,719$ 946,276,765 58,000,000 23,500,000 $2,553,531,484
2017 1,779,945,259$ 1,271,758,380 180,000,000 $3,231,703,639
2018 1,601,840,207$ 818,773,750 158,200,000 $2,578,813,957
2019 1,824,896,250$ 820,224,392 350,300,000 $2,995,420,642
2020 944,150,000$ 776,615,000 $1,720,765,000
2021 976,500,000$ 782,375,000 84,000,000 $1,842,875,000
2005 996,244,943$ 100,000,000 198,500,000 1,294,744,943$
2006 1,164,214,765$ 79,000,000 238,850,000 1,482,064,765$
2007 1,299,680,741$ 89,000,000 1,651,800,000 100,000,000 3,140,480,741$
2008 1,643,111,638$ 115,000,000 649,680,000 235,000,000 2,642,791,638$
2009 1,306,547,436$ 140,000,000 410,300,000 180,000,000 95,000,000 2,131,847,436$
2010 768,916,316$ 140,500,000 679,200,000 80,000,000 95,000,000 1,763,616,316$
2011 429,305,153$ 272,725,000 120,000,000 95,000,000 917,030,153$ 2012 1,438,396,556$ 157,200,000 628,649,193 233,420,000 95,000,000 34,162,000 2,586,827,749$ 2013 2,362,902,455$ 143,000,000 635,239,168 238,360,000 95,000,000 85,113,000 10,000,000 3,569,614,623$
2014 2,372,478,833$ 204,400,000 706,719,100 380,430,000 95,000,000 59,728,000 10,000,000 3,828,755,933$
2015 2,294,682,544$ 315,500,000 588,830,000 331,970,000 175,000,000 19,669,000 15,000,000 3,740,651,544$
2016 1,919,513,300$ 312,100,000 956,276,765 58,000,000 118,500,000 21,425,000 15,000,000 3,400,815,065$
2017 986,643,080$ 240,400,000 1,223,863,380 180,000,000 40,000,000 21,108,000 8,921,436 2,700,935,896$
2018 1,372,337,090$ 200,000,000 1,372,033,750 158,200,000 40,000,000 15,820,000 15,000,000 3,173,390,840$
2019 1,071,162,050$ 200,000,000 1,574,424,392 350,300,000 95,000,000 12,525,000 15,000,000 3,318,411,442$
2020 30,000,000$ 291,600,000 706,000,000 126,000,000 10,565,000 25,000,000 9,096,428 1,198,261,428$
2021 30,000,000$ 186,200,000 10,570,000 25,000,000 9,446,428 261,216,428$
* The Recommended Executive totals do not include amounts authorized for the UConn 2000 Infrastructure Improvement Program, for pension
obligation bonds, for the CSCU 2020 Infrastructure Improvement Program, for the Connecticut Bioscience Collaboration Program, for the
Bioscience Innovation Fund, for GAAP conversion bonds or for the Strategic Defense Investment Act, except for proposed adjustments.
ENACTED
GENERAL ASSEMBLY
RECOMMENDED
EXECUTIVE
Capital Program
D - 1
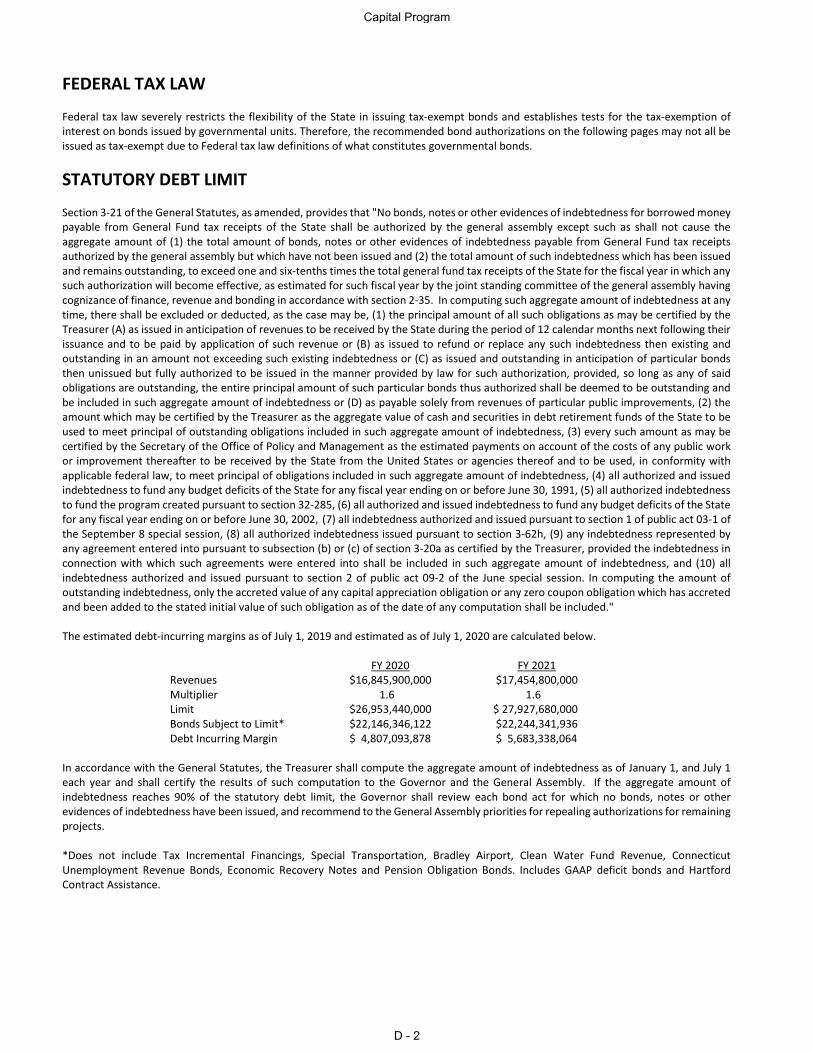
FEDERAL TAX LAW Federal tax law severely restricts the flexibility of the State in issuing tax-exempt bonds and establishes tests for the tax-exemption of interest on bonds issued by governmental units. Therefore, the recommended bond authorizations on the following pages may not all be issued as tax-exempt due to Federal tax law definitions of what constitutes governmental bonds.
STATUTORY DEBT LIMIT Section 3-21 of the General Statutes, as amended, provides that "No bonds, notes or other evidences of indebtedness for borrowed money payable from General Fund tax receipts of the State shall be authorized by the general assembly except such as shall not cause the aggregate amount of (1) the total amount of bonds, notes or other evidences of indebtedness payable from General Fund tax receipts authorized by the general assembly but which have not been issued and (2) the total amount of such indebtedness which has been issued and remains outstanding, to exceed one and six-tenths times the total general fund tax receipts of the State for the fiscal year in which any such authorization will become effective, as estimated for such fiscal year by the joint standing committee of the general assembly having cognizance of finance, revenue and bonding in accordance with section 2-35. In computing such aggregate amount of indebtedness at any time, there shall be excluded or deducted, as the case may be, (1) the principal amount of all such obligations as may be certified by the Treasurer (A) as issued in anticipation of revenues to be received by the State during the period of 12 calendar months next following their issuance and to be paid by application of such revenue or (B) as issued to refund or replace any such indebtedness then existing and outstanding in an amount not exceeding such existing indebtedness or (C) as issued and outstanding in anticipation of particular bonds then unissued but fully authorized to be issued in the manner provided by law for such authorization, provided, so long as any of said obligations are outstanding, the entire principal amount of such particular bonds thus authorized shall be deemed to be outstanding and be included in such aggregate amount of indebtedness or (D) as payable solely from revenues of particular public improvements, (2) the amount which may be certified by the Treasurer as the aggregate value of cash and securities in debt retirement funds of the State to be used to meet principal of outstanding obligations included in such aggregate amount of indebtedness, (3) every such amount as may be certified by the Secretary of the Office of Policy and Management as the estimated payments on account of the costs of any public work or improvement thereafter to be received by the State from the United States or agencies thereof and to be used, in conformity with applicable federal law, to meet principal of obligations included in such aggregate amount of indebtedness, (4) all authorized and issued indebtedness to fund any budget deficits of the State for any fiscal year ending on or before June 30, 1991, (5) all authorized indebtedness to fund the program created pursuant to section 32-285, (6) all authorized and issued indebtedness to fund any budget deficits of the State for any fiscal year ending on or before June 30, 2002, (7) all indebtedness authorized and issued pursuant to section 1 of public act 03-1 of the September 8 special session, (8) all authorized indebtedness issued pursuant to section 3-62h, (9) any indebtedness represented by any agreement entered into pursuant to subsection (b) or (c) of section 3-20a as certified by the Treasurer, provided the indebtedness in connection with which such agreements were entered into shall be included in such aggregate amount of indebtedness, and (10) all indebtedness authorized and issued pursuant to section 2 of public act 09-2 of the June special session. In computing the amount of outstanding indebtedness, only the accreted value of any capital appreciation obligation or any zero coupon obligation which has accreted and been added to the stated initial value of such obligation as of the date of any computation shall be included." The estimated debt-incurring margins as of July 1, 2019 and estimated as of July 1, 2020 are calculated below. FY 2020 FY 2021 Revenues $16,845,900,000 $17,454,800,000 Multiplier 1.6 1.6 Limit $26,953,440,000 $ 27,927,680,000 Bonds Subject to Limit* $22,146,346,122 $22,244,341,936 Debt Incurring Margin $ 4,807,093,878 $ 5,683,338,064 In accordance with the General Statutes, the Treasurer shall compute the aggregate amount of indebtedness as of January 1, and July 1 each year and shall certify the results of such computation to the Governor and the General Assembly. If the aggregate amount of indebtedness reaches 90% of the statutory debt limit, the Governor shall review each bond act for which no bonds, notes or other evidences of indebtedness have been issued, and recommend to the General Assembly priorities for repealing authorizations for remaining projects. *Does not include Tax Incremental Financings, Special Transportation, Bradley Airport, Clean Water Fund Revenue, Connecticut Unemployment Revenue Bonds, Economic Recovery Notes and Pension Obligation Bonds. Includes GAAP deficit bonds and Hartford Contract Assistance.
Capital Program
D - 2
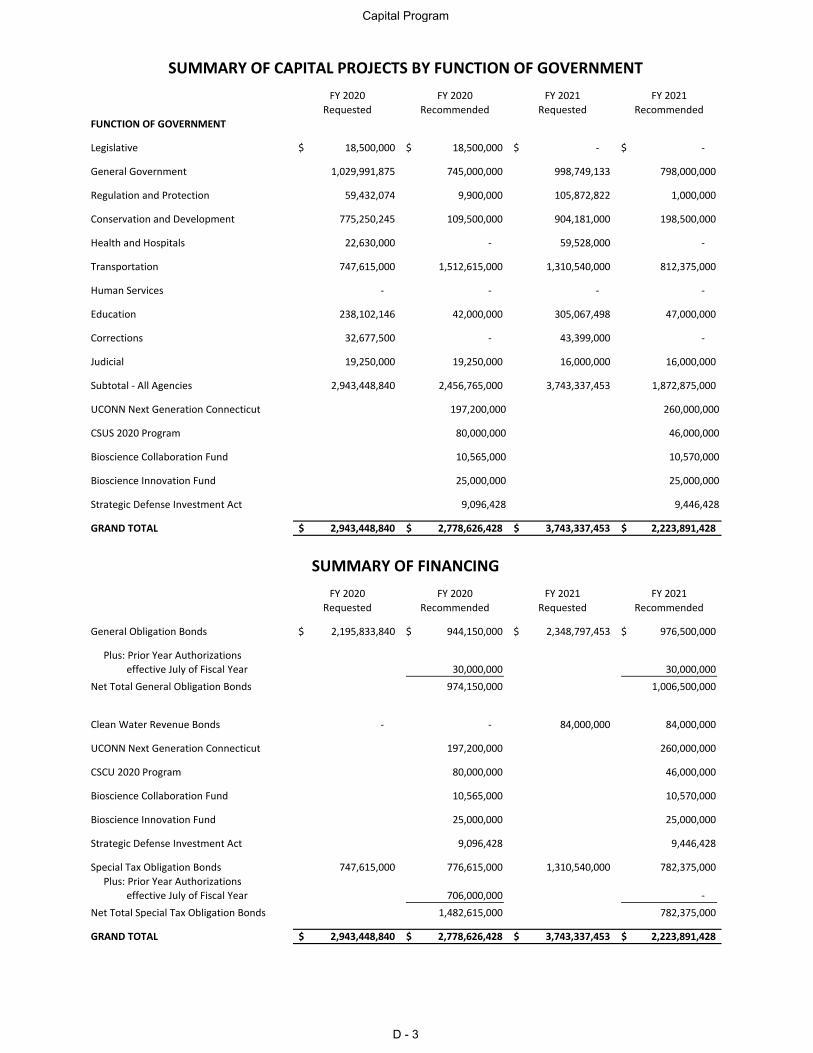
FY 2020 FY 2020 FY 2021 FY 2021Requested Recommended Requested Recommended
FUNCTION OF GOVERNMENT
Legislative 18,500,000$ 18,500,000$ -$ -$
General Government 1,029,991,875 745,000,000 998,749,133 798,000,000
Regulation and Protection 59,432,074 9,900,000 105,872,822 1,000,000
Conservation and Development 775,250,245 109,500,000 904,181,000 198,500,000
Health and Hospitals 22,630,000 - 59,528,000 -
Transportation 747,615,000 1,512,615,000 1,310,540,000 812,375,000
Human Services - - - -
Education 238,102,146 42,000,000 305,067,498 47,000,000
Corrections 32,677,500 - 43,399,000 -
Judicial 19,250,000 19,250,000 16,000,000 16,000,000
Subtotal - All Agencies 2,943,448,840 2,456,765,000 3,743,337,453 1,872,875,000
UCONN Next Generation Connecticut 197,200,000 260,000,000
CSUS 2020 Program 80,000,000 46,000,000
Bioscience Collaboration Fund 10,565,000 10,570,000
Bioscience Innovation Fund 25,000,000 25,000,000
Strategic Defense Investment Act 9,096,428 9,446,428 GRAND TOTAL 2,943,448,840$ 2,778,626,428$ 3,743,337,453$ 2,223,891,428$
FY 2020 FY 2020 FY 2021 FY 2021Requested Recommended Requested Recommended
General Obligation Bonds 2,195,833,840$ 944,150,000$ 2,348,797,453$ 976,500,000$
Plus: Prior Year Authorizations effective July of Fiscal Year 30,000,000 30,000,000 Net Total General Obligation Bonds 974,150,000 1,006,500,000
Clean Water Revenue Bonds - - 84,000,000 84,000,000
UCONN Next Generation Connecticut 197,200,000 260,000,000
CSCU 2020 Program 80,000,000 46,000,000
Bioscience Collaboration Fund 10,565,000 10,570,000
Bioscience Innovation Fund 25,000,000 25,000,000
Strategic Defense Investment Act 9,096,428 9,446,428
Special Tax Obligation Bonds 747,615,000 776,615,000 1,310,540,000 782,375,000 Plus: Prior Year Authorizations effective July of Fiscal Year 706,000,000 - Net Total Special Tax Obligation Bonds 1,482,615,000 782,375,000
GRAND TOTAL 2,943,448,840$ 2,778,626,428$ 3,743,337,453$ 2,223,891,428$
SUMMARY OF CAPITAL PROJECTS BY FUNCTION OF GOVERNMENT
SUMMARY OF FINANCING
Capital Program
D - 3
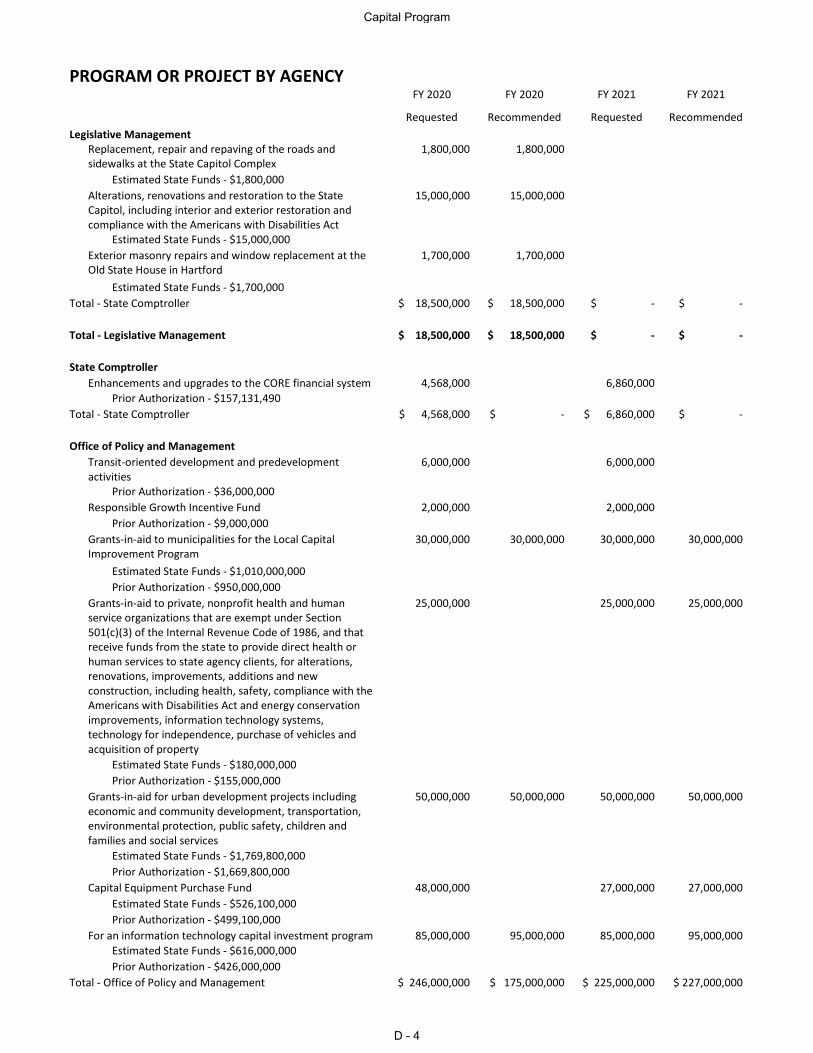
PROGRAM OR PROJECT BY AGENCY FY 2020 FY 2020 FY 2021 FY 2021
Requested Recommended Requested Recommended Legislative Management
Replacement, repair and repaving of the roads and sidewalks at the State Capitol Complex
1,800,000 1,800,000
Estimated State Funds - $1,800,000
Alterations, renovations and restoration to the State Capitol, including interior and exterior restoration and compliance with the Americans with Disabilities Act
15,000,000 15,000,000
Estimated State Funds - $15,000,000
Exterior masonry repairs and window replacement at the Old State House in Hartford
1,700,000 1,700,000
Estimated State Funds - $1,700,000 Total - State Comptroller $ 18,500,000 $ 18,500,000 $ - $ -
Total - Legislative Management $ 18,500,000 $ 18,500,000 $ - $ -
State Comptroller Enhancements and upgrades to the CORE financial system 4,568,000 6,860,000 Prior Authorization - $157,131,490
Total - State Comptroller $ 4,568,000 $ - $ 6,860,000 $ -
Office of Policy and Management Transit-oriented development and predevelopment
activities 6,000,000 6,000,000
Prior Authorization - $36,000,000 Responsible Growth Incentive Fund 2,000,000 2,000,000
Prior Authorization - $9,000,000 Grants-in-aid to municipalities for the Local Capital Improvement Program
30,000,000 30,000,000 30,000,000 30,000,000
Estimated State Funds - $1,010,000,000 Prior Authorization - $950,000,000
Grants-in-aid to private, nonprofit health and human service organizations that are exempt under Section 501(c)(3) of the Internal Revenue Code of 1986, and that receive funds from the state to provide direct health or human services to state agency clients, for alterations, renovations, improvements, additions and new construction, including health, safety, compliance with the Americans with Disabilities Act and energy conservation improvements, information technology systems, technology for independence, purchase of vehicles and acquisition of property
25,000,000 25,000,000 25,000,000
Estimated State Funds - $180,000,000 Prior Authorization - $155,000,000
Grants-in-aid for urban development projects including economic and community development, transportation, environmental protection, public safety, children and families and social services
50,000,000 50,000,000 50,000,000 50,000,000
Estimated State Funds - $1,769,800,000 Prior Authorization - $1,669,800,000
Capital Equipment Purchase Fund 48,000,000 27,000,000 27,000,000 Estimated State Funds - $526,100,000 Prior Authorization - $499,100,000
For an information technology capital investment program 85,000,000 95,000,000 85,000,000 95,000,000 Estimated State Funds - $616,000,000 Prior Authorization - $426,000,000
Total - Office of Policy and Management $ 246,000,000 $ 175,000,000 $ 225,000,000 $ 227,000,000
Capital Program
D - 4
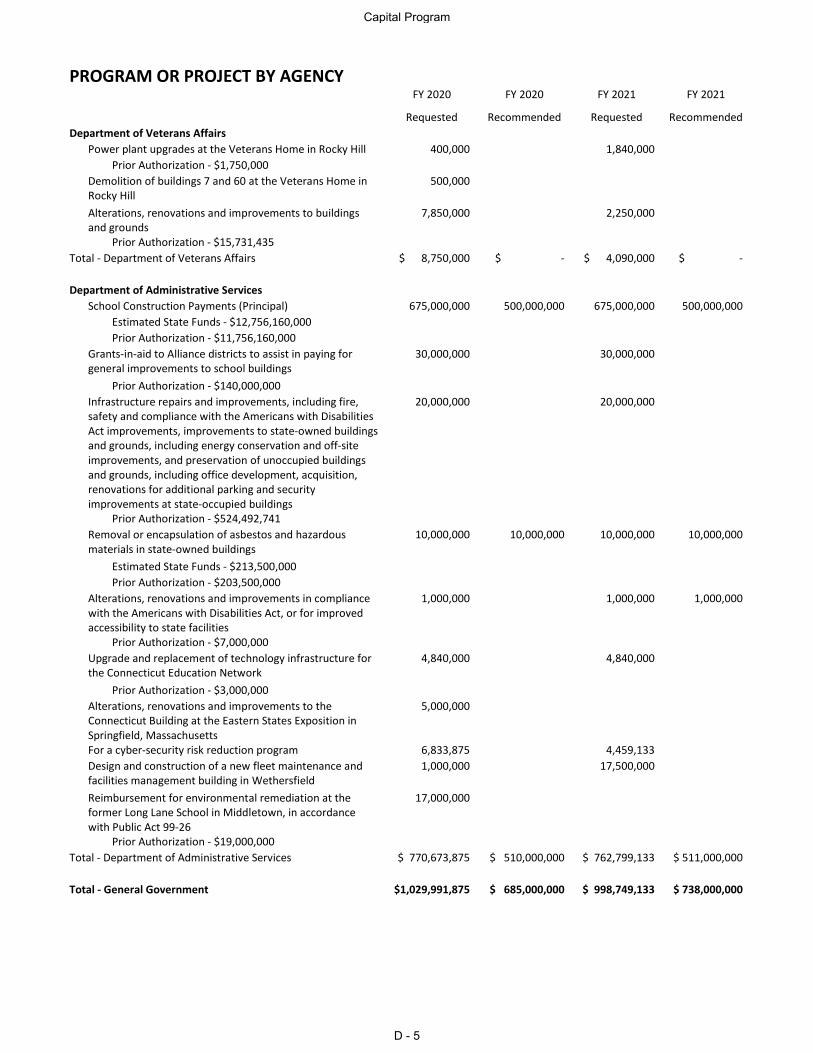
PROGRAM OR PROJECT BY AGENCY FY 2020 FY 2020 FY 2021 FY 2021
Requested Recommended Requested Recommended Department of Veterans Affairs
Power plant upgrades at the Veterans Home in Rocky Hill 400,000 1,840,000 Prior Authorization - $1,750,000
Demolition of buildings 7 and 60 at the Veterans Home in Rocky Hill
500,000
Alterations, renovations and improvements to buildings and grounds
7,850,000 2,250,000
Prior Authorization - $15,731,435 Total - Department of Veterans Affairs $ 8,750,000 $ - $ 4,090,000 $ -
Department of Administrative Services School Construction Payments (Principal) 675,000,000 500,000,000 675,000,000 500,000,000
Estimated State Funds - $12,756,160,000 Prior Authorization - $11,756,160,000
Grants-in-aid to Alliance districts to assist in paying for general improvements to school buildings
30,000,000 30,000,000
Prior Authorization - $140,000,000 Infrastructure repairs and improvements, including fire, safety and compliance with the Americans with Disabilities Act improvements, improvements to state-owned buildings and grounds, including energy conservation and off-site improvements, and preservation of unoccupied buildings and grounds, including office development, acquisition, renovations for additional parking and security improvements at state-occupied buildings
20,000,000 20,000,000
Prior Authorization - $524,492,741 Removal or encapsulation of asbestos and hazardous materials in state-owned buildings
10,000,000 10,000,000 10,000,000 10,000,000
Estimated State Funds - $213,500,000 Prior Authorization - $203,500,000
Alterations, renovations and improvements in compliance with the Americans with Disabilities Act, or for improved accessibility to state facilities
1,000,000 1,000,000 1,000,000
Prior Authorization - $7,000,000 Upgrade and replacement of technology infrastructure for the Connecticut Education Network
4,840,000 4,840,000
Prior Authorization - $3,000,000 Alterations, renovations and improvements to the Connecticut Building at the Eastern States Exposition in Springfield, Massachusetts
5,000,000
For a cyber-security risk reduction program 6,833,875 4,459,133 Design and construction of a new fleet maintenance and facilities management building in Wethersfield
1,000,000 17,500,000
Reimbursement for environmental remediation at the former Long Lane School in Middletown, in accordance with Public Act 99-26
17,000,000
Prior Authorization - $19,000,000 Total - Department of Administrative Services $ 770,673,875 $ 510,000,000 $ 762,799,133 $ 511,000,000
Total - General Government $1,029,991,875 $ 685,000,000 $ 998,749,133 $ 738,000,000
Capital Program
D - 5
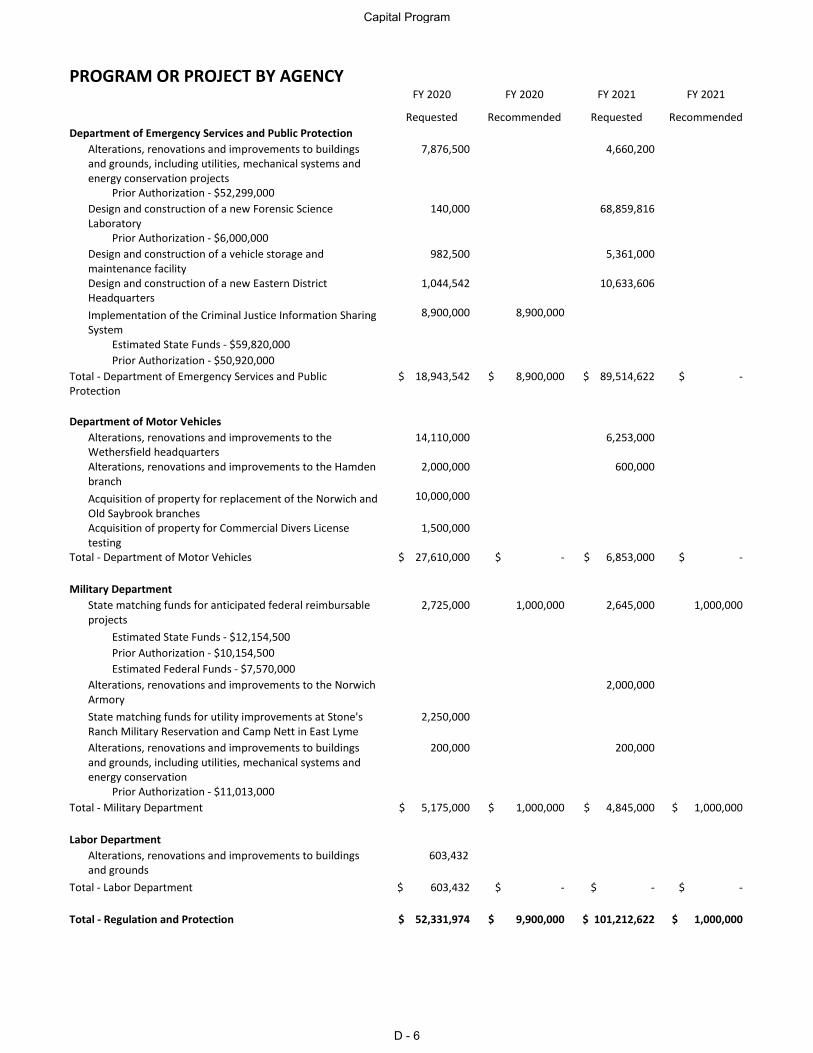
PROGRAM OR PROJECT BY AGENCY FY 2020 FY 2020 FY 2021 FY 2021
Requested Recommended Requested Recommended Department of Emergency Services and Public Protection
Alterations, renovations and improvements to buildings and grounds, including utilities, mechanical systems and energy conservation projects
7,876,500 4,660,200
Prior Authorization - $52,299,000 Design and construction of a new Forensic Science Laboratory
140,000 68,859,816
Prior Authorization - $6,000,000 Design and construction of a vehicle storage and maintenance facility
982,500 5,361,000
Design and construction of a new Eastern District Headquarters
1,044,542 10,633,606
Implementation of the Criminal Justice Information Sharing System
8,900,000 8,900,000
Estimated State Funds - $59,820,000 Prior Authorization - $50,920,000
Total - Department of Emergency Services and Public Protection
$ 18,943,542 $ 8,900,000 $ 89,514,622 $ -
Department of Motor Vehicles Alterations, renovations and improvements to the
Wethersfield headquarters 14,110,000 6,253,000
Alterations, renovations and improvements to the Hamden branch
2,000,000 600,000
Acquisition of property for replacement of the Norwich and Old Saybrook branches
10,000,000
Acquisition of property for Commercial Divers License testing
1,500,000
Total - Department of Motor Vehicles $ 27,610,000 $ - $ 6,853,000 $ -
Military Department
State matching funds for anticipated federal reimbursable projects
2,725,000 1,000,000 2,645,000 1,000,000
Estimated State Funds - $12,154,500 Prior Authorization - $10,154,500 Estimated Federal Funds - $7,570,000
Alterations, renovations and improvements to the Norwich Armory
2,000,000
State matching funds for utility improvements at Stone's Ranch Military Reservation and Camp Nett in East Lyme
2,250,000
Alterations, renovations and improvements to buildings and grounds, including utilities, mechanical systems and energy conservation
200,000 200,000
Prior Authorization - $11,013,000 Total - Military Department $ 5,175,000 $ 1,000,000 $ 4,845,000 $ 1,000,000
Labor Department Alterations, renovations and improvements to buildings
and grounds 603,432
Total - Labor Department $ 603,432 $ - $ - $ -
Total - Regulation and Protection $ 52,331,974 $ 9,900,000 $ 101,212,622 $ 1,000,000
Capital Program
D - 6
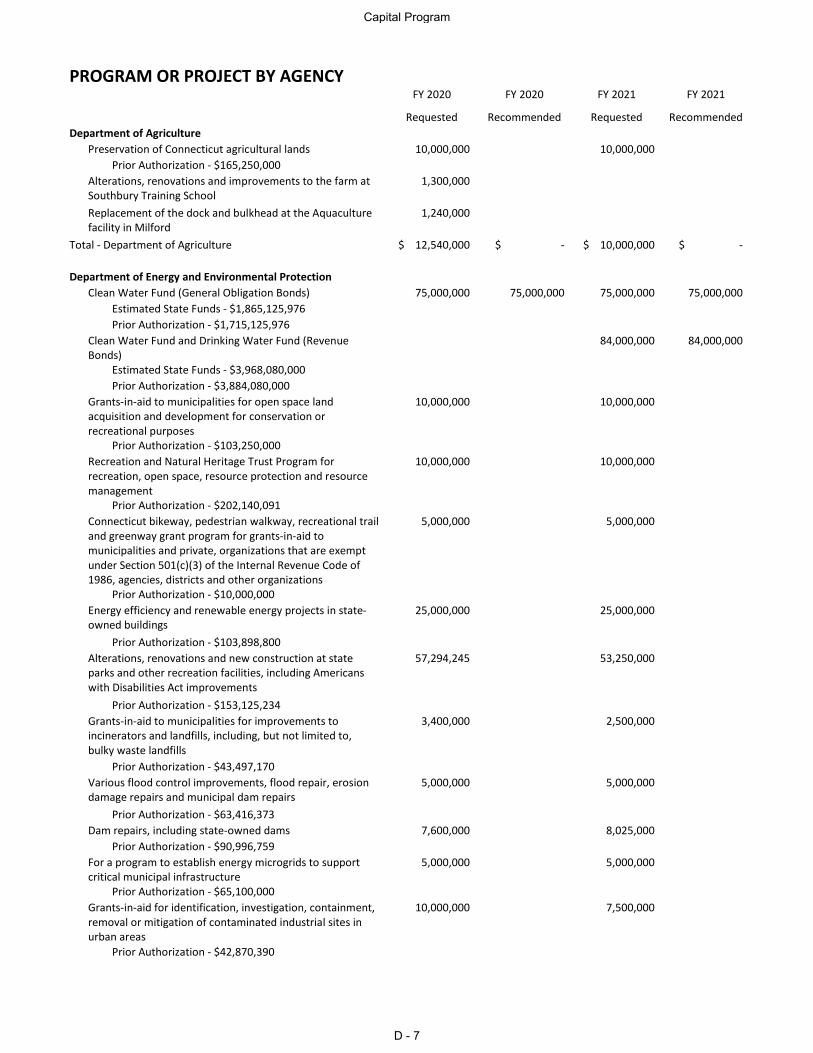
PROGRAM OR PROJECT BY AGENCY FY 2020 FY 2020 FY 2021 FY 2021
Requested Recommended Requested Recommended Department of Agriculture
Preservation of Connecticut agricultural lands 10,000,000 10,000,000 Prior Authorization - $165,250,000
Alterations, renovations and improvements to the farm at Southbury Training School
1,300,000
Replacement of the dock and bulkhead at the Aquaculture facility in Milford
1,240,000
Total - Department of Agriculture $ 12,540,000 $ - $ 10,000,000 $ -
Department of Energy and Environmental Protection Clean Water Fund (General Obligation Bonds) 75,000,000 75,000,000 75,000,000 75,000,000
Estimated State Funds - $1,865,125,976 Prior Authorization - $1,715,125,976
Clean Water Fund and Drinking Water Fund (Revenue Bonds)
84,000,000 84,000,000
Estimated State Funds - $3,968,080,000 Prior Authorization - $3,884,080,000
Grants-in-aid to municipalities for open space land acquisition and development for conservation or recreational purposes
10,000,000 10,000,000
Prior Authorization - $103,250,000 Recreation and Natural Heritage Trust Program for recreation, open space, resource protection and resource management
10,000,000 10,000,000
Prior Authorization - $202,140,091 Connecticut bikeway, pedestrian walkway, recreational trail and greenway grant program for grants-in-aid to municipalities and private, organizations that are exempt under Section 501(c)(3) of the Internal Revenue Code of 1986, agencies, districts and other organizations
5,000,000 5,000,000
Prior Authorization - $10,000,000 Energy efficiency and renewable energy projects in state-owned buildings
25,000,000 25,000,000
Prior Authorization - $103,898,800 Alterations, renovations and new construction at state parks and other recreation facilities, including Americans with Disabilities Act improvements
57,294,245 53,250,000
Prior Authorization - $153,125,234 Grants-in-aid to municipalities for improvements to incinerators and landfills, including, but not limited to, bulky waste landfills
3,400,000 2,500,000
Prior Authorization - $43,497,170 Various flood control improvements, flood repair, erosion damage repairs and municipal dam repairs
5,000,000 5,000,000
Prior Authorization - $63,416,373 Dam repairs, including state-owned dams 7,600,000 8,025,000
Prior Authorization - $90,996,759 For a program to establish energy microgrids to support critical municipal infrastructure
5,000,000 5,000,000
Prior Authorization - $65,100,000 Grants-in-aid for identification, investigation, containment, removal or mitigation of contaminated industrial sites in urban areas
10,000,000 7,500,000
Prior Authorization - $42,870,390
Capital Program
D - 7
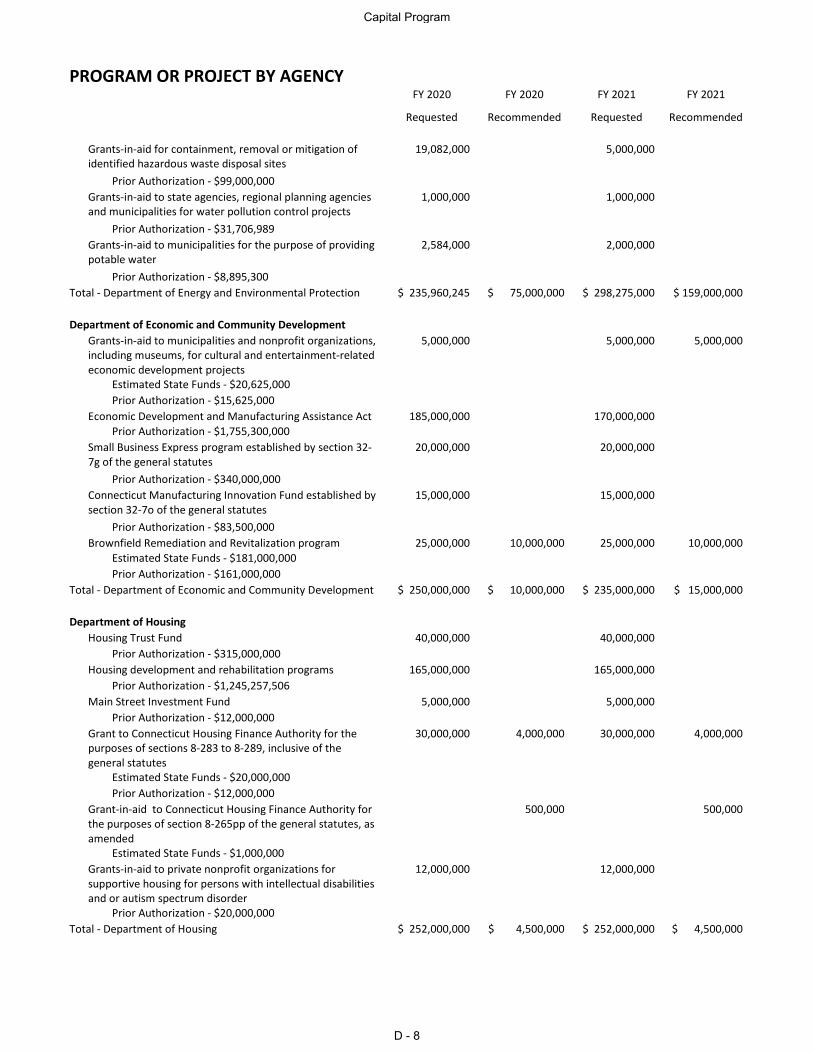
PROGRAM OR PROJECT BY AGENCY FY 2020 FY 2020 FY 2021 FY 2021
Requested Recommended Requested Recommended
Grants-in-aid for containment, removal or mitigation of identified hazardous waste disposal sites
19,082,000 5,000,000
Prior Authorization - $99,000,000 Grants-in-aid to state agencies, regional planning agencies and municipalities for water pollution control projects
1,000,000 1,000,000
Prior Authorization - $31,706,989 Grants-in-aid to municipalities for the purpose of providing potable water
2,584,000 2,000,000
Prior Authorization - $8,895,300 Total - Department of Energy and Environmental Protection $ 235,960,245 $ 75,000,000 $ 298,275,000 $ 159,000,000
Department of Economic and Community Development Grants-in-aid to municipalities and nonprofit organizations,
including museums, for cultural and entertainment-related economic development projects
5,000,000 5,000,000 5,000,000
Estimated State Funds - $20,625,000 Prior Authorization - $15,625,000
Economic Development and Manufacturing Assistance Act 185,000,000 170,000,000 Prior Authorization - $1,755,300,000
Small Business Express program established by section 32-7g of the general statutes
20,000,000 20,000,000
Prior Authorization - $340,000,000 Connecticut Manufacturing Innovation Fund established by section 32-7o of the general statutes
15,000,000 15,000,000
Prior Authorization - $83,500,000 Brownfield Remediation and Revitalization program 25,000,000 10,000,000 25,000,000 10,000,000
Estimated State Funds - $181,000,000 Prior Authorization - $161,000,000
Total - Department of Economic and Community Development $ 250,000,000 $ 10,000,000 $ 235,000,000 $ 15,000,000
Department of Housing Housing Trust Fund 40,000,000 40,000,000
Prior Authorization - $315,000,000 Housing development and rehabilitation programs 165,000,000 165,000,000
Prior Authorization - $1,245,257,506 Main Street Investment Fund 5,000,000 5,000,000
Prior Authorization - $12,000,000
Grant to Connecticut Housing Finance Authority for the purposes of sections 8-283 to 8-289, inclusive of the general statutes
30,000,000 4,000,000 30,000,000 4,000,000
Estimated State Funds - $20,000,000 Prior Authorization - $12,000,000
Grant-in-aid to Connecticut Housing Finance Authority for the purposes of section 8-265pp of the general statutes, as amended
500,000 500,000
Estimated State Funds - $1,000,000
Grants-in-aid to private nonprofit organizations for supportive housing for persons with intellectual disabilities and or autism spectrum disorder
12,000,000 12,000,000
Prior Authorization - $20,000,000 Total - Department of Housing $ 252,000,000 $ 4,500,000 $ 252,000,000 $ 4,500,000
Capital Program
D - 8
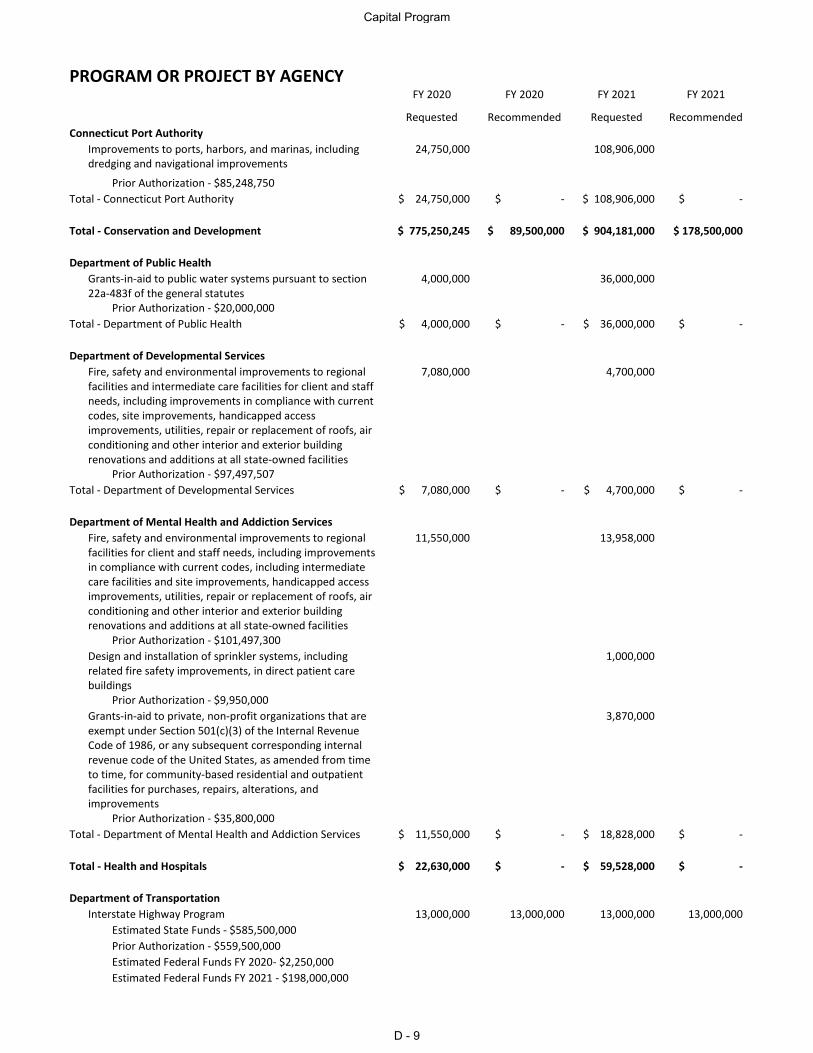
PROGRAM OR PROJECT BY AGENCY FY 2020 FY 2020 FY 2021 FY 2021
Requested Recommended Requested Recommended Connecticut Port Authority Improvements to ports, harbors, and marinas, including
dredging and navigational improvements 24,750,000 108,906,000
Prior Authorization - $85,248,750 Total - Connecticut Port Authority $ 24,750,000 $ - $ 108,906,000 $ -
Total - Conservation and Development $ 775,250,245 $ 89,500,000 $ 904,181,000 $ 178,500,000
Department of Public Health Grants-in-aid to public water systems pursuant to section
22a-483f of the general statutes 4,000,000 36,000,000
Prior Authorization - $20,000,000 Total - Department of Public Health $ 4,000,000 $ - $ 36,000,000 $ -
Department of Developmental Services Fire, safety and environmental improvements to regional
facilities and intermediate care facilities for client and staff needs, including improvements in compliance with current codes, site improvements, handicapped access improvements, utilities, repair or replacement of roofs, air conditioning and other interior and exterior building renovations and additions at all state-owned facilities
7,080,000 4,700,000
Prior Authorization - $97,497,507 Total - Department of Developmental Services $ 7,080,000 $ - $ 4,700,000 $ -
Department of Mental Health and Addiction Services Fire, safety and environmental improvements to regional
facilities for client and staff needs, including improvements in compliance with current codes, including intermediate care facilities and site improvements, handicapped access improvements, utilities, repair or replacement of roofs, air conditioning and other interior and exterior building renovations and additions at all state-owned facilities
11,550,000 13,958,000
Prior Authorization - $101,497,300 Design and installation of sprinkler systems, including related fire safety improvements, in direct patient care buildings
1,000,000
Prior Authorization - $9,950,000 Grants-in-aid to private, non-profit organizations that are exempt under Section 501(c)(3) of the Internal Revenue Code of 1986, or any subsequent corresponding internal revenue code of the United States, as amended from time to time, for community-based residential and outpatient facilities for purchases, repairs, alterations, and improvements
3,870,000
Prior Authorization - $35,800,000 Total - Department of Mental Health and Addiction Services $ 11,550,000 $ - $ 18,828,000 $ -
Total - Health and Hospitals $ 22,630,000 $ - $ 59,528,000 $ -
Department of Transportation Interstate Highway Program 13,000,000 13,000,000 13,000,000 13,000,000
Estimated State Funds - $585,500,000 Prior Authorization - $559,500,000 Estimated Federal Funds FY 2020- $2,250,000 Estimated Federal Funds FY 2021 - $198,000,000
Capital Program
D - 9
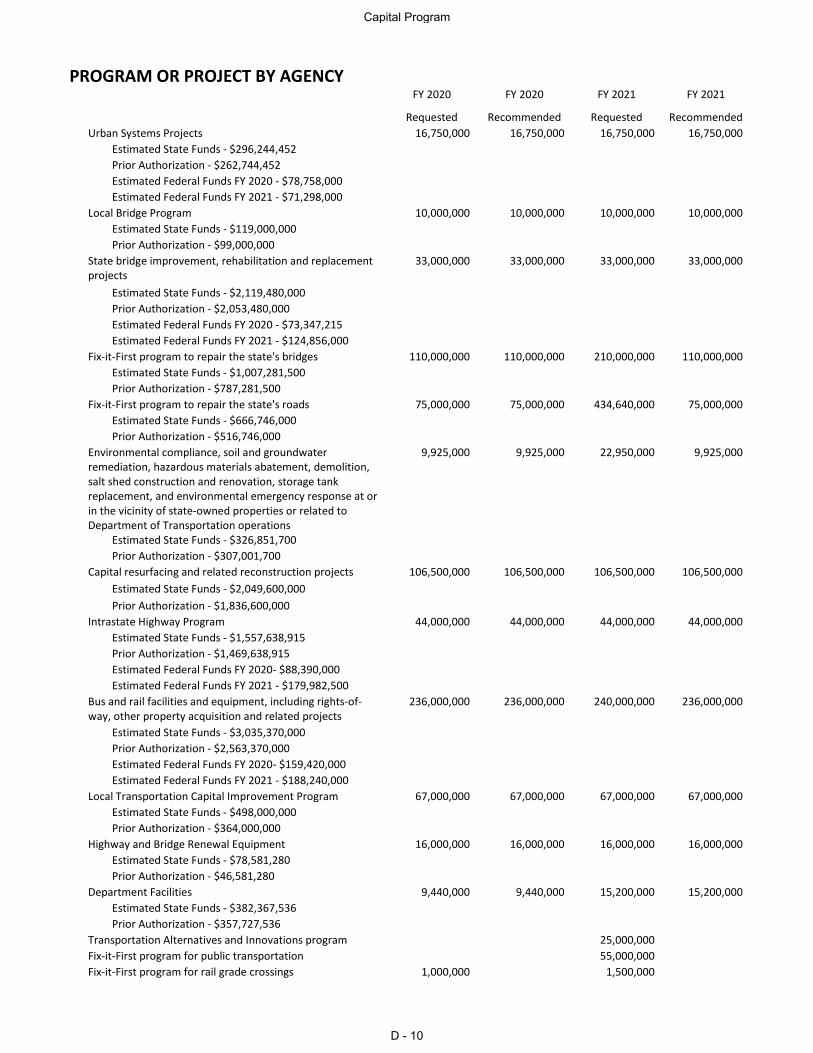
PROGRAM OR PROJECT BY AGENCY FY 2020 FY 2020 FY 2021 FY 2021
Requested Recommended Requested Recommended Urban Systems Projects 16,750,000 16,750,000 16,750,000 16,750,000
Estimated State Funds - $296,244,452 Prior Authorization - $262,744,452 Estimated Federal Funds FY 2020 - $78,758,000 Estimated Federal Funds FY 2021 - $71,298,000
Local Bridge Program 10,000,000 10,000,000 10,000,000 10,000,000 Estimated State Funds - $119,000,000 Prior Authorization - $99,000,000
State bridge improvement, rehabilitation and replacement projects
33,000,000 33,000,000 33,000,000 33,000,000
Estimated State Funds - $2,119,480,000 Prior Authorization - $2,053,480,000 Estimated Federal Funds FY 2020 - $73,347,215 Estimated Federal Funds FY 2021 - $124,856,000
Fix-it-First program to repair the state's bridges 110,000,000 110,000,000 210,000,000 110,000,000 Estimated State Funds - $1,007,281,500 Prior Authorization - $787,281,500
Fix-it-First program to repair the state's roads 75,000,000 75,000,000 434,640,000 75,000,000 Estimated State Funds - $666,746,000 Prior Authorization - $516,746,000
Environmental compliance, soil and groundwater remediation, hazardous materials abatement, demolition, salt shed construction and renovation, storage tank replacement, and environmental emergency response at or in the vicinity of state-owned properties or related to Department of Transportation operations
9,925,000 9,925,000 22,950,000 9,925,000
Estimated State Funds - $326,851,700 Prior Authorization - $307,001,700
Capital resurfacing and related reconstruction projects 106,500,000 106,500,000 106,500,000 106,500,000 Estimated State Funds - $2,049,600,000 Prior Authorization - $1,836,600,000
Intrastate Highway Program 44,000,000 44,000,000 44,000,000 44,000,000 Estimated State Funds - $1,557,638,915 Prior Authorization - $1,469,638,915 Estimated Federal Funds FY 2020- $88,390,000 Estimated Federal Funds FY 2021 - $179,982,500
Bus and rail facilities and equipment, including rights-of-way, other property acquisition and related projects
236,000,000 236,000,000 240,000,000 236,000,000
Estimated State Funds - $3,035,370,000 Prior Authorization - $2,563,370,000 Estimated Federal Funds FY 2020- $159,420,000 Estimated Federal Funds FY 2021 - $188,240,000
Local Transportation Capital Improvement Program 67,000,000 67,000,000 67,000,000 67,000,000 Estimated State Funds - $498,000,000 Prior Authorization - $364,000,000
Highway and Bridge Renewal Equipment 16,000,000 16,000,000 16,000,000 16,000,000 Estimated State Funds - $78,581,280 Prior Authorization - $46,581,280
Department Facilities 9,440,000 9,440,000 15,200,000 15,200,000 Estimated State Funds - $382,367,536 Prior Authorization - $357,727,536
Transportation Alternatives and Innovations program 25,000,000 Fix-it-First program for public transportation 55,000,000 Fix-it-First program for rail grade crossings 1,000,000 1,500,000
Capital Program
D - 10
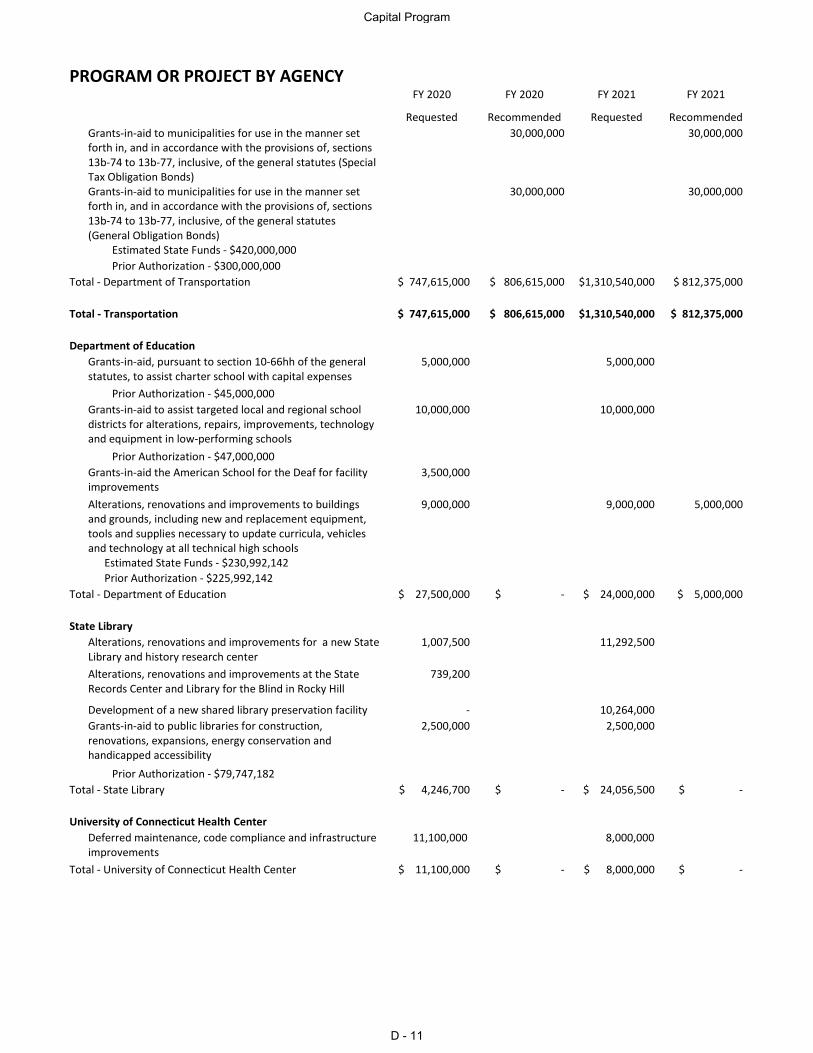
PROGRAM OR PROJECT BY AGENCY FY 2020 FY 2020 FY 2021 FY 2021
Requested Recommended Requested Recommended
Grants-in-aid to municipalities for use in the manner set forth in, and in accordance with the provisions of, sections 13b-74 to 13b-77, inclusive, of the general statutes (Special Tax Obligation Bonds)
30,000,000 30,000,000
Grants-in-aid to municipalities for use in the manner set forth in, and in accordance with the provisions of, sections 13b-74 to 13b-77, inclusive, of the general statutes (General Obligation Bonds)
30,000,000 30,000,000
Estimated State Funds - $420,000,000 Prior Authorization - $300,000,000
Total - Department of Transportation $ 747,615,000 $ 806,615,000 $1,310,540,000 $ 812,375,000
Total - Transportation $ 747,615,000 $ 806,615,000 $1,310,540,000 $ 812,375,000
Department of Education Grants-in-aid, pursuant to section 10-66hh of the general
statutes, to assist charter school with capital expenses 5,000,000 5,000,000
Prior Authorization - $45,000,000 Grants-in-aid to assist targeted local and regional school districts for alterations, repairs, improvements, technology and equipment in low-performing schools
10,000,000 10,000,000
Prior Authorization - $47,000,000 Grants-in-aid the American School for the Deaf for facility improvements
3,500,000
Alterations, renovations and improvements to buildings and grounds, including new and replacement equipment, tools and supplies necessary to update curricula, vehicles and technology at all technical high schools
9,000,000 9,000,000 5,000,000
Estimated State Funds - $230,992,142 Prior Authorization - $225,992,142 Total - Department of Education $ 27,500,000 $ - $ 24,000,000 $ 5,000,000
State Library
Alterations, renovations and improvements for a new State Library and history research center
1,007,500 11,292,500
Alterations, renovations and improvements at the State Records Center and Library for the Blind in Rocky Hill
739,200
Development of a new shared library preservation facility - 10,264,000 Grants-in-aid to public libraries for construction, renovations, expansions, energy conservation and handicapped accessibility
2,500,000 2,500,000
Prior Authorization - $79,747,182 Total - State Library $ 4,246,700 $ - $ 24,056,500 $ -
University of Connecticut Health Center Deferred maintenance, code compliance and infrastructure
improvements 11,100,000 8,000,000
Total - University of Connecticut Health Center $ 11,100,000 $ - $ 8,000,000 $ -
Capital Program
D - 11
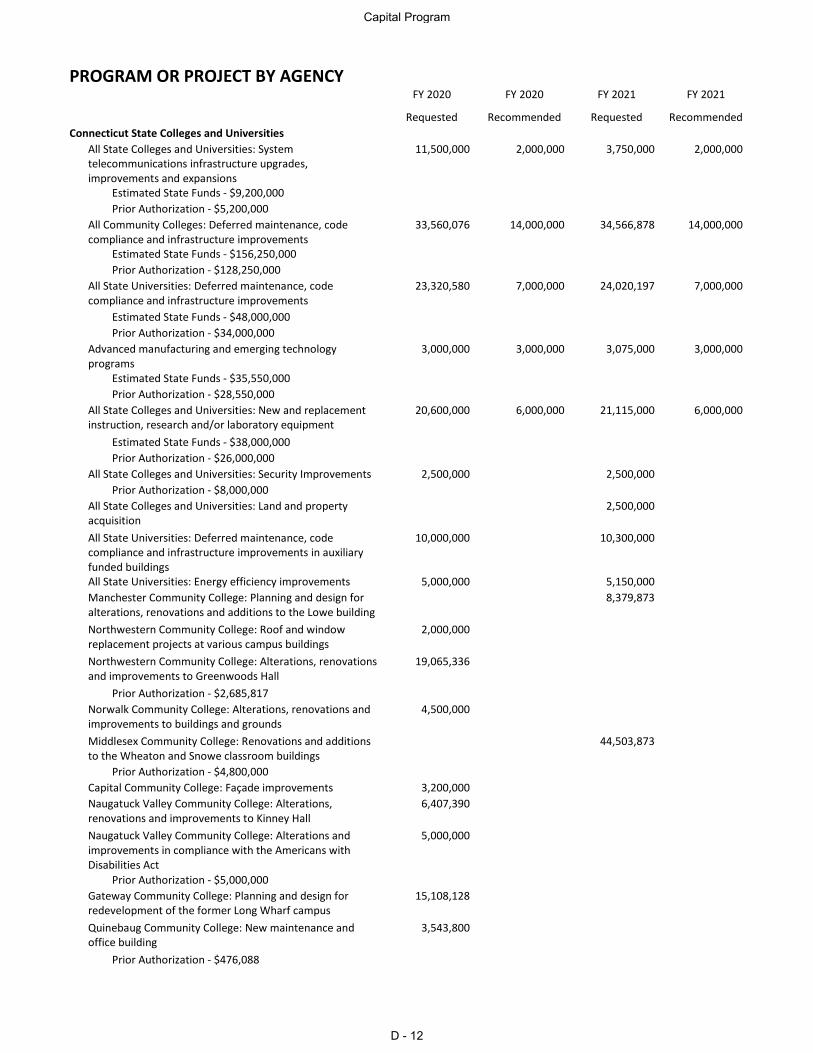
PROGRAM OR PROJECT BY AGENCY FY 2020 FY 2020 FY 2021 FY 2021
Requested Recommended Requested Recommended Connecticut State Colleges and Universities All State Colleges and Universities: System
telecommunications infrastructure upgrades, improvements and expansions
11,500,000 2,000,000 3,750,000 2,000,000
Estimated State Funds - $9,200,000 Prior Authorization - $5,200,000
All Community Colleges: Deferred maintenance, code compliance and infrastructure improvements
33,560,076 14,000,000 34,566,878 14,000,000
Estimated State Funds - $156,250,000 Prior Authorization - $128,250,000
All State Universities: Deferred maintenance, code compliance and infrastructure improvements
23,320,580 7,000,000 24,020,197 7,000,000
Estimated State Funds - $48,000,000 Prior Authorization - $34,000,000
Advanced manufacturing and emerging technology programs
3,000,000 3,000,000 3,075,000 3,000,000
Estimated State Funds - $35,550,000 Prior Authorization - $28,550,000
All State Colleges and Universities: New and replacement instruction, research and/or laboratory equipment
20,600,000 6,000,000 21,115,000 6,000,000
Estimated State Funds - $38,000,000 Prior Authorization - $26,000,000
All State Colleges and Universities: Security Improvements 2,500,000 2,500,000 Prior Authorization - $8,000,000
All State Colleges and Universities: Land and property acquisition
2,500,000
All State Universities: Deferred maintenance, code compliance and infrastructure improvements in auxiliary funded buildings
10,000,000 10,300,000
All State Universities: Energy efficiency improvements 5,000,000 5,150,000 Manchester Community College: Planning and design for alterations, renovations and additions to the Lowe building
8,379,873
Northwestern Community College: Roof and window replacement projects at various campus buildings
2,000,000
Northwestern Community College: Alterations, renovations and improvements to Greenwoods Hall
19,065,336
Prior Authorization - $2,685,817 Norwalk Community College: Alterations, renovations and
improvements to buildings and grounds 4,500,000
Middlesex Community College: Renovations and additions to the Wheaton and Snowe classroom buildings
44,503,873
Prior Authorization - $4,800,000 Capital Community College: Façade improvements 3,200,000 Naugatuck Valley Community College: Alterations,
renovations and improvements to Kinney Hall 6,407,390
Naugatuck Valley Community College: Alterations and improvements in compliance with the Americans with Disabilities Act
5,000,000
Prior Authorization - $5,000,000 Gateway Community College: Planning and design for
redevelopment of the former Long Wharf campus 15,108,128
Quinebaug Community College: New maintenance and office building
3,543,800
Prior Authorization - $476,088
Capital Program
D - 12
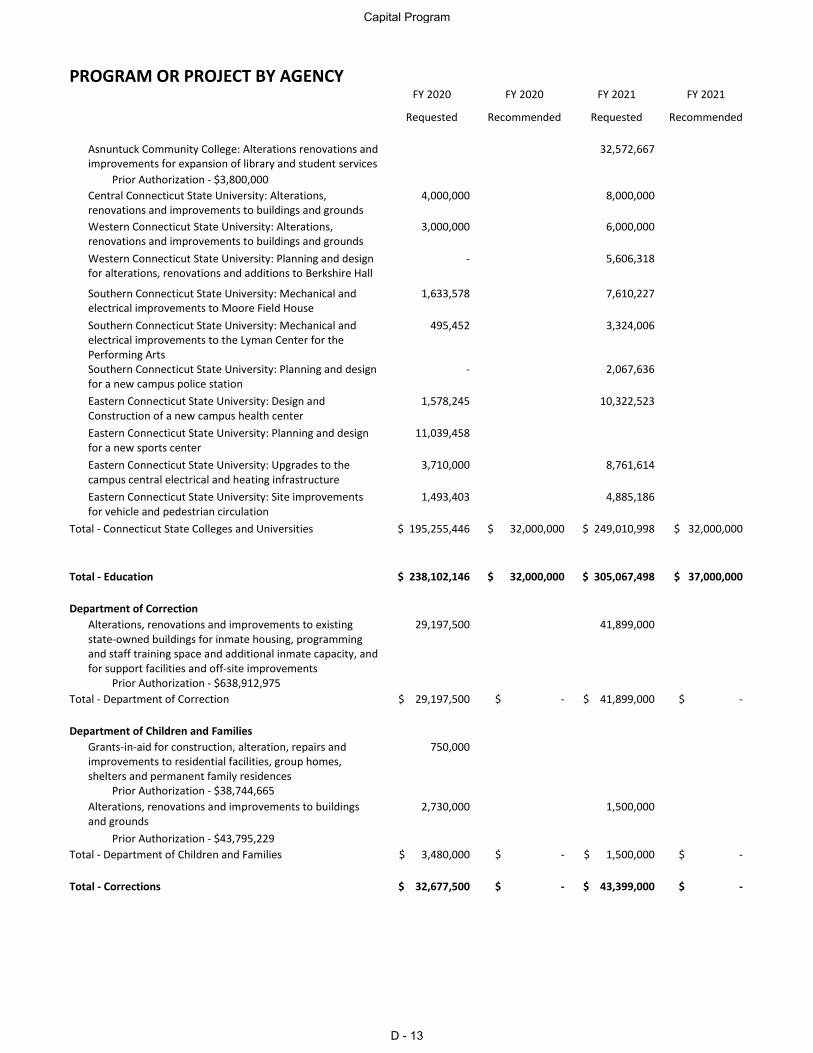
PROGRAM OR PROJECT BY AGENCY FY 2020 FY 2020 FY 2021 FY 2021
Requested Recommended Requested Recommended Asnuntuck Community College: Alterations renovations and
improvements for expansion of library and student services 32,572,667
Prior Authorization - $3,800,000 Central Connecticut State University: Alterations,
renovations and improvements to buildings and grounds 4,000,000 8,000,000
Western Connecticut State University: Alterations, renovations and improvements to buildings and grounds
3,000,000 6,000,000
Western Connecticut State University: Planning and design for alterations, renovations and additions to Berkshire Hall
- 5,606,318
Southern Connecticut State University: Mechanical and electrical improvements to Moore Field House
1,633,578 7,610,227
Southern Connecticut State University: Mechanical and electrical improvements to the Lyman Center for the Performing Arts
495,452 3,324,006
Southern Connecticut State University: Planning and design for a new campus police station
- 2,067,636
Eastern Connecticut State University: Design and Construction of a new campus health center
1,578,245 10,322,523
Eastern Connecticut State University: Planning and design for a new sports center
11,039,458
Eastern Connecticut State University: Upgrades to the campus central electrical and heating infrastructure
3,710,000 8,761,614
Eastern Connecticut State University: Site improvements for vehicle and pedestrian circulation
1,493,403 4,885,186
Total - Connecticut State Colleges and Universities $ 195,255,446 $ 32,000,000 $ 249,010,998 $ 32,000,000
Total - Education $ 238,102,146 $ 32,000,000 $ 305,067,498 $ 37,000,000
Department of Correction Alterations, renovations and improvements to existing
state-owned buildings for inmate housing, programming and staff training space and additional inmate capacity, and for support facilities and off-site improvements
29,197,500 41,899,000
Prior Authorization - $638,912,975 Total - Department of Correction $ 29,197,500 $ - $ 41,899,000 $ -
Department of Children and Families
Grants-in-aid for construction, alteration, repairs and improvements to residential facilities, group homes, shelters and permanent family residences
750,000
Prior Authorization - $38,744,665 Alterations, renovations and improvements to buildings and grounds
2,730,000 1,500,000
Prior Authorization - $43,795,229 Total - Department of Children and Families $ 3,480,000 $ - $ 1,500,000 $ -
Total - Corrections $ 32,677,500 $ - $ 43,399,000 $ -
Capital Program
D - 13
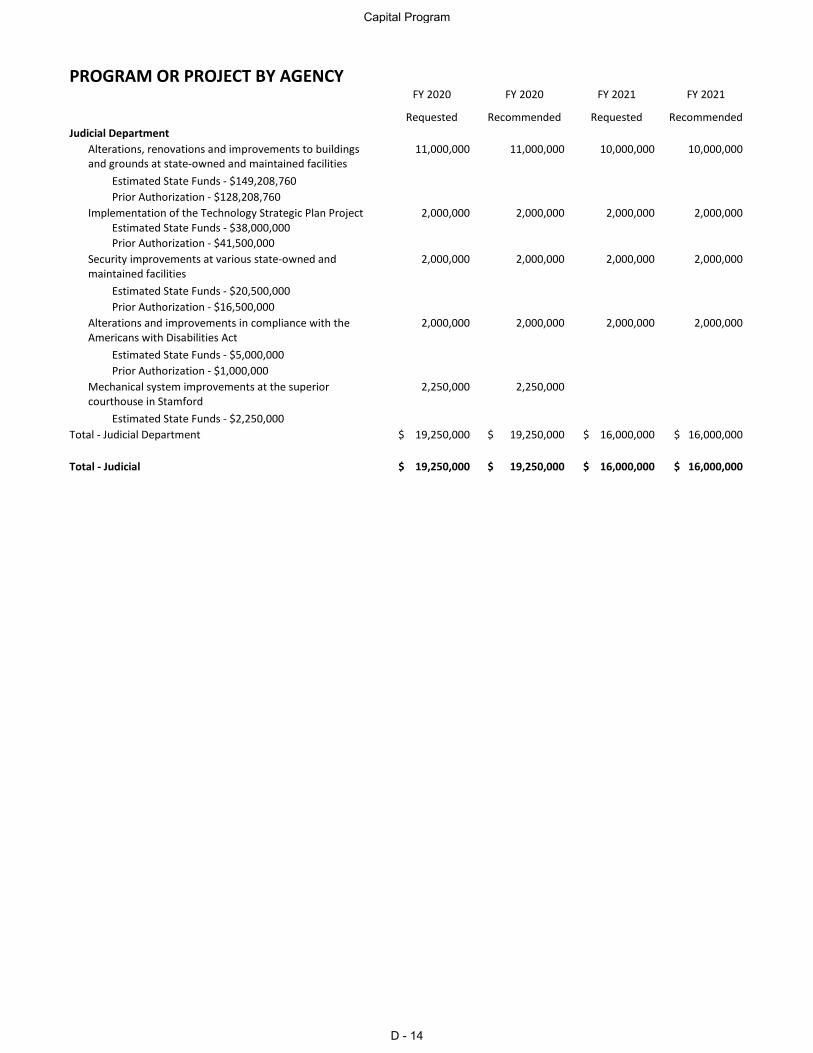
PROGRAM OR PROJECT BY AGENCY FY 2020 FY 2020 FY 2021 FY 2021
Requested Recommended Requested Recommended Judicial Department
Alterations, renovations and improvements to buildings and grounds at state-owned and maintained facilities
11,000,000 11,000,000 10,000,000 10,000,000
Estimated State Funds - $149,208,760 Prior Authorization - $128,208,760
Implementation of the Technology Strategic Plan Project 2,000,000 2,000,000 2,000,000 2,000,000 Estimated State Funds - $38,000,000 Prior Authorization - $41,500,000
Security improvements at various state-owned and maintained facilities
2,000,000 2,000,000 2,000,000 2,000,000
Estimated State Funds - $20,500,000 Prior Authorization - $16,500,000
Alterations and improvements in compliance with the Americans with Disabilities Act
2,000,000 2,000,000 2,000,000 2,000,000
Estimated State Funds - $5,000,000 Prior Authorization - $1,000,000
Mechanical system improvements at the superior courthouse in Stamford
2,250,000 2,250,000
Estimated State Funds - $2,250,000 Total - Judicial Department $ 19,250,000 $ 19,250,000 $ 16,000,000 $ 16,000,000
Total - Judicial $ 19,250,000 $ 19,250,000 $ 16,000,000 $ 16,000,000
Capital Program
D - 14
SECTION E
MUNICIPAL AID

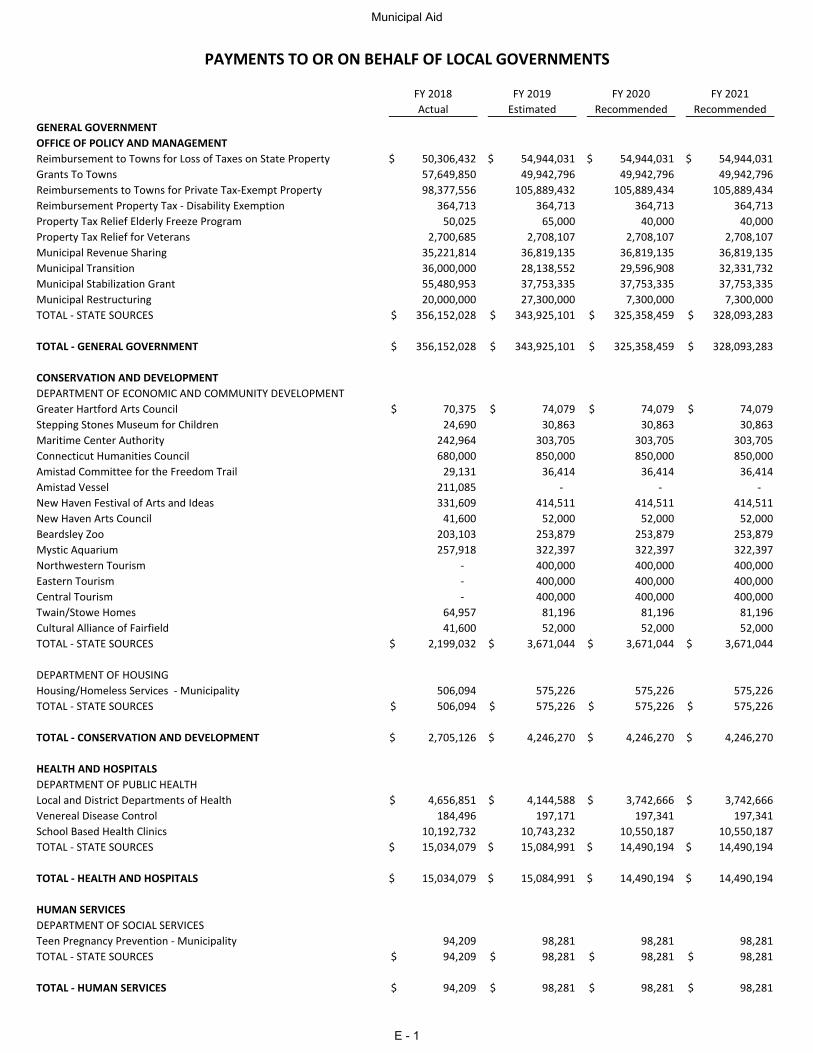
FY 2018 FY 2019 FY 2020 FY 2021
Actual Estimated Recommended Recommended
GENERAL GOVERNMENT
OFFICE OF POLICY AND MANAGEMENT
Reimbursement to Towns for Loss of Taxes on State Property 50,306,432$ 54,944,031$ 54,944,031$ 54,944,031$
Grants To Towns 57,649,850 49,942,796 49,942,796 49,942,796
Reimbursements to Towns for Private Tax-Exempt Property 98,377,556 105,889,432 105,889,434 105,889,434
Reimbursement Property Tax - Disability Exemption 364,713 364,713 364,713 364,713
Property Tax Relief Elderly Freeze Program 50,025 65,000 40,000 40,000
Property Tax Relief for Veterans 2,700,685 2,708,107 2,708,107 2,708,107
Municipal Revenue Sharing 35,221,814 36,819,135 36,819,135 36,819,135
Municipal Transition 36,000,000 28,138,552 29,596,908 32,331,732
Municipal Stabilization Grant 55,480,953 37,753,335 37,753,335 37,753,335
Municipal Restructuring 20,000,000 27,300,000 7,300,000 7,300,000
TOTAL - STATE SOURCES 356,152,028$ 343,925,101$ 325,358,459$ 328,093,283$
TOTAL - GENERAL GOVERNMENT 356,152,028$ 343,925,101$ 325,358,459$ 328,093,283$
CONSERVATION AND DEVELOPMENT
DEPARTMENT OF ECONOMIC AND COMMUNITY DEVELOPMENT
Greater Hartford Arts Council 70,375$ 74,079$ 74,079$ 74,079$
Stepping Stones Museum for Children 24,690 30,863 30,863 30,863
Maritime Center Authority 242,964 303,705 303,705 303,705
Connecticut Humanities Council 680,000 850,000 850,000 850,000
Amistad Committee for the Freedom Trail 29,131 36,414 36,414 36,414
Amistad Vessel 211,085 - - -
New Haven Festival of Arts and Ideas 331,609 414,511 414,511 414,511
New Haven Arts Council 41,600 52,000 52,000 52,000
Beardsley Zoo 203,103 253,879 253,879 253,879
Mystic Aquarium 257,918 322,397 322,397 322,397
Northwestern Tourism - 400,000 400,000 400,000
Eastern Tourism - 400,000 400,000 400,000
Central Tourism - 400,000 400,000 400,000
Twain/Stowe Homes 64,957 81,196 81,196 81,196
Cultural Alliance of Fairfield 41,600 52,000 52,000 52,000
TOTAL - STATE SOURCES 2,199,032$ 3,671,044$ 3,671,044$ 3,671,044$
DEPARTMENT OF HOUSING
Housing/Homeless Services - Municipality 506,094 575,226 575,226 575,226
TOTAL - STATE SOURCES 506,094$ 575,226$ 575,226$ 575,226$
TOTAL - CONSERVATION AND DEVELOPMENT 2,705,126$ 4,246,270$ 4,246,270$ 4,246,270$
HEALTH AND HOSPITALS
DEPARTMENT OF PUBLIC HEALTH
Local and District Departments of Health 4,656,851$ 4,144,588$ 3,742,666$ 3,742,666$
Venereal Disease Control 184,496 197,171 197,341 197,341
School Based Health Clinics 10,192,732 10,743,232 10,550,187 10,550,187
TOTAL - STATE SOURCES 15,034,079$ 15,084,991$ 14,490,194$ 14,490,194$
TOTAL - HEALTH AND HOSPITALS 15,034,079$ 15,084,991$ 14,490,194$ 14,490,194$
HUMAN SERVICES
DEPARTMENT OF SOCIAL SERVICES
Teen Pregnancy Prevention - Municipality 94,209 98,281 98,281 98,281
TOTAL - STATE SOURCES 94,209$ 98,281$ 98,281$ 98,281$
TOTAL - HUMAN SERVICES 94,209$ 98,281$ 98,281$ 98,281$
PAYMENTS TO OR ON BEHALF OF LOCAL GOVERNMENTS
Municipal Aid
E - 1
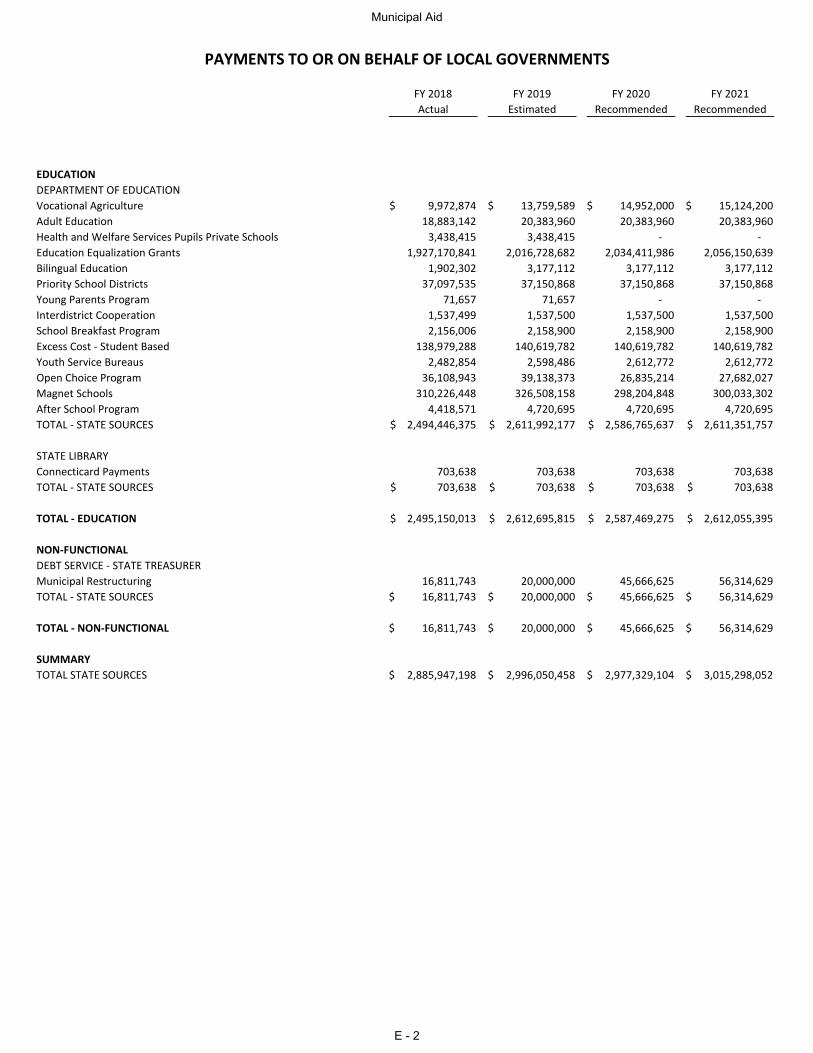
FY 2018 FY 2019 FY 2020 FY 2021
Actual Estimated Recommended Recommended
PAYMENTS TO OR ON BEHALF OF LOCAL GOVERNMENTS
EDUCATION
DEPARTMENT OF EDUCATION
Vocational Agriculture 9,972,874$ 13,759,589$ 14,952,000$ 15,124,200$
Adult Education 18,883,142 20,383,960 20,383,960 20,383,960
Health and Welfare Services Pupils Private Schools 3,438,415 3,438,415 - -
Education Equalization Grants 1,927,170,841 2,016,728,682 2,034,411,986 2,056,150,639
Bilingual Education 1,902,302 3,177,112 3,177,112 3,177,112
Priority School Districts 37,097,535 37,150,868 37,150,868 37,150,868
Young Parents Program 71,657 71,657 - -
Interdistrict Cooperation 1,537,499 1,537,500 1,537,500 1,537,500
School Breakfast Program 2,156,006 2,158,900 2,158,900 2,158,900
Excess Cost - Student Based 138,979,288 140,619,782 140,619,782 140,619,782
Youth Service Bureaus 2,482,854 2,598,486 2,612,772 2,612,772
Open Choice Program 36,108,943 39,138,373 26,835,214 27,682,027
Magnet Schools 310,226,448 326,508,158 298,204,848 300,033,302
After School Program 4,418,571 4,720,695 4,720,695 4,720,695
TOTAL - STATE SOURCES 2,494,446,375$ 2,611,992,177$ 2,586,765,637$ 2,611,351,757$
STATE LIBRARY
Connecticard Payments 703,638 703,638 703,638 703,638
TOTAL - STATE SOURCES 703,638$ 703,638$ 703,638$ 703,638$
TOTAL - EDUCATION 2,495,150,013$ 2,612,695,815$ 2,587,469,275$ 2,612,055,395$
NON-FUNCTIONAL
DEBT SERVICE - STATE TREASURER
Municipal Restructuring 16,811,743 20,000,000 45,666,625 56,314,629
TOTAL - STATE SOURCES 16,811,743$ 20,000,000$ 45,666,625$ 56,314,629$
TOTAL - NON-FUNCTIONAL 16,811,743$ 20,000,000$ 45,666,625$ 56,314,629$
SUMMARY
TOTAL STATE SOURCES 2,885,947,198$ 2,996,050,458$ 2,977,329,104$ 3,015,298,052$
Municipal Aid
E - 2
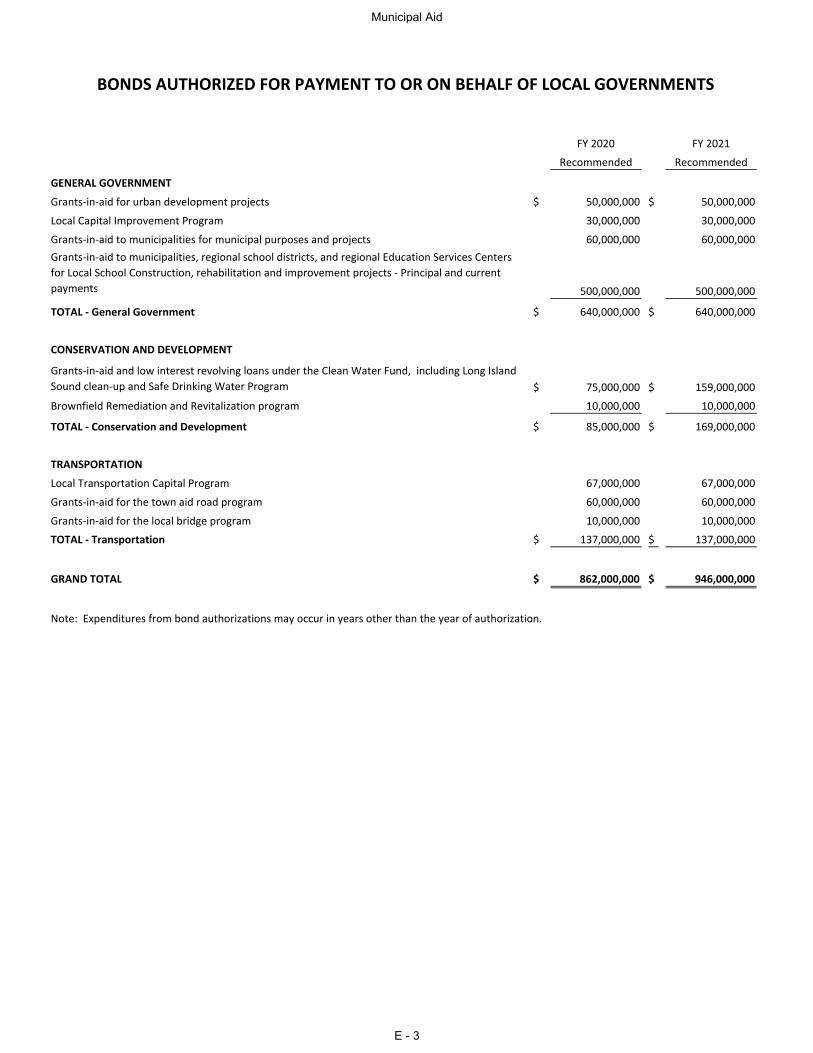
FY 2020 FY 2021
Recommended Recommended
GENERAL GOVERNMENT
Grants‐in‐aid for urban development projects $ 50,000,000 $ 50,000,000
Local Capital Improvement Program 30,000,000 30,000,000
Grants‐in‐aid to municipalities for municipal purposes and projects 60,000,000 60,000,000 Grants‐in‐aid to municipalities, regional school districts, and regional Education Services Centers for Local School Construction, rehabilitation and improvement projects ‐ Principal and current payments 500,000,000 500,000,000
TOTAL ‐ General Government $ 640,000,000 $ 640,000,000
CONSERVATION AND DEVELOPMENT
Grants‐in‐aid and low interest revolving loans under the Clean Water Fund, including Long Island Sound clean‐up and Safe Drinking Water Program $ 75,000,000 $ 159,000,000
Brownfield Remediation and Revitalization program 10,000,000 10,000,000
TOTAL ‐ Conservation and Development $ 85,000,000 $ 169,000,000
TRANSPORTATION
Local Transportation Capital Program 67,000,000 67,000,000
Grants‐in‐aid for the town aid road program 60,000,000 60,000,000
Grants‐in‐aid for the local bridge program 10,000,000 10,000,000
TOTAL ‐ Transportation $ 137,000,000 $ 137,000,000
GRAND TOTAL $ 862,000,000 $ 946,000,000
Note: Expenditures from bond authorizations may occur in years other than the year of authorization.
BONDS AUTHORIZED FOR PAYMENT TO OR ON BEHALF OF LOCAL GOVERNMENTS
Municipal Aid
E - 3
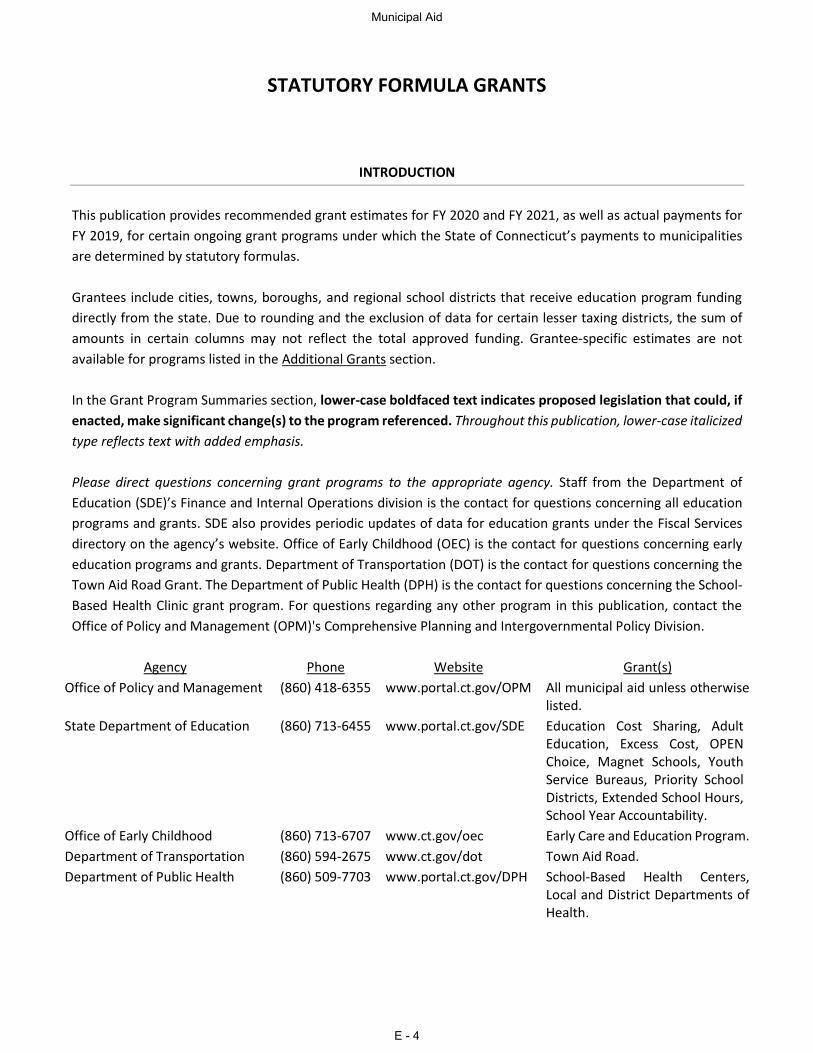
STATUTORY FORMULA GRANTS
INTRODUCTION
This publication provides recommended grant estimates for FY 2020 and FY 2021, as well as actual payments for
FY 2019, for certain ongoing grant programs under which the State of Connecticut’s payments to municipalities
are determined by statutory formulas.
Grantees include cities, towns, boroughs, and regional school districts that receive education program funding
directly from the state. Due to rounding and the exclusion of data for certain lesser taxing districts, the sum of
amounts in certain columns may not reflect the total approved funding. Grantee-specific estimates are not
available for programs listed in the Additional Grants section.
In the Grant Program Summaries section, lower-case boldfaced text indicates proposed legislation that could, if
enacted, make significant change(s) to the program referenced. Throughout this publication, lower-case italicized
type reflects text with added emphasis.
Please direct questions concerning grant programs to the appropriate agency. Staff from the Department of
Education (SDE)’s Finance and Internal Operations division is the contact for questions concerning all education
programs and grants. SDE also provides periodic updates of data for education grants under the Fiscal Services
directory on the agency’s website. Office of Early Childhood (OEC) is the contact for questions concerning early
education programs and grants. Department of Transportation (DOT) is the contact for questions concerning the
Town Aid Road Grant. The Department of Public Health (DPH) is the contact for questions concerning the School-
Based Health Clinic grant program. For questions regarding any other program in this publication, contact the
Office of Policy and Management (OPM)'s Comprehensive Planning and Intergovernmental Policy Division.
Agency Phone Website Grant(s)
Office of Policy and Management (860) 418-6355 www.portal.ct.gov/OPM All municipal aid unless otherwise listed.
State Department of Education (860) 713-6455 www.portal.ct.gov/SDE Education Cost Sharing, Adult Education, Excess Cost, OPEN Choice, Magnet Schools, Youth Service Bureaus, Priority School Districts, Extended School Hours, School Year Accountability.
Office of Early Childhood (860) 713-6707 www.ct.gov/oec Early Care and Education Program.
Department of Transportation (860) 594-2675 www.ct.gov/dot Town Aid Road.
Department of Public Health (860) 509-7703 www.portal.ct.gov/DPH School-Based Health Centers, Local and District Departments of Health.
Municipal Aid
E - 4
Note – C.G.S. section 12-62 governs real property revaluation requirements for Connecticut towns. A town’s
failure to implement a revaluation in accordance with statutory requirements could result in the imposition of a
penalty equal to the forfeiture of 50% of its Mashantucket Pequot and Mohegan Grant and the loss of the amount
otherwise allocable under the Local Capital Improvement Program (LoCIP). The Secretary of the Office of Policy
and Management may waive the penalty for a reason set forth in C.G.S. section 12-62(d).
GRANT PROGRAM SUMMARIES
The grant estimates that follow are for the programs described below.
Audit adjustments or the receipt of more current data can significantly impact actual payments.
STATE-OWNED REAL PROPERTY PAYMENT-IN-LIEU OF TAXES (PILOT)
The Office of Policy and Management administers this PILOT program pursuant to C.G.S. section 12-19a, section
12-19b, section 12-19c, section 4b-39, section 32-666, and section 12-18b. This program provides payments for
real property tax losses due to exemptions applicable to state-owned real property, certain real property that is
the subject of a state lease or long-term financing contract, municipally-owned airports and certain land held in
trust by the federal government.
Under current law, grant payments in FY 2020 will reflect GLY 2018 grand lists, and grant payments in FY 2021 will
reflect GLY 2019 grand lists.
A property’s use and the amount of state-owned real property in a town have historically determined PILOT
percentages, which are:
(1) 100% for state prison facilities used for purposes of incarceration in the prior fiscal year, that portion of
the John Dempsey Hospital used as a permanent medical ward for prisoners, the Connecticut Juvenile
Training School, land designated under the 1983 settlement boundary and taken into trust by the federal
government for the Mashantucket Pequot Tribal Nation on or after June 8, 1999, and all state-owned
property in a town in which the State of Connecticut owns more than 50% of the property within the
town’s boundaries;
(2) 65% for the Connecticut Valley Hospital and Whiting Forensic Hospital; and
(3) 45% for all other state-owned real property, certain real property leased by the state as described in
section 4b-39, municipally-owned airports and certain other real property owned or controlled by the
federal government.
A grantee’s payment in any year may reflect a modification due to an audit of an amount previously paid. Since
FY 2015, the four towns of Windsor Locks, Suffield, East Granby and Windsor receive a total of $4,678,571.79
Municipal Aid
E - 5
directly from the Connecticut Airport Authority, for the Bradley International Airport property, regardless of actual
property tax loss. This payment is not part of the State Owned PILOT payment.
There is also a proportionate reduction of PILOT totals to the amount of the appropriation in any year in which
funding is insufficient.
For FY 2018 and FY 2019, a town-by-town payment list was established in Section 592 of P.A. 17-2 (JSS).
For FY 2020 and FY 2021, recommended payments reflect maintaining the FY 2019 payment list to maintain a
consistent level of funding in each year of the biennium.
Grantees receive PILOT payments on or before September 30th.
PRIVATE COLLEGES AND GENERAL AND FREE STANDING CHRONIC DISEASE HOSPITALS PILOT
The Office of Policy and Management administers this PILOT program pursuant to C.G.S. section 12-19b(b), section
12-20a, section 12-20b, and section 12-18b. This program provides payments for real property tax losses due to
exemptions applicable to eligible private colleges and general and free standing chronic disease hospitals.
Under current law, grant payments in FY 2020 will reflect GLY 2018 grand lists, and grant payments in FY 2021 will
reflect GLY 2019 grand lists.
The calculation of the PILOT for towns and certain fire districts reflects 77% of their tax losses for the appropriate
grand list. Exceptions to this calculation include the campuses of the Connecticut Healthcare Systems located in
Newington and West Haven and owned by the United States Department of Veterans’ Affairs. Additionally, C.G.S.
section 12-20b and section 12-19b specify the following payments: $100,000 for the Connecticut Hospice in
Branford; $1,000,000 for the United States Coast Guard Academy in New London; and $60,000 for the state-
owned forest in Voluntown.
A grantee’s payment in any year may reflect a modification due to an audit of an amount previously paid. There
is also a proportionate reduction of PILOT totals to the amount of the appropriation in any year in which funding
is insufficient.
For FY 2018 and FY 2019, a town-by-town payment list was established in section 591 of P.A. 17-2(JSS).
For FY 2020 and FY 2021, recommended payments reflect maintaining the FY 2019 payment list to maintain a
consistent level of funding in each year of the biennium.
Grantees receive PILOT payments on or before September 30th.
Municipal Aid
E - 6
MUNICIPAL REVENUE SHARING GRANT
Grants are made pursuant to payment lists in C.G.S. section 4-66l(d)(1) and (2). For FY 2018 and FY 2019, a town-
by-town payment list was established in section 590 of P.A. 17-2 (JSS).
For FY 2020 and FY 2021, recommended payments reflect maintaining the FY 2019 payment list to maintain a
consistent level of funding in each year of the biennium.
MUNICIPAL TRANSITION GRANT
C.G.S. section 4-66l(c), as amended by sections 23 and 24 of P.A. 18-81, provides for motor vehicle property tax
grants. Pursuant to section 12-71e of the general statutes as amended by section 699 of P.A. 17-2 (JSS),
municipalities may not impose mill rates higher than 45 mills on motor vehicles. The municipal transition grant
reimburses local governments for the foregone tax revenue resulting from this motor vehicle property tax cap.
For FY 2019, a town-by-town payment list was established in section 23 of P.A. 18-81.
For FY 2020, recommended grants to municipalities represent the difference between their motor vehicle
property tax revenue at 45 mills and their motor vehicle tax revenue if their motor vehicle mill rate had been
the same as their real and personal property mill rate, based on each town’s grand list in the assessment year
commencing on October 1, 2016.
For FY 2021, recommended grants represent the same formula as in FY 2020, but refer to the assessment year
commencing on October 1, 2017 instead of 2016.
Grants are paid by August 1st.
MUNICIPAL STABILIZATION GRANT
Municipal Stabilization grants are paid to municipalities based on a statutory payment list established in Section
589 of P.A. 17-2(JSS).
For FY 2020 and FY 2021, recommended payments reflect maintaining the FY 2019 payment list to maintain a
consistent level of funding in each year of the biennium.
MASHANTUCKET PEQUOT AND MOHEGAN FUND GRANT
The Office of Policy and Management administers this program under which payments from the proceeds of the
Mashantucket Pequot and Mohegan Fund are determined pursuant to C.G.S. section 3-55i, section 3-55j, section
3-55k, and section 96 of P.A. 06-187, which is not codified but remains in effect.
Municipal Aid
E - 7
The statutory amount cited for each formula is allocated based on the following:
(1) $20 million on the basis of the PILOT for State-owned Real Property – the amount for each town is
calculated at one-third of the difference between what the town receives as a PILOT (excluding prior year
adjustments), and what it would have received if the PILOT program had been funded at $85,205,085.
After required minimum payments are reflected, town-specific amounts are prorated to $20 million. In
accordance with P.A. 15-244 section 192(a), beginning in FY 2016, the amount provided through this
portion of the formula is equal to the amount provided in FY 2015;
(2) $20.1 million on the basis of the PILOT for Private Colleges and General and Free Standing Chronic Disease
Hospitals – the percent of each town’s PILOT (excluding prior year adjustments) to the total PILOT for all
towns is calculated and the result is multiplied by the $20,123,916 allocated for this portion of the
formula. In accordance with P.A. 15-244 section 192(c), beginning in FY 2016, the amount provided
through this portion of the formula is equal to the amount provided in FY 2015;
(3) $35 million on the basis of C.G.S. section 3-55j(e) – a modification of the Property Tax Relief Fund formula
in C.G.S. section 7-528;
(4) $5.475 million allocated to certain designated municipalities on the basis of said Property Tax Relief Fund
formula; and
(5) An additional $47.5 million for all towns, distributed pro rata on the basis of each town’s grant determined
under (1) through (4) above, to the total of all such grants, pursuant to C.G.S. section 3-55j(j).
Regardless of the formulas described in (1) through (4) above, the amounts allocated to 28 towns are specifically
set forth in C.G.S. section 3-55j(g). In addition, Ledyard, Montville, North Stonington, Norwich and Preston each
receive an additional $750,000 annually as set forth in C.G.S. section 3-55l(b).
Towns receive a proportionate share of an additional $1.6 million. These towns are members of the Southeastern
Connecticut Council of Governments, or distressed municipalities that are members of either the Northeastern
Connecticut Council of Governments or the Windham Region Council of Governments.
A town’s grant is its total formula-derived amount reduced proportionately to the program’s annual
appropriation, although the additional amounts payable to the towns described in the preceding paragraph are
not subject to this provision. Pursuant to C.G.S. section 22a-27j, a town’s first grant payment in any year may
reflect a deduction of up to $4,000 if the town has failed to make required payments to the Environmental Quality
Fund. The estimates shown in this publication do not reflect these deductions, nor do they separately reflect that
portion of the grant based on the PILOT formulas described above in (1) and (2) that certain towns must share
with an eligible special services district located within their boundaries.
For FY 2018 and FY 2019, a town-by-town payment list was established in Section 592 of P.A. 17-2 (JSS).
Municipal Aid
E - 8
For FY 2020 and FY 2021, recommended payments reflect maintaining the FY 2019 payment list to maintain a
consistent level of funding in each year of the biennium.
Grantees receive payments in three installments on or before January 1st, April 1st and June 30th.
TOWN AID ROAD FUND GRANT
The Department of Transportation administers the Town Aid Road Fund grant pursuant to C.G.S. section 13a-175a
through section 13a-175e, inclusive, and section 13a-175i. Towns and boroughs use these grants for various
purposes, including the construction and maintenance of public highways, roads and bridges. The Secretary of the
Office of Policy and Management may approve the use of funds for other purposes. Grant calculations depend
upon factors that include population data and the number of a municipality’s improved and unimproved road
miles. There is an allocation to the amounts the statutes specify for each formula calculation. Additionally, there
is a proportionate adjustment of grant totals, as calculated, to the amount of funding available.
Municipalities receive 50% of this grant in July and the balance in January.
LOCAL CAPITAL IMPROVEMENT PROGRAM (LoCIP)
LoCIP grants are administered pursuant to C.G.S. section 7-535 through section 7-538, inclusive. The Office of
Policy and Management must approve LoCIP projects; eligibility parameters and expanded uses and time frames
are described in C.G.S. section 7-536.
Towns and boroughs must request reimbursement for an approved project within seven years of its approval date
although there may be a waiver of this provision under appropriate terms and conditions. Reimbursement cannot
exceed the total of a grantee’s unused entitlement. This includes the formula-generated amount for the current
fiscal year (which is available on March 1) and the unused portion of all previous entitlements.
Grantees receive payments after expenses have been incurred and local funds have been expended for an
approved project by submitting a certified reimbursement request and providing required expenditure
information. Payments are issued once the reimbursement request has been approved and after funds become
available following the allotment of funds from state bond proceeds.
As a result of a $65 million dollar difference between credited entitlements and the aggregate bond authorization,
towns were notified in December 2016 that the cumulative dollar amount of LoCIP project approvals had reached
the $825 million level of current bonding. No further projects could be authorized, effectively freezing any current
entitlements not yet associated with an authorized project, and no entitlements would be credited to towns in
2017. The cause for the $65 million dollar difference dates back to 2004 when the General Assembly passed P.A.
04-1, entitling towns to be credited an additional $30 million in LoCIP funds for each year of the 2014-2015
biennium, without increasing the aggregate bond authorization to fund the entitlements. Additionally, the
General Assembly decreased the aggregate LoCIP bond authorization by $5 million.
Municipal Aid
E - 9
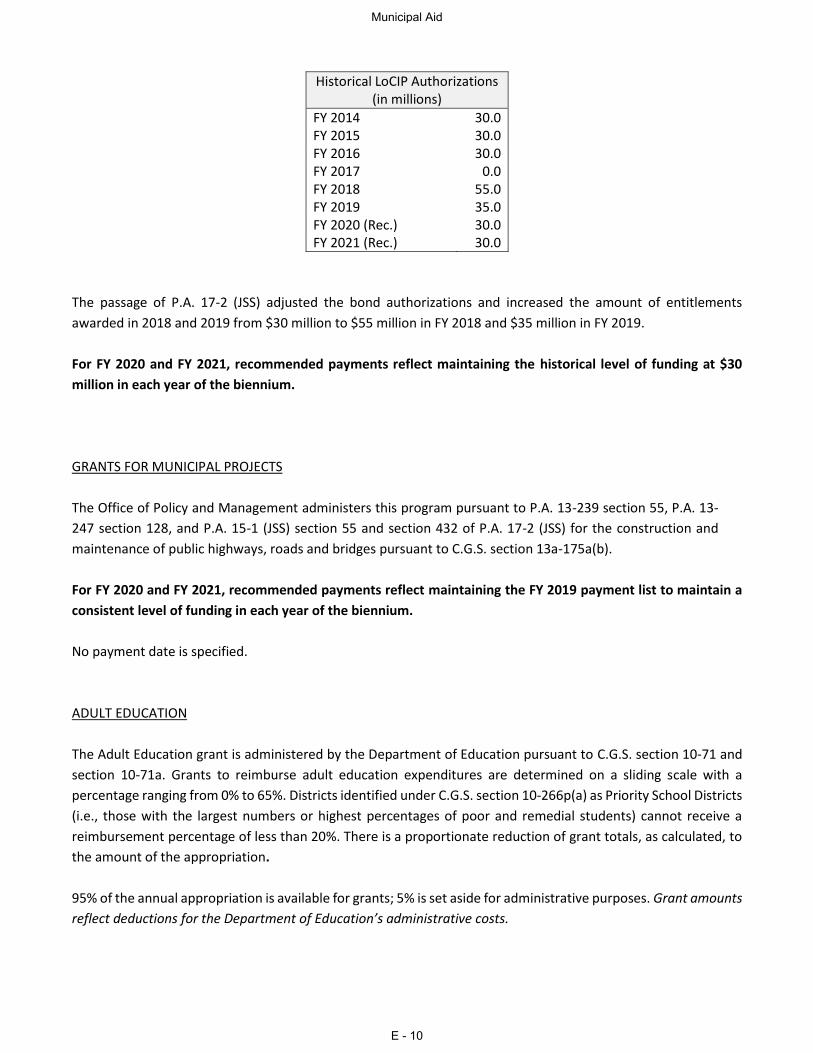
Historical LoCIP Authorizations (in millions)
FY 2014 30.0 FY 2015 30.0 FY 2016 30.0 FY 2017 0.0 FY 2018 55.0 FY 2019 35.0 FY 2020 (Rec.) 30.0 FY 2021 (Rec.) 30.0
The passage of P.A. 17-2 (JSS) adjusted the bond authorizations and increased the amount of entitlements
awarded in 2018 and 2019 from $30 million to $55 million in FY 2018 and $35 million in FY 2019.
For FY 2020 and FY 2021, recommended payments reflect maintaining the historical level of funding at $30
million in each year of the biennium.
GRANTS FOR MUNICIPAL PROJECTS
The Office of Policy and Management administers this program pursuant to P.A. 13-239 section 55, P.A. 13-
247 section 128, and P.A. 15-1 (JSS) section 55 and section 432 of P.A. 17-2 (JSS) for the construction and
maintenance of public highways, roads and bridges pursuant to C.G.S. section 13a-175a(b).
For FY 2020 and FY 2021, recommended payments reflect maintaining the FY 2019 payment list to maintain a
consistent level of funding in each year of the biennium.
No payment date is specified.
ADULT EDUCATION
The Adult Education grant is administered by the Department of Education pursuant to C.G.S. section 10-71 and
section 10-71a. Grants to reimburse adult education expenditures are determined on a sliding scale with a
percentage ranging from 0% to 65%. Districts identified under C.G.S. section 10-266p(a) as Priority School Districts
(i.e., those with the largest numbers or highest percentages of poor and remedial students) cannot receive a
reimbursement percentage of less than 20%. There is a proportionate reduction of grant totals, as calculated, to
the amount of the appropriation.
95% of the annual appropriation is available for grants; 5% is set aside for administrative purposes. Grant amounts
reflect deductions for the Department of Education’s administrative costs.
Municipal Aid
E - 10
For FY 2020 and FY 2021, recommended payments reflect sustained funding at the same level as FY 2019 in each
year of the biennium.
Grantees receive 66% of this grant in August and the balance in May.
EDUCATION COST SHARING (ECS)
The Department of Education administers the Education Equalization Grants pursuant to C.G.S. section 10-262f,
section 10-262g, section 10-262h, section 10-262i, and section 10-262j.
In FY 2019, ECS grants included one-time additional funding of $2.9 million for students who were displaced from
hurricanes in 2017.
For FY 2020 and FY 2021, recommended modifications to the ECS formula include: (1) replacing the free and
reduced price lunch component of the formula with direct certification, and (2) accelerating the phase-down
percentage for reduced ECS grants from the original 8.33% through FY 2028 in statute to 25% through FY 2022.
ECS payments are made as follows: 25% in October, 25% in January, and the balance in April.
ADDITIONAL GRANTS - GRANT PROGRAM SUMMARIES
Grantee-specific estimates are not available for these programs.
SCHOOL-BASED HEALTH CENTERS
The Department of Public Health distributes grants for school based health centers pursuant to its powers under
C.G.S. section 19a-2a. Funding supports the operation of 80 school based health centers and 11 expanded sites in
FY 2019. School-based health centers provide comprehensive primary health care (including medical, mental and
oral health care) to enrolled students in communities that have large numbers of low income, high risk children
and adolescents.
The Commissioner of Public Health certifies payments at various times.
Municipal Aid
E - 11
SPECIAL EDUCATION: EXCESS COSTS-STUDENT BASED
The Department of Education administers the Excess Costs-Student Based grant pursuant to C.G.S. section 10-
76d, section 10-76g and section 10-253. Costs in excess of four and one-half times a town’s average cost per pupil
for the prior year are paid for students placed in a special education program by a school district, pursuant to
C.G.S. section 10-76g(b).
For placements initiated by a state agency, a Superior Court or a federally recognized Native American tribe (rather
than by a local school district), this program provides 100% reimbursement of costs in excess of the district’s prior
year Net Current Expenditure Per Pupil (NCEP), pursuant to C.G.S. section 10-76d(e)(3) and section 10-76g(a)(1).
For certain no-nexus students and special education students who reside on state property, 100% of the current
year cost is covered, pursuant to C.G.S. section 10-76g(a)(1) and section 10-76d(e)(3).
There is a proportionate reduction of grant totals, as calculated, to the amount of the appropriation.
Grantees receive 75% of their payments in February and the balance in May.
OPEN CHOICE GRANT
The Department of Education administers the OPEN Choice grant, pursuant to C.G.S. section 10-266aa, to
encourage inter-district attendance between the cities and suburbs. Both the sending and receiving districts
equally share the credit for these students for those state grants that use resident students or average daily
membership data. The department provides, within available appropriations, an annual grant to the local or
regional board of education for each receiving district in an amount equal to:
(A) three thousand dollars for each out-of-district student who attends school in the receiving district under the
program if the number of such out of district students is less than two per cent of the total student population
of such receiving district,
(B) four thousand dollars for each out-of-district student who attends school in the receiving district under the
program if the number of such out-of-district students is greater than or equal to two per cent but less than
3% of the total student population of such receiving district,
(C) six thousand dollars for each out-of-district student who attends school in the receiving district under the
program if the number of such out of district students is greater than or equal to three per cent but less than
4% of the total student population of such receiving district,
(D) six thousand dollars for each out-of-district student who attends school in a receiving district under the
program if the Commissioner of Education determines that the receiving district has an enrollment of greater
than four thousand students and has increased the number of students in the program by at least 50% from
the previous fiscal year, or
(E) eight thousand dollars for each out-of-district student who attends school in the receiving district under the
program if the number of such out of district students is greater than or equal to 4%of the total student
population of such receiving district.
Municipal Aid
E - 12
OPEN Choice inter-district school attendance between Hartford and other districts may include preschool
programs in addition to all-day kindergarten. Grants are available for before- and after-school care and remedial
services for preschool students as well as for subsidies to receiving districts.
Grantees receive a portion of their grant in November and the balance in April.
MAGNET SCHOOLS
The Department of Education provides grants for the operation of inter-district magnet schools pursuant to
C.G.S. section 10-264l.
The determination of grant amounts depends upon factors such as a magnet school’s resident and non-resident
student counts and whether it is run by a Regional Educational Service Center (RESC), by the town in which the
school is located, or by another entity.
Greater per pupil grant amounts are available for inter-district magnet schools that assist Connecticut in
meeting the goals pursuant to the decision in Sheff v. O’Neill, 238 Conn. 1 (1996), or any related stipulation or
order in effect.
Up to $500,000 may be set aside for administrative purposes. Grant amounts reflect deductions for the
Department of Education’s administrative costs.
Grants are paid as follows:
Operating grants –70% by September 1st and the balance by May 1st.
Transportation grants –50% in October and the balance in May.
YOUTH SERVICE BUREAUS
The Youth Service Bureau program that the Department of Education administers pursuant to C.G.S. section 10-
19m through section 10-19p, assists in the provision of comprehensive services to delinquent and troubled
youth, including prevention and intervention programs, treatment and follow-up services.
SCHOOL-BASED CHILD HEALTH
Pursuant to C.G.S. section 10-76d(a), local and regional boards of education are required to bill Medicaid where
possible for services provided on behalf of eligible children. A local or regional board of education with a student
population of less than a thousand may be exempted from this requirement if the board can demonstrate that
the administrative effort will cost more than the revenue associated with it. The Department of Social Services
remits grants to those local and regional boards of education that determine the Medicaid eligibility of their
special education students and furnish the information the agency needs to obtain federal reimbursement for
Municipal Aid
E - 13
certain services that eligible students receive (e.g., physical, occupational and speech therapies, mental health
services, nursing and the provision of medical supplies and specialized transportation).
Eligible boards of education receive 50% of the amount of the federal reimbursement that the state collects, based
on the federal financial participation plan in effect on January 1, 2003.
Estimates are preliminary projections that may change, depending on the actual number of claims processed.
Grantees must reimburse the state if they receive an amount in excess of that to which they are entitled.
Grantees receive payments at least quarterly.
LOCAL AND DISTRICT DEPARTMENTS OF HEALTH
A statutory per capita grant is paid by the Department of Public Health to eligible local health authorities, pursuant
to C.G.S. section 19a-202, and section 19a-245. Upon application:
Each health district that has a population of at least 50,000 or serves at least three municipalities receives
$1.85 per capita for each town, city and borough of such district, provided (1) the commissioner approves
the district’s public health program and budget, and (2) the towns, cities and boroughs of such district
appropriate from annual tax receipts for the maintenance of the health district not less than $1 per capita;
and
Each municipal health department receives $1.18 per capita, provided the municipality (1) employs a full-
time director of health, (2) submits a public health program and budget which is approved by the
commissioner, (3) appropriates not less than $1 per capita from annual tax receipts for health department
services, and (4) has a population of at least 50,000. By law, every city or town having a population over
40,000 for a period of five consecutive years must hire a full-time local director of health.
The recommended budget provides 80% of the funding that would be required to fully fund statutory per capita
grants to local health departments and districts in FY 2020.
PRIORITY SCHOOL DISTRICT PROGRAM
The Department of Education administers the three grants that comprise the Priority School District Program:
those for Priority School Districts, Extended School Hours and School Year Accountability (or Summer School).
The table shown below reflects recommended appropriations for the components of the Priority School District
Program. Descriptions of each grant follow.
Municipal Aid
E - 14
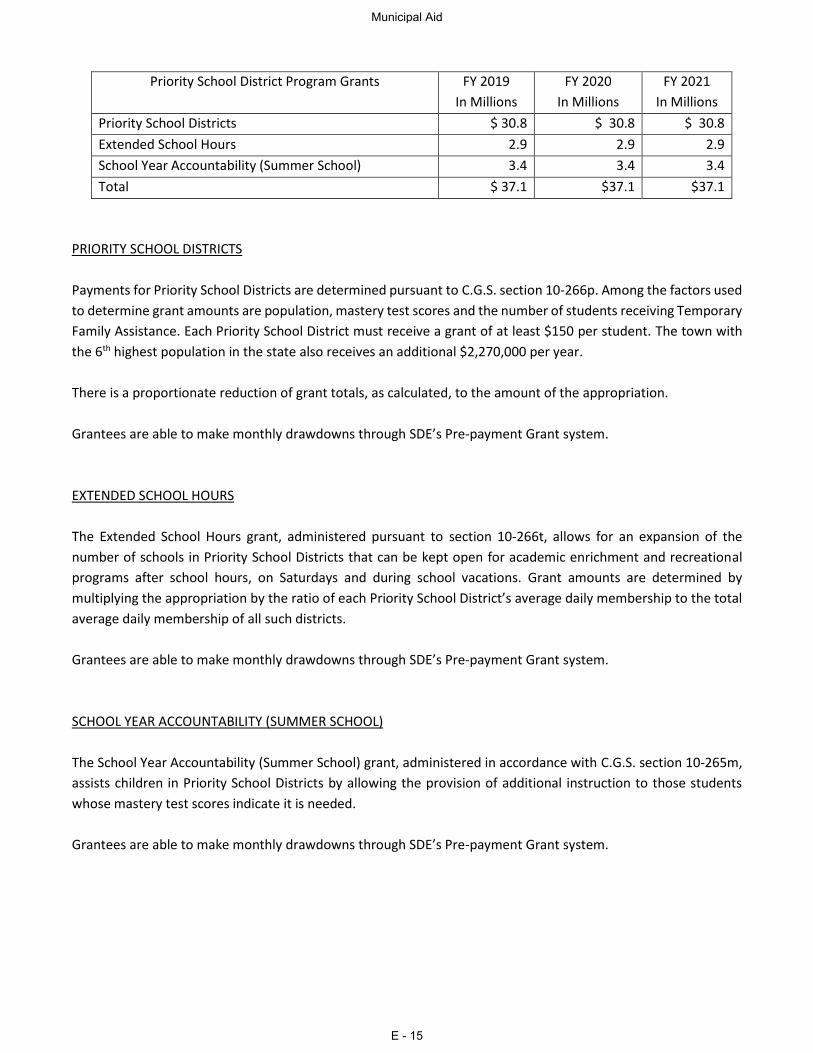
Priority School District Program Grants FY 2019
In Millions
FY 2020
In Millions
FY 2021
In Millions
Priority School Districts $ 30.8 $ 30.8 $ 30.8
Extended School Hours 2.9 2.9 2.9
School Year Accountability (Summer School) 3.4 3.4 3.4
Total $ 37.1 $37.1 $37.1
PRIORITY SCHOOL DISTRICTS
Payments for Priority School Districts are determined pursuant to C.G.S. section 10-266p. Among the factors used
to determine grant amounts are population, mastery test scores and the number of students receiving Temporary
Family Assistance. Each Priority School District must receive a grant of at least $150 per student. The town with
the 6th highest population in the state also receives an additional $2,270,000 per year.
There is a proportionate reduction of grant totals, as calculated, to the amount of the appropriation.
Grantees are able to make monthly drawdowns through SDE’s Pre-payment Grant system.
EXTENDED SCHOOL HOURS
The Extended School Hours grant, administered pursuant to section 10-266t, allows for an expansion of the
number of schools in Priority School Districts that can be kept open for academic enrichment and recreational
programs after school hours, on Saturdays and during school vacations. Grant amounts are determined by
multiplying the appropriation by the ratio of each Priority School District’s average daily membership to the total
average daily membership of all such districts.
Grantees are able to make monthly drawdowns through SDE’s Pre-payment Grant system.
SCHOOL YEAR ACCOUNTABILITY (SUMMER SCHOOL)
The School Year Accountability (Summer School) grant, administered in accordance with C.G.S. section 10-265m,
assists children in Priority School Districts by allowing the provision of additional instruction to those students
whose mastery test scores indicate it is needed.
Grantees are able to make monthly drawdowns through SDE’s Pre-payment Grant system.
Municipal Aid
E - 15
EARLY CARE AND EDUCATION
This grant is the consolidation of separate existing grants into one grant program. The Early Childhood Program,
Child Care Services, and School Readiness are administered within this one program.
School Readiness
The purpose of the School Readiness grant is to initiate and expand pre-kindergarten programs. This grant is administered by the Office of Early Childhood in accordance with C.G.S. section 10-16o through section 10-16r, inclusive. The grant distribution formula is based on each district's School Readiness program capacity multiplied by its per-child cost (which cannot exceed $8,927 per child). Grantees receive payments monthly.
Early Childhood Program
Certain school districts that serve at least 40% of lunches free or at a reduced price are eligible for a
separate grant. Non-priority school districts that are ranked between one and fifty, in descending order
according to wealth, are eligible to compete for this grant. Because of its competitive nature, funding for
this grant is not reflected in this publication.
Child Care Services
The Office of Early Childhood issues Child Care Services grants pursuant to C.G.S. section 8-210 in order
to fund a portion of the costs needed to develop and operate licensed day care centers for children
disadvantaged by reasons of economic, social or environmental conditions. Grantees receive payments
at various times, in accordance with contracts entered into with the Office of Early Childhood.
Municipal Aid
E - 16
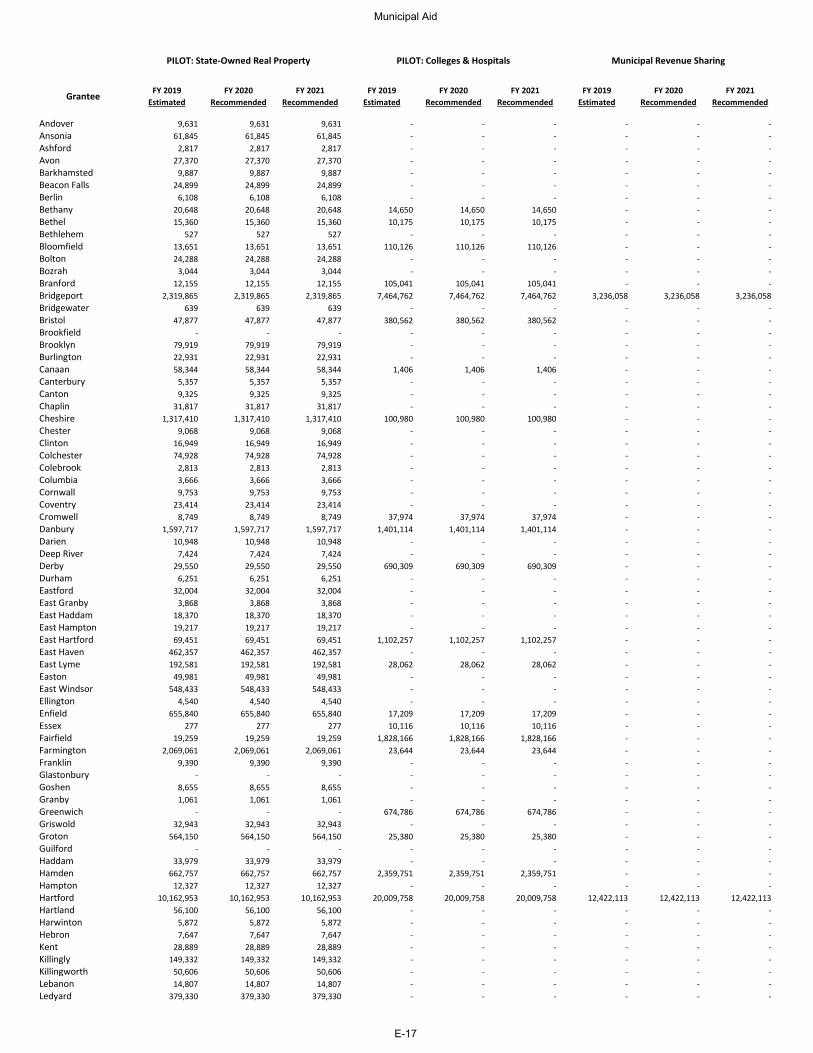
Grantee FY 2019 Estimated
FY 2020 Recommended
FY 2021 Recommended
FY 2019 Estimated
FY 2020 Recommended
FY 2021 Recommended
FY 2019 Estimated
FY 2020 Recommended
FY 2021 Recommended
Andover 9,631 9,631 9,631 - - - - - - Ansonia 61,845 61,845 61,845 - - - - - - Ashford 2,817 2,817 2,817 - - - - - - Avon 27,370 27,370 27,370 - - - - - - Barkhamsted 9,887 9,887 9,887 - - - - - - Beacon Falls 24,899 24,899 24,899 - - - - - - Berlin 6,108 6,108 6,108 - - - - - - Bethany 20,648 20,648 20,648 14,650 14,650 14,650 - - - Bethel 15,360 15,360 15,360 10,175 10,175 10,175 - - - Bethlehem 527 527 527 - - - - - - Bloomfield 13,651 13,651 13,651 110,126 110,126 110,126 - - - Bolton 24,288 24,288 24,288 - - - - - - Bozrah 3,044 3,044 3,044 - - - - - - Branford 12,155 12,155 12,155 105,041 105,041 105,041 - - - Bridgeport 2,319,865 2,319,865 2,319,865 7,464,762 7,464,762 7,464,762 3,236,058 3,236,058 3,236,058 Bridgewater 639 639 639 - - - - - - Bristol 47,877 47,877 47,877 380,562 380,562 380,562 - - - Brookfield - - - - - - - - - Brooklyn 79,919 79,919 79,919 - - - - - - Burlington 22,931 22,931 22,931 - - - - - - Canaan 58,344 58,344 58,344 1,406 1,406 1,406 - - - Canterbury 5,357 5,357 5,357 - - - - - - Canton 9,325 9,325 9,325 - - - - - - Chaplin 31,817 31,817 31,817 - - - - - - Cheshire 1,317,410 1,317,410 1,317,410 100,980 100,980 100,980 - - - Chester 9,068 9,068 9,068 - - - - - - Clinton 16,949 16,949 16,949 - - - - - - Colchester 74,928 74,928 74,928 - - - - - - Colebrook 2,813 2,813 2,813 - - - - - - Columbia 3,666 3,666 3,666 - - - - - - Cornwall 9,753 9,753 9,753 - - - - - - Coventry 23,414 23,414 23,414 - - - - - - Cromwell 8,749 8,749 8,749 37,974 37,974 37,974 - - - Danbury 1,597,717 1,597,717 1,597,717 1,401,114 1,401,114 1,401,114 - - - Darien 10,948 10,948 10,948 - - - - - - Deep River 7,424 7,424 7,424 - - - - - - Derby 29,550 29,550 29,550 690,309 690,309 690,309 - - - Durham 6,251 6,251 6,251 - - - - - - Eastford 32,004 32,004 32,004 - - - - - - East Granby 3,868 3,868 3,868 - - - - - - East Haddam 18,370 18,370 18,370 - - - - - - East Hampton 19,217 19,217 19,217 - - - - - - East Hartford 69,451 69,451 69,451 1,102,257 1,102,257 1,102,257 - - - East Haven 462,357 462,357 462,357 - - - - - - East Lyme 192,581 192,581 192,581 28,062 28,062 28,062 - - - Easton 49,981 49,981 49,981 - - - - - - East Windsor 548,433 548,433 548,433 - - - - - - Ellington 4,540 4,540 4,540 - - - - - - Enfield 655,840 655,840 655,840 17,209 17,209 17,209 - - - Essex 277 277 277 10,116 10,116 10,116 - - - Fairfield 19,259 19,259 19,259 1,828,166 1,828,166 1,828,166 - - - Farmington 2,069,061 2,069,061 2,069,061 23,644 23,644 23,644 - - - Franklin 9,390 9,390 9,390 - - - - - - Glastonbury - - - - - - - - - Goshen 8,655 8,655 8,655 - - - - - - Granby 1,061 1,061 1,061 - - - - - - Greenwich - - - 674,786 674,786 674,786 - - - Griswold 32,943 32,943 32,943 - - - - - - Groton 564,150 564,150 564,150 25,380 25,380 25,380 - - - Guilford - - - - - - - - - Haddam 33,979 33,979 33,979 - - - - - - Hamden 662,757 662,757 662,757 2,359,751 2,359,751 2,359,751 - - - Hampton 12,327 12,327 12,327 - - - - - - Hartford 10,162,953 10,162,953 10,162,953 20,009,758 20,009,758 20,009,758 12,422,113 12,422,113 12,422,113 Hartland 56,100 56,100 56,100 - - - - - - Harwinton 5,872 5,872 5,872 - - - - - - Hebron 7,647 7,647 7,647 - - - - - - Kent 28,889 28,889 28,889 - - - - - - Killingly 149,332 149,332 149,332 - - - - - - Killingworth 50,606 50,606 50,606 - - - - - - Lebanon 14,807 14,807 14,807 - - - - - - Ledyard 379,330 379,330 379,330 - - - - - -
PILOT: State-Owned Real Property PILOT: Colleges & Hospitals Municipal Revenue Sharing
Municipal Aid
E-17
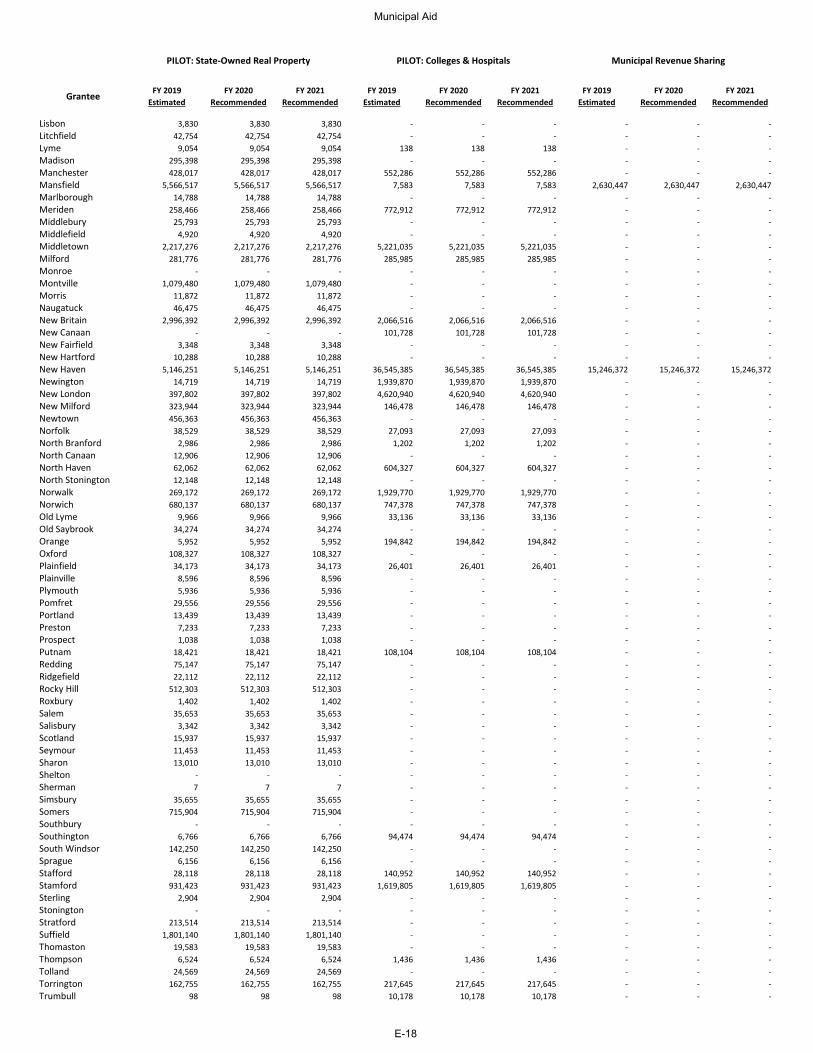
Grantee FY 2019 Estimated
FY 2020 Recommended
FY 2021 Recommended
FY 2019 Estimated
FY 2020 Recommended
FY 2021 Recommended
FY 2019 Estimated
FY 2020 Recommended
FY 2021 Recommended
PILOT: State-Owned Real Property PILOT: Colleges & Hospitals Municipal Revenue Sharing
Lisbon 3,830 3,830 3,830 - - - - - - Litchfield 42,754 42,754 42,754 - - - - - - Lyme 9,054 9,054 9,054 138 138 138 - - - Madison 295,398 295,398 295,398 - - - - - - Manchester 428,017 428,017 428,017 552,286 552,286 552,286 - - - Mansfield 5,566,517 5,566,517 5,566,517 7,583 7,583 7,583 2,630,447 2,630,447 2,630,447 Marlborough 14,788 14,788 14,788 - - - - - - Meriden 258,466 258,466 258,466 772,912 772,912 772,912 - - - Middlebury 25,793 25,793 25,793 - - - - - - Middlefield 4,920 4,920 4,920 - - - - - - Middletown 2,217,276 2,217,276 2,217,276 5,221,035 5,221,035 5,221,035 - - - Milford 281,776 281,776 281,776 285,985 285,985 285,985 - - - Monroe - - - - - - - - - Montville 1,079,480 1,079,480 1,079,480 - - - - - - Morris 11,872 11,872 11,872 - - - - - - Naugatuck 46,475 46,475 46,475 - - - - - - New Britain 2,996,392 2,996,392 2,996,392 2,066,516 2,066,516 2,066,516 - - - New Canaan - - - 101,728 101,728 101,728 - - - New Fairfield 3,348 3,348 3,348 - - - - - - New Hartford 10,288 10,288 10,288 - - - - - - New Haven 5,146,251 5,146,251 5,146,251 36,545,385 36,545,385 36,545,385 15,246,372 15,246,372 15,246,372 Newington 14,719 14,719 14,719 1,939,870 1,939,870 1,939,870 - - - New London 397,802 397,802 397,802 4,620,940 4,620,940 4,620,940 - - - New Milford 323,944 323,944 323,944 146,478 146,478 146,478 - - - Newtown 456,363 456,363 456,363 - - - - - - Norfolk 38,529 38,529 38,529 27,093 27,093 27,093 - - - North Branford 2,986 2,986 2,986 1,202 1,202 1,202 - - - North Canaan 12,906 12,906 12,906 - - - - - - North Haven 62,062 62,062 62,062 604,327 604,327 604,327 - - - North Stonington 12,148 12,148 12,148 - - - - - - Norwalk 269,172 269,172 269,172 1,929,770 1,929,770 1,929,770 - - - Norwich 680,137 680,137 680,137 747,378 747,378 747,378 - - - Old Lyme 9,966 9,966 9,966 33,136 33,136 33,136 - - - Old Saybrook 34,274 34,274 34,274 - - - - - - Orange 5,952 5,952 5,952 194,842 194,842 194,842 - - - Oxford 108,327 108,327 108,327 - - - - - - Plainfield 34,173 34,173 34,173 26,401 26,401 26,401 - - - Plainville 8,596 8,596 8,596 - - - - - - Plymouth 5,936 5,936 5,936 - - - - - - Pomfret 29,556 29,556 29,556 - - - - - - Portland 13,439 13,439 13,439 - - - - - - Preston 7,233 7,233 7,233 - - - - - - Prospect 1,038 1,038 1,038 - - - - - - Putnam 18,421 18,421 18,421 108,104 108,104 108,104 - - - Redding 75,147 75,147 75,147 - - - - - - Ridgefield 22,112 22,112 22,112 - - - - - - Rocky Hill 512,303 512,303 512,303 - - - - - - Roxbury 1,402 1,402 1,402 - - - - - - Salem 35,653 35,653 35,653 - - - - - - Salisbury 3,342 3,342 3,342 - - - - - - Scotland 15,937 15,937 15,937 - - - - - - Seymour 11,453 11,453 11,453 - - - - - - Sharon 13,010 13,010 13,010 - - - - - - Shelton - - - - - - - - - Sherman 7 7 7 - - - - - - Simsbury 35,655 35,655 35,655 - - - - - - Somers 715,904 715,904 715,904 - - - - - - Southbury - - - - - - - - - Southington 6,766 6,766 6,766 94,474 94,474 94,474 - - - South Windsor 142,250 142,250 142,250 - - - - - - Sprague 6,156 6,156 6,156 - - - - - - Stafford 28,118 28,118 28,118 140,952 140,952 140,952 - - - Stamford 931,423 931,423 931,423 1,619,805 1,619,805 1,619,805 - - - Sterling 2,904 2,904 2,904 - - - - - - Stonington - - - - - - - - - Stratford 213,514 213,514 213,514 - - - - - - Suffield 1,801,140 1,801,140 1,801,140 - - - - - - Thomaston 19,583 19,583 19,583 - - - - - - Thompson 6,524 6,524 6,524 1,436 1,436 1,436 - - - Tolland 24,569 24,569 24,569 - - - - - - Torrington 162,755 162,755 162,755 217,645 217,645 217,645 - - - Trumbull 98 98 98 10,178 10,178 10,178 - - -
Municipal Aid
E-18
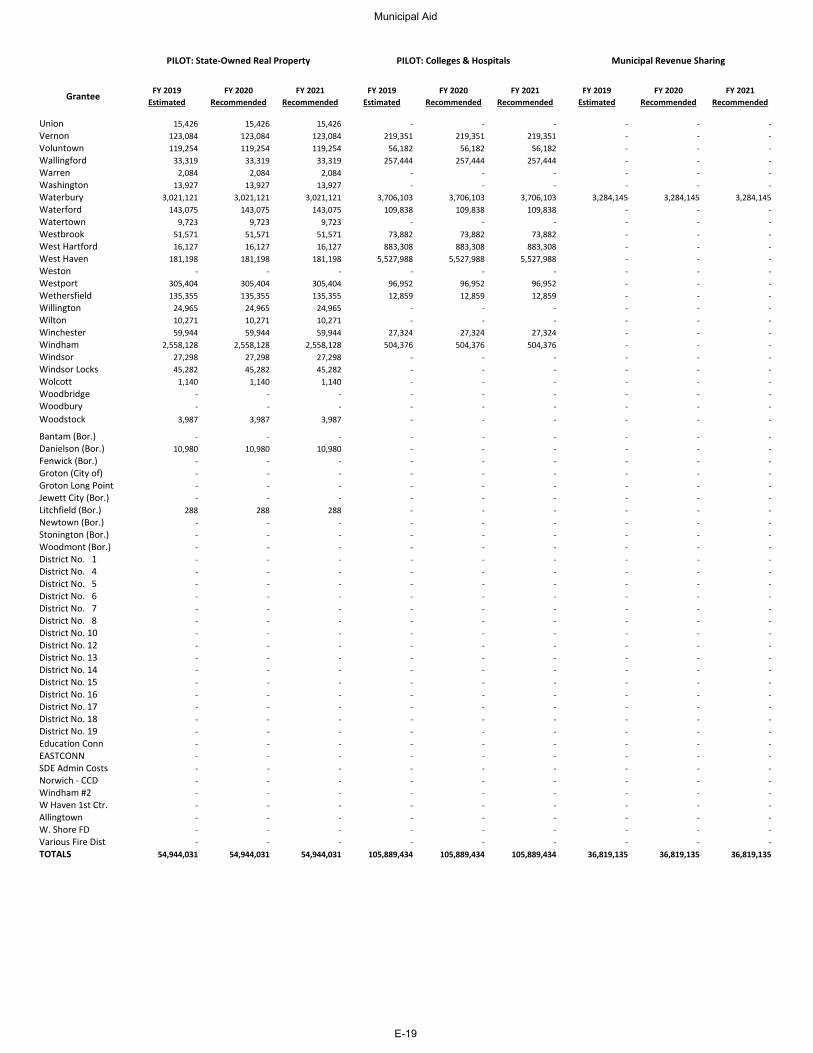
Grantee FY 2019 Estimated
FY 2020 Recommended
FY 2021 Recommended
FY 2019 Estimated
FY 2020 Recommended
FY 2021 Recommended
FY 2019 Estimated
FY 2020 Recommended
FY 2021 Recommended
PILOT: State-Owned Real Property PILOT: Colleges & Hospitals Municipal Revenue Sharing
Union 15,426 15,426 15,426 - - - - - - Vernon 123,084 123,084 123,084 219,351 219,351 219,351 - - - Voluntown 119,254 119,254 119,254 56,182 56,182 56,182 - - - Wallingford 33,319 33,319 33,319 257,444 257,444 257,444 - - - Warren 2,084 2,084 2,084 - - - - - - Washington 13,927 13,927 13,927 - - - - - - Waterbury 3,021,121 3,021,121 3,021,121 3,706,103 3,706,103 3,706,103 3,284,145 3,284,145 3,284,145 Waterford 143,075 143,075 143,075 109,838 109,838 109,838 - - - Watertown 9,723 9,723 9,723 - - - - - - Westbrook 51,571 51,571 51,571 73,882 73,882 73,882 - - - West Hartford 16,127 16,127 16,127 883,308 883,308 883,308 - - - West Haven 181,198 181,198 181,198 5,527,988 5,527,988 5,527,988 - - - Weston - - - - - - - - - Westport 305,404 305,404 305,404 96,952 96,952 96,952 - - - Wethersfield 135,355 135,355 135,355 12,859 12,859 12,859 - - - Willington 24,965 24,965 24,965 - - - - - - Wilton 10,271 10,271 10,271 - - - - - - Winchester 59,944 59,944 59,944 27,324 27,324 27,324 - - - Windham 2,558,128 2,558,128 2,558,128 504,376 504,376 504,376 - - - Windsor 27,298 27,298 27,298 - - - - - - Windsor Locks 45,282 45,282 45,282 - - - - - - Wolcott 1,140 1,140 1,140 - - - - - - Woodbridge - - - - - - - - - Woodbury - - - - - - - - - Woodstock 3,987 3,987 3,987 - - - - - -
Bantam (Bor.) - - - - - - - - - Danielson (Bor.) 10,980 10,980 10,980 - - - - - - Fenwick (Bor.) - - - - - - - - - Groton (City of) - - - - - - - - - Groton Long Point - - - - - - - - - Jewett City (Bor.) - - - - - - - - - Litchfield (Bor.) 288 288 288 - - - - - - Newtown (Bor.) - - - - - - - - - Stonington (Bor.) - - - - - - - - - Woodmont (Bor.) - - - - - - - - - District No. 1 - - - - - - - - - District No. 4 - - - - - - - - - District No. 5 - - - - - - - - - District No. 6 - - - - - - - - - District No. 7 - - - - - - - - - District No. 8 - - - - - - - - - District No. 10 - - - - - - - - - District No. 12 - - - - - - - - - District No. 13 - - - - - - - - - District No. 14 - - - - - - - - - District No. 15 - - - - - - - - - District No. 16 - - - - - - - - - District No. 17 - - - - - - - - - District No. 18 - - - - - - - - - District No. 19 - - - - - - - - - Education Conn - - - - - - - - - EASTCONN - - - - - - - - - SDE Admin Costs - - - - - - - - - Norwich - CCD - - - - - - - - - Windham #2 - - - - - - - - - W Haven 1st Ctr. - - - - - - - - - Allingtown - - - - - - - - - W. Shore FD - - - - - - - - - Various Fire Dist - - - - - - - - - TOTALS 54,944,031 54,944,031 54,944,031 105,889,434 105,889,434 105,889,434 36,819,135 36,819,135 36,819,135
Municipal Aid
E-19
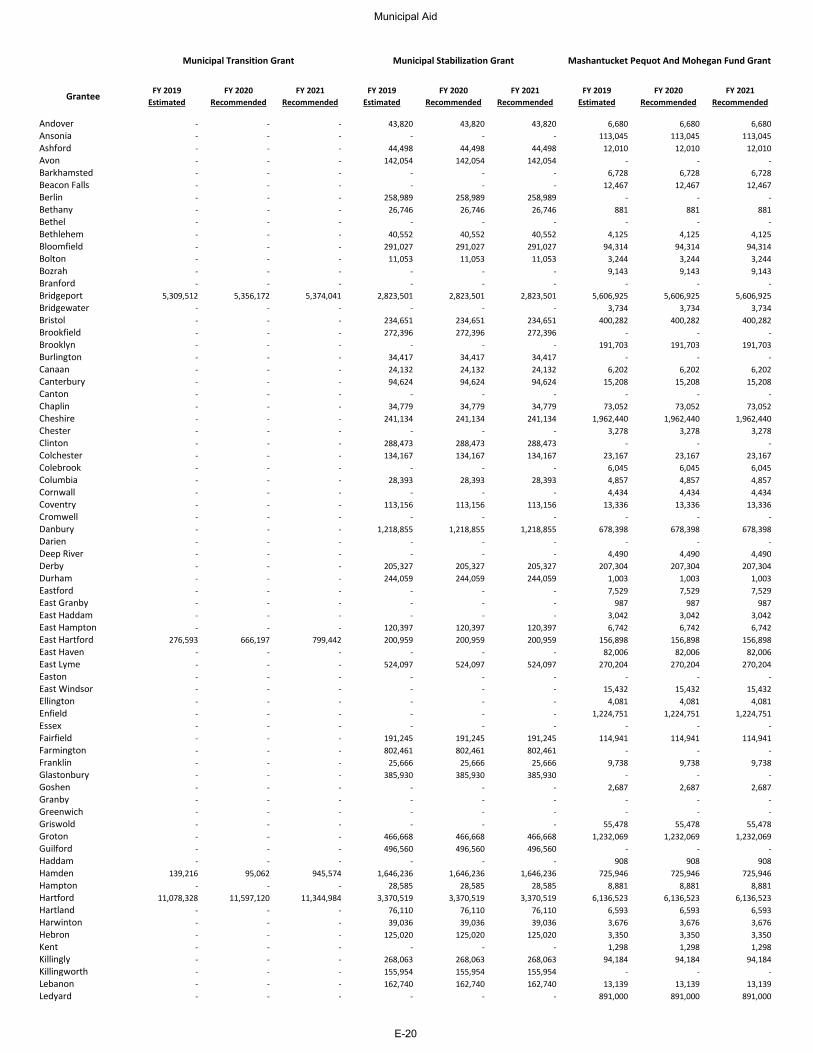
Grantee
AndoverAnsoniaAshfordAvonBarkhamstedBeacon FallsBerlinBethanyBethelBethlehemBloomfieldBoltonBozrahBranfordBridgeportBridgewaterBristolBrookfieldBrooklynBurlingtonCanaanCanterburyCantonChaplinCheshireChesterClintonColchesterColebrookColumbiaCornwallCoventryCromwellDanburyDarienDeep RiverDerbyDurhamEastfordEast GranbyEast HaddamEast HamptonEast HartfordEast HavenEast LymeEastonEast WindsorEllingtonEnfieldEssexFairfieldFarmingtonFranklinGlastonburyGoshenGranbyGreenwichGriswoldGrotonGuilfordHaddamHamdenHamptonHartfordHartlandHarwintonHebronKentKillinglyKillingworthLebanonLedyard
FY 2019 Estimated
FY 2020 Recommended
FY 2021 Recommended
FY 2019 Estimated
FY 2020 Recommended
FY 2021 Recommended
FY 2019 Estimated
FY 2020 Recommended
FY 2021 Recommended
- - - 43,820 43,820 43,820 6,680 6,680 6,680 - - - - - - 113,045 113,045 113,045 - - - 44,498 44,498 44,498 12,010 12,010 12,010 - - - 142,054 142,054 142,054 - - - - - - - - - 6,728 6,728 6,728 - - - - - - 12,467 12,467 12,467 - - - 258,989 258,989 258,989 - - - - - - 26,746 26,746 26,746 881 881 881 - - - - - - - - - - - - 40,552 40,552 40,552 4,125 4,125 4,125 - - - 291,027 291,027 291,027 94,314 94,314 94,314 - - - 11,053 11,053 11,053 3,244 3,244 3,244 - - - - - - 9,143 9,143 9,143 - - - - - - - - -
5,309,512 5,356,172 5,374,041 2,823,501 2,823,501 2,823,501 5,606,925 5,606,925 5,606,925 - - - - - - 3,734 3,734 3,734 - - - 234,651 234,651 234,651 400,282 400,282 400,282 - - - 272,396 272,396 272,396 - - - - - - - - - 191,703 191,703 191,703 - - - 34,417 34,417 34,417 - - - - - - 24,132 24,132 24,132 6,202 6,202 6,202 - - - 94,624 94,624 94,624 15,208 15,208 15,208 - - - - - - - - - - - - 34,779 34,779 34,779 73,052 73,052 73,052 - - - 241,134 241,134 241,134 1,962,440 1,962,440 1,962,440 - - - - - - 3,278 3,278 3,278 - - - 288,473 288,473 288,473 - - - - - - 134,167 134,167 134,167 23,167 23,167 23,167 - - - - - - 6,045 6,045 6,045 - - - 28,393 28,393 28,393 4,857 4,857 4,857 - - - - - - 4,434 4,434 4,434 - - - 113,156 113,156 113,156 13,336 13,336 13,336 - - - - - - - - - - - - 1,218,855 1,218,855 1,218,855 678,398 678,398 678,398 - - - - - - - - - - - - - - - 4,490 4,490 4,490 - - - 205,327 205,327 205,327 207,304 207,304 207,304 - - - 244,059 244,059 244,059 1,003 1,003 1,003 - - - - - - 7,529 7,529 7,529 - - - - - - 987 987 987 - - - - - - 3,042 3,042 3,042 - - - 120,397 120,397 120,397 6,742 6,742 6,742
276,593 666,197 799,442 200,959 200,959 200,959 156,898 156,898 156,898 - - - - - - 82,006 82,006 82,006 - - - 524,097 524,097 524,097 270,204 270,204 270,204 - - - - - - - - - - - - - - - 15,432 15,432 15,432 - - - - - - 4,081 4,081 4,081 - - - - - - 1,224,751 1,224,751 1,224,751 - - - - - - - - - - - - 191,245 191,245 191,245 114,941 114,941 114,941 - - - 802,461 802,461 802,461 - - - - - - 25,666 25,666 25,666 9,738 9,738 9,738 - - - 385,930 385,930 385,930 - - - - - - - - - 2,687 2,687 2,687 - - - - - - - - - - - - - - - - - - - - - - - - 55,478 55,478 55,478 - - - 466,668 466,668 466,668 1,232,069 1,232,069 1,232,069 - - - 496,560 496,560 496,560 - - - - - - - - - 908 908 908
139,216 95,062 945,574 1,646,236 1,646,236 1,646,236 725,946 725,946 725,946 - - - 28,585 28,585 28,585 8,881 8,881 8,881
11,078,328 11,597,120 11,344,984 3,370,519 3,370,519 3,370,519 6,136,523 6,136,523 6,136,523 - - - 76,110 76,110 76,110 6,593 6,593 6,593 - - - 39,036 39,036 39,036 3,676 3,676 3,676 - - - 125,020 125,020 125,020 3,350 3,350 3,350 - - - - - - 1,298 1,298 1,298 - - - 268,063 268,063 268,063 94,184 94,184 94,184 - - - 155,954 155,954 155,954 - - - - - - 162,740 162,740 162,740 13,139 13,139 13,139 - - - - - - 891,000 891,000 891,000
Mashantucket Pequot And Mohegan Fund GrantMunicipal Transition Grant Municipal Stabilization Grant
Municipal Aid
E-20
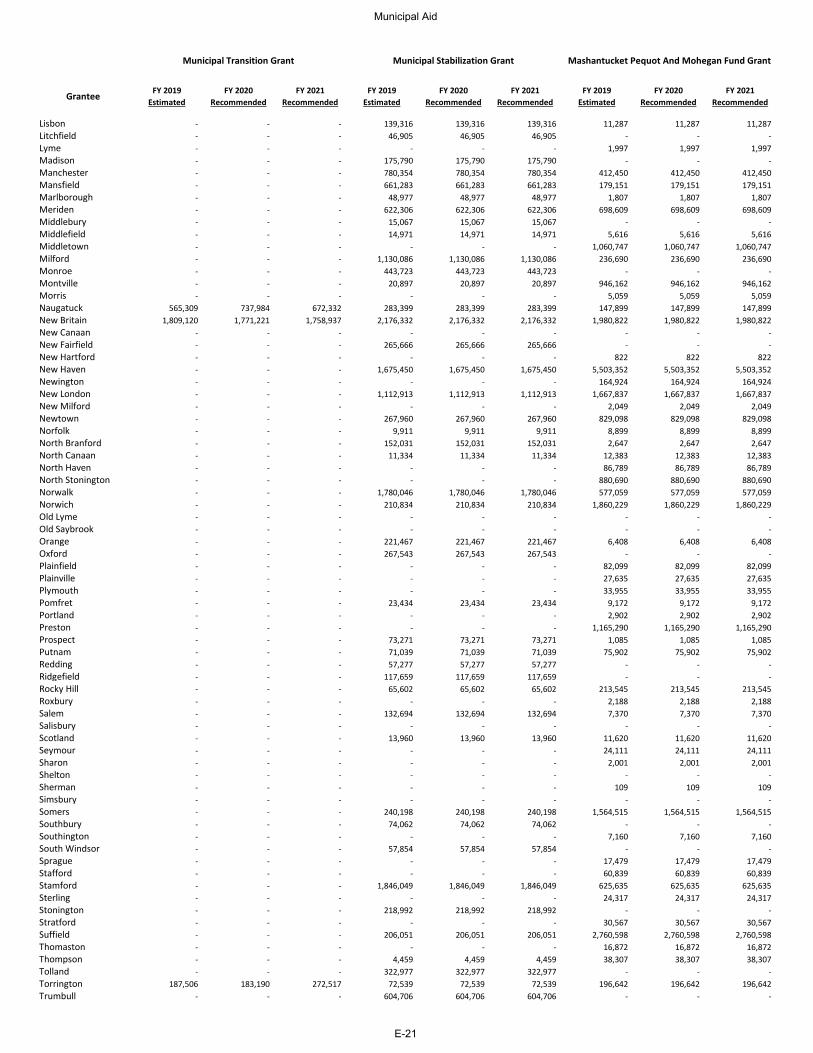
Grantee
LisbonLitchfieldLymeMadisonManchesterMansfieldMarlboroughMeridenMiddleburyMiddlefieldMiddletownMilfordMonroeMontvilleMorrisNaugatuckNew BritainNew CanaanNew FairfieldNew HartfordNew HavenNewingtonNew LondonNew MilfordNewtownNorfolkNorth BranfordNorth CanaanNorth HavenNorth StoningtonNorwalkNorwichOld LymeOld SaybrookOrangeOxfordPlainfieldPlainvillePlymouthPomfretPortlandPrestonProspectPutnamReddingRidgefieldRocky HillRoxburySalemSalisburyScotlandSeymourSharonSheltonShermanSimsburySomersSouthburySouthingtonSouth WindsorSpragueStaffordStamfordSterlingStoningtonStratfordSuffieldThomastonThompsonTollandTorringtonTrumbull
FY 2019 Estimated
FY 2020 Recommended
FY 2021 Recommended
FY 2019 Estimated
FY 2020 Recommended
FY 2021 Recommended
FY 2019 Estimated
FY 2020 Recommended
FY 2021 Recommended
Mashantucket Pequot And Mohegan Fund GrantMunicipal Transition Grant Municipal Stabilization Grant
- - - 139,316 139,316 139,316 11,287 11,287 11,287 - - - 46,905 46,905 46,905 - - - - - - - - - 1,997 1,997 1,997 - - - 175,790 175,790 175,790 - - - - - - 780,354 780,354 780,354 412,450 412,450 412,450 - - - 661,283 661,283 661,283 179,151 179,151 179,151 - - - 48,977 48,977 48,977 1,807 1,807 1,807 - - - 622,306 622,306 622,306 698,609 698,609 698,609 - - - 15,067 15,067 15,067 - - - - - - 14,971 14,971 14,971 5,616 5,616 5,616 - - - - - - 1,060,747 1,060,747 1,060,747 - - - 1,130,086 1,130,086 1,130,086 236,690 236,690 236,690 - - - 443,723 443,723 443,723 - - - - - - 20,897 20,897 20,897 946,162 946,162 946,162 - - - - - - 5,059 5,059 5,059
565,309 737,984 672,332 283,399 283,399 283,399 147,899 147,899 147,899 1,809,120 1,771,221 1,758,937 2,176,332 2,176,332 2,176,332 1,980,822 1,980,822 1,980,822
- - - - - - - - - - - - 265,666 265,666 265,666 - - - - - - - - - 822 822 822 - - - 1,675,450 1,675,450 1,675,450 5,503,352 5,503,352 5,503,352 - - - - - - 164,924 164,924 164,924 - - - 1,112,913 1,112,913 1,112,913 1,667,837 1,667,837 1,667,837 - - - - - - 2,049 2,049 2,049 - - - 267,960 267,960 267,960 829,098 829,098 829,098 - - - 9,911 9,911 9,911 8,899 8,899 8,899 - - - 152,031 152,031 152,031 2,647 2,647 2,647 - - - 11,334 11,334 11,334 12,383 12,383 12,383 - - - - - - 86,789 86,789 86,789 - - - - - - 880,690 880,690 880,690 - - - 1,780,046 1,780,046 1,780,046 577,059 577,059 577,059 - - - 210,834 210,834 210,834 1,860,229 1,860,229 1,860,229 - - - - - - - - - - - - - - - - - - - - - 221,467 221,467 221,467 6,408 6,408 6,408 - - - 267,543 267,543 267,543 - - - - - - - - - 82,099 82,099 82,099 - - - - - - 27,635 27,635 27,635 - - - - - - 33,955 33,955 33,955 - - - 23,434 23,434 23,434 9,172 9,172 9,172 - - - - - - 2,902 2,902 2,902 - - - - - - 1,165,290 1,165,290 1,165,290 - - - 73,271 73,271 73,271 1,085 1,085 1,085 - - - 71,039 71,039 71,039 75,902 75,902 75,902 - - - 57,277 57,277 57,277 - - - - - - 117,659 117,659 117,659 - - - - - - 65,602 65,602 65,602 213,545 213,545 213,545 - - - - - - 2,188 2,188 2,188 - - - 132,694 132,694 132,694 7,370 7,370 7,370 - - - - - - - - - - - - 13,960 13,960 13,960 11,620 11,620 11,620 - - - - - - 24,111 24,111 24,111 - - - - - - 2,001 2,001 2,001 - - - - - - - - - - - - - - - 109 109 109 - - - - - - - - - - - - 240,198 240,198 240,198 1,564,515 1,564,515 1,564,515 - - - 74,062 74,062 74,062 - - - - - - - - - 7,160 7,160 7,160 - - - 57,854 57,854 57,854 - - - - - - - - - 17,479 17,479 17,479 - - - - - - 60,839 60,839 60,839 - - - 1,846,049 1,846,049 1,846,049 625,635 625,635 625,635 - - - - - - 24,317 24,317 24,317 - - - 218,992 218,992 218,992 - - - - - - - - - 30,567 30,567 30,567 - - - 206,051 206,051 206,051 2,760,598 2,760,598 2,760,598 - - - - - - 16,872 16,872 16,872 - - - 4,459 4,459 4,459 38,307 38,307 38,307 - - - 322,977 322,977 322,977 - - -
187,506 183,190 272,517 72,539 72,539 72,539 196,642 196,642 196,642 - - - 604,706 604,706 604,706 - - -
Municipal Aid
E-21
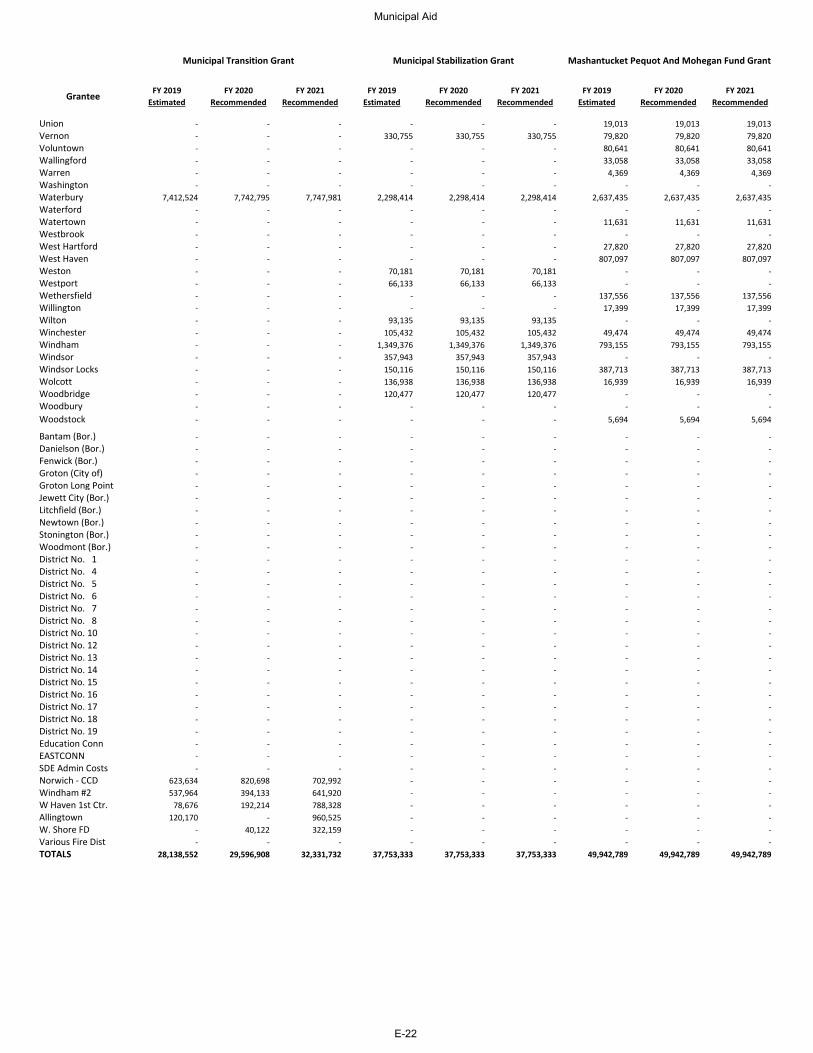
Grantee
UnionVernonVoluntownWallingfordWarrenWashingtonWaterburyWaterfordWatertownWestbrookWest HartfordWest HavenWestonWestportWethersfieldWillingtonWiltonWinchesterWindhamWindsorWindsor LocksWolcottWoodbridgeWoodburyWoodstock
Bantam (Bor.)Danielson (Bor.)Fenwick (Bor.)Groton (City of)Groton Long PointJewett City (Bor.)Litchfield (Bor.)Newtown (Bor.)Stonington (Bor.)Woodmont (Bor.)District No. 1District No. 4District No. 5District No. 6District No. 7District No. 8District No. 10District No. 12District No. 13District No. 14District No. 15District No. 16District No. 17District No. 18District No. 19Education ConnEASTCONNSDE Admin CostsNorwich - CCD Windham #2W Haven 1st Ctr.Allingtown W. Shore FD Various Fire DistTOTALS
FY 2019 Estimated
FY 2020 Recommended
FY 2021 Recommended
FY 2019 Estimated
FY 2020 Recommended
FY 2021 Recommended
FY 2019 Estimated
FY 2020 Recommended
FY 2021 Recommended
Mashantucket Pequot And Mohegan Fund GrantMunicipal Transition Grant Municipal Stabilization Grant
- - - - - - 19,013 19,013 19,013 - - - 330,755 330,755 330,755 79,820 79,820 79,820 - - - - - - 80,641 80,641 80,641 - - - - - - 33,058 33,058 33,058 - - - - - - 4,369 4,369 4,369 - - - - - - - - -
7,412,524 7,742,795 7,747,981 2,298,414 2,298,414 2,298,414 2,637,435 2,637,435 2,637,435 - - - - - - - - - - - - - - - 11,631 11,631 11,631 - - - - - - - - - - - - - - - 27,820 27,820 27,820 - - - - - - 807,097 807,097 807,097 - - - 70,181 70,181 70,181 - - - - - - 66,133 66,133 66,133 - - - - - - - - - 137,556 137,556 137,556 - - - - - - 17,399 17,399 17,399 - - - 93,135 93,135 93,135 - - - - - - 105,432 105,432 105,432 49,474 49,474 49,474 - - - 1,349,376 1,349,376 1,349,376 793,155 793,155 793,155 - - - 357,943 357,943 357,943 - - - - - - 150,116 150,116 150,116 387,713 387,713 387,713 - - - 136,938 136,938 136,938 16,939 16,939 16,939 - - - 120,477 120,477 120,477 - - - - - - - - - - - - - - - - - - 5,694 5,694 5,694
- - - - - - - - - - - - - - - - - - - - - - - - - - - - - - - - - - - - - - - - - - - - - - - - - - - - - - - - - - - - - - - - - - - - - - - - - - - - - - - - - - - - - - - - - - - - - - - - - - - - - - - - - - - - - - - - - - - - - - - - - - - - - - - - - - - - - - - - - - - - - - - - - - - - - - - - - - - - - - - - - - - - - - - - - - - - - - - - - - - - - - - - - - - - - - - - - - - - - - - - - - - - - - - - - - - - - - - - - - - - - - - - - - - - - - - - - - - - - - - - - - - - - - - - - - - -
623,634 820,698 702,992 - - - - - - 537,964 394,133 641,920 - - - - - -
78,676 192,214 788,328 - - - - - - 120,170 - 960,525 - - - - - -
- 40,122 322,159 - - - - - - - - - - - - - - -
28,138,552 29,596,908 32,331,732 37,753,333 37,753,333 37,753,333 49,942,789 49,942,789 49,942,789
Municipal Aid
E-22
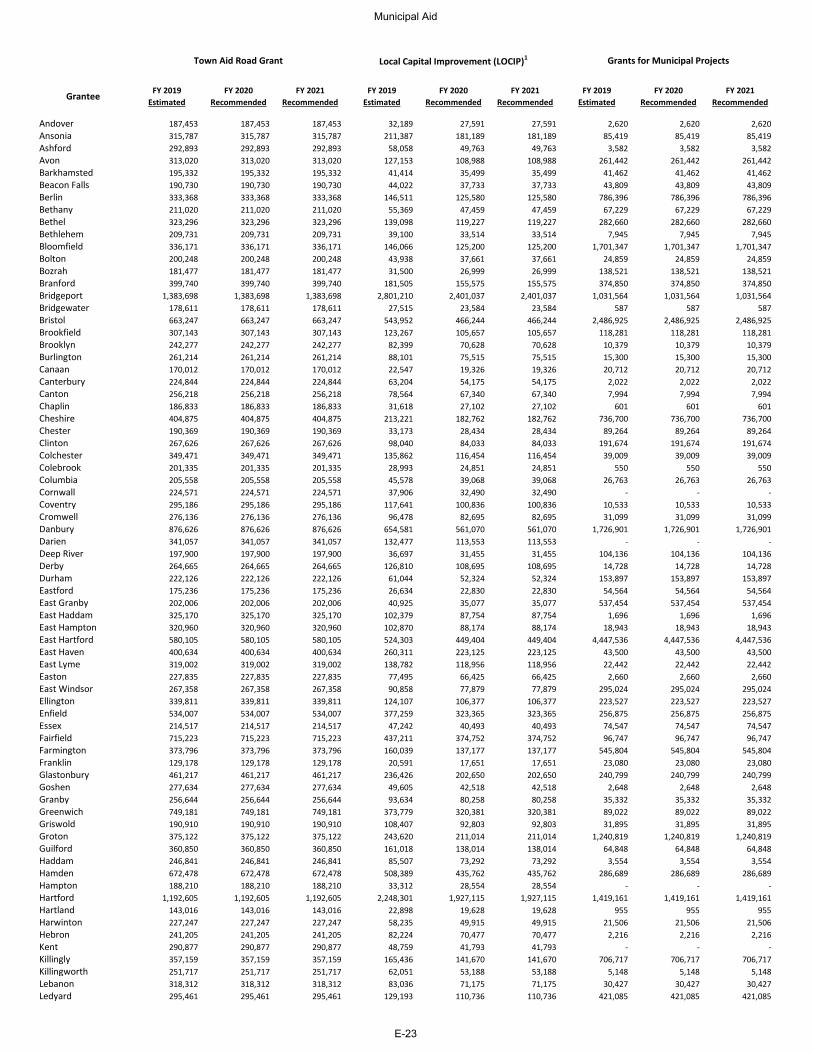
Grantee
AndoverAnsoniaAshfordAvonBarkhamstedBeacon FallsBerlinBethanyBethelBethlehemBloomfieldBoltonBozrahBranfordBridgeportBridgewaterBristolBrookfieldBrooklynBurlingtonCanaanCanterburyCantonChaplinCheshireChesterClintonColchesterColebrookColumbiaCornwallCoventryCromwellDanburyDarienDeep RiverDerbyDurhamEastfordEast GranbyEast HaddamEast HamptonEast HartfordEast HavenEast LymeEastonEast WindsorEllingtonEnfieldEssexFairfieldFarmingtonFranklinGlastonburyGoshenGranbyGreenwichGriswoldGrotonGuilfordHaddamHamdenHamptonHartfordHartlandHarwintonHebronKentKillinglyKillingworthLebanonLedyard
FY 2019 Estimated
FY 2020 Recommended
FY 2021 Recommended
FY 2019 Estimated
FY 2020 Recommended
FY 2021 Recommended
FY 2019 Estimated
FY 2020 Recommended
FY 2021 Recommended
187,453 187,453 187,453 32,189 27,591 27,591 2,620 2,620 2,620 315,787 315,787 315,787 211,387 181,189 181,189 85,419 85,419 85,419 292,893 292,893 292,893 58,058 49,763 49,763 3,582 3,582 3,582 313,020 313,020 313,020 127,153 108,988 108,988 261,442 261,442 261,442 195,332 195,332 195,332 41,414 35,499 35,499 41,462 41,462 41,462 190,730 190,730 190,730 44,022 37,733 37,733 43,809 43,809 43,809 333,368 333,368 333,368 146,511 125,580 125,580 786,396 786,396 786,396 211,020 211,020 211,020 55,369 47,459 47,459 67,229 67,229 67,229 323,296 323,296 323,296 139,098 119,227 119,227 282,660 282,660 282,660 209,731 209,731 209,731 39,100 33,514 33,514 7,945 7,945 7,945 336,171 336,171 336,171 146,066 125,200 125,200 1,701,347 1,701,347 1,701,347 200,248 200,248 200,248 43,938 37,661 37,661 24,859 24,859 24,859 181,477 181,477 181,477 31,500 26,999 26,999 138,521 138,521 138,521 399,740 399,740 399,740 181,505 155,575 155,575 374,850 374,850 374,850
1,383,698 1,383,698 1,383,698 2,801,210 2,401,037 2,401,037 1,031,564 1,031,564 1,031,564 178,611 178,611 178,611 27,515 23,584 23,584 587 587 587 663,247 663,247 663,247 543,952 466,244 466,244 2,486,925 2,486,925 2,486,925 307,143 307,143 307,143 123,267 105,657 105,657 118,281 118,281 118,281 242,277 242,277 242,277 82,399 70,628 70,628 10,379 10,379 10,379 261,214 261,214 261,214 88,101 75,515 75,515 15,300 15,300 15,300 170,012 170,012 170,012 22,547 19,326 19,326 20,712 20,712 20,712 224,844 224,844 224,844 63,204 54,175 54,175 2,022 2,022 2,022 256,218 256,218 256,218 78,564 67,340 67,340 7,994 7,994 7,994 186,833 186,833 186,833 31,618 27,102 27,102 601 601 601 404,875 404,875 404,875 213,221 182,762 182,762 736,700 736,700 736,700 190,369 190,369 190,369 33,173 28,434 28,434 89,264 89,264 89,264 267,626 267,626 267,626 98,040 84,033 84,033 191,674 191,674 191,674 349,471 349,471 349,471 135,862 116,454 116,454 39,009 39,009 39,009 201,335 201,335 201,335 28,993 24,851 24,851 550 550 550 205,558 205,558 205,558 45,578 39,068 39,068 26,763 26,763 26,763 224,571 224,571 224,571 37,906 32,490 32,490 - - - 295,186 295,186 295,186 117,641 100,836 100,836 10,533 10,533 10,533 276,136 276,136 276,136 96,478 82,695 82,695 31,099 31,099 31,099 876,626 876,626 876,626 654,581 561,070 561,070 1,726,901 1,726,901 1,726,901 341,057 341,057 341,057 132,477 113,553 113,553 - - - 197,900 197,900 197,900 36,697 31,455 31,455 104,136 104,136 104,136 264,665 264,665 264,665 126,810 108,695 108,695 14,728 14,728 14,728 222,126 222,126 222,126 61,044 52,324 52,324 153,897 153,897 153,897 175,236 175,236 175,236 26,634 22,830 22,830 54,564 54,564 54,564 202,006 202,006 202,006 40,925 35,077 35,077 537,454 537,454 537,454 325,170 325,170 325,170 102,379 87,754 87,754 1,696 1,696 1,696 320,960 320,960 320,960 102,870 88,174 88,174 18,943 18,943 18,943 580,105 580,105 580,105 524,303 449,404 449,404 4,447,536 4,447,536 4,447,536 400,634 400,634 400,634 260,311 223,125 223,125 43,500 43,500 43,500 319,002 319,002 319,002 138,782 118,956 118,956 22,442 22,442 22,442 227,835 227,835 227,835 77,495 66,425 66,425 2,660 2,660 2,660 267,358 267,358 267,358 90,858 77,879 77,879 295,024 295,024 295,024 339,811 339,811 339,811 124,107 106,377 106,377 223,527 223,527 223,527 534,007 534,007 534,007 377,259 323,365 323,365 256,875 256,875 256,875 214,517 214,517 214,517 47,242 40,493 40,493 74,547 74,547 74,547 715,223 715,223 715,223 437,211 374,752 374,752 96,747 96,747 96,747 373,796 373,796 373,796 160,039 137,177 137,177 545,804 545,804 545,804 129,178 129,178 129,178 20,591 17,651 17,651 23,080 23,080 23,080 461,217 461,217 461,217 236,426 202,650 202,650 240,799 240,799 240,799 277,634 277,634 277,634 49,605 42,518 42,518 2,648 2,648 2,648 256,644 256,644 256,644 93,634 80,258 80,258 35,332 35,332 35,332 749,181 749,181 749,181 373,779 320,381 320,381 89,022 89,022 89,022 190,910 190,910 190,910 108,407 92,803 92,803 31,895 31,895 31,895 375,122 375,122 375,122 243,620 211,014 211,014 1,240,819 1,240,819 1,240,819 360,850 360,850 360,850 161,018 138,014 138,014 64,848 64,848 64,848 246,841 246,841 246,841 85,507 73,292 73,292 3,554 3,554 3,554 672,478 672,478 672,478 508,389 435,762 435,762 286,689 286,689 286,689 188,210 188,210 188,210 33,312 28,554 28,554 - - -
1,192,605 1,192,605 1,192,605 2,248,301 1,927,115 1,927,115 1,419,161 1,419,161 1,419,161 143,016 143,016 143,016 22,898 19,628 19,628 955 955 955 227,247 227,247 227,247 58,235 49,915 49,915 21,506 21,506 21,506 241,205 241,205 241,205 82,224 70,477 70,477 2,216 2,216 2,216 290,877 290,877 290,877 48,759 41,793 41,793 - - - 357,159 357,159 357,159 165,436 141,670 141,670 706,717 706,717 706,717 251,717 251,717 251,717 62,051 53,188 53,188 5,148 5,148 5,148 318,312 318,312 318,312 83,036 71,175 71,175 30,427 30,427 30,427 295,461 295,461 295,461 129,193 110,736 110,736 421,085 421,085 421,085
Town Aid Road Grant Local Capital Improvement (LOCIP)1 Grants for Municipal Projects
Municipal Aid
E-23
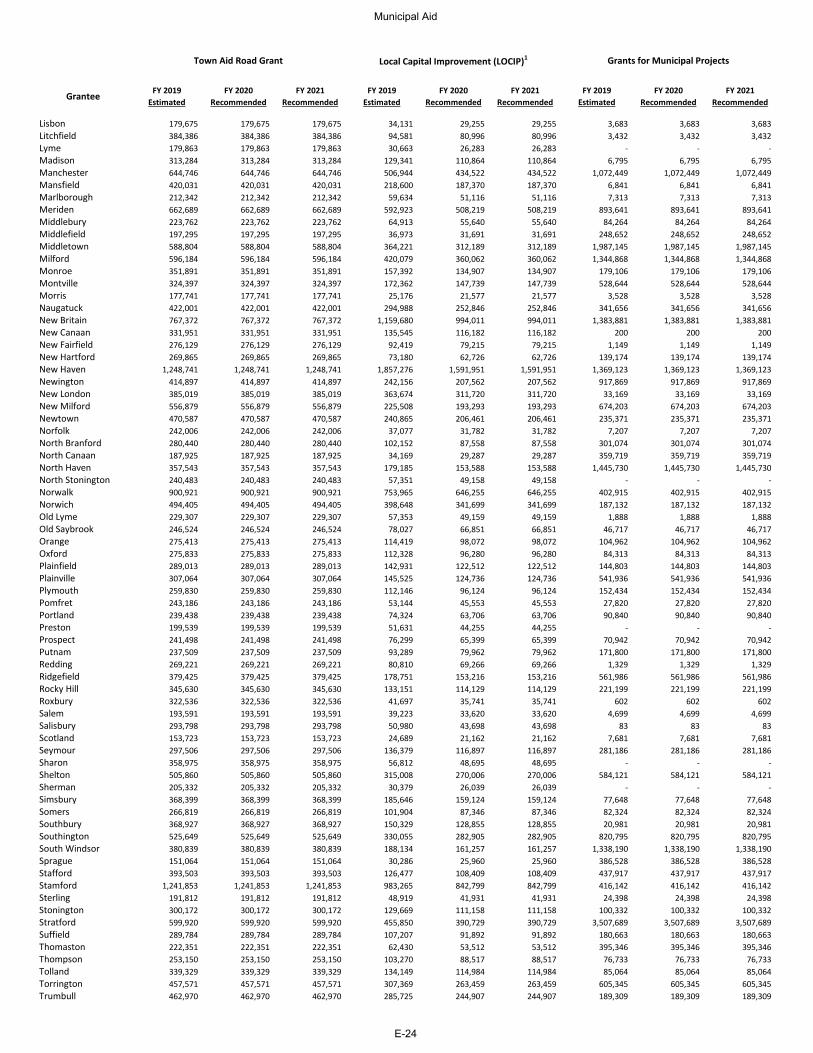
Grantee
LisbonLitchfieldLymeMadisonManchesterMansfieldMarlboroughMeridenMiddleburyMiddlefieldMiddletownMilfordMonroeMontvilleMorrisNaugatuckNew BritainNew CanaanNew FairfieldNew HartfordNew HavenNewingtonNew LondonNew MilfordNewtownNorfolkNorth BranfordNorth CanaanNorth HavenNorth StoningtonNorwalkNorwichOld LymeOld SaybrookOrangeOxfordPlainfieldPlainvillePlymouthPomfretPortlandPrestonProspectPutnamReddingRidgefieldRocky HillRoxburySalemSalisburyScotlandSeymourSharonSheltonShermanSimsburySomersSouthburySouthingtonSouth WindsorSpragueStaffordStamfordSterlingStoningtonStratfordSuffieldThomastonThompsonTollandTorringtonTrumbull
FY 2019 Estimated
FY 2020 Recommended
FY 2021 Recommended
FY 2019 Estimated
FY 2020 Recommended
FY 2021 Recommended
FY 2019 Estimated
FY 2020 Recommended
FY 2021 Recommended
Town Aid Road Grant Local Capital Improvement (LOCIP)1 Grants for Municipal Projects
179,675 179,675 179,675 34,131 29,255 29,255 3,683 3,683 3,683 384,386 384,386 384,386 94,581 80,996 80,996 3,432 3,432 3,432 179,863 179,863 179,863 30,663 26,283 26,283 - - - 313,284 313,284 313,284 129,341 110,864 110,864 6,795 6,795 6,795 644,746 644,746 644,746 506,944 434,522 434,522 1,072,449 1,072,449 1,072,449 420,031 420,031 420,031 218,600 187,370 187,370 6,841 6,841 6,841 212,342 212,342 212,342 59,634 51,116 51,116 7,313 7,313 7,313 662,689 662,689 662,689 592,923 508,219 508,219 893,641 893,641 893,641 223,762 223,762 223,762 64,913 55,640 55,640 84,264 84,264 84,264 197,295 197,295 197,295 36,973 31,691 31,691 248,652 248,652 248,652 588,804 588,804 588,804 364,221 312,189 312,189 1,987,145 1,987,145 1,987,145 596,184 596,184 596,184 420,079 360,062 360,062 1,344,868 1,344,868 1,344,868 351,891 351,891 351,891 157,392 134,907 134,907 179,106 179,106 179,106 324,397 324,397 324,397 172,362 147,739 147,739 528,644 528,644 528,644 177,741 177,741 177,741 25,176 21,577 21,577 3,528 3,528 3,528 422,001 422,001 422,001 294,988 252,846 252,846 341,656 341,656 341,656 767,372 767,372 767,372 1,159,680 994,011 994,011 1,383,881 1,383,881 1,383,881 331,951 331,951 331,951 135,545 116,182 116,182 200 200 200 276,129 276,129 276,129 92,419 79,215 79,215 1,149 1,149 1,149 269,865 269,865 269,865 73,180 62,726 62,726 139,174 139,174 139,174
1,248,741 1,248,741 1,248,741 1,857,276 1,591,951 1,591,951 1,369,123 1,369,123 1,369,123 414,897 414,897 414,897 242,156 207,562 207,562 917,869 917,869 917,869 385,019 385,019 385,019 363,674 311,720 311,720 33,169 33,169 33,169 556,879 556,879 556,879 225,508 193,293 193,293 674,203 674,203 674,203 470,587 470,587 470,587 240,865 206,461 206,461 235,371 235,371 235,371 242,006 242,006 242,006 37,077 31,782 31,782 7,207 7,207 7,207 280,440 280,440 280,440 102,152 87,558 87,558 301,074 301,074 301,074 187,925 187,925 187,925 34,169 29,287 29,287 359,719 359,719 359,719 357,543 357,543 357,543 179,185 153,588 153,588 1,445,730 1,445,730 1,445,730 240,483 240,483 240,483 57,351 49,158 49,158 - - - 900,921 900,921 900,921 753,965 646,255 646,255 402,915 402,915 402,915 494,405 494,405 494,405 398,648 341,699 341,699 187,132 187,132 187,132 229,307 229,307 229,307 57,353 49,159 49,159 1,888 1,888 1,888 246,524 246,524 246,524 78,027 66,851 66,851 46,717 46,717 46,717 275,413 275,413 275,413 114,419 98,072 98,072 104,962 104,962 104,962 275,833 275,833 275,833 112,328 96,280 96,280 84,313 84,313 84,313 289,013 289,013 289,013 142,931 122,512 122,512 144,803 144,803 144,803 307,064 307,064 307,064 145,525 124,736 124,736 541,936 541,936 541,936 259,830 259,830 259,830 112,146 96,124 96,124 152,434 152,434 152,434 243,186 243,186 243,186 53,144 45,553 45,553 27,820 27,820 27,820 239,438 239,438 239,438 74,324 63,706 63,706 90,840 90,840 90,840 199,539 199,539 199,539 51,631 44,255 44,255 - - - 241,498 241,498 241,498 76,299 65,399 65,399 70,942 70,942 70,942 237,509 237,509 237,509 93,289 79,962 79,962 171,800 171,800 171,800 269,221 269,221 269,221 80,810 69,266 69,266 1,329 1,329 1,329 379,425 379,425 379,425 178,751 153,216 153,216 561,986 561,986 561,986 345,630 345,630 345,630 133,151 114,129 114,129 221,199 221,199 221,199 322,536 322,536 322,536 41,697 35,741 35,741 602 602 602 193,591 193,591 193,591 39,223 33,620 33,620 4,699 4,699 4,699 293,798 293,798 293,798 50,980 43,698 43,698 83 83 83 153,723 153,723 153,723 24,689 21,162 21,162 7,681 7,681 7,681 297,506 297,506 297,506 136,379 116,897 116,897 281,186 281,186 281,186 358,975 358,975 358,975 56,812 48,695 48,695 - - - 505,860 505,860 505,860 315,008 270,006 270,006 584,121 584,121 584,121 205,332 205,332 205,332 30,379 26,039 26,039 - - - 368,399 368,399 368,399 185,646 159,124 159,124 77,648 77,648 77,648 266,819 266,819 266,819 101,904 87,346 87,346 82,324 82,324 82,324 368,927 368,927 368,927 150,329 128,855 128,855 20,981 20,981 20,981 525,649 525,649 525,649 330,055 282,905 282,905 820,795 820,795 820,795 380,839 380,839 380,839 188,134 161,257 161,257 1,338,190 1,338,190 1,338,190 151,064 151,064 151,064 30,286 25,960 25,960 386,528 386,528 386,528 393,503 393,503 393,503 126,477 108,409 108,409 437,917 437,917 437,917
1,241,853 1,241,853 1,241,853 983,265 842,799 842,799 416,142 416,142 416,142 191,812 191,812 191,812 48,919 41,931 41,931 24,398 24,398 24,398 300,172 300,172 300,172 129,669 111,158 111,158 100,332 100,332 100,332 599,920 599,920 599,920 455,850 390,729 390,729 3,507,689 3,507,689 3,507,689 289,784 289,784 289,784 107,207 91,892 91,892 180,663 180,663 180,663 222,351 222,351 222,351 62,430 53,512 53,512 395,346 395,346 395,346 253,150 253,150 253,150 103,270 88,517 88,517 76,733 76,733 76,733 339,329 339,329 339,329 134,149 114,984 114,984 85,064 85,064 85,064 457,571 457,571 457,571 307,369 263,459 263,459 605,345 605,345 605,345 462,970 462,970 462,970 285,725 244,907 244,907 189,309 189,309 189,309
Municipal Aid
E-24
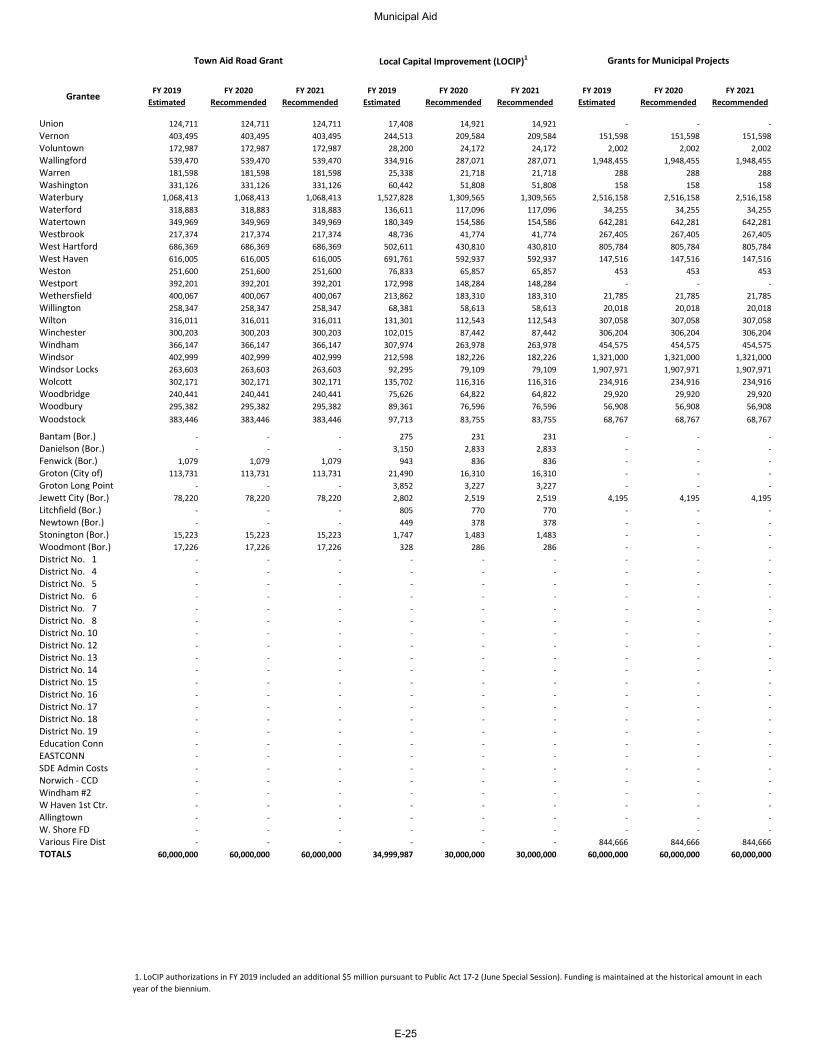
Grantee
UnionVernonVoluntownWallingfordWarrenWashingtonWaterburyWaterfordWatertownWestbrookWest HartfordWest HavenWestonWestportWethersfieldWillingtonWiltonWinchesterWindhamWindsorWindsor LocksWolcottWoodbridgeWoodburyWoodstock
Bantam (Bor.)Danielson (Bor.)Fenwick (Bor.)Groton (City of)Groton Long PointJewett City (Bor.)Litchfield (Bor.)Newtown (Bor.)Stonington (Bor.)Woodmont (Bor.)District No. 1District No. 4District No. 5District No. 6District No. 7District No. 8District No. 10District No. 12District No. 13District No. 14District No. 15District No. 16District No. 17District No. 18District No. 19Education ConnEASTCONNSDE Admin CostsNorwich - CCD Windham #2W Haven 1st Ctr.Allingtown W. Shore FD Various Fire DistTOTALS
FY 2019 Estimated
FY 2020 Recommended
FY 2021 Recommended
FY 2019 Estimated
FY 2020 Recommended
FY 2021 Recommended
FY 2019 Estimated
FY 2020 Recommended
FY 2021 Recommended
Town Aid Road Grant Local Capital Improvement (LOCIP)1 Grants for Municipal Projects
124,711 124,711 124,711 17,408 14,921 14,921 - - - 403,495 403,495 403,495 244,513 209,584 209,584 151,598 151,598 151,598 172,987 172,987 172,987 28,200 24,172 24,172 2,002 2,002 2,002 539,470 539,470 539,470 334,916 287,071 287,071 1,948,455 1,948,455 1,948,455 181,598 181,598 181,598 25,338 21,718 21,718 288 288 288 331,126 331,126 331,126 60,442 51,808 51,808 158 158 158
1,068,413 1,068,413 1,068,413 1,527,828 1,309,565 1,309,565 2,516,158 2,516,158 2,516,158 318,883 318,883 318,883 136,611 117,096 117,096 34,255 34,255 34,255 349,969 349,969 349,969 180,349 154,586 154,586 642,281 642,281 642,281 217,374 217,374 217,374 48,736 41,774 41,774 267,405 267,405 267,405 686,369 686,369 686,369 502,611 430,810 430,810 805,784 805,784 805,784 616,005 616,005 616,005 691,761 592,937 592,937 147,516 147,516 147,516 251,600 251,600 251,600 76,833 65,857 65,857 453 453 453 392,201 392,201 392,201 172,998 148,284 148,284 - - - 400,067 400,067 400,067 213,862 183,310 183,310 21,785 21,785 21,785 258,347 258,347 258,347 68,381 58,613 58,613 20,018 20,018 20,018 316,011 316,011 316,011 131,301 112,543 112,543 307,058 307,058 307,058 300,203 300,203 300,203 102,015 87,442 87,442 306,204 306,204 306,204 366,147 366,147 366,147 307,974 263,978 263,978 454,575 454,575 454,575 402,999 402,999 402,999 212,598 182,226 182,226 1,321,000 1,321,000 1,321,000 263,603 263,603 263,603 92,295 79,109 79,109 1,907,971 1,907,971 1,907,971 302,171 302,171 302,171 135,702 116,316 116,316 234,916 234,916 234,916 240,441 240,441 240,441 75,626 64,822 64,822 29,920 29,920 29,920 295,382 295,382 295,382 89,361 76,596 76,596 56,908 56,908 56,908 383,446 383,446 383,446 97,713 83,755 83,755 68,767 68,767 68,767
- - - 275 231 231 - - - - - - 3,150 2,833 2,833 - - -
1,079 1,079 1,079 943 836 836 - - - 113,731 113,731 113,731 21,490 16,310 16,310 - - -
- - - 3,852 3,227 3,227 - - - 78,220 78,220 78,220 2,802 2,519 2,519 4,195 4,195 4,195
- - - 805 770 770 - - - - - - 449 378 378 - - -
15,223 15,223 15,223 1,747 1,483 1,483 - - - 17,226 17,226 17,226 328 286 286 - - -
- - - - - - - - - - - - - - - - - - - - - - - - - - - - - - - - - - - - - - - - - - - - - - - - - - - - - - - - - - - - - - - - - - - - - - - - - - - - - - - - - - - - - - - - - - - - - - - - - - - - - - - - - - - - - - - - - - - - - - - - - - - - - - - - - - - - - - - - - - - - - - - - - - - - - - - - - - - - - - - - - - - - - - - - - - - - - - - - - - - - - - - - - - - - - - - - - - - - - - - - - - - - - - - - - - - - - 844,666 844,666 844,666
60,000,000 60,000,000 60,000,000 34,999,987 30,000,000 30,000,000 60,000,000 60,000,000 60,000,000
1. LoCIP authorizations in FY 2019 included an additional $5 million pursuant to Public Act 17-2 (June Special Session). Funding is maintained at the historical amount in each year of the biennium.
Municipal Aid
E-25
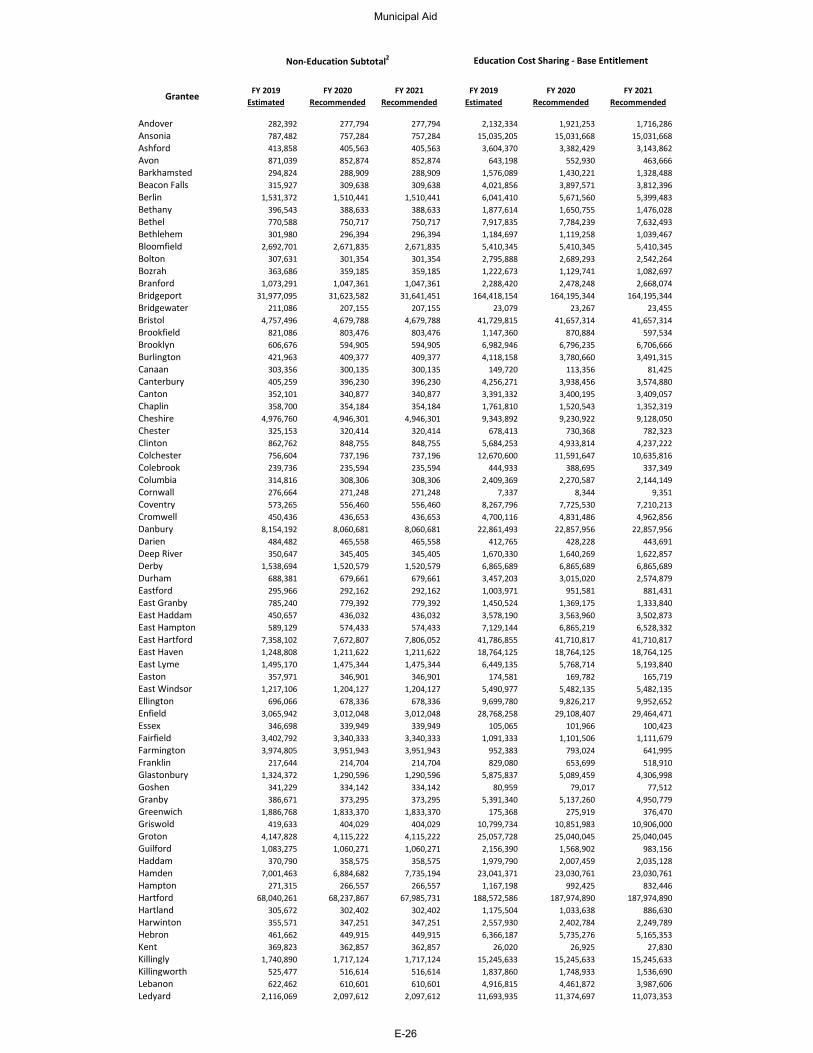
Grantee
AndoverAnsoniaAshfordAvonBarkhamstedBeacon FallsBerlinBethanyBethelBethlehemBloomfieldBoltonBozrahBranfordBridgeportBridgewaterBristolBrookfieldBrooklynBurlingtonCanaanCanterburyCantonChaplinCheshireChesterClintonColchesterColebrookColumbiaCornwallCoventryCromwellDanburyDarienDeep RiverDerbyDurhamEastfordEast GranbyEast HaddamEast HamptonEast HartfordEast HavenEast LymeEastonEast WindsorEllingtonEnfieldEssexFairfieldFarmingtonFranklinGlastonburyGoshenGranbyGreenwichGriswoldGrotonGuilfordHaddamHamdenHamptonHartfordHartlandHarwintonHebronKentKillinglyKillingworthLebanonLedyard
FY 2019 Estimated
FY 2020 Recommended
FY 2021 Recommended
FY 2019 Estimated
FY 2020 Recommended
FY 2021 Recommended
282,392 277,794 277,794 2,132,334 1,921,253 1,716,286 787,482 757,284 757,284 15,035,205 15,031,668 15,031,668 413,858 405,563 405,563 3,604,370 3,382,429 3,143,862 871,039 852,874 852,874 643,198 552,930 463,666 294,824 288,909 288,909 1,576,089 1,430,221 1,328,488 315,927 309,638 309,638 4,021,856 3,897,571 3,812,396
1,531,372 1,510,441 1,510,441 6,041,410 5,671,560 5,399,483 396,543 388,633 388,633 1,877,614 1,650,755 1,476,028 770,588 750,717 750,717 7,917,835 7,784,239 7,632,493 301,980 296,394 296,394 1,184,697 1,119,258 1,039,467
2,692,701 2,671,835 2,671,835 5,410,345 5,410,345 5,410,345 307,631 301,354 301,354 2,795,888 2,689,293 2,542,264 363,686 359,185 359,185 1,222,673 1,129,741 1,082,697
1,073,291 1,047,361 1,047,361 2,288,420 2,478,248 2,668,074 31,977,095 31,623,582 31,641,451 164,418,154 164,195,344 164,195,344
211,086 207,155 207,155 23,079 23,267 23,455 4,757,496 4,679,788 4,679,788 41,729,815 41,657,314 41,657,314
821,086 803,476 803,476 1,147,360 870,884 597,534 606,676 594,905 594,905 6,982,946 6,796,235 6,706,666 421,963 409,377 409,377 4,118,158 3,780,660 3,491,315 303,356 300,135 300,135 149,720 113,356 81,425 405,259 396,230 396,230 4,256,271 3,938,456 3,574,880 352,101 340,877 340,877 3,391,332 3,400,195 3,409,057 358,700 354,184 354,184 1,761,810 1,520,543 1,352,319
4,976,760 4,946,301 4,946,301 9,343,892 9,230,922 9,128,050 325,153 320,414 320,414 678,413 730,368 782,323 862,762 848,755 848,755 5,684,253 4,933,814 4,237,222 756,604 737,196 737,196 12,670,600 11,591,647 10,635,816 239,736 235,594 235,594 444,933 388,695 337,349 314,816 308,306 308,306 2,409,369 2,270,587 2,144,149 276,664 271,248 271,248 7,337 8,344 9,351 573,265 556,460 556,460 8,267,796 7,725,530 7,210,213 450,436 436,653 436,653 4,700,116 4,831,486 4,962,856
8,154,192 8,060,681 8,060,681 22,861,493 22,857,956 22,857,956 484,482 465,558 465,558 412,765 428,228 443,691 350,647 345,405 345,405 1,670,330 1,640,269 1,622,857
1,538,694 1,520,579 1,520,579 6,865,689 6,865,689 6,865,689 688,381 679,661 679,661 3,457,203 3,015,020 2,574,879 295,966 292,162 292,162 1,003,971 951,581 881,431 785,240 779,392 779,392 1,450,524 1,369,175 1,333,840 450,657 436,032 436,032 3,578,190 3,563,960 3,502,873 589,129 574,433 574,433 7,129,144 6,865,219 6,528,332
7,358,102 7,672,807 7,806,052 41,786,855 41,710,817 41,710,817 1,248,808 1,211,622 1,211,622 18,764,125 18,764,125 18,764,125 1,495,170 1,475,344 1,475,344 6,449,135 5,768,714 5,193,840
357,971 346,901 346,901 174,581 169,782 165,719 1,217,106 1,204,127 1,204,127 5,490,977 5,482,135 5,482,135
696,066 678,336 678,336 9,699,780 9,826,217 9,952,652 3,065,942 3,012,048 3,012,048 28,768,258 29,108,407 29,464,471
346,698 339,949 339,949 105,065 101,966 100,423 3,402,792 3,340,333 3,340,333 1,091,333 1,101,506 1,111,679 3,974,805 3,951,943 3,951,943 952,383 793,024 641,995
217,644 214,704 214,704 829,080 653,699 518,910 1,324,372 1,290,596 1,290,596 5,875,837 5,089,459 4,306,998
341,229 334,142 334,142 80,959 79,017 77,512 386,671 373,295 373,295 5,391,340 5,137,260 4,950,779
1,886,768 1,833,370 1,833,370 175,368 275,919 376,470 419,633 404,029 404,029 10,799,734 10,851,983 10,906,000
4,147,828 4,115,222 4,115,222 25,057,728 25,040,045 25,040,045 1,083,275 1,060,271 1,060,271 2,156,390 1,568,902 983,156
370,790 358,575 358,575 1,979,790 2,007,459 2,035,128 7,001,463 6,884,682 7,735,194 23,041,371 23,030,761 23,030,761
271,315 266,557 266,557 1,167,198 992,425 832,446 68,040,261 68,237,867 67,985,731 188,572,586 187,974,890 187,974,890
305,672 302,402 302,402 1,175,504 1,033,638 886,630 355,571 347,251 347,251 2,557,930 2,402,784 2,249,789 461,662 449,915 449,915 6,366,187 5,735,276 5,165,353 369,823 362,857 362,857 26,020 26,925 27,830
1,740,890 1,717,124 1,717,124 15,245,633 15,245,633 15,245,633 525,477 516,614 516,614 1,837,860 1,748,933 1,536,690 622,462 610,601 610,601 4,916,815 4,461,872 3,987,606
2,116,069 2,097,612 2,097,612 11,693,935 11,374,697 11,073,353
Non-Education Subtotal2 Education Cost Sharing - Base Entitlement
Municipal Aid
E-26
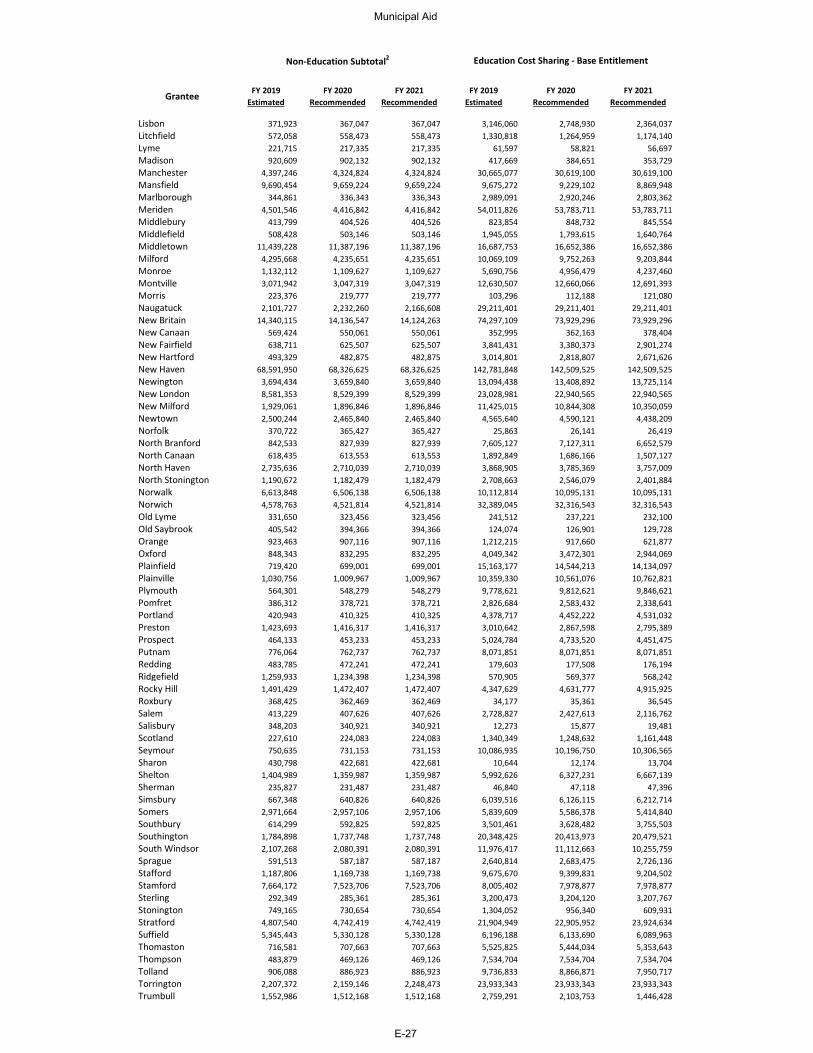
Grantee
LisbonLitchfieldLymeMadisonManchesterMansfieldMarlboroughMeridenMiddleburyMiddlefieldMiddletownMilfordMonroeMontvilleMorrisNaugatuckNew BritainNew CanaanNew FairfieldNew HartfordNew HavenNewingtonNew LondonNew MilfordNewtownNorfolkNorth BranfordNorth CanaanNorth HavenNorth StoningtonNorwalkNorwichOld LymeOld SaybrookOrangeOxfordPlainfieldPlainvillePlymouthPomfretPortlandPrestonProspectPutnamReddingRidgefieldRocky HillRoxburySalemSalisburyScotlandSeymourSharonSheltonShermanSimsburySomersSouthburySouthingtonSouth WindsorSpragueStaffordStamfordSterlingStoningtonStratfordSuffieldThomastonThompsonTollandTorringtonTrumbull
FY 2019 Estimated
FY 2020 Recommended
FY 2021 Recommended
FY 2019 Estimated
FY 2020 Recommended
FY 2021 Recommended
Non-Education Subtotal2 Education Cost Sharing - Base Entitlement
371,923 367,047 367,047 3,146,060 2,748,930 2,364,037 572,058 558,473 558,473 1,330,818 1,264,959 1,174,140 221,715 217,335 217,335 61,597 58,821 56,697 920,609 902,132 902,132 417,669 384,651 353,729
4,397,246 4,324,824 4,324,824 30,665,077 30,619,100 30,619,100 9,690,454 9,659,224 9,659,224 9,675,272 9,229,102 8,869,948
344,861 336,343 336,343 2,989,091 2,920,246 2,803,362 4,501,546 4,416,842 4,416,842 54,011,826 53,783,711 53,783,711
413,799 404,526 404,526 823,854 848,732 845,554 508,428 503,146 503,146 1,945,055 1,793,615 1,640,764
11,439,228 11,387,196 11,387,196 16,687,753 16,652,386 16,652,386 4,295,668 4,235,651 4,235,651 10,069,109 9,752,263 9,203,844 1,132,112 1,109,627 1,109,627 5,690,756 4,956,479 4,237,460 3,071,942 3,047,319 3,047,319 12,630,507 12,660,066 12,691,393
223,376 219,777 219,777 103,296 112,188 121,080 2,101,727 2,232,260 2,166,608 29,211,401 29,211,401 29,211,401
14,340,115 14,136,547 14,124,263 74,297,109 73,929,296 73,929,296 569,424 550,061 550,061 352,995 362,163 378,404 638,711 625,507 625,507 3,841,431 3,380,373 2,901,274 493,329 482,875 482,875 3,014,801 2,818,807 2,671,626
68,591,950 68,326,625 68,326,625 142,781,848 142,509,525 142,509,525 3,694,434 3,659,840 3,659,840 13,094,438 13,408,892 13,725,114 8,581,353 8,529,399 8,529,399 23,028,981 22,940,565 22,940,565 1,929,061 1,896,846 1,896,846 11,425,015 10,844,308 10,350,059 2,500,244 2,465,840 2,465,840 4,565,640 4,590,121 4,438,209
370,722 365,427 365,427 25,863 26,141 26,419 842,533 827,939 827,939 7,605,127 7,127,311 6,652,579 618,435 613,553 613,553 1,892,849 1,686,166 1,507,127
2,735,636 2,710,039 2,710,039 3,868,905 3,785,369 3,757,009 1,190,672 1,182,479 1,182,479 2,708,663 2,546,079 2,401,884 6,613,848 6,506,138 6,506,138 10,112,814 10,095,131 10,095,131 4,578,763 4,521,814 4,521,814 32,389,045 32,316,543 32,316,543
331,650 323,456 323,456 241,512 237,221 232,100 405,542 394,366 394,366 124,074 126,901 129,728 923,463 907,116 907,116 1,212,215 917,660 621,877 848,343 832,295 832,295 4,049,342 3,472,301 2,944,069 719,420 699,001 699,001 15,163,177 14,544,213 14,134,097
1,030,756 1,009,967 1,009,967 10,359,330 10,561,076 10,762,821 564,301 548,279 548,279 9,778,621 9,812,621 9,846,621 386,312 378,721 378,721 2,826,684 2,583,432 2,338,641 420,943 410,325 410,325 4,378,717 4,452,222 4,531,032
1,423,693 1,416,317 1,416,317 3,010,642 2,867,598 2,795,389 464,133 453,233 453,233 5,024,784 4,733,520 4,451,475 776,064 762,737 762,737 8,071,851 8,071,851 8,071,851 483,785 472,241 472,241 179,603 177,508 176,194
1,259,933 1,234,398 1,234,398 570,905 569,377 568,242 1,491,429 1,472,407 1,472,407 4,347,629 4,631,777 4,915,925
368,425 362,469 362,469 34,177 35,361 36,545 413,229 407,626 407,626 2,728,827 2,427,613 2,116,762 348,203 340,921 340,921 12,273 15,877 19,481 227,610 224,083 224,083 1,340,349 1,248,632 1,161,448 750,635 731,153 731,153 10,086,935 10,196,750 10,306,565 430,798 422,681 422,681 10,644 12,174 13,704
1,404,989 1,359,987 1,359,987 5,992,626 6,327,231 6,667,139 235,827 231,487 231,487 46,840 47,118 47,396 667,348 640,826 640,826 6,039,516 6,126,115 6,212,714
2,971,664 2,957,106 2,957,106 5,839,609 5,586,378 5,414,840 614,299 592,825 592,825 3,501,461 3,628,482 3,755,503
1,784,898 1,737,748 1,737,748 20,348,425 20,413,973 20,479,521 2,107,268 2,080,391 2,080,391 11,976,417 11,112,663 10,255,759
591,513 587,187 587,187 2,640,814 2,683,475 2,726,136 1,187,806 1,169,738 1,169,738 9,675,670 9,399,831 9,204,502 7,664,172 7,523,706 7,523,706 8,005,402 7,978,877 7,978,877
292,349 285,361 285,361 3,200,473 3,204,120 3,207,767 749,165 730,654 730,654 1,304,052 956,340 609,931
4,807,540 4,742,419 4,742,419 21,904,949 22,905,952 23,924,634 5,345,443 5,330,128 5,330,128 6,196,188 6,133,690 6,089,963
716,581 707,663 707,663 5,525,825 5,444,034 5,353,643 483,879 469,126 469,126 7,534,704 7,534,704 7,534,704 906,088 886,923 886,923 9,736,833 8,866,871 7,950,717
2,207,372 2,159,146 2,248,473 23,933,343 23,933,343 23,933,343 1,552,986 1,512,168 1,512,168 2,759,291 2,103,753 1,446,428
Municipal Aid
E-27
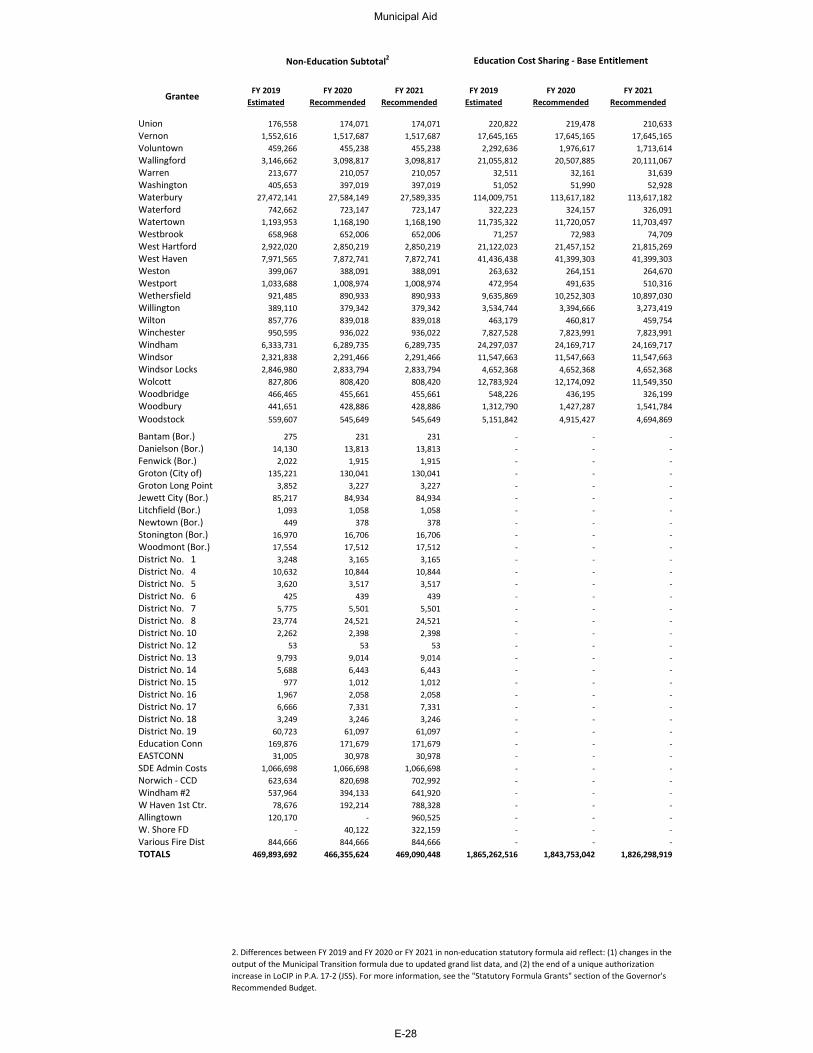
Grantee
UnionVernonVoluntownWallingfordWarrenWashingtonWaterburyWaterfordWatertownWestbrookWest HartfordWest HavenWestonWestportWethersfieldWillingtonWiltonWinchesterWindhamWindsorWindsor LocksWolcottWoodbridgeWoodburyWoodstock
Bantam (Bor.)Danielson (Bor.)Fenwick (Bor.)Groton (City of)Groton Long PointJewett City (Bor.)Litchfield (Bor.)Newtown (Bor.)Stonington (Bor.)Woodmont (Bor.)District No. 1District No. 4District No. 5District No. 6District No. 7District No. 8District No. 10District No. 12District No. 13District No. 14District No. 15District No. 16District No. 17District No. 18District No. 19Education ConnEASTCONNSDE Admin CostsNorwich - CCD Windham #2W Haven 1st Ctr.Allingtown W. Shore FD Various Fire DistTOTALS
FY 2019 Estimated
FY 2020 Recommended
FY 2021 Recommended
FY 2019 Estimated
FY 2020 Recommended
FY 2021 Recommended
Non-Education Subtotal2 Education Cost Sharing - Base Entitlement
176,558 174,071 174,071 220,822 219,478 210,633 1,552,616 1,517,687 1,517,687 17,645,165 17,645,165 17,645,165
459,266 455,238 455,238 2,292,636 1,976,617 1,713,614 3,146,662 3,098,817 3,098,817 21,055,812 20,507,885 20,111,067
213,677 210,057 210,057 32,511 32,161 31,639 405,653 397,019 397,019 51,052 51,990 52,928
27,472,141 27,584,149 27,589,335 114,009,751 113,617,182 113,617,182 742,662 723,147 723,147 322,223 324,157 326,091
1,193,953 1,168,190 1,168,190 11,735,322 11,720,057 11,703,497 658,968 652,006 652,006 71,257 72,983 74,709
2,922,020 2,850,219 2,850,219 21,122,023 21,457,152 21,815,269 7,971,565 7,872,741 7,872,741 41,436,438 41,399,303 41,399,303
399,067 388,091 388,091 263,632 264,151 264,670 1,033,688 1,008,974 1,008,974 472,954 491,635 510,316
921,485 890,933 890,933 9,635,869 10,252,303 10,897,030 389,110 379,342 379,342 3,534,744 3,394,666 3,273,419 857,776 839,018 839,018 463,179 460,817 459,754 950,595 936,022 936,022 7,827,528 7,823,991 7,823,991
6,333,731 6,289,735 6,289,735 24,297,037 24,169,717 24,169,717 2,321,838 2,291,466 2,291,466 11,547,663 11,547,663 11,547,663 2,846,980 2,833,794 2,833,794 4,652,368 4,652,368 4,652,368
827,806 808,420 808,420 12,783,924 12,174,092 11,549,350 466,465 455,661 455,661 548,226 436,195 326,199 441,651 428,886 428,886 1,312,790 1,427,287 1,541,784 559,607 545,649 545,649 5,151,842 4,915,427 4,694,869
275 231 231 - - - 14,130 13,813 13,813 - - -
2,022 1,915 1,915 - - - 135,221 130,041 130,041 - - -
3,852 3,227 3,227 - - - 85,217 84,934 84,934 - - -
1,093 1,058 1,058 - - - 449 378 378 - - -
16,970 16,706 16,706 - - - 17,554 17,512 17,512 - - -
3,248 3,165 3,165 - - - 10,632 10,844 10,844 - - -
3,620 3,517 3,517 - - - 425 439 439 - - -
5,775 5,501 5,501 - - - 23,774 24,521 24,521 - - -
2,262 2,398 2,398 - - - 53 53 53 - - -
9,793 9,014 9,014 - - - 5,688 6,443 6,443 - - -
977 1,012 1,012 - - - 1,967 2,058 2,058 - - - 6,666 7,331 7,331 - - - 3,249 3,246 3,246 - - -
60,723 61,097 61,097 - - - 169,876 171,679 171,679 - - -
31,005 30,978 30,978 - - - 1,066,698 1,066,698 1,066,698 - - -
623,634 820,698 702,992 - - - 537,964 394,133 641,920 - - -
78,676 192,214 788,328 - - - 120,170 - 960,525 - - -
- 40,122 322,159 - - - 844,666 844,666 844,666 - - -
469,893,692 466,355,624 469,090,448 1,865,262,516 1,843,753,042 1,826,298,919
2. Differences between FY 2019 and FY 2020 or FY 2021 in non-education statutory formula aid reflect: (1) changes in the output of the Municipal Transition formula due to updated grand list data, and (2) the end of a unique authorization increase in LoCIP in P.A. 17-2 (JSS). For more information, see the "Statutory Formula Grants" section of the Governor's Recommended Budget.
Municipal Aid
E-28
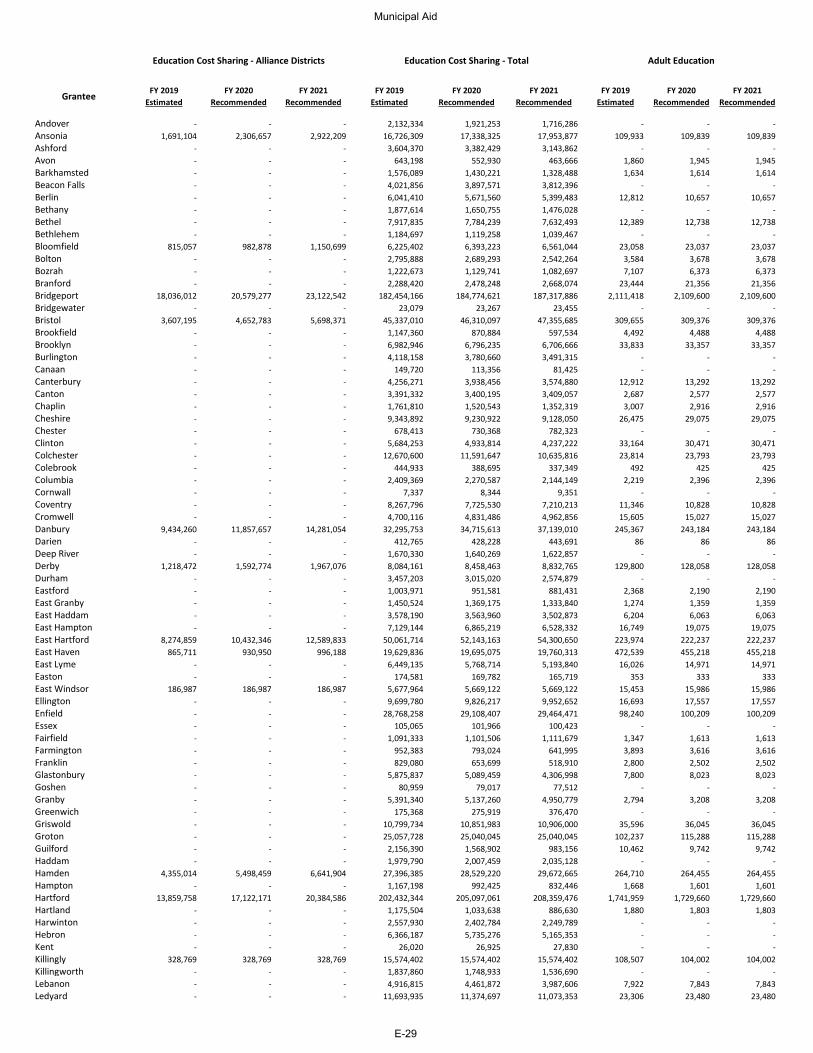
Grantee
AndoverAnsoniaAshfordAvonBarkhamstedBeacon FallsBerlinBethanyBethelBethlehemBloomfieldBoltonBozrahBranfordBridgeportBridgewaterBristolBrookfieldBrooklynBurlingtonCanaanCanterburyCantonChaplinCheshireChesterClintonColchesterColebrookColumbiaCornwallCoventryCromwellDanburyDarienDeep RiverDerbyDurhamEastfordEast GranbyEast HaddamEast HamptonEast HartfordEast HavenEast LymeEastonEast WindsorEllingtonEnfieldEssexFairfieldFarmingtonFranklinGlastonburyGoshenGranbyGreenwichGriswoldGrotonGuilfordHaddamHamdenHamptonHartfordHartlandHarwintonHebronKentKillinglyKillingworthLebanonLedyard
FY 2019 Estimated
FY 2020 Recommended
FY 2021 Recommended
FY 2019 Estimated
FY 2020 Recommended
FY 2021 Recommended
FY 2019 Estimated
FY 2020 Recommended
FY 2021 Recommended
- - - 2,132,334 1,921,253 1,716,286 - - - 1,691,104 2,306,657 2,922,209 16,726,309 17,338,325 17,953,877 109,933 109,839 109,839
- - - 3,604,370 3,382,429 3,143,862 - - - - - - 643,198 552,930 463,666 1,860 1,945 1,945 - - - 1,576,089 1,430,221 1,328,488 1,634 1,614 1,614 - - - 4,021,856 3,897,571 3,812,396 - - - - - - 6,041,410 5,671,560 5,399,483 12,812 10,657 10,657 - - - 1,877,614 1,650,755 1,476,028 - - - - - - 7,917,835 7,784,239 7,632,493 12,389 12,738 12,738 - - - 1,184,697 1,119,258 1,039,467 - - -
815,057 982,878 1,150,699 6,225,402 6,393,223 6,561,044 23,058 23,037 23,037 - - - 2,795,888 2,689,293 2,542,264 3,584 3,678 3,678 - - - 1,222,673 1,129,741 1,082,697 7,107 6,373 6,373 - - - 2,288,420 2,478,248 2,668,074 23,444 21,356 21,356
18,036,012 20,579,277 23,122,542 182,454,166 184,774,621 187,317,886 2,111,418 2,109,600 2,109,600 - - - 23,079 23,267 23,455 - - -
3,607,195 4,652,783 5,698,371 45,337,010 46,310,097 47,355,685 309,655 309,376 309,376 - - - 1,147,360 870,884 597,534 4,492 4,488 4,488 - - - 6,982,946 6,796,235 6,706,666 33,833 33,357 33,357 - - - 4,118,158 3,780,660 3,491,315 - - - - - - 149,720 113,356 81,425 - - - - - - 4,256,271 3,938,456 3,574,880 12,912 13,292 13,292 - - - 3,391,332 3,400,195 3,409,057 2,687 2,577 2,577 - - - 1,761,810 1,520,543 1,352,319 3,007 2,916 2,916 - - - 9,343,892 9,230,922 9,128,050 26,475 29,075 29,075 - - - 678,413 730,368 782,323 - - - - - - 5,684,253 4,933,814 4,237,222 33,164 30,471 30,471 - - - 12,670,600 11,591,647 10,635,816 23,814 23,793 23,793 - - - 444,933 388,695 337,349 492 425 425 - - - 2,409,369 2,270,587 2,144,149 2,219 2,396 2,396 - - - 7,337 8,344 9,351 - - - - - - 8,267,796 7,725,530 7,210,213 11,346 10,828 10,828 - - - 4,700,116 4,831,486 4,962,856 15,605 15,027 15,027
9,434,260 11,857,657 14,281,054 32,295,753 34,715,613 37,139,010 245,367 243,184 243,184 - - - 412,765 428,228 443,691 86 86 86 - - - 1,670,330 1,640,269 1,622,857 - - -
1,218,472 1,592,774 1,967,076 8,084,161 8,458,463 8,832,765 129,800 128,058 128,058 - - - 3,457,203 3,015,020 2,574,879 - - - - - - 1,003,971 951,581 881,431 2,368 2,190 2,190 - - - 1,450,524 1,369,175 1,333,840 1,274 1,359 1,359 - - - 3,578,190 3,563,960 3,502,873 6,204 6,063 6,063 - - - 7,129,144 6,865,219 6,528,332 16,749 19,075 19,075
8,274,859 10,432,346 12,589,833 50,061,714 52,143,163 54,300,650 223,974 222,237 222,237 865,711 930,950 996,188 19,629,836 19,695,075 19,760,313 472,539 455,218 455,218
- - - 6,449,135 5,768,714 5,193,840 16,026 14,971 14,971 - - - 174,581 169,782 165,719 353 333 333
186,987 186,987 186,987 5,677,964 5,669,122 5,669,122 15,453 15,986 15,986 - - - 9,699,780 9,826,217 9,952,652 16,693 17,557 17,557 - - - 28,768,258 29,108,407 29,464,471 98,240 100,209 100,209 - - - 105,065 101,966 100,423 - - - - - - 1,091,333 1,101,506 1,111,679 1,347 1,613 1,613 - - - 952,383 793,024 641,995 3,893 3,616 3,616 - - - 829,080 653,699 518,910 2,800 2,502 2,502 - - - 5,875,837 5,089,459 4,306,998 7,800 8,023 8,023 - - - 80,959 79,017 77,512 - - - - - - 5,391,340 5,137,260 4,950,779 2,794 3,208 3,208 - - - 175,368 275,919 376,470 - - - - - - 10,799,734 10,851,983 10,906,000 35,596 36,045 36,045 - - - 25,057,728 25,040,045 25,040,045 102,237 115,288 115,288 - - - 2,156,390 1,568,902 983,156 10,462 9,742 9,742 - - - 1,979,790 2,007,459 2,035,128 - - -
4,355,014 5,498,459 6,641,904 27,396,385 28,529,220 29,672,665 264,710 264,455 264,455 - - - 1,167,198 992,425 832,446 1,668 1,601 1,601
13,859,758 17,122,171 20,384,586 202,432,344 205,097,061 208,359,476 1,741,959 1,729,660 1,729,660 - - - 1,175,504 1,033,638 886,630 1,880 1,803 1,803 - - - 2,557,930 2,402,784 2,249,789 - - - - - - 6,366,187 5,735,276 5,165,353 - - - - - - 26,020 26,925 27,830 - - -
328,769 328,769 328,769 15,574,402 15,574,402 15,574,402 108,507 104,002 104,002 - - - 1,837,860 1,748,933 1,536,690 - - - - - - 4,916,815 4,461,872 3,987,606 7,922 7,843 7,843 - - - 11,693,935 11,374,697 11,073,353 23,306 23,480 23,480
Education Cost Sharing - Alliance Districts Education Cost Sharing - Total Adult Education
Municipal Aid
E-29
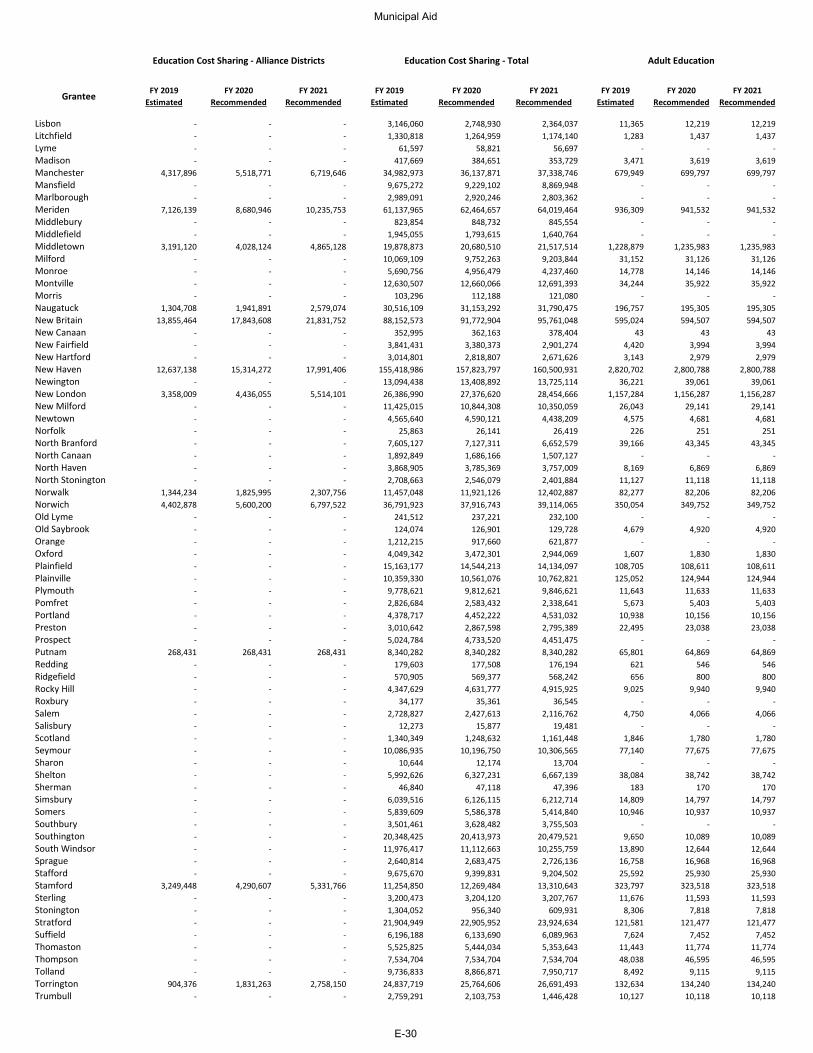
Grantee
LisbonLitchfieldLymeMadisonManchesterMansfieldMarlboroughMeridenMiddleburyMiddlefieldMiddletownMilfordMonroeMontvilleMorrisNaugatuckNew BritainNew CanaanNew FairfieldNew HartfordNew HavenNewingtonNew LondonNew MilfordNewtownNorfolkNorth BranfordNorth CanaanNorth HavenNorth StoningtonNorwalkNorwichOld LymeOld SaybrookOrangeOxfordPlainfieldPlainvillePlymouthPomfretPortlandPrestonProspectPutnamReddingRidgefieldRocky HillRoxburySalemSalisburyScotlandSeymourSharonSheltonShermanSimsburySomersSouthburySouthingtonSouth WindsorSpragueStaffordStamfordSterlingStoningtonStratfordSuffieldThomastonThompsonTollandTorringtonTrumbull
FY 2019 Estimated
FY 2020 Recommended
FY 2021 Recommended
FY 2019 Estimated
FY 2020 Recommended
FY 2021 Recommended
FY 2019 Estimated
FY 2020 Recommended
FY 2021 Recommended
Education Cost Sharing - Alliance Districts Education Cost Sharing - Total Adult Education
- - - 3,146,060 2,748,930 2,364,037 11,365 12,219 12,219 - - - 1,330,818 1,264,959 1,174,140 1,283 1,437 1,437 - - - 61,597 58,821 56,697 - - - - - - 417,669 384,651 353,729 3,471 3,619 3,619
4,317,896 5,518,771 6,719,646 34,982,973 36,137,871 37,338,746 679,949 699,797 699,797 - - - 9,675,272 9,229,102 8,869,948 - - - - - - 2,989,091 2,920,246 2,803,362 - - -
7,126,139 8,680,946 10,235,753 61,137,965 62,464,657 64,019,464 936,309 941,532 941,532 - - - 823,854 848,732 845,554 - - - - - - 1,945,055 1,793,615 1,640,764 - - -
3,191,120 4,028,124 4,865,128 19,878,873 20,680,510 21,517,514 1,228,879 1,235,983 1,235,983 - - - 10,069,109 9,752,263 9,203,844 31,152 31,126 31,126 - - - 5,690,756 4,956,479 4,237,460 14,778 14,146 14,146 - - - 12,630,507 12,660,066 12,691,393 34,244 35,922 35,922 - - - 103,296 112,188 121,080 - - -
1,304,708 1,941,891 2,579,074 30,516,109 31,153,292 31,790,475 196,757 195,305 195,305 13,855,464 17,843,608 21,831,752 88,152,573 91,772,904 95,761,048 595,024 594,507 594,507
- - - 352,995 362,163 378,404 43 43 43 - - - 3,841,431 3,380,373 2,901,274 4,420 3,994 3,994 - - - 3,014,801 2,818,807 2,671,626 3,143 2,979 2,979
12,637,138 15,314,272 17,991,406 155,418,986 157,823,797 160,500,931 2,820,702 2,800,788 2,800,788 - - - 13,094,438 13,408,892 13,725,114 36,221 39,061 39,061
3,358,009 4,436,055 5,514,101 26,386,990 27,376,620 28,454,666 1,157,284 1,156,287 1,156,287 - - - 11,425,015 10,844,308 10,350,059 26,043 29,141 29,141 - - - 4,565,640 4,590,121 4,438,209 4,575 4,681 4,681 - - - 25,863 26,141 26,419 226 251 251 - - - 7,605,127 7,127,311 6,652,579 39,166 43,345 43,345 - - - 1,892,849 1,686,166 1,507,127 - - - - - - 3,868,905 3,785,369 3,757,009 8,169 6,869 6,869 - - - 2,708,663 2,546,079 2,401,884 11,127 11,118 11,118
1,344,234 1,825,995 2,307,756 11,457,048 11,921,126 12,402,887 82,277 82,206 82,206 4,402,878 5,600,200 6,797,522 36,791,923 37,916,743 39,114,065 350,054 349,752 349,752
- - - 241,512 237,221 232,100 - - - - - - 124,074 126,901 129,728 4,679 4,920 4,920 - - - 1,212,215 917,660 621,877 - - - - - - 4,049,342 3,472,301 2,944,069 1,607 1,830 1,830 - - - 15,163,177 14,544,213 14,134,097 108,705 108,611 108,611 - - - 10,359,330 10,561,076 10,762,821 125,052 124,944 124,944 - - - 9,778,621 9,812,621 9,846,621 11,643 11,633 11,633 - - - 2,826,684 2,583,432 2,338,641 5,673 5,403 5,403 - - - 4,378,717 4,452,222 4,531,032 10,938 10,156 10,156 - - - 3,010,642 2,867,598 2,795,389 22,495 23,038 23,038 - - - 5,024,784 4,733,520 4,451,475 - - -
268,431 268,431 268,431 8,340,282 8,340,282 8,340,282 65,801 64,869 64,869 - - - 179,603 177,508 176,194 621 546 546 - - - 570,905 569,377 568,242 656 800 800 - - - 4,347,629 4,631,777 4,915,925 9,025 9,940 9,940 - - - 34,177 35,361 36,545 - - - - - - 2,728,827 2,427,613 2,116,762 4,750 4,066 4,066 - - - 12,273 15,877 19,481 - - - - - - 1,340,349 1,248,632 1,161,448 1,846 1,780 1,780 - - - 10,086,935 10,196,750 10,306,565 77,140 77,675 77,675 - - - 10,644 12,174 13,704 - - - - - - 5,992,626 6,327,231 6,667,139 38,084 38,742 38,742 - - - 46,840 47,118 47,396 183 170 170 - - - 6,039,516 6,126,115 6,212,714 14,809 14,797 14,797 - - - 5,839,609 5,586,378 5,414,840 10,946 10,937 10,937 - - - 3,501,461 3,628,482 3,755,503 - - - - - - 20,348,425 20,413,973 20,479,521 9,650 10,089 10,089 - - - 11,976,417 11,112,663 10,255,759 13,890 12,644 12,644 - - - 2,640,814 2,683,475 2,726,136 16,758 16,968 16,968 - - - 9,675,670 9,399,831 9,204,502 25,592 25,930 25,930
3,249,448 4,290,607 5,331,766 11,254,850 12,269,484 13,310,643 323,797 323,518 323,518 - - - 3,200,473 3,204,120 3,207,767 11,676 11,593 11,593 - - - 1,304,052 956,340 609,931 8,306 7,818 7,818 - - - 21,904,949 22,905,952 23,924,634 121,581 121,477 121,477 - - - 6,196,188 6,133,690 6,089,963 7,624 7,452 7,452 - - - 5,525,825 5,444,034 5,353,643 11,443 11,774 11,774 - - - 7,534,704 7,534,704 7,534,704 48,038 46,595 46,595 - - - 9,736,833 8,866,871 7,950,717 8,492 9,115 9,115
904,376 1,831,263 2,758,150 24,837,719 25,764,606 26,691,493 132,634 134,240 134,240 - - - 2,759,291 2,103,753 1,446,428 10,127 10,118 10,118
Municipal Aid
E-30
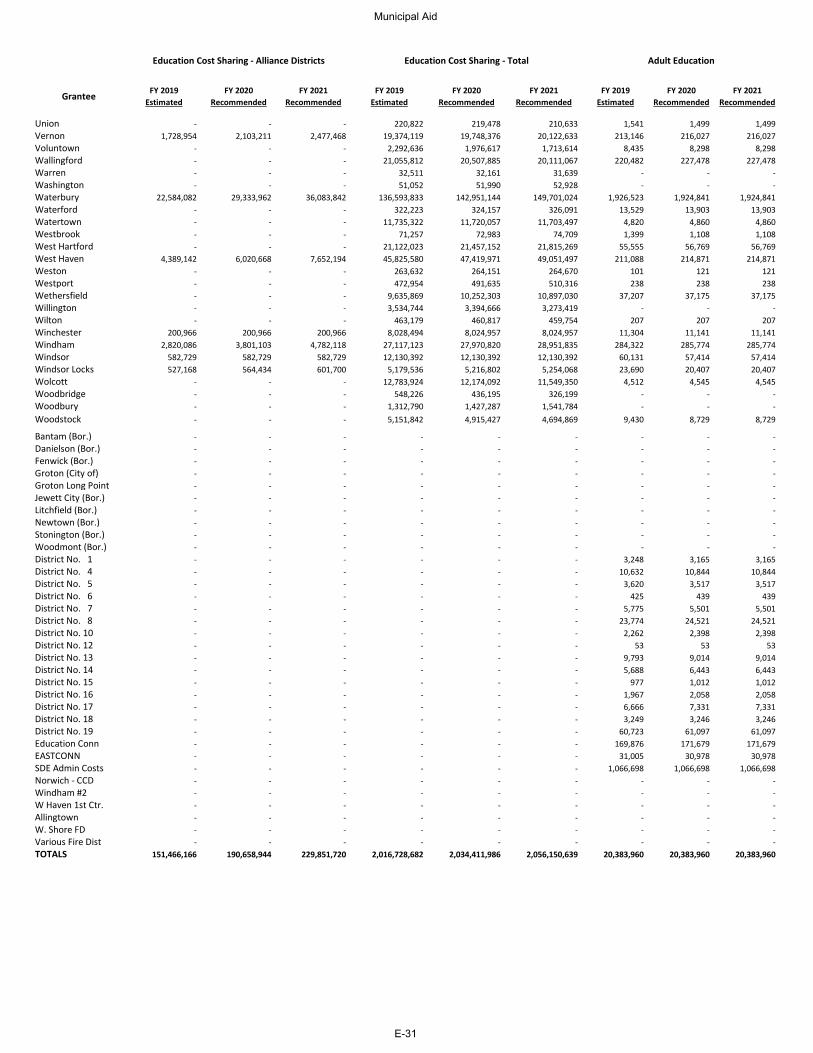
Grantee
UnionVernonVoluntownWallingfordWarrenWashingtonWaterburyWaterfordWatertownWestbrookWest HartfordWest HavenWestonWestportWethersfieldWillingtonWiltonWinchesterWindhamWindsorWindsor LocksWolcottWoodbridgeWoodburyWoodstock
Bantam (Bor.)Danielson (Bor.)Fenwick (Bor.)Groton (City of)Groton Long PointJewett City (Bor.)Litchfield (Bor.)Newtown (Bor.)Stonington (Bor.)Woodmont (Bor.)District No. 1District No. 4District No. 5District No. 6District No. 7District No. 8District No. 10District No. 12District No. 13District No. 14District No. 15District No. 16District No. 17District No. 18District No. 19Education ConnEASTCONNSDE Admin CostsNorwich - CCD Windham #2W Haven 1st Ctr.Allingtown W. Shore FD Various Fire DistTOTALS
FY 2019 Estimated
FY 2020 Recommended
FY 2021 Recommended
FY 2019 Estimated
FY 2020 Recommended
FY 2021 Recommended
FY 2019 Estimated
FY 2020 Recommended
FY 2021 Recommended
Education Cost Sharing - Alliance Districts Education Cost Sharing - Total Adult Education
- - - 220,822 219,478 210,633 1,541 1,499 1,499 1,728,954 2,103,211 2,477,468 19,374,119 19,748,376 20,122,633 213,146 216,027 216,027
- - - 2,292,636 1,976,617 1,713,614 8,435 8,298 8,298 - - - 21,055,812 20,507,885 20,111,067 220,482 227,478 227,478 - - - 32,511 32,161 31,639 - - - - - - 51,052 51,990 52,928 - - -
22,584,082 29,333,962 36,083,842 136,593,833 142,951,144 149,701,024 1,926,523 1,924,841 1,924,841 - - - 322,223 324,157 326,091 13,529 13,903 13,903 - - - 11,735,322 11,720,057 11,703,497 4,820 4,860 4,860 - - - 71,257 72,983 74,709 1,399 1,108 1,108 - - - 21,122,023 21,457,152 21,815,269 55,555 56,769 56,769
4,389,142 6,020,668 7,652,194 45,825,580 47,419,971 49,051,497 211,088 214,871 214,871 - - - 263,632 264,151 264,670 101 121 121 - - - 472,954 491,635 510,316 238 238 238 - - - 9,635,869 10,252,303 10,897,030 37,207 37,175 37,175 - - - 3,534,744 3,394,666 3,273,419 - - - - - - 463,179 460,817 459,754 207 207 207
200,966 200,966 200,966 8,028,494 8,024,957 8,024,957 11,304 11,141 11,141 2,820,086 3,801,103 4,782,118 27,117,123 27,970,820 28,951,835 284,322 285,774 285,774
582,729 582,729 582,729 12,130,392 12,130,392 12,130,392 60,131 57,414 57,414 527,168 564,434 601,700 5,179,536 5,216,802 5,254,068 23,690 20,407 20,407
- - - 12,783,924 12,174,092 11,549,350 4,512 4,545 4,545 - - - 548,226 436,195 326,199 - - - - - - 1,312,790 1,427,287 1,541,784 - - - - - - 5,151,842 4,915,427 4,694,869 9,430 8,729 8,729
- - - - - - - - - - - - - - - - - - - - - - - - - - - - - - - - - - - - - - - - - - - - - - - - - - - - - - - - - - - - - - - - - - - - - - - - - - - - - - - - - - - - - - - - - - - - - - - - 3,248 3,165 3,165 - - - - - - 10,632 10,844 10,844 - - - - - - 3,620 3,517 3,517 - - - - - - 425 439 439 - - - - - - 5,775 5,501 5,501 - - - - - - 23,774 24,521 24,521 - - - - - - 2,262 2,398 2,398 - - - - - - 53 53 53 - - - - - - 9,793 9,014 9,014 - - - - - - 5,688 6,443 6,443 - - - - - - 977 1,012 1,012 - - - - - - 1,967 2,058 2,058 - - - - - - 6,666 7,331 7,331 - - - - - - 3,249 3,246 3,246 - - - - - - 60,723 61,097 61,097 - - - - - - 169,876 171,679 171,679 - - - - - - 31,005 30,978 30,978 - - - - - - 1,066,698 1,066,698 1,066,698 - - - - - - - - - - - - - - - - - - - - - - - - - - - - - - - - - - - - - - - - - - - - - - - - - - - - - -
151,466,166 190,658,944 229,851,720 2,016,728,682 2,034,411,986 2,056,150,639 20,383,960 20,383,960 20,383,960
Municipal Aid
E-31
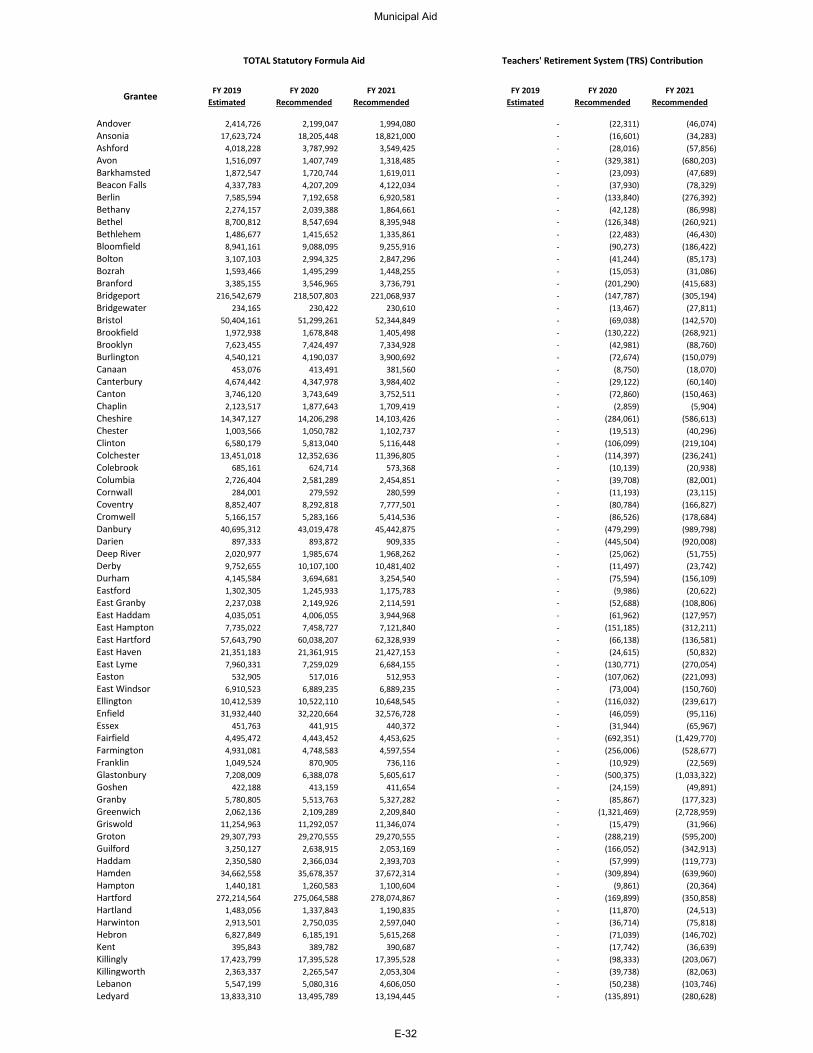
Grantee
AndoverAnsoniaAshfordAvonBarkhamstedBeacon FallsBerlinBethanyBethelBethlehemBloomfieldBoltonBozrahBranfordBridgeportBridgewaterBristolBrookfieldBrooklynBurlingtonCanaanCanterburyCantonChaplinCheshireChesterClintonColchesterColebrookColumbiaCornwallCoventryCromwellDanburyDarienDeep RiverDerbyDurhamEastfordEast GranbyEast HaddamEast HamptonEast HartfordEast HavenEast LymeEastonEast WindsorEllingtonEnfieldEssexFairfieldFarmingtonFranklinGlastonburyGoshenGranbyGreenwichGriswoldGrotonGuilfordHaddamHamdenHamptonHartfordHartlandHarwintonHebronKentKillinglyKillingworthLebanonLedyard
FY 2019 Estimated
FY 2020 Recommended
FY 2021 Recommended
FY 2019 Estimated
FY 2020 Recommended
FY 2021 Recommended
2,414,726 2,199,047 1,994,080 - (22,311) (46,074) 17,623,724 18,205,448 18,821,000 - (16,601) (34,283)
4,018,228 3,787,992 3,549,425 - (28,016) (57,856) 1,516,097 1,407,749 1,318,485 - (329,381) (680,203) 1,872,547 1,720,744 1,619,011 - (23,093) (47,689) 4,337,783 4,207,209 4,122,034 - (37,930) (78,329) 7,585,594 7,192,658 6,920,581 - (133,840) (276,392) 2,274,157 2,039,388 1,864,661 - (42,128) (86,998) 8,700,812 8,547,694 8,395,948 - (126,348) (260,921) 1,486,677 1,415,652 1,335,861 - (22,483) (46,430) 8,941,161 9,088,095 9,255,916 - (90,273) (186,422) 3,107,103 2,994,325 2,847,296 - (41,244) (85,173) 1,593,466 1,495,299 1,448,255 - (15,053) (31,086) 3,385,155 3,546,965 3,736,791 - (201,290) (415,683)
216,542,679 218,507,803 221,068,937 - (147,787) (305,194) 234,165 230,422 230,610 - (13,467) (27,811)
50,404,161 51,299,261 52,344,849 - (69,038) (142,570) 1,972,938 1,678,848 1,405,498 - (130,222) (268,921) 7,623,455 7,424,497 7,334,928 - (42,981) (88,760) 4,540,121 4,190,037 3,900,692 - (72,674) (150,079)
453,076 413,491 381,560 - (8,750) (18,070) 4,674,442 4,347,978 3,984,402 - (29,122) (60,140) 3,746,120 3,743,649 3,752,511 - (72,860) (150,463) 2,123,517 1,877,643 1,709,419 - (2,859) (5,904)
14,347,127 14,206,298 14,103,426 - (284,061) (586,613) 1,003,566 1,050,782 1,102,737 - (19,513) (40,296) 6,580,179 5,813,040 5,116,448 - (106,099) (219,104)
13,451,018 12,352,636 11,396,805 - (114,397) (236,241) 685,161 624,714 573,368 - (10,139) (20,938)
2,726,404 2,581,289 2,454,851 - (39,708) (82,001) 284,001 279,592 280,599 - (11,193) (23,115)
8,852,407 8,292,818 7,777,501 - (80,784) (166,827) 5,166,157 5,283,166 5,414,536 - (86,526) (178,684)
40,695,312 43,019,478 45,442,875 - (479,299) (989,798) 897,333 893,872 909,335 - (445,504) (920,008)
2,020,977 1,985,674 1,968,262 - (25,062) (51,755) 9,752,655 10,107,100 10,481,402 - (11,497) (23,742) 4,145,584 3,694,681 3,254,540 - (75,594) (156,109) 1,302,305 1,245,933 1,175,783 - (9,986) (20,622) 2,237,038 2,149,926 2,114,591 - (52,688) (108,806) 4,035,051 4,006,055 3,944,968 - (61,962) (127,957) 7,735,022 7,458,727 7,121,840 - (151,185) (312,211)
57,643,790 60,038,207 62,328,939 - (66,138) (136,581) 21,351,183 21,361,915 21,427,153 - (24,615) (50,832)
7,960,331 7,259,029 6,684,155 - (130,771) (270,054) 532,905 517,016 512,953 - (107,062) (221,093)
6,910,523 6,889,235 6,889,235 - (73,004) (150,760) 10,412,539 10,522,110 10,648,545 - (116,032) (239,617) 31,932,440 32,220,664 32,576,728 - (46,059) (95,116)
451,763 441,915 440,372 - (31,944) (65,967) 4,495,472 4,443,452 4,453,625 - (692,351) (1,429,770) 4,931,081 4,748,583 4,597,554 - (256,006) (528,677) 1,049,524 870,905 736,116 - (10,929) (22,569) 7,208,009 6,388,078 5,605,617 - (500,375) (1,033,322)
422,188 413,159 411,654 - (24,159) (49,891) 5,780,805 5,513,763 5,327,282 - (85,867) (177,323) 2,062,136 2,109,289 2,209,840 - (1,321,469) (2,728,959)
11,254,963 11,292,057 11,346,074 - (15,479) (31,966) 29,307,793 29,270,555 29,270,555 - (288,219) (595,200)
3,250,127 2,638,915 2,053,169 - (166,052) (342,913) 2,350,580 2,366,034 2,393,703 - (57,999) (119,773)
34,662,558 35,678,357 37,672,314 - (309,894) (639,960) 1,440,181 1,260,583 1,100,604 - (9,861) (20,364)
272,214,564 275,064,588 278,074,867 - (169,899) (350,858) 1,483,056 1,337,843 1,190,835 - (11,870) (24,513) 2,913,501 2,750,035 2,597,040 - (36,714) (75,818) 6,827,849 6,185,191 5,615,268 - (71,039) (146,702)
395,843 389,782 390,687 - (17,742) (36,639) 17,423,799 17,395,528 17,395,528 - (98,333) (203,067)
2,363,337 2,265,547 2,053,304 - (39,738) (82,063) 5,547,199 5,080,316 4,606,050 - (50,238) (103,746)
13,833,310 13,495,789 13,194,445 - (135,891) (280,628)
Teachers' Retirement System (TRS) ContributionTOTAL Statutory Formula Aid
Municipal Aid
E-32
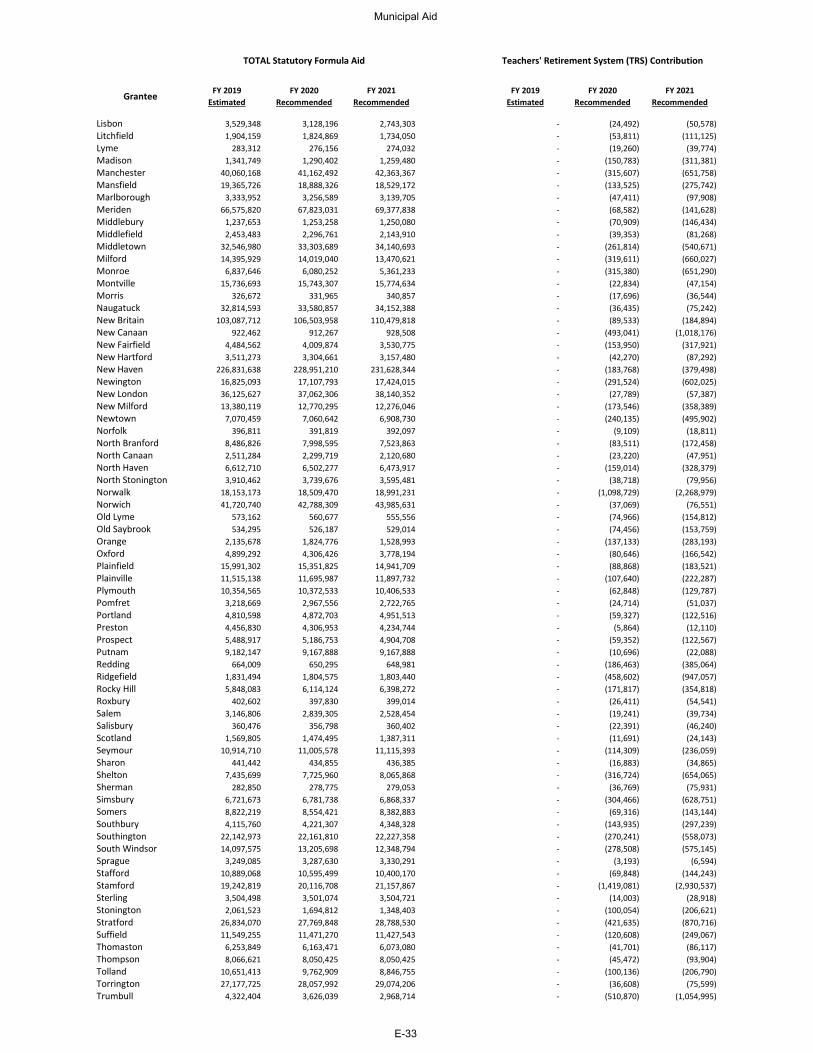
Grantee
LisbonLitchfieldLymeMadisonManchesterMansfieldMarlboroughMeridenMiddleburyMiddlefieldMiddletownMilfordMonroeMontvilleMorrisNaugatuckNew BritainNew CanaanNew FairfieldNew HartfordNew HavenNewingtonNew LondonNew MilfordNewtownNorfolkNorth BranfordNorth CanaanNorth HavenNorth StoningtonNorwalkNorwichOld LymeOld SaybrookOrangeOxfordPlainfieldPlainvillePlymouthPomfretPortlandPrestonProspectPutnamReddingRidgefieldRocky HillRoxburySalemSalisburyScotlandSeymourSharonSheltonShermanSimsburySomersSouthburySouthingtonSouth WindsorSpragueStaffordStamfordSterlingStoningtonStratfordSuffieldThomastonThompsonTollandTorringtonTrumbull
FY 2019 Estimated
FY 2020 Recommended
FY 2021 Recommended
FY 2019 Estimated
FY 2020 Recommended
FY 2021 Recommended
Teachers' Retirement System (TRS) ContributionTOTAL Statutory Formula Aid
3,529,348 3,128,196 2,743,303 - (24,492) (50,578) 1,904,159 1,824,869 1,734,050 - (53,811) (111,125)
283,312 276,156 274,032 - (19,260) (39,774) 1,341,749 1,290,402 1,259,480 - (150,783) (311,381)
40,060,168 41,162,492 42,363,367 - (315,607) (651,758) 19,365,726 18,888,326 18,529,172 - (133,525) (275,742)
3,333,952 3,256,589 3,139,705 - (47,411) (97,908) 66,575,820 67,823,031 69,377,838 - (68,582) (141,628)
1,237,653 1,253,258 1,250,080 - (70,909) (146,434) 2,453,483 2,296,761 2,143,910 - (39,353) (81,268)
32,546,980 33,303,689 34,140,693 - (261,814) (540,671) 14,395,929 14,019,040 13,470,621 - (319,611) (660,027)
6,837,646 6,080,252 5,361,233 - (315,380) (651,290) 15,736,693 15,743,307 15,774,634 - (22,834) (47,154)
326,672 331,965 340,857 - (17,696) (36,544) 32,814,593 33,580,857 34,152,388 - (36,435) (75,242)
103,087,712 106,503,958 110,479,818 - (89,533) (184,894) 922,462 912,267 928,508 - (493,041) (1,018,176)
4,484,562 4,009,874 3,530,775 - (153,950) (317,921) 3,511,273 3,304,661 3,157,480 - (42,270) (87,292)
226,831,638 228,951,210 231,628,344 - (183,768) (379,498) 16,825,093 17,107,793 17,424,015 - (291,524) (602,025) 36,125,627 37,062,306 38,140,352 - (27,789) (57,387) 13,380,119 12,770,295 12,276,046 - (173,546) (358,389)
7,070,459 7,060,642 6,908,730 - (240,135) (495,902) 396,811 391,819 392,097 - (9,109) (18,811)
8,486,826 7,998,595 7,523,863 - (83,511) (172,458) 2,511,284 2,299,719 2,120,680 - (23,220) (47,951) 6,612,710 6,502,277 6,473,917 - (159,014) (328,379) 3,910,462 3,739,676 3,595,481 - (38,718) (79,956)
18,153,173 18,509,470 18,991,231 - (1,098,729) (2,268,979) 41,720,740 42,788,309 43,985,631 - (37,069) (76,551)
573,162 560,677 555,556 - (74,966) (154,812) 534,295 526,187 529,014 - (74,456) (153,759)
2,135,678 1,824,776 1,528,993 - (137,133) (283,193) 4,899,292 4,306,426 3,778,194 - (80,646) (166,542)
15,991,302 15,351,825 14,941,709 - (88,868) (183,521) 11,515,138 11,695,987 11,897,732 - (107,640) (222,287) 10,354,565 10,372,533 10,406,533 - (62,848) (129,787)
3,218,669 2,967,556 2,722,765 - (24,714) (51,037) 4,810,598 4,872,703 4,951,513 - (59,327) (122,516) 4,456,830 4,306,953 4,234,744 - (5,864) (12,110) 5,488,917 5,186,753 4,904,708 - (59,352) (122,567) 9,182,147 9,167,888 9,167,888 - (10,696) (22,088)
664,009 650,295 648,981 - (186,463) (385,064) 1,831,494 1,804,575 1,803,440 - (458,602) (947,057) 5,848,083 6,114,124 6,398,272 - (171,817) (354,818)
402,602 397,830 399,014 - (26,411) (54,541) 3,146,806 2,839,305 2,528,454 - (19,241) (39,734)
360,476 356,798 360,402 - (22,391) (46,240) 1,569,805 1,474,495 1,387,311 - (11,691) (24,143)
10,914,710 11,005,578 11,115,393 - (114,309) (236,059) 441,442 434,855 436,385 - (16,883) (34,865)
7,435,699 7,725,960 8,065,868 - (316,724) (654,065) 282,850 278,775 279,053 - (36,769) (75,931)
6,721,673 6,781,738 6,868,337 - (304,466) (628,751) 8,822,219 8,554,421 8,382,883 - (69,316) (143,144) 4,115,760 4,221,307 4,348,328 - (143,935) (297,239)
22,142,973 22,161,810 22,227,358 - (270,241) (558,073) 14,097,575 13,205,698 12,348,794 - (278,508) (575,145)
3,249,085 3,287,630 3,330,291 - (3,193) (6,594) 10,889,068 10,595,499 10,400,170 - (69,848) (144,243) 19,242,819 20,116,708 21,157,867 - (1,419,081) (2,930,537)
3,504,498 3,501,074 3,504,721 - (14,003) (28,918) 2,061,523 1,694,812 1,348,403 - (100,054) (206,621)
26,834,070 27,769,848 28,788,530 - (421,635) (870,716) 11,549,255 11,471,270 11,427,543 - (120,608) (249,067)
6,253,849 6,163,471 6,073,080 - (41,701) (86,117) 8,066,621 8,050,425 8,050,425 - (45,472) (93,904)
10,651,413 9,762,909 8,846,755 - (100,136) (206,790) 27,177,725 28,057,992 29,074,206 - (36,608) (75,599)
4,322,404 3,626,039 2,968,714 - (510,870) (1,054,995)
Municipal Aid
E-33
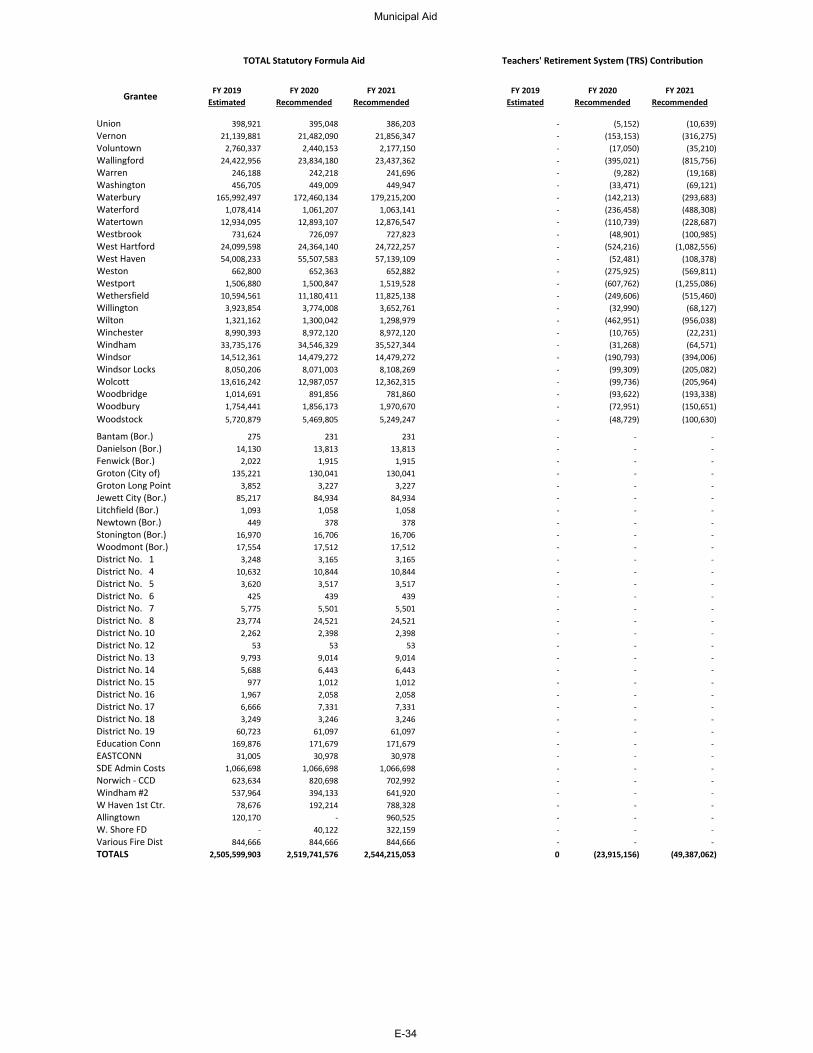
Grantee
UnionVernonVoluntownWallingfordWarrenWashingtonWaterburyWaterfordWatertownWestbrookWest HartfordWest HavenWestonWestportWethersfieldWillingtonWiltonWinchesterWindhamWindsorWindsor LocksWolcottWoodbridgeWoodburyWoodstock
Bantam (Bor.)Danielson (Bor.)Fenwick (Bor.)Groton (City of)Groton Long PointJewett City (Bor.)Litchfield (Bor.)Newtown (Bor.)Stonington (Bor.)Woodmont (Bor.)District No. 1District No. 4District No. 5District No. 6District No. 7District No. 8District No. 10District No. 12District No. 13District No. 14District No. 15District No. 16District No. 17District No. 18District No. 19Education ConnEASTCONNSDE Admin CostsNorwich - CCD Windham #2W Haven 1st Ctr.Allingtown W. Shore FD Various Fire DistTOTALS
FY 2019 Estimated
FY 2020 Recommended
FY 2021 Recommended
FY 2019 Estimated
FY 2020 Recommended
FY 2021 Recommended
Teachers' Retirement System (TRS) ContributionTOTAL Statutory Formula Aid
398,921 395,048 386,203 - (5,152) (10,639) 21,139,881 21,482,090 21,856,347 - (153,153) (316,275)
2,760,337 2,440,153 2,177,150 - (17,050) (35,210) 24,422,956 23,834,180 23,437,362 - (395,021) (815,756)
246,188 242,218 241,696 - (9,282) (19,168) 456,705 449,009 449,947 - (33,471) (69,121)
165,992,497 172,460,134 179,215,200 - (142,213) (293,683) 1,078,414 1,061,207 1,063,141 - (236,458) (488,308)
12,934,095 12,893,107 12,876,547 - (110,739) (228,687) 731,624 726,097 727,823 - (48,901) (100,985)
24,099,598 24,364,140 24,722,257 - (524,216) (1,082,556) 54,008,233 55,507,583 57,139,109 - (52,481) (108,378)
662,800 652,363 652,882 - (275,925) (569,811) 1,506,880 1,500,847 1,519,528 - (607,762) (1,255,086)
10,594,561 11,180,411 11,825,138 - (249,606) (515,460) 3,923,854 3,774,008 3,652,761 - (32,990) (68,127) 1,321,162 1,300,042 1,298,979 - (462,951) (956,038) 8,990,393 8,972,120 8,972,120 - (10,765) (22,231)
33,735,176 34,546,329 35,527,344 - (31,268) (64,571) 14,512,361 14,479,272 14,479,272 - (190,793) (394,006)
8,050,206 8,071,003 8,108,269 - (99,309) (205,082) 13,616,242 12,987,057 12,362,315 - (99,736) (205,964)
1,014,691 891,856 781,860 - (93,622) (193,338) 1,754,441 1,856,173 1,970,670 - (72,951) (150,651) 5,720,879 5,469,805 5,249,247 - (48,729) (100,630)
275 231 231 - - - 14,130 13,813 13,813 - - -
2,022 1,915 1,915 - - - 135,221 130,041 130,041 - - -
3,852 3,227 3,227 - - - 85,217 84,934 84,934 - - -
1,093 1,058 1,058 - - - 449 378 378 - - -
16,970 16,706 16,706 - - - 17,554 17,512 17,512 - - -
3,248 3,165 3,165 - - - 10,632 10,844 10,844 - - -
3,620 3,517 3,517 - - - 425 439 439 - - -
5,775 5,501 5,501 - - - 23,774 24,521 24,521 - - -
2,262 2,398 2,398 - - - 53 53 53 - - -
9,793 9,014 9,014 - - - 5,688 6,443 6,443 - - -
977 1,012 1,012 - - - 1,967 2,058 2,058 - - - 6,666 7,331 7,331 - - - 3,249 3,246 3,246 - - -
60,723 61,097 61,097 - - - 169,876 171,679 171,679 - - -
31,005 30,978 30,978 - - - 1,066,698 1,066,698 1,066,698 - - -
623,634 820,698 702,992 - - - 537,964 394,133 641,920 - - -
78,676 192,214 788,328 - - - 120,170 - 960,525 - - -
- 40,122 322,159 - - - 844,666 844,666 844,666 - - -
2,505,599,903 2,519,741,576 2,544,215,053 0 (23,915,156) (49,387,062)
Municipal Aid
E-34
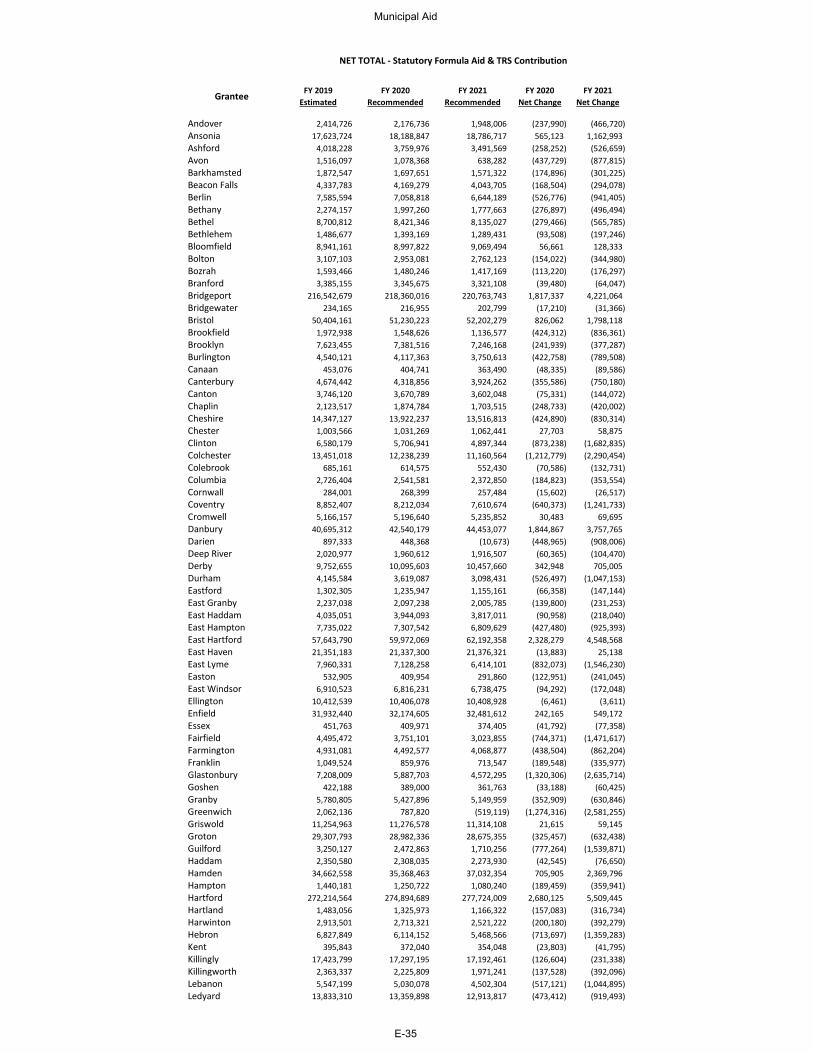
Grantee
AndoverAnsoniaAshfordAvonBarkhamstedBeacon FallsBerlinBethanyBethelBethlehemBloomfieldBoltonBozrahBranfordBridgeportBridgewaterBristolBrookfieldBrooklynBurlingtonCanaanCanterburyCantonChaplinCheshireChesterClintonColchesterColebrookColumbiaCornwallCoventryCromwellDanburyDarienDeep RiverDerbyDurhamEastfordEast GranbyEast HaddamEast HamptonEast HartfordEast HavenEast LymeEastonEast WindsorEllingtonEnfieldEssexFairfieldFarmingtonFranklinGlastonburyGoshenGranbyGreenwichGriswoldGrotonGuilfordHaddamHamdenHamptonHartfordHartlandHarwintonHebronKentKillinglyKillingworthLebanonLedyard
FY 2019 Estimated
FY 2020 Recommended
FY 2021 Recommended
FY 2020 Net Change
FY 2021 Net Change
2,414,726 2,176,736 1,948,006 (237,990) (466,720) 17,623,724 18,188,847 18,786,717 565,123 1,162,993
4,018,228 3,759,976 3,491,569 (258,252) (526,659) 1,516,097 1,078,368 638,282 (437,729) (877,815) 1,872,547 1,697,651 1,571,322 (174,896) (301,225) 4,337,783 4,169,279 4,043,705 (168,504) (294,078) 7,585,594 7,058,818 6,644,189 (526,776) (941,405) 2,274,157 1,997,260 1,777,663 (276,897) (496,494) 8,700,812 8,421,346 8,135,027 (279,466) (565,785) 1,486,677 1,393,169 1,289,431 (93,508) (197,246) 8,941,161 8,997,822 9,069,494 56,661 128,333 3,107,103 2,953,081 2,762,123 (154,022) (344,980) 1,593,466 1,480,246 1,417,169 (113,220) (176,297) 3,385,155 3,345,675 3,321,108 (39,480) (64,047)
216,542,679 218,360,016 220,763,743 1,817,337 4,221,064 234,165 216,955 202,799 (17,210) (31,366)
50,404,161 51,230,223 52,202,279 826,062 1,798,118 1,972,938 1,548,626 1,136,577 (424,312) (836,361) 7,623,455 7,381,516 7,246,168 (241,939) (377,287) 4,540,121 4,117,363 3,750,613 (422,758) (789,508)
453,076 404,741 363,490 (48,335) (89,586) 4,674,442 4,318,856 3,924,262 (355,586) (750,180) 3,746,120 3,670,789 3,602,048 (75,331) (144,072) 2,123,517 1,874,784 1,703,515 (248,733) (420,002)
14,347,127 13,922,237 13,516,813 (424,890) (830,314) 1,003,566 1,031,269 1,062,441 27,703 58,875 6,580,179 5,706,941 4,897,344 (873,238) (1,682,835)
13,451,018 12,238,239 11,160,564 (1,212,779) (2,290,454) 685,161 614,575 552,430 (70,586) (132,731)
2,726,404 2,541,581 2,372,850 (184,823) (353,554) 284,001 268,399 257,484 (15,602) (26,517)
8,852,407 8,212,034 7,610,674 (640,373) (1,241,733) 5,166,157 5,196,640 5,235,852 30,483 69,695
40,695,312 42,540,179 44,453,077 1,844,867 3,757,765 897,333 448,368 (10,673) (448,965) (908,006)
2,020,977 1,960,612 1,916,507 (60,365) (104,470) 9,752,655 10,095,603 10,457,660 342,948 705,005 4,145,584 3,619,087 3,098,431 (526,497) (1,047,153) 1,302,305 1,235,947 1,155,161 (66,358) (147,144) 2,237,038 2,097,238 2,005,785 (139,800) (231,253) 4,035,051 3,944,093 3,817,011 (90,958) (218,040) 7,735,022 7,307,542 6,809,629 (427,480) (925,393)
57,643,790 59,972,069 62,192,358 2,328,279 4,548,568 21,351,183 21,337,300 21,376,321 (13,883) 25,138
7,960,331 7,128,258 6,414,101 (832,073) (1,546,230) 532,905 409,954 291,860 (122,951) (241,045)
6,910,523 6,816,231 6,738,475 (94,292) (172,048) 10,412,539 10,406,078 10,408,928 (6,461) (3,611) 31,932,440 32,174,605 32,481,612 242,165 549,172
451,763 409,971 374,405 (41,792) (77,358) 4,495,472 3,751,101 3,023,855 (744,371) (1,471,617) 4,931,081 4,492,577 4,068,877 (438,504) (862,204) 1,049,524 859,976 713,547 (189,548) (335,977) 7,208,009 5,887,703 4,572,295 (1,320,306) (2,635,714)
422,188 389,000 361,763 (33,188) (60,425) 5,780,805 5,427,896 5,149,959 (352,909) (630,846) 2,062,136 787,820 (519,119) (1,274,316) (2,581,255)
11,254,963 11,276,578 11,314,108 21,615 59,145 29,307,793 28,982,336 28,675,355 (325,457) (632,438)
3,250,127 2,472,863 1,710,256 (777,264) (1,539,871) 2,350,580 2,308,035 2,273,930 (42,545) (76,650)
34,662,558 35,368,463 37,032,354 705,905 2,369,796 1,440,181 1,250,722 1,080,240 (189,459) (359,941)
272,214,564 274,894,689 277,724,009 2,680,125 5,509,445 1,483,056 1,325,973 1,166,322 (157,083) (316,734) 2,913,501 2,713,321 2,521,222 (200,180) (392,279) 6,827,849 6,114,152 5,468,566 (713,697) (1,359,283)
395,843 372,040 354,048 (23,803) (41,795) 17,423,799 17,297,195 17,192,461 (126,604) (231,338)
2,363,337 2,225,809 1,971,241 (137,528) (392,096) 5,547,199 5,030,078 4,502,304 (517,121) (1,044,895)
13,833,310 13,359,898 12,913,817 (473,412) (919,493)
NET TOTAL - Statutory Formula Aid & TRS Contribution
Municipal Aid
E-35
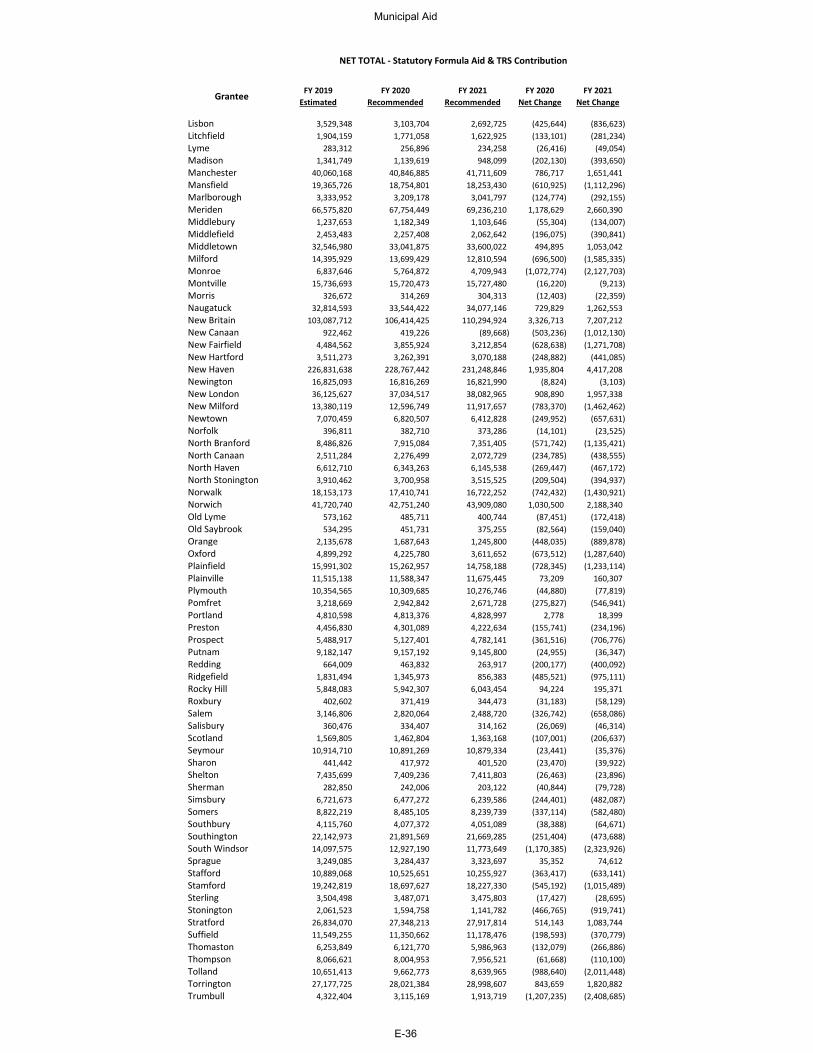
Grantee
LisbonLitchfieldLymeMadisonManchesterMansfieldMarlboroughMeridenMiddleburyMiddlefieldMiddletownMilfordMonroeMontvilleMorrisNaugatuckNew BritainNew CanaanNew FairfieldNew HartfordNew HavenNewingtonNew LondonNew MilfordNewtownNorfolkNorth BranfordNorth CanaanNorth HavenNorth StoningtonNorwalkNorwichOld LymeOld SaybrookOrangeOxfordPlainfieldPlainvillePlymouthPomfretPortlandPrestonProspectPutnamReddingRidgefieldRocky HillRoxburySalemSalisburyScotlandSeymourSharonSheltonShermanSimsburySomersSouthburySouthingtonSouth WindsorSpragueStaffordStamfordSterlingStoningtonStratfordSuffieldThomastonThompsonTollandTorringtonTrumbull
FY 2019 Estimated
FY 2020 Recommended
FY 2021 Recommended
FY 2020 Net Change
FY 2021 Net Change
NET TOTAL - Statutory Formula Aid & TRS Contribution
3,529,348 3,103,704 2,692,725 (425,644) (836,623) 1,904,159 1,771,058 1,622,925 (133,101) (281,234)
283,312 256,896 234,258 (26,416) (49,054) 1,341,749 1,139,619 948,099 (202,130) (393,650)
40,060,168 40,846,885 41,711,609 786,717 1,651,441 19,365,726 18,754,801 18,253,430 (610,925) (1,112,296)
3,333,952 3,209,178 3,041,797 (124,774) (292,155) 66,575,820 67,754,449 69,236,210 1,178,629 2,660,390
1,237,653 1,182,349 1,103,646 (55,304) (134,007) 2,453,483 2,257,408 2,062,642 (196,075) (390,841)
32,546,980 33,041,875 33,600,022 494,895 1,053,042 14,395,929 13,699,429 12,810,594 (696,500) (1,585,335)
6,837,646 5,764,872 4,709,943 (1,072,774) (2,127,703) 15,736,693 15,720,473 15,727,480 (16,220) (9,213)
326,672 314,269 304,313 (12,403) (22,359) 32,814,593 33,544,422 34,077,146 729,829 1,262,553
103,087,712 106,414,425 110,294,924 3,326,713 7,207,212 922,462 419,226 (89,668) (503,236) (1,012,130)
4,484,562 3,855,924 3,212,854 (628,638) (1,271,708) 3,511,273 3,262,391 3,070,188 (248,882) (441,085)
226,831,638 228,767,442 231,248,846 1,935,804 4,417,208 16,825,093 16,816,269 16,821,990 (8,824) (3,103) 36,125,627 37,034,517 38,082,965 908,890 1,957,338 13,380,119 12,596,749 11,917,657 (783,370) (1,462,462)
7,070,459 6,820,507 6,412,828 (249,952) (657,631) 396,811 382,710 373,286 (14,101) (23,525)
8,486,826 7,915,084 7,351,405 (571,742) (1,135,421) 2,511,284 2,276,499 2,072,729 (234,785) (438,555) 6,612,710 6,343,263 6,145,538 (269,447) (467,172) 3,910,462 3,700,958 3,515,525 (209,504) (394,937)
18,153,173 17,410,741 16,722,252 (742,432) (1,430,921) 41,720,740 42,751,240 43,909,080 1,030,500 2,188,340
573,162 485,711 400,744 (87,451) (172,418) 534,295 451,731 375,255 (82,564) (159,040)
2,135,678 1,687,643 1,245,800 (448,035) (889,878) 4,899,292 4,225,780 3,611,652 (673,512) (1,287,640)
15,991,302 15,262,957 14,758,188 (728,345) (1,233,114) 11,515,138 11,588,347 11,675,445 73,209 160,307 10,354,565 10,309,685 10,276,746 (44,880) (77,819)
3,218,669 2,942,842 2,671,728 (275,827) (546,941) 4,810,598 4,813,376 4,828,997 2,778 18,399 4,456,830 4,301,089 4,222,634 (155,741) (234,196) 5,488,917 5,127,401 4,782,141 (361,516) (706,776) 9,182,147 9,157,192 9,145,800 (24,955) (36,347)
664,009 463,832 263,917 (200,177) (400,092) 1,831,494 1,345,973 856,383 (485,521) (975,111) 5,848,083 5,942,307 6,043,454 94,224 195,371
402,602 371,419 344,473 (31,183) (58,129) 3,146,806 2,820,064 2,488,720 (326,742) (658,086)
360,476 334,407 314,162 (26,069) (46,314) 1,569,805 1,462,804 1,363,168 (107,001) (206,637)
10,914,710 10,891,269 10,879,334 (23,441) (35,376) 441,442 417,972 401,520 (23,470) (39,922)
7,435,699 7,409,236 7,411,803 (26,463) (23,896) 282,850 242,006 203,122 (40,844) (79,728)
6,721,673 6,477,272 6,239,586 (244,401) (482,087) 8,822,219 8,485,105 8,239,739 (337,114) (582,480) 4,115,760 4,077,372 4,051,089 (38,388) (64,671)
22,142,973 21,891,569 21,669,285 (251,404) (473,688) 14,097,575 12,927,190 11,773,649 (1,170,385) (2,323,926)
3,249,085 3,284,437 3,323,697 35,352 74,612 10,889,068 10,525,651 10,255,927 (363,417) (633,141) 19,242,819 18,697,627 18,227,330 (545,192) (1,015,489)
3,504,498 3,487,071 3,475,803 (17,427) (28,695) 2,061,523 1,594,758 1,141,782 (466,765) (919,741)
26,834,070 27,348,213 27,917,814 514,143 1,083,744 11,549,255 11,350,662 11,178,476 (198,593) (370,779)
6,253,849 6,121,770 5,986,963 (132,079) (266,886) 8,066,621 8,004,953 7,956,521 (61,668) (110,100)
10,651,413 9,662,773 8,639,965 (988,640) (2,011,448) 27,177,725 28,021,384 28,998,607 843,659 1,820,882
4,322,404 3,115,169 1,913,719 (1,207,235) (2,408,685)
Municipal Aid
E-36
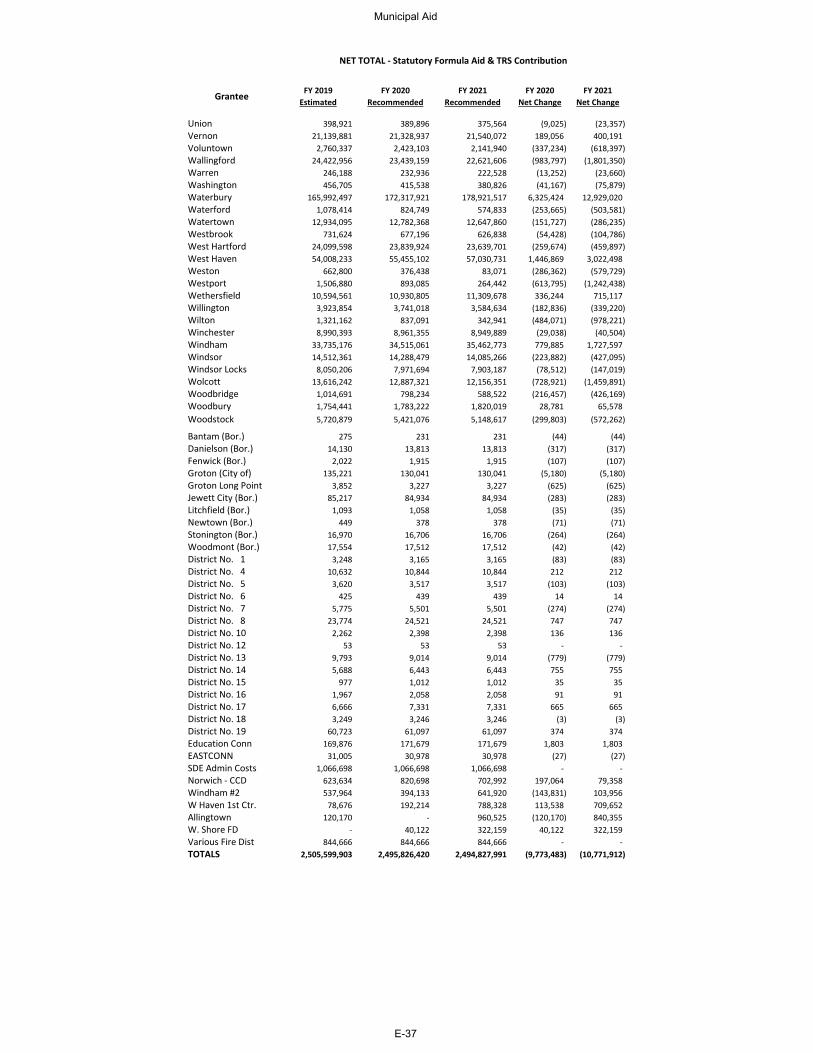
Grantee
UnionVernonVoluntownWallingfordWarrenWashingtonWaterburyWaterfordWatertownWestbrookWest HartfordWest HavenWestonWestportWethersfieldWillingtonWiltonWinchesterWindhamWindsorWindsor LocksWolcottWoodbridgeWoodburyWoodstock
Bantam (Bor.)Danielson (Bor.)Fenwick (Bor.)Groton (City of)Groton Long PointJewett City (Bor.)Litchfield (Bor.)Newtown (Bor.)Stonington (Bor.)Woodmont (Bor.)District No. 1District No. 4District No. 5District No. 6District No. 7District No. 8District No. 10District No. 12District No. 13District No. 14District No. 15District No. 16District No. 17District No. 18District No. 19Education ConnEASTCONNSDE Admin CostsNorwich - CCD Windham #2W Haven 1st Ctr.Allingtown W. Shore FD Various Fire DistTOTALS
FY 2019 Estimated
FY 2020 Recommended
FY 2021 Recommended
FY 2020 Net Change
FY 2021 Net Change
NET TOTAL - Statutory Formula Aid & TRS Contribution
398,921 389,896 375,564 (9,025) (23,357) 21,139,881 21,328,937 21,540,072 189,056 400,191
2,760,337 2,423,103 2,141,940 (337,234) (618,397) 24,422,956 23,439,159 22,621,606 (983,797) (1,801,350)
246,188 232,936 222,528 (13,252) (23,660) 456,705 415,538 380,826 (41,167) (75,879)
165,992,497 172,317,921 178,921,517 6,325,424 12,929,020 1,078,414 824,749 574,833 (253,665) (503,581)
12,934,095 12,782,368 12,647,860 (151,727) (286,235) 731,624 677,196 626,838 (54,428) (104,786)
24,099,598 23,839,924 23,639,701 (259,674) (459,897) 54,008,233 55,455,102 57,030,731 1,446,869 3,022,498
662,800 376,438 83,071 (286,362) (579,729) 1,506,880 893,085 264,442 (613,795) (1,242,438)
10,594,561 10,930,805 11,309,678 336,244 715,117 3,923,854 3,741,018 3,584,634 (182,836) (339,220) 1,321,162 837,091 342,941 (484,071) (978,221) 8,990,393 8,961,355 8,949,889 (29,038) (40,504)
33,735,176 34,515,061 35,462,773 779,885 1,727,597 14,512,361 14,288,479 14,085,266 (223,882) (427,095)
8,050,206 7,971,694 7,903,187 (78,512) (147,019) 13,616,242 12,887,321 12,156,351 (728,921) (1,459,891)
1,014,691 798,234 588,522 (216,457) (426,169) 1,754,441 1,783,222 1,820,019 28,781 65,578 5,720,879 5,421,076 5,148,617 (299,803) (572,262)
275 231 231 (44) (44) 14,130 13,813 13,813 (317) (317)
2,022 1,915 1,915 (107) (107) 135,221 130,041 130,041 (5,180) (5,180)
3,852 3,227 3,227 (625) (625) 85,217 84,934 84,934 (283) (283)
1,093 1,058 1,058 (35) (35) 449 378 378 (71) (71)
16,970 16,706 16,706 (264) (264) 17,554 17,512 17,512 (42) (42)
3,248 3,165 3,165 (83) (83) 10,632 10,844 10,844 212 212
3,620 3,517 3,517 (103) (103) 425 439 439 14 14
5,775 5,501 5,501 (274) (274) 23,774 24,521 24,521 747 747
2,262 2,398 2,398 136 136 53 53 53 - -
9,793 9,014 9,014 (779) (779) 5,688 6,443 6,443 755 755
977 1,012 1,012 35 35 1,967 2,058 2,058 91 91 6,666 7,331 7,331 665 665 3,249 3,246 3,246 (3) (3)
60,723 61,097 61,097 374 374 169,876 171,679 171,679 1,803 1,803
31,005 30,978 30,978 (27) (27) 1,066,698 1,066,698 1,066,698 - -
623,634 820,698 702,992 197,064 79,358 537,964 394,133 641,920 (143,831) 103,956
78,676 192,214 788,328 113,538 709,652 120,170 - 960,525 (120,170) 840,355
- 40,122 322,159 40,122 322,159 844,666 844,666 844,666 - -
2,505,599,903 2,495,826,420 2,494,827,991 (9,773,483) (10,771,912)
Municipal Aid
E-37
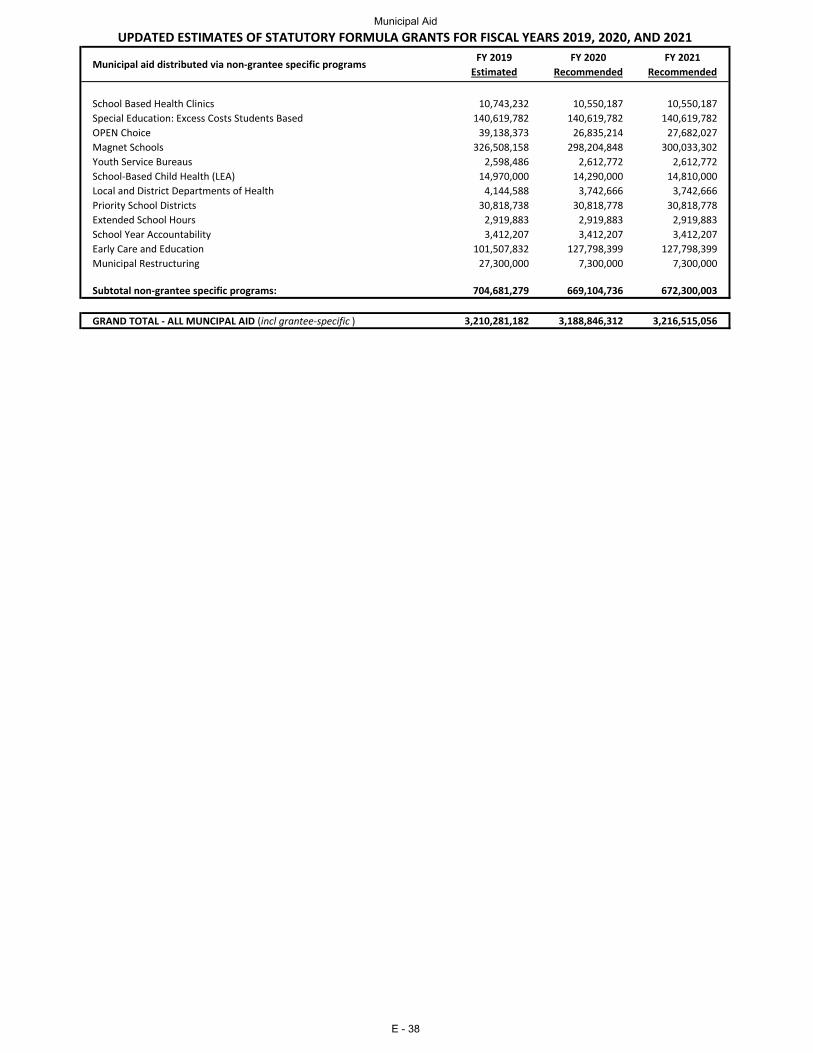
UPDATED ESTIMATES OF STATUTORY FORMULA GRANTS FOR FISCAL YEARS 2019, 2020, AND 2021
Municipal aid distributed via non-grantee specific programsFY 2019
EstimatedFY 2020
RecommendedFY 2021
Recommended
School Based Health Clinics 10,743,232 10,550,187 10,550,187Special Education: Excess Costs Students Based 140,619,782 140,619,782 140,619,782OPEN Choice 39,138,373 26,835,214 27,682,027Magnet Schools 326,508,158 298,204,848 300,033,302Youth Service Bureaus 2,598,486 2,612,772 2,612,772School-Based Child Health (LEA) 14,970,000 14,290,000 14,810,000Local and District Departments of Health 4,144,588 3,742,666 3,742,666Priority School Districts 30,818,738 30,818,778 30,818,778Extended School Hours 2,919,883 2,919,883 2,919,883School Year Accountability 3,412,207 3,412,207 3,412,207Early Care and Education 101,507,832 127,798,399 127,798,399Municipal Restructuring 27,300,000 7,300,000 7,300,000
Subtotal non-grantee specific programs: 704,681,279 669,104,736 672,300,003
GRAND TOTAL - ALL MUNCIPAL AID (incl grantee-specific ) 3,210,281,182 3,188,846,312 3,216,515,056
Municipal Aid
E - 38
INDEX

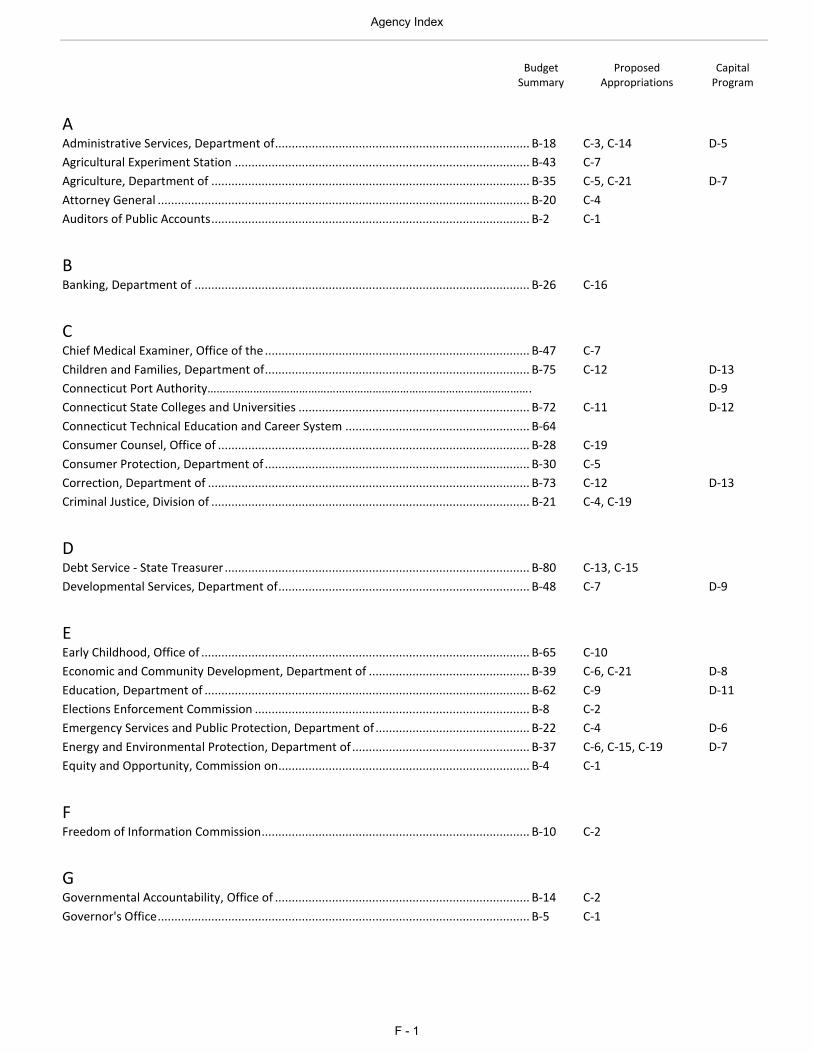
Budget Proposed Capital Summary Appropriations Program
A Administrative Services, Department of ............................................................................ B-18 C-3, C-14 D-5
Agricultural Experiment Station ........................................................................................ B-43 C-7
Agriculture, Department of ............................................................................................... B-35 C-5, C-21 D-7
Attorney General ............................................................................................................... B-20 C-4
Auditors of Public Accounts ............................................................................................... B-2 C-1
B Banking, Department of .................................................................................................... B-26 C-16
C Chief Medical Examiner, Office of the ............................................................................... B-47 C-7
Children and Families, Department of ............................................................................... B-75 C-12 D-13
Connecticut Port Authority……………………………………………………………………………………………. D-9
Connecticut State Colleges and Universities ..................................................................... B-72 C-11 D-12
Connecticut Technical Education and Career System ....................................................... B-64
Consumer Counsel, Office of ............................................................................................. B-28 C-19
Consumer Protection, Department of ............................................................................... B-30 C-5
Correction, Department of ................................................................................................ B-73 C-12 D-13
Criminal Justice, Division of ............................................................................................... B-21 C-4, C-19
D Debt Service - State Treasurer ........................................................................................... B-80 C-13, C-15
Developmental Services, Department of ........................................................................... B-48 C-7 D-9
E Early Childhood, Office of .................................................................................................. B-65 C-10
Economic and Community Development, Department of ................................................ B-39 C-6, C-21 D-8
Education, Department of ................................................................................................. B-62 C-9 D-11
Elections Enforcement Commission .................................................................................. B-8 C-2
Emergency Services and Public Protection, Department of .............................................. B-22 C-4 D-6
Energy and Environmental Protection, Department of ..................................................... B-37 C-6, C-15, C-19 D-7
Equity and Opportunity, Commission on........................................................................... B-4 C-1
F Freedom of Information Commission................................................................................ B-10 C-2
G Governmental Accountability, Office of ............................................................................ B-14 C-2
Governor's Office ............................................................................................................... B-5 C-1
Agency Index
F - 1
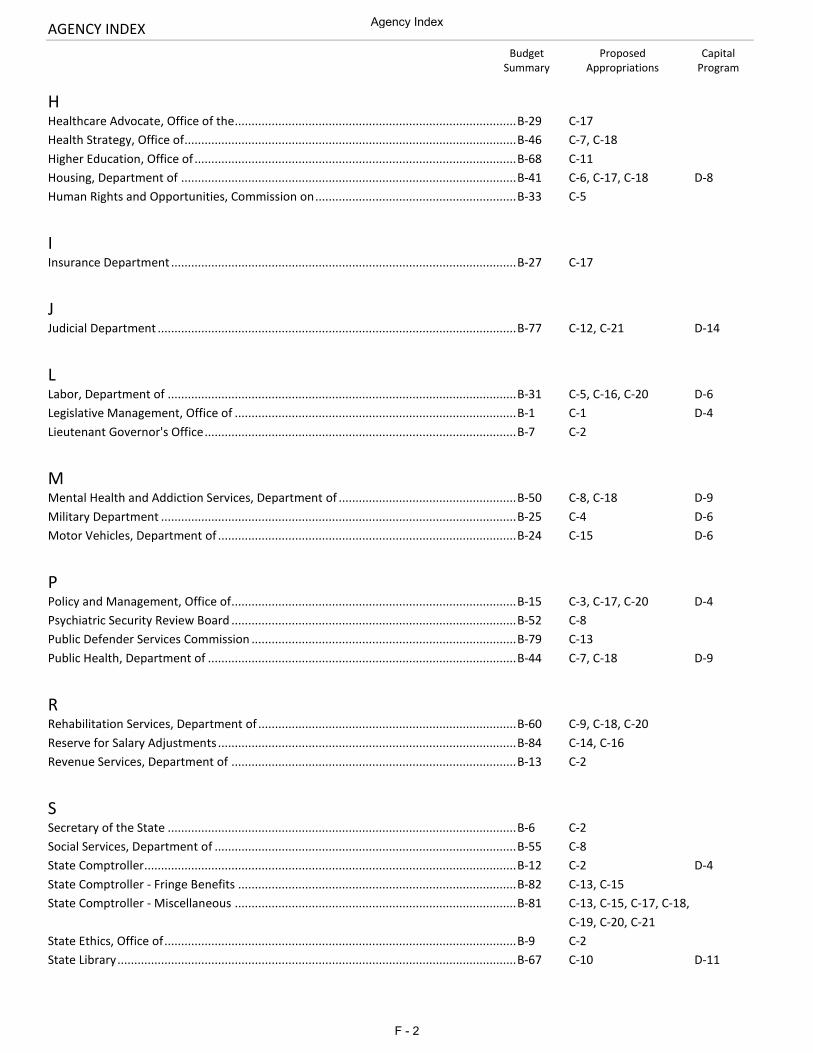
AGENCY INDEX
Budget Proposed Capital Summary Appropriations Program
H Healthcare Advocate, Office of the .................................................................................... B-29 C-17
Health Strategy, Office of ................................................................................................... B-46 C-7, C-18
Higher Education, Office of ................................................................................................ B-68 C-11
Housing, Department of .................................................................................................... B-41 C-6, C-17, C-18 D-8
Human Rights and Opportunities, Commission on ............................................................ B-33 C-5
I Insurance Department ....................................................................................................... B-27 C-17
J Judicial Department ........................................................................................................... B-77 C-12, C-21 D-14
L Labor, Department of ........................................................................................................ B-31 C-5, C-16, C-20 D-6
Legislative Management, Office of .................................................................................... B-1 C-1 D-4
Lieutenant Governor's Office ............................................................................................. B-7 C-2
M Mental Health and Addiction Services, Department of ..................................................... B-50 C-8, C-18 D-9
Military Department .......................................................................................................... B-25 C-4 D-6
Motor Vehicles, Department of ......................................................................................... B-24 C-15 D-6
P Policy and Management, Office of..................................................................................... B-15 C-3, C-17, C-20 D-4
Psychiatric Security Review Board ..................................................................................... B-52 C-8
Public Defender Services Commission ............................................................................... B-79 C-13
Public Health, Department of ............................................................................................ B-44 C-7, C-18 D-9
R Rehabilitation Services, Department of ............................................................................. B-60 C-9, C-18, C-20
Reserve for Salary Adjustments ......................................................................................... B-84 C-14, C-16
Revenue Services, Department of ..................................................................................... B-13 C-2
S Secretary of the State ........................................................................................................ B-6 C-2
Social Services, Department of .......................................................................................... B-55 C-8
State Comptroller............................................................................................................... B-12 C-2 D-4
State Comptroller - Fringe Benefits ................................................................................... B-82 C-13, C-15
State Comptroller - Miscellaneous .................................................................................... B-81 C-13, C-15, C-17, C-18,
........................................................................................................................................... C-19, C-20, C-21
State Ethics, Office of ......................................................................................................... B-9 C-2
State Library ....................................................................................................................... B-67 C-10 D-11
Agency Index
F - 2
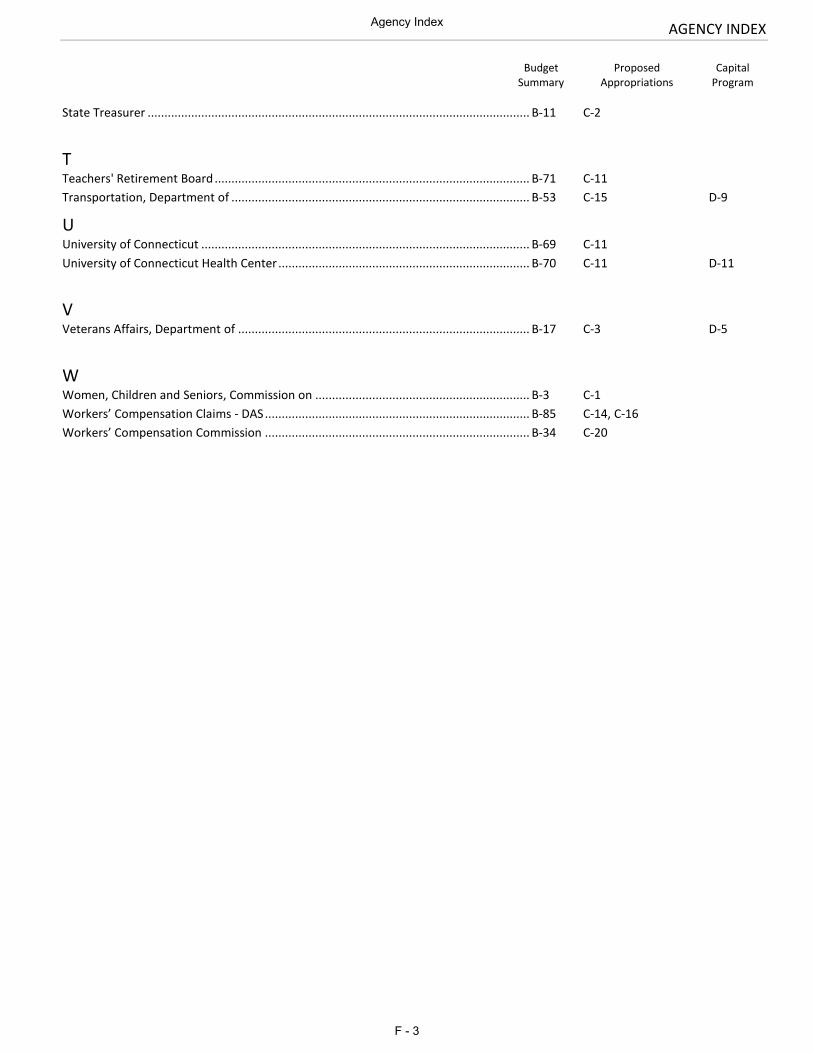
AGENCY INDEX
Budget Proposed Capital Summary Appropriations Program
State Treasurer .................................................................................................................. B-11 C-2
T Teachers' Retirement Board .............................................................................................. B-71 C-11
Transportation, Department of ......................................................................................... B-53 C-15 D-9
U University of Connecticut .................................................................................................. B-69 C-11
University of Connecticut Health Center ........................................................................... B-70 C-11 D-11
V Veterans Affairs, Department of ....................................................................................... B-17 C-3 D-5
W Women, Children and Seniors, Commission on ................................................................ B-3 C-1
Workers’ Compensation Claims - DAS ............................................................................... B-85 C-14, C-16
Workers’ Compensation Commission ............................................................................... B-34 C-20
Agency Index
F - 3