Embed Size (px)
Citation preview
English summary with full translation of consolidated financial information
Quarterly Report filed with the Japanese governmentpursuant to the Financial Instruments and Exchange
Law of Japan
For the nine months endedDecember 31, 2015
Panasonic CorporationOsaka, Japan
CONTENTS
Page
Disclaimer Regarding Forward-Looking Statements ------------------------------------------------------------------------------------------
Corporate Information -----------------------------------------------------------------------------------------------------------------------(1) Consolidated Financial Summary -----------------------------------------------------------------------------------------------------(2) Principal Businesses -------------------------------------------------------------------------------------------------------------------
The Business Overview ----------------------------------------------------------------------------------------------------------------------(1) Operating Results -----------------------------------------------------------------------------------------------------------------------(2) Operating Results by Segment --------------------------------------------------------------------------------------------------------(3) Assets, Liabilities and Equity ---------------------------------------------------------------------------------------------------------(4) Cash Flows ------------------------------------------------------------------------------------------------------------------------------(5) Research and Development -----------------------------------------------------------------------------------------------------------(6) Capital Investment ---------------------------------------------------------------------------------------------------------------------(7) Depreciation ----------------------------------------------------------------------------------------------------------------------------(8) Number of Employees ----------------------------------------------------------------------------------------------------------------(9) Risk Factors ----------------------------------------------------------------------------------------------------------------------------
Shares and Shareholders ---------------------------------------------------------------------------------------------------------------------(1) Shares of Common Stock Issued ----------------------------------------------------------------------------------------------------(2) Amount of Common Stock (Stated Capital) ----------------------------------------------------------------------------------------
Financial Statements -------------------------------------------------------------------------------------------------------------------------
1
223
4456677777
888
9
Disclaimer Regarding Forward-Looking Statements
This quarterly report includes forward-looking statements (that include those within the meaning of Section 27A of the U.S. Securities Act of 1933, as amended, and Section 21E of the U.S. Securities Exchange Act of 1934), as amended about Panasonic and its Group companies (the Panasonic Group). To the extent that statements in this quarterly report do not relate to historical or current facts, they constitute forward-looking statements. These forward-looking statements are based on the current assumptions and beliefs of the Panasonic Group in light of the information currently available to it, and involve known and unknown risks, uncertainties and other factors. Such risks, uncertainties and other factors may cause the Panasonic Group's actual results, performance, achievements or financial position to be materially different from any future results, performance, achievements or financial position expressed or implied by these forward-looking statements. Panasonic undertakes no obligation to publicly update any forward-looking statements after the date of this quarterly report. Investors are advised to consult any further disclosures by Panasonic in its subsequent filings under the Financial Instrument and Exchange Act of Japan (the FIEA) and other publicly disclosed documents.
The risks, uncertainties and other factors referred to above include, but are not limited to, economic conditions, particularly consumer spending and corporate capital expenditures in the Americas, Europe, Japan, China and other Asian countries; volatility in demand for electronic equipment and components from business and industrial customers, as well as consumers in many product and geographical markets; the possibility that excessive currency rate fluctuations of the U.S. dollar, the euro, the Chinese yuan and other currencies against the yen may adversely affect costs and prices of Panasonic’s products and services and certain other transactions that are denominated in these foreign currencies; the possibility of the Panasonic Group incurring additional costs of raising funds, because of changes in the fund raising environment; the possibility of the Panasonic Group not being able to respond to rapid technological changes and changing consumer preferences with timely and cost-effective introductions of new products in markets that are highly competitive in terms of both price and technology; the possibility of not achieving expected results or incurring unexpected losses in connection with the alliances or mergers and acquisitions; the possibility of not being able to achieve its business objectives through joint ventures and other collaborative agreements with other companies, including due to the pressure of price reduction exceeding that which can be achieved by its effort and decrease in demand for products from business partners which Panasonic highly depends on in BtoB business areas; the possibility of the Panasonic Group not being able to maintain competitive strength in many product and geographical areas; the possibility of incurring expenses resulting from any defects in products or services of the Panasonic Group; the possibility that the Panasonic Group may face intellectual property infringement claims by third parties; current and potential, direct and indirect restrictions imposed by other countries over trade, manufacturing, labor and operations; fluctuations in market prices of securities and other assets in which the Panasonic Group has holdings or changes in valuation of long-lived assets, including property, plant and equipment and goodwill, deferred tax assets and uncertain tax positions; future changes or revisions to accounting policies or accounting rules; the possibility of incurring expenses resulting from a leakage of customers’ or confidential information from Panasonic’s systems due to unauthorized access or a detection of vulnerability of network-connected products of the Panasonic Group; as well as natural disasters including earthquakes, prevalence of infectious diseases throughout the world, disruption of supply chain and other events that may negatively impact business activities of the Panasonic Group. The factors listed above are not all-inclusive and further information is contained in the most recent English translated version of Panasonic’s securities reports under the FIEA and any other documents which are disclosed on its website.
- 1 -
Corporate Information
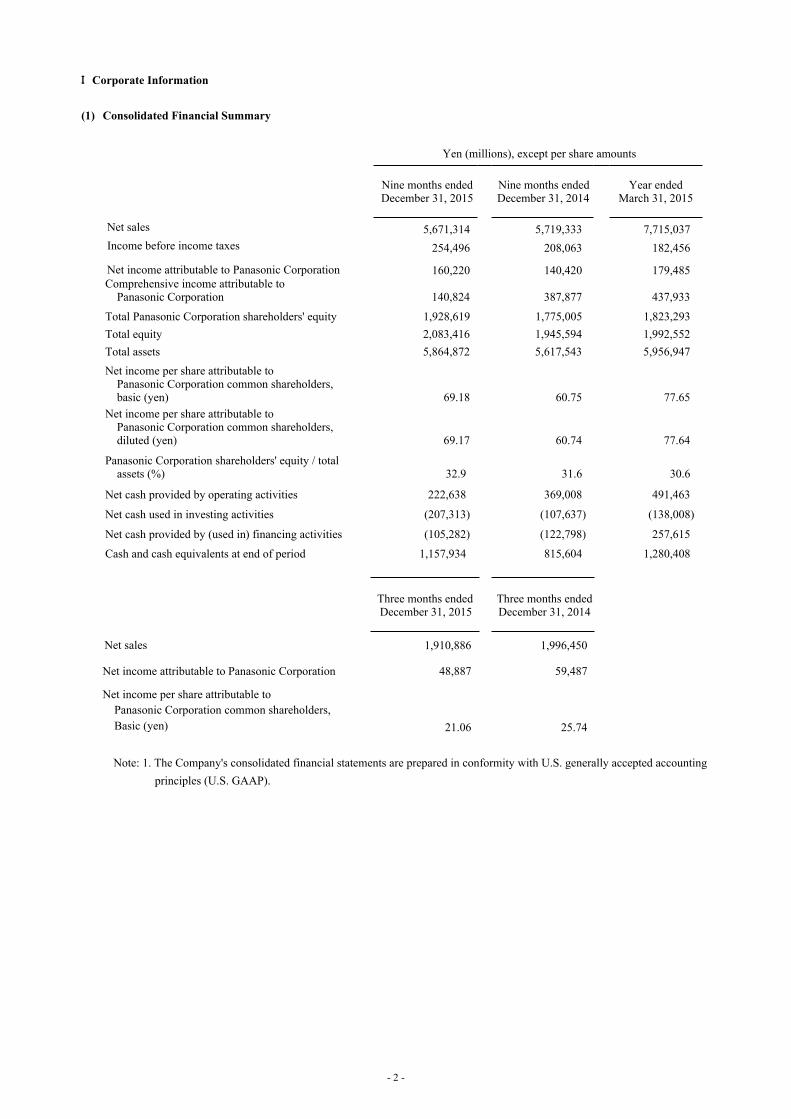
(1) Consolidated Financial Summary
Yen (millions), except per share amounts
Nine months ended December 31, 2015
Nine months ended December 31, 2014
Year endedMarch 31, 2015
Net sales 5,671,314 5,719,333 7,715,037Income before income taxes 254,496 208,063 182,456
Net income attributable to Panasonic Corporation 160,220 140,420 179,485 Comprehensive income attributable to Panasonic Corporation 140,824 387,877 437,933
Total Panasonic Corporation shareholders' equity 1,928,619 1,775,005 1,823,293 Total equity 2,083,416 1,945,594 1,992,552 Total assets 5,864,872 5,617,543 5,956,947 Net income per share attributable to Panasonic Corporation common shareholders, basic (yen) 69.18 60.75 77.65 Net income per share attributable to Panasonic Corporation common shareholders, diluted (yen) 69.17 60.74 77.64
Panasonic Corporation shareholders' equity / total assets (%) 32.9 31.6 30.6
Net cash provided by operating activities 222,638 369,008 491,463
Net cash used in investing activities (207,313) (107,637) (138,008)
Net cash provided by (used in) financing activities (105,282) (122,798) 257,615
Cash and cash equivalents at end of period 1,157,934 815,604 1,280,408
Three months ended December 31, 2015
Three months ended December 31, 2014
Net sales 1,910,886 1,996,450
Net income attributable to Panasonic Corporation 48,887 59,487
Net income per share attributable to Panasonic Corporation common shareholders, Basic (yen) 21.06 25.74
Note: 1. The Company's consolidated financial statements are prepared in conformity with U.S. generally accepted accounting principles (U.S. GAAP).
- 2 -
(2) Principal Businesses
The Panasonic Group is comprised primarily of the parent Panasonic Corporation and 479 consolidated subsidiaries in and outside of Japan, operating in close cooperation with each other. As a comprehensive electronics manufacturer, Panasonic is engaged in production, sales and service activities in a broad array of business areas.
Panasonic supplies a spectrum of electric/electronic equipment and related products, which are categorized into the following five segments: Appliances, Eco Solutions, AVC Networks, Automotive & Industrial Systems, and Other.
During the nine months ended December 31, 2015, there were changes in principal businesses and major affiliated companies asfollows.
Consolidated subsidiary:As of April 1, 2015, SANYO North America Corporation (Automotive & Industrial Systems and Other) was merged into Panasonic Corporation of North America.
As of August 7, 2015, the Company acquired 100% of shares in ITC Global Inc. in the U.S. and ITC Global Netherlands Cooperatief U.A. in the Netherland. Accordingly, both of companies and subsidiaries of both companies (collectively, "ITC Global") became consolidated subsidiaries of the Company (AVC Networks). ITC Global is a provider of satellite communication service for the ocean energy industry.
Associated company under the equity method:As of June 30, 2015, Panasonic acquired 49% of shares in Ficosa International S.A. (Ficosa) which is a manufacture of mirror for automotive-use in Spain classifying it as an associated company under the equity method.
The Company's consolidated financial statements have been prepared in conformity with U.S. GAAP, and the scope of affiliates are disclosed based on the definition of those accounting principles. The same applies to “ The Business Overview.”
- 3 -
The Business Overview
(1) Operating Results
During the nine months ended December 31, 2015 under review, the economic growth in China slowed down, while employment environment and personal spending in the U.S. were favorable, and economy in Europe continued to recover. In Japan, economy continued to moderately recover, while weakness was still seen such as in personal spending and exportation.
In this recent business condition, Panasonic has determined its business fields for sustainable growth and has been promoting various initiatives to make a major change towards generating profit from sales growth.
As one of the initiatives, for automotive business, Panasonic took a 49% stake in Ficosa International, S.A. (Ficosa) in Spain in June 2015. The Company started business alliance with Ficosa to launch electronic mirror system business in a timely manner. For housing business, the Company opened an elderly housing with supportive service in September 2015, for the first time in the neighborhood of Tokyo. In food distribution solution business, one of the core BtoB solution business, the Company announced to acquire Hussmann Corporation in December 2015, a leading company in commercial refrigerated and freezer display cases in the U.S. Panasonic has been promoting energy-efficient and environment-conscious refrigerated and freezer display cases for food distribution solution business mainly in Japan, China and Asia and this acquisition will enable Panasonic to combine Hussmann’s customer relationship and maintenance and service ability with Panasonic’s wide-range product lineup. The Company will make this synergy into growth in the U.S. and its neighboring countries.
Consolidated group sales for nine months ended December 31, 2015 decreased by 1% to 5,671.3 billion yen from the same period of fiscal 2015 (a year ago). Domestic sales decreased year on year due mainly to sales decrease of solar photovoltaic systems and home and building products, while sales in home appliances were stable. Overseas sales slightly increased year on year due mainly to positive effect from yen depreciation for six months ended September 30, 2015 and sales increase in BtoB solution business, while sales in devices declined and sales in TVs decreased due mainly to downsizing marketing activities to focus on profitability.
Operating profit* increased by 10% to 320.3 billion yen from a year ago due to withdrawing and downsizing unprofitable businesses and improvement through restructuring. The Company has strategically focused high value-added products, which contributed to overall growth as well. Income before income taxes increased by 22% to 254.5 billion yen compared with the same period of last year due mainly to the reduction of expenses for preventing further accidents with the residential water heating systems in other income (deductions) incurred a year ago. Net income attributable to Panasonic Corporation increased by 14% to 160.2 billion yen from a year ago.
* In order to be consistent with generally accepted financial reporting practices in Japan, operating profit, a non-GAAP measure, is presented as net sales less cost of sales and selling, general and administrative expenses. The Company believes that this is useful to investors in comparing the Company's financial results with those of other Japanese companies.
- 4 -
(2) Operating Results by Segment
Certain businesses were transferred among segments on April 1, 2015. Accordingly, the figures for segment information in fiscal 2015 have been reclassified to conform to the presentation for fiscal 2016.
The Company’s nine-month consolidated sales and profits by segment comparing with previous year’s are summarized as follows:
Appliances
Sales decreased by 3% to 1,777.2 billion yen from a year ago due mainly to sales decrease in TV business as a result of downsizing marketing activities. Sales in air-conditioners and refrigeration / air-conditioning devices in China decreased, while sales in home appliances and personal-care products were favorable mainly in Japan and Asia.
Segment profit increased by 21% to 70.3 billion yen from a year ago due mainly to sales increase in home appliances and profit improvement in TVs, offsetting the negative impact of exchange rate movement.
Eco Solutions
Sales decreased by 3% to 1,182.2 billion yen compared with the previous year. Sales in housing related business and solar photovoltaic systems decreased suffering from weak demand in Japan, while sales in wiring devices and circuit breakers were favorable mainly in Asia.
Segment profit decreased significantly by 27% to 55.6 billion yen from a year ago due to considerable sales decrease in solar photovoltaic systems.
AVC Networks
Sales increased by 3% to 854.1 billion yen from a year ago. Vertical Solution Business maintained strong sales, leading segment-wide growth. Sales in Visual and Imaging Business including security systems also increased.
Segment profit increased significantly by 134% to 50.6 billion yen from a year ago, due to sales increase mainly in Vertical Solution Business and restructuring benefit from previous years.
Automotive& Industrial Systems
Sales decreased by 1% to 2,063.2 billion yen from a year ago. Sales increase in automotive electronics and automotive infotainment systems in North America was unable to offset impact from some business termination in Industrial Business and sales decline in ICT related rechargeable batteries in Energy Business.
Segment profit decreased by 5% to 84.5 billion yen from a year ago due mainly to sales decrease and R&D cost increase in growing areas such as Automotive Business.
Other
Sales decreased by 7% to 415.1 billion yen from a year ago due mainly to business transfers, while sales in PanaHome increased.
Segment profit increased by 171% to 4.1 billion yen from a year ago due to PanaHome.
- 5 -
(3) Assets, Liabilities and Equity
The Company’s consolidated total assets as of December 31, 2015 decreased by 92.1 billion yen to 5,864.9 billion yen from March 31, 2015 due mainly to decrease in cash and cash equivalents and account receivables in addition to several currencies’ depreciation, while inventory seasonally increased.
The Company’s consolidated total liabilities as of December 31, 2015 decreased by 182.9 billion yen to 3,781.5 billion yen from March 31, 2015 due mainly to redemption of unsecured straight bonds and decrease in retirement and severance benefit.
Panasonic Corporation shareholders’ equity increased by 105.3 billion yen, compared with March 31, 2015, to 1,928.6 billion yen due mainly to recording of net income attributable to Panasonic Corporation. Adding noncontrolling interests to Panasonic Corporation shareholders’ equity, total equity was 2,083.4 billion yen.
(4) Cash Flows
Cash flows from operating activities
Net cash provided by operating activities for the nine months ended December 31, 2015 decreased by 146.4 billion yen to 222.6 billion yen compared with a year ago due mainly to an increase of working capital resulted from changes in trade payables and inventories.
Cash flows from investing activities
Net cash used in investing activities increased by 99.7 billion yen to 207.3 billion yen compared with a year ago due mainly to purchase of subsidiaries’ and associated companies’ shares.
Accordingly, free cash flow (net cash provided by operating activities plus net cash provided by investing activities) decreased by 246.0 billion yen from a year ago to an inflow of 15.3 billion yen.
Cash flows from financing activities
Net cash used in financing activities decreased by 17.5 billion yen to 105.3 billion yen, compared with a year ago due mainly to increase in short-term borrowings.
Taking into consideration exchange rate movement, cash and cash equivalents totaled 1,157.9 billion yen as of December 31, 2015, decreased by 122.5 billion yen compared with the end of the fiscal 2015.
- 6 -
(5) Research and Development
Panasonic's R&D expenditures for the nine months ended December 31, 2015 totaled 344.2 billion yen, a decrease of 0.1% from a year ago. There were no significant changes in R&D activities for the period.
(6) Capital Investment
Panasonic's capital investment (tangible assets) for the nine months ended December 31, 2015 totaled 160.9 billion yen, an increase of 7% from a year ago.
(7) Depreciation
Panasonic's depreciation (tangible assets) for the nine months ended December 31, 2015 totaled 175.5 billion yen, a decrease of 0.3% from a year ago.
(8) Number of Employees
Number of employees at the end of the third quarter of fiscal 2016 was 252,604, a decrease of 1,480, compared with the end of the fiscal 2015.
(9) Risk Factors
There were no risks newly identified during the nine months ended December 31, 2015.During the nine months ended December 31, 2015, there were no significant changes with regard to the "Risk Factors" stated in the annual securities report of the prior fiscal year.
- 7 -

Shares and Shareholders
(1) Shares of Common Stock Issued as of December 31, 2015: 2,453,053,497 shares
The common stock of the Company is listed on the Tokyo and Nagoya stock exchanges in Japan.
(2) Amount of Common Stock (Stated Capital) as of December 31, 2015: 258,740 million yen
- 8 -
CONTENTSFinancial Statements
Index of Consolidated Financial Statements of Panasonic Corporation and Subsidiaries:
Page
Consolidated Balance Sheets as of December 31 and March 31, 2015 ……………………………………………………… 10
Consolidated Statements of Income and Consolidated Statements of Comprehensive Income for the nine and three months ended December 31, 2015 and 2014………………………………………………………… 12
Consolidated Statements of Cash Flows for the nine months ended December 31, 2015 and 2014………………………… 14
Notes to Consolidated Financial Statements ………………………………………………………………………………… 16
- 9 -
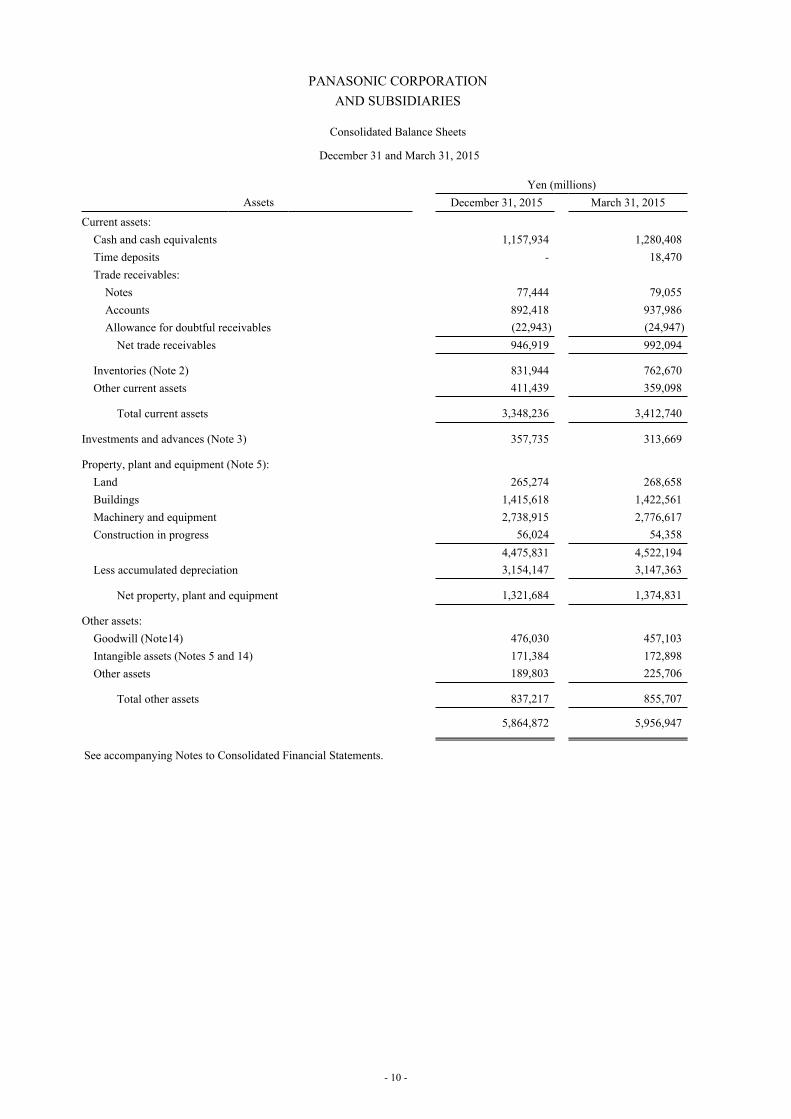
PANASONIC CORPORATIONAND SUBSIDIARIES
Consolidated Balance Sheets
December 31 and March 31, 2015
Yen (millions)Assets December 31, 2015 March 31, 2015
Current assets:Cash and cash equivalents 1,157,934 1,280,408Time deposits - 18,470Trade receivables:
Notes 77,444 79,055Accounts 892,418 937,986Allowance for doubtful receivables (22,943) (24,947)
Net trade receivables 946,919 992,094
Inventories (Note 2) 831,944 762,670Other current assets 411,439 359,098
Total current assets 3,348,236 3,412,740
Investments and advances (Note 3) 357,735 313,669
Property, plant and equipment (Note 5):Land 265,274 268,658Buildings 1,415,618 1,422,561Machinery and equipment 2,738,915 2,776,617Construction in progress 56,024 54,358
4,475,831 4,522,194Less accumulated depreciation 3,154,147 3,147,363
Net property, plant and equipment 1,321,684 1,374,831
Other assets:Goodwill (Note14) 476,030 457,103Intangible assets (Notes 5 and 14) 171,384 172,898Other assets 189,803 225,706
Total other assets 837,217 855,707
5,864,872 5,956,947
See accompanying Notes to Consolidated Financial Statements.
- 10 -
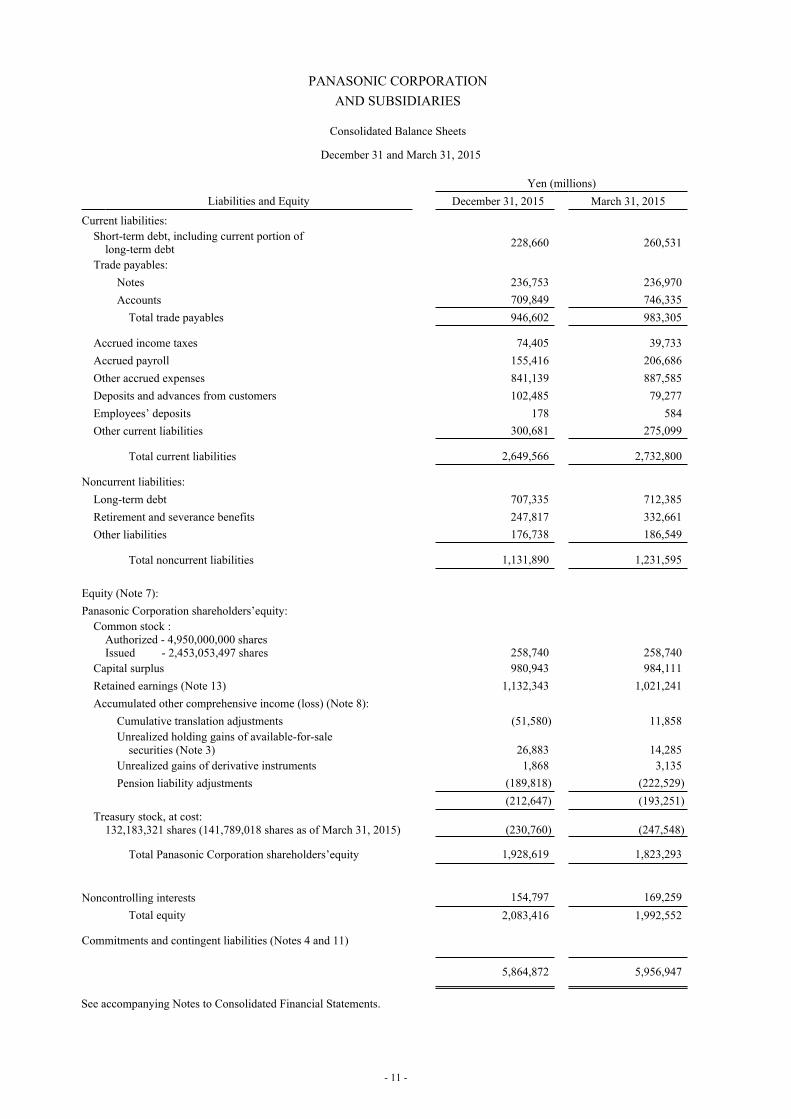
PANASONIC CORPORATIONAND SUBSIDIARIES
Consolidated Balance Sheets
December 31 and March 31, 2015
Yen (millions)Liabilities and Equity December 31, 2015 March 31, 2015
Current liabilities:Short-term debt, including current portion of
long-term debt 228,660 260,531
Trade payables:Notes 236,753 236,970Accounts 709,849 746,335
Total trade payables 946,602 983,305
Accrued income taxes 74,405 39,733Accrued payroll 155,416 206,686Other accrued expenses 841,139 887,585Deposits and advances from customers 102,485 79,277Employees’ deposits 178 584Other current liabilities 300,681 275,099
Total current liabilities 2,649,566 2,732,800
Noncurrent liabilities:Long-term debt 707,335 712,385Retirement and severance benefits 247,817 332,661Other liabilities 176,738 186,549
Total noncurrent liabilities 1,131,890 1,231,595
Equity (Note 7):Panasonic Corporation shareholders’equity:
Common stock :Authorized - 4,950,000,000 sharesIssued - 2,453,053,497 shares 258,740 258,740
Capital surplus 980,943 984,111Retained earnings (Note 13) 1,132,343 1,021,241Accumulated other comprehensive income (loss) (Note 8):
Cumulative translation adjustments (51,580) 11,858Unrealized holding gains of available-for-sale
securities (Note 3) 26,883 14,285Unrealized gains of derivative instruments 1,868 3,135Pension liability adjustments (189,818) (222,529)
(212,647) (193,251)Treasury stock, at cost:
132,183,321 shares (141,789,018 shares as of March 31, 2015) (230,760) (247,548)
Total Panasonic Corporation shareholders’equity 1,928,619 1,823,293
Noncontrolling interests 154,797 169,259Total equity 2,083,416 1,992,552
Commitments and contingent liabilities (Notes 4 and 11)
5,864,872 5,956,947
See accompanying Notes to Consolidated Financial Statements.
- 11 -
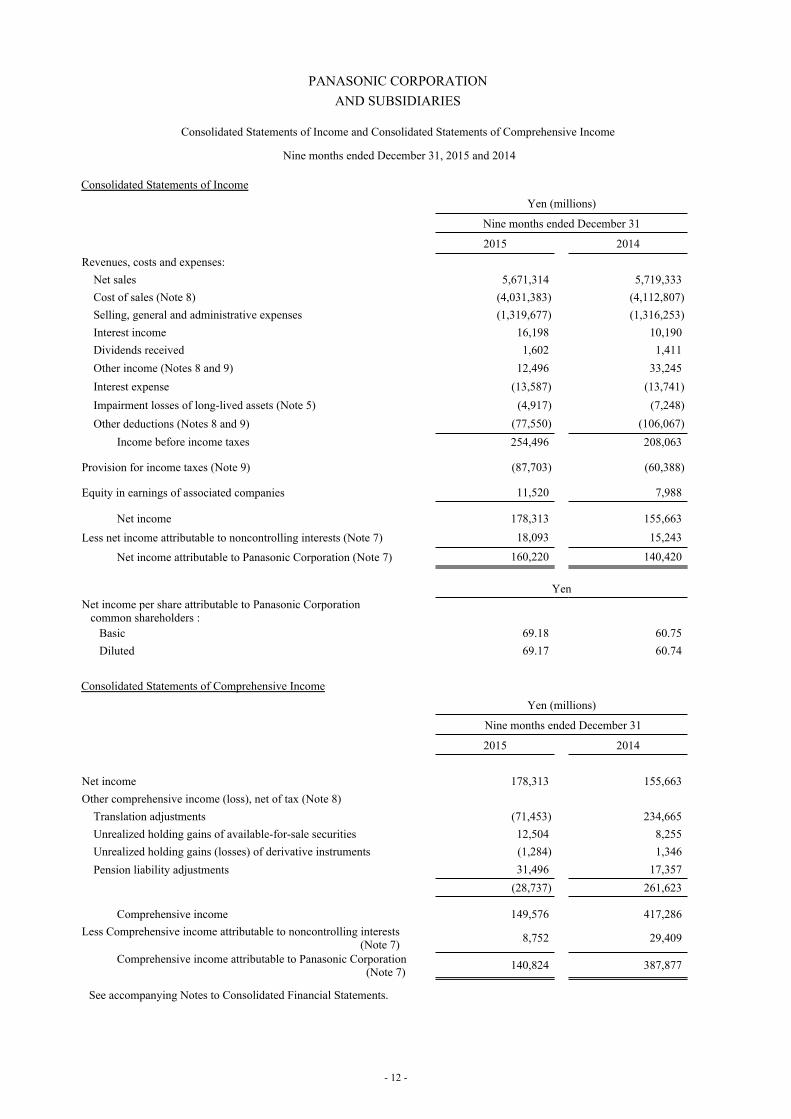
PANASONIC CORPORATIONAND SUBSIDIARIES
Consolidated Statements of Income and Consolidated Statements of Comprehensive Income
Nine months ended December 31, 2015 and 2014
Consolidated Statements of Income Yen (millions)
Nine months ended December 31
2015 2014Revenues, costs and expenses:
Net sales 5,671,314 5,719,333Cost of sales (Note 8) (4,031,383) (4,112,807)Selling, general and administrative expenses (1,319,677) (1,316,253)Interest income 16,198 10,190Dividends received 1,602 1,411Other income (Notes 8 and 9) 12,496 33,245Interest expense (13,587) (13,741)Impairment losses of long-lived assets (Note 5) (4,917) (7,248)Other deductions (Notes 8 and 9) (77,550) (106,067)
Income before income taxes 254,496 208,063
Provision for income taxes (Note 9) (87,703) (60,388)
Equity in earnings of associated companies 11,520 7,988
Net income 178,313 155,663Less net income attributable to noncontrolling interests (Note 7) 18,093 15,243
Net income attributable to Panasonic Corporation (Note 7) 160,220 140,420
YenNet income per share attributable to Panasonic Corporation common shareholders :
Basic 69.18 60.75Diluted 69.17 60.74
Consolidated Statements of Comprehensive IncomeYen (millions)
Nine months ended December 31
2015 2014
Net income 178,313 155,663Other comprehensive income (loss), net of tax (Note 8)
Translation adjustments (71,453) 234,665Unrealized holding gains of available-for-sale securities 12,504 8,255Unrealized holding gains (losses) of derivative instruments (1,284) 1,346Pension liability adjustments 31,496 17,357
(28,737) 261,623
Comprehensive income 149,576 417,286Less Comprehensive income attributable to noncontrolling interests (Note 7) 8,752 29,409
Comprehensive income attributable to Panasonic Corporation (Note 7) 140,824 387,877
See accompanying Notes to Consolidated Financial Statements.
- 12 -
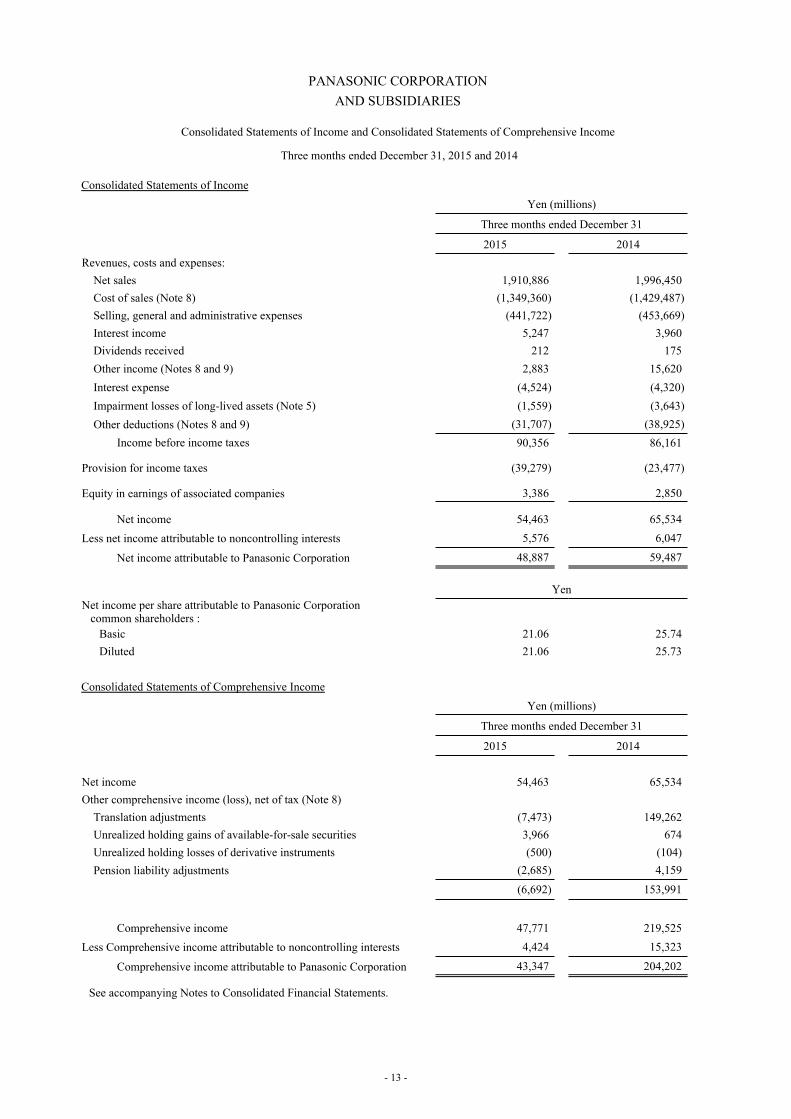
PANASONIC CORPORATIONAND SUBSIDIARIES
Consolidated Statements of Income and Consolidated Statements of Comprehensive Income
Three months ended December 31, 2015 and 2014
Consolidated Statements of Income Yen (millions)
Three months ended December 31
2015 2014Revenues, costs and expenses:
Net sales 1,910,886 1,996,450Cost of sales (Note 8) (1,349,360) (1,429,487)Selling, general and administrative expenses (441,722) (453,669)Interest income 5,247 3,960Dividends received 212 175Other income (Notes 8 and 9) 2,883 15,620Interest expense (4,524) (4,320)Impairment losses of long-lived assets (Note 5) (1,559) (3,643)Other deductions (Notes 8 and 9) (31,707) (38,925)
Income before income taxes 90,356 86,161
Provision for income taxes (39,279) (23,477)
Equity in earnings of associated companies 3,386 2,850
Net income 54,463 65,534Less net income attributable to noncontrolling interests 5,576 6,047
Net income attributable to Panasonic Corporation 48,887 59,487
YenNet income per share attributable to Panasonic Corporation common shareholders :
Basic 21.06 25.74Diluted 21.06 25.73
Consolidated Statements of Comprehensive Income Yen (millions)
Three months ended December 31
2015 2014
Net income 54,463 65,534Other comprehensive income (loss), net of tax (Note 8)
Translation adjustments (7,473) 149,262Unrealized holding gains of available-for-sale securities 3,966 674Unrealized holding losses of derivative instruments (500) (104)Pension liability adjustments (2,685) 4,159
(6,692) 153,991
Comprehensive income 47,771 219,525Less Comprehensive income attributable to noncontrolling interests 4,424 15,323
Comprehensive income attributable to Panasonic Corporation 43,347 204,202
See accompanying Notes to Consolidated Financial Statements.
- 13 -
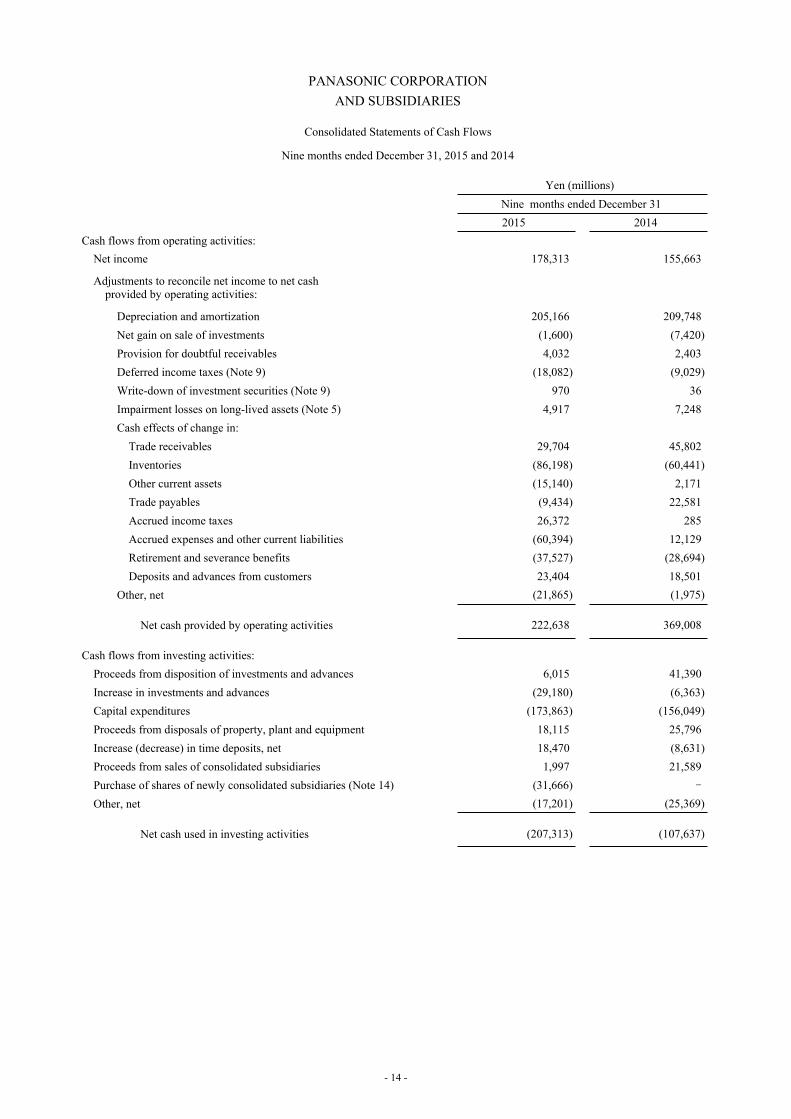
PANASONIC CORPORATIONAND SUBSIDIARIES
Consolidated Statements of Cash Flows
Nine months ended December 31, 2015 and 2014
Yen (millions) Nine months ended December 312015 2014
Cash flows from operating activities:Net income 178,313 155,663
Adjustments to reconcile net income to net cash provided by operating activities:
Depreciation and amortization 205,166 209,748Net gain on sale of investments (1,600) (7,420)Provision for doubtful receivables 4,032 2,403Deferred income taxes (Note 9) (18,082) (9,029)Write-down of investment securities (Note 9) 970 36Impairment losses on long-lived assets (Note 5) 4,917 7,248Cash effects of change in:
Trade receivables 29,704 45,802Inventories (86,198) (60,441)Other current assets (15,140) 2,171Trade payables (9,434) 22,581Accrued income taxes 26,372 285Accrued expenses and other current liabilities (60,394) 12,129Retirement and severance benefits (37,527) (28,694)Deposits and advances from customers 23,404 18,501
Other, net (21,865) (1,975)
Net cash provided by operating activities 222,638 369,008
Cash flows from investing activities:Proceeds from disposition of investments and advances 6,015 41,390Increase in investments and advances (29,180) (6,363)Capital expenditures (173,863) (156,049)Proceeds from disposals of property, plant and equipment 18,115 25,796Increase (decrease) in time deposits, net 18,470 (8,631)Proceeds from sales of consolidated subsidiaries 1,997 21,589Purchase of shares of newly consolidated subsidiaries (Note 14) (31,666)Other, net (17,201) (25,369)
Net cash used in investing activities (207,313) (107,637)
- 14 -
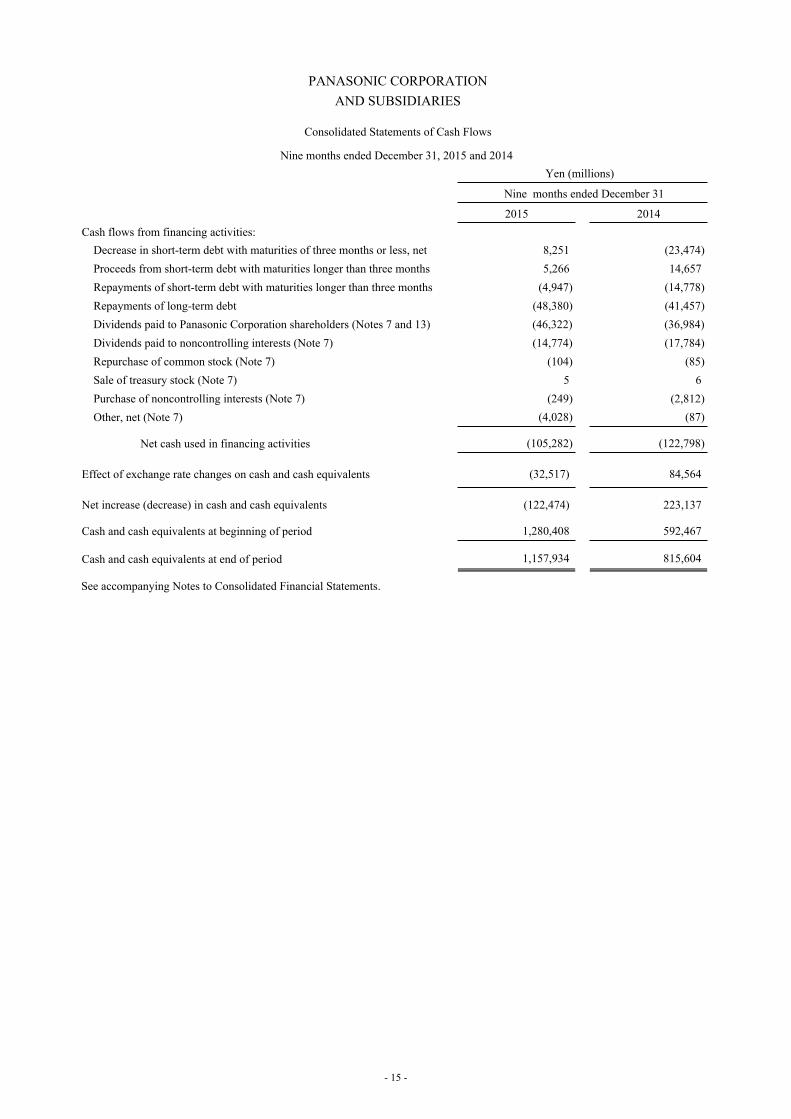
PANASONIC CORPORATIONAND SUBSIDIARIES
Consolidated Statements of Cash Flows
Nine months ended December 31, 2015 and 2014Yen (millions)
Nine months ended December 31
2015 2014Cash flows from financing activities:
Decrease in short-term debt with maturities of three months or less, net 8,251 (23,474)Proceeds from short-term debt with maturities longer than three months 5,266 14,657Repayments of short-term debt with maturities longer than three months (4,947) (14,778)Repayments of long-term debt (48,380) (41,457)Dividends paid to Panasonic Corporation shareholders (Notes 7 and 13) (46,322) (36,984)Dividends paid to noncontrolling interests (Note 7) (14,774) (17,784)Repurchase of common stock (Note 7) (104) (85)Sale of treasury stock (Note 7) 5 6Purchase of noncontrolling interests (Note 7) (249) (2,812)Other, net (Note 7) (4,028) (87)
Net cash used in financing activities (105,282) (122,798)
Effect of exchange rate changes on cash and cash equivalents (32,517) 84,564
Net increase (decrease) in cash and cash equivalents (122,474) 223,137
Cash and cash equivalents at beginning of period 1,280,408 592,467
Cash and cash equivalents at end of period 1,157,934 815,604
See accompanying Notes to Consolidated Financial Statements.
- 15 -
PANASONIC CORPORATIONAND SUBSIDIARIES
Notes to Consolidated Financial Statements
(1) Summary of Significant Accounting Policies
(a) Basis of Presentation of Consolidated Financial Statements
The Company and its domestic subsidiaries maintain their books of account in conformity with financial accounting standards of Japan, and its foreign subsidiaries in conformity with those of the countries of their domicile.
The consolidated financial statements presented herein have been prepared in a manner that reflects adjustments which are necessary to conform with U.S. generally accepted accounting principles (U.S. GAAP).
(b) Principles of Consolidation
The consolidated financial statements include the accounts of the Company and its majority-owned, controlled subsidiaries. The Company also consolidates entities in which controlling interest exists through variable interests in accordance with the provisions of Financial Accounting Standards Board (FASB) Accounting Standards Codification (ASC) 810, “Consolidation.” All significant intercompany balances and transactions have been eliminated on consolidation.
The equity method is used to account for investments in associated companies in which the Company exerts significant influence, generally having a 20% to 50% voting interest, and corporate joint ventures. These investments are included in “Investments and advances” in the consolidated balance sheets.
The Company has 479 consolidated subsidiaries and 97 associated companies under equity method as of December 31, 2015.
The Company accounts for the defined benefit pension plans and the lump-sum payment plans in accordance with the provisions of ASC 715, “Compensation-Retirement Benefits.” In accordance with the provisions, funded status of defined benefit pension plans (that is the balance of plan assets less benefit obligations) is recognized on the consolidated balance sheets and pension liability adjustments, net of tax, are recorded in the “Accumulated other comprehensive income (loss).”
Actuarial net gains and losses in excess of the corridor (10% of benefit obligations or fair value of plan assets, whichever is greater) are amortized over the average remaining service period of employees, except for the plan described as follows.
The Company and certain domestic subsidiaries made a transition from the defined benefit pension plan to a defined contribution pension plan, effective after the date of transition with respect to employees’ future service. Actuarial net gains and losses related to the defined benefit pension plan that are maintained for employees' past service in excess of the corridor are amortized over the average remaining life expectancy of plan participants.
- 16 -
(c) Description of Business
Panasonic Corporation (hereinafter, the “Company,” including consolidated subsidiaries, unless the context otherwise requires) is one of the world’s leading producers of electronic and electric products. The Company currently offers a comprehensive range of products, systems and components for consumer, business and industrial use based on sophisticated electronics and precision technology, expanding to building materials and equipments, and housing business.
Sales by segment for the nine months ended December 31, 2015 were as follows: Appliances—28%, Eco Solutions—19%, AVC Networks—14%, Automotive & Industrial Systems—33% and Other—6%. A sales breakdown by geographical market was as follows: Japan—46%, North and South America—17%, Europe—10%, and Asia and Others—27%.
Sales by segment for the three months ended December 31, 2015 were as follows: Appliances—29%, Eco Solutions—19%, AVC Networks—13%, Automotive & Industrial Systems—32% and Other—7%. A sales breakdown by geographical market was as follows: Japan—48%, North and South America—16%, Europe—10%, and Asia and Others—26%.
The Company is not dependent on a single supplier and has no significant difficulty in obtaining raw materials from suppliers.
(d) Use of Estimates
The preparation of consolidated financial statements requires management to make estimates and assumptions that affect the reported amounts of assets and liabilities and disclosure of contingent assets and liabilities at the date of the consolidated financial statements, and the reported amounts of revenues and expenses during the reporting period. Actual results could differ from those estimates. Significant estimates and assumptions are reflected in valuation and disclosure of revenue recognition, allowance for doubtful receivables, valuation of inventories, impairment of long-lived assets, impairment of goodwill, environmental liabilities, valuation of deferred tax assets, uncertain tax positions, employee retirement and severance benefit plans and assets acquired and liabilities assumed in business combinations.Management evaluated the subsequent events through February 12, 2016, the issue date of the Company's consolidated financial statements.
(e) Reclassifications
Certain reclassifications have been made to the prior period’s consolidated financial statements in order to conform with the presentation used for fiscal 2016.
- 17 -
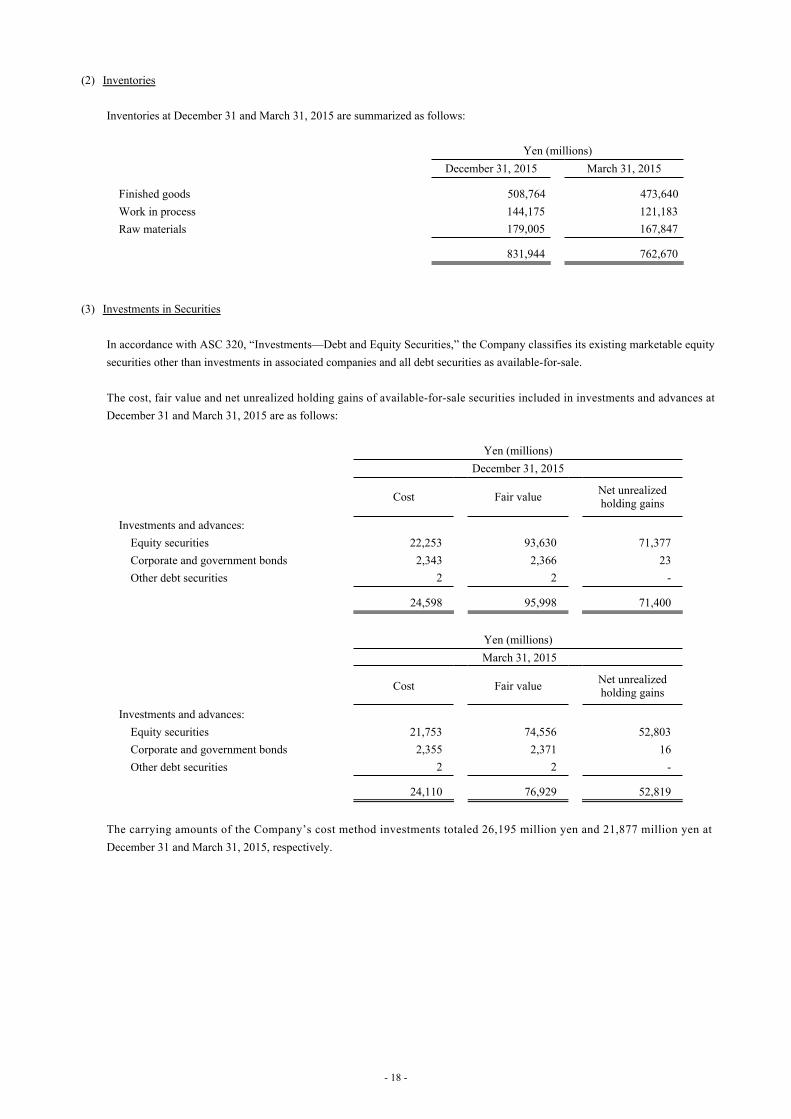
(2) Inventories
Inventories at December 31 and March 31, 2015 are summarized as follows:
Yen (millions)December 31, 2015 March 31, 2015
Finished goods 508,764 473,640Work in process 144,175 121,183Raw materials 179,005 167,847
831,944 762,670
(3) Investments in Securities
In accordance with ASC 320, “Investments—Debt and Equity Securities,” the Company classifies its existing marketable equity securities other than investments in associated companies and all debt securities as available-for-sale.
The cost, fair value and net unrealized holding gains of available-for-sale securities included in investments and advances at December 31 and March 31, 2015 are as follows:
Yen (millions)December 31, 2015
Cost Fair value Net unrealizedholding gains
Investments and advances:Equity securities 22,253 93,630 71,377Corporate and government bonds 2,343 2,366 23Other debt securities 2 2 -
24,598 95,998 71,400
Yen (millions) March 31, 2015
Cost Fair value Net unrealizedholding gains
Investments and advances:Equity securities 21,753 74,556 52,803Corporate and government bonds 2,355 2,371 16Other debt securities 2 2 -
24,110 76,929 52,819
The carrying amounts of the Company’s cost method investments totaled 26,195 million yen and 21,877 million yen at December 31 and March 31, 2015, respectively.
- 18 -
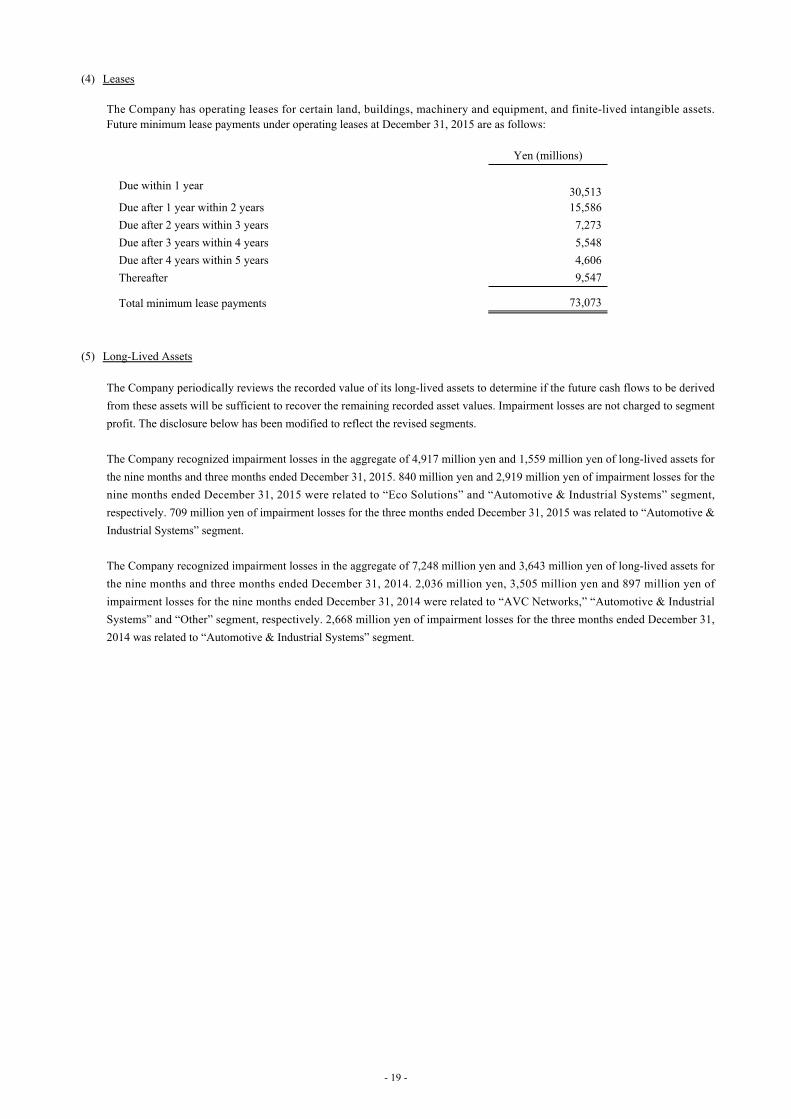
(4) Leases
The Company has operating leases for certain land, buildings, machinery and equipment, and finite-lived intangible assets. Future minimum lease payments under operating leases at December 31, 2015 are as follows:
Yen (millions)
Due within 1 year 30,513Due after 1 year within 2 years 15,586Due after 2 years within 3 years 7,273Due after 3 years within 4 years 5,548Due after 4 years within 5 years 4,606Thereafter 9,547
Total minimum lease payments 73,073
(5) Long-Lived Assets
The Company periodically reviews the recorded value of its long-lived assets to determine if the future cash flows to be derived from these assets will be sufficient to recover the remaining recorded asset values. Impairment losses are not charged to segment profit. The disclosure below has been modified to reflect the revised segments.
The Company recognized impairment losses in the aggregate of 4,917 million yen and 1,559 million yen of long-lived assets for the nine months and three months ended December 31, 2015. 840 million yen and 2,919 million yen of impairment losses for the nine months ended December 31, 2015 were related to “Eco Solutions” and “Automotive & Industrial Systems” segment, respectively. 709 million yen of impairment losses for the three months ended December 31, 2015 was related to “Automotive & Industrial Systems” segment.
The Company recognized impairment losses in the aggregate of 7,248 million yen and 3,643 million yen of long-lived assets for the nine months and three months ended December 31, 2014. 2,036 million yen, 3,505 million yen and 897 million yen of impairment losses for the nine months ended December 31, 2014 were related to “AVC Networks,” “Automotive & Industrial Systems” and “Other” segment, respectively. 2,668 million yen of impairment losses for the three months ended December 31, 2014 was related to “Automotive & Industrial Systems” segment.
- 19 -
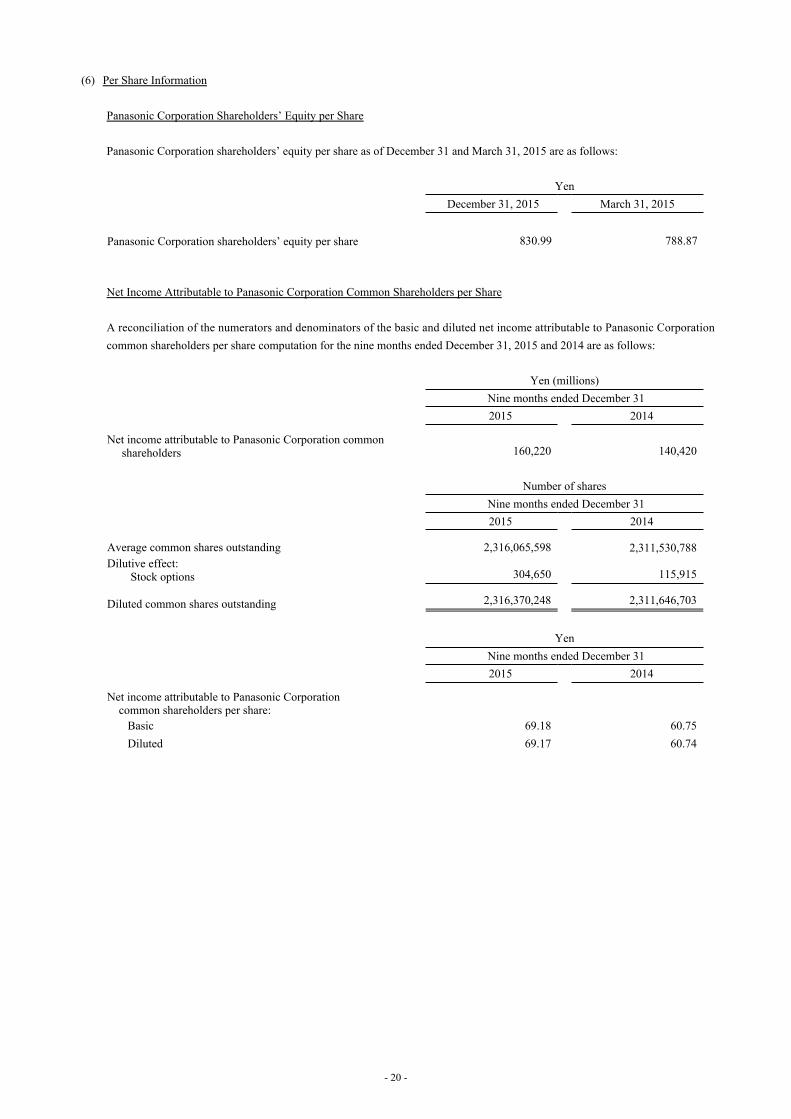
(6) Per Share Information
Panasonic Corporation Shareholders’ Equity per Share
Panasonic Corporation shareholders’ equity per share as of December 31 and March 31, 2015 are as follows:
Yen December 31, 2015 March 31, 2015
Panasonic Corporation shareholders’ equity per share 830.99 788.87
Net Income Attributable to Panasonic Corporation Common Shareholders per Share
A reconciliation of the numerators and denominators of the basic and diluted net income attributable to Panasonic Corporation common shareholders per share computation for the nine months ended December 31, 2015 and 2014 are as follows:
Yen (millions) Nine months ended December 31
2015 2014
Net income attributable to Panasonic Corporation common shareholders 160,220 140,420
Number of shares Nine months ended December 31
2015 2014
Average common shares outstanding 2,316,065,598 2,311,530,788Dilutive effect: Stock options 304,650 115,915
Diluted common shares outstanding 2,316,370,248 2,311,646,703
Yen Nine months ended December 31
2015 2014
Net income attributable to Panasonic Corporation common shareholders per share:
Basic 69.18 60.75 Diluted 69.17 60.74
- 20 -
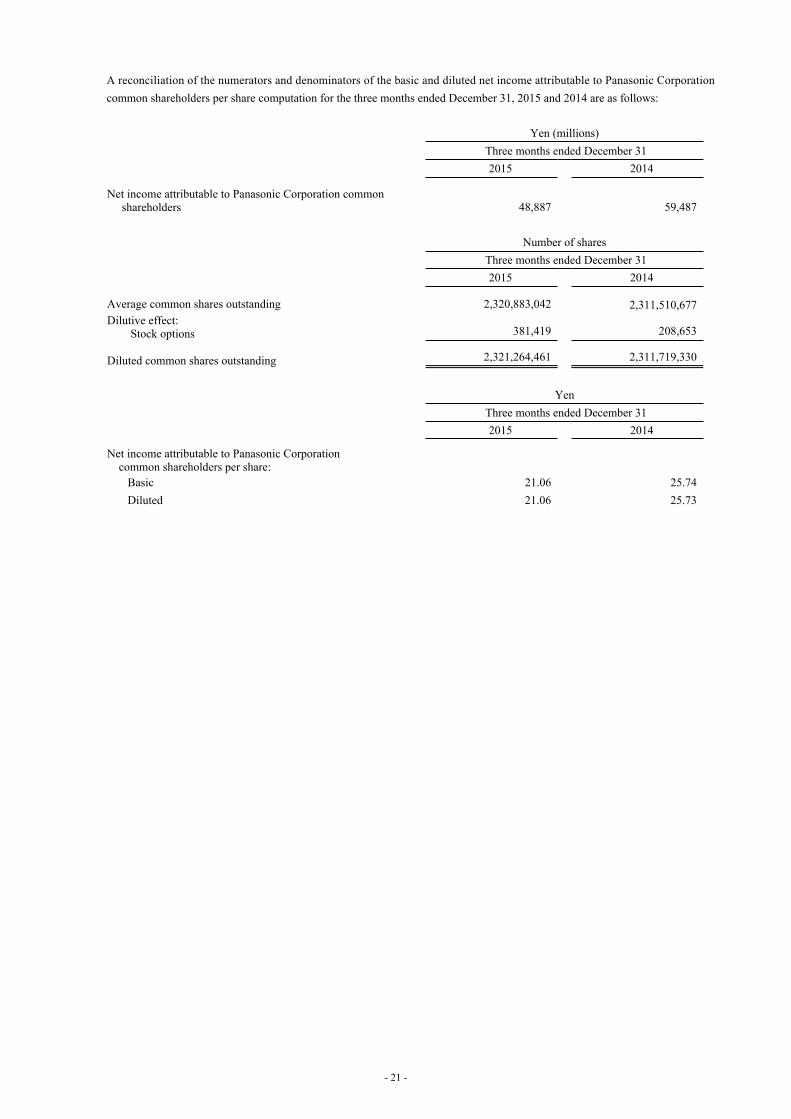
A reconciliation of the numerators and denominators of the basic and diluted net income attributable to Panasonic Corporation common shareholders per share computation for the three months ended December 31, 2015 and 2014 are as follows:
Yen (millions) Three months ended December 31
2015 2014
Net income attributable to Panasonic Corporation common shareholders 48,887 59,487
Number of shares Three months ended December 31
2015 2014
Average common shares outstanding 2,320,883,042 2,311,510,677Dilutive effect: Stock options 381,419 208,653
Diluted common shares outstanding 2,321,264,461 2,311,719,330
Yen Three months ended December 31
2015 2014
Net income attributable to Panasonic Corporation common shareholders per share:
Basic 21.06 25.74 Diluted 21.06 25.73
- 21 -
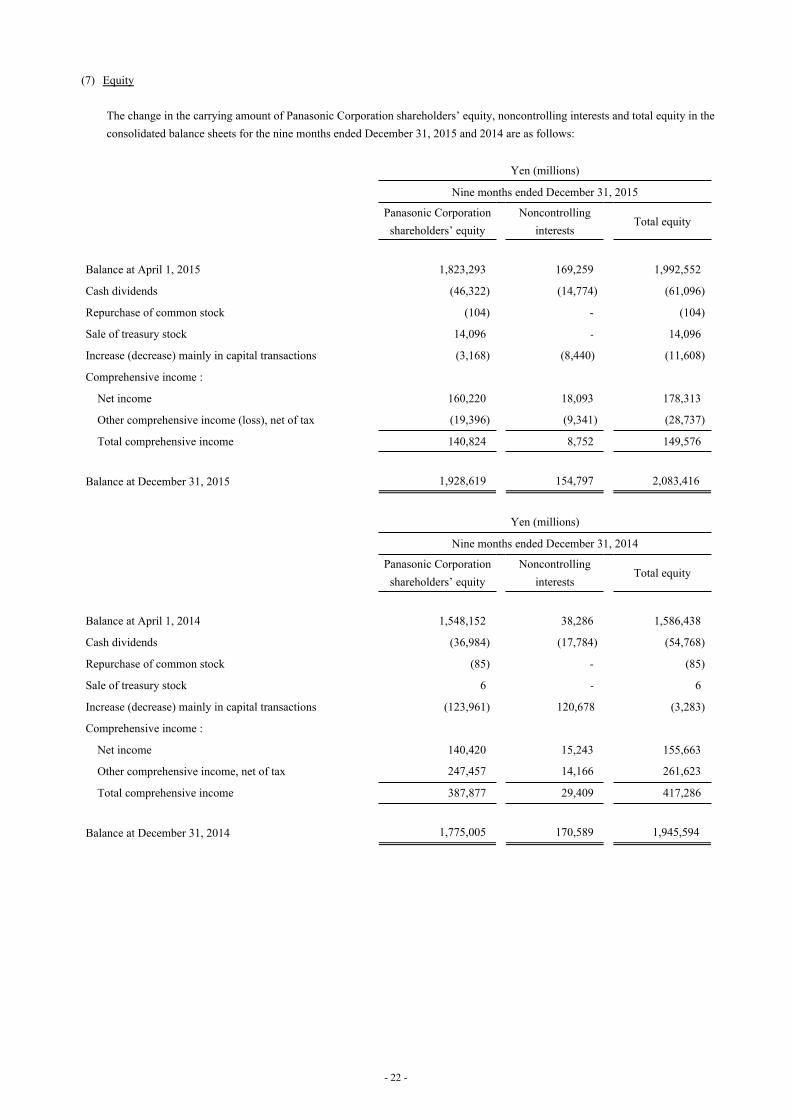
(7) Equity
The change in the carrying amount of Panasonic Corporation shareholders’ equity, noncontrolling interests and total equity in the consolidated balance sheets for the nine months ended December 31, 2015 and 2014 are as follows:
Yen (millions)
Nine months ended December 31, 2015
Panasonic Corporation shareholders’ equity
Noncontrolling interests
Total equity
Balance at April 1, 2015 1,823,293 169,259 1,992,552
Cash dividends (46,322) (14,774) (61,096)
Repurchase of common stock (104) - (104)
Sale of treasury stock 14,096 - 14,096
Increase (decrease) mainly in capital transactions (3,168) (8,440) (11,608)
Comprehensive income :
Net income 160,220 18,093 178,313
Other comprehensive income (loss), net of tax (19,396) (9,341) (28,737)
Total comprehensive income 140,824 8,752 149,576
Balance at December 31, 2015 1,928,619 154,797 2,083,416
Yen (millions)
Nine months ended December 31, 2014
Panasonic Corporation shareholders’ equity
Noncontrolling interests
Total equity
Balance at April 1, 2014 1,548,152 38,286 1,586,438
Cash dividends (36,984) (17,784) (54,768)
Repurchase of common stock (85) - (85)
Sale of treasury stock 6 - 6
Increase (decrease) mainly in capital transactions (123,961) 120,678 (3,283)
Comprehensive income :
Net income 140,420 15,243 155,663
Other comprehensive income, net of tax 247,457 14,166 261,623
Total comprehensive income 387,877 29,409 417,286
Balance at December 31, 2014 1,775,005 170,589 1,945,594
- 22 -
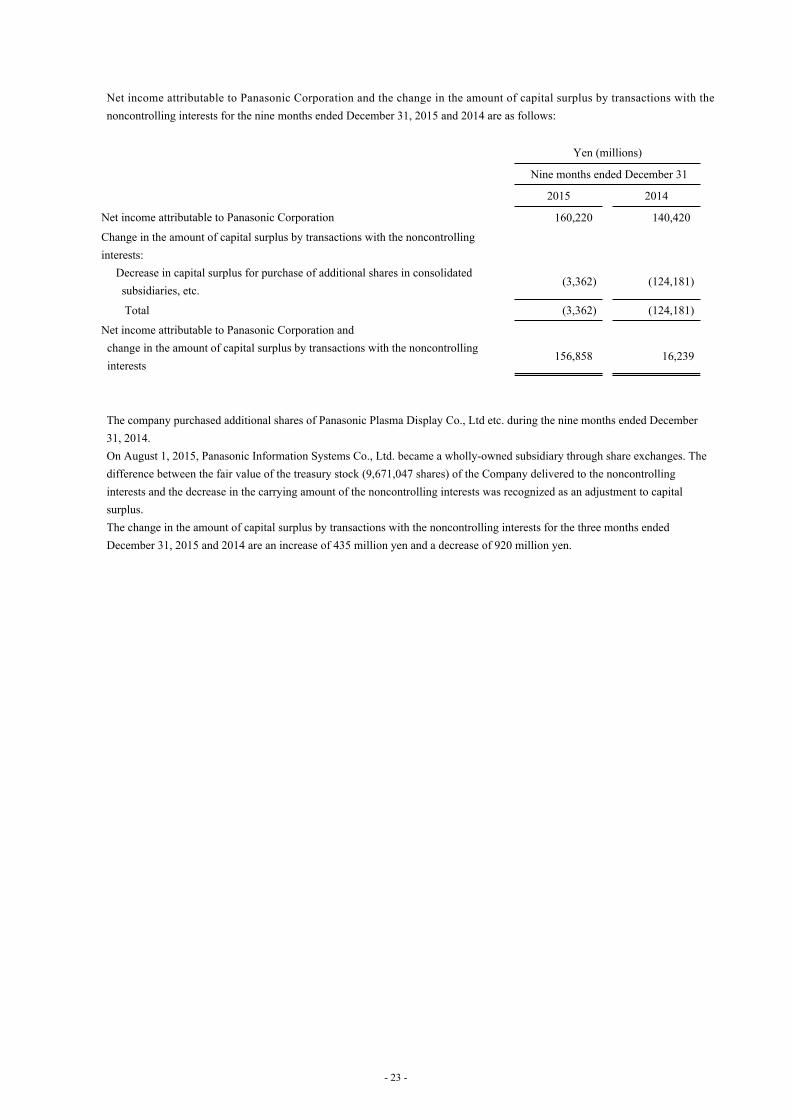
Net income attributable to Panasonic Corporation and the change in the amount of capital surplus by transactions with the noncontrolling interests for the nine months ended December 31, 2015 and 2014 are as follows:
Yen (millions)
Nine months ended December 31
2015 2014
Net income attributable to Panasonic Corporation 160,220 140,420
Change in the amount of capital surplus by transactions with the noncontrolling interests:
Decrease in capital surplus for purchase of additional shares in consolidated subsidiaries, etc.
(3,362) (124,181)
Total (3,362) (124,181)
Net income attributable to Panasonic Corporation andchange in the amount of capital surplus by transactions with the noncontrolling interests
156,858 16,239
The company purchased additional shares of Panasonic Plasma Display Co., Ltd etc. during the nine months ended December 31, 2014.On August 1, 2015, Panasonic Information Systems Co., Ltd. became a wholly-owned subsidiary through share exchanges. The difference between the fair value of the treasury stock (9,671,047 shares) of the Company delivered to the noncontrolling interests and the decrease in the carrying amount of the noncontrolling interests was recognized as an adjustment to capital surplus.The change in the amount of capital surplus by transactions with the noncontrolling interests for the three months ended December 31, 2015 and 2014 are an increase of 435 million yen and a decrease of 920 million yen.
- 23 -
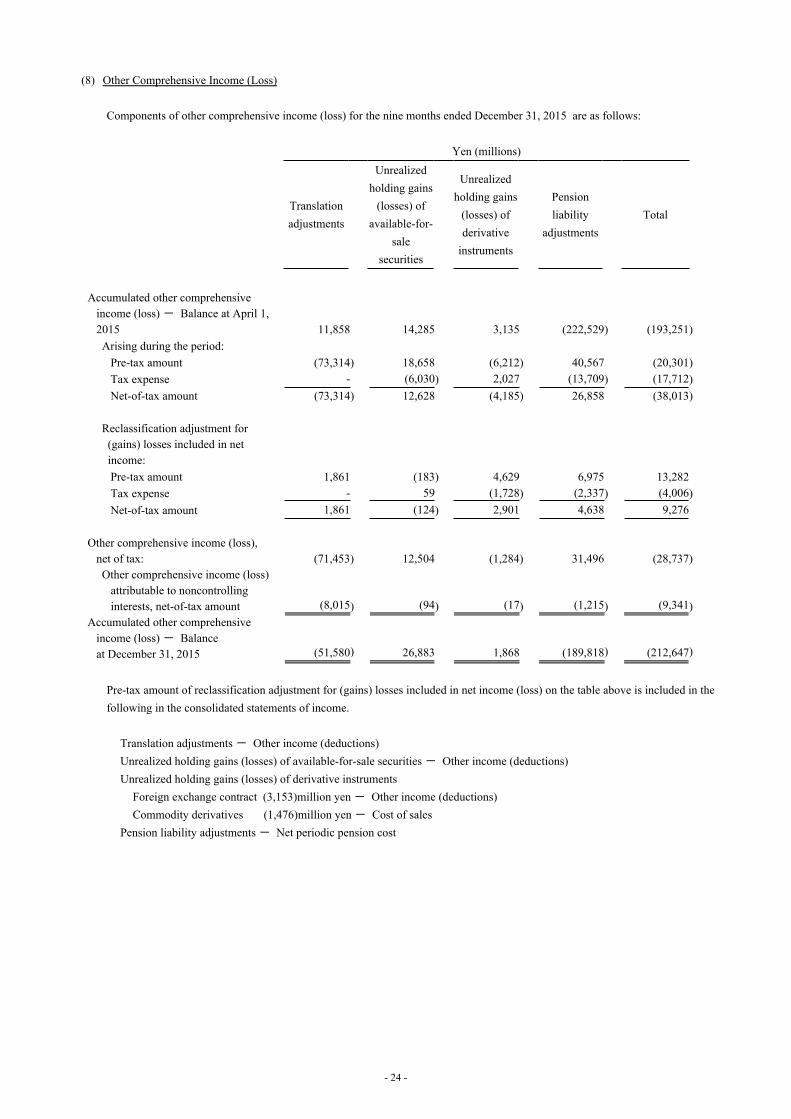
(8) Other Comprehensive Income (Loss)
Components of other comprehensive income (loss) for the nine months ended December 31, 2015 are as follows:
Yen (millions)
Translation adjustments
Unrealized holding gains
(losses) of available-for-
sale securities
Unrealized holding gains
(losses) of derivative
instruments
Pension liability
adjustmentsTotal
Accumulated other comprehensive income (loss) Balance at April 1, 2015 11,858 14,285 3,135 (222,529) (193,251)
Arising during the period:Pre-tax amount (73,314) 18,658 (6,212) 40,567 (20,301)Tax expense - (6,030) 2,027 (13,709) (17,712)Net-of-tax amount (73,314) 12,628 (4,185) 26,858 (38,013)
Reclassification adjustment for (gains) losses included in net income:
Pre-tax amount 1,861 (183) 4,629 6,975 13,282Tax expense - 59 (1,728) (2,337) (4,006)Net-of-tax amount 1,861 (124) 2,901 4,638 9,276
Other comprehensive income (loss), net of tax: (71,453) 12,504 (1,284) 31,496 (28,737)
Other comprehensive income (loss) attributable to noncontrolling interests, net-of-tax amount (8,015) (94) (17) (1,215) (9,341)
Accumulated other comprehensive income (loss) Balance at December 31, 2015 (51,580) 26,883 1,868 (189,818) (212,647)
Pre-tax amount of reclassification adjustment for (gains) losses included in net income (loss) on the table above is included in the following in the consolidated statements of income.
Translation adjustments Other income (deductions)Unrealized holding gains (losses) of available-for-sale securities Other income (deductions)Unrealized holding gains (losses) of derivative instruments
Foreign exchange contract (3,153)million yen Other income (deductions) Commodity derivatives (1,476)million yen Cost of sales
Pension liability adjustments Net periodic pension cost
- 24 -
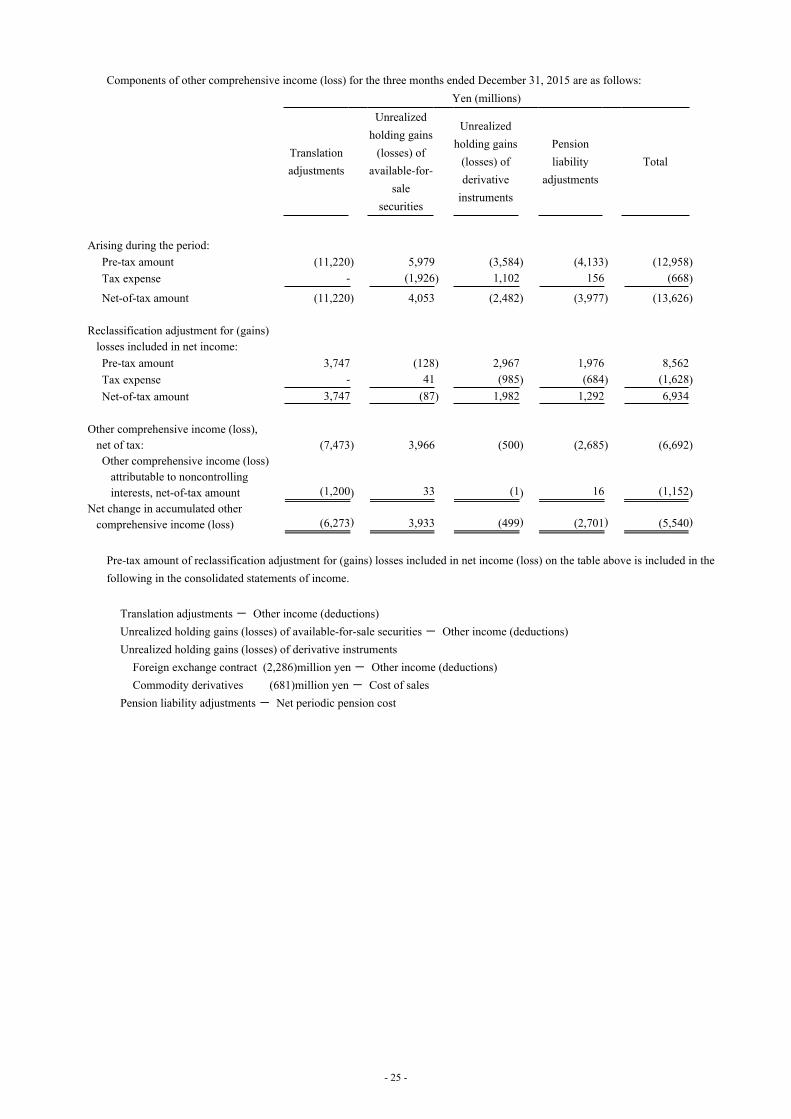
Components of other comprehensive income (loss) for the three months ended December 31, 2015 are as follows:Yen (millions)
Translation adjustments
Unrealized holding gains
(losses) of available-for-
sale securities
Unrealized holding gains
(losses) of derivative
instruments
Pension liability
adjustmentsTotal
Arising during the period: Pre-tax amount (11,220) 5,979 (3,584) (4,133) (12,958) Tax expense - (1,926) 1,102 156 (668)
Net-of-tax amount (11,220) 4,053 (2,482) (3,977) (13,626)
Reclassification adjustment for (gains) losses included in net income:
Pre-tax amount 3,747 (128) 2,967 1,976 8,562 Tax expense - 41 (985) (684) (1,628) Net-of-tax amount 3,747 (87) 1,982 1,292 6,934
Other comprehensive income (loss), net of tax: (7,473) 3,966 (500) (2,685) (6,692)
Other comprehensive income (loss) attributable to noncontrolling interests, net-of-tax amount (1,200) 33 (1) 16 (1,152)
Net change in accumulated other comprehensive income (loss) (6,273) 3,933 (499) (2,701) (5,540)
Pre-tax amount of reclassification adjustment for (gains) losses included in net income (loss) on the table above is included in the following in the consolidated statements of income.
Translation adjustments Other income (deductions)Unrealized holding gains (losses) of available-for-sale securities Other income (deductions)Unrealized holding gains (losses) of derivative instruments
Foreign exchange contract (2,286)million yen Other income (deductions) Commodity derivatives (681)million yen Cost of sales
Pension liability adjustments Net periodic pension cost
- 25 -
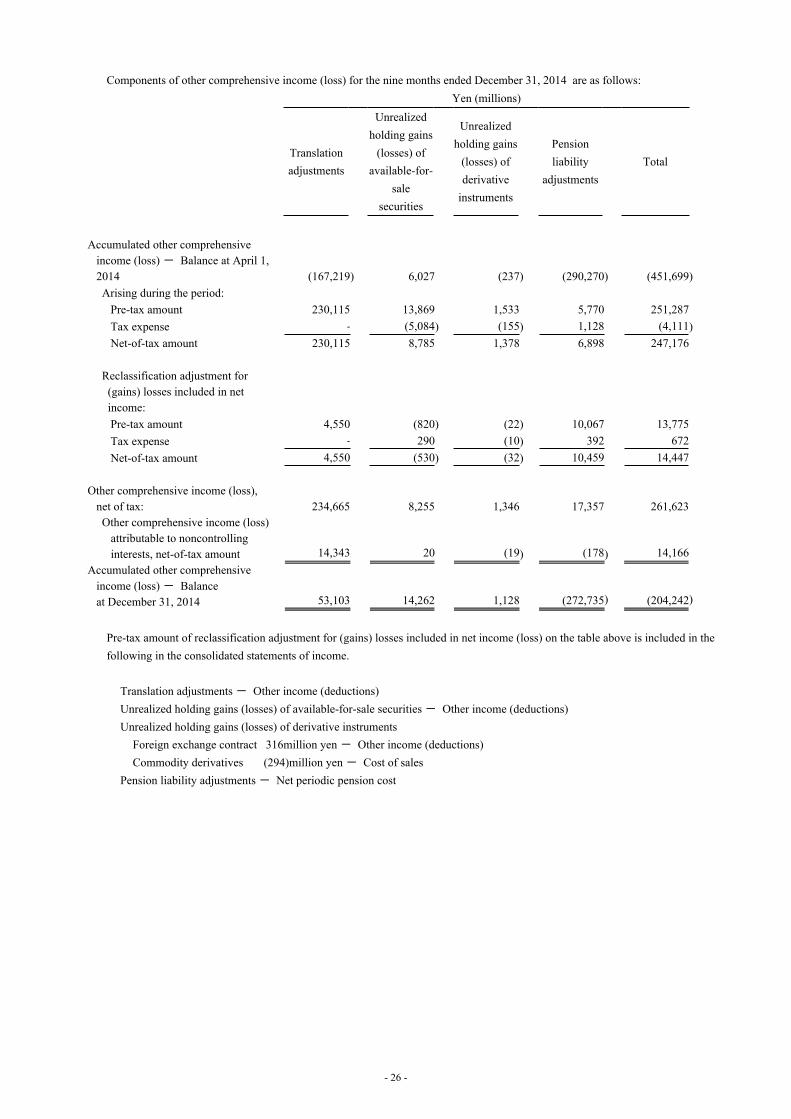
Components of other comprehensive income (loss) for the nine months ended December 31, 2014 are as follows:Yen (millions)
Translation adjustments
Unrealized holding gains
(losses) of available-for-
sale securities
Unrealized holding gains
(losses) of derivative
instruments
Pension liability
adjustmentsTotal
Accumulated other comprehensive income (loss) Balance at April 1, 2014 (167,219) 6,027 (237) (290,270) (451,699)
Arising during the period:Pre-tax amount 230,115 13,869 1,533 5,770 251,287Tax expense - (5,084) (155) 1,128 (4,111)Net-of-tax amount 230,115 8,785 1,378 6,898 247,176
Reclassification adjustment for (gains) losses included in net income:
Pre-tax amount 4,550 (820) (22) 10,067 13,775Tax expense - 290 (10) 392 672Net-of-tax amount 4,550 (530) (32) 10,459 14,447
Other comprehensive income (loss), net of tax: 234,665 8,255 1,346 17,357 261,623
Other comprehensive income (loss) attributable to noncontrolling interests, net-of-tax amount 14,343 20 (19) (178) 14,166
Accumulated other comprehensive income (loss) Balance at December 31, 2014 53,103 14,262 1,128 (272,735) (204,242)
Pre-tax amount of reclassification adjustment for (gains) losses included in net income (loss) on the table above is included in the following in the consolidated statements of income.
Translation adjustments Other income (deductions)Unrealized holding gains (losses) of available-for-sale securities Other income (deductions)Unrealized holding gains (losses) of derivative instruments
Foreign exchange contract 316million yen Other income (deductions) Commodity derivatives (294)million yen Cost of sales
Pension liability adjustments Net periodic pension cost
- 26 -
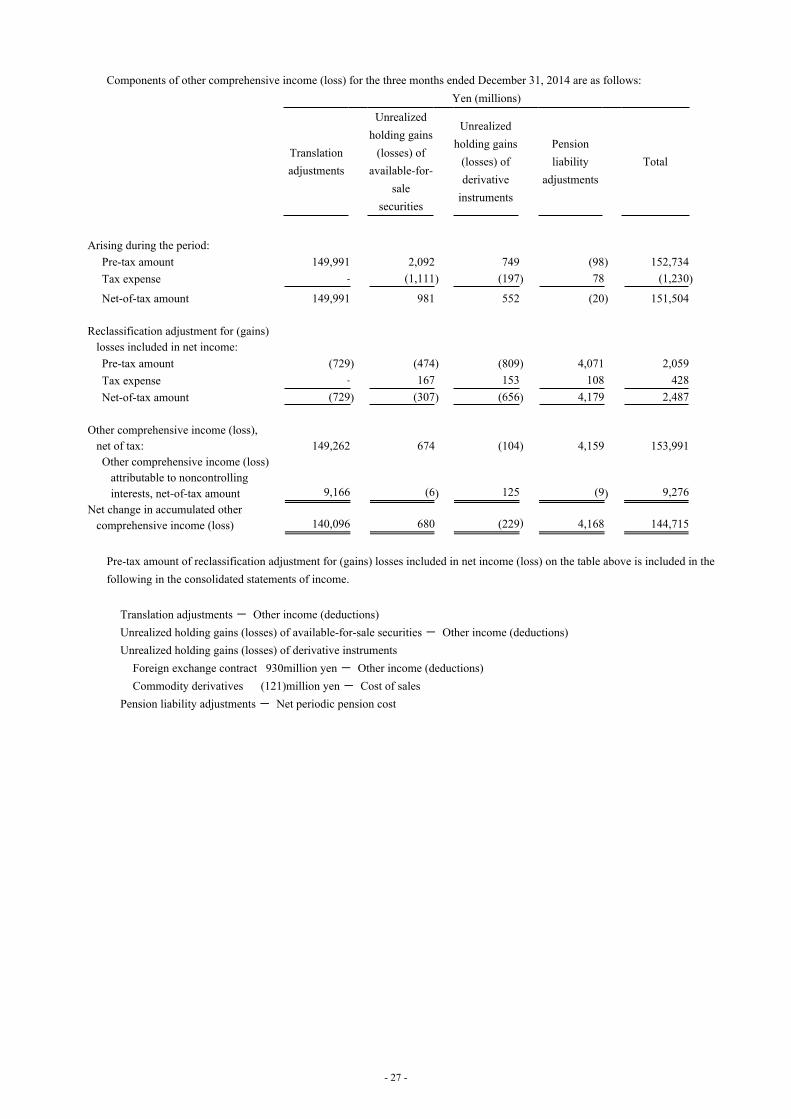
Components of other comprehensive income (loss) for the three months ended December 31, 2014 are as follows:Yen (millions)
Translation adjustments
Unrealized holding gains
(losses) of available-for-
sale securities
Unrealized holding gains
(losses) of derivative
instruments
Pension liability
adjustmentsTotal
Arising during the period: Pre-tax amount 149,991 2,092 749 (98) 152,734 Tax expense - (1,111) (197) 78 (1,230)
Net-of-tax amount 149,991 981 552 (20) 151,504
Reclassification adjustment for (gains) losses included in net income:
Pre-tax amount (729) (474) (809) 4,071 2,059 Tax expense - 167 153 108 428 Net-of-tax amount (729) (307) (656) 4,179 2,487
Other comprehensive income (loss), net of tax: 149,262 674 (104) 4,159 153,991
Other comprehensive income (loss) attributable to noncontrolling interests, net-of-tax amount 9,166 (6) 125 (9) 9,276
Net change in accumulated other comprehensive income (loss) 140,096 680 (229) 4,168 144,715
Pre-tax amount of reclassification adjustment for (gains) losses included in net income (loss) on the table above is included in the following in the consolidated statements of income.
Translation adjustments Other income (deductions)Unrealized holding gains (losses) of available-for-sale securities Other income (deductions)Unrealized holding gains (losses) of derivative instruments
Foreign exchange contract 930million yen Other income (deductions) Commodity derivatives (121)million yen Cost of sales
Pension liability adjustments Net periodic pension cost
- 27 -
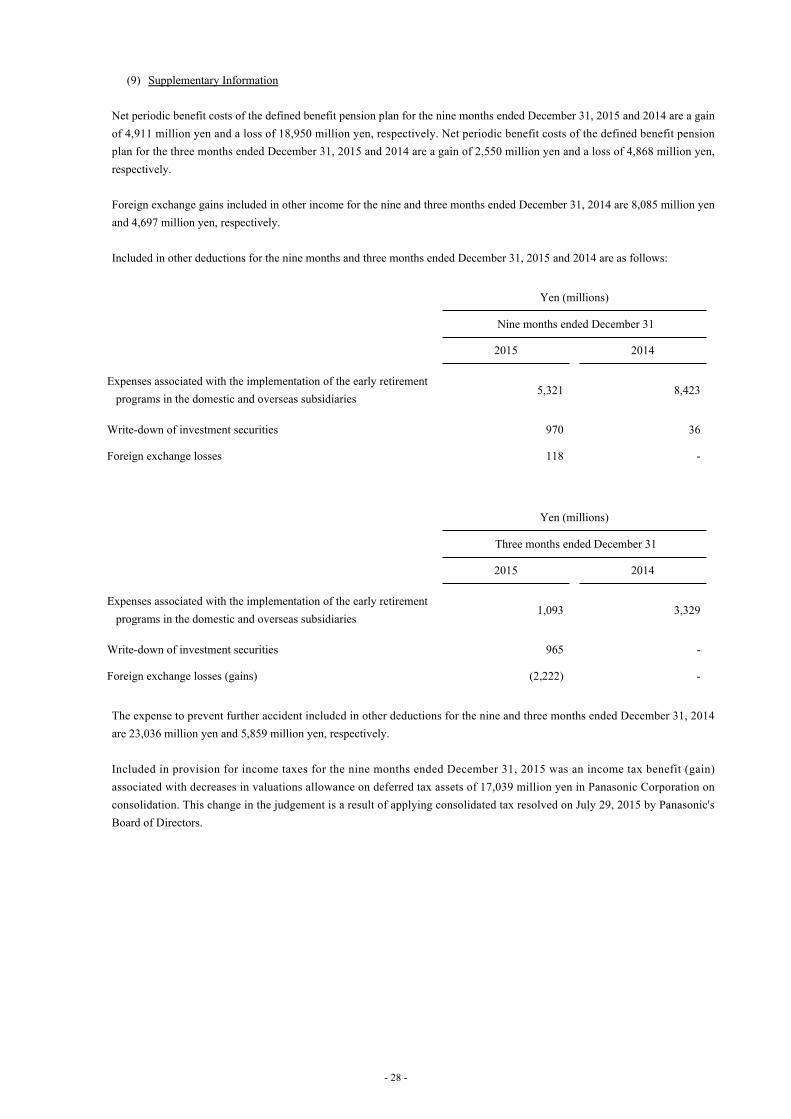
(9) Supplementary Information
Net periodic benefit costs of the defined benefit pension plan for the nine months ended December 31, 2015 and 2014 are a gain of 4,911 million yen and a loss of 18,950 million yen, respectively. Net periodic benefit costs of the defined benefit pension plan for the three months ended December 31, 2015 and 2014 are a gain of 2,550 million yen and a loss of 4,868 million yen, respectively.
Foreign exchange gains included in other income for the nine and three months ended December 31, 2014 are 8,085 million yen and 4,697 million yen, respectively.
Included in other deductions for the nine months and three months ended December 31, 2015 and 2014 are as follows:
Yen (millions)
Nine months ended December 31
2015 2014
Expenses associated with the implementation of the early retirement programs in the domestic and overseas subsidiaries
5,321 8,423
Write-down of investment securities 970 36
Foreign exchange losses 118 -
Yen (millions)
Three months ended December 31
2015 2014
Expenses associated with the implementation of the early retirement programs in the domestic and overseas subsidiaries
1,093 3,329
Write-down of investment securities 965 -
Foreign exchange losses (gains) (2,222) -
The expense to prevent further accident included in other deductions for the nine and three months ended December 31, 2014 are 23,036 million yen and 5,859 million yen, respectively.
Included in provision for income taxes for the nine months ended December 31, 2015 was an income tax benefit (gain) associated with decreases in valuations allowance on deferred tax assets of 17,039 million yen in Panasonic Corporation on consolidation. This change in the judgement is a result of applying consolidated tax resolved on July 29, 2015 by Panasonic's Board of Directors.
- 28 -
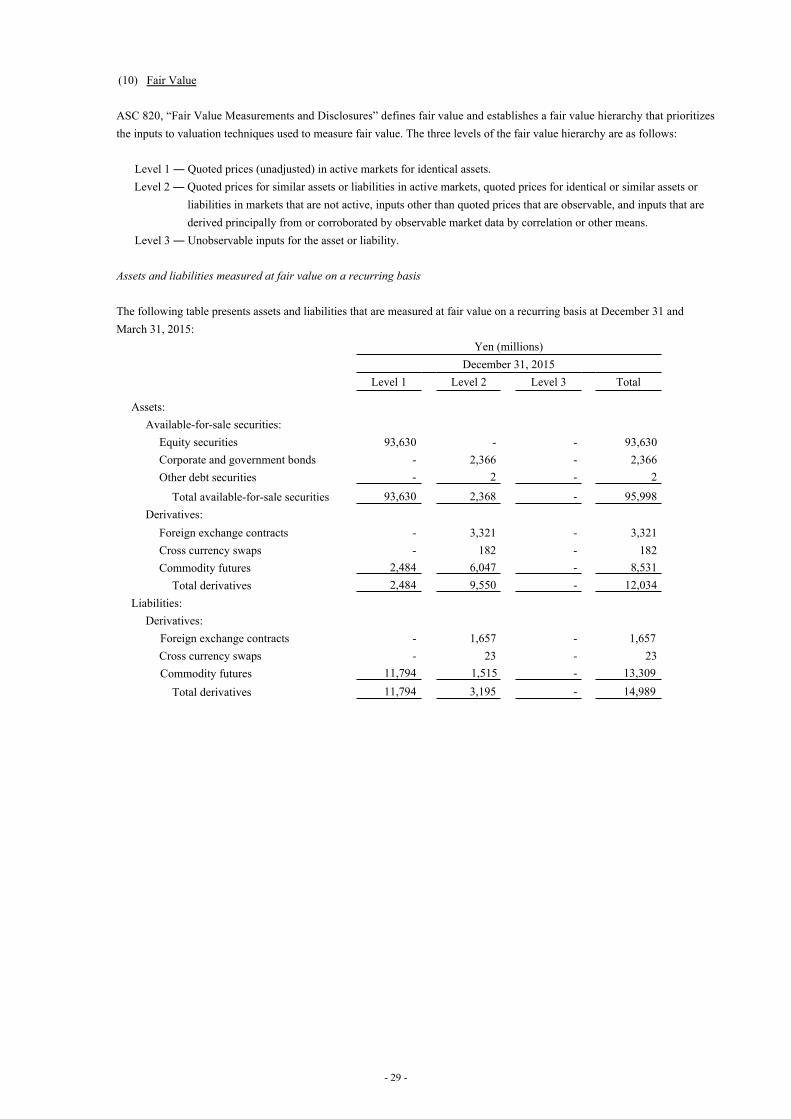
(10) Fair Value
ASC 820, “Fair Value Measurements and Disclosures” defines fair value and establishes a fair value hierarchy that prioritizes the inputs to valuation techniques used to measure fair value. The three levels of the fair value hierarchy are as follows:
Level 1 ― Quoted prices (unadjusted) in active markets for identical assets. Level 2 ― Quoted prices for similar assets or liabilities in active markets, quoted prices for identical or similar assets or
liabilities in markets that are not active, inputs other than quoted prices that are observable, and inputs that are derived principally from or corroborated by observable market data by correlation or other means.
Level 3 ― Unobservable inputs for the asset or liability.
Assets and liabilities measured at fair value on a recurring basis
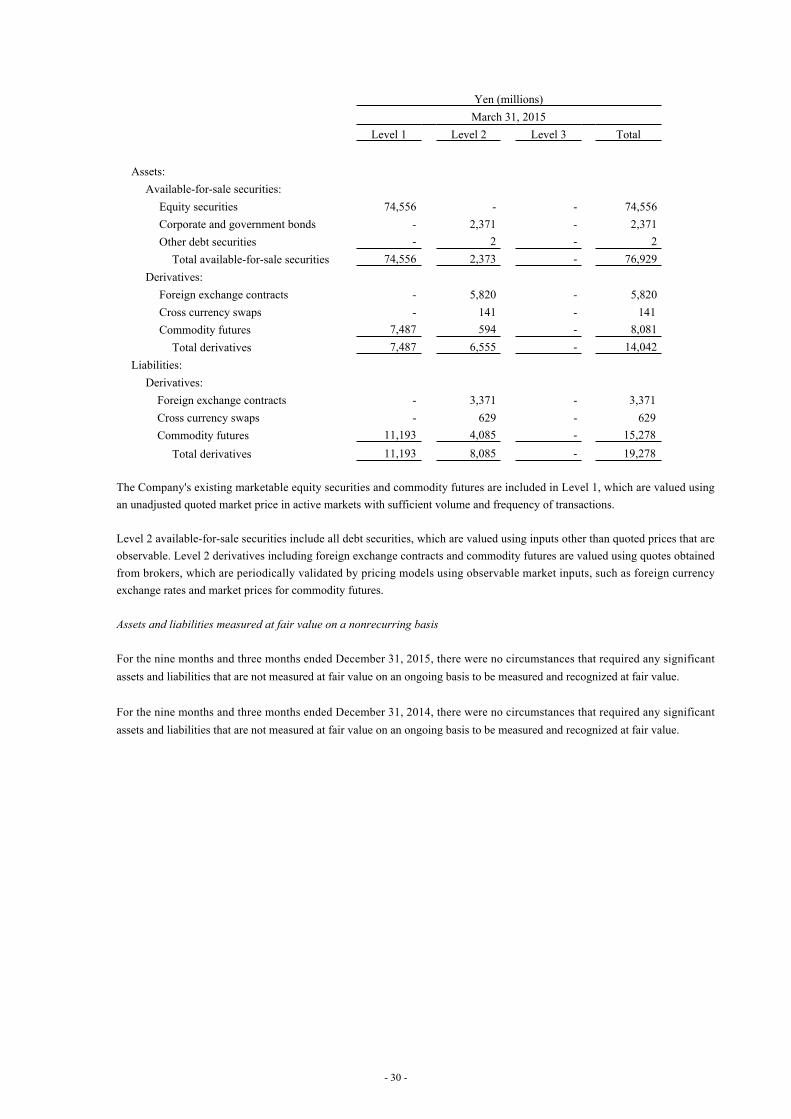
The following table presents assets and liabilities that are measured at fair value on a recurring basis at December 31 and March 31, 2015:
Yen (millions)December 31, 2015
Level 1 Level 2 Level 3 Total
Assets:Available-for-sale securities:
Equity securities 93,630 - - 93,630 Corporate and government bonds - 2,366 - 2,366 Other debt securities - 2 - 2
Total available-for-sale securities 93,630 2,368 - 95,998Derivatives:
Foreign exchange contracts - 3,321 - 3,321 Cross currency swaps - 182 - 182 Commodity futures 2,484 6,047 - 8,531
Total derivatives 2,484 9,550 - 12,034Liabilities:
Derivatives: Foreign exchange contracts - 1,657 - 1,657
Cross currency swaps - 23 - 23 Commodity futures 11,794 1,515 - 13,309
Total derivatives 11,794 3,195 - 14,989
- 29 -
Yen (millions)March 31, 2015
Level 1 Level 2 Level 3 Total
Assets:Available-for-sale securities:
Equity securities 74,556 - - 74,556 Corporate and government bonds - 2,371 - 2,371 Other debt securities - 2 - 2
Total available-for-sale securities 74,556 2,373 - 76,929Derivatives:
Foreign exchange contracts - 5,820 - 5,820 Cross currency swaps - 141 - 141 Commodity futures 7,487 594 - 8,081
Total derivatives 7,487 6,555 - 14,042Liabilities:
Derivatives: Foreign exchange contracts - 3,371 - 3,371 Cross currency swaps - 629 - 629 Commodity futures 11,193 4,085 - 15,278
Total derivatives 11,193 8,085 - 19,278
The Company's existing marketable equity securities and commodity futures are included in Level 1, which are valued using an unadjusted quoted market price in active markets with sufficient volume and frequency of transactions.
Level 2 available-for-sale securities include all debt securities, which are valued using inputs other than quoted prices that are observable. Level 2 derivatives including foreign exchange contracts and commodity futures are valued using quotes obtained from brokers, which are periodically validated by pricing models using observable market inputs, such as foreign currency exchange rates and market prices for commodity futures.
Assets and liabilities measured at fair value on a nonrecurring basis
For the nine months and three months ended December 31, 2015, there were no circumstances that required any significant assets and liabilities that are not measured at fair value on an ongoing basis to be measured and recognized at fair value.
For the nine months and three months ended December 31, 2014, there were no circumstances that required any significant assets and liabilities that are not measured at fair value on an ongoing basis to be measured and recognized at fair value.
- 30 -
The fair value of financial instruments
The following methods and assumptions were used to estimate the fair value of each class of financial instruments for which it is practicable to estimate that value:
Available-for-sale securitiesThe carrying amount is equal to the fair value which is estimated based on quoted market prices. The fair value is also described in Note 3.
Long-term debt, including current portionThe fair value of long-term debt is estimated based on quoted market prices or the present value of future cash flows using appropriate current discount rates. The Company classified long-term debt in Level 2. The carrying amount and fair value at December 31, 2015 are 917,060 million yen and 929,585 million yen, respectively. The carrying amount and fair value at March 31, 2015 are 962,029 million yen and 974,671 million yen, respectively.
Derivative financial instrumentsThe fair value of derivative financial instruments is estimated based on unadjusted market prices or quotes obtained from brokers, which are periodically validated by pricing models using observable inactive market inputs.
AdvancesThe fair value of advances is estimated based on the present value of future cash flows using appropriate current discount rates. The Company classified advances in Level 2. The carrying amount approximates fair value.
Financial instruments other than those listed above (such as Cash and cash equivalents, Time deposits, Trade receivables, Short-term debt, Trade payables, Accrued expenses)The carrying amount approximates fair value because of the short maturity of these instruments.
LimitationsFair value estimates are made at a specific point in time, based on relevant market information and information about the financial instruments. These estimates are subjective in nature and involve uncertainties and matters of significant judgments and therefore cannot be determined with precision. Changes in assumptions could significantly affect the estimates.
- 31 -
(11) Commitments and Contingent Liabilities
The Company provides guarantees to third parties mainly on bank loans provided to associated companies and customers. The guarantees are made to enhance their credit. For each guarantee provided, the Company is required to perform under the guarantee if the guaranteed party defaults on a payment. Also, the Company sold certain trade receivables to independent third parties, some of which are with recourse. If the collectibility of those receivables with recourse becomes doubtful, the Company is obligated to assume the liabilities. At December 31, 2015, the maximum amount of undiscounted payments the Company would have to make in the event of default was 25,502 million yen. The carrying amount of the liabilities recognized for the Company’s obligations as a guarantor under those guarantees at December 31, 2015 was immaterial.
In connection with the sale and lease back of certain machinery and equipment, the Company guarantees a specific value of the leased assets. For each guarantee provided, the Company is required to perform under the guarantee if certain conditions are met during or at the end of the lease term. At December 31, 2015, the maximum amount of undiscounted payments the Company would have to make in the event that these conditions were met was 1,065 million yen. The carrying amount of the liabilities recognized for the Company’s obligations as guarantors under those guarantees at December 31, 2015 was immaterial.
The Company and certain subsidiaries are under the term of leasehold interest contracts for land of domestic factories and have obligations for restitution on their leaving. The asset retirement obligations cannot be reasonably estimated because the durations of use of the leased assets are not specified and there are no plans to undertake relocation in the future. Therefore, the Company did not recognize asset retirement obligations.
The Company and certain of its subsidiaries are subject to a number of legal proceedings including civil litigations related to trade, tax, products or intellectual properties, or governmental investigations. The Company has been dealing with the various litigations and investigations. Depending upon the outcome of these different proceedings, the Company and certain of its subsidiaries may be subject to an uncertain amount of fines, and accordingly the Company has accrued for certain probable and reasonable estimated amounts for the fines.
Since November 2007, the Company and MT Picture Display Co., Ltd. (MTPD), a subsidiary of the Company, have been subjected to investigations by government authorities, including the Japan Fair Trade Commission, the U.S. Department of Justice and the European Commission, in respect of alleged antitrust violations relating to cathode ray tubes (CRTs). For the year ended March 31, 2010, the Japan Fair Trade Commission (JFTC) issued a cease and desist order against MTPD and assessed a fine against its three subsidiaries in South East Asia, but each named company challenged the orders. In May 2015, JFTC made a decision to revoke a part of the orders and sustain the other, but MTPD and its subsidiaries appealed to the Tokyo High Court because they believe the decision is factually and legally erroneous. For the year ended March 31, 2013, the Company and MTPD received notification of a European Commission Decision in violation of EU competition law and appealed to the European General Court against the decision because the Company believes this decision is factually and legally erroneous as it applies to the Company and MTPD. In September 2015, the European General Court rendered the judgment to accept some of the arguments but reject the other arguments made by the Company and MTPD. The Company appealed to the European Court of Justice. Since June 2012, the Company and Sanyo Electric Co., Ltd., a subsidiary of the Company, have been subjected to investigations by the European Commission, in respect of alleged antitrust violations relating to the rechargeable battery. Other than those above, there are a number of legal actions against the Company and certain subsidiaries. Management is of the opinion that damages, if any, resulting from these actions, will not have a material effect on the Company's consolidated financial statements.
The ability to predict the outcome of these actions and proceedings is difficult to assess given that certain of the investigations and legal proceedings are still at an early stage, present novel legal theories, involve a large number of parties or taking place in jurisdictions outside of Japan where the laws are complex or unclear. Accordingly, the Company is unable to estimate the losses or range of losses for the actions and proceedings where there is only a reasonable possibility that a loss exceeding amounts already recognized may have been incurred.
- 32 -
(12) Segment Information
In accordance with the provisions of ASC 280, “Segment Reporting,” the segments reported below are the components of the Company for which separate financial information is available that is evaluated regularly by the chief operating decision maker of the Company in deciding how to allocate resources and in assessing performance.
“Appliances” is comprised of development, manufacture and sales of consumer electronics (such as flat panel TVs, refrigerators, washing machines, personal-care products, microwave ovens, home audio equipment, video equipment, vacuum cleaners, rice cookers), air-conditioners (such as room air-conditioners, large-sized air-conditioners), cold chain (such as showcases), devices (such as compressors, fuel cells) and bicycle related products.
“Eco Solutions” is comprised of development, manufacture and sales of products such as lighting fixtures, lamps, wiring devices, solar photovoltaic systems, water-related products, interior furnishing materials, ventilation and air-conditioning equipment, air purifiers, and nursing-care-related products.
“AVC Networks” is comprised of development, manufacture and sales of products such as aircraft in-flight entertainment systems, PCs, projectors, digital cameras, mobile phones, surveillance cameras, fixed phones and faxes, and social infrastructure systems equipment.
“Automotive & Industrial Systems” is comprised of development, manufacture and sales of automotive products (such as car-use-multimedia-related equipment, electrical components), energy products (such as lithium-ion batteries, storage batteries, dry batteries), industrial devices (such as electronic components, electronic materials, automation controls, semiconductors, LCD panels, optical devices) and factory solutions (such as electronic-component-mounting machines, welding equipment, electric motors).
“Other” consists of PanaHome Corporation and others.
- 33 -
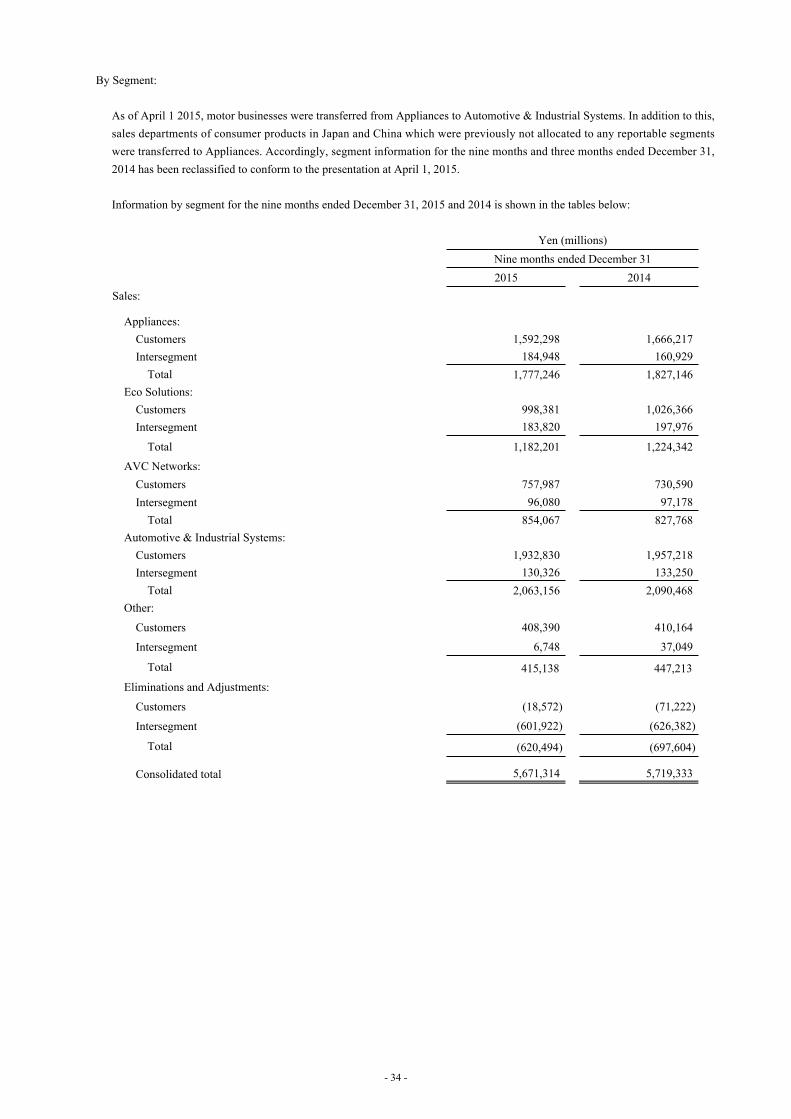
By Segment:
As of April 1 2015, motor businesses were transferred from Appliances to Automotive & Industrial Systems. In addition to this, sales departments of consumer products in Japan and China which were previously not allocated to any reportable segments were transferred to Appliances. Accordingly, segment information for the nine months and three months ended December 31, 2014 has been reclassified to conform to the presentation at April 1, 2015.
Information by segment for the nine months ended December 31, 2015 and 2014 is shown in the tables below:
Yen (millions)Nine months ended December 312015 2014
Sales:
Appliances:Customers 1,592,298 1,666,217Intersegment 184,948 160,929
Total 1,777,246 1,827,146Eco Solutions:
Customers 998,381 1,026,366Intersegment 183,820 197,976
Total 1,182,201 1,224,342
AVC Networks:Customers 757,987 730,590Intersegment 96,080 97,178
Total 854,067 827,768Automotive & Industrial Systems:
Customers 1,932,830 1,957,218Intersegment 130,326 133,250
Total 2,063,156 2,090,468Other:
Customers 408,390 410,164
Intersegment 6,748 37,049
Total 415,138 447,213Eliminations and Adjustments:
Customers (18,572) (71,222)
Intersegment (601,922) (626,382)
Total (620,494) (697,604)
Consolidated total 5,671,314 5,719,333
- 34 -
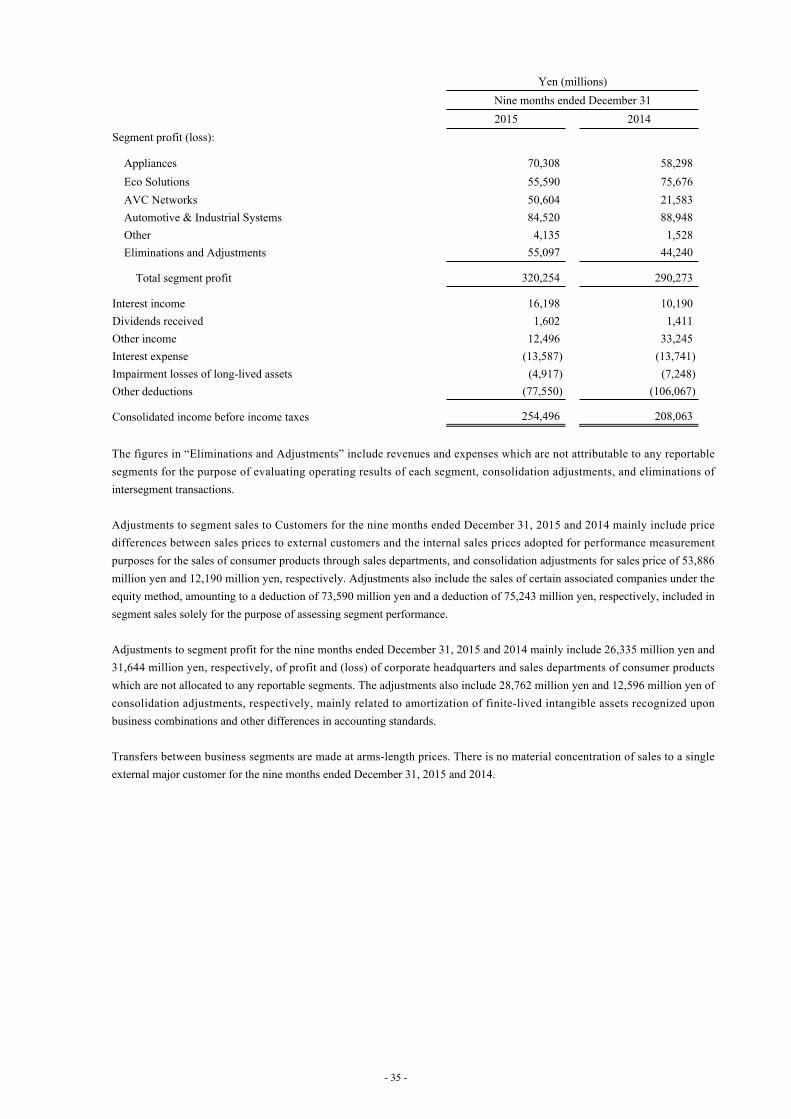
Yen (millions)Nine months ended December 312015 2014
Segment profit (loss):
Appliances 70,308 58,298Eco Solutions 55,590 75,676AVC Networks 50,604 21,583Automotive & Industrial Systems 84,520 88,948Other 4,135 1,528Eliminations and Adjustments 55,097 44,240
Total segment profit 320,254 290,273
Interest income 16,198 10,190Dividends received 1,602 1,411Other income 12,496 33,245Interest expense (13,587) (13,741)Impairment losses of long-lived assets (4,917) (7,248)Other deductions (77,550) (106,067)
Consolidated income before income taxes 254,496 208,063
The figures in “Eliminations and Adjustments” include revenues and expenses which are not attributable to any reportable segments for the purpose of evaluating operating results of each segment, consolidation adjustments, and eliminations of intersegment transactions.
Adjustments to segment sales to Customers for the nine months ended December 31, 2015 and 2014 mainly include price differences between sales prices to external customers and the internal sales prices adopted for performance measurement purposes for the sales of consumer products through sales departments, and consolidation adjustments for sales price of 53,886 million yen and 12,190 million yen, respectively. Adjustments also include the sales of certain associated companies under the equity method, amounting to a deduction of 73,590 million yen and a deduction of 75,243 million yen, respectively, included in segment sales solely for the purpose of assessing segment performance.
Adjustments to segment profit for the nine months ended December 31, 2015 and 2014 mainly include 26,335 million yen and 31,644 million yen, respectively, of profit and (loss) of corporate headquarters and sales departments of consumer products which are not allocated to any reportable segments. The adjustments also include 28,762 million yen and 12,596 million yen of consolidation adjustments, respectively, mainly related to amortization of finite-lived intangible assets recognized upon business combinations and other differences in accounting standards.
Transfers between business segments are made at arms-length prices. There is no material concentration of sales to a single external major customer for the nine months ended December 31, 2015 and 2014.
- 35 -
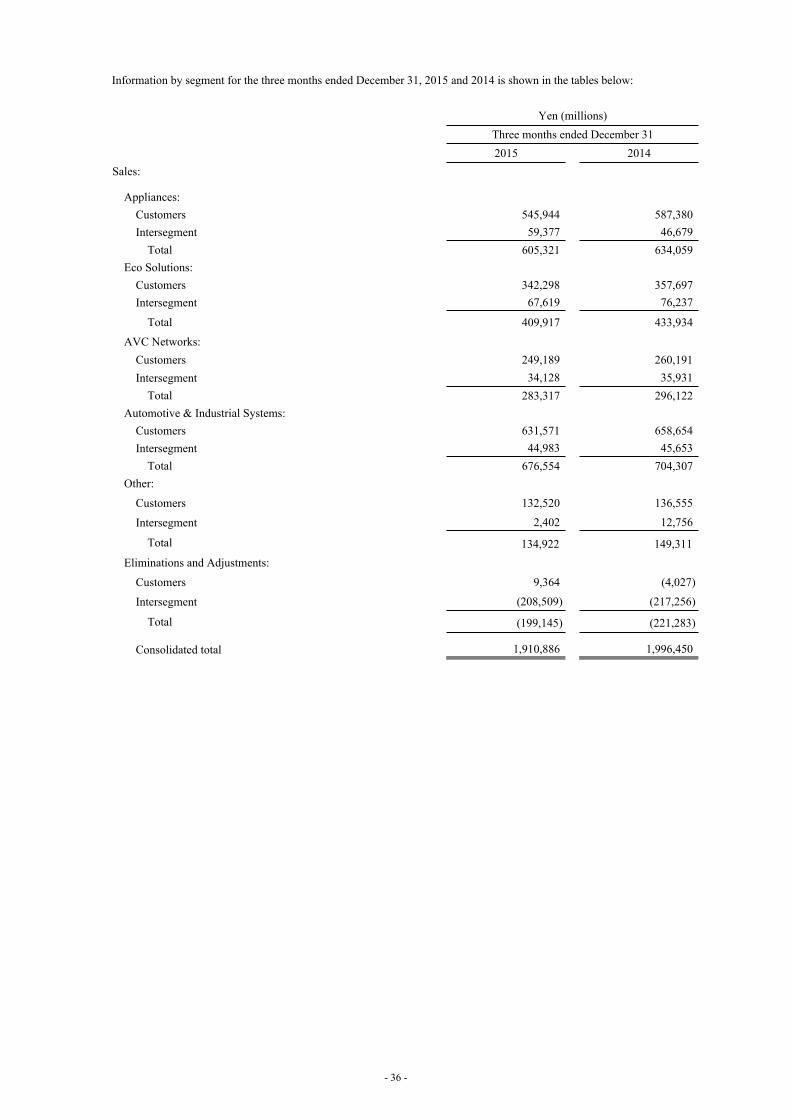
Information by segment for the three months ended December 31, 2015 and 2014 is shown in the tables below:
Yen (millions)Three months ended December 312015 2014
Sales:
Appliances:Customers 545,944 587,380Intersegment 59,377 46,679
Total 605,321 634,059Eco Solutions:
Customers 342,298 357,697Intersegment 67,619 76,237
Total 409,917 433,934
AVC Networks:Customers 249,189 260,191Intersegment 34,128 35,931
Total 283,317 296,122Automotive & Industrial Systems:
Customers 631,571 658,654Intersegment 44,983 45,653
Total 676,554 704,307Other:
Customers 132,520 136,555
Intersegment 2,402 12,756
Total 134,922 149,311Eliminations and Adjustments:
Customers 9,364 (4,027)
Intersegment (208,509) (217,256)
Total (199,145) (221,283)
Consolidated total 1,910,886 1,996,450
- 36 -
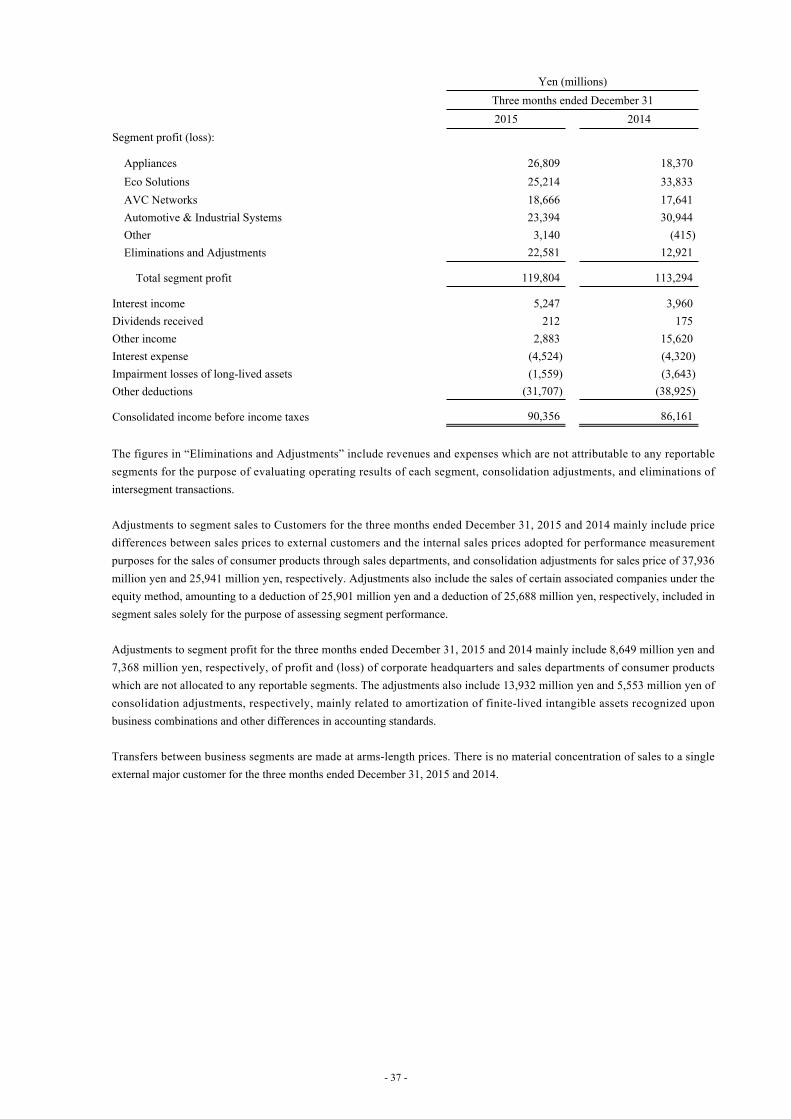
Yen (millions)Three months ended December 312015 2014
Segment profit (loss):
Appliances 26,809 18,370Eco Solutions 25,214 33,833AVC Networks 18,666 17,641Automotive & Industrial Systems 23,394 30,944Other 3,140 (415)Eliminations and Adjustments 22,581 12,921
Total segment profit 119,804 113,294
Interest income 5,247 3,960Dividends received 212 175Other income 2,883 15,620Interest expense (4,524) (4,320)Impairment losses of long-lived assets (1,559) (3,643)Other deductions (31,707) (38,925)
Consolidated income before income taxes 90,356 86,161
The figures in “Eliminations and Adjustments” include revenues and expenses which are not attributable to any reportable segments for the purpose of evaluating operating results of each segment, consolidation adjustments, and eliminations of intersegment transactions.
Adjustments to segment sales to Customers for the three months ended December 31, 2015 and 2014 mainly include price differences between sales prices to external customers and the internal sales prices adopted for performance measurement purposes for the sales of consumer products through sales departments, and consolidation adjustments for sales price of 37,936 million yen and 25,941 million yen, respectively. Adjustments also include the sales of certain associated companies under the equity method, amounting to a deduction of 25,901 million yen and a deduction of 25,688 million yen, respectively, included in segment sales solely for the purpose of assessing segment performance.
Adjustments to segment profit for the three months ended December 31, 2015 and 2014 mainly include 8,649 million yen and 7,368 million yen, respectively, of profit and (loss) of corporate headquarters and sales departments of consumer products which are not allocated to any reportable segments. The adjustments also include 13,932 million yen and 5,553 million yen of consolidation adjustments, respectively, mainly related to amortization of finite-lived intangible assets recognized upon business combinations and other differences in accounting standards.
Transfers between business segments are made at arms-length prices. There is no material concentration of sales to a single external major customer for the three months ended December 31, 2015 and 2014.
- 37 -
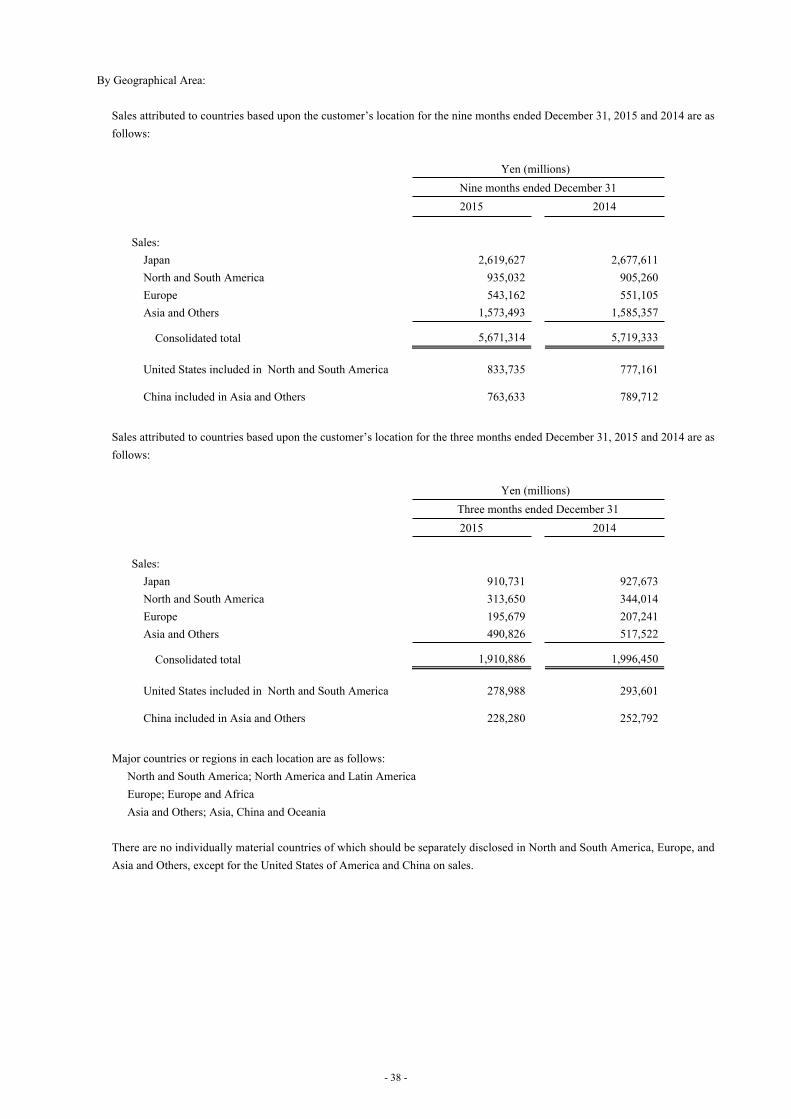
By Geographical Area:
Sales attributed to countries based upon the customer’s location for the nine months ended December 31, 2015 and 2014 are as follows:
Yen (millions)Nine months ended December 312015 2014
Sales:Japan 2,619,627 2,677,611North and South America 935,032 905,260Europe 543,162 551,105Asia and Others 1,573,493 1,585,357
Consolidated total 5,671,314 5,719,333
United States included in North and South America 833,735 777,161
China included in Asia and Others 763,633 789,712
Sales attributed to countries based upon the customer’s location for the three months ended December 31, 2015 and 2014 are as follows:
Yen (millions)Three months ended December 312015 2014
Sales:Japan 910,731 927,673North and South America 313,650 344,014Europe 195,679 207,241Asia and Others 490,826 517,522
Consolidated total 1,910,886 1,996,450
United States included in North and South America 278,988 293,601
China included in Asia and Others 228,280 252,792
Major countries or regions in each location are as follows:North and South America; North America and Latin AmericaEurope; Europe and AfricaAsia and Others; Asia, China and Oceania
There are no individually material countries of which should be separately disclosed in North and South America, Europe, and Asia and Others, except for the United States of America and China on sales.
- 38 -

(13) Cash Dividends
On April 28, 2015, the board of directors approved a year-end dividend of 10.0 yen per share, totaling 23,113 million yen on outstanding common stock as of March 31, 2015. The dividends, which became effective on June 4, 2015, were sourced out of retained earnings.
On October 29, 2015, the board of directors approved an interim dividend of 10.0 yen per share, totaling 23,209 million yen on outstanding common stock as of September 30, 2015. The dividends, which will become effective on December 1, 2015, were sourced out of retained earnings.
- 39 -
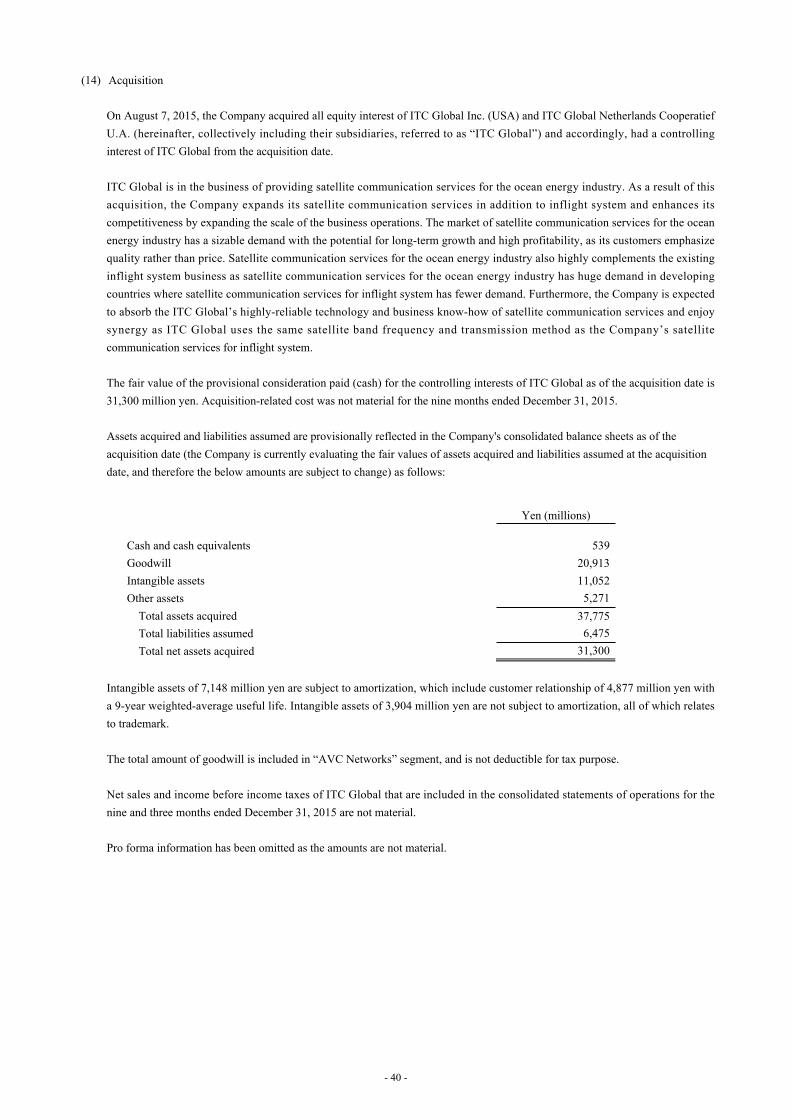
(14) Acquisition
On August 7, 2015, the Company acquired all equity interest of ITC Global Inc. (USA) and ITC Global Netherlands Cooperatief U.A. (hereinafter, collectively including their subsidiaries, referred to as “ITC Global”) and accordingly, had a controlling interest of ITC Global from the acquisition date.
ITC Global is in the business of providing satellite communication services for the ocean energy industry. As a result of this acquisition, the Company expands its satellite communication services in addition to inflight system and enhances its competitiveness by expanding the scale of the business operations. The market of satellite communication services for the ocean energy industry has a sizable demand with the potential for long-term growth and high profitability, as its customers emphasize quality rather than price. Satellite communication services for the ocean energy industry also highly complements the existing inflight system business as satellite communication services for the ocean energy industry has huge demand in developing countries where satellite communication services for inflight system has fewer demand. Furthermore, the Company is expected to absorb the ITC Global’s highly-reliable technology and business know-how of satellite communication services and enjoy synergy as ITC Global uses the same satellite band frequency and transmission method as the Company’s satellite communication services for inflight system.
The fair value of the provisional consideration paid (cash) for the controlling interests of ITC Global as of the acquisition date is 31,300 million yen. Acquisition-related cost was not material for the nine months ended December 31, 2015.
Assets acquired and liabilities assumed are provisionally reflected in the Company's consolidated balance sheets as of the acquisition date (the Company is currently evaluating the fair values of assets acquired and liabilities assumed at the acquisition date, and therefore the below amounts are subject to change) as follows:
Yen (millions)
Cash and cash equivalents 539Goodwill 20,913Intangible assets 11,052Other assets 5,271
Total assets acquired 37,775Total liabilities assumed 6,475Total net assets acquired 31,300
Intangible assets of 7,148 million yen are subject to amortization, which include customer relationship of 4,877 million yen with a 9-year weighted-average useful life. Intangible assets of 3,904 million yen are not subject to amortization, all of which relates to trademark.
The total amount of goodwill is included in “AVC Networks” segment, and is not deductible for tax purpose.
Net sales and income before income taxes of ITC Global that are included in the consolidated statements of operations for the nine and three months ended December 31, 2015 are not material.
Pro forma information has been omitted as the amounts are not material.
- 40 -