Embed Size (px)
Citation preview

Quantitative Evaluation of a Pulmonary ContourSegmentation Algorithm in X-ray Computed
Tomography Images1
Beatriz Sousa Santos, PhD, Carlos Ferreira, PhD, Jose Silvestre Silva, MSc, Augusto Silva, PhD, Luısa Teixeira, MD
Rationale and Objectives. Pulmonary contour extraction from thoracic x-ray computed tomography images is a manda-tory preprocessing step in many automated or semiautomated analysis tasks. This study was conducted to quantitativelyassess the performance of a method for pulmonary contour extraction and region identification.
Materials and Methods. The automatically extracted contours were statistically compared with manually drawn pulmo-nary contours detected by six radiologists on a set of 30 images. Exploratory data analysis, nonparametric statistical tests,and multivariate analysis were used, on the data obtained using several figures of merit, to perform a study of the interob-server variability among the six radiologists and the contour extraction method. The intraobserver variability of two hu-man observers was also studied.
Results. In addition to a strong consistency among all of the quality indexes used, a wider interobserver variability wasfound among the radiologists than the variability of the contour extraction method when compared with each radiologist.The extraction method exhibits a similar behavior (as a pulmonary contour detector), to the six radiologists, for the usedimage set.
Conclusion. As an overall result of the application of this evaluation methodology, the consistency and accuracy of thecontour extraction method was confirmed to be adequate for most of the quantitative requirements of radiologists. Thisevaluation methodology could be applied to other scenarios.
Key Words. Quantitative evaluation; computed tomography (CT); pulmonary segmentation; interobserver and intraob-server variability.© AUR, 2004
Acad Radiol 2004; 11:868–878
1 From the Departamento de Electronica e Telecomunicacoes (B.S.S.,J.S.S., A.S.), the Instituto de Engenharia Electronica e Telematica de Aveiro(B.S.S., A.S.), and the Departamento de Economia, Gestao e EngenhariaIndustrial (C.F.), Universidade de Aveiro, Portugal; the Centro de Investiga-cao Operacional, Universidade de Lisboa, Portugal (C.F.); the Departa-mento de Fısica, Faculdade de Ciencias e Tecnologia, Universidade de Co-imbra, Portugal (J.S.S.); Servico de Imagiologia, Hospitais da Universidadede Coimbra, Portugal (L.T.). Received January 14, 2004; revision requestedMarch 30; revision received and accepted April 26. Address correspon-dence to B.S.S. DET Departamento de Electronica e Telecomunicacoes,Universidade de Aveiro, 3810 Aveiro, Portugal.
© AUR, 2004doi:10.1016/j.acra.2004.05.004
868
We have reached a point at which computed tomography(CT) images can be reconstructed faster than they can beread. This fact encourages software developers to designprograms that will aid radiologists in the reading of CTimages and in diagnosing conditions on the basis of CTfindings (1). Segmentation often occurs as a preprocessingstep of more global image analysis tasks, as is the case ofcomputer-aided analysis of pulmonary x-ray tomograms(2), where many analytic procedures start by correctlyidentifying the pulmonary regions (3–6). Most algorithmsfor the segmentation of pulmonary regions are based onintensity discrimination within the Hounsfield scale (7–9);
however this task may become very complex because of
Academic Radiology, Vol 11, No 8, August 2004 EVALUATION OF A SEGMENTATION ALGORITHM
the presence of spurious structures within the same scalerange or the visual merging of the pulmonary regionsthemselves. In previous works (10,11) we presented algo-rithms designed to cope with these difficulties, whichgenerate contours with a variable degree of similarity tothose provided by radiologists.
A quantitative evaluation of the performance of thesealgorithms is crucial before their clinical use can be con-sidered. Yet, the performance evaluation of segmentationalgorithms in medical imaging is recognized as a difficultproblem; actually, if one can find in the literature a sig-nificant number of contributions concerning the overallsegmentation problem by itself, the same is not true whenlooking for quality and effectiveness assessments per-formed in some systematic way (12) and having a practi-cal value (13).
This evaluation encounters the first great obstacle: thefact that the ground truth is unknown (13) (ie, it is notpossible to identify the real contour corresponding to agiven image). This problem is often circumvented usingthe contour resulting from manually tracing the objectboundary by a knowledgeable human as a surrogate ofthat truth. However, not only will contours drawn by tworadiologists be different (interobserver variability), butthere will also not be agreement between contours drawnby the same radiologist at different occasions (intraob-server variability). These two types of variability have tobe taken into account in the performance evaluation ofsegmentation algorithms; we will have to compare thisperformance with the performance of several radiologistsin some statistically supported manner.
In an earlier work (11) we verified that a greater simi-larity existed between the contours produced by our algo-rithm and the contours drawn by two expert radiologists,than between the contours drawn by the same two radiol-ogists. This meant that the interobserver variability be-tween our algorithm and any of the two radiologists wasless than the interobserver variability between the tworadiologists. To investigate if this was specific for thosetwo radiologists, or if it was more general, we have per-formed a study including six radiologists from differenthospitals.
To further investigate this issue, we have consideredthe study of the intraobserver variability relevant; in thisrespect our algorithm has a clear advantage because itsintraobserver variability is zero. Still, the comparison ofthe interobserver variability between our algorithm and
each radiologist to hers/his intraobserver variability couldprovide interesting additional information on the perfor-mance of the algorithm.
While other authors have proposed pulmonary segmen-tation algorithms and have evaluated them (4,8), theyhave not compared their performance as contour detectorswith as many radiologists, nor have they used such a sta-tistically based method as we have used in this study.
MATERIALS AND METHODS
Quality Assessment Strategies
It is common to treat the physician ground truth asunquestionable, and assume it as a relatively error-freegold standard; however, there is some level of variabilityin the specification of the ground truth and it is importantto have an estimate of this level. This type of variabilityis an important concern in determining the appropriatecriteria for matching a detected contour to a ground truthcontour (13).
Quantitative evaluation of the performance of segmen-tation algorithms in medical imaging has been recognizedas an important problem. However, many of the evalua-tion studies that have been carried out did not use a largeenough dataset, real images, convenient performance met-rics, appropriate statistical methods, or a suitable groundtruth. Thus, they cannot be considered correct or com-plete. Several methodologies have been proposed to per-form this evaluation appropriately. The Handbook ofMedical Imaging (13) presents a thorough overview ofthe field. Chalana and Kim (12) also present a concreteapproach to segmentation performance assessmentthrough contour comparison.
Quantitative Evaluation of the PerformanceAs mentioned previously, the ideal way of evaluating
the performance of our segmentation algorithm would beto compare the contours detected on a valid test datasetwith the “real contours” corresponding to each image.However, as we have seen, there are no such real con-tours. Several expert radiologists will detect different con-tours on the same image (see Fig 1b); also, each expertradiologist will detect on the same image, at differenttimes, slightly different contours, unlike our algorithm,which always detects the same contours on the same im-age (its variability is 0 and it does not depend on anyseed points introduced by a human observer, as other pul-monary segmentation algorithms (14–18)). This intraob-
server variability can be used as a “variability quantum”;869

g con
SOUSA SANTOS ET AL Academic Radiology, Vol 11, No 8, August 2004
it gives an idea of the level of variability that has to beexpected and thus can be acceptable to exist between anytwo contour detectors (algorithm or human). Therefore,comparing the variability between our algorithm and eachradiologist with the intraobserver variability of any expertcould work as an “acceptability measure” of that variabil-ity.
As a consequence of the intraobserver and interob-server variability, the manually drawn contours can beconsidered as a collection of ground truths, all of themequally acceptable. To circumvent this problem we haveperformed two studies (using different methods) to com-pare the behavior of our algorithm, as a contour detector,with the behavior of a reasonable number of expert radi-ologists. These studies involve the assessment of the in-terobserver variability among a number of “contour detec-tors”: several humans and one automated (our algorithm).The rationale for this study was that, if the interobservervariability between the algorithm and any of the radiolo-
Figure 1. Images (a, c) and correspondin
gists is similar in magnitude to the interobserver variabil-
870
ity between any two radiologists, then the difference be-tween the algorithm and the radiologists, as contour de-tectors, could be considered not significant. This rationalis similar to the one behind the study by Sivaramakrishnaet al (19) to validate a segmentation algorithm of mam-mographic images, which also seems comparable to ourcase.
Interobserver VariabilityIn our first study concerning interobserver variability
we directly compared the contours produced by all detec-tors (algorithm vs all radiologists and every radiologist vsall the others and algorithm). In a subsequent study wecompared each detector with a reference contour (surro-gate ground truth) obtained from the hand-drawn con-tours, as described by Ferreira et al (20).
To perform these studies we asked six experiencedradiologists, from three different hospitals, to draw con-tours of the pulmonary regions on the chosen images.
tours detected by six radiologists (b, d).
This number of radiologists seemed reasonable for such a

Academic Radiology, Vol 11, No 8, August 2004 EVALUATION OF A SEGMENTATION ALGORITHM
study, taking into consideration that they have beentrained and work at three different hospitals. Moreover, itwould be difficult to obtain the collaboration of more ra-diologists.
Intraobserver VariabilityTo assess intraobserver variability, we asked two radi-
ologists to hand-draw the contours on the same set ofimages twice, without telling them that they had alreadydrawn contours on those images. We chose the youngestradiologist and the head of the CT department who wasresponsible for thoracic radiology at the University Hospi-tal, because these radiologists have a significant differ-ence in years of experience. This choice was made in thehope of obtaining two significantly different values ofintraobserver variability (which would probably not be thecase if the two radiologists had approximately the sameexperience).
The time elapsed between the delineation of the twocontours on the same image by the same radiologist wasat least 1 month (which agrees with the proposal of Wag-ner et al (21)]) to minimize the effect of the recollectionof having drawn the previous contours.
Test DatasetThe proper choice of the used dataset is very impor-
tant; a poor selection of either the number of images orthe method to select these images can jeopardize the va-lidity of the evaluation procedure. We used 30 512 � 512images (N � 60 contours) selected using a pseudorandomgenerator from a set of 253 images that had not beenused to develop the algorithm. These images were all theimages that could be used to support diagnosis corre-sponding to exams of eight patients collected at the Radi-ology Department of the University Hospital in Coimbra,independently of their pathologies. While the used datasetcontained images corresponding to different pulmonarylevels, which increased variability, using images from agreater number of patients would probably increase casevariability. We used the power of a hypothesis test tocalculate the sample size, N, of the test dataset, specifyingthe smallest difference that would be worthwhile to de-tect. This means, according to Altman (22), trying tomake “clinical” importance and statistical significanceagree. As a first approach, we hoped to be able to detecta difference of 1 standard deviation. We set the power(1-�) at 90% and chose a 1% significance level (�); usingthe nomogram for calculating sample size (22), this gives
a total sample of N � 60.Hand-outlined ContoursOur radiologists manually outlined all the contours on
transparent sheets superimposed on quality printings ofthe test images working independently from each otherand (as much as possible) in the same way and on thesame conditions. The obtained contours were digitizedand processed to identify the contours of left and rightlungs. This identification is performed computing the im-age Radon transforms for 0° and 90°, estimating the cen-ter of each lung from the maximum values of these twotransforms. Applying a morphologic filling starting fromthe center of one lung and a second filling starting fromany point external to the lungs, we obtained an imagecontaining the filled area of the other lung. The contourof the lung was then easily obtained. Erosion was ap-plied to obtain a thinner version of each of the con-tours (20).
We have chosen this method as a compromise betweenfeasibility to the radiologists and acceptable accuracy.
References Contour Obtained from the Hand-drawn Contours
In the last study of interobserver variability, we com-pared all contours to reference contours obtained from thesix contours detected by the radiologists on each image,as described by Ferreira et al (20). For most images hav-ing diagnostic value, the contours detected by all the radi-ologists are only slightly different and thus using a kindof “average” contour seemed an acceptable surrogate to“ground truth” (Fig 1b); however, in particular regions ofa few images of the data set, affected by partial volumeeffect or motion artifacts, the six radiologists detectedcontours that seem to correspond to the use of differentsegmentation criteria (Fig 1d); in this case an “average”contour does not make sense as “ground truth” and a dif-ferent approach should be used. This needs further inves-tigation; however, the impact on the results of this studyis not expected to be significant because of the smallnumber of images and reduced zones where this fact wasobserved in the used data set.
Comparing ContoursThe comparison between any two contours was accom-
plished in two different ways: one based on the local dis-tances between contours and the other exploring a simi-larity measure between the image masks (binary imagescontaining the pulmonary areas defined by the contours).
The computation of distances between contours implies
defining pairs of matching points on both contours. To871

g po
SOUSA SANTOS ET AL Academic Radiology, Vol 11, No 8, August 2004
find these pairs of points we used an auxiliary contour asshown in Figure 2. Differences between the contourswere quantified using the Euclidean distances measuredbetween corresponding points (11).
Figures of MeritThe values of the computed distances between the con-
tours allow a localized and accurate quantification of theirdifferences, easily assessable through simple visualizationtechniques. However, we consider it fundamental to useglobal quality figures of merit, which facilitate a compre-hensive comparison. Thus, several figures of merit, basedon the computed distances, were used as performancemeasures:the Pratt figure of merit FPratt (23):
FPratt �1
N �i�1
N 1
1 � � � di2 (1)
the Mean Distance:
dmean �1
N �i�1
N
di (2)
the Maximum Distance:
dmax � max1�i�N
�di� (3)
and the number of distances greater than 5 pixels (ap-proximately 1% error for a resolution of 512 � 512):
n�1% ��i�1
N mi
N(4)
Figure 2. Definition of the auxiliary contoutwo contours A and B. P and Q are matchin
(where mi � 0 if di � 5 and mi � 1 if di � 5).
872
The Pratt figure of merit gives a general impression ofthe distances between contours; it is a relative measureand varies in the interval [0,1] where “1” means a com-plete match of the contours. In our case, �, which is anormalization parameter related to the size of the con-tours, was chosen to be 1/9 so that if all the distances di
are equal to 3 pixels, FPratt will have a value of 0.5. Thevalue of 3 pixels was chosen to produce a scale that al-lows enough discrimination among the contours drawn bythe radiologists.
The mean distance also gives an integrated view of thedistances between contours, while the maximum distancegives a worst case view. Finally, the number of distancesgreater than 1% (5 pixels in our case) provides informa-tion on the number of relevant errors and thus comple-ments the information obtained from the previous indexes.
Another figure of merit was computed based on thesimilarity between the two binary images, A and B, in-cluding the areas defined by the pulmonary contours. Thissimple measure of similarity may be defined by:
� � cos�1� A � B
�A� � �B�� (5)
where “.” and “� �” denote the usual inner product andnorm of vectors. In a Hilbert space context, � is the anglebetween two binary image vectors A and B.
The correct identification of the measurement scale(24) is an important issue concerning the information pro-vided by these figures of merit and the statistical methodsthat can be used. In this respect, the Pratt and � figures ofmerit are measured on an ordinal scale whereas the meanerror and the number of distances greater than 5 pixelsare measured on a ratio scale.
Statistical MethodsAs a first step in the analysis of the data obtained from
btain pairs of corresponding points onints on the contours under comparison.
r to o
the comparison among contours using all figures of merit,
Academic Radiology, Vol 11, No 8, August 2004 EVALUATION OF A SEGMENTATION ALGORITHM
we performed an exploratory data analysis (25); this anal-ysis provided an overview of the structure of the data(showing the amplitudes, asymmetries, location, possibleoutliers, etc) and also some clues to the type of statisticaltests to be used to test our hypothesis. The software usedwas Statistica (Statsoft, Tulsa, OK) (26).
Because the sample set did not correspond to indepen-dent experiments, nor did the data have a normal distribu-tion, a nonparametric test was used (27). We also usedmultivariate data analysis (28) to assess if our algorithmis generally comparable to the six human observers as acontour detector on the used image data set.
RESULTS
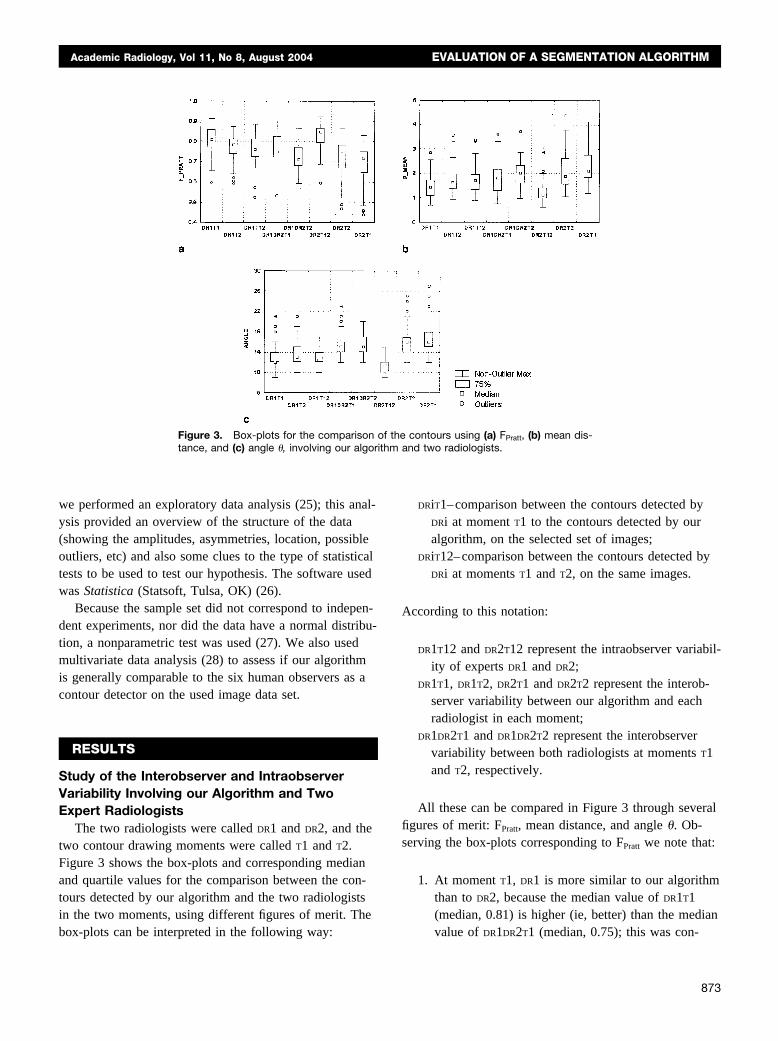
Study of the Interobserver and IntraobserverVariability Involving our Algorithm and TwoExpert Radiologists
The two radiologists were called DR1 and DR2, and thetwo contour drawing moments were called T1 and T2.Figure 3 shows the box-plots and corresponding medianand quartile values for the comparison between the con-tours detected by our algorithm and the two radiologistsin the two moments, using different figures of merit. The
Figure 3. Box-plots for the comparisontance, and (c) angle �, involving our algor
box-plots can be interpreted in the following way:
DRiT1–comparison between the contours detected byDRi at moment T1 to the contours detected by ouralgorithm, on the selected set of images;
DRiT12–comparison between the contours detected byDRi at moments T1 and T2, on the same images.
According to this notation:
DR1T12 and DR2T12 represent the intraobserver variabil-ity of experts DR1 and DR2;
DR1T1, DR1T2, DR2T1 and DR2T2 represent the interob-server variability between our algorithm and eachradiologist in each moment;
DR1DR2T1 and DR1DR2T2 represent the interobservervariability between both radiologists at moments T1and T2, respectively.
All these can be compared in Figure 3 through severalfigures of merit: FPratt, mean distance, and angle �. Ob-serving the box-plots corresponding to FPratt we note that:
1. At moment T1, DR1 is more similar to our algorithmthan to DR2, because the median value of DR1T1(median, 0.81) is higher (ie, better) than the median
contours using (a) FPratt, (b) mean dis-and two radiologists.
of theithm
value of DR1DR2T1 (median, 0.75); this was con-
873

SOUSA SANTOS ET AL Academic Radiology, Vol 11, No 8, August 2004
firmed using a nonparametric test for the equality ofthe median, the Wilcoxon test (28), which rejectedthe null hypothesis (P � .00004). Also the range ofthe values is smaller for DR1T1 than for DR1DR2T1.Both results suggest that the interobserver variabil-ity between the two radiologists is higher than thevariability between DR1 and our algorithm;
2. At moment T2, both DR1 and DR2 are more similarto our algorithm than to each other; for instance,the median value of DR1T2 (median, 0.78) is higherthan the median value of DR1DR2T2 (median, 0.70),confirmed using the Wilcoxon test (P � .00009).
3. DR1 is more similar to our algorithm than to himselfbecause the median value of DR1T1 (median, 0.81) ishigher (better) than the median value of DR1T12 (me-dian, 0.76), according to the Wilcoxon test (P �.00007). On the other hand, the median value ofDR1T2 (median, 0.78) was not considered significantlydifferent of the median value of DR1T12, according tothe Wilcoxon test (P � .4). The above results suggestthat the interobserver variability between DR1 and ouralgorithm is � the intraobserver variability of DR1.
These findings are not contradicted by the observation ofthe information obtained using the other figures of merit andwere confirmed using a nonparametric method, the Fried-man’s two-way analysis of variance (27). The calculatedH � 157.67 (with N � 60 and k � 8); under the null hy-pothesis (equality of medians), H has a �2 distribution with(k-1) degrees of freedom. In our case, for a 1% significancelevel (�), �2
(7);0.01 � 18.48; thus H � 157.67���2(7);0.01 �
18.48 (P � .000001) and the null hypothesis is rejected.Table 1 presents the sum of ranks in ascending order.
This means that the medians are in fact significantly
Table 1Friedman ANOVA for the Comparison of the Contours usingFPratt- H � 157.67, (P < .000001) and the Null Hypothesis isRejected
Variable Sum of Ranks
DR2T1 144DR1DR2T2 186DR2T2 203DR1T12 272DR1DR2T1 284DR1T2 293DR1T1 377DR2T12 401
different, which reinforces the three observations pre-
874
sented above. Moreover, these observations can be con-firmed through Table 1, where we can see, for instance,that the sum of ranks corresponding to DR1T1 and DR1T2are both higher than the sum of ranks corresponding toDR1T12 (377, 299, and 272, respectively).
Taking the observation of Table 1 further, we noticethat all (except DR2T1) variabilities between our algorithmand each radiologist are less than (at least) the interob-server variability between the two radiologists at momentT2 (DR1DR2T2).
These and other findings that can be extracted fromthese results seem to indicate that, as a detector of pulmo-nary contours on the used set of images, our algorithmbehaves as a third human observer.
Study of the Interobserver Variability ThroughDirect Comparison Among the Algorithm and SixExpert Radiologists
Let us generalize the previous comparison to six radi-ologists. DR1 . . . DR6 stand for the six radiologists and Afor the algorithm. Figure 4 shows the box-plots and corre-sponding median and quartile values for the comparisonbetween the contours detected by our algorithm and thesix radiologists in all possible combinations using FPratt
(considering that, for instance, DRi_DRj is equal to DRj_DRi,we only show one). Thus, in Figure 4, the meaning is:
A_DRi–comparison between the contours detected byour algorithm and the contours detected by DRi, on
Figure 4. Box-plots comparing contours detected by the algo-rithm (A) and all the radiologists (DR) using FPratt.
the selected set of images; it represents the interob-

Academic Radiology, Vol 11, No 8, August 2004 EVALUATION OF A SEGMENTATION ALGORITHM
server variability between our algorithm and thisradiologist;
DRi_DRj–comparison between the contours detected byDRi and the contours detected by DRj, on the selectedset of images; it represents the interobserver vari-ability between these two radiologists.
Observing Figure 4 we note that the median valuescorresponding to situations of the type A_DRi are generallyhigher and more similar among them than the ones corre-sponding to DRi_DRj.
Performing a correspondence analysis (28) and observ-ing the plane defined by the first two axis (which repre-sents approximately 46% of the total inertia), we noticethat our algorithm is clearly included in the main groupsformed by the comparisons among all the radiologists andthe algorithm. Comparisons between DR5, DR6 and DR2seem to be isolated. This could be because DR2 had justfinished his training as a radiologist and DR5 and DR6 bothwork in the same hospital (different from DR2).
Study of the Interobserver Variability Using aReference Contour
We primarily show results obtained using the Prattfigure of merit because we have concluded in previousstudies, and confirmed through this one, that the figuresof merit (except for the maximum distance) produce con-sistent results, conveying the same type of information.
As a first approach, we studied the interobserver vari-ability among all radiologists and the algorithm in aworst-case scenario. This was performed using the maxi-mum distance figure of merit and exploratory data analy-sis. Figure 5 shows the box-plots of the data resultingfrom the comparison of the contours obtained by eachdetector (humans and algorithm) to the reference contoursusing the maximum distance. On these plots we observe aconcentration of the smaller values, some outliers for alldetectors (corresponding to images that should be ana-lyzed) and median values for all detectors between 5.4and 9.9 pixels; these values can be considered low forimages of 512 � 512 pixels. Thus, even in this case allthe detectors (including our algorithm) seem to have agood performance for the used image data set.
As a second approach, we studied the variability be-tween the reference and all radiologists as well as thealgorithm using the Pratt figure of merit and exploratorydata analysis. In this study, we included the contoursdrawn by all the radiologists (DR1 to DR6) in first time,
the contours drawn by DR1 and DR2 the second time (asDR1_T2 and DR2_T2), as well as the contours obtained us-ing our algorithm (A). Observing Figure 6, which showsthe box corresponding to these data, we notice that themedian value obtained for our algorithm is quite similarto the value for radiologist DR4_T1, higher than the valuesfor radiologists DR1_T2, DR3_T1, DR5_T1, DR6_T1 andlower than the values for radiologists DR1_T1, DR2_T1,DR2_T2. This indicates that our algorithm produced, forthe used image set, contours more similar to the referencethan a significant part of the radiologists.
The above result suggested that we should further ex-plore the relation among the performance of our algo-rithm as a detector to the performance of all the radiolo-gists. Thus, we used clustering analysis (28), whichclosely associated our algorithm with DR1_T1 as shown bythe dendogram plot of Figure 7; this means that, in this
Figure 5. Box-plots corresponding to the comparison (to thereference) of the contours detected by each detector (DR1 to DR6and the algorithm ALG) using the maximum distance figure ofmerit.
Figure 6. Box-plots corresponding to the comparison (to thereference) of the contours detected by each radiologist, in thefirst time (DR1_T1 to DR6_T1), two radiologists in the second time(DR1_T2 and DR2_T2) and the algorithm (A) using FPratt.
context, our algorithm is more similar to radiologist DR1
875

SOUSA SANTOS ET AL Academic Radiology, Vol 11, No 8, August 2004
than he is to himself in different moments, namelyDR1_T1 and DR1_T2. This conclusion was already obtainedin the previous study through direct comparison amongradiologists and algorithm.
A confirmation of this result was obtained through theuse of another method of multivariate data analysis. Fig-ure 8 shows the projection on the plane defined by thefirst two axes (approximately 66% of the total inertia) ofa correspondence analysis. Observing this figure, we no-tice that our algorithm is clearly included in a group offour radiologists (DR1_T1, DR1_T2, DR3_ T1, DR4_T1), radi-ologists DR5 and DR6 form another group and DR2 is iso-lated between the two groups. Note that the same conclu-sion could be drawn from the dendogram of Figure 7.This could be related, as observed in the previous study,to the facts that radiologists DR5 and DR6 work in thesame department, (different from the others) and perhapsuse different segmentation criteria, radiologist DR2 hasjust finished his training as a radiologist and all the othershave a much larger experience. To obtain a global aver-age view of the distance between detected contours andthe reference, we used the mean-distance figure of meritand angle �, and we obtained a confirmation of the resultspreviously found through the Pratt figure of merit (20).
CONCLUSIONS
In this article we propose a methodology to the quanti-tative evaluation of the performance of a pulmonary con-tour segmentation algorithm involving the study of inter-observer and intraobserver variability.
Making accurate, unbiased estimates or comparisons of
Figure 7. Dendogram plot (clustering analysis) showing all theradiologists in the first time (DR1_T1 to DR6_T1), two radiologists inthe second time (DR1_T2 and DR2_T2), and the algorithm (A) usingFPratt.
performance is, in general, a very difficult task. However,
876
some guidelines are known to facilitate it (13,22,29). Forour case, we considered the following guidelines useful:
• Report results on common test datasets;• Use test datasets different from those used to train the
segmentation method;• Use an adequate methodology to choose the test data-
sets and clearly state it (eg, the inclusion and exclusioncriteria and the determination of the sample size);
• Choose carefully and define clearly the observers andmethods used to obtain the ground-truth;
• Let the observers operate in the same conditions;• Clearly specify the performance metric (figures of
merit) used;• Correctly identify the measurement scales, which deter-
mine the kind of statistical methods that could be used;• Choose hypothesis tests compatible with the quality
indexes used and clearly justify it (as the chosen � and� and if the test is one- or two-tailed);
• Use nonparametric tests if the data is categorical, thestatistical distribution of the data is unknown (orknown and not suitable for parametric methods) or thesample size is small;
• Use paired test if possible (if all the methods can beapplied to the same image).
We present results concerning the interobserver vari-ability among six radiologists and the algorithm, usingtwo different approaches:
Through the direct comparison of the contours detectedby this algorithm to the contours hand-drawn by sixradiologists;
Through a comparison to a reference contour (obtainedfrom the hand-drawn contours) used as a surrogateground truth.
This last approach is easier to generalize to a greaternumber of radiologists; however, it is necessary to furtherinvestigate what is the most correct way of computing thereference contour when radiologists use different segmen-tation criteria.
All the comparisons were made using several figuresof merit. While the Pratt figure of merit, the mean dis-tance, and the angle � produced consistent results convey-ing the same type of information, an integrated view ofthe distances between contours, maximum distance is use-
ful for worst-case scenarios.
Academic Radiology, Vol 11, No 8, August 2004 EVALUATION OF A SEGMENTATION ALGORITHM
We also assessed the intraobserver variability of tworadiologists to have a measure of the level of interob-server variability that is expected and has to be accepted.
We believe this methodology is general enough to beapplicable to many other problems of segmentation onmedical images, in spite of the fact that it was developedfor this specific application.
Concerning the performance of our segmentation algo-rithm, the results presented allow us to conclude that it ispossibly as good a lung contour detector, in most thoracicCT images with diagnostic value, as any of the six radiol-ogists. This assertion is mainly based on the fact that itexhibits a greater “agreement” to any of the radiologiststhan the radiologists among them, in the used image set.This is true, with a few exceptions, for images with com-plex vascular patterns crossing the interface between themediastinic and pulmonary fields.
ACKNOWLEDGMENT
The authors express their gratitude to the followingradiologists for drawing contours: Dr Pedro Agostinhofrom University Hospital of Coimbra, Dr Rui Pinho eMelo and Dr Jorge Pinho e Melo from CENTAC–Centerof Computed Tomography, Aveiro; Dr Anabela Fidalgoand Dr Fernando Figueiredo from the Imagiology Depart-ment at the Hospital Infante D. Pedro, Aveiro. The au-thors are also grateful to an anonymous reviewer for his
Figure 8. Correspondence analysis plot(DR1_T1 to DR6_T1), two radiologists in thealgorithm (ALG) using FPratt.
pertinent comments and suggestions.
REFERENCES
1. Robb WL. Perspective on the first 10 years of the CT scanner indus-try. Acad Radiol 2003; 10:756–760.
2. Brink J, Heiken JP, Wang G, McEnery KW, Schlueter FJ, Vannier MW.Helical CT: principles and technical considerations. Radiographics1994; 14:887–893.
3. Li B, Christensen G, Hoffmann E, McLeannan G, Reinhardt J. Estab-lishing a normative atlas of the human lung: intersubject warping andregistration of volumetric CT images. Acad Radiol 2003; 10:255–265.
4. Brown MS, McNitt-Gray MF, Mankovich NJ, et al. Method for seg-mentation chest CT image data using an anatomical model: prelimi-nary results. IEEE Trans Med Imaging 1997; 16:828–839.
5. Sonka M, Park W, Hoffman EA. Rule-based detection of intrathoracicairways trees. IEEE Trans Med Imaging 1996; 15:314–326.
6. Duryea J, Boone JM. A fully automated algorithm for the segmentationof lung fields on digital chest radiographic images. Med Phys 1995;22:183–191.
7. Parker RP. Measurement of basic CT data. In: Moores BM, Parker RP,Pullan BR, eds. Proceedings of physical aspects of medical imaging.Manchester, UK: Wiley & Sons, 1980; 291–295.
8. Hu S, Hoffman EA, Reinhardt JM. Automatic lung segmentation foraccurate quantization of volume x-ray CT images. IEEE Trans Med Im-aging 2001; 20:490–498.
9. Hasegawa A, Lo S-CB, Lin J-S, Freedman MT, Mun SK. A shift-invari-ant neural network for the lung field segmentation in chest radiogra-phy. J VLSI Signal Process 1998; 18:241–250.
10. Silva JS, Silva A, Santos BS. Lung segmentation methods in x-ray CTimages. In: Proceedings of V Ibero-American Symposium On PatternRecognition-SIARP’2000. Lisbon, Portugal: APRP—Portuguese Asso-ciation for Pattern Recognition; 2000, 583–598.
11. Silva A, Silva JS, Santos BS, Ferreira C. Fast pulmonary contour ex-traction in x-ray CT images: a methodology and quality assessment.In: Chen C-T, Clough AV, eds. SPIE-Medical Imaging 2001: Physiol-ogy and Function from Multidimensional Images. Bellingham, WA:SPIE, 2001;4321:216–224.
12. Chalana V, Kim Y. A methodology for evaluation of boundary detec-tion algorithms on medical images. IEEE Trans Pattern Anal MachineIntell 1997; 16:642–652.
13. Bowyer KW. Validation of medical image analysis techniques. In: Fitz-
ing all the radiologists in the first timend time (DR1_T2 and DR2_T2), and the
showseco
patrick J, Sonka M, eds. Handbook of medical imaging. Vol 2. Medical
877

SOUSA SANTOS ET AL Academic Radiology, Vol 11, No 8, August 2004
image processing and analysis (cap. X). Bellingham, WA: SPIE-TheInternational Society for Optical Engineering, 1999; 567–606.
14. Blake A, Isard M. Active contours. London: Springer Verlag, 1998.15. Gunn SR, Nixon MS. A robust snake implementation; a dual active
contour. IEEE Trans Pattern Anal Machine Intell 1997; 19:63–68.16. Kass M, Witkin A, Terzopoulos D. Snakes: active contour models. Int
J Comput Vision 1988; 1:321–331.17. Liang J, McInerney T, Terzopoulos D. United snakes. In: International
Conference of Computer Vision—Volume 2, September 20-25,Kerkyra, Greece, 1999; 933–940.
18. Yezzi A, Kichenassamy S, Kumar A, Olver P, Tannenbaum A. A geo-metric snake model for segmentation of medical imagery. IEEE TransMed Imaging 1997; 16:199–209.
19. Sivaramakrishna R, Obuchowski N, Chilcote W, Powell K. Automatic seg-mentation of mammographic density. Acad Radiol 2001; 8:250–256.
20. Ferreira C, Santos BS, Silva JS, Silva A. Comparison of a segmenta-tion algorithm to six expert imagiologists in detecting pulmonary con-tours on x-ray CT images. In: SPIE Medical Imaging 2003: Image Per-ception, Observer Performance and Technology Assessment. Belling-ham, WA: SPIE, 2003; 347–358.
21. Wagner R, Beiden S, Campbell G, Metz C, Sacks W. Contemporary
issues for experimental design in assessment of medical imaging and878
computer-assist systems. In: SPIE Medical Imaging 2003: Image Per-ception, Observer Performance and Technology Assessment. Belling-ham, WA: SPIE, 2003; 5034:213–224.
22. Altman DG. Practical statistics for medical research: London, UK:CRC Press; 1999.
23. Abdou IE, Pratt WK. Quantitative design and evaluation of enhance-ment/thresholding edge detectors. Proceedings IEEE 1979; 67:753–763.
24. Sachs L. Applied statistics-a handbook of techniques. New York, NY:Springer-Verlag, 1984.
25. Hoaglin D, Mosteller F, Tukey J. Understanding robust and exploratorydata analysis. Wiley & Sons, 1983.
26. Statsoft. Statistica-release 5.5 for Windows. Statsoft Inc, 1999.27. Gibbons JD. Nonparametric methods for quantitative analysis. Syra-
cuse, NY: American Sciences Press, 1997.28. Hair JF, Anderson RE, Tatham RL, Black WC. Multivariate data analy-
sis with readings. Upper Saddle River, NJ: Prentice-Hall, 1995.29. Buvat I, et al. The need to develop guidelines for the evaluation of
medical image processing procedures. In: Hanson KM, ed. SPIE-Med-ical Imaging 1999: Image Processing. Bellingham, WA: SPIE, 1999;
1466–1477.


