Embed Size (px)
Citation preview
Method for Cortical Bone Structural Analysis FromMagnetic Resonance Images1
Bryon R. Gomberg, PhD2, Punam K. Saha, PhD, Felix W. Wehrli, PhD
Rationale and Objectives. Quantitative evaluation of cortical bone architecture as a means to assess bone strength typi-cally is accomplished on the basis of images obtained by means of dual-energy X-ray absorptiometry (DXA) or computedtomography. Magnetic resonance (MR) imaging has potential advantages for this task in that it allows imaging in arbitraryscan planes at high spatial resolution. However, several hurdles have to be overcome to make this approach practical, in-cluding resolution of issues related to nonlinear receive coil sensitivity, variations in marrow composition, and the pres-ence of periosteal isointense tissues, which all complicate segmentation. The aim of this study is to develop MR acquisi-tion and analysis methods optimized for the detection of cortical boundaries in such complex geometries as the femoral neck.
Materials and Methods. Cortical boundary detection is achieved by radially tracing intensity profiles that intersect theperiosteal and endosteal boundaries of bone. Profiles subsequently are normalized to the intensity of the marrow signal,processed with morphologic image operators, and binarized. The resulting boundaries are mapped back onto the spatialimage, and erroneous boundary points are removed. From the detected cortical boundaries, cortical cross-sectional areaand thickness are computed. The method was evaluated on cortical bone specimens and human volunteers on the basis ofhigh-resolution images acquired at a 1.5-Tesla field strength. To assess whether the method is sensitive to detect the ex-pected dependencies of cortical parameters in weight-bearing bone on overall habitus, 10 women aged 46–73 years (meanage, 56 years) underwent the cortical imaging protocol in the proximal femur, and results were compared with DXA bonemineral density parameters of the hip and spine.
Results. Reproducibility was approximately 2%. Double oblique images of the femoral neck in the 10 women studiedshowed that cortical cross-sectional area correlated strongly with height (r � 0.88; p � .0008), whereas cortical diameterversus age approached significance (r � 0.61; p � .06). Measurements in specimens of some cortical parameters indicatedresolution dependence. However, note that specimen ranking within each parameter remained constant across all resolu-tions studied.
Conclusion. Data suggest the new method to be robust and applicable on standard clinical MR scanners at arbitrary ana-tomic locations to yield clinically meaningful quantitative results.
Key Words. Cortical bone; computer-aided measurement; magnetic resonance imaging; osteoporosis.
© AUR, 2005
Acad Radiol 2005; 12:1320–13321 From the Department of Radiology, Laboratory for Structural NMR Imag-ing, University of Pennsylvania Medical Center, 3400 Spruce Street, Phila-delphia, Pennsylvania 19104. Received May 12, 2005; Accepted June 27.Address correspondence to: F.W.W. e-mail: [email protected]
This research was supported in part by grants no. T32 CA 74781, RO1 AR41443, RO1 40671, and R21 AR 47112 from The National Institutes ofHealth.2 Current address: Hadassah Medical Organization, Radiology Institute,POB 12000, Jerusalem, Israel 91120.
© AUR, 2005doi:10.1016/j.acra.2005.06.012
1320
In age-related and postmenopausal osteoporosis, bone lossleads to both trabecular bone atrophy and cortical thin-ning (1–3). This effect is compensated partially by anincrease in cortical diameter (4), thus increasing torsionalstiffness while reducing buckling resistance (5). Recentdata suggest that weakened cortical bone primarily maybe responsible for intracapsular hip fracture (6), thus em-phasizing the importance of quantitatively assessing andmonitoring cortical structure. Support for the role of corti-
cal bone architecture as a risk factor for hip fracture is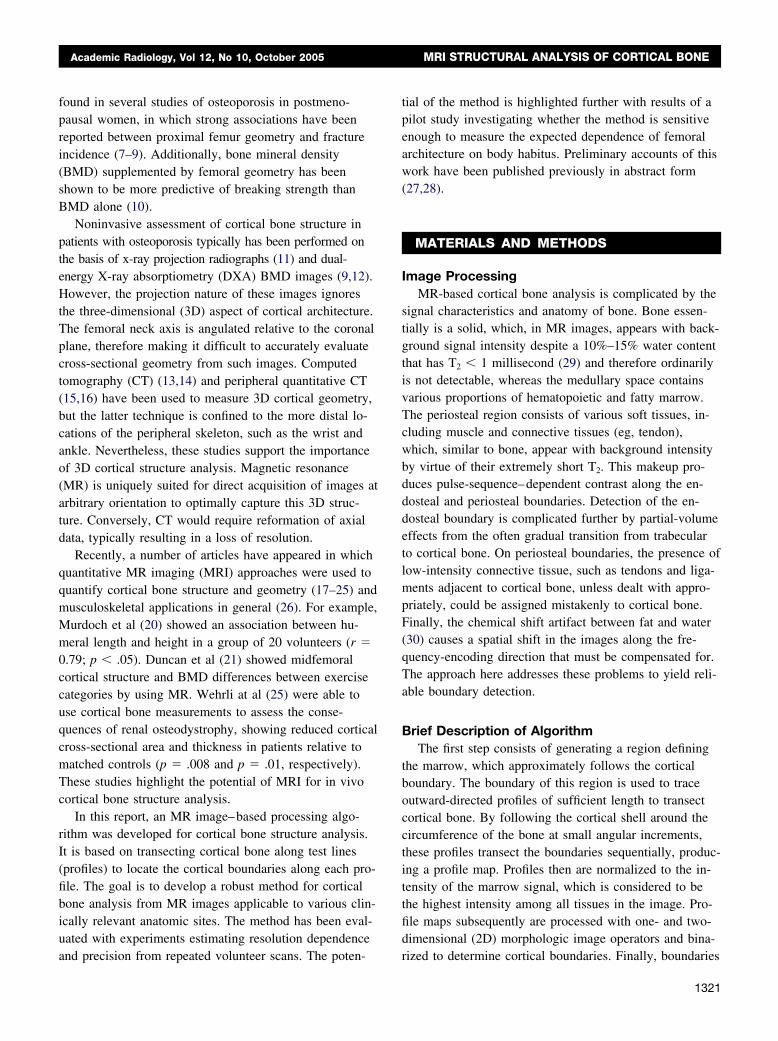
Academic Radiology, Vol 12, No 10, October 2005 MRI STRUCTURAL ANALYSIS OF CORTICAL BONE
found in several studies of osteoporosis in postmeno-pausal women, in which strong associations have beenreported between proximal femur geometry and fractureincidence (7–9). Additionally, bone mineral density(BMD) supplemented by femoral geometry has beenshown to be more predictive of breaking strength thanBMD alone (10).
Noninvasive assessment of cortical bone structure inpatients with osteoporosis typically has been performed onthe basis of x-ray projection radiographs (11) and dual-energy X-ray absorptiometry (DXA) BMD images (9,12).However, the projection nature of these images ignoresthe three-dimensional (3D) aspect of cortical architecture.The femoral neck axis is angulated relative to the coronalplane, therefore making it difficult to accurately evaluatecross-sectional geometry from such images. Computedtomography (CT) (13,14) and peripheral quantitative CT(15,16) have been used to measure 3D cortical geometry,but the latter technique is confined to the more distal lo-cations of the peripheral skeleton, such as the wrist andankle. Nevertheless, these studies support the importanceof 3D cortical structure analysis. Magnetic resonance(MR) is uniquely suited for direct acquisition of images atarbitrary orientation to optimally capture this 3D struc-ture. Conversely, CT would require reformation of axialdata, typically resulting in a loss of resolution.
Recently, a number of articles have appeared in whichquantitative MR imaging (MRI) approaches were used toquantify cortical bone structure and geometry (17–25) andmusculoskeletal applications in general (26). For example,Murdoch et al (20) showed an association between hu-meral length and height in a group of 20 volunteers (r �0.79; p � .05). Duncan et al (21) showed midfemoralcortical structure and BMD differences between exercisecategories by using MR. Wehrli at al (25) were able touse cortical bone measurements to assess the conse-quences of renal osteodystrophy, showing reduced corticalcross-sectional area and thickness in patients relative tomatched controls (p � .008 and p � .01, respectively).These studies highlight the potential of MRI for in vivocortical bone structure analysis.
In this report, an MR image–based processing algo-rithm was developed for cortical bone structure analysis.It is based on transecting cortical bone along test lines(profiles) to locate the cortical boundaries along each pro-file. The goal is to develop a robust method for corticalbone analysis from MR images applicable to various clin-ically relevant anatomic sites. The method has been eval-uated with experiments estimating resolution dependence
and precision from repeated volunteer scans. The poten-tial of the method is highlighted further with results of apilot study investigating whether the method is sensitiveenough to measure the expected dependence of femoralarchitecture on body habitus. Preliminary accounts of thiswork have been published previously in abstract form(27,28).
MATERIALS AND METHODS
Image ProcessingMR-based cortical bone analysis is complicated by the
signal characteristics and anatomy of bone. Bone essen-tially is a solid, which, in MR images, appears with back-ground signal intensity despite a 10%–15% water contentthat has T2 � 1 millisecond (29) and therefore ordinarilyis not detectable, whereas the medullary space containsvarious proportions of hematopoietic and fatty marrow.The periosteal region consists of various soft tissues, in-cluding muscle and connective tissues (eg, tendon),which, similar to bone, appear with background intensityby virtue of their extremely short T2. This makeup pro-duces pulse-sequence–dependent contrast along the en-dosteal and periosteal boundaries. Detection of the en-dosteal boundary is complicated further by partial-volumeeffects from the often gradual transition from trabecularto cortical bone. On periosteal boundaries, the presence oflow-intensity connective tissue, such as tendons and liga-ments adjacent to cortical bone, unless dealt with appro-priately, could be assigned mistakenly to cortical bone.Finally, the chemical shift artifact between fat and water(30) causes a spatial shift in the images along the fre-quency-encoding direction that must be compensated for.The approach here addresses these problems to yield reli-able boundary detection.
Brief Description of AlgorithmThe first step consists of generating a region defining
the marrow, which approximately follows the corticalboundary. The boundary of this region is used to traceoutward-directed profiles of sufficient length to transectcortical bone. By following the cortical shell around thecircumference of the bone at small angular increments,these profiles transect the boundaries sequentially, produc-ing a profile map. Profiles then are normalized to the in-tensity of the marrow signal, which is considered to bethe highest intensity among all tissues in the image. Pro-file maps subsequently are processed with one- and two-dimensional (2D) morphologic image operators and bina-
rized to determine cortical boundaries. Finally, boundaries1321
s acq
GOMBERG ET AL Academic Radiology, Vol 12, No 10, October 2005
are mapped back onto the spatial image, and erroneousboundary points are removed. From the detected corticalboundaries, cortical cross-sectional area and thickness arecomputed.
Marrow Region DetectionTo accurately locate profiles that transect cortical bone,
an approximate estimate of the marrow region is gener-ated. This marrow region then serves as the basis for se-lecting the starting locations for profile extension. At suchlocations as the tibial midshaft, cortical bone is thickenough that a simple 3D region-growing technique canaccurately isolate the marrow region. Toward this goal, aseed point is selected manually, and neighboring intensi-ties are used to determine marrow intensity mean and SD.To decrease noise in the image, an 11-voxel square me-dian filter is applied, a size small enough to not span thecortical shell. Region growing proceeds from an arbi-trarily selected central seed point to include all connectedvoxels at an intensity range of within �2 SD of the mar-row average. Typically, a 95% confidence interval is used(�2.6 SD), but for this application, the marrow regionshould be slightly smaller than the endosteal surface;therefore, �2 SD was found to give better results.
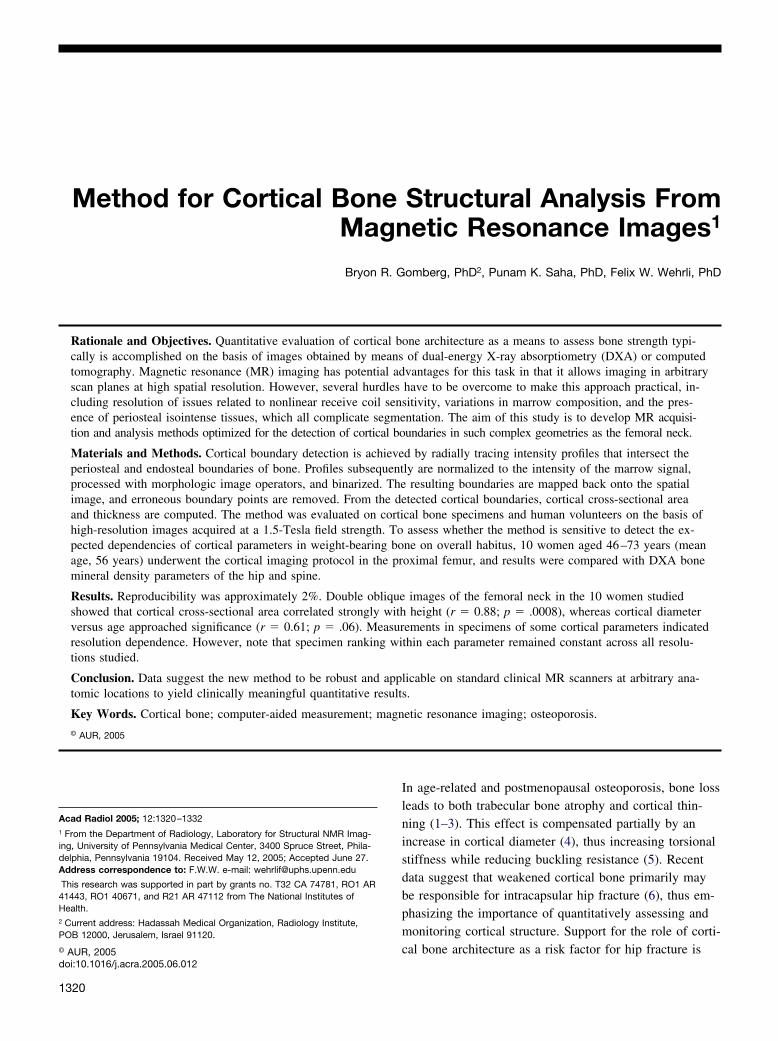
At locations rich in trabecular bone (eg, the distaltibia), the cortical shell is thinner and the use of surfacecoils leads to intensity shading, thus requiring a modifiedprocessing algorithm. In these cases, image intensities arefirst normalized to eliminate low-frequency intensity gra-dients (Figure 1a). Assuming that fatty marrow voxels
Figure 1. (a) Unprocessed MR image of the distal tibia (137 � 1intensity normalization. Notice the strong shading effect in image
have the highest intensity and these tissues are distributed
1322
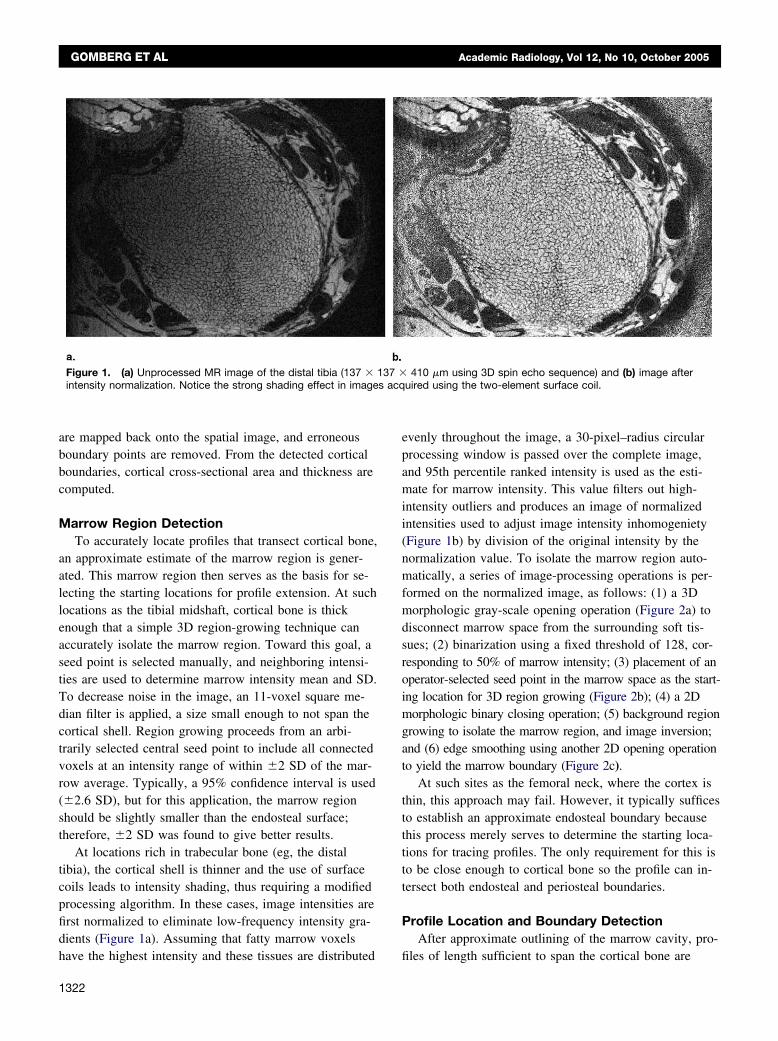
evenly throughout the image, a 30-pixel–radius circularprocessing window is passed over the complete image,and 95th percentile ranked intensity is used as the esti-mate for marrow intensity. This value filters out high-intensity outliers and produces an image of normalizedintensities used to adjust image intensity inhomogeniety(Figure 1b) by division of the original intensity by thenormalization value. To isolate the marrow region auto-matically, a series of image-processing operations is per-formed on the normalized image, as follows: (1) a 3Dmorphologic gray-scale opening operation (Figure 2a) todisconnect marrow space from the surrounding soft tis-sues; (2) binarization using a fixed threshold of 128, cor-responding to 50% of marrow intensity; (3) placement of anoperator-selected seed point in the marrow space as the start-ing location for 3D region growing (Figure 2b); (4) a 2Dmorphologic binary closing operation; (5) background regiongrowing to isolate the marrow region, and image inversion;and (6) edge smoothing using another 2D opening operationto yield the marrow boundary (Figure 2c).
At such sites as the femoral neck, where the cortex isthin, this approach may fail. However, it typically sufficesto establish an approximate endosteal boundary becausethis process merely serves to determine the starting loca-tions for tracing profiles. The only requirement for this isto be close enough to cortical bone so the profile can in-tersect both endosteal and periosteal boundaries.
Profile Location and Boundary DetectionAfter approximate outlining of the marrow cavity, pro-
410 �m using 3D spin echo sequence) and (b) image afteruired using the two-element surface coil.
37 �
files of length sufficient to span the cortical bone are
Academic Radiology, Vol 12, No 10, October 2005 MRI STRUCTURAL ANALYSIS OF CORTICAL BONE
specified (Figure 3). Intensities along each profile are sub-sequently arranged consecutively in an array (profile posi-tion vs profile number) for detection of endosteal andperiosteal boundaries. Toward this goal, the marrow re-gion first is eroded morphologically by approximately one
Figure 2. Sequence of automated operations to determine the mtion separating marrow space from surrounding soft tissues, (b) mtected boundary on original image.
quarter of the profile length to separate the starting loca-
tions of the profiles from the endosteal boundary. Theregion border is detected by subtracting the same regionmorphologically eroded by one voxel, and the orientationof the boundary is determined at each location by least-squares fitting the five neighboring boundary locations to
w region (distal tibial metaphysis): (a) gray-scale opening opera-w space selected by 3D region growing, and (c) overlay of de-
arroarro
a straight line. Profiles then are extended from the bound-
1323
GOMBERG ET AL Academic Radiology, Vol 12, No 10, October 2005
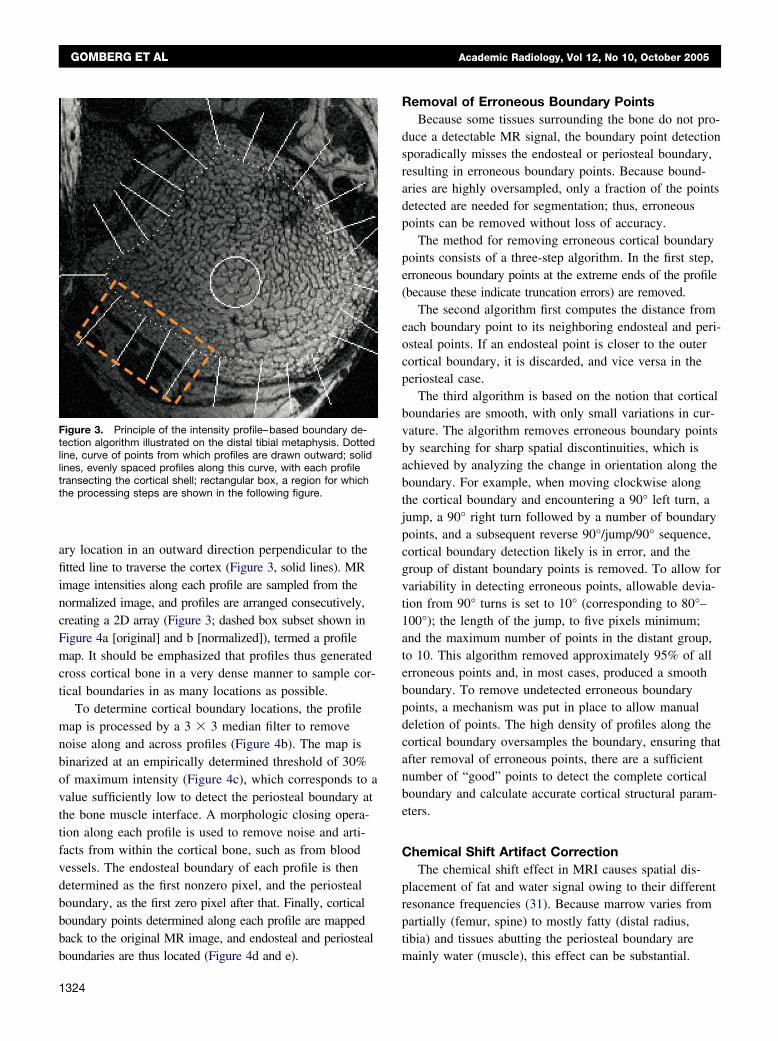
ary location in an outward direction perpendicular to thefitted line to traverse the cortex (Figure 3, solid lines). MRimage intensities along each profile are sampled from thenormalized image, and profiles are arranged consecutively,creating a 2D array (Figure 3; dashed box subset shown inFigure 4a [original] and b [normalized]), termed a profilemap. It should be emphasized that profiles thus generatedcross cortical bone in a very dense manner to sample cor-tical boundaries in as many locations as possible.
To determine cortical boundary locations, the profilemap is processed by a 3 � 3 median filter to removenoise along and across profiles (Figure 4b). The map isbinarized at an empirically determined threshold of 30%of maximum intensity (Figure 4c), which corresponds to avalue sufficiently low to detect the periosteal boundary atthe bone muscle interface. A morphologic closing opera-tion along each profile is used to remove noise and arti-facts from within the cortical bone, such as from bloodvessels. The endosteal boundary of each profile is thendetermined as the first nonzero pixel, and the periostealboundary, as the first zero pixel after that. Finally, corticalboundary points determined along each profile are mappedback to the original MR image, and endosteal and periosteal
Figure 3. Principle of the intensity profile–based boundary de-tection algorithm illustrated on the distal tibial metaphysis. Dottedline, curve of points from which profiles are drawn outward; solidlines, evenly spaced profiles along this curve, with each profiletransecting the cortical shell; rectangular box, a region for whichthe processing steps are shown in the following figure.
boundaries are thus located (Figure 4d and e).
1324
Removal of Erroneous Boundary PointsBecause some tissues surrounding the bone do not pro-
duce a detectable MR signal, the boundary point detectionsporadically misses the endosteal or periosteal boundary,resulting in erroneous boundary points. Because bound-aries are highly oversampled, only a fraction of the pointsdetected are needed for segmentation; thus, erroneouspoints can be removed without loss of accuracy.
The method for removing erroneous cortical boundarypoints consists of a three-step algorithm. In the first step,erroneous boundary points at the extreme ends of the profile(because these indicate truncation errors) are removed.
The second algorithm first computes the distance fromeach boundary point to its neighboring endosteal and peri-osteal points. If an endosteal point is closer to the outercortical boundary, it is discarded, and vice versa in theperiosteal case.
The third algorithm is based on the notion that corticalboundaries are smooth, with only small variations in cur-vature. The algorithm removes erroneous boundary pointsby searching for sharp spatial discontinuities, which isachieved by analyzing the change in orientation along theboundary. For example, when moving clockwise alongthe cortical boundary and encountering a 90° left turn, ajump, a 90° right turn followed by a number of boundarypoints, and a subsequent reverse 90°/jump/90° sequence,cortical boundary detection likely is in error, and thegroup of distant boundary points is removed. To allow forvariability in detecting erroneous points, allowable devia-tion from 90° turns is set to 10° (corresponding to 80°–100°); the length of the jump, to five pixels minimum;and the maximum number of points in the distant group,to 10. This algorithm removed approximately 95% of allerroneous points and, in most cases, produced a smoothboundary. To remove undetected erroneous boundarypoints, a mechanism was put in place to allow manualdeletion of points. The high density of profiles along thecortical boundary oversamples the boundary, ensuring thatafter removal of erroneous points, there are a sufficientnumber of “good” points to detect the complete corticalboundary and calculate accurate cortical structural param-eters.
Chemical Shift Artifact CorrectionThe chemical shift effect in MRI causes spatial dis-
placement of fat and water signal owing to their differentresonance frequencies (31). Because marrow varies frompartially (femur, spine) to mostly fatty (distal radius,tibia) and tissues abutting the periosteal boundary are
mainly water (muscle), this effect can be substantial.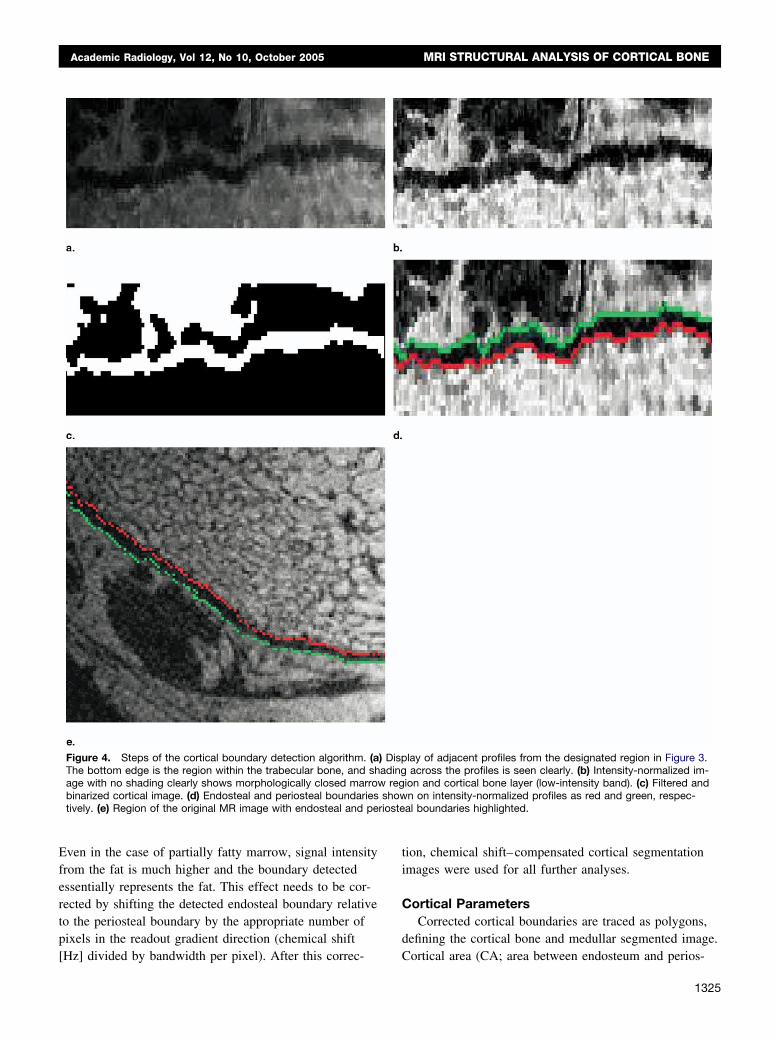
rioste
Academic Radiology, Vol 12, No 10, October 2005 MRI STRUCTURAL ANALYSIS OF CORTICAL BONE
Even in the case of partially fatty marrow, signal intensityfrom the fat is much higher and the boundary detectedessentially represents the fat. This effect needs to be cor-rected by shifting the detected endosteal boundary relativeto the periosteal boundary by the appropriate number ofpixels in the readout gradient direction (chemical shift
Figure 4. Steps of the cortical boundary detection algorithm. (aThe bottom edge is the region within the trabecular bone, and shage with no shading clearly shows morphologically closed marrowbinarized cortical image. (d) Endosteal and periosteal boundariestively. (e) Region of the original MR image with endosteal and pe
[Hz] divided by bandwidth per pixel). After this correc-
tion, chemical shift–compensated cortical segmentationimages were used for all further analyses.
Cortical ParametersCorrected cortical boundaries are traced as polygons,
defining the cortical bone and medullar segmented image.
lay of adjacent profiles from the designated region in Figure 3.across the profiles is seen clearly. (b) Intensity-normalized im-
ion and cortical bone layer (low-intensity band). (c) Filtered andn on intensity-normalized profiles as red and green, respec-al boundaries highlighted.
) Dispading
regshow
Cortical area (CA; area between endosteum and perios-
1325
GOMBERG ET AL Academic Radiology, Vol 12, No 10, October 2005
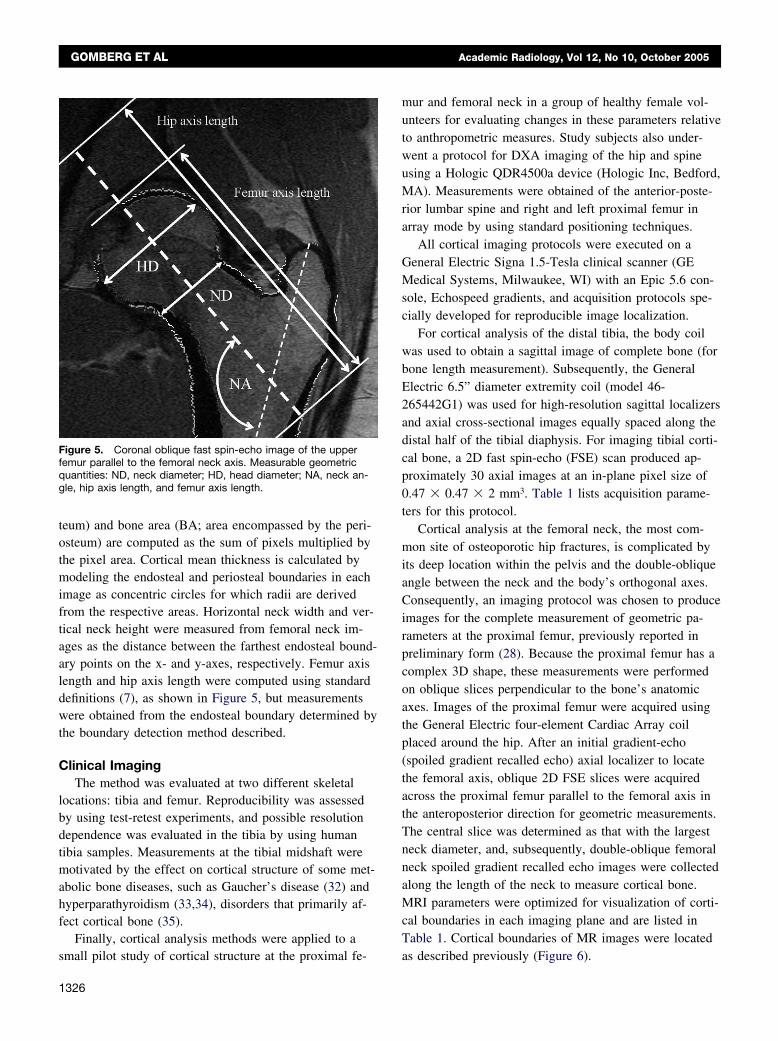
teum) and bone area (BA; area encompassed by the peri-osteum) are computed as the sum of pixels multiplied bythe pixel area. Cortical mean thickness is calculated bymodeling the endosteal and periosteal boundaries in eachimage as concentric circles for which radii are derivedfrom the respective areas. Horizontal neck width and ver-tical neck height were measured from femoral neck im-ages as the distance between the farthest endosteal bound-ary points on the x- and y-axes, respectively. Femur axislength and hip axis length were computed using standarddefinitions (7), as shown in Figure 5, but measurementswere obtained from the endosteal boundary determined bythe boundary detection method described.
Clinical ImagingThe method was evaluated at two different skeletal
locations: tibia and femur. Reproducibility was assessedby using test-retest experiments, and possible resolutiondependence was evaluated in the tibia by using humantibia samples. Measurements at the tibial midshaft weremotivated by the effect on cortical structure of some met-abolic bone diseases, such as Gaucher’s disease (32) andhyperparathyroidism (33,34), disorders that primarily af-fect cortical bone (35).
Finally, cortical analysis methods were applied to a
Figure 5. Coronal oblique fast spin-echo image of the upperfemur parallel to the femoral neck axis. Measurable geometricquantities: ND, neck diameter; HD, head diameter; NA, neck an-gle, hip axis length, and femur axis length.
small pilot study of cortical structure at the proximal fe-
1326
mur and femoral neck in a group of healthy female vol-unteers for evaluating changes in these parameters relativeto anthropometric measures. Study subjects also under-went a protocol for DXA imaging of the hip and spineusing a Hologic QDR4500a device (Hologic Inc, Bedford,MA). Measurements were obtained of the anterior-poste-rior lumbar spine and right and left proximal femur inarray mode by using standard positioning techniques.
All cortical imaging protocols were executed on aGeneral Electric Signa 1.5-Tesla clinical scanner (GEMedical Systems, Milwaukee, WI) with an Epic 5.6 con-sole, Echospeed gradients, and acquisition protocols spe-cially developed for reproducible image localization.
For cortical analysis of the distal tibia, the body coilwas used to obtain a sagittal image of complete bone (forbone length measurement). Subsequently, the GeneralElectric 6.5” diameter extremity coil (model 46-265442G1) was used for high-resolution sagittal localizersand axial cross-sectional images equally spaced along thedistal half of the tibial diaphysis. For imaging tibial corti-cal bone, a 2D fast spin-echo (FSE) scan produced ap-proximately 30 axial images at an in-plane pixel size of0.47 � 0.47 � 2 mm3. Table 1 lists acquisition parame-ters for this protocol.
Cortical analysis at the femoral neck, the most com-mon site of osteoporotic hip fractures, is complicated byits deep location within the pelvis and the double-obliqueangle between the neck and the body’s orthogonal axes.Consequently, an imaging protocol was chosen to produceimages for the complete measurement of geometric pa-rameters at the proximal femur, previously reported inpreliminary form (28). Because the proximal femur has acomplex 3D shape, these measurements were performedon oblique slices perpendicular to the bone’s anatomicaxes. Images of the proximal femur were acquired usingthe General Electric four-element Cardiac Array coilplaced around the hip. After an initial gradient-echo(spoiled gradient recalled echo) axial localizer to locatethe femoral axis, oblique 2D FSE slices were acquiredacross the proximal femur parallel to the femoral axis inthe anteroposterior direction for geometric measurements.The central slice was determined as that with the largestneck diameter, and, subsequently, double-oblique femoralneck spoiled gradient recalled echo images were collectedalong the length of the neck to measure cortical bone.MRI parameters were optimized for visualization of corti-cal boundaries in each imaging plane and are listed inTable 1. Cortical boundaries of MR images were located
as described previously (Figure 6).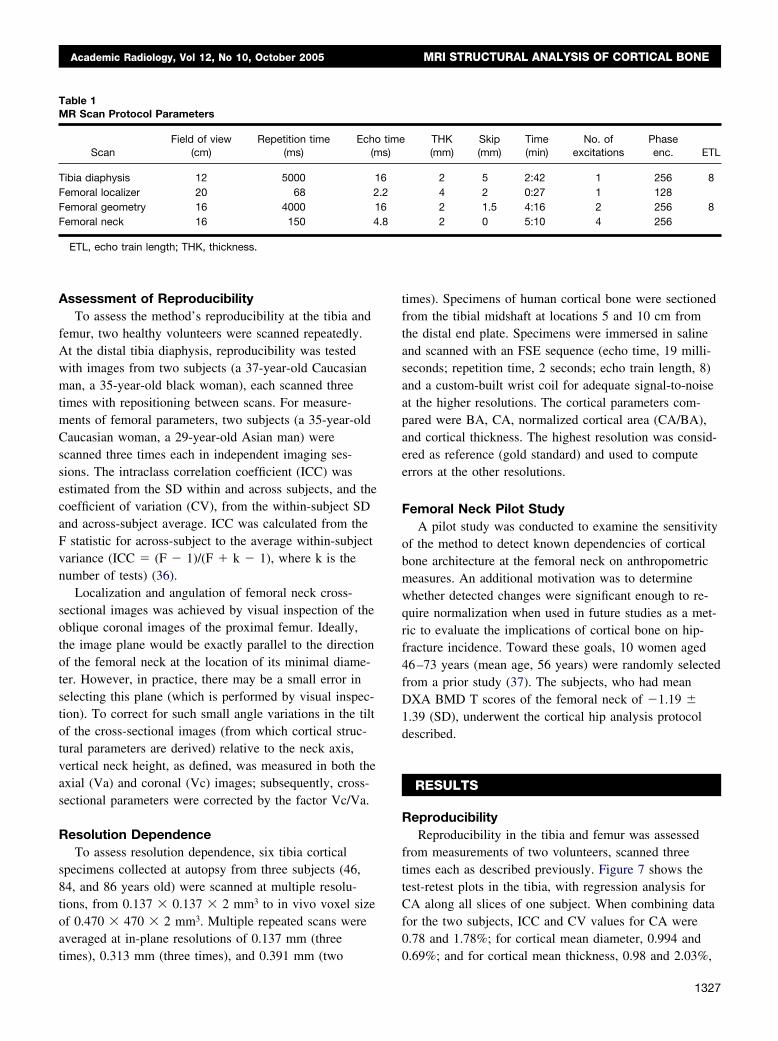
Academic Radiology, Vol 12, No 10, October 2005 MRI STRUCTURAL ANALYSIS OF CORTICAL BONE
Assessment of ReproducibilityTo assess the method’s reproducibility at the tibia and
femur, two healthy volunteers were scanned repeatedly.At the distal tibia diaphysis, reproducibility was testedwith images from two subjects (a 37-year-old Caucasianman, a 35-year-old black woman), each scanned threetimes with repositioning between scans. For measure-ments of femoral parameters, two subjects (a 35-year-oldCaucasian woman, a 29-year-old Asian man) werescanned three times each in independent imaging ses-sions. The intraclass correlation coefficient (ICC) wasestimated from the SD within and across subjects, and thecoefficient of variation (CV), from the within-subject SDand across-subject average. ICC was calculated from theF statistic for across-subject to the average within-subjectvariance (ICC � (F � 1)/(F � k � 1), where k is thenumber of tests) (36).
Localization and angulation of femoral neck cross-sectional images was achieved by visual inspection of theoblique coronal images of the proximal femur. Ideally,the image plane would be exactly parallel to the directionof the femoral neck at the location of its minimal diame-ter. However, in practice, there may be a small error inselecting this plane (which is performed by visual inspec-tion). To correct for such small angle variations in the tiltof the cross-sectional images (from which cortical struc-tural parameters are derived) relative to the neck axis,vertical neck height, as defined, was measured in both theaxial (Va) and coronal (Vc) images; subsequently, cross-sectional parameters were corrected by the factor Vc/Va.
Resolution DependenceTo assess resolution dependence, six tibia cortical
specimens collected at autopsy from three subjects (46,84, and 86 years old) were scanned at multiple resolu-tions, from 0.137 � 0.137 � 2 mm3 to in vivo voxel sizeof 0.470 � 470 � 2 mm3. Multiple repeated scans wereaveraged at in-plane resolutions of 0.137 mm (three
Table 1MR Scan Protocol Parameters
ScanField of view
(cm)Repetition time
(ms)Echo
(m
Tibia diaphysis 12 5000 1Femoral localizer 20 68 2Femoral geometry 16 4000 1Femoral neck 16 150 4
ETL, echo train length; THK, thickness.
times), 0.313 mm (three times), and 0.391 mm (two
times). Specimens of human cortical bone were sectionedfrom the tibial midshaft at locations 5 and 10 cm fromthe distal end plate. Specimens were immersed in salineand scanned with an FSE sequence (echo time, 19 milli-seconds; repetition time, 2 seconds; echo train length, 8)and a custom-built wrist coil for adequate signal-to-noiseat the higher resolutions. The cortical parameters com-pared were BA, CA, normalized cortical area (CA/BA),and cortical thickness. The highest resolution was consid-ered as reference (gold standard) and used to computeerrors at the other resolutions.
Femoral Neck Pilot StudyA pilot study was conducted to examine the sensitivity
of the method to detect known dependencies of corticalbone architecture at the femoral neck on anthropometricmeasures. An additional motivation was to determinewhether detected changes were significant enough to re-quire normalization when used in future studies as a met-ric to evaluate the implications of cortical bone on hip-fracture incidence. Toward these goals, 10 women aged46–73 years (mean age, 56 years) were randomly selectedfrom a prior study (37). The subjects, who had meanDXA BMD T scores of the femoral neck of �1.19 �1.39 (SD), underwent the cortical hip analysis protocoldescribed.
RESULTS
ReproducibilityReproducibility in the tibia and femur was assessed
from measurements of two volunteers, scanned threetimes each as described previously. Figure 7 shows thetest-retest plots in the tibia, with regression analysis forCA along all slices of one subject. When combining datafor the two subjects, ICC and CV values for CA were0.78 and 1.78%; for cortical mean diameter, 0.994 and
THK(mm)
Skip(mm)
Time(min)
No. ofexcitations
Phaseenc. ETL
2 5 2:42 1 256 84 2 0:27 1 1282 1.5 4:16 2 256 82 0 5:10 4 256
times)
6.26.8
0.69%; and for cortical mean thickness, 0.98 and 2.03%,
1327
GOMBERG ET AL Academic Radiology, Vol 12, No 10, October 2005
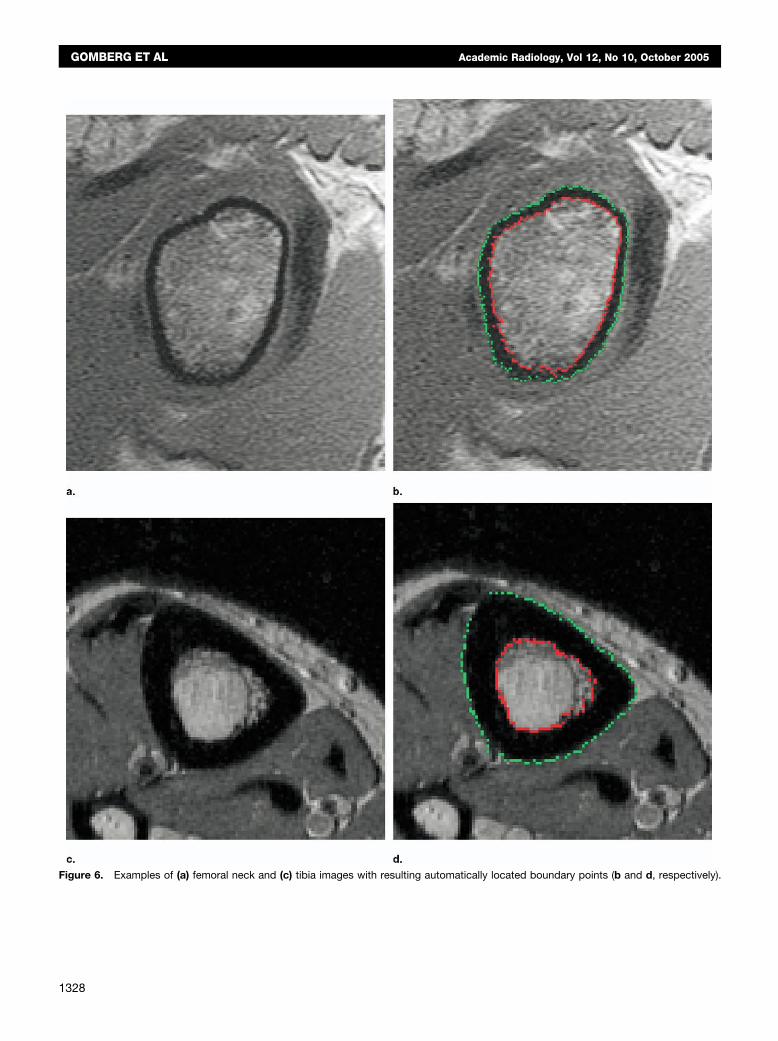
Figure 6. Examples of (a) femoral neck and (c) tibia images with resulting automatically located boundary points (b and d, respectively).
1328
Academic Radiology, Vol 12, No 10, October 2005 MRI STRUCTURAL ANALYSIS OF CORTICAL BONE
respectively. In the proximal femur, average CVs acrossall parameters were 2.4% and 1.4% for femoral neck pa-rameters and hip geometry, respectively. Femoral parame-ter ICC estimates ranged from 0.79 to 0.98, with an aver-age of 0.86.
Resolution DependenceResolution dependence experiments indicate a nearly
linear increase in apparent structural parameters with im-age pixel size (average r2 value range, 0.89–0.92; Figure8). It is evident from Figure 8 that the slopes are verysimilar and the rank of the parameters is preserved. Theerror at in vivo resolution relative to the gold-standardresolution is 6% for BA and 29% for cortical thickness,the latter being particularly difficult to measure at in vivoresolution. Figure 8 shows a representative graph of CAversus resolution, illustrating linear dependence and rankpreservation. The anatomic accuracy of boundary detec-tion is illustrated with data from the femoral neck andtibia example shown previously (Figure 6).
Femoral Neck Pilot StudyResults from the femoral neck pilot study show that
for correlation with age, no parameter was significant;however, several MR-derived geometric parameters ap-proached significance, with neck diameter leading the rest(r � �0.61; p � .06). DXA BMD correlated significantly
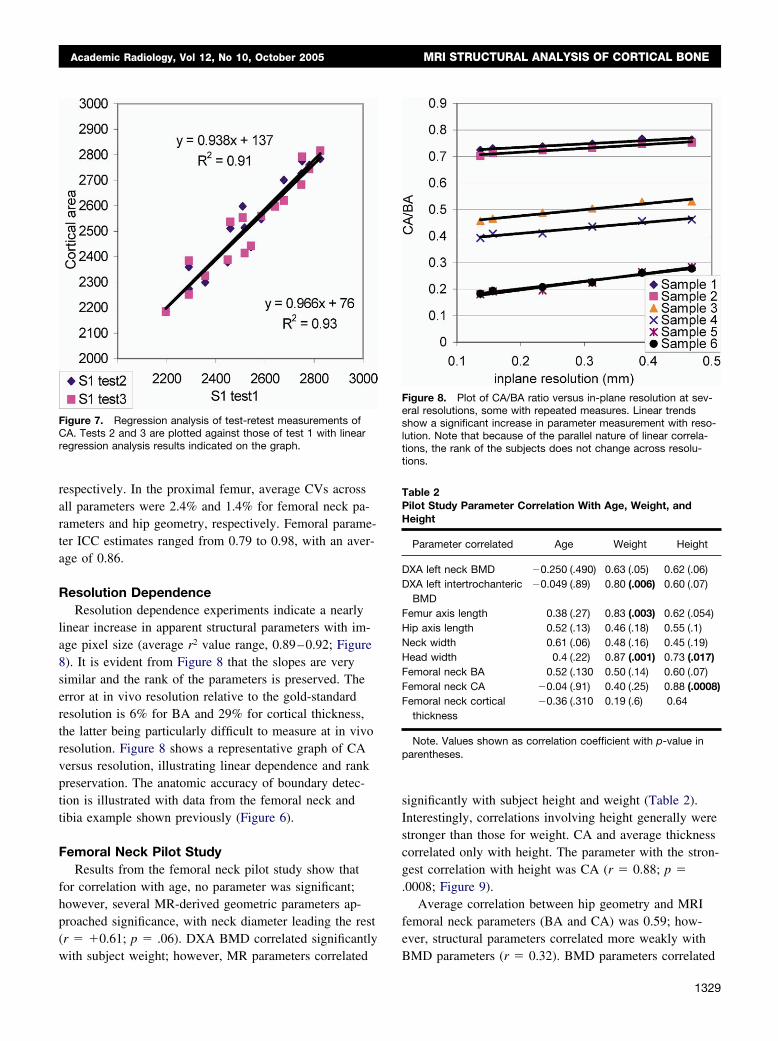
Figure 7. Regression analysis of test-retest measurements ofCA. Tests 2 and 3 are plotted against those of test 1 with linearregression analysis results indicated on the graph.
with subject weight; however, MR parameters correlated
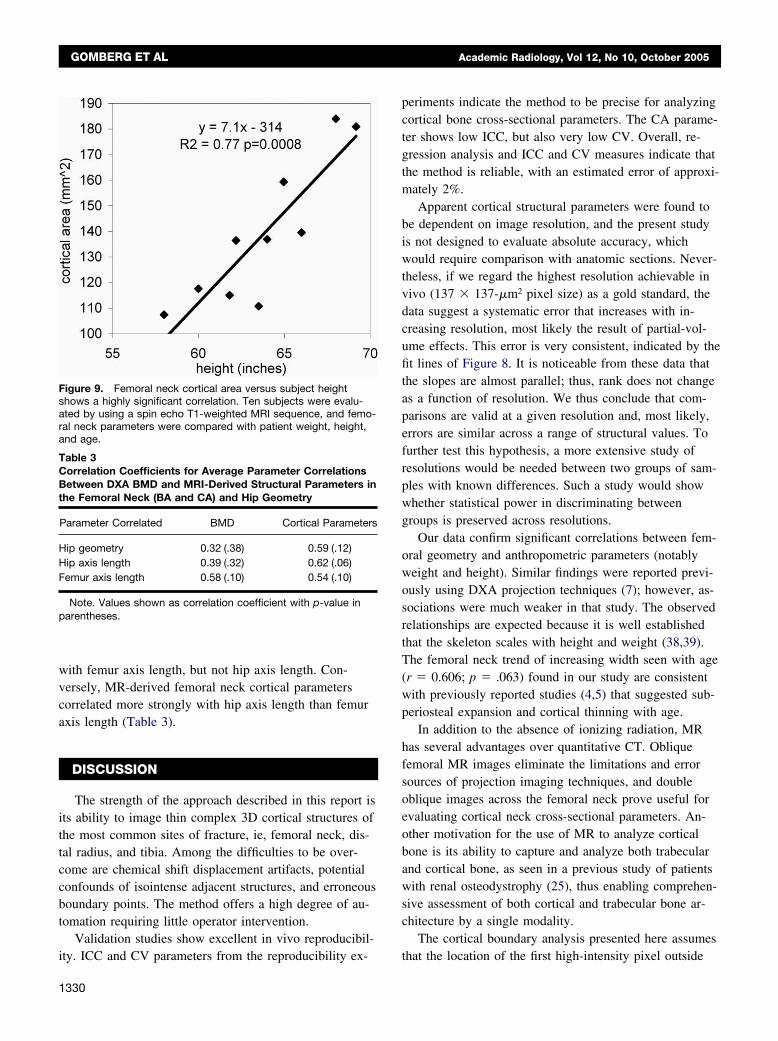
significantly with subject height and weight (Table 2).Interestingly, correlations involving height generally werestronger than those for weight. CA and average thicknesscorrelated only with height. The parameter with the stron-gest correlation with height was CA (r � 0.88; p �.0008; Figure 9).
Average correlation between hip geometry and MRIfemoral neck parameters (BA and CA) was 0.59; how-ever, structural parameters correlated more weakly with
Figure 8. Plot of CA/BA ratio versus in-plane resolution at sev-eral resolutions, some with repeated measures. Linear trendsshow a significant increase in parameter measurement with reso-lution. Note that because of the parallel nature of linear correla-tions, the rank of the subjects does not change across resolu-tions.
Table 2Pilot Study Parameter Correlation With Age, Weight, andHeight
Parameter correlated Age Weight Height
DXA left neck BMD �0.250 (.490) 0.63 (.05) 0.62 (.06)DXA left intertrochanteric
BMD�0.049 (.89) 0.80 (.006) 0.60 (.07)
Femur axis length 0.38 (.27) 0.83 (.003) 0.62 (.054)Hip axis length 0.52 (.13) 0.46 (.18) 0.55 (.1)Neck width 0.61 (.06) 0.48 (.16) 0.45 (.19)Head width 0.4 (.22) 0.87 (.001) 0.73 (.017)Femoral neck BA 0.52 (.130 0.50 (.14) 0.60 (.07)Femoral neck CA �0.04 (.91) 0.40 (.25) 0.88 (.0008)Femoral neck cortical
thickness�0.36 (.310 0.19 (.6) 0.64
Note. Values shown as correlation coefficient with p-value inparentheses.
BMD parameters (r � 0.32). BMD parameters correlated
1329
GOMBERG ET AL Academic Radiology, Vol 12, No 10, October 2005
with femur axis length, but not hip axis length. Con-versely, MR-derived femoral neck cortical parameterscorrelated more strongly with hip axis length than femuraxis length (Table 3).
DISCUSSION
The strength of the approach described in this report isits ability to image thin complex 3D cortical structures ofthe most common sites of fracture, ie, femoral neck, dis-tal radius, and tibia. Among the difficulties to be over-come are chemical shift displacement artifacts, potentialconfounds of isointense adjacent structures, and erroneousboundary points. The method offers a high degree of au-tomation requiring little operator intervention.
Validation studies show excellent in vivo reproducibil-
Figure 9. Femoral neck cortical area versus subject heightshows a highly significant correlation. Ten subjects were evalu-ated by using a spin echo T1-weighted MRI sequence, and femo-ral neck parameters were compared with patient weight, height,and age.
Table 3Correlation Coefficients for Average Parameter CorrelationsBetween DXA BMD and MRI-Derived Structural Parameters inthe Femoral Neck (BA and CA) and Hip Geometry
Parameter Correlated BMD Cortical Parameters
Hip geometry 0.32 (.38) 0.59 (.12)Hip axis length 0.39 (.32) 0.62 (.06)Femur axis length 0.58 (.10) 0.54 (.10)
Note. Values shown as correlation coefficient with p-value inparentheses.
ity. ICC and CV parameters from the reproducibility ex-
1330
periments indicate the method to be precise for analyzingcortical bone cross-sectional parameters. The CA parame-ter shows low ICC, but also very low CV. Overall, re-gression analysis and ICC and CV measures indicate thatthe method is reliable, with an estimated error of approxi-mately 2%.
Apparent cortical structural parameters were found tobe dependent on image resolution, and the present studyis not designed to evaluate absolute accuracy, whichwould require comparison with anatomic sections. Never-theless, if we regard the highest resolution achievable invivo (137 � 137-�m2 pixel size) as a gold standard, thedata suggest a systematic error that increases with in-creasing resolution, most likely the result of partial-vol-ume effects. This error is very consistent, indicated by thefit lines of Figure 8. It is noticeable from these data thatthe slopes are almost parallel; thus, rank does not changeas a function of resolution. We thus conclude that com-parisons are valid at a given resolution and, most likely,errors are similar across a range of structural values. Tofurther test this hypothesis, a more extensive study ofresolutions would be needed between two groups of sam-ples with known differences. Such a study would showwhether statistical power in discriminating betweengroups is preserved across resolutions.
Our data confirm significant correlations between fem-oral geometry and anthropometric parameters (notablyweight and height). Similar findings were reported previ-ously using DXA projection techniques (7); however, as-sociations were much weaker in that study. The observedrelationships are expected because it is well establishedthat the skeleton scales with height and weight (38,39).The femoral neck trend of increasing width seen with age(r � 0.606; p � .063) found in our study are consistentwith previously reported studies (4,5) that suggested sub-periosteal expansion and cortical thinning with age.
In addition to the absence of ionizing radiation, MRhas several advantages over quantitative CT. Obliquefemoral MR images eliminate the limitations and errorsources of projection imaging techniques, and doubleoblique images across the femoral neck prove useful forevaluating cortical neck cross-sectional parameters. An-other motivation for the use of MR to analyze corticalbone is its ability to capture and analyze both trabecularand cortical bone, as seen in a previous study of patientswith renal osteodystrophy (25), thus enabling comprehen-sive assessment of both cortical and trabecular bone ar-chitecture by a single modality.
The cortical boundary analysis presented here assumes
that the location of the first high-intensity pixel outside
Academic Radiology, Vol 12, No 10, October 2005 MRI STRUCTURAL ANALYSIS OF CORTICAL BONE
the marrow cavity represents periosteum. This assumptionmay not be satisfied in the case of high-intensity intracor-tical structures (eg, arteries, veins) and low-intensity ex-tracortical structures (eg, tendons, ligaments). The formeris not a significant problem because intracortical vesselsusually are small and ordinarily below the image resolu-tion limit. However, surrounding tendons and ligaments,both soft tissues with high collagen and low water con-tent, may have very low intensity except at echo timesmuch shorter than tissue T2. This confound, potentiallyleading to erroneous boundary detection, can be circum-vented by using short echo time imaging sequences. Inaddition, the choice of intensity threshold used for detect-ing cortical boundaries is based on the much lower inten-sity of muscle tissue surrounding bone. In future applica-tions of the technique, this threshold could be selectedseparately for endosteal and periosteal boundary detec-tion, depending on the tissue intensities actually presentalong each profile.
In summary, our data indicate that MRI is suited foranalyzing cortical bone structure, offering an alternativeto existing x-ray–based methods. Enhancement of thespatial sensitivity of a dedicated hip coil would furtherimprove the performance of the method in the proximalfemur. Finally, our data indicate substantial sensitivity indetecting the implications of body weight and height oncortical bone architecture of the hip, which underscoresthe need for data normalization when cortical structure isused as a possible indicator of hip fracture risk.
CONCLUSIONS
This report shows that parameters related to corticalbone architecture can be derived from MR images. Themethod exploits the high contrast between bone and softtissues, allowing reliable detection of periosteal and en-dosteal boundaries. The data presented show the methodto be reproducible and robust, requiring minimal user in-tervention.
ACKNOWLEDGMENT
The authors thank Dr Babette Zemel of the Children’sHospital of Philadelphia for assisting with the DXA scans.
REFERENCES
1. Horikoshi T, Endo N, Uchiyama T, Tanizawa T, Takahashi HE. Periph-eral quantitative computed tomography of the femoral neck in 60 Japa-nese women. Calcif Tissue Int 1999; 65:447–453.
2. Nielsen SP, Xie X, Barenholdt O. Geometric properties of distal radius
and pathogenesis of Colles fracture: a peripheral quantitative com-puted tomography study. J Clin Densitom 2001; 4:209–219.3. Pistoia W, van Rietbergen B, Ruegsegger P. Mechanical consequencesof different scenarios for simulated bone atrophy and recovery in thedistal radius. Bone 2003; 33:937–945.
4. Khosla S, Lufkin EG, Hodgson SF, Fitzpatrick LA, Melton LJ III. Epide-miology and clinical features of osteoporosis in young individuals. Bone1994; 15:551–555.
5. Beck TJ, Oreskovic TL, Stone KL, et al. Structural adaptation to chang-ing skeletal load in the progression toward hip fragility: the study ofosteoporotic fractures. J Bone Miner Res 2001; 16:1108–1119.
6. Crabtree N, Loveridge N, Parker M, et al. Intracapsular hip fracture andthe region-specific loss of cortical bone: analysis by peripheral quanti-tative computed tomography. J Bone Miner Res 2001; 16:1318–1328.
7. Gnudi S, Ripamonti C, Gualtieri G, Malavolta N. Geometry of proximalfemur in the prediction of hip fracture in osteoporotic women. Br J Ra-diol 1999; 72:729–733.
8. Michelotti J, Clark J. Femoral neck length and hip fracture risk. J BoneMiner Res 1999; 14:1714–1720.
9. Alonso CG, Curiel MD, Carranza FH, Cano RP, Perez AD. Femoralbone mineral density, neck-shaft angle and mean femoral neck widthas predictors of hip fracture in men and women. Multicenter Project forResearch in Osteoporosis. Osteoporos Int 2000; 11:714–720.
10. Beck TJ, Ruff CB, Warden KE, Scott WW Jr, Rao GU. Predicting femo-ral neck strength from bone mineral data. A structural approach. InvestRadiol 1990; 25:6–18.
11. Weissman BN. Osteoporosis: radiologic and nuclear medicine proce-dures. Public Health Rep 1987; Jul/Aug(suppl):S127–S130.
12. Peacock M, Liu G, Carey M, et al. Bone mass and structure at the hipin men and women over the age of 60 years. Osteoporos Int 1998;8:231–239.
13. Basu PK, Beall AG, Simmons DJ, Vannier M. 3-D femoral stress analy-sis using CT scans and p-version FEM. Biomater Med Devices ArtifOrgans 1985; 13:163–186.
14. Lang TF, Keyak JH, Heitz MW, et al. Volumetric quantitative computedtomography of the proximal femur: precision and relation to bonestrength. Bone 1997; 21:101–108.
15. Rauch F, Klein K, Allolio B, Schonau E. Age at menarche and corticalbone geometry in premenopausal women. Bone 1999; 25:69–73.
16. Schoenau E, Neu CM, Rauch F, Manz F. The development of bonestrength at the proximal radius during childhood and adolescence.J Clin Endocrinol Metab 2001; 86:613–618.
17. Lang T, Augat P, Majumdar S, Ouyang X, Genant HK. Noninvasive as-sessment of bone density and structure using computed tomographyand magnetic resonance. Bone 1998; 22(suppl):S149–S153.
18. Grampp S, Henk CB, Imhof H. CT and MR assessment of osteoporo-sis. Semin Ultrasound CT MR 1999; 20:2–9.
19. Woodhead HJ, Kemp AF, Blimkie CJR, et al. Measurement of mid-femoral shaft geometry: repeatability and accuracy using magnetic res-onance imaging and dual-energy X-ray absorptiometry. J Bone MinerRes 2001; 16:2251–2259.
20. Murdoch AH, Mathias KJ, Smith FW. Measurement of the bony anat-omy of the humerus using magnetic resonance imaging. Proc InstMech Eng [H] 2002; 216:31–35.
21. Duncan CS, Blimkie CJ, Kemp A, et al. Mid-femur geometry and bio-mechanical properties in 15- to 18-yr-old female athletes. Med SciSports Exerc 2002; 34:673–681.
22. Hogler W, Blimkie CJ, Cowell CT, et al. A comparison of bone geome-try and cortical density at the mid-femur between prepuberty andyoung adulthood using magnetic resonance imaging. Bone 2003; 33:771–778.
23. Daly RM, Saxon L, Turner CH, Robling AG, Bass SL. The relationshipbetween muscle size and bone geometry during growth and in re-sponse to exercise. Bone 2004; 34:281–287.
24. McKay HA, Sievanen H, Petit MA, et al. Application of magnetic reso-nance imaging to evaluation of femoral neck structure in growing girls.J Clin Densitom 2004; 7:161–168.
25. Wehrli FW, Leonard MB, Saha PK, Gomberg BR. Quantitative high-resolution magnetic resonance imaging reveals structural implicationsof renal osteodystrophy on trabecular and cortical bone. J Magn ResonImaging 2004; 20:83–89.
26. Young IR, Bydder GM. Magnetic resonance: new approaches to imag-
ing of the musculoskeletal system. Physiol Meas 2003; 24:R1–23.1331

GOMBERG ET AL Academic Radiology, Vol 12, No 10, October 2005
27. Gomberg BR, Saha PK, Song HK, Wehrli FW. Algorithm for measuringcortical bone thickness from high-resolution MR images [abstract]. In:Proc. ISMRM 8th Annual Meeting, Denver, CO; 2000; 2137.
28. Gomberg BR, Hilaire L, Saha PK, Loh L, Fernandez-Seara MA, WehrliFW. MR-based morphometry of the proximal femur [abstract]. In: Proc.ISMRM 10th Annual Meeting, Honolulu, HI: 2002; 105.
29. Wehrli FW, Gomberg BR, Saha KP, Song HK, Hwang SN, Snyder PJ.Digital topological analysis of in vivo MR microimages of trabecularbone reveals structural implications of osteoporosis. J Bone Miner Res2001; 16:1520–1531.
30. Callaghan PT. Principles of nuclear magnetic resonance microscopy.New York: Oxford University, 1991.
31. Sepponen RE, Sipponen JT, Tanttu JI. A method for chemical shiftimaging: demonstration of bone marrow involvement with protonchemical shift imaging. J Comput Assist Tomogr 1984; 8:585–587.
32. Wenstrup RJ, Roca-Espiau M, Weinreb NJ, Bembi B. Skeletal as-
pects of Gaucher disease: a review. Br J Radiol 2002; 75(suppl 1):S2–S12.1332
33. Chappard C, Houillier P, Paillard M. Bone status in primary hyperpara-thyroidism. Joint Bone Spine 2001; 68:112–119.
34. Steiniche T, Christiansen P, Vesterby A, et al. Primaryhyperparathyroidism: bone structure, balance, and remodeling beforeand 3 years after surgical treatment. Bone 2000; 26:535–543.
35. Parfitt AM. A structural approach to renal bone disease. J Bone MinerRes 1998; 13:1213–1220.
36. Shrout PE, Fleiss JL. Intraclass correlations: uses in assessing raterreliability. Psychol Bull 1979; 86:420–428.
37. Wehrli FW, Saha PK, Gomberg BR, et al. Role of magnetic resonancefor assessing structure and function of trabecular bone. Top Magn Re-son Imaging 2002; 13:335–355.
38. Kardinaal AF, Hoorneman G, Vaananen K, et al. Determinants of bonemass and bone geometry in adolescent and young adult women. CalcifTissue Int 2000; 66:81–89.
39. Gilsanz V, Kovanlikaya A, Costin G, Roe TF, Sayre J, Kaufman F. Dif-
ferential effect of gender on the sizes of the bones in the axial and ap-pendicular skeletons. J Clin Endocrinol Metab 1997; 82:1603–1607.


