Embed Size (px)
Citation preview

REVIEW SUMMARY
Cortical High-Density Counterstream ArchitecturesNikola T. Markov, Mária Ercsey-Ravasz, David C. Van Essen, Kenneth Knoblauch,
Zoltán Toroczkai,* Henry Kennedy*
Background: The cerebral cortex is divisible into many individual areas, each exhibiting distinct connectivity profi les, architecture, and physiological characteristics. Interactions among cortical areas underlie higher sensory, motor, and cognitive functions. Graph theory provides an important framework for understanding network properties of the interareal weighted and directed connectiv-ity matrix reported in recent studies.
Advances: We derive an exponential distance rule that predicts many binary and weighted features of the cortical network, including effi ciency of information transfer, the high specifi city of long-distance compared to short-distance connections, wire length minimization, and the existence of a highly interconnected cortical core. We propose a bow-tie representation of the cortex, which combines these features with hierarchical processing.
Outlook: The exponential distance rule has important implications for understanding scaling prop-erties of the cortex and developing future large-scale dynamic models of the cortex.
1 NOVEMBER 2013 VOL 342 SCIENCE www.sciencemag.org578
ARTICLE OUTLINE
Density and Small-World Architectures
Binary Specifi city in the High-Density
Cortical Graph
Hierarchical Organization
Rich-Club and Bow-Tie Structure
A Cortical Distance Rule as Cost-of-Wiring
Principle: The EDR Model
Effi ciency of Information Transfer
Optimal Placement
Concluding Remarks
Future Perspectives
The list of author affi liations is available in the full article online.*Corresponding author. E-mail [email protected] (H.K.); [email protected] (Z.T.)
The Heavily Connected Brain
0.0 0.1 0.2 0.3 0.4 0.5 0.6 0.7
4.0
3.0
2.0
1.0
3.5
2.5
1.5
Graph density
Av
era
ge
Pa
thle
ng
th
Modha and Singh 2010
Young 1993
Felleman and Van Essen, 1991
Jouve et al, 1998 predicted
Jouve et al, 1998
Honey et al, 2007
Markov et al, 2013
FVE 1991 predicted
FF FF
FB FB
Prefrontal Occipital Parietal Temporal Frontal
FF
V2
F5 F7
F27m 24c
PBr
STPr
STPcSTPi
9/46v
10
7A
8L
46d
8m 9/46d
8B
2
ProM
7B
F1
5
TEpd
TEO
V4
V1
DP
MT
FB
Density and topology of the cortical graph. (Left) The 66% density of the cortical matrix (black triangle) is considerably greater than in previous reports (colored points) and is inconsistent with a small-world network. (Right) A bow-tie representation of the high-density cortical matrix. The high-effi ciency cortical core has defi ned relations with the cortical periphery in the two fans.
READ THE FULL ARTICLE ONLINE
http://dx.doi.org/10.1126/science.1238406
Cite this article as N. T. Markov et al., Science 342, 1238406 (2013). DOI: 10.1126/science.1238406
Published by AAAS
REVIEW
Cortical High-DensityCounterstream ArchitecturesNikola T. Markov,1,2,3 Mária Ercsey-Ravasz,4 David C. Van Essen,5 Kenneth Knoblauch,1,2*Zoltán Toroczkai,6,7*† Henry Kennedy1,2*†
Small-world networks provide an appealing description of cortical architecture owing to theircapacity for integration and segregation combined with an economy of connectivity. Previousreports of low-density interareal graphs and apparent small-world properties are challenged bydata that reveal high-density cortical graphs in which economy of connections is achieved byweight heterogeneity and distance-weight correlations. These properties define a model thatpredicts many binary and weighted features of the cortical network including a core-periphery,a typical feature of self-organizing information processing systems. Feedback and feedforwardpathways between areas exhibit a dual counterstream organization, and their integration into localcircuits constrains cortical computation. Here, we propose a bow-tie representation of interarealarchitecture derived from the hierarchical laminar weights of pathways between the high-efficiencydense core and periphery.
Because the concepts of localization of func-tion and parcellation into cortical areasare closely intertwined, elucidating the
global pattern of areal interactions is central tounderstanding higher brain functions (1–5). Ce-rebral cortex in the macaque monkey is sub-divided into a mosaic of ~100 cortical areas, eachdisplaying characteristic features, including cyto-architecture (6). Each area has a characteristicconnectivity profile thought to contribute todetermining its functional properties (1, 7, 8).Here, we review how interareal connectivity atthe single-cell level (9), revealed by quantitativeanatomical tract tracing, is relevant to our under-standing of large-scale cortical networks and theirhierarchical organization (8, 10–13).
The circuitry of cerebral cortex is dominatedby local (within-area) connections, and interarealconnections constitute only about 20% of totalcortical connectivity. Hence, the dozens of long-distance projections to areas beyond the imme-diate neighboring areas account for ~ 5% (10).Local networks conform in many ways to acanonical microcircuit that spans all corticallayers (14, 15) and includes recurrent excita-tion presumed to shape and amplify the sparse
input from subcortical and distant corticalsources (16).
Felleman and Van Essen (FVE) showed thatinterareal connectivity obeys hierarchical con-straints rooted in the strong anatomical regular-ities of feedforward and feedback pathways (17).In this way, multiple distributed cortical hierar-chies form a large-scale model of the cortex (17)that reflects the laminar integration of interarealconnectivity into local circuits (18) and is rel-evant to sensory (17, 19, 20), motor (21, 22), andcognitive (23–27) systems. The structural featuresof interareal interactions may provide importantinsights into the observed dynamics of large-scaleinterareal networks controlling information flowthrough the cortex (1, 28, 29).
Density and Small-World ArchitecturesGraph theory provides a powerful frameworkfor investigating complex networks such as thosefound in the brain. Many insights into the func-tional processes supported by such networks havebeen gleaned from analysis at the binary level(i.e., connections present or absent; see Glossaryfor definitions) (30). One important class of mod-els that has received much attention is that ofsmall-world (SW) networks, distinguished by highclustering coupledwith a short average path length(also called characteristic path length) across thegraph (31). The relevance of the SW property tounderstanding the cortex comes from its proposedcapacity to optimize essential cortical features,including functional integration and segregation(32, 33).
Several studies based on collations of pub-lished anatomical tract tracing data (34–38) con-cluded that the cortical interareal network conformsto the SW network model of Watts and Strogatz(31). According to this hypothesis, efficient sig-nal propagation through cortical circuits benefits
from a modest number of shortcuts connectingdifferent communities across the cortical graph.
The SWhypothesis for interareal connectivityhas been challenged by recent studies that used aconsistent and optimized methodology to estab-lish a quantitative data-base of macaque interarealconnectivity (8, 11). We segmented the corticalsheet into 91 cortical areas and quantitativelyanalyzed the incoming connections to a subset of29 areas chosen to represent five major regionsof the cortex. By using similar procedures andidentical area definitions across brains, this effortset out to overcome the limitations inherent incollated datasets that combine results across manyanatomical studies (39). These limitations arisefrom the diversity of procedures used among dif-ferent anatomical studies, including cross-studydifferences in parcellation schemes, extent of cor-tex examined, tracer sensitivity, criteria for accept-ing the presence or absence of a connection, andthe spatial resolution of the analysis.
Injections of retrograde tracers in the 29 areasrevealed 36% more connections than previouslyreported (8, 10). These so-called new-found pro-jections (NFPs) were presumably missed by ear-lier studies for several reasons, including thatthey link widely separated areas (long-distanceconnections) and tend to be sparse, therefore re-quiring high resolution obtained by optimizedsampling frequency for their detection (40, 41).Notably, repeat injections in selected areas andstatistical modeling of the variability of projectionmagnitude demonstrated well-defined weightedconnectivity profiles for each area and indicatedhigh consistency for pathways of sufficient strength(8, 10). Inclusion of the NFPs considerably in-creases the cortical network density (i.e., the num-ber of binary connections that exist relative to thetotal number of connections possible) (42). Thedensity of the full interareal network (FIN), rep-resented by the graph (or matrix)G91x91, remainsunknown. However, a dominating set analysis ofthe currently known interareal network representedas the G29x91 subgraph of the FIN predicts thatthe FIN is itself a densely connected network (8).
TheG29x29 interareal subgraph, formed amongthe injected (target) nodes, is edge-complete (seeGlossary), and it has a link density of 66% (i.e.,two-thirds of connections that can exist do exist)(8). The G29x29 is denser than any subgraph usedin previous studies of the cortical network. Figure1A displays the differences in density and aver-age path length of various published subgraphsthat have been used to investigate the large-scaleproperties of the cortex. FVE analyzed severalhundred publications and reported on 32 visualareas and 305 pathways, for a graph density of32% (17). In their meta-analysis, many pathwayswere identified as untested (i.e., the subgraphwasedge-incomplete); they predicted a density of 45%if the unknown connections were to be tested.Three subsequent studies added collated data tothe FVE data set, thus generating subgraphs of 47
SPECIALSECTION
1Stem cell and Brain Research Institute, INSERM U846, 18 Av-enue Doyen Lépine, 69500 Bron, France. 2Université de Lyon,Université Lyon I, 69003 Lyon, France. 3Yale University, De-partment of Neurobiology, New Haven, CT 06520, USA. 4FacultyofPhysics,Babes-BolyaiUniversity, Cluj-Napoca,400084Romania.5Department of Anatomy and Neurobiology, Washington Uni-versity School of Medicine, St. Louis, MO 63110–1093, USA.6Department of Physics and Interdisciplinary Center for Net-work Science and Applications, University of Notre Dame, NotreDame, IN 46556, USA. 7Max Planck Institute for the Physics ofComplex Systems, 01187 Dresden, Germany.
*These authors contributed equally to this work.†Corresponding author. E-mail: [email protected](H.K.); [email protected] (Z.T.)
www.sciencemag.org SCIENCE VOL 342 1 NOVEMBER 2013 1238406-1
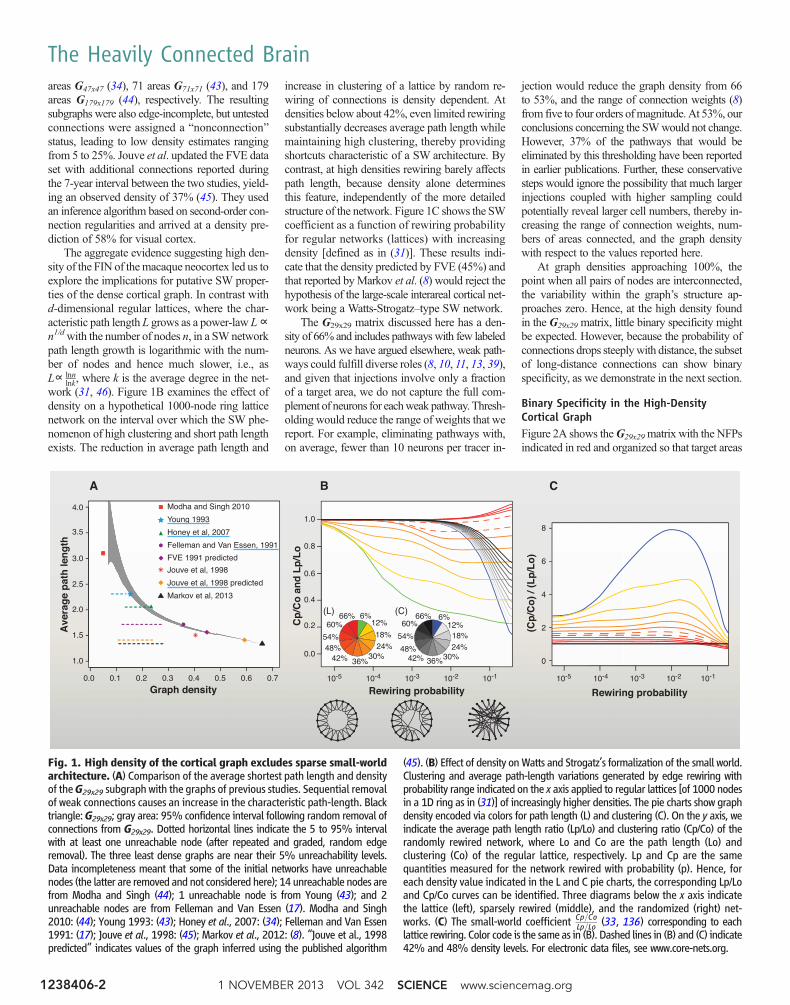
areas G47x47 (34), 71 areas G71x71 (43), and 179areas G179x179 (44), respectively. The resultingsubgraphs were also edge-incomplete, but untestedconnections were assigned a “nonconnection”status, leading to low density estimates rangingfrom 5 to 25%. Jouve et al. updated the FVE dataset with additional connections reported duringthe 7-year interval between the two studies, yield-ing an observed density of 37% (45). They usedan inference algorithm based on second-order con-nection regularities and arrived at a density pre-diction of 58% for visual cortex.
The aggregate evidence suggesting high den-sity of the FIN of themacaque neocortex led us toexplore the implications for putative SW proper-ties of the dense cortical graph. In contrast withd-dimensional regular lattices, where the char-acteristic path length L grows as a power-law L∝n1/dwith the number of nodes n, in a SWnetworkpath length growth is logarithmic with the num-ber of nodes and hence much slower, i.e., asL∝ lnn
lnk, where k is the average degree in the net-work (31, 46). Figure 1B examines the effect ofdensity on a hypothetical 1000-node ring latticenetwork on the interval over which the SW phe-nomenon of high clustering and short path lengthexists. The reduction in average path length and
increase in clustering of a lattice by random re-wiring of connections is density dependent. Atdensities below about 42%, even limited rewiringsubstantially decreases average path length whilemaintaining high clustering, thereby providingshortcuts characteristic of a SW architecture. Bycontrast, at high densities rewiring barely affectspath length, because density alone determinesthis feature, independently of the more detailedstructure of the network. Figure 1C shows the SWcoefficient as a function of rewiring probabilityfor regular networks (lattices) with increasingdensity [defined as in (31)]. These results indi-cate that the density predicted by FVE (45%) andthat reported byMarkov et al. (8) would reject thehypothesis of the large-scale interareal cortical net-work being a Watts-Strogatz–type SW network.
The G29x29 matrix discussed here has a den-sity of 66% and includes pathwayswith few labeledneurons. As we have argued elsewhere, weak path-ways could fulfill diverse roles (8, 10, 11, 13, 39),and given that injections involve only a fractionof a target area, we do not capture the full com-plement of neurons for eachweak pathway. Thresh-olding would reduce the range of weights that wereport. For example, eliminating pathways with,on average, fewer than 10 neurons per tracer in-
jection would reduce the graph density from 66to 53%, and the range of connection weights (8)from five to four orders ofmagnitude. At 53%, ourconclusions concerning the SWwould not change.However, 37% of the pathways that would beeliminated by this thresholding have been reportedin earlier publications. Further, these conservativesteps would ignore the possibility that much largerinjections coupled with higher sampling couldpotentially reveal larger cell numbers, thereby in-creasing the range of connection weights, num-bers of areas connected, and the graph densitywith respect to the values reported here.
At graph densities approaching 100%, thepoint when all pairs of nodes are interconnected,the variability within the graph’s structure ap-proaches zero. Hence, at the high density foundin the G29x29matrix, little binary specificity mightbe expected. However, because the probability ofconnections drops steeplywith distance, the subsetof long-distance connections can show binaryspecificity, as we demonstrate in the next section.
Binary Specificity in the High-DensityCortical GraphFigure 2A shows theG29x29matrix with the NFPsindicated in red and organized so that target areas
0.0 0.1 0.2 0.3 0.4 0.5 0.6 0.7
4.01.0
0.8
0.6
0.4
0.2
0.00
2
4
6
8
3.0
2.0
1.0
3.5
2.5
1.5
Graph density
Ave
rag
e p
ath
len
gth
Modha and Singh 2010
Young 1993
Felleman and Van Essen, 1991
Jouve et al, 1998 predicted
Jouve et al, 1998
Honey et al, 2007
Markov et al, 2013
10-5 10-4 10-3 10-2 10-1 10-5 10-4 10-3 10-2 10-1
Rewiring probability
Cp
/Co
an
d L
p/L
o
6%12%
18%
24%30%
36%42%48%54%
60%66% 6%
12%18%24%
30%36%42%48%
54%
60%66%
B
(L) (C)
A C
Rewiring probability
(Cp
/Co
) / (
Lp
/Lo
)FVE 1991 predicted
Fig. 1. High density of the cortical graph excludes sparse small-worldarchitecture. (A) Comparison of the average shortest path length and densityof theG29x29 subgraph with the graphs of previous studies. Sequential removalof weak connections causes an increase in the characteristic path-length. Blacktriangle:G29x29; gray area: 95% confidence interval following random removal ofconnections from G29x29. Dotted horizontal lines indicate the 5 to 95% intervalwith at least one unreachable node (after repeated and graded, random edgeremoval). The three least dense graphs are near their 5% unreachability levels.Data incompleteness meant that some of the initial networks have unreachablenodes (the latter are removed and not considered here); 14 unreachable nodes arefrom Modha and Singh (44); 1 unreachable node is from Young (43); and 2unreachable nodes are from Felleman and Van Essen (17). Modha and Singh2010: (44); Young 1993: (43); Honey et al., 2007: (34); Felleman and Van Essen1991: (17); Jouve et al., 1998: (45); Markov et al., 2012: (8). “Jouve et al., 1998predicted” indicates values of the graph inferred using the published algorithm
(45). (B) Effect of density onWatts and Strogatz’s formalization of the small world.Clustering and average path-length variations generated by edge rewiring withprobability range indicated on the x axis applied to regular lattices [of 1000 nodesin a 1D ring as in (31)] of increasingly higher densities. The pie charts show graphdensity encoded via colors for path length (L) and clustering (C). On the y axis, weindicate the average path length ratio (Lp/Lo) and clustering ratio (Cp/Co) of therandomly rewired network, where Lo and Co are the path length (Lo) andclustering (Co) of the regular lattice, respectively. Lp and Cp are the samequantities measured for the network rewired with probability (p). Hence, foreach density value indicated in the L and C pie charts, the corresponding Lp/Loand Cp/Co curves can be identified. Three diagrams below the x axis indicatethe lattice (left), sparsely rewired (middle), and the randomized (right) net-works. (C) The small-world coefficient Cp=Co
Lp=Lo (33, 136) corresponding to eachlattice rewiring. Color code is the same as in (B). Dashed lines in (B) and (C) indicate42% and 48% density levels. For electronic data files, see www.core-nets.org.
1 NOVEMBER 2013 VOL 342 SCIENCE www.sciencemag.org1238406-2
The Heavily Connected Brain
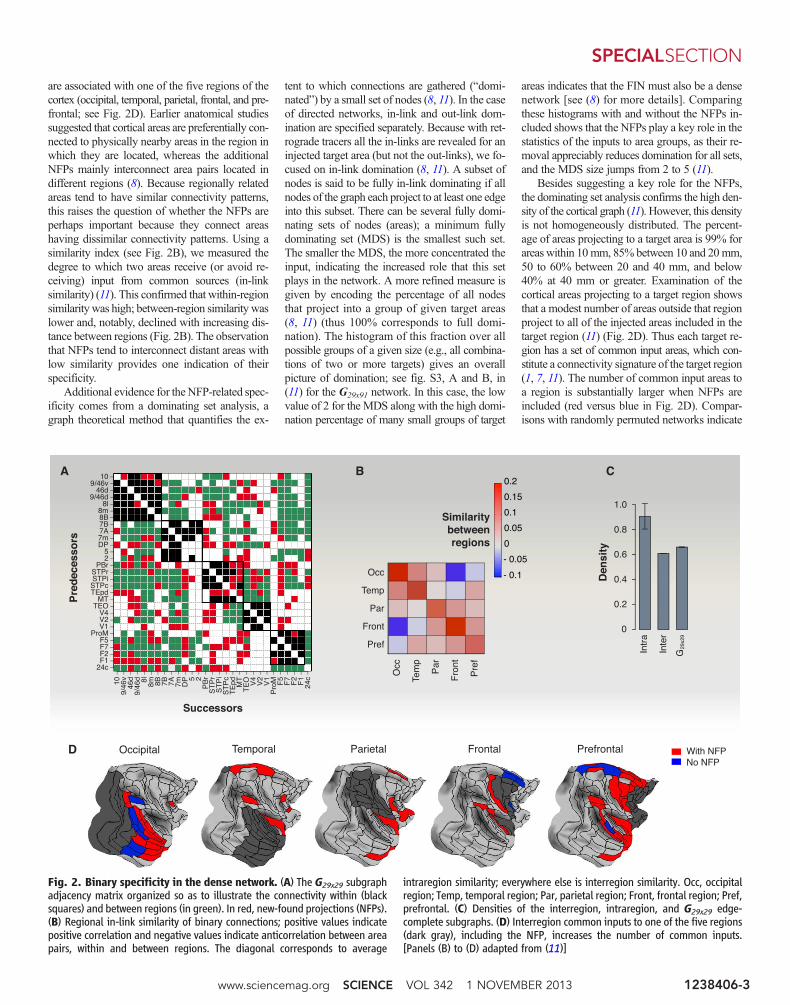
are associated with one of the five regions of thecortex (occipital, temporal, parietal, frontal, and pre-frontal; see Fig. 2D). Earlier anatomical studiessuggested that cortical areas are preferentially con-nected to physically nearby areas in the region inwhich they are located, whereas the additionalNFPs mainly interconnect area pairs located indifferent regions (8). Because regionally relatedareas tend to have similar connectivity patterns,this raises the question of whether the NFPs areperhaps important because they connect areashaving dissimilar connectivity patterns. Using asimilarity index (see Fig. 2B), we measured thedegree to which two areas receive (or avoid re-ceiving) input from common sources (in-linksimilarity) (11). This confirmed that within-regionsimilarity was high; between-region similarity waslower and, notably, declined with increasing dis-tance between regions (Fig. 2B). The observationthat NFPs tend to interconnect distant areas withlow similarity provides one indication of theirspecificity.
Additional evidence for theNFP-related spec-ificity comes from a dominating set analysis, agraph theoretical method that quantifies the ex-
tent to which connections are gathered (“domi-nated”) by a small set of nodes (8, 11). In the caseof directed networks, in-link and out-link dom-ination are specified separately. Because with ret-rograde tracers all the in-links are revealed for aninjected target area (but not the out-links), we fo-cused on in-link domination (8, 11). A subset ofnodes is said to be fully in-link dominating if allnodes of the graph each project to at least one edgeinto this subset. There can be several fully domi-nating sets of nodes (areas); a minimum fullydominating set (MDS) is the smallest such set.The smaller the MDS, the more concentrated theinput, indicating the increased role that this setplays in the network. A more refined measure isgiven by encoding the percentage of all nodesthat project into a group of given target areas(8, 11) (thus 100% corresponds to full domi-nation). The histogram of this fraction over allpossible groups of a given size (e.g., all combina-tions of two or more targets) gives an overallpicture of domination; see fig. S3, A and B, in(11) for the G29x91 network. In this case, the lowvalue of 2 for the MDS along with the high domi-nation percentage of many small groups of target
areas indicates that the FIN must also be a densenetwork [see (8) for more details]. Comparingthese histograms with and without the NFPs in-cluded shows that the NFPs play a key role in thestatistics of the inputs to area groups, as their re-moval appreciably reduces domination for all sets,and the MDS size jumps from 2 to 5 (11).
Besides suggesting a key role for the NFPs,the dominating set analysis confirms the high den-sity of the cortical graph (11). However, this densityis not homogeneously distributed. The percent-age of areas projecting to a target area is 99% forareas within 10mm, 85% between 10 and 20mm,50 to 60% between 20 and 40 mm, and below40% at 40 mm or greater. Examination of thecortical areas projecting to a target region showsthat a modest number of areas outside that regionproject to all of the injected areas included in thetarget region (11) (Fig. 2D). Thus each target re-gion has a set of common input areas, which con-stitute a connectivity signature of the target region(1, 7, 11). The number of common input areas toa region is substantially larger when NFPs areincluded (red versus blue in Fig. 2D). Compar-isons with randomly permuted networks indicate
B
Successors
Pre
dec
esso
rs
24cF1F2F7F5
ProMV1V2V4
TEOMT
TEpdSTPcSTPiSTPr
PBr25
DP7m7A7B8B8m
8l9/46d
46d9/46v
10A
24c
F1
F2
F7
F5
Pro
MV1
V2
V4
TE
OM
TT
Epd
ST
Pc
ST
Pi
ST
Pr
PB
r25D
P7m7A7B8B8m
8l9/
46d
46d
9/46
v10
- 0.1
- 0.05
0
0.05
0.1
0.15
0.2
Similaritybetweenregions
Pref
Front
Par
Temp
Occ
Pre
f
Fro
nt
Par
Tem
p
Occ
C
D Temporal Parietal Frontal PrefrontalOccipital With NFPNo NFP
Intr
a
Inte
r
G29
x29
Den
sity
0
0.2
0.4
0.6
0.8
1.0
Fig. 2. Binary specificity in the dense network. (A) The G29x29 subgraphadjacency matrix organized so as to illustrate the connectivity within (blacksquares) and between regions (in green). In red, new-found projections (NFPs).(B) Regional in-link similarity of binary connections; positive values indicatepositive correlation and negative values indicate anticorrelation between areapairs, within and between regions. The diagonal corresponds to average
intraregion similarity; everywhere else is interregion similarity. Occ, occipitalregion; Temp, temporal region; Par, parietal region; Front, frontal region; Pref,prefrontal. (C) Densities of the interregion, intraregion, and G29x29 edge-complete subgraphs. (D) Interregion common inputs to one of the five regions(dark gray), including the NFP, increases the number of common inputs.[Panels (B) to (D) adapted from (11)]
www.sciencemag.org SCIENCE VOL 342 1 NOVEMBER 2013 1238406-3
SPECIALSECTION

that the increase in the number of common inputsafter inclusion of NFPs significantly exceeds thatwhich would occur from an increase in densityby the addition of an equivalent number of ran-dom connections (11). Further, the specificity ofthe long-distance connections and hence of theNFP is indicated by the fact that the density of theinterregional edge-complete graphs is considerablylower than for those formed by intraregional con-nections (Fig. 2C). Note, that the specificity of theNFP connectivity is the same as for all long-distanceconnections, including those already known (11).
The impact of the interareal pathways on thephysiology of the target areas is constrained bythe laminar origins of the parent neurons of thepathway and the cortical layers targeted by their
synaptic terminals. These laminar constraints oninterareal pathways contribute to determining cor-tical hierarchies (17), which we address in thenext section.
Hierarchical OrganizationMore than 70% of all the projections to a givenlocus on the cortical sheet arise fromwithin 1.5 to2.5 mm, so that cortical connectivity is domi-nated by short-distance (10), local connectionsthat conform to a canonical microcircuit optimizedto amplify and shape weaker long-distance corticalinputs (Fig. 3A) (16). Therefore, when consideringlong-distance interareal pathways, it is importantto consider not only the strength and the specif-icity of the connections, but also their pronounced
laminar asymmetry determined by the directionof the connection. Hence, feedforward (FF) path-ways (mostly directed rostrally) originate princi-pally from supragranular layers and terminate inlayer 4 in higher areas (47–49), whereas feedback(FB) pathways (mostly directed caudally) originatemainly from infragranular layers in higher areasand avoid layer 4 in lower areas (47, 49–51).Pairwise comparison of the connections has beenused to reveal cortical hierarchies (17, 52). Whilethe FVE model is indeterminate (53), it can bepartially resolved by using a continuous scale suchas hierarchical distance based on the fraction ofsupragranular layer neurons (SLNs) (Fig. 3B)(54–56). The SLN index quantifies an orderrelation between areas as defined by their laminar
L 1
L 4
L 3B
L 5
L 6
Level a Level b Level c
L 2/3A
2/3
5/64
a gfedcb
Feedforward Feedback
1
1.0 0.6 0.2
-3
-2
-1
SLN
log
10(F
LN
e)
B C
E
L3A,3B
L4
L6
L5
L4
L6
L5
Thal ThalSub
Area a Area b
L3A,3B
A
D
V1
V2
V4
TEO
TEpd LIP8m
MSTTH/TF
peri
7A
V3A
V3 8L
MT
FST
STPc
1
2
3
4
5
6
7
8
9
10
Level
DP
Fig. 3. Cortical hierarchy. (A) Canonical microcircuit [adapted with per-mission (131)]. (B) Cartoon of the laminar distribution of projections to acortical mid-level area. (C) Relationship of SLN and FLN. The strongest pathwaysare the short-distance lateral connections with an SLN of ~0.5; long-distanceFF and particularly FB are substantially weaker. (D) Cortical counterstreams.FB and FF are organized in a dual counterstream system localized in supra- andinfragranular compartments. In the supragranular compartment, the layer 3Bpyramidal cells have long-distance FF axons targeting layer 4 of higher-orderareas, while the pyramidal neurons of layer 3A have short-range FB axonstargeting the supragranular layers of lower-order areas. In the infragranularcompartment, layer 6 has long-distance FB axons that avoid layer 4 and
largely target layer 1, whereas layer 5 has short-distance FF axons. Layers 3Aand B are the major supragranular output layers and layer 4 is the major inputlayer for FF projections, and layer 1 the major input layer for FB projections.Apical dendrites of pyramidal cells of layers 3A and 3B and, to a lesser extent,layer 5 reach layer 1, where they can receive FB influences, while some of thebasal dendrites of FF layer 3B neurons are located in layer 4. (E) A hierarchicalorganization of the visual cortical areas using SLN as a hierarchical distancemeasure (12). The projection of area 8L (frontal eye field) to area V4, and fromarea V4 to area 8L, are both defined by their SLN as FF and therefore form astrong loop (12). (D and E) Color coding: red, FF; blue, FB. [Panel (D) from(12)]. For electronic data files, see www.core-nets.org.
1 NOVEMBER 2013 VOL 342 SCIENCE www.sciencemag.org1238406-4
The Heavily Connected Brain
profiles of connectivity and thereby allows esti-mation of the hierarchical distance separatingthem (57). Further analysis shows that connec-tions between neighboring areas have the highestweight, defined as the fraction of labeled neurons(FLN) (10, 58), whereas long-distance FF and FBconnections have lower weights (Fig. 3, B and C).
Interest in the hierarchical organization of thecortex is fueled by evidence that FF and FB pro-cesses are distinct physiologically. A useful, albeitoversimplified characterization is that FF con-nections are “driving” and FB connections are“modulatory” (59–63). Further, FF and FB path-ways engage different glutamate receptor subtypes(64). If the two polarities indeed have relativelydistinct roles, one might predict that any givenneuron would contribute to only one type of path-way, rather than supplying axons to both. Thishas been tested by injecting two distinguishableretrograde tracers in higher and lower corticalareas and examining the intermediate areas fordouble-labeled neurons (i.e., neurons with a bi-furcating axon directed at both pathways). Theresults showed that the FF and FB neurons in theintermediate areaswere virtually all single-labeled,which is striking given the commonality of axonalbifurcation (57, 65). Not only do FF and FBconstitute distinct populations, but they also formtwo segregated streams, consistent with earlierobservations (47, 66, 67). The supra- and theinfragranular layers each have a counterstreamorganization, most pronounced in the supra-granular layers (Fig. 3D) (12, 68). Further, thesupragranular counterstream showed a point-to-point (i.e., topographical) precise connectivity inboth FF and FB directions, whereas the infra-granular counterstream has a more diffuse topog-raphy showing high divergence and convergencein both directions (12). Hence, contrary to pre-vious assertions, topographic precision distinguishessupragranular layer from infragranular connec-tions and not FB versus FF pathways (12).
The integration of interareal connections intothe canonical microcircuit of a target area pre-sumably determines how top-down and bottom-up streams affect processing within the target area(18). The concept of hierarchical processing hasinfluenced theories of cortical computation, pre-dictive coding, and emerging concepts of infer-ence in cortical function (18, 69, 70). Recentprogress in elucidating interareal communicationincludes the demonstration of gamma-band phasecoherence in the supragranular and beta-bandcoherence in the infragranular layers (71, 72).These differences in coherence reflect differencesin interareal synchronization (73–76), which arethought to facilitate effective communication(74, 77). Recently beta-gamma asymmetries havebeen shown to correlate with the aforementionedSLN fraction, suggesting a match between ana-tomically and functionally defined hierarchies (18).The SLN analysis revealed infrequent, but po-tentially important, departures from the reciprocity
of FF and FB projections. For instance, instead ofFF being invariably reciprocated by FB, a few FFpathways are reciprocated by a FF, thereby form-ing a strong loop (54, 78, 79), which is illustratedin Fig. 3E, where the FF projection of V4 to thefrontal eye field (area 8L) is reciprocated by a FFand not a FB connection (12, 54). Given the evi-dence for different physiological roles of FF andFB pathways, such anti-hierarchical pathwaysmayallow circulation of information up and down thecortical hierarchy entirely via FF pathways. Thefunctional importance of these rare so-called strongloops (79) remains to be determined.
Rich-Club and Bow-Tie StructurePrevious studies based on sparse cortical networkshave suggested an important structural heteroge-neity in the cortex, where hub areas are statis-tically more interconnected than expected, forminga so-called rich club (80–82) or central core (44).Using methods adapted to high-density graphs(83), we have shown that the G29x29 subgraphharbors 13 cliques (complete subgraphs in whichall possible connections are present) of size 10.This results in a very high, 92% density coreformed of 17 nodes in the edge-complete G29x29
(13), a periphery of 12 nodes with a density of49%, and a 54% density of connectivity betweenthe periphery and core. Because additional in-
jections cannot change the structure of theG29x29
subgraph, this implies that the FIN also has a densecore (to which the core of G29x29 must belong,being 92% dense), possibly larger than that ofG29x29. The core-periphery distinction is also sup-ported by the average strength of connections, asthe fraction of labeled neurons (FLN, seeGlossary)between the core and periphery is on averageweakerthan within either the core or periphery (13).
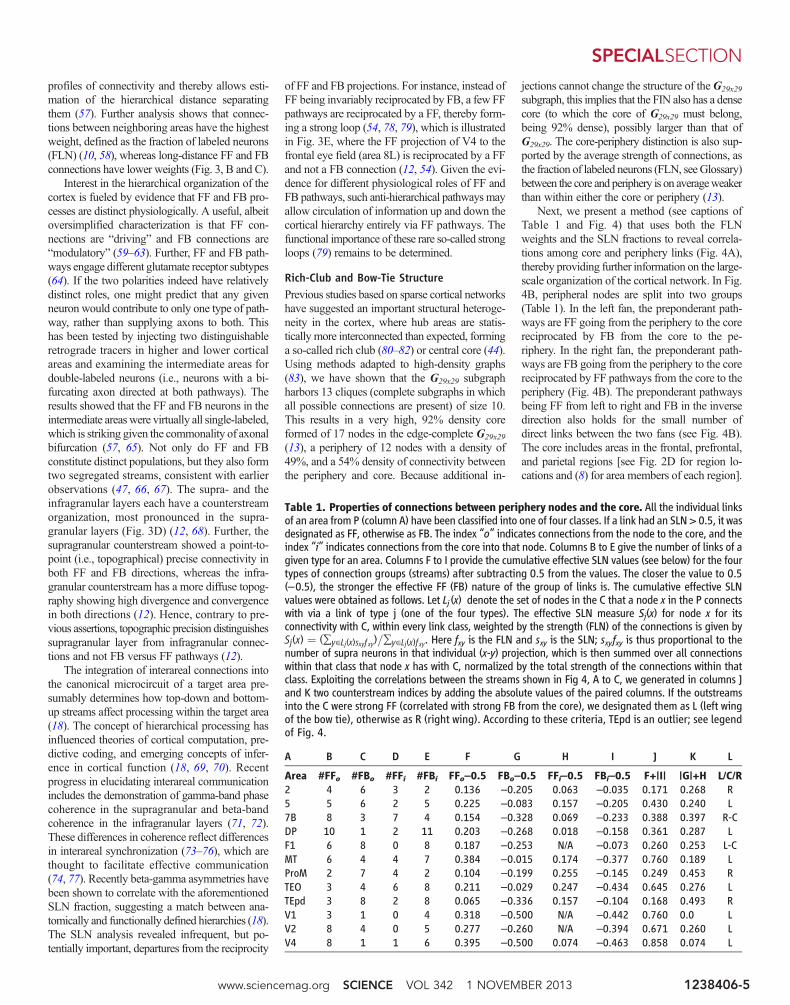
Next, we present a method (see captions ofTable 1 and Fig. 4) that uses both the FLNweights and the SLN fractions to reveal correla-tions among core and periphery links (Fig. 4A),thereby providing further information on the large-scale organization of the cortical network. In Fig.4B, peripheral nodes are split into two groups(Table 1). In the left fan, the preponderant path-ways are FF going from the periphery to the corereciprocated by FB from the core to the pe-riphery. In the right fan, the preponderant path-ways are FB going from the periphery to the corereciprocated by FF pathways from the core to theperiphery (Fig. 4B). The preponderant pathwaysbeing FF from left to right and FB in the inversedirection also holds for the small number ofdirect links between the two fans (see Fig. 4B).The core includes areas in the frontal, prefrontal,and parietal regions [see Fig. 2D for region lo-cations and (8) for area members of each region].
Table 1. Properties of connections between periphery nodes and the core. All the individual linksof an area from P (column A) have been classified into one of four classes. If a link had an SLN > 0.5, it wasdesignated as FF, otherwise as FB. The index “o” indicates connections from the node to the core, and theindex “i” indicates connections from the core into that node. Columns B to E give the number of links of agiven type for an area. Columns F to I provide the cumulative effective SLN values (see below) for the fourtypes of connection groups (streams) after subtracting 0.5 from the values. The closer the value to 0.5(–0.5), the stronger the effective FF (FB) nature of the group of links is. The cumulative effective SLNvalues were obtained as follows. Let Lj (x) denote the set of nodes in the C that a node x in the P connectswith via a link of type j (one of the four types). The effective SLN measure Sj(x) for node x for itsconnectivity with C, within every link class, weighted by the strength (FLN) of the connections is given bySj(x) ¼ (∑y∈Lj(x)sxyf xy)=∑y∈Lj(x)f xy. Here fxy is the FLN and sxy is the SLN; sxyfxy is thus proportional to thenumber of supra neurons in that individual (x-y) projection, which is then summed over all connectionswithin that class that node x has with C, normalized by the total strength of the connections within thatclass. Exploiting the correlations between the streams shown in Fig 4, A to C, we generated in columns Jand K two counterstream indices by adding the absolute values of the paired columns. If the outstreamsinto the C were strong FF (correlated with strong FB from the core), we designated them as L (left wingof the bow tie), otherwise as R (right wing). According to these criteria, TEpd is an outlier; see legendof Fig. 4.
A B C D E F G H I J K L
Area #FFo #FBo #FFi #FBi FFo–0.5 FBo–0.5 FFi–0.5 FBi–0.5 F+|I| |G|+H L/C/R2 4 6 3 2 0.136 –0.205 0.063 –0.035 0.171 0.268 R5 5 6 2 5 0.225 –0.083 0.157 –0.205 0.430 0.240 L7B 8 3 7 4 0.154 –0.328 0.069 –0.233 0.388 0.397 R-CDP 10 1 2 11 0.203 –0.268 0.018 –0.158 0.361 0.287 LF1 6 8 0 8 0.187 –0.253 N/A –0.073 0.260 0.253 L-CMT 6 4 4 7 0.384 –0.015 0.174 –0.377 0.760 0.189 LProM 2 7 4 2 0.104 –0.199 0.255 –0.145 0.249 0.453 RTEO 3 4 6 8 0.211 –0.029 0.247 –0.434 0.645 0.276 LTEpd 3 8 2 8 0.065 –0.336 0.157 –0.104 0.168 0.493 RV1 3 1 0 4 0.318 –0.500 N/A –0.442 0.760 0.0 LV2 8 4 0 5 0.277 –0.260 N/A –0.394 0.671 0.260 LV4 8 1 1 6 0.395 –0.500 0.074 –0.463 0.858 0.074 L
www.sciencemag.org SCIENCE VOL 342 1 NOVEMBER 2013 1238406-5
SPECIALSECTION
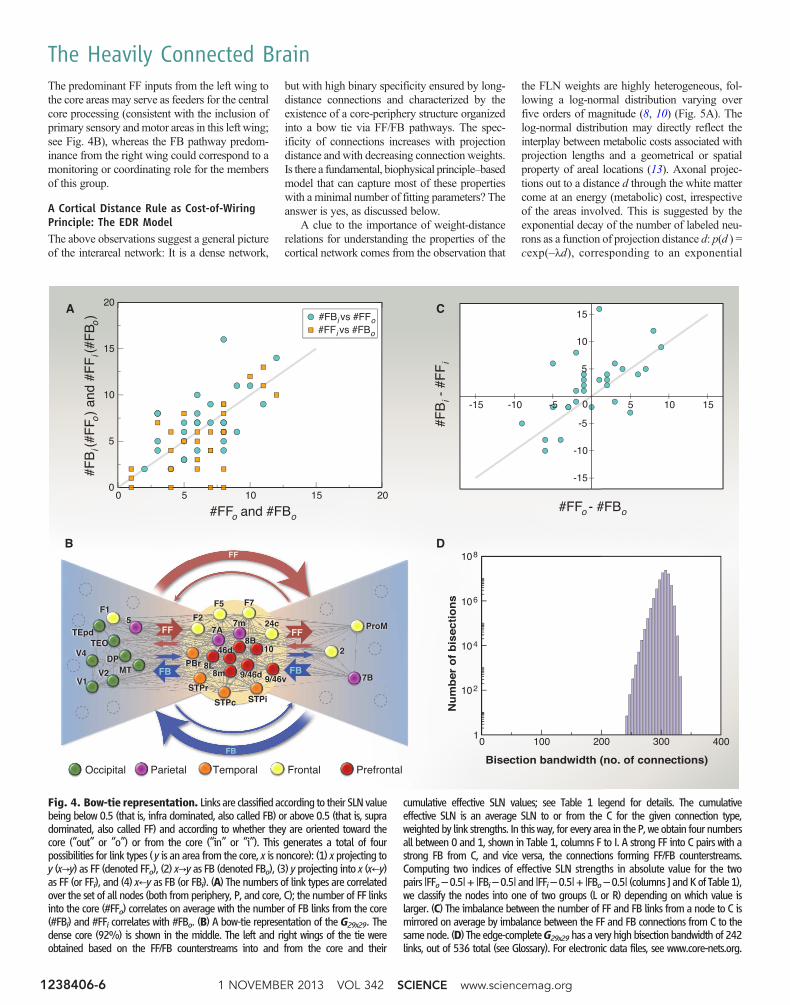
The predominant FF inputs from the left wing tothe core areas may serve as feeders for the centralcore processing (consistent with the inclusion ofprimary sensory andmotor areas in this left wing;see Fig. 4B), whereas the FB pathway predom-inance from the right wing could correspond to amonitoring or coordinating role for the membersof this group.
A Cortical Distance Rule as Cost-of-WiringPrinciple: The EDR ModelThe above observations suggest a general pictureof the interareal network: It is a dense network,
but with high binary specificity ensured by long-distance connections and characterized by theexistence of a core-periphery structure organizedinto a bow tie via FF/FB pathways. The spec-ificity of connections increases with projectiondistance andwith decreasing connection weights.Is there a fundamental, biophysical principle–basedmodel that can capture most of these propertieswith a minimal number of fitting parameters? Theanswer is yes, as discussed below.
A clue to the importance of weight-distancerelations for understanding the properties of thecortical network comes from the observation that
the FLN weights are highly heterogeneous, fol-lowing a log-normal distribution varying overfive orders of magnitude (8, 10) (Fig. 5A). Thelog-normal distribution may directly reflect theinterplay between metabolic costs associated withprojection lengths and a geometrical or spatialproperty of areal locations (13). Axonal projec-tions out to a distance d through the white mattercome at an energy (metabolic) cost, irrespectiveof the areas involved. This is suggested by theexponential decay of the number of labeled neu-rons as a function of projection distance d: p(d ) =cexp(–ld), corresponding to an exponential
FF FF
FB FB
Prefrontal Occipital Parietal Temporal Frontal
FF
FB
0 5 10 15 200
5
10
15
20A
-15 -10 -5 5 10 15
-15
-10
-5
5
10
15
0
0 100 200 300 400
Bisection bandwidth (no. of connections)
1
108
106
104
102
Nu
mb
er o
f b
isec
tio
ns
#FB
i(#F
F o)
and
#FF
i(#F
B o)
#FFo and #FBo
#FBi vs #FFo#FFi vs #FBo
#FB
i -
#FF
i
#FFo - #FBo
C
DB
F15
TEpdTEO
V4
V1
DPMTV2
F5 F7
F27m 24c
PBr
STPr
STPc STPi
9/46v
10
7A
8L
46d
8m 9/46d
8B2
ProM
7B
Fig. 4. Bow-tie representation. Links are classified according to their SLNvaluebeing below 0.5 (that is, infra dominated, also called FB) or above 0.5 (that is, supradominated, also called FF) and according to whether they are oriented toward thecore (“out” or “o”) or from the core (“in” or “i”). This generates a total of fourpossibilities for link types (y is an area from the core, x is noncore): (1) x projecting toy (x→y) as FF (denoted FFo), (2) x→y as FB (denoted FBo), (3) y projecting into x (x←y)as FF (or FFi), and (4) x←y as FB (or FBi). (A) The numbers of link types are correlatedover the set of all nodes (both from periphery, P, and core, C); the number of FF linksinto the core (#FFo) correlates on average with the number of FB links from the core(#FBi) and #FFi correlates with #FBo. (B) A bow-tie representation of the G29x29. Thedense core (92%) is shown in the middle. The left and right wings of the tie wereobtained based on the FF/FB counterstreams into and from the core and their
cumulative effective SLN values; see Table 1 legend for details. The cumulativeeffective SLN is an average SLN to or from the C for the given connection type,weighted by link strengths. In this way, for every area in the P, we obtain four numbersall between 0 and 1, shown in Table 1, columns F to I. A strong FF into C pairs with astrong FB from C, and vice versa, the connections forming FF/FB counterstreams.Computing two indices of effective SLN strengths in absolute value for the twopairs |FFo–0.5|+ |FBi–0.5| and |FFi–0.5|+ |FBo–0.5| (columns J andKof Table1),we classify the nodes into one of two groups (L or R) depending on which value islarger. (C) The imbalance between the number of FF and FB links from a node to C ismirrored on average by imbalance between the FF and FB connections from C to thesamenode. (D) The edge-completeG29x29has a very high bisection bandwidth of 242links, out of 536 total (see Glossary). For electronic data files, see www.core-nets.org.
1 NOVEMBER 2013 VOL 342 SCIENCE www.sciencemag.org1238406-6
The Heavily Connected Brain
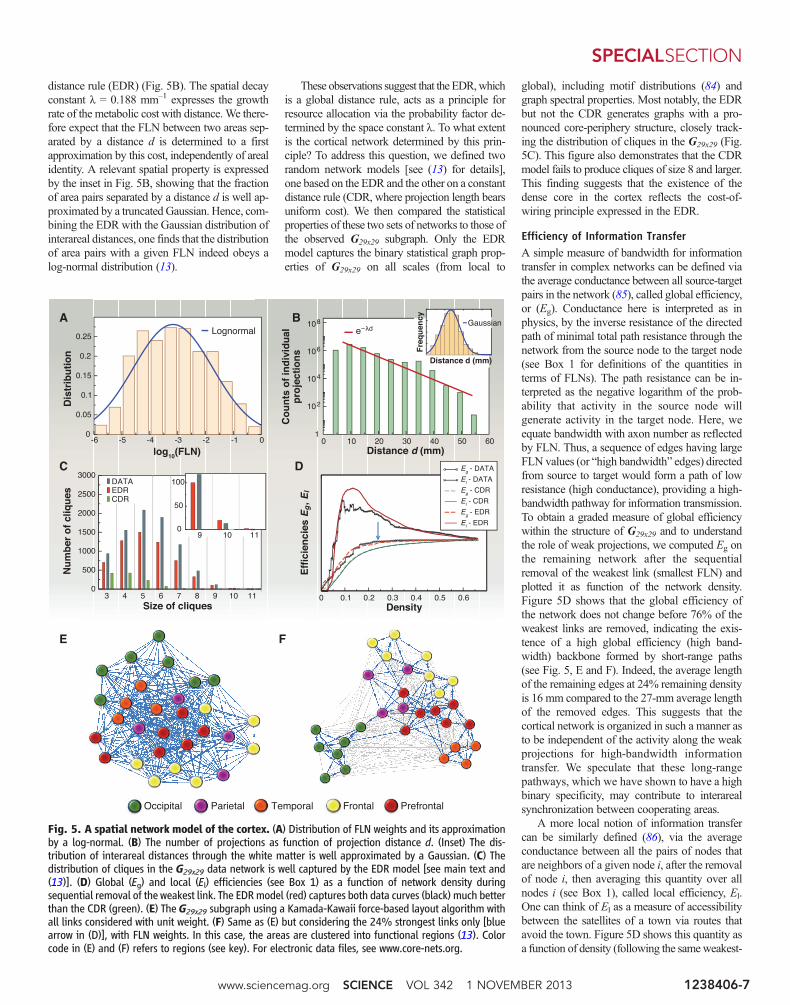
distance rule (EDR) (Fig. 5B). The spatial decayconstant l = 0.188 mm–1 expresses the growthrate of the metabolic cost with distance. We there-fore expect that the FLN between two areas sep-arated by a distance d is determined to a firstapproximation by this cost, independently of arealidentity. A relevant spatial property is expressedby the inset in Fig. 5B, showing that the fractionof area pairs separated by a distance d is well ap-proximated by a truncated Gaussian. Hence, com-bining the EDR with the Gaussian distribution ofinterareal distances, one finds that the distributionof area pairs with a given FLN indeed obeys alog-normal distribution (13).
These observations suggest that the EDR,whichis a global distance rule, acts as a principle forresource allocation via the probability factor de-termined by the space constant l. To what extentis the cortical network determined by this prin-ciple? To address this question, we defined tworandom network models [see (13) for details],one based on the EDR and the other on a constantdistance rule (CDR, where projection length bearsuniform cost). We then compared the statisticalproperties of these two sets of networks to those ofthe observed G29x29 subgraph. Only the EDRmodel captures the binary statistical graph prop-erties of G29x29 on all scales (from local to
global), including motif distributions (84) andgraph spectral properties. Most notably, the EDRbut not the CDR generates graphs with a pro-nounced core-periphery structure, closely track-ing the distribution of cliques in the G29x29 (Fig.5C). This figure also demonstrates that the CDRmodel fails to produce cliques of size 8 and larger.This finding suggests that the existence of thedense core in the cortex reflects the cost-of-wiring principle expressed in the EDR.
Efficiency of Information TransferA simple measure of bandwidth for informationtransfer in complex networks can be defined viathe average conductance between all source-targetpairs in the network (85), called global efficiency,or (Eg). Conductance here is interpreted as inphysics, by the inverse resistance of the directedpath of minimal total path resistance through thenetwork from the source node to the target node(see Box 1 for definitions of the quantities interms of FLNs). The path resistance can be in-terpreted as the negative logarithm of the prob-ability that activity in the source node willgenerate activity in the target node. Here, weequate bandwidth with axon number as reflectedby FLN. Thus, a sequence of edges having largeFLN values (or “high bandwidth” edges) directedfrom source to target would form a path of lowresistance (high conductance), providing a high-bandwidth pathway for information transmission.To obtain a graded measure of global efficiencywithin the structure of G29x29 and to understandthe role of weak projections, we computed Eg onthe remaining network after the sequentialremoval of the weakest link (smallest FLN) andplotted it as function of the network density.Figure 5D shows that the global efficiency ofthe network does not change before 76% of theweakest links are removed, indicating the exis-tence of a high global efficiency (high band-width) backbone formed by short-range paths(see Fig. 5, E and F). Indeed, the average lengthof the remaining edges at 24% remaining densityis 16 mm compared to the 27-mm average lengthof the removed edges. This suggests that thecortical network is organized in such a manner asto be independent of the activity along the weakprojections for high-bandwidth informationtransfer. We speculate that these long-rangepathways, which we have shown to have a highbinary specificity, may contribute to interarealsynchronization between cooperating areas.
A more local notion of information transfercan be similarly defined (86), via the averageconductance between all the pairs of nodes thatare neighbors of a given node i, after the removalof node i, then averaging this quantity over allnodes i (see Box 1), called local efficiency, El.One can think of El as a measure of accessibilitybetween the satellites of a town via routes thatavoid the town. Figure 5D shows this quantity asa function of density (following the sameweakest-
-6 -5 -4 -3 -2 -1 0
log10(FLN)
0
0.05
0.1
0.15
0.2
0.25
Dis
trib
uti
on
Lognormal
0 10 20 30 40 50 60Distance d (mm)
1
Co
un
ts o
f in
div
idu
alp
roje
ctio
ns
e−λd
Distance d (mm)
Fre
qu
ency
Gaussian
3 4 5 6 7 8 9 10 11Size of cliques
0
500
1000
1500
2000
2500
3000
Nu
mb
er o
f cl
iqu
es
DATAEDRCDR
9 10 110
50
100
Prefrontal Occipital Parietal Temporal Frontal
A B
C D
E F
108
106
104
102
0 0.1 0.2 0.3 0.4 0.5 0.6Density
Eff
icie
nci
es Eg, E
l
El - DATA
Eg - CDR
El - CDR
Eg - EDR
Eg - DATA
El - EDR
Fig. 5. A spatial network model of the cortex. (A) Distribution of FLN weights and its approximationby a log-normal. (B) The number of projections as function of projection distance d. (Inset) The dis-tribution of interareal distances through the white matter is well approximated by a Gaussian. (C) Thedistribution of cliques in the G29x29 data network is well captured by the EDR model [see main text and(13)]. (D) Global (Eg) and local (El) efficiencies (see Box 1) as a function of network density duringsequential removal of the weakest link. The EDRmodel (red) captures both data curves (black) much betterthan the CDR (green). (E) The G29x29 subgraph using a Kamada-Kawaii force-based layout algorithm withall links considered with unit weight. (F) Same as (E) but considering the 24% strongest links only [bluearrow in (D)], with FLN weights. In this case, the areas are clustered into functional regions (13). Colorcode in (E) and (F) refers to regions (see key). For electronic data files, see www.core-nets.org.
www.sciencemag.org SCIENCE VOL 342 1 NOVEMBER 2013 1238406-7
SPECIALSECTION

link removal procedure as above). Intriguingly,local efficiency increases sharply with weak-linkremoval (or inactivity), compared to the globalefficiency. The weak-link removal increases lo-cality because the weak links are long-range.This tends to prune the interregional shortcutsand physiologically would be predicted to de-crease interactions between diverse functionalmodalities, leading to a more localized structureof the remaining network. It eliminates thoseneighbors of a node to which it connects via weaklinks, thus disconnecting regions and modalitiesbut preserving dense within-region connections.Accordingly, the paths linking the remaining neigh-bors of the node (avoiding that node) are allstrong, having small path resistance (large con-ductance), and hence the measure of local ef-
ficiency becomes large. The redundancy of localstrong paths [the complete triangle is the mostabundant three-motif, formed by strong links asshown in figure 3B of (13)] guarantees that thenumber of edges on a path between two nodes issmall, which further decreases the path resistancebetween the nodes and hence further increasesthe local efficiency.
These changes in local efficiency indicate flex-ibility of network modularity and long-distancefunctional interactions—for example, in responseto changes in cognitive load (13, 87). This sug-gests that in the cortical network, local informa-tion processing is voluminous, and because of theredundancy of local high-conductance paths, it ismuch more efficient than global information pro-cessing, whose efficiency acts at a constant base
line (Box 1). Notably, the organization of the cor-tical network around a high-efficiency backbonewith constant global efficiency and optimal localefficiency behavior is also captured well by theEDR (Fig. 5D). These efficiencies are not binarygraph measures, but are based on weights (FLNs).By contrast, the CDR fails completely, especiallyfor the local efficiency measure (Fig. 5D).
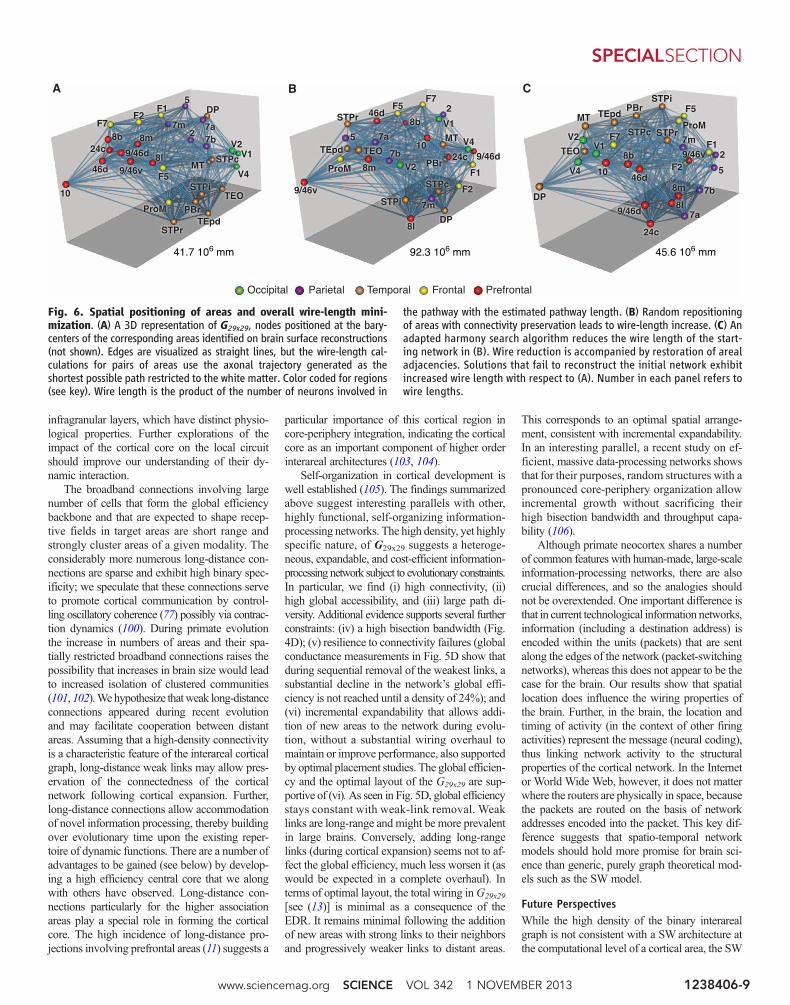
Optimal PlacementThe ability of the weight-distance relations of theG29x29 to predict numerous features of the cor-tical network underlines the importance of theembedded nature of real-world networks wherenodes are located in three-dimensional (3D) Eu-clidean space and are linked by weighted anddirected edges (88). An important aspect of theembedded cortical network is the spatial layout ofcortical areas. Numerous studies have presentedevidence that the spatial layout is optimized tominimize total wire length (89–91). A recent studyused collated data for 95 areas of the macaque andclaimed that optimized component rearrange-ments based on a simulated annealing algorithmcould substantially reduce total wire (92). How-ever, the database used by that study was edge-incomplete and the network density derived fromit had a low density. In addition, weights wereonly classified as being on one of four levels. Weadapted evolutionary optimization algorithms andapplied them to our database to search for arealplacements that minimize total wire length; wefound alternative organizations that shorten thebinary network by 5%. For the weighted net-work, the maximum reduction was less than 1%and involved a small number of switches be-tween adjacent areas (Fig. 6) (13). Figure 6Ashows a 3D representation of the G29x29 networkwith areas color coded to indicate regional iden-tity. Figure 6B is an example of shuffled arealpositions leading to increased wire length andloss of adjacency of areas originally from thesame region. An optimization procedure appliedto the randomized network leads to regional clus-tering similar to that observed in the cortex (Fig.6C). Further, random networks based on theEDR had significantly shorter wire lengths thanCDR-generated networks. These results thereforeconfirm that wire minimization is a constitutiveorganizational principle of the cortical network(89–91, 93–99) and suggest that this design con-straint is at least partially implemented by theoperation of the EDR generating the weight dis-tributions of interareal projections (13).
Concluding RemarksIn summary, the interareal network achieves econ-omy of connectivity and communication efficien-cy by means of a distribution of weights, spatialorganization and a core-periphery structure in theform of a bow tie with a dense core. Interarealconnections integrate across the local circuits viadual counter-streams located in the supra- and
i ji j
pi fij , pi
wij wij wjk
fij fjk= == wik =
or ln
link resistance:
Large FLN fi j , small link resistance wij = – ln fi j Small FLN fi j , large link resistance wij = – ln fi j
- additive
j j pi ln fi j
ln fi j
ln fjk= +
– +jk k
ωxy
y
x
x
xy
*
ωxy*
r
N (N − 1) rxy
1 1Eg =
: degree of i
x y=
N rxy/i
1 1El =k ( − 1)
1
x y=
i
i
y
ki
i k i{i}
B
A
Box 1. Efficiency measures for information transfer in networks.
In the simplest approximation, we may interpret the FLN weight fij of the projection from sourcearea i to target area j as the probability pi→j that activity in i will induce activity in j. Assuming thatthese are independent events, the probability of activity in area k induced along the path i→j→k willbe given by the product of the FLNs: pi→j→k = fij·fjk or ln(pi→j→k) = ln(pi→j) + ln(pj→k). Then, thepositive quantity wij = –ln(fij) can be interpreted as a measure of resistance for information transferalong the i→j link, as small FLN (weak links) induce a large resistance and vice versa. Addi-tionally, based on our assumption above, the link resistance is additive along network paths. Wedefine the resistance rxy from an arbitrarynode x to an arbitrary node y as thesmallest sum of link resistances amongall directed paths wxy from x to y, that is,rxy ¼ min
wxy∑
ði,jÞ∈wxy
wij . The highest transmis-
sion probability path will be the one,wxy* , that achieves this minimum (seefigure). The global efficiency measureEg is defined as the average conduct-ance (inverse resistance) between all thepossible N(N – 1) node pairs, where N isthe number of nodes in the network asshown in (A).
A local efficiency measure El is de-fined in (B): We remove a node i with allits links and then we compute the aver-age of the resistances between all pairsof its neighbors as measured throughthe rest of the network, and finally, weaverage these quantities over all nodes i.Thus, El quantifies the degree to whichthe satellites of a typical city can com-municate via paths that avoid the city (B).
Schematics for efficiencymeasures.(A) Global efficiency and (B) local effi-ciency. The dashed curves are schematicpaths through the rest of the network(not shown). Here {i} denotes the set ofnetwork neighbors of node i.
1 NOVEMBER 2013 VOL 342 SCIENCE www.sciencemag.org1238406-8
The Heavily Connected Brain
infragranular layers, which have distinct physio-logical properties. Further explorations of theimpact of the cortical core on the local circuitshould improve our understanding of their dy-namic interaction.
The broadband connections involving largenumber of cells that form the global efficiencybackbone and that are expected to shape recep-tive fields in target areas are short range andstrongly cluster areas of a given modality. Theconsiderably more numerous long-distance con-nections are sparse and exhibit high binary spec-ificity; we speculate that these connections serveto promote cortical communication by control-ling oscillatory coherence (77) possibly via contrac-tion dynamics (100). During primate evolutionthe increase in numbers of areas and their spa-tially restricted broadband connections raises thepossibility that increases in brain size would leadto increased isolation of clustered communities(101, 102).Wehypothesize thatweak long-distanceconnections appeared during recent evolutionand may facilitate cooperation between distantareas. Assuming that a high-density connectivityis a characteristic feature of the interareal corticalgraph, long-distance weak links may allow pres-ervation of the connectedness of the corticalnetwork following cortical expansion. Further,long-distance connections allow accommodationof novel information processing, thereby buildingover evolutionary time upon the existing reper-toire of dynamic functions. There are a number ofadvantages to be gained (see below) by develop-ing a high efficiency central core that we alongwith others have observed. Long-distance con-nections particularly for the higher associationareas play a special role in forming the corticalcore. The high incidence of long-distance pro-jections involving prefrontal areas (11) suggests a
particular importance of this cortical region incore-periphery integration, indicating the corticalcore as an important component of higher orderinterareal architectures (103, 104).
Self-organization in cortical development iswell established (105). The findings summarizedabove suggest interesting parallels with other,highly functional, self-organizing information-processing networks. The high density, yet highlyspecific nature, of G29x29 suggests a heteroge-neous, expandable, and cost-efficient information-processing network subject to evolutionary constraints.In particular, we find (i) high connectivity, (ii)high global accessibility, and (iii) large path di-versity. Additional evidence supports several furtherconstraints: (iv) a high bisection bandwidth (Fig.4D); (v) resilience to connectivity failures (globalconductance measurements in Fig. 5D show thatduring sequential removal of the weakest links, asubstantial decline in the network’s global effi-ciency is not reached until a density of 24%); and(vi) incremental expandability that allows addi-tion of new areas to the network during evolu-tion, without a substantial wiring overhaul tomaintain or improve performance, also supportedby optimal placement studies. The global efficien-cy and the optimal layout of the G29x29 are sup-portive of (vi).As seen in Fig. 5D, global efficiencystays constant with weak-link removal. Weaklinks are long-range and might be more prevalentin large brains. Conversely, adding long-rangelinks (during cortical expansion) seems not to af-fect the global efficiency, much less worsen it (aswould be expected in a complete overhaul). Interms of optimal layout, the total wiring inG29x29
[see (13)] is minimal as a consequence of theEDR. It remains minimal following the additionof new areas with strong links to their neighborsand progressively weaker links to distant areas.
This corresponds to an optimal spatial arrange-ment, consistent with incremental expandability.In an interesting parallel, a recent study on ef-ficient, massive data-processing networks showsthat for their purposes, random structures with apronounced core-periphery organization allowincremental growth without sacrificing theirhigh bisection bandwidth and throughput capa-bility (106).
Although primate neocortex shares a numberof common features with human-made, large-scaleinformation-processing networks, there are alsocrucial differences, and so the analogies shouldnot be overextended. One important difference isthat in current technological information networks,information (including a destination address) isencoded within the units (packets) that are sentalong the edges of the network (packet-switchingnetworks), whereas this does not appear to be thecase for the brain. Our results show that spatiallocation does influence the wiring properties ofthe brain. Further, in the brain, the location andtiming of activity (in the context of other firingactivities) represent the message (neural coding),thus linking network activity to the structuralproperties of the cortical network. In the Internetor World Wide Web, however, it does not matterwhere the routers are physically in space, becausethe packets are routed on the basis of networkaddresses encoded into the packet. This key dif-ference suggests that spatio-temporal networkmodels should hold more promise for brain sci-ence than generic, purely graph theoretical mod-els such as the SW model.
Future PerspectivesWhile the high density of the binary interarealgraph is not consistent with a SW architecture atthe computational level of a cortical area, the SW
V1V2
V4MT
DP
7a
STPc
TEO
TEpdSTPr
STPi
7m
PBr
7b2
5
10
8b
46d
9/46d24c
F2F1
8m
8l9/46v
ProM
F5
F7 V1
V2
V4MT
DP
7a
STPc
TEOTEpd
STPr
STPi 7m
PBr7b
2
510
8b46d
9/46d24c
F2
F18m
8l
9/46v
ProM
F5F7
A CB
Parietal Temporal FrontalOccipital Prefrontal
V1V2
V4
MT
DP
7a
STPc
TEO
TEpd
STPr
STPi
7m
PBr
7b
2
510
8b
46d
9/46d
24c
F2
F1
8m
8l
9/46v
ProM
F5
F7
41.7 106 mm 92.3 106 mm 45.6 106 mm
Fig. 6. Spatial positioning of areas and overall wire-length mini-mization. (A) A 3D representation of G29x29, nodes positioned at the bary-centers of the corresponding areas identified on brain surface reconstructions(not shown). Edges are visualized as straight lines, but the wire-length cal-culations for pairs of areas use the axonal trajectory generated as theshortest possible path restricted to the white matter. Color coded for regions(see key). Wire length is the product of the number of neurons involved in
the pathway with the estimated pathway length. (B) Random repositioningof areas with connectivity preservation leads to wire-length increase. (C) Anadapted harmony search algorithm reduces the wire length of the start-ing network in (B). Wire reduction is accompanied by restoration of arealadjacencies. Solutions that fail to reconstruct the initial network exhibitincreased wire length with respect to (A). Number in each panel refers towire lengths.
www.sciencemag.org SCIENCE VOL 342 1 NOVEMBER 2013 1238406-9
SPECIALSECTION
concept may nonetheless be relevant at finer spa-tial scales. For example, the high clustering andshort path lengths indicative of SW architectureare suggested by diffusion magnetic resonanceimaging (MRI) analysis at a node scale of a fewmillimeters (about the size of the voxels) (107).Here, the importance of the SW parameters re-vealed by this approach must be considered withrespect to the methodological thresholding im-posed by the whole-brain imaging technique. The
nonrandom connectivity at the single-cell levelraises the issue of SW architecture at this scale(108, 109). The rich variety of cell identitiesposits a conceptual challenge for the potential ofSW network at the single-cell level. Large-scalecircuit mapping at the single-cell level is notcurrently feasible, although innovative approachesmight conceivably provide the appropriate datain mice (110). At the interareal level, our resultsindicate that the spatially embedded nature of the
cortical network determines many of its proper-ties, such as structural and weighted graph char-acteristics. Could similar weight-distance relationsoperate for single neurons, thereby suggesting asimilar operational logic over different scales?Like interareal connectivity, local connectivityshows an exponential density decay (10), reflect-ing the decrease in the likelihood of synapticcontact with distance (111). Also, log-normal dis-tributions like that of interareal weights havebeen observed for the distribution of synapticstrengths of single neurons (109).
The EDR that we describe shows that thespatial constant of interareal density decay ac-counts for many of the binary and weighted fea-tures of the cortical graph, as well as the importantdesign feature of wire minimization. Given thehigh scalability of mammalian neocortex, accom-modating five orders of magnitude range of brainweight (112), we examined the spatial location ofcortical areas in the G29x29 subgraph and foundthat when magnitude of connections is taken intoaccount, it shows an optimal placement of areapositions indicating minimization of metabolicexpenditure on total wire length, also well pre-dicted by the EDR. Given these results it will beinstructive to explore the weight-distance rela-tions in different species to determine how thedecay parameter l changes with brain size. Thismay provide insights into a common rule govern-ing scaling properties of the brain and also allowimproved extrapolation of our understanding ofthe connectivity of the macaque brain obtainedusing invasive techniques to the larger and lessdirectly accessible human brain.
A core-periphery structure has been observedin other self-organized information-processingarchitectures, both human-made such as theWorldWide Web (113) and the Internet (114, 115), andin biological networks, such as in metabolism(116, 117), the immune system (118), and cellsignaling (119–121). The resulting bow tie is anevolutionarily favored structure for awide varietyof complex networks (122, 123), expressing thefact that functional or living systems have aninput interface, a processing unit, and an outputinterface. This is because these systems are not inthermodynamic equilibrium and are required tomaintain energy and matter flow through the sys-tem. While the overall bow-tie structure is com-mon, we have seen that for the brain it emergesthrough a counterstream organization of the di-rected links between core and periphery, showingits specific nature when compared to other bowties in biology or technical networks. However,the full details of this structural organization willonly become evident when additional tracer-basedanatomical data are incorporated.
Although the interareal connectivity data ex-plored here has revealed interesting features ofthe cortical network, many additional analysesremain to be done. It will be important to com-plement the quantification of connectivity by func-
Box 2. Glossary of technical terms.
1. Area: A region of the cortex with specific cytoarchitecture and associated with a function.Target area: An area that received a retrograde tracer injection. Source area: An areacontaining labeled neurons projecting to a target area.
2. Average path length: Average value of shortest path lengths between all node pairs inthe graph. Length here is measured in hop-counts along directed edges.
3. Binary specificity: The degree to which a network or a graph differs in its binary graphtheoretical properties from a random graph.
4. Bisection bandwidth: The minimum of the number of connections between two, equal-size partitions of the nodes of a graph, taken over all such partitions.
5. Clustering: The average of the fraction of connected neighbors of a node (fraction oftriangles).
6. Counterstream: Refers to the organization principle by which there are streams ascending(supragranular layer) and descending (infragranular layer) the cortical hierarchy (135).Recently, this has been extended to include a dual counterstream organization where anascending and descending stream is identified in each of the two compartments (12).
7. Dominating set: A set of nodes in a graph such that all nodes of the graph have at leastone edge with one of their end-nodes in this set.
8. Edge: A link or connection between two nodes directed from one to the other, hereinterareal pathway. There can be at most two directed links, oppositely oriented between anytwo nodes.
9. Edge-complete subgraph: A subgraph that has exactly the same connections between itsnodes as the connections between the same nodes in the larger graph that this subgraph ispart of.
10. FLN: Fraction of labeled neurons: For a given injection (target area i) and source area j,the FLN is the ratio fij between the number of labeled neurons in area j and the total numberof extrinsic (not in i) labeled neurons for that injection. We use FLN as a measure of weight(10, 58).
11. Gnxm (sub)graph or matrix: For every one of the n targets (injected areas), it specifieswhich of the m sources project into that target (0 if no projection, 1 if there is a projection).Here, G91x91 denotes the full graph of interareal connections, G29x91 represents the currentlyknown projections from all areas into the injected 29 areas, and G29x29 denotes the subgraphformed by the connections among the target areas only. The latter is edge-complete, i.e., thestatus of connectivity is fully known within this set of nodes.
12. Nodes: Discrete entities represented as points or vertices in graph theory for the purposeof studying the patterns of interactions among them (represented as links or edges). In thiscase, a node represents a cortical area.
13. SLN: The fraction of supragranular labeled neurons is defined for each source areaprojecting to an injected target area. SLN corresponds to the number of retrogradely labeledneurons located in the supragranular layer divided by the total number of neurons (in infra-and supragranular layers). SLN distinguishes FF and FB pathways and can be used to cal-culate hierarchical distance (12, 54, 55).
1 NOVEMBER 2013 VOL 342 SCIENCE www.sciencemag.org1238406-10
The Heavily Connected Brain

tional and improved molecular characterizationof cortical areas and also of the parent neurons(124–126). A necessary and complementary de-velopment will be to use anterograde tracers toexamine the laminar integration of interareal con-nectivity, combining quantification and morpho-logical characterization at the synaptic level(127, 128). Finally, our use of the term “canonicalmicrocircuit” in the sense of a stereotyped circuitconstituting a fundamental cortical building blockshould be tempered by the evidence for largeregional differences in cell densities and dendriticarbor sizes (129, 130). While it is generally ac-cepted that the local circuit exhibits cell-specificconnectivity across the cortex (thereby conform-ing to a canonical circuit) and likewise that thereare consistent input-output patterns across thedifferent areas (131), there is nevertheless only asingle quantitative interlaminar connectivity map,namely, for cat area 17 (132). The concept of thecanonical microcircuit provides a coherent frame-work for thinking about neocortical function, andevidence of variations of local connectivity pointto the need to establish additional quantitativeinterlaminar maps. Dynamic models built on ex-isting quantitative interlaminar maps (132, 133)give realistic dynamics (134). Extending this typeof modeling to include interareal relations be-comes a reasonable next step.
References and Notes1. S. L. Bressler, V. Menon, Large-scale brain networks in
cognition: Emerging methods and principles. TrendsCogn. Sci. 14, 277–290 (2010). doi: 10.1016/j.tics.2010.04.004; pmid: 20493761
2. V. B. Mountcastle, The columnar organization of theneocortex. Brain 120, 701–722 (1997). doi: 10.1093/brain/120.4.701; pmid: 9153131
3. M. G. Rosa, R. Tweedale, Brain maps, great and small:Lessons from comparative studies of primate visualcortical organization. Philos. Trans. R. Soc. Lond. B Biol.Sci. 360, 665–691 (2005). doi: 10.1098/rstb.2005.1626; pmid: 15937007
4. S. Zeki; The Ferrier Lecture, The Ferrier Lecture 1995behind the seen: The functional specialization of thebrain in space and time. Philos. Trans. R. Soc. Lond. BBiol. Sci. 360, 1145–1183 (2005). doi: 10.1098/rstb.2005.1666; pmid: 16147515
5. A. Schüz, M. Miller, Cortical Areas: Unity and Diversity(Taylor and Francis, London, 2002).
6. D. C. Van Essen, M. F. Glasser, D. L. Dierker, J. Harwell,Cortical parcellations of the macaque monkey analyzedon surface-based atlases. Cereb. Cortex 22, 2227–2240(2012). doi: 10.1093/cercor/bhr290; pmid: 22052704
7. S. L. Bressler, Inferential constraint sets in theorganization of visual expectation. Neuroinformatics 2,227–238 (2004). doi: 10.1385/NI:2:2:227; pmid: 15319518
8. N. T. Markov et al., A weighted and directed interarealconnectivity matrix for macaque cerebral cortex.Cereb. Cortex (2012). doi: 10.1093/cercor/bhs270;pmid: 23010748
9. J. L. Lanciego, F. G. Wouterlood, A half century ofexperimental neuroanatomical tracing. J. Chem.Neuroanat. 42, 157–183 (2011). doi: 10.1016/j.jchemneu.2011.07.001; pmid: 21782932
10. N. T. Markov et al., Weight consistency specifiesregularities of macaque cortical networks. Cereb. Cortex21, 1254–1272 (2011). doi: 10.1093/cercor/bhq201;pmid: 21045004
11. N. T. Markov et al., The role of long-range connections onthe specificity of the macaque interareal cortical network.Proc. Natl. Acad. Sci. U.S.A. 110, 5187–5192 (2013).doi: 10.1073/pnas.1218972110; pmid: 23479610
12. N. T. Markov et al., The anatomy of hierarchy:Feedforward and feedback pathways in macaque visualcortex. J. Comp. Neurol. n/a (2013). doi: 10.1002/cne.23458; pmid: 23983048
13. M. Ercsey-Ravasz et al., A predictive network model ofcerebral cortical connectivity based on a distance rule.Neuron 80, 184–197 (2013). doi: 10.1016/j.neuron.2013.07.036; pmid: 24094111
14. C. D. Gilbert, T. N. Wiesel, Morphology and intracorticalprojections of functionally characterised neurones in thecat visual cortex. Nature 280, 120–125 (1979).doi: 10.1038/280120a0; pmid: 552600
15. R. J. Douglas, K. A. C. Martin, D. Whitteridge, A canonicalmicrocircuit for neocortex. Neural Comput. 1, 480–488(1989). doi: 10.1162/neco.1989.1.4.480
16. R. J. Douglas, C. Koch, M. Mahowald, K. A. Martin,H. H. Suarez, Recurrent excitation in neocortical circuits.Science 269, 981–985 (1995). doi: 10.1126/science.7638624; pmid: 7638624
17. D. J. Felleman, D. C. Van Essen, Distributed hierarchicalprocessing in the primate cerebral cortex. Cereb. Cortex1, 1–47 (1991). doi: 10.1093/cercor/1.1.1; pmid: 1822724
18. A. M. Bastos et al., Canonical microcircuits for predictivecoding. Neuron 76, 695–711 (2012). doi: 10.1016/j.neuron.2012.10.038; pmid: 23177956
19. J. H. Kaas, T. A. Hackett, M. J. Tramo, Auditory processingin primate cerebral cortex. Curr. Opin. Neurobiol. 9,164–170 (1999) [published erratum appears inCurr. Opin. Neurobiol. 9, 500 (1999)]. doi: 10.1016/S0959-4388(99)80022-1; pmid: 10322185
20. D. Boussaoud, L. G. Ungerleider, R. Desimone, Pathwaysfor motion analysis: Cortical connections of the medialsuperior temporal and fundus of the superior temporalvisual areas in the macaque. J. Comp. Neurol. 296,462–495 (1990). doi: 10.1002/cne.902960311;pmid: 2358548
21. S. Shipp, The importance of being agranular: Acomparative account of visual and motor cortex. Philos.Trans. R. Soc. Lond. B Biol. Sci. 360, 797–814 (2005).doi: 10.1098/rstb.2005.1630; pmid: 15937013
22. R. A. Adams, S. Shipp, K. J. Friston, Predictions notcommands: Active inference in the motor system. BrainStruct. Funct. 218, 611–643 (2013). doi: 10.1007/s00429-012-0475-5; pmid: 23129312
23. H. Barbas, Pattern in the laminar origin of corticocorticalconnections. J. Comp. Neurol. 252, 415–422 (1986).doi: 10.1002/cne.902520310; pmid: 3793985
24. H. Barbas, N. Rempel-Clower, Cortical structure predictsthe pattern of corticocortical connections. Cereb. Cortex7, 635–646 (1997). doi: 10.1093/cercor/7.7.635;pmid: 9373019
25. E. Koechlin, C. Ody, F. Kouneiher, The architecture ofcognitive control in the human prefrontal cortex. Science302, 1181–1185 (2003). doi: 10.1126/science.1088545;pmid: 14615530
26. R. C. O’Reilly, S. A. Herd, W. M. Pauli, Computationalmodels of cognitive control. Curr. Opin. Neurobiol. 20,257–261 (2010). doi: 10.1016/j.conb.2010.01.008;pmid: 20185294
27. M. M. Botvinick, Hierarchical models of behavior andprefrontal function. Trends Cogn. Sci. 12, 201–208(2008). doi: 10.1016/j.tics.2008.02.009; pmid: 18420448
28. E. Bullmore, O. Sporns, The economy of brain networkorganization. Nat. Rev. Neurosci. 13, 336–349 (2012).pmid: 22498897
29. M. E. Raichle, Two views of brain function. Trends Cogn. Sci.14, 180–190 (2010). doi: 10.1016/j.tics.2010.01.008;pmid: 20206576
30. M. E. J. Newman, The structure and function of complexnetworks. SIAM Rev. 45, 167–256 (2003). doi: 10.1137/S003614450342480
31. D. J. Watts, S. H. Strogatz, Collective dynamics of ‘small-world’ networks. Nature 393, 440–442 (1998).doi: 10.1038/30918; pmid: 9623998
32. G. Tononi, O. Sporns, G. M. Edelman, A measure for braincomplexity: Relating functional segregation andintegration in the nervous system. Proc. Natl. Acad. Sci.U.S.A. 91, 5033–5037 (1994). doi: 10.1073/pnas.91.11.5033; pmid: 8197179
33. O. Sporns, C. J. Honey, Small worlds inside big brains.Proc. Natl. Acad. Sci. U.S.A. 103, 19219–19220 (2006).doi: 10.1073/pnas.0609523103; pmid: 17159140
34. C. J. Honey, R. Kötter, M. Breakspear, O. Sporns, Networkstructure of cerebral cortex shapes functional connectivityon multiple time scales. Proc. Natl. Acad. Sci. U.S.A. 104,10240–10245 (2007). doi: 10.1073/pnas.0701519104;pmid: 17548818
35. O. Sporns, G. Tononi, G. M. Edelman, Theoreticalneuroanatomy: Relating anatomical and functionalconnectivity in graphs and cortical connection matrices.Cereb. Cortex 10, 127–141 (2000). doi: 10.1093/cercor/10.2.127; pmid: 10667981
36. C. C. Hilgetag, G. A. Burns, M. A. O’Neill, J. W. Scannell,M. P. Young, Anatomical connectivity defines the organizationof clusters of cortical areas in the macaque monkey andthe cat. Philos. Trans. R. Soc. Lond. B Biol. Sci. 355, 91–110(2000). doi: 10.1098/rstb.2000.0551; pmid: 10703046
37. K. E. Stephan et al., Computational analysis of functionalconnectivity between areas of primate cerebral cortex.Philos. Trans. R. Soc. Lond. B Biol. Sci. 355, 111–126(2000). doi: 10.1098/rstb.2000.0552; pmid: 10703047
38. O. Sporns, J. D. Zwi, The small world of the cerebralcortex. Neuroinformatics 2, 145–162 (2004).doi: 10.1385/NI:2:2:145; pmid: 15319512
39. H. Kennedy, K. Knoblauch, Z. Toroczkai, Why datacoherence and quality is critical for understandinginterareal cortical networks. Neuroimage 80, 37–45(2013). doi: 10.1016/j.neuroimage.2013.04.031;pmid: 23603347
40. J. Vezoli et al., Quantitative analysis of connectivity in thevisual cortex: Extracting function from structure.Neuroscientist 10, 476–482 (2004). doi: 10.1177/1073858404268478; pmid: 15359013
41. For criteria for inclusion of injection sites, see Markov et al.(8); for discussion of the sensitivity and location of uptakezones of the tracers used, see supplementary informationin Markov et al. (10); for sampling frequency anddetection of weak connections see Vezoli et al. (40); foratlases and electronic data files, see www.core-nets.org.
42. M. E. J. Newman, Networks: An Introduction (OxfordUniv. Press, Oxford, 2010).
43. M. P. Young, The organization of neural systems in theprimate cerebral cortex. Proc. R. Soc. Lond. B Biol. Sci.252, 13–18 (1993). doi: 10.1098/rspb.1993.0040;pmid: 8389046
44. D. S. Modha, R. Singh, Network architecture of thelong-distance pathways in the macaque brain. Proc. Natl.Acad. Sci. U.S.A. 107, 13485–13490 (2010).doi: 10.1073/pnas.1008054107; pmid: 20628011
45. B. Jouve, P. Rosenstiehl, M. Imbert, A mathematicalapproach to the connectivity between the cortical visualareas of the macaque monkey. Cereb. Cortex 8, 28–39(1998). doi: 10.1093/cercor/8.1.28; pmid: 9510383
46. M. Barthélemy, Spatial networks. Phys. Rep. 499, 1–101(2011). doi: 10.1016/j.physrep.2010.11.002
47. K. S. Rockland, D. N. Pandya, Laminar origins andterminations of cortical connections of the occipital lobein the rhesus monkey. Brain Res. 179, 3–20 (1979).doi: 10.1016/0006-8993(79)90485-2; pmid: 116716
48. D. C. Van Essen, S. M. Zeki, The topographic organizationof rhesus monkey prestriate cortex. J. Physiol. 277,193–226 (1978). pmid: 418173
49. M. Wong-Riley, Reciprocal connections between striateand prestriate cortex in squirrel monkey as demonstratedby combined peroxidase histochemistry andautoradiography. Brain Res. 147, 159–164 (1978).doi: 10.1016/0006-8993(78)90781-3; pmid: 77701
50. J. H. Kaas, C. S. Lin, Cortical projections of area 18 in owlmonkeys. Vision Res. 17, 739–741 (1977). doi: 10.1016/S0042-6989(77)80013-8; pmid: 414440
51. J. Tigges, W. B. Spatz, M. Tigges, Reciprocal point-to-point connections between parastriate and striate cortex
www.sciencemag.org SCIENCE VOL 342 1 NOVEMBER 2013 1238406-11
SPECIALSECTION

in the squirrel monkey (Saimiri). J. Comp. Neurol. 148,481–489 (1973). doi: 10.1002/cne.901480406;pmid: 4350354
52. J. H. R. Maunsell, D. C. van Essen, The connections of themiddle temporal visual area (MT) and their relationshipto a cortical hierarchy in the macaque monkey.J. Neurosci. 3, 2563–2586 (1983). pmid: 6655500
53. C. C. Hilgetag, M. A. O’Neill, M. P. Young, Indeterminateorganization of the visual system. Science 271, 776–777(1996). doi: 10.1126/science.271.5250.776; pmid: 8628990
54. P. Barone, A. Batardiere, K. Knoblauch, H. Kennedy,Laminar distribution of neurons in extrastriate areasprojecting to visual areas V1 and V4 correlates with thehierarchical rank and indicates the operation of a distancerule. J. Neurosci. 20, 3263–3281 (2000).pmid: 10777791
55. A. T. Reid, A. Krumnack, E. Wanke, R. Kötter,Optimization of cortical hierarchies with continuousscales and ranges. Neuroimage 47, 611–617 (2009).doi: 10.1016/j.neuroimage.2009.04.061; pmid: 19398021
56. A. Krumnack, A. T. Reid, E. Wanke, G. Bezgin, R. Kötter,Criteria for optimizing cortical hierarchies withcontinuous ranges. Front. Neuroinform. 4, 7 (2010).pmid: 20407634
57. N. T. Markov, H. Kennedy, The importance of beinghierarchical. Curr. Opin. Neurobiol. 23, 187–194 (2013).doi: 10.1016/j.conb.2012.12.008; pmid: 23339864
58. S. Clavagnier, A. Falchier, H. Kennedy, Long-distancefeedback projections to area V1: Implications formultisensory integration, spatial awareness, and visualconsciousness. Cogn. Affect. Behav. Neurosci. 4,117–126 (2004). doi: 10.3758/CABN.4.2.117;pmid: 15460918
59. H. Supèr, V. A. Lamme, Strength of figure-ground activityin monkey primary visual cortex predicts saccadicreaction time in a delayed detection task. Cereb. Cortex17, 1468–1475 (2007). doi: 10.1093/cercor/bhl058;pmid: 16920884
60. J. F. Jehee, P. R. Roelfsema, G. Deco, J. M. Murre,V. A. Lamme, Interactions between higher and lowervisual areas improve shape selectivity of higher levelneurons-explaining crowding phenomena. Brain Res.1157, 167–176 (2007). doi: 10.1016/j.brainres.2007.03.090; pmid: 17540349
61. H. S. Scholte, J. Jolij, J. J. Fahrenfort, V. A. Lamme,Feedforward and recurrent processing in scene segmentation:Electroencephalography and functional magnetic resonanceimaging. J. Cogn. Neurosci. 20, 2097–2109 (2008).doi: 10.1162/jocn.2008.20142; pmid: 18416684
62. C. M. Chen et al., Functional anatomy and interaction offast and slow visual pathways in macaque monkeys.Cereb. Cortex 17, 1561–1569 (2007). doi: 10.1093/cercor/bhl067; pmid: 16950866
63. L. B. Ekstrom, P. R. Roelfsema, J. T. Arsenault,G. Bonmassar, W. Vanduffel, Bottom-up dependentgating of frontal signals in early visual cortex. Science321, 414–417 (2008). doi: 10.1126/science.1153276;pmid: 18635806
64. M. W. Self, R. N. Kooijmans, H. Supèr, V. A. Lamme,P. R. Roelfsema, Different glutamate receptors conveyfeedforward and recurrent processing in macaque V1.Proc. Natl. Acad. Sci. U.S.A. 109, 11031–11036(2012). doi: 10.1073/pnas.1119527109;pmid: 22615394
65. H. Kennedy, J. Bullier, A double-labeling investigation ofthe afferent connectivity to cortical areas V1 and V2 ofthe macaque monkey. J. Neurosci. 5, 2815–2830 (1985).pmid: 3840201
66. K. S. Rockland, in Extrastriate Cortex in Primates,K. S. Rockland, J. H. Kaas, A. Peters, Eds. (Plenum Press,New York, 1997), vol. 12, pp. 243-293.
67. J. Tigges et al., Areal and laminar distribution of neuronsinterconnecting the central visual cortical areas 17, 18,19, and MT in squirrel monkey (Saimiri). J. Comp. Neurol.202, 539–560 (1981). doi: 10.1002/cne.902020407;pmid: 7298914
68. J. Bullier, in 23 Problems in Systems Neuroscience,J. L. van Hemmen, T. J. Sejnowski, Eds. (Oxford UniversityPress USA, 2006), pp. 103-132.
69. T. S. Lee, D. Mumford, Hierarchical Bayesian inference inthe visual cortex. J. Opt. Soc. Am. A Opt. Image Sci. Vis.20, 1434–1448 (2003). doi: 10.1364/JOSAA.20.001434;pmid: 12868647
70. K. Friston, The free-energy principle: A unified braintheory? Nat. Rev. Neurosci. 11, 127–138 (2010).doi: 10.1038/nrn2787; pmid: 20068583
71. E. A. Buffalo, P. Fries, R. Landman, T. J. Buschman,R. Desimone, Laminar differences in gamma and alphacoherence in the ventral stream. Proc. Natl. Acad.Sci. U.S.A. 108, 11262–11267 (2011). doi: 10.1073/pnas.1011284108; pmid: 21690410
72. D. Xing, C. I. Yeh, S. Burns, R. M. Shapley, Laminaranalysis of visually evoked activity in the primaryvisual cortex. Proc. Natl. Acad. Sci. U.S.A. 109,13871–13876 (2012). doi: 10.1073/pnas.1201478109;pmid: 22872866
73. G. G. Gregoriou, S. J. Gotts, H. Zhou, R. Desimone,High-frequency, long-range coupling between prefrontaland visual cortex during attention. Science 324,1207–1210 (2009). doi: 10.1126/science.1171402;pmid: 19478185
74. C. A. Bosman et al., Attentional stimulus selectionthrough selective synchronization between monkey visualareas. Neuron 75, 875–888 (2012). doi: 10.1016/j.neuron.2012.06.037; pmid: 22958827
75. R. F. Salazar, N. M. Dotson, S. L. Bressler, C. M. Gray,Content-specific fronto-parietal synchronization duringvisual working memory. Science 338, 1097–1100(2012). doi: 10.1126/science.1224000; pmid: 23118014
76. X. J. Wang, Neurophysiological and computationalprinciples of cortical rhythms in cognition. Physiol. Rev.90, 1195–1268 (2010). doi: 10.1152/physrev.00035.2008; pmid: 20664082
77. P. Fries, A mechanism for cognitive dynamics: Neuronalcommunication through neuronal coherence. TrendsCogn. Sci. 9, 474–480 (2005). doi: 10.1016/j.tics.2005.08.011; pmid: 16150631
78. J. C. Anderson, H. Kennedy, K. A. Martin, Pathways ofattention: Synaptic relationships of frontal eye field toV4, lateral intraparietal cortex, and area 46 in macaquemonkey. J. Neurosci. 31, 10872–10881 (2011).doi: 10.1523/JNEUROSCI.0622-11.2011; pmid: 21795539
79. F. Crick, C. Koch, Constraints on cortical and thalamicprojections: The no-strong-loops hypothesis. Nature 391,245–250 (1998). doi: 10.1038/34584; pmid: 9440687
80. L. Harriger, M. P. van den Heuvel, O. Sporns, Rich cluborganization of macaque cerebral cortex and its rolein network communication. PLOS ONE 7, e46497 (2012).doi: 10.1371/journal.pone.0046497; pmid: 23029538
81. M. A. de Reus, M. P. van den Heuvel, Rich cluborganization and intermodule communication in the catconnectome. J. Neurosci. 33, 12929–12939 (2013).doi: 10.1523/JNEUROSCI.1448-13.2013; pmid: 23926249
82. M. P. van den Heuvel, R. S. Kahn, J. Goñi, O. Sporns,High-cost, high-capacity backbone for global braincommunication. Proc. Natl. Acad. Sci. U.S.A. 109,11372–11377 (2012). doi: 10.1073/pnas.1203593109;pmid: 22711833
83. C. Bron, J. Kerbosch, Algorithm 457: Finding all cliquesof an undirected graph. Commun. ACM 16, 575–577(1973). doi: 10.1145/362342.362367
84. R. Milo et al., Superfamilies of evolved and designednetworks. Science 303, 1538–1542 (2004).doi: 10.1126/science.1089167; pmid: 15001784
85. V. Latora, M. Marchiori, Economic small-world behaviorin weighted networks. Eur. Phys. J. B 32, 249–263(2003). doi: 10.1140/epjb/e2003-00095-5
86. I. Vragović, E. Louis, A. Díaz-Guilera, Efficiency ofinformational transfer in regular and complex networks.Phys. Rev. E Stat. Nonlin. Soft Matter Phys. 71 (3 Pt. 2A),036122 (2005). doi: 10.1103/PhysRevE.71.036122;pmid: 15903508
87. M. G. Kitzbichler, R. N. Henson, M. L. Smith, P. J. Nathan,E. T. Bullmore, Cognitive effort drives workspaceconfiguration of human brain functional networks.J. Neurosci. 31, 8259–8270 (2011). doi: 10.1523/JNEUROSCI.0440-11.2011; pmid: 21632947
88. S. Boccaletti, V. Latora, Y. Moreno, M. Chavez,D. U. Hwang, Complex networks: Structure and dynamics.Phys. Rep. 424, 175–308 (2006). doi: 10.1016/j.physrep.2005.10.009
89. C. Cherniak, Z. Mokhtarzada, R. Rodriguez-Esteban,K. Changizi, Global optimization of cerebral cortex layout.Proc. Natl. Acad. Sci. U.S.A. 101, 1081–1086 (2004).doi: 10.1073/pnas.0305212101; pmid: 14722353
90. V. A. Klyachko, C. F. Stevens, Connectivity optimizationand the positioning of cortical areas. Proc. Natl. Acad.Sci. U.S.A. 100, 7937–7941 (2003). doi: 10.1073/pnas.0932745100; pmid: 12796510
91. A. Raj, Y. H. Chen, The wiring economy principle:Connectivity determines anatomy in the human brain.PLOS ONE 6, e14832 (2011). doi: 10.1371/journal.pone.0014832; pmid: 21915250
92. M. Kaiser, C. C. Hilgetag, Nonoptimal componentplacement, but short processing paths, due tolong-distance projections in neural systems. PLOSComput. Biol. 2, e95 (2006). doi: 10.1371/journal.pcbi.0020095; pmid: 16848638
93. C. Cherniak, Component placement optimization in thebrain. J. Neurosci. 14, 2418–2427 (1994).pmid: 8158278
94. C. Cherniak, Neural wiring optimization. Prog. Brain Res.195, 361–371 (2012). doi: 10.1016/B978-0-444-53860-4.00017-9; pmid: 22230636
95. C. Cherniak, M. Changizi, D. Kang, Large-scale optimizationof neuron arbors. Phys. Rev. E Stat. Phys. Plasmas FluidsRelat. Interdiscip. Topics 59 (5 Pt. B), 6001–6009 (1999).doi: 10.1103/PhysRevE.59.6001; pmid: 11969583
96. D. B. Chklovskii, Optimal sizes of dendritic and axonalarbors in a topographic projection. J. Neurophysiol. 83,2113–2119 (2000). pmid: 10758121
97. D. B. Chklovskii, T. Schikorski, C. F. Stevens, Wiringoptimization in cortical circuits. Neuron 34, 341–347(2002). doi: 10.1016/S0896-6273(02)00679-7;pmid: 11988166
98. A. A. Koulakov, D. B. Chklovskii, Orientation preferencepatterns in mammalian visual cortex: A wire lengthminimization approach. Neuron 29, 519–527 (2001).doi: 10.1016/S0896-6273(01)00223-9; pmid: 11239440
99. M. Rivera-Alba et al., Wiring economy and volumeexclusion determine neuronal placement in theDrosophila brain. Curr. Biol. 21, 2000–2005 (2011).doi: 10.1016/j.cub.2011.10.022; pmid: 22119527
100. W. Wang, J. J. Slotine, On partial contraction analysis forcoupled nonlinear oscillators. Biol. Cybern. 92, 38–53(2005). doi: 10.1007/s00422-004-0527-x; pmid: 15650898
101. S. Herculano-Houzel, B. Mota, P. Wong, J. H. Kaas,Connectivity-driven white matter scaling and folding inprimate cerebral cortex. Proc. Natl. Acad. Sci. U.S.A.107, 19008–19013 (2010). doi: 10.1073/pnas.1012590107; pmid: 20956290
102. R. J. Douglas, K. A. Martin, Behavioral architecture of thecortical sheet. Curr. Biol. 22, R1033–R1038 (2012).doi: 10.1016/j.cub.2012.11.017; pmid: 23257185
103. K. Man, J. Kaplan, H. Damasio, A. Damasio, Neuralconvergence and divergence in the mammalian cerebralcortex: From experimental neuroanatomy to functionalneuroimaging. J. Comp. Neurol. 10.1002/cne.23408 (2013).doi: 10.1002/cne.23408; pmid: 23840023
104. S. Dehaene, J. P. Changeux, Experimental and theoreticalapproaches to conscious processing. Neuron 70, 200–227(2011). doi: 10.1016/j.neuron.2011.03.018; pmid: 21521609
105. H. Kennedy, C. Dehay, Self-organization and interarealnetworks in the primate cortex. Prog. Brain Res. 195,341–360 (2012). doi: 10.1016/B978-0-444-53860-4.00016-7; pmid: 22230635
106. A. Singla, C.-Y. Hong, L. Popa, P. Brighten Godfrey, in3rd USENIX Workshop on hot topics in cloud computing(HotCloud) (2011).
107. P. Hagmann et al., Mapping human whole-brainstructural networks with diffusion MRI. PLOS ONE 2, e597(2007). doi: 10.1371/journal.pone.0000597;pmid: 17611629
108. Y. Yoshimura, J. L. Dantzker, E. M. Callaway, Excitatorycortical neurons form fine-scale functional networks.
1 NOVEMBER 2013 VOL 342 SCIENCE www.sciencemag.org1238406-12
The Heavily Connected Brain

Nature 433, 868–873 (2005). doi: 10.1038/nature03252; pmid: 15729343
109. S. Song, P. J. Sjöström, M. Reigl, S. Nelson,D. B. Chklovskii, Highly nonrandom features of synapticconnectivity in local cortical circuits. PLOS Biol. 3, e68(2005). doi: 10.1371/journal.pbio.0030068; pmid: 15737062
110. A. M. Zador et al., Sequencing the connectome.PLOS Biol. 10, e1001411 (2012). doi: 10.1371/journal.pbio.1001411; pmid: 23109909
111. V. Braitenberg, A. Schüz, Cortex: Statistics and Geometryof Neuronal Connectivity (Springer-Verlag, BerlinHeidelberg New York, ed. 2, 1998).
112. G. F. Striedter, Principles of Brain Evolution (SinauerAssociates, Sunderland, MA, 2005).
113. A. Broder et al., Graph structure in the Web. Comput.Netw. 33, 309–320 (2000). doi: 10.1016/S1389-1286(00)00083-9
114. S. L. Tauro, C. Palmer, G. Siganos, M. Faloutsos, in GlobalTelecommunications Conference, 2001. GLOBECOM'01.IEEE (IEEE, San Antonio, TX, 2001), vol. 3, pp. 1667–1671.
115. G. Siganos, S. L. Tauro, M. Faloutsos, Jellyfish: Aconceptual model for the as internet topology. J. Commun.Networks 8, 339–350 (2006). doi: 10.1109/JCN.2006.6182774
116. H. Ma et al., The Edinburgh human metabolic networkreconstruction and its functional analysis. Mol. Syst. Biol. 3,135 (2007). doi: 10.1038/msb4100177; pmid: 17882155
117. H. Ma, A. P. Zeng, Reconstruction of metabolic networksfrom genome data and analysis of their global structurefor various organisms. Bioinformatics 19, 270–277(2003). doi: 10.1093/bioinformatics/19.2.270;pmid: 12538249
118. M. Natarajan, K. M. Lin, R. C. Hsueh, P. C. Sternweis,R. Ranganathan, A global analysis of cross-talk in amammalian cellular signalling network. Nat. Cell Biol. 8,571–580 (2006). doi: 10.1038/ncb1418; pmid: 16699502
119. K. Oda, H. Kitano, A comprehensive map of the toll-likereceptor signaling network. Mol. Syst. Biol. 2, 20060015 (2006).
120. K. Oda, Y. Matsuoka, A. Funahashi, H. Kitano, Acomprehensive pathway map of epidermal growth factor
receptor signaling. Mol. Syst. Biol. 1, 2005 0010(2005).
121. N. Polouliakh, R. Nock, F. Nielsen, H. Kitano, G-proteincoupled receptor signaling architecture of mammalianimmune cells. PLOS ONE 4, e4189 (2009). doi: 10.1371/journal.pone.0004189; pmid: 19142232
122. M. Csete, J. Doyle, Bow ties, metabolism and disease.Trends Biotechnol. 22, 446–450 (2004). doi: 10.1016/j.tibtech.2004.07.007; pmid: 15331224
123. J. C. Doyle, M. Csete, Architecture, constraints, and behavior.Proc. Natl. Acad. Sci. U.S.A. 108 (suppl. 3), 15624–15630(2011). doi: 10.1073/pnas.1103557108; pmid: 21788505
124. T. Yamamori, Selective gene expression in regionsof primate neocortex: Implications for corticalspecialization. Prog. Neurobiol. 94, 201–222(2011). doi: 10.1016/j.pneurobio.2011.04.008;pmid: 21621585
125. P. R. Hof, J. H. Morrison, Neurofilament proteindefines regional patterns of cortical organization inthe macaque monkey visual system: A quantitativeimmunohistochemical analysis. J. Comp. Neurol. 352,161–186 (1995). doi: 10.1002/cne.903520202;pmid: 7721988
126. A. Bernard et al., Transcriptional architecture of theprimate neocortex. Neuron 73, 1083–1099 (2012).doi: 10.1016/j.neuron.2012.03.002; pmid: 22445337
127. Q. Wang, O. Sporns, A. Burkhalter, Network analysis ofcorticocortical connections reveals ventral and dorsalprocessing streams in mouse visual cortex. J. Neurosci.32, 4386–4399 (2012). doi: 10.1523/JNEUROSCI.6063-11.2012; pmid: 22457489
128. J. C. Anderson, T. Binzegger, K. A. Martin, K. S. Rockland,The connection from cortical area V1 to V5: A lightand electron microscopic study. J. Neurosci. 18,10525–10540 (1998). pmid: 9852590
129. C. E. Collins, Variability in neuron densities across thecortical sheet in primates. Brain Behav. Evol. 78, 37–50(2011). doi: 10.1159/000327319; pmid: 21691046
130. Q. Wen, A. Stepanyants, G. N. Elston, A. Y. Grosberg,D. B. Chklovskii, Maximization of the connectivityrepertoire as a statistical principle governing the shapes
of dendritic arbors. Proc. Natl. Acad. Sci. U.S.A. 106,12536–12541 (2009). doi: 10.1073/pnas.0901530106;pmid: 19622738
131. R. J. Douglas, K. A. Martin, Neuronal circuits of the neocortex.Annu. Rev. Neurosci. 27, 419–451 (2004). doi: 10.1146/annurev.neuro.27.070203.144152; pmid: 15217339
132. T. Binzegger, R. J. Douglas, K. A. Martin, A quantitativemap of the circuit of cat primary visual cortex.J. Neurosci. 24, 8441–8453 (2004). doi: 10.1523/JNEUROSCI.1400-04.2004; pmid: 15456817
133. A. M. Thomson, D. C. West, Y. Wang, A. P. Bannister,Synaptic connections and small circuits involving excitatoryand inhibitory neurons in layers 2-5 of adult rat andcat neocortex: Triple intracellular recordings and biocytinlabelling in vitro. Cereb. Cortex 12, 936–953 (2002).doi: 10.1093/cercor/12.9.936; pmid: 12183393
134. T. C. Potjans, M. Diesmann, The cell-type specificcortical microcircuit: Relating structure and activityin a full-scale spiking network model. Cereb. Cortex(2012). doi: 10.1093/cercor/bhs358; pmid: 23203991
135. S. Ullman, in High-Level Vision (Bradford/MIT Press,Cambridge, MA, 2000).
136. M. D. Humphries, K. Gurney, T. J. Prescott, The brainstemreticular formation is a small-world, not scale-free,network. Proc. Biol. Sci. 273, 503–511 (2006).doi: 10.1098/rspb.2005.3354; pmid: 16615219
Acknowledgements: We acknowledge C. Lamy and P. Miseryfor histology and M. A. Gariel for data analysis. This workwas supported by FP6-2005 IST-1583 (H.K.); FP7-2007ICT-216593 (H.K.); ANR-11-BSV4-501 (H.K.); LabEx CORTEX(ANR-11-LABX-0042) (H.K.); PN-II-RU-TE-2011-3-0121,FP7-PEOPLE-2011-IIF-299915 (M.E.-R.); National Institute ofMental Health grant R01 MH60974 (D.C.V.E.); Notre Dame’sInterdisciplinary Center for Network Science and Applications(iCeNSA) funds; and, in part, by grant FA9550-12-1-0405 from theU.S. Air Force Office of Scientific Research and Defense AdvancedResearch Projects Agency (Z.T.).
10.1126/science.1238406
www.sciencemag.org SCIENCE VOL 342 1 NOVEMBER 2013 1238406-13
SPECIALSECTION


