Embed Size (px)
Citation preview
Plant Cell, Tissue and Organ Culture 31: 37-46, 1992. (~) 1992 Ktuwer Academic Publishers. Printed in the Netherlands.
Quantification of organelle changes in plant suspension cultures during growth
Bonnie S. Watson, John S. Fletcher* & Scott D. Russell Department of Botany and Microbiology, University of Oklahoma, 770 Van Vleet Oval, Norman, Oklahoma 73019 (* requests for offprints)
Received 14 February 1991; accepted in revised form 16 March 1992
Key words: cell culture, development, stereology, ultrastructure
Abstract
Stereological techniques were used to quantify ultrastructural changes which occurred during matura- tion of cultured Paul's Scarlet rose cells. The volume and ultrastructural composition of young, dividing, unsynchronized 5-day-old cells were compared to that of mature, nondividing 14-day-old cells. The volume of the 14-day-old cells was 4-fold greater than that of the 5-day-old cells, primarily due to vacuole expansion. Numerous quantitative changes occurred in the organelle composition during cell maturation, but distinctive differences were observed in the magnitude and direction of change among the different types of organelles. There was an overall decline in the plastid population as measured by both percent of cell volume and numbers of plastids per cell. The percent of cell volume and numbers of lipid bodies increased, whereas the percent volume of the mitochondria remained relatively constant while the number per cell declined.
Introduction
In previous work with plant cultures, it has been shown that under regimented growth conditions rapidly growing suspension cultures pass through a sequence of growth periods: unsynchronized cell division, expansion, and stationary (non- dividing-nonexpanding) (King & Street 1973). Each period lasts several days and is similar to one of the developmental stages characteristic of cells present in meristematic regions of intact plants. With rose cultures it has been shown that as the cells progress through the various growth periods, a number of important physiological processes, organic acid metabolism (Fletcher & Beevers 1970), amino acid synthesis (Hunt & Fletcher 1976; Nesius & Fletcher 1975), respira- tion (Hunt & Fletcher 1976), and protein synthe- sis (Hunt & Fletcher 1976; Mohanty & Fletcher 1980) change dramatically. It has also been es-
tablished with various cell lines that during cul- ture growth cells experience numerous ultra- structural changes (Fowke 1986; Sutton-Jones & Street 1968). The relationship between physio- logical and ultrastructural changes in plant cul- tures is not well understood, and was therefore the focus of this investigation.
Stereological analyses originally introduced by Delesse in 1847 to examine geological specimens has been used very effectively by plant scientists to quantify the ultrastructural composition of cells in several tissues and organs (Briarty 1980; Forde & Steer 1976; Hajibagheri et al. 1984; Kunce et al. 1984; Mauseth 1980; Toth 1982). Our study employed morphometric analysis to examine plant cultures. We quantified and com- pared the ultrastructural features of rapidly di- viding, unsynchronized 5-day-old cells with ma- ture, nondividing 14-day-old cells. The potential significance of the differences was discussed in
38
relationship to physiological changes reported in earlier studies with rose cells.
Materials and methods
Plant material
Nonphotosynthet ic suspension cultures of Rosa cv. Paul's Scarlet cells were grown in 250ml flasks containing 80 ml of sterile MPR medium, pH 5.5 (Reider et al. 1982). This line of cultured cells, started from pith tissue in 1957 (Tulecke 1963), has been maintained in suspension since 1972. The cultures were grown in the dark on a New Brunswick model V rotary shaker operated at 180 rpm. The temperature was kept at a con- stant 25°C. New cultures were started every two weeks by inoculating a flask of fresh medium with approximately 0.5 g of cells taken from a 14-day-old culture.
Cell volume determinations
Since this cell line has the tendency to grow as aggregates (Nesius & Fletcher 1975) the volume of individual cells was difficult to determine. To ensure an accurate measurement, two methods were used to determine cell volume: the classi- cal, micrometer method (Nesius et al. 1972) was applied to external cells and a new method was developed using volume of the cell mass divided by the number of cells in the aggregate as de- termined by nuclear DNA fluorochromes.
In the micrometer method, individual cells at the perimeter of the cluster were measured using a micrometer eyepiece calibrated with a stage micrometer . Lengths and diameters of 21 to 22 cells were measured on a Nikon microscope and the average cell volume calculated by assuming a capsule-shape for the cells as described in (Jones et al. 1973), using the formula:
Average Cell Volume = 7r{(S/2)2(L - S)
+ 4 /3(S/2) 3 }
where S = diameter of the cell and L = length of the cell.
In the second, new method we determined the average volume of individual cells by dividing
the volume of a single clump by the number of cells within the clump, as visualized by fluores- cence of nuclear DNA. Cell aggregates were fixed in FAA (Formalin-Alcohol-Acetic Acid) for 30min, then incubated with 5 ~ g m l Hoechst 33258 D N A fluorochrome for 10rain. This f luorochrome selectively intercalated into the double-stranded helical DNA structure, al- lowing nuclei to be readily observed. Sixteen to twenty spherical clumps of cells" at each develop- ment stage were examined on a Leitz Dialux 20 microscope equipped with UV fluorescence, phase contrast and microphotographic equip- ment. Each clump was photographed using phase contrast at a magnification of x 100; final print magnification was x160. Individual nuclei within the clump were counted using fluores- cence microscopy by focusing through different focal planes within the cell clump. Cells of this particular line are uninucleated.
Clump area was determined by measuring the clump perimeter on each micrograph with a Gel- man Polar Planimeter (sensitive to .01 in2). The radius of the clump was found using the formula for area of a circle (r = A/~r) and this number was substituted into the formula for the volume of a sphere ( V = 4/37rr 3) to yield clump volume.
Specimen preparation for electron microscopy
Cells were collected on a Miracloth filter and fixed at room temperature for 1.5h in 3% glutaraldehyde, pH 7.3. Millonig's sodium phos- phate buffer diluted 1:1 (v:v) with MPR medium was used to buffer the glutaraldehyde and balance the osmolarity. After washing × 3 with 0 .1M KH2PO4, pH 7.2, the cells were post-fixed in 2% phosphate buffered OsO 4, pH 7.2, for 30 rain at 0°C and then rinsed x 3 with ice-cold distilled water. Material was dehydrated using a graded series of acetone (15, 30, 50, 70, 90, 100% x 2). The cells were infiltrated and embedded in Spurr's resin and sectioned (80- 100nm) with glass knives on a Sorvall MT2-B ultramicrotome. Sections were stained with uranyl acetate and lead citrate using the drop suspension method (Galey & Nilsson 1966), then mounted on formvar/carbon-coated slot grids. Thin sections were examined on a Zeiss 10 trans- mission electron microscope.
Sampling methods
Replicate cell samples were harvested from 5- and 14-day-old cultures during three different 14 day growth cycles. At least six blocks were pre- pared per growth cycle; from these one block was selected for sectioning. Thin sections were taken at two levels separated by a sufficient number of thick sections to assure that no cell was sampled twice. Only one section per level was analyzed, yielding a total of six samples per age. Five to seven electron micrographs (x 2000) of each section were taken at regular intervals to assure that non-overlapping areas were sampled. Higher magnification micrographs (×8000) were made within the field of the lower magnification micrographs. In a few cases, when the percent cytoplasm in the x2000 micrographs was ex- t remely low, the cytoplasm in adjacent cells was examined at x8000. Care was taken to ensure that there was never any overlap in the fields which were analyzed at x8000. Final print mag- nification was x4700 for the lower magnification prints and x18800 for the higher magnification micrographs.
Stereological procedures
Weibel-type hierarchical test systems (Weibel & Bolender 1973) were used to determine the vol- ume density or fraction (Vv) of each cell compo- nent studied. Cell wall, vacuole, nuclear and cytoplasmic volume were estimated by superim- posing a plastic overlay of a square lattice (d = 25 mm) onto the lower magnification electron micrographs. Three hundred points per sample were counted, giving a total of 1800 points per age. This number of points assured a confidence level of 95% for sampling components having a volume fraction of 9% (Weibel 1979).
A similar method was used to estimate the volume fractions of plastids, mitochondria, lipid bodies, ER, Golgi bodies and hyaloplasm using a denser square lattice overlay (d = 10mm) and the higher magnification micrographs. Only points falling on cytoplasmic components were counted. A total of 4200 points (700 points/ sample) was counted for samples from 5-day-old cultures; the confidence level corresponding with this number of points was 95% for components
39
having volume densities of 5% or larger (Weibel 1979). Due to the small amount of cytoplasm found in cells from older cultures, only 300 points per sample (1800 points total) were ana- lyzed for samples from 14-day-old cultures; re- suiting in confidence levels of 95% for sampling components with Vv = 9% (Weibel 1979). The percentage of cell volume occupied by each com- ponent was determined by multiplying the vol- ume fraction by 100.
Numbers of mitochondria, plastids, and lipid bodies were determined by using the formula (Toth 1982; Weibel & Bolender 1973; Weibel 1979).
Na )3
where /3 = the shape coefficient, k = the size co- efficient, Na = number of points falling on the organelle and Pp = total number of points coun- ted. The coefficient 1.07 was used as k for each of these organelles, which was sufficient for size variations of up to 25%. The shape coefficient was determined by relating the ratio of length over width (~r) for each organelle to particle volume. The length and width of 28 mitochon- dria, 17 plastids and 13 lipids bodies were mea- sured, a mean ratio for each organelle type was calculated and /3 was determined from a graph published by Weibel & Bolender (1973). The calculated /3 was 1.47, 1.83 and 1.39 for mito- chondria, plastids and lipid bodies, respectively. The average volume of an organelle class was determined by dividing the total organelle vol- ume by the number of organelles in that class.
Both mitochondria and lipid bodies had a uniform shape and the variation in length/diam- eter ratios for each of these organelle types was small. In contrast, the morphology of plastids appeared variable. In calculations involving plas- tids it was assumed that although they varied in shape, their volumes were fairly uniform. Based on this assumption, a capsule shape was used to determine the length/diameter ratios which were then used to calculate plastid volume. Because of the potential error associated with the uniform shape assumption, a second method was used to determine the volume of plastids in young cells. Eleven plastids from day 5 cells were serially
40
recons t ruc ted , using the Boulder H V E M 3-D Recons t ruc t ion p rog ram (Young et al. 1987). A value o f 0.17 + 0.017 pt, m 3 was de te rmined by the recons t ruc t ion me thod , c o m p a r e d to the shape coefficient der ived value of 0.21 ixm 3. Approxi - m a t e a g r e e m e n t be tween the average plastid vol- u m e de t e rmined by the two different me thods gave c redence to the assumpt ion that the plastids were fairly un i fo rm in volume.
The vo lume of older , mature cells was more than 4 times greater than the vo lume of the younge r , dividing cells (Table 2). This vo lume change was mainly due to vacuole expansion; the vacuole increased 563% (Table 2) in volume as the cells aged. On a percent basis the vacuole increased f rom 69.5% of the total cell vo lume in y o u n g e r cells to 83.6% in older cells (Table 3). C o n c u r r e n t with this increase in vacuole size was
Results
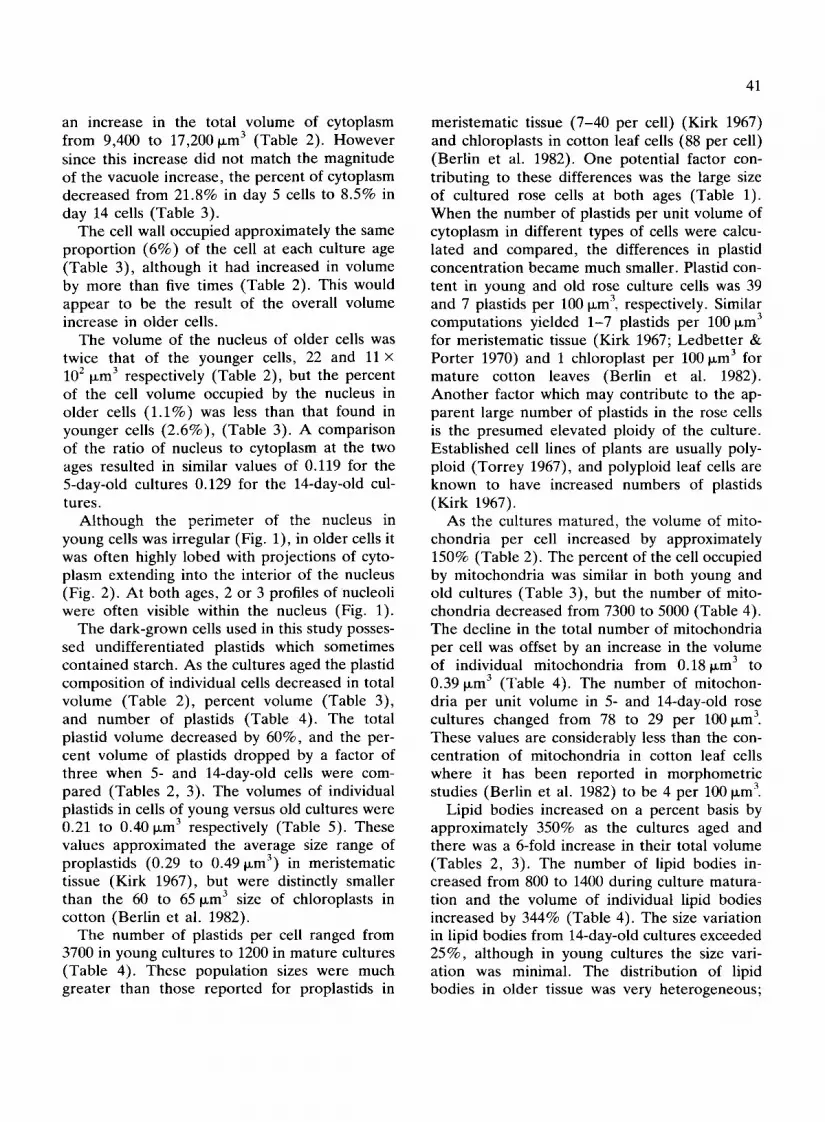
T h e general appearance of cul tured rose cells was similar to that r epor ted for o ther plant tissue cul tures ( D a v e y & Street 1971; Fowke 1986; Su t ton-Jones & Street 1968). The 5-day-old, di- viding cells were smaller than the 14-day-old, m a t u r e nondividing cells, but cells were highly vacuo la ted at bo th ages (Figs 4, 5). D a y five cells con ta ined cytoplasmic strands extending into the cen te r o f the cell (Fig. 4), whereas by day 14 the re was usually only a thin s trand of cytoplasm lining the p lasma m e m b r a n e (Figs 3, 5).
The two me thods used to measure absolute cell vo lume yielded similar results. The clump vo lume /ce l l n u m b e r m e t h o d resul ted in average cell vo lumes of 4.3 x 10⁴ p,m 3 for cells f rom 5- day-o ld cul tures and 20.2 × 10⁴ p,m 3 for cells f r o m 14-day-old cul tures (Table 1). The per iphera l cell l eng th /d i ame te r m e t h o d resulted in average cell vo lumes o f 5.2 x 10⁴ p~m 3 and 18.7 x 10⁴p, m 3 for 5- and 14-day-old cultures, respectively. The two measuremen t s at each age were no t statistically different ( p < . 0 5 ) . Vol- umes ob ta ined by the c lump volume/ce l l n u m b e r m e t h o d were used in all subsequent calculations concern ing organelles since the sample size for this m e t h o d was larger.
Table I. Influence of culture age on the average volume of individual cells.
Method of measurement Culture age
5 day 14 day
(X I0 4 ~,m 3)
Micrometer 5.2 (0.8)" 18.7 (1.8) Clump vol./Cell no. 4.3 (0.3) 20.2 (1.8)
Table 2. Average total volume occupied by cell components in individual cells at two different culture ages.
Cell component Culture age
5 day 14 day
( X 10 2 ~m 3)
Cell 431 (33) a 2,020 (179) Cell wall 24 (4) 133 (18) Nucleus 11 (2) 22 (8) Vacuole 300 (20) 1,689 (57) Cytoplasm 94 (15) 172 (40) Hyaloplasm
(Cytoplasmic matrix) 55 (2) 125 (4) Plastids 8 (1) 5 (2) Mitochondria 13 (0.7) 19 (4) Lipid bodies 1 (0.2) 8 (5) ER 17 (2) 14 (2) Golgi bodies 0.7 (0.2) -
Mean +_ (SE).
Table 3. Percent of cell or cytoplasm volume occupied by cell components at two different culture ages.
Cell component Culture age
5 day 14 day
(% of cell vol.)
Cell wall 5.5 (1.0) a 6.6 (0.9) Nucleus 2.6 (0.5) 1.1 (0.4) Vacuole 69.5 (4.7) 83.6 (2.8) Cytoplasm 21.8 (3.4) 8.5 (2.0)
(% of cytoplasm vol.)
Hyaloplasm (Cytoplasmic matrix) 58.8 (1.9) 72.7 (2.5)
Plastid 8.2 (1.2) 2.7 (1.0) Mitochondria 13.7 (0.8) 11.2 (2.1) Lipid bodies 1.3 (0.2) 4.6 (2.9) ER 17.6 (2.3) 8.4 (0.9) Golgi bodies 0.8 (0.2) -
" Mean -+ (SE). " Mean +- (SE).
an increase in the total volume of cytoplasm from 9,400 to 17,200 i, tm 3 (Table 2). However since this increase did not match the magnitude of the vacuole increase, the percent of cytoplasm decreased from 21.8% in day 5 cells to 8.5% in day 14 cells (Table 3).
The cell wall occupied approximately the same proportion (6%) of the cell at each culture age (Table 3), although it had increased in volume by more than five times (Table 2). This would appear to be the result of the overall volume increase in older cells.
The volume of the nucleus of older cells was twice that of the younger cells, 22 and 11 x 102 t~m 3 respectively (Table 2), but the percent of the cell volume occupied by the nucleus in older cells (1.1%) was less than that found in younger cells (2.6%), (Table 3). A comparison of the ratio of nucleus to cytoplasm at the two ages resulted in similar values of 0.119 for the 5-day-old cultures 0.129 for the 14-day-old cul- tures.
Although the perimeter of the nucleus in young cells was irregular (Fig. 1), in older cells it was often highly lobed with projections of cyto- plasm extending into the interior of the nucleus (Fig. 2). At both ages, 2 or 3 profiles of nucleoli were often visible within the nucleus (Fig. 1).
The dark-grown cells used in this study posses- sed undifferentiated plastids which sometimes contained starch. As the cultures aged the plastid composition of individual ceils decreased in total volume (Table 2), percent volume (Table 3), and number of plastids (Table 4). The total plastid volume decreased by 60%, and the per- cent volume of plastids dropped by a factor of three when 5- and 14-day-old cells were com- pared (Tables 2, 3). The volumes of individual plastids in cells of young versus old cultures were 0.21 to 0.40 p,m 3 respectively (Table 5). These values approximated the average size range of proplastids (0.29 to 0.49 p,m 3) in meristematic tissue (Kirk 1967), but were distinctly smaller than the 60 to 65 i.zm 3 size of chloroplasts in cotton (Berlin et al. 1982).
The number of plastids per cell ranged from 3700 in young cultures to 1200 in mature cultures (Table 4). These population sizes were much greater than those reported for proplastids in
41
meristematic tissue (7-40 per cell) (Kirk 1967) and chloroplasts in cotton leaf cells (88 per cell) (Berlin et al. 1982). One potential factor con- tributing to these differences was the large size of cultured rose cells at both ages (Table 1). When the number of plastids per unit volume of cytoplasm in different types of cells were calcu- lated and compared, the differences in plastid concentration became much smaller. Plastid con- tent in young and old rose culture cells was 39 and 7 plastids per 100 p~m 3, respectively. Similar
3 computations yielded 1-7 plastids per 100 Ixm for meristematic tissue (Kirk 1967; Ledbetter & Porter 1970) and 1 chloroplast per 100 p,m 3 for mature cotton leaves (Berlin et al. 1982). Another factor which may contribute to the ap- parent large number of plastids in the rose cells is the presumed elevated ploidy of the culture. Established cell lines of plants are usually poly- ploid (Torrey 1967), and polyploid leaf cells are known to have increased numbers of plastids (Kirk 1967).
As the cultures matured, the volume of mito- chondria per cell increased by approximately 150% (Table 2). The percent of the cell occupied by mitochondria was similar in both young and old cultures (Table 3), but the number of mito- chondria decreased from 7300 to 5000 (Table 4). The decline in the total number of mitochondria per cell was offset by an increase in the volume of individual mitochondria from 0.181~m 3 to 0.39 p,m 3 (Table 4). The number of mitochon- dria per unit volume in 5- and 14-day-old rose cultures changed from 78 to 29 per 100 i~m 3. These values are considerably less than the con- centration of mitochondria in cotton leaf cells where it has been reported in morphometric studies (Berlin et al. 1982) to be 4 per 100 p,m 3.
Lipid bodies increased on a percent basis by approximately 350% as the cultures aged and there was a 6-fold increase in their total volume (Tables 2, 3). The number of lipid bodies in- creased from 800 to 1400 during culture matura- tion and the volume of individual lipid bodies increased by 344% (Table 4). The size variation in lipid bodies from 14-day-old cultures exceeded 25%, although in young cultures the size vari- ation was minimal. The distribution of lipid bodies in older tissue was very heterogeneous;

42
Fig. 1.
43
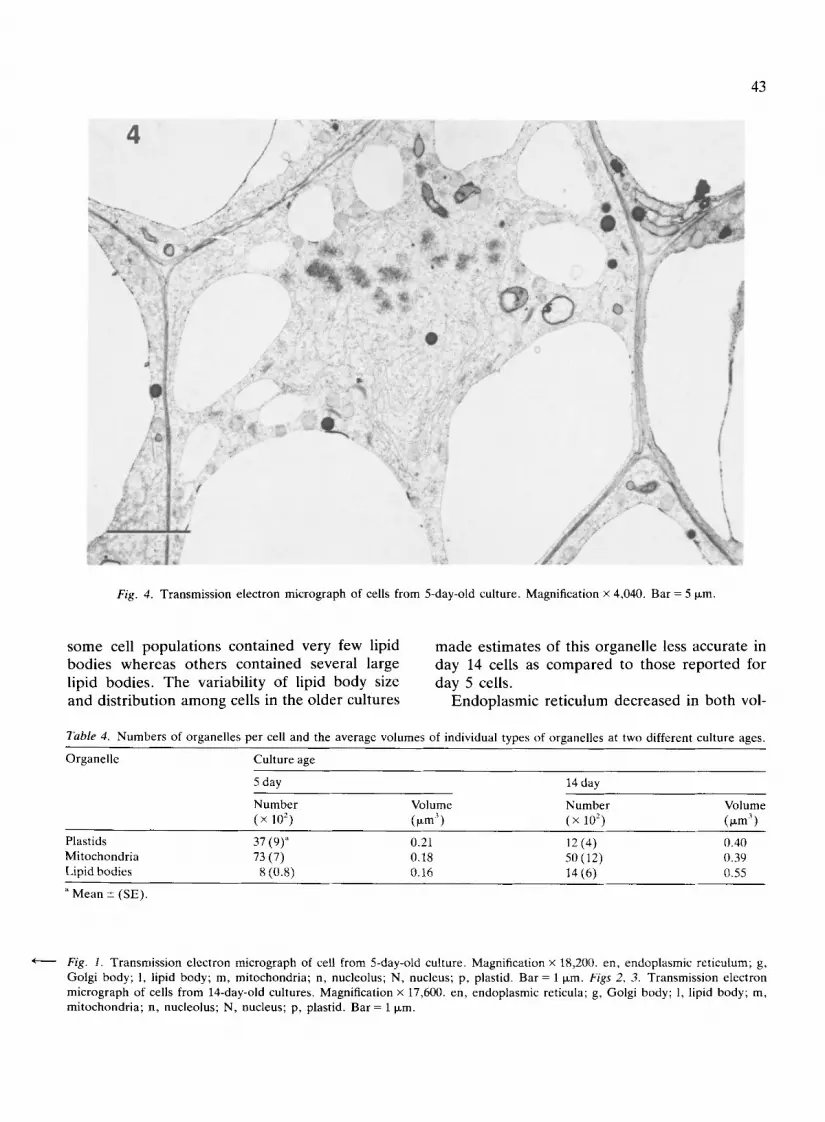
Fig. 4. Transmission electron micrograph of cells from 5-day-old culture. Magnification x 4,040. Bar = 5 p~m.
some cell populations contained very few lipid b o d i e s w h e r e a s o t h e r s c o n t a i n e d s e v e r a l l a r g e
l i p i d b o d i e s . T h e v a r i a b i l i t y o f l ip id b o d y s ize
a n d d i s t r i b u t i o n a m o n g ce l l s in t h e o l d e r c u l t u r e s
made estimates of this organelle less accurate in day 14 cells as compared to those reported for day 5 ceils.
Endoplasmic reticulum decreased in both vol-
Table 4. Numbers of organelles per cell and the average volumes of individual types of organelles at two different culture ages.
Organelle Culture age
5 day 14 day
Number Volume Number Volume (x 10 2) (~m 3) (x 10 2) (p,m 3)
Plastids 37 (9) 2 0.21 12 (4) 0.40 Mitochondria 73 (7) 0.18 50 (12) 0.39 Lipid bodies 8 (0.8) 0.16 I4 (6) 0.55
Mean _+ (SE).
Fig. I. Transmission electron micrograph of cell from 5-day-old culture. Magnification x 18,200. en, endoplasmic reticulum; g, Golgi body; 1, lipid body; m, mitochondria; n, nucleolus; N, nucleus; p, plastid. Bar = 1 ixm. Figs 2, 3. Transmission electron micrograph of cells from 14-day-old cultures. Magnification x 17,600. en, endoplasmic reticula; g, Golgi body; 1, lipid body; m, mitochondria; n, nucleolus; N, nucleus; p, plastid. Bar = 1 ~m.
44
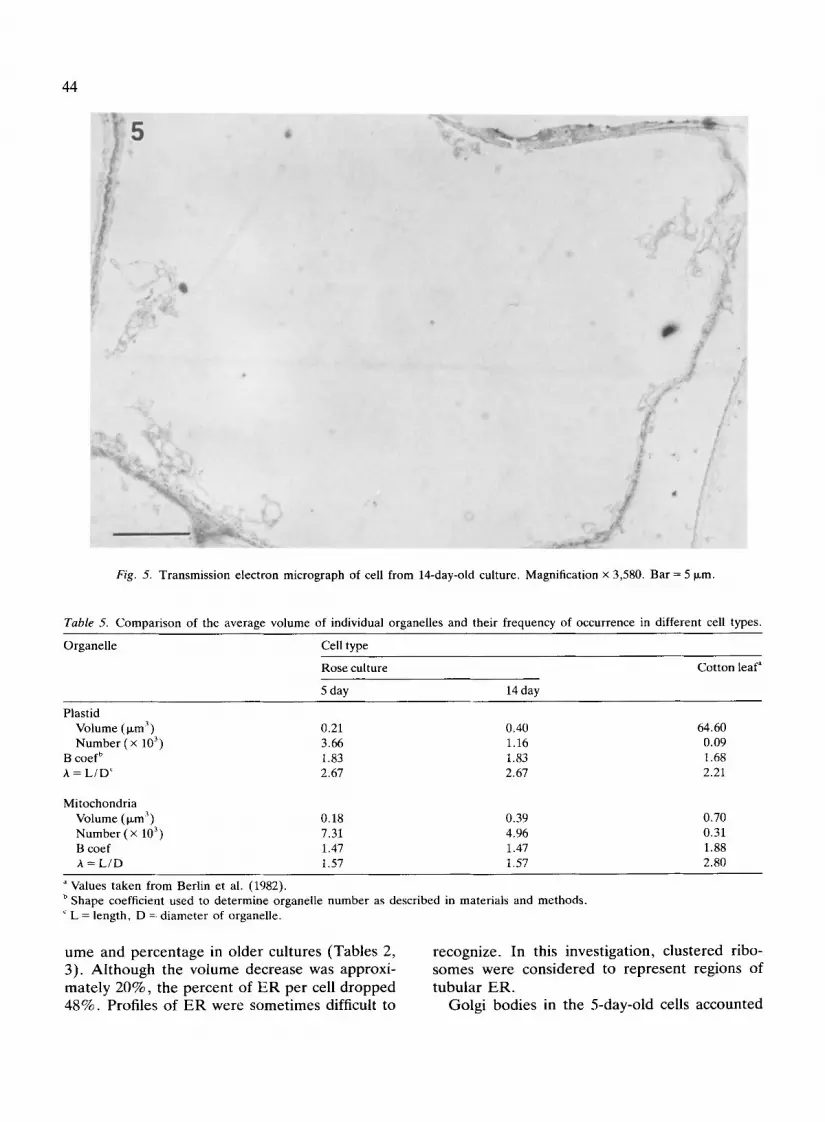
Fig. 5. Transmission electron micrograph of cell from 14-day-old culture. Magnification x 3,580. Bar = 5 Ixm.
Table 5. Comparison of the average volume of individual organelles and their frequency of occurrence in different cell types.
Organelle Cell type
Rose culture Cotton leaf"
5 day 14 day
Plastid Volume (txm 3) 0.21 0.40 64.60 Number ( × 103) 3.66 1.16 0.09
B coef b 1.83 t.83 1.68 A = L / D c 2.67 2.67 2.21
Mitochondria Volume (ixm 3) 0.18 0.39 0.70 Number ( × 103) 7.31 4.96 0.31 B coef 1.47 1.47 1.88 A = L / D 1.57 t.57 2.80
Values taken from Berlin et al. (1982). b Shape coefficient used to determine organelle number as described in materials and methods. c L = length, D = diameter of organelle.
ume and percentage in older cultures (Tables 2, 3). Although the volume decrease was approxi- mately 20%, the percent of ER per cell dropped 48%. Profiles of ER were sometimes difficult to
recognize. In this investigation, clustered ribo- somes were considered to represent regions of tubular ER.
Golgi bodies in the 5-day-old cells accounted

for 0.8% of the cell volume (Table 3), but by 14 days the presence of this organelle was observed so infrequently that the number of cell samples used in this study did not permit a statistically accurate quantification of this organelle. Micro- bodies were not detected at either age.
Discussion
When dividing, unsynchronized 5-day-old cells matured into expanded, nondividing 14-day-old cells there was a selective decline in some of the cells' membranous components. When the per- cent volume data (Table 3) was ,analyzed, the percent of the cell volume occupied by plastids and ER declined; whereas the percent occupied by mitochondria and the nucleus remained rela- tively constant. It was also observed that the volume of individual plastids and mitochondria both increased from day 5 to day 14, the plastids by 190% and the mitochondria by 217%. Through a further analysis of the total and in- dividual volume increases of plastids and mito- chondria it was estimated that the number of plastids per cell declined from 3700 to 1200 and mitochondria from 7300 to 5000 between 5 and 14.
Since the plastid component declined in both percent volume and number per cell it can be concluded that an overall decline in the plastome of the cells occurred from 5 to 14 days of culture growth. A similar conclusion cannot be drawn for the mitochondria, however, because the per- cent volume remained constant while the num- ber per cell declined. The opposing fluctuations in volume and number may be due to the fusion of mitochondria between days 5 and 14, or another possibility would be the enlargement of one portion of the population and the degra- dation of a second portion. Although we are not certain of the mechanism responsible for the changes in the populations of plastids and mito- chondria between days 5 and 14, it can be con- cluded that the total volume occupied by plastids declined by 60% while the mitochondrial volume increased. The disappearance of chloroplasts be- fore mitochondria has been reported for photo- synthetic leaf tissue (Thimann 1980), but to our knowledge this is the first report of such a rela-
45
tionship between plastids and mitochondria in nongreen tissue.
The decline in the presence of plastids and ER was accompanied by an increase in the total volume and size of lipid droplets (Tables 3, 4). The concurrence of these two events suggests the possibility that the lipid droplets arose from the breakdown products of plastids and ER. It has been proposed that lipid droplets form as vesi- cles from the ER (Hadley 1985). Lipid droplets have also been observed to form as inclusions in chloroplasts (Thimann 1980). In this study, small lipid droplets were occasionally observed within plastids. However, this occurred so infrequently that no conclusions about the importance of plastids in lipid formation were possible.
Three of the cell structures which we ex- amined, the ER, plastids and mitochondria are either directly or indirectly involved in protein synthesis. The ER is associated with polypeptide formation, plastids are the site for the synthesis of several amino acids including the aspartate family (Wallsgrove et al. 1983), and mitochon- dria have been shown in rose cultures to contrib- ute as much as one-fourth of their metabolized carbon to amino acid skeletons (Hunt & Fletcher 1976). Recognizing the involvement of these cell components with protein synthesis, it is of inter- est to compare the observed structural changes noted in the study with previous protein and respiration data collected on cultures of Paul's Scarlet rose (Hunt & Fletcher 1976; Mohanty & Fletcher 1980). In earlier studies it was shown that the maximum rate of protein synthesis (110 mg protein/g frwt) (Hunt & Fletcher 1976) was on day 5 and thereafter declined rapidly until day 10, where it remained at a fairly con- stant and low level until culture death. A com- parison of this information with data collected in the present study showed that the number and total volume of both the ER and plastids de- clined in parallel with the previously observed decline in the rate of protein synthesis, but the volume of the mitochondria remained relatively constant during this time period. Furthermore it should be noted that this period of structural stability within the mitochondria (day 5 to 10) has previously been shown to be a period when the respiration rate (l~moles C O J g fr wt/h) (Hunt & Fletcher 1976) declined by 226%. This
46
a p p a r e n t a b s e n c e o f c o r r e l a t i o n b e t w e e n m i t o -
c h o n d r i a l s t r u c t u r e a n d f u n c t i o n h a s b e e n re-
p o r t e d p r e v i o u s l y ( F l e t c h e r & B e e v e r s 1970) . A
f u t u r e g o a l o f o u r r e s e a r c h wil l b e t o e s t a b l i s h
t h e r e l a t i o n s h i p b e t w e e n t h e a c t i v i t i e s o f s e l e c t e d
p l a s t i d a n d m i t o c h o n d r i a l e n z y m e s a n d t h e u l t r a -
s t r u c t u r a l c h a n g e s n o t e d in t h i s r e p o r t .
References
Berlin J, Ouisenberry JE, Bailey F, Woodworth M & McMichael BL (1982) Effect of water stress on cotton leaves. Plant Physiol. 70:238-243
Briarty LG (1980) Stereological analysis of cotyledon cell development in Phaseolus II. The developing cotyledon. J. Exp. Bot. 31:1387-1398
Davey MR & Street HE (1971) Studies on the growth in culture of plant cells. J. Exp. Bot. 22:90-95
Fletcher JS & Beevers H (1970) Acetate metabolism in cell suspension cultures. Plant Physiol. 45:765-772
Forde J & Steer MW (1976) The use of quantitative electron microscopy in the study of lipid composition of mem- branes. J. Exp. Bot. 27:1137-1141
Fowke LC (1986) Ultrastructural cytology of cultured plant tissues, cells and protoplasts. In: Vasil IK (Ed) Cell Cul- ture and Somatic Cell Genetics of Plants, Vol 3 (pp 323-342). Academic Press, Orlando
Galey FR & Nilsson SEG (1966) A new method for transfer- ring sections from the liquid surface of the trough through staining solutions to the supporting film of a grid. J. Ultrastruct. Res. 14:405-410
Hadley NF (I985) The Adaptive Role of Lipids in Biological Systems (pp 42-43). John Wiley and Sons Inc., New York
Hajibagheri MS, Hall JL & Flowers TJ (1984) Stereological analysis of leaf cells of the halophyte Suaeda maritima (L.) Dum. J. Exp. Bot. 35:1547-1557
Hunt L & Fletcher JS (1976) Estimated drainage of carbon from the tricarboxylic acid cycle for protein synthesis in suspension cultures of Paul's Scarlet rose cells. Plant Phy- siol. 57:304-307
Jones IH, Barrett JN & Gopal PPS (1973) Growth and nutrition of a suspension culture of Pogostemon cablin Benth. (Patchouli). J. Exp. Bot. 24:145-158
King PJ & Street HE (1973) Growth patterns in cell cultures. In: Street HE (Ed) Plant Tissue and Cell Culture (pp 269-337). Univ. California, Press, Berkeley
Kirk JD (1967) The Plastid (p 63). W.H. Freeman and Co., London
Kunce CM, Trelease RN & Doman DC (1984) Ontogeny of glyoxysomes in cotton s e e d s - a morphometric analysis. Planta 161:156-164
Ledbetter MC & Porter KR (1970) Introduction to the Fine Structure of Plant Cells (p 9). Springer-Verlag, Berlin
Mauseth JD (1980) A morphometric study of the ultra- structure of Echinocereus engelmannii (Cactaceae) I. Shoot apical meristems at germination. Amer. J. Bot. 67: 173- 181
Mohanty B & Fletcher JS (1980) Ammonium influence on nitrogen assimilating enzymes and protein accumulation in suspension cultures of Paul's Scarlet rose. Physiol. Plant. 48:453-459
Nesius KK, Uchytil LE & Fletcher JS (1972) Minimal or- ganic medium for suspension cultures of Paul's Scarlet rose. Planta 106:173-176
Nesius KK & Fletcher JS (1975) Contribution of nonauto- trophic carbon dioxide fixation to protein synthesis in suspension culture of Paul's Scarlet Rose. Plant Physiol. 55:643-645
Reider ML, Smith BA & Fletcher JS (1982) Protein content and subculturing properties of senescing plant suspension cultures. In Vitro 82:1004-1008
Sutton-Jones B & Street HE (1968) Studies on the growth in culture of plant cells. J. Exp. Bot. 19:114-118
Thimann KV (1980) The senescence of leaves. In: Thimann KV (Ed) Senescence in Plants (pp 85-115). CRC Press, Boca Raton
Torrey JG (1967) Morphogenesis in relation to chromosomal constitution in long-term plant tissue culture. Physiol. Plant 20:265-275
Toth R (1982) An introduction to morphometric cytology and its application to botanical research. Amer. J. Bot. 69: 1694-1706
Tulecke W (1963) Research on tissue cultures of higher plants. Technical report AD-431-213 (pp 63-124). Aeros- pace medical research laboratory, Wright-Patterson AFB, Ohio
Wallsgrove RM, Lea PJ & Miflin BJ (1983) Intracellular localization of aspartate kinase and the enzymes of threonine and methionine biosynthesis in green leaves. Plant Physiol. 71:780-784
Weibel ER & Bolender RP (1973) Stereological techniques for electron microscopic morphometry. In: Hayat MA (Ed) Principles and Techniques of Electron Microscopy, Biological Applications, Vol 3 (pp 237-296). Van Nostrand Reinhold Co., New York
Weibel ER (1979) Stereological Methods (pp 91-100). Aca- demic Press, London
Young SJ, Royer SM, Groves PM & Kinnamon JC (I987) Three-dimensional reconstruction from serial micrographs using the IBM PC. J. Electron Microsc. Tech. 6:207-217


