Embed Size (px)
Citation preview
Proud ownershipAker ASA annual report 2018
Aker ASA annual report 2018 2
Aker’s vision is to practice proud ownership.
Aker ASA annual report 2018 3
Content1. This is Aker 5 Highlights 6
Key performance indicators 7
Changes in net asset value 8
2. Letter from the President and CEO 11
3. Shareholder information 14
4. Investment overview 16 Industrial holdings 17
Financial investments 24
Alternative performance measures 25
5. Board of Directors' report 27
6. Annual accounts 38 Aker Group 39
Aker ASA 94
Aker ASA and holding companies 114
7. Board of Directors 124
8. Management 127
Financial calendar 2019Aker reserves the right to revise the dates.
Annual General Meeting 2019: 26 AprilAnnouncement of 1Q 2019: 10 MayAnnouncement of 2Q 2019: 18 JulyAnnouncement of 3Q 2019: 1 November
Aker ASA annual report 2018 4
Aker ASA annual report 2018 5This is Aker
Aker ASA (Aker) is an industrial investment company that exercises active ownership to create value. Aker combines industrial expertise with knowledge of the capital markets and financial strength. In its capacity as owner, Aker helps to develop and strengthen the companies in its portfolio of industrial holdings and financial investments. Aker works through the boards of the portfolio companies to drive forward strategy development, operational improvements, financing, restructuring and transactions.
Aker’s ownership interests are concentrated in the oil and gas, maritime assets and marine biotechnology sectors. The investments are divided into Industrial holdings and Financial investments.
The Industrial holdings are strategic assets and are managed with a long-term perspective. They comprise Aker’s ownership interests in Aker BP, Aker Solutions, Akastor, Kvaerner, Ocean Yield and Aker BioMarine.
The Financial investments comprise cash and other assets. The portfolio includes three relatively new companies: the oil company Aker Energy (a field operator in Ghana), the software company Cognite and the real estate development company FP Eiendom. These three companies are growing rapidly under Aker’s ownership. Aker Energy and Cognite will be included in Aker's Industrial holdings portfolio from first quarter 2019.
SizeAker is the largest shareholder, directly or indirectly, in eight companies listed on Oslo Stock Exchange. Aker and companies in which Aker is the largest investor had a total turnover of more than NOK 70 billion in 2018, and a workforce of approximately 28 000, including temporary hires. About 50 per cent of the workforce is located in Norway.
Net asset value (NAV) growth is a key performance indicator for Aker ASA and holding companies. As at 31 December 2018, NAV amounted to NOK 41.7 billion, compared to NOK 41.8 billion one year prior. In addition, a dividend of NOK 1.3 billion was paid in 2018.
OwnershipSince re-listing on the Oslo Stock Exchange on 8 September 2004, Aker has generated an average annual return of 27 per cent, including dividends. At the beginning of 2019, Aker had 13 388 shareholders. Aker’s main shareholder is Kjell Inge Røkke, who owns 68.2 per cent of Aker through his company The Resource Group TRG AS. Through a private company, CEO Øyvind Eriksen owns 0.2 per cent of the B-shares in TRG Holding AS, as well as 219 072 shares in Aker.
This is AkerSince its establishment in 1841, Aker has been a driving force for the development of internationally focused, knowledge-based industry in Norway.
Aker is the largest shareholder, directly or indirectly, in eight companies
listed on Oslo Stock Exchange. Aker and companies in which
Aker is the largest investor had a total
turnover of more than NOK 70 billion
in 2018.
Aker ASA annual report 2018 6 This is Aker | Highlights 2018
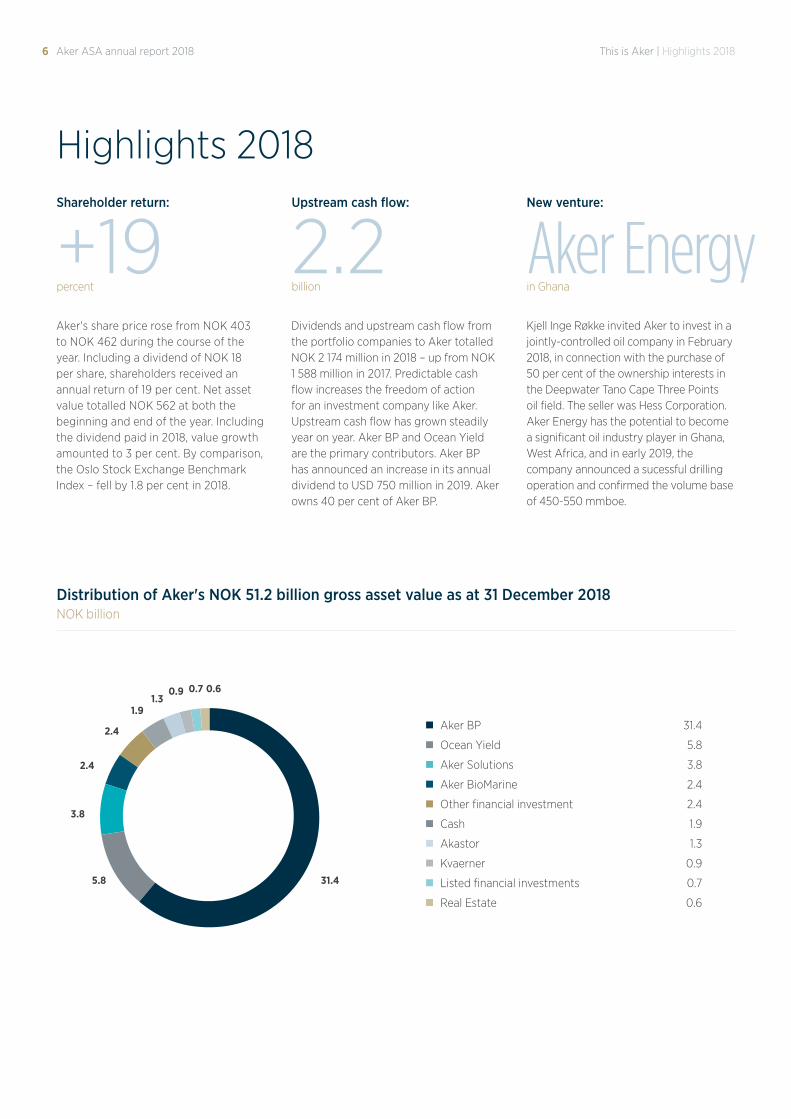
n Aker BP 31.4
n Ocean Yield 5.8
n Aker Solutions 3.8
n Aker BioMarine 2.4
n Other financial investment 2.4
n Cash 1.9
n Akastor 1.3
n Kvaerner 0.9
n Listed financial investments 0.7
n Real Estate 0.6
NOK billionDistribution of Aker's NOK 51.2 billion gross asset value as at 31 December 2018
Highlights 2018
Aker's share price rose from NOK 403 to NOK 462 during the course of the year. Including a dividend of NOK 18 per share, shareholders received an annual return of 19 per cent. Net asset value totalled NOK 562 at both the beginning and end of the year. Including the dividend paid in 2018, value growth amounted to 3 per cent. By comparison, the Oslo Stock Exchange Benchmark Index – fell by 1.8 per cent in 2018.
Dividends and upstream cash flow from the portfolio companies to Aker totalled NOK 2 174 million in 2018 – up from NOK 1 588 million in 2017. Predictable cash flow increases the freedom of action for an investment company like Aker. Upstream cash flow has grown steadily year on year. Aker BP and Ocean Yield are the primary contributors. Aker BP has announced an increase in its annual dividend to USD 750 million in 2019. Aker owns 40 per cent of Aker BP.
Kjell Inge Røkke invited Aker to invest in a jointly-controlled oil company in February 2018, in connection with the purchase of 50 per cent of the ownership interests in the Deepwater Tano Cape Three Points oil field. The seller was Hess Corporation. Aker Energy has the potential to become a significant oil industry player in Ghana, West Africa, and in early 2019, the company announced a sucessful drilling operation and confirmed the volume base of 450-550 mmboe.
+19 2.2percent billion
Shareholder return: Upstream cash flow: New venture:
Eiendom
Andre børsnoterte investeringer
Kværner
Akastor
Kontanter og likvide fondsinvesteringer
Andre �nansiellle investeringer
Aker BioMarine
Aker Solutions
Ocean Yield
Aker BP
0.60.70.9
2.4
3.8
31.45.8
2.4
1.91.3
Aker Energyin Ghana
Aker ASA annual report 2018 7This is Aker | Key performance indicators
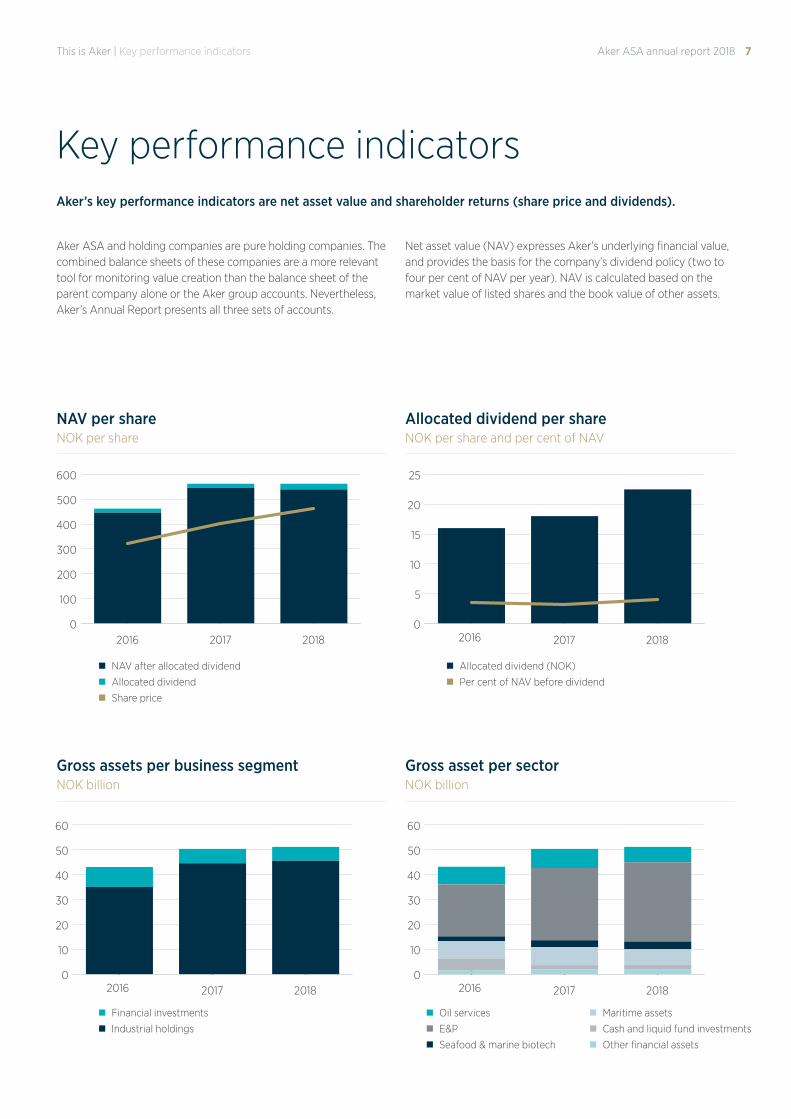
Key performance indicatorsAker’s key performance indicators are net asset value and shareholder returns (share price and dividends).
Aker ASA and holding companies are pure holding companies. The combined balance sheets of these companies are a more relevant tool for monitoring value creation than the balance sheet of the parent company alone or the Aker group accounts. Nevertheless, Aker’s Annual Report presents all three sets of accounts.
Net asset value (NAV) expresses Aker’s underlying financial value, and provides the basis for the company’s dividend policy (two to four per cent of NAV per year). NAV is calculated based on the market value of listed shares and the book value of other assets.
0
100
200
300
400
500
600 Utbytte
VEK etter utbytte
2016 2017 2018
0
10
20
30
40
50
60 Finansielle investeringer
Industrielle investeringer
2016 2017 20180
10
20
30
40
50
60 Oljeservice
Leting og oljeproduksjon
Sjømat og marin bioteknologi
Maritime Assets
Kontanter og likvider
Annet
2016 2017 2018
NOK per shareNAV per share
NOK billionGross assets per business segment
NOK per share and per cent of NAVAllocated dividend per share
NOK billionGross asset per sector
n NAV after allocated dividend
n Allocated dividend
n Share price
n Financial investments
n Industrial holdings
n Allocated dividend (NOK)
n Per cent of NAV before dividend
n Oil services
n E&P
n Seafood & marine biotech
n Maritime assets
n Cash and liquid fund investments
n Other financial assets
0
5
10
15
20
25
2016 2017 2018
Aker ASA annual report 2018 8 This is Aker | Changes in net asset value
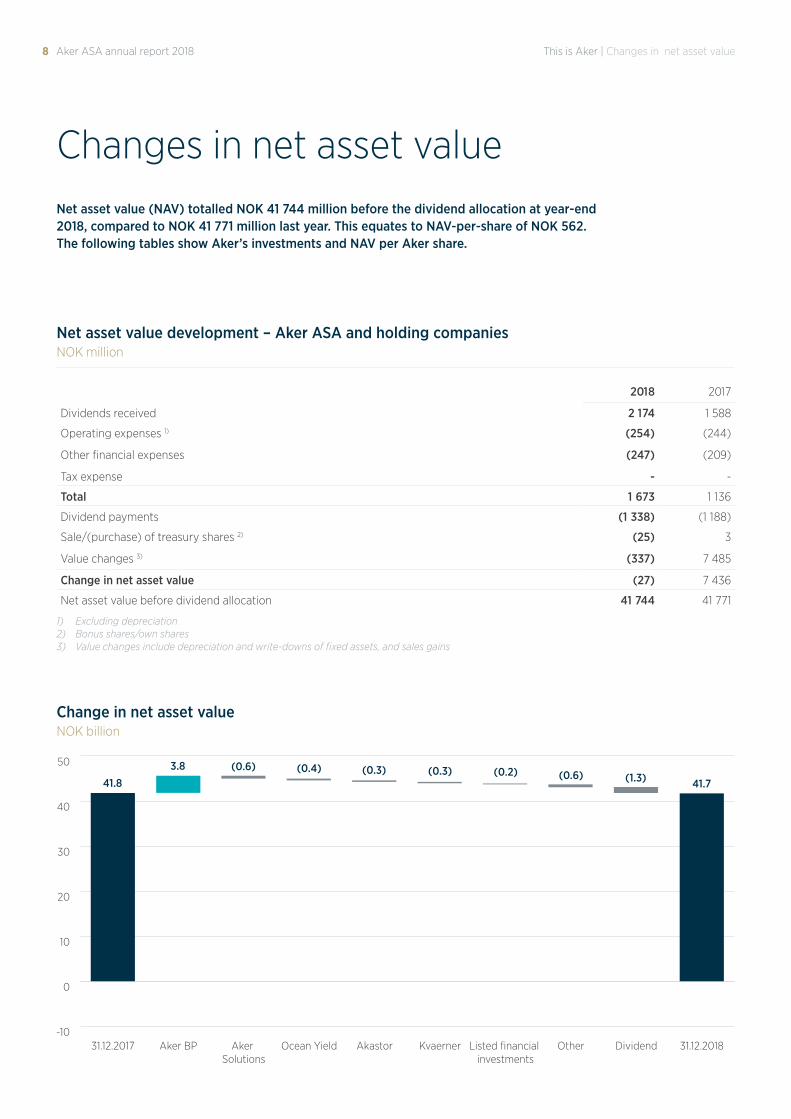
NOK billionChange in net asset value
NOK millionNet asset value development – Aker ASA and holding companies
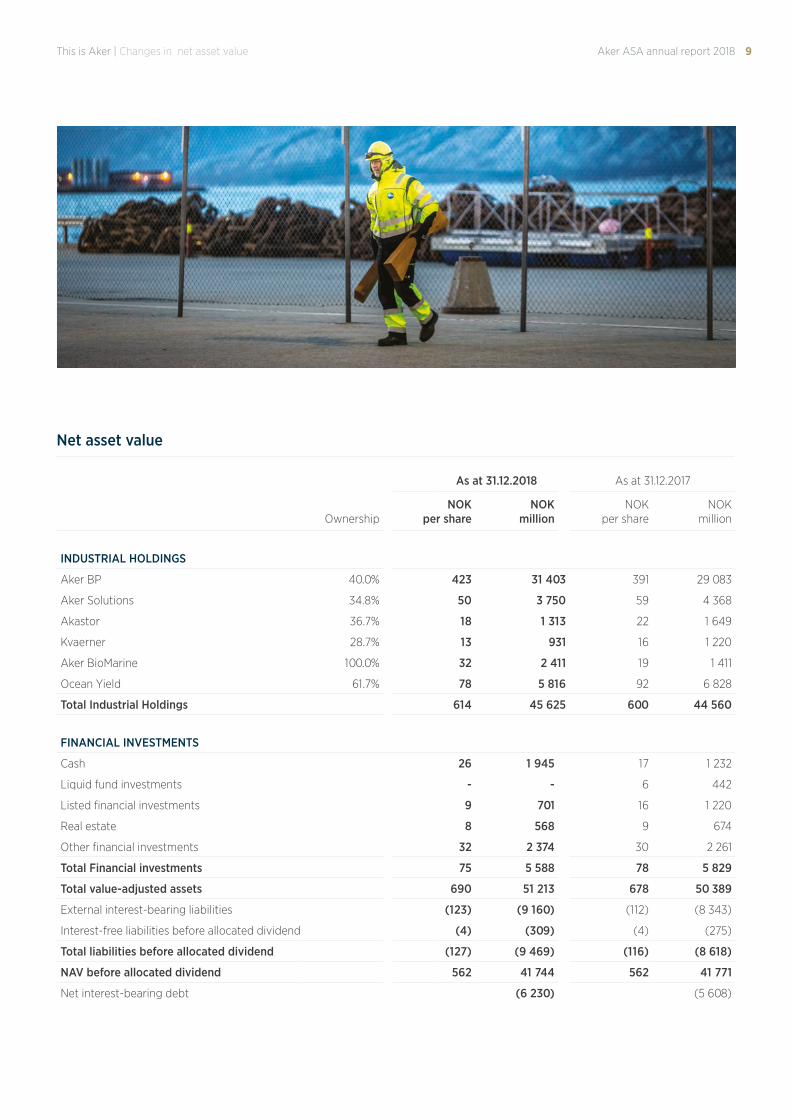
Changes in net asset valueNet asset value (NAV) totalled NOK 41 744 million before the dividend allocation at year-end 2018, compared to NOK 41 771 million last year. This equates to NAV-per-share of NOK 562. The following tables show Aker’s investments and NAV per Aker share.
2018 2017
Dividends received 2 174 1 588
Operating expenses 1) (254) (244)
Other financial expenses (247) (209)
Tax expense - -
Total 1 673 1 136
Dividend payments (1 338) (1 188)
Sale/(purchase) of treasury shares 2) (25) 3
Value changes 3) (337) 7 485
Change in net asset value (27) 7 436
Net asset value before dividend allocation 41 744 41 771
1) Excluding depreciation2) Bonus shares/own shares3) Value changes include depreciation and write-downs of fixed assets, and sales gains
-10
0
10
20
30
40
50
31.12.2018DividendOtherListed financial investments
KvaernerAkastorOcean YieldAker Solutions
Aker BP31.12.2017
3.8 (0.6) (0.4) (0.3) (0.3) (0.2) (0.6) (1.3) 41.741.8
Aker ASA annual report 2018 9This is Aker | Changes in net asset value
Net asset value
As at 31.12.2018 As at 31.12.2017
OwnershipNOK
per shareNOK
millionNOK
per shareNOK
million
INDUSTRIAL HOLDINGS
Aker BP 40.0% 423 31 403 391 29 083
Aker Solutions 34.8% 50 3 750 59 4 368
Akastor 36.7% 18 1 313 22 1 649
Kvaerner 28.7% 13 931 16 1 220
Aker BioMarine 100.0% 32 2 411 19 1 411
Ocean Yield 61.7% 78 5 816 92 6 828
Total Industrial Holdings 614 45 625 600 44 560
FINANCIAL INVESTMENTS
Cash 26 1 945 17 1 232
Liquid fund investments - - 6 442
Listed financial investments 9 701 16 1 220
Real estate 8 568 9 674
Other financial investments 32 2 374 30 2 261
Total Financial investments 75 5 588 78 5 829
Total value-adjusted assets 690 51 213 678 50 389
External interest-bearing liabilities (123) (9 160) (112) (8 343)
Interest-free liabilities before allocated dividend (4) (309) (4) (275)
Total liabilities before allocated dividend (127) (9 469) (116) (8 618)
NAV before allocated dividend 562 41 744 562 41 771
Net interest-bearing debt (6 230) (5 608)
Aker ASA annual report 2018 10 Letter from the President and CEO
Aker ASA annual report 2018 11Letter from the President and CEO
After 10 years as Aker’s President and CEO, I can look back on an inspiring journey in a company together with skilled colleagues, and I look forward to what the future holds.
From 1 January 2009 to 1 January 2019, Aker’s share price increased from NOK 137 to NOK 462, and net asset value from NOK 255 to NOK 562 per share. In addition, we have distributed NOK 113 per share in dividends during this period, excluding the additional NOK 22.50 per share to be paid in May this year.
Measured in terms of share price growth and dividends, the return to shareholders over the past 10 years totals NOK 32.7 billion – or an average of 18.1 per cent per year. For our reference, the Oslo Stock Exchange Benchmark Index (OSEBX), generated an average annual return of 13.5 per cent over the same period. In 2018, Aker’s shareholders achieved a return of 19.1 per cent, in a year in which the OSEBX fell by 1.8 per cent.
Behind these facts and figures are the people and organisations we can thank for Aker’s strong performance. That is what impresses me the most.
Industrial progress2018 was one of the most sucessful years I have experienced during my time at Aker. In the first three quarters, oil and share prices rose, but in the fourth quarter the gains of the preceding nine months were wiped out by a 35 per
cent drop in oil prices. Industrially, Aker and the industrial portfolio companies have taken several important and significant steps:
§ Aker BP has laid the foundation for potentially tripling production from 155 700 barrels per day in 2018 to approximately 450 000 barrels per day in 2025, based on its existing portfolio only. In 2018, the company strengthened its position in key areas on the Norwegian Continental Shelf through the purchase of 11 licenses from Total and the acquisition of Equinor’s King Lear discovery. Aker BP’s strong operational performance and improvement programme for secure and effective operations, reduces the cost per produced barrel of oil over time. Aker BP’s strong industrial and financial position has enabled the company to increase its annual dividend from USD 450 million in 2018 to USD 750 million in 2019, with the aim of further annual increases of USD 100 million per year until 2023. This gives Aker predictability, and is set to generate more than NOK 16 billion to Aker over the next five years at the current dollar exchange rate.
§ Aker Solutions continued its successful improvement and cost-cutting efforts in 2018, and is on track with its improvement programme aimed at cutting costs by 50 per cent by 2021, compared to 2015 cost
Forward march!Aker started and ended 2018 with its net asset value at NOK 562 per share. However, it would be wrong to conclude that Aker has been "at ease". Aker and its portfolio companies made great advances over the past year. After 10 years
as Aker’s President and CEO, I can
look back on an inspiring journey in the company
together with skilled colleagues, and I
look forward to what the future holds.
Aker ASA annual report 2018 12
and activity levels. The company has become more competitive, winning several important contracts on the Norwegian Continental Shelf and internationally last year, in particular in Africa, Asia, Brazil and the UK. Aker Solutions has become even more attractive to customers, partners and industrial stakeholders. The oil service market – including the subsea, field design and MMO segments – is expected to grow in the years ahead.
§ Akastor completed several transactions in 2018. Mitsui acquired 50 per cent of Akastor’s portfolio company AKOFS Offshore, making it an equal partner with Akastor in the company. The transaction released USD 142.5 million in cash to Akastor. Since the split from Aker Solutions in 2014, Akastor has released NOK 6.1 billion in capital through divestments. Akastor entered into an agreement to merge its portfolio company First Geo and AGR, thereby taking a controlling interest in a leading sub-surface and well operations company. The equity investment in Odfjell Drilling is an opportunistic venture in a market Akastor knows well. Moreover, a strategy has been developed and adopted for growing Akastor’s most important portfolio company, MHWirth, through improvement initiatives and transactions. The aim is to list the company in a few years’ time.
§ Kvaerner boosted its order backlog by 32 per cent, to NOK 10.6 billion by year-end 2018, with the yards at Stord and Verdal continuing to deliver projects on time and with the high level of quality. Kvaerner is making systematic efforts to improve productivity and cost levels at the two specialist yards, as well as in its project management, design and purchasing functions. In 2019, Kvaerner Stord will celebrate its 100th anniversary, marking a proud history of adaptability and cooperation between employee representatives, engineers, specialist workers, management and owners. Having started life as a herring-oil factory that took on ship and
industrial equipment repairs in the off season, over time Kvaerner grew into an oil-industry pioneer and the builder of the world’s largest tankers. Kvaerner continues to demonstrate impressive willingness and ability to adapt.
§ Ocean Yield invested approximately NOK 5 billion in 2018, increasing its portfolio from 40 to 57 vessels. Continued diversification is improving the company’s robustness in the face of market fluctuations. A stable revenue-generator over the past 10 years – the FPSO Dhirubhai-1 – completed a contract in India in September 2018. A charter option agreement for the ship has been signed with Aker Energy. If the option is exercised in the second quarter of 2019, Aker Energy will charter Dhirubhai-1 for the next 15 years. Even without this agreement, Ocean Yield had an EBITDA order backlog of signed contracts totalling more than NOK 30 billion as at year-end 2018, and an average remaining contract tenor of 11 years. This provides a solid foundation for attractive dividend generation in the years to come.
§ Aker BioMarine is growing rapidly. In 2018, the company reported a 22 per cent increase in sales, to NOK 1.3 billion, and almost doubled EBITDA to NOK 269 million compared to 2017. The omega-3 market is improving after a few years of stagnation and falling demand. Asia in particular is developing into a growth market offering significant opportunities. The delivery of a new krill vessel in January 2019 improves harvesting efficiency and capacity. Moreover, the company secured an additional krill licence in December 2018, bringing the total number of licences to four. The company has invested in increased production capacity at its SUPERBA™ krill oil factory in Houston. Aker’s wholly-owned subsidiary is in a period of accelerating growth that may require additional investment going forward.
A strong positionAker BioMarine has built a strong position in a growing market with SUPERBA™ Krill Oil – a niche product in the omega 3 nutritional supplements market. In the aquaculture market QRILL™-branded products have a strong market position. We continue to evaluate strategic opportunities for further growth, and are more than likely to take steps to crystallise the investment in Aker BioMarine in the longer term. It is too early to say when and how this may happen.
Aker BioMarine is one of three unlisted value drivers in Aker’s portfolio. The two others are the oil company Aker Energy and the software company Cognite. Accordingly, these three companies are only available to investors through the Aker share. Listed companies, on the other hand, like Aker BP, Aker Solutions, Akastor, Kvaerner, Ocean Yield, American Shipping and Philly Shipyard – all companies in which Aker is the largest shareholder – are available for direct investments, allowing investors to increase or reduce their shareholdings relative to Aker’s exposure in line with their own assessments.
The start of something bigAker Energy was established one year ago in connection with the purchase of 50 per cent of the Deepwater Tano Cape Three Points block on the Ghanaian continental shelf. Aker and Kjell Inge Røkke’s private company TRG each own 49 per cent of Aker Energy, while Aker Energy employees have acquired the remaining 2 per cent. Without Kjell Inge’s presence in the neighbouring block, his intuition, drive and entrepreneurship, Aker Energy would not be an operator in Ghana. The work done in 2018 has laid the foundation for a venture with substantial promise.
Based on potential analysis of existing discoveries, the estimated resource potential is 450-550 million barrels of oil equivalents. The potential may also prove to be even larger.
Aker Energy aims to replicate Aker BP’s success, including bringing the company’s production in Ghana to at least 450 000 barrels per day by 2025. However, there are also significant
Letter from the President and CEO
Aker ASA annual report 2018 13
differences between the Norwegian Continental Shelf and Ghana. The Ghanaian oil field is located at depths of 2 500–3 000 metres, and the country’s oil and gas industry is less mature than Norway’s. Aker’s task will therefore extend beyond oil and gas production to include developing local content in Ghana, inspired by the beginning of the Norwegian oil service industry and its development over the past 50 years.
Once the Ghanaian authorities have approved the plan of development, Aker Energy will start a process to raise capital either through an IPO or a transaction, or a combination of the two. The initial objective is to secure sufficient capital funding for the period until “first oil”. In our view, it should be possible to start production in 2022. In order to achieve this goal, we are dependent on Ghanaian authorities and partners to follow our time schedule and support Aker Energy in reaching important milestones.
Cognite is growing quicklyIn the software company Cognite, we control the pace of progress, and progress is rapid. In just two years, the company has expanded from zero to about 200 employees from 23 countries per March 2019. Cognite is attracting brilliant programmers and other talented individuals.
The company has built an industrial data platform that gathers, processes and analyses enormous volumes of data continuously. For example, Cognite and its digitalisation capacity are central to Aker BP’s improvement programme, which seeks to reduce the cost per barrel of produced oil. Moreover, live access to data makes operations safer and more efficient.
Cognite began cooperating with many new industrial customers in various industries in 2018, and achieved operating revenues of NOK 164 million. At a minimum, sales revenues are expected to double in 2019. Cognite is currently establishing a local presence in the US and Japan. As of the first quarter of 2019, both Cognite and Aker Energy have been included in Aker’s portfolio of industrial investments.
World Ocean HeadquartersThe portfolio of unlisted companies also includes FP Eiendom (formerly Fornebuporten Holding). Under the radar, Aker’s wholly-owned real estate development company has contributed NOK 870 million in net asset value since 2012.
FP Eiendom’s land bank has a book value of approximately NOK 600 million. In cooperation with Aker, REV Ocean, which is owned by Kjell Inge and is currently constructing the world’s most advanced research and expedition ship, announced a plan to build the World Ocean Headquarters on FP Eiendom’s plot at Fornebu. The plan for a 250 metre-tall tower was “shot down” by local politicians even before the proposal had been submitted to the local authorities.
Aker has a firm intention to construct a landmark building designed to remind us of the importance of the oceans. Where and how this will be done remains to be clarified through dialogue with politicians and authorities who share our commitment to the world’s oceans.
The target is to create a leading global knowledge centre that actively helps to develop knowledge of and overcome environmental challenges associated with the oceans. Since our own portfolio companies also have to face up to these challenges, the World Ocean Headquarters are central to Aker’s long-term development.
An ocean of opportunitiesThe oceans and seabed resources have been the core of Aker's businesses ever since the company was established in 1841. We want to build a strong Aker for future generations. We will do this by developing knowledge industries based on current expertise and our networks. Aker and the portfolio companies must continue attracting skilled and talented individuals.
We see numerous marine and maritime opportunities. Aker BioMarine, Aker Solutions, Akastor, Kvaerner, Ocean Yield and Cognite are six examples of
companies with different approaches to opportunities and solutions. As responsible oil producers, Aker BP and Aker Energy are also a potential part of the solution.
Aker is in constant development. Since I took the role as CEO 10 years ago, the company’s net asset value has almost tripled. 80 per cent of Aker’s current asset portfolio amounted to less than 10 per cent of Aker’s assets in 2009. The greatest change is that Aker has built a significant exploration and production company on the Norwegian Continental Shelf.
Oil and gas will remain a priority for Aker in many years to come. While we are aware of climate and environmental challenges, these will not be solved by stopping oil and gas production in Norway or Ghana. Aker Solutions, Kvaerner and Akastor have developed technologies that are part of the solution. As a shareholder in Aker BP and Aker Energy, Aker’s target is to build a safe and profitable offshore petroleum activity that is as environmentally friendly as possible.
The most effective solutions to environmental and climate challenges are those that face realities. Global energy demand is increasing, and the reality is that oil and gas will remain an important energy source for many decades to come. An important solution from an environmental perspective is therefore to produce oil and gas in the most sustainable manner possible. The question is how we, and the rest of the oil and gas industry, will respond to new opportunities and challenges. This will be a key component of our strategies and decisions in future.
The current order for Aker and our portfolio companies is still "forward march", in the most sustainable manner possible.
Øyvind Eriksen President and CEO
Letter from the President and CEO
Aker ASA annual report 2018 14
Aker works to ensure that its share price reflects its underlying value by making all price-sensitive information available to the market.
Aker’s goal is to create value for its shareholders in the form of dividends and share price growth over time. In February 2006, the company’s board adopted the following dividend policy:
“Aker ASA’s dividend policy supports the company’s intention to maintain a solid balance sheet and liquidity reserves adequate to handle future obligations. The company’s objective is to pay dividends annually that amount to 2-4 per cent of the company’s net asset value. In determining net asset value, the share prices of Aker’s exchange-listed investments are applied.”
The board has proposed a dividend of NOK 22.50 per share for 2018:
Shares and share capitalAker ASA has 74 321 862 ordinary shares, each with a par value of NOK 28 (see Note 9 to the company’s annual accounts). Aker ASA has a single share class, and each share carries one vote. The company held 53 070 treasury shares as at 31 December 2018.
As at 31 December 2018, the company had 13 388 shareholders. Kjell Inge Røkke is Aker ASA's main shareholder. Through The Resource Group TRG AS, he holds 68.18 per cent of Aker ASA shares. According to the shareholder register maintained by the Norwegian Central Securities Depository (VPS), non-Norwegian shareholders held 14.98 per cent of the company’s shares as at 31 December 2018. VPS does not identify shareholders registered via nominee accounts.
Stock-exchange listingAker ASA is listed on the Oslo Stock Exchange with the ticker code AKER. Aker ASA’s shares are registered with VPS with the registration number ISIN NO 0010234552. DNB ASA is the company’s registrar.
Current board authorisationsAt the annual general meeting on 20 April 2018, Aker’s shareholders authorised the board to acquire up to 7 432 186 Aker ASA shares with a total
par value of NOK 208 101 208. The authorisation also encompassed the acquisition of agreement liens in shares. The per-share purchase price may not be less than NOK 4 nor exceed NOK 1 200. The board is free to decide the method for acquiring or disposing of treasury shares. The authorisation is valid until the 2019 annual general meeting, though no longer than until 30 June 2019.
In the period 28 March 2018 to 26 March 2019, the company acquired 50 000 treasury shares, and distributed 12 663 treasury shares in connection with the employee incentive programme.
Share option plansAker ASA had no share option plans as at 31 December 2018.
Investor relationsAker seeks to maintain an open and direct dialogue with shareholders, debt holders, financial analysts and the stock markets in general. In addition to capital markets days, the company arranges regular presentations for, and meetings with, shareholders, analysts and investors.
All Aker ASA press releases, stock exchange notices and investor relations (IR) publications are available on the company’s website, www.akerasa.com.
Shareholder informationAker is committed to maintaining an open dialogue with shareholders, investors, analysts and the financial markets in general.
Shareholder information
Year Allocated dividend
(NOK)
Allocated dividend as %
of NAV
2012 12.00 3.72013 13.00 3.92014 10.00 4.12015 10.00 3.62016 16.00 3.52017 18.00 3.22018 22.50 4.0
Aker ASA annual report 2018 15
This online resource also offers access to the company’s quarterly and annual reports, prospectuses, corporate presentations, articles of association, financial calendar, investor relations and communications policy and corporate governance information.
Electronic quarterly and annual reportsAker ASA's annual reports are published on the company’s website at the same time as they are released via the Oslo Stock Exchange distribution service, www.newsweb.no (ticker: AKER).
Quarterly reports are distributed electronically and via the company’s website.
Nomination committeeThe company’s nomination committee has the following members: § Kjell Inge Røkke (chairman) § Gerhard Heiberg § Leif-Arne Langøy
Shareholders who wish to contact the nomination committee may do so using the following email address: [email protected]
Audit committeeThe company’s audit committee has the following members: § Finn Berg Jacobsen (chairman) § Kristin Krohn Devold § Atle Tranøy
Annual general meetingAker ASA’s annual general meeting is held in April. Written notification is sent to all shareholders and shareholder nominees.
Meeting notices and attendance registration forms are sent to shareholders by the deadlines laid down in the Norwegian Public Limited Liability Companies Act, and made available on the company’s website and through the Oslo Stock Exchange distribution service. The annual report and other enclosures to the meeting notice are made available solely via the company’s website and the Oslo Stock Exchange distribution service. Shareholders who wish to receive the enclosures by post must contact the company.
Shareholders who are unable to attend the general meeting may vote on individual agenda items electronically on Aker ASA's website during the pre-meeting registration period. Shareholders may change their votes or opt to attend the meeting in person throughout the registration period.
Shareholders may also vote by proxy. The company has designed its proxy forms to allow shareholders to vote on (issue voting instructions for) individual agenda items.
Procedures for electronic voting and the appointment of proxies with voting instructions are described in the meeting notice and on Aker ASA's website.
The company does not appoint an independent proxy to vote on behalf of shareholders. Aker considers that shareholders’ interests are adequately safeguarded by permitting the participation of an appointed proxy or authorisation of the meeting chair/board chairman/other appointed representative to vote according to specific instructions.
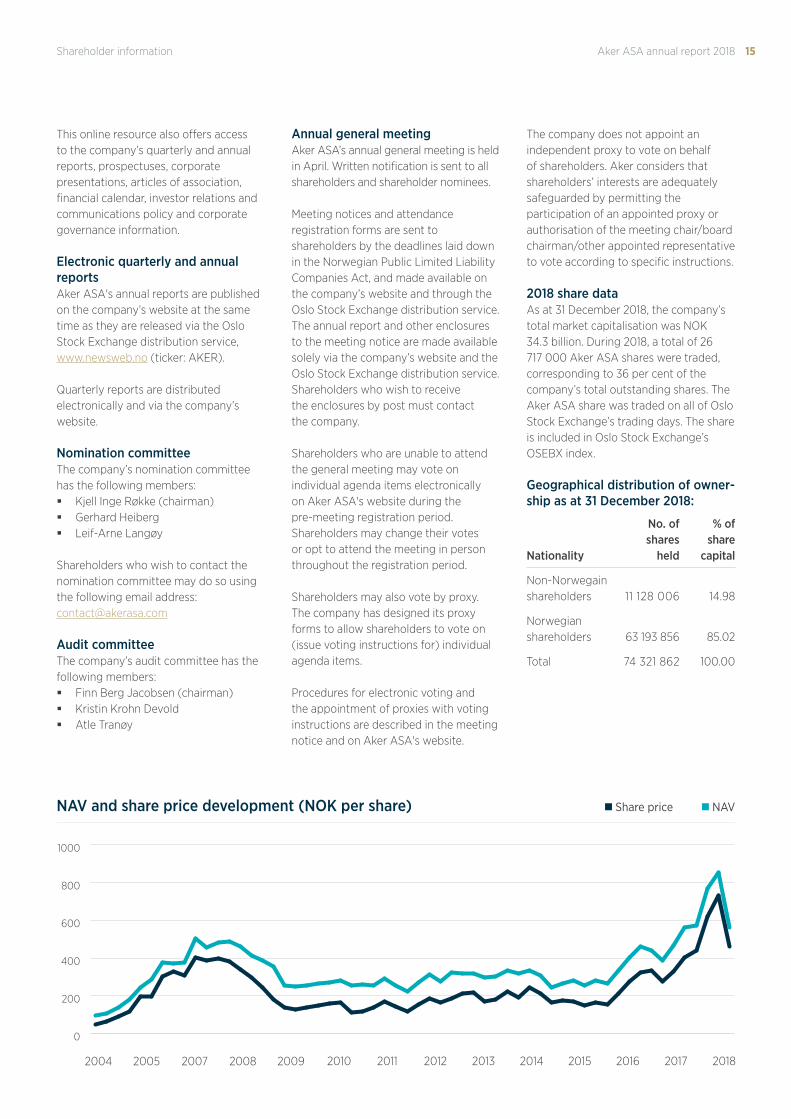
2018 share dataAs at 31 December 2018, the company’s total market capitalisation was NOK 34.3 billion. During 2018, a total of 26 717 000 Aker ASA shares were traded, corresponding to 36 per cent of the company’s total outstanding shares. The Aker ASA share was traded on all of Oslo Stock Exchange’s trading days. The share is included in Oslo Stock Exchange’s OSEBX index.
Shareholder information
Geographical distribution of owner-ship as at 31 December 2018:
Nationality
No. of shares
held
% of share
capital
Non-Norwegain shareholders 11 128 006 14.98
Norwegian shareholders 63 193 856 85.02
Total 74 321 862 100.00
n Share price nNAVNAV and share price development (NOK per share)
2004 2005 2007 2008 2009 2010 2011 2012 2013 2014 2015 2016 2017 2018
0
200
400
600
800
1000
Aker ASA annual report 2018 16
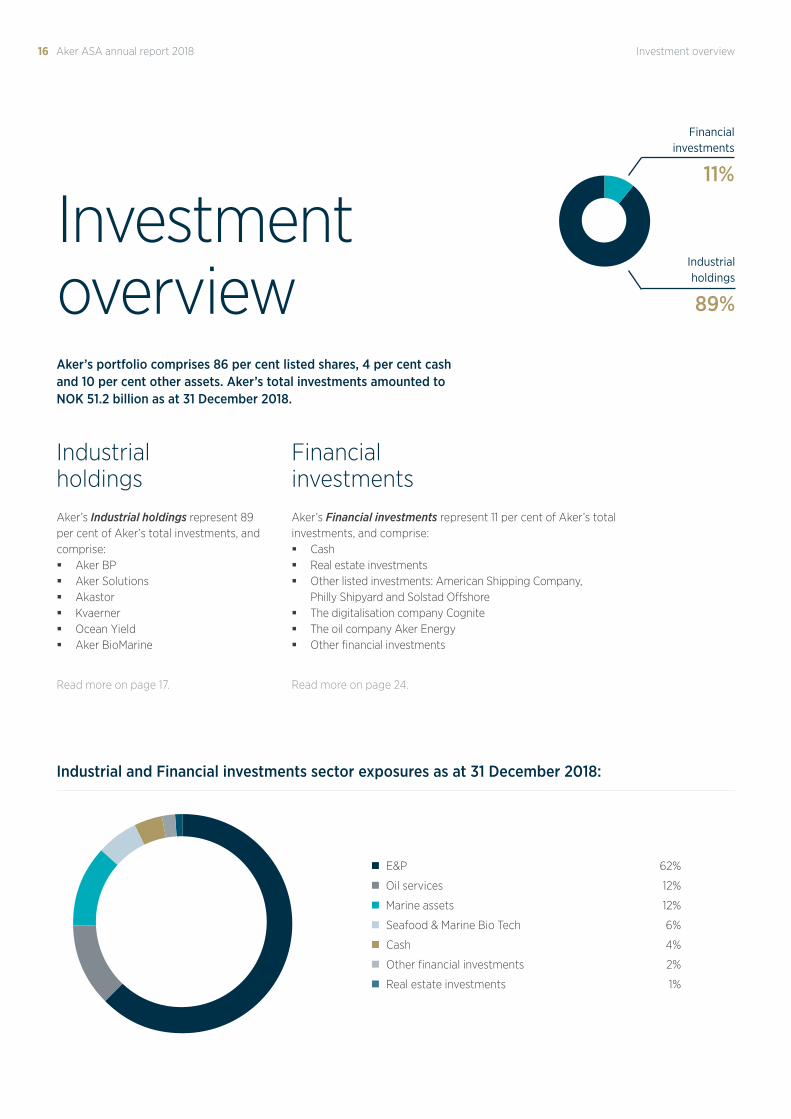
Investment overviewAker’s portfolio comprises 86 per cent listed shares, 4 per cent cash and 10 per cent other assets. Aker’s total investments amounted to NOK 51.2 billion as at 31 December 2018.
Aker’s Industrial holdings represent 89 per cent of Aker’s total investments, and comprise: § Aker BP § Aker Solutions § Akastor § Kvaerner § Ocean Yield § Aker BioMarine
Read more on page 17.
Aker’s Financial investments represent 11 per cent of Aker’s total investments, and comprise: § Cash § Real estate investments § Other listed investments: American Shipping Company,
Philly Shipyard and Solstad Offshore § The digitalisation company Cognite § The oil company Aker Energy § Other financial investments
Read more on page 24.
Financial investments
Industrial holdings
89%
11%
Industrial holdings
Financial investments
n E&P 62%
n Oil services 12%
n Marine assets 12%
n Seafood & Marine Bio Tech 6%
n Cash 4%
n Other financial investments 2%
n Real estate investments 1%
Industrial and Financial investments sector exposures as at 31 December 2018:
Eiendomsinvesteringer
Andre �nansielle investeringer
Kontanter
Sjømat og marin bioteknologi
Maritime eiendele
Oljeservice
Leting og oljeproduksjon
Investment overview
Aker ASA annual report 2018 17
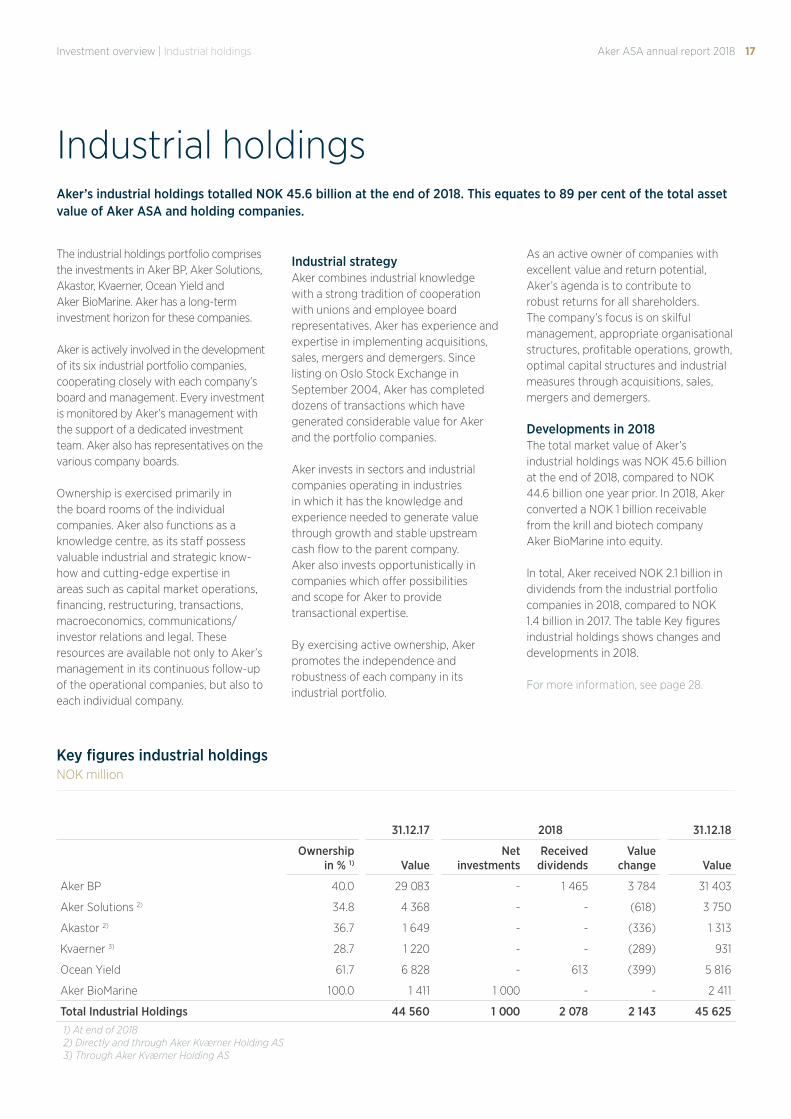
Industrial holdingsAker’s industrial holdings totalled NOK 45.6 billion at the end of 2018. This equates to 89 per cent of the total asset value of Aker ASA and holding companies.
The industrial holdings portfolio comprises the investments in Aker BP, Aker Solutions, Akastor, Kvaerner, Ocean Yield and Aker BioMarine. Aker has a long-term investment horizon for these companies.
Aker is actively involved in the development of its six industrial portfolio companies, cooperating closely with each company’s board and management. Every investment is monitored by Aker’s management with the support of a dedicated investment team. Aker also has representatives on the various company boards.
Ownership is exercised primarily in the board rooms of the individual companies. Aker also functions as a knowledge centre, as its staff possess valuable industrial and strategic know-how and cutting-edge expertise in areas such as capital market operations, financing, restructuring, transactions, macroeconomics, communications/investor relations and legal. These resources are available not only to Aker’s management in its continuous follow-up of the operational companies, but also to each individual company.
Industrial strategyAker combines industrial knowledge with a strong tradition of cooperation with unions and employee board representatives. Aker has experience and expertise in implementing acquisitions, sales, mergers and demergers. Since listing on Oslo Stock Exchange in September 2004, Aker has completed dozens of transactions which have generated considerable value for Aker and the portfolio companies.
Aker invests in sectors and industrial companies operating in industries in which it has the knowledge and experience needed to generate value through growth and stable upstream cash flow to the parent company. Aker also invests opportunistically in companies which offer possibilities and scope for Aker to provide transactional expertise.
By exercising active ownership, Aker promotes the independence and robustness of each company in its industrial portfolio.
As an active owner of companies with excellent value and return potential, Aker’s agenda is to contribute to robust returns for all shareholders. The company’s focus is on skilful management, appropriate organisational structures, profitable operations, growth, optimal capital structures and industrial measures through acquisitions, sales, mergers and demergers.
Developments in 2018The total market value of Aker’s industrial holdings was NOK 45.6 billion at the end of 2018, compared to NOK 44.6 billion one year prior. In 2018, Aker converted a NOK 1 billion receivable from the krill and biotech company Aker BioMarine into equity.
In total, Aker received NOK 2.1 billion in dividends from the industrial portfolio companies in 2018, compared to NOK 1.4 billion in 2017. The table Key figures industrial holdings shows changes and developments in 2018.
For more information, see page 28.
31.12.17 2018 31.12.18
Ownershipin % 1) Value
Netinvestments
Receiveddividends
Valuechange Value
Aker BP 40.0 29 083 - 1 465 3 784 31 403
Aker Solutions 2) 34.8 4 368 - - (618) 3 750
Akastor 2) 36.7 1 649 - - (336) 1 313
Kvaerner 3) 28.7 1 220 - - (289) 931
Ocean Yield 61.7 6 828 - 613 (399) 5 816
Aker BioMarine 100.0 1 411 1 000 - - 2 411
Total Industrial Holdings 44 560 1 000 2 078 2 143 45 6251) At end of 20182) Directly and through Aker Kværner Holding AS3) Through Aker Kværner Holding AS
NOK millionKey figures industrial holdings
Investment overview | Industrial holdings
Aker ASA annual report 2018 18 Investment overview | Industrial holdings
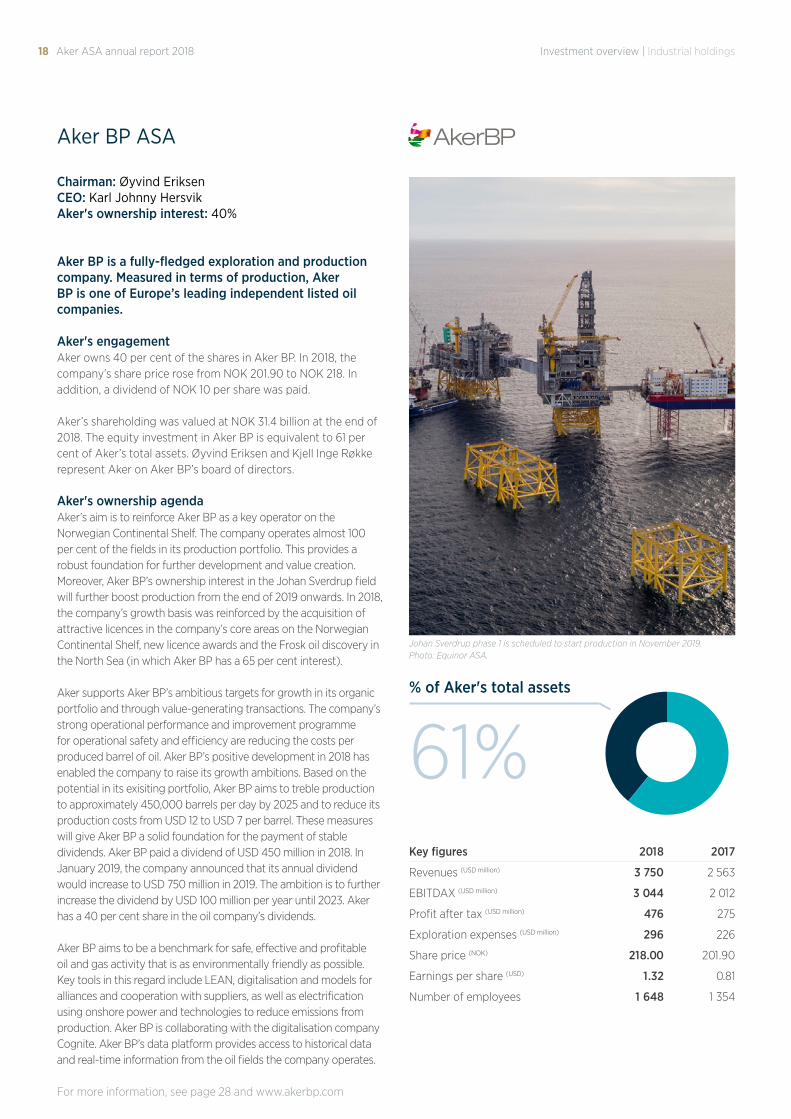
Chairman: Øyvind EriksenCEO: Karl Johnny HersvikAker's ownership interest: 40%
Aker BP ASA
Aker BP is a fully-fledged exploration and production company. Measured in terms of production, Aker BP is one of Europe’s leading independent listed oil companies.
Aker's engagementAker owns 40 per cent of the shares in Aker BP. In 2018, the company’s share price rose from NOK 201.90 to NOK 218. In addition, a dividend of NOK 10 per share was paid.
Aker’s shareholding was valued at NOK 31.4 billion at the end of 2018. The equity investment in Aker BP is equivalent to 61 per cent of Aker’s total assets. Øyvind Eriksen and Kjell Inge Røkke represent Aker on Aker BP’s board of directors.
Aker's ownership agendaAker’s aim is to reinforce Aker BP as a key operator on the Norwegian Continental Shelf. The company operates almost 100 per cent of the fields in its production portfolio. This provides a robust foundation for further development and value creation. Moreover, Aker BP’s ownership interest in the Johan Sverdrup field will further boost production from the end of 2019 onwards. In 2018, the company’s growth basis was reinforced by the acquisition of attractive licences in the company’s core areas on the Norwegian Continental Shelf, new licence awards and the Frosk oil discovery in the North Sea (in which Aker BP has a 65 per cent interest).
Aker supports Aker BP’s ambitious targets for growth in its organic portfolio and through value-generating transactions. The company’s strong operational performance and improvement programme for operational safety and efficiency are reducing the costs per produced barrel of oil. Aker BP’s positive development in 2018 has enabled the company to raise its growth ambitions. Based on the potential in its exisiting portfolio, Aker BP aims to treble production to approximately 450,000 barrels per day by 2025 and to reduce its production costs from USD 12 to USD 7 per barrel. These measures will give Aker BP a solid foundation for the payment of stable dividends. Aker BP paid a dividend of USD 450 million in 2018. In January 2019, the company announced that its annual dividend would increase to USD 750 million in 2019. The ambition is to further increase the dividend by USD 100 million per year until 2023. Aker has a 40 per cent share in the oil company’s dividends.
Aker BP aims to be a benchmark for safe, effective and profitable oil and gas activity that is as environmentally friendly as possible. Key tools in this regard include LEAN, digitalisation and models for alliances and cooperation with suppliers, as well as electrification using onshore power and technologies to reduce emissions from production. Aker BP is collaborating with the digitalisation company Cognite. Aker BP’s data platform provides access to historical data and real-time information from the oil fields the company operates.
For more information, see page 28 and www.akerbp.com
Key figures 2018 2017
Revenues (USD million) 3 750 2 563
EBITDAX (USD million) 3 044 2 012
Profit after tax (USD million) 476 275
Exploration expenses (USD million) 296 226
Share price (NOK) 218.00 201.90
Earnings per share (USD) 1.32 0.81
Number of employees 1 648 1 354
% of Aker's total assets
61%
Johan Sverdrup phase 1 is scheduled to start production in November 2019. Photo: Equinor ASA.
Aker ASA annual report 2018 19
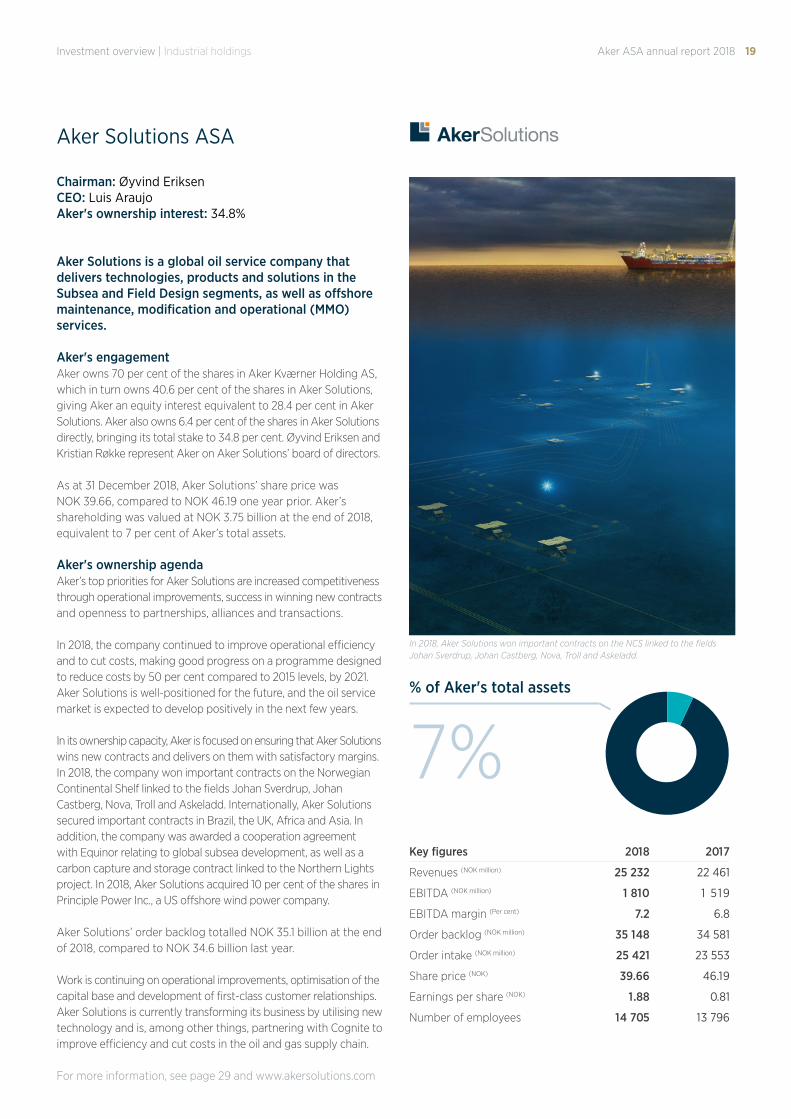
% of Aker's total assets
7%
Aker Solutions ASA
Investment overview | Industrial holdings
Chairman: Øyvind EriksenCEO: Luis AraujoAker's ownership interest: 34.8%
Aker Solutions is a global oil service company that delivers technologies, products and solutions in the Subsea and Field Design segments, as well as offshore maintenance, modification and operational (MMO) services.
Aker's engagementAker owns 70 per cent of the shares in Aker Kværner Holding AS, which in turn owns 40.6 per cent of the shares in Aker Solutions, giving Aker an equity interest equivalent to 28.4 per cent in Aker Solutions. Aker also owns 6.4 per cent of the shares in Aker Solutions directly, bringing its total stake to 34.8 per cent. Øyvind Eriksen and Kristian Røkke represent Aker on Aker Solutions’ board of directors.
As at 31 December 2018, Aker Solutions’ share price was NOK 39.66, compared to NOK 46.19 one year prior. Aker’s shareholding was valued at NOK 3.75 billion at the end of 2018, equivalent to 7 per cent of Aker’s total assets.
Aker's ownership agendaAker’s top priorities for Aker Solutions are increased competitiveness through operational improvements, success in winning new contracts and openness to partnerships, alliances and transactions.
In 2018, the company continued to improve operational efficiency and to cut costs, making good progress on a programme designed to reduce costs by 50 per cent compared to 2015 levels, by 2021. Aker Solutions is well-positioned for the future, and the oil service market is expected to develop positively in the next few years.
In its ownership capacity, Aker is focused on ensuring that Aker Solutions wins new contracts and delivers on them with satisfactory margins. In 2018, the company won important contracts on the Norwegian Continental Shelf linked to the fields Johan Sverdrup, Johan Castberg, Nova, Troll and Askeladd. Internationally, Aker Solutions secured important contracts in Brazil, the UK, Africa and Asia. In addition, the company was awarded a cooperation agreement with Equinor relating to global subsea development, as well as a carbon capture and storage contract linked to the Northern Lights project. In 2018, Aker Solutions acquired 10 per cent of the shares in Principle Power Inc., a US offshore wind power company.
Aker Solutions’ order backlog totalled NOK 35.1 billion at the end of 2018, compared to NOK 34.6 billion last year.
Work is continuing on operational improvements, optimisation of the capital base and development of first-class customer relationships. Aker Solutions is currently transforming its business by utilising new technology and is, among other things, partnering with Cognite to improve efficiency and cut costs in the oil and gas supply chain.
For more information, see page 29 and www.akersolutions.com
Key figures 2018 2017
Revenues (NOK million) 25 232 22 461
EBITDA (NOK million) 1 810 1 519
EBITDA margin (Per cent) 7.2 6.8
Order backlog (NOK million) 35 148 34 581
Order intake (NOK million) 25 421 23 553
Share price (NOK) 39.66 46.19
Earnings per share (NOK) 1.88 0.81
Number of employees 14 705 13 796
In 2018, Aker Solutions won important contracts on the NCS linked to the fields Johan Sverdrup, Johan Castberg, Nova, Troll and Askeladd.
Aker ASA annual report 2018 20
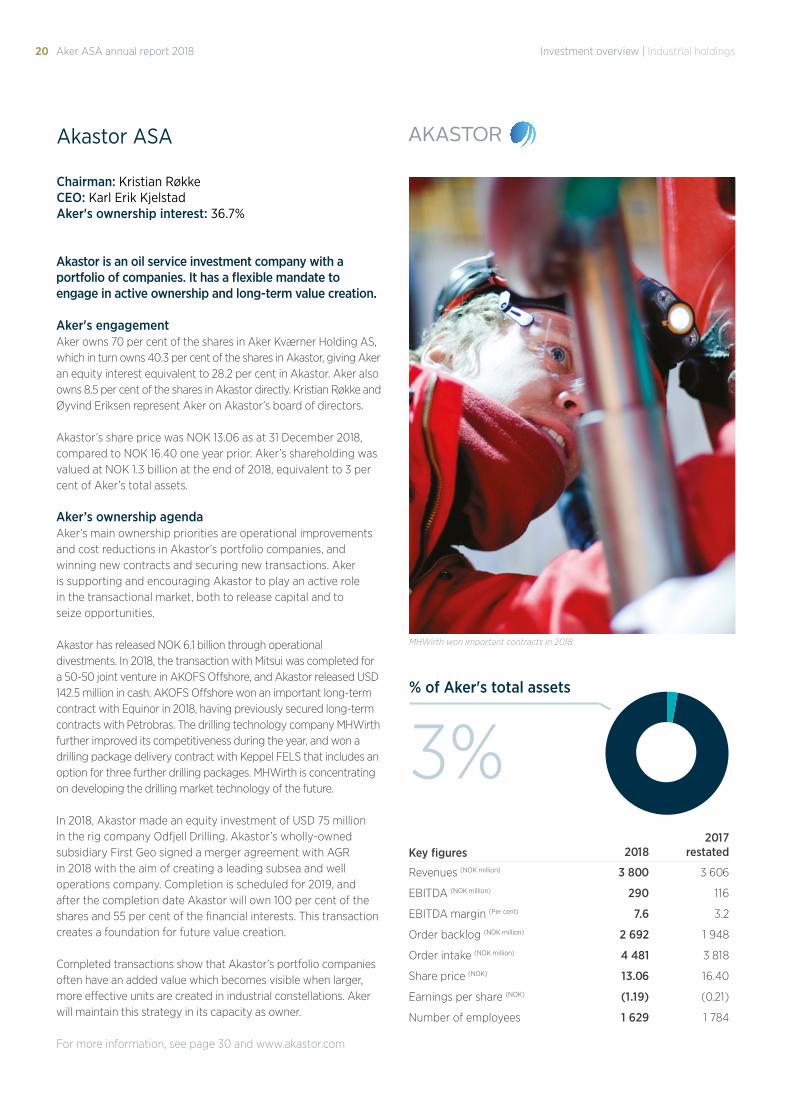
Akastor ASA
Chairman: Kristian RøkkeCEO: Karl Erik KjelstadAker's ownership interest: 36.7%
Akastor is an oil service investment company with a portfolio of companies. It has a flexible mandate to engage in active ownership and long-term value creation.
Aker's engagementAker owns 70 per cent of the shares in Aker Kværner Holding AS, which in turn owns 40.3 per cent of the shares in Akastor, giving Aker an equity interest equivalent to 28.2 per cent in Akastor. Aker also owns 8.5 per cent of the shares in Akastor directly. Kristian Røkke and Øyvind Eriksen represent Aker on Akastor’s board of directors.
Akastor’s share price was NOK 13.06 as at 31 December 2018, compared to NOK 16.40 one year prior. Aker’s shareholding was valued at NOK 1.3 billion at the end of 2018, equivalent to 3 per cent of Aker’s total assets.
Aker’s ownership agendaAker’s main ownership priorities are operational improvements and cost reductions in Akastor’s portfolio companies, and winning new contracts and securing new transactions. Aker is supporting and encouraging Akastor to play an active role in the transactional market, both to release capital and to seize opportunities.
Akastor has released NOK 6.1 billion through operational divestments. In 2018, the transaction with Mitsui was completed for a 50-50 joint venture in AKOFS Offshore, and Akastor released USD 142.5 million in cash. AKOFS Offshore won an important long-term contract with Equinor in 2018, having previously secured long-term contracts with Petrobras. The drilling technology company MHWirth further improved its competitiveness during the year, and won a drilling package delivery contract with Keppel FELS that includes an option for three further drilling packages. MHWirth is concentrating on developing the drilling market technology of the future.
In 2018, Akastor made an equity investment of USD 75 million in the rig company Odfjell Drilling. Akastor’s wholly-owned subsidiary First Geo signed a merger agreement with AGR in 2018 with the aim of creating a leading subsea and well operations company. Completion is scheduled for 2019, and after the completion date Akastor will own 100 per cent of the shares and 55 per cent of the financial interests. This transaction creates a foundation for future value creation.
Completed transactions show that Akastor’s portfolio companies often have an added value which becomes visible when larger, more effective units are created in industrial constellations. Aker will maintain this strategy in its capacity as owner.
For more information, see page 30 and www.akastor.com
Key figures
2018
2017 restated
Revenues (NOK million) 3 800 3 606
EBITDA (NOK million) 290 116
EBITDA margin (Per cent) 7.6 3.2
Order backlog (NOK million) 2 692 1 948
Order intake (NOK million) 4 481 3 818
Share price (NOK) 13.06 16.40
Earnings per share (NOK) (1.19) (0.21)
Number of employees 1 629 1 784
% of Aker's total assets
3%
Investment overview | Industrial holdings
MHWirth won important contracts in 2018.
Aker ASA annual report 2018 21
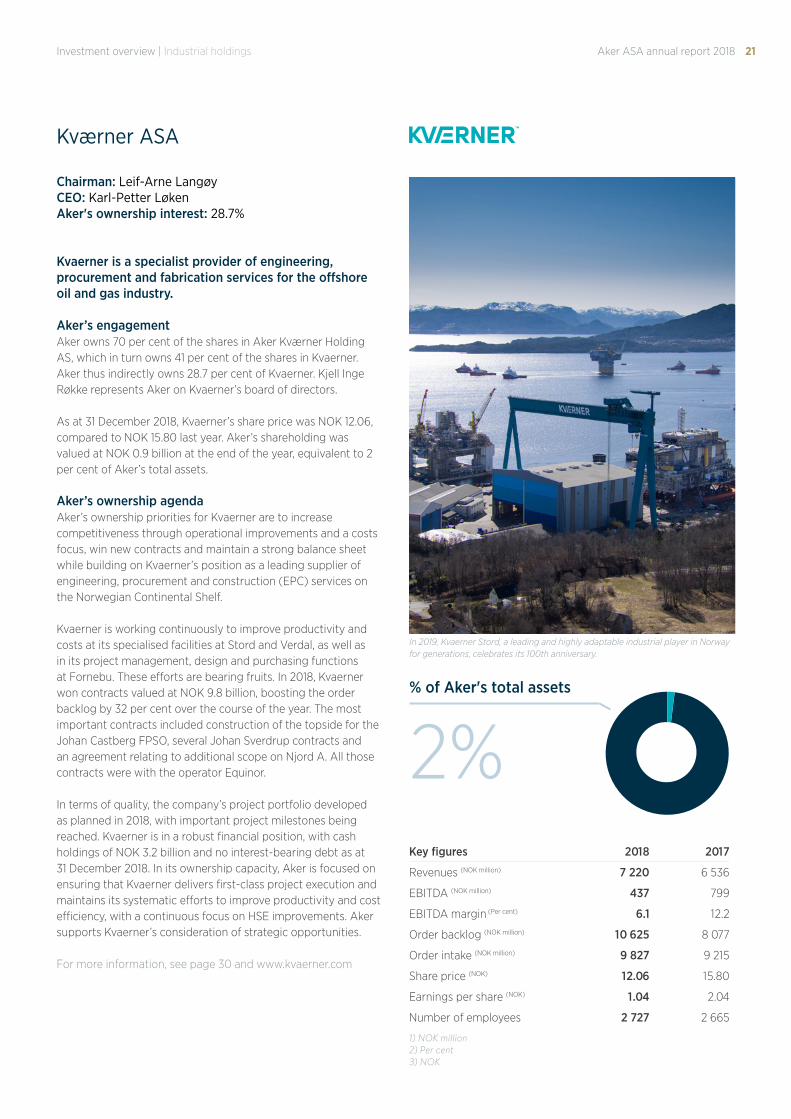
Kvaerner is a specialist provider of engineering, procurement and fabrication services for the offshore oil and gas industry.
Aker’s engagementAker owns 70 per cent of the shares in Aker Kværner Holding AS, which in turn owns 41 per cent of the shares in Kvaerner. Aker thus indirectly owns 28.7 per cent of Kvaerner. Kjell Inge Røkke represents Aker on Kvaerner’s board of directors.
As at 31 December 2018, Kvaerner’s share price was NOK 12.06, compared to NOK 15.80 last year. Aker’s shareholding was valued at NOK 0.9 billion at the end of the year, equivalent to 2 per cent of Aker’s total assets.
Aker’s ownership agendaAker’s ownership priorities for Kvaerner are to increase competitiveness through operational improvements and a costs focus, win new contracts and maintain a strong balance sheet while building on Kvaerner’s position as a leading supplier of engineering, procurement and construction (EPC) services on the Norwegian Continental Shelf.
Kvaerner is working continuously to improve productivity and costs at its specialised facilities at Stord and Verdal, as well as in its project management, design and purchasing functions at Fornebu. These efforts are bearing fruits. In 2018, Kvaerner won contracts valued at NOK 9.8 billion, boosting the order backlog by 32 per cent over the course of the year. The most important contracts included construction of the topside for the Johan Castberg FPSO, several Johan Sverdrup contracts and an agreement relating to additional scope on Njord A. All those contracts were with the operator Equinor.
In terms of quality, the company’s project portfolio developed as planned in 2018, with important project milestones being reached. Kvaerner is in a robust financial position, with cash holdings of NOK 3.2 billion and no interest-bearing debt as at 31 December 2018. In its ownership capacity, Aker is focused on ensuring that Kvaerner delivers first-class project execution and maintains its systematic efforts to improve productivity and cost efficiency, with a continuous focus on HSE improvements. Aker supports Kvaerner’s consideration of strategic opportunities.
For more information, see page 30 and www.kvaerner.com
Kværner ASA
Chairman: Leif-Arne LangøyCEO: Karl-Petter LøkenAker's ownership interest: 28.7%
Key figures 2018 2017
Revenues (NOK million) 7 220 6 536
EBITDA (NOK million) 437 799
EBITDA margin (Per cent) 6.1 12.2
Order backlog (NOK million) 10 625 8 077
Order intake (NOK million) 9 827 9 215
Share price (NOK) 12.06 15.80
Earnings per share (NOK) 1.04 2.04
Number of employees 2 727 2 665
1) NOK million2) Per cent3) NOK
% of Aker's total assets
2%
Investment overview | Industrial holdings
In 2019, Kvaerner Stord, a leading and highly adaptable industrial player in Norway for generations, celebrates its 100th anniversary.
Aker ASA annual report 2018 22
Ocean Yield ASA
Chairman: Frank O. ReiteCEO: Lars SolbakkenAker's ownership interest: 61.7%
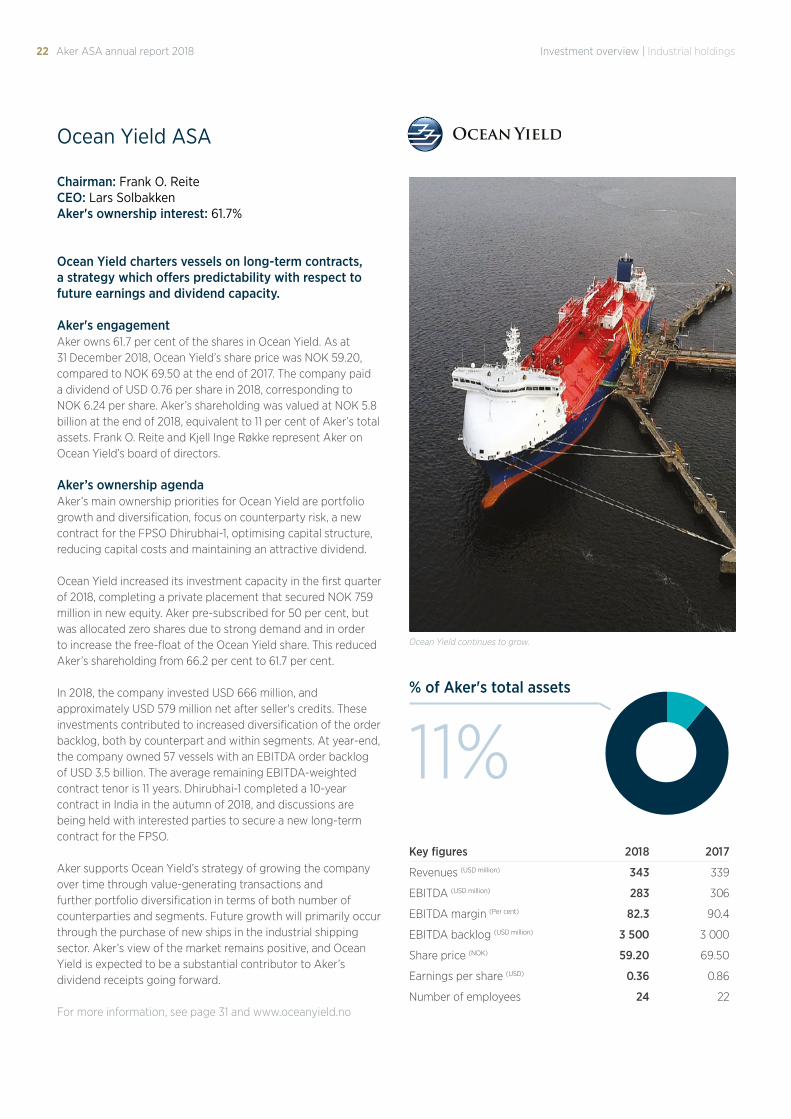
Ocean Yield charters vessels on long-term contracts, a strategy which offers predictability with respect to future earnings and dividend capacity.
Aker's engagementAker owns 61.7 per cent of the shares in Ocean Yield. As at 31 December 2018, Ocean Yield’s share price was NOK 59.20, compared to NOK 69.50 at the end of 2017. The company paid a dividend of USD 0.76 per share in 2018, corresponding to NOK 6.24 per share. Aker’s shareholding was valued at NOK 5.8 billion at the end of 2018, equivalent to 11 per cent of Aker’s total assets. Frank O. Reite and Kjell Inge Røkke represent Aker on Ocean Yield’s board of directors.
Aker’s ownership agendaAker’s main ownership priorities for Ocean Yield are portfolio growth and diversification, focus on counterparty risk, a new contract for the FPSO Dhirubhai-1, optimising capital structure, reducing capital costs and maintaining an attractive dividend.
Ocean Yield increased its investment capacity in the first quarter of 2018, completing a private placement that secured NOK 759 million in new equity. Aker pre-subscribed for 50 per cent, but was allocated zero shares due to strong demand and in order to increase the free-float of the Ocean Yield share. This reduced Aker’s shareholding from 66.2 per cent to 61.7 per cent.
In 2018, the company invested USD 666 million, and approximately USD 579 million net after seller's credits. These investments contributed to increased diversification of the order backlog, both by counterpart and within segments. At year-end, the company owned 57 vessels with an EBITDA order backlog of USD 3.5 billion. The average remaining EBITDA-weighted contract tenor is 11 years. Dhirubhai-1 completed a 10-year contract in India in the autumn of 2018, and discussions are being held with interested parties to secure a new long-term contract for the FPSO.
Aker supports Ocean Yield’s strategy of growing the company over time through value-generating transactions and further portfolio diversification in terms of both number of counterparties and segments. Future growth will primarily occur through the purchase of new ships in the industrial shipping sector. Aker’s view of the market remains positive, and Ocean Yield is expected to be a substantial contributor to Aker’s dividend receipts going forward.
For more information, see page 31 and www.oceanyield.no
Key figures 2018 2017
Revenues (USD million) 343 339
EBITDA (USD million) 283 306
EBITDA margin (Per cent) 82.3 90.4
EBITDA backlog (USD million) 3 500 3 000
Share price (NOK) 59.20 69.50
Earnings per share (USD) 0.36 0.86
Number of employees 24 22
% of Aker's total assets
11%
Investment overview | Industrial holdings
Ocean Yield continues to grow.
Aker ASA annual report 2018 23
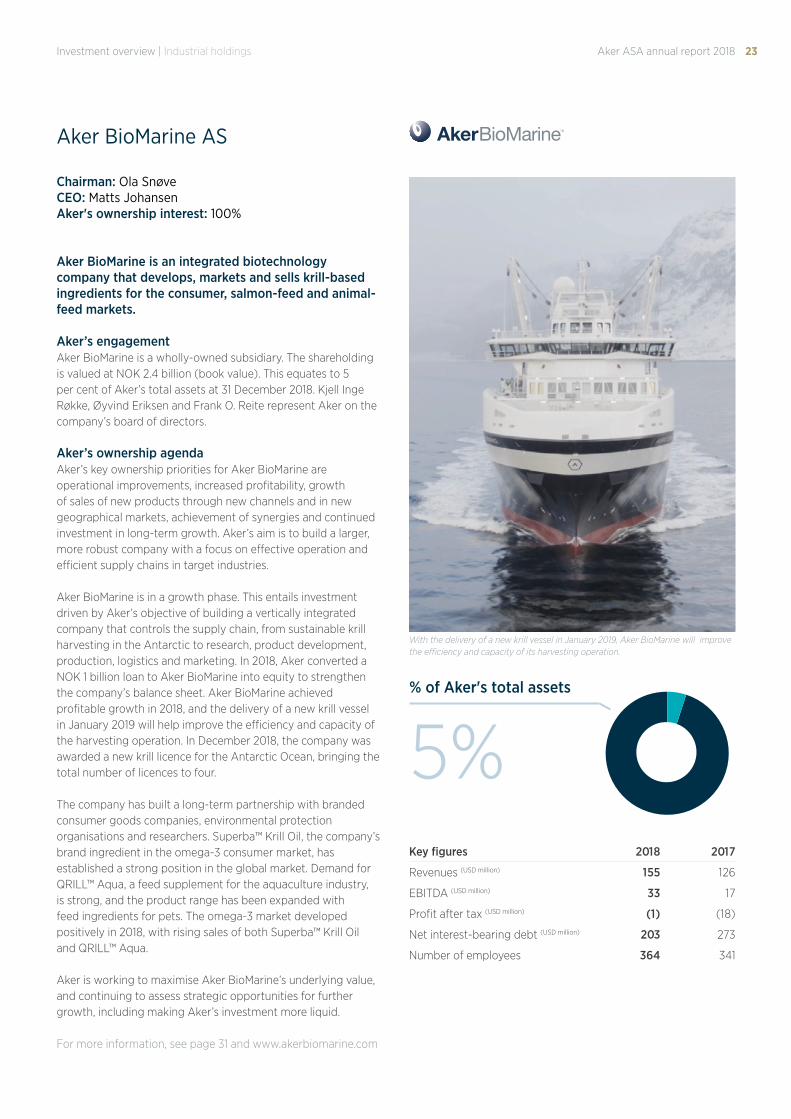
Aker BioMarine AS
Aker BioMarine is an integrated biotechnology company that develops, markets and sells krill-based ingredients for the consumer, salmon-feed and animal-feed markets.
Aker’s engagementAker BioMarine is a wholly-owned subsidiary. The shareholding is valued at NOK 2.4 billion (book value). This equates to 5 per cent of Aker’s total assets at 31 December 2018. Kjell Inge Røkke, Øyvind Eriksen and Frank O. Reite represent Aker on the company’s board of directors.
Aker’s ownership agendaAker’s key ownership priorities for Aker BioMarine are operational improvements, increased profitability, growth of sales of new products through new channels and in new geographical markets, achievement of synergies and continued investment in long-term growth. Aker’s aim is to build a larger, more robust company with a focus on effective operation and efficient supply chains in target industries.
Aker BioMarine is in a growth phase. This entails investment driven by Aker’s objective of building a vertically integrated company that controls the supply chain, from sustainable krill harvesting in the Antarctic to research, product development, production, logistics and marketing. In 2018, Aker converted a NOK 1 billion loan to Aker BioMarine into equity to strengthen the company’s balance sheet. Aker BioMarine achieved profitable growth in 2018, and the delivery of a new krill vessel in January 2019 will help improve the efficiency and capacity of the harvesting operation. In December 2018, the company was awarded a new krill licence for the Antarctic Ocean, bringing the total number of licences to four.
The company has built a long-term partnership with branded consumer goods companies, environmental protection organisations and researchers. Superba™ Krill Oil, the company’s brand ingredient in the omega-3 consumer market, has established a strong position in the global market. Demand for QRILL™ Aqua, a feed supplement for the aquaculture industry, is strong, and the product range has been expanded with feed ingredients for pets. The omega-3 market developed positively in 2018, with rising sales of both Superba™ Krill Oil and QRILL™ Aqua.
Aker is working to maximise Aker BioMarine’s underlying value, and continuing to assess strategic opportunities for further growth, including making Aker’s investment more liquid.
For more information, see page 31 and www.akerbiomarine.com
Chairman: Ola SnøveCEO: Matts JohansenAker's ownership interest: 100%
Key figures 2018 2017
Revenues (USD million) 155 126
EBITDA (USD million) 33 17
Profit after tax (USD million) (1) (18)
Net interest-bearing debt (USD million) 203 273
Number of employees 364 341
% of Aker's total assets
5%
Investment overview | Industrial holdings
With the delivery of a new krill vessel in January 2019, Aker BioMarine will improve the efficiency and capacity of its harvesting operation.
Aker ASA annual report 2018 24
31.12.18 31.12.17
Cash 1 945 1 232
Liquid fund investments - 442
Listed financial investments 701 1 220
Real estate 568 674
Other financial investments 2 373 2 261
Total financial investments 5 588 5 829
The value of financial investments totalled NOK 5.6 billion at the end of 2018, including NOK 1.9 billion in cash. This equates to 11 per cent of the total asset value of Aker ASA and holding companies.
The Financial investments segment encompasses cash, equity investments in listed companies such as American Shipping Company, Philly Shipyard and Solstad Offshore, the real estate development company FP Eiendom, the 65 per cent shareholding in the digitalisation company Cognite, 49 per cent of the shares in Aker Energy, and other assets and receivables. From 2019, Aker Energy and Cognite are included in the portfolio of industrial investments.
At year-end 2018, Aker had cash holdings of NOK 1.95 billion. The company’s liquidity reserve, including undrawn credit facillities, totalled NOK 5.2 billion as at 31 December 2018.
The listed financial investments American Shipping Company, Philly Shipyard and Solstad Offshore were valued at NOK 0.7 billion at the end of 2018. In total, these companies caused a decrease in net asset value of NOK 0.2 billion. Solstad Offshore faces a difficult situation in a challenging market, and has announced negotiations with creditors and other stakeholders to improve its financial position.
Other financial investments comprise equity investments, internal and external receivables and other assets. The largest investment in this category is Aker Energy, a company established jointly with The Resource Group TRG AS in February 2018 which subsequently acquired Hess Corporation’s 50 per cent ownership interest in the Deepwater Tano Cape Three Points block in Ghana. So far, the company has focused on preparing a plan of development of the oil field and on drilling appraisal wells to investigate the field’s characteristics. The first appraisal well was drilled at the end of the year, and confirmed expectations of the field. Based on existing seismological data, drilled wells and analysis of Pecan 4A results, the existing discoveries are estimated to contain contingent resources (2C) totalling between 450 million and 550 million barrels of oil equivalents. The potential is significantly higher. Aker sees value-creation opportunities for Aker Energy and the nation of Ghana.
Cognite achieved growth throughout 2018, in line with the digitalisation company’s ambitious business plan. The company continues to attract
highly skilled programmers and other talented staff, bringing its workforce to 110 employees at year-end, compared to 37 at the end of 2017. Cognite is playing an active role in oil and gas industry digitalisation, and additionally demonstrated considerable commercial potential outside this sector in 2018. Cognite has been awarded a contract to develop a digitalisation strategy for Aker BP, and its digital data platform has been an important factor in the oil company’s efforts to make operations more secure and efficient. During the course of 2018, Cognite also secured agreements with several other major clients, supporting the company’s growth objectives.
FP Eiendom (formerly Fornebuporten Holding) had an exposure to real estate development projects of NOK 568 million as at 31 December 2018, down from NOK 674 million at year-end 2017. The reduction is mainly due to the joint establishment of FP Bolig with external investors, a transaction which released NOK 361 million in cash for Aker, including a sales gain of NOK 194 million.
For more information, see page 31
Financial investments
NOK millionKey figures financial investments
Investment overview | Financial investments
Aker ASA annual report 2018 25
Aker ASA refers to alternative performance measures with regards to Aker ASA and holding companies’ financial results and those of its portfolio companies, as a supplement to the financial statements prepared in accordance with IFRS. Such performance measures are frequently used by securities analysts, investors and other interested parties, and they are meant to provide an enhanced insight into operations, financing and future prospects of the group. The definitions of these measures are as follows:
§ EBITDA: operating profit before depreciation, amortisation, and impairment charges.
§ EBITDA margin: EBITDA divided by revenue.
§ EBITDAX: operating profit before depreciation, amortisation, impairment charges and exploration expenses.
§ Equity ratio: total equity divided by total assets.
§ Gross asset value: the sum of all assets determined by applying the market value of listed shares and the book value of other assets.
§ Kboed: thousand barrels of oil equivalents per day
§ Net asset value (NAV): gross asset value less liabilities.
§ NAV per share: NAV divided by the
total number of outstanding Aker ASA shares.
§ Net interest-bearing receivables/debt: cash, cash equivalents and interest-bearing receivables (current and non-current), less interest-bearing debt (current and non-current).
§ Order intake: new signed contracts in the period and expansion of existing contracts. The estimated value of potential options and change orders is not included.
§ Order backlog: estimated value of remaining work under signed contracts.
§ Value-adjusted equity ratio: NAV divided by gross asset value.
Alternative performance measures
Investment overview | Alternative performance measures
Aker ASA annual report 2018 26 Board of Directors' report
Aker ASA annual report 2018 27
2018 was a year of high volatility in oil prices, international financial markets and share prices. At year-end, Aker’s** net asset value was on par with last year, at NOK 41.7 billion. In addition, a dividend of NOK 1.3 billion was paid in 2018. The shareholder return, defined as share price growth plus distributed dividends, totalled 19 per cent. By comparison, the Oslo Stock Exchange Benchmark Index (OSEBX) – fell by 2 per cent during the year.
Aker ASA* and its industrial holdings companies are well-positioned, characterised by robust balance sheets, financial flexibility and strong market positions. Upstream dividend to Aker increased to NOK 2.2 billion in 2018, up from NOK 1.6 billion in 2017. Aker’s financial strength provides capacity for both future investments and predictable dividends to its shareholders. The board of directors is proposing a dividend of NOK 1.7 billion, or NOK 22.50 per share, payable in May 2019.
In industrial terms, important steps were taken in 2018, and the underlying performance of the portfolio companies is on a positive trend. However, the value development in 2018 was severely impacted by the drop in oil prices in the fourth quarter and the general decline in global stock markets, particularly in the oil and gas sector. Following three successive quarters of net asset value (NAV) growth, Aker’s NAV ended the year at the same level as at the beginning of the year. NAV is a core performance
indicator at Aker and is determined by applying the market value of exchange-listed shares and book value for other assets. NAV is a key determinant of the company’s dividend.
Also in 2018, Aker BP was the most important contributor among the portfolio companies, boosting Aker’s NAV by NOK 2.3 billion and generating NOK 1.5 billion in dividends to Aker. While Ocean Yield paid NOK 0.6 billion in dividends to Aker, the value of the shareholding fell by NOK 1.0 billion during the year. The other portfolio companies listed on Oslo Stock Exchange paid no dividends and had a negative share price development.
The oil service companies in Aker’s portfolio – Aker Solutions, Akastor and Kvaerner – continued to focus on their improvement programmes effectively and profitably in 2018. Aker’s wholly-owned krill and biotechnology company, Aker BioMarine, achieved increased harvests, sales and profits.
* Aker ASA refers to the parent company.
** Aker refers to Aker ASA and holding companies, as specified in Note 1 to the annual accounts of Aker ASA and holding companies, page 117.
Aker Group refers to Aker ASA and subsidiaries consolidated into the Group accounts, as specified in Note 9 to the annual accounts of the Aker Group, page 62.
Board of Directors' report
In industrial terms, important steps were taken
in 2018, and the underlying
performance of the portfolio
companies is on a positive trend.
Board of Directors' report
Aker ASA annual report 2018 28
1. Key developments in 2018Volatility was the new normal in 2018. Oil prices started the year at USD 67 per barrel, peaked at USD 86 and ended the year at USD 54 per barrel. The financial markets were impacted by the trade conflict between the USA and China, protectionism, fear of a global economic downturn, uncertainty about the consequences of Brexit and other geopolitical factors. Cumulatively, these circumstances triggered major fluctuations in share prices and foreign exchange rates.
Through its concentration on equity investments in the oil and gas sector, Aker is exposed to developments in oil prices and activity levels in the oil service industry. In the first quarter, Aker’s NAV increased from NOK 41.8 billion to NOK 42.4 billion, and its share price from NOK 403 to NOK 440.50. In the second quarter, NAV increased by 34.6 per cent, to NOK 57.1 billion. The share price reached NOK 623, and a dividend of NOK 18 per share was paid for the financial year 2017. In the third quarter, NAV increased by a further 10.8 per cent, to NOK 63.3 billion, while the share price rose to NOK 734.
At year-end 2018, NAV stood at NOK 41.7 billion, representing a drop of 34 per cent during the fourth quarter, and the share price ended the year at NOK 462. Including the NOK 1.3 billion dividend distribution made to shareholders, NAV rose by 3 per cent in 2018. The shareholder return, defined as share price growth plus distributed dividends, totalled 19 per cent. By comparison, the Oslo Stock Exchange Benchmark Index (OSEBX) – fell by 2 per cent during the year.
After dividend allocation for 2018, Aker’s value-adjusted equity ratio was 78 per cent at year-end, and its book equity ratio 53 per cent. Cash holdings totalled NOK 1.9 billion, up from NOK 1.2 billion last year. Gross interest-bearing debt amounted to NOK 9.2 billion, while net interest-bearing debt stood at NOK 6.2 billion.
Aker’s unlisted investments in Aker BioMarine, Aker Energy, Cognite and FP Eiendom are recognised in NAV at book
value. In February 2018, Aker co-founded Aker Energy as a 50/50 owned company with Kjell Inge Røkke’s privately owned company The Resource Group TRG AS (TRG), in connection with the purchase of Hess Corporation’s 50 per cent stake in the Deepwater Tano Cape Three Points block in Ghana. The first appraisal well was drilled at the end of the year, and confirmed the expectations to the volume base. The digitalisation company Cognite, which was established in 2017, is developing positively, achieving growth and expanding its customer portfolio. In 2018, FP Eiendom (formerly Fornebuporten Holding) established the company FP Bolig in collaboration with external partners to undertake residential development at Fornebu. The transaction released NOK 361 million in cash for Aker.
Aker BP has announced an increase in its dividend distribution from USD 450 million in 2018 to USD 750 million in 2019, and aims to annually increase the dividend by an additional USD 100 million in the period to 2023. Through its 40 per cent stake in Aker BP, Aker is set to receive a substantial dividend stream in the years ahead.
On 20 April 2018, Aker ASA’s annual general meeting approved the distribution of a NOK 18 per share ordinary dividend for 2017. The board of directors proposes a cash dividend of NOK 22.50 per share for 2018. The proposal corresponds to a 4.9 per cent yield on the share price at the close of 2018 and represents 4.0 per cent of NAV.
2. Business operations and locationAker ASA is an industrial investment company with a history dating back to 1841. The company is domiciled in Norway, with headquarters at Fornebu.
As an active owner and equity investor, Aker employs its financial strength and industrial knowledge to further develop the operating companies in its portfolio. Through its participation on the boards of its portfolio companies, Aker drives strategic development, operational improvements, restructuring, and facilitates transactions. Aker’s objectives are securing long-term profitable growth and returns, and building sound organisational cultures in
all its portfolio companies. The aim is to ensure sustainable value creation for all shareholders.
Aker’s investments are divided into two portfolios: Industrial holdings and Financial investments. As at year-end 2018, Aker was directly or indirectly the largest shareholder in eight companies listed on the Oslo Stock Exchange.
a. Industrial holdingsAker’s industrial holdings are the company’s long-term investments and comprise six companies, of which five are listed. These include the integrated exploration and production company Aker BP; the oil services company Aker Solutions; the oil services investment company Akastor; the engineering, procurement and construction company Kvaerner; the ship-owning company Ocean Yield; and the krill and biotechnology company Aker BioMarine.
The value of Aker’s industrial holdings amounted to NOK 45.6 billion as at 31 December 2018, equivalent to 89 per cent of Aker’s value-adjusted gross asset value, up from NOK 44.6 billion at year-end 2017. In 2018, Aker converted a NOK 1 billion receivable from Aker BioMarine into equity, bringing the book value of the unlisted investment to NOK 2.4 billion as at 31 December 2018.
Aker BP’s value increase contributed NOK 2.3 billion to Aker’s NAV in 2018. The value decreases of the other companies were NOK 1.0 billion for Ocean Yield, NOK 0.6 billion for Aker Solutions, NOK 0.3 billion for Akastor and NOK 0.3 billion for Kvaerner. Dividends received from Aker BP and Ocean Yield totalled NOK 2.1 billion.
Aker BPAker BP is a fully-fledged oil and gas exploration and production (E&P) company operating on the Norwegian Continental Shelf (NCS).
Aker’s portfolio company in the E&P sector continued to grow in 2018. Aker BP strengthened its position in its key areas on the NCS through the purchase of 11 licenses from Total and the King Lear discovery from Equinor. These acquisitions boosted Aker BP’s
Board of Directors' report
Aker ASA annual report 2018 29
contingent resources by 173 million barrels of oil equivalents, bringing its total contingent resources to 946 million barrels of oil equivalents as per year-end 2018, compared to 785 million barrels of oil equivalents last year.
During the course of the year, Aker BP’s five field centres achieved satisfactory operational stability and good profitability. Collaboration models and alliances with oil service suppliers have helped to reduce costs and improved efficiency with regard to exploration, drilling, operations, maintenance, modifications and field development. Digitalisation contributes to more secure and efficient operations.
Aker BP’s production averaged 155 700 barrels of oil equivalents per day in 2018. The company’s operating revenues totalled USD 3.8 billion, compared to USD 2.6 billion in 2017. EBITDAX amounted to USD 3.0 billion, up from USD 2.0 billion in 2017.
Aker BP’s positive development has enabled the company to adopt even more ambitious growth targets, namely to triple production by 2025 and to cut production costs from USD 12 to USD 7 per barrel. The company’s profitable growth forecasts and strong balance sheet have enabled it to increase the dividend to its shareholders. Aker BP’s board has proposed an increase in the dividend to USD 750 million in 2019, with the aim of further annual rises of USD 100 million per year in the period to 2023.
For 2019, Aker BP aims to produce between 155 000 and 160 000 barrels of oil equivalents per day. First-oil on the Johan Sverdrup field is expected in November 2019.
At present, Aker BP is the operator for almost 100 per cent of its portfolio of producing fields, providing a strong foundation for further development and value creation. The company has scheduled a large and promising exploration programme for 2019. Aker BP plans to participate in 15 exploration wells with an estimated resource potential – so-called net unrisked resources – totalling 500 million barrels of oil equivalents.
The company has adopted ambitious targets for growth in the existing portfolio and through value-generating transactions. In its capacity as an owner, Aker sees the Norwegian Continental Shelf as an attractive investment region due to both strong prospectivity and a stable tax system that stimulates profitable new investments. Aker supports Aker BP’s plans for profitable growth, and will drive forward efforts to ensure smarter and more efficient operations through alliances and collaboration models. Digitalisation is a crucial aspect of Aker BP’s improvement programme, and is playing a key role in change processes.
Aker BP has entered into a long-term cooperation agreement with Cognite, and is a proactive adopter of digital solutions aboard Aker BP-operated platforms. The company is the first in Norway to operate a manned platform (the Ivar Aasen platform) from an onshore control room. Crew aboard both the Ivar Aasen platform and the Skarv FPSO are using handheld units to access live data from the company’s industrial data platform. The technology is currently being rolled-out to Aker BP’s other FPSO and platforms.
Aker wants to contribute to make the Norwegian Continental Shelf an international benchmark for safe, profitable offshore petroleum production that is sustainable. Aker BP continues to be one of the oil and gas producers with the lowest carbon intensity. The company’s emissions per produced barrel are lower than the average for the Norwegian Continental Shelf, and less than half the global average. Aker BP is making targeted efforts to reduce emissions, improve safety and boost efficiency throughout the supply chain. The Aker BP share was priced at NOK 218 on 31 December 2018, compared to NOK 201.90 at the end of 2017. This equates to a price increase of 8 per cent. Aker also received dividends from Aker BP totalling NOK 1 465 million.
Aker SolutionsAker Solutions is a global oil services company that provides services, technologies, and product solutions within subsea and field design. The
company operates in global niches with high barriers to entry and is set up to generate an attractive return on capital through an asset-light business model.
In 2018, Aker Solutions continued its efforts to improve operational effectiveness and reduce its cost base, and is on track to achieve its target of cutting costs by 50 per cent by 2021 compared to 2015 levels. The company is well-positioned for the future, and the oil service market is expected to develop positively in the longer term.
The company’s order backlog stood at NOK 35.1 billion at the end of 2018. The ratio between the order backlog and expected revenue for 2019 is at a healthy level. In 2018, Aker Solutions delivered satisfactorily on its order and project portfolios.
Aker Solutions’ operating revenues totalled NOK 25.2 billion in 2018, up from NOK 22.5 billion the previous year. EBITDA totalled NOK 1.8 billion, compared to NOK 1.5 billion in 2017. The company’s financial position is robust, and it had a liquidity reserve of NOK 7.5 billion at year-end 2018.
During the course of 2018, the company won important contracts linked to the Johan Sverdrup, Johan Castberg, Nova, Troll and Askeladd fields on the Norwegian Continental Shelf. Internationally, Aker Solutions secured several major contracts, inter alia in Brazil, the UK, Africa and Asia. This includes the Lingshui and Liuhua field developments in China, the first phase of the major Mero field development in Brazil, two sizable maintenance contracts – also in Brazil – and a strategically important contract with BP in Angola. Further, the company was awarded a collaboration agreement with Equinor relating to global subsea development projects, as well as a carbon capture contract under the Northern Lights project. In 2018, Aker Solutions purchased 10 per cent of the shares in the US wind energy company Principle Power Inc., and entered into a collaboration agreement with Cognite covering the development of digital services and solutions.
Board of Directors' report
Aker ASA annual report 2018 30
In its ownership capacity, Aker is focused on ensuring that Aker Solutions executes projects and wins new contracts with satisfactory margins. To succeed in this regard, the company must continue to develop first-class customer relationships and remain focused on further operational improvements and strengthening of its capital base. At the same time, the global oil service industry is consolidating, and Aker Solutions has entered into several cooperation agreements and alliances. Aker is taking an active approach in its capacity as owner in order to strengthen Aker Solutions’ industrial operations in the international market.
Aker Solutions’ share price closed the year at NOK 39.66, down from NOK 46.19 as at year-end 2017. The board of Aker Solutions has proposed that no dividend should be paid for the 2018 financial year.
AkastorAkastor is an oil services investment company with a portfolio of industrial holdings and financial investments. MHWirth and AKOFS Offshore are the two most important companies in the portfolio. Akastor has a flexible mandate for active ownership and seeks to realize the value potential of its businesses.
Since its creation in 2014, Akastor has divested businesses and released approximately NOK 6 billion in capital. In 2018, an agreement was entered into under which Mitsui acquired a 50 per cent stake in AKOFS Offshore. The deal released USD 142.5 million in cash for Akastor. AKOFS Offshore won an important long-term contract with Equinor in 2018, supplementing existing long-term contracts with Petrobras.
In 2018, Akastor made an equity investment of USD 75 million in the rig company Odfjell Drilling. Further, Akastor’s wholly-owned subsidiary First Geo signed a merger agreement with AGR with the aim of creating a leading subsea and well operations company. Completion is scheduled for 2019, and after the completion date Akastor will own 100 per cent of the shares and 55 per cent of the economic interest.
Akastor’s largest investment, the drilling technology company MHWirth, continues its efforts to improve operations and cost efficiency, as well as developing technology solutions for the drilling industry . The company strengthened its competitiveness further, winning a drilling package contract with Keppel FELS with options for three further drilling packages.
Akastor is working closely with its portfolio companies to implement operational improvements, cost reductions and strategic initiatives to strengthen the company’s competitiveness and position in challenging markets.
Akastor’s operating revenues totalled NOK 3.8 billion in 2018, compared to NOK 3.6 billion in 2017. EBITDA totalled NOK 290 million, compared to NOK 116 million in 2017. Akastor had a liquidity reserve of NOK 2.2 billion at year-end 2018.
Aker’s priority as owner is for Akastor to develop and realise the value of the portfolio companies. The transactions completed in 2018 show that Akastor’s portfolio companies often have an added value which becomes visible through industrial constellations in larger and more efficient units. These efforts are continuing.
Akastor’s share price closed the year at NOK 13.06, down from NOK 16.40 as at year-end 2017. No dividend has been proposed for the financial year 2018.
KvaernerKvaerner is a specialised supplier of offshore installations and onshore process plants for projects in the upstream oil and gas sector, as well as other related segments. One of the company’s competitive strengths is its ability to take on projects encompassing engineering, procurement and fabrication (EPC) services under a single contract. Although the EPC market remained challenging in 2018, with tough competition, Kvaerner succeeded in winning new important contracts. Existing projects are being executed as planned and in accordance with quality standards and budgets.
Kvaerner is constantly seeking to enhance productivity and improve cost levels at its specialised plants at Stord and in Verdal, as well as in its project management, design and procurement functions at Fornebu. Capacity has been adjusted to a lower activity level, and the delivery model has been refined to strengthen competitiveness. Digitalisation, robotisation and development of competencies are playing increasingly prominent roles in the company’s continuous improvement strategy.
In 2018, Kvaerner was awarded a NOK 3.8 billion contract to construct the topside for the FPSO to be used in the Johan Castberg field development. New contracts were also won in connection with the Johan Sverdrup development, with Kvaerner and Aker Solutions jointly winning a NOK 3.4 billion contract for modification of the riser platform and field centre. Half of the contract value will accrue to Kvaerner. Kvaerner also signed a new contract with Equinor to deliver the jacket for the processing platform to be used in Phase 2 of Johan Sverdrup. This is Kvaerner’s fourth jacket for the Johan Sverdrup field, and demonstrates Kvaerner’s competitiveness. Moreover, in 2018 Equinor expanded the scope of its upgrade of the Njord A platform to include work in addition to the NOK 5 billion contract awarded in 2017.
Kvaerner had operating revenues of NOK 7.2 billion in 2018, compared to NOK 6.5 billion the previous year. EBITDA totalled NOK 437 million, down from NOK 799 million in 2017. At year-end 2018, Kvaerner held NOK 3.2 billion in cash and had no interest-bearing debt.
Kvaerner’s order intake totalled NOK 9.8 billion in 2018, while the order backlog amounted to NOK 10.6 billion at the end of the year.
Kvaerner’s most important short-term focus areas are to deliver ongoing projects in line with customer expectations and to win new contracts. Since being spun off as a separate group in 2011, Kvaerner has delivered a predictable and satisfactory profit performance. In its ownership capacity, Aker is focused on ensuring that
Board of Directors' report
Aker ASA annual report 2018 31
Kvaerner continues to deliver first-class project execution, focuses on HSE improvements and maintains its systematic efforts to improve productivity and cost efficiency.
Kvaerner’s share price closed at NOK 12.06 on 31 December 2018, compared to NOK 15.80 at the end of 2017. The board of Kvaerner has proposed a dividend of NOK 1 per share.
Ocean YieldOcean Yield is a ship-owning company. Its mandate is to build a diversified portfolio of modern vessels on long-term charters to creditworthy counterparties.
Ocean Yield increased its investment capacity in 2018 through a share issue that secured NOK 759 million in new equity for the company. Aker presubscribed for half of the issue, but was allocated zero shares due to strong demand and in order to increase the free-float of the Ocean Yield share. This reduced Aker’s shareholding from 66.2 per cent to 61.7 per cent.
In 2018, the company invested a total of USD 666 million (USD 579 million net of seller’s credits). The number of vessels in the portfolio increased from 40 to 57. The growth occurred in the following segments: bulk carriers, crude-oil tankers (VLCC) and container ships (3,800 TEU). These investments helped diversify the order backlog in terms of both the number of counterparties and segments. The FPSO Dhirubhai-1 completed a 10-year contract with Reliance Industries in India in September 2018. Ocean Yield has entered into an option agreement giving Aker Energy the right to charter Dhirubhai-1 on bareboat terms. Aker Energy has paid USD 3 million for the option, which is exercisable in the second quarter of 2019. If the option is exercised, the agreement will have a duration of 15 years. Ocean Yield’s operating revenue totalled USD 343 million in 2018, compared to USD 339 million in 2017.
EBITDA amounted to USD 283 million, compared to USD 307 million in 2017. The EBITDA order backlog linked to signed contracts totalled USD 3.5 billion at the end of 2018, while the average remaining contract tenor was 11 years.
This ensures predictability with respect to earnings and dividend capacity. The company is maintaining its ambition of paying attractive quarterly dividends to its shareholders.
Aker supports Ocean Yield’s strategy of building a larger company over time through making value-accretive transactions and diversifying its portfolio further. Future growth will primarily occur through acquisition of new vessels on long-term charters in the industrial shipping sector.
Diversification helps improve the company’s robustness in the face of fluctuations in individual segments.
Ocean Yield’s share price stood at NOK 59.20 as at 31 December 2018, down from NOK 69.50 at the end of 2017. Aker received NOK 613 million in dividends from Ocean Yield in 2018 (NOK 6.25 per share).
Aker BioMarineAker BioMarine is an integrated biotechnology company that harvests krill in the Antarctic Ocean and develops, manufactures, markets and sells krill-based ingredients to the consumer health and animal nutrition and aquaculture markets.
The company is vertically integrated and controls the entire value chain, from sustainable krill harvesting in the Antarctic to research, product development, production, logistics and marketing. Aker BioMarine has developed long-term partnerships with leading branded consumer goods companies, environmental protection organisations and researchers. In 2018, Aker BioMarine was named Europe’s most innovative company by the European Business Awards.
Aker BioMarine’s core products are QRILL™ Aqua, a value-added ingredient for the aquaculture industry, and Superba™ Krill Oil, a phospholipid omega-3 dietary supplement for the consumer market. The market for QRILL™ products continued to develop favourably in 2018. Superba™ Krill Oil has a strong position in its market segment. The omega-3 market grew in 2018, particularly in Asia, which is becoming a
growth market with great potential. Sales of both Superba™ Krill Oil and QRILL™ Aqua increased from 2017 to 2018.
Aker BioMarine is in a growth phase requiring additional investments. In 2018, Aker converted a NOK 1 billion loan to Aker BioMarine into equity to strengthen the company’s balance sheet. The company is well positioned to expand geographically and maintain product sales in higher price segments, through its strong supply chain, a solid innovation product pipeline and stable long-term partnerships with customers. The company holds US krill oil patents which cover its production process and product recipes. Aker BioMarine’s krill-oil factory in Houston has expanded its capacity.
The company’s improved performance in 2018 generated operating revenues of USD 155 million, compared to USD 126 million in 2017. EBITDA amounted to USD 33 million, almost a double from last year’s total of USD 17 million.
At the end of 2018, Aker BioMarine was awarded a new krill licence, bringing the total number of licences to four. Delivery of a new krill vessel in January 2019 will help improve harvesting efficiency and capacity.
Aker's shares in Aker BioMarine had a book value of NOK 2.4 billion as at 31 December 2018. Aker is considering different options for long-term value generation by Aker BioMarine. The aim is to build a larger, more robust company that achieves profitable growth through a focus on robust operations and efficient supply chains in its industry segments. This growth strategy may require further investment by Aker.
b. Financial investmentsFinancial investments comprise all Aker assets not defined as industrial holdings, including cash, other listed investments, real estate and other investments. The value of Aker’s financial investments amounted to NOK 5.6 billion as at 31 December 2018, representing 11 per cent of Aker’s net asset value, compared to NOK 5.8 billion as at 31 December 2017.
Aker’s cash holdings increased to NOK 1.9 billion in 2018, from NOK 1.2 billion the previous year. The increase is primarily
Board of Directors' report
Aker ASA annual report 2018 32
attributable to NOK 2.2 billion in dividends received from portfolio companies, net issue of new bond debt of NOK 0.7 billion and the divestment of fund investments totalling NOK 0.4 billion. This was partly offset by Aker’s payment of NOK 1.3 billion in dividend to its shareholders in 2018, total operating and financial expenses of NOK 0.6 billion, the NOK 0.5 billion investment in Aker Energy and the issue of NOK 0.5 billion in financing to Aker BioMarine. Aker takes a conservative approach to the management of its cash holdings, spreading deposits between several banks with high credit ratings.
Aker sold its liquid fund investments in two funds managed by Norron in 2018, releasing a total of NOK 428 million, but continues as investor in the fund management company.
The value of other listed investments was NOK 0.7 billion as at year-end 2018, down from NOK 1.2 billion in 2017. The value of Aker’s investments in Philly Shipyard and Solstad Offshore fell by NOK 290 million and NOK 253 million, respectively, to NOK 203 million and NOK 101 million as at year-end 2018. Philly Shipyard needs to secure new contracts in 2019 to ensure its future operations. Solstad Offshore is in a difficult position in a challenging market. The company has entered into a standstill agreement with creditors granting an interest and amortisation waiver until the summer of 2019.
The value of Aker’s direct equity exposure to American Shipping Company (AMSC) increased to NOK 385 million, from NOK 276 million in 2017. Aker also received dividends totalling NOK 79 million from AMSC during the year, and realised a cash gain of NOK 291 million on its indirect total return swap (TRS) exposure to AMSC upon rollover of the TRSs in November 2018.
Aker’s total exposure to real estate investments stood at NOK 568 million as at 31 December 2018, down from NOK 674 million at year-end 2017. The reduction is due to the establishment of FP Bolig together with external partners in the spring of 2018, which released NOK 361 million in cash for Aker, including a sale gain of NOK 194 million.
Other financial investments consist of equity investments, internal and external receivables, and other assets. The largest items are the investment in Aker Energy, receivables from Aker BioMarine AS and Ocean Harvest Invest AS, and airplane ownership. The value of other financial investments was NOK 2.4 billion as at 31 December 2018, compared to NOK 2.3 billion as at year-end 2017. The increase is mainly due to the investment in Aker Energy, a loan to Aker BioMarine and the purchase of an airplane, partly offset by the conversion into equity of part of the outstanding loan to Aker BioMarine.
Together with The Resource Group TRG AS (TRG), Aker formed the company Aker Energy at the start of 2018. Aker Energy then entered into an agreement to acquire Hess Corporation’s 50 per cent stake in the Deepwater Tano Cape Three Points block in Ghana. During its first year, the company has grown to 120 employees, including temporary staffing. So far, the company’s focus has been the preparation of a plan of development for the oil field and the drilling of appraisal wells to provide deeper insights into the field’s geological characteristics. The first appraisal well was drilled at the end of the year, and verified the existing volume base.
The digitalisation company Cognite, which was established at the beginning of 2017, continued in 2018 to grow in line with its ambitious business plan. The company continues to attract highly qualified staff, bringing its workforce to 110 employees at year-end, compared to 37 at the end of 2017. Cognite is playing an active role in the digitalisation of the oil and gas industry, and demonstrated in 2018 considerable commercial potential also outside that sector. Cognite has been awarded a contract to develop a digitalisation strategy for Aker BP, and its digital data platform has been an important factor in the oil company’s efforts to make operations more secure and efficient. While Aker BP remains the company’s largest customer, Cognite also secured agreements with several other major clients in 2018, supporting the company’s growth objectives. The investment in Cognite has a book value of NOK 42 million.
3. Presentation of annual accountsAker ASA’s annual accounts consist of the consolidated financial statements, the separate financial statement of the parent, and the combined financial statements for Aker ASA and holding companies. It is the latter financial statements that are highlighted in Aker’s internal and external reporting. The combined accounts show the aggregate financial position of the holding companies, including total available liquidity and net debt relative to the investments in the underlying operational companies. NAV for Aker ASA and holding companies forms the basis for Aker’s dividend policy.
Pursuant to section 3-3a of the Norwegian Accounting Act, it is confirmed that the accounts have been prepared based on the assumption that Aker is a going concern and the board confirms that this assumption continues to apply.
a. Combined accounts for Aker ASA and holding companiesCombined income statementThe combined profit and loss account for Aker ASA and holding companies (Aker) shows a pre-tax profit of NOK 1.5 billion for 2018. The corresponding 2017 figure was a profit of NOK 0.8 billion. The change is mainly due to an increase of NOK 645 million in dividends received from Aker BP and a NOK 194 million gain realised through the establishment of FP Bolig. Operating expenses amounted to NOK 254 million in 2018, compared to NOK 244 million in 2017.
Net financial items (including dividends received, but excluding value changes) amounted to NOK 1.9 billion in 2018, up from NOK 1.4 billion the previous year. Dividends received amounted to NOK 2.2 billion, while net interest expenses, write-downs on receivables and other provisions totalled NOK 247 million. The net value change on shares amounted to minus NOK 383 million in 2018. This drop was primarily due to the decline in the value of the investment in Solstad Offshore, and a decrease in the value of Aker’s direct holdings in Akastor and Aker Solutions.
Board of Directors' report
Aker ASA annual report 2018 33
Combined balance sheetThe combined balance sheet of Aker ASA and holding companies shows a total book value for assets of NOK 23.7 billion as at 31 December 2018, including long-term equity investments of NOK 20.1 billion and cash holdings of NOK 1.9 billion. The asset value amounted to NOK 51.2 billion as at 31 December 2018. The corresponding 2017 figure was NOK 50.4 billion.
The value of Aker’s industrial holdings was NOK 45.6 billion as at 31 December 2018, compared to NOK 44.6 billion at year-end 2017. The change is mainly attributable to value increases for the investment in Aker BP and an increased book value for Aker BioMarine due to the conversion of debt into equity in 2018. These increases were partly offset by value reductions of the investments in Aker Solutions, Akastor, Kvaerner and Ocean Yield.
The value of Aker’s financial investments amounted to NOK 5.6 billion as at year-end 2018, compared to NOK 5.8 billion as at 31 December 2017. Cash holdings increased from NOK 1.2 billion in 2017 to NOK 1.9 billion in 2018. The changes are discussed in the Financial investments section above.
Gross interest-bearing liabilities amounted to NOK 9.2 billion as at 31 December 2018, up from NOK 8.3 billion one year prior. Net interest-bearing liabilities totalled NOK 6.2 billion as at year-end 2018, up from NOK 5.6 billion at the end of 2017.
In 2018, the AKER11 bond was repaid on maturity, and Aker issued the five-year, NOK 2.0 billion AKER14 bond. As at 31 December 2018, the total outstanding bond debt amounted to NOK 6.2 billion. Bank debt totalled NOK 3.0 billion, and comprised two bank loans denominated in USD. For one of these bank loans the borrowing limit was in 2018 increased from USD 350 to USD 450 million, of which USD 250 million was drawn by year-end 2018. In addition, the due date for the loan was extended by one year, to 2021. As at 31 December 2018, total undrawn credit facilities amounted to NOK 3.2 billion.
Aker’s NAV as at 31 December 2018 was NOK 41.7 billion, compared to NOK 41.8 billion at year-end 2017.
b. Group accounts The main companies included in Aker’s consolidated accounts are Aker Solutions, Akastor, Kvaerner, Ocean Yield, Aker BioMarine, Aker Energy, FP Eiendom, Cognite and Philly Shipyard. Aker BP is accounted for as an associate.
Income statementThe Aker Group had operating revenues of NOK 42.2 billion in 2018, compared to NOK 40.9 billion the previous year. Total operating expenses came in at NOK 37.8 billion in 2018, compared to NOK 35.3 billion in 2017. The increase in operating revenues and operating expenses is explained by increased activity for Aker Solutions, Akastor and Kvaerner as the activity level within the oil service sector has improved compared with the recent years challenging market conditions.
In 2018, depreciation and amortisation amounted to NOK 2.1 billion, compared to NOK 2.2 billion the prior year.
Impairment charges in 2018 amounted to NOK 0.2 billion, mainly explained by impairments of goodwill and vessels in Ocean Yield. Net financial expenses were NOK 1.3 billion in 2018, compared NOK 1.0 billion in 2017. The increase in net financial expenses is primarily due to currency effects from hedging instruments, which were negative in 2018 but positive in 2017.
The pre-tax profit from continued operations came in at NOK 1.4 billion in 2018, compared to a pre-tax profit from continued operations of NOK 2.6 billion in 2017. Tax expenses in 2018 were NOK 0.5 billion, resulting in a net profit from continued operations of NOK 0.9 billion. In 2017, the tax expense was NOK 0.9 billion, resulting in a net loss from continued operations of NOK 1.8 billion.
Balance sheetThe Aker Group's total assets amounted to NOK 92.8 billion as at 31 December 2018, compared to NOK 84.6 billion as at year-end 2017. Total non-current assets were NOK 67.1 billion as at 31 December 2018, compared to NOK 61.7
billion at year-end 2017. The Group’s total intangible assets were NOK 11.0 billion as at 31 December 2018, up from NOK 9.5 billion one year earlier. Of this, goodwill amounted to NOK 7.5 billion at year-end 2018, which is the same level as at 31 December 2017. Goodwill has been tested for impairment and this resulted in an impairment loss of NOK 80 million in 2018 related to Ocean Yield’s FPSO Dhirubhai-1. Current assets were NOK 25.7 billion as at 31 December 2018, up from NOK 22.9 billion a year before.
Current liabilities amounted to NOK 23.3 billion, while non-current liabilities totalled NOK 27.5 billion at year-end 2018. The corresponding 2017 figures were NOK 18.3 billion and NOK 26.2 billion, respectively. The Group’s interest-bearing debt amounted to NOK 30.4 billion as at 31 December 2018, compared to NOK 28.1 billion at year-end 2017.
The Group’s equity ratio was 45 per cent at year-end 2018, compared to 47 per cent at the end of 2017.
Cash flow statementAs at 31 December 2018, the Group had cash of NOK 9.8 billion, up from NOK 8.1 billion in 2017.
The Group’s net cash flow from operations amounted to NOK 5.3 billion in 2018, compared to NOK 2.4 billion in 2017. The change is mainly explained by increased dividend received from Aker BP, and cash flow from discontinued operations and changes in other net operating assets and liabilities that was positive with NOK 0.8 billion in 2018 while it was negative with 2.1 billion in 2017. The NOK 0.9 billion difference between operating profit before depreciation and amortisation and net cash flow from operations in 2018 is primarily attributable to changes in working capital and dividends received from Aker BP, partly offset by interest and tax paid.
Net cash flow from investment activities totalled minus NOK 4.7 billion in 2018, compared to minus NOK 3.5 billion in 2017. Cash flow for 2018 primarily comprised investments in vessels, real estate, plant and equipment of NOK 5.6 billion, and investments in shares in other
Board of Directors' report
Aker ASA annual report 2018 34
companies of NOK 1.0 billion. Divestment of shares in subsidiaries amounted to NOK 1.8 billion and divestments of other shares amounted to NOK 0.5 billion.
Net cash flow from financing activities amounted to plus NOK 1.0 billion in 2018, compared to minus NOK 3.4 billion in 2017. Cash flow for the year from financing activities is primarily attributable to a net increase in debt of NOK 1.8 billion, and increased equity in subsidiaries of NOK 0.9 billion, partly offset by dividend payments totalling NOK 1.7 billion. The dividends were split between shareholders in Aker ASA of NOK 1.3 billion and minority shareholders in the subsidiaries of NOK 0.4 billion.
c. Aker ASA accountsThe parent company Aker ASA achieved a profit for the year 2018 of NOK 1.8 billion, compared to a profit of NOK 1.6 billion in 2017. The 2018 profits are primarily attributable to dividend income from Aker Capital AS (which inter alia owns the shares in Aker BP and Ocean Yield), partly offset by write-downs of the investments in Aker Kvaerner Holding, Aker Solutions and Akastor.
Assets totalled NOK 30.6 billion as at 31 December 2018, compared to NOK 28.4 billion as at year-end 2017. As at the end of 2017, equity amounted to NOK 20.1 billion at year-end 2018. This results in an equity ratio of 66 per cent at the end of 2018.
Information on salary and other remuneration to executive management and compensation guidelines is presented in Note 33 to the consolidated financial statements.
Research and developmentThe parent company had no research and development activities in 2018. The R&D activities of the group are presented in the annual reports of the respective operational portfolio companies.
Allocation of profit and dividend in Aker ASA The board of directors has proposed, for approval at the annual general meeting, an ordinary cash dividend of NOK 22.50 per share for 2018. The proposal reflects anticipated cash flows, financing
requirements and the need for financial flexibility. The proposed dividend corresponds to approximately 4.0 per cent of NAV, which is within the range of Aker’s dividend policy of paying out 2–4 per cent of NAV.
Transfers to other equity amount to NOK 96 million, representing the net profit of the year of NOK 1.77 billion less the proposed dividend of NOK 1.67 billion.
4. Management model, corporate governance, control and complianceAker is a public limited liability company organised under Norwegian law with a governance structure based on Norwegian corporate law and other regulatory requirements. The company’s corporate governance model has been designed to provide a foundation for long-term value creation and to ensure good control. Aker’s Code of Conduct expresses Aker’s expectations regarding its portfolio companies’ codes of conduct.
Aker’s principal owner, Kjell Inge Røkke, participates actively in Aker’s development. Mr Røkke is Aker’s Chairman of the Board.
Aker has nine directors, none of whom are executives and four of whom are employee representatives. The majority of the directors are independent of the company’s management and significant business partners. The Chairman of the Board and Deputy Chairman are elected at the annual general meeting.
Aker follows the Norwegian Code of Practice for Corporate Governance. The company’s practice largely complies with the Code’s recommendations. Reference is made to the Corporate Governance Report. This report has been approved by the board and is available on the company’s website: www.akerasa.com.
5. Board of directors’ activitiesThe board of directors has an annual plan for its work, which includes recurring key topics such as strategy review, investment planning, risk and compliance oversight, financial reporting and budget review.
The board evaluates its own performance and collective expertise once a year.
Aker’s board of directors held six meetings in 2018. The attendance of the board members averaged 89 per cent. In addition, five telephone conferences were held. Aker’s audit committee met seven times in 2018.
Further information on the mandate and the work of Aker’s board of directors and audit committee is available in Aker’s Corporate Governance Report. The board members’ shareholdings and remunerations are presented in Note 33 to the consolidated accounts.
6. Business and societyAker’s goal is to be an attractive employer, a preferred partner for business associates, and a valuable member of society. Aker’s most important contribution to society is to create value and build forward-looking companies that operate in an environmentally, ethically and socially responsible manner. Profitability is a prerequisite for achieving these objectives.
The operations of the parent company Aker ASA have negligible effect on the external environment.
As a significant shareholder in several companies, Aker works to promote businesses that are responsible and sustainable, including the financial, social and environmental consequences of the operations of Aker and the portfolio companies.
The Aker Group’s operating portfolio companies report individually on their impact on the external environment. Section 3-3c of the Norwegian Accounting Act requires large companies to account for their efforts to integrate corporate social responsibility into their business strategies and day-to–day operations. Aker has complied with this requirement in a separate document approved by the board of directors and published on its website under “Corporate Responsibility in Aker”.
Board of Directors' report
Aker ASA annual report 2018 35
7. Our employeesAker ASA had a total of 39 employees as at 31 December 2018 – 22 men and 17 women. In its hiring processes, the company focuses on whether the candidates are qualified for the position, regardless of ethnic origin, religious beliefs, sexual orientation, nationality and other criteria considered irrelevant to their work.
The company endeavours to provide flexible working conditions so that employment at Aker ASA offers opportunities for a work-life balance. Varied and challenging work tasks and good career-development prospects, coupled with job security and competitive pay, are also important factors in making Aker ASA an attractive employer.
As at 31 December 2018, the number of regular employees working for companies of which Aker is the main shareholder, directly or indirectly, totalled 21 627, including approximately 11 405 employees in Norway.
About 17 per cent of the employees of the Aker Group are women. Many companies in which Aker has a major ownership interest are cornerstones of their local communities that recruit locally. Aker has entered into an international framework agreement with the Norwegian United Federation of Trade Unions (Fellesforbundet), IndustriALL Global Union, NITO and Tekna. The international framework agreement sets out fundamental labour rights and contains references to standards relating to health, safety and the environment (HSE) work, pay, working time and employment conditions. The agreement commits Aker to respecting and supporting fundamental human rights and union rights in the societies in which the companies operate. These principles are delineated in the United Nations’ Universal Declaration of Human Rights, the OECD Guidelines for Multinational Enterprises, and the ILO Declaration on Fundamental Principles and Rights at Work.
For generations, Aker has cooperated closely with employee organisations. Employee representatives participate in key decision-making processes, including
through board representation. Aker has partnered with its employees and those of its relevant operating companies to establish an international works council. In addition, the company’s Norwegian trade unions hold annual union representative conferences and maintain working committees at the portfolio companies Aker BP, Aker Solutions, Akastor, Kvaerner and Aker BioMarine.
Due to volatile activity levels within the E&P impacting the oil services sector, Aker’s portfolio companies in this sector have made necessary capacity adjustments. The feedback received so far shows that while the downsizing processes are challenging, efforts are being made to implement them within the framework of existing positive working relations with employee organisations. Constructive cooperation with employee representatives and their organisations is a prerequisite for success in making market adjustments and restructuring. Aker has a long tradition of involving and including employee representatives in processes that may entail major changes for businesses and local communities. In the current challenging market situation, employees have contributed to profit improvements through their willingness and ability to adapt, cooperate, drive processes forward and make cost reductions.
The rate of sick leave among Aker ASA employees was at 1.4 per cent in 2018, compared to 2.2 per cent in 2017. The corresponding figure for the Aker Group as a whole was 2.9 per cent in 2018, compared to 3 per cent in 2017.
The portfolio companies did not report any work-related fatalities in 2018 nor 2017. There were 40 reported accidents that led to absence from work, compared to 34 in 2017. The accidents are discussed further in the reports of the operating entities.
8. Events after the balance-sheet dateOn 12 March 2019, Aker Solutions announced a master contract to support the delivery of a subsea compression system for the Chevron-operated Jansz-Io field offshore Australia. The first service order under the master contract will be for front-end engineering and
design of a subsea compression station that will boost the recovery of gas from the field.
On 10 January 2019, Aker Energy announced a successful drilling operation of the Pecan-4A appraisal well in the Deepwater Tano/Cape Three Points (DWT/CTP) block offshore Ghana. On 4 March 2019, Aker Energy further announced that oil had been encountered in the drilling the Pecan South-1A well, the first of two additional appraisal wells. On 28 March 2019, Aker Energy, on behalf of its license partners, submitted an integrated Plan of Development (PoD) to Ghanaian authorities for the DWT/CTP block. The PoD presents an overall plan for a phased development and production of the petroleum resources in the block, with a firm Phase 1 plan for development and production of the Pecan field. The total oil reserves on the Pecan field is estimated at 334 million barrels, and the contingent resources (2C) is estimated to 110-210 mmboe for the remaining volume base of the existing discoveries. Based on the Pecan South results and pre-drill estimates of Pecan South East, the company estimates a potential volume upside of an additional 150-450 mmboe to the mentioned reserves and 2C resources.
The total investment in the Pecan development project is estimated to USD 4.4 billion. First oil from the Pecan field is estimated to be produced 35 months after a final investment decision following approval from the authorities. Further phases will be detailed in addendums to the integrated PoD.
9. Risks and risk managementAker has a long-standing tradition of industrial and financial risk-taking. The company has evolved with the economic cycles and its strategy has adapted to market changes and company-specific issues in its portfolio. As presented in their respective notes to the financial statements, Aker ASA, the Aker Group, and Aker ASA and holding companies are exposed to financial risk, oil price, currency and interest rate risk, liquidity risk, market risk, credit risk, counterparty risk, and operational risk at the underlying company level.
Board of Directors' report
Aker ASA annual report 2018 36 Board of Directors' report
Rather than diversifying risk by spreading investments across many different industries, Aker is focused on sectors in which the company possesses special expertise. The company has established a model for risk management, based upon identifying, assessing and monitoring major financial, strategic and operational risks in each business segment, drawing up contingency plans for those risks and attending to implementation and supervision.
The identified risks and how they are managed are reported to the Aker Board on a regular basis. Aker continuously works to improve its risk management process.
Risk management in Aker is based on the principle that risk evaluation is an integral part of all business activities. Consequently, management of operational risk lies primarily with the underlying operating companies, but Aker ASA actively supervises risk management through its participation in the boards of directors of the various companies.
Aker’s main strategy for mitigating risk related to short-term value fluctuations is to maintain a solid financial position and strong creditworthiness. Aker has established clear financial guidelines that further regulate monitoring and follow-up of financial risk issues. Key governance parameters have been identified and are monitored closely. A finance committee has been appointed to focus particularly on issues and decisions related to financial investments, debt funding and foreign exchange issues.
Financial market exposures, including currency, interest, and liquidity risks, are discussed in greater detail in Note 6 to the consolidated financial statements.
The main risks that Aker ASA and holding companies are exposed to are related to changes in the value of the listed assets due to market price fluctuations. The development of the global economy, and energy prices in particular, as well as currency fluctuations, are important variables in
assessing near-term market fluctuations. These variables may also influence the underlying value of Aker’s unlisted assets. Aker ASA and its holding companies are also exposed to the risk of insufficient access to external financing. The company seeks to reduce this risk by maintaining a robust liquidity reserve and proactively planning refinancing activities.
Like Aker, the companies in Aker’s portfolio are exposed to commercial risks, financial risks and market risks. In addition these companies, through their business activities within their respective sectors, are also exposed to legal/regulatory risks and political risks, i.e. political decisions on petroleum taxes, environmental regulations and operational risks, including major accidents which may have significant financial impact.
Oil prices were volatile in 2018, fluctuating between USD 86 and USD 54 per barrel, and remain lower than in the period 2011–2014. Combined with high expected price volatility, this is feeding ongoing uncertainty in the oil and gas sector. Aker BP’s revenues are impacted by oil-price fluctuations. The activity level in the offshore oil service market is affecting Aker Solutions, Akastor and Kvaerner. The activity level affects the oil service companies' and Ocean Yield's counterparties, and the companies are therefore monitoring counterparty risk closely.
For further information on Aker’s risk management, see the report on corporate governance available on the company’s website.
10. OutlookInvestments in listed shares comprised 86 per cent of Aker’s assets as per 31 December 2018. About 74 per cent of Aker’s investments was associated with the oil and gas sector, 12 percent with the maritime industry, seafood and marine biotechnology 6 per cent, cash represented 4 per cent, and other assets 3 per cent. Aker’s NAV will thus be influenced by a number of factors, including but not limited to fluctuations in market prices, commodity prices, exchange rates and operational performance.
Over the last years, the oil service industry has been under pressure due to cutbacks in E&P spending which has led to a decline in activity. Fewer projects have been sanctioned globally. At the same time, cost-cutting measures and increased operational efficiency across the industry have brought down break-even costs for offshore projects. Aker expects that this will lead to more projects being sanctioned, and that spending will increase. Oil price volatility is, however, significant, which creates uncertainty with level and timing. Aker expects the overall activity level to remain subdued as E&P companies continue to take a cautious approach to new investments, also taking into account the high oil price volatility. Aker’s portfolio companies in the oil and gas sector will continue to increase competitiveness through increased productivity, efficiency and standardisation, improved technology offerings, and by exploring strategic partnerships and alliances. Aker remains positive about the longer term outlook for oil and gas and will therefore continue to evaluate strategic alternatives and opportunities in the sector.
The maritime leasing segment requires focus on capital structure diversification. Ocean Yield has identified interesting investment opportunities going forward, but main focus short term is on recontracting Dhirubhai-1.
Aker BioMarine is pursuing a long-term strategy to diversify its market exposure in terms of both industries and geographical coverage. Its main markets are the aquaculture industry – particularly the market for salmon farming supplements – and the dietary supplement market in Europe, North America and Australia. The salmon market has been developing positively for several years, and Qrill™ Aqua has gained increasing market share. The dietary supplement market, and the market for omega-3 ingredients in particular, has been challenging for the past three years, but did achieve growth in 2018.
Upstream dividends to Aker are expected to increase further in 2019, mainly due to the announced increase in
Aker ASA annual report 2018 37
Fornebu, 29 March 2019Aker ASA
Amram Hadida (sign)Director
Arnfinn Stensø (sign)Director
Atle Tranøy (sign)Director
Øyvind Eriksen (sign)President and CEO
Karen Simon (sign)Director
Tommy Angeltveit (sign)Director
Anne Marie Cannon (sign)Director
Finn Berg Jacobsen (sign)Deputy Chairman
Kristin Krohn Devold (sign)Director
Kjell Inge Røkke (sign)Chairman
Board of Directors' report
Aker BP’s dividend and dividends from Ocean Yield and Kvaerner. Although Aker Solutions and Akastor have the financial capacity to pay dividends and Kvaerner has the capacity to pay a higher dividend than proposed for 2018, Aker supports the view of the boards of directors that the companies should maintain robust cash holdings in the present market environment.
Aker considers the financial position of its portfolio companies to be robust. The companies have a moderate debt level and have capacity to increase their gearing to facilitate growth through investments.
Aker’s strong balance sheet enables the company to face unforeseen operational challenges and short-term market
fluctuations, as well as to seize value-accretive investment opportunities. As an industrial investment company, Aker will use its resources and competence to promote and support the development of the companies in its portfolio, and to consider new investments.

Annual accounts
38 Annual accounts | Aker GroupAker ASA annual report 2018
Aker GroupIncome statement and total comprehensive income 40Balance sheet at 31 December 42Consolidated statement of changes in equity 43Cash flow statement 44Notes to the financial statements 45
Note 1 | Corporate information 45
Note 2 | Basis for preparation and estimates and assumptions 45
Note 3 | Changes in accounting policies 46
Note 4 | New standards and interpretations not yet adopted 51
Note 5 | Accounting principles 52
Note 6 | Financial risk and exposure 56
Note 7 | Acquisition of subsidiaries and transactions with minority interests 60
Note 8 | Sale of subsidiaries and discontinued operations 61
Note 9 | Operating segments and significant subsidiaries 62
Note 10 | Operating revenue 66
Note 11 | Wages, personnel expenses and other operating expenses 68
Note 12 | Impairments 69
Note 13 | Financial income and financial expenses 71
Note 14 | Tax 72
Note 15 | Property, Plant and Equipment 74
Note 16 | Intangible assets 75
Note 17 | Investments in associates and joint ventures 76
Note 18 | Interest-bearing assets 79
Note 19 | Other shares and non-current assets 80
Note 20 | Inventories 80
Note 21 | Trade and other short-term interest-free receivables 80
Note 22 | Basis for earnings per share, dividend per share, and paid-in equity 81
Note 23 | Minority interests 81
Note 24 | Other comprehensive income 82
Note 25 | Interest-bearing liabilities 82
Note 26 | Pension expenses and pension liabilities 85
Note 27 | Other interest-free long-term liabilities 86
Note 28 | Provisions 87
Note 29 | Trade and other payables 88
Note 30 | Financial instruments 88
Note 31 | Contingencies, guarantee liabilities and legal claims 89
Note 32 | Transactions and agreements with related parties 90
Note 33 | Vested salary and other remuneration to the board of directors, nomination committee, CEO and other senior executives at Aker ASA 91
Note 34 | Events after the balance sheet date 93
39Annual accounts | Aker Group Aker ASA annual report 2018
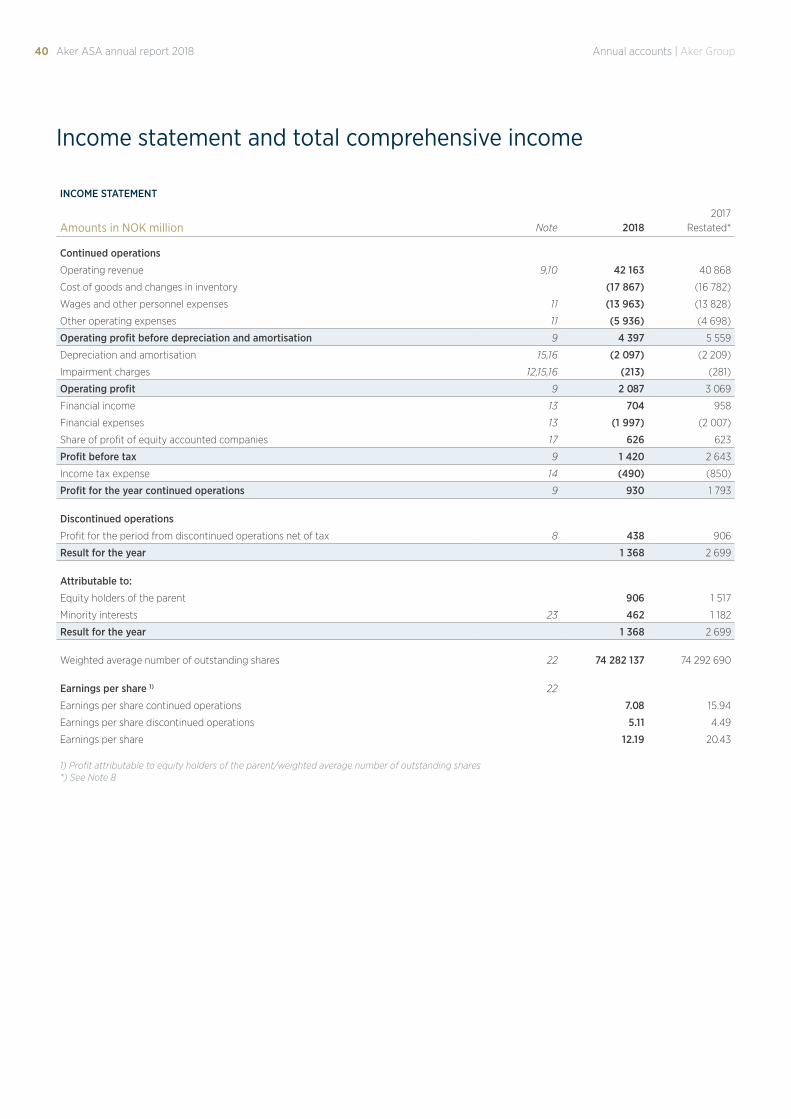
40 Annual accounts | Aker GroupAker ASA annual report 2018
Income statement and total comprehensive income
INCOME STATEMENT
2017Amounts in NOK million Note 2018 Restated*
Continued operations
Operating revenue 9,10 42 163 40 868
Cost of goods and changes in inventory (17 867) (16 782)
Wages and other personnel expenses 11 (13 963) (13 828)
Other operating expenses 11 (5 936) (4 698)
Operating profit before depreciation and amortisation 9 4 397 5 559
Depreciation and amortisation 15,16 (2 097) (2 209)
Impairment charges 12,15,16 (213) (281)
Operating profit 9 2 087 3 069
Financial income 13 704 958
Financial expenses 13 (1 997) (2 007)
Share of profit of equity accounted companies 17 626 623
Profit before tax 9 1 420 2 643
Income tax expense 14 (490) (850)
Profit for the year continued operations 9 930 1 793
Discontinued operations
Profit for the period from discontinued operations net of tax 8 438 906
Result for the year 1 368 2 699
Attributable to:
Equity holders of the parent 906 1 517
Minority interests 23 462 1 182
Result for the year 1 368 2 699
Weighted average number of outstanding shares 22 74 282 137 74 292 690
Earnings per share 1) 22
Earnings per share continued operations 7.08 15.94
Earnings per share discontinued operations 5.11 4.49
Earnings per share 12.19 20.43
1) Profit attributable to equity holders of the parent/weighted average number of outstanding shares*) See Note 8
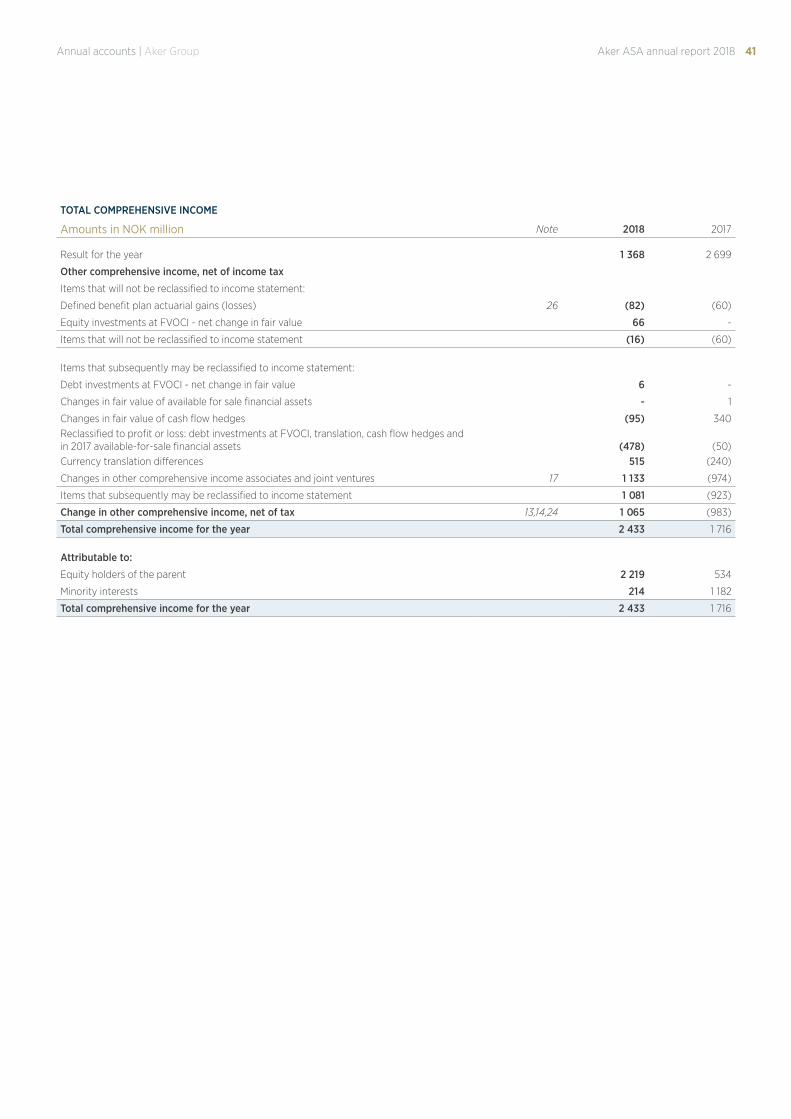
41Annual accounts | Aker Group Aker ASA annual report 2018
TOTAL COMPREHENSIVE INCOME
Amounts in NOK million Note 2018 2017
Result for the year 1 368 2 699
Other comprehensive income, net of income tax
Items that will not be reclassified to income statement:
Defined benefit plan actuarial gains (losses) 26 (82) (60)
Equity investments at FVOCI - net change in fair value 66 -
Items that will not be reclassified to income statement (16) (60)
Items that subsequently may be reclassified to income statement:
Debt investments at FVOCI - net change in fair value 6 -
Changes in fair value of available for sale financial assets - 1
Changes in fair value of cash flow hedges (95) 340Reclassified to profit or loss: debt investments at FVOCI, translation, cash flow hedges and in 2017 available-for-sale financial assets (478) (50)Currency translation differences 515 (240)
Changes in other comprehensive income associates and joint ventures 17 1 133 (974)
Items that subsequently may be reclassified to income statement 1 081 (923)
Change in other comprehensive income, net of tax 13,14,24 1 065 (983)
Total comprehensive income for the year 2 433 1 716
Attributable to:
Equity holders of the parent 2 219 534
Minority interests 214 1 182
Total comprehensive income for the year 2 433 1 716
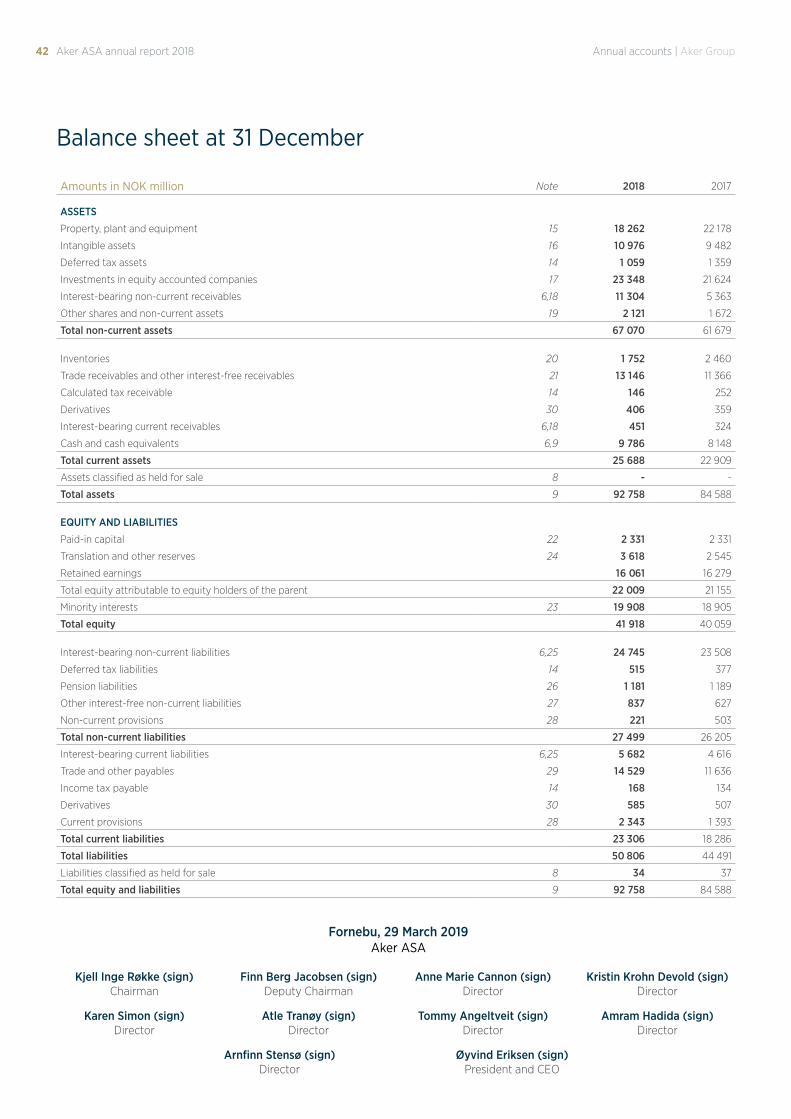
42 Annual accounts | Aker GroupAker ASA annual report 2018
Balance sheet at 31 December
Amounts in NOK million Note 2018 2017
ASSETS
Property, plant and equipment 15 18 262 22 178
Intangible assets 16 10 976 9 482
Deferred tax assets 14 1 059 1 359
Investments in equity accounted companies 17 23 348 21 624
Interest-bearing non-current receivables 6,18 11 304 5 363
Other shares and non-current assets 19 2 121 1 672
Total non-current assets 67 070 61 679
Inventories 20 1 752 2 460
Trade receivables and other interest-free receivables 21 13 146 11 366
Calculated tax receivable 14 146 252
Derivatives 30 406 359
Interest-bearing current receivables 6,18 451 324
Cash and cash equivalents 6,9 9 786 8 148
Total current assets 25 688 22 909
Assets classified as held for sale 8 - -
Total assets 9 92 758 84 588
EQUITY AND LIABILITIES
Paid-in capital 22 2 331 2 331
Translation and other reserves 24 3 618 2 545
Retained earnings 16 061 16 279
Total equity attributable to equity holders of the parent 22 009 21 155
Minority interests 23 19 908 18 905
Total equity 41 918 40 059
Interest-bearing non-current liabilities 6,25 24 745 23 508
Deferred tax liabilities 14 515 377
Pension liabilities 26 1 181 1 189
Other interest-free non-current liabilities 27 837 627
Non-current provisions 28 221 503
Total non-current liabilities 27 499 26 205
Interest-bearing current liabilities 6,25 5 682 4 616
Trade and other payables 29 14 529 11 636
Income tax payable 14 168 134
Derivatives 30 585 507
Current provisions 28 2 343 1 393
Total current liabilities 23 306 18 286
Total liabilities 50 806 44 491
Liabilities classified as held for sale 8 34 37
Total equity and liabilities 9 92 758 84 588
Fornebu, 29 March 2019Aker ASA
Amram Hadida (sign)Director
Arnfinn Stensø (sign)Director
Atle Tranøy (sign)Director
Øyvind Eriksen (sign)President and CEO
Karen Simon (sign)Director
Tommy Angeltveit (sign)Director
Anne Marie Cannon (sign)Director
Finn Berg Jacobsen (sign)Deputy Chairman
Kristin Krohn Devold (sign)Director
Kjell Inge Røkke (sign)Chairman
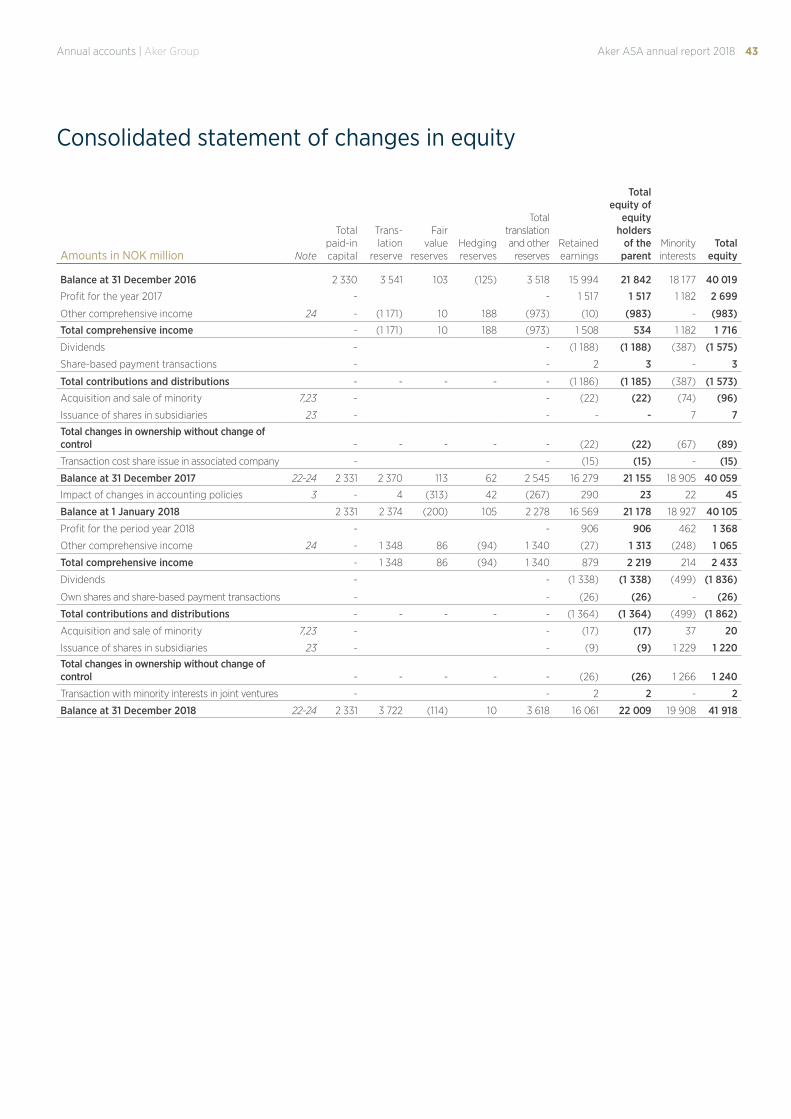
43Annual accounts | Aker Group Aker ASA annual report 2018
Consolidated statement of changes in equity
Amounts in NOK million Note
Total paid-in capital
Trans-lation
reserve
Fair value
reservesHedgingreserves
Total translation and other
reservesRetained earnings
Total equity of
equity holders
of the parent
Minorityinterests
Total equity
Balance at 31 December 2016 2 330 3 541 103 (125) 3 518 15 994 21 842 18 177 40 019
Profit for the year 2017 - - 1 517 1 517 1 182 2 699
Other comprehensive income 24 - (1 171) 10 188 (973) (10) (983) - (983)
Total comprehensive income - (1 171) 10 188 (973) 1 508 534 1 182 1 716
Dividends - - (1 188) (1 188) (387) (1 575)
Share-based payment transactions - - 2 3 - 3
Total contributions and distributions - - - - - (1 186) (1 185) (387) (1 573)
Acquisition and sale of minority 7,23 - - (22) (22) (74) (96)
Issuance of shares in subsidiaries 23 - - - - 7 7
Total changes in ownership without change of control - - - - - (22) (22) (67) (89)
Transaction cost share issue in associated company - - (15) (15) - (15)
Balance at 31 December 2017 22-24 2 331 2 370 113 62 2 545 16 279 21 155 18 905 40 059
Impact of changes in accounting policies 3 - 4 (313) 42 (267) 290 23 22 45
Balance at 1 January 2018 2 331 2 374 (200) 105 2 278 16 569 21 178 18 927 40 105
Profit for the period year 2018 - - 906 906 462 1 368
Other comprehensive income 24 - 1 348 86 (94) 1 340 (27) 1 313 (248) 1 065
Total comprehensive income - 1 348 86 (94) 1 340 879 2 219 214 2 433
Dividends - - (1 338) (1 338) (499) (1 836)
Own shares and share-based payment transactions - - (26) (26) - (26)
Total contributions and distributions - - - - - (1 364) (1 364) (499) (1 862)
Acquisition and sale of minority 7,23 - - (17) (17) 37 20
Issuance of shares in subsidiaries 23 - - (9) (9) 1 229 1 220Total changes in ownership without change of control - - - - - (26) (26) 1 266 1 240
Transaction with minority interests in joint ventures - - 2 2 - 2
Balance at 31 December 2018 22-24 2 331 3 722 (114) 10 3 618 16 061 22 009 19 908 41 918
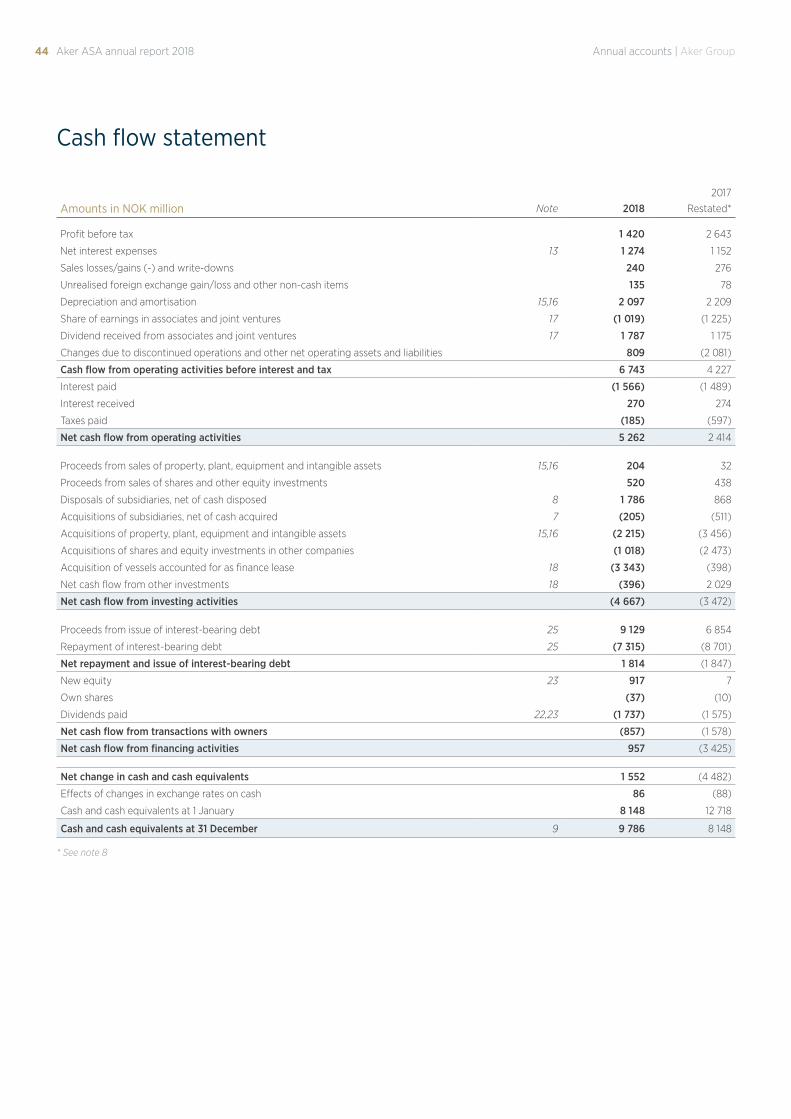
44 Annual accounts | Aker GroupAker ASA annual report 2018
Cash flow statement
2017
Amounts in NOK million Note 2018 Restated*
Profit before tax 1 420 2 643
Net interest expenses 13 1 274 1 152
Sales losses/gains (-) and write-downs 240 276
Unrealised foreign exchange gain/loss and other non-cash items 135 78
Depreciation and amortisation 15,16 2 097 2 209
Share of earnings in associates and joint ventures 17 (1 019) (1 225)
Dividend received from associates and joint ventures 17 1 787 1 175
Changes due to discontinued operations and other net operating assets and liabilities 809 (2 081)
Cash flow from operating activities before interest and tax 6 743 4 227
Interest paid (1 566) (1 489)
Interest received 270 274
Taxes paid (185) (597)
Net cash flow from operating activities 5 262 2 414
Proceeds from sales of property, plant, equipment and intangible assets 15,16 204 32
Proceeds from sales of shares and other equity investments 520 438
Disposals of subsidiaries, net of cash disposed 8 1 786 868
Acquisitions of subsidiaries, net of cash acquired 7 (205) (511)
Acquisitions of property, plant, equipment and intangible assets 15,16 (2 215) (3 456)
Acquisitions of shares and equity investments in other companies (1 018) (2 473)
Acquisition of vessels accounted for as finance lease 18 (3 343) (398)
Net cash flow from other investments 18 (396) 2 029
Net cash flow from investing activities (4 667) (3 472)
Proceeds from issue of interest-bearing debt 25 9 129 6 854
Repayment of interest-bearing debt 25 (7 315) (8 701)
Net repayment and issue of interest-bearing debt 1 814 (1 847)
New equity 23 917 7
Own shares (37) (10)
Dividends paid 22,23 (1 737) (1 575)
Net cash flow from transactions with owners (857) (1 578)
Net cash flow from financing activities 957 (3 425)
Net change in cash and cash equivalents 1 552 (4 482)
Effects of changes in exchange rates on cash 86 (88)
Cash and cash equivalents at 1 January 8 148 12 718
Cash and cash equivalents at 31 December 9 9 786 8 148
* See note 8
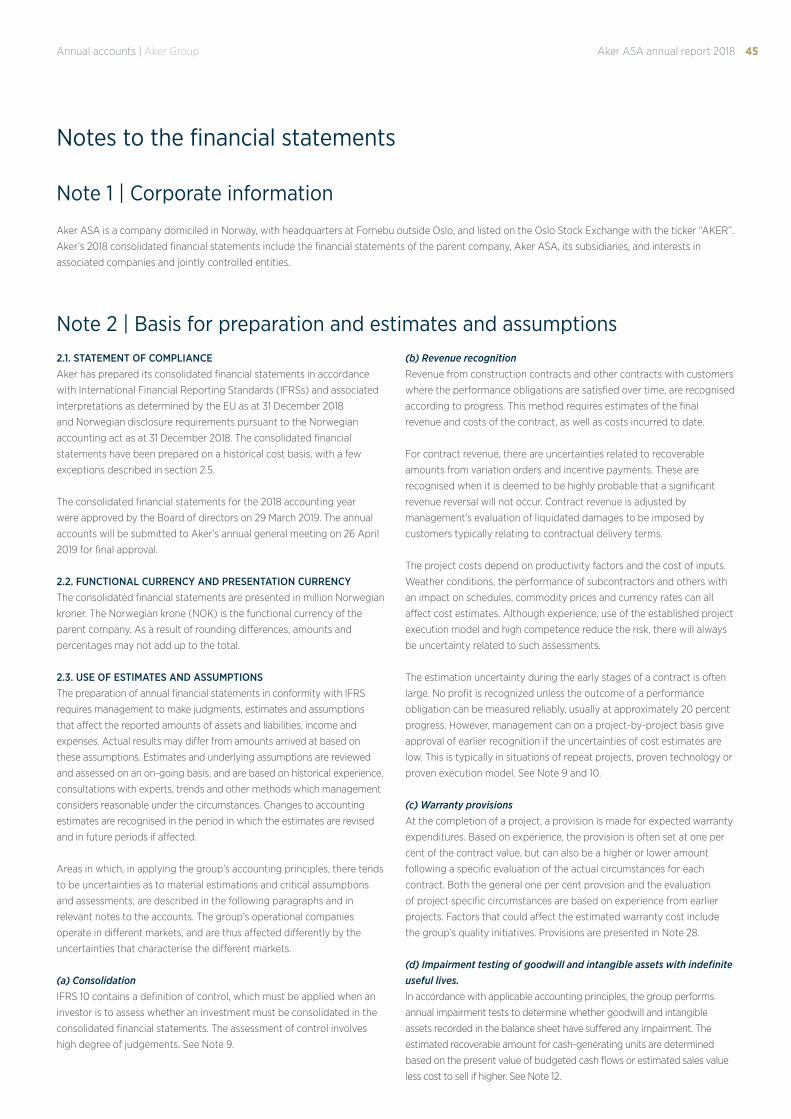
45Annual accounts | Aker Group Aker ASA annual report 2018
Notes to the financial statements
Note 1 | Corporate information
Note 2 | Basis for preparation and estimates and assumptions
Aker ASA is a company domiciled in Norway, with headquarters at Fornebu outside Oslo, and listed on the Oslo Stock Exchange with the ticker “AKER”.
Aker’s 2018 consolidated financial statements include the financial statements of the parent company, Aker ASA, its subsidiaries, and interests in
associated companies and jointly controlled entities.
2.1. STATEMENT OF COMPLIANCEAker has prepared its consolidated financial statements in accordance
with International Financial Reporting Standards (IFRSs) and associated
interpretations as determined by the EU as at 31 December 2018
and Norwegian disclosure requirements pursuant to the Norwegian
accounting act as at 31 December 2018. The consolidated financial
statements have been prepared on a historical cost basis, with a few
exceptions described in section 2.5.
The consolidated financial statements for the 2018 accounting year
were approved by the Board of directors on 29 March 2019. The annual
accounts will be submitted to Aker’s annual general meeting on 26 April
2019 for final approval.
2.2. FUNCTIONAL CURRENCY AND PRESENTATION CURRENCYThe consolidated financial statements are presented in million Norwegian
kroner. The Norwegian krone (NOK) is the functional currency of the
parent company. As a result of rounding differences, amounts and
percentages may not add up to the total.
2.3. USE OF ESTIMATES AND ASSUMPTIONSThe preparation of annual financial statements in conformity with IFRS
requires management to make judgments, estimates and assumptions
that affect the reported amounts of assets and liabilities, income and
expenses. Actual results may differ from amounts arrived at based on
these assumptions. Estimates and underlying assumptions are reviewed
and assessed on an on-going basis, and are based on historical experience,
consultations with experts, trends and other methods which management
considers reasonable under the circumstances. Changes to accounting
estimates are recognised in the period in which the estimates are revised
and in future periods if affected.
Areas in which, in applying the group’s accounting principles, there tends
to be uncertainties as to material estimations and critical assumptions
and assessments, are described in the following paragraphs and in
relevant notes to the accounts. The group’s operational companies
operate in different markets, and are thus affected differently by the
uncertainties that characterise the different markets.
(a) ConsolidationIFRS 10 contains a definition of control, which must be applied when an
investor is to assess whether an investment must be consolidated in the
consolidated financial statements. The assessment of control involves
high degree of judgements. See Note 9.
(b) Revenue recognitionRevenue from construction contracts and other contracts with customers
where the performance obligations are satisfied over time, are recognised
according to progress. This method requires estimates of the final
revenue and costs of the contract, as well as costs incurred to date.
For contract revenue, there are uncertainties related to recoverable
amounts from variation orders and incentive payments. These are
recognised when it is deemed to be highly probable that a significant
revenue reversal will not occur. Contract revenue is adjusted by
management’s evaluation of liquidated damages to be imposed by
customers typically relating to contractual delivery terms.
The project costs depend on productivity factors and the cost of inputs.
Weather conditions, the performance of subcontractors and others with
an impact on schedules, commodity prices and currency rates can all
affect cost estimates. Although experience, use of the established project
execution model and high competence reduce the risk, there will always
be uncertainty related to such assessments.
The estimation uncertainty during the early stages of a contract is often
large. No profit is recognized unless the outcome of a performance
obligation can be measured reliably, usually at approximately 20 percent
progress. However, management can on a project-by-project basis give
approval of earlier recognition if the uncertainties of cost estimates are
low. This is typically in situations of repeat projects, proven technology or
proven execution model. See Note 9 and 10.
(c) Warranty provisionsAt the completion of a project, a provision is made for expected warranty
expenditures. Based on experience, the provision is often set at one per
cent of the contract value, but can also be a higher or lower amount
following a specific evaluation of the actual circumstances for each
contract. Both the general one per cent provision and the evaluation
of project specific circumstances are based on experience from earlier
projects. Factors that could affect the estimated warranty cost include
the group’s quality initiatives. Provisions are presented in Note 28.
(d) Impairment testing of goodwill and intangible assets with indefinite useful lives.In accordance with applicable accounting principles, the group performs
annual impairment tests to determine whether goodwill and intangible
assets recorded in the balance sheet have suffered any impairment. The
estimated recoverable amount for cash-generating units are determined
based on the present value of budgeted cash flows or estimated sales value
less cost to sell if higher. See Note 12.
46 Annual accounts | Aker GroupAker ASA annual report 2018
(e) TaxThe group is subject to income taxes in numerous jurisdictions.
Significant judgment is required to determine provisions for income
taxes worldwide. Aker incurs an income-tax payable and/or earns
a considerable tax receivable. The group also recognises changes
in deferred tax or deferred tax benefits. These figures are based on
management’s interpretation of applicable laws and regulations, and
relevant court decisions. The quality of these estimates is largely
dependent on management’s ability to apply complex set of rules, its
ability to identify changes to existing rules and, in the case of deferred
tax benefits, its ability to project future earnings from which a loss carry-
forward may be deducted for tax purposes. See Note 14.
(f) Financial instrumentsThe group is exposed to various risks resulting from its use of financial
instruments. This includes credit risk, liquidity risk and market risk
(including currency- and interest rate risk). Note 6 and Note 30 present
information about the group’s exposure to each of these risks, the
group’s objectives, the principles and processes for measuring and
managing risk, and the group’s capital management.
(g) Contingent assets and liabilitiesAs a result of their extensive worldwide operations, group companies
sometimes become involved in legal disputes. Provisions have been
made to cover the expected outcomes of the disputes where negative
outcomes are likely and reliable estimates can be prepared. However, the
final outcome of these cases will always be subject to uncertainties and
resulting liabilities may deviate from booked provisions. See Note 31.
h) Acquisition costs – explorationThe accounting policy of Aker’s subsidiary Aker Energy is to temporarily
recognize expenses relating to the drilling of exploration wells in the
balance sheet as capitalized exploration expenditures, pending an
evaluation of potential oil and gas discoveries. If resources are not
discovered, or if recovery of the resources is considered technically or
commercially unviable, the costs of exploration wells are expensed.
Decisions as to whether this expenditure should remain capitalized or be
expensed during the period, may materially affect the operating result for
the period.
2.4. FAIR VALUE MEASUREMENTThe Group uses valuation techniques that are appropriate in the
circumstances and for which sufficient data are available to measure fair
value, maximising the use of relevant observable inputs and minimising
the use of unobservable inputs.
All assets and liabilities for which fair values are measured or disclosed in
the financial statements are categorised within the fair value hierarchy,
described below, based on the lowest level of input that is significant to
the fair value measurement as a whole:
§ Level 1: Quoted (unadjusted) market prices in active markets for
identical assets or liabilities.
§ Level 2: Valuation techniques for which the lowest level input that
is significant to the fair value measurement is directly or indirectly
observable.
§ Level 3: Valuation techniques for which the lowest level input that is
significant to the fair value measurement is unobservable.
The Group determines whether transfers have occurred between levels in the
hierarchy by re-assessing categorisation at the end of each reporting period.
For the purpose of fair value disclosures, the group has determined asset
and liability classes based on their nature, characteristics and associated
risks, and the applicable level within the fair value hierarchy. See Note 30.
2.5. BASIS OF MEASUREMENTThe consolidated financial statements have been prepared on a historical
cost basis, with except for the following items:
§ Derivative financial instruments are measured at fair value
§ Non-derivative financial instruments at fair value through profit and
loss are measured at fair value
§ Debt instruments at fair value through profit and loss are measured
at fair value
§ Contingent consideration assumed in business combinations are
measured at fair value
§ Net defined benefit asset or liability is recognised at fair value of plan
assets less the present value of the defined benefit obligation
Note 3 | Changes in accounting policies
With effect from 1 January 2018, Aker has implemented IFRS 15 Revenue
from Contracts with Customers and IFRS 9 Financial Instruments. Other new
interpretations and changes to standards are also effective from 1. January 2018,
but they do not have a material effect on the group’s financial statements.
3.1 IFRS 15 REVENUE FROM CONTRACTS WITH CUSTOMERS IFRS 15 Revenue from Contracts with Customers was adopted on 1
January 2018 and replaced IAS 11 Construction Contracts and IAS 18
Revenue. The new standard has been implemented retrospectively
with the cumulative effect recognised in equity at the date of initial
application. In accordance with the transitional provisions in IFRS 15,
comparative figures have not been restated. The accounting principles
that is the basis for the comparative 2017 figures are described in the
2017 annual report available on www.akerasa.com.
3.1.1 Accounting policy under IFRS 15IFRS 15 establishes a five-step method that applies to all customer
contracts. Under the new standard, only approved customer contracts
with a firm commitment are basis for revenue recognition. Variation
orders are included when they have been approved, either verbally, in
writing, or implied by customary business practice. The deliveries in
the contracts are reviewed to identify distinct performance obligations,
and revenue is recognised in line with how the entity satisfies these
performance obligations – either over time or at a point in time. This
assessment may involve significant judgement. For contracts with
customers for which the performance obligations are satisfied over
time, revenue is recognised over time using a cost progress method.
For contracts with customers for which the performance obligations
are satisfied at a point in time, revenue is recognised at the point in time
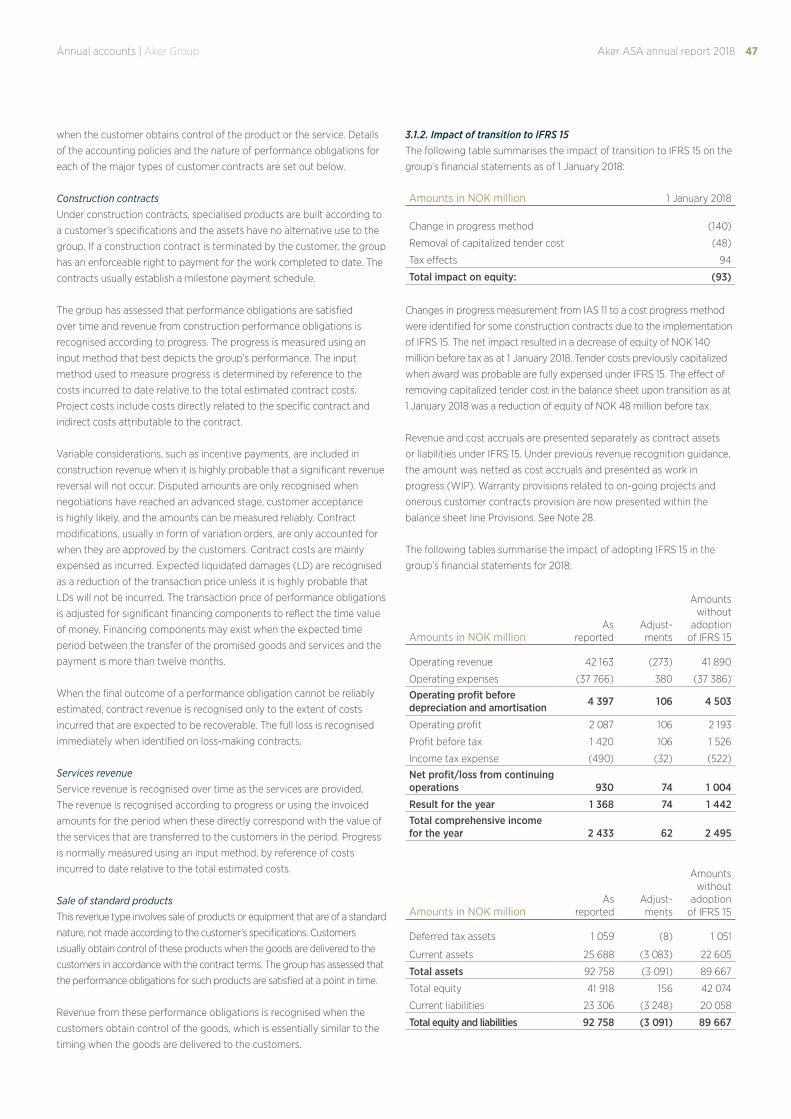
47Annual accounts | Aker Group Aker ASA annual report 2018
when the customer obtains control of the product or the service. Details
of the accounting policies and the nature of performance obligations for
each of the major types of customer contracts are set out below.
Construction contractsUnder construction contracts, specialised products are built according to
a customer’s specifications and the assets have no alternative use to the
group. If a construction contract is terminated by the customer, the group
has an enforceable right to payment for the work completed to date. The
contracts usually establish a milestone payment schedule.
The group has assessed that performance obligations are satisfied
over time and revenue from construction performance obligations is
recognised according to progress. The progress is measured using an
input method that best depicts the group’s performance. The input
method used to measure progress is determined by reference to the
costs incurred to date relative to the total estimated contract costs.
Project costs include costs directly related to the specific contract and
indirect costs attributable to the contract.
Variable considerations, such as incentive payments, are included in
construction revenue when it is highly probable that a significant revenue
reversal will not occur. Disputed amounts are only recognised when
negotiations have reached an advanced stage, customer acceptance
is highly likely, and the amounts can be measured reliably. Contract
modifications, usually in form of variation orders, are only accounted for
when they are approved by the customers. Contract costs are mainly
expensed as incurred. Expected liquidated damages (LD) are recognised
as a reduction of the transaction price unless it is highly probable that
LDs will not be incurred. The transaction price of performance obligations
is adjusted for significant financing components to reflect the time value
of money. Financing components may exist when the expected time
period between the transfer of the promised goods and services and the
payment is more than twelve months.
When the final outcome of a performance obligation cannot be reliably
estimated, contract revenue is recognised only to the extent of costs
incurred that are expected to be recoverable. The full loss is recognised
immediately when identified on loss-making contracts.
Services revenueService revenue is recognised over time as the services are provided.
The revenue is recognised according to progress or using the invoiced
amounts for the period when these directly correspond with the value of
the services that are transferred to the customers in the period. Progress
is normally measured using an input method, by reference of costs
incurred to date relative to the total estimated costs.
Sale of standard productsThis revenue type involves sale of products or equipment that are of a standard
nature, not made according to the customer’s specifications. Customers
usually obtain control of these products when the goods are delivered to the
customers in accordance with the contract terms. The group has assessed that
the performance obligations for such products are satisfied at a point in time.
Revenue from these performance obligations is recognised when the
customers obtain control of the goods, which is essentially similar to the
timing when the goods are delivered to the customers.
3.1.2. Impact of transition to IFRS 15The following table summarises the impact of transition to IFRS 15 on the
group’s financial statements as of 1 January 2018:
Amounts in NOK million 1 January 2018
Change in progress method (140)
Removal of capitalized tender cost (48)
Tax effects 94
Total impact on equity: (93)
Changes in progress measurement from IAS 11 to a cost progress method
were identified for some construction contracts due to the implementation
of IFRS 15. The net impact resulted in a decrease of equity of NOK 140
million before tax as at 1 January 2018. Tender costs previously capitalized
when award was probable are fully expensed under IFRS 15. The effect of
removing capitalized tender cost in the balance sheet upon transition as at
1 January 2018 was a reduction of equity of NOK 48 million before tax.
Revenue and cost accruals are presented separately as contract assets
or liabilities under IFRS 15. Under previous revenue recognition guidance,
the amount was netted as cost accruals and presented as work in
progress (WIP). Warranty provisions related to on-going projects and
onerous customer contracts provision are now presented within the
balance sheet line Provisions. See Note 28.
The following tables summarise the impact of adopting IFRS 15 in the
group’s financial statements for 2018:
Amounts in NOK millionAs
reportedAdjust-ments
Amounts without
adoption of IFRS 15
Operating revenue 42 163 (273) 41 890
Operating expenses (37 766) 380 (37 386)
Operating profit before depreciation and amortisation 4 397 106 4 503
Operating profit 2 087 106 2 193
Profit before tax 1 420 106 1 526
Income tax expense (490) (32) (522)
Net profit/loss from continuing operations 930 74 1 004
Result for the year 1 368 74 1 442Total comprehensive income for the year 2 433 62 2 495
Amounts in NOK millionAs
reportedAdjust-ments
Amounts without
adoption of IFRS 15
Deferred tax assets 1 059 (8) 1 051
Current assets 25 688 (3 083) 22 605
Total assets 92 758 (3 091) 89 667
Total equity 41 918 156 42 074
Current liabilities 23 306 (3 248) 20 058
Total equity and liabilities 92 758 (3 091) 89 667
48 Annual accounts | Aker GroupAker ASA annual report 2018
3.2 IFRS 9 FINANCIAL INSTRUMENTS IFRS 9 Financial Instruments was adopted on 1 January 2018 and
replaced IAS 39 Financial Instruments Recognition and Measurement.
The new standard has been implemented retrospectively with the
cumulative effect recognised in equity at the date of initial application.
In accordance with the transitional provisions in IFRS 9, comparative
figures have not been restated. The accounting principles that is the basis
for the comparative 2017 figures are described in the 2017 annual report
available on www.akerasa.com.
3.2.1 Accounting policy under IFRS 9Classification of financial assetsThe group classifies its financial assets in the following measurement
categories:
§ Those to be measured subsequently at fair value (either through OCI
or through profit or loss), and
§ Those to be measured at amortised cost.
The classification depends on the entity’s business model for managing
the financial assets and the contractual terms of the cash flows.
For assets measured at fair value, gains and losses will either be recorded
in profit or loss or OCI. For investments in equity instruments that are
not held for trading, this will depend on whether the group has made an
irrevocable election at the time of initial recognition to account for the
equity investment at fair value through other comprehensive income
(FVOCI). Financial assets are not reclassified subsequent to their initial
recognition unless the group changes its business model for managing
financial assets.
Recognition and derecognition of financial assetsRegular way purchases and sales of financial assets are recognised on trade-
date, the date on which the group commits to purchase or sell the asset.
Financial assets are derecognised when the rights to receive cash flows from
the financial assets have expired or have been transferred and the group has
transferred substantially all the risks and rewards of ownership.
Measurement of financial assetsAt initial recognition, the group measures a financial asset (unless it
is a trade receivable without a significant financing component) at its
fair value plus, in the case of a financial asset not at FVPL, transaction
costs that are directly attributable to the acquisition of the financial
asset. Transaction costs of financial assets carried at FVPL are expensed
in profit or loss. Trade receivables without a significant financing
component are initially measured at the transaction price.
Financial assets with embedded derivatives are considered in their
entirety when determining whether their cash flows are solely payment
of principal and interest.
Debt instruments
Subsequent measurement of debt instruments depends on the group’s
business model for managing the asset and the cash flow characteristics
of the asset. There are three measurement categories into which the
group classifies its debt instruments:
§ Amortised cost: Assets that are held for collection of contractual
cash flows where those cash flows represent solely payments of
principal and interest are measured at amortised cost using the
effective interest rate method. The amortised cost is reduced by
impairment losses. Interest income, foreign exchange gains and
losses, impairments, and any gain or loss arising on derecognition are
recognised in profit and loss.
§ FVOCI: Assets that are held both for collection of contractual cash
flows and for selling the financial assets, where the assets’ cash flows
represent solely payments of principal and interest, are measured
at FVOCI. Interest income calculated using the effective interest
method, foreign exchange gains and losses and impairment are
recognised in profit or loss. Other net gains and losses are recognised
in OCI. On derecognition, the cumulative gain or loss previously
recognised in OCI is reclassified from equity to profit or loss.
§ FVPL: Assets that do not meet the criteria for amortised cost or
FVOCI are measured at FVPL. Net gains and losses, including any
interest, are recognised in profit or loss. However, see section below
regarding derivatives designated as hedging instruments.
Equity instruments
The group subsequently measures all equity investments at fair value.
Where the group has irrevocably elected (an election that is made on an
investment -by-investment basis) to present fair value gains and losses
on equity investments in OCI, there is no subsequent reclassification of
fair value gains and losses to profit or loss following the derecognition
of the investment. Dividends from such investments continue to be
recognised in profit or loss when the group’s right to receive payments is
established.
Impairment of financial assetsThe group assesses on a forward-looking basis the expected credit loss
associated with its debt instruments carried at amortised cost and FVOCI.
The impairment methodology applied depends on whether there has
been a significant increase in credit risk.
There are mainly financial receivables (including trade receivables),
contract assets and financial lease receivables that are subject to the
expected credit loss model (ECL) in IFRS 9. For trade receivables, the
group applies the simplified approach permitted by IFRS 9, which
requires expected lifetime losses to be recognised from initial recognition
of the receivables.
Financial liabilities – initial recognition, classification, subsequent meas-urement, gains and losses and derecognition.A financial liability is initially measured at fair value and, for a financial
liability not at FVPL, net of transaction costs that are directly attributable
to its issue. Financial liabilities are classified as measured at amortised
cost or FVPL. A financial liability is classified at FVPL if it is classified as
held-for-trading, it is a derivative or it is designated as such on initial
recognition. Financial liabilities at FVPL are measured at fair value and net
gains and losses, including any interest expense, are recognised in profit
or loss. Other financial liabilities are subsequently measured at amortised
cost using the effective interest method. Interest expense and foreign
exchange gains and losses are recognised in profit or loss. Any gain or
loss on derecognition is also recognised in profit or loss. See section
below regarding derivatives designated as hedging instruments.
The group derecognises a financial liability when its contractual
obligations are discharged, cancelled or expire. The group also
derecognises a financial liability when its terms are modified, and the
49Annual accounts | Aker Group Aker ASA annual report 2018
cash flows of the modified liability are substantially different, in which
case a new financial liability based on the modified terms is recognised at
fair value. On derecognition of a financial liability, the difference between
the carrying amount extinguished and the consideration paid (including
any non-cash assets transferred or liabilities assumed) is recognised in
profit or loss.
Offsetting of financial assets and liabilitiesFinancial assets and financial liabilities are offset, and the net amount
presented in the balance sheet when, and only when, the group currently
has a legally enforceable right to set off the amounts and it intends either
to settle them on a net basis or to realise the asset and settle the liability
simultaneously.
Derivative financial instruments and hedge accountingThe group holds derivative financial instruments to hedge its foreign
currency and interest rate risk exposures. Derivatives are initially
recognised at fair value, and attributable transaction costs are recognised
in profit or loss as incurred.
Embedded derivatives are separated from the host contract and
accounted for separately if the host contract is not a financial asset and
the following criteria are met: i) the economic characteristics and risks
of the embedded derivative are not closely related to the economic
characteristics and risks of the host, ii) a separate instrument with the
same terms as the embedded derivative would meet the definition of a
derivative, and iii) the hybrid contract is not measured at fair value with
changes in fair value recognised in profit or loss.
Derivatives not being part of hedge accounting are measured at fair value
and all changes in value are recognised in profit and loss. The group may
designate certain derivatives as hedging instruments to hedge the fair
value of recognised assets or liabilities (fair value hedges), the variability
in cash flows associated with highly probable forecast transactions
arising from changes in foreign exchange rates and interest rates (cash
flow hedges), and certain derivatives and non-derivative financial
liabilities as hedges of foreign exchange risk on a net investment in a
foreign operation (net investment hedges). At inception of designated
hedging relationships, the group documents the risk management
objective and strategy for undertaking the hedge. The group also
documents the economic relationship between the hedged item and the
hedging instrument, including whether the changes in cash flows of the
hedged item and hedging instrument are expected to offset each other.
Cash flow hedges
When a derivative is designated as the hedging instrument in a
hedge of the variability in cash flows attributable to a particular risk
associated with a recognised asset or liability, or a highly probable
forecast transaction that could affect profit or loss, the effective portion
of changes in the fair value of the derivative is recognised in other
comprehensive income and presented in the hedging reserve within
equity. The amount recognised in other comprehensive income is
removed and included in profit or loss in the same period as the hedged
cash flows affect profit or loss under the same line item in the income
statement as the hedged item. Any ineffective portion of changes in the
fair value of the derivative is recognised immediately in profit or loss.
If the hedging instrument no longer meets the criteria for hedge
accounting, expires or is sold, terminated, exercised, or the designation
is revoked, then hedge accounting is discontinued prospectively. The
cumulative gain or loss previously recognised in other comprehensive
income and presented in the hedging reserve in equity remains there
until the forecast transaction affects profit or loss. If the forecast
transaction is no longer expected to occur, then the balance in other
comprehensive income is recognised immediately in profit or loss. In
other cases, the amount recognised in other comprehensive income
is transferred to profit or loss in the same period that the hedged item
affects profit or loss.
Fair value hedges
Changes in the fair value of derivatives designated as fair value hedges
are recognised in profit or loss. The hedged object is valued at fair value
with respect to the risk that is hedged. Gains or losses attributable to
the hedged risk are recognised in profit or loss and the hedged object’s
carried amount is adjusted.
Net investment hedges
Foreign currency differences arising from the translation of a financial
liability designated as a hedge of a net investment in a foreign operation
are recognised in other comprehensive income to the extent that the
hedge is effective and are presented within equity in the translation
reserve. To the extent that the hedge is ineffective, such differences are
recognised in profit or loss. When the hedged part of a net investment is
disposed of, the relevant amount in the translation reserve is transferred
to profit or loss as part of the profit or loss on disposal.
3.2.2 Impact of transition to IFRS 9The following table summarises the impact of transition to IFRS 9 on the
group’s financial statements as of 1 January 2018:
Amounts in NOK million 1 January 2018
Reclassification of hedge reserve 174
Other effects 4
Tax effects (40)
Total impact on equity: 138
The group has elected to adopt the new general hedge accounting model
in IFRS 9. The new hedge accounting rules will align the accounting for
hedging instruments more closely with the group’s risk management
practices. The group has concluded that all hedge relationships
designated under IAS 39 as of 31 December 2017 met the criteria for
hedge accounting under IFRS 9 as of 1 January 2018 and therefore
regarded as continuing hedging relationships.
The group uses forward foreign exchange contracts to hedge the variability
in cash flows arising from changes in foreign exchange rates relating to
foreign currency borrowings, receivables, sales and inventory purchases.
For all cash flow hedges under IAS 39, the amounts accumulated in the
cash flow hedge reserve are reclassified to profit or loss as a reclassification
adjustment in the same period as the hedged transaction occurs and
affects profit or loss. Under IFRS 9, for cash flow hedges associated with
forecast transactions that subsequently result in recognition of a non-
financial asset or a non-financial liability, the amounts accumulated in
the cash flow hedge reserve and the cost of hedging reserve are instead
included directly in the initial cost of the non-financial asset or non-financial
liability when recognised. This change has resulted in an increase of NOK
174 million excluding tax of the carrying amount of the hedge reserve.
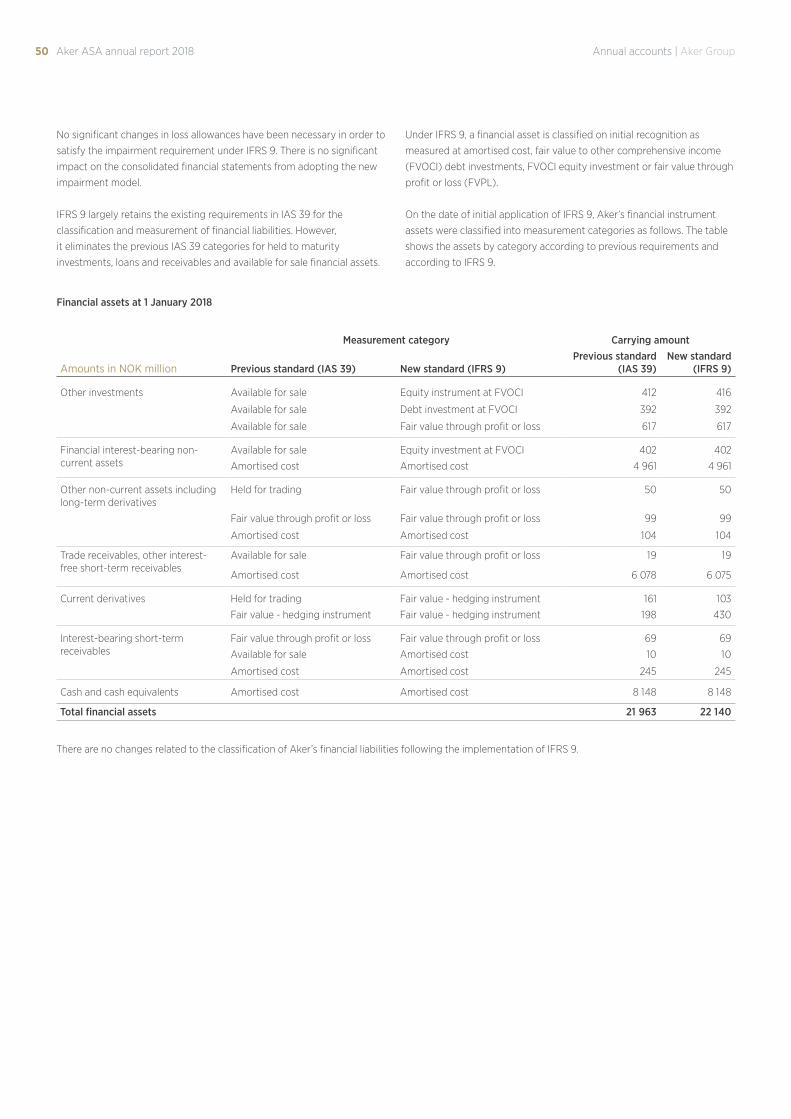
50 Annual accounts | Aker GroupAker ASA annual report 2018
No significant changes in loss allowances have been necessary in order to
satisfy the impairment requirement under IFRS 9. There is no significant
impact on the consolidated financial statements from adopting the new
impairment model.
IFRS 9 largely retains the existing requirements in IAS 39 for the
classification and measurement of financial liabilities. However,
it eliminates the previous IAS 39 categories for held to maturity
investments, loans and receivables and available for sale financial assets.
Under IFRS 9, a financial asset is classified on initial recognition as
measured at amortised cost, fair value to other comprehensive income
(FVOCI) debt investments, FVOCI equity investment or fair value through
profit or loss (FVPL).
On the date of initial application of IFRS 9, Aker’s financial instrument
assets were classified into measurement categories as follows. The table
shows the assets by category according to previous requirements and
according to IFRS 9.
Financial assets at 1 January 2018
Measurement category Carrying amount
Amounts in NOK million Previous standard (IAS 39) New standard (IFRS 9)Previous standard
(IAS 39)New standard
(IFRS 9)
Other investments Available for sale Equity instrument at FVOCI 412 416
Available for sale Debt investment at FVOCI 392 392
Available for sale Fair value through profit or loss 617 617
Financial interest-bearing non-current assets
Available for sale Equity investment at FVOCI 402 402
Amortised cost Amortised cost 4 961 4 961
Other non-current assets including long-term derivatives
Held for trading Fair value through profit or loss 50 50
Fair value through profit or loss Fair value through profit or loss 99 99
Amortised cost Amortised cost 104 104
Trade receivables, other interest-free short-term receivables
Available for sale Fair value through profit or loss 19 19
Amortised cost Amortised cost 6 078 6 075
Current derivatives Held for trading Fair value - hedging instrument 161 103
Fair value - hedging instrument Fair value - hedging instrument 198 430
Interest-bearing short-term receivables
Fair value through profit or loss Fair value through profit or loss 69 69
Available for sale Amortised cost 10 10
Amortised cost Amortised cost 245 245
Cash and cash equivalents Amortised cost Amortised cost 8 148 8 148
Total financial assets 21 963 22 140
There are no changes related to the classification of Aker’s financial liabilities following the implementation of IFRS 9.
51Annual accounts | Aker Group Aker ASA annual report 2018
Note 4 | New standards and interpretations not yet adoptedA number of new standards are effective for annual periods beginning
after 1 January 2018 and earlier application is permitted. The group has
however not early adopted the new or amended standards in preparing
these consolidated financial statements.
Of those standards that are not yet effective, IFRS 16 Leases is expected
to have material impact on the group’s financial statements in the period
of initial application.
IFRS 16 LEASES The group is required to adopt IFRS 16 Leases from 1 January 2019. The
standard replaces IAS 17 Leases and related interpretations. The group
has assessed the estimated impact that initial application of IFRS 16 will
have on its consolidated financial statements, as described below. The
actual impacts of adopting the standard on 1 January 2019 may differ
from the estimate.
IFRS 16 introduces a single, on-balance sheet lease accounting model for
lessees, with optional exemptions for short-term leases and leases of low
value items. A lessee recognises a right-of-use asset representing its right
to use the underlying asset and a lease liability representing its obligation to
make lease payments. Lessor accounting remains similar to current standard
– i.e. lessors continue to classify leases as finance or operating leases.
Leases in which the group is a lesseeThe group will recognise new assets and liabilities for its operating leases
of warehouses, rental of offices and factory facilities and machines and
vehicles. The nature of expenses related to those leases will now change
because the group will recognise a depreciation charge for right-of-use
assets and interest expenses on lease liabilities.
Previously, the group recognised operating lease expense on a straight-
line basis over the term of the lease, and recognised assets and liabilities
only to the extent that there was a timing difference between actual lease
payments and the expense recognised.
In addition, the group will no longer recognise provisions for operating
leases that it assesses to be onerous. Instead, the group will include the
payments due under the lease in its lease liability. No significant impact is
expected for the group’s finance leases.
Based on the information current available, the group estimates that it
will recognise additional lease liabilities of approximately NOK 6.5 billion
as of 1 January 2019.
Leases in which the group is a lessorThe group has reassessed the classification of sub-leases in which the
group is a lessor. Based on the information currently available, the group
expects that it will reclassify some of its sub-leases as a finance lease,
resulting in recognition of a finance lease receivable of approximately
NOK 0.7 billion as of 1 January 2019.
No significant impact is expected for other leases in which the group is a
lessor.
TransitionThe group plans to apply IFRS 16 initially from 1 January 2019, using the
modified retrospective approach. Therefore, the cumulative effect of
adopting IFRS 16 will be recognised as an adjustment to the opening
balance of equity at 1 January 2019, with no restatement of comparative
information. Based on the information current available, the group
estimates that the impact of transition to IFRS 16 on the group’s equity as
of 1 January 2019 is a reduction of approximately NOK 0.4 billion.
The group plans to apply the following practical expedients on transition
to IFRS 16:
§ Non-lease components for housing contracts, machines and vehicles
will not be separated.
§ Rely on assessment of whether leases are onerous applying IAS 37
on 31 December 2018 as an alternative to performing an impairment
review of right-of-use assets for all leases on 1 January 2019. The
group expects to reduce the right-of-use assets at 1 January 2019
by approximately NOK 0.2 billion of the onerous lease provision
recognised as of 31 December 2018.
§ Apply the short-term lease practical expedient to leases ending
within 2019 and assets of low value on a lease-by-lease basis.
§ Exclude initial direct costs from measurement of right-of-use assets
at the date of initial application.
Based on the information current available, the group estimates that it
will recognise right-of-use assets of approximately NOK 5.0 billion as of
1 January 2019 after reclassification of finance lease and onerous lease
provisions as mentioned above.
Other standardsThe following amended standards and interpretations are not expected
to have a significant impact on the group’s consolidated financial
statements:
§ IFRIC 23 Uncertainty over Tax Treatments
§ Prepayment Features with Negative Compensation (Amendments to
IFRS 9)
§ Long-term Interests in Associates and Joint Ventures (Amendments
to IAS 28)
§ Plan Amendment, Curtailment or Settlement (Amendments to IAS
19)
§ Annual Improvements to IFRS Standards 2015-2017 Cycle – various
standards
§ Amendments to References to Conceptual Framework in IFRS
Standards
§ IFRS 17 Insurance Contracts
52 Annual accounts | Aker GroupAker ASA annual report 2018
Note 5 | Accounting principlesThe accounting principles presented below have been applied
consistently for all periods and companies that are presented in the
consolidated financial statements. Comparative figures have been
restated in accordance with this year’s presentation, see however
information provided in Note 3 regarding IFRS 15 Revenue from Contracts
with customers and IFRS 9 Financial Instruments.
5.1. GROUP ACCOUNTING AND CONSOLIDATION PRINCIPLES5.1.1. SubsidiariesSubsidiaries are companies controlled by Aker. Control requires three
elements:
a. a) ownership interests that give the investor power to direct the
relevant activities of the investee,
b. b) that the investor is exposed to variable returns from the investee,
and that
c. c) decision-making power allows the investor to affect its variable
returns from the investee.
Subsidiaries are included in the consolidated accounts from the day
control is achieved and until control ceases.
Acquisitions of companies that meet the definition of a business
combination are recognised using the acquisition method. See further
description in section 5.8 Intangible assets. Acquisitions of companies,
which are not defined as business combinations, are recorded as asset
acquisitions. The cost of such purchases is allocated between the
individual identifiable assets and liabilities acquired based on their fair
values on the acquisition date. Goodwill is not recognised in connection
with such acquisitions, nor is deferred tax recognised in connection with
differences arising in the recognition of such assets.
Minority interests have been disclosed separately from the parent
company owners’ equity and liabilities in the balance sheet, and are
recorded as a separate item in the consolidated profit and loss account.
5.1.2. Investments in associatesAn associate is defined as a company over which the group has
significant influence, but which is not a subsidiary nor a joint
arrangement. Significant influence is the power to participate in the
financial and operating policy decisions of the investee, without having
control or joint control of those policies. The group’s investments in
associates are accounted for using the equity method and are initially
recognised at cost. Received dividends are recognised as a reduction of
the book value of the investment, and are presented as part of net cash
flow from operating activities in the cash flow statement.
Investments include goodwill upon acquisition less any accumulated
impairment losses. The consolidated financial statements reflect the
group’s share of the associate’s profits or losses and equity changes, after
restatement to comply with the group’s accounting principles, from the time
significant influence is established until such influence ceases. If the group’s
share of accumulated losses exceeds its interest in the entity, the group does
not recognise further losses unless it has incurred or guaranteed obligations
with respect to the associate. If control is achieved in stages, goodwill is
measured on the date control is obtained, and any changes in the value of
previously held equity interests are recognised as profits or losses.
5.1.3. Interests in joint arrangementsA joint arrangement is a contractual arrangement whereby two or
more parties undertake an economic activity that is subject to joint
control. A joint arrangement is either a joint venture or a joint operation.
The classification of a joint arrangement as a joint venture or a joint
operation depends upon the rights and obligations of the parties to the
arrangement. A joint venture is a joint arrangement whereby the parties
that have joint control of the arrangement have rights to the net assets
of the arrangement. A joint operation is a joint arrangement whereby
the parties that have joint control of the arrangement have rights to the
assets, and obligations for the liabilities, relating to the arrangement.
Joint ventures are accounted for using the equity method and are initially
recognised at cost. Received dividends are recognised as a reduction of
the book value of the investment, and are presented as part of net cash
flow from operating activities in the cash flow statement.
The subsidiary Aker Energy has a 50 per cent ownership interest in a
license offshore Ghana, which is classified as joint operations under IFRS
11. The group recognises the investment by reporting its share of related
revenues, expenses, assets, liabilities and cash flows under the respective
items in the financial statements.
5.1.4. Elimination of transactions upon consolidationIntragroup balances and transactions, and any unrealised gains and
losses or revenues and expenses arising from intragroup transactions, are
eliminated in preparing the consolidated financial statements. Unrealised
gains arising from transactions with equity accounted investees are
eliminated against the investment to the extent of the group’s interest in
the investee.
5.1.5. Foreign currency translations and transactionsItems are initially recorded in the financial statements of each subsidiary
in the subsidiary’s functional currency, i.e. the currency that best reflects
the economic substance of the underlying events and circumstances
relevant to that subsidiary. Foreign currency transactions are translated
into the functional currency of the respective subsidiary using the
exchange rates prevailing on the date of each transaction. Receivables
and liabilities in foreign currencies are translated into the functional
currency using the exchange rates on the balance sheet date. Foreign
currency exchange gains and losses resulting from the settlement of such
transactions and from the translation of monetary assets and liabilities
denominated in foreign currencies are recognised in the profit and loss
account.
The consolidated financial statements are presented in Norwegian kroner.
Financial statements of subsidiaries whose functional currencies are
different from the presentation currency (NOK) are translated into NOK
in the following way:
§ Balance sheet items are translated using the exchange rates on the
balance sheet date
§ Profit or loss items are translated using the average exchange rates
for the period (if the average exchange rates for the period do not
provide a fair estimate of the transaction rate, the actual transaction
rate is used).
53Annual accounts | Aker Group Aker ASA annual report 2018
Translation differences arising from the translation of net investments
in foreign operations and from related hedging objects are specified as
translation differences in other comprehensive income, and are specified
under shareholders’ equity. When a foreign entity is sold, translation
differences are recognised in the profit and loss account as part of the
gain or loss on the sale. Foreign exchange gains or losses on receivables
from and liabilities payable to a foreign entity are recognised in the profit
and loss, except when settlement is neither planned nor likely to occur
in the foreseeable future. Such foreign exchange gains and losses are
considered to form part of the net investment in the foreign activity and
are recognised in other comprehensive income as translation differences.
5.2. DISCONTINUED OPERATIONSA discontinued operation is a component of the group’s business
operations that represents a separate, major line of business or a
geographical area of operations that has been disposed of or is held for
sale. Classification as a discontinued operation occurs at the earlier of
disposal or when the operation meets the criteria to be classified as held
for sale.
Profits or losses from discontinued operations (after tax), are reclassified
and presented as a separate line item in the financial statements. The
comparatives are restated accordingly.
5.3. REVENUE FROM CONTRACTS WITH CUSTOMERS AND OTHER INCOME5.3.1. Revenue from contracts with customersThe group has initially applied IFRS 15 Revenue from Contracts with
customers from 1 January 2018. Information about the effect of initially
applying IFRS 15 and the group’s accounting policies relating to contracts
with customers are provided in Note 3.
5.3.2. Revenue from charter agreementsRevenues related to vessel bareboat charter agreements are recognised
over the charter period. Time-charter agreements may include a revenue-
sharing agreement with the charterer. Revenue related to profit sharing
agreements is recognised when the amount can be reliably estimated.
5.3.3. Other income Gains and losses resulting from acquisition and disposal of businesses
which do not represent discontinued operations are included in Other
income within operating profit. In case of acquisitions in stages, such
gains may come from the remeasurement of previously held interests
in the acquired entity. Changes in the fair value of the contingent
consideration from acquisition of a subsidiary or non-controlling interest
are recognised in Other income as gains or losses.
5.4. PENSION BENEFITS AND SHARE-BASED PAYMENTS5.4.1. Pension benefitsFor defined benefit plans, the liability recognised is the defined benefit
obligation as at the balance sheet date, minus the fair value of plan
assets. The defined benefit obligation is calculated by independent
actuaries and is measured as the present value of estimated future
cash outflows. The pension cost is allocated to profit and loss over the
employees’ estimated time of service. Actuarial gains and losses arising
from experience adjustments, changes in actuarial assumptions, and
amendments to pension plans are recognised in other comprehensive
income (“OCI”). The net interest expense for the period is calculated
by applying the discount rate to the net defined benefit liability, thus
comprises both interest on the liability and the return on the pension
plan assets. The difference between the actual return on the pension plan
assets and the recognised return is recognised against the OCI on an
ongoing basis.
For defined contribution plans, contributions are paid into pension
insurance plans. Contributions to defined contribution plans are charged
to the profit and loss account in the period to which the contributions
relate.
5.4.2. Share-based paymentsShare-based payment expense is measured at fair value over the service
period. All changes in fair value are recognised in the income statement.
5.5. EXPENSES5.5.1. Lease agreements (as lessee) Leases under which a significant proportion of the risks and rewards of
ownership is retained by the lessor are classified as operating leases.
Lease payments under operating leases are recognised in the profit and
loss account on a straight-line basis over the lease period. Any lease
incentives received are recognised as an integral part of the total lease
expense over the term of the lease.
Leases under which the group has substantially all the risks and rewards
of ownership, are classified as financial leases and are capitalised at
the inception of the lease at the lower of the fair value of the leased
property or the present value of the minimum lease payments. Following
initial capitalisation, the same accounting principle that applies to the
corresponding asset is used. Lease payments are apportioned between
financial expenses and the reduction in the lease liability. Finance
expenses are recognised as finance costs in profit or loss.
Contingent lease payments are accounted for by revising the minimum
lease payments over the remaining term of the lease, when the
contingencies of the variable lease have been met and the adjustment
amount is known.
5.5.2. Finance expensesFinance expenses comprise interest expense on borrowings, unwinding
of the discount on provisions, changes in the fair value of financial assets
at fair value through profit or loss, impairment losses recognised on
financial assets, and losses on hedging instruments that are recognised in
profit or loss. Borrowing costs not directly attributable to the acquisition
or production of a qualifying asset are recognised in profit or loss using
the effective-interest method. Foreign currency gains and losses are
reported on a net basis.
5.5.3. Income taxIncome tax comprises current and deferred tax. An income tax expense
is recognised in the profit and loss account unless it relates to items
recognised directly in equity, in which case it is recognised in equity.
Current tax is the expected tax payable on the taxable income for the year,
using tax rates enacted or substantively enacted as at the balance sheet
date, and any adjustments to tax payable in respect of previous years.
Deferred tax is calculated based on the temporary differences between
the carrying amounts of assets and liabilities and the amounts used for
54 Annual accounts | Aker GroupAker ASA annual report 2018
taxation purposes. Deferred tax is measured at the tax rates that are
expected to be applied to the temporary differences when they reverse.
Deferred tax is not recognised for the following temporary differences:
§ initial recognition of assets or liabilities in a transaction that is not a
business combination and that affects neither accounting nor taxable
profit.
§ differences relating to investments in joint ventures, if it is probable
that they will not reverse in the foreseeable future.
§ tax-increasing temporary differences upon initial recognition of
goodwill.
Deferred tax assets and liabilities are offset if:
§ there is a legally enforceable right to offset current tax liabilities and
assets
§ they relate to income taxes levied by the same tax authority on the
same taxable entity, or on different taxable entities that intend to
settle current tax liabilities and assets on a net basis, or to realise
their tax assets and liabilities simultaneously.
A deferred tax asset will be recognised if it is probable that future taxable
profits will be available against which the temporary difference can be
utilised.
5.6. INVENTORYInventory is stated at the lower of cost or net realisable value. Cost is
determined by the first-in first-out (FIFO) method, or the weighted
average cost formula depending on the nature of the inventory. The cost
of finished goods and work in progress comprises raw materials, direct
labour and other direct costs, and related production overhead (based on
normal operating capacity). Net realisable value is the estimated selling
price in the ordinary course of business, less the costs of completion and
selling expenses.
5.7. PROPERTY, PLANT, AND EQUIPMENT5.7.1. Recognition and measurementAn item of property, plant and equipment is recognised as an asset if it
is probable that the future economic benefits associated with the assets
will flow to the group, and its cost can be reliably measured. Property,
plant and equipment is measured at cost less accumulated depreciation
and impairment losses.
Cost includes expenditures directly attributable to the asset’s acquisition
and if material the costs of dismantling and removing the items and
restoring the site on which they are located. The cost of self-constructed
assets includes the cost of materials and direct labour, any other costs
directly attributable to bringing the asset to a working condition for
its intended use. Borrowing costs associated with loans to finance the
construction of property, plant and equipment are capitalised over the
period necessary to complete an asset and make it ready for its intended
use. Other borrowing costs are expensed. When significant parts of an
item of property, plant, and equipment have different useful lives, major
components are accounted for as separate items of property, plant, and
equipment.
A gain or loss on the disposal of an item of property, plant and equipment
is determined by comparing the disposal proceeds with the carrying
amount of that item; any loss is included in impairment charges.
5.7.2. Subsequent costsThe cost of replacing part of an item of property, plant and equipment is
recognised in the carrying amount of the item if it is probable that future
economic benefits associated with the asset will flow to the group and its
cost can be measured reliably. The carrying amount of the replaced part
is derecognised. The costs of day-to-day maintenance of property, plant
and equipment are recognised in profit and loss as incurred.
5.7.3. DepreciationDepreciation is recognised in profit and loss on a straight-line basis over
the estimated useful life of each major component of an item of property,
plant and equipment. Leased assets are depreciated over the shorter of
the lease term or the asset’s useful life, unless it is highly probable that
the group will acquire ownership at the end of the lease term. Land is not
depreciated. Depreciation methods, useful lives, and residual values are
reviewed at each balance sheet date.
5.8. INTANGIBLE ASSETS5.8.1. GoodwillAll business combinations in the group are recognised using the
acquisition method. Goodwill represents values arising from the
acquisitions of subsidiaries, associates, and joint ventures. Goodwill is
allocated to cash-generating units and is tested annually for impairment.
For associates and joint ventures, the carrying amount of goodwill is
included in the carrying amount of the investment in the associates.
Negative goodwill arising on an acquisition is recognised directly in
the profit and loss account. Minority interests are measured at the net
value of identifiable assets and liabilities in the acquired company or at
fair-value including a goodwill element. The method of measurement is
decided individually for each acquisition.
Goodwill is measured as a residual at the acquisition date and constitutes
the sum of total consideration transferred in connection with the business
combination, the carrying amount of the minority interests and the fair
value of the previous ownership interest in the acquired company at the
time of acquisition, less the net recognised amount (normally fair value)
of the identifiable assets acquired and liabilities assumed.
Acquisitions of minority interests are accounted for as transactions
with equity holders in their capacity as equity holders, and therefore no
goodwill is recognised as a result of such transactions. In subsequent
measurements, goodwill is valued at acquisition cost, less accumulated
impairment losses.
5.8.2. Research and developmentExpenditures on research activities undertaken to gain new scientific or
technical knowledge and understanding are recognised in profit and loss
in the period incurred.
Development expenditure that applies research findings to a plan or
design for the production of a new or substantially improved product
or process is capitalised if the product or process is technically and
commercially feasible and the group has sufficient resources to complete
development. The capitalised amount includes the cost of materials,
direct labour expenses and an appropriate proportion of overhead
expenses. Other development expenditure is recognised in the profit and
loss account as an expense in the period in which it occurs. Capitalised
development expenditures are recognised at cost less accumulated
amortisation and impairment losses.
55Annual accounts | Aker Group Aker ASA annual report 2018
5.8.3. Other intangible assetsExpenditures on internally generated goodwill and brand names are
recognised in profit and loss in the period in which they are incurred.
Other acquired intangible assets (patents, trademarks and other rights),
are recognised in the balance sheet at cost less accumulated amortisation
and impairment losses. Amortisation is charged to the income statement
on a straight-line basis over the estimated useful lives of intangible assets
unless such lives are indefinite. Intangible assets are amortised from the
date they are available for use.
5.9. IMPAIRMENT OF NON-FINANCIAL ASSETSThe carrying amounts of the group’s non-financial assets are reviewed
at each reporting date to determine whether there is any indication of
impairment. If any such indication exists, the asset’s recoverable amount
is estimated. For goodwill and intangible assets that have indefinite
useful lives or that are not yet available for use, the recoverable amount
is also estimated annually at the balance sheet date irrespective of any
impairment indicators. The recoverable amount of an asset or cash-
generating unit is the greater of its value in use and its fair value less
costs to sell.
For the purpose of impairment testing, assets are grouped together into
the smallest group of assets that generates cash inflows from continuing
use that are largely independent of the cash inflows of other assets
or groups of assets (the “cash-generating unit”, or “CGU”). Goodwill
acquired in a business combination is allocated to the groups of CGUs
that are expected to benefit from the synergies of the combination.
An impairment loss is recognised if the carrying amount of an asset or its
CGU exceeds its estimated recoverable amount. Impairment losses are
recognised in profit or loss. Impairment losses recognised in respect of
CGUs are allocated first to reduce the carrying amount of any goodwill
allocated to the units, and then to reduce the carrying amounts of the
other assets in the unit (or group of units), on a pro rata basis.
An impairment loss in respect of goodwill and intangible assets that have
indefinite useful lives is not reversed. In respect of other assets, impairment
losses recognised in prior periods are assessed as at each reporting date
as to any indications that the loss has decreased or no longer exists. An
impairment loss is reversed if there has been a change in the estimates
used to determine the recoverable amount. An impairment loss is reversed
only to the extent that the asset’s carrying amount does not exceed the
carrying amount that would have been determined, net of depreciation
and amortisation, if no impairment loss had been recognised.
5.10. ASSETS HELD FOR SALE OR DISTRIBUTIONNon-current assets, or disposal groups comprising assets and liabilities,
that are expected to be recovered primarily through sale or distribution
rather than through continuing use, are classified as held for sale or
distribution. This condition is regarded as met only when the sale is highly
probable, and the asset or disposal group is available for immediate sale
or distribution in its present condition.
Non-current assets and disposal groups classified as held for sale or
distribution are measured at the lower of their carrying amount and fair
value less costs to sell. Property, plant and equipment and intangible
assets once classified as held for sale or distribution are not depreciated
or amortised, but are considered in the overall impairment testing of the
disposal group.
Non-current asset classified as held for sale and the assets of a disposal group
classified as held for sale are presented separately from other assets in the
statement of financial position. Liabilities of a disposal group classified as held
for sale shall be presented separately from other liabilities in the statement
of financial position. The balance sheet for prior periods is not reclassified to
reflect the classification in the balance sheet for the latest period presented.
5.11. FINANCIAL ASSETS AND LIABILITIESThe group has initially applied IFRS 9 Financial instruments from 1
January 2018. Information about the effect of initially applying IFRS 9 and
the group’s accounting policies relating to financial assets and liabilities
are provided in Note 3.
5.12. SHARE CAPITAL, TREASURY SHARES AND EQUITY RESERVESOrdinary shares are classified as equity. Incremental costs directly attributable
to the issue of ordinary shares and share options are recognised as a deduction
from equity, net of any tax effects. When share capital is repurchased, the
amount of the consideration paid including directly attributable costs and
net of any tax effects, is recognised as a deduction from equity. Repurchased
shares are classified as treasury shares and are presented as a deduction
from total equity. When treasury shares are sold or reissued, the amount
received is recognised as an increase in equity, and the surplus or deficit
resulting from the transaction is transferred to/from retained earnings.
The translation reserve comprises all foreign currency differences arising
from the translation of the financial statements of foreign operations,
as well as from the translation of liabilities that hedge the group’s net
investment in a foreign operation.
The fair value reserve comprises the cumulative net change in the fair
value of financial assets at FVOCI.
The hedging reserve applies to cash flow hedges entered into in order
to hedge against changes in income and expenses that may arise from
exchange rate fluctuations. The profit or loss effect of such transactions
is included in the profit and loss account upon recognition of the hedged
cash flow. The hedging reserve represents the value of such hedging
instruments that is not yet recognised in the income statement.
5.13. PROVISIONSA provision is recognised when the group has a present legal or
constructive obligation as a result of a past event, it is probable that
payments or other outflow of economic benefits will be required to settle
the obligation, and a reliable estimate can be made of the amount of the
obligation. Provisions are determined as the present value of expected
future cash flows, discounted by a market based pre-tax discount rate.
Warranty provisions are made for expected future expenses related to
delivered products and services. The provisions are based on historic data and
a weighting of all possible outcomes against their associated probabilities.
A provision for restructuring is recognised when an approved, detailed
and formal restructuring plan exists, and the restructuring either has
begun or has been announced to the affected parties.
Provisions for contract losses are recognised when the expected revenues
from a contract are lower than the cost of meeting the contractual
obligations. Before provisions are made, all impairment losses on assets
associated with the contract are recognised.
56 Annual accounts | Aker GroupAker ASA annual report 2018
5.14. EARNINGS PER SHAREThe calculation of ordinary earnings per share is based on the profit
attributable to ordinary shares using the weighted average number of
shares outstanding during the reporting period, after deduction of the
average number of treasury shares held over the period. The calculation
of diluted earnings per share is consistent with the calculation of ordinary
earnings per share, and gives effect to all ordinary shares with dilutive
potential that were outstanding during the period.
5.15. SEGMENT REPORTINGAker defines operating segments based on the group’s internal
management and reporting structure. The group’s chief operating
decision maker, responsible for the allocation of resources and
assessment of the performance in the different operating segments, is
defined as the board of directors, the group president and CEO and the
CFO. Aker’s investment portfolio comprises two segments: Industrial
holdings and Financial investments. The recognition and measurement
applied in segment reporting is consistent with the accounting principles
applied when preparing the financial statements. Transactions between
segments are conducted on market terms and conditions. Comparative
segment information is usually re-presented for changes in reporting
segments. See Note 9 Operating segments and significant subsidiaries.
FINANCIAL RISKThe Aker Group consists of various operations and companies that are
exposed to different types of financial risks, including credit-, liquidity-
and market risk (e.g. oil price-, interest- and currency risk). The purpose
of risk management is to measure and manage financial risk in a reliable
manner, thereby increasing predictability and reducing negative effects
on Aker’s financial results. The Group uses different financial instruments
to manage its financial exposure actively.
CAPITAL MANAGEMENTThe overall objectives of Aker’s capital management policy are to
maintain a strong capital base to retain investor, creditor and market
confidence, to ensure financial flexibility for the seizure of opportunities
as they arise, and to maintain a capital structure that minimises the
company’s cost of capital. For its surplus liquidity, Aker pursues a
conservative placement strategy with minimal risk. The placements need
to be flexible in terms of liquidity.
The target rate of return for the Industrial holdings is 12 per cent. The
target return for the Financial investments portfolio depends on the
composition of the portfolio, including the size of cash deposits and
the risk profile of the receivables. In addition, Aker has defined financial
target indicators (FTIs) that regulate the relationship between cash and
interest-bearing debt, as well as the capital structure. The ratios work as
guidelines for investment activities and capital allocation.
The governing principle of Aker’s dividend policy is that the company
at all times should have a solid balance sheet and liquidity reserves
sufficient to deal with future liabilities. The policy of the company is to
pay annual dividends corresponding to 2-4 per cent of net asset value
(value-adjusted). The market prices of listed companies are used in
calculating net asset value, while book values are used for other assets.
CREDIT RISKThe Group’s financial assets are bank deposits, trade and other
receivables, derivatives, and investments in shares. The Group’s exposure
to credit risk is mainly related to external receivables. For large projects
and long-term lease contracts, assessment of credit risk related to
customers and subcontractors are performed in the tender phase and
throughout the contract period. Large and long-term projects are closely
monitored in accordance with agreed milestones.
Trade receivables presented in the balance sheet are net of provisions
for bad debts, which are estimated based on prior experience as well as
specific assessments for some of the receivables.
Transactions involving derivative financial instruments are with
counterparties with sound credit ratings and with whom the Group has
signed a netting agreement.
The company within the group with the largest exposure to credit risk,
is Ocean Yield. Ocean Yield faces credit risk through counterparties
that may not be able to meet its obligations under a long-term charter
contract. In order to mitigate this, the company charters out the vessels
to internationally well-recognised companies within the shipping and
offshore industry. However, as shipping and oil service markets are
volatile, there is no complete protection against potential counterparty
default. In December 2018, Solstad Offshore entered into a 6-month
standstill period with respect to payment of interest, instalments and
charter hire with the secured lenders and other creditors. Following
the standstill agreement there is a risk related to Solstad Offshore’s
obligations under the charter contract with Ocean Yield for the two AHTS
vessels Far Senator and Far Statesman. This resulted in an impairment of
the two vessels at the end of 2018, see Note 12.
Note 6 | Financial risk and exposure
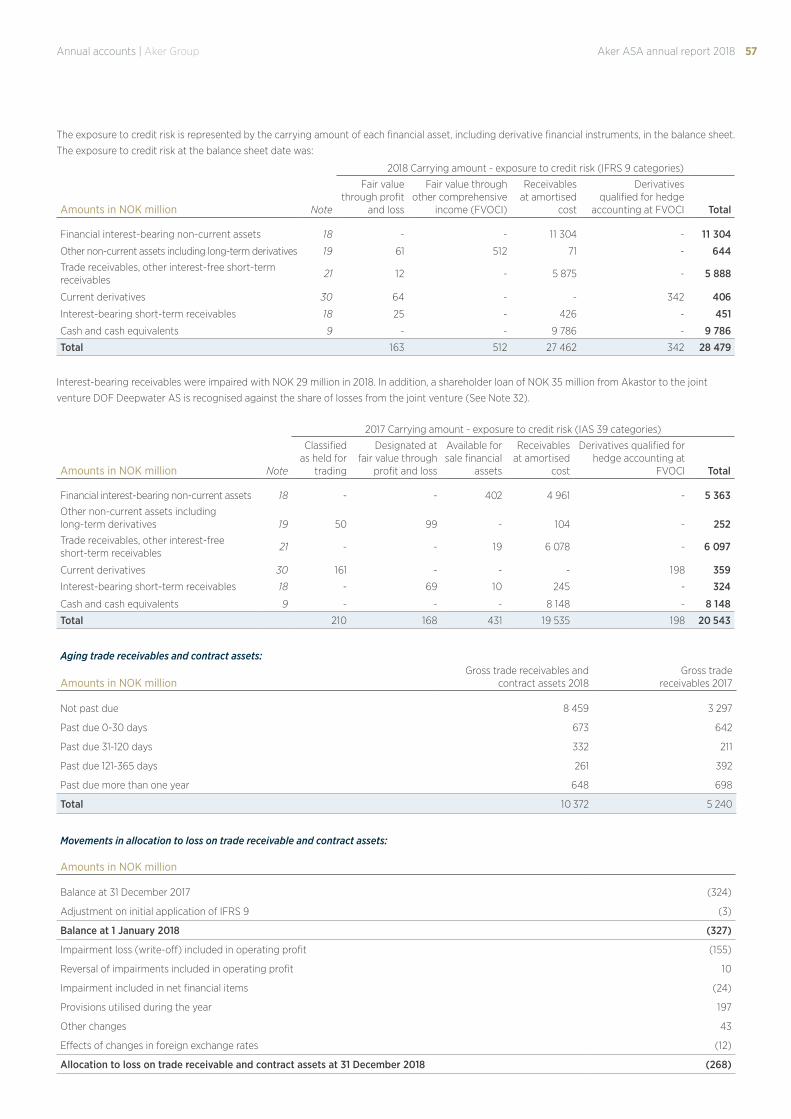
57Annual accounts | Aker Group Aker ASA annual report 2018
2018 Carrying amount - exposure to credit risk (IFRS 9 categories)
Amounts in NOK million Note
Fair value through profit
and loss
Fair value through other comprehensive
income (FVOCI)
Receivables at amortised
cost
Derivatives qualified for hedge
accounting at FVOCI Total
Financial interest-bearing non-current assets 18 - - 11 304 - 11 304
Other non-current assets including long-term derivatives 19 61 512 71 - 644Trade receivables, other interest-free short-term receivables
21 12 - 5 875 - 5 888
Current derivatives 30 64 - - 342 406
Interest-bearing short-term receivables 18 25 - 426 - 451
Cash and cash equivalents 9 - - 9 786 - 9 786
Total 163 512 27 462 342 28 479
The exposure to credit risk is represented by the carrying amount of each financial asset, including derivative financial instruments, in the balance sheet.
The exposure to credit risk at the balance sheet date was:
Interest-bearing receivables were impaired with NOK 29 million in 2018. In addition, a shareholder loan of NOK 35 million from Akastor to the joint
venture DOF Deepwater AS is recognised against the share of losses from the joint venture (See Note 32).
2017 Carrying amount - exposure to credit risk (IAS 39 categories)
Amounts in NOK million Note
Classified as held for
trading
Designated at fair value through
profit and loss
Available for sale financial
assets
Receivables at amortised
cost
Derivatives qualified for hedge accounting at
FVOCI Total
Financial interest-bearing non-current assets 18 - - 402 4 961 - 5 363Other non-current assets including long-term derivatives 19 50 99 - 104 - 252Trade receivables, other interest-free short-term receivables
21 - - 19 6 078 - 6 097
Current derivatives 30 161 - - - 198 359
Interest-bearing short-term receivables 18 - 69 10 245 - 324
Cash and cash equivalents 9 - - - 8 148 - 8 148
Total 210 168 431 19 535 198 20 543
Aging trade receivables and contract assets:
Amounts in NOK millionGross trade receivables and
contract assets 2018Gross trade
receivables 2017
Not past due 8 459 3 297
Past due 0-30 days 673 642
Past due 31-120 days 332 211
Past due 121-365 days 261 392
Past due more than one year 648 698
Total 10 372 5 240
Movements in allocation to loss on trade receivable and contract assets:
Amounts in NOK million
Balance at 31 December 2017 (324)
Adjustment on initial application of IFRS 9 (3)
Balance at 1 January 2018 (327)
Impairment loss (write-off) included in operating profit (155)
Reversal of impairments included in operating profit 10
Impairment included in net financial items (24)
Provisions utilised during the year 197
Other changes 43
Effects of changes in foreign exchange rates (12)
Allocation to loss on trade receivable and contract assets at 31 December 2018 (268)
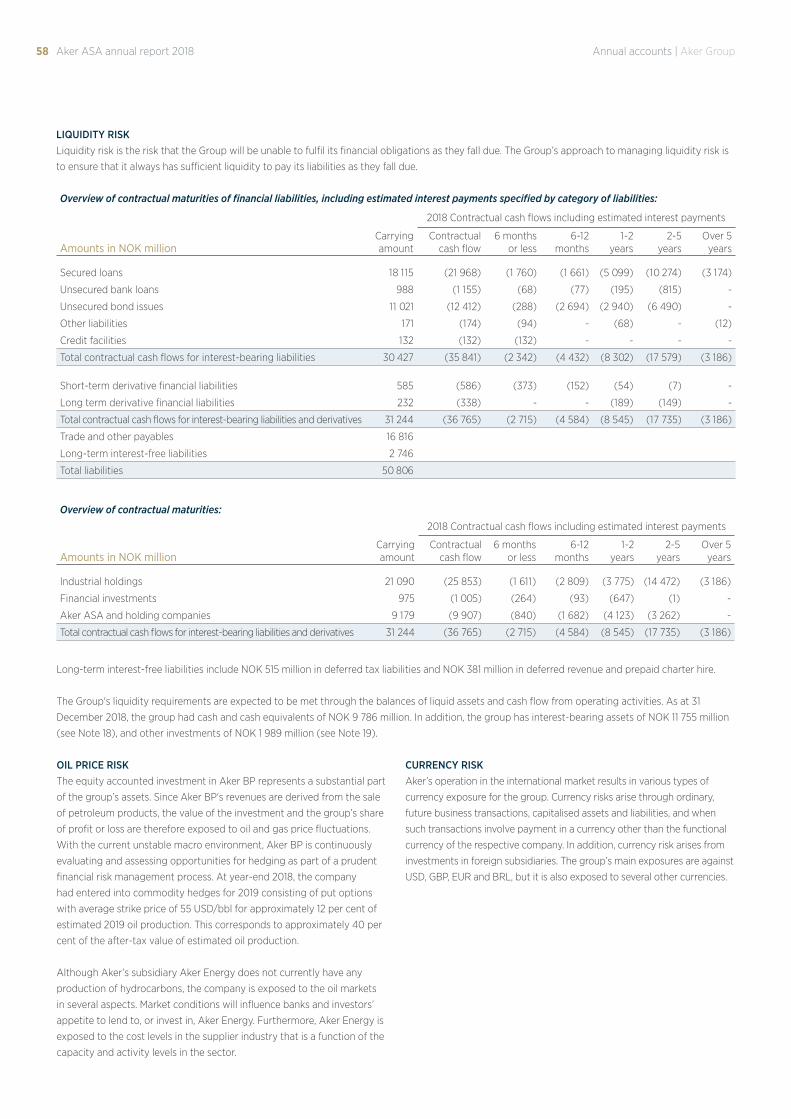
58 Annual accounts | Aker GroupAker ASA annual report 2018
Overview of contractual maturities:
2018 Contractual cash flows including estimated interest payments
Amounts in NOK millionCarrying amount
Contractual cash flow
6 months or less
6-12 months
1-2 years
2-5 years
Over 5 years
Industrial holdings 21 090 (25 853) (1 611) (2 809) (3 775) (14 472) (3 186)
Financial investments 975 (1 005) (264) (93) (647) (1) -
Aker ASA and holding companies 9 179 (9 907) (840) (1 682) (4 123) (3 262) -
Total contractual cash flows for interest-bearing liabilities and derivatives 31 244 (36 765) (2 715) (4 584) (8 545) (17 735) (3 186)
Long-term interest-free liabilities include NOK 515 million in deferred tax liabilities and NOK 381 million in deferred revenue and prepaid charter hire.
The Group's liquidity requirements are expected to be met through the balances of liquid assets and cash flow from operating activities. As at 31
December 2018, the group had cash and cash equivalents of NOK 9 786 million. In addition, the group has interest-bearing assets of NOK 11 755 million
(see Note 18), and other investments of NOK 1 989 million (see Note 19).
OIL PRICE RISKThe equity accounted investment in Aker BP represents a substantial part
of the group’s assets. Since Aker BP's revenues are derived from the sale
of petroleum products, the value of the investment and the group’s share
of profit or loss are therefore exposed to oil and gas price fluctuations.
With the current unstable macro environment, Aker BP is continuously
evaluating and assessing opportunities for hedging as part of a prudent
financial risk management process. At year-end 2018, the company
had entered into commodity hedges for 2019 consisting of put options
with average strike price of 55 USD/bbl for approximately 12 per cent of
estimated 2019 oil production. This corresponds to approximately 40 per
cent of the after-tax value of estimated oil production.
Although Aker’s subsidiary Aker Energy does not currently have any
production of hydrocarbons, the company is exposed to the oil markets
in several aspects. Market conditions will influence banks and investors’
appetite to lend to, or invest in, Aker Energy. Furthermore, Aker Energy is
exposed to the cost levels in the supplier industry that is a function of the
capacity and activity levels in the sector.
CURRENCY RISKAker’s operation in the international market results in various types of
currency exposure for the group. Currency risks arise through ordinary,
future business transactions, capitalised assets and liabilities, and when
such transactions involve payment in a currency other than the functional
currency of the respective company. In addition, currency risk arises from
investments in foreign subsidiaries. The group’s main exposures are against
USD, GBP, EUR and BRL, but it is also exposed to several other currencies.
Overview of contractual maturities of financial liabilities, including estimated interest payments specified by category of liabilities:
2018 Contractual cash flows including estimated interest payments
Amounts in NOK millionCarrying amount
Contractual cash flow
6 months or less
6-12 months
1-2 years
2-5 years
Over 5 years
Secured loans 18 115 (21 968) (1 760) (1 661) (5 099) (10 274) (3 174)
Unsecured bank loans 988 (1 155) (68) (77) (195) (815) -
Unsecured bond issues 11 021 (12 412) (288) (2 694) (2 940) (6 490) -
Other liabilities 171 (174) (94) - (68) - (12)
Credit facilities 132 (132) (132) - - - -
Total contractual cash flows for interest-bearing liabilities 30 427 (35 841) (2 342) (4 432) (8 302) (17 579) (3 186)
Short-term derivative financial liabilities 585 (586) (373) (152) (54) (7) -
Long term derivative financial liabilities 232 (338) - - (189) (149) -
Total contractual cash flows for interest-bearing liabilities and derivatives 31 244 (36 765) (2 715) (4 584) (8 545) (17 735) (3 186)
Trade and other payables 16 816
Long-term interest-free liabilities 2 746
Total liabilities 50 806
LIQUIDITY RISKLiquidity risk is the risk that the Group will be unable to fulfil its financial obligations as they fall due. The Group’s approach to managing liquidity risk is
to ensure that it always has sufficient liquidity to pay its liabilities as they fall due.
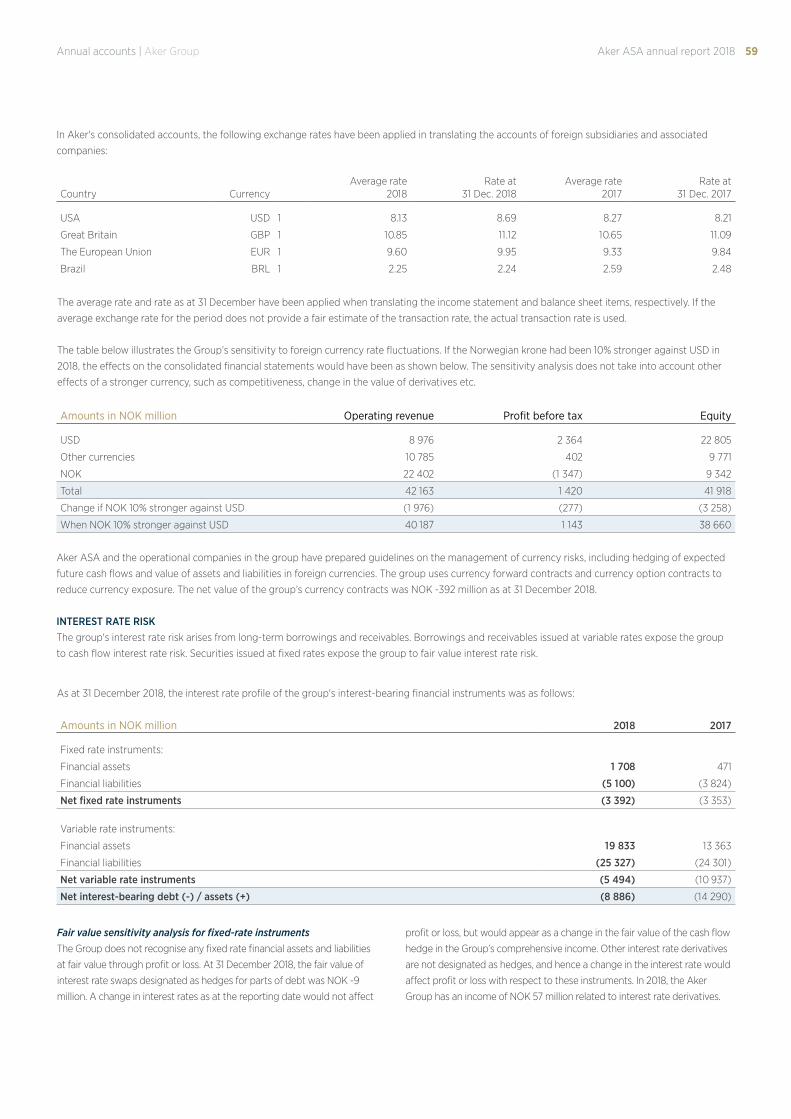
59Annual accounts | Aker Group Aker ASA annual report 2018
In Aker's consolidated accounts, the following exchange rates have been applied in translating the accounts of foreign subsidiaries and associated
companies:
Country CurrencyAverage rate
2018Rate at
31 Dec. 2018Average rate
2017Rate at
31 Dec. 2017
USA USD 1 8.13 8.69 8.27 8.21
Great Britain GBP 1 10.85 11.12 10.65 11.09
The European Union EUR 1 9.60 9.95 9.33 9.84
Brazil BRL 1 2.25 2.24 2.59 2.48
Amounts in NOK million Operating revenue Profit before tax Equity
USD 8 976 2 364 22 805
Other currencies 10 785 402 9 771
NOK 22 402 (1 347) 9 342
Total 42 163 1 420 41 918
Change if NOK 10% stronger against USD (1 976) (277) (3 258)
When NOK 10% stronger against USD 40 187 1 143 38 660
The average rate and rate as at 31 December have been applied when translating the income statement and balance sheet items, respectively. If the
average exchange rate for the period does not provide a fair estimate of the transaction rate, the actual transaction rate is used.
The table below illustrates the Group’s sensitivity to foreign currency rate fluctuations. If the Norwegian krone had been 10% stronger against USD in
2018, the effects on the consolidated financial statements would have been as shown below. The sensitivity analysis does not take into account other
effects of a stronger currency, such as competitiveness, change in the value of derivatives etc.
Aker ASA and the operational companies in the group have prepared guidelines on the management of currency risks, including hedging of expected
future cash flows and value of assets and liabilities in foreign currencies. The group uses currency forward contracts and currency option contracts to
reduce currency exposure. The net value of the group’s currency contracts was NOK -392 million as at 31 December 2018.
INTEREST RATE RISKThe group's interest rate risk arises from long-term borrowings and receivables. Borrowings and receivables issued at variable rates expose the group
to cash flow interest rate risk. Securities issued at fixed rates expose the group to fair value interest rate risk.
Amounts in NOK million 2018 2017
Fixed rate instruments:
Financial assets 1 708 471
Financial liabilities (5 100) (3 824)
Net fixed rate instruments (3 392) (3 353)
Variable rate instruments:
Financial assets 19 833 13 363
Financial liabilities (25 327) (24 301)
Net variable rate instruments (5 494) (10 937)
Net interest-bearing debt (-) / assets (+) (8 886) (14 290)
As at 31 December 2018, the interest rate profile of the group's interest-bearing financial instruments was as follows:
Fair value sensitivity analysis for fixed-rate instrumentsThe Group does not recognise any fixed rate financial assets and liabilities
at fair value through profit or loss. At 31 December 2018, the fair value of
interest rate swaps designated as hedges for parts of debt was NOK -9
million. A change in interest rates as at the reporting date would not affect
profit or loss, but would appear as a change in the fair value of the cash flow
hedge in the Group’s comprehensive income. Other interest rate derivatives
are not designated as hedges, and hence a change in the interest rate would
affect profit or loss with respect to these instruments. In 2018, the Aker
Group has an income of NOK 57 million related to interest rate derivatives.
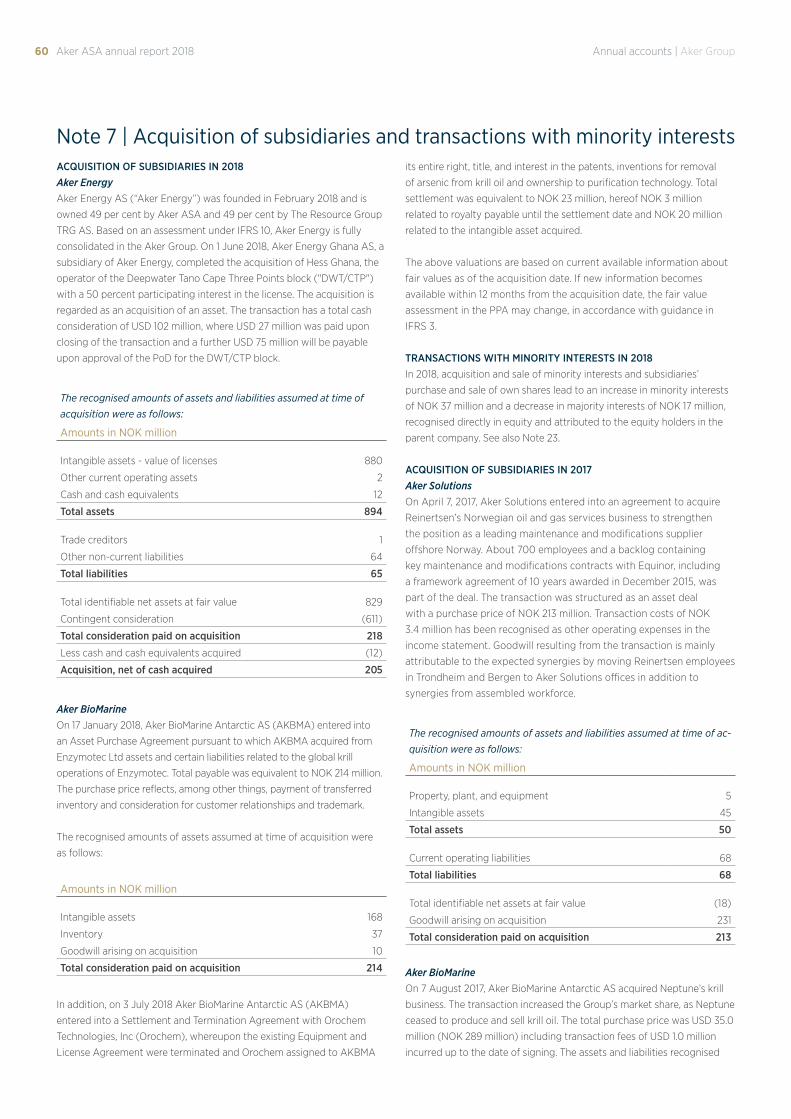
60 Annual accounts | Aker GroupAker ASA annual report 2018
Note 7 | Acquisition of subsidiaries and transactions with minority interestsACQUISITION OF SUBSIDIARIES IN 2018Aker EnergyAker Energy AS (“Aker Energy”) was founded in February 2018 and is
owned 49 per cent by Aker ASA and 49 per cent by The Resource Group
TRG AS. Based on an assessment under IFRS 10, Aker Energy is fully
consolidated in the Aker Group. On 1 June 2018, Aker Energy Ghana AS, a
subsidiary of Aker Energy, completed the acquisition of Hess Ghana, the
operator of the Deepwater Tano Cape Three Points block ("DWT/CTP")
with a 50 percent participating interest in the license. The acquisition is
regarded as an acquisition of an asset. The transaction has a total cash
consideration of USD 102 million, where USD 27 million was paid upon
closing of the transaction and a further USD 75 million will be payable
upon approval of the PoD for the DWT/CTP block.
The recognised amounts of assets and liabilities assumed at time of acquisition were as follows:
Amounts in NOK million
Intangible assets - value of licenses 880
Other current operating assets 2
Cash and cash equivalents 12
Total assets 894
Trade creditors 1
Other non-current liabilities 64
Total liabilities 65
Total identifiable net assets at fair value 829
Contingent consideration (611)
Total consideration paid on acquisition 218
Less cash and cash equivalents acquired (12)
Acquisition, net of cash acquired 205
Aker BioMarine On 17 January 2018, Aker BioMarine Antarctic AS (AKBMA) entered into
an Asset Purchase Agreement pursuant to which AKBMA acquired from
Enzymotec Ltd assets and certain liabilities related to the global krill
operations of Enzymotec. Total payable was equivalent to NOK 214 million.
The purchase price reflects, among other things, payment of transferred
inventory and consideration for customer relationships and trademark.
The recognised amounts of assets assumed at time of acquisition were
as follows:
Amounts in NOK million
Intangible assets 168
Inventory 37
Goodwill arising on acquisition 10
Total consideration paid on acquisition 214
In addition, on 3 July 2018 Aker BioMarine Antarctic AS (AKBMA)
entered into a Settlement and Termination Agreement with Orochem
Technologies, Inc (Orochem), whereupon the existing Equipment and
License Agreement were terminated and Orochem assigned to AKBMA
its entire right, title, and interest in the patents, inventions for removal
of arsenic from krill oil and ownership to purification technology. Total
settlement was equivalent to NOK 23 million, hereof NOK 3 million
related to royalty payable until the settlement date and NOK 20 million
related to the intangible asset acquired.
The above valuations are based on current available information about
fair values as of the acquisition date. If new information becomes
available within 12 months from the acquisition date, the fair value
assessment in the PPA may change, in accordance with guidance in
IFRS 3.
TRANSACTIONS WITH MINORITY INTERESTS IN 2018In 2018, acquisition and sale of minority interests and subsidiaries’
purchase and sale of own shares lead to an increase in minority interests
of NOK 37 million and a decrease in majority interests of NOK 17 million,
recognised directly in equity and attributed to the equity holders in the
parent company. See also Note 23.
ACQUISITION OF SUBSIDIARIES IN 2017Aker SolutionsOn April 7, 2017, Aker Solutions entered into an agreement to acquire
Reinertsen’s Norwegian oil and gas services business to strengthen
the position as a leading maintenance and modifications supplier
offshore Norway. About 700 employees and a backlog containing
key maintenance and modifications contracts with Equinor, including
a framework agreement of 10 years awarded in December 2015, was
part of the deal. The transaction was structured as an asset deal
with a purchase price of NOK 213 million. Transaction costs of NOK
3.4 million has been recognised as other operating expenses in the
income statement. Goodwill resulting from the transaction is mainly
attributable to the expected synergies by moving Reinertsen employees
in Trondheim and Bergen to Aker Solutions offices in addition to
synergies from assembled workforce.
The recognised amounts of assets and liabilities assumed at time of ac-quisition were as follows:
Amounts in NOK million
Property, plant, and equipment 5
Intangible assets 45
Total assets 50
Current operating liabilities 68
Total liabilities 68
Total identifiable net assets at fair value (18)
Goodwill arising on acquisition 231
Total consideration paid on acquisition 213
Aker BioMarine On 7 August 2017, Aker BioMarine Antarctic AS acquired Neptune’s krill
business. The transaction increased the Group’s market share, as Neptune
ceased to produce and sell krill oil. The total purchase price was USD 35.0
million (NOK 289 million) including transaction fees of USD 1.0 million
incurred up to the date of signing. The assets and liabilities recognised
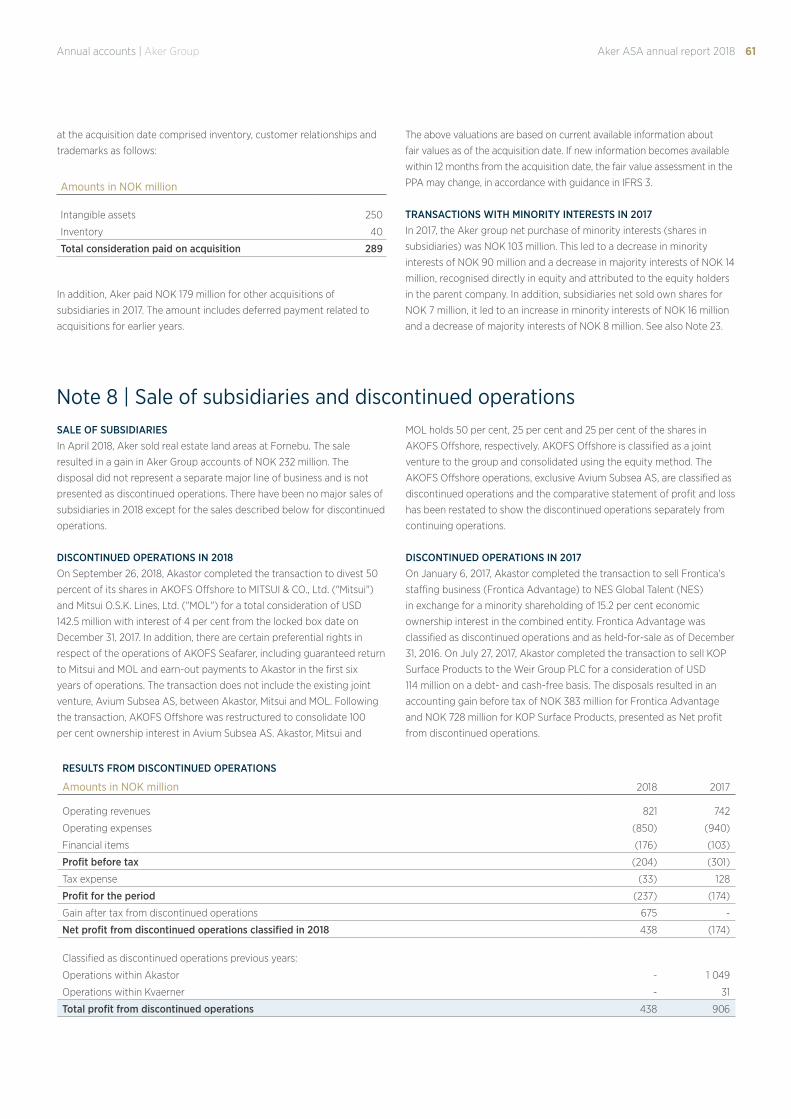
61Annual accounts | Aker Group Aker ASA annual report 2018
Note 8 | Sale of subsidiaries and discontinued operationsSALE OF SUBSIDIARIESIn April 2018, Aker sold real estate land areas at Fornebu. The sale
resulted in a gain in Aker Group accounts of NOK 232 million. The
disposal did not represent a separate major line of business and is not
presented as discontinued operations. There have been no major sales of
subsidiaries in 2018 except for the sales described below for discontinued
operations.
DISCONTINUED OPERATIONS IN 2018On September 26, 2018, Akastor completed the transaction to divest 50
percent of its shares in AKOFS Offshore to MITSUI & CO., Ltd. ("Mitsui")
and Mitsui O.S.K. Lines, Ltd. ("MOL") for a total consideration of USD
142.5 million with interest of 4 per cent from the locked box date on
December 31, 2017. In addition, there are certain preferential rights in
respect of the operations of AKOFS Seafarer, including guaranteed return
to Mitsui and MOL and earn-out payments to Akastor in the first six
years of operations. The transaction does not include the existing joint
venture, Avium Subsea AS, between Akastor, Mitsui and MOL. Following
the transaction, AKOFS Offshore was restructured to consolidate 100
per cent ownership interest in Avium Subsea AS. Akastor, Mitsui and
MOL holds 50 per cent, 25 per cent and 25 per cent of the shares in
AKOFS Offshore, respectively. AKOFS Offshore is classified as a joint
venture to the group and consolidated using the equity method. The
AKOFS Offshore operations, exclusive Avium Subsea AS, are classified as
discontinued operations and the comparative statement of profit and loss
has been restated to show the discontinued operations separately from
continuing operations.
DISCONTINUED OPERATIONS IN 2017On January 6, 2017, Akastor completed the transaction to sell Frontica's
staffing business (Frontica Advantage) to NES Global Talent (NES)
in exchange for a minority shareholding of 15.2 per cent economic
ownership interest in the combined entity. Frontica Advantage was
classified as discontinued operations and as held-for-sale as of December
31, 2016. On July 27, 2017, Akastor completed the transaction to sell KOP
Surface Products to the Weir Group PLC for a consideration of USD
114 million on a debt- and cash-free basis. The disposals resulted in an
accounting gain before tax of NOK 383 million for Frontica Advantage
and NOK 728 million for KOP Surface Products, presented as Net profit
from discontinued operations.
at the acquisition date comprised inventory, customer relationships and
trademarks as follows:
Amounts in NOK million
Intangible assets 250
Inventory 40
Total consideration paid on acquisition 289
In addition, Aker paid NOK 179 million for other acquisitions of
subsidiaries in 2017. The amount includes deferred payment related to
acquisitions for earlier years.
The above valuations are based on current available information about
fair values as of the acquisition date. If new information becomes available
within 12 months from the acquisition date, the fair value assessment in the
PPA may change, in accordance with guidance in IFRS 3.
TRANSACTIONS WITH MINORITY INTERESTS IN 2017In 2017, the Aker group net purchase of minority interests (shares in
subsidiaries) was NOK 103 million. This led to a decrease in minority
interests of NOK 90 million and a decrease in majority interests of NOK 14
million, recognised directly in equity and attributed to the equity holders
in the parent company. In addition, subsidiaries net sold own shares for
NOK 7 million, it led to an increase in minority interests of NOK 16 million
and a decrease of majority interests of NOK 8 million. See also Note 23.
RESULTS FROM DISCONTINUED OPERATIONS
Amounts in NOK million 2018 2017
Operating revenues 821 742
Operating expenses (850) (940)
Financial items (176) (103)
Profit before tax (204) (301)
Tax expense (33) 128
Profit for the period (237) (174)
Gain after tax from discontinued operations 675 -
Net profit from discontinued operations classified in 2018 438 (174)
Classified as discontinued operations previous years:
Operations within Akastor - 1 049
Operations within Kvaerner - 31
Total profit from discontinued operations 438 906
62 Annual accounts | Aker GroupAker ASA annual report 2018
CASH FLOW FROM DISCONTINUED OPERATIONS
Amounts in NOK million 2018 2017
Net cash flow from operating activities 8 (322)
Net cash flow from investing activities 1 043 (42)
Net cash flow discontinued operations 1 051 (364)
Classified as discontinued operations previous years:
Operations within Akastor - 876
Operations within Kvaerner (3) (3)
Total from discontinued operations 1 048 509
ASSETS AND LIABILITIES HELD FOR SALELiabilities of NOK 34 million classified as held for sale at 31 December 2018 are remaining legacies related to Kvaerner’s sale of its the onshore
construction business in North America in 2013.
Note 9 | Operating segments and significant subsidiariesOperating segments are identified based on the Group’s internal
management- and reporting structure. The Group’s chief operating
decision makers, who are responsible for the allocation of resources and
assessment of performance in the different operating segments, are
defined as the board of directors, the CEO and the CFO.
Aker’s investment portfolio comprises two segments: Industrial holdings
and Financial investments. The primary focus for businesses within Industrial
holdings is long-term value creation. Businesses within Financial investments
are managed as a portfolio with focus on financial and strategic opportunities.
Recognition and measurement applied to segment reporting is consistent
with the accounting principles applied when preparing the financial
statements. Transactions between segments are conducted on market
terms and conditions. Operational revenues and segment assets are
based on the geographical location of companies.
AN OVERVIEW OF OPERATING SEGMENTSIndustrial holdingsAker Solutions Leading global supplier of products, systems and services for the oil and gas industry.
The Aker Group’s ownership interest is 46.93%. Aker ASA indirectly owns 34.76%. Aker Kværner Holding AS owns 40.56% of Aker Solutions ASA. Aker ASA owns 70% of Aker Kværner Holding AS. In addition, Aker ASA owns directly 6.37% of Aker Solutions ASA.
Akastor Akastor is an oil-services investment company with a portfolio of industrial holdings and other investments. The Aker Group’s ownership interest is 48.78%. Aker ASA indirectly owns 36.71%. Aker Kværner Holding AS owns 40.27% of Akastor ASA. Aker ASA owns 70% of Aker Kværner Holding AS. In addition, Aker ASA owns directly 8.52% of Akastor ASA.
Aker BP Exploration and production (E&P) company on the Norwegian Continental Shelf.Ownership interest 40.00%. The company is defined as an associated company in the Aker Group, and is accounted for using the equity method.
Kværner Leading global provider of engineering and construction services to the energy and process industry.The Aker Group’s ownership interest is 41.02%. Aker ASA indirectly owns 28.71%. Aker Kværner Holding AS owns 41.02% of Kværner ASA. Aker ASA owns 70% of Aker Kværner Holding AS.
Ocean Yield Owns, operates and charters vessels. Ownership interest 61.65% as at 31 December 2018.
Aker BioMarine Biotechnology company. Harvesting of krill, production and sale. Ownership interest 100%.
Financial investmentsPhilly Shipyard Design and construction of vessels. Ownership interest 57.56%.
Solstad Offshore Owns and operates platform supply-vessels, anchor handling vessels and construction service-vessels. Ownership interest 23.10%. The company is defined as an associated company in the Aker Group, and is accounted for using the equity method.
Aker Energy E&P company. Owns a 50% ownership interest in the Deepwater Tano Cape Three Points block that is under devel-opment in Ghana. The group’s ownership in the company is 49.03%.With effect from 2019, Aker Energy will be part of industrial holdings.
Cognite Software and digitalisation company. Ownership interest 65.24%.With effect from 2019, Cognite will be part of industrial holdings.
Other and eliminations
Aker ASA and holding companies Cash, other financial investments and other assets. Companies included are listed in Note 1 in the annual accounts of Aker ASA and holding companies.
Other Other companies and eliminations. See next section for overview of group entities.
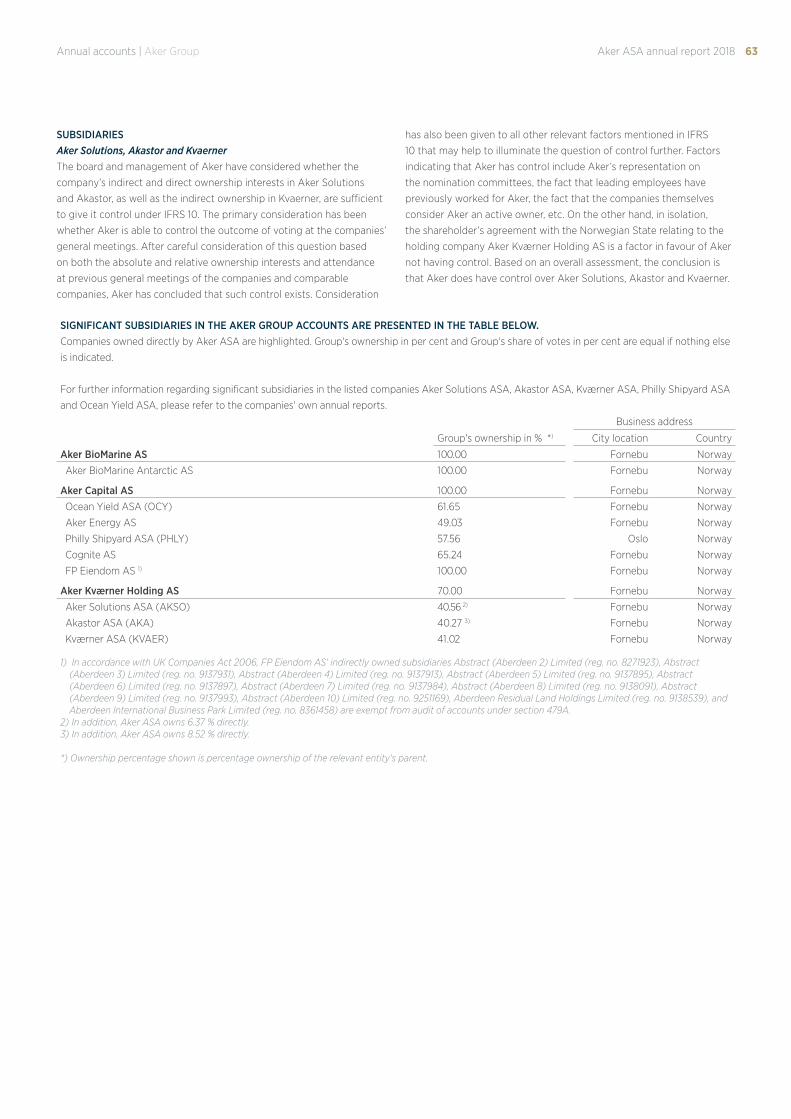
63Annual accounts | Aker Group Aker ASA annual report 2018
SUBSIDIARIESAker Solutions, Akastor and KvaernerThe board and management of Aker have considered whether the
company’s indirect and direct ownership interests in Aker Solutions
and Akastor, as well as the indirect ownership in Kvaerner, are sufficient
to give it control under IFRS 10. The primary consideration has been
whether Aker is able to control the outcome of voting at the companies’
general meetings. After careful consideration of this question based
on both the absolute and relative ownership interests and attendance
at previous general meetings of the companies and comparable
companies, Aker has concluded that such control exists. Consideration
has also been given to all other relevant factors mentioned in IFRS
10 that may help to illuminate the question of control further. Factors
indicating that Aker has control include Aker’s representation on
the nomination committees, the fact that leading employees have
previously worked for Aker, the fact that the companies themselves
consider Aker an active owner, etc. On the other hand, in isolation,
the shareholder’s agreement with the Norwegian State relating to the
holding company Aker Kværner Holding AS is a factor in favour of Aker
not having control. Based on an overall assessment, the conclusion is
that Aker does have control over Aker Solutions, Akastor and Kvaerner.
SIGNIFICANT SUBSIDIARIES IN THE AKER GROUP ACCOUNTS ARE PRESENTED IN THE TABLE BELOW.Companies owned directly by Aker ASA are highlighted. Group's ownership in per cent and Group's share of votes in per cent are equal if nothing else
is indicated.
For further information regarding significant subsidiaries in the listed companies Aker Solutions ASA, Akastor ASA, Kværner ASA, Philly Shipyard ASA
and Ocean Yield ASA, please refer to the companies' own annual reports.
Business address
Group's ownership in % *) City location Country
Aker BioMarine AS 100.00 Fornebu Norway
Aker BioMarine Antarctic AS 100.00 Fornebu Norway
Aker Capital AS 100.00 Fornebu Norway
Ocean Yield ASA (OCY) 61.65 Fornebu Norway
Aker Energy AS 49.03 Fornebu Norway
Philly Shipyard ASA (PHLY) 57.56 Oslo Norway
Cognite AS 65.24 Fornebu Norway
FP Eiendom AS 1) 100.00 Fornebu Norway
Aker Kværner Holding AS 70.00 Fornebu Norway
Aker Solutions ASA (AKSO) 40.56 2) Fornebu Norway
Akastor ASA (AKA) 40.27 3) Fornebu Norway
Kværner ASA (KVAER) 41.02 Fornebu Norway
1) In accordance with UK Companies Act 2006, FP Eiendom AS' indirectly owned subsidiaries Abstract (Aberdeen 2) Limited (reg. no. 8271923), Abstract (Aberdeen 3) Limited (reg. no. 9137931), Abstract (Aberdeen 4) Limited (reg. no. 9137913), Abstract (Aberdeen 5) Limited (reg. no. 9137895), Abstract (Aberdeen 6) Limited (reg. no. 9137897), Abstract (Aberdeen 7) Limited (reg. no. 9137984), Abstract (Aberdeen 8) Limited (reg. no. 9138091), Abstract (Aberdeen 9) Limited (reg. no. 9137993), Abstract (Aberdeen 10) Limited (reg. no. 9251169), Aberdeen Residual Land Holdings Limited (reg. no. 9138539), and Aberdeen International Business Park Limited (reg. no. 8361458) are exempt from audit of accounts under section 479A.
2) In addition, Aker ASA owns 6.37 % directly.3) In addition, Aker ASA owns 8.52 % directly. *) Ownership percentage shown is percentage ownership of the relevant entity's parent.
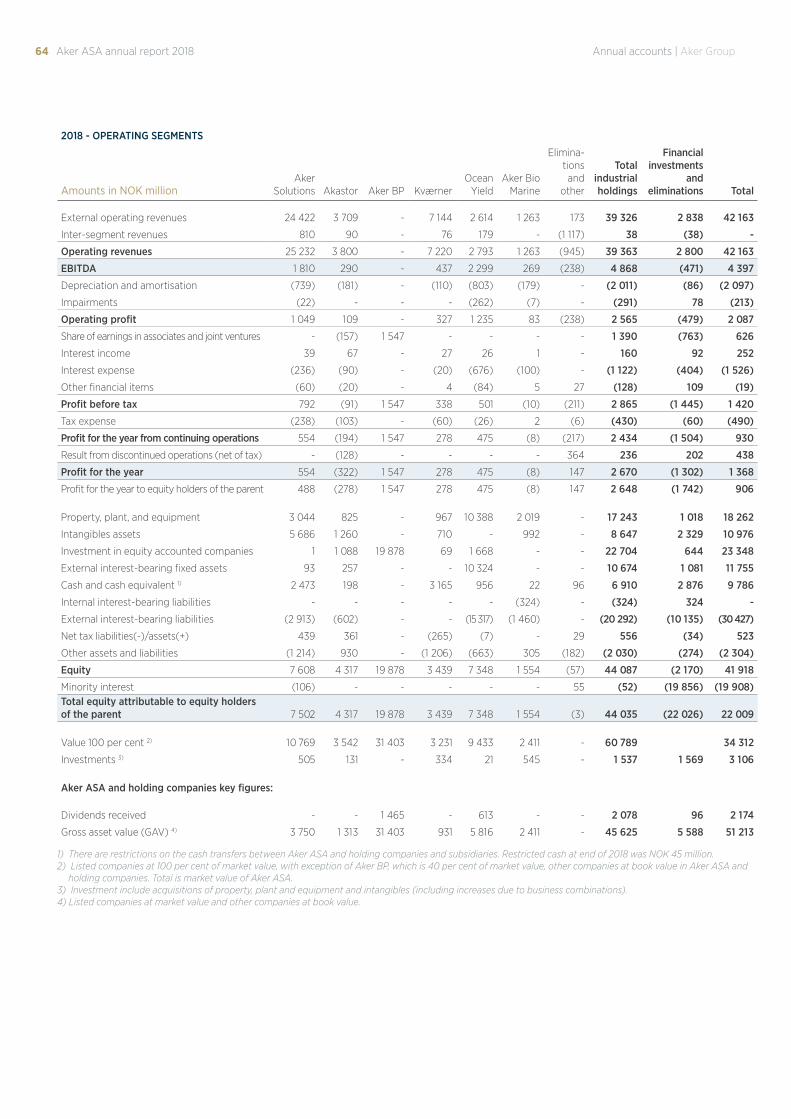
64 Annual accounts | Aker GroupAker ASA annual report 2018
2018 - OPERATING SEGMENTS
Amounts in NOK millionAker
Solutions Akastor Aker BP KværnerOcean
YieldAker Bio
Marine
Elimina-tions and
other
Total industrial holdings
Financial investments
and eliminations Total
External operating revenues 24 422 3 709 - 7 144 2 614 1 263 173 39 326 2 838 42 163
Inter-segment revenues 810 90 - 76 179 - (1 117) 38 (38) -
Operating revenues 25 232 3 800 - 7 220 2 793 1 263 (945) 39 363 2 800 42 163
EBITDA 1 810 290 - 437 2 299 269 (238) 4 868 (471) 4 397
Depreciation and amortisation (739) (181) - (110) (803) (179) - (2 011) (86) (2 097)
Impairments (22) - - - (262) (7) - (291) 78 (213)
Operating profit 1 049 109 - 327 1 235 83 (238) 2 565 (479) 2 087
Share of earnings in associates and joint ventures - (157) 1 547 - - - - 1 390 (763) 626
Interest income 39 67 - 27 26 1 - 160 92 252
Interest expense (236) (90) - (20) (676) (100) - (1 122) (404) (1 526)
Other financial items (60) (20) - 4 (84) 5 27 (128) 109 (19)
Profit before tax 792 (91) 1 547 338 501 (10) (211) 2 865 (1 445) 1 420
Tax expense (238) (103) - (60) (26) 2 (6) (430) (60) (490)
Profit for the year from continuing operations 554 (194) 1 547 278 475 (8) (217) 2 434 (1 504) 930
Result from discontinued operations (net of tax) - (128) - - - - 364 236 202 438
Profit for the year 554 (322) 1 547 278 475 (8) 147 2 670 (1 302) 1 368
Profit for the year to equity holders of the parent 488 (278) 1 547 278 475 (8) 147 2 648 (1 742) 906
Property, plant, and equipment 3 044 825 - 967 10 388 2 019 - 17 243 1 018 18 262
Intangibles assets 5 686 1 260 - 710 - 992 - 8 647 2 329 10 976
Investment in equity accounted companies 1 1 088 19 878 69 1 668 - - 22 704 644 23 348
External interest-bearing fixed assets 93 257 - - 10 324 - - 10 674 1 081 11 755
Cash and cash equivalent 1) 2 473 198 - 3 165 956 22 96 6 910 2 876 9 786
Internal interest-bearing liabilities - - - - - (324) - (324) 324 -
External interest-bearing liabilities (2 913) (602) - - (15 317) (1 460) - (20 292) (10 135) (30 427)
Net tax liabilities(-)/assets(+) 439 361 - (265) (7) - 29 556 (34) 523
Other assets and liabilities (1 214) 930 - (1 206) (663) 305 (182) (2 030) (274) (2 304)
Equity 7 608 4 317 19 878 3 439 7 348 1 554 (57) 44 087 (2 170) 41 918
Minority interest (106) - - - - - 55 (52) (19 856) (19 908)Total equity attributable to equity holders of the parent 7 502 4 317 19 878 3 439 7 348 1 554 (3) 44 035 (22 026) 22 009
Value 100 per cent 2) 10 769 3 542 31 403 3 231 9 433 2 411 - 60 789 34 312
Investments 3) 505 131 - 334 21 545 - 1 537 1 569 3 106
Aker ASA and holding companies key figures:
Dividends received -
- 1 465 - 613 -
- 2 078 96 2 174
Gross asset value (GAV) 4) 3 750 1 313 31 403 931 5 816 2 411 - 45 625 5 588 51 213
1) There are restrictions on the cash transfers between Aker ASA and holding companies and subsidiaries. Restricted cash at end of 2018 was NOK 45 million.2) Listed companies at 100 per cent of market value, with exception of Aker BP, which is 40 per cent of market value, other companies at book value in Aker ASA and
holding companies. Total is market value of Aker ASA.3) Investment include acquisitions of property, plant and equipment and intangibles (including increases due to business combinations).4) Listed companies at market value and other companies at book value.
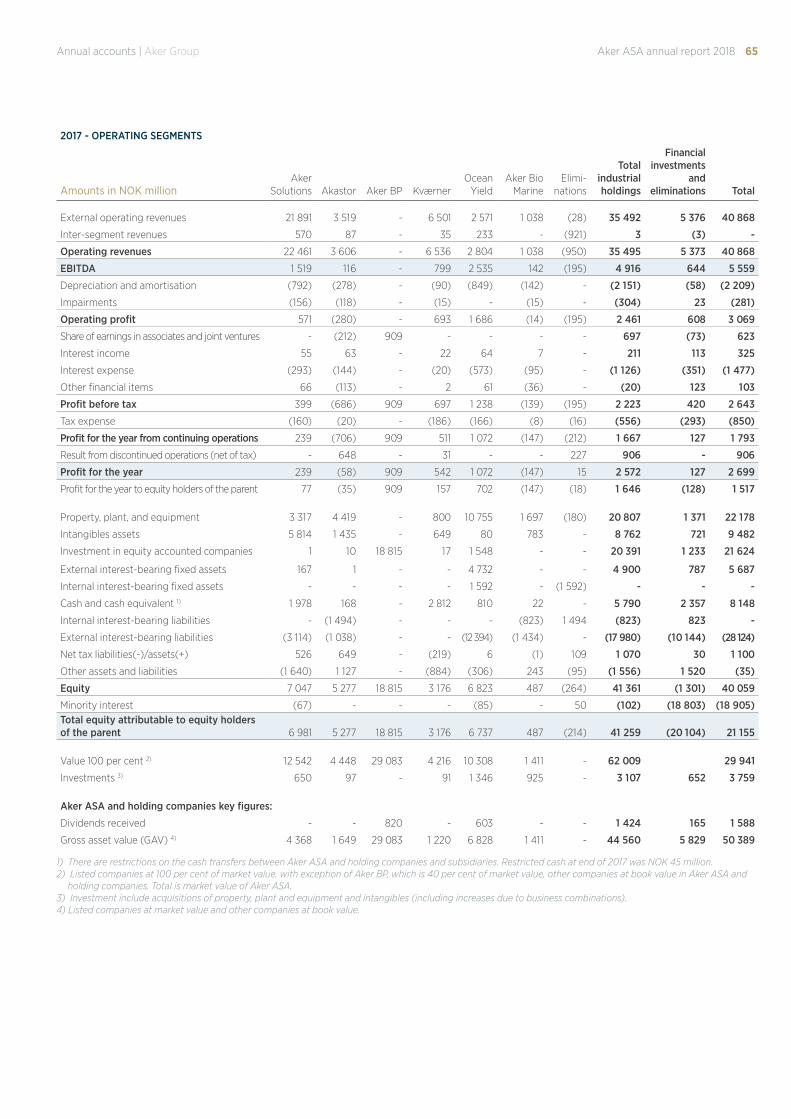
65Annual accounts | Aker Group Aker ASA annual report 2018
2017 - OPERATING SEGMENTS
Amounts in NOK millionAker
Solutions Akastor Aker BP KværnerOcean
YieldAker Bio
Marine Elimi-
nations
Total industrial holdings
Financial investments
and eliminations Total
External operating revenues 21 891 3 519 - 6 501 2 571 1 038 (28) 35 492 5 376 40 868
Inter-segment revenues 570 87 - 35 233 - (921) 3 (3) -
Operating revenues 22 461 3 606 - 6 536 2 804 1 038 (950) 35 495 5 373 40 868
EBITDA 1 519 116 - 799 2 535 142 (195) 4 916 644 5 559
Depreciation and amortisation (792) (278) - (90) (849) (142) - (2 151) (58) (2 209)
Impairments (156) (118) - (15) - (15) - (304) 23 (281)
Operating profit 571 (280) - 693 1 686 (14) (195) 2 461 608 3 069
Share of earnings in associates and joint ventures - (212) 909 - - - - 697 (73) 623
Interest income 55 63 - 22 64 7 - 211 113 325
Interest expense (293) (144) - (20) (573) (95) - (1 126) (351) (1 477)
Other financial items 66 (113) - 2 61 (36) - (20) 123 103
Profit before tax 399 (686) 909 697 1 238 (139) (195) 2 223 420 2 643
Tax expense (160) (20) - (186) (166) (8) (16) (556) (293) (850)
Profit for the year from continuing operations 239 (706) 909 511 1 072 (147) (212) 1 667 127 1 793
Result from discontinued operations (net of tax) - 648 - 31 - - 227 906 - 906
Profit for the year 239 (58) 909 542 1 072 (147) 15 2 572 127 2 699
Profit for the year to equity holders of the parent 77 (35) 909 157 702 (147) (18) 1 646 (128) 1 517
Property, plant, and equipment 3 317 4 419 - 800 10 755 1 697 (180) 20 807 1 371 22 178
Intangibles assets 5 814 1 435 - 649 80 783 - 8 762 721 9 482
Investment in equity accounted companies 1 10 18 815 17 1 548 - - 20 391 1 233 21 624
External interest-bearing fixed assets 167 1 - - 4 732 - - 4 900 787 5 687
Internal interest-bearing fixed assets - - - - 1 592 - (1 592) - - -
Cash and cash equivalent 1) 1 978 168 - 2 812 810 22 - 5 790 2 357 8 148
Internal interest-bearing liabilities - (1 494) - - - (823) 1 494 (823) 823 -
External interest-bearing liabilities (3 114) (1 038) - - (12 394) (1 434) - (17 980) (10 144) (28 124)
Net tax liabilities(-)/assets(+) 526 649 - (219) 6 (1) 109 1 070 30 1 100
Other assets and liabilities (1 640) 1 127 - (884) (306) 243 (95) (1 556) 1 520 (35)
Equity 7 047 5 277 18 815 3 176 6 823 487 (264) 41 361 (1 301) 40 059
Minority interest (67) - - - (85) - 50 (102) (18 803) (18 905)Total equity attributable to equity holders of the parent 6 981 5 277 18 815 3 176 6 737 487 (214) 41 259 (20 104) 21 155
Value 100 per cent 2) 12 542 4 448 29 083 4 216 10 308 1 411 - 62 009 29 941
Investments 3) 650 97 - 91 1 346 925 - 3 107 652 3 759
Aker ASA and holding companies key figures:
Dividends received - - 820 - 603 - - 1 424 165 1 588
Gross asset value (GAV) 4) 4 368 1 649 29 083 1 220 6 828 1 411 - 44 560 5 829 50 389
1) There are restrictions on the cash transfers between Aker ASA and holding companies and subsidiaries. Restricted cash at end of 2017 was NOK 45 million.2) Listed companies at 100 per cent of market value, with exception of Aker BP, which is 40 per cent of market value, other companies at book value in Aker ASA and
holding companies. Total is market value of Aker ASA.3) Investment include acquisitions of property, plant and equipment and intangibles (including increases due to business combinations).4) Listed companies at market value and other companies at book value.
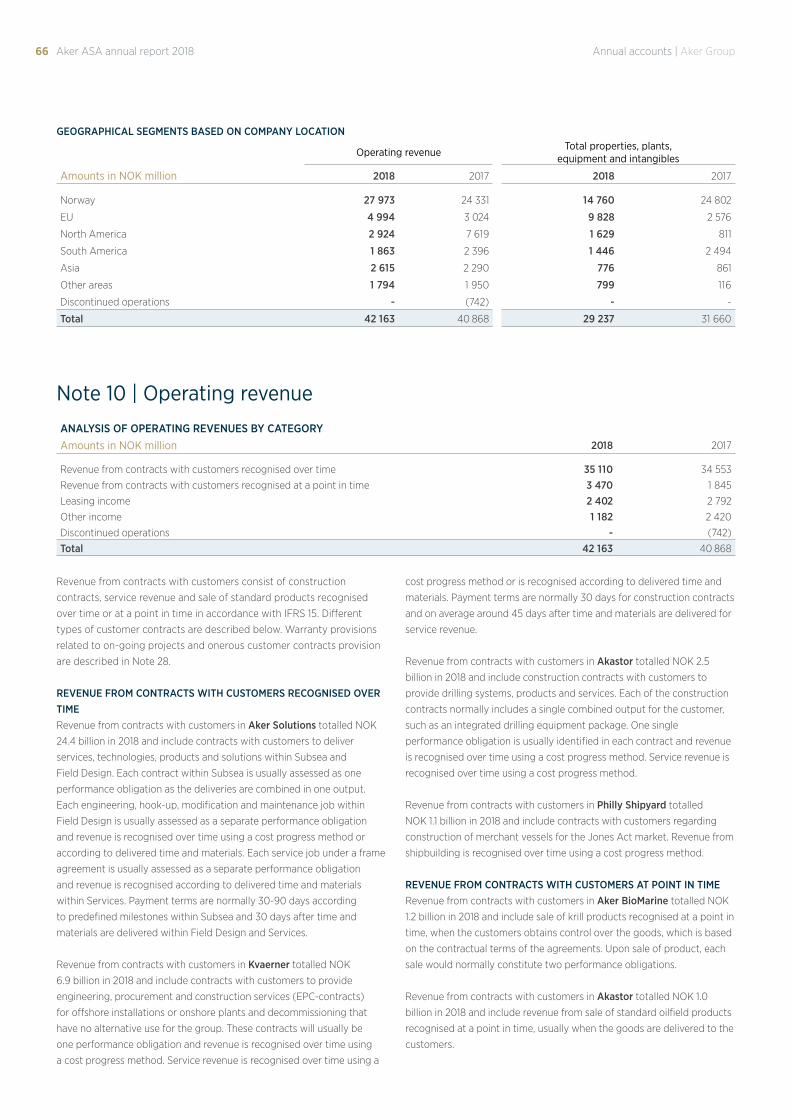
66 Annual accounts | Aker GroupAker ASA annual report 2018
Operating revenue Total properties, plants, equipment and intangibles
Amounts in NOK million 2018 2017 2018 2017
Norway 27 973 24 331 14 760 24 802
EU 4 994 3 024 9 828 2 576
North America 2 924 7 619 1 629 811
South America 1 863 2 396 1 446 2 494
Asia 2 615 2 290 776 861
Other areas 1 794 1 950 799 116
Discontinued operations - (742) - -
Total 42 163 40 868 29 237 31 660
Note 10 | Operating revenueANALYSIS OF OPERATING REVENUES BY CATEGORYAmounts in NOK million 2018 2017
Revenue from contracts with customers recognised over time 35 110 34 553
Revenue from contracts with customers recognised at a point in time 3 470 1 845
Leasing income 2 402 2 792
Other income 1 182 2 420
Discontinued operations - (742)
Total 42 163 40 868
Revenue from contracts with customers consist of construction
contracts, service revenue and sale of standard products recognised
over time or at a point in time in accordance with IFRS 15. Different
types of customer contracts are described below. Warranty provisions
related to on-going projects and onerous customer contracts provision
are described in Note 28.
REVENUE FROM CONTRACTS WITH CUSTOMERS RECOGNISED OVER TIMERevenue from contracts with customers in Aker Solutions totalled NOK
24.4 billion in 2018 and include contracts with customers to deliver
services, technologies, products and solutions within Subsea and
Field Design. Each contract within Subsea is usually assessed as one
performance obligation as the deliveries are combined in one output.
Each engineering, hook-up, modification and maintenance job within
Field Design is usually assessed as a separate performance obligation
and revenue is recognised over time using a cost progress method or
according to delivered time and materials. Each service job under a frame
agreement is usually assessed as a separate performance obligation
and revenue is recognised according to delivered time and materials
within Services. Payment terms are normally 30-90 days according
to predefined milestones within Subsea and 30 days after time and
materials are delivered within Field Design and Services.
Revenue from contracts with customers in Kvaerner totalled NOK
6.9 billion in 2018 and include contracts with customers to provide
engineering, procurement and construction services (EPC-contracts)
for offshore installations or onshore plants and decommissioning that
have no alternative use for the group. These contracts will usually be
one performance obligation and revenue is recognised over time using
a cost progress method. Service revenue is recognised over time using a
cost progress method or is recognised according to delivered time and
materials. Payment terms are normally 30 days for construction contracts
and on average around 45 days after time and materials are delivered for
service revenue.
Revenue from contracts with customers in Akastor totalled NOK 2.5
billion in 2018 and include construction contracts with customers to
provide drilling systems, products and services. Each of the construction
contracts normally includes a single combined output for the customer,
such as an integrated drilling equipment package. One single
performance obligation is usually identified in each contract and revenue
is recognised over time using a cost progress method. Service revenue is
recognised over time using a cost progress method.
Revenue from contracts with customers in Philly Shipyard totalled
NOK 1.1 billion in 2018 and include contracts with customers regarding
construction of merchant vessels for the Jones Act market. Revenue from
shipbuilding is recognised over time using a cost progress method.
REVENUE FROM CONTRACTS WITH CUSTOMERS AT POINT IN TIMERevenue from contracts with customers in Aker BioMarine totalled NOK
1.2 billion in 2018 and include sale of krill products recognised at a point in
time, when the customers obtains control over the goods, which is based
on the contractual terms of the agreements. Upon sale of product, each
sale would normally constitute two performance obligations.
Revenue from contracts with customers in Akastor totalled NOK 1.0
billion in 2018 and include revenue from sale of standard oilfield products
recognised at a point in time, usually when the goods are delivered to the
customers.
GEOGRAPHICAL SEGMENTS BASED ON COMPANY LOCATION
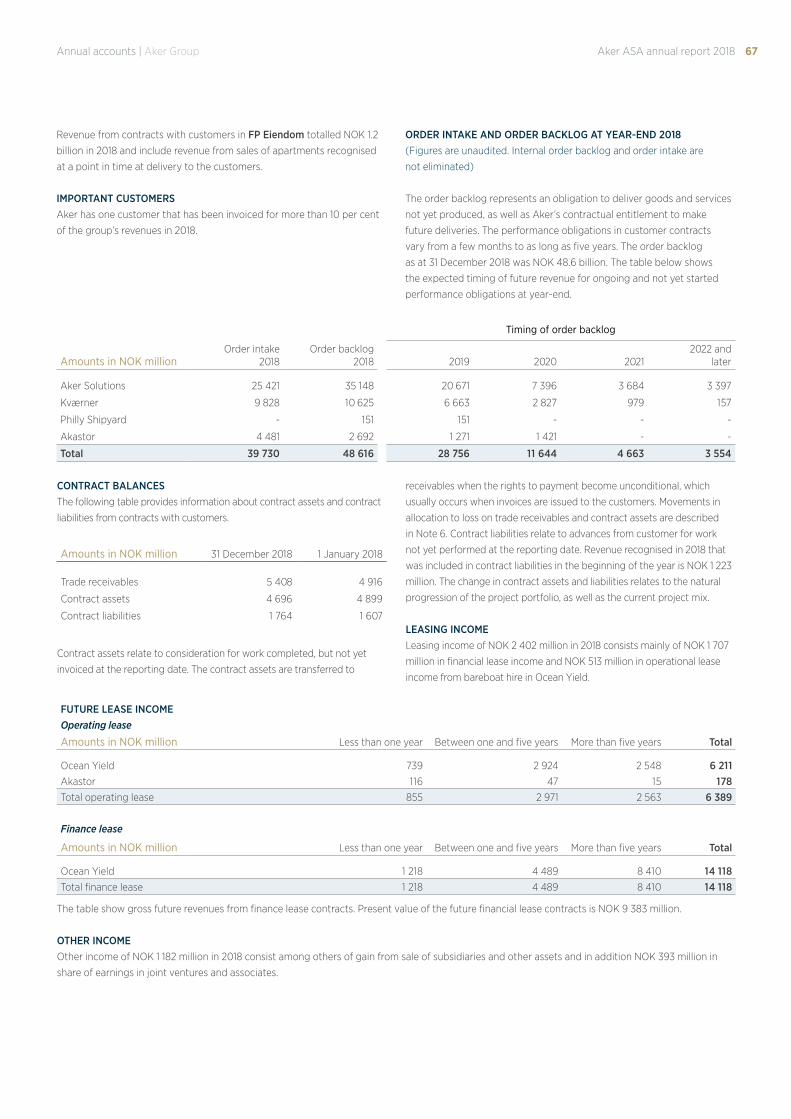
67Annual accounts | Aker Group Aker ASA annual report 2018
Timing of order backlog
Amounts in NOK millionOrder intake
2018Order backlog
2018 2019 2020 20212022 and
later
Aker Solutions 25 421 35 148 20 671 7 396 3 684 3 397
Kværner 9 828 10 625 6 663 2 827 979 157
Philly Shipyard - 151 151 - - -
Akastor 4 481 2 692 1 271 1 421 - -
Total 39 730 48 616 28 756 11 644 4 663 3 554
FUTURE LEASE INCOME Operating lease
Amounts in NOK million Less than one year Between one and five years More than five years Total
Ocean Yield 739 2 924 2 548 6 211Akastor 116 47 15 178Total operating lease 855 2 971 2 563 6 389
Finance lease
Amounts in NOK million Less than one year Between one and five years More than five years Total
Ocean Yield 1 218 4 489 8 410 14 118Total finance lease 1 218 4 489 8 410 14 118
The table show gross future revenues from finance lease contracts. Present value of the future financial lease contracts is NOK 9 383 million.
OTHER INCOMEOther income of NOK 1 182 million in 2018 consist among others of gain from sale of subsidiaries and other assets and in addition NOK 393 million in
share of earnings in joint ventures and associates.
Revenue from contracts with customers in FP Eiendom totalled NOK 1.2
billion in 2018 and include revenue from sales of apartments recognised
at a point in time at delivery to the customers.
IMPORTANT CUSTOMERSAker has one customer that has been invoiced for more than 10 per cent
of the group’s revenues in 2018.
ORDER INTAKE AND ORDER BACKLOG AT YEAR-END 2018 (Figures are unaudited. Internal order backlog and order intake are
not eliminated)
The order backlog represents an obligation to deliver goods and services
not yet produced, as well as Aker’s contractual entitlement to make
future deliveries. The performance obligations in customer contracts
vary from a few months to as long as five years. The order backlog
as at 31 December 2018 was NOK 48.6 billion. The table below shows
the expected timing of future revenue for ongoing and not yet started
performance obligations at year-end.
CONTRACT BALANCESThe following table provides information about contract assets and contract
liabilities from contracts with customers.
Amounts in NOK million 31 December 2018 1 January 2018
Trade receivables 5 408 4 916
Contract assets 4 696 4 899
Contract liabilities 1 764 1 607
Contract assets relate to consideration for work completed, but not yet
invoiced at the reporting date. The contract assets are transferred to
receivables when the rights to payment become unconditional, which
usually occurs when invoices are issued to the customers. Movements in
allocation to loss on trade receivables and contract assets are described
in Note 6. Contract liabilities relate to advances from customer for work
not yet performed at the reporting date. Revenue recognised in 2018 that
was included in contract liabilities in the beginning of the year is NOK 1 223
million. The change in contract assets and liabilities relates to the natural
progression of the project portfolio, as well as the current project mix.
LEASING INCOMELeasing income of NOK 2 402 million in 2018 consists mainly of NOK 1 707
million in financial lease income and NOK 513 million in operational lease
income from bareboat hire in Ocean Yield.
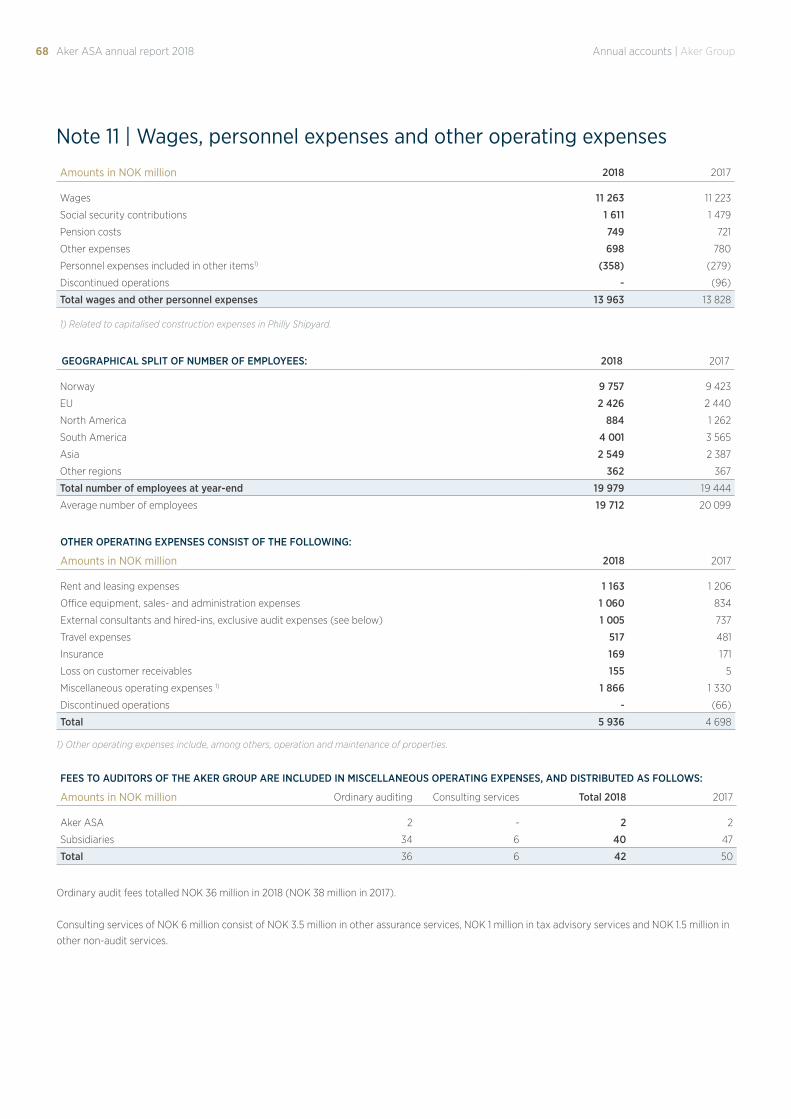
68 Annual accounts | Aker GroupAker ASA annual report 2018
OTHER OPERATING EXPENSES CONSIST OF THE FOLLOWING:
Amounts in NOK million 2018 2017
Rent and leasing expenses 1 163 1 206
Office equipment, sales- and administration expenses 1 060 834
External consultants and hired-ins, exclusive audit expenses (see below) 1 005 737
Travel expenses 517 481
Insurance 169 171
Loss on customer receivables 155 5
Miscellaneous operating expenses 1) 1 866 1 330
Discontinued operations - (66)
Total 5 936 4 698
1) Other operating expenses include, among others, operation and maintenance of properties.
FEES TO AUDITORS OF THE AKER GROUP ARE INCLUDED IN MISCELLANEOUS OPERATING EXPENSES, AND DISTRIBUTED AS FOLLOWS:
Amounts in NOK million Ordinary auditing Consulting services Total 2018 2017
Aker ASA 2 - 2 2
Subsidiaries 34 6 40 47
Total 36 6 42 50
Ordinary audit fees totalled NOK 36 million in 2018 (NOK 38 million in 2017).
Consulting services of NOK 6 million consist of NOK 3.5 million in other assurance services, NOK 1 million in tax advisory services and NOK 1.5 million in
other non-audit services.
Amounts in NOK million 2018 2017
Wages 11 263 11 223
Social security contributions 1 611 1 479
Pension costs 749 721
Other expenses 698 780
Personnel expenses included in other items1) (358) (279)
Discontinued operations - (96)
Total wages and other personnel expenses 13 963 13 828
1) Related to capitalised construction expenses in Philly Shipyard.
Note 11 | Wages, personnel expenses and other operating expenses
GEOGRAPHICAL SPLIT OF NUMBER OF EMPLOYEES: 2018 2017
Norway 9 757 9 423
EU 2 426 2 440
North America 884 1 262
South America 4 001 3 565
Asia 2 549 2 387
Other regions 362 367
Total number of employees at year-end 19 979 19 444
Average number of employees 19 712 20 099
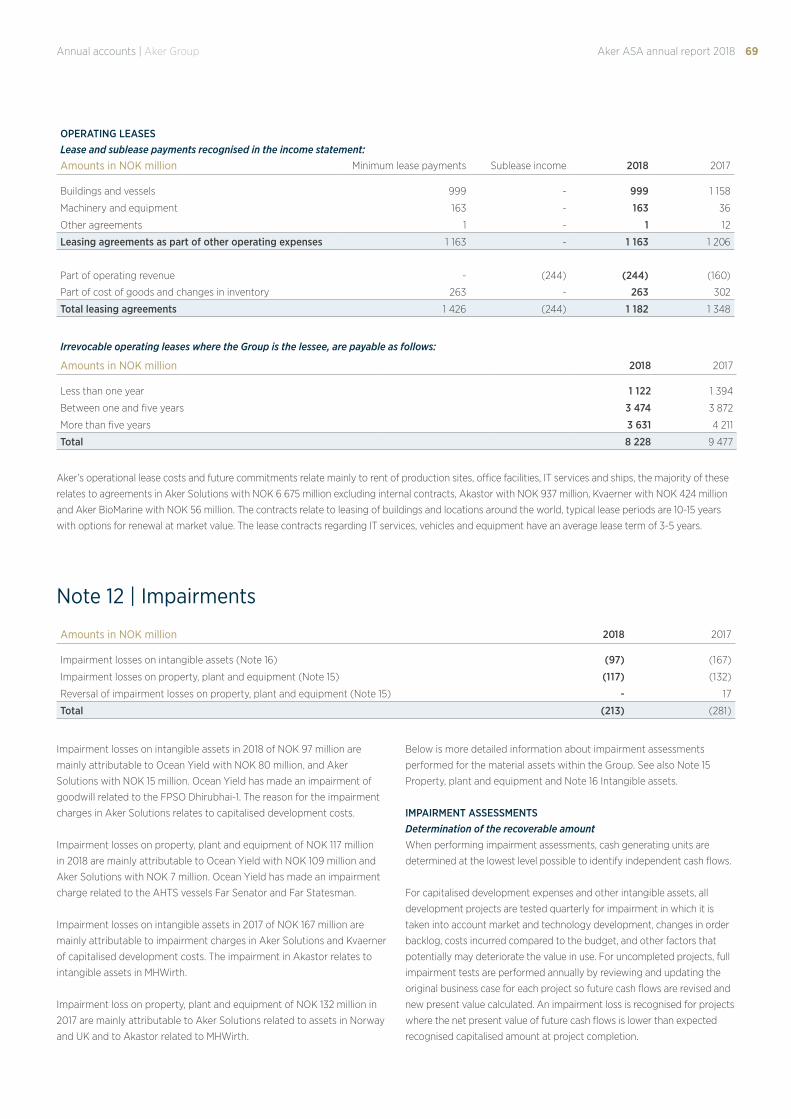
69Annual accounts | Aker Group Aker ASA annual report 2018
Aker’s operational lease costs and future commitments relate mainly to rent of production sites, office facilities, IT services and ships, the majority of these
relates to agreements in Aker Solutions with NOK 6 675 million excluding internal contracts, Akastor with NOK 937 million, Kvaerner with NOK 424 million
and Aker BioMarine with NOK 56 million. The contracts relate to leasing of buildings and locations around the world, typical lease periods are 10-15 years
with options for renewal at market value. The lease contracts regarding IT services, vehicles and equipment have an average lease term of 3-5 years.
OPERATING LEASESLease and sublease payments recognised in the income statement: Amounts in NOK million Minimum lease payments Sublease income 2018 2017
Buildings and vessels 999 - 999 1 158
Machinery and equipment 163 - 163 36
Other agreements 1 - 1 12
Leasing agreements as part of other operating expenses 1 163 - 1 163 1 206
Part of operating revenue - (244) (244) (160)
Part of cost of goods and changes in inventory 263 - 263 302
Total leasing agreements 1 426 (244) 1 182 1 348
Irrevocable operating leases where the Group is the lessee, are payable as follows:
Amounts in NOK million 2018 2017
Less than one year 1 122 1 394
Between one and five years 3 474 3 872
More than five years 3 631 4 211
Total 8 228 9 477
Note 12 | Impairments
Amounts in NOK million 2018 2017
Impairment losses on intangible assets (Note 16) (97) (167)
Impairment losses on property, plant and equipment (Note 15) (117) (132)
Reversal of impairment losses on property, plant and equipment (Note 15) - 17
Total (213) (281)
Impairment losses on intangible assets in 2018 of NOK 97 million are
mainly attributable to Ocean Yield with NOK 80 million, and Aker
Solutions with NOK 15 million. Ocean Yield has made an impairment of
goodwill related to the FPSO Dhirubhai-1. The reason for the impairment
charges in Aker Solutions relates to capitalised development costs.
Impairment losses on property, plant and equipment of NOK 117 million
in 2018 are mainly attributable to Ocean Yield with NOK 109 million and
Aker Solutions with NOK 7 million. Ocean Yield has made an impairment
charge related to the AHTS vessels Far Senator and Far Statesman.
Impairment losses on intangible assets in 2017 of NOK 167 million are
mainly attributable to impairment charges in Aker Solutions and Kvaerner
of capitalised development costs. The impairment in Akastor relates to
intangible assets in MHWirth.
Impairment loss on property, plant and equipment of NOK 132 million in
2017 are mainly attributable to Aker Solutions related to assets in Norway
and UK and to Akastor related to MHWirth.
Below is more detailed information about impairment assessments
performed for the material assets within the Group. See also Note 15
Property, plant and equipment and Note 16 Intangible assets.
IMPAIRMENT ASSESSMENTSDetermination of the recoverable amountWhen performing impairment assessments, cash generating units are
determined at the lowest level possible to identify independent cash flows.
For capitalised development expenses and other intangible assets, all
development projects are tested quarterly for impairment in which it is
taken into account market and technology development, changes in order
backlog, costs incurred compared to the budget, and other factors that
potentially may deteriorate the value in use. For uncompleted projects, full
impairment tests are performed annually by reviewing and updating the
original business case for each project so future cash flows are revised and
new present value calculated. An impairment loss is recognised for projects
where the net present value of future cash flows is lower than expected
recognised capitalised amount at project completion.
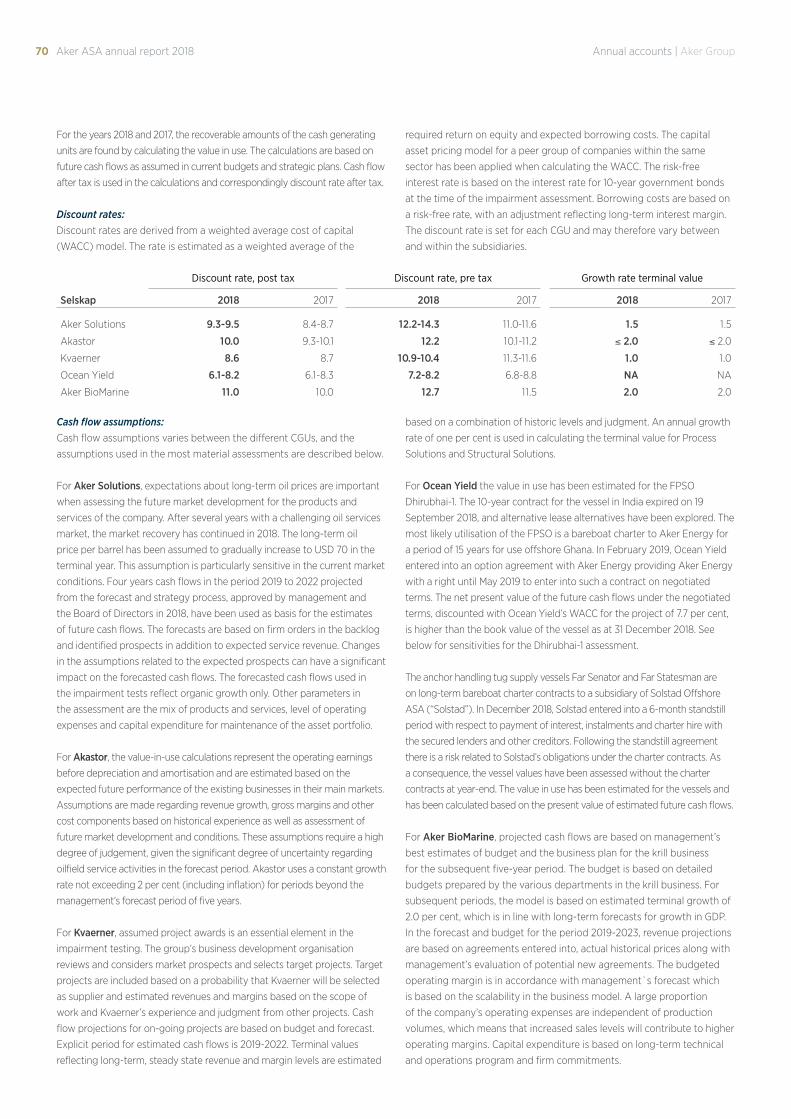
70 Annual accounts | Aker GroupAker ASA annual report 2018
Discount rate, post tax Discount rate, pre tax Growth rate terminal value
Selskap 2018 2017 2018 2017 2018 2017
Aker Solutions 9.3-9.5 8.4-8.7 12.2-14.3 11.0-11.6 1.5 1.5
Akastor 10.0 9.3-10.1 12.2 10.1-11.2 ≤ 2.0 ≤ 2.0
Kvaerner 8.6 8.7 10.9-10.4 11.3-11.6 1.0 1.0
Ocean Yield 6.1-8.2 6.1-8.3 7.2-8.2 6.8-8.8 NA NA
Aker BioMarine 11.0 10.0 12.7 11.5 2.0 2.0
Cash flow assumptions:Cash flow assumptions varies between the different CGUs, and the
assumptions used in the most material assessments are described below.
For Aker Solutions, expectations about long-term oil prices are important
when assessing the future market development for the products and
services of the company. After several years with a challenging oil services
market, the market recovery has continued in 2018. The long-term oil
price per barrel has been assumed to gradually increase to USD 70 in the
terminal year. This assumption is particularly sensitive in the current market
conditions. Four years cash flows in the period 2019 to 2022 projected
from the forecast and strategy process, approved by management and
the Board of Directors in 2018, have been used as basis for the estimates
of future cash flows. The forecasts are based on firm orders in the backlog
and identified prospects in addition to expected service revenue. Changes
in the assumptions related to the expected prospects can have a significant
impact on the forecasted cash flows. The forecasted cash flows used in
the impairment tests reflect organic growth only. Other parameters in
the assessment are the mix of products and services, level of operating
expenses and capital expenditure for maintenance of the asset portfolio.
For Akastor, the value-in-use calculations represent the operating earnings
before depreciation and amortisation and are estimated based on the
expected future performance of the existing businesses in their main markets.
Assumptions are made regarding revenue growth, gross margins and other
cost components based on historical experience as well as assessment of
future market development and conditions. These assumptions require a high
degree of judgement, given the significant degree of uncertainty regarding
oilfield service activities in the forecast period. Akastor uses a constant growth
rate not exceeding 2 per cent (including inflation) for periods beyond the
management’s forecast period of five years.
For Kvaerner, assumed project awards is an essential element in the
impairment testing. The group’s business development organisation
reviews and considers market prospects and selects target projects. Target
projects are included based on a probability that Kvaerner will be selected
as supplier and estimated revenues and margins based on the scope of
work and Kvaerner’s experience and judgment from other projects. Cash
flow projections for on-going projects are based on budget and forecast.
Explicit period for estimated cash flows is 2019-2022. Terminal values
reflecting long-term, steady state revenue and margin levels are estimated
based on a combination of historic levels and judgment. An annual growth
rate of one per cent is used in calculating the terminal value for Process
Solutions and Structural Solutions.
For Ocean Yield the value in use has been estimated for the FPSO
Dhirubhai-1. The 10-year contract for the vessel in India expired on 19
September 2018, and alternative lease alternatives have been explored. The
most likely utilisation of the FPSO is a bareboat charter to Aker Energy for
a period of 15 years for use offshore Ghana. In February 2019, Ocean Yield
entered into an option agreement with Aker Energy providing Aker Energy
with a right until May 2019 to enter into such a contract on negotiated
terms. The net present value of the future cash flows under the negotiated
terms, discounted with Ocean Yield’s WACC for the project of 7.7 per cent,
is higher than the book value of the vessel as at 31 December 2018. See
below for sensitivities for the Dhirubhai-1 assessment.
The anchor handling tug supply vessels Far Senator and Far Statesman are
on long-term bareboat charter contracts to a subsidiary of Solstad Offshore
ASA (“Solstad”). In December 2018, Solstad entered into a 6-month standstill
period with respect to payment of interest, instalments and charter hire with
the secured lenders and other creditors. Following the standstill agreement
there is a risk related to Solstad’s obligations under the charter contracts. As
a consequence, the vessel values have been assessed without the charter
contracts at year-end. The value in use has been estimated for the vessels and
has been calculated based on the present value of estimated future cash flows.
For Aker BioMarine, projected cash flows are based on management’s
best estimates of budget and the business plan for the krill business
for the subsequent five-year period. The budget is based on detailed
budgets prepared by the various departments in the krill business. For
subsequent periods, the model is based on estimated terminal growth of
2.0 per cent, which is in line with long-term forecasts for growth in GDP.
In the forecast and budget for the period 2019-2023, revenue projections
are based on agreements entered into, actual historical prices along with
management’s evaluation of potential new agreements. The budgeted
operating margin is in accordance with management`s forecast which
is based on the scalability in the business model. A large proportion
of the company’s operating expenses are independent of production
volumes, which means that increased sales levels will contribute to higher
operating margins. Capital expenditure is based on long-term technical
and operations program and firm commitments.
For the years 2018 and 2017, the recoverable amounts of the cash generating
units are found by calculating the value in use. The calculations are based on
future cash flows as assumed in current budgets and strategic plans. Cash flow
after tax is used in the calculations and correspondingly discount rate after tax.
Discount rates: Discount rates are derived from a weighted average cost of capital
(WACC) model. The rate is estimated as a weighted average of the
required return on equity and expected borrowing costs. The capital
asset pricing model for a peer group of companies within the same
sector has been applied when calculating the WACC. The risk-free
interest rate is based on the interest rate for 10-year government bonds
at the time of the impairment assessment. Borrowing costs are based on
a risk-free rate, with an adjustment reflecting long-term interest margin.
The discount rate is set for each CGU and may therefore vary between
and within the subsidiaries.
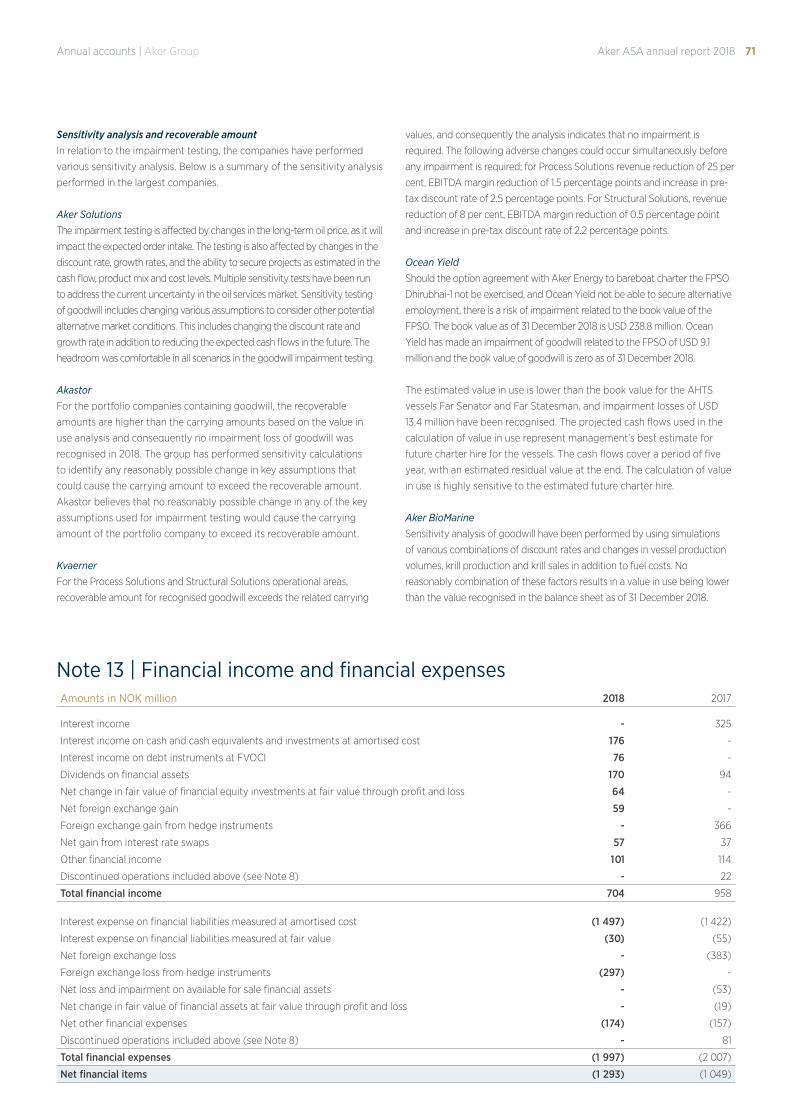
71Annual accounts | Aker Group Aker ASA annual report 2018
Sensitivity analysis and recoverable amountIn relation to the impairment testing, the companies have performed
various sensitivity analysis. Below is a summary of the sensitivity analysis
performed in the largest companies.
Aker Solutions The impairment testing is affected by changes in the long-term oil price, as it will
impact the expected order intake. The testing is also affected by changes in the
discount rate, growth rates, and the ability to secure projects as estimated in the
cash flow, product mix and cost levels. Multiple sensitivity tests have been run
to address the current uncertainty in the oil services market. Sensitivity testing
of goodwill includes changing various assumptions to consider other potential
alternative market conditions. This includes changing the discount rate and
growth rate in addition to reducing the expected cash flows in the future. The
headroom was comfortable in all scenarios in the goodwill impairment testing.
AkastorFor the portfolio companies containing goodwill, the recoverable
amounts are higher than the carrying amounts based on the value in
use analysis and consequently no impairment loss of goodwill was
recognised in 2018. The group has performed sensitivity calculations
to identify any reasonably possible change in key assumptions that
could cause the carrying amount to exceed the recoverable amount.
Akastor believes that no reasonably possible change in any of the key
assumptions used for impairment testing would cause the carrying
amount of the portfolio company to exceed its recoverable amount.
KvaernerFor the Process Solutions and Structural Solutions operational areas,
recoverable amount for recognised goodwill exceeds the related carrying
values, and consequently the analysis indicates that no impairment is
required. The following adverse changes could occur simultaneously before
any impairment is required; for Process Solutions revenue reduction of 25 per
cent, EBITDA margin reduction of 1.5 percentage points and increase in pre-
tax discount rate of 2.5 percentage points. For Structural Solutions, revenue
reduction of 8 per cent, EBITDA margin reduction of 0.5 percentage point
and increase in pre-tax discount rate of 2.2 percentage points.
Ocean YieldShould the option agreement with Aker Energy to bareboat charter the FPSO
Dhirubhai-1 not be exercised, and Ocean Yield not be able to secure alternative
employment, there is a risk of impairment related to the book value of the
FPSO. The book value as of 31 December 2018 is USD 238.8 million. Ocean
Yield has made an impairment of goodwill related to the FPSO of USD 9.1
million and the book value of goodwill is zero as of 31 December 2018.
The estimated value in use is lower than the book value for the AHTS
vessels Far Senator and Far Statesman, and impairment losses of USD
13.4 million have been recognised. The projected cash flows used in the
calculation of value in use represent management’s best estimate for
future charter hire for the vessels. The cash flows cover a period of five
year, with an estimated residual value at the end. The calculation of value
in use is highly sensitive to the estimated future charter hire.
Aker BioMarineSensitivity analysis of goodwill have been performed by using simulations
of various combinations of discount rates and changes in vessel production
volumes, krill production and krill sales in addition to fuel costs. No
reasonably combination of these factors results in a value in use being lower
than the value recognised in the balance sheet as of 31 December 2018.
Note 13 | Financial income and financial expensesAmounts in NOK million 2018 2017
Interest income - 325
Interest income on cash and cash equivalents and investments at amortised cost 176 -
Interest income on debt instruments at FVOCI 76 -
Dividends on financial assets 170 94
Net change in fair value of financial equity investments at fair value through profit and loss 64 -
Net foreign exchange gain 59 -
Foreign exchange gain from hedge instruments - 366
Net gain from interest rate swaps 57 37
Other financial income 101 114
Discontinued operations included above (see Note 8) - 22
Total financial income 704 958
Interest expense on financial liabilities measured at amortised cost (1 497) (1 422)
Interest expense on financial liabilities measured at fair value (30) (55)
Net foreign exchange loss - (383)
Foreign exchange loss from hedge instruments (297) -
Net loss and impairment on available for sale financial assets - (53)
Net change in fair value of financial assets at fair value through profit and loss - (19)
Net other financial expenses (174) (157)
Discontinued operations included above (see Note 8) - 81
Total financial expenses (1 997) (2 007)
Net financial items (1 293) (1 049)
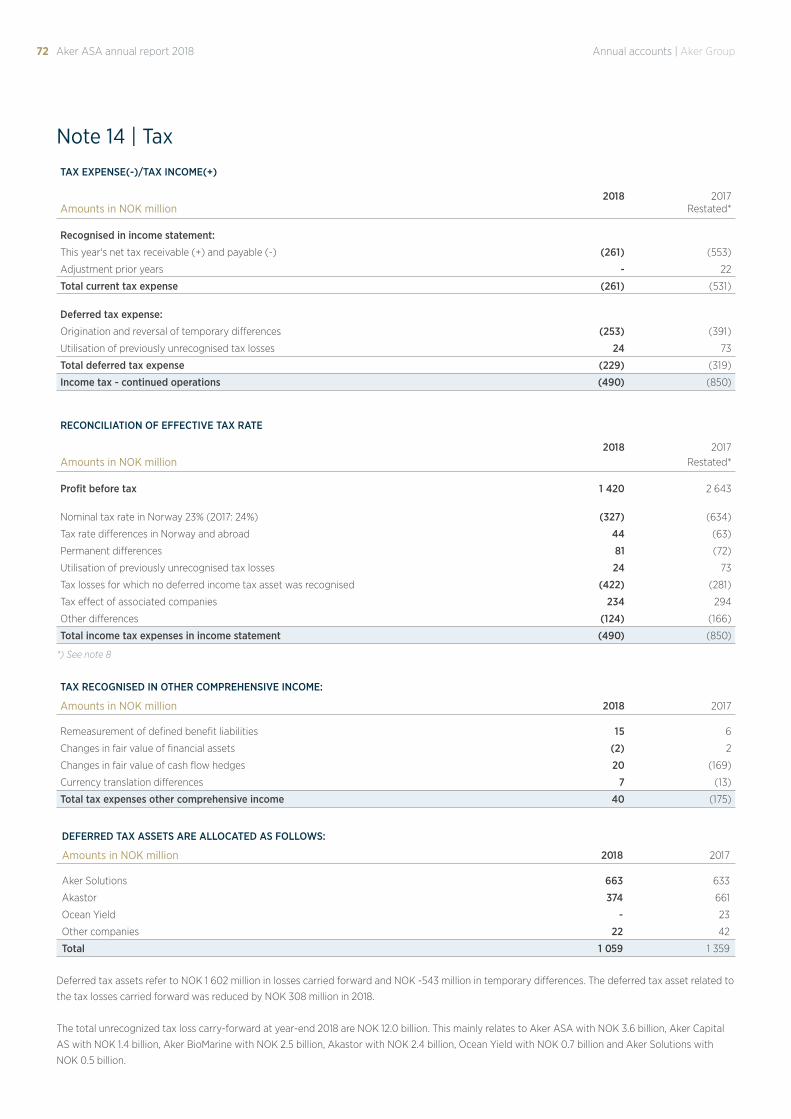
72 Annual accounts | Aker GroupAker ASA annual report 2018
Note 14 | Tax
TAX EXPENSE(-)/TAX INCOME(+)
2018 2017Amounts in NOK million Restated*
Recognised in income statement:
This year's net tax receivable (+) and payable (-) (261) (553)
Adjustment prior years - 22
Total current tax expense (261) (531)
Deferred tax expense:
Origination and reversal of temporary differences (253) (391)
Utilisation of previously unrecognised tax losses 24 73
Total deferred tax expense (229) (319)
Income tax - continued operations (490) (850)
RECONCILIATION OF EFFECTIVE TAX RATE
2018 2017Amounts in NOK million Restated*
Profit before tax 1 420 2 643
Nominal tax rate in Norway 23% (2017: 24%) (327) (634)
Tax rate differences in Norway and abroad 44 (63)
Permanent differences 81 (72)
Utilisation of previously unrecognised tax losses 24 73
Tax losses for which no deferred income tax asset was recognised (422) (281)
Tax effect of associated companies 234 294
Other differences (124) (166)
Total income tax expenses in income statement (490) (850)
*) See note 8
Deferred tax assets refer to NOK 1 602 million in losses carried forward and NOK -543 million in temporary differences. The deferred tax asset related to
the tax losses carried forward was reduced by NOK 308 million in 2018.
The total unrecognized tax loss carry-forward at year-end 2018 are NOK 12.0 billion. This mainly relates to Aker ASA with NOK 3.6 billion, Aker Capital
AS with NOK 1.4 billion, Aker BioMarine with NOK 2.5 billion, Akastor with NOK 2.4 billion, Ocean Yield with NOK 0.7 billion and Aker Solutions with
NOK 0.5 billion.
TAX RECOGNISED IN OTHER COMPREHENSIVE INCOME:
Amounts in NOK million 2018 2017
Remeasurement of defined benefit liabilities 15 6
Changes in fair value of financial assets (2) 2
Changes in fair value of cash flow hedges 20 (169)
Currency translation differences 7 (13)
Total tax expenses other comprehensive income 40 (175)
DEFERRED TAX ASSETS ARE ALLOCATED AS FOLLOWS:
Amounts in NOK million 2018 2017
Aker Solutions 663 633
Akastor 374 661
Ocean Yield - 23
Other companies 22 42
Total 1 059 1 359
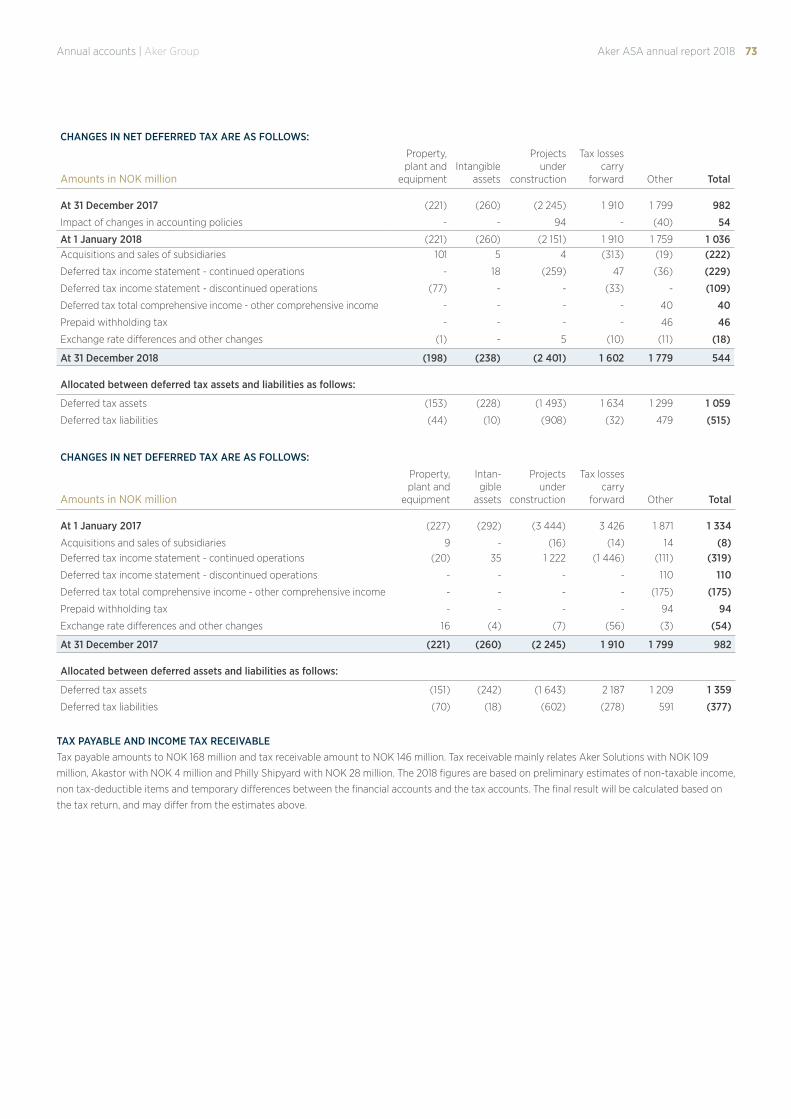
73Annual accounts | Aker Group Aker ASA annual report 2018
CHANGES IN NET DEFERRED TAX ARE AS FOLLOWS:
Amounts in NOK million
Property, plant and
equipmentIntangible
assets
Projects under
construction
Tax losses carry
forward Other Total
At 31 December 2017 (221) (260) (2 245) 1 910 1 799 982
Impact of changes in accounting policies - - 94 - (40) 54
At 1 January 2018 (221) (260) (2 151) 1 910 1 759 1 036Acquisitions and sales of subsidiaries 101 5 4 (313) (19) (222)
Deferred tax income statement - continued operations - 18 (259) 47 (36) (229)
Deferred tax income statement - discontinued operations (77) - - (33) - (109)
Deferred tax total comprehensive income - other comprehensive income - - - - 40 40
Prepaid withholding tax - - - - 46 46
Exchange rate differences and other changes (1) - 5 (10) (11) (18)
At 31 December 2018 (198) (238) (2 401) 1 602 1 779 544
Allocated between deferred tax assets and liabilities as follows:
Deferred tax assets (153) (228) (1 493) 1 634 1 299 1 059
Deferred tax liabilities (44) (10) (908) (32) 479 (515)
CHANGES IN NET DEFERRED TAX ARE AS FOLLOWS:
Amounts in NOK million
Property, plant and
equipment
Intan-gible
assets
Projects under
construction
Tax losses carry
forward Other Total
At 1 January 2017 (227) (292) (3 444) 3 426 1 871 1 334
Acquisitions and sales of subsidiaries 9 - (16) (14) 14 (8)Deferred tax income statement - continued operations (20) 35 1 222 (1 446) (111) (319)
Deferred tax income statement - discontinued operations - - - - 110 110
Deferred tax total comprehensive income - other comprehensive income - - - - (175) (175)
Prepaid withholding tax - - - - 94 94
Exchange rate differences and other changes 16 (4) (7) (56) (3) (54)
At 31 December 2017 (221) (260) (2 245) 1 910 1 799 982
Allocated between deferred assets and liabilities as follows:
Deferred tax assets (151) (242) (1 643) 2 187 1 209 1 359
Deferred tax liabilities (70) (18) (602) (278) 591 (377)
TAX PAYABLE AND INCOME TAX RECEIVABLETax payable amounts to NOK 168 million and tax receivable amount to NOK 146 million. Tax receivable mainly relates Aker Solutions with NOK 109
million, Akastor with NOK 4 million and Philly Shipyard with NOK 28 million. The 2018 figures are based on preliminary estimates of non-taxable income,
non tax-deductible items and temporary differences between the financial accounts and the tax accounts. The final result will be calculated based on
the tax return, and may differ from the estimates above.
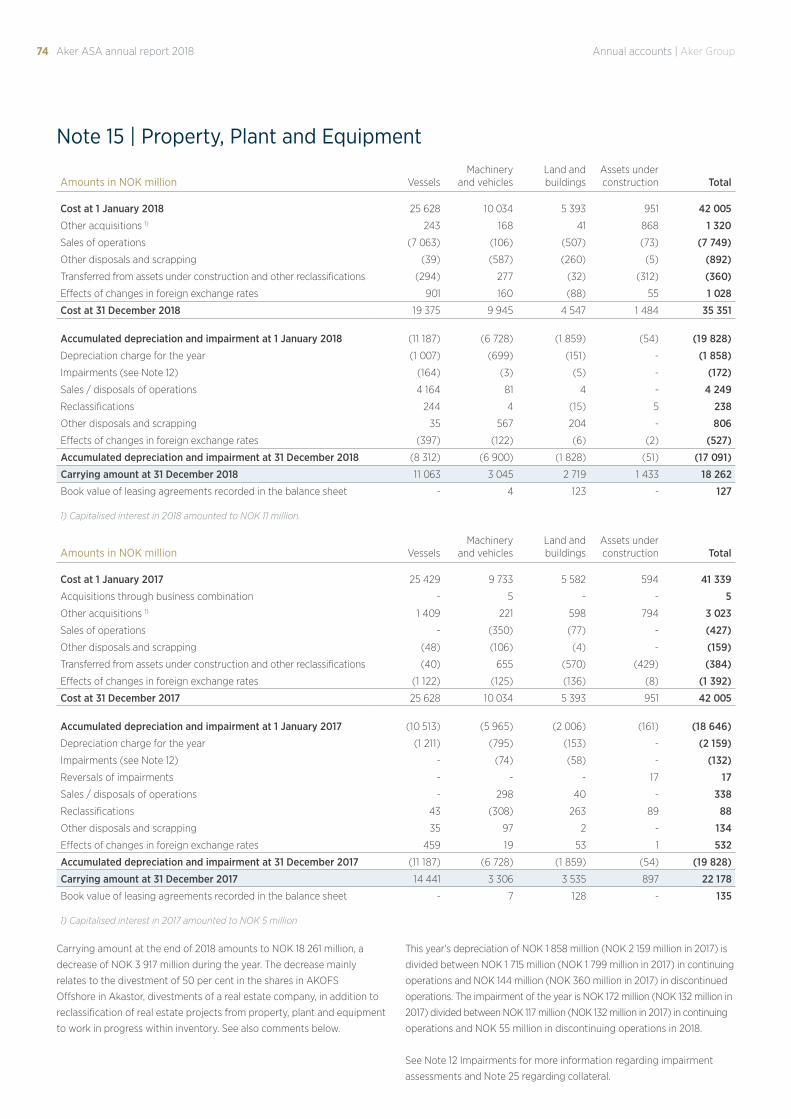
74 Annual accounts | Aker GroupAker ASA annual report 2018
Note 15 | Property, Plant and Equipment
Amounts in NOK million VesselsMachinery
and vehiclesLand and buildings
Assets under construction Total
Cost at 1 January 2018 25 628 10 034 5 393 951 42 005
Other acquisitions 1) 243 168 41 868 1 320
Sales of operations (7 063) (106) (507) (73) (7 749)
Other disposals and scrapping (39) (587) (260) (5) (892)
Transferred from assets under construction and other reclassifications (294) 277 (32) (312) (360)
Effects of changes in foreign exchange rates 901 160 (88) 55 1 028
Cost at 31 December 2018 19 375 9 945 4 547 1 484 35 351
Accumulated depreciation and impairment at 1 January 2018 (11 187) (6 728) (1 859) (54) (19 828)
Depreciation charge for the year (1 007) (699) (151) - (1 858)
Impairments (see Note 12) (164) (3) (5) - (172)
Sales / disposals of operations 4 164 81 4 - 4 249
Reclassifications 244 4 (15) 5 238
Other disposals and scrapping 35 567 204 - 806
Effects of changes in foreign exchange rates (397) (122) (6) (2) (527)
Accumulated depreciation and impairment at 31 December 2018 (8 312) (6 900) (1 828) (51) (17 091)
Carrying amount at 31 December 2018 11 063 3 045 2 719 1 433 18 262
Book value of leasing agreements recorded in the balance sheet - 4 123 - 127
1) Capitalised interest in 2018 amounted to NOK 11 million.
Amounts in NOK million VesselsMachinery
and vehiclesLand and buildings
Assets under construction Total
Cost at 1 January 2017 25 429 9 733 5 582 594 41 339
Acquisitions through business combination - 5 - - 5
Other acquisitions 1) 1 409 221 598 794 3 023
Sales of operations - (350) (77) - (427)
Other disposals and scrapping (48) (106) (4) - (159)
Transferred from assets under construction and other reclassifications (40) 655 (570) (429) (384)
Effects of changes in foreign exchange rates (1 122) (125) (136) (8) (1 392)
Cost at 31 December 2017 25 628 10 034 5 393 951 42 005
Accumulated depreciation and impairment at 1 January 2017 (10 513) (5 965) (2 006) (161) (18 646)
Depreciation charge for the year (1 211) (795) (153) - (2 159)
Impairments (see Note 12) - (74) (58) - (132)
Reversals of impairments - - - 17 17
Sales / disposals of operations - 298 40 - 338
Reclassifications 43 (308) 263 89 88
Other disposals and scrapping 35 97 2 - 134
Effects of changes in foreign exchange rates 459 19 53 1 532
Accumulated depreciation and impairment at 31 December 2017 (11 187) (6 728) (1 859) (54) (19 828)
Carrying amount at 31 December 2017 14 441 3 306 3 535 897 22 178
Book value of leasing agreements recorded in the balance sheet - 7 128 - 135
1) Capitalised interest in 2017 amounted to NOK 5 million
Carrying amount at the end of 2018 amounts to NOK 18 261 million, a
decrease of NOK 3 917 million during the year. The decrease mainly
relates to the divestment of 50 per cent in the shares in AKOFS
Offshore in Akastor, divestments of a real estate company, in addition to
reclassification of real estate projects from property, plant and equipment
to work in progress within inventory. See also comments below.
This year's depreciation of NOK 1 858 million (NOK 2 159 million in 2017) is
divided between NOK 1 715 million (NOK 1 799 million in 2017) in continuing
operations and NOK 144 million (NOK 360 million in 2017) in discontinued
operations. The impairment of the year is NOK 172 million (NOK 132 million in
2017) divided between NOK 117 million (NOK 132 million in 2017) in continuing
operations and NOK 55 million in discontinuing operations in 2018.
See Note 12 Impairments for more information regarding impairment
assessments and Note 25 regarding collateral.
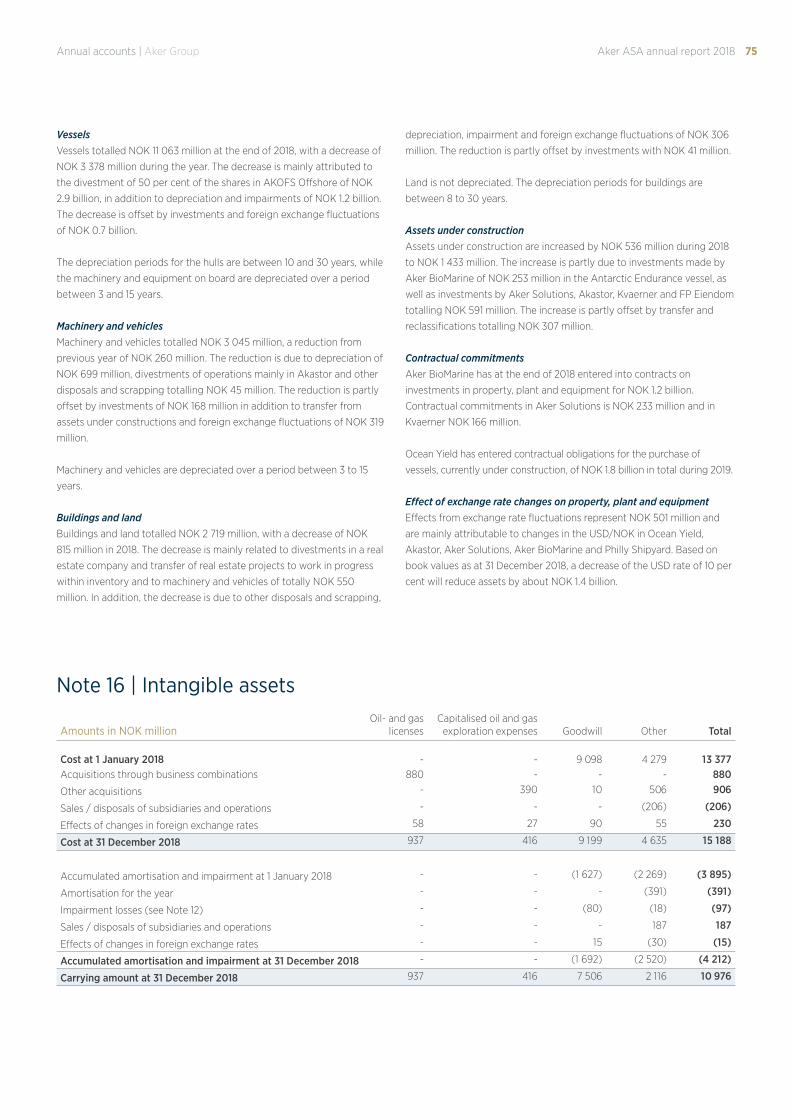
75Annual accounts | Aker Group Aker ASA annual report 2018
Note 16 | Intangible assets
VesselsVessels totalled NOK 11 063 million at the end of 2018, with a decrease of
NOK 3 378 million during the year. The decrease is mainly attributed to
the divestment of 50 per cent of the shares in AKOFS Offshore of NOK
2.9 billion, in addition to depreciation and impairments of NOK 1.2 billion.
The decrease is offset by investments and foreign exchange fluctuations
of NOK 0.7 billion.
The depreciation periods for the hulls are between 10 and 30 years, while
the machinery and equipment on board are depreciated over a period
between 3 and 15 years.
Machinery and vehiclesMachinery and vehicles totalled NOK 3 045 million, a reduction from
previous year of NOK 260 million. The reduction is due to depreciation of
NOK 699 million, divestments of operations mainly in Akastor and other
disposals and scrapping totalling NOK 45 million. The reduction is partly
offset by investments of NOK 168 million in addition to transfer from
assets under constructions and foreign exchange fluctuations of NOK 319
million.
Machinery and vehicles are depreciated over a period between 3 to 15
years.
Buildings and landBuildings and land totalled NOK 2 719 million, with a decrease of NOK
815 million in 2018. The decrease is mainly related to divestments in a real
estate company and transfer of real estate projects to work in progress
within inventory and to machinery and vehicles of totally NOK 550
million. In addition, the decrease is due to other disposals and scrapping,
depreciation, impairment and foreign exchange fluctuations of NOK 306
million. The reduction is partly offset by investments with NOK 41 million.
Land is not depreciated. The depreciation periods for buildings are
between 8 to 30 years.
Assets under constructionAssets under construction are increased by NOK 536 million during 2018
to NOK 1 433 million. The increase is partly due to investments made by
Aker BioMarine of NOK 253 million in the Antarctic Endurance vessel, as
well as investments by Aker Solutions, Akastor, Kvaerner and FP Eiendom
totalling NOK 591 million. The increase is partly offset by transfer and
reclassifications totalling NOK 307 million.
Contractual commitmentsAker BioMarine has at the end of 2018 entered into contracts on
investments in property, plant and equipment for NOK 1.2 billion.
Contractual commitments in Aker Solutions is NOK 233 million and in
Kvaerner NOK 166 million.
Ocean Yield has entered contractual obligations for the purchase of
vessels, currently under construction, of NOK 1.8 billion in total during 2019.
Effect of exchange rate changes on property, plant and equipmentEffects from exchange rate fluctuations represent NOK 501 million and
are mainly attributable to changes in the USD/NOK in Ocean Yield,
Akastor, Aker Solutions, Aker BioMarine and Philly Shipyard. Based on
book values as at 31 December 2018, a decrease of the USD rate of 10 per
cent will reduce assets by about NOK 1.4 billion.
Amounts in NOK millionOil- and gas
licensesCapitalised oil and gas
exploration expenses Goodwill Other Total
Cost at 1 January 2018 - - 9 098 4 279 13 377Acquisitions through business combinations 880 - - - 880
Other acquisitions - 390 10 506 906
Sales / disposals of subsidiaries and operations - - - (206) (206)
Effects of changes in foreign exchange rates 58 27 90 55 230
Cost at 31 December 2018 937 416 9 199 4 635 15 188
Accumulated amortisation and impairment at 1 January 2018 - - (1 627) (2 269) (3 895)
Amortisation for the year - - - (391) (391)
Impairment losses (see Note 12) - - (80) (18) (97)
Sales / disposals of subsidiaries and operations - - - 187 187
Effects of changes in foreign exchange rates - - 15 (30) (15)
Accumulated amortisation and impairment at 31 December 2018 - - (1 692) (2 520) (4 212)
Carrying amount at 31 December 2018 937 416 7 506 2 116 10 976
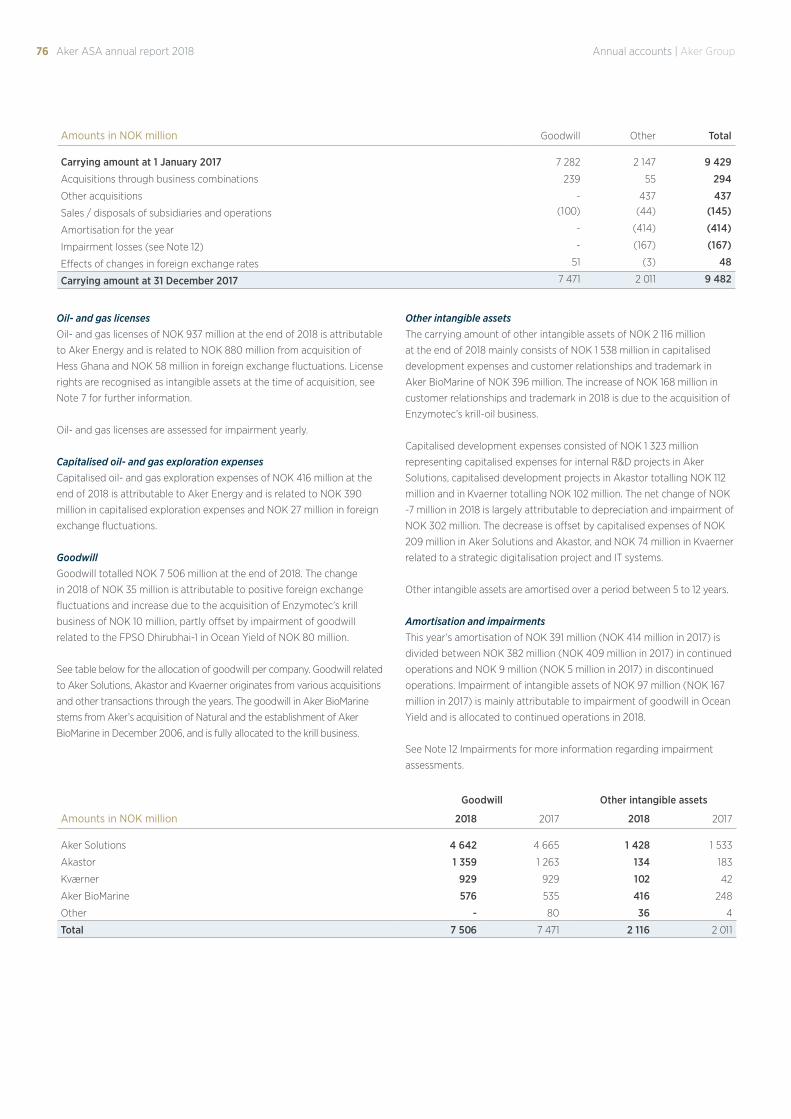
76 Annual accounts | Aker GroupAker ASA annual report 2018
Oil- and gas licensesOil- and gas licenses of NOK 937 million at the end of 2018 is attributable
to Aker Energy and is related to NOK 880 million from acquisition of
Hess Ghana and NOK 58 million in foreign exchange fluctuations. License
rights are recognised as intangible assets at the time of acquisition, see
Note 7 for further information.
Oil- and gas licenses are assessed for impairment yearly.
Capitalised oil- and gas exploration expensesCapitalised oil- and gas exploration expenses of NOK 416 million at the
end of 2018 is attributable to Aker Energy and is related to NOK 390
million in capitalised exploration expenses and NOK 27 million in foreign
exchange fluctuations.
GoodwillGoodwill totalled NOK 7 506 million at the end of 2018. The change
in 2018 of NOK 35 million is attributable to positive foreign exchange
fluctuations and increase due to the acquisition of Enzymotec’s krill
business of NOK 10 million, partly offset by impairment of goodwill
related to the FPSO Dhirubhai-1 in Ocean Yield of NOK 80 million.
See table below for the allocation of goodwill per company. Goodwill related
to Aker Solutions, Akastor and Kvaerner originates from various acquisitions
and other transactions through the years. The goodwill in Aker BioMarine
stems from Aker’s acquisition of Natural and the establishment of Aker
BioMarine in December 2006, and is fully allocated to the krill business.
Other intangible assetsThe carrying amount of other intangible assets of NOK 2 116 million
at the end of 2018 mainly consists of NOK 1 538 million in capitalised
development expenses and customer relationships and trademark in
Aker BioMarine of NOK 396 million. The increase of NOK 168 million in
customer relationships and trademark in 2018 is due to the acquisition of
Enzymotec’s krill-oil business.
Capitalised development expenses consisted of NOK 1 323 million
representing capitalised expenses for internal R&D projects in Aker
Solutions, capitalised development projects in Akastor totalling NOK 112
million and in Kvaerner totalling NOK 102 million. The net change of NOK
-7 million in 2018 is largely attributable to depreciation and impairment of
NOK 302 million. The decrease is offset by capitalised expenses of NOK
209 million in Aker Solutions and Akastor, and NOK 74 million in Kvaerner
related to a strategic digitalisation project and IT systems.
Other intangible assets are amortised over a period between 5 to 12 years.
Amortisation and impairmentsThis year’s amortisation of NOK 391 million (NOK 414 million in 2017) is
divided between NOK 382 million (NOK 409 million in 2017) in continued
operations and NOK 9 million (NOK 5 million in 2017) in discontinued
operations. Impairment of intangible assets of NOK 97 million (NOK 167
million in 2017) is mainly attributable to impairment of goodwill in Ocean
Yield and is allocated to continued operations in 2018.
See Note 12 Impairments for more information regarding impairment
assessments.
Goodwill Other intangible assets
Amounts in NOK million 2018 2017 2018 2017
Aker Solutions 4 642 4 665 1 428 1 533
Akastor 1 359 1 263 134 183
Kværner 929 929 102 42
Aker BioMarine 576 535 416 248
Other - 80 36 4
Total 7 506 7 471 2 116 2 011
Amounts in NOK million Goodwill Other Total
Carrying amount at 1 January 2017 7 282 2 147 9 429
Acquisitions through business combinations 239 55 294
Other acquisitions - 437 437
Sales / disposals of subsidiaries and operations (100) (44) (145)
Amortisation for the year - (414) (414)
Impairment losses (see Note 12) - (167) (167)
Effects of changes in foreign exchange rates 51 (3) 48
Carrying amount at 31 December 2017 7 471 2 011 9 482
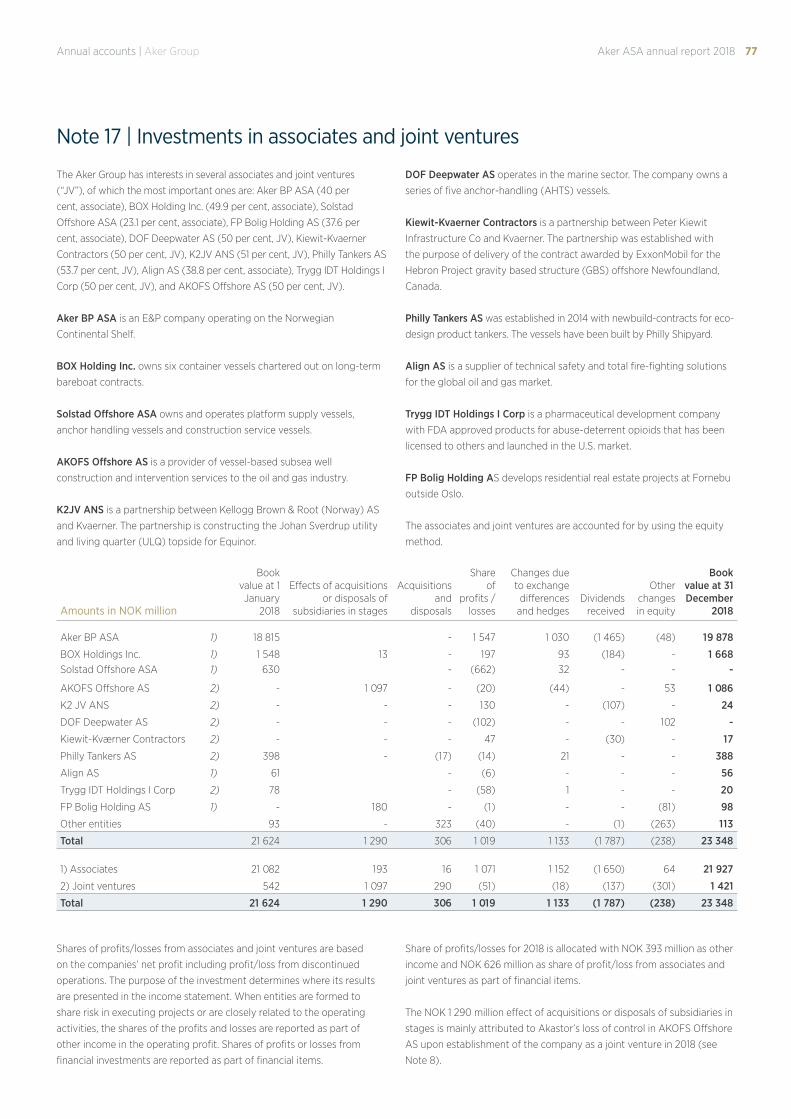
77Annual accounts | Aker Group Aker ASA annual report 2018
Amounts in NOK million
Book value at 1 January
2018
Effects of acquisitions or disposals of
subsidiaries in stages
Acquisitions and
disposals
Share of
profits /losses
Changes due to exchange
differences and hedges
Dividends received
Other changes in equity
Book value at 31 December
2018
Aker BP ASA 1) 18 815 - 1 547 1 030 (1 465) (48) 19 878
BOX Holdings Inc. 1) 1 548 13 - 197 93 (184) - 1 668Solstad Offshore ASA 1) 630 - (662) 32 - - -
AKOFS Offshore AS 2) - 1 097 - (20) (44) - 53 1 086
K2 JV ANS 2) - - - 130 - (107) - 24
DOF Deepwater AS 2) - - - (102) - - 102 -
Kiewit-Kværner Contractors 2) - - - 47 - (30) - 17
Philly Tankers AS 2) 398 - (17) (14) 21 - - 388
Align AS 1) 61 - (6) - - - 56
Trygg IDT Holdings I Corp 2) 78 - (58) 1 - - 20
FP Bolig Holding AS 1) - 180 - (1) - - (81) 98
Other entities 93 - 323 (40) - (1) (263) 113
Total 21 624 1 290 306 1 019 1 133 (1 787) (238) 23 348
1) Associates 21 082 193 16 1 071 1 152 (1 650) 64 21 927
2) Joint ventures 542 1 097 290 (51) (18) (137) (301) 1 421
Total 21 624 1 290 306 1 019 1 133 (1 787) (238) 23 348
Shares of profits/losses from associates and joint ventures are based
on the companies’ net profit including profit/loss from discontinued
operations. The purpose of the investment determines where its results
are presented in the income statement. When entities are formed to
share risk in executing projects or are closely related to the operating
activities, the shares of the profits and losses are reported as part of
other income in the operating profit. Shares of profits or losses from
financial investments are reported as part of financial items.
Share of profits/losses for 2018 is allocated with NOK 393 million as other
income and NOK 626 million as share of profit/loss from associates and
joint ventures as part of financial items.
The NOK 1 290 million effect of acquisitions or disposals of subsidiaries in
stages is mainly attributed to Akastor’s loss of control in AKOFS Offshore
AS upon establishment of the company as a joint venture in 2018 (see
Note 8).
Note 17 | Investments in associates and joint ventures
The Aker Group has interests in several associates and joint ventures
(“JV”), of which the most important ones are: Aker BP ASA (40 per
cent, associate), BOX Holding Inc. (49.9 per cent, associate), Solstad
Offshore ASA (23.1 per cent, associate), FP Bolig Holding AS (37.6 per
cent, associate), DOF Deepwater AS (50 per cent, JV), Kiewit-Kvaerner
Contractors (50 per cent, JV), K2JV ANS (51 per cent, JV), Philly Tankers AS
(53.7 per cent, JV), Align AS (38.8 per cent, associate), Trygg IDT Holdings I
Corp (50 per cent, JV), and AKOFS Offshore AS (50 per cent, JV).
Aker BP ASA is an E&P company operating on the Norwegian
Continental Shelf.
BOX Holding Inc. owns six container vessels chartered out on long-term
bareboat contracts.
Solstad Offshore ASA owns and operates platform supply vessels,
anchor handling vessels and construction service vessels.
AKOFS Offshore AS is a provider of vessel-based subsea well
construction and intervention services to the oil and gas industry.
K2JV ANS is a partnership between Kellogg Brown & Root (Norway) AS
and Kvaerner. The partnership is constructing the Johan Sverdrup utility
and living quarter (ULQ) topside for Equinor.
DOF Deepwater AS operates in the marine sector. The company owns a
series of five anchor-handling (AHTS) vessels.
Kiewit-Kvaerner Contractors is a partnership between Peter Kiewit
Infrastructure Co and Kvaerner. The partnership was established with
the purpose of delivery of the contract awarded by ExxonMobil for the
Hebron Project gravity based structure (GBS) offshore Newfoundland,
Canada.
Philly Tankers AS was established in 2014 with newbuild-contracts for eco-
design product tankers. The vessels have been built by Philly Shipyard.
Align AS is a supplier of technical safety and total fire-fighting solutions
for the global oil and gas market.
Trygg IDT Holdings I Corp is a pharmaceutical development company
with FDA approved products for abuse-deterrent opioids that has been
licensed to others and launched in the U.S. market.
FP Bolig Holding AS develops residential real estate projects at Fornebu
outside Oslo.
The associates and joint ventures are accounted for by using the equity
method.
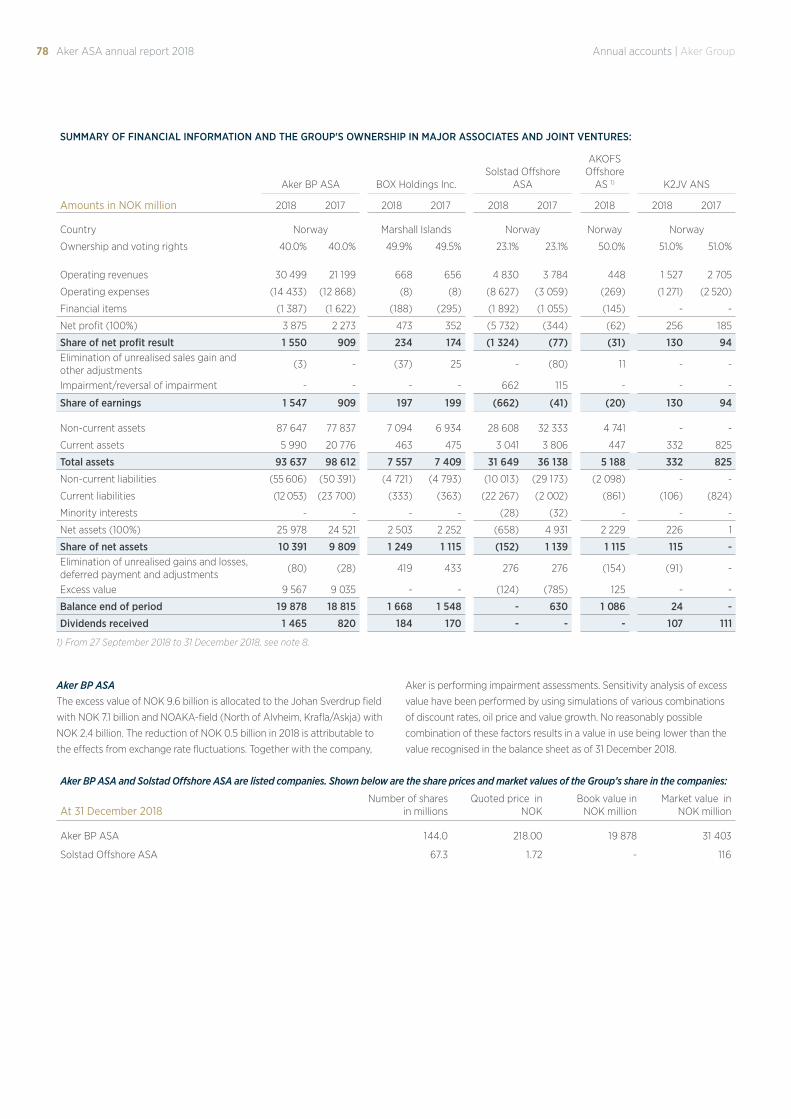
78 Annual accounts | Aker GroupAker ASA annual report 2018
SUMMARY OF FINANCIAL INFORMATION AND THE GROUP'S OWNERSHIP IN MAJOR ASSOCIATES AND JOINT VENTURES:
Aker BP ASA BOX Holdings Inc.Solstad Offshore
ASA
AKOFS Offshore
AS 1) K2JV ANS
Amounts in NOK million 2018 2017 2018 2017 2018 2017 2018 2018 2017
Country Norway Marshall Islands Norway Norway Norway
Ownership and voting rights 40.0% 40.0% 49.9% 49.5% 23.1% 23.1% 50.0% 51.0% 51.0%
Operating revenues 30 499 21 199 668 656 4 830 3 784 448 1 527 2 705
Operating expenses (14 433) (12 868) (8) (8) (8 627) (3 059) (269) (1 271) (2 520)
Financial items (1 387) (1 622) (188) (295) (1 892) (1 055) (145) - -
Net profit (100%) 3 875 2 273 473 352 (5 732) (344) (62) 256 185
Share of net profit result 1 550 909 234 174 (1 324) (77) (31) 130 94Elimination of unrealised sales gain and other adjustments
(3) - (37) 25 - (80) 11 - -
Impairment/reversal of impairment - - - - 662 115 - - -
Share of earnings 1 547 909 197 199 (662) (41) (20) 130 94
Non-current assets 87 647 77 837 7 094 6 934 28 608 32 333 4 741 - -
Current assets 5 990 20 776 463 475 3 041 3 806 447 332 825
Total assets 93 637 98 612 7 557 7 409 31 649 36 138 5 188 332 825
Non-current liabilities (55 606) (50 391) (4 721) (4 793) (10 013) (29 173) (2 098) - -
Current liabilities (12 053) (23 700) (333) (363) (22 267) (2 002) (861) (106) (824)
Minority interests - - - - (28) (32) - - -
Net assets (100%) 25 978 24 521 2 503 2 252 (658) 4 931 2 229 226 1
Share of net assets 10 391 9 809 1 249 1 115 (152) 1 139 1 115 115 -Elimination of unrealised gains and losses, deferred payment and adjustments
(80) (28) 419 433 276 276 (154) (91) -
Excess value 9 567 9 035 - - (124) (785) 125 - -
Balance end of period 19 878 18 815 1 668 1 548 - 630 1 086 24 -
Dividends received 1 465 820 184 170 - - - 107 111
1) From 27 September 2018 to 31 December 2018, see note 8.
Aker BP ASAThe excess value of NOK 9.6 billion is allocated to the Johan Sverdrup field
with NOK 7.1 billion and NOAKA-field (North of Alvheim, Krafla/Askja) with
NOK 2.4 billion. The reduction of NOK 0.5 billion in 2018 is attributable to
the effects from exchange rate fluctuations. Together with the company,
Aker is performing impairment assessments. Sensitivity analysis of excess
value have been performed by using simulations of various combinations
of discount rates, oil price and value growth. No reasonably possible
combination of these factors results in a value in use being lower than the
value recognised in the balance sheet as of 31 December 2018.
Aker BP ASA and Solstad Offshore ASA are listed companies. Shown below are the share prices and market values of the Group’s share in the companies:
At 31 December 2018Number of shares
in millionsQuoted price in
NOKBook value in
NOK millionMarket value in
NOK million
Aker BP ASA 144.0 218.00 19 878 31 403
Solstad Offshore ASA 67.3 1.72 - 116
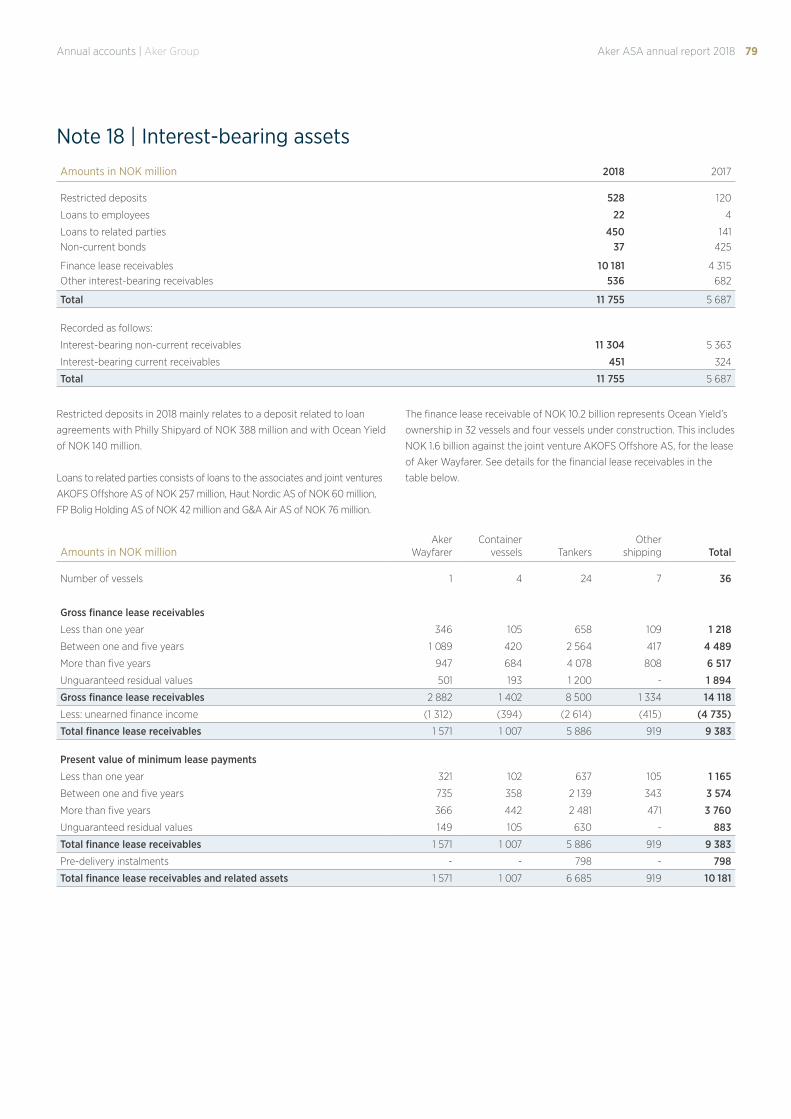
79Annual accounts | Aker Group Aker ASA annual report 2018
Restricted deposits in 2018 mainly relates to a deposit related to loan
agreements with Philly Shipyard of NOK 388 million and with Ocean Yield
of NOK 140 million.
Loans to related parties consists of loans to the associates and joint ventures
AKOFS Offshore AS of NOK 257 million, Haut Nordic AS of NOK 60 million,
FP Bolig Holding AS of NOK 42 million and G&A Air AS of NOK 76 million.
The finance lease receivable of NOK 10.2 billion represents Ocean Yield’s
ownership in 32 vessels and four vessels under construction. This includes
NOK 1.6 billion against the joint venture AKOFS Offshore AS, for the lease
of Aker Wayfarer. See details for the financial lease receivables in the
table below.
Note 18 | Interest-bearing assetsAmounts in NOK million 2018 2017
Restricted deposits 528 120
Loans to employees 22 4
Loans to related parties 450 141Non-current bonds 37 425
Finance lease receivables 10 181 4 315Other interest-bearing receivables 536 682
Total 11 755 5 687
Recorded as follows:
Interest-bearing non-current receivables 11 304 5 363
Interest-bearing current receivables 451 324
Total 11 755 5 687
Amounts in NOK millionAker
WayfarerContainer
vessels TankersOther
shipping Total
Number of vessels 1 4 24 7 36
Gross finance lease receivables
Less than one year 346 105 658 109 1 218
Between one and five years 1 089 420 2 564 417 4 489
More than five years 947 684 4 078 808 6 517
Unguaranteed residual values 501 193 1 200 - 1 894
Gross finance lease receivables 2 882 1 402 8 500 1 334 14 118
Less: unearned finance income (1 312) (394) (2 614) (415) (4 735)
Total finance lease receivables 1 571 1 007 5 886 919 9 383
Present value of minimum lease payments
Less than one year 321 102 637 105 1 165
Between one and five years 735 358 2 139 343 3 574
More than five years 366 442 2 481 471 3 760
Unguaranteed residual values 149 105 630 - 883
Total finance lease receivables 1 571 1 007 5 886 919 9 383
Pre-delivery instalments - - 798 - 798
Total finance lease receivables and related assets 1 571 1 007 6 685 919 10 181
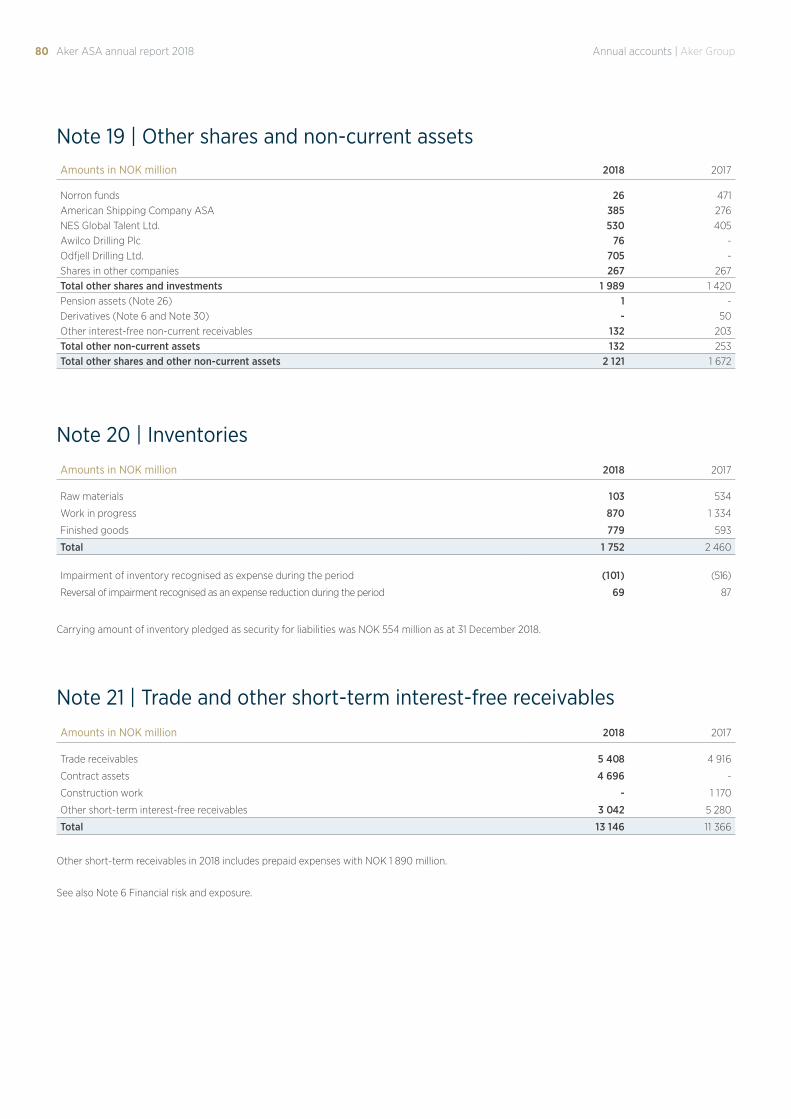
80 Annual accounts | Aker GroupAker ASA annual report 2018
Note 19 | Other shares and non-current assetsAmounts in NOK million 2018 2017
Norron funds 26 471American Shipping Company ASA 385 276NES Global Talent Ltd. 530 405Awilco Drilling Plc 76 -Odfjell Drilling Ltd. 705 -Shares in other companies 267 267Total other shares and investments 1 989 1 420Pension assets (Note 26) 1 -Derivatives (Note 6 and Note 30) - 50Other interest-free non-current receivables 132 203Total other non-current assets 132 253Total other shares and other non-current assets 2 121 1 672
Note 20 | InventoriesAmounts in NOK million 2018 2017
Raw materials 103 534
Work in progress 870 1 334
Finished goods 779 593
Total 1 752 2 460
Impairment of inventory recognised as expense during the period (101) (516)
Reversal of impairment recognised as an expense reduction during the period 69 87
Carrying amount of inventory pledged as security for liabilities was NOK 554 million as at 31 December 2018.
Note 21 | Trade and other short-term interest-free receivablesAmounts in NOK million 2018 2017
Trade receivables 5 408 4 916
Contract assets 4 696 -
Construction work - 1 170
Other short-term interest-free receivables 3 042 5 280
Total 13 146 11 366
Other short-term receivables in 2018 includes prepaid expenses with NOK 1 890 million.
See also Note 6 Financial risk and exposure.
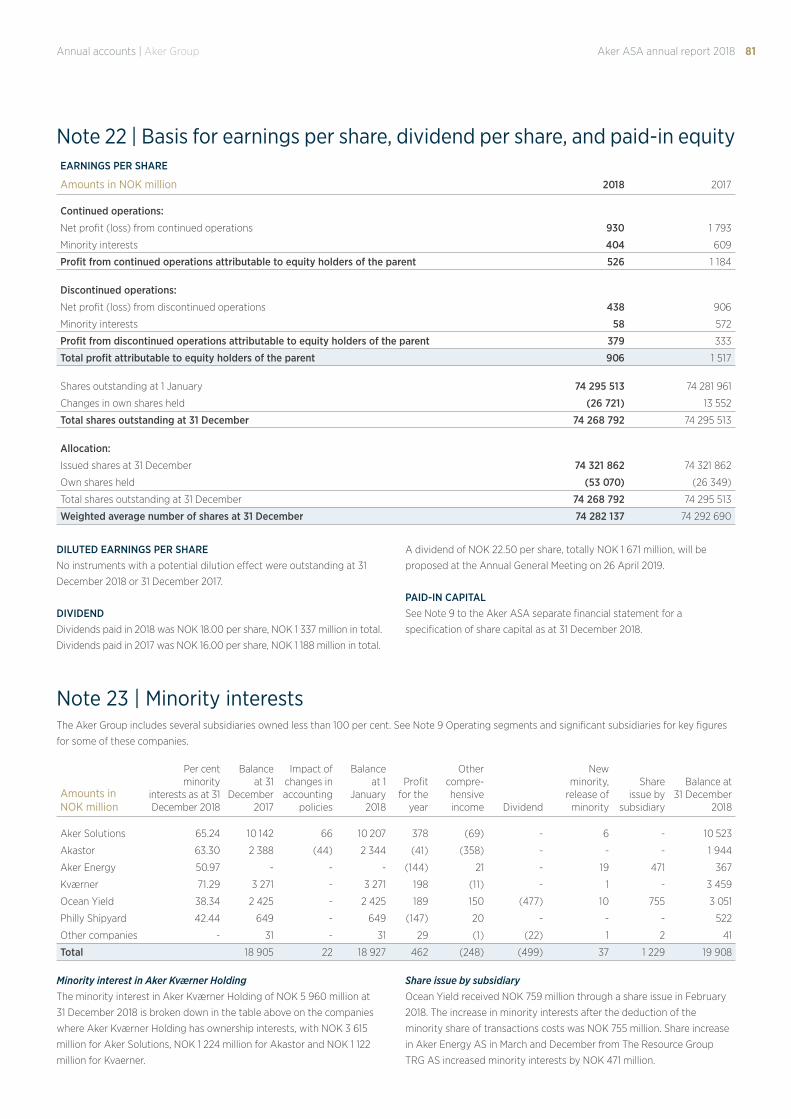
81Annual accounts | Aker Group Aker ASA annual report 2018
Note 22 | Basis for earnings per share, dividend per share, and paid-in equityEARNINGS PER SHARE
Amounts in NOK million 2018 2017
Continued operations:
Net profit (loss) from continued operations 930 1 793
Minority interests 404 609
Profit from continued operations attributable to equity holders of the parent 526 1 184
Discontinued operations:
Net profit (loss) from discontinued operations 438 906
Minority interests 58 572
Profit from discontinued operations attributable to equity holders of the parent 379 333
Total profit attributable to equity holders of the parent 906 1 517
Shares outstanding at 1 January 74 295 513 74 281 961
Changes in own shares held (26 721) 13 552
Total shares outstanding at 31 December 74 268 792 74 295 513
Allocation:
Issued shares at 31 December 74 321 862 74 321 862
Own shares held (53 070) (26 349)
Total shares outstanding at 31 December 74 268 792 74 295 513
Weighted average number of shares at 31 December 74 282 137 74 292 690
DILUTED EARNINGS PER SHARENo instruments with a potential dilution effect were outstanding at 31
December 2018 or 31 December 2017.
DIVIDENDDividends paid in 2018 was NOK 18.00 per share, NOK 1 337 million in total.
Dividends paid in 2017 was NOK 16.00 per share, NOK 1 188 million in total.
A dividend of NOK 22.50 per share, totally NOK 1 671 million, will be
proposed at the Annual General Meeting on 26 April 2019.
PAID-IN CAPITALSee Note 9 to the Aker ASA separate financial statement for a
specification of share capital as at 31 December 2018.
Note 23 | Minority interestsThe Aker Group includes several subsidiaries owned less than 100 per cent. See Note 9 Operating segments and significant subsidiaries for key figures
for some of these companies.
Amounts in NOK million
Per cent minority
interests as at 31 December 2018
Balance at 31
December 2017
Impact of changes in accounting
policies
Balance at 1
January 2018
Profit for the
year
Other compre-hensive income Dividend
New minority,
release of minority
Share issue by
subsidiary
Balance at 31 December
2018
Aker Solutions 65.24 10 142 66 10 207 378 (69) - 6 - 10 523
Akastor 63.30 2 388 (44) 2 344 (41) (358) - - - 1 944
Aker Energy 50.97 - - - (144) 21 - 19 471 367
Kværner 71.29 3 271 - 3 271 198 (11) - 1 - 3 459
Ocean Yield 38.34 2 425 - 2 425 189 150 (477) 10 755 3 051
Philly Shipyard 42.44 649 - 649 (147) 20 - - - 522
Other companies - 31 - 31 29 (1) (22) 1 2 41
Total 18 905 22 18 927 462 (248) (499) 37 1 229 19 908
Minority interest in Aker Kværner HoldingThe minority interest in Aker Kværner Holding of NOK 5 960 million at
31 December 2018 is broken down in the table above on the companies
where Aker Kværner Holding has ownership interests, with NOK 3 615
million for Aker Solutions, NOK 1 224 million for Akastor and NOK 1 122
million for Kvaerner.
Share issue by subsidiaryOcean Yield received NOK 759 million through a share issue in February
2018. The increase in minority interests after the deduction of the
minority share of transactions costs was NOK 755 million. Share increase
in Aker Energy AS in March and December from The Resource Group
TRG AS increased minority interests by NOK 471 million.
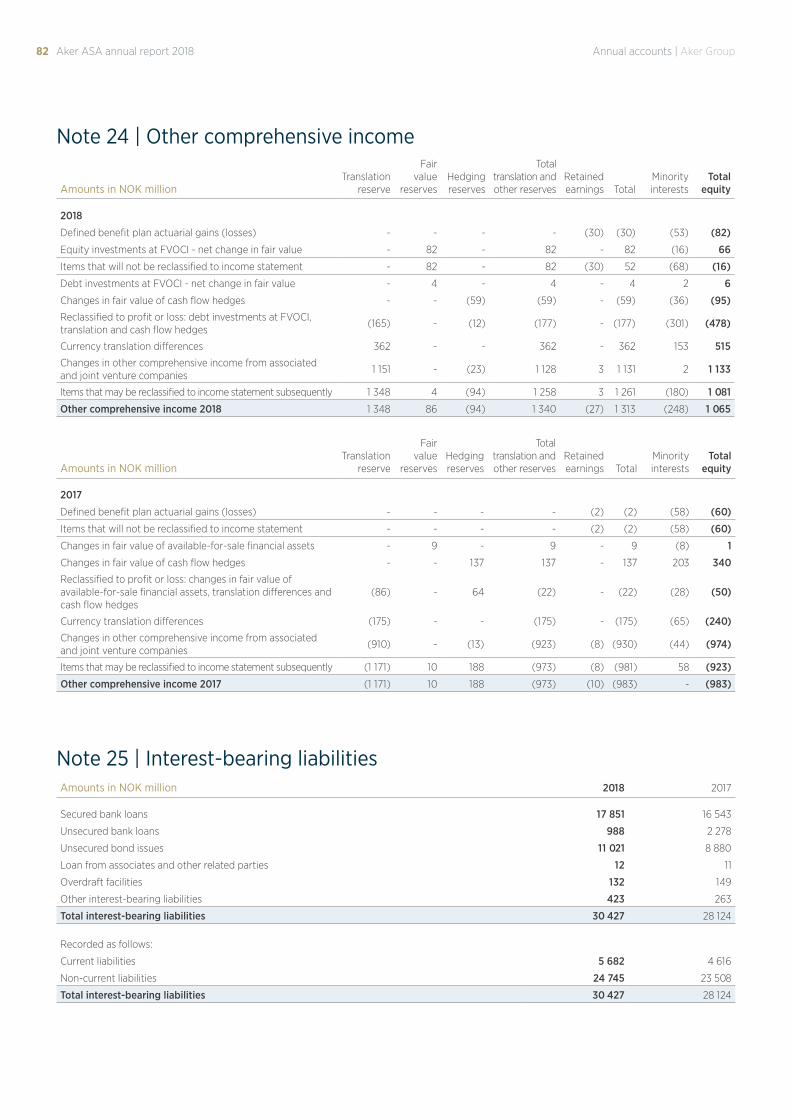
82 Annual accounts | Aker GroupAker ASA annual report 2018
Note 24 | Other comprehensive income
Amounts in NOK millionTranslation
reserve
Fair value
reservesHedging reserves
Total translation and other reserves
Retained earnings Total
Minority interests
Total equity
2018
Defined benefit plan actuarial gains (losses) - - - - (30) (30) (53) (82)
Equity investments at FVOCI - net change in fair value - 82 - 82 - 82 (16) 66
Items that will not be reclassified to income statement - 82 - 82 (30) 52 (68) (16)
Debt investments at FVOCI - net change in fair value - 4 - 4 - 4 2 6
Changes in fair value of cash flow hedges - - (59) (59) - (59) (36) (95)
Reclassified to profit or loss: debt investments at FVOCI, translation and cash flow hedges
(165) - (12) (177) - (177) (301) (478)
Currency translation differences 362 - - 362 - 362 153 515
Changes in other comprehensive income from associated and joint venture companies
1 151 - (23) 1 128 3 1 131 2 1 133
Items that may be reclassified to income statement subsequently 1 348 4 (94) 1 258 3 1 261 (180) 1 081
Other comprehensive income 2018 1 348 86 (94) 1 340 (27) 1 313 (248) 1 065
Amounts in NOK millionTranslation
reserve
Fair value
reservesHedging reserves
Total translation and other reserves
Retained earnings Total
Minority interests
Total equity
2017
Defined benefit plan actuarial gains (losses) - - - - (2) (2) (58) (60)
Items that will not be reclassified to income statement - - - - (2) (2) (58) (60)
Changes in fair value of available-for-sale financial assets - 9 - 9 - 9 (8) 1
Changes in fair value of cash flow hedges - - 137 137 - 137 203 340
Reclassified to profit or loss: changes in fair value of available-for-sale financial assets, translation differences and cash flow hedges
(86) - 64 (22) - (22) (28) (50)
Currency translation differences (175) - - (175) - (175) (65) (240)
Changes in other comprehensive income from associated and joint venture companies
(910) - (13) (923) (8) (930) (44) (974)
Items that may be reclassified to income statement subsequently (1 171) 10 188 (973) (8) (981) 58 (923)
Other comprehensive income 2017 (1 171) 10 188 (973) (10) (983) - (983)
Note 25 | Interest-bearing liabilitiesAmounts in NOK million 2018 2017
Secured bank loans 17 851 16 543
Unsecured bank loans 988 2 278
Unsecured bond issues 11 021 8 880
Loan from associates and other related parties 12 11
Overdraft facilities 132 149
Other interest-bearing liabilities 423 263
Total interest-bearing liabilities 30 427 28 124
Recorded as follows:
Current liabilities 5 682 4 616
Non-current liabilities 24 745 23 508
Total interest-bearing liabilities 30 427 28 124
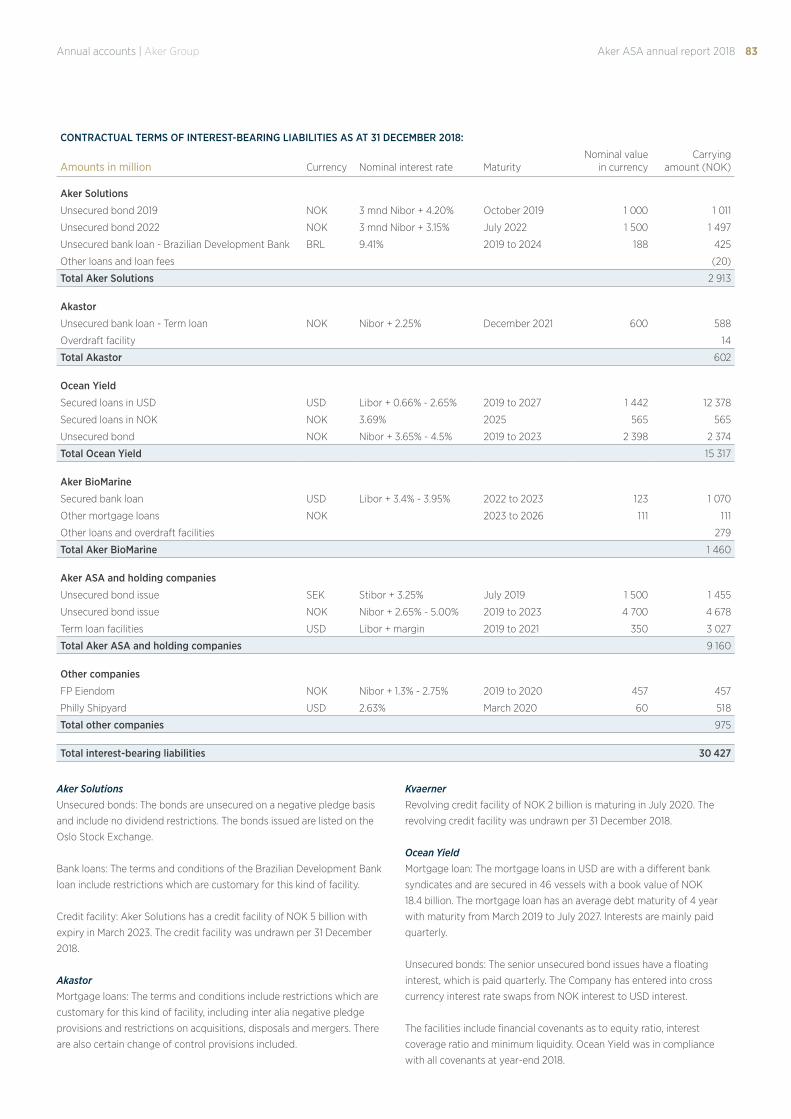
83Annual accounts | Aker Group Aker ASA annual report 2018
CONTRACTUAL TERMS OF INTEREST-BEARING LIABILITIES AS AT 31 DECEMBER 2018:
Amounts in million Currency Nominal interest rate MaturityNominal value
in currency Carrying
amount (NOK)
Aker Solutions
Unsecured bond 2019 NOK 3 mnd Nibor + 4.20% October 2019 1 000 1 011
Unsecured bond 2022 NOK 3 mnd Nibor + 3.15% July 2022 1 500 1 497
Unsecured bank loan - Brazilian Development Bank BRL 9.41% 2019 to 2024 188 425
Other loans and loan fees (20)
Total Aker Solutions 2 913
Akastor
Unsecured bank loan - Term loan NOK Nibor + 2.25% December 2021 600 588
Overdraft facility 14
Total Akastor 602
Ocean Yield
Secured loans in USD USD Libor + 0.66% - 2.65% 2019 to 2027 1 442 12 378
Secured loans in NOK NOK 3.69% 2025 565 565
Unsecured bond NOK Nibor + 3.65% - 4.5% 2019 to 2023 2 398 2 374
Total Ocean Yield 15 317
Aker BioMarine
Secured bank loan USD Libor + 3.4% - 3.95% 2022 to 2023 123 1 070
Other mortgage loans NOK 2023 to 2026 111 111
Other loans and overdraft facilities 279
Total Aker BioMarine 1 460
Aker ASA and holding companies
Unsecured bond issue SEK Stibor + 3.25% July 2019 1 500 1 455
Unsecured bond issue NOK Nibor + 2.65% - 5.00% 2019 to 2023 4 700 4 678
Term loan facilities USD Libor + margin 2019 to 2021 350 3 027
Total Aker ASA and holding companies 9 160
Other companies
FP Eiendom NOK Nibor + 1.3% - 2.75% 2019 to 2020 457 457
Philly Shipyard USD 2.63% March 2020 60 518
Total other companies 975
Total interest-bearing liabilities 30 427
Aker SolutionsUnsecured bonds: The bonds are unsecured on a negative pledge basis
and include no dividend restrictions. The bonds issued are listed on the
Oslo Stock Exchange.
Bank loans: The terms and conditions of the Brazilian Development Bank
loan include restrictions which are customary for this kind of facility.
Credit facility: Aker Solutions has a credit facility of NOK 5 billion with
expiry in March 2023. The credit facility was undrawn per 31 December
2018.
AkastorMortgage loans: The terms and conditions include restrictions which are
customary for this kind of facility, including inter alia negative pledge
provisions and restrictions on acquisitions, disposals and mergers. There
are also certain change of control provisions included.
KvaernerRevolving credit facility of NOK 2 billion is maturing in July 2020. The
revolving credit facility was undrawn per 31 December 2018.
Ocean Yield Mortgage loan: The mortgage loans in USD are with a different bank
syndicates and are secured in 46 vessels with a book value of NOK
18.4 billion. The mortgage loan has an average debt maturity of 4 year
with maturity from March 2019 to July 2027. Interests are mainly paid
quarterly.
Unsecured bonds: The senior unsecured bond issues have a floating
interest, which is paid quarterly. The Company has entered into cross
currency interest rate swaps from NOK interest to USD interest.
The facilities include financial covenants as to equity ratio, interest
coverage ratio and minimum liquidity. Ocean Yield was in compliance
with all covenants at year-end 2018.
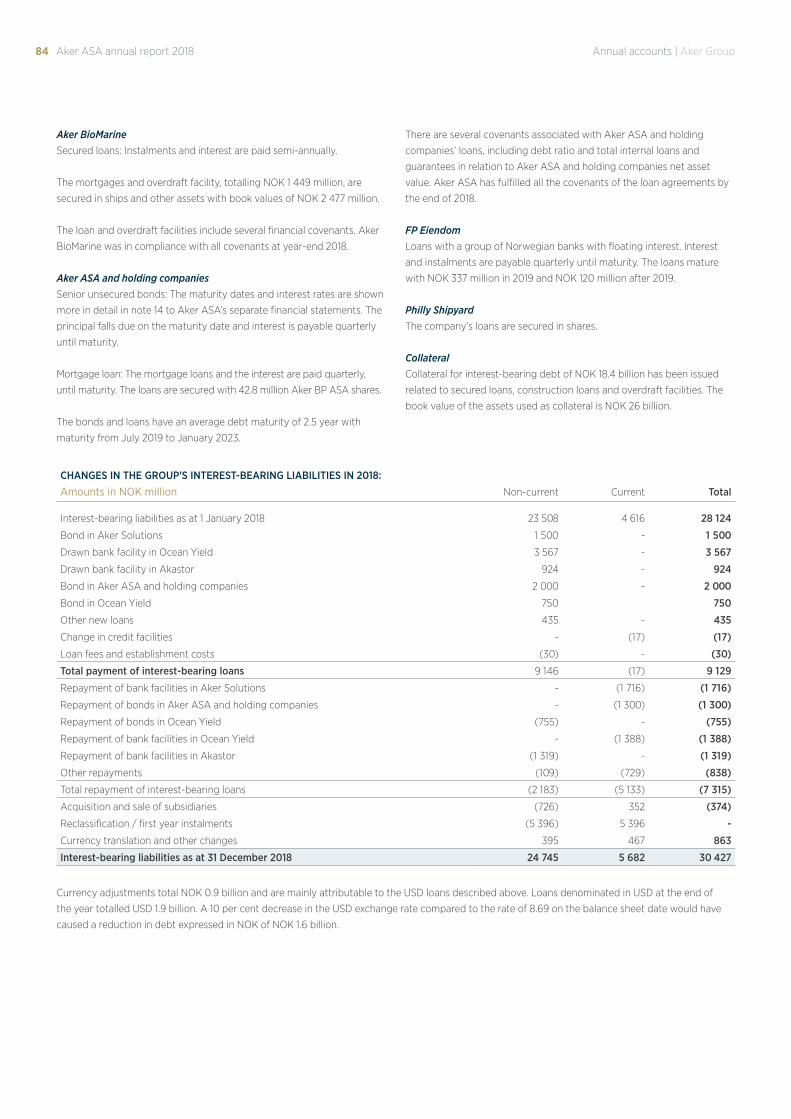
84 Annual accounts | Aker GroupAker ASA annual report 2018
CHANGES IN THE GROUP'S INTEREST-BEARING LIABILITIES IN 2018:
Amounts in NOK million Non-current Current Total
Interest-bearing liabilities as at 1 January 2018 23 508 4 616 28 124
Bond in Aker Solutions 1 500 - 1 500
Drawn bank facility in Ocean Yield 3 567 - 3 567
Drawn bank facility in Akastor 924 - 924
Bond in Aker ASA and holding companies 2 000 - 2 000
Bond in Ocean Yield 750 750
Other new loans 435 - 435
Change in credit facilities - (17) (17)
Loan fees and establishment costs (30) - (30)
Total payment of interest-bearing loans 9 146 (17) 9 129
Repayment of bank facilities in Aker Solutions - (1 716) (1 716)
Repayment of bonds in Aker ASA and holding companies - (1 300) (1 300)
Repayment of bonds in Ocean Yield (755) - (755)
Repayment of bank facilities in Ocean Yield - (1 388) (1 388)
Repayment of bank facilities in Akastor (1 319) - (1 319)
Other repayments (109) (729) (838)
Total repayment of interest-bearing loans (2 183) (5 133) (7 315)
Acquisition and sale of subsidiaries (726) 352 (374)
Reclassification / first year instalments (5 396) 5 396 -
Currency translation and other changes 395 467 863
Interest-bearing liabilities as at 31 December 2018 24 745 5 682 30 427
Currency adjustments total NOK 0.9 billion and are mainly attributable to the USD loans described above. Loans denominated in USD at the end of
the year totalled USD 1.9 billion. A 10 per cent decrease in the USD exchange rate compared to the rate of 8.69 on the balance sheet date would have
caused a reduction in debt expressed in NOK of NOK 1.6 billion.
Aker BioMarineSecured loans: Instalments and interest are paid semi-annually.
The mortgages and overdraft facility, totalling NOK 1 449 million, are
secured in ships and other assets with book values of NOK 2 477 million.
The loan and overdraft facilities include several financial covenants. Aker
BioMarine was in compliance with all covenants at year-end 2018.
Aker ASA and holding companiesSenior unsecured bonds: The maturity dates and interest rates are shown
more in detail in note 14 to Aker ASA’s separate financial statements. The
principal falls due on the maturity date and interest is payable quarterly
until maturity.
Mortgage loan: The mortgage loans and the interest are paid quarterly,
until maturity. The loans are secured with 42.8 million Aker BP ASA shares.
The bonds and loans have an average debt maturity of 2.5 year with
maturity from July 2019 to January 2023.
There are several covenants associated with Aker ASA and holding
companies’ loans, including debt ratio and total internal loans and
guarantees in relation to Aker ASA and holding companies net asset
value. Aker ASA has fulfilled all the covenants of the loan agreements by
the end of 2018.
FP EiendomLoans with a group of Norwegian banks with floating interest. Interest
and instalments are payable quarterly until maturity. The loans mature
with NOK 337 million in 2019 and NOK 120 million after 2019.
Philly ShipyardThe company’s loans are secured in shares.
CollateralCollateral for interest-bearing debt of NOK 18.4 billion has been issued
related to secured loans, construction loans and overdraft facilities. The
book value of the assets used as collateral is NOK 26 billion.

85Annual accounts | Aker Group Aker ASA annual report 2018
The Aker Group’s Norwegian companies mainly cover their pension
liabilities through group pension plans managed by life insurance
companies. The Norwegian companies in the Group are subject to the
Norwegian Act relating to mandatory occupational pensions, and the
Group meets the requirements of this legislation.
In addition, some of the Norwegian companies are members of an
agreement-based early retirement plan (AFP). The schemes provide a
large proportion of the Norwegian employees the opportunity to retire
before the normal retirement age in Norway of 67 years. Employees who
choose retirement will retain a lifelong benefit from the age of 62 years.
The Group’s companies outside Norway have pension plans based on
local practice and regulations.
The Group also has uninsured pension liabilities for which provisions have
been made.
The discount rates used in 2018 and 2017 are based on the Norwegian
high-quality corporate bond rate.
The following assumptions have been made when calculating liabilities
and expenses in Norway:
Balance 2018Profit/loss 2018
and balance 2017
Expected return 2.8 % 2.4 %
Discount rate 2.8 % 2.4 %
Wage growth 2.8 % 2.5 %
Pension adjustment 0.0 %-4.0 % 0.0 %-2.3 %
Mortality table K2013 K2013
Note 26 | Pension expenses and pension liabilities
PENSION EXPENSE RECOGNISED IN PROFIT AND LOSS:
Amounts in NOK million 2018 2017
Expense related to benefits earned during the period 90 93
Interest expense accrued on pension liabilities 35 39
Expected return on pension funds (11) (14)
Service costs 1 1
Pension expense recognised from defined benefit plans 114 120
Contribution plans (employer's contribution) 658 628
Total pension expense recognised in profit and loss 772 748
Allocation in income statement:
Pension cost recognised as part of wages and other personal expenses 749 721
Interest expenses and expected return recognised as part of net financial items 23 27
Total pension expense recognised in profit and loss 772 748
REMEASUREMENT LOSS (GAIN) INCLUDED IN OTHER COMPREHENSIVE INCOME:
Amounts in NOK million 2018 2017
Change in discount rate and other financial assumptions (4) 2
Change in life expectancy 6 (39)
Change in other assumptions 95 103
Other comprehensive income - loss/(gain) before tax 97 66
Tax (15) (6)
Other comprehensive income - loss/(gain) after tax 82 60
CHANGES IN NET PRESENT VALUE OF BENEFIT-BASED PENSION LIABILITIES:
Amounts in NOK million 2018 2017
Net pension liabilities at 1 January 1 189 1 238
Pension expense recognised from defined benefit plans 114 120
Acquisitions and disposals (7) (18)
Pension payments (68) (62)
Payments received (130) (154)
Remeasurements included in other comprehensive income 97 66
Effects of changes in exchange rates and other changes (16) (1)
Net pension liabilities at 31 December 1 180 1 189
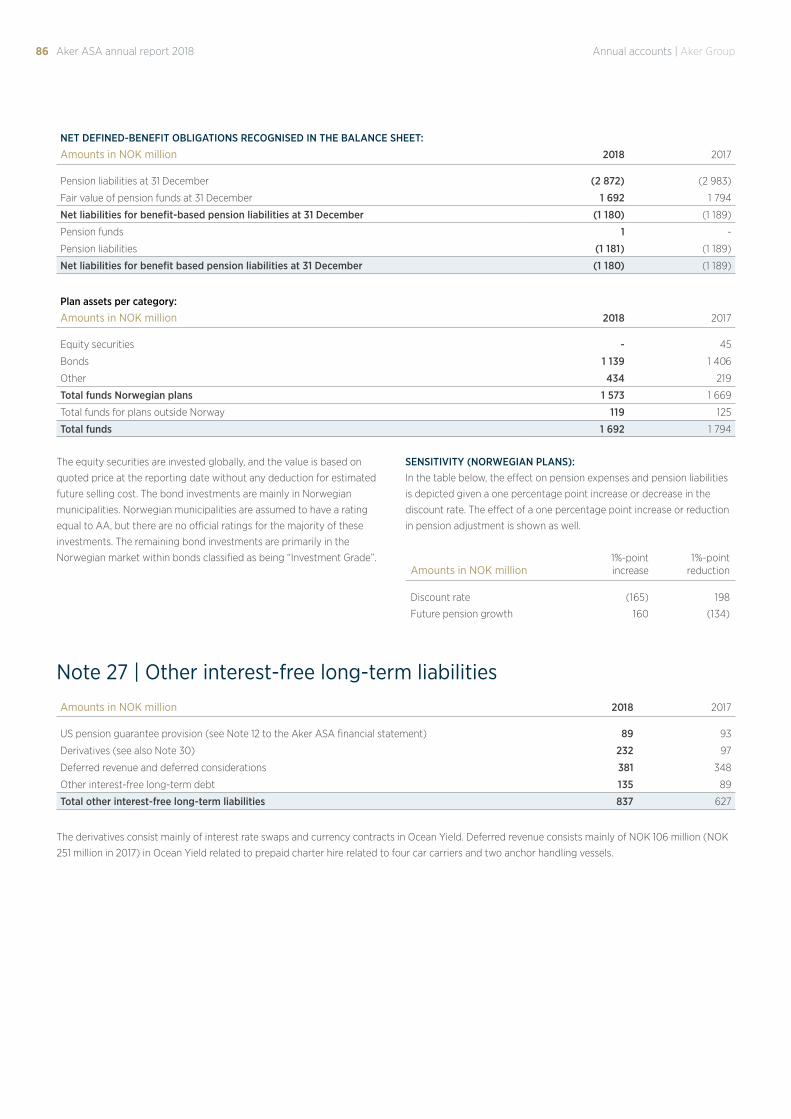
86 Annual accounts | Aker GroupAker ASA annual report 2018
NET DEFINED-BENEFIT OBLIGATIONS RECOGNISED IN THE BALANCE SHEET:
Amounts in NOK million 2018 2017
Pension liabilities at 31 December (2 872) (2 983)
Fair value of pension funds at 31 December 1 692 1 794
Net liabilities for benefit-based pension liabilities at 31 December (1 180) (1 189)
Pension funds 1 -
Pension liabilities (1 181) (1 189)
Net liabilities for benefit based pension liabilities at 31 December (1 180) (1 189)
Plan assets per category:
Amounts in NOK million 2018 2017
Equity securities - 45
Bonds 1 139 1 406
Other 434 219
Total funds Norwegian plans 1 573 1 669
Total funds for plans outside Norway 119 125
Total funds 1 692 1 794
The equity securities are invested globally, and the value is based on
quoted price at the reporting date without any deduction for estimated
future selling cost. The bond investments are mainly in Norwegian
municipalities. Norwegian municipalities are assumed to have a rating
equal to AA, but there are no official ratings for the majority of these
investments. The remaining bond investments are primarily in the
Norwegian market within bonds classified as being “Investment Grade”.
SENSITIVITY (NORWEGIAN PLANS):In the table below, the effect on pension expenses and pension liabilities
is depicted given a one percentage point increase or decrease in the
discount rate. The effect of a one percentage point increase or reduction
in pension adjustment is shown as well.
Amounts in NOK million1%-point increase
1%-point reduction
Discount rate (165) 198
Future pension growth 160 (134)
The derivatives consist mainly of interest rate swaps and currency contracts in Ocean Yield. Deferred revenue consists mainly of NOK 106 million (NOK
251 million in 2017) in Ocean Yield related to prepaid charter hire related to four car carriers and two anchor handling vessels.
Amounts in NOK million 2018 2017
US pension guarantee provision (see Note 12 to the Aker ASA financial statement) 89 93
Derivatives (see also Note 30) 232 97
Deferred revenue and deferred considerations 381 348
Other interest-free long-term debt 135 89
Total other interest-free long-term liabilities 837 627
Note 27 | Other interest-free long-term liabilities
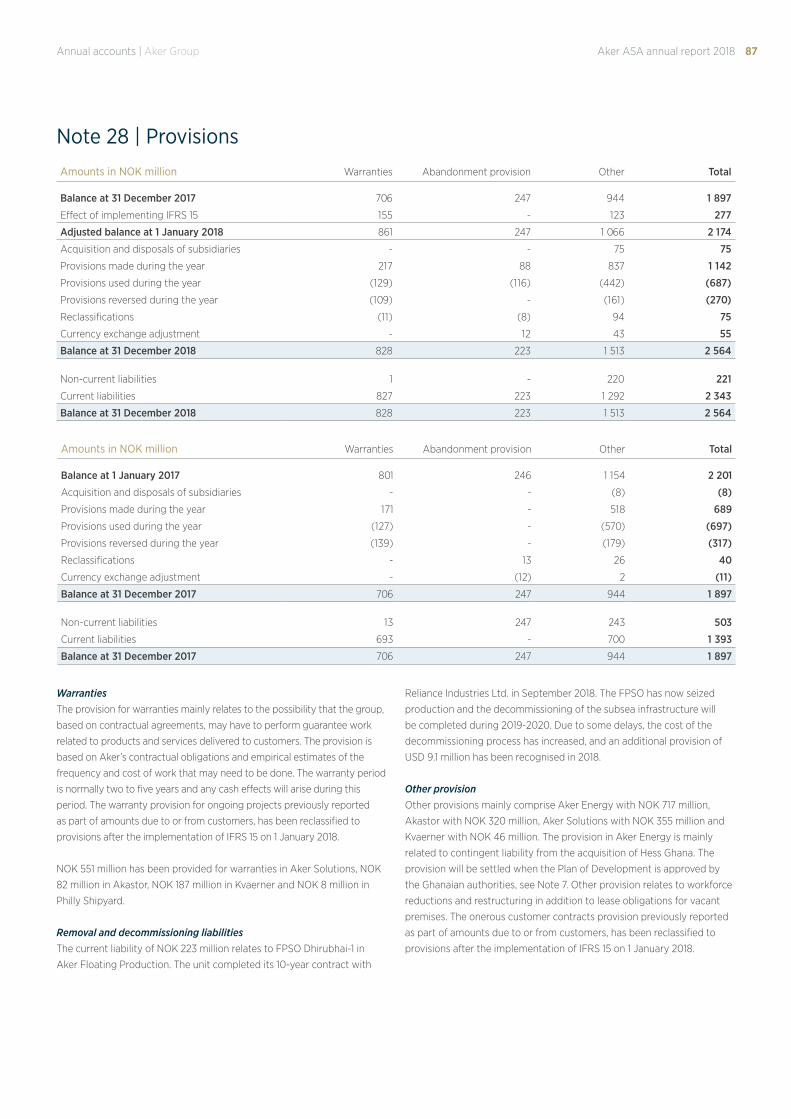
87Annual accounts | Aker Group Aker ASA annual report 2018
Amounts in NOK million Warranties Abandonment provision Other Total
Balance at 31 December 2017 706 247 944 1 897
Effect of implementing IFRS 15 155 - 123 277
Adjusted balance at 1 January 2018 861 247 1 066 2 174
Acquisition and disposals of subsidiaries - - 75 75
Provisions made during the year 217 88 837 1 142
Provisions used during the year (129) (116) (442) (687)
Provisions reversed during the year (109) - (161) (270)
Reclassifications (11) (8) 94 75
Currency exchange adjustment - 12 43 55
Balance at 31 December 2018 828 223 1 513 2 564
Non-current liabilities 1 - 220 221
Current liabilities 827 223 1 292 2 343
Balance at 31 December 2018 828 223 1 513 2 564
Note 28 | Provisions
Amounts in NOK million Warranties Abandonment provision Other Total
Balance at 1 January 2017 801 246 1 154 2 201
Acquisition and disposals of subsidiaries - - (8) (8)
Provisions made during the year 171 - 518 689
Provisions used during the year (127) - (570) (697)
Provisions reversed during the year (139) - (179) (317)
Reclassifications - 13 26 40
Currency exchange adjustment - (12) 2 (11)
Balance at 31 December 2017 706 247 944 1 897
Non-current liabilities 13 247 243 503
Current liabilities 693 - 700 1 393
Balance at 31 December 2017 706 247 944 1 897
WarrantiesThe provision for warranties mainly relates to the possibility that the group,
based on contractual agreements, may have to perform guarantee work
related to products and services delivered to customers. The provision is
based on Aker’s contractual obligations and empirical estimates of the
frequency and cost of work that may need to be done. The warranty period
is normally two to five years and any cash effects will arise during this
period. The warranty provision for ongoing projects previously reported
as part of amounts due to or from customers, has been reclassified to
provisions after the implementation of IFRS 15 on 1 January 2018.
NOK 551 million has been provided for warranties in Aker Solutions, NOK
82 million in Akastor, NOK 187 million in Kvaerner and NOK 8 million in
Philly Shipyard.
Removal and decommissioning liabilitiesThe current liability of NOK 223 million relates to FPSO Dhirubhai-1 in
Aker Floating Production. The unit completed its 10-year contract with
Reliance Industries Ltd. in September 2018. The FPSO has now seized
production and the decommissioning of the subsea infrastructure will
be completed during 2019-2020. Due to some delays, the cost of the
decommissioning process has increased, and an additional provision of
USD 9.1 million has been recognised in 2018.
Other provisionOther provisions mainly comprise Aker Energy with NOK 717 million,
Akastor with NOK 320 million, Aker Solutions with NOK 355 million and
Kvaerner with NOK 46 million. The provision in Aker Energy is mainly
related to contingent liability from the acquisition of Hess Ghana. The
provision will be settled when the Plan of Development is approved by
the Ghanaian authorities, see Note 7. Other provision relates to workforce
reductions and restructuring in addition to lease obligations for vacant
premises. The onerous customer contracts provision previously reported
as part of amounts due to or from customers, has been reclassified to
provisions after the implementation of IFRS 15 on 1 January 2018.
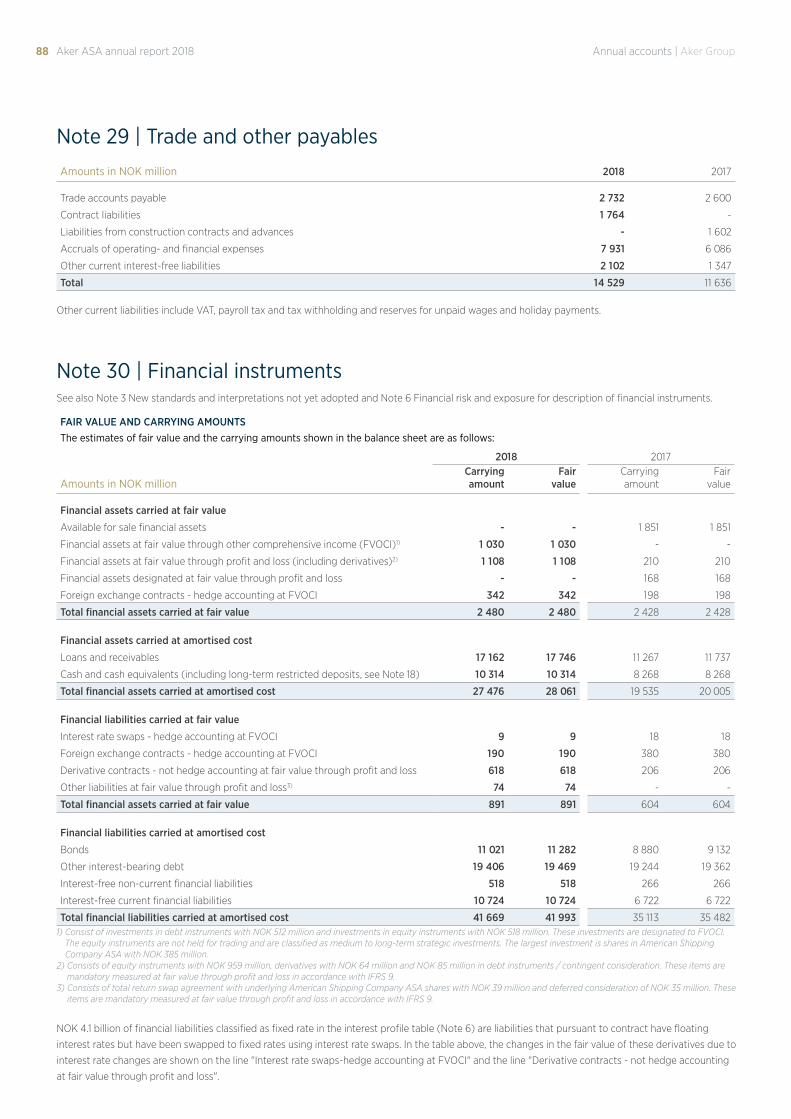
88 Annual accounts | Aker GroupAker ASA annual report 2018
Note 29 | Trade and other payablesAmounts in NOK million 2018 2017
Trade accounts payable 2 732 2 600
Contract liabilities 1 764 -
Liabilities from construction contracts and advances - 1 602
Accruals of operating- and financial expenses 7 931 6 086
Other current interest-free liabilities 2 102 1 347
Total 14 529 11 636
Other current liabilities include VAT, payroll tax and tax withholding and reserves for unpaid wages and holiday payments.
Note 30 | Financial instrumentsSee also Note 3 New standards and interpretations not yet adopted and Note 6 Financial risk and exposure for description of financial instruments.
NOK 4.1 billion of financial liabilities classified as fixed rate in the interest profile table (Note 6) are liabilities that pursuant to contract have floating
interest rates but have been swapped to fixed rates using interest rate swaps. In the table above, the changes in the fair value of these derivatives due to
interest rate changes are shown on the line "Interest rate swaps-hedge accounting at FVOCI" and the line "Derivative contracts - not hedge accounting
at fair value through profit and loss".
FAIR VALUE AND CARRYING AMOUNTSThe estimates of fair value and the carrying amounts shown in the balance sheet are as follows:
2018 2017
Amounts in NOK millionCarrying amount
Fair value
Carrying amount
Fair value
Financial assets carried at fair value
Available for sale financial assets - - 1 851 1 851
Financial assets at fair value through other comprehensive income (FVOCI)1) 1 030 1 030 - -
Financial assets at fair value through profit and loss (including derivatives)2) 1 108 1 108 210 210
Financial assets designated at fair value through profit and loss - - 168 168
Foreign exchange contracts - hedge accounting at FVOCI 342 342 198 198
Total financial assets carried at fair value 2 480 2 480 2 428 2 428
Financial assets carried at amortised cost
Loans and receivables 17 162 17 746 11 267 11 737
Cash and cash equivalents (including long-term restricted deposits, see Note 18) 10 314 10 314 8 268 8 268
Total financial assets carried at amortised cost 27 476 28 061 19 535 20 005
Financial liabilities carried at fair value
Interest rate swaps - hedge accounting at FVOCI 9 9 18 18
Foreign exchange contracts - hedge accounting at FVOCI 190 190 380 380
Derivative contracts - not hedge accounting at fair value through profit and loss 618 618 206 206
Other liabilities at fair value through profit and loss3) 74 74 - -
Total financial assets carried at fair value 891 891 604 604
Financial liabilities carried at amortised cost
Bonds 11 021 11 282 8 880 9 132
Other interest-bearing debt 19 406 19 469 19 244 19 362
Interest-free non-current financial liabilities 518 518 266 266
Interest-free current financial liabilities 10 724 10 724 6 722 6 722
Total financial liabilities carried at amortised cost 41 669 41 993 35 113 35 4821) Consist of investments in debt instruments with NOK 512 million and investments in equity instruments with NOK 518 million. These investments are designated to FVOCI.
The equity instruments are not held for trading and are classified as medium to long-term strategic investments. The largest investment is shares in American Shipping Company ASA with NOK 385 million.
2) Consists of equity instruments with NOK 959 million, derivatives with NOK 64 million and NOK 85 million in debt instruments / contingent consideration. These items are mandatory measured at fair value through profit and loss in accordance with IFRS 9.
3) Consists of total return swap agreement with underlying American Shipping Company ASA shares with NOK 39 million and deferred consideration of NOK 35 million. These items are mandatory measured at fair value through profit and loss in accordance with IFRS 9.
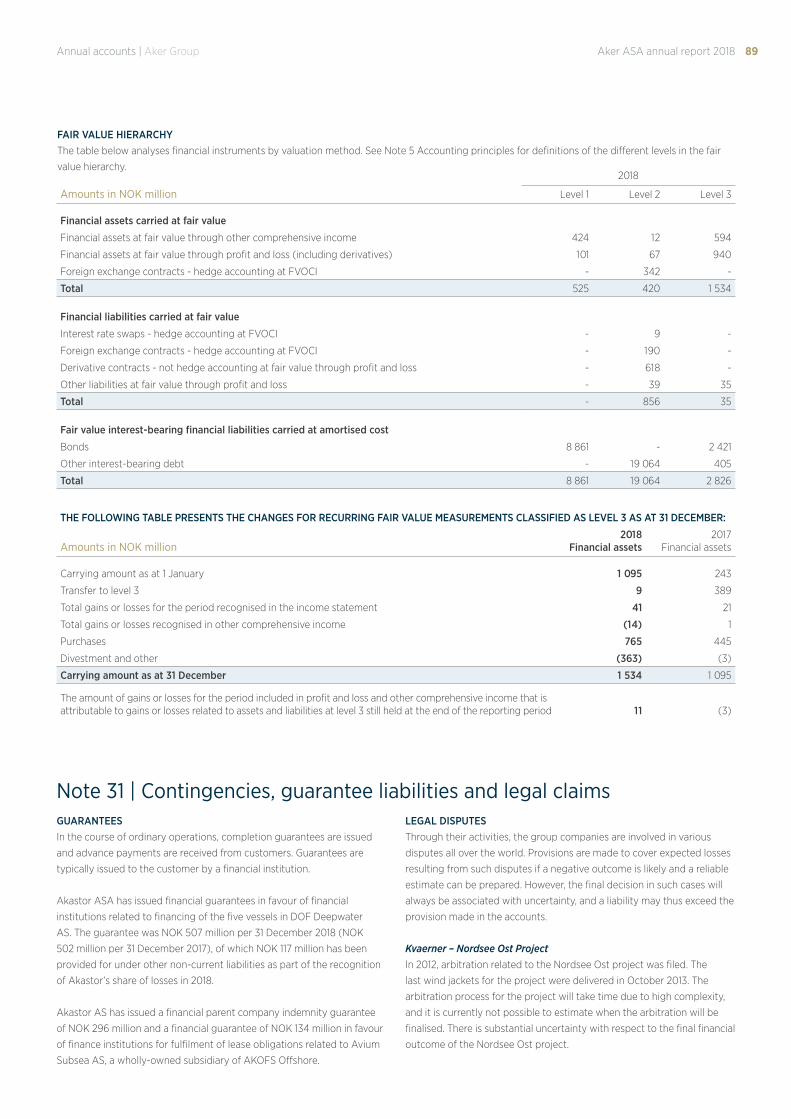
89Annual accounts | Aker Group Aker ASA annual report 2018
THE FOLLOWING TABLE PRESENTS THE CHANGES FOR RECURRING FAIR VALUE MEASUREMENTS CLASSIFIED AS LEVEL 3 AS AT 31 DECEMBER:
Amounts in NOK million2018
Financial assets2017
Financial assets
Carrying amount as at 1 January 1 095 243
Transfer to level 3 9 389
Total gains or losses for the period recognised in the income statement 41 21
Total gains or losses recognised in other comprehensive income (14) 1
Purchases 765 445
Divestment and other (363) (3)
Carrying amount as at 31 December 1 534 1 095
The amount of gains or losses for the period included in profit and loss and other comprehensive income that is attributable to gains or losses related to assets and liabilities at level 3 still held at the end of the reporting period 11 (3)
GUARANTEESIn the course of ordinary operations, completion guarantees are issued
and advance payments are received from customers. Guarantees are
typically issued to the customer by a financial institution.
Akastor ASA has issued financial guarantees in favour of financial
institutions related to financing of the five vessels in DOF Deepwater
AS. The guarantee was NOK 507 million per 31 December 2018 (NOK
502 million per 31 December 2017), of which NOK 117 million has been
provided for under other non-current liabilities as part of the recognition
of Akastor’s share of losses in 2018.
Akastor AS has issued a financial parent company indemnity guarantee
of NOK 296 million and a financial guarantee of NOK 134 million in favour
of finance institutions for fulfilment of lease obligations related to Avium
Subsea AS, a wholly-owned subsidiary of AKOFS Offshore.
LEGAL DISPUTESThrough their activities, the group companies are involved in various
disputes all over the world. Provisions are made to cover expected losses
resulting from such disputes if a negative outcome is likely and a reliable
estimate can be prepared. However, the final decision in such cases will
always be associated with uncertainty, and a liability may thus exceed the
provision made in the accounts.
Kvaerner – Nordsee Ost ProjectIn 2012, arbitration related to the Nordsee Ost project was filed. The
last wind jackets for the project were delivered in October 2013. The
arbitration process for the project will take time due to high complexity,
and it is currently not possible to estimate when the arbitration will be
finalised. There is substantial uncertainty with respect to the final financial
outcome of the Nordsee Ost project.
Note 31 | Contingencies, guarantee liabilities and legal claims
FAIR VALUE HIERARCHYThe table below analyses financial instruments by valuation method. See Note 5 Accounting principles for definitions of the different levels in the fair
value hierarchy. 2018
Amounts in NOK million Level 1 Level 2 Level 3
Financial assets carried at fair value
Financial assets at fair value through other comprehensive income 424 12 594
Financial assets at fair value through profit and loss (including derivatives) 101 67 940
Foreign exchange contracts - hedge accounting at FVOCI - 342 -
Total 525 420 1 534
Financial liabilities carried at fair value
Interest rate swaps - hedge accounting at FVOCI - 9 -
Foreign exchange contracts - hedge accounting at FVOCI - 190 -
Derivative contracts - not hedge accounting at fair value through profit and loss - 618 -
Other liabilities at fair value through profit and loss - 39 35
Total - 856 35
Fair value interest-bearing financial liabilities carried at amortised cost
Bonds 8 861 - 2 421
Other interest-bearing debt - 19 064 405
Total 8 861 19 064 2 826
90 Annual accounts | Aker GroupAker ASA annual report 2018
Note 32 | Transactions and agreements with related partiesAker ASA’s main shareholder is TRG Holding AS, controlled by Kjell Inge
Røkke through The Resource Group TRG AS (TRG AS). The Aker Group
treats all companies controlled by Kjell Inge Røkke as related parties.
TRANSACTIONS WITH KJELL INGE RØKKE AND FAMILYThrough TRG AS, Kjell Inge Røkke owns various companies with
investments in industrial properties, as well as 40 per cent of the shares
of the commercial real estate company Fornebu Gateway AS. Companies
within the group are tenants at several of these properties. In 2018,
companies within the group paid NOK 89 million in rent to the real
estate companies owned by TRG and NOK 170 million in rent to Fornebu
Gateway AS (NOK 86 million to the real estate companies owned by TRG
and NOK 171 million in rent to Fornebu Gateway AS in 2017).
Since 2015, Aker ASA has guaranteed for certain pension liabilities in TRG AS
(previously Aker Maritime Finance AS) that the company took over from
Aker ASA in 2015 (see Note 12 to Aker ASA’s separate financial statement).
TRG AS has in 2018 contributed NOK 471 million in equity to Aker Energy
AS. Part of this amount was initially provided as a loan that later was
converted to equity, including accrued interest on the loan with NOK 3
million. Petrica Holding AS and AGM Petroleum Ghana Ltd., companies
controlled by TRG AS that explore an adjacent oil field in Ghana, were in
2018 invoiced NOK 14 million from Aker Energy AS for manhours related
to Petrica/AGM’s oil field.
When Aker employees perform services for Kjell Inge Røkke or other
related parties, Aker’s expenses are billed in full. In 2018, TRG AS and
Kjell Inge Røkke paid NOK 2.2 million plus value added tax for services
and rental of premises (NOK 2.0 million in 2017). TRG AS and Kjell Inge
Røkke have provided services to Aker for NOK 1.6 million in 2018 (NOK 1.6
million in 2017).
Except for the above-mentioned transactions, and remuneration for his
work as chairman of the board of Aker ASA and board representative in
other companies within the group (see Note 33), Aker has no material
outstanding accounts or other transactions with Kjell Inge Røkke.
Kristian Røkke, son of Kjell Inge Røkke, was hired as Chief Investment Officer
in Aker ASA from 1 January 2018. See Note 33 for information about his
remuneration in 2018. In 2017, he earned NOK 6 394 790 in salary and other
remuneration as CEO of Akastor. In 2017, he also earned remuneration for
his role as member of the board of Aker ASA (see Note 33).
TRANSACTIONS WITH EMPLOYEES In parallel with an issue of shares in Cognite to newly recruited employees
in the company during 2018, Øyvind Eriksen was as Cognite’s chairman
of the board given the opportunity to purchase two percent of the shares
in the company. Eriksen purchased the shares from Aker on the same
market terms and conditions as the Cognite employees, including sales
restrictions and a five-year lockup-period. The purchase price for the
shares was NOK 2 million.
As part of a co-investment program for leading employees in Aker
Energy, Aker sold in 1 250 001 shares (1.9 per cent) in Aker Energy to
employees of the company in 2018. The shares were sold at market terms
for a total amount of NOK 19 million.
TRANSACTIONS WITH ASSOCIATES AND JOINT VENTURES OUTSIDE ORDINARY COURSE OF BUSINESSSeveral of the companies within the group have transactions with related
parties to the group as part of their ordinary course of business. This
particularly applies to Aker BP, who received products and services from
several companies within the group, including Aker Solutions, Akastor,
Kvaerner, Ocean Yield and Cognite. Below are descriptions of other
transactions with associates and joint ventures outside ordinary course
of business.
DOF Deepwater ASAker’s subsidiary Akastor have issued a shareholder’s loan to the joint
venture DOF Deepwater AS (a company owned 50 per cent by Akastor
and 50 per cent by DOF ASA). During 2018, the shareholder’s loan was
increased by NOK 24 million. As of 31 December 2018, the balance of the
shareholder’s loan was NOK 35 million, while the carrying amount has
been reduced to zero due to recognition of Akastor’s share of losses in
2018. Akastor ASA has issued financial guarantees in favour of financial
institutions related to financing of the five vessels in DOF Deepwater AS
(see Note 31).
AKOFS Offshore ASAs of 31 December 2018, Akastor ASA had interest-bearing receivables
against AKOFS Offshore amounting to NOK 257 million with maturity
in September 2019. Akastor AS has issued a financial parent company
indemnity guarantee of NOK 296 million and a financial guarantee of
NOK 134 million in favour of finance institutions for fulfilment of lease
obligations related to Avium Subsea AS, a wholly-owned subsidiary
of AKOFS Offshore. In addition, Akastor ASA has issued a guarantee
TAX CLAIMSGroup companies are regularly involved in matters under consideration
by local tax authorities in various countries. The group treats matters,
which have not been finally resolved, in accordance with the information
available at the time the annual accounts are issued.
Aker Solutions – Tax claim BrazilThe tax authorities in the state of Parana in Brazil has claimed the
Aker Solutions company in Brazil for approximately BRL 311 million
(NOK 705 million) including penalties and interests, stating that the
conditions for the export exemption from ICMS are not fulfilled. ICMS
is a value added tax on sales and services related to the movement of
goods. Management has the opinion that a successful outcome in the
administrative appeal system or in a judicial process is likely based on
current law and practice. The claim is regarded as a contingent liability
since the possible outcome will be confirmed by the occurrence of an
uncertain future event (a potential court decision). No provision has been
made for this contingent liability since a cash outflow is not considered
probable, nor is it possible to establish a reliable estimate.
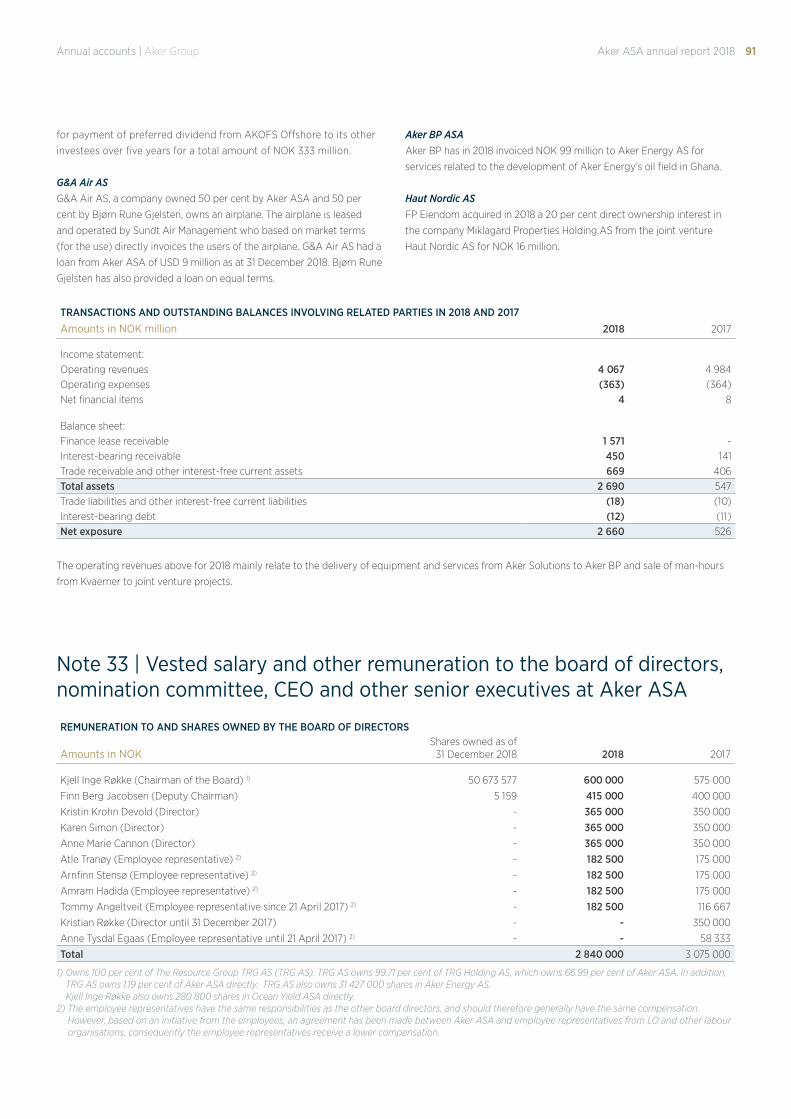
91Annual accounts | Aker Group Aker ASA annual report 2018
for payment of preferred dividend from AKOFS Offshore to its other
investees over five years for a total amount of NOK 333 million.
G&A Air ASG&A Air AS, a company owned 50 per cent by Aker ASA and 50 per
cent by Bjørn Rune Gjelsten, owns an airplane. The airplane is leased
and operated by Sundt Air Management who based on market terms
(for the use) directly invoices the users of the airplane. G&A Air AS had a
loan from Aker ASA of USD 9 million as at 31 December 2018. Bjørn Rune
Gjelsten has also provided a loan on equal terms.
Aker BP ASAAker BP has in 2018 invoiced NOK 99 million to Aker Energy AS for
services related to the development of Aker Energy’s oil field in Ghana.
Haut Nordic ASFP Eiendom acquired in 2018 a 20 per cent direct ownership interest in
the company Miklagard Properties Holding AS from the joint venture
Haut Nordic AS for NOK 16 million.
TRANSACTIONS AND OUTSTANDING BALANCES INVOLVING RELATED PARTIES IN 2018 AND 2017
Amounts in NOK million 2018 2017
Income statement:Operating revenues 4 067 4 984Operating expenses (363) (364)Net financial items 4 8
Balance sheet:Finance lease receivable 1 571 -Interest-bearing receivable 450 141Trade receivable and other interest-free current assets 669 406Total assets 2 690 547Trade liabilities and other interest-free current liabilities (18) (10)Interest-bearing debt (12) (11)Net exposure 2 660 526
The operating revenues above for 2018 mainly relate to the delivery of equipment and services from Aker Solutions to Aker BP and sale of man-hours
from Kvaerner to joint venture projects.
REMUNERATION TO AND SHARES OWNED BY THE BOARD OF DIRECTORS
Amounts in NOKShares owned as of
31 December 2018 2018 2017
Kjell Inge Røkke (Chairman of the Board) 1) 50 673 577 600 000 575 000
Finn Berg Jacobsen (Deputy Chairman) 5 159 415 000 400 000
Kristin Krohn Devold (Director) - 365 000 350 000
Karen Simon (Director) - 365 000 350 000
Anne Marie Cannon (Director) - 365 000 350 000
Atle Tranøy (Employee representative) 2) - 182 500 175 000
Arnfinn Stensø (Employee representative) 2) - 182 500 175 000
Amram Hadida (Employee representative) 2) - 182 500 175 000
Tommy Angeltveit (Employee representative since 21 April 2017) 2) - 182 500 116 667
Kristian Røkke (Director until 31 December 2017) - - 350 000
Anne Tysdal Egaas (Employee representative until 21 April 2017) 2) - - 58 333
Total 2 840 000 3 075 000
1) Owns 100 per cent of The Resource Group TRG AS (TRG AS). TRG AS owns 99.71 per cent of TRG Holding AS, which owns 66.99 per cent of Aker ASA. In addition, TRG AS owns 1.19 per cent of Aker ASA directly. TRG AS also owns 31 427 000 shares in Aker Energy AS. Kjell Inge Røkke also owns 280 800 shares in Ocean Yield ASA directly.
2) The employee representatives have the same responsibilities as the other board directors, and should therefore generally have the same compensation. However, based on an initiative from the employees, an agreement has been made between Aker ASA and employee representatives from LO and other labour organisations, consequently the employee representatives receive a lower compensation.
Note 33 | Vested salary and other remuneration to the board of directors, nomination committee, CEO and other senior executives at Aker ASA
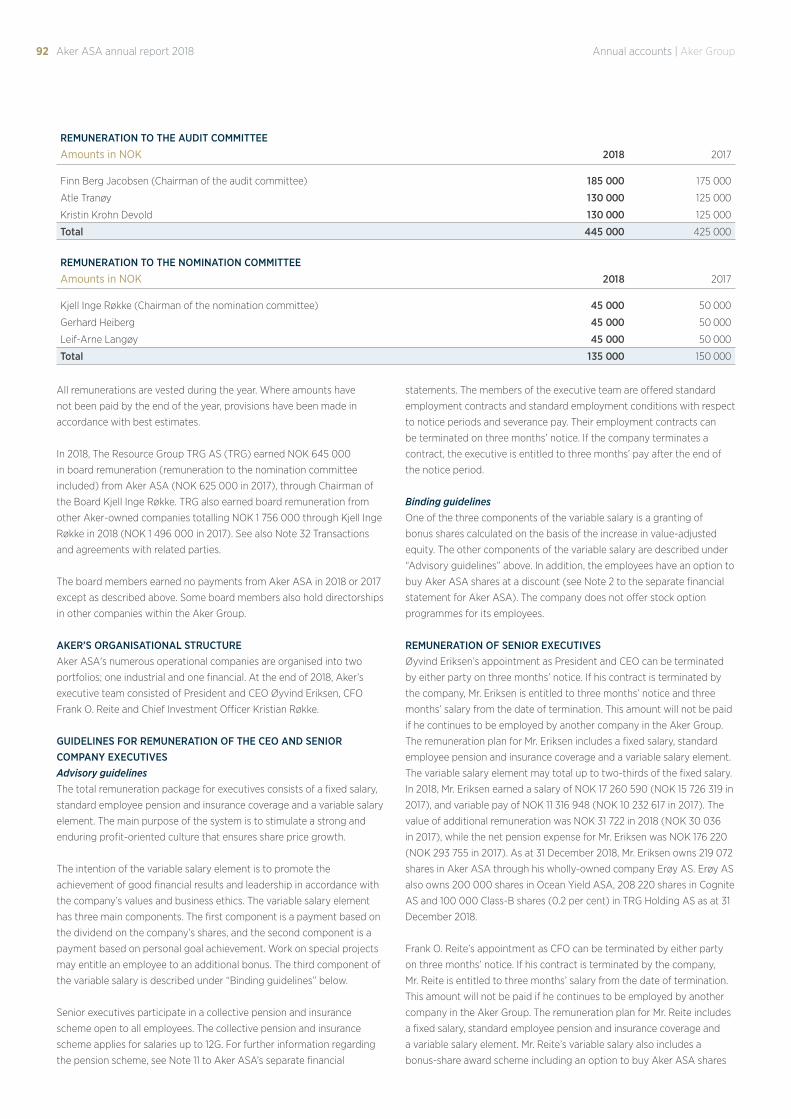
92 Annual accounts | Aker GroupAker ASA annual report 2018
All remunerations are vested during the year. Where amounts have
not been paid by the end of the year, provisions have been made in
accordance with best estimates.
In 2018, The Resource Group TRG AS (TRG) earned NOK 645 000
in board remuneration (remuneration to the nomination committee
included) from Aker ASA (NOK 625 000 in 2017), through Chairman of
the Board Kjell Inge Røkke. TRG also earned board remuneration from
other Aker-owned companies totalling NOK 1 756 000 through Kjell Inge
Røkke in 2018 (NOK 1 496 000 in 2017). See also Note 32 Transactions
and agreements with related parties.
The board members earned no payments from Aker ASA in 2018 or 2017
except as described above. Some board members also hold directorships
in other companies within the Aker Group.
AKER’S ORGANISATIONAL STRUCTUREAker ASA's numerous operational companies are organised into two
portfolios; one industrial and one financial. At the end of 2018, Aker’s
executive team consisted of President and CEO Øyvind Eriksen, CFO
Frank O. Reite and Chief Investment Officer Kristian Røkke.
GUIDELINES FOR REMUNERATION OF THE CEO AND SENIOR COMPANY EXECUTIVESAdvisory guidelinesThe total remuneration package for executives consists of a fixed salary,
standard employee pension and insurance coverage and a variable salary
element. The main purpose of the system is to stimulate a strong and
enduring profit-oriented culture that ensures share price growth.
The intention of the variable salary element is to promote the
achievement of good financial results and leadership in accordance with
the company’s values and business ethics. The variable salary element
has three main components. The first component is a payment based on
the dividend on the company’s shares, and the second component is a
payment based on personal goal achievement. Work on special projects
may entitle an employee to an additional bonus. The third component of
the variable salary is described under “Binding guidelines” below.
Senior executives participate in a collective pension and insurance
scheme open to all employees. The collective pension and insurance
scheme applies for salaries up to 12G. For further information regarding
the pension scheme, see Note 11 to Aker ASA’s separate financial
statements. The members of the executive team are offered standard
employment contracts and standard employment conditions with respect
to notice periods and severance pay. Their employment contracts can
be terminated on three months’ notice. If the company terminates a
contract, the executive is entitled to three months’ pay after the end of
the notice period.
Binding guidelinesOne of the three components of the variable salary is a granting of
bonus shares calculated on the basis of the increase in value-adjusted
equity. The other components of the variable salary are described under
“Advisory guidelines” above. In addition, the employees have an option to
buy Aker ASA shares at a discount (see Note 2 to the separate financial
statement for Aker ASA). The company does not offer stock option
programmes for its employees.
REMUNERATION OF SENIOR EXECUTIVESØyvind Eriksen’s appointment as President and CEO can be terminated
by either party on three months’ notice. If his contract is terminated by
the company, Mr. Eriksen is entitled to three months’ notice and three
months’ salary from the date of termination. This amount will not be paid
if he continues to be employed by another company in the Aker Group.
The remuneration plan for Mr. Eriksen includes a fixed salary, standard
employee pension and insurance coverage and a variable salary element.
The variable salary element may total up to two-thirds of the fixed salary.
In 2018, Mr. Eriksen earned a salary of NOK 17 260 590 (NOK 15 726 319 in
2017), and variable pay of NOK 11 316 948 (NOK 10 232 617 in 2017). The
value of additional remuneration was NOK 31 722 in 2018 (NOK 30 036
in 2017), while the net pension expense for Mr. Eriksen was NOK 176 220
(NOK 293 755 in 2017). As at 31 December 2018, Mr. Eriksen owns 219 072
shares in Aker ASA through his wholly-owned company Erøy AS. Erøy AS
also owns 200 000 shares in Ocean Yield ASA, 208 220 shares in Cognite
AS and 100 000 Class-B shares (0.2 per cent) in TRG Holding AS as at 31
December 2018.
Frank O. Reite’s appointment as CFO can be terminated by either party
on three months’ notice. If his contract is terminated by the company,
Mr. Reite is entitled to three months’ salary from the date of termination.
This amount will not be paid if he continues to be employed by another
company in the Aker Group. The remuneration plan for Mr. Reite includes
a fixed salary, standard employee pension and insurance coverage and
a variable salary element. Mr. Reite’s variable salary also includes a
bonus-share award scheme including an option to buy Aker ASA shares
REMUNERATION TO THE AUDIT COMMITTEE
Amounts in NOK 2018 2017
Finn Berg Jacobsen (Chairman of the audit committee) 185 000 175 000
Atle Tranøy 130 000 125 000
Kristin Krohn Devold 130 000 125 000
Total 445 000 425 000
REMUNERATION TO THE NOMINATION COMMITTEE
Amounts in NOK 2018 2017
Kjell Inge Røkke (Chairman of the nomination committee) 45 000 50 000
Gerhard Heiberg 45 000 50 000
Leif-Arne Langøy 45 000 50 000
Total 135 000 150 000
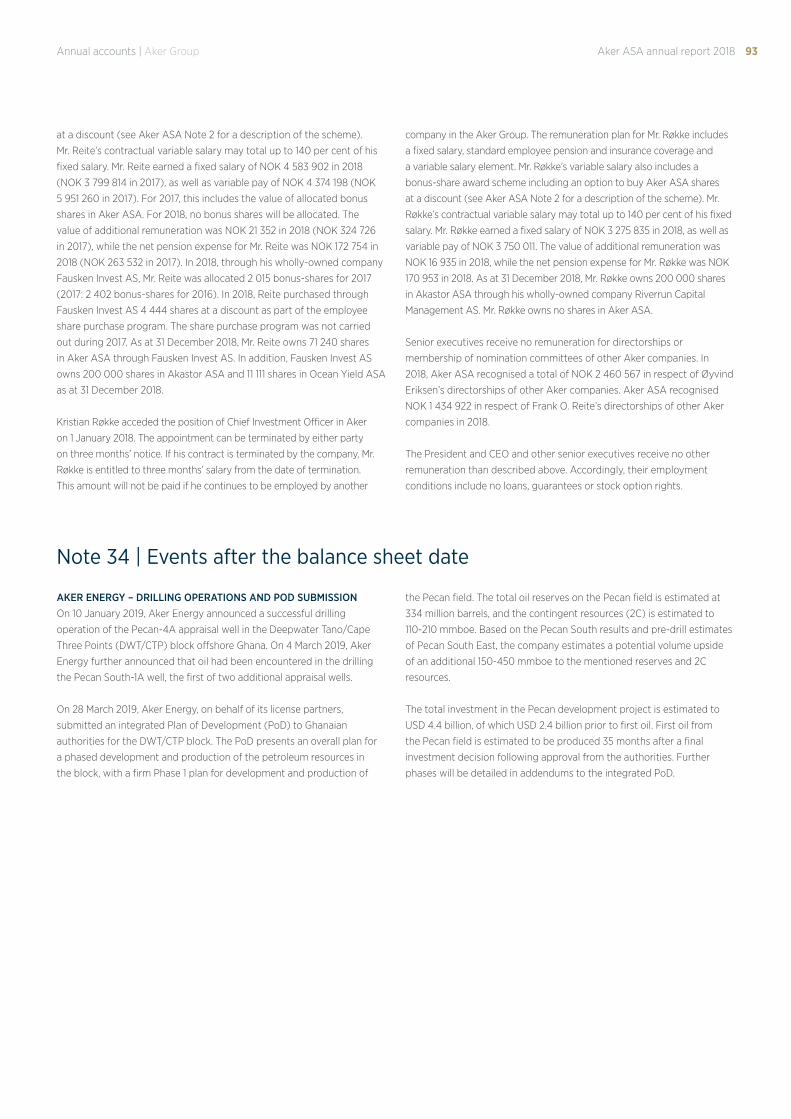
93Annual accounts | Aker Group Aker ASA annual report 2018
at a discount (see Aker ASA Note 2 for a description of the scheme).
Mr. Reite’s contractual variable salary may total up to 140 per cent of his
fixed salary. Mr. Reite earned a fixed salary of NOK 4 583 902 in 2018
(NOK 3 799 814 in 2017), as well as variable pay of NOK 4 374 198 (NOK
5 951 260 in 2017). For 2017, this includes the value of allocated bonus
shares in Aker ASA. For 2018, no bonus shares will be allocated. The
value of additional remuneration was NOK 21 352 in 2018 (NOK 324 726
in 2017), while the net pension expense for Mr. Reite was NOK 172 754 in
2018 (NOK 263 532 in 2017). In 2018, through his wholly-owned company
Fausken Invest AS, Mr. Reite was allocated 2 015 bonus-shares for 2017
(2017: 2 402 bonus-shares for 2016). In 2018, Reite purchased through
Fausken Invest AS 4 444 shares at a discount as part of the employee
share purchase program. The share purchase program was not carried
out during 2017. As at 31 December 2018, Mr. Reite owns 71 240 shares
in Aker ASA through Fausken Invest AS. In addition, Fausken Invest AS
owns 200 000 shares in Akastor ASA and 11 111 shares in Ocean Yield ASA
as at 31 December 2018.
Kristian Røkke acceded the position of Chief Investment Officer in Aker
on 1 January 2018. The appointment can be terminated by either party
on three months’ notice. If his contract is terminated by the company, Mr.
Røkke is entitled to three months’ salary from the date of termination.
This amount will not be paid if he continues to be employed by another
company in the Aker Group. The remuneration plan for Mr. Røkke includes
a fixed salary, standard employee pension and insurance coverage and
a variable salary element. Mr. Røkke’s variable salary also includes a
bonus-share award scheme including an option to buy Aker ASA shares
at a discount (see Aker ASA Note 2 for a description of the scheme). Mr.
Røkke’s contractual variable salary may total up to 140 per cent of his fixed
salary. Mr. Røkke earned a fixed salary of NOK 3 275 835 in 2018, as well as
variable pay of NOK 3 750 011. The value of additional remuneration was
NOK 16 935 in 2018, while the net pension expense for Mr. Røkke was NOK
170 953 in 2018. As at 31 December 2018, Mr. Røkke owns 200 000 shares
in Akastor ASA through his wholly-owned company Riverrun Capital
Management AS. Mr. Røkke owns no shares in Aker ASA.
Senior executives receive no remuneration for directorships or
membership of nomination committees of other Aker companies. In
2018, Aker ASA recognised a total of NOK 2 460 567 in respect of Øyvind
Eriksen’s directorships of other Aker companies. Aker ASA recognised
NOK 1 434 922 in respect of Frank O. Reite’s directorships of other Aker
companies in 2018.
The President and CEO and other senior executives receive no other
remuneration than described above. Accordingly, their employment
conditions include no loans, guarantees or stock option rights.
Note 34 | Events after the balance sheet date
AKER ENERGY – DRILLING OPERATIONS AND POD SUBMISSIONOn 10 January 2019, Aker Energy announced a successful drilling
operation of the Pecan-4A appraisal well in the Deepwater Tano/Cape
Three Points (DWT/CTP) block offshore Ghana. On 4 March 2019, Aker
Energy further announced that oil had been encountered in the drilling
the Pecan South-1A well, the first of two additional appraisal wells.
On 28 March 2019, Aker Energy, on behalf of its license partners,
submitted an integrated Plan of Development (PoD) to Ghanaian
authorities for the DWT/CTP block. The PoD presents an overall plan for
a phased development and production of the petroleum resources in
the block, with a firm Phase 1 plan for development and production of
the Pecan field. The total oil reserves on the Pecan field is estimated at
334 million barrels, and the contingent resources (2C) is estimated to
110-210 mmboe. Based on the Pecan South results and pre-drill estimates
of Pecan South East, the company estimates a potential volume upside
of an additional 150-450 mmboe to the mentioned reserves and 2C
resources.
The total investment in the Pecan development project is estimated to
USD 4.4 billion, of which USD 2.4 billion prior to first oil. First oil from
the Pecan field is estimated to be produced 35 months after a final
investment decision following approval from the authorities. Further
phases will be detailed in addendums to the integrated PoD.
Aker ASAIncome statement 95Balance sheet as at 31 December 96Cash flow statement 97Notes to the financial statements 98
Note 1 | Accounting principles 98
Note 2 | Salaries and other personnel expenses 99
Note 3 | Property, plant and equipment 100
Note 4 | Shares in subsidiaries 100
Note 5 | Investments in associates and joint venture companies 101
Note 6 | Other non-current financial assets and receivables from subsidiaries 101
Note 7 | Impairments and reversals of impairment of shares 102
Note 8 | Cash and cash equivalents 102
Note 9 | Shareholders' equity 102
Note 10 | Tax expense and deferred tax 103
Note 11 | Pension expenses and pension liabilities 104
Note 12 | Other non-current provisions 105
Note 13 | Non-current liabilities to subsidiaries 105
Note 14 | External interest-bearing debt 106
Note 15 | Other current liabilities 106
Note 16 | Guarantee obligations 106
Note 17 | Financial market risk 106
Note 18 | Shares owned by board members and key executives 107
Note 19 | Salary and other remuneration to the Board of directors, nomination committee, CEO and other senior executives 107
Note 20 | Disputes and contingent liabilities 107
Note 21 | Events after the balance sheet date 107
Directors’ responsibility statement 108
Independent auditor's report 109
94 Aker ASA annual report 2018 Annual accounts | Aker ASA
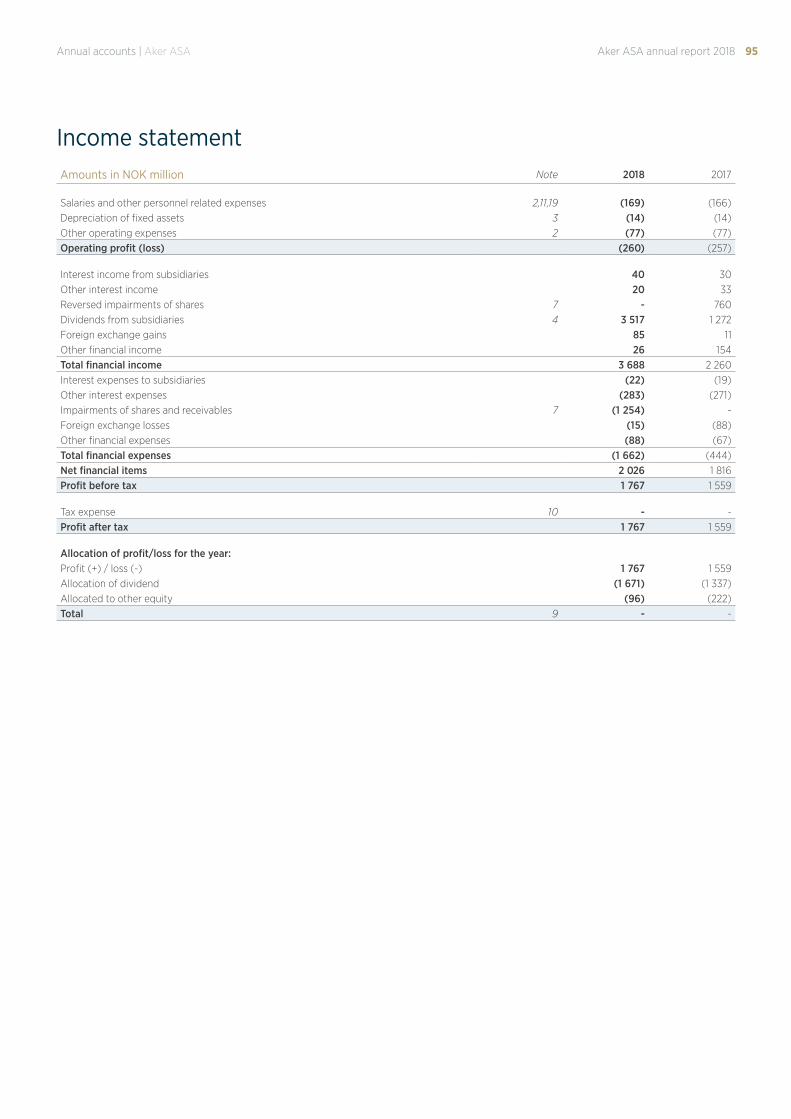
95Aker ASA annual report 2018Annual accounts | Aker ASA
Income statementAmounts in NOK million Note 2018 2017
Salaries and other personnel related expenses 2,11,19 (169) (166)Depreciation of fixed assets 3 (14) (14)Other operating expenses 2 (77) (77)Operating profit (loss) (260) (257)
Interest income from subsidiaries 40 30Other interest income 20 33Reversed impairments of shares 7 - 760Dividends from subsidiaries 4 3 517 1 272Foreign exchange gains 85 11Other financial income 26 154Total financial income 3 688 2 260Interest expenses to subsidiaries (22) (19)Other interest expenses (283) (271)Impairments of shares and receivables 7 (1 254) -Foreign exchange losses (15) (88)Other financial expenses (88) (67)Total financial expenses (1 662) (444)Net financial items 2 026 1 816Profit before tax 1 767 1 559
Tax expense 10 - -Profit after tax 1 767 1 559
Allocation of profit/loss for the year:Profit (+) / loss (-) 1 767 1 559Allocation of dividend (1 671) (1 337)Allocated to other equity (96) (222)Total 9 - -
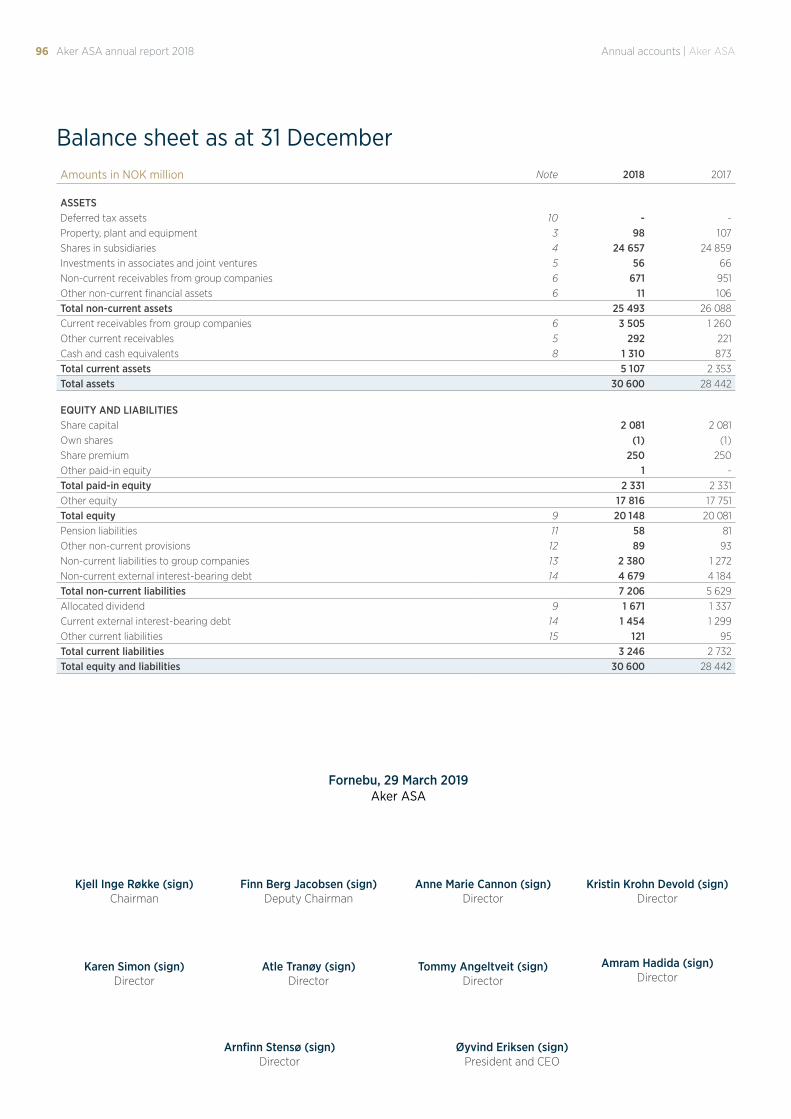
96 Aker ASA annual report 2018 Annual accounts | Aker ASA
Balance sheet as at 31 DecemberAmounts in NOK million Note 2018 2017
ASSETSDeferred tax assets 10 - -Property, plant and equipment 3 98 107Shares in subsidiaries 4 24 657 24 859Investments in associates and joint ventures 5 56 66Non-current receivables from group companies 6 671 951Other non-current financial assets 6 11 106Total non-current assets 25 493 26 088Current receivables from group companies 6 3 505 1 260Other current receivables 5 292 221Cash and cash equivalents 8 1 310 873Total current assets 5 107 2 353Total assets 30 600 28 442
EQUITY AND LIABILITIESShare capital 2 081 2 081Own shares (1) (1)Share premium 250 250Other paid-in equity 1 -Total paid-in equity 2 331 2 331Other equity 17 816 17 751Total equity 9 20 148 20 081Pension liabilities 11 58 81Other non-current provisions 12 89 93Non-current liabilities to group companies 13 2 380 1 272Non-current external interest-bearing debt 14 4 679 4 184Total non-current liabilities 7 206 5 629Allocated dividend 9 1 671 1 337Current external interest-bearing debt 14 1 454 1 299Other current liabilities 15 121 95Total current liabilities 3 246 2 732Total equity and liabilities 30 600 28 442
Fornebu, 29 March 2019Aker ASA
Amram Hadida (sign)Director
Arnfinn Stensø (sign)Director
Atle Tranøy (sign)Director
Øyvind Eriksen (sign)President and CEO
Karen Simon (sign)Director
Tommy Angeltveit (sign)Director
Anne Marie Cannon (sign)Director
Finn Berg Jacobsen (sign)Deputy Chairman
Kristin Krohn Devold (sign)Director
Kjell Inge Røkke (sign)Chairman
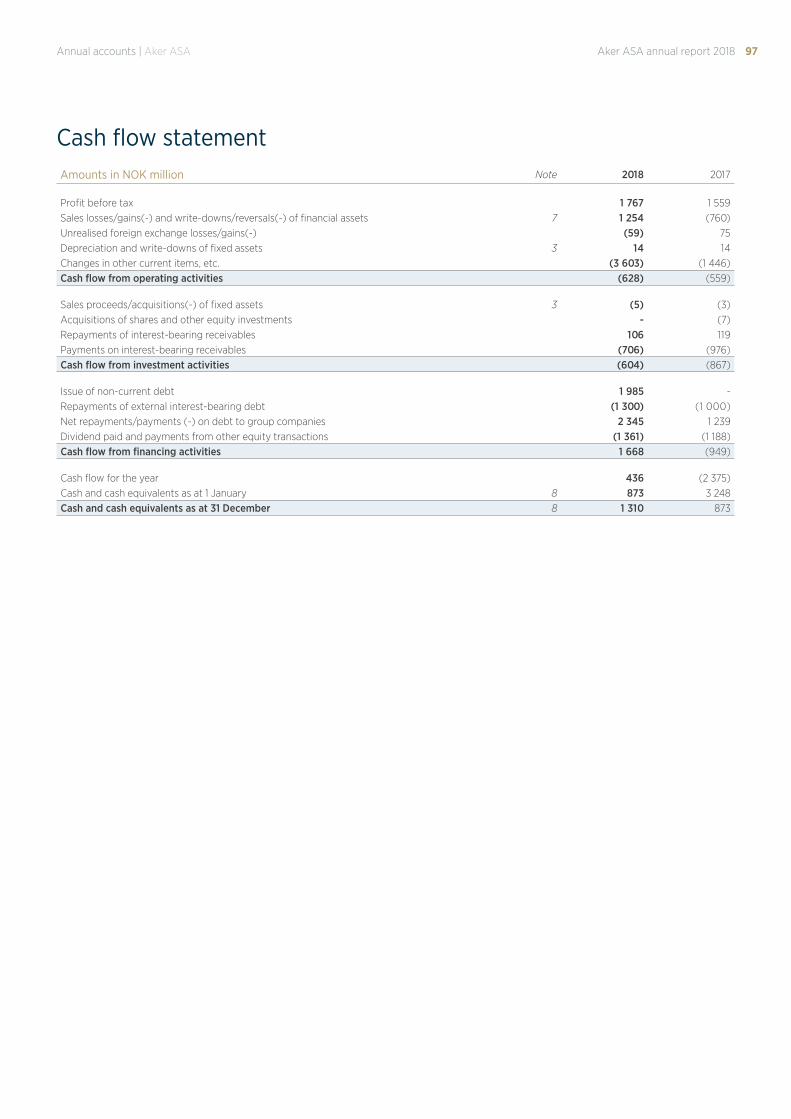
97Aker ASA annual report 2018Annual accounts | Aker ASA
Cash flow statementAmounts in NOK million Note 2018 2017
Profit before tax 1 767 1 559Sales losses/gains(-) and write-downs/reversals(-) of financial assets 7 1 254 (760)Unrealised foreign exchange losses/gains(-) (59) 75Depreciation and write-downs of fixed assets 3 14 14Changes in other current items, etc. (3 603) (1 446)Cash flow from operating activities (628) (559)
Sales proceeds/acquisitions(-) of fixed assets 3 (5) (3)Acquisitions of shares and other equity investments - (7)Repayments of interest-bearing receivables 106 119Payments on interest-bearing receivables (706) (976)Cash flow from investment activities (604) (867)
Issue of non-current debt 1 985 -Repayments of external interest-bearing debt (1 300) (1 000)Net repayments/payments (-) on debt to group companies 2 345 1 239Dividend paid and payments from other equity transactions (1 361) (1 188)Cash flow from financing activities 1 668 (949)
Cash flow for the year 436 (2 375)Cash and cash equivalents as at 1 January 8 873 3 248Cash and cash equivalents as at 31 December 8 1 310 873
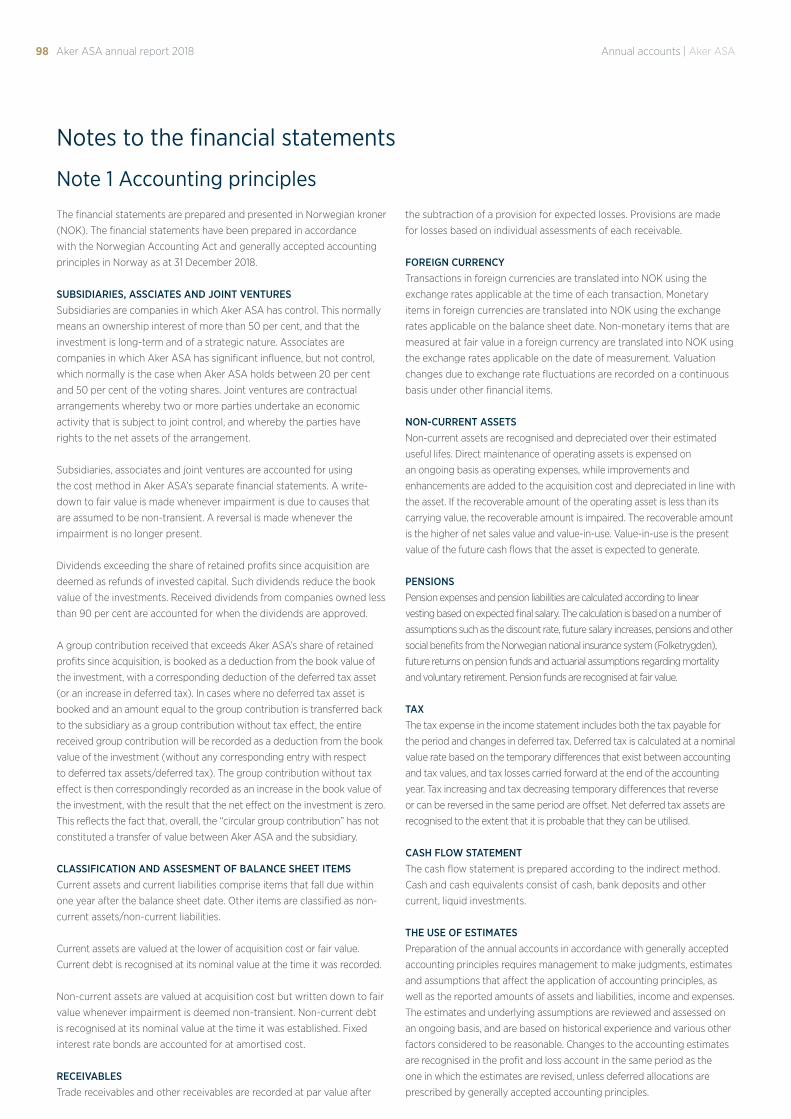
98 Aker ASA annual report 2018 Annual accounts | Aker ASA
Notes to the financial statements
Note 1 Accounting principles
The financial statements are prepared and presented in Norwegian kroner
(NOK). The financial statements have been prepared in accordance
with the Norwegian Accounting Act and generally accepted accounting
principles in Norway as at 31 December 2018.
SUBSIDIARIES, ASSCIATES AND JOINT VENTURESSubsidiaries are companies in which Aker ASA has control. This normally
means an ownership interest of more than 50 per cent, and that the
investment is long-term and of a strategic nature. Associates are
companies in which Aker ASA has significant influence, but not control,
which normally is the case when Aker ASA holds between 20 per cent
and 50 per cent of the voting shares. Joint ventures are contractual
arrangements whereby two or more parties undertake an economic
activity that is subject to joint control, and whereby the parties have
rights to the net assets of the arrangement.
Subsidiaries, associates and joint ventures are accounted for using
the cost method in Aker ASA’s separate financial statements. A write-
down to fair value is made whenever impairment is due to causes that
are assumed to be non-transient. A reversal is made whenever the
impairment is no longer present.
Dividends exceeding the share of retained profits since acquisition are
deemed as refunds of invested capital. Such dividends reduce the book
value of the investments. Received dividends from companies owned less
than 90 per cent are accounted for when the dividends are approved.
A group contribution received that exceeds Aker ASA’s share of retained
profits since acquisition, is booked as a deduction from the book value of
the investment, with a corresponding deduction of the deferred tax asset
(or an increase in deferred tax). In cases where no deferred tax asset is
booked and an amount equal to the group contribution is transferred back
to the subsidiary as a group contribution without tax effect, the entire
received group contribution will be recorded as a deduction from the book
value of the investment (without any corresponding entry with respect
to deferred tax assets/deferred tax). The group contribution without tax
effect is then correspondingly recorded as an increase in the book value of
the investment, with the result that the net effect on the investment is zero.
This reflects the fact that, overall, the “circular group contribution” has not
constituted a transfer of value between Aker ASA and the subsidiary.
CLASSIFICATION AND ASSESMENT OF BALANCE SHEET ITEMSCurrent assets and current liabilities comprise items that fall due within
one year after the balance sheet date. Other items are classified as non-
current assets/non-current liabilities.
Current assets are valued at the lower of acquisition cost or fair value.
Current debt is recognised at its nominal value at the time it was recorded.
Non-current assets are valued at acquisition cost but written down to fair
value whenever impairment is deemed non-transient. Non-current debt
is recognised at its nominal value at the time it was established. Fixed
interest rate bonds are accounted for at amortised cost.
RECEIVABLESTrade receivables and other receivables are recorded at par value after
the subtraction of a provision for expected losses. Provisions are made
for losses based on individual assessments of each receivable.
FOREIGN CURRENCYTransactions in foreign currencies are translated into NOK using the
exchange rates applicable at the time of each transaction. Monetary
items in foreign currencies are translated into NOK using the exchange
rates applicable on the balance sheet date. Non-monetary items that are
measured at fair value in a foreign currency are translated into NOK using
the exchange rates applicable on the date of measurement. Valuation
changes due to exchange rate fluctuations are recorded on a continuous
basis under other financial items.
NON-CURRENT ASSETSNon-current assets are recognised and depreciated over their estimated
useful lifes. Direct maintenance of operating assets is expensed on
an ongoing basis as operating expenses, while improvements and
enhancements are added to the acquisition cost and depreciated in line with
the asset. If the recoverable amount of the operating asset is less than its
carrying value, the recoverable amount is impaired. The recoverable amount
is the higher of net sales value and value-in-use. Value-in-use is the present
value of the future cash flows that the asset is expected to generate.
PENSIONSPension expenses and pension liabilities are calculated according to linear
vesting based on expected final salary. The calculation is based on a number of
assumptions such as the discount rate, future salary increases, pensions and other
social benefits from the Norwegian national insurance system (Folketrygden),
future returns on pension funds and actuarial assumptions regarding mortality
and voluntary retirement. Pension funds are recognised at fair value.
TAXThe tax expense in the income statement includes both the tax payable for
the period and changes in deferred tax. Deferred tax is calculated at a nominal
value rate based on the temporary differences that exist between accounting
and tax values, and tax losses carried forward at the end of the accounting
year. Tax increasing and tax decreasing temporary differences that reverse
or can be reversed in the same period are offset. Net deferred tax assets are
recognised to the extent that it is probable that they can be utilised.
CASH FLOW STATEMENTThe cash flow statement is prepared according to the indirect method.
Cash and cash equivalents consist of cash, bank deposits and other
current, liquid investments.
THE USE OF ESTIMATESPreparation of the annual accounts in accordance with generally accepted
accounting principles requires management to make judgments, estimates
and assumptions that affect the application of accounting principles, as
well as the reported amounts of assets and liabilities, income and expenses.
The estimates and underlying assumptions are reviewed and assessed on
an ongoing basis, and are based on historical experience and various other
factors considered to be reasonable. Changes to the accounting estimates
are recognised in the profit and loss account in the same period as the
one in which the estimates are revised, unless deferred allocations are
prescribed by generally accepted accounting principles.
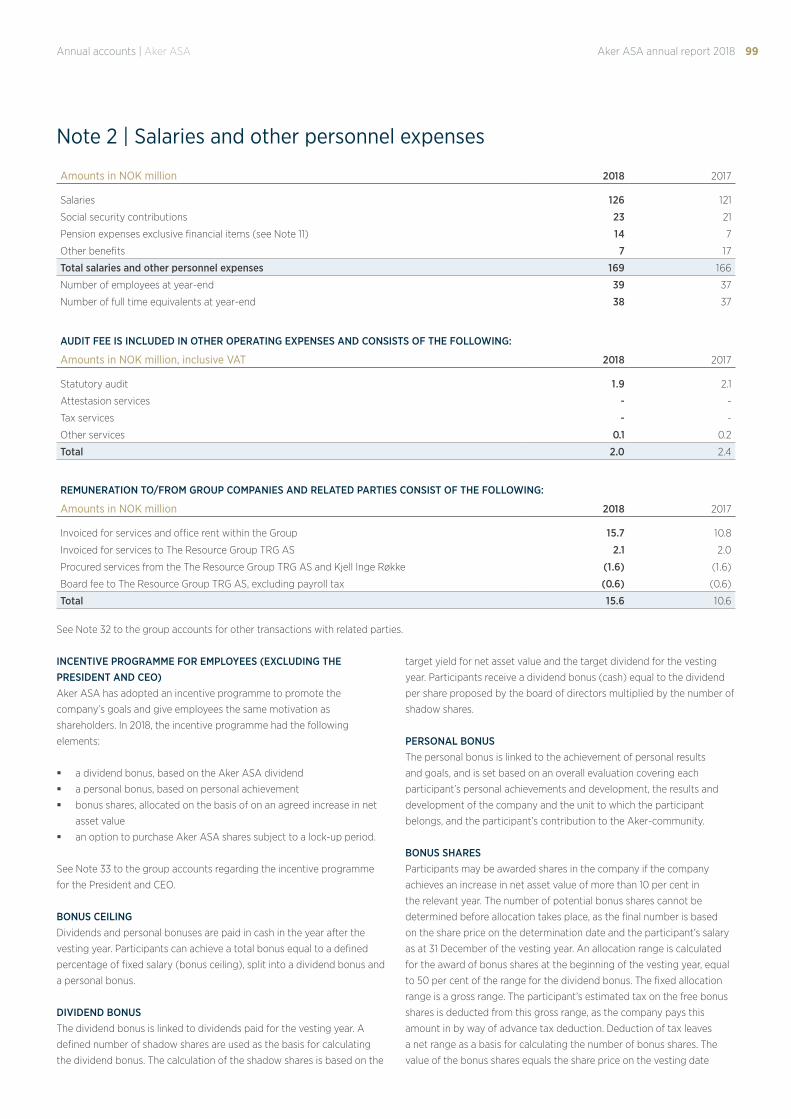
99Aker ASA annual report 2018Annual accounts | Aker ASA
Amounts in NOK million 2018 2017
Salaries 126 121
Social security contributions 23 21
Pension expenses exclusive financial items (see Note 11) 14 7
Other benefits 7 17
Total salaries and other personnel expenses 169 166
Number of employees at year-end 39 37
Number of full time equivalents at year-end 38 37
AUDIT FEE IS INCLUDED IN OTHER OPERATING EXPENSES AND CONSISTS OF THE FOLLOWING:
Amounts in NOK million, inclusive VAT 2018 2017
Statutory audit 1.9 2.1
Attestasion services - -
Tax services - -
Other services 0.1 0.2
Total 2.0 2.4
REMUNERATION TO/FROM GROUP COMPANIES AND RELATED PARTIES CONSIST OF THE FOLLOWING:
Amounts in NOK million 2018 2017
Invoiced for services and office rent within the Group 15.7 10.8
Invoiced for services to The Resource Group TRG AS 2.1 2.0
Procured services from the The Resource Group TRG AS and Kjell Inge Røkke (1.6) (1.6)
Board fee to The Resource Group TRG AS, excluding payroll tax (0.6) (0.6)
Total 15.6 10.6
See Note 32 to the group accounts for other transactions with related parties.
Note 2 | Salaries and other personnel expenses
INCENTIVE PROGRAMME FOR EMPLOYEES (EXCLUDING THE PRESIDENT AND CEO) Aker ASA has adopted an incentive programme to promote the
company’s goals and give employees the same motivation as
shareholders. In 2018, the incentive programme had the following
elements:
§ a dividend bonus, based on the Aker ASA dividend
§ a personal bonus, based on personal achievement
§ bonus shares, allocated on the basis of on an agreed increase in net
asset value
§ an option to purchase Aker ASA shares subject to a lock-up period.
See Note 33 to the group accounts regarding the incentive programme
for the President and CEO.
BONUS CEILINGDividends and personal bonuses are paid in cash in the year after the
vesting year. Participants can achieve a total bonus equal to a defined
percentage of fixed salary (bonus ceiling), split into a dividend bonus and
a personal bonus.
DIVIDEND BONUSThe dividend bonus is linked to dividends paid for the vesting year. A
defined number of shadow shares are used as the basis for calculating
the dividend bonus. The calculation of the shadow shares is based on the
target yield for net asset value and the target dividend for the vesting
year. Participants receive a dividend bonus (cash) equal to the dividend
per share proposed by the board of directors multiplied by the number of
shadow shares.
PERSONAL BONUSThe personal bonus is linked to the achievement of personal results
and goals, and is set based on an overall evaluation covering each
participant’s personal achievements and development, the results and
development of the company and the unit to which the participant
belongs, and the participant’s contribution to the Aker-community.
BONUS SHARESParticipants may be awarded shares in the company if the company
achieves an increase in net asset value of more than 10 per cent in
the relevant year. The number of potential bonus shares cannot be
determined before allocation takes place, as the final number is based
on the share price on the determination date and the participant’s salary
as at 31 December of the vesting year. An allocation range is calculated
for the award of bonus shares at the beginning of the vesting year, equal
to 50 per cent of the range for the dividend bonus. The fixed allocation
range is a gross range. The participant’s estimated tax on the free bonus
shares is deducted from this gross range, as the company pays this
amount in by way of advance tax deduction. Deduction of tax leaves
a net range as a basis for calculating the number of bonus shares. The
value of the bonus shares equals the share price on the vesting date
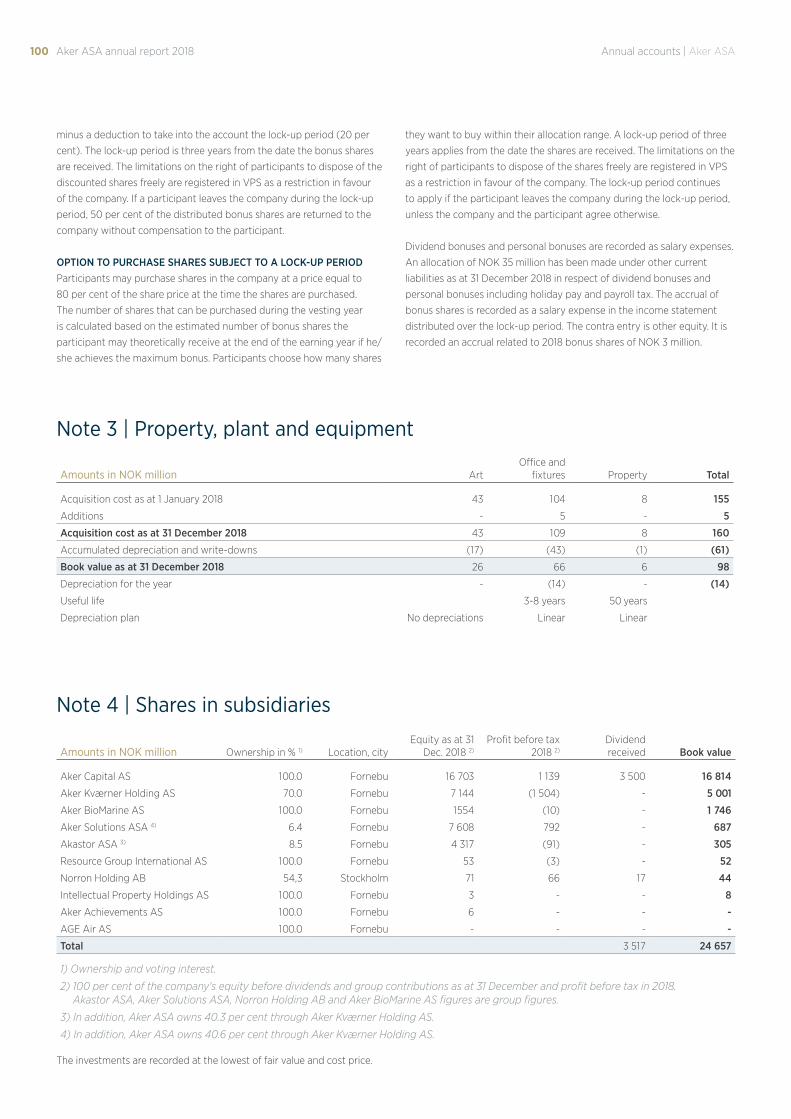
100 Aker ASA annual report 2018 Annual accounts | Aker ASA
Note 3 | Property, plant and equipment
minus a deduction to take into the account the lock-up period (20 per
cent). The lock-up period is three years from the date the bonus shares
are received. The limitations on the right of participants to dispose of the
discounted shares freely are registered in VPS as a restriction in favour
of the company. If a participant leaves the company during the lock-up
period, 50 per cent of the distributed bonus shares are returned to the
company without compensation to the participant.
OPTION TO PURCHASE SHARES SUBJECT TO A LOCK-UP PERIOD Participants may purchase shares in the company at a price equal to
80 per cent of the share price at the time the shares are purchased.
The number of shares that can be purchased during the vesting year
is calculated based on the estimated number of bonus shares the
participant may theoretically receive at the end of the earning year if he/
she achieves the maximum bonus. Participants choose how many shares
they want to buy within their allocation range. A lock-up period of three
years applies from the date the shares are received. The limitations on the
right of participants to dispose of the shares freely are registered in VPS
as a restriction in favour of the company. The lock-up period continues
to apply if the participant leaves the company during the lock-up period,
unless the company and the participant agree otherwise.
Dividend bonuses and personal bonuses are recorded as salary expenses.
An allocation of NOK 35 million has been made under other current
liabilities as at 31 December 2018 in respect of dividend bonuses and
personal bonuses including holiday pay and payroll tax. The accrual of
bonus shares is recorded as a salary expense in the income statement
distributed over the lock-up period. The contra entry is other equity. It is
recorded an accrual related to 2018 bonus shares of NOK 3 million.
Amounts in NOK million ArtOffice and
fixtures Property Total
Acquisition cost as at 1 January 2018 43 104 8 155
Additions - 5 - 5
Acquisition cost as at 31 December 2018 43 109 8 160
Accumulated depreciation and write-downs (17) (43) (1) (61)
Book value as at 31 December 2018 26 66 6 98
Depreciation for the year - (14) - (14)
Useful life 3-8 years 50 years
Depreciation plan No depreciations Linear Linear
Amounts in NOK million Ownership in % 1) Location, cityEquity as at 31
Dec. 2018 2)
Profit before tax 2018 2)
Dividend received Book value
Aker Capital AS 100.0 Fornebu 16 703 1 139 3 500 16 814
Aker Kværner Holding AS 70.0 Fornebu 7 144 (1 504) - 5 001
Aker BioMarine AS 100.0 Fornebu 1554 (10) - 1 746
Aker Solutions ASA 4) 6.4 Fornebu 7 608 792 - 687
Akastor ASA 3) 8.5 Fornebu 4 317 (91) - 305
Resource Group International AS 100.0 Fornebu 53 (3) - 52
Norron Holding AB 54,3 Stockholm 71 66 17 44
Intellectual Property Holdings AS 100.0 Fornebu 3 - - 8
Aker Achievements AS 100.0 Fornebu 6 - - -
AGE Air AS 100.0 Fornebu - - - -
Total 3 517 24 657
1) Ownership and voting interest.
2) 100 per cent of the company's equity before dividends and group contributions as at 31 December and profit before tax in 2018. Akastor ASA, Aker Solutions ASA, Norron Holding AB and Aker BioMarine AS figures are group figures.
3) In addition, Aker ASA owns 40.3 per cent through Aker Kværner Holding AS.
4) In addition, Aker ASA owns 40.6 per cent through Aker Kværner Holding AS.
The investments are recorded at the lowest of fair value and cost price.
Note 4 | Shares in subsidiaries
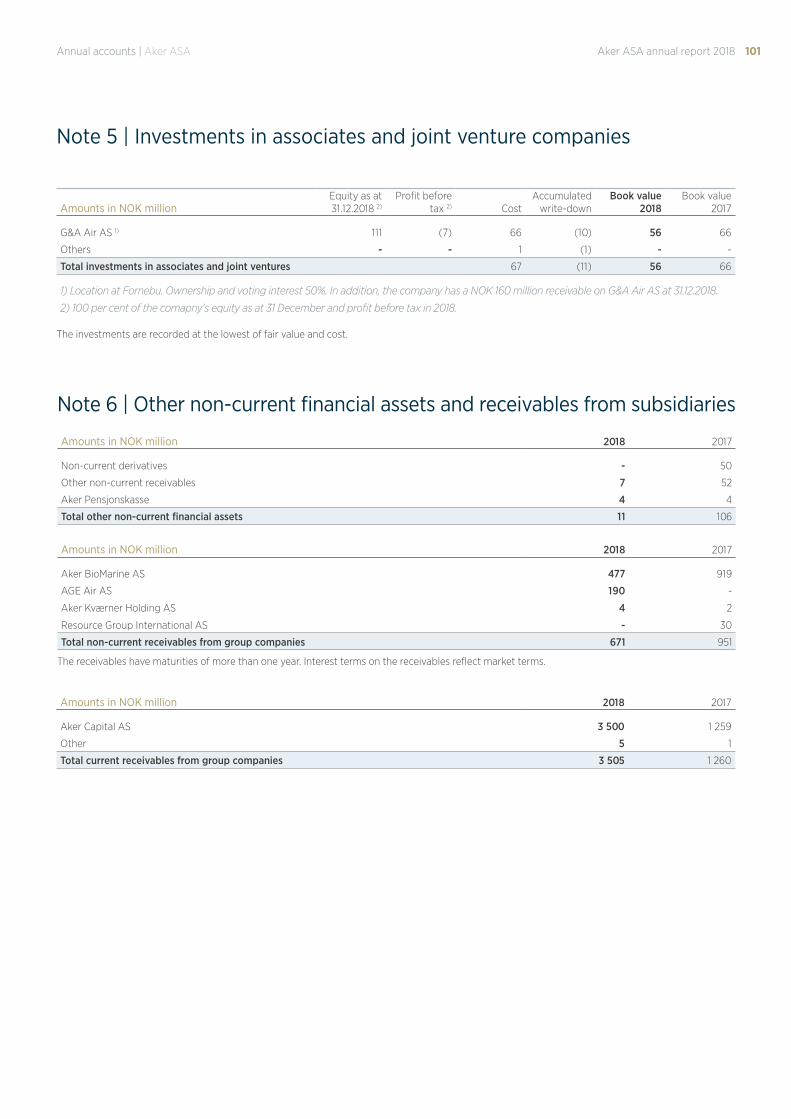
101Aker ASA annual report 2018Annual accounts | Aker ASA
Amounts in NOK millionEquity as at 31.12.2018 2)
Profit before tax 2) Cost
Accumulated write-down
Book value 2018
Book value 2017
G&A Air AS 1) 111 (7) 66 (10) 56 66
Others - - 1 (1) - -
Total investments in associates and joint ventures 67 (11) 56 66
1) Location at Fornebu. Ownership and voting interest 50%. In addition, the company has a NOK 160 million receivable on G&A Air AS at 31.12.2018.
2) 100 per cent of the comapny's equity as at 31 December and profit before tax in 2018.
The investments are recorded at the lowest of fair value and cost.
Note 5 | Investments in associates and joint venture companies
Amounts in NOK million 2018 2017
Non-current derivatives - 50
Other non-current receivables 7 52
Aker Pensjonskasse 4 4
Total other non-current financial assets 11 106
Amounts in NOK million 2018 2017
Aker BioMarine AS 477 919
AGE Air AS 190 -
Aker Kværner Holding AS 4 2
Resource Group International AS - 30
Total non-current receivables from group companies 671 951
The receivables have maturities of more than one year. Interest terms on the receivables reflect market terms.
Note 6 | Other non-current financial assets and receivables from subsidiaries
Amounts in NOK million 2018 2017
Aker Capital AS 3 500 1 259
Other 5 1
Total current receivables from group companies 3 505 1 260
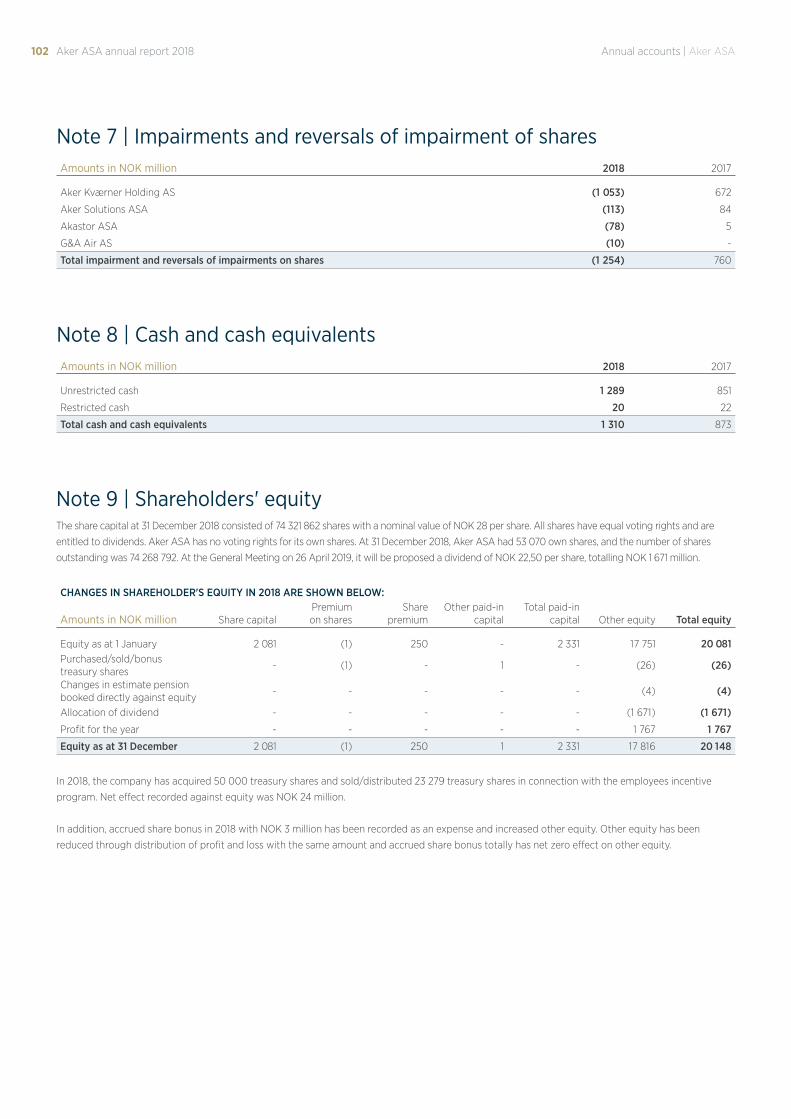
102 Aker ASA annual report 2018 Annual accounts | Aker ASA
Amounts in NOK million 2018 2017
Aker Kværner Holding AS (1 053) 672
Aker Solutions ASA (113) 84
Akastor ASA (78) 5
G&A Air AS (10) -
Total impairment and reversals of impairments on shares (1 254) 760
Amounts in NOK million 2018 2017
Unrestricted cash 1 289 851
Restricted cash 20 22
Total cash and cash equivalents 1 310 873
Note 7 | Impairments and reversals of impairment of shares
Note 8 | Cash and cash equivalents
Note 9 | Shareholders' equity
CHANGES IN SHAREHOLDER'S EQUITY IN 2018 ARE SHOWN BELOW:
Amounts in NOK million Share capitalPremium on shares
Share premium
Other paid-in capital
Total paid-in capital Other equity Total equity
Equity as at 1 January 2 081 (1) 250 - 2 331 17 751 20 081Purchased/sold/bonus treasury shares
- (1) - 1 - (26) (26)
Changes in estimate pension booked directly against equity
- - - - - (4) (4)
Allocation of dividend - - - - - (1 671) (1 671)
Profit for the year - - - - - 1 767 1 767
Equity as at 31 December 2 081 (1) 250 1 2 331 17 816 20 148
The share capital at 31 December 2018 consisted of 74 321 862 shares with a nominal value of NOK 28 per share. All shares have equal voting rights and are
entitled to dividends. Aker ASA has no voting rights for its own shares. At 31 December 2018, Aker ASA had 53 070 own shares, and the number of shares
outstanding was 74 268 792. At the General Meeting on 26 April 2019, it will be proposed a dividend of NOK 22,50 per share, totalling NOK 1 671 million.
In 2018, the company has acquired 50 000 treasury shares and sold/distributed 23 279 treasury shares in connection with the employees incentive
program. Net effect recorded against equity was NOK 24 million.
In addition, accrued share bonus in 2018 with NOK 3 million has been recorded as an expense and increased other equity. Other equity has been
reduced through distribution of profit and loss with the same amount and accrued share bonus totally has net zero effect on other equity.
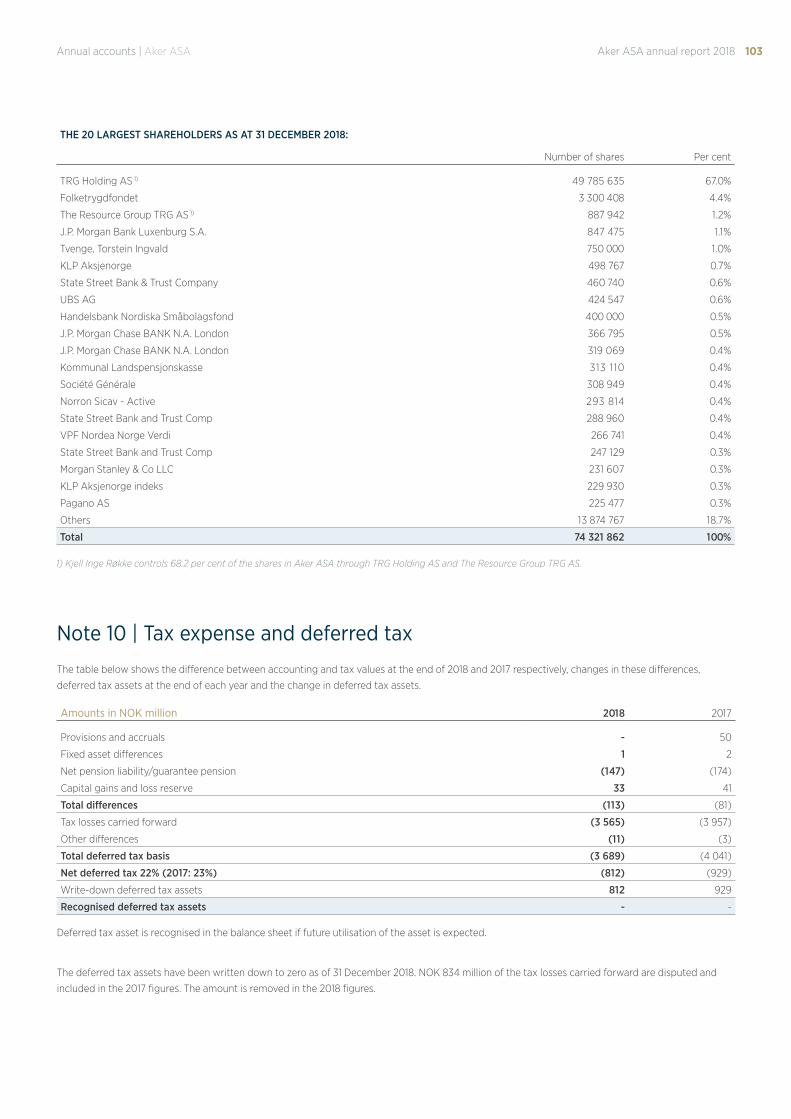
103Aker ASA annual report 2018Annual accounts | Aker ASA
THE 20 LARGEST SHAREHOLDERS AS AT 31 DECEMBER 2018:
Number of shares Per cent
TRG Holding AS 1) 49 785 635 67.0%
Folketrygdfondet 3 300 408 4.4%
The Resource Group TRG AS 1) 887 942 1.2%
J.P. Morgan Bank Luxenburg S.A. 847 475 1.1%
Tvenge, Torstein Ingvald 750 000 1.0%
KLP Aksjenorge 498 767 0.7%
State Street Bank & Trust Company 460 740 0.6%
UBS AG 424 547 0.6%
Handelsbank Nordiska Småbolagsfond 400 000 0.5%
J.P. Morgan Chase BANK N.A. London 366 795 0.5%
J.P. Morgan Chase BANK N.A. London 319 069 0.4%
Kommunal Landspensjonskasse 313 110 0.4%
Société Générale 308 949 0.4%
Norron Sicav - Active 293 814 0.4%
State Street Bank and Trust Comp 288 960 0.4%
VPF Nordea Norge Verdi 266 741 0.4%
State Street Bank and Trust Comp 247 129 0.3%
Morgan Stanley & Co LLC 231 607 0.3%
KLP Aksjenorge indeks 229 930 0.3%
Pagano AS 225 477 0.3%
Others 13 874 767 18.7%
Total 74 321 862 100%
1) Kjell Inge Røkke controls 68.2 per cent of the shares in Aker ASA through TRG Holding AS and The Resource Group TRG AS.
The table below shows the difference between accounting and tax values at the end of 2018 and 2017 respectively, changes in these differences,
deferred tax assets at the end of each year and the change in deferred tax assets.
Amounts in NOK million 2018 2017
Provisions and accruals - 50
Fixed asset differences 1 2
Net pension liability/guarantee pension (147) (174)
Capital gains and loss reserve 33 41
Total differences (113) (81)
Tax losses carried forward (3 565) (3 957)
Other differences (11) (3)
Total deferred tax basis (3 689) (4 041)
Net deferred tax 22% (2017: 23%) (812) (929)
Write-down deferred tax assets 812 929
Recognised deferred tax assets - -
Deferred tax asset is recognised in the balance sheet if future utilisation of the asset is expected.
The deferred tax assets have been written down to zero as of 31 December 2018. NOK 834 million of the tax losses carried forward are disputed and
included in the 2017 figures. The amount is removed in the 2018 figures.
Note 10 | Tax expense and deferred tax
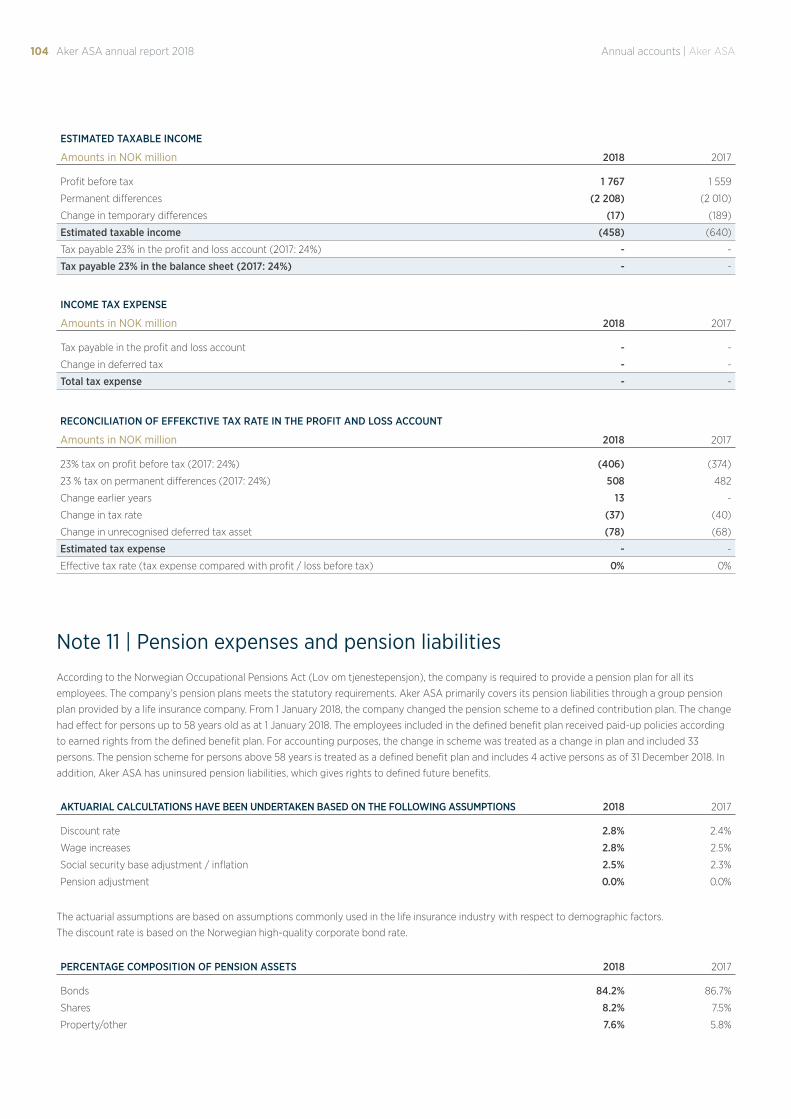
104 Aker ASA annual report 2018 Annual accounts | Aker ASA
ESTIMATED TAXABLE INCOME
Amounts in NOK million 2018 2017
Profit before tax 1 767 1 559
Permanent differences (2 208) (2 010)
Change in temporary differences (17) (189)
Estimated taxable income (458) (640)
Tax payable 23% in the profit and loss account (2017: 24%) - -
Tax payable 23% in the balance sheet (2017: 24%) - -
INCOME TAX EXPENSE
Amounts in NOK million 2018 2017
Tax payable in the profit and loss account - -
Change in deferred tax - -
Total tax expense - -
RECONCILIATION OF EFFEKCTIVE TAX RATE IN THE PROFIT AND LOSS ACCOUNT
Amounts in NOK million 2018 2017
23% tax on profit before tax (2017: 24%) (406) (374)
23 % tax on permanent differences (2017: 24%) 508 482
Change earlier years 13 -
Change in tax rate (37) (40)
Change in unrecognised deferred tax asset (78) (68)
Estimated tax expense - -
Effective tax rate (tax expense compared with profit / loss before tax) 0% 0%
Note 11 | Pension expenses and pension liabilities
According to the Norwegian Occupational Pensions Act (Lov om tjenestepensjon), the company is required to provide a pension plan for all its
employees. The company’s pension plans meets the statutory requirements. Aker ASA primarily covers its pension liabilities through a group pension
plan provided by a life insurance company. From 1 January 2018, the company changed the pension scheme to a defined contribution plan. The change
had effect for persons up to 58 years old as at 1 January 2018. The employees included in the defined benefit plan received paid-up policies according
to earned rights from the defined benefit plan. For accounting purposes, the change in scheme was treated as a change in plan and included 33
persons. The pension scheme for persons above 58 years is treated as a defined benefit plan and includes 4 active persons as of 31 December 2018. In
addition, Aker ASA has uninsured pension liabilities, which gives rights to defined future benefits.
AKTUARIAL CALCULTATIONS HAVE BEEN UNDERTAKEN BASED ON THE FOLLOWING ASSUMPTIONS 2018 2017
Discount rate 2.8% 2.4%
Wage increases 2.8% 2.5%
Social security base adjustment / inflation 2.5% 2.3%
Pension adjustment 0.0% 0.0%
The actuarial assumptions are based on assumptions commonly used in the life insurance industry with respect to demographic factors.
The discount rate is based on the Norwegian high-quality corporate bond rate.
PERCENTAGE COMPOSITION OF PENSION ASSETS 2018 2017
Bonds 84.2% 86.7%
Shares 8.2% 7.5%
Property/other 7.6% 5.8%
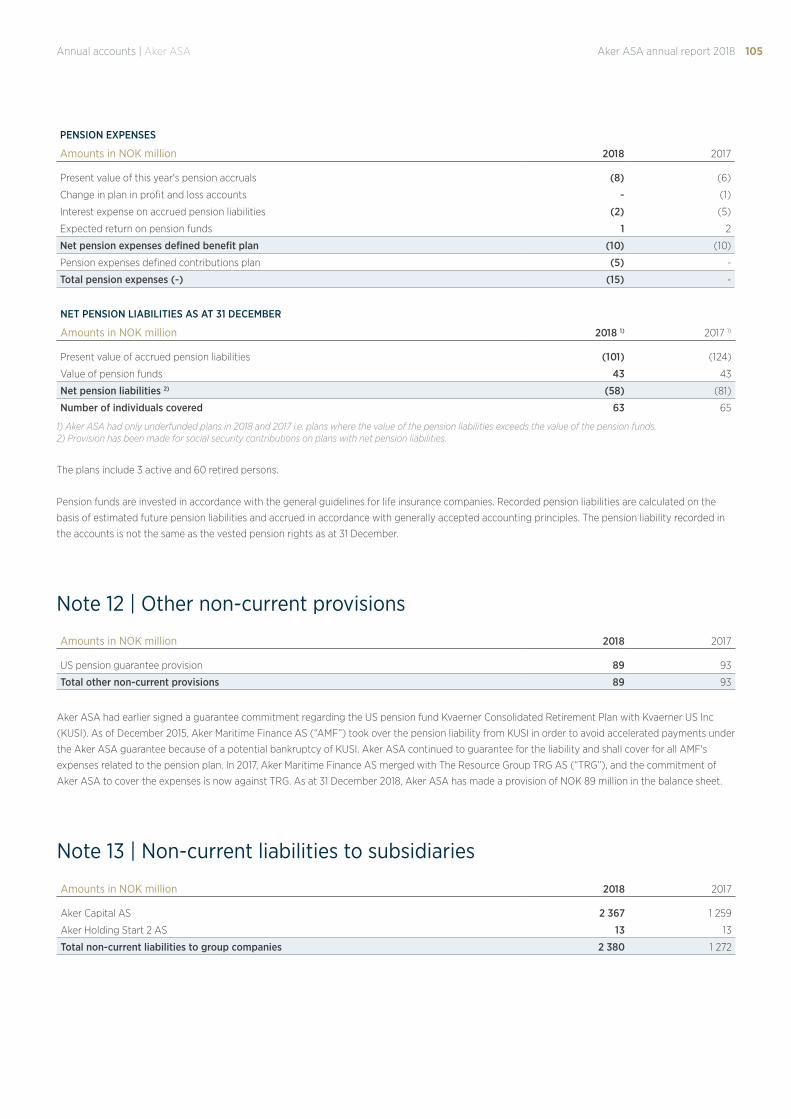
105Aker ASA annual report 2018Annual accounts | Aker ASA
PENSION EXPENSES
Amounts in NOK million 2018 2017
Present value of this year's pension accruals (8) (6)
Change in plan in profit and loss accounts - (1)
Interest expense on accrued pension liabilities (2) (5)
Expected return on pension funds 1 2
Net pension expenses defined benefit plan (10) (10)
Pension expenses defined contributions plan (5) -
Total pension expenses (-) (15) -
NET PENSION LIABILITIES AS AT 31 DECEMBER
Amounts in NOK million 2018 1) 2017 1)
Present value of accrued pension liabilities (101) (124)
Value of pension funds 43 43
Net pension liabilities 2) (58) (81)
Number of individuals covered 63 65
1) Aker ASA had only underfunded plans in 2018 and 2017 i.e. plans where the value of the pension liabilities exceeds the value of the pension funds.2) Provision has been made for social security contributions on plans with net pension liabilities.
The plans include 3 active and 60 retired persons.
Pension funds are invested in accordance with the general guidelines for life insurance companies. Recorded pension liabilities are calculated on the
basis of estimated future pension liabilities and accrued in accordance with generally accepted accounting principles. The pension liability recorded in
the accounts is not the same as the vested pension rights as at 31 December.
Note 12 | Other non-current provisions
Amounts in NOK million 2018 2017
US pension guarantee provision 89 93
Total other non-current provisions 89 93
Aker ASA had earlier signed a guarantee commitment regarding the US pension fund Kvaerner Consolidated Retirement Plan with Kvaerner US Inc
(KUSI). As of December 2015, Aker Maritime Finance AS (“AMF”) took over the pension liability from KUSI in order to avoid accelerated payments under
the Aker ASA guarantee because of a potential bankruptcy of KUSI. Aker ASA continued to guarantee for the liability and shall cover for all AMF's
expenses related to the pension plan. In 2017, Aker Maritime Finance AS merged with The Resource Group TRG AS (“TRG”), and the commitment of
Aker ASA to cover the expenses is now against TRG. As at 31 December 2018, Aker ASA has made a provision of NOK 89 million in the balance sheet.
Note 13 | Non-current liabilities to subsidiaries
Amounts in NOK million 2018 2017
Aker Capital AS 2 367 1 259
Aker Holding Start 2 AS 13 13
Total non-current liabilities to group companies 2 380 1 272
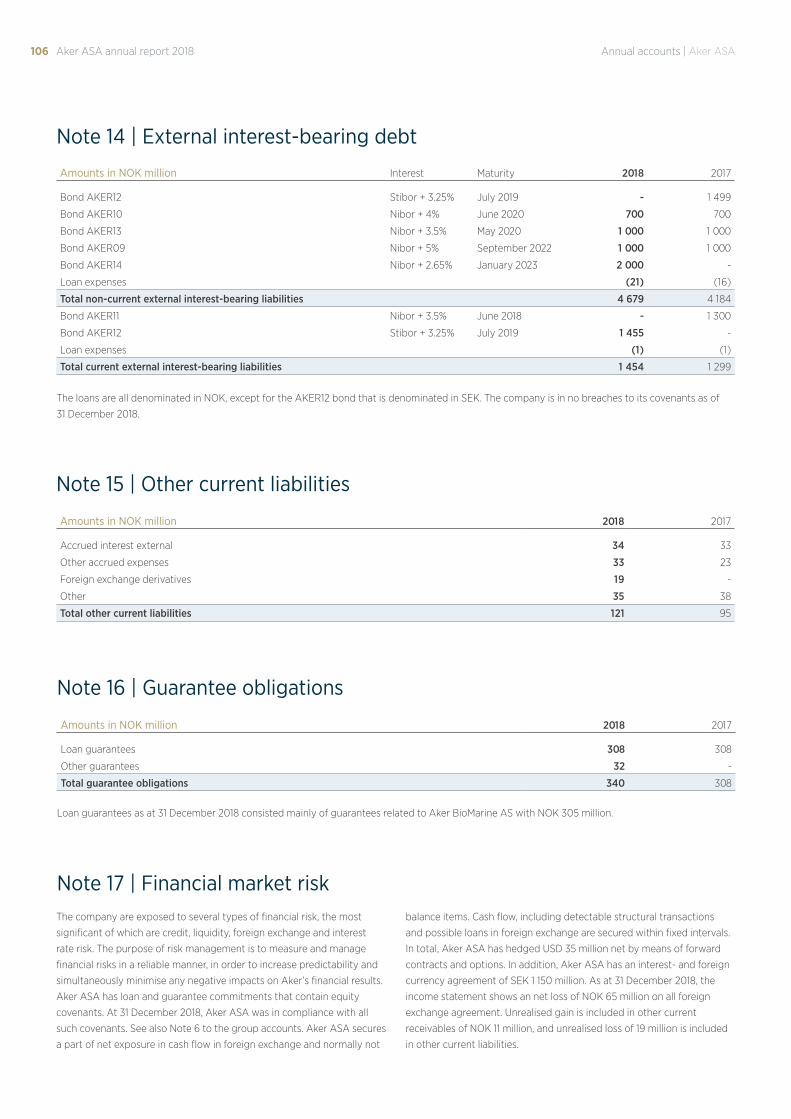
106 Aker ASA annual report 2018 Annual accounts | Aker ASA
Amounts in NOK million Interest Maturity 2018 2017
Bond AKER12 Stibor + 3.25% July 2019 - 1 499
Bond AKER10 Nibor + 4% June 2020 700 700
Bond AKER13 Nibor + 3.5% May 2020 1 000 1 000
Bond AKER09 Nibor + 5% September 2022 1 000 1 000
Bond AKER14 Nibor + 2.65% January 2023 2 000 -
Loan expenses (21) (16)
Total non-current external interest-bearing liabilities 4 679 4 184
Bond AKER11 Nibor + 3.5% June 2018 - 1 300
Bond AKER12 Stibor + 3.25% July 2019 1 455 -
Loan expenses (1) (1)
Total current external interest-bearing liabilities 1 454 1 299
The loans are all denominated in NOK, except for the AKER12 bond that is denominated in SEK. The company is in no breaches to its covenants as of
31 December 2018.
Note 14 | External interest-bearing debt
Note 15 | Other current liabilities
Amounts in NOK million 2018 2017
Accrued interest external 34 33
Other accrued expenses 33 23
Foreign exchange derivatives 19 -
Other 35 38
Total other current liabilities 121 95
Note 16 | Guarantee obligations
Loan guarantees as at 31 December 2018 consisted mainly of guarantees related to Aker BioMarine AS with NOK 305 million.
Note 17 | Financial market riskThe company are exposed to several types of financial risk, the most
significant of which are credit, liquidity, foreign exchange and interest
rate risk. The purpose of risk management is to measure and manage
financial risks in a reliable manner, in order to increase predictability and
simultaneously minimise any negative impacts on Aker’s financial results.
Aker ASA has loan and guarantee commitments that contain equity
covenants. At 31 December 2018, Aker ASA was in compliance with all
such covenants. See also Note 6 to the group accounts. Aker ASA secures
a part of net exposure in cash flow in foreign exchange and normally not
balance items. Cash flow, including detectable structural transactions
and possible loans in foreign exchange are secured within fixed intervals.
In total, Aker ASA has hedged USD 35 million net by means of forward
contracts and options. In addition, Aker ASA has an interest- and foreign
currency agreement of SEK 1 150 million. As at 31 December 2018, the
income statement shows an net loss of NOK 65 million on all foreign
exchange agreement. Unrealised gain is included in other current
receivables of NOK 11 million, and unrealised loss of 19 million is included
in other current liabilities.
Amounts in NOK million 2018 2017
Loan guarantees 308 308
Other guarantees 32 -
Total guarantee obligations 340 308
107Aker ASA annual report 2018Annual accounts | Aker ASA
Note 18 | Shares owned by board members and key executives
Note 19 | Salary and other remuneration to the Board of directors, nomi-nation committee, CEO and other senior executives
Note 20 | Disputes and contingent liabilities
Note 21 | Events after the balance sheet date
See Note 33 to the financial statements of the Group.
See Note 33 to the financial statements of the Group.
There are no known major disputes or contingent liabilities as at 31.12.18.
There have not been any other major events after the balance sheet date. See also Note 34 in the financial statement of the Group.
108 Aker ASA annual report 2018 Annual accounts | Aker ASA
Directors’ responsibility statement
Today, the board of directors and the president and chief executive officer reviewed and approved the board of directors’ report and the consolidated and separate annual financial statements of Aker ASA, consolidated and parent company for the year ending and as of 31 December 2018.
Aker ASA’s consolidated financial statements have been prepared in accordance with IFRSs and IFRICs adopted by the EU as well as additional disclosure requirements in the Norwegian Accounting Act and as such are to be applied per 31 December 2018. The separate financial statements of Aker ASA and the parent company have been prepared in accordance with the Norwegian Accounting Act and Norwegian accounting standards as at 31 December 2018. The board of directors’ report for the group and the parent company satisfy with the requirements of the Norwegian Accounting Act and Norwegian accounting standard no. 16, as at 31 December 2018.
To the best of our knowledge: § The consolidated and separate annual financial statements for 2018 have been prepared in accordance with applicable
accounting standards. § The consolidated and separate annual financial statements give a true and fair overall view of the assets, liabilities, financial
position and profit/loss of the group and for the parent company as of 31 December. § The board of directors’ report provides a true and fair review of the
– – development and performance of the business and the position of the group and the parent company, – – the principal risks and uncertainties the group and the parent company may face.
Fornebu, 29 March 2019Aker ASA
Amram Hadida (sign)Director
Arnfinn Stensø (sign)Director
Atle Tranøy (sign)Director
Øyvind Eriksen (sign)President and CEO
Karen Simon (sign)Director
Tommy Angeltveit (sign)Director
Anne Marie Cannon (sign)Director
Finn Berg Jacobsen (sign)Deputy Chairman
Kristin Krohn Devold (sign)Director
Kjell Inge Røkke (sign)Chairman
109Aker ASA annual report 2018
Independent auditor's report
KPMG AS Sørkedalsveien 6 Postboks 7000 Majorstuen 0306 Oslo
Telephone +47 04063 Fax +47 22 60 96 01 Internet www.kpmg.no Enterprise 935 174 627 MVA
KPMG AS, a Norwegian limited liability company and member firm of the KPMG network of independent member firms affiliated with KPMG International Cooperative (“KPMG International”), a Swiss entity. Statsautoriserte revisorer - medlemmer av Den norske Revisorforening
Offices in: Oslo Alta Arendal Bergen Bodø Drammen
Elverum Finnsnes Hamar Haugesund Knarvik Kristiansand
Mo i Rana Molde Skien Sandefjord Sandnessjøen Stavanger
Stord Straume Tromsø Trondheim Tynset Ålesund
To the Annual Shareholder's Meeting of Aker ASA
Independent auditor’s report Report on the Audit of the Financial Statements
Opinion
We have audited the financial statements of Aker ASA. The financial statements comprise:
• The financial statements of the parent company Aker ASA (the Company), which comprise the balance sheet as at 31 December 2018, and income statement and cash flow statement for the year then ended, and notes to the financial statements, including a summary of significant accounting policies, and
• The consolidated financial statements of Aker ASA and its subsidiaries (the Group), which comprise the balance sheet as at 31 December 2018, and income statement, statement of total comprehensive income, statement of changes in equity, cash flow for the year then ended, and notes to the financial statements, including a summary of significant accounting policies.
In our opinion:
• The financial statements are prepared in accordance with the law and regulations.
• The accompanying financial statements give a true and fair view of the financial position of the Company as at 31 December 2018, and its financial performance and its cash flows for the year then ended in accordance with the Norwegian Accounting Act and accounting standards and practices generally accepted in Norway.
• The accompanying consolidated financial statements give a true and fair view of the financial position of the Group as at 31 December 2018, and its financial performance and its cash flows for the year then ended in accordance with International Financial Reporting Standards as adopted by the EU.
Basis for Opinion
We conducted our audit in accordance with laws, regulations, and auditing standards and practices generally accepted in Norway, including International Standards on Auditing (ISAs). Our responsibilities under those standards are further described in the Auditor’s Responsibilities for the Audit of the Financial Statements section of our report. We are independent of the Company and the Group as required by laws and regulations, and we have fulfilled our other ethical responsibilities in accordance with these requirements. We believe that the audit evidence we have obtained is sufficient and appropriate to provide a basis for our opinion.
Key Audit Matters
Key audit matters are those matters that, in our professional judgment, were of most significance in our audit of the financial statements of the current period. These matters were addressed in the context of our audit of the financial statements as a whole, and in forming our opinion thereon, and we do not provide a separate opinion on these matters.
Annual accounts | Aker ASA | Independent auditor's report
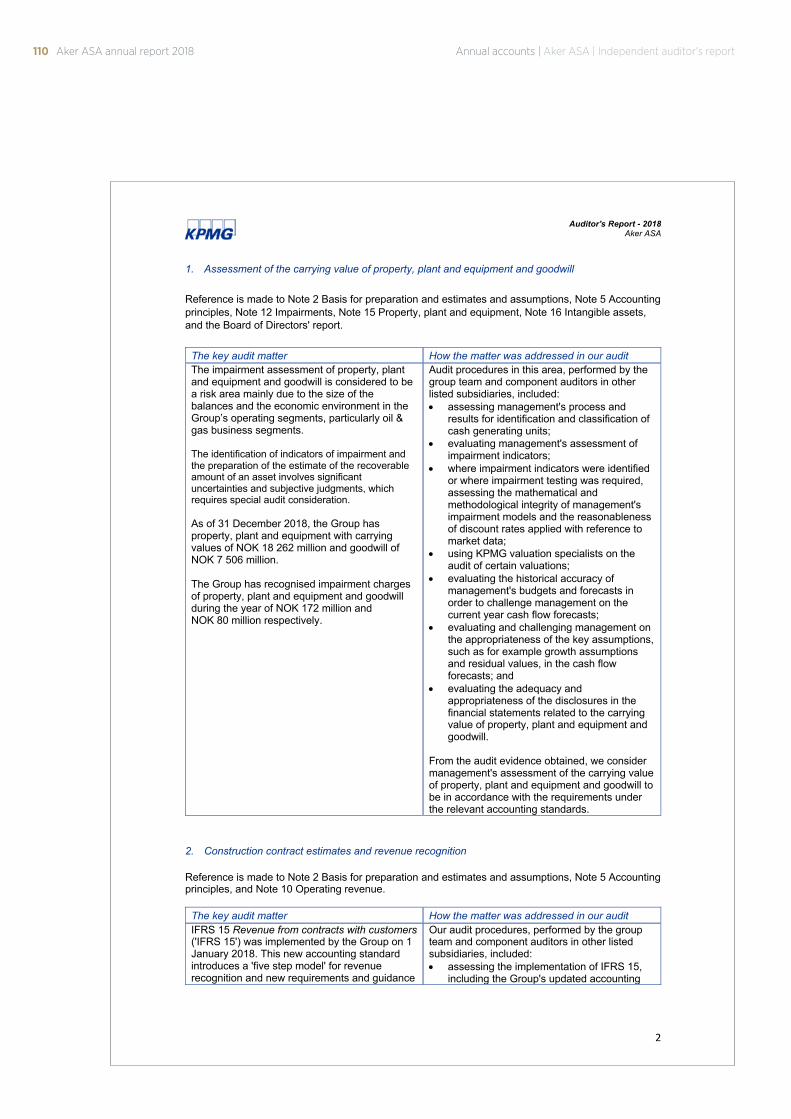
110 Aker ASA annual report 2018 Annual accounts | Aker ASA | Independent auditor's report
Auditor's Report - 2018 Aker ASA
2
1. Assessment of the carrying value of property, plant and equipment and goodwill Reference is made to Note 2 Basis for preparation and estimates and assumptions, Note 5 Accounting principles, Note 12 Impairments, Note 15 Property, plant and equipment, Note 16 Intangible assets, and the Board of Directors' report.
The key audit matter How the matter was addressed in our audit The impairment assessment of property, plant and equipment and goodwill is considered to be a risk area mainly due to the size of the balances and the economic environment in the Group’s operating segments, particularly oil & gas business segments. The identification of indicators of impairment and the preparation of the estimate of the recoverable amount of an asset involves significant uncertainties and subjective judgments, which requires special audit consideration. As of 31 December 2018, the Group has property, plant and equipment with carrying values of NOK 18 262 million and goodwill of NOK 7 506 million. The Group has recognised impairment charges of property, plant and equipment and goodwill during the year of NOK 172 million and NOK 80 million respectively.
Audit procedures in this area, performed by the group team and component auditors in other listed subsidiaries, included: • assessing management's process and
results for identification and classification of cash generating units;
• evaluating management's assessment of impairment indicators;
• where impairment indicators were identified or where impairment testing was required, assessing the mathematical and methodological integrity of management's impairment models and the reasonableness of discount rates applied with reference to market data;
• using KPMG valuation specialists on the audit of certain valuations;
• evaluating the historical accuracy of management's budgets and forecasts in order to challenge management on the current year cash flow forecasts;
• evaluating and challenging management on the appropriateness of the key assumptions, such as for example growth assumptions and residual values, in the cash flow forecasts; and
• evaluating the adequacy and appropriateness of the disclosures in the financial statements related to the carrying value of property, plant and equipment and goodwill.
From the audit evidence obtained, we consider management's assessment of the carrying value of property, plant and equipment and goodwill to be in accordance with the requirements under the relevant accounting standards.
2. Construction contract estimates and revenue recognition
Reference is made to Note 2 Basis for preparation and estimates and assumptions, Note 5 Accounting principles, and Note 10 Operating revenue.
The key audit matter How the matter was addressed in our audit IFRS 15 Revenue from contracts with customers ('IFRS 15') was implemented by the Group on 1 January 2018. This new accounting standard introduces a 'five step model' for revenue recognition and new requirements and guidance
Our audit procedures, performed by the group team and component auditors in other listed subsidiaries, included: • assessing the implementation of IFRS 15,
including the Group's updated accounting
111Aker ASA annual report 2018Annual accounts | Aker ASA | Independent auditor's report
Auditor's Report - 2018 Aker ASA
3
relevant to project accounting estimates and judgements. IFRS 15 has introduced a higher degree of judgment in determining the number of performance obligations which can impact the timing and amount of revenue recognition for certain contracts. Accounting for long term construction contracts involves management estimates and judgments which are often complex and involve assumptions regarding future events for which there may be little or no external corroborative evidence available. The key judgements and estimates applied by management include their assessment of the stage of project completion as well as assessing the estimated future contract revenue and cost outcomes. Revenue and cost outcomes factored in management's forecasts include: • incentive payments; • key performance indicators; • liquidated damages; and • expected fulfilment cost.
As such, these contract accounting estimates also require significant attention during the audit and are subject to a high degree of auditor judgment.
policies, transition impact assessment, application to construction and service contract accounting and disclosures;
• for financially significant contracts and any contracts with a reasonable possibility of being in a significant loss-making position, we applied professional skepticism and critically assessed the accounting estimates and judgments against the requirements of IFRS 15;
• challenging management's assumptions in determining if certain contracts contain single or multiple performance obligations by obtaining, reading, and critically assessing the terms and conditions of relevant contractual documents;
• assessing contractual revenue forecasts including corroborating those forecasts with reference to signed contracts and variation orders;
• assessing variable considerations estimates included in forecasted revenue against the requirements of IFRS 15;
• obtained and read the terms and conditions of significant contracts and comparing these to management's assessment of the contract forecasts;
• evaluating management's process for assessing measurement of progress and the method applied;
• challenging management on estimated recovery of incentive payments, incentives linked to key performance indicators and recognition of liquidated damages;
• reading and discussing project reports with management and comparing current forecasts to historical outcomes where relevant;
• challenging management on the estimate of cost to complete and the risk assessment related to forecast cost; and
• evaluating the adequacy and appropriateness of the disclosures in the financial statements related to IFRS 15 transition effects, revenue from construction contracts and service contracts.
From the audit evidence obtained, we consider construction contract estimates and revenue recognition to be consistent with the requirements under the relevant accounting standards.
Other information
Management is responsible for the other information. The other information comprises the information included in the Annual Report, with the exception of the financial statements and the Independent auditor's report.
112 Aker ASA annual report 2018
Auditor's Report - 2018 Aker ASA
4
Our opinion on the financial statements does not cover the other information and we do not express any form of assurance conclusion thereon, with the exception of our report on Other Legal and Regulatory Requirements below.
In connection with our audit of the financial statements, our responsibility is to read the other information and, in doing so, consider whether the other information is materially inconsistent with the financial statements or our knowledge obtained in the audit or otherwise appears to be materially misstated.
If, based on the work we have performed, we conclude that there is a material misstatement of this other information, we are required to report that fact. We have nothing to report in this regard.
Responsibilities of the Board of Directors and the Managing Director for the Financial Statements
The Board of Directors and the Managing Director (Management) are responsible for the preparation in accordance with law and regulations, including fair presentation of the financial statements of the Company in accordance with the Norwegian Accounting Act and accounting standards and practices generally accepted in Norway, and for the preparation and fair presentation of the financial statements of the Group in accordance with International Financial Reporting Standards as adopted by the EU, and for such internal control as management determines is necessary to enable the preparation of financial statements that are free from material misstatement, whether due to fraud or error.
In preparing the financial statements, management is responsible for assessing the Company’s and the Group’s ability to continue as a going concern, disclosing, as applicable, matters related to going concern. The financial statements of the Company use the going concern basis of accounting insofar as it is not likely that the enterprise will cease operations. The financial statements of the Group use the going concern basis of accounting unless management either intends to liquidate the Group or to cease operations, or has no realistic alternative but to do so.
Auditor’s Responsibilities for the Audit of the Financial Statements
Our objectives are to obtain reasonable assurance about whether the financial statements as a whole are free from material misstatement, whether due to fraud or error, and to issue an auditor’s report that includes our opinion. Reasonable assurance is a high level of assurance, but is not a guarantee that an audit conducted in accordance with laws, regulations, and auditing standards and practices generally accepted in Norway, including ISAs will always detect a material misstatement when it exists. Misstatements can arise from fraud or error and are considered material if, individually or in aggregate, they could reasonably be expected to influence the economic decisions of users taken on the basis of these financial statements.
As part of an audit in accordance with laws, regulations, and auditing standards and practices generally accepted in Norway, including ISAs, we exercise professional judgment and maintain professional scepticism throughout the audit. We also:
• identify and assess the risks of material misstatement of the financial statements, whether due to fraud or error. We design and perform audit procedures responsive to those risks, and obtain audit evidence that is sufficient and appropriate to provide a basis for our opinion. The risk of not detecting a material misstatement resulting from fraud is higher than for one resulting from error, as fraud may involve collusion, forgery, intentional omissions, misrepresentations, or the override of internal control.
• obtain an understanding of internal control relevant to the audit in order to design audit procedures that are appropriate in the circumstances, but not for the purpose of expressing an opinion on the effectiveness of the Company's or the Group's internal control.
• evaluate the appropriateness of accounting policies used and the reasonableness of accounting estimates and related disclosures made by management.
• conclude on the appropriateness of management’s use of the going concern basis of accounting and, based on the audit evidence obtained, whether a material uncertainty exists related to events or conditions that may cast significant doubt on the Company and the Group's ability to continue as a going concern. If we conclude that a material uncertainty
Annual accounts | Aker ASA | Independent auditor's report
113Aker ASA annual report 2018
Auditor's Report - 2018 Aker ASA
5
exists, we are required to draw attention in our auditor’s report to the related disclosures in the financial statements or, if such disclosures are inadequate, to modify our opinion. Our conclusions are based on the audit evidence obtained up to the date of our auditor's report. However, future events or conditions may cause the Company and the Group to cease to continue as a going concern.
• evaluate the overall presentation, structure and content of the financial statements, including the disclosures, and whether the financial statements represent the underlying transactions and events in a manner that achieves fair presentation.
• obtain sufficient appropriate audit evidence regarding the financial information of the entities or business activities within the Group to express an opinion on the consolidated financial statements. We are responsible for the direction, supervision and performance of the group audit. We remain solely responsible for our audit opinion.
We communicate with the Board of Directors regarding, among other matters, the planned scope and timing of the audit and significant audit findings, including any significant deficiencies in internal control that we identify during our audit.
We also provide the Board of Directors with a statement that we have complied with relevant ethical requirements regarding independence, and to communicate with them all relationships and other matters that may reasonably be thought to bear on our independence, and where applicable, related safeguards.
From the matters communicated with the Board of Directors, we determine those matters that were of most significance in the audit of the financial statements of the current period and are therefore the key audit matters. We describe these matters in our auditor’s report unless law or regulation precludes public disclosure about the matter or when, in extremely rare circumstances, we determine that a matter should not be communicated in our report because the adverse consequences of doing so would reasonably be expected to outweigh the public interest benefits of such communication.
Report on Other Legal and Regulatory Requirements
Opinion on the Board of Directors’ report
Based on our audit of the financial statements as described above, it is our opinion that the information presented in the Board of Directors’ report and in the statements on Corporate Governance and Corporate Social Responsibility concerning the financial statements, the going concern assumption, and the proposal for the allocation of the profit is consistent with the financial statements and complies with the law and regulations.
Opinion on Registration and Documentation
Based on our audit of the financial statements as described above, and control procedures we have considered necessary in accordance with the International Standard on Assurance Engagements (ISAE) 3000, Assurance Engagements Other than Audits or Reviews of Historical Financial Information, it is our opinion that management has fulfilled its duty to produce a proper and clearly set out registration and documentation of the Company's accounting information in accordance with the law and bookkeeping standards and practices generally accepted in Norway.
Oslo, 29 March 2019 KPMG AS Arve Gevoll State Authorised Public Accountant Note: This translation from Norwegian has been prepared for information purposes only.
Annual accounts | Aker ASA | Independent auditor's report
114 Aker ASA annual report 2018 Annual accounts | Aker ASA and holding companies
Aker ASA and holding companiesCombined income statement 115Combined balance sheet as at 31 December 116Notes to the financial statements 117
Note 1 | Accounting principles and basis for preparation 117
Note 2 | Operating revenues 117
Note 3 | Dividends received 117
Note 4 | Other financial items 118
Note 5 | Value change of shares and fund gains 118
Note 6 | Tax 118
Note 7 | Equity investments 119
Note 8 | Property, plant and equipment and financial interest-free non-current assets 119
Note 9 | Interest-bearing receivables and interest-free non-current receivables 120
Note 10 | Cash and cash equivalents 120
Note 11 | Shareholders' equity 120
Note 12 | Interest-free current and non-current liabilities 120
Note 13 | Interest-bearing current and non-current liabilities 121
Note 14 | Risk 121
Independent auditor's report 122
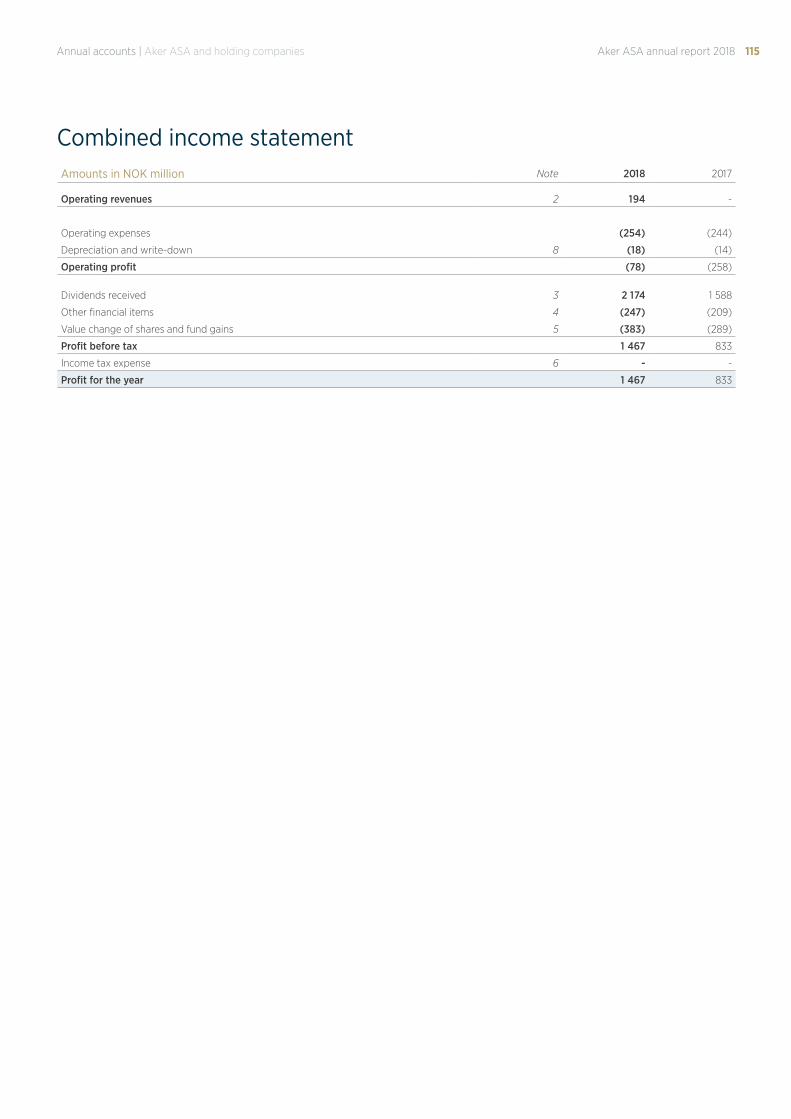
115Aker ASA annual report 2018Annual accounts | Aker ASA and holding companies
Combined income statementAmounts in NOK million Note 2018 2017
Operating revenues 2 194 -
Operating expenses (254) (244)
Depreciation and write-down 8 (18) (14)
Operating profit (78) (258)
Dividends received 3 2 174 1 588
Other financial items 4 (247) (209)
Value change of shares and fund gains 5 (383) (289)
Profit before tax 1 467 833
Income tax expense 6 - -
Profit for the year 1 467 833
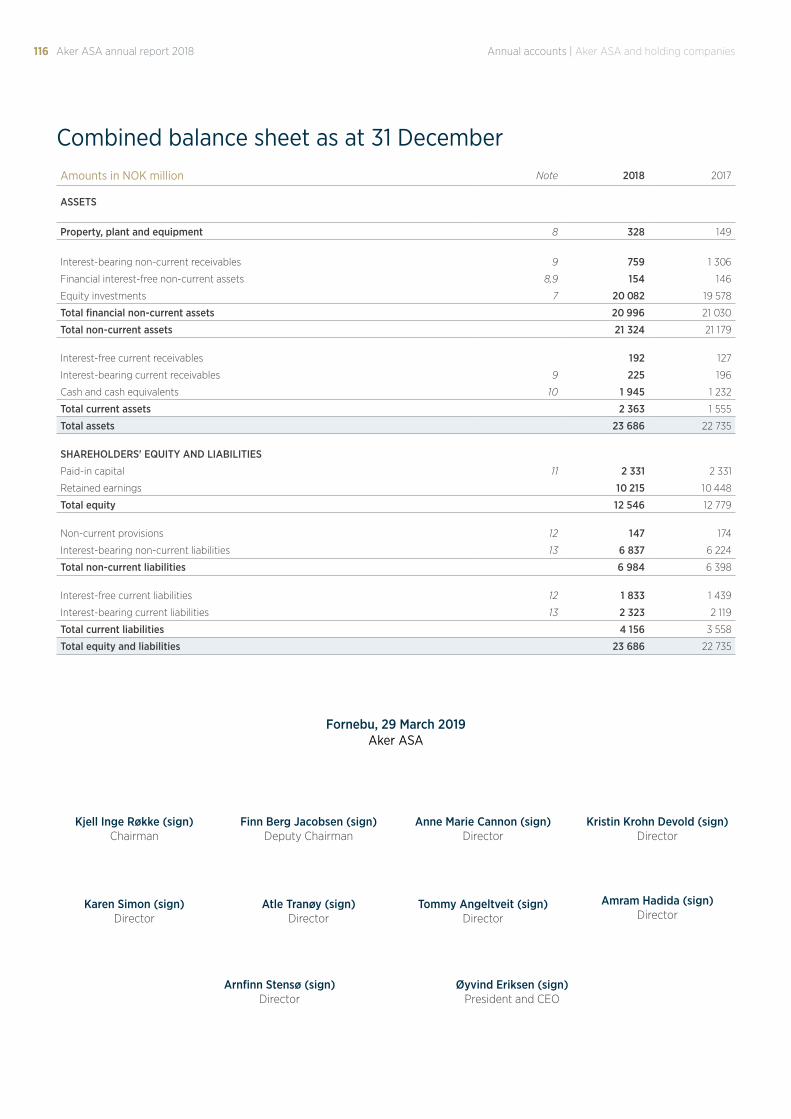
116 Aker ASA annual report 2018 Annual accounts | Aker ASA and holding companies
Combined balance sheet as at 31 DecemberAmounts in NOK million Note 2018 2017
ASSETS
Property, plant and equipment 8 328 149
Interest-bearing non-current receivables 9 759 1 306
Financial interest-free non-current assets 8,9 154 146
Equity investments 7 20 082 19 578
Total financial non-current assets 20 996 21 030
Total non-current assets 21 324 21 179
Interest-free current receivables 192 127
Interest-bearing current receivables 9 225 196
Cash and cash equivalents 10 1 945 1 232
Total current assets 2 363 1 555
Total assets 23 686 22 735
SHAREHOLDERS' EQUITY AND LIABILITIES
Paid-in capital 11 2 331 2 331
Retained earnings 10 215 10 448
Total equity 12 546 12 779
Non-current provisions 12 147 174
Interest-bearing non-current liabilities 13 6 837 6 224
Total non-current liabilities 6 984 6 398
Interest-free current liabilities 12 1 833 1 439
Interest-bearing current liabilities 13 2 323 2 119
Total current liabilities 4 156 3 558
Total equity and liabilities 23 686 22 735
Fornebu, 29 March 2019Aker ASA
Amram Hadida (sign)Director
Arnfinn Stensø (sign)Director
Atle Tranøy (sign)Director
Øyvind Eriksen (sign)President and CEO
Karen Simon (sign)Director
Tommy Angeltveit (sign)Director
Anne Marie Cannon (sign)Director
Finn Berg Jacobsen (sign)Deputy Chairman
Kristin Krohn Devold (sign)Director
Kjell Inge Røkke (sign)Chairman
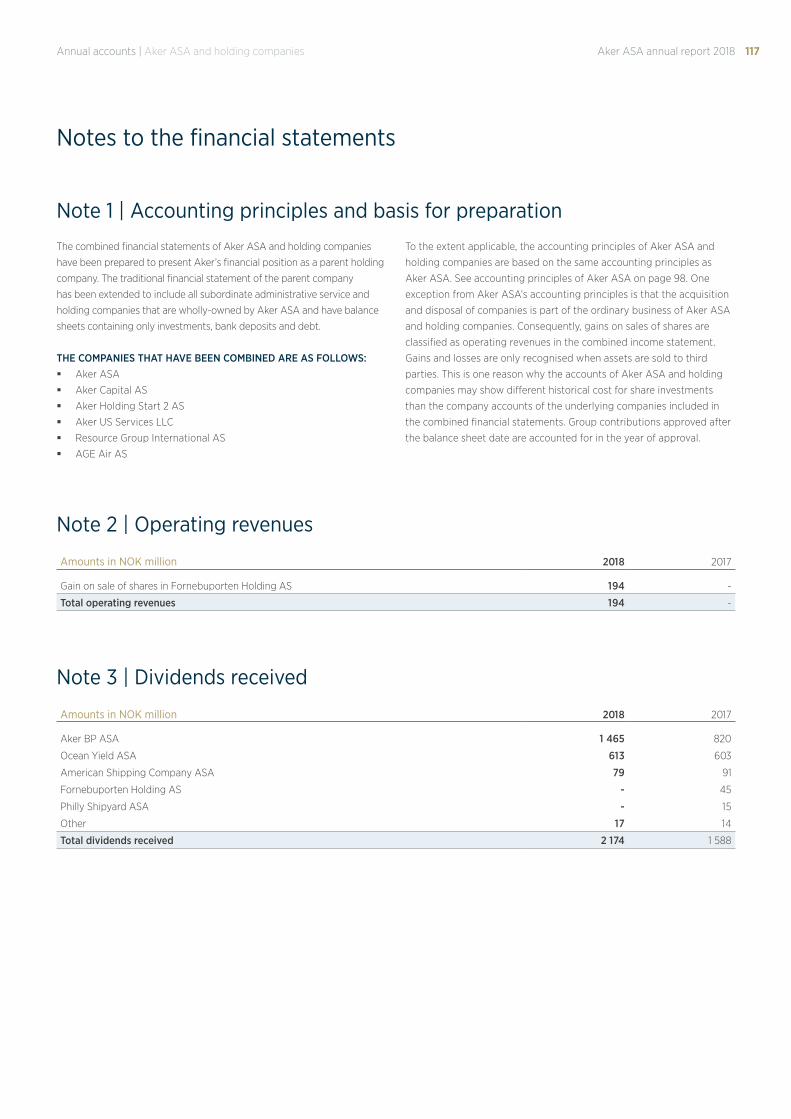
117Aker ASA annual report 2018Annual accounts | Aker ASA and holding companies
Note 1 | Accounting principles and basis for preparation
Note 2 | Operating revenues
Note 3 | Dividends received
The combined financial statements of Aker ASA and holding companies
have been prepared to present Aker’s financial position as a parent holding
company. The traditional financial statement of the parent company
has been extended to include all subordinate administrative service and
holding companies that are wholly-owned by Aker ASA and have balance
sheets containing only investments, bank deposits and debt.
THE COMPANIES THAT HAVE BEEN COMBINED ARE AS FOLLOWS: § Aker ASA
§ Aker Capital AS
§ Aker Holding Start 2 AS
§ Aker US Services LLC
§ Resource Group International AS
§ AGE Air AS
To the extent applicable, the accounting principles of Aker ASA and
holding companies are based on the same accounting principles as
Aker ASA. See accounting principles of Aker ASA on page 98. One
exception from Aker ASA’s accounting principles is that the acquisition
and disposal of companies is part of the ordinary business of Aker ASA
and holding companies. Consequently, gains on sales of shares are
classified as operating revenues in the combined income statement.
Gains and losses are only recognised when assets are sold to third
parties. This is one reason why the accounts of Aker ASA and holding
companies may show different historical cost for share investments
than the company accounts of the underlying companies included in
the combined financial statements. Group contributions approved after
the balance sheet date are accounted for in the year of approval.
Amounts in NOK million 2018 2017
Gain on sale of shares in Fornebuporten Holding AS 194 -
Total operating revenues 194 -
Amounts in NOK million 2018 2017
Aker BP ASA 1 465 820
Ocean Yield ASA 613 603
American Shipping Company ASA 79 91
Fornebuporten Holding AS - 45
Philly Shipyard ASA - 15
Other 17 14
Total dividends received 2 174 1 588
Notes to the financial statements
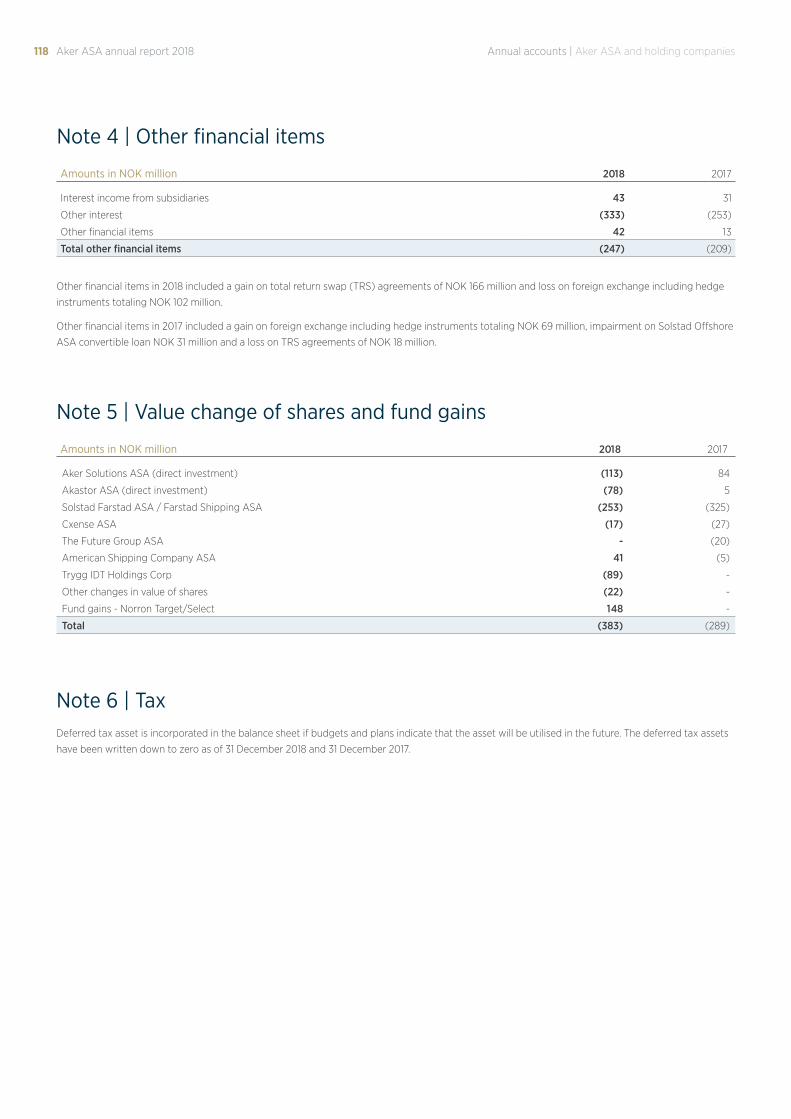
118 Aker ASA annual report 2018 Annual accounts | Aker ASA and holding companies
Note 4 | Other financial items
Note 5 | Value change of shares and fund gains
Note 6 | Tax
Amounts in NOK million 2018 2017
Interest income from subsidiaries 43 31
Other interest (333) (253)
Other financial items 42 13
Total other financial items (247) (209)
Amounts in NOK million 2018 2017
Aker Solutions ASA (direct investment) (113) 84
Akastor ASA (direct investment) (78) 5
Solstad Farstad ASA / Farstad Shipping ASA (253) (325)
Cxense ASA (17) (27)
The Future Group ASA - (20)
American Shipping Company ASA 41 (5)
Trygg IDT Holdings Corp (89) -
Other changes in value of shares (22) -
Fund gains - Norron Target/Select 148 -
Total (383) (289)
Other financial items in 2018 included a gain on total return swap (TRS) agreements of NOK 166 million and loss on foreign exchange including hedge
instruments totaling NOK 102 million.
Other financial items in 2017 included a gain on foreign exchange including hedge instruments totaling NOK 69 million, impairment on Solstad Offshore
ASA convertible loan NOK 31 million and a loss on TRS agreements of NOK 18 million.
Deferred tax asset is incorporated in the balance sheet if budgets and plans indicate that the asset will be utilised in the future. The deferred tax assets
have been written down to zero as of 31 December 2018 and 31 December 2017.
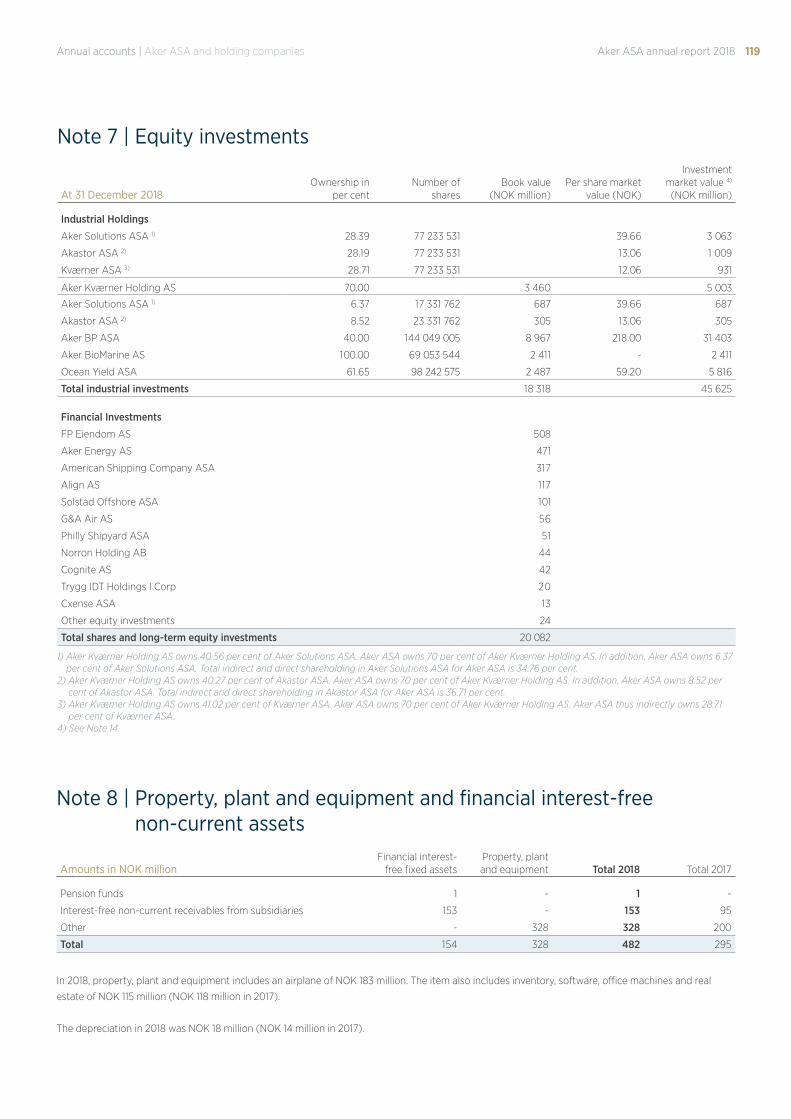
119Aker ASA annual report 2018Annual accounts | Aker ASA and holding companies
Note 8 | Property, plant and equipment and financial interest-free non-current assets
Note 7 | Equity investments
Amounts in NOK millionFinancial interest-
free fixed assetsProperty, plant and equipment Total 2018 Total 2017
Pension funds 1 - 1 -
Interest-free non-current receivables from subsidiaries 153 - 153 95
Other - 328 328 200
Total 154 328 482 295
At 31 December 2018Ownership in
per centNumber of
sharesBook value
(NOK million)Per share market
value (NOK)
Investmentmarket value 4)
(NOK million)
Industrial Holdings
Aker Solutions ASA 1) 28.39 77 233 531 39.66 3 063
Akastor ASA 2) 28.19 77 233 531 13.06 1 009
Kværner ASA 3) 28.71 77 233 531 12.06 931
Aker Kværner Holding AS 70.00 3 460 5 003
Aker Solutions ASA 1) 6.37 17 331 762 687 39.66 687
Akastor ASA 2) 8.52 23 331 762 305 13.06 305
Aker BP ASA 40.00 144 049 005 8 967 218.00 31 403
Aker BioMarine AS 100.00 69 053 544 2 411 - 2 411
Ocean Yield ASA 61.65 98 242 575 2 487 59.20 5 816
Total industrial investments 18 318 45 625
Financial Investments
FP Eiendom AS 508
Aker Energy AS 471
American Shipping Company ASA 317
Align AS 117
Solstad Offshore ASA 101
G&A Air AS 56
Philly Shipyard ASA 51
Norron Holding AB 44
Cognite AS 42
Trygg IDT Holdings I Corp 20
Cxense ASA 13
Other equity investments 24
Total shares and long-term equity investments 20 082
1) Aker Kværner Holding AS owns 40.56 per cent of Aker Solutions ASA. Aker ASA owns 70 per cent of Aker Kværner Holding AS. In addition, Aker ASA owns 6.37 per cent of Aker Solutions ASA. Total indirect and direct shareholding in Aker Solutions ASA for Aker ASA is 34.76 per cent.
2) Aker Kværner Holding AS owns 40.27 per cent of Akastor ASA. Aker ASA owns 70 per cent of Aker Kværner Holding AS. In addition, Aker ASA owns 8.52 per cent of Akastor ASA. Total indirect and direct shareholding in Akastor ASA for Aker ASA is 36.71 per cent.
3) Aker Kværner Holding AS owns 41.02 per cent of Kværner ASA. Aker ASA owns 70 per cent of Aker Kværner Holding AS. Aker ASA thus indirectly owns 28.71 per cent of Kværner ASA.
4) See Note 14.
In 2018, property, plant and equipment includes an airplane of NOK 183 million. The item also includes inventory, software, office machines and real
estate of NOK 115 million (NOK 118 million in 2017).
The depreciation in 2018 was NOK 18 million (NOK 14 million in 2017).
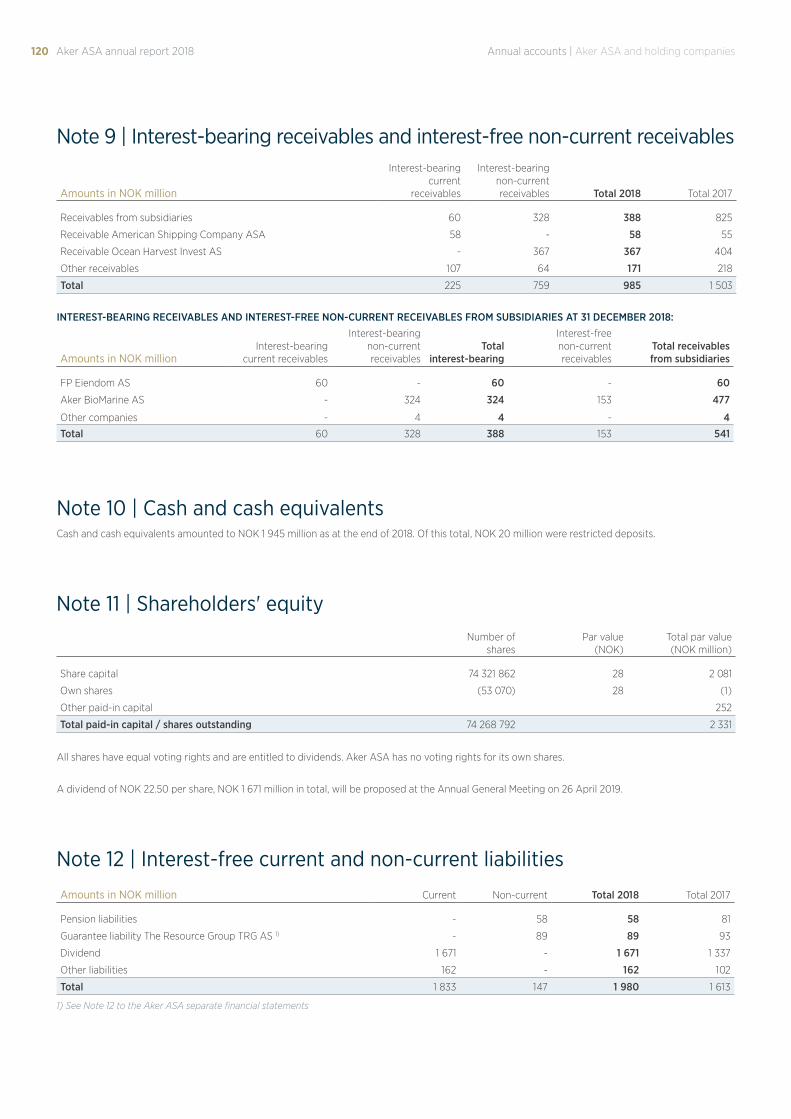
120 Aker ASA annual report 2018 Annual accounts | Aker ASA and holding companies
Note 9 | Interest-bearing receivables and interest-free non-current receivables
Note 10 | Cash and cash equivalents
Note 11 | Shareholders' equity
Amounts in NOK million
Interest-bearing current
receivables
Interest-bearingnon-currentreceivables Total 2018 Total 2017
Receivables from subsidiaries 60 328 388 825
Receivable American Shipping Company ASA 58 - 58 55
Receivable Ocean Harvest Invest AS - 367 367 404
Other receivables 107 64 171 218
Total 225 759 985 1 503
INTEREST-BEARING RECEIVABLES AND INTEREST-FREE NON-CURRENT RECEIVABLES FROM SUBSIDIARIES AT 31 DECEMBER 2018:
Amounts in NOK millionInterest-bearing
current receivables
Interest-bearingnon-current receivables
Totalinterest-bearing
Interest-freenon-currentreceivables
Total receivablesfrom subsidiaries
FP Eiendom AS 60 - 60 - 60
Aker BioMarine AS - 324 324 153 477
Other companies - 4 4 - 4Total 60 328 388 153 541
Number of shares
Par value(NOK)
Total par value (NOK million)
Share capital 74 321 862 28 2 081
Own shares (53 070) 28 (1)
Other paid-in capital 252
Total paid-in capital / shares outstanding 74 268 792 2 331
Cash and cash equivalents amounted to NOK 1 945 million as at the end of 2018. Of this total, NOK 20 million were restricted deposits.
All shares have equal voting rights and are entitled to dividends. Aker ASA has no voting rights for its own shares.
A dividend of NOK 22.50 per share, NOK 1 671 million in total, will be proposed at the Annual General Meeting on 26 April 2019.
Note 12 | Interest-free current and non-current liabilities
Amounts in NOK million Current Non-current Total 2018 Total 2017
Pension liabilities - 58 58 81
Guarantee liability The Resource Group TRG AS 1) - 89 89 93
Dividend 1 671 - 1 671 1 337
Other liabilities 162 - 162 102
Total 1 833 147 1 980 1 613
1) See Note 12 to the Aker ASA separate financial statements
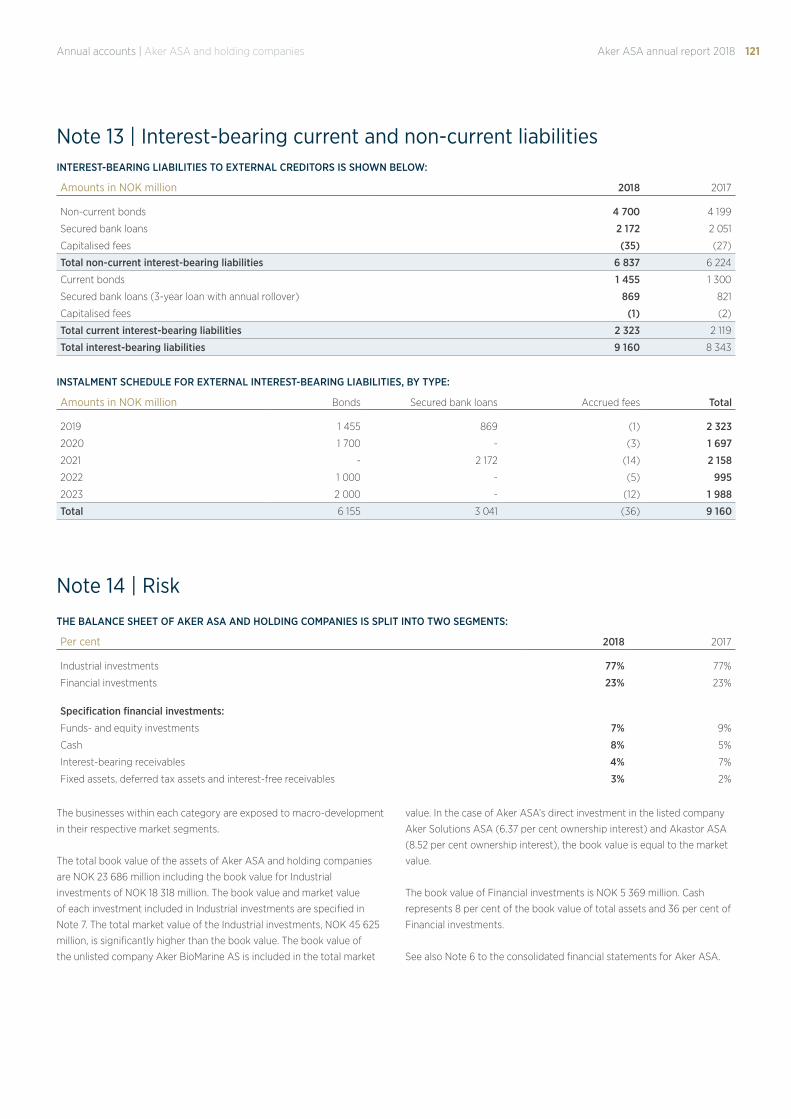
121Aker ASA annual report 2018Annual accounts | Aker ASA and holding companies
Note 13 | Interest-bearing current and non-current liabilitiesINTEREST-BEARING LIABILITIES TO EXTERNAL CREDITORS IS SHOWN BELOW:
Amounts in NOK million 2018 2017
Non-current bonds 4 700 4 199
Secured bank loans 2 172 2 051
Capitalised fees (35) (27)
Total non-current interest-bearing liabilities 6 837 6 224
Current bonds 1 455 1 300
Secured bank loans (3-year loan with annual rollover) 869 821
Capitalised fees (1) (2)
Total current interest-bearing liabilities 2 323 2 119
Total interest-bearing liabilities 9 160 8 343
INSTALMENT SCHEDULE FOR EXTERNAL INTEREST-BEARING LIABILITIES, BY TYPE:
Amounts in NOK million Bonds Secured bank loans Accrued fees Total
2019 1 455 869 (1) 2 323
2020 1 700 - (3) 1 697
2021 - 2 172 (14) 2 158
2022 1 000 - (5) 995
2023 2 000 - (12) 1 988
Total 6 155 3 041 (36) 9 160
Note 14 | Risk
THE BALANCE SHEET OF AKER ASA AND HOLDING COMPANIES IS SPLIT INTO TWO SEGMENTS:
Per cent 2018 2017
Industrial investments 77% 77%
Financial investments 23% 23%
Specification financial investments:
Funds- and equity investments 7% 9%
Cash 8% 5%
Interest-bearing receivables 4% 7%
Fixed assets, deferred tax assets and interest-free receivables 3% 2%
The businesses within each category are exposed to macro-development
in their respective market segments.
The total book value of the assets of Aker ASA and holding companies
are NOK 23 686 million including the book value for Industrial
investments of NOK 18 318 million. The book value and market value
of each investment included in Industrial investments are specified in
Note 7. The total market value of the Industrial investments, NOK 45 625
million, is significantly higher than the book value. The book value of
the unlisted company Aker BioMarine AS is included in the total market
value. In the case of Aker ASA’s direct investment in the listed company
Aker Solutions ASA (6.37 per cent ownership interest) and Akastor ASA
(8.52 per cent ownership interest), the book value is equal to the market
value.
The book value of Financial investments is NOK 5 369 million. Cash
represents 8 per cent of the book value of total assets and 36 per cent of
Financial investments.
See also Note 6 to the consolidated financial statements for Aker ASA.
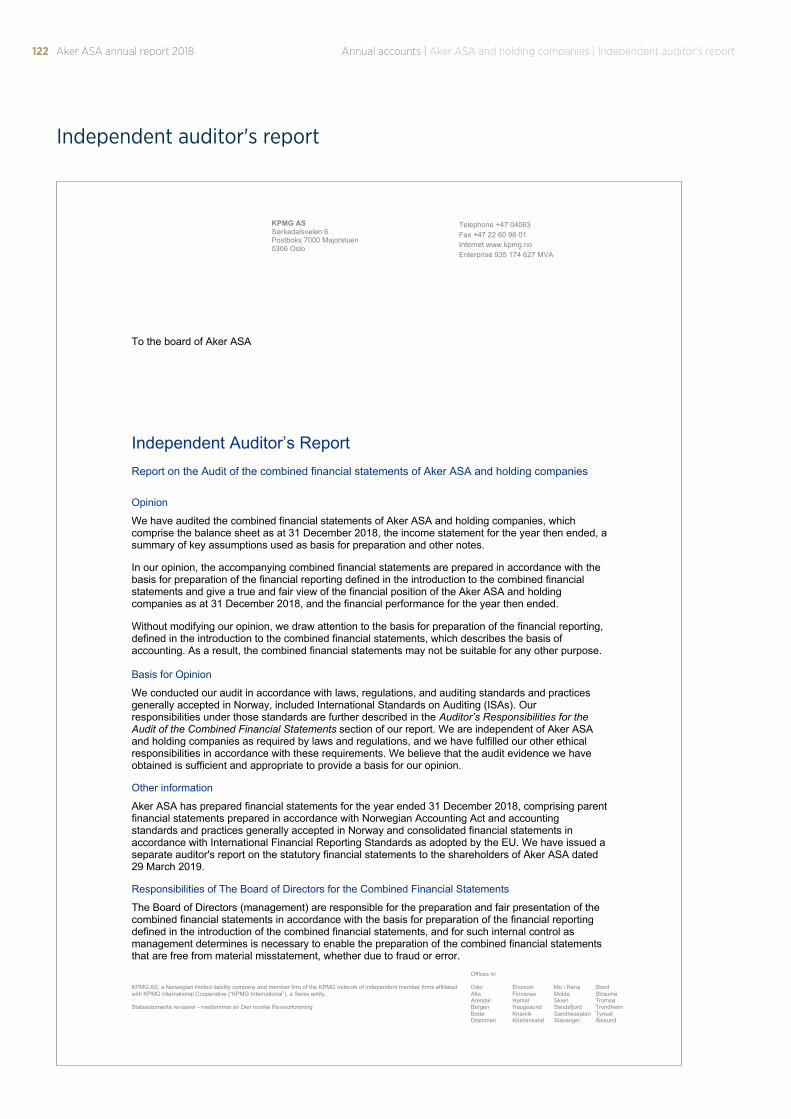
122 Aker ASA annual report 2018
Independent auditor's report
KPMG AS Sørkedalsveien 6 Postboks 7000 Majorstuen 0306 Oslo
Telephone +47 04063 Fax +47 22 60 96 01 Internet www.kpmg.no Enterprise 935 174 627 MVA
KPMG AS, a Norwegian limited liability company and member firm of the KPMG network of independent member firms affiliated with KPMG International Cooperative (“KPMG International”), a Swiss entity. Statsautoriserte revisorer - medlemmer av Den norske Revisorforening
Offices in: Oslo Alta Arendal Bergen Bodø Drammen
Elverum Finnsnes Hamar Haugesund Knarvik Kristiansand
Mo i Rana Molde Skien Sandefjord Sandnessjøen Stavanger
Stord Straume Tromsø Trondheim Tynset Ålesund
To the board of Aker ASA
Independent Auditor’s Report Report on the Audit of the combined financial statements of Aker ASA and holding companies
Opinion
We have audited the combined financial statements of Aker ASA and holding companies, which comprise the balance sheet as at 31 December 2018, the income statement for the year then ended, a summary of key assumptions used as basis for preparation and other notes.
In our opinion, the accompanying combined financial statements are prepared in accordance with the basis for preparation of the financial reporting defined in the introduction to the combined financial statements and give a true and fair view of the financial position of the Aker ASA and holding companies as at 31 December 2018, and the financial performance for the year then ended.
Without modifying our opinion, we draw attention to the basis for preparation of the financial reporting, defined in the introduction to the combined financial statements, which describes the basis of accounting. As a result, the combined financial statements may not be suitable for any other purpose. Basis for Opinion
We conducted our audit in accordance with laws, regulations, and auditing standards and practices generally accepted in Norway, included International Standards on Auditing (ISAs). Our responsibilities under those standards are further described in the Auditor’s Responsibilities for the Audit of the Combined Financial Statements section of our report. We are independent of Aker ASA and holding companies as required by laws and regulations, and we have fulfilled our other ethical responsibilities in accordance with these requirements. We believe that the audit evidence we have obtained is sufficient and appropriate to provide a basis for our opinion.
Other information
Aker ASA has prepared financial statements for the year ended 31 December 2018, comprising parent financial statements prepared in accordance with Norwegian Accounting Act and accounting standards and practices generally accepted in Norway and consolidated financial statements in accordance with International Financial Reporting Standards as adopted by the EU. We have issued a separate auditor's report on the statutory financial statements to the shareholders of Aker ASA dated 29 March 2019.
Responsibilities of The Board of Directors for the Combined Financial Statements
The Board of Directors (management) are responsible for the preparation and fair presentation of the combined financial statements in accordance with the basis for preparation of the financial reporting defined in the introduction of the combined financial statements, and for such internal control as management determines is necessary to enable the preparation of the combined financial statements that are free from material misstatement, whether due to fraud or error.
Annual accounts | Aker ASA and holding companies | Independent auditor's report
123Aker ASA annual report 2018
Auditor's report - 2018
Aker ASA and holding companies
2
Auditor’s Responsibilities for the Audit of the Combined Financial Statements
Our objectives are to obtain reasonable assurance about whether the combined financial statements as a whole are free from material misstatement, whether due to fraud or error, and to issue an auditor’s report that includes our opinion. Reasonable assurance is a high level of assurance, but is not a guarantee that an audit conducted in accordance with laws, regulations, and auditing standards and practices generally accepted in Norway, including ISAs will always detect a material misstatement when it exists. Misstatements can arise from fraud or error and are considered material if, individually or in aggregate, they could reasonably be expected to influence the economic decisions of users taken on the basis of these combined financial statements.
As part of an audit in accordance with laws, regulations, and auditing standards and practices generally accepted in Norway, included International Standards on Auditing (ISAs), we exercise professional judgment and maintain professional scepticism throughout the audit. We also:
• identify and assess the risks of material misstatement of the combined financial statements, whether due to fraud or error. We design and perform audit procedures responsive to those risks, and obtain audit evidence that is sufficient and appropriate to provide a basis for our opinion. The risk of not detecting a material misstatement resulting from fraud is higher than for one resulting from error, as fraud may involve collusion, forgery, intentional omissions, misrepresentations, or the override of internal control.
• obtain an understanding of internal control relevant to the audit in order to design audit procedures that are appropriate in the circumstances, but not for the purpose of expressing an opinion on the effectiveness of Aker ASA and holding companies' internal control.
• evaluate the appropriateness of accounting policies used and the reasonableness of accounting estimates and related disclosures made by management.
• evaluate the overall presentation, structure and content of the financial statements, including the disclosures, and whether the combined financial statements represent the underlying transactions and events in a manner that achieves fair presentation.
We communicate with the Board of Directors regarding, among other matters, the planned scope and timing of the audit and significant audit findings, including any significant deficiencies in internal control that we identify during our audit.
Oslo, 29 March 2019 KPMG AS Arve Gevoll State Authorised Public Accountant
[Translation has been made for information purposes only]
Annual accounts | Aker ASA and holding companies | Independent auditor's report
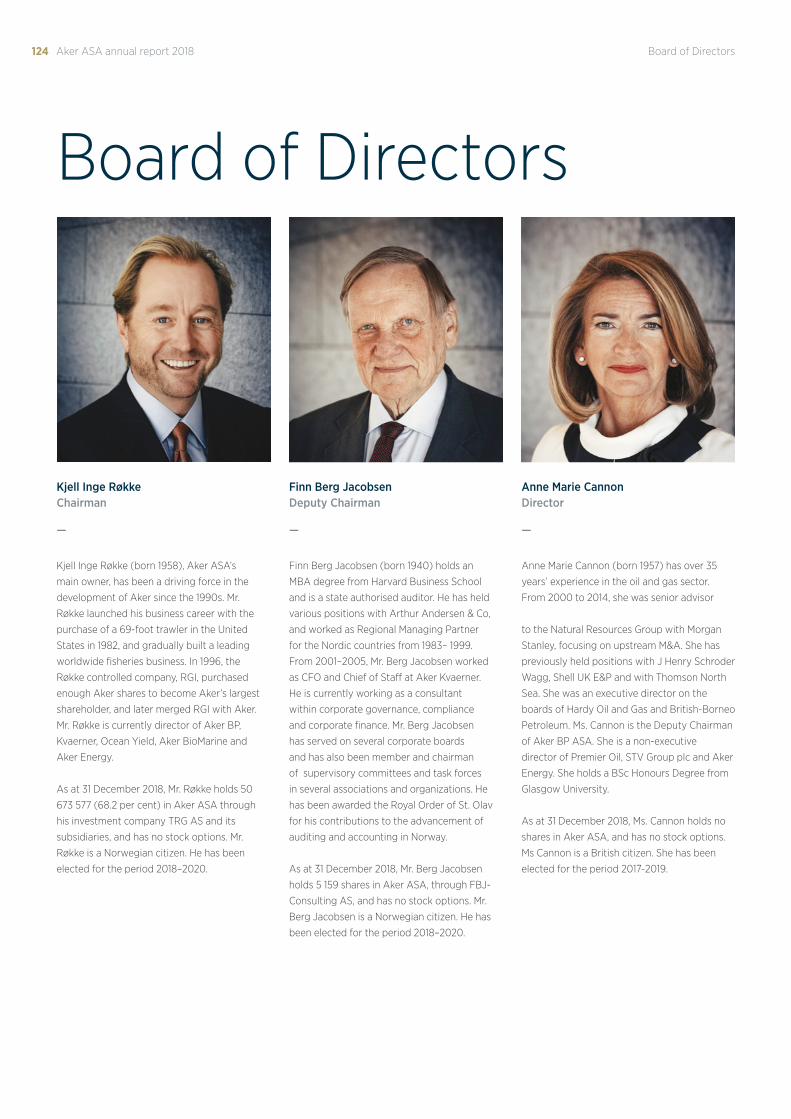
124 Aker ASA annual report 2018 Board of Directors
Board of Directors
Kjell Inge Røkke Chairman
—
Kjell Inge Røkke (born 1958), Aker ASA’s
main owner, has been a driving force in the
development of Aker since the 1990s. Mr.
Røkke launched his business career with the
purchase of a 69-foot trawler in the United
States in 1982, and gradually built a leading
worldwide fisheries business. In 1996, the
Røkke controlled company, RGI, purchased
enough Aker shares to become Aker’s largest
shareholder, and later merged RGI with Aker.
Mr. Røkke is currently director of Aker BP,
Kvaerner, Ocean Yield, Aker BioMarine and
Aker Energy.
As at 31 December 2018, Mr. Røkke holds 50
673 577 (68.2 per cent) in Aker ASA through
his investment company TRG AS and its
subsidiaries, and has no stock options. Mr.
Røkke is a Norwegian citizen. He has been
elected for the period 2018–2020.
Finn Berg Jacobsen Deputy Chairman
—
Finn Berg Jacobsen (born 1940) holds an
MBA degree from Harvard Business School
and is a state authorised auditor. He has held
various positions with Arthur Andersen & Co,
and worked as Regional Managing Partner
for the Nordic countries from 1983– 1999.
From 2001–2005, Mr. Berg Jacobsen worked
as CFO and Chief of Staff at Aker Kvaerner.
He is currently working as a consultant
within corporate governance, compliance
and corporate finance. Mr. Berg Jacobsen
has served on several corporate boards
and has also been member and chairman
of supervisory committees and task forces
in several associations and organizations. He
has been awarded the Royal Order of St. Olav
for his contributions to the advancement of
auditing and accounting in Norway.
As at 31 December 2018, Mr. Berg Jacobsen
holds 5 159 shares in Aker ASA, through FBJ-
Consulting AS, and has no stock options. Mr.
Berg Jacobsen is a Norwegian citizen. He has
been elected for the period 2018–2020.
Anne Marie Cannon Director
—
Anne Marie Cannon (born 1957) has over 35
years’ experience in the oil and gas sector.
From 2000 to 2014, she was senior advisor
to the Natural Resources Group with Morgan
Stanley, focusing on upstream M&A. She has
previously held positions with J Henry Schroder
Wagg, Shell UK E&P and with Thomson North
Sea. She was an executive director on the
boards of Hardy Oil and Gas and British-Borneo
Petroleum. Ms. Cannon is the Deputy Chairman
of Aker BP ASA. She is a non-executive
director of Premier Oil, STV Group plc and Aker
Energy. She holds a BSc Honours Degree from
Glasgow University.
As at 31 December 2018, Ms. Cannon holds no
shares in Aker ASA, and has no stock options.
Ms Cannon is a British citizen. She has been
elected for the period 2017-2019.
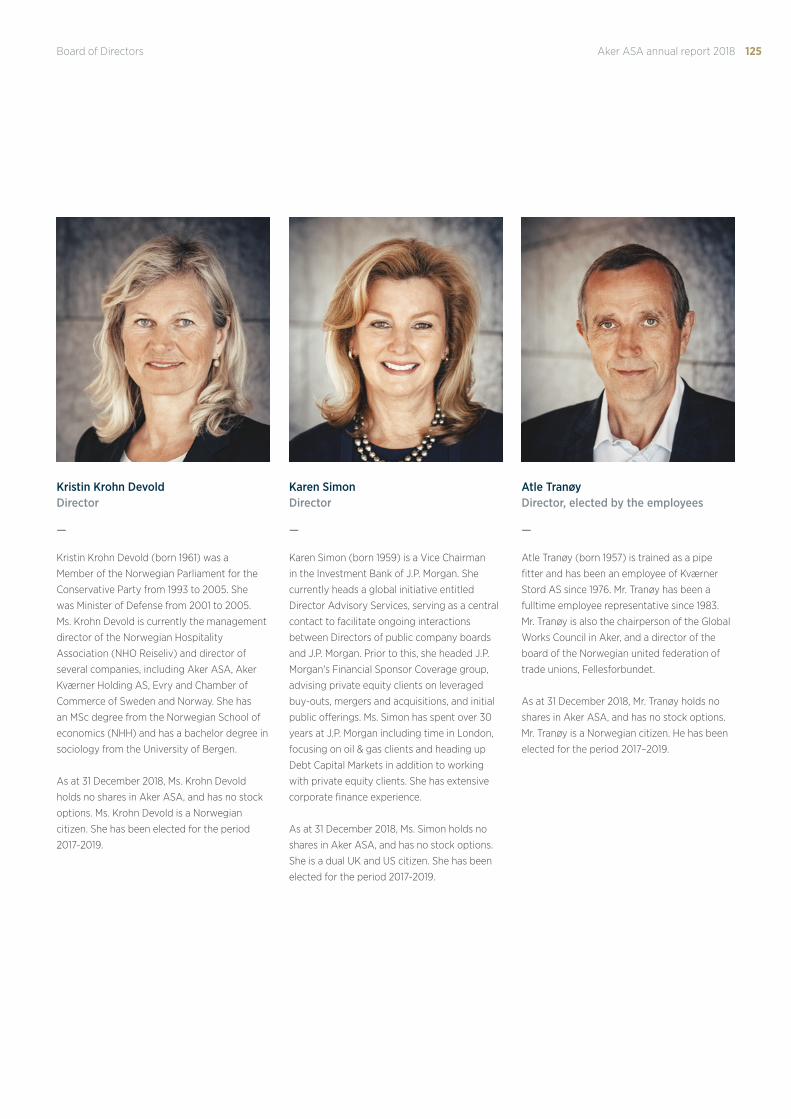
125Aker ASA annual report 2018Board of Directors
Kristin Krohn Devold Director
—
Kristin Krohn Devold (born 1961) was a
Member of the Norwegian Parliament for the
Conservative Party from 1993 to 2005. She
was Minister of Defense from 2001 to 2005.
Ms. Krohn Devold is currently the management
director of the Norwegian Hospitality
Association (NHO Reiseliv) and director of
several companies, including Aker ASA, Aker
Kværner Holding AS, Evry and Chamber of
Commerce of Sweden and Norway. She has
an MSc degree from the Norwegian School of
economics (NHH) and has a bachelor degree in
sociology from the University of Bergen.
As at 31 December 2018, Ms. Krohn Devold
holds no shares in Aker ASA, and has no stock
options. Ms. Krohn Devold is a Norwegian
citizen. She has been elected for the period
2017-2019.
Karen Simon Director
—
Karen Simon (born 1959) is a Vice Chairman
in the Investment Bank of J.P. Morgan. She
currently heads a global initiative entitled
Director Advisory Services, serving as a central
contact to facilitate ongoing interactions
between Directors of public company boards
and J.P. Morgan. Prior to this, she headed J.P.
Morgan's Financial Sponsor Coverage group,
advising private equity clients on leveraged
buy-outs, mergers and acquisitions, and initial
public offerings. Ms. Simon has spent over 30
years at J.P. Morgan including time in London,
focusing on oil & gas clients and heading up
Debt Capital Markets in addition to working
with private equity clients. She has extensive
corporate finance experience.
As at 31 December 2018, Ms. Simon holds no
shares in Aker ASA, and has no stock options.
She is a dual UK and US citizen. She has been
elected for the period 2017-2019.
Atle Tranøy Director, elected by the employees
—
Atle Tranøy (born 1957) is trained as a pipe
fitter and has been an employee of Kværner
Stord AS since 1976. Mr. Tranøy has been a
fulltime employee representative since 1983.
Mr. Tranøy is also the chairperson of the Global
Works Council in Aker, and a director of the
board of the Norwegian united federation of
trade unions, Fellesforbundet.
As at 31 December 2018, Mr. Tranøy holds no
shares in Aker ASA, and has no stock options.
Mr. Tranøy is a Norwegian citizen. He has been
elected for the period 2017–2019.
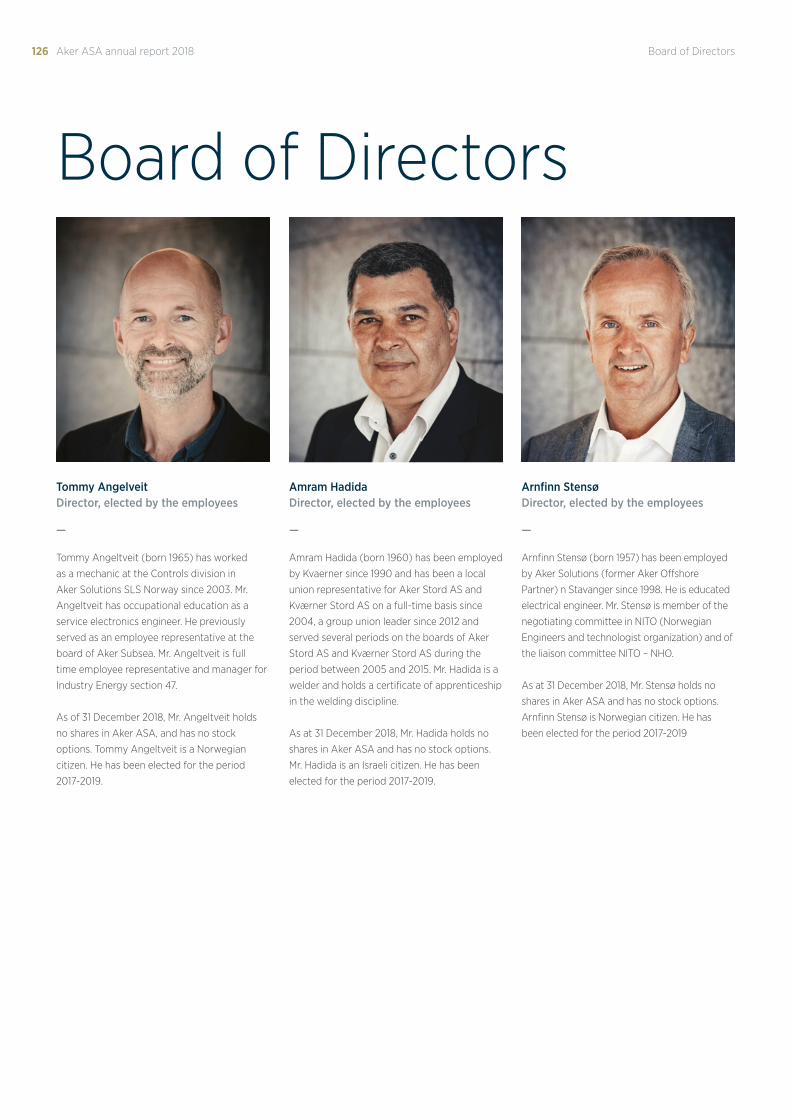
126 Aker ASA annual report 2018 Board of Directors
Board of Directors
Amram Hadida Director, elected by the employees
—
Amram Hadida (born 1960) has been employed
by Kvaerner since 1990 and has been a local
union representative for Aker Stord AS and
Kværner Stord AS on a full-time basis since
2004, a group union leader since 2012 and
served several periods on the boards of Aker
Stord AS and Kværner Stord AS during the
period between 2005 and 2015. Mr. Hadida is a
welder and holds a certificate of apprenticeship
in the welding discipline.
As at 31 December 2018, Mr. Hadida holds no
shares in Aker ASA and has no stock options.
Mr. Hadida is an Israeli citizen. He has been
elected for the period 2017-2019.
Arnfinn Stensø Director, elected by the employees
—
Arnfinn Stensø (born 1957) has been employed
by Aker Solutions (former Aker Offshore
Partner) n Stavanger since 1998. He is educated
electrical engineer. Mr. Stensø is member of the
negotiating committee in NITO (Norwegian
Engineers and technologist organization) and of
the liaison committee NITO – NHO.
As at 31 December 2018, Mr. Stensø holds no
shares in Aker ASA and has no stock options.
Arnfinn Stensø is Norwegian citizen. He has
been elected for the period 2017-2019
Tommy Angelveit Director, elected by the employees
—
Tommy Angeltveit (born 1965) has worked
as a mechanic at the Controls division in
Aker Solutions SLS Norway since 2003. Mr.
Angeltveit has occupational education as a
service electronics engineer. He previously
served as an employee representative at the
board of Aker Subsea. Mr. Angeltveit is full
time employee representative and manager for
Industry Energy section 47.
As of 31 December 2018, Mr. Angeltveit holds
no shares in Aker ASA, and has no stock
options. Tommy Angeltveit is a Norwegian
citizen. He has been elected for the period
2017-2019.
127Aker ASA annual report 2018Management
Management
Øyvind Eriksen President & CEO
—
Øyvind Eriksen (born 1964) joined Aker ASA
in January 2009. Mr. Eriksen holds a law
degree from the University of Oslo. He joined
Norwegian law firm BA-HR in 1990, where
he became a partner in 1996 and a director/
chairman in 2003. As a corporate attorney
he among other things worked with strategic
and operational development, M&A and
negotiations. Among other, Mr. Eriksen worked
closely with Aker. Mr. Eriksen has held several
board positions in different industries, including
shipping, finance, asset management, offshore
drilling, fisheries, media, trade and industry.
As CEO Mr. Eriksen is currently chairman of
the board in Aker BP ASA, Aker Solutions
ASA, Cognite AS, Aker Capital AS and Aker
Kværner Holding AS, and a director of several
companies, including Aker Energy AS, Akastor
ASA, The Resource Group TRG AS, TRG
Holding AS and Reitangruppen AS.
As at 31 December 2018, Mr. Eriksen holds
219 072 shares in Aker ASA through the
company Erøy AS. He has no stock options.
Through Erøy AS, Mr. Eriksen also holds 0.20
percent of the B-shares in TRG Holding AS.
Mr. Eriksen is a Norwegian citizen.
Frank O. Reite CFO
—
Frank O. Reite (born 1970) joined Aker in 1995,
and became CFO in Aker ASA in August 2015.
He holds a B.A. in business administration
from Handelshøyskolen BI in Oslo. Mr. Reite
came from the position of President & CEO
of Akastor, and has previously held a variety
of executive positions in the Aker group,
including overseeing and developing Aker's
investments in Converto Capital Fund AS,
Havfisk ASA, Norway Seafoods AS and Aker
Yards ASA. Mr. Reite also has experience from
banking and served as Operating Director at
Paine & Partners, a New Yorkbased private
equity firm. Mr. Reite is Chair of the board in
Ocean Yield ASA.
As of 31 December 2018, Mr. Reite holds 71
240 shares in Aker ASA through the company
Fausken Invest AS. He has no stock options.
Mr. Reite is a Norwegian citizen.
Kristian Røkke Chief investment officer
—
Kristian Røkke (born 1983) has been the
Chief Investment Officer of Aker ASA since
January 2018. He has extensive experience
from offshore oil services, shipbuilding
industry and mergers and transactions. Røkke
joined Aker ASA from Akastor, an investment
company listed on the stock exchange, where
he was the CEO from 2015. Røkke is Chair of
the board of Akastor ASA, Director of TRG
Holding AS, Aker Capital AS, Aker Solutions
ASA and previously a Director of Aker ASA.
He holds an MBA from The Wharton School,
University of Pennsylvania.
As of 31 December 2018, Kristian Røkke
owns no shares in Aker ASA and has no
options. Røkke holds both Norwegian and
American citizenships.
AKER ASA
Oksenøyveien 10, NO-1366 Lysaker, Norway
Post: P.O Box 243, NO-1326 Lysaker, Norway
Telefon: +47 24 13 00 00
E-post: [email protected]
www.akerasa.com
Imag
es: B
ård
Gud
im, I
lja H
ende
l and
Ake
rs p
ortf
olio
com
pani
es. D
esig
n: T
ania
Goff
redo
Des
ign.


