Embed Size (px)
Citation preview
ANNUAL
REPORT 2013
Trigon Agri is an integrated
soft commodities producer,
storage provider and trader.
Its core operations are
cereals production in
Rostov, Russia and cereals
production in Central-
Eastern Ukraine.
CONTENTS
HIGHLIGHTS OF 2013 ......................................................................................................................... 2
COMMENTS BY THE CHAIRMAN: ........................................................................................................... 3
OVERVIEW OF TRIGON AGRI ............................................................................................................... 4
COMPETITIVE STRENGHTS .................................................................................................................. 5
GOALS .............................................................................................................................................. 6
HISTORY ........................................................................................................................................... 7
FINANCIAL AND OPERATIONAL REVIEW ................................................................................................ 9
CORPORATE GOVERNANCE ................................................................................................................ 29
CORPORATE SOCIAL RESPONSIBILITY ................................................................................................ 36
FINANCIAL HISTORY......................................................................................................................... 39
THE SHARE ..................................................................................................................................... 40
FINANCIAL CALENDAR ...................................................................................................................... 42
CONSOLIDATED FINANCIAL STATEMENTS ........................................................................................... 43
CONSOLIDATED STATEMENT OF FINANCIAL POSITION ......................................................................... 43
CONSOLIDATED INCOME STATEMENT ................................................................................................. 44 CONSOLIDATED CONDENSED STATEMENT OF CHANGES IN EQUITY ...................................................................... 45 CONSOLIDATED CONDENSED STATEMENT OF CASH FLOWS .................................................................................... 47
NOTES TO THE CONSOLIDATED FINANCIAL STATEMENTS ..................................................................... 49
MANAGEMENT`S STATEMENT ON THE ANNUAL REPORT ...................................................................... 105
INDEPENDENT AUDITOR´S REPORT ................................................................................................. 106
DEFINITIONS ................................................................................................................................. 107
T R I G O N A G R I A N N U A L R E P O R T 2 0 1 3 PAGE 2
HIGHLIGHTS OF 2013 Total revenue, other income, fair value
adjustments and net changes in inventory
amounted to EUR 75.4 million (EUR 73.0
million in 2012).
EBITDA was a loss of EUR 1.1 million
(profit of EUR 19.5 million in 2012).
The Net loss was EUR 16.8 million (profit
of EUR 1.7 million in 2012).
The consolidated assets as of December 31,
2013 amounted to EUR 185.2 million (EUR
214.0 million at December 31, 2012).
Income statement, EUR thousand 2012 2013
Total revenue, other income and fair value adjustments and net changes in inventories 73,006 75,389
Cost of purchased goods for trading purposes -14,165 -15,010
OPEX -60,635 -63,819
Other (losses)/gains - net 19,540 2,327
EBITDA 19,480 -1,113
EBIT 10,846 -9,371
Net financial items -8,687 -6,785
Net profit/loss 1,687 -16,844
Balance sheet, EUR thousand 31.12.2012 31.12.2013
Total assets 213,965 185,247
incl Non-current assets 167,831 155,617
incl Property, plant and equipment 147,473 132,750
Investment in property, plant and equipment 9,059 6,912
Net debt 61,268 69,080
Total equity 128,566 103,805
Cash flow statement, EUR thousand 2012 2013
Cash flows from operating activities 10,842 9,263
Cash flows from investing activities -19,249 -14,511
Cash flows from financing activities -2,648 2,280
Effects of exchange rate changes -68 -225
Cash and cash equivalents at beginning of period 19,313 8,190
Cash and cash equivalents at end of period 8,190 4,997
Key figures 31.12.2012 31.12.2013
Number of shares, end of the period 129,627,479 129,627,479
Number of shares outstanding, end of the period 129,627,479 129,627,479
Total number of employees 1,569 1,455
Land under control, hectares 169,811 167,381 incl land under registered ownership, hectares 113,767 113,926
Ratios 2012 2013
Earnings per share (EPS), EUR 0.01 -0.13
Book value per share, EUR 0.99 0.80
Return on assets (ROA) 1% -9%
Return on equity (ROE) 1% -15%
Equity ratio, % 60% 56%
Current ratio 1.45 1.51
Acid test 0.60 0.72
T R I G O N A G R I A N N U A L R E P O R T 2 0 1 3 PAGE 3
COMMENTS BY THE CHAIRMAN:
Trigon Agri’s Founder and Chairman of the Board,
Joakim Helenius
The dramatic events we are witnessing in Ukraine
have not affected Trigon Agri’s business interests.
If anything the sharp devaluation of the Ukrainian
Hryvna will benefit us as a lot of our costs are fixed
in Hryvna whereas our revenue is fixed in U.S.
Dollars. It is too early to forecast the longer-term
impact of the fast evolving events but the strong
probability is that it will lead to a better business
environment than the one we have had to operate
in during recent years.
The weak 2013 results were the result of the very
weak price environment for soft commodities which
have stressed the entire farming industry in the
Black Sea region and beyond. The weak results
have however made it possible for us to carry out a
significant cost cutting exercise. Cost savings for
2014 come to more than EUR 6 million for the core
businesses alone. The cuts do not involve a
decrease in fertilizer application per hectare which
means that future yield potential is not being
sacrificed.
When we effect the divestment of non-core
businesses (more on progress below) listed in
previous reports this will impact results going
forwards as follows:
Interest payments: will fall by almost EUR 8 million
(assuming repayment of all loans).
Depreciation: will decline by EUR 3.5 million
leaving the core business with annual depreciation
of around EUR 4.8 million.
Assuming the fulfillment of the divestment program
combined with the cost cuts in the core business
areas we will move into 2015 with a very strong
balance sheet and underlying profitability. In order
to get an idea of the impact the cost cuts and
planned divestments will have on Trigon Agri’s
results one can make the theoretical assumption
that if they had been made ahead of the fiscal year
2013 Trigon Agri would have been able to achieve
a net profit rather that the disappointing net loss of
EUR 16.8 million.
The winter crops sowed last Autumn which will be
harvested this Summer are currently in a very
good condition, especially in Rostov, but it is still
much too early to draw any firm conclusions from
this. We were fortunate in that we managed to get
our fields seeded before the onset of the heavy
Autumn rains which disrupted seeding in large
parts of the Black Sea region.
As far as the divestments are concerned we remain
optimistic about the overall progress. Unfortunately
the buyer who had signed up to acquire the Penza
cluster unexpectedly did not manage to raise the
financing required to finalise the deal. We are now
in negotiations with three new serious alternative
investors. Additionally to announced divestments
we are in advanced discussions with four interested
investors with regards to our remaining stake in
Trigon Agri’s Estonian dairy farms.
T R I G O N A G R I A N N U A L R E P O R T 2 0 1 3 PAGE 4
OVERVIEW OF TRIGON AGRI
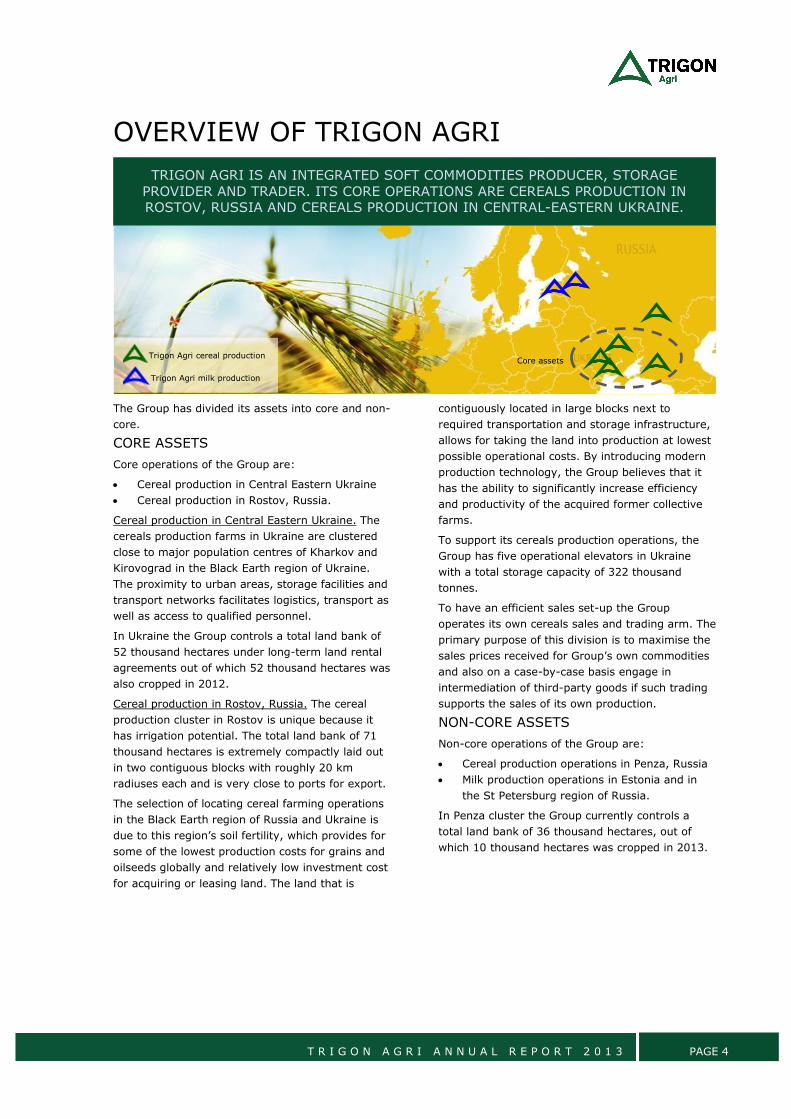
The Group has divided its assets into core and non-
core.
CORE ASSETS
Core operations of the Group are:
Cereal production in Central Eastern Ukraine
Cereal production in Rostov, Russia.
Cereal production in Central Eastern Ukraine. The
cereals production farms in Ukraine are clustered
close to major population centres of Kharkov and
Kirovograd in the Black Earth region of Ukraine.
The proximity to urban areas, storage facilities and
transport networks facilitates logistics, transport as
well as access to qualified personnel.
In Ukraine the Group controls a total land bank of
52 thousand hectares under long-term land rental
agreements out of which 52 thousand hectares was
also cropped in 2012.
Cereal production in Rostov, Russia. The cereal
production cluster in Rostov is unique because it
has irrigation potential. The total land bank of 71
thousand hectares is extremely compactly laid out
in two contiguous blocks with roughly 20 km
radiuses each and is very close to ports for export.
The selection of locating cereal farming operations
in the Black Earth region of Russia and Ukraine is
due to this region’s soil fertility, which provides for
some of the lowest production costs for grains and
oilseeds globally and relatively low investment cost
for acquiring or leasing land. The land that is
contiguously located in large blocks next to
required transportation and storage infrastructure,
allows for taking the land into production at lowest
possible operational costs. By introducing modern
production technology, the Group believes that it
has the ability to significantly increase efficiency
and productivity of the acquired former collective
farms.
To support its cereals production operations, the
Group has five operational elevators in Ukraine
with a total storage capacity of 322 thousand
tonnes.
To have an efficient sales set-up the Group
operates its own cereals sales and trading arm. The
primary purpose of this division is to maximise the
sales prices received for Group’s own commodities
and also on a case-by-case basis engage in
intermediation of third-party goods if such trading
supports the sales of its own production.
NON-CORE ASSETS
Non-core operations of the Group are:
Cereal production operations in Penza, Russia
Milk production operations in Estonia and in
the St Petersburg region of Russia.
In Penza cluster the Group currently controls a
total land bank of 36 thousand hectares, out of
which 10 thousand hectares was cropped in 2013.
TRIGON AGRI IS AN INTEGRATED SOFT COMMODITIES PRODUCER, STORAGE
PROVIDER AND TRADER. ITS CORE OPERATIONS ARE CEREALS PRODUCTION IN ROSTOV, RUSSIA AND CEREALS PRODUCTION IN CENTRAL-EASTERN UKRAINE.
Trigon Agri cereal production
Trigon Agri milk production
Core assets
T R I G O N A G R I A N N U A L R E P O R T 2 0 1 3 PAGE 5
COMPETITIVE STRENGTHS The Group believes that its main competitive
strengths are:
HIGH-QUALITY LAND PORTFOLIO
All of the Group’s land area for cereal production is
located in the Black Earth region, offering some of
the lowest production costs of grains and oilseeds
globally.
OPTIMAL GEOGRAPHIC LOCATION WITH
ACCESS TO REQUIRED
INFRASTRUCTURE AND PERSONNEL
The Group’s production clusters are contiguous and
compact, allowing for low production logistics
costs, and are located close to regional population
centres providing access to required infrastructure
and personnel.
SOME OF THE LOWEST PRODUCTION
COSTS IN ITS REGION
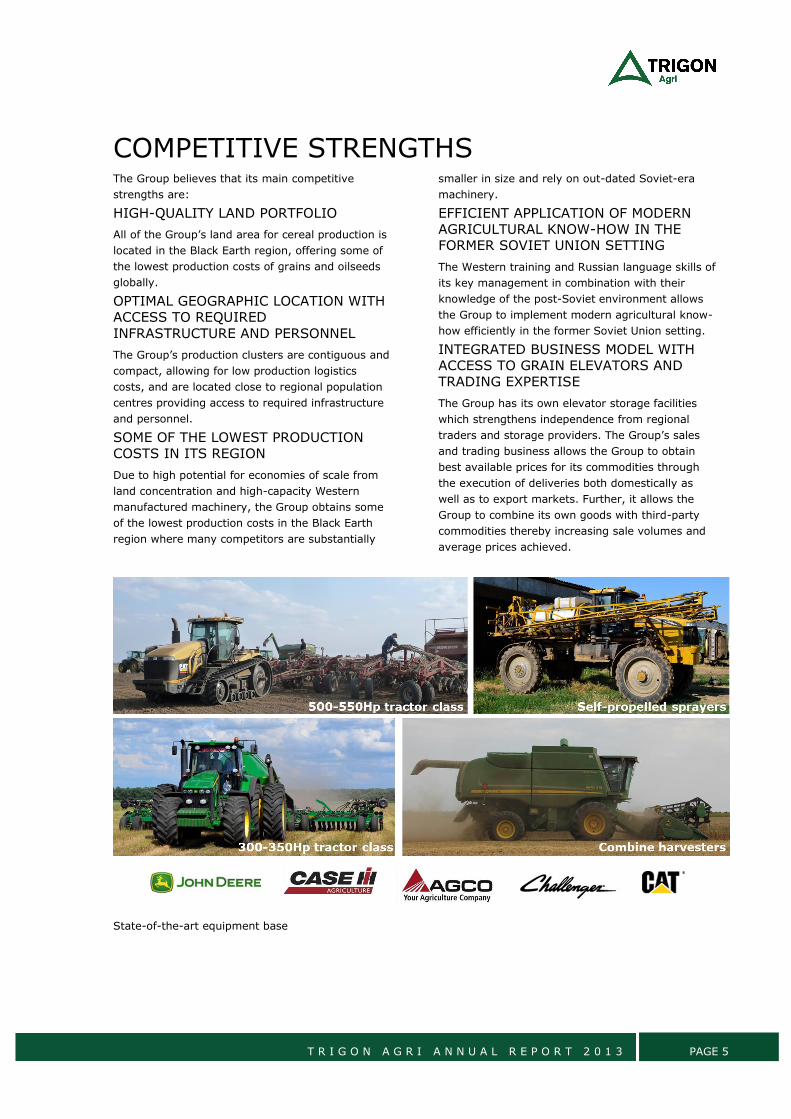
Due to high potential for economies of scale from
land concentration and high-capacity Western
manufactured machinery, the Group obtains some
of the lowest production costs in the Black Earth
region where many competitors are substantially
smaller in size and rely on out-dated Soviet-era
machinery.
EFFICIENT APPLICATION OF MODERN
AGRICULTURAL KNOW-HOW IN THE
FORMER SOVIET UNION SETTING
The Western training and Russian language skills of
its key management in combination with their
knowledge of the post-Soviet environment allows
the Group to implement modern agricultural know-
how efficiently in the former Soviet Union setting.
INTEGRATED BUSINESS MODEL WITH
ACCESS TO GRAIN ELEVATORS AND
TRADING EXPERTISE
The Group has its own elevator storage facilities
which strengthens independence from regional
traders and storage providers. The Group’s sales
and trading business allows the Group to obtain
best available prices for its commodities through
the execution of deliveries both domestically as
well as to export markets. Further, it allows the
Group to combine its own goods with third-party
commodities thereby increasing sale volumes and
average prices achieved.
State-of-the-art equipment base
T R I G O N A G R I A N N U A L R E P O R T 2 0 1 3 PAGE 6
GOALS The Company has formulated a comprehensive
goal and a set of four-year goals.
COMPREHENSIVE GOAL
Trigon Agri as a commodity producer is a price
taker and, thus, revenues are highly dependent on
market prices for the commodities it produces.
Although the Group can to some extent manage its
revenues through choosing the timing for the sale
of its commodities (the Group owns elevator
storage capacity which allows it to store its produce
over longer time periods), the main operational
focus of the Group is on cost management.
Therefore, the Group’s operational goal is to
produce its commodities at the lowest possible
price per tonne. This is planned to be achieved
through continuous improvements of the efficiency
in its production operations.
FOUR-YEAR GOALS
Over the next four years Trigon Agri aims to:
Avoid issuing new shares
Focus our business on core assets by
disposing of our non-core assets
Pay off our debt from non-core asset
disposals so as to leave us essentially
debt-free
Roll out irrigation on appropriate land
holdings in Russia and Ukraine
Look into high margin crops made possible
through irrigation as well as early stage
processing as ways over time to decrease
earnings volatility and increase margins
T R I G O N A G R I A N N U A L R E P O R T 2 0 1 3 PAGE 7
HISTORY 2006
Trigon Agri was established in May 2006 by the
asset management company Trigon Capital. The
initially committed start-up capital of EUR 20
million was raised from Trigon Capital and primarily
Finnish high net worth individuals. Trigon Capital
remains a non-controlling shareholder in the Group
while its wholly-owned subsidiary Trigon Agri
Advisors provides management services to the
Group.
With the start-up capital raised, the Group made
its first investments in farming companies in 2006
by acquiring cereal farming operations in eastern
Ukraine nearby the city of Kharkov. The
acquisitions marked the establishment of the first
production cluster of the Group. The Group’s dairy
farms were acquired during the second half of
2006. Since the St Petersburg farm was of
greenfield character, commercial milk production
did not start until April 2008.
2007
On May, 17 2007, Trigon Agri completed a private
placing of shares to institutional investors and high
net worth individuals in several European Union
member states and in the United States securing
approximately EUR 50 million, before issue costs.
Following the private placing, the Group’s shares
were listed on the NASDAQ OMX First North
alternative stock exchange in Stockholm on 18 May
2007.
With the capital raised in 2007, the Group
continued the expansion of its cereal farming in
Kharkov and made the first investments into
railroad connected large storage facilities
(elevators) pursuing its strategy of building an
integrated production, storage and trading
operation.
2008
During the first quarter of 2008, the Group also
established a second production cluster nearby the
city of Kirovograd in Ukraine, and two further
clusters nearby the cities of Samara and Penza in
Russia. After the set-up of operations in three
additional cereal production clusters in the Black
Earth region, the Group had by the middle of 2008
established a strong platform for cereal production,
storage and trading throughout the Black Earth
regions of Ukraine and Russia.
On April, 7 2008, Trigon Agri entered into an
agreement with Ramburs Group, a leading
Ukrainian commodities trading group, for the
establishment of the joint venture company
Ramburs Trigon. The joint venture handled sales
and trading activities as well as the management of
the cereal storage operations of the Group.
On May, 6 2008, Trigon Agri completed a further
follow-on capital raising of EUR 105 million to fund
the expansion of its operations in the Black Earth
regions of Ukraine and Russia. The funds raised
from the placing were intended for financing
investment programmes in the existing production
clusters.
2009
In late 2009, the Group acquired the fifth
operational cereal cluster in Stavropol, Russia.
Additionally, the Group acquired a brownfield
elevator site next to its farming operations in the
Penza region and increased its freehold ownership of
land in Russia to 80,276 hectares.
In December 2009, the Group signed an agreement
to acquire a brownfield elevator site next to its
farming operations in the Stavropol region.
2010
In August 2010, the Group acquired the non-
controlling share of Ramburs Trigon, thereby fully
taking over the operations of its sales and trading
joint venture.
Since December 8, 2010 the shares of Trigon Agri
A/S are listed on main market of Small Cap segment
on NASDAQ OMX Stockholm.
2011
In 2Q 2011 Trigon Agri concluded a four-year bond
issue in amount of SEK 350 million with an annual
interest rate of 11%.
Since December 14, 2011 the bonds of Trigon Agri
are listed on the Corporate Bond List of NASDAQ
OMX Stockholm.
2012
In April 2012 the Group finalized acquisition of
Estonian dairy farm AS Väätsa Agro, the largest
milk production farm in Estonia in terms of milk
quota. At the time of the acquisition the company
farmed 4,160 hectares of farmland and had 3,386
dairy animals, including 1,685 milking cows.
In 4Q 2012 Trigon Agri carried out a land-swap
transaction in Russia involving the acquisition of a
new 71 thousand hectares production cluster in
Rostov Oblast in exchange for its two current
Russian production clusters in Samara and
Stavropol.
T R I G O N A G R I A N N U A L R E P O R T 2 0 1 3 PAGE 8
2013
As part of the Group’s longer-term planning the
Group divided its assets into core and non-core
with focus on core assets. The core assets of the
Group are cereals production operations in Ukraine
and cereals production operations in the Rostov
cluster in Russia. The non-core assets of the Group
are cereals production operations in Penza, Russia
and milk production operations in St Petersburg
region in Russia and in Estonia.
In 2Q 2013 the Group completed a limited capital
raising for its Estonian dairy farming subsidiary AS
Trigon Dairy Farming Estonia (‘TDFE’). As a part of
the transaction, the Ingman Group from Finland
acquired 21% of TDFE.
In 4Q 2013 the Group disposed 15.3% in AS Trigon
Dairy Farming Estonia. Following the transaction
Trigon Agri retains an ownership stake of 63.7% in
AS Trigon Dairy Farming Estonia.
T R I G O N A G R I A N N U A L R E P O R T 2 0 1 3 PAGE 9
FINANCIAL AND OPERATIONAL REVIEW
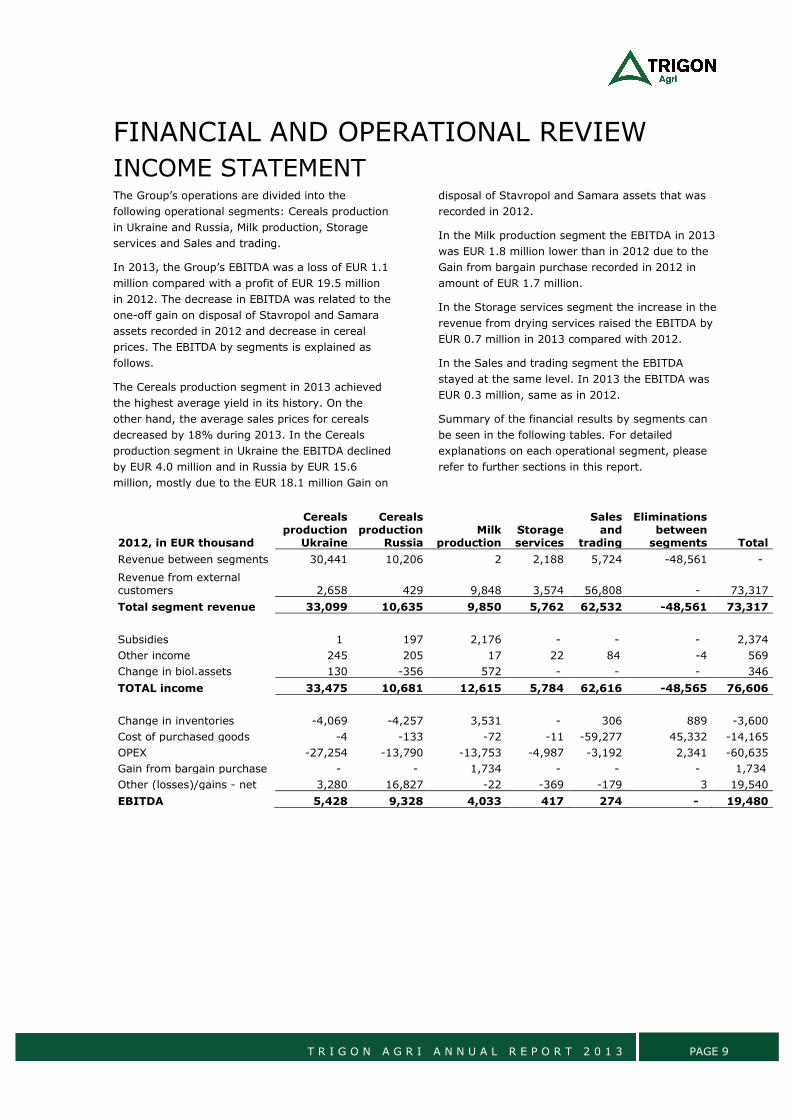
INCOME STATEMENT The Group’s operations are divided into the
following operational segments: Cereals production
in Ukraine and Russia, Milk production, Storage
services and Sales and trading.
In 2013, the Group’s EBITDA was a loss of EUR 1.1
million compared with a profit of EUR 19.5 million
in 2012. The decrease in EBITDA was related to the
one-off gain on disposal of Stavropol and Samara
assets recorded in 2012 and decrease in cereal
prices. The EBITDA by segments is explained as
follows.
The Cereals production segment in 2013 achieved
the highest average yield in its history. On the
other hand, the average sales prices for cereals
decreased by 18% during 2013. In the Cereals
production segment in Ukraine the EBITDA declined
by EUR 4.0 million and in Russia by EUR 15.6
million, mostly due to the EUR 18.1 million Gain on
disposal of Stavropol and Samara assets that was
recorded in 2012.
In the Milk production segment the EBITDA in 2013
was EUR 1.8 million lower than in 2012 due to the
Gain from bargain purchase recorded in 2012 in
amount of EUR 1.7 million.
In the Storage services segment the increase in the
revenue from drying services raised the EBITDA by
EUR 0.7 million in 2013 compared with 2012.
In the Sales and trading segment the EBITDA
stayed at the same level. In 2013 the EBITDA was
EUR 0.3 million, same as in 2012.
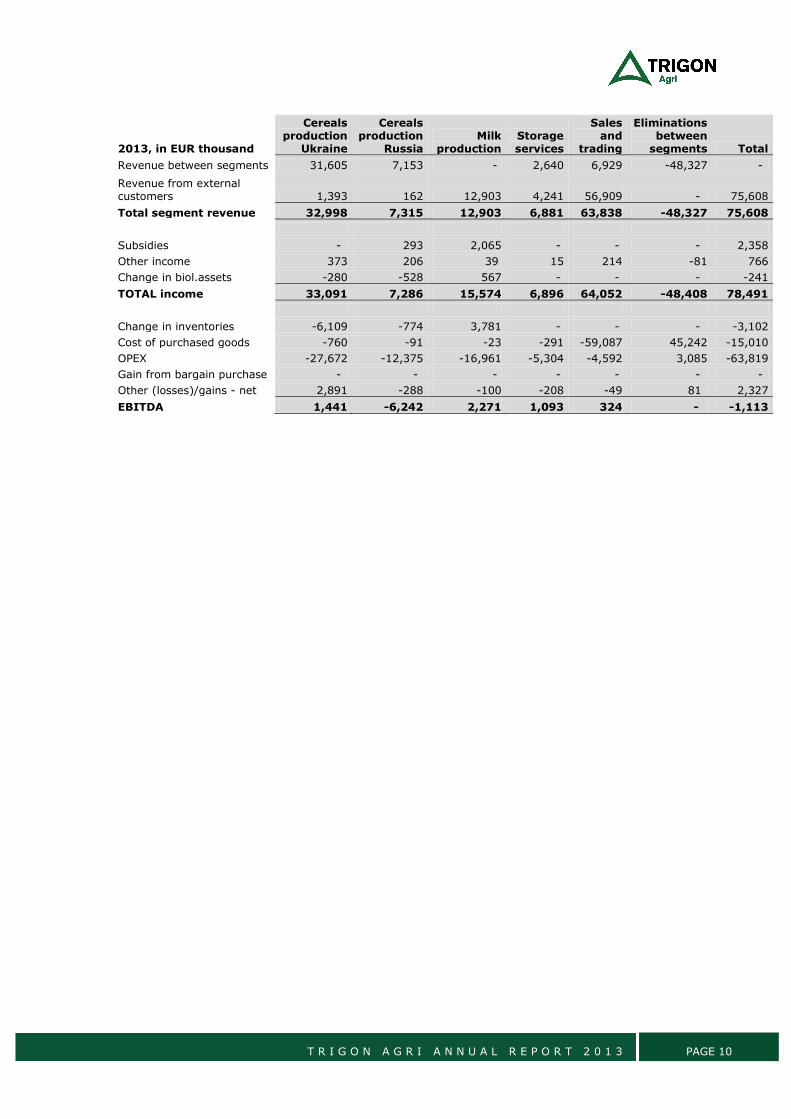
Summary of the financial results by segments can
be seen in the following tables. For detailed
explanations on each operational segment, please
refer to further sections in this report.
2012, in EUR thousand
Cereals production
Ukraine
Cereals production
Russia Milk
production Storage services
Sales and
trading
Eliminations between
segments Total
Revenue between segments 30,441 10,206 2 2,188 5,724 -48,561 -
Revenue from external customers 2,658 429 9,848 3,574 56,808 - 73,317
Total segment revenue 33,099 10,635 9,850 5,762 62,532 -48,561 73,317
Subsidies 1 197 2,176 - - - 2,374
Other income 245 205 17 22 84 -4 569
Change in biol.assets 130 -356 572 - - - 346
TOTAL income 33,475 10,681 12,615 5,784 62,616 -48,565 76,606
Change in inventories -4,069 -4,257 3,531 - 306 889 -3,600
Cost of purchased goods -4 -133 -72 -11 -59,277 45,332 -14,165
OPEX -27,254 -13,790 -13,753 -4,987 -3,192 2,341 -60,635
Gain from bargain purchase - - 1,734 - - - 1,734
Other (losses)/gains - net 3,280 16,827 -22 -369 -179 3 19,540
EBITDA 5,428 9,328 4,033 417 274 - 19,480
T R I G O N A G R I A N N U A L R E P O R T 2 0 1 3 PAGE 10
2013, in EUR thousand
Cereals production
Ukraine
Cereals production
Russia Milk
production Storage services
Sales and
trading
Eliminations between
segments Total
Revenue between segments 31,605 7,153 - 2,640 6,929 -48,327 -
Revenue from external customers 1,393 162 12,903 4,241 56,909 - 75,608
Total segment revenue 32,998 7,315 12,903 6,881 63,838 -48,327 75,608
Subsidies - 293 2,065 - - - 2,358
Other income 373 206 39 15 214 -81 766
Change in biol.assets -280 -528 567 - - - -241
TOTAL income 33,091 7,286 15,574 6,896 64,052 -48,408 78,491
Change in inventories -6,109 -774 3,781 - - - -3,102
Cost of purchased goods -760 -91 -23 -291 -59,087 45,242 -15,010
OPEX -27,672 -12,375 -16,961 -5,304 -4,592 3,085 -63,819
Gain from bargain purchase - - - - - - -
Other (losses)/gains - net 2,891 -288 -100 -208 -49 81 2,327
EBITDA 1,441 -6,242 2,271 1,093 324 - -1,113
T R I G O N A G R I A N N U A L R E P O R T 2 0 1 3 PAGE 11
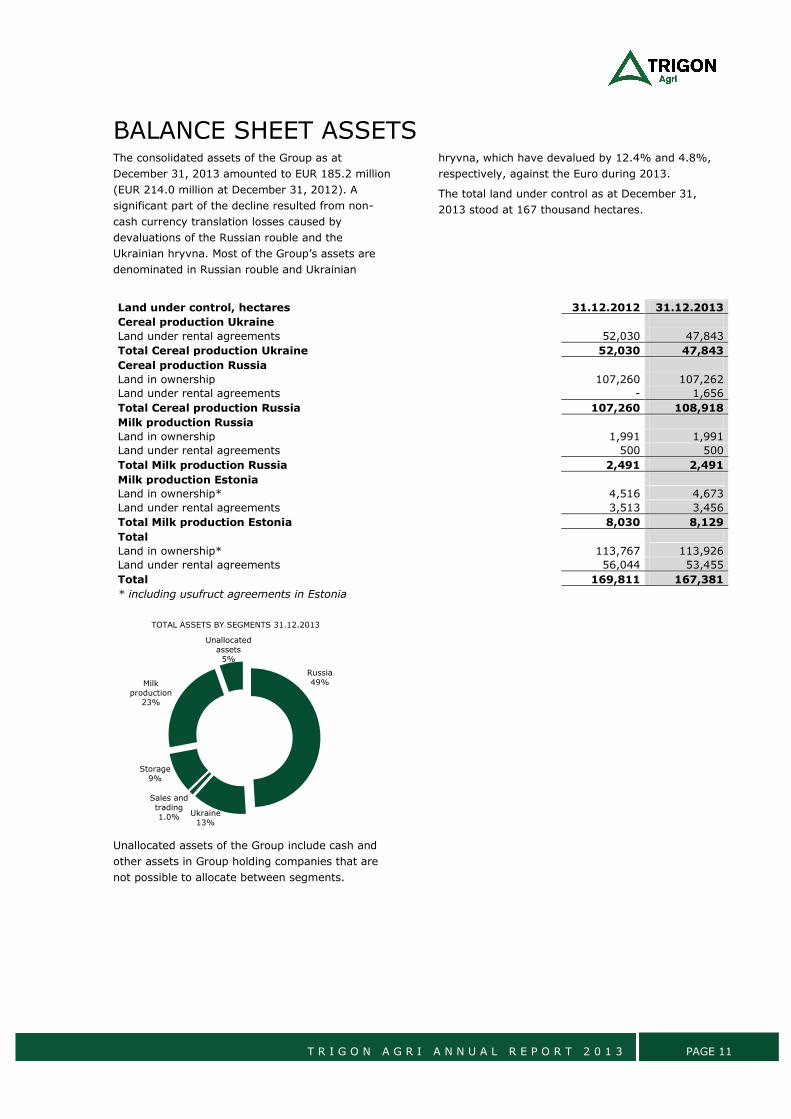
BALANCE SHEET ASSETS The consolidated assets of the Group as at
December 31, 2013 amounted to EUR 185.2 million
(EUR 214.0 million at December 31, 2012). A
significant part of the decline resulted from non-
cash currency translation losses caused by
devaluations of the Russian rouble and the
Ukrainian hryvna. Most of the Group’s assets are
denominated in Russian rouble and Ukrainian
hryvna, which have devalued by 12.4% and 4.8%,
respectively, against the Euro during 2013.
The total land under control as at December 31,
2013 stood at 167 thousand hectares.
Land under control, hectares 31.12.2012 31.12.2013
Cereal production Ukraine
Land under rental agreements 52,030 47,843
Total Cereal production Ukraine 52,030 47,843
Cereal production Russia
Land in ownership 107,260 107,262
Land under rental agreements - 1,656
Total Cereal production Russia 107,260 108,918
Milk production Russia
Land in ownership 1,991 1,991
Land under rental agreements 500 500
Total Milk production Russia 2,491 2,491
Milk production Estonia
Land in ownership* 4,516 4,673
Land under rental agreements 3,513 3,456
Total Milk production Estonia 8,030 8,129
Total
Land in ownership* 113,767 113,926
Land under rental agreements 56,044 53,455
Total 169,811 167,381
* including usufruct agreements in Estonia
Unallocated assets of the Group include cash and
other assets in Group holding companies that are
not possible to allocate between segments.
Russia49%
Ukraine13%
Sales and trading1.0%
Storage9%
Milk production
23%
Unallocated assets
5%
TOTAL ASSETS BY SEGMENTS 31.12.2013
T R I G O N A G R I A N N U A L R E P O R T 2 0 1 3 PAGE 12
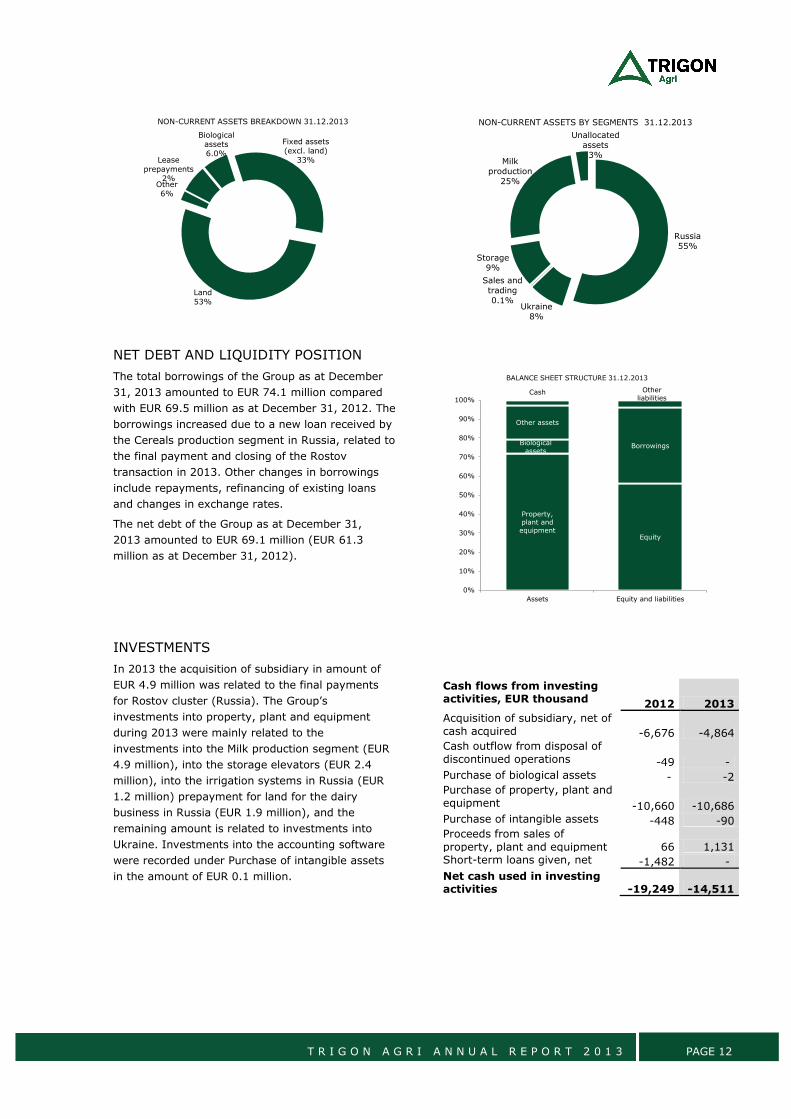
NET DEBT AND LIQUIDITY POSITION
The total borrowings of the Group as at December
31, 2013 amounted to EUR 74.1 million compared
with EUR 69.5 million as at December 31, 2012. The
borrowings increased due to a new loan received by
the Cereals production segment in Russia, related to
the final payment and closing of the Rostov
transaction in 2013. Other changes in borrowings
include repayments, refinancing of existing loans
and changes in exchange rates.
The net debt of the Group as at December 31,
2013 amounted to EUR 69.1 million (EUR 61.3
million as at December 31, 2012).
INVESTMENTS
In 2013 the acquisition of subsidiary in amount of
EUR 4.9 million was related to the final payments
for Rostov cluster (Russia). The Group’s
investments into property, plant and equipment
during 2013 were mainly related to the
investments into the Milk production segment (EUR
4.9 million), into the storage elevators (EUR 2.4
million), into the irrigation systems in Russia (EUR
1.2 million) prepayment for land for the dairy
business in Russia (EUR 1.9 million), and the
remaining amount is related to investments into
Ukraine. Investments into the accounting software
were recorded under Purchase of intangible assets
in the amount of EUR 0.1 million.
Cash flows from investing activities, EUR thousand 2012 2013
Acquisition of subsidiary, net of
cash acquired -6,676 -4,864 Cash outflow from disposal of
discontinued operations -49 - Purchase of biological assets - -2 Purchase of property, plant and
equipment -10,660 -10,686 Purchase of intangible assets -448 -90 Proceeds from sales of
property, plant and equipment 66 1,131 Short-term loans given, net -1,482 -
Net cash used in investing activities -19,249 -14,511
Fixed assets (excl. land)
33%
Land 53%
Lease prepayments
2%Other 6%
Biological assets6.0%
NON-CURRENT ASSETS BREAKDOWN 31.12.2013
Russia55%
Ukraine8%
Sales and trading0.1%
Storage9%
Milk production
25%
Unallocated assets
3%
NON-CURRENT ASSETS BY SEGMENTS 31.12.2013
Property, plant and equipment
Biological assets
Other assets
Cash
Equity
Borrowings
Other liabilities
0%
10%
20%
30%
40%
50%
60%
70%
80%
90%
100%
Assets Equity and liabilities
BALANCE SHEET STRUCTURE 31.12.2013
T R I G O N A G R I A N N U A L R E P O R T 2 0 1 3 PAGE 13
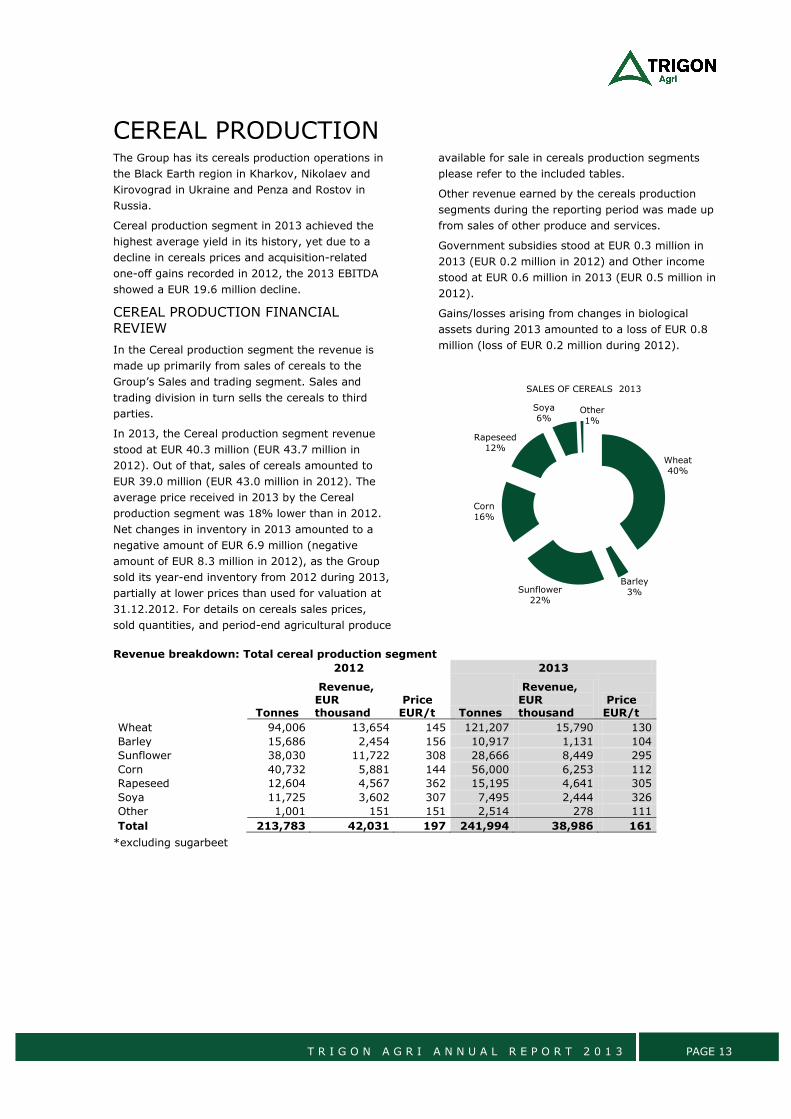
CEREAL PRODUCTION The Group has its cereals production operations in
the Black Earth region in Kharkov, Nikolaev and
Kirovograd in Ukraine and Penza and Rostov in
Russia.
Cereal production segment in 2013 achieved the
highest average yield in its history, yet due to a
decline in cereals prices and acquisition-related
one-off gains recorded in 2012, the 2013 EBITDA
showed a EUR 19.6 million decline.
CEREAL PRODUCTION FINANCIAL
REVIEW
In the Cereal production segment the revenue is
made up primarily from sales of cereals to the
Group’s Sales and trading segment. Sales and
trading division in turn sells the cereals to third
parties.
In 2013, the Cereal production segment revenue
stood at EUR 40.3 million (EUR 43.7 million in
2012). Out of that, sales of cereals amounted to
EUR 39.0 million (EUR 43.0 million in 2012). The
average price received in 2013 by the Cereal
production segment was 18% lower than in 2012.
Net changes in inventory in 2013 amounted to a
negative amount of EUR 6.9 million (negative
amount of EUR 8.3 million in 2012), as the Group
sold its year-end inventory from 2012 during 2013,
partially at lower prices than used for valuation at
31.12.2012. For details on cereals sales prices,
sold quantities, and period-end agricultural produce
available for sale in cereals production segments
please refer to the included tables.
Other revenue earned by the cereals production
segments during the reporting period was made up
from sales of other produce and services.
Government subsidies stood at EUR 0.3 million in
2013 (EUR 0.2 million in 2012) and Other income
stood at EUR 0.6 million in 2013 (EUR 0.5 million in
2012).
Gains/losses arising from changes in biological
assets during 2013 amounted to a loss of EUR 0.8
million (loss of EUR 0.2 million during 2012).
Revenue breakdown: Total cereal production segment
2012 2013
Tonnes
Revenue, EUR thousand
Price EUR/t Tonnes
Revenue, EUR thousand
Price EUR/t
Wheat 94,006 13,654 145 121,207 15,790 130
Barley 15,686 2,454 156 10,917 1,131 104
Sunflower 38,030 11,722 308 28,666 8,449 295
Corn 40,732 5,881 144 56,000 6,253 112
Rapeseed 12,604 4,567 362 15,195 4,641 305
Soya 11,725 3,602 307 7,495 2,444 326
Other 1,001 151 151 2,514 278 111
Total 213,783 42,031 197 241,994 38,986 161
*excluding sugarbeet
Wheat40%
Barley3%Sunflower
22%
Corn16%
Rapeseed12%
Soya6%
Other1%
SALES OF CEREALS 2013
T R I G O N A G R I A N N U A L R E P O R T 2 0 1 3 PAGE 14
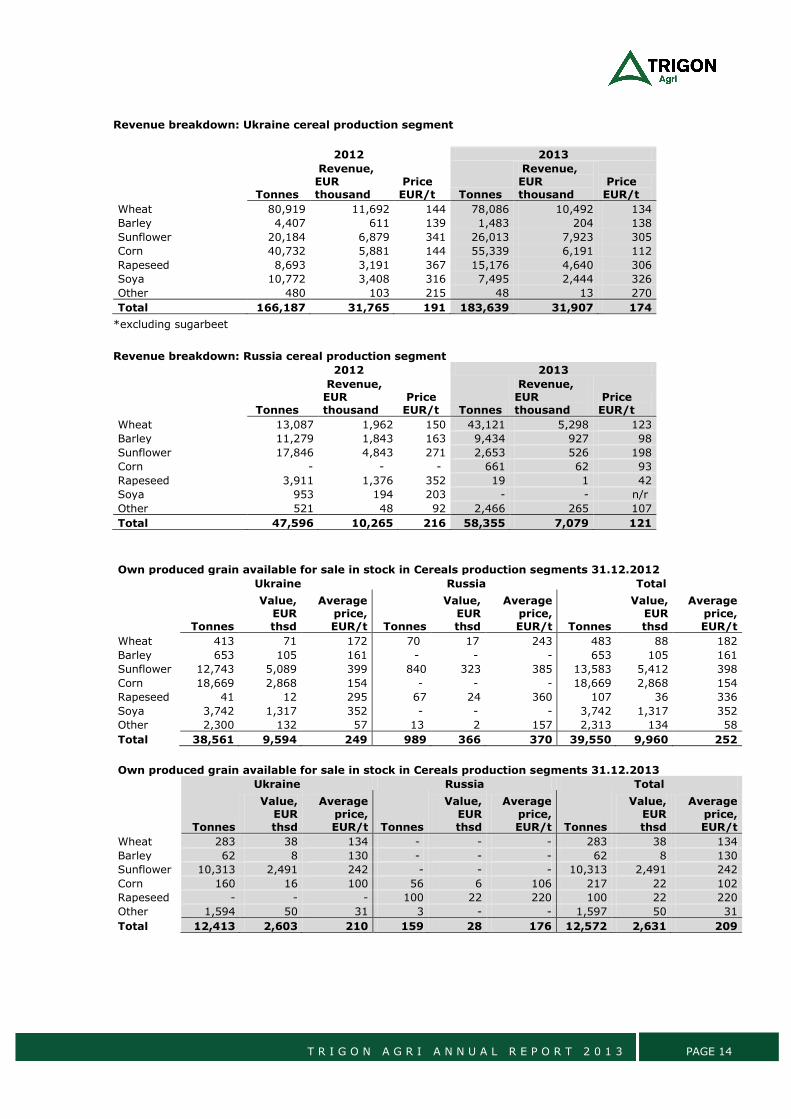
Revenue breakdown: Ukraine cereal production segment
2012 2013
Tonnes
Revenue, EUR thousand
Price EUR/t Tonnes
Revenue, EUR thousand
Price EUR/t
Wheat 80,919 11,692 144 78,086 10,492 134
Barley 4,407 611 139 1,483 204 138
Sunflower 20,184 6,879 341 26,013 7,923 305
Corn 40,732 5,881 144 55,339 6,191 112
Rapeseed 8,693 3,191 367 15,176 4,640 306
Soya 10,772 3,408 316 7,495 2,444 326
Other 480 103 215 48 13 270
Total 166,187 31,765 191 183,639 31,907 174
*excluding sugarbeet
Revenue breakdown: Russia cereal production segment
2012 2013
Tonnes
Revenue, EUR thousand
Price EUR/t Tonnes
Revenue, EUR thousand
Price EUR/t
Wheat 13,087 1,962 150 43,121 5,298 123
Barley 11,279 1,843 163 9,434 927 98
Sunflower 17,846 4,843 271 2,653 526 198
Corn - - - 661 62 93
Rapeseed 3,911 1,376 352 19 1 42
Soya 953 194 203 - - n/r
Other 521 48 92 2,466 265 107
Total 47,596 10,265 216 58,355 7,079 121
Own produced grain available for sale in stock in Cereals production segments 31.12.2012
Ukraine Russia Total
Tonnes
Value, EUR thsd
Average price, EUR/t Tonnes
Value, EUR thsd
Average price, EUR/t Tonnes
Value, EUR thsd
Average price, EUR/t
Wheat 413 71 172 70 17 243 483 88 182
Barley 653 105 161 - - - 653 105 161
Sunflower 12,743 5,089 399 840 323 385 13,583 5,412 398
Corn 18,669 2,868 154 - - - 18,669 2,868 154
Rapeseed 41 12 295 67 24 360 107 36 336
Soya 3,742 1,317 352 - - - 3,742 1,317 352
Other 2,300 132 57 13 2 157 2,313 134 58
Total 38,561 9,594 249 989 366 370 39,550 9,960 252
Own produced grain available for sale in stock in Cereals production segments 31.12.2013
Ukraine Russia Total
Tonnes
Value, EUR thsd
Average price, EUR/t Tonnes
Value, EUR thsd
Average price, EUR/t Tonnes
Value, EUR thsd
Average price, EUR/t
Wheat 283 38 134 - - - 283 38 134
Barley 62 8 130 - - - 62 8 130
Sunflower 10,313 2,491 242 - - - 10,313 2,491 242
Corn 160 16 100 56 6 106 217 22 102
Rapeseed - - - 100 22 220 100 22 220
Other 1,594 50 31 3 - - 1,597 50 31
Total 12,413 2,603 210 159 28 176 12,572 2,631 209
T R I G O N A G R I A N N U A L R E P O R T 2 0 1 3 PAGE 15
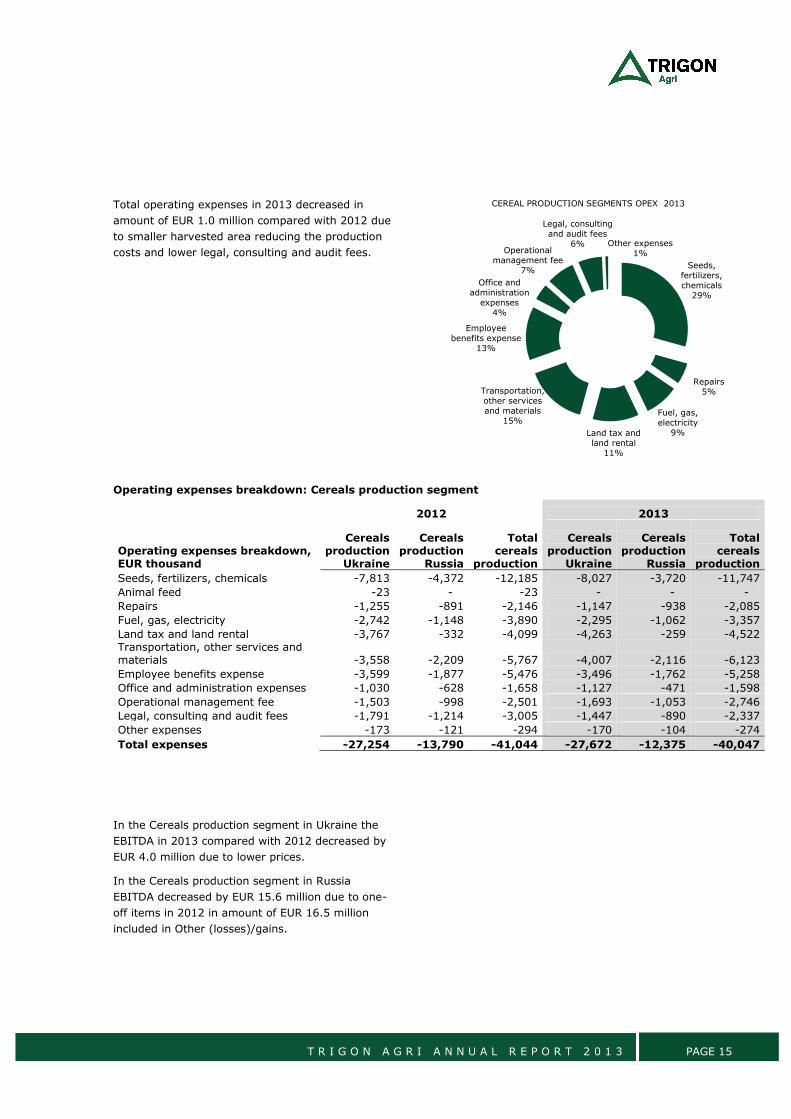
Total operating expenses in 2013 decreased in
amount of EUR 1.0 million compared with 2012 due
to smaller harvested area reducing the production
costs and lower legal, consulting and audit fees.
Operating expenses breakdown: Cereals production segment
2012 2013
Operating expenses breakdown, EUR thousand
Cereals production
Ukraine
Cereals production
Russia
Total cereals
production
Cereals production
Ukraine
Cereals production
Russia
Total cereals
production
Seeds, fertilizers, chemicals -7,813 -4,372 -12,185 -8,027 -3,720 -11,747
Animal feed -23 - -23 - - -
Repairs -1,255 -891 -2,146 -1,147 -938 -2,085
Fuel, gas, electricity -2,742 -1,148 -3,890 -2,295 -1,062 -3,357
Land tax and land rental -3,767 -332 -4,099 -4,263 -259 -4,522 Transportation, other services and materials -3,558 -2,209 -5,767 -4,007 -2,116 -6,123
Employee benefits expense -3,599 -1,877 -5,476 -3,496 -1,762 -5,258
Office and administration expenses -1,030 -628 -1,658 -1,127 -471 -1,598
Operational management fee -1,503 -998 -2,501 -1,693 -1,053 -2,746
Legal, consulting and audit fees -1,791 -1,214 -3,005 -1,447 -890 -2,337
Other expenses -173 -121 -294 -170 -104 -274
Total expenses -27,254 -13,790 -41,044 -27,672 -12,375 -40,047
In the Cereals production segment in Ukraine the
EBITDA in 2013 compared with 2012 decreased by
EUR 4.0 million due to lower prices.
In the Cereals production segment in Russia
EBITDA decreased by EUR 15.6 million due to one-
off items in 2012 in amount of EUR 16.5 million
included in Other (losses)/gains.
Seeds, fertilizers, chemicals
29%
Repairs5%
Fuel, gas, electricity
9%Land tax and land rental
11%
Transportation, other services and materials
15%
Employee benefits expense
13%
Office and administration
expenses4%
Operational management fee
7%
Legal, consulting and audit fees
6% Other expenses1%
CEREAL PRODUCTION SEGMENTS OPEX 2013
T R I G O N A G R I A N N U A L R E P O R T 2 0 1 3 PAGE 16
Cereals production segment
2012 2013
in EUR thousand
Cereals production
Ukraine
Cereals production
Russia
Total cereals
production
Cereals production
Ukraine
Cereals production
Russia
Total cereals
production
Revenue between segments 30,441 10,206 40,647 31,605 7,153 38758
Revenue from external customers 2,658 429 3,087 1,393 162 1555
Total segment revenue 33,099 10,635 43,734 32,998 7,315 40,313
Subsidies 1 197 198 0 293 293
Other income 245 205 450 373 206 579
Change in biol.assets 130 -356 -226 -280 -528 -808
TOTAL income 33,475 10,681 44,156 33,091 7,286 40,377
Change in inventories -4,069 -4,257 -8,326 -6,109 -774 -6,883
Cost of purchased goods -4 -133 -137 -760 -91 -851
OPEX -27,254 -13,790 -41,044 -27,672 -12,375 -40,047
Other (losses)/gains - net 3,280 16,827 20,107 2,891 -288 2,603
EBITDA 5,428 9,328 14,756 1,441 -6,242 -4,801
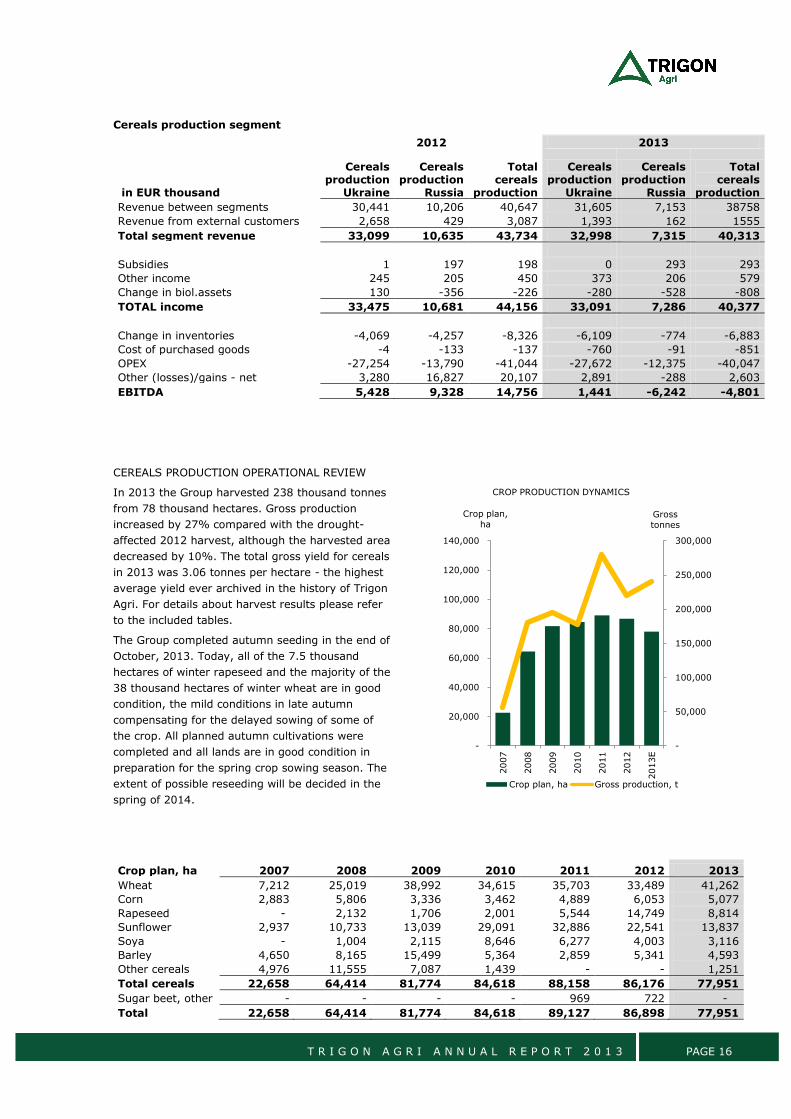
CEREALS PRODUCTION OPERATIONAL REVIEW
In 2013 the Group harvested 238 thousand tonnes
from 78 thousand hectares. Gross production
increased by 27% compared with the drought-
affected 2012 harvest, although the harvested area
decreased by 10%. The total gross yield for cereals
in 2013 was 3.06 tonnes per hectare - the highest
average yield ever archived in the history of Trigon
Agri. For details about harvest results please refer
to the included tables.
The Group completed autumn seeding in the end of
October, 2013. Today, all of the 7.5 thousand
hectares of winter rapeseed and the majority of the
38 thousand hectares of winter wheat are in good
condition, the mild conditions in late autumn
compensating for the delayed sowing of some of
the crop. All planned autumn cultivations were
completed and all lands are in good condition in
preparation for the spring crop sowing season. The
extent of possible reseeding will be decided in the
spring of 2014.
Crop plan, ha 2007 2008 2009 2010 2011 2012 2013
Wheat 7,212 25,019 38,992 34,615 35,703 33,489 41,262
Corn 2,883 5,806 3,336 3,462 4,889 6,053 5,077
Rapeseed - 2,132 1,706 2,001 5,544 14,749 8,814
Sunflower 2,937 10,733 13,039 29,091 32,886 22,541 13,837
Soya - 1,004 2,115 8,646 6,277 4,003 3,116
Barley 4,650 8,165 15,499 5,364 2,859 5,341 4,593
Other cereals 4,976 11,555 7,087 1,439 - - 1,251
Total cereals 22,658 64,414 81,774 84,618 88,158 86,176 77,951
Sugar beet, other - - - - 969 722 -
Total 22,658 64,414 81,774 84,618 89,127 86,898 77,951
-
50,000
100,000
150,000
200,000
250,000
300,000
-
20,000
40,000
60,000
80,000
100,000
120,000
140,000
2007
2008
2009
2010
2011
2012
2013E
Gross tonnes
Crop plan, ha
CROP PRODUCTION DYNAMICS
Crop plan, ha Gross production, t
T R I G O N A G R I A N N U A L R E P O R T 2 0 1 3 PAGE 17
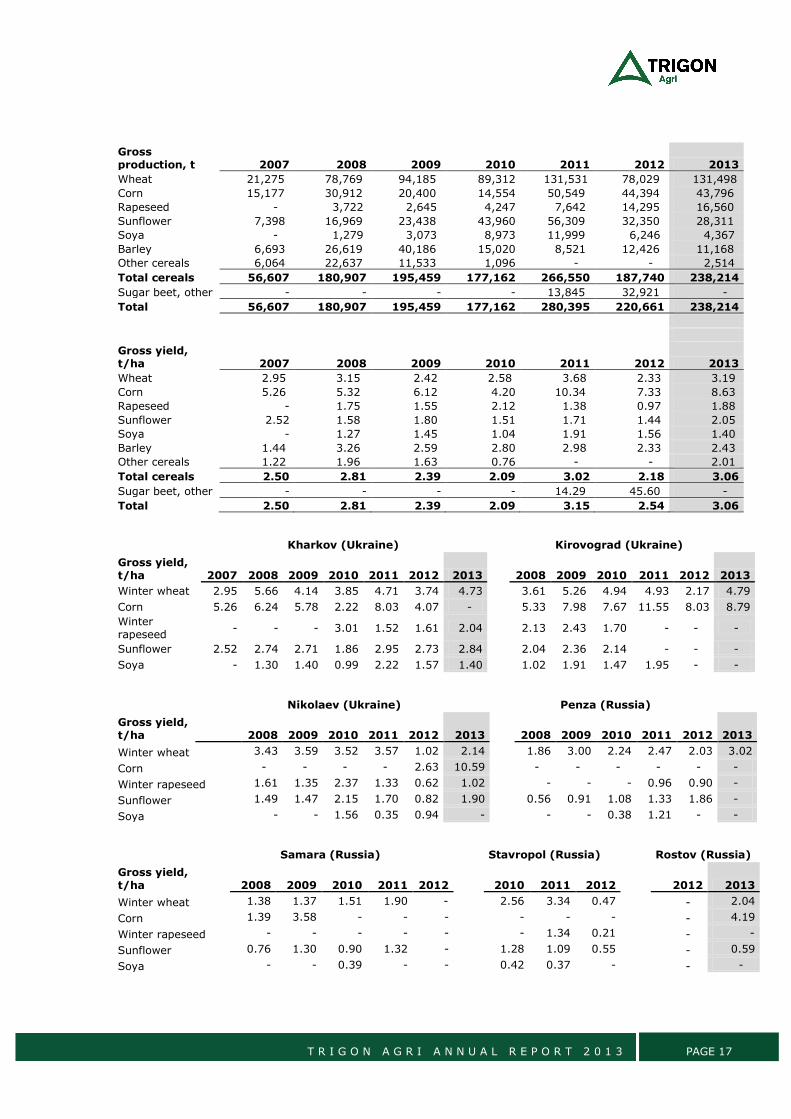
Gross production, t 2007 2008 2009 2010 2011 2012 2013
Wheat 21,275 78,769 94,185 89,312 131,531 78,029 131,498
Corn 15,177 30,912 20,400 14,554 50,549 44,394 43,796
Rapeseed - 3,722 2,645 4,247 7,642 14,295 16,560
Sunflower 7,398 16,969 23,438 43,960 56,309 32,350 28,311
Soya - 1,279 3,073 8,973 11,999 6,246 4,367
Barley 6,693 26,619 40,186 15,020 8,521 12,426 11,168
Other cereals 6,064 22,637 11,533 1,096 - - 2,514
Total cereals 56,607 180,907 195,459 177,162 266,550 187,740 238,214
Sugar beet, other - - - - 13,845 32,921 -
Total 56,607 180,907 195,459 177,162 280,395 220,661 238,214
Gross yield, t/ha 2007 2008 2009 2010 2011 2012 2013
Wheat 2.95 3.15 2.42 2.58 3.68 2.33 3.19
Corn 5.26 5.32 6.12 4.20 10.34 7.33 8.63
Rapeseed - 1.75 1.55 2.12 1.38 0.97 1.88
Sunflower 2.52 1.58 1.80 1.51 1.71 1.44 2.05
Soya - 1.27 1.45 1.04 1.91 1.56 1.40
Barley 1.44 3.26 2.59 2.80 2.98 2.33 2.43
Other cereals 1.22 1.96 1.63 0.76 - - 2.01
Total cereals 2.50 2.81 2.39 2.09 3.02 2.18 3.06
Sugar beet, other - - - - 14.29 45.60 -
Total 2.50 2.81 2.39 2.09 3.15 2.54 3.06
Kharkov (Ukraine)
Kirovograd (Ukraine)
Gross yield, t/ha 2007 2008 2009 2010 2011 2012 2013
2008 2009 2010 2011 2012 2013
Winter wheat 2.95 5.66 4.14 3.85 4.71 3.74 4.73
3.61 5.26 4.94 4.93 2.17 4.79
Corn 5.26 6.24 5.78 2.22 8.03 4.07 -
5.33 7.98 7.67 11.55 8.03 8.79
Winter rapeseed
- - - 3.01 1.52 1.61 2.04
2.13 2.43 1.70 - - -
Sunflower 2.52 2.74 2.71 1.86 2.95 2.73 2.84
2.04 2.36 2.14 - - -
Soya - 1.30 1.40 0.99 2.22 1.57 1.40
1.02 1.91 1.47 1.95 - -
Nikolaev (Ukraine)
Penza (Russia)
Gross yield, t/ha 2008 2009 2010 2011 2012 2013
2008 2009 2010 2011 2012 2013
Winter wheat 3.43 3.59 3.52 3.57 1.02 2.14
1.86 3.00 2.24 2.47 2.03 3.02
Corn - - - - 2.63 10.59
- - - - - -
Winter rapeseed 1.61 1.35 2.37 1.33 0.62 1.02
- - - 0.96 0.90 -
Sunflower 1.49 1.47 2.15 1.70 0.82 1.90
0.56 0.91 1.08 1.33 1.86 -
Soya - - 1.56 0.35 0.94 -
- - 0.38 1.21 - -
Samara (Russia)
Stavropol (Russia)
Rostov (Russia)
Gross yield, t/ha
2008 2009 2010 2011 2012
2010 2011 2012
2012 2013
Winter wheat
1.38 1.37 1.51 1.90 -
2.56 3.34 0.47
- 2.04
Corn
1.39 3.58 - - -
- - -
- 4.19
Winter rapeseed - - - - -
- 1.34 0.21
- -
Sunflower
0.76 1.30 0.90 1.32 -
1.28 1.09 0.55
- 0.59
Soya
- - 0.39 - -
0.42 0.37 -
- -
T R I G O N A G R I A N N U A L R E P O R T 2 0 1 3 PAGE 18
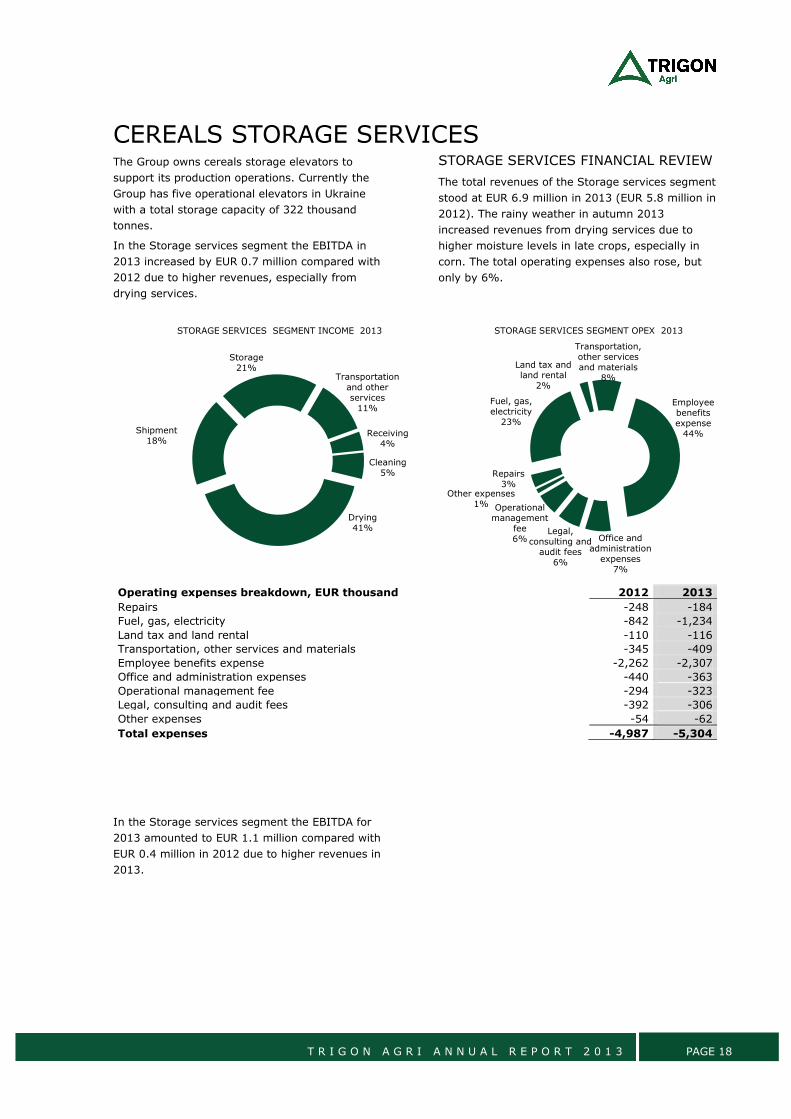
CEREALS STORAGE SERVICES The Group owns cereals storage elevators to
support its production operations. Currently the
Group has five operational elevators in Ukraine
with a total storage capacity of 322 thousand
tonnes.
In the Storage services segment the EBITDA in
2013 increased by EUR 0.7 million compared with
2012 due to higher revenues, especially from
drying services.
STORAGE SERVICES FINANCIAL REVIEW
The total revenues of the Storage services segment
stood at EUR 6.9 million in 2013 (EUR 5.8 million in
2012). The rainy weather in autumn 2013
increased revenues from drying services due to
higher moisture levels in late crops, especially in
corn. The total operating expenses also rose, but
only by 6%.
Operating expenses breakdown, EUR thousand 2012 2013
Repairs -248 -184
Fuel, gas, electricity -842 -1,234
Land tax and land rental -110 -116
Transportation, other services and materials -345 -409
Employee benefits expense -2,262 -2,307
Office and administration expenses -440 -363
Operational management fee -294 -323
Legal, consulting and audit fees -392 -306
Other expenses -54 -62
Total expenses -4,987 -5,304
In the Storage services segment the EBITDA for
2013 amounted to EUR 1.1 million compared with
EUR 0.4 million in 2012 due to higher revenues in
2013.
Receiving4%
Cleaning5%
Drying41%
Shipment18%
Storage21%
Transportation and other services
11%
STORAGE SERVICES SEGMENT INCOME 2013
Repairs3%
Fuel, gas, electricity
23%
Land tax and land rental
2%
Transportation, other services and materials
8%
Employee benefits expense
44%
Office and administration
expenses7%
Operational management
fee6%
Legal, consulting and
audit fees6%
Other expenses1%
STORAGE SERVICES SEGMENT OPEX 2013
T R I G O N A G R I A N N U A L R E P O R T 2 0 1 3 PAGE 19
in EUR thousand 2012 2013
Revenue between segments 2,188 2,640
Revenue from external customers 3,574 4,241
Total segment revenue 5,762 6,881
Other income 22 15
TOTAL income 5,784 6,896
Cost of purchased goods -11 -291
OPEX -4,987 -5,304
Other (losses)/gains - net -369 -208
EBITDA 417 1,093
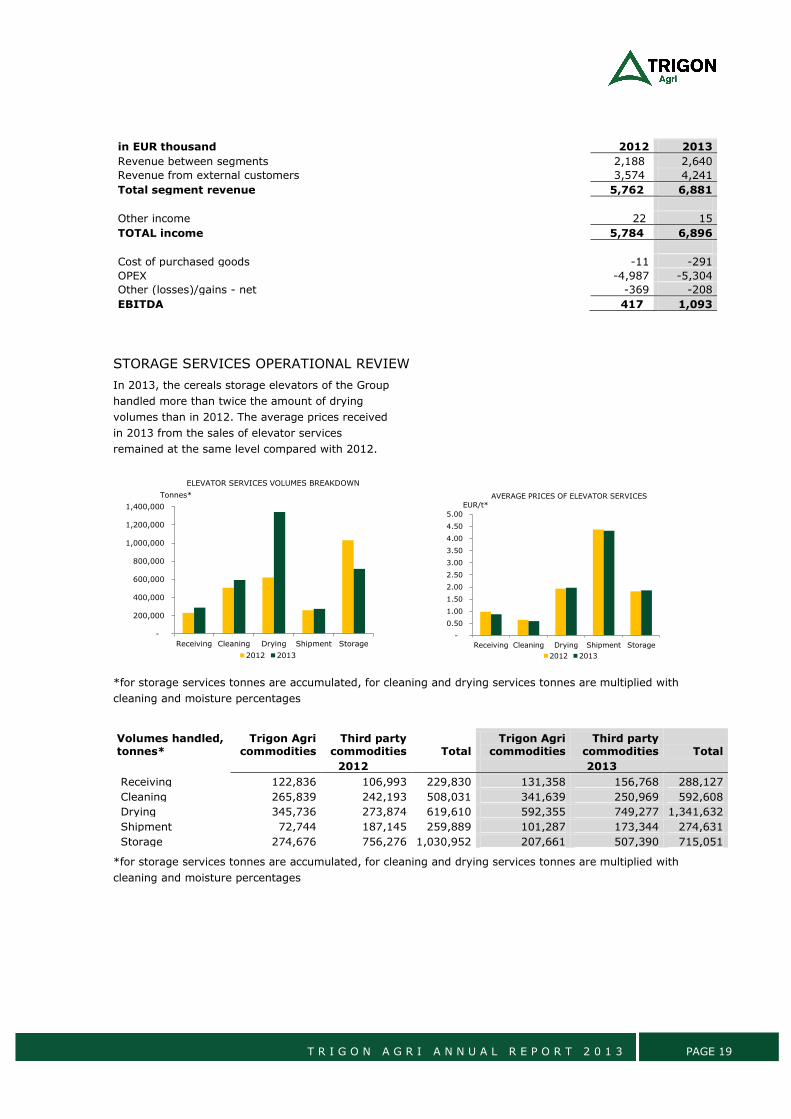
STORAGE SERVICES OPERATIONAL REVIEW
In 2013, the cereals storage elevators of the Group
handled more than twice the amount of drying
volumes than in 2012. The average prices received
in 2013 from the sales of elevator services
remained at the same level compared with 2012.
*for storage services tonnes are accumulated, for cleaning and drying services tonnes are multiplied with
cleaning and moisture percentages
Volumes handled, tonnes*
Trigon Agri commodities
Third party commodities Total
Trigon Agri commodities
Third party commodities Total
2012 2013
Receiving 122,836 106,993 229,830 131,358 156,768 288,127
Cleaning 265,839 242,193 508,031 341,639 250,969 592,608
Drying 345,736 273,874 619,610 592,355 749,277 1,341,632
Shipment 72,744 187,145 259,889 101,287 173,344 274,631
Storage 274,676 756,276 1,030,952 207,661 507,390 715,051
*for storage services tonnes are accumulated, for cleaning and drying services tonnes are multiplied with
cleaning and moisture percentages
-
200,000
400,000
600,000
800,000
1,000,000
1,200,000
1,400,000
Receiving Cleaning Drying Shipment Storage
Tonnes*
ELEVATOR SERVICES VOLUMES BREAKDOWN
2012 2013
-
0.50
1.00
1.50
2.00
2.50
3.00
3.50
4.00
4.50
5.00
Receiving Cleaning Drying Shipment Storage
EUR/t*
AVERAGE PRICES OF ELEVATOR SERVICES
2012 2013
T R I G O N A G R I A N N U A L R E P O R T 2 0 1 3 PAGE 20
SALES AND TRADING The main purpose of the Sales and trading
segment is to maximize the cereals sales prices
received for the Group’s own commodity
production. Depending on market situation, the
Sales and trading department is also engaged in
intermediation of third-party goods. In addition to
the cereals sales the Sales and trading division
organizes purchases of seeds and fertilizers for the
cereals production companies of the Group.
In the Sales and trading segment the EBITDA in
2013 was EUR 0.3 million (EUR 0.3 million in 2012)
SALES AND TRADING FINANCIAL
REVIEW
The total revenue of the Sales and trading segment
in 2013 stood at EUR 63.8 million (EUR 62.5 million
in 2012). Out of that, EUR 56.9 million (EUR 56.8
million in 2012) was generated from the sales of
cereals (own produced and third party). Although
higher volumes of cereals were sold, the 21%
decrease in average price kept revenues at the
same level. For details on the cereals sales prices
and sold quantities in the Sales and trading
segment please refer to the included tables.
Other revenue in 2013 was mainly related to the
intermediation of seeds and fertilizers to the Group
cereals production companies.
Cost of purchased goods decreased from EUR 59.3
million in 2012 to EUR 59.1 million in 2013 due to
lower purchase prices in 2013.
Revenue breakdown: Sales of cereals in Sales and trading segment
2012 2013
Tonnes
Revenue, EUR thousand
Price EUR/t Tonnes
Revenue, EUR thousand
Price EUR/t
Wheat 95,669 15,939 167 147,698 23,992 162
Barley 17,800 3,075 173 12,564 1,367 109
Sunflower 50,400 16,444 326 35,047 10,524 300
Corn 50,000 9,102 182 83,000 10,275 124
Rapeseed 18,284 8,233 450 20,648 8,010 388
Soya 12,696 3,949 311 7,221 2,492 345
Other 534 81 152 2,478 250 101
Total 245,383 56,822 232 308,657 56,909 184
incl own produced 204,999
242,675
incl third party 40,384
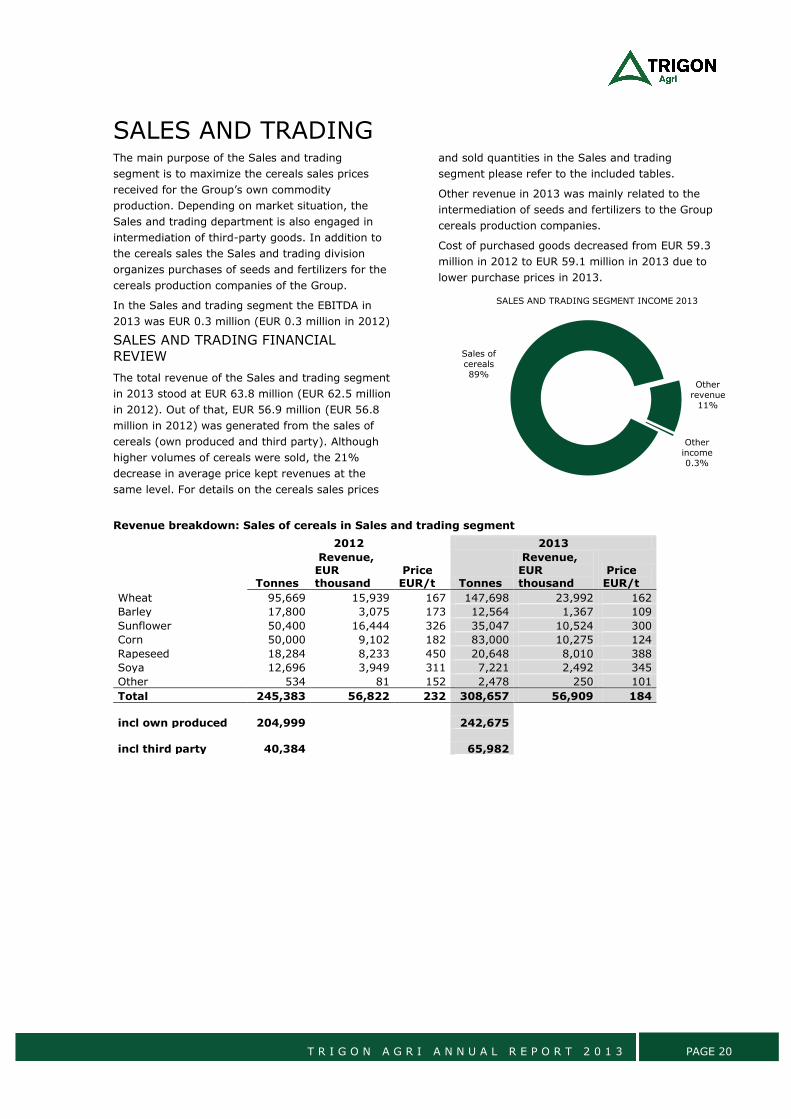
65,982
Sales of cereals89%
Other revenue
11%
Other income0.3%
SALES AND TRADING SEGMENT INCOME 2013
T R I G O N A G R I A N N U A L R E P O R T 2 0 1 3 PAGE 21
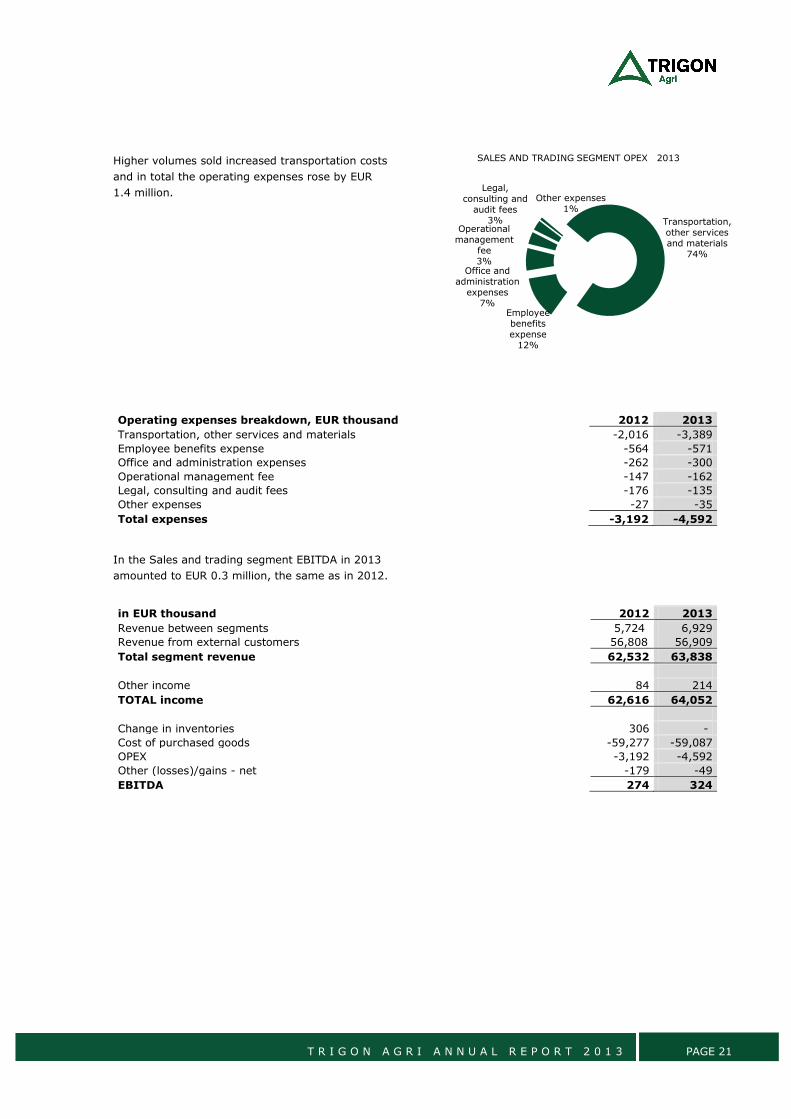
Higher volumes sold increased transportation costs
and in total the operating expenses rose by EUR
1.4 million.
Operating expenses breakdown, EUR thousand 2012 2013
Transportation, other services and materials -2,016 -3,389
Employee benefits expense -564 -571
Office and administration expenses -262 -300
Operational management fee -147 -162
Legal, consulting and audit fees -176 -135
Other expenses -27 -35
Total expenses -3,192 -4,592
In the Sales and trading segment EBITDA in 2013
amounted to EUR 0.3 million, the same as in 2012.
in EUR thousand 2012 2013
Revenue between segments 5,724 6,929
Revenue from external customers 56,808 56,909
Total segment revenue 62,532 63,838
Other income 84 214
TOTAL income 62,616 64,052
Change in inventories 306 -
Cost of purchased goods -59,277 -59,087
OPEX -3,192 -4,592
Other (losses)/gains - net -179 -49
EBITDA 274 324
Transportation, other services and materials
74%
Employee benefits expense
12%
Office and administration
expenses7%
Operational management
fee3%
Legal, consulting and
audit fees3%
Other expenses1%
SALES AND TRADING SEGMENT OPEX 2013

T R I G O N A G R I A N N U A L R E P O R T 2 0 1 3 PAGE 22
SALES AND TRADING OPERATIONAL REVIEW
The total volume of cereals sold by the Sales and
trading segment in 2013 was 309 thousand tonnes
(245 thousand tonnes in 2012). The proportion of
sales to export markets has increased from 34% in
2012 to 44% in 2013. Commodities produced by
the Group comprised 79% of the total sales
volumes.
Trigon commodities
79%
3rd parties21%
SALES AND TRADING SEGMENT CEREALS SALES VOLUME BREAKDOWN 2013
Sales to Ukraine and
Russia56%
Export sales44%
SALES AND TRADING SEGMENT CEREALS SALES VOLUME BREAKDOWN 2013
T R I G O N A G R I A N N U A L R E P O R T 2 0 1 3 PAGE 23
MILK PRODUCTION
The Group’s milk production operations are located
in Estonia and in the St Petersburg region of
Russia.
In the Milk production segment the EBITDA in 2013
amounted to EUR 2.3 million (EUR 4.0 million in
2012). Both revenues and expenses in 2013 were
higher compared with 2012 due to higher prices of
milk, increase in productivity and higher feed costs,
as well as Väätsa Farm acquisition in 2Q 2012.
Additionally, a Gain from bargain purchase was
recorded in 2012 in amount of EUR 1.7 million.
in EUR thousand 2012 2013
Revenue between segments 2 -
Revenue from external customers 9,848 12,903
Total segment revenue 9,850 12,903
Subsidies 2,176 2,065
Other income 17 39
Change in biol.assets 572 567
TOTAL income 12,615 15,574
Change in inventories 3,531 3,781
Cost of purchased goods -72 -23
OPEX -13,753 -16,961
Gain from bargain purchase 1,734 -
Other (losses)/gains - net -22 -100
EBITDA 4,033 2,271
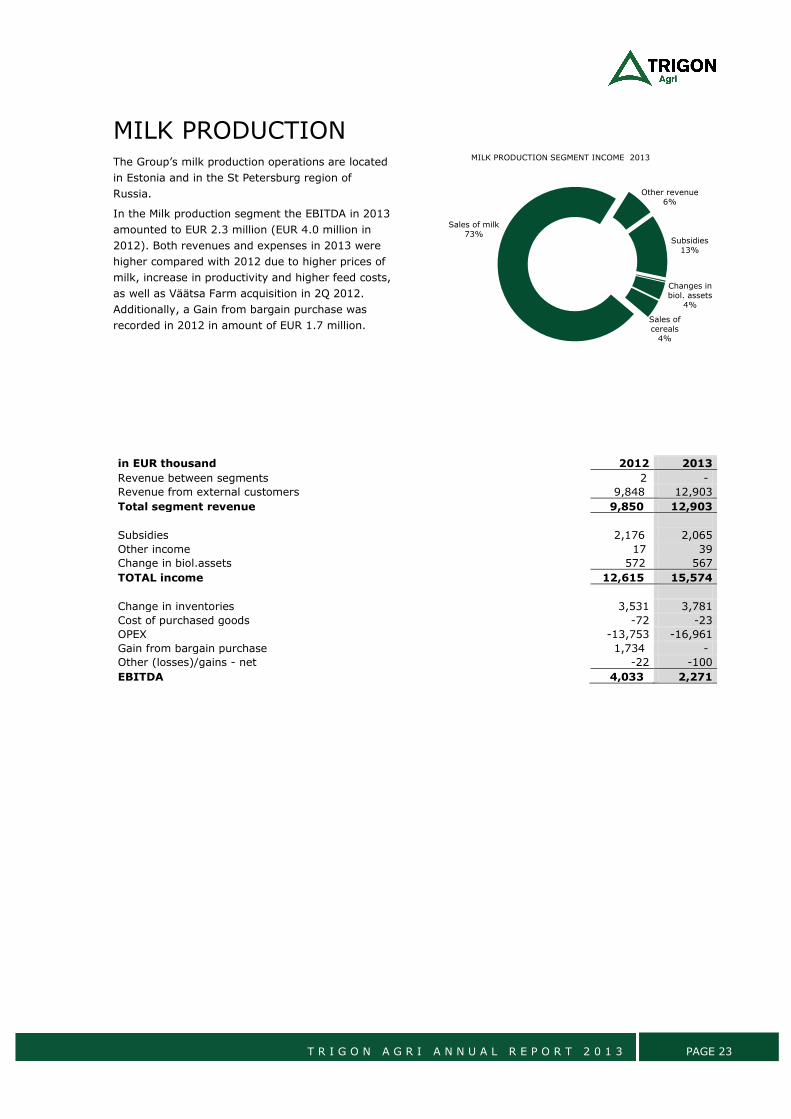
Sales of cereals
4%
Sales of milk73%
Other revenue6%
Subsidies13%
Changes in biol. assets
4%
MILK PRODUCTION SEGMENT INCOME 2013
T R I G O N A G R I A N N U A L R E P O R T 2 0 1 3 PAGE 24
EVENTS AFTER BALANCE SHEET DATE
The Russian rouble and the Ukrainian hryvna have
continued to devalue in 2014. The assets on the
Group’s balance sheet in Russia and Ukraine are
denominated in local currency and will decrease in
euro terms when rouble and hryvna weaken
against the euro. Additionally, part of the Group’s
costs decrease in euro terms when rouble and
hryvna weaken against the euro. A significant part
of the Group’s revenues (cereals sales) are either
denominated in foreign currencies or driven by
prices in foreign currencies.
For further information on the situation in Ukraine
and potential impact on the Group, please refer to
note 3.5.
T R I G O N A G R I A N N U A L R E P O R T 2 0 1 3 PAGE 25
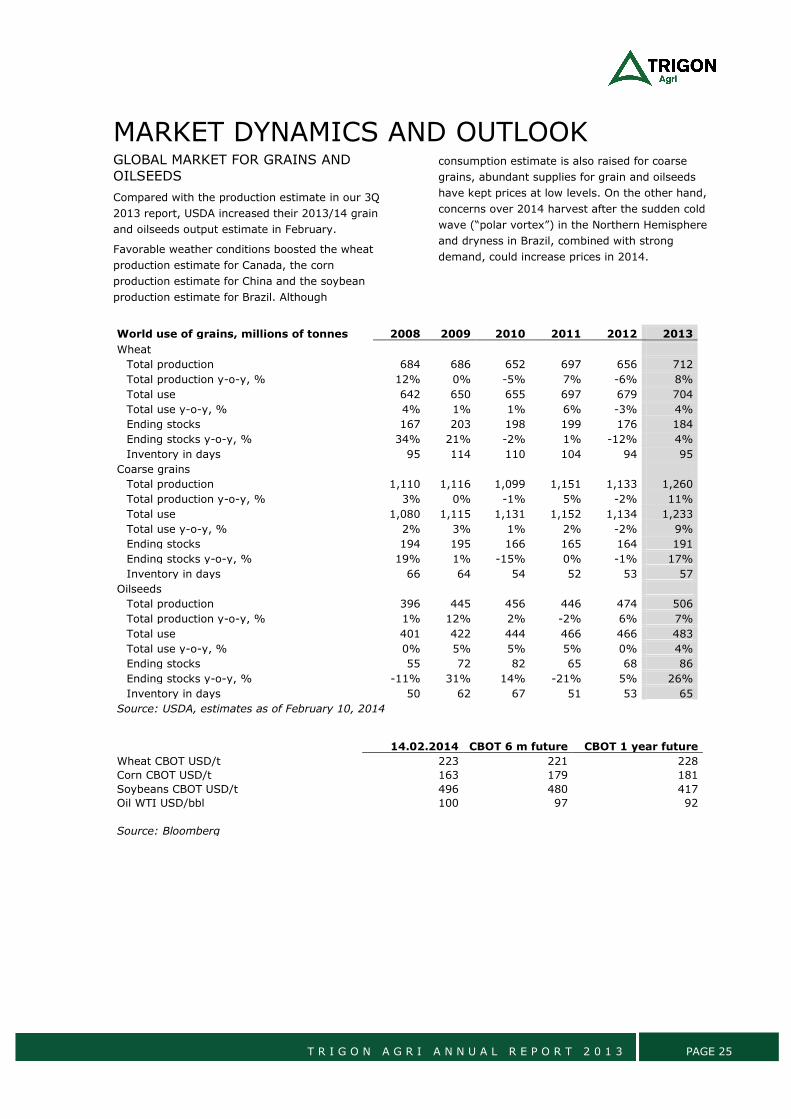
MARKET DYNAMICS AND OUTLOOK GLOBAL MARKET FOR GRAINS AND
OILSEEDS
Compared with the production estimate in our 3Q
2013 report, USDA increased their 2013/14 grain
and oilseeds output estimate in February.
Favorable weather conditions boosted the wheat
production estimate for Canada, the corn
production estimate for China and the soybean
production estimate for Brazil. Although
consumption estimate is also raised for coarse
grains, abundant supplies for grain and oilseeds
have kept prices at low levels. On the other hand,
concerns over 2014 harvest after the sudden cold
wave (“polar vortex”) in the Northern Hemisphere
and dryness in Brazil, combined with strong
demand, could increase prices in 2014.
World use of grains, millions of tonnes 2008 2009 2010 2011 2012 2013
Wheat
Total production 684 686 652 697 656 712
Total production y-o-y, % 12% 0% -5% 7% -6% 8%
Total use 642 650 655 697 679 704
Total use y-o-y, % 4% 1% 1% 6% -3% 4%
Ending stocks 167 203 198 199 176 184
Ending stocks y-o-y, % 34% 21% -2% 1% -12% 4%
Inventory in days 95 114 110 104 94 95
Coarse grains
Total production 1,110 1,116 1,099 1,151 1,133 1,260
Total production y-o-y, % 3% 0% -1% 5% -2% 11%
Total use 1,080 1,115 1,131 1,152 1,134 1,233
Total use y-o-y, % 2% 3% 1% 2% -2% 9%
Ending stocks 194 195 166 165 164 191
Ending stocks y-o-y, % 19% 1% -15% 0% -1% 17%
Inventory in days 66 64 54 52 53 57
Oilseeds
Total production 396 445 456 446 474 506
Total production y-o-y, % 1% 12% 2% -2% 6% 7%
Total use 401 422 444 466 466 483
Total use y-o-y, % 0% 5% 5% 5% 0% 4%
Ending stocks 55 72 82 65 68 86
Ending stocks y-o-y, % -11% 31% 14% -21% 5% 26%
Inventory in days 50 62 67 51 53 65
Source: USDA, estimates as of February 10, 2014
14.02.2014 CBOT 6 m future CBOT 1 year future
Wheat CBOT USD/t 223 221 228
Corn CBOT USD/t 163 179 181
Soybeans CBOT USD/t 496 480 417
Oil WTI USD/bbl 100 97 92
Source: Bloomberg
T R I G O N A G R I A N N U A L R E P O R T 2 0 1 3 PAGE 26
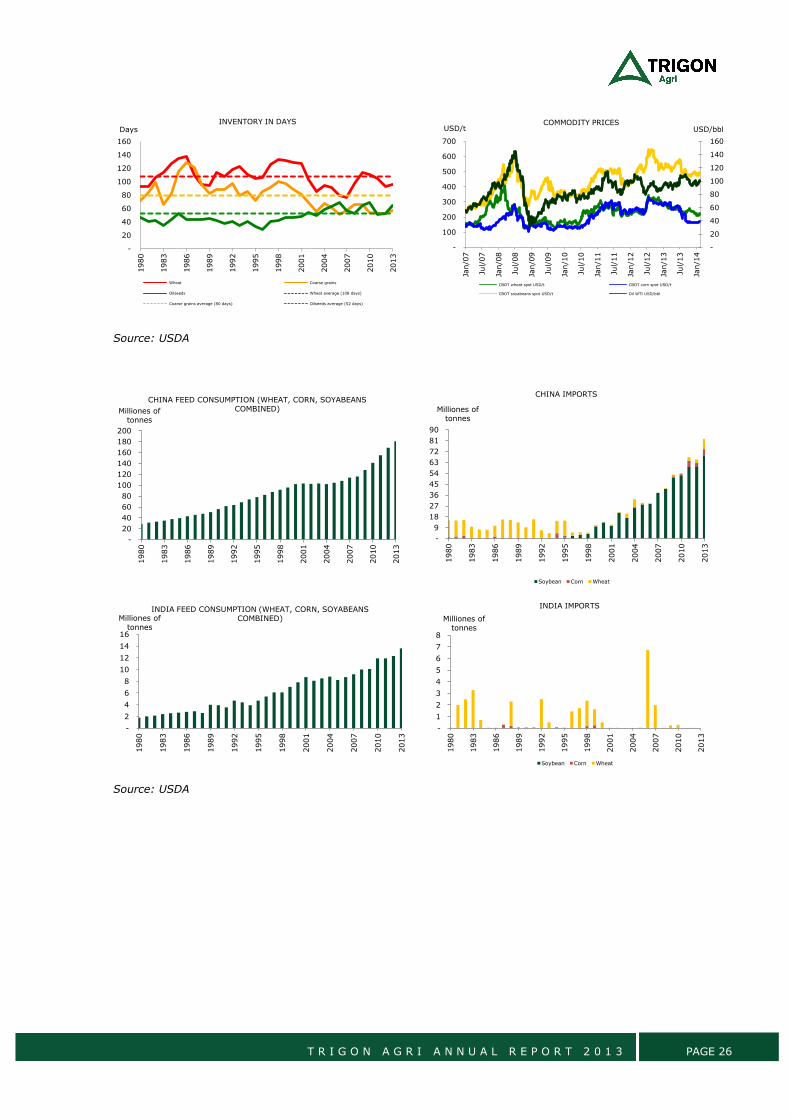
Source: USDA
Source: USDA
-
20
40
60
80
100
120
140
1601980
1983
1986
1989
1992
1995
1998
2001
2004
2007
2010
2013
DaysINVENTORY IN DAYS
Wheat Coarse grains
Oilseeds Wheat average (108 days)
Coarse grains average (80 days) Oilseeds average (52 days)
-
20
40
60
80
100
120
140
160
-
100
200
300
400
500
600
700
Jan/0
7
Jul/
07
Jan/0
8
Jul/
08
Jan/0
9
Jul/
09
Jan/1
0
Jul/
10
Jan/1
1
Jul/
11
Jan/1
2
Jul/
12
Jan/1
3
Jul/
13
Jan/1
4
USD/bblUSD/tCOMMODITY PRICES
CBOT wheat spot USD/t CBOT corn spot USD/t
CBOT soyabeans spot USD/t Oil WTI USD/bbl
-
20
40
60
80
100
120
140
160
180
200
1980
1983
1986
1989
1992
1995
1998
2001
2004
2007
2010
2013
Milliones of tonnes
CHINA FEED CONSUMPTION (WHEAT, CORN, SOYABEANS COMBINED)
-
9
18
27
36
45
54
63
72
81
90
1980
1983
1986
1989
1992
1995
1998
2001
2004
2007
2010
2013
Milliones of tonnes
CHINA IMPORTS
Soybean Corn Wheat
-
2
4
6
8
10
12
14
16
1980
1983
1986
1989
1992
1995
1998
2001
2004
2007
2010
2013
Milliones of tonnes
INDIA FEED CONSUMPTION (WHEAT, CORN, SOYABEANS COMBINED)
-
1
2
3
4
5
6
7
8
1980
1983
1986
1989
1992
1995
1998
2001
2004
2007
2010
2013
Milliones of tonnes
INDIA IMPORTS
Soybean Corn Wheat
T R I G O N A G R I A N N U A L R E P O R T 2 0 1 3 PAGE 27
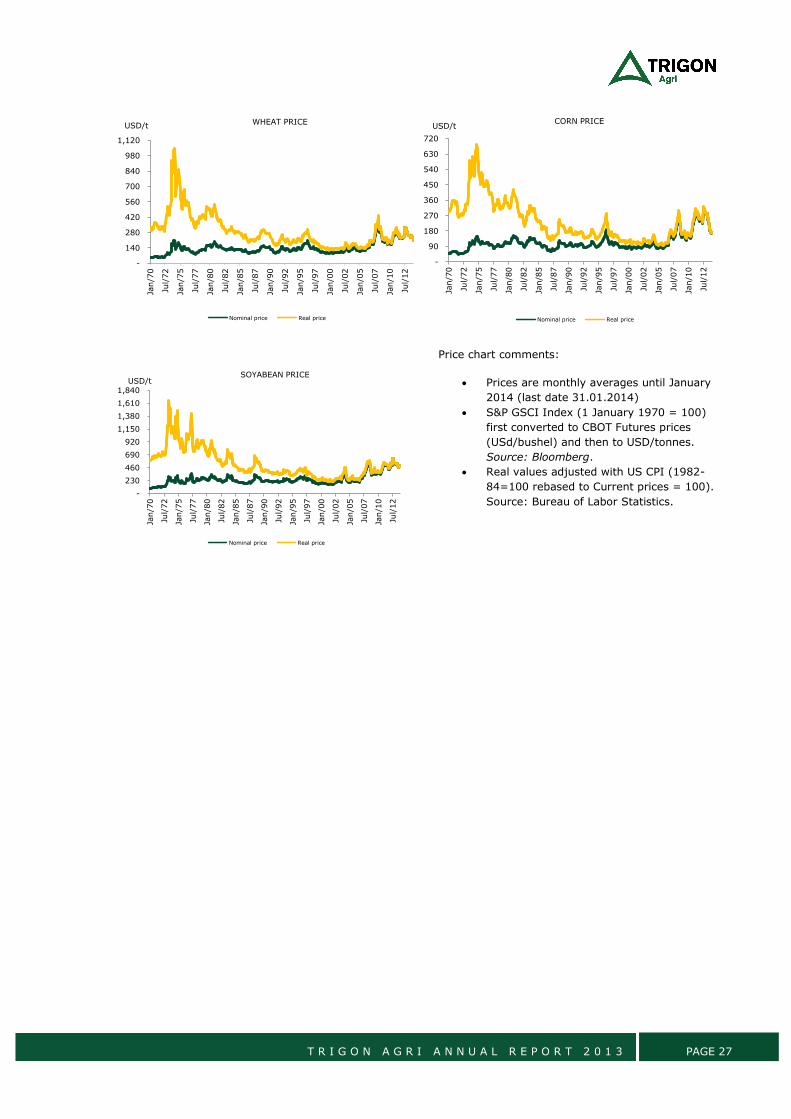
Price chart comments:
Prices are monthly averages until January
2014 (last date 31.01.2014)
S&P GSCI Index (1 January 1970 = 100)
first converted to CBOT Futures prices
(USd/bushel) and then to USD/tonnes.
Source: Bloomberg.
Real values adjusted with US CPI (1982-
84=100 rebased to Current prices = 100).
Source: Bureau of Labor Statistics.
-
140
280
420
560
700
840
980
1,120Ja
n/7
0
Jul/
72
Jan/7
5
Jul/
77
Jan/8
0
Jul/
82
Jan/8
5
Jul/
87
Jan/9
0
Jul/
92
Jan/9
5
Jul/
97
Jan/0
0
Jul/
02
Jan/0
5
Jul/
07
Jan/1
0
Jul/
12
USD/t WHEAT PRICE
Nominal price Real price
-
90
180
270
360
450
540
630
720
Jan/7
0
Jul/
72
Jan/7
5
Jul/
77
Jan/8
0
Jul/
82
Jan/8
5
Jul/
87
Jan/9
0
Jul/
92
Jan/9
5
Jul/
97
Jan/0
0
Jul/
02
Jan/0
5
Jul/
07
Jan/1
0
Jul/
12
USD/tCORN PRICE
Nominal price Real price
-
230
460
690
920
1,150
1,380
1,610
1,840
Jan/7
0
Jul/
72
Jan/7
5
Jul/
77
Jan/8
0
Jul/
82
Jan/8
5
Jul/
87
Jan/9
0
Jul/
92
Jan/9
5
Jul/
97
Jan/0
0
Jul/
02
Jan/0
5
Jul/
07
Jan/1
0
Jul/
12
USD/tSOYABEAN PRICE
Nominal price Real price
T R I G O N A G R I A N N U A L R E P O R T 2 0 1 3 PAGE 28
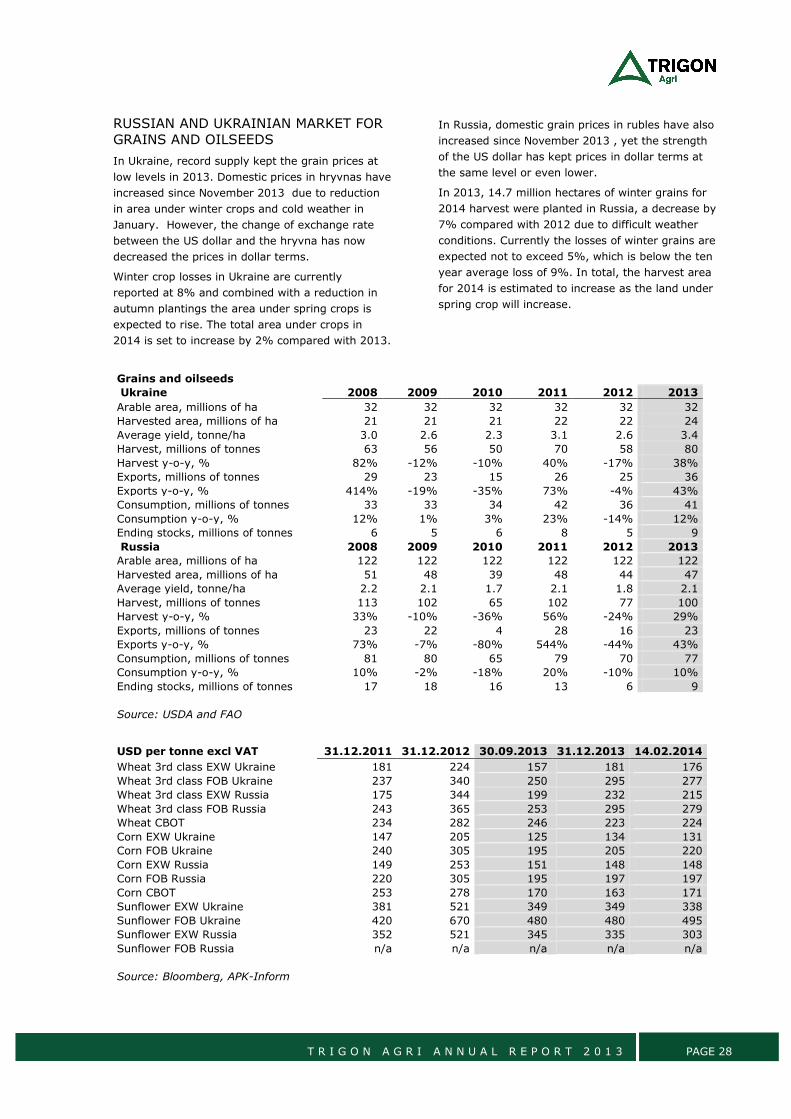
RUSSIAN AND UKRAINIAN MARKET FOR
GRAINS AND OILSEEDS
In Ukraine, record supply kept the grain prices at
low levels in 2013. Domestic prices in hryvnas have
increased since November 2013 due to reduction
in area under winter crops and cold weather in
January. However, the change of exchange rate
between the US dollar and the hryvna has now
decreased the prices in dollar terms.
Winter crop losses in Ukraine are currently
reported at 8% and combined with a reduction in
autumn plantings the area under spring crops is
expected to rise. The total area under crops in
2014 is set to increase by 2% compared with 2013.
In Russia, domestic grain prices in rubles have also
increased since November 2013 , yet the strength
of the US dollar has kept prices in dollar terms at
the same level or even lower.
In 2013, 14.7 million hectares of winter grains for
2014 harvest were planted in Russia, a decrease by
7% compared with 2012 due to difficult weather
conditions. Currently the losses of winter grains are
expected not to exceed 5%, which is below the ten
year average loss of 9%. In total, the harvest area
for 2014 is estimated to increase as the land under
spring crop will increase.
Grains and oilseeds Ukraine 2008 2009 2010 2011 2012 2013
Arable area, millions of ha 32 32 32 32 32 32
Harvested area, millions of ha 21 21 21 22 22 24
Average yield, tonne/ha 3.0 2.6 2.3 3.1 2.6 3.4
Harvest, millions of tonnes 63 56 50 70 58 80
Harvest y-o-y, % 82% -12% -10% 40% -17% 38%
Exports, millions of tonnes 29 23 15 26 25 36
Exports y-o-y, % 414% -19% -35% 73% -4% 43%
Consumption, millions of tonnes 33 33 34 42 36 41
Consumption y-o-y, % 12% 1% 3% 23% -14% 12%
Ending stocks, millions of tonnes 6 5 6 8 5 9
Russia 2008 2009 2010 2011 2012 2013
Arable area, millions of ha 122 122 122 122 122 122
Harvested area, millions of ha 51 48 39 48 44 47
Average yield, tonne/ha 2.2 2.1 1.7 2.1 1.8 2.1
Harvest, millions of tonnes 113 102 65 102 77 100
Harvest y-o-y, % 33% -10% -36% 56% -24% 29%
Exports, millions of tonnes 23 22 4 28 16 23
Exports y-o-y, % 73% -7% -80% 544% -44% 43%
Consumption, millions of tonnes 81 80 65 79 70 77
Consumption y-o-y, % 10% -2% -18% 20% -10% 10%
Ending stocks, millions of tonnes 17 18 16 13 6 9
Source: USDA and FAO
USD per tonne excl VAT 31.12.2011 31.12.2012 30.09.2013 31.12.2013 14.02.2014
Wheat 3rd class EXW Ukraine 181 224 157 181 176
Wheat 3rd class FOB Ukraine 237 340 250 295 277
Wheat 3rd class EXW Russia 175 344 199 232 215
Wheat 3rd class FOB Russia 243 365 253 295 279
Wheat CBOT 234 282 246 223 224
Corn EXW Ukraine 147 205 125 134 131
Corn FOB Ukraine 240 305 195 205 220
Corn EXW Russia 149 253 151 148 148
Corn FOB Russia 220 305 195 197 197
Corn CBOT 253 278 170 163 171
Sunflower EXW Ukraine 381 521 349 349 338
Sunflower FOB Ukraine 420 670 480 480 495
Sunflower EXW Russia 352 521 345 335 303
Sunflower FOB Russia n/a n/a n/a n/a n/a
Source: Bloomberg, APK-Inform
T R I G O N A G R I A N N U A L R E P O R T 2 0 1 3 PAGE 29
CORPORATE GOVERNANCE INTRODUCTION
The full Report on Corporate Governance during
the period of 1 January 2013-31 December 2013
(“Report”) is published at the same time with the
Annual Report on the Company’s web page
(available at http://www.trigonagri.com/wp-
content/uploads/2012/03/Trigon-Agri-Report-on-
Corporate-Governance-2013.pdf ).The following
constitutes Trigon Agri’s statutory reporting on
corporate governance in accordance with Section
107 b (1)(3) of the Danish Financial Statements
Act.
Despite the absence of any Danish law requirement
to apply the Danish Recommendations on
Corporate Governance (“Code”, available at
www.corporategovernance.dk), the Board of
Directors and Executive Board feel strongly about
sound corporate governance and applies the Code
within Trigon Agri.
The principles of corporate governance in Trigon
Agri are described below and governed by the
Articles of Association, applicable laws, the Code,
Rules of Procedure for both of the Boards,
exchange requirements and market practice.
Specific reference is made to any areas in which
Trigon Agri deviates from the Code, as is required
by the ‘comply or explain’ principle in the Code.
It is Trigon Agri’s declared intention to secure that
the standards and principles of good corporate
governance will be adhered to at all times.
The governance of Trigon Agri is attended to by:
• The General Meeting of Shareholders
• The Board of Directors
• The Executive Board
Trigon Agri Advisors provides management
advisory services to the company.
GENERAL MEETING
The General Meeting of Shareholders has supreme
authority in all matters and things pertaining to the
Company subject to the limits set by statute and
by the Articles of Association. Any share carries
one vote in the General Meeting of Shareholders.
The members of the Board of Directors and the
auditor are elected by the General Meeting of
Shareholders.
BOARD OF DIRECTORS
The Board of Directors consists of five members. In
accordance with the Code, at least half of the
members must be independent of the company,
management and shareholders, and this
requirement is fulfilled by Trigon Agri having three
independent members of the Board of Directors
(Raivo Vare, David Mathew and René Nyberg).
In accordance with the Code the elected members
of the Board of Directors are appointed to hold
office for one year and thus the election term
expires at the annual General Meeting following the
election. The Board of Directors shall have a
Chairman, which they shall elect from among their
members.
More information for the Board of Directors has
been presented in the following paragraphs. No
member of the Board of Directors has management
positions in any other Danish company.
Joakim Helenius (born 1957)
Chairman of the Board of Directors of Trigon Agri
since 2007 (Supervisory Board until its dissolution
in 2010).
Shareholdings in Company: 10,424,0341.
Warrant holdings: none.
Other current active positions:
Supervisory Board member in Trigon
Capital (8)
Supervisory Board member in Trigon
Capital subsidiary companies (Trigon
Capital ownership less than 100%) (7)
Supervisory Board member in other Trigon
Agri Group companies (4)
AS Marat, Supervisory board
ERGO Funds AS, Supervisory board
OÜ Helenius Baltic, Management board
Experience (highlights of former positions):
Baltic Republics Fund, Board of Directors
AS Baltika, Supervisory Board
EMV, Supervisory Board
FKSM, Supervisory Board
Estonian Savings Bank, Supervisory Board
Hansapank, Supervisory Board
Reval Hotelligrupi AS, Supervisory Board
Koger & Sumberg, Supervisory Board
Gutta, Supervisory Board
Olainfarm, Supervisory Board
1 Owns 305,700 shares directly and
10,118,334 indirectly, i.e. controls an entity (55.69
per cent) which holds 10,118,334 shares in the
Company.
T R I G O N A G R I A N N U A L R E P O R T 2 0 1 3 PAGE 30
Sylvester and Sanitas, Supervisory Board
Merrill Lynch International Bank, Board of
Directors
Goldman Sachs International Limited, Vice
President of fixed income division
AS Estonian Air, Supervisory Board
Supervisory Board member in Trigon
Capital Group companies
Pertti Laine (born 1941)
Member of Board of Directors of Trigon Agri since
2007 (Supervisory Board until its dissolution in
2010).
Shareholdings in Company: 8,817,8362.
Warrant holdings: None.
Other current active positions:
Supervisory Board member / member of
Board of Directors in Trigon Capital (3)
Veikko Laine Ltd, Board of Directors
Osaühing Karlskroona, Board of Directors
Länsiauto Oy, Board of Directors
Taaleritehdas Oyj, Board of Directors
Experience (highlights of former positions):
Finnlines Plc, Chairman
Nordic Aluminium Oyj, Board of Directors
Evox Rifa Oyj, Board of Directors
Conventum Oyj, Board of Directors
United Bankers Ltd, Board of Directors
Evox Rifa Group Plc, Board of Directos
Amanda Capital Plc, Board of Directors
eQ Oyj, Board of Directors
Supervisory Board member in Trigon Agri
Group companies
René Nyberg (born 1946)
Member of Board of Directors of Trigon Agri since
2008 (Supervisory Board until its dissolution in
2010).
Shareholdings in Company: 15,000.
Warrant holdings: None.
Other current active positions:
East Office of Finnish Industries, CEO
Experience (highlights of former positions):
Foreign Ministry of Finland:
– Assistant Secretary General of the
Finnish-Soviet Economic Commission
– Director for Security Policy
– Director for Eastern Affairs
2 Does not own any shares directly. Controls
an entity (83.33 per cent) which holds 8,817,836
shares in the Company.
– Ambassador of Finland, Berlin
– Ambassador of Finland, OSCE, Vienna
– Ambassador of Finland, Moscow
Raivo Vare (born 1958)
Member of Board of Directors of Trigon
Agri since 2012.
Shareholdings in Company: None.
Warrant holdings: None.
Other current active positions:
Live Nature OÜ, Owner
AS SmartCap, Member of the Supervisory
Council/Board of Directors
AS Smart City Group, Member of the
Supervisory Council/Board of Directors
AS Mainor Ülemiste, Member of the
Supervisory Council/Board of Directors
3D Technologies R&D AS, Member of the
Supervisory Council/Board of Directors
AS Sthenos Grupp, Chairman of the
Supervisory Council/Board of Directors
AS Superia, Member of the Supervisory
Council/Board of Directors
Member of Supervisory Board/Board of
Directors, Trigon Agri Group companies
(2)
Experience (highlights of former
positions):
Minister of State
Minister of Transport and Communications
Development Director and Member of the
Management Board of Estonian Railways
Ltd
Chief Executive Officer and Member of the
Management Board of Pakterminal Ltd
Director and Member of the Management
Board of the Bank of Tallinn
Industrial Advisor, EQT Funds
Management Ltd.
Member of Advisory Board of Norwegian
Eastern Europe Group
Member of Transport Industry Task Force
of EU-Russia Industrialists’ Round Table
Supervisory Board/Board of Directors
member in Trigon Agri Group companies
Supervisory Board/Board of Directors
member in Trigon Capital Group
companies
Member of Board of Directors/Supervisory
Council in several other different
companies in telecom, real estate etc.
David Mathew (born 1954)
Member of Board of Directors of Trigon Agri since
2012.
Shareholdings in Company: None.
Warrant holdings: None.
T R I G O N A G R I A N N U A L R E P O R T 2 0 1 3 PAGE 31
Experience (highlights of former positions):
Director of Robert Fleming
Director of Baring Brothers Hong Kong
Director of Jardine Matheson China
All the members of Board of Directors are at the
age below 80 which is the retirement age for Board
of Directors set by Articles of Association.
A Board of Directors meeting shall constitute a
quorum when more than half the directors are
present. Resolutions by the Board of Directors shall
be passed by a simple majority of votes. The Board
of Directors has held five physical meetings during
2012 and several via electronic means.
The Board of Directors is the highest level of the
management structure, which primary functions
are to be responsible for the overall and strategic
management as well as decision outside of the
day-to-day management, i.e. decisions of unusual
nature or of major importance. The Board of
Directors will arrange for the proper organisation of
the activities of Trigon Agri, and will ensure that
the keeping of accounts and the administration of
property are carried out in a satisfactory way.
The Board of Directors has drawn up rules of
procedure governing the performance of its duties.
Fees paid to Board of Directors are resolved by
General Meeting and are disclosed under section
‘related Party Transactions’.
EXECUTIVE BOARD
The Board of Directors has appointed an Executive
Board consisting of two members to be responsible
for the day-to-day operations of the company. One
of the managers of the Executive Board shall be
appointed the CEO.
List of management positions of Executive Board
members in other companies is presented in the
following paragraphs. No member of the Executive
Board has management positions in any other
Danish company.
Ülo Adamson (born 1978)
Chairman of the Executive Board, CEO and the
President of Trigon Agri, in charge of the financial
and operational strategy of the company since
2007.
Shareholdings in Company: None.
Warrant holdings: None.
Other current active positions:
Supervisory Board / Management Board
member of Trigon Agri Group companies
(7)
Supervisory Board / Management Board
member in Trigon Capital (7)
Supervisory Board / Management Board
member in Trigon Capital subsidiary
companies (Trigon Capital ownership less
than 100%) (7)
OÜ Invenio (personal investment
company)
Experience (highlights of former positions):
AS Telema, Supervisory Board
Trigon Capital Sp. Z.o.o., Management
board
ST Coffee Advisors Ltd, Board of Directors
Quadro Media Sp. Z.o.o., Supervisory
board
OÜ Macro Kinnisvara, Supervisory board
AS Martinson Trigon Venture Partners,
Management board
AS MARTINSON TRIGON, Supervisory
board
Supervisory Board / Management Board
member of Trigon Capital Group
companies
Konstantin Kotivnenko (born 1978)
Member of the Executive Board of Trigon Agri since
2010, responsible for sourcing, structuring and set-
up of the majority of Trigon Agri A/S acquisitions in
Ukraine and Russia.
Shareholdings in Company: None.
Warrant holdings: None.
Other current active positions:
Supervisory Board member in Trigon Agri
Group companies (2)
Supervisory Board / Management Board
member in Trigon Capital (1)
Management Board member in Trigon
Capital subsidiary company (Trigon Capital
ownership less than 100%) (1)
Experience (highlights of former positions):
Law Firm Sorainen, Attorney at Law
Supervisory Board member of Trigon Agri
Group companies
The Executive Board shall be accountable to the
Board of Directors for managing the company in
accordance with applicable law in force, the
company's Articles of Association, the Rules of
Procedure of the Board of Directors and the
Guidelines for Segregation of Duties between the
Board of Directors and Executive Board.
According to the Advisory Agreement with Trigon
Agri Advisors, the parties have undertaken to
ensure that person(s) nominated by Trigon Agri
Advisors are appointed as members of the
Executive Board and that such members from time
T R I G O N A G R I A N N U A L R E P O R T 2 0 1 3 PAGE 32
to time may be replaced by such persons as Trigon
Agri Advisors may designate.
The Board of Directors has drawn up guidelines to
segregation of duties between the Board of
Directors and the Executive Board.
Fees paid to Executive Board are disclosed under
section ‘related Party Transactions’.
ADVISORY AGREEMENT
Trigon Agri has entered into the Advisory
Agreement with Trigon Agri Advisors. Pursuant to
the Advisory Agreement, Trigon Agri Advisors is
the exclusive provider of strategic management
services and general management services to
Trigon Agri, including strategic and financial
management, structuring of land and farm
acquisitions and designing financing solutions.
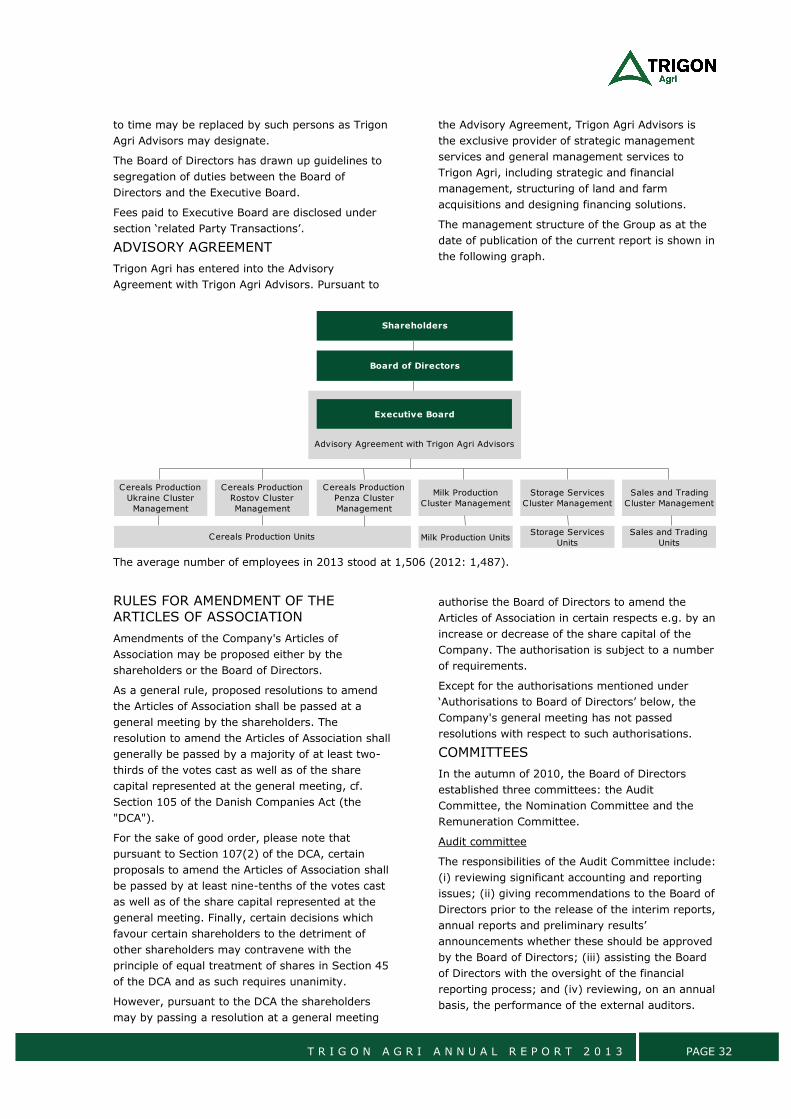
The management structure of the Group as at the
date of publication of the current report is shown in
the following graph.
The average number of employees in 2013 stood at 1,506 (2012: 1,487).
RULES FOR AMENDMENT OF THE
ARTICLES OF ASSOCIATION
Amendments of the Company's Articles of
Association may be proposed either by the
shareholders or the Board of Directors.
As a general rule, proposed resolutions to amend
the Articles of Association shall be passed at a
general meeting by the shareholders. The
resolution to amend the Articles of Association shall
generally be passed by a majority of at least two-
thirds of the votes cast as well as of the share
capital represented at the general meeting, cf.
Section 105 of the Danish Companies Act (the
"DCA").
For the sake of good order, please note that
pursuant to Section 107(2) of the DCA, certain
proposals to amend the Articles of Association shall
be passed by at least nine-tenths of the votes cast
as well as of the share capital represented at the
general meeting. Finally, certain decisions which
favour certain shareholders to the detriment of
other shareholders may contravene with the
principle of equal treatment of shares in Section 45
of the DCA and as such requires unanimity.
However, pursuant to the DCA the shareholders
may by passing a resolution at a general meeting
authorise the Board of Directors to amend the
Articles of Association in certain respects e.g. by an
increase or decrease of the share capital of the
Company. The authorisation is subject to a number
of requirements.
Except for the authorisations mentioned under
‘Authorisations to Board of Directors’ below, the
Company's general meeting has not passed
resolutions with respect to such authorisations.
COMMITTEES
In the autumn of 2010, the Board of Directors
established three committees: the Audit
Committee, the Nomination Committee and the
Remuneration Committee.
Audit committee
The responsibilities of the Audit Committee include:
(i) reviewing significant accounting and reporting
issues; (ii) giving recommendations to the Board of
Directors prior to the release of the interim reports,
annual reports and preliminary results’
announcements whether these should be approved
by the Board of Directors; (iii) assisting the Board
of Directors with the oversight of the financial
reporting process; and (iv) reviewing, on an annual
basis, the performance of the external auditors.
Shareholders
Board of Directors
Executive Board
Cereals Production
Ukraine Cluster
Management
Cereals Production
Rostov Cluster
Management
Cereals Production
Penza Cluster
Management
Milk Production
Cluster Management
Storage Services
Cluster Management
Sales and Trading
Cluster Management
Milk Production UnitsStorage Services
Units
Sales and Trading
UnitsCereals Production Units
Advisory Agreement with Trigon Agri Advisors
T R I G O N A G R I A N N U A L R E P O R T 2 0 1 3 PAGE 33
The members of the Audit Committee shall be
appointed by the Board of Directors and among its
members. Trigon Agri’s Audit Committee currently
consists of Raivo Vare (Chairman) and David
Mathew.
The Audit Committee shall meet as frequently as
the Chairman of the Audit Committee deems
necessary, but it should be at least twice a year. In
2013, the Audit Committee held two physical
meetings and several via electronic form.
Nomination Committee
The Nomination Committee’s duties include: (i)
identifying and recommending members to the
Board of Directors and Executive Board to the
Board of Directors; (ii) evaluating the structure,
size, composition and performance of the Board of
Directors and Executive Board and to propose any
changes in this respect to the Board of Directors;
and (iii) considering proposals submitted by
relevant persons for candidates for executive
positions.
The Nomination Committee shall consist of two to
four persons and at least half of its members shall
be independent of Trigon Agri and its subsidiaries.
The members of the Nomination Committee shall
be appointed by the Board of Directors and among
its members. The Nomination Committee currently
consists of Pertti Laine (Chairman), Joakim
Helenius, Raivo Vare, and David Mathew.
In 2013, the Nomination Committee held one
meeting via electronic form.
Remuneration Committee
The Remuneration Committee’s duties include to
make proposals to the Board of Directors, prior to
approval at the general meeting, on the
remuneration policy and the principles of the
incentive pay schemes for the Board of Directors
and the Executive Board and to ensure that the
remuneration is consistent with Trigon Agri’s
remuneration policy and the evaluation of the
performance of the persons concerned.
The members of the Remuneration Committee shall
be appointed by the Board of Directors and among
its members. The Remuneration Committee shall
consist of two to three members and the Chairman
of the Board of Directors shall always be the
Chairman of the Remuneration Committee. At least
half of the members shall be independent in
relation to Trigon Agri and its subsidiaries. Trigon
Agri’s Remuneration Committee consists of Joakim
Helenius (Chairman) and René Nyberg. The
Remuneration Committee shall convene as often as
considered necessary by the Chairman of the
Committee and at least once a year.
In 2013 the Remuneration Committee held one
meeting via electronic form.
INTERNAL CONTROL
The Executive Board is responsible for the
organisation and administration of the Company,
which includes establishing an effective system of
internal control. Internal control in this context
refers to those measures taken by the Executive
Board, the senior executives and other personnel
to ensure that the bookkeeping and the Company’s
financial condition in general are controlled and
reported upon in a reliable fashion and in
compliance with relevant legislation, applicable
accounting standards and other requirements
related to the Company’s listing on the Stock
exchange.
In order to ensure that the organisational
structure, chain of command and authority are well
defined and clearly communicated, the Company
has prepared written instructions and formal
routines for division of labour between the
Executive Board, the Board of Directors, the
management and other personnel. The Executive
Board has established general guidelines for the
Company’s activities in internal policies, manuals
and codes. Controls have also been carried out to
ensure that the IT-/computer systems involved in
the reporting process support a sufficiently high
dependability for its task. The Company has
established fixed routines and invested in reliable
technical applications to guarantee a fast and
reliable way of sharing information throughout the
organisation. Internal policies and general
guidelines for financial reporting are communicated
between the Executive Board, senior executives
and other personnel through regular meetings and
via electronic form.
The internal control system followed in 2013
consisted of risk assessment, reporting
instructions, control procedures and monitoring.
The Executive Board and also the Audit Committee
assess risks related to financial reporting that the
Company is exposed to. The main risks have been
identified as risk of fraud and misconduct. Certain
risks have been disclosed and explained also in the
Annual Report under section Financial Risk
Management.
Several control procedures have been integrated in
the accounting and reporting systems such as
finance policy, internal reporting guidelines and
certain internal accounting control routines.
The Executive Board follows up to ensure that any
internal control weaknesses are addressed and that
potential errors are detected and reported and
corrected in timely and orderly fashion.
T R I G O N A G R I A N N U A L R E P O R T 2 0 1 3 PAGE 34
The policies, guidelines and routines are updated
on an on-going basis and are introduced to
employees regularly via electronic form or internal
training events.
Monitoring over accounting and financial reporting
is conducted by the Executive Board and Audit
Committee on a regular basis. Monitoring
procedures are designed to identify risks, detect
errors and correct any weaknesses. The Executive
Board receives monthly internal financial reporting
and the Audit Committee receives quarterly interim
reports.
SUMMARY OF CODE
RECOMMENDATIONS NOT FOLLOWED
AND REASONS WHY NOT FOLLOWED
The following table is a summary from the Report
and outlines the Code recommendations the
Company did not follow as well as explanation why
the Company did not comply with the
recommendation. Regardless, the Company is
satisfied with its Code adherence discipline.
Recommendation Reason why the Company complied only partially
2.1.1. The Committee recommends that at least
once a year the board of directors take a position
on the matters related to the board’s performance
of its responsibilities.
The procedure is being established and will be approved
and implemented in the first half of 2014.
3.5.1. The Committee recommends that the board
of directors establish an evaluation procedure
where contributions and results of the board of
directors and the individual members, as well as
collaboration with the executive board are annually
evaluated. Significant changes deriving from the
evaluation should be included in the management
commentary or on the company’s website.
The procedure is being established and will be approved
and implemented in the first half of 2014.
4.1.1. The Committee recommends that the
board of directors prepare a clear and transparent
remuneration policy for the board of directors and
the executive board, including
• a detailed description of the components
of the remuneration for members of the board of
directors and the executive board,
• the reasons for choosing the individual
components of the remuneration, and
• a description of the criteria on which the
balance between the individual components of the
remuneration is based.
The remuneration policy should be approved by
the general meeting and published on the
company’s website.
No separate remuneration policy has been adopted.
However, since the remuneration of the Board of
Directors and Executive Board is very transparent, the
Company does not see the need for a separate policy.
The remuneration of the Board of Directors is always
resolved by the annual general meeting.
The remuneration of the Executive Board is resolved by
the Board of Directors following the annual general
meeting.
The Company notes the following:
The Company has entered into an Advisory Agreement
with AS Trigon Agri Advisors (Advisor). The Executive
Board (save for CEO) receive compensation from the
Advisor and the compensation is included in the
management fee paid to the Advisor. Detailed information
about the Advisory Agreement is available here
http://www.trigonagri.com/corporate-
governance/advisory-agreement/
The agenda of the annual general meeting includes
agenda item regarding remuneration of Board of Directors
and is very transparent as the fee is resolved as annual
flat fee per each individual member.
5.2.1. The Committee recommends that the board
of directors decide whether to establish a
whistleblower scheme for expedient and
confidential notification of possible or suspected
wrongdoing.
The matter will be evaluated during first half of 2014.
T R I G O N A G R I A N N U A L R E P O R T 2 0 1 3 PAGE 35
T R I G O N A G R I A N N U A L R E P O R T 2 0 1 3 PAGE 36
CORPORATE SOCIAL RESPONSIBILITY The Group management has a policy on social
responsibility with the following focus areas:
Human rights
The Group operates in countries where businesses’
exposure to human rights violations is limited.
Consequently, the Group does not conduct any
activities, liaise or contract with business partners
or suppliers in countries considered high-risk in
terms of human rights abuses. Therefore there is
no separate formal human rights policy. However,
Trigon Agri is respecting human rights and
supports the UN Global Compact principles for
human rights and labour. The rights include the
rights covered in the International Bill of Human
Rights and the principles concerning fundamental
rights set out in the International Labour
Organization’s Declaration on Fundamental
Principles and Rights at Work.
In 2013 there were no registrations of violations of
human rights or incidents of discrimination
reported.
The Group strives for gender equality and does not
discriminate based on gender. While the Board of
Directors (5 members) and Executive Board (2
members) consist of men, the next level of
management and top specialists consists of 48% of
women and 52% of men. In 2013, the Group
adopted new rules of procedure stating that the
Board of Directors must assess every year whether
men and women are equally represented on the
Board of Director, or whether there is a
requirement for the definition of a target ratio for
the share of the underrepresented sex on the
Board of Directors. The Board of Directors has
assessed this matter and considered it appropriate
not to have a specific target for the
underrepresented gender in the Board of Directors
and Executive Board effectively meaning that the
target is set to zero and continue not to
discriminate based on gender when searching for
new member of the Board of Directors or Executive
Board.
Health and safety
The Group health and safety policy provides a brief
overview of major principles in the field of health
and safety.
According to the health and safety policy basic
obligations of Trigon Agri in the area of health and
safety are to provide:
safe and healthy systems of work;
safe and healthy work environment;
adequate amenities;
safe and healthy premises of work;
safe and well maintained plant and machinery;
safe methods of handling, storing and
transporting materials;
adequate instruction and training for
employees;
adequate supervision by competent and
trained personnel;
relevant and adequate information for all
employees;
responsible person.
According to the health and safety policy each
employee of the Group is encouraged to play a
vital and responsible role in maintaining a safe and
healthy workplace through:
being involved in the workplace health and
safety system;
sticking to correct procedures and equipment;
wearing appropriate clothing and equipment as
and when required;
ensuring all accidents and incidents are
reported to direct superior and responsible
staff member;
helping new employees, trainees and visitors
to the workplace understand the right safety
procedures and their objective;
telling your direct superior immediately of any
health and safety concerns;
keeping the work place tidy to minimise the
risk of any trips and falls.
The Group has implemented strict work safety
regulations and provides proper training to
employees in order to ensure safety and avoid
accidents.
The Group has dedicated work safety officers to
ensure compliance with the policy. General health
and safety induction training is provided for all
employees.
In 2013 there were no work place accidents
reported.
T R I G O N A G R I A N N U A L R E P O R T 2 0 1 3 PAGE 37
Community involvement
Trigon Agri contributes to making the communities
in which it operates better places to live and do
business. Trigon Agri values mutually beneficial
relationships with communities where it operates
and strives to engage or consult communities
regarding business development plans that have a
material impact on those communities.
Trigon Agri strives to support on select basis local
municipalities and organizations taking into
account the availability of resources. For example,
the support can be in the form of organising local
events, buying equipment to schools, helping with
renovation works of public facilities, etc. A record
of contributions and donations shall be kept to
monitor activities and progress.
In 2013, the Group’s subsidiaries in Russia and
Ukraine have supported local municipalities and
organisations by
making non-returnable charity and financial
aid payments
buying renovation materials or organizing
small renovation works for schools, churches,
kindergartens
buying necessary equipment and furnishing for
the various local organisations (incl. machinery
and furnishing for schools and other local
organisations)
doing gifts for children, students or veteran
organisations
supporting other local activities (for example
supporting veteran’s trips, organising local
events, transportation and catering).
The Group has also given financial aid and
organised events and training for its employees
and bought Christmas gifts for the children of the
employees.
The financial resources allocated by the Group for
community support amounted to nearly EUR 0.3
million. The activities have improved the facilities
in the local communities and helped to carry out
events, increasing the welfare of people in the
communities where Trigon Agri operates.
Environment
Trigon Agri is committed to operating the
agricultural businesses under its control utilising
environmentally and agronomically sustainable
production methods. We recognise the need to
honour the responsibilities we have with respect to
protecting the environment and to the consumer
by ensuring that the food we produce is both safe
and of a high standard.
To achieve this commitment we ensure that all our
agronomists and managers are fully trained with
the most up to date technical information, to
ensure that there is optimal use of seeds, fertilisers
and pesticides so as to keep a sound balance
between production and the environment. Trigon
Agri’s cultivation, field application, and harvesting
philosophy focuses on the minimal usage of energy
thus minimising the Group’s carbon footprint. The
crop rotations adopted are carefully planned to
ensure no build-up of pests, diseases or weeds. We
are highly water conscious and at all times look to
preserve this most precious resource. All waste
materials are disposed of in an environmentally
sensitive way so as to minimise pollution of our
planet.
The Group has a real-time, 24 hour,
computerized control centre and immediate
reaction to on-ground mistakes. This has
resulted in a drop in fuel consumption of 10-
25% (depending on type of machinery) and
prevents non-compliances, accidents and
technical failures (speed limits, servicing,
diagnostics).
Maintaining soil fertility is ensured by having in
place a sustainable rotation, nutrient
management plan, soil management plan and
crop protection management plan. These are
enforced by approving annual budgets where
the utilization of hectares and application of
nutrients and chemicals is detailed.
Soil management – low-till farming is used
whenever possible. This helps to preserve soil
microbes, preserve natural drainage, results in
less nitrogen leaching and lowers fuel
consumption. Cultivation is not carried out up
and down any slopes wherever possible, to
prevent soil erosion.
Crop protection – chemicals are applied strictly
adhering to label recommendations that
specify which crops the chemical can be
applied to, application rate per hectare,
permissible frequency of application and
harvest interval – i.e. the minimum time
period that has to be left between application
and harvest to ensure food safety. Reduced
application rates are used when they have
internally been proven to be sufficient, which
also assists to reduce our environmental
footprint.
Nutrient management – appropriate quantities
and application practices are used to ensure
optimum growing conditions, maintain soil
fertility and prevent pollution that would be
caused by over-application of nutrients.
Fertilizer and Pesticide storage – national
regulations are followed that specify maximum
T R I G O N A G R I A N N U A L R E P O R T 2 0 1 3 PAGE 38
quantities permissible to store and the
required distance from habitation.
Fuel consumption is monitored using real-time
GPS tracking of vehicles for example enforcing
optimum driving speeds and engine
revolutions helps to reduce fuel
consumption.Waste disposal – washed
chemical, fertilizer and seed packaging are
delivered to a special factory where they are
incinerated to provide energy for power
production.
Accident and emergency plan – in case of
chemical spill there is an action plan listing
specific steps in each vehicle and all relevant
operatives have been trained in the procedure.
The Group has acted in accordance with this policy
for several years, thus new activities were not
carried out in 2013. No environmental incidents
were reported in 2013.
Trigon Agri will continue ensure that all its
employees are fully conversant with the aims set
out in this policy statement in order that all its
activities are compliant and represent best
practise.
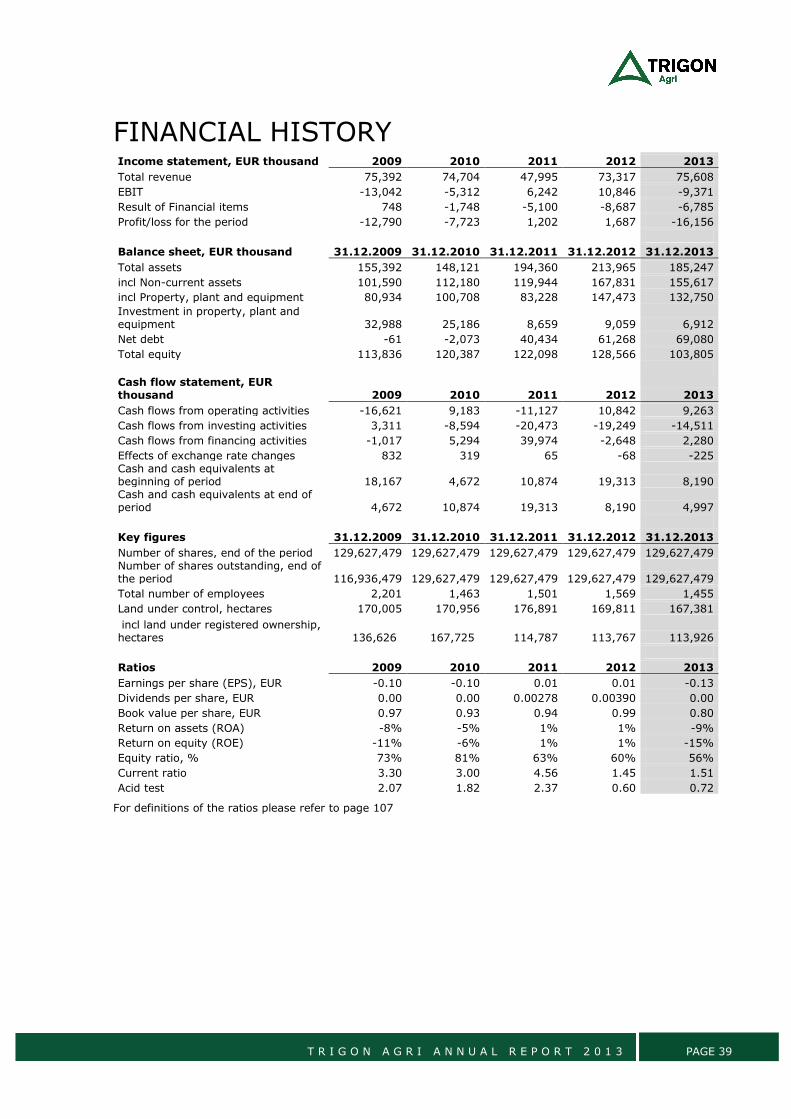
T R I G O N A G R I A N N U A L R E P O R T 2 0 1 3 PAGE 39
FINANCIAL HISTORY Income statement, EUR thousand 2009 2010 2011 2012 2013
Total revenue 75,392 74,704 47,995 73,317 75,608
EBIT -13,042 -5,312 6,242 10,846 -9,371
Result of Financial items 748 -1,748 -5,100 -8,687 -6,785
Profit/loss for the period -12,790 -7,723 1,202 1,687 -16,156
Balance sheet, EUR thousand 31.12.2009 31.12.2010 31.12.2011 31.12.2012 31.12.2013
Total assets 155,392 148,121 194,360 213,965 185,247
incl Non-current assets 101,590 112,180 119,944 167,831 155,617
incl Property, plant and equipment 80,934 100,708 83,228 147,473 132,750
Investment in property, plant and equipment 32,988 25,186 8,659 9,059 6,912
Net debt -61 -2,073 40,434 61,268 69,080
Total equity 113,836 120,387 122,098 128,566 103,805
Cash flow statement, EUR thousand 2009 2010 2011 2012 2013
Cash flows from operating activities -16,621 9,183 -11,127 10,842 9,263
Cash flows from investing activities 3,311 -8,594 -20,473 -19,249 -14,511
Cash flows from financing activities -1,017 5,294 39,974 -2,648 2,280
Effects of exchange rate changes 832 319 65 -68 -225 Cash and cash equivalents at beginning of period 18,167 4,672 10,874 19,313 8,190 Cash and cash equivalents at end of period 4,672 10,874 19,313 8,190 4,997
Key figures 31.12.2009 31.12.2010 31.12.2011 31.12.2012 31.12.2013
Number of shares, end of the period 129,627,479 129,627,479 129,627,479 129,627,479 129,627,479 Number of shares outstanding, end of the period 116,936,479 129,627,479 129,627,479 129,627,479 129,627,479
Total number of employees 2,201 1,463 1,501 1,569 1,455
Land under control, hectares 170,005 170,956 176,891 169,811 167,381
incl land under registered ownership, hectares 136,626 167,725 114,787 113,767 113,926
Ratios 2009 2010 2011 2012 2013
Earnings per share (EPS), EUR -0.10 -0.10 0.01 0.01 -0.13
Dividends per share, EUR 0.00 0.00 0.00278 0.00390 0.00
Book value per share, EUR 0.97 0.93 0.94 0.99 0.80
Return on assets (ROA) -8% -5% 1% 1% -9%
Return on equity (ROE) -11% -6% 1% 1% -15%
Equity ratio, % 73% 81% 63% 60% 56%
Current ratio 3.30 3.00 4.56 1.45 1.51
Acid test 2.07 1.82 2.37 0.60 0.72
For definitions of the ratios please refer to page 107
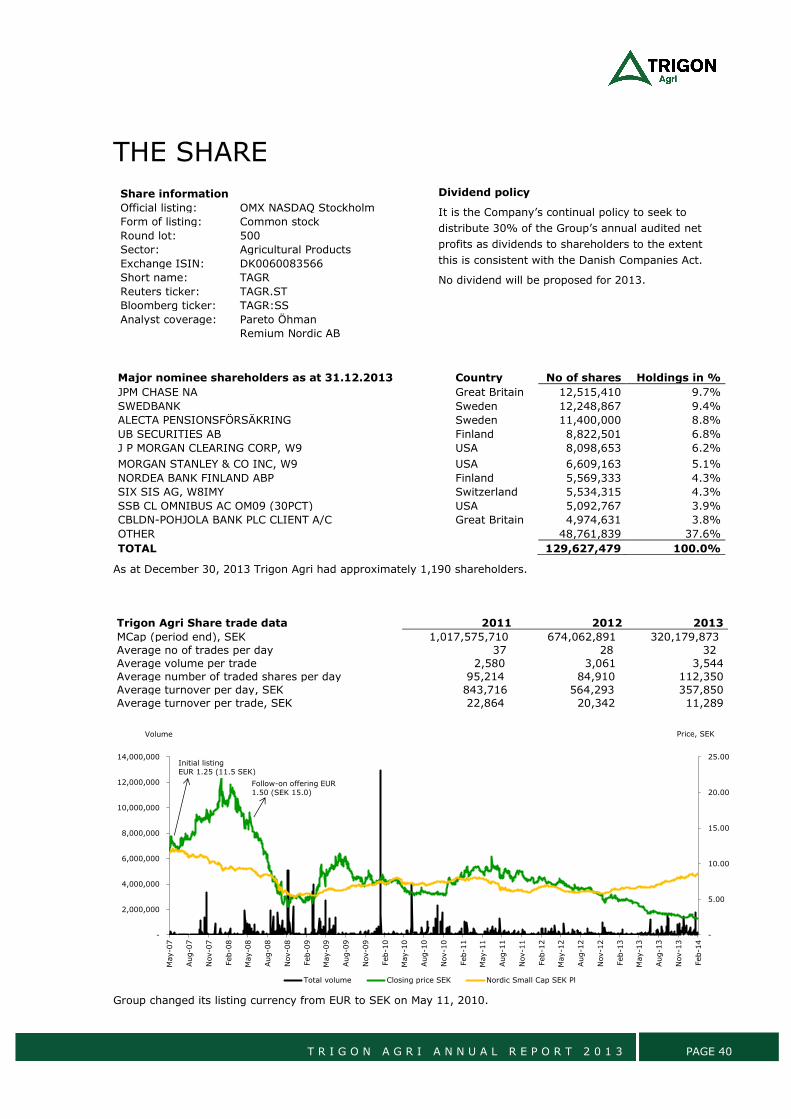
T R I G O N A G R I A N N U A L R E P O R T 2 0 1 3 PAGE 40
THE SHARE
Share information
Official listing: OMX NASDAQ Stockholm
Form of listing: Common stock
Round lot: 500
Sector: Agricultural Products
Exchange ISIN: DK0060083566
Short name: TAGR
Reuters ticker: TAGR.ST
Bloomberg ticker: TAGR:SS
Analyst coverage: Pareto Öhman
Remium Nordic AB
Dividend policy
It is the Company’s continual policy to seek to
distribute 30% of the Group’s annual audited net
profits as dividends to shareholders to the extent
this is consistent with the Danish Companies Act.
No dividend will be proposed for 2013.
Major nominee shareholders as at 31.12.2013 Country No of shares Holdings in %
JPM CHASE NA Great Britain 12,515,410 9.7%
SWEDBANK Sweden 12,248,867 9.4%
ALECTA PENSIONSFÖRSÄKRING Sweden 11,400,000 8.8%
UB SECURITIES AB Finland 8,822,501 6.8%
J P MORGAN CLEARING CORP, W9 USA 8,098,653 6.2%
MORGAN STANLEY & CO INC, W9 USA 6,609,163 5.1%
NORDEA BANK FINLAND ABP Finland 5,569,333 4.3%
SIX SIS AG, W8IMY Switzerland 5,534,315 4.3%
SSB CL OMNIBUS AC OM09 (30PCT) USA 5,092,767 3.9%
CBLDN-POHJOLA BANK PLC CLIENT A/C Great Britain 4,974,631 3.8%
OTHER
48,761,839 37.6%
TOTAL
129,627,479 100.0%
As at December 30, 2013 Trigon Agri had approximately 1,190 shareholders.
Trigon Agri Share trade data 2011 2012 2013
MCap (period end), SEK 1,017,575,710 674,062,891 320,179,873
Average no of trades per day 37 28 32
Average volume per trade 2,580 3,061 3,544
Average number of traded shares per day 95,214 84,910 112,350
Average turnover per day, SEK 843,716 564,293 357,850
Average turnover per trade, SEK 22,864 20,342 11,289
Group changed its listing currency from EUR to SEK on May 11, 2010.
-
5.00
10.00
15.00
20.00
25.00
-
2,000,000
4,000,000
6,000,000
8,000,000
10,000,000
12,000,000
14,000,000
May-0
7
Aug-0
7
Nov-0
7
Feb-0
8
May-0
8
Aug-0
8
Nov-0
8
Feb-0
9
May-0
9
Aug-0
9
Nov-0
9
Feb-1
0
May-1
0
Aug-1
0
Nov-1
0
Feb-1
1
May-1
1
Aug-1
1
Nov-1
1
Feb-1
2
May-1
2
Aug-1
2
Nov-1
2
Feb-1
3
May-1
3
Aug-1
3
Nov-1
3
Feb-1
4
Price, SEKVolume
Total volume Closing price SEK Nordic Small Cap SEK Pl
Initial listing EUR 1.25 (11.5 SEK)
Follow-on offering EUR 1.50 (SEK 15.0)
T R I G O N A G R I A N N U A L R E P O R T 2 0 1 3 PAGE 41
BONDS
Bonds information
Official listing: Corporate Bond List of OMX NASDAQ Stockholm
Exchange ISIN: SE0004019008
Short name: TAGR 001 O2
Currency: SEK
Annual interest rate: 11%
Expiry date: 29.06.2015
Next coupon date: 29.06.2014
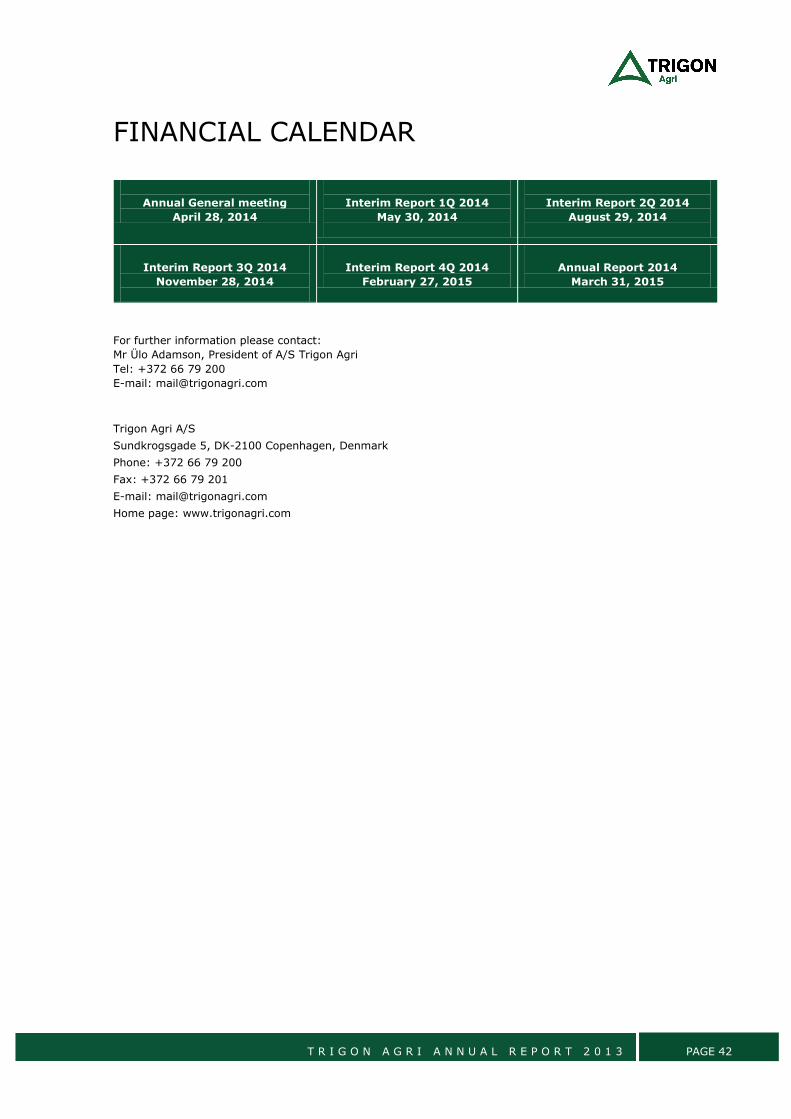
T R I G O N A G R I A N N U A L R E P O R T 2 0 1 3 PAGE 42
FINANCIAL CALENDAR
Annual General meeting
April 28, 2014
Interim Report 1Q 2014
May 30, 2014
Interim Report 2Q 2014
August 29, 2014
Interim Report 3Q 2014
November 28, 2014
Interim Report 4Q 2014
February 27, 2015
Annual Report 2014
March 31, 2015
For further information please contact:
Mr Ülo Adamson, President of A/S Trigon Agri
Tel: +372 66 79 200
E-mail: [email protected]
Trigon Agri A/S
Sundkrogsgade 5, DK-2100 Copenhagen, Denmark
Phone: +372 66 79 200
Fax: +372 66 79 201
E-mail: [email protected]
Home page: www.trigonagri.com
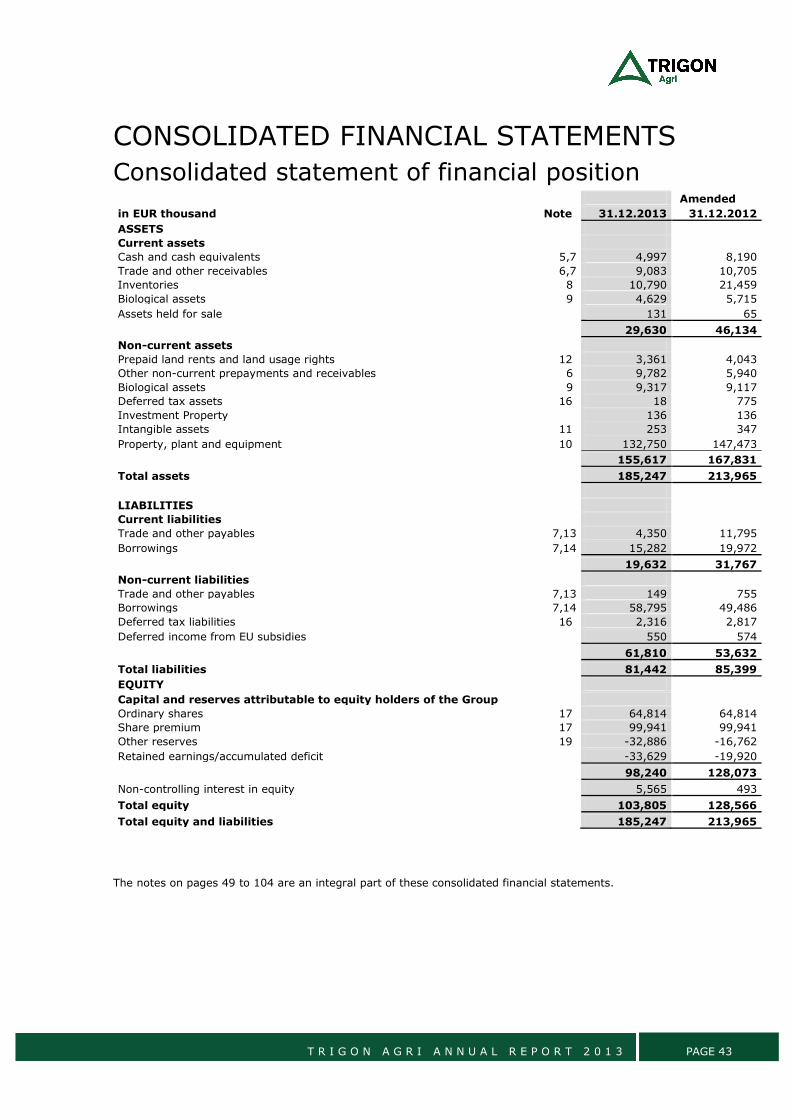
T R I G O N A G R I A N N U A L R E P O R T 2 0 1 3 PAGE 43
CONSOLIDATED FINANCIAL STATEMENTS
Consolidated statement of financial position
Amended
in EUR thousand Note 31.12.2013 31.12.2012
ASSETS
Current assets
Cash and cash equivalents 5,7 4,997 8,190
Trade and other receivables 6,7 9,083 10,705
Inventories 8 10,790 21,459
Biological assets 9 4,629 5,715
Assets held for sale
131 65
29,630 46,134
Non-current assets
Prepaid land rents and land usage rights 12 3,361 4,043
Other non-current prepayments and receivables 6 9,782 5,940
Biological assets 9 9,317 9,117
Deferred tax assets 16 18 775
Investment Property 136 136
Intangible assets 11 253 347
Property, plant and equipment 10 132,750 147,473
155,617 167,831
Total assets
185,247 213,965
LIABILITIES
Current liabilities
Trade and other payables 7,13 4,350 11,795
Borrowings 7,14 15,282 19,972
19,632 31,767
Non-current liabilities
Trade and other payables 7,13 149 755
Borrowings 7,14 58,795 49,486
Deferred tax liabilities 16 2,316 2,817
Deferred income from EU subsidies
550 574
61,810 53,632
Total liabilities
81,442 85,399
EQUITY
Capital and reserves attributable to equity holders of the Group
Ordinary shares 17 64,814 64,814
Share premium 17 99,941 99,941
Other reserves 19 -32,886 -16,762
Retained earnings/accumulated deficit
-33,629 -19,920
98,240 128,073
Non-controlling interest in equity
5,565 493
Total equity
103,805 128,566
Total equity and liabilities
185,247 213,965
The notes on pages 49 to 104 are an integral part of these consolidated financial statements.
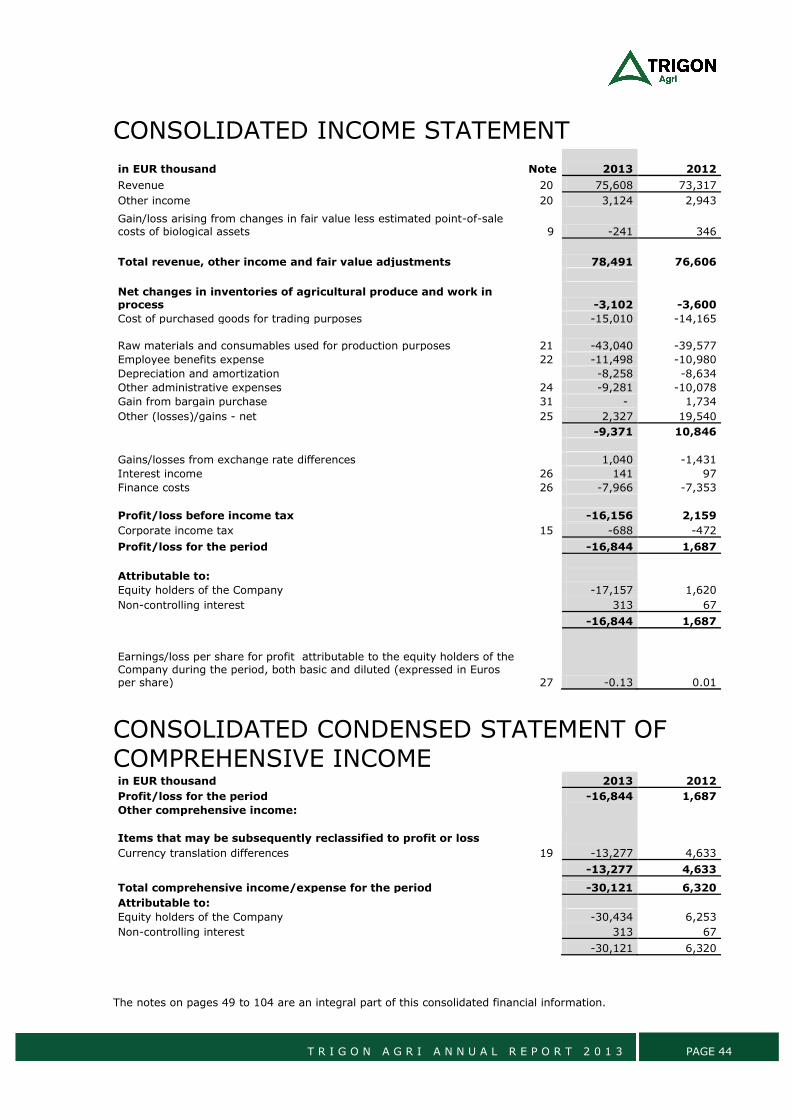
T R I G O N A G R I A N N U A L R E P O R T 2 0 1 3 PAGE 44
CONSOLIDATED INCOME STATEMENT
in EUR thousand Note 2013 2012
Revenue 20 75,608 73,317
Other income 20 3,124 2,943
Gain/loss arising from changes in fair value less estimated point-of-sale costs of biological assets 9 -241 346
Total revenue, other income and fair value adjustments
78,491 76,606
Net changes in inventories of agricultural produce and work in process
-3,102 -3,600
Cost of purchased goods for trading purposes
-15,010 -14,165
Raw materials and consumables used for production purposes 21 -43,040 -39,577
Employee benefits expense 22 -11,498 -10,980
Depreciation and amortization
-8,258 -8,634
Other administrative expenses 24 -9,281 -10,078
Gain from bargain purchase 31 - 1,734
Other (losses)/gains - net 25 2,327 19,540
-9,371 10,846
Gains/losses from exchange rate differences
1,040 -1,431
Interest income 26 141 97
Finance costs 26 -7,966 -7,353
Profit/loss before income tax
-16,156 2,159
Corporate income tax 15 -688 -472
Profit/loss for the period
-16,844 1,687
Attributable to:
Equity holders of the Company
-17,157 1,620
Non-controlling interest
313 67
-16,844 1,687
Earnings/loss per share for profit attributable to the equity holders of the Company during the period, both basic and diluted (expressed in Euros per share) 27 -0.13 0.01
CONSOLIDATED CONDENSED STATEMENT OF
COMPREHENSIVE INCOME in EUR thousand
2013 2012
Profit/loss for the period
-16,844 1,687
Other comprehensive income:
Items that may be subsequently reclassified to profit or loss
Currency translation differences 19 -13,277 4,633
-13,277 4,633
Total comprehensive income/expense for the period
-30,121 6,320
Attributable to:
Equity holders of the Company
-30,434 6,253
Non-controlling interest
313 67
-30,121 6,320
The notes on pages 49 to 104 are an integral part of this consolidated financial information.
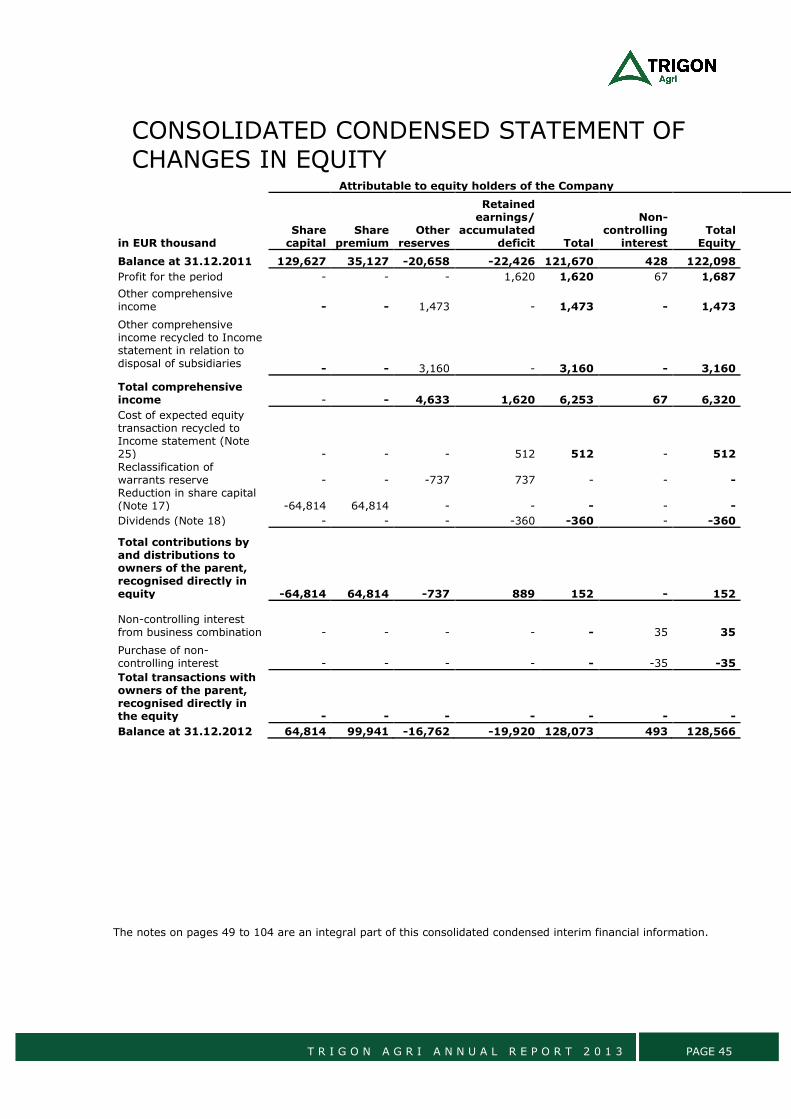
T R I G O N A G R I A N N U A L R E P O R T 2 0 1 3 PAGE 45
CONSOLIDATED CONDENSED STATEMENT OF CHANGES IN EQUITY
Attributable to equity holders of the Company
in EUR thousand Share capital
Share premium
Other reserves
Retained earnings/
accumulated deficit Total
Non-controlling
interest Total
Equity
Balance at 31.12.2011 129,627 35,127 -20,658 -22,426 121,670 428 122,098 Profit for the period - - - 1,620 1,620 67 1,687
Other comprehensive income - - 1,473 - 1,473
- 1,473
Other comprehensive income recycled to Income statement in relation to disposal of subsidiaries - - 3,160 -
3,160
-
3,160
Total comprehensive income - - 4,633 1,620 6,253 67 6,320
Cost of expected equity transaction recycled to Income statement (Note 25) - - - 512 512 - 512
Reclassification of warrants reserve - - -737 737 - -
-
Reduction in share capital (Note 17) -64,814 64,814 - - - - - Dividends (Note 18) - - - -360 -360 - -360
Total contributions by and distributions to owners of the parent, recognised directly in equity -64,814 64,814 -737 889
152 -
152
Non-controlling interest from business combination - - - - -
35
35
Purchase of non-controlling interest - - - - - -35 -35
Total transactions with owners of the parent, recognised directly in the equity - - - - - - -
Balance at 31.12.2012 64,814 99,941 -16,762 -19,920 128,073 493 128,566
The notes on pages 49 to 104 are an integral part of this consolidated condensed interim financial information.
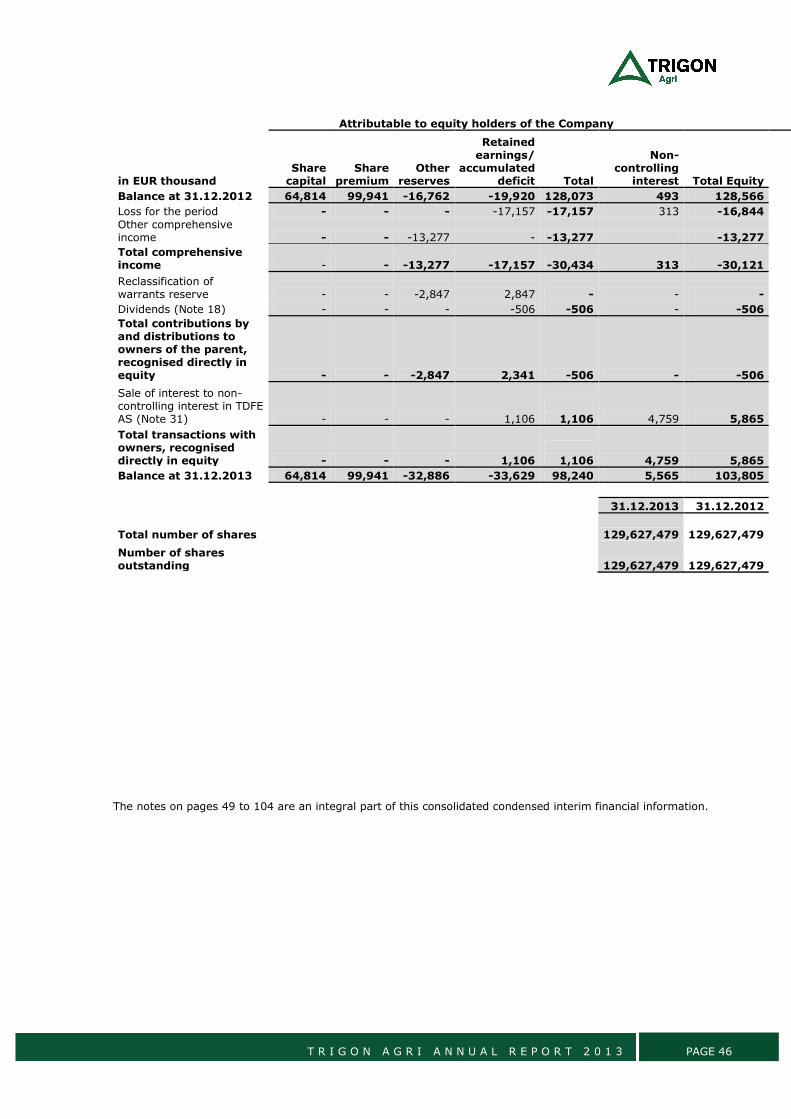
T R I G O N A G R I A N N U A L R E P O R T 2 0 1 3 PAGE 46
Attributable to equity holders of the Company
in EUR thousand Share capital
Share premium
Other reserves
Retained earnings/
accumulated deficit Total
Non-controlling
interest Total Equity
Balance at 31.12.2012 64,814 99,941 -16,762 -19,920 128,073 493 128,566
Loss for the period - - - -17,157 -17,157 313 -16,844
Other comprehensive income - - -13,277 - -13,277 -13,277 Total comprehensive income - - -13,277 -17,157 -30,434 313 -30,121
Reclassification of warrants reserve - - -2,847 2,847 - - - Dividends (Note 18) - - - -506 -506 - -506
Total contributions by and distributions to owners of the parent, recognised directly in equity - - -2,847 2,341 -506 - -506
Sale of interest to non-controlling interest in TDFE AS (Note 31) - - - 1,106
1,106 4,759 5,865
Total transactions with owners, recognised directly in equity - - - 1,106
1,106 4,759 5,865
Balance at 31.12.2013 64,814 99,941 -32,886 -33,629 98,240 5,565 103,805
31.12.2013 31.12.2012
Total number of shares
129,627,479 129,627,479
Number of shares outstanding
129,627,479 129,627,479
The notes on pages 49 to 104 are an integral part of this consolidated condensed interim financial information.
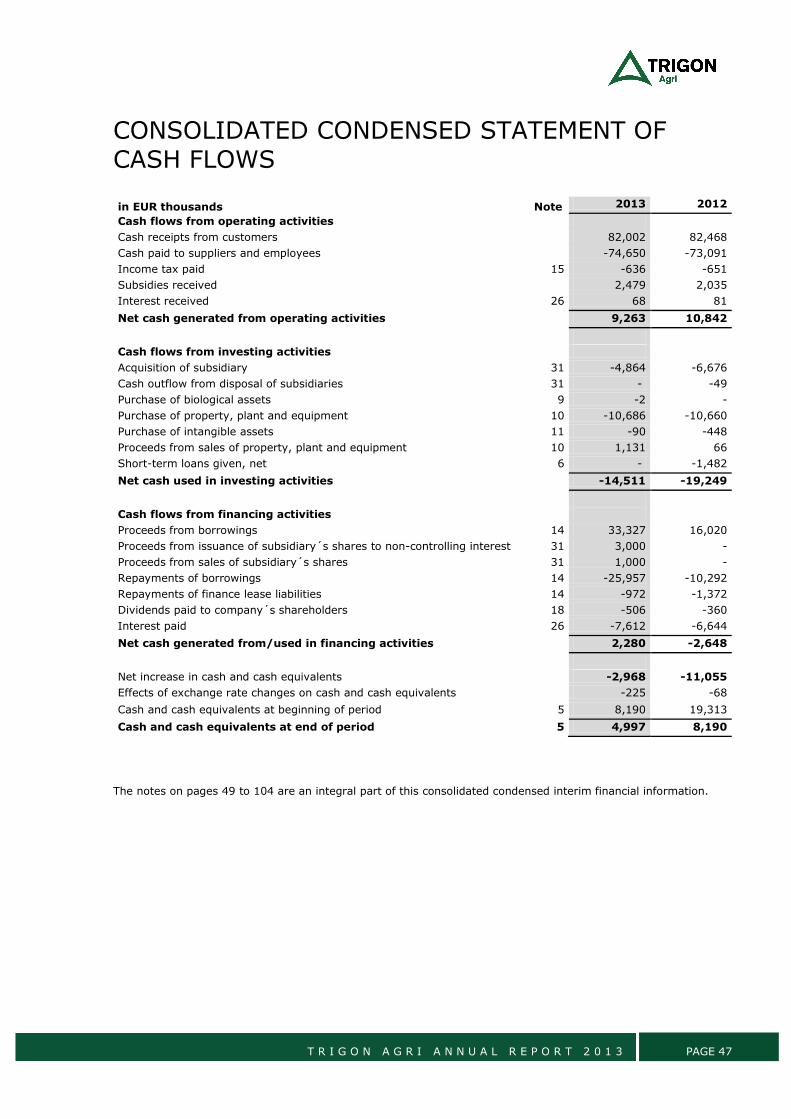
T R I G O N A G R I A N N U A L R E P O R T 2 0 1 3 PAGE 47
CONSOLIDATED CONDENSED STATEMENT OF CASH FLOWS
in EUR thousands Note 2013 2012
Cash flows from operating activities
Cash receipts from customers 82,002 82,468
Cash paid to suppliers and employees -74,650 -73,091
Income tax paid 15 -636 -651
Subsidies received 2,479 2,035
Interest received 26 68 81
Net cash generated from operating activities 9,263 10,842
Cash flows from investing activities
Acquisition of subsidiary 31 -4,864 -6,676
Cash outflow from disposal of subsidiaries 31 - -49
Purchase of biological assets 9 -2 -
Purchase of property, plant and equipment 10 -10,686 -10,660
Purchase of intangible assets 11 -90 -448
Proceeds from sales of property, plant and equipment 10 1,131 66
Short-term loans given, net 6 - -1,482
Net cash used in investing activities -14,511 -19,249
Cash flows from financing activities
Proceeds from borrowings 14 33,327 16,020
Proceeds from issuance of subsidiary´s shares to non-controlling interest 31 3,000 -
Proceeds from sales of subsidiary´s shares 31 1,000 -
Repayments of borrowings 14 -25,957 -10,292
Repayments of finance lease liabilities 14 -972 -1,372
Dividends paid to company´s shareholders 18 -506 -360
Interest paid 26 -7,612 -6,644
Net cash generated from/used in financing activities 2,280 -2,648
Net increase in cash and cash equivalents -2,968 -11,055
Effects of exchange rate changes on cash and cash equivalents -225 -68
Cash and cash equivalents at beginning of period 5 8,190 19,313
Cash and cash equivalents at end of period 5 4,997 8,190
The notes on pages 49 to 104 are an integral part of this consolidated condensed interim financial information.
T R I G O N A G R I A N N U A L R E P O R T 2 0 1 3 PAGE 48
CONTENTS OF NOTES TO THE CONSOLIDATED FINANCIAL STATEMENTS
1. GENERAL INFORMATION ................................................................................................................................. 49 2. SUMMARY OF SIGNIFICANT ACCOUNTING POLICIES ................................................................................ 49 3. FINANCIAL RISK MANAGEMENT .................................................................................................................... 59 4. CRITICAL ACCOUNTING ESTIMATES AND JUDGMENT ............................................................................... 67 5. CASH AND CASH EQUIVALENTS .................................................................................................................... 69 6. TRADE AND OTHER RECEIVABLES ................................................................................................................ 69 7. FINANCIAL INSTRUMENTS BY CATEGORY ................................................................................................... 71 8. INVENTORIES ................................................................................................................................................... 71 9. BIOLOGICAL ASSETS ....................................................................................................................................... 72 10. PROPERTY, PLANT AND EQUIPMENT ............................................................................................................. 73 11. INTANGIBLE ASSETS ....................................................................................................................................... 75 12. PREPAID LAND RENTS AND LAND USAGE RIGHTS .................................................................................... 75 13. TRADE AND OTHER PAYABLES ....................................................................................................................... 76 14. BORROWINGS ................................................................................................................................................... 76 15. INCOME TAX ...................................................................................................................................................... 78 16. DEFERRED TAX ................................................................................................................................................. 79 17. SHARE CAPITAL ................................................................................................................................................ 80 18. DIVIDENDS PER SHARE .................................................................................................................................. 81 19. OTHER RESERVES ............................................................................................................................................ 81 20. REVENUE AND OTHER INCOME ..................................................................................................................... 82 21. RAW MATERIALS AND CONSUMABLES USED FOR PRODUCTION PURPOSES ........................................ 82 22. EMPLOYEE BENEFIT EXPENSE ........................................................................................................................ 83 23. OPERATING LEASE PAYMENTS ....................................................................................................................... 83 24. OTHER ADMINISTRATIVE EXPENSES ............................................................................................................ 83 25. OTHER LOSSES/GAINS ................................................................................................................................... 83 26. FINANCE INCOME AND FINANCE COST ........................................................................................................ 84 27. EARNINGS/LOSS PER SHARE ......................................................................................................................... 84 28. SEGMENT REPORTING ..................................................................................................................................... 85 29. CONTINGENCIES .............................................................................................................................................. 86 30. COMMITMENTS ................................................................................................................................................. 88 31. BUSINESS COMBINATIONS AND TRANSACTIONS WITH NON-CONTROLLING INTEREST ................... 88 32. GROUP STRUCTURE ......................................................................................................................................... 90 33. RELATED PARTY TRANSACTIONS .................................................................................................................. 92 34. FEES TO THE AUDITORS APPOINTED BY THE SHAREHOLDERS ............................................................... 93 35. EVENTS AFTER THE BALANCE SHEET DATE ................................................................................................ 94 36. FINANCIAL STATEMENTS OF THE PARENT COMPANY ................................................................................ 95 37. NOTES TO THE FINANCIAL STATEMENTS OF THE PARENT COMPANY .................................................... 98
T R I G O N A G R I A N N U A L R E P O R T 2 0 1 3 PAGE 49
NOTES TO THE CONSOLIDATED FINANCIAL STATEMENTS
1. GENERAL INFORMATION Trigon Agri A/S (The Company) is an integrated
soft commodities producer (operating commercial
cereals and dairy farms), storage provider and
trader with operations in Ukraine, Russia and
Estonia. The Company was established on
December 11, 2006. The Company has subsidiaries
in Estonia, Cyprus, Russia, Ukraine and Switzerland
(together hereinafter referred to as “the Group”).
The list of all Group subsidiaries is provided in Note
32.
The parent company is a limited liability company
incorporated and domiciled in Denmark. The
address of its registered office is Sundkrogsgade 5,
DK-2100 Copenhagen. The company listed its
shares on the Stockholm First North Stock
Exchange in May 18, 2007. From December 8,
2010 the company’s shares are traded in main
market Small Cap segment on NASDAQ OMX
Stockholm. The Group’s owners are legal and
physical persons and no sole shareholder has
control over the Group’s activities.
These financial statements were authorised for issue
by the Board of Directors on March 31, 2014.
2. SUMMARY OF SIGNIFICANT ACCOUNTING
POLICIES
The principal accounting policies applied in the
preparation of these financial statements are set out
below. The policies have been consistently applied to
all the years presented unless otherwise stated.
2.1 BASIS OF PREPARATION
The consolidated financial statements of Trigon
Agri A/S have been prepared in accordance with
International Financial Reporting Standards (IFRS)
as adopted by the European Union and additional
Danish statutory disclosure requirements for
annual reports. The consolidated financial
statements have been prepared under the
historical cost convention, as modified by the
revaluation of biological assets, available-for-sale
financial assets and financial assets at fair value
through profit or loss.
The reporting period of the financial statements is
the calendar year.
The Company prepares its separate financial
statements in accordance with IFRS and the
additional Danish requirements for annual reports.
Parent company financial statements are presented
after notes to the consolidated financial statements
in the same set of financial statements.
The preparation of financial statements in
conformity with IFRS requires the use of certain
critical accounting estimates. It also requires
management to exercise its judgment in the
process of applying the Group’s accounting policies.
The areas involving a higher degree of judgment or
complexity, or areas where assumptions and
estimates are significant to the consolidated
financial statements are disclosed in Note 4.
The following new or revised standards and
interpretations became effective for the Group from
1 January 2013:
• Presentation of Items of Other
Comprehensive Income, amendments to IAS 1;
(effective for annual periods beginning on or after
1 July 2012). The amendments require entities to
separate items presented in other comprehensive
income into two groups, based on whether or not
they may be reclassified to profit or loss in the
future. The suggested title used by IAS 1 has
changed to ‘statement of profit or loss and other
comprehensive income’. The amended standard
resulted in changed presentation of consolidated
financial statements, but did not have any impact
on measurement of transactions and balances.
• IFRS 13, Fair Value Measurement
(effective for annual periods beginning on or after
1 January 2013) aims to improve consistency and
reduce complexity by providing a revised definition
of fair value, and a single source of fair value
measurement and disclosure requirements for use
across IFRSs. The Standard resulted in additional
disclosures in these consolidated financial
statements. Refer to Note 2.8 and 2.10.
There are no other new or revised standards or
interpretations that are effective for the first time
for the financial year beginning on or after 1
T R I G O N A G R I A N N U A L R E P O R T 2 0 1 3 PAGE 50
January 2013 that would be expected to have a
material impact to the Group.
Certain new or revised standards and
interpretations have been issued that are
mandatory for the Group’s annual periods
beginning on or after 1 January 2014, and which
the Group has not early adopted.
• IFRS 12, Disclosure of Interest in Other
Entities (effective for annual periods beginning on
or after 1 January 2014), applies to entities that
have an interest in a subsidiary, a joint
arrangement, an associate or an separately
structured entity. IFRS 12 sets out the required
disclosures for entities reporting under the two new
standards: IFRS 10, Consolidated financial
statements, and IFRS 11, Joint arrangements, and
replaces the disclosure requirements currently
found in IAS 28 “Investments in associates”. IFRS
12 requires entities to disclose information that
helps financial statement readers to evaluate the
nature, risks and financial effects associated with
the entity’s interests in subsidiaries, associates,
joint arrangements and separately structured
entities. To meet these objectives, the new
standard requires disclosures in a number of areas,
including (i) significant judgements and
assumptions made in determining whether an
entity controls, jointly controls, or significantly
influences its interests in other entities, (ii)
extended disclosures on share of non-controlling
interests in group activities and cash flows, (iii)
summarised financial information of subsidiaries
with material non-controlling interests, and (iv)
detailed disclosures of interests in separately
structured entities. The Group is currently
assessing the impact of the standard on its
financial statements.
There are no other new or revised standards or
interpretations that are not yet effective that would
be expected to have a material impact on the
Group.
2.2 CONSOLIDATION
(a) Subsidiaries
Subsidiaries are all entities (including special
purpose entities) over which the Group has the
power to govern the financial and operating policies
generally accompanying a shareholding of more than
one half of the voting rights. The existence and
effect of potential voting rights that are currently
exercisable or convertible are considered when
assessing whether the Group controls another
entity. The Group also assesses existence of control
where it does not have more than 50% of the voting
power but is able to govern the financial and
operating policies by virtue of de-facto control.
De-facto control may arise in circumstances where
the size of the Group’s voting rights relative to the
size and dispersion of holdings of other shareholders
give the Group the power to govern the financial and
operating policies, etc. Subsidiaries are fully
consolidated from the date on which control is
transferred to the Group. They are de-consolidated
from the date that control ceases.
The Group uses the acquisition method of
accounting to account for business combinations.
The consideration transferred for the acquisition of a
subsidiary is the fair values of the assets
transferred, the liabilities incurred and the equity
interests issued by the Group. Any difference
between fair value and carrying value of assets
transferred is recognised in the income statement.
The consideration transferred includes the fair value
of any asset or liability resulting from a contingent
consideration arrangement. Acquisition-related costs
are expensed as incurred. Identifiable assets
acquired and liabilities and contingent liabilities
assumed in a business combination are measured
initially at their fair values at the acquisition date.
On an acquisition-by-acquisition basis, the Group
recognises any non-controlling interest in the
acquiree either at fair value or at the non-controlling
interest’s proportionate share of the acquiree’s net
assets. The excess of the consideration transferred,
the amount of any non-controlling interest in the
acquiree and the acquisition-date fair value of any
previous equity interest in the acquiree over the fair
value of the Group’s share of the identifiable net
assets acquired is recorded as goodwill. If this is less
than the fair value of the net assets of the subsidiary
acquired in the case of a bargain purchase, the
difference is recognised directly in the income
statement.
Inter-company transactions, balances and unrealised
profits on transactions between Group companies
are eliminated. Losses are also eliminated but
considered whether they indicate an impairment that
requires recognition in consolidated financial
statements. Accounting policies of subsidiaries have
been changed where necessary to ensure
consistency with the policies adopted by the Group.
(b) Transactions with non-controlling interests
The Group treats transactions with non-controlling
interests as transactions with equity owners of the
group. For purchases from non-controlling interests,
the difference between any consideration paid and
the relevant share acquired of the carrying value of
net assets of the subsidiary is recorded in equity.
Gains or losses on disposals to non-controlling
interests are also recorded in equity.
T R I G O N A G R I A N N U A L R E P O R T 2 0 1 3 PAGE 51
2.3 FOREIGN CURRENCY TRANSLATION
(a) Functional and presentation currency
Items included in the financial statements of each of
the Group’s entities are measured using the
currency of the primary economic environment in
which the entity operates (‘the functional currency’).
The functional currencies of group entities are the
following: for Estonian subsidiaries the Euro, for
Ukrainian subsidiaries the Ukrainian hryvna, for
Russian subsidiaries the Russian rouble, for Cypriot
subsidiaries the Euro and for Danish parent company
the Euro). The consolidated financial statements are
presented in Euro, which is the functional currency
for the parent company and the presentation
currency for the group.
(b) Transactions and balances
Foreign currency transactions are translated into the
functional currency using the exchange rates
prevailing at the dates of the transactions. Foreign
exchange gains and losses resulting from the
settlement of such transactions and from the
translation at year-end exchange rates of monetary
assets and liabilities denominated in foreign
currencies are recognised in the income statement.
Foreign exchange gains and losses that relate to
borrowings and cash equivalents are presented in
the income statement within ‘Gains/losses from
exchange rate differences’. All other foreign
exchange gains and losses are presented in the
income statement within ‘Other (losses)/gains – net.
(c) Group companies
The results and financial position of all the Group
entities (none of which has the currency of a
hyperinflationary economy) that have a functional
currency different from the presentation currency
are translated into the presentation currency as
follows:
a) assets and liabilities for each balance sheet
presented are translated at the closing rate at
the date of that balance sheet;
b) income and expenses for each income statement
are translated at average exchange rates (unless
this average is not a reasonable approximation
of the cumulative effect of the rates prevailing
on the transaction dates, in which case income
and expenses are translated at the rate on the
dates of the transactions); and
c) all resulting exchange differences are recognised
in other comprehensive income.
On consolidation, exchange differences arising from
the translation of the net investment in foreign
operations and of borrowings are taken to
shareholders’ equity. When a foreign operation is
partially disposed of or sold, exchange differences
that were recorded in Other comprehensive income
are recognised in the income statement as part of
the gain or loss on sale.
Goodwill and fair value adjustments arising on the
acquisition of a foreign entity are treated as assets
and liabilities of the foreign entity and translated at
the closing rate.
The following year-end exchange rates as quoted by
the European Central Bank or Ukrainian Central
Bank have been used for December 31, 2013 in
translation to the presentation currency: 1 Euro =
11.0415 Ukrainian hryvnas, 1 Euro = 45.3246
Russian roubles. The average rates used in
translating of income statement lines were: 1 Euro =
10.6157 Ukrainian hryvnas, 1 Euro = 42.3370
Russian Roubles.
The following year-end exchange rates have been
used for December 31, 2012 in translation to the
presentation currency: 1 Euro = 10.5372 Ukrainian
hryvnas, 1 Euro = 40.3295 Russian roubles. The
average rates used in translating of income
statement lines were: 1 Euro = 10.2706 Ukrainian
hryvnas, 1 Euro = 39.9262 Russian Roubles.
2.4 PROPERTY, PLANT AND
EQUIPMENT
All property, plant and equipment is stated at
historical cost less depreciation and impairment,
where required. Historical cost includes
expenditure that is directly attributable to the
acquisition of the items.
Subsequent costs are included in the asset’s carrying
amount or recognised as a separate asset, as
appropriate, only when it is probable that future
economic benefits associated with the item will flow
to the Group and the cost of the item can be
measured reliably. The carrying amount of the
replaced part is derecognised. All other repairs and
maintenance are charged to the income statement
during the financial period in which they are
incurred.
Land is not depreciated. Depreciation on other
assets is calculated using the straight-line method to
allocate their cost to their residual values over their
estimated useful lives, as follows:
Buildings 25-40 years
Machinery 7-20 years
Vehicles 3-5 years
Furniture, fittings and equipment 3-8 years
T R I G O N A G R I A N N U A L R E P O R T 2 0 1 3 PAGE 52
The assets’ residual values and useful lives are
reviewed, and adjusted if appropriate, at each
balance sheet date.
An asset’s carrying amount is written down
immediately to its recoverable amount if the asset’s
carrying amount is greater than its estimated
recoverable amount (Note 2.6).
Gains and losses on disposals are determined by
comparing the proceeds with the carrying amount
and are recognised within Other gains/losses – net,
in the income statement.
Borrowing costs are capitalised in the cost of the
item of property, plant and equipment if they are
directly attributable to the acquisition, construction
or production of the qualifying asset.
2.5 INTANGIBLE ASSETS
(a) Licences
Acquired computer software licences are capitalised
on the basis of the costs incurred to acquire and
bring to use the specific software. These costs are
amortised over their estimated useful lives of two
to ten years.
2.6 IMPAIRMENT OF NON-FINANCIAL
ASSETS
Assets that are subject to depreciation are reviewed
for impairment whenever events or changes in
circumstances indicate that the carrying amount
may not be recoverable. An impairment loss is
recognised for the amount by which the asset’s
carrying amount exceeds its recoverable amount. The
recoverable amount is the higher of an asset’s fair
value less costs to sell and value in use. For the
purposes of assessing impairment, assets are
grouped at the lowest levels for which there are
separately identifiable cash flows (cash-generating
units). Non-financial assets other than goodwill that
suffered impairment are reviewed for possible
reversal of the impairment at each reporting date.
2.7 FINANCIAL ASSETS
(a) Classification
The Group classifies its financial assets in the
following categories: loans and receivables, available
for sale, and at fair value through profit and loss.
The classification depends on the purpose for which
the financial assets were acquired. Management
determines the classification of its financial assets at
initial recognition. The Group only has financial
assets in category “Loans and receivables”.
Loans and receivables are non-derivative financial
assets with fixed or determinable payments that are
not quoted in an active market. They are included in
current assets, except for maturities greater than 12
months after the balance sheet date. These are
classified as non-current assets. The group’s loans
and receivables comprise “Trade and other
receivables” (see Note 6) and Cash and cash
equivalents (see Note 5) in the balance sheet. See
Note 2.11 for measurement of trade receivables.
(b) Recognition and measurement
Regular purchases and sales of financial assets are
recognised on the trade-date – the date on which
the Group commits to purchase or sell the asset.
Investments are initially recognised at fair value plus
transaction costs for all financial assets not carried
at fair value through profit or loss. Financial assets
are derecognised when the rights to receive cash
flows from the investments have expired or have
been transferred and the Group has transferred
substantially all risks and rewards of ownership.
Loans and receivables are carried at amortised cost
using the effective interest method.
The Group assesses at each balance sheet date
whether there is objective evidence that a financial
asset or a group of financial assets is impaired.
Impairment testing of trade receivables is described
in Note 2.11.
(c) Impairment of financial assets carried at
amortised cost
The Group assesses at the end of each reporting
period whether there is objective evidence that a
financial asset or group of financial assets is
impaired. A financial asset or a Group of financial
assets is impaired and impairment losses are
incurred only if there is objective evidence of
impairment as a result of one or more events that
occurred after the initial recognition of the asset (a
‘loss event’) and that loss event (or events) has an
impact on the estimated future cash flows of the
financial asset or Group of financial assets that can
be reliably estimated. Evidence of impairment may
include indications that the debtors or a group of
debtors is experiencing significant financial difficulty,
default or delinquency in interest or principal
payments, the probability that they will enter
bankruptcy or other financial reorganisation.
For loans and receivables category, the amount of
the loss is measured as the difference between the
asset’s carrying amount and the present value of
estimated future cash flows (excluding future credit
losses that have not been incurred) discounted at
the financial asset’s original effective interest rate.
The carrying amount of the asset is reduced and the
amount of the loss is recognised in the consolidated
income statement. If, in a subsequent period, the
amount of the impairment loss decreases and the
decrease can be related objectively to an event
T R I G O N A G R I A N N U A L R E P O R T 2 0 1 3 PAGE 53
occurring after the impairment was recognised, the
reversal of the previously recognised impairment
loss is recognised in the consolidated income
statement.
2.8 AGRICULTURE
Agricultural activity is defined by the management
as an activity of the biological transformation of
biological assets for sale into agricultural produce or
into additional biological assets. Agricultural produce
is defined as the harvested product of the Group’s
biological assets and a biological asset is defined as
a living animal or plant. The Group has determined
the groups of its biological assets to be livestock and
growing crops.
Biological assets are measured on initial recognition
and at each balance sheet date at its fair value less
estimated point-of-sale cost, except for the case
where the fair value cannot be measured reliably on
initial recognition. Agricultural produce harvested
from the Group’s biological assets is measured at its
fair value less estimated point-of-sale costs at the
point of harvest and is subsequently recorded as
inventories and measured in accordance with the
accounting principles of inventory (Note 2.10 (a)).
If an active market exists for a biological asset or
agricultural produce, the quoted price in that market
is the appropriate basis for determining the fair
value of that asset. If an active market does not
exist the most proximate market transaction price,
provided that there has not been a significant
change in economic circumstances between the date
of that transaction and the balance sheet date, is
used in determining fair value. Cost is used as an
approximation of fair value when little biological
transformation has taken place since initial cost
incurrence, e.g. within short time after seeding the
crop.
A gain or loss arising on initial recognition of a
biological asset at fair value less estimated point-of-
sale costs and from a subsequent change in fair
value less estimated point-of-sale costs of a
biological asset is included in profit or loss for the
period in which it arises as “Gain/loss arising from
changes in fair value less estimated point of sale
costs of biological assets”.
The biological assets are recorded as current and
non-current biological assets based on the
operational cycle of the respective biological assets.
In general, biological assets of growing plants are
recognised as current assets, because the
operational cycle is less than 12 months. Dairy herd
is recorded as non-current biological asset.
(a) Livestock and dairy herd
Livestock are measured at their fair value less
estimated point-of-sale costs. The fair value of
livestock is determined in co-operation with Animal
Breeders Association and based on market prices of
livestock of similar age, breed and genetic merit
based on the relevant market, taking into account
transaction prices, sales opportunities in local and
export markets, and the market situation in the
dairy sector. The fair value of dairy herd also takes
into account the milk quota attached to the herd.
The fair value measurements are categorized under
Level 2 in the fair value hierarchy, as defined by
IFRS 13.
Milk within EU can be sold based on milk quotas
allocated by the State for each producer. The milk
quota itself cannot be separated from the herd and
the agricultural business as it is not possible to trade
with the quota in EU countries where the Group
operates without selling it together with the herd
and the agricultural business. Also, there is no active
market available for the herd without the milk
quota. As the fair value of the herd can be
determined reliably only together with the attached
milk quota, the Group considers the milk quota to be
an integral part of the fair value of the dairy herd.
Milk outside EU can be sold free of any quota and
therefore the fair value of herd is not affected by the
sales restrictions.
(b) Crops – cereals and grassland
Crops are measured at their fair value less
estimated point-of-sale costs. The fair value
measurements are categorized under Level 2 in the
fair value hierarchy, as defined by IFRS 13. At initial
recognition (after seeding) the crops are measured
at cost as the market-determined values are not
available for such biological assets. The cost includes
direct costs related to the management of the
biological transformation of biological assets, like
costs of seeds, fertilising, cultivation, labour costs of
employees directly involved in production process,
fuel and energy and related production overheads
(based on normal operating capacity). The crops are
measured at fair value once the fair value becomes
reliably measurable. Usually the fair value of a crop
can be reliably measured only immediately before
harvest. This does not create a significant limitation
in valuation of crop balances at year-end, as the
main increase in fair value is attributable to the
same accounting period when the crop is harvested.
As the main growth period of the crops is April to
July, the change in the fair values is always the
highest in the second quarter of the year. The
biological assets are revalued using the latest
information about actual harvesting results of the
early crops, harvest related cash outflows and cereal
T R I G O N A G R I A N N U A L R E P O R T 2 0 1 3 PAGE 54
sales market prices. Yields for the late crops are
estimated using the latest field surveys. The cereals
sales prices used for revaluation include actual
contracted prices and latest market prices.
2.9 GOVERNMENT GRANTS
(a) Government grants related to agricultural
activity
An unconditional government grant related to a
biological asset measured at its fair value less
estimated point-of-sale costs is recognised as
income when the government grant becomes
receivable (government grants for dairy herd,
general area- aid subsidies). If a government grant
related to a biological asset measured at its fair
value less estimated point-of-sale costs is
conditional, including whereby a government grant
requires a Group company not to engage in specified
agricultural activity, the Group recognises the
government grant as income when the conditions
attaching to the government grant are met
(investment subsidies, area-aid environmental
subsidies) and until then aid received is recognised
as a liability.
(b) Government grants related to purchase of
property, plant and equipment
Grants from the government are recognised at their
fair value where there is a reasonable assurance
that the grant will be received and the group will
comply with all attached conditions. Government
grants relating to property, plant and equipment are
included in non-current liabilities as deferred
government grants and are amortised to the income
statement on a straight-line basis over the expected
lives of the related assets.
(c) Ukraine VAT treatment for companies under
agricultural regime
In Ukraine there is a special VAT treatment for
companies under agricultural regime. Companies
under agricultural regime are not obliged to pay VAT
and the net of VAT receivable and payable is
recorded under Other Losses/Gains. Amount
recognized under Other Losses/Gains is measured as
a difference between VAT on sales invoices issued
during the year and purchase invoiced received
during the year. VAT balances receivable on the
balance sheet relate to capitalized costs. These VAT
balances are recognized in the Income statement
according to the amortization schedules of the
capitalized costs.
2.10 INVENTORIES
Inventories that are measured at fair value are
categorized under Level 2 in the fair value
hierarchy, as defined by IFRS 13.
(a) Agricultural produce
(i) Milk
Milk is initially measured at its fair value less
estimated point-of-sale costs at the time of
milking and subsequently recorded as
inventories. The fair value of milk is determined
based on market prices in the local area.
(ii) Grain- own produced (harvested)
Grain and feeds produced by the Group are
initially measured at its fair value less estimated
point-of-sale costs at the time of harvest and
recorded in inventories until sold to third parties
or used internally for feeding animals or for
seeds. Grains and feed produced by the Group is
subsequently measured at net realisable value.
The net realisable value of feed is determined
based on market prices in the local area. The net
realisable value of grain is determined based on
quoted prices on the nearest market or if
multiple markets are available, of the market
where the Group’s company expects to sell the
produce.
(iii) Other agricultural produce
Other agricultural produce are initially recorded
cost. Cost of other agricultural produce is
determined using FIFO method. Write-down of
other agricultural produce (excluding grain) to
the net realisable value (if lower than cost) is
included in income statement as change is
inventories. Net realisable value is the estimated
selling price in the ordinary course of business,
less applicable variable selling expenses.
(b) Grain – purchased from third parties
Purchased grain from third parties is initially
recorded at purchase price and subsequently
measured at fair value less estimated costs to sell.
The fair value of grain is determined based on
quoted prices on the nearest market or if multiple
markets are available, of the market where the
Group’s company expects to sell the produce.
(c) Work-in-progress related to field preparation
Cost of agricultural preparation on fields before
seeding is recorded as work-in-progress in
inventories. Work in progress comprises raw
materials, direct labour costs, other direct costs
and overheads (based on normal operating
capacity). After seeding the cost of field
T R I G O N A G R I A N N U A L R E P O R T 2 0 1 3 PAGE 55
preparation is reclassified as biological assets held
at fair value (Note 2.8 (b)).
(d) Raw materials
Inventories are stated at the lower of costs and net
realisable value. Cost is determined using first-in,
first-out (FIFO) method. Net realisable value is the
estimated selling price in the ordinary course of
business, less applicable variable selling expenses.
2.11 TRADE RECEIVABLES
Trade receivables are amounts due from customers
for merchandise sold or services performed in the
ordinary course of business. If collection is
expected in one year or less (or in the normal
operating cycle of the business if longer), they are
classified as current assets. If not, they are
presented as non-current assets.
Trade receivables are recognised initially at fair
value and subsequently measured at amortised
cost using the effective interest method, less
provision for impairment.
2.12 CASH AND CASH EQUIVALENTS
Cash and cash equivalents includes cash in hand,
deposits held at call with banks, other short-term
highly liquid investments with original maturities of
three months or less, and bank overdrafts.
Deposits over three months are classified as cash
and cash equivalents if they are readily convertible
to a known amount of cash and are subject to
insignificant risk of changes in value. Bank
overdrafts are shown within borrowings in current
liabilities on the balance sheet.
2.13 SHARE CAPITAL
Ordinary shares are classified as equity. Incremental
costs directly attributable to the issue of new shares
or options are shown in equity as a deduction, net
of tax, from the proceeds.
2.14 TRADE PAYABLES
Trade payables are obligations to pay for goods or
services that have been acquired in the ordinary
course of business from suppliers. Accounts payable
are classified as current liabilities if payment is due
within one year or less (or in the normal operating
cycle of the business if longer). If not, they are
presented as non-current liabilities.
Trade payables are recognised initially at fair value
and subsequently measured at amortised cost using
the effective interest method.
2.15 BORROWINGS
Borrowings are recognised initially at fair value, net
of transaction costs incurred. Borrowings are
subsequently stated at amortised cost; any
difference between the proceeds (net of transaction
costs) and the redemption value is recognised in the
income statement over the period of the borrowings
using the effective interest method. Borrowing costs
are capitalised to the cost of a qualifying asset if
these are directly attributable to the acquisition,
construction or production of the asset and the
capitalisation rate is disclosed in Notes. Other
borrowing costs are recognised as expense.
Borrowings are classified as current liabilities unless
the Group has an unconditional right to defer
settlement of the liability for at least 12 months
after the balance sheet date.
2.16 CURRENT AND DEFERRED
INCOME TAX
The tax expense for the period comprises current
and deferred tax. Tax is recognised in the income
statement, except to the extent that it relates to
items recognised directly in equity. In this case, the
tax is also recognised in equity.
a) Corporate income tax
The current income tax charge is calculated on the
basis of the tax laws enacted or substantively
enacted at the balance sheet date in the countries
where the Company and its subsidiaries operate and
generate taxable income. Management periodically
evaluates positions taken in tax returns with respect
to situations in which applicable tax regulations is
subject to interpretation and establishes provisions
where appropriate on the basis of amounts expected
to be paid to the tax authorities.
The effective income tax rate in Ukraine is 19% (in
2012 21%) and in Russia 20%. Agricultural
producers in both Ukraine and Russia are exempted
from the ordinary corporate income tax system if
they meet the requirements to be recognised as
agricultural producers (Note 2.16 (b)). The income
tax in Estonia is calculated only on distributed
earnings with the effective rate 21/79 of the
distributed amount (Note 2.17 (c))
Deferred income tax is provided in full, using the
liability method, on temporary differences arising
between the tax bases of assets and liabilities and
their carrying amounts in the consolidated financial
statements. However, the deferred income tax is not
accounted for if it arises from initial recognition of an
asset or liability in a transaction other than a
business combination that at the time of the
transaction affects neither accounting nor taxable
profit nor loss. Deferred income tax is determined
using tax rates (and laws) that have been enacted or
substantially enacted by the balance sheet date and
are expected to apply when the related deferred
income tax asset is realised or the deferred income
tax liability is settled.
T R I G O N A G R I A N N U A L R E P O R T 2 0 1 3 PAGE 56
Deferred income tax assets are recognised to the
extent that it is probable that future taxable profit
will be available against which the temporary
differences can be utilised.
Deferred income tax is provided on temporary
differences arising on investments in subsidiaries and
associates, except where the timing of the reversal of
the temporary difference is controlled by the Group
and it is probable that the temporary difference will
not reverse in the foreseeable future.
Deferred income tax assets and liabilities are offset
when there is a legally enforceable right to offset
current tax assets against current tax liabilities and
when the deferred income taxes assets and liabilities
relate to income taxes levied by the same taxation
authority on either the taxable entity or different
taxable entities where there is an intention and
ability to settle the balances on a net basis.
b) Agricultural tax regimes in Ukraine and Russia
Both in Ukraine and Russia companies are exempt
from ordinary corporate income tax regime if they
meet criteria to be recognised as agricultural
producers.
In Ukraine, a company is considered to be an
agricultural producer if it derived at least 75% of its
revenue in the previous tax year from the sales of
self-produced agricultural product. Simplified
agricultural tax means that the agricultural producer
pays tax based not on its profits, but on the total
area used for agricultural production.
In Russia a company can apply for the agricultural
tax regime if it meets the criteria of an agricultural
company. However, the companies on a general tax
regime having the revenue from sales of self-
produced agricultural produce have reduced tax
rates.
c) Income tax in Estonia
According to the Income Tax Act of Estonia, the
annual profit earned by enterprises is not taxed and
thus there are no temporary differences between the
tax bases and carrying values of assets and liabilities
and no deferred tax assets or liabilities arise.
Instead of taxing the net profit, the distribution of
retained earnings is subject to income tax of 21/79
of the amount paid out as dividends. The corporate
income tax arising from the payment of dividends is
accounted for as an expense in the period when
dividends are declared, regardless of the actual
payment date or the period for which dividends are
paid.
2.17 EMPLOYEE BENEFITS
(a) Pension obligations and other post-employment
obligations
The Group does not operate pension schemes and
does not provide post-retirement benefits to their
retirees. Pension obligations may arise due to a legal
obligation to pay for the incapability to work because
of an accident.
The Group has legal obligation to pay contributions
to the state pension funds according to the local
regulations of each country of location. The
contributions to the local pension funds are treated
as social security tax payments.
(b) Termination benefits
Termination benefits are payable when employment
is terminated by the Group before the normal
retirement date, or whenever an employee accepts
voluntary redundancy in exchange for these
benefits. The Group recognises termination benefits
when it is demonstrably committed to either:
terminating the employment of current employees
according to a detailed formal plan without possibility
of withdrawal; or providing termination benefits as a
result of an offer made to encourage voluntary
redundancy. Benefits falling due more than 12
months after the balance sheet date are discounted
to present value.
2.18 PROVISIONS
Provisions for environmental restoration,
restructuring costs and legal claims are recognised
when: the Group has a present legal or
constructive obligation as a result of past events; it
is probable that an outflow of resources will be
required to settle the obligation; and the amount
can be reliably estimated. Restructuring provisions
comprise lease termination penalties and employee
termination payments. Provisions are not
recognised for future operating losses.
Where there are a number of similar obligations, the
likelihood that an outflow will be required in
settlement is determined by considering the class of
obligations as a whole. A provision is recognised
even if the likelihood of an outflow with respect to
any one item included in the same class of
obligations may be small.
Provisions are measured at the present value of the
expenditures expected to be required to settle the
obligation using a pre-tax rate that reflects current
market assessments of the time value of money and
the risks specific to the obligation. The increase in
the provision due to passage of time is recognised
as interest expense.
T R I G O N A G R I A N N U A L R E P O R T 2 0 1 3 PAGE 57
2.19 REVENUE RECOGNITION
Revenue comprises the fair value of the
consideration received or receivable for the sale of
goods and services in the ordinary course of the
Group’s activities. Revenue is shown net of value-
added tax, returns, rebates and discounts and after
eliminating sales within the Group.
The Group recognises revenue when the amount of
revenue can be reliably measured, it is probable that
future economic benefits will flow to the entity and
specific criteria have been met for each of the
Group’s activities as described below. The amount of
revenue is not considered to be reliably measurable
until all contingencies relating to the sale have been
resolved. The Group bases its estimates on historical
results, taking into consideration the type of
customer, the type of transaction and the specifics
of each arrangement.
(a) Sales of goods – agricultural produce
The Group’s main revenue arises from the sales of
agricultural produce – grain and milk. The
agricultural produce is subject to quality control at
the point of sale and the sales value is depending on
the quality. Revenue from sales of agricultural
produce is recognised after the results of quality
control are available.
(b) Sales of biological assets
The Group sells living animals for slaughtering. The
revenue from sales of living animals is recognised
after the animals have been delivered to the
slaughterhouse.
(c) Sales of services
The Group occasionally sells services to other
agricultural producers. Revenue from the services is
recognised when the service has been provided.
(d) Interest income
Interest income is recognised on a time-proportion
basis using the effective interest method. When a
receivable is impaired, the Group reduces the
carrying amount to its recoverable amount, being
the estimated future cash flow discounted at the
original effective interest rate of the instrument, and
continues unwinding the discount as interest
income. Interest income on impaired loans is
recognised using the original effective interest rate.
(e) Dividend income
Dividend income is recognised when the right to
receive payment is established.
2.20 LEASES
The Group as a lessee.
Leases in which a significant portion of the risks and
rewards of ownership are retained by the lessor are
classified as operating leases. Payments made under
operating leases (net of any incentives received
from the lessor) are charged to the income
statement on a straight-line basis over the period of
the lease. Land lease is considered to be operating
lease unless the title of the land passes to the lessee
at the end of the lease period.
Leases in which the risks and rewards incidental to
the ownership of an asset are transferred
substantially to the lessee are classified as finance
leases. At the commencement of the lease term, the
Group recognises the asset purchased on finance
lease term on its balance sheet at the amount lower
of the present value of future rent payments of fair
value of the leased asset.
Each lease payment is allocated between the liability
and finance charges so as to achieve a constant rate
on the finance balance outstanding. The
corresponding rental obligations, net of future
finance charges, are included in borrowings. The
interest cost is charged to the income statement
over the lease period using the effective interest
method. The assets acquired under finance leases
are depreciated over the shorter of their useful life
or lease term if the Group is not reasonably certain
that it will obtain ownership by the end of the lease
term.
2.21 DIVIDEND DISTRIBUTION
Dividend distribution to the Group’s shareholders is
recognised as a liability in the Group’s financial
statements in the period in which the dividends are
approved by the Group’s shareholders.
2.22 SEGMENT REPORTING
Operating segments are reported in a manner
consistent with the internal reporting provided to the
chief operating decision-maker. The chief operating
decision-maker, who is responsible for allocating
resources and assessing performance of the
operating segments, has been identified as the
Executive Board. The Executive Board considers the
business from a geographical and operational
perspective. Local production units, which are
interlinked with each other in operational activities,
are aggregated in the internal reporting in
production clusters. Segments are presented to the
management on aggregated unit basis, indicating
separately plant cultivation and animal husbandry if
they are both material for the clusters’ revenue.
T R I G O N A G R I A N N U A L R E P O R T 2 0 1 3 PAGE 58
2.23 SHARE-BASED PAYMENTS
The fair value of services assumed to have been
received in exchange for the equity instruments
(warrants) issued is generally recognised as an
expense in the income statement and in other
reserves in equity during the vesting period (from
the grant date of warrants until the vesting date). In
case the services assumed form part of the costs
directly attributable to the issue of new shares, the
costs are shown in equity as a deduction from the
proceeds as a part of related translation costs and
not as an expense in the income statement. The fair
value of the services received is determined by
reference to the fair value (market value) of equity
instruments granted at the grant date, which equals
the fair value of services received by the Group. The
proceeds received net of any directly attributable
transaction costs are credited to share capital
(nominal value) and share premium when the
options are exercised.
2.24 CHANGES TO COMPARATIVES
Certain changes have been made to the
presentation of taxes on dividends in the cash flow
statement. Taxes on dividends in amount of EUR
97 thousand in 2012 have been reclassified from
line item ‘Income tax paid’ to line item ‘Dividends
paid to company’s shareholders’.
COMPLETION OF THE PROVISIONAL PURCHASE
PRICE ALLOCATION AS AT DECEMBER 31, 2012
Certain changes have been made to the balance
sheet as at December 31, 2012 in relation to the
completion of the provisional purchase price
allocation as at December 31, 2012 for the Rostov
cluster business combination.
The initial provisional amounts recognised in the
2012 financial statements for the Rostov cluster
business combination were determined only
provisionally and have been amended according to
the exact balances of assets and liabilities
transferred. Below is the amended balance sheet
as at December 31, 2012, listing all the
adjustments made to the previous figures. For
details please see Note 31.
COMPLETION OF THE PROVISIONAL PURCHASE PRICE ALLOCATION AS AT DECEMBER 31, 2012
Amended
in EUR thousand Note 31.12.2012 Adjustments 31.12.2012
ASSETS Current assets Biological assets 9 5,500 215 5,715
45,919 215 46,134
Non-current assets Other non-current prepayments and receivables 6 2,426 3,514 5,940
Investment Property - 136 136
164,181 3,650 167,831
Total assets
210,100 3,865 213,965
LIABILITIES Current liabilities
Trade and other payables
13 16,031 -4,236 11,795
Borrowings 14 11,871 8,101 19,972
27,902 3,865 31,767
Total liabilities
81,534 3,865 85,399
Total equity and liabilities
210,100 3,865 213,965
T R I G O N A G R I A N N U A L R E P O R T 2 0 1 3 PAGE 59
3. FINANCIAL RISK MANAGEMENT 3.1 FINANCIAL RISK FACTORS
The Group’s activities expose it to a variety of
financial risks: market risk (including currency risk,
commodity price risk, cash flow interest rate risk,
fair value interest rate risk), credit risk, liquidity
risk and capital repatriation risk. The Group’s
overall risk management program acknowledges
the unpredictability of financial markets and on the
basis of the current business operations of the
Group the management is following financial risk
management policies to minimise potential adverse
effects on the Group’s financial performance from
unpredictable fluctuations in the financial markets.
The Group’s centralised controlling and risk
management function carries out risk management
activities on a day-to-day basis in close
cooperation with the regional management
members.
(a) Market risk
(i) Foreign exchange risk
The Group operates in Estonia, Ukraine and Russia
and is exposed to foreign exchange risk arising
primarily from exposures to the US dollar, Russian
rouble, Ukrainian hryvna and Swedish krona.
Foreign exchange risks from US dollar, Swedish
krona, Russian rouble and Ukrainian hryvna arise
mainly from recognised assets and liabilities. Foreign
exchange risk from Swedish krona arises from
Trigon Agri four-year bonds issued in 2011. The
Group has not implemented any currency risk
management policies.
Ukrainian hryvna, Russian rouble, Swedish krona
and US dollar have floating exchange rate.
The average value of hryvna relative to euro
depreciated in 2013 (depreciated in 2012).
Russian rouble depreciated in value in 2013
(appreciation relative to euro in 2012).
Swedish krona depreciated relative to euro in 2013
(appreciated relative to euro in 2012).
Reasonably possible change
Impact on Income statement
UAH +/- 10% +/-372
RUB +/- 10% +/-144
SEK +/- 10% -/+4,117
USD +/- 10% -/+1,011
The changes in exchange rates of Russian rouble
and Ukrainian hryvna have been unfavourable to the
Group’s business in 2013 (favourable in 2012). The
changes in exchange rates of rouble and hryvna
decreased the value of the net investment in 2013
(increased in 2012).
(ii) Commodity price risk
The Group is exposed to commodities price risk
because of the significant size of its business
operations in the production of cereals. In case
cereals produced by the Group in Russia and Ukraine
are primarily exported, a significant share of the
Group’s revenues will be exposed to global
fluctuations in agricultural commodity prices. The
milk production operations of the Group are to a
much lesser extent affected by global commodity
prices since the raw milk is sold regionally and
cannot be exported over long distances. This is
further supported by the fact that milk powder, a
milk product commodity which can be transported
over long distances, does not directly compete with
raw milk due to the inferiority of milk powder based
end-product quality. Such lower quality makes milk
powder a secondary raw material to the milk
processing companies operating in the target
countries of the Group and allows the Group to
negotiate fresh high quality raw milk price relatively
independently of global milk powder price levels.
The Group’s strategy is not to hedge against any
commodity price movements in order to provide its
shareholders a direct exposure to the fluctuation in
the market. Unlike traditional large-scale farming
enterprises that have typically used a financial
hedging strategy to protect against adverse price
fluctuations or the risks inherent in a highly seasonal
business, the Group does not engage in any
commodity hedging. The Group believes that its
diversified geographic production base, its crop
rotation system and its combination of cereal
production and dairy farming provide its business
with sufficient operational stability, while enabling
investors to pursue their own individual hedging
strategies.
(iii) Cash flow and fair value interest rate risk
As the Group has no significant floating interest-
bearing assets, the Group’s income and operating
cash flows are substantially independent of changes
in market interest rates. Cash (see Note 5) is
invested in short term deposits and thus interest
rate risk does not affect significantly the Group.
The Group’s interest rate risk arises from long-term
borrowings. Borrowings issued at variable rates
expose the Group to cash flow interest rate risk. The
Group analyses its interest rate exposure on a
dynamic basis. Various scenarios are simulated
T R I G O N A G R I A N N U A L R E P O R T 2 0 1 3 PAGE 60
taking into consideration refinancing, renewal of
existing positions and alternative financing.
Breakdown between floating and fixed interest rates
for the existing borrowings of the Group is shown
below:
Amended
in EUR thousand 31.12.2013 31.12.2012
Bank borrowings and finance lease (outstanding amount) Floating rate 13,810 8,083
incl. related to 6-month EURIBOR 9,082 6,283
incl. related to 3-month EURIBOR 235 -
incl. related to 5-year EURIBOR - 723
incl. related to bank´s base interest rate - 1,077
incl. related to LIBOR 4,493 -
Fixed rate 60,267 61,375
74,077 69,458
At 31 December 2013, if interest rates on floating
interest rate borrowings at that date had been 50
basis points higher with all other variables held
constant, net profit for the year would have been
EUR 69 thousand lower, as a result of higher interest
expense on floating rate borrowings. At 31
December 2012, if interest rates on floating interest
rate borrowings at that date had been 50 basis
points lower (higher) with all other variables held
constant, net profit for the year would have been
EUR 40 thousand higher (lower), as a result of lower
(higher) interest expense on floating rate borrowings
(b) Credit risk and counterparty business risk
Credit risk for the Group arises from cash and cash
equivalents, deposits with banks and financial
institutions and customers, including outstanding
receivables and committed transactions. Credit limits
are not normally set for individual companies, as all
balances are closely monitored specifically (see also
Note 6 for details). For banks and financial
institutions, the Group’s policy is to work with
institutions, which have an internationally reputable
strategic shareholder as the majority investor. (See
also Note 5 for details).
(c) Liquidity risk
The Group’s main liquidity risks derive from the
cyclical nature of agricultural production. Field-works
in spring and harvest in autumn entails
concentration of costs and working capital need in
the spring season and concentration of revenues in
the autumn season. The cyclicality is stronger in
cereals production and much lower in dairy
production, as dairy production revenues accrue
evenly throughout the whole operating year. The
Group has been lowering the cyclicality also in
cereals production by acquiring its own warehousing
infrastructure to store grain for longer time periods
and to be able to sell cereal products more evenly
throughout the year. In addition, the management
monitors the liquidity risk by following the main key
performance indicators on a continuous basis,
including cash flows.
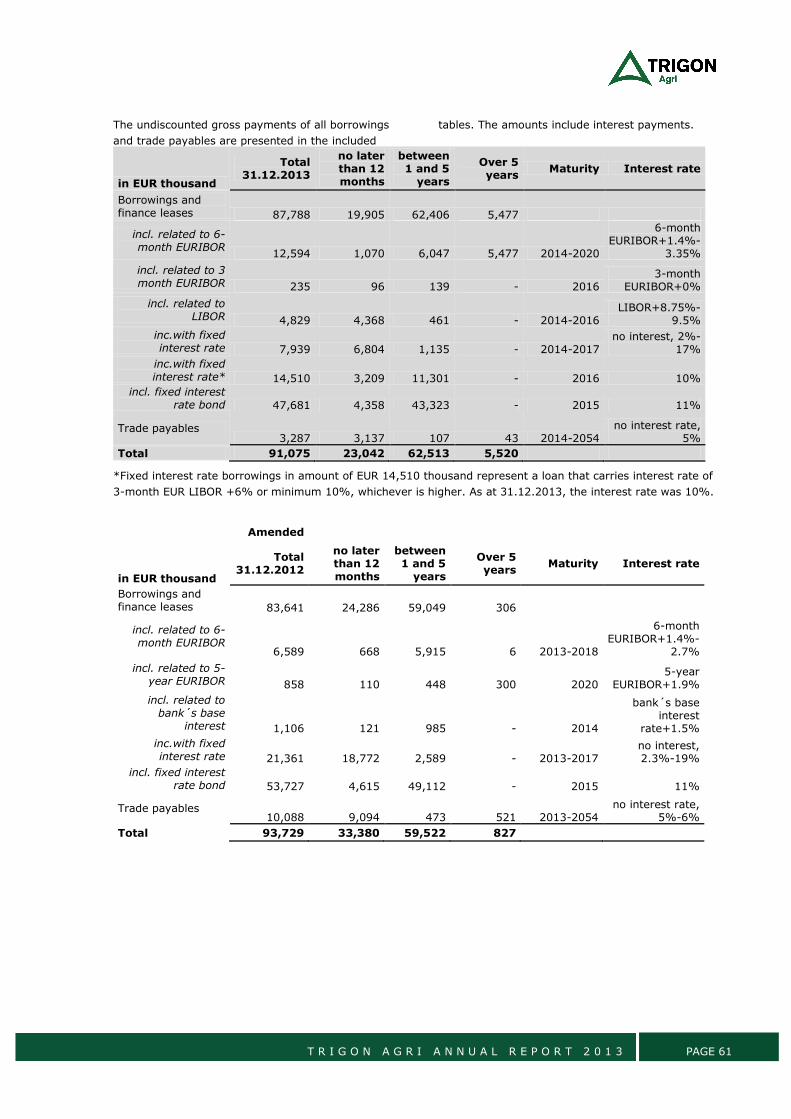
T R I G O N A G R I A N N U A L R E P O R T 2 0 1 3 PAGE 61
The undiscounted gross payments of all borrowings
and trade payables are presented in the included
tables. The amounts include interest payments.
in EUR thousand
Total 31.12.2013
no later than 12 months
between 1 and 5
years
Over 5 years
Maturity Interest rate
Borrowings and finance leases 87,788 19,905 62,406 5,477
incl. related to 6-month EURIBOR
12,594 1,070 6,047 5,477 2014-2020
6-month EURIBOR+1.4%-
3.35%
incl. related to 3 month EURIBOR 235 96 139 - 2016
3-month EURIBOR+0%
incl. related to LIBOR 4,829 4,368 461 - 2014-2016
LIBOR+8.75%-9.5%
inc.with fixed interest rate 7,939 6,804 1,135 - 2014-2017
no interest, 2%-17%
inc.with fixed interest rate* 14,510 3,209 11,301 - 2016 10%
incl. fixed interest rate bond 47,681 4,358 43,323 - 2015 11%
Trade payables 3,287 3,137 107 43 2014-2054
no interest rate, 5%
Total 91,075 23,042 62,513 5,520
*Fixed interest rate borrowings in amount of EUR 14,510 thousand represent a loan that carries interest rate of
3-month EUR LIBOR +6% or minimum 10%, whichever is higher. As at 31.12.2013, the interest rate was 10%.
Amended
in EUR thousand
Total 31.12.2012
no later than 12 months
between 1 and 5
years
Over 5 years
Maturity Interest rate
Borrowings and finance leases 83,641 24,286 59,049 306
incl. related to 6-month EURIBOR
6,589 668 5,915 6 2013-2018
6-month EURIBOR+1.4%-
2.7%
incl. related to 5-year EURIBOR 858 110 448 300 2020
5-year EURIBOR+1.9%
incl. related to bank´s base
interest 1,106 121 985 - 2014
bank´s base interest
rate+1.5%
inc.with fixed interest rate 21,361 18,772 2,589 - 2013-2017
no interest, 2.3%-19%
incl. fixed interest rate bond 53,727 4,615 49,112 - 2015 11%
Trade payables 10,088 9,094 473 521 2013-2054
no interest rate, 5%-6%
Total 93,729 33,380 59,522 827
T R I G O N A G R I A N N U A L R E P O R T 2 0 1 3 PAGE 62
3.2 CAPITAL RISK MANAGEMENT
The Group considers as capital its equity and
borrowings.
All significant bank borrowings of the Group will be
approved by the Board of Directors of the Group
prior to being drawn upon. The Board of Directors
will also approve the leveraging strategy to be
worked out by the management, keeping in mind (i)
safeguarding the Group’s ability to continue as a
going concern in order to provide returns for
shareholders and benefits for other stakeholders and
(ii) development of an optimal capital structure so as
to reduce the cost of capital.
As of December 31, 2013 (and as of December 31,
2012), the Group was financed in addition to the
owners’ equity by proceeds of the four-year bond
issue. For as long as the bonds remain outstanding,
based on the Terms and Conditions of the bonds,
the Group undertakes:
(a) to procure that the ratio of Financial
indebtedness to shareholders’ equity will never
exceed seventy five (75) per cent. (calculated on the
basis of audited annual financial reports, quarterly
unaudited financial reports or, where relevant, a
special financial report);
(b) not to for any financial year (i) pay any dividend
on shares, (ii) repurchase any of its own shares, (iii)
redeem its share capital or other restricted equity
with repayment to shareholders or (iv) to make any
other similar distribution to the shareholders of the
Company, if such distribution mentioned under (i),
(ii), (iii) or (iv) above would exceed thirty (30) per
cent. of the Net Profit;
(c) to take all measures required to ensure that the
Bonds continue being listed on NASDAQ OMX for as
long as any Bonds are outstanding (however, taking
into account the rules and regulations of NASDAQ
OMX and the CSD (as amended from time to time)
preventing trading in the Bonds in close connection
to the redemption of the Bonds);
(d) not to:
(i) issue any Market Loans with higher
priority than the Bonds;
(ii) provide or permit to subsist any
security or permit someone else to provide
or permit to subsist any security in the form
of a contingent liability or otherwise to
secure any present or future Market Loan of
the Company; or
(iii) provide or permit to subsist any
security over any of the Company’s assets
(present or future) to secure any present or
future Market Loan taken up by any other
person than the Company;
(e) to ensure that the Company’s Subsidiaries do not
issue any Market Loans and furthermore, when
taking up a loan, observe the provisions in (d)(i)-(iii)
above (for the avoidance of doubt, any reference to
the Company under (d)(iii) above shall, when
interpreting this provision be construed as a
reference to the respective Subsidiary);
(f) not to use any of the proceeds from the issue of
the Bonds outside of the ordinary course of
business;
(g) to prepare and publish quarterly reports (which
reports shall be prepared consistently with the same
accounting principles that are applied when
preparing the Company’s annual financial reports
and published not later than two (2) months after
the end of the relevant quarter. Once the Bonds
have been listed such reports shall be published in
accordance with the then applicable regulations by
NASDAQ OMX);
(h) not later than within twenty (20) days from the
Agent’s request to prepare a special unaudited
financial report as per the historic date the Agent
stated in its request (which report shall be prepared
consistently with the same rules and accounting
principles that are applied when preparing the
Company’s annual financial reports and quarterly
financial reports); and
(i) together with each quarterly report or no later
than twenty (20) days from the Agent’s request, to
provide a compliance certificate signed by two duly
authorised signatories of the Company on its behalf,
and accompanied by a report setting out the
calculations of (and compliance with) the financial
covenants, certifying that so far as it is aware no
event which would entitle the Agent to accelerate
the Bonds is outstanding or, if it is aware that such
an event is outstanding, specifying the event and
the steps, if any, being taken to remedy it.
According to the terms of bonds, the bonds will be
redeemed early in case one or more persons acting
together shall acquire control over Trigon Agri by
acquiring control over more than 50% of voting
rights in the company or over the right to appoint
or remove the whole or majority of the Board of
Directors.
The total Group capital is influenced by exchange
rate fluctuations of Ukrainian hryvna, Russian rouble
and Swedish krona, as described also in Note 3.1. a)
i). The total recognised decrease in equity from
currency translation differences amounted to EUR
T R I G O N A G R I A N N U A L R E P O R T 2 0 1 3 PAGE 63
32,887 thousand at December 31, 2013 (EUR
19,610 thousand at December 31, 2012).
According to the terms of bonds, the Group monitors
capital on the basis of the Financial indebtedness to
shareholders’ equity ratio. Financial indebtedness"
means the total amount of any indebtedness of the
Group Company on a consolidated basis, at any
given time, in respect of:
(a) the principal amount outstanding in
respect of any monies borrowed or raised including,
without limitation, pursuant to the Bonds;
(b) the principal amount outstanding in
respect of any Market Loan;
(c) any Finance Lease;
(d) any net liability incurred under interest
rate management arrangements;
(e) any guarantee or other assurance against
financial loss in respect of a type referred to in the
above items;
(f) any counter indemnity obligation in
respect of a guarantee, indemnity, bond, standby or
documentary letter of credit or any other instrument
issued by a bank or financial institution; and
(g) any amount raised under any other
transaction (including any forward sale or purchase,
sale and sale back or sale and leaseback agreement)
having the commercial effect of a borrowing or
otherwise classified as borrowings under the
Accounting Principles.
Shareholders’ equity means the total shareholders’
equity of the Group Company on a consolidated
basis at any given time.
The Financial indebtedness to shareholders’ equity
ratios as at December 31, 2013 and December 31,
2012 were as follows:
Amended
in EUR thousand 31.12.2013 31.12.2012
Total borrowings (Note 15)
74,077 69,458
Total shareholders´ equity
103,805 128,566
Financial indebtedness to shareholders’ equity
71% 54%
As described in Note 10, significant portion of
reduction of equity is due to devaluation of the
Russian rouble and the Ukrainian hryvna that has
led to decrease of the book value of rouble and
hryvna denominated assets on the Group's balance
sheet. Russian rouble and Ukrainian hryvna have
continued to devalue in 2014. The assets on the
Group’s balance sheet in Russia and Ukraine are
denominated in local currency and will decrease in
euro terms when rouble and hryvna weaken against
the euro.
In order to counterbalance the negative impact of
the currency devaluation on the book values of
Group's assets, the management is considering
adopting a policy of revaluing its freehold land to fair
value in accordance with fair value provisions of IAS
16 ‘Property, plant and equipment’. Currently
freehold land is stated at historic cost. The
revaluation of land would provide shareholders with
a more representative value than the historic cost
basis and would enable to protect against the
fluctuations of local currencies against the euro.
The bond expires in June 2015. The management
aims to repay the bond using the proceeds that
would come from non-core asset disposals. For
further information, please refer to Note 3.5.
Capital repatriation risk
The capital repatriation risk derives from the Group’s
investments into Ukrainian and Russian subsidiaries.
Potential changes in the political environment in
Ukraine or Russia may impose restrictions on
repatriating capital invested into these countries.
The Group’s policy is to make investments into
Ukraine and Russia only via Cypriot holding
companies. The advantageous double taxations
treaties with Ukraine and Russia make Cyprus a
favoured location of inward investments to these
regions by several internationally recognised
investors as well as for Ukrainian and Russian own
capital, which seeks to have foreign domiciliation. In
the assessment of the Group’s management,
carrying out investments into Ukraine and Russia via
Cypriot holding companies is the best possible hedge
for minimising capital repatriation risks.
3.3 FAIR VALUE ESTIMATION
The carrying value less impairment provision of
trade receivables and trade payables are assumed
to approximate their fair values. The fair value of
financial liabilities for disclosure purposes is
estimated by discounting the future contractual
cash flows at the current market interest rate that
is available to the group for similar financial
instruments. The Group’s management estimates
that the fair values of the financial assets (Notes 5,
6) and financial liabilities (Notes 13, 14) recognised
in the balance sheet at amortised cost do not
significantly differ from their carrying amounts
presented in the Group’s consolidated balance
sheet on 31 December 2013 and 31 December
2012. The management estimates that the fair
value of long-term borrowings does not
significantly differ from their carrying amounts. The
T R I G O N A G R I A N N U A L R E P O R T 2 0 1 3 PAGE 64
fair value of financial liabilities is determined on the
basis of discounted future contractual cash flows,
using a market interest rate, which is available for
the Group upon using similar financial instruments.
Trade receivables and trade payables are
recognised at amortised cost, due to which the
management estimates that their carrying amount
approximates their fair value.
Trigon Agri bonds are listed on NASDAQ OMX. As
there have been no material transactions, the
Group considers that the carrying amount of the
bonds approximate their fair value.
3.4 OTHER RISK FACTORS
RISKS RELATED TO UKRAINIAN LAND
RENTAL
Ukrainian law imposes several restrictions on
ownership of agricultural land. Foreign citizens or
foreign legal entities are not allowed to acquire
agricultural land, and it is unclear whether a
Ukrainian company controlled by non-Ukrainians
may own agricultural land in Ukraine. Moreover,
there is a blanket moratorium against selling
freeholds of agricultural land until adoption of
particular legal act on the land market and land
cadastre in Ukraine.
The Group owns the buildings and structures of its
Ukrainian farms and controls the Ukrainian land
through registered long-term leases supplemented
with a right of first refusal to acquire the freehold,
or through signed, but not yet registered, leases.
However, under the current legislation, the Group
may not be able to exercise its right of first refusal
to acquire the freehold. In the event that the
Group’s title to any of its land is challenged, and
the Group is unable to defend such a claim, the
Group risks losing its rights to such land which
could materially affect the Group’s business,
financial condition, and operational results.
RISKS RELATED TO LAND OWNERSHIP
IN RUSSIA
Russian law does not allow a foreign entity nor a
foreign controlled Russian entity to own agricultural
land in Russia. A Russian entity is considered a
foreign controlled entity when more than 50 per
cent of its share capital is owned by a foreign
entity.
The Russian agricultural land of the Group is
currently owned by Russian operating companies,
which are wholly-owned subsidiaries of the relevant
holding companies incorporated in Russia. The
Russian parent holding companies are, in turn,
owned (depending on the Company, directly or
indirectly) by Cypriot holding companies. While this
structure technically complies with the Russian law
restriction on the foreign ownership of Russian
agricultural land, no assurances can be given that
the ownership structure could not be challenged on
the basis that they possibly violate the spirit of the
law. The Russian courts and legal system generally
tend to adopt a formal approach to legislative
interpretation. However, no assurance can be given
as to how a Russian court would treat each
particular situation brought to its consideration or
as to future developments in the Russian legal
system which may give greater weight to
substance over form.
If the Russian agricultural land holding structure of
the Group is found to breach the above mentioned
Russian law restriction, the Group could be forced
to either sell its land, or return the land to the
previous owner (in which case it will be entitled to
require the purchase price back from the previous
owner), or introduce Russian shareholders to its
subsidiaries, which may have a material adverse
effect on the Group’s business, financial condition
and operational results.
3.5 SITUATION IN UKRAINE AND
POTENTIAL IMPACT ON THE
GROUP’S OPERATIONS
Background:
The Ukrainian economy is considered to be
developing and characterised by relatively high
economic and political risks. The future stability of
the Ukrainian economy is largely dependent upon
reforms and the effectiveness of economic,
financial and monetary measures undertaken by
government, together with tax, legal, regulatory,
and political developments. As a developing
economy, it is vulnerable to market downturns and
economic slowdowns elsewhere in the world.
In 2013, the world demand for Ukraine's main
export commodities, steel and iron ore, was weak.
The year was marked by one of record crop
harvests; however world prices for wheat, corn and
sunflower seed reduced significantly due to peak
harvests in other crop producing regions. In 2013
Ukraine's GDP was flat year on year (2012:
increase by 0.2%), while industrial output
contracted by 4.7% (2012: reduction by 0.5%).
The Government of Ukraine introduced a number of
restrictions in relation to foreign exchange aiming
to support the national currency, the Ukrainian
Hryvnia. Inflation during the year was close to zero
as the National Bank of Ukraine reduced the money
supply. The national foreign exchange reserves
reduced to the level of 3 month imports at year
end due to reduced inflows from sale of
commodities and agro produce, the need to settle
scheduled payments, primarily with the
T R I G O N A G R I A N N U A L R E P O R T 2 0 1 3 PAGE 65
International Monetary Fund, and to pay the
current and past purchase of natural gas.
The anticipated association agreement with the
European Union was not signed at the end of
November 2013. The Government announced a
deal with the Russian Federation for the purchase
of Ukrainian Government bonds up to USD 15
billion, of which USD 3 billion was provided in
December 2013. The political system of Ukraine
experienced instability with a number of protests
against the Government’s actions in late 2013 and
street violence in January - February 2014. At the
end of January 2014, the President of Ukraine
accepted the resignation of Ukraine’s Prime
Minister. Following this, the Russian Government
suspended the support of the Ukrainian
Government and Moody’s Investors Service
downgraded Ukraine's government bond rating to
Caa2 from Caa1 with a negative outlook. To
stabilise the deteriorating political situation, the
Parliament voted a return of the 2004 Constitution
and dismissed the President. On 26 February, the
newly formed Parliament majority coalition
appointed a Prime Minister and the Government.
During January-February 2014, the Ukrainian
Hryvnia saw a significant decrease in value against
the major world currencies. The new Government
called for immediate dialogue with the
International Monetary Fund to provide financing
and avoid possible default. On 1 March, the
Russian parliament granted approval for the use of
armed forces in Ukraine. Russian troops were
believed to be occupying government offices and
other locations in Crimea. The Ukrainian armed
forces were put on full alert.
On 16 March, a referendum was held in Crimea
where 96% of voters supported Crimea joining
Russia. The EU and U.S. condemned the
referendum as illegal. On 18 March, Russia
annexed Crimea. At this point it is impossible to
predict how far the ambitions of Russia will go in
Ukraine and whether Russia will try to invade
eastern Ukraine. Apart from Crimea, there have
been violent clashes between pro-Russian
demonstrators and Ukrainian nationalist in the city
of Kharkov which is located close to the Russian
border.
Impact on the Group’s operations
A significant part of Trigon Agri’s operations are
located in the Kharkov region, where the Group
has in total 32.7 thousand hectares, out of which
21.0 thousand hectares has been seeded with
winter crops in autumn 2013. The book value of
fixed assets as at 31.12.2013 stands at EUR 7.8
million, including vehicles and machinery in amount
of EUR 5.1 million. Additionally, prepayments for
land rent amount to EUR 2.4 million.
The Group has significant balances receivable with
and prepayments made to various government
departments in Ukraine in total amount of EUR
1,340 thousand. Out of this amount, the timing of
settlement is uncertain and is dependent upon the
availability of State funds for prepaid income taxes
of EUR 90 thousand and VAT recoverable of EUR
293 thousand.
The current situation could impact the Group’s
ability to operate in Ukraine and the value of
Ukrainian assets.
Devaluation impact:
The Group is impacted by the devaluation of the
Ukrainian hryvna and the Russian rouble. As
described in Note 10, significant portion of
reduction of equity is due to devaluation of the
Russian rouble and the Ukrainian hryvna that has
led to decrease of the book value of rouble and
hryvna denominated assets on the Group's balance
sheet. Russian rouble and Ukrainian hryvna have
continued to devalue in 2014. The assets on the
Group’s balance sheet in Russia and Ukraine are
denominated in local currency and will decrease in
euro terms when rouble and hryvna weaken
against the euro.
In order to counterbalance the negative impact of
the currency devaluation on the book values of
Group's assets, the management is considering
adopting a policy of revaluing its freehold land to
fair value in accordance with fair value provisions
of IAS 16 ‘Property, plant and equipment’.
Currently freehold land is stated at historic cost.
Land prices are considered to be stable measured
in EURO and therefore increasing in local currency
when local currencies are devaluing. The
revaluation of land would provide shareholders with
a more representative value than the historic cost
basis and would enable to protect against the
fluctuations of local currencies against the euro.
Impact on liquidity:
The Group has issued SEK nominated bonds
amounting to 41.2 million EUR. Covenants are
attached to the bonds. As described in Note 3.2,
Financial indebtedness to shareholders’ equity as of
31 December 2013 is 71%. According to covenants
Financial indebtedness to shareholders’ equity
should at all-time be below 75%.
There is uncertainty as to whether the devaluation
of Ukrainian hryvna and Russian rouble will result
in Financial indebtedness to shareholders’ equity
breaching the covenant limit of 75%. To
counterbalance the impact of the devaluation, the
management is considering adopting a policy of
T R I G O N A G R I A N N U A L R E P O R T 2 0 1 3 PAGE 66
revaluing its freehold land to fair value (as
explained above under “Devaluation impact”),
which would also provide shareholders with a more
representative value of the Group’s land holdings.
The bond expires in June 2015. Management aims
to repay the bond using the proceeds that would
come from non-core asset disposals. If the
situation in Ukraine gets worse and the Group
would have to repay the bond early, the Group
could launch a fire sale of non-core assets and, if
necessary, include parts of core assets to the sale.
As explained in the Chairman’s comment, the
Group has implemented cost cuts and is working
on the disposal of non-core asset disposals that
include the dairy businesses in Estonia and Russia,
and the cereals production cluster in Penza.
Based on the initiatives implemented, the
initiatives planned and possible further initiatives if
the situations worsened the Group expect to have
sufficient cash to continue its business.
The final resolution and the effects of the political
and economic crisis are difficult to predict but they
may have further severe effects on the Ukrainian
economy and the Group’s business.
T R I G O N A G R I A N N U A L R E P O R T 2 0 1 3 PAGE 67
4. CRITICAL ACCOUNTING ESTIMATES AND
JUDGMENT Estimates and judgments are continually evaluated
and are based on historical experience and other
factors, including expectations of future events that
are believed to be reasonable under the
circumstances.
4.1 CRITICAL ACCOUNTING ESTIMATES
AND ASSUMPTIONS
The Group makes estimates and assumptions
concerning the future. The resulting accounting
estimates will, by definition, rarely equal the related
actual results. The estimates and assumptions that
have a significant risk of causing a material
adjustment to the carrying amounts of assets and
liabilities within the next financial year are outlined
below.
a) Fair value of biological assets
The Group’s biological assets are measured at fair
value less point-of-sale costs at each balance sheet
date (value at December 31, 2013 was EUR 13,946
thousand, value at December 31, 2012 was EUR
14,832 thousand). Due to the specifics of the
agricultural production, fair value of some crops and
animals cannot be determined reliably in their
present status. The biological assets in the countries
where the Group operates (Ukraine, Russia and
Estonia) are mostly not traded on active market.
Therefore the fair value is determined using the
alternative methods described in Note 2.8. The use
of alternative methods of fair value estimation
requires the Group to refer to latest transactions and
use price averages, or to use cost as an
approximation of fair value in case when little
biological transformation has taken place since initial
cost incurrence, e.g. within short time after seeding
the crop. Because the carrying value of the biological
assets in the plant cultivation is based on cost upon
initial recognition, no variability analysis is relevant.
Were the actual prices for the biological assets in
animal husbandry higher by 10% from
management’s estimates, the net profit would
increase by EUR 876 thousand (EUR 870 thousand in
2012), if the prices were lower by 10%, the net
profit would decrease by the same amount.
b) Useful lives of property, plant and
equipment
The depreciable items of property, plant and
equipment amounted to EUR 46,862 thousand as at
December 31, 2013 (EUR 53,228 thousand as at
December 31, 2012). The remaining balance
includes land, which does not depreciate; and
construction in process. Management has estimated
useful lifetimes for depreciable property, plant and
equipment. However, the actual useful lifetimes can
be different than those estimated by the
management. If the average useful lifetime would be
10% longer (shorter) than estimated by the
management, it would decrease (increase) the
depreciation charge by EUR 746 thousand (EUR 766
thousand in 2012).
c) Net realisable value and fair value less
costs to sell of inventories
The Group has its agricultural produce in inventory
as of the year end. The agricultural produce and
inventories for commodities trading have been
valued to fair value less costs to sell. The fair value
of the grain is determined based on the market
statistics published by APK-Inform or in case the
Group had sold or had sales contracts for its
inventory then those actual prices were used.
Would the prices been lower than estimated by
10%, the value of the inventories would be EUR
263 thousand less and the equity smaller by the
equal amount (in 2012: EUR 1,086 thousand).
d) Fair values of the assets and liabilities
analysed in purchase price allocations in
accounting for business combinations
The Group has estimated the fair values of the
assets and liabilities of the subsidiaries acquired in
course of the business combinations. Because the
subsidiaries have been bought from different
counterparties on arm's length conditions, these
different transactions provided additional
comparative basis for determining the fair values of
assets and liabilities, in addition to the information
disclosed in public by the competitors and that
provided by consultants.
e) Distinction between the business
combinations and asset purchases
The Group decides at each purchase of majority
share of a company or major group of assets
whether the acquisition is a business combination
or asset acquisition. The acquisition is classified as
business combination when the assets acquired
and liabilities assumed constitute a business. For
each acquisition, the Group analyses whether it has
inputs, processes applied to those inputs and
T R I G O N A G R I A N N U A L R E P O R T 2 0 1 3 PAGE 68
created outputs in place before acquisition with the
main component being processes. Acquisition of a
company owning property, plant and equipment or
inventories without having in place processes to
generate outputs is not considered a business
combination.
f) Recoverable values of the non-current
assets
In 2013 impairment test was carried out, no
requirement for impairment was identified. The
value-in-use method was applied to determine the
recoverable values of non-current assets in
operating clusters (cereals production Ukraine;
cereals production Rostov; cereals production
Penza; storage services and sales and trading; milk
production Estonia, milk production Russia). Cash
flows were projected in each cluster, including
revenues, operating expenses, investment
requirements and working capital needs. The test
demonstrated that the Group’s assets recoverable
value is higher than the carrying amount in all of
its operating segments. The Group has used in the
model its target yields and 3-year average prices
for cereals, except for 2014 where lower prices
were used. The Group applied 2% long-term
growth rate that has been aggregated from the
long-term growth perspective in the respective
country and estimation of the growth in food prices
in relation to other inputs. The discount rates
applied were the following: 16% in Ukraine, 11% in
Russia and 7% in Estonia.
In 2012 the impairment testing was not necessary
as the management of the Group did not identify
any indication of impairment.
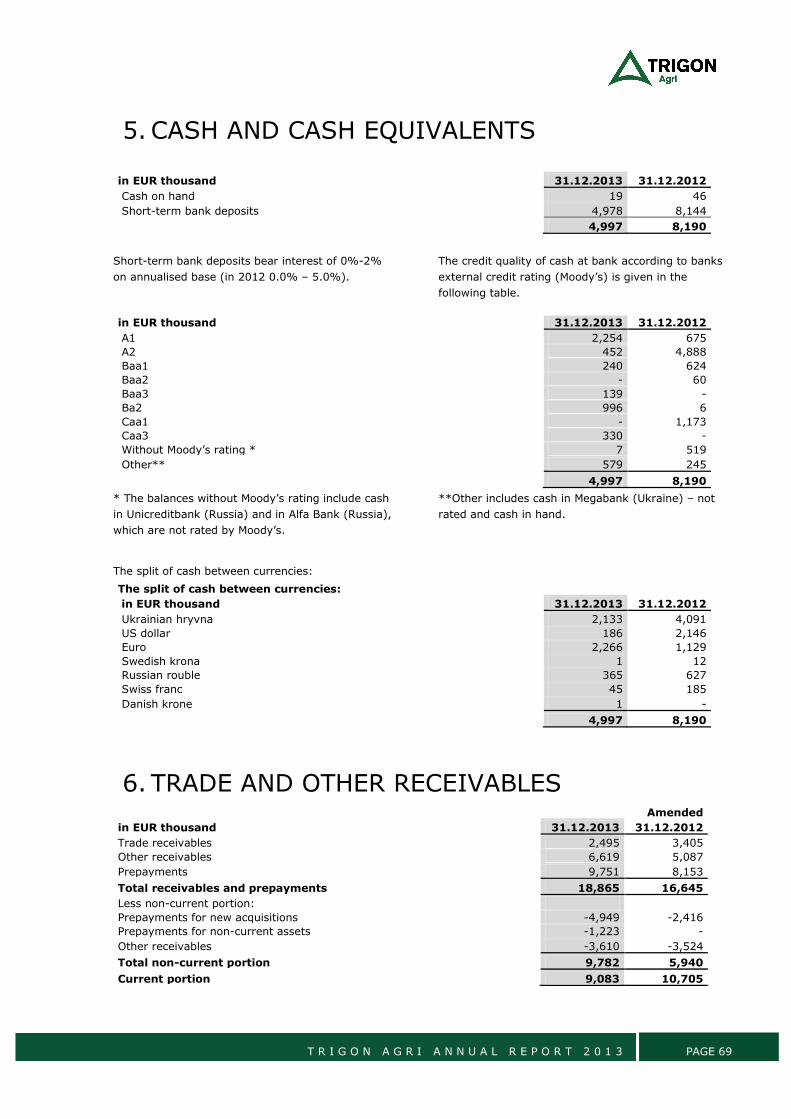
T R I G O N A G R I A N N U A L R E P O R T 2 0 1 3 PAGE 69
5. CASH AND CASH EQUIVALENTS
in EUR thousand 31.12.2013 31.12.2012
Cash on hand 19 46
Short-term bank deposits 4,978 8,144
4,997 8,190
Short-term bank deposits bear interest of 0%-2%
on annualised base (in 2012 0.0% – 5.0%).
The credit quality of cash at bank according to banks
external credit rating (Moody’s) is given in the
following table.
in EUR thousand 31.12.2013 31.12.2012
A1 2,254 675
A2 452 4,888
Baa1 240 624
Baa2 - 60
Baa3 139 -
Ba2 996 6
Caa1 - 1,173
Caa3 330 -
Without Moody’s rating * 7 519
Other** 579 245
4,997 8,190
* The balances without Moody’s rating include cash
in Unicreditbank (Russia) and in Alfa Bank (Russia),
which are not rated by Moody’s.
**Other includes cash in Megabank (Ukraine) – not
rated and cash in hand.
The split of cash between currencies:
The split of cash between currencies: in EUR thousand 31.12.2013 31.12.2012
Ukrainian hryvna 2,133 4,091
US dollar 186 2,146
Euro 2,266 1,129
Swedish krona 1 12
Russian rouble 365 627
Swiss franc 45 185
Danish krone 1 -
4,997 8,190
6. TRADE AND OTHER RECEIVABLES
Amended
in EUR thousand 31.12.2013 31.12.2012
Trade receivables 2,495 3,405
Other receivables 6,619 5,087
Prepayments 9,751 8,153
Total receivables and prepayments 18,865 16,645
Less non-current portion:
Prepayments for new acquisitions -4,949 -2,416
Prepayments for non-current assets -1,223 -
Other receivables -3,610 -3,524
Total non-current portion 9,782 5,940
Current portion 9,083 10,705
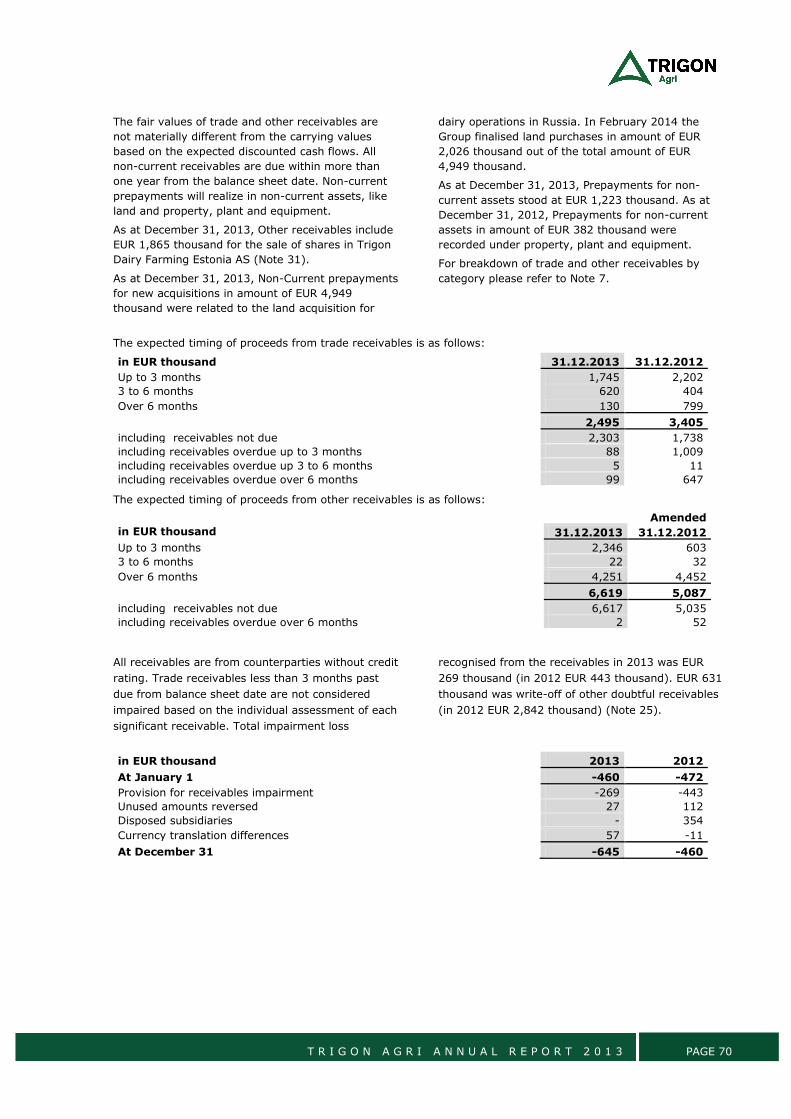
T R I G O N A G R I A N N U A L R E P O R T 2 0 1 3 PAGE 70
The fair values of trade and other receivables are
not materially different from the carrying values
based on the expected discounted cash flows. All
non-current receivables are due within more than
one year from the balance sheet date. Non-current
prepayments will realize in non-current assets, like
land and property, plant and equipment.
As at December 31, 2013, Other receivables include
EUR 1,865 thousand for the sale of shares in Trigon
Dairy Farming Estonia AS (Note 31).
As at December 31, 2013, Non-Current prepayments
for new acquisitions in amount of EUR 4,949
thousand were related to the land acquisition for
dairy operations in Russia. In February 2014 the
Group finalised land purchases in amount of EUR
2,026 thousand out of the total amount of EUR
4,949 thousand.
As at December 31, 2013, Prepayments for non-
current assets stood at EUR 1,223 thousand. As at
December 31, 2012, Prepayments for non-current
assets in amount of EUR 382 thousand were
recorded under property, plant and equipment.
For breakdown of trade and other receivables by
category please refer to Note 7.
The expected timing of proceeds from trade receivables is as follows:
in EUR thousand 31.12.2013 31.12.2012
Up to 3 months 1,745 2,202
3 to 6 months 620 404
Over 6 months 130 799
2,495 3,405
including receivables not due 2,303 1,738
including receivables overdue up to 3 months 88 1,009
including receivables overdue up 3 to 6 months 5 11
including receivables overdue over 6 months 99 647
The expected timing of proceeds from other receivables is as follows:
Amended
in EUR thousand 31.12.2013 31.12.2012
Up to 3 months 2,346 603
3 to 6 months 22 32
Over 6 months 4,251 4,452
6,619 5,087
including receivables not due 6,617 5,035
including receivables overdue over 6 months 2 52
All receivables are from counterparties without credit
rating. Trade receivables less than 3 months past
due from balance sheet date are not considered
impaired based on the individual assessment of each
significant receivable. Total impairment loss
recognised from the receivables in 2013 was EUR
269 thousand (in 2012 EUR 443 thousand). EUR 631
thousand was write-off of other doubtful receivables
(in 2012 EUR 2,842 thousand) (Note 25).
in EUR thousand 2013 2012
At January 1 -460 -472
Provision for receivables impairment -269 -443
Unused amounts reversed 27 112
Disposed subsidiaries - 354
Currency translation differences 57 -11
At December 31 -645 -460
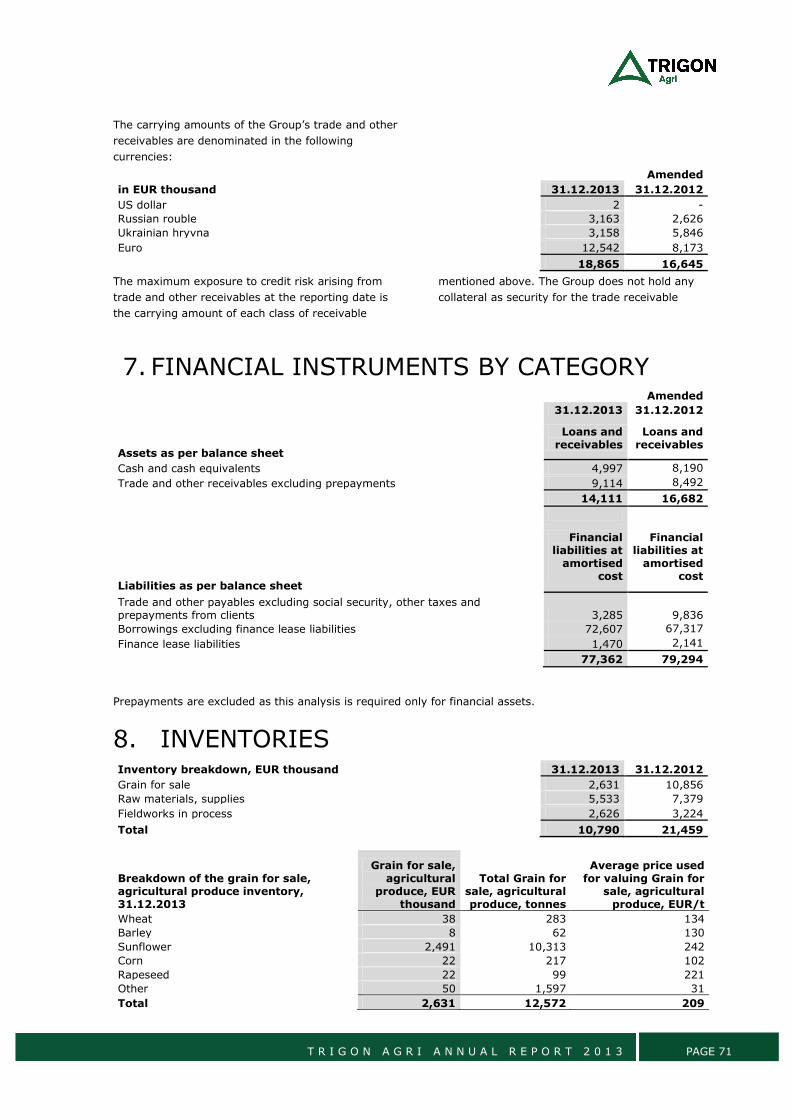
T R I G O N A G R I A N N U A L R E P O R T 2 0 1 3 PAGE 71
The carrying amounts of the Group’s trade and other
receivables are denominated in the following
currencies:
Amended
in EUR thousand 31.12.2013 31.12.2012
US dollar 2 -
Russian rouble 3,163 2,626
Ukrainian hryvna 3,158 5,846
Euro 12,542 8,173
18,865 16,645
The maximum exposure to credit risk arising from
trade and other receivables at the reporting date is
the carrying amount of each class of receivable
mentioned above. The Group does not hold any
collateral as security for the trade receivable
7. FINANCIAL INSTRUMENTS BY CATEGORY
Amended
31.12.2013 31.12.2012
Assets as per balance sheet
Loans and receivables
Loans and receivables
Cash and cash equivalents 4,997 8,190
Trade and other receivables excluding prepayments 9,114 8,492
14,111 16,682
Liabilities as per balance sheet
Financial liabilities at
amortised cost
Financial liabilities at
amortised cost
Trade and other payables excluding social security, other taxes and prepayments from clients 3,285 9,836
Borrowings excluding finance lease liabilities 72,607 67,317
Finance lease liabilities 1,470 2,141
77,362 79,294
Prepayments are excluded as this analysis is required only for financial assets.
8. INVENTORIES Inventory breakdown, EUR thousand 31.12.2013 31.12.2012
Grain for sale 2,631 10,856
Raw materials, supplies 5,533 7,379
Fieldworks in process 2,626 3,224
Total 10,790 21,459
Breakdown of the grain for sale, agricultural produce inventory, 31.12.2013
Grain for sale, agricultural
produce, EUR thousand
Total Grain for sale, agricultural produce, tonnes
Average price used for valuing Grain for
sale, agricultural produce, EUR/t
Wheat 38 283 134
Barley 8 62 130
Sunflower 2,491 10,313 242
Corn 22 217 102
Rapeseed 22 99 221
Other 50 1,597 31
Total 2,631 12,572 209
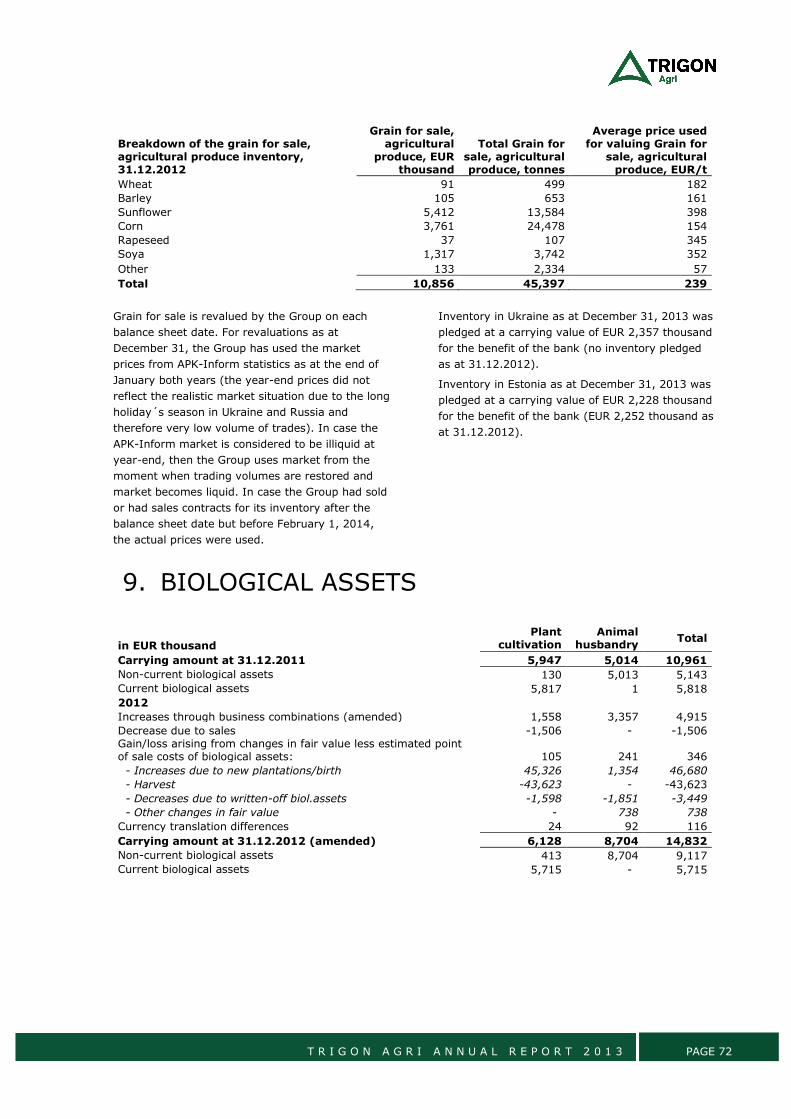
T R I G O N A G R I A N N U A L R E P O R T 2 0 1 3 PAGE 72
Breakdown of the grain for sale, agricultural produce inventory, 31.12.2012
Grain for sale, agricultural
produce, EUR thousand
Total Grain for sale, agricultural produce, tonnes
Average price used for valuing Grain for
sale, agricultural produce, EUR/t
Wheat 91 499 182
Barley 105 653 161
Sunflower 5,412 13,584 398
Corn 3,761 24,478 154
Rapeseed 37 107 345
Soya 1,317 3,742 352
Other 133 2,334 57
Total 10,856 45,397 239
Grain for sale is revalued by the Group on each
balance sheet date. For revaluations as at
December 31, the Group has used the market
prices from APK-Inform statistics as at the end of
January both years (the year-end prices did not
reflect the realistic market situation due to the long
holiday´s season in Ukraine and Russia and
therefore very low volume of trades). In case the
APK-Inform market is considered to be illiquid at
year-end, then the Group uses market from the
moment when trading volumes are restored and
market becomes liquid. In case the Group had sold
or had sales contracts for its inventory after the
balance sheet date but before February 1, 2014,
the actual prices were used.
Inventory in Ukraine as at December 31, 2013 was
pledged at a carrying value of EUR 2,357 thousand
for the benefit of the bank (no inventory pledged
as at 31.12.2012).
Inventory in Estonia as at December 31, 2013 was
pledged at a carrying value of EUR 2,228 thousand
for the benefit of the bank (EUR 2,252 thousand as
at 31.12.2012).
9. BIOLOGICAL ASSETS
in EUR thousand
Plant cultivation
Animal husbandry
Total
Carrying amount at 31.12.2011 5,947 5,014 10,961
Non-current biological assets 130 5,013 5,143
Current biological assets 5,817 1 5,818
2012 Increases through business combinations (amended) 1,558 3,357 4,915
Decrease due to sales -1,506 - -1,506 Gain/loss arising from changes in fair value less estimated point of sale costs of biological assets: 105 241 346
- Increases due to new plantations/birth 45,326 1,354 46,680
- Harvest -43,623 - -43,623
- Decreases due to written-off biol.assets -1,598 -1,851 -3,449
- Other changes in fair value - 738 738
Currency translation differences 24 92 116
Carrying amount at 31.12.2012 (amended) 6,128 8,704 14,832
Non-current biological assets 413 8,704 9,117
Current biological assets 5,715 - 5,715
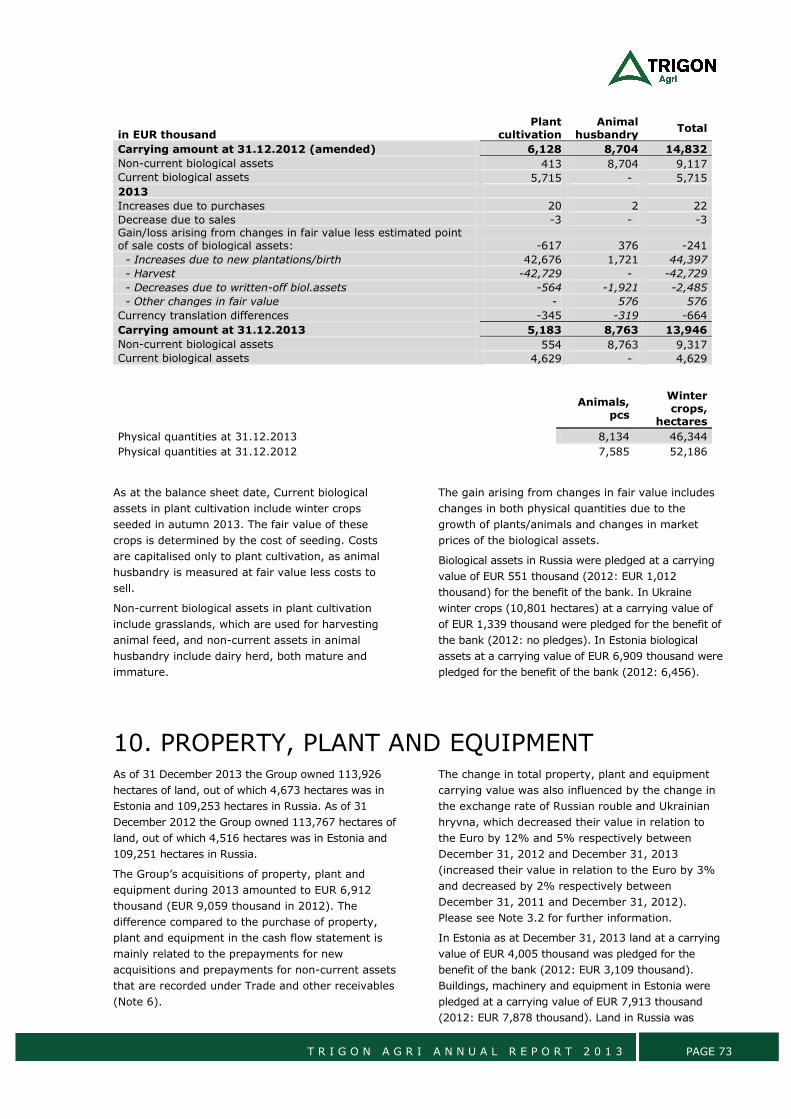
T R I G O N A G R I A N N U A L R E P O R T 2 0 1 3 PAGE 73
in EUR thousand Plant
cultivation Animal
husbandry Total
Carrying amount at 31.12.2012 (amended) 6,128 8,704 14,832
Non-current biological assets 413 8,704 9,117
Current biological assets 5,715 - 5,715
2013
Increases due to purchases 20 2 22
Decrease due to sales -3 - -3 Gain/loss arising from changes in fair value less estimated point of sale costs of biological assets: -617 376 -241
- Increases due to new plantations/birth 42,676 1,721 44,397
- Harvest -42,729 - -42,729
- Decreases due to written-off biol.assets -564 -1,921 -2,485
- Other changes in fair value - 576 576
Currency translation differences -345 -319 -664
Carrying amount at 31.12.2013 5,183 8,763 13,946
Non-current biological assets 554 8,763 9,317
Current biological assets 4,629 - 4,629
Animals, pcs
Winter crops,
hectares
Physical quantities at 31.12.2013 8,134 46,344
Physical quantities at 31.12.2012 7,585 52,186
As at the balance sheet date, Current biological
assets in plant cultivation include winter crops
seeded in autumn 2013. The fair value of these
crops is determined by the cost of seeding. Costs
are capitalised only to plant cultivation, as animal
husbandry is measured at fair value less costs to
sell.
Non-current biological assets in plant cultivation
include grasslands, which are used for harvesting
animal feed, and non-current assets in animal
husbandry include dairy herd, both mature and
immature.
The gain arising from changes in fair value includes
changes in both physical quantities due to the
growth of plants/animals and changes in market
prices of the biological assets.
Biological assets in Russia were pledged at a carrying
value of EUR 551 thousand (2012: EUR 1,012
thousand) for the benefit of the bank. In Ukraine
winter crops (10,801 hectares) at a carrying value of
of EUR 1,339 thousand were pledged for the benefit of
the bank (2012: no pledges). In Estonia biological
assets at a carrying value of EUR 6,909 thousand were
pledged for the benefit of the bank (2012: 6,456).
10. PROPERTY, PLANT AND EQUIPMENT As of 31 December 2013 the Group owned 113,926
hectares of land, out of which 4,673 hectares was in
Estonia and 109,253 hectares in Russia. As of 31
December 2012 the Group owned 113,767 hectares of
land, out of which 4,516 hectares was in Estonia and
109,251 hectares in Russia.
The Group’s acquisitions of property, plant and
equipment during 2013 amounted to EUR 6,912
thousand (EUR 9,059 thousand in 2012). The
difference compared to the purchase of property,
plant and equipment in the cash flow statement is
mainly related to the prepayments for new
acquisitions and prepayments for non-current assets
that are recorded under Trade and other receivables
(Note 6).
The change in total property, plant and equipment
carrying value was also influenced by the change in
the exchange rate of Russian rouble and Ukrainian
hryvna, which decreased their value in relation to
the Euro by 12% and 5% respectively between
December 31, 2012 and December 31, 2013
(increased their value in relation to the Euro by 3%
and decreased by 2% respectively between
December 31, 2011 and December 31, 2012).
Please see Note 3.2 for further information.
In Estonia as at December 31, 2013 land at a carrying
value of EUR 4,005 thousand was pledged for the
benefit of the bank (2012: EUR 3,109 thousand).
Buildings, machinery and equipment in Estonia were
pledged at a carrying value of EUR 7,913 thousand
(2012: EUR 7,878 thousand). Land in Russia was
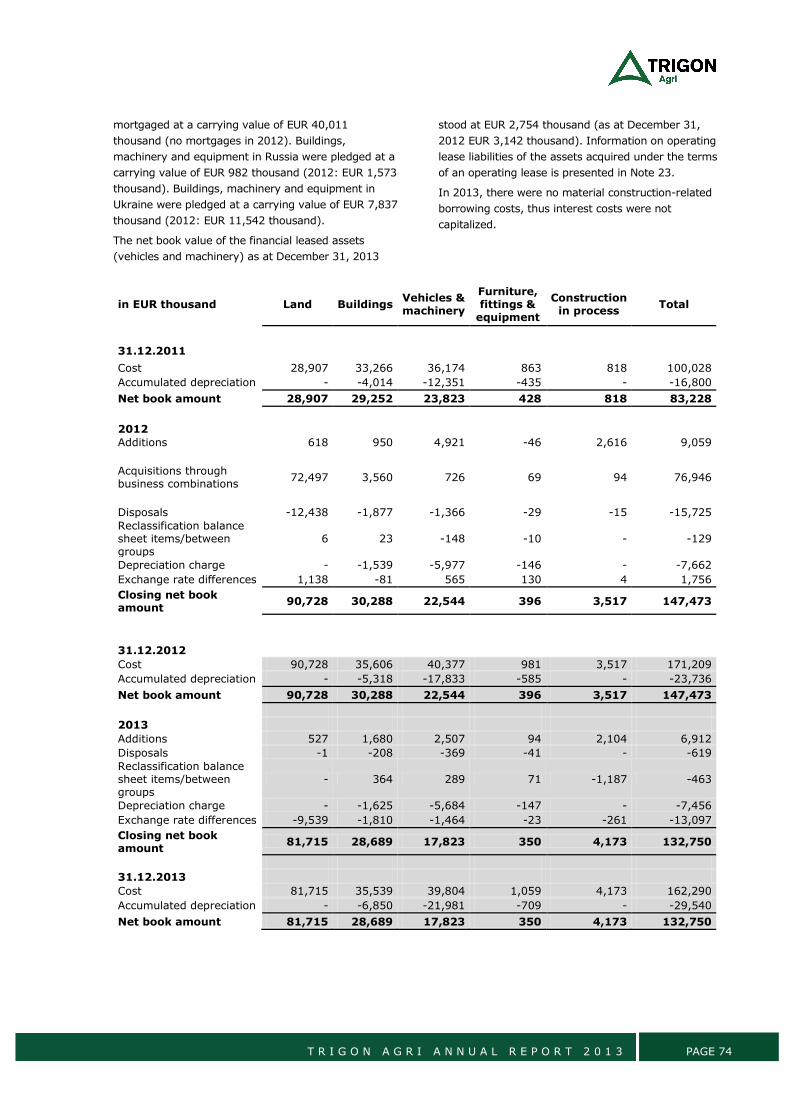
T R I G O N A G R I A N N U A L R E P O R T 2 0 1 3 PAGE 74
mortgaged at a carrying value of EUR 40,011
thousand (no mortgages in 2012). Buildings,
machinery and equipment in Russia were pledged at a
carrying value of EUR 982 thousand (2012: EUR 1,573
thousand). Buildings, machinery and equipment in
Ukraine were pledged at a carrying value of EUR 7,837
thousand (2012: EUR 11,542 thousand).
The net book value of the financial leased assets
(vehicles and machinery) as at December 31, 2013
stood at EUR 2,754 thousand (as at December 31,
2012 EUR 3,142 thousand). Information on operating
lease liabilities of the assets acquired under the terms
of an operating lease is presented in Note 23.
In 2013, there were no material construction-related
borrowing costs, thus interest costs were not
capitalized.
in EUR thousand Land Buildings Vehicles & machinery
Furniture, fittings &
equipment
Construction in process
Total
31.12.2011
Cost 28,907 33,266 36,174 863 818 100,028
Accumulated depreciation - -4,014 -12,351 -435 - -16,800
Net book amount 28,907 29,252 23,823 428 818 83,228
2012
Additions 618 950 4,921 -46 2,616 9,059
Acquisitions through business combinations
72,497 3,560 726 69 94 76,946
Disposals -12,438 -1,877 -1,366 -29 -15 -15,725
Reclassification balance sheet items/between groups
6 23 -148 -10 - -129
Depreciation charge - -1,539 -5,977 -146 - -7,662
Exchange rate differences 1,138 -81 565 130 4 1,756
Closing net book amount
90,728 30,288 22,544 396 3,517 147,473
31.12.2012
Cost 90,728 35,606 40,377 981 3,517 171,209
Accumulated depreciation - -5,318 -17,833 -585 - -23,736
Net book amount 90,728 30,288 22,544 396 3,517 147,473
2013
Additions 527 1,680 2,507 94 2,104 6,912
Disposals -1 -208 -369 -41 - -619
Reclassification balance sheet items/between groups
- 364 289 71 -1,187 -463
Depreciation charge - -1,625 -5,684 -147 - -7,456
Exchange rate differences -9,539 -1,810 -1,464 -23 -261 -13,097
Closing net book amount
81,715 28,689 17,823 350 4,173 132,750
31.12.2013
Cost 81,715 35,539 39,804 1,059 4,173 162,290
Accumulated depreciation - -6,850 -21,981 -709 - -29,540
Net book amount 81,715 28,689 17,823 350 4,173 132,750
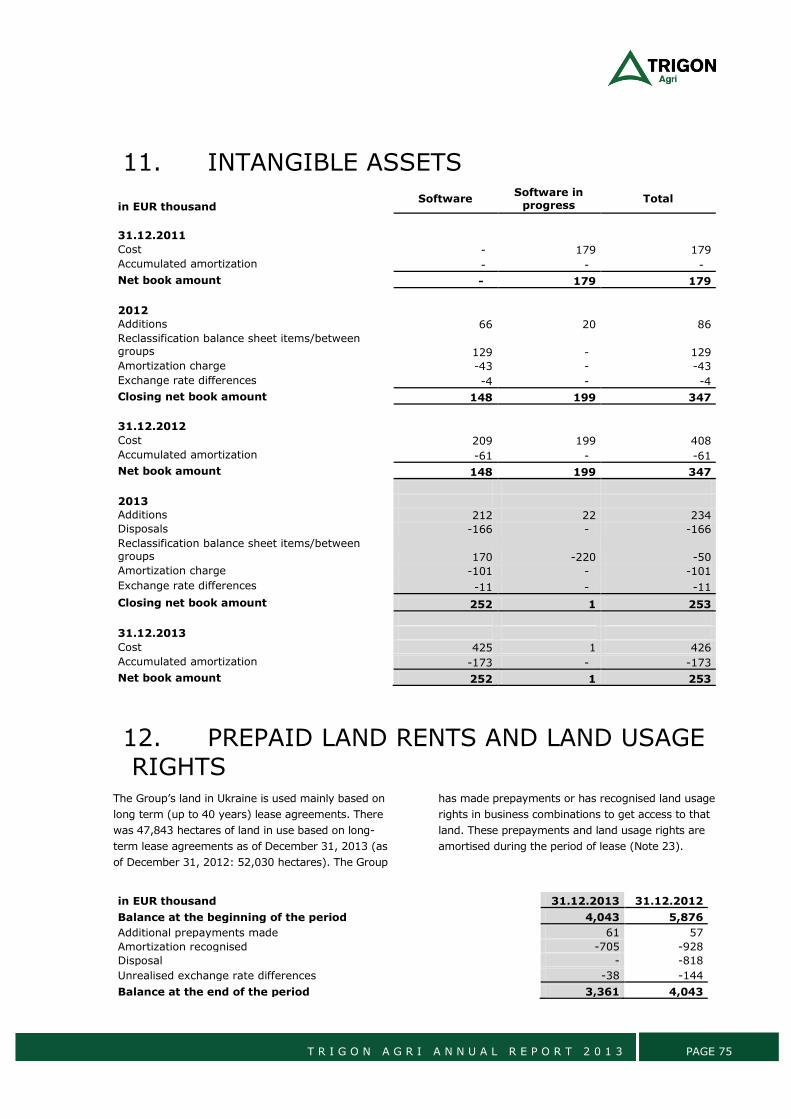
T R I G O N A G R I A N N U A L R E P O R T 2 0 1 3 PAGE 75
11. INTANGIBLE ASSETS
in EUR thousand Software
Software in progress
Total
31.12.2011
Cost - 179 179
Accumulated amortization - - -
Net book amount - 179 179
2012 Additions 66 20 86
Reclassification balance sheet items/between groups 129 - 129
Amortization charge -43 - -43
Exchange rate differences -4 - -4
Closing net book amount 148 199 347
31.12.2012
Cost 209 199 408
Accumulated amortization -61 - -61
Net book amount 148 199 347
2013
Additions 212 22 234
Disposals -166 - -166
Reclassification balance sheet items/between groups 170 -220 -50
Amortization charge -101 - -101
Exchange rate differences -11 - -11
Closing net book amount 252 1 253
31.12.2013
Cost 425 1 426
Accumulated amortization -173 - -173
Net book amount 252 1 253
12. PREPAID LAND RENTS AND LAND USAGE RIGHTS
The Group’s land in Ukraine is used mainly based on
long term (up to 40 years) lease agreements. There
was 47,843 hectares of land in use based on long-
term lease agreements as of December 31, 2013 (as
of December 31, 2012: 52,030 hectares). The Group
has made prepayments or has recognised land usage
rights in business combinations to get access to that
land. These prepayments and land usage rights are
amortised during the period of lease (Note 23).
in EUR thousand 31.12.2013 31.12.2012
Balance at the beginning of the period 4,043 5,876
Additional prepayments made 61 57
Amortization recognised -705 -928
Disposal - -818
Unrealised exchange rate differences -38 -144
Balance at the end of the period 3,361 4,043
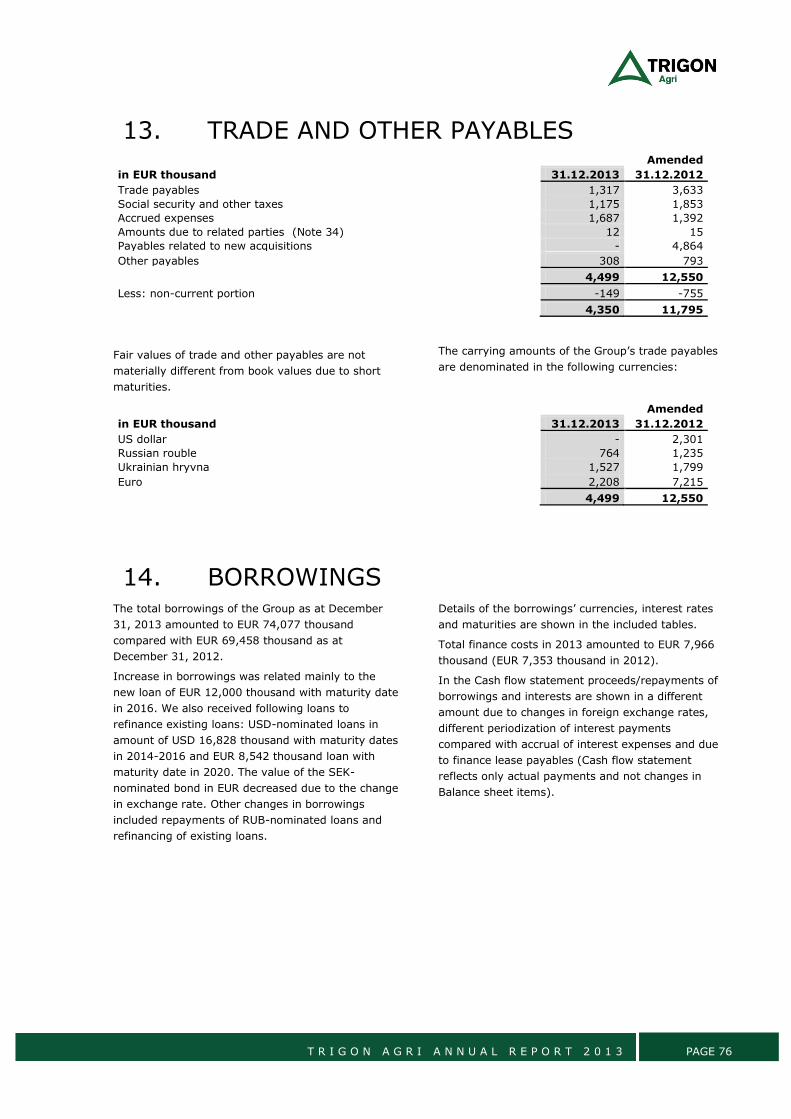
T R I G O N A G R I A N N U A L R E P O R T 2 0 1 3 PAGE 76
13. TRADE AND OTHER PAYABLES
Amended
in EUR thousand 31.12.2013 31.12.2012
Trade payables 1,317 3,633
Social security and other taxes 1,175 1,853
Accrued expenses 1,687 1,392
Amounts due to related parties (Note 34) 12 15
Payables related to new acquisitions - 4,864
Other payables 308 793
4,499 12,550
Less: non-current portion -149 -755
4,350 11,795
Fair values of trade and other payables are not
materially different from book values due to short
maturities.
The carrying amounts of the Group’s trade payables
are denominated in the following currencies:
Amended
in EUR thousand 31.12.2013 31.12.2012
US dollar - 2,301
Russian rouble 764 1,235
Ukrainian hryvna 1,527 1,799
Euro 2,208 7,215
4,499 12,550
14. BORROWINGS The total borrowings of the Group as at December
31, 2013 amounted to EUR 74,077 thousand
compared with EUR 69,458 thousand as at
December 31, 2012.
Increase in borrowings was related mainly to the
new loan of EUR 12,000 thousand with maturity date
in 2016. We also received following loans to
refinance existing loans: USD-nominated loans in
amount of USD 16,828 thousand with maturity dates
in 2014-2016 and EUR 8,542 thousand loan with
maturity date in 2020. The value of the SEK-
nominated bond in EUR decreased due to the change
in exchange rate. Other changes in borrowings
included repayments of RUB-nominated loans and
refinancing of existing loans.
Details of the borrowings’ currencies, interest rates
and maturities are shown in the included tables.
Total finance costs in 2013 amounted to EUR 7,966
thousand (EUR 7,353 thousand in 2012).
In the Cash flow statement proceeds/repayments of
borrowings and interests are shown in a different
amount due to changes in foreign exchange rates,
different periodization of interest payments
compared with accrual of interest expenses and due
to finance lease payables (Cash flow statement
reflects only actual payments and not changes in
Balance sheet items).
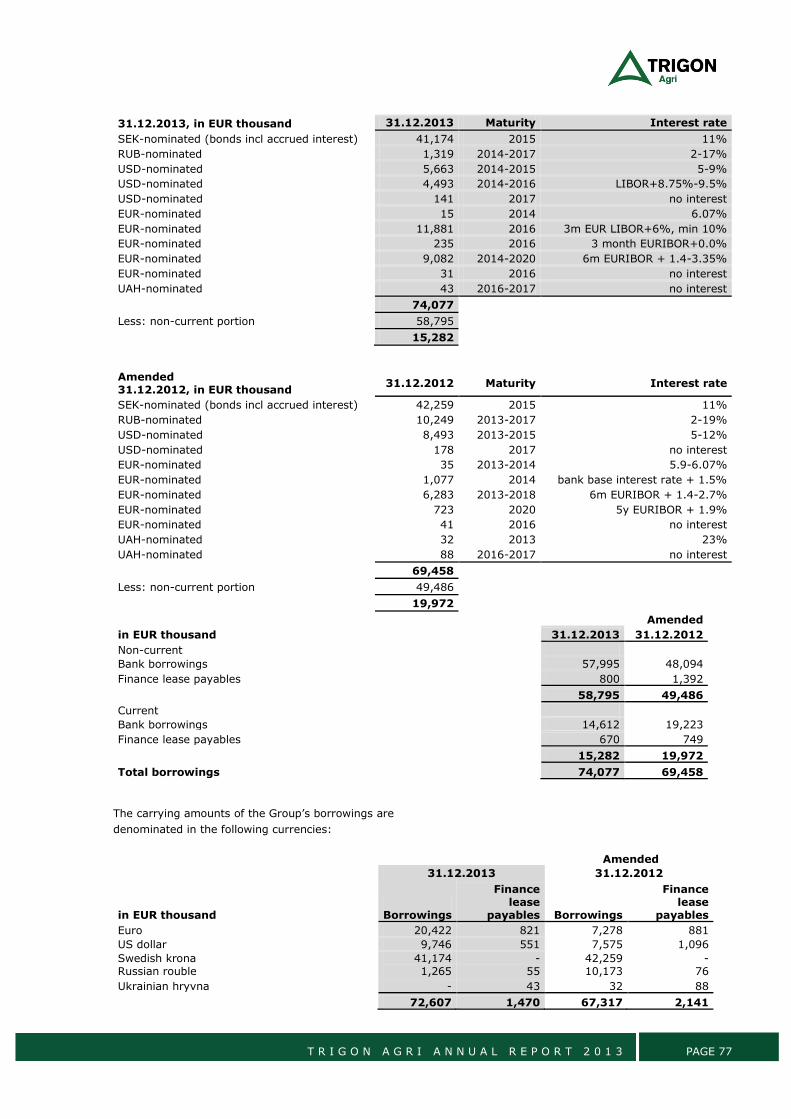
T R I G O N A G R I A N N U A L R E P O R T 2 0 1 3 PAGE 77
31.12.2013, in EUR thousand 31.12.2013 Maturity Interest rate
SEK-nominated (bonds incl accrued interest) 41,174 2015 11%
RUB-nominated 1,319 2014-2017 2-17%
USD-nominated 5,663 2014-2015 5-9%
USD-nominated 4,493 2014-2016 LIBOR+8.75%-9.5%
USD-nominated 141 2017 no interest
EUR-nominated 15 2014 6.07%
EUR-nominated 11,881 2016 3m EUR LIBOR+6%, min 10%
EUR-nominated 235 2016 3 month EURIBOR+0.0%
EUR-nominated 9,082 2014-2020 6m EURIBOR + 1.4-3.35%
EUR-nominated 31 2016 no interest
UAH-nominated 43 2016-2017 no interest
74,077
Less: non-current portion 58,795
15,282
Amended 31.12.2012, in EUR thousand
31.12.2012 Maturity Interest rate
SEK-nominated (bonds incl accrued interest) 42,259 2015 11%
RUB-nominated 10,249 2013-2017 2-19%
USD-nominated 8,493 2013-2015 5-12%
USD-nominated 178 2017 no interest
EUR-nominated 35 2013-2014 5.9-6.07%
EUR-nominated 1,077 2014 bank base interest rate + 1.5%
EUR-nominated 6,283 2013-2018 6m EURIBOR + 1.4-2.7%
EUR-nominated 723 2020 5y EURIBOR + 1.9%
EUR-nominated 41 2016 no interest
UAH-nominated 32 2013 23%
UAH-nominated 88 2016-2017 no interest
69,458
Less: non-current portion 49,486
19,972
Amended
in EUR thousand 31.12.2013 31.12.2012
Non-current Bank borrowings 57,995 48,094
Finance lease payables 800 1,392
58,795 49,486
Current Bank borrowings 14,612 19,223
Finance lease payables 670 749
15,282 19,972
Total borrowings 74,077 69,458
The carrying amounts of the Group’s borrowings are
denominated in the following currencies:
Amended
31.12.2013 31.12.2012
in EUR thousand
Borrowings
Finance lease
payables Borrowings
Finance lease
payables
Euro 20,422 821 7,278 881
US dollar 9,746 551 7,575 1,096
Swedish krona 41,174 - 42,259 - Russian rouble 1,265 55 10,173 76
Ukrainian hryvna - 43 32 88
72,607 1,470 67,317 2,141
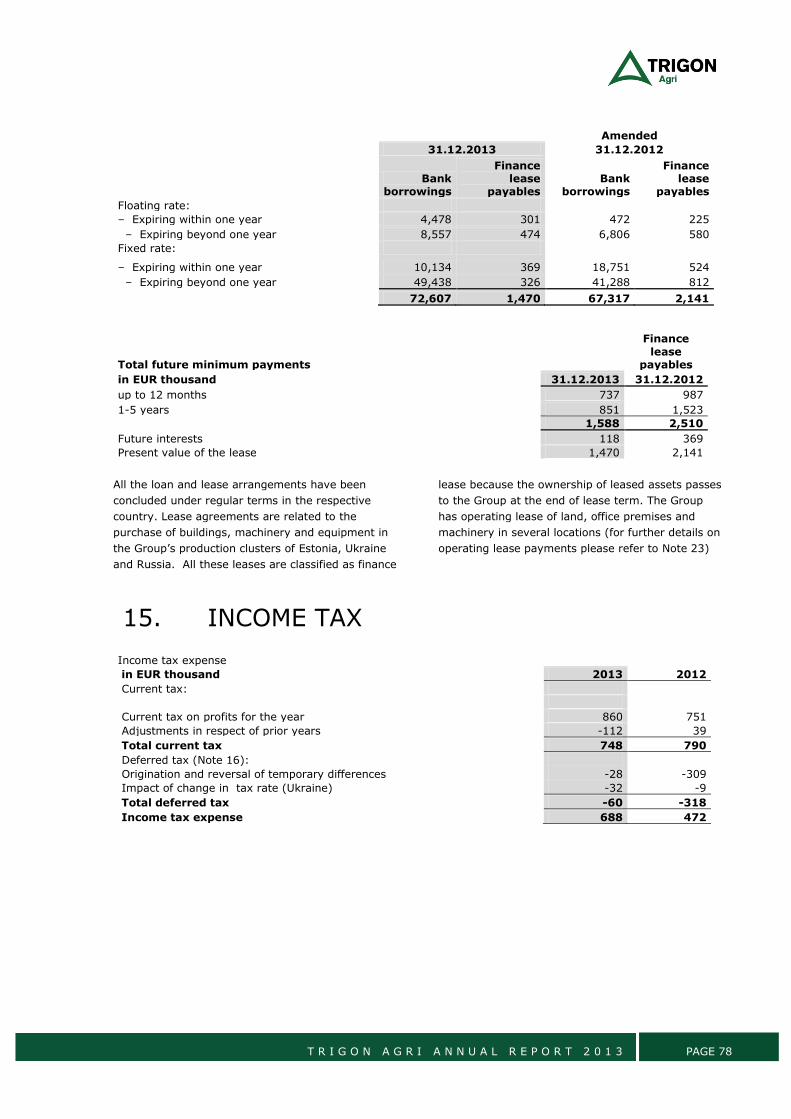
T R I G O N A G R I A N N U A L R E P O R T 2 0 1 3 PAGE 78
Amended
31.12.2013 31.12.2012
Bank borrowings
Finance lease
payables Bank
borrowings
Finance lease
payables
Floating rate: – Expiring within one year 4,478 301 472 225
– Expiring beyond one year 8,557 474 6,806 580
Fixed rate:
– Expiring within one year 10,134 369 18,751 524
– Expiring beyond one year 49,438 326 41,288 812
72,607 1,470 67,317 2,141
Total future minimum payments
Finance
lease payables
in EUR thousand 31.12.2013 31.12.2012
up to 12 months 737 987
1-5 years 851 1,523
1,588 2,510
Future interests 118 369
Present value of the lease 1,470 2,141
All the loan and lease arrangements have been
concluded under regular terms in the respective
country. Lease agreements are related to the
purchase of buildings, machinery and equipment in
the Group’s production clusters of Estonia, Ukraine
and Russia. All these leases are classified as finance
lease because the ownership of leased assets passes
to the Group at the end of lease term. The Group
has operating lease of land, office premises and
machinery in several locations (for further details on
operating lease payments please refer to Note 23)
15. INCOME TAX
Income tax expense in EUR thousand 2013 2012
Current tax:
Current tax on profits for the year 860 751
Adjustments in respect of prior years -112 39
Total current tax 748 790
Deferred tax (Note 16): Origination and reversal of temporary differences -28 -309
Impact of change in tax rate (Ukraine) -32 -9
Total deferred tax -60 -318
Income tax expense 688 472
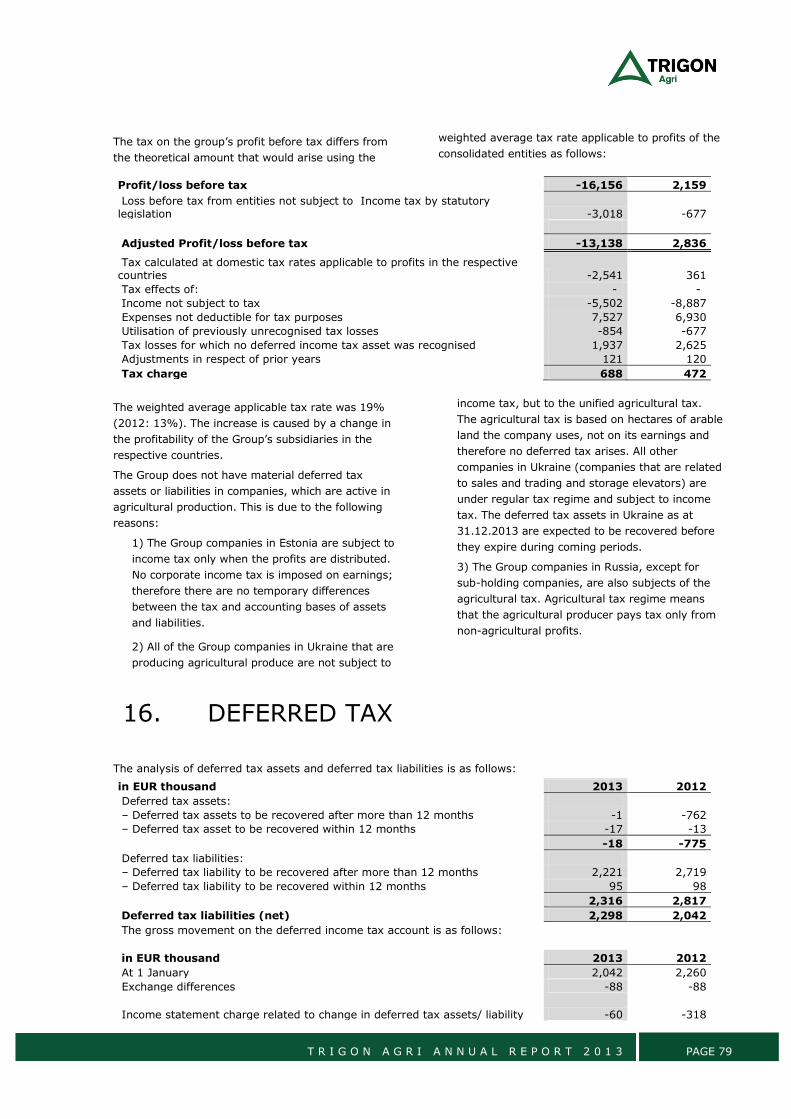
T R I G O N A G R I A N N U A L R E P O R T 2 0 1 3 PAGE 79
The tax on the group’s profit before tax differs from
the theoretical amount that would arise using the
weighted average tax rate applicable to profits of the
consolidated entities as follows:
Profit/loss before tax -16,156 2,159
Loss before tax from entities not subject to Income tax by statutory legislation -3,018 -677
Adjusted Profit/loss before tax -13,138 2,836
Tax calculated at domestic tax rates applicable to profits in the respective countries -2,541 361
Tax effects of: - -
Income not subject to tax -5,502 -8,887
Expenses not deductible for tax purposes 7,527 6,930
Utilisation of previously unrecognised tax losses -854 -677
Tax losses for which no deferred income tax asset was recognised 1,937 2,625
Adjustments in respect of prior years 121 120
Tax charge 688 472
The weighted average applicable tax rate was 19%
(2012: 13%). The increase is caused by a change in
the profitability of the Group’s subsidiaries in the
respective countries.
The Group does not have material deferred tax
assets or liabilities in companies, which are active in
agricultural production. This is due to the following
reasons:
1) The Group companies in Estonia are subject to
income tax only when the profits are distributed.
No corporate income tax is imposed on earnings;
therefore there are no temporary differences
between the tax and accounting bases of assets
and liabilities.
2) All of the Group companies in Ukraine that are
producing agricultural produce are not subject to
income tax, but to the unified agricultural tax.
The agricultural tax is based on hectares of arable
land the company uses, not on its earnings and
therefore no deferred tax arises. All other
companies in Ukraine (companies that are related
to sales and trading and storage elevators) are
under regular tax regime and subject to income
tax. The deferred tax assets in Ukraine as at
31.12.2013 are expected to be recovered before
they expire during coming periods.
3) The Group companies in Russia, except for
sub-holding companies, are also subjects of the
agricultural tax. Agricultural tax regime means
that the agricultural producer pays tax only from
non-agricultural profits.
16. DEFERRED TAX
The analysis of deferred tax assets and deferred tax liabilities is as follows:
in EUR thousand 2013 2012
Deferred tax assets: – Deferred tax assets to be recovered after more than 12 months -1 -762
– Deferred tax asset to be recovered within 12 months -17 -13
-18 -775
Deferred tax liabilities: – Deferred tax liability to be recovered after more than 12 months 2,221 2,719
– Deferred tax liability to be recovered within 12 months 95 98
2,316 2,817
Deferred tax liabilities (net) 2,298 2,042
The gross movement on the deferred income tax account is as follows:
in EUR thousand 2013 2012
At 1 January 2,042 2,260
Exchange differences -88 -88
Income statement charge related to change in deferred tax assets/ liability -60 -318
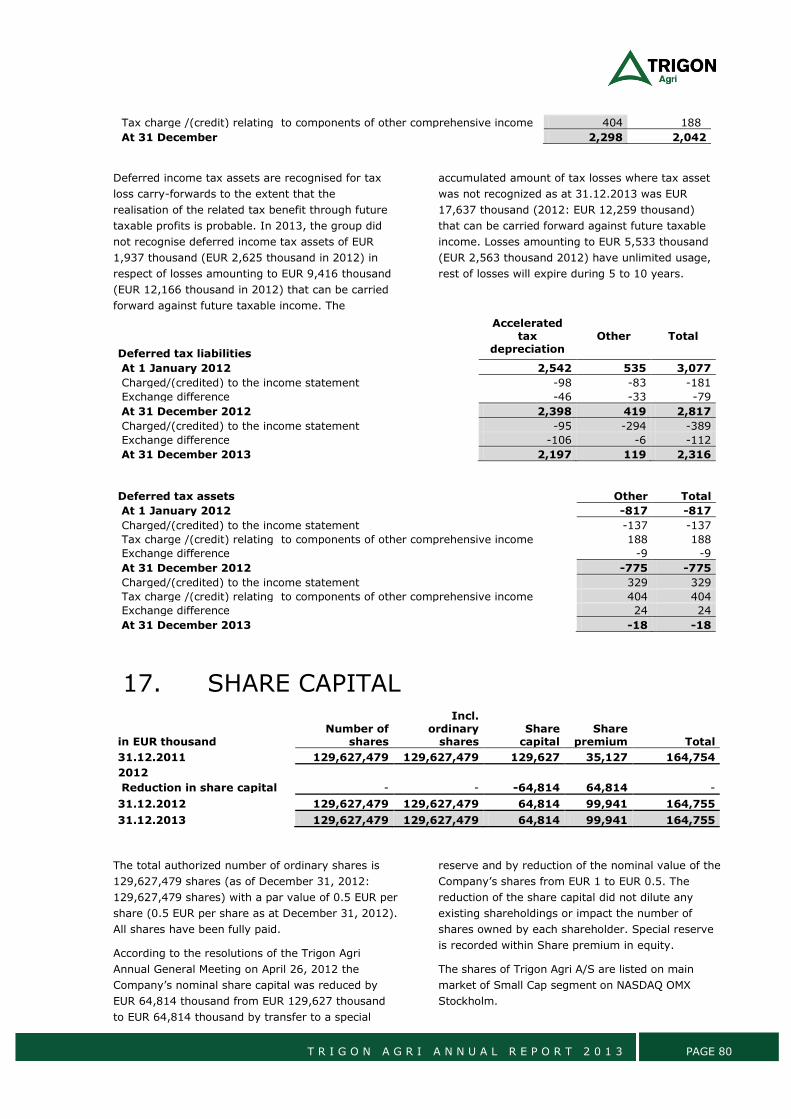
T R I G O N A G R I A N N U A L R E P O R T 2 0 1 3 PAGE 80
Tax charge /(credit) relating to components of other comprehensive income 404 188
At 31 December 2,298 2,042
Deferred income tax assets are recognised for tax
loss carry-forwards to the extent that the
realisation of the related tax benefit through future
taxable profits is probable. In 2013, the group did
not recognise deferred income tax assets of EUR
1,937 thousand (EUR 2,625 thousand in 2012) in
respect of losses amounting to EUR 9,416 thousand
(EUR 12,166 thousand in 2012) that can be carried
forward against future taxable income. The
accumulated amount of tax losses where tax asset
was not recognized as at 31.12.2013 was EUR
17,637 thousand (2012: EUR 12,259 thousand)
that can be carried forward against future taxable
income. Losses amounting to EUR 5,533 thousand
(EUR 2,563 thousand 2012) have unlimited usage,
rest of losses will expire during 5 to 10 years.
Deferred tax liabilities
Accelerated tax
depreciation Other Total
At 1 January 2012 2,542 535 3,077
Charged/(credited) to the income statement -98 -83 -181
Exchange difference -46 -33 -79
At 31 December 2012 2,398 419 2,817
Charged/(credited) to the income statement -95 -294 -389
Exchange difference -106 -6 -112
At 31 December 2013 2,197 119 2,316
Deferred tax assets
Other Total
At 1 January 2012
-817 -817
Charged/(credited) to the income statement
-137 -137
Tax charge /(credit) relating to components of other comprehensive income 188 188
Exchange difference
-9 -9
At 31 December 2012
-775 -775
Charged/(credited) to the income statement
329 329
Tax charge /(credit) relating to components of other comprehensive income 404 404
Exchange difference
24 24
At 31 December 2013
-18 -18
17. SHARE CAPITAL
in EUR thousand Number of
shares
Incl. ordinary
shares Share capital
Share premium Total
31.12.2011 129,627,479 129,627,479 129,627 35,127 164,754
2012 Reduction in share capital - - -64,814 64,814 -
31.12.2012 129,627,479 129,627,479 64,814 99,941 164,755
31.12.2013 129,627,479 129,627,479 64,814 99,941 164,755
The total authorized number of ordinary shares is
129,627,479 shares (as of December 31, 2012:
129,627,479 shares) with a par value of 0.5 EUR per
share (0.5 EUR per share as at December 31, 2012).
All shares have been fully paid.
According to the resolutions of the Trigon Agri
Annual General Meeting on April 26, 2012 the
Company’s nominal share capital was reduced by
EUR 64,814 thousand from EUR 129,627 thousand
to EUR 64,814 thousand by transfer to a special
reserve and by reduction of the nominal value of the
Company’s shares from EUR 1 to EUR 0.5. The
reduction of the share capital did not dilute any
existing shareholdings or impact the number of
shares owned by each shareholder. Special reserve
is recorded within Share premium in equity.
The shares of Trigon Agri A/S are listed on main
market of Small Cap segment on NASDAQ OMX
Stockholm.
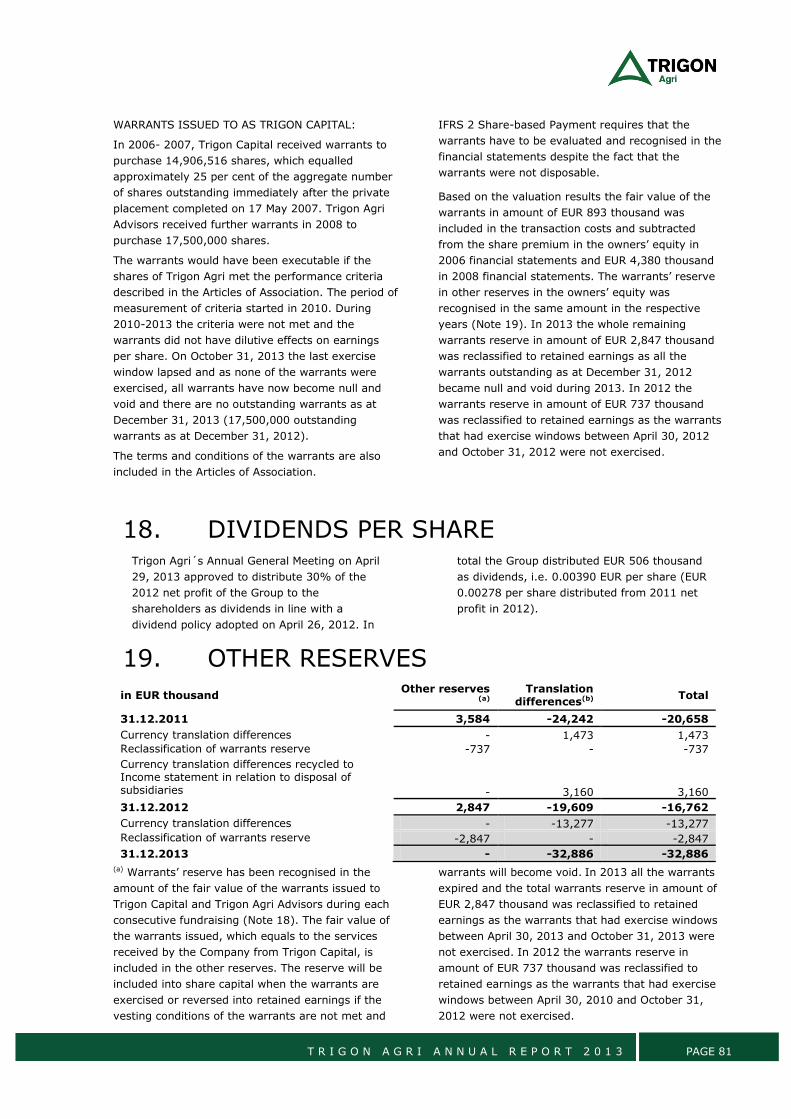
T R I G O N A G R I A N N U A L R E P O R T 2 0 1 3 PAGE 81
WARRANTS ISSUED TO AS TRIGON CAPITAL:
In 2006- 2007, Trigon Capital received warrants to
purchase 14,906,516 shares, which equalled
approximately 25 per cent of the aggregate number
of shares outstanding immediately after the private
placement completed on 17 May 2007. Trigon Agri
Advisors received further warrants in 2008 to
purchase 17,500,000 shares.
The warrants would have been executable if the
shares of Trigon Agri met the performance criteria
described in the Articles of Association. The period of
measurement of criteria started in 2010. During
2010-2013 the criteria were not met and the
warrants did not have dilutive effects on earnings
per share. On October 31, 2013 the last exercise
window lapsed and as none of the warrants were
exercised, all warrants have now become null and
void and there are no outstanding warrants as at
December 31, 2013 (17,500,000 outstanding
warrants as at December 31, 2012).
The terms and conditions of the warrants are also
included in the Articles of Association.
IFRS 2 Share-based Payment requires that the
warrants have to be evaluated and recognised in the
financial statements despite the fact that the
warrants were not disposable.
Based on the valuation results the fair value of the
warrants in amount of EUR 893 thousand was
included in the transaction costs and subtracted
from the share premium in the owners’ equity in
2006 financial statements and EUR 4,380 thousand
in 2008 financial statements. The warrants’ reserve
in other reserves in the owners’ equity was
recognised in the same amount in the respective
years (Note 19). In 2013 the whole remaining
warrants reserve in amount of EUR 2,847 thousand
was reclassified to retained earnings as all the
warrants outstanding as at December 31, 2012
became null and void during 2013. In 2012 the
warrants reserve in amount of EUR 737 thousand
was reclassified to retained earnings as the warrants
that had exercise windows between April 30, 2012
and October 31, 2012 were not exercised.
18. DIVIDENDS PER SHARE Trigon Agri´s Annual General Meeting on April
29, 2013 approved to distribute 30% of the
2012 net profit of the Group to the
shareholders as dividends in line with a
dividend policy adopted on April 26, 2012. In
total the Group distributed EUR 506 thousand
as dividends, i.e. 0.00390 EUR per share (EUR
0.00278 per share distributed from 2011 net
profit in 2012).
19. OTHER RESERVES
in EUR thousand Other reserves
(a) Translation
differences(b) Total
31.12.2011 3,584 -24,242 -20,658
Currency translation differences - 1,473 1,473
Reclassification of warrants reserve -737 - -737
Currency translation differences recycled to Income statement in relation to disposal of subsidiaries - 3,160 3,160
31.12.2012 2,847 -19,609 -16,762
Currency translation differences - -13,277 -13,277
Reclassification of warrants reserve -2,847 - -2,847
31.12.2013 - -32,886 -32,886
(a) Warrants’ reserve has been recognised in the
amount of the fair value of the warrants issued to
Trigon Capital and Trigon Agri Advisors during each
consecutive fundraising (Note 18). The fair value of
the warrants issued, which equals to the services
received by the Company from Trigon Capital, is
included in the other reserves. The reserve will be
included into share capital when the warrants are
exercised or reversed into retained earnings if the
vesting conditions of the warrants are not met and
warrants will become void. In 2013 all the warrants
expired and the total warrants reserve in amount of
EUR 2,847 thousand was reclassified to retained
earnings as the warrants that had exercise windows
between April 30, 2013 and October 31, 2013 were
not exercised. In 2012 the warrants reserve in
amount of EUR 737 thousand was reclassified to
retained earnings as the warrants that had exercise
windows between April 30, 2010 and October 31,
2012 were not exercised.
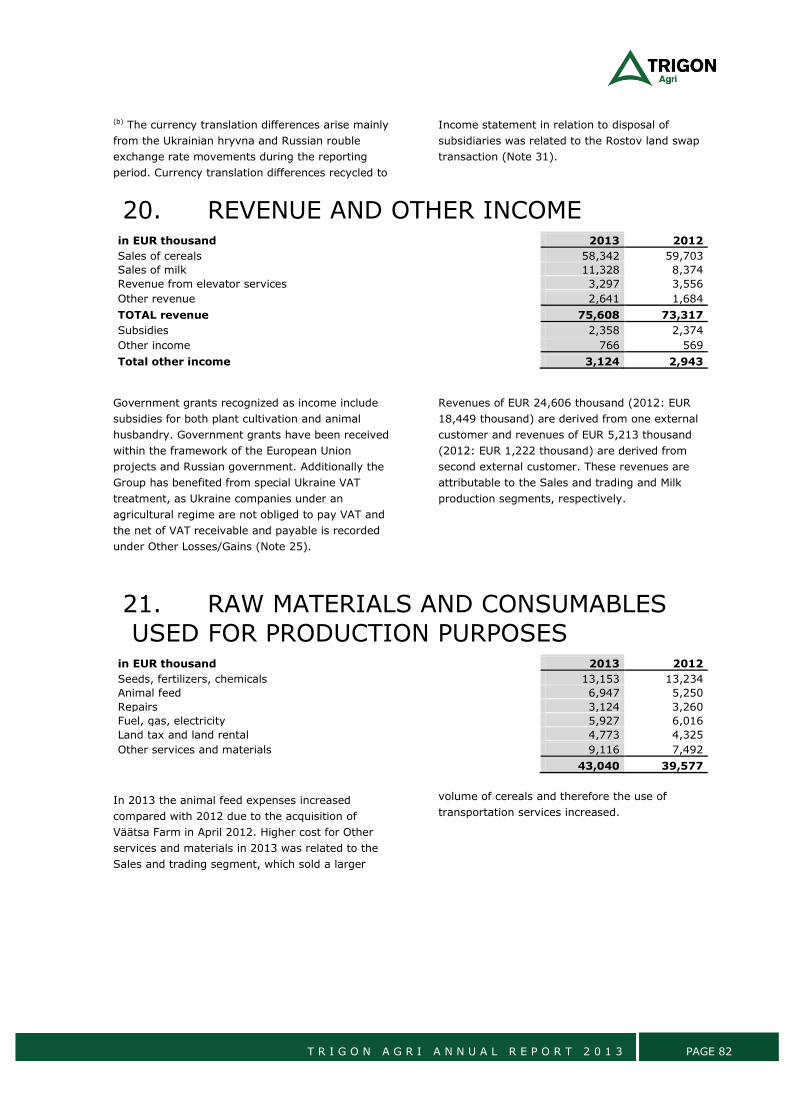
T R I G O N A G R I A N N U A L R E P O R T 2 0 1 3 PAGE 82
(b) The currency translation differences arise mainly
from the Ukrainian hryvna and Russian rouble
exchange rate movements during the reporting
period. Currency translation differences recycled to
Income statement in relation to disposal of
subsidiaries was related to the Rostov land swap
transaction (Note 31).
20. REVENUE AND OTHER INCOME in EUR thousand 2013 2012
Sales of cereals 58,342 59,703
Sales of milk 11,328 8,374
Revenue from elevator services 3,297 3,556
Other revenue 2,641 1,684
TOTAL revenue 75,608 73,317
Subsidies 2,358 2,374
Other income 766 569
Total other income 3,124 2,943
Government grants recognized as income include
subsidies for both plant cultivation and animal
husbandry. Government grants have been received
within the framework of the European Union
projects and Russian government. Additionally the
Group has benefited from special Ukraine VAT
treatment, as Ukraine companies under an
agricultural regime are not obliged to pay VAT and
the net of VAT receivable and payable is recorded
under Other Losses/Gains (Note 25).
Revenues of EUR 24,606 thousand (2012: EUR
18,449 thousand) are derived from one external
customer and revenues of EUR 5,213 thousand
(2012: EUR 1,222 thousand) are derived from
second external customer. These revenues are
attributable to the Sales and trading and Milk
production segments, respectively.
21. RAW MATERIALS AND CONSUMABLES
USED FOR PRODUCTION PURPOSES in EUR thousand 2013 2012
Seeds, fertilizers, chemicals 13,153 13,234
Animal feed 6,947 5,250
Repairs 3,124 3,260
Fuel, gas, electricity 5,927 6,016
Land tax and land rental 4,773 4,325
Other services and materials 9,116 7,492
43,040 39,577
In 2013 the animal feed expenses increased
compared with 2012 due to the acquisition of
Väätsa Farm in April 2012. Higher cost for Other
services and materials in 2013 was related to the
Sales and trading segment, which sold a larger
volume of cereals and therefore the use of
transportation services increased.
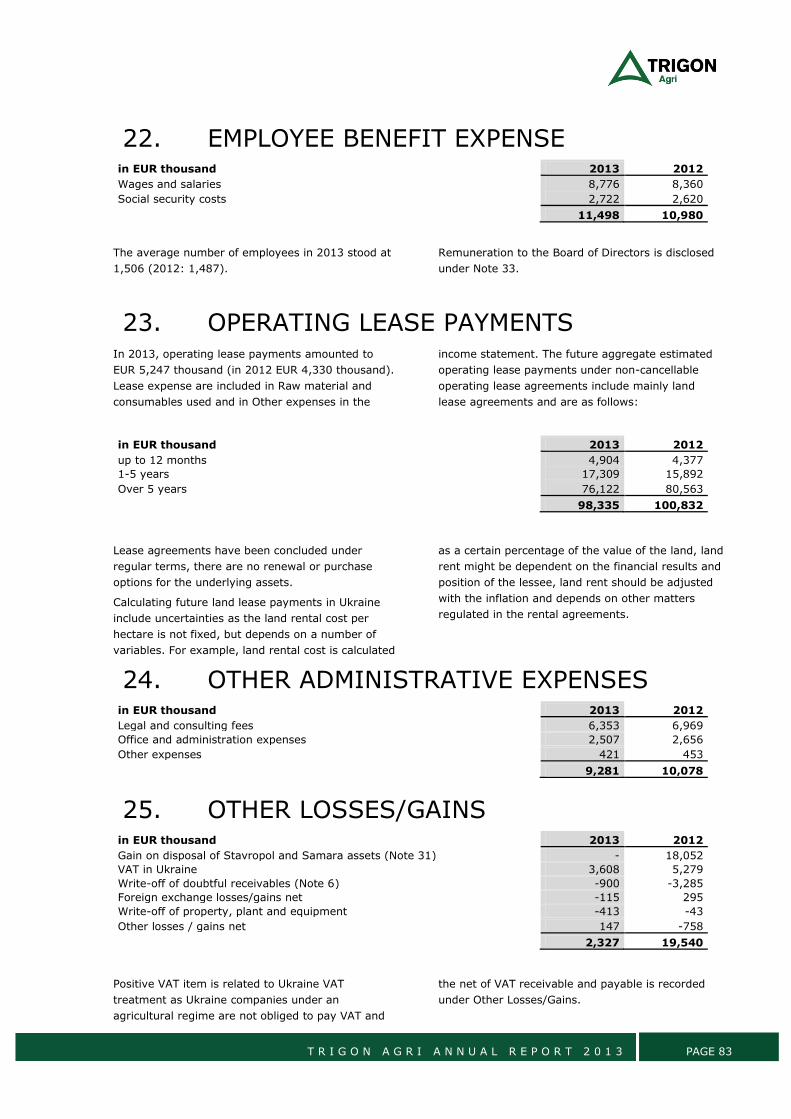
T R I G O N A G R I A N N U A L R E P O R T 2 0 1 3 PAGE 83
22. EMPLOYEE BENEFIT EXPENSE in EUR thousand 2013 2012
Wages and salaries 8,776 8,360
Social security costs 2,722 2,620
11,498 10,980
The average number of employees in 2013 stood at
1,506 (2012: 1,487).
Remuneration to the Board of Directors is disclosed
under Note 33.
23. OPERATING LEASE PAYMENTS In 2013, operating lease payments amounted to
EUR 5,247 thousand (in 2012 EUR 4,330 thousand).
Lease expense are included in Raw material and
consumables used and in Other expenses in the
income statement. The future aggregate estimated
operating lease payments under non-cancellable
operating lease agreements include mainly land
lease agreements and are as follows:
in EUR thousand 2013 2012
up to 12 months 4,904 4,377
1-5 years 17,309 15,892
Over 5 years 76,122 80,563
98,335 100,832
Lease agreements have been concluded under
regular terms, there are no renewal or purchase
options for the underlying assets.
Calculating future land lease payments in Ukraine
include uncertainties as the land rental cost per
hectare is not fixed, but depends on a number of
variables. For example, land rental cost is calculated
as a certain percentage of the value of the land, land
rent might be dependent on the financial results and
position of the lessee, land rent should be adjusted
with the inflation and depends on other matters
regulated in the rental agreements.
24. OTHER ADMINISTRATIVE EXPENSES in EUR thousand 2013 2012
Legal and consulting fees 6,353 6,969
Office and administration expenses 2,507 2,656
Other expenses 421 453
9,281 10,078
25. OTHER LOSSES/GAINS in EUR thousand 2013 2012
Gain on disposal of Stavropol and Samara assets (Note 31) - 18,052
VAT in Ukraine 3,608 5,279
Write-off of doubtful receivables (Note 6) -900 -3,285
Foreign exchange losses/gains net -115 295
Write-off of property, plant and equipment -413 -43
Other losses / gains net 147 -758
2,327 19,540
Positive VAT item is related to Ukraine VAT
treatment as Ukraine companies under an
agricultural regime are not obliged to pay VAT and
the net of VAT receivable and payable is recorded
under Other Losses/Gains.
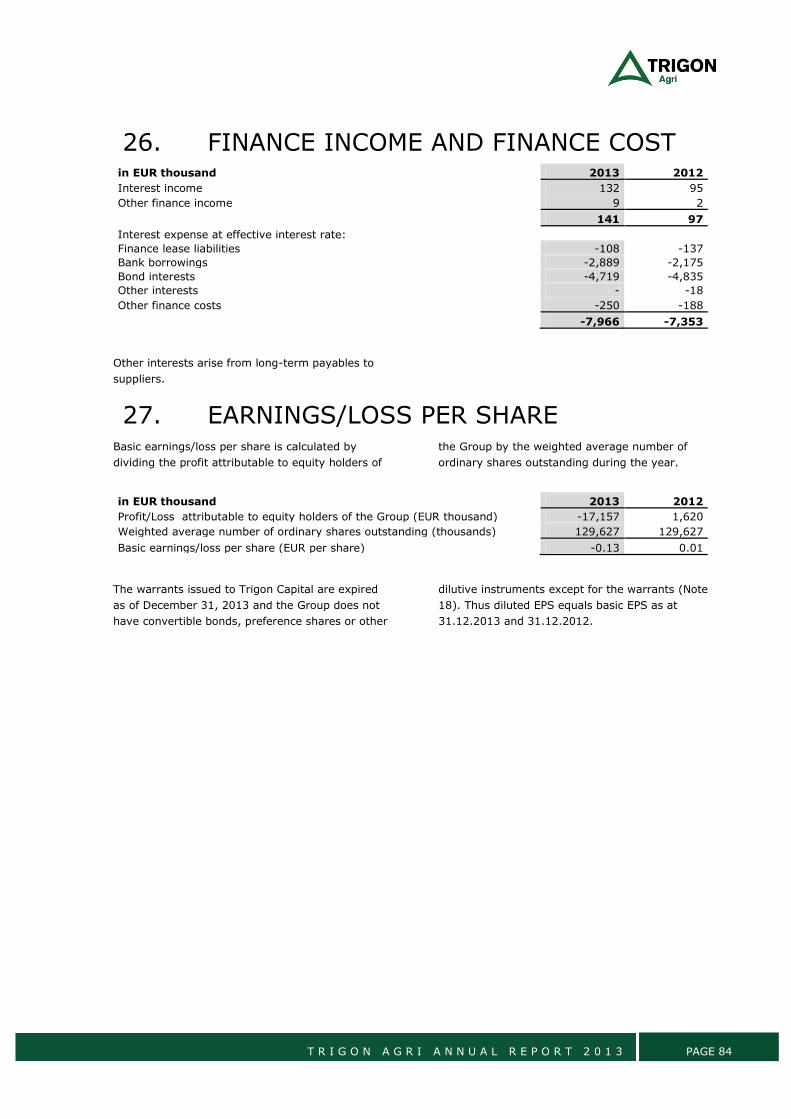
T R I G O N A G R I A N N U A L R E P O R T 2 0 1 3 PAGE 84
26. FINANCE INCOME AND FINANCE COST in EUR thousand 2013 2012
Interest income 132 95
Other finance income 9 2
141 97
Interest expense at effective interest rate: Finance lease liabilities -108 -137
Bank borrowings -2,889 -2,175
Bond interests -4,719 -4,835
Other interests - -18
Other finance costs -250 -188
-7,966 -7,353
Other interests arise from long-term payables to
suppliers.
27. EARNINGS/LOSS PER SHARE Basic earnings/loss per share is calculated by
dividing the profit attributable to equity holders of
the Group by the weighted average number of
ordinary shares outstanding during the year.
in EUR thousand 2013 2012
Profit/Loss attributable to equity holders of the Group (EUR thousand) -17,157 1,620
Weighted average number of ordinary shares outstanding (thousands) 129,627 129,627
Basic earnings/loss per share (EUR per share) -0.13 0.01
The warrants issued to Trigon Capital are expired
as of December 31, 2013 and the Group does not
have convertible bonds, preference shares or other
dilutive instruments except for the warrants (Note
18). Thus diluted EPS equals basic EPS as at
31.12.2013 and 31.12.2012.
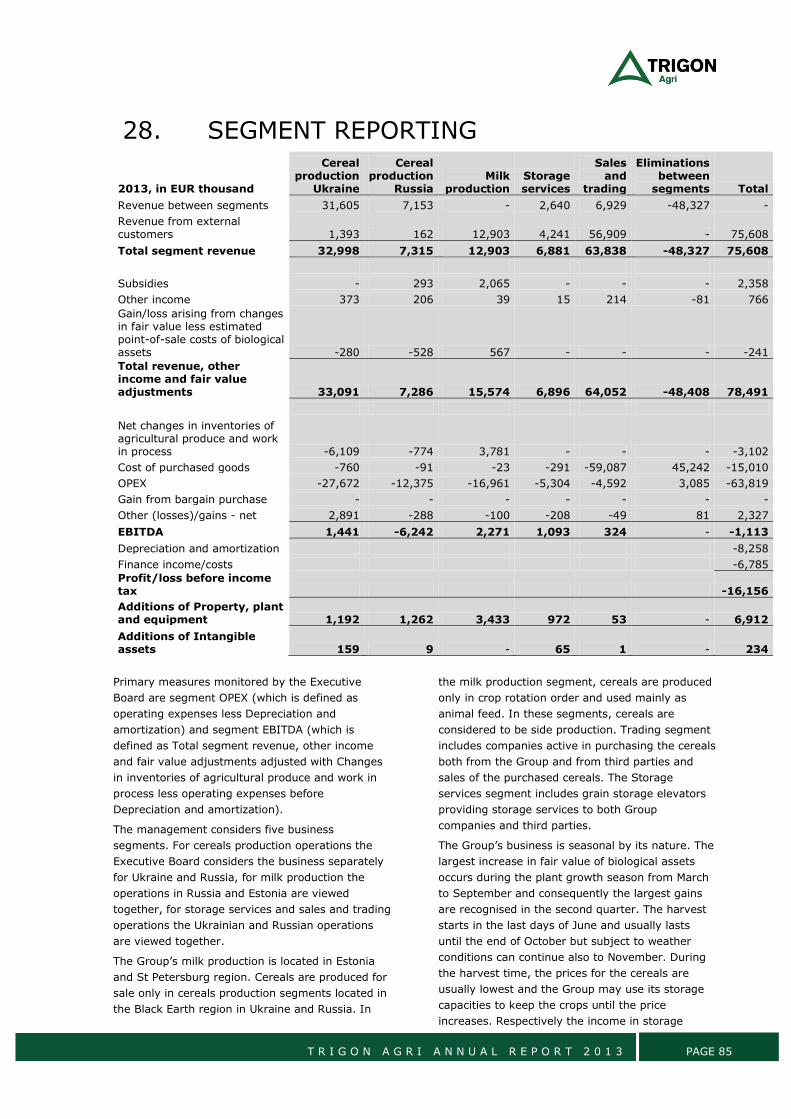
T R I G O N A G R I A N N U A L R E P O R T 2 0 1 3 PAGE 85
28. SEGMENT REPORTING
2013, in EUR thousand
Cereal production
Ukraine
Cereal production
Russia Milk
production Storage services
Sales and
trading
Eliminations between
segments Total
Revenue between segments 31,605 7,153 - 2,640 6,929 -48,327 -
Revenue from external customers 1,393 162 12,903 4,241 56,909 - 75,608
Total segment revenue 32,998 7,315 12,903 6,881 63,838 -48,327 75,608
Subsidies - 293 2,065 - - - 2,358
Other income 373 206 39 15 214 -81 766
Gain/loss arising from changes in fair value less estimated point-of-sale costs of biological assets -280 -528 567 - - - -241
Total revenue, other income and fair value adjustments 33,091 7,286 15,574 6,896 64,052 -48,408 78,491
Net changes in inventories of agricultural produce and work in process -6,109 -774 3,781 - - - -3,102
Cost of purchased goods -760 -91 -23 -291 -59,087 45,242 -15,010
OPEX -27,672 -12,375 -16,961 -5,304 -4,592 3,085 -63,819
Gain from bargain purchase - - - - - - -
Other (losses)/gains - net 2,891 -288 -100 -208 -49 81 2,327
EBITDA 1,441 -6,242 2,271 1,093 324 - -1,113
Depreciation and amortization -8,258
Finance income/costs -6,785
Profit/loss before income tax -16,156
Additions of Property, plant and equipment 1,192 1,262 3,433 972 53 - 6,912
Additions of Intangible assets 159 9 - 65 1 - 234
Primary measures monitored by the Executive
Board are segment OPEX (which is defined as
operating expenses less Depreciation and
amortization) and segment EBITDA (which is
defined as Total segment revenue, other income
and fair value adjustments adjusted with Changes
in inventories of agricultural produce and work in
process less operating expenses before
Depreciation and amortization).
The management considers five business
segments. For cereals production operations the
Executive Board considers the business separately
for Ukraine and Russia, for milk production the
operations in Russia and Estonia are viewed
together, for storage services and sales and trading
operations the Ukrainian and Russian operations
are viewed together.
The Group’s milk production is located in Estonia
and St Petersburg region. Cereals are produced for
sale only in cereals production segments located in
the Black Earth region in Ukraine and Russia. In
the milk production segment, cereals are produced
only in crop rotation order and used mainly as
animal feed. In these segments, cereals are
considered to be side production. Trading segment
includes companies active in purchasing the cereals
both from the Group and from third parties and
sales of the purchased cereals. The Storage
services segment includes grain storage elevators
providing storage services to both Group
companies and third parties.
The Group’s business is seasonal by its nature. The
largest increase in fair value of biological assets
occurs during the plant growth season from March
to September and consequently the largest gains
are recognised in the second quarter. The harvest
starts in the last days of June and usually lasts
until the end of October but subject to weather
conditions can continue also to November. During
the harvest time, the prices for the cereals are
usually lowest and the Group may use its storage
capacities to keep the crops until the price
increases. Respectively the income in storage
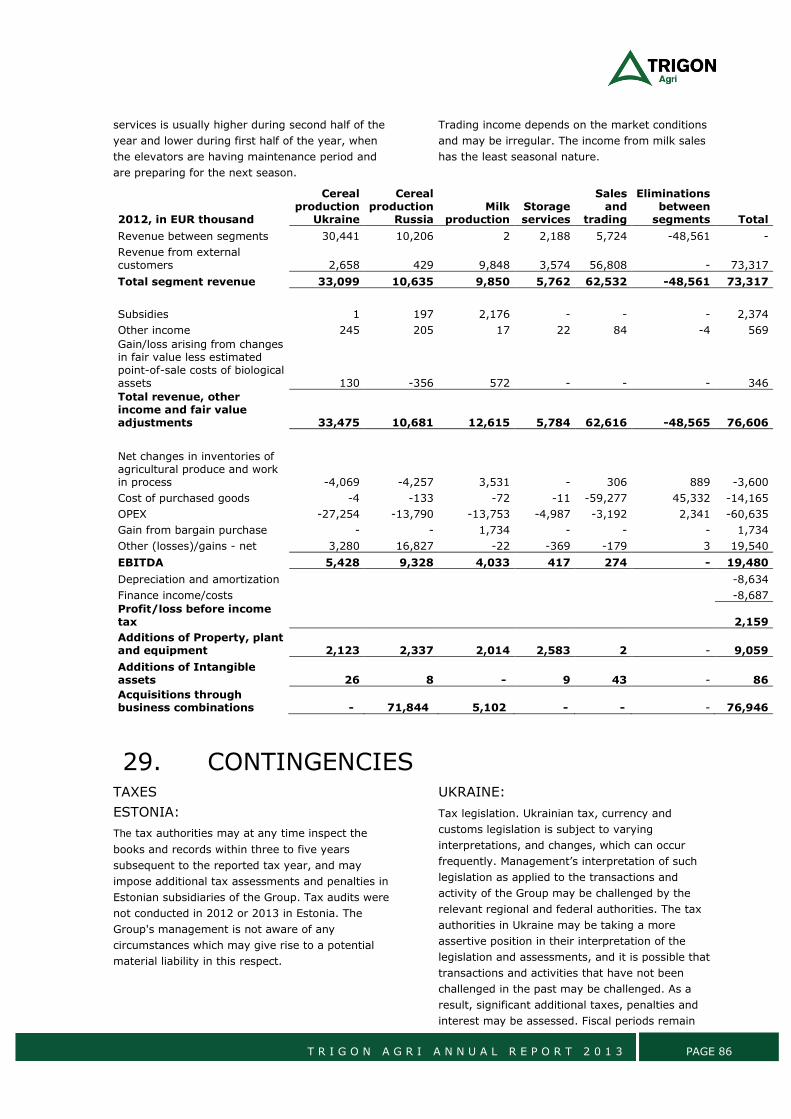
T R I G O N A G R I A N N U A L R E P O R T 2 0 1 3 PAGE 86
services is usually higher during second half of the
year and lower during first half of the year, when
the elevators are having maintenance period and
are preparing for the next season.
Trading income depends on the market conditions
and may be irregular. The income from milk sales
has the least seasonal nature.
2012, in EUR thousand
Cereal production
Ukraine
Cereal production
Russia Milk
production Storage services
Sales and
trading
Eliminations between
segments Total
Revenue between segments 30,441 10,206 2 2,188 5,724 -48,561 -
Revenue from external customers 2,658 429 9,848 3,574 56,808 - 73,317
Total segment revenue 33,099 10,635 9,850 5,762 62,532 -48,561 73,317
Subsidies 1 197 2,176 - - - 2,374
Other income 245 205 17 22 84 -4 569
Gain/loss arising from changes in fair value less estimated point-of-sale costs of biological assets 130 -356 572 - - - 346
Total revenue, other income and fair value adjustments 33,475 10,681 12,615 5,784 62,616 -48,565 76,606
Net changes in inventories of agricultural produce and work in process -4,069 -4,257 3,531 - 306 889 -3,600
Cost of purchased goods -4 -133 -72 -11 -59,277 45,332 -14,165
OPEX -27,254 -13,790 -13,753 -4,987 -3,192 2,341 -60,635
Gain from bargain purchase - - 1,734 - - - 1,734
Other (losses)/gains - net 3,280 16,827 -22 -369 -179 3 19,540
EBITDA 5,428 9,328 4,033 417 274 - 19,480
Depreciation and amortization
-8,634
Finance income/costs
-8,687
Profit/loss before income tax 2,159
Additions of Property, plant and equipment 2,123 2,337 2,014 2,583 2 - 9,059
Additions of Intangible assets 26 8 - 9 43 - 86
Acquisitions through business combinations - 71,844 5,102 - - -
76,946
29. CONTINGENCIES TAXES
ESTONIA:
The tax authorities may at any time inspect the
books and records within three to five years
subsequent to the reported tax year, and may
impose additional tax assessments and penalties in
Estonian subsidiaries of the Group. Tax audits were
not conducted in 2012 or 2013 in Estonia. The
Group's management is not aware of any
circumstances which may give rise to a potential
material liability in this respect.
UKRAINE:
Tax legislation. Ukrainian tax, currency and
customs legislation is subject to varying
interpretations, and changes, which can occur
frequently. Management’s interpretation of such
legislation as applied to the transactions and
activity of the Group may be challenged by the
relevant regional and federal authorities. The tax
authorities in Ukraine may be taking a more
assertive position in their interpretation of the
legislation and assessments, and it is possible that
transactions and activities that have not been
challenged in the past may be challenged. As a
result, significant additional taxes, penalties and
interest may be assessed. Fiscal periods remain
T R I G O N A G R I A N N U A L R E P O R T 2 0 1 3 PAGE 87
open to review by the authorities in respect of
taxes for three calendar years preceding the year
of review. Under certain circumstances reviews
may cover longer periods.
The tax consequence of transactions for Ukrainian
taxation purposes is frequently determined by the
form in which transactions are documented and the
underlying accounting treatment prescribed by
Ukrainian GAAP.
The Group performed legal merger of 5 companies
acquired in 2008 in Kirovograd region. For the
merger to be effective, the Tax Authorities are
obliged to issue confirmation about missing of the
tax liabilities. The Group has received these
confirmations for all 5 companies. Tax Authorities
performed regular revisions in two Kharkov cluster
companies and revealed no misstatements in these
companies. Tax Authorities also performed revision
in 2010 in one Kirovograd cluster company and as
a result issued order for paying UAH 16 million
(EUR 1,391 thousand as at December 31,2009)
income tax. The Group considered that request
unjustified and challenged the order in court. The
Group won the case in the Court of First Instance
and the Group’s legal consultants were of opinion
that paying the amount requested by the local Tax
Authority is unlikely and no provision were
recognised against the contingency. The next court
session took place in 2012. The appellate court
ruled in favour of the Company and as at the date
of the current report the decision of the appellate
court has come into effect. However, the Tax
authority filed cassation to the Higher
Administrative court of Ukraine (HACU). The HACU
opened cassation proceedings by rendering ruling,
dated 30.10.2012 № К/9991/66276/12. Cassation
proceedings are still on-going.
RUSSIA:
Tax legislation. Russian tax legislation is subject to
varying interpretations, and changes, which can
occur frequently. Management’s interpretation of
such legislation as applied to the transactions and
activity of the Group may be challenged by the
relevant authorities.
The Russian tax authorities may be taking a more
assertive and sophisticated approach in their
interpretation of the legislation and tax
examinations. This includes them following
guidance from the Supreme Arbitration Court for
anti-avoidance claims based on reviewing the
substance and business purpose of transactions.
Combined with a possible increase in tax collection
efforts to respond to budget pressures, the above
may lead to an increase in the level and frequency
of scrutiny by the tax authorities. In particular, it is
possible that transactions and activities that have
not been challenged in the past may be challenged.
As a result, significant additional taxes, penalties
and interest may be assessed.
Fiscal periods remain open to review by the
authorities in respect of taxes for three calendar
years preceding the year of review. Under certain
circumstances reviews may cover longer periods.
Russian transfer pricing legislation provides the
possibility for tax authorities to make transfer
pricing adjustments and impose additional tax
liabilities in respect of all controllable transactions,
provided that the transaction price differs from the
market price by more than 20%.
Controllable transactions include transactions with
interdependent parties, as determined under the
Russian Tax Code, all cross-border transactions
(irrespective whether performed between related
or unrelated parties), transactions where the price
applied by a taxpayer differs by more than 20%
from the price applied in similar transactions by the
same taxpayer within a short period of time, and
barter transactions. There is no formal guidance as
to how these rules should be applied in practice. In
the past, the arbitration court practice with this
respect has been contradictory.
Tax liabilities arising from transactions between
companies are determined using actual transaction
prices. It is possible with the evolution of the
interpretation of the transfer pricing rules in the
Russian Federation and the changes in the
approach of the Russian tax authorities, that such
transfer prices could be challenged. Given the brief
nature of the current Russian transfer pricing rules,
the impact of any such challenge cannot be reliably
estimated; however, it may be significant to the
financial position and/or the overall operations of
the entity.
CHANGE OF CONTROL
Trigon Agri has entered into the Advisory
Agreement with Trigon Agri Advisors. Advisory
Agreement include change of control clauses.
Trigon Agri has the right to terminate the Advisory
Agreement if the controlling interest of the Advisor
or Trigon Capital are transferred to a third party or
if more than 5% of the voting shares of the Advisor
or Trigon Capital are acquired, directly or
indirectly, by the competitors of Trigon Agri.
In 2011 Trigon Agri issued four-year bonds. The
Terms and conditions of the bonds also include
change of control clauses (please refer to Note
3.2).
T R I G O N A G R I A N N U A L R E P O R T 2 0 1 3 PAGE 88
30. COMMITMENTS The Group leases land and passenger cars under
non-cancellable operating lease agreements. Future
rent payments from non-cancellable lease
agreements are disclosed in Note 23. The Group has
no other commitments.
31. BUSINESS COMBINATIONS AND TRANSACTIONS WITH NON-CONTROLLING
INTEREST
TRANSACTIONS IN 2013
Disposal of interest in a subsidiary without loss of control
On May 30, 2013, a 21% interest in Trigon Dairy
Farming Estonia AS was sold to non-controlling
interest by way of a share issue. Trigon Dairy
Farming Estonia AS received EUR 3,000 thousand
of proceeds from the share issue.
On December 12, 2013, the Group sold a 15.3%
interest in Trigon Dairy Farming Estonia AS to non-
controlling interest for a consideration of EUR
2,865 thousand. In 2013 the Group received EUR
1,000 thousand cash proceeds for the sale and the
remaining amount receivable as at December 31,
2013 was EUR 1,865 thousand.
The total carrying amount of non-controlling
interests disposed of was EUR 4,759 thousand and
the increase in parent’s equity EUR 1,106
thousand.
In EUR thousand 2013 2012
Carrying amount of non-controlling interests disposed of -4,759 -
Proceeds from subsidiary's share issue 3,000 -
Consideration received from non-controlling interests 2,865 -
Increase in parent's equity 1,106 -
TRANSACTIONS IN 2012
Business combination. On April 4, 2012, the Group
acquired 97.8676% of dairy company Väätsa Agro
AS in Estonia to expand its dairy production
activities. In addition to the initial acquisition in
April, on August 7, 2012 the Group acquired also
the non-controlling interests of Väätsa Agro AS for
EUR 35 thousand leaving the Group 100% owner of
Väätsa Agro AS.
The gain from the bargain purchase arising from
the acquisition of 97.8675% of Väätsa Agro AS
reflects the difference between the net value of the
acquired assets and the purchase price of the
Väätsa farm and shows that the acquisition was
carried out at very favourable terms due to a
distressed sale by the previous owners.
Väätsa acquisition-related costs in the amount of
EUR 295 thousand have been charged to other
administrative expenses in the consolidated income
statement.
Since acquisition in 2012 Väätsa Agro revenue
stood at EUR 3,393 thousand and loss EUR 327
thousand.
Had Väätsa Agro AS been consolidated from
January 1, 2012, the consolidated statement of
income would show additional revenue of EUR
1,183 thousand and less profit of EUR 24 thousand.
The purchase price allocation as of April 1, 2012
arising from the acquisition is as follows:
In EUR thousand
- Total purchase price
7,300
- Cash paid
7,300
Total purchase considerations
7,300
Fair value of net assets acquired
9,034
T R I G O N A G R I A N N U A L R E P O R T 2 0 1 3 PAGE 89
The assets and liabilities as of April 1, 2012 arising from the acquisition are as follows:
In EUR thousand Fair value
Cash and deposits 659
Trade receivables and prepayments 466
Inventory 1,017
Biological Assets 3,537
Non-current investments 3
Property, plant and equipment 5,102
Payables and accrued expenses -1,715
Net assets 9,069
Non-controlling interest 35
Net assets acquired 9,034
Gain from bargain purchase -1,734
Purchase consideration settled in cash 7,300
Cash and cash equivalents in subsidiary acquired -659
Cash flow on acquisition 6,641
Business combination. On December 14, 2012, the
Group obtained control of 100% of Ennivolorous
Holding Ltd, 100% of CJSC Markon and 100% of
CJSC Smart (reorganized CJSC Pobeda), which
represents a new 71 thousand hectare cereals
production cluster in Rostov Oblast in Russia.
The transaction was structured as a land-swap deal
where Trigon Agri acquired ownership of legal
entities involved in agricultural activities and
having a free-hold title to 71 thousand hectares of
farmland in the Rostov Oblast in exchange for its
two existing Russian production clusters in Samara
and Stavropol.
The payment for the shares of the acquired entities
was effected in the form of shares in the Group’s
two existing production clusters in Samara
(Investment property) (45 thousand hectares of
farmland in ownership) and Stavropol (33 thousand
hectares of farmland in ownership) and a monetary
payment of EUR 10.9 million. Out of the monetary
payment, Trigon Agri paid EUR 6 million as a
prepayment in 2011 and EUR 4.9 million in 2013.
Trigon Agri’s new production cluster in Russia’s
Rostov oblast offers exceptional potential for
consistent profitability. The main competitive
advantages of the newly acquired farms are
proximity to export ports, good historical rainfall,
contiguous layout of the land and irrigation
potential. Irrigation allows for a much more
predictable yield profile, as insufficient rainfall is
mitigated through artificial irrigation.
The following table summarises the consideration
paid for the legal entities acquired, as well as the
fair value of assets acquired and liabilities assumed
at the acquisition date. The Group has recognised a
gain on disposal of EUR 18,052 thousand as a
difference between fair value and carrying value of
its disposed assets in Stavropol and Samara. The
gain is included in Other (losses)/gains - net in the
consolidated income statement (Note 26).
Based on the management’s calculations and fair
value estimates from external valuators, majority
of the gain arose from the disposal of the Stavropol
cluster assets, because at the time of the Stavropol
cluster acquisition in 2009 the assets were
acquired in a distressed sale and therefore the cost
was relatively low.
The fair value of land received and given up was
determined based on the comparable sales
transactions in similar regions, adjusted for a
number of factors to reflect the differences with the
comparable transactions. External evaluators were
used to assess the fair value of land plots in Rostov
and Samara cluster.
Because of acquisition of existing agricultural
businesses the transaction meets the definition of a
business combination, although the majority of the
value acquired is attributable to land.
Acquisition-related costs of EUR 278 thousand have
been charged to other administrative expenses in
the consolidated income statement in 2012 and
EUR 162 thousand in 2013.
The initial provisional amounts recognized in the
2012 financial statements for the business
combination were determined only provisionally
and have been amended according to the finalized
purchase price allocation.
The amount of biological assets acquired increased
by EUR 215 thousand, representing a higher value
of fieldworks than was initially provisioned.
Non-current prepayments increased by EUR 3,514
thousand. The amount includes prepayment for an
additional 1,656 hectares of land and livestock.
T R I G O N A G R I A N N U A L R E P O R T 2 0 1 3 PAGE 90
The amount of investment property transferred
decreased by EUR 136 thousand as part of the
assets in Samara remained under the control of the
Group.
The amount of liabilities transferred decreased by
EUR 6,362 thousand.
Payables and accrued expenses assumed increased
by EUR 1,740 thousand.
All the above changes were offset against the total
purchase consideration.
As a result of the amendments, the total purchase
consideration and fair value of net assets acquired
both increased by EUR 1,990 thousand.
Total cash payment for the transaction decreased
by EUR 4,236 thousand and amounted to EUR
10,864.
In EUR thousand Provisional Correction Amended
Fair value of transferred assets 63,787 -136 63,651
Fair value of transferred liabilities -6,758 6,362 -396
Cash paid 15,100 -4,236 10,864
Total purchase considerations 72,129 1,990 74,119
Fair value of net assets acquired 72,129 1,990 74,119
Recognised amounts of identifiable assets acquired and liabilities assumed:
In EUR thousand Fair value Correction Amended Fair value
Trade receivables and prepayments 347 - 347
Inventory 871 - 871
Biological Assets 1,164 215 1,379
Non-current prepayments - 3,514 3,514
Property, plant and equipment 71,844 - 71,844
Payables and accrued expenses -2,097 -1,740 -3,837
Net assets 72,129 1,990 74,119
Net assets acquired 72,129 1,990 74,119
Gain on disposal
Fair value of net assets disposed 57,029 6,226 63,255
Less carrying value of net assets disposed -35,817 -6,226 -42,043
Less foreign exchange reserve recycled from Other comprehensive income to Income statement -3,160 - -3,160
Total gain on disposal 18,052 - 18,052
Fair value of net assets disposed increased by EUR
6,226 thousand and consists of the above-
mentioned decrease in transferred investment
property (EUR 136 thousand) and liabilities
(EUR6,362 thousand). The same amounts
correspond to the decrease in the carrying value of
net assets disposed of EUR 6,226 thousand.
32. GROUP STRUCTURE The Group’s parent company A/S Trigon Agri is
registered in Denmark. The parent company owns
directly ten subsidiaries (including a branch in
Estonia), which are holding companies for the Group
operations in Estonia, Ukraine, Russia. These
holdings are: Trigon Farming AS (Estonia); TC
Farming Russia Ltd. (Cyprus), TC Farming Ukraine
Ltd. (Cyprus), Arsetta Investments Ltd. (Cyprus),
United Grain (Suisse) SA (Switzerland), Trigon Dairy
Farming AS (Estonia), Trigon Security Llc. (Ukraine),
Trigon Agri A/S Eesti filiaal (Estonia), Ennivolorous
Holdings Limited (Cyprus).
TC Farming Russia and TC Farming Ukraine have
both participations in their subsidiary companies in
Ukraine and Russia due to the local legislation,
which requires that at least two shareholders must
exist. TC Farming Ukraine owns also shares of the
Ukrainian elevators. Trigon Dairy Farming AS owns
milk production companies in Estonia and Russia.
T R I G O N A G R I A N N U A L R E P O R T 2 0 1 3 PAGE 91
All intermediary holding companies have members
of the parent Company’s Board of Directors as
members of the management board, who are
responsible for the management of the respective
companies.
Transfer of funds from subsidiaries to A/S Trigon
Agri is not restricted. However, transfer of funds
from Ukraine and Russia to intermediary holdings
may be subject to restrictions in relation to foreign
currency transactions due to the occasional
limitations in local legislation. As of December 31,
2013 the Group included the following companies:
Country of registration
Segment Ownership percentage
Legal Status in the Group
1 Trigon Agri Ltd. Denmark - 100% Parent company
2 TC Farming Ukraine Ltd. Cyprus - 100% Subsidiary
3 TC Farming Russia Ltd. Cyprus - 100% Subsidiary
4 Arsetta Investments Ltd. Cyprus - 100% Subsidiary
5 Ennivolorous Holding Limited Cyprus - 100% Subsidiary
6 LLC Trigon Farming Ukraine - 100% Subsidiary
7 Costwern Ltd Cyprus - 100% Subsidiary
8 Trigon Farming Ltd. Estonia - 100% Subsidiary
9 LLC Russian Agro Investors Russia - 100% Subsidiary
10 United Grain (SUISSE) SA Switzerland Trading 100% Subsidiary
11 LLC Trigon Farming Kharkiv Ukraine Ukraine cereals production 100% Subsidiary
12 LLC Trigon Agro 2 Ukraine Ukraine cereals production 100% Subsidiary
13 OJSC Krasnokutskagrohim Ukraine Ukraine cereals production 64.87% Subsidiary
14 PJV Kolos Ukraine Ukraine cereals production 100% Subsidiary
15 LLC Kirovograd agroinvestment company
Ukraine Ukraine cereals production 100% Subsidiary
16 LLC Agro Capital Center Ukraine Ukraine cereals production 100% Subsidiary
17 LLC Agroperspektiva Ukraine Ukraine cereals production 100% Subsidiary
18 LLC Objedinjonnye Agrarnye Sistemy
Ukraine Ukraine cereals production 100% Subsidiary
19 PAC Molniya-1 Ukraine Ukraine cereals production 100% Subsidiary
20 LLC Trigon-Export Ukraine Trading 100% Subsidiary
21 LLC Trigon Export Vostok (Volga-Grain)
Russia Trading 100% Subsidiary
22 LLC Trigon-Elevator Ukraine Elevators 100% Subsidiary
23 LLC Trigon-Elevator Vostok Russia Elevators 100% Subsidiary
24 LLC Kovyaqovskoуe Ukraine Elevators 100% Subsidiary
25 CJSC Vovchanskiy Combinat Khliboproduktiv
Ukraine Elevators 100% Subsidiary
26 LLC Ludmilovsky elevator Ukraine Elevators 100% Subsidiary
27 OJSC Yavkinskiy elevator Ukraine Elevators 92.33% Subsidiary
28 OJSC Novomirgorodski elevator Ukraine Elevators 85.70% Subsidiary
29 LLC Trigon Security Ukraine - 100% Subsidiary
30 LLC Agroholding Moskovie Russia Russia cereals production 100% Subsidiary
31 LLC Surskaya Niva Russia Russia cereals production 100% Subsidiary
32 LLC Surskiy Kray Russia Russia cereals production 100% Subsidiary
33 LLC Sura Agro Russia Russia cereals production 100% Subsidiary
34 LLC Surskoe Pole Russia Russia cereals production 100% Subsidiary
35 LLC Agrofirma Russia Russia cereals production 100% Subsidiary
36 LLC Surskoe Zerno Russia Russia cereals production 100% Subsidiary
37 LLC Agro Russia Russia cereals production 100% Subsidiary
38 CJSC Markon Russia Russia cereals production 100% Subsidiary
39 OJSC Plemennoy zavod Gashunskiy
Russia Russia cereals production 100% Subsidiary
40 CJSC Zimovmikovskiy agrocompany
Russia Russia cereals production 100% Subsidiary
41 Ltd Trigon Dairy Farming Estonia Milk production 100% Subsidiary
42 LLC Trigon Moloko Russia Milk production 100% Subsidiary
43 LLC Dobruchi-2 Russia Milk production 100% Subsidiary
44 Ltd Trigon Dairy Farming Estonia Estonia Milk production 63.71% Subsidiary
45 Kaiu LT Llc. Estonia Milk production 100% Subsidiary
T R I G O N A G R I A N N U A L R E P O R T 2 0 1 3 PAGE 92
Country of registration
Segment Ownership percentage
Legal Status in the Group
46 Kärla Farmers Cooperative Estonia Milk production 100% Subsidiary
47 LLC Saare Farmer Estonia Milk production 100% Subsidiary
48 LLC Eikla Agro Estonia Milk production 90% Subsidiary
49 LLC Lindoria Estonia Milk production 100% Subsidiary
50 Ltd Väätsa Agro Estonia Milk production 100% Subsidiary
33. RELATED PARTY TRANSACTIONS The following parties are considered to be related
parties:
• AS Trigon Capital, who owns 7.81 % of
shares and held options for further shares (Note
18);
• Member of the Executive Boards and the
Boards of Directors of parent company and
subsidiaries and their immediate family members;
• Entities under the control of the members
of the Executive Board and Board of Directors or
their family members;
• Individuals with significant ownership and
entities under their control unless these individuals
lack the opportunity to exert significant influence
over the business decisions of the Group.
The Group’s owners are legal and physical persons
and no sole shareholder has control over the
Group’s activities.
AS Trigon Capital, which owns 7,81% of the total
voting shares (7.81% at December 31, 2012) and
held the warrants described in Note 18, provides
management services to the Group.
(a) Sales and purchases
in EUR thousand Sales and purchases 2013 2012
Purchase of management services - AS Trigon Capital and its subsidiaries 3,381 2,943
Purchase of goods and services from AS Trigon Capital and its subsidiaries 204 412
The following table sets forth the aggregate gross
amounts of salaries and other remuneration by the
Group to the members of its Board of Directors and
Executive Board in 2013 and in 2012.
in EUR thousand
Salary (incl social
security costs)
Bonuses Total
2013
Members of Board of Directors 65 - 65
Members of the Executive Board 146 - 146
211 - 211
2012
Members of Board of Directors 106 - 106
Members of the Executive Board 144 - 144
250 - 250
The payments from the company to the Executive
Board members in 2013 amounted to EUR 146
thousand (in 2012 EUR 144 thousand). In
accordance with the management agreement signed
between the Group and Trigon Agri Advisors,
Executive Board members compensation form a part
of the management fee payable to Trigon Agri
Advisors. Therefore, in each reporting period where
payments are made directly from the Group to any
Executive Board members, the management fee for
such period is reduced by the corresponding amount
as the payment to the Executive Board members
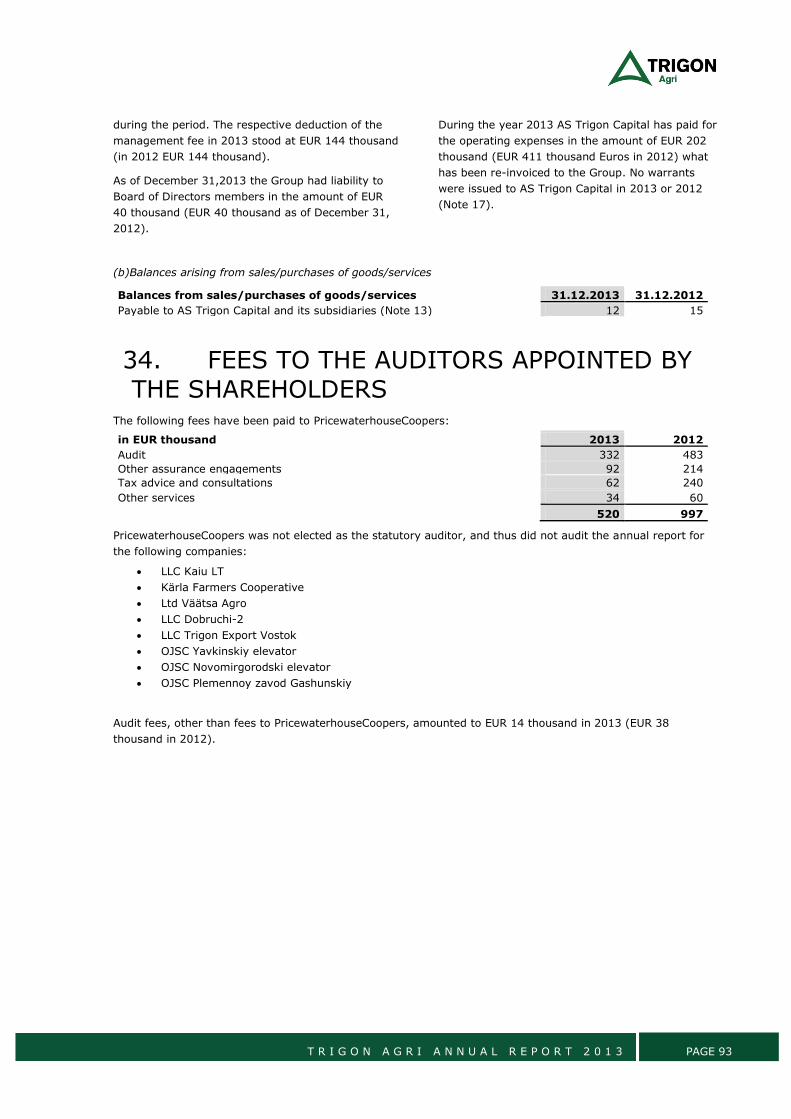
T R I G O N A G R I A N N U A L R E P O R T 2 0 1 3 PAGE 93
during the period. The respective deduction of the
management fee in 2013 stood at EUR 144 thousand
(in 2012 EUR 144 thousand).
As of December 31,2013 the Group had liability to
Board of Directors members in the amount of EUR
40 thousand (EUR 40 thousand as of December 31,
2012).
During the year 2013 AS Trigon Capital has paid for
the operating expenses in the amount of EUR 202
thousand (EUR 411 thousand Euros in 2012) what
has been re-invoiced to the Group. No warrants
were issued to AS Trigon Capital in 2013 or 2012
(Note 17).
(b)Balances arising from sales/purchases of goods/services
Balances from sales/purchases of goods/services 31.12.2013 31.12.2012
Payable to AS Trigon Capital and its subsidiaries (Note 13) 12 15
34. FEES TO THE AUDITORS APPOINTED BY
THE SHAREHOLDERS The following fees have been paid to PricewaterhouseCoopers:
in EUR thousand 2013 2012
Audit 332 483
Other assurance engagements 92 214
Tax advice and consultations 62 240
Other services 34 60
520 997
PricewaterhouseCoopers was not elected as the statutory auditor, and thus did not audit the annual report for
the following companies:
LLC Kaiu LT
Kärla Farmers Cooperative
Ltd Väätsa Agro
LLC Dobruchi-2
LLC Trigon Export Vostok
OJSC Yavkinskiy elevator
OJSC Novomirgorodski elevator
OJSC Plemennoy zavod Gashunskiy
Audit fees, other than fees to PricewaterhouseCoopers, amounted to EUR 14 thousand in 2013 (EUR 38
thousand in 2012).
T R I G O N A G R I A N N U A L R E P O R T 2 0 1 3 PAGE 94
35. EVENTS AFTER THE BALANCE SHEET DATE
As at the date of the current report, no damages to
the winter crops have been occurred and the
necessity for the reseeding will be determined in
due course.
In February 2014 the Group finalised land
purchases in amount of EUR 2,026 thousand for its
dairy operations in Russia. Full consideration of
EUR 2,026 thousand for the two transactions was
already paid in 2013 and accounted for under non-
current prepayments on the balance sheet as at
31.12.2013.
The Russian rouble and the Ukrainian hryvna have
continued to devalue in 2014. The assets on the
Group’s balance sheet in Russia and Ukraine are
denominated in local currency and will decrease in
euro terms when rouble and hryvna weaken
against the euro. Additionally, part of the Group’s
costs decrease in euro terms when rouble and
hryvna weaken against the euro. A significant part
of the Group’s revenues (cereals sales) are either
denominated in foreign currencies or driven by
prices in foreign currencies.
For further information on the situation in Ukraine
and potential impact on the Group, please refer to
note 3.5.
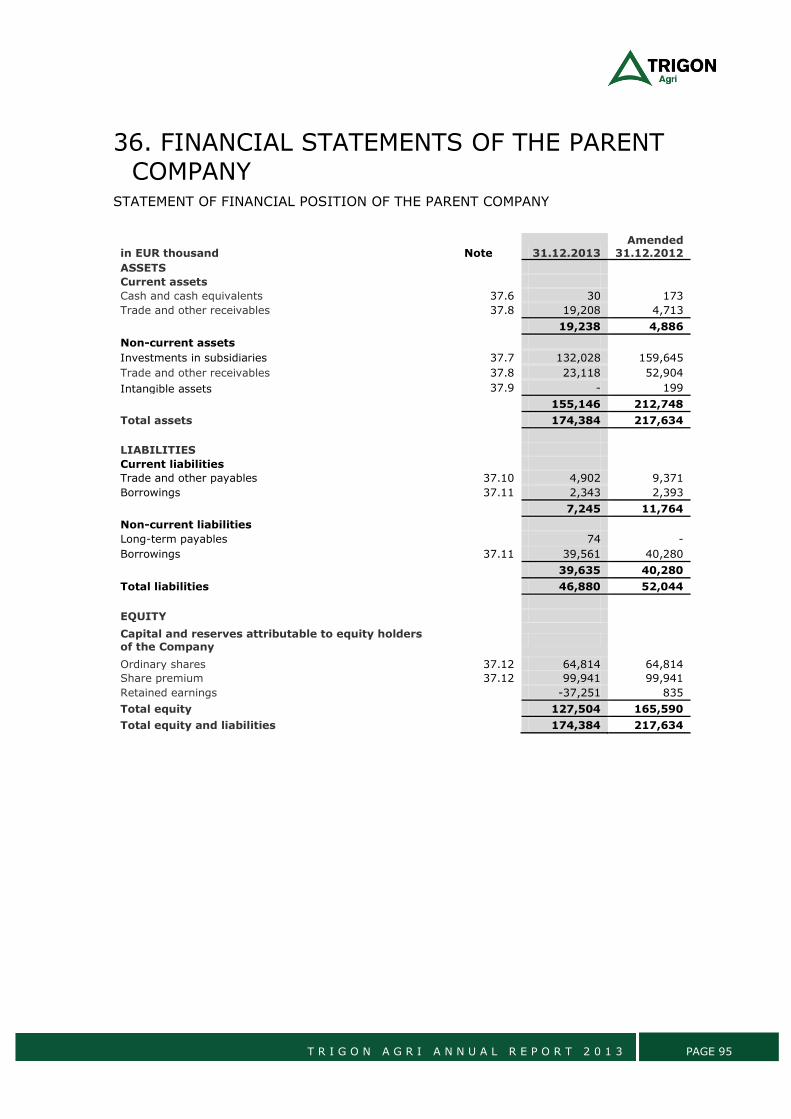
T R I G O N A G R I A N N U A L R E P O R T 2 0 1 3 PAGE 95
36. FINANCIAL STATEMENTS OF THE PARENT COMPANY
STATEMENT OF FINANCIAL POSITION OF THE PARENT COMPANY
in EUR thousand Note 31.12.2013 Amended
31.12.2012
ASSETS
Current assets
Cash and cash equivalents 37.6 30 173
Trade and other receivables 37.8 19,208 4,713
19,238 4,886
Non-current assets
Investments in subsidiaries 37.7 132,028 159,645
Trade and other receivables 37.8 23,118 52,904
Intangible assets 37.9 - 199
155,146 212,748
Total assets 174,384 217,634
LIABILITIES
Current liabilities
Trade and other payables 37.10 4,902 9,371
Borrowings 37.11 2,343 2,393
7,245 11,764
Non-current liabilities
Long-term payables 74 -
Borrowings 37.11 39,561 40,280
39,635 40,280
Total liabilities 46,880 52,044
EQUITY
Capital and reserves attributable to equity holders of the Company
Ordinary shares 37.12 64,814 64,814
Share premium 37.12 99,941 99,941
Retained earnings -37,251 835
Total equity
127,504 165,590
Total equity and liabilities
174,384 217,634
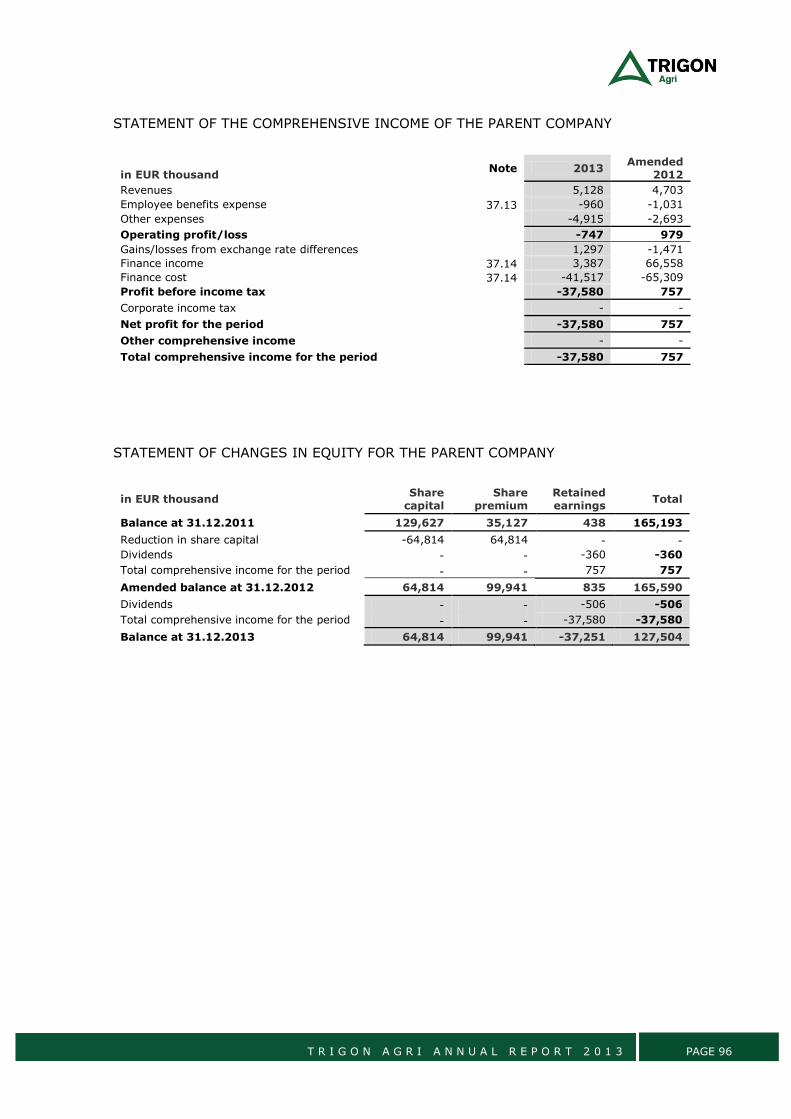
T R I G O N A G R I A N N U A L R E P O R T 2 0 1 3 PAGE 96
STATEMENT OF THE COMPREHENSIVE INCOME OF THE PARENT COMPANY
in EUR thousand Note 2013
Amended 2012
Revenues
5,128 4,703
Employee benefits expense 37.13 -960 -1,031
Other expenses -4,915 -2,693
Operating profit/loss -747 979
Gains/losses from exchange rate differences 1,297 -1,471
Finance income 37.14 3,387 66,558
Finance cost 37.14 -41,517 -65,309
Profit before income tax -37,580 757
Corporate income tax
- -
Net profit for the period
-37,580 757
Other comprehensive income
- -
Total comprehensive income for the period
-37,580 757
STATEMENT OF CHANGES IN EQUITY FOR THE PARENT COMPANY
in EUR thousand Share
capital Share
premium Retained earnings
Total
Balance at 31.12.2011 129,627 35,127 438 165,193
Reduction in share capital -64,814 64,814 - -
Dividends - - -360 -360
Total comprehensive income for the period - - 757 757
Amended balance at 31.12.2012 64,814 99,941 835 165,590
Dividends - - -506 -506
Total comprehensive income for the period - - -37,580 -37,580
Balance at 31.12.2013 64,814 99,941 -37,251 127,504
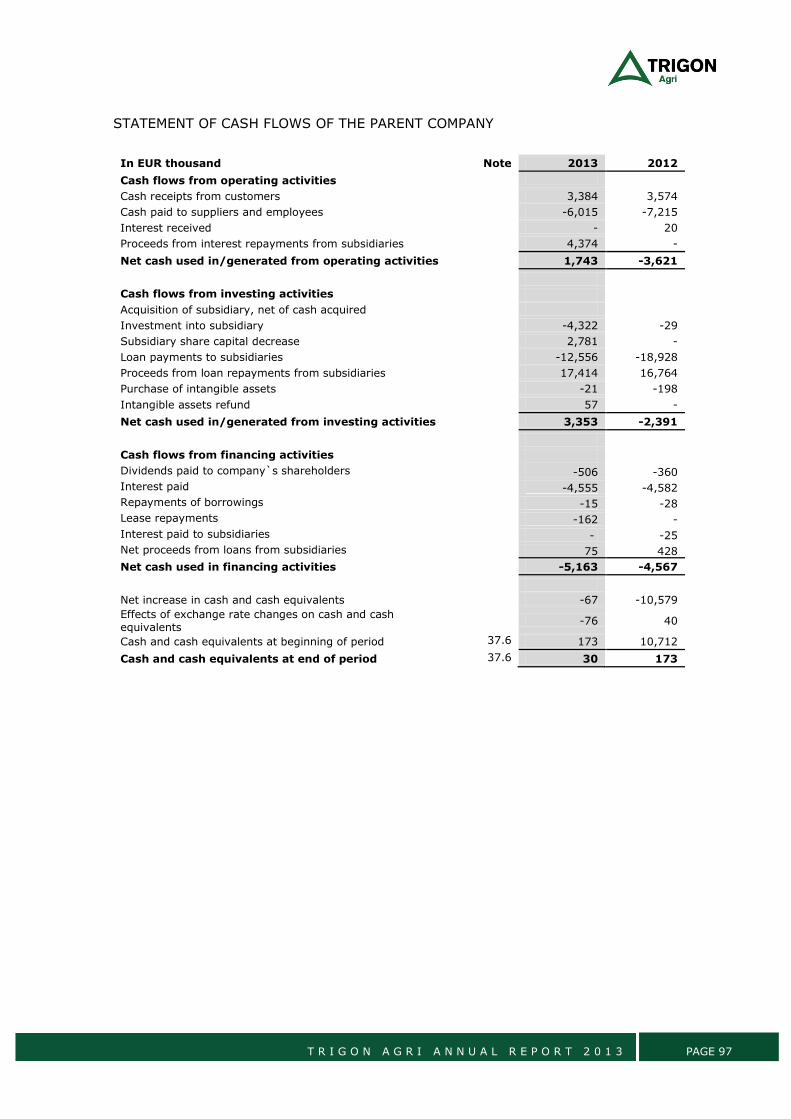
T R I G O N A G R I A N N U A L R E P O R T 2 0 1 3 PAGE 97
STATEMENT OF CASH FLOWS OF THE PARENT COMPANY
In EUR thousand Note 2013 2012
Cash flows from operating activities
Cash receipts from customers 3,384 3,574
Cash paid to suppliers and employees -6,015 -7,215
Interest received - 20
Proceeds from interest repayments from subsidiaries 4,374 -
Net cash used in/generated from operating activities 1,743 -3,621
Cash flows from investing activities
Acquisition of subsidiary, net of cash acquired
Investment into subsidiary -4,322 -29
Subsidiary share capital decrease 2,781 -
Loan payments to subsidiaries -12,556 -18,928
Proceeds from loan repayments from subsidiaries
17,414 16,764
Purchase of intangible assets
-21 -198
Intangible assets refund
57 -
Net cash used in/generated from investing activities 3,353 -2,391
Cash flows from financing activities Dividends paid to company`s shareholders -506 -360
Interest paid -4,555 -4,582
Repayments of borrowings -15 -28
Lease repayments -162 -
Interest paid to subsidiaries - -25
Net proceeds from loans from subsidiaries
75 428
Net cash used in financing activities -5,163 -4,567
Net increase in cash and cash equivalents -67 -10,579
Effects of exchange rate changes on cash and cash equivalents
-76 40
Cash and cash equivalents at beginning of period 37.6 173 10,712
Cash and cash equivalents at end of period 37.6 30 173
T R I G O N A G R I A N N U A L R E P O R T 2 0 1 3 PAGE 98
37. NOTES TO THE FINANCIAL STATEMENTS OF THE PARENT COMPANY 37.1 GENERAL INFORMATION
The Company was established on December 11,
2006. Trigon Agri A/S (‘the Company”) is the
parent company of the Trigon Agri Group. The
Company is a limited liability company incorporated
and domiciled in Denmark. The address of its
registered certificates of subscription office is
Sundkrogsgade 5, DK-2100 Copenhagen.
The Parent Company has in 2011 established a
branch "Trigon Agri Eesti Filiaal" in Estonia. The
branch employs the people of Tallinn office, that
were transferred to Trigon Agri Eesti Filiaal from
Trigon Agri subsidiary Trigon Farming, and who
perform overall management of the subsidiaries,
consolidation, legal, controlling etc.
The Company prepares its separate financial
statements in accordance with IFRS and the
additional Danish requirements for annual reports.
The principal accounting policies applied in the
preparation of these financial statements are set
out below.
37.2 ACCOUNTING PRINCIPLES
Basis of preparation of the financial statements of
the parent company
The financial statements of Trigon Agri A/S have
been prepared in accordance with International
Financial Reporting Standards, as adopted by the
EU (IFRS). The parent company has applied the
same accounting policies as the Group, except for
the investments in subsidiaries as described below.
See Note 2 to the Consolidated Financial
Statements, for the summary of significant
accounting policies of the Group.
Long-term investments in subsidiaries and
associate companies
In the separate financial statements of the parent
company the investments in subsidiaries are
recognised and measured at cost. Equity interests
in foreign currencies are translated to the reporting
currency using the historical exchange rate
prevailing at the time of transaction. Where cost
exceeds the recoverable amount, the carrying value
is written down to the recoverable amount.
Dividends from investments in subsidiaries, joint
ventures and associates are recognized as income
in the financial year when the dividends are
distributed.
Segment reporting
The Board of Directors has determined that the
activities of the parent company form a single
operating segment. The internal reporting reviewed
by the Board of Directors is prepared using the
same accounting principles and format of
statement of financial position and statement of
comprehensive income as provided in these
separate financial statements.
Dividend income
Dividend income is recognised when the right to
receive payment is established. Dividend income is
recognised within Finance income in the Statement
of the comprehensive income.
37.3 CRITICAL ACCOUNTING
ESTIMATES
On each balance sheet date the management of
the parent company evaluates the investments and
loans to subsidiaries. In 2012 impairment was
recorded in investment in TC Farming Russia Ltd
due to disposal of its subsidiaries in Samara and
Stavropol cluster (Note 37.7 and 31).
37.4 FINANCIAL RISK MANAGEMENT
Financial risk management principles of Trigon Agri
A/S correspond to the principles used for the whole
Group. For further information of the financial risk
management principles used please refer to the
consolidated financial statements Note 3. For details
concerning the parent company please refer to the
other Notes of the financial statements of the parent
company.
37.5 CHANGES TO COMPARATIVES
Certain changes have been made to the
presentation of taxes on dividends in the cash flow
statement. Taxes on dividends in amount of EUR
97 thousand in 2012 have been reclassified from
line item ‘Income tax paid’ to line item ‘Dividends
paid to company’s shareholders’.
COMPLETION OF THE PROVISIONAL PURCHASE
PRICE ALLOCATION AS AT DECEMBER 31, 2012
Certain changes have been made to the balance
sheet as at December 31, 2012 in relation to the
completion of the provisional purchase price
allocation as at December 31, 2012 for the Rostov
cluster business combination.
The initial provisional amounts recognised in the
2012 financial statements for the Rostov cluster
business combination were determined only
provisionally and have been amended according to
the exact balances of assets and liabilities
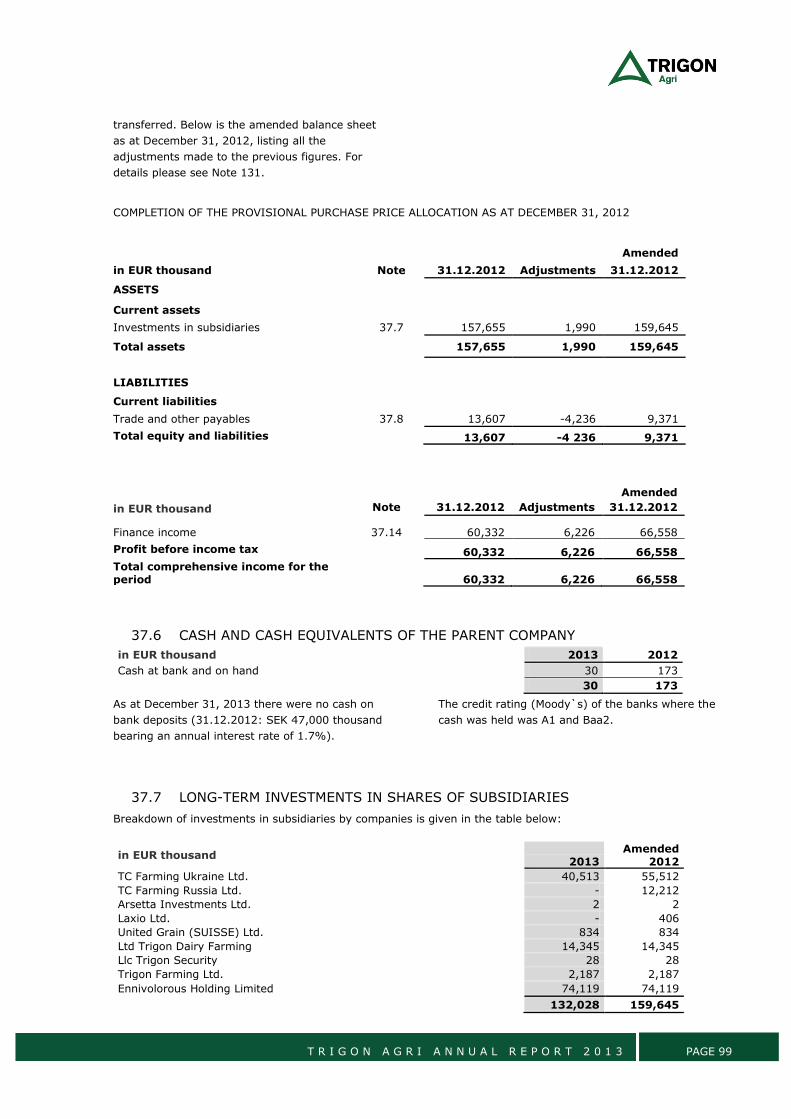
T R I G O N A G R I A N N U A L R E P O R T 2 0 1 3 PAGE 99
transferred. Below is the amended balance sheet
as at December 31, 2012, listing all the
adjustments made to the previous figures. For
details please see Note 131.
COMPLETION OF THE PROVISIONAL PURCHASE PRICE ALLOCATION AS AT DECEMBER 31, 2012
Amended
in EUR thousand Note 31.12.2012 Adjustments 31.12.2012
ASSETS
Current assets
Investments in subsidiaries 37.7 157,655 1,990 159,645
Total assets
157,655 1,990 159,645
LIABILITIES
Current liabilities
Trade and other payables 37.8 13,607 -4,236 9,371
Total equity and liabilities
13,607 -4 236 9,371
Amended
in EUR thousand Note 31.12.2012 Adjustments 31.12.2012
Finance income 37.14 60,332 6,226 66,558
Profit before income tax
60,332 6,226 66,558
Total comprehensive income for the period
60,332 6,226 66,558
37.6 CASH AND CASH EQUIVALENTS OF THE PARENT COMPANY
in EUR thousand
2013 2012
Cash at bank and on hand
30 173
30 173
As at December 31, 2013 there were no cash on
bank deposits (31.12.2012: SEK 47,000 thousand
bearing an annual interest rate of 1.7%).
The credit rating (Moody`s) of the banks where the
cash was held was A1 and Baa2.
37.7 LONG-TERM INVESTMENTS IN SHARES OF SUBSIDIARIES
Breakdown of investments in subsidiaries by companies is given in the table below:
in EUR thousand
2013
Amended 2012
TC Farming Ukraine Ltd.
40,513 55,512
TC Farming Russia Ltd.
- 12,212
Arsetta Investments Ltd.
2 2
Laxio Ltd.
- 406
United Grain (SUISSE) Ltd.
834 834
Ltd Trigon Dairy Farming
14,345 14,345
Llc Trigon Security
28 28
Trigon Farming Ltd.
2,187 2,187
Ennivolorous Holding Limited
74,119 74,119
132,028 159,645
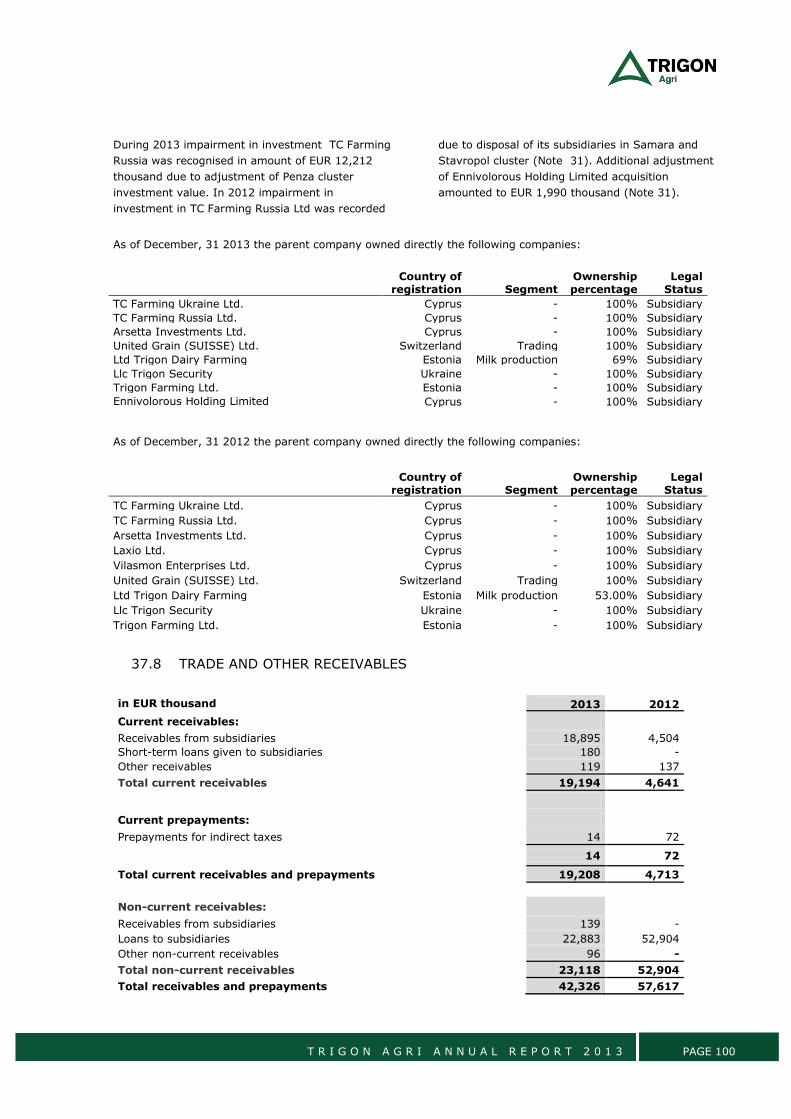
T R I G O N A G R I A N N U A L R E P O R T 2 0 1 3 PAGE 100
During 2013 impairment in investment TC Farming
Russia was recognised in amount of EUR 12,212
thousand due to adjustment of Penza cluster
investment value. In 2012 impairment in
investment in TC Farming Russia Ltd was recorded
due to disposal of its subsidiaries in Samara and
Stavropol cluster (Note 31). Additional adjustment
of Ennivolorous Holding Limited acquisition
amounted to EUR 1,990 thousand (Note 31).
As of December, 31 2013 the parent company owned directly the following companies:
Country of
registration Segment Ownership percentage
Legal Status
TC Farming Ukraine Ltd. Cyprus - 100% Subsidiary
TC Farming Russia Ltd. Cyprus - 100% Subsidiary
Arsetta Investments Ltd. Cyprus - 100% Subsidiary
United Grain (SUISSE) Ltd. Switzerland Trading 100% Subsidiary
Ltd Trigon Dairy Farming Estonia Milk production 69% Subsidiary
Llc Trigon Security Ukraine - 100% Subsidiary
Trigon Farming Ltd. Estonia - 100% Subsidiary
Ennivolorous Holding Limited Cyprus - 100% Subsidiary
As of December, 31 2012 the parent company owned directly the following companies:
37.8 TRADE AND OTHER RECEIVABLES
in EUR thousand
2013 2012
Current receivables:
Receivables from subsidiaries
18,895 4,504
Short-term loans given to subsidiaries
180 -
Other receivables
119 137
Total current receivables
19,194 4,641
Current prepayments:
Prepayments for indirect taxes
14 72
14 72
Total current receivables and prepayments
19,208 4,713
Non-current receivables:
Receivables from subsidiaries
139 -
Loans to subsidiaries
22,883 52,904
Other non-current receivables 96 -
Total non-current receivables 23,118 52,904
Total receivables and prepayments
42,326 57,617
Country of
registration Segment Ownership percentage
Legal Status
TC Farming Ukraine Ltd. Cyprus - 100% Subsidiary
TC Farming Russia Ltd. Cyprus - 100% Subsidiary
Arsetta Investments Ltd. Cyprus - 100% Subsidiary
Laxio Ltd. Cyprus - 100% Subsidiary
Vilasmon Enterprises Ltd. Cyprus - 100% Subsidiary
United Grain (SUISSE) Ltd. Switzerland Trading 100% Subsidiary
Ltd Trigon Dairy Farming Estonia Milk production 53.00% Subsidiary
Llc Trigon Security Ukraine - 100% Subsidiary
Trigon Farming Ltd. Estonia - 100% Subsidiary
T R I G O N A G R I A N N U A L R E P O R T 2 0 1 3 PAGE 101
Breakdown of the loans to subsidiaries by companies is given below:
in EUR thousand
31.12.2013 31.12.2012
TC Farming Ukraine Ltd.
182 13,744
TC Farming Russia Ltd.
15,931 22,210
Russian Agro Investors Ltd.
2,478 13,281
Surskoe Zerno Ltd.
508 474
Ltd Trigon Dairy Farming
3,784 3,195
OAO Plemennoy zavod Gashunsky 180 -
Total loans to subsidiaries
23,063 52,904
During 2013 loans to group companies were
impaired in amount of EUR 24,133 thousand to
reflect the losses in the Russia cluster, including
currency translation losses (Note 37.14). During
2012, short-term loans in amount of EUR 6,000
thousand were reclassified to prepayments for
Rostov cluster acquisition. The completion of the
acquisition was carried out in 4Q 2012. For more
information on the Rostov cluster acquisition please
refer to Note 31.
The ageing analysis of trade receivables is as follows:
in EUR thousand
31.12.2013 31.12.2012
Up to 3 months
14 36
Over 6 months
19,020 4,468
19,034 4,504
including receivables not due
19,034 4,504
The expected timing of proceeds from other receivables is as follows:
in EUR thousand
31.12.2013 31.12.2012
Up to 3 months
23 29
Over 6 months
96 108
119 137
including receivables not due
119 137
The expected timing of proceeds from loan receivables is as follows:
in EUR thousand
31.12.2013 31.12.2012
including receivables not due
23,063 52,904
The effective interest rates on non-current receivables were as follows:
2013 2012
Loans to related parties
7.0-11.0% 7.0-11.0%
The carrying amounts of the trade and other receivables were denominated in the following
currencies:
in EUR thousand
31.12.2013 31.12.2012
US dollar
507 501
Russian rouble
22 25
Euro
41,797 57,091
42,326 57,617
T R I G O N A G R I A N N U A L R E P O R T 2 0 1 3 PAGE 102
37.9 INTANGIBLE ASSETS
As at December 31, 2013 investments under
development amounting to EUR 164 thousand
were written down due to project termination.
Refund for unfinished project was EUR 57
thousand. Intangible assets included investments
into consolidation software.
37.10 TRADE AND OTHER PAYABLES
in EUR thousand
31.12.2013
Amended 31.12.2012
Trade payables
146 4,982
Social security and other taxes
23 47
Accrued expenses
311 448
Amounts due to related parties
4,496 3,894
4,976 9,371
Less: non-current portion
-74 -
4,902 9,371
As at December 31, 2012 trade payables in amount
of EUR 4,863 thousand, related to the deferred
payment of the Rostov cluster acquisition, that was
settled during year 2013. For more information on
the Rostov cluster acquisition please refer to Note
31.
in EUR thousand
31.12.2013
Amended 31.12.2012
Euro
4,976 9,371
4,976 9,371
37.11 BORROWINGS
As at December 31, 2013 borrowings in amount of
EUR 41,904 thousand (EUR 42,673 thousand as at
December 31, 2012) include liability for four-year
SEK-nominated bonds with maturity date in June
29, 2015 in amount of EUR 38,977 thousand (EUR
39,866 thousand as at December 31, 2012),
accrued interests in amount of EUR 2,197 thousand
(EUR 2,232 thousand as at December 31, 2012),
borrowings from subsidiaries EUR 50 thousand and
finance lease in amount of EUR 96 thousand. The
bonds are nominated in SEK and are bearing
annual fixed interest rate of 11%. For further
information please refer to consolidated financial
statements Note 14. Finance lease is bearing 3-
month EURIBOR interest rate and is due in 2016.
37.12 SHARE CAPITAL OF THE PARENT COMPANY
in EUR thousand Number of
shares Ordinary
shares Share
capital Share
premium Total
Balance at 31.12.2011 129,627,479 129,627,479 129,627 35,127 164,754
Reduction in share capital -
- -64,814
64,814
-
Balance at 31.12.2012 129,627,479 129,627,479 64,814 99,941 164,755
Balance at 31.12.2013 129,627,479 129,627,479 64,814 99,941 164,755
The Company was founded on December 11, 2006
with total ordinary share capital at foundation of
500,000 Danish kronas (EUR 67,018). At the
foundation, the Company had only ordinary shares.
As of March 27, 2007 the Company’s share capital
was changed to be EUR nominated, the share
capital was increased with issue of additional
85,133 shares for cash.
On April 2, 2007, the Company issued 19,475,328
new ordinary shares with a par value of EUR 1 per
share. For additional information regarding the
share capital please see Note 116 in the
consolidated financial statements.
On May 10, 2007 the Company’s extraordinary
shareholder’s meeting made a resolution to
increase the share capital issuing 40,000,000 new
shares with a par value of EUR 1 per share. The
T R I G O N A G R I A N N U A L R E P O R T 2 0 1 3 PAGE 103
new investors subscribed all 40,000,000 shares
with the price of EUR 1.25 per share. The payment
for the subscribed shares was made in cash. After
the new share issue the share capital increased to
EUR 59,627,479.
Starting from May 18, 2007 the shares of Trigon
Agri A/S were listed in First North stock exchange
in Stockholm, an alternative market place part of
the OMX Nordic Exchange.
On May 6, 2008 the Group’s extraordinary
shareholder’s meeting made a resolution to
increase the share capital issuing 70,000,000 new
shares with a par value of EUR 1 per share. The
new investors subscribed all 70,000,000 shares
with the price of EUR 1.50 per share. The payment
for the subscribed shares was made in cash. After
the share issue the share capital increased to EUR
129,627,479.
Based on the resolution of the Extraordinary
General Meeting of the shareholders, which was
held on 29 October 2008 in Copenhagen, the Board
of Directors was authorised to acquire own shares
on behalf of the company. The purpose of acquiring
the company’s own shares was to enhance
shareholder value.
As of December 31, 2008 the Company had
purchased 10,700,100 shares and paid for the
shares EUR 4,246,067 whereas the amount of
unsettled trades as of December 31, 2008 was EUR
30,580.
As of December 31, 2009 the Company had
purchased 12,857,000 shares and paid for the
shares EUR 5,757 thousand. The shares were
bought to provide additional value to the investors.
There were no unsettled trades at December 31,
2009. All treasury shares were sold in February
2011 with the average price of EUR 0.765 per share.
Total proceeds from the sales were EUR 9,638
thousand (net of fees paid to the brokers).
Since December 8, 2010 the shares of Trigon Agri
A/S are listed on main market of Small Cap segment
on NASDAQ OMX Stockholm.
37.13 EMPLOYEE BENEFITS EXPENSE
Employee benefits expense in amount of EUR 960
thousand (EUR 1,031 thousand in 2012) includes
salary expenses in amount of EUR 737 thousand
(EUR 769 thousand in 2012) and social tax
expenses in amount of EUR 223 thousand (EUR
262 thousand in 2012).
The average number of employees in 2013 was 21
(21 in 2012).
in EUR thousand
2013 2012
Fees of Members of Board of Directors and Executive Board
184 191
Social security costs related to fees of Members of Board of Directors and Executive Board
27 59
211 250
Wages and salaries
553 578
Social security costs
196 203
749 781
960 1,031
37.14 FINANCE INCOME AND FINANCE COSTS
in EUR thousand
2013 Amended
2012
Interest income
3,387 3,302
Dividend income from related party
- 63,255
Other finance income
- 1
3,387 66,558
Bond interests
-4,719 -4,835
Other interests
-21 -11
Loans impairment -24,133 -
Write-down of subsidiaries
-12,644 -60,277
Other finance costs
- -186
-41,517 -65,309
T R I G O N A G R I A N N U A L R E P O R T 2 0 1 3 PAGE 104
37.15 RELATED PARTY TRANSACTIONS
Sales and purchases
2013 2012
Sale of services to group companies
1,882 4,692
Purchase of management services - AS Trigon Capital and its subsidiaries
3,231 -
Purchase of goods and services from AS Trigon Capital and its subsidiaries
198 393
The following table sets forth the aggregate gross amounts of salaries and other remuneration to the Board of
Directors and Executive Board in 2013 and in 2012.
in EUR thousand
Salary (incl social
security costs) Bonuses Total
2013
Members of Board of Directors 65 - 65
Members of the Executive Board 146 - 146
211
- 211
2012
Members of Board of Directors 106 - 106
Members of the Executive Board 144 - 144
250 - 250
Balances from sales/purchases of goods/services
31.12.2013 31.12.2012
Payable to AS Trigon Capital and its subsidiaries
12 15
37.16 FEES TO THE AUDITORS OF THE PARENT COMPANY
The following fees have been paid to PricewaterhouseCoopers:
in EUR thousand
2013 2012
Audit
212 335
Other assurance engagements
29 198
Tax advice and consultations
38 67
Other services
34 58
313 658
T R I G O N A G R I A N N U A L R E P O R T 2 0 1 3 PAGE 105
MANAGEMENT’S STATEMENT ON THE ANNUAL REPORT The Board of Directors and Executive Board have
today considered and adopted the Annual Report of
Trigon Agri A/S for the financial year 1 January –
31 December 2013.
The Annual Report is prepared in accordance with
International Financial Reporting Standards (IFRS)
as adopted by the EU. Moreover, the Annual Report
is prepared in accordance with additional Danish
disclosure requirements for listed companies.
In our opinion, the Consolidated Financial
Statements and the Financial Statements give a
true and fair view of the financial position at 31
December 2013 of the Group and the Company
and of the results of the Group and Company
operations and cash flows for the financial year 1
January – 31 December 2013.
In our opinion, Management’s Review includes a
true and fair account of the development in the
operations and financial circumstances of the
Group and the Company, of the results for the year
and of the financial position of the Group and the
Company as well as a description of the most
significant risks and elements of uncertainty facing
the Group and the Company.
We recommend that the Annual Report be adopted
at the Annual General Meeting.
Copenhagen, March 31, 2014
__________________ __________________ ______________________________
Joakim Helenius Pertti Laine Erkk iRené Nyberg
______llarniemi
Chairman of the Member of the Member of the
Board of Directors Board of Directors Board of Directors
__________________ __________________
Raivo Vare David Mathew
Member of the Member of the
Board of Directors Board of Directors
__________________ _________________________
Ülo Adamson Konstantin Kotivnenko
Chairman of the Member of the
Executive Board Executive Board
T R I G O N A G R I A N N U A L R E P O R T 2 0 1 3 PAGE 106
INDEPENDENT AUDITOR’S REPORT
To the Shareholders of Trigon Agri A/S
Report on Consolidated Financial
Statements and Parent Company Financial
Statements
We have audited the Consolidated Financial Statements and the
Parent Company Financial Statements (incorporated in note 36-
37) of Trigon Agri A/S for the financial year 1 January to 31
December 2013, which comprise statement of financial
position, income statement, statement of comprehensive
income, statement of changes in equity, cash flow statement
and notes, including summary of significant accounting policies,
for the Group as well as for the Parent Company. The
Consolidated Financial Statements and the Parent Company
Financial Statements are prepared in accordance with
International Financial Reporting Standards as adopted by the
EU and Danish disclosure requirements for listed companies.
Management’s Responsibility for the Consolidated
Financial Statements and the Parent Company Financial
Statements
Management is responsible for the preparation of Consolidated
Financial Statements and Parent Company Financial Statements
that give a true and fair view in accordance with International
Financial Reporting Standards as adopted by the EU and Danish
disclosure requirements for listed companies, and for such
internal control as Management determines is necessary to
enable the preparation of Consolidated Financial Statements
and Parent Company Financial Statements that are free from
material misstatement, whether due to fraud or error.
Auditor’s Responsibility
Our responsibility is to express an opinion on the Consolidated
Financial Statements and the Parent Company Financial
Statements based on our audit. We conducted our audit in
accordance with International Standards on Auditing and
additional requirements under Danish audit regulation. This
requires that we comply with ethical requirements and plan and
perform the audit to obtain reasonable assurance whether the
Consolidated Financial Statements and the Parent Company
Financial Statements are free from material misstatement.
An audit involves performing procedures to obtain audit
evidence about the amounts and disclosures in the
Consolidated Financial Statements and the Parent Company
Financial Statements. The procedures selected depend on the
auditor’s judgment, including the assessment of the risks of
material misstatement of the Consolidated Financial Statements
and the Parent Company Financial Statements, whether due to
fraud or error. In making those risk assessments, the auditor
considers internal control relevant to the Company’s
preparation of Consolidated Financial Statements and Parent
Company Financial Statements that give a true and fair view in
order to design audit procedures that are appropriate in the
circumstances, but not for the purpose of expressing an opinion
on the effectiveness of the Company’s internal control. An audit
also includes evaluating the appropriateness of accounting
policies used and the reasonableness of accounting estimates
made by Management, as well as evaluating the overall
presentation of the Consolidated Financial Statements and the
Parent Company Financial Statements.
We believe that the audit evidence we have obtained is
sufficient and appropriate to provide a basis for our audit
opinion.
The audit has not resulted in any qualification.
Opinion
In our opinion, the Consolidated Financial Statements and the
Parent Company Financial Statements give a true and fair view
of the Group’s and the Parent Company’s financial position at
31 December 2013 and of the results of the Group’s and the
Parent Company’s operations and cash flows for the financial
year 1 January to 31 December 2013 in accordance with
International Financial Reporting Standards as adopted by the
EU and Danish disclosure requirements for listed companies.
Emphasis of Matter
We draw your attention to Note 3.5 to the consolidated
financial statements. The operations of the Group, and those of
other entities in Ukraine, have been affected and may continue
to be affected for the foreseeable future, by the continuing
uncertainties in Ukraine. This could also affect Group's liquidity.
Our opinion is not qualified in respect of this matter.
Statement on Management’s Review
We have read Management’s Review in accordance with the
Danish Financial Statements Act. We have not performed any
procedures additional to the audit of the Consolidated Financial
Statements and the Parent Company Financial Statements. On
this basis, in our opinion, the information provided in
Management’s Review is consistent with the Consolidated
Financial Statements and the Parent Company Financial
Statements.
Copenhagen, March 31, 2014
PricewaterhouseCoopers
Statsautoriseret Revisionspartnerselskab
Jens Otto Damgaard
State Authorised Public Accountant
Tue Stensgaard Sørensen
State Authorised Public Accountant
T R I G O N A G R I A N N U A L R E P O R T 2 0 1 3 PAGE 107
DEFINITIONS
Acid test (Total current assets – Inventories(inventories including biological assets))/Total current liabilities. The acid test or quick ratio measures a company’s ability to use its near cash or quick assets to immediately extinguish or retire its short-term liabilities (liabilities due within the next twelve months).
Current ratio Total current assets/Total current liabilities. The current ratio measures a company’s ability to meet short-term obligations (liabilities due within the next twelve months).
Earnings per share Net result attributable to the shareholders of the Company/ weighted average number of common shares outstanding during the period (in accordance with IAS 33). Earnings/loss per share for profit attributable to the equity holders of the Company during the year, both basic and diluted.
EBITDA EBITDA is calculated by adding to the operating profit the annual depreciation of the fixed assets and amortisation of land-related long-term prepayments
EBITDA margin EBITDA/ Total revenue, other income and fair value adjustments. EBITDA is calculated by adding to the operating profit the annual depreciation of the fixed assets and amortisation of land-related long-term prepayments. EBITDA margin measures a company’s earnings after operational cash costs (i.e. excluding depreciation and amortisation) relative to its revenue, independent of the Company’s financing and tax position.
Equity ratio Total equity/Total assets. Equity ratio measures financial leverage, demonstrating the capital structure of a company.
Net profit margin Net profit attributable to the owners of the parent company/ Total revenue, other income and fair value adjustments. Net profit margin measures a company’s net profitability relative to its revenue.
Return on assets (ROA) Net profit attributable to the owners of the parent company/Average total assets. Return on assets compares income with total assets measuring management’s ability and efficiency in using the firm’s assets to generate profits
Return on equity (ROE) Net profit attributable to the owners of the parent company/Average equity excluding minority interest. Return on equity relates income with the equity capital measuring management’s ability and efficiency in generating return to the shareholders of the Company.
Book value per share
Dividends per share
Total Stockholders’ equity/ weighted average number of common shares outstanding during the period (in accordance with IAS 33).The book value per share measures the per share value of a company based on its equity available to
shareholders. Dividends/ weighted average number of common shares outstanding during the period (in accordance with IAS 33). The total dividends paid out over an entire year divided by the number of outstanding ordinary shares issued.


