Embed Size (px)
Citation preview

Annual report 2013


CONNECTING IMAGESWe design and develop visualization solutions that encompass the entire visualization spectrum
CONNECTING PEOPLEWe are unified by a mutual goal: to achieve operational excellence

CONNECTING PEOPLEWe are unified by a mutual goal: to achieve operational excellence
CONNECTING VALUESWe share a common set of seven corporate values
We t
rust
each
othe
r
We deal openly &
ethically
We delight our customers
We are
accou
ntable
We
enco
urag
e te
am p
lay
We lead by innovation
We care about our people

CONNECTING CUSTOMER NEEDSWe facilitate a one-stop-shop approach to increase customer satisfaction

CONNECTING CUSTOMER NEEDSWe facilitate a one-stop-shop approach to increase customer satisfaction
CONNECTING GOALSWe aim to create shared value, enabling society to advance and our company to grow

CONNECTING TECHNOLOGIESWe bring to market a suite of networking and collaboration products based on a common technology platform

CONNECTING TECHNOLOGIESWe bring to market a suite of networking and collaboration products based on a common technology platform
CONNECTING PROCESSESWe are streamlining and synchronizing business processes to improve operational efficiency

CONNECTING STAKEHOLDERSWe reach out to customers, partners, shareholders and other stakeholders to strengthen relations

CONNECTING STAKEHOLDERSWe reach out to customers, partners, shareholders and other stakeholders to strengthen relations
LETTER FROM OUR CHAIRMAN AND CEO
Dear Shareholders, Customers, Partners and Employees,
In 2013, while operating in a challenging global economic environment,
and despite early signs of weakening demand for its digital cinema pro-
jectors, Barco staged a repeat performance of its record 2012 year.
Sales increased ever so slightly to €1.158 billion, while operational prof-
itability remained robust at €153 million. Currency translations had a
noticeable impact on the reported results: in constant currency terms,
sales would have been €31 million higher, and EBITDA some €6 million
better.
Continued focus on operational excellence enabled the company to con-
tinuously reduce its working capital needs and generate healthy operating
cash flow while also absorbing two strategic acquisitions.
Fueled by the solid performance of its projection division, Barco’s annual
sales exceeded €1 billion for the third consecutive year. The company is
gradually transforming its traditional cinema-centric focus to become a
broader, digital visualization solutions company.
11Barco | annual report 2013 | Letter from Chairman and CEO

A STABLE COMPANY POSITIONED FOR PROFITABLE GROWTHEarly in 2013 – to make Barco even more customer-centric and market
driven – we established market divisions alongside our traditional product
divisions. Responding to ever-growing demand for integrated systems
with expanded functionalities, each of our market divisions now can
draw on the full portfolio of Barco’s capabilities to develop integrated
solutions tailored to its customers’ specific needs. The recent acquisitions
of AWIND, JAOTech and projectiondesign®, as well as IPVS, have greatly
enhanced our ability to offer end-to-end solutions – not just in terms of
superior visualization standards, but also in terms of connectivity and
user-friendly interactivity.
We trust that, with a book-to-bill ratio above 1 in all of its businesses
except Digital Cinema, Barco is well positioned for sustainable and prof-
itable growth.
Herman Daems, Chairman
12 Barco | annual report 2013 | Letter from Chairman and CEO

PROJECTION CONTINUES TO GROW DESPITE CINEMA MARKET DECLINEBarco further increased its market share in a softening cinema market
with a capture rate of about 50% and confirmed its leadership with major
roll-out deals in Latin America, China and India. Coupled with an exclusive
partnership for projection with IMAX, Barco remains the de facto standard
for cinema projection.
Building on our reputation for superior technology, we have been actively
expanding our product offering to build further on our ‘cinema of the
future’ concept. Thanks to an exclusive deal with DreamWorks Animation,
we already have 250 reference installations for the Auro 11.1 immersive
3D sound technology worldwide. Further diversification includes the
introduction of smaller footprint projectors, and we are also readying
our laser projection offering to capitalize on the ROI and light output
benefits of this technology.
The acquisition of Norway-based projectiondesign® proved to be success-
ful. We are making good progress with the integration and are gearing up
their products, channels, and know-how to realize Barco’s comeback in
the professional AV market. Barco’s high-end 3-chip DLP® product range
was complemented with mid-range 1-chip DLP® projectors – resulting
in one of the widest portfolios in the market and providing an answer
to any projection need. The launch of the ‘Connect’ partner program –
at our first-ever global partner conference in Malta – clearly shows our
commitment to this market segment, and helped us double sales in
this segment year-on-year. In venues & hospitality as well, Barco holds
a strong position and leads in offering high lumens projection for the
experience economy.
Barco staged a repeat performance of its record 2012 year
Eric Van Zele, CEO
13Barco | annual report 2013 | Letter from Chairman and CEO

HEALTHCARE: NEW SEGMENTS FUELING GROWTHBEYOND DIAGNOSTIC IMAGINGBarco kept its dominant market position in diagnostic imaging with the
introduction of a complete portfolio of LED displays – an achievement
that was honored with the Frost & Sullivan 2013 product line strategy
award. Although the diagnostic imaging segment is a mature one, it will
remain an important revenue contributor for the division, with a healthy
replacement cycle in digitized markets in Western Europe and North
America and significant growth potential in the BRIC countries.
While maintaining leadership in diagnostic imaging, the Healthcare
division continued its investment strategy in new market segments.
Operating theaters are a prime source of revenue for today’s healthcare
organizations, and the investments we’ve made for the digital operating
room are starting to yield results with reference deals, first partnerships,
and installations in Europe and North America.
Orders picked up in the hospital IT segment in Q4, as healthcare enter-
prises increasingly invest in patient care and clinical workflow solutions. To
further accelerate market penetration, Barco secured a partnership with a
leading software provider in the UK to offer customers a full solution that
encompasses both terminals and software for interactive patient care.
RECONFIGURING ADVANCED VISUALIZATIONYear-on-year sales in the Advanced Visualization division declined by
more than 10%. Volumes remained stable in terms of number of units
shipped, but the gradual shift in the market’s mid-segment to cheaper,
lower-margin LCD video walls is impacting revenue and profitability.
In addition to a number of specific cost-reduction programs, and in
response to the challenging market conditions, we strengthened our
focus on the traffic & transportation and security & surveillance segments
and started to renew and diversify our product portfolio to meet market
demand for collaborative visualization and decision-making. In a world full
of sensors, cameras and other data streams, integrated and networked
systems are key enablers for our customers in monitoring their business-
or life-critical applications. Operators in the field need to be connected
to headquarters in real-time so that they and their managers always
have all details available to take complex decisions in a split second.
With more than 1000 sites worldwide using digital networked video-wall
solutions in 2013, Barco reconfirmed its technological leadership position
for control rooms.
At the same time, we have been preparing to complement our product
portfolio and to further diversify with competitive video-wall solutions,
tiled near-seamless LCD video walls, graphics controller portfolio and
software, and even cloud-enabled technologies. This approach allows
us to further penetrate the mid-segment and grow beyond visualization
and video walls to offer customer-integrated systems for collaborative
decision-making.
PROFITABILITY RESTORED IN DEFENSE & AEROSPACE ACTIVITIES In the first half of 2013, Defense was impacted negatively by the seques-
tration in the US and budget restrictions on government spending
worldwide, which led to reduced order volumes. Avionics, on the other
hand, did well – and Barco cockpit displays were among those selected
for integration into the first-ever Chinese commercial airliner.
In the first half of the year, we took decisive restructuring measures for
our Defense & Aerospace division. Actions were aimed at streamlining the
business, helping the business optimize its product portfolio, responding to
market opportunities in emerging markets, and (in the US) strengthening
the focus on key accounts. Thanks to this approach, we managed to bring
the division back to profitability. With a good recovery in order intake at
the end of the year, we are confident about our prospects in this business.
14 Barco | annual report 2013 | Letter from Chairman and CEO

REAPING THE BENEFITS OF OUR VENTURE APPROACHWhen we implemented the venture structure three years ago, we wanted
some of our (new) businesses to embrace a more entrepreneurial spirit
and introduce new technologies or revamp the portfolio without the
burden of a corporate organization.
That approach has proven to be successful. The ClickShare venture brought
breakthrough collaboration technology to the meeting room and has
already shipped more than 12,000 units worldwide. LiveDots – our LED
venture – successfully repositioned its product portfolio and can now
proudly boast landmark installations in top locations in cities like Paris,
New York, Johannesburg and London. In addition, High End Systems – our
digital lighting venture – managed to recover from unfriendly market
conditions and has made a comeback in the rental & staging industry.
All ventures are now profitable and have proven their added value. Click-
Share has already been gradually integrated into the Barco structure, and
High End Systems will be. We intend to decide about the future of the
other ventures in the course of 2014.
BEYOND VISUALIZATION – INTO NETWORKINGAND COLLABORATIONThe acquisitions of projectiondesign® and AWIND have helped us expand
our commercial reach and technology portfolio in line with our vision ‘to
provide best-in-class networked visualization solutions that enable our
customers to run their businesses more effectively’.
This entails ‘thinking from the customer instead of from the product’ –
and, based on this customer intimacy and market knowledge, we have
to grow Barco beyond visualization into networking and collaboration.
Projection and display technologies will remain a core element of our
business proposition, but they will be complemented with hardware and
software solutions that enable the distribution of images and data streams
to support collaboration within and beyond facilities.
Thinking from the customer instead of from the product, we have to grow Barco beyond visualization into networking and collaboration
For Barco, this means supplementing our display portfolio with soft-
ware-enabled solutions, exploring new business models that complement
the current CAPEX-based approach, adding cloud and multimedia technol-
ogies to our offering, and moving from products to solutions and systems.
80 YEARS OF TRANSFORMATIONBarco will celebrate its 80th Anniversary in 2014 – and we are looking to
the future with confidence.
In the last few years, we moved forward on our strategy to prepare the
company for the next growth stage: moving beyond visualization into net-
working and collaboration. We are committed to following this course and
to creating sustainable value with all businesses in the markets we serve.
To further drive this transformation and realize the company’s full poten-
tial, the Board reserves most of the company’s financial resources for
future growth investments. By raising our dividend to €1.50 per share,
we want to express our gratitude to our shareholders as we continue to
transform the company along the paths of profitable growth.
Eric Van Zele Herman Daems
CEO Chairman
15Barco | annual report 2013 | Letter from Chairman and CEO

20
11
1,041.2
20
12
1,1562
01
31,158
SALES
(in millions of euro)
0
200
400
600
800
1,000
1,200
100
300
500
700
900
1,100
20
11
75.8
20
12
94.2
20
13
59.4
NET INCOME
(in millions of euro)
0
20
40
60
80
100
120
10
30
50
70
90
110
20
11
1,082.9
20
12
1,133.8
20
13
1,150.5
ORDERS
(in millions of euro)
0
200
400
600
800
1,000
1,200
100
300
500
700
900
1,100
20
11
479.9
20
12
461.2
20
13
460.9
ORDER BOOK
(in millions of euro)
0
100
200
300
400
500
600
50
150
250
350
450
550
20
11
78.4
20
12
100.2
20
13
79
EBIT(before restructuring & impairment)
(in millions of euro)
0
20
40
60
80
100
120
10
30
50
70
90
110
20
11
68.4
20
12
97.6
20
13
69.6
EBIT(after restructuring & impairment)
(in millions of euro)
0
20
40
60
80
100
120
10
30
50
70
90
110
0
20
40
60
80
100
120
130
140
150
160
10
30
50
70
90
110
20
11
130.2
20
12
159.52
01
3153.2
EBITDA(before restructuring & impairment)
(in millions of euro)
0
20
40
60
80
100
120
130
140
150
160
10
30
50
70
90
110
20
11
130.2
20
12
159.5
20
13
143.8
EBITDA(after restructuring & impairment)
(in millions of euro)
KEY FIGURES
16 Barco | annual report 2013 | Key figures

(IN THOUSANDS OF EURO) 2013 2012 2011
Balance sheet & personnel
Equity 579,366 538,050 460,703
Balance sheet total 1,047,822 921,879 814,567
Net financial cash/(debt) (f) 104,435 111,166 61,635
Operating capital employed (e) 466,653 389,569 399,534
Net working capital (e) 54,782 95,425 162,222
Personnel on 31 December 3,979 3,727 3,507
Ratios
DSO (b) 52 48 56
Inventory turns (c) 3,2 3,1 2,7
DPO (d) 52 57 54
ROCE (%) (e) 15% 24% 20%
(IN EURO) 2013 2012 2011
Key figures per share
Number of shares on 31 December (in thousands) 12,989 12,757 12,755
Per share (in euro)
EPS 4.86 7.84 6.32
Diluted EPS 4.71 7.50 6.21
Gross dividend 1.50 1.40 1.10
Net dividend 1.13 1.05 0.83
Gross dividend yield (h) 2.6% 2.6% 2.8%
Yearly return (i) 6.6% 44.2% -17.4%
Pay-out ratio (j) 34.1% 19.0% 18.5%
Price/earnings ratio (k) 11.7% 7.0% 6.1%
(a) EBIT+ depreciation on capital expenditure (PP&E) + amortization on capitalized deve-lopment cost
(b) DSO = ((Trade debtors, net) / (sales past quarter))*90(c) Inventory turns = 12 / [Inventory / (Average Monthly Sales x Material Cost of Goods
Sold %)](d) DPO = trade payables / (material cost + services and other costs + inventory move-
ment + purchases of (in)tangible fixed assets) x 365
(e) For calculation see page 142(f) For calculation see page 207(g) For calculation see page 140
Share price (in euro) 2013 2012 2011
Average closing price 59.96 48.64 46.41
Highest closing price 69.95 58.75 59.50
Lowest closing price 52.58 36.52 31.20
Closing price on 31 Dec 56.70 54.50 38.76
Average number of shares traded daily 34,105 29,298 29,722
Stock market capitalization on 31 December (in millions) 736.5 695.3 492.7
(h) Gross dividend/ closing rate on 31 December 2013(i) Increase or decrease share price + gross dividend, divided by closing share price of previous year(j) Gross dividend x number of shares on 31 December / net result(k) Share price 31 December / net result per share
(IN THOUSANDS OF EURO) 2013 2012 2011
Income statement before restructuring and goodwill impairment
Orders 1,150,470 1,133,781 1,082,895
Orderbook 460,856 461,157 479,918
Net sales 1,158,015 1,155,984 1,041,244
Gross profit 386,496 375,633 312,932
EBIT 79,024 100,238 78,359
EBITDA (a) 153,234 159,476 130,223
Ratios
EBIT on sales 6.8% 8.7% 7.5%
EBITDA on sales 13.2% 13.8% 12.5%
Net financial cash (/debt) on EBITDA 68.2% 69.7% 47.3%
Restructuring and goodwill impairment costs -9,428 -2,671 -10,000
(IN THOUSANDS OF EURO) 2013 2012 2011
Income statement after restructuring and goodwill impairment
EBIT 69,596 97,567 68,359
EBITDA (a) 143,806 159,476 130,223
Free cash flow (g) 70,172 121,577 81,237
Profit/(loss) before taxes 67,434 98,656 65,829
Net income 59,403 94,241 75,850
Net income attributable to non-controlling interest 2,284
Net income attributable to the equity holder of the parent 57,119 94,241 75,850
Ratios
EBIT on sales 6.0% 8.4% 6.6%
EBITDA on sales 12.4% 13.8% 12.5%
Net financial cash (/debt) on EBITDA 72.6% 69.7% 47.3%
FINANCIAL HIGHLIGHTS
17Barco | annual report 2013 | Financial highlights

1934Lucien De Puydt establishes the Belgian
American Radio Corporation NV (BARCO).
The company specializes in assembling
radios with parts from the United States
1935Our first year of production,
we assemble 2,000 radios
1949We present the first Barco
television prototypes
2,000
1938Barco employees at
City Hall of Poperinge
(Belgium)
Barco | annual report 2013 | 80 years Barco

LOOKING FORWARD TO 2014: CELEBRATING 80 YEARSOF BARCO (1934-2014)
1968We provide studio monitors to the Belgian national radio and
television broadcasting station (BRT). The technical perfection of
these systems attracts customers from all over the world
1951We introduce the Barcobox jukebox
1974Our partner Sosea distributes Barco TVs throughout
Senegal and its neighbouring countries
19 Barco | annual report 2013 | 80 years Barco

1981Two companies are born: Barco Electronic
(broadcasting) and Barco Industries
(industrial and professional activities)
23 June 1986Barco Industries is quoted on the Brus-
sels Stock Exchange. Opening stock price:
€65.41
15 June 1987Barco Electronic issues 772,200 shares on
the Brussels Stock Exchange
1989Barco Electronic and Barco Industries merge
into a single, international electronics group
with worldwide ambitions
12 December 1986CEO Hugo Vandamme receives the Belgian
Oscar for exports
772,200
20Barco | annual report 2013 | 80 years Barco

90
1990We become a truly global company,
with acquisitions and subsidiaries in
many countries
1992Working on CRT projectors in the
Barco lab
2000We become a Next 150 company
2011For the first time in history, we pass the
€1 billion in sales landmark
TodayWe are a global leader in the design and
development of visualization products,
active in more than 90 countries, with
about 4,000 employees
1997Since 1997, we are listed on the
BEL-20 index of the Brussels Stock
Exchange
one
Barco | annual report 2013 | 80 years Barco

TABLE OF CONTENTS
OUR COMPANY24-33
OUR STRATEGY34-43
OUR SUSTAINABILITY PLAN44-61
Letter from the Chairmanand the CEO 11 Key figures 16Financial highlights 1780 years of Barco 18
Our company 26Our technology 30We trust each other 31Our business areas 32
Our strategy 34We delight our customers 35Objectives and progress 38
Our people 48We care about our people 51Our world 54Our planet 58We deal openly and ethically 61
22 Barco | annual report 2013 | Table of contents

OUR ACTIVITIES62-109
DIRECTORS’ REPORT110-155
BARCO CONSOLIDATED156-227
Entertainment & Corporate 64We are accountable 75
Healthcare 76We lead by innovation 85
Industrial & Government 86
Defense & Aerospace 96We encourage team play 105
Ventures 106
Corporate governance statement 113Statutory auditor 133Comments on the results 134Information about the share 150
Income statement 159Balance sheet 161Cash flow statement 162Changes in equity 164Notes to the consolidatedfinancial statements 172Auditor’s report 223
BARCO NV 225Balance sheet after appropriation 226Income statement 227Proposed appropriation of Barco NV result 227
Contact information 228
23Barco | annual report 2013 | Table of contents

Our company
Companyprofile
page 26
Ourtechnology
page 30
Ourbusinessareas
page 32
Ourstrategy
page 34
Objectives &progress
page 38
24 Barco | annual report 2013 | Our company

Our company
Companyprofile
page 26
Ourtechnology
page 30
Ourbusinessareas
page 32
Ourstrategy
page 34
Objectives &progress
page 38
25Barco | annual report 2013 | Our company

COMPANY STRUCTURE 2013 COMPANY STRUCTURE 2014*
HEALTHCARE
PROJECTION
ADVANCED VISUALIZATION
DEFENSE & AEROSPACE
VENTURES» LiveDots // High End Systems // Orthogon // Silex
VENTURES» LiveDots // Orthogon // Silex
HEALTHCARE
ENTERTAINMENT & CORPORATE» including High End Systems
INDUSTRIAL & GOVERNMENT
DEFENSE & AEROSPACE
COMPANY PROFILE
*OUR NEW CORPORATE STRATEGY
Effective 1 January 2014, Barco took steps to sharpen its focus on markets
by promoting the product and solution portfolios of all businesses and
cross-selling throughout the company. To emphasize our market focus,
the Projection and Advanced Visualization divisions have been renamed,
while the High End Systems venture has been integrated into the core:
• Barco’s Projection division is now called Entertainment & Corporate
and will integrate High End Systems.
• The Advanced Visualization division is now called Industrial &
Government.
At the start of 2014, 3 activities remain in the Venture group: LiveDots,
Orthogon and Silex.
26 Barco | annual report 2013 | Our company

GEOGRAPHICAL FOOTPRINT
FEBRUARY
FEBRUARY
14
25
14 February 2013: Acquisition of WiFi
content sharing specialist AWIND
25 February 2013: Acquisition of
projectiondesign® completed
Sites
Americas
» Argentina
» Brazil
» Canada
» Colombia
» Mexico
» United States
Asia-Pacific
» Australia
» China
» India
» Japan
» Malaysia
» Singapore
» South Korea
» Taiwan
Europe & Middle East
» Belgium
» Denmark
» France
» Germany
» Israel
» Italy
» Norway
» Poland
» Russia
» Spain
» Sweden
» Switzerland
» Turkey
» United Arab
Emirates
» United Kingdom
R&D and/or manufacturing facilities
» Belgium
» China
» France
» Germany
» India
» Italy
» Norway
» United Kingdom
» United States
27Barco | annual report 2013 | Our company

ASIAPACIFIC27%
NORTHAMERICA
32%
41%EMEALA*
ASIAPACIFIC22%
NORTHAMERICA
34%
44%EMEALA*
2013 2012
ASIAPACIFIC27%
NORTHAMERICA
31%
ASIAPACIFIC24%
NORTHAMERICA
34%
42%EMEALA*
42%EMEALA*
2013 2012
SALES PER DIVISION GEOGRAPHICAL BREAKDOWN OF SALES
GEOGRAPHICAL BREAKDOWN OF ORDERS
2013
2012*
PROJECTION44%
ADVANCED VISUALIZATION17%
17%HEALTHCARE
9%VENTURES
13%DEFENSE & AEROSPACE
PROJECTION41%
ADVANCED VISUALIZATION18%
18%HEALTHCARE
9%VENTURES
14%DEFENSE & AEROSPACE
*Sales per division for 2012 have been restated according to the 2013 organization * Europe, Middle East, Africa, Latin America
COMPANY PROFILE
28 Barco | annual report 2013 | Our company

20
10
20
11
20
12
20
13
3,5073,499 3,725 3,982
NORTH AMERICA APAC
15%
75%
10%
EMEALA*
70%
men
30%
women
EMPLOYEES PER FUNCTIONAL GROUP
NUMBER OF EMPLOYEES GEOGRAPHICAL DISTRIBUTION EMPLOYEES BY GENDER
Administration
2013
325
248
380
176
1,337
90
78
789
559
2012
Customer Projects
Customer Service
Marketing
Manufacturing & Logistics
Procurement
Quality, Supply chain & Support
Research & Development
Sales
* Europe, Middle East, Africa, Latin America
29Barco | annual report 2013 | Our company

OUR TECHNOLOGY
We meet the highest requirements in visualization and bring a wide display portfolio to a variety of markets – from high-resolution medical displays, to rear-projection video walls, to rugged displays and LED solutions.
Featuring one-chip or three-chip DLP® technology and brightness levels of up to 40,000 lumens, in 2D and 3D, our high-end and mid-segment projector models can be used for meeting rooms, digital cinema, post-production, virtual reality, simulation and events.
We bring to market a suite of software-enabled systems, including networking and cloud-based capabilities. Result? All-round connectivity for uninterrupted, shared, and mobile access to data, anytime, anywhere.
DISPLAY TECHNOLOGY PROJECTION TECHNOLOGY CONNECTIVITY & COLLABORATION
30 Barco | annual report 2013 | Our company
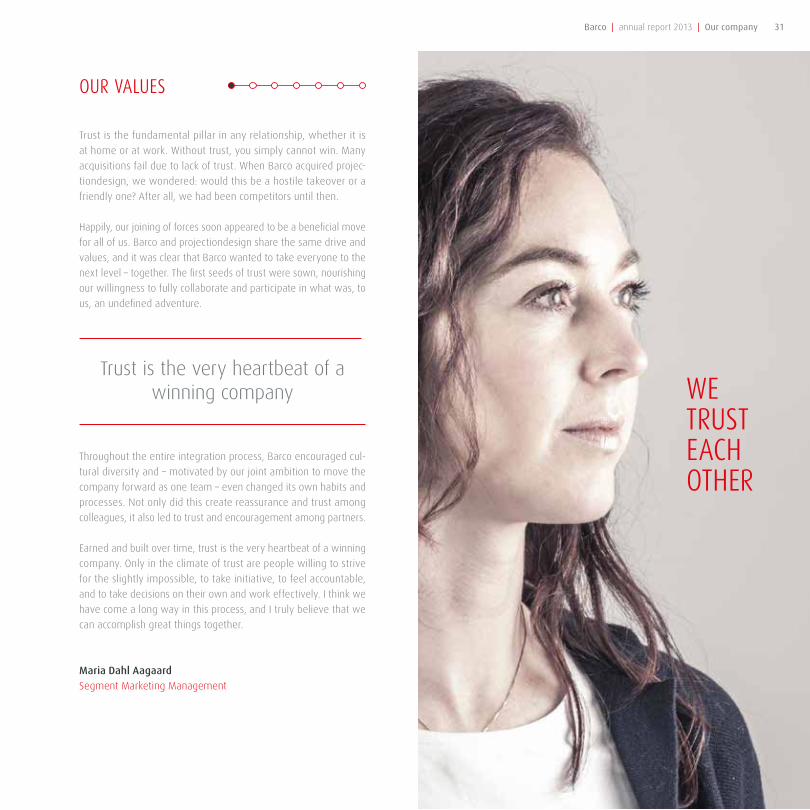
OUR VALUES
Trust is the fundamental pillar in any relationship, whether it is
at home or at work. Without trust, you simply cannot win. Many
acquisitions fail due to lack of trust. When Barco acquired projec-
tiondesign, we wondered: would this be a hostile takeover or a
friendly one? After all, we had been competitors until then.
Happily, our joining of forces soon appeared to be a beneficial move
for all of us. Barco and projectiondesign share the same drive and
values, and it was clear that Barco wanted to take everyone to the
next level – together. The first seeds of trust were sown, nourishing
our willingness to fully collaborate and participate in what was, to
us, an undefined adventure.
Throughout the entire integration process, Barco encouraged cul-
tural diversity and – motivated by our joint ambition to move the
company forward as one team – even changed its own habits and
processes. Not only did this create reassurance and trust among
colleagues, it also led to trust and encouragement among partners.
Earned and built over time, trust is the very heartbeat of a winning
company. Only in the climate of trust are people willing to strive
for the slightly impossible, to take initiative, to feel accountable,
and to take decisions on their own and work effectively. I think we
have come a long way in this process, and I truly believe that we
can accomplish great things together.
Maria Dahl Aagaard
Segment Marketing Management
WE TRUST EACH OTHER
Trust is the very heartbeat of a winning company
31Barco | annual report 2013 | Our company

As a global technology company, Barco designs and develops visualization solutions – encompassing the entire visualization spectrum – for a variety of professional markets. By offering top-quality, user-friendly imaging products, we enable our customers to optimize productivity and business efficiency.
OUR BUSINESS AREAS
ENTERTAINMENT & CORPORATE» Visitor attractions
» Corporate AV
» Rental & staging
» Venues & hospitality
» Research, design & scientific
» Movie theaters
» Theater lobbies
» High-end residential
Connecting ideas page 64
HEALTHCARE» Radiology
» Pathology
» Mammography
» Dentistry
» Surgery
» Point of care
» Clinical specialties
Connecting lives page 76
32 Barco | annual report 2013 | Our company

DEFENSE & AEROSPACE» Air traffic control & management
» Avionics
» C4ISR
» Command centers
» Training
Connecting missions page 96
INDUSTRIAL & GOVERNMENT» Emergency operations centers
» Oil & gas
» Security/CCTV
» Telecom
» Traffic management
» Utilities & process control
» Automotive
» Science
Connecting big data page 86
Barco (NYSE, Euronext Brussels: BAR) employs about 4,000 people in over 90 countries. Our facilities for Sales & Marketing, Customer Support, R&D and Manufacturing span the globe – from Europe and the Americas through to Asia-Pacific.
VENTURES
33Barco | annual report 2013 | Our company

OUR VALUES
14 years in project management have taught me that keeping
your customers happy is about doing more than what is expected
of you. That’s how we delight our customers, instead of merely
satisfying them. Customer delight is about providing unexpected
extras by fostering open communication, anticipating needs, and
building relationships.
I believe building interpersonal relationships with customers, inter-
nal or external, is the single most differentiating factor between
customer satisfaction and customer delight. At the end of the day,
customers do business with people they like and understand. That’s
why values such as integrity, accountability, trust, and mutual
respect are the cornerstone of our code of conduct.
Meeting and exceeding customer expectations requires energy and
hard work. At Barco, we make sure that everyone – back office and
front office – is close to the customer. Regular touch points, such
as customer visits and testimonials, give us insight into what’s at
stake and fuel relationships.
Every day, we convince people that customer delight is every-
one’s job. Our Customer Delight test, through which each employee
receives a Customer Delight score and immediate action points for
improving his/her customer focus, is just one of the tools to make
customer delight part of our DNA.
Kathy Verledens
Virtual Factory Management
WE DELIGHT OUR CUSTOMERS
Interpersonal relationships make the difference between customer satisfaction and customer delight
34 Barco | annual report 2013 | Our strategy

OUR STRATEGY
AMBITION
Our stated ambition is: to be a global leader in collaborative visualization systems for professional uses, with the objective of offering best-in-class networked visualization solutions that enable our customers to run their businesses more effectively. We intend to realize our growth ambitions by moving beyond visualization and including networking and collaboration in the product portfolio.
2011-2012 Consolidate global leadership
2013-2015 Seize growth opportunityin networkedvisualization
Read more about our strategy, growth drivers and achievements in our business review (pages 62-109)
35Barco | annual report 2013 | Our strategy

Employee engagement score of 72 (vs. 68 benchmark)
Company culture supporting creativity and entrepreneurship
Teamwork effectiveness score of 84(vs. 78 benchmark)
4,000 motivated and committed employees
Integrity score of 89 (vs. 75 benchmark)
Customer loyalty score of 86 (vs. 70 benchmark)
Global code of ethics and business conduct
OUR VALUES
OUR STRENGTHS
CAPABILITIES
• Lead in technological innovation on the visualization core
• Expand visualization product portfolio with software-enabled systems, including networking, collaboration, and services
• Include cloud-based as well as premise-based solutions in the portfolio
• Sustain and reinforce leadership position in Entertainment & Corporate, Healthcare, and Industrial & Government markets
• Expand into the mid-range segment of our focus markets
• Extend our offer to include connectivity (networking) & interactivity (collaboration)
• Expand to volume markets to increase scalability and competitiveness
• Consolidate leadership position in traditional markets in Western Europe and the US
• Increase revenue from growth markets by continued focus on BRIC and emerging countries
• Focus on operational excellence throughout the company
• Strengthen the company’s global position through an optimized organization
MARKETS GEOGRAPHIES
OPERATIONS
WE CARE ABOUT OUR PEOPLE
WE LEAD BY INNOVATION
WE ENCOURAGE TEAM PLAY
WE ARE ACCOUNTABLE
WE TRUST EACH OTHER
WE DELIGHT OUR CUSTOMERS
WE DEAL OPENLY & ETHICALLY
We are deploying our strategy for growth in three domains: capabilities, markets, and geographies. In addition, to support these three strategic axes, we will generate resources for these investments and create value by a continued focus on operational excellence.
OUR STRATEGY
36 Barco | annual report 2013 | Our strategy

Employee engagement score of 72 (vs. 68 benchmark)
Company culture supporting creativity and entrepreneurship
Teamwork effectiveness score of 84(vs. 78 benchmark)
4,000 motivated and committed employees
Integrity score of 89 (vs. 75 benchmark)
Customer loyalty score of 86 (vs. 70 benchmark)
Global code of ethics and business conduct
OUR VALUES
OUR STRENGTHS
CAPABILITIES
• Lead in technological innovation on the visualization core
• Expand visualization product portfolio with software-enabled systems, including networking, collaboration, and services
• Include cloud-based as well as premise-based solutions in the portfolio
• Sustain and reinforce leadership position in Entertainment & Corporate, Healthcare, and Industrial & Government markets
• Expand into the mid-range segment of our focus markets
• Extend our offer to include connectivity (networking) & interactivity (collaboration)
• Expand to volume markets to increase scalability and competitiveness
• Consolidate leadership position in traditional markets in Western Europe and the US
• Increase revenue from growth markets by continued focus on BRIC and emerging countries
• Focus on operational excellence throughout the company
• Strengthen the company’s global position through an optimized organization
MARKETS GEOGRAPHIES
OPERATIONS
WE CARE ABOUT OUR PEOPLE
WE LEAD BY INNOVATION
WE ENCOURAGE TEAM PLAY
WE ARE ACCOUNTABLE
WE TRUST EACH OTHER
WE DELIGHT OUR CUSTOMERS
WE DEAL OPENLY & ETHICALLY
37Barco | annual report 2013 | Our strategy

• Defend & strengthen leadership
position in projection & display
solutions for Barco’s target markets
• Strategic focus on corporate AV
opportunities
• Capitalize on IP connectivity and
collaboration opportunity
• Become the standard for easy
sharing of multimedia content
• Prepare for services to further
enhance the customer experience
and develop service as a revenue
generator
OBJECTIVES & PROGRESS
VISUALIZATION
CAPABILITIES
NETWORKEDVISUALIZATION
DISPLAYTECHNOLOGY
CONNECTIVITY
PROJECTIONTECHNOLOGY
COLLABORATION
OBJECTIVES 2013
VISUALIZATIONCORE
CONNECTIVITY & COLLABORATION
SERVICES
38 Barco | annual report 2013 | Our strategy

• Release of OBLX free-standing structure
• Launch of LED-based displays for air traffic control and defense
• Introduction of LED-based medical display line
• Launch of slim and lightweight outdoor LED displays
• Acquisition of projectiondesign®, provider of mid-range projectors
• Launch of Present, Collaborate, and Impress projectors for Corporate AV
• Release of CSM, the ClickShare solution for mid-segment applications
• Acquisition of WiFi content-sharing specialist AWIND to leverage visualization
capabilities for professional networking and collaboration
• Nexxis for OR installed in +200 operating rooms
• Launch of Nexxis-compatible surgical displays
• Introduction of rugged desktop-over-IP solution for enhanced collaboration and
better decision-making in mission-critical environments
• Launch of CareConnex, a networked interactive patient care solution
• Release of ClickShare app to display iPad or iPhone content on a ClickShare
• Release of CineMate app to run digital cinema equipment from mobile devices
• Introduction of collaborative integrated flow and arrival management with
Collaborative Flow Manager (CFM)
• New version of our digital control room for faster response times and better
decision-making
• Installation of a dedicated global services team
• Larger contract awards based on Barco’s worldwide service capabilities
• Upgrade our product portfolio with
high-performance displays & projection
solutions across all core markets
• Incorporate solid-state illumination into
product designs, including the release
of the cinema laser projector
• Further enhance display technology
solutions on the levels of brightness,
resolution, uniformity control and
management
• Strategic focus on corporate AV
opportunities
• Bring to market a suite of networking
products, based on a common platform
serving multiple vertical markets
• Extend the networking capabilities of
our existing products to all of Barco’s
markets, based on a common platform
• Focus on software- and cloud-based
solutions
• Extend the ClickShare channel network
worldwide, add strategic partners, and
double the installed base
• Leverage in-house capabilities and
develop a dedicated services portfolio
• Turn service into a competitive
advantage for Barco
PROGRESS 2013 OBJECTIVES 2014
39Barco | annual report 2013 | Our strategy

• Sustain and reinforce leadership
position in our core markets
• Grow business further in mid-
segment, with strong focus on 2-tier
channel model
• Expand to volume markets
to increase scalability and
competitiveness
OBJECTIVES & PROGRESS
HIGH
MID
LOW
MARKETS
OBJECTIVES 2013
LEADERSHIP
FOCUS ON MID-SEGMENT
FOCUS ON VOLUME MARKETS
40 Barco | annual report 2013 | Our strategy

• 40% market share in Entertainment (Cinema and Venues & Hospitality), 45%
market share in Diagnostic & Modality Imaging, 20% market share in Industrial &
Government
• Sales increase of 1.02% versus 2012
• Over 223 technology patents
• Acquisition of Norway-based projectiondesign®, provider of mid-range projectors
• Launch of affordable single-chip ReaLED™ projector for training, simulation and
visitor attraction applications
• Introduction of new ClickShare CSM Base Unit for low-end meeting rooms
• Launch of two new industry-standard rear-projection video wall cubes: Overview
MVL-621 and MVL-721
• Kick-off of mid-segment product offering for the Advanced Visualization division
with the OBLX video wall
• Introduction of industry-standard Nio 2MP and 3MP diagnostic displays with LED
backlights
• Launch of Collaborate range of single-chip DLP projectors to facilitate collaboration
in meeting rooms
• Defend leadership position in Barco’s
core markets and expand the share of
wallet
• Grow channel sales worldwide and
expand the number of strategic
partnerships
• Continue to expand the mid-segment
product offering in Entertainment,
Corporate and Industrial & Government
• Become the strongest challenger in
corporate AV and grow faster than
the market in corporate AV
RESULTS OBJECTIVES 2014
41Barco | annual report 2013 | Our strategy

Increase revenue from growth markets
through local sales and marketing
focus
OBJECTIVES & PROGRESS
GEOGRAPHIES FOCUS ON EMERGING MARKETS
OBJECTIVES 2013
OPERATIONS Start roll-out of company-wide ERP
platform as driver for common pro-
cesses and systems
Strengthen the company’s global posi-
tion through an optimized organization
and engaged employees, with a focus
on building a factory of the future
Generate free cash flow through focus
on operational excellence
FOCUS ON OPERATIONAL EXCELLENCE
42 Barco | annual report 2013 | Our strategy

• Acquisition of Taiwan-based AWIND
• We are the first manufacturer with 10,000 digital cinema projector installations in
Greater China
• Our largest LED solution lights up the Absa Tower in Johannesburg, South Africa
• China’s State Grid System is equipped with China’s largest control center display,
comprising 17x4 Barco OVL display cubes
• We support the first virtual reality training program in China’s commercial aviation
industry
• More than 50 screens equipped with Auro 11.1 3D sound in the APAC region
• Indian Suresh Productions and Ramanaidu Studios use Auro 11.1 for Tollywood movies
• Royal Films and Cine Colombia select Barco to complete digital cinema deployments
throughout Colombia
• ClickShare collaboration system distributed in India, Middle East and North Africa
• Dozens of medical displays installed in Indian hospitals, e.g. Fortis Memorial Research
Institute, the Regional Cancer Center, and Apollo Hospitals
• Increase our installed base in
the emerging markets across all
industries
• Develvop channels & partnerships
to strengthen our position in the
emerging countries
• Focus on China, Russia, Middle East
and Latin America to take part in the
high investments in infrastructure in
these regions
RESULTS OBJECTIVES 2014
• +500 users on new CRM platform
• Go-live in Noida (India) on 4 January 2014
• Software Lab achieved CMMI Level 3 certification
• +110 Six Sigma Green & Black Belts
• 2 Lean Six Sigma Green Belt Awards
• Continued footprint in China and India for local growth
• Increased strategic presence of procurement in emerging countries
• Progress in cost-reduction programs with the involvement of procurement,
operations & R&D
• Improvements in inventory management and continued good management of
receivables pushed
• Working Capital/Sales down to < 5% compared to 10% in 2012
• ROCE remains healthy at 15% compared to 24% in 2012
• Defects in projection division cut down to 8% (versus 34% in 2012)
• Prepare full implementation of One
Platform in 2015
• Strengthen the market focus of our
divisions to support cross-selling and
leverage different solutions towards
all businesses
• Customer focus and innovation
• Further roll-out of Lean Six Sigma
methodology
• Continue to build “factory of the
future” capabilities with an increased
focus on economically, socially &
ecologically sustainable solutions
• Organize for flexibility with multi-
product plants and a flexible work
organization
• Continue with cost-reduction
programs across the board
43Barco | annual report 2013 | Our strategy

Our sustainability plan
OurPeople
Our plan:to be one
page 48
OurWorld
Our plan: supporting communities through funding and collaborationpage 54
Our Planet
Our plan: to reduce environmental footprint
page 58
44 Barco | annual report 2013 | Our sustainability plan

Our sustainability plan
OurPeople
Our plan:to be one
page 48
OurWorld
Our plan: supporting communities through funding and collaborationpage 54
Our Planet
Our plan: to reduce environmental footprint
page 58
45Barco | annual report 2013 | Our sustainability plan

OUR VALUES
OUR STRENGTHS
OUR PLAN
OUR OBJECTIVES
WE DEAL OPENLY & ETHICALLY
TO BE ONE
• Improve employee engagement and enablement scores in 2014
• Roll out corporate transparency program in 2014
• Roll out talent management program in 2014
• Roll out the Smart at Work program to make remote collaboration a standard way of working by 2015
• Standardize and synchronize all business processes by 2015
• Unite 1,600 employees on a new campus by 2016
• Establish the Barco Foundation in 2014 by setting up sustainable collaboration with non-profit organizations
• Optimize our corporate sponsorship program in 2014
• Ensure all suppliers comply with our sustainable procurement policy by the end of 2014
• Set up a sustainable supplier base and ensure environmentally friendly transportation by 2015
• Incorporate innovative LED technology developments into products by 2015
• Phase out non-compliant or at-risk components from product designs by 2016
• Raise awareness of the importance of environmental compliance and enforcement
• Eliminate 80% of wasted energy sources by 2016
TO SUPPORT COMMUNITIES THROUGH FUNDING
TO REDUCE ENVIRONMENTAL FOOTPRINT
Global code of ethics and business conduct
Customer loyalty score of 86 (vs. 70 benchmark)
Integrity score of 89 (vs. 75 benchmark)
4,000 motivated and committed employees
Teamwork effectiveness score of 84(vs. 78 benchmark)
Company culture supporting creativity and entrepreneurship
Employee engagement score of 72 (vs. 68 benchmark)
WE DELIGHT OUR CUSTOMERS
WE TRUST EACH OTHER
WE ARE ACCOUNTABLE
WE ENCOURAGE TEAM PLAY
WE LEAD BY INNOVATION
WE CARE ABOUT OUR PEOPLE
46 Barco | annual report 2013 | Our sustainability plan

OUR VALUES
OUR STRENGTHS
OUR PLAN
OUR OBJECTIVES
WE DEAL OPENLY & ETHICALLY
TO BE ONE
• Improve employee engagement and enablement scores in 2014
• Roll out corporate transparency program in 2014
• Roll out talent management program in 2014
• Roll out the Smart at Work program to make remote collaboration a standard way of working by 2015
• Standardize and synchronize all business processes by 2015
• Unite 1,600 employees on a new campus by 2016
• Establish the Barco Foundation in 2014 by setting up sustainable collaboration with non-profit organizations
• Optimize our corporate sponsorship program in 2014
• Ensure all suppliers comply with our sustainable procurement policy by the end of 2014
• Set up a sustainable supplier base and ensure environmentally friendly transportation by 2015
• Incorporate innovative LED technology developments into products by 2015
• Phase out non-compliant or at-risk components from product designs by 2016
• Raise awareness of the importance of environmental compliance and enforcement
• Eliminate 80% of wasted energy sources by 2016
TO SUPPORT COMMUNITIES THROUGH FUNDING
TO REDUCE ENVIRONMENTAL FOOTPRINT
Global code of ethics and business conduct
Customer loyalty score of 86 (vs. 70 benchmark)
Integrity score of 89 (vs. 75 benchmark)
4,000 motivated and committed employees
Teamwork effectiveness score of 84(vs. 78 benchmark)
Company culture supporting creativity and entrepreneurship
Employee engagement score of 72 (vs. 68 benchmark)
WE DELIGHT OUR CUSTOMERS
WE TRUST EACH OTHER
WE ARE ACCOUNTABLE
WE ENCOURAGE TEAM PLAY
WE LEAD BY INNOVATION
WE CARE ABOUT OUR PEOPLE
47Barco | annual report 2013 | Our sustainability plan

OUR PEOPLE
1. Smart at Work
We are investing in new ways to facilitate col-
laboration in the workplace and make easy
remote collaboration across the globe a stan-
dard way of working. We want to improve
audio and video quality, and the remote shar-
ing of applications and data.
+43 meeting rooms revamped with a new
audio and video conferencing infrastructure
2. One Campus: bringing people together
As part of the Smart at Work program, we will
centralize all Kortrijk activities in one location,
with a special focus on smart mobility and col-
laboration in order to enhance flexibility and
stimulate creativity on the work floor. The new
building – covering 58,000 m² – will unite 1,600
Barco people by 2016.
OUR PLAN: TO BE ONE
tobeone reflects our devotion to the
idea that all Barco employees – in all of
the 90 countries – are one team. A team
of equals, unified by a mutual cause: to
achieve operational excellence.
+80DECEMBER
2
+80 meeting rooms equipped with our
ClickShare wireless presentation system
2 December 2013
Start of construction of One Campus
48 Barco | annual report 2013 | Our sustainability plan

3. One IT platform makes it easier
to share and collaborate
By 2015, we will have a global SAP-based ERP
platform to standardize, simplify, and synchro-
nize all business processes.
4. Yes! to corporate transparency
We are committed to making corporate deci-
sion-making and business operations open to
all employees through roadshows, brown bag
sessions, open houses featuring guided tours
and demonstrations, face-to-face meetings,
and online Q&A platforms.
Strategy roadshow in Taiwan
5. Recognizing and rewarding talent
To strengthen employee engagement, we
recognize talent by means of an advanced
performance management process and high-
level training opportunities.
Barco University
7,900+30
25305
+500 users on SAP CRM platform by end
of 2013
+30 open houses & team events
25 strategy roadshows worldwide
7,900 performance reviews
305 educational programs offered
+500
49Barco | annual report 2013 | Our sustainability plan

REACHING OUT TO OUR STAKEHOLDERS
To be one reflects our ambition to create a culture that can be shared not only by our employees,
but by our customers, partners, and shareholders as well.
2. Fostering relationships with
analysts and investors
Our Analyst & Investor Days are designed to
open communication channels between our
management teams and leading players in the
financial community. They provide a unique
opportunity to discuss long-term strategy and
help foster relationships between business
leaders and investors.
1. Let’s Connect!
Partners of our Connect! program can rely on
a direct communication link with our channel
account and marketing managers, backed up
by almost 4,000 employees. The program has
been developed to help partners sell Barco
solutions and services more effectively through
professional assistance and technical backup.
3. Having an ear for customer needs
Strong customer relations and loyalty are
two of our key performance indicators. With
our annual loyalty survey, we learn how our
customers and partners think about us, and
whether they are satisfied with the services
we offer. Thanks to the results of this survey,
each employee can contribute to increasing
customer loyalty and improving our chances
of doing business with them again.
SEPTEMBER10
20
07
78
20
08
81
20
09
79
20
10
80
20
11
80
20
12
83
20
13
86
Indu
stry
ben
chm
ark
(70)
10 September 2013
Analyst & Investor Day
Customer satisfaction
consistently above benchmark
+400 resellers signed up for
ClickShare partner program
+400
Click here to read more about
the partner program
50 Barco | annual report 2013 | Our sustainability plan

OUR VALUES
We care about our people, including colleagues, customers, suppli-
ers, and society in general. A respect for each other’s well-being
is a major priority for us. Because people determine the success
of our organization and make our company thrive.
Our culture of appreciation is reflected in every way we deal with
people. Employees are guided on their career path, and strong
relationships are built through online communities, buddy programs
for new employees, and company events. Fun initiatives – such as
the Day of the Barco Engineer and Happy Compliment Day – are
significant drivers of this culture.
We involve customers and suppliers in the decisions we make.
With mutual respect and their best interests at heart, we move
our business forward in a sustainable manner. Our corporate social
responsibility task force and the Supplier Sustainability Program
are just two of the efforts that reflect our willingness to go the
extra mile.
Our approach builds trust and engages hearts, and translates into
actions that serve the entire community. Our people take the lead in
charity projects, both internal and external, and show their commit-
ment to the company and the causes we support, time and again.
Catherine Weyne
Internal Communications
WECARE ABOUT OUR PEOPLE
Our approach builds trust and engages hearts
51Barco | annual report 2013 | Our sustainability plan

1 March: Happy Compliment Day
27,650 compliment cards distributed
20 March: Day of the Barco Engineer
800 engineers in the spotlights
EMPLOYEE SATISFACTION SURVEY:
WHERE ARE WE TODAY?
In 2010 and 2012, we conducted a survey to measure and understand employee
motivation, engagement and satisfaction. In 2013, following the survey, we
identified 3 overall focus areas: customer focus, innovation, and leadership
development. MARCH1
MARCH20
2010
GI*
2012 72 70 72 60 77 70 60 53 79 69 62 55 66 60
EMP
LOYE
E EN
GA
GEM
ENT
CLEA
R &
PR
OM
ISIN
G D
IREC
TIO
N
CON
FID
ENCE
IN
LEA
DER
S
QU
ALI
TY &
CU
STO
MER
FO
CUS
RES
PEC
T &
REC
OG
NIT
ION
DEV
ELO
PM
ENT
& O
PP
OR
TUN
ITIE
S
PAY
& B
ENEF
ITS
PER
FOR
MA
NCE
MA
NA
GEM
ENT
AU
THO
RIT
Y &
EM
PO
WER
MEN
T
RES
OU
RCE
S
TRA
ININ
G
COLL
AB
OR
ATI
ON
WO
RK
, ST
RU
CTU
RE
& P
RO
CESS
EMP
LOYE
E EN
AB
LEM
ENT
*general industry (GI) norm
52 Barco | annual report 2013 | Our sustainability plan

ACTIONS 2013
INNOVATION
• Inauguration of the Barco Patent Wall
• Introduction of Virtual Tech Days & monthly
Tech Talks
• Day of the Barco Engineer
• Barco University course on innovation
• Start of One Campus & One Platform
• Installation of Innovation Board featuring
internal and external experts
• Introduction of ‘time to experiment’ policy
• Optimization of Lean Six Sigma
• Creativity supported across the organization
& embedded in evaluation process
• Venture divisions to trigger entrepreneurial
spirit
LEADERSHIP DEVELOPMENT• Vision statement explained in 25
strategy roadshows
• Q&A with the CEO (online platform)
• Cross-divisional Gemba walks
(management by walking around)
• Creation of Subject Matter Experts
communities
CUSTOMER FOCUS• IT service desk survey to measure
internal customer satisfaction
• Customer visits for back office employees
• Launch of internal Customer Delight
campaign, providing employees with a
customer focus score and action points for
improving customer focus
• Open Days in Madrid for customers and
partners
• Customer focus track included in
onboarding program and product
management training
• Introduction of Meeting-free Fridays to free
up time for customers
IT service desk survey:
95% of incidents are resolved
+70% of customers are extremely satisfied
95%
+70%
53Barco | annual report 2013 | Our sustainability plan

OUR WORLD
OUR PLAN: TO SUPPORT COMMUNITIES THROUGH FUNDING AND COLLABORATION
The way we engage with the world around
us reflects our ambition to give back to soci-
ety and contribute towards better quality
of life.
1. Because children are the future
With our children’s wellbeing program, we support young people in their education,
upbringing, personal development, and care.
• €613 raised for Adopt-a-Family, a US holiday support program
• €275 and 25 Christmas gifts donated to Sacramento Children’s Home
• €5,764 donated to SOS Children’s Village
• €1,102 donated to Salvation Army’s Angel Tree (Christmas assistance)
• 10,000 SMD components donated to VTI Menen, a technical school in Belgium, to
teach pupils how to solder
For every diagnostic display or ClickShare we sell in India, we donate a small
amount to SOS Children’s Village. In 2013, we donated €5,764 to this cause.
54 Barco | annual report 2013 | Our sustainability plan
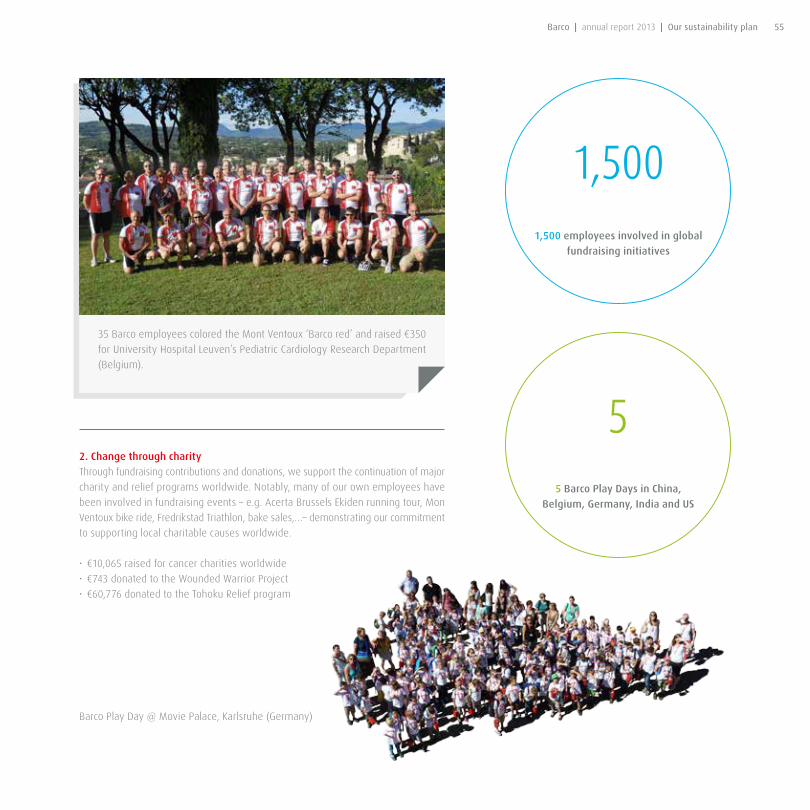
2. Change through charity
Through fundraising contributions and donations, we support the continuation of major
charity and relief programs worldwide. Notably, many of our own employees have
been involved in fundraising events – e.g. Acerta Brussels Ekiden running tour, Mon
Ventoux bike ride, Fredrikstad Triathlon, bake sales,…– demonstrating our commitment
to supporting local charitable causes worldwide.
• €10,065 raised for cancer charities worldwide
• €743 donated to the Wounded Warrior Project
• €60,776 donated to the Tohoku Relief program
Barco Play Day @ Movie Palace, Karlsruhe (Germany)
35 Barco employees colored the Mont Ventoux ‘Barco red’ and raised €350
for University Hospital Leuven’s Pediatric Cardiology Research Department
(Belgium).
55 Barco Play Days in China,
Belgium, Germany, India and US
1,5001,500 employees involved in global
fundraising initiatives
55Barco | annual report 2013 | Our sustainability plan

Preferred visualization partner for the
European Championship Wheelchair
Rugby
3. Promoting technology
As part of the technology education program, we teach young students
how technology is being used today, give them the opportunity to explore
high-tech projects and exciting experiments, and encourage them to
pursue a career in technology. Over 100 young people participated in
our TechnoGirls Day, Technology Olympiad, Science Day (Dag van de
Wetenschap), and First Lego League.
Young Barco Technics in First Lego League Benelux Final
First Lego League is a robotics program for 9 to 14 year olds,
designed to get children excited about science and technology.
On 25 January, 4 Barco coaches and 18 children played the Ben-
elux final and took home the Nature’s Fury Research Award.
30+30+ projectors for use at the
Moscow Biennale of
Contemporary Art
€2,519Contribution via Belgian
sponsorship program for
employee fundraising
efforts
56 Barco | annual report 2013 | Our sustainability plan

4. Corporate sponsorship program
In achieving our goal of supporting the community, we make both finan-
cial and non-monetary contributions to organizations worldwide.
Moscow Biennale of Contemporary Art
Supporting the Berlinale Film Festival with 19 digital cinema
projectors and 2 technicians
Causes and organizations we supported this year:
• BC SPCA Drive for Lives (US animal transfer program)
• Gwinnett Children’s Shelter (US)
• Magic Bus Foundation (India)
• VTI Menen (Belgium)
• iMinds Conference (Belgium)
• Flanders Fields Memorial Garden (Belgium)
• Film Fest Gent (Belgium)
• Cinema De Keizer (Belgium)
• Cannes Lions (France)
• Ondernemers voor Ondernemers vzw (Belgium)
• Several actions for Pink Ribbon (worldwide)
• Kinepolis Antwerpen (Belgium)
BARCO FOUNDATION
We firmly believe that environmental, social, and governance
investments create financial value for our company. But more
than that, we consider it our duty to contribute to improving
quality of life. In 2014, our increasing efforts to operate in a
highly sustainable manner will be translated into the inaugu-
ration of the Barco Foundation. With the Foundation, we aim
to create shared value, based on corporate policies and prac-
tices, to enable society to advance and our company to grow.
57Barco | annual report 2013 | Our sustainability plan

OUR PLANET
OUR PLAN: TO REDUCE ENVIRONMENTAL FOOTPRINT
We are reducing our environmental foot-
print, from the manufacture and use of
our products to our global activities within
facilities, procurement, product transport,
and business travel.
2. A network of green suppliers
Our Supplier Sustainability Program encourages
suppliers to share environmental informa-
tion within the supply chain and phase out
non-compliant or at-risk components from
product designs by 2016.
Progress of environmental data collection
(coverage of supplier parts)
1. Know your environment
The Green Knowledge Program has been devel-
oped to raise awareness of the importance of
environmental compliance and enforcement.
We engaged +1,200 suppliers to use green
components
Since 2010, 28 Green Knowledge Owners
distribute information about developments
on compliance and eco-design across the
entire organization
+1,20028
74.3%05 2013
83.5%09 2013
89.1%12 2013
58 Barco | annual report 2013 | Our sustainability plan

3. Changing mobility and saving energy
We will explore alternative mobility, moni-
tor energy consumption and CO2 emission,
and maintain sustainability as a key guiding
principle in the construction of One Campus
to eliminate 80% of wasted energy sources
by 2016.
Maximum level of CO2 emission
allowed for company cars
4. To fly or not to fly?
Over the last two years, we have been working
on a sustainable supplier base and environ-
mentally friendly transportation, replacing air
freight by sea freight transportation to reduce
our carbon footprint.
Replacing air freight by sea freight
5. A policy of procuring green
To ensure sustainable procurement, we are
urging suppliers to comply with our code of
business conduct and ethics. By the end of
2014, we expect all suppliers to comply with
our sustainable procurement policy.
142 key and core suppliers comply with
our code of conduct and ethics
Inbound transportation carbon emissions
reduced by 44%
14 million watt hours saved in our first
low-energy weekend, which equals the
average energy consumption of 4 families
in one year
165 g/km2010
145 g/km2011
145 g/km2012
135 g/km2013
Before 2012
2013
VOLUME100%
COST100%
VOLUME65% 35%
COST91% 9%
44%14
million 142
59Barco | annual report 2013 | Our sustainability plan

ONE CAMPUS: A WINDOW OF OPPORTUNITYOne Campus opens new windows of opportunity in terms of environmen-
tal sustainability. Its technical infrastructure will be evaluated based on
environmental performance. The new building will feature “free cooling”
units and solar panels, and energy monitoring will help optimize the
efficient use of energy.
6. Sustainable solid state illumination
We are gradually phasing out traditional CCFL
and Xenon lamps in our product designs and
are replacing them by solid state lighting to
save energy and reduce environmental waste.
Our LED medical displays reduce power con-
sumption by 30%
30%
60 Barco | annual report 2013 | Our sustainability plan

OUR VALUES
For us, open and ethical conduct means: ensuring a safe and enjoy-
able working environment, complying with laws, regulations and
policies, and operating in a transparent and socially responsible
manner. Every day, we put this philosophy into practice, conducting
our business in accordance with the highest standards of ethical
behavior.
Because ethical conduct is a joint responsibility, our ethical values
have been translated into a formal code of conduct: the ‘Barco
Code of Ethics and Business Conduct’ offers employees – as well as
suppliers, partners, and customers – a framework for understanding
and acting on our shared responsibilities.
In our team, openness and transparency toward customers and
co-workers are crucial. In roadmap discussions, we consider the
needs of the market while touching base with R&D, procurement,
and strategic marketing. We are always open to debate, never hold
back information, and communicate and share our vision for every
decision that is made.
This is true for everyone at the company, regardless of position and
level of responsibility. The strategy roadshows are a great example
of how management is able to get the whole organization to work
toward a joint objective through open communication. When it
comes to ethical and transparent behavior, we all walk the talk.
Jun Wei
Product Management
When it comes to ethical and transparent behavior, we all walk
the talk WE DEAL OPENLY AND ETHICALLY
61Barco | annual report 2013 | Our sustainability plan

Ouractivities
ConnectingIdeas
Entertainment& Corporate
page 64
ConnectingLives
Healthcare
page 76
ConnectingBig Data
Industrial &Government
page 86
ConnectingMissions
Defense &Aerospace
page 96
ConnectingBusinesses
Ventures
page 106
62 Barco | annual report 2013 | Our activities

Ouractivities
ConnectingIdeas
Entertainment& Corporate
page 64
ConnectingLives
Healthcare
page 76
ConnectingBig Data
Industrial &Government
page 86
ConnectingMissions
Defense &Aerospace
page 96
ConnectingBusinesses
Ventures
page 106
63Barco | annual report 2013 | Our activities

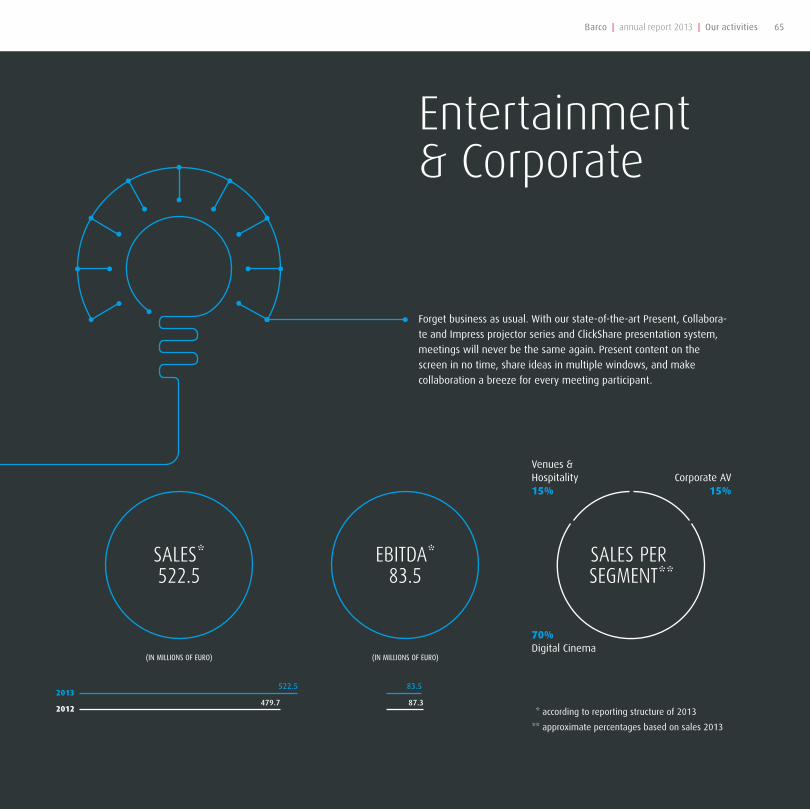
522.5
479.72013
2012
83.5
87.3
(IN MILLIONS OF EURO)
SALES*522.5
(IN MILLIONS OF EURO)
EBITDA*83.5
Venues &Hospitality15%
70%Digital Cinema
Corporate AV15%
SALES PER SEGMENT**
CONNECTINGIDEAS
Entertainment& Corporate
Forget business as usual. With our state-of-the-art Present, Collabora-
te and Impress projector series and ClickShare presentation system,
meetings will never be the same again. Present content on the
screen in no time, share ideas in multiple windows, and make
collaboration a breeze for every meeting participant.
* according to reporting structure of 2013
** approximate percentages based on sales 2013
64 Barco | annual report 2013 | Our activities
522.5
479.72013
2012
83.5
87.3
(IN MILLIONS OF EURO)
SALES*522.5
(IN MILLIONS OF EURO)
EBITDA*83.5
Venues &Hospitality15%
70%Digital Cinema
Corporate AV15%
SALES PER SEGMENT**
CONNECTINGIDEAS
Entertainment& Corporate
Forget business as usual. With our state-of-the-art Present, Collabora-
te and Impress projector series and ClickShare presentation system,
meetings will never be the same again. Present content on the
screen in no time, share ideas in multiple windows, and make
collaboration a breeze for every meeting participant.
* according to reporting structure of 2013
** approximate percentages based on sales 2013
65Barco | annual report 2013 | Our activities
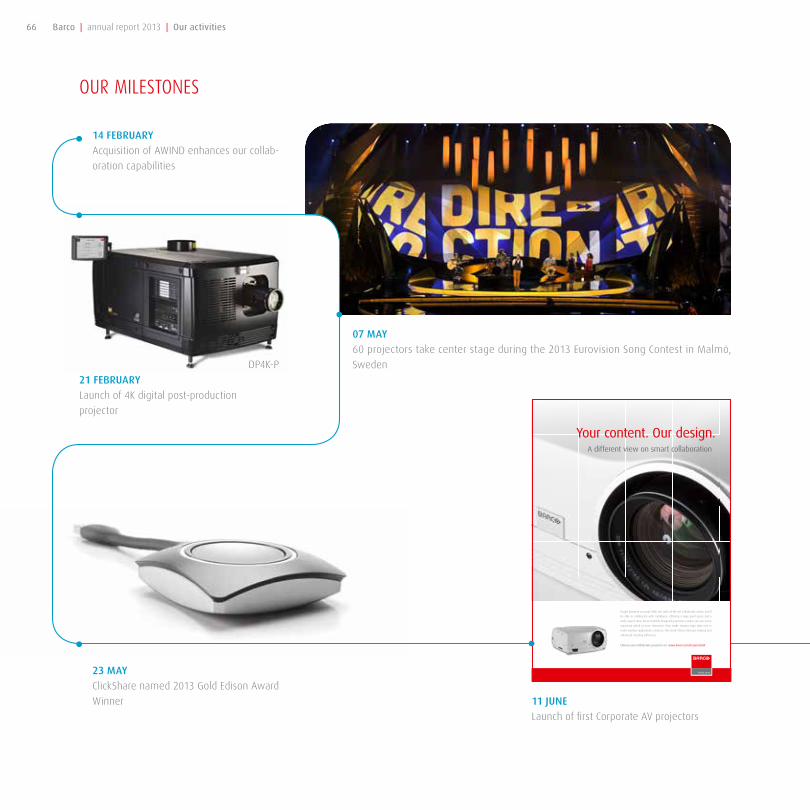
OUR MILESTONES
21 FEBRUARY
Launch of 4K digital post-production
projector
07 MAY
60 projectors take center stage during the 2013 Eurovision Song Contest in Malmö,
Sweden
14 FEBRUARY
Acquisition of AWIND enhances our collab-
oration capabilities
23 MAY
ClickShare named 2013 Gold Edison Award
Winner 11 JUNE
Launch of first Corporate AV projectors
DP4K-P
Forget business as usual. With our state-of-the-art Collaborate series, you’ll be able to collaborate with confi dence. Offering a large pixel space and a wide aspect ratio, these stylishly designed projectors ensure you see every important detail at once. Moreover, they make sharing large data sets in multi-window applications a breeze. The result? Better decision-making and enhanced meeting effi ciency.
Choose your Collaborate projector on www.barco.com/CorporateAV
A different view on smart collaboration
Your content. Our design.
66 Barco | annual report 2013 | Our activities

12 JUNE
Introduction of 20,000-lumen rental projector
with standard light-on-demand functionality
25 JUNE
Over 50 films scheduled to be released in
Auro 11.1 immersive sound
24 JULY
Installation of a 250 m² LED display (1,527 C7 tiles) at Les Quatre Temps in Paris, Europe’s
largest shopping center
22 NOVEMBER
Expansion of ClickShare portfolio to bring
our wireless collaboration technology to
any meeting room
HDX-W20 FLEX
67Barco | annual report 2013 | Our activities

Barco 23 April 2013
Getting ready for the Eurovision Song Contest in Sweden!
Like - Comment - Share 408 28 109
Barco 7 November 2013
“Great immersive experience” “Mind blowing” “Terrific sound” “The best sound”... These were few of the comments from visitors who heard #Barco #Auro at #FICCI #MEBC in Bangalore. Have you heard #Auro yet?
Like - Comment - Share 6 1
Barco 25 June 2013
“The greatest benefit of Auro 11.1 is that it is a great storytelling device. It is a technique to put in the hands of storytellers, artists, film makers and directors that allows them to enhance the movie experience, enhance the storytelling and immerse people into it.” Jeffrey Katzenberg (CEO, DreamWorks Animation)
Like - Comment - Share 41 1 11
Like us on Facebook
68 Barco | annual report 2013 | Our activities

OUR STRATEGIC CHOICES
3 QUESTIONS TOWIM BUYENSBARCO’S GENERAL MANAGER ENTERTAINMENT & CORPORATE
What key trends are driving your business?
From movie theaters to museums, today it’s all about the visitor
experience. Additionally, infrastructure investments in the emerging
regions are triggering demand for innovative visualization solutions.
This is also true for enterprises and corporate organizations, where
‘bring your own device’ and remote working policies are changing
the corporate landscape.
What will the entertainment & corporate business be like
moving forward from here?
In entertainment, we will maintain our focus on capturing mar-
ket share in the emerging countries and lower-end segments, as
we also extend our share of wallet beyond projectors – by, for
example, offering a dedicated services portfolio. For venues and
hospitality, we will strengthen our focus on the fixed installations
market (in addition to the rental & staging markets) to drive visitor
experiences. However, our biggest opportunities lie in corporate AV.
What will be the main focus in terms of capabilities and
technology?
Solid-state illumination, networking capabilities that enable visual
collaboration, and the development of best-in-class, hassle-free,
immersive solutions will be our core activities.
69Barco | annual report 2013 | Our activities

MARKET TRENDS [01]
IT’S ALL ABOUT THE EXPERIENCE (AND ROI)With big-screen TVs present in almost every home, quick theater-to-DVD
turnarounds, and video-on-demand providing inexpensive movies right in
your living room, the cinema industry needs to step up its game fast. The
cinema of the future is no longer about movies alone. Instead, moviego-
ers expect a premium entertainment experience from entrance to exit.
New innovations and technologies – such as high frame rates for increased
image quality, 4K resolution, 3D sound and video, and laser projection –
help create a premium immersive experience and are driving the industry
forward. 3D ticket sales, for example, have proven to drive high revenue.
However, today’s movie theaters are operating at just 20% occupancy,
which means the industry is eager to find ways to fill the 80% of unused
capacity.
Theaters worldwide have already been expanding from feature-film only
to alternative content, such as live streaming of opera or sports events.
But the real game-changers will be provided by digital signage (in the
lobby and corridors or on facades) and smart interactive cinema (by
pushing content to smartphones, for example) to provide visitors with a
truly immersive cinema experience.
The venues and hospitality industries are also shifting towards this
so-called ‘experience economy’. Museums, houses of worship, plane-
tariums, and shopping malls are incorporating interactive and creative
technologies to engage with their audiences. Creating unique, memora-
ble, and personal experiences will be key in drawing visitors and guests
back, time and again.
DZINE AND MANGANELLI GROUP FRANCE JOINTLY WON A DAILYDOOH AWARD
dZine and Manganelli Group France jointly won a DailyDOOH Award
in the Best Quick Service Restaurant/Bar or Restaurant Deployment
category. The award-winning digital signage solution – display units
that broadcast a mix of product information and entertainment,
while pushing dishes that have sufficient stock on the menu board
– was developed for Flunch Restaurants Europe, a chain with 200
restaurants in France, Spain, Portugal, Italy, Poland and Russia.
70 Barco | annual report 2013 | Our activities

Designed along three spatial axes (width, depth and
height), rather than the two axes of traditional surround
sound, the Auro 11.1 immersive sound format provides
an immersive cinema audio experience, with lifelike
sound coming from all directions.
71Barco | annual report 2013 | Our activities

A CLOSER LOOK
LASER BEHIND THE SCENESLaser illumination is a logical next step in maximizing the
opportunities of digital in the ‘cinema of the future’. The
impact of laser on the cinema industry could be bigger than
that of any other technology introduction so far! We unveiled
our 55,000 lumens 4K prototype laser projector to the public
for the first time in January 2012. But where does it go from
here?
Right now – via product development, setting up framework
agreements with suppliers, testing and certification – we
are developing the prototype into a real finished product.
We cannot give away all of our secrets – but we do commit
to delivering a product that meets and exceeds the require-
ments of cinema exhibition.
By continually pushing the boundaries in product design, the
laser projector is bound to redefine the industry standard
once it has been perfected. What you can do with it, how
you can use it, the maintenance required over its lifetime
– all will be a significant improvement on what exhibitors
are used to now.
MARKET TRENDS [02]
BRIC NATIONS TAKE THE LEAD Because the digital cinema projector market is nearing saturation
in North America and Western Europe, growth is being driven
mainly by strong demand in the emerging markets. To attract
a growing middle class in these markets – as well as Hollywood
and Western European movie distributors – traditional cinemas
are converting to digital projection, and investments in ambitious
multiplex projects are on the rise.
Additionally, world-class sporting events are increasingly being
staged in the BRIC nations – e.g. the FIFA World Cup 2014 and
the 2016 Olympic Games in Brazil, the World Cup 2018 in Russia,
the 2010 Commonwealth Games in India, and the 2008 Olympics
in China – which is triggering new infrastructure investments and
growing demand for media, entertainment, and AV solutions in
these emerging markets.
Auro 11.1 takes over the Indian cinema industry with installa-
tions in Manasa Theatre (Bangalore), Dhanya Theatre (Kollam), and
‘Tollywood’ (Suresh Productions and Ramanaidu Studios).
Click here to learn everything
about laser on our laser blog.
72 Barco | annual report 2013 | Our activities

10,000 digital cinema projectors installed in
Greater China. We are the first manufacturer
to reach this number!
10,000
70%
Through agreements with Cinemark Interna-
tional, Cinesystem Cinemas, and Cinemex,
we expanded our digital footprint through-
out Brazil and Central and South America.
With the Cinemex deal, our Latin American
market share in digital cinema grew to over
70%!
12 FLM-HD20 projectors brought the official World Cup ball to life
during a massive projection mapping in Rio De Janeiro’s Parque
Lage.
73Barco | annual report 2013 | Our activities

With ClickShare for wireless presentation at the click of a
button, we significantly improved meeting dynamics and
reduced setup times. But because there are big differences
between the needs of small, standard meeting rooms
and those of high-profile meeting rooms, boardrooms and
conference rooms, we now offer ClickShare in two flavors:
the new CSM Base Unit and the original full-featured CSC
Base Unit.
MARKET TRENDS [03]
THE CORPORATE FUTURE IS MOBILE AND INTERACTIVEEnterprise mobility continues to grow worldwide. According to our
‘Meeting room of the future’ survey, which we jointly organized with
InAVate and PFM magazine, 91% of business managers work remotely on
a regular basis, with 27% working remotely almost daily. When attending
a meeting, 82% bring their own device (the majority of these are laptops,
but other mobile devices are on the rise).
The future is mobile – and, as increasing numbers of employees are work-
ing remotely, meeting spaces must become more flexible and support
a greater range of technologies and demands for virtual conferencing.
Today’s changing work environment requires new visualization and
collaboration technologies that improve efficiency and productivity in
meeting rooms, board rooms, and auditoriums.
Click here to read the full results of the‘Meeting room of the future’
survey.
74 Barco | annual report 2013 | Our activities

OUR VALUES
Accountability is one of the fundamentals of a successful orga-
nization. As business professionals, it’s our responsibility to be
accountable to our colleagues and customers. By taking full owner-
ship of tasks, actions, and results, and by continuously challenging
and evaluating ourselves, we help our company thrive.
As part of the sales team, customers are my greatest responsibility.
The whole team focuses on a core set of KPIs, such as on-time
delivery and customer satisfaction, as we constantly look for new
ways to improve customer focus. Some of my colleagues are now
‘divisional experts’ – providing specific product- or procedure-related
support – so that we can find the best solution for our customers.
But more than that, accountability is key throughout our entire com-
pany culture. We take ownership both individually and collectively.
People are proud of being part of the Barco family – and this pride
drives them to find ways to take the company forward, even if it
requires extra personal effort.
From product managers diversifying the product portfolio so that
we can reach multiple markets to sales administrators developing
their skills in the Six Sigma tools, everyone of us meets challenges
with a positive attitude. And we all know that a positive mind leads
to positive solutions. Is there a better way to keep customers and
colleagues satisfied?
Alberto Caycho Polonio
Sales Coordination
WE ARE ACCOUNTABLE
We take ownership both individually and collectively
75Barco | annual report 2013 | Our activities

Healthcare
CareConnex connects lives by helping patients keep in touch with
friends and family at home. By helping build relationships between
patients and their caregivers. And by making vital patient information
available to those who make life-defining decisions.
195.7
206.52013
2012
26.3
23.8
(IN MILLIONS OF EURO)
SALES195.7
(IN MILLIONS OF EURO)
EBITDA26.3
New segments (digital surgery & hospital IT systems)15%
85%Traditional segments
(diagnostic & modality)
* approximate percentages based on sales 2013
SALES PER SEGMENT*
CONNECTINGLIVES
76 Barco | annual report 2013 | Our activities

Healthcare
CareConnex connects lives by helping patients keep in touch with
friends and family at home. By helping build relationships between
patients and their caregivers. And by making vital patient information
available to those who make life-defining decisions.
195.7
206.52013
2012
26.3
23.8
(IN MILLIONS OF EURO)
SALES195.7
(IN MILLIONS OF EURO)
EBITDA26.3
New segments (digital surgery & hospital IT systems)15%
85%Traditional segments
(diagnostic & modality)
* approximate percentages based on sales 2013
SALES PER SEGMENT*
CONNECTINGLIVES
77Barco | annual report 2013 | Our activities

powered by
Barco @Barco 5 decHad an amazing time in #Chicago at #RSNA13. Thanks to all our partners and see you next year!
Expand Reply Retweet Favorite More
Geretweet door BarcoHospedia @Hospedia 25 NovPowered by Hospedia, @Barco’s CareConnex in the news hpnon-line.com/dailyupdates/N... via @HPN_Online
Expand Reply Retweet Favorite More
Geretweet door BarcoAMD FirePro @AMDFirePro 3 DecNew @Barco MXRT-7500 Medical Imaging Display controller using AMD FirePro W series technologyFireuser.com/blog/barco_mxr... pic.twitter.com/q1H119CeL
Expand Reply Retweet Favorite More
Follow us on twitter
78 Barco | annual report 2013 | Our activities

OUR STRATEGIC CHOICES
3 QUESTIONSTO PIET CANDEELBARCO’S GENERAL MANAGER HEALTHCARE
What key trends are driving your business?
The driving forces behind our activities are: the need for increased
efficiency and value in healthcare, demand in emerging markets,
the consumerization of healthcare – turning patients into medical
shoppers and shifting more responsibility to them – and ‘the net-
work’ as a universal platform for new technologies.
What will the healthcare business be like moving forward
from here?
We’re gearing up for sustainable growth over the next few years
– especially in the new market segments of surgical imaging and
healthcare IT – while securing our leadership position in diagnostic
imaging and mammography. Our extended geographic focus will
be on Brazil, China, Russia and the Middle East.
What will be the main focus in terms of capabilities and
technology?
Through a continuous focus on innovation in display technology,
we continue to improve diagnostic image quality while bringing
economic value to radiology. Additionally, we will incorporate new
functionality into our digital OR offering and expand our interactive
patient care solutions.
79Barco | annual report 2013 | Our activities

www.barco.com/clinical
Built with healthcare specialists in mind, Barco’s Eonis displays help you
deliver the best patient care. View crisp medical images to make confident
decisions. See consistent images for easy collaboration with colleagues.
Share images with patients to explain procedures and treatments. And enjoy
a stylish design that blends perfectly into your medical office.
Eonis is also available with a white cover, featuring a protective front glass
panel that can be cleaned and disinfected completely.
The precision healthcare specialists need
Eonis
OUR MILESTONES
03 JUNE
Launch of CareConnex in partnership with Hospedia:
a complete interactive patient care solution
21 JUNE
Smart bedside terminals installed at
Oost-Limburg Hospital – a first in Belgium
12 MARCH
Targeting the dental and clinical markets with the
attractive, fully cleanable 22” Eonis display
powered by
80 Barco | annual report 2013 | Our activities
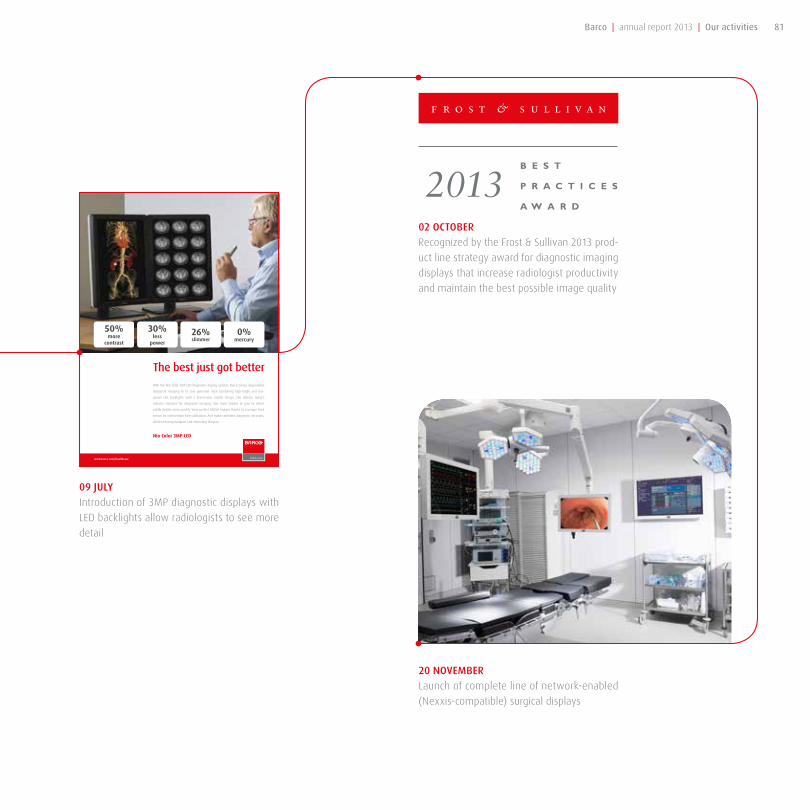
09 JULY
Introduction of 3MP diagnostic displays with
LED backlights allow radiologists to see more
detail
02 OCTOBER
Recognized by the Frost & Sullivan 2013 prod-
uct line strategy award for diagnostic imaging
displays that increase radiologist productivity
and maintain the best possible image quality
20 NOVEMBER
Launch of complete line of network-enabled
(Nexxis-compatible) surgical displays
www.barco.com/healthcare
With the Nio Color 3MP LED diagnostic display system, Barco brings dependable
diagnostic imaging to its true potential. Now combining high-bright and low-
power LED backlights with a brand-new, stylish design, Nio defines today’s
industry standard for diagnostic imaging. See more shades of gray to detect
subtle details more quickly. View perfect DICOM images thanks to a unique front
sensor for intervention-free calibration. And make confident diagnostic decisions,
while reducing footprint and extending lifespan.
Nio Color 3MP LED
The best just got better
50%more
contrast
30%less
power
26%slimmer
0%mercury
81Barco | annual report 2013 | Our activities

€118,000 €173,460 €2.5MILLION
€2.8MILLION
Real-timepatient feedback
Electronicmeal ordering
Clinical accessat the bedside
Interactivepatient care
MARKET TRENDS [01]
FASTER DIAGNOSES WITH FLATTENING BUDGETS
Lifestyle-linked diseases (e.g. cardiovascular diseases, diabetes, etc.)
continue to grow globally, while an ageing population increases the
level of care required by patients. By 2050, the number of patients
per doctor is expected to double, driving the need for faster and
more efficient diagnoses.
At the same time, healthcare spending is under scrutiny. The Affordable
Care Act in the United States, for example, urges the US healthcare indus-
try to save €563 billion in the next decade. Hence, the industry needs
new ways to deliver care more efficiently and more effectively.
Our entire product portfolio has been built to reduce the total cost of ownership and provide a high return on investment. As a proof point
of what our solutions can do, we gladly refer to a study carried out by Deloitte and Hospedia which indicates that CareConnex for interactive
patient care can help save hospitals no less than €2.8 million per year!
82 Barco | annual report 2013 | Our activities

www.barco.com/healthcare
50more
candela
25%less
power
50%longer
backlight warranty
0%mercury
The best just got better
Did you know that, compared to a dual-head 3MP system, a 6MP
diagnostic display has proven to increase productivity by up to 19%
while reducing eye strain? For even better performance, Barco
has now optimized its 6MP diagnostic display with LED backlight
technology. Boost brightness levels for enhanced diagnostic
accuracy, while saving energy and extending lifespan. See more
shades of gray to detect subtle details more quickly. And reduce
windowing and leveling time to read more studies each day.
Coronis Fusion 6MP LED
CoF_LED_ad_hpA4 Apr13.indd 1 17/04/13 15:27
With the introduction of the Coronis
Fusion 6MP with LED backlights – for
viewing of multi-modality diagnostic
images side-by-side on a single screen
– we managed to increase a radiolo-
gist’s reading productivity by up to
19% while reducing eye strain (see
Montefiore study).
MARKET TRENDS [02]
PATIENTS OR MEDICAL SHOPPERS?
In a time when better quality of life is rapidly becoming a habit
of life, active healthcare is shifting from institutions to individuals.
Consumerization of healthcare refers to the trend of transforming
patients into consumers and shifting more responsibility for care to
the patient. Patients today are ‘medical shoppers’, empowered by
the Internet to actively research, assess, and rate healthcare and
healthcare delivery organizations.
In the USA, for example, the Hospital Consumer Assessment of
Healthcare Providers and Systems (HCAHPS) survey provides a
standardized methodology for measuring patients’ perspectives
on hospital care. These scores directly impact reimbursements
from healthcare insurers and give good healthcare providers a
competitive edge.
With our interactive patient care solutions, we enable
healthcare providers to position themselves for success.
Offering a host of patient-focused services (e.g. TV, Inter-
net, video-on-demand, and extensive patient education
and feedback options), CareConnex has a significant impact
on patient satisfaction, which is a valuable indicator of the
quality of care delivered and can even impact hospital
reimbursement.
83Barco | annual report 2013 | Our activities

MARKET TRENDS [03]
IP AS A COMMONBACKBONE
New trends – such as e-health, Electronic Medical Records, remote
surgery, among others – are radically transforming healthcare deliv-
ery. Therefore, patient records, diagnostic information, and even
the operating theater are increasingly relying on networked
technologies to change the way we access and share health
information.
Providing a universal IT platform, IP technology is able to link
patient data from previously disconnected systems, offering
medical staff a patient-centric view of health information. Facili-
tating access, retrieval, and sharing of patient data, this technology
enables healthcare professionals worldwide to provide safer, time-
lier and more effective care.
We introduced a complete line of network-enabled surgical
displays (MDSC) that feature an integrated IP decoder and are
fully compatible with the Nexxis digital OR solution. This way,
surgeons can easily distribute uncompressed video and data over
the IP network, to any location, and without delay.
+500
+500 orders for Nexxis
digital OR
+200
+200 Nexxis installations
worldwide
84 Barco | annual report 2013 | Our activities

OUR VALUES
Barco has always operated at the forefront of technology. Over
the years, we’ve introduced a number of firsts in many industries,
including the healthcare industry: the first 10MP diagnostic display,
the first seamless multi-modality display, MediCal QAWeb for online
QA and asset management, and many more.
Additionally, we have developed a host of patented image-en-
hancing technologies to present radiologists with the best possible
diagnostic image quality. With about 60 technology patents in
healthcare imaging – over 200 Barco-wide – we have an astonishing
legacy of technological breakthroughs.
Our most recent innovation is the LED backlights that have been
designed specifically for healthcare applications. They render more
JNDs (Just Noticeable Differences) to help radiologists see more
shades of gray. We have also re-designed our patented uniformity
technologies for the unique characteristics of LED backlit displays
to make it easier to detect the smallest abnormalities.
By making subtle details more noticeable more quickly, we can
reduce windowing and leveling time so that radiologists can read
more studies each day – and, ultimately, deliver better care. It’s
amazing to see how you can make a difference by putting people
and technology together.
Tom Kimpe
Technology & Innovation Healthcare
We have an astonishing legacy of technological breakthroughs
WELEADBYINNOVATION
85Barco | annual report 2013 | Our activities

192.5
205.22013
2012
13.3
23.9
(IN MILLIONS OF EURO)
SALES*192.5
(IN MILLIONS OF EURO)
EBITDA*13.3
Other markets (research & design, virtual reality): 20%
40%Utilities & process control
Security & surveillance
40%
SALES PER SEGMENT**
CONNECTINGBIG DATA
Industrial &Government
Our digital control room solution can manage millions of inputs from
hundreds of different device types – and displays them in exactly the
way you choose. Fuse information into one common picture, turn big
data into big insights, and collaborate in the most optimal way.
Reliance Petroleum, India
* according to reporting structure of 2013
** approximate percentages based on sales 2013
86 Barco | annual report 2013 | Our activities

192.5
205.22013
2012
13.3
23.9
(IN MILLIONS OF EURO)
SALES*192.5
(IN MILLIONS OF EURO)
EBITDA*13.3
Other markets (research & design, virtual reality): 20%
40%Utilities & process control
Security & surveillance
40%
SALES PER SEGMENT**
CONNECTINGBIG DATA
Industrial &Government
Our digital control room solution can manage millions of inputs from
hundreds of different device types – and displays them in exactly the
way you choose. Fuse information into one common picture, turn big
data into big insights, and collaborate in the most optimal way.
Reliance Petroleum, India
* according to reporting structure of 2013
** approximate percentages based on sales 2013
87Barco | annual report 2013 | Our activities

OUR MILESTONES
29 JANUARY
Introduction of free-standing OBLX structure
for tiled LCD video walls
25 MARCH
Visualizing 3,000 cameras and 60,000 passengers per year for Delhi International Airport
22 APRIL
180 partners and customers attended the Bra-
zilian AVS Days, a one-day event zooming in
on networked visualization
88 Barco | annual report 2013 | Our activities

06 JUNE
Dassault Systèmes selects our Galaxy projectors and powerwalls to
demonstrate immersive 3D experiences in its new state-of-the-art
Executive Briefing Center
12 JUNE
New version of networked visualization sys-
tem for faster response times and better
decision-making
www.barco.com
The full-featured, fully redundant OverView O series
The new industry-standard OverView M series
True colors, for lifeBarco presents its expanded OverView family of rear-projection video walls, the most comprehensive portfolio on the market today. This impressive product range offers the most optimal visualization solution for any control room, not only in terms of image quality, but also in viewing comfort, ease of maintenance, and operator-friendliness.
• Warmest LED colors• Automatic white point and color calibration• Liquid cooling for longer lifetime• Multiple redundancy levels• 3rd generation LEDs for unmatched brightenss
Discover our complete portfolio on www.barco.com/overviewLED
MVL_ad_148x210.indd 1 18/09/12 22:38
20 AUGUST
Release of two new rear-projection video wall
cubes in the OverView M series (MVL-621 &
MVL-721)
16 OCTOBER
Supporting intelligent traffic monitoring in 5
Brazilian Operation Control Centers
89Barco | annual report 2013 | Our activities

Barco @Barco 25 OktRefurbishing the #control #room @eandis_cvba, #Belgium’s biggest distribution #grid operator, reflects deep expertise http://ow.ly/qa2f4
Expand Reply Retweet Favorite More
Barco @Barco 16 OktKeeping an eye on Brazil’s highways thanks to Arteris & our OVL #videowalls. Drive safely! #controlrooms #traffic http://ow.ly/pRPu0
Expand Reply Retweet Favorite More
Barco @Barco 7 OktWhat will urban mobility look like in the future? Barco happily spon-sored the #ITS Congress #Brussels http://ow.ly/pzwAN
Expand Reply Retweet Favorite More
Barco @Barco 12 JunNew version of networked visualization system for faster response times&better decision-making/1st showcase @InfoComm http://bit.ly/11vCZlL
Expand Reply Retweet Favorite More
Follow us on twitter
90 Barco | annual report 2013 | Our activities

OUR STRATEGIC CHOICES
3 QUESTIONS TOJACQUES BERTRANDBARCO’S GENERAL MANAGER INDUSTRIAL & GOVERNMENT
What key trends are driving your business?
The rise of the smart city, natural resources exploration, and energy
management systems, combined with a growing demand for effec-
tive visualization in emerging and mid-end markets, are our key
drivers.
What will the industrial & government business be like
moving forward from here?
With big data and collaboration becoming increasingly important,
the main focus will be on networked visualization. Additionally,
we’ll be expanding into the mid-segment with a smart and tiled
LCD offering.
What will be the main focus in terms of capabilities and
technology?
We will invest in new screen technologies and LCD-based solu-
tions. The development of enhanced and integrated networking
and collaboration technologies will remain at the center of our
activities. Additionally, we will leverage our professional services
as a differentiator.
91Barco | annual report 2013 | Our activities

Our TransForm N networking technology is being used in
1,000 digital control rooms worldwide.
1,000
92 Barco | annual report 2013 | Our activities

REMOTE REMOTE REMOTE INTERACTIONINTERACTIONINTERACTIONINTERACTIONINTERACTIONINTERACTIONINTERACTIONINTERACTION
REMOTE REMOTE REMOTE NETWORKNETWORKNETWORK
SURVEILLANCE CAMERA
BUSINESS DATA
TRAFFICCAMERA
Smarter visualization
www.barco.com/controlrooms
Networked visualization leading to smarter decision making
A reliable networked visualization solution is indispensable to
monitor, analyze, and share an ever increasing number of video
and data sources all over the world. That is why Barco designed
its networked visualization solution, the simplest and most fl ex-
ible way to securely distribute any information to any location.
The result: faster and smarter decision-making.
Learn more about networked visualization at www.barco.com/netviz
MARKET TRENDS [01]
SMART GRIDS AND NETWORKED COLLABORATION
A global need for efficient energy usage is fueling the rise of smart
grids – which connect thousands of smart meters that communi-
cate over an intelligent network to monitor energy performance
and anticipate usage patterns. IBM predicts that, by 2020, smart
grid technology will be a €32 billion business – up from €3.6
billion in 2011.
Networked technologies are re-defining the industrial and govern-
mental landscape – with emergency, traffic, security and process
control centers increasingly sharing information and collaborating
to enhance situational awareness. As the volume of data to be
monitored and analyzed continues to grow at an astonishing rate,
clear and accurate data representation is becoming central to
networked operations.
Our new digital control room solution accelerates response times
when navigating through ‘big data’ and improves decision-making.
Including major security, synchronization, performance and applica-
bility improvements, the new version is an even smarter solution for
collaboration, enabling governments and companies to distribute any
visual information to any location.
Click hereto discover how Barco control
rooms enable a smarter tomorrow
93Barco | annual report 2013 | Our activities

MARKET TRENDS [02]
BRIC COUNTRIES: NEW INFRASTRUCTURES
Industrial and urban growth is driving large infrastructure
investments in the emerging BRIC markets. For example, Brazil’s
infrastructure budget for the 2016 Olympics is €10 billion. Goldman Sachs
estimates that, over the next 10 years alone, India will require €1.2 tril-
lion in infrastructure investment. And in 2013, the Chinese government
approved plans for €115 billion in infrastructure spending.
Diverse infrastructure projects in airports, railways, roads, urban transport,
stadiums, hotels, and telecommunications are raising demand for control
room technology as well as smart city management systems.
175 OVL display cubes installed at Bharti Airtel India, a global player
in integrated telecom solutions.
40 OVL display cubes installed at Arteris S.A., one of Brazil’s
largest toll road concession holders.
94 Barco | annual report 2013 | Our activities

MARKET TRENDS [03]
LARGE-DISPLAY TECHNOLOGY FOR SMALLER CONTROLROOMS
Big data, networked collaboration, and new infrastructures are
increasing demand for large-display technology in small to medi-
um-sized control and collaboration rooms. For these mid-end
markets, tiled LCD video walls provide a flexible, cost-effective,
easy-to-install, and easy-to-maintain alternative to rear-pro-
jection video walls.
The introduction of the OBLX free-standing LCD video wall
structure enables users to position a video wall at any
location. Because no wall support is needed, an OBLX can
be placed in control rooms, meeting rooms, lobbies, emer-
gency operations centers, or even art exhibitions and retail
stores. Moreover, using extension kits, a 2x2 LCD video
wall can be expanded with virtually no horizontal limit!
China’s largest control center display – comprising 68
OVL display cubes – is at the heart of the country’s State
Grid System.
68
OBLX free-standing structure for LCD video wall displays
95Barco | annual report 2013 | Our activities
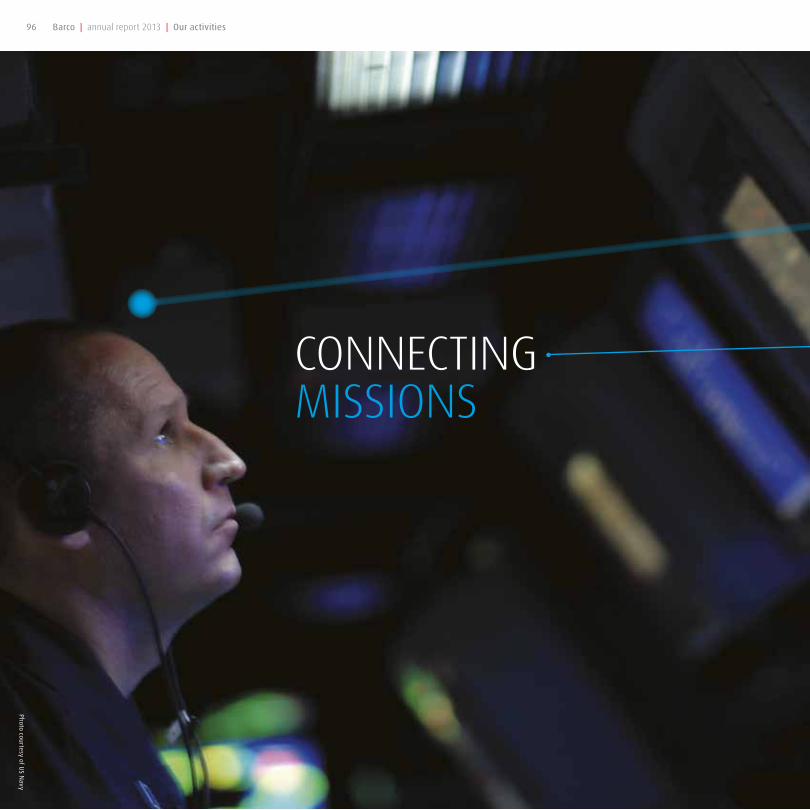
Defense &Aerospace
149.7
167.32013
2012
20.2
17.6
(IN MILLIONS OF EURO)
SALES*149.7
(IN MILLIONS OF EURO)
EBITDA*20.2
Training25%
40%Aerospace
Defense35%
SALES PER SEGMENT**
CONNECTINGMISSIONS
Our solutions for defense and aerospace applications bring you the
clearest and most accurate images. Connect to mission-critical
information in no time, make life-saving decisions thanks to increased
situational awareness, and improve mission effectiveness.
* according to reporting structure of 2013
** approximate percentages based on sales 2013
Photo courtesy of US N
avy
96 Barco | annual report 2013 | Our activities

Defense &Aerospace
149.7
167.32013
2012
20.2
17.6
(IN MILLIONS OF EURO)
SALES*149.7
(IN MILLIONS OF EURO)
EBITDA*20.2
Training25%
40%Aerospace
Defense35%
SALES PER SEGMENT**
CONNECTINGMISSIONS
Our solutions for defense and aerospace applications bring you the
clearest and most accurate images. Connect to mission-critical
information in no time, make life-saving decisions thanks to increased
situational awareness, and improve mission effectiveness.
* according to reporting structure of 2013
** approximate percentages based on sales 2013
97Barco | annual report 2013 | Our activities

OUR MILESTONES
11 FEBRUARY
New wide-screen tower display for air traffic
control
17 JUNE
Introduction of extremely lightweight avionics
display (FDU-2108)
10 JUNE
Installation of the first simulation and virtual
reality training system for China’s commercial
aviation industry
20 MAY
New U.S Training & Simulation Demo Center
TCD-361
98 Barco | annual report 2013 | Our activities

18 JUNE
Russian authorities place follow-on order for
6 Beriev aircraft
21 JUNE
Introduction of the cockpit of the future at Paris
Air Show
10 SEPTEMBER
Introduction of rugged desktop-over-IP solution
(Nexxis RNA)
7 OCTOBER
ISIS 2Kx2K main display for air traffic control
redesigned for more comfort and higher per-
formanceF-50
CDMS-3000
27 NOVEMBER
Launch of the world’s most compact 120 Hz
WQXGA projector for training & simulation
99Barco | annual report 2013 | Our activities

0:13/2:26
360° flight training simulation dome
Suscribed
253 viewsbarcoTV - 176 video’s
4 0
Watch more on our YouTube channel
100 Barco | annual report 2013 | Our activities

OUR STRATEGIC CHOICES
3 QUESTIONSTO DAVE SCOTTBARCO’S GENERAL MANAGER DEFENSE & AEROSPACE
What key trends are driving your business?
We notice three major trends in our industry. The first is a focus on
‘lowest cost, technically acceptable’ solutions due to government
budget restraints. The second is growth in the BRICT countries
where we see increased airline travel, new airports and addi-
tional defense and security needs. Finally, we see an increase in
unmanned systems taking over critical jobs where danger and
risks are very high.
What will the defense & aerospace business be like moving
forward from here?
There is a distinct shift from military to civil aerospace business so
we will focus our portfolio on this area, especially for civil flight
simulation as well as the civil airline industry. The principles that
define the defense market will remain however, so we will continue
to adapt our products to also meet the future needs of this segment.
What will be the main focus in terms of capabilities and
technology?
We will focus on products that are lower weight, lower cost, using
multi-touch and networked technologies. These will be targeted
to unmanned systems, civil simulators and avionics environments
with a special regional focus on the BRICT and APAC regions.
101Barco | annual report 2013 | Our activities

MARKET TRENDS [01]
COST IS EVERYTHING!
With budgetary pressures increasing (mainly in the US, which rep-
resents 40 - 50% of the global defense market), governments are
adopting a ‘low price, technically acceptable’ attitude in order
to decrease military spending. They are selecting those products
that meet the minimal requirements and come with a lower price
tag, rather than their high-level, best-value counterparts.
Cost-conscious strategies are also driving the need for commercial
and military aircraft to become more fuel-efficient. For most
airlines, fuel costs (about 40% of operations) have surpassed labor
costs as their largest expense. This is prompting the industry to
implement fuel-saving practices, such as simulator-based training,
the use of light-weight materials, and new flight techniques.
Commercial Aircraft Corporation of China Ltd. (COMAC) has
selected our simulation and virtual reality training system for
the day-to-day training of its aerospace engineers. This is the first
simulation and virtual reality system in China’s commercial
aviation industry.
We introduced the FDU-2108, the lightest 12” flight display
for business jet cockpits. Weighing only 2 kg, and without
compromising on image quality and reliability, the FDU marks a
major breakthrough in cockpit display design.
102 Barco | annual report 2013 | Our activities

MARKET TRENDS [02]
EMERGING COUNTRIES BECOME SELF-RELIANT
Just as they seek self-sufficiency in their economy, developing
countries are pursuing self-reliance in defense technology.
Establishing an indigenous defense industry helps meet domestic
needs and protect national security.
Needless to say, this evolution opens up opportunities. In India, for
example, military spending will likely total nearly €110 million by
2017 (McKinsey). The BRIC countries and the Asia-Pacific region
in particular will offer tremendous export potential for global
defense industries, especially for those with a local presence.
Brazilian Airspace Control System Implementation Commission
(CISCEA) has ordered no less than 437 ISIS displays for use in
its air traffic control and training centers for military operations
across the country.
2kgweight of our lightest
cockpit display
12,00012,000 ISIS displays for ATC
installed worldwide
20,00020,000 air traffic controllers
rely on Barco every day
103Barco | annual report 2013 | Our activities

MARKET TRENDS [03]
UNMANNED AIRCRAFT: THE FUTURE
The rise of network-centric systems and cyber defense are
fueling the quick adoption of unmanned aircraft systems (UAS).
These remotely piloted, or self-piloted, aircraft systems can be used
for military (e.g. reconnaissance & surveillance) as well as civil
applications (e.g. firefighting, law enforcement, pipeline monitor-
ing). The civilian air space will reportedly be open to all kinds of
UAS in the US by 2015, and in Europe by 2016.
Additionally, despite increasing budget constraints in the defense
and aerospace industries, the international market for unmanned
aircraft systems is expected to double to €100 billion in the
next decade (according to the Association for Unmanned Vehicle
Systems International).
With the new HD-30 rugged display, we
added new technologies to improve
operator performance and comfort
in mobile shelters and ground sta-
tions, from which UAS are typically
operated. Minimal power consumption,
noiseless operation, ultra-fast image
rendering, and highly accurate Infrared
technology are just a few of the differ-
entiators.
Our Nexxis RNA adapters support uncompressed streaming of
desktop content (DVI, audio, USB) over the IP network, enabling
real-time interaction with remote servers or computers –
without dedicated video switches and without sacrificing image
quality!
104 Barco | annual report 2013 | Our activities

OUR VALUES
Good team players act in the best interests of the company. They
put aside differences to resolve issues and move forward for the
common good. They treat colleagues with respect. And they are
confident and trusting, encouraging team members to get the job
done.
Team play is a crucial asset in our project deployment team. Col-
lective effort and mutual cooperation are second nature to us. By
working together as one team – across geographic and organiza-
tional boundaries – we achieve common goals and ultimately get
the results we’re after.
Winning as a team is one of our greatest motivators, driving us to do
things better – together. With the iXL program (our employee-driven
improvement program), for example, we motivate colleagues
worldwide to share their ideas and best practices through a ded-
icated online platform.
In addition to all of those aspects of team play, we collaborate on
helping people grow personally as well as professionally. Last year,
about one hundred of our colleagues organized and participated in
the Barco Play Days, providing games and activities for children in
need. That’s team play reaching out to the world.
Kenny De Cloedt
Program Office Management
Winning as a team is one of our greatest motivators
WE ENCOURAGE TEAM PLAY
105Barco | annual report 2013 | Our activities

Ventures
101
98.32013
2012
9.9
6.9
(IN MILLIONS OF EURO)
SALES101
(IN MILLIONS OF EURO)
EBITDA9.9
VENTURES
CONNECTING
Our ventures have proven to be powerful cradles of innovation and
entrepreneurship, where we can test new business models or venture
into newer technologies or segments.
LiveDots
Silex
Orthogon
BUSINESSES
106 Barco | annual report 2013 | Our activities

Ventures
101
98.32013
2012
9.9
6.9
(IN MILLIONS OF EURO)
SALES101
(IN MILLIONS OF EURO)
EBITDA9.9
VENTURES
CONNECTING
Our ventures have proven to be powerful cradles of innovation and
entrepreneurship, where we can test new business models or venture
into newer technologies or segments.
LiveDots
Silex
Orthogon
BUSINESSES
107Barco | annual report 2013 | Our activities

OUR MILESTONES
7 APRIL
Silex FPGA design speeds transactions in
award-winning Atos Worldline Hardware Secu-
rity Module (HSM)
8 APRIL
LiveDots adds C8 to its C-series LED display
family
19 MARCH
LiveDots lights up Johannesburg with 20 million
LEDs – the largest LED solution to date!
108 Barco | annual report 2013 | Our activities

6 June
Orthogon extends proven air traffic manage-
ment software to support airports and airlines
3 JULY
LiveDots introduces V14m,
a 14mm transparent LED display
12 September
Silex launches Video over IP
with JPEG 2000 reference design
18 December
Orthogon wins Best-in-Class award
at the SESAR SWIM Master Class
www.barco.com/airtrafficcontrol
Barco's OSYRIS arrival and departure management softwareoffers ANSPs, airports and airlines a perfect sense of direction tomanage today’s crowded airspace. OSYRIS allows to generatemore capacity for runways and airspace, which reduces air trafficdelays and environmental impact.
Perfect sense of directionArrival and Departure Manager
osyris_ad_def_international_airport_review2_210x135mm_Opmaak 1 18/10/12 12:10 Pagina 1
109Barco | annual report 2013 | Our activities

Directors’report
110 Barco | annual report 2013 | Directors’ report

Directors’report
111Barco | annual report 2013 | Directors’ report

DECLARATION REGARDING THE INFORMATIONGIVEN IN THE ANNUAL REPORT 2013
The undersigned declare that:
» the annual accounts, which are in line with the standards applicable for annual accounts, give
a true and fair view of the capital, the financial situation and the results of the issuer and the
consolidated companies;
» the annual report gives a true and fair view of the development and the results of the
company and of the position of the issuer and the consolidated companies, as well as a
description of the main risks and uncertainties they are faced with.
Eric Van Zele, CEO Carl Peeters, CFO
OWNERSHIP OF THE COMPANY’S SHARES
On 31 December 2013, the capital amounted to 55,533,952.32 euro, represented by 12,988,829
shares. Ownership of the company’s shares was as follows:
Gimv (*) 9.62% (1,249,921)
Dr. Ir. U. Vandeurzen Management Firm Nv (*) 2.85% (369,861)
Norges Bank (the Central Bank of Norway) 3.23% (418,742)
Templeton Investment Counsel, LLC 4.90% (636,239)
Barco 5.50% (715,206)
Public 73.90% (9,598,860)
Total 100% (12,988,829)
Fully diluted
Gimv (*) 9.47% (1,249,921)
Dr. Ir. U. Vandeurzen Management Firm Nv (*) 2.81% (369,861)
Norges Bank (the Central Bank of Norway) 3.18% (418,742)
Templeton Investment Counsel, LLC 4.82% (636,239)
Barco 5.41% (715,206)
Public 74.31% (9,810,683)
Total 100% (13,200,652)
(*) acting in concert
112 Barco | annual report 2013 | Directors’ report

BOARD OF DIRECTORS, BOARD COMMITTEES AND CORE LEADERSHIP TEAM
CORPORATE GOVERNANCE STATEMENT
INTRODUCTION
In accordance with article 96, §2 of the Companies Code, Barco applies the Corporate Governance
Code 2009 as reference code. This code can be downloaded via the link
www.corporategovernancecommittee.be.
Barco’s Corporate Governance Charter is available for download at
www.barco.com/investors/corporategovernance.
BOARD OF DIRECTORS Situation on 1 March 2014
Chairman Herman Daems (1) 2016*
President & CEO Eric Van Zele (3) 2014*
Directors ADP Vision BVBA (represented by Antoon De Proft) (2) 2015*
Praksis BVBA (represented by Bruno Holthof) (2) 2014*
Lumis NV (represented by Luc Missorten) (2) 2014*
Oosterveld Nederland B.V. (represented by Jan P. Oosterveld) (1) 2014*
KANKU BVBA (represented by Christina von Wackerbarth) (2) 2016*
Adisys Corporation (represented by Ashok K. Jain) (2) 2017*
Secretary Kurt Verheggen General Counsel
(1) non-executive directors // (2) non-executive independent directors // (3) executive director
* Date on which the term of office expires: end of the annual meeting
113Barco | annual report 2013 | Directors’ report

BOARD OF DIRECTORS
Ashok K. Jain [01]
Christina von Wackerbarth [03]
Jan P. Oosterveld [02]
Luc Missorten [04]
114 Barco | annual report 2013 | Directors’ report

Herman Daems [06]
Chairman of the Board of Directors
Bruno Holthof [07]
Antoon De Proft [08]
Eric Van Zele [05]
President & Chief Executive Officer
115Barco | annual report 2013 | Directors’ report

Herman Daems (°1946)
[06] is Chairman of the Board of Directors of Barco and BNP Paribas
Fortis. He is also Chairman of the International Private Equity Valuation
Guidelines Board and he holds several other Board positions. Professor
Daems is on the faculty of the K.U. Leuven. He studied theoretical physics
and economics and holds a PhD in Economics.
Eric Van Zele (°1948)
[05] has been President and CEO of Barco since 2009. He is Chairman
of the Board of Reynaers Aluminium NV. Previously, he held top man-
agement positions at the Indian Avantha Group, Pauwels International,
Telindus NV and Raychem Corporation. Mr. Van Zele holds a Master’s
degree in Mechanical Engineering from the K.U. Leuven and post-graduate
degrees in Management from Stanford University.
Antoon De Proft (°1960)
[08] holds a Master’s degree in Electrical Engineering and a post-graduate
degree in Medical Engineering. He has been President & CEO of ICOS
Vision Systems Corporation. Today, Mr. De Proft has his own consultancy
company, and he serves on several Boards, including a position as Chair-
man of IMEC.
Bruno Holthof (°1961)
[07] is CEO of the Antwerp Hospital Network, a major Belgian hospital
group. Prior to this, he was a partner at McKinsey & Company, where
he became an expert in the areas of strategy, organization and opera-
tions. He is also a Board member of bpost, Belgium’s postal service. Mr.
Holthof holds an MBA from Harvard Business School and an MD/PhD
from the K.U. Leuven.
Luc Missorten (°1955)
[04] is CEO of Corelio, a leading Belgian multimedia company, and CEO of
Mediahuis, a joint venture between media groups Corelio and Concentra.
He served on the Board of LMS and Bank Degroof. Before joining Corelio,
he was CFO at Inbev and UCB. Mr. Missorten holds a Law degree from the
K.U. Leuven, a Master of Laws from the University of California – Berke-
ley, and a Certificate of Advanced European Studies from the College of
Europe in Bruges.
Jan P. Oosterveld (°1944)
[02] held several senior management positions at Royal Philips Electronics
before he retired in 2004. He is a professor at IESE, owns a consultancy
company, and holds several Board positions. Mr. Oosterveld holds a Mas-
ter’s degree in Mechanical Engineering from the Technical University
Eindhoven and an MBA from the IESE Business School, Barcelona.
Christina von Wackerbarth (°1954)
[03] has held several top positions at VNU Belgium, VNU Magazines
International, and the Flemish public broadcasting company VRT. Today,
she is active as a Media Consultant and Executive Coach, and she serves
on the Board of telecom operator Mobistar. Ms. von Wackerbarth holds a
degree in Romance Philology and Linguistics, has completed an Advanced
Management Program at Insead, and holds a Master’s degree in Consult-
ing and Clinical Coaching from HEC Versailles/Insead.
Ashok K. Jain (°1955)
[01] holds a Master of Technology degree from the Indian Institute of
Technology in Delhi, India. During his career, Mr. Jain has founded several
technology start-ups and has converted them into successful businesses
through strong leadership coupled with insights into emerging opportuni-
ties and trends in the global economy. Mr. Jain was founder and Chairman
of the Board of IP Video Systems, which was acquired by Barco in Febru-
ary 2012. He currently serves as Chairman on the Board of Directors of
Teraburst Networks Inc. and is an advisor to Rocket Fuel Inc. Mr. Jain is
of Indian origin and has US citizenship.
Kurt Verheggen (°1970)
serves as Company Secretary of the Board. He is the General Counsel of
Barco. He started his career with the law firm Linklaters and then worked
as Legal Counsel for CMB, GDF Suez and General Electric. He holds a law
degree from the K.U. Leuven, a Master of Laws from Tulane University
Law School in New Orleans, and a Master’s degree in Real Estate from
the Antwerp Management School.
BOARD OF DIRECTORS
116 Barco | annual report 2013 | Directors’ report

CHANGES
In 2013, following his temporary appointment by the Board, Mr. Ashok K.
Jain (Adisys Corporation) was definitively appointed by the shareholders
at the general meeting of 25 April 2013.
All non-executive directors hold or have held senior positions in leading
international companies or organizations. Their biographies can be found
on pages 114 - 116 of this annual report.
BOARD COMMITTEES
Further to the changes in the Board, the composition of the various com-
mittees has also been adapted accordingly.
AUDIT COMMITTEEThe audit committee is composed of three members, namely: Mr. Luc
Missorten, who acts as Chairman, Mr. Bruno Holthof, and Mr. Jan P.
Oosterveld. Mr. Missorten and Mr. Holthof are independent non-executive
directors. The audit committee’s members have relevant expertise in
financial, accounting and legal matters as shown in the biographies on
pages 114 - 116. The Board of Directors therefore opines that the audit
committee meets the statutory requirements of independence and exper-
tise in accounting and auditing. Each year, the audit committee assesses
its composition and its operation, evaluates its own effectiveness, and
makes the necessary recommendations regarding these matters to the
Board of Directors.
Both the statutory auditor and the head of the internal audit have direct
and unlimited access to the Chairman of the audit committee and to the
Chairman of the Board of Directors.
REMUNERATION & NOMINATION COMMITTEEThe Board of Directors has made use of the possibility to combine the
remuneration committee and the nomination committee into a single
committee.
The remuneration & nomination committee consists of three independent
directors: Christina von Wackerbarth who acts as Chairman, Luc Missorten
and Antoon De Proft, all being independent non-executive directors.
STRATEGIC COMMITTEEThe members of the strategic committee are Herman Daems (Chairman),
Eric Van Zele, Jan P. Oosterveld, Bruno Holthof, and Antoon De Proft. On 25
November 2013, the Board also appointed Mr. Ashok K. Jain as member
of the strategic committee.
117Barco | annual report 2013 | Directors’ report

CORE LEADERSHIP TEAM Situation on 1 March 2013
Carl Peeters [04]
Chief Finance Officer
Piet Candeel [03]
General Manager Healthcare
Wim Buyens [05]
General Manager Entertainment & Corporate
Paul Matthijs [02]
General Manager
Retail & Advertising, Venturing
Jacques Bertrand [01]
General Manager
Industrial & Government
118 Barco | annual report 2013 | Directors’ report

Filip Pintelon [09]
Chief Operating Officer
Jan Van Acoleyen [08]
Chief Human Resources Officer
Dave Scott [07]
General Manager
Defense & Aerospace
Ney Corsino [06]
General Manager
International Sales & Sales Operations
119Barco | annual report 2013 | Directors’ report

Jacques Bertrand [01]
joined Barco in 1986 after obtaining a degree in Electronic Engineering.
He took up sales and product management roles in the former Barco
Graphics division and was responsible for the start-up and expansion of
Barco Graphics in Asia-Pacific. In 2000, he was appointed President Barco
Japan, and in 2005, he was promoted to President Barco Asia-Pacific. In
2011, Mr. Bertrand became Chief Sales Officer of Barco and moved back
to Belgium. In August 2013, he was appointed President of the Industrial
& Government division.
Paul Matthijs [02]
Paul Matthijs is General Manager of the Retail & Advertising and Venturing
divisions. Prior to this position, he held several positions in R&D, product
management and general management in the Medical Imaging, Enter-
tainment and Venture divisions of Barco. Mr. Matthijs holds a Master’s
degree in Electronic Engineering and an MBA from Vlerick Business School.
Piet Candeel [03]
is General Manager of the Healthcare division. Prior to his present position,
he held several positions in marketing, sales, and general management in
a variety of business units in Barco over a span of 25 years. Mr. Candeel
holds an Officer Degree in Nautical Electronics, a post-graduate degree
in Marketing from EHSAL Brussels and an MBA from the University of
Antwerp (UFSIA). He is also a graduate of Stanford University’s Executive
Program (SEP).
Carl Peeters [04]
started with Barco in 1987 and held the positions of Marketing Manager
and Division Manager in the former Barco Graphics division. Later, he was
responsible for mergers and acquisitions, and he was appointed CFO of
BarcoNet when this division became a separate public company. After the
delisting of BarcoNet in 2002, Mr. Peeters rejoined Barco, where he was
appointed CFO in 2010. He holds a Master’s degree in Applied Economics
and a post-graduate degree in Business Administration.
Wim Buyens [05]
is General Manager of the Entertainment & Corporate division. He started
at Barco in November 2007 as Vice President Digital Cinema within the
Media & Entertainment division. Prior to joining Barco, he held several
management positions at the Danish technology company Bruel & Kjaer.
Mr. Buyens holds a degree in Engineering and obtained his executive
management education at Stanford University and IMD in Lausanne.
Ney Corsino [06]
is General Manager International Sales and Sales Operations. Prior to this,
he managed Barco Latin America. Before joining Barco, he held several
management positions at Philips. Mr. Corsino is originally from Brazil and
holds a Bachelor’s degree in Electronic Engineering and a post-graduate
degree in Economics.
Dave Scott [07]
is General Manager of the Defense & Aerospace division. He holds a
degree in Electrical Engineering from Virginia Polytechnic Institute and
state University. Mr. Scott was co-founder of Chromatics Inc., which was
acquired by Barco in 1990. In 2001, he became Chief Operating Officer
for BarcoView and, in January 2004, he was appointed President Barco
North America. In 2010, Mr. Scott assumed his present position while
maintaining legal responsibility for managing the North American region
as the Head of Barco, Inc.
Jan Van Acoleyen [08]
is Chief Human Resources Officer. Prior to joining Barco in 2007, he
held senior HR positions in high-tech companies such as Alcatel and
Agfa-Gevaert. Mr. Van Acoleyen holds a Master’s degree in Educational
sciences from the K.U. Leuven and an Executive MBA from the University
of Antwerp.
Filip Pintelon [09]
joined Barco in 2008 as President of Avionics & Simulation and President
of Media, Entertainment & Simulation, before assuming the roles of COO
and General Manager of the Networking division. Prior to joining Barco,
he held top positions at LMS, Andersen Consulting and The Boston Consult-
ing Group. After graduating from the K.U. Leuven with a Master’s degree
in Mathematics/Informatics in 1986, Mr. Pintelon earned an MBA from
Vlerick Leuven Gent Management school.
CORE LEADERSHIP TEAM
120 Barco | annual report 2013 | Directors’ report

Reference is made to Title 1 and 2 of Barco’s Corporate Governance Charter for an overview of the responsibilities of the Board of Directors and its
committees.
The table below provides a comprehensive overview of the directors’ attendance at the Board of Directors and committees’ meetings:
At regular intervals, the Board has reviewed the company’s structure
against its long term strategy, evaluated possible acquisition opportuni-
ties presented by the strategic committee, examined the divestment
of assets deemed no longer strategic. The Board closely monitored the
implementation of strategic projects such as the consolidation of the
company’s activities in Kortrijk on one campus or the implementation of
one common ERP-system. Finally, the Board has also attended several
demonstrations of new technologies in areas such as networked con-
nectivity and wireless presentation.
ACTIVITY REPORT ON BOARD AND BOARD COMMITTEES’ MEETINGS
BOARD OF DIRECTORS
In 2013, the Board of Directors met 7 times. One of the meetings was
held in the offices of projectiondesign® in Frederikstad (Norway).
At every meeting, the Board of Directors reviewed and discussed the
financial results as well as the short to mid-term financial forecast of the
company. In the beginning of the year, upon recommendation by the
audit committee, the Board approved the financial results of 2012 and
proposed the dividend for approval by the shareholders. It also deliberated
on the renewal of the director’s mandates as presented by the Remu-
neration and nomination committee. It deliberated on and subsequently
approved the acquisition of AWIND. At dedicated meetings, the Board,
in close concert with the core leadership team, reflected on each of the
divisions’ and ventures’ strategies for the short to mid-term and approved
the 2014 financial budget.
Board of Directors Audit committeeRemuneration
& nomination committeeStrategic committee
Eric Van Zele (3) 7 5 3 2
Herman Daems (1) 7 1 2
Bruno Holthof (2) 7 5 2
Luc Missorten (2) 6 5 3
Jan P. Oosterveld (1) 7 5 2
Christina von Wackerbarth (2) 7 3
Antoon De Proft (2) 7 3 2
Ashok K. Jain (2) 7 1
(1) non-executive directors (2) non-executive independent directors (3) executive director
121Barco | annual report 2013 | Directors’ report

AUDIT COMMITTEE
The audit committee meets at least twice a year with the statutory audi-
tor and the head of internal audit to consult with them about matters
falling under the power of the audit committee and about any matters
arising from the audit. The CEO and CFO also attend the meetings of the
audit committee, unless the members of the audit committee wish to
meet separately.
The audit committee assists the Board of Directors in fulfilling its oversight
responsibilities with respect to the:
» Risk management and internal control arrangements
» Reliability and integrity of the Group’s financial statements and
periodical and occasional reporting
» Compliance with legal and regulatory requirements as well as the
Code of Ethics and Business Conduct
» Performance, qualifications and independence of the external
auditors
» Performance of the internal audit function.
In 2013, the audit committee convened five times. The Chairman of the
audit committee reported the outcome of each meeting to the Board
of Directors. The yearly report of the activities of the audit committee,
including the audit committee’s self-assessment, has been submitted to
the Board of Directors.
The statutory auditor attended three meetings during which it reported
on the results of its audit procedures and highlighted specific attention
points. The statutory auditor’s management letter contained no recom-
mendations for material adjustments.
The audit committee reviewed the Group’s overall risk areas and risk
management and control procedures related to the following areas:
legal & compliance risks, IT risks, currency and treasury instrument risks,
health, safety and environmental risks, internal control risks and insur-
ance program.
Each quarter, the financial reports are discussed, with special attention to
the critical accounting judgments and uncertainties, consistent application
of valuation rules and off balance sheet obligations. The audit committee
meeting of December is dedicated to the preparation of the year-end
closing, with a particular focus on the review of the impairment testing
procedures performed on goodwill and on capitalized development cost.
REMUNERATION AND NOMINATION COMMITTEE
The remuneration and nomination committee meets at least two times
per year, as well as whenever changes are necessary in the composition
of the Board of Directors, be they appointments or reappointments. The
committee is aware of the importance of diversity in the composition of
the Board of Directors in general, and of gender diversity in particular.
The committee takes this into account whenever new directors need
to be appointed. In this respect, the Board is in the process of identi-
fying potential candidates for future nominations given the upcoming
membership renewals. The CEO participates in the meetings when the
remuneration and nomination plan proposed by the CEO for members of
the core leadership team is discussed, but not when his own remunera-
tion is being decided.
In fulfilling its responsibilities, the remuneration and nomination com-
mittee has access to all resources that it deems appropriate, including
external advice.
In 2013, the remuneration & nomination committee met 3 times.
The remuneration & nomination committee has reviewed the remunera-
tion of the senior leadership team and the CEO. This included the definition
and evaluation of bonus criteria, bonus deferral principles as well as an
overall assessment of composition and positioning of the reward packages
based on external data. This was done with regard to the 2013 bonus
review as well as the 2013 salary review and bonus plans. In prepara-
tion for the general meeting, the committee prepared and reviewed the
remuneration report. The nomination of new Board members and the
performance as well as succession of the senior leadership team were
also on the agenda. In 2013 the Chairman of the remuneration and
nomination committee conducted individual interviews with key leaders
in Barco supporting the strategy for 2014 and beyond.
With regard to the stock option plan 2013, the committee took the oppor-
tunity to investigate different equity-based reward practices and the
characteristics of the stock option plan before approving and submitting
it for Board approval. Upon the CEO’s recommendation, the committee
approved the grants for the senior leadership team and the principles for
eligibility of Barco employees. The grant for the CEO was proposed and
reviewed by the committee in preparation for Board approval.
122 Barco | annual report 2013 | Directors’ report
STRATEGIC COMMITTEE
The Board of Directors has set up a strategic committee, including the
Chairman and the CEO. The Chairman presides over this strategic com-
mittee. Members of the executive management and other members can
be invited to attend meetings of the strategic committee. The committee
meets when an issue is introduced by the CEO. The committee meets at
least one time per year to evaluate the existing strategy.
Upon the proposal of the CEO, the strategic committee discusses options
that could influence the company’s strategic path. Possible topics that
may be discussed in this committee include acquisitions, mergers and
the sale of a given activity. Other important strategic choices can also
be discussed in the committee, such as investing in new technologies,
markets or regions that could have an important impact on the future of
the company. This relates to investments running over a number of years
that involve a minimum engagement by the company of 10 million euro
over the entire duration of the project.
In 2013, the strategic committee met 2 times.
The executive management presented a selected number of proposals
for acquisitions. The strategic committee conducted in-depth discussions
about the strategic value of the proposed transactions in view of the
company’s long-term strategy. The committee also evaluated the oppor-
tunities as well as the risk profiles of the projects and gave appropriate
instructions regarding the transaction parameters.
EVALUATION OF THE BOARD OF DIRECTORS AND ITS COMMITTEES
The Board of Directors regularly carries out a process of self-evaluation.
The intention is to evaluate the functioning of the Board as a whole and of
its committees. In this respect individual and private interviews are held
with each of the directors, leading to a report which is submitted to the
full Board for review and action. The topics discussed are: the quality of
the interaction between management and the Board, the quality of the
information and documents submitted to the Board, the preparation of
the Board meetings, the quality of the discussions and decision-making
of the Board, the extent to which all relevant strategic, organizational and
managerial issues are addressed by the Board, and the contribution of all
Board members to the decision-making process at the Board. This process
allows for actions to be taken, aiming at the continuous improvement
of the governance of the company. Moreover, prior to a director’s (re-)
appointment, the remuneration & nomination committee discusses and
evaluates the individual director’s contribution to the Board.
The above is fully in line with the Corporate Governance Code. Reference is
also made to Title 1 (1.3) of the company’s Corporate Governance Charter
on www.barco.com/investors/corporategovernance.
123Barco | annual report 2013 | Directors’ report

REMUNERATION REPORT
BOARD OF DIRECTORS
On 25 April 2013, pursuant to article 17 of the articles of association, the
general meeting set the aggregate annual remuneration for the year
2013 at 2,354,075 euro for the entire Board of Directors. This amount also
includes the remuneration for the executive director. The balance of the
amount was apportioned amongst the other members of the Board in
line with its internal rules.
Also in line with the internal rules, a fixed remuneration of 20,500 euro
is granted to non-executive directors and an additional amount based
on attendance at meetings of the Board and of the committees. The
attendance fee per meeting of the Board and the committees is set at
2,550 euro. The Chairman of the audit committee receives an attendance
fee of 5,125 euro per meeting. These remunerations are charged as
general costs.
Directors do not receive any remuneration linked to performance or
results.
There were no shares granted.
Fixed Remuneration Board attendance Committee attendance Total 2013
Herman Daems 205,000* 205,000
Bruno Holthof 20,500 17,850 17,850 56,200
Luc Missorten 20,500 15,300 33,275 69,075
Jan P. Oosterveld 20,500 17,850 17,850 56,200
Christina von Wackerbarth 20,500 17,850 7,650 46,000
Antoon De Proft 20,500 17,850 12,750 51,100
Ashok K. Jain 20,500 17,850 2,550 40,900
* 161,000 euro plus 44,000 euro in retirement benefits
At the company’s request, the following directors have taken up specific
assignments outside the scope of their directorship for which they have
been compensated as described hereafter:
- Jan P. Oosterveld: 12,000 euro
- Ashok K. Jain: 11,482.40 USD
REMUNERATION CEO AND CORPORATE SENIORVICE PRESIDENTS 2013 (IN EURO)
For the executive director and the corporate senior Vice Presidents, the
remuneration is determined by the remuneration & nomination committee,
in line with the rules described in the company’s ‘Corporate Governance
Charter’ under Title 4 (‘Remuneration’), available on www.barco.com/
investors/corporategovernance.
124 Barco | annual report 2013 | Directors’ report

BASIC PRINCIPLES OF SENIOR EXECUTIVESREWARD REVIEW PROCESS
Barco wants to be an attractive company for top talent in the technology
market space, based on sustainable human resources practices. Competi-
tive reward, together with career and development opportunities, is at
the heart of Barco’s employee value proposition. Overall, Barco strives
for a position above the market median on the total reward proposition,
with a substantial variable part based on company, team and individual
performance.
2013 variable payment was based on company (40%), divisional/func-
tional (30%) and individual performance (30%).
The reward packages of the senior executive and extended management
teams are reviewed by the remuneration and nomination committee on
an annual basis. The committee assesses overall market competitiveness
(based on bi-annual external market data), individual market positioning
and sustained individual performance. This review results in updated
individual reward packages and reward policies, as well as the criteria
for the annual Barco Bonus plan.
The 2013 variable payment is based on EBIT, free cash flow, costs, orders,
sales and individual targets. If the target variable part of the compensa-
tion of individual members of the executive management should exceed
the 25% threshold on total compensation, the deferral will be based on
sustained profitability.
REMUNERATION PACKAGE 2013 OF THE CEO
» fixed gross salary of 645,750 euro.
» 2013 variable remuneration of 650,000 euro. The target variable
part is above 25% of total compensation and as a result, in line
with the Law on Corporate Governance, 50% of this amount will be
deferred (25% in 2014 and 25% in 2015) and is subject to sustained
profitability.
» deferred 2011 variable remuneration of 198,900 euro in line with the
deferral conditions.
» Deferred 2012 variable remuneration of 204,750 euro in line with the
deferral conditions.
» contribution for retirement benefits of 300,000 euro.
» other components of the remuneration: 24,248 euro.
There is no claw back provision. The assessment of the performance is
based on audited results.
In 2013, 25,000 stock options were granted to the CEO. 15,000 warrants/
stock options were exercised and no warrants/stock options lapsed. Since
stock option grants are based on neither individual nor company perfor-
mance, these are not to be considered variable remuneration as defined
by the Law on Corporate Governance.
There were no shares granted.
TOTAL REMUNERATION 2013 FOR THE CORPORATE SENIORVICE PRESIDENTS, MEMBERS OF THE CORE LEADERSHIP TEAM
» fixed salary of 2,002,367 euro
» variable remuneration of 555,131 euro
» contribution for retirement benefits of 228,974 euro
» other components of the remuneration: 176,713 euro (healthcare
insurance, personal risk insurance, company car)
There is no claw back provision. The assessment of the performance is
based on audited results.
In 2013, 18,000 stock options were granted to and accepted by Corporate
Senior Vice Presidents, members of the core leadership team. Since stock
option grants are based on neither individual nor company performance,
these are not to be considered variable remuneration as defined by the
Law on Corporate Governance.
125Barco | annual report 2013 | Directors’ report

Jacques Bertrand: 3,000
Wim Buyens: 5,000
Piet Candeel: 3,000
Carl Peeters: 1,000
Filip Pintelon: 3,000
Dave Scott: 3,000
A total of 35,850 warrants/stock options were exercised, while 3,786
warrants granted in 2000 at an exercise price of 91.92 euro expired on
13 July 2013.
There were no shares granted.
Reference is made to page 212 of this annual report for an overview of
the warrants and stock options exercisable under the warrant and stock
option plans.
The group of Corporate Senior Vice Presidents in office on 1 March 2014
is presented on pages 118 - 120 in this annual report.
CONTRACTUAL RELATIONSHIPS
Contract between Barco and Eric Van Zele, CEO
In case of termination of the contract by Barco the contract provides a
notice period or compensation in lieu of 6 months.
CONTRACTS BETWEEN BARCO AND CORPORATE SENIOR VICE
PRESIDENTS, MEMBERS OF THE CORE LEADERSHIP TEAM
Individual arrangements in case of termination
of the contract by Barco
The employment contracts of Jacques Bertrand, Wim Buyens, Piet Candeel,
Carl Peeters, Filip Pintelon and Jan Van Acoleyen were signed before the
Belgian Corporate Governance Law of 6 April 2010 came into force. The
total compensation in case of termination is based on age, seniority in the
Barco Group and the total of the individual compensation and benefits.
Dave Scott has a US employment agreement. There is no contractual
arrangement in case of termination and the Barco US Termination and
Severance Policy will therefore be applicable. His contract was signed
before the Belgian Corporate Governance Law of 6 April 2010 came
into force. Steve Leyland has a French employment agreement with a
contractual arrangement in case of termination. The total compensation
in case of termination is equivalent to 6 months of total compensation
during the first 36 months of employment and to 12 months of total
compensation after 36 months of employment.
PRESENTATION OF THE REMUNERATION REPORTTO THE SHAREHOLDERS
The Remuneration Report will be submitted for vote to the shareholders
at the shareholders’ meeting of 24 April 2014.
POLICIES OF CONDUCT
TRANSPARENCY OF TRANSACTIONS INVOLVING SHARESOR OTHER FINANCIAL INSTRUMENTS OF BARCO
In line with the Royal Decree of 5 March 2006, members of the Board of
Directors and the core leadership team must notify the FSMA (Financial
Services Market Authority) of any transactions involving shares or other
financial instruments of Barco within 5 business days after the transac-
tion. Transactions by the core leadership team following the exercise
of warrants and options have been made public on the website of the
FSMA (www.fsma.be) in May and June 2013. The Compliance Officer
has also published on the Barco website (www.barco.com/investors/
corporategovernance), all transactions by insiders at the end of the first
month following every quarter.
Reference is also made to Title 7 (1) of the Company’s Corporate Gov-
ernance Charter on www.barco.com/investors/corporategovernance.
126 Barco | annual report 2013 | Directors’ report

RISK MANAGEMENT AND CONTROL PROCESSES
INTRODUCTION
Barco operates a risk management and control framework in accordance
with the Companies Law Code and the Corporate Governance Code 2009.
Barco is exposed to a wide variety of risks within the context of its
business operations that can result in the objectives being affected or
not achieved. Controlling those risks is a core task of the Board of Direc-
tors, the core leadership team and all other employees with managerial
responsibilities.
The risk management and control system has been set up to reach the
following goals:
» Achievement of the company objectives
» Operational excellence
» Correct and timely financial reporting
» Compliance with all applicable laws and regulations
The principles of the COSO reference framework and the ISO 31000 risk
management standard have served as a source of inspiration to Barco in
the set up of its risk management and control system.
CONFLICTS OF INTEREST
BASIC PRINCIPLES
» Art. 523 of the Companies Code sets the rules for conflicts of interest
that may arise within the context of a director’s mandate.
» Each board member sees to it that these rules are strictly observed
» Any act or transaction which may potentially give rise to a conflict of
interest is carefully scutinized to avoid that such conflict may arise.
» In 2013, none of the directors reported any conflict of interest as
referred to in article 523 of the Companies Code.
FUNCTIONAL CONFLICT OF INTEREST
A director who is a director or business manager of a customer or sup-
plier or who is employed by a customer or supplier shall report this fact
to the Board of Directors prior to the deliberations concerning a topic
on the agenda relating (whether directly or indirectly) to this customer
or supplier. This obligation also applies when a family member of the
director is in the above-mentioned position.
The same rule applies when a director or his or her family members
(whether directly or indirectly) hold more than 5% of the shares with
voting rights of a customer or supplier.
Subsequently, the director in question:
» shall leave the meeting while this topic on the agenda is being dealt
with;
» shall not be permitted to participate in the deliberations and
decision-making about the topic in question.
These provisions are not applicable when the customer or supplier is a
listed company and the participation of the director (or his or her family
members) takes place within the framework of assets that have been
placed under the management of an asset manager who manages these
assets in accordance with his own judgment, without taking the director
(or his or her family members) into account.
Financial risks
Operational risks
Force Majeure
Strategic risks
Macro-economic risks
Acquisitions and diversions
Human relatedSite related
Liability
Intellectual property
Product compliance
Contract management
Ethics and business conduct
Governmental restrictions
Cooperation with strategic partners
Market and technology dynamics
Accounting and financial reporting
Currency and interest fluctuations
Liquidity, loans and capital
Bankruptcy of customers and partners
Key componentsCapacity constraints
Transport and storage
Knowhow and qualified people
Health and safety of people
Information and communication technology
Concentration and specialization riskNew product development
Legal risks
127Barco | annual report 2013 | Directors’ report

CONTROL ENVIRONMENT
Barco strives for an overall compliance and a risk-awareness attitude by
defining clear roles and responsibilities in all relevant domains. This way,
the company fosters an environment in which its business objectives
and strategies are pursued in a controlled manner. This environment is
created through the implementation of different companywide policies
and procedures such as:
» The code of ethics and business conduct
» Decision and Signature Authority Rules
» The Barco values
» The quality management system
» Risk profiling, reporting and mitigation processes
The core leadership team fully endorses these initiatives. The employees
are regularly informed and trained on these subjects in order to develop
sufficient risk management and control at all levels and in all areas of the
organization. The Risk and Compliance Manager is in charge of the overall
coordination of the risk management and control process.
RISK MANAGEMENT SYSTEM
RISK MANAGEMENT PROCESS AND METHODOLOGY
All employees are accountable for the timely identification and qualitative
assessment of the risks (and significant changes to them) within their
area of responsibility.
Within the different key, management, assurance, and supporting pro-
cesses, the risks associated with the business are identified, analyzed,
pre-evaluated and challenged by internal and external assessments.
In addition to these integrated risk reviews, periodic assessments are
performed to check whether proper risk review and control measures
are in place and to discover unidentified or unreported risks. This process
is driven by the risk and compliance manager.
The risks are further evaluated to set the right prioritization by allocating
them in a consistent manner to an impact scale on the one hand, and a
likelihood scale on the other hand. The scale for impact and likelihood
are based on the acceptable level of risk exposure that is determined by
the Board of Directors.
All risks are recorded in the risk register of the related process with a spec-
ification of their impact and likelihood. In addition, each risk is allocated
to a risk owner who is responsible for setting up and implementing the
mitigation action plan and the monitoring and follow-up of his/her risk.
On a corporate level, the risk matrix is drawn up based on the risk score
(impact x likelihood), whereby risks are classified as ‘Unacceptable risk’,
‘Risk under observation’ or ‘Acceptable risk’.
‘Unacceptable risks’ are contained by means of an action plan to minimize
the effects of such risks on the organization’s ability to achieve its objec-
tives. Also, the risks ‘under observation’ are monitored by a member of
the core leadership team.
BEFORE AFTER
IMPACT
Likelihood
Neg
ligib
le
Min
imal
Serio
us
Criti
cal
Dest
ruct
ive
Frequent
Probably
Possible
Unlikely
Rarely
PREVENTION RECOVERY
128 Barco | annual report 2013 | Directors’ report

These processes are facilitated by the risk and compliance manager by:
» Providing tools and training to identify, analyze, evaluate, report,
escalate and mitigate risks,
» Raising overall awareness of risk management, compliance and
control within the company,
» Encouraging continuous improvement.
All risks are specified in the Barco risk universe, which can be divided
into five categories:
» Strategic risks: macro-economic risks, acquisitions, co-operation with
strategic partners and technology and market dynamics.
» Operational risks: concentrating and specialization, capacity
constraints, transport and storage, key components, and single
sources, new product development, know-how and qualified
personnel, health and safety of people, and information and
communication technologies.
» Financial risks: the risks connected to the accounting and financial
reporting, currency and interest fluctuations, liquidity, loans and
capital, bankruptcy of customers and partners, forecast and planning.
» Legal and compliance: ethics and business conduct, liability,
government regulations, product compliance, intellectual property
and contract management.
» Force Majeure risks are grouped in a site-related and a human-
related risk domain.
MOST IMPORTANT RISK FACTORS
Barco has identified and analyzed its corporate risks.
While this list is not exhaustive, Barco specifically recognizes that the
following risks deserve attention:
Strategic risks
Acquisition risks
Part of Barco’s long-term growth strategy is based on acquisitions. Despite
the fact that Barco has well-defined parameters for potential acquisitions
and carries out due-diligence processes with the utmost care, acquisitions
always entail risks. These risks may be associated with the integration
of the acquired company into the group. The growth of the acquired
business may be slower than forecast, or the acquired technological
knowledge may not be as valuable as anticipated. These risks may result
in impaired goodwill.
Macro-economic risks
Beyond Barco’s immediate business environment, an overall negative
economic climate, a lack of liquidity in the financial markets, or a global
stock market collapse may have a negative effect on Barco, its customers
and its partners. A recession may slow Barco’s customers and partners
down or render them unable to secure the funds for planned investments.
To mitigate its own risks in terms of liquidity, Barco increased its commit-
ted credit facilities to €115 million in December 2011 and continued to
focus on a pro-active cash generating strategy. These committed credit
facilities have recently been extended in tenor and have been increased
with another €50 million, leading to total available committed credit
lines of €165 million per 31 December 2013, which are for the biggest
part undrawn. On the other hand, the fact that Barco conducts business
in a variety of markets and geographical regions may reduce the impact
of bad economic conditions, as they may not affect all markets and
regions equally.
Operational risks
Risks related to new products
Barco is active in very specialized, selected professional markets for
visualization technologies. In order to maintain, or attain, market-leader
status in each of its key markets, the company annually invests consider-
ably in research & development. In 2013, this investment amounted to
€95.5 million, or 8.2% of sales. With regard to the selected professional
markets, the company’s main challenge is to define the right products
to introduce into each market. Risks associated with this challenge are:
» not being the first to market a new product, which may lead to
smaller market share than anticipated or even to discontinuation of
the product.
» using third-party components that do not meet the expected quality
levels, resulting in unusually high (or higher than anticipated/
provisioned) warranty expenses.
» not achieving the expected sales volume or profitability, due to lack
of competiveness.
» New technologies such as networked connectivity and wireless
presentation.
» introducing new products that are not yet ready to be marketed,
resulting in unusually high (or higher than anticipated/provisioned)
warranty expenses.
129Barco | annual report 2013 | Directors’ report

The continuous improvement of the New Product Introduction (NPI) pro-
gram is driven by the green and the red teams and is supported by several
competence groups. In 2013, two of the objectives were:
» performing better requirements & risk management
» empowering the NPI project managers
execution
Lean&AgileDesignToValue
Just d
o it
111npi444all
201320132013SCOPE
NPI
Key components
Expected sales volumes may not be achieved due to a shortage of com-
ponents. This shortage may be a global phenomenon, due to an economic
crisis or a major natural disaster. It may, however, also be linked to the
introduction of new products that require new components, which may
not yet be available in the required volumes. Key components sourced
by a single source receive dedicated follow-up with mandatory high
management attention.
Barco’s global procurement team tracks suppliers closely to anticipate
potential disruptions. By reducing its supplier database, Barco seeks
to build a more collaborative relationship with its suppliers to Barco’s
advantage.
IT risks
Barco makes extensive use of IT systems and platforms to support its
operations. As configuration, hardware or software failures may occur,
which can hamper these operations, proper fail-safe and recovery pro-
cedures are in place to mitigate these risks.
SUPPLIERMANAGEMENT
SupplierQualification
SupplierEvaluation
SupplierSourcing
Phasing outof suppliers
ContinuousSupplierImprovement
130 Barco | annual report 2013 | Directors’ report

In addressing safety risks inherent to any modern IT infrastructure, Barco’s
facility and IT management is fully compliant with ITAR and C-TPAT guide-
lines, proactively scans its network for vulnerabilities, strictly regulates
access to its networks, and regularly performs disaster recovery exercises.
Barco is in the process of implementing a new ERP (Enterprise Resource
Planning) system and selected SAP ECC as its main platform. In combina-
tion with this, Barco also wants to lift its processes to a higher level. The
implementation of ERP systems has been a challenge for many organiza-
tions in the past. Therefore, Barco is continuously identifying the risks and
setting proper controls during the new ERP implementation. By controlling
and minimizing the major business risks in the first instance, the scene
can be set for a successful implementation of the new ERP system.
Financial risks
The risks measures related to the accounting and financial reporting risks
are described in the ‘Barco consolidated’ section.
Legal and compliance risks
Compliance and governmental regulations
In a company of Barco’s size and scope, an employee’s actions can result
in a breach of laws and regulations or company ethics. Any resulting
criminal prosecution or fine can of course have a negative effect on
the company’s image, business and share value. This risk is higher in
emerging markets, as the knowledge of local laws and regulations, or
the monitoring of ethical standards, may still be less developed than in
more mature markets.
Compliance rules affect each employee in his or her daily work. All
associates exert effort to comply with legal, corporate and local Barco
policies and procedures and to strive together towards a truly compliant
organization based on Barco’s Code of Ethics and Business Conduct.
The Legal, Risk and Compliance department assists in ensuring compli-
ance by collecting and sharing the knowledge of functional, regional
and divisional compliance owners supported by local Legal & Compli-
ance Managers. The compliance management system and the Barco
compliance overview guide the organization through the complex web
of rules and regulations.
Force majeure risks
Events of an exceptional nature (such as a fire) may affect the company
itself, or events on a larger scale (such as flooding, earthquake or extreme
weather conditions) may affect component suppliers. These kinds of
events, which can also include terrorist attacks or disease epidemics
(Human related force majeure risks), can destabilize part or all of the
world’s economy.
Especially in the case of an R&D and/or a manufacturing site (Site related
force majeure risks), those events may seriously affect the company’s
competitive position, as they may disrupt deliveries to customers or post-
pone new product releases. Barco has set up an international insurance
program with reputable underwriters to cover both its assets and loss of
income in case of business interruption due to such exceptional events.
The coverage as well as the insured amounts are reviewed regularly
and benchmarked with the assistance of professional insurance brokers.
Nevertheless, it is impossible to calculate beforehand what the negative
impact of such events might actually be.
131Barco | annual report 2013 | Directors’ report
CONTROL ACTIVITIES
Control measures are in place to minimize the effect of risk on Barco’s abil-
ity to achieve its objectives. These control activities are embedded in the
company’s key processes and systems to assure that the risk responses
and the company’s overall objectives are carried out as designed. Control
activities are conducted throughout the organization, at all levels and
all departments.
The Risk and Compliance Manager supports the adoption of clear pro-
cesses and procedures for a wide range of business operations related to
compliance and export control. The Risk and Compliance Manager reports
on his activities to the core leadership team and to the audit committee.
In addition to these control activities, an insurance program is being
implemented for selected risk categories that cannot be absorbed without
material effect on the company’s balance sheet.
INFORMATION AND COMMUNICATION
Timely, complete and accurate information flow – both top-down as well
as bottom-up – is a cornerstone of effective risk management.
In operational domains, Barco has implemented a management con-
trol and reporting system (MCRS) to support efficient management and
reporting of business transactions and risks. This system enables Barco’s
management to capture relevant information on particular areas of busi-
ness operations at regular time intervals. The process enforces clear
assignment of roles and responsibilities, thus ensuring consistent com-
munication to all stakeholders regarding external and internal changes
or risks impacting their areas of responsibility.
In addition to the MCRS, the company has put several measures in place
to assure security of confidential information and to provide a commu-
nication channel for employees to report any (suspected) violations of
laws, regulations, company policies or ethical values.
MONITORING OF CONTROL MECHANISMS
Monitoring helps to ensure that internal control continues to operate
effectively.
The continuity and the quality of Barco’s risk management and control
framework is assessed by the following actors:
» Internal Audit. The tasks and responsibilities assigned to Internal
Audit are recorded in the Internal Audit Charter, which has been
approved by the audit committee and the Board of Directors. The key
mission of Internal Audit as defined in the Internal Audit Charter is “to
add value to the organization by applying a systematic, disciplined
approach to evaluating the internal control system and providing
recommendations to improve it.”
» External auditor, in the context of its review of the annual accounts.
» Compliance Officer, within the framework of the company’s
Corporate Governance Charter.
» Risk and Compliance Manager, who plays a pivotal role in the
organization by ensuring appropriate coordination and follow-up of
risk items.
» Audit committee: the Board of Directors and the audit committee
have ultimate responsibility with respect to internal control and
risk management. (See also the ‘Board committees’ section in this
annual report.)
132 Barco | annual report 2013 | Directors’ report

STATUTORY AUDITOR
At the annual shareholders meeting of 26 April 2012, Ernst & Young
Bedrijfsrevisoren BCVBA, De Kleetlaan 2, 1831 Brussels, was re-appointed
as statutory auditor of the company for a period of 3 years. Given the
retirement of Mr. Jan De Luyck in 2013, Ernst & Young Bedrijfsrevisoren
BCVBA is now represented by Mrs. Lieve Cornelis and Mr. Marnix Van
Dooren.
In 2013, remuneration paid to the statutory auditor for auditing activities
amounted to 475,355 euro. Remuneration paid to the statutory auditor
for special assignments was 10,917 euro.
RISK MANAGEMENT AND INTERNAL CONTROL WITH REGARDTO THE PROCESS OF FINANCIAL REPORTING
The accurate and consistent application of accounting rules throughout
the company is assured by means of Finance and Accounting Manuals,
which are available for the key accounting sections.
Specifically within the financial domain, a quarterly, bottom-up risk analy-
sis is conducted to identify and document the current risk factors. Action
plans are defined for all key risks. The results of this analysis are discussed
with the statutory auditor.
The accounting teams are responsible for producing the accounting figures
(closing bookings, reconciliations, etc.), whereas the controlling teams
check the validity of these figures. These audits include coherence tests
by comparison with historical and budget figures, as well as sample
checks of transactions according to their materiality.
All material areas of the financial statements concerning critical account-
ing judgments and uncertainties are periodically reported to the audit
committee.
Specific internal control activities with respect to financial reporting are
in place, including the use of a periodic closing and reporting checklist.
This checklist assures clear communication of timelines, completeness
of tasks, and clear assignment of responsibilities. Specific identification
procedures for financial risks are in place to assure the completeness of
financial accruals.
Uniform reporting of financial information throughout the organization
ensures a consistent flow of information, which allows the detection of
potential anomalies.
An external financial calendar is planned in consultation with the Board
and the core leadership team, and this calendar is announced to the
external stakeholders. The objective of this external financial reporting
is to provide Barco’s stakeholders with the information necessary for
making sound business decisions.
133Barco | annual report 2013 | Directors’ report

COMMENTS ON THE RESULTS
Barco advanced its strategy to move beyond Digital Cinema. While
maintaining its market leadership in Digital Cinema, Barco positioned
the company to penetrate the corporate AV segment. The addition of
projectiondesign® contributed to profitable growth of 9% for the Projec-
tion division.
Barco also saw increasing momentum in order intake from new mar-
ket segments, notably Digital Surgery, Patient Care and ClickShare. This
illustrates the traction the company is gaining in executing its strategy
to capture share in new and mid segment markets.
However, Advanced Visualization experienced competitive pressures in
the mid segment in addition to ongoing soft demand for control room
solutions. After introducing new mid segment solutions, orders began
to rebound during the fourth quarter.
A continued focus on operational performance and excellence enabled
Barco to maintain profitability and generate strong cash flow while absorb-
ing two strategic acquisitions. EBITDA performance for the year was in
line with 2012 reflecting the combination of a strengthening gross margin
and improved cost discipline across the board that compensated for the
acquisition-related increase in operating expenses.
Unfavorable foreign currency effects prevented Barco from achieving its
goal of delivering another year of profitable growth. In constant currency,
sales grew 3% or 31 million euro and our EBITDA was approaching 160
million euro.
In terms of profitability, the strategic acquisitions weighed on 2013 EBIT
and net earnings. Separately, the improvements Barco made in opera-
tional profitability in Healthcare and Defense & Aerospace resulted in a
13.7% EBITDA margin for the second half of the year. In the short term
the company will continue to implement a number of cost down programs
and adjust selected operating expenses.
As Barco reaps the benefits of operational excellence and gains further
traction with is growth initiatives, the company remains committed to
delivering sustainable profitable growth.
DIVIDEND AND SHARE BUYBACK PROGRAM
The Board will propose to the general assembly to increase the dividend
from 1.40 euro per share paid in 2013 to 1.50 euro per share to be paid
out in 2014. It remains Barco’s objective to generate consistent dividend
growth for the shareholders.
The Board will also propose the authorization to initiate a share buyback
program within the statutory limits.
134 Barco | annual report 2013 | Directors’ report
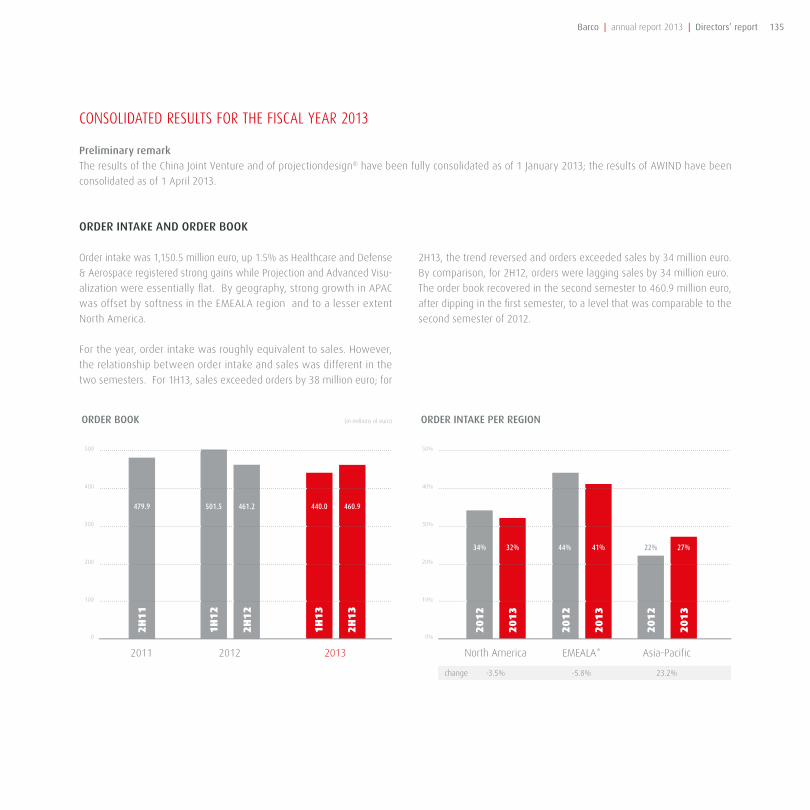
CONSOLIDATED RESULTS FOR THE FISCAL YEAR 2013
Preliminary remark
The results of the China Joint Venture and of projectiondesign® have been fully consolidated as of 1 January 2013; the results of AWIND have been
consolidated as of 1 April 2013.
ORDER INTAKE AND ORDER BOOK
Order intake was 1,150.5 million euro, up 1.5% as Healthcare and Defense
& Aerospace registered strong gains while Projection and Advanced Visu-
alization were essentially flat. By geography, strong growth in APAC
was offset by softness in the EMEALA region and to a lesser extent
North America.
For the year, order intake was roughly equivalent to sales. However,
the relationship between order intake and sales was different in the
two semesters. For 1H13, sales exceeded orders by 38 million euro; for
2H13, the trend reversed and orders exceeded sales by 34 million euro.
By comparison, for 2H12, orders were lagging sales by 34 million euro.
The order book recovered in the second semester to 460.9 million euro,
after dipping in the first semester, to a level that was comparable to the
second semester of 2012.
(in millions of euro)ORDER BOOK
0
2011 2012 2013 Asia-PacificEMEALA*North America
500
100
200
300
400
1H
12
501.5
2H
12
461.2
1H
13
440.0
2H
13
460.9
2H
11
479.9
ORDER INTAKE PER REGION
0%
50%
10%
20%
30%
40%
44%
20
12
41%
20
13
22%
20
12
27%
20
13
32%
20
13
2H
11
34%
20
12
23.2%-5.8%-3.5%change
135Barco | annual report 2013 | Directors’ report

SALES
Sales of 1,158.0 million euro reflect growth in Projection and the Ventures
offset by declines in the other divisions. Sales grew strongly in the APAC
region, offsetting a decline in North America, with the EMEALA-region
being flat.
27%
31%
42%42%
24%
0%
2H
11
34%
50%
10%
20%
30%
40%
Asia-PacificEMEALA*North America
12.1%-0.3%-7.6%change
20
13
20
12
20
13
20
12
20
13
20
12
SALES PER REGION
EMEALA region includes Europe, Middle East, Africa and Latin America
136 Barco | annual report 2013 | Directors’ report

IN MILLIONS OF EURO 2013 2012
Sales 1,158.00 100.00% 1,156.00 100.00%
Cost of goods sold -771.5 -66.60% -780.4 -67.50%
Gross profit 386.5 33.40% 375.6 32.50%
Research & development -95.5 -8.20% -84.1 -7.30%
Sales & marketing -160.7 -13.90% -142.2 -12.30%
General & administration -55.7 -4.80% -52.2 -4.50%
Other operating result 4.4 0.40% 3.0 0.30%
EBIT before restructuring and goodwill impairment 79.0 6.80% 100.2 8.70%
Restructuring and goodwill impairment costs -9.4 -0.80% -2.7 -0.20%
EBIT after restructuring and goodwill impairment 69.6 6.00% 97.6 8.40%
Interest expense, net -2.2 -0.20% 1.1 0.10%
Income taxes -8.1 -0.70% -5.0 -0.40%
Share in the result of JV's 0.1 0.00% 0.5 0.00%
Net income 59.4 5.10% 94.2 8.20%
EBITDA 153.2 13.20% 159.5 13.80%
INCOME STATEMENT
137Barco | annual report 2013 | Directors’ report

IN THOUSANDS OF EURO 2013
sales EBITDA % EBITDA
Projection 522.5 83.4 16.0%
Healthcare 195.7 26.3 13.4%
Advanced Visualization 192.5 13.3 6.9%
Defense & Aerospace 149.7 20.2 13.5%
Ventures 101.0 9.9 9.8%
Intra-group eliminations -3.5
Group 1,158.0 153.2 13.2%
PROFITABILITY
Gross profit
Gross profit increased 2.9% to 386.5 million euro from 375.6 million euro.
As a result the gross profit margin improved further to 33.4%, compared
to 32.5% in 2012.
Operational expenses
Total indirect expenses represent 27% of sales and increased 10.2% from
24% of sales in 2012 and 2011. This increase is largely due to the addition
of projectiondesign® and AWIND with a higher indirect cost structure and
strengthened by associated amortization of intangibles.
Research & Development expenses increased 10.2 million euro to
107.5 million euro, reflecting new product development projects in the
Advanced Visualization division, the addition of projectiondesign® and
amortization of technology acquired from projectiondesign® and AWIND.
As a percent of sales, research and development expenses increased to
9.3% from 8.4% last year. Sales & Marketing expenses increased 18.5
million euro to 160.7 million euro compared to 142.2 million euro last year,
in large part due to the above-mentioned acquisitions. As a percent of
sales, Sales & Marketing expenses rose to 13.9%, compared to 12.3% last
year. General & administration expenses were 55.7 million euro, compared
to 52.2 million euro last year or 4.8% of sales versus 4.5% last year.
Other operating results amounted to 4.4 million euro, compared to 3.0
million euro last year.
138 Barco | annual report 2013 | Directors’ report

EBITDA & EBIT
EBITDA was 153.2 million euro, a decrease of 6.2 million euro compared
to 159.5 million euro the year before. EBITDA margin was 13.2% versus
13.8% in 2012. EBITDA margin improved in 2H13 to a 13.7% level, com-
pared to a 12.8% for 1H13. Barco’s operational profit margin remained
healthy considering the company made important investments to its
growth, including acquisitions, and incurred costs related to those acqui-
sitions.
EBIT before restructuring was 79.0 million euro or 6.8%, compared to
100.2 million euro or 8.7% in 2012.
The decline in EBIT in comparison to EBITDA is due to increased amortiza-
tions as follows:
» Higher amortization of capitalized development costs in the amount
of 7 million euro
» Higher amortization of intangibles booked in connection with the recent
acquisitions in accordance with IFRS-guidelines (Knowhow/Technology,
Customer lists and Trade names) in the amount of 5.8 million euro
As a result the gap between EBITDA margin and EBIT margin versus sales
widened from 5.1ppts of sales in 2012 to 6.4ppts in 2013.
The company will continue to record amortization on knowhow/technol-
ogy and customer list in 2014; Trade names (1.2 million euro) and costs
related to the inventory step-up & retention bonus (3.8 million euro) were
fully amortized & absorbed in 2013.
INCOME TAXES
In 2013 taxes were 8.1 million euro, for a tax rate of 12.0%, compared to
5.0 million euro in 2012, or a tax rate of 5.0%.
NET INCOME
Net income for the year was 59.4 million euro, including 9.4 million euro
in charges, consisting of a non-recurring restructuring charge and an
impairment charge, that were booked in connection with actions taken
to right size selected operations primarily in the Defense & Aerospace
and Advanced Visualization divisions. These non-recurring charges in
combination with an increased tax-rate resulted in a decrease in net
income attributable to equity holders compared to last year.
Net earnings per ordinary share (EPS) for the year were 4.86 euro, down
from 7.84 euro in 2012. Fully diluted net earnings per share were 4.71
euro, compared to 7.50 euro last year.
139Barco | annual report 2013 | Directors’ report

IN THOUSANDS OF EURO 2013 2012 2011
EBIT after restructuring and goodwill impairment 69,596 97,567 68,359
Impairment of capitalized development costs and goodwill 858 3,644 11,328
Restructuring provision (personnel) -2,890 - -3,351
Unrealized foreign currency translation gain on Kladno liquidation - -3,735 -
Amortization capitalized development cost 49,145 42,138 36,448
Depreciation of tangible and intangible fixed assets 24,207 16,126 14,088
Gain/(Loss) on tangible fixed assets 10 -24 -85
Share in the profit/(loss) of joint ventures and associates 61 547 -
Gross operating free cash flow 140,986 156,263 126,787
Changes in trade receivables 25,775 8,267 12,462
Changes in inventory 29,282 10,460 -2,483
Changes in trade payables -29,889 10,567 -14,693
Other changes in net working capital 9,746 19,015 35,923
Change in net working capital 34,915 48,310 31,208
Net operating free cash flow 175,901 204,574 157,995
Interest received 1,394 2,826 912
Interest paid -3,556 -1,738 -3,442
Income taxes -18,886 -4,200 -10,718
Cash flow from operating activities 154,853 201,462 144,748
Expenditure on product development -62,072 -56,296 -46,454
Purchases of tangible & intangible fixed assets -22,869 -24,853 -20,302
Proceeds on disposals of tangible & intangible fixed assets 260 1,264 3,245
Cash flow from investing activities (excluding acquisitions) -84,681 -79,885 -63,511
Free cash flow 70,172 121,577 81,237
FREE CASH FLOW
Free cash flow for the year was 70.2 million euro compared to 121.6 million euro for 2012 and consisted of negative cash flow of 11.6 million euro
for the first semester, offset by positive cash flow of 81.8 million euro for the second semester.
Barco generated 140.9 million euro in gross operating cash flow and
decreased working capital by 34.9 million euro, primarily payables and
inventories, achieving a net working capital balance of 4.7% on sales,
versus 8.2% year-end 2012.*
*Barco did not acquire any of its own shares in 2013. The company now owns 715,206 of its own shares or 5.51% before dilution.
140 Barco | annual report 2013 | Directors’ report

BALANCE SHEET
IN THOUSANDS OF EURO NOTE 31/12/2013 31/12/2012 31/12/2011
ASSETS
Goodwill 9 145,705 68,809 43,921
Capitalized development cost 10 93,248 81,978 69,020
Other intangible assets 11 55,169 25,093 14,565
Land and buildings 11 27,017 28,744 30,569
Other tangible assets 11 40,120 30,661 27,479
Investments 8 11,824 44,445 9,300
Deferred tax assets 12 62,333 61,948 56,763
Other non-current assets 14 14,286 18,041 19,134
Non-current assets 449,702 359,719 270,751
Inventory 13 211,575 223,677 233,928
Trade debtors 14 177,467 183,082 187,114
Other amounts receivable 14 44,102 29,053 35,197
Cash and cash equivalents 15 156,545 122,139 79,165
Prepaid expenses and accrued income 8,431 4,209 8,412
Current assets 598,120 562,160 543,816
Total assets 1,047,822 921,879 814,567
EQUITY AND LIABILITIES
Equity 579,366 538,050 460,703
Long-term debts 15 40,410 12,695 19,014
Deferred tax liabilities 12 11,721 3,089 5,005
Other long-term liabilities 16 15,322 10,161 8,117
Non-current liabilities 67,453 25,945 32,136
Current portion of long-term debts 15 3,582 4,105 1,691
Short-term debts 15 11,657 1,302 6,593
Trade payables 18 114,133 127,528 110,791
Advances received from customers 18 93,562 73,587 55,748
Tax payables 30,124 25,012 21,556
Employee benefit liabilities 57,248 57,958 51,741
Other current liabilities 12,115 8,241 8,045
Accrued charges and deferred income 31,778 20,763 23,488
Provisions 19 46,804 39,388 42,075
Current liabilities 401,003 357,884 321,728
Total equity and liabilities 1,047,822 921,879 814,567
141Barco | annual report 2013 | Directors’ report

IN THOUSANDS OF EURO 2013 2012 2011
Trade debtors 177,467 183,082 187,114
Inventory 211,575 223,677 233,928
Trade payables -114,133 -127,528 -110,791
Other working capital -220,126 -183,806 -148,028
Total working capital 54,782 95,425 162,222
Long term assets & liabilities 266,166 225,335 193,391
Operating capital employed 320,948 320,760 355,613
Goodwill 145,705 68,809 43,921
Operating capital employed (incl goodwill) 466,653 389,569 399,534
EBIT before restructuring & impairment 79,024 100,238 78,359
ROCE after tax (%) (a) 15.00% 24.00% 20.00%
RETURN ON CAPITAL EMPLOYED
(a) Tax rate used is the effective tax rate, i.e. 12% in 2013, 5% in 2012,
0% in 2011 (in 2011, effective tax rate was positive, therefore kept at 0%).
ROCE (after Tax) stood at 15%, compared to 16% at 30 June 2013 and 24%
at 31 December 2012. The decrease reflects the impact of acquisitions
on goodwill and intangibles and the higher effective tax rate of 12.0%
compared to 5.0% last year.
Barco ended 2013 with a net financial cash position of 104.4 million euro,
compared to 24.2 million euro on 30 June 2013 and 111.2 million euro
on 31 December 2012.
Over 2013, changes in trade receivables were 25.8 million euro positive,
while changes in inventory were 29.3 million euro offset by negative
changes in trade payables for an amount of 29.9 million euro. Other
changes in working capital for 9.7 million euro include advances on
customer projects and increase in other liabilities.
At the end of 2013, trade receivables were 177.5 million euro, 5.6 million
lower than than 31 December 2012. DSO were at 52 days, compared to
57 days as of 30 June 2013 and 48 days as of 31 December 2012.
At 211.6 million euro inventory was 12.1 million euro lower than on 31
December 2012 and 39.8 million euro lower than on June 2013. Inventory
turns were at 3.2, compared to 3.0, at the end of June 2013 and 3.1 at
the end of December 2012.
Trade payables stood at 114.1 million euro at the end of December 2013,
compared to 118.4 million euro at the end of June 2013 and compared
to 127.5 million euro at the end of December 2012.
Goodwill increased to 145.7 million euro on 31 December 2013 from 68.8
million on 31 December 2012. The increase in goodwill was driven by
the acquisitions of projectiondesign® and AWIND.
Other intangible assets increased from 25.0 million euro on 31 December
2012 to 55.2 million euro while non-current liabilities increased from 25.9
million euro on 31 December 2012 to 67.5 million euro. Other intangible
assets increased due to fair value adjustments (according to IFRS) on
the acquisitions and due to the investments in the new ERP package
SAP (other intangible assets under construction). Non-current liabilities
increased from 25.9 million euro on 31 December 2012 to 67.5 million
euro mainly due to a financial leasing related to the acquisition of
projectiondesign® and a draw down on Barco’s credit facility from the
European Investment Bank.
Capital expenditure, excluding capitalized development, was 22.9 million
euro, compared to 24.9 million euro for the same period last year.
142 Barco | annual report 2013 | Directors’ report

DIVISIONAL RESULTS FOR FISCAL YEAR 2013
IN THOUSANDS OF EURO 2013 FULL YEAR 2012 FULL YEAR
Sales
Projection 522,492 479,711
Healthcare 195,708 206,455
Advanced Visualization 192,540 227,682
Defense & Aerospace 149,716 130,682
Ventures 101,033 112,173
Intra-group eliminations -3,473 -719
Group 1,158,015 1,155,984
EBITDA before restructuring
Projection 83,450 87,278
Healthcare 26,348 23,809
Advanced Visualization 13,338 26,392
Defense & Aerospace 20,193 12,757
Ventures 9,905 9,240
Group 153,234 159,476
REMARK ON BARCO’S ORGANIZATIONAL STRUCTURE 2014
Effective 1 January 2014, Barco took steps to sharpen the organization’s
focus on markets by promoting the product and solution portfolios of all
businesses and cross selling throughout the company.
To emphasize the market focus, the Projection and the Advanced Visual-
ization divisions have been renamed and the venture High End Systems
has been integrated into the core. For details about the new organizational
structure please go to the description of our business areas on page 26
For the analysis of the 2013 results the composition and the naming of
the divisions remain unchanged.
143Barco | annual report 2013 | Directors’ report

PROJECTION DIVISION
Sales and order intake in the projection division continued to shift in
favor of Professional AV as a result of the addition of projectiondesign®
during fiscal 2013. For the year, Professional AV accounted for 30% of
sales versus 25% last year and 35% of order intake versus 25% last year.
Within Digital Cinema, Barco reached a capture rate of 50% and further
expanded its market share with program wins and roll-outs in Latin
America, China and India. With more than 40,000 digital cinema projec-
tors delivered over the last 6 years, Barco is market leader and is well
positioned to reap the benefits of a large installed base with service and
maintenance-contracts and future upgrade and replacement programs.
In the Professional AV segment, Barco successfully implemented its
plans to integrate projectiondesign® and the company is on track to
align projectiondesign®’s profitability with Barco’s financial targets for the
Projection division by optimizing manufacturing and supply chain opera-
tions, and sales and marketing resources. Barco continued to penetrate
the mid venue and corporate projection segments, extending its global
network and launching 11 new projectors during the second semester,
and is now well positioned to drive growth in this market.
83.4
494.4 522.5479.7
87.3
0
2H
11
490.4
500
100
200
300
400
Orders Sales EBITDA
-4.4%8.9%0.8%change
PROJECTION DIVISION
20
13
20
12
20
13
20
12
(in millions of euro)
16.0%18.2%
EBITDA margin
» Order volume was in line with last year
reflecting growth in the Professional AV
market offset by a reduction of about 10%
for Digital Cinema. Order intake was essen-
tially flat in the EMEALA region, decreased
in North America and increased in APAC.
» Digital Cinema’s top line was flat in a soft-
ening market compared to 2012 while
Professional AV posted strong sales increases
mainly in the Corporate AV segment, due to
the addition of projectiondesign®. Sales in
the EMEALA and APAC region were up offset
by slower sales in North America.
» EBITDA margin, while still solid at 16%,
was lower than 2012 reflecting the addi-
tion of projectiondesign®. In 2H13 the good
progress projectiondesign® made to lift its
profitability was partially offset by increased
spending on R&D and Sales & marketing to
support the Corporate AV market.
144 Barco | annual report 2013 | Directors’ report
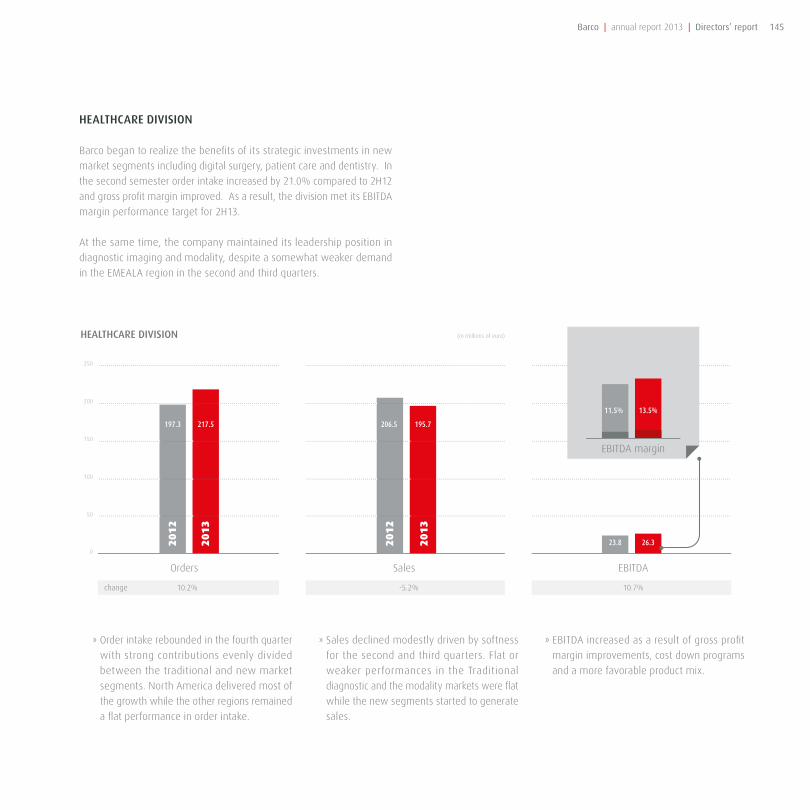
HEALTHCARE DIVISION
Barco began to realize the benefits of its strategic investments in new
market segments including digital surgery, patient care and dentistry. In
the second semester order intake increased by 21.0% compared to 2H12
and gross profit margin improved. As a result, the division met its EBITDA
margin performance target for 2H13.
At the same time, the company maintained its leadership position in
diagnostic imaging and modality, despite a somewhat weaker demand
in the EMEALA region in the second and third quarters.
26.3
217.5
23.80
2H
11
197.3
250
50
100
150
200
195.7206.5
Orders Sales EBITDA
10.7%-5.2%10.2%change
HEALTHCARE DIVISION
20
13
20
12
20
13
20
12
(in millions of euro)
13.5%11.5%
EBITDA margin
» Order intake rebounded in the fourth quarter
with strong contributions evenly divided
between the traditional and new market
segments. North America delivered most of
the growth while the other regions remained
a flat performance in order intake.
» Sales declined modestly driven by softness
for the second and third quarters. Flat or
weaker performances in the Traditional
diagnostic and the modality markets were flat
while the new segments started to generate
sales.
» EBITDA increased as a result of gross profit
margin improvements, cost down programs
and a more favorable product mix.
145Barco | annual report 2013 | Directors’ report

ADVANCED VISUALIZATION DIVISION
The Advanced Visualization division posted lower sales for the year.
Development of solutions for the mid segment took longer than antici-
pated, control room projects were delayed and demand from customers
in Europe was soft. With the introduction of solutions for the mid seg-
ment in the second semester, order intake improved towards the end
of the year. As a result of lower sales and higher R&D expenses, EBITDA
declined year over year.
Cost down programs on the videowall cubes & LCD-solutions and oper-
ating cost reduction programs are both ongoing. These programs are
expected to position the division for restored profit contribution in 2014.
Sales of ClickShare steadily increased each quarter. Since launching
ClickShare in the fourth quarter of 2012, Barco has been certified to sell
ClickShare in more than 60 countries worldwide and has sold over 12,500
units while adding new partners and channels.
13.3
203.0
23.9
0
2H
11
250
50
100
150
200
192.5205.2207.2
Orders Sales EBITDA
-44.4%-6.2%-2.0%change
ADVANCED VISUALIZATION DIVISION
20
13
20
12
20
13
20
12
(in millions of euro)
6.9%11.6%
EBITDA margin
» Global order intake was slightly down com-
pared to 2012, reflecting softness in Control
Rooms, particularly in parts of the European
and North American region, partially offset
by growth in collaboration solutions in the
second quarter.
» Sales were down compared to 2012 driven
by delays in control room projects in Europe
and the Middle East partially offset by a
growing contribution of the collaboration
segment.
» Gross profit margin remained fairly stable
while the combination of lower sales and
increased spending on networked and col-
laboration solutions and higher sales and
marketing expenses caused EBITDA to
decline both in absolute terms and as a
percent of sales.
146 Barco | annual report 2013 | Directors’ report

DEFENSE & AEROSPACE DIVISION
Growth in avionics during 2013 was overshadowed by the ongoing reduc-
tion in defense spending worldwide which led to project delays and
cancellations. However, demand among defense customers improved
during the second semester with new and delayed business starting to
kick-in. As a result, Barco signed new frame agreements, saw order intake
increase and ended the year with a book-to-bill ratio of 1.05.
20.2
157.1
17.6
0
2H
11
250
50
100
150
200
149.7167.3135.1
Orders Sales EBITDA
15.0%-10.5%16.3%change
DEFENSE & AEROSPACE DIVISION
20
13
20
12
20
13
20
12
(in millions of euro)
13.5%10.5%
EBITDA margin
» Strong global order intake in the second
semester with wins in both defense and
aerospace in all three regions.
» Sales were down, reflecting growth in the
APAC region offset by decreases in the EMEA
and North America region.
» Profitability improved through better focus
on higher margin products and on key
accounts, strict operating expense control
and cost reduction actions taken in the sec-
ond quarter. As a result, the division made
good progress in the second half toward the
division’s EBITDA margin goal of 15%.
147Barco | annual report 2013 | Directors’ report

VENTURESSales remained flat year-on-year while the profitability increased thanks
to sustained profitability in LiveDots and turnaround for High End Systems.
9.9
81.0
7.0
0
2H
11
50
100
150
200
101.098.3106.9
Orders Sales EBITDA
42.0%2.8%-24.2%change
20
13
20
12
20
13
20
12
(in millions of euro)
9.8%7.1%
EBITDA margin
OUTLOOK FOR 2014
The following statements are forward looking and actual results may
differ materially.
For 2014, Barco anticipates that the macro-economic environment will
remain challenging and that currency translations may have a significant
effect on reported results.
Nevertheless, the company expects to generate sales growth albeit in
low single digits.
The combination of strategic growth initiatives, cost reductions and spend-
ing control is expected to result in improved profitability.
While executing on the strategic priorities, management also plans to
strengthen its global competitive positioning through continued focus on
operational excellence, and to make decisions regarding Barco’s portfo-
lio of venture companies and to execute on its plan to deploy financial
resources to support growth initiatives in Barco’s core activities.
The Board will propose to the general assembly to extend the mandate
of Eric Van Zele in order to ensure continuity of the company’s strategic
direction and to build on the strong track record of Barco’s current execu-
tive team in realizing the company’s strategic objectives.
148 Barco | annual report 2013 | Directors’ report

KEY FIGURES FOR THE SHAREHOLDER
IN EURO 2013 2012 2011
Number of shares (in thousands): 12,989 12,757 12,755
Per share (in euro)
EPS 4.86 7.84 6.32
Diluted EPS 4.71 7.50 6.21
Gross dividend 1.50 1.40 1.10
Net dividend 1.125 1.05 0.825
Gross dividend yield (a) 2.6% 2.6% 2.8%
Yearly return (b) 6.6% 44.2% -17.4%
Pay-out ratio (c) 34.1% 19.0% 18.5%
Price/earnings ratio (d) 11.7 7.0 6.1
(a) Gross dividend/ closing rate on 31 December 2013
(b) Increase or decrease share price + gross dividend, divided by closing share price of previous year
(c) Gross dividend x number of shares on 31 December / net result
(d) share price 31 December / net result per share
IN EURO 2013 2012 2011
Share price
Average closing price 59.96 48.64 46.41
Highest closing price 69.95 58.75 59.50
Lowest closing price 52.58 36.52 31.20
Closing price on 31 December 56.70 54.50 38.76
Average number of shares traded daily 34,105 (e) 29,298 (e) 29,722 (e)
Stock market capitalization on 31 December (in millions) 736.5 695.3 492.7
(e) The average number of shares traded daily for 2013 is taking into account the trades on NYSE Euronext as well as registered trades on alterna-
tive platforms BATS, Chi-X, Turquoise and Equiduct. On average for 2013, 87% of these trades were registered on NYSE Euronext and 13% on the
alternative platforms combined.
149Barco | annual report 2013 | Directors’ report

DIVIDEND
The Board of Directors decided to recommend to the general assembly
to pay a dividend of 1.5 euro (gross) per share over 2013. This is 1.125
euro net, on withholding tax of 25%.
At 1.50 euro, the pay-out ratio is 32.8%.
INFORMATION ABOUT THE SHARE
Euronext Brussels
Barco share BAR ISIN BE0003790079
Barco VVPR-strip BARS ISIN BE0005583548
Reuters BARBt.BR
Bloomberg BAR BB
Market capitalization (31 December 2013) 718.4 million euro
Highest capitalization (14 March 2013) 886.3 million euro
Lowest capitalization (28 August 2013) 671.0 million euro
Share price 31 December 2012 54.50 euro
Share price 31 December 2013 56.7 euro
Velocity (2013) 59.80%
Comment (1): Based on the Fidessa stock report: http://fragmentation.fidessa.com/ The numbers referenced here take into account the
trades in the Lit-category: Euronext and the alternative platforms BATS Chi-X, Turquiose and Equiduct. We have excluded the Dark pools,
the SI and the off-book transactions.
According to this data, the portion traded on alternative platforms has evolved from 5% in 2011, 12% in 2012 and 13% in 2013.
LIQUIDITY SOURCE 2013 2012 2011
Total yearly volume (shares)Fidessa (1) 8,674,804 7,500,210 7,638,624
Euronext 7,576,594 6,620,286 7,222,595
Average number of shares tradedFidessa 34,105 29,298 29,722
Euronext 29,787 25,860 28,010
Total yearly volume (turnover)Fidessa 517.99 million euro 365.07 million euro 347.27 million euro
Euronext 453.95 million euro 384.71 million euro 330.57 million euro
150 Barco | annual report 2013 | Directors’ report

ANALYSTS COVERING BARCO FINANCIAL CALENDAR 2013
ABN AMRO Bank Marc Hesselink
Bank Degroof Bart Jooris
Exane BNP Paribas David Vagman
Flemish Federation of Investors and Investor Clubs
Gert De Mesure
Goldman Sachs International Benjamin Moore
Carl Hazeley
ING Emmanuel Carlier
KBC Securities Guy Sips
Kempen & Co. Erwin Dut
Leleux Associated Brokers Geert Van Herck
Petercam Stefaan Genoe
Kepler Cheuvreux Peter Olofsen
Announcement of results 2H13 and FY13 Friday 7 February 2014
Trading update 1Q14 Thursday 24 April 2014
Extraordinary General Shareholders meeting Thursday 24 April 2014
Annual General Shareholders meeting Thursday 24 April 2014
Announcement of results 1H14 Wednesday 23 July 2014
Trading update 3Q14 Wednesday 22 October 2014
55,000
50,000
45,000
40,000
35,000
30,000
25,000
20,000
15,000
10,000
5,000
0
Janu
ary
Febr
uary
Mar
ch
April
May
June July
Augu
st
Sept
embe
r
Octo
ber
Nove
mbe
r
Dece
mbe
r
Janu
ary
Febr
uary
Mar
ch
April
May
June July
Augu
st
Sept
embe
r
Octo
ber
Nove
mbe
r
Dece
mbe
r
Janu
ary
Febr
uary
Mar
ch
April
May
June July
Augu
st
Sept
embe
r
Octo
ber
Nove
mbe
r
Dece
mbe
r
DAILY AVERAGE SHARES TRADED
2013 2012 2011
151Barco | annual report 2013 | Directors’ report

EVOLUTION OF THE SHARE PRICE
The Barco share price closed at €56.70 on 31 December 2013 – 2.2%
higher than the closing price of €54.50 the year before.
On the back of a strong track record and good performances, closing and
average prices have returned to pre-financial-crisis levels: the average
closing price is at its highest level since 2007, and the closing price on
31 December is the best since 2006.
This evolution pushed the market capitalization of the company to around
€700 million. Overall, analyst expectations varied during the year between
€60 and €70, to close the year with a consensus target price of €62.
Over the last few years, Barco’s share volatility has been typically higher
than that of the indexes, reflected in higher price variations versus the
market. In 2013, however – and despite some very specific spike effects
– volatility decreased compared to previous years, with the lowest abso-
lute and relative variance gap (between lowest & highest share price)
in 8 years.
Liquidity of the share has again improved for the second year in a row –
with approximately 10% more volume traded on Euronext, and a similar
increase on the alternative platforms.
The full year performance of the share for 2013 was rather soft. Major
indices – such as the CAC40 (+18%) and the BEL20 (+18%) – booked
impressive gains, while Barco’s share won 2.2% over the full year. How-
ever, the behavior of the stock price in 2013 was rather atypical and
contrary to the major indices, with a much stronger performance in the
first half of the year, a downward correction in the summer, and a com-
parable performance over the last 4 months of the year.
In the first three months of the year, the share price rose strongly (+25%),
reaching a peak of €69.60 on 15 March, followed by a fairly stable period
for the full first semester. Concerns about the impact of the anticipated
slowdown of the digital cinema market as of Q3 started to have an effect
from July onward, resulting in a steep decline on 1 and 2 July, which
pushed the share price back to the level of the beginning of the year.
After a short upward correction following the quite good results of the
first half, the share price slipped down again in August (to a level around
€53 - €55), and then started a new, more moderate, rise toward €61
following the analyst and investor day. The Q3 results – announcing a
slightly weaker sales performance against a challenging comparison
base – triggered a hefty day (“sell on the news”), which resulted in an
exceptional trading volume (more than 200,000 shares traded) and a
-9% hit. Subsequently, the share price hovered between €53 and €55
in the fourth quarter, and then finally closed the year on a positive note
at €56.70.
Since July 2013, some first shorters were registered on the Barco share.
A first US fund went short on the share in August and moved out again
in October, after which a London-based fund developed a short position
of 1.5% by the end of October – a position that they still had by the end
of the year.
The increased liquidity of the share reflects continued interest in the
market.
Barco started the year with a buy recommendation across the board, sup-
ported by listings in a number of preference lists. By the end of the first
half, and after the peak performance at about €69, the share was removed
from most preference lists and was downgraded by a number of brokers.
Despite a very decent performance in the first half of 2013, the invest-
ment community remained somewhat concerned about Barco’s resilience
against a slowdown in the cinema market and the impact that would
have on the earnings. The general trend is acknowledgement of Barco’s
strategy as being the right way forward, with concern regarding the tim-
ing of the outcomes of the growth initiatives.
Between the end of 2008 (with a closing price of €17.90) and the end of
2013 (with a closing price of €56.70), the Barco share realized a 215%
increase in value – a perfect illustration of the positive impact of the
turn-around strategy kicked off in 2009 and the company’s positive per-
formance track record.
Barco thanks its shareholders for their continued confidence in the com-
pany, its board of directors, its management and its employees, as the
company progresses on its path of sustainable growth.
152 Barco | annual report 2013 | Directors’ report

INVESTOR RELATIONS
A study of Barco’s global shareholdership at 31 December 2013* identified
ownership of almost 90% of the company, with identified institutional
investors holding 64% of all shares, 5.5% being treasury shares held by
the company and 24% held by retail investors.
2013 IN RETROSPECT
2013 was a tale of two halves for Barco – with weaker Q3 sales arrest-
ing the strong performance of the projection division in the first half.
In the first six months of the year, substantial upside was registered on
Barco’s share, with entries of both growth and value investors. From July
onwards, analyst perception started to turn, and the flat guidance given
in the release of 3Q earnings caused a sell-off with shares slumping by
8.8% in the last 6 months.
In the first six months of the year, Barco seems to have mirrored the
market trend, with an early market rally offset by pullback driven by
profit taking, softer macro data, and the potential for US fiscal stimulus
withdrawals. In the first quarter, the share rose by 25% – outperforming
the market – and then softened in 2Q to land at around €60 for the first
semester, which was still a good 12% rise. There was good turnover
in this period, with 6 new firms entering the Top 10 buyers. In this first
semester, Barco’s share was attractive for growth-oriented firms and with
an attractive valuation to appeal to value investors as well. Good inflows
were noted from the United Kingdom and the United States.
Following this strong first-half performance, Barco’s investment case took
a hit in the second half of the year – triggered by analysts downgrading
their recommendation and strengthening the profit-taking trend. Weaker
Q3 sales and flat EBITDA guidance prompted a sell-off across institutional
investors and an 8.8% drag on share price performance over the full
semester. Substantial outflows occurred in Germany and the United States
in the second half, offset by inflows from Belgium (through GIMV), the
Nordic region (with Norges bank), London, Switzerland and New York.
60
80
100
120
140
02-1
1-20
13
02-0
1-20
13
02-0
2-20
13
02-0
3-20
13
02-0
4-20
13
02-0
5-20
13
02-0
6-20
13
02-0
7-20
13
02-0
8-20
13
02-0
9-20
13
02-1
0-20
13
02-1
2-20
13
31-1
2-20
13
Barco Share price 2013
Barco
02-1
1-20
13
02-0
1-20
13
02-0
2-20
13
02-0
3-20
13
02-0
4-20
13
02-0
5-20
13
02-0
6-20
13
02-0
7-20
13
02-0
8-20
13
02-0
9-20
13
02-1
0-20
13
02-1
2-20
13
31-1
2-20
13
Barco / Bel 20 / Next 150
Barco Bel 20 Next 150
Barco / Eurostoxx 50 / Eurostoxx Technology / Nasdaq - 100
Barco Eurostoxx 50 Eurostoxx technology Nasdaq - 100
02-1
1-20
13
02-0
1-20
13
02-0
2-20
13
02-0
3-20
13
02-0
4-20
13
02-0
5-20
13
02-0
6-20
13
02-0
7-20
13
02-0
8-20
13
02-0
9-20
13
02-1
0-20
13
02-1
2-20
13
31-1
2-20
13
40
50
60
70
80
60
80
100
120
140
153Barco | annual report 2013 | Directors’ report

GEOGRAPHICAL DISTRIBUTION
At the end of the year, 34% of the institutional shares were owned in
North America (United States & Canada), down from around 40% a year
before. 33% were owned in Belgium (up from 30% in 2012), 13% were
owned in the UK (down from 8% the year before), and 6% in France (flat
year-on-year). The remaining shares are owned in the rest of Europe:
Germany, Switzerland, the Nordic regions, and the Netherlands.
Over the year, positions rose in the UK, Belgium and the rest of Europe.
Shareholdership was stable for the United States but fell for Canada,
France and Germany.
BARCO’S INVESTMENT CASE
Although the second-half evolution impacted the presence of growth
investors, Barco’s investment case became more appealing to value-
oriented investors. The stock remains a good value play, residing in the
top 20% of underpriced securities globally. Margin growth resulting
from reducing cost and restructuring measures and a contingency of the
downside risk could fuel upside.
In addition, Barco’s dividend yield can also prove to be fair compensation
for shares, which may underperform in the near term.
Value investors have taken 35% of the shareholder base (coming from
33% last year), while the combination of growth- and GARP-investors
has declined from 22% at end 2012 to 19% at the end of 2013. GARP
investors hold 16% of the institutionally owned shares (up from 15% at
end 2012).
CONCENTRATION
We welcomed 4 newcomers to the Top 10 holders over the year.
Share price concentration went down in the first six months of the year,
and then rebounded to the level of end 2012. The Top 10, Top 25 and
Top 50 represent 38%, 51% and 59% of the free float, respectively.
Compared to the Mid Cap client benchmark, Barco is below average in
terms of shareholder concentration, which should result in less share price
volatility if a top investor decides to divest. A majority of Barco’s institu-
tional shares are held by investors classified as ‘low turnover’ (expected
holding periods exceeding 24 months), which should also prove to be
a stabilizing factor.
There is selected exposure to hedge funds: One US fund in Q3 was
replaced by a London-based hedge fund in Q4 and is still holding the
position.
STRATEGY 2013 - 2014
Despite a challenging macro-economic environment, and the above-
mentioned shift from growth to a more value-oriented investment case,
Barco continued its investor relations efforts in roadshows, conference
calls and company visits with regular visits to the tier 1 cities such as
London, New York, Brussels, Paris and Frankfurt, while exploring and
maintaining other geographies as well.
We organized another successful and well-attended Analyst & Investor Day
in September 2013, kicked-off the consensus-gathering with institutional
research analysts, and released the first shareholder guide.
For 2014, we intend to advance this strategy to reach out to the worldwide
IR community through roadshows, conference calls and company visits
and to extend and strengthen the portfolio of IR-related material. This
includes upgrading the investor relations website and the release of new
or updated IR-related deliverables such as a fact sheet, consensus and
research reports, and the shareholder guide.
154 Barco | annual report 2013 | Directors’ report

TOTAL SHAREHOLDER COMPOSITION
Institutional60%
Retail22%
Company Related6%
Miscellaneous12%
INSTITUTIONAL SHARES BY INVESTMENT STYLE
Value35%
Growth19%
GARP16%
Index4%
Other26%
Hedge Fund <1%
INSTITUTIONAL SHARES BY GEOGRAPHY
Belgium33%
UnitedStates24%
UnitedKingdom13%
Canada10%
Rest of Europe11%
Rest of the World <1%
France6%
Germany3%
155Barco | annual report 2013 | Directors’ report

Barcoconsolidated
156 Barco | annual report 2013 | Directors’ report

Barcoconsolidated
157Barco | annual report 2013 | Barco consolidated

IFRS FINANCIAL STATEMENTS
INTRODUCTION
This chapter of the Annual Report contains the IFRS audited consolidated financial statements including the notes thereon prepared in accordance with
the International Financial Reporting Standards as adopted by the European Union.
The chapter ‘Comments on the results’ provides an analysis of the developments during the financial year 2013 and the results and is based on the
IFRS consolidated financial statements and should be read in conjunction with these statements.
158 Barco | annual report 2013 | Barco consolidated

INCOME STATEMENT
IN THOUSANDS OF EURO NOTE 2013 2012 2011
Net sales 3 1,158,015 1,155,984 1,041,244
Cost of goods sold 3 -771,519 -780,351 -728,313
Gross profit 3 386,496 375,633 312,932
Research and development expenses 3 -95,476 -84,124 -74,650
Sales and marketing expenses 3 -160,670 -142,157 -122,493
General and administration expenses 3 -55,689 -52,155 -50,221
Other operating income (expense) - net 3 4,362 3,040 12,792
EBIT before restructuring and goodwill impairment 3 79,024 100,238 78,359
Restructuring and goodwill impairment costs 5 -9,428 -2,671 -10,000
EBIT after restructuring and goodwill impairment 69,596 97,567 68,359
Interest income 1,394 2,826 912
Interest expense -3,556 -1,738 -3,442
Income before taxes 67,434 98,656 65,829
Income taxes 6 -8,092 -4,962 10,407
Result after taxes 59,342 93,694 76,236
Share in the result of joint ventures and associates 8 61 547 -386
Net income 59,403 94,241 75,850
Net income attributable to non-controlling interest 2,284 - -
Net income attributable to the equity holder of the parent 57,119 94,241 75,850
Earnings per share (in euro) 7 4,86 7,84 6,32
Diluted earnings per share (in euro) 7 4,71 7,50 6,21
159Barco | annual report 2013 | Barco consolidated

STATEMENT OF COMPREHENSIVE INCOME
IN THOUSANDS OF EURO 2013 2012 2011
Net income 59,403 94,241 75,850
Other comprehensive income to be reclassified to profit or loss in subsequent periods:
Exchange differences on translation of foreign operations (a) -14,411 -6,683 -1,787
Net gain/(loss) on cash flow hedges 596 361 -550
Income tax -72 -18 -
Net gain/(loss) on cash flow hedges, net of tax 524 343 -550
Other comprehensive income (loss) for the period, net of tax -13,887 -6,340 -2,337
Other comprehensive income (loss) for the period, net of tax, attributable to equity holders of the parent -13,810 -6,340 -2,337
Other comprehensive income (loss) for the period, net of tax, non-controlling interest -77 - -
Total comprehensive income for the period, net of tax, attributable to equity holder of the parent 45,594 87,901 73,513
Total comprehensive income for the period, net of tax, non-controlling interest -77 - -
The accompanying notes are an integral part of this income statement.
(a) Translation exposure gives rise to non-cash exchange gains/losses. Examples are foreign equity and other long-term investments abroad.
These long-term investments give rise to periodic translation gains/losses that are non-cash in nature until the investment is realized or
liquidated. The comprehensive income line commonly shows a positive result in case the foreign currency in countries where investments were
made appreciates versus the euro, and a negative result in case the foreign currency depreciates.
In 2013, the negative exchange differences in the comprehensive income line were mainly booked on foreign operations held in Indian Rupee,
US Dollar and Norwegian Krone.
160 Barco | annual report 2013 | Barco consolidated

BALANCE SHEET
IN THOUSANDS OF EURO NOTE 31/12/2013 31/12/2012 31/12/2011
ASSETS
Goodwill 9 145,705 68,809 43,921
Capitalized development cost 10 93,248 81,978 69,020
Other intangible assets 11 55,169 25,093 14,565
Land and buildings 11 27,017 28,744 30,569
Other tangible assets 11 40,120 30,661 27,479
Investments 8 11,824 44,445 9,300
Deferred tax assets 12 62,333 61,948 56,763
Other non-current assets 14 14,286 18,041 19,134
Non-current assets 449,702 359,719 270,751
Inventory 13 211,575 223,677 233,928
Trade debtors 14 177,467 183,082 187,114
Other amounts receivable 14 44,102 29,053 35,197
Cash and cash equivalents 15 156,545 122,139 79,165
Prepaid expenses and accrued income 8,431 4,209 8,412
Current assets 598,120 562,160 543,816
Total assets 1,047,822 921,879 814,567
EQUITY AND LIABILITIES
Equity attributable to equityholders of the parent 17 574,943 538,050 460,703
Non-controlling interests 1.2. 4,423 - -
Equity 579,366 538,050 460,703
Long-term debts 15 40,410 12,695 19,014
Deferred tax liabilities 12 11,721 3,089 5,005
Other long-term liabilities 16 15,322 10,161 8,117
Non-current liabilities 67,453 25,945 32,136
Current portion of long-term debts 15 3,582 4,105 1,691
Short-term debts 15 11,657 1,302 6,593
Trade payables 18 114,133 127,528 110,791
Advances received from customers 18 93,562 73,587 55,748
Tax payables 30,124 25,012 21,556
Employee benefit liabilities 57,248 57,958 51,741
Other current liabilities 12,115 8,241 8,045
Accrued charges and deferred income 31,778 20,763 23,488
Provisions 19 46,804 39,388 42,075
Current liabilities 401,003 357,884 321,728
Total equity and liabilities 1,047,822 921,879 814,567
The accompanying notes are an integral part of this balance sheet.
161Barco | annual report 2013 | Barco consolidated

CASH FLOW STATEMENT
IN THOUSANDS OF EURO NOTE 2013 2012 2011
Cash flow from operating activities
EBIT after restructuring and goodwill impairment 69,596 97,567 68,359
Impairment of capitalized development costs and goodwill 9 858 3,644 11,328
Restructuring provision (personnel) -2,890 - -3,351
Unrealized foreign currency translation gain on Kladno liquidation - -3,735 -
Amortization capitalized development cost 3 49,145 42,138 36,448
Depreciation of tangible and intangible fixed assets 10 24,207 16,126 14,088
Gain/(Loss) on tangible fixed assets 10 -24 -85
Share options recognized as cost 17 1,337 782 676
Share in the profit/(loss) of joint ventures and associates 8 61 547 -386
Gross operating cash flow 142,323 157,046 127,076
Changes in trade receivables 25,775 8,267 12,462
Changes in inventory 29,282 10,460 -2,483
Changes in trade payables -29,889 10,567 -14,693
Other changes in net working capital 9,746 19,015 35,923
Change in net working capital 34,915 48,310 31,208
Net operating cash flow 177,238 205,356 158,284
Interest received 1,394 2,826 912
Interest paid -3,556 -1,738 -3,442
Income taxes -18,886 -4,200 -10,718
Cash flow from operating activities 156,190 202,245 145,037
Cash flow from investing activities
Expenditure on product development 3 -62,072 -56,296 -46,454
Purchases of tangible and intangible fixed assets 10 -22,869 -24,853 -20,302
Proceeds on disposals of tangible and intangible fixed assets 260 1,264 3,245
Acquisition of Group companies, net of acquired cash 1.2, 24 -51,686 -27,994 -9,316
Disposal of Group companies, net of disposed cash 1.2, 24 - - -1,460
Other investing activities 8 -3,060 -33,358 -8,000
Interest in joint-ventures 8 - -1,253 -974
Cash flow from investing activities
(including acquisitions and divestments) -139,428 -142,491 -83,261
162 Barco | annual report 2013 | Barco consolidated

IN THOUSANDS OF EURO NOTE 2013 2012 2011
Cash flow from financing activities
Dividends paid -16,856 -13,153 -12,670
Share issue 7,713 1,144 3,593
Acquisition of own shares 1,390 - -
Proceeds from (+) payments (-) of long-term liabilities 17,860 -3,603 -1,255
Proceeds from (+) payments (-) of short-term liabilities 12,646 -666 -18,399
Cash flow from financing activities 22,753 -16,278 -28,730
Net increase/(decrease) in cash and cash equivalents 39,515 43,476 33,046
Cash and cash equivalents at beginning of period 122,139 79,164 46,042
Cash and cash equivalents (CTA) (a) -5,109 -502
Change in consolidation method 77
Cash and cash equivalents at end of period 156,545 122,139 79,164
The accompanying notes are an integral part of this income statement.
(a) From 2012 onwards, Barco is working with a new consolidation package, which makes it possible to exclude the FX impact out of the cash flow
movements. The net FX impact on the cash flow movement is therefore shown on a separate line ‘CTA on cash and cash equivalents’ from 2012
onwards.
163Barco | annual report 2013 | Barco consolidated

CHANGES IN EQUITY
IN THOUSANDS OF EURO
Sharecapital andpremium
Retained earnings
Share-based
payments
Cumulativetranslation adjustment
Cash flowhedgereserve
Own shares
Equityattributable to equityholders of the parent
Non-Controlling
InterestEquity
Balance on 1 January 2011 185,319 282,166 3,478 -28,757 -975 -45,641 395,590 1 395,591
Net income - 75,850 - - - - 75,850 - 75,850
Dividend - -12,670 - - - - -12,670 - -12,670
Capital increase 3,593 - - - - - 3,593 - 3,593
Other comprehensive income -loss
for the period, net of tax - - - -1,787 -549 - -2,336 -1 -2,337
Share-based payment - - 676 - - - 676 - 676
Balance on 31 December 2011 188,912 345,347 4,154 -30,544 -1,524 -45,641 460,703 - 460,703
Balance on 1 January 2012 188,912 345,347 4,154 -30,544 -1,524 -45,641 460,703 - 460,703
Net income - 94,241 - - - - 94,241 - 94,241
Dividend - -12,480 - - - - -12,480 - -12,480
Capital increase 1,144 - - - - - 1,144 - 1,144
Other comprehensive income (loss)
for the period, net of tax - - - -6,683 343 - -6,340 - -6,340
Share-based payment - - 782 - - - 782 - 782
Balance on 31 December 2012 190,056 427,107 4,936 -37,227 -1,181 -45,641 538,050 - 538,050
Balance on 1 January 2013 190,056 427,107 4,936 -37,227 -1,181 -45,641 538,050 - 538,050
Net income attributable to equity-
holders of the parent - 57,119 - - - - 57,119 2,284 59,403
Dividend - -16,856 - - - - -16,856 - -16,856
Capital increase 7,713 - - - - - 7,713 - 7,713
Other comprehensive income (loss)
for the period, net of tax - - - -14,334 524 - -13,810 -77 -13,887
Exercise of options - - - - - 1,390 1,390 1,390
Share-based payment - - 1,337 - - - 1,337 - 1,337
Change in consolidation method 2,216 2,216
Balance on 31 December 2013 197,769 467,370 6,273 -51,561 -657 -44,250 574,943 4,423 579,367
The accompanying notes are an integral part of this income statement.
164 Barco | annual report 2013 | Barco consolidated
SIGNIFICANT IFRS ACCOUNTING PRINCIPLES
1. ACCOUNTING PRINCIPLES
1.1. STATEMENT OF COMPLIANCE AND BASIS OF PRESENTATION
The consolidated financial statements of the Barco group have been prepa-
red in accordance with International Financial Reporting Standards (IFRS),
as adopted for use in the EU. All standards and interpretations issued by
the International Accounting Standards Board (IASB) and the International
Financial Reporting Interpretations Committee (IFRIC) effective year-end
2013 and adopted by the European Union are applied by Barco.
The consolidated financial statements are presented in thousands of euro
and are prepared under the historical cost convention, except for the
measurement at fair value of investments and derivative financial instru-
ments. The financial statements were authorized for issue by the Board
of Directors on 4 February 2014. The chairman has the power to amend
the financial statements until the shareholders’ meeting of 24 April 2014.
1.2. PRINCIPLES OF CONSOLIDATION
General
The consolidated financial statements comprise the financial statements
of the parent company, Barco nv, and its controlled subsidiaries, after the
elimination of all intercompany transactions.
Subsidiaries
Subsidiaries are consolidated from the date the parent obtains control
until the date control ceases. Acquisitions of subsidiaries are accounted
for using the purchase method of accounting. Control exists when Barco
has the power to govern the financial and operating policies of an entity
so as to obtain benefits from its activities. The financial statements of
subsidiaries are prepared according to the parent’s company reporting
schedule, using consistent accounting policies.
Non-controlling Interests
Non-controlling Interests represent the portion of profit or loss and net
assets not held by the group and are presented separately in the income
statement and within equity in the consolidated balance sheet, separately
from shareholder’s equity.
Investments in associated companies
Investments in associated companies over which the company has signi-
ficant influence (typically those that are 20-50% owned) are accounted
for under the equity method of accounting and are carried in the balance
sheet at the lower of the equity method amount and the recoverable
amount, and the pro rata share of income (loss) of associated companies
is included in income.
Joint ventures
The company’s interest in jointly controlled entities is recognized using
the equity method, which involves recognizing a proportionate share of
the joint ventures on the face of its income statement. The investment is
presented as non-current asset on the face of the balance sheet.
2. GOODWILL
Goodwill represents the excess of the cost of the acquisition over the fair
value of identifiable net assets and contingent liabilities of a subsidiary
or associated company at the date of acquisition.
Goodwill is carried at cost less any accumulated impairment losses.
3. RESEARCH AND DEVELOPMENT COSTSResearch and development costs are expensed as incurred, except for
development costs, which relate to the design and testing of new or
improved materials, products or technologies, which are capitalized to the
extent that it is expected that such assets will generate future economic
benefits and the recognition criteria of IFRS are met. Capitalized deve-
lopment costs are amortized on a systematic basis over their expected
useful lives. General estimate of useful life is 2 years, unless a longer
or shorter period can be justified. This period is not exceeding 4 years.
4. OTHER INTANGIBLE ASSETSIntangible assets acquired separately are capitalized at cost.
Intangible assets acquired as part of a business combination are capi-
talized at fair value separately from goodwill if the fair value can be
measured reliably on initial recognition and are amortized over their
economic life time. Other intangible assets are amortized on a straight-
line basis not exceeding 7 years.
165Barco | annual report 2013 | Barco consolidated

5. PROPERTY, PLANT AND EQUIPMENTProperty, plant and equipment are stated at cost less accumulated depre-
ciation and accumulated impairment losses. Generally, depreciation is
computed on a straight-line basis over the estimated useful life of the
asset. The carrying amounts are reviewed at each balance sheet date to
assess whether they are recorded in excess of their recoverable amounts,
and where carrying values exceed this estimated recoverable amount,
assets are written down to their recoverable amount.
Estimated useful life is:
- buildings 20 years
- installations 10 years
- production machinery 5 years
- measurement equipment 4 years
- tools and models 3 years
- furniture 10 years
- office equipment 5 years
- computer equipment 3 years
- vehicles 5 years
- demo material 1 to 3 years
- leasehold improvements and finance leases: cfr underlying asset,
limited to outstanding period of lease contract
An item of property, plant and equipment is derecognized upon disposal or
when no future economic benefits are expected from its use or disposal.
Any gain or loss arising on de-recognition of the asset is included in profit
or loss in the year the asset is derecognized.
6. LEASESFinance leases, which effectively transfer to the group substantially
all risks and benefits incidental to ownership of the leased item, are
capitalized as property, plant and equipment at the fair value of the
leased property, or, if lower, at the present value of the minimum lease
payments. The corresponding liabilities are recorded as long-term or
current liabilities depending on the period in which they are due. Lease
interest is charged to the income statement as a financial cost using the
effective interest method. Capitalized leased assets are depreciated over
the shorter of the estimated useful life of the asset and the lease term,
if there is no reasonable certainty that the Group will obtain ownership
by the end of the lease term.
Operating leases, where the lessor effectively retains substantially all
the risks and benefits of ownership over the lease term, are classified as
operating leases. Operating lease payments are expressed in the income
statement on a straight line basis over the lease term.
7. INVESTMENTS Investments are treated as financial assets available for sale and are
initially recognized at cost, being the fair value of the consideration
given and including acquisition costs associated with the investment.
For investments quoted in an active market, the quoted market price is
the best measure of fair value. For investments not quoted in an active
market, the carrying amount is the historical cost, if a reliable estimate
of the fair value cannot be made. An impairment loss is recorded when
the carrying amount exceeds the estimated recoverable amount.
8. OTHER NON-CURRENT ASSETSOther non-current assets include long-term interest-bearing receivables
and cash guarantees. Such long-term receivables are accounted for as
loans and receivables originated by the company and are carried at
amortized cost. An impairment loss is recorded when the carrying amount
exceeds the estimated recoverable amount.
9. INVENTORIESInventories are stated at the lower of cost or net realizable value. Cost is
determined on a first in first out (FIFO) basis. Net realizable value is the
estimated selling price in the ordinary course of business less the estima-
ted costs of completion and the estimated costs of completing the sale.
In addition to the cost of materials and direct labor, the relevant proportion
of production overhead is included in the inventory values.
10. REVENUE RECOGNITIONRevenue is recognized when it is probable that the economic benefits will
flow to the group and the revenue can be reliably measured.
For product sales, revenue is recognized when the significant risks and
rewards of ownership of the goods have passed to the buyer. Sales are
recognized when persuasive evidence of an arrangement exists, deli-
very has occurred, the fee is fixed and determinable, and collectability
is probable.
For revenue out of projects, the percentage of completion method is used,
provided that the outcome of the project can be assessed with reasonable
certainty. These projects generally have a lifetime of less than one year.
For sales of services, revenue is recognized by reference to the stage
of completion.
166 Barco | annual report 2013 | Barco consolidated

11. GOVERNMENT GRANTSGovernment grants related to development projects, for which costs are
capitalized, are classified as deferred income and recognized as income
in proportion to the depreciation of the underlying fixed assets. Govern-
ment grants related to research projects and other forms of government
assistance are recognized as income upon irreversible achievement and
by reference to the relevant expenses incurred.
12. TRADE DEBTORS AND OTHER AMOUNTS RECEIVABLETrade debtors and other amounts receivable are shown on the balance
sheet at nominal value (in general, the original amount invoiced) less an
allowance for doubtful debts. Such an allowance is recorded in operating
income when it is probable that the company will not be able to collect
all amounts due. Allowances are calculated on an individual basis, and
on a portfolio basis for groups of receivables that are not individually
identified as impaired. The calculation of the allowances is based on an
aging analysis of the trade debtors.
13. CASH AND CASH EQUIVALENTSCash and cash equivalents consist of cash on hand and balances with
banks and short-term investments with an original maturity date or notice
period of three months or less. It is the group’s policy to hold investments
to maturity. All investments are initially recognized at fair value, which is
the cost at recognition date. Gains and losses are recognized in income
when the investments are redeemed or impaired, as well as through
the amortization process.
14. PROVISIONS Provisions are recorded when the group has a present legal or constructive
obligation as a result of a past event, it is probable that an outflow of resour-
ces embodying economic benefits will be required to settle the obligation
and a reliable estimate can be made to the amount of the obligation.
The group recognizes the estimated liability to repair or replace products
still under warranty at the balance sheet date. The provision is calculated
based on historical experience of the level of repairs and replacements.
A provision for restructuring is only recognized when the group has
approved a detailed and formal restructuring plan, and the restructu-
ring has either commenced or has been announced publicly before the
balance sheet date.
15. EQUITY – COSTS OF AN EQUITY TRANSACTION The transaction costs of an equity transaction are accounted for as a
deduction from equity, net of any related income tax benefit.
16. INTEREST-BEARING LOANS AND BORROWINGSAll loans and borrowings are initially recognized at cost, being the fair
value of the consideration received net of issue costs associated with
the loan/borrowing. Subsequent to initial recognition, interest-bearing
loans and borrowings are stated at amortized cost using the effective
interest rate method. Amortized cost is calculated by taking into account
any issue costs and any discount or premium on settlement.
17. TRADE AND OTHER PAYABLESTrade and other payables are stated at fair value, which is the cost at
recognition date.
18. EMPLOYEE BENEFITSEmployee benefits are recognized as an expense when the group consu-
mes the economic benefit arising from service provided by an employee
in exchange for employee benefits, and as a liability when an employee
has provided service in exchange for employee benefits to be paid in the
future. General pension plans are defined contribution plans. Obligations
for these plans are recognized as an expense in the income statement
as incurred. Pension obligations caused by legal requirements and some
exceptional cases where the additional pension plan includes defined
benefit obligations, are treated as post employment benefits of a defined
benefit type.
19. TRANSACTIONS IN FOREIGN CURRENCIESTransactions in foreign currencies are recorded at the rates of exchange
prevailing at the date of transaction or at the end of the month before the
date of the transaction. At the end of the accounting period the unsettled
balances on foreign currency receivables and liabilities are valued at the
rates of exchange prevailing at the end of the accounting period. Foreign
exchange gains and losses are recognized in the income statement in
the period in which they arise.
20. FOREIGN GROUP COMPANIESIn the consolidated accounts all items in the profit and loss accounts of
foreign subsidiaries are translated into euro at the average exchange rates
for the accounting period. The balance sheets of foreign group companies
are translated into euro at the rates of exchange ruling at the year-end.
The resulting exchange differences are classified in a separate compo-
nent of ‘other comprehensive income’, until disposal of the investment.
167Barco | annual report 2013 | Barco consolidated

21. DERIVATIVE FINANCIAL INSTRUMENTSDerivative financial instruments are recognized initially at cost, which
is the fair value of the consideration given (in the case of an asset) or
received (in the case of a liability) for it. Transaction costs are considered
in the initial measurement of all financial assets and liabilities. Subsequent
to initial recognition, derivative financial instruments are stated at fair
value. The fair values of derivative interest contracts are estimated by
discounting expected future cash flows using current market interest
rates and yield curve over the remaining term of the instrument. The
fair value of forward exchange contracts is their market price at the
balance sheet date.
Derivative financial instruments that are either hedging instruments that
are not designated or do not qualify as hedges are carried at fair value
with changes in value included in the income statement.
Where a derivative financial instrument is designated as a hedge of
the variability in cash flows of a recognized asset or liability, or a highly
probable forecasted transaction, the effective part of any gain or loss
on the derivative financial instrument is recognized directly in ‘other
comprehensive income’ with the ineffective part recognized directly in
profit and loss.
22. INCOME TAXESCurrent taxes are based on the results of the group companies and are
calculated according to local tax rules.
Deferred tax assets and liabilities are determined, using the liability
method, for all temporary differences arising between the tax basis
of assets and liabilities and their carrying values for financial reporting
purposes. Tax rates used are expected to apply to the period when the
asset is realized or the liability is settled, based on tax rates and tax laws
that have been enacted or substantially enacted at the balance sheet date.
Deferred tax assets are recognized for all deductible temporary diffe-
rences, carry-forward of unused tax credits and unused tax losses, to
the extent that it is probable that taxable profit will be available against
which the deductible temporary differences, carry-forward of unused tax
credits and tax losses can be utilized. The carrying amount of deferred
income tax assets is reviewed at each balance sheet date and reduced
to the extent that it is no longer probable that sufficient taxable profit
will be available to allow all or part of the deferred income tax asset to
be utilized.
Deferred income tax assets and deferred income tax liabilities are offset,
if a legally enforceable right exists to set off current tax assets against
current income tax liabilities and the deferred income taxes relate to the
same taxable entity and the same taxation authority.
23. IMPAIRMENT OF ASSETSGoodwill is reviewed for impairment at least annually. For other tangi-
ble and intangible assets, at each balance sheet date, an assessment is
made as to whether any indication exists that assets may be impaired.
If any such indication exists, an impairment test is carried out in order
to determine if and to what extent a valuation allowance is necessary
to reduce the asset to its value in use (the present value of estimated
future cash flows) or, if higher, to its fair value less cost to sell. The fair
value less costs to sell is the amount obtainable from the sale of an asset
in an arm’s length transaction less the costs to sell while value in use is
the present value of the future cash flows expected to be derived from
an asset. Recoverable amounts are estimated for individual assets or,
if this is not possible, for the cash-generating unit to which the assets
belong. An impairment loss is recognized whenever the carrying amount
of an asset or its cash-generating unit exceeds its recoverable amount.
Impairment losses are recognized in the income statement. Reversal of
impairment losses recognized in prior years is included as income when
there is an indication that the impairment losses recognized for the asset
are no longer needed or the need has decreased, except for impairment
losses on goodwill, which are never reversed.
24. SHARE-BASED PAYMENTBarco created warrants for staff and non-executive directors as well as
for individuals who play an important role for the company. According to
the publication of IFRS2, the cost of share-based payment transactions is
reflected in the income statement.
The warrants are valued at grant date, based on the share price at grant
date, exercise price, expected volatility, dividend estimates, and interest
rates. Warrant cost is taken into result on a straight-line basis from the
grant date until the first exercise date.
25. EARNINGS PER SHAREThe group calculates both basic and diluted earnings per share in accor-
dance with IAS 33, Earnings per share. Under IAS 33, basic earnings
per share are computed using the weighted average number of shares
outstanding during the period. Diluted earnings per share are computed
using the weighted average number of shares outstanding during the
period plus the dilutive effect of warrants outstanding during the period.
168 Barco | annual report 2013 | Barco consolidated

As diluted earnings per share can not be higher than basic earnings per
share, diluted earnings per share are kept equal to basic earnings per
share in case of negative net earnings.
26. DISCONTINUED OPERATIONS AND NON-CURRENT ASSETS HELD FOR SALEA discontinued operation is a component of the group that either has
been disposed of, or is classified as held for sale and represents a separate
major line of business and is part of a single coordinated plan to dispose
of a separate major line of business or is a subsidiary acquired exclusively
with a view to resale.
The group classifies a non-current asset (or disposal group) as held for sale
if its carrying amount will be recovered principally through a sale transac-
tion rather than through continuing use. Immediately before classification
as held for sale, the group measures the carrying amount of the asset
(or all the assets and liabilities in the disposal group) in accordance with
applicable IFRSs. Then, on initial classification as held for sale, non-current
assets and disposal groups are recognized at the lower of their carrying
amounts and fair value less costs to sell. Impairment losses are recognized
for any initial or subsequent write-down of the asset (or disposal group)
to fair value less costs to sell.
169Barco | annual report 2013 | Barco consolidated

IFRS ACCOUNTING STANDARDS ADOPTED AS FROM 2013
Several amendments apply for the first time in 2013. However they do
not impact the annual consolidated financial statements of the Group.
The nature and the impact of each of the following new standards,
amendments and/or interpretations are described below:
» IAS 1 Presentation of Items of Other Comprehensive Income –
Amendments to IAS 1
» IAS 1 Presentation of Financial Statements
» IAS 12 Income Taxes – Recovery of Tax Assets
» IAS 19 Employee Benefits (amended)
» IFRS 7 Financial Instruments: Disclosures - Offsetting Financial Assets
and Financial Liabilities - Amendments to IFRS 7
» IFRS 13 Fair Value Measurement
» IFRIC 12 Stripping Costs in the Production Phase of a Surface Mine
» Annual Improvements to IFRS (Issued May 2012)
IAS 1 PRESENTATION OF ITEMS OF OTHER COMPREHENSIVE INCOME – AMENDMENTS TO IAS 1The amendments to IAS 1 introduce a grouping of items presented in other
comprehensive income (OCI). Items that could be reclassified (or recycled)
to profit or loss at a future point in time (e.g. net gain on hedge of net
investment, exchange differences on translation of foreign operations,
net movement on cash flow hedges and net loss or gain on available-
for-sale financial assets) now have to be presented separately from items
that will never be reclassified (e.g. actuarial gains and losses on defined
benefit plans and revaluation of land and buildings). The amendment
affected presentation only and had no impact on the Group’s financial
position or performance.
IAS 19 EMPLOYEE BENEFITS (REVISED 2011) (IAS 19R)IAS 19R includes a number of amendments to the accounting for defined
benefit plans, including actuarial gains and losses that are now recognized
in other comprehensive income (OCI) and permanently excluded from
profit and loss; expected returns on plan assets that are no longer recog-
nized in profit or loss, instead, there is a requirement to recognize interest
on the net defined benefit liability (asset) in profit or loss, calculated using
the discount rate used to measure the defined benefit obligation, and;
unvested past service costs are now recognized in profit or loss at the
earlier of when the amendment occurs or when the related restructuring
or termination costs are recognized. Other amendments include new
disclosures, such as, quantitative sensitivity disclosures.
In case of the Group, the transition to IAS 19R had no material impact on
the net defined benefit plan obligations.
IFRS 7 FINANCIAL INSTRUMENTS: DISCLOSURES - OFFSETTING FINANCIAL ASSETS AND FINANCIAL LIABILITIES - AMENDMENTS TO IFRS 7The amendment requires an entity to disclose information about rights
to set-off financial instruments and related arrangements (e.g., collateral
agreements). The disclosures would provide users with information that
is useful in evaluating the effect of netting arrangements on an entity’s
financial position. The new disclosures are required for all recognized
financial instruments that are set off in accordance with IAS 32. The dis-
closures also apply to recognized financial instruments that are subject
to an enforceable master netting arrangement or similar agreement,
irrespective of whether the financial instruments are set off in accordance
with IAS 32. As the Group is not setting off financial instruments in accor-
dance with IAS 32 and does not have relevant offsetting arrangements,
the amendment does not have an impact on the Group.
IFRS 13 FAIR VALUE MEASUREMENTIFRS 13 establishes a single source of guidance under IFRS for all fair value
measurements. IFRS 13 does not change when fair value is required to be
used, but rather provides guidance on how to measure fair value under
IFRS. IFRS 13 defined fair value as an exit price. Application of IFRS 13
has not materially impacted the fair value measurements of the Group.
Additional disclosures where required, are provided in the individual notes
relating to the assets and liabilities whose fair values were determined.
Fair value hierarchy is provided in Note 20.
IFRIC 20 STRIPPING COSTS IN THE PRODUCTION PHASE OF A SURFACE MINEIFRIC 20 applies to waste removal (stripping) costs incurred in surface
mining activity, during the production phase of the mine. The interpreta-
tion addresses the accounting for the benefit from the stripping activity.
This interpretation did not have an impact on the Group’s financial position
and performance.
The Group has not early adopted any other standard, interpretation or
amendment that has been issued but is not yet effective.
170 Barco | annual report 2013 | Barco consolidated

IMPROVEMENTS TO IFRSS (ISSUED MAY 2012) In May 2012, the IASB issued the 2009-2011 cycle improvements to its
standards and interpretations, primarily with a view to removing inconsis-
tencies and clarifying wording. When the adoption of an improvement is
deemed to have an impact on the financial statements or the performance
of the Group, its impact is described below:
» IAS 1 Presentation of Financial Statements: The amendments clarify
the difference between voluntary additional comparative information
and the minimum required comparative information. An entity must
include comparative information in the related notes to the financial
statements when it voluntary provides comparative information beyond
the minimum required comparative period. The amendments also
clarify that the opening statement of financial position (as at 1 January
2012 in the case of the Group), presented as a result of retrospective
restatement or reclassification of items in financial statements, does
not have to be accompanied by comparative information in the related
notes. As a result, the Group has not included comparative information
in respect of the opening statement of financial position as at 1 January
2012. The amendments affect presentation only and disclosure only,
and have no impact on the Group’s financial position of performance.
» IAS 16 Property, Plant and Equipment: The amendment clarifies that
major spare parts and servicing equipment that meet the definition
of property, plant and equipment are not inventory. The amendments
did not have impact on the Group’s financial position.
» IAS 32 Financial Instruments: Presentation: The amendment clari-
fies that income taxes arising from distributions to equity holders are
accounted for in accordance with IAS 12. The amendment removes
existing income tax requirements from IAS 32 and requires entities to
apply the requirements in IAS 12 to any income tax arising from dis-
tributions to equity holders. This improvement did not have an impact
on the Group’s financial position.
IFRS ACCOUNTING STANDARDS EFFECTIVE AS FROM 2014 ONWARDS
STANDARDS ISSUED BUT NOT YET EFFECTIVEStandards and interpretations issued but not yet effective up to the date
of issuance of the Group’s financial statements are listed below. The
listing of standards and interpretations issued are those that the Group
reasonably expects to have an impact on disclosures, financial position
or performance when applied at a future date. The Group intends to
adopt these standards and interpretations when they become effective.
» IFRS 9 Financial Instruments1, effective 1 January 2015
» IFRS 10 Consolidated Financial Statements, effective 1 January 2014
» IFRS 11 Joint Arrangements, effective 1 January 2014
» IFRS 12 Disclosure of Interests in Other Entities, effective 1 January 2014
» IFRS 10-12 - Transition Guidance, effective 1 January 2014
» IFRS 10, IFRS 12 and IAS 27 - Investment Entities1, effective 1 January
2014
» IAS 27 Separate Financial Statements, effective 1 January 2014
» IAS 28 Investments in Associates and Joint Ventures, effective 1
January 2014
» IAS 32 Financial Instruments - Presentation: Offsetting Financial Assets
and Financial Liabilities, effective 1 January 2014
» IAS 36 Impairment of Assets - Recoverable Amount Disclosures for Non-
financial Assets1, effective 1 January 2014
» IAS 39 Financial Instruments: Recognition and Measurement -
Novation of Derivatives and Continuation of Hedge Accounting1,
effective 1 January 2014
» IFRIC 21 Levies1, effective 1 January 2014
1 Not yet endorsed by the EU as per 31 December 2013
171Barco | annual report 2013 | Barco consolidated

CRITICAL ACCOUNTING JUDGMENTS AND KEY SOURCES OF ESTIMATION UNCERTAINTY
GENERAL BUSINESS RISKSWe refer to the chapter ‘Risk factors’ for an overview of the risks
affecting businesses of the Barco Group
KEY SOURCES OF ESTIMATION UNCERTAINTY » Deferred tax assets are recognized for the carry-forward of unused
tax losses and unused tax credits to the extent that it is probable
that future taxable profit will be available against which the unused
tax losses and unused tax credits can be utilized. In making its
judgment, management takes into account elements such as long-
term business strategy and tax planning opportunities (see note 12
‘Deferred tax assets – deferred tax liabilities’).
» Impairment of goodwill: the Group tests the goodwill for impairment
annually or more frequently if there are indications that goodwill might
be impaired (see note 9 .’Goodwill’).
» Development costs are capitalized in accordance with the accounting
policy. Initial capitalization of costs is based on management’s judg-
ment that technological and economical feasibility is confirmed, usually
when a product development project has reached a defined milestone
according to an established project management model. In determin-
ing the amounts to be capitalized management makes assumptions
regarding the expected future cash generation of the project, discount
rates to be applied and the expected period of benefits.
» Impairment of development costs: Barco tests the capitalized devel-
opment for impairment if there are indications that capitalized
development might be impaired (see note 10. ‘Capitalized develop-
ment costs’).
NOTES TO THE CONSOLIDATED FINANCIAL STATEMENTS
1. Consolidated companies
1.1 List of consolidated companies on 31 December 2013
1.2 List of associated companies on 31 December 2013
1.3 Acquisitions and divestments
2. Operating Segments information
2.1 Basis of operating segments information
2.2 Projection
2.3 Healthcare
2.4 Advanced Visualization
2.5 Defense and Aerospace
2.6 Ventures
2.7 Reconciliation of segment information with group information
2.8 Geographic information
3. Income from operations (EBIT)
4. Revenues and expenses by nature
5. Restructuring and impairment costs
6. Income taxes
7. Earnings per share
8. Investments
9. Goodwill
10. Capitalized development cost
11. Other intangible assets and tangible fixed assets
12. Deferred tax assets – deferred tax liabilities
13. Inventory
14. Amounts receivable and non-current assets
15. Net financial cash/debt
16. Other long-term liabilities
17. Equity attributable to equity holders of the parent
18. Trade payables and advances received from customers
19. Provisions
20. Risk management – derivative financial instruments
21. Operating leases
22. Rights and commitments not reflected in the balance sheet
23. Related party transactions
24. Cash flow statement: effect of acquisitions and disposals
25. Events subsequent to the balance sheet date
172 Barco | annual report 2013 | Barco consolidated

1. CONSOLIDATED COMPANIES
1.1. LIST OF CONSOLIDATED COMPANIES ON 31 DECEMBER 2013
Europe, Middle-East and Africa
Argentina Barco Argentina S.R.L. c/o Grant Thornton Argentina, Avenida Corrientes 327 piso 3, C1043AAD Buenos Aires 100%
Belgium Barco Coordination Center NV President Kennedypark 35, 8500 Kortrijk 100%
Belgium Barco Integrated Solutions NV President Kennedypark 35, 8500 Kortrijk 100%
Belgium Innovative Designs NV President Kennedypark 35, 8500 Kortrijk 100%
Belgium Barco Silex SA Scientific Parc, rue du Bosquet 7, 1348 Ottignies, Louvain-La-Neuve 100%
Belgium dZine NV t Hoge 49, 8500 Kortrijk 100%
Brazil Barco Ltda. Av. Ibirapuera, 2332, 8° andar, conj 82, Torre II, Moema, 04028-002 São Paulo 100%
Colombia Barco Colombia SAS Calle 90 N° 8-31, apt 60, 110221 Bogota 100%
Denmark Barco A/S c/o PwC, att. RAS Strandvejen 44, 2900 Hellerup 100%
France Barco SAS 177 Avenue Georges Clémenceau, Immeuble “Le Plein Ouest”, 92000 Nanterre 100%
France Barco Silex SAS ZI Rousset-Peynier, Immeuble CCE-CD6, Route de Trets, 13790 Peynier 100%
France Barco Texen 7 rue Roger Camboulives, Parc Technologique de Basso Cambo, 31000 Toulouse 100%
Germany Barco Control Rooms GmbH Greschbachstrasse 5 a, 76229 Karlsruhe 100%
Germany Barco Orthogon GmbH Hastedter Osterdeich 222, 28207 Bremen 100%
Germany Barco GmbH Greschbachstrasse 5 a, 76229 Karlsruhe 100%
Israel Barco Electronic Systems Ltd. 53 Etzel Street, 75706 Rishon Lezion 100%
Italy Barco S.r.l. Via Monferrato 7, 20094 Corsico-MI 100%
Italy FIMI S.r.l. c/o Studio Ciavarella, via Vittor Pisani n. 6, 20124 Milano 100%
Mexico Barco Visual Solutions S.A. de C.V. Mariano Escobedo No. 476 Piso 10 Col. Anzures, C.P. 11590 D.F. México 100%
Netherlands Barco B.V. Schootense Dreef 22, 5708HZ Helmond 100%
Norway Barco Norway AS c/o Grant Thornton, Bogstadveien 30, 0355 Oslo 100%
Norway Projection Holding AS Habornveien 53, 1630 Gamle Fredrikstad 100%
Norway Projectiondesign AS Habornveien 53, 1630 Gamle Fredrikstad 100%
Poland Barco Sp. z o.o. Marywilska 16, 03-228 Warsaw 100%
Russia Barco Services OOO ulitsa Kondratyuka, 3, 129515 Moscow 100%
Spain Barco Electronic Systems, S.A. Travesera de las Corts 371, 08029 Barcelona 100%
Sweden Barco Sverige AB Kyrkvägen 1, 192 72 Sollentuna 100%
United Kingdom Barco Ltd. Venture House, Downshire Way, Arlington Square, RG12 1WA Bracknell 100%
United Kingdom JAOtech Ltd. Unit 7 Perrywood Business Park, Honeycrock Lane, RH1 5DZ Redhill, Surrey 100%
173Barco | annual report 2013 | Barco consolidated

Americas
Canada Barco Visual Solutions, Inc. 2000 Mansfield Drive, Suite 1400, Montreal, H3A 3A2 Quebec 100%
United States Barco Federal Systems LLC 1209 Orange Street, 19801 Wilmington-DE 100%
United States Barco, Inc. 1209 Orange Street, 19801 Wilmington-DE 100%
United States Barco Lighting Systems, Inc. 350 N. St. Paul St., 75201 Dallas-TX 100%
Asia-Pacific
Australia Barco Systems Pty. Ltd. 2 Rocklea Drive, VIC 3207 Port Melbourne 100 %
China Barco Trading (Shanghai) Co., Ltd. Rm501, 180 Hua Shen Road, Wai Gao Qiao Free Trade Zone, 200031 Shanghai 100 %
China Barco Visual (Beijing) Electronics Co., Ltd. No. 16 Changsheng Road, Chang Ping Park, Zhong Guan Cun Science Park,
Chang Ping District, 102200 Beijing 100 %
China Barco Visual (Beijing) Trading Co., Ltd. No. 16 Changsheng Road, Chang Ping Park, Zhong Guan Cun Science Park,
Chang Ping District, 102200 Beijing 100 %
China CFG Barco (Beijing) Electronics Co., Ltd. No. 16 Changsheng Road, Chang Ping Park, Zhong Guan Cun Science Park,
Chang Ping District, 102200 Beijing
58 %
Hong Kong Barco Ltd. Suite 2808, 28/F., Central Plaza, 18 Harbour Road, Wanchai 100 %
Hong Kong Barco Visual Electronics Co., Ltd. Suite 2808, 28/F., Central Plaza, 18 Harbour Road, Wanchai 100 %
Hong Kong Barco China (Holding) Ltd. Suite 2808, 28/F., Central Plaza, 18 Harbour Road, Wanchai 100 %
India Barco Electronic Systems Pvt. Ltd. c/o Perfect Accounting & Shared Services P.Ltd., E-20, 1st & 2nd Floor,
Main Market, Hauz Khas, 110016 New Delhi 100 %
Japan Barco Co., Ltd. Yamato International Bldg 8F, 5-1-1 Heiwajima, Ota-ku, 143-0006 Tokyo 100 %
Korea Barco Ltd. 42 Youngdongdaero 106-Gil, Gangnam-Gu, 135-881 Seoul 100 %
Malaysia Barco Sdn. Bhd. No. 13A, Jalan SS21/56B, Damansara Utama, 47400 Petaling Jaya, Selangor 100 %
Singapore Barco Pte Ltd. No. 10 Changi South Lane, #04-01 Ossia Building, 486162 Singapore 100 %
Taiwan Barco Ltd. 12F-2, 88, Dunhua N. Rd., 105 Taipei City 100 %
Taiwan JAOtech (Taiwan) Ltd. 5F, No. 59, Lane 77, Xing-ai Road, Naihu District, 11494 Taipei 100 %
Taiwan Awind Inc. 17th Floor, No. 866-5, Zhongzhen Road, Zhonghe District, 235 New Taipei City 100 %
1.2. LIST OF ASSOCIATED COMPANIES ON 31 DECEMBER 2013
Europe, Middle-East and Africa
Norway Habornveien 53 AS Haborneveien 53, 1630 Gamle Fredrikstad 42%
(a) This company is a joint venture and accounted for using the equity method.
174 Barco | annual report 2013 | Barco consolidated

01/01/13
IN THOUSANDS OF EURO BEFORE ACQUISITION FAIR VALUE RESTATEMENTS AFTER ACQUISITION
Other intangible fixed assets 157 18,384 18,541
Leased buildings 11,782 - 11,782
Other non-current assets 2,261 - 2,261
Total non-current assets 14,200 18,384 32,584
Inventory 16,184 -2,322 13,863
Trade receivables 11,143 - 11,143
Other current assets 1,182 - 1,182
Total current assets 28,509 -2,322 26,188
Provisions -203 -4,245 -4,448
Leasing debt -12,016 - -12,016
Financial debt -3,183 - -3,183
Deferred tax liability 1,701 -3,436 -1,735
Total non-current liabilities -13.701 -7.681 -21.382
Other current liabilities -7,511 - -7,511
Total current liabilities -7,511 - -7,511
Cash -716 - -716
Total net assets acquired 20,782 8,381 29,163
Total acquisition cost 64,762
Goodwill 35,599
Note: Fair value restatements also include restatements from local (Norwegian) Gaap to IFRS.
1.3. ACQUISITIONS AND DIVESTMENTS
2013
Acquisition of projectiondesign
Per 21 February 2013, Barco acquired the remaining shares of the Norway-based company projectiondesign, after acquiring 61% of the shares on 19
December 2012. The acquisition reflects Barco’s strategy to strengthen its leading position in high-performance projection technology by advancing
further into the mid-segment of its target markets.
The effective control was transferred on 1 January 2013. projectiondesign is integrated in Barco’s Projection division.
The acquisition has been accounted for using the acquisition method conform IFRS3 Business Combinations (Revised). In 2013, projectiondesign has con-
tributed 51.7 million euro to the total turnover of the Group, resulting 1.9 million euro EBITDA. This contribution in the first year was negatively impacted
by IFRS restatements recorded in the opening balance sheet. The IFRS restatements related to fair value adjustments on inventory and the valuation
of other intangible fixed assets: technology (amortized over 6 years), customer list (amortized over 6 years) and trade names (amortized over 1 year).
The following table summarizes the consideration paid for projectiondesign and the amounts of the assets acquired and liabilities assumed recognized
at the acquisition date.
Assets and Liabilities Projectiondesign
175Barco | annual report 2013 | Barco consolidated

IN THOUSANDS OF EURO
Cash flow on acquisition
Net cash acquired with the subsidiary -716
Cash paid -50,832
Net cash flow on acquisition -51,547
The total acquisition cost includes the amount paid at closing of 17.8 million euro in 2013, the amount paid per 19 December 2012 of 33 million euro
and a vendor loan of 13.9 million euro (101.5 million NOK) to be paid to the former shareholders, which is considered as a pre-existing right at the
moment of the acquisition and repayable in 2014, 2015 and 2016. The contract provided for additional earn-out payments, depending on the adjusted
EBITDA realized in 2013 (minimum 50 million NOK). Per end of 2013 the requirements for the earn-out payment are not met. The goodwill recognized
at acquisition is related to the assembled workforce, the company’s ability to develop state-of-the-art technologies and synergies resulting from the
combination of projectiondesign with Barco. Barco is becoming a market leader in projection solutions for both large and mid-venue markets after this
acquisition. The goodwill is not tax deductible.
Acquisition of AWIND
Per 26 March 2013, Barco acquired 100% of the shares of the Taiwan-based company AWIND, a leading provider of wireless content sharing and
WIFI-enabled presentations. This transaction advances Barco’s strategy of leveraging its strengths in visualization to establish a leadership position in
professional networking and collaboration. The effective control was transferred on 1 April 2013.
The acquisition has been accounted for using the acquisition method conform IFRS3 Business Combinations (Revised). In 2013, AWIND has contributed
6.9 million euro to the total turnover of the Group, resulting 1.1 million euro EBITDA. This contribution in the first year was negatively impacted by IFRS
restatements recorded in the opening balance sheet. The IFRS restatements related to fair value adjustments on the valuation of other intangible fixed
assets: technology (amortized over 6 years), customer list (amortized over 5 years) and trade names (amortized over 1 year).
The following table summarizes the consideration paid for AWIND and the amounts of the assets acquired and liabilities assumed recognized at the
acquisition date.
Assets and Liabilities AWIND
176 Barco | annual report 2013 | Barco consolidated

01/04/13
IN THOUSANDS OF EURO BEFORE ACQUISITION FAIR VALUE RESTATEMENTS AFTER ACQUISITION
Other intangible fixed assets 80 12,653 12,733
Other tangible fixed assets 125 - 125
Total non-current assets 205 12,653 12,858
Inventory 786 - 786
Trade receivables 919 - 919
Other current assets 276 - 276
Total current assets 1,980 - 1,980
Deferred tax liability - -2,151 -2,151
Total non-current liabilities - -2,151 -2,151
Other current liabilities -743 - -743
Total current liabilities -743 - -743
Cash 2,508 - 2,508
Total net assets acquired 3,949 10,502 14,451
Upfront consideration 51,621
Deferred consideration 4,615
Total acquisition cost 56,236
Goodwill 41,785
IN THOUSANDS OF EURO
Cash flow on acquisition
Net cash acquired with the subsidiary 2,508
Cash paid -51,621
Net cash flow on acquisition -49,113
The total acquisition cost includes the amount paid at closing of 52.1 million US dollar (40 million euro recalculated at FX rate acquisition date), 15 million
US dollar (11.6 million euro recalculated at FX rate on the acquisition date) put in escrow for 24 months and 6 million US dollar deferred consideration
(4.6 million euro recalculated at FX rate on the acquisition date), retained for 15 months.
The goodwill recognized at acquisition is related to the future cash flows Barco expects to realize based on the sale of products using the AWIND
technology. The goodwill is not tax deductible.
The goodwill has been assigned to the Advanced Visualization division.
177Barco | annual report 2013 | Barco consolidated

Change in consolidation method Chinese joint venture CFG Barco
Effective as of 1 January 2013, the contract with Barco’s joint venture partner China Film Group has been modified, resulting in Barco obtaining control
over CFG Barco (Beijing) Electronics Co, Ltd. Barco’ s ownership in the company of 58% remained unchanged and no additional consideration was paid
for the change in control. As a result of obtaining control CFG Barco has been fully consolidated as from 1 January 2013 onwards. As a result of the full
consolidation, a non-controlling interest of 42% is shown as from 1 January 2013. Until 31 December 2012, CFG Barco has been taken up at equity method.
The step acquisition has been accounted for using the acquisition method conform IFRS3 Business Combinations (Revised). Since CFG Barco has been
established in 2011 and has taken over all manufacturing activities from Barco China with respect to the projectors for the Chinese market end 2012,
the re-measurement of the acquisition date fair value of the equity interest in CFG Barco, held immediately before the acquisition date did not mate-
rially differ from the equity interest in the company before the business combination. Therefore no gain or loss needed to be recognized as a result of
re-measuring to fair value the equity interest in CFG Barco.
The following table summarizes the amounts of the assets acquired and liabilities assumed of CFG recognized at the date of transfer of control.
Assets and Liabilities CFG Barco
01/01/13
IN THOUSANDS OF EURO BEFORE TRANSFER OF CONTROL FAIR VALUE RESTATEMENTS AFTER TRANSFER OF CONTROL
Deferred tax assets 728 - 728
Other non-current assets 684 - 684
Total non-current assets 1,412 - 1,412
Inventory 9,959 - 9,959
Trade receivables 14,314 - 14,314
Other current assets 5,919 - 5,919
Total current assets 30,192 - 30,192
Trade payables -13,111 - -13,111
Other current liabilities -12,867 - -12,867
Advances received on contracts in progress -18,480 - -18,480
Total current liabilities -44,457 - -44,457
Cash 18,138 - 18,138
Total net assets acquired 5,285 - 5,285
In 2013, CFG Barco has contributed 48 million euro to the total turnover of the Group, resulting 8.1 million euro EBITDA.
IN THOUSANDS OF EURO
Cash flow on the date of transfer of control
Net cash acquired with the subsidiary 18,138
Cash paid -
Net cash flow on the date of transfer of control 18,138
178 Barco | annual report 2013 | Barco consolidated

Assets and Liabilities JAOTech
01/01/12
IN THOUSANDS OF EURO OPENING B/S FAIR VALUE RESTATEMENTS IFRS OPENING B/S
Total non-current assets 837 -686 151
Inventory 2,732 -720 2,011
Trade receivables 5,507 -16 5,491
Other current assets 453 -16 437
Total current assets 8,691 -753 7,939
Total non-current liabilities -308 -537 -845
Trade payables -4,784 - -4,784
Other current liabilities -4,452 -160 -4,612
Total current liabilities -9,236 -160 -9,396
Cash 562 562
Total net assets 546 -2,135 -1,589
Total acquisition cost (excl net cash) 13,628
Goodwill 15,217
IN THOUSANDS OF EURO
Cash flow on acquisition
Net cash acquired with the subsidiary 562
Cash paid -9,628
Net cash flow on acquisition -9,065
2012
Acquisition of projectiondesign
Per 19 December 2012, Barco acquired 61% of the shares of projectiondesign, a Norway-based leader in projection technology, from the private equity
fund Herkules Capital. The transaction advances Barco’s strategy to expand into the mid-segment of its target markets and to strengthen its number
one position in high-performance projection technology. The amount paid at closing is 244m NOK (33.4 million euro). The effective control is only
transferred on 1 January 2013.
Acquisition of JAOTech
Per 3 February 2012, Barco acquired 100% of the shares of the UK-based company JAOTech Ltd, a leading manufacturer of patient entertainment and
point-of-care terminals for hospitals. The acquisition fits within Barco’s long-term vision of increasing healthcare efficiency and its growth strategy of
expanding into multiple healthcare segments.
The acquisition has been accounted for using the acquisition method conform IFRS3 Business Combinations (Revised). The following table summarizes
the consideration paid for JAOTech Ltd and the amounts of the assets acquired and liabilities assumed recognized at the acquisition date.
179Barco | annual report 2013 | Barco consolidated

The total acquisition cost includes the amount paid at closing of 9.6 million euro and a deferred consideration of 1 million euro, payable early 2014.
The contract further provides for additional earn-out payments. The earn-out payments depend on the cumulative gross margin generated for the
financial years ended 31 December 2012 to 31 December 2014. There are no minimum or maximum earn-out payments stipulated in the contract.
Total earn-out payments of 3 million euro were at moment of acquisition assumed to be probable and are therefore added to the acquisition cost.
There have been no earn-out payments made per 31 December 2012 and 31 December 2013. The requirements for the earn-out cannot be met anymore
and therefore the 3 million euro assumed earn-out payable has been taken in other operating income in 2013. See note 3.d.
The goodwill recognized at acquisition is related to the ‘surprix’ Barco was willing to pay because of the commercial and operational synergies expected
to be achieved from integrating JAOtech into the Healthcare division and is not tax deductable.
In 2012, JAOTech contributed 9.7 million euro to the total turnover of the group and contributed negative 2.1 million euro to the total profit before
taxes of the group.
180 Barco | annual report 2013 | Barco consolidated

Assets and Liabilities IP Video Systems
IN THOUSANDS OF EURO BEFORE ACQUISITION DATE FAIR VALUE RESTATEMENTS AFTER ACQUISITION DATE
Know-how - 4,673 4,673
Tangible fixed assets 7 -3 4
Deferred tax assets - 695 695
Total non-current assets 7 5,365 5,372
Inventory 285 - 285
Total current assets 285 - 285
Warranty provision - -35 -35
Total non-current liabilities - -35 -35
Retention bonus accrual - -1,748 -1,748
Total current liabilities - -1,748 -1,748
Total net assets 292 3,582 3,874
Acquisition price 15,179
Goodwill 11,305
Acquisition of IP Video Systems
Per 31 January 2012, Barco acquired the networked visualization activities of IP Video Systems (IPVS), a California-based innovator in networked
visualization solutions. The acquisition fits within Barco’s overall strategy to invest in high-performance networked visualization technology, and will
strengthen the company’s product portfolio in a large number of markets.
Barco mainly acquired the products, know-how and warranty obligations of the IP Video Systems business, all through an asset deal. The asset deal
needs to be seen as a business combination since Barco acquired all of the company’s personnel on top of the agreed purchased assets. Therefore the
acquisition has been accounted for using the acquisition method conform IFRS3 Business Combinations Revised.
The following table summarizes the consideration paid for IP Video Systems and the amounts of the assets acquired and liabilities assumed recognized
at the acquisition date.
The total acquisition cost includes the amount paid at closing of 20 million USD (15.2 million euro recalculated at FX rate at acquisition date). The
goodwill recognized at acquisition is related to the technology developed by IPVS and the future cash flows Barco will be able to realize based on the
sale of products using the IPVS technology. The acquisition fits in Barco’s corporate strategy to invest in high-performance networked visualization
technologies. The total goodwill amount is tax deductible in Barco Inc over a period of 15 years.
181Barco | annual report 2013 | Barco consolidated

Assets and Liabilities CineStore
IN THOUSANDS OF EURO BEFORE ACQUISITION DATE 01/04/11
Know-how - 4,702
Other tangible and intangible assets 763 600
Total non-current assets 763 5,302
Inventory 2,714 2,714
Other current assets - 145
Total current assets 2,714 2,859
Warranty provision -1,964 -2,547
Total non-current liabilities -1,964 -2,547
Total current liabilities -225 -225
Net assets 1,288 5,389
Acquisition cost 6,419
Goodwill 1,030
2011
CineStore
Per 31 March 2011, Barco acquired the CineStore activities of cinema solutions provider XDC, based in Liège, Belgium. The acquisition is an extension of
the Digital Cinema product offering of the Group and fits within Barco’s broader strategy to move up in the value chain from digital projection supplier
to provider of total cinema visualization solutions.
Barco mainly acquired the products, know-how and warranty obligations of the XDC CineStore business through an asset deal. The total acquisition
cost amounts to 6.4 million euro and equals the fair value of the acquired net assets, which are as follows:
The total acquisition cost paid at closing of the deal amounts to 6.4 million euro. The contract further provided for two additional earn-out payments.
The first additional earn-out payment is determined based on the number of servers, originally developed by XDC, sold to the XDC group over the
coming 4 years. The second earn-out payment is a percentage on the sales realized by Barco on all products sold to third parties within the framework
of the CineStore activities over the coming 4 years. There are no minimum or maximum earn-out payments foreseen in the contract.
The goodwill and the know-how recognized at acquisition are related to specific server technology developed by XDC. The total goodwill of 1 million
euro is allocated to the Projection division.
In 2011 the CineStore activities contributed 1.7 million euro to the total turnover of the group.
182 Barco | annual report 2013 | Barco consolidated

2. OPERATING SEGMENTS INFORMATION
2.1. BASIS OF OPERATING SEGMENTS INFORMATION
Effective 1 January 2013, Barco changed the composition of three divisions as follows:
Barco’s business activities:
» Projection (former Entertainment division adding acquisition of
projectiondesign): designs and manufactures a broad family of pro-
jectors, LED displays and image processing products for use at events,
concerts, open-air festival stages, retail stores, sports stadiums, muse-
ums, auditoria, meeting rooms and movie theaters.
» Advanced Visualization (former Control Rooms and Simulation divi-
sion adding two venture group companies dZine and Clickshare):
offers a complete portfolio of high-quality video wall modules in a wide
range of sizes and resolutions. In addition, Advanced Visualization has a
strong focus on dedicated collaboration software, professional services
and smart networked solutions.
» Healthcare: has a solid reputation for delivering dependable visual-
ization solutions that are central to the provision of quality healthcare.
The product offering includes leading-edge displays for radiology, mam-
mography, surgery, dentistry, pathology and modality imaging, along
with DICOM compliant review displays, networked digital OR systems,
and point-of-care devices.
» Defense and Aerospace: provides high-performance display systems,
large-screen visualization platforms, advanced processing modules
and network-client applications, all ensuring continuous information
availability in harsh environmental conditions. The training business,
previously included in Control Rooms and Simulation, has been added
to the Defense and Aerospace division.
Barco’s ventures:
» Barco Silex: active in high level electronic engineering.
» High End Systems: specialized in professional entertainment lighting
products.
» LiveDots: offers high-performance LED display solutions for indoor and
outdoor installations.
» Orthogon: develops software components for the Air Traffic Control
market.
Management (Core Leadership Team is considered to be the Chief Oper-
ating Decision Maker) monitors the results of each of the core divisions
and the ventures as 5 divisions separately so as to make decisions about
resource allocation and performance assessment. Division performance is
evaluated based on EBITDA. Group financing (including finance costs and
finance revenue) and income taxes are managed on a group basis and
are not allocated to the operating divisions.
As a consequence, the group aligned its segment reporting with this
business structure, resulting in 5 operating segments. The 2012 financials
have been restated for comparison reasons.
Transfer prices between operating segments are on an arm’s length basis
in a manner similar to transactions with third parties.
We refer to p62 for more explanation on the activities performed by each
division.
183Barco | annual report 2013 | Barco consolidated

2.2 PROJECTION
IN THOUSANDS OF EURO 2013 2012 VARIANCE
2013-2012
Net sales 522,492 100.0% 479,711 100.0% 42,778
external sales 522,344 100.0% 479,562 100.0% 42,782
interdivision sales 150 0.0% 149 0.0% -
Cost of goods sold -354,855 -67.9% -334,745 -69.8% -20,113
Gross profit 167,637 32.1% 144,968 30.2% 22,666
EBIT before restructuring and goodwill impairment 62,095 11.9% 74,175 15.5% -12,080
Amortization capitalized development 10,940 2.1% 8,382 1.7% 2,557
Depreciation TFA and software 10,415 2.0% 4,720 1.0% 5,695
EBITDA 83,450 16.0% 87,278 18.2% -3,828
Capitalized development 19,196 3.7% 15,453 3.2% 3,743
Capital expenditures TFA and software 7,037 1.3% 6,526 1.4% 510
Segment assets 255,459 179,855
Segment liabilities 195,790 139,241
IN THOUSANDS OF EURO 2013 2012 VARIANCE
2013-2012
Net sales 195,708 100.0% 206,455 100.0% -10,748
external sales 195,697 100.0% 206,371 100.0% -10,674
interdivision sales 11 0.0% 84 0.0% -73
Cost of goods sold -127,849 -65.3% -136,243 -66.0% 8,393
Gross profit 67,858 34.7% 70,213 34.0% -2,354
EBIT before restructuring and goodwill impairment 9,428 4.8% 11,045 5.3% -1,617
Amortization capitalized development 12,750 6.5% 8,817 4.3% 3,933
Depreciation TFA and software 4,171 2.1% 3,947 1.9% 224
EBITDA 26,348 13.5% 23,809 11.5% 2,539
Capitalized development 15,300 7.8% 13,992 6.8% 1,307
Capital expenditures TFA and software 4,116 2.1% 4,836 2.3% -720
Segment assets 127,825 126,473
Segment liabilities 44,435 50,980
2.3 HEALTHCARE
184 Barco | annual report 2013 | Barco consolidated

2.4. ADVANCED VISUALIZATION
IN THOUSANDS OF EURO 2013 2012 VARIANCE
2013-2012
Net sales 192,540 100.0% 205,162 100.0% -12,622
external sales 190,567 99.0% 204,828 99.8% -14,261
interdivision sales 1,973 1.0% 334 0.2% 1,639
Cost of goods sold -120,649 -62.7% -124,649 -60.8% 4,000
Gross profit 71,890 37.3% 80,513 39.2% -8,622
EBIT before restructuring and goodwill impairment -2,888 -1.5% 11,115 5.4% -14,003
Amortization capitalized development 10,077 5.2% 9,016 4.4% 1,061
Depreciation TFA and software 6,148 3.2% 3,722 1.8% 2,427
EBITDA 13,338 6.9% 23,852 11.6% -10,515
Capitalized development 13,145 6.8% 11,480 5.6% 1,665
Capital expenditures TFA and software 6,928 3.6% 8,537 4.2% -1,609
Segment assets 182,649 137,689
Segment liabilities 58,346 59,999
IN THOUSANDS OF EURO 2013 2012 VARIANCE
2013-2012
Net sales 149,716 100.0% 167,277 100.0% -17,562
external sales 149,516 99.9% 166,959 99.8% -17,444
interdivision sales 200 0.1% 318 0.2% -118
Cost of goods sold -100,012 -66.8% -114,802 -68.6% 14,790
Gross profit 49,704 33.2% 52,475 31.4% -2,772
EBIT before restructuring and goodwill impairment 8,430 5.6% 5,098 3.0% 3,332
Amortization capitalized development 9,071 6.1% 9,279 5.5% -208
Depreciation TFA and software 2,692 1.8% 3,182 1.9% -491
EBITDA 20,193 13.5% 17,560 10.5% 2,633
Capitalized development 7,299 4.9% 9,449 5.6% -2,150
Capital expenditures TFA and software 4,113 2.7% 4,192 2.5% -79
Segment assets 129,336 135,656
Segment liabilities 38,353 35,765
2.5. DEFENSE AND AEROSPACE
185Barco | annual report 2013 | Barco consolidated

2.6 VENTURES
IN THOUSANDS OF EURO 2013 2012 VARIANCE
2013-2012
Net sales 101,033 100.0% 98,269 100.0% 2,764
external sales 99,891 98.9% 98,263 100.0% 1,628
interdivision sales 1,142 1.1% 6 0.0% 1,136
Cost of goods sold -70,835 -70.1% -70,874 -72.1% 39
Gross profit 30,198 29.9% 27,395 27.9% 2,803
EBIT before restructuring and goodwill impairment 1,959 1.9% -1,195 -1.2% 3,154
Amortization capitalized development 7,166 7.1% 7,617 7.8% -452
Depreciation TFA and software 781 0.8% 555 0.6% 226
EBITDA 9,905 9.8% 6,977 7.1% 2,928
Capitalized development 7,132 7.1% 5,919 6.0% 1,213
Capital expenditures TFA and software 675 0.7% 762 0.8% -87
Segment assets 52,585 63,736
Segment liabilities 16,021 22,906
IN THOUSANDS OF EURO 2013 2012
External sales
Projection 522,344 479,562
Healthcare 195,697 206,371
Advanced Visualization 190,567 204,828
Defense and Aerospace 149,516 166,959
Ventures 99,891 98,263
Total external sales segments 1,158,015 1,155,984
Net Income
EBITDA before restructuring
Projection 83,450 87,278
Healthcare 26,348 23,809
Advanced Visualization 13,338 23,852
Defense and Aerospace 20,193 17,560
Ventures 9,905 6,977
2.7. RECONCILIATION OF SEGMENT INFORMATION WITH GROUP INFORMATION
186 Barco | annual report 2013 | Barco consolidated

IN THOUSANDS OF EURO 2013 2012
Amortization
Projection 10,940 8,382
Healthcare 12,750 8,817
Advanced Visualization 10,077 9,016
Defense and Aerospace 9,071 9,279
Ventures 7,166 7,617
Depreciation
Projection 10,415 4,720
Healthcare 4,171 3,947
Advanced Visualization 6,148 3,722
Defense and Aerospace 2,692 3,182
Ventures 781 555
EBIT before restructuring and goodwill impairment
Projection 62,095 74,175
Healthcare 9,428 11,045
Advanced Visualization -2,888 11,115
Defense and Aerospace 8,430 5,098
Ventures 1,959 -1,195
Restructuring and goodwill impairment costs -9,428 -2,671
Total EBIT after restructuring and goodwill impairment 69,596 97,567
Interest income (expense) - net -2,161 1,089
Income taxes -8,092 -4,962
Result after taxes 59,342 93,694
Share in the result of joint ventures and associates 61 547
Net income 59,403 94,241
Net income attributable to non-controlling interest 2,284 -
Net Income attributable to equityholders of the parent 57,119 94,241
187Barco | annual report 2013 | Barco consolidated

IN THOUSANDS OF EURO 2013 2012
Assets
Segment assets
Projection 255,459 179,855
Healthcare 127,825 126,473
Advanced Visualization 182,649 137,689
Defense and Aerospace 129,336 135,656
Ventures 52,585 63,736
Total segment assets 747,853 643,409
Investments 11,824 44,445
Deferred tax assets 62,333 61,948
Cash and cash equivalents 156,545 122,139
Other non-allocated assets 69,267 50,022
Total assets 1,047,822 921,879
Liabilities
Segment liabilities
Projection 195,790 139,241
Healthcare 44,435 50,980
Advanced Visualization 58,346 64,975
Defense and Aerospace 38,353 27,974
Ventures 16,021 25,721
Total segment liabilities 352,946 308,890
Equity attributable to equityholders of the parent 574,943 538,050
Non-controlling interest 4,423 -
Long-term debts 40,410 12,695
Deferred tax liabilities 11,721 3,089
Current portion of long-term debts 3,582 4,105
Short-term debts 11,657 1,302
Other non-allocated liabilities 48,141 53,748
Total equity and liabilities 1,047,822 921,879
188 Barco | annual report 2013 | Barco consolidated

Management directs sales of the Group based on the regions to which the goods are shipped or the services are rendered and has three reportable
regions Europe, Middle East, Africa and Latin America (EMEALA), North America (NA) and Asia-Pacific (APAC).
We refer to the ‘Comments on the results’ on p134 for a split of revenue from external customers based on the geographical location of the customers
to whom the invoice is issued. There is no significant (i.e. representing more than 10% of the Group’s revenue) concentration of Barco’s revenues with
one customer.
Sales to Belgium represent 38.4 million euro of the Group revenues in 2013 versus 43.7 million 2012.
Barco has no customers which represent more than 10% of total turnover of the group.
Below table gives an overview of the assets per region and the most important capital expenditures in non-current assets per region:
IN THOUSANDS OF EURO 2013 2012
Net sales
Europe - Middle East - Africa - Latin Americ 499,899 43.2% 504,068 43.6%
North America 361,076 31.2% 391,035 33.8%
Asia-Pacific 297,040 25.7% 260,881 22.6%
Total 1,158,015 100.0% 1,155,984 100.0%
Total assets
Europe - Middle East - Africa - Latin America 606,435 57.9% 621,730 67.4%
North America 169,037 16.1% 155,895 16.9%
Asia-Pacific 267,792 25.6% 126,457 13.7%
Group 4,558 0.4% 17,796 1.9%
Total 1,047,822 100.0% 921,879 100.0%
Capitalized development
Europe - Middle East - Africa - Latin America 54,863 88.4% 48,272 85.7%
North America 6,293 10.1% 6,786 12.1%
Asia-Pacific 916 1.5% 1,237 2.2%
Group - 0.0% - 0.0%
Total 62,072 100% 56,296 100%
Purchases of tangible and intangible fixed assets
Europe - Middle East - Africa - Latin America 17,716 71.3% 17,716 71.3%
North America 2,221 8.9% 2,221 8.9%
Asia-Pacific 4,916 19.8% 4,916 19.8%
Total 22,869 100% 24,851 100%
2.8 GEOGRAPHIC INFORMATION
189Barco | annual report 2013 | Barco consolidated

3. INCOME FROM OPERATIONS (EBIT)
IN THOUSANDS OF EURO 2013 2012 2011
Net Sales 1,158,015 1,155,984 1,041,244
Cost of goods sold -771,519 -780,351 -728,313
Gross profit 386,496 375,633 312,932
Gross profit as % of sales 33.4% 32.5% 30.1%
Indirect costs -311,835 -278,435 -247,364
Other operating income (expenses) - net 4,362 3,040 12,792
EBIT before restructuring and goodwill impairment 79,024 100,238 78,359
EBIT before restructuring and goodwill impairment as % of sales 6.8% 8.7% 7.5%
The steady increase in EBIT over the last years has come to an end in 2013, the result from higher indirect costs, as sales remained stable (+ 0.2%)
and gross profit margins were higher than previous years.
IN THOUSANDS OF EURO 2013 2012 2011
Product sales 808,570 70% 748,385 65% 659,667 63%
Project sales 257,737 22% 322,318 28% 308,591 30%
Service sales 91,708 8% 85,282 7% 72,982 7%
Sales 1,158,015 1,155,984 1,041,240
Major part of the sales relate to product sales (in 2013: 70%, in 2012: 65%, 2011: 63%). Project sales include combined sales from products, installations,
and services. Most of these project sales have a lifetime of less than one year.
We refer to note 2.Segment Information and to the chapter ‘Comments on the results’ for more explanation on sales and income from operations.
190 Barco | annual report 2013 | Barco consolidated

Indirect costs and other operating income (expenses) - net
Indirect costs represent 27% of sales in 2013 versus 24% of sales in 2012 and 23% of sales in 2011. The higher indirect costs in 2013 are affected by
the new acquisitions done in 2013, which had on the one hand a higher indirect cost structure than Barco and on the other hand have led to higher
amortizations on intangibles (result of fair value adjustments), included in the indirect costs. Excluding the amortizations on intangibles, indirect costs
represent 26% of sales in 2013 versus 24% in 2012 and 2011.
Right sizing actions in the new acquired entities were undertaken. Barco has also announced a formal restructuring plan in order to lower indirect costs
again to alevel in line with corporate objectives.
(a) Research and development expenses
IN THOUSANDS OF EURO 2013 2012 2011
Research and development epxenses (a) -95,476 -84,124 -74,650
Sales and marketing expenses (b) -160,670 -142,157 -122,493
General and administration expenses ( c ) -55,689 -52,155 -50,221
Indirect costs -311,835 -278,435 -247,364
Other operating income (expenses) - net (d) 4,362 3,040 12,792
Indirect costs and other operating income (expenses) - net -307,472 -275,395 -234,572
Amortization intangibles on acquisitions included in indirect costs -9,318 -3,507 -2,175
Indirect costs excluding amortizations on intangibles acquisitions -302,516 -274,928 -245,189
IN THOUSANDS OF EURO 2013 2012 2011
Research & development expenses 107,545 97,308 83,327
Capitalized development expenses -62,072 -56,296 -46,454
Amortization capitalized development expenses 49,145 42,138 36,448
Impairment of capitalized development expenses 858 973 1,328
Capitalized development, net -12,069 -13,184 -8,677
Research and development expenses, net 95,476 84,124 74,650
In order to sustain our technological leadership, Barco strongly invests in R&D, new technologies, and innovation. We refer to ‘Our strategy’ for more details.
Research and development cash expenses represent 9.3% of sales in 2013 compared to 8.4% of sales in 2012 and 8.0% in 2011.
In 2013, the higher development expenses have led to higher capitalization (58% of total research and development expenses in 2013, 58% in 2012,
56% in 2011) compared to amortization expenses, which had a positive impact on the income from operations (EBIT) of 12 million euro (compared to
a positive impact of the 13.2 million euro in 2012 and 8.7 million euro in 2011).
191Barco | annual report 2013 | Barco consolidated

The increase in the research and development cash expenses are impacted by the acquisitions performed in 2013, which have led to higher amortiza-
tions on intangibles (result from the fair value adjustments) for a total amount of 5.1 million euro. Excluding this impact research and development cash
expenses represent 8.8% of sales in 2013. Note that the line ‘Amortization capitalized development expenses’ only include the amortization charges
on own development projects. The amortization on acquired technology is included in the line ‘Research & Development expenses’.
Impairment costs on capitalized development expenses are presented on the line “Research and development expenses”. For more explanation on
impairment costs on capitalized development we refer to note 10.
Research and development activities are spread over the divisions as follows:
IN THOUSANDS OF EURO GROUP ADVANCED VISUALIZATION PROJECTION
Research & development expenses 107,545 23,162 37,548
Capitalized development expenses -62,072 -13,145 -19,196
Amortization capitalized development expenses 49,145 10,077 10,842
Impairment of capitalized development expenses 858 - 98
Capitalized development, net -12,069 -3,068 -8,256
Research & development expenses 95,476 20,094 29,292
IN THOUSANDS OF EURO HEALTHCARE DEFENSE AND AEROSPACE VENTURES
Research & development expenses 24,551 13,091 9,194
Capitalized development expenses -15,300 -7,299 -7,132
Amortization capitalized development expenses 12,398 8,952 6,876
Impairment of capitalized development expenses 352 119 290
Capitalized development, net -2,550 1,773 33
Research & development expenses 22,001 14,863 9,227
IN THOUSANDS OF EURO 2013 % OF SALES 2012 % OF SALES 2011 % OF SALES
Sales and marketing expenses 160,670 13,9% 142,157 12,3% 122,493 11,8%
(b) Sales and marketing expenses
Sales and marketing expenses include all indirect costs related to the sales and customer service organization which are not billed as part of a product
or service to the customer as well as the costs related to regional or divisional marketing activities.
The higher sales and marketing expenses were partly caused by the new acquisitions done in 2013, which had on the one hand higher indirect sales
and marketing expenses than Barco and on the other hand have led to higher amortizations on intangibles (caused by fair value adjustments) for an
amount of 4.2 million euro, included in the sales and marketing expenses. Excluding the amortizations on intangibles sales and marketing expenses
represent 13.5% of sales.
192 Barco | annual report 2013 | Barco consolidated

(c) General and administration expenses
IN THOUSANDS OF EURO 2013 % OF SALES 2012 % OF SALES 2011 % OF SALES
General and administration expenses 55,689 4,8% 52,155 4,5% 50,221 4,8%
General and administration expenses include the costs related to general and divisional management, finance and accounting, information technology,
human resources and investor relations.
(d) Other operating income (expense) – net
IN THOUSANDS OF EURO 2013 2012 2011
Exchange gains and losses (net) 923 -1,431 2,563
Bank charges -1,501 -1,596 -2,021
Bad debt provisions (net of write-offs and reversals of write-offs) -125 -1,541 1,991
Other provisions (net of additions and reversals of provisions) -3,199 1,098 4,115
Cost of share-based payments -1,337 -782 -676
Gains/(Loss) on disposal of tangible fixed assets -10 24 278
Rental income 310 470 704
Investment grants 5,196 3,996 6,433
Reversal earn-out (b) 3,547 - -
CTA on liquidation Barco Manufacturing SRO (a) - 3,735 -
Other (net) 557 -932 -595
Total 4,362 3,040 12,792
(a) In 2012, the investment in Czech, Barco Manufacturing SRO has been liquidated, resulting in the realization of the foreign currency
translation for an amount of 3.7million euro.
(b) Reversal of the accrual related to the earn-out of JAOTech. We refer to note 1.2. Acquisitions and divestments for more explanation.
193Barco | annual report 2013 | Barco consolidated

4. REVENUES AND EXPENSES BY NATURE
The table below provides information on the major items contributing to the EBIT, categorized by nature.
IN THOUSANDS OF EURO 2013 2012 2011
Sales (note 3) 1,158,015 1,155,984 1,041,244
Material cost -653,685 -670,604 -585,245
Services and other costs -122,145 -117,359 -137,461
Personnel cost -295,384 -267,882 -247,562
Capitalized development cost (note 10) 62,072 56,296 46,454
Amortization and impairment of capitalized development -50,004 -43,112 -37,776
Depreciation property, plant, equipment and software -24,207 -16,126 -14,088
Other operating income (expense) - net (note 3) 4,362 3,040 12,792
EBIT before restructuring and impairment 79,024 100,238 78,359
Personnel cost includes the cost for temporary personnel for an amount of 3.5 million euro (in 2012: 7.6 million euro, in 2011: 6.2 million euro).
Average number of employees in 2013 was 3,979 (versus 3,665 in 2012 and 3,527 in 2011), including 2,946 white-collars (in 2012: 2,652; in 2011:
2,487) and 1,033 blue-collars (in 2012: 1,013; in 2011: 1,040)
5. RESTRUCTURING AND IMPAIRMENT COSTS
IN THOUSANDS OF EURO 2013 2012 2011
Lay off costs 7,059 - -
Inventory write offs 1,096 - -
Impairment on work in progress 820 - -
Provision for other risks and claims 454 - -
Restructuring costs 9,428 - -
Impairment goodwill (a) - 2,671 10,000
Impairment costs - 2,671 10,000
Total restructuring and impairment 9,428 2,671 10,000
(a) Please refer to note 9. Goodwill for explanation on impairment goodwill
Barco has announced a formal restructuring plan in order to rightsize certain activities, mainly in Defense and Aerospace and Advanced Visualization.
194 Barco | annual report 2013 | Barco consolidated

6. INCOME TAXES
IN THOUSANDS OF EURO 2013 2012 2011
Current versus deferred income taxes
Current income taxes -3,802 -12,103 -6,647
Deferred income taxes -4,290 7,142 17,054
Income taxes -8,092 -4,962 10,407
Income taxes versus income before taxes
EBIT after restructuring and goodwill impairment 69,596 97,567 68,359
Interest income (expense) - net -2,161 1,089 -2,530
Income before taxes 67,434 98,656 65,829
Income taxes -8,092 -4,962 10,407
Effective income tax rate % -12,0% -5,0% 15,8%
Income before taxes 67,434 98,656 65,829
Theoretical tax rate 34% 34% 34%
Theoretical tax credit/(cost) -22,928 -33,543 -22,382
Non deductible expenses/non taxable income for tax purposes
Impairment of goodwill - -908 -3,399
CTA impact on liquidation Barco Manufacturing SRO (d) - 1,270 -
Other non-deductible expenses -1,456 -1,765 -1,295
Income not taxed
Government grants exempt from tax 1,460 944 1,764
Mutual agreement procedure - transfer price adjustment (f) 6,293 - -
Patent income deduction (PID) (c) 2,208 6,627 9,689
Notional interest deduction (NID) (e) 2,369 2,714 5,028
Investment allowances (a) 213 872 741
(Use)/Set-up of deferred tax assets, not recognised in prior years -358 14,627 16,262
Deferred tax assets, derecognised in current year (b) -4,909 -938 -117
Effect of different tax rates in foreign companies 6,322 3,740 2,138
Tax adjustments related to prior periods 2,695 1,399 1,978
Reported taxes related to current income before taxes -8,092 -4,962 10,407
195Barco | annual report 2013 | Barco consolidated

(a) Spread taxation on capital expenditure and research and development costs of prior years
(b) See note 12
(c) The PID is applicable in Barco NV as of fiscal year 2010. The deduction in the consolidated figures is only included as from 2011 upon obtaining the
formal approval from the tax authorities.
(d) In 2012, the CTA impact on Barco Manufacturing SRO has been taken in income in the consolidated figures when the related company was liqui-
dated, but is non taxable for tax purposes.
(e) Notional interest deduction in 2013 and 2012 only relates to the amounts which can be offset by the current year taxable result.
(f) Transfer price adjustment as a result of a transfer pricing audit in Belgium whereby a shift of results was performed from the US to Belgium. This has
been agreed upon by the US tax authorities through a mutual agreement procedure concluded end of 2013. The income has been taxed in Belgium
in previous years through adjustment of the tax loss carry forwards. The income recognized in Barco NV (Belgium) this year is therefore tax exempt.
7. EARNINGS PER SHARE
IN THOUSANDS OF EURO 2013 2012 2011
Net income 59,403 94,241 75,850
Weighted average of shares 12,213,492 12,018,573 11,995,483
Basic earnings per share (in euro) 4.86 7.84 6.32
Basic earnings per share 4.86 7.84 6.32
Net income 59,403 94,241 75,850
Weighted average of shares (diluted) 12,608,396 12,560,900 12,217,326
Diluted earnings per share (in euro) (a) 4.71 7.50 6.21
Diluted earnings per share (a) 4.71 7.50 6.21
(a) The difference between the weighted average of shares and weighted average of shares (diluted) is due to exercisable warrants, which are in the
money (which means that the closing rate of the Barco share was higher than the exercise price).
For more detailed information concerning the shares and warrants, we refer to note 17.
196 Barco | annual report 2013 | Barco consolidated

8. INVESTMENTS
IN THOUSANDS OF EURO 2013 2012 2011
Investments (a) 10,947 41,377 8,326
Interest in joint ventures and associates (b) 877 3,068 973
Total investments 11,824 44,445 9,300
(a) In 2013 and 2011, investments include entities in which Barco owns less than 20% of the shares. In 2012, investments included, on top of entities
in which Barco owns less than 20%, the acquisition of 61% of the shares of projectiondesign for an amount of 33.4 million euro, which took place
19 December 2012. The effective control was only transferred on 1 January 2013.
(b) In 2011, the Group had a 50% interest in Barco Toyo Medical Systems Japan Co, a jointly controlled entity which was part of the Healthcare division
and a 58% interest in CFG Barco (Beijing) Electronics Co., LTD, a jointly controlled entity which was part of the Projection division. In 2012, Barco
acquired the remaining 50% interest in Barco Toyo Medical Systems Japan Co. The acquisition cost was limited (about 50 thousand euros). After the
acquisition, Barco Toyo has been merged with Barco Co, Ltd. The interest in joint ventures in 2012 therefore only includes the 58% interest in CFG
Barco (Beijing) Electronics Co., LTD. Effective as of 1 January 2013, the contract with Barco’s joint venture partner China Film Group has been modified,
resulting in Barco obtaining control over CFG Barco (Beijing) Electronics Co, Ltd. Barco’s ownership in the company of 58% remained unchanged
and no additional consideration was paid for the change in control. As a result of obtaining control CFG Barco has been fully consolidated as from
1 January 2013 onwards.
In 2013, the Group has obtained a 42% interest in Habornveien 53, AS, through the acquisition of projectiondesign, which is part of the Projection division.
The Group’s share of the assets and liabilities as at 31 December 2013, 2012 and 2011 and income and expenses of the jointly controlled entities and
associates for the year ended 31 December 2013, 2012 and 2011, which are accounted for using the equity method:
IN THOUSANDS OF EURO 2013 2012 2011
Share of the joint ventures' and associates' balance sheet:
Current assets 117 28,060 6,652
Non-current assets 4,384 820 113
Current liabilities 260 25,812 5,792
Non-current liabilities 3,364 - -
Equity 877 3,068 973
Share of the joint ventures' and associates' revenue and profit:
Sales 388 40,305 3,632
Gross profit 255 3,254 389
EBIT 253 812 -411
Profit/(Loss) of the year 61 547 -386
The Group has no share of any contingent liabilities or capital commitments as at 31 December 2013, 2012 and 2011.
197Barco | annual report 2013 | Barco consolidated

9. GOODWILL
IN THOUSANDS OF EURO 2013 2012 2011
At cost
On 1 January 107,616 80,057 79,027
Acquisitions 77,384 27,567 1,030
Translation (losses)/gains -488 -8 -
On 31 December 184,512 107,616 80,057
Impairment
On 1 January 38,807 36,136 26,136
Impairment losses - 2,671 10,000
On 31 December 38,807 38,807 36,136
Net book value
On 1 January 68,809 43,922 52,892
On 31 December 145,705 68,809 43,921
Acquisitions in 2013 include goodwill related to the acquisition of projectiondesign for 35.6 million euro and AWIND for 41.8 million euro.
In 2012, acquisitions include goodwill related to the acquisition of JAOTech for 15.2 million euro and IP Video Systems for 11.3 million euro. On top,
additional earn-out payments on previous acquisitions of € 0.6 million euro are assumed to be probable and were added to the goodwill, and the
acquisition of 50% of the remaining shares in Barco Toyo Medical Systems Japan Co resulted in 0.4 million euro additional goodwill.
In 2011, acquisitions fully consist of the CineStore business combination. For more detailed information concerning these acquisitions, we refer to note 1.2.
In 2013, the impairment tests on goodwill did not result in any impairment.
In 2012, the impairment tests on goodwill resulted in impairment charges recorded for an amount of 2.7 million euro, fully related to dZine as a result
of lower sales generated in the digital signage market compared to business plan targets at acquisition date.
The impairment tests on goodwill in 2011 resulted in impairment charges recorded for an amount of 10 million euro, fully related to Barco’s Ventures,
more specifically to High End Systems. There is no remaining goodwill on High End Systems after this impairment was booked.
The global recession, which started end of 2008, had a profound impact on the fundamentals of the Media, Entertainment & Simulation business group.
Total spending in the events markets dropped to less than half of levels recorded before the crisis and the conversion of analog to digital billboards
came to a virtual standstill (-80%). Consequently, the value of the acquisition Barco made in prior years to strengthen its position in these markets
dropped very substantially which in turn fuelled the need for impairments on goodwill. In the years after 2009, the events market recovered but High
End Systems was not able to achieve a sales growth minimum required to assure a break-even EBIT result.
See below for explanations on the impairment testing performed.
198 Barco | annual report 2013 | Barco consolidated
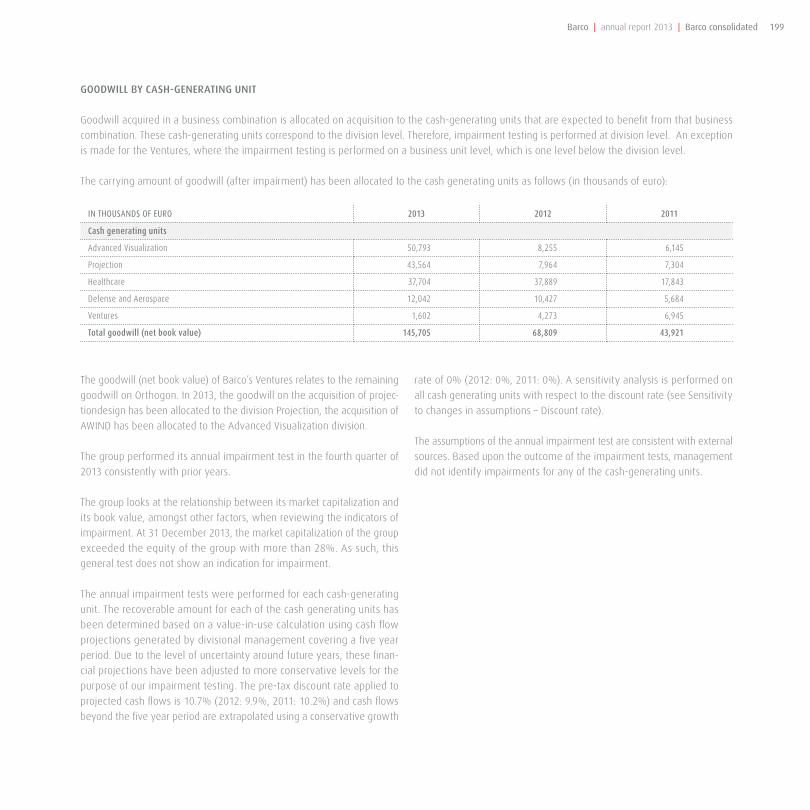
GOODWILL BY CASH-GENERATING UNIT
Goodwill acquired in a business combination is allocated on acquisition to the cash-generating units that are expected to benefit from that business
combination. These cash-generating units correspond to the division level. Therefore, impairment testing is performed at division level. An exception
is made for the Ventures, where the impairment testing is performed on a business unit level, which is one level below the division level.
The carrying amount of goodwill (after impairment) has been allocated to the cash generating units as follows (in thousands of euro):
IN THOUSANDS OF EURO 2013 2012 2011
Cash generating units
Advanced Visualization 50,793 8,255 6,145
Projection 43,564 7,964 7,304
Healthcare 37,704 37,889 17,843
Defense and Aerospace 12,042 10,427 5,684
Ventures 1,602 4,273 6,945
Total goodwill (net book value) 145,705 68,809 43,921
The goodwill (net book value) of Barco’s Ventures relates to the remaining
goodwill on Orthogon. In 2013, the goodwill on the acquisition of projec-
tiondesign has been allocated to the division Projection, the acquisition of
AWIND has been allocated to the Advanced Visualization division.
The group performed its annual impairment test in the fourth quarter of
2013 consistently with prior years.
The group looks at the relationship between its market capitalization and
its book value, amongst other factors, when reviewing the indicators of
impairment. At 31 December 2013, the market capitalization of the group
exceeded the equity of the group with more than 28%. As such, this
general test does not show an indication for impairment.
The annual impairment tests were performed for each cash-generating
unit. The recoverable amount for each of the cash generating units has
been determined based on a value-in-use calculation using cash flow
projections generated by divisional management covering a five year
period. Due to the level of uncertainty around future years, these finan-
cial projections have been adjusted to more conservative levels for the
purpose of our impairment testing. The pre-tax discount rate applied to
projected cash flows is 10.7% (2012: 9.9%, 2011: 10.2%) and cash flows
beyond the five year period are extrapolated using a conservative growth
rate of 0% (2012: 0%, 2011: 0%). A sensitivity analysis is performed on
all cash generating units with respect to the discount rate (see Sensitivity
to changes in assumptions – Discount rate).
The assumptions of the annual impairment test are consistent with external
sources. Based upon the outcome of the impairment tests, management
did not identify impairments for any of the cash-generating units.
199Barco | annual report 2013 | Barco consolidated

KEY ASSUMPTIONS USED IN VALUE-IN-USE CALCULATIONS
The calculation of value-in-use for all divisions is most sensitive to the
following assumptions:
» Sales growth rate used during the projection period;
» EBIT;
» Growth rate used to extrapolate cash flows beyond the budget period;
» Discount rates;
Sales growth rate used during the projection period – Sales growth
rate used over the projected period has been kept conservatively at zero
percent for the cash-generating units within the business segments Pro-
jection and Healthcare, since even then there is no risk for impairment.
For Advanced visualization, growth rate in the first year of the projected
period has been set at 15%, taken into account management’s expected
increase in sales of the Collaboration products. In the following years of
the projected period, a growth rate of 3% is assumed, same as for all other
cash-generating units for which a growth rate of 3% per year is assumed
for the 5 year period.
EBIT as percentage of sales – EBIT as percentage of sales is based on
average percentages over the three years preceding the start of the budget
period. EBIT levels increase over the projected period for anticipated effi-
ciency improvements. Efficiency improvements can be cost reductions as
well as margin improvements. An increase of 1 to 1.5 percentage point per
annum was applied for all divisions, except for Healthcare and Projection.
For the Healthcare division, a stable EBIT as percentage of sales is kept at
8% over the whole budget period, which is 1% higher than the average
over the last three years.
For the Projection division, a stable EBIT as percentage of sales is kept at
9% over the whole budget period, which is below the average over the
last three years, since even then there is no risk for impairment.
Growth rate estimates – The long-term rate used to extrapolate the
projection has been kept conservatively at zero % for all divisions.
Discount rates – Discount rates reflect the current market assessment of
the risks specific to Barco Group. The discount rate was estimated based
on a (long-term) pre-tax cost of capital, the risks being implicit in the
cash flows. The long term discount rate was determined on group level
and amounted to 10.7% for the year 2013 and has been applied to all
cash-generating units.
SENSITIVITY TO CHANGES IN ASSUMPTIONS
With regard to the assessment of value-in-use of the Projection division
and Orthogon (part of the Ventures), management believes, based on
sensitivity analysis performed, that no reasonable possible change in any
of the above key assumptions would cause the carrying value of the unit
to materially exceed its recoverable amount.
For the other divisions, per 31 December 2013, the estimated recoverable
amount, after impairment of capitalized development recorded, is closer
to its carrying value and, consequently, changes in the key assumption
could result in impairment losses. The implications of the key assumptions
for the recoverable amount are discussed below:
Sales growth rate used during the budget period – Management has
considered the possibility of lower than budgeted sales growth during the
budget period. For Healthcare and Defense & Aerospace, changes in the
sales growth rate during the budget period does not cause the carrying
value of the division to materially exceed its recoverable amount. For
Advanced Visualization no or negative sales growth over the budget period
would result in an impairment.
EBIT percentage on sales – Management has considered the possibility
of lower than budgeted EBIT percentages on sales.
For Healthcare, an EBIT level which remains at 7% (instead of 8%) at a
constant sales level, would lead to impairment.
For the Defense & Aerospace division, a reduction of more than 1% in
the last year of the budget period would result in an impairment and for
Advanced Visualization, any deviation from the EBIT level in the last year
of the budget period would have an impairment as result.
Discount rates – change in the weighted average cost with 2% would
result in an impairment for Advanced Visualization.
Growth rate estimate – a sales decline beyond the budget period would
result in an impairment for Advanced Visualization if the decline would
be more than 1%.
Even a decrease (which would result in a negative sales evolution) in the
long-term rate, used to extrapolate the projection beyond the budget
period, would not result in an additional impairment for all the other
divisions, in case the decrease would be less than 3%.
200 Barco | annual report 2013 | Barco consolidated

10. CAPITALIZED DEVELOPMENT COSTS
IN THOUSANDS OF EURO 2013 2012 2011
At cost
On 1 January 308,496 355,680 322,708
Expenditure 62,072 56,296 46,454
Sales and disposals -4,131 -102,237 -15,017
Acquisition of subsidiary - - 957
Disposal of subsidiary - - -
Translation (losses)/gains -2,979 -1,244 579
On 31 December 363,457 308,496 355,680
Impairment
On 1 January 20,061 19,088 17,760
Expenditure 858 973 1,328
On 31 December 20,920 20,061 19,088
Amortization
On 1 January 206,456 267,571 245,570
Amortization 49,145 42,138 36,448
Sales and disposals -4,131 -102,237 -15,017
Acquisition of subsidiary - - 570
Disposal of subsidiary - - -
Translation (losses)/gains -2,181 -1,017 -
On 31 December 249,289 206,456 267,571
Net book value
On 1 January 81,978 69,020 59,378
On 31 December 93,248 81,978 69,020
Consistent with the tests performed in the previous years, Barco performed impairment tests in the fourth quarter of 2013. Based upon these tests,
impairment costs have been recognized for an amount of 0.9 million euro. Similar impairment tests revealed the need to recognize impairment losses
on capitalized development in 2012 and 2011 for 1 million euro and 1.3 million respectively. The impairment losses recognized represent the write
down of certain specific capitalized development projects.
The recognized impairment losses on capitalized development are allocated to the business segments as follows:
201Barco | annual report 2013 | Barco consolidated

IN THOUSANDS OF EURO 2013 2012 2011
Advanced Visualization - 15 302
Projection 98 703 416
Healthcare 352 - 220
Defense and Aerospace 119 - -
Ventures 290 255 390
Total 858 973 1,328
202 Barco | annual report 2013 | Barco consolidated

Othe
rIn
tang
ible
asse
ts
Othe
r Int
angi
ble
asse
ts u
nder
cont
ruct
ion
Tota
l oth
erin
tang
ible
asse
ts
Land
and
bu
ildin
gs
Plan
t,
Mac
hine
ry a
nd
equi
pmen
t
Furn
iture
, off
ice
equi
pmen
t and
ve
hicl
es
Othe
r pro
pert
y,
plan
t and
eq
uipm
ent
Asse
ts u
nder
co
nstr
uctio
n
Tota
l Oth
er ta
ngi-
ble
asse
ts
Tota
l
Tota
l
Tota
l
11. OTHER INTANGIBLE ASSETS AND TANGIBLE FIXED ASSETS
In 2013, the capital expenditures amount to 22.9 million euro, compared to 24.9 million euro in 2012 and 20.3 million euro in 2011.
Other intangible assets under construction relate for the major part to the investment in the new ERP system, for which the capital expenditures
amount to 10 million euro in 2013 (8.3 million euro in 2012). The capital expenditures in the other tangible assets relate for the major part to R&D
and IT equipment.
The net book value of the other intangible assets and tangible fixed assets acquired in 2013 through acquisitions amounts to 44.7 million euro. Other
intangible assets for an amount of 31.9 million euro: 17.7 million technology, 12.1 million customer relations and 1.2 million trade names.
We refer to Note 1.2 on “Acquisitions and divestments” and Note 23 on “Cash flow statement: effect of acquisitions and disposals” for more details
on these transactions.
IN THOUSANDS OF EURO 2013 2012 2011
At cost
On 1 January 35,661 13,623 49,284 64,928 92,608 37,163 9,441 4,356 143,568 257,780 244,710 246,222
Expenditure 2,125 10,095 12,219 581 3,184 3,705 1,715 1,464 10,068 22,869 24,851 20,302
Sales and disposals -832 - -832 - -3,804 -3,612 -689 - -8,105 -8,938 -15,229 -27,440
Acquisition of subsidiary 31,915 - 31,915 212 7,614 1,335 12,301 - 21,250 53,377 4,909 5,285
Disposal of subsidiary - - - - - - - - - - - -
Transfers - - - - - - - - - - - -
Translation (losses)/gains -3,405 - -3,405 -519 -1,994 -973 -2,136 -150 -5,253 -9,178 -1,461 341
On 31 Dec 2013 65,464 23,717 89,181 65,202 97,607 37,618 20,633 5,670 161,528 315,911 257,780 244,710
Depreciation
On 1 January 24,192 - 24,192 36,184 78,778 26,825 7,304 - 112,907 173,283 172,097 181,467
Depreciation 10,496 - 10,496 2,248 5,109 4,727 1,631 - 11,466 24,210 16,126 14,088
Sales and disposals -818 - -818 - -3,792 -3,411 -648 - -7,850 -8,668 -13,913 -24,265
Acquisition of subsidiary 612 - 612 5 6,663 621 498 - 7,782 8,400 23 369
Disposal of subsidiary - - - - - - - - - - - -
Transfers - - - - - - - - - - - -
Translation (losses)/gains -470 - -470 -252 -1,665 -686 -547 - -2,898 -3,620 -1,051 438
On 31 Dec 2013 34,012 - 34,012 38,185 85,093 28,076 8,238 - 121,407 193,604 173,283 172,097
Carrying amount
On 1 January 2013 11,470 13,623 25,093 28,744 13,830 10,338 2,137 4,356 30,661 84,497 72,613 64,755
On 31 Dec 2013 31,452 23,717 55,169 27,017 12,514 9,542 12,395 5,670 40,121 122,306 84,497 72,613
203Barco | annual report 2013 | Barco consolidated

12. DEFERRED TAX ASSETS – DEFERRED TAX LIABILITIES
Deferred tax assets and liabilities are attributable to the following items:
Movements in the deferred tax assets / (liabilities) arise from the following:
IN THOUSANDS OF EUROAs at
1 January
Recognized through income
statement
Recognized through equity
Acquisitions and disposals
Exchange gains and losses
As at 31 December
Capitalized development cost -8,139 -386 - - 258 -8,267
Patents, licenses, ... - 1,357 - -6,930 326 -5,247
Tangible fixed assets and software -579 334 - 4 -112 -353
Inventory 13,536 2,237 - 875 -572 16,076
Trade debtors 299 -393 - 18 -33 -109
Provisions 4,908 2,523 - 1,025 -465 7,991
Employee benefits 2,389 -1,470 - 223 -153 990
Deferred revenue 1,989 142 - - -129 2,002
Other items 1,686 -724 - 223 -93 1,091
Tax value of loss carry forwards 22,182 -4,909 - 1,611 -35 18,849
Tax value of tax credits 20,587 -3,001 - - - 17,586
Total 58,858 -4,290 - -2,950 -1,008 50,611
Assets Liabilities Net asset/(liability)
IN THOUSANDS OF EURO 2013 2012 2011 2013 2012 2011 2013 2012 2011
Capitalized development cost 181 83 53 -8,448 -8,222 -7,928 -8,267 -8,139 -7,875
Patents, licenses, ... - - 205 -5,247 - - -5,247 - 205
Tangible fixed assets and software 2,191 2,146 1,944 -2,544 -2,725 -2,820 -353 -579 -876
Inventory 16,389 14,261 15,001 -313 -725 -775 16,076 13,536 14,226
Trade debtors 872 1,038 960 -981 -739 -5,069 -109 299 -4,109
Provisions 9,594 4,932 2,091 -1,603 -24 -67 7,991 4,908 2,024
Employee benefits 990 2,389 1,431 - - - 990 2,389 1,431
Deferred revenue 2,011 2,024 1,488 -9 -35 - 2,002 1,989 1,488
Other items 4,067 3,911 3,624 -2,976 -2,225 -2,074 1,091 1,686 1,550
Tax value of loss carry forwards 18,849 22,182 22,399 - - - 18,849 22,182 22,399
Tax value of tax credits 18,197 21,103 21,929 -611 -516 -634 17,586 20,587 21,295
Gross tax assets/(liabilities) 73,342 74,069 71,125 -22,731 -15,211 -19,367 50,611 58,858 51,759
Offset of tax -11,010 -12,122 -14,361 11,010 12,122 14,361 - - -
Net tax assets/(liabilities) 62,333 61,947 56,764 -11,721 -3,089 -5,006 50,612 58,858 51,759
204 Barco | annual report 2013 | Barco consolidated

On top of the tax losses and tax credits for which a net deferred tax
is recognized (net deferred tax asset of respectively 18.9 million euro
and 18.2 million euro), the Group owns tax losses carried forward and
other temporary differences on which no deferred tax asset is recognized
amounting to 61.7 million euro as of 31 December 2013 (at 34% tax rate
resulting in a non recognized deferred tax asset of rounded 21 million
euro). Deferred tax assets have not been recognized on these items
because it is not probable that future profit will be available in the near
future against which the benefits can be utilized. The tax losses carried
forward and other temporary differences on which no deferred tax asset
is recognized have no expiration date.
Deferred tax assets relate for the major part to the tax value of loss carry
forwards and tax credits and almost fully relate to Belgium. In assessing
the realizability of deferred tax assets, management considers whether
it is probable that some portion or all of the deferred tax assets will
be realized within the foreseeable future. The ultimate realization of
deferred tax assets is dependent upon the generation of future taxable
income during the periods in which those temporary differences become
deductible. Management considers the scheduled reversal of deferred tax
liabilities, projected future taxable income and tax planning strategies in
making this assessment. In order to fully realize the deferred tax asset,
the group will need to generate future taxable income in the countries
where the net operating losses were incurred. Based upon the level of
historical taxable income and projections for future taxable income over
the periods in which the deferred tax assets are deductible, management
believes as at 31 December 2013, it is probable that the group will realize
all of the recognized benefits of these deductible differences.
13. INVENTORY
(a) Inventory turns = 12 / [Inventory / (Average Monthly Sales last 12 months x Material Cost of Goods Sold %)]
The amount of write-offs recognized as expense in 2013 amounts to 15.4 million euro (2012: 16.5 million euro, 2011: 14.8 million euro).
The inventory turns further improved compared to the previous years, reaching 3.2 at the end of 2013.
IN THOUSANDS OF EURO 2013 2012 2011
Raw materials and consumables 95,491 89,910 102,417
Work in progress 86,865 94,083 93,694
Finished goods 128,292 126,747 116,446
Write-off on inventories -99,072 -87,063 -78,628
Inventory 211,575 223,677 233,928
Inventory turns (a) 3.2 3.1 2.7
205Barco | annual report 2013 | Barco consolidated

14. AMOUNTS RECEIVABLE AND OTHER NON-CURRENT ASSETS
Per 31 December 2013, the number of days sales outstanding are at a level between the very low 2012 and normal 2011 level, reaching 52 days at
the end of 2013. The outstanding trade debtors are lower than the 2012 and 2011 level.
The bad debt reserve in proportion to the gross amount of trade debtors remains under control: 3.5% per 31 December 2013 (2012: 3.8%, 2011: 3.5%).
( a ) Movement in bad debt reserve
IN THOUSANDS OF EURO 2013 2012 2011
Trade debtors - gross 183,805 190,278 193,925
Trade debtors - bad debt reserve (a) -6,338 -7,196 -6,811
Trade debtors - net (b) 177,467 183,082 187,114
V.A.T. Receivable 11,122 7,141 6,793
Taxes receivable 30,207 16,992 21,738
Currency rate swap (note 20) 361 -644 40
Guarantees paid 226 1,484 1,613
Other 2,186 4,079 5,013
Other amounts receivable 44,102 29,053 35,197
Other non-current assets (c) 14,286 18,041 19,134
Number of days sales outstanding (DSO) (d) (d) 52 48 56
IN THOUSANDS OF EURO 2013 2012 2011
On 1 January -7,196 -6,811 -10,145
Acquisition of subsidiaries -562 -83 -
Additional provisions -2,678 -5,731 -1,279
Amounts used 1,374 1,190 1,399
Amounts unused 2,553 4,189 3,229
Translation (losses) / gains 171 -50 -15
On 31 December -6,338 -7,196 -6,811
206 Barco | annual report 2013 | Barco consolidated

( b ) At 31 December 2013, the aging analysis of trade receivables is as follows:
In 2013, total overdue amounts remained stable compared to the previous periods at a total amount of 35.8 million euro (2012: 36 million euro, 2011:
37.3 million euro).
In 2013, the bad debt reserve amounts to 75% of the trade receivables more than 90 days overdue (2012: 85%, 2011: 72%).
( c ) Other non-current assets
The decrease in the other non-current assets during 2013 mainly relates to long-term receivables in the frame of vendor financing programs, amounting
to 3.5 million euro per 31 December 2013, of which 3.5 million (see note 15) are offset by a long-term debt of the same amount (2012: 11 million euro,
of which 7.1 million euro offset by a long-term debt, 2011: 12.5 million euro, of which 9.8 million euro offset by a long-term debt).
( d ) Number of days sales outstanding (DSO)
DSO = (( Trade debtors, net) / (sales past quarter)) * 90
15. NET FINANCIAL CASH/DEBT
The net financial cash remained at a high level in 2013. This is the net result of the free cash flow generated (70.2 million euro in 2013 versus 121.6
million euro in 2012 and 81.2 million in 2011) and the cash outflows related to acquisitions and dividends paid out.
IN THOUSANDS OF EURO 2013 2012 2011
Not due 148,038 154,304 156,647
Overdue less than 30 days 17,925 19,146 17,424
Overdue between 30 and 90 days 9,422 8,337 10,414
Overdue more than 90 days 8,420 8,491 9,440
Total gross 183,805 190,278 193,925
Bad debt reserve -6,338 -7,196 -6,811
Total 177,467 183,082 187,114
IN THOUSANDS OF EURO 2013 2012 2011
Deposits (a) 13,646 15,338 1,264
Cash at bank (b) 142,796 106,706 77,817
Cash in hand 103 95 83
Cash and cash equivalents 156,545 122,139 79,165
Long-term financial receivables (c) 3,539 7,129 9,768
Long-term debts (c) (d) -40,410 -12,695 -19,014
Current portion of long-term debts (d) -3,582 -4,105 -1,691
Short-term debts (e) -11,657 -1,302 -6,593
Net financial cash / (debt) 104,435 111,166 61,635
207Barco | annual report 2013 | Barco consolidated

(a) Deposits
Deposits are short-term, highly liquid investments, which are readily convertible to known amounts of cash.
The short-term deposits do not carry a material risk of change in valuation.
At closing date, deposits include:
The average rate of the deposits in INR is 7.34%, in CNY 1.49% and USD 0.07%
(b) Cash at bank
Cash at bank is immediately available. Most of the cash is held on accounts with higher interest-yield compared to classical cash accounts. It is deno-
minated in the following currencies:
(c) Long-term financial receivables
Since 2010, Barco entered into a specific vendor financing program granted to a selective number of international customers. The purpose of vendor
financing is to grant extended payment terms to such customers, whilst Barco continues to benefit from prompt payment of the open accounts recei-
vable position by having a financial institution in the middle. The financial institution will directly (buyer credit) or following a receivable sale (supplier
credit) open a credit in favor of the customer, thereby assuming the risk of non-payment on the spread payment plan in all material respect.
In the case of a supplier credit, Barco continues to serve as collection agent after the sale of the accounts receivable on a non-recourse basis, which
leads to a long-term financial receivable from the customer (in line “Other non-current assets”) this being offset by a long-term financial debt position
towards the financial institution for the same amount (in line “Long-term debts”). Due to its non-recourse character, both positions are being eliminated
in the net financial cash/(debt). Per the end of 2013, the outstanding long-term financial receivables have decreased to 3.5 million euro compared to 7.1
million euro in 2012. When the vendor financing takes the form of a buyer credit (direct financial contract between customer and financial institution,
and no role for Barco as collection agent), no positions are being reflected in the balance sheet.
Where Barco assumes a small residual risk on the customer’s payment behavior with recourse character (either in the form of supplier credit or buyer
credit), provisions are being account for.
IN THOUSANDS OF EURO 2013 2012 2011
» deposits in INR, with an average interest rate of 7.34% 1,665 1,304 992
» deposits in EUR - 10,000 -
» deposits in USD, with an average interest rate of 0.07% 1,994 3,790 -
» deposits in CNY, with an average interest rate of 1.49% 9,589 - -
» deposits in other currencies 398 244 272
Total deposits 13,646 15,338 1,264
2013 2012 2011
» EUR 40.0% 57.3% 62.7%
» USD 8.0% 18.6% 17.3%
» CNY 38.6% 11.4% 5.0%
» INR 0.1% 0.0% 1.5%
» Other 13.3% 12.7% 13.5%
208 Barco | annual report 2013 | Barco consolidated

(d) Long-term financial debts
A linearly amortizing 15 million euro credit facility backed by a cap-floor agreement in relation to Belgian real estate financing was early terminated
in 2013. A financial leasing contract of 10.5 million euro was added following the projectiondesign acquisition.
Besides specific real-estate financing in US & Norway, the Barco Group has a total of 165 million euro committed credit facilities available, following a
new debt portfolio restructuring in December 2013. The portfolio consists of 3 major tranches:
» Barco NV received a 50 million euro research, development and innovation (RDI) Credit Facility from the European Investment Bank. The aim of the
facility is to finance RDI activities for networked visualization connectivity and software in its Entertainment, Healthcare and Control Rooms divisions.
The Credit Facility has a remaining availability period of 6 months. Drawings under the facility have a long-term tenor of minimum 4 years.
» Barco NV and Barco CC (as co-obligors) signed a number of bilateral committed Credit Facilities with a selected group of commercial banks for a
total amount of 85 million euro. The Credit Facilities have an availability period till December 2016. Drawings under the facilities have a short-term
tenor.
» Barco NV signed a number of bilateral committed Credit Facilities for a total amount of 30 million euro (with accordion clause for an additional 7.5
million euro). The Credit Facilities aim at financing Barco’s new HQ campus project and have a long-term tenor of 15 years following an availability
period of maximum 2 years (period of construction).
As at 31 December 2013, an amount of 25 million euro is drawn under the RDI Credit Facility from the European Investment Bank.
Barco is meeting all requirements of the loan covenants on its available credit facilities.
Analysis of long-term financial debts, including the current portion of long-term financial debts, as to currencies:
2013 2012 2011
- EUR 25,177 2,781 4,813
- USD 7,058 11,186 15,570
- NOK 10,554 - -
- Other 1,202 2,833 322
Total 43,991 16,800 20,705
Analysis of long-term financial debts including the current portion of long-term financial debts, as to interest rates:
TYPE OF INTEREST RATE MATURITY 31 December 2013 31 December 2012 31 December 2011
Real Estate financing:
- variable, limited by cap-floor agreements (Belgium) - 2,250 3,750
- variable, swapped into fixed (US) Later than 2018 3,671 4,548 6,705
- fixed, financial leasing (Norway) Later than 2018 10,554 - -
RDI financing:
- fixed, European Investment Bank Later than 2018 25,000 - -
Vendor financing (offset by long-term receivable) 3,539 7,129 9,793
Other 1,227 2,874 457
Total long-term financial debts 43,991 16,800 20,705
Analysis of long-term financial debts including the current portion of long-term financial debts, as to interest rates:
209Barco | annual report 2013 | Barco consolidated

The long-term debts (including interests due), excluding the current portion of the long-term debts, are payable as follows:
(e) Short-term financial debts
Analysis of the short-term financial debts on 31 December:
Limited usage per 31 December 2013 is mainly executed on uncommitted bank facilities. The available 85 million euro bilateral Credit Facilities that
when used also translate in a short term debt position were almost completely undrawn.
16. OTHER LONG-TERM LIABILITIES
(a) Earn-out payments
In the agreement with Royal Philips Electronics relating to the acquisition of FIMI Srl in 2010, an additional earn-out of 10 million euro was foreseen,
payable by Barco NV over the period 2011 until 2014. The earn-out equals to 35% of the cumulative net purchase value of the Philips Group with FIMI
over the five years following the acquisition date and is limited to 2.5 million euro per year. In 2013, 2012 and 2011 an earn-out portion of 7.5 million
euro was paid. The 2.5 million euro earn-out payable early 2014 is presented on the line “Other current liabilities”.
Per 31 December 2013 Per 31 December 2012 Per 31 December 2011
Payable in 2015 11,166 Payable in 2014 7,982 Payable in 2013 9,783
Payable in 2016 6,515 Payable in 2015 576 Payable in 2014 3,659
Payable in 2017 6,358 Payable in 2016 355 Payable in 2015 259
Payable in 2018 6,275 Payable in 2017 176 Payable in 2016 259
Later 22,964 Later 5,425 Later 7,999
Total long-term debts 53,277 Total long-term debts 14,514 Total long-term debts 21,958
IN THOUSANDS OF EURO 2013 2012 2011
Effective interest rate
BalanceEffective interest
rateBalance
Effective interest rate
Balance
» EUR 1.0% 10,502 2.0% 300 - -
» USD - - 3.0% 7 2.4% 5,796
» CNY - - - - - -
» Other 2.5% 1,155 2.8% 996 3.2% 797
Total 11,657 1,302 6,593
IN THOUSANDS OF EURO 2013 2012 2011
Governmental loans 2,993 3,114 3,117
Earn-out payments (a) - 6,047 5,000
Deferred consideration (b) - 1,000 -
Vendor Loan (c) 12,329 - -
Other long-term liabilities 15,322 10,161 8,117
210 Barco | annual report 2013 | Barco consolidated

The JAOTech acquisition contract provided for additional earn-out payments, which depend on the cumulative gross margin generated for the financial
years ended 31 December 2012 to 31 December 2014. There are no minimum or maximum earn-out payments stipulated in the contract. Total earn-
out payments of 3 million euro were assumed to be probable and were assumed to become payable early 2015. However in 2013 it became clear
that the minimum requirements cannot be met anymore and therefore the outstanding loan was reversed in 2013. (see note 1.2 and note 3.d Other
operating income and expense)
(b) Deferred consideration
The JAOTech acquisition agreement further provides for a deferred consideration of 1 million euro, recognized as liability in 2012. As the deferred
consideration is payable early 2014, the 1 million euro is presented on the line ‘Other current liabilities’.
(c) Vendor loan
Upon acquisition of projectiondesign, a vendor loan of 12.3 million euro (103.1 million NOK) was taken over and will have to be paid to the former
shareholders of projectiondesign.
The other long-term liabilities, excluding the current portion of the long-term liabilities, are repayable as follows:
Per 31 December 2013 Per 31 December 2012 Per 31 December 2011
Payable in 2015 8,798 Payable in 2014 3,914 Payable in 2013 2,533
Payable in 2016 3,527 Payable in 2015 3,140 Payable in 2014 2,533
Payable in 2017 0 Payable in 2016 0 Payable in 2015 33
Payable in 2018 0 Payable in 2017 0 Payable in 2016 33
Later 2,997 Later 3,108 Later 2,985
Total long-term debts 15,322 Total long-term debts 10,161 Total long-term debts 8,117
211Barco | annual report 2013 | Barco consolidated

17. EQUITY ATTRIBUTABLE TO EQUITY HOLDERS OF THE PARENT
IN THOUSANDS OF EURO 2013 2012 2011
Share capital 55,533 54,631 54,532
Share premium 142,235 135,425 134,381
Share-based payments 6,273 4,936 4,154
Acquired own shares -44,250 -45,641 -45,641
Retained earnings 467,370 427,107 345,348
Cumulative translation adjustment -51,561 -37,227 -30,546
Derivatives -657 -1,181 -1,524
Equity attributable to equity holders of the parent 574,943 538,050 460,703
1. SHARE CAPITAL AND SHARE PREMIUM
The following capital increases took place in 2013:
» Through the exercise of 206,783 warrants into the same number of
new shares on 24 June 2013 with a resulting increase of the statutory
capital of 887 (‘000) euro and an increase of the share premium
account of 6.713 (‘000) euro.
» Through the exercise of 2,331 warrants into the same number of new
shares on 20 September 2013 with a resulting increase of the statutory
capital of 8 (‘000) euro and an increase of the share premium account
of 67 (‘000) euro.
» Through the exercise of 1,669 warrants into the same number of new
shares on 20 December 2013 with a resulting increase of the statutory
capital of 7 (‘000) euro and an increase of the share premium account
of 32 (‘000) euro.
As a result thereof the company’s share capital amounts to 55.5 million
euro on 31 December 2013, consisting of 12,988,829 fully paid shares.
The share premium amounts to 142.2 million euro.
2. SHARE-BASED PAYMENTS
On 16 September 2013, 3 new option plans have been approved by the
Board of Directors. These 3 option plans entitled the Board of Directors
to grant maximum 149,050 stock options before 31 December 2013.
Each stock option gives right to the acquisition of one (1) share. In 2013,
124,550 stock options have been granted to employees and management
of the group based upon these option plans. On 31 December 2013, no
options remained available for distribution under the 2013 stock option
schemes given the expiry dates of the plans per 31 December 2013.
Warrants exercisable under the warrant and stock option plans
The total number of outstanding warrants on 31 December 2013
amounted to 211,823 which can lead to the creation of 211,823 new
shares. Since 2010, stock options have been granted. The total number of
outstanding stock options on 31 December 2013 amounted to 397,505. The
company’s own shares will be used under the outstanding stock option
plan to fulfill the commitment. During 2013, 210,783 warrants and 22,750
stock options have been exercised; in 2012, 23,370 warrants have been
exercised; in 2011 84,721 warrants were exercised. These warrants and
stock options may be exercised the earliest 3 years after the allocation
date over a period of maximum 10 years and during a couple of fixed
periods over the year. Below an overview is given of the outstanding
warrant and stock option plans:
212 Barco | annual report 2013 | Barco consolidated

(1) For a large number of warrants this last exercise date was extended with three (3) years according to article 407 of the law of 24 December 2002(2) Deviation of exercise price as a result of the implementation of the UK sub plan(3) Deviation of exercise price as a result of the implementation of the US sub plan
Allocation date End termExercise price
(in euro) Balance on31 Dec 2012
Granted in 2013
Exercised in 2013
Cancelled in 2013
Expiredin 2013
Balance on31 Dec 2013
Warrants
09/16/99 09/15/091 93.58 - - - - - -
07/13/00 07/12/101 91.92 128,459 - -67 - -128,392 -
06/18/02 06/17/121 42.01 23,082 - -13,866 - -60 9,156
06/24/022 06/23/12 40.55 - - - - - -
11/04/02 11/03/121 42.40 3,400 - -3,400 - - -
06/23/03 06/22/13 50.75 37,019 - -26,907 - -10,112 -
06/23/032 06/22/13 50.50 380 - -300 - -80 -
09/15/03 09/14/13 57.52 800 - - - -800 -
03/29/04 03/28/14 67.00 57,572 - -1,670 - -82 55,820
03/29/042 03/28/14 66.50 585 - -30 - - 555
09/12/052 11/09/15 60.51 52,227 - -10,108 - -90 42,029
09/12/05 11/09/15 63.15 1,210 - -160 - - 1,050
09/12/053 11/09/15 61.35 8,470 - -2,300 - -80 6,090
11/09/06 11/08/16 65.05 59,956 - -5,575 - -285 54,096
11/09/062 11/08/16 66.15 1,155 - -80 - - 1,075
11/12/07 11/11/17 50.68 66,045 - -40,340 - -200 25,505
11/12/072 11/11/17 51.53 2,737 - -800 - - 1,937
12/15/07 12/14/17 50.48 20,970 - -20,970 - - -
05/28/09 05/27/19 19.62 85,700 - -74,110 -200 - 11,390
05/28/092 05/27/19 24.00 12,920 - -9,700 - -100 3,120
05/28/093 05/27/19 23.57 400 - -400 - - -
Total number of warrants 563,087 - -210,783 -200 -140,281 211,823
Stock options
10/28/10 10/27/15 35.85 32,300 - -8,500 -100 - 23,700
10/28/10 10/27/20 35.85 34,750 - - - - 34,750
10/28/103 10/27/15 41.75 20,600 - -14,250 - -100 6,250
10/28/11 10/27/16 36.65 31,900 - - -650 - 31,250
10/28/11 10/27/21 36.65 29,435 - - -100 - 29,335
10/28/113 10/27/16 41.70 27,415 - - -250 - 27,165
10/31/12 10/30/22 52.37 55,260 - - - - 55,260
10/31/12 10/30/20 52.37 26,860 - - -200 - 26,660
10/31/122 10/30/22 53.28 2,000 - - - - 2,000
10/31/123 10/30/20 53.00 36,935 - - -350 - 36,585
10/21/13 10/20/23 59.03 - 58,350 - - - 58,350
10/21/13 10/20/21 59.03 - 29,900 - - - 29,900
10/21/133 10/20/21 60.94 - 36,300 - - - 36,300
Total number of stock options 297,455 124,550 -22,750 -1.650 -100 397,505
213Barco | annual report 2013 | Barco consolidated

The cost of these warrant/stock option plans is included in the income
statement. The warrants/stock options are valued at grant date, based on
the share price at grant date, exercise price, expected volatility, dividend
estimates and interest rates. The warrant/stock option cost is taken into
result on a straight-line basis from the grant date until the first exercise
date. The share-based payment expenses amounted to 1.3 million euro
in 2013 (2012: 0.8 million euro; 2011: 0.7 million euro; 2010).
4. ACQUIRED OWN SHARES
Barco did not acquire own shares in 2013, 2012 and 2011. Barco sold
21,807 own shares upon the exercise of 21,807 stock options per 24 June
2013 with a resulting decrease of the own shares of 1,332 (‘000) euro, 600
own shares through the exercise of 600 stock options per 20 September
2013 with a resulting decrease of the own shares of 36 (‘000) euro and
350 own shares through the exercise of 350 stock options per 20 Decem-
ber 2013 with a resulting decrease of the own shares of 22 (‘000) euro.
The number of own shares acquired by Barco NV up to 31 December 2013
therefore decreased to 715,206 own shares (2012: 737,963, 2011: 737,963).
5. RETAINED EARNINGS
The change in retained earnings includes the net income of 2013 and
the distribution of 16.9 million euro dividend, as approved by the general
shareholders meeting of 25 April 2013.
6. CUMULATIVE TRANSLATION ADJUSTMENT
In 2013, exchange differences on translation of foreign operations have a
negative impact of 14.3 million, mainly relating to the Indian Rupee (4.8
million euro), US Dollar (2.3 million euro), Norwegian Krone (2 million
euro), Australian Dollar (1.4 million euro) and Taiwan Dollar (1.2 million
euro).
In 2012, exchange differences on translation of foreign operations have
a negative impact of 6.7 million euro, mainly relating to the liquidation
of the investment in Czech, Barco Manufacturing SRO, resulting in the
realization of the foreign currency translation for an amount of 3.7mil-
lion euro positive impact on the result of the year (see note 3 (d)). The
remaining negative exchange differences mainly relate to the Indian
Rupee (1.8 million euro negative impact on equity) and the American
dollar (0.7 million euro negative impact on equity).
In 2011, exchange differences on translation of foreign operations have
a negative impact on the consolidated equity of 1.8 million euro, mainly
relating to the Indian Rupee (4.2 million euro negative impact on equity)
offset by 1.1 million euro positive impact of the American dollar and the
1.3 million euro of the Chinese Yen.
7. DERIVATIVES
Derivative financial instruments are disclosed in note 20.
18. TRADE PAYABLES AND ADVANCES RECEIVED FROM CUSTOMERS
(a) DPO = trade payables / (material cost + services and other costs + inventory movement + purchases of (in)tangible fixed assets) x 365
(b) Most payment terms of customers define that 30% of the total invoice needs to be prepaid before delivery of the goods. The increase in 2013 is
caused by the change in consolidation method of CFG Barco and the acquisition of projectiondesign, as both entities have important amounts of advances.
IN THOUSANDS OF EURO 2013 2012 2011
Trade payables 114,133 127,528 110,791
Days payable outstanding (DPO) (a) 52 57 54
Advances received from customers (b) 93,562 73,587 55,748
214 Barco | annual report 2013 | Barco consolidated
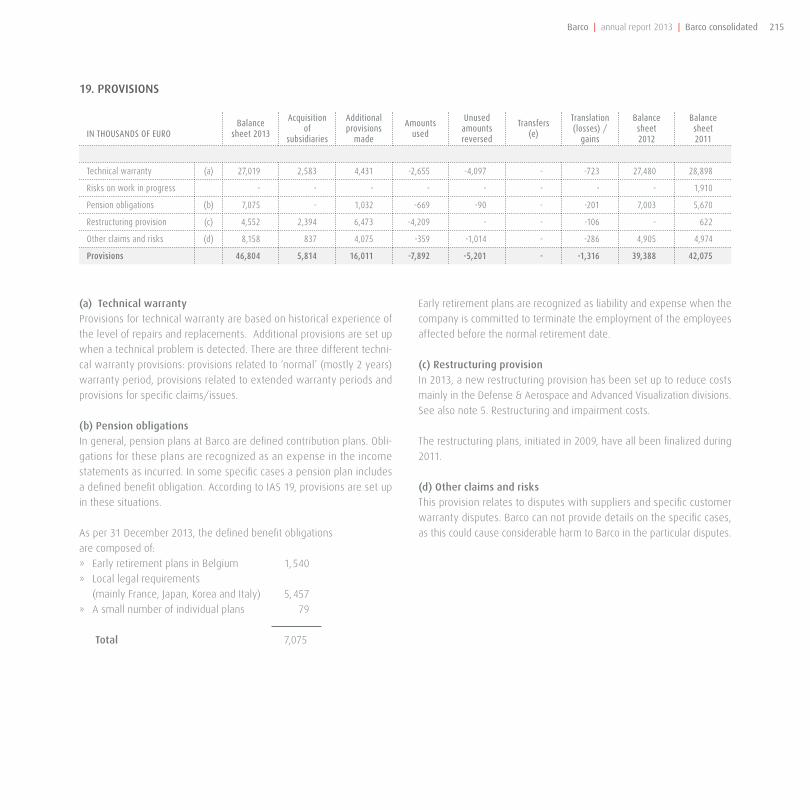
IN THOUSANDS OF EUROBalance
sheet 2013
Acquisitionof
subsidiaries
Additionalprovisions
made
Amountsused
Unusedamountsreversed
Transfers(e)
Translation (losses) /
gains
Balancesheet2012
Balancesheet2011
Technical warranty (a) 27,019 2,583 4,431 -2,655 -4,097 - -723 27,480 28,898
Risks on work in progress - - - - - - - - 1,910
Pension obligations (b) 7,075 - 1,032 -669 -90 - -201 7,003 5,670
Restructuring provision (c) 4,552 2,394 6,473 -4,209 - - -106 - 622
Other claims and risks (d) 8,158 837 4,075 -359 -1,014 - -286 4,905 4,974
Provisions 46,804 5,814 16,011 -7,892 -5,201 - -1,316 39,388 42,075
(a) Technical warranty
Provisions for technical warranty are based on historical experience of
the level of repairs and replacements. Additional provisions are set up
when a technical problem is detected. There are three different techni-
cal warranty provisions: provisions related to ‘normal’ (mostly 2 years)
warranty period, provisions related to extended warranty periods and
provisions for specific claims/issues.
(b) Pension obligations
In general, pension plans at Barco are defined contribution plans. Obli-
gations for these plans are recognized as an expense in the income
statements as incurred. In some specific cases a pension plan includes
a defined benefit obligation. According to IAS 19, provisions are set up
in these situations.
As per 31 December 2013, the defined benefit obligations
are composed of:
» Early retirement plans in Belgium 1, 540
» Local legal requirements
(mainly France, Japan, Korea and Italy) 5, 457
» A small number of individual plans 79
Total 7,075
Early retirement plans are recognized as liability and expense when the
company is committed to terminate the employment of the employees
affected before the normal retirement date.
(c) Restructuring provision
In 2013, a new restructuring provision has been set up to reduce costs
mainly in the Defense & Aerospace and Advanced Visualization divisions.
See also note 5. Restructuring and impairment costs.
The restructuring plans, initiated in 2009, have all been finalized during
2011.
(d) Other claims and risks
This provision relates to disputes with suppliers and specific customer
warranty disputes. Barco can not provide details on the specific cases,
as this could cause considerable harm to Barco in the particular disputes.
19. PROVISIONS
215Barco | annual report 2013 | Barco consolidated

FOREIGN CURRENCY RISK
Recognized assets and liabilities
Barco incurs foreign currency risk on recognized assets and liabilities
when they are denominated in a currency other than the company’s local
currency. Such risks may be naturally covered when a monetary item
at the asset side (such as a trade receivable or cash deposit) in a given
currency is matched with a monetary item at the liability side (such as
a trade payable or loan) in the same currency.
Forward exchange contracts and selectively option contracts are used to
manage the currency risk arising from recognized receivables and pay-
ables, which are not naturally hedged. This is particularly the case for the
USD (and USD-related currencies), for which receivables are systematically
higher than payables. No hedge accounting is applied to these contracts.
The balances on foreign currency monetary items are valued at the rates
of exchange prevailing at the end of the accounting period. Derivative
financial instruments that are used to reduce the exposure of these bal-
ances are rated in the balance sheet at fair value. Both changes in foreign
currency balances and in fair value of derivative financial instruments are
recognized in the income statement.
Forecasted transactions
Barco selectively designates forward contracts to forecasted sales. Hedge
accounting is applied to these contracts. The portion of the gain or loss
on the hedging instrument that will be determined as an effective hedge
is recognized directly in comprehensive income. On 31 December 2013,
there were no forward contracts outstanding under hedge accounting
treatment.
Estimated sensitivity to currency fluctuations
Main sensitivity to currency fluctuations is related to the evolution of
the USD versus the euro. This sensitivity is caused by following factors:
» The fair value of foreign currency monetary items is impacted by
currency fluctuations. In order to eliminate most of these effects in
USD and USD-related currencies, Barco uses monetary items and/or
derivative financial instruments as described above, which are meant
to offset the impact of such results to a major extent. Impact on
operating result is currently estimated at about 2 million euro when
the year-end USD-rate changes with 10% compared to the beginning
of a period, exclusive of the mitigating hedge impact.
» As the company has no cash flow hedges in place that aim at
hedging forecasted transactions, a similar currency fluctuation in USD
rates would not have any effect on the equity position of Barco.
» Profit margins may be negatively affected because an important part
of sales are realized in USD or USD-related currencies, while costs are
incurred to a smaller part in these currencies. Impact on operating
result is currently estimated at 18 million euro when the average
USD-rate in a year changes with 10%. Barco has done great efforts
in recent years to increase its natural hedging against the USD by
increasing its operational costs in USD or USD-related currencies and
by purchasing more components in these currencies. The natural
hedge ratio of Barco reached in 2013 a level close to 65%.
» Another impact is the fact that some of Barco’s main competitors are
USD-based. Whenever the USD decreases in value against the euro,
these competitors have a worldwide competitive advantage over
Barco. This impact on operating result cannot be measured reliably.
20 RISK MANAGEMENT - DERIVATIVE FINANCIAL INSTRUMENTS
General risk factors are described in the director’s report ‘Risk Factors’.
Derivative financial instruments are used to reduce the exposure to fluctuations in foreign exchange rates and interest rates. These instruments are
subject to the risk of market rates changing subsequent to acquisition. These changes are generally offset by opposite effects on the item being hedged.
216 Barco | annual report 2013 | Barco consolidated

INTEREST RATE RISK
Barco uses following hedging instruments to manage its interest rate risk:
Swap on outstanding or anticipated borrowing
Barco has an outstanding variable loan of 5.1 million US dollar (3.7 mil-
lion euro) in place, of which variable interest rate conditions have been
swapped into a fixed 3.86%.
Barco also concluded an interest rate swap of 5.7 million euro by means
of a pre-hedge of expected future drawings under the 30 million euro
bilateral committed Credit Facilities that aim at financing Barco’s new
HQ campus. This instrument swaps the variable interest rate into a fixed
2.45%.
Both swaps are determined as an effective hedge of outstanding or
anticipated borrowings and meet the hedging requirements of IAS 39.
The fair values of the effective portion of the hedging instrument are
therefore recognized directly in comprehensive income under hedge
accounting treatment.
As the US dollar swap is only partially hedge effective, the fair value of the
swap for its non-effective portion (difference between notional amount
of 9.4 million US dollar or 6.8 million euro equivalent and outstanding
loan amount) is recognized in the income statement.
Estimated sensitivity to interest rate fluctuations
Management doesn’t expect the short-term interest rate to increase
significantly in the immediate foreseeable future, which limits the interest
exposure on the short-term debt portfolio.
With reference to the Fair Values table below, more than 90% of Barco’s
outstanding long-term debt portfolio has a fixed interest rate charac-
ter, which again limits the exposure of the company to interest rate
fluctuations. This ratio increases to over 95% when including the swap
instruments disclosed above.
CREDIT RISK
Credit risk on accounts receivable
Credit evaluations are performed on all customers requiring credit over
a certain amount. The credit risk is monitored on a continuous basis.
In a number of cases collateral is being requested before a credit risk is
accepted. Specific trade finance instruments such as letters of credit and
bills of exchange are regularly used in order to minimize the credit risk.
In 2013, Barco continued to conclude credit insurances in order to cover
credit risks on specific customers with whom Barco entered into vendor
financing agreements. Such vendor financing agreements are concluded
and monitored on a case by case basis.
Credit risk on liquid securities and short-term investments
A policy defining acceptable counter parties and the maximum risk per
counter party is in place. Short-term investments are done in marketable
securities, cash holdings or in fixed term deposits with reputable banks.
217Barco | annual report 2013 | Barco consolidated

IN THOUSANDS OF EURO 2013 2012 2011
Carrying amount / Fair value (approx,)
Financial assets
Trade receivables 177,467 183,082 187,114
Other receivables 44,102 29,053 35,197
Loan and other receivables 43,888 28,198 35,157
Interest rate swap - - 0
Currency rate swap 214 855 40
Other non-current assets 14,286 18,041 19,134
Cash and short-term deposits 156,545 122,139 79,165
Total 392,400 352,315 320,610
Financial liabilities
Financial debts 38,121 15,453 18,492
Floating rate borrowings 3,686 5,730 8,605
Fixed rate borrowings 34,435 9,723 9,887
Other debts 15,322 10,161 8,117
Short-term debts 11,657 1,302 6,593
Trade payables 114,133 127,528 110,791
Dividends payable 2,105 2,121 2,946
Interest rate swap 1,129 17 1,843
Other liabilities 10,994 8,241 8,045
Total 193,462 164,823 156,825
FAIR VALUES
Set out below is an overview of the carrying amounts of the group’s financial instruments that are showing in the financial statements. In general, the
carrying amounts are assumed to be a close approximation of the fair value.
The fair value of the financial assets and liabilities is defined as the amount at which the instrument could be exchanged in a current transaction
between willing parties, other than in a forced or liquidation sale.
The following methods and assumptions were used to estimate the fair values:
» Cash and short-term deposits, trade receivables, trade payables, and other current liabilities approximate their carrying amounts largely due to the
short-term maturities of these instruments.
» Long term fixed rate and variable rate other assets are evaluated by the Group based on parameters such as interest rates, specific country risk
factors, individual creditworthiness of the customer and the risk characteristics of the financed project. Based on this evaluation, allowances
are taken to account for the expected losses of these receivables. As at 31 December 2013, the carrying amounts of such receivables, net of
allowances, are assumed not to be materially different from their calculated fair values.
218 Barco | annual report 2013 | Barco consolidated

» The fair value of unquoted instruments, loans from banks and other financial liabilities, obligations under finance leases as well as other non-
current financial liabilities is estimated by discounting future cash flows using the effective interest rates currently available for debt on similar
terms, credit risk and remaining maturities. As at 31 December 2013, the effective interest rate is not materially different from the nominal
interest rate of the financial obligation.
» The group enters into derivative financial instruments with various counterparties, principally financial institutions with investment grade credit
ratings. Derivatives valued using valuation techniques with market observable inputs are mainly interest rate (cap/floor) swaps and foreign
exchange forward contracts. The most frequently applied valuation techniques include forward pricing and swap models, using present value
calculations. The models incorporate various inputs including foreign exchange spot and forward rates and interest rate curves.
FAIR VALUE HIERARCHY
As at 31 December 2013, the Group held the following financial instruments measured at fair value:
The group uses the following hierarchy for determining and disclosing the fair value of financial instruments by valuation technique:
Level 1: quoted (unadjusted) prices in active markets for identical assets or liabilities
Level 2: other techniques for which all inputs which have a significant effect on the recorded fair value are observable, either directly or indirectly
Level 3: techniques which use inputs which have a significant effect on the recorded fair value that are not based on observable market data.
All fair values mentioned in the above table relate to Level 2.
During the reporting period ending 31 December 2013, there were no transfers between Level 1 and Level 2 fair value measurements, and no
transfers into and out of Level 3 fair value measurements.
IN THOUSANDS OF EURO 2013 2012 2011
Assets measured at fair value
Financial assets at fair value through profit or loss
Foreign exchange contracts - non-hedged 276 140 467
Interest rate swap - - -
Financial assets at fair value through equity
Foreign exchange contracts - hedged - - -
Liabilities measured at fair value
Financial liabilities at fair value through profit or loss
Foreign exchange contracts - non-hedged 62 784 428
Interest rate swap 534 690 317
Financial liabilities at fair value through equity
Foreign exchange contracts - hedged - - -
Interest rate swap 630 1,162 1,526
219Barco | annual report 2013 | Barco consolidated

CAPITAL MANAGEMENT
Management evaluates its capital needs based on following data:
In 2013, Barco had another year of solid cash flow generation, which has led to a net cash position consolidating at a level of 104.4 million euro per 31
December 2013 compared to 111.2 million euro as per end of 2012, even after the acquisition activity elsewhere disclosed. Also, the solvency position
and other current ratios consolidated at very healthy levels.
Together with the in 2013 enlarged and extended committed credit facilities, management considers that it has secured a very healthy liquidity profile
and strong capital base for the further development of the group.
21. OPERATING LEASES
Non-cancellable operating leases mainly relate to leases of factory facilities, warehouses and sales offices. During the current year, the total rent
expenses recognized in the income statement amounted to 16.7 million euro, whereof 9.7 million euro relating to rent of buildings.
IN THOUSANDS OF EURO 2013 2012 2011
Net financial cash / (debt) 104,435 111,166 61,635
Equity 579,366 538,050 460,703
% Net financial cash (debt) / Equity 18,0% 20,7% 13,4%
IN THOUSANDS OF EURO 2012 2011 2010
Equity 579,366 538,050 460,703
Total equity and liabilities 1,047,822 921,879 814,567
% Equity / Total equity and liabilities 55,3% 58,4% 56,6%
IN THOUSANDS OF EURO 2013 2012 2011
Non-cancellable operating leases are payable as follows:
Less than one year 6,916 6,282 5,850
Between one and five years 13,705 10,320 7,209
More than five years 20,605 4,774 -
Total 41,226 21,376 13,059
220 Barco | annual report 2013 | Barco consolidated

22. RIGHTS AND COMMITMENTS NOT REFLECTED IN THE BALANCE SHEET
(a) Guarantees given to third parties mainly relate to guarantees given to customers for ongoing projects, guarantees given to suppliers for investment
projects and to authorities for commitments related to VAT, duties, etc.
(b) The outstanding debts guaranteed by the mortgage obligations amount to 3.7 million euro per 31 December 2013.
(c) Barco appeals on a vendor-lease program with the obligation to take back sold goods, in case of insolvency of the client. No buy-back provision is
set up for this risk as all risks and rewards are transferred upon the sale. Total possible value of the obligation to take back sold goods has decreased
to 5.7 million euro (2012: 7.7 million euro, 2011: 10.3 million euro in 2011).
(d) This relates to the HQ One Campus project.
23. RELATED PARTY TRANSACTIONS
For more information with respect to remuneration for directors and members of the executive management, we refer to the ‘Corporate governance’
chapter on of the annual report.
IN THOUSANDS OF EURO 2013 2012 2011
Guarantees given to third parties (a) 10,703 11,566 19,303
Mortgage obligations given as security (b)
» book value of the relevant assets 2,555 3,001 3,600
» total of the mortgage 6,798 8,345 9,629
Buy back obligations (c) 5,684 7,673 10,258
Purchase commitment (d) 29,400 - -
221Barco | annual report 2013 | Barco consolidated

24. CASH FLOW STATEMENT: EFFECT OF ACQUISITIONS AND DISPOSALS
The table below shows the effect of acquisitions and disposals on the balance sheet movement of the group. The 2013 acquisition relates to the
projectiondesign and AWIND business combinations. The 2012 acquisition relates to the IPVS and JAOTech business combinations. The 2011 acquisition
fully relates to the CineStore asset deal. See Note 1.2 for more information on these acquisitions.
The total purchase price in 2013 relates to the acquisition of projectiondesign of 50.8 million euro, the acquisition of AWIND of 51.6 million euro and
current year’s earn-out payment on the 2010 Fimi acquisition for an amount of 2.5 million euro.
The cash flow statement acquisitions show net of acquired cash of projectiondesign and AWIND and the cash received via the change in consolidation
method of the Chinese joint venture (in total 20 million euro) and excluding the amount paid at the end of 2012 on the acquisition of projectiondesign
of 33.4 million euro.
The total purchase price in 2012 relates to the acquisition of the IP Video Systems activities of 20 million USD and the JAOTech acquisition for an amount
of 9.6 million euro upfront payment and the 2012 earn-out payment on the 2010 Fimi acquisition for an amount of 2.5 million euro.
The total purchase price in 2011 relates to the acquisition of the CineStore activities of 6.4 million euro and the 2011 earn-out payment on the 2010
Fimi acquisition for an amount of 2.9 million euro.
IN THOUSANDS OF EURO ACQUISITIONS DISPOSALS
2013 2012 2011 2013 2012 2011
Non-current assets 45,442 5,733 5,690 - - -
Capitalized development cost - 387 - - -
Customer list 12,124 - - - - -
Know-how 19,149 4,882 4,702 - - -
Leased building 11,782
Tangible assets and other intangible assets 1,231 4 600 - - -
Deferred tax assets 846 - - - -
Other non-current assets 1,155 - - - - -
Current assets 28,167 9,603 2,859 - - -
Inventory 14,648 2,745 2,714 - - -
Trade debtors & other receivables 13,519 6,858 145 - - -1,992
Other current assets
Non-current liabilities 42,079 5,090 2,547 - - -
Long-term debts, interest-bearing liabilities 33,745 4,000 - - - -
Deferrred tax liabilities 3,886 164 - - - 3,452
Provisions 4,448 927 2,547 - - -
Current liabilities 5,768 10,707 -2,672 - - -
Trade payables 523 6,989 225 - - -
Other payables 5,245 3,718 -2,897 - - -
Net-identifiable assets and liabilities 25,763 -461 8,673 - - -
Goodwill on acquisitions 77,398 27,574 1,690 - - -
Received/(paid) consideration - - - - -1,460
Acquired cash 1,792 882 - - - -
Purchase price 104,953 27,994 10,363 - - -
222 Barco | annual report 2013 | Barco consolidated

The 2011 disposals relate to the remaining part of the sales price of the 2009 divestment of Barco’s Advanced Visualization (AVIS) business, which was
put in escrow and received in 2011, and the taxes paid in 2011 on the plus value realized on this sale.
We refer to the Cash flow statement and note 1.2 on acquisitions.
Goodwill and fair value adjustments arising on the acquisition of a foreign entity are carried in terms of historical cost using the exchange rate at the
date of the acquisition.
25. EVENTS SUBSEQUENT TO THE BALANCE SHEET DATE
There are no major events subsequent to the balance sheet date which have a major impact on the further evolution of the company.
AUDITOR’S REPORTSTATUTORY AUDITOR’S REPORT TO THE GENERAL MEETING OF SHARE-
HOLDERS OF BARCO NV ON THE CONSOLIDATED FINANCIAL STATEMENTS
FOR THE YEAR ENDED 31 DECEMBER 2013
In accordance with the legal requirements, we report to you on the
execution of our mandate as statutory auditor. This report contains our
opinion on the consolidated balance sheet as of 31 December 2013,
the consolidated income statement, consolidated statement of realized
and unrealized income, consolidated statement of changes in equity,
and consolidated cash flow statement for the year ended 31 December
2013, and on the notes, and includes the required additional statements.
REPORT ON THE CONSOLIDATED FINANCIAL STATEMENTS - UNQUALIFIED OPINIONWe have audited the consolidated financial statements of Barco NV (‘the
Company’) and its subsidiaries (jointly ‘the Group’) for the year ended
31 December 2013, prepared in accordance with International Financial
Reporting Standards as adopted by the European Union, with a balance
sheet total of €1,047,822,000 and net income (attributable to the equity
holders of the parent) of €57,119,000.
Responsibility of the Board of Directors for the preparation of the
consolidated financial statements
The Board of Directors is responsible for the preparation and fair pre-
sentation of the consolidated financial statements in accordance with
International Financial Reporting Standards as adopted by the European
Union, and for the implementation of internal control that it considers
necessary for the preparation of financial statements that are free from
material misstatement, whether due to fraud or error.
Responsibility of the statutory auditor
Our responsibility is to express an opinion on these consolidated financial
statements based on our audit. We conducted our audit in accordance
with the International Standards on Auditing (ISA). Those standards
require us to comply with the ethical requirements and plan and perform
the audit to obtain reasonable assurance that the financial statements
are free from material misstatement.
223Barco | annual report 2013 | Barco consolidated

An audit involves performing procedures to obtain audit evidence about
the amounts and disclosures in the consolidated financial statements.
The procedures selected depend on the statutory auditor’s judgment,
including the assessment of the risks of material misstatement of the
consolidated financial statements, whether due to fraud or error. In making
those risk assessments, the statutory auditor considers internal controls
relevant to the Group’s preparation and fair presentation of the consol-
idated financial statements in order to design audit procedures that are
appropriate in the circumstances, but not for the purpose of expressing
an opinion on the effectiveness of the Group’s internal control. An audit
also includes evaluating the appropriateness of accounting policies used,
the reasonableness of significant accounting estimates made by the Board
of Directors, and the presentation of the consolidated financial statements
taken as a whole.
We have obtained from the Board of Directors and the company’s and
group’s officials the explanations and information necessary for per-
forming our audit.
We believe that the audit evidence we have obtained is sufficient and
appropriate to provide a basis for our opinion.
Unqualified opinion
In our opinion, the consolidated financial statements of the Company
for the year ended 31 December 2013 give a true and fair view of the
Group’s financial position as at 31 December 2013 and of the results of its
operations and its cash flows in accordance with the International Financial
Reporting Standards as adopted by the European Union.
Report on other legal and regulatory requirements
The preparation and the assessment of the information that should be
included in the directors’ report on the consolidated financial statements
are the directors’ responsibility.
ADDITIONAL COMMENTS
Within the context of our mandate, it is our responsibility to report, in all
material respects, our findings with regard to certain legal and regulatory
obligations. On this basis, we make the following comment, which does
not modify the scope of our opinion on the financial statements:
The directors’ report on the consolidated financial statements includes
the information required by law and is consistent with the consolidated
financial statements and does not contain any inconsistencies with the
information that we became aware of during the execution of our man-
date.
Ghent, 4 February 2014
Ernst & Young Auditors BCVBA
Statutory auditor
represented by
Lieve Cornelis Marnix Van Dooren
Partner Partner
224 Barco | annual report 2013 | Barco consolidated

BARCO NV
SUMMARY VERSION OF STATUTORY ACCOUNTS BARCO NV
The financial statements of the parent company, Barco NV, are presented
below in a condensed form.
The accounting principles used for the statutory annual accounts of Barco
NV differ from the accounting principles used for the consolidated annual
accounts: the statutory annual accounts follow the Belgian legal require-
ments, while the consolidated annual accounts follow the International
Financial Reporting Standards. Only the consolidated annual financial
statements as set forth in the preceding pages present a true and fair
view of the financial position and performance of the Barco Group.
The management report of the Board of Directors to the Annual General
Meeting of Shareholders and the annual accounts of Barco NV, as well
as the Auditor’s Report, will be filed with the National Bank of Belgium
within the statutory periods. These documents are available on request
from Barco’s Investor Relations department, and at www.barco.com.
The statutory auditor’s report is unqualified and certifies that the
non-consolidated financial statements of Barco NV for the year ended
31 December 2013 give a true and fair view of the financial position
and results of the company in accordance with all legal and regulatory
dispositions.
225Barco | annual report 2013 | Barco consolidated

BALANCE SHEET AFTER APPROPRIATION
IN THOUSANDS OF EURO 2013 2012 2011
Non-current assets 861,926 762,327 706,089
Intangible fixed assets 101,503 88,729 63,353
Tangible fixed assets 21,849 23,257 22,536
Financial fixed assets 728,431 637,292 606,238
Amounts receivable after more than one year 10,143 13,049 13,962
Current assets 272,239 312,282 327,388
Stocks and contracts in progress 95,403 113,002 133,222
Amounts receivable within one year 116,713 134,119 134,024
Investments (own shared) 44,431 45,845 45,845
Cash at bank and in hand 209 656 38
Deferred charges and accrued income 15,483 18,660 14,259
TOTAL ASSETS 1,134,165 1,074,609 1,033,477
Equity 444,062 414,118 398,808
Capital 55,534 54,632 54,532
Share premium account 142,726 135,425 134,381
Reserves 50,645 52,058 52,059
Accumulated profits 193,305 170,627 156,503
Investment grants 1,852 1,376 1,333
Provisions and deferred taxes 16,597 15,737 19,656
Provisions for liabilities and charges 16,597 15,737 19,656
Creditors 673,506 644,754 615,013
Amounts payable after more than one year 45,194 34,059 39,421
Amounts payable within one year 628,312 610,695 575,592
TOTAL LIABILITIES 1,134,165 1,074,609 1,033,477
The increase of the intangible fixed assets of 13 million euro in 2013 is mainly caused by the implementation cost of SAP ERP software (10 million
euro increase in 2013 compared to 8.3 million in 2012). The capital expenditures related to the new SAP ERP-software are not yet amortized as the
project is still in the design phase of the global template and no roll-outs have been performed yet. The first roll-out is planned April 2014 in India.
The increase of 91 million euro of financial fixed assets consists the acquisition of the shares of AWIND (56 million euro), the purchase of the remaining
shares in projectiondesign for an amount of 17 million euro (61% of the shares were bought end 2012 for 33 million euro), and the capital increase
of Barco US of 18 million euro.
The liabilities mainly include intercompany debts (466 million euro), for the major part towards Barco Coordination Center NV.
226 Barco | annual report 2013 | Barco consolidated

INCOME STATEMENT
IN THOUSANDS OF EURO 2013 2012 2011
Sales 668,830 745,103 654,512
Operating income/(loss) 30,809 43,681 47,072
Financial result 5,277 -3,710 -5,166
Extra-ordinary result -568 -14,345 12,358
Income taxes 4,158 5,354 9,839
Profit/(loss) for the year 39,676 30,980 64,103
PROPOSED APPROPRIATION OF BARCO NV RESULT
IN THOUSANDS OF EURO 2013 2012 2011
Profit/(loss) for the year for appropriation 39,676 30,980 64,103
Profit brought forward 170,627 156,503 104,881
Profit to be appropriated 210,302 187,483 168,984
Transfer to other reserves 1,413 - -
Profit to be carried forward 193,305 170,627 156,503
Gross dividends 18,410 16,856 12,481
Total 210,302 187,483 168,984
Barco NV sales in 2013 amounts to 669 million euro, which is 10% lower than in 2012, mainly due to decrease in sales in Digital Cinema, but still 2%
higher than the sales realized in 2011. The operating income decreased by 27% in 2013 to 31 million euro, compared to an operating income of 43
million euro in 2012.
The financial results increased from -3.7 million euro in 2012 to +5.3 million euro in 2013 due to dividends received in 2013 for an amount of 8.9 million
euro (5 million euro of Barco Singapore & 3.9 million euro of Barco Silex).
The extra-ordinary result in 2012 of -14 million euro related to the statutory impairment on the investment in Barco AS (Denmark) for an amount of 7.5
million euro and on the investment in JaoTech Ltd for an amount of 7 million euro. In 2013, the extra-ordinary charges of 0.6 million euro are caused
by the realisation loss on own shares through the exercise of stock options.
The profit on Income Taxes of 4 million euro in 2013 and +5 million euro in 2012 is related to a tax credit on research and development expenses.
The Board of Directors of Barco NV proposed a gross dividend of 1.5 euro per share relating to the 2013 result.
227Barco | annual report 2013 | Barco consolidated

Registered office
Pres. Kennedypark 35
BE-8500 Kortrijk
Tel.: +32 (0)56 23 32 11
Fax: +32 (0)56 26 22 62
Group management
Pres. Kennedypark 35
BE-8500 Kortrijk
Tel.: +32 (0)56 23 32 11
Fax: +32 (0)56 26 22 62
Stock exchange
NYSE Euronext Brussels
Financial information
More information can be obtained at the
Investor Relations Department of the group
management:
Carl Vanden Bussche
Director Investor Relations
Tel.: +32 (0)56 26 23 22
Fax: +32 (0)56 26 22 62
E-mail: [email protected]
Copyright© 2014 Barco NV
All rights reserved
Realization
Barco Corporate Marketing
Focus Advertising
Publisher
Carl Peeters
Senior VP-CFO
Barco
President Kennedypark 35
8500 Kortrijk – Belgium
228 Barco | annual report 2013 | Barco consolidated

Annual report 2013
www.barco.com
Bar
co a
nn
ual r
epor
t 20
13


