Embed Size (px)
Citation preview
Annual Report 2013.
Landesbank Baden-Württemberg Landesbank Baden-Württemberg
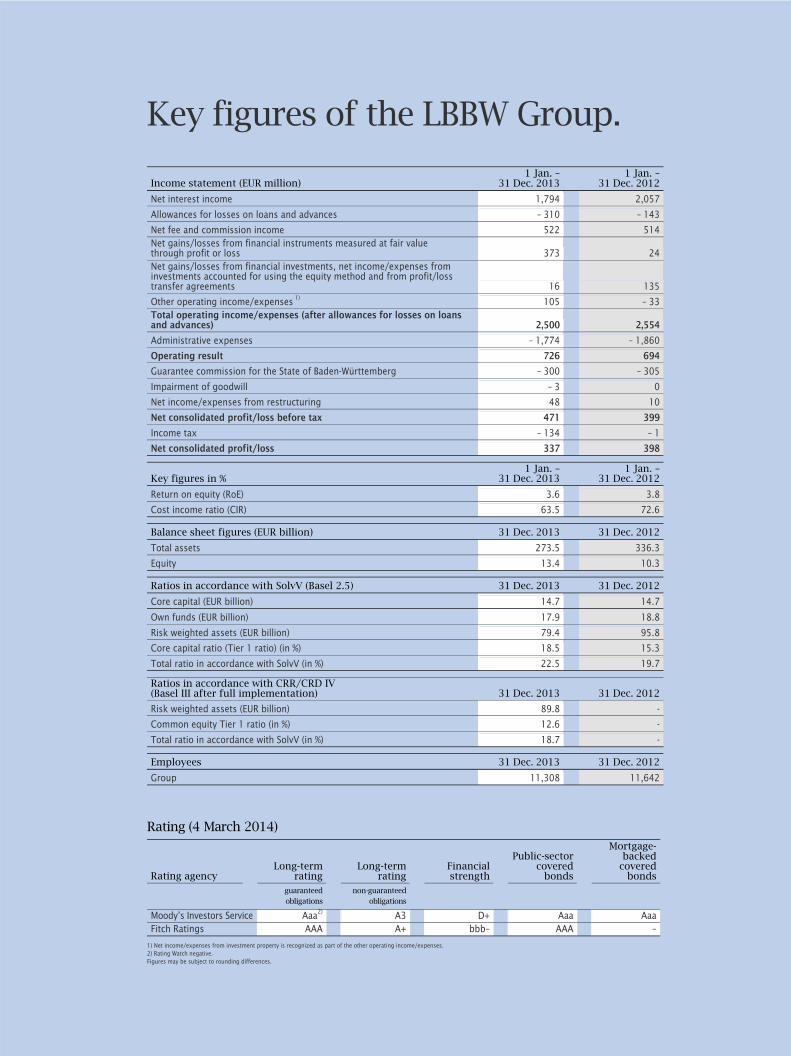
Key figures of the LBBW Group.
Income statement (EUR million) 1 Jan. –
31 Dec. 2013 1 Jan. –
31 Dec. 2012
Net interest income 1,794 2,057
Allowances for losses on loans and advances – 310 – 143
Net fee and commission income 522 514Net gains/losses from financial instruments measured at fair value through profit or loss 373 24Net gains/losses from financial investments, net income/expenses from investments accounted for using the equity method and from profit/loss transfer agreements 16 135
Other operating income/expenses 1) 105 – 33Total operating income/expenses (after allowances for losses on loans and advances) 2,500 2,554
Administrative expenses – 1,774 – 1,860
Operating result 726 694
Guarantee commission for the State of Baden-Württemberg – 300 – 305
Impairment of goodwill – 3 0
Net income/expenses from restructuring 48 10
Net consolidated profit/loss before tax 471 399
Income tax – 134 – 1
Net consolidated profit/loss 337 398
Key figures in % 1 Jan. –
31 Dec. 2013 1 Jan. –
31 Dec. 2012
Return on equity (RoE) 3.6 3.8
Cost income ratio (CIR) 63.5 72.6 Balance sheet figures (EUR billion) 31 Dec. 2013 31 Dec. 2012
Total assets 273.5 336.3
Equity 13.4 10.3 Ratios in accordance with SolvV (Basel 2.5) 31 Dec. 2013 31 Dec. 2012
Core capital (EUR billion) 14.7 14.7
Own funds (EUR billion) 17.9 18.8
Risk weighted assets (EUR billion) 79.4 95.8
Core capital ratio (Tier 1 ratio) (in %) 18.5 15.3
Total ratio in accordance with SolvV (in %) 22.5 19.7 Ratios in accordance with CRR/CRD IV (Basel III after full implementation) 31 Dec. 2013 31 Dec. 2012
Risk weighted assets (EUR billion) 89.8 -
Common equity Tier 1 ratio (in %) 12.6 -
Total ratio in accordance with SolvV (in %) 18.7 - Employees 31 Dec. 2013 31 Dec. 2012
Group 11,308 11,642
Rating (4 March 2014)
Rating agency Long-term
rating Long-term
ratingFinancialstrength
Public-sector covered
bonds
Mortgage-backed
covered bonds
guaranteed
obligations
non-guaranteed
obligations
Moody’s Investors Service Aaa2) A3 D+ Aaa AaaFitch Ratings AAA A+ bbb– AAA –
1) Net income/expenses from investment property is recognized as part of the other operating income/expenses. 2) Rating Watch negative. Figures may be subject to rounding differences.
FOR
EWO
RD
AN
D R
EPO
RT
S C
OM
BIN
ED M
AN
AG
EMEN
T R
EPO
RT
C
ON
SOLI
DA
TED
FIN
AN
CIA
L ST
AT
EMEN
TS
FU
RT
HE
R I
NFO
RM
AT
ION
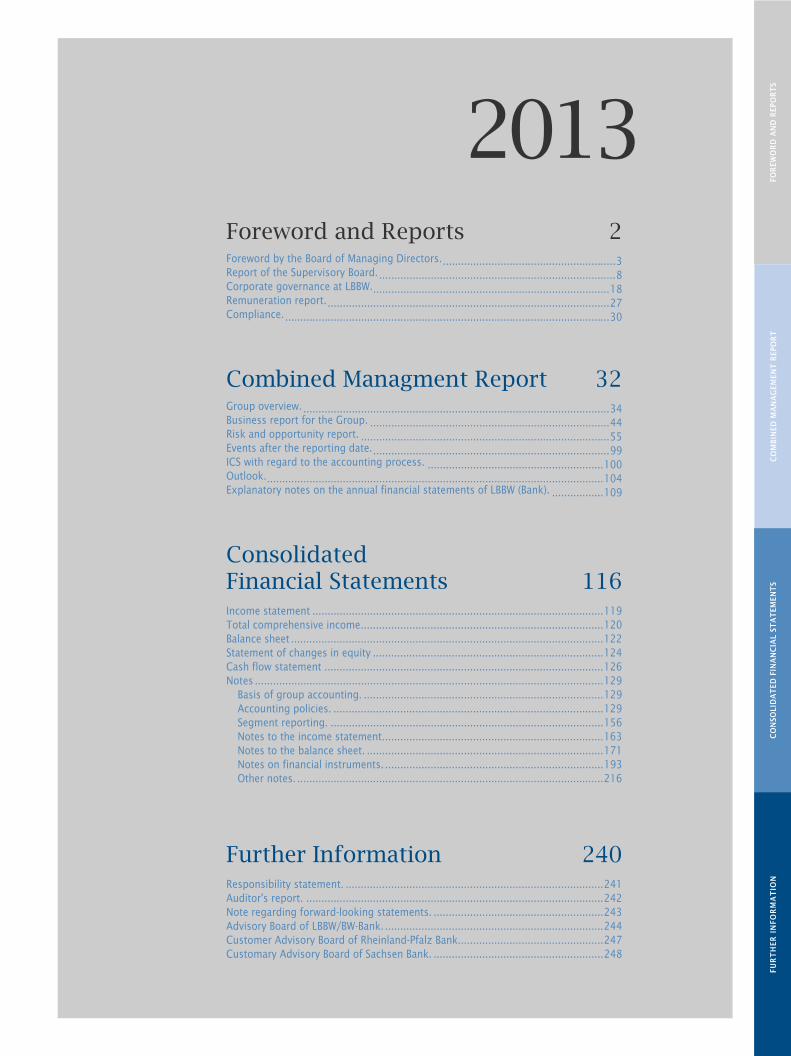
2013 Foreword and Reports 2 Foreword by the Board of Managing Directors..........................................................3 Report of the Supervisory Board. ..............................................................................8 Corporate governance at LBBW...............................................................................18 Remuneration report..............................................................................................27 Compliance............................................................................................................30
Combined Managment Report 32 Group overview. .....................................................................................................34 Business report for the Group. ...............................................................................44 Risk and opportunity report. ..................................................................................55 Events after the reporting date...............................................................................99 ICS with regard to the accounting process. ..........................................................100 Outlook................................................................................................................104 Explanatory notes on the annual financial statements of LBBW (Bank). .................109
Consolidated Financial Statements 116 Income statement ................................................................................................119 Total comprehensive income................................................................................120 Balance sheet .......................................................................................................122 Statement of changes in equity ............................................................................124 Cash flow statement ............................................................................................126 Notes ...................................................................................................................129
Basis of group accounting. ...............................................................................129 Accounting policies. .........................................................................................129 Segment reporting. ..........................................................................................156 Notes to the income statement.........................................................................163 Notes to the balance sheet. ..............................................................................171 Notes on financial instruments. ........................................................................193 Other notes. .....................................................................................................216
Further Information 240 Responsibility statement. .....................................................................................241 Auditor's report. ..................................................................................................242 Note regarding forward-looking statements. ........................................................243 Advisory Board of LBBW/BW-Bank. ........................................................................244 Customer Advisory Board of Rheinland-Pfalz Bank................................................247 Customary Advisory Board of Sachsen Bank. ........................................................248

2
Foreword and Reports.
FOREWORD AND REPORTS — FOREWORD BY THE BOARD OF MANAGING DIRECTORS
FOR
EWO
RD
AN
D R
EPO
RT
S
3
Foreword by the Board of Managing Directors.
Dear customers, dear business partners of the LBBW Group,
Behind us lies another demanding year. Highly competitive markets and
mounting regulatory requirements posed challenges for the entire
banking sector. Even so, LBBW has once again made significant headway.
On a particularly encouraging note, the extensive restructuring activities
begun in 2009 have been successfully completed in all main respects.
We have managed to convert LBBW into a solely customer-driven bank
and have further expanded our customer-related activities. Once again
risks were reduced substantially.
In 2013, we generated net consolidated profit before tax of
EUR 471 million in accordance with IFRS. As a result, we have clearly
achieved our goal of closing the year with a profit. This is a gratifying
result particularly since we had to contend with a number of sources of
strain, such as low interest rates, mounting regulatory costs, the return
to a normal level of allowances for losses on loans and advances, and
our ongoing efforts to run off risks particularly in the credit substitute
business. As of the beginning of the year, we have been able to look back
on a total of eight consecutive profitable quarters. This shows that the
extensive restructuring activities implemented in the wake of the
financial market crisis and the reorientation of our Bank have resulted
in the sustained stabilization that we have been aiming for.
At the level of LBBW (Bank), we generated net profit before taxes and
hybrid capital service of EUR 531 million (in accordance with the
German Commercial Code) in 2013. As a result, we will be able not only
to honor the current interest payments on existing profit-participation
certificates and silent partners' contributions, but also catch up in full
on the outstanding payments omitted in earlier years.
FOREWORD AND REPORTS — FOREWORD BY THE BOARD OF MANAGING DIRECTORS
4
This was particularly important for us in order to justify the trust placed
in the Bank's ability to regenerate itself in this regard as well. After the
discharge of the outstanding past and current interest payments on
hybrid capital, the net profit stands at EUR 72 million.
As in the previous year, all operating segments made a positive
contribution to consolidated net profit in the 2013 financial year. Once
again, the Corporates segment was a core and reliable source of income
for our Bank in 2013. Given difficult underlying conditions in our
corporate customer business, which was dominated by competitive
market conditions and muted borrowing demand, earnings fell short of
the previous year's figure, which, however, had been characterized by a
relatively strong performance and extraordinarily low allowances for
losses on loans and advances. We were gratified by the positive
experience we are enjoying in the wake of our regional growth initiatives
in the corporate customer business.
Earnings in the Retail/Savings Bank segment were slightly up on the
previous year in 2013. In this connection, business with our private
customers once again provided stable underpinnings for our business
performance despite the low interest rates, cost-intensive additional
consumer-protection requirements and intense market competition.
Moreover, our investments aimed at expanding our business with high-
net-worth customers also yielded encouraging results.
The Financial Markets segment in 2013 likewise generated earnings in
excess of the previous year. In addition to a respectable operating
business, this performance was also driven by special factors. In its
current customer-oriented form, the capital market business is an
important source of income and forms a valuable part of our sustained
business model, allowing us to assist our various customers with
bespoke solutions and products.
FOREWORD AND REPORTS — FOREWORD BY THE BOARD OF MANAGING DIRECTORS
FOR
EWO
RD
AN
D R
EPO
RT
S
5
In the course of the year, we again reduced our risk-weighted assets
substantially by running off risk exposure outside our core business on
a systematic and targeted basis. We currently already satisfy the more
stringent future Basel III requirements. Thanks to these measures and
the conversion of the silent partners' contributions held by our owners
in an amount of EUR 2.2 billion as of 1 January 2013, our common
equity Tier 1 ratio on the basis of full implementation of the Basel III
requirements has improved considerably again, standing at 12.6 % as of
31 December 2013. Looking forward, we will be able to continue
supporting the local economy on this basis as a potent finance partner.
At the same time, we are well positioned for the comprehensive bank
review ahead of the transfer of regulatory responsibility to the European
Central Bank. Subject to the necessary approval by the bank regulator,
we still plan to repay hybrid capital worth EUR 1 billion to our owners
this year. This will not have any effect on our common equity Tier 1
ratio under Basel III.
Against the backdrop of the numerous regulatory measures and
demanding market and interest-rate environment, we assume that
conditions in the banking sector will remain challenging in 2014.
Despite this, we are facing the future with some confidence following
the successful completion of our restructuring activities. The fact that
we were able to complete the restructuring phase in 2013 marked an
important step forward for our Bank. Furthermore, we consider the EU
Commission's decision to waive its original requirement of a change in
LBBW's corporate status due to the corporate governance structures
implemented as constituting further acknowledgment of our earnest
restructuring efforts. The far-reaching changes which we have achieved
with our restructuring activities place us in a good competitive position
as a Bank with a business model clearly oriented to customer business
focusing on long-standing relationships, serious products and quality
service and advice. We now want to systematically consolidate and
strengthen this position in the long term. Thereby, we will be continuing
to place great store by risk and cost-conscious activity. Accordingly, we
expect to be able to report substantial profit for 2014 as well.
FOREWORD AND REPORTS — FOREWORD BY THE BOARD OF MANAGING DIRECTORS
6
We would like to take this opportunity to again most sincerely thank all
those who have accompanied and supported us on our arduous course
over the last few years: our employees, our owners and also the many
faithful customers and business partners of our Bank, who have placed
their trust in us even during the difficult restructuring phase, and
vindicated the course that we have taken. It is on this basis that we will
continue our work on developing LBBW (Bank) and the LBBW Group.
Yours sincerely
The Board of Managing Directors
HANS-JÖRG VETTER
Chairman
MICHAEL HORN
Deputy Chairman
KARL MANFRED LOCHNER
INGO MANDT
DR. MARTIN SETZER
VOLKER WIRTH

FOR
EWO
RD
AN
D R
EPO
RT
S
7
FOREWORD AND REPORTS — REPORT OF THE SUPERVISORY BOARD
8
Report of the Supervisory Board.
Ladies and gentlemen,
In the past financial year we advised the Board of Managing Directors of
LBBW on the management of the Company and regularly monitored its
performance. The Board of Managing Directors of Landesbank Baden-
Württemberg regularly informed us on major developments within the
Bank and the Group in 2013 in a regular, timely and comprehensive
manner. We intensively discussed the economic situation of the
individual business units and the business situation of the LBBW Group
with the Board of Managing Directors. Moreover, we were kept abreast of
the risk, liquidity and capital management of the Bank, as well as of
transactions and events of considerable importance for the Bank, and
advised the Board of Managing Directors on these matters. In addition,
we discussed the progress of restructuring with the Board of Managing
Directors, while at the same time critically scrutinizing and monitoring
the corporate governance and planning of LBBW. Between the meetings I,
in my capacity as Chairman of the Supervisory Board, maintained
regular contact with the Chairman of the Board of Managing Directors.
The Supervisory Board was involved in decisions of major importance
for LBBW and, when required, granted its approval after extensive
consultation and examination. The Supervisory Board and its
committees performed the duties entrusted to them in accordance with
the law and the articles of association.
Following an additional review, the EU Commission issued a further
ruling in which it revised its ruling of 15 December 2009 on the
provision of state aid by Germany to restructure Landesbank Baden-
Württemberg stipulating that it was to be converted into a joint-stock
company under German or European law. Under this revised ruling,
LBBW will be able to continue operating as a public-law institution. In
return, broad agreement was achieved on LBBW's governance structure;
among other things, the independence of the Chairman of the
Supervisory Board stipulated in the ruling of 15 December 2009 was
extended beyond his current term of office. LBBW will be reporting on
the observance of these requirements up to and including 2020.
FOREWORD AND REPORTS — REPORT OF THE SUPERVISORY BOARD
FOR
EWO
RD
AN
D R
EPO
RT
S
9
Supervisory Board meetings.
In the year under review, the Supervisory Board held a total of six
meetings, each of which was attended by representatives of the
competent statutory and regulatory authorities.
We critically reviewed the reports of the Board of Managing Directors for
the Supervisory Board and its committees and, in some cases, requested
additional information, which was always provided promptly and to our
satisfaction.
The agendas of all the ordinary meetings of the Supervisory Board
included regular reports by the Board of Managing Directors on the
current situation, recent trends with respect to risk weighted assets,
equity ratios and net exposure to selected eurozone countries as well
as reports by the respective committee chairpersons. Where necessary,
we passed the requisite resolutions in response to changes in the
committees. In 2013, we again deliberated on numerous statutory and
regulatory changes, such as the debates on and impact of the Basel III
resolutions, Ringfencing Act, the EU deposit guarantee system, the
minimum requirements for the design of recovery plans, the Remunera-
tion Ordinance for Institutions and the possible implementation of a
financial transaction tax.
At the meeting on 25 February 2013 we dealt in detail with IT out-
sourcing matters and the Financial Markets segment. In addition, we
approved the issue of letters of comfort as well as changes to the
business allocation plan and deputization arrangements. As well as this,
we deliberated at this meeting on equity issuing business and retail
business matters.
The focus of the meeting on 22 April 2013 comprised the report by the
Board of Managing Directors on the 2012 financial year and approval of
the annual financial statements for 2012 as well as acknowledgement of
the consolidated financial statements for 2012. The resolution passed
was based on the recommendations of the Audit Committee and the
ensuing detailed discussions with the statutory auditor KPMG. In
addition to this, we accepted the proposal by the Audit Committee and
recommended to the annual general meeting that KPMG be appointed as
auditor of the annual financial statements in accordance with Section 36
FOREWORD AND REPORTS — REPORT OF THE SUPERVISORY BOARD
10
of the German Securities Trading Act for financial year 2013. As well as
this, the Supervisory Board acknowledged the supplementary
information on IT outsourcing, approved the IT outsourcing model
submitted and instructed the Board of Managing Directors to implement
the main elements as approved.
At the meeting on 22 July 2013, we acknowledged the contractual
implementation of IT outsourcing and risk measurement, which formed
the basis of the decision concerning IT outsourcing. Thereupon, we dealt
with the amended bylaws for LBBW's Risk Committee and the possibility
of raising subordinate capital, passing the necessary resolutions. The
Supervisory Board additionally acknowledged the detailed report of the
Remuneration Committee for 2012 in accordance with the Remunera-
tion Ordinance for Institutions. As well as this, we approved the
amended business allocation plan for the Board of Managing Directors
and intensively discussed developments and future trends in retail
banking.
At our meeting on 23 September 2013, the matters with which we
concerned ourselves included the expertise required for the minimum
requirements for the design of recovery plans as well as personnel
matters. In addition, the Board of Managing Directors briefed us on
the potential tax implications of transactions executed in the more
distant past.
At our extraordinary meeting on 26 November 2013, we dealt solely
with personnel matters.
At the last meeting of the year on 16 December 2013, we heard the
reports from the subcommittees and, in this connection, dealt with the
Bank's business strategy and the main results of the risk report as at
30 September 2013. In addition, the Supervisory Board approved an
amended business allocation plan for the Board of Managing Directors
of LBBW effective 1 January 2014 – against the backdrop of the
necessary restructuring of risk controlling in accordance with the
minimum requirements for risk management, among other things.
Furthermore, we focused on the business plan for 2014, the medium-
term plan for the years from 2014 through 2018, the personnel strategy,
equity investment matters and issues pertaining to the Board of
FOREWORD AND REPORTS — REPORT OF THE SUPERVISORY BOARD
FOR
EWO
RD
AN
D R
EPO
RT
S
11
Managing Directors. We also dealt with requirements in connection with
the balance sheet assessment, the Remuneration Ordinance for
Institutions and the implementation of the minimum requirements for
the designs of recovery plans.
Supervisory Board committees – adjustments to the structure of
supervisory bodies to satisfy the requirements of CRD IV.
Adjustments were made to the structure of the Supervisory Board's
committees ahead of the amendments to the German Banking Act taking
effect from 1 January 2014.
The Supervisory Board has established a total of four committees from
among its number. In addition to the existing Risk, Audit and Executive
Committees, with the latter assuming the statutory duties of the
Nomination Committee from 1 January 2014, the Supervisory Board
established the Compensation Control Committee also required under
the amended German Banking Act at its meeting on 16 December 2013.
The current membership of the committees is printed on page 16 of this
Annual Report.
The Executive Committee met eight times in the period under review. Its
consultations dealt with the preparation of the meetings of the full
Supervisory Board, especially personnel matters and questions relating
to the remuneration of the Board of Managing Directors, legal issues as
well as strategic matters such as the progress of restructuring at LBBW.
In addition, decisions were made within the core remit of the Executive
Committee.
The Audit Committee held a total of five meetings in 2013. In the
presence of the statutory auditor KPMG, it discussed the annual
financial statements and the consolidated financial statements of LBBW
as well as the audit reports. It obtained the auditor's declaration of
independence and, in accordance with the resolution passed at the
annual general meeting, placed the audit mandate with the statutory
auditor KPMG. The Audit Committee agreed on the main points of the
audit and the fee with the statutory auditor. Furthermore, it discussed
mandates for the statutory auditor for the provision of project-related
services outside the scope of the statutory audit and revised the
FOREWORD AND REPORTS — REPORT OF THE SUPERVISORY BOARD
12
thresholds for compulsory approval by the Supervisory Board for
mandating advisory services. The Audit Committee acknowledged the
expertise and measures for reorganizing Internal Auditing, the
minimum requirements for structuring the design of recovery plans and
compliance. In accordance with its remit, it was briefed in good time on
the tax implications of transactions in the more distant past. In addition,
it discussed the half-yearly financial report with the Board of Managing
Directors and the auditor. The Audit Committee received regular reports
on the current status and results of the audit of annual financial
statements. As well as this, it satisfied itself of the efficacy of internal
control, risk, auditing and compliance systems and monitored the
accounting process. The Audit Committee oversaw the main activities of
the Internal Auditing department and its material and staffing resources.
Representatives of the Bank's Compliance and Internal Auditing
departments reported to the Committee regularly on matters of current
relevance. Likewise, the Audit Committee was kept informed of the
progress of special audits and complaints by the regulatory authorities.
The meetings of the Audit Committee were attended by representatives
of the statutory auditor, who reported on their auditing activities.
In a total of ten meetings, the Risk Committee held in-depth discussions
on the Bank's risk situation and risk management as well as its exposure
requiring disclosure in accordance with the law, the articles of
association and the bylaws, granting its approval where this was
required in individual cases. Specifically, the Committee dealt with the
Bank's credit, market-price, liquidity, equity-investment, legal,
reputation and operational risks, which together with a discussion of the
Bank's risk-bearing capacity formed part of the regular risk reports of
the Board of Managing Directors. The Risk Committee discussed the
business strategy and, based on this, the uniform group risk strategy
with the Board of Managing Directors. Various portfolios were examined
in detail in the light of economic or regulatory developments. This also
included regular reporting on the progress made in winding down
LBBW's credit investment portfolio.
The members of the Supervisory Board were kept regularly informed of
the work of the committees and the resolutions which they passed via the
reports submitted by the respective chairpersons of the committees.
FOREWORD AND REPORTS — REPORT OF THE SUPERVISORY BOARD
FOR
EWO
RD
AN
D R
EPO
RT
S
13
All members of the Supervisory Board attended the meetings of the
Supervisory Board and the committees in 2013 with only a few
exceptions (average attendance 89 %).
Training and development measures.
The members of the Supervisory Board assumed responsibility for
taking part in the training and development measures which they
required to perform their duties. They were given appropriate support
for this by LBBW. In addition to individual development measures, the
Supervisory Board received training from external specialists in a total
of two workshops – »Legal Update for Supervisory Board Members« and
»Latest Trends in Bank Supervision«. As well as this, a preview was given
of upcoming regulatory, accounting and legal issues relevant in 2014.
Annual and consolidated financial statements.
The statutory auditor KPMG audited the annual financial statements and
the consolidated financial statements of LBBW for 2013 including the
management report, issuing an unqualified auditor's certificate. The
annual financial statements were prepared in accordance with the
provisions of the German Commercial Code (Handelsgesetzbuch – HGB)
and the consolidated financial statements in accordance with the
International Financial Reporting Standards (IFRS). The documentation
relating to the financial statements and the principal auditor's reports
were forwarded to all members of the Supervisory Board in good time.
The members of the Audit Committee additionally received the full set
of documents and notes on the audit reports; all members of the
Supervisory Board had an opportunity to inspect these documents. The
auditor attended the meetings of the Audit Committee and the
Supervisory Board, elaborated on the main results of the audit and was
available to answer any questions. At its balance sheet meeting on
24 March 2014 the Audit Committee discussed the documentation
relating to the financial statements in detail with the Board of Managing
Directors and the statutory auditor.
After inspecting the reports and discussing them in detail, the
Supervisory Board accepted the Audit Committee's recommendation
that no objections were to be raised to the annual and consolidated
FOREWORD AND REPORTS — REPORT OF THE SUPERVISORY BOARD
14
financial statements at its meeting on 28 March 2014. The Supervisory
Board approved the annual financial statements prepared by the Board
of Managing Directors for the year ended 31 December 2013 and
acknowledged the consolidated financial statements for 2013.
Conflicts of interest.
The Risk Committee dealt with the credit approvals stipulated by
Section 15 of the German Banking Act (Kreditwesengesetz – KWG) and in
accordance with its bylaws. Those members of the Supervisory Board
who at the time at which the resolutions were passed were members of
the decision-making bodies of the borrowers concerned or were exposed
to a possible conflict of interests for any other reasons did not
participate in the deliberations and voting.
Legal disputes.
The Supervisory Board and the individual committees continuously
obtained detailed information on any major legal disputes. Where
necessary, we consulted with external specialists.
Personnel changes in the Board of Managing Directors
and the Supervisory Board.
There were various changes within the Supervisory Board and the Board
of Managing Directors of LBBW.
The Lord Mayor of the State Capital of Stuttgart, Mr. Fritz Kuhn, was
appointed to the Supervisory Board effective 7 January 2013 to replace
his predecessor Professor Dr. Wolfgang Schuster.
Mr. Carsten Claus, Chairman of the Board of Managing Directors of
Kreissparkasse Böblingen and Regional Chairman of the Baden-
Württemberg savings banks, was appointed to the Supervisory Board
effective 1 August 2013 to replace Mr. Wirth, who joined LBBW on
1 August 2013 as Executive Managing Director (Generalbevollmächtigter).
Mr. Hans-Joachim Strüder, who was a member of the Board of Managing
Directors of LBBW with responsibility for capital markets business,
resigned from the Board of Managing Directors upon the expiry of his
FOREWORD AND REPORTS — REPORT OF THE SUPERVISORY BOARD
FOR
EWO
RD
AN
D R
EPO
RT
S
15
contract effective 31 March 2013, leaving LBBW. Following his
retirement, Mr. Hans-Jörg Vetter assumed responsibility for financial
markets on an interim basis.
Mr. Hans-Jörg Vetter's contract was renewed in July 2013.
On 26 November 2013, we relieved Mr. Michael Horn, Deputy Chairman
of the Board of Managing Directors of LBBW, from his duties until further
notice with his consent. Mr. Horn decided to take this step due to the
impending proceedings before the Regional Court of Stuttgart in order to
prevent LBBW from any harm notwithstanding his unchanging conviction
that there is no basis for the charges against him in fact or in law.
At our meeting on 16 December 2013, we appointed Mr. Alexander
Freiherr von Uslar-Gleichen to the Board of Managing Directors. He will
be assuming this position on 1 October 2014 at the latest.
Effective 1 January 2014, Dr. Martin Setzer and Mr. Volker Wirth, who
had hitherto been generally Executive Managing Directors
(Generalbevollmächtigte), were appointed to the Bank's Board of
Managing Directors.
On behalf of the members of the Supervisory Board, I would like to
thank the Board of Managing Directors and the employees for their great
personal commitment and their performance in what was a challenging
2013 financial year.
For the Supervisory Board
HANS WAGENER CHAIRMAN
FOREWORD AND REPORTS — REPORT OF THE SUPERVISORY BOARD
16
Supervisory Board of LBBW.
Chairman.
HANS WAGENER Auditor, tax consultant
Deputy Chairman.
DR. NILS SCHMID MDL Deputy Minister-President, Minister of Finance and Economics of the State of Baden-Württemberg
Members.
HANS BAUER Employee Representative of Landesbank Baden-Württemberg
CARSTEN CLAUS from 1 August 2013 Chairman of the Board of Managing Directors of Kreissparkasse Böblingen
HARALD COBLENZ Employee Representative of Landesbank Baden-Württemberg
WOLFGANG DIETZ Lord Mayor of the town of Weil am Rhein
WALTER FRÖSCHLE Employee Representative of Landesbank Baden-Württemberg
HELMUT HIMMELSBACH Chairman of the Supervisory Board of Südwestdeutsche Salzwerke AG
PROF. DR. SC. TECHN. DIETER HUNDT Chairman of the Supervisory Board of Allgaier Werke GmbH
JENS JUNGBAUER Employee Representative of Landesbank Baden-Württemberg
BETTINA KIES-HARTMANN Employee Representative of Landesbank Baden-Württemberg
FRITZ KUHN from 7 January 2013 Lord Mayor of the State Capital Stuttgart
KLAUS-PETER MURAWSKI State Secretary in the State Ministry of Baden-Württemberg and Head of the State Chancellery
GÜNTHER NOLLERT Employee Representative of Landesbank Baden-Württemberg
DR. FRITZ OESTERLE Attorney at law, law firm Oesterle
MARTIN PETERS Managing Partner of the Eberspächer Group
NORBERT H. QUACK Attorney at law, notary, law firm Quack Gutterer & Partner
CLAUS SCHMIEDEL MDL Chairman of the SPD Parliamentary Group in the State Parliament of Baden-Württemberg
PETER SCHNEIDER President of the Sparkassenverband Baden-Württemberg (the Savings Bank Association of Baden-Württemberg)
PROF. DR. WOLFGANG SCHUSTER until 6 January 2013 Retired Lord Mayor of the State Capital Stuttgart
DR.-ING. HANS-JOCHEM STEIM Chairman of the Supervisory Board of Hugo Kern und Liebers GmbH & Co. KG
VOLKER WIRTH until 30 June 2013 Savings Bank Director, Chairman of the Board of Managing Directors of Sparkasse Singen-Radolfzell
NORBERT ZIPF Employee Representative of Landesbank Baden-Württemberg
Executive Committee of LBBW.
Chairman.
HANS WAGENER Auditor, tax consultant
Deputy Chairman.
DR. NILS SCHMID MDL Deputy Minister-President, Minister of Finance and Economics of the State of Baden-Württemberg
Members.
FRITZ KUHN from 24 January 2013 Lord Mayor of the State Capital Stuttgart
PETER SCHNEIDER President of the Sparkassenverband Baden-Württemberg (the Savings Bank Association of Baden-Württemberg)
PROF. DR. WOLFGANG SCHUSTER until 6 January 2013 Retired Lord Mayor of the State Capital Stuttgart
NORBERT ZIPF Employee Representative of Landesbank Baden-Württemberg
FOREWORD AND REPORTS — REPORT OF THE SUPERVISORY BOARD
FOR
EWO
RD
AN
D R
EPO
RT
S
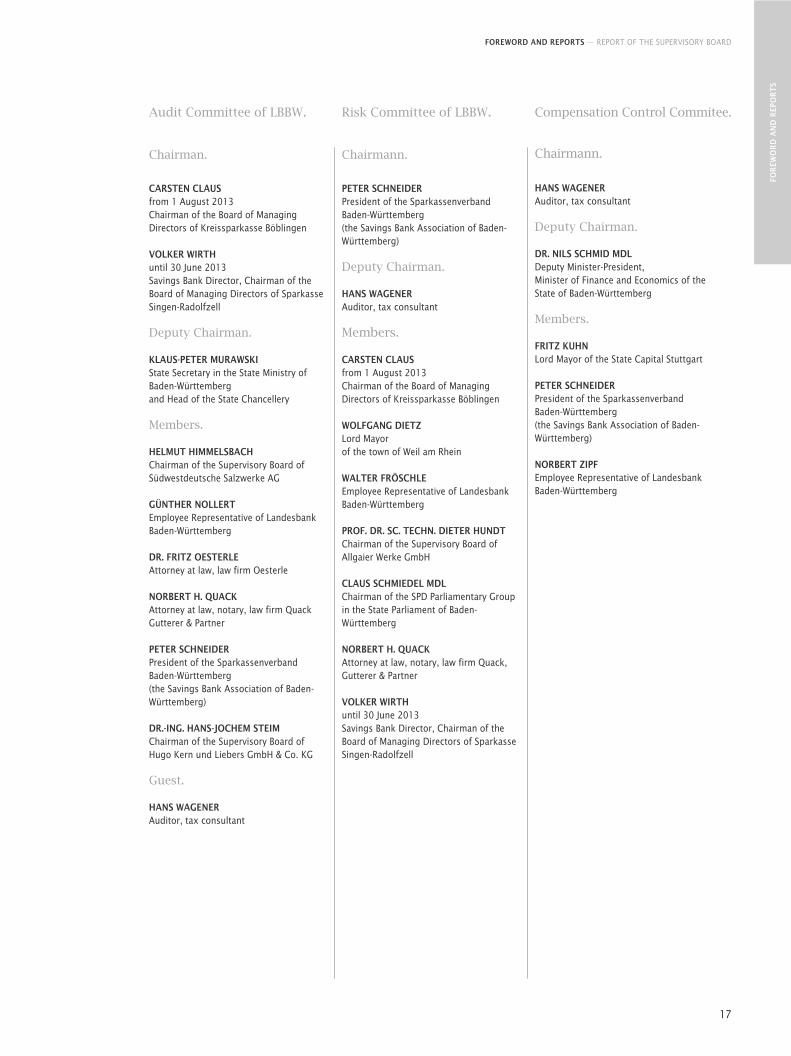
17
Audit Committee of LBBW.
Chairman.
CARSTEN CLAUS from 1 August 2013 Chairman of the Board of Managing Directors of Kreissparkasse Böblingen
VOLKER WIRTH until 30 June 2013 Savings Bank Director, Chairman of the Board of Managing Directors of Sparkasse Singen-Radolfzell
Deputy Chairman.
KLAUS-PETER MURAWSKI State Secretary in the State Ministry of Baden-Württemberg and Head of the State Chancellery
Members.
HELMUT HIMMELSBACH Chairman of the Supervisory Board of Südwestdeutsche Salzwerke AG
GÜNTHER NOLLERT Employee Representative of Landesbank Baden-Württemberg
DR. FRITZ OESTERLE Attorney at law, law firm Oesterle
NORBERT H. QUACK Attorney at law, notary, law firm Quack Gutterer & Partner
PETER SCHNEIDER President of the Sparkassenverband Baden-Württemberg (the Savings Bank Association of Baden-Württemberg)
DR.-ING. HANS-JOCHEM STEIM Chairman of the Supervisory Board of Hugo Kern und Liebers GmbH & Co. KG
Guest.
HANS WAGENER Auditor, tax consultant
Risk Committee of LBBW.
Chairmann.
PETER SCHNEIDER President of the Sparkassenverband Baden-Württemberg (the Savings Bank Association of Baden-Württemberg)
Deputy Chairman.
HANS WAGENER Auditor, tax consultant
Members.
CARSTEN CLAUS from 1 August 2013 Chairman of the Board of Managing Directors of Kreissparkasse Böblingen
WOLFGANG DIETZ Lord Mayor of the town of Weil am Rhein
WALTER FRÖSCHLE Employee Representative of Landesbank Baden-Württemberg
PROF. DR. SC. TECHN. DIETER HUNDT Chairman of the Supervisory Board of Allgaier Werke GmbH
CLAUS SCHMIEDEL MDL Chairman of the SPD Parliamentary Group in the State Parliament of Baden-Württemberg
NORBERT H. QUACK Attorney at law, notary, law firm Quack, Gutterer & Partner
VOLKER WIRTH until 30 June 2013 Savings Bank Director, Chairman of the Board of Managing Directors of Sparkasse Singen-Radolfzell
Compensation Control Commitee.
Chairmann.
HANS WAGENER Auditor, tax consultant
Deputy Chairman.
DR. NILS SCHMID MDL Deputy Minister-President, Minister of Finance and Economics of the State of Baden-Württemberg
Members.
FRITZ KUHN Lord Mayor of the State Capital Stuttgart
PETER SCHNEIDER President of the Sparkassenverband Baden-Württemberg (the Savings Bank Association of Baden-Württemberg)
NORBERT ZIPF Employee Representative of Landesbank Baden-Württemberg
FOREWORD AND REPORTS — CORPORATE GOVERNANCE
18
Corporate governance at LBBW.
Landesbank Baden-Württemberg places great importance on good corporate governance. LBBW
takes account of key aspects of the German Corporate Governance Code. This is a set of essential
legal regulations governing the management and monitoring of German listed companies and also
contains nationally and internationally recognized standards for good and responsible corporate
governance – in the form of recommendations.
As the Code is geared toward listed joint-stock companies, not all points of it are applicable to
Landesbank Baden-Württemberg, since LBBW is not a listed bank but an institution incorporated
under public law. Several provisions of the German Corporate Governance Code can therefore only
be transferred analogously to Landesbank Baden-Württemberg. In terms of content, LBBW's
corporate governance is oriented very closely to the spirit of the German Corporate Governance
Code. For a large number of recommendations of the German Corporate Governance Code there are
therefore special regulations in the legislation governing LBBW, in the articles of association and
bylaws of the executive bodies and further committees.
As the management and supervisory rules applicable to corporations have been implemented and
are observed at LBBW – particularly after the changes to its governance structure in 2010 – and the
contribution of external expertise has proved its merits, the condition imposed by the European
Commission in its resolution of 15 December 2009 concerning the aid provided by the German
government that Landesbank Baden-Württemberg be transformed into a joint-stock company in
accordance with German or European law has been modified following a further review of this matter.
What was decisive for the Commission was that corporate governance at LBBW should be equivalent
to that of a private-sector company and that the duties of the Annual General Meeting and the
Supervisory Board of LBBW – as is presently the case – should be organized in accordance with the
rules applicable to a joint-stock company. It was similarly stressed that the members of the Board of
Managing Directors should make their decisions independently of any external instructions.
Accordingly, LBBW is able to retain its original legal form as a public-law institution.
In return, broad agreement was achieved on LBBW's governance structure; among other things, the
independence of the Chairman of the Supervisory Board beyond his current term of office was
guaranteed, as stipulated in the ruling of 15 December 2009. Furthermore, the number of
independent members of the Supervisory Board will be increased from the current seven to a total of
eight in future – including the Chairman of the Supervisory Board – at the latest at the beginning of
the next period of office. LBBW will be reporting on the observance of these requirements up to and
including 2020. Accordingly, the percentage of independent members of the Supervisory Board of
LBBW is now more than one third of the total number of members. This ensures that corporate
governance at LBBW does not differ from that of its competitors – including in the light of the
changes made by the European Commission to its original ruling on state aid.
FOREWORD AND REPORTS — CORPORATE GOVERNANCE
FOR
EWO
RD
AN
D R
EPO
RT
S
19
Corporate governance, as practiced at LBBW, is presented below. The structure of the report is based
on the standards of the German Corporate Governance Code, which is voluntary and not mandatory
for LBBW on account of its legal form.
Shareholders and annual general meeting. Shareholders.
As an institution incorporated under public law, LBBW has not securitized any equities. The
shareholders are therefore described as owners (Träger) and not as shareholders.
As of the beginning of January 2013, the owners of Landesbank Baden-Württemberg are as follows:
■ Sparkassenverband Baden-Württemberg (SVBW) (Savings Bank Association of Baden-Württemberg)
with a 40.534118 % stake in the share capital,
■ the State of Baden-Württemberg (state)
with a 24.988379 % stake in the share capital,
■ the State Capital of Stuttgart (city)
with a 18.931764 % stake in the share capital,
■ Landesbeteiligungen Baden-Württemberg GmbH (Landesbeteiligungen BW)
with a 13.539374 % stake in the share capital and
■ Landeskreditbank Baden-Württemberg – Förderbank – (L-Bank)
with a stake of 2.006365 % in the share capital.
The owners of LBBW assume their rights before or during the annual general meeting within the
scope of the opportunities offered by the articles of association and thereby exercise their voting
rights. The voting rights of the owners are based on the size of their stake in the share capital, with
each euro granting one vote.
The share capital comprises the capital existing prior to the date on which the capital increase of
22 June 2009 took effect, and the capital created after the date on which the capital increase of
22 June 2009 took effect (share capital class A), as well as the share capital which was formed on the
date on which the capital increase of 22 June 2009 took effect (share capital class B).
Annual general meeting.
At the annual general meeting, the owners exercise their rights over the affairs of LBBW in the
absence of any stipulations to the contrary in the legislation governing Landesbank Baden-
Württemberg or the articles of association of LBBW. The owners are represented at the annual
general meeting by one or several people.
The powers of the annual general meeting encompass the typical tasks of an annual general meeting
based on joint stock companies legislation, for example, voting on the appropriation of net profit, or
granting discharge to the members of the Supervisory Board and the Board of Managing Directors.
The annual general meeting further makes decisions about the articles of association and any
changes thereto, and about key business measures, such as corporate agreements, setting and
changes to the share capital, the issue of profit participation rights and granting of silent partnership
contributions. The Supervisory Board decides whether to change the principles of business policy.
FOREWORD AND REPORTS — CORPORATE GOVERNANCE
20
The functions of supervising and monitoring the Board of Managing Directors, including the
appointment and dismissal of members of this board, lie with the Supervisory Board. The Board of
Managing Directors submits the audited annual financial statements to the Supervisory Board for
approval in line with LBBW's articles of association.
LBBW's share capital can be increased or decreased by a resolution passed at the annual general
meeting. LBBW can accept participatory capital, silent partnership contributions as well as
subordinated guarantee capital, and other forms of capital as provided for in the German Banking
Act (Kreditwesengesetz) from its owners and third parties.
When making a change to the share capital, a decision needs to be made about what categories of
share capital are subject to the change. Every owner who has a stake in the share capital category
concerned is entitled to a share in the corresponding share capital category based on their
shareholding in the event of increases. If one owner fails to exercise their subscription right within a
share capital category, this right will accrue to the other owners for a corresponding consideration in
proportion to their share in this share capital category, unless they have reached an agreement to
the contrary among themselves.
The ordinary general meeting takes place within the first eight months of the year. Further general
meetings are called if the good of LBBW so requires and also when the Supervisory Board or an
owner makes an application detailing the agenda items. The internal regulations of the annual
general meeting provide more details in this respect, particularly as regards the form and deadline
for requests that a meeting be held and for the calling of a meeting.
In contrast with a joint-stock company, LBBW provides its owners with the documents required for the
annual general meeting, such as the convocation documents for the annual general meeting, directly
by e-mail or by mail rather than via its website, in view of the small number of owners.
Interoperation of the Board of Managing Directors and the Supervisory Board.
The Board of Managing Directors and the Supervisory Board work closely together for the good of
the Company. The Board of Managing Directors agrees the strategic direction of the Company with
the Supervisory Board and they discuss the status of strategy implementation at regular intervals.
For business of fundamental importance, the articles of association or the Supervisory Board
stipulate that the consent of the Supervisory Board is required. Examples include decisions or
measures that fundamentally change the Bank's net assets, financial position or results of operations.
According to LBBW's understanding, supplying the Supervisory Board with sufficient information is
the joint task of the Board of Managing Directors and the Supervisory Board. The Board of Managing
Directors provides the Supervisory Board with regular, prompt and comprehensive information about
all relevant questions relating to planning, business performance, the risk situation, effectiveness of
the internal control system, the internal auditing system and compliance. It examines variations in the
business development from the plans and targets drawn up and gives reasons for such variations.
FOREWORD AND REPORTS — CORPORATE GOVERNANCE
FOR
EWO
RD
AN
D R
EPO
RT
S
21
The Supervisory Board decides the duties of disclosure and reporting requirements of the Board of
Managing Directors. Reporting by the Board of Managing Directors to the Supervisory Board is
generally carried out in written form. Documents required for a decision are generally forwarded to
members of the Supervisory Board in good time before the meeting.
The Chairman of the Board of Managing Directors informs the Chairman of the Supervisory Board and
the Deputy Chairman about important events, and this between the individual meeting dates as well.
Based on LBBW's and its owners' understanding, good corporate governance requires open
discussion between the Board of Managing Directors and the Supervisory Board and internally within
the Board of Managing Directors and the Supervisory Board. Full and comprehensive confidentiality
is of decisive importance. The members of the Supervisory Board and the Board of Managing
Directors are therefore bound to secrecy. This obligation remains even after the end of their activity
within the executive bodies of the Landesbank. All members of the executive bodies ensure that
employees asked by them to provide support observe the same obligation to secrecy.
The Board of Managing Directors and the Supervisory Board observe the rules of proper corporate
governance. Should they culpably breach the due diligence expected of a prudent and conscientious
director or Supervisory Board member, they shall be liable to pay damages to LBBW. There is no
breach of obligations for business decisions if the member of the Board of Managing Directors or
Supervisory Board may reasonably have assumed that they were acting for the good of the Company
on the basis of fair information (business judgment rule).
With regard to the D&O insurance taken out for the Board of Managing Directors, a deductible has
been agreed of 10 % of the loss up to one and a half times the board member's annual fixed
remuneration. A corresponding deductible was also agreed when the D&O insurance was taken out
for the members of the Supervisory Board.
Decisions about granting loans to members of the Board of Managing Directors and the Supervisory
Board and related parties are made by the Risk Committee in accordance with Section 15 of the
German Banking Act (Kreditwesengesetz). The fact that the Risk Committee is a Supervisory Board
committee ensures that the Supervisory Board will be involved in the aforesaid lending decisions.
LBBW has been reporting on its corporate governance in a report on corporate governance forming
part of the annual report since the financial year 2010.
Board of Managing Directors. Duties and responsibilities.
The Board of Managing Directors manages the business of LBBW under its own responsibility
pursuant to the law and in the Company's interest, i. e., by taking the needs of the owners, its
employees and other groups (stakeholders) affiliated to the Company into account, with the aim of
achieving sustainable added value. In accordance with the legal principles of LBBW, it is responsible
for any LBBW matters that do not fall within the remit of another authority based on the legislation
governing Landesbank Baden-Württemberg or the articles of association of LBBW. In managing the
business the members of the Board of Managing Directors exercise the due diligence of a prudent
FOREWORD AND REPORTS — CORPORATE GOVERNANCE
22
and conscientious business manager. In so doing, the Board of Managing Directors develops the
strategic direction of the Company, agrees this with the Supervisory Board and ensures it is
implemented. Furthermore, the Board of Managing Directors ensures compliance with the statutory
regulations and the Company's internal rules and works toward ensuring that they are observed by
LBBW Group companies. The Board of Managing Directors further ensures a reasonable risk
management and risk control within the Group.
The Board of Managing Directors is the line superior for all employees of LBBW, including its
subsidiaries, branches, stock market offices, representative offices and legally dependent
institutions under public law. The Board of Managing Directors strives for diversity and therefore a
reasonable inclusion of women, in particular, when filling management positions within the Bank.
Members of the Board of Managing Directors.
The Board of Managing Directors consists of several members. The members of the Board of
Managing Directors, the Chairman and his deputy or deputies are determined and appointed by the
Supervisory Board. In filling positions on the Board of Managing Directors, the Supervisory Board
strives for diversity and therefore particularly a reasonable proportion of women.
To ensure the maximum in terms of flexibility, LBBW has refrained from fixing an allocation of
competences for the members of the Board of Managing Directors in the bylaws. A schedule of
responsibilities governs the departmental responsibilities of individual board members. The
Supervisory Board makes decisions about the bylaws of the Board of Managing Directors and about
the approval of the proposed allocation of responsibilities.
Remuneration.
Details on the remuneration of the Board of Managing Directors can be found in the remuneration report.
Conflicts of interest.
The members of the Board of Managing Directors at LBBW are bound by a comprehensive
noncompetition clause during their activity for LBBW. Board members and employees may also not
demand or accept any gifts or other benefits from third parties for themselves or for others or grant
third parties unfair advantages.
Members of the Board of Managing Directors are obliged to act in the interests of the Bank. No
member of the Board may pursue personal interests when making their decisions and exploit
business opportunities open to the Bank for their own ends. Every member of the board should
disclose any possible conflicts of interest to the Supervisory Board immediately and inform the other
board members. All business between LBBW, on the one hand, and the members of the Board of
Managing Directors or persons or enterprises closely associated with them, on the other, must
satisfy industry standards. Important business requires the consent of the Supervisory Board.
Members of the Board of Managing Directors may only accept secondary activities, in particular
appointments to supervisory boards outside the LBBW Group, with the consent of the Executive
FOREWORD AND REPORTS — CORPORATE GOVERNANCE
FOR
EWO
RD
AN
D R
EPO
RT
S
23
Committee. The Executive Committee consists of the Chairman of the Supervisory Board, the Deputy
Chairman and three members of the Supervisory Board. This ensures that the Supervisory Board is
involved in the decision about secondary activities of the Board of Managing Directors.
In the event of a conflict of interests, the member concerned will not take part in the deliberations
and voting on the item in question by the Board of Managing Directors. Section 18 paragraphs 1– 3
and 5 of the Municipal Code for Baden-Württemberg apply accordingly for the members of the Board
of Managing Directors in this regard.
Supervisory Board. Duties and responsibilities.
It is the duty of the Supervisory Board to offer regular advice and oversee the Board of Managing
Directors' management of LBBW. It is involved in decisions of key importance to the Company. It is
responsible for the appointment and dismissal of the members of the Board of Managing Directors
and of the Chairman and Deputy Chairmen of the Board and for setting the remuneration of the
Board of Managing Directors. The Supervisory Board is able to appoint deputy board members, who
have the same rights and obligations as the board members.The Supervisory Board has set itself its
own bylaws. The Supervisory Board has a Chairman and a Deputy Chairman.
Tasks and powers of the Supervisory Board Chairman.
The Chairman of the Supervisory Board calls a meeting of the Supervisory Board as required, but no
less than four times a year, and chairs its meetings. The bylaws for the Supervisory Board set out
further details, in particular, the format and deadlines for the calling of meetings. The Chairman
coordinates the work in the Supervisory Board, chairs its meetings and attends to the affairs of the
Supervisory Board in dealings with outside parties.
The Chairman of the Supervisory Board takes part in the meetings of the Audit Committee as a
permanent guest.
The Chairman of the Supervisory Board is in regular contact with the Board of Managing Directors, in
particular with its Chairman, and discusses with the latter strategy, business development and risk
management at LBBW. The Chairman of the Supervisory Board is informed immediately by the
Chairman of the Board of Managing Directors about important events that are of key importance in
the assessment of the position and development of the Company and its management. The
Chairman of the Supervisory Board then notifies the Supervisory Board and calls an extraordinary
meeting of the Supervisory Board if required.
Formation of committees.
Due to the specific circumstances of LBBW and the number of its members, the Supervisory Board
has formed four well-qualified committees in the shape of the Executive Committee, the Compen-
sation Control Committee, the Audit Committee and the Risk Committee. The respective committee
chairmen regularly report on the work of the committees to the Supervisory Board.
FOREWORD AND REPORTS — CORPORATE GOVERNANCE
24
The Audit Committee deals, in particular, with the effectiveness of the internal control system and
internal auditing, as well as issues relating to accounting, risk management and compliance. It also
monitors the audit of the annual and consolidated financial statements and the required indepen-
dence of the auditor, and agrees to the auditor's fee, in addition to issuing the audit assignment to
the auditor, which allows it to determine the focus of the audit. The Chairman of the Audit
Committee has specific knowledge and experience of the application of accounting standards and
internal control procedures. The Chairman of the Audit Committee is independent and is not a
former member of LBBW's Board of Managing Directors.
The Executive Committee performs the statutory duties of the Nomination Committee; in the
absence of anything to the contrary in the legislation on Landesbank Baden-Württemberg, the
proposals for the election of members of the Supervisory Board are prepared solely by the
representatives of the owners.
Members of the Supervisory Board.
To ensure that all owners are adequately represented within the new executive bodies of LBBW, the
owners had the right to delegate members for the first Supervisory Board, provided they were not to
be elected as Supervisory Board members for the employees. The number of members in the
Supervisory Board delegated by the owners reflects their participating interest. The federal state,
association, and city agreed unanimously on the appointment of the Chairman of the Supervisory
Board. Taking this into account, LBBW strives for diversity in the composition of the Supervisory
Board and for a reasonable proportion of women.
The composition of the Supervisory Board is such that its members collectively possess the requisite
knowledge, skills and technical experience to assume their tasks in due form.
The members of the Supervisory Board assume responsibility for taking part in the training and
development measures which they required to perform their duties. They receive reasonable support for
this from LBBW, e.g. through the designation of specific seminars and the availability of corresponding
lectures. Two specialist seminars were organized in 2013 especially for the Supervisory Board.
To enable the Supervisory Board to provide independent advice and oversee the Board of Managing
Directors independently, the Supervisory Board includes independent members, the number of
which is set out in LBBW's rules and regulations. Supervisory Board members are seen as
independent if they have no business or personal relationship with the Company or its Board of
Managing Directors that could constitute the basis for a conflict of interest. There are no former
members of the Board of Managing Directors on the Supervisory Board. Each Supervisory Board
member takes care that they have sufficient time to fulfill their role.
If a member of the Supervisory Board has attended fewer than half of the meetings of the
Supervisory Board, a note to that effect is included in the Supervisory Board's report.
FOREWORD AND REPORTS — CORPORATE GOVERNANCE
FOR
EWO
RD
AN
D R
EPO
RT
S
25
Remuneration.
Details on the remuneration of the Supervisory Board can be found in the remuneration report.
Conflicts of interest.
Every member of the Supervisory Board is obliged to act in the interests of the Bank. They may not
pursue any personal interests in their decisions, nor use any business opportunities open to the
Company for their own advantage. Any conflicts of interest, in particular those that may arise
because of an advisory or executive function exercised for customers, suppliers, lenders or other
business partners must be disclosed to the Supervisory Board. In the event of a conflict of interests,
the member concerned does not participate in the deliberations and voting of the Supervisory Board
on the issue in question. Section 18 paragraphs 1 to 3 and 5 of the Municipal Code for Baden-
Württemberg apply to the members of the Supervisory Board accordingly in this regard.
The Supervisory Board also provides information at the annual general meeting about any conflicts
of interest that may have arisen and how they were handled. Any material conflicts of interest of a
non-temporary nature existing in the person of a Supervisory Board member will lead to a member's
appointment being terminated. Furthermore, any consulting, other service or employment contracts
of a Supervisory Board member with the Company require the Supervisory Board's approval.
The Supervisory Board regularly checks the efficiency of its activities.
Transparency.
LBBW treats its owners equally in terms of information.
Information that LBBW has to publish outside Germany because of the applicable capital market
legislation is released immediately on the domestic market.
LBBW supports good contact with its owners. It is the view of LBBW that publication of a financial
calendar would not offer any added value. Such a calendar is therefore not provided.
Accounting and audit of the annual accounts. Accounting.
The owners and third parties are primarily provided with information via the consolidated financial
statements. They also receive information during the financial year through the half-yearly financial
report. The consolidated financial statements and the abbreviated consolidated financial statements
of the half-yearly financial report are compiled in accordance with the relevant international
accounting standards.
The consolidated financial statements are compiled by the Board of Managing Directors and audited
by the auditor and the Supervisory Board. The Audit Committee, as a Supervisory Board commitee,
discusses the half-yearly financial reports with the Board of Managing Directors prior to publication.

FOREWORD AND REPORTS — CORPORATE GOVERNANCE
26
In addition, the German Financial Reporting Enforcement Panel (Prüfstelle für Rechnungslegung) and
the German Federal Financial Supervisory Authority are authorized to check that the consolidated
financial statements comply with the applicable accounting standards (enforcement). As a company
not listed on the stock market, LBBW publishes its consolidated financial statements and its half-yearly
financial reports within the timescale required by the German Securities Trading Act (Wertpapier-
handelsgesetz – WpHG). The annual report is published at the latest four months after the end of each
financial year (Section 37v WpHG) and the half-yearly financial report two months following the end of
the reporting period at the latest (Section 37w WpHG).
LBBW publishes a list of third-party companies in which it holds an equity investment of not
insignificant importance to the Company in its annual report. This does not include any trading
portfolios of credit and financial service institutions through which no voting rights are exercised.
In its consolidated financial statements LBBW explains the relationships with representatives of the
owners who are to be considered as related parties within the meaning of the applicable accounting
standards.
Audit of the annual accounts.
Prior to submitting the proposal to the annual general meeting for the appointment of the auditor,
the Supervisory Board or the Audit Committee obtains a declaration from the proposed auditor
stating whether any and, if applicable, which, business, financial and personal or other relationships
exist between the auditor and its executive bodies and audit managers, on the one hand, and LBBW
and the members of its executive bodies, on the other, which may give reason to doubt the auditor's
independence. The declaration also states the extent to which other services were provided for LBBW
over the past financial year, in particular in terms of consultancy, and have been contractually
agreed for the following financial year.
The Supervisory Board commissions the auditor and reaches an agreement with the latter about the fee.
The auditor notifies the Chairman of the Supervisory Board and/or the Chairman of the Audit
Committee immediately of any grounds for disqualification or partiality that may emerge during the
course of an audit, provided that they are not rectified immediately.
The Supervisory Board also agreed that the auditor will immediately report on all events and findings
of importance to the Supervisory Board's duties that may arise while carrying out the audit. The
auditor takes part in the deliberations of the Supervisory Board and the Audit Committee relating to
the annual financial statements and the consolidated financial statements and reports on the key
results of its audit.
FOREWORD AND REPORTS — REMUNERATION REPORT
FOR
EWO
RD
AN
D R
EPO
RT
S
27
Remuneration report.
Board of Managing Directors1). Principles of the remuneration system. Responsibility.
The Supervisory Board makes decisions on the remuneration system including the main contractual
elements for the members of the Board of Managing Directors, and fixes the remuneration payable
to them. The Executive Committee or, since its establishment on 16 December 2013, the Compen-
sation Control Committee, assumes an important advisory role in this respect and prepares the
resolutions of the Compensation Control Committee.
Principles of the remuneration system.
The Supervisory Board has approved a new remuneration system for members of the Board of
Managing Directors that came into effect on 1 January 2013. The focus of the new system is on
gearing remuneration to the attainment of sustained business success without offering incentives to
take disproportionately high risks. For this reason, the Supervisory Board has, among other things,
set a measurement period of three years for variable remuneration and a ratio of 1:1.5 as a
reasonable upper limit for the ratio of fixed to variable remuneration.
The remuneration parameters that determine variable remuneration are geared toward achieving the
targets derived from the Bank’s strategy on a sustained basis. The parameters for the payment of
bonuses are the Group’s overall success and the individual Board members’ contribution to profit,
which are measured and assessed with the help of qualitative and quantitative factors. Contributions
to profit can be positive or negative and accordingly have an impact on variable remuneration. 60 %
of the variable annual remuneration is deferred for a period of four years and paid out on a time-
proportionate basis. This may be reduced within this period or even lapse (malus). 50 % of this
deferred remuneration is based on sustained performance.
Pension entitlement is structured as defined contribution.
An arrangement based on the final salary applies in the case of some of the members of the Board
of Managing Directors, the amount of which is calculated according to the length of their service on
the Board of Managing Directors.
The Supervisory Board regularly reviews the appropriateness of the Board remuneration model as
well as the level and composition of the Board remuneration.
1) The term »Board of Managing Directors« hereinafter refers to the Board of Managing Directors and the generally Executive Managing Directors (Generalbevollmächtigte) of LBBW.
FOREWORD AND REPORTS — REMUNERATION REPORT
28
Remuneration 2013.
In 2013, remuneration of the members of LBBW’s Board of Managing Directors consisted of fixed,
non-performance-based remuneration, variable performance-based remuneration and other benefits
(essentially the use of a company car with driver). Moreover, the members of the Board of Managing
Directors are eligible for inclusion in a company pension scheme.
In 2013, the members of the Board of Managing Directors received fixed remuneration of a total of
EUR 4.19 million for the performance of their duties on the Board. In addition, variable remuneration
totaling EUR 0.58 million was paid out. The sum total of other benefits came to EUR 0.11 million. As
at 31 December 2013, pension obligations according to IFRS for serving Board members as at the
balance sheet date totaled EUR 9.83 million.
Supervisory Board. Principles of remuneration for Supervisory Board members.
The annual general meeting on 22 July 2011 decided on the remuneration of Supervisory Board
members as follows:
■ The members of the Supervisory Board receive a fixed remuneration of EUR 25,000 for the
respective financial year. The Chairman of the Supervisory Board receives twice and the Deputy
Chairman 1.5 times the fixed remuneration of a Supervisory Board member.
■ Supervisory Board members who hold a seat on a committee receive further fixed remuneration of
EUR 10,000 per committee. The Chairman of a committee receives 2.0 times and the Deputy
Chairman 1.5 times the further fixed remuneration.
■ Each Supervisory Board member receives an attendance allowance of EUR 200 to attend a meeting
of the Supervisory Board or one of its committees.
■ The Supervisory Board members are further reimbursed for the expenditure that they incur in
connection with performing their duties as members of the Supervisory Board (travel expenses,
individual bank-specific further training, etc.).
■ The Supervisory Board members are reimbursed for the value-added tax incurred that they have
to pay as a result of their activity as a member of the Supervisory Board or a committee.
The employee representatives on the Supervisory Board employed at LBBW also receive their salary
as employees.
The remuneration of Supervisory Board members who are not part of the Supervisory Board for a
complete financial year is paid pro rata for their term in office.
Remuneration 2013.
For the 2013 financial year, a total of EUR 0.94 million was paid in salaries and EUR 0.06 million in
attendance allowances to the members of the Supervisory Board.
FOREWORD AND REPORTS — REMUNERATION REPORT
FOR
EWO
RD
AN
D R
EPO
RT
S
29
Other information.
There is also pecuniary loss liability insurance for members of the Board of Managing Directors and
Supervisory Board (»D&O«). The deductible is 10 % of the loss up to a maximum of 1.5 times the
fixed annual remuneration.
Landesbank Baden-Württemberg
The Board of Managing Directors The Supervisory Board
FOREWORD AND REPORTS — COMPLIANCE
30
Compliance.
Responsible entrepreneurial activities are based on compliance with rules and laws. Effective
compliance management creates long-term transparency with regard to risks and prevents criminal
activities such as money laundering, the financing of terrorism, fraud, corruption or insider trading.
At the same time, compliance with data protection laws and financial sanctions is monitored.
In addition, LBBW has established an internal control system (ICS) Center to support the divisions in
their operational responsibility for the controls implemented in the business processes. The ICS
Center defines the structures for a monitoring process; it is the main contact responsible for issuing
organizational instructions (e.g. scheduling of control tests as well as reporting paths and formats)
and the central instance for ensuring compliance with defined quality standards in the process steps
performed (e.g. risk analysis, control monitoring).
Capital markets compliance.
One key focus of capital market compliance in 2013 was on overseeing the implementation of new
requirements with respect to the recording of inducements at LBBW. In accordance with the
»Minimum Requirements for the Compliance Function and Additional Requirements Governing Rules
of Conduct, Organization and Transparency pursuant to Sections 31 et seq. of the Securities Trading
Act (Wertpapierhandelsgesetz – WpHG) for Investment Services Enterprises« (MaComp) of
31 August 2012, LBBW submits proof to BaFin from 2013 onwards that inducements serve the
purpose of improving service quality. Accordingly, inducements must be recorded in a directory of
inducements. In addition, LBBW determines in a directory of utilization the quality-improvement
measures for which the inducements have been utilized, thus creating heightened transparency.
Advice given to the individual departments on matters pertaining to capital market compliance was
additionally individualized and training activities expanded in the light of specific target-group
requirements. Branch supervision was further intensified. Ongoing monitoring of securities
transactions to ensure compliance with statutory requirements was continued.
Anti-money laundering.
Activities in 2013 concentrated on ongoing further work on the development of the LBBW Group's
procedural rules in accordance with statutory and regulatory requirements. The main focus was on
adjustments to and the implementation of Group-wide requirements at the branches and Group
subsidiaries. In addition, duties of care in relations with correspondent banks were enhanced. All
employees conducting banking operations or providing auxiliary services for banking operations in
the widest sense of the term were again made aware of the methods of money laundering in the
form of training sessions on specific topics.
FOREWORD AND REPORTS — COMPLIANCE
FOR
EWO
RD
AN
D R
EPO
RT
S
31
Financial sanctions/embargoes.
As a result of further work on the procedural rules and system adjustments, it has been possible to
additionally raise the level of standardization in the handling of financial sanctions and embargo
checks. LBBW checks its customers against national and international sanction lists on a daily basis.
Similarly, all foreign transactions are reviewed. The Financial Sanctions/Embargoes unit within
LBBW's Compliance division advises the divisions on matters pertaining to foreign trade law and
monitors the observance of national and international sanction requirements. As in earlier years, this
constituted the main thrust of the activities performed in 2013.
Prevention of fraud/other criminal activities.
The main focus concerned further work on the procedural rules. For one thing, this entailed further
adjustments to and the implementation of Group-wide requirements at the branches and Group
subsidiaries. For another, the anti-fraud and anti-corruption requirements were additionally fine-tuned.
Thus, for example, the policy on the acceptance and granting of benefits (»gifts policy«), which had
been established in autumn 2012, was implemented in full in 2013. Moreover, under the guidance of
the »Central Unit«, which had been installed in 2012, Bank-wide sharing of experience with respect to
consultations on and the coordination of preventive measures for addressing identified risks from
criminal activities targeted at the Bank was additionally enhanced. The Bank's so-called Fraud
Prevention Board (FPB) is the forum for providing advice and communicating on these risks and for
coordinating the response to them.
Data protection.
LBBW attaches top priority to treating customers' data confidentially. After the successful
implementation of Group policies for a uniform national and international data protection standard,
connected with the ensuing execution of audits at the foreign Group companies, the next step was
taken in 2013. On the basis of the audit findings, work on implementing and harmonizing the
Group's data protection policy was continued at the foreign offices accompanied by further efforts to
heighten the responsible staff's awareness (in an English-language learning program) of the need for
data protection at the branches and representative offices.
As part of its central bank function, LBBW performs numerous services for the savings banks. For the
first time, the processes and systems used in this connection were successfully audited by external
experts in the light of the requirements under data protection legislation. The results were docu-
mented in a report which was submitted to all savings bank customers for archiving and certification
purposes.
In 2013 too, general training courses were conducted on data protection while in addition certain
divisions were provided with further information specific to this group. Audits were performed at
selected external waste management companies, one subsidiary and selected divisions.
32
Combined management report.
ZU
SAM
MEN
GEF
ASS
TER
LA
GEB
ERIC
HT
33
The following information should be read in conjunction with the consolidated financial statements and associated notesThe 2013 consolidated financial statements and the 2013 combined management report were issued an unqualified auditor's report by KPMG Aktiengesellschaft Wirtschafts-prüfungsgesellschaft.
COMBINED MANAGEMENT REPORT — GROUP OVERVIEW
34
Group overview. This annual report published by Landesbank Baden-Württemberg comprises the combined
management report, the consolidated financial statements (IFRS) and the notes to the consolidated
financial statements. The management report of LBBW (Bank) and the group management report
were compiled in accordance with German Accounting Standard no. 20 (DRS 20), and thus comprise
the report on the Group, as well as on LBBW (Bank), with notes based on the German Commercial
Code. The LBBW (Bank) annual financial statements according to the German Commercial Code (HGB)
and the combined management report will be published simultaneously in the German Federal
Gazette (Bundesanzeiger).
Structure and business activities of the LBBW Group.
The Landesbank Baden-Württemberg (LBBW) Group for the most part comprises the single entity
Landesbank Baden-Württemberg, which is referred to below as LBBW (Bank).
LBBW (Bank) is a public law institution (rechtsfähige Anstalt öffentlichen Rechts) with four registered
offices in Stuttgart, Karlsruhe, Mannheim and Mainz. Its owners are the Savings Bank Association of
Baden-Württemberg (Sparkassenverband Baden-Württemberg) with 40.534 %, the state capital,
Stuttgart, with 18.932 % and the State of Baden-Württemberg with 40.534 % of the share capital. The
State of Baden-Württemberg holds its share directly and indirectly through Landesbeteiligungen
Baden-Württemberg GmbH and L-Bank.
LBBW is a universal and commercial bank that combines the range of services of a large bank with
the regional proximity of its retail banks. LBBW (Bank) is represented in its core regions of Baden-
Württemberg, Rhineland-Palatinate and Saxony, and the neighboring economic areas, under their
respective brands:
■ Baden-Württembergische Bank (BW-Bank) operates private and corporate customer business in the
core market of Baden-Württemberg. BW-Bank assumes the role of municipal savings bank within
the state capital, Stuttgart.
■ LBBW bundles its small and medium-sized corporate customer and private customer business in
Saxony and neighboring regions under the umbrella of Sachsen Bank.
■ Rheinland-Pfalz Bank focuses on business with SMEs in Rhineland-Palatinate and neighboring
regions.
LBBW (Bank) offers the entire range of business and services of a modern universal bank via its
network of around 200 branches and locations across Germany. The business with large corporates
operating across Germany and internationally, capital markets business, real estate financing and
the Bank's function as the central bank for savings banks in Baden-Württemberg, Rhineland-
Palatinate and Saxony are located within LBBW (Bank) itself. Essential staff and service functions are
also concentrated within LBBW (Bank).
COMBINED MANAGEMENT REPORT — GROUP OVERVIEW
CO
MB
INED
MA
NA
GEM
ENT
REP
OR
T
35
LBBW (Bank) also supports the corporate customers of LBBW and of the savings banks with their
international activities. Branches and representative offices worldwide offer support with country
expertise, market know-how and financial solutions. To complement this, LBBW has German Centers
in Beijing, Singapore, Mexico City, Delhi.Gurgaon and Moscow that advise German corporate
customers on market entry and make local offices and networks available to them.
The range of services and products offered by LBBW (Bank) within the Group is enhanced by
subsidiaries specializing in specific business areas, such as leasing, factoring, asset management,
real estate and equity finance.
Business model of the LBBW Group. LBBW's business model rests on five pillars with a clear focus on customer business.
Strategically, LBBW focuses on its core business especially in the regions of Baden-Württemberg,
Rhineland-Palatinate and Saxony as well as the respective neighboring regions. Above all, LBBW is
the partner for corporate and private customers in those regions as well as for the savings banks.
This is accompanied by efficient real estate financing and capital market products, which are also
targeted at institutional customers.
Corporate customers.
Corporate customer business chiefly focuses on small and medium-sized companies in the regional
core markets. BW-Bank addresses corporate customers in Baden-Württemberg and selectively also in
Bavaria. In Rhineland-Palatinate, North Rhine Westphalia and Hesse, this function is assumed by
Rheinland-Pfalz Bank and in central Germany by Sachsen Bank.
In addition, LBBW (Bank) maintains business relations with selected large corporates in Germany,
Austria and Switzerland. Corporate customer business also encompasses business with
municipalities.
Various subsidiaries such as SüdLeasing, MKB Mittelrheinische Bank/MMV Leasing, SüdFactoring and
Süd Beteiligungen provide specialist products and services.
LBBW (Bank) also supports its customers in international business in important and emerging
economic regions worldwide.
LBBW (Bank) sees itself principally as a primary bank to SMEs, offering long-term, sustained support
to its customers on matters concerning financial services and all the related strategic issues.
Private customers.
Private customer business is particularly targeted at the wealthy customer groups in the regional
markets of Baden-Württemberg, Saxony and Rhineland-Palatinate as well as in the neighboring
economic areas. In addition, wealth management services are offered to high net-worth customers.
As the savings bank for the City of Stuttgart, BW-Bank is open to all citizens, providing its customers
in the state capital with the full array of banking services.

COMBINED MANAGEMENT REPORT — GROUP OVERVIEW
36
In addition to bespoke advice aimed at creating long-term customer relationships, first-class
products and services are at the core of the business philosophy. The products on offer range from
classic checking accounts and credit card business through financing solutions to complex securities
and pension-savings products.
Savings banks.
In this business area, LBBW (Bank) primarily acts as a central bank to the savings banks in the core
markets of Baden-Württemberg, Saxony and Rhineland-Palatinate, providing them with a broad range
of products and services, and forming a service partnership with them.
Overall, this business area comprises three main types of cooperation:
■ First and foremost, the savings banks' proprietary business, which entails services in all hedging
and investment product categories.
■ In market partner business, LBBW products are offered for resale to the savings banks' own retail
and corporate customers, in addition to joint loan extension.
■ Service business encompasses research, securities clearing and management, international
payment transactions, documentary payments etc.
Real estate financing.
The real estate financing business is geared toward private and institutional investors, real estate
companies, project developers, open and closed-end funds, privatization agencies, real estate
investment trusts (REITs) and housing companies.
New business in commercial real estate financing concentrates on the defined core markets of
Germany, the United States and the United Kingdom particularly in the residential, office and retail
real estate segments.
The subsidiary LBBW Immobilien Management GmbH additionally provides real estate development,
real estate asset management and real estate services with a focus on the core markets of Baden-
Württemberg and Rhineland-Palatinate, the Rhine Main region and Munich. In addition, it performs
real estate services within the Group.
Financial markets.
The financial markets segment primarily supports companies, savings banks, banks, private
customers and institutional customers. Institutional investors include, for example, pension funds,
insurance companies, asset managers, local authorities, foundations and churches.
Its activities concentrate on German-speaking regions. LBBW (Bank) supports its international
customers chiefly on the money and foreign currency markets and in issuing business.
Financial markets business also includes trading activities in the capital market environment. LBBW (Bank)
particularly offers its customers solutions for managing interest-rate, currency and commodity risks as
well as for raising and investing short-term and long-term cash in the capital markets.
COMBINED MANAGEMENT REPORT — GROUP OVERVIEW
CO
MB
INED
MA
NA
GEM
ENT
REP
OR
T
37
LBBW (Bank) additionally offers support in optimizing balance sheet structures and asset/liability
management as well as the savings banks' proprietary business, i. e. interest rate and credit
products.
The subsidiary LBBW Asset Management Investmentgesellschaft mbH complements the product range
of LBBW (Bank) in capital markets business. It primarily focuses on consulting and the management of
security trust assets for institutional and private investors.
Credit investment.
Alongside the five pillars of the LBBW business model, the non-strategic credit substitute business of
LBBW, the former Sachsen LB and the former Landesbank Rheinland-Pfalz is pooled within this
segment. This particularly includes bonds, credit derivatives, securitizations and structured
products. The portfolio is being fully run off.
Segment allocation and coordination.
In LBBW's segment reporting, the two pillars corporate customers and real estate financing are
assigned to the Corporates segment, while private customer and savings bank business forms
part of the Retail/Savings Banks segment. The Financial Markets segment is identical to the pillar
described here. Information on the segments can be found in the IFRS segment report included in
the notes.
Within this business model, LBBW's Board of Managing Directors manages the Bank as a whole by
tracking a set of performance indicators along the strategic business areas/segments in the light of
the Group's risk-bearing capacity. The information required therefore is derived from compre-
hensive, target-oriented monthly reports. The following financial performance indicators are of
particular relevance in the management of the Group:
■ the common equity Tier 1 ratio/risk weighted assets (after full implementation of Basel III/fully loaded)
■ consolidated total assets (IFRS)
■ net consolidated profit/loss before tax (IFRS)
■ net profit before tax (HGB) in the case of LBBW (Bank)
■ the cost/income ratio
Restructuring process at the LBBW Group. Systematic restructuring to create a solely customer-driven bank now completed.
LBBW (Bank) launched a far-reaching restructuring program in 2009 in conjunction with capital and
guarantee measures by the owners and EU state aid proceedings. The systematic running-down of
business areas that are now outside the Bank’s core business – especially non-customer related,
volatile credit substitute business – was at the heart of this restructuring, while at the same time
greater emphasis was placed on already existing and traditionally strong customer business.
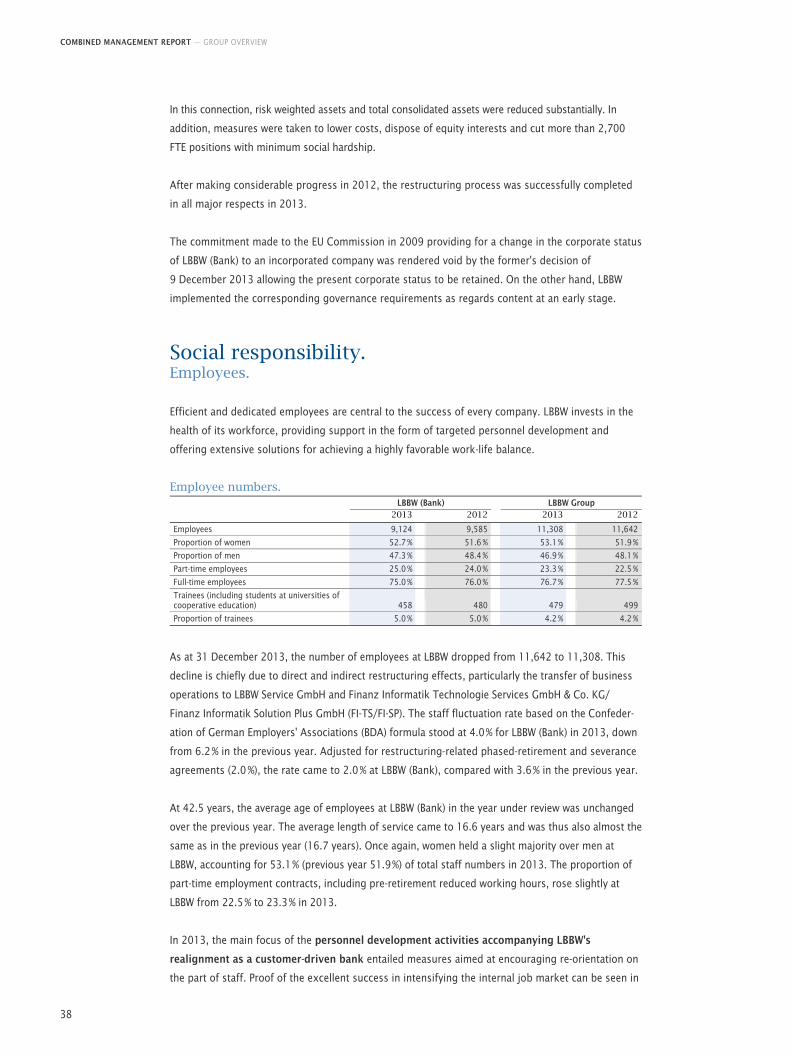
COMBINED MANAGEMENT REPORT — GROUP OVERVIEW
38
In this connection, risk weighted assets and total consolidated assets were reduced substantially. In
addition, measures were taken to lower costs, dispose of equity interests and cut more than 2,700
FTE positions with minimum social hardship.
After making considerable progress in 2012, the restructuring process was successfully completed
in all major respects in 2013.
The commitment made to the EU Commission in 2009 providing for a change in the corporate status
of LBBW (Bank) to an incorporated company was rendered void by the former's decision of
9 December 2013 allowing the present corporate status to be retained. On the other hand, LBBW
implemented the corresponding governance requirements as regards content at an early stage.
Social responsibility. Employees.
Efficient and dedicated employees are central to the success of every company. LBBW invests in the
health of its workforce, providing support in the form of targeted personnel development and
offering extensive solutions for achieving a highly favorable work-life balance.
Employee numbers. LBBW (Bank) LBBW Group 2013 2012 2013 2012
Employees 9,124 9,585 11,308 11,642
Proportion of women 52.7 % 51.6 % 53.1 % 51.9 %
Proportion of men 47.3 % 48.4 % 46.9 % 48.1 %
Part-time employees 25.0 % 24.0 % 23.3 % 22.5 %
Full-time employees 75.0 % 76.0 % 76.7 % 77.5 %
Trainees (including students at universities of cooperative education) 458 480 479 499
Proportion of trainees 5.0 % 5.0 % 4.2 % 4.2 %
As at 31 December 2013, the number of employees at LBBW dropped from 11,642 to 11,308. This
decline is chiefly due to direct and indirect restructuring effects, particularly the transfer of business
operations to LBBW Service GmbH and Finanz Informatik Technologie Services GmbH & Co. KG/
Finanz Informatik Solution Plus GmbH (FI-TS/FI-SP). The staff fluctuation rate based on the Confeder-
ation of German Employers' Associations (BDA) formula stood at 4.0 % for LBBW (Bank) in 2013, down
from 6.2 % in the previous year. Adjusted for restructuring-related phased-retirement and severance
agreements (2.0 %), the rate came to 2.0 % at LBBW (Bank), compared with 3.6 % in the previous year.
At 42.5 years, the average age of employees at LBBW (Bank) in the year under review was unchanged
over the previous year. The average length of service came to 16.6 years and was thus also almost the
same as in the previous year (16.7 years). Once again, women held a slight majority over men at
LBBW, accounting for 53.1 % (previous year 51.9 %) of total staff numbers in 2013. The proportion of
part-time employment contracts, including pre-retirement reduced working hours, rose slightly at
LBBW from 22.5 % to 23.3 % in 2013.
In 2013, the main focus of the personnel development activities accompanying LBBW's
realignment as a customer-driven bank entailed measures aimed at encouraging re-orientation on
the part of staff. Proof of the excellent success in intensifying the internal job market can be seen in
COMBINED MANAGEMENT REPORT — GROUP OVERVIEW
CO
MB
INED
MA
NA
GEM
ENT
REP
OR
T
39
the almost 1,200 vacancy notices (2012: 1,000) posted, nearly all of which were filled by means of
internal changes, re-entry to the workforce following the family phase and the permanent
employment of apprentices.
Regardless of the still challenging market environment, LBBW views the professional qualification
of young people as an important social and business responsibility that it is very glad to address. At
the end of 2013, 479 (previous year: 499) trainees and students from universities of cooperative
education were working at LBBW. At 4.2 %, the proportion of trainees was unchanged over the
previous year, testifying to LBBW's sustained commitment to vocational education, the quality of
which is acknowledged and praised by external bodies.
Despite the greatest possible cost awareness, LBBW (Bank) maintained spending on staff
qualifications and training at the previous year's level. Managers and employees were able to
select specific training courses from a wide range of seminars for professional and personal
development. This is supplemented by foreign-language courses, tuition on specific subjects by
external seminar organizers and courses in business administration. LBBW managers underwent
special Bank-wide training aimed at heightening their awareness of »mental health«. In corporate
customer business, the focus was on integrated financial advisory services, while workshops on how
to conduct high-quality advisory talks were held in private customer and private banking business.
Against the backdrop of demographic changes, working conditions that facilitate an acceptable
work-life balance are extremely important to foster the potential of the Bank’s workforce to
optimum effect for the mutual benefit of both sides. LBBW (Bank) provides its employees with
extensive assistance in this respect. For example, Bank employees can utilize childcare services at all
head offices. Depending on requirements, optimized solutions are available, e.g. children's day care
services, kindergartens, emergency childcare and special arrangements during the school holidays.
This has also been confirmed by the »Career and Family« re-auditing exercise performed by the non-
profit foundation Hertie-Stiftung in 2013. LBBW ranked in the top 25 % of all companies reviewed.
The auditors particularly praised the fact that the working-hour framework which LBBW provides its
employees offers a great deal of flexibility, adding that, in addition to a wide range of different
working-hour models, there are various part-time options as well as scope for taking extended leave
of absence thanks to working-time accounts. This is additionally supplemented with the general
possibility of working from home.
Since 2013, greater allowance has also been made for an improvement in the balance between work
and life in connection with care for family members. For the first time, three seminars dealing with
such matters were offered last year. The enormous demand on the part of employees shows how
important this subject is to them. LBBW is also committed to helping employees in this particular
phase of their lives. Accordingly, LBBW (Bank) employees may apply for an additional six months of
leave of absence on top of the care period in accordance with the Care Leave Act. In addition, it is
possible to apply for leave of absence each year for up to ten days to care for family members. The
Bank pays the employee's salary on a voluntary basis during this period. Since January 2013, it has
also been possible for employees who care for family members to temporarily reduce their working
hours for a period of up to two years.
COMBINED MANAGEMENT REPORT — GROUP OVERVIEW
40
Healthy, efficient and motivated employees are a material factor in a company's success. It is for this
reason that company health management is viewed as a strategic investment by LBBW (Bank). It
seeks to evaluate and, as far as possible, optimize all material factors in the Bank impacting health,
e.g. physical working conditions, processes and duties. However, »soft« factors such as the respect
which employees perceive, the scope which they have in the performance of their duties and social
support also exert a particular impact on health. As managers play a decisive role in all these aspects,
they undergo compulsory and systematic training in »health-oriented management« at LBBW (Bank).
Employees are also given incentives to maintain and improve their own health. Among other things,
a healthy style of life is encouraged by a range of exercise and relaxation options close to the
workplace, some of which are organized in conjunction with fitness studios. Some of the canteens
are certified in accordance with organic food standards, offering a wide range of healthy food.
Social responsibility towards staff forms a key element of the corporate culture at LBBW (Bank). In line
with this, it aids employees with personal or professional problems as well as in times of stress. In
addition to medical care at the larger offices, the company medical service provides first aid close to
the workplace as well as a large number of measures aimed at promoting health. The social affairs
office also provides solution-oriented assistance, conflict management and immediate support in
crisis situations. As well as this, many managers receive advice on how best to work with their
employees. Workshops for staff are also available.
The quality of health management at LBBW (Bank) has again been confirmed by the »Excellence
Status« in the »Corporate Health Award 2013« in a Germany-wide comparison of companies by
Handelsblatt, TÜV SÜD and EuPD Research.
In accordance with the provisions of Sections 7 and 8 of the Remuneration Ordinance for
Institutions (InstitutsVergV) of 13 October 2010, LBBW (Bank) will be preparing a remuneration
report for 2013, which it expects to publish at www.LBBW.de in the 3rd quarter of 2014.
LBBW improvement process.
In 2013, the number of improvements proposed by employees rose by 11.7 % to 3,789. Last year,
1,393 ideas were put into practice, generating benefits worth EUR 9.1 million. The LBBW improve-
ment process was awarded the German Ideas Award for the second consecutive year by the German
Institute for Business Administration (Deutsches Institut für Betriebswirtschaft) in recognition of the
best idea management system in the banking, insurance and financial services sector.
As an idea management model, the LBBW improvement process encourages employees to contribute
their ideas. In this way, they can help in the further development of the Group either by means of
spontaneous ideas or by taking part in specific workshops on process optimization. The purpose is to
encourage ideas and creativity as a determinant of success in the market place, thus supporting day-to-
day activities. Hands-on customer orientation, an awareness of costs and income, secure and efficient
work processes and outstanding products are the goals which the LBBW improvement process helps to
support.
Encouragingly, this also furthers a culture of cross-process and cross-segment cooperation within the
Group. Managers define themselves as coaches for their employees' ideas. The structure of and
processes within the LBBW improvement process ensure that employees' spontaneous ideas receive
COMBINED MANAGEMENT REPORT — GROUP OVERVIEW
CO
MB
INED
MA
NA
GEM
ENT
REP
OR
T
41
due attention across all management levels. This is additionally aided by a separate decision-making
body. An electronic workflow enhances the Group methodology. This year as well the Group is
committed to additionally boosting staff participation and to utilizing ideas as a basis for successful
further development.
Sustainability.
The commitment of LBBW to sustainability is anchored in both its business strategy and its business.
Sustainability policies and goals, the climate strategy and specific guidelines provide a binding
framework for responsible activity on the part of each individual, thus creating the basis for
systematically sustainable corporate governance in all business segments.
Sustainability strategy and management.
The LBBW sustainability policy consolidates LBBW's guiding principles on sustainable development in
the areas of corporate governance, business operations, human resources, communication, and
LBBW's commitment as a corporate citizen. It thus defines the framework for all sustainability
activities within LBBW and forms the basis for integrating economic, ecological and social aspects in
overall corporate activity.
LBBW has set itself appropriate goals in the definition of its sustainability policy. These are
implemented on the basis of the »Sustainability Guidelines« (see below). In addition, the LBBW
climate strategy describes the Bank's position on key climate-related issues.
The standards defined apply to LBBW (Bank) including BW-Bank, Rheinland-Pfalz Bank, and
Sachsen Bank as well as to the wholly-owned subsidiaries integrated in the sustainability manage-
ment system of LBBW (Bank), namely GastroEvent GmbH, LBBW Immobilien Management GmbH and
LBBW Asset Management Investmentgesellschaft mbH, all of which are based in Stuttgart.
LBBW's commitment to sustainability is described at length at http://www.lbbw.de/sustainability. The 2014 sustainability report containing the figures as at 31 December 2013 is expected to be
published at the beginning of November.
Sustainability Guidelines.
The Sustainability Guidelines define the corridor within which LBBW pursues its sustainability goals in
investment and lending business, in human resources policy and in the stewardship of resources,
and therefore form the foundation for sustainable development.
Sustainability Guidelines in investment business.
LBBW takes account of sustainability-related factors in its investment business. In this connection, it
follows the United Nations Principles for Responsible Investment.
LBBW offers private and institutional investors a broad range of sustainable investment products;
asset-management customers are able to invest in accordance with their ethical principles.
Sustainability Guidelines in lending business.
Looking forward, LBBW wants to focus its lending business on transactions, projects, products and
customer groups which allow it to improve its sustainability track record. This also includes the
COMBINED MANAGEMENT REPORT — GROUP OVERVIEW
42
detection, avoidance and management of risks liable to arise from financing transactions. At the
same time, it wants to finance projects which support sustainable development and also offer
business opportunities for LBBW. With respect to project finance, this may for example include
plants, technologies and companies in the renewable energies segment. As well as this, investment
finance for water treatment and supply as well as energy infrastructure such as electricity grids and
storage systems will grow in importance.
Sustainability Guidelines in relations with personnel.
LBBW is committed on an ongoing basis to being an attractive employer of and reliable partner to its
employees. Knowing that capable and committed employees are the most important factor for the
success of any company, it is investing in its employees' health, furthering them with targeted
personnel development measures and helping them to achieve an optimum life/work balance. We
want to gain outstanding talents and ensure that they remain with us; LBBW views the professional
qualification of young people as an important social and business responsibility that it is very glad to
address (see also page 39).
Sustainability Guidelines in business operations.
At LBBW, the procurement of products and services follows strict criteria which expressly also include
environmental and social aspects. These criteria are considered in contract award decisions. The
standards which LBBW applies to its own use of resources are equally as demanding. Thus, for example,
CO2 emissions from company travel, building management, IT and the consumption of materials are
to be steadily reduced.
Sustainability ratings.
Munich-based oekom research AG has awarded LBBW an overall rating of C+ on a scale of A+ to D–.
This puts it in 2nd place out of a total of 33 international banks in the current »Financials/Public &
Regional Banks 2013« sector study (as at May 2013). LBBW meets the minimum standards for
sustainability management as defined by oekom research and is rated »prime«. This means that the
LBBW securities traded on the market qualify for investment from an ecological and social
perspective.
In the 2013 Sustainalytics Sustainability Rating, LBBW received 72 out of a possible 100 points
(previous year: 72) and therefore ranks 8th out of 73 in the international banking industry category
for non-listed banks (as at 31 December 2013).
As an issuer of public-sector covered bonds, mortgage-backed bonds and unsecured bonds (the
term »unsecured bond« includes all types of unsecured fixed-income securities as well as fixed-term
and savings deposits), LBBW was rated »positive« in the imug sustainability rankings.
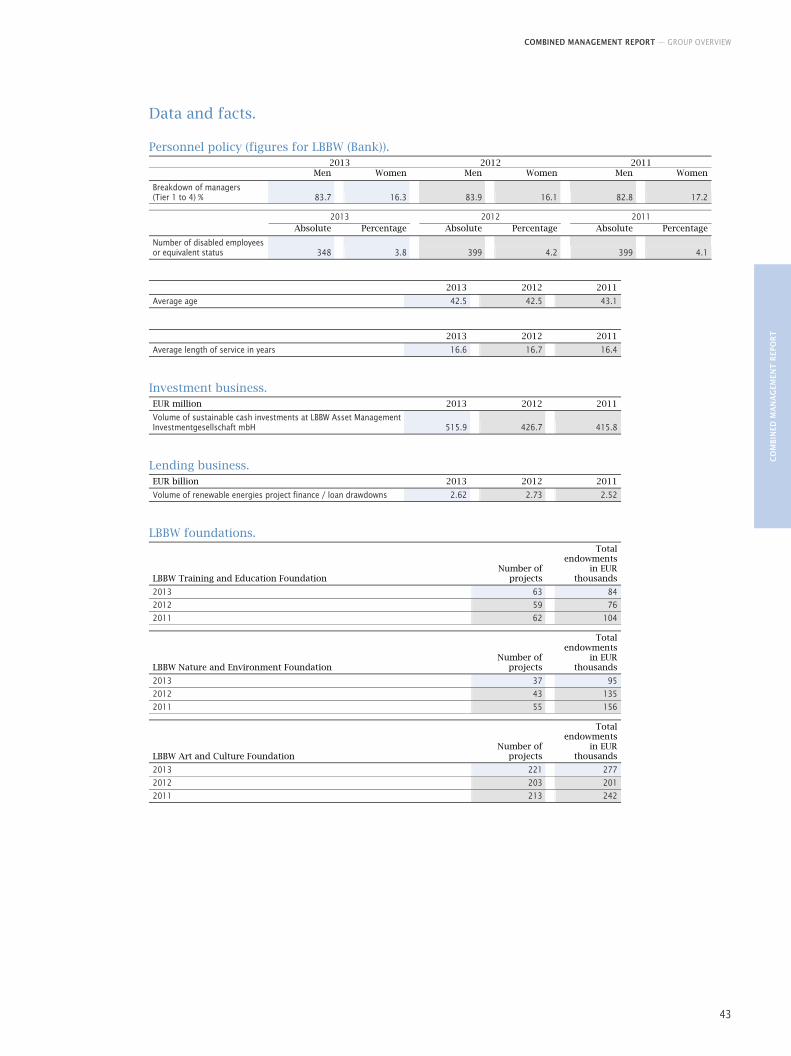
COMBINED MANAGEMENT REPORT — GROUP OVERVIEW
CO
MB
INED
MA
NA
GEM
ENT
REP
OR
T
43
Data and facts.
Personnel policy (figures for LBBW (Bank)). 2013 2012 2011 Men Women Men Women Men Women
Breakdown of managers (Tier 1 to 4) % 83.7 16.3 83.9 16.1 82.8 17.2 2013 2012 2011 Absolute Percentage Absolute Percentage Absolute Percentage
Number of disabled employees or equivalent status 348 3.8 399 4.2 399 4.1
2013 2012 2011
Average age 42.5 42.5 43.1
2013 2012 2011
Average length of service in years 16.6 16.7 16.4
Investment business. EUR million 2013 2012 2011
Volume of sustainable cash investments at LBBW Asset Management Investmentgesellschaft mbH 515.9 426.7 415.8
Lending business. EUR billion 2013 2012 2011
Volume of renewable energies project finance / loan drawdowns 2.62 2.73 2.52
LBBW foundations.
LBBW Training and Education Foundation Number of
projects
Total endowments
in EUR thousands
2013 63 84
2012 59 76
2011 62 104
LBBW Nature and Environment Foundation Number of
projects
Total endowments
in EUR thousands
2013 37 95
2012 43 135
2011 55 156
LBBW Art and Culture Foundation Number of
projects
Total endowments
in EUR thousands
2013 221 277
2012 203 201
2011 213 242
COMBINED MANAGEMENT REPORT — BUSINESS REPORT FOR THE GROUP
44
Business report for the Group.
Overall economic development. Global economy.
The past year was initially marked by a high level of uncertainty, but this faded significantly in the
course of the year, resulting in a report card for the global economy that is still satisfactory overall.
In terms of numbers, global GDP is likely to have grown by 3.1 %, which is currently only marginally
lower than the 2012 figure, when global GDP expanded by 3.2 %.
The following factors in particular were instrumental in this growth. Economic activity in the USA
picked up from the second quarter. The fiscal policy problems which could aptly be described with
the terms »budget dispute« and »debt ceiling« were resolved thanks to a compromise reached for
the time being between the Democrats and the Republicans. All told, while GDP growth in the USA
slipped from 2.8 % to 1.9 %, this can still be considered an acceptable result on the whole given that
companies have shown a degree of restraint with their investments and that private households were
under increasing pressure due to the higher social security contributions – all the more so since the
steady recovery in the US residential real estate market continued during the year.
The debt crisis of the eurozone countries lost some of its urgency, the situation in Cyprus not-
withstanding. The reforms in the peripheral countries particularly affected by the crisis seem to be
having an effect. Ireland, Spain and Portugal managed to return to growth in 2013. That said, the
situation in many countries of the eurozone remains difficult, as demonstrated by the 2013 figures –
GDP is likely to have contracted by 0.5 %, resembling the decline of – 0.6 % recorded for 2012. Italy
and France, in particular, where growth is persistently weak, are giving cause for concern. GDP growth
contracted in two out of four quarters in France in 2013, while in Italy the economy had not expanded
for nine consecutive quarters before recording a figure of 0.1 % in the closing quarter of 2014.
2013 was another eventful year in terms of economic policy, although the debt crisis did abate
perceptibly in the eurozone. Following the resolutions on Cyprus, which imposed a substantial
package of reforms and forced bank customers to take their share of the burden in winding up and
restructuring two large banks in the country in return for an aid package of EUR 10 billion, the
Bundestag was not called upon to approve any additional assistance. Considerable progress was
made at European level to create an EU-wide banking union: In particular, laying the foundations for
a single ECB-run banking supervisory system covering the largest banks, and agreeing upon a
Recovery and Resolution Directive, which amongst other things provides for a liability cascade that
starts with equity capital and finishes with unsecured customer deposits before public funds can be
used to bail out a bank.
COMBINED MANAGEMENT REPORT — BUSINESS REPORT FOR THE GROUP
CO
MB
INED
MA
NA
GEM
ENT
REP
OR
T
45
Germany.
The annual assessment of German GDP seems rather unimpressive according to the flash report of
the German Federal Statistical Office, revealing modest growth of just 0.5 % adjusted for calendar
effects. However, it should be noted that the year got off to a weak start with stagnating GDP
because of the bad weather conditions, resulting in a negative statistical overhang from the previous
year amounting to a quarter percentage point. But a »short burst of speed« in quarters two and
three, when GDP grew by 0.7 % and 0.3 %, fueled a significant upturn in economic activity. The main
drivers of this economic growth were private consumer spending and changes in inventories, while
foreign trade and investments, both normally traditional pillars of German economic activity, made
negative contributions this time round. At the start of the year the seasonally-adjusted unemploy-
ment rate sat at just under 7 %, and remained there in the course of the year. Pressure on prices was
subdued in the year under review, settling at an annual average of 1.5 % in comparison with the
previous year. Inflation was once again influenced by sharp fluctuations in the price of foods as well
as fuels and heating oil.
Central bank policy.
The Federal Reserve left its key interest rate unchanged in the historically low range of 0 % to 0.25 %
for the fifth calendar year in succession, but at the end of the year it took the much-awaited first
step towards exiting the ultra-expansionary monetary policy it has pursued for years. On a monthly
basis from January 2014 it will only buy USD 75 billion in US Treasuries and mortgage bonds, which
is USD 10 billion less than before, as announced by the Federal Open Market Committee of the
Federal Reserve system on 18 December. Furthermore, as in previous statements the Fed also held
out the prospect of raising interest rates if the jobless rate falls permanently below 6.5 % (in
January 2014 the unemployment rate in the USA came to 6.6 %) and mid- to long-term inflation
expectations hover around the 2 % mark.
In the eurozone, by contrast, the ECB loosened its monetary policy twice in the period under review.
The first move came in May when the ECB lowered its main refinancing rate from 0.75 % to 0.5 %, the
rate used for the weekly ECB tenders and which is therefore mandatory for the liquidity supply of
commercial banks in the eurozone. The second step was in November, when the ECB shaved another
25 basis points off to 0.25 %, making reference to looming deflationary risks (the inflation rate
having previously dropped unexpectedly from 1.1 % to 0.7 %). However, the deposit rate used by
commercial banks to place their surplus liquidity at the ECB, remained at 0 %, even though ECB
President Draghi revealed that the ECB had focused on the issue of negative deposit interest rates
and found this to be a plausible scenario. The ECB moreover underlined its willingness to support
economic activity in the eurozone with low interest rates by disclosing that it intended to keep the
key interest rate at its current level or below for a lengthy period. This far-reaching announcement –
unheard of in the history of the ECB, which previously was always very careful to avoid giving
indications of future decisions – is now a fixture in communications between the ECB and the
financial markets as »forward guidance«.
COMBINED MANAGEMENT REPORT — BUSINESS REPORT FOR THE GROUP
46
Bond market.
Diminishing fears about the collapse of the European Monetary Union in conjunction with monetary
policy announcements shaped yield trends on German bond markets to a large extent. On balance
though, 2013 was a weak year for Bunds in terms of earnings. Yields on 10-year Bunds dropped
from roughly 1.30 % to 1.19 % between January and May. Since then, however, the yield trend has
been upwards. Yields of 1.94 % were recorded at year-end. Since the ECB lowered its key rate by 50
basis points over the same period, other factors are likely to have played a part here. In first place,
the eurozone debt crisis proved to be much less volatile than in previous years: This was reflected in
the lower risk premiums on bonds issued by countries previously classified as risky, such as Spain or
Italy, compared with German Bunds. Secondly, the Republic of Ireland announced it intended to
issue its own capital market instruments again from 2014 to fund its financing requirements, and
would not need additional financial assistance. Furthermore, the US Federal Reserve signaled a
gradual end to what has so far been a very expansionary monetary policy. Yields on the market for
US Treasuries rose from approximately 1.60 % in May to just under 3 % by the year-end, which also
put some pressure on German Bunds. Ultimately, yields on Bunds probably seemed increasingly
unattractive for many investors against the backdrop of price trends on equity markets, which likely
created some selling pressure on the bond market.
Currency market.
The EUR enjoyed a strong year in 2013 against the USD, and appreciated significantly compared to the
previous year's close. While the EUR cost USD 1.32 at the start of the year, and bottomed out for the
year at USD 1.28, at the end of March, it closed out 2013 with a rate of roughly USD 1.38 per EUR. In
this context the EUR is likely to have benefited not only from the easing debt crisis in the eurozone but
also from the improving current accounts in the region. The EUR managed to appreciate strongly
against the JPY, which fell from 114 to 145 per EUR. On balance, the EUR exchange rate barely changed
against the GBP: at the start of 2012 it stood at GBP 0.82 per EUR, while it ended the year at 0.83.
Against the CHF the EUR appreciated only marginally from 1.21 to 1.23.
Stock market.
On the stock market, the past year will go down in the annals of history as one of the best in recent
years. Many of the key indices, including the Dow Jones Industrial and the DAX, reached new
historical highs. Over the year the DAX rose from 7,612 to 9,552 points, or by more than 25 %.
Second-tier indices also enjoyed an outstanding year: The MDax comprising small and medium-sized
German companies increased by 39 % from 11,914 to 16,574 points.
Banking industry performance.
Developments in the German banking industry in 2013 were largely influenced by the ongoing
adjustments in the sector in response to the growing regulatory requirements and the low interest
level, which constitutes an increasing burden for German banks. The easing in tension on the
international financial markets compared with 2012 and the robust German economic activity given
the circumstances were supportive for developments in the industry. That said, credit demand in the
economy remained subdued in a still fiercely competitive market environment in the corporate as
COMBINED MANAGEMENT REPORT — BUSINESS REPORT FOR THE GROUP
CO
MB
INED
MA
NA
GEM
ENT
REP
OR
T
47
well as the private customer business, with many companies having good liquidity as well as
reluctant to invest in view of the many floating uncertainties.
The changes in the banking industry continued, primarily against the backdrop of the gradual
implementation of Basel III from 2014 and the ongoing implementation of EU Commission
requirements at many institutions. What is more, adjusting to the growing regulatory and legal
requirements in 2013 tied down capacities and resources at institutions to a significant extent.
Large German banks were obliged for the first time to submit recovery plans in accordance with
MaSan requirements by the end of the year. In the run-up to the single supervisory mechanism for
about 130 systemically relevant banks under the aegis of the ECB – among them LBBW as well –
a comprehensive banking review was launched in the second half of 2013.
Business performance of the LBBW Group. Results of operations, net assets and financial position.
Business development in 2013.
The trends which dominated in the previous year continued to prevail over the global banking
industry in 2013. The main topics for the European banking industry, alongside the progress being
made with regulatory issues, were the continued pressure to increase equity and reduce risk
weighted assets.
Persistently low interest rates, stable or falling credit risk premiums for countries and businesses as
well as the extremely bright stock markets around the world influenced market events.
Amid this setting, the LBBW Group continued its positive performance in the 2013 financial year,
despite the fiercely competitive markets and muted credit demand. The change in focus towards a
customer-driven bank and the implementation of the obligations derived from the restructuring
launched in 2009 were both successfully completed in all main areas in 2013.
The Group succeeded in generating a positive result for the eighth consecutive quarter. The 2013
financial year therefore closed out with a net profit before tax figure of EUR 471 million, which
represents an improvement of EUR 72 million on the previous year (2012: EUR 399 million). In spite
of the sharp reduction in total assets – which fell by EUR 63 billion to EUR 274 billion compared with
the previous year – LBBW can look back on a moderate increase in net income (before allowances for
losses on loans and advances) in core business areas. Allowances for losses on loans and advances
remained moderate thanks to the sound economic conditions in the core markets, particularly
Germany, but increased noticeably on the previous year. The absence of major burdens caused by
turmoil on the financial markets and the slight reduction in administrative expenses exerted a
positive effect on earnings.
COMBINED MANAGEMENT REPORT — BUSINESS REPORT FOR THE GROUP
48
Alongside the key performance indicators referred to above that are relevant for management
purposes (profit before tax and total assets), the cost income ratio (CIR) is another management
indicator, which improved by 9.1 % points to 63.5 % following the positive development in both
income and costs throughout the 2013 financial year.
Net consolidated profit before tax came in roughly EUR 100 million higher than planned in the 2013
financial year. This development was boosted by the better-than-expected performance of credit
derivatives, positive contributions from the real estate business, one-off effects, including the
reversal of provisions, and allowances for losses from loans and advances that were significantly
lower than budgeted. Risk-reducing measures, subdued credit demand and the persistently low
interest rate had the opposite effect. On the other hand, administrative expenses were as planned.
All these developments produced a cost/income ratio of 63.5 %, slightly higher than planned.
Total assets of the LBBW Group fell much more strongly in the course of the year than originally
anticipated. The good market conditions, inter alia, were used to effect a systematic reduction in assets.
The Group's financial position throughout the entire reporting year was satisfactory given the good
liquidity. The Group was able to obtain funding on the requisite scale via the market at all times.
The main instrument for managing capital at the LBBW Group is the common equity Tier 1 ratio
after full implementation of Basel III (fully loaded). LBBW has a solid capital base with a ratio of
12.6 % as at 2013 year-end. Alongside the conversion of silent partners' contributions as at 2012
year-end, the faster reduction in risk weighted assets (principally in the non-core banking portfolios)
contributed to improving this ratio.
The Tier 1 capital ratio according to Basel 2.5 came in at 18.5 % for the LBBW Group at the end of
2013. This constitutes an improvement of 3.2 % points compared to the previous year. The total
ratio increased to 22.5 %, which means the capital ratios of LBBW easily exceed the market average.
All in all, the LBBW Group made positive progress with all management-related performance
indicators throughout the 2013 financial year.
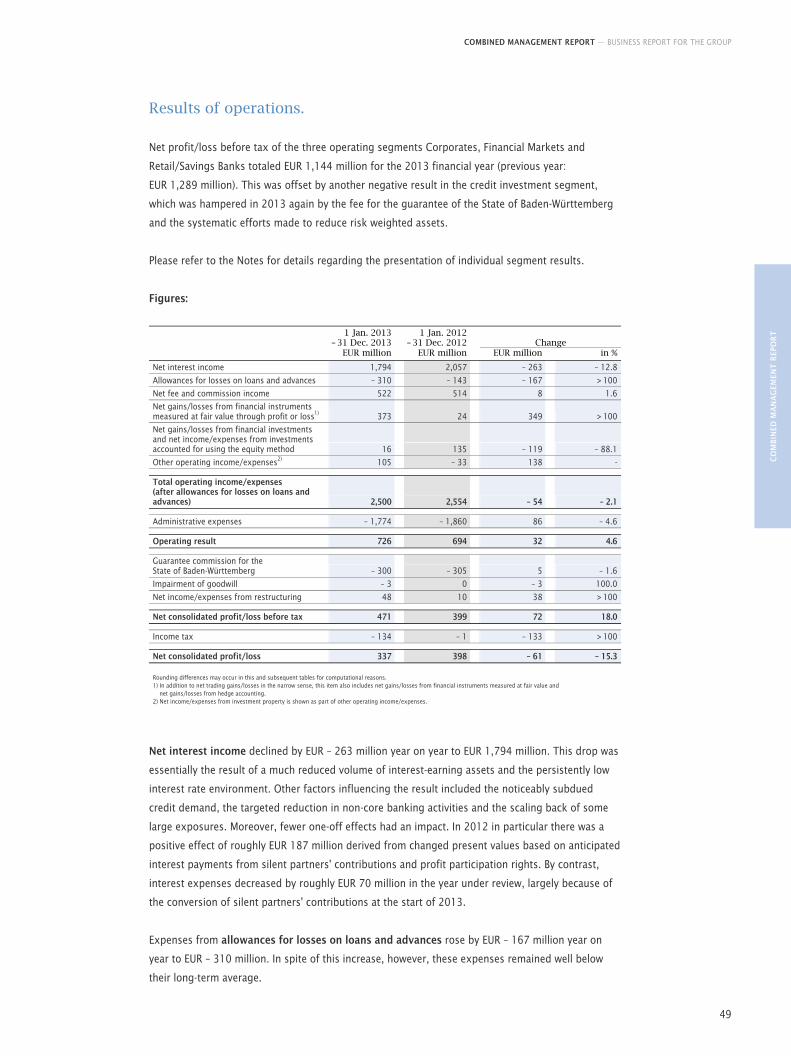
COMBINED MANAGEMENT REPORT — BUSINESS REPORT FOR THE GROUP
CO
MB
INED
MA
NA
GEM
ENT
REP
OR
T
49
Results of operations.
Net profit/loss before tax of the three operating segments Corporates, Financial Markets and
Retail/Savings Banks totaled EUR 1,144 million for the 2013 financial year (previous year:
EUR 1,289 million). This was offset by another negative result in the credit investment segment,
which was hampered in 2013 again by the fee for the guarantee of the State of Baden-Württemberg
and the systematic efforts made to reduce risk weighted assets.
Please refer to the Notes for details regarding the presentation of individual segment results.
Figures:
1 Jan. 2013
– 31 Dec. 2013 1 Jan. 2012
– 31 Dec. 2012 Change EUR million EUR million EUR million in %
Net interest income 1,794 2,057 – 263 – 12.8
Allowances for losses on loans and advances – 310 – 143 – 167 > 100
Net fee and commission income 522 514 8 1.6
Net gains/losses from financial instruments measured at fair value through profit or loss1) 373 24 349 > 100
Net gains/losses from financial investments and net income/expenses from investments accounted for using the equity method 16 135 – 119 – 88.1
Other operating income/expenses2) 105 – 33 138 - Total operating income/expenses (after allowances for losses on loans and advances) 2,500 2,554 – 54 – 2.1 Administrative expenses – 1,774 – 1,860 86 – 4.6 Operating result 726 694 32 4.6 Guarantee commission for the State of Baden-Württemberg – 300 – 305 5 – 1.6
Impairment of goodwill – 3 0 – 3 100.0
Net income/expenses from restructuring 48 10 38 > 100 Net consolidated profit/loss before tax 471 399 72 18.0 Income tax – 134 – 1 – 133 > 100 Net consolidated profit/loss 337 398 – 61 – 15.3 Rounding differences may occur in this and subsequent tables for computational reasons. 1) In addition to net trading gains/losses in the narrow sense, this item also includes net gains/losses from financial instruments measured at fair value and
net gains/losses from hedge accounting. 2) Net income/expenses from investment property is shown as part of other operating income/expenses.
Net interest income declined by EUR – 263 million year on year to EUR 1,794 million. This drop was
essentially the result of a much reduced volume of interest-earning assets and the persistently low
interest rate environment. Other factors influencing the result included the noticeably subdued
credit demand, the targeted reduction in non-core banking activities and the scaling back of some
large exposures. Moreover, fewer one-off effects had an impact. In 2012 in particular there was a
positive effect of roughly EUR 187 million derived from changed present values based on anticipated
interest payments from silent partners' contributions and profit participation rights. By contrast,
interest expenses decreased by roughly EUR 70 million in the year under review, largely because of
the conversion of silent partners' contributions at the start of 2013.
Expenses from allowances for losses on loans and advances rose by EUR – 167 million year on
year to EUR – 310 million. In spite of this increase, however, these expenses remained well below
their long-term average.
COMBINED MANAGEMENT REPORT — BUSINESS REPORT FOR THE GROUP
50
Net fee and commission income improved in the year under review by EUR 8 million to
EUR 522 million, with the individual types of fees and commissions performing differently. On the one
hand, substantial improvements were seen in net fee and commission income from the securities and
custody business (EUR 21 million, including transaction-based business with customers and savings
banks), but this was offset by lower net fee and commission income in the lending, trustee and
guarantee (aval) business owing to the subdued credit demand (EUR – 15 million).
Net gains/losses from financial instruments measured at fair value through profit or loss rose
substantially year on year by EUR 349 million to EUR 373 million. The encouraging annual gain was
largely driven by trade in interest-rate derivatives. In addition, the reversal of impairment losses on
rating-induced transactions amounting to EUR 65 million had a beneficial impact (particularly for spread
tightening in bank and sovereign names that had an effect on credit derivatives; previous year:
EUR 305 million). The negative result from the previous year was largely affected by valuation
adjustments (inter alia for market parameters, counterparty risks and legal risks) and by hedging
currency risks using derivatives. The market valuation of own liabilities resulted in an expense of
EUR – 82 million because of LBBW's better credit rating, but this was still lower than the previous year
(EUR – 144 million).
Net gains/losses from financial investments and net income/expenses from investments
accounted for using the equity method worsened year on year from EUR 135 million to
EUR 16 million. This result was dominated once again by the continued reduction in volumes and
risks in non-core banking business (credit substitute business). This involved consciously accepting
some burdens on earnings in the course of the year. What is more, lower income was generated
from the sale of equity investments.
Profit of EUR 24 million was made from selling securities (previous year: EUR – 21 million). Write-ups
in the credit investment portfolio, which was particularly affected by the financial market crisis, were
roughly the same size. This was offset by an expense derived from adjusting the reimbursement
rights in connection with the guarantee provided by the State of Baden-Württemberg totaling
EUR – 56 million (previous year: EUR – 17 million).
The sale of equity investments in the financial year produced a profit of EUR 37 million (previous
year: EUR 172 million). Net gains/losses from investments accounted for using the equity method
in the period under review totaled EUR 6 million, and were therefore EUR – 48 million less than the
previous year's figure.
Other operating income/expenses and net income/expenses from investment property
improved significantly due to a variety of one-off effects and amounted to EUR 105 million, up from
EUR – 33 million in the previous year. Successful project developments helped to generate earnings
of EUR 111 million (previous year: EUR 12 million) in real estate. These were partially negated by
impairments on real estate amounting to EUR – 38 million and declining rental income from real
estate (EUR – 21 million). It should be noted here that the residential housing portfolio of LBBW
Immobilien GmbH was sold as at the end of the first quarter in 2012 in accordance with EU require-
ments. An expense of EUR – 30 million was incurred in connection with the sale of a subsidiary as
part of the planned reduction in the investment portfolio. Moreover, allocations to, and reversals of,
provisions connected to legal and litigation risks almost balanced each other out in comparison with
the previous year.
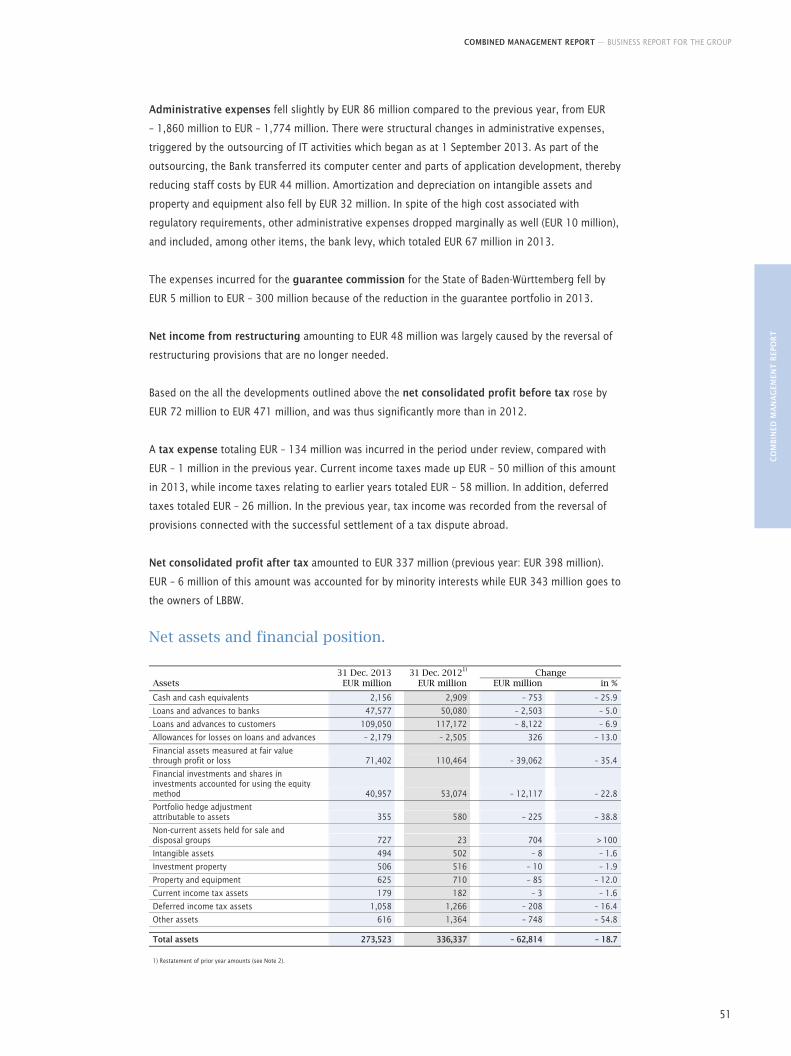
COMBINED MANAGEMENT REPORT — BUSINESS REPORT FOR THE GROUP
CO
MB
INED
MA
NA
GEM
ENT
REP
OR
T
51
Administrative expenses fell slightly by EUR 86 million compared to the previous year, from EUR
– 1,860 million to EUR – 1,774 million. There were structural changes in administrative expenses,
triggered by the outsourcing of IT activities which began as at 1 September 2013. As part of the
outsourcing, the Bank transferred its computer center and parts of application development, thereby
reducing staff costs by EUR 44 million. Amortization and depreciation on intangible assets and
property and equipment also fell by EUR 32 million. In spite of the high cost associated with
regulatory requirements, other administrative expenses dropped marginally as well (EUR 10 million),
and included, among other items, the bank levy, which totaled EUR 67 million in 2013.
The expenses incurred for the guarantee commission for the State of Baden-Württemberg fell by
EUR 5 million to EUR – 300 million because of the reduction in the guarantee portfolio in 2013.
Net income from restructuring amounting to EUR 48 million was largely caused by the reversal of
restructuring provisions that are no longer needed.
Based on the all the developments outlined above the net consolidated profit before tax rose by
EUR 72 million to EUR 471 million, and was thus significantly more than in 2012.
A tax expense totaling EUR – 134 million was incurred in the period under review, compared with
EUR – 1 million in the previous year. Current income taxes made up EUR – 50 million of this amount
in 2013, while income taxes relating to earlier years totaled EUR – 58 million. In addition, deferred
taxes totaled EUR – 26 million. In the previous year, tax income was recorded from the reversal of
provisions connected with the successful settlement of a tax dispute abroad.
Net consolidated profit after tax amounted to EUR 337 million (previous year: EUR 398 million).
EUR – 6 million of this amount was accounted for by minority interests while EUR 343 million goes to
the owners of LBBW.
Net assets and financial position.
31 Dec. 2013 31 Dec. 20121)
Change Assets EUR million EUR million EUR million in %
Cash and cash equivalents 2,156 2,909 – 753 – 25.9
Loans and advances to banks 47,577 50,080 – 2,503 – 5.0
Loans and advances to customers 109,050 117,172 – 8,122 – 6.9
Allowances for losses on loans and advances – 2,179 – 2,505 326 – 13.0
Financial assets measured at fair value through profit or loss 71,402 110,464 – 39,062 – 35.4
Financial investments and shares in investments accounted for using the equity method 40,957 53,074 – 12,117 – 22.8
Portfolio hedge adjustment attributable to assets 355 580 – 225 – 38.8
Non-current assets held for sale and disposal groups 727 23 704 > 100
Intangible assets 494 502 – 8 – 1.6
Investment property 506 516 – 10 – 1.9
Property and equipment 625 710 – 85 – 12.0
Current income tax assets 179 182 – 3 – 1.6
Deferred income tax assets 1,058 1,266 – 208 – 16.4
Other assets 616 1,364 – 748 – 54.8 Total assets 273,523 336,337 – 62,814 – 18.7
1) Restatement of prior year amounts (see Note 2).
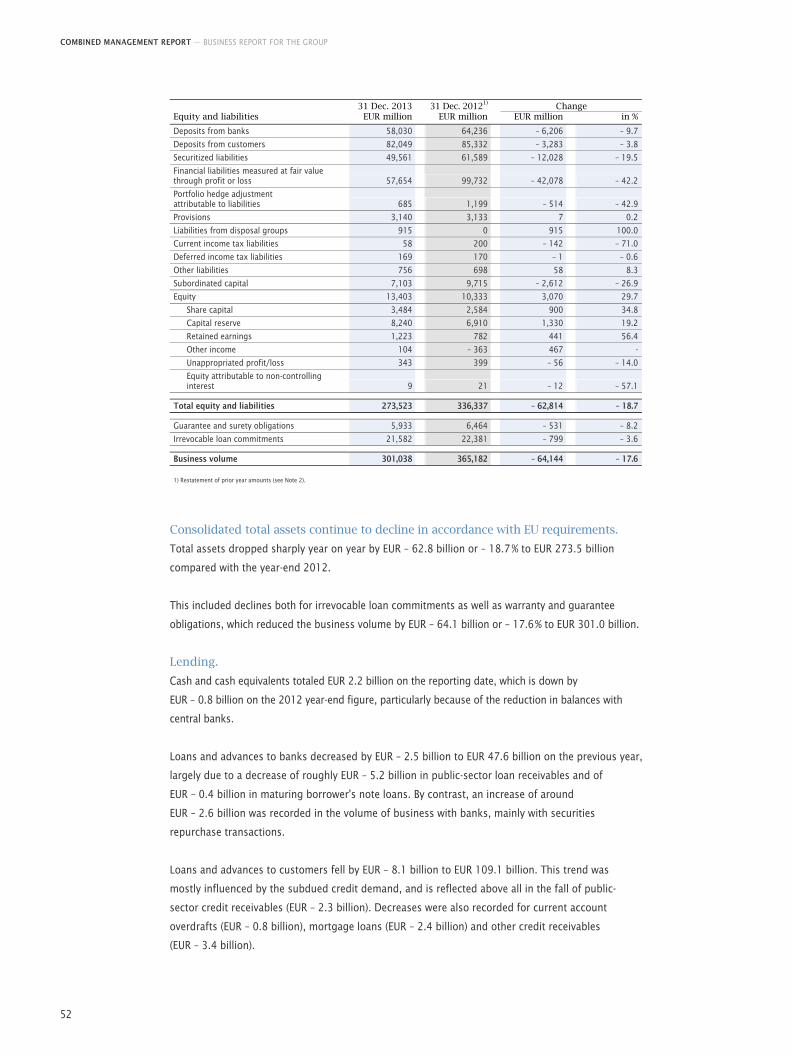
COMBINED MANAGEMENT REPORT — BUSINESS REPORT FOR THE GROUP
52
31 Dec. 2013 31 Dec. 20121)
Change Equity and liabilities EUR million EUR million EUR million in %
Deposits from banks 58,030 64,236 – 6,206 – 9.7
Deposits from customers 82,049 85,332 – 3,283 – 3.8
Securitized liabilities 49,561 61,589 – 12,028 – 19.5
Financial liabilities measured at fair value through profit or loss 57,654 99,732 – 42,078 – 42.2
Portfolio hedge adjustment attributable to liabilities 685 1,199 – 514 – 42.9
Provisions 3,140 3,133 7 0.2
Liabilities from disposal groups 915 0 915 100.0
Current income tax liabilities 58 200 – 142 – 71.0
Deferred income tax liabilities 169 170 – 1 – 0.6
Other liabilities 756 698 58 8.3
Subordinated capital 7,103 9,715 – 2,612 – 26.9
Equity 13,403 10,333 3,070 29.7
Share capital 3,484 2,584 900 34.8
Capital reserve 8,240 6,910 1,330 19.2
Retained earnings 1,223 782 441 56.4
Other income 104 – 363 467 -
Unappropriated profit/loss 343 399 – 56 – 14.0
Equity attributable to non-controlling interest 9 21 – 12 – 57.1
Total equity and liabilities 273,523 336,337 – 62,814 – 18.7 Guarantee and surety obligations 5,933 6,464 – 531 – 8.2
Irrevocable loan commitments 21,582 22,381 – 799 – 3.6 Business volume 301,038 365,182 – 64,144 – 17.6 1) Restatement of prior year amounts (see Note 2).
Consolidated total assets continue to decline in accordance with EU requirements.
Total assets dropped sharply year on year by EUR – 62.8 billion or – 18.7 % to EUR 273.5 billion
compared with the year-end 2012.
This included declines both for irrevocable loan commitments as well as warranty and guarantee
obligations, which reduced the business volume by EUR – 64.1 billion or – 17.6 % to EUR 301.0 billion.
Lending.
Cash and cash equivalents totaled EUR 2.2 billion on the reporting date, which is down by
EUR – 0.8 billion on the 2012 year-end figure, particularly because of the reduction in balances with
central banks.
Loans and advances to banks decreased by EUR – 2.5 billion to EUR 47.6 billion on the previous year,
largely due to a decrease of roughly EUR – 5.2 billion in public-sector loan receivables and of
EUR – 0.4 billion in maturing borrower's note loans. By contrast, an increase of around
EUR – 2.6 billion was recorded in the volume of business with banks, mainly with securities
repurchase transactions.
Loans and advances to customers fell by EUR – 8.1 billion to EUR 109.1 billion. This trend was
mostly influenced by the subdued credit demand, and is reflected above all in the fall of public-
sector credit receivables (EUR – 2.3 billion). Decreases were also recorded for current account
overdrafts (EUR – 0.8 billion), mortgage loans (EUR – 2.4 billion) and other credit receivables
(EUR – 3.4 billion).
COMBINED MANAGEMENT REPORT — BUSINESS REPORT FOR THE GROUP
CO
MB
INED
MA
NA
GEM
ENT
REP
OR
T
53
Financial assets measured at fair value through profit or loss fell sharply by EUR – 39.1 billion, from
EUR 110.5 billion to EUR 71.4 billion, thereby making a significant contribution to the massive
reduction in total assets. This means maturing money market instruments, which make up a
significant share of the trading portfolio, alongside interest-rate derivatives, exceeded new business
by approximately EUR – 7.0 billion. In the year under review, derivatives with matching fair values at
portfolio level as at 2012 year-end were closed in the amount of EUR – 11.7 billion. Furthermore,
derivatives were transferred to a central liquidator and subsequently netted. As a result of netting, the
positions which lead to a reduction in total assets increased by EUR 1.0 billion. A slight increase in the
interest rate resulted in a further decline of market values, particularly with interest-rate derivatives.
Despite maturities, the portfolio of bonds and debentures rose by roughly EUR 1.8 billion.
Holdings of financial investments and shares in investments accounted for using the equity method fell
by EUR – 12.1 billion to EUR 41.0 billion, which was mainly the result of further reductions in the credit
investment segment and of maturities and disposals of securities from the banking book. However, the
portfolio of investments accounted for using the equity method remained almost unchanged.
As at 31 December 2013, non-current assets held for sale and disposal groups contained the assets
of a subsidiary company recognized in accordance with IFRS 5.
Other assets decreased in the reporting year by EUR – 0.7 billion from EUR 1.4 billion to
EUR 0.6 billion. This reduction was primarily caused by sales of project developments owned by LBBW
Immobilien GmbH as well as the increased deposits of securities as initial margins for derivatives.
Funding.
Under equity and liabilities, deposits from banks decreased by EUR – 6.2 billion to EUR 58.0 billion in
the year under review. This decline was largely attributable to maturing borrower's note loans and
registered covered bonds totaling EUR – 3.5 billion. The holding of securities repurchase trans-
actions also fell by EUR – 1.1 billion as at the reporting date, while call and term deposits along with
current account overdrafts declined by another EUR – 1.2 billion.
Deposits from customers fell by EUR – 3.3 billion to EUR 82.0 billion. The reasons for this reduction
included maturing registered covered bonds and borrower's note loans amounting to EUR – 4.5 billion
as well as a lower volume of securities repurchase transactions totaling EUR – 1.6 billion. However,
current account liabilities rose sharply by EUR 3.3 billion.
The holding of securitized liabilities registered a significant decrease in the year under review, falling by
EUR – 12.0 billion to EUR 49.6 billion. The main factors here were maturing borrower's note loans and
covered bonds amounting to approximately EUR – 13.1 billion. In light of the restrained credit demand
in lending, these maturities were only partly offset by new issues in the year under review totaling
roughly EUR 7.1 billion. Looking at public covered bonds in particular, the disposals of bullet instru-
ments amounting to EUR – 6.0 billion were only partially replaced by, inter alia, two jumbo issues
maturing in 2013 totaling EUR – 2.8 billion.
COMBINED MANAGEMENT REPORT — BUSINESS REPORT FOR THE GROUP
54
Financial liabilities measured at fair value through profit or loss and totaling EUR 99.7 billion fell
sharply by EUR – 42.1 billion to EUR 57.7 billion. This development corresponded to trends on the
assets side and was largely due to the same reasons.
As at 31 December 2013, liabilities from disposal groups included the assets of a subsidiary
company recognized in accordance with IFRS 5.
Equity.
Equity of the LBBW Group increased by EUR 3.1 billion to EUR 13.4 billion in the year under review.
The increase in share capital as well as in the capital reserve amounting to EUR 2.2 billion was offset
by a related decline in silent partners' contributions in subordinated capital totaling EUR 2.3 billion
following the conversion as at 1 January 2013.
The change in the revaluation reserve by a total of EUR 475 million, which is included under other
income, was attributable both to the reduced portfolio and recoveries in securities prices
(EUR 521 million). This was offset by a decline in sales and the valuation of investments and shares
in affiliated companies amounting to EUR – 46 million.
Financial position.
LBBW's funding strategy is determined by the Asset Liability Committee (ALCo). Here the Group
focuses on ensuring a balanced structure in terms of the groups of products and investors used. The
Group's financial position throughout the entire reporting year was satisfactory on account of the
good liquidity. LBBW was always able to obtain funding on the market on the requisite scale. The
liquidity indicator as per LiqV was only reported at the level of the Bank, and totaled 1.47 as at
31 December 2013 (previous year: 1.64).
COMBINED MANAGEMENT REPORT — RISK AND OPPORTUNITY REPORT
CO
MB
INED
MA
NA
GEM
ENT
REP
OR
T
55
Risk and opportunity report.
Basic principles.
Risk-oriented management of the Bank as a whole.
LBBW defines risk management as the use of a comprehensive set of tools to address risks within
the scope of the risk-bearing capacity and the strategy set out by the Board of Managing Directors.
Risks should be taken within the scope of the internal control process, in a deliberate and controlled
manner, and on the basis of the associated opportunities for income and growth potential.
The internal control process thus forms a core element of the group-wide system for risk-oriented
steering instruments and particularly comprises the organizational and operational structure, the
risk management and control processes, and internal auditing.
Risk strategy.
The Board of Managing Directors and the Risk Committee stipulate the principles of the risk
management system by defining risk strategies that are consistent with LBBW’s business strategy.
Risk strategy guidelines are defined in the group risk strategy, which applies to the entire Group and
across all risk categories; these are consolidated in the form of risk tolerance in accordance with the
Minimum Requirements for Risk Management (MaRisk). It is determined through the definition of
basic risk-strategy principles, strategic limits, the liquidity risk tolerance, and the principles of risk
management and observed in all business activities.
The basic risk-strategy principles reflect the conservative risk policy defined in the business strategy:
■ Sustainable observance of risk-bearing capacity even under stress conditions
■ Solvency and observance of liquidity risk tolerance at all times
■ Sustainable observance of EBA stress test requirements and the regulatory minimum ratios
The strategic limit system operationalizes the requirements and objectives defined in the business
strategy for all material risk types covered by risk-bearing capacity. The upper risk limit for eco-
nomic capital for 2014 was defined by the Group's Board of Managing Directors, taking into account
the aforementioned fundamental risk strategy requirements and the economic capital forecast for
the coming five years, and allocated to the material risk types. Further details can be found in the
section on the risk situation of the LBBW Group.
The liquidity risk tolerance caps the liquidity risk in the narrower meaning (i.e. it limits the risk of
not meeting payment obligations). Further information can be found in the section on liquidity risks.
COMBINED MANAGEMENT REPORT — RISK AND OPPORTUNITY REPORT
56
The risk guidelines represent core principles for balancing opportunities and risks within LBBW. They
contribute to the creation of a uniform risk culture and – in accordance with materiality principles –
form the framework for the precise organization of processes and methods of risk management.
They include general risk guidelines on the topics of MaRisk, management, new products and
markets and outsourcing as well as risk guidelines on specific risk types.
In addition, the specific risk strategies approved for each material risk type document the current
and target risk profile of LBBW, specify customer-, product- and market-specific guidelines and
thereby create the framework for medium-term planning together with the business strategy.
Operational implementation of these requirements is monitored by deviation analyses, business area
dialogs, monthly analyses of results, and strategic and operational limit systems.
Risk management systems. Risk capital management.
Risk types.
The overall risk profile of the LBBW Group is ascertained annually by Group Risk Control on the basis
of the group risk inventory and is presented to the Board of Managing Directors in the form of a risk
map. Risk measurement of the material subsidiaries is based on the transparency principle; i.e. the
types of risk identified as material in the respective companies are integrated in the group-wide risk
measurement of the respective type of risk. LBBW shows companies whose risks are regarded as
immaterial in investment risk.
The following material risk types were identified for 2013:
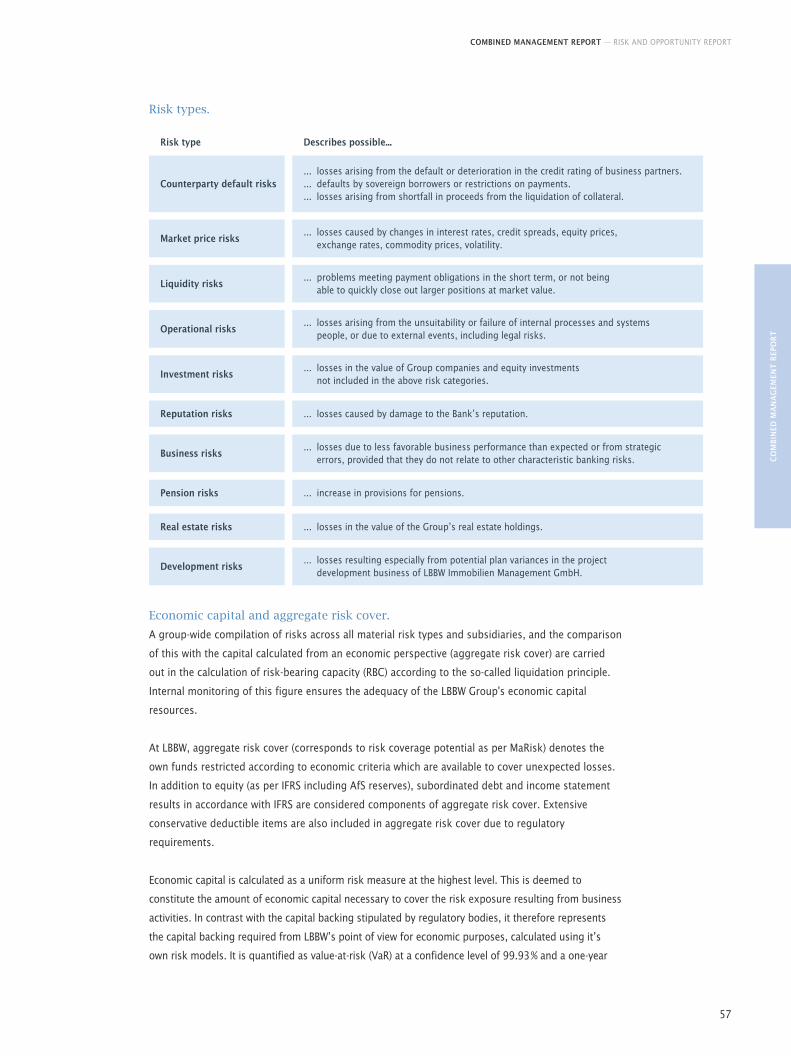
COMBINED MANAGEMENT REPORT — RISK AND OPPORTUNITY REPORT
CO
MB
INED
MA
NA
GEM
ENT
REP
OR
T
57
Risk types.
Risk type Describes possible...
Counterparty default risks... losses arising from the default or deterioration in the credit rating of business partners.... defaults by sovereign borrowers or restrictions on payments.... losses arising from shortfall in proceeds from the liquidation of collateral.
Market price risks... losses caused by changes in interest rates, credit spreads, equity prices, exchange rates, commodity prices, volatility.
... problems meeting payment obligations in the short term, or not being able to quickly close out larger positions at market value.
Liquidity risks
Operational risks... losses arising from the unsuitability or failure of internal processes and systems people, or due to external events, including legal risks.
... losses in the value of Group companies and equity investments not included in the above risk categories.
Investment risks
Reputation risks ... losses caused by damage to the Bank’s reputation.
... losses due to less favorable business performance than expected or from strategic errors, provided that they do not relate to other characteristic banking risks.
Business risks
Pension risks ... increase in provisions for pensions.
... losses in the value of the Group’s real estate holdings.Real estate risks
Development risks... losses resulting especially from potential plan variances in the project development business of LBBW Immobilien Management GmbH.
Economic capital and aggregate risk cover.
A group-wide compilation of risks across all material risk types and subsidiaries, and the comparison
of this with the capital calculated from an economic perspective (aggregate risk cover) are carried
out in the calculation of risk-bearing capacity (RBC) according to the so-called liquidation principle.
Internal monitoring of this figure ensures the adequacy of the LBBW Group's economic capital
resources.
At LBBW, aggregate risk cover (corresponds to risk coverage potential as per MaRisk) denotes the
own funds restricted according to economic criteria which are available to cover unexpected losses.
In addition to equity (as per IFRS including AfS reserves), subordinated debt and income statement
results in accordance with IFRS are considered components of aggregate risk cover. Extensive
conservative deductible items are also included in aggregate risk cover due to regulatory
requirements.
Economic capital is calculated as a uniform risk measure at the highest level. This is deemed to
constitute the amount of economic capital necessary to cover the risk exposure resulting from business
activities. In contrast with the capital backing stipulated by regulatory bodies, it therefore represents
the capital backing required from LBBW’s point of view for economic purposes, calculated using it’s
own risk models. It is quantified as value-at-risk (VaR) at a confidence level of 99.93 % and a one-year
COMBINED MANAGEMENT REPORT — RISK AND OPPORTUNITY REPORT
58
holding period for credit, market price, real estate, development, investment and operational risks, and
using simplified procedures for other risks.
By contrast, liquidity risks are managed and limited by the quantitative and procedural rules defined
in the liquidity risk tolerance.
The upper risk limit for economic capital (economic capital limit) represents the Group-wide
overarching limit for all relevant quantified risk types. This limit reflects LBBW Group's maximum
willingness to accept risk. In keeping with the conservative principle underlying risk tolerance it is
substantially below the aggregate risk cover and thus provides scope for risks arising from unfore-
seeable stress situations. On the basis of the upper economic capital limit, economic capital limits
are defined for the various directly quantified risk types and for the other risks not quantified within
a model approach. The risk-bearing capacity is monitored by Group Risk Control by means of a
traffic light system. The respective traffic light thresholds are linked to the recovery plan in
accordance with the Minimum Requirements for the Design of Recovery Plans (MaSan) and tied to
options for action. Risks within the framework of the LBBW Group's risk-bearing capacity are
described before possible measures to limit risks (so-called gross presentation).
In addition to management across risk types, economic risk management is implemented at segment
level. LBBW’s risk capital management also includes the management of regulatory capital. Further
details on this can be found in the Notes.
Stress tests.
In addition to statistical indicators, which are ultimately based on historical data, and risk
measurement tools, stress scenarios play an important part in risk assessment. They analyze in
advance the impact of possible economic volatility and market crises in order to establish whether
LBBW is able to withstand extreme situations.
Stress tests are therefore an integral part of LBBW's risk management. The stress scenarios are
arranged in such a way that extraordinary but plausible events of different degrees of severity can
be considered in terms of their impact on economic and regulatory capital and on the liquidity
situation.
For this purpose, various methods ranging from a simple sensitivity analysis to complex macro-
economic scenarios addressing multiple risk types are applied. So-called inverse stress testing is
also conducted regularly to examine which scenarios could threaten the existence of the LBBW
Group.
In order to ensure risk-bearing capacity and regulatory capital ratios even in a stress case, so-called
RBC stress scenarios are defined for the various risk types. These stress scenarios are economically
focused across different types of risk, whose definition was geared in particular to LBBW's risk
concentrations. In addition to the analysis of the economic and regulatory capital in the status quo,
the Group’s resistance to stress is also monitored on the basis of these scenarios. Infringements are
monitored and escalated by Group Risk Control using the traffic light method.
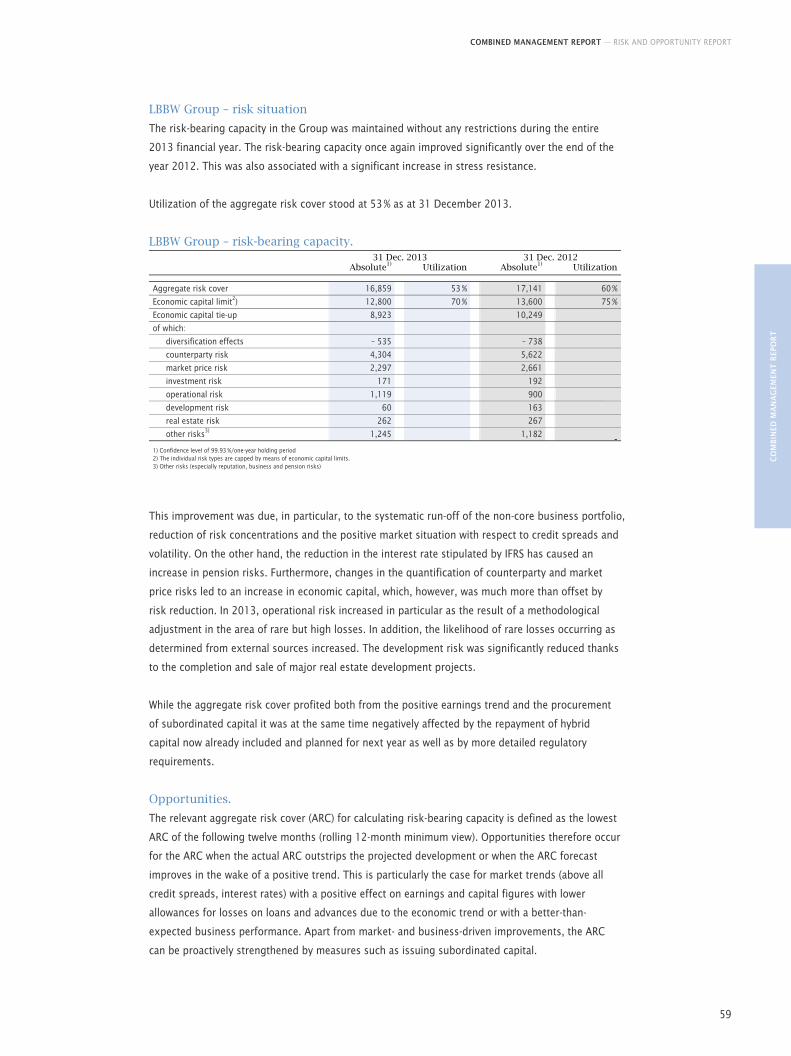
COMBINED MANAGEMENT REPORT — RISK AND OPPORTUNITY REPORT
CO
MB
INED
MA
NA
GEM
ENT
REP
OR
T
59
LBBW Group – risk situation
The risk-bearing capacity in the Group was maintained without any restrictions during the entire
2013 financial year. The risk-bearing capacity once again improved significantly over the end of the
year 2012. This was also associated with a significant increase in stress resistance.
Utilization of the aggregate risk cover stood at 53 % as at 31 December 2013.
LBBW Group – risk-bearing capacity. 31 Dec. 2013 31 Dec. 2012 Absolute1)
Utilization Absolute1)
Utilization Aggregate risk cover 16,859 53 % 17,141 60 %
Economic capital limit2) 12,800 70 % 13,600 75 %
Economic capital tie-up 8,923 10,249
of which:
diversification effects – 535 – 738
counterparty risk 4,304 5,622
market price risk 2,297 2,661
investment risk 171 192
operational risk 1,119 900
development risk 60 163
real estate risk 262 267
other risks3) 1,245 1,182 - 1) Confidence level of 99.93 %/one-year holding period 2) The individual risk types are capped by means of economic capital limits. 3) Other risks (especially reputation, business and pension risks)
This improvement was due, in particular, to the systematic run-off of the non-core business portfolio,
reduction of risk concentrations and the positive market situation with respect to credit spreads and
volatility. On the other hand, the reduction in the interest rate stipulated by IFRS has caused an
increase in pension risks. Furthermore, changes in the quantification of counterparty and market
price risks led to an increase in economic capital, which, however, was much more than offset by
risk reduction. In 2013, operational risk increased in particular as the result of a methodological
adjustment in the area of rare but high losses. In addition, the likelihood of rare losses occurring as
determined from external sources increased. The development risk was significantly reduced thanks
to the completion and sale of major real estate development projects.
While the aggregate risk cover profited both from the positive earnings trend and the procurement
of subordinated capital it was at the same time negatively affected by the repayment of hybrid
capital now already included and planned for next year as well as by more detailed regulatory
requirements.
Opportunities.
The relevant aggregate risk cover (ARC) for calculating risk-bearing capacity is defined as the lowest
ARC of the following twelve months (rolling 12-month minimum view). Opportunities therefore occur
for the ARC when the actual ARC outstrips the projected development or when the ARC forecast
improves in the wake of a positive trend. This is particularly the case for market trends (above all
credit spreads, interest rates) with a positive effect on earnings and capital figures with lower
allowances for losses on loans and advances due to the economic trend or with a better-than-
expected business performance. Apart from market- and business-driven improvements, the ARC
can be proactively strengthened by measures such as issuing subordinated capital.
COMBINED MANAGEMENT REPORT — RISK AND OPPORTUNITY REPORT
60
The risk-bearing capacity situation is influenced by economic capital in addition to the aggregate
risk cover. The development of economic capital depends on a large number of factors. An upbeat
market for credit spreads, interest rates and volatilities as well as the consistent wind-down of the
portfolio of non-core business may likewise bring about a reduction of economic capital as may, for
example, an economy-fueled improvement in the portfolio quality.
Risk management processes and reporting. Risk management and monitoring.
LBBW’s risk management and monitoring is based on the guidelines of the risk strategy and the
defined limits and approval powers.
At LBBW, transactions can only be entered into within clearly defined limits or approval powers
and in accordance with the principles of the risk strategy. Within the defined framework, risk
management decisions are made by the departments with portfolio responsibilities, maintaining
the separation of functions; these decisions are monitored by central Group Risk Control. The risk
control and risk management system set up for this purpose covers all material risks and the
details specific to the risk types.
Potential concentration of risk receives particular attention. On the one hand, concentrations tend
to arise as a result of the synchronization of risk positions within one risk type. On the other hand,
they can also be produced as a result of common risk factors or interactions between various risk
factors of different risk types. At LBBW, appropriate processes are used to identify and to
deliberately manage risk concentration. Risks to the Group’s going concern status must be
excluded. Differentiated monitoring processes (e.g. report on risk concentrations, stress tests)
and limits (e.g. sector and country limits) are available for the purpose of monitoring this
strategic requirement.
An overview of the structure and individual elements of the risk management system of LBBW is
given in the following chart:
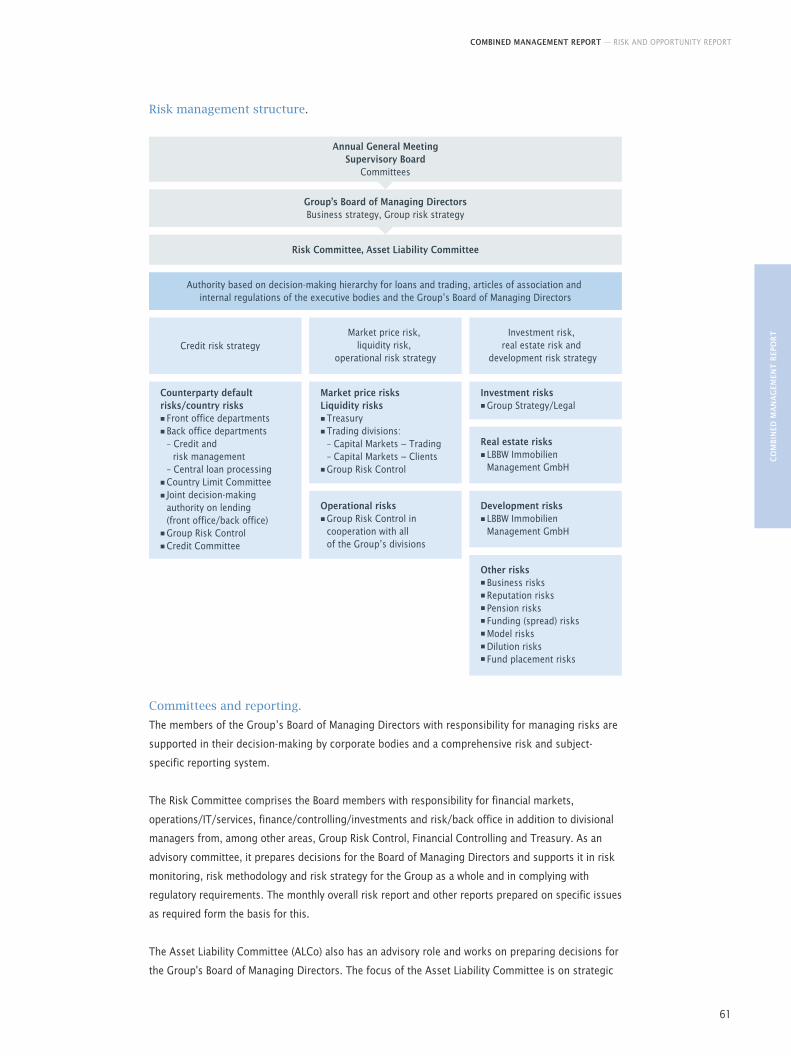
COMBINED MANAGEMENT REPORT — RISK AND OPPORTUNITY REPORT
CO
MB
INED
MA
NA
GEM
ENT
REP
OR
T
61
Risk management structure.
Annual General MeetingSupervisory Board
Committees
Authority based on decision-making hierarchy for loans and trading, articles of association and internal regulations of the executive bodies and the Group’s Board of Managing Directors
Group’s Board of Managing DirectorsBusiness strategy, Group risk strategy
Risk Committee, Asset Liability Committee
Credit risk strategyMarket price risk,
liquidity risk, operational risk strategy
Investment risk, real estate risk and
development risk strategy
Investment risks Group Strategy/Legal
Market price risksLiquidity risks Treasury Trading divisions: – Capital Markets − Trading – Capital Markets − Clients Group Risk Control
Counterparty default risks/country risks Front office departments Back office departments – Credit and risk management – Central loan processing Country Limit Committee Joint decision-making authority on lending (front office/back office) Group Risk Control Credit Committee
Real estate risks LBBW Immobilien Management GmbH
Development risks LBBW Immobilien Management GmbH
Operational risks Group Risk Control in cooperation with all of the Group’s divisions
Other risks Business risks Reputation risks Pension risks Funding (spread) risks Model risks Dilution risks Fund placement risks
Committees and reporting.
The members of the Group’s Board of Managing Directors with responsibility for managing risks are
supported in their decision-making by corporate bodies and a comprehensive risk and subject-
specific reporting system.
The Risk Committee comprises the Board members with responsibility for financial markets,
operations/IT/services, finance/controlling/investments and risk/back office in addition to divisional
managers from, among other areas, Group Risk Control, Financial Controlling and Treasury. As an
advisory committee, it prepares decisions for the Board of Managing Directors and supports it in risk
monitoring, risk methodology and risk strategy for the Group as a whole and in complying with
regulatory requirements. The monthly overall risk report and other reports prepared on specific issues
as required form the basis for this.
The Asset Liability Committee (ALCo) also has an advisory role and works on preparing decisions for
the Group's Board of Managing Directors. The focus of the Asset Liability Committee is on strategic
COMBINED MANAGEMENT REPORT — RISK AND OPPORTUNITY REPORT
62
resource management for the Group as a whole. It supports the Board of Managing Directors,
among other things in structuring the balance sheet, managing capital and liquidity as well as in
funding and managing market-price risks. The Committee comprises the Chairman of the Board of
Managing Directors, the Board members responsible for finance/controlling/investments in addition
to specific divisional managers from Treasury, Group Risk Control, Financial Controlling and Finance,
among other areas.
New Product Process.
New types of product at LBBW are subject to a New Product Process that ensures that the product is
included in LBBW's various systems, such as accounting or group risk control. Any potential legal
consequences are also outlined.
This concerns trading and credit products. The main focus is on trading products. If it is not
possible to fully integrate the products into the model immediately, a step-by-step approach is taken
in which the products are initially traded only under very strict supervision.
Process-independent monitoring.
The Group Auditing division is a process-independent department that monitors the operations and
business workflows, risk management and control and the internal control system (ICS) with the aim
of safeguarding LBBW’s assets and boosting its operating performance. The Group Auditing division
exercises its duties autonomously. The Board of Managing Directors is informed of the results of
audits in written audit reports which are discussed with the audited operating units. The Group
Auditing division also monitors the measures taken in response to the audit findings.
The auditing activities of the Group Auditing division are generally based on an audit schedule,
approved annually by the Board of Managing Directors, on the basis of a long-term risk-oriented
plan which records all the activities and processes of the LBBW Group, allowing for risk weighting, in
a reasonable period, but always within thee years.
Regulatory developments.
MaRisk.
LBBW is subject to the regulations on the Minimum Requirements for Risk Management (MaRisk). On
14 December 2012 the German Federal Financial Supervisory Authority (Bundesanstalt für Finanz-
dienstleistungsaufsicht – BaFin) detailed and extended the minimum requirements via the 4th
MaRisk amendment. This was prompted by various European regulatory projects such as CRD IV, the
EBA Guidelines on Internal Governance and the CEBS Guidelines on Liquidity Cost Benefit Allocation.
As a result of the new version of MaRisk the requirements for risk-bearing capacity and the capital
planning process, for early risk detection and the risk controlling and compliance function as well as
for the netting system for liquidity costs, benefits and risks were tightened up and extended.
In principle, the new minimum requirements were to be implemented by 31 December 2013. Most
of the topics were processed by the end of the year. Any outstanding topics will be implemented at
the beginning of 2014 in line with the MaRisk implementation timetable.
COMBINED MANAGEMENT REPORT — RISK AND OPPORTUNITY REPORT
CO
MB
INED
MA
NA
GEM
ENT
REP
OR
T
63
Basel III.
On 27 June 2013 the CRD IV/CRR legislative package was published in the EU Gazette. This means
that the rules and regulations in Basel III are now anchored in European law. These rules and regu-
lations are to be applied for the first time as at 1 January 2014.
As a key element of the so-called Single Book, the regulations aim at an improvement in the loss
absorption capacity of equity, the expansion of risk measurement and more stringent risk weighting
for specific assets, such as derivatives or loans to banks. In future, banks will therefore be required
to hold considerably more equity to cover their risk weighted assets. This will be operationalized
through higher minimum ratios and additional capital buffers, which will be defined by law imme-
diately in part and otherwise at the discretion of the national authorities in line with legal require-
ments, such as a systemic and a counter-cyclical capital buffer.
These new regulatory developments have implications for business strategy, the strategic direction
of the business areas, management metrics and technical reporting capacity. The interdependencies
between the new regulatory developments and business strategy call for an integrated approach.
LBBW prepared intensively for implementation in the financial year with an implementation project
that systematically identifies the requirements of the management control system and takes into
account the effects in the strategic and operational planning process.
LBBW supported the development of the legal norms on a national as well as an international level by
participating actively in the consultation process.
MaSan.
At the international level the Financial Stability Board (FSB) submitted standards (so-called key
attributes) on the well-ordered recovery and resolution of banks as early as November 2011. In
June 2012 the EU Commission also published a directive on crisis management, which calls for the
implementation of the key attributes at the European level by the year 2015. In response to this, in
November 2012 BaFin issued the Minimum Requirements for the Design of Recovery Plans (MaSan)
for consultation. In this connection BaFin requested recovery plans from potential nationally
systemically relevant banks by the end of 2013.
LBBW drew up the recovery plan and submitted it to the regulatory authority.
The strategic analysis showed the company structure and business activities and how they are
interlinked. In addition to this, an assessment was made as to which business activities are essential
for LBBW and whether the disappearance of one business activity was critical for the market as a
whole. Suitable options for action in a critical case were analyzed in the section on options for action.
In this context the feasibility of the options for action and their effects on the parameters capital,
risk, liquidity and income in the normal case and in stress situations was studied. The section on
recovery indicators identified recovery thresholds using a traffic light system in line with the steering
instruments and MaRisk.
The recovery plan is due to be updated on an annual basis.
COMBINED MANAGEMENT REPORT — RISK AND OPPORTUNITY REPORT
64
EMIR.
In response to the crisis on the financial markets, at their summit in Pittsburgh in 2009 the G-20
states approved a comprehensive reorganization of the market for derivatives traded over the counter
(OTC derivatives). The changes envisaged are intended to bring about an improvement in market
transparency, limit systemic risks and enhance protection against market abuse.
The following changes in the derivatives market were envisaged in order to achieve the goals set:
■ All standardized OTC derivatives are to be traded on stock exchanges or electronic marketplaces
and settled via a central counterparty (CCP).
■ Contracts for OTC derivatives that are not settled centrally are to be subject to higher equity
capital and hedging requirements. This is designed to reduce the risks resulting from these
transactions and promote central clearing.
■ All contracts for derivatives are to be entered in central transaction registers. This requirement
covers exchange-traded and OTC derivatives.
In the EU the G-20 requirements were implemented when the European Market Infrastructure
Regulation (EMIR) came into effect on 16 August 2012. Detailed explanations have been or will in
the near future be described in technical regulatory standards by the responsible market regulatory
body, the European Securities and Markets Authority (ESMA), and approved by the EU bodies. In the
USA the corresponding legal foundations were set out in Title VII of the Dodd-Frank Act on
21 July 2010.
The first requirements from EMIR have been in effect since March and September 2013 respectively
and more important requirements are to follow in early 2014, for example the requirements relating
to entries in the transaction register. These regulatory requirements will come into effect gradually
and be fully operative by the beginning of 2015.
At LBBW the creation of regulatory compliance was combined with the EU regulation on derivatives,
EMIR, and Title VII of the Dodd-Frank Act starting in autumn 2012 to form part of a cluster of
projects. In addition, LBBW had already begun to implement the clearing obligation for interest-rate
derivatives and to offer a corresponding clearing service for its customers as of 2010. The aim of the
projects is to implement the LBBW processes and systems in such a way that the regulatory
requirements in the derivatives business can be observed at all times. The first regulatory milestones
were achieved in 2013.
COMBINED MANAGEMENT REPORT — RISK AND OPPORTUNITY REPORT
CO
MB
INED
MA
NA
GEM
ENT
REP
OR
T
65
Risk types.1) Counterparty risk.
Definition.
The umbrella term counterparty risk describes the loss potential resulting from the fact that
business partners may in future no longer be in a position to fulfill their contractually agreed
payment obligations in full. A counterparty risk may occur both from direct contractual relationships
(e.g. granting loans, buying a security) and indirectly, e.g. from hedging obligations (especially
issuing guarantees, selling hedging via a credit derivative).
The main characteristics of this risk are defined and briefly explained below.
Credit risk.
Here the term credit risk, often used synonymously with counterparty risk, describes the counter-
party risk from the lending operation, i.e. from granting loans and hedging lending by third parties
(e.g. via guarantees).
Issuer risk.
The term issuer risk covers a counterparty risk resulting from securities. It covers both the direct
securities portfolio and securities referenced via derivatives (especially via credit derivatives).
Counterparty credit risk.
Counterparty credit risk describes the counterparty risk from financial transactions (especially derivatives
transactions), resulting from the fact that the contracting party (counterparty) is no longer in a position
to meet their obligations. In this situation on the one hand the position that becomes open upon closing
may entail costs (so-called replacement risk), while on the other there is a risk that advance payments
have been made to the counterparty without the counterparty being able to provide the corresponding
counter-performance (so-called advance payment, performance and/or settlement risk).
Country risk.
The term country risk designates a counterparty risk that arises because, due to critical political or
economic developments in a country (or entire region), the transfer of foreign exchange is not
possible or only possible to a limited extent.
Collateral risk.
Collateral risk is not direct counterparty risk, but describes the potential that collateral received to
reduce the counterparty risk loses value, especially if this happens systematically (e.g. due to turmoil
on real estate markets).
1) Information on economic capital tied up for the individual risk types can be found in the section on the risk management system/risk situation of the LBBW Group.
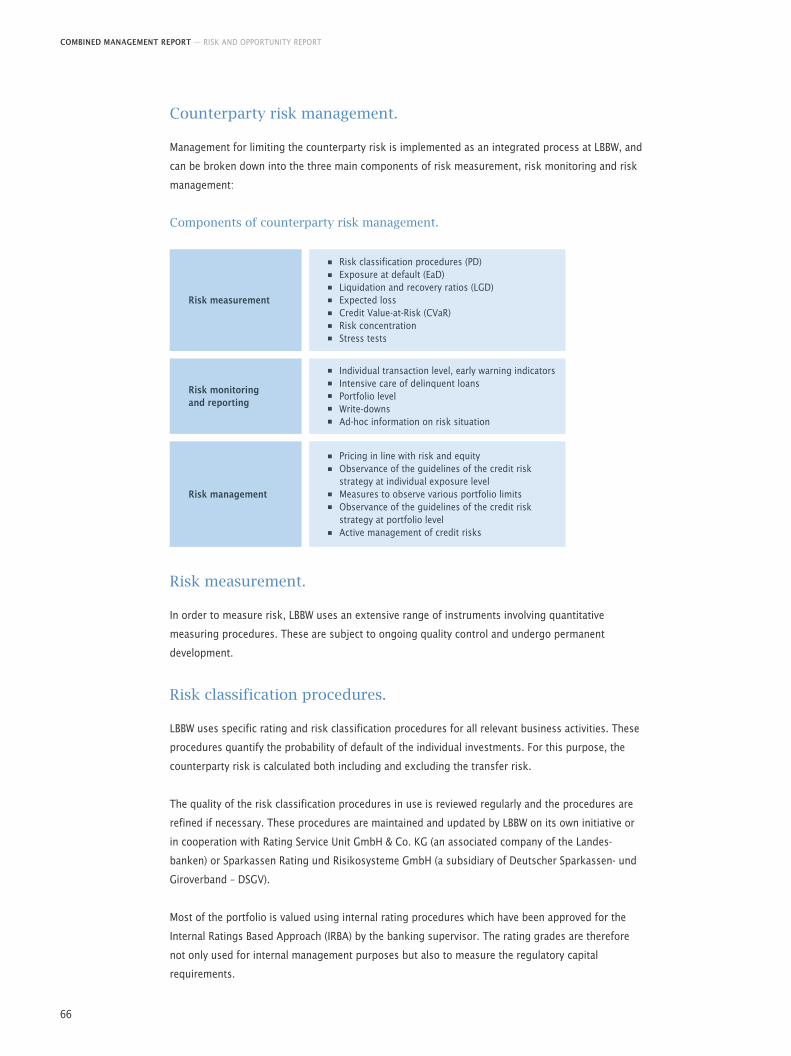
COMBINED MANAGEMENT REPORT — RISK AND OPPORTUNITY REPORT
66
Counterparty risk management.
Management for limiting the counterparty risk is implemented as an integrated process at LBBW, and
can be broken down into the three main components of risk measurement, risk monitoring and risk
management:
Components of counterparty risk management.
Risk measurement
Risk monitoring and reporting
Risk classification procedures (PD)Exposure at default (EaD)Liquidation and recovery ratios (LGD)Expected lossCredit Value-at-Risk (CVaR)Risk concentration Stress tests
Risk management
Individual transaction level, early warning indicators Intensive care of delinquent loansPortfolio levelWrite-downsAd-hoc information on risk situation
Pricing in line with risk and equityObservance of the guidelines of the credit risk strategy at individual exposure levelMeasures to observe various portfolio limitsObservance of the guidelines of the credit risk strategy at portfolio levelActive management of credit risks
Risk measurement.
In order to measure risk, LBBW uses an extensive range of instruments involving quantitative
measuring procedures. These are subject to ongoing quality control and undergo permanent
development.
Risk classification procedures.
LBBW uses specific rating and risk classification procedures for all relevant business activities. These
procedures quantify the probability of default of the individual investments. For this purpose, the
counterparty risk is calculated both including and excluding the transfer risk.
The quality of the risk classification procedures in use is reviewed regularly and the procedures are
refined if necessary. These procedures are maintained and updated by LBBW on its own initiative or
in cooperation with Rating Service Unit GmbH & Co. KG (an associated company of the Landes-
banken) or Sparkassen Rating und Risikosysteme GmbH (a subsidiary of Deutscher Sparkassen- und
Giroverband – DSGV).
Most of the portfolio is valued using internal rating procedures which have been approved for the
Internal Ratings Based Approach (IRBA) by the banking supervisor. The rating grades are therefore
not only used for internal management purposes but also to measure the regulatory capital
requirements.
COMBINED MANAGEMENT REPORT — RISK AND OPPORTUNITY REPORT
CO
MB
INED
MA
NA
GEM
ENT
REP
OR
T
67
Exposure.
Whereas exposure is tied to a specific date for reporting purposes, potential future exposure is
calculated to determine the credit value-at-risk and for linear offsetting, e.g. with derivatives and
foreign-currency transactions. This is calculated for the most part on the basis of fair values and the
corresponding add-ons. The add-on calculation takes account of the remaining maturity, product
type and market factors (interest, currency etc.). Netting and collateral agreements are used for
reducing risk. The capital charges for credit derivatives held in the trading book take account of the
settlement payments and actual fair value losses as a result of default (jump-to-default method).
(Modified) nominals are used for issuer and reference debtor risks from securities and holdings in
the banking book.
Evaluating collateral.
Collateral is evaluated on the basis of its market value, which is reviewed regularly and on an ad hoc
basis and adjusted in the event of any change in the relevant factors. Loss given default is estimated
on the basis of the valuation of the individual items of collateral. In this respect, differentiated
estimates are calculated for liquidation rates (average proceeds expected from the liquidation of
collateral) and for recovery rates (proportion of the proceeds from the unsecured portion of a
receivable). The estimates are based on empirical values and pool data recorded by the Bank itself
and in cooperation with savings banks and other Landesbanken.
Expected losses.
The expected loss – as an indicator that depends on customer creditworthiness, an estimation of the
loss at default and the expected exposure at default – provides the basis for the level of the
standard risk costs. In preliminary costing at the individual transaction level, these are included in
the calculation of risk-adequate loan terms. In terms of the portfolio this figure (standard risk costs
in basis points) may provide information on the expected risk content of a portfolio. In connection
with the calculation of impairments, the concept of the expected loss is also resorted to for calcu-
lating general allowances for losses on loans and advances in order to estimate the incurred loss
that has not yet been recognized because of delays in information.
The market price of the counterparty risk of OTC derivatives and money market loans accounted for
at fair value is measured using the so-called credit value adjustment (CVA). This is included in the
income statement of LBBW as a valuation adjustment. The credit ratings of the counterparty and of
LBBW are taken into consideration.
COMBINED MANAGEMENT REPORT — RISK AND OPPORTUNITY REPORT
68
Credit value-at-risk.
At LBBW, unexpected loss or credit value-at-risk (CVaR) represents the potential present value loss of
a portfolio above its expected loss. This determines the amount that will not be exceeded by losses
with a probability (confidence level) defined by parameterizing the risk-bearing capacity within a
time horizon of one year. LBBW uses a credit portfolio model based on the modeling of rating
migration to calculate this value. The individual borrowers are assigned default and migration
probabilities corresponding to their ratings. These are modeled with the help of internal and
external data in such a way that correlations between borrowers can be adequately taken into
account and borrower, sector and country concentration mapped. The credit portfolio model uses a
Monte Carlo simulation approach to calculate risk. CVaR is used as the parameter for economic
capital used for credit risks in the risk-bearing capacity analysis and in LBBW’s management.
Risk concentration and stress tests.
One of the main tasks of counterparty risk management is to avoid the concentration of risks from
individual exposures and also at the portfolio level. For this purpose, there are specific limit systems
restricting the acceptance of exposures at the borrower, sector and country level. Concentration
risks in counterparty risk are clearly identified and recorded and monitored by including CVaR in the
risk-bearing capacity.
In addition, extensive stress scenarios – particularly in the light of possible concentration risks – are
calculated at LBBW Group level to analyze possible changes in LBBW's portfolio arising from potential
developments (e.g. sector crises) or the market environment. Moreover, counterparty risks are inclu-
ded in scenarios covering multiple risk types.
Risk monitoring and reporting. Individual transaction level.
A system is in place for the early detection of risks, comprising procedural regulations and system-
generated signals, whose goal it is to detect any deterioration in credit ratings at an early stage.
As part of risk monitoring, the risk managers responsible continuously check compliance with the
limits granted as well as any changes in information of relevance for credit ratings. This includes
monitoring any irregularities in account behavior, evaluating company news and observing macro-
economic and sector trends. In cases in which market data can be observed for a given company, a
market data-based system is additionally used.
The early detection of any deterioration in credit ratings allows appropriate countermeasures, e.g.
additional collateral or pre-emptive restructuring, to be taken in consultation with the customer.
Depending on the level of risk, problem assets are classified as cases requiring intensified support,
restructuring or liquidation and are dealt with by the departments responsible. LBBW aims to
minimize losses through successful restructuring activities, in line with the Bank’s own interests and
those of its customers.
COMBINED MANAGEMENT REPORT — RISK AND OPPORTUNITY REPORT
CO
MB
INED
MA
NA
GEM
ENT
REP
OR
T
69
Portfolio level.
Counterparty risk is monitored at the portfolio level in the Group Risk Control division, which, from
an organizational point of view, is separate from the front and operational back office divisions. This
division is responsible for ensuring the suitability of rating procedures, measuring counterparty risk,
monitoring counterparty credit, country and sector limits and drawing up risk reports. Utilization of
the exposure and CVaR limits set is shown in the monthly overall risk report.
■ Compliance with country limits is monitored on a daily basis with a special limit system.
■ The portfolio of financials has both an overall limit and country-related limits, in addition to the
country limit itself.
Sector risks arising from the corporates portfolio are restricted and monitored through the stipu-
lation of sector-specific limits. The limit system is based on a risk-oriented sector key designed
specifically for this purpose, which combines sector segments with high dependence of losses along
the value chain. For example, mechanical engineering companies whose products are sold predom-
inantly to customers from the automotive industry are also assigned to the automotive industry.
Adjustments to problem assets.
Allowances for losses on loans and advances necessary for counterparty risks are calculated in
accordance with uniform Group-wide standards and their appropriateness monitored on an ongoing
or ad hoc basis. Allowances for losses on loans and advances are set aside or increased if objective
indications point to an (increased) impairment in financial assets. Objective evidence of impairment
includes default events that have already occurred, such as:
■ arrears/infringement > 90 days,
■ unlikely repayment (doubts as to the credit rating),
■ rating-induced restructuring/debt rescheduling or
■ insolvency (petition).
In addition to this, forbearance (defined as concessions to the borrower for economic or legal
reasons in connection with his financial difficulties that would otherwise not be granted) may
indicate an impairment. This is checked on a case-by-case basis.
Reporting.
An ad hoc reporting process is implemented for significant and extraordinary events for specific
reporting to the decision-makers in charge. The most important periodic reports are as follows:
COMBINED MANAGEMENT REPORT — RISK AND OPPORTUNITY REPORT
70
■ The overall risk report presented monthly in the Risk Committee, including details about the risk
situation at the portfolio level, compliance with requirements of the credit risk strategy and
compliance with the material limits. Portfolio analyses additionally report on the risk situation of
individual sectors and risk concentrations, for example.
■ The comprehensive credit risk report, submitted on a quarterly basis as part of the overall risk
report. This contains additional detailed information on the development of allowances for losses
on loans and advances, rating distributions, size classes, product types, remaining maturities,
new business, and risk concentration arising from individual commitments.
■ The quarterly report on the business areas containing the relevant information on the steering
instruments (capital, risk and earnings indicators) for each defined business area.
■ Half-yearly in-depth sector report with detailed information on the sector situation, portfolio
structure and the top customers in each sector.
Risk management.
Counterparty risks are managed, in particular, through the requirements of the credit risk strategy,
through the economic capital allocation to sub-portfolios with the aid of the CVaR and the
monitoring of concentration risks at the level of sectors, countries and individual counterparties.
Individual transaction level.
Risk management at the level of individual exposures is the duty of the credit back offices. As a rule,
the upper limits are set individually by the respective holder of approval powers. This upper limit is
taken into account for all of a customer's or borrower unit's risk-relevant transactions. A material
part of managing individual transactions involves monitoring compliance with the requirements
defined in the credit risk strategy. This determines the framework for LBBW’s business strategy on
the basis of the business strategy and in the light of the Group risk strategy. Particular attention is
paid to avoiding concentration risks.
From an economic point of view, the question of whether a transaction will produce an adequate
profit on a risk-adjusted basis is a key consideration before entering into business; for this reason,
preliminary costing of all individual transactions is compulsory. In addition to the historical interest
rate, the components in the calculations are the cost requirement margin (cover for processing
costs), the risk range (cover for expected loss) and the capital range (interest on equity to cover
unexpected loss). The results of the preliminary costing calculation form the basis of business
management at customer level.
Sub-portfolio level.
The risk management measures differ depending on the respective sub-portfolio level:
■ Country limits are determined by the Board of Managing Directors, based on the proposals of the
Country Limit Committee. If the country limit is almost fully utilized, the affected front and bank
office units are notified and if the limit is exceeded a ban on business is imposed to counteract
the excess. If country credit ratings deteriorate, limits are reduced and/or bans on business
issued. Wind-down targets also exist for countries that are the focus of particular attention.
COMBINED MANAGEMENT REPORT — RISK AND OPPORTUNITY REPORT
CO
MB
INED
MA
NA
GEM
ENT
REP
OR
T
71
■ The limitation on the portfolios of financial institutions and the corporates sector portfolio
triggers controlling measures such as hedging transactions to reduce risk or a ban on new
business etc. if certain thresholds are exceeded.
■ At the business area level, risks are limited through measures to ensure adherence to the
quantitative guidelines of the credit risk strategy with regard to upper limits, rating structures and
the portfolio quality, among others.
Total portfolio level.
In the management of the Group's credit portfolio, utilization of the limit on the economic capital for
counterparty risks based on the CVaR is monitored particularly closely. A traffic light system
recognizes at an early stage if limits are close to being fully utilized and measures to mitigate risk
are initiated. In addition, the results of the stress tests provide indications of potentially dangerous
risk constellations which necessitate measures for the reduction of risk.
Risk situation of the LBBW Group. Preliminary note.
The quantitative information on the risk situation is based on the management approach. LBBW's
risk situation is therefore reported on the basis of the figures used for the purpose of conducting
internal risk management and reporting to the Board of Managing Directors and the corporate
bodies. The management approach differs partially from balance sheet reporting. This can be put
down to the presentation from risk aspects and deviations from the companies included for
accounting purposes according to IFRS. In internal risk management the SüdLeasing Group and
LBBW Luxemburg S.A. are included as consolidated subsidiaries.
The differences between the figures used for internal risk management on the one hand and
external accounting on the other can be quantified as follows:
Reconciliation of accounting approach to management approach. Reconciliation EUR million as at 31 Dec. 2013
Carrying amount
Basis of consolidation Measurement Other
Management approach
Cash and cash equivalents 2,156 – 2 215 0 2,369
Receivables 156,627 – 375 26,771 – 1,464 181,560
Financial investments (LaR) 19,209 – 3,456 365 42 16,160
Financial investments (AfS) 21,451 2,104 – 2,214 – 77 21,265
Positive fair values from hedging derivatives 3,399 – 9 1,501 0 4,891
Trading assets (HfT) 66,687 3,108 28,871 33 98,699
Financial assets designated at fair value 1,316 – 263 – 292 1 761
Non-current assets held for sale and disposal groups 727 – 669 0 0 58
COMBINED MANAGEMENT REPORT — RISK AND OPPORTUNITY REPORT
72
Development of exposure.
Gross exposure is defined as the fair value or utilization plus open external loan commitments.
Net exposure also includes risk-mitigating effects such as netting and collateral agreements, the
hedging effect of credit derivatives or the inclusion of classic credit collateral such as real estate
liens, financial collateral, guarantees or bonds.
There is a difference in presentation compared to the 2012 annual report resulting from the greater
differentiation in presenting exposures introduced in 2013. This affects principally the gross
exposure, where the inclusion of collateral in repo/lending operations has been modified. Net
exposure is only slightly changed.
Exposure to credit risks in 2013 was always in accordance with the RBC of the LBBW Group.
The following table shows the development of the two exposure variables and the risk-mitigating
effects compared to 31 December 2012. The information as at 31 December 2012 (old) contains the
figures before methodological adjustments.
Development of exposure.
EUR million 31 Dec. 2013
(new)
31 Dec. 2012 (new)
31 Dec. 2012 (old)
Gross exposure 374,643 451,583 426,582 Netting/collateral 68,502 101,436 77,002
Credit derivatives (protection buy) 20,550 29,338 29,338
Classic credit collateral 42,781 42,730 42,677
Net exposure 242,810 278,079 277,565
The new definition of exposure is used for the reporting date of 31 December 2013. As at
31 December 2013, gross exposure stood at around EUR 375 billion, EUR 77 billion or 17.0 % less
that at the end of 2012 (new basis). This change was the result of the wind-down of the non-core
business portfolio, market value trends in interest-rate derivatives and the closure of offsetting
derivative positions. The completed portfolio wind-down is also particularly evident from the
decrease in net exposure, which is down by EUR 35 billion or 12.7 % to approx. EUR 243 billion.
The details given below on portfolio quality, sectors, regions and size classes provide an overview of
the aspects which are relevant for LBBW's risk situation. Net exposure forms the principal basis.
Portfolio quality.
Presenting the portfolio by internal rating class depicts how the portfolio quality has developed
compared to 31 December 2012.
COMBINED MANAGEMENT REPORT — RISK AND OPPORTUNITY REPORT
CO
MB
INED
MA
NA
GEM
ENT
REP
OR
T
73
Portfolio quality. EUR million in % EUR million in % Net exposure 31 Dec. 2013 31 Dec. 2013 31 Dec. 2012 31 Dec. 2012
1(AAAA) 59,614 24.6 % 68,927 24.8 %
1(AAA) – 1(A–) 111,322 45.8 % 122,044 44.0 %
2 – 5 43,023 17.7 % 46,568 16.8 %
6 – 8 13,823 5.7 % 22,708 8.2 %
9 – 10 6,102 2.5 % 5,731 2.1 %
11 – 15 2,911 1.2 % 4,613 1.7 %
16 – 18 (default)1) 3,768 1.6 % 4,501 1.6 %
Other 2,246 0.9 % 2,473 0.9 % Total 242,810 100.0 % 277,565 100.0 % 1) »Default« refers to exposure for which a default event as defined in section 125 SolvV has occurred, e.g. 90-day default, improbability of repayment or the recognition of write-
downs. The exposure is presented before allowances for losses on loans and advances/impairments.
As was the case last year, around a quarter of the net exposure was assigned to the best rating class
1(AAAA). This includes in particular German non-central public-sector entities. The shares of further
very good to good ratings (1(AAA) to 5) increased from 60.8 % to 63.6 %, which means that the share
in the overall portfolio with an investment-grade rating (1(AAAA) to 5) now stands at 88.1 % (for
comparison 31 December 2012: 85.6 %). The net exposure in the default rating classes (16–18) was
reduced by around EUR 0.7 billion as a result of winding down or selling exposures.
Sectors.
The presentation by net exposure, credit value-at-risk (CVaR) and default portfolio likewise provides
information on the scope of business activities and the risk situation in the respective sector. The
sector classification in the following table is based on LBBW's internal risk-oriented sector key.
Sectors. EUR million Net
exposure31 Dec. 2013
CVaR31 Dec. 2013
Default31 Dec. 2013
Net exposure
31 Dec. 2012
CVaR 31 Dec. 2012
Default31 Dec. 2012
Financials 114,560 982 364 129,865 1,360 506
of which transactions under specific state liability1) 41,583 60 130 54,751 119 284
Companies 73,891 2,549 3,215 81,047 2,963 3,798
Automotive 9,331 420 305 10,734 539 332
Construction 5,811 213 304 5,697 292 387
Commercial real estate (CRE) 8,082 458 959 10,377 561 1,395
Utilities 6,170 153 28 6,610 247 20
Housing 4,314 262 150 4,442 200 149
Other sectors2) 40,183 1,043 1,467 43,187 1,124 1,515 Public sector 47,799 586 2 59,089 1,079 1 Private individuals 6,560 187 186 7,563 221 195 Total 242,810 4,304 3,768 277,565 5,622 4,501
1) This figure shows transactions with guarantor's liability, transactions for risk minimization covered by a guarantee provided by the State of Baden Württemberg
or transactions with a SoFFin guarantee. This also includes central banks or banks with a state background. 2) »Other sectors« combines company sectors with net exposure of less than 5 % of the company portfolio as at 31 December 2013.
COMBINED MANAGEMENT REPORT — RISK AND OPPORTUNITY REPORT
74
With a net exposure of EUR 115 billion, financials represent the largest of the four sectors (financials,
corporates, public sector and private individuals). The year-on-year drop of around EUR 15 billion
results to the tine of approx. EUR 13 billion from completed transactions with guarantor's liability. The
marked reduction in CVaR is due mainly to the lower net exposure and changes in market data. The
transactions in default comprise chiefly securitization positions for which LBBW holds a deductible
from the risk shield concluded with the State of Baden Württemberg (see Notes for details).
The share of exposures to companies in the net exposure declined by 8.8 %, or almost EUR 7 billion,
to EUR 74 billion compared to 31 December 2012. The substantial decrease in CVaR (– 14.0 %) is
attributable to numerous individual effects (such as rating improvements and reductions in non-
investment-grade names and changes in market data) brought about in the main by the top five
corporate sectors. As in the previous year the corporate sectors account for more than half of CVaR
(53 % and 59 % respectively as at 31 December 2012). The CVaR breakdown by business segment is
similar – here too at 59 % (for comparison 53 % as at 31 December 2012) the Corporates segment
accounts for the greatest share of CVaR.
In the table above, company sectors with net exposure of at least 5 % of the company portfolio are
shown separately. As in the previous year, automotive and commercial real estate sectors were the
most important sectors in the portfolio. For this reason, they will continue to be monitored closely in
the interests of managing sector concentration. The »other sectors« item includes a further 25
corporate sectors that contribute significantly to sector diversification within the company portfolio.
Net exposure to public-sector bodies contracted by around EUR 11 billion to EUR 48 billion. This
reduction was predominantly concentrated in Germany and South Western Europe.
For private individuals there was a similar decline in net exposure and CVaR. This portfolio has a
particularly high level of granularity.
Regions.
The share of German business in the net exposure has hardly changed at all and stands at approx.
75 %. As a result of the LBBW Group's focus on the core markets in private, SME and large customer
business, its function as a clearing bank for the savings banks, the run-off of exposure to foreign
financial institutions and public-sector bodies, German business will continue to account for a large
part of the portfolio.
Foreign exposure was particularly spread across Western Europe and North America. By contrast,
exposure to Eastern Europe, Latin America, Africa and supranationals is of only subordinate
importance and results principally from export finance.
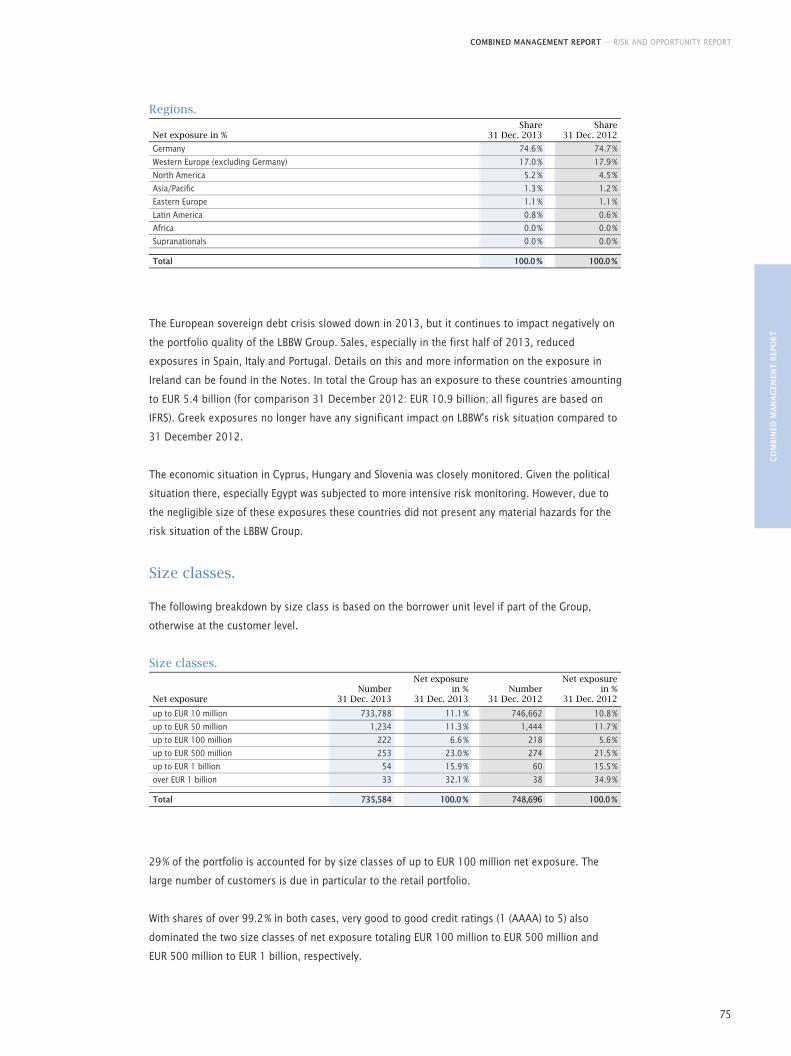
COMBINED MANAGEMENT REPORT — RISK AND OPPORTUNITY REPORT
CO
MB
INED
MA
NA
GEM
ENT
REP
OR
T
75
Regions.
Net exposure in % Share
31 Dec. 2013
Share 31 Dec. 2012
Germany 74.6 % 74.7 %
Western Europe (excluding Germany) 17.0 % 17.9 %
North America 5.2 % 4.5 %
Asia/Pacific 1.3 % 1.2 %
Eastern Europe 1.1 % 1.1 %
Latin America 0.8 % 0.6 %
Africa 0.0 % 0.0 %
Supranationals 0.0 % 0.0 %
Total 100.0 % 100.0 %
The European sovereign debt crisis slowed down in 2013, but it continues to impact negatively on
the portfolio quality of the LBBW Group. Sales, especially in the first half of 2013, reduced
exposures in Spain, Italy and Portugal. Details on this and more information on the exposure in
Ireland can be found in the Notes. In total the Group has an exposure to these countries amounting
to EUR 5.4 billion (for comparison 31 December 2012: EUR 10.9 billion; all figures are based on
IFRS). Greek exposures no longer have any significant impact on LBBW's risk situation compared to
31 December 2012.
The economic situation in Cyprus, Hungary and Slovenia was closely monitored. Given the political
situation there, especially Egypt was subjected to more intensive risk monitoring. However, due to
the negligible size of these exposures these countries did not present any material hazards for the
risk situation of the LBBW Group.
Size classes.
The following breakdown by size class is based on the borrower unit level if part of the Group,
otherwise at the customer level.
Size classes.
Number Net exposure
in % Number Net exposure
in % Net exposure 31 Dec. 2013 31 Dec. 2013 31 Dec. 2012 31 Dec. 2012
up to EUR 10 million 733,788 11.1 % 746,662 10.8 %
up to EUR 50 million 1,234 11.3 % 1,444 11.7 %
up to EUR 100 million 222 6.6 % 218 5.6 %
up to EUR 500 million 253 23.0 % 274 21.5 %
up to EUR 1 billion 54 15.9 % 60 15.5 %
over EUR 1 billion 33 32.1 % 38 34.9 %
Total 735,584 100.0 % 748,696 100.0 %
29 % of the portfolio is accounted for by size classes of up to EUR 100 million net exposure. The
large number of customers is due in particular to the retail portfolio.
With shares of over 99.2 % in both cases, very good to good credit ratings (1 (AAAA) to 5) also
dominated the two size classes of net exposure totaling EUR 100 million to EUR 500 million and
EUR 500 million to EUR 1 billion, respectively.
COMBINED MANAGEMENT REPORT — RISK AND OPPORTUNITY REPORT
76
The portfolio share of commitments in excess of EUR 1 billion net exposure fell by around three
percentage points in relative terms over the previous year to 32.1 %; in absolute terms, the exposure
in this size class fell by EUR 18 billion. As at 31 December 2013, 31 % of this size class comprised
Landesbanken and savings banks (of which more than two-thirds are under guarantor's liability) and
a further 41 % public-sector bodies (particularly German non-central public-sector entities). The
remaining 28 % was spread across banks and companies almost exclusively with very good to good
credit ratings. A further reduction in the share in the overall portfolio of the size class with net
exposure of > EUR 1 billion will be achieved by means of the successive disposal of individual large
exposures.
Opportunities.
LBBW's core business activity involves assuming counterparty risks. According to the principles of
the credit risk strategy, credits are adjusted for risk when priced. Selecting transactions with a
favorable risk/return ratio offers special opportunities for profit. Furthermore, a positive trend in the
economic situation may offer an opportunity to improve the quality of the portfolio, thus resulting in
lower write-down requirements.
Market price risks. Definition.
LBBW defines market price risks as potential losses resulting from unfavorable changes in market
prices or factors influencing prices. Market price risks are broken down into the categories equities,
interest rates and currency/commodities.
The following characteristics of market price risks arise as a result of the nature of LBBW’s business
activities:
Equity risk.
The equity risk results from fluctuations in share and/or index prices and from share or index volatilities.
Interest rate risk.
The interest rate risk is based, for example, on changes in market interest rates, interest spreads,
credit spreads or interest rate volatility.
Currency/commodity risk.
Currency / commodity risks are summarized and reported under the FX risk type in the LBBW Group.
The currency risk is based on exchange rate trends and the commodity risk on changes in the price
of precious metals and commodities.
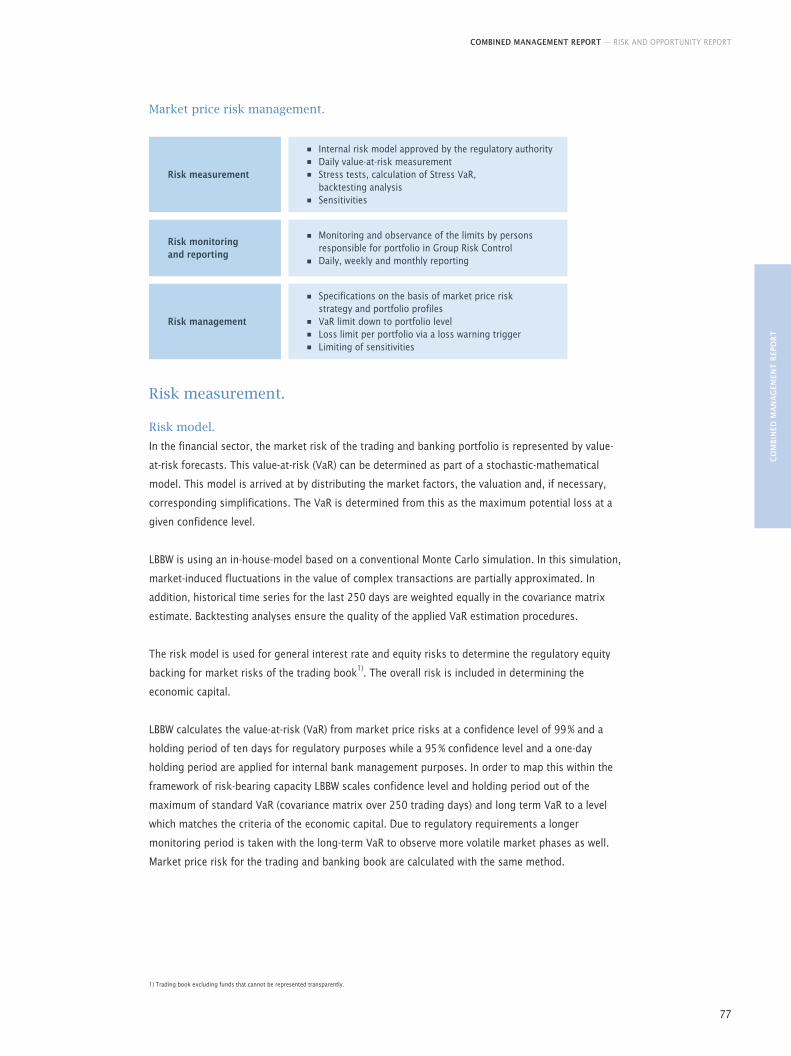
COMBINED MANAGEMENT REPORT — RISK AND OPPORTUNITY REPORT
CO
MB
INED
MA
NA
GEM
ENT
REP
OR
T
77
Market price risk management.
Risk measurement
Risk monitoringand reporting
Risk management
Specifications on the basis of market price risk strategy and portfolio profiles VaR limit down to portfolio levelLoss limit per portfolio via a loss warning triggerLimiting of sensitivities
Internal risk model approved by the regulatory authorityDaily value-at-risk measurementStress tests, calculation of Stress VaR, backtesting analysisSensitivities
Monitoring and observance of the limits by persons responsible for portfolio in Group Risk ControlDaily, weekly and monthly reporting
Risk measurement.
Risk model.
In the financial sector, the market risk of the trading and banking portfolio is represented by value-
at-risk forecasts. This value-at-risk (VaR) can be determined as part of a stochastic-mathematical
model. This model is arrived at by distributing the market factors, the valuation and, if necessary,
corresponding simplifications. The VaR is determined from this as the maximum potential loss at a
given confidence level.
LBBW is using an in-house-model based on a conventional Monte Carlo simulation. In this simulation,
market-induced fluctuations in the value of complex transactions are partially approximated. In
addition, historical time series for the last 250 days are weighted equally in the covariance matrix
estimate. Backtesting analyses ensure the quality of the applied VaR estimation procedures.
The risk model is used for general interest rate and equity risks to determine the regulatory equity
backing for market risks of the trading book1). The overall risk is included in determining the
economic capital.
LBBW calculates the value-at-risk (VaR) from market price risks at a confidence level of 99 % and a
holding period of ten days for regulatory purposes while a 95 % confidence level and a one-day
holding period are applied for internal bank management purposes. In order to map this within the
framework of risk-bearing capacity LBBW scales confidence level and holding period out of the
maximum of standard VaR (covariance matrix over 250 trading days) and long term VaR to a level
which matches the criteria of the economic capital. Due to regulatory requirements a longer
monitoring period is taken with the long-term VaR to observe more volatile market phases as well.
Market price risk for the trading and banking book are calculated with the same method.
1) Trading book excluding funds that cannot be represented transparently.
COMBINED MANAGEMENT REPORT — RISK AND OPPORTUNITY REPORT
78
Trading books and the strategic interest-rate position of the banking book can be affected by
potentially detrimental developments in market interest rates.
LBBW identifies credit spread risk as its most significant risk. The positions of the trading book and
the banking book that are sensitive to creditworthiness are mapped onto rating- and sector-specific
yield curves. In this way, general credit spread risks from bonds and ABS are also measured. In
addition, the issuer-specific risk for securities is calculated using the spread of individual issuers.
Reference borrowers are allocated to CDS sector curves for credit spread risks from credit
derivatives. Furthermore, in order to calculate economic capital a premium is added for the credit
spread risk from marketable loans.
The calculations of VaR and sensitivities are completed with separate stress scenarios for the trading
and the banking book on a weekly basis. Stress testing is used to examine how the value of the
portfolio changes under extreme market conditions. LBBW uses both self-defined e.g. synthetic as
well as historical market movements with a focus on modeling particular curve trends and spread
changes. Synthetic scenarios are based mostly on selected market factor groups such as individual
and combined interest rate shifts or credit spread shifts. Historical scenarios were generated from
the data analyses of market shocks. All scenarios serve the purpose of modeling extreme events on
the financial markets that are not specifically included in VaR as history-based indicator. The results
are reported to the decision-makers both on a portfolio basis and with regard to their impact on the
Group as a whole. These changes in value from the stress simulation are also integrated in the stress
scenarios for multiple risk types and are therefore relevant for risk-bearing capacity.
In order to calculate the StressVaR, instead of the last 250 trading days a period of observation is
assumed that covers a significant stress period. The StressVaR is calculated on a weekly basis using
the relevant observation period for the portfolio required for the regulatory report (trading book
excluding funds). A second calculation simulates the increase in risk under stress for the period of
relevance for the Group. This value is also integrated in the stress scenarios for multiple risk types
and is therefore relevant for risk-bearing capacity. The relevant observation period is determined on
a quarterly basis for the SolvV portfolio as well as for the Group.
New products and further development of the risk model.
The introduction of new products aside, in 2013 the Bank prepared the following model adjustments
in the course of the regular development of the market risk model:
■ Changeover of the model of volatilities for interest-rate options
■ Use of an amended aggregation method to calculate the SolvV risk amount
The Bank is currently engaged in the acceptance procedure with the regulatory authority with regard
to the aforementioned items.
For the purpose of regular quality assurance and validation, the adequacy of risk modeling and the
risk factors used are reviewed regularly in addition to valuations. If certain markets and risk types
become more important in the future, LBBW can flexibly expand the self-developed model.
However, there are limits for the valuation procedure in general. All types of modeling entail a
simplification compared to reality. LBBW addresses such model risks by further analyses and
COMBINED MANAGEMENT REPORT — RISK AND OPPORTUNITY REPORT
CO
MB
INED
MA
NA
GEM
ENT
REP
OR
T
79
limitations, as well as valuation adjustments, if necessary. An appropriate amount is also included in
risk-bearing capacity for model risks. Specifically, allowance is made for returns from micro issues as
well as products with simplified inclusion in risk and backtesting.
Validation of the risk model.
The quality of the resulting VaR forecasts must be reviewed for regulatory purposes within the scope
of a regular validation process conducted by an independent organizational unit. The process starts
by reviewing the model design and identifying possible model risks. Subsequently through custom-
ized validation analyses the materiality of the risk model is quantified, both isolated and combined.
In this context particular importance is attached to the backtesting analysis, in other words, the
statistical backward comparison of the actual changes to the portfolio with the corresponding VaR
forecasts. The pure valuation changes of the portfolio excluding new business and intraday results
(so-called CleanPL) are used for these changes in portfolio value.
Additional backtesting on the basis of the so-called DirtyPL is conducted due to regulatory
requirements. DirtyPL is the actual change in value net of commissions and fees. It is calculated on
the basis of the economic result.
Risk monitoring and reporting.
The utilization of limits and compliance with the detailed risk strategy among other things defined in
the portfolio characteristics, are monitored by the relevant persons with portfolio responsibilities in
Group Risk Control and reported to the Group's Board of Managing Directors. Reporting comprises
specifically:
■ Daily report with overview of the P&L and risk development.
■ Weekly stress test report comprising the effects of the stress scenarios.
■ Overall risk report that is prepared monthly and contains detailed information about P&L and risk
development, StressVaR, economic capital and monitoring of the economic capital limit.
Risk management.
The strategic framework for quantitative market price risk management in the LBBW Group is set by
the Board of Managing Directors by fixing the limit for economic capital for market price risks within
the framework of risk-bearing capacity. The loss-warning trigger acts as an indicator for losses of
market value in the economic P&L and thus also entails a reduction of the aggregate risk bearing
capacity. The loss-warning triggers at divisional and/or segment level are fixed by the Board of
Managing Directors at least once a year allowing for risk tolerance. Distribution among the portfolios
below this level is effected by the responsible person in Trading.
The relevant VaR amount is calculated for strategic management and monthly inclusion in the
economic capital limit in the strategic limit system. If it is not possible to completely quantify the
risks, appropriate cushions or reserves are formed.
Differentiated VaR portfolio limits are linked to the economic capital limit. Together with the loss-
warning triggers and jointly with the sub-strategies these set the risk-related scope for action by the
divisions, departments and groups of Corporate Center/Financial Markets, the Credit Investment
COMBINED MANAGEMENT REPORT — RISK AND OPPORTUNITY REPORT
80
Portfolio division and the subsidiaries. The persons responsible for managing market price risks in the
LBBW Group are defined via the escalation policy.
Operational management (intraday and end of day) in LBBW's trading books is conducted using
sensitivity limits. The end-of-day portfolio limits monitored by Group Risk Control are to be observed.
Furthermore, various special limits and restrictions (e.g. from the New Products process) have been
approved. These are monitored by Group Risk Control and if necessary escalated to the Risk
Committee.
Internal transactions are concluded between the trading units, which are included in the calculations
of market price risk for detailed risk management.
The requirements for proactive management of the material LBBW portfolios are documented in the
portfolio profile, following on from the market price risk strategy.
Risk situation of the LBBW Group.
Development of market price risks.
Exposure to market price risks in 2013 was always in accordance with the risk-bearing capacity of the
LBBW Group. The risk limit was not exceeded in 2013 for the individual Group entities either. The
same applies to the limits for the corresponding division and department portfolios. The loss warning
trigger was not breached either for any material portfolio in 2013.
LBBW's market price risks are generally characterized by interest rate risk and the credit spread risks
contained therein. The overall risk is dominated by the positions in the banking book. The banking
book of the LBBW Group comprises largely the Credit Investment (non-core-business portfolio) and
Treasury (interest-rate and liquidity management as well as cover pool) portfolios. The basis risks in the
interest area between individual European sovereign and financial curves and the swap curve, as well as
the exposure to credit spreads including the risks from fixed-income securities, credit derivatives and
the credit substitute business, play a decisive part here. Equity risks, along with currency and
commodity risks, are less significant for LBBW than interest rate and spread risks. Commodity risks also
include risks from precious metals and notes and coins portfolios, which LBBW holds to only a limited
degree. Commodity risks are included in the currency risks.
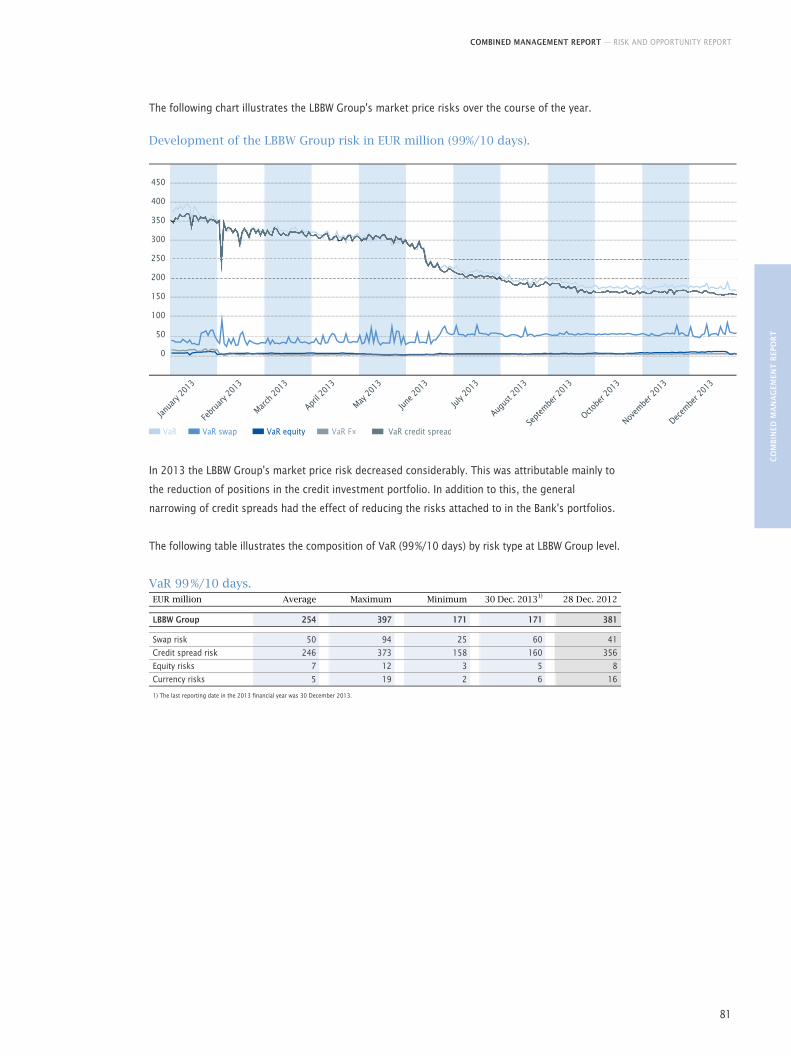
COMBINED MANAGEMENT REPORT — RISK AND OPPORTUNITY REPORT
CO
MB
INED
MA
NA
GEM
ENT
REP
OR
T
81
The following chart illustrates the LBBW Group's market price risks over the course of the year.
150
200
250
300
350
400
450
100
50
0
Janua
ry 2
013
Febr
uary
201
3
March
201
3
April 2
013
May 2
013
June
201
3
July
2013
Augus
t 201
3
Sept
embe
r 201
3
Octobe
r 201
3
Novem
ber 2
013
Decem
ber 2
013
VaR VaR swap VaR equity VaR Fx VaR credit spread
Development of the LBBW Group risk in EUR million (99%/10 days).
In 2013 the LBBW Group's market price risk decreased considerably. This was attributable mainly to
the reduction of positions in the credit investment portfolio. In addition to this, the general
narrowing of credit spreads had the effect of reducing the risks attached to in the Bank's portfolios.
The following table illustrates the composition of VaR (99 %/10 days) by risk type at LBBW Group level.
VaR 99 %/10 days. EUR million Average Maximum Minimum 30 Dec. 20131)
28 Dec. 2012 LBBW Group 254 397 171 171 381 Swap risk 50 94 25 60 41
Credit spread risk 246 373 158 160 356
Equity risks 7 12 3 5 8
Currency risks 5 19 2 6 16 1) The last reporting date in the 2013 financial year was 30 December 2013.
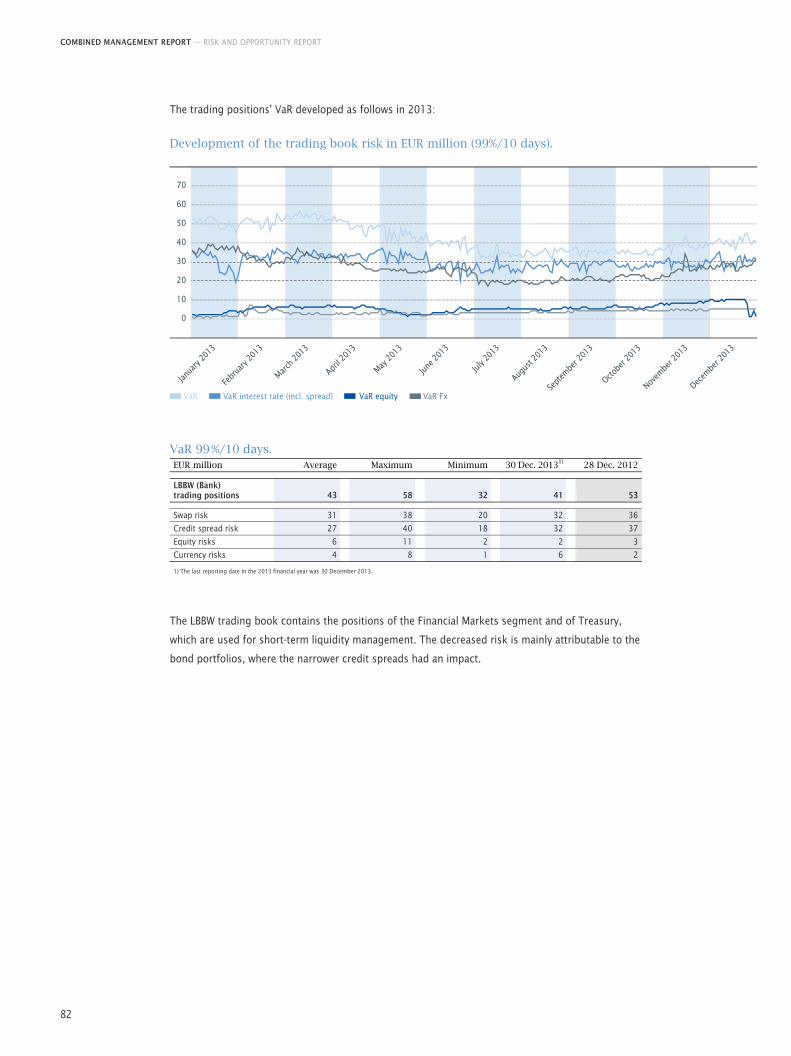
COMBINED MANAGEMENT REPORT — RISK AND OPPORTUNITY REPORT
82
The trading positions' VaR developed as follows in 2013:
Janua
ry 2
013
Febr
uary
201
3
March
201
3
April 2
013
May 2
013
June
201
3
July
2013
Augus
t 201
3
Sept
embe
r 201
3
Octobe
r 201
3
Novem
ber 2
013
Decem
ber 2
013
10
20
30
40
50
60
70
0
VaR VaR interest rate (incl. spread) VaR equity VaR Fx
Development of the trading book risk in EUR million (99%/10 days).
VaR 99 %/10 days. EUR million Average Maximum Minimum 30 Dec. 20131) 28 Dec. 2012 LBBW (Bank) trading positions 43 58 32 41 53 Swap risk 31 38 20 32 36
Credit spread risk 27 40 18 32 37
Equity risks 6 11 2 2 3
Currency risks 4 8 1 6 2 1) The last reporting date in the 2013 financial year was 30 December 2013.
The LBBW trading book contains the positions of the Financial Markets segment and of Treasury,
which are used for short-term liquidity management. The decreased risk is mainly attributable to the
bond portfolios, where the narrower credit spreads had an impact.
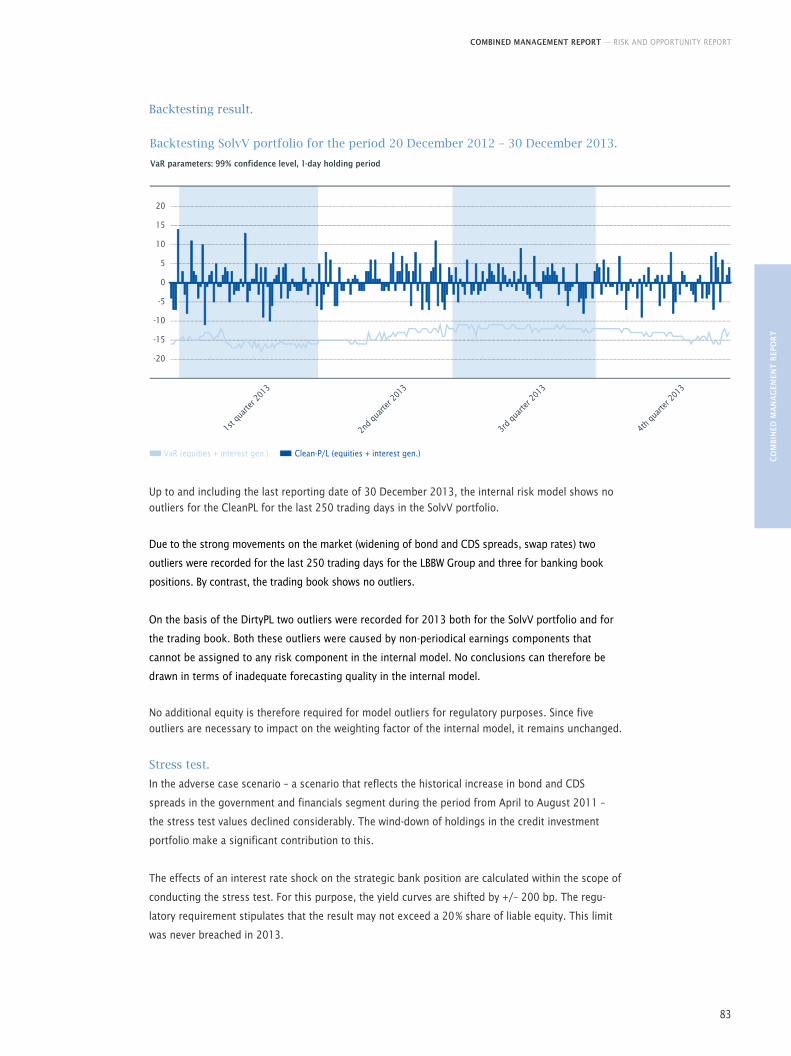
COMBINED MANAGEMENT REPORT — RISK AND OPPORTUNITY REPORT
CO
MB
INED
MA
NA
GEM
ENT
REP
OR
T
83
Backtesting result.
1st q
uarte
r 201
3
2nd
quar
ter 2
013
3rd
quar
ter 2
013
4th
quar
ter 2
013
-20
-15
-10
-5
0
5
10
15
20
VaR (equities + interest gen.) Clean-P/L (equities + interest gen.)
Backtesting SolvV portfolio for the period 20 December 2012 – 30 December 2013.
VaR parameters: 99% confidence level, 1-day holding period
Up to and including the last reporting date of 30 December 2013, the internal risk model shows no
outliers for the CleanPL for the last 250 trading days in the SolvV portfolio.
Due to the strong movements on the market (widening of bond and CDS spreads, swap rates) two
outliers were recorded for the last 250 trading days for the LBBW Group and three for banking book
positions. By contrast, the trading book shows no outliers.
On the basis of the DirtyPL two outliers were recorded for 2013 both for the SolvV portfolio and for
the trading book. Both these outliers were caused by non-periodical earnings components that
cannot be assigned to any risk component in the internal model. No conclusions can therefore be
drawn in terms of inadequate forecasting quality in the internal model.
No additional equity is therefore required for model outliers for regulatory purposes. Since five
outliers are necessary to impact on the weighting factor of the internal model, it remains unchanged.
Stress test.
In the adverse case scenario – a scenario that reflects the historical increase in bond and CDS
spreads in the government and financials segment during the period from April to August 2011 –
the stress test values declined considerably. The wind-down of holdings in the credit investment
portfolio make a significant contribution to this.
The effects of an interest rate shock on the strategic bank position are calculated within the scope of
conducting the stress test. For this purpose, the yield curves are shifted by +/– 200 bp. The regu-
latory requirement stipulates that the result may not exceed a 20 % share of liable equity. This limit
was never breached in 2013.
COMBINED MANAGEMENT REPORT — RISK AND OPPORTUNITY REPORT
84
Market liquidity risks.
Market liquidity risk designates the risk that transactions cannot be closed out, or can only be closed
out at a loss, due to inadequate market depth or market disruptions. For example, if a large volume
were to be bought or sold quickly, then a corresponding market-price influence would be anticipated,
potentially reducing the expected proceeds.
The market liquidity risk is calculated for bonds, credit derivatives, equities and swaps. It is broken
down into exogenous and endogenous risks. The exogenous market liquidity risk results from the
fact that the valuation of market risk positions is based on mid values but bid or ask prices are
achieved when positions are closed out. When the exogenous risk is calculated, the volatility of the
bid-ask spread is included. The endogenous market liquidity risk occurs in cases where the Bank's
own position relative to market capacity can no longer be ignored. Here there is a risk that liquidation
or closeout of the position will result in an additional change in the bid-ask spread that is unfavorable
from LBBW's point of view.
Since February 2013, market liquidity risk has been calculated using a new model that includes
bonds, credit derivatives, swaps and equities. As at 30. December 2013 the market liquidity risk
calculated using this model stood at EUR 363 million and had decreased significantly in the course
of the financial year. A major contributory factor here was the reduction of holdings in the credit
investment portfolio.
Opportunities.
The portfolios of the LBBW Group depend to a considerable extent on interest rate and credit spread
trends. A drop in the interest rate or narrowing of the relevant credit spreads has a positive effect
for the LBBW Group from today's point of view. The extent of this effect depends on the perfor-
mance of the LBBW Group's holdings.
Liquidity risks. Definition.
LBBW's liquidity risk monitoring and management activities draw a distinction between short-term
liquidity risk, which represents the risk of insolvency due to an acute funding shortfall, and the
funding (spread) risk, which describes the adverse effects on income resulting from a possible
deterioration of funding spreads.
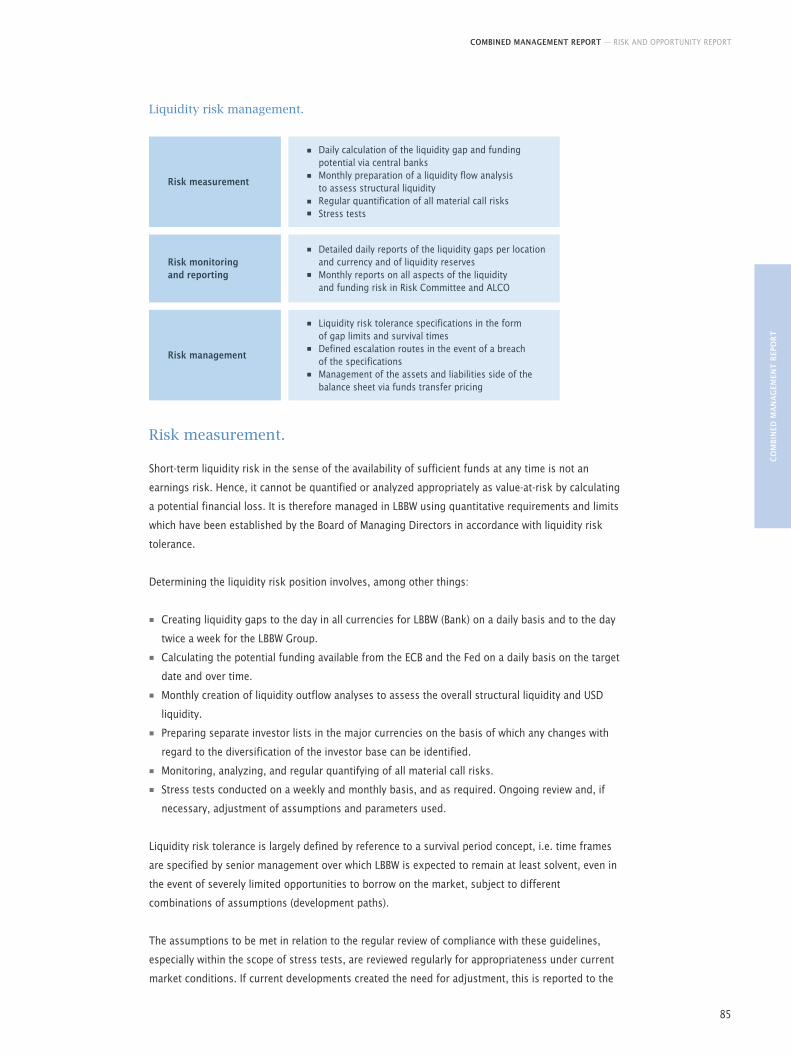
COMBINED MANAGEMENT REPORT — RISK AND OPPORTUNITY REPORT
CO
MB
INED
MA
NA
GEM
ENT
REP
OR
T
85
Liquidity risk management.
Risk measurement
Risk monitoring and reporting
Risk management
Liquidity risk tolerance specifications in the form of gap limits and survival timesDefined escalation routes in the event of a breach of the specificationsManagement of the assets and liabilities side of the balance sheet via funds transfer pricing
Detailed daily reports of the liquidity gaps per location and currency and of liquidity reservesMonthly reports on all aspects of the liquidity and funding risk in Risk Committee and ALCO
Daily calculation of the liquidity gap and funding potential via central banksMonthly preparation of a liquidity flow analysis to assess structural liquidityRegular quantification of all material call risksStress tests
Risk measurement.
Short-term liquidity risk in the sense of the availability of sufficient funds at any time is not an
earnings risk. Hence, it cannot be quantified or analyzed appropriately as value-at-risk by calculating
a potential financial loss. It is therefore managed in LBBW using quantitative requirements and limits
which have been established by the Board of Managing Directors in accordance with liquidity risk
tolerance.
Determining the liquidity risk position involves, among other things:
■ Creating liquidity gaps to the day in all currencies for LBBW (Bank) on a daily basis and to the day
twice a week for the LBBW Group.
■ Calculating the potential funding available from the ECB and the Fed on a daily basis on the target
date and over time.
■ Monthly creation of liquidity outflow analyses to assess the overall structural liquidity and USD
liquidity.
■ Preparing separate investor lists in the major currencies on the basis of which any changes with
regard to the diversification of the investor base can be identified.
■ Monitoring, analyzing, and regular quantifying of all material call risks.
■ Stress tests conducted on a weekly and monthly basis, and as required. Ongoing review and, if
necessary, adjustment of assumptions and parameters used.
Liquidity risk tolerance is largely defined by reference to a survival period concept, i.e. time frames
are specified by senior management over which LBBW is expected to remain at least solvent, even in
the event of severely limited opportunities to borrow on the market, subject to different
combinations of assumptions (development paths).
The assumptions to be met in relation to the regular review of compliance with these guidelines,
especially within the scope of stress tests, are reviewed regularly for appropriateness under current
market conditions. If current developments created the need for adjustment, this is reported to the

COMBINED MANAGEMENT REPORT — RISK AND OPPORTUNITY REPORT
86
management via the Risk Committee and leads to timely adjustments when duly authorized. In
addition, there is a limit system for the maximum funding requirements based on maturities from
the business portfolio across various time frames.
The following measures, amongst other things, are used for the early identification of new call risks
or increased risk from known but previously immaterial call risks.
■ Permanent analysis of the documented business operations (overall risk report, ALCo documents,
New Product Processes) with regard to new or increasingly significant call risks.
■ Monitoring the daily cash flows in the ECB account, with regard to major cash flows that are not
from transactions due or other familiar causes of payments flows.
All key subsidiaries as defined in the risk inventory and all conduits/SIVs are included in regular
reporting of liquidity risks in accordance with LBBW guidelines. The liquidity risks of subsidiaries and
equity investments are judged equally and reported as liquidity risks in the balance sheet.
Risk monitoring and reporting.
The regular monitoring of liquidity risks is the responsibility of the Risk Committee at the
management level, while Liquidity Risk Control within the Group Risk Control division is responsible
for daily monitoring at the operational level. As part of the overall risk report, all material aspects of
liquidity risk, such as liquidity requirements, liquidity reserves and compliance with the specifications
on liquidity risk tolerance including the results of the stress tests carried out, are reported in detail to
the Risk Committee. Various reports are prepared daily as part of the continuous monitoring, which
show the different partial aspects of liquidity and liquidity risk – such as disaggregation of the
liquidity gaps by currency – in detail and are distributed in Group Risk Control and Treasury.
Risk management.
The Asset Liability Committee (ALCo), which meets on a monthly basis, is the central body for
managing liquidity and funding. The Asset Liability Committee prepares the liquidity and funding
strategy on behalf of the Group’s Board of Managing Directors, and monitors the implementation
of decisions. Treasury prepares all the decisions to be made by the Asset Liability Committee with
the aim of active income and risk optimization while simultaneously ensuring solvency at all times
and compliance with the requirements with respect to liquidity risk tolerance. The ALCo is also
responsible for determining the strategy for calculating the internal settlement rates (Funds
Transfer Pricing) and for reviewing the steering effect of the Funds Transfer Prices on the
business areas and the Group’s liquidity and funding situation.
Treasury is responsible for the operational management of market-and risk-adequate internal
transfer prices that have to be adjusted continuously to market conditions, and is a fundamental
component of the management of the assets and liabilities sides of the balance sheet.
The purpose of LBBW's funding strategy is to diversify product and investor groups. In 2013,
investments by savings banks and institutional investors within Germany constituted the main
sources of medium- and long-term funding in addition to retail business. Covered bonds continue to
represent a material source of funding.
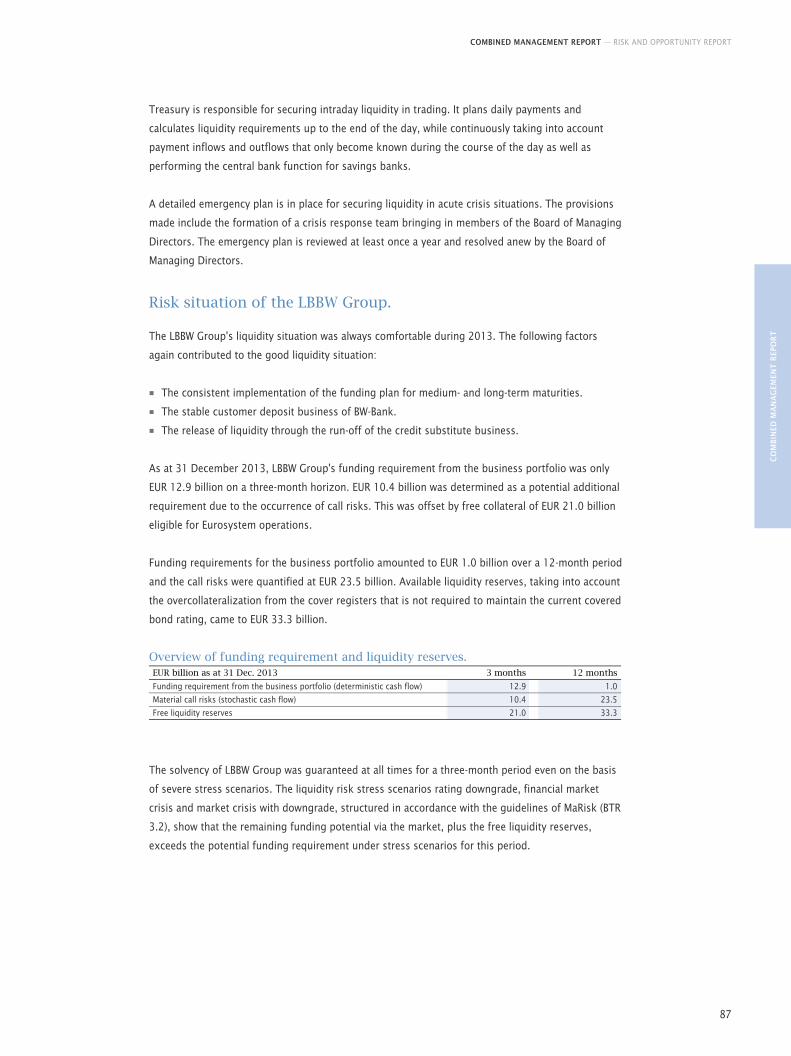
COMBINED MANAGEMENT REPORT — RISK AND OPPORTUNITY REPORT
CO
MB
INED
MA
NA
GEM
ENT
REP
OR
T
87
Treasury is responsible for securing intraday liquidity in trading. It plans daily payments and
calculates liquidity requirements up to the end of the day, while continuously taking into account
payment inflows and outflows that only become known during the course of the day as well as
performing the central bank function for savings banks.
A detailed emergency plan is in place for securing liquidity in acute crisis situations. The provisions
made include the formation of a crisis response team bringing in members of the Board of Managing
Directors. The emergency plan is reviewed at least once a year and resolved anew by the Board of
Managing Directors.
Risk situation of the LBBW Group.
The LBBW Group's liquidity situation was always comfortable during 2013. The following factors
again contributed to the good liquidity situation:
■ The consistent implementation of the funding plan for medium- and long-term maturities.
■ The stable customer deposit business of BW-Bank.
■ The release of liquidity through the run-off of the credit substitute business.
As at 31 December 2013, LBBW Group's funding requirement from the business portfolio was only
EUR 12.9 billion on a three-month horizon. EUR 10.4 billion was determined as a potential additional
requirement due to the occurrence of call risks. This was offset by free collateral of EUR 21.0 billion
eligible for Eurosystem operations.
Funding requirements for the business portfolio amounted to EUR 1.0 billion over a 12-month period
and the call risks were quantified at EUR 23.5 billion. Available liquidity reserves, taking into account
the overcollateralization from the cover registers that is not required to maintain the current covered
bond rating, came to EUR 33.3 billion.
Overview of funding requirement and liquidity reserves. EUR billion as at 31 Dec. 2013 3 months 12 months
Funding requirement from the business portfolio (deterministic cash flow) 12.9 1.0
Material call risks (stochastic cash flow) 10.4 23.5
Free liquidity reserves 21.0 33.3
The solvency of LBBW Group was guaranteed at all times for a three-month period even on the basis
of severe stress scenarios. The liquidity risk stress scenarios rating downgrade, financial market
crisis and market crisis with downgrade, structured in accordance with the guidelines of MaRisk (BTR
3.2), show that the remaining funding potential via the market, plus the free liquidity reserves,
exceeds the potential funding requirement under stress scenarios for this period.
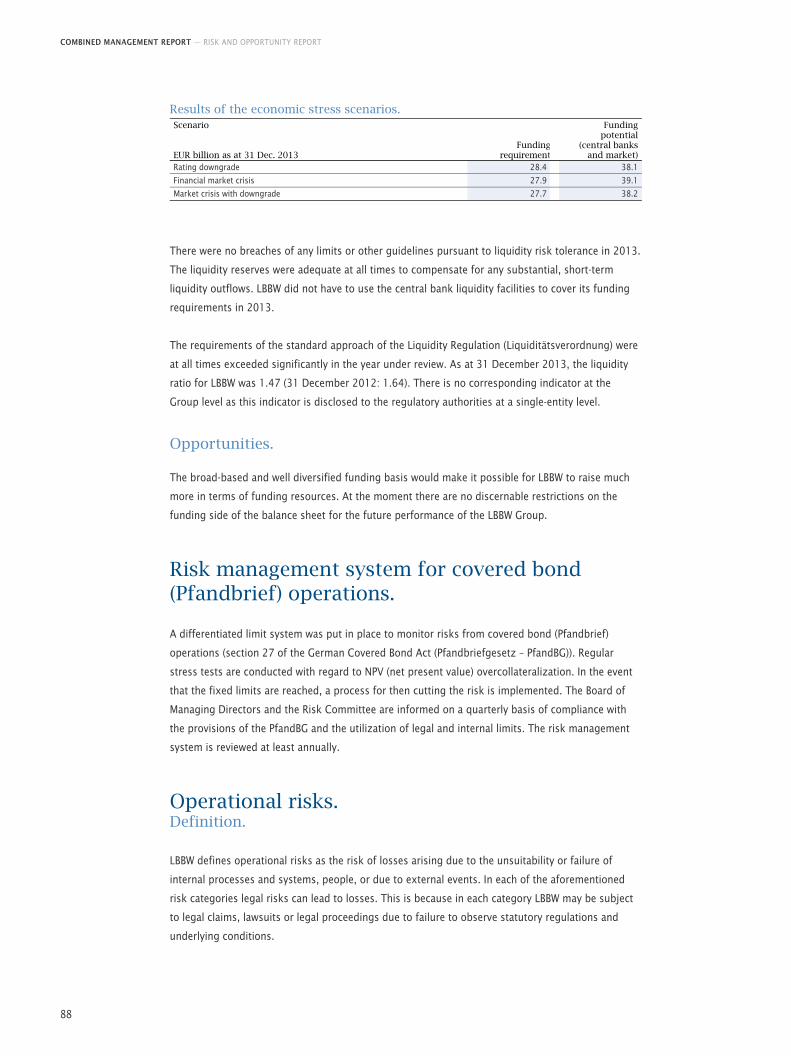
COMBINED MANAGEMENT REPORT — RISK AND OPPORTUNITY REPORT
88
Results of the economic stress scenarios. Scenario EUR billion as at 31 Dec. 2013
Funding requirement
Funding potential
(central banks and market)
Rating downgrade 28.4 38.1
Financial market crisis 27.9 39.1
Market crisis with downgrade 27.7 38.2
There were no breaches of any limits or other guidelines pursuant to liquidity risk tolerance in 2013.
The liquidity reserves were adequate at all times to compensate for any substantial, short-term
liquidity outflows. LBBW did not have to use the central bank liquidity facilities to cover its funding
requirements in 2013.
The requirements of the standard approach of the Liquidity Regulation (Liquiditätsverordnung) were
at all times exceeded significantly in the year under review. As at 31 December 2013, the liquidity
ratio for LBBW was 1.47 (31 December 2012: 1.64). There is no corresponding indicator at the
Group level as this indicator is disclosed to the regulatory authorities at a single-entity level.
Opportunities.
The broad-based and well diversified funding basis would make it possible for LBBW to raise much
more in terms of funding resources. At the moment there are no discernable restrictions on the
funding side of the balance sheet for the future performance of the LBBW Group.
Risk management system for covered bond (Pfandbrief) operations.
A differentiated limit system was put in place to monitor risks from covered bond (Pfandbrief)
operations (section 27 of the German Covered Bond Act (Pfandbriefgesetz – PfandBG)). Regular
stress tests are conducted with regard to NPV (net present value) overcollateralization. In the event
that the fixed limits are reached, a process for then cutting the risk is implemented. The Board of
Managing Directors and the Risk Committee are informed on a quarterly basis of compliance with
the provisions of the PfandBG and the utilization of legal and internal limits. The risk management
system is reviewed at least annually.
Operational risks. Definition.
LBBW defines operational risks as the risk of losses arising due to the unsuitability or failure of
internal processes and systems, people, or due to external events. In each of the aforementioned
risk categories legal risks can lead to losses. This is because in each category LBBW may be subject
to legal claims, lawsuits or legal proceedings due to failure to observe statutory regulations and
underlying conditions.
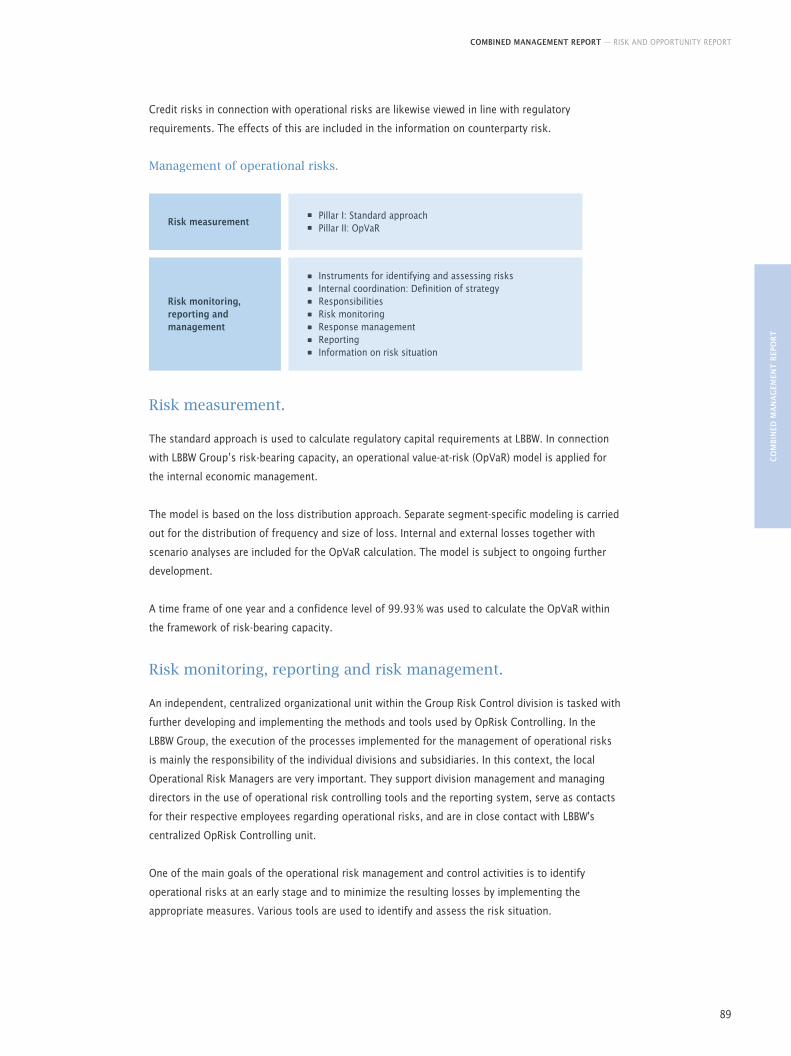
COMBINED MANAGEMENT REPORT — RISK AND OPPORTUNITY REPORT
CO
MB
INED
MA
NA
GEM
ENT
REP
OR
T
89
Credit risks in connection with operational risks are likewise viewed in line with regulatory
requirements. The effects of this are included in the information on counterparty risk.
Management of operational risks.
Risk measurement
Risk monitoring, reporting and management
Instruments for identifying and assessing risksInternal coordination: Definition of strategyResponsibilitiesRisk monitoringResponse managementReportingInformation on risk situation
Pillar I: Standard approachPillar II: OpVaR
Risk measurement.
The standard approach is used to calculate regulatory capital requirements at LBBW. In connection
with LBBW Group’s risk-bearing capacity, an operational value-at-risk (OpVaR) model is applied for
the internal economic management.
The model is based on the loss distribution approach. Separate segment-specific modeling is carried
out for the distribution of frequency and size of loss. Internal and external losses together with
scenario analyses are included for the OpVaR calculation. The model is subject to ongoing further
development.
A time frame of one year and a confidence level of 99.93 % was used to calculate the OpVaR within
the framework of risk-bearing capacity.
Risk monitoring, reporting and risk management.
An independent, centralized organizational unit within the Group Risk Control division is tasked with
further developing and implementing the methods and tools used by OpRisk Controlling. In the
LBBW Group, the execution of the processes implemented for the management of operational risks
is mainly the responsibility of the individual divisions and subsidiaries. In this context, the local
Operational Risk Managers are very important. They support division management and managing
directors in the use of operational risk controlling tools and the reporting system, serve as contacts
for their respective employees regarding operational risks, and are in close contact with LBBW's
centralized OpRisk Controlling unit.
One of the main goals of the operational risk management and control activities is to identify
operational risks at an early stage and to minimize the resulting losses by implementing the
appropriate measures. Various tools are used to identify and assess the risk situation.
COMBINED MANAGEMENT REPORT — RISK AND OPPORTUNITY REPORT
90
In addition to the internal and external incident database, a risk inventory is conducted annually with
self-assessments and scenario analyses. In the self-assessments, the individual risks of the LBBW
Group’s individual divisions are collected. The division-specific analysis of these risks was extended
last year in order to be able to provide the divisions with more extensive information relevant to risk
management. The greatest risks detected in the course of the self-assessments are aggregated in
the scenario analysis using standard scenarios; they are then analyzed extensively and measures for
reducing the risks are collected. This methodology has been rolled out in all LBBW business units
and principal subsidiaries. The results of the scenario analysis are used in the OpVaR model. In
addition, new risk indicators (segment-specific and cross-segment) were included in the analysis and
reporting extended.
OpRisk measure management plays a key role in managing operational risks. To the extent that this
is possible and reasonable, the central Group Strategy/Legal division obtains insurance policies to
cover potential losses.
The centralized OpRisk Controlling unit provides decision-makers with relevant information as part
of regular risk reporting. The Risk Committee also supports the Board of Managing Directors in
exercising its supervisory function.
Last year the software for recording and managing operational risks was further developed. New
functions ensure improved data evaluation. In addition to this, workflows and processes were
optimized, making reporting easier, among other things.
The OpVaR model used for internal controlling is integrated into the Group’s strategic limit system.
There are economic stress scenarios that vary the risk parameters of the OpVaR model (frequency or
amount of loss in expected future loss events). This covers the main business lines and event types.
The stress scenarios for operational risk are also incorporated in the overlapping stress scenarios for
risk-bearing capacity.
Risk situation of the LBBW Group.
Exposure to operational risks in 2013 was always in accordance with the risk-bearing capacity of the
LBBW Group. Looking forward, LBBW does not expect any operational risks to its going-concern
status. Despite the extensive precautionary measures taken, operational risks can never be entirely
avoided.
The legal risks, IT risks and personnel risks are set out below as they are key areas of the
operational risk.
Legal risks.
The definition of operational risks also includes legal risks. Legal risks comprise economic risks due
to full or partial failure to comply with the framework of rules established by legal regulations and
court rulings. These arise, for example, due to inadequate knowledge of the concrete legal position,
insufficient application of the law or failure to react in a timely manner to changes in underlying
legal conditions. This also applies if there is no fault or if the situation was unavoidable, for example
as a consequence of changes in legislation, jurisdiction and administrative practice, especially at
national and European level.
COMBINED MANAGEMENT REPORT — RISK AND OPPORTUNITY REPORT
CO
MB
INED
MA
NA
GEM
ENT
REP
OR
T
91
Legal risks are managed especially by the legal departments (as part of the Group Strategy/Legal
division) of LBBW. These carry out a legal advisory role for the Group. In addition, their
responsibilities include early identification of legal risks in business units and central divisions in
cooperation with the latter, and efforts to limit these in a suitable manner. The legal departments
have developed or examined and approved for use by business areas of LBBW a variety of contract
forms and sample contracts in order to minimize legal risks and simplify the business activities of
the front office and trading divisions. In relation to this, LBBW is supported by the cooperation of the
German Savings Bank Association (DSGV) and the forms developed in the committees there and
made available by the Sparkassenverlag publishing house. Approved, standardized contract
materials are used for derivative transactions wherever possible. If legal questions arise in new areas
of business or during the development of new banking products, the legal departments supervise
and actively shape these processes.
Furthermore, the legal departments monitor all relevant planned legislation, developments in court
rulings, and new standards stipulated by the supervisory authorities in the Group's key areas of
activity in close cooperation with the Association of German Public Sector Banks (Bundesverband
Öffentlicher Banken Deutschlands – VÖB), the German Savings Bank Association (Deutscher
Sparkassen- und Giroverband), and the Association of German Pfandbrief Banks (Verband deutscher
Pfandbriefbanken – VdP) in particular.
To the extent that this results in LBBW having to take action with regard to legal matters or adapt
its policies, the legal departments are instrumental in disseminating information quickly and
implementing measures within the Group. There are currently no legal risks liable to threaten
LBBW's going-concern status. Nor does the Group Strategy/Legal division have reason to believe
that such risks will arise at LBBW in the foreseeable future.
In view of recent rulings by the Supreme Court and higher courts, the banking landscape continues to
face not inconsiderable legal risks from customer transactions in complex derivatives. In the past
financial year LBBW succeeded in significantly reducing the consequent risks, which result in particular
from holdings of the former Sachsen LB. However, the legislative trend mentioned remains relevant
for LBBW as well, especially as this has not resulted in any consistent ruling. On the basis of the legal
analysis of holdings initiated by the LBBW Board of Managing Directors the risk processes have been
further developed. These take account, among other things, of current developments in consumer law,
which is still in the process of change, also by continuously monitoring the legal situation. On the
basis of current knowledge, sufficient precautions have been taken to cover these risks, although this
will depend on future trends in court rulings and the outcome of legal disputes.
IT risks.
Today the principal business processes of the Bank are to a large extent supported by IT or depend
on IT solutions. As a result, IT security is also becoming increasingly important. In line with this
increasing importance LBBW operates an Information Security Management System (ISMS) based on
international standard ISO 27001 and is continuously further developing the ISMS. Threats and risks
resulting from cybercrime are combated using a wide variety of security measures with a view to
reducing this threat to an acceptable level.
By outsourcing its IT production operations and part of its applications development to a profes-
sional service provider specializing in financial institutions, LBBW has created the basis for forward-
COMBINED MANAGEMENT REPORT — RISK AND OPPORTUNITY REPORT
92
looking IT operations. LBBW focuses on risk-reducing benefits, such as the systematic use of
standardization, increased cost efficiency and maintaining its ability to innovate.
Controlling and monitoring processes have been established and staffed especially against the
backdrop of services being provided by outside providers. Checks of the observance of external and
internal guidelines as well as the adequate positioning of these functions have been established and
these are continuously reviewed and adjusted.
The planned migration to the OS-Plus platform meets the criterion of standardization to a
particularly high degree. However, the reduction in the number of different systems resulting from
the LBBW merger also sustainably reduces operational risks and also form part of the target corridor
of LBBW IT's standardization strategy.
LBBW has set up a special IT crisis response team to ensure that its business operations are
maintained and that it can function if IT systems fail; in the event of an emergency, this team will
coordinate all activities and provide centralized communications capabilities, also with the IT service
providers, in accordance with defined procedures. The procedure and organizational measures to be
taken in the event of a crisis are described in an IT crisis management manual. The IT service
providers have emergency plans in place for operating IT systems in an emergency; these are
reviewed in regular exercises. In the context of the general Business Continuity Management of
LBBW, IT emergency plans are compared against the requirements of the business continuity plans
of the specialized divisions.
Personnel risks.
LBBW's success depends materially on the commitment of its staff – and is also anchored in LBBW's
mission statement: »We as employees drive the success of the Bank; with competence, knowledge
and commitment«. LBBW's comprehensive personnel risk management aims to identify negative
trends (risk monitoring) and evaluate suitable measures to prevent or minimize risks (risk
management).
The Human Resources department distinguishes between various types of personnel risk for
purposes of risk monitoring and management. The goal is to identify bottleneck, resignation,
adjustment, and motivation risks early on, and to minimize the resulting costs, such as staff
recruitment, termination and staff turnover expenses. These risks are measured by periodically
evaluating and analyzing key human resources indicators, such as turnover rates, absences, or data
concerning personnel development measures (particularly management training measures), as well
as comparing these indicators across the Group.
In the risk category resignation risk, for example, employees leaving LBBW are asked to comment in
writing on their reasons for leaving. This provides these employees with another opportunity to
express freely their opinion about LBBW as an employer.
One focus here is on developing and promoting young employees within the company. In order to
address the risk of a shortage of high-performance employees (bottleneck risk), employee potential is
systematically documented and analyzed. Changes in LBBW's age structure is observed particularly
closely against the backdrop of demographic changes.
COMBINED MANAGEMENT REPORT — RISK AND OPPORTUNITY REPORT
CO
MB
INED
MA
NA
GEM
ENT
REP
OR
T
93
LBBW has already implemented a series of measures to address possible personnel risks. These
measures range from legal protection for LBBW to ensuring that employees are qualified to perform
the tasks assigned to them. Among other things, a target group-oriented specialist training program
is held annually. In addition, a dedicated department is responsible for providing training in and
monitoring of statutory money laundering and compliance regulations.
Since restructuring began, it has been possible to agree on the cutting of more than 2,700 full-time
equivalent positions through voluntary redundancies. As the layoff process was implemented on a
controlled basis and affected only selected function groups, the risk of undesirable resignations by
employees is considered low and very manageable.
Opportunities.
At LBBW the interfaces between the divisions in terms of operational risks (e.g. Risk Controlling,
Compliance, Auditing, BCM) are constantly enhanced and optimized. In addition, various committees
are engaged in a regular exchange of ideas. This contributes to avoiding potential losses.
Furthermore, the processes relating to legal risks, new products or outsourcing are regularly
monitored and further developed. The extension of risk indicators and reporting makes it possible
to react more rapidly to unwanted developments. These measures help to constantly improve the
risk situation.
Other material risks. Investment risks.
LBBW invests within the Group in other companies or assigns functions to subsidiaries if this appears
to be appropriate in the light of strategic aims or returns.
Depending on LBBW's possibilities for exerting influence, management of the subsidiaries and equity
investments is effected by means of defined measures and processes (including quarterly jours fixes
with selected subsidiaries, plausibility checks of the multi-year plans, various reports to the Board of
Managing directors and corporate bodies of LBBW and the corporate bodies of the subsidiaries).
The early identification of business and risk development in the subsidiaries and equity investments
is particularly important to the management of equity investments. These serve the purpose of
holding regular coordination meetings at the corresponding specialist levels of LBBW and the
strategically important subsidiaries. The management and monitoring at the level of these
subsidiaries are performed by institutionalized supervisory boards or comparable bodies. At Group
level management and control is effected by involving the staff, market and operating divisions in
the decision-making process.
COMBINED MANAGEMENT REPORT — RISK AND OPPORTUNITY REPORT
94
From the point of view of risk a distinction is made between two categories of companies in the
LBBW portfolio of equity investments (direct LBBW subsidiaries and equity investments and those
held via holding companies):
Material subsidiaries, that is, companies in which LBBW is the majority shareholder or has a
controlling interest within the meaning of section 290 (2) no. 1 – 3 of the German Commercial
Code (HGB) and whose risk potential (in the main risk types, i.e. credit risk, market price risk,
liquidity risk, operational risk, real estate risk and development risk) is deemed to be material from
the Group's perspective.
Non-material subsidiaries and equity investments, that is, companies in which LBBW is the majority
shareholder or has a controlling interest within the meaning of section 290 (2) no. 1 – 3 of the
German Commercial Code (HGB), but whose risk potential is deemed to be immaterial from the
Group's perspective, or minority equity investments, that is, companies in which LBBW as the
minority shareholder in the absence of a controlling interest does not have the equivalent position
as with majority interests.
As far as possible, material subsidiaries are treated in line with the transparency principle. In
accordance with the transparency principle, types of risk identified as material at the respective
companies are measured according to the principles and parameters of LBBW, and included at the
level of the LBBW Group in an aggregation assessment. This applies specifically to the risk types of
credit, market price, real estate and development risk.
In the case of non-material and material subsidiaries, where only the liquidity and/or operational
risks are material, the risk potential is quantified with the LBBW Group credit portfolio on the basis
of the interest held and included as a whole in the Bank's risk management system, using an
integrated calculation. This calculation is performed using a ratings-based CVaR approach including
stress testing, which is prepared by Group Risk Control and serves as the basis for recognition in the
risk-bearing capacity.
The business and risk trends in the portfolios of LBBW's non-material subsidiaries are generally
reflected in the value of the investment as used to calculate the investment risk.
LBBW pursues a selective equity investment policy. When acquisitions of companies are planned, a
comprehensive risk analysis (legal, financial etc.) is normally conducted in the form of a due
diligence exercise with the involvement of specialized divisions of LBBW. Of particular importance
here, among other things, is ensuring that inappropriate concentration of risk does not arise in the
investment portfolio.
LBBW uses transaction agreements to contractually hedge risks as far as possible. In addition, the
buying process includes the valuation of the company taking into account capital-market-oriented
risk premiums.
Enterprise values for the subsidiaries and equity investments of LBBW are calculated in accordance
with the guidelines issued by the Institute of Public Auditors in Germany (Institut der
Wirtschaftsprüfer in Deutschland e. V. – IDW) at least once a year as part of preparatory work for the
annual financial statements. For the half-yearly report, an impairment test of the book values is
COMBINED MANAGEMENT REPORT — RISK AND OPPORTUNITY REPORT
CO
MB
INED
MA
NA
GEM
ENT
REP
OR
T
95
performed, using the projections for the subsidiaries and equity investments to hand if necessary. A
plausibility check of the valuations is performed on selected subsidiaries and equity investments as
at 31 March and 30 September.
Besides the risk of a potential decline in value as the result of defaults, there also exists the risk of
receiving insufficient return or no return at all on its investments, which, however corresponds to the
general book value or market value risk due to the focus on capitalized income value in the valuation
of equity investments. The main drivers here are the large strategic subsidiaries and equity invest-
ments. LBBW's equity investment portfolio has a strong financial focus. Accordingly, a disruption in
this market segment may lead to significant losses from equity investments.
In addition, liability risks arise from the profit/loss transfer agreements entered into with a number
of subsidiaries. Furthermore, LBBW has signed letters of comfort with various subsidiaries. LBBW still
has guarantor's liability and maintenance obligation with respect to former equity investments in
public-sector companies.
Management and monitoring systems ensure that LBBW is continually informed about the situation
at the subsidiaries and equity investments. In addition, the subsidiaries pursue a conservative risk
policy synchronized with LBBW to the extent that LBBW can influence such policies.
LBBW has continued to make good progress in reducing equity investment portfolios: In 2013,
among other things, the shares in Württembergische Lebensversicherung AG and Börse Düsseldorf
AG were sold. Furthermore, at the beginning of January 2014 the contracts were signed on the sale
of LBBW Bank CZ a.s. Moreover, the number of smaller equity investments was reduced further in
accordance with the new business strategy. Further investments are to be sold off step by step in
2014 too as part of the realignment.
Opportunities.
Generally speaking, LBBW's strategic equity investments and subsidiaries offer an opportunity to
optimally exploit market potential and thereby strengthen LBBW's market position vis-a-vis target
customers and core markets as well as an opportunity to optimally exploit existing value potential
and an adequate return on capital (dividends/payouts).
The portfolio of equity investments is being reduced as part of the realignment process. The sale of
subsidiaries and equity investments at Group level makes it possible to generate income for LBBW,
depending on the respective market situation and given appropriate investor demand. Furthermore
such sales revamp the portfolio of equity investments, thereby reducing its complexity.
Reputation risks, business risks and pension risks.
Reputation risk is the risk of a loss or foregone profit due to (impending) damage to/deterioration of
LBBW’s reputation in the eyes of owners, customers, employees, business partners or the wider
public. Reputation risk is not a component of operational risk. However, reputation risks may be
caused by an incident of loss resulting from operational risk or other risk types becoming public
knowledge.
COMBINED MANAGEMENT REPORT — RISK AND OPPORTUNITY REPORT
96
As regards reputation risks, a distinction is made between transaction-based and non-transaction-
based management. In non-transaction-based management, Communications/Marketing/General
Secretary is responsible in particular for ensuring controlled public and press relations. In order to
implement a policy of sustainability the Corporate Sustainability and Health department defines
standards for all business areas. The transaction-based analysis of new transactions with regard to
reputation risks is carried out on a decentralized basis by the front office particularly within the
context of the New Products Process (NPP) and the credit application process. The Compliance
division and the Corporate Sustainability and Health department support the relevant front office
divisions in their day-to-day business in identifying and assessing reputation risks. In the case of
OTC derivatives for interest-rate, currency and commodity management there is a product
certification process upstream of the NPP.
Business risk is the risk of unexpected falls in earnings and negative plan variances not caused by
other defined risk types.
Among other things, business risk may be caused by changes in customer behavior or changes to
the economic environment that are not of a legal nature. Business performance risk can be caused
by lower income due to possible strategic misjudgments. The front office is responsible for taking
individual measures as part of ongoing operating activities aimed at managing risks associated with
business activities. Financial Controlling carries out a central comparison of planning and actual
business development. The implementation of and adherence to the business strategy decided on
by the Board of Managing Directors and the division-specific plans in line with this, as well as the
implementation of strategic decisions made by the committees, are monitored by the relevant
divisions together with Financial Controlling.
The pension risk entails the possible need to increase pension provisions on account of heightened
pension expense, and in particular, valuation effects. This may particularly be caused by changes in
interest rates, pensions, and salaries. Pension risks are quantified by means of scenario analyses on
the basis of an actuarial report. In the current setting, rising interest rates will provide LBBW with an
opportunity of falling pension provisions with correspondingly lower pension risks.
Reputation risks, business risks and pension risks are taken into account within the scope of the
risk-bearing capacity. They are quantified by means of expert-based approximation procedures and
scenario-based investigations.
Real estate risks.
Real estate risks are defined as potential negative changes in the value of the Bank's own real estate
holdings due to deterioration in the general situation on the real estate markets or deterioration in
the particular attributes of an individual property (market influences, planning conditions or other
requirements of public law etc). This does not include development risks from residential and
commercial project development business, which form a separate risk category, or risks from service
business. The latter are taken into consideration in the LBBW Group as part of business risk.
Real estate risks can arise in properties owned by the Group (office buildings) as well as in the
commercial buildings used by third parties. The real estate portfolio is managed by the subsidiary
LBBW Immobilien Group.
COMBINED MANAGEMENT REPORT — RISK AND OPPORTUNITY REPORT
CO
MB
INED
MA
NA
GEM
ENT
REP
OR
T
97
Conversely, in the event of a positive change in market conditions opportunities arise for positive
changes in value and the generation of further income (higher rents, extensions of leases, possibility
of leasing difficult space etc.). LBBW uses a real estate value-at-risk (IVaR) model to measure real
estate risk. The central Group Risk Control division calculates IVaR indicators for real estate risks
quarterly and incorporates these into the Group's analysis of risk-bearing capacity. The input data in
this model are the volatilities and correlations derived from market data histories assigned to the
portfolio values.
The operating subsidiaries of LBBW Immobilien Group with operations in asset, property and facility
management are also controlled using special real-estate-specific indicators such as rent increases,
vacancy rates and amounts in arrears. The real estate portfolio is monitored and analyzed for risks
in the course of quarterly portfolio valuation using the fair value approach. The goal is to identify at
an early stage and analyze any adverse factors occurring as part of or relating to LBBW’s activities.
Proactive risk management ensures a balanced ratio of opportunities and risks within the portfolio.
The commercial portfolio is diversified by type of use, especially for office and retail property, as
well as by size category. Diversification in terms of macro-location is limited as the commercial
portfolio is predominantly located in Stuttgart. However, this is a stable market with relatively low
rent fluctuations overall. What is more, the real estate owned by LBBW Immobilien is mostly situated
in prime locations with low rental risk and leased to tenants of good credit standing. The credit
rating of potential tenants is examined carefully when new properties are let and attempts are
always made to ensure that the lease is as long as possible. Overall, macro-location risks are
therefore considered to be manageable.
The commercial properties in LBBW's portfolio are reviewed using a comprehensive set of real-estate-
relevant criteria such as, for example, the cost/income ratio, risk aspects, the Group's strategy for
use/growth of the site, the site's potential for development, portfolio diversification or use by the
Group, and appropriate solutions are found on a case-by-case basis.
The customer in owner-occupied real estate business is LBBW. Most of the properties are used for
office or bank purposes. The target portfolio is continually adapted to the uses required by the LBBW
Group as well as aiming to reduce the amount of space at the LBBW central offices. This is largely
being achieved by concentrating on properties owned by LBBW and by avoiding rented space as
much as possible. As a result, this is not expected to have a significant influence on the holdings
LBBW uses itself or the real estate risk.
COMBINED MANAGEMENT REPORT — RISK AND OPPORTUNITY REPORT
98
Development risks.
Development risks are defined as the bundle of risks that typically arise when implementing com-
mercial and residential project developments. The risks in this field mainly arise from planning and
approval, the projected construction costs and deadline, and especially from letting and selling.
Additional risks, such as the credit risk on the part of partners or the implementation of decisions
regarding the partners, also apply if project developments are implemented in partner projects. The
occurrence of these risks may also result in the forecast return not being generated, the invested
capital not being recovered in full – or not at all in extreme cases – or the need for further equity
injections, provided it is not non-recourse financing.
Conversely, in the event of a positive change in market conditions opportunities arise for higher exit
proceeds, driven by higher rental income as well as higher multiples. At the same time, however, a
positive market trend makes it more difficult to purchase suitable development properties at
favorable prices.
The regional focus is on the core markets of Baden-Württemberg, Rhineland-Palatinate, the Rhine
Main region and Munich. The LBBW Immobilien Group acts as an investor and service provider in
commercial and residential real estate on these markets. Work on existing projects outside these
target markets continued to proceed well in the 2013 financial year. The new projects are running
on schedule and there is no evidence at present of any material risks.
The LBBW Immobilien Group uses a risk model that was validated with the assistance of an auditing
company to measure development risks. The model is based on a risk driver tree that identifies risks
and shows the ranges in which these can fluctuate even before a construction project begins. From
this, mark-ups and mark-downs on all future costs and revenues are determined and applied to the
so-called real case calculation. A normal and extreme risk is calculated on the basis of different
fluctuation ranges of risk factors. Development risk is calculated quarterly by the Controlling
division of the LBBW Immobilien Group. The central Group Risk Control division includes this in the
LBBW Group’s analysis of risk-bearing capacity.

COMBINED MANAGEMENT REPORT — EVENTS AFTER THE REPORTING DATE
CO
MB
INED
MA
NA
GEM
ENT
REP
OR
T
99
Events after the reporting date.
No significant events have occurred since 1 January 2014 which LBBW expects to affect LBBW's net
assets, financial position or results of operations in any material way.
COMBINED MANAGEMENT REPORT — ICS WITH REGARD TO THE ACCOUNTING PROCESS
100
ICS with regard to the accounting process.
The LBBW Group defines the internal control and risk management system (ICS) as a comprehensive
system and applies the definitions of the German Institute of Public Auditors in Germany (Institut der
Wirtschaftsprüfer in Deutschland e. V., IDW) on the accounting-related internal control system
(IDW PS 261 Item 19 f.) and the risk management system (IDW PS 340 Item 4). It entails principles,
processes, and measures that are aimed at the implementation, in organizational terms, of
management decisions
■ to ensure the efficacy and economic efficiency of the business activities (incl. the protection of
assets as well as the prevention and discovery of any financial loss)
■ to safeguard the propriety and reliability of internal and external accounting, and
■ to observe the statutory rules and regulations of relevance for LBBW.
The ICS for the accounting process and management reporting helps to provide a true and fair view
of the net assets, financial position and results of operations of LBBW (Bank) and the LBBW Group.
A key aim is to ensure that all transactions are recorded, processed and documented in full and
correctly in accordance with statutory provisions and standards, the provisions of the articles of
association, and other guidelines.
It must also be ensured that companies included within the scope of consolidation are incorporated
into the processes, to guarantee the consolidated financial statements are prepared appropriately
and in due time.
The accounting-related internal control and risk management system is an integral component of
the ICS for the steering instruments.
Control environment.
LBBW has a clear organizational, corporate, control and monitoring structure. Its Board of Managing
Directors takes overall responsibility for proper business organization. All strategic units are
involved in preparing the individual and consolidated financial statements as well as the manage-
ment report by means of a clearly defined management and reporting organization. The depart-
ments of all Group companies involved in the accounting process conform to quantitative and
qualitative requirements. The employees tasked with the accounting process are provided with
regular, comprehensive training.
COMBINED MANAGEMENT REPORT — ICS WITH REGARD TO THE ACCOUNTING PROCESS
CO
MB
INED
MA
NA
GEM
ENT
REP
OR
T
101
Risk assessment and control activities.
The controls are geared toward ensuring that the individual and consolidated financial statements as
well as the management report are prepared in accordance with the applicable provisions of the
German Commercial Code (Handelsgesetzbuch, HGB) and the International Financial Reporting
Standards (IFRS) as well as proper and timely compliance with internal and external financial
reporting requirements. Clear regulations are in place regarding the scope of the controls and
responsibilities integrated into working processes.
In particular, the dual-control principle, the separation of functions and the assignment of
authorities in line with existing decision-making regulations ought to be mentioned, that have
also been included in the regulations arranged by the respective Group companies.
Control functions are exercised in the respective competent department throughout the Group.
The control targets defined at LBBW map the identified risks in their entirety.
Both the individual financial statements for the Bank and the consolidated financial statements are
prepared centrally by the Finance division at LBBW (Bank) with the involvement of the specialized
divisions.
Detailed timetables and workflows are in place for the individual and consolidated financial state-
ments (monthly, quarterly, half-yearly and annual financial statements), which are monitored and
automatically managed centrally. Responsibilities in all areas of the accounting process are clearly
assigned. The relevant activities in terms of risk are distributed across several organizational units
within the organization of business processes. The principle of dual control is applied to all pro-
cesses relevant to accounting, the assignment of authorities complied with and the separation of
functions taken into account.
The companies incorporated in the consolidated financial statements have IT-based processes in
place for preparing their financial statements (in accordance with local laws). This results in the
delivery of the coordinated and audited reporting packages for the purposes of preparing the
consolidated financial statements. The senior management of the respective Group company is
responsible for the completeness and accuracy of the results transmitted to the Consolidated
Financial Statements group.
The consolidated financial statements are prepared in accordance with IFRS and taking into account
the standard recognition and measurement requirements set out in the Group Manual.
Financial instruments measured at fair value at LBBW (Bank and Group) are assessed either on the
basis of quoted prices for active markets (stock exchanges, brokers, price service agencies etc.) or on
the basis of recognized and standard measurement methods using publicly available input data (e.g.
yield curves, volatilities, spreads). In cases where not all the input parameters can be observed directly
on the market, fair values are calculated using realistic assumptions, based on market conditions. The
prices used for accounting purposes are checked independently of trading and validated by the
separate organizational unit, Independent Price Verification, within Group Risk Control.
COMBINED MANAGEMENT REPORT — ICS WITH REGARD TO THE ACCOUNTING PROCESS
102
Higher-level control and coordination of the interdivisional process of preparing the LBBW
management report are carried out centrally by the Group Communication division under the
overall responsibility of the Finance division. The preparation process is integrated into the
timetables and workflows for the half-yearly and annual financial statements. Applying the
principle of dual control, the sections of the management report are produced separately by the
specialized departments and approved by the divisional managers. The Group Communication
division (internal records office) checks the content of the entire management report for
consistency.
Information and communication.
The risk principles of the LBBW Group, the organizational structure and procedures and the
processes of the accounting-related ICS are set out in manuals and guidelines (e.g. accounting
guidelines, operating procedures, specialist concepts etc.), which are regularly adjusted to current
external and internal developments and published on the intranet of LBBW (Bank). This also applies
to the Group Manual, which contains the measurement and accounting rules for preparing the
consolidated financial statements. These are updated regularly in accordance with current IFRS rules
and forwarded to the Group companies.
The Basic Accounting Issues / NPP group identifies and analyzes all legal changes which have an
impact on the accounting process. It informs the specialized divisions and subsidiaries affected and
initiates implementation.
New types of products are examined in detail in the Bank's New Product Process and in the Group
companies with regard to their treatment according to statutory accounting rules. This process also
defines the structures and embedded derivatives for each product type. In the case of new types of
products, the correct mapping, analysis and recognition of transaction types is also checked in a test
phase. If systems and/or processes of the Group head office are required for Group companies' new
product types, the Basic Accounting Issues / NPP group determines how they should be treated
according to statutory accounting rules.
The Consolidated Financial Statements group prepares the figures for the consolidated financial
statements using standardized consolidation software on the basis of the information provided by
the companies included in the consolidated financial statements. The data consistency of the
information provided by the Group companies is inspected again by checking rules implemented
and comprehensive validation. The notes to the consolidated financial statements are also prepared
using standardized software. The Consolidated Financial Statements group guarantees the
completeness and accuracy of the relevant explanatory notes on the basis of the information
provided by the Group companies.
Financial reports created in connection with accounting and sent to external parties or readers are
checked for consistency by an internal records office before being sent.
Furthermore, the Board of Managing Directors has issued rules that it must be informed immediately
if doubts arise in individual divisions or Group companies as to proper business organization (ad
hoc reporting requirement). The same also applies to accounting. If information is also significant in
COMBINED MANAGEMENT REPORT — ICS WITH REGARD TO THE ACCOUNTING PROCESS
CO
MB
INED
MA
NA
GEM
ENT
REP
OR
T
103
terms of risk aspects, the Group Board of Managing Directors must also forward the information to
the Risk Committee of the Supervisory Board.
Monitoring.
LBBW's current ICS is characterized by strongly decentralized responsibility of the specialized
divisions for essential accounting-relevant processes. Within the scope of the »Strengthening the
accounting-related internal control system« project, an ICS records office was established in
Accounting, to guarantee the central monitoring ability of the ICS.
The effectiveness and suitability of the accounting-related internal control system and the risk
management system are regularly monitored. This ensures that potential improvements are
identified and processes are adjusted accordingly where required. A type of monitoring is conducted
continuously while the consolidated annual / half-yearly financial statements are being prepared.
Bilateral and multilateral coordination talks are held at regular intervals between the employees
involved in the preparation of the annual and consolidated financial statements to discuss and
analyze any problems that arise. Adequate measures are derived and incorporated into ongoing
processes.
Both the Audit Committee of the Supervisory Board and Group Auditing serve as senior monitoring
bodies. Group Auditing is responsible for process-independent monitoring of business operations
and, as such, is an instrument used by the entire management. The Audit Committee, as a
committee of the Supervisory Board, deals with the analysis and preparation of the findings of the
audit of the annual accounts and informs the Supervisory Board of these activities.
COMBINED MANAGEMENT REPORT — OUTLOOK
104
Outlook. Anticipated economic performance.
The prospects for 2014 are good on the whole. There are expectations of a significant global
acceleration in economic momentum. Global GDP is anticipated to increase by 3.8 % compared to 2013,
and a recovery is predicted in all main regions with the exception of China. Leading economic indicators
have largely risen in recent months, and for the most part signal steady or accelerating growth.
In the USA, LBBW expects GDP growth to pick up from 1.9 % to 3.0 %. Economic activity is being aided
in this respect by the diminishing burden of cuts in government spending. Investment in residential
construction is likely to increase at double-digit rates, while investment in plant and machinery will
grow at a high single-digit rate. Finally, consumer spending by private households is forecast to
grow by more than 2.5 %.
While the eurozone economy will not yet be able to return to pre-crisis figures, after the modest
decline registered for GDP in 2013 LBBW predicts economic growth for 2014 of 1.0 % as the
eurozone should be able to benefit from the global economic recovery. Investment trends should
also gradually turn upwards again, taking advantage of the persistently low interest rates. However,
this is subject to a recovery of the entire banking industry in the eurozone.
Germany's prospects are bright. According to LBBW the German economy is benefiting from
domestic demand, where we should highlight consumption, which is being stimulated by the good
conditions on the labor market, and investments, particularly residential building investments, which
are enjoying the low interest rates and the rising prices of residential property. Investments in plant
and machinery should also pick up after a muted year in 2013. The significant easing of tensions
regarding the eurozone debt crisis has dispelled the uncertainty regarding the survival of monetary
union, which likely prompted companies to hold back in the year under review.
LBBW does not expect the eurozone economy to slip into a deflation spiral as seen in Japan in the
1990s. Although inflation has been weak because of the certain easing of energy prices and sluggish
economic activity – inflation in the eurozone totaled 1.4 % and in Germany 1.5 % – as the economy
picks up during 2014 companies will also have more opportunities to pass price increases onto
consumers. The rate of inflation in Germany will likely remain around 1.5 % in the coming year as
well, while LBBW estimates a slightly lower figure of 1.2 % for eurozone inflation.
Interest rates are expected to rise gradually in the anticipated economic conditions. Yet influenced
by the persistently expansionary policy adopted by the ECB, which is expected to keep its main
refinancing rate unchanged at 0.25 % for 2014, levels should remain moderate compared to
historical rates. LBBW anticipates a rate of 2.30 % for 10-year Bunds by the end of 2014.
COMBINED MANAGEMENT REPORT — OUTLOOK
CO
MB
INED
MA
NA
GEM
ENT
REP
OR
T
105
Industry and competitive situation.
For 2014 LBBW expects the market environment to remain very competitive on the German banking
market. The interest level is likely to remain a strain factor on German banks in 2014. Nonetheless,
the robust income and employment situation in Germany coupled with the faster economic growth
that is anticipated in 2014 should be supportive for banking industry developments. Legal risks
remain one uncertainty factor for the industry, as do the risks associated with the yet unresolved
debt crisis. First and foremost, however, LBBW expects the regulatory measures and the volatile
legislative environment to continue fueling the uncertainty and weigh on the industry. The funda-
mental changes in the industry, especially the deleveraging process, are likely to continue in this
context.
Following the gradual introduction of the higher capital and liquidity requirements of Basel III
from 1 January 2014, the main regulatory projects for the industry at present include, above all,
the new supervision and recovery and resolution mechanism as well as the future requirements
regarding deposit guarantees at European level. At present, the minimum leverage ratio which is
to be expected by the industry to apply under Basel III from 2018 is 3 %. However, this figure will
not be finalized until 2017. The requirements associated with the European Central Bank taking
over joint supervision duties in autumn 2014, and especially the balance sheet assessment, will
tie down further resources in 2014 at the institutions affected. There will also be additional
requirements laid at the door of German banks from the ongoing modernization of supervisory
reporting. The agreement reached at the end of 2013 following lengthy discussions between the
European Commission, the Council of the European Union and the European Parliament regarding
the revision of the European deposit guarantee directive and the cornerstones of future
regulations on the restructuring and resolution of banks will probably increase the cost burden
for the industry significantly in the coming years. What is crucial for the German banking market
in terms of deposit guarantees is that the institutional guarantee systems already in place in the
cooperative sector and in the German Savings Bank Finance Group (Sparkassenfinanzgruppe) may
be maintained in the future and used in the course of prevention measures. There is still some
ambiguity as regards the specific format and the effective date for introducing the planned
financial transactions tax and the European dual banking law. At the beginning of the year the
latter seems to be leaning towards a narrower definition of prohibited transactions in comparison
with the Liikanen Report and decision-making powers for the regulatory authorities regarding the
possible separation of high-risk trading activities. It remains to be seen what any further
legislative changes will be. By contrast, the US dual banking law, the Volcker Rule, was adopted in
December 2013. Further challenges for the industry loom in the shape of the revision to the
financial market directive (MiFID II), which sets higher technical and consumer protection
requirements and which will probably be applicable from 2016/2017, as well as the fundamental
revision of trading book regulations by the Basel Committee on Banking Supervision.
COMBINED MANAGEMENT REPORT — OUTLOOK
106
Company forecast.
Preliminary remarks.
The following forecast is based on LBBW planning produced at the end of 2013. Alongside an
improvement in economic conditions, it assumes a persistently low interest rate over the forecasting
period. Furthermore, the forecast assumes that credit spreads, especially for sovereigns, remain
stable in 2014 at the level registered in autumn 2013.
Outlook for LBBW.
In 2014 LBBW will continue the strategy adopted as part of its business model, designed to offer
reliable product ranges to its customers whilst placing a strong focus on quality in service and
consultancy. This involves developing lasting and reliable customer relationships and continuing to
concentrate on risk-conscious growth.
The most significant financial performance indicators for LBBW will likely develop as follows in the
2014 financial year at Group level, in comparison with the previous year:
After risk weighted assets were consistently reduced at Group level in 2013, a healthy common
equity Tier 1 ratio of 12.6 % was achieved by year-end taking all the Basel III requirements into
account (fully loaded). This is significantly higher than the future requirement of the regulatory
authority as it is currently set. For the coming year in 2014 the common equity Tier 1 ratio in
accordance with Basel III (fully loaded) is also expected to surpass the regulatory requirement
substantially. The planning for risk weighted assets in 2014 was rather conservative, with a value
considerably higher than that for the financial year and the earmarking of reserves to cope with even
tighter regulations as well as unforeseen developments.
LBBW still assumes it will repay hybrid capital in 2014 totaling EUR 1 billion – subject to the approval
of the financial supervisory authority. However, this reduction has no impact on the common equity
Tier 1 ratio referred to above.
Following the continued reduction in non-core activities, total assets in the 2013 financial year
dropped sharply to EUR 274 billion. LBBW is targeting a gradual reduction of non-core business to
eliminate it completely. The planned expansion of core activities compensates for this, and indeed
total assets under IFRS by the end of 2014 should be back to the level of 2013 for the LBBW Group.
In the 2013 financial year the net consolidated profit before tax for the LBBW Group under IFRS rose
impressively to EUR 471 million. The figure anticipated for 2014 should be consistent with the
previous year, provided there are no unforeseen turbulences on the market or an unexpectedly
pronounced economic setback. The assumption here is that income will develop in line with the
previous year's trends, while there will be a noticeable increase in allowances for losses on loans and
advances as conservatively planned.
COMBINED MANAGEMENT REPORT — OUTLOOK
CO
MB
INED
MA
NA
GEM
ENT
REP
OR
T
107
The planned continuation of cost-cutting measures is countered by the rising burdens generated by the
increase in regulatory requirements, which means there should not be any significant change in
administrative expenses in 2014 over the previous year. Based on the outlined development of
income and expenses, in 2014 the LBBW Group expects its cost/income ratio to remain at the level
of 2013.
The forecast result for LBBW in the 2014 financial year is subject to significant risks in that the
assumptions made in the forecast may in fact not be confirmed in the course of the year. Market
parameters could develop unexpectedly: for example, interest could continue to fall or credit
spreads could widen again. Massive pressure from competitors could also result in lower-than-
planned margins, and thus lower income. The focus on client-centered business could lead to a
higher than expected increase in allowances for losses on loans and advances too if economic
conditions deteriorate, and therefore to negative deviations from LBBW's forecasts. Achieving the
forecast targets is also still subject to the risk of unforeseen regulatory or legal measures as well as
the debt and confidence crisis in the eurozone, which is still unresolved. In the event of significant
negative deviations from the forecasts in the course of 2014, especially in the Corporates segment,
this could result in a goodwill write-down in the segment.
However, there are also some opportunities for LBBW to exceed the forecasts in the 2014 financial
year, if future conditions differ from the assumptions made during the planning stage. Market
parameters could develop unexpectedly for example, i.e. interest rates could rise or credit spreads
could tighten further. The solid market position of LBBW and the expansion of this position could
help LBBW cope better with its competitors than originally expected, thereby generating higher levels
of income than planned. Were the economic recovery to continue this could result in lower
allowances for losses on loans and advances, while risk weighted assets might also come in lower
than planned. If the regulatory requirements are not as tight as anticipated this could trigger some
positive deviations from the projected development of LBBW's activities too. And finally, a long-term
solution to the debt and confidence crisis in the eurozone could provide an opportunity to exceed
forecasts.
At segment level, LBBW predicts the following developments for the 2014 financial year in
comparison with 2013. While the operating segments are expected to make a positive contribution
to earnings, it is anticipated that the Credit Investment segment will make another loss.
In the Corporates segment in the afore mentioned period, LBBW anticipates perceptible growth in
total assets given the planned expansion of the segment. Parallel to this – and with a selective, risk-
based choice of exposures – risk weighted assets are expected to rise only moderately in accordance
with Basel III (fully loaded). Projected net consolidated profit before tax in 2014 should fall slightly
short of the previous year's figure. The previous year's reduction in large, risky – and thus highly
profitable – exposures will initially be a drag on results, and only be compensated for gradually
throughout 2014 with the projected expansion of business. This is why LBBW expects income in
2014 to remain at the level of the previous year. The results in the 2014 financial year will also likely
be boosted by the conservative forecast of allowances for losses on loans and advances, which should
be noticeably higher than the previous year, and the marginal increase expected in administrative
expenses from growth initiatives. This produces a predicted cost/income ratio for the segment in
2014 that should be around the level of the previous year.
COMBINED MANAGEMENT REPORT — OUTLOOK
108
Total assets for the Retail/Savings Banks segment are expected to grow somewhat less dynamically
in 2014 compared with the previous year. Based on the aimed-for approval of further internal rating
procedures, however, the segment anticipates a marked reduction in risk weighted assets as per
Basel III (fully loaded). Consolidated net profit before tax over the same period is expected to be
substantially lower than in 2013. This is largely because of the moderate increase in administrative
expenses, caused in particular by one-off expenses incurred from consolidating core banking
systems and the higher allowances for losses on loans and advances. As a result, the cost/income
ratio expected for 2014 is likely to be slightly higher than the previous year.
In the Financial Markets segment, LBBW anticipates a modest increase in total assets for the 2014
financial year compared with the previous year against a backdrop of slightly higher projected
income. A significant increase is projected for risk weighted assets under Basel III (fully loaded) by
the end of 2014 in view of the possible renewed tightening of regulatory requirements. Net
consolidated profit before tax should come in slightly below the 2013 figure, particularly on account
of an expected modest increase in administrative expenses. Consequently, the cost/income ratio for
2014 is expected to stay at the previous year's level.
In view of the continued portfolio rundown, total assets in the Credit Investment segment are
expected to fall sharply again by the end of 2014. The main drivers in this respect are the
guaranteed portfolios (guarantee portfolio and Sealink), which do not tie up any risk weighted assets
of note. This means the reduction in total assets has little effect on the development of risk
weighted assets. At segment level the net consolidated result before tax for the 2014 financial year
is once again expected to be a loss, which is likely to be considerably lower than the previous year.
The continued portfolio reduction does generate some counter-effects too, which is why LBBW
expects that the much lower income will partially be compensated for by a much lower fee for the
guarantee of the State of Baden-Württemberg.
The encouraging result for LBBW (Bank) in the 2013 financial year in accordance with the German
Commercial Code (HGB) was sufficient, as expected, to discharge the outstanding interest payments
– in accordance with the given contractual terms – for the interest missed on hybrid capital in
previous years. Taking the servicing of hybrid capital into account, LBBW (Bank) projects a net profit
before taxes (in accordance with the HGB) for the whole of 2014 that will easily surpass the previous
year's figure.
In summary, LBBW has managed to put in place a sustainable business model in the form of a purely
customer-driven bank, and reinforce it. The stability achieved in conjunction with the sound capital
base provides a good starting position for competing successfully on the market. This means LBBW
will continue to expand its large and stable base of customers in the future and serve as their
reliable partner.
COMBINED MANAGEMENT REPORT — EXPLANATORY NOTES ON THE LBBW ANNUAL FINANCIAL STATEMENTS
CO
MB
INED
MA
NA
GEM
ENT
REP
OR
T
109
Explanatory notes on the annual financial statements of LBBW (Bank).
Result of operations, net assets and financial position. Business development in 2013.
LBBW (Bank) continued its positive development in the 2013 financial year, despite fiercely
competitive markets, subdued credit demand and ever-increasing regulatory requirements.
The Bank succeeded in generating a profit for the fourth consecutive year. Net profit before tax
and hybrid capital servicing totaled EUR 531 million and was therefore roughly the same as the
previous year (2012: EUR 535 million; cf. table 2). The change in focus towards a customer-driven
bank and implementation of the obligations derived from the EU-driven restructuring launched in
2009 were both successfully completed in all main areas in 2013. In spite of the sharp reduction in
total assets, LBBW can look back on a moderate increase in net income (before allowances for
losses on loans and advances) in core business areas. Allowances for losses on loans and advances
remained moderate, but increased visibly on the previous year. The steady scaling back of business
in non-core banking areas continued. The comparatively good economic conditions in the core
markets, especially Germany, and the absence of any major problems derived from turmoil on the
financial markets were supportive of this development.
Thanks to this good result the Bank will be able to discharge the outstanding past and current interest
payments on hybrid capital – in accordance with the given contractual terms – for the past financial year.
Net profit before tax and hybrid capital servicing came in roughly EUR 60 million lower than planned in
the 2013 financial year. Income fell perceptibly short of budget owing to measures taken to reduce
risks, the persistently low interest rate, the reduction of some large exposures and the more restrained
credit demand. By contrast, allowances for losses on loans and advances turned out much better than
planned thanks to the positive economic climate. Administrative expenses were as budgeted.
The management of the Group is generally guided by the IFRS key figures. As a significant part of
the Group, the Bank is managed in accordance with these figures.
The business volume of LBBW (Bank) fell during the financial year by – 17.4 % or EUR – 67.2 billion
to EUR 319.6 billion. This was a significant step for the Bank in its restructuring to become a purely
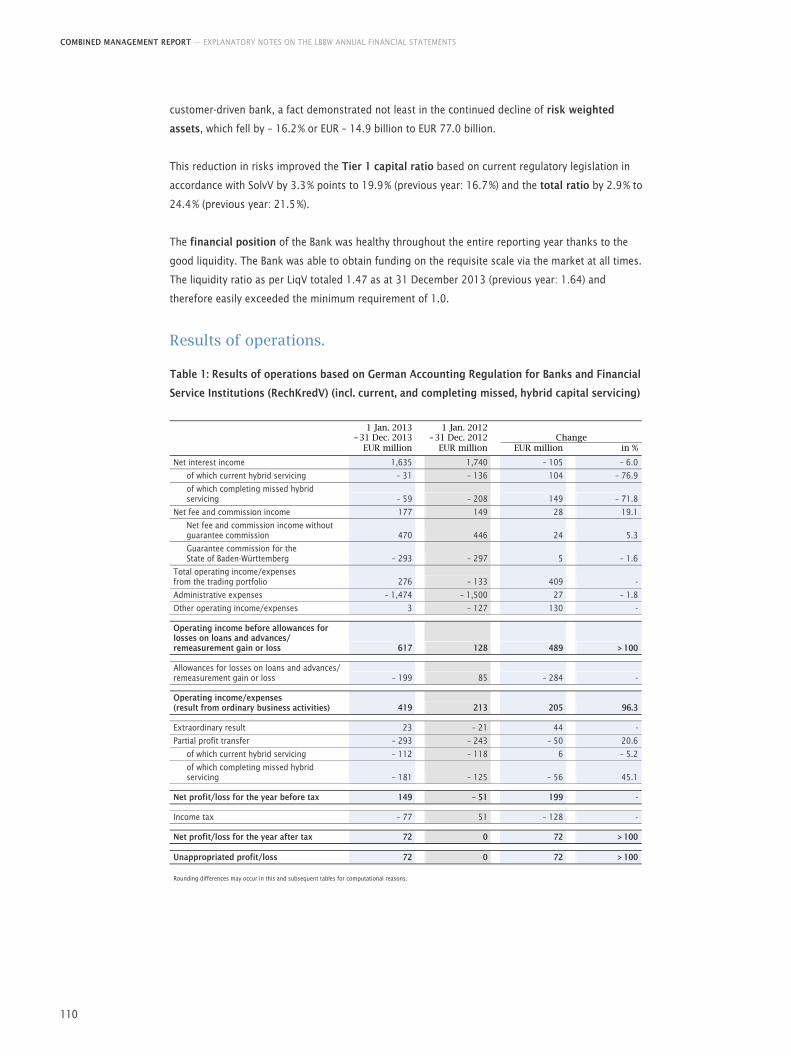
COMBINED MANAGEMENT REPORT — EXPLANATORY NOTES ON THE LBBW ANNUAL FINANCIAL STATEMENTS
110
customer-driven bank, a fact demonstrated not least in the continued decline of risk weighted
assets, which fell by – 16.2 % or EUR – 14.9 billion to EUR 77.0 billion.
This reduction in risks improved the Tier 1 capital ratio based on current regulatory legislation in
accordance with SolvV by 3.3 % points to 19.9 % (previous year: 16.7 %) and the total ratio by 2.9 % to
24.4 % (previous year: 21.5 %).
The financial position of the Bank was healthy throughout the entire reporting year thanks to the
good liquidity. The Bank was able to obtain funding on the requisite scale via the market at all times.
The liquidity ratio as per LiqV totaled 1.47 as at 31 December 2013 (previous year: 1.64) and
therefore easily exceeded the minimum requirement of 1.0.
Results of operations.
Table 1: Results of operations based on German Accounting Regulation for Banks and Financial
Service Institutions (RechKredV) (incl. current, and completing missed, hybrid capital servicing)
1 Jan. 2013
– 31 Dec. 2013 1 Jan. 2012
– 31 Dec. 2012 Change EUR million EUR million EUR million in %
Net interest income 1,635 1,740 – 105 – 6.0
of which current hybrid servicing – 31 – 136 104 – 76.9
of which completing missed hybrid servicing – 59 – 208 149 – 71.8
Net fee and commission income 177 149 28 19.1
Net fee and commission income without guarantee commission 470 446 24 5.3
Guarantee commission for the State of Baden-Württemberg – 293 – 297 5 – 1.6
Total operating income/expenses from the trading portfolio 276 – 133 409 -
Administrative expenses – 1,474 – 1,500 27 – 1.8
Other operating income/expenses 3 – 127 130 - Operating income before allowances for losses on loans and advances/ remeasurement gain or loss 617 128 489 > 100 Allowances for losses on loans and advances/ remeasurement gain or loss – 199 85 – 284 - Operating income/expenses (result from ordinary business activities) 419 213 205 96.3 Extraordinary result 23 – 21 44 -
Partial profit transfer – 293 – 243 – 50 20.6
of which current hybrid servicing – 112 – 118 6 – 5.2
of which completing missed hybrid servicing – 181 – 125 – 56 45.1
Net profit/loss for the year before tax 149 – 51 199 - Income tax – 77 51 – 128 - Net profit/loss for the year after tax 72 0 72 > 100 Unappropriated profit/loss 72 0 72 > 100 Rounding differences may occur in this and subsequent tables for computational reasons.
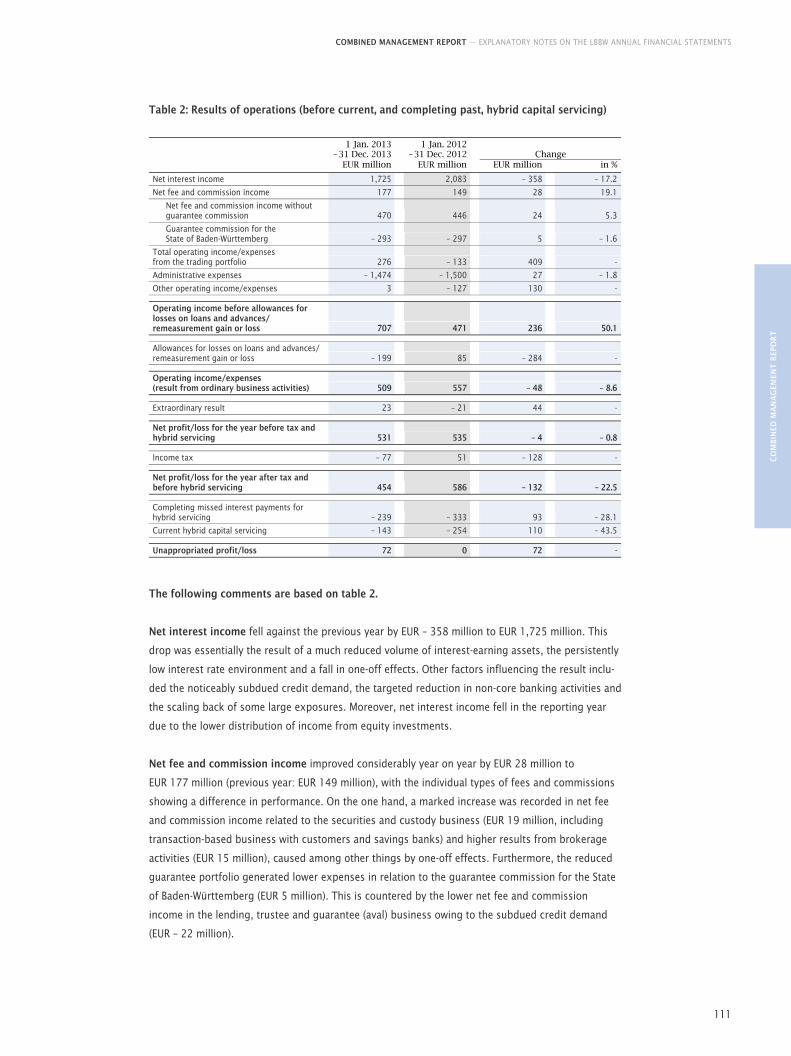
COMBINED MANAGEMENT REPORT — EXPLANATORY NOTES ON THE LBBW ANNUAL FINANCIAL STATEMENTS
CO
MB
INED
MA
NA
GEM
ENT
REP
OR
T
111
Table 2: Results of operations (before current, and completing past, hybrid capital servicing)
1 Jan. 2013
– 31 Dec. 2013 1 Jan. 2012
– 31 Dec. 2012 Change EUR million EUR million EUR million in %
Net interest income 1,725 2,083 – 358 – 17.2
Net fee and commission income 177 149 28 19.1
Net fee and commission income without guarantee commission 470 446 24 5.3
Guarantee commission for the State of Baden-Württemberg – 293 – 297 5 – 1.6
Total operating income/expenses from the trading portfolio 276 – 133 409 -
Administrative expenses – 1,474 – 1,500 27 – 1.8
Other operating income/expenses 3 – 127 130 - Operating income before allowances for losses on loans and advances/ remeasurement gain or loss 707 471 236 50.1 Allowances for losses on loans and advances/ remeasurement gain or loss – 199 85 – 284 - Operating income/expenses (result from ordinary business activities) 509 557 – 48 – 8.6 Extraordinary result 23 – 21 44 - Net profit/loss for the year before tax and hybrid servicing 531 535 – 4 – 0.8 Income tax – 77 51 – 128 - Net profit/loss for the year after tax and before hybrid servicing 454 586 – 132 – 22.5 Completing missed interest payments for hybrid servicing – 239 – 333 93 – 28.1
Current hybrid capital servicing – 143 – 254 110 – 43.5 Unappropriated profit/loss 72 0 72 -
The following comments are based on table 2.
Net interest income fell against the previous year by EUR – 358 million to EUR 1,725 million. This
drop was essentially the result of a much reduced volume of interest-earning assets, the persistently
low interest rate environment and a fall in one-off effects. Other factors influencing the result inclu-
ded the noticeably subdued credit demand, the targeted reduction in non-core banking activities and
the scaling back of some large exposures. Moreover, net interest income fell in the reporting year
due to the lower distribution of income from equity investments.
Net fee and commission income improved considerably year on year by EUR 28 million to
EUR 177 million (previous year: EUR 149 million), with the individual types of fees and commissions
showing a difference in performance. On the one hand, a marked increase was recorded in net fee
and commission income related to the securities and custody business (EUR 19 million, including
transaction-based business with customers and savings banks) and higher results from brokerage
activities (EUR 15 million), caused among other things by one-off effects. Furthermore, the reduced
guarantee portfolio generated lower expenses in relation to the guarantee commission for the State
of Baden-Württemberg (EUR 5 million). This is countered by the lower net fee and commission
income in the lending, trustee and guarantee (aval) business owing to the subdued credit demand
(EUR – 22 million).
COMBINED MANAGEMENT REPORT — EXPLANATORY NOTES ON THE LBBW ANNUAL FINANCIAL STATEMENTS
112
Total operating income/expenses from the trading portfolio improved year on year from
EUR – 133 million to EUR 276 million. This encouraging result was derived in particular from securities
and derivatives trading for customers. The previous year was considerably burdened by valuation
adjustments (for market parameters, counterparty risks and legal risks, among other things). In light
of the positive earnings trend, the sum of EUR 30 million (previous year: EUR 0 million) was allocated
to the reserve for general banking risks in the reporting period from the statutory risk discount for
the trading portfolio.
Administrative expenses fell by EUR 27 million year on year from EUR – 1,500 million to
EUR – 1,474 million. There were structural changes in administrative expenses, influenced by the
outsourcing of IT activities which began on 1 September 2013. As part of this outsourcing the Bank
transferred its computer center and parts of application development. All told, staff costs were
reduced by EUR 22 million. This figure already contains the higher expenses for state aid provi-
sions due to changes made to the valuation methodology. Amortization and depreciation on
intangible assets as well as property and equipment improved by EUR 16 million. By contrast, other
administrative expense rose by EUR 11 million on account of more stringent regulatory require-
ments. This expense included the bank levy, which totaled EUR 67 million in 2013.
Other operating income/expenses improved by EUR 130 million to EUR 3 million thanks to a
variety of one-off effects. In contrast to the previous year, allocations to, and reversals of, provisions
connected to legal and litigation risks almost balanced each other out.
Allowances for losses on loans and advances/remeasurement gain or loss deteriorated overall
compared with the previous year by EUR – 284 million to EUR – 199 million (previous year:
EUR 85 million).
■ The remeasurement gain or loss on securities, borrower's note loans and derivatives from
the liquidity reserve fell by EUR – 12 million to EUR 12 million. This result was influenced partly
by the continued decline in volume and run-down of risk in portfolios that are no longer part of
the core business (credit substitute business). Here, repayments and divestments reduced the
exposure to some countries in Southern Europe which are currently the focus of attention.
■ The remeasurement gain or loss on securities held as long-term investments fell by
EUR – 51 million to EUR 39 million. This decline stemmed principally from an increase in write-
downs on securities held in the non-core banking portfolio compared with the previous year.
Positions were also being purposefully scaled back here as part of the ongoing risk reduction
measures. The result was positively influenced by the reductions in some large exposures.
■ The remeasurement gain or loss from equity investments and affiliated companies declined
by EUR – 83 million to EUR – 19 million, which was primarily due to lower reversals of impairment
losses and higher expenses for losses accepted.
■ Allowances for losses on loans and advances rose compared with the previous year by
EUR – 138 million to EUR – 230 million, but still remained below the long-term average.
The extraordinary result improved by EUR 44 million to EUR 23 million. This was largely attributable
to the reversal of restructuring provisions totaling EUR 52 million that were no longer required.
Net profit/loss before tax and hybrid servicing for the 2013 financial year amounted to
EUR 531 million (previous year: EUR 535 million).
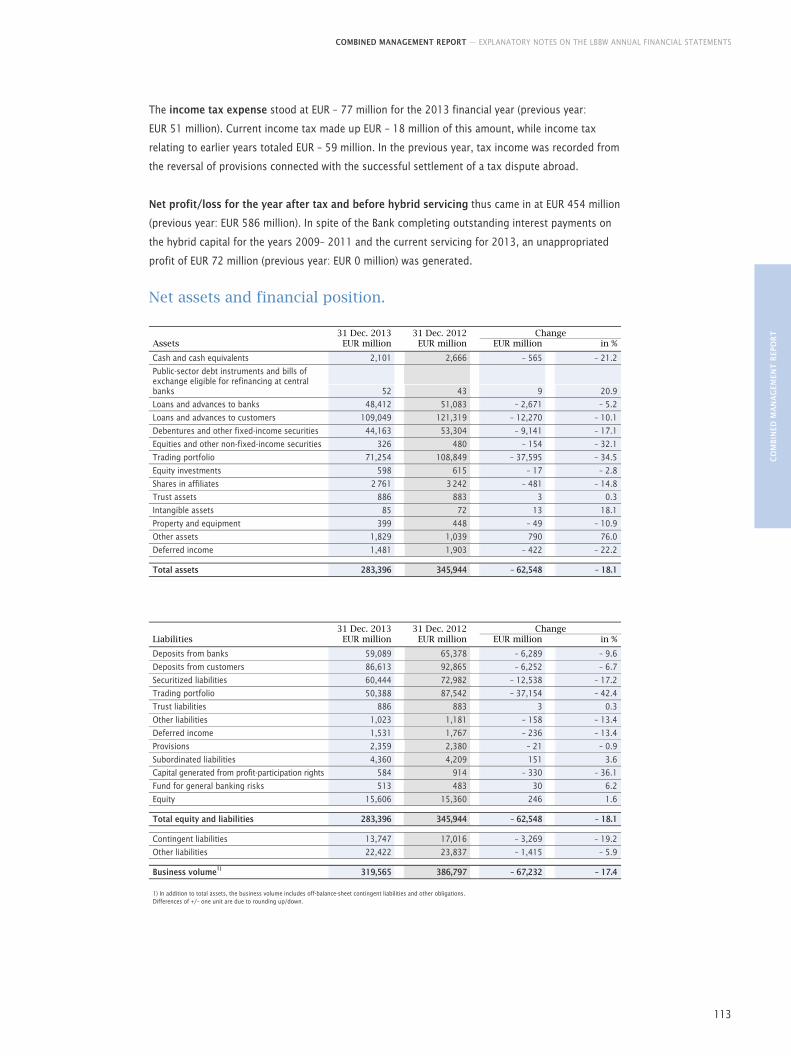
COMBINED MANAGEMENT REPORT — EXPLANATORY NOTES ON THE LBBW ANNUAL FINANCIAL STATEMENTS
CO
MB
INED
MA
NA
GEM
ENT
REP
OR
T
113
The income tax expense stood at EUR – 77 million for the 2013 financial year (previous year:
EUR 51 million). Current income tax made up EUR – 18 million of this amount, while income tax
relating to earlier years totaled EUR – 59 million. In the previous year, tax income was recorded from
the reversal of provisions connected with the successful settlement of a tax dispute abroad.
Net profit/loss for the year after tax and before hybrid servicing thus came in at EUR 454 million
(previous year: EUR 586 million). In spite of the Bank completing outstanding interest payments on
the hybrid capital for the years 2009– 2011 and the current servicing for 2013, an unappropriated
profit of EUR 72 million (previous year: EUR 0 million) was generated.
Net assets and financial position.
31 Dec. 2013 31 Dec. 2012 Change Assets EUR million EUR million EUR million in %
Cash and cash equivalents 2,101 2,666 – 565 – 21.2
Public-sector debt instruments and bills of exchange eligible for refinancing at central banks 52 43 9 20.9
Loans and advances to banks 48,412 51,083 – 2,671 – 5.2
Loans and advances to customers 109,049 121,319 – 12,270 – 10.1
Debentures and other fixed-income securities 44,163 53,304 – 9,141 – 17.1
Equities and other non-fixed-income securities 326 480 – 154 – 32.1
Trading portfolio 71,254 108,849 – 37,595 – 34.5
Equity investments 598 615 – 17 – 2.8
Shares in affiliates 2 761 3 242 – 481 – 14.8
Trust assets 886 883 3 0.3
Intangible assets 85 72 13 18.1
Property and equipment 399 448 – 49 – 10.9
Other assets 1,829 1,039 790 76.0
Deferred income 1,481 1,903 – 422 – 22.2 Total assets 283,396 345,944 – 62,548 – 18.1
31 Dec. 2013 31 Dec. 2012 Change Liabilities EUR million EUR million EUR million in %
Deposits from banks 59,089 65,378 – 6,289 – 9.6
Deposits from customers 86,613 92,865 – 6,252 – 6.7
Securitized liabilities 60,444 72,982 – 12,538 – 17.2
Trading portfolio 50,388 87,542 – 37,154 – 42.4
Trust liabilities 886 883 3 0.3
Other liabilities 1,023 1,181 – 158 – 13.4
Deferred income 1,531 1,767 – 236 – 13.4
Provisions 2,359 2,380 – 21 – 0.9
Subordinated liabilities 4,360 4,209 151 3.6
Capital generated from profit-participation rights 584 914 – 330 – 36.1
Fund for general banking risks 513 483 30 6.2
Equity 15,606 15,360 246 1.6 Total equity and liabilities 283,396 345,944 – 62,548 – 18.1 Contingent liabilities 13,747 17,016 – 3,269 – 19.2
Other liabilities 22,422 23,837 – 1,415 – 5.9 Business volume1) 319,565 386,797 – 67,232 – 17.4
1) In addition to total assets, the business volume includes off-balance-sheet contingent liabilities and other obligations. Differences of +/– one unit are due to rounding up/down.
COMBINED MANAGEMENT REPORT — EXPLANATORY NOTES ON THE LBBW ANNUAL FINANCIAL STATEMENTS
114
Business volume.
Total assets dropped sharply in the financial year by EUR – 62.5 billion or – 18.1 % to EUR 283.4 billion.
The declining volumes of contingent liabilities (from guarantees and warranties) totaling roughly
EUR – 3.3 billion as well as of other obligations (from irrevocable loan commitments) totaling around
EUR – 1.4 billion contributed to the reduction too, bringing the business volume down by
EUR – 67.2 billion or – 17.4 % to EUR 319.6 billion.
Lending.
The volume of cash and cash equivalents as at 31 December 2013 came in at EUR 2.1 billion, or
EUR – 0.6 billion less than at the previous year-end.
Loans and advances to banks fell by EUR – 2.7 billion to EUR 48.4 billion compared with the previous
year. This decline was essentially due to a decrease of EUR – 5.1 billion in public-sector loan
receivables, while the portfolio of collateralized securities repurchase transactions increased.
As at 31 December 2013, loans and advances to customers amounted to EUR 109.0 billion, or
EUR – 12.3 billion less than at 2012 year-end. Nearly every type of credit was affected by the
reduced volume, including public-sector loans and mortgage loans. Loan receivables with
customers outside Germany declined sharply over the reporting year as a whole.
In the course of the period under review the portfolio of bonds and other fixed-income securities
decreased by EUR – 9.1 billion, from EUR 53.3 billion to EUR 44.2 billion . This reduction was
attributable both to maturities and disposals of securities from the banking book as well as the
increased wind-down of the credit investment portfolio.
Trading assets fell sharply compared to the previous year by EUR – 37.6 billion to just
EUR 71.3 billion. In 2013, derivatives with matching market values at portfolio level as at 2012 year-
end were closed in the amount of roughly EUR – 11.7 billion. Furthermore, derivatives were
transferred to a central liquidator and subsequently netted. As a result of netting, the positions
which lead to a reduction in total assets increased by EUR 0.7 billion. Additionally, the moderate
increase in interest resulted in a reduction of the market values of interest rate derivatives in
particular. A substantial decline in money market transactions was also recorded, amounting to
EUR – 7.2 billion.
Funding.
Deposits from banks dropped by EUR – 6.3 billion to EUR 59.1 billion in comparison with the
previous year-end. Alongside maturing bonds in the shape of registered covered bonds and
borrower's note loans, the reduction in this portfolio was also influenced by declining business
volumes of money market and securities repurchase transactions.
Deposits from customers fell by EUR – 6.3 billion year on year, from EUR 92.9 billion to
EUR 86.6 billion, which was largely due to maturing borrower's note loans and registered covered
bonds as well as lower holdings of securities repurchase transactions. By contrast, giro liabilities
increased.

COMBINED MANAGEMENT REPORT — EXPLANATORY NOTES ON THE LBBW ANNUAL FINANCIAL STATEMENTS
CO
MB
INED
MA
NA
GEM
ENT
REP
OR
T
115
Throughout the year, securitized liabilities fell sharply by EUR – 12.5 billion to EUR 60.4 billion.
Against the backdrop of lower lending activity, only part of the maturing covered bonds and
debentures had to be replaced. This meant the maturing covered bonds and debentures fell by
roughly EUR – 11.0 billion and money market transactions by around EUR – 1.5 billion.
Trading liabilities slumped sharply year on year in line with the asset trends by EUR – 37.2 billion to
EUR 50.4 billion.
Equity.
The Bank's equity rose slightly in the reporting year by EUR 0.2 billion to EUR 15.6 billion. The
increase in share capital as well as in the capital reserve amounting to EUR 2.2 billion was offset by a
related decline in silent partners' contributions totaling EUR 2.1 billion as a result of the conversion
effective 1 January 2013.
Financial position.
LBBW's funding strategy is determined by the Asset Liability Committee (ALCo). Here the Bank focuses
on ensuring a balanced structure in terms of groups of products and investors used. The Bank's
financial position throughout the entire reporting year was satisfactory given the good liquidity. The
Bank was always able to obtain funding on the market on the requisite scale. The liquidity indicator as
per LiqV totaled 1.47 as of 31 December 2013 (previous year: 1.64).
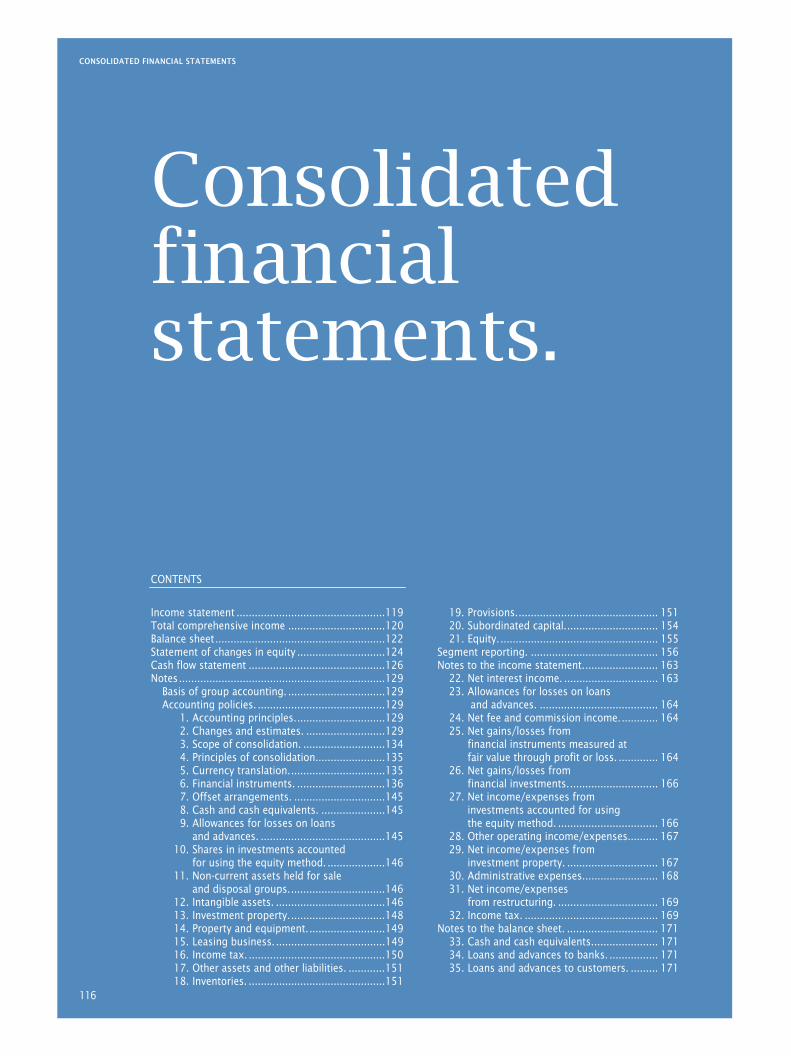
CONSOLIDATED FINANCIAL STATEMENTS
116
CONTENTS
Income statement .................................................119 Total comprehensive income ................................120 Balance sheet........................................................122 Statement of changes in equity .............................124 Cash flow statement .............................................126 Notes....................................................................129
Basis of group accounting. ................................129 Accounting policies. ..........................................129
1. Accounting principles..............................129 2. Changes and estimates. ..........................129 3. Scope of consolidation. ...........................134 4. Principles of consolidation.......................135 5. Currency translation................................135 6. Financial instruments. .............................136 7. Offset arrangements. ..............................145 8. Cash and cash equivalents. .....................145 9. Allowances for losses on loans
and advances. .........................................145 10. Shares in investments accounted
for using the equity method. ...................146 11. Non-current assets held for sale
and disposal groups................................146 12. Intangible assets. ....................................146 13. Investment property................................148 14. Property and equipment..........................149 15. Leasing business. ....................................149 16. Income tax. .............................................150 17. Other assets and other liabilities. ............151 18. Inventories. .............................................151
19. Provisions............................................... 151 20. Subordinated capital............................... 154 21. Equity. .................................................... 155
Segment reporting. .......................................... 156 Notes to the income statement......................... 163
22. Net interest income. ............................... 163 23. Allowances for losses on loans
and advances. ....................................... 164 24. Net fee and commission income............. 164 25. Net gains/losses from
financial instruments measured at fair value through profit or loss. ............. 164
26. Net gains/losses from financial investments.............................. 166
27. Net income/expenses from investments accounted for using the equity method. ................................. 166
28. Other operating income/expenses.......... 167 29. Net income/expenses from
investment property. .............................. 167 30. Administrative expenses......................... 168 31. Net income/expenses
from restructuring. ................................. 169 32. Income tax. ............................................ 169
Notes to the balance sheet. .............................. 171 33. Cash and cash equivalents...................... 171 34. Loans and advances to banks. ................ 171 35. Loans and advances to customers. ......... 171
Consolidated financial statements.
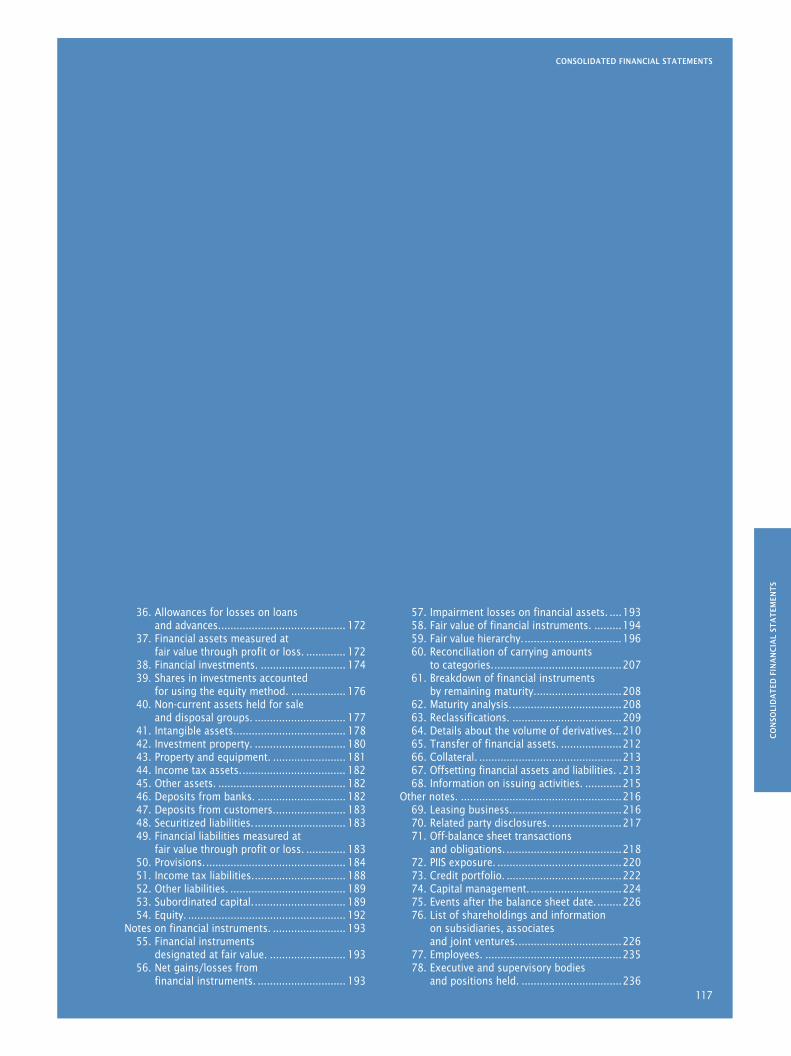
CO
NSO
LID
AT
ED F
INA
NC
IAL
STA
TEM
ENT
S
CONSOLIDATED FINANCIAL STATEMENTS
117
36. Allowances for losses on loans and advances.......................................... 172
37. Financial assets measured at fair value through profit or loss. ............. 172
38. Financial investments. ............................ 174 39. Shares in investments accounted
for using the equity method. .................. 176 40. Non-current assets held for sale
and disposal groups. .............................. 177 41. Intangible assets..................................... 178 42. Investment property. .............................. 180 43. Property and equipment. ........................ 181 44. Income tax assets................................... 182 45. Other assets. .......................................... 182 46. Deposits from banks. ............................. 182 47. Deposits from customers........................ 183 48. Securitized liabilities. .............................. 183 49. Financial liabilities measured at
fair value through profit or loss. ............. 183 50. Provisions. .............................................. 184 51. Income tax liabilities............................... 188 52. Other liabilities. ...................................... 189 53. Subordinated capital............................... 189 54. Equity. .................................................... 192
Notes on financial instruments. ........................ 193 55. Financial instruments
designated at fair value. ......................... 193 56. Net gains/losses from
financial instruments. ............................. 193
57. Impairment losses on financial assets. ....193 58. Fair value of financial instruments. .........194 59. Fair value hierarchy.................................196 60. Reconciliation of carrying amounts
to categories...........................................207 61. Breakdown of financial instruments
by remaining maturity.............................208 62. Maturity analysis.....................................208 63. Reclassifications. ....................................209 64. Details about the volume of derivatives...210 65. Transfer of financial assets. ....................212 66. Collateral. ...............................................213 67. Offsetting financial assets and liabilities. .213 68. Information on issuing activities. ............215
Other notes. .....................................................216 69. Leasing business.....................................216 70. Related party disclosures. .......................217 71. Off-balance sheet transactions
and obligations. ......................................218 72. PIIS exposure. .........................................220 73. Credit portfolio. ......................................222 74. Capital management. ..............................224 75. Events after the balance sheet date.........226 76. List of shareholdings and information
on subsidiaries, associates and joint ventures...................................226
77. Employees. .............................................235 78. Executive and supervisory bodies
and positions held. .................................236
CONSOLIDATED FINANCIAL STATEMENTS
118
The consolidated financial statements of Landesbank Baden-Württemberg for the 2013 financial year were prepared in accordance with International Financial Reporting Standards (IFRS) recognized by the European Union and the applicable provisions of the Handels-gesetzbuch (HGB, German Commercial Code) in accordance with section 315a (1) HGB.
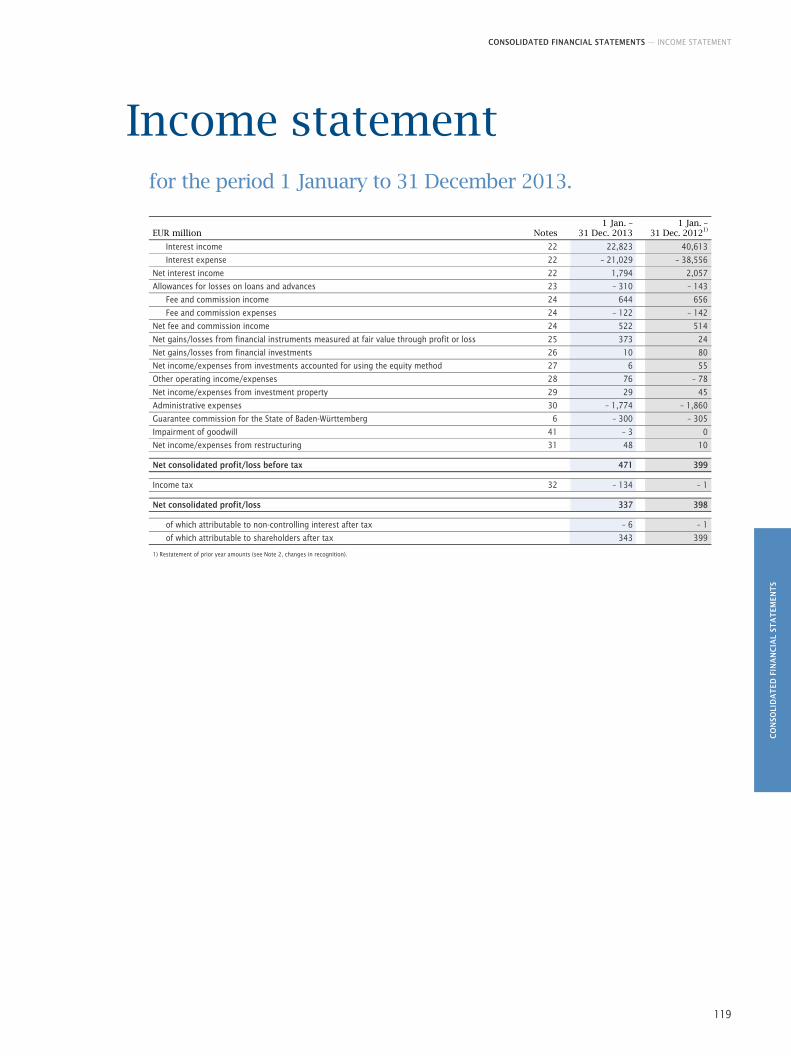
CONSOLIDATED FINANCIAL STATEMENTS — INCOME STATEMENT
119
CO
NSO
LID
AT
ED F
INA
NC
IAL
STA
TEM
ENT
S
Income statement for the period 1 January to 31 December 2013.
EUR million Notes
1 Jan. – 31 Dec. 2013
1 Jan. –31 Dec. 20121)
Interest income 22 22,823 40,613
Interest expense 22 – 21,029 – 38,556
Net interest income 22 1,794 2,057
Allowances for losses on loans and advances 23 – 310 – 143
Fee and commission income 24 644 656
Fee and commission expenses 24 – 122 – 142
Net fee and commission income 24 522 514
Net gains/losses from financial instruments measured at fair value through profit or loss 25 373 24
Net gains/losses from financial investments 26 10 80
Net income/expenses from investments accounted for using the equity method 27 6 55
Other operating income/expenses 28 76 – 78
Net income/expenses from investment property 29 29 45
Administrative expenses 30 – 1,774 – 1,860
Guarantee commission for the State of Baden-Württemberg 6 – 300 – 305
Impairment of goodwill 41 – 3 0
Net income/expenses from restructuring 31 48 10 Net consolidated profit/loss before tax 471 399 Income tax 32 – 134 – 1 Net consolidated profit/loss 337 398
of which attributable to non-controlling interest after tax – 6 – 1
of which attributable to shareholders after tax 343 399 1) Restatement of prior year amounts (see Note 2, changes in recognition).
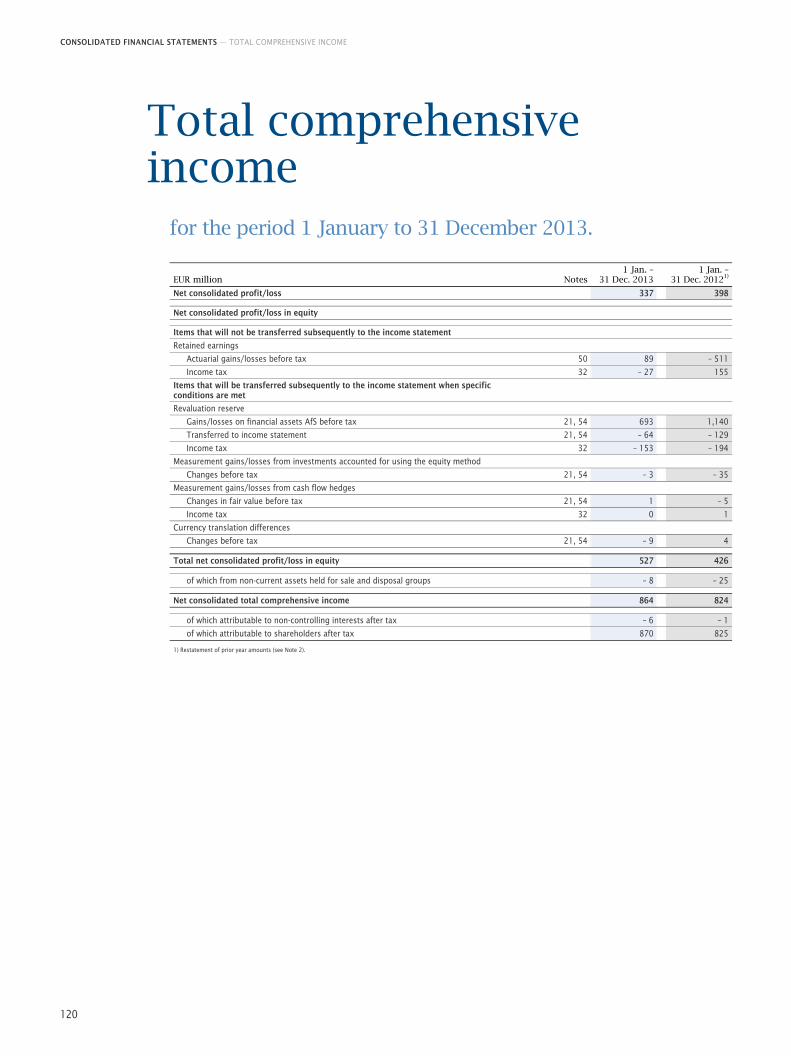
CONSOLIDATED FINANCIAL STATEMENTS — TOTAL COMPREHENSIVE INCOME
120
Total comprehensive income
for the period 1 January to 31 December 2013.
EUR million Notes 1 Jan. –
31 Dec. 2013
1 Jan. –31 Dec. 20121)
Net consolidated profit/loss 337 398 Net consolidated profit/loss in equity Items that will not be transferred subsequently to the income statement
Retained earnings
Actuarial gains/losses before tax 50 89 – 511
Income tax 32 – 27 155
Items that will be transferred subsequently to the income statement when specific conditions are met
Revaluation reserve
Gains/losses on financial assets AfS before tax 21, 54 693 1,140
Transferred to income statement 21, 54 – 64 – 129
Income tax 32 – 153 – 194
Measurement gains/losses from investments accounted for using the equity method
Changes before tax 21, 54 – 3 – 35
Measurement gains/losses from cash flow hedges
Changes in fair value before tax 21, 54 1 – 5
Income tax 32 0 1
Currency translation differences
Changes before tax 21, 54 – 9 4 Total net consolidated profit/loss in equity 527 426
of which from non-current assets held for sale and disposal groups – 8 – 25 Net consolidated total comprehensive income 864 824
of which attributable to non-controlling interests after tax – 6 – 1
of which attributable to shareholders after tax 870 825 1) Restatement of prior year amounts (see Note 2).

CO
NSO
LID
AT
ED F
INA
NC
IAL
STA
TEM
ENT
S
121
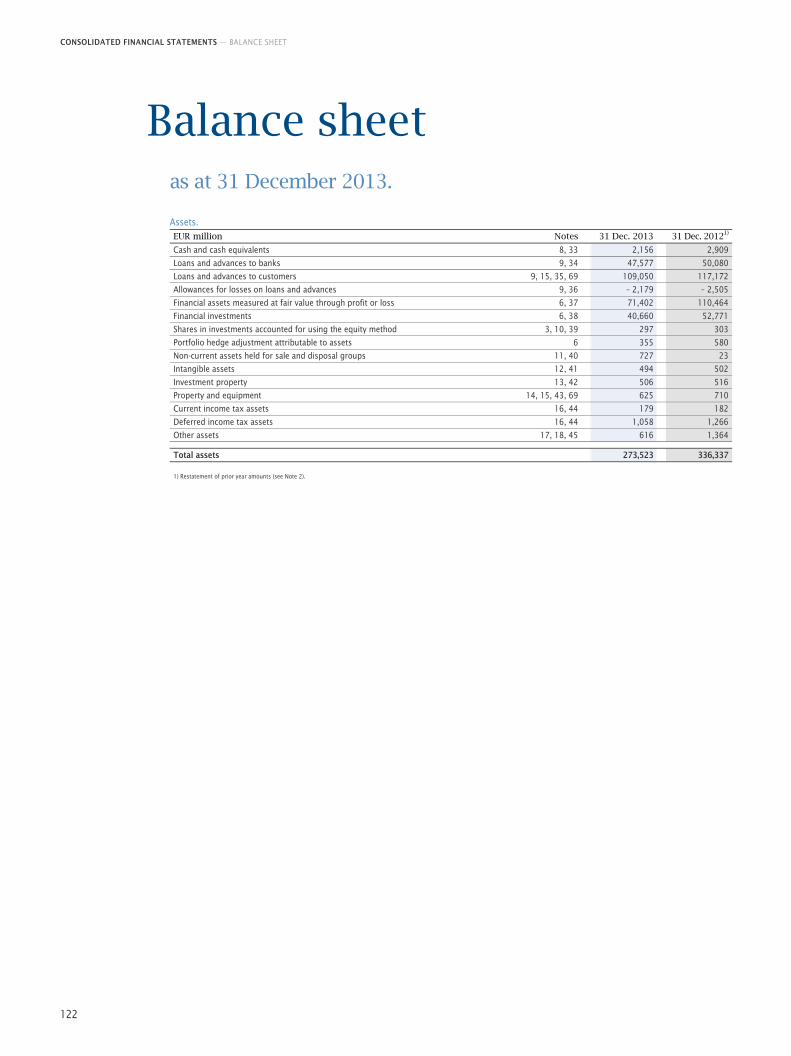
CONSOLIDATED FINANCIAL STATEMENTS — BALANCE SHEET
122
Balance sheet as at 31 December 2013.
Assets. EUR million Notes 31 Dec. 2013 31 Dec. 20121)
Cash and cash equivalents 8, 33 2,156 2,909
Loans and advances to banks 9, 34 47,577 50,080
Loans and advances to customers 9, 15, 35, 69 109,050 117,172
Allowances for losses on loans and advances 9, 36 – 2,179 – 2,505
Financial assets measured at fair value through profit or loss 6, 37 71,402 110,464
Financial investments 6, 38 40,660 52,771
Shares in investments accounted for using the equity method 3, 10, 39 297 303
Portfolio hedge adjustment attributable to assets 6 355 580
Non-current assets held for sale and disposal groups 11, 40 727 23
Intangible assets 12, 41 494 502
Investment property 13, 42 506 516
Property and equipment 14, 15, 43, 69 625 710
Current income tax assets 16, 44 179 182
Deferred income tax assets 16, 44 1,058 1,266
Other assets 17, 18, 45 616 1,364 Total assets 273,523 336,337 1) Restatement of prior year amounts (see Note 2).
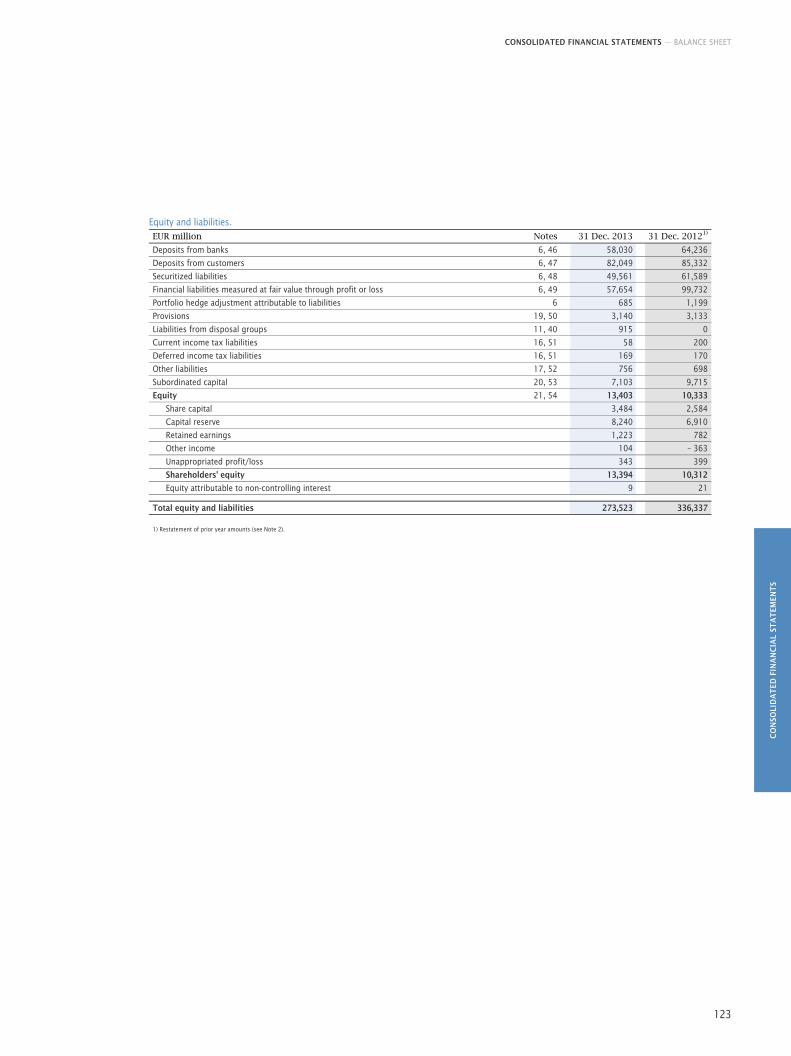
CONSOLIDATED FINANCIAL STATEMENTS — BALANCE SHEET
CO
NSO
LID
AT
ED F
INA
NC
IAL
STA
TEM
ENT
S
123
Equity and liabilities. EUR million Notes 31 Dec. 2013 31 Dec. 20121)
Deposits from banks 6, 46 58,030 64,236
Deposits from customers 6, 47 82,049 85,332
Securitized liabilities 6, 48 49,561 61,589
Financial liabilities measured at fair value through profit or loss 6, 49 57,654 99,732
Portfolio hedge adjustment attributable to liabilities 6 685 1,199
Provisions 19, 50 3,140 3,133
Liabilities from disposal groups 11, 40 915 0
Current income tax liabilities 16, 51 58 200
Deferred income tax liabilities 16, 51 169 170
Other liabilities 17, 52 756 698
Subordinated capital 20, 53 7,103 9,715
Equity 21, 54 13,403 10,333
Share capital 3,484 2,584
Capital reserve 8,240 6,910
Retained earnings 1,223 782
Other income 104 – 363
Unappropriated profit/loss 343 399
Shareholders' equity 13,394 10,312
Equity attributable to non-controlling interest 9 21 Total equity and liabilities 273,523 336,337 1) Restatement of prior year amounts (see Note 2).
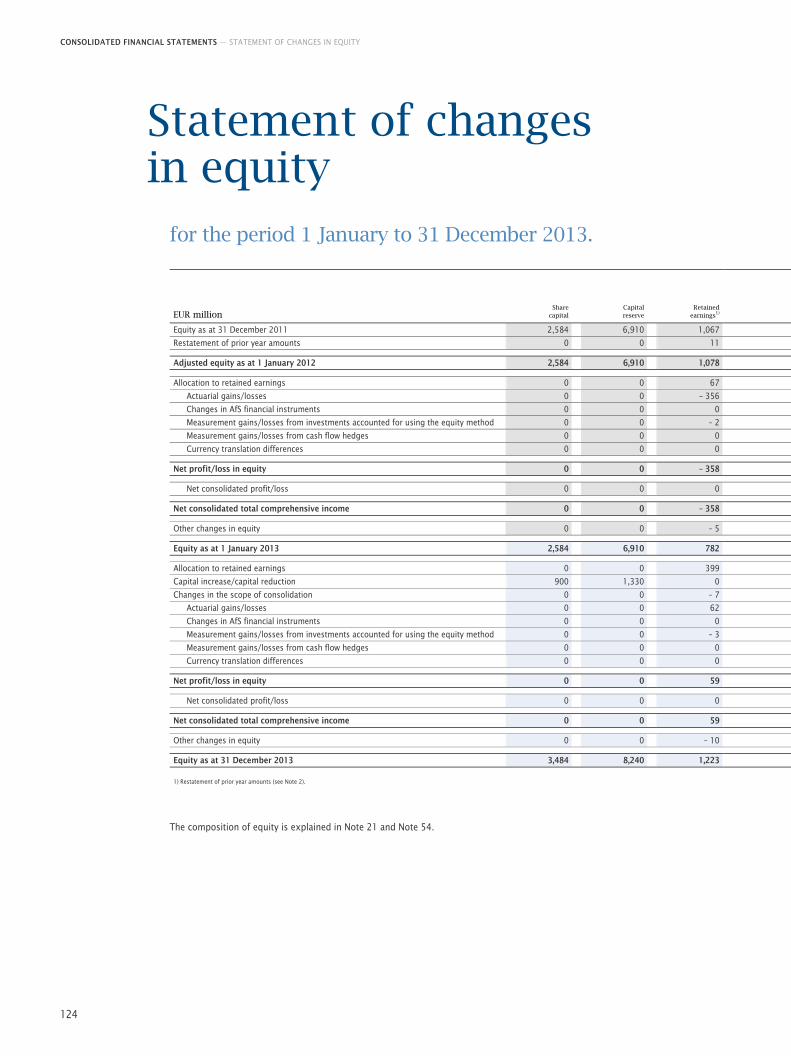
CONSOLIDATED FINANCIAL STATEMENTS — STATEMENT OF CHANGES IN EQUITY
124
Statement of changes in equity
for the period 1 January to 31 December 2013.
EUR million
Share capital
Capital reserve
Retainedearnings1)
Equity as at 31 December 2011 2,584 6,910 1,067
Restatement of prior year amounts 0 0 11 Adjusted equity as at 1 January 2012 2,584 6,910 1,078 Allocation to retained earnings 0 0 67
Actuarial gains/losses 0 0 – 356
Changes in AfS financial instruments 0 0 0
Measurement gains/losses from investments accounted for using the equity method 0 0 – 2
Measurement gains/losses from cash flow hedges 0 0 0
Currency translation differences 0 0 0
Net profit/loss in equity 0 0 – 358
Net consolidated profit/loss 0 0 0
Net consolidated total comprehensive income 0 0 – 358 Other changes in equity 0 0 – 5 Equity as at 1 January 2013 2,584 6,910 782 Allocation to retained earnings 0 0 399
Capital increase/capital reduction 900 1,330 0
Changes in the scope of consolidation 0 0 – 7
Actuarial gains/losses 0 0 62
Changes in AfS financial instruments 0 0 0
Measurement gains/losses from investments accounted for using the equity method 0 0 – 3
Measurement gains/losses from cash flow hedges 0 0 0
Currency translation differences 0 0 0
Net profit/loss in equity 0 0 59
Net consolidated profit/loss 0 0 0
Net consolidated total comprehensive income 0 0 59 Other changes in equity 0 0 – 10 Equity as at 31 December 2013 3,484 8,240 1,223 1) Restatement of prior year amounts (see Note 2).
The composition of equity is explained in Note 21 and Note 54.
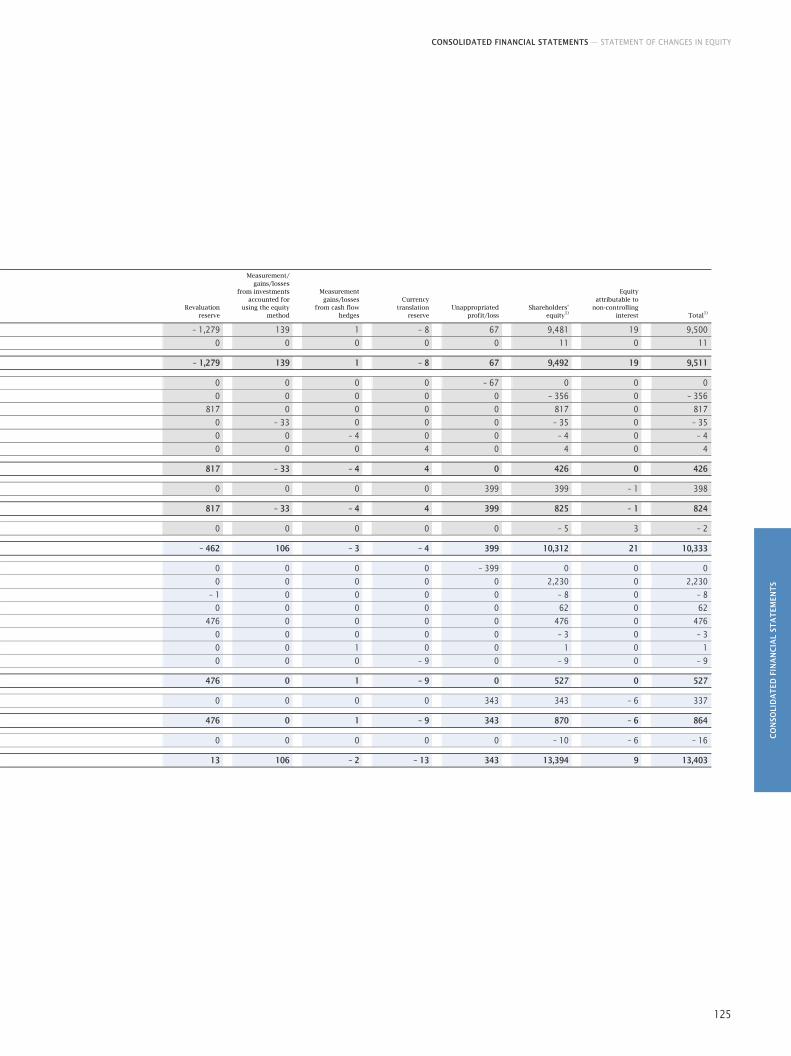
CO
NSO
LID
AT
ED F
INA
NC
IAL
STA
TEM
ENT
S
CONSOLIDATED FINANCIAL STATEMENTS — STATEMENT OF CHANGES IN EQUITY
125
Revaluation
reserve
Measurement/ gains/losses
from investments accounted for
using the equity method
Measurement gains/losses
from cash flow hedges
Currency translation
reserve
Unappropriated profit/loss
Shareholders' equity1)
Equity attributable to
non-controlling interest Total1)
– 1,279 139 1 – 8 67 9,481 19 9,500
0 0 0 0 0 11 0 11 – 1,279 139 1 – 8 67 9,492 19 9,511 0 0 0 0 – 67 0 0 0
0 0 0 0 0 – 356 0 – 356
817 0 0 0 0 817 0 817
0 – 33 0 0 0 – 35 0 – 35
0 0 – 4 0 0 – 4 0 – 4
0 0 0 4 0 4 0 4 817 – 33 – 4 4 0 426 0 426 0 0 0 0 399 399 – 1 398 817 – 33 – 4 4 399 825 – 1 824 0 0 0 0 0 – 5 3 – 2 – 462 106 – 3 – 4 399 10,312 21 10,333 0 0 0 0 – 399 0 0 0
0 0 0 0 0 2,230 0 2,230
– 1 0 0 0 0 – 8 0 – 8
0 0 0 0 0 62 0 62
476 0 0 0 0 476 0 476
0 0 0 0 0 – 3 0 – 3
0 0 1 0 0 1 0 1
0 0 0 – 9 0 – 9 0 – 9 476 0 1 – 9 0 527 0 527 0 0 0 0 343 343 – 6 337 476 0 1 – 9 343 870 – 6 864 0 0 0 0 0 – 10 – 6 – 16 13 106 – 2 – 13 343 13,394 9 13,403
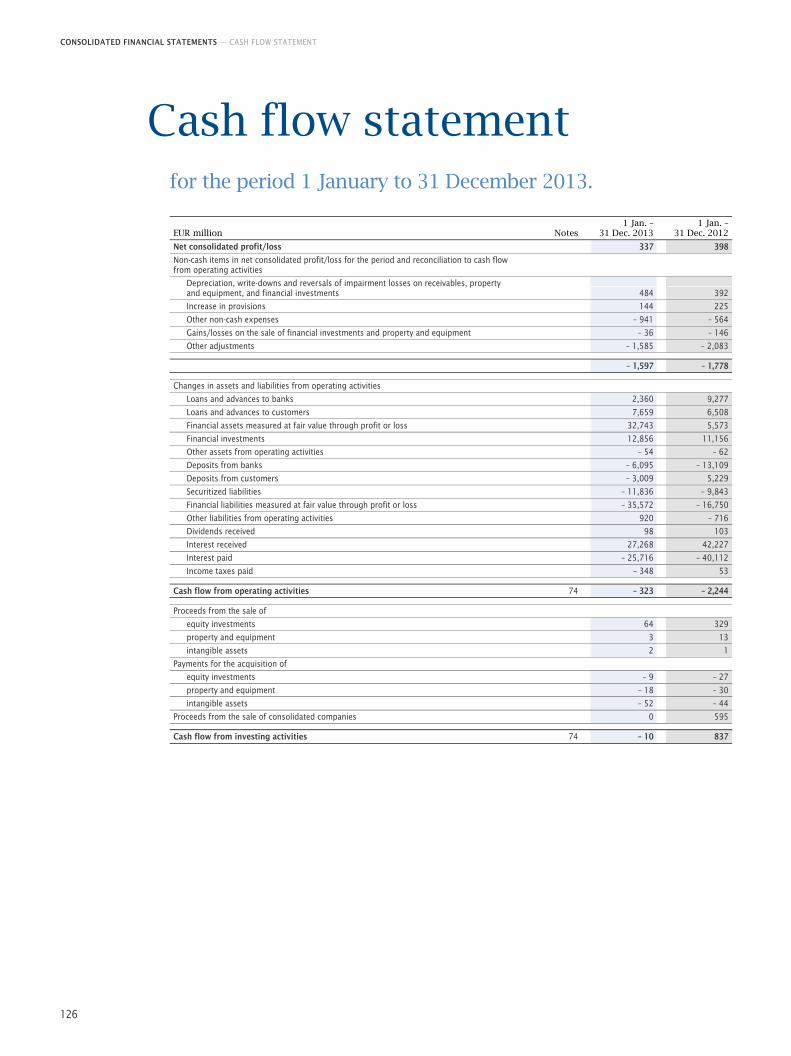
CONSOLIDATED FINANCIAL STATEMENTS — CASH FLOW STATEMENT
126
Cash flow statement for the period 1 January to 31 December 2013.
EUR million Notes
1 Jan. – 31 Dec. 2013
1 Jan. – 31 Dec. 2012
Net consolidated profit/loss 337 398
Non-cash items in net consolidated profit/loss for the period and reconciliation to cash flow from operating activities
Depreciation, write-downs and reversals of impairment losses on receivables, property and equipment, and financial investments 484 392
Increase in provisions 144 225
Other non-cash expenses – 941 – 564
Gains/losses on the sale of financial investments and property and equipment – 36 – 146
Other adjustments – 1,585 – 2,083 – 1,597 – 1,778 Changes in assets and liabilities from operating activities
Loans and advances to banks 2,360 9,277
Loans and advances to customers 7,659 6,508
Financial assets measured at fair value through profit or loss 32,743 5,573
Financial investments 12,856 11,156
Other assets from operating activities – 54 – 62
Deposits from banks – 6,095 – 13,109
Deposits from customers – 3,009 5,229
Securitized liabilities – 11,836 – 9,843
Financial liabilities measured at fair value through profit or loss – 35,572 – 16,750
Other liabilities from operating activities 920 – 716
Dividends received 98 103
Interest received 27,268 42,227
Interest paid – 25,716 – 40,112
Income taxes paid – 348 53 Cash flow from operating activities 74 – 323 – 2,244 Proceeds from the sale of
equity investments 64 329
property and equipment 3 13
intangible assets 2 1
Payments for the acquisition of
equity investments – 9 – 27
property and equipment – 18 – 30
intangible assets – 52 – 44
Proceeds from the sale of consolidated companies 0 595 Cash flow from investing activities 74 – 10 837
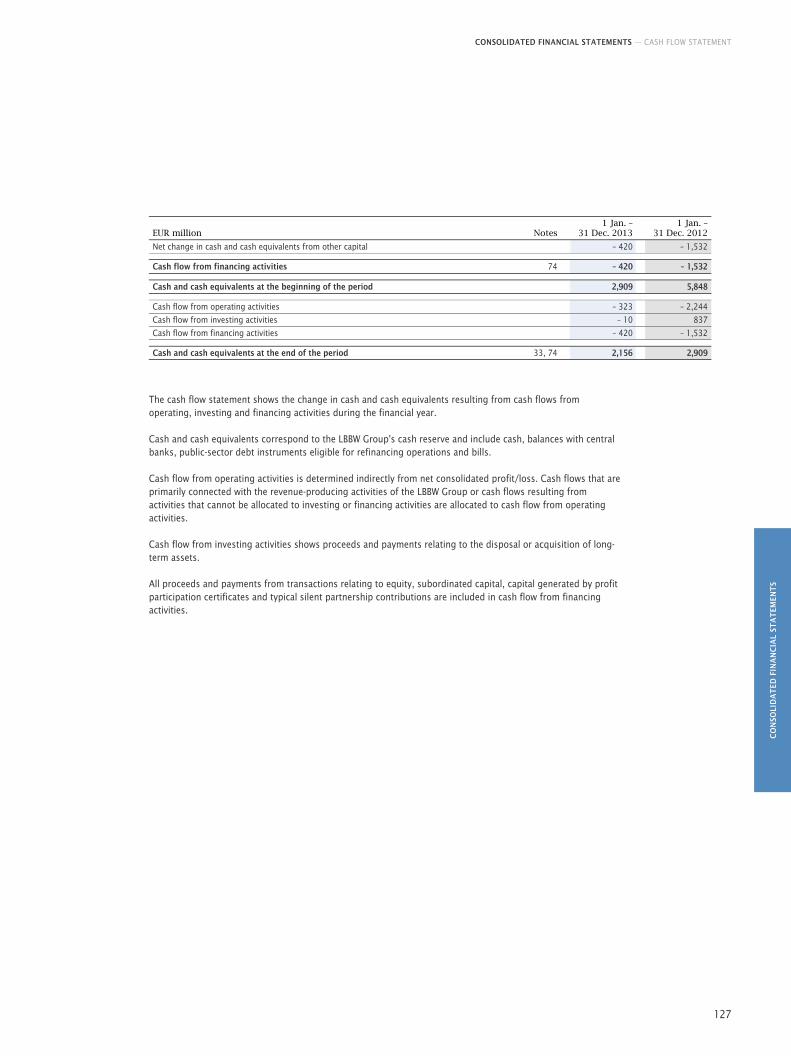
CONSOLIDATED FINANCIAL STATEMENTS — CASH FLOW STATEMENT
CO
NSO
LID
AT
ED F
INA
NC
IAL
STA
TEM
ENT
S
127
EUR million Notes
1 Jan. – 31 Dec. 2013
1 Jan. – 31 Dec. 2012
Net change in cash and cash equivalents from other capital – 420 – 1,532 Cash flow from financing activities 74 – 420 – 1,532 Cash and cash equivalents at the beginning of the period 2,909 5,848 Cash flow from operating activities – 323 – 2,244
Cash flow from investing activities – 10 837
Cash flow from financing activities – 420 – 1,532 Cash and cash equivalents at the end of the period 33, 74 2,156 2,909
The cash flow statement shows the change in cash and cash equivalents resulting from cash flows from operating, investing and financing activities during the financial year.
Cash and cash equivalents correspond to the LBBW Group's cash reserve and include cash, balances with central banks, public-sector debt instruments eligible for refinancing operations and bills.
Cash flow from operating activities is determined indirectly from net consolidated profit/loss. Cash flows that are primarily connected with the revenue-producing activities of the LBBW Group or cash flows resulting from activities that cannot be allocated to investing or financing activities are allocated to cash flow from operating activities.
Cash flow from investing activities shows proceeds and payments relating to the disposal or acquisition of long-term assets.
All proceeds and payments from transactions relating to equity, subordinated capital, capital generated by profit participation certificates and typical silent partnership contributions are included in cash flow from financing activities.

128
CONSOLIDATED FINANCIAL STATEMENTS — NOTES
CO
NSO
LID
AT
ED F
INA
NC
IAL
STA
TEM
ENT
S
129
Notes for the 2013 financial year.
Basis of group accounting.
Landesbank Baden-Baden-Württemberg (LBBW (Bank)), as the parent company of the Group, is a public law institution (rechtsfähige Anstalt des öffentlichen Rechts) with registered offices in Stuttgart, Karlsruhe, Mannheim and Mainz.
The consolidated financial statements for the 2013 financial year were prepared in accordance with section 315a (1) of the German Commercial Code (HGB) and Commission Regulation (EU) no. 1606/2002 of the European Parliament and of the Council dated 19 July 2002 (IAS regulation) in accordance with the regulations of the International Financial Reporting Standards (IFRS) as applicable in the European Union. The standards and interpretations published at the time of preparation of the financial statements, adopted by the European Union and relevant and binding for the Group, are authoritative.
The consolidated financial statements of LBBW were approved by the Board of Managing Directors for publication on 11 March 2014.
Accounting policies.
1. Accounting principles. The consolidated financial statements are based on the going concern principle.
In accordance with IAS 27.24 and IAS 28.26, financial statements in the LBBW Group are prepared using uniform accounting policies. These were applied consistently to the reporting periods shown, unless stated otherwise. As a rule, the annual financial statements of the consolidated companies or investments accounted for using the equity method are prepared on the balance sheet date of the consolidated financial statements of LBBW. Different reporting dates exist only in one case. In this case too, the figures as at 31 December 2013 are taken into consideration in these consolidated financial statements.
The reporting currency is the euro (EUR). The amounts in these consolidated financial statements are generally rounded commercially to EUR millions. This may result in minor aggregation differences; however, these do not have any adverse effect on the reporting quality. The reporting year is the calendar year.
The consolidated financial statements are prepared on the basis of historical and amortized cost as well as fair value. The fair value is used in the case of investment property, financial investments classified as available for sale, and financial assets and liabilities measured at fair value through profit or loss.
Income and expenses are accrued. Interest income and expenses are presented using the effective interest method.
Borrowing costs for qualifying assets (inventories, non-current assets) are capitalized. A qualified asset is a non-financial asset that requires a considerable amount of time to prepare it for its intended use or state of sale.
Long-term construction orders exist within the Group. Given the immateriality of these transactions, no further details were provided.
2. Changes and estimates. IFRS applied for the first time. The following IFRS were applied for the first time in the 2013 financial year.
IFRS 13 Fair Value Measurement.
This standard includes criteria to determine the fair value and extends the reporting obligations to include the fair value.
CONSOLIDATED FINANCIAL STATEMENTS — NOTES
130
In the course of the first-time application of IFRS 13, the reported status was subject to change: legal risks from ancillary obligations with derivatives are now recognized as provisions and no longer priced at the fair value of the derivative. In addition, the classifications were revised. The additional reporting requirements are included in Note 59.
IAS 19 Employee Benefits.
This standard changes the recording and measurement of performance-oriented pension plans and benefits consequent on ending the employment relationship, as well as the provisions for the disclosures. Actuarial gains and losses must be included in other income within equity immediately when occurred. In addition, an interest rate equal to the discount rate must be assumed in future from the plan assets, which is used to measure the associated pension obligations. Because of the changed definition for post-employment benefits in IAS 19, top-up contributions must now be accrued through installments within the scope of partial retirement agreements.
The first-time application has no material impact on the consolidated financial statements of LBBW, apart from the additional disclosures in the Notes (see Note 50). For this reason, no adjustment has been made to the prior year amounts.
Presentation of Items of Other Comprehensive Income – Amendments to IAS 1.
This standard leads to a change in the reported status of the items in Other income within the statement of comprehensive income. Items that still emerge as being recognized in income at a later stage must be identified separately from the other items in Other income.
In addition to the change in reported status stated above, the first-time application had no material impact on the consolidated financial statements of LBBW.
Annual Improvements to IFRSs (2009 –2011 Cycle).
This collective standard that was approved within the scope of the annual improvement projects is an IASB tool for implementing necessary but not otherwise urgent amendments to the existing IFRS framework. The changes may be of a purely editorial nature but they may also have an impact on the recognition, measurement and reporting of assets and liabilities as well as on the extent of the reporting obligations.
The first-time application had no material impact on the consolidated financial statements of LBBW.
Offsetting Financial Assets and Financial Liabilities – Amendments to IFRS 7.
This standard enhances the reporting requirements in connection with the netting of financial instruments.
The first-time application had no material impact on the consolidated financial statements of LBBW. The additional reporting requirements are included in Note 67.
Deferred Tax: Recovery of Underlying Assets – Amendments to IAS 12.
This standard supplements IAS 12 with the addition of an exception in relation to the measurement of deferred tax liabilities or claims in connection with investment property that is measured at fair value.
The first-time application had no material impact on the consolidated financial statements of LBBW.
Recoverable Amount Disclosures for Non-Financial Assets – Amendments to IAS 36.
This standard corrects an overly broad interpretation of reporting requirements from the adoption of IFRS 13 and will be applied early in LBBW's consolidated financial statements on a voluntarily basis.
Government Loans – Amendments to IFRS 1, Severe Hyperinflation and Removal of Fixed Dates for First-time Adopters – Amendments to IFRS 1, IFRIC 20 Stripping Costs in the Production Phase of a Surface Mine.
These IFRS are not relevant for the preparation of the consolidated financial statements of LBBW and therefore do not impact on them.
CONSOLIDATED FINANCIAL STATEMENTS — NOTES
CO
NSO
LID
AT
ED F
INA
NC
IAL
STA
TEM
ENT
S
131
IFRS to be applied in future. The following IFRS had not yet taken effect as at 31 December 2013. Unless otherwise stated, these IFRS are already recognized in European law and LBBW does not intend to apply them earlier on a voluntary basis:
IFRS 10 Consolidated Financial Statements.
This standard contains the new regulations on consolidation and replaces the corresponding provisions in IAS 27 »Consolidated and Separate Financial Statements« and SIC-12 »Consolidation – Special Purpose Entities«. At the core of the changes is the redefinition of the parent-subsidiary relationship and therefore the scope of consolidation. Full consolidation will be initiated in the future if the following three features have been cumulatively fulfilled:
■ LBBW has direct or indirect decision-making authority to determine key business activities for the economic success of an enterprise.
■ It is subject to variable returns from these companies that can be both positive and negative. ■ It can use its decision-making authority to impact on the amount of the company's variable returns.
IFRS 10 is to be applied for the first time in the 2014 financial year.
IFRS 10 can impact on the IFRS scope of consolidation. The application of this new standard can lead to a scenario whereby subsidiaries or special-purpose entities consolidated in accordance with IAS 27/ SIC-12 no longer have to be consolidated or subsidiaries/special-purpose entities that were not consolidated pursuant to the previous regulations must be newly consolidated.
On the basis of the findings of our previous analyses, the existing interpretation of the standards and depending on materiality considerations, we expect that two additional securitization companies will be required to consolidate as a result of the first-time application of IFRS 10. The impact on current total assets is likely to be less than 1 %. The consolidation of these companies is likely to reduce the irrevocable loan commitments by approx. 7 %. Material effects on profitability are not expected.
Changes may arise in relation to the statements made on account of technical decisions that have not yet been concluded.
IFRS 11 Joint Arrangements.
This standard contains the new accounting rules for joint ventures and combined operations and replaced IAS 31 »Interests in Joint Ventures« and SIC-13 »Jointly Controlled Entities – Non-Monetary Contributions by Venturers«. The new IFRS distinguished between joint ventures and combined operations. Joint ventures may only be included in the consolidated financial statements in future using the equity method and no longer optionally using proportionate consolidation. In contrast, assets and liabilities applicable to the investor as well as expenses and income from combined operations are included proportionately in the consolidated financial statements.
IFRS 11 is to be applied in the 2014 financial year. The first-time application is not expected to have any material effect on the consolidated financial statements of LBBW.
IFRS 12 Disclosure of Interests in Other Entities.
The disclosure requirements in respect of IFRS 10, IFRS 11 and IAS 28 are included in this standard. Specifically, information must be disclosed that offers an insight into the risks and their financial implications that are associated with subsidiaries, joint ventures and associates. In addition, IFRS 12 requires details about structured companies that are not controlled. Structured companies always exist if the holder of voting rights or comparable rights cannot exercise a controlling influence over the company.
IFRS 12 is to be applied for the first time in the 2014 financial year and leads to an extension of the reporting requirements in the Notes, particularly in connection with structured companies.
IAS 27 Separate Financial Statements.
This standard replaces the previous IAS 27 »Consolidated and Separate Financial Statements«. Its scope of application extends exclusively to the preparation of separate financial statements.
The changes are applicable for the first time in the 2014 financial year and have no impact on the consolidated financial statements of LBBW.
CONSOLIDATED FINANCIAL STATEMENTS — NOTES
132
IAS 28 Investments in Associates and Joint Ventures.
This standard contains mainly the definition of an associate and provisions for using the equity method for associates and joint ventures and replaces IAS 28 »Investments in Associates and Joint Ventures« in future.
These changes are applicable for the first time in the 2014 financial year and have no material impact on the consolidated financial statements of LBBW.
Consolidated Financial Statements, Joint Arrangements and Disclosure of Interests in Other Entities – Transition Guidance – Amendments to IFRS 10, IFRS 11 and IFRS 12.
This standard facilitates above all the easy transition to IFRS 10, IFRS 11 and IFRS 12. In particular, the mandatory presentation of comparative figures is restricted to the previous year. In addition, comparative data is no longer necessary for structured entities over which no control is exercised.
These changes are applicable for the first time in the 2014 financial year.
Investment Entities – Amendments to IFRS 10, IFRS 11 and IAS 27.
This standard provides for an exemption from the consolidation obligation for subsidiaries of specific parent companies in accordance with IFRS 10. This affects parent companies that meet the requirements of an investment entity within the meaning of this standard.
These changes are applicable for the first time in the 2014 financial year. The first-time application is not expected to have any impact on the consolidated financial statements of LBBW.
Offsetting Financial Assets and Financial Liabilities – Amendments to IAS 32.
This standard contains clarification concerning the requirements for offsetting financial assets and financial liabilities.
These changes are applicable for the first time in the 2014 financial year. The first-time application is not expected to have any impact on the consolidated financial statements of LBBW.
Novation of Derivatives and Continuation of Hedge Accounting – Amendments to IAS 39.
This standard extends the scope of the applications that can provide relief from discontinuing hedge accounting in relation to a novation of hedging instruments. Under certain circumstances, novations of hedging instruments to a central counterparty may no longer lead to a discontinuation of hedge accounting.
The changes will become effective as of the 2014 financial year. Applications include, in particular, transfers of hedging derivatives concluded off-exchange to a central counterparty in conjunction with the European Market Infrastructure Regulation (EMIR). The first-time application is not expected to have any material effect on the consolidated financial statements.
Annual Improvements to IFRSs 2010– 2012 Cycle, Annual Improvements to IFRS 2011– 2013 Cycle.
This collective standard that was approved within the scope of the annual improvement projects is an IASB tool for implementing necessary but not otherwise urgent amendments to the existing IFRS framework. The changes may be of a purely editorial nature but they may also have an impact on the recognition, measurement and reporting of assets and liabilities as well as on the extent of the reporting obligations.
Some of the changes from the »Annual Improvements to IFRSs 2010– 2012 Cycle« standard will become effective for the first time as of 1 July 2014 while others will not be effective until the 2015 financial year. The first-time application is not expected to have any material impact on the consolidated financial statements of LBBW. It had not been recognized in European Law as at the balance sheet date.
The change to the »Annual Improvements to IFRSs 2011– 2013 Cycle« standard will become effective for the first time in the 2015 financial year. The first-time application is not expected to have any material impact on the consolidated financial statements of LBBW. It had not been recognized in European Law as at the balance sheet date.
CONSOLIDATED FINANCIAL STATEMENTS — NOTES
CO
NSO
LID
AT
ED F
INA
NC
IAL
STA
TEM
ENT
S
133
IFRIC 21 Levies.
This interpretation governs the accounting of public levies. It sets out when and in what amount these levies should be recognized. Its scope of application also includes the banking levy imposed by the Financial Market Stabilization Authority (FMSA).
IFRIC 21 is expected to become effective for the first time in the 2014 financial year. The first-time application is not expected to have any impact on the consolidated financial statements. It had not been recognized in European Law as at the balance sheet date.
Defined Benefit Plans: Employee Contributions – Amendments to IAS 19.
This standard determines how contributions that the employees (or third parties) make themselves to defined benefit plans must be reported by the assenting company.
The changes will be effective for the first time in the 2015 financial year. The impact of the first-time application on the consolidated financial statements is still being reviewed. It had not been recognized in European Law as at the balance sheet date.
IFRS 9 Financial Instruments (2009), IFRS 9 Financial Instruments (2010), Mandatory Effective Date and Transition Disclosures – Amendments to IFRS 9 and IFRS 7, IFRS 9 Financial Instruments – Hedge Accounting and amendments to IFRS 9, IFRS 7 and IAS 39.
IFRS 9 is intended to replace IAS 39 in the medium term. The preparations for IFRS 9 have not yet been concluded. As things stand at present, the following central changes are expected: For the classification and measurement of financial instruments, the underlying business model and the product characteristics will be decisive in future in relation to cash flows. Allowances for losses on loans and advances will no longer be restricted to losses already incurred but will also comprise expected losses, and hedge accounting will be oriented more closely to risk management.
Based on the current discussions in the IASB, the effective date for the mandatory first-time application is expected to be 2018. The rules adopted to date by the IASB have not yet been recognized in European law. In view of the final framework that is only just beginning to emerge, specific statements cannot be made about the expected impact of the first-time application on the consolidated financial statements.
Changes in recognition. The classification of the product structure shown in the Notes was changed in the current year under review. This impacts on the items loans and advances to banks and customers, allowances for losses on loans and advances, as well as deposits from banks. In addition, the economic hedging derivatives that do not qualify as a hedging relationship pursuant to IAS 39 and the assets and liabilities that were previously designated at fair value will be reclassified in trading assets/trading liabilities. For the purpose of improved clarity, the relevant prior year values were adjusted accordingly. The said changes impact only on the disclosures in the Notes and have no effect on the balance sheet and the income statement.
For the purpose of uniform accounting of leasing transactions within the Group, the recognition of income and expenses of a fully consolidated company included in net interest income was changed from gross to net. The prior year figures were adjusted accordingly. This does not impact on net interest income.
Changes. Estimates and assumptions were made in accordance with the accounting standards concerned for determining the assets, liabilities, income and expenses recognized in the consolidated financial statements. These are based on historical experiences and other factors such as plans and – as far as can be currently judged – probable expectations and forecasts of future events. Such significant estimates can change from time to time and significantly affect the net assets and financial position, as well as the results of operations.
In addition, discretionary decisions were reached when preparing the financial statements regarding the determination of the scope of consolidation, the classification of the financial instruments, investment property, the leasing relationships and the allocation to the levels pursuant to IFRS 13.
Estimates and assumptions mainly relate to the calculation of the fair value of financial instruments and investment property, the value of assets and the calculation of the allowances for losses on loans and advances, as well as the recognition and measurement of subordinated capital, provisions and deferred taxes. Moreover, estimates and assumptions are made regarding specific cash flows. Where significant estimates and/or complex judgements were required, the assumptions made are explained in detail in the Notes to the corresponding item.
The estimates and assumptions are each based on the level of knowledge currently available about the expected future business performance and trends in the global and sector-specific environment. Where actual values differ
CONSOLIDATED FINANCIAL STATEMENTS — NOTES
134
from the estimates made, the underlying assumptions and – if necessary – the carrying amounts of the relevant assets and liabilities are adjusted accordingly on a prospective basis.
The following changes in estimates were applied on a prospective basis in accordance with IAS 8.39 in the financial year:
■ During the year under review, model adjustments were made in determining the probability of default and the loss ratios for the CVA calculation of OTC derivatives, which led to a reduction of EUR 11.3 million in the valuation discounts.
■ The estimate for valuing reserves for additional benefits is based on newly established statistical mathematical procedures. The EUR 39.0 million increase in these provisions was raised through the actuarial gains and losses in equity, of which EUR 37 million are attributable to the refinement of the estimation method.
The following matter was amended retrospectively in accordance with IAS 8.42 in the financial year:
Fee and commission income of EUR 15.5 million was received in the financial year that would have been allocated to the 2012 period. Given that this approach was also applied in the prior periods and the amounts were proven to be of similar size, the situation was broadly the same in the comparable periods. The correction was therefore applied retroactively as of the 2012 financial year, in equity as in loans and advances to banks (EUR +14 million), loans and advances to customers (EUR +2 million) and in the deferred income tax assets (EUR – 5 million).
3. Scope of consolidation. In addition to LBBW (Bank) as the parent company, 111 subsidiaries (previous year: 106 subsidiaries) and 15 special-purpose entities (previous year: 17 special-purpose entities) were included in the consolidated financial statements.
A subsidiary is an entity that is controlled by another entity (known as the parent). The parent has the ability to control the entity if it directly or indirectly holds a majority of the voting rights in the entity or has the de facto ability to influence the entity. Control of special-purpose entities is assumed to exist when one of the following criteria is met in substance: (i) the business activities of the special-purpose entity (SPE) are conducted on behalf of the Group in accordance with its specific business needs in such a way that the LBBW Group obtains benefits from these operations, (ii) the Group has the direct or indirect decision-making power to obtain the majority of the benefits of the SPE's business activities, (iii) the Group has the right to obtain the majority of the benefits of the SPE and may therefore be exposed to risks incident to the activities of the SPE, (iv) the Group retains the majority of the residual or ownership risks related to the SPE or its assets in order to obtain benefits from its business activities.
Inclusion of SPEs in the consolidated financial statements does not depend on the extent of the equity investment or the proportion of voting rights.
With the consolidation of the SPEs, all the material risks arising from these entities are included in LBBW's consolidated financial statements.
The following subsidiaries were deconsolidated in the period under review:
■ SüdLeasing Finance-Holding GmbH ■ Einkaufszentrum Stachus München GmbH (LBBW Immobilien Management GmbH subgroup) ■ HIRP Housing Initiative Rheinland-Pfalz Management- und Entwicklungsgesellschaft mbH i. L. (LBBW
Immobilien Management GmbH subgroup)
In addition, the following special-purpose vehicles were deconsolidated:
■ BWInvest-TR6-Fonds ■ LBBW EuroLiquid
No major effects resulted from the above mentioned deconsolidations.
CONSOLIDATED FINANCIAL STATEMENTS — NOTES
CO
NSO
LID
AT
ED F
INA
NC
IAL
STA
TEM
ENT
S
135
The following subsidiaries were consolidated for the first time in 2013:
■ BW Capital Markets Inc. (inclusion as a subgroup, including four further companies) ■ John Deere Leasing GmbH ■ EAST Portfolio s.r.o. ■ Rheinpromenade Mainz GmbH & Co. KG (LBBW Immobilien Management GmbH subgroup)
Four joint ventures (31 December 2012: six joint ventures) and an unchanged seven associates are accounted for using the equity method in the consolidated financial statements.
A joint venture is a contractual arrangement whereby two or more parties undertake activities subject to joint control or manage jointly controlled assets or jointly controlled entities. An associate is an entity over which the LBBW Group exercises significant influence. Associates are companies in which LBBW holds a voting interest of between 20 % and 50 % (rebuttable presumption of association).
A total of 176 (previous year: 181) subsidiaries and SPEs were not included in the consolidated financial statements because their individual and aggregate influence on the net assets, financial position and results of operations of the LBBW Group is not significant. These mainly include property management companies and shelf companies, as well as start-up financings in the area of equity investments. The interests in these entities are either measured at fair value or carried at amortized cost and reported under »Financial investments«.
We refer to the list of shareholdings recognized in the annual report for the subsidiaries, SPEs, joint ventures and associates included in the consolidated financial statements, as well as the entities and equity investments omitted on grounds of insignificance (see Note 76).
4. Principles of consolidation. The subsidiaries and SPEs are consolidated according to the purchase method in accordance with IAS 27.18 in conjunction with IFRS 3. Accordingly, all of the subsidiaries' assets and liabilities recognized from the acquirer's perspective at the time of acquisition or at the time when controlling influence is acquired are recognized at their fair value. The remeasured assets and liabilities are taken over into the consolidated balance sheet, taking deferred taxes into account, and are treated according to the standards to be applied in the subsequent periods.
Where the cost for the business combination exceeds the fair value of the assets and liabilities at initial acquisition, goodwill (goodwill in proportion with the investment) is recorded under intangible assets. The share of the equity or in the net gain/loss of the fully consolidated companies of LBBW Group not attributable to shareholders is reported separately in »Equity attributable to non-controlling interest« or »Net income/loss of which attributable to non-controlling interest after tax« in the income statement.
Intra-group receivables and liabilities, as well as income, expenses and profits and losses resulting from intra-group transactions were adjusted in accordance with IAS 27.20 et seq. or the elimination of the interim result.
Joint ventures and associates are accounted for using the equity method provided they are not of minor significance for the presentation of the LBBW Group's net assets, financial position and results of operations. The pro rata share in profit or loss of the investments accounted for using the equity method is recorded in the consolidated financial statements at the same time. Investments accounted for using the equity method are measured on the basis of the Group's share in equity plus goodwill.
5. Currency translation. The foreign currency translation in the Group is conducted in accordance with IAS 21. Each LBBW Group company determines its functional currency. The items included in the financial statements of the relevant group company are measured using this functional currency and translated into the reporting currency (euro).
A foreign currency transaction must be initially recognized at the spot rate between the functional currency and the foreign currency at the transaction date. Monetary assets and liabilities denominated in foreign currency and unsettled foreign currency spot transactions are always translated into euros at the prevailing closing rate. Non-monetary items measured at amortized cost are translated at the historical rate at the transaction date. Non-monetary items measured at fair value are translated at prevailing exchange rates on the date of the fair value measurement (closing rate).
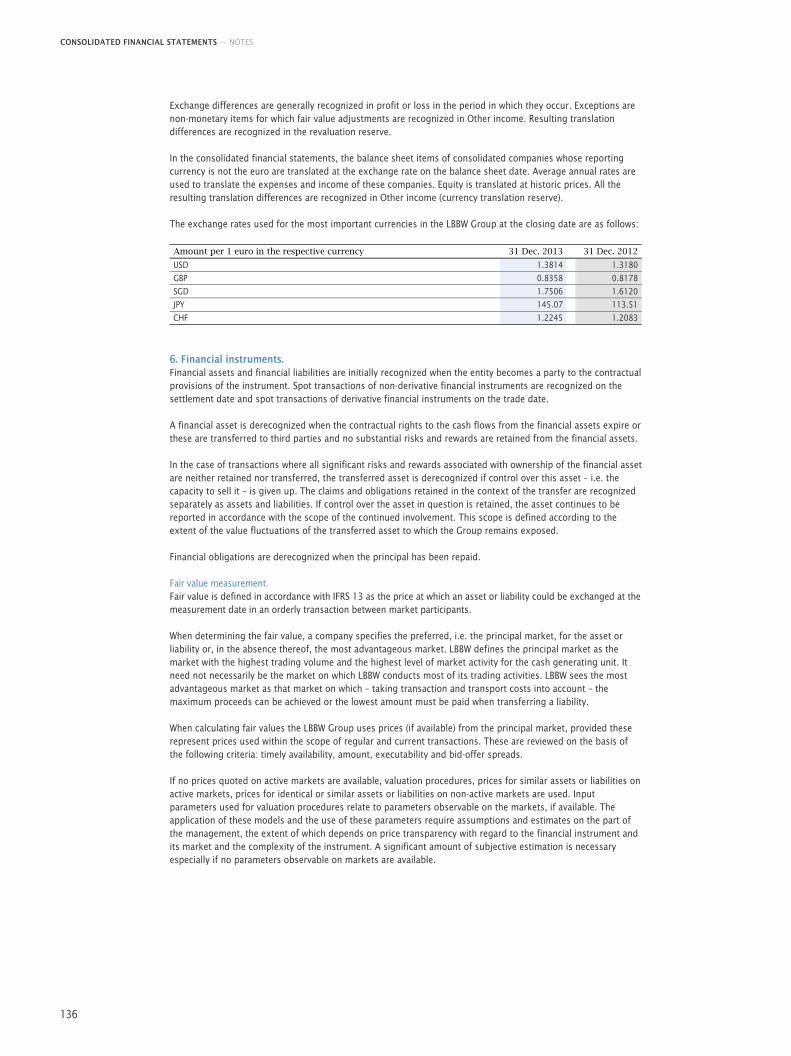
CONSOLIDATED FINANCIAL STATEMENTS — NOTES
136
Exchange differences are generally recognized in profit or loss in the period in which they occur. Exceptions are non-monetary items for which fair value adjustments are recognized in Other income. Resulting translation differences are recognized in the revaluation reserve.
In the consolidated financial statements, the balance sheet items of consolidated companies whose reporting currency is not the euro are translated at the exchange rate on the balance sheet date. Average annual rates are used to translate the expenses and income of these companies. Equity is translated at historic prices. All the resulting translation differences are recognized in Other income (currency translation reserve).
The exchange rates used for the most important currencies in the LBBW Group at the closing date are as follows:
Amount per 1 euro in the respective currency 31 Dec. 2013 31 Dec. 2012
USD 1.3814 1.3180
GBP 0.8358 0.8178
SGD 1.7506 1.6120
JPY 145.07 113.51
CHF 1.2245 1.2083
6. Financial instruments. Financial assets and financial liabilities are initially recognized when the entity becomes a party to the contractual provisions of the instrument. Spot transactions of non-derivative financial instruments are recognized on the settlement date and spot transactions of derivative financial instruments on the trade date.
A financial asset is derecognized when the contractual rights to the cash flows from the financial assets expire or these are transferred to third parties and no substantial risks and rewards are retained from the financial assets.
In the case of transactions where all significant risks and rewards associated with ownership of the financial asset are neither retained nor transferred, the transferred asset is derecognized if control over this asset – i.e. the capacity to sell it – is given up. The claims and obligations retained in the context of the transfer are recognized separately as assets and liabilities. If control over the asset in question is retained, the asset continues to be reported in accordance with the scope of the continued involvement. This scope is defined according to the extent of the value fluctuations of the transferred asset to which the Group remains exposed.
Financial obligations are derecognized when the principal has been repaid.
Fair value measurement. Fair value is defined in accordance with IFRS 13 as the price at which an asset or liability could be exchanged at the measurement date in an orderly transaction between market participants.
When determining the fair value, a company specifies the preferred, i.e. the principal market, for the asset or liability or, in the absence thereof, the most advantageous market. LBBW defines the principal market as the market with the highest trading volume and the highest level of market activity for the cash generating unit. It need not necessarily be the market on which LBBW conducts most of its trading activities. LBBW sees the most advantageous market as that market on which – taking transaction and transport costs into account – the maximum proceeds can be achieved or the lowest amount must be paid when transferring a liability.
When calculating fair values the LBBW Group uses prices (if available) from the principal market, provided these represent prices used within the scope of regular and current transactions. These are reviewed on the basis of the following criteria: timely availability, amount, executability and bid-offer spreads.
If no prices quoted on active markets are available, valuation procedures, prices for similar assets or liabilities on active markets, prices for identical or similar assets or liabilities on non-active markets are used. Input parameters used for valuation procedures relate to parameters observable on the markets, if available. The application of these models and the use of these parameters require assumptions and estimates on the part of the management, the extent of which depends on price transparency with regard to the financial instrument and its market and the complexity of the instrument. A significant amount of subjective estimation is necessary especially if no parameters observable on markets are available.
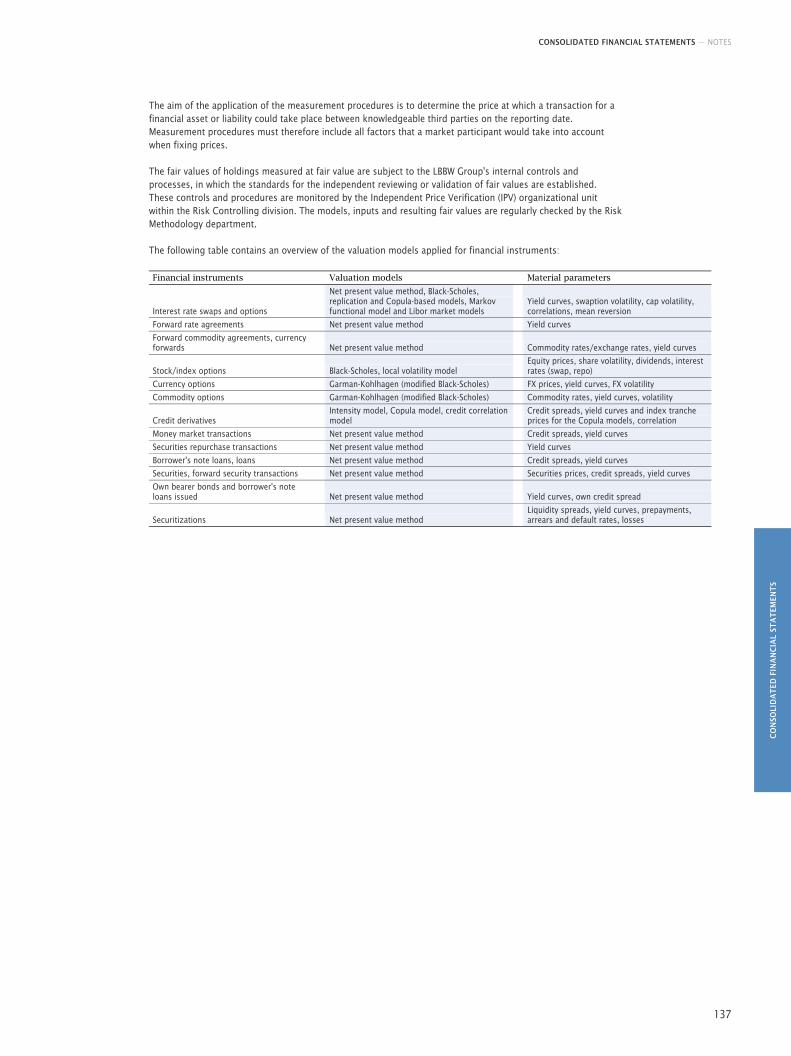
CONSOLIDATED FINANCIAL STATEMENTS — NOTES
CO
NSO
LID
AT
ED F
INA
NC
IAL
STA
TEM
ENT
S
137
The aim of the application of the measurement procedures is to determine the price at which a transaction for a financial asset or liability could take place between knowledgeable third parties on the reporting date. Measurement procedures must therefore include all factors that a market participant would take into account when fixing prices.
The fair values of holdings measured at fair value are subject to the LBBW Group's internal controls and processes, in which the standards for the independent reviewing or validation of fair values are established. These controls and procedures are monitored by the Independent Price Verification (IPV) organizational unit within the Risk Controlling division. The models, inputs and resulting fair values are regularly checked by the Risk Methodology department.
The following table contains an overview of the valuation models applied for financial instruments:
Financial instruments Valuation models Material parameters
Interest rate swaps and options
Net present value method, Black-Scholes, replication and Copula-based models, Markov functional model and Libor market models
Yield curves, swaption volatility, cap volatility, correlations, mean reversion
Forward rate agreements Net present value method Yield curves
Forward commodity agreements, currency forwards Net present value method Commodity rates/exchange rates, yield curves
Stock/index options Black-Scholes, local volatility model
Equity prices, share volatility, dividends, interest rates (swap, repo)
Currency options Garman-Kohlhagen (modified Black-Scholes) FX prices, yield curves, FX volatility
Commodity options Garman-Kohlhagen (modified Black-Scholes) Commodity rates, yield curves, volatility
Credit derivatives
Intensity model, Copula model, credit correlation model
Credit spreads, yield curves and index tranche prices for the Copula models, correlation
Money market transactions Net present value method Credit spreads, yield curves
Securities repurchase transactions Net present value method Yield curves
Borrower's note loans, loans Net present value method Credit spreads, yield curves
Securities, forward security transactions Net present value method Securities prices, credit spreads, yield curves
Own bearer bonds and borrower's note loans issued Net present value method Yield curves, own credit spread
Securitizations Net present value method
Liquidity spreads, yield curves, prepayments, arrears and default rates, losses
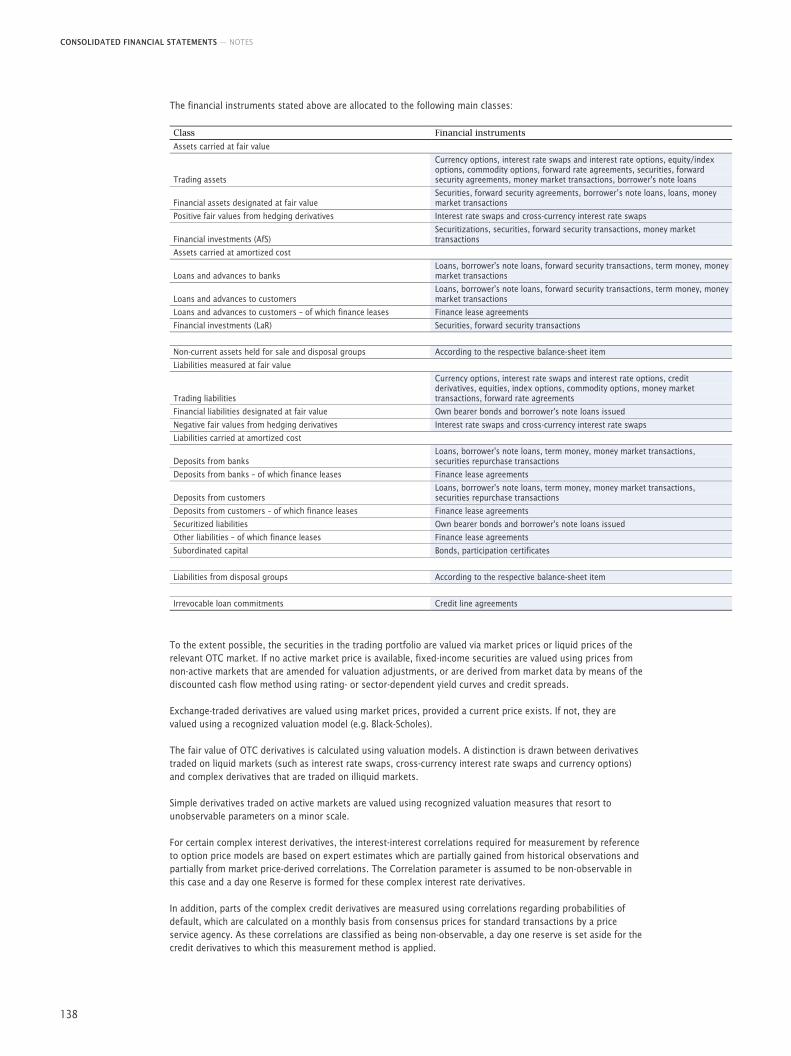
CONSOLIDATED FINANCIAL STATEMENTS — NOTES
138
The financial instruments stated above are allocated to the following main classes:
Class Financial instruments
Assets carried at fair value
Trading assets
Currency options, interest rate swaps and interest rate options, equity/index options, commodity options, forward rate agreements, securities, forward security agreements, money market transactions, borrower's note loans
Financial assets designated at fair value
Securities, forward security agreements, borrower’s note loans, loans, money market transactions
Positive fair values from hedging derivatives Interest rate swaps and cross-currency interest rate swaps
Financial investments (AfS)
Securitizations, securities, forward security transactions, money market transactions
Assets carried at amortized cost
Loans and advances to banks
Loans, borrower's note loans, forward security transactions, term money, money market transactions
Loans and advances to customers
Loans, borrower's note loans, forward security transactions, term money, money market transactions
Loans and advances to customers – of which finance leases Finance lease agreements
Financial investments (LaR) Securities, forward security transactions
Non-current assets held for sale and disposal groups According to the respective balance-sheet item
Liabilities measured at fair value
Trading liabilities
Currency options, interest rate swaps and interest rate options, credit derivatives, equities, index options, commodity options, money market transactions, forward rate agreements
Financial liabilities designated at fair value Own bearer bonds and borrower's note loans issued
Negative fair values from hedging derivatives Interest rate swaps and cross-currency interest rate swaps
Liabilities carried at amortized cost
Deposits from banks
Loans, borrower's note loans, term money, money market transactions, securities repurchase transactions
Deposits from banks – of which finance leases Finance lease agreements
Deposits from customers
Loans, borrower's note loans, term money, money market transactions, securities repurchase transactions
Deposits from customers – of which finance leases Finance lease agreements
Securitized liabilities Own bearer bonds and borrower's note loans issued
Other liabilities – of which finance leases Finance lease agreements
Subordinated capital Bonds, participation certificates
Liabilities from disposal groups According to the respective balance-sheet item
Irrevocable loan commitments Credit line agreements
To the extent possible, the securities in the trading portfolio are valued via market prices or liquid prices of the relevant OTC market. If no active market price is available, fixed-income securities are valued using prices from non-active markets that are amended for valuation adjustments, or are derived from market data by means of the discounted cash flow method using rating- or sector-dependent yield curves and credit spreads.
Exchange-traded derivatives are valued using market prices, provided a current price exists. If not, they are valued using a recognized valuation model (e.g. Black-Scholes).
The fair value of OTC derivatives is calculated using valuation models. A distinction is drawn between derivatives traded on liquid markets (such as interest rate swaps, cross-currency interest rate swaps and currency options) and complex derivatives that are traded on illiquid markets.
Simple derivatives traded on active markets are valued using recognized valuation measures that resort to unobservable parameters on a minor scale.
For certain complex interest derivatives, the interest-interest correlations required for measurement by reference to option price models are based on expert estimates which are partially gained from historical observations and partially from market price-derived correlations. The Correlation parameter is assumed to be non-observable in this case and a day one Reserve is formed for these complex interest rate derivatives.
In addition, parts of the complex credit derivatives are measured using correlations regarding probabilities of default, which are calculated on a monthly basis from consensus prices for standard transactions by a price service agency. As these correlations are classified as being non-observable, a day one reserve is set aside for the credit derivatives to which this measurement method is applied.
CONSOLIDATED FINANCIAL STATEMENTS — NOTES
CO
NSO
LID
AT
ED F
INA
NC
IAL
STA
TEM
ENT
S
139
The fair value of securitizations for which the market prices of market services providers are to hand is measured on the basis of these prices and the classification in Level II (see fair value hierarchy). The fair values for impaired securitizations, or such for which there are not sufficient market prices (Level III) are calculated using valuation models. These are standard market models based on the discounted cash flow method. Some of the parameters used by these models cannot be observed on the markets. In this case, the fair value is influenced by the assumptions and estimates made by LBBW. These assumptions are chosen with the greatest possible care by the back office of the LBBW Group. The parameters to be calculated comprise defaults, recovery rates and repayment ratios. These are calculated per asset class. Investment bank and rating agency research as well as own observations or derivations from the transactions are used to determine these parameters. The projections are calculated on the basis of expectations relating to the macroeconomic environment and taking the historically available data into account.
If the fair value of a financial instrument that is calculated using valuation methods does not take sufficient account of factors such as bid-offer spreads or close-out costs, liquidity, model, credit and/or counterparty risk, the Bank calculates valuation adjustments. The methods used do not always observe parameters observed on the market. Valuation adjustments are currently made within the LBBW Group, particularly for the following issues:
■ Recognition of credit risks in relation to credit risks from receivables and counterparty default risks from OTC derivatives (credit valuation adjustment).
■ Adjustments to mid-price based measurements on the use of bid/ask prices, for example, as close-out valuation adjustments for OTC interest rate and credit derivatives.
■ Weaknesses in the models and/or parameters used, for example, so-called model valuation adjustments for specific interest rate and credit derivatives.
■ Day one profit or loss for specific complex derivatives. ■ Adjustments for using market prices from markets that are not active (Level II/Level III) for interest-bearing
securities.
When calculating the fair value of listed equity holdings that are allocated to the available-for-sale category, prices traded on an active market are used, if available. For non-listed companies or if no prices traded on an active market are available, the fair value is measured via a valuation method. The LBBW Group measures fair value in these cases mainly by means of the net income value, the discounted cash flow or the net asset value method. The valuation method is selected on the basis of a fixed decision tree. The fair value of real estate leasing special-purpose vehicles is generally measured on the basis of the DCF method. The net income value approach is generally used for the measurements of all other major equity investments. If the application of the net income value approach is associated with considerable uncertainty or cannot be depended on to be reliable due to a lack of data, the net asset value method is used, provided the equity investment's business activities are stable.
The fair value of assets and liabilities measured at amortized cost is calculated by discounting the future cash flows, taking into account rating-dependent spreads (exception: repurchase transactions). If rating-dependent spreads are derived from rating information obtained from external sources, classification is in Level II. Rating information obtained from internal sources requires classification in Level III. The fair values of receivables with a default rating are determined on the basis of expected future cash flows. The carrying amount is stated as the fair value of short-term assets and liabilities (e.g. current account assets and liabilities).
Fair value hierarchy. The fair values used when measuring financial instruments are to be classified in a three-level fair value hierarchy, taking into consideration the measurement methods and parameters used to carry out this measurement. If parameters from different levels are used to determine the fair value, the resulting fair value is assigned to the lowest level whose parameter has a material effect on the fair value measurement.
CONSOLIDATED FINANCIAL STATEMENTS — NOTES
140
The three-level fair value hierarchy with Level I, Level II, and Level III – the terminology provided for in IFRS 13 – is defined as follows within the LBBW Group:
■ All financial instruments with prices quoted on active markets are assigned to the first group (Level I). ■ OTC derivatives measured using models, tradable credits, structured Group debt instruments designated at
fair value, units in investment funds and certain corporate/financial and government bonds with automatic provision from market information systems (observable parameters) and liquid asset-backed securities are assigned to the second group (Level II).
■ Level III comprises financial instruments for which one or more parameters are not based on observable market data and which exert a more than immaterial effect on the fair value of an instrument. This includes complex OTC derivatives, certain private equity investments, most of the loans and certain high-grade structured bonds including illiquid asset-backed securities and structured securitizations.
Exchange-traded derivatives and equity instruments, as well as debentures that are traded in very liquid markets are allocated as standard to Level I. OTC derivatives, and less liquid debentures and equity instruments, are allocated to Level II. Derivatives whose values are influenced by correlation are allocated to Level III.
If the main parameters used change in the course of the fair value measurement, the classification in the fair value hierarchy is also adjusted. At the end of the reporting period, the necessary reclassifications between levels I-III is carried out using quality criteria for the market data used in the valuation that are defined by risk controlling. Prompt availability, volume, executability and bid-offer spreads of the market data play a particular role.
Sensitivity analysis. If the model value of financial instruments is based on non-observable market parameters, alternative para-meters are used to determine the potential estimation uncertainties. The interest-interest correlations that are classified as unobservable are amplified in parallel (in relative terms) by +10 % / – 20 % in the stress scenario. The correlations for credit derivatives that are classified as non-observable are changed by +10 % (absolute) or – 30 % (absolute) in the stress scenario. The correlations for equity derivatives that are classified as unobservable are changed in the stress scenario by +15 % (absolute) or – 25 % (absolute).
For most of the securities classified as Level III only one non-observable parameter is included in the fair value calculation, preventing any interactions between Level III parameters. The overall sensitivity of the products whose fair value calculation includes more than one non-observable parameter is immaterial. A calculation of the interactions between these parameters has therefore been dispensed with.
For the investments classified as Level III the calculation of the sensitivities essentially takes place through an upshift/downshift of the individual beta factors. If no beta factors are used in the measurement, the sensitivities are calculated on the basis of the average percentage change in fair value. This is based on the upshift/downshift of the investments whose measurement is based on a beta factor.
The use of non-observable parameters for the measurement of financial instruments can lead to differences between the transaction price and the fair value. This deviation is referred to as day one profit or loss, which is distributed throughout the term of the financial instrument through profit or loss.
Financial assets or financial liabilities measured at fair value through profit or loss. This category in IAS 39 makes a distinction between financial instruments classified as held for trading (HfT) and financial instruments irrevocably designated at fair value through profit or loss at the time of acquisition (designated at fair value/fair value option (FVO)). Financial assets and liabilities in this category are measured at fair value through profit or loss.
Derivatives, money market transactions, securities and borrower's note loans acquired for the purpose of generating a profit from short-term fluctuations in market prices or dealing margins are classified as held for trading. This subcategory includes those derivative financial instruments (broken down into trading derivatives and economic hedging derivatives) that are used for trading purposes or are part of an economic hedge and do not satisfy IAS 39 requirements for hedge accounting. Financial instruments held for trading are reported in the balance sheet under »Financial assets measured at fair value through profit or loss« or »Financial liabilities measured at fair value through profit or loss«. Unrealized measurement gains/losses as well as realized gains and losses are recognized in »Net gains/losses from financial instruments measured at fair value through profit or loss«.
CONSOLIDATED FINANCIAL STATEMENTS — NOTES
CO
NSO
LID
AT
ED F
INA
NC
IAL
STA
TEM
ENT
S
141
The »Financial instruments designated at fair value« subcategory includes financial instruments that were not acquired nor are held for trading purposes, but are measured at fair value through profit or loss. Financial instruments with embedded derivatives which are required to be separated but are not spun off are assigned to the fair value option. Additionally, the fair value option is applied to eliminate or significantly reduce inconsistencies in the measurement or recognition of financial instruments. Compound financial instruments mainly include LBBW's own bearer bonds and borrower's note loans issued, which are structured with interest rate, credit, equity and/or currency derivatives. When eliminating measurement inconsistencies for financial instruments designated at fair value, this concerns securities and associated liabilities which would otherwise have been subject to different measurement conventions than the associated derivatives. Financial instruments that qualify for the fair value option on initial recognition are reported in the balance sheet under »Financial assets measured at fair value through profit or loss« or »Financial liabilities measured at fair value through profit or loss«. The effects of changes in the fair value of the designated financial instruments are carried in »Net gains/losses of financial instruments measured at fair value through profit or loss«.
Current income from financial instruments held for trading and designated at fair value is reported in the net interest income item.
Available-for-sale assets. Available-for-sale financial assets include all non-derivative financial instruments that have not already been assigned to other categories. Financial instruments designated as available-for-sale financial assets are reported under »Financial investments«. Measurement is at fair value. The remeasurement gain or loss is reported in »Other income« under the subitem »Revaluation reserve« of AfS financial instruments. Impairment losses and realized remeasurement gains/ losses are reported in the income statement. Reversals of impairment losses on debt instruments are recognized through profit or loss (up to amortized cost), while reversals of impairment losses on equity instruments are reported in »Other income«.
In the case of debt instruments, a test is performed at each balance sheet date or when specific events arise in order to assess whether there is any objective evidence that individual financial assets are impaired. Objective evidence of impairment includes, in particular, significant financial difficulty for the borrower, a breach of contract, a strong likelihood that the borrower will enter bankruptcy or other financial reorganization. Impairments for securities that do not represent securitizations are identified through rating classes (default rating).
LBBW's entire securitization portfolio is subject to a regular (currently quarterly) review. Impairment is determined within the scope of this so-called clustering. The clustering aims to monitor the performance of all the ABS transactions in the portfolio and to identify those transactions for which impairments must be created. Clustering itself is a process that is based on the existence of specific cash flow model scenarios, the assessment of specific indicators and transactions details, an analyst's estimate regarding transaction-specific features and any guarantee that might be granted by a monoliner or other guarantor. The potential impairment on debt instruments identified on the basis of these criteria is checked as to whether the current fair value falls below the amortized costs less any repayments and amortization. The amortized costs less current fair value (and any impairment charges previously recognized through profit or loss) equal the impairment charge recognized for the period.
An equity instrument is impaired if there is a significant or prolonged decline in its fair value to below its cost. For available-for-sale assets, a significant impairment is assumed if the fair value at the measurement date is at least 20 % below the cost of the asset. Permanent impairment exists if the fair value is permanently more than 5 % below the cost of the asset over a period of twelve months.
Income or expenses from currency translation are reported for debt instruments (e.g. bonds and debentures) under currency gains/losses, while income and expenses from currency translation are reported for equity instruments (e.g. shares, equity investments, interests in companies) in the revaluation reserve in Other income. When a financial instrument is sold or in the event of impairment, the change in value accrued in the revaluation reserve is recorded under net gains/losses from financial investments.
Silent partnership contributions with participation in losses are also categorized as financial investments (AfS) and are measured accordingly at fair value.
CONSOLIDATED FINANCIAL STATEMENTS — NOTES
142
Derivatives. At LBBW Group, derivatives are used to hedge balance sheet and/or off-balance-sheet items within the scope of its asset/ liability management, to hedge value fluctuations in, for example, fixed-income securities against changes in the market interest rate and to hedge credit spreads for corporate bonds. Derivatives are also used to hedge fluctuations in interest rates or other market prices for trading transactions. Furthermore, derivative financial transactions are performed as trading transactions.
As at the balance sheet date, the LBBW Group has the following types of derivatives in its balance sheet portfolio:
■ Forwards and futures are contractual agreements for the purchase or sale of a specific financial instrument at a specified price and at a specified time in the future. Forwards are non-standardized contracts traded on the OTC market. Futures are contracts for standardized volumes and are traded on stock exchanges.
■ Swaps are contractual agreements between two parties where one stream of interest payments and/or currencies is exchanged for another based on a specified nominal value in the case of certain events arising.
■ Credit derivatives (see Note 64). ■ Options are contractual agreements that give the buyer the right to buy or sell a specific amount of a financial
instrument at a specified price on a specified date or during a specified period of time.
Hedging transactions within the meaning of IAS 39 (hedge accounting) are reported under »financial assets measured at fair value through profit or loss« (positive fair values on the assets side) or under »financial liabilities measured at fair value through profit or loss« (negative fair values on the liabilities side).
Embedded derivatives. Structured instruments are financial instruments that are composed of a host contract and one or more derivatives, where the embedded derivatives are a component of a contract and therefore not traded separately. In accordance with IAS 39, embedded derivatives are separated from the host contract and accounted for as standalone derivatives if all of the conditions below are satisfied:
■ the structured instrument is not already measured at fair value through profit or loss, ■ the economic characteristics and risks of the embedded derivative are not closely related to those of the host
contract and ■ the terms of the embedded derivative would meet the definition of a derivative.
If a structured product is separated for accounting purposes, the host contract must be accounted for in accordance with its category and the embedded derivative accounted for separately in the held-for-trading category. The host contract is measured subject to the category to which this host contract would be assigned. Embedded derivatives that are separated from their host contract are measured at fair value with changes in value recognized in profit or loss. If the criteria for separation of the embedded derivatives are not met, the host contract and the embedded derivative must be recognized and measured as one asset or one liability.
Hedge accounting. The hedge relationship is documented at the inception of the hedge. The documentation clearly identifies the hedged item and the hedging transaction, it encompasses the definition of the risk being hedged, the description of the hedging strategy and the risk management objective, and defines the method used to assess the hedging instrument's effectiveness. In accordance with the provisions of IAS 39, the hedge relationship must be expected to be highly effective at its inception and throughout the entire term. In addition, effectiveness must also regularly be reviewed retrospectively. A hedge relationship is considered to be effective if the ratio of the changes in value from the hedging transaction to the hedged part of the hedged item is between 80 % and 125 %. An ineffective hedge relationship must be reversed. A reversed hedge relationship can be redesignated for the remaining term provided it is assumed to be effective for the remaining term (prospective test).
If the requirements for hedge accounting in accordance with IAS 39.71 et seq. are met, a decision is made as to whether the hedge relationship will be accounted for as a fair value hedge or as a cash flow hedge. Fair value hedges serve to hedge the exposure to market price risk and therefore the related changes in fair value. They exist in the form of micro fair value hedges and portfolio fair value hedges.
In a micro fair value hedge the carrying amount of the hedged item is adjusted for the change in the fair value of the hedged risk and recognized in profit or loss. This applies to the financial instruments valued at amortized cost as well as to the hedged item measured at fair value, whose changes in value are recorded in »Other income«. Changes in the fair value of the hedged item not attributable to the hedged risk are accounted for in accordance with the guidance applicable to the relevant category.
CONSOLIDATED FINANCIAL STATEMENTS — NOTES
CO
NSO
LID
AT
ED F
INA
NC
IAL
STA
TEM
ENT
S
143
LBBW uses the portfolio fair value hedge to hedge interest rate risks within the meaning of IAS 39. The rules applicable to portfolio fair value hedges on interest rate risks enable LBBW to reproduce internal Bank manage-ment of interest rate risks. The portfolios contain both receivables and liabilities that are subject at regular intervals to prospective and retrospective measurement of effectiveness in a dynamic hedge accounting cycle. The cash flow is allocated to the appropriate time interval for each financial instrument according to the expected maturity.
In the case of portfolio fair value hedges, a separate line item (portfolio hedge adjustment attributable to assets/liabilities) is carried on the face of the balance sheet to record the valuation effect on the hedged items as regards the hedged risk.
The measurement gains and losses resulting from the measurement of the hedging transaction generally offset the measurement effect of the hedged items attributable to the hedged risk. These are recognized under »net income/loss from financial instruments measured at fair value through profit or loss«.
The cash flow hedge used to a limited extent in the Group hedges the risks arising from future cash flows. The hedging transaction is recognized in the balance sheet at fair value. The resulting changes in fair value are recognized in »Other income« in the revaluation reserve.
A hedging relationship ends when the hedged item or the hedging transaction expires, is sold, is terminated before maturity or is designated for other purposes, or if the hedge no longer meets the criteria to qualify for hedge accounting. If a financial instrument used to hedge changes in the fair value of a hedged item is terminated before maturity or designated for other purposes, the interest-related fair value adjustment included in the carrying amount of the hedged item is amortized over its remaining maturity and netted against interest income or expenses. In the event of disposal or early repayment of the hedged assets or liabilities, the adjustments in the fair value of the hedged item are recognized along with the realized gains/ losses from the disposal or repayment.
Securities repurchase and lending agreements. The LBBW Group enters into both securities repurchase and lending agreements.
Genuine repurchase (repo) agreements are contracts providing for the transfer of securities against payment of a specified amount in which the return of the securities to the pledgor at a later date for a price agreed in advance is also agreed.
As the pledgor, the LBBW Group continues to carry the assets pledged on the balance sheet and also recognizes the proceeds received as a loan to the pledgee.
As the pledgee, the LBBW Group only recognizes a corresponding receivable from the pledgor as an asset.
These transactions are measured in accordance with the underlying categories in IAS 39. Interest payments on repurchase agreements are recorded as interest income or interest expense. Any premiums/discounts to be accrued/deferred (or differences between the amount received on transfer and the amount to be repaid on return) are recorded in the relevant balance sheet item. Amounts written back from premiums/discounts are reported under »Net interest income«.
Only genuine repurchase agreements are currently made in the LBBW Group.
Lending agreements are non-cash lending transactions in which ownership of securities or other tangible assets (commodities) is transferred with an obligation on the borrower to retransfer securities or tangible assets of the same type, quality, and quantity on expiration of the agreed period of time and pay a fee for the duration of the loan. As the borrower, the LBBW Group does not report the borrowed securities/tangible assets. If the borrowed securities/tangible assets are sold on to another party, a gain on disposal is recognized as an asset and an obligation to return the securities is recognized under »Trading liabilities« at the same time. The consideration paid by the borrower is reported under »Net interest income« depending on the category to which the security/tangible asset is assigned in accordance with IAS 39. The collection of interest or dividends depends on the form of the contract and can favor either the borrower or the lender. The interest and dividends are reported accordingly under »Net interest income«.
As the lender, the LBBW Group continues to report the securities and tangible assets in accordance with the rules applicable to the relevant category in IAS 39.
Financial guarantee contracts (assignor). Obligations arising from guarantees provided by Group companies relate to contracts that require the Group to make specified payments to reimburse the holder for a loss which incurs because a specified borrower fails to make payment when due in accordance with the terms of a debt instrument. These contracts meet the
CONSOLIDATED FINANCIAL STATEMENTS — NOTES
144
requirements for a financial guarantee within the meaning of IAS 39.9 and are therefore not to be measured as a derivative.
Financial guarantees are recognized at fair value within the scope of the initial valuation. The present value of the outstanding premium payments is netted against the present value of the obligations arising from the financial guarantee contracts; in arm's length transactions, the two amounts are the same.
Due to the insignificance of the amounts involved, no fair values are presented in the Notes.
Financial guarantee contracts (assignee). Based on the agreement dated 26 June 2009, LBBW arranged risk protection with the State of Baden-Württemberg in the form of a guarantee structure with effect from 30 June 2009. GPBW GmbH & Co. KG, a guarantee company of the State of Baden-Württemberg, granted LBBW an original guarantee in the total amount of EUR 12.7 billion to hedge losses on set reference assets. The guarantee portfolio was reduced to EUR 10.4 billion as at 31 December 2013 through repayments and the sale of reference assets. The guarantee is made up of EUR 5.4 billion for an ABS portfolio of LBBW and various Group companies and EUR 5.0 billion for a (junior) loan in the same amount provided by LBBW to Sealink Funding Ltd. (Sealink), a non-consolidated SPE in which certain risk-bearing structured ABS were transferred in connection with the acquisition of the former Landesbank Sachsen AG. LBBW bears the first loss on assets in the ABS portfolio up to an as yet unpaid amount of EUR 0.9 billion until 31 December 2013 (original amount: EUR 1.9 billion).
The guarantee meets the requirements for a financial guarantee within the meaning of IAS 39.9 and is therefore not measured as a derivative. For accounting purposes, the hedging effect of the guarantee related to the loan to Sealink will be netted directly against the valuation of the loan (net method), while the hedging effect of the guarantee related to the securitization portfolio will be recorded separately as a reimbursement claim in the financial investments (at its gross value), since this is a maximum guarantee.
The fees incurred for providing the guarantee structure are reported in the »guarantee commission for the State of Baden-Württemberg« single line item within the income statement.
Measurement at amortized cost. The amortized cost of a financial asset or liability is calculated on the basis of the cost of the asset at the time of acquisition, taking into account any principal repayments, plus or minus accumulated amortization of any difference between the original amount and the amount repayable at maturity using a process corresponding to the effective interest rate method less any write-down for impairment losses incurred.
Loans and receivables. Loans and receivables (LaR) are all non-derivative financial instruments with fixed or determinable payments that are not quoted in an active market, unless they are designated at fair value through profit and loss (aFV) at the date of initial recognition. Loans and receivables are carried at amortized cost using the effective interest method. Loans and receivables are tested for impairment at each closing date or whenever there are indications of potential impairment. Accordingly, write-downs must also be charged through profit or loss if necessary (see Note 6). Impairment losses are reversed in the income statement. Reversals are limited to the amortized cost that would have been recorded at the measurement date without impairment losses.
Loans and receivables include loans and advances to banks, loans and advances to customers and financial investments not classified as available for sale. Loans and advances to banks and loans and advances to customers primarily comprise originated loans, borrower's note loans, overnight and term money as well as pledgee transactions.
Other liabilities. These financial liabilities include all financial liabilities under the scope of application of IAS 39 that are measured at amortized cost.
In accordance with IAS 39, own bonds held by LBBW are deducted from issued debentures. Own bonds held in the Group are offset at their respective redemption value against the amortized cost of the issued debentures. The difference between the redemption value and the amortized cost of the Group's own debentures is recognized in net »Net interest income«..
Held-to-maturity financial investments. Currently, LBBW Group does not use the category of held-to-maturity financial investments.
CONSOLIDATED FINANCIAL STATEMENTS — NOTES
CO
NSO
LID
AT
ED F
INA
NC
IAL
STA
TEM
ENT
S
145
7. Offset arrangements. Financial assets and financial liabilities are mutually offset in balance sheet terms if the Group has a legally enforceable right to set off the recognized amounts and intends either to settle on a net basis or to liquidate the respective asset and settle the associated liability simultaneously. In all other cases, they are recorded by way of gross disclosure.
If asset and liabilities, such as own issues repurchased, are reported as offset in the balance sheet, the associated income and expenditure in the income statement must also be offset, unless offsetting is expressly prohibited by an applicable accounting standard.
8. Cash and cash equivalents. In addition to cash and balances with central banks due on demand, cash and cash equivalents include public-sector debt instruments and bills due in up to three months. All items are reported at their nominal value.
9. Allowances for losses on loans and advances. The item »Allowances for losses on loans and advances« comprises write-downs on financial instruments reported as loans and advances. This includes all loans that are not subject to fair value measurement. Undrawn loan commitments and contingent liabilities are not taken into account here.
In the case of the write-downs, a difference is made between specific valuation allowances, collective valuation allowances and portfolio valuation allowances. A write-down is generally created where there are recognizable indications of impairment. If this is the case, specific valuation allowances are recognized for significant receivables and collective valuation allowances for insignificant receivables. If there are no indications, portfolio valuation allowances are created, since it can be assumed that certain risks have already occurred but were not yet recognized. If objective evidence of impairment exists in the case of significant receivables but no specific valuation allowance has to be recognized because the present value of the estimated cash flows at least equals its carrying amount, these significant receivables are also included in the portfolio valuation allowances. In the collective valuation of such cases, LBBW distinguished between two constellations. Receivables that feature a specific valuation allowance of 0 due to their comprehensive collateralization are also subject in the portfolio valuation allowance to a provisioning ratio of 0 % calculated on the basis of an expert opinion. A portfolio valuation allowance totaling 10 % of the unsecured exposure at default is recognized for all other receivables. Specific valuation allowances (IAS 39.63) are recognized for the credit and country risks associated with loans and advances to customers and banks according to standards uniform throughout the Group. For this a test is performed at each balance sheet date to assess whether there is any objective evidence that individual financial assets or a group of financial assets are impaired. Objective evidence of impairment includes, in particular, significant financial difficulty for the borrower, a breach of contract (default or past due interest or principal payments), a strong likelihood that the borrower will enter bankruptcy or other financial reorganization, and forbearance (granting by the lender, for economic or legal reasons relating to the borrower's financial difficulty, of a concession that the lender would not otherwise consider.
The impairment loss is measured as the carrying amount of the loan less the present value of the estimated cash flows. To calculate estimated future cash flows, the amounts and accrual date of all anticipated proceeds from the loan (interest and repayments) as well as any payments from the liquidation of collaterals are estimated.
Interest income from impaired receivables does not include the contractually agreed interest income or the accrual of any discounts; rather, it is calculated in accordance with IFRS on the basis of the change in the present value of estimated future cash flows at the next balance sheet date (so-called unwinding). Expected incoming payments reduce both the carrying amount of the receivables as well as the estimated cash flows, while unexpected payments reduce the allowances for losses on loans and advances recognized in profit or loss.
Collective valuation allowances and portfolio valuation allowances are calculated as the product of the carrying amount (capital balance, arrears and pro rata interest), the probability that the exposure will default within one year (PD), the individual loss ratio taking collateral into account (LGD), and a factor that values the duration of arrears in the flow of information (LIP) for the portfolio valuation allowances reported on the assets side of the balance sheet.
The impairment of loans or parts of loans not subject to impairment leads to a direct write-off (IAS 39.63). Recoveries on loans and advances already written off are recognized through profit or loss.
CONSOLIDATED FINANCIAL STATEMENTS — NOTES
146
Loans are derecognized if they are uncollectible, where no surrogate substitutes the defaulted receivable. This is the case, for example, with:
■ insolvency, when the collateral is realized or no insolvency ratio is expected, ■ terminated exposures where the residual receivables are uncollectible, ■ the claim is waived fully or partially, and ■ sale of receivables with a loss.
To the extent that it relates to receivables reported on the face of the balance sheet, the total amount of allowances for losses on loans and advances is deducted as a separate item from loans and advances to banks and customers on the face of the balance sheet. On the other hand, allowances for losses on loans and advances for off-balance-sheet transactions are shown in the item »Provisions for credit risks«. Provisions for credit risks are recognized when current obligations exist and the settlement of these obligations can be expected to be associated with an outflow of resources. These obligations are recognized at the amount that LBBW would reasonably have to pay to settle the obligation or to transfer it to a third party according to the circumstances as of the reporting date.
10. Shares in investments accounted for using the equity method. Investments in associates or joint ventures accounted for using the equity method are carried at cost in the consolidated balance sheet once a significant influence is obtained or on formation of the company. This also comprises goodwill from the acquisition of an associate or a joint venture. In subsequent years, the figure accounted for using the equity method is adjusted by the Group's share in the associate's equity. The proportion of profit or loss generated by the investment is reported in the income statement as net income/loss from companies accounted for using the equity method. Changes in the investment's revaluation reserve are recognized directly and proportionately in Other income.
Because of the valuation of the equity investment, the equity value must be adjusted if necessary. The impairment test is conducted on the basis of IAS 39 and IAS 36.
Investments in associates that are not incorporated in the consolidated financial statements on account of their immaterial importance, are carried under »Financial investments«.
11. Non-current assets held for sale and disposal groups. The carrying amount of long-term assets or groups of assets and debt (disposal groups), whose disposal is planned, is realized largely through the disposal business and not through continued use.
With regard to the cumulative fulfillment of the conditions stated below, the assets or disposal groups in question should be classified as held for sale and shown separately from the other assets or debt in the balance sheet. The criteria for classification as held for sale are that the assets or disposal groups can be disposed of in their present condition at prevailing conditions and that the disposal is highly likely. The disposal is highly probable if the plan to sell the asset is completed, an active program to find a buyer and to complete the plan has been initiated to actively offer the asset or the disposal group at a price that is appropriate relative to the current fair value and the disposal is likely to be within one year from the date of classification.
Assets classified as held for sale are measured at the lower value comprising carrying amount and fair value less the cost of disposal. The depreciation of the assets is suspended from the date they are classified as held for sale. Assets or disposal groups classified as held for sale are recognized separately in the balance sheet item »Non-current assets held for sale and disposal groups«.
Gains/losses from the measurement and gains/losses from the disposal of these assets or disposal groups that are not included in a discontinued operation are contained in the income statement and are not separated. The total profit or loss from discontinued business divisions must be shown separately in the item »Profit or loss from discontinued operations«.
12. Intangible assets. Goodwill and software acquired or developed inhouse are mainly recognized under »Intangible assets«.
Goodwill is calculated as the excess of the cost of the acquisition over the acquirer's interest in the fair value of the net assets of the purchased company, net of deferred taxes and is allocated to the appropriate cash-generating units (CGUs). The LBBW Group has identified the business segments Corporates I, Corporates II, International Business, and Financial Markets as CGUs.
When preparing the consolidated financial statements, goodwill is tested for impairment at least once a year, or during the year, if there are indications of potential impairment (triggering events, such as changes in the relevant market environment, legal conditions, the technical environment or the capitalization rate, or if results are expected to be negative or significantly lower than planned in the longer term).
CONSOLIDATED FINANCIAL STATEMENTS — NOTES
CO
NSO
LID
AT
ED F
INA
NC
IAL
STA
TEM
ENT
S
147
The recoverable amount of the CGU, which recognizes goodwill, is compared with the carrying amount. The carrying amount is determined through the equity assigned to the CGU. The recoverable amount is the higher of the fair value less sales costs and the value in use. The Group calculates the achievable amount on the basis of the value in use. If the value in use exceeds the carrying amount of the cash-generating unit, the asset is not impaired and it is not necessary to estimate the fair value less selling costs. In addition to the profit forecasts, the fair value of a business segment is largely determined by the capitalization rate on which the profit forecasts are based and, to a much lesser extent, by the long-term growth discount. If the recoverable amount of the cash-generating unit is below its carrying amount, an impairment loss is recognized and reported in the income statement under the item »Impairment of goodwill«.
In order to determine the recoverable amount, the Group initially calculates the value in use of the business segments. The value in use is the present value of the future cash flows expected to be derived from the relevant business segments.
The Group's own income valuation model is used to calculate the value in use. The special conditions of the banking business and regulatory requirements are taken into account. The model is used to calculate the present value of estimated future income that can be distributed to shareholders after the relevant regulatory capital requirements have been fulfilled.
The discounted cash flow (DCF) model is based on profit forecasts on the basis of business plans agreed by management for a five-year period. The earnings components that are relevant to forecasts are determined using a top-down process followed by bottom-up validation, taking into account underlying macroeconomic data and market and competition analyses specific to the business field. Past experience is also taken into account when profit forecasts are made. In planning, the Bank differentiates between core bank activities to be continued and areas expected to finish or be wound down in the medium term. Whereas falling risk weighted assets and revenues are forecast for the individual areas to be discontinued, they are expected to rise in the medium term in the case of core bank activities. Due to the planned intensification of customer business, increasing revenues are expected to be accompanied by constant risk weighted assets in the Financial Markets segment.
The profit forecasts form the basis for the derivation of a sustainable profit level, which is discounted to the calculation date using the capitalization rate.
The capitalization rates applied are calculated on the basis of the Capital Asset Pricing Model, which includes a risk-free basic interest rate, a market risk premium, and a systematic risk factor (beta factor). The following external information sources are used: the values for the risk-free basic interest rate are calculated from historical market data using the Svensson method. The market risk premium is determined using empirical data. For each business segment, the beta factors for presenting risks specific to LBBW are derived from beta factors of comparable peer groups specific to the sector.
In validating the achievable amounts calculated for the business segments, the important value drivers of each business segment are reviewed at least once a year. As a test of the resilience of the achievable amounts calculated, the major parameters of the profit forecasts are subjected to a sensitivity test.
Purchased intangible assets are carried at amortized cost, i.e. less their cumulative write-downs and impairment. Internally developed software is capitalized at cost if the recognition criteria in accordance with IAS 38 are met. The capitalized costs mainly include total staff costs and expenses incurred for external services during development. As in the previous year, the internally developed or purchased software is amortized over three to ten years on a straight line basis. In connection with an acquisition, customer relationships were also capitalized which only have limited contractual use. These are amortized over six to 16 years on a straight line basis. Where indications of impairment exist, the recoverable amount is calculated and compared with the carrying amount. In the event of impairment, the amortization is adjusted over the remaining useful life of the intangible asset. Impairment losses are charged as write-downs through profit or loss. Amortization, write-downs and impairment losses on intangible assets, excluding goodwill, are recognized under »Administrative expenses« in the income statement. Income from reversals of impairment losses on intangible assets, excluding goodwill due to prohibition of reversal, is recognized under »Other operating income«.
Intangible assets are derecognized when sold. Gains and losses on disposal are the difference between the net proceeds from the disposal of the asset, if any, and its carrying amount. The profit or loss on the disposal of the asset is recognized through profit or loss at the date of derecognition.
CONSOLIDATED FINANCIAL STATEMENTS — NOTES
148
13. Investment property. Property leased out to third parties for purposes of generating profit is reported separately in the balance sheet as investment property according to IAS 40 as long as it is held to earn rental income and/or for capital appreciation. Where mixed-use properties exist and the non-owner-occupied parts can be sold separately or leased out separately, these parts are accounted for separately. Mixed-use properties with a leased portion of over 80 % of the total area are consistently derecognized from property and equipment and classified in their entirety as investment property.
Investment property is measured initially at its cost including transaction costs. These can also include direct borrowing costs if the respective properties are so-called qualifying assets. Remeasurement is at fair value on the closing date. This is determined primarily from model-based valuations. Regular actuarial reports are obtained for some investment property to validate the fair value from the model-based valuations.
In the measurement of investment property, the estimating uncertainties are based on the assumptions used to calculate future cash flows. Changes in parameters such as the inflation rate, interest rate, anticipated cost trends and leasing, market conditions and vacancy rates affect future cash flows and, consequently, the fair value.
The value of investment property is assessed based on cash calculated per property on the basis of the discounted cash flow method. The contributions to earnings determined by this method are checked for plausibility and verified by means of reference figures from broker associations, past experience from LBBW's own disposals and appraisals by external experts. In order to ensure that the appraisals are available at the time the financial statements are drawn up, the management team responsible decides for which properties external appraisals are to be commissioned in the first quarter of each year. In line with internal provisions, it must be ensured that an appraisal of the main properties is conducted at least once every three years by an independent expert.
Fair value is calculated using the discounted cash flow method based on the following assumption. For valuation purposes, a property (building) is defined as an independent strategic cash-generating unit. The expected cash flows generated per cash-generating unit are calculated assuming income from property management. For a detailed planning period of ten years, the cash generated is calculated as the net amount of payments received and payments made in connection with management of the property. A residual value for the cash-generating unit is forecast for the end of the planning period by capitalizing the cash generated in the tenth year as a perpetual annuity.
In the case of commercial real estate, future income during the planning period is forecast based on the contractually agreed target rent or, after the contract period has expired, the property-specific market rent. The calculation is made on the basis of a valuation tool that is based on the discounted cash flow method.
Future expenditure is determined by means of a differentiated system, with administrative expenses based on standard market rates. Costs associated with loss of rental income are calculated at a flat rate on the basis of the target rents, depending on the sales cost and the credit standing of the tenant. Costs associated with vacancies, new rental costs, maintenance costs and maintenance backlogs are calculated for each specific property, supplemented by the Group's own experience if applicable. If ground rent (Erbbauzins) is to be taken into account, this is calculated individually on the basis of existing contracts.
The cash generated in each period is discounted to the valuation date by applying a property-specific market discount rate. The discount rate is derived from the capitalization rate plus a percentage-based risk premium. The capitalization rate takes into account the quality of the property, the type of property and the macro- and micro-location.
All other things being equal, an increase in the underlying market rents would lead to an increase in the fair value, while a decrease in the underlying market rents would lead to a decline in the fair value. All other things being equal, an increase in the underlying future expenditure would lead to a decline in the fair value, while a decline in the underlying future expenditure would lead to an increase in the fair value. Higher discount rates would, all other things being equal, lead to lower fair values, while lower discount rates would lead to correspondingly higher fair values.
A change in the assumptions on expected market rents generally leads to a corresponding change in the discount rate and to a reverse change in the vacancy ratios and therefore the vacancy costs.
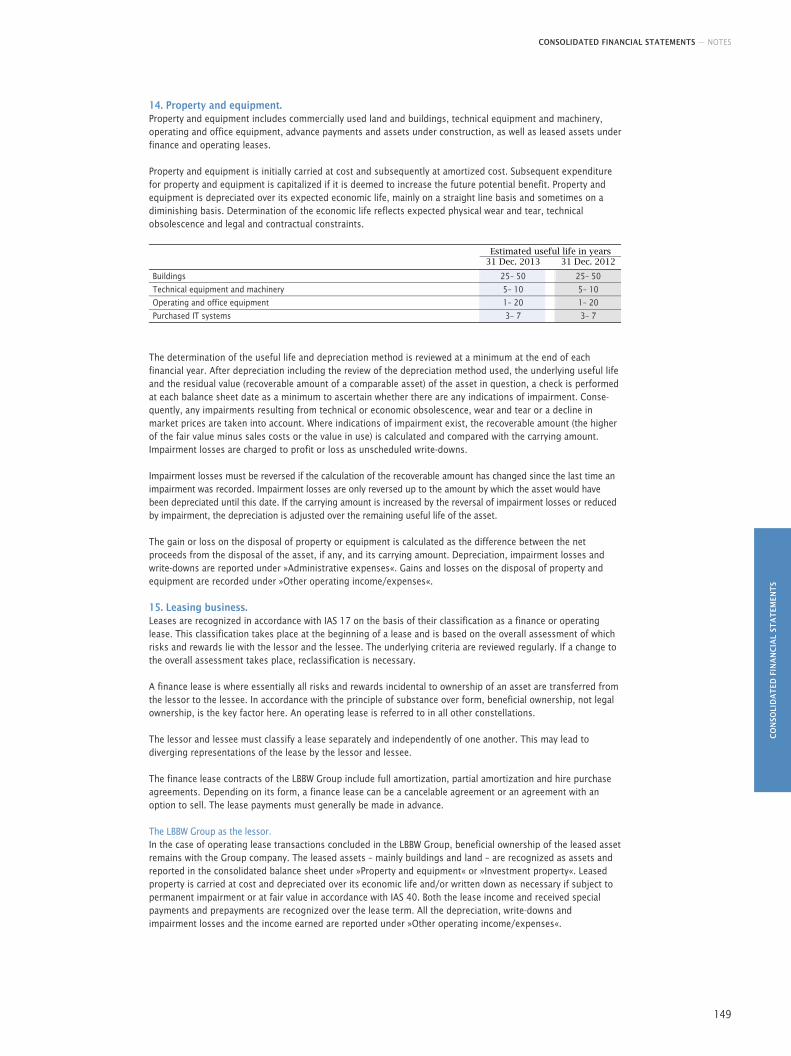
CONSOLIDATED FINANCIAL STATEMENTS — NOTES
CO
NSO
LID
AT
ED F
INA
NC
IAL
STA
TEM
ENT
S
149
14. Property and equipment. Property and equipment includes commercially used land and buildings, technical equipment and machinery, operating and office equipment, advance payments and assets under construction, as well as leased assets under finance and operating leases.
Property and equipment is initially carried at cost and subsequently at amortized cost. Subsequent expenditure for property and equipment is capitalized if it is deemed to increase the future potential benefit. Property and equipment is depreciated over its expected economic life, mainly on a straight line basis and sometimes on a diminishing basis. Determination of the economic life reflects expected physical wear and tear, technical obsolescence and legal and contractual constraints.
Estimated useful life in years 31 Dec. 2013 31 Dec. 2012
Buildings 25– 50 25– 50
Technical equipment and machinery 5– 10 5– 10
Operating and office equipment 1– 20 1– 20
Purchased IT systems 3– 7 3– 7
The determination of the useful life and depreciation method is reviewed at a minimum at the end of each financial year. After depreciation including the review of the depreciation method used, the underlying useful life and the residual value (recoverable amount of a comparable asset) of the asset in question, a check is performed at each balance sheet date as a minimum to ascertain whether there are any indications of impairment. Conse-quently, any impairments resulting from technical or economic obsolescence, wear and tear or a decline in market prices are taken into account. Where indications of impairment exist, the recoverable amount (the higher of the fair value minus sales costs or the value in use) is calculated and compared with the carrying amount. Impairment losses are charged to profit or loss as unscheduled write-downs.
Impairment losses must be reversed if the calculation of the recoverable amount has changed since the last time an impairment was recorded. Impairment losses are only reversed up to the amount by which the asset would have been depreciated until this date. If the carrying amount is increased by the reversal of impairment losses or reduced by impairment, the depreciation is adjusted over the remaining useful life of the asset.
The gain or loss on the disposal of property or equipment is calculated as the difference between the net proceeds from the disposal of the asset, if any, and its carrying amount. Depreciation, impairment losses and write-downs are reported under »Administrative expenses«. Gains and losses on the disposal of property and equipment are recorded under »Other operating income/expenses«.
15. Leasing business. Leases are recognized in accordance with IAS 17 on the basis of their classification as a finance or operating lease. This classification takes place at the beginning of a lease and is based on the overall assessment of which risks and rewards lie with the lessor and the lessee. The underlying criteria are reviewed regularly. If a change to the overall assessment takes place, reclassification is necessary.
A finance lease is where essentially all risks and rewards incidental to ownership of an asset are transferred from the lessor to the lessee. In accordance with the principle of substance over form, beneficial ownership, not legal ownership, is the key factor here. An operating lease is referred to in all other constellations.
The lessor and lessee must classify a lease separately and independently of one another. This may lead to diverging representations of the lease by the lessor and lessee.
The finance lease contracts of the LBBW Group include full amortization, partial amortization and hire purchase agreements. Depending on its form, a finance lease can be a cancelable agreement or an agreement with an option to sell. The lease payments must generally be made in advance.
The LBBW Group as the lessor. In the case of operating lease transactions concluded in the LBBW Group, beneficial ownership of the leased asset remains with the Group company. The leased assets – mainly buildings and land – are recognized as assets and reported in the consolidated balance sheet under »Property and equipment« or »Investment property«. Leased property is carried at cost and depreciated over its economic life and/or written down as necessary if subject to permanent impairment or at fair value in accordance with IAS 40. Both the lease income and received special payments and prepayments are recognized over the lease term. All the depreciation, write-downs and impairment losses and the income earned are reported under »Other operating income/expenses«.
CONSOLIDATED FINANCIAL STATEMENTS — NOTES
150
With a finance lease, the leased asset is derecognized and a receivable due from the lessee equivalent to the net investment value on the date on which the contract is concluded is shown under the item »Loans and advances to customers« or »Loans and advances to banks«. Lease payments received are broken down into an interest component recognized in income and a repayment component. While income is recognized on an accrual basis as interest income and is reported in net interest income, the repayment part reduces the receivables carried on the balance sheet.
The direct costs incurred by the lessor on the date on which the contract is concluded are assigned to the leasing contract. The internal interest rate underlying the lease term is determined in such a way that the initial direct costs are included automatically in the lease receivables.
The LBBW Group as the lessee. With a lease that is classified as operating lease, the lease payments are recorded as »Administrative expenses« over the lease term. T he breakdown of the lease payments corresponds to the time pattern of the user's benefit from the perspective of the LBBW Group. If the time pattern of the user's benefit differs from the actual payments of the expense to be recognized, the difference is recognized or deferred on the assets or the liabilities side of the balance sheet as appropriate.
If a lease term is classified as finance lease, the LBBW Group is the beneficial owner of the leased property and records this as an asset in the consolidated balance sheet. At the time of acquisition, the leased property is recognized at the fair value or at the present value of minimum lease payments, whichever is lower, and a payable in the corresponding amount is recognized as a liability. In subsequent remeasurement, the asset recognized is depreciated in accordance with IAS 16/IAS 38 or measured at fair value in accordance with IAS 40. If there is no reasonable certainty with property and equipment that LBBW or a consolidated subsidiary (lessee) will obtain ownership by the end of the lease term, the asset is depreciated over the (shorter) lease term (and not its economic life). If the lessee benefits from part of the residual value of the leased asset – essentially, buildings, operating and office equipment – the asset is depreciated to this value. The finance lease installments are apportioned into an interest component and a repayment component using the effective interest rate method. This repayment component is recognized against the liability, not affecting profit or loss while the interest component is recognized as interest expense.
As IAS 17 includes no special requirements for recognition of impairments, the general regulations on impairment (IAS 36) also apply to leases.
16. Income tax. IAS 12 governs the recognition and measurement of income tax. Current income tax liabilities and assets are calculated at current tax rates and carried at the expected payment or refund amount.
Deferred income tax assets and liabilities are recognized in respect of temporary differences. Taxable and deductible temporary differences are calculated as the difference between the IFRS carrying amount of an asset or liability and its local tax base (adjusted for permanent differences). The tax base is determined based on the tax regulations of the country in which the taxation occurs. Deferred income tax assets and liabilities are calculated at the tax rates that are expected to apply when the asset is realized or the liability is settled. The effect of tax rate changes on deferred taxes is recognized in profit or loss during the period in which the changes were approved by legislative bodies.
Deferred tax liabilities are carried for temporary differences that will result in a tax expense when settled. Deferred tax assets are recognized if tax relief is expected and likely to be utilized when temporary differences are reversed. If temporary differences relate to items that are credited or charged directly to equity, the resulting deferred taxes are also recognized in »Other income« in the subitems revaluation reserve or retained earnings.
A deferred tax asset is recognized for a tax loss carryforward if it is probable that the carryforward will be used in a future period by reference to budget accounts. Unrecognized loss carryforwards are stated in accordance with their maturity. In recognizing deferred income tax assets owing to interest carryforwards, the same accounting policies and valuation methods are applied as for deferred income tax assets from tax loss carryforwards. Deferred tax assets arising from temporary differences and loss carryforwards are reviewed for impairment at each balance sheet date.
Deferred tax assets are set off against deferred tax liabilities in accordance with IAS 12.74.
CONSOLIDATED FINANCIAL STATEMENTS — NOTES
CO
NSO
LID
AT
ED F
INA
NC
IAL
STA
TEM
ENT
S
151
17. Other assets and other liabilities. »Other assets« includes assets which, considered separately, are not significant for the disclosure of balance sheet assets and cannot be allocated to any other balance sheet item. This also includes inventories, which are described in the following Note.
»Other liabilities« includes accruals and obligations which, considered separately, are not significant for the disclosure of balance sheet liabilities and cannot be allocated to any other balance sheet item.
Assets and liabilities in these items are measured at amortized cost.
18. Inventories. The activities that are related to the real estate business of LBBW Immobilien Management GmbH are shown in »Inventories«. These include mainly specific land and similar rights with finished and/or unfinished buildings as well as project finance earmarked for sale in the course of ordinary business activities.
In accordance with IAS 2.9, inventories are measured at the lower of cost of inventories and net realizable value. The cost of inventories is calculated in accordance with IAS 2.10 et seq. using the weighted average cost formula, while the net realizable value is calculated in accordance with IAS 2.28 et seq. The cost of inventories that cannot be exchanged and of goods and products or services created and separated for special projects is calculated through allocation of their individual cost of purchase or production. The costs include the directly allocable costs of acquisitions and provision, the production costs include all directly allocable costs plus production and material costs. The expected, individually realizable sales proceeds less estimated completion costs and additional costs incurred until the sale are recognized as the net realizable value. The results of these operating activities are recognized under the »Other operating income/expenses« item, which also includes the changes in value.
The capitalization of borrowing costs on the basis of IAS 23 is conditional upon the property being a qualifying asset. These interest costs are largely incurred in connection with commercial project development, which can be attributed to the acquisition of land or the construction of buildings during the production period. No interest on debt capital was recognized during the financial year as all refinancing took place within the Group.
19. Provisions. Provisions for pensions and other post-employment benefit obligations. General information. Provisions for pensions and similar post-employment benefit obligations primarily consist of provisions for the obligation to pay company pensions, on the occurrence of biometric risks (old age, invalidity, death) based on direct pension commitments. The nature and amount of the pension payable to employees entitled to pension benefits are governed by the applicable pension rules (incl. total commitments and company agreements), which depend largely on the date that employment commenced. Due to other commitments, further indirect entitle-ments or claims exist against LBBW's supplementary pension fund (Zusatzversorgungskasse – ZVK) and the benevolent fund (Unterstützungskasse LBBW e.V); both facilities are closed for new policies. All of the aforementioned pension commitments are defined benefit plans within the meaning of IAS 19.
As a result of indirect pension commitments that are entered as defined contribution plans within the meaning of IAS 19, pension benefits from predecessor institutions are taken over and continued. To finance this, the relevant Group company contributes set amounts to external pension funds with individual participation by employees.
Employer-funded pension plans within Germany. For the LBBW merger in 1999, all existing pension arrangements were closed for new policies and a standard pension fund was introduced for new entrants in the form of a service contract; this is the so-called LBBW capital account plant that is classified and entered as a defined benefit plan. The company pensions will be disbursed primarily in the form of a one-off payment or in installments. The lump-sum benefits comprise annual components that are arrived at by multiplying a salary-related contribution with an age-related factor, which takes into account risk and biometric risks. The obligation to extend contributions applies for a limited period of time and features a dynamization provison.
Following the integration of Landesbank Sachsen, its pension arrangements from 2006 was also closed for new policies as at 31 December 2008 and the active employees were transferred to the LBBW capital account plan with an unlimited period of contribution. The entitlements accrued until the time of integration were credited to the Basiskonto of the LBBW capital account plan as an initial benefit module.
As at 1 January 2002, the persons with compulsory ZVK insurance were transferred to the LBBW capital account plan by way of a service agreement. To protect the vested rights, the contribution payable to the Basiskonto (retirement account financed by the employer) for this group of employees equates to the minimum contribution payable by the Bank as an apportionment contribution when applying the collective labor agreement on the additional pension provision for public-sector employees in the respective calendar year (minimum contribution).
CONSOLIDATED FINANCIAL STATEMENTS — NOTES
152
Employer-financed commitments within Germany from predecessor institutions, acquired institutions and integrated institutions. Various pension arrangements – closed to new entrants – exist from different predecessor, acquired and integrated institutions. These range from period of service and salary-dependent, total benefit commitments that sometimes relate to individual contractual provisions (retirement pension guidelines), limitation commitment and commitments with a split pension formula, through to pension component plans. Defined benefit plans should therefore be understood as commitments to grant a defined level of benefit in relation to the active salaries, taking into account additional pension payments (e.g. statutory pension), whereby a limitation commitment sets a defined level of benefit that may be not exceeded by the pension payments plus qualifying pension benefits.
Some current and former employees are entitled to aid (medical support). This was entered as defined benefit plans and the corresponding provisions pursuant to IAS 19 were created for employees that are still entitled to post-employment aid.
Employer-financed commitments within Germany. In order to established further entitlements and to implement the legal claim to salary conversion, LBBW offers the so-called Aufbaukonto (retirement account to which contributions are made by the employee) of the LBBW capital account plan as a direct pension commitment. A standard model exists throughout the Group since January 2012, where the employees' individual gross conversion amount is converted into a benefit module by multiplying it by a market interest-related age factor. The age factors are set each year.
There are also employer-financed entitlements from earlier conversions of earnings into pension contributions, whose structures are largely similar. Reinsurance agreements are also concluded in some cases to fund the pension benefits. There are no provisioning requirements for the deferred compensation option that is also offered, as this is entered as a defined benefit plan within the meaning of IAS 19. Direct insurance agreements are concluded with provider from the savings banks' environment to secure long-term performance.
Commitments outside of Germany. The employees of Landesbank Baden-Württemberg's London Branch were offered a direct final salary pension plan that is based on the number of years in service, which is closed for new policies and was replaced by a defined contribution plan within the meaning of IAS 19 for new employees. The pension plan's pension obligations are backed by plan assets managed by a pension trust. The pension plan as well as the pension trust are subject to UK regulations, according to which the Bank and the trustees responsible for the trust have to develop a funding strategy and plan contributions to the trust. The Bank bears the risks from the pension plan, including investment and demographic risks (longevity risk, in particular). Annuity contracts were concluded in the past to hedge risk when retirement began for those entitled to a pension. Term life insurance policies to cover mortality risk during active service exist for some beneficiaries. The pension plan bears the remaining risk.
The Bank and the trustees review the investment strategy every three years and adjust it if necessary. If there is a shortfall in cover, a contribution plan is agreed to reach the desired degree of cover. Some of the plan assets, such as the annuity contracts, are covered by the expected payment obligations with matching maturities (asset-liability matching).
For reasons of materiality, the information in Note 50 is not differentiated for the foreign plans.
CONSOLIDATED FINANCIAL STATEMENTS — NOTES
CO
NSO
LID
AT
ED F
INA
NC
IAL
STA
TEM
ENT
S
153
Valuation and recognition in the balance sheet. According to the provisions of IAS 19, the total obligations for the defined benefit plans are calculated annually by independent actuaries. In this process, the present value of the defined benefit obligation is calculated at each reporting date using the projected unit credit method. This calculation takes into consideration not only the pensions and entitlements known at the balance sheet date, but also the future expected rates of increase of pensionable salaries and pensions, the expected benefit cases (old age, invalidity, death) as well as fluctuation rates. In addition to the benefits trend, it is assumed in the measurement of the pension obligations that the active employees' benefit trend will be slightly higher than the average trend up to their 50th year, on account of career development. The present value of the pension obligations is based on a calculatory interest rate derived from the Towers Watson's RATE:Link methodology. The data basis for deter-mining the interest rate is the AA-rated corporate bonds compiled in Bloomberg for the eurozone by at least half of the rating agencies. Using actuarial methods, a yield curve is derived from this data, and from this a calculatory interest rate of similar maturity to the obligations is established. The probabilities of death, invalidity and probabilities of marriage are found in the mortality tables compiled by Prof. Klaus Heubeck. The earliest age for the start of retirement in the statutory pension scheme is generally used (mainly 63 years). The premises described above are reviewed annually and adjusted if necessary.
Deviations from the expected development of the pension obligations as well as changes to the calculation parameters (employee turnover rate, salary increase, pension increase or discount rate) lead to so-called actuarial gains or losses. These are recognized directly in retained earnings or »Other income« in their full amount in the year they arise, resulting in corresponding changes in equity.
The amount to be recorded as an asset or liability is calculated from the present value of the defined benefit obligation at the balance sheet date less the fair value of the plan assets (if any) at the balance sheet date. The past service cost arises due to changes in the defined benefit plan that impact on the pension entitlements accrued. Interest expense is the share of the increase in the present value of the defined benefit obligation, or the existing plan assets of the pension provisions, that arise because the benefits are closer to settlement. The staff costs equate to the present value of the annual increase in the pension entitlements accrued plus unrecognized past service costs.
The income expected from the plan assets is offset against the interest expense, so that only net interest expense is recognized. The calculatory interest rate is used for calculating net interest income. Service costs and net interest income are reported in »Administrative expenses«.
Risks and management. In the case of defined benefit plans, the relevant Group company is obligated to grant benefits pledged to former employees and their dependants. The associated risks are carried by the Group company in question, the parent having relieved individual Group companies of some obligations.
Material risks are balance sheet, liquidity and investment risks. In accordance with IAS 19, balance sheet risks arise especially in relation to the impact of pension obligations on equity, as the difference between expected and actual pension obligations is recognized in Other income and leads to changes in equity. The basis and amount of balance sheet risk determine the aforementioned actuarial gains or losses. They can therefore provide relief or be a burden. The main factor in relation to balance sheet risks are the calculatory interest rate, the yield of the plan assets, as well as the other economic and demographic measurement factors.
The calculatory interest rate plays a key role in determining the scope of obligations, not least on account of its volatility. The general lowering of interest rates in the last two years resulted in a markedly lower calculatory interest rate and therefore to a sharp increase in the pension obligations. Furthermore, portfolio and market development that deviate from the measurement assumptions impact on the obligation amount and therefore on the corresponding balance sheet item. Actual salary and pension increases that are higher or lower than assumed are reflected accordingly in losses or gains. With the general contribution and limit systems, the performance of the entitlements and claims in the event of external providers, such as BVV or the statutory pension scheme, impact on the level of provision to be made by the Group company, which can have a relatively strong impact on the pension obligations, especially with lasting trend changes. Besides the economic risks stated, so-called biometric risks also exist. Since a large proportion of the pension obligations is attributable to lifelong benefit entitlements, the risk of longevity in particular must be stated. Deviations in the actual mortality rates observed from the mortality tables also result in gains or losses.
Sensitivity analyses were carried our for the material parameters. In addition to the calculatory interest rate, the most influential parameters examined were the impact of the salary, pension and career trend, as well as the staff turnover probability. The mortality, salary and pension trend impact on the obligations arising from the capital accounts open to new entrants (Basiskonto and Aufbaukonto) and the fluctuation have comparatively little impact, since life-long benefits are generally not granted and the pension entitlements for active employees do not grow dynamically with the salaries. This will gradually reduce the balance sheet risk for the Group companies over time.
CONSOLIDATED FINANCIAL STATEMENTS — NOTES
154
Meeting pension obligations entails the payment of pensions and therefore a capital outflow. Save for the calculatory interest rate, which does not impact on the amount of benefit payments, the balance sheet risk factors described above also affect the liquidity requirements. Since no plan assets were separated for the direct pension obligations, the benefit payments must be met from the assets of the Group companies. Plan assets that can be produced from the pension payments are available for the indirect obligations of LBBW's benevolent fund and supplementary pension fund. If sufficient cover is not available, the sponsoring undertakings are required to make additional contributions. The plan assets are subject to investment risk that is countered by careful asset management.
The mandatory protection against the insolvency of LBBW pension obligations applies to commitments given before the elimination of the guarantor’s liability in 2005, via the pension insurance association. All pension commitments dating from before this date are insolvency-protected through the guarantor's liability and maintenance obligation.
Other provisions. Provisions are recognized for uncertain obligations to third parties and anticipated losses from onerous contracts. Provisions are carried at the best estimate. This is the amount required to settle the present obligation at the balance sheet date (amount that LBBW or a consolidated subsidiary would rationally pay to settle the obligation or to transfer it to a third party) and which is most likely to occur. In doing so, management included empirical values from similar transactions and may have drawn on opinions by independent experts.
The other personnel-related provisions include provisions for staff anniversaries and provisions for early retirement and partial retirement.
According to the provisions governing long service awards, an anniversary bonus is awarded to employees who have been with the Company for 10, 25, 40 and 50 years, the amount of which is guided by company or collective bargaining agreements. The corresponding anniversary provisions are calculated and set aside.
Provisions are also created for concluded partial retirement agreements. The legally required capital preservation of accrued benefits in the case of partial retirement is covered by a two-sided trustee agreement. The appropriated assets held in the custodian accounts is invested in the money market and offset against the corresponding provisions.
Provisions are also created for concluded and potential early retirement agreements; potential provisions are weighted with a probability of 30 %.
LBBW offers its employees in the Bank and some subsidiaries a long-term account, the so-called LBBW FlexiWertkonto. It offers employees the opportunity to pay in part of their remuneration in the FlexiWertkonto, which they can use again in the form of time (withdrawal time). A two-sided trustee agreement was drawn up to secure these accrued retirement benefits as prescribed by law. Provisions are created for obligations arising from these accounts and offset against the accrued retirement benefits.
As a rule, the same risks apply to all other provisions as for the post-retirement obligations, albeit to a much lesser extent owing to the shorter obligation period.
Provisions for off-balance sheet credit risks as well as other provisions that include provisions for restructuring and legal disputes are carried where the LBBW Group has a legal or constructive obligation from a past event where fulfilling the obligation is likely to lead to an outflow of resources embodying economic benefits and a reliable estimate of the amount of the obligation can be made.
Non-current provisions are discounted where the effect is material.
20. Subordinated capital. The LBBW Group reports subordinated liabilities (e. g. borrower's note loans or issues), profit participation rights and typical silent partnership contributions under »Subordinated capital«. Subordinated capital constitutes both equity and debt for commercial law and banking regulatory purposes. In view of the contractually agreed repayment of capital, the subordinated liabilities and profit participation rights are classified as debt in accordance with IFRS. In accordance with IAS 32, the silent partnership contributions are also recognized as debt, on account of the existence of a contractual right of termination or repayment to the investor. This also applies to silent partnership contributions, which are recognized as liable equity for regulatory purposes and within the meaning of the German Banking Act (KWG).
CONSOLIDATED FINANCIAL STATEMENTS — NOTES
CO
NSO
LID
AT
ED F
INA
NC
IAL
STA
TEM
ENT
S
155
Generally, subordinated capital is carried at amortized cost. In case of changes in interest and repayment cash flows, the carrying amount for capital from profit participation rights and silent partnership contributions is reported at present value in the balance sheet. LBBW assumes that nominal EUR 1 billion in silent partnership contributions will be repaid and has taken this into consideration in its estimates for future cash flow for calculating the present value. The repayment depends on the approval of BaFin that was still pending at the time of preparing the annual statements.
The amortized costs are adjusted for effects from hedge accounting. Explanations on hedge accounting can be found in the general accounting and valuation methods for the financial instruments (see Note 6).
21. Equity. The share capital is the capital paid in by the owners of Landesbank Baden-Württemberg (the State of Baden-Württemberg, Sparkassenverband Baden-Württemberg (Savings Bank Association of Baden-Württemberg), the state capital Stuttgart, Landeskreditbank Baden-Württemberg – Förderbank – and Landesbeteiligungen Baden-Württemberg GmbH) in accordance with section 5 Gesetz über die Landesbank Baden-Württemberg (Landesbank Baden-Württemberg Act) in conjunction with section 3 of the ordinance of Landesbank Baden-Württemberg.
The capital reserve includes the amount in excess of the (theoretical) nominal value that is achieved when issuing units (offering premium).
In addition to transfers from the net consolidated profit/loss, retained earnings include the Group's share in the unappropriated profit/loss of the consolidated subsidiaries to the extent that these profits were generated since the inclusion of such subsidiaries in the scope of consolidation. The other retained earnings include the effects of the first time adoption of IFRS (with the exception of other income) as well as actuarial gains/losses and the associated deferred taxes in connection with the recognition of provisions for pensions.
The effects of the fair value measurement of the AfS securities and equity investments, as well as valuation changes recognized directly in equity from investments accounted for using the equity method, are reported under »Other income« under the item revaluation reserve, if necessary after deduction of any deferred taxes. These gains or losses are not recognized through profit or loss until the asset is sold or written off. The revaluation reserve also includes the offsetting item from the recognition of deferred tax assets or liabilities on measurement differences in equity. In addition, the remeasurement gain or loss from cash flow hedges includes the portion of the profit or loss with no effect on the income statement, and the offsetting item from the recognition of deferred tax assets and liabilities on cash flow hedges is also reported in this item. Cash flows from variable interest bonds with maximum maturities of five years and average maturities of approximately 2.5 years are hedged. The currency translation reserve is also included in this item. The balance of currency translation differences arising due to capital consolidation is allocated to the currency translation reserve. These amounts arise from the translation of the annual financial statements of an economically independent entity into the Group's reporting currency.
Non-controlling interests are stated as a separate subitem in equity; besides the shareholders of the parent company, other shareholders hold a stake in the equity of individual subsidiaries.
CONSOLIDATED FINANCIAL STATEMENTS — NOTES
156
Segment reporting.
The segment reporting of the LBBW Group for the 2013 financial year is also drawn up in accordance with the provisions of IFRS 8. Following the management approach, segment reporting is therefore based on internal management reporting to the Group’s Board of Managing Directors, which, in its function as the chief operating decision-maker, regularly makes decisions about the allocation of resources and the assessment of the performance of the segments on this basis.
Classification of segments. The business segments presented below are defined as product and customer groups in accordance with the Group's internal organizational structures, in accordance with the internal management report. Subsidiaries and equity investments are assigned to the individual segments according to their business orientation.
Segment reporting at the LBBW Group is divided into the following segments:
■ The Corporates segment is an aggregate reporting segment in accordance with IFRS 8.12 and includes the business segments Corporates I, Corporates II and International Business. This segment includes the following material subsidiaries: LBBW Immobilien Management GmbH, Süd-KapitalbeteiligungsGesellschaft mbH, SüdLeasing GmbH, MKB Mittelrheinische Bank GmbH and SüdFactoring GmbH. The Corporates segment comprises business with SMEs, with a focus on the core markets of Baden-Württemberg, Saxony and Rhineland-Palatinate, key accounts and business with the public sector. On the financing side, the solutions offered range from classic through structured to off-balance sheet financing. Services are also offered in the areas of international business, cash management, interest rate, currency and commodities management, asset and pension management. Products relating to the primary capital markets business for our customers in the Corporates segment and commercial real estate financing are also included here.
■ Apart from trading activities in connection with the customer business, the Financial Markets segment also includes all sales activities with banks, sovereigns, insurance companies and pension funds. The product portfolio contains financial instruments for the management of liquidity and interest rate, currency and credit risks. Financing solutions are also offered on the primary market in the field of equity and debt, along with asset management services. The Corporates segment includes all results from financial market transactions with corporate customers. As a significant subsidiary, LBBW Asset Management Investmentgesellschaft mbH is allocated to the Financial Markets segment.
■ The Retail/Savings Bank segment includes all activities in the private customer business involving retail, investment, private banking and wealth management customers. The products on offer cover classic checking accounts, real estate financing, investment advice, and specialized services – particularly for wealth management customers – such as financial planning, asset management, securities account management, and foundation management. Business activities connected with the Bank’s function as the central bank for savings banks are also included in this segment
■ The Credit Investment segment essentially pools the Group's credit substitute business. In particular, this includes the Bank’s own investments in plain vanilla bonds, structured securitizations and credit derivatives. It also includes the financing of the special-purpose entity Sealink Funding.
■ The Corporate Items segment comprises all business activities not included in the operating segments mentioned above. In addition to treasury activities (especially the result generated from the central investment of own funds, lending/deposit-taking operations, IFRS specifics in relation to the refinancing and the management of strategic investments and cover funds), this notably consists of equity investments not included in the consolidated interim financial statements, the costs of strategic projects for the Bank as a whole and to prepare for the new regulatory requirements, and extraordinary income in connection with the restructuring plan approved by the EU (e. g. restructuring income or expenses.
■ The Reconciliation/Consolidation column includes matters related solely to consolidation. In addition, this segment reconciles internal financial control data with external financial reporting.
CONSOLIDATED FINANCIAL STATEMENTS — NOTES
CO
NSO
LID
AT
ED F
INA
NC
IAL
STA
TEM
ENT
S
157
Valuation methods. Segment information is based on the internal financial control data documented by Financial Controlling, which combine external financial reporting methods and economic valuation methods. The resulting differences in valuation and reporting compared with the IFRS Group figures are presented in the reconciliation statement.
As a rule, the income and expenses of the LBBW Group are allocated to the individual segments in which they arise. There is therefore no significant income resulting from transactions between the segments.
Net interest income is calculated using the market interest method. This also includes the capital benefit, i.e. investment income from equity.
Allowances for losses on loans and advances correspond to the carrying amounts in the income statement and are allocated to the segments in which they arise.
Net gains/losses from financial instruments measured at fair value through profit or loss include net trading gains/losses, net gains/losses from hedge accounting and net gains/losses from financial instruments designated at fair value.
Net gains/losses from financial investments are reported in a single item along with net income/expenses from investments accounted for using the equity method and net gains/losses from profit or loss transfer agreements, and allocated to the segments in which they arise.
Net income/expenses from investment property are recognized as part of other operating income/expenses.
Besides direct personnel and material expenses, the administrative expenses of a segment include expenses assigned on the basis of intragroup cost allocation. Bank levy is allocated to the segments. Overheads are allocated on a pro rata basis.
The assets on the balance sheet are reported as segment assets. They are allocated to the segments on the basis of internal management reporting.
In anticipation of the forthcoming conversion of the regulatory requirements from Basel 2.5 to Basel III as of 1 January 2014, LBBW integrated the new requirements already in the 2013 financial year, on the basis of the full implementation in internal management (fully loaded). The risk weighted assets in accordance with Basel III were not determined retrospectively for the 2012 financial year. To complement this and achieve better comparability, the risk weighted assets and the corresponding ratios of tied-up equity and return on equity (RoE) will be reported for information purposes according to the current regulatory requirements (Basel 2.5) in the 2013 financial year.
The average tied-up capital in the segments is calculated on the basis of the risk weighted assets and imputed Tier 1 capital backing.
A segment’s return on equity (RoE) is calculated based on the ratio of net consolidated profit/loss before tax to average equity deemed to be tied up in accordance with regulatory requirements. The cost/income ratio (CIR) is calculated from the ratio of administrative expenses to the aggregate of net interest income, net fee and commission income, the net gains/losses of financial instruments measured at fair value and other operating income/expenses.
The corrections to the balance sheet owing to matters in accordance with IAS 8.42 were taken into account in the segment reporting in the 2013 financial year.
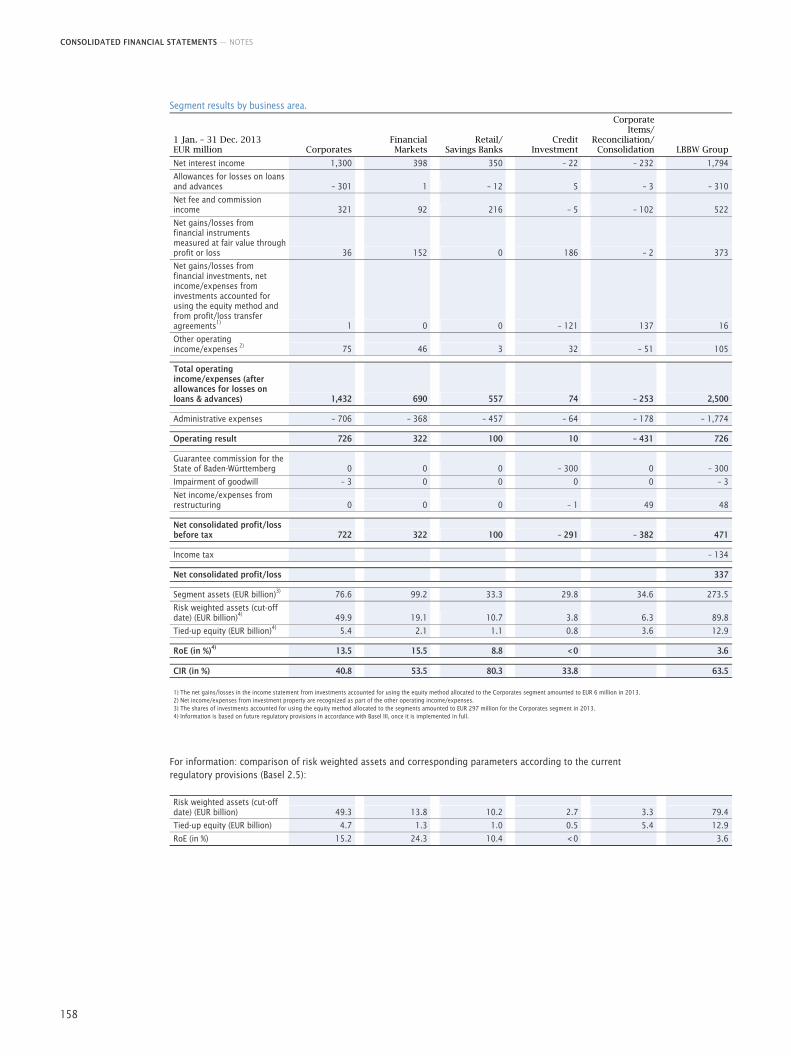
CONSOLIDATED FINANCIAL STATEMENTS — NOTES
158
Segment results by business area.
1 Jan. – 31 Dec. 2013 EUR million Corporates
Financial Markets
Retail/Savings Banks
Credit Investment
Corporate Items/
Reconciliation/Consolidation LBBW Group
Net interest income 1,300 398 350 – 22 – 232 1,794
Allowances for losses on loans and advances – 301 1 – 12 5 – 3 – 310
Net fee and commission income 321 92 216 – 5 – 102 522
Net gains/losses from financial instruments measured at fair value through profit or loss 36 152 0 186 – 2 373
Net gains/losses from financial investments, net income/expenses from investments accounted for using the equity method and from profit/loss transfer agreements1) 1 0 0 – 121 137 16
Other operating income/expenses 2) 75 46 3 32 – 51 105 Total operating income/expenses (after allowances for losses on loans & advances) 1,432 690 557 74 – 253 2,500 Administrative expenses – 706 – 368 – 457 – 64 – 178 – 1,774 Operating result 726 322 100 10 – 431 726 Guarantee commission for the State of Baden-Württemberg 0 0 0 – 300 0 – 300
Impairment of goodwill – 3 0 0 0 0 – 3
Net income/expenses from restructuring 0 0 0 – 1 49 48 Net consolidated profit/loss before tax 722 322 100 – 291 – 382 471 Income tax – 134 Net consolidated profit/loss 337 Segment assets (EUR billion)3) 76.6 99.2 33.3 29.8 34.6 273.5
Risk weighted assets (cut-off date) (EUR billion)4) 49.9 19.1 10.7 3.8 6.3 89.8
Tied-up equity (EUR billion)4) 5.4 2.1 1.1 0.8 3.6 12.9 RoE (in %)4) 13.5 15.5 8.8 < 0 3.6 CIR (in %) 40.8 53.5 80.3 33.8 63.5 1) The net gains/losses in the income statement from investments accounted for using the equity method allocated to the Corporates segment amounted to EUR 6 million in 2013. 2) Net income/expenses from investment property are recognized as part of the other operating income/expenses. 3) The shares of investments accounted for using the equity method allocated to the segments amounted to EUR 297 million for the Corporates segment in 2013. 4) Information is based on future regulatory provisions in accordance with Basel III, once it is implemented in full.
For information: comparison of risk weighted assets and corresponding parameters according to the current regulatory provisions (Basel 2.5):
Risk weighted assets (cut-off date) (EUR billion) 49.3 13.8 10.2 2.7 3.3 79.4
Tied-up equity (EUR billion) 4.7 1.3 1.0 0.5 5.4 12.9
RoE (in %) 15.2 24.3 10.4 < 0 3.6
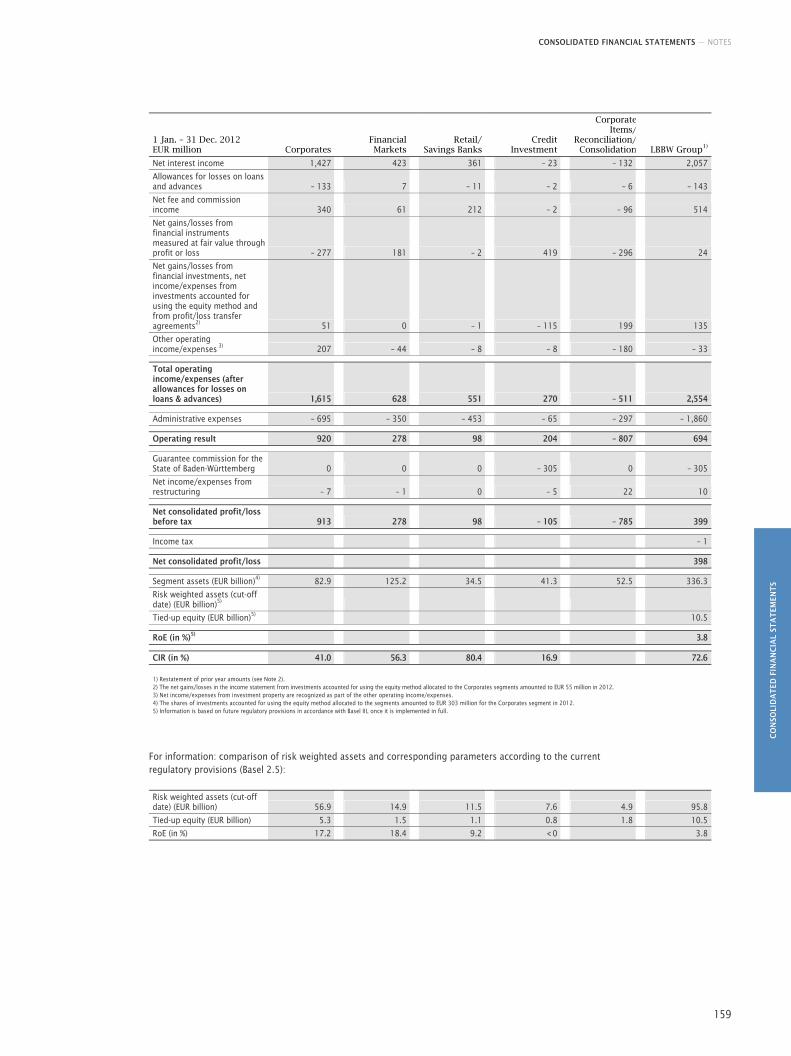
CONSOLIDATED FINANCIAL STATEMENTS — NOTES
CO
NSO
LID
AT
ED F
INA
NC
IAL
STA
TEM
ENT
S
159
1 Jan. – 31 Dec. 2012 EUR million Corporates
Financial Markets
Retail/Savings Banks
Credit Investment
Corporate Items/
Reconciliation/Consolidation LBBW Group1)
Net interest income 1,427 423 361 – 23 – 132 2,057
Allowances for losses on loans and advances – 133 7 – 11 – 2 – 6 – 143
Net fee and commission income 340 61 212 – 2 – 96 514
Net gains/losses from financial instruments measured at fair value through profit or loss – 277 181 – 2 419 – 296 24
Net gains/losses from financial investments, net income/expenses from investments accounted for using the equity method and from profit/loss transfer agreements2) 51 0 – 1 – 115 199 135
Other operating income/expenses 3) 207 – 44 – 8 – 8 – 180 – 33 Total operating income/expenses (after allowances for losses on loans & advances) 1,615 628 551 270 – 511 2,554 Administrative expenses – 695 – 350 – 453 – 65 – 297 – 1,860 Operating result 920 278 98 204 – 807 694 Guarantee commission for the State of Baden-Württemberg 0 0 0 – 305 0 – 305
Net income/expenses from restructuring – 7 – 1 0 – 5 22 10 Net consolidated profit/loss before tax 913 278 98 – 105 – 785 399 Income tax – 1 Net consolidated profit/loss 398 Segment assets (EUR billion)4) 82.9 125.2 34.5 41.3 52.5 336.3
Risk weighted assets (cut-off date) (EUR billion)5)
Tied-up equity (EUR billion)5) 10.5 RoE (in %)5) 3.8 CIR (in %) 41.0 56.3 80.4 16.9 72.6 1) Restatement of prior year amounts (see Note 2). 2) The net gains/losses in the income statement from investments accounted for using the equity method allocated to the Corporates segments amounted to EUR 55 million in 2012. 3) Net income/expenses from investment property are recognized as part of the other operating income/expenses. 4) The shares of investments accounted for using the equity method allocated to the segments amounted to EUR 303 million for the Corporates segment in 2012. 5) Information is based on future regulatory provisions in accordance with Basel III, once it is implemented in full.
For information: comparison of risk weighted assets and corresponding parameters according to the current regulatory provisions (Basel 2.5):
Risk weighted assets (cut-off date) (EUR billion) 56.9 14.9 11.5 7.6 4.9 95.8
Tied-up equity (EUR billion) 5.3 1.5 1.1 0.8 1.8 10.5
RoE (in %) 17.2 18.4 9.2 < 0 3.8
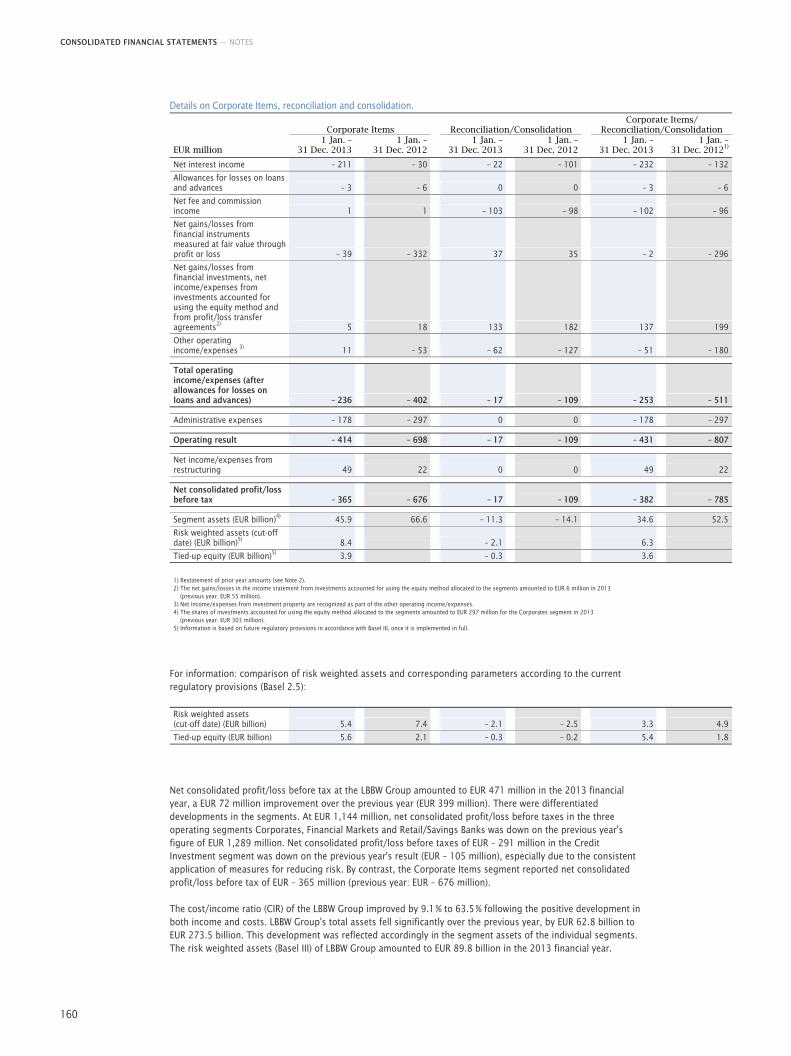
CONSOLIDATED FINANCIAL STATEMENTS — NOTES
160
Details on Corporate Items, reconciliation and consolidation.
Corporate Items Reconciliation/Consolidation Corporate Items/
Reconciliation/Consolidation
EUR million 1 Jan. –
31 Dec. 2013
1 Jan. – 31 Dec. 2012
1 Jan. – 31 Dec. 2013
1 Jan. – 31 Dec. 2012
1 Jan. – 31 Dec. 2013
1 Jan. –31 Dec. 20121)
Net interest income – 211 – 30 – 22 – 101 – 232 – 132
Allowances for losses on loans and advances – 3 – 6 0 0 – 3 – 6
Net fee and commission income 1 1 – 103 – 98 – 102 – 96
Net gains/losses from financial instruments measured at fair value through profit or loss – 39 – 332 37 35 – 2 – 296
Net gains/losses from financial investments, net income/expenses from investments accounted for using the equity method and from profit/loss transfer agreements2) 5 18 133 182 137 199
Other operating income/expenses 3) 11 – 53 – 62 – 127 – 51 – 180 Total operating income/expenses (after allowances for losses on loans and advances) – 236 – 402 – 17 – 109 – 253 – 511 Administrative expenses – 178 – 297 0 0 – 178 – 297 Operating result – 414 – 698 – 17 – 109 – 431 – 807 Net income/expenses from restructuring 49 22 0 0 49 22 Net consolidated profit/loss before tax – 365 – 676 – 17 – 109 – 382 – 785 Segment assets (EUR billion)4) 45.9 66.6 – 11.3 – 14.1 34.6 52.5
Risk weighted assets (cut-off date) (EUR billion)5) 8.4 – 2.1 6.3
Tied-up equity (EUR billion)5) 3.9 – 0.3 3.6 1) Restatement of prior year amounts (see Note 2). 2) The net gains/losses in the income statement from investments accounted for using the equity method allocated to the segments amounted to EUR 6 million in 2013
(previous year: EUR 55 million). 3) Net income/expenses from investment property are recognized as part of the other operating income/expenses. 4) The shares of investments accounted for using the equity method allocated to the segments amounted to EUR 297 million for the Corporates segment in 2013
(previous year: EUR 303 million). 5) Information is based on future regulatory provisions in accordance with Basel III, once it is implemented in full.
For information: comparison of risk weighted assets and corresponding parameters according to the current regulatory provisions (Basel 2.5):
Risk weighted assets (cut-off date) (EUR billion) 5.4 7.4 – 2.1 – 2.5 3.3 4.9
Tied-up equity (EUR billion) 5.6 2.1 – 0.3 – 0.2 5.4 1.8
Net consolidated profit/loss before tax at the LBBW Group amounted to EUR 471 million in the 2013 financial year, a EUR 72 million improvement over the previous year (EUR 399 million). There were differentiated developments in the segments. At EUR 1,144 million, net consolidated profit/loss before taxes in the three operating segments Corporates, Financial Markets and Retail/Savings Banks was down on the previous year's figure of EUR 1,289 million. Net consolidated profit/loss before taxes of EUR – 291 million in the Credit Investment segment was down on the previous year's result (EUR – 105 million), especially due to the consistent application of measures for reducing risk. By contrast, the Corporate Items segment reported net consolidated profit/loss before tax of EUR – 365 million (previous year: EUR – 676 million).
The cost/income ratio (CIR) of the LBBW Group improved by 9.1 % to 63.5 % following the positive development in both income and costs. LBBW Group's total assets fell significantly over the previous year, by EUR 62.8 billion to EUR 273.5 billion. This development was reflected accordingly in the segment assets of the individual segments. The risk weighted assets (Basel III) of LBBW Group amounted to EUR 89.8 billion in the 2013 financial year.
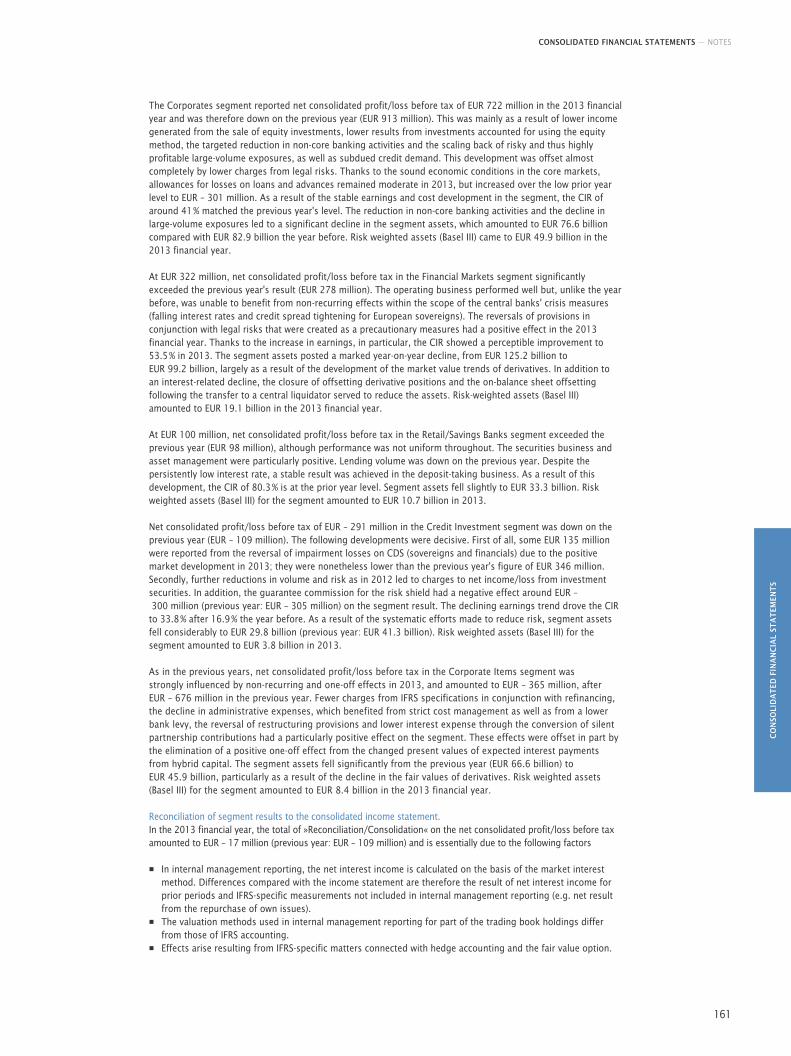
CONSOLIDATED FINANCIAL STATEMENTS — NOTES
CO
NSO
LID
AT
ED F
INA
NC
IAL
STA
TEM
ENT
S
161
The Corporates segment reported net consolidated profit/loss before tax of EUR 722 million in the 2013 financial year and was therefore down on the previous year (EUR 913 million). This was mainly as a result of lower income generated from the sale of equity investments, lower results from investments accounted for using the equity method, the targeted reduction in non-core banking activities and the scaling back of risky and thus highly profitable large-volume exposures, as well as subdued credit demand. This development was offset almost completely by lower charges from legal risks. Thanks to the sound economic conditions in the core markets, allowances for losses on loans and advances remained moderate in 2013, but increased over the low prior year level to EUR – 301 million. As a result of the stable earnings and cost development in the segment, the CIR of around 41 % matched the previous year's level. The reduction in non-core banking activities and the decline in large-volume exposures led to a significant decline in the segment assets, which amounted to EUR 76.6 billion compared with EUR 82.9 billion the year before. Risk weighted assets (Basel III) came to EUR 49.9 billion in the 2013 financial year.
At EUR 322 million, net consolidated profit/loss before tax in the Financial Markets segment significantly exceeded the previous year's result (EUR 278 million). The operating business performed well but, unlike the year before, was unable to benefit from non-recurring effects within the scope of the central banks' crisis measures (falling interest rates and credit spread tightening for European sovereigns). The reversals of provisions in conjunction with legal risks that were created as a precautionary measures had a positive effect in the 2013 financial year. Thanks to the increase in earnings, in particular, the CIR showed a perceptible improvement to 53.5 % in 2013. The segment assets posted a marked year-on-year decline, from EUR 125.2 billion to EUR 99.2 billion, largely as a result of the development of the market value trends of derivatives. In addition to an interest-related decline, the closure of offsetting derivative positions and the on-balance sheet offsetting following the transfer to a central liquidator served to reduce the assets. Risk-weighted assets (Basel III) amounted to EUR 19.1 billion in the 2013 financial year.
At EUR 100 million, net consolidated profit/loss before tax in the Retail/Savings Banks segment exceeded the previous year (EUR 98 million), although performance was not uniform throughout. The securities business and asset management were particularly positive. Lending volume was down on the previous year. Despite the persistently low interest rate, a stable result was achieved in the deposit-taking business. As a result of this development, the CIR of 80.3 % is at the prior year level. Segment assets fell slightly to EUR 33.3 billion. Risk weighted assets (Basel III) for the segment amounted to EUR 10.7 billion in 2013.
Net consolidated profit/loss before tax of EUR – 291 million in the Credit Investment segment was down on the previous year (EUR – 109 million). The following developments were decisive. First of all, some EUR 135 million were reported from the reversal of impairment losses on CDS (sovereigns and financials) due to the positive market development in 2013; they were nonetheless lower than the previous year's figure of EUR 346 million. Secondly, further reductions in volume and risk as in 2012 led to charges to net income/loss from investment securities. In addition, the guarantee commission for the risk shield had a negative effect around EUR – 300 million (previous year: EUR – 305 million) on the segment result. The declining earnings trend drove the CIR to 33.8 % after 16.9 % the year before. As a result of the systematic efforts made to reduce risk, segment assets fell considerably to EUR 29.8 billion (previous year: EUR 41.3 billion). Risk weighted assets (Basel III) for the segment amounted to EUR 3.8 billion in 2013.
As in the previous years, net consolidated profit/loss before tax in the Corporate Items segment was strongly influenced by non-recurring and one-off effects in 2013, and amounted to EUR – 365 million, after EUR – 676 million in the previous year. Fewer charges from IFRS specifications in conjunction with refinancing, the decline in administrative expenses, which benefited from strict cost management as well as from a lower bank levy, the reversal of restructuring provisions and lower interest expense through the conversion of silent partnership contributions had a particularly positive effect on the segment. These effects were offset in part by the elimination of a positive one-off effect from the changed present values of expected interest payments from hybrid capital. The segment assets fell significantly from the previous year (EUR 66.6 billion) to EUR 45.9 billion, particularly as a result of the decline in the fair values of derivatives. Risk weighted assets (Basel III) for the segment amounted to EUR 8.4 billion in the 2013 financial year.
Reconciliation of segment results to the consolidated income statement. In the 2013 financial year, the total of »Reconciliation/Consolidation« on the net consolidated profit/loss before tax amounted to EUR – 17 million (previous year: EUR – 109 million) and is essentially due to the following factors
■ In internal management reporting, the net interest income is calculated on the basis of the market interest method. Differences compared with the income statement are therefore the result of net interest income for prior periods and IFRS-specific measurements not included in internal management reporting (e.g. net result from the repurchase of own issues).
■ The valuation methods used in internal management reporting for part of the trading book holdings differ from those of IFRS accounting.
■ Effects arise resulting from IFRS-specific matters connected with hedge accounting and the fair value option.
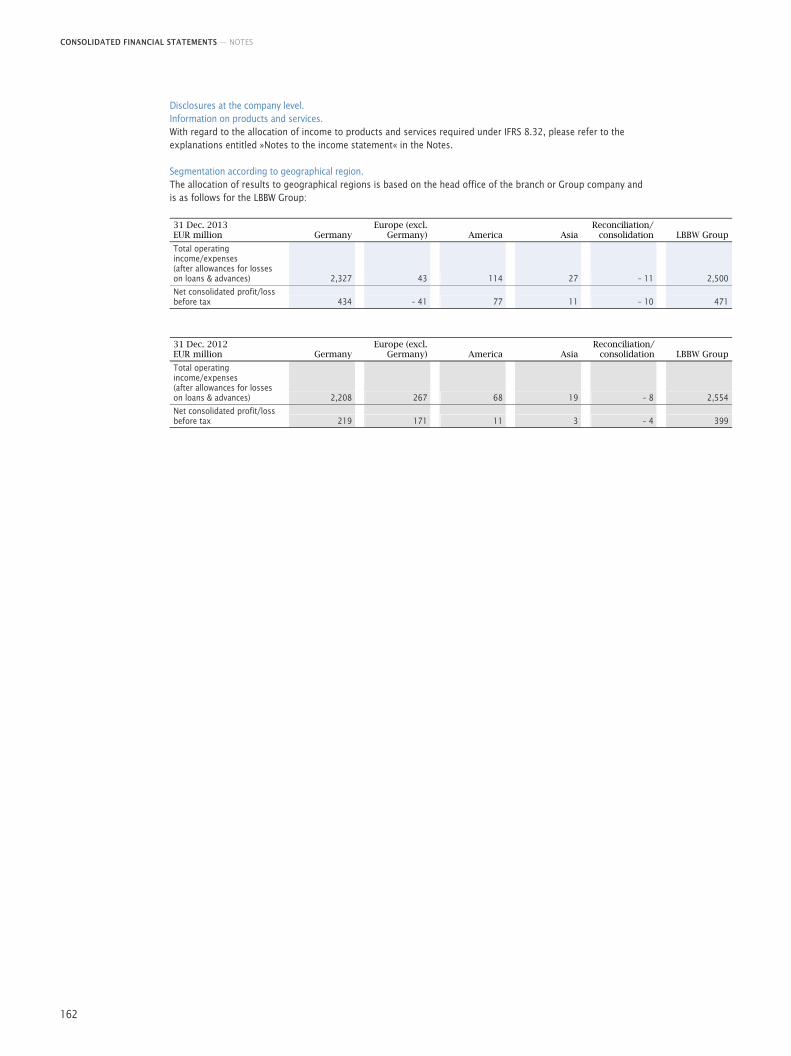
CONSOLIDATED FINANCIAL STATEMENTS — NOTES
162
Disclosures at the company level. Information on products and services. With regard to the allocation of income to products and services required under IFRS 8.32, please refer to the explanations entitled »Notes to the income statement« in the Notes.
Segmentation according to geographical region. The allocation of results to geographical regions is based on the head office of the branch or Group company and is as follows for the LBBW Group:
31 Dec. 2013 EUR million Germany
Europe (excl. Germany) America Asia
Reconciliation/consolidation LBBW Group
Total operating income/expenses (after allowances for losses on loans & advances) 2,327 43 114 27 – 11 2,500
Net consolidated profit/loss before tax 434 – 41 77 11 – 10 471
31 Dec. 2012 EUR million Germany
Europe (excl. Germany) America Asia
Reconciliation/ consolidation LBBW Group
Total operating income/expenses (after allowances for losses on loans & advances) 2,208 267 68 19 – 8 2,554
Net consolidated profit/loss before tax 219 171 11 3 – 4 399
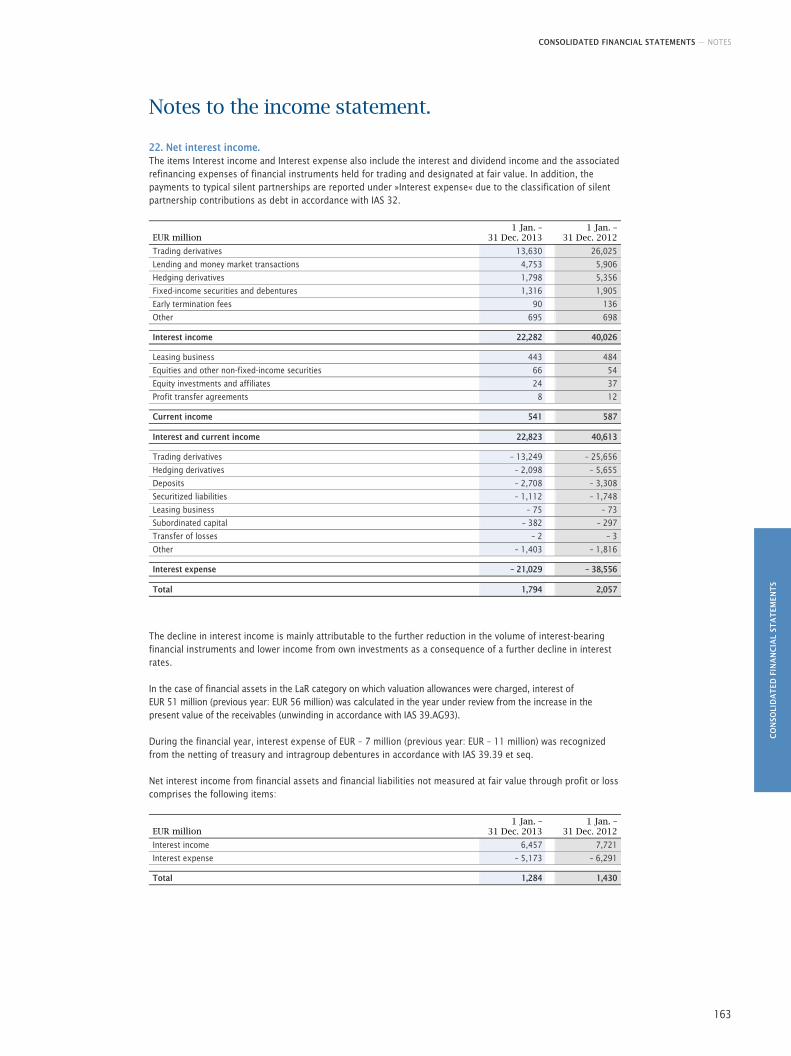
CONSOLIDATED FINANCIAL STATEMENTS — NOTES
CO
NSO
LID
AT
ED F
INA
NC
IAL
STA
TEM
ENT
S
163
Notes to the income statement.
22. Net interest income. The items Interest income and Interest expense also include the interest and dividend income and the associated refinancing expenses of financial instruments held for trading and designated at fair value. In addition, the payments to typical silent partnerships are reported under »Interest expense« due to the classification of silent partnership contributions as debt in accordance with IAS 32.
EUR million 1 Jan. –
31 Dec. 2013
1 Jan. – 31 Dec. 2012
Trading derivatives 13,630 26,025
Lending and money market transactions 4,753 5,906
Hedging derivatives 1,798 5,356
Fixed-income securities and debentures 1,316 1,905
Early termination fees 90 136
Other 695 698 Interest income 22,282 40,026 Leasing business 443 484
Equities and other non-fixed-income securities 66 54
Equity investments and affiliates 24 37
Profit transfer agreements 8 12 Current income 541 587 Interest and current income 22,823 40,613 Trading derivatives – 13,249 – 25,656
Hedging derivatives – 2,098 – 5,655
Deposits – 2,708 – 3,308
Securitized liabilities – 1,112 – 1,748
Leasing business – 75 – 73
Subordinated capital – 382 – 297
Transfer of losses – 2 – 3
Other – 1,403 – 1,816 Interest expense – 21,029 – 38,556 Total 1,794 2,057
The decline in interest income is mainly attributable to the further reduction in the volume of interest-bearing financial instruments and lower income from own investments as a consequence of a further decline in interest rates.
In the case of financial assets in the LaR category on which valuation allowances were charged, interest of EUR 51 million (previous year: EUR 56 million) was calculated in the year under review from the increase in the present value of the receivables (unwinding in accordance with IAS 39.AG93).
During the financial year, interest expense of EUR – 7 million (previous year: EUR – 11 million) was recognized from the netting of treasury and intragroup debentures in accordance with IAS 39.39 et seq.
Net interest income from financial assets and financial liabilities not measured at fair value through profit or loss comprises the following items:
EUR million 1 Jan. –
31 Dec. 2013
1 Jan. – 31 Dec. 2012
Interest income 6,457 7,721
Interest expense – 5,173 – 6,291 Total 1,284 1,430
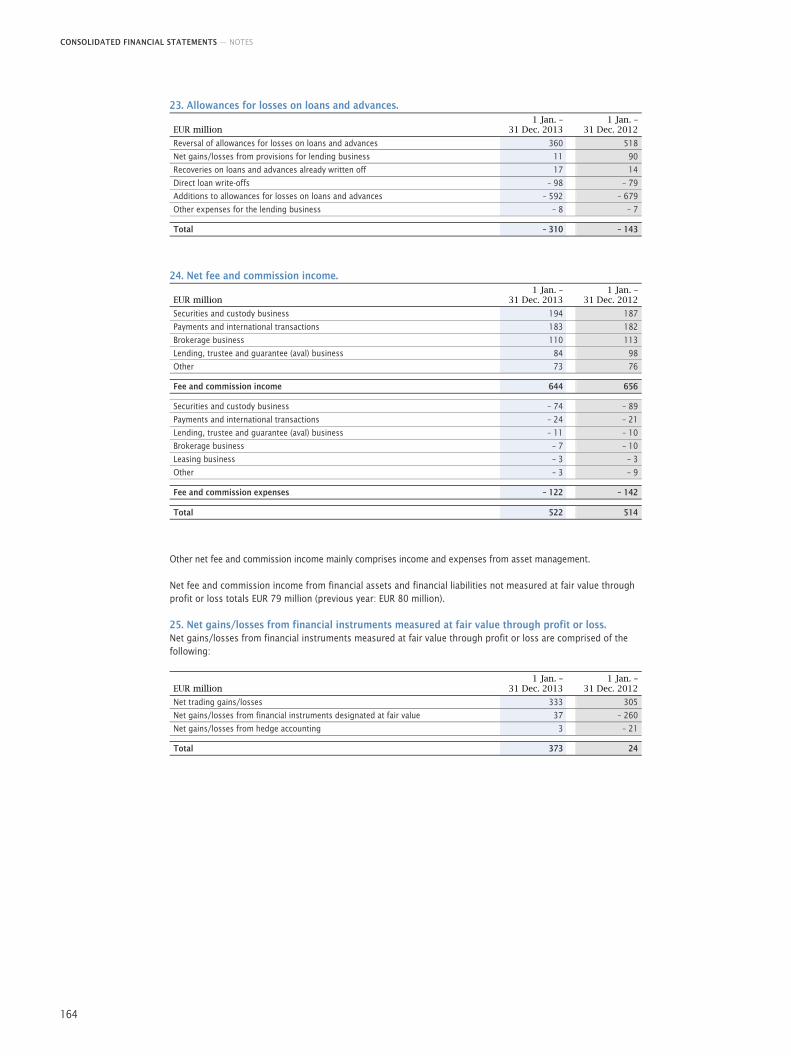
CONSOLIDATED FINANCIAL STATEMENTS — NOTES
164
23. Allowances for losses on loans and advances.
EUR million 1 Jan. –
31 Dec. 2013
1 Jan. – 31 Dec. 2012
Reversal of allowances for losses on loans and advances 360 518
Net gains/losses from provisions for lending business 11 90
Recoveries on loans and advances already written off 17 14
Direct loan write-offs – 98 – 79
Additions to allowances for losses on loans and advances – 592 – 679
Other expenses for the lending business – 8 – 7 Total – 310 – 143
24. Net fee and commission income.
EUR million 1 Jan. –
31 Dec. 2013
1 Jan. – 31 Dec. 2012
Securities and custody business 194 187
Payments and international transactions 183 182
Brokerage business 110 113
Lending, trustee and guarantee (aval) business 84 98
Other 73 76 Fee and commission income 644 656 Securities and custody business – 74 – 89
Payments and international transactions – 24 – 21
Lending, trustee and guarantee (aval) business – 11 – 10
Brokerage business – 7 – 10
Leasing business – 3 – 3
Other – 3 – 9 Fee and commission expenses – 122 – 142 Total 522 514
Other net fee and commission income mainly comprises income and expenses from asset management.
Net fee and commission income from financial assets and financial liabilities not measured at fair value through profit or loss totals EUR 79 million (previous year: EUR 80 million).
25. Net gains/losses from financial instruments measured at fair value through profit or loss. Net gains/losses from financial instruments measured at fair value through profit or loss are comprised of the following:
EUR million 1 Jan. –
31 Dec. 2013
1 Jan. – 31 Dec. 2012
Net trading gains/losses 333 305
Net gains/losses from financial instruments designated at fair value 37 – 260
Net gains/losses from hedge accounting 3 – 21 Total 373 24
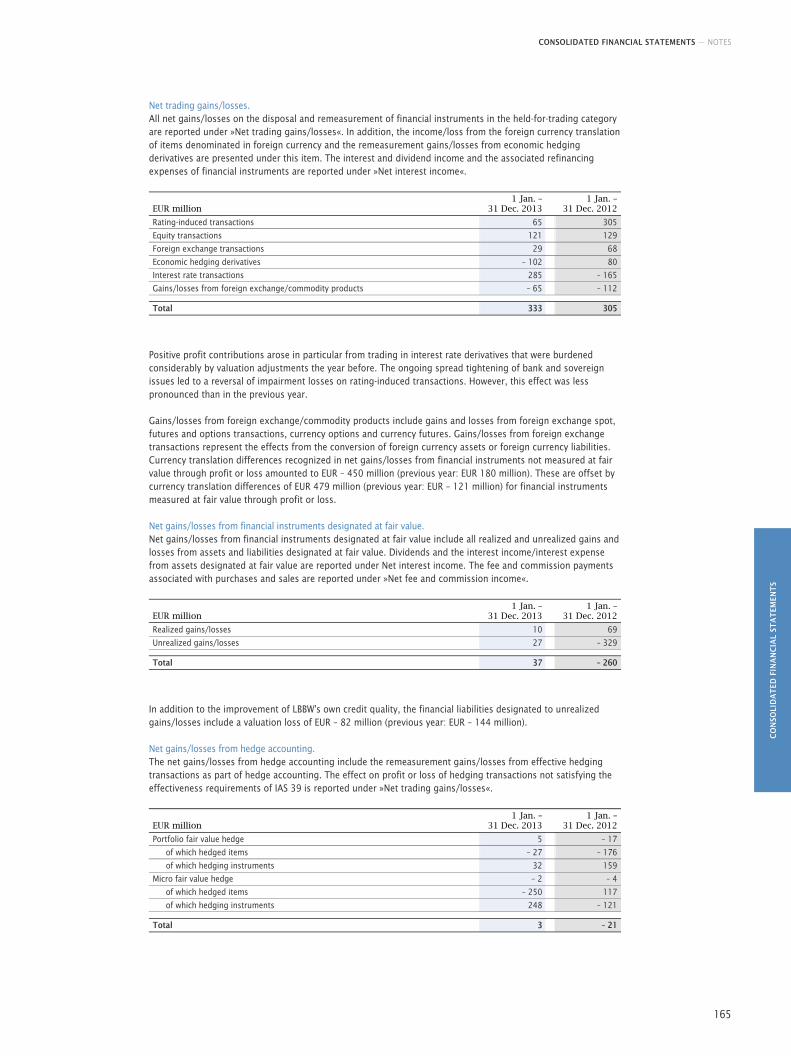
CONSOLIDATED FINANCIAL STATEMENTS — NOTES
CO
NSO
LID
AT
ED F
INA
NC
IAL
STA
TEM
ENT
S
165
Net trading gains/losses. All net gains/losses on the disposal and remeasurement of financial instruments in the held-for-trading category are reported under »Net trading gains/losses«. In addition, the income/loss from the foreign currency translation of items denominated in foreign currency and the remeasurement gains/losses from economic hedging derivatives are presented under this item. The interest and dividend income and the associated refinancing expenses of financial instruments are reported under »Net interest income«.
EUR million 1 Jan. –
31 Dec. 2013
1 Jan. – 31 Dec. 2012
Rating-induced transactions 65 305
Equity transactions 121 129
Foreign exchange transactions 29 68
Economic hedging derivatives – 102 80
Interest rate transactions 285 – 165
Gains/losses from foreign exchange/commodity products – 65 – 112 Total 333 305
Positive profit contributions arose in particular from trading in interest rate derivatives that were burdened considerably by valuation adjustments the year before. The ongoing spread tightening of bank and sovereign issues led to a reversal of impairment losses on rating-induced transactions. However, this effect was less pronounced than in the previous year.
Gains/losses from foreign exchange/commodity products include gains and losses from foreign exchange spot, futures and options transactions, currency options and currency futures. Gains/losses from foreign exchange transactions represent the effects from the conversion of foreign currency assets or foreign currency liabilities. Currency translation differences recognized in net gains/losses from financial instruments not measured at fair value through profit or loss amounted to EUR – 450 million (previous year: EUR 180 million). These are offset by currency translation differences of EUR 479 million (previous year: EUR – 121 million) for financial instruments measured at fair value through profit or loss.
Net gains/losses from financial instruments designated at fair value. Net gains/losses from financial instruments designated at fair value include all realized and unrealized gains and losses from assets and liabilities designated at fair value. Dividends and the interest income/interest expense from assets designated at fair value are reported under Net interest income. The fee and commission payments associated with purchases and sales are reported under »Net fee and commission income«.
EUR million 1 Jan. –
31 Dec. 2013
1 Jan. – 31 Dec. 2012
Realized gains/losses 10 69
Unrealized gains/losses 27 – 329 Total 37 – 260
In addition to the improvement of LBBW's own credit quality, the financial liabilities designated to unrealized gains/losses include a valuation loss of EUR – 82 million (previous year: EUR – 144 million).
Net gains/losses from hedge accounting. The net gains/losses from hedge accounting include the remeasurement gains/losses from effective hedging transactions as part of hedge accounting. The effect on profit or loss of hedging transactions not satisfying the effectiveness requirements of IAS 39 is reported under »Net trading gains/losses«.
EUR million 1 Jan. –
31 Dec. 2013
1 Jan. – 31 Dec. 2012
Portfolio fair value hedge 5 – 17
of which hedged items – 27 – 176
of which hedging instruments 32 159
Micro fair value hedge – 2 – 4
of which hedged items – 250 117
of which hedging instruments 248 – 121 Total 3 – 21
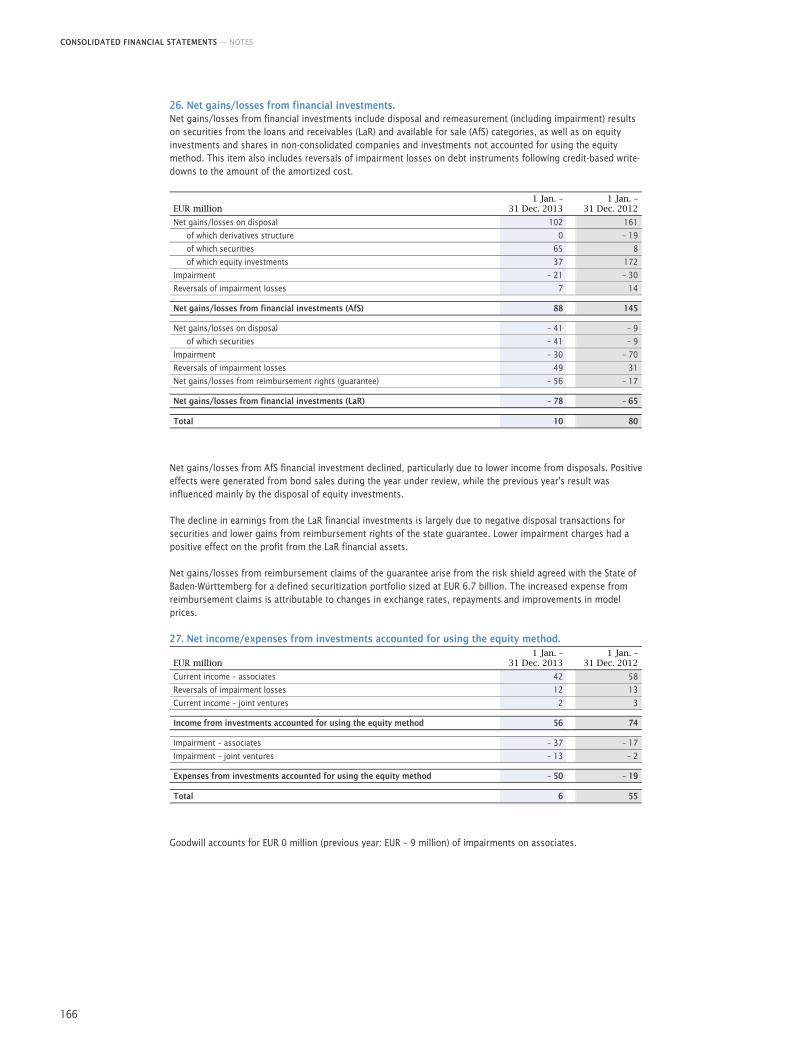
CONSOLIDATED FINANCIAL STATEMENTS — NOTES
166
26. Net gains/losses from financial investments. Net gains/losses from financial investments include disposal and remeasurement (including impairment) results on securities from the loans and receivables (LaR) and available for sale (AfS) categories, as well as on equity investments and shares in non-consolidated companies and investments not accounted for using the equity method. This item also includes reversals of impairment losses on debt instruments following credit-based write-downs to the amount of the amortized cost.
EUR million 1 Jan. –
31 Dec. 2013
1 Jan. – 31 Dec. 2012
Net gains/losses on disposal 102 161
of which derivatives structure 0 – 19
of which securities 65 8
of which equity investments 37 172
Impairment – 21 – 30
Reversals of impairment losses 7 14 Net gains/losses from financial investments (AfS) 88 145 Net gains/losses on disposal – 41 – 9
of which securities – 41 – 9
Impairment – 30 – 70
Reversals of impairment losses 49 31
Net gains/losses from reimbursement rights (guarantee) – 56 – 17 Net gains/losses from financial investments (LaR) – 78 – 65 Total 10 80
Net gains/losses from AfS financial investment declined, particularly due to lower income from disposals. Positive effects were generated from bond sales during the year under review, while the previous year's result was influenced mainly by the disposal of equity investments.
The decline in earnings from the LaR financial investments is largely due to negative disposal transactions for securities and lower gains from reimbursement rights of the state guarantee. Lower impairment charges had a positive effect on the profit from the LaR financial assets.
Net gains/losses from reimbursement claims of the guarantee arise from the risk shield agreed with the State of Baden-Württemberg for a defined securitization portfolio sized at EUR 6.7 billion. The increased expense from reimbursement claims is attributable to changes in exchange rates, repayments and improvements in model prices.
27. Net income/expenses from investments accounted for using the equity method.
EUR million 1 Jan. –
31 Dec. 2013
1 Jan. – 31 Dec. 2012
Current income – associates 42 58
Reversals of impairment losses 12 13
Current income – joint ventures 2 3 Income from investments accounted for using the equity method 56 74 Impairment – associates – 37 – 17
Impairment – joint ventures – 13 – 2 Expenses from investments accounted for using the equity method – 50 – 19 Total 6 55
Goodwill accounts for EUR 0 million (previous year: EUR – 9 million) of impairments on associates.
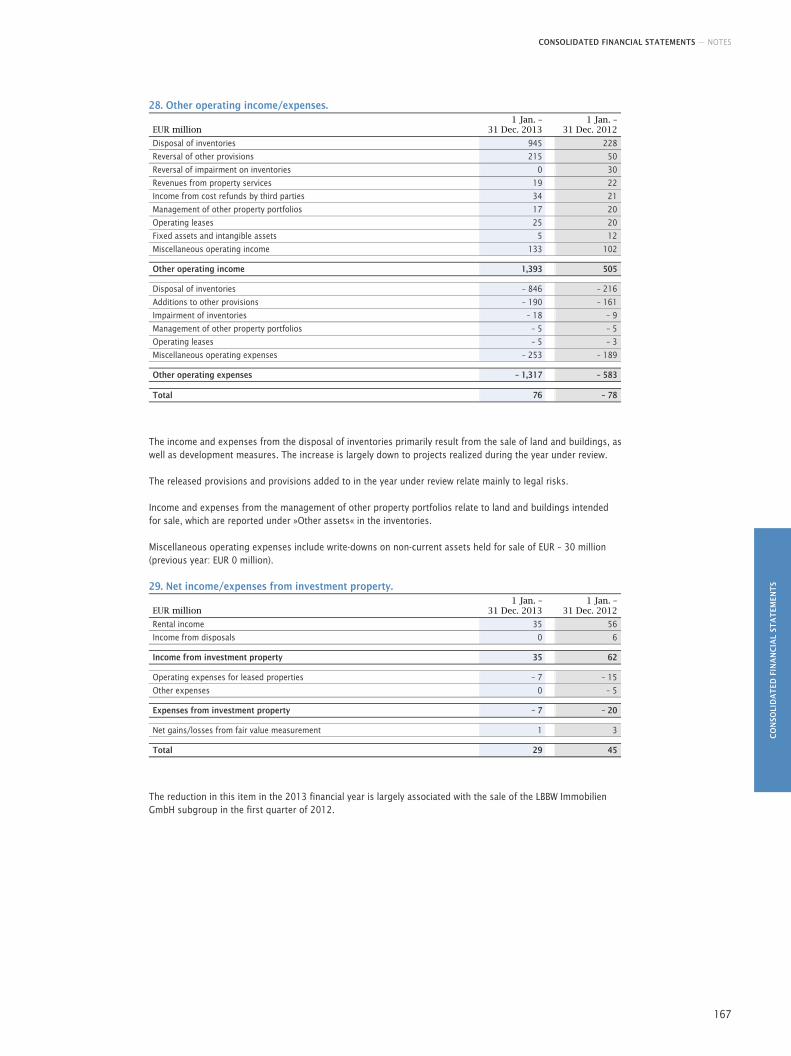
CONSOLIDATED FINANCIAL STATEMENTS — NOTES
CO
NSO
LID
AT
ED F
INA
NC
IAL
STA
TEM
ENT
S
167
28. Other operating income/expenses.
EUR million 1 Jan. –
31 Dec. 2013
1 Jan. – 31 Dec. 2012
Disposal of inventories 945 228
Reversal of other provisions 215 50
Reversal of impairment on inventories 0 30
Revenues from property services 19 22
Income from cost refunds by third parties 34 21
Management of other property portfolios 17 20
Operating leases 25 20
Fixed assets and intangible assets 5 12
Miscellaneous operating income 133 102 Other operating income 1,393 505 Disposal of inventories – 846 – 216
Additions to other provisions – 190 – 161
Impairment of inventories – 18 – 9
Management of other property portfolios – 5 – 5
Operating leases – 5 – 3
Miscellaneous operating expenses – 253 – 189 Other operating expenses – 1,317 – 583 Total 76 – 78
The income and expenses from the disposal of inventories primarily result from the sale of land and buildings, as well as development measures. The increase is largely down to projects realized during the year under review.
The released provisions and provisions added to in the year under review relate mainly to legal risks.
Income and expenses from the management of other property portfolios relate to land and buildings intended for sale, which are reported under »Other assets« in the inventories.
Miscellaneous operating expenses include write-downs on non-current assets held for sale of EUR – 30 million (previous year: EUR 0 million).
29. Net income/expenses from investment property.
EUR million 1 Jan. –
31 Dec. 2013
1 Jan. – 31 Dec. 2012
Rental income 35 56
Income from disposals 0 6 Income from investment property 35 62 Operating expenses for leased properties – 7 – 15
Other expenses 0 – 5 Expenses from investment property – 7 – 20 Net gains/losses from fair value measurement 1 3 Total 29 45
The reduction in this item in the 2013 financial year is largely associated with the sale of the LBBW Immobilien GmbH subgroup in the first quarter of 2012.
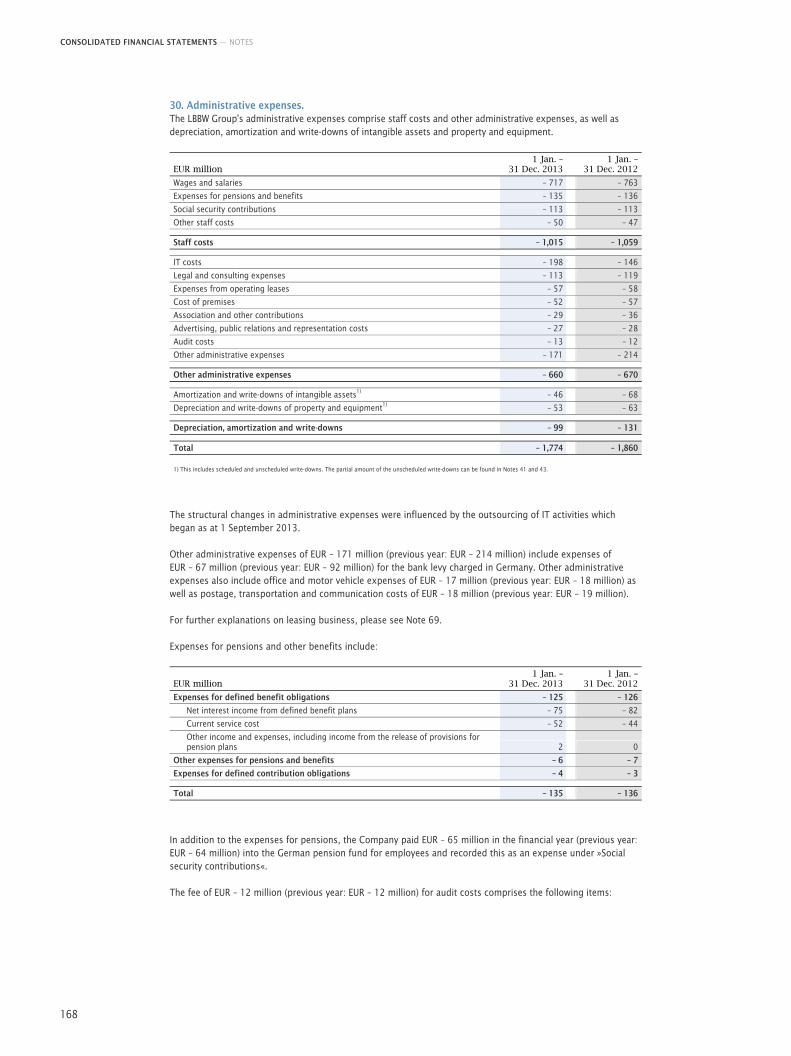
CONSOLIDATED FINANCIAL STATEMENTS — NOTES
168
30. Administrative expenses. The LBBW Group's administrative expenses comprise staff costs and other administrative expenses, as well as depreciation, amortization and write-downs of intangible assets and property and equipment.
EUR million 1 Jan. –
31 Dec. 2013
1 Jan. – 31 Dec. 2012
Wages and salaries – 717 – 763
Expenses for pensions and benefits – 135 – 136
Social security contributions – 113 – 113
Other staff costs – 50 – 47 Staff costs – 1,015 – 1,059 IT costs – 198 – 146
Legal and consulting expenses – 113 – 119
Expenses from operating leases – 57 – 58
Cost of premises – 52 – 57
Association and other contributions – 29 – 36
Advertising, public relations and representation costs – 27 – 28
Audit costs – 13 – 12
Other administrative expenses – 171 – 214 Other administrative expenses – 660 – 670 Amortization and write-downs of intangible assets1) – 46 – 68
Depreciation and write-downs of property and equipment1) – 53 – 63 Depreciation, amortization and write-downs – 99 – 131 Total – 1,774 – 1,860 1) This includes scheduled and unscheduled write-downs. The partial amount of the unscheduled write-downs can be found in Notes 41 and 43.
The structural changes in administrative expenses were influenced by the outsourcing of IT activities which began as at 1 September 2013.
Other administrative expenses of EUR – 171 million (previous year: EUR – 214 million) include expenses of EUR – 67 million (previous year: EUR – 92 million) for the bank levy charged in Germany. Other administrative expenses also include office and motor vehicle expenses of EUR – 17 million (previous year: EUR – 18 million) as well as postage, transportation and communication costs of EUR – 18 million (previous year: EUR – 19 million).
For further explanations on leasing business, please see Note 69.
Expenses for pensions and other benefits include:
EUR million 1 Jan. –
31 Dec. 2013
1 Jan. – 31 Dec. 2012
Expenses for defined benefit obligations – 125 – 126
Net interest income from defined benefit plans – 75 – 82
Current service cost – 52 – 44
Other income and expenses, including income from the release of provisions for pension plans 2 0
Other expenses for pensions and benefits – 6 – 7
Expenses for defined contribution obligations – 4 – 3 Total – 135 – 136
In addition to the expenses for pensions, the Company paid EUR – 65 million in the financial year (previous year: EUR – 64 million) into the German pension fund for employees and recorded this as an expense under »Social security contributions«.
The fee of EUR – 12 million (previous year: EUR – 12 million) for audit costs comprises the following items:

CONSOLIDATED FINANCIAL STATEMENTS — NOTES
CO
NSO
LID
AT
ED F
INA
NC
IAL
STA
TEM
ENT
S
169
EUR million 1 Jan. –
31 Dec. 2013
1 Jan. – 31 Dec. 2012
Audit services – 8 – 6
Audit-related services – 1 – 1
Other services – 4 – 5 Total – 13 – 12
31. Net income/expenses from restructuring.
EUR million 1 Jan. –
31 Dec. 2013
1 Jan. – 31 Dec. 2012
Reversal of provisions for restructuring measures 51 22
Additions to restructuring provisions – 3 – 6
Ongoing expenses for restructuring measures 0 – 6 Total 48 10
32. Income tax. Income and expenses from income taxes are broken down as follows:
EUR million 1 Jan. –
31 Dec. 2013
1 Jan. – 31 Dec. 2012
Income tax in the reporting period – 50 – 23
Income tax from previous years – 58 50 Current income tax – 108 27
of which decrease in actual income tax expense from utilization of previously unrecognized loss carryforwards and tax credits 62 3
Deferred income tax – 26 – 28
of which deferred income tax expense/income from change in temporary differences 50 57
of which deferred tax expense/income from change in tax rates – 5 – 10
of which deferred tax expense/income from change in write-downs 0 – 48
of which decrease in deferred income tax expense from previously unrecognized prior period temporary differences 13 – 8
of which decrease in deferred income tax expense from previously unrecognized loss carryforwards and tax credits 48 11
Total – 134 – 1
The following reconciliation shows the relationship between reported and expected income taxes:
EUR million 1 Jan. –
31 Dec. 2013
1 Jan. – 31 Dec. 2012
Net consolidated profit/loss before tax 471 399 Applicable tax rate 30.34,% 30.34,% Expected income tax – 143 – 121 Tax effects
from non-deductible operating expenses – 92 – 171
from value adjustments 85 – 80
from taxes from the previous year recorded in the financial year – 138 67
from permanent tax effects 79 86
from changes in tax rates – 4 – 5
from non-deductible income tax (withholding tax and foreign taxes) 0 – 1
from differing tax rates affecting on deferred taxes as shown in profit or loss – 7 14
from other differences – 5 3
from tax-free income 91 207 Total – 134 – 1
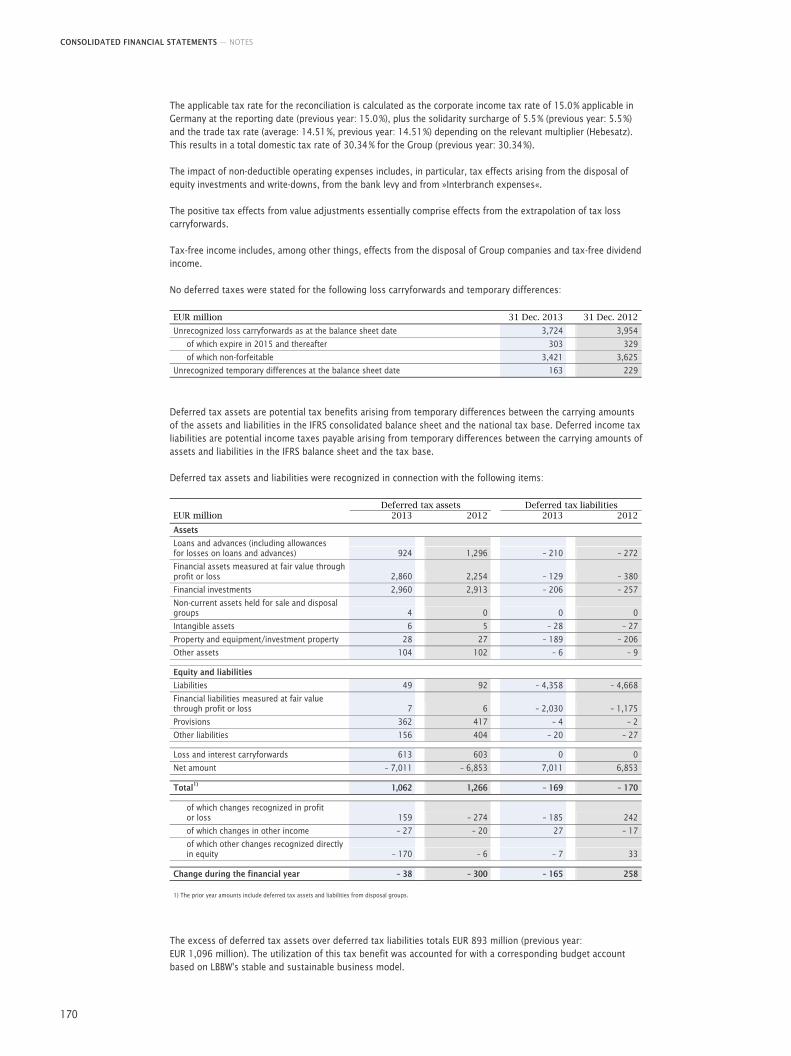
CONSOLIDATED FINANCIAL STATEMENTS — NOTES
170
The applicable tax rate for the reconciliation is calculated as the corporate income tax rate of 15.0 % applicable in Germany at the reporting date (previous year: 15.0 %), plus the solidarity surcharge of 5.5 % (previous year: 5.5 %) and the trade tax rate (average: 14.51 %, previous year: 14.51 %) depending on the relevant multiplier (Hebesatz). This results in a total domestic tax rate of 30.34 % for the Group (previous year: 30.34 %).
The impact of non-deductible operating expenses includes, in particular, tax effects arising from the disposal of equity investments and write-downs, from the bank levy and from »Interbranch expenses«.
The positive tax effects from value adjustments essentially comprise effects from the extrapolation of tax loss carryforwards.
Tax-free income includes, among other things, effects from the disposal of Group companies and tax-free dividend income.
No deferred taxes were stated for the following loss carryforwards and temporary differences:
EUR million 31 Dec. 2013 31 Dec. 2012
Unrecognized loss carryforwards as at the balance sheet date 3,724 3,954
of which expire in 2015 and thereafter 303 329
of which non-forfeitable 3,421 3,625
Unrecognized temporary differences at the balance sheet date 163 229
Deferred tax assets are potential tax benefits arising from temporary differences between the carrying amounts of the assets and liabilities in the IFRS consolidated balance sheet and the national tax base. Deferred income tax liabilities are potential income taxes payable arising from temporary differences between the carrying amounts of assets and liabilities in the IFRS balance sheet and the tax base.
Deferred tax assets and liabilities were recognized in connection with the following items:
Deferred tax assets Deferred tax liabilities EUR million 2013 2012 2013 2012
Assets
Loans and advances (including allowances for losses on loans and advances) 924 1,296 – 210 – 272
Financial assets measured at fair value through profit or loss 2,860 2,254 – 129 – 380
Financial investments 2,960 2,913 – 206 – 257
Non-current assets held for sale and disposal groups 4 0 0 0
Intangible assets 6 5 – 28 – 27
Property and equipment/investment property 28 27 – 189 – 206
Other assets 104 102 – 6 – 9 Equity and liabilities
Liabilities 49 92 – 4,358 – 4,668
Financial liabilities measured at fair value through profit or loss 7 6 – 2,030 – 1,175
Provisions 362 417 – 4 – 2
Other liabilities 156 404 – 20 – 27 Loss and interest carryforwards 613 603 0 0
Net amount – 7,011 – 6,853 7,011 6,853 Total1) 1,062 1,266 – 169 – 170
of which changes recognized in profit or loss 159 – 274 – 185 242
of which changes in other income – 27 – 20 27 – 17
of which other changes recognized directly in equity – 170 – 6 – 7 33
Change during the financial year – 38 – 300 – 165 258 1) The prior year amounts include deferred tax assets and liabilities from disposal groups.
The excess of deferred tax assets over deferred tax liabilities totals EUR 893 million (previous year: EUR 1,096 million). The utilization of this tax benefit was accounted for with a corresponding budget account based on LBBW's stable and sustainable business model.
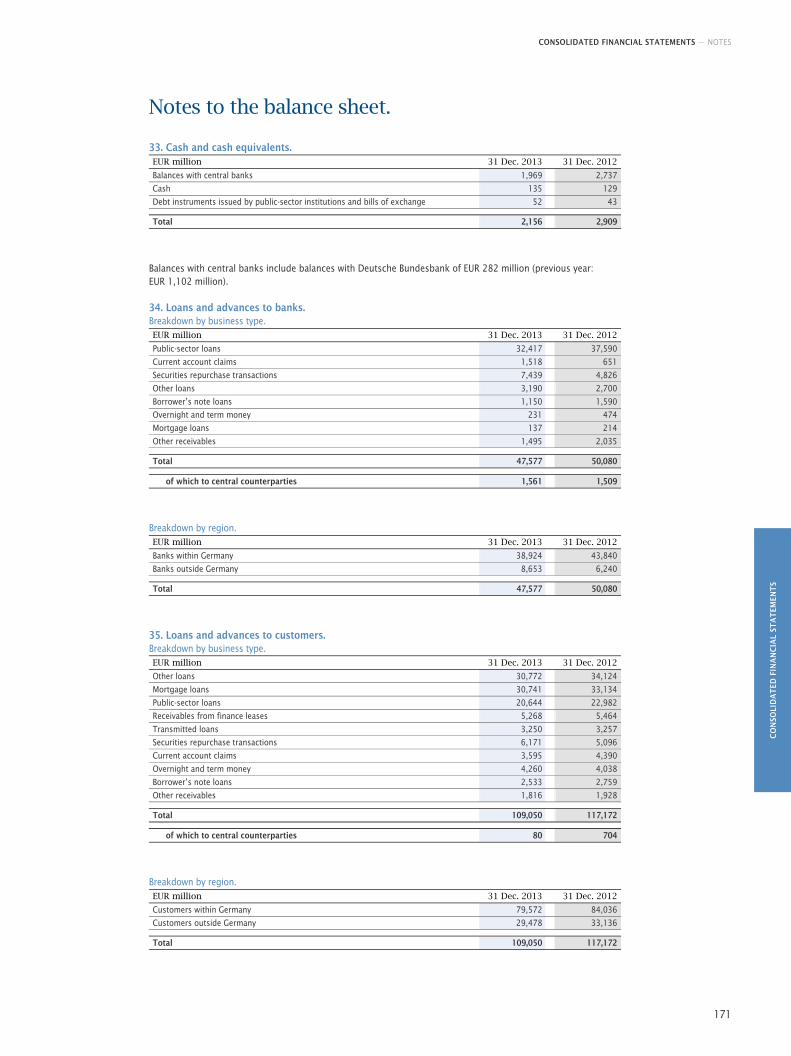
CONSOLIDATED FINANCIAL STATEMENTS — NOTES
CO
NSO
LID
AT
ED F
INA
NC
IAL
STA
TEM
ENT
S
171
Notes to the balance sheet.
33. Cash and cash equivalents. EUR million 31 Dec. 2013 31 Dec. 2012
Balances with central banks 1,969 2,737
Cash 135 129
Debt instruments issued by public-sector institutions and bills of exchange 52 43 Total 2,156 2,909
Balances with central banks include balances with Deutsche Bundesbank of EUR 282 million (previous year: EUR 1,102 million).
34. Loans and advances to banks. Breakdown by business type. EUR million 31 Dec. 2013 31 Dec. 2012
Public-sector loans 32,417 37,590
Current account claims 1,518 651
Securities repurchase transactions 7,439 4,826
Other loans 3,190 2,700
Borrower’s note loans 1,150 1,590
Overnight and term money 231 474
Mortgage loans 137 214
Other receivables 1,495 2,035 Total 47,577 50,080
of which to central counterparties 1,561 1,509
Breakdown by region. EUR million 31 Dec. 2013 31 Dec. 2012
Banks within Germany 38,924 43,840
Banks outside Germany 8,653 6,240 Total 47,577 50,080
35. Loans and advances to customers. Breakdown by business type. EUR million 31 Dec. 2013 31 Dec. 2012
Other loans 30,772 34,124
Mortgage loans 30,741 33,134
Public-sector loans 20,644 22,982
Receivables from finance leases 5,268 5,464
Transmitted loans 3,250 3,257
Securities repurchase transactions 6,171 5,096
Current account claims 3,595 4,390
Overnight and term money 4,260 4,038
Borrower’s note loans 2,533 2,759
Other receivables 1,816 1,928 Total 109,050 117,172
of which to central counterparties 80 704
Breakdown by region. EUR million 31 Dec. 2013 31 Dec. 2012
Customers within Germany 79,572 84,036
Customers outside Germany 29,478 33,136 Total 109,050 117,172
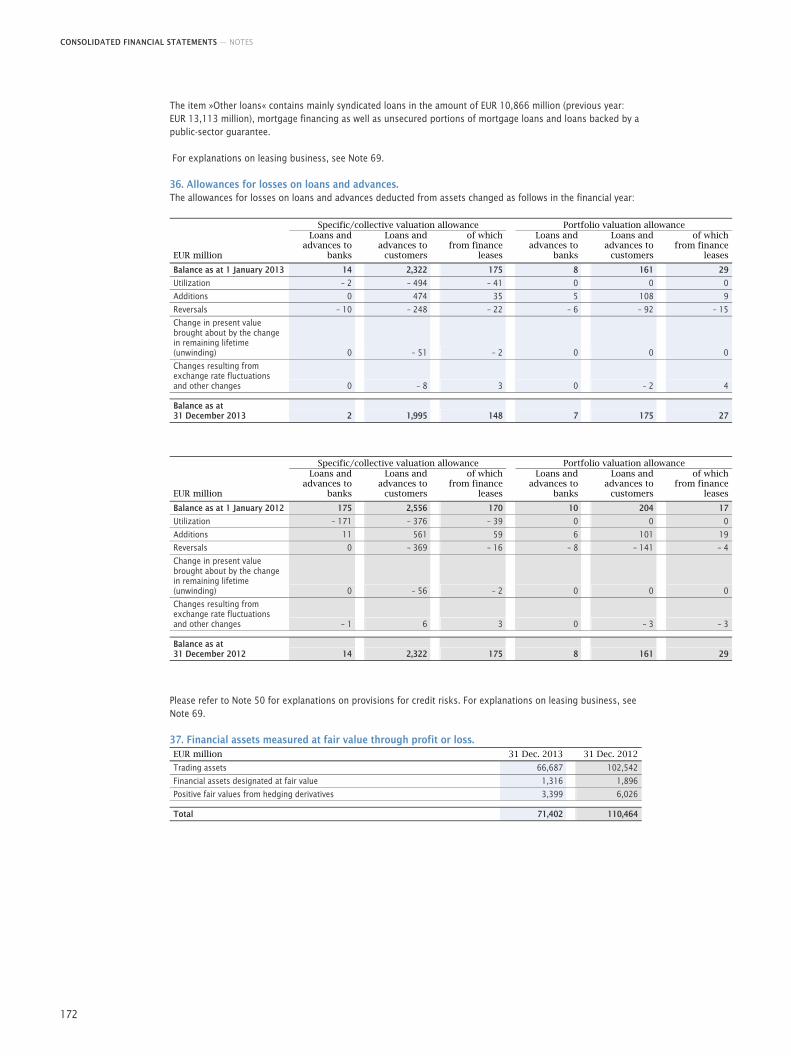
CONSOLIDATED FINANCIAL STATEMENTS — NOTES
172
The item »Other loans« contains mainly syndicated loans in the amount of EUR 10,866 million (previous year: EUR 13,113 million), mortgage financing as well as unsecured portions of mortgage loans and loans backed by a public-sector guarantee.
For explanations on leasing business, see Note 69.
36. Allowances for losses on loans and advances. The allowances for losses on loans and advances deducted from assets changed as follows in the financial year:
Specific/collective valuation allowance Portfolio valuation allowance
EUR million
Loans and advances to
banks
Loans and advances to
customers
of which from finance
leases
Loans and advances to
banks
Loans and advances to
customers
of which from finance
leases
Balance as at 1 January 2013 14 2,322 175 8 161 29
Utilization – 2 – 494 – 41 0 0 0
Additions 0 474 35 5 108 9
Reversals – 10 – 248 – 22 – 6 – 92 – 15
Change in present value brought about by the change in remaining lifetime (unwinding) 0 – 51 – 2 0 0 0
Changes resulting from exchange rate fluctuations and other changes 0 – 8 3 0 – 2 4 Balance as at 31 December 2013 2 1,995 148 7 175 27
Specific/collective valuation allowance Portfolio valuation allowance
EUR million
Loans and advances to
banks
Loans and advances to
customers
of which from finance
leases
Loans and advances to
banks
Loans and advances to
customers
of which from finance
leases
Balance as at 1 January 2012 175 2,556 170 10 204 17
Utilization – 171 – 376 – 39 0 0 0
Additions 11 561 59 6 101 19
Reversals 0 – 369 – 16 – 8 – 141 – 4
Change in present value brought about by the change in remaining lifetime (unwinding) 0 – 56 – 2 0 0 0
Changes resulting from exchange rate fluctuations and other changes – 1 6 3 0 – 3 – 3 Balance as at 31 December 2012 14 2,322 175 8 161 29
Please refer to Note 50 for explanations on provisions for credit risks. For explanations on leasing business, see Note 69.
37. Financial assets measured at fair value through profit or loss. EUR million 31 Dec. 2013 31 Dec. 2012
Trading assets 66,687 102,542
Financial assets designated at fair value 1,316 1,896
Positive fair values from hedging derivatives 3,399 6,026 Total 71,402 110,464
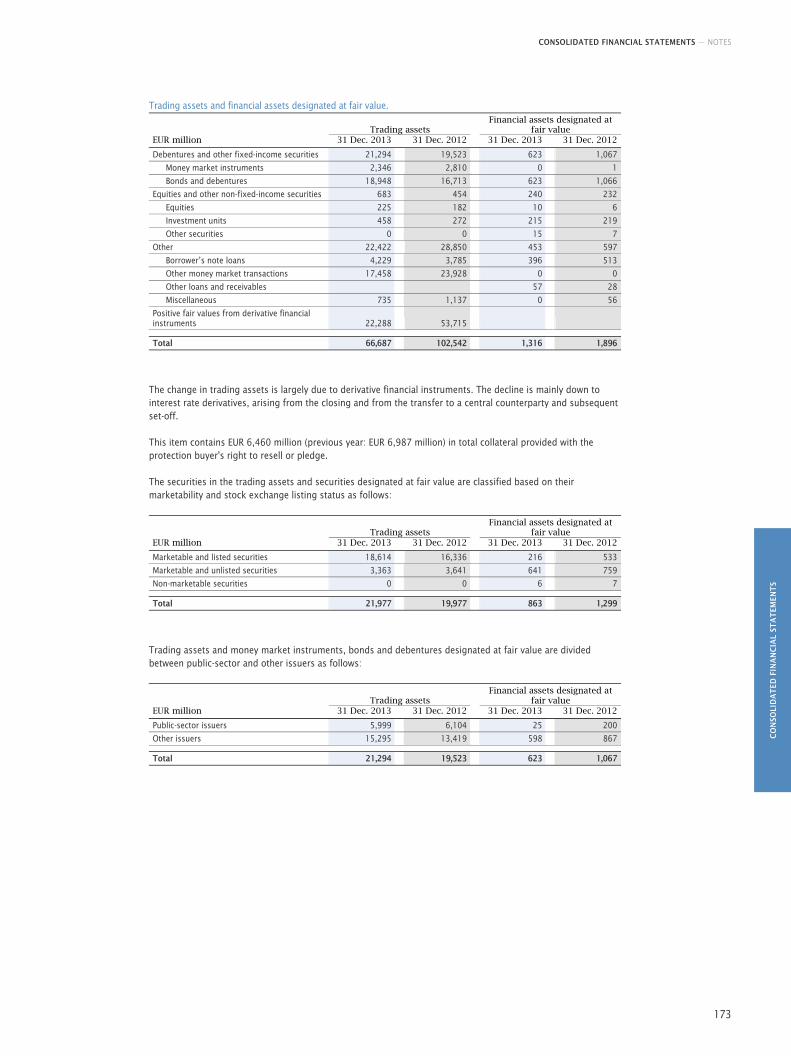
CONSOLIDATED FINANCIAL STATEMENTS — NOTES
CO
NSO
LID
AT
ED F
INA
NC
IAL
STA
TEM
ENT
S
173
Trading assets and financial assets designated at fair value.
Trading assets Financial assets designated at
fair value EUR million 31 Dec. 2013 31 Dec. 2012 31 Dec. 2013 31 Dec. 2012
Debentures and other fixed-income securities 21,294 19,523 623 1,067
Money market instruments 2,346 2,810 0 1
Bonds and debentures 18,948 16,713 623 1,066
Equities and other non-fixed-income securities 683 454 240 232
Equities 225 182 10 6
Investment units 458 272 215 219
Other securities 0 0 15 7
Other 22,422 28,850 453 597
Borrower’s note loans 4,229 3,785 396 513
Other money market transactions 17,458 23,928 0 0
Other loans and receivables 57 28
Miscellaneous 735 1,137 0 56
Positive fair values from derivative financial instruments 22,288 53,715 Total 66,687 102,542 1,316 1,896
The change in trading assets is largely due to derivative financial instruments. The decline is mainly down to interest rate derivatives, arising from the closing and from the transfer to a central counterparty and subsequent set-off.
This item contains EUR 6,460 million (previous year: EUR 6,987 million) in total collateral provided with the protection buyer's right to resell or pledge.
The securities in the trading assets and securities designated at fair value are classified based on their marketability and stock exchange listing status as follows:
Trading assets Financial assets designated at
fair value EUR million 31 Dec. 2013 31 Dec. 2012 31 Dec. 2013 31 Dec. 2012
Marketable and listed securities 18,614 16,336 216 533
Marketable and unlisted securities 3,363 3,641 641 759
Non-marketable securities 0 0 6 7 Total 21,977 19,977 863 1,299
Trading assets and money market instruments, bonds and debentures designated at fair value are divided between public-sector and other issuers as follows:
Trading assets Financial assets designated at
fair value EUR million 31 Dec. 2013 31 Dec. 2012 31 Dec. 2013 31 Dec. 2012
Public-sector issuers 5,999 6,104 25 200
Other issuers 15,295 13,419 598 867 Total 21,294 19,523 623 1,067
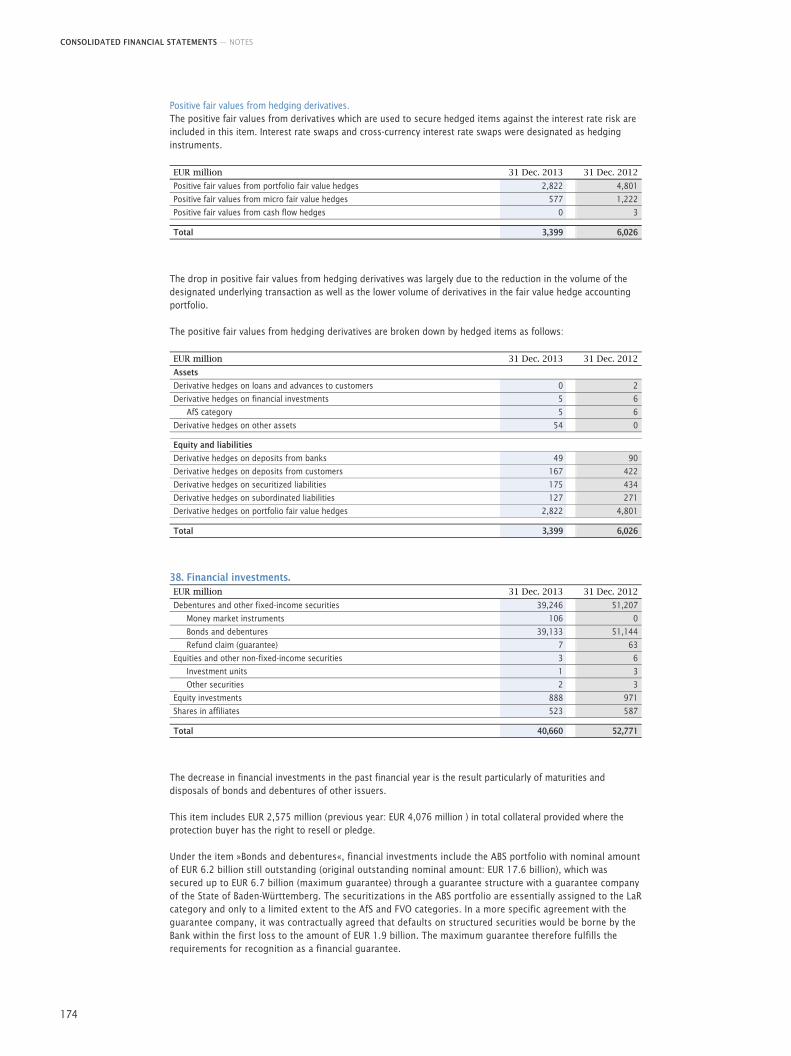
CONSOLIDATED FINANCIAL STATEMENTS — NOTES
174
Positive fair values from hedging derivatives. The positive fair values from derivatives which are used to secure hedged items against the interest rate risk are included in this item. Interest rate swaps and cross-currency interest rate swaps were designated as hedging instruments.
EUR million 31 Dec. 2013 31 Dec. 2012
Positive fair values from portfolio fair value hedges 2,822 4,801
Positive fair values from micro fair value hedges 577 1,222
Positive fair values from cash flow hedges 0 3 Total 3,399 6,026
The drop in positive fair values from hedging derivatives was largely due to the reduction in the volume of the designated underlying transaction as well as the lower volume of derivatives in the fair value hedge accounting portfolio.
The positive fair values from hedging derivatives are broken down by hedged items as follows:
EUR million 31 Dec. 2013 31 Dec. 2012
Assets
Derivative hedges on loans and advances to customers 0 2
Derivative hedges on financial investments 5 6
AfS category 5 6
Derivative hedges on other assets 54 0 Equity and liabilities
Derivative hedges on deposits from banks 49 90
Derivative hedges on deposits from customers 167 422
Derivative hedges on securitized liabilities 175 434
Derivative hedges on subordinated liabilities 127 271
Derivative hedges on portfolio fair value hedges 2,822 4,801 Total 3,399 6,026
38. Financial investments. EUR million 31 Dec. 2013 31 Dec. 2012
Debentures and other fixed-income securities 39,246 51,207
Money market instruments 106 0
Bonds and debentures 39,133 51,144
Refund claim (guarantee) 7 63
Equities and other non-fixed-income securities 3 6
Investment units 1 3
Other securities 2 3
Equity investments 888 971
Shares in affiliates 523 587 Total 40,660 52,771
The decrease in financial investments in the past financial year is the result particularly of maturities and disposals of bonds and debentures of other issuers.
This item includes EUR 2,575 million (previous year: EUR 4,076 million ) in total collateral provided where the protection buyer has the right to resell or pledge.
Under the item »Bonds and debentures«, financial investments include the ABS portfolio with nominal amount of EUR 6.2 billion still outstanding (original outstanding nominal amount: EUR 17.6 billion), which was secured up to EUR 6.7 billion (maximum guarantee) through a guarantee structure with a guarantee company of the State of Baden-Württemberg. The securitizations in the ABS portfolio are essentially assigned to the LaR category and only to a limited extent to the AfS and FVO categories. In a more specific agreement with the guarantee company, it was contractually agreed that defaults on structured securities would be borne by the Bank within the first loss to the amount of EUR 1.9 billion. The maximum guarantee therefore fulfills the requirements for recognition as a financial guarantee.
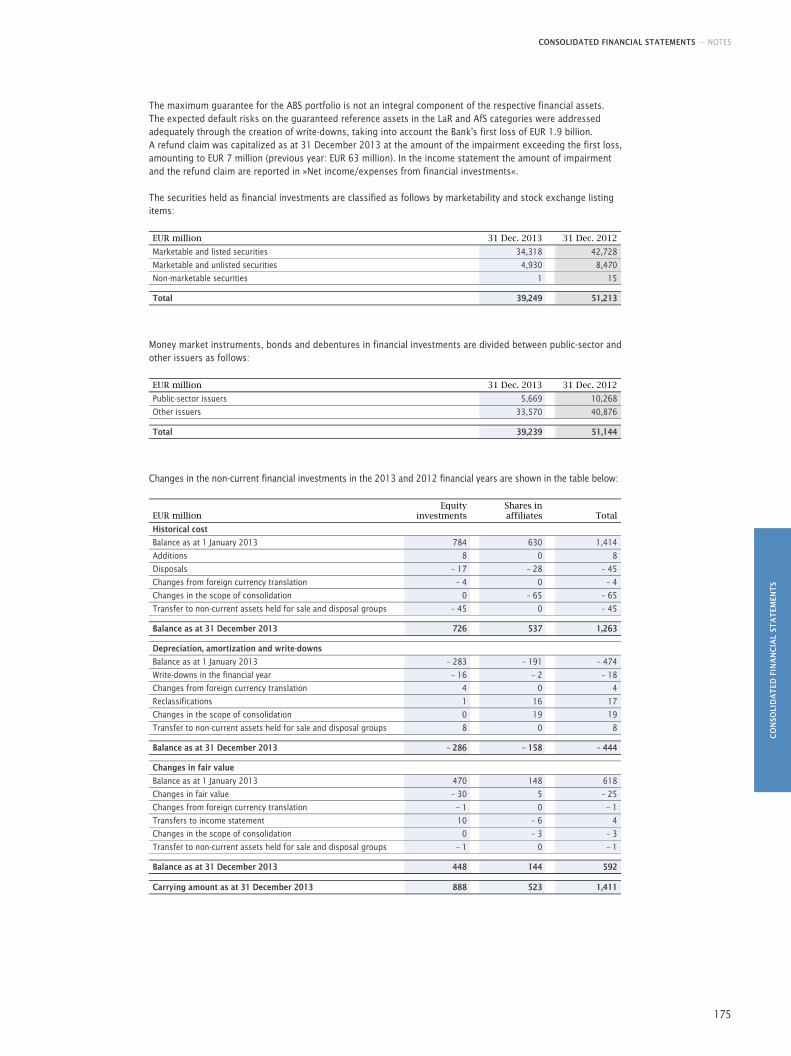
CONSOLIDATED FINANCIAL STATEMENTS — NOTES
CO
NSO
LID
AT
ED F
INA
NC
IAL
STA
TEM
ENT
S
175
The maximum guarantee for the ABS portfolio is not an integral component of the respective financial assets. The expected default risks on the guaranteed reference assets in the LaR and AfS categories were addressed adequately through the creation of write-downs, taking into account the Bank's first loss of EUR 1.9 billion. A refund claim was capitalized as at 31 December 2013 at the amount of the impairment exceeding the first loss, amounting to EUR 7 million (previous year: EUR 63 million). In the income statement the amount of impairment and the refund claim are reported in »Net income/expenses from financial investments«.
The securities held as financial investments are classified as follows by marketability and stock exchange listing items:
EUR million 31 Dec. 2013 31 Dec. 2012
Marketable and listed securities 34,318 42,728
Marketable and unlisted securities 4,930 8,470
Non-marketable securities 1 15 Total 39,249 51,213
Money market instruments, bonds and debentures in financial investments are divided between public-sector and other issuers as follows:
EUR million 31 Dec. 2013 31 Dec. 2012
Public-sector issuers 5,669 10,268
Other issuers 33,570 40,876 Total 39,239 51,144
Changes in the non-current financial investments in the 2013 and 2012 financial years are shown in the table below:
EUR million Equity
investments
Shares in affiliates Total
Historical cost
Balance as at 1 January 2013 784 630 1,414
Additions 8 0 8
Disposals – 17 – 28 – 45
Changes from foreign currency translation – 4 0 – 4
Changes in the scope of consolidation 0 – 65 – 65
Transfer to non-current assets held for sale and disposal groups – 45 0 – 45 Balance as at 31 December 2013 726 537 1,263 Depreciation, amortization and write-downs
Balance as at 1 January 2013 – 283 – 191 – 474
Write-downs in the financial year – 16 – 2 – 18
Changes from foreign currency translation 4 0 4
Reclassifications 1 16 17
Changes in the scope of consolidation 0 19 19
Transfer to non-current assets held for sale and disposal groups 8 0 8 Balance as at 31 December 2013 – 286 – 158 – 444 Changes in fair value
Balance as at 1 January 2013 470 148 618
Changes in fair value – 30 5 – 25
Changes from foreign currency translation – 1 0 – 1
Transfers to income statement 10 – 6 4
Changes in the scope of consolidation 0 – 3 – 3
Transfer to non-current assets held for sale and disposal groups – 1 0 – 1 Balance as at 31 December 2013 448 144 592 Carrying amount as at 31 December 2013 888 523 1,411
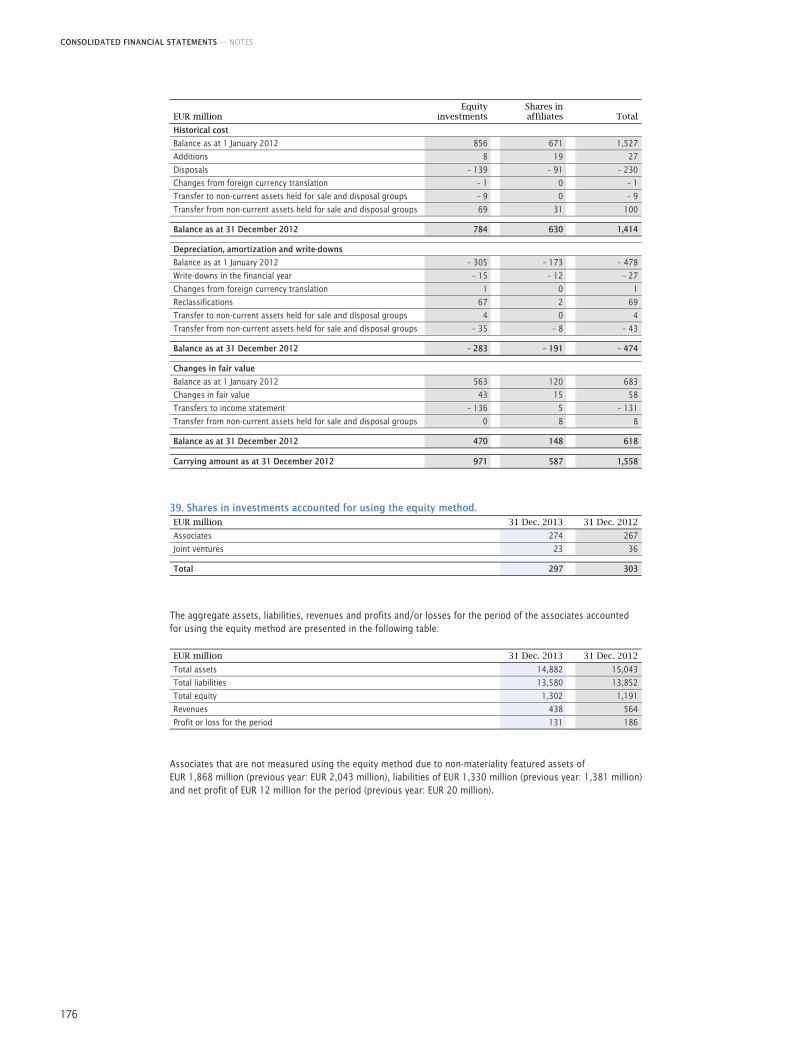
CONSOLIDATED FINANCIAL STATEMENTS — NOTES
176
EUR million Equity
investments
Shares in affiliates Total
Historical cost
Balance as at 1 January 2012 856 671 1,527
Additions 8 19 27
Disposals – 139 – 91 – 230
Changes from foreign currency translation – 1 0 – 1
Transfer to non-current assets held for sale and disposal groups – 9 0 – 9
Transfer from non-current assets held for sale and disposal groups 69 31 100 Balance as at 31 December 2012 784 630 1,414 Depreciation, amortization and write-downs
Balance as at 1 January 2012 – 305 – 173 – 478
Write-downs in the financial year – 15 – 12 – 27
Changes from foreign currency translation 1 0 1
Reclassifications 67 2 69
Transfer to non-current assets held for sale and disposal groups 4 0 4
Transfer from non-current assets held for sale and disposal groups – 35 – 8 – 43 Balance as at 31 December 2012 – 283 – 191 – 474 Changes in fair value
Balance as at 1 January 2012 563 120 683
Changes in fair value 43 15 58
Transfers to income statement – 136 5 – 131
Transfer from non-current assets held for sale and disposal groups 0 8 8 Balance as at 31 December 2012 470 148 618 Carrying amount as at 31 December 2012 971 587 1,558
39. Shares in investments accounted for using the equity method. EUR million 31 Dec. 2013 31 Dec. 2012
Associates 274 267
Joint ventures 23 36 Total 297 303
The aggregate assets, liabilities, revenues and profits and/or losses for the period of the associates accounted for using the equity method are presented in the following table:
EUR million 31 Dec. 2013 31 Dec. 2012
Total assets 14,882 15,043
Total liabilities 13,580 13,852
Total equity 1,302 1,191
Revenues 438 564
Profit or loss for the period 131 186
Associates that are not measured using the equity method due to non-materiality featured assets of EUR 1,868 million (previous year: EUR 2,043 million), liabilities of EUR 1,330 million (previous year: 1,381 million) and net profit of EUR 12 million for the period (previous year: EUR 20 million).
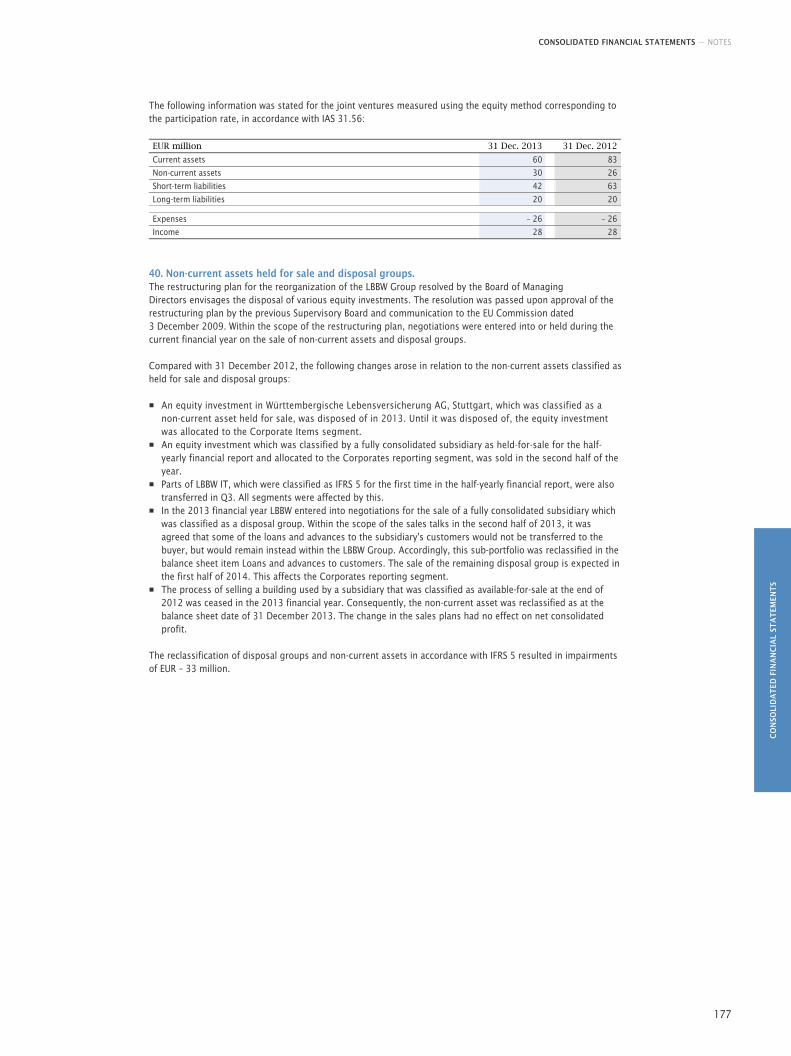
CONSOLIDATED FINANCIAL STATEMENTS — NOTES
CO
NSO
LID
AT
ED F
INA
NC
IAL
STA
TEM
ENT
S
177
The following information was stated for the joint ventures measured using the equity method corresponding to the participation rate, in accordance with IAS 31.56:
EUR million 31 Dec. 2013 31 Dec. 2012
Current assets 60 83
Non-current assets 30 26
Short-term liabilities 42 63
Long-term liabilities 20 20 Expenses – 26 – 26
Income 28 28
40. Non-current assets held for sale and disposal groups. The restructuring plan for the reorganization of the LBBW Group resolved by the Board of Managing Directors envisages the disposal of various equity investments. The resolution was passed upon approval of the restructuring plan by the previous Supervisory Board and communication to the EU Commission dated 3 December 2009. Within the scope of the restructuring plan, negotiations were entered into or held during the current financial year on the sale of non-current assets and disposal groups.
Compared with 31 December 2012, the following changes arose in relation to the non-current assets classified as held for sale and disposal groups:
■ An equity investment in Württembergische Lebensversicherung AG, Stuttgart, which was classified as a non-current asset held for sale, was disposed of in 2013. Until it was disposed of, the equity investment was allocated to the Corporate Items segment.
■ An equity investment which was classified by a fully consolidated subsidiary as held-for-sale for the half-yearly financial report and allocated to the Corporates reporting segment, was sold in the second half of the year.
■ Parts of LBBW IT, which were classified as IFRS 5 for the first time in the half-yearly financial report, were also transferred in Q3. All segments were affected by this.
■ In the 2013 financial year LBBW entered into negotiations for the sale of a fully consolidated subsidiary which was classified as a disposal group. Within the scope of the sales talks in the second half of 2013, it was agreed that some of the loans and advances to the subsidiary's customers would not be transferred to the buyer, but would remain instead within the LBBW Group. Accordingly, this sub-portfolio was reclassified in the balance sheet item Loans and advances to customers. The sale of the remaining disposal group is expected in the first half of 2014. This affects the Corporates reporting segment.
■ The process of selling a building used by a subsidiary that was classified as available-for-sale at the end of 2012 was ceased in the 2013 financial year. Consequently, the non-current asset was reclassified as at the balance sheet date of 31 December 2013. The change in the sales plans had no effect on net consolidated profit.
The reclassification of disposal groups and non-current assets in accordance with IFRS 5 resulted in impairments of EUR – 33 million.
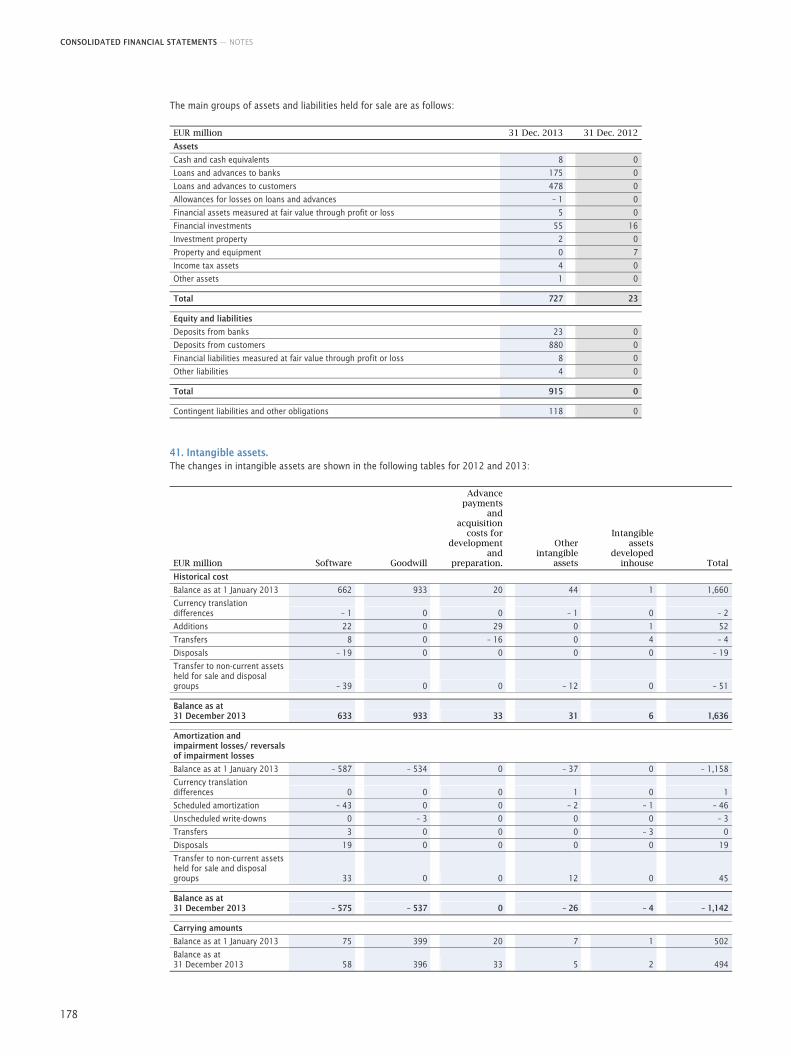
CONSOLIDATED FINANCIAL STATEMENTS — NOTES
178
The main groups of assets and liabilities held for sale are as follows:
EUR million 31 Dec. 2013 31 Dec. 2012
Assets
Cash and cash equivalents 8 0
Loans and advances to banks 175 0
Loans and advances to customers 478 0
Allowances for losses on loans and advances – 1 0
Financial assets measured at fair value through profit or loss 5 0
Financial investments 55 16
Investment property 2 0
Property and equipment 0 7
Income tax assets 4 0
Other assets 1 0 Total 727 23 Equity and liabilities
Deposits from banks 23 0
Deposits from customers 880 0
Financial liabilities measured at fair value through profit or loss 8 0
Other liabilities 4 0 Total 915 0 Contingent liabilities and other obligations 118 0
41. Intangible assets. The changes in intangible assets are shown in the following tables for 2012 and 2013:
EUR million Software Goodwill
Advance payments
and acquisition
costs for development
and preparation.
Other intangible
assets
Intangible assets
developed inhouse Total
Historical cost
Balance as at 1 January 2013 662 933 20 44 1 1,660
Currency translation differences – 1 0 0 – 1 0 – 2
Additions 22 0 29 0 1 52
Transfers 8 0 – 16 0 4 – 4
Disposals – 19 0 0 0 0 – 19
Transfer to non-current assets held for sale and disposal groups – 39 0 0 – 12 0 – 51 Balance as at 31 December 2013 633 933 33 31 6 1,636 Amortization and impairment losses/ reversals of impairment losses
Balance as at 1 January 2013 – 587 – 534 0 – 37 0 – 1,158
Currency translation differences 0 0 0 1 0 1
Scheduled amortization – 43 0 0 – 2 – 1 – 46
Unscheduled write-downs 0 – 3 0 0 0 – 3
Transfers 3 0 0 0 – 3 0
Disposals 19 0 0 0 0 19
Transfer to non-current assets held for sale and disposal groups 33 0 0 12 0 45 Balance as at 31 December 2013 – 575 – 537 0 – 26 – 4 – 1,142 Carrying amounts
Balance as at 1 January 2013 75 399 20 7 1 502
Balance as at 31 December 2013 58 396 33 5 2 494
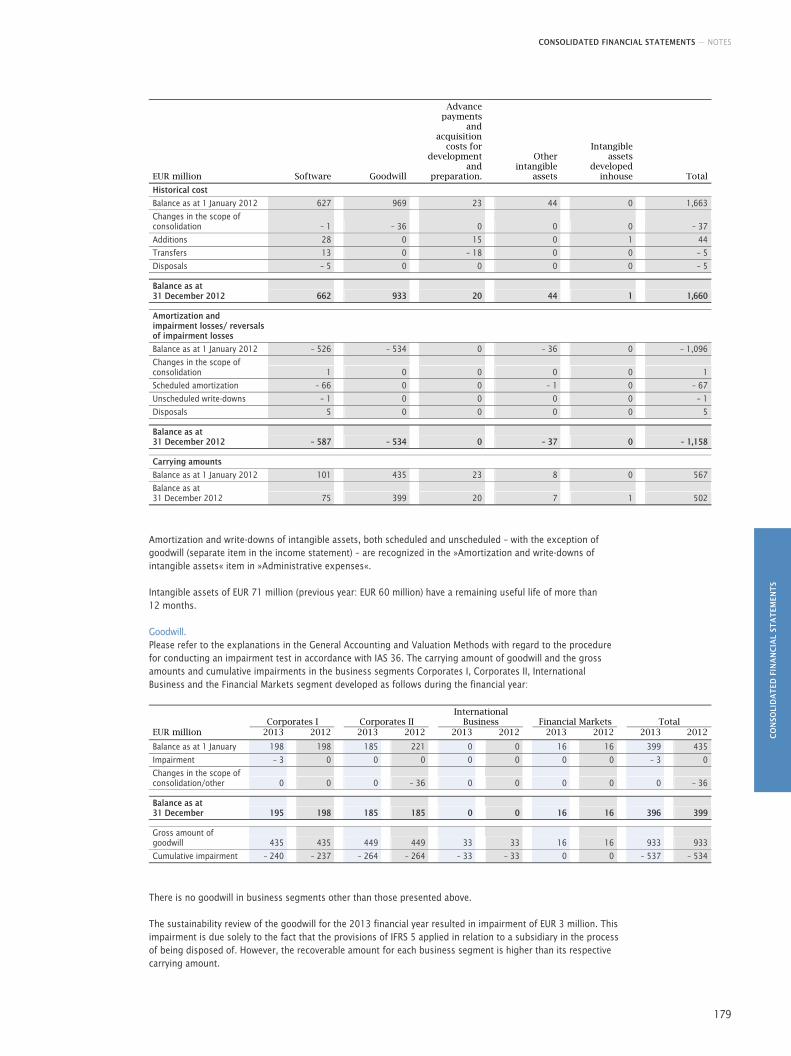
CONSOLIDATED FINANCIAL STATEMENTS — NOTES
CO
NSO
LID
AT
ED F
INA
NC
IAL
STA
TEM
ENT
S
179
EUR million Software Goodwill
Advance payments
and acquisition
costs for development
and preparation.
Other intangible
assets
Intangible assets
developed inhouse Total
Historical cost
Balance as at 1 January 2012 627 969 23 44 0 1,663
Changes in the scope of consolidation – 1 – 36 0 0 0 – 37
Additions 28 0 15 0 1 44
Transfers 13 0 – 18 0 0 – 5
Disposals – 5 0 0 0 0 – 5 Balance as at 31 December 2012 662 933 20 44 1 1,660 Amortization and impairment losses/ reversals of impairment losses
Balance as at 1 January 2012 – 526 – 534 0 – 36 0 – 1,096
Changes in the scope of consolidation 1 0 0 0 0 1
Scheduled amortization – 66 0 0 – 1 0 – 67
Unscheduled write-downs – 1 0 0 0 0 – 1
Disposals 5 0 0 0 0 5 Balance as at 31 December 2012 – 587 – 534 0 – 37 0 – 1,158 Carrying amounts
Balance as at 1 January 2012 101 435 23 8 0 567
Balance as at 31 December 2012 75 399 20 7 1 502
Amortization and write-downs of intangible assets, both scheduled and unscheduled – with the exception of goodwill (separate item in the income statement) – are recognized in the »Amortization and write-downs of intangible assets« item in »Administrative expenses«.
Intangible assets of EUR 71 million (previous year: EUR 60 million) have a remaining useful life of more than 12 months.
Goodwill. Please refer to the explanations in the General Accounting and Valuation Methods with regard to the procedure for conducting an impairment test in accordance with IAS 36. The carrying amount of goodwill and the gross amounts and cumulative impairments in the business segments Corporates I, Corporates II, International Business and the Financial Markets segment developed as follows during the financial year:
Corporates I Corporates II International
Business Financial Markets Total EUR million 2013 2012 2013 2012 2013 2012 2013 2012 2013 2012
Balance as at 1 January 198 198 185 221 0 0 16 16 399 435
Impairment – 3 0 0 0 0 0 0 0 – 3 0
Changes in the scope of consolidation/other 0 0 0 – 36 0 0 0 0 0 – 36 Balance as at 31 December 195 198 185 185 0 0 16 16 396 399 Gross amount of goodwill 435 435 449 449 33 33 16 16 933 933
Cumulative impairment – 240 – 237 – 264 – 264 – 33 – 33 0 0 – 537 – 534
There is no goodwill in business segments other than those presented above.
The sustainability review of the goodwill for the 2013 financial year resulted in impairment of EUR 3 million. This impairment is due solely to the fact that the provisions of IFRS 5 applied in relation to a subsidiary in the process of being disposed of. However, the recoverable amount for each business segment is higher than its respective carrying amount.
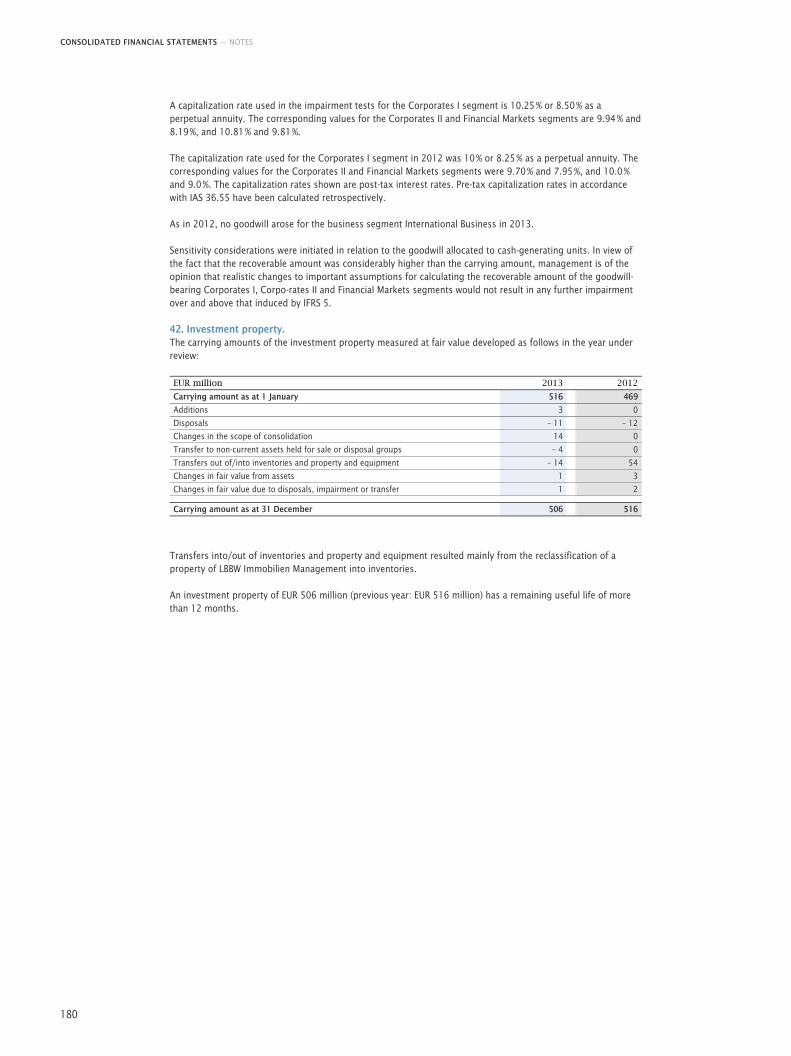
CONSOLIDATED FINANCIAL STATEMENTS — NOTES
180
A capitalization rate used in the impairment tests for the Corporates I segment is 10.25 % or 8.50 % as a perpetual annuity. The corresponding values for the Corporates II and Financial Markets segments are 9.94 % and 8.19 %, and 10.81 % and 9.81 %.
The capitalization rate used for the Corporates I segment in 2012 was 10 % or 8.25 % as a perpetual annuity. The corresponding values for the Corporates II and Financial Markets segments were 9.70 % and 7.95 %, and 10.0 % and 9.0 %. The capitalization rates shown are post-tax interest rates. Pre-tax capitalization rates in accordance with IAS 36.55 have been calculated retrospectively.
As in 2012, no goodwill arose for the business segment International Business in 2013.
Sensitivity considerations were initiated in relation to the goodwill allocated to cash-generating units. In view of the fact that the recoverable amount was considerably higher than the carrying amount, management is of the opinion that realistic changes to important assumptions for calculating the recoverable amount of the goodwill-bearing Corporates I, Corpo-rates II and Financial Markets segments would not result in any further impairment over and above that induced by IFRS 5.
42. Investment property. The carrying amounts of the investment property measured at fair value developed as follows in the year under review:
EUR million 2013 2012
Carrying amount as at 1 January 516 469
Additions 3 0
Disposals – 11 – 12
Changes in the scope of consolidation 14 0
Transfer to non-current assets held for sale or disposal groups – 4 0
Transfers out of/into inventories and property and equipment – 14 54
Changes in fair value from assets 1 3
Changes in fair value due to disposals, impairment or transfer 1 2 Carrying amount as at 31 December 506 516
Transfers into/out of inventories and property and equipment resulted mainly from the reclassification of a property of LBBW Immobilien Management into inventories.
An investment property of EUR 506 million (previous year: EUR 516 million) has a remaining useful life of more than 12 months.
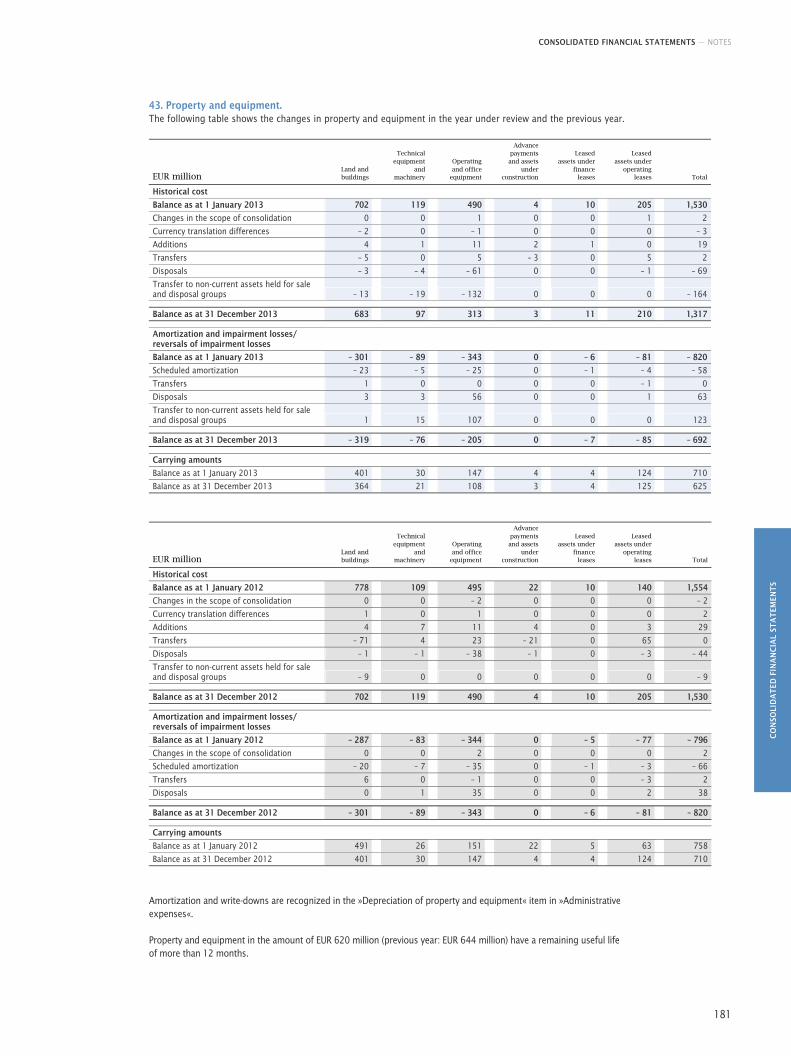
CONSOLIDATED FINANCIAL STATEMENTS — NOTES
CO
NSO
LID
AT
ED F
INA
NC
IAL
STA
TEM
ENT
S
181
43. Property and equipment. The following table shows the changes in property and equipment in the year under review and the previous year.
EUR million Land and buildings
Technical equipment
and machinery
Operating and office
equipment
Advance payments and assets
under construction
Leased assets under
finance leases
Leased assets under
operating leases Total
Historical cost
Balance as at 1 January 2013 702 119 490 4 10 205 1,530
Changes in the scope of consolidation 0 0 1 0 0 1 2
Currency translation differences – 2 0 – 1 0 0 0 – 3
Additions 4 1 11 2 1 0 19
Transfers – 5 0 5 – 3 0 5 2
Disposals – 3 – 4 – 61 0 0 – 1 – 69
Transfer to non-current assets held for sale and disposal groups – 13 – 19 – 132 0 0 0 – 164 Balance as at 31 December 2013 683 97 313 3 11 210 1,317 Amortization and impairment losses/ reversals of impairment losses
Balance as at 1 January 2013 – 301 – 89 – 343 0 – 6 – 81 – 820
Scheduled amortization – 23 – 5 – 25 0 – 1 – 4 – 58
Transfers 1 0 0 0 0 – 1 0
Disposals 3 3 56 0 0 1 63
Transfer to non-current assets held for sale and disposal groups 1 15 107 0 0 0 123 Balance as at 31 December 2013 – 319 – 76 – 205 0 – 7 – 85 – 692 Carrying amounts
Balance as at 1 January 2013 401 30 147 4 4 124 710
Balance as at 31 December 2013 364 21 108 3 4 125 625
EUR million Land and buildings
Technical equipment
and machinery
Operating and office
equipment
Advance payments and assets
under construction
Leased assets under
finance leases
Leased assets under
operating leases Total
Historical cost
Balance as at 1 January 2012 778 109 495 22 10 140 1,554
Changes in the scope of consolidation 0 0 – 2 0 0 0 – 2
Currency translation differences 1 0 1 0 0 0 2
Additions 4 7 11 4 0 3 29
Transfers – 71 4 23 – 21 0 65 0
Disposals – 1 – 1 – 38 – 1 0 – 3 – 44
Transfer to non-current assets held for sale and disposal groups – 9 0 0 0 0 0 – 9 Balance as at 31 December 2012 702 119 490 4 10 205 1,530 Amortization and impairment losses/ reversals of impairment losses
Balance as at 1 January 2012 – 287 – 83 – 344 0 – 5 – 77 – 796
Changes in the scope of consolidation 0 0 2 0 0 0 2
Scheduled amortization – 20 – 7 – 35 0 – 1 – 3 – 66
Transfers 6 0 – 1 0 0 – 3 2
Disposals 0 1 35 0 0 2 38 Balance as at 31 December 2012 – 301 – 89 – 343 0 – 6 – 81 – 820 Carrying amounts
Balance as at 1 January 2012 491 26 151 22 5 63 758
Balance as at 31 December 2012 401 30 147 4 4 124 710
Amortization and write-downs are recognized in the »Depreciation of property and equipment« item in »Administrative expenses«.
Property and equipment in the amount of EUR 620 million (previous year: EUR 644 million) have a remaining useful life of more than 12 months.
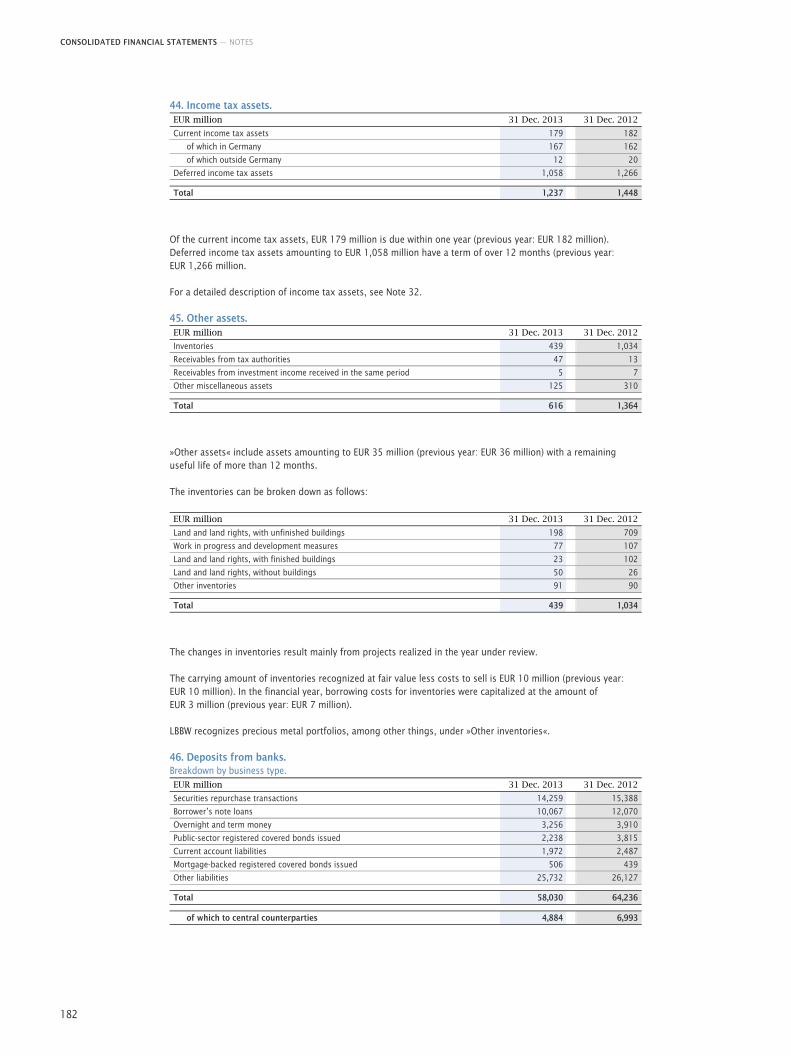
CONSOLIDATED FINANCIAL STATEMENTS — NOTES
182
44. Income tax assets. EUR million 31 Dec. 2013 31 Dec. 2012
Current income tax assets 179 182
of which in Germany 167 162
of which outside Germany 12 20
Deferred income tax assets 1,058 1,266 Total 1,237 1,448
Of the current income tax assets, EUR 179 million is due within one year (previous year: EUR 182 million). Deferred income tax assets amounting to EUR 1,058 million have a term of over 12 months (previous year: EUR 1,266 million.
For a detailed description of income tax assets, see Note 32.
45. Other assets. EUR million 31 Dec. 2013 31 Dec. 2012
Inventories 439 1,034
Receivables from tax authorities 47 13
Receivables from investment income received in the same period 5 7
Other miscellaneous assets 125 310 Total 616 1,364
»Other assets« include assets amounting to EUR 35 million (previous year: EUR 36 million) with a remaining useful life of more than 12 months.
The inventories can be broken down as follows:
EUR million 31 Dec. 2013 31 Dec. 2012
Land and land rights, with unfinished buildings 198 709
Work in progress and development measures 77 107
Land and land rights, with finished buildings 23 102
Land and land rights, without buildings 50 26
Other inventories 91 90 Total 439 1,034
The changes in inventories result mainly from projects realized in the year under review.
The carrying amount of inventories recognized at fair value less costs to sell is EUR 10 million (previous year: EUR 10 million). In the financial year, borrowing costs for inventories were capitalized at the amount of EUR 3 million (previous year: EUR 7 million).
LBBW recognizes precious metal portfolios, among other things, under »Other inventories«.
46. Deposits from banks. Breakdown by business type. EUR million 31 Dec. 2013 31 Dec. 2012
Securities repurchase transactions 14,259 15,388
Borrower’s note loans 10,067 12,070
Overnight and term money 3,256 3,910
Public-sector registered covered bonds issued 2,238 3,815
Current account liabilities 1,972 2,487
Mortgage-backed registered covered bonds issued 506 439
Other liabilities 25,732 26,127 Total 58,030 64,236
of which to central counterparties 4,884 6,993
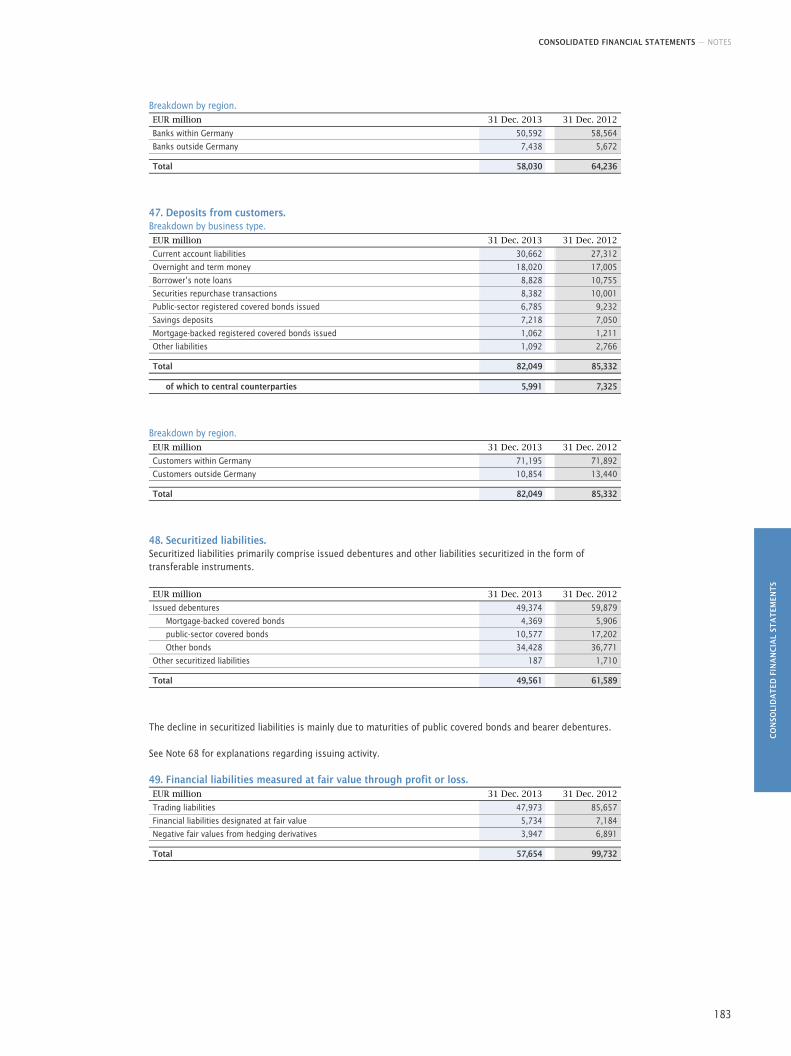
CONSOLIDATED FINANCIAL STATEMENTS — NOTES
CO
NSO
LID
AT
ED F
INA
NC
IAL
STA
TEM
ENT
S
183
Breakdown by region. EUR million 31 Dec. 2013 31 Dec. 2012
Banks within Germany 50,592 58,564
Banks outside Germany 7,438 5,672 Total 58,030 64,236
47. Deposits from customers. Breakdown by business type. EUR million 31 Dec. 2013 31 Dec. 2012
Current account liabilities 30,662 27,312
Overnight and term money 18,020 17,005
Borrower’s note loans 8,828 10,755
Securities repurchase transactions 8,382 10,001
Public-sector registered covered bonds issued 6,785 9,232
Savings deposits 7,218 7,050
Mortgage-backed registered covered bonds issued 1,062 1,211
Other liabilities 1,092 2,766 Total 82,049 85,332
of which to central counterparties 5,991 7,325
Breakdown by region. EUR million 31 Dec. 2013 31 Dec. 2012
Customers within Germany 71,195 71,892
Customers outside Germany 10,854 13,440 Total 82,049 85,332
48. Securitized liabilities. Securitized liabilities primarily comprise issued debentures and other liabilities securitized in the form of transferable instruments.
EUR million 31 Dec. 2013 31 Dec. 2012
Issued debentures 49,374 59,879
Mortgage-backed covered bonds 4,369 5,906
public-sector covered bonds 10,577 17,202
Other bonds 34,428 36,771
Other securitized liabilities 187 1,710 Total 49,561 61,589
The decline in securitized liabilities is mainly due to maturities of public covered bonds and bearer debentures.
See Note 68 for explanations regarding issuing activity.
49. Financial liabilities measured at fair value through profit or loss. EUR million 31 Dec. 2013 31 Dec. 2012
Trading liabilities 47,973 85,657
Financial liabilities designated at fair value 5,734 7,184
Negative fair values from hedging derivatives 3,947 6,891 Total 57,654 99,732
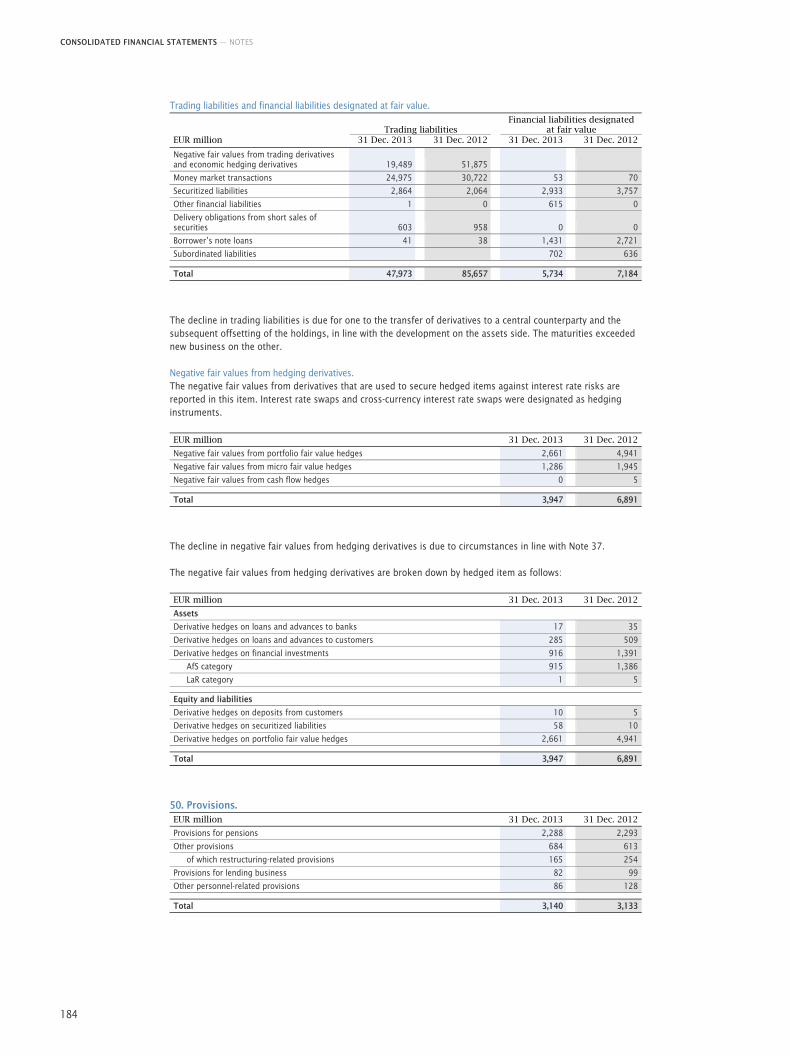
CONSOLIDATED FINANCIAL STATEMENTS — NOTES
184
Trading liabilities and financial liabilities designated at fair value.
Trading liabilities Financial liabilities designated
at fair value EUR million 31 Dec. 2013 31 Dec. 2012 31 Dec. 2013 31 Dec. 2012
Negative fair values from trading derivatives and economic hedging derivatives 19,489 51,875
Money market transactions 24,975 30,722 53 70
Securitized liabilities 2,864 2,064 2,933 3,757
Other financial liabilities 1 0 615 0
Delivery obligations from short sales of securities 603 958 0 0
Borrower’s note loans 41 38 1,431 2,721
Subordinated liabilities 702 636 Total 47,973 85,657 5,734 7,184
The decline in trading liabilities is due for one to the transfer of derivatives to a central counterparty and the subsequent offsetting of the holdings, in line with the development on the assets side. The maturities exceeded new business on the other.
Negative fair values from hedging derivatives. The negative fair values from derivatives that are used to secure hedged items against interest rate risks are reported in this item. Interest rate swaps and cross-currency interest rate swaps were designated as hedging instruments.
EUR million 31 Dec. 2013 31 Dec. 2012
Negative fair values from portfolio fair value hedges 2,661 4,941
Negative fair values from micro fair value hedges 1,286 1,945
Negative fair values from cash flow hedges 0 5 Total 3,947 6,891
The decline in negative fair values from hedging derivatives is due to circumstances in line with Note 37.
The negative fair values from hedging derivatives are broken down by hedged item as follows:
EUR million 31 Dec. 2013 31 Dec. 2012
Assets
Derivative hedges on loans and advances to banks 17 35
Derivative hedges on loans and advances to customers 285 509
Derivative hedges on financial investments 916 1,391
AfS category 915 1,386
LaR category 1 5 Equity and liabilities
Derivative hedges on deposits from customers 10 5
Derivative hedges on securitized liabilities 58 10
Derivative hedges on portfolio fair value hedges 2,661 4,941 Total 3,947 6,891
50. Provisions. EUR million 31 Dec. 2013 31 Dec. 2012
Provisions for pensions 2,288 2,293
Other provisions 684 613
of which restructuring-related provisions 165 254
Provisions for lending business 82 99
Other personnel-related provisions 86 128 Total 3,140 3,133
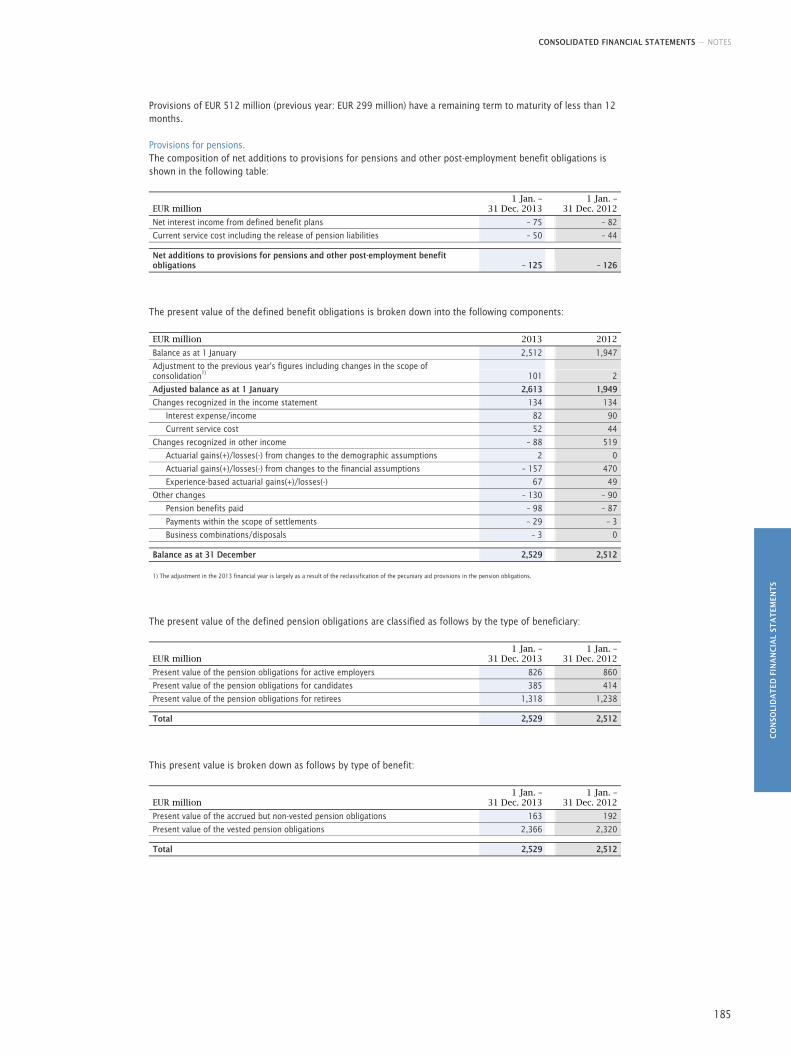
CONSOLIDATED FINANCIAL STATEMENTS — NOTES
CO
NSO
LID
AT
ED F
INA
NC
IAL
STA
TEM
ENT
S
185
Provisions of EUR 512 million (previous year: EUR 299 million) have a remaining term to maturity of less than 12 months.
Provisions for pensions. The composition of net additions to provisions for pensions and other post-employment benefit obligations is shown in the following table:
EUR million 1 Jan. –
31 Dec. 2013
1 Jan. – 31 Dec. 2012
Net interest income from defined benefit plans – 75 – 82
Current service cost including the release of pension liabilities – 50 – 44 Net additions to provisions for pensions and other post-employment benefit obligations – 125 – 126
The present value of the defined benefit obligations is broken down into the following components:
EUR million 2013 2012
Balance as at 1 January 2,512 1,947
Adjustment to the previous year's figures including changes in the scope of consolidation1) 101 2
Adjusted balance as at 1 January 2,613 1,949
Changes recognized in the income statement 134 134
Interest expense/income 82 90
Current service cost 52 44
Changes recognized in other income – 88 519
Actuarial gains(+)/losses(-) from changes to the demographic assumptions 2 0
Actuarial gains(+)/losses(-) from changes to the financial assumptions – 157 470
Experience-based actuarial gains(+)/losses(-) 67 49
Other changes – 130 – 90
Pension benefits paid – 98 – 87
Payments within the scope of settlements – 29 – 3
Business combinations/disposals – 3 0 Balance as at 31 December 2,529 2,512 1) The adjustment in the 2013 financial year is largely as a result of the reclassification of the pecuniary aid provisions in the pension obligations.
The present value of the defined pension obligations are classified as follows by the type of beneficiary:
EUR million 1 Jan. –
31 Dec. 2013
1 Jan. – 31 Dec. 2012
Present value of the pension obligations for active employers 826 860
Present value of the pension obligations for candidates 385 414
Present value of the pension obligations for retirees 1,318 1,238 Total 2,529 2,512
This present value is broken down as follows by type of benefit:
EUR million 1 Jan. –
31 Dec. 2013
1 Jan. – 31 Dec. 2012
Present value of the accrued but non-vested pension obligations 163 192
Present value of the vested pension obligations 2,366 2,320 Total 2,529 2,512
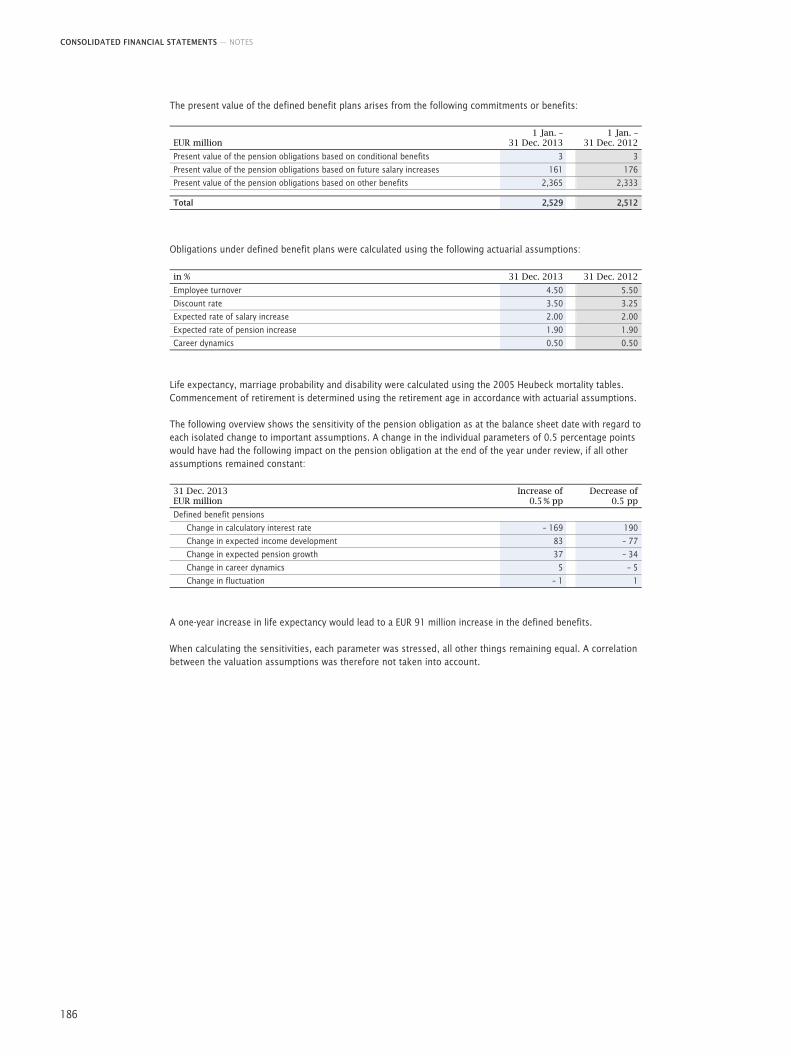
CONSOLIDATED FINANCIAL STATEMENTS — NOTES
186
The present value of the defined benefit plans arises from the following commitments or benefits:
EUR million 1 Jan. –
31 Dec. 2013
1 Jan. – 31 Dec. 2012
Present value of the pension obligations based on conditional benefits 3 3
Present value of the pension obligations based on future salary increases 161 176
Present value of the pension obligations based on other benefits 2,365 2,333 Total 2,529 2,512
Obligations under defined benefit plans were calculated using the following actuarial assumptions:
in % 31 Dec. 2013 31 Dec. 2012
Employee turnover 4.50 5.50
Discount rate 3.50 3.25
Expected rate of salary increase 2.00 2.00
Expected rate of pension increase 1.90 1.90
Career dynamics 0.50 0.50
Life expectancy, marriage probability and disability were calculated using the 2005 Heubeck mortality tables. Commencement of retirement is determined using the retirement age in accordance with actuarial assumptions.
The following overview shows the sensitivity of the pension obligation as at the balance sheet date with regard to each isolated change to important assumptions. A change in the individual parameters of 0.5 percentage points would have had the following impact on the pension obligation at the end of the year under review, if all other assumptions remained constant:
31 Dec. 2013 EUR million
Increase of 0.5 % pp
Decrease of 0.5 pp
Defined benefit pensions
Change in calculatory interest rate – 169 190
Change in expected income development 83 – 77
Change in expected pension growth 37 – 34
Change in career dynamics 5 – 5
Change in fluctuation – 1 1
A one-year increase in life expectancy would lead to a EUR 91 million increase in the defined benefits.
When calculating the sensitivities, each parameter was stressed, all other things remaining equal. A correlation between the valuation assumptions was therefore not taken into account.
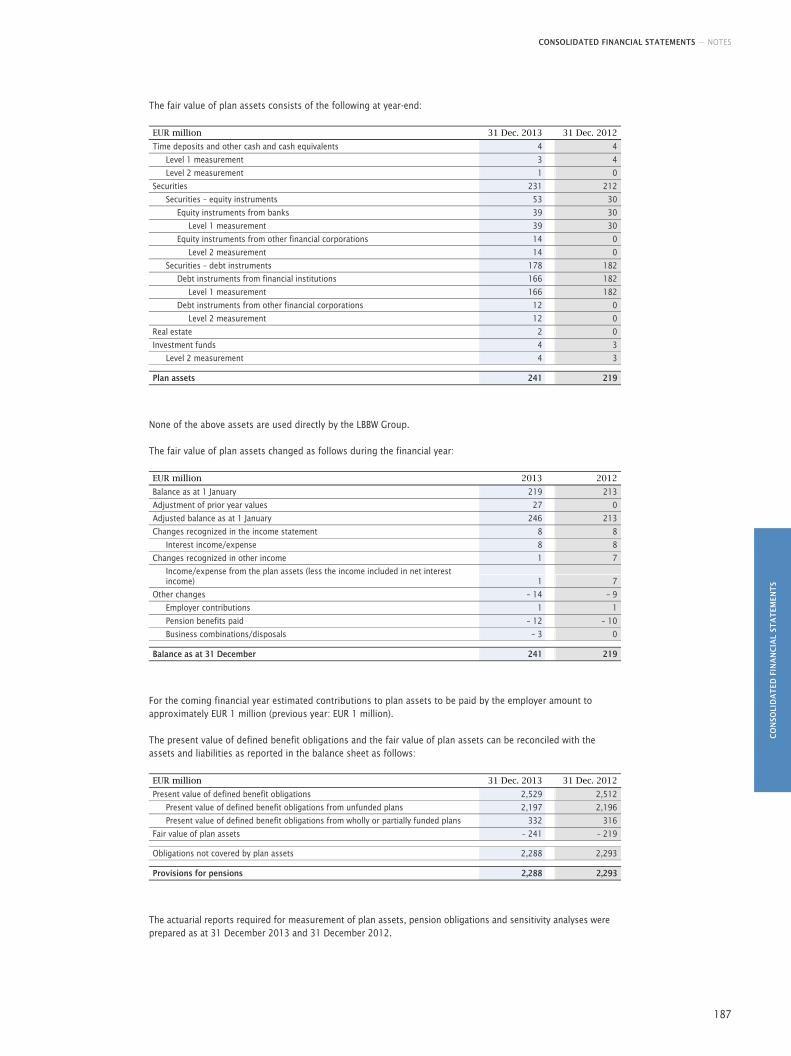
CONSOLIDATED FINANCIAL STATEMENTS — NOTES
CO
NSO
LID
AT
ED F
INA
NC
IAL
STA
TEM
ENT
S
187
The fair value of plan assets consists of the following at year-end:
EUR million 31 Dec. 2013 31 Dec. 2012
Time deposits and other cash and cash equivalents 4 4
Level 1 measurement 3 4
Level 2 measurement 1 0
Securities 231 212
Securities – equity instruments 53 30
Equity instruments from banks 39 30
Level 1 measurement 39 30
Equity instruments from other financial corporations 14 0
Level 2 measurement 14 0
Securities – debt instruments 178 182
Debt instruments from financial institutions 166 182
Level 1 measurement 166 182
Debt instruments from other financial corporations 12 0
Level 2 measurement 12 0
Real estate 2 0
Investment funds 4 3
Level 2 measurement 4 3 Plan assets 241 219
None of the above assets are used directly by the LBBW Group.
The fair value of plan assets changed as follows during the financial year:
EUR million 2013 2012
Balance as at 1 January 219 213
Adjustment of prior year values 27 0
Adjusted balance as at 1 January 246 213
Changes recognized in the income statement 8 8
Interest income/expense 8 8
Changes recognized in other income 1 7
Income/expense from the plan assets (less the income included in net interest income) 1 7
Other changes – 14 – 9
Employer contributions 1 1
Pension benefits paid – 12 – 10
Business combinations/disposals – 3 0 Balance as at 31 December 241 219
For the coming financial year estimated contributions to plan assets to be paid by the employer amount to approximately EUR 1 million (previous year: EUR 1 million).
The present value of defined benefit obligations and the fair value of plan assets can be reconciled with the assets and liabilities as reported in the balance sheet as follows:
EUR million 31 Dec. 2013 31 Dec. 2012
Present value of defined benefit obligations 2,529 2,512
Present value of defined benefit obligations from unfunded plans 2,197 2,196
Present value of defined benefit obligations from wholly or partially funded plans 332 316
Fair value of plan assets – 241 – 219 Obligations not covered by plan assets 2,288 2,293 Provisions for pensions 2,288 2,293
The actuarial reports required for measurement of plan assets, pension obligations and sensitivity analyses were prepared as at 31 December 2013 and 31 December 2012.
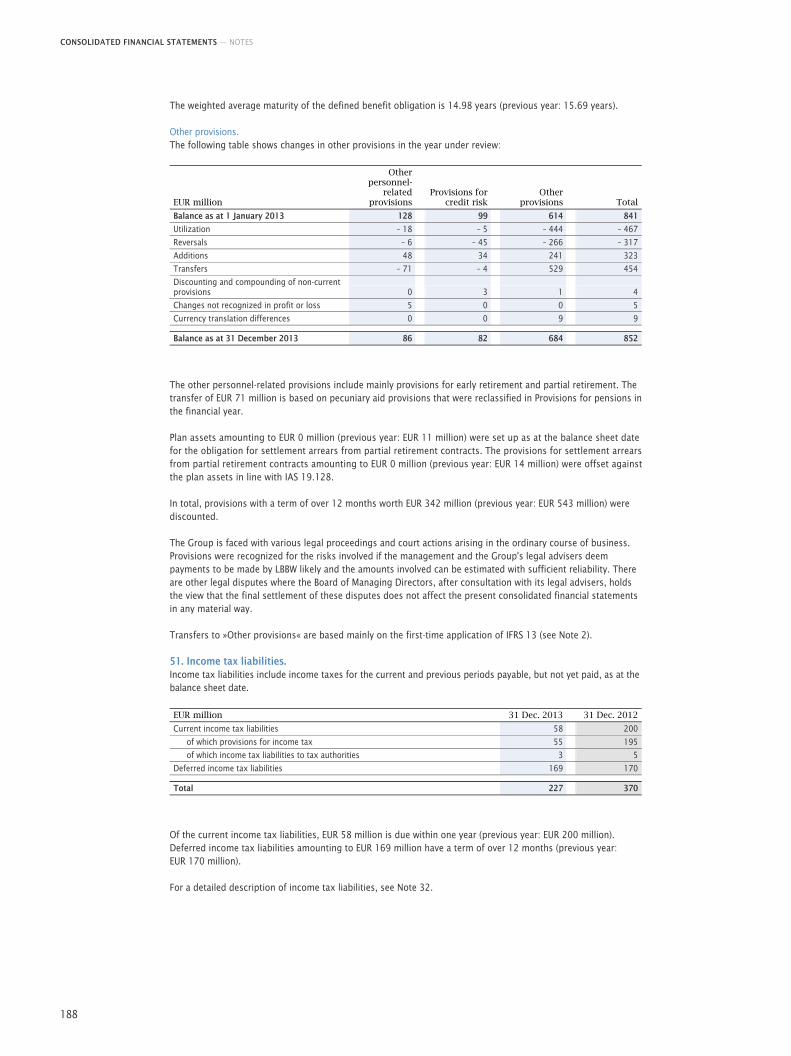
CONSOLIDATED FINANCIAL STATEMENTS — NOTES
188
The weighted average maturity of the defined benefit obligation is 14.98 years (previous year: 15.69 years).
Other provisions. The following table shows changes in other provisions in the year under review:
EUR million
Other personnel-
related provisions
Provisions for credit risk
Other provisions Total
Balance as at 1 January 2013 128 99 614 841
Utilization – 18 – 5 – 444 – 467
Reversals – 6 – 45 – 266 – 317
Additions 48 34 241 323
Transfers – 71 – 4 529 454
Discounting and compounding of non-current provisions 0 3 1 4
Changes not recognized in profit or loss 5 0 0 5
Currency translation differences 0 0 9 9 Balance as at 31 December 2013 86 82 684 852
The other personnel-related provisions include mainly provisions for early retirement and partial retirement. The transfer of EUR 71 million is based on pecuniary aid provisions that were reclassified in Provisions for pensions in the financial year.
Plan assets amounting to EUR 0 million (previous year: EUR 11 million) were set up as at the balance sheet date for the obligation for settlement arrears from partial retirement contracts. The provisions for settlement arrears from partial retirement contracts amounting to EUR 0 million (previous year: EUR 14 million) were offset against the plan assets in line with IAS 19.128.
In total, provisions with a term of over 12 months worth EUR 342 million (previous year: EUR 543 million) were discounted.
The Group is faced with various legal proceedings and court actions arising in the ordinary course of business. Provisions were recognized for the risks involved if the management and the Group's legal advisers deem payments to be made by LBBW likely and the amounts involved can be estimated with sufficient reliability. There are other legal disputes where the Board of Managing Directors, after consultation with its legal advisers, holds the view that the final settlement of these disputes does not affect the present consolidated financial statements in any material way.
Transfers to »Other provisions« are based mainly on the first-time application of IFRS 13 (see Note 2).
51. Income tax liabilities. Income tax liabilities include income taxes for the current and previous periods payable, but not yet paid, as at the balance sheet date.
EUR million 31 Dec. 2013 31 Dec. 2012
Current income tax liabilities 58 200
of which provisions for income tax 55 195
of which income tax liabilities to tax authorities 3 5
Deferred income tax liabilities 169 170 Total 227 370
Of the current income tax liabilities, EUR 58 million is due within one year (previous year: EUR 200 million). Deferred income tax liabilities amounting to EUR 169 million have a term of over 12 months (previous year: EUR 170 million).
For a detailed description of income tax liabilities, see Note 32.
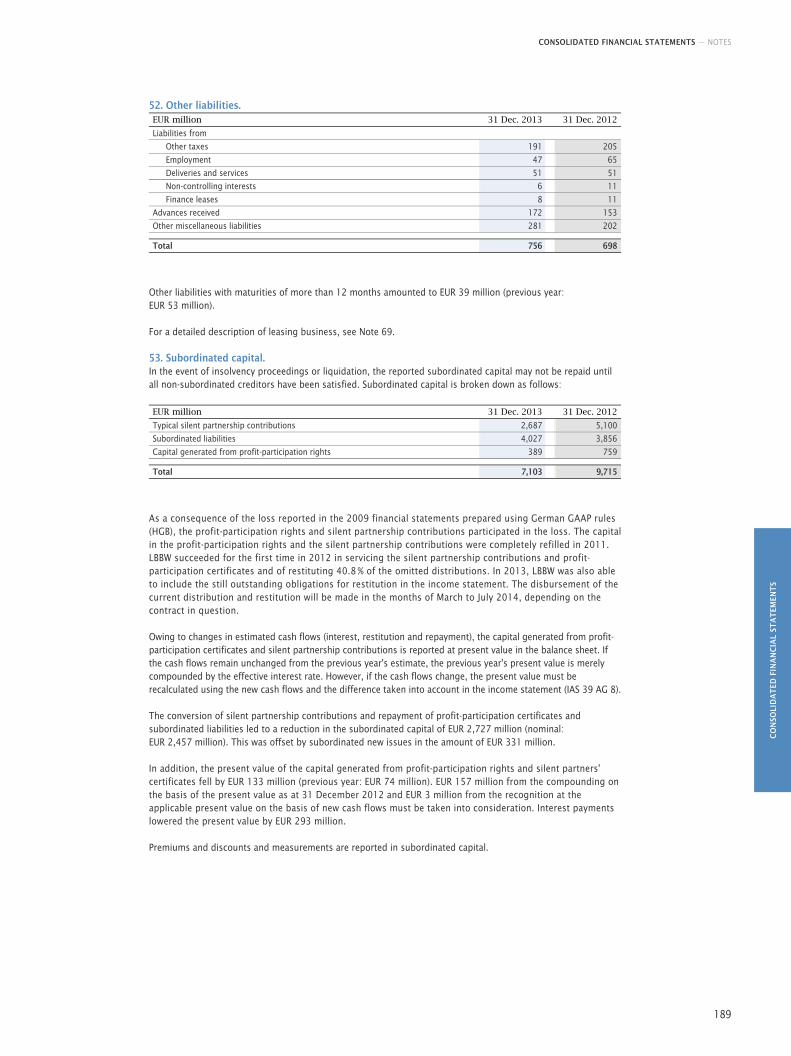
CONSOLIDATED FINANCIAL STATEMENTS — NOTES
CO
NSO
LID
AT
ED F
INA
NC
IAL
STA
TEM
ENT
S
189
52. Other liabilities. EUR million 31 Dec. 2013 31 Dec. 2012
Liabilities from
Other taxes 191 205
Employment 47 65
Deliveries and services 51 51
Non-controlling interests 6 11
Finance leases 8 11
Advances received 172 153
Other miscellaneous liabilities 281 202 Total 756 698
Other liabilities with maturities of more than 12 months amounted to EUR 39 million (previous year: EUR 53 million).
For a detailed description of leasing business, see Note 69.
53. Subordinated capital. In the event of insolvency proceedings or liquidation, the reported subordinated capital may not be repaid until all non-subordinated creditors have been satisfied. Subordinated capital is broken down as follows:
EUR million 31 Dec. 2013 31 Dec. 2012
Typical silent partnership contributions 2,687 5,100
Subordinated liabilities 4,027 3,856
Capital generated from profit-participation rights 389 759 Total 7,103 9,715
As a consequence of the loss reported in the 2009 financial statements prepared using German GAAP rules (HGB), the profit-participation rights and silent partnership contributions participated in the loss. The capital in the profit-participation rights and the silent partnership contributions were completely refilled in 2011. LBBW succeeded for the first time in 2012 in servicing the silent partnership contributions and profit-participation certificates and of restituting 40.8 % of the omitted distributions. In 2013, LBBW was also able to include the still outstanding obligations for restitution in the income statement. The disbursement of the current distribution and restitution will be made in the months of March to July 2014, depending on the contract in question.
Owing to changes in estimated cash flows (interest, restitution and repayment), the capital generated from profit-participation certificates and silent partnership contributions is reported at present value in the balance sheet. If the cash flows remain unchanged from the previous year's estimate, the previous year's present value is merely compounded by the effective interest rate. However, if the cash flows change, the present value must be recalculated using the new cash flows and the difference taken into account in the income statement (IAS 39 AG 8).
The conversion of silent partnership contributions and repayment of profit-participation certificates and subordinated liabilities led to a reduction in the subordinated capital of EUR 2,727 million (nominal: EUR 2,457 million). This was offset by subordinated new issues in the amount of EUR 331 million.
In addition, the present value of the capital generated from profit-participation rights and silent partners' certificates fell by EUR 133 million (previous year: EUR 74 million). EUR 157 million from the compounding on the basis of the present value as at 31 December 2012 and EUR 3 million from the recognition at the applicable present value on the basis of new cash flows must be taken into consideration. Interest payments lowered the present value by EUR 293 million.
Premiums and discounts and measurements are reported in subordinated capital.
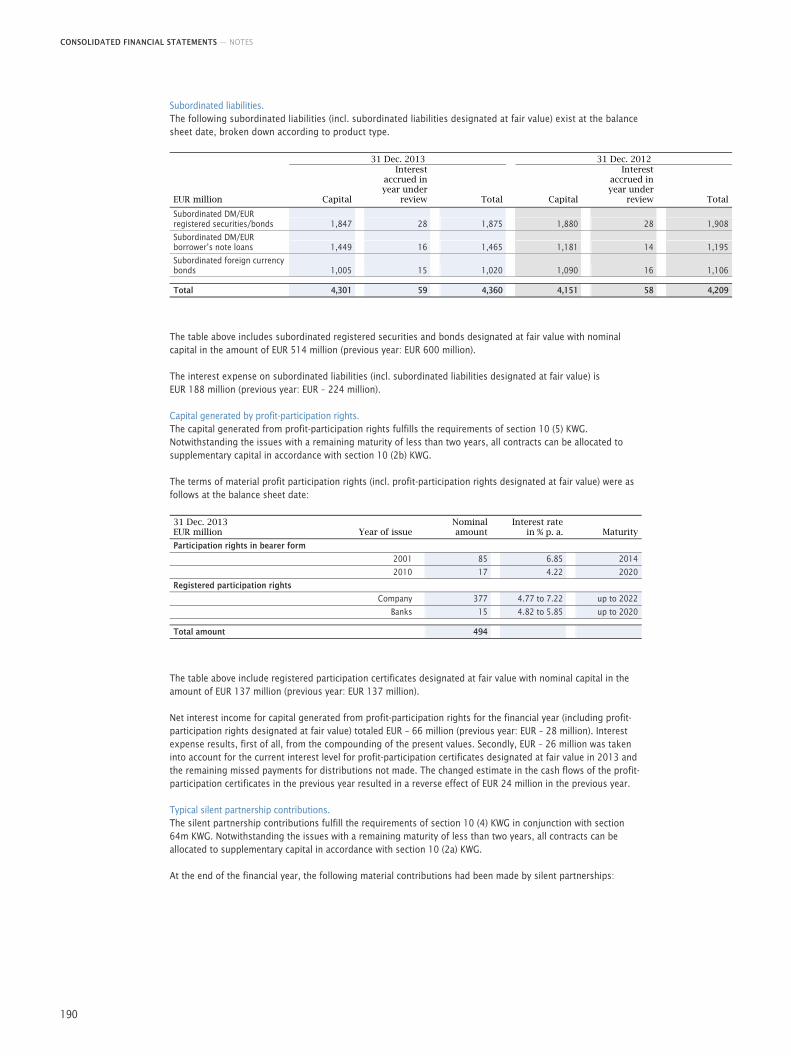
CONSOLIDATED FINANCIAL STATEMENTS — NOTES
190
Subordinated liabilities. The following subordinated liabilities (incl. subordinated liabilities designated at fair value) exist at the balance sheet date, broken down according to product type.
31 Dec. 2013 31 Dec. 2012
EUR million Capital
Interest accrued in year under
review Total Capital
Interest accrued in year under
review Total
Subordinated DM/EUR registered securities/bonds 1,847 28 1,875 1,880 28 1,908
Subordinated DM/EUR borrower’s note loans 1,449 16 1,465 1,181 14 1,195
Subordinated foreign currency bonds 1,005 15 1,020 1,090 16 1,106 Total 4,301 59 4,360 4,151 58 4,209
The table above includes subordinated registered securities and bonds designated at fair value with nominal capital in the amount of EUR 514 million (previous year: EUR 600 million).
The interest expense on subordinated liabilities (incl. subordinated liabilities designated at fair value) is EUR 188 million (previous year: EUR – 224 million).
Capital generated by profit-participation rights. The capital generated from profit-participation rights fulfills the requirements of section 10 (5) KWG. Notwithstanding the issues with a remaining maturity of less than two years, all contracts can be allocated to supplementary capital in accordance with section 10 (2b) KWG.
The terms of material profit participation rights (incl. profit-participation rights designated at fair value) were as follows at the balance sheet date:
31 Dec. 2013 EUR million Year of issue
Nominal amount
Interest rate in % p. a. Maturity
Participation rights in bearer form
2001 85 6.85 2014
2010 17 4.22 2020
Registered participation rights
Company 377 4.77 to 7.22 up to 2022
Banks 15 4.82 to 5.85 up to 2020
Total amount 494
The table above include registered participation certificates designated at fair value with nominal capital in the amount of EUR 137 million (previous year: EUR 137 million).
Net interest income for capital generated from profit-participation rights for the financial year (including profit-participation rights designated at fair value) totaled EUR – 66 million (previous year: EUR – 28 million). Interest expense results, first of all, from the compounding of the present values. Secondly, EUR – 26 million was taken into account for the current interest level for profit-participation certificates designated at fair value in 2013 and the remaining missed payments for distributions not made. The changed estimate in the cash flows of the profit-participation certificates in the previous year resulted in a reverse effect of EUR 24 million in the previous year.
Typical silent partnership contributions. The silent partnership contributions fulfill the requirements of section 10 (4) KWG in conjunction with section 64m KWG. Notwithstanding the issues with a remaining maturity of less than two years, all contracts can be allocated to supplementary capital in accordance with section 10 (2a) KWG.
At the end of the financial year, the following material contributions had been made by silent partnerships:
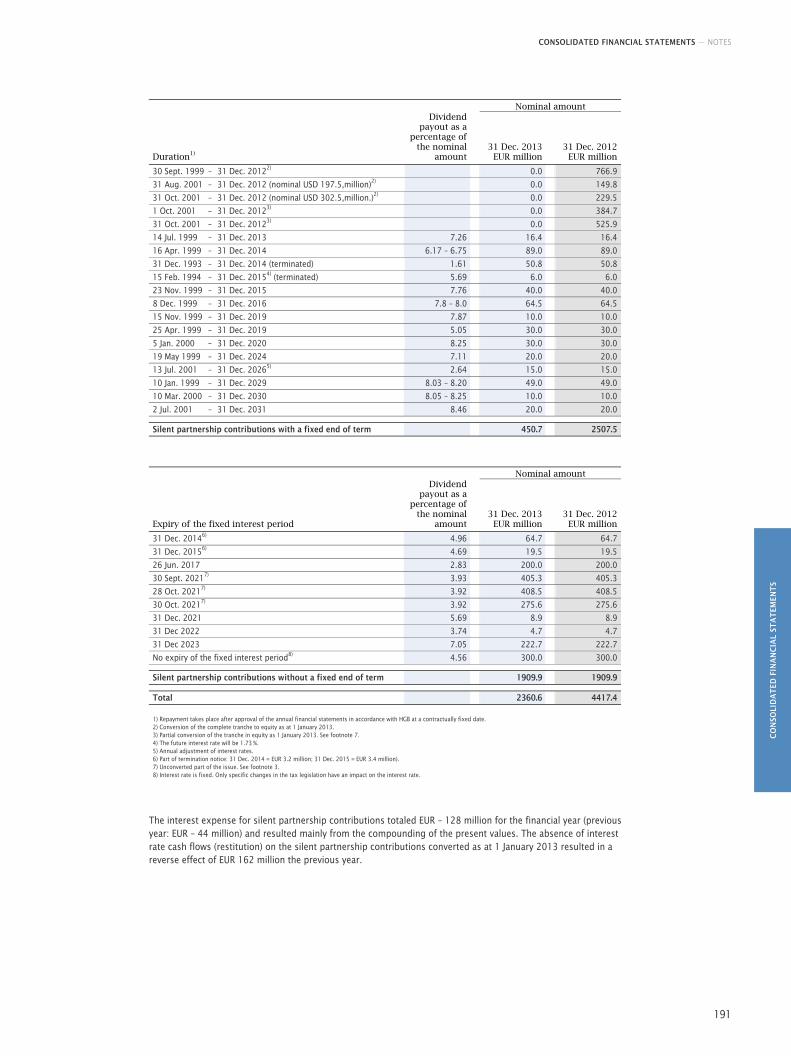
CONSOLIDATED FINANCIAL STATEMENTS — NOTES
CO
NSO
LID
AT
ED F
INA
NC
IAL
STA
TEM
ENT
S
191
Nominal amount
Duration1)
Dividend payout as a
percentage of the nominal
amount
31 Dec. 2013EUR million
31 Dec. 2012 EUR million
30 Sept. 1999 – 31 Dec. 20122) 0.0 766.9
31 Aug. 2001 – 31 Dec. 2012 (nominal USD 197.5,million)2) 0.0 149.8
31 Oct. 2001 – 31 Dec. 2012 (nominal USD 302.5,million.)2) 0.0 229.5
1 Oct. 2001 – 31 Dec. 20123) 0.0 384.7
31 Oct. 2001 – 31 Dec. 20123) 0.0 525.9
14 Jul. 1999 – 31 Dec. 2013 7.26 16.4 16.4
16 Apr. 1999 – 31 Dec. 2014 6.17 – 6.75 89.0 89.0
31 Dec. 1993 – 31 Dec. 2014 (terminated) 1.61 50.8 50.8
15 Feb. 1994 – 31 Dec. 20154) (terminated) 5.69 6.0 6.0
23 Nov. 1999 – 31 Dec. 2015 7.76 40.0 40.0
8 Dec. 1999 – 31 Dec. 2016 7.8 – 8.0 64.5 64.5
15 Nov. 1999 – 31 Dec. 2019 7.87 10.0 10.0
25 Apr. 1999 – 31 Dec. 2019 5.05 30.0 30.0
5 Jan. 2000 – 31 Dec. 2020 8.25 30.0 30.0
19 May 1999 – 31 Dec. 2024 7.11 20.0 20.0
13 Jul. 2001 – 31 Dec. 20265) 2.64 15.0 15.0
10 Jan. 1999 – 31 Dec. 2029 8.03 – 8.20 49.0 49.0
10 Mar. 2000 – 31 Dec. 2030 8.05 – 8.25 10.0 10.0
2 Jul. 2001 – 31 Dec. 2031 8.46 20.0 20.0 Silent partnership contributions with a fixed end of term 450.7 2507.5
Nominal amount
Expiry of the fixed interest period
Dividend payout as a
percentage of the nominal
amount
31 Dec. 2013EUR million
31 Dec. 2012 EUR million
31 Dec. 20146) 4.96 64.7 64.7
31 Dec. 20156) 4.69 19.5 19.5
26 Jun. 2017 2.83 200.0 200.0
30 Sept. 20217) 3.93 405.3 405.3
28 Oct. 20217) 3.92 408.5 408.5
30 Oct. 20217) 3.92 275.6 275.6
31 Dec. 2021 5.69 8.9 8.9
31 Dec 2022 3.74 4.7 4.7
31 Dec 2023 7.05 222.7 222.7
No expiry of the fixed interest period8) 4.56 300.0 300.0 Silent partnership contributions without a fixed end of term 1909.9 1909.9 Total 2360.6 4417.4 1) Repayment takes place after approval of the annual financial statements in accordance with HGB at a contractually fixed date. 2) Conversion of the complete tranche to equity as at 1 January 2013. 3) Partial conversion of the tranche in equity as 1 January 2013. See footnote 7. 4) The future interest rate will be 1.73 %. 5) Annual adjustment of interest rates. 6) Part of termination notice: 31 Dec. 2014 = EUR 3.2 million; 31 Dec. 2015 = EUR 3.4 million). 7) Unconverted part of the issue. See footnote 3. 8) Interest rate is fixed. Only specific changes in the tax legislation have an impact on the interest rate.
The interest expense for silent partnership contributions totaled EUR – 128 million for the financial year (previous year: EUR – 44 million) and resulted mainly from the compounding of the present values. The absence of interest rate cash flows (restitution) on the silent partnership contributions converted as at 1 January 2013 resulted in a reverse effect of EUR 162 million the previous year.
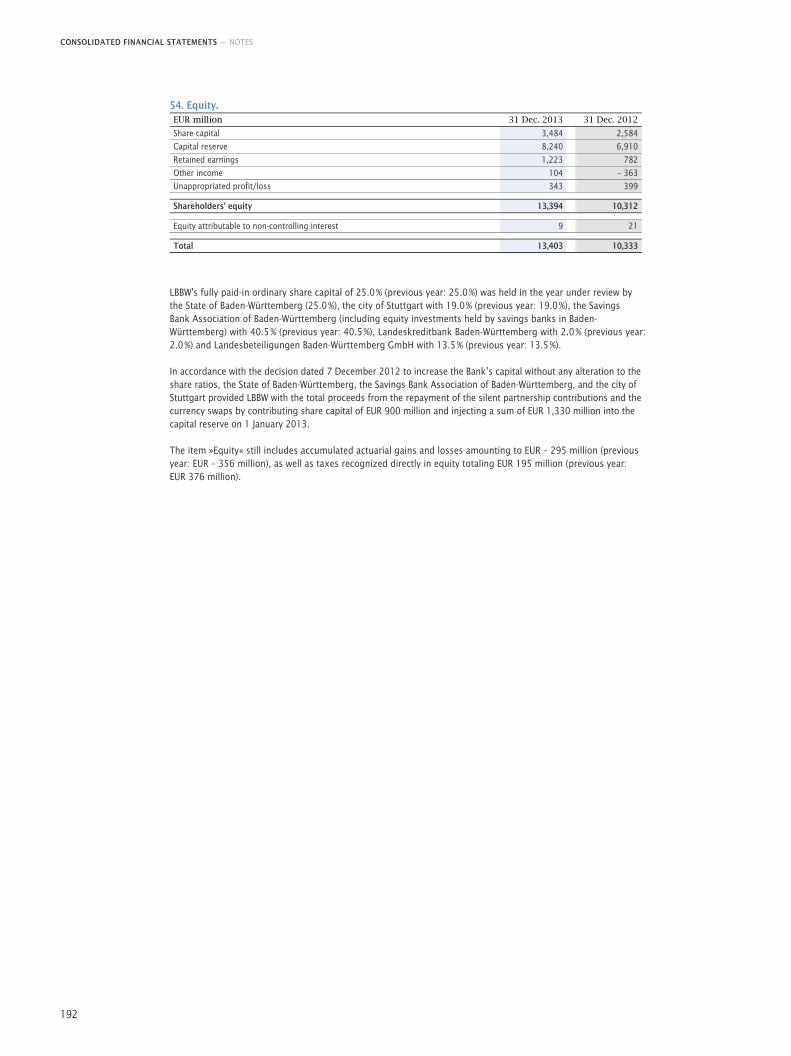
CONSOLIDATED FINANCIAL STATEMENTS — NOTES
192
54. Equity. EUR million 31 Dec. 2013 31 Dec. 2012
Share capital 3,484 2,584
Capital reserve 8,240 6,910
Retained earnings 1,223 782
Other income 104 – 363
Unappropriated profit/loss 343 399 Shareholders' equity 13,394 10,312 Equity attributable to non-controlling interest 9 21 Total 13,403 10,333
LBBW's fully paid-in ordinary share capital of 25.0 % (previous year: 25.0 %) was held in the year under review by the State of Baden-Württemberg (25.0 %), the city of Stuttgart with 19.0 % (previous year: 19.0 %), the Savings Bank Association of Baden-Württemberg (including equity investments held by savings banks in Baden-Württemberg) with 40.5 % (previous year: 40.5 %), Landeskreditbank Baden-Württemberg with 2.0 % (previous year: 2.0 %) and Landesbeteiligungen Baden-Württemberg GmbH with 13.5 % (previous year: 13.5 %).
In accordance with the decision dated 7 December 2012 to increase the Bank’s capital without any alteration to the share ratios, the State of Baden-Württemberg, the Savings Bank Association of Baden-Württemberg, and the city of Stuttgart provided LBBW with the total proceeds from the repayment of the silent partnership contributions and the currency swaps by contributing share capital of EUR 900 million and injecting a sum of EUR 1,330 million into the capital reserve on 1 January 2013.
The item »Equity« still includes accumulated actuarial gains and losses amounting to EUR – 295 million (previous year: EUR – 356 million), as well as taxes recognized directly in equity totaling EUR 195 million (previous year: EUR 376 million).
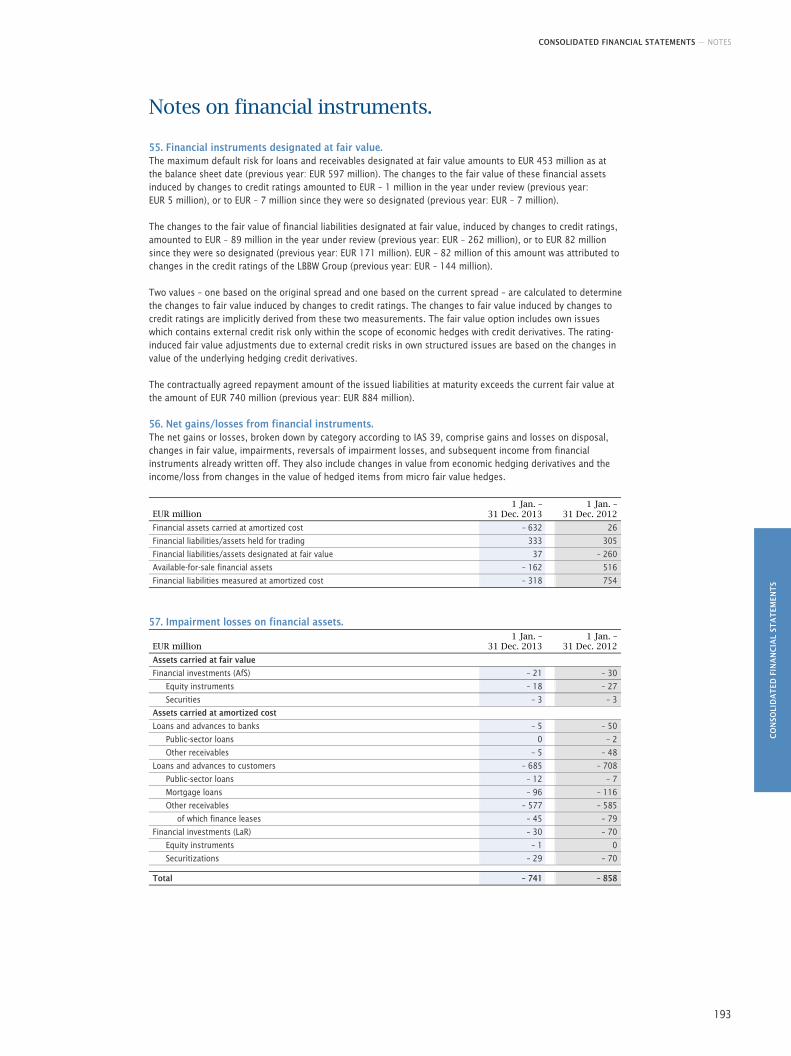
CONSOLIDATED FINANCIAL STATEMENTS — NOTES
CO
NSO
LID
AT
ED F
INA
NC
IAL
STA
TEM
ENT
S
193
Notes on financial instruments.
55. Financial instruments designated at fair value. The maximum default risk for loans and receivables designated at fair value amounts to EUR 453 million as at the balance sheet date (previous year: EUR 597 million). The changes to the fair value of these financial assets induced by changes to credit ratings amounted to EUR – 1 million in the year under review (previous year: EUR 5 million), or to EUR – 7 million since they were so designated (previous year: EUR – 7 million).
The changes to the fair value of financial liabilities designated at fair value, induced by changes to credit ratings, amounted to EUR – 89 million in the year under review (previous year: EUR – 262 million), or to EUR 82 million since they were so designated (previous year: EUR 171 million). EUR – 82 million of this amount was attributed to changes in the credit ratings of the LBBW Group (previous year: EUR – 144 million).
Two values – one based on the original spread and one based on the current spread – are calculated to determine the changes to fair value induced by changes to credit ratings. The changes to fair value induced by changes to credit ratings are implicitly derived from these two measurements. The fair value option includes own issues which contains external credit risk only within the scope of economic hedges with credit derivatives. The rating-induced fair value adjustments due to external credit risks in own structured issues are based on the changes in value of the underlying hedging credit derivatives.
The contractually agreed repayment amount of the issued liabilities at maturity exceeds the current fair value at the amount of EUR 740 million (previous year: EUR 884 million).
56. Net gains/losses from financial instruments. The net gains or losses, broken down by category according to IAS 39, comprise gains and losses on disposal, changes in fair value, impairments, reversals of impairment losses, and subsequent income from financial instruments already written off. They also include changes in value from economic hedging derivatives and the income/loss from changes in the value of hedged items from micro fair value hedges.
EUR million 1 Jan. –
31 Dec. 2013
1 Jan. – 31 Dec. 2012
Financial assets carried at amortized cost – 632 26
Financial liabilities/assets held for trading 333 305
Financial liabilities/assets designated at fair value 37 – 260
Available-for-sale financial assets – 162 516
Financial liabilities measured at amortized cost – 318 754
57. Impairment losses on financial assets.
EUR million 1 Jan. –
31 Dec. 2013
1 Jan. – 31 Dec. 2012
Assets carried at fair value
Financial investments (AfS) – 21 – 30
Equity instruments – 18 – 27
Securities – 3 – 3
Assets carried at amortized cost
Loans and advances to banks – 5 – 50
Public-sector loans 0 – 2
Other receivables – 5 – 48
Loans and advances to customers – 685 – 708
Public-sector loans – 12 – 7
Mortgage loans – 96 – 116
Other receivables – 577 – 585
of which finance leases – 45 – 79
Financial investments (LaR) – 30 – 70
Equity instruments – 1 0
Securitizations – 29 – 70 Total – 741 – 858
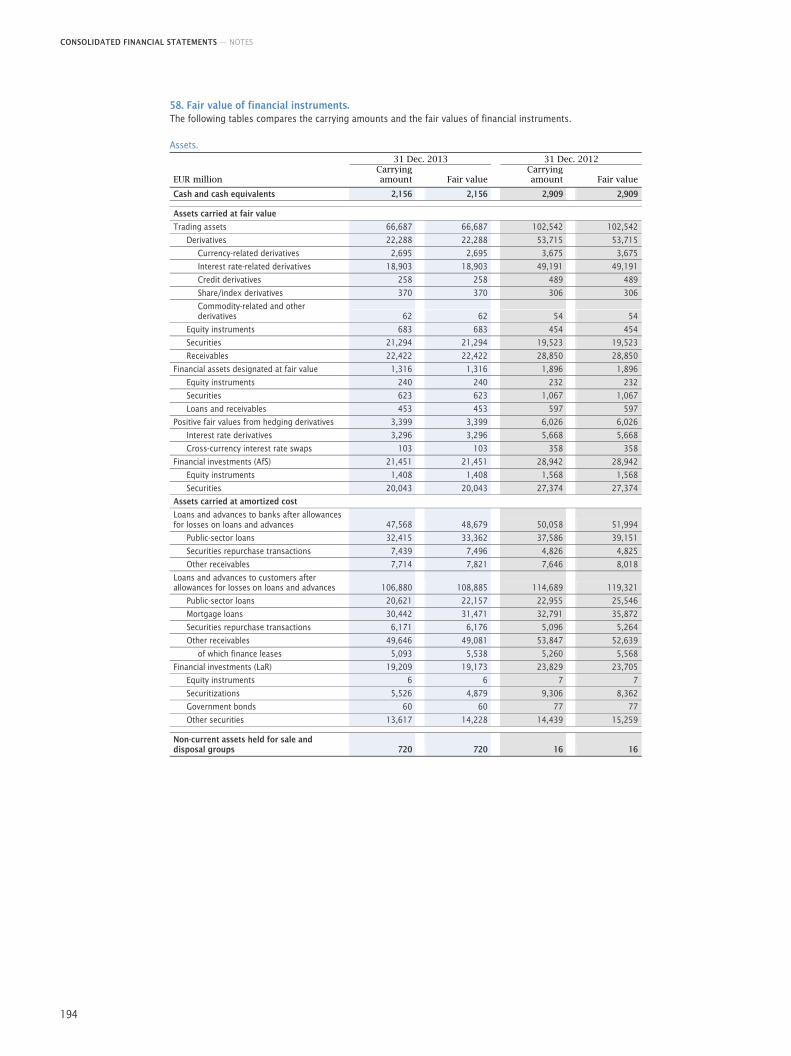
CONSOLIDATED FINANCIAL STATEMENTS — NOTES
194
58. Fair value of financial instruments. The following tables compares the carrying amounts and the fair values of financial instruments.
Assets. 31 Dec. 2013 31 Dec. 2012
EUR million Carrying amount Fair value
Carrying amount Fair value
Cash and cash equivalents 2,156 2,156 2,909 2,909 Assets carried at fair value
Trading assets 66,687 66,687 102,542 102,542
Derivatives 22,288 22,288 53,715 53,715
Currency-related derivatives 2,695 2,695 3,675 3,675
Interest rate-related derivatives 18,903 18,903 49,191 49,191
Credit derivatives 258 258 489 489
Share/index derivatives 370 370 306 306
Commodity-related and other derivatives 62 62 54 54
Equity instruments 683 683 454 454
Securities 21,294 21,294 19,523 19,523
Receivables 22,422 22,422 28,850 28,850
Financial assets designated at fair value 1,316 1,316 1,896 1,896
Equity instruments 240 240 232 232
Securities 623 623 1,067 1,067
Loans and receivables 453 453 597 597
Positive fair values from hedging derivatives 3,399 3,399 6,026 6,026
Interest rate derivatives 3,296 3,296 5,668 5,668
Cross-currency interest rate swaps 103 103 358 358
Financial investments (AfS) 21,451 21,451 28,942 28,942
Equity instruments 1,408 1,408 1,568 1,568
Securities 20,043 20,043 27,374 27,374
Assets carried at amortized cost
Loans and advances to banks after allowances for losses on loans and advances 47,568 48,679 50,058 51,994
Public-sector loans 32,415 33,362 37,586 39,151
Securities repurchase transactions 7,439 7,496 4,826 4,825
Other receivables 7,714 7,821 7,646 8,018
Loans and advances to customers after allowances for losses on loans and advances 106,880 108,885 114,689 119,321
Public-sector loans 20,621 22,157 22,955 25,546
Mortgage loans 30,442 31,471 32,791 35,872
Securities repurchase transactions 6,171 6,176 5,096 5,264
Other receivables 49,646 49,081 53,847 52,639
of which finance leases 5,093 5,538 5,260 5,568
Financial investments (LaR) 19,209 19,173 23,829 23,705
Equity instruments 6 6 7 7
Securitizations 5,526 4,879 9,306 8,362
Government bonds 60 60 77 77
Other securities 13,617 14,228 14,439 15,259 Non-current assets held for sale and disposal groups 720 720 16 16
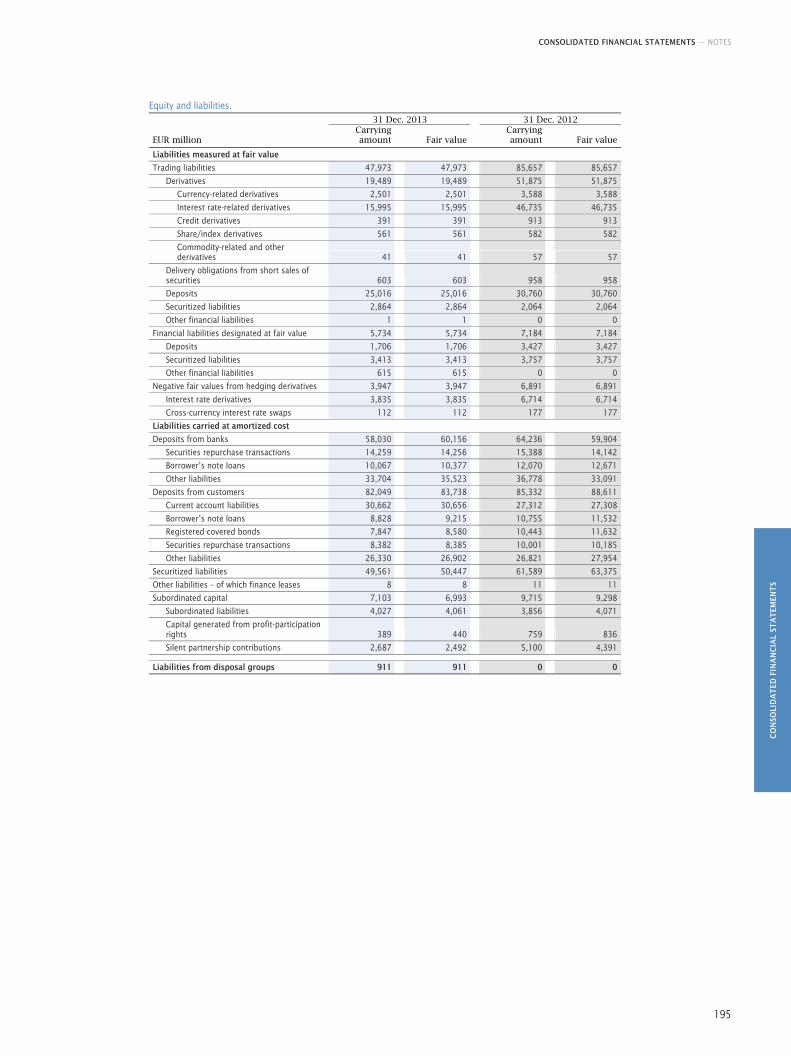
CONSOLIDATED FINANCIAL STATEMENTS — NOTES
CO
NSO
LID
AT
ED F
INA
NC
IAL
STA
TEM
ENT
S
195
Equity and liabilities. 31 Dec. 2013 31 Dec. 2012
EUR million Carrying amount Fair value
Carrying amount Fair value
Liabilities measured at fair value
Trading liabilities 47,973 47,973 85,657 85,657
Derivatives 19,489 19,489 51,875 51,875
Currency-related derivatives 2,501 2,501 3,588 3,588
Interest rate-related derivatives 15,995 15,995 46,735 46,735
Credit derivatives 391 391 913 913
Share/index derivatives 561 561 582 582
Commodity-related and other derivatives 41 41 57 57
Delivery obligations from short sales of securities 603 603 958 958
Deposits 25,016 25,016 30,760 30,760
Securitized liabilities 2,864 2,864 2,064 2,064
Other financial liabilities 1 1 0 0
Financial liabilities designated at fair value 5,734 5,734 7,184 7,184
Deposits 1,706 1,706 3,427 3,427
Securitized liabilities 3,413 3,413 3,757 3,757
Other financial liabilities 615 615 0 0
Negative fair values from hedging derivatives 3,947 3,947 6,891 6,891
Interest rate derivatives 3,835 3,835 6,714 6,714
Cross-currency interest rate swaps 112 112 177 177
Liabilities carried at amortized cost
Deposits from banks 58,030 60,156 64,236 59,904
Securities repurchase transactions 14,259 14,256 15,388 14,142
Borrower’s note loans 10,067 10,377 12,070 12,671
Other liabilities 33,704 35,523 36,778 33,091
Deposits from customers 82,049 83,738 85,332 88,611
Current account liabilities 30,662 30,656 27,312 27,308
Borrower’s note loans 8,828 9,215 10,755 11,532
Registered covered bonds 7,847 8,580 10,443 11,632
Securities repurchase transactions 8,382 8,385 10,001 10,185
Other liabilities 26,330 26,902 26,821 27,954
Securitized liabilities 49,561 50,447 61,589 63,375
Other liabilities – of which finance leases 8 8 11 11
Subordinated capital 7,103 6,993 9,715 9,298
Subordinated liabilities 4,027 4,061 3,856 4,071
Capital generated from profit-participation rights 389 440 759 836
Silent partnership contributions 2,687 2,492 5,100 4,391 Liabilities from disposal groups 911 911 0 0
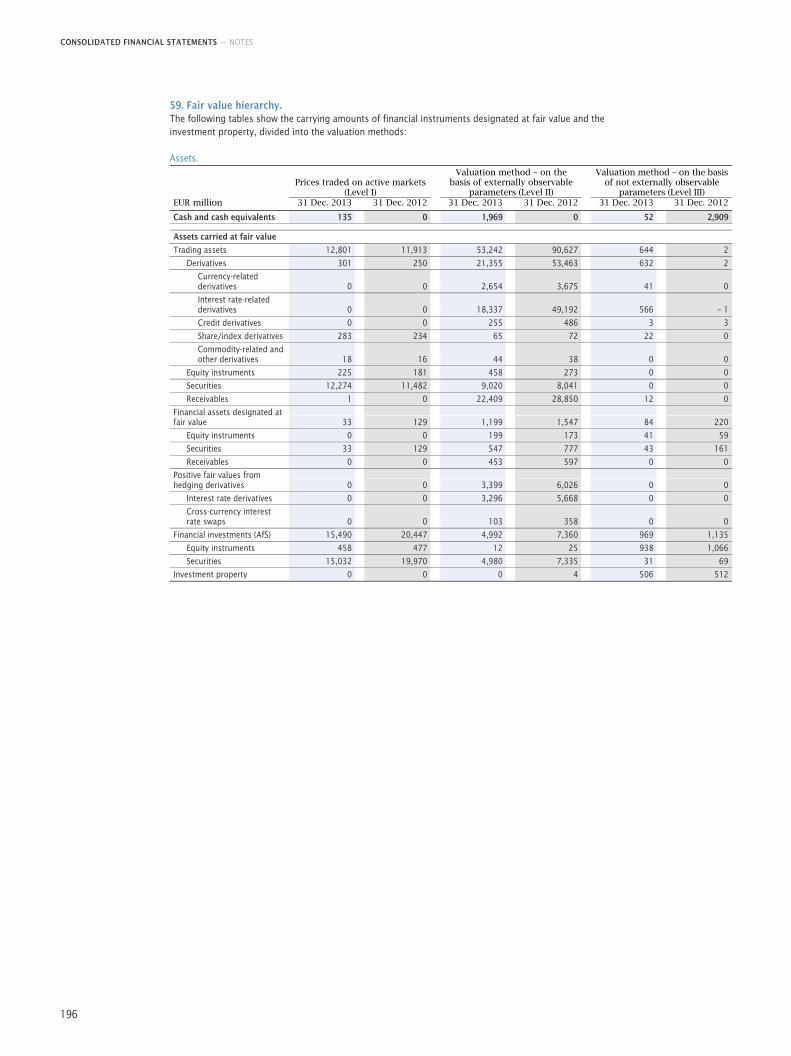
CONSOLIDATED FINANCIAL STATEMENTS — NOTES
196
59. Fair value hierarchy. The following tables show the carrying amounts of financial instruments designated at fair value and the investment property, divided into the valuation methods:
Assets.
Prices traded on active markets
(Level I)
Valuation method – on the basis of externally observable
parameters (Level II)
Valuation method – on the basis of not externally observable
parameters (Level III) EUR million 31 Dec. 2013 31 Dec. 2012 31 Dec. 2013 31 Dec. 2012 31 Dec. 2013 31 Dec. 2012
Cash and cash equivalents 135 0 1,969 0 52 2,909 Assets carried at fair value
Trading assets 12,801 11,913 53,242 90,627 644 2
Derivatives 301 250 21,355 53,463 632 2
Currency-related derivatives 0 0 2,654 3,675 41 0
Interest rate-related derivatives 0 0 18,337 49,192 566 – 1
Credit derivatives 0 0 255 486 3 3
Share/index derivatives 283 234 65 72 22 0
Commodity-related and other derivatives 18 16 44 38 0 0
Equity instruments 225 181 458 273 0 0
Securities 12,274 11,482 9,020 8,041 0 0
Receivables 1 0 22,409 28,850 12 0
Financial assets designated at fair value 33 129 1,199 1,547 84 220
Equity instruments 0 0 199 173 41 59
Securities 33 129 547 777 43 161
Receivables 0 0 453 597 0 0
Positive fair values from hedging derivatives 0 0 3,399 6,026 0 0
Interest rate derivatives 0 0 3,296 5,668 0 0
Cross-currency interest rate swaps 0 0 103 358 0 0
Financial investments (AfS) 15,490 20,447 4,992 7,360 969 1,135
Equity instruments 458 477 12 25 938 1,066
Securities 15,032 19,970 4,980 7,335 31 69
Investment property 0 0 0 4 506 512
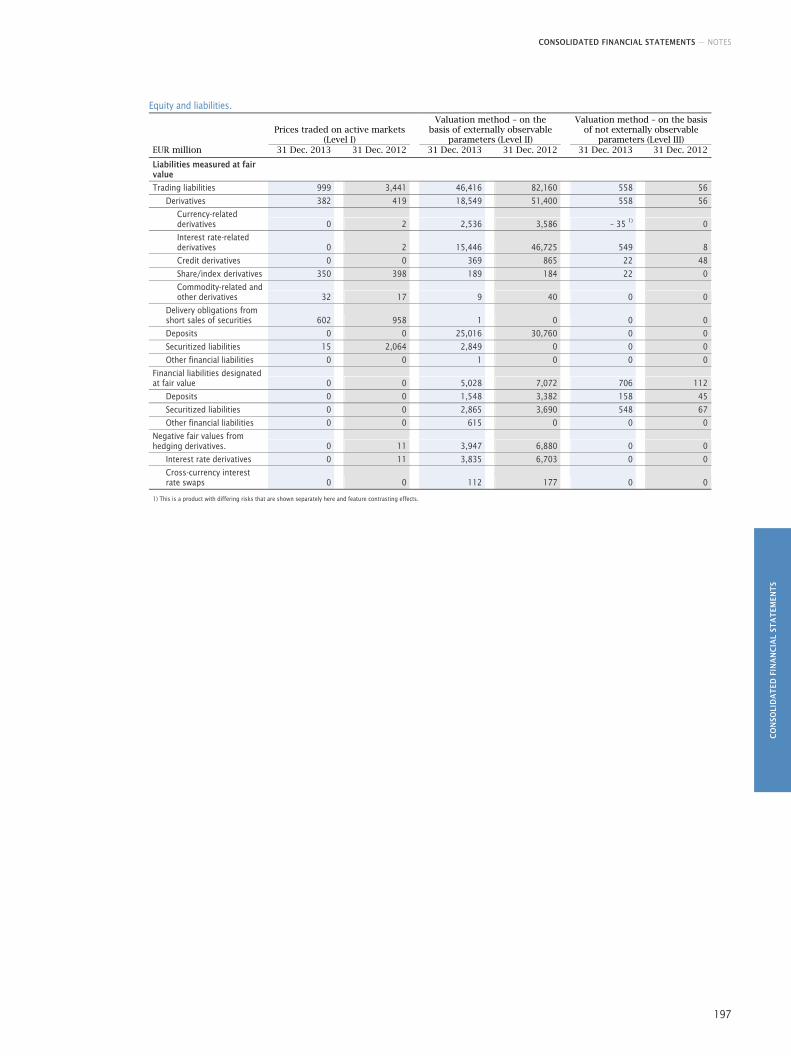
CONSOLIDATED FINANCIAL STATEMENTS — NOTES
CO
NSO
LID
AT
ED F
INA
NC
IAL
STA
TEM
ENT
S
197
Equity and liabilities.
Prices traded on active markets
(Level I)
Valuation method – on the basis of externally observable
parameters (Level II)
Valuation method – on the basis of not externally observable
parameters (Level III) EUR million 31 Dec. 2013 31 Dec. 2012 31 Dec. 2013 31 Dec. 2012 31 Dec. 2013 31 Dec. 2012
Liabilities measured at fair value
Trading liabilities 999 3,441 46,416 82,160 558 56
Derivatives 382 419 18,549 51,400 558 56
Currency-related derivatives 0 2 2,536 3,586 – 35 1) 0
Interest rate-related derivatives 0 2 15,446 46,725 549 8
Credit derivatives 0 0 369 865 22 48
Share/index derivatives 350 398 189 184 22 0
Commodity-related and other derivatives 32 17 9 40 0 0
Delivery obligations from short sales of securities 602 958 1 0 0 0
Deposits 0 0 25,016 30,760 0 0
Securitized liabilities 15 2,064 2,849 0 0 0
Other financial liabilities 0 0 1 0 0 0
Financial liabilities designated at fair value 0 0 5,028 7,072 706 112
Deposits 0 0 1,548 3,382 158 45
Securitized liabilities 0 0 2,865 3,690 548 67
Other financial liabilities 0 0 615 0 0 0
Negative fair values from hedging derivatives. 0 11 3,947 6,880 0 0
Interest rate derivatives 0 11 3,835 6,703 0 0
Cross-currency interest rate swaps 0 0 112 177 0 0
1) This is a product with differing risks that are shown separately here and feature contrasting effects.
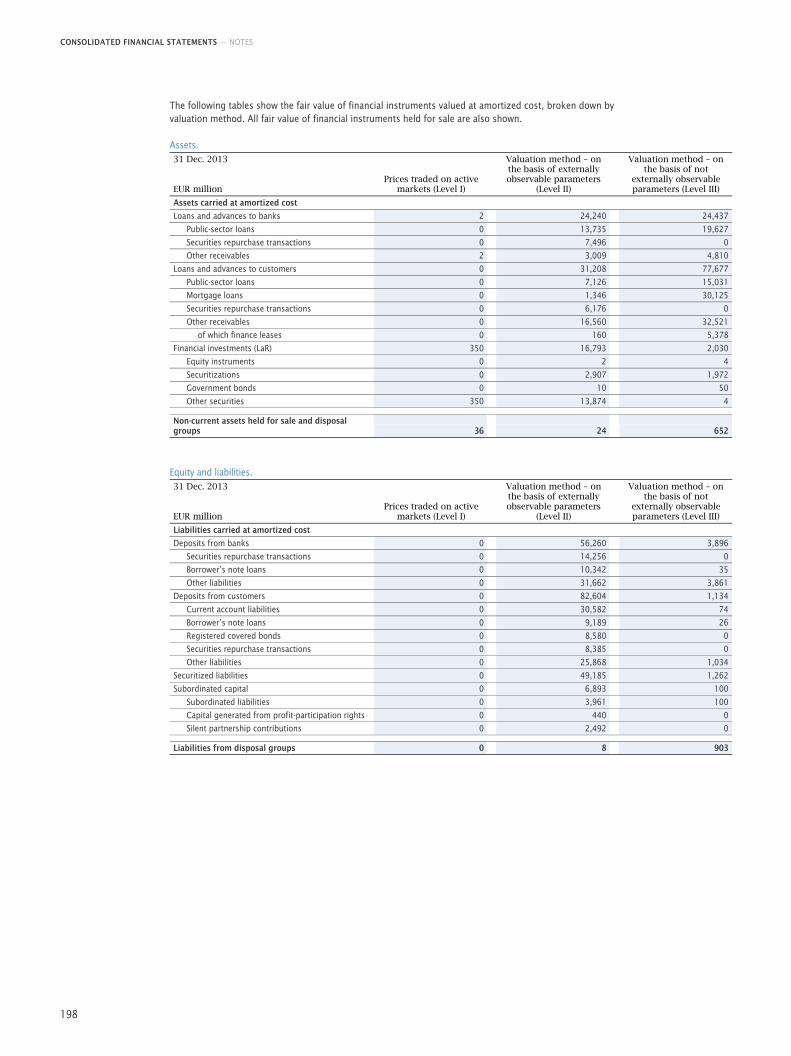
CONSOLIDATED FINANCIAL STATEMENTS — NOTES
198
The following tables show the fair value of financial instruments valued at amortized cost, broken down by valuation method. All fair value of financial instruments held for sale are also shown.
Assets. 31 Dec. 2013 EUR million
Prices traded on active markets (Level I)
Valuation method – on the basis of externally observable parameters
(Level II)
Valuation method – on the basis of not
externally observable parameters (Level III)
Assets carried at amortized cost
Loans and advances to banks 2 24,240 24,437
Public-sector loans 0 13,735 19,627
Securities repurchase transactions 0 7,496 0
Other receivables 2 3,009 4,810
Loans and advances to customers 0 31,208 77,677
Public-sector loans 0 7,126 15,031
Mortgage loans 0 1,346 30,125
Securities repurchase transactions 0 6,176 0
Other receivables 0 16,560 32,521
of which finance leases 0 160 5,378
Financial investments (LaR) 350 16,793 2,030
Equity instruments 0 2 4
Securitizations 0 2,907 1,972
Government bonds 0 10 50
Other securities 350 13,874 4 Non-current assets held for sale and disposal groups 36 24 652
Equity and liabilities. 31 Dec. 2013 EUR million
Prices traded on active markets (Level I)
Valuation method – on the basis of externally observable parameters
(Level II)
Valuation method – on the basis of not
externally observable parameters (Level III)
Liabilities carried at amortized cost
Deposits from banks 0 56,260 3,896
Securities repurchase transactions 0 14,256 0
Borrower’s note loans 0 10,342 35
Other liabilities 0 31,662 3,861
Deposits from customers 0 82,604 1,134
Current account liabilities 0 30,582 74
Borrower’s note loans 0 9,189 26
Registered covered bonds 0 8,580 0
Securities repurchase transactions 0 8,385 0
Other liabilities 0 25,868 1,034
Securitized liabilities 0 49,185 1,262
Subordinated capital 0 6,893 100
Subordinated liabilities 0 3,961 100
Capital generated from profit-participation rights 0 440 0
Silent partnership contributions 0 2,492 0 Liabilities from disposal groups 0 8 903
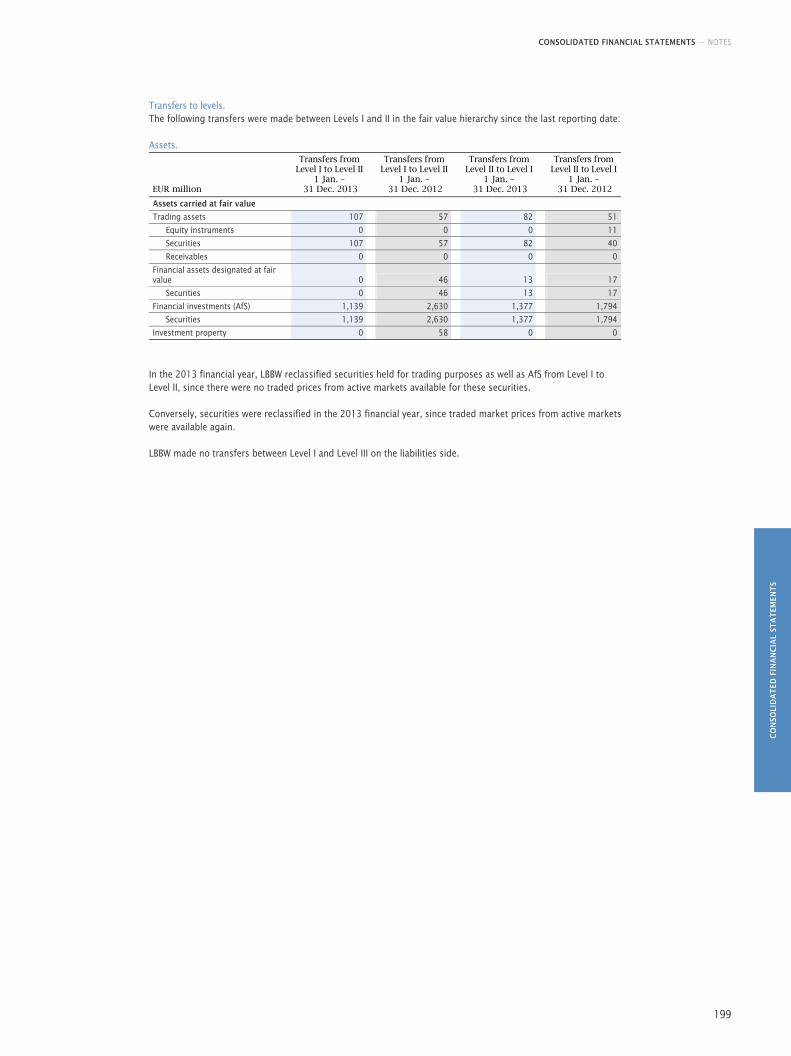
CONSOLIDATED FINANCIAL STATEMENTS — NOTES
CO
NSO
LID
AT
ED F
INA
NC
IAL
STA
TEM
ENT
S
199
Transfers to levels. The following transfers were made between Levels I and II in the fair value hierarchy since the last reporting date:
Assets.
Transfers from
Level I to Level II Transfers from
Level I to Level II Transfers from
Level II to Level I Transfers from
Level II to Level I
EUR million 1 Jan. –
31 Dec. 2013
1 Jan. – 31 Dec. 2012
1 Jan. – 31 Dec. 2013
1 Jan. – 31 Dec. 2012
Assets carried at fair value
Trading assets 107 57 82 51
Equity instruments 0 0 0 11
Securities 107 57 82 40
Receivables 0 0 0 0
Financial assets designated at fair value 0 46 13 17
Securities 0 46 13 17
Financial investments (AfS) 1,139 2,630 1,377 1,794
Securities 1,139 2,630 1,377 1,794
Investment property 0 58 0 0
In the 2013 financial year, LBBW reclassified securities held for trading purposes as well as AfS from Level I to Level II, since there were no traded prices from active markets available for these securities.
Conversely, securities were reclassified in the 2013 financial year, since traded market prices from active markets were available again.
LBBW made no transfers between Level I and Level III on the liabilities side.
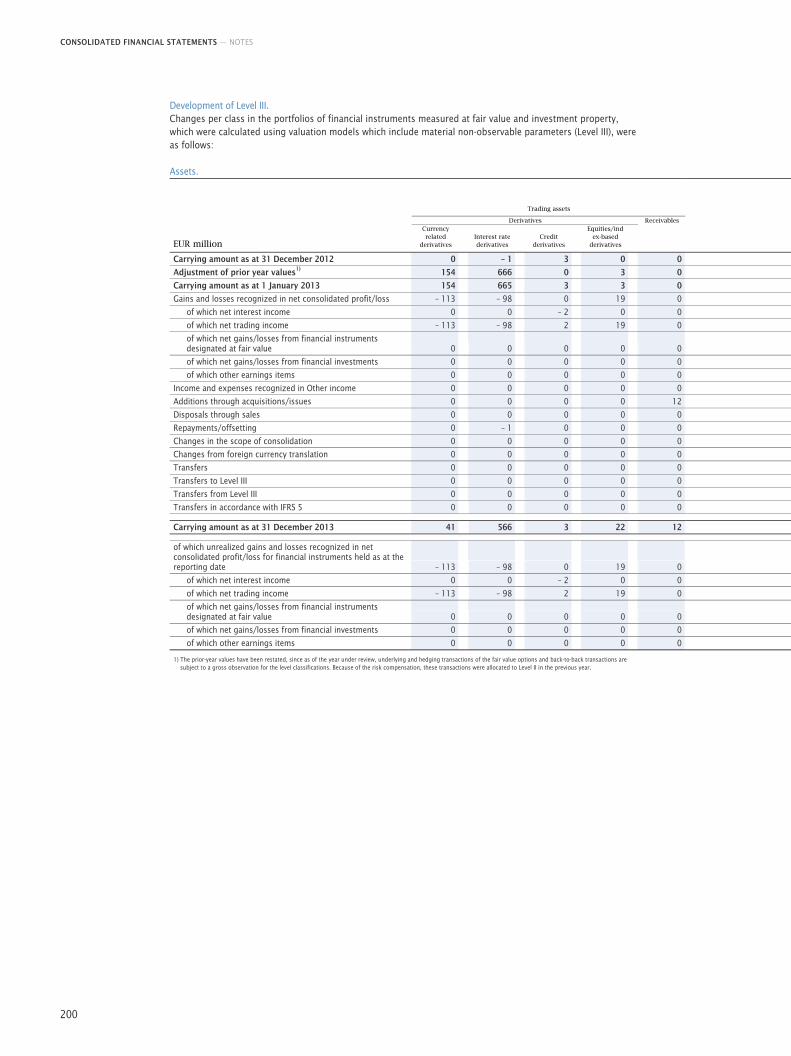
CONSOLIDATED FINANCIAL STATEMENTS — NOTES
200
Development of Level III. Changes per class in the portfolios of financial instruments measured at fair value and investment property, which were calculated using valuation models which include material non-observable parameters (Level III), were as follows:
Assets.
Trading assets
Derivatives Receivables
EUR million
Currency related
derivatives
Interest rate derivatives
Credit derivatives
Equities/index-based
derivatives
Carrying amount as at 31 December 2012 0 – 1 3 0 0
Adjustment of prior year values1) 154 666 0 3 0
Carrying amount as at 1 January 2013 154 665 3 3 0
Gains and losses recognized in net consolidated profit/loss – 113 – 98 0 19 0
of which net interest income 0 0 – 2 0 0
of which net trading income – 113 – 98 2 19 0
of which net gains/losses from financial instruments designated at fair value 0 0 0 0 0
of which net gains/losses from financial investments 0 0 0 0 0
of which other earnings items 0 0 0 0 0
Income and expenses recognized in Other income 0 0 0 0 0
Additions through acquisitions/issues 0 0 0 0 12
Disposals through sales 0 0 0 0 0
Repayments/offsetting 0 – 1 0 0 0
Changes in the scope of consolidation 0 0 0 0 0
Changes from foreign currency translation 0 0 0 0 0
Transfers 0 0 0 0 0
Transfers to Level III 0 0 0 0 0
Transfers from Level III 0 0 0 0 0
Transfers in accordance with IFRS 5 0 0 0 0 0 Carrying amount as at 31 December 2013 41 566 3 22 12 of which unrealized gains and losses recognized in net consolidated profit/loss for financial instruments held as at the reporting date – 113 – 98 0 19 0
of which net interest income 0 0 – 2 0 0
of which net trading income – 113 – 98 2 19 0
of which net gains/losses from financial instruments designated at fair value 0 0 0 0 0
of which net gains/losses from financial investments 0 0 0 0 0
of which other earnings items 0 0 0 0 0 1) The prior-year values have been restated, since as of the year under review, underlying and hedging transactions of the fair value options and back-to-back transactions are
subject to a gross observation for the level classifications. Because of the risk compensation, these transactions were allocated to Level II in the previous year.
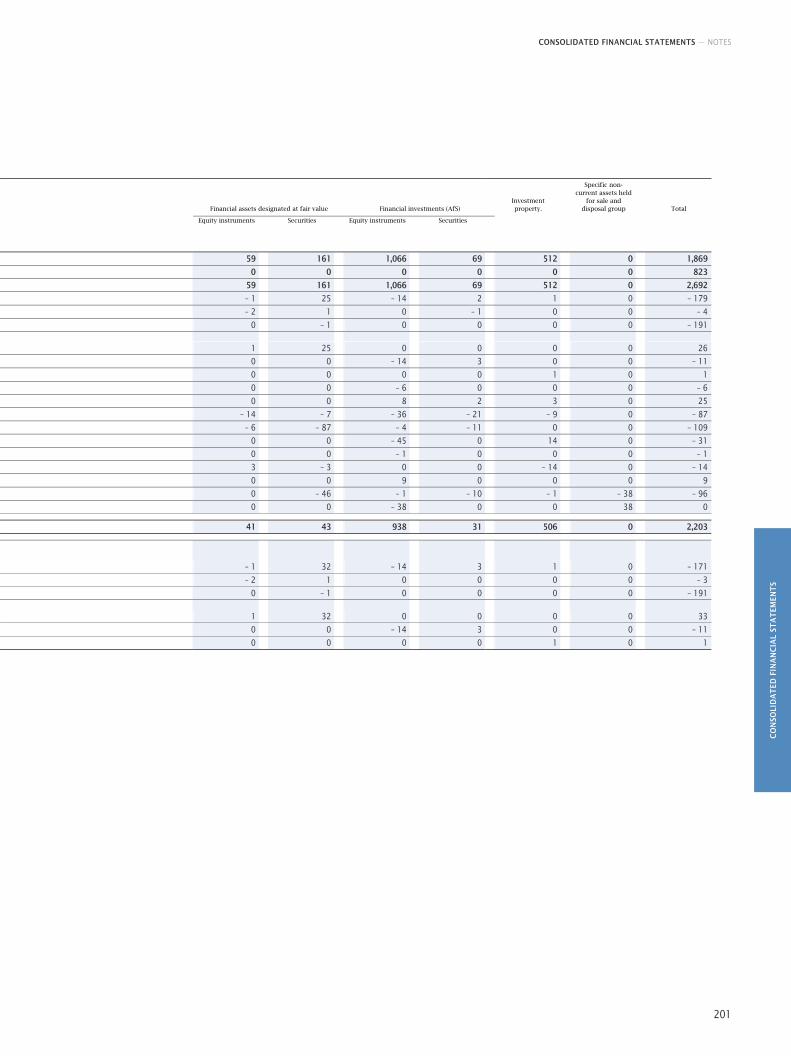
CONSOLIDATED FINANCIAL STATEMENTS — NOTES
CO
NSO
LID
AT
ED F
INA
NC
IAL
STA
TEM
ENT
S
201
Financial assets designated at fair value Financial investments (AfS) Investment property.
Specific non-current assets held
for sale and disposal group Total
Equity instruments Securities Equity instruments Securities
59 161 1,066 69 512 0 1,869
0 0 0 0 0 0 823
59 161 1,066 69 512 0 2,692
– 1 25 – 14 2 1 0 – 179
– 2 1 0 – 1 0 0 – 4
0 – 1 0 0 0 0 – 191
1 25 0 0 0 0 26
0 0 – 14 3 0 0 – 11
0 0 0 0 1 0 1
0 0 – 6 0 0 0 – 6
0 0 8 2 3 0 25
– 14 – 7 – 36 – 21 – 9 0 – 87
– 6 – 87 – 4 – 11 0 0 – 109
0 0 – 45 0 14 0 – 31
0 0 – 1 0 0 0 – 1
3 – 3 0 0 – 14 0 – 14
0 0 9 0 0 0 9
0 – 46 – 1 – 10 – 1 – 38 – 96
0 0 – 38 0 0 38 0
41 43 938 31 506 0 2,203 – 1 32 – 14 3 1 0 – 171
– 2 1 0 0 0 0 – 3
0 – 1 0 0 0 0 – 191
1 32 0 0 0 0 33
0 0 – 14 3 0 0 – 11
0 0 0 0 1 0 1
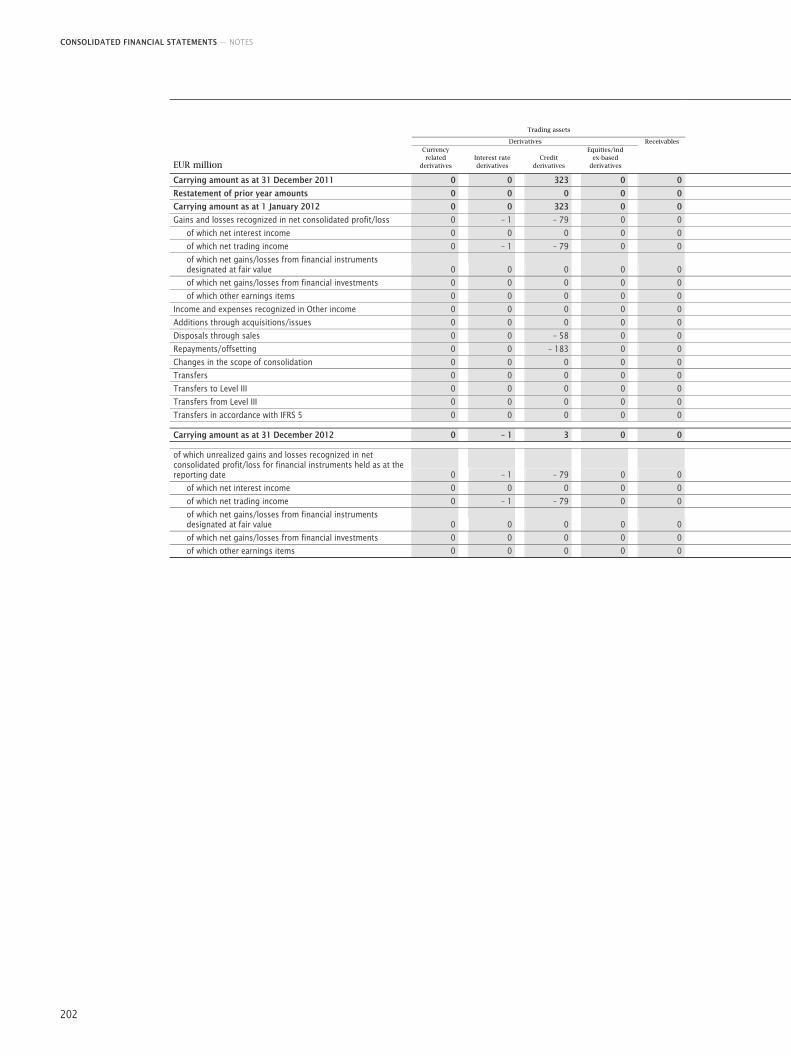
CONSOLIDATED FINANCIAL STATEMENTS — NOTES
202
Trading assets
Derivatives Receivables
EUR million
Currency related
derivatives
Interest rate derivatives
Credit derivatives
Equities/index-based
derivatives
Carrying amount as at 31 December 2011 0 0 323 0 0
Restatement of prior year amounts 0 0 0 0 0
Carrying amount as at 1 January 2012 0 0 323 0 0
Gains and losses recognized in net consolidated profit/loss 0 – 1 – 79 0 0
of which net interest income 0 0 0 0 0
of which net trading income 0 – 1 – 79 0 0
of which net gains/losses from financial instruments designated at fair value 0 0 0 0 0
of which net gains/losses from financial investments 0 0 0 0 0
of which other earnings items 0 0 0 0 0
Income and expenses recognized in Other income 0 0 0 0 0
Additions through acquisitions/issues 0 0 0 0 0
Disposals through sales 0 0 – 58 0 0
Repayments/offsetting 0 0 – 183 0 0
Changes in the scope of consolidation 0 0 0 0 0
Transfers 0 0 0 0 0
Transfers to Level III 0 0 0 0 0
Transfers from Level III 0 0 0 0 0
Transfers in accordance with IFRS 5 0 0 0 0 0 Carrying amount as at 31 December 2012 0 – 1 3 0 0 of which unrealized gains and losses recognized in net consolidated profit/loss for financial instruments held as at the reporting date 0 – 1 – 79 0 0
of which net interest income 0 0 0 0 0
of which net trading income 0 – 1 – 79 0 0
of which net gains/losses from financial instruments designated at fair value 0 0 0 0 0
of which net gains/losses from financial investments 0 0 0 0 0
of which other earnings items 0 0 0 0 0
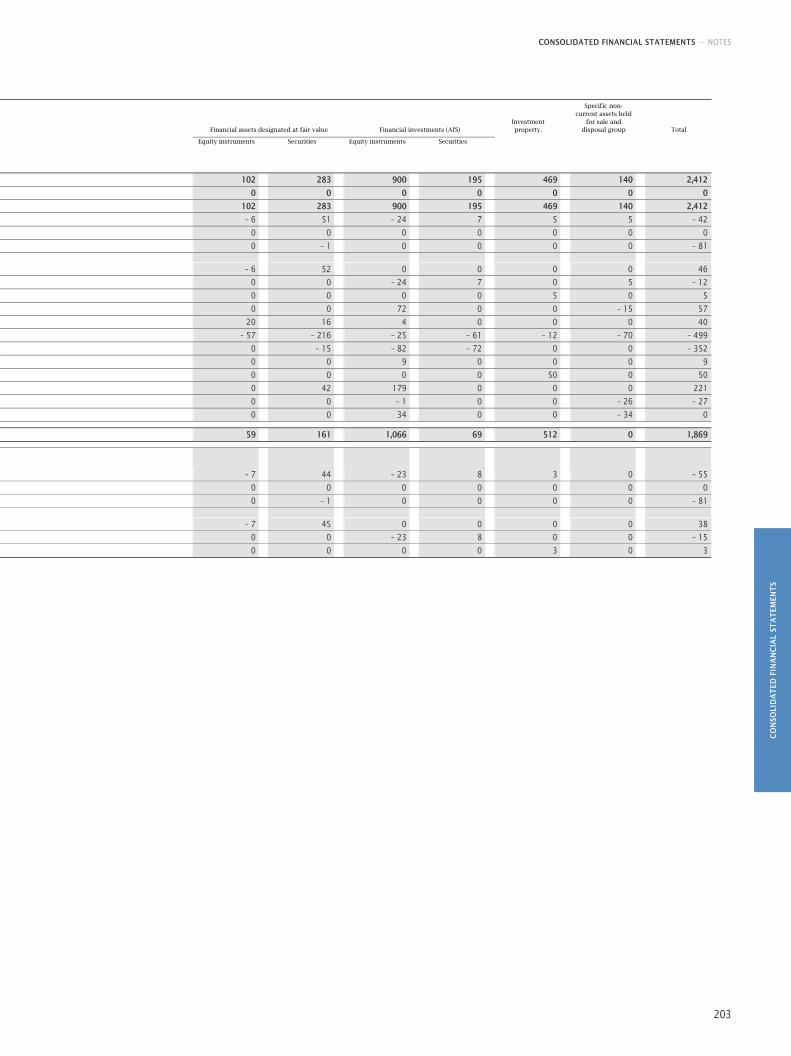
CONSOLIDATED FINANCIAL STATEMENTS — NOTES
CO
NSO
LID
AT
ED F
INA
NC
IAL
STA
TEM
ENT
S
203
Financial assets designated at fair value Financial investments (AfS) Investment property.
Specific non-current assets held
for sale and disposal group Total
Equity instruments Securities Equity instruments Securities
102 283 900 195 469 140 2,412
0 0 0 0 0 0 0
102 283 900 195 469 140 2,412
– 6 51 – 24 7 5 5 – 42
0 0 0 0 0 0 0
0 – 1 0 0 0 0 – 81
– 6 52 0 0 0 0 46
0 0 – 24 7 0 5 – 12
0 0 0 0 5 0 5
0 0 72 0 0 – 15 57
20 16 4 0 0 0 40
– 57 – 216 – 25 – 61 – 12 – 70 – 499
0 – 15 – 82 – 72 0 0 – 352
0 0 9 0 0 0 9
0 0 0 0 50 0 50
0 42 179 0 0 0 221
0 0 – 1 0 0 – 26 – 27
0 0 34 0 0 – 34 0
59 161 1,066 69 512 0 1,869 – 7 44 – 23 8 3 0 – 55
0 0 0 0 0 0 0
0 – 1 0 0 0 0 – 81
– 7 45 0 0 0 0 38
0 0 – 23 8 0 0 – 15
0 0 0 0 3 0 3
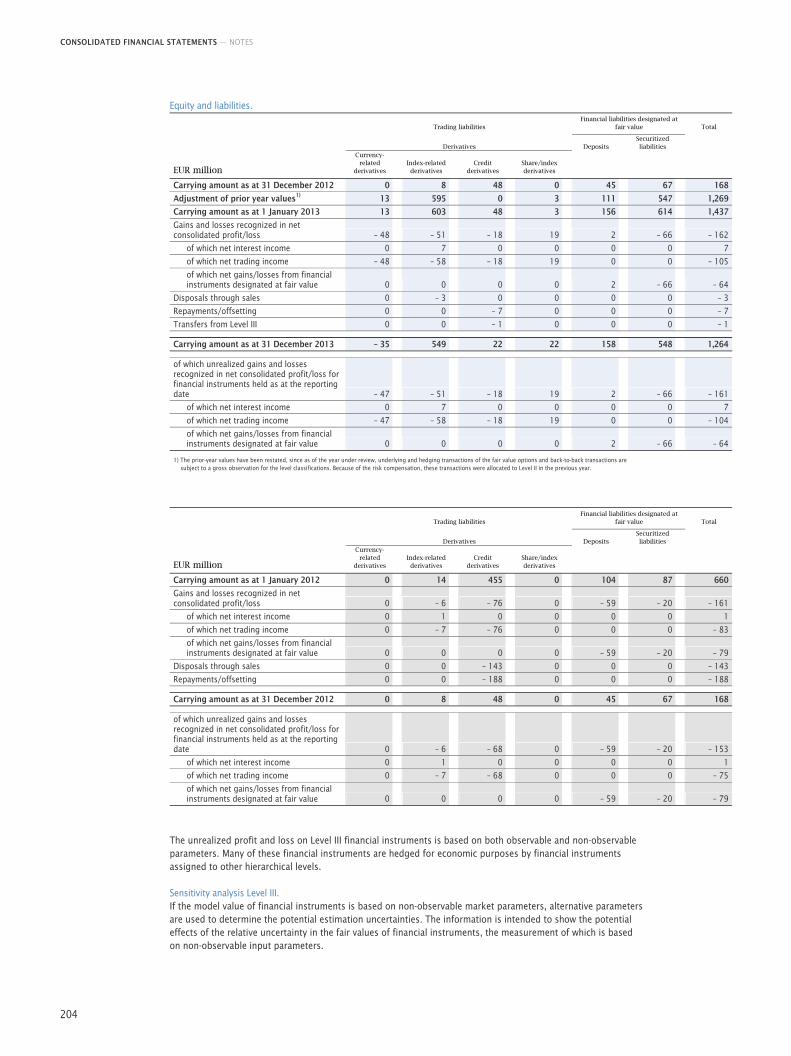
CONSOLIDATED FINANCIAL STATEMENTS — NOTES
204
Equity and liabilities.
Trading liabilities Financial liabilities designated at
fair value Total
Derivatives Deposits Securitized liabilities
EUR million
Currency-related
derivatives
Index-related derivatives
Credit derivatives
Share/index derivatives
Carrying amount as at 31 December 2012 0 8 48 0 45 67 168
Adjustment of prior year values1) 13 595 0 3 111 547 1,269
Carrying amount as at 1 January 2013 13 603 48 3 156 614 1,437
Gains and losses recognized in net consolidated profit/loss – 48 – 51 – 18 19 2 – 66 – 162
of which net interest income 0 7 0 0 0 0 7
of which net trading income – 48 – 58 – 18 19 0 0 – 105
of which net gains/losses from financial instruments designated at fair value 0 0 0 0 2 – 66 – 64
Disposals through sales 0 – 3 0 0 0 0 – 3
Repayments/offsetting 0 0 – 7 0 0 0 – 7
Transfers from Level III 0 0 – 1 0 0 0 – 1 Carrying amount as at 31 December 2013 – 35 549 22 22 158 548 1,264 of which unrealized gains and losses recognized in net consolidated profit/loss for financial instruments held as at the reporting date – 47 – 51 – 18 19 2 – 66 – 161
of which net interest income 0 7 0 0 0 0 7
of which net trading income – 47 – 58 – 18 19 0 0 – 104
of which net gains/losses from financial instruments designated at fair value 0 0 0 0 2 – 66 – 64
1) The prior-year values have been restated, since as of the year under review, underlying and hedging transactions of the fair value options and back-to-back transactions are subject to a gross observation for the level classifications. Because of the risk compensation, these transactions were allocated to Level II in the previous year.
Trading liabilities Financial liabilities designated at
fair value Total
Derivatives Deposits Securitized liabilities
EUR million
Currency-related
derivatives
Index-related derivatives
Credit derivatives
Share/index derivatives
Carrying amount as at 1 January 2012 0 14 455 0 104 87 660
Gains and losses recognized in net consolidated profit/loss 0 – 6 – 76 0 – 59 – 20 – 161
of which net interest income 0 1 0 0 0 0 1
of which net trading income 0 – 7 – 76 0 0 0 – 83
of which net gains/losses from financial instruments designated at fair value 0 0 0 0 – 59 – 20 – 79
Disposals through sales 0 0 – 143 0 0 0 – 143
Repayments/offsetting 0 0 – 188 0 0 0 – 188 Carrying amount as at 31 December 2012 0 8 48 0 45 67 168 of which unrealized gains and losses recognized in net consolidated profit/loss for financial instruments held as at the reporting date 0 – 6 – 68 0 – 59 – 20 – 153
of which net interest income 0 1 0 0 0 0 1
of which net trading income 0 – 7 – 68 0 0 0 – 75
of which net gains/losses from financial instruments designated at fair value 0 0 0 0 – 59 – 20 – 79
The unrealized profit and loss on Level III financial instruments is based on both observable and non-observable parameters. Many of these financial instruments are hedged for economic purposes by financial instruments assigned to other hierarchical levels.
Sensitivity analysis Level III. If the model value of financial instruments is based on non-observable market parameters, alternative parameters are used to determine the potential estimation uncertainties. The information is intended to show the potential effects of the relative uncertainty in the fair values of financial instruments, the measurement of which is based on non-observable input parameters.
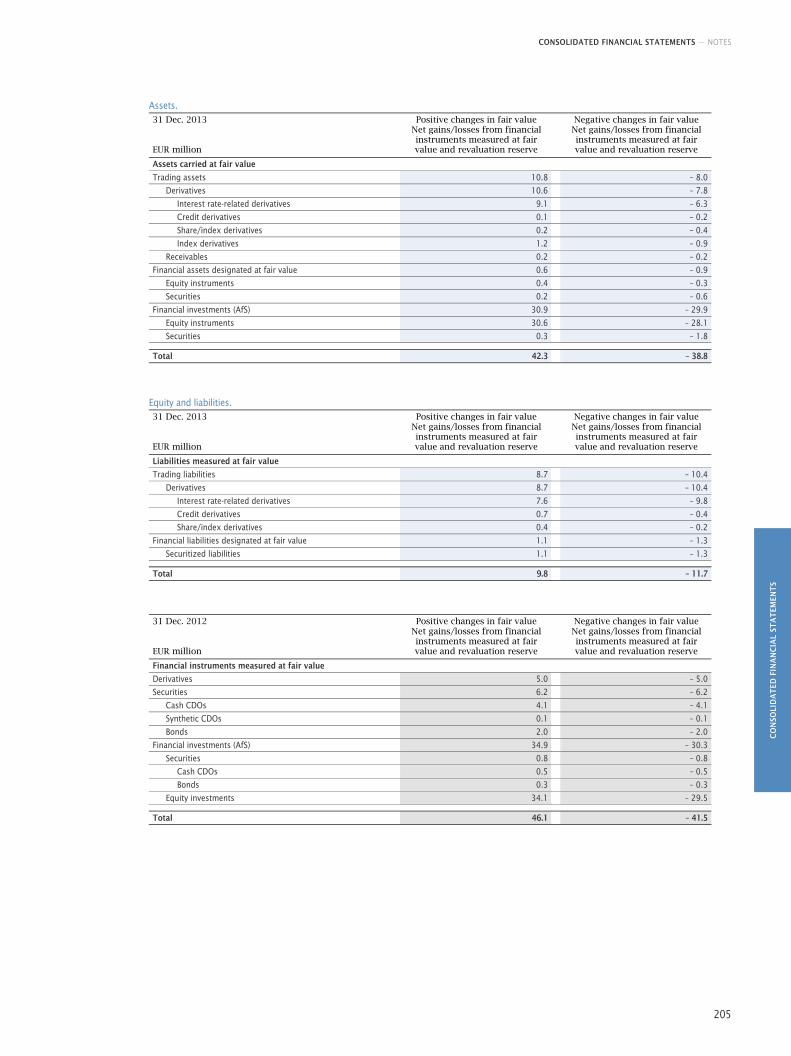
CONSOLIDATED FINANCIAL STATEMENTS — NOTES
CO
NSO
LID
AT
ED F
INA
NC
IAL
STA
TEM
ENT
S
205
Assets. 31 Dec. 2013 Positive changes in fair value Negative changes in fair value
EUR million
Net gains/losses from financial instruments measured at fair value and revaluation reserve
Net gains/losses from financial instruments measured at fair value and revaluation reserve
Assets carried at fair value
Trading assets 10.8 – 8.0
Derivatives 10.6 – 7.8
Interest rate-related derivatives 9.1 – 6.3
Credit derivatives 0.1 – 0.2
Share/index derivatives 0.2 – 0.4
Index derivatives 1.2 – 0.9
Receivables 0.2 – 0.2
Financial assets designated at fair value 0.6 – 0.9
Equity instruments 0.4 – 0.3
Securities 0.2 – 0.6
Financial investments (AfS) 30.9 – 29.9
Equity instruments 30.6 – 28.1
Securities 0.3 – 1.8 Total 42.3 – 38.8
Equity and liabilities. 31 Dec. 2013 Positive changes in fair value Negative changes in fair value
EUR million
Net gains/losses from financial instruments measured at fair value and revaluation reserve
Net gains/losses from financial instruments measured at fair value and revaluation reserve
Liabilities measured at fair value
Trading liabilities 8.7 – 10.4
Derivatives 8.7 – 10.4
Interest rate-related derivatives 7.6 – 9.8
Credit derivatives 0.7 – 0.4
Share/index derivatives 0.4 – 0.2
Financial liabilities designated at fair value 1.1 – 1.3
Securitized liabilities 1.1 – 1.3 Total 9.8 – 11.7
31 Dec. 2012 Positive changes in fair value Negative changes in fair value
EUR million
Net gains/losses from financial instruments measured at fair value and revaluation reserve
Net gains/losses from financial instruments measured at fair value and revaluation reserve
Financial instruments measured at fair value
Derivatives 5.0 – 5.0
Securities 6.2 – 6.2
Cash CDOs 4.1 – 4.1
Synthetic CDOs 0.1 – 0.1
Bonds 2.0 – 2.0
Financial investments (AfS) 34.9 – 30.3
Securities 0.8 – 0.8
Cash CDOs 0.5 – 0.5
Bonds 0.3 – 0.3
Equity investments 34.1 – 29.5 Total 46.1 – 41.5
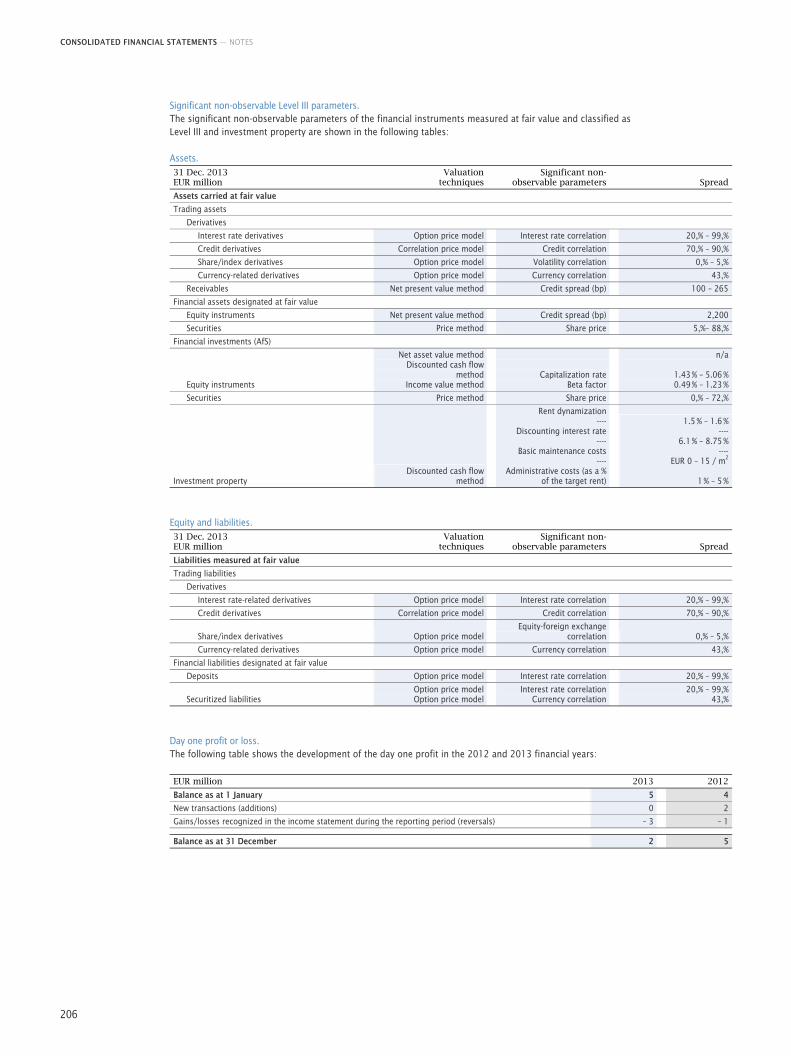
CONSOLIDATED FINANCIAL STATEMENTS — NOTES
206
Significant non-observable Level III parameters. The significant non-observable parameters of the financial instruments measured at fair value and classified as Level III and investment property are shown in the following tables:
Assets. 31 Dec. 2013 EUR million
Valuationtechniques
Significant non-observable parameters Spread
Assets carried at fair value
Trading assets
Derivatives
Interest rate derivatives Option price model Interest rate correlation 20,% – 99,%
Credit derivatives Correlation price model Credit correlation 70,% – 90,%
Share/index derivatives Option price model Volatility correlation 0,% – 5,%
Currency-related derivatives Option price model Currency correlation 43,%
Receivables Net present value method Credit spread (bp) 100 – 265
Financial assets designated at fair value
Equity instruments Net present value method Credit spread (bp) 2,200
Securities Price method Share price 5,%– 88,%
Financial investments (AfS)
Equity instruments
Net asset value methodDiscounted cash flow
methodIncome value method
Capitalization rate Beta factor
n/a
1.43 % – 5.06 %0.49 % – 1.23 %
Securities Price method Share price 0,% – 72,%
Investment property Discounted cash flow
method
Rent dynamization ----
Discounting interest rate ----
Basic maintenance costs ----
Administrative costs (as a % of the target rent)
1.5 % – 1.6 %----
6.1 % – 8.75 %----
EUR 0 – 15 / m2
1 % – 5 %
Equity and liabilities. 31 Dec. 2013 EUR million
Valuationtechniques
Significant non-observable parameters Spread
Liabilities measured at fair value
Trading liabilities
Derivatives
Interest rate-related derivatives Option price model Interest rate correlation 20,% – 99,%
Credit derivatives Correlation price model Credit correlation 70,% – 90,%
Share/index derivatives Option price model
Equity-foreign exchange correlation 0,% – 5,%
Currency-related derivatives Option price model Currency correlation 43,%
Financial liabilities designated at fair value
Deposits Option price model Interest rate correlation 20,% – 99,%
Securitized liabilities Option price modelOption price model
Interest rate correlation Currency correlation
20,% – 99,%43,%
Day one profit or loss. The following table shows the development of the day one profit in the 2012 and 2013 financial years:
EUR million 2013 2012
Balance as at 1 January 5 4
New transactions (additions) 0 2
Gains/losses recognized in the income statement during the reporting period (reversals) – 3 – 1 Balance as at 31 December 2 5
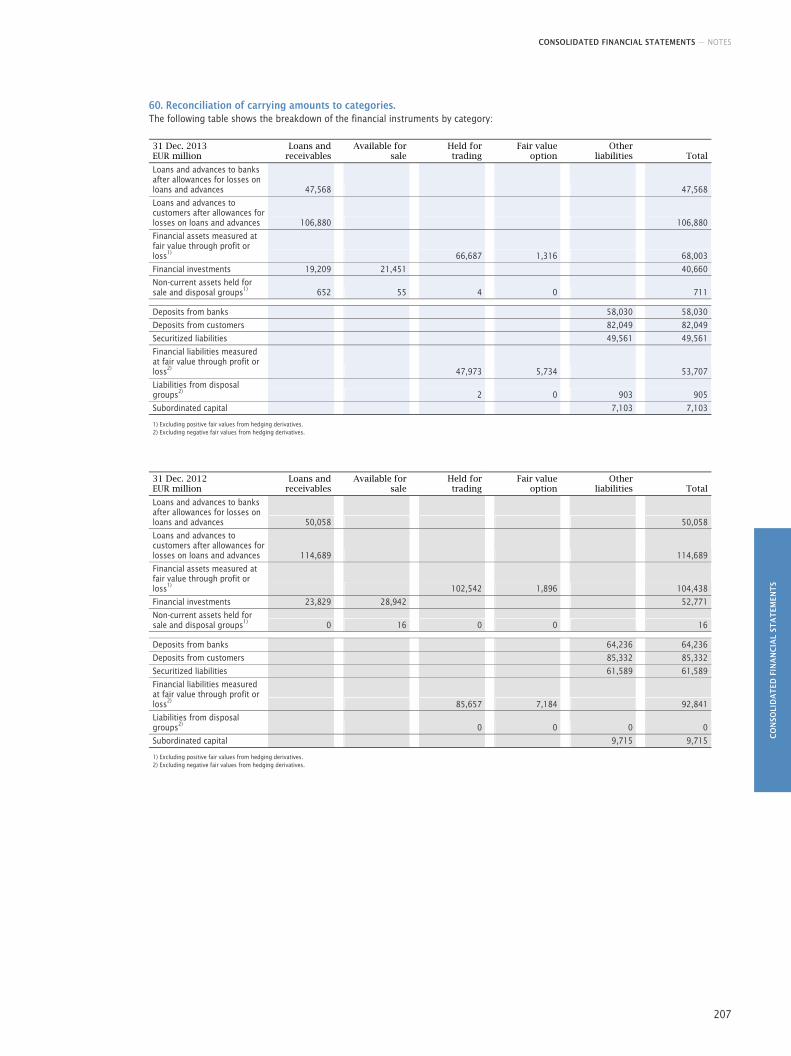
CONSOLIDATED FINANCIAL STATEMENTS — NOTES
CO
NSO
LID
AT
ED F
INA
NC
IAL
STA
TEM
ENT
S
207
60. Reconciliation of carrying amounts to categories. The following table shows the breakdown of the financial instruments by category:
31 Dec. 2013 EUR million
Loans and receivables
Available for sale
Held for trading
Fair value option
Other liabilities Total
Loans and advances to banks after allowances for losses on loans and advances 47,568 47,568
Loans and advances to customers after allowances for losses on loans and advances 106,880 106,880
Financial assets measured at fair value through profit or loss1) 66,687 1,316 68,003
Financial investments 19,209 21,451 40,660
Non-current assets held for sale and disposal groups1) 652 55 4 0 711 Deposits from banks 58,030 58,030
Deposits from customers 82,049 82,049
Securitized liabilities 49,561 49,561
Financial liabilities measured at fair value through profit or loss2) 47,973 5,734 53,707
Liabilities from disposal groups2) 2 0 903 905
Subordinated capital 7,103 7,103 1) Excluding positive fair values from hedging derivatives. 2) Excluding negative fair values from hedging derivatives.
31 Dec. 2012 EUR million
Loans and receivables
Available for sale
Held for trading
Fair value option
Other liabilities Total
Loans and advances to banks after allowances for losses on loans and advances 50,058 50,058
Loans and advances to customers after allowances for losses on loans and advances 114,689 114,689
Financial assets measured at fair value through profit or loss1) 102,542 1,896 104,438
Financial investments 23,829 28,942 52,771
Non-current assets held for sale and disposal groups1) 0 16 0 0 16 Deposits from banks 64,236 64,236
Deposits from customers 85,332 85,332
Securitized liabilities 61,589 61,589
Financial liabilities measured at fair value through profit or loss2) 85,657 7,184 92,841
Liabilities from disposal groups2) 0 0 0 0
Subordinated capital 9,715 9,715 1) Excluding positive fair values from hedging derivatives. 2) Excluding negative fair values from hedging derivatives.
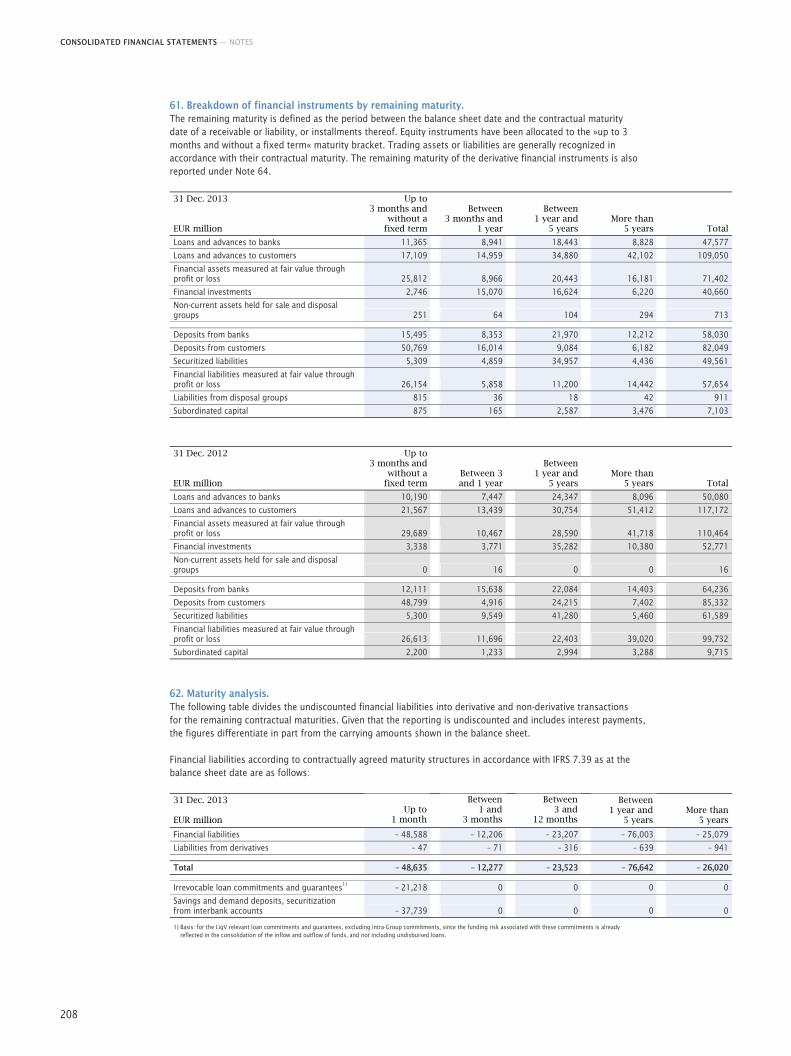
CONSOLIDATED FINANCIAL STATEMENTS — NOTES
208
61. Breakdown of financial instruments by remaining maturity. The remaining maturity is defined as the period between the balance sheet date and the contractual maturity date of a receivable or liability, or installments thereof. Equity instruments have been allocated to the »up to 3 months and without a fixed term« maturity bracket. Trading assets or liabilities are generally recognized in accordance with their contractual maturity. The remaining maturity of the derivative financial instruments is also reported under Note 64.
31 Dec. 2013 EUR million
Up to 3 months and
without a fixed term
Between 3 months and
1 year
Between 1 year and
5 years
More than 5 years Total
Loans and advances to banks 11,365 8,941 18,443 8,828 47,577
Loans and advances to customers 17,109 14,959 34,880 42,102 109,050
Financial assets measured at fair value through profit or loss 25,812 8,966 20,443 16,181 71,402
Financial investments 2,746 15,070 16,624 6,220 40,660
Non-current assets held for sale and disposal groups 251 64 104 294 713 Deposits from banks 15,495 8,353 21,970 12,212 58,030
Deposits from customers 50,769 16,014 9,084 6,182 82,049
Securitized liabilities 5,309 4,859 34,957 4,436 49,561
Financial liabilities measured at fair value through profit or loss 26,154 5,858 11,200 14,442 57,654
Liabilities from disposal groups 815 36 18 42 911
Subordinated capital 875 165 2,587 3,476 7,103
31 Dec. 2012 EUR million
Up to 3 months and
without a fixed term
Between 3 and 1 year
Between 1 year and
5 years
More than 5 years Total
Loans and advances to banks 10,190 7,447 24,347 8,096 50,080
Loans and advances to customers 21,567 13,439 30,754 51,412 117,172
Financial assets measured at fair value through profit or loss 29,689 10,467 28,590 41,718 110,464
Financial investments 3,338 3,771 35,282 10,380 52,771
Non-current assets held for sale and disposal groups 0 16 0 0 16 Deposits from banks 12,111 15,638 22,084 14,403 64,236
Deposits from customers 48,799 4,916 24,215 7,402 85,332
Securitized liabilities 5,300 9,549 41,280 5,460 61,589
Financial liabilities measured at fair value through profit or loss 26,613 11,696 22,403 39,020 99,732
Subordinated capital 2,200 1,233 2,994 3,288 9,715
62. Maturity analysis. The following table divides the undiscounted financial liabilities into derivative and non-derivative transactions for the remaining contractual maturities. Given that the reporting is undiscounted and includes interest payments, the figures differentiate in part from the carrying amounts shown in the balance sheet.
Financial liabilities according to contractually agreed maturity structures in accordance with IFRS 7.39 as at the balance sheet date are as follows:
31 Dec. 2013
EUR million
Up to 1 month
Between 1 and
3 months
Between 3 and
12 months
Between 1 year and
5 years
More than 5 years
Financial liabilities – 48,588 – 12,206 – 23,207 – 76,003 – 25,079
Liabilities from derivatives – 47 – 71 – 316 – 639 – 941 Total – 48,635 – 12,277 – 23,523 – 76,642 – 26,020 Irrevocable loan commitments and guarantees1) – 21,218 0 0 0 0
Savings and demand deposits, securitization from interbank accounts – 37,739 0 0 0 0 1) Basis: for the LiqV relevant loan commitments and guarantees, excluding intra-Group commitments, since the funding risk associated with these commitments is already
reflected in the consolidation of the inflow and outflow of funds, and not including undisbursed loans.
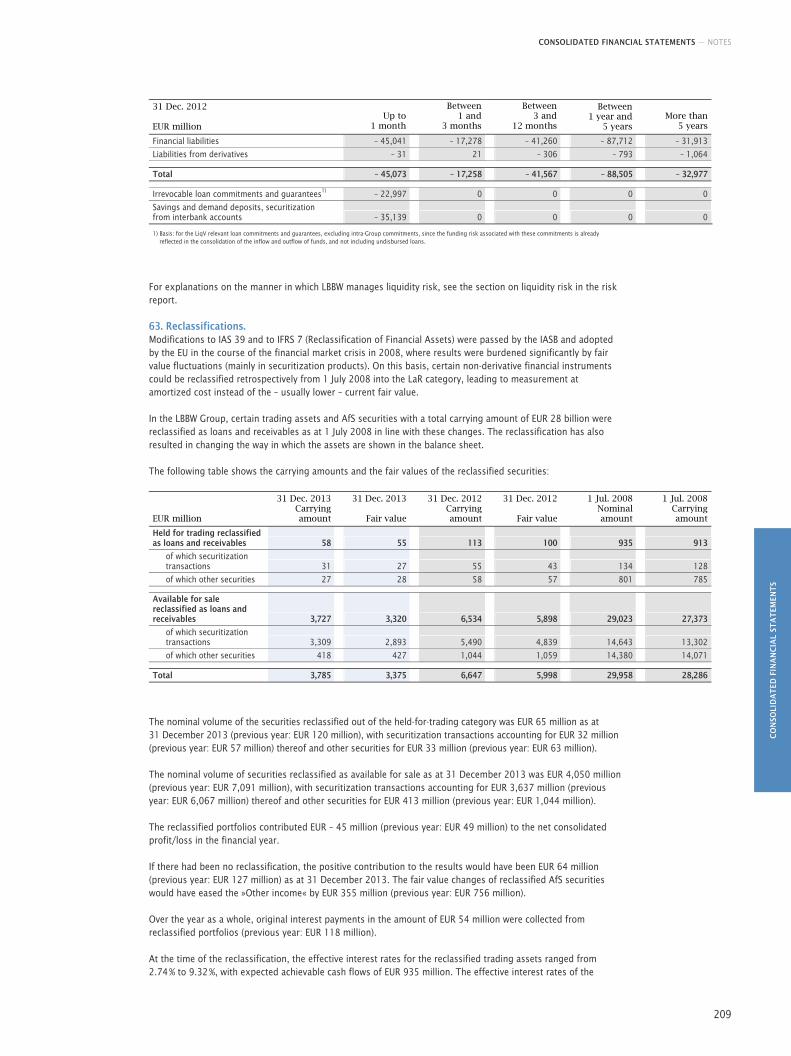
CONSOLIDATED FINANCIAL STATEMENTS — NOTES
CO
NSO
LID
AT
ED F
INA
NC
IAL
STA
TEM
ENT
S
209
31 Dec. 2012
EUR million
Up to 1 month
Between 1 and
3 months
Between 3 and
12 months
Between 1 year and
5 years
More than 5 years
Financial liabilities – 45,041 – 17,278 – 41,260 – 87,712 – 31,913
Liabilities from derivatives – 31 21 – 306 – 793 – 1,064 Total – 45,073 – 17,258 – 41,567 – 88,505 – 32,977 Irrevocable loan commitments and guarantees1) – 22,997 0 0 0 0
Savings and demand deposits, securitization from interbank accounts – 35,139 0 0 0 0 1) Basis: for the LiqV relevant loan commitments and guarantees, excluding intra-Group commitments, since the funding risk associated with these commitments is already
reflected in the consolidation of the inflow and outflow of funds, and not including undisbursed loans.
For explanations on the manner in which LBBW manages liquidity risk, see the section on liquidity risk in the risk report.
63. Reclassifications. Modifications to IAS 39 and to IFRS 7 (Reclassification of Financial Assets) were passed by the IASB and adopted by the EU in the course of the financial market crisis in 2008, where results were burdened significantly by fair value fluctuations (mainly in securitization products). On this basis, certain non-derivative financial instruments could be reclassified retrospectively from 1 July 2008 into the LaR category, leading to measurement at amortized cost instead of the – usually lower – current fair value.
In the LBBW Group, certain trading assets and AfS securities with a total carrying amount of EUR 28 billion were reclassified as loans and receivables as at 1 July 2008 in line with these changes. The reclassification has also resulted in changing the way in which the assets are shown in the balance sheet.
The following table shows the carrying amounts and the fair values of the reclassified securities:
31 Dec. 2013 31 Dec. 2013 31 Dec. 2012 31 Dec. 2012 1 Jul. 2008 1 Jul. 2008
EUR million Carrying amount Fair value
Carrying amount Fair value
Nominal amount
Carrying amount
Held for trading reclassified as loans and receivables 58 55 113 100 935 913
of which securitization transactions 31 27 55 43 134 128
of which other securities 27 28 58 57 801 785 Available for sale reclassified as loans and receivables 3,727 3,320 6,534 5,898 29,023 27,373
of which securitization transactions 3,309 2,893 5,490 4,839 14,643 13,302
of which other securities 418 427 1,044 1,059 14,380 14,071 Total 3,785 3,375 6,647 5,998 29,958 28,286
The nominal volume of the securities reclassified out of the held-for-trading category was EUR 65 million as at 31 December 2013 (previous year: EUR 120 million), with securitization transactions accounting for EUR 32 million (previous year: EUR 57 million) thereof and other securities for EUR 33 million (previous year: EUR 63 million).
The nominal volume of securities reclassified as available for sale as at 31 December 2013 was EUR 4,050 million (previous year: EUR 7,091 million), with securitization transactions accounting for EUR 3,637 million (previous year: EUR 6,067 million) thereof and other securities for EUR 413 million (previous year: EUR 1,044 million).
The reclassified portfolios contributed EUR – 45 million (previous year: EUR 49 million) to the net consolidated profit/loss in the financial year.
If there had been no reclassification, the positive contribution to the results would have been EUR 64 million (previous year: EUR 127 million) as at 31 December 2013. The fair value changes of reclassified AfS securities would have eased the »Other income« by EUR 355 million (previous year: EUR 756 million).
Over the year as a whole, original interest payments in the amount of EUR 54 million were collected from reclassified portfolios (previous year: EUR 118 million).
At the time of the reclassification, the effective interest rates for the reclassified trading assets ranged from 2.74 % to 9.32 %, with expected achievable cash flows of EUR 935 million. The effective interest rates of the
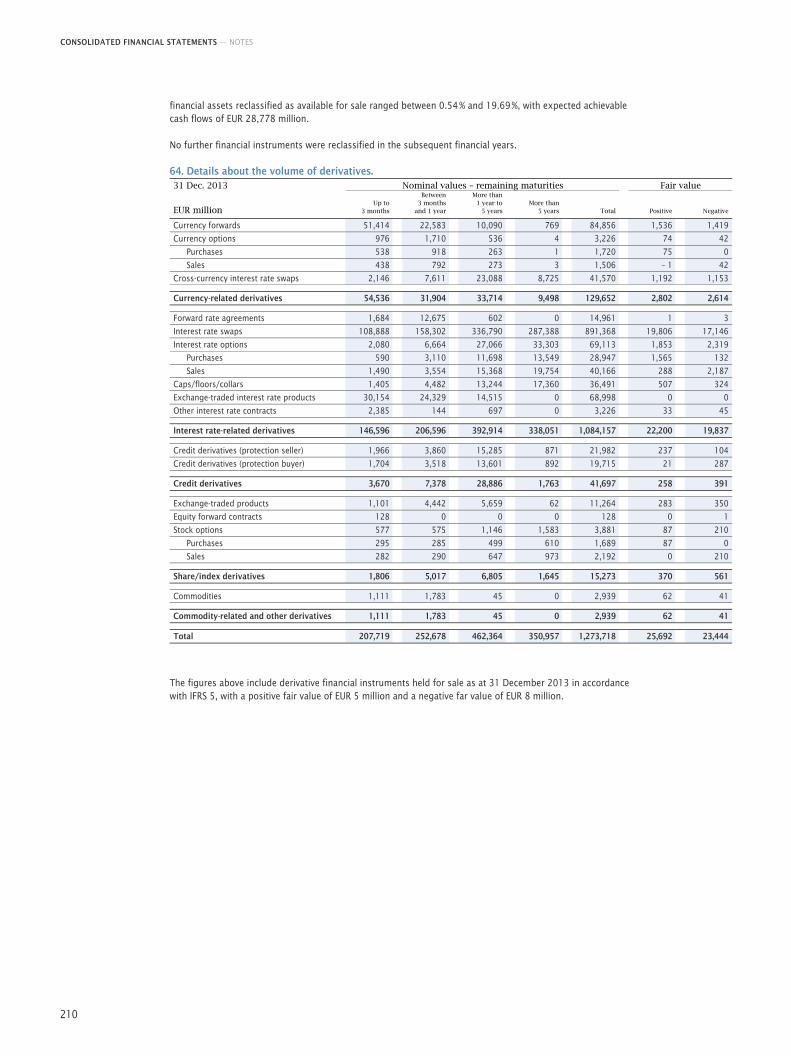
CONSOLIDATED FINANCIAL STATEMENTS — NOTES
210
financial assets reclassified as available for sale ranged between 0.54 % and 19.69 %, with expected achievable cash flows of EUR 28,778 million.
No further financial instruments were reclassified in the subsequent financial years.
64. Details about the volume of derivatives. 31 Dec. 2013 Nominal values – remaining maturities Fair value
EUR million Up to
3 months
Between 3 months
and 1 year
More than 1 year to
5 years
More than 5 years Total Positive Negative
Currency forwards 51,414 22,583 10,090 769 84,856 1,536 1,419
Currency options 976 1,710 536 4 3,226 74 42
Purchases 538 918 263 1 1,720 75 0
Sales 438 792 273 3 1,506 – 1 42
Cross-currency interest rate swaps 2,146 7,611 23,088 8,725 41,570 1,192 1,153 Currency-related derivatives 54,536 31,904 33,714 9,498 129,652 2,802 2,614 Forward rate agreements 1,684 12,675 602 0 14,961 1 3
Interest rate swaps 108,888 158,302 336,790 287,388 891,368 19,806 17,146
Interest rate options 2,080 6,664 27,066 33,303 69,113 1,853 2,319
Purchases 590 3,110 11,698 13,549 28,947 1,565 132
Sales 1,490 3,554 15,368 19,754 40,166 288 2,187
Caps/floors/collars 1,405 4,482 13,244 17,360 36,491 507 324
Exchange-traded interest rate products 30,154 24,329 14,515 0 68,998 0 0
Other interest rate contracts 2,385 144 697 0 3,226 33 45 Interest rate-related derivatives 146,596 206,596 392,914 338,051 1,084,157 22,200 19,837 Credit derivatives (protection seller) 1,966 3,860 15,285 871 21,982 237 104
Credit derivatives (protection buyer) 1,704 3,518 13,601 892 19,715 21 287 Credit derivatives 3,670 7,378 28,886 1,763 41,697 258 391 Exchange-traded products 1,101 4,442 5,659 62 11,264 283 350
Equity forward contracts 128 0 0 0 128 0 1
Stock options 577 575 1,146 1,583 3,881 87 210
Purchases 295 285 499 610 1,689 87 0
Sales 282 290 647 973 2,192 0 210 Share/index derivatives 1,806 5,017 6,805 1,645 15,273 370 561 Commodities 1,111 1,783 45 0 2,939 62 41 Commodity-related and other derivatives 1,111 1,783 45 0 2,939 62 41 Total 207,719 252,678 462,364 350,957 1,273,718 25,692 23,444
The figures above include derivative financial instruments held for sale as at 31 December 2013 in accordance with IFRS 5, with a positive fair value of EUR 5 million and a negative far value of EUR 8 million.
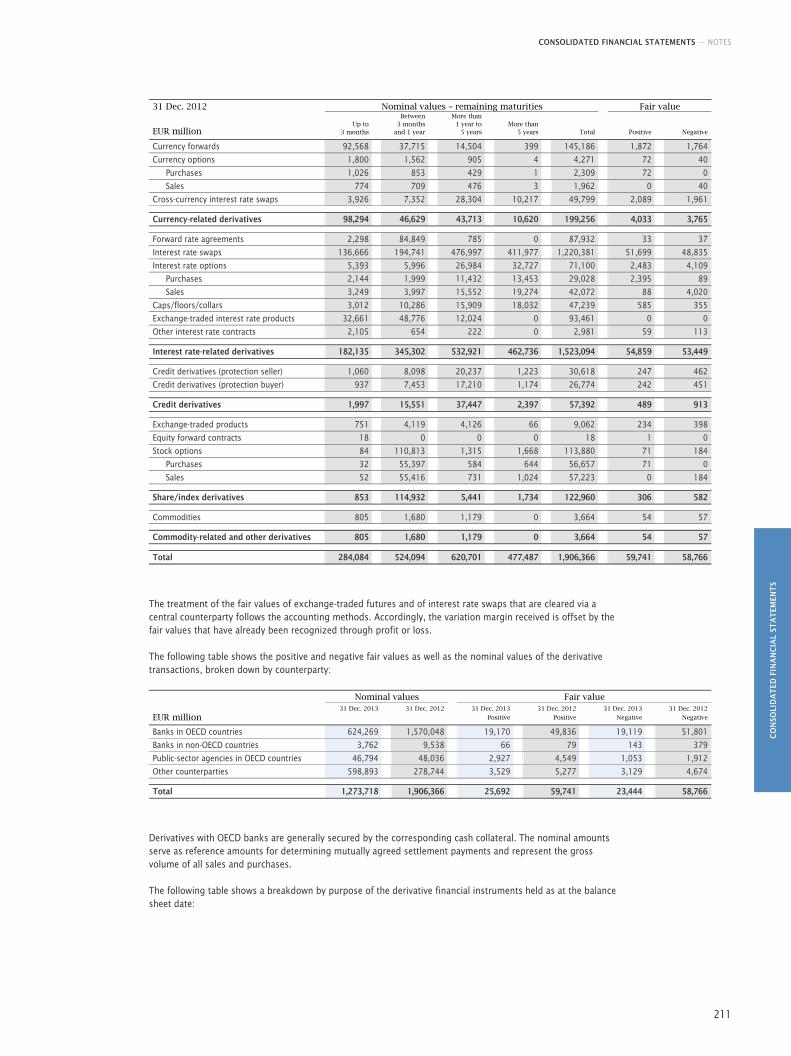
CONSOLIDATED FINANCIAL STATEMENTS — NOTES
CO
NSO
LID
AT
ED F
INA
NC
IAL
STA
TEM
ENT
S
211
31 Dec. 2012 Nominal values – remaining maturities Fair value
EUR million Up to
3 months
Between 3 months
and 1 year
More than 1 year to
5 years
More than 5 years Total Positive Negative
Currency forwards 92,568 37,715 14,504 399 145,186 1,872 1,764
Currency options 1,800 1,562 905 4 4,271 72 40
Purchases 1,026 853 429 1 2,309 72 0
Sales 774 709 476 3 1,962 0 40
Cross-currency interest rate swaps 3,926 7,352 28,304 10,217 49,799 2,089 1,961 Currency-related derivatives 98,294 46,629 43,713 10,620 199,256 4,033 3,765 Forward rate agreements 2,298 84,849 785 0 87,932 33 37
Interest rate swaps 136,666 194,741 476,997 411,977 1,220,381 51,699 48,835
Interest rate options 5,393 5,996 26,984 32,727 71,100 2,483 4,109
Purchases 2,144 1,999 11,432 13,453 29,028 2,395 89
Sales 3,249 3,997 15,552 19,274 42,072 88 4,020
Caps/floors/collars 3,012 10,286 15,909 18,032 47,239 585 355
Exchange-traded interest rate products 32,661 48,776 12,024 0 93,461 0 0
Other interest rate contracts 2,105 654 222 0 2,981 59 113 Interest rate-related derivatives 182,135 345,302 532,921 462,736 1,523,094 54,859 53,449 Credit derivatives (protection seller) 1,060 8,098 20,237 1,223 30,618 247 462
Credit derivatives (protection buyer) 937 7,453 17,210 1,174 26,774 242 451 Credit derivatives 1,997 15,551 37,447 2,397 57,392 489 913 Exchange-traded products 751 4,119 4,126 66 9,062 234 398
Equity forward contracts 18 0 0 0 18 1 0
Stock options 84 110,813 1,315 1,668 113,880 71 184
Purchases 32 55,397 584 644 56,657 71 0
Sales 52 55,416 731 1,024 57,223 0 184 Share/index derivatives 853 114,932 5,441 1,734 122,960 306 582 Commodities 805 1,680 1,179 0 3,664 54 57 Commodity-related and other derivatives 805 1,680 1,179 0 3,664 54 57 Total 284,084 524,094 620,701 477,487 1,906,366 59,741 58,766
The treatment of the fair values of exchange-traded futures and of interest rate swaps that are cleared via a central counterparty follows the accounting methods. Accordingly, the variation margin received is offset by the fair values that have already been recognized through profit or loss.
The following table shows the positive and negative fair values as well as the nominal values of the derivative transactions, broken down by counterparty:
Nominal values Fair value 31 Dec. 2013 31 Dec. 2012 31 Dec. 2013 31 Dec. 2012 31 Dec. 2013 31 Dec. 2012
EUR million Positive Positive Negative Negative
Banks in OECD countries 624,269 1,570,048 19,170 49,836 19,119 51,801
Banks in non-OECD countries 3,762 9,538 66 79 143 379
Public-sector agencies in OECD countries 46,794 48,036 2,927 4,549 1,053 1,912
Other counterparties 598,893 278,744 3,529 5,277 3,129 4,674 Total 1,273,718 1,906,366 25,692 59,741 23,444 58,766
Derivatives with OECD banks are generally secured by the corresponding cash collateral. The nominal amounts serve as reference amounts for determining mutually agreed settlement payments and represent the gross volume of all sales and purchases.
The following table shows a breakdown by purpose of the derivative financial instruments held as at the balance sheet date:
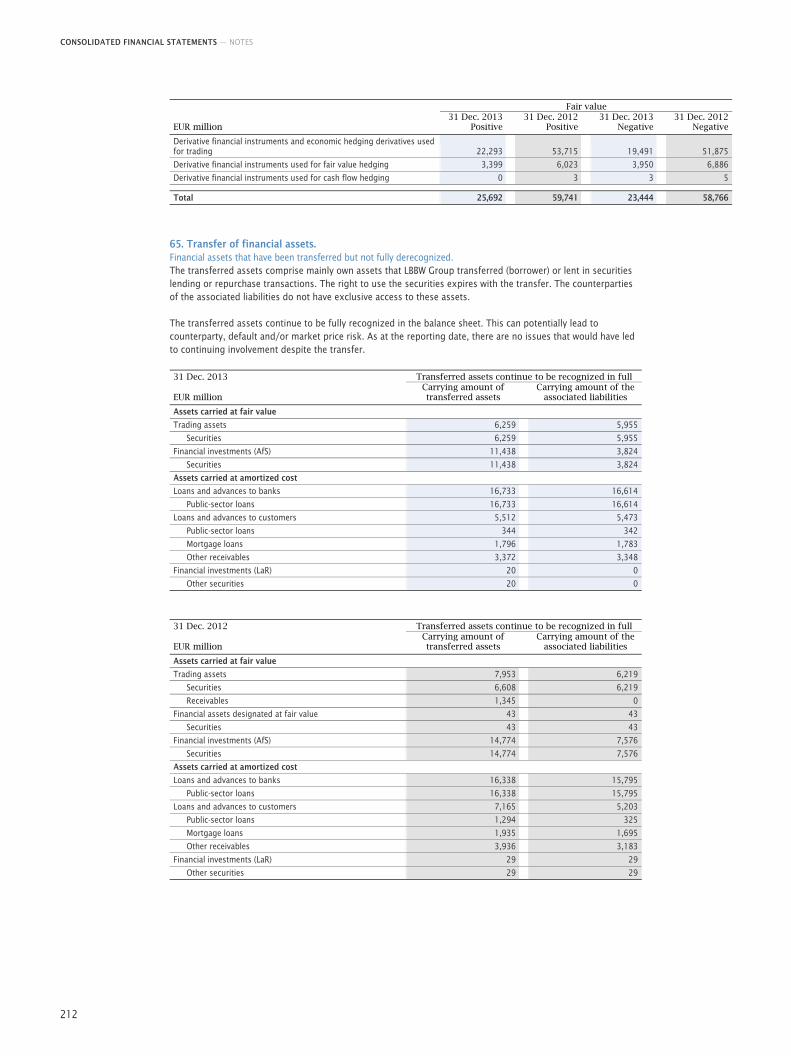
CONSOLIDATED FINANCIAL STATEMENTS — NOTES
212
Fair value 31 Dec. 2013 31 Dec. 2012 31 Dec. 2013 31 Dec. 2012EUR million Positive Positive Negative Negative
Derivative financial instruments and economic hedging derivatives used for trading 22,293 53,715 19,491 51,875
Derivative financial instruments used for fair value hedging 3,399 6,023 3,950 6,886
Derivative financial instruments used for cash flow hedging 0 3 3 5 Total 25,692 59,741 23,444 58,766
65. Transfer of financial assets. Financial assets that have been transferred but not fully derecognized. The transferred assets comprise mainly own assets that LBBW Group transferred (borrower) or lent in securities lending or repurchase transactions. The right to use the securities expires with the transfer. The counterparties of the associated liabilities do not have exclusive access to these assets.
The transferred assets continue to be fully recognized in the balance sheet. This can potentially lead to counterparty, default and/or market price risk. As at the reporting date, there are no issues that would have led to continuing involvement despite the transfer.
31 Dec. 2013 Transferred assets continue to be recognized in full
EUR million Carrying amount of transferred assets
Carrying amount of the associated liabilities
Assets carried at fair value
Trading assets 6,259 5,955
Securities 6,259 5,955
Financial investments (AfS) 11,438 3,824
Securities 11,438 3,824
Assets carried at amortized cost
Loans and advances to banks 16,733 16,614
Public-sector loans 16,733 16,614
Loans and advances to customers 5,512 5,473
Public-sector loans 344 342
Mortgage loans 1,796 1,783
Other receivables 3,372 3,348
Financial investments (LaR) 20 0
Other securities 20 0
31 Dec. 2012 Transferred assets continue to be recognized in full
EUR million Carrying amount of transferred assets
Carrying amount of the associated liabilities
Assets carried at fair value
Trading assets 7,953 6,219
Securities 6,608 6,219
Receivables 1,345 0
Financial assets designated at fair value 43 43
Securities 43 43
Financial investments (AfS) 14,774 7,576
Securities 14,774 7,576
Assets carried at amortized cost
Loans and advances to banks 16,338 15,795
Public-sector loans 16,338 15,795
Loans and advances to customers 7,165 5,203
Public-sector loans 1,294 325
Mortgage loans 1,935 1,695
Other receivables 3,936 3,183
Financial investments (LaR) 29 29
Other securities 29 29
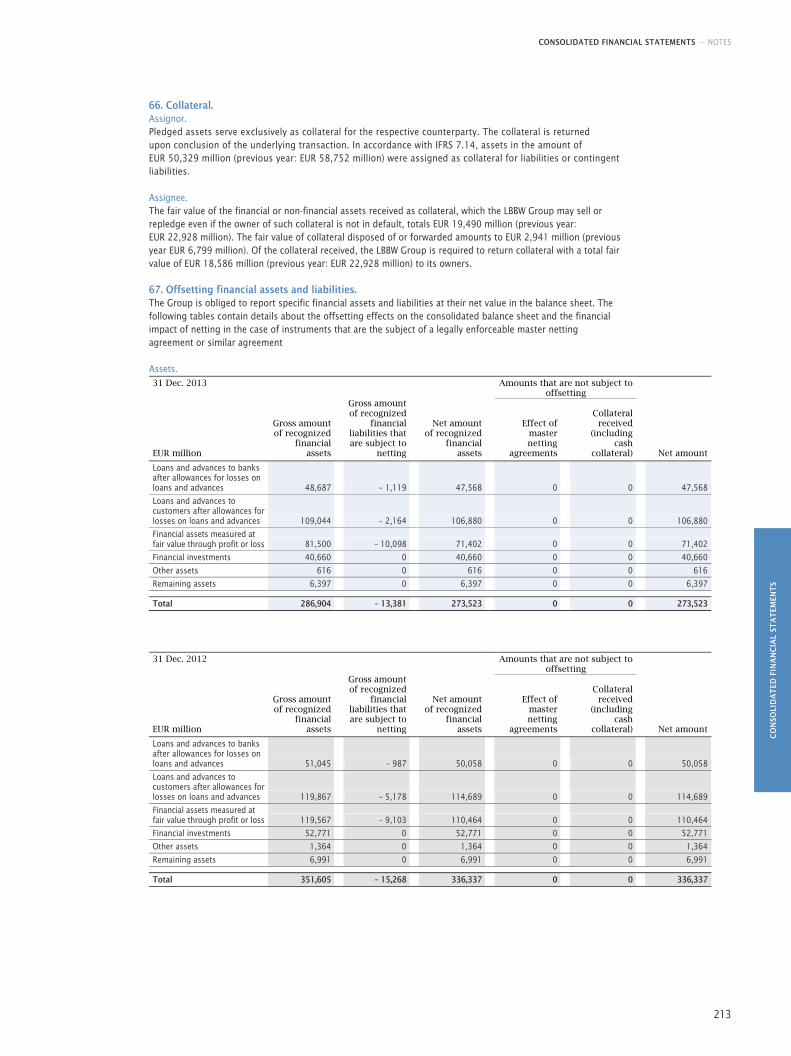
CONSOLIDATED FINANCIAL STATEMENTS — NOTES
CO
NSO
LID
AT
ED F
INA
NC
IAL
STA
TEM
ENT
S
213
66. Collateral. Assignor. Pledged assets serve exclusively as collateral for the respective counterparty. The collateral is returned upon conclusion of the underlying transaction. In accordance with IFRS 7.14, assets in the amount of EUR 50,329 million (previous year: EUR 58,752 million) were assigned as collateral for liabilities or contingent liabilities.
Assignee. The fair value of the financial or non-financial assets received as collateral, which the LBBW Group may sell or repledge even if the owner of such collateral is not in default, totals EUR 19,490 million (previous year: EUR 22,928 million). The fair value of collateral disposed of or forwarded amounts to EUR 2,941 million (previous year EUR 6,799 million). Of the collateral received, the LBBW Group is required to return collateral with a total fair value of EUR 18,586 million (previous year: EUR 22,928 million) to its owners.
67. Offsetting financial assets and liabilities. The Group is obliged to report specific financial assets and liabilities at their net value in the balance sheet. The following tables contain details about the offsetting effects on the consolidated balance sheet and the financial impact of netting in the case of instruments that are the subject of a legally enforceable master netting agreement or similar agreement
Assets. 31 Dec. 2013
Amounts that are not subject to offsetting
EUR million
Gross amount of recognized
financial assets
Gross amount of recognized
financial liabilities that are subject to
netting
Net amount of recognized
financial assets
Effect of master netting
agreements
Collateral received
(including cash
collateral) Net amount
Loans and advances to banks after allowances for losses on loans and advances 48,687 – 1,119 47,568 0 0 47,568
Loans and advances to customers after allowances for losses on loans and advances 109,044 – 2,164 106,880 0 0 106,880
Financial assets measured at fair value through profit or loss 81,500 – 10,098 71,402 0 0 71,402
Financial investments 40,660 0 40,660 0 0 40,660
Other assets 616 0 616 0 0 616
Remaining assets 6,397 0 6,397 0 0 6,397 Total 286,904 – 13,381 273,523 0 0 273,523
31 Dec. 2012
Amounts that are not subject to offsetting
EUR million
Gross amount of recognized
financial assets
Gross amount of recognized
financial liabilities that are subject to
netting
Net amount of recognized
financial assets
Effect of master netting
agreements
Collateral received
(including cash
collateral) Net amount
Loans and advances to banks after allowances for losses on loans and advances 51,045 – 987 50,058 0 0 50,058
Loans and advances to customers after allowances for losses on loans and advances 119,867 – 5,178 114,689 0 0 114,689
Financial assets measured at fair value through profit or loss 119,567 – 9,103 110,464 0 0 110,464
Financial investments 52,771 0 52,771 0 0 52,771
Other assets 1,364 0 1,364 0 0 1,364
Remaining assets 6,991 0 6,991 0 0 6,991 Total 351,605 – 15,268 336,337 0 0 336,337
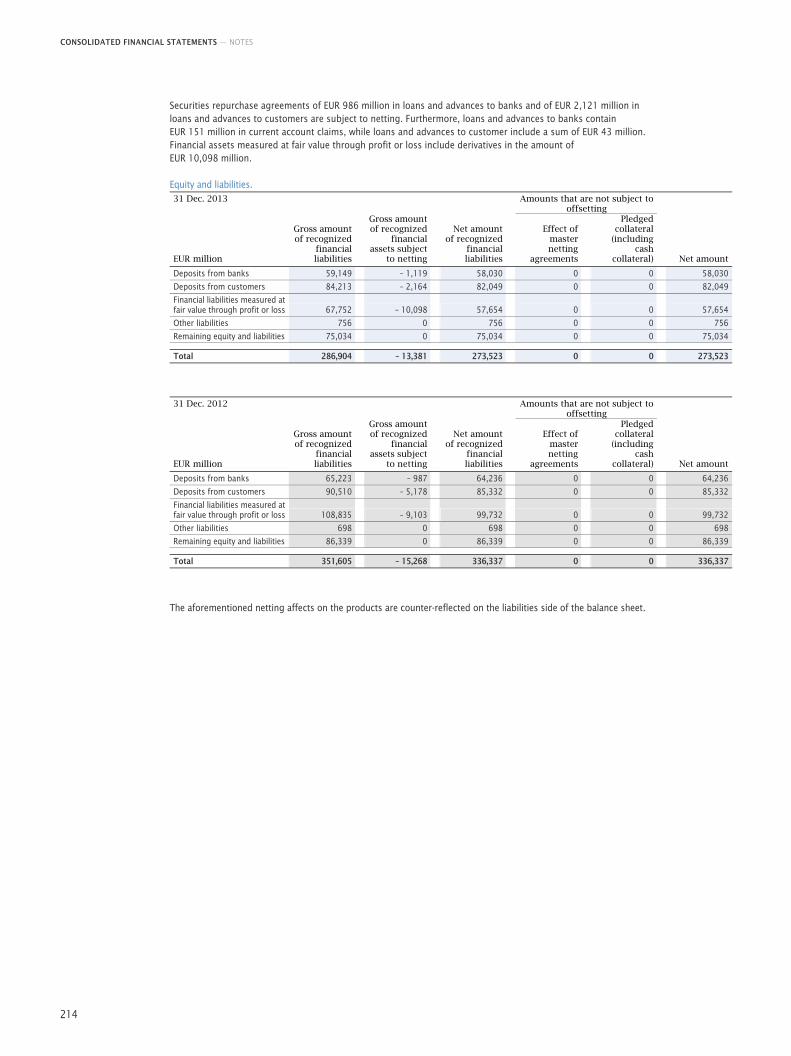
CONSOLIDATED FINANCIAL STATEMENTS — NOTES
214
Securities repurchase agreements of EUR 986 million in loans and advances to banks and of EUR 2,121 million in loans and advances to customers are subject to netting. Furthermore, loans and advances to banks contain EUR 151 million in current account claims, while loans and advances to customer include a sum of EUR 43 million. Financial assets measured at fair value through profit or loss include derivatives in the amount of EUR 10,098 million.
Equity and liabilities. 31 Dec. 2013
Amounts that are not subject to offsetting
EUR million
Gross amount of recognized
financial liabilities
Gross amount of recognized
financial assets subject
to netting
Net amount of recognized
financial liabilities
Effect of master netting
agreements
Pledged collateral
(including cash
collateral) Net amount
Deposits from banks 59,149 – 1,119 58,030 0 0 58,030
Deposits from customers 84,213 – 2,164 82,049 0 0 82,049
Financial liabilities measured at fair value through profit or loss 67,752 – 10,098 57,654 0 0 57,654
Other liabilities 756 0 756 0 0 756
Remaining equity and liabilities 75,034 0 75,034 0 0 75,034
Total 286,904 – 13,381 273,523 0 0 273,523
31 Dec. 2012
Amounts that are not subject to offsetting
EUR million
Gross amount of recognized
financial liabilities
Gross amount of recognized
financial assets subject
to netting
Net amount of recognized
financial liabilities
Effect of master netting
agreements
Pledged collateral
(including cash
collateral) Net amount
Deposits from banks 65,223 – 987 64,236 0 0 64,236
Deposits from customers 90,510 – 5,178 85,332 0 0 85,332
Financial liabilities measured at fair value through profit or loss 108,835 – 9,103 99,732 0 0 99,732
Other liabilities 698 0 698 0 0 698
Remaining equity and liabilities 86,339 0 86,339 0 0 86,339
Total 351,605 – 15,268 336,337 0 0 336,337
The aforementioned netting affects on the products are counter-reflected on the liabilities side of the balance sheet.
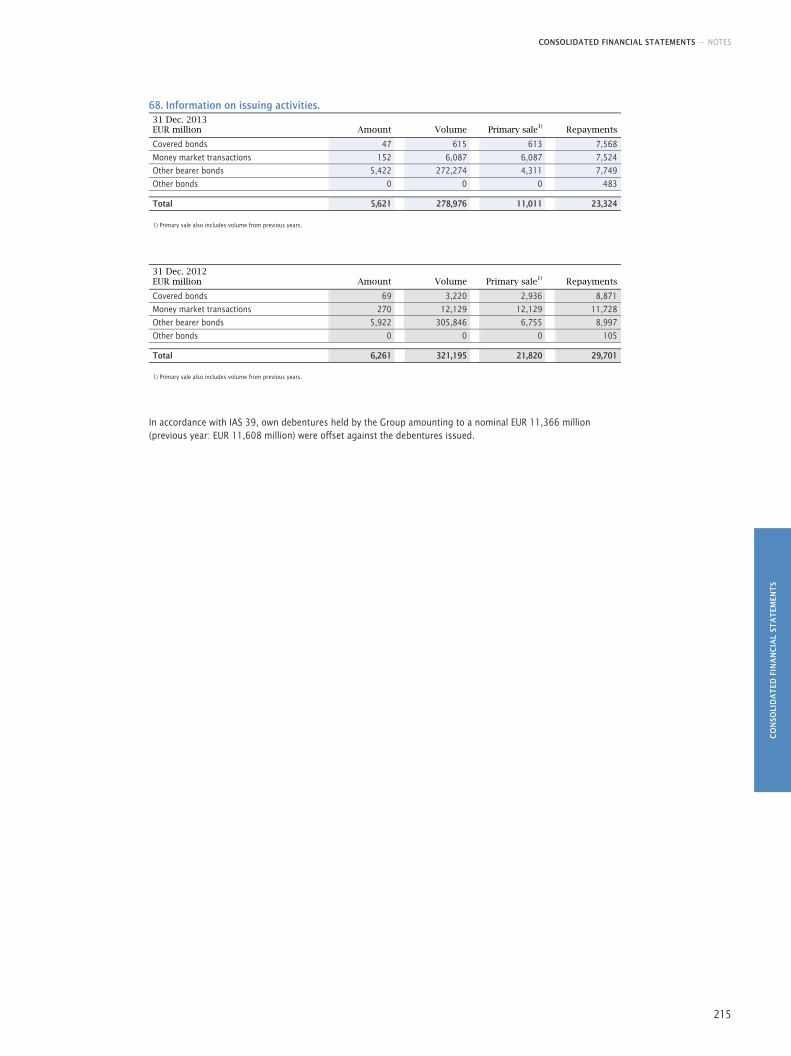
CONSOLIDATED FINANCIAL STATEMENTS — NOTES
CO
NSO
LID
AT
ED F
INA
NC
IAL
STA
TEM
ENT
S
215
68. Information on issuing activities. 31 Dec. 2013 EUR million Amount Volume Primary sale1)
Repayments
Covered bonds 47 615 613 7,568
Money market transactions 152 6,087 6,087 7,524
Other bearer bonds 5,422 272,274 4,311 7,749
Other bonds 0 0 0 483 Total 5,621 278,976 11,011 23,324 1) Primary sale also includes volume from previous years.
31 Dec. 2012 EUR million Amount Volume Primary sale1)
Repayments
Covered bonds 69 3,220 2,936 8,871
Money market transactions 270 12,129 12,129 11,728
Other bearer bonds 5,922 305,846 6,755 8,997
Other bonds 0 0 0 105 Total 6,261 321,195 21,820 29,701 1) Primary sale also includes volume from previous years.
In accordance with IAS 39, own debentures held by the Group amounting to a nominal EUR 11,366 million (previous year: EUR 11,608 million) were offset against the debentures issued.
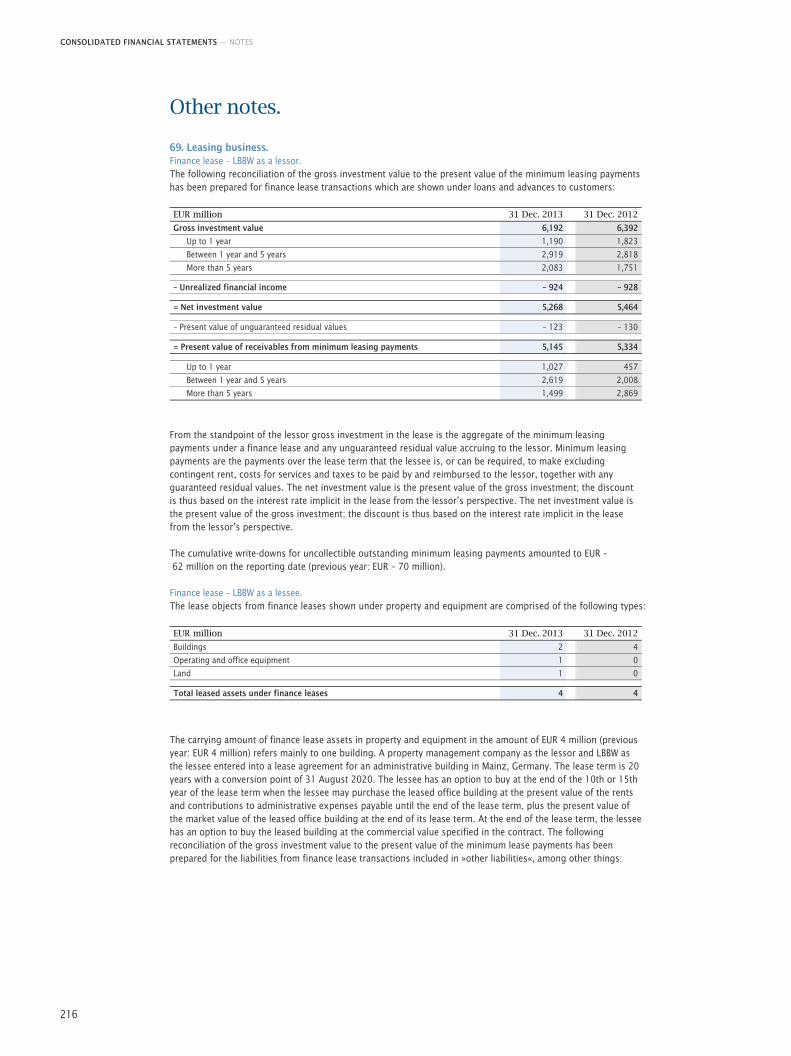
CONSOLIDATED FINANCIAL STATEMENTS — NOTES
216
Other notes.
69. Leasing business. Finance lease – LBBW as a lessor. The following reconciliation of the gross investment value to the present value of the minimum leasing payments has been prepared for finance lease transactions which are shown under loans and advances to customers:
EUR million 31 Dec. 2013 31 Dec. 2012
Gross investment value 6,192 6,392
Up to 1 year 1,190 1,823
Between 1 year and 5 years 2,919 2,818
More than 5 years 2,083 1,751 – Unrealized financial income – 924 – 928 = Net investment value 5,268 5,464 – Present value of unguaranteed residual values – 123 – 130 = Present value of receivables from minimum leasing payments 5,145 5,334
Up to 1 year 1,027 457
Between 1 year and 5 years 2,619 2,008
More than 5 years 1,499 2,869
From the standpoint of the lessor gross investment in the lease is the aggregate of the minimum leasing payments under a finance lease and any unguaranteed residual value accruing to the lessor. Minimum leasing payments are the payments over the lease term that the lessee is, or can be required, to make excluding contingent rent, costs for services and taxes to be paid by and reimbursed to the lessor, together with any guaranteed residual values. The net investment value is the present value of the gross investment; the discount is thus based on the interest rate implicit in the lease from the lessor’s perspective. The net investment value is the present value of the gross investment; the discount is thus based on the interest rate implicit in the lease from the lessor’s perspective.
The cumulative write-downs for uncollectible outstanding minimum leasing payments amounted to EUR – 62 million on the reporting date (previous year: EUR – 70 million).
Finance lease – LBBW as a lessee. The lease objects from finance leases shown under property and equipment are comprised of the following types:
EUR million 31 Dec. 2013 31 Dec. 2012
Buildings 2 4
Operating and office equipment 1 0
Land 1 0 Total leased assets under finance leases 4 4
The carrying amount of finance lease assets in property and equipment in the amount of EUR 4 million (previous year: EUR 4 million) refers mainly to one building. A property management company as the lessor and LBBW as the lessee entered into a lease agreement for an administrative building in Mainz, Germany. The lease term is 20 years with a conversion point of 31 August 2020. The lessee has an option to buy at the end of the 10th or 15th year of the lease term when the lessee may purchase the leased office building at the present value of the rents and contributions to administrative expenses payable until the end of the lease term, plus the present value of the market value of the leased office building at the end of its lease term. At the end of the lease term, the lessee has an option to buy the leased building at the commercial value specified in the contract. The following reconciliation of the gross investment value to the present value of the minimum lease payments has been prepared for the liabilities from finance lease transactions included in »other liabilities«, among other things:
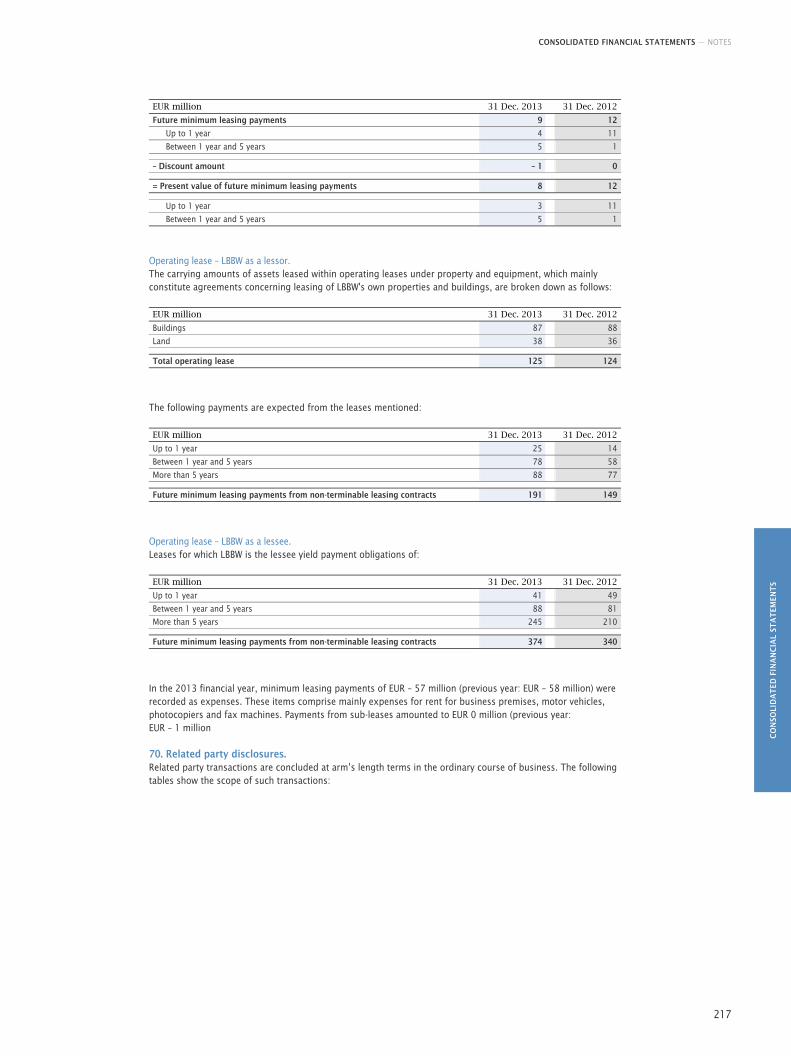
CONSOLIDATED FINANCIAL STATEMENTS — NOTES
CO
NSO
LID
AT
ED F
INA
NC
IAL
STA
TEM
ENT
S
217
EUR million 31 Dec. 2013 31 Dec. 2012
Future minimum leasing payments 9 12
Up to 1 year 4 11
Between 1 year and 5 years 5 1 – Discount amount – 1 0 = Present value of future minimum leasing payments 8 12
Up to 1 year 3 11
Between 1 year and 5 years 5 1
Operating lease – LBBW as a lessor. The carrying amounts of assets leased within operating leases under property and equipment, which mainly constitute agreements concerning leasing of LBBW's own properties and buildings, are broken down as follows:
EUR million 31 Dec. 2013 31 Dec. 2012
Buildings 87 88
Land 38 36 Total operating lease 125 124
The following payments are expected from the leases mentioned:
EUR million 31 Dec. 2013 31 Dec. 2012
Up to 1 year 25 14
Between 1 year and 5 years 78 58
More than 5 years 88 77 Future minimum leasing payments from non-terminable leasing contracts 191 149
Operating lease – LBBW as a lessee. Leases for which LBBW is the lessee yield payment obligations of:
EUR million 31 Dec. 2013 31 Dec. 2012
Up to 1 year 41 49
Between 1 year and 5 years 88 81
More than 5 years 245 210 Future minimum leasing payments from non-terminable leasing contracts 374 340
In the 2013 financial year, minimum leasing payments of EUR – 57 million (previous year: EUR – 58 million) were recorded as expenses. These items comprise mainly expenses for rent for business premises, motor vehicles, photocopiers and fax machines. Payments from sub-leases amounted to EUR 0 million (previous year: EUR – 1 million
70. Related party disclosures. Related party transactions are concluded at arm’s length terms in the ordinary course of business. The following tables show the scope of such transactions:
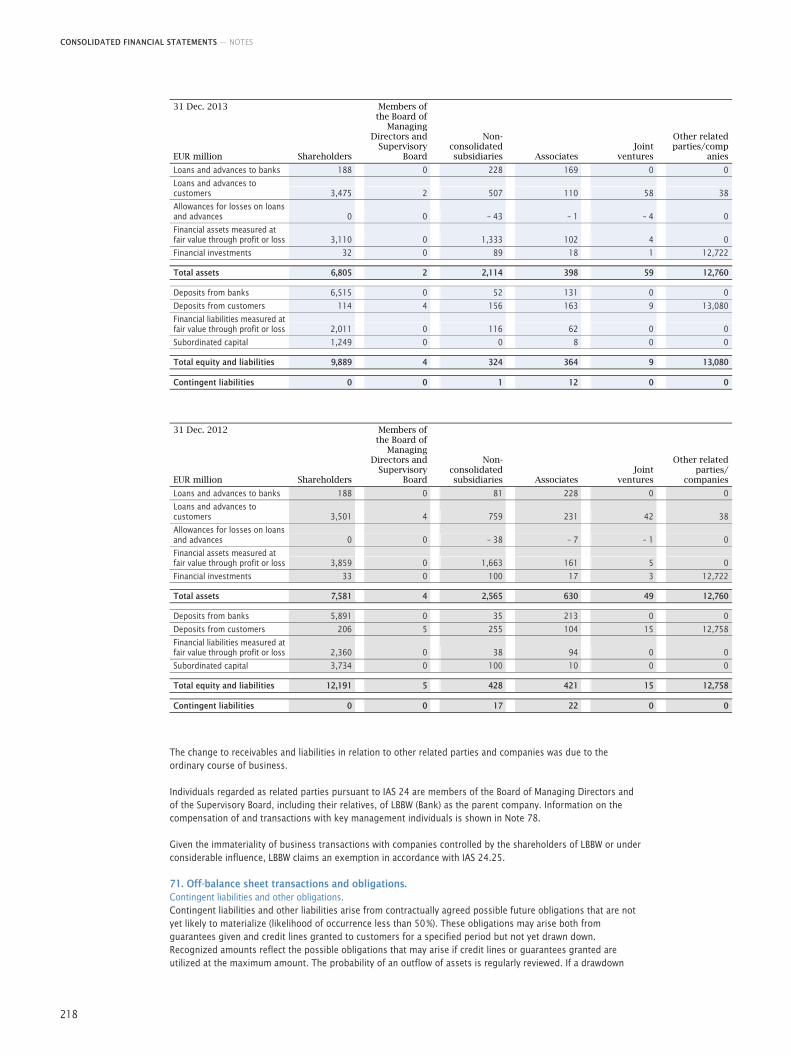
CONSOLIDATED FINANCIAL STATEMENTS — NOTES
218
31 Dec. 2013 EUR million Shareholders
Members of the Board of
Managing Directors and
Supervisory Board
Non-consolidated subsidiaries Associates
Joint ventures
Other related parties/comp
anies
Loans and advances to banks 188 0 228 169 0 0
Loans and advances to customers 3,475 2 507 110 58 38
Allowances for losses on loans and advances 0 0 – 43 – 1 – 4 0
Financial assets measured at fair value through profit or loss 3,110 0 1,333 102 4 0
Financial investments 32 0 89 18 1 12,722
Total assets 6,805 2 2,114 398 59 12,760
Deposits from banks 6,515 0 52 131 0 0
Deposits from customers 114 4 156 163 9 13,080
Financial liabilities measured at fair value through profit or loss 2,011 0 116 62 0 0
Subordinated capital 1,249 0 0 8 0 0
Total equity and liabilities 9,889 4 324 364 9 13,080
Contingent liabilities 0 0 1 12 0 0
31 Dec. 2012 EUR million Shareholders
Members of the Board of
Managing Directors and
Supervisory Board
Non-consolidated subsidiaries Associates
Joint ventures
Other related parties/
companies
Loans and advances to banks 188 0 81 228 0 0
Loans and advances to customers 3,501 4 759 231 42 38
Allowances for losses on loans and advances 0 0 – 38 – 7 – 1 0
Financial assets measured at fair value through profit or loss 3,859 0 1,663 161 5 0
Financial investments 33 0 100 17 3 12,722
Total assets 7,581 4 2,565 630 49 12,760
Deposits from banks 5,891 0 35 213 0 0
Deposits from customers 206 5 255 104 15 12,758
Financial liabilities measured at fair value through profit or loss 2,360 0 38 94 0 0
Subordinated capital 3,734 0 100 10 0 0
Total equity and liabilities 12,191 5 428 421 15 12,758
Contingent liabilities 0 0 17 22 0 0
The change to receivables and liabilities in relation to other related parties and companies was due to the ordinary course of business.
Individuals regarded as related parties pursuant to IAS 24 are members of the Board of Managing Directors and of the Supervisory Board, including their relatives, of LBBW (Bank) as the parent company. Information on the compensation of and transactions with key management individuals is shown in Note 78.
Given the immateriality of business transactions with companies controlled by the shareholders of LBBW or under considerable influence, LBBW claims an exemption in accordance with IAS 24.25.
71. Off-balance sheet transactions and obligations. Contingent liabilities and other obligations. Contingent liabilities and other liabilities arise from contractually agreed possible future obligations that are not yet likely to materialize (likelihood of occurrence less than 50 %). These obligations may arise both from guarantees given and credit lines granted to customers for a specified period but not yet drawn down. Recognized amounts reflect the possible obligations that may arise if credit lines or guarantees granted are utilized at the maximum amount. The probability of an outflow of assets is regularly reviewed. If a drawdown
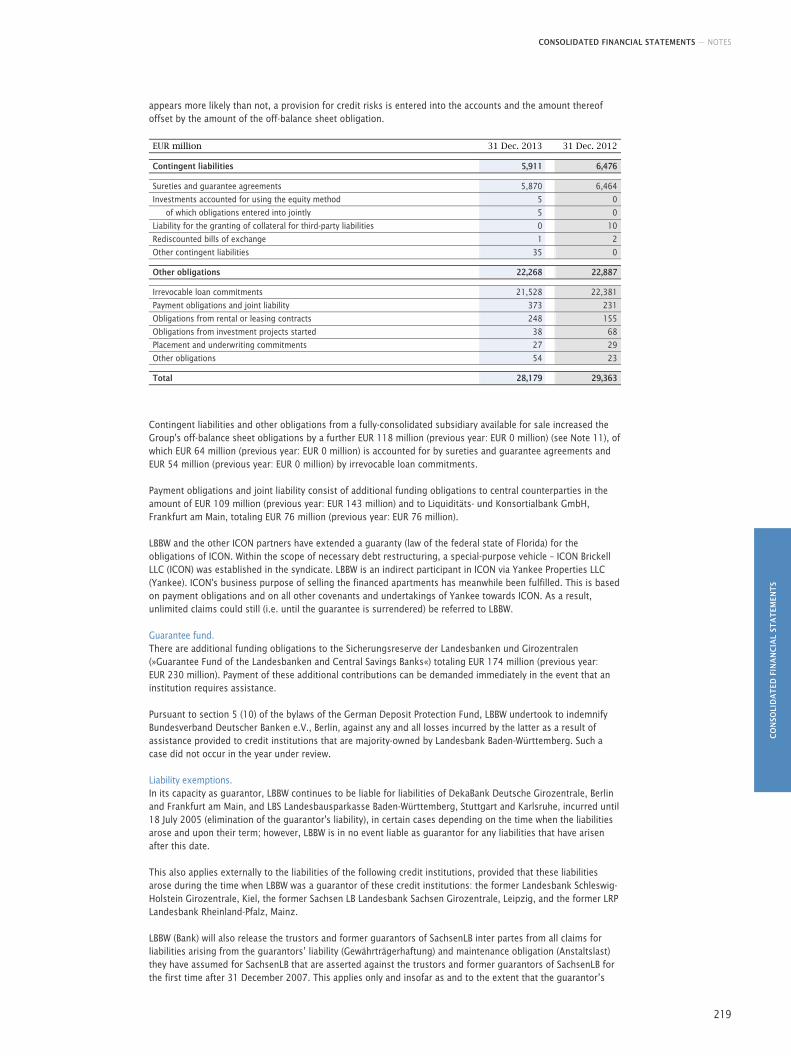
CONSOLIDATED FINANCIAL STATEMENTS — NOTES
CO
NSO
LID
AT
ED F
INA
NC
IAL
STA
TEM
ENT
S
219
appears more likely than not, a provision for credit risks is entered into the accounts and the amount thereof offset by the amount of the off-balance sheet obligation.
EUR million 31 Dec. 2013 31 Dec. 2012 Contingent liabilities 5,911 6,476 Sureties and guarantee agreements 5,870 6,464
Investments accounted for using the equity method 5 0
of which obligations entered into jointly 5 0
Liability for the granting of collateral for third-party liabilities 0 10
Rediscounted bills of exchange 1 2
Other contingent liabilities 35 0 Other obligations 22,268 22,887 Irrevocable loan commitments 21,528 22,381
Payment obligations and joint liability 373 231
Obligations from rental or leasing contracts 248 155
Obligations from investment projects started 38 68
Placement and underwriting commitments 27 29
Other obligations 54 23 Total 28,179 29,363
Contingent liabilities and other obligations from a fully-consolidated subsidiary available for sale increased the Group's off-balance sheet obligations by a further EUR 118 million (previous year: EUR 0 million) (see Note 11), of which EUR 64 million (previous year: EUR 0 million) is accounted for by sureties and guarantee agreements and EUR 54 million (previous year: EUR 0 million) by irrevocable loan commitments.
Payment obligations and joint liability consist of additional funding obligations to central counterparties in the amount of EUR 109 million (previous year: EUR 143 million) and to Liquiditäts- und Konsortialbank GmbH, Frankfurt am Main, totaling EUR 76 million (previous year: EUR 76 million).
LBBW and the other ICON partners have extended a guaranty (law of the federal state of Florida) for the obligations of ICON. Within the scope of necessary debt restructuring, a special-purpose vehicle – ICON Brickell LLC (ICON) was established in the syndicate. LBBW is an indirect participant in ICON via Yankee Properties LLC (Yankee). ICON's business purpose of selling the financed apartments has meanwhile been fulfilled. This is based on payment obligations and on all other covenants and undertakings of Yankee towards ICON. As a result, unlimited claims could still (i.e. until the guarantee is surrendered) be referred to LBBW.
Guarantee fund. There are additional funding obligations to the Sicherungsreserve der Landesbanken und Girozentralen (»Guarantee Fund of the Landesbanken and Central Savings Banks«) totaling EUR 174 million (previous year: EUR 230 million). Payment of these additional contributions can be demanded immediately in the event that an institution requires assistance.
Pursuant to section 5 (10) of the bylaws of the German Deposit Protection Fund, LBBW undertook to indemnify Bundesverband Deutscher Banken e.V., Berlin, against any and all losses incurred by the latter as a result of assistance provided to credit institutions that are majority-owned by Landesbank Baden-Württemberg. Such a case did not occur in the year under review.
Liability exemptions. In its capacity as guarantor, LBBW continues to be liable for liabilities of DekaBank Deutsche Girozentrale, Berlin and Frankfurt am Main, and LBS Landesbausparkasse Baden-Württemberg, Stuttgart and Karlsruhe, incurred until 18 July 2005 (elimination of the guarantor's liability), in certain cases depending on the time when the liabilities arose and upon their term; however, LBBW is in no event liable as guarantor for any liabilities that have arisen after this date.
This also applies externally to the liabilities of the following credit institutions, provided that these liabilities arose during the time when LBBW was a guarantor of these credit institutions: the former Landesbank Schleswig-Holstein Girozentrale, Kiel, the former Sachsen LB Landesbank Sachsen Girozentrale, Leipzig, and the former LRP Landesbank Rheinland-Pfalz, Mainz.
LBBW (Bank) will also release the trustors and former guarantors of SachsenLB inter partes from all claims for liabilities arising from the guarantors’ liability (Gewährträgerhaftung) and maintenance obligation (Anstaltslast) they have assumed for SachsenLB that are asserted against the trustors and former guarantors of SachsenLB for the first time after 31 December 2007. This applies only and insofar as and to the extent that the guarantor’s
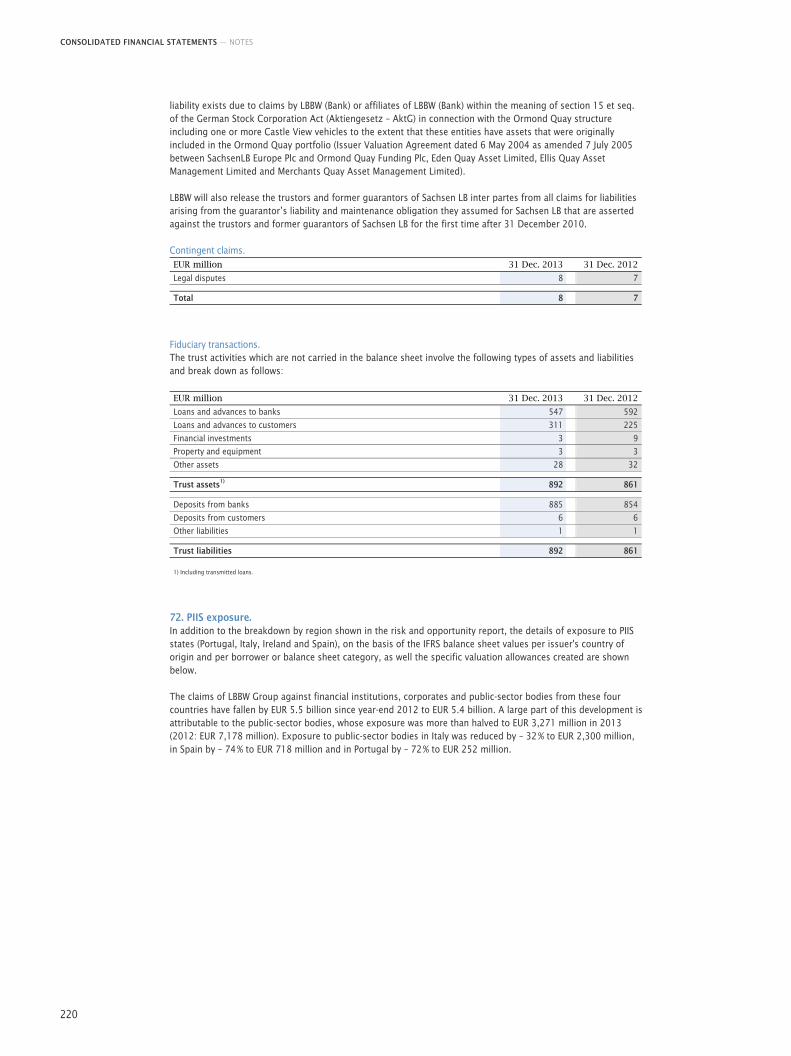
CONSOLIDATED FINANCIAL STATEMENTS — NOTES
220
liability exists due to claims by LBBW (Bank) or affiliates of LBBW (Bank) within the meaning of section 15 et seq. of the German Stock Corporation Act (Aktiengesetz – AktG) in connection with the Ormond Quay structure including one or more Castle View vehicles to the extent that these entities have assets that were originally included in the Ormond Quay portfolio (Issuer Valuation Agreement dated 6 May 2004 as amended 7 July 2005 between SachsenLB Europe Plc and Ormond Quay Funding Plc, Eden Quay Asset Limited, Ellis Quay Asset Management Limited and Merchants Quay Asset Management Limited).
LBBW will also release the trustors and former guarantors of Sachsen LB inter partes from all claims for liabilities arising from the guarantor’s liability and maintenance obligation they assumed for Sachsen LB that are asserted against the trustors and former guarantors of Sachsen LB for the first time after 31 December 2010.
Contingent claims. EUR million 31 Dec. 2013 31 Dec. 2012
Legal disputes 8 7 Total 8 7
Fiduciary transactions. The trust activities which are not carried in the balance sheet involve the following types of assets and liabilities and break down as follows:
EUR million 31 Dec. 2013 31 Dec. 2012
Loans and advances to banks 547 592
Loans and advances to customers 311 225
Financial investments 3 9
Property and equipment 3 3
Other assets 28 32 Trust assets1) 892 861 Deposits from banks 885 854
Deposits from customers 6 6
Other liabilities 1 1 Trust liabilities 892 861 1) Including transmitted loans.
72. PIIS exposure. In addition to the breakdown by region shown in the risk and opportunity report, the details of exposure to PIIS states (Portugal, Italy, Ireland and Spain), on the basis of the IFRS balance sheet values per issuer's country of origin and per borrower or balance sheet category, as well the specific valuation allowances created are shown below.
The claims of LBBW Group against financial institutions, corporates and public-sector bodies from these four countries have fallen by EUR 5.5 billion since year-end 2012 to EUR 5.4 billion. A large part of this development is attributable to the public-sector bodies, whose exposure was more than halved to EUR 3,271 million in 2013 (2012: EUR 7,178 million). Exposure to public-sector bodies in Italy was reduced by – 32 % to EUR 2,300 million, in Spain by – 74 % to EUR 718 million and in Portugal by – 72 % to EUR 252 million.
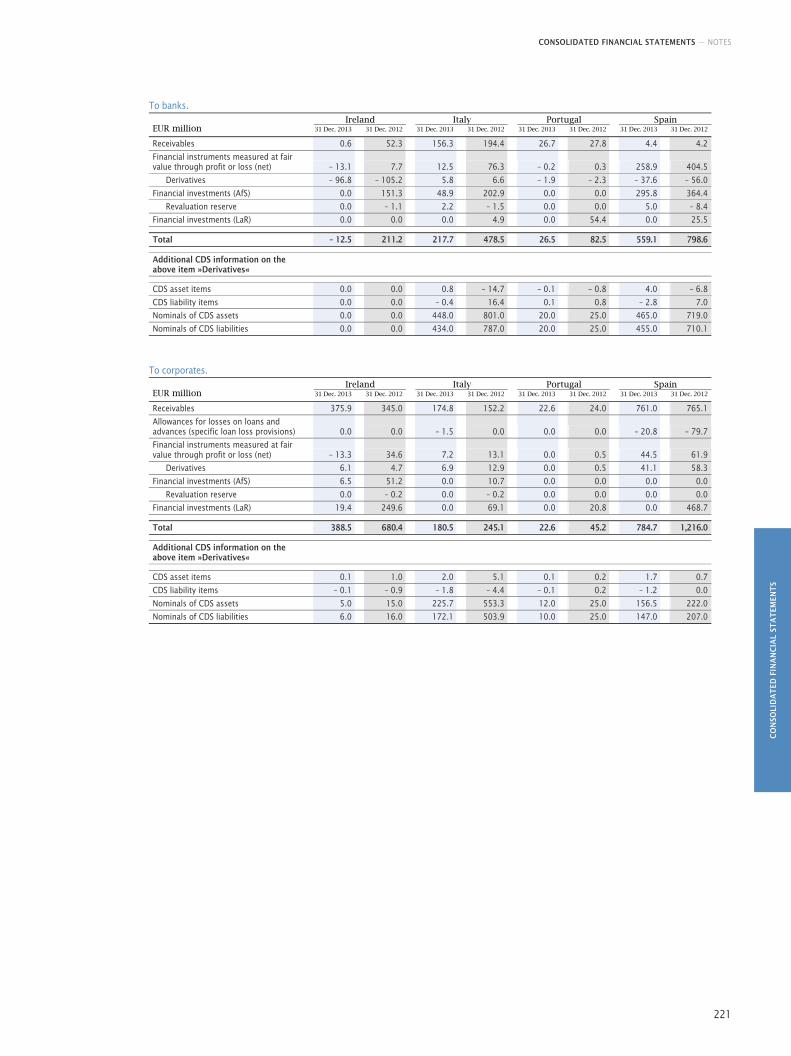
CONSOLIDATED FINANCIAL STATEMENTS — NOTES
CO
NSO
LID
AT
ED F
INA
NC
IAL
STA
TEM
ENT
S
221
To banks. Ireland Italy Portugal Spain EUR million 31 Dec. 2013 31 Dec. 2012 31 Dec. 2013 31 Dec. 2012 31 Dec. 2013 31 Dec. 2012 31 Dec. 2013 31 Dec. 2012
Receivables 0.6 52.3 156.3 194.4 26.7 27.8 4.4 4.2
Financial instruments measured at fair value through profit or loss (net) – 13.1 7.7 12.5 76.3 – 0.2 0.3 258.9 404.5
Derivatives – 96.8 – 105.2 5.8 6.6 – 1.9 – 2.3 – 37.6 – 56.0
Financial investments (AfS) 0.0 151.3 48.9 202.9 0.0 0.0 295.8 364.4
Revaluation reserve 0.0 – 1.1 2.2 – 1.5 0.0 0.0 5.0 – 8.4
Financial investments (LaR) 0.0 0.0 0.0 4.9 0.0 54.4 0.0 25.5 Total – 12.5 211.2 217.7 478.5 26.5 82.5 559.1 798.6 Additional CDS information on the above item »Derivatives« CDS asset items 0.0 0.0 0.8 – 14.7 – 0.1 – 0.8 4.0 – 6.8
CDS liability items 0.0 0.0 – 0.4 16.4 0.1 0.8 – 2.8 7.0
Nominals of CDS assets 0.0 0.0 448.0 801.0 20.0 25.0 465.0 719.0
Nominals of CDS liabilities 0.0 0.0 434.0 787.0 20.0 25.0 455.0 710.1
To corporates. Ireland Italy Portugal Spain EUR million 31 Dec. 2013 31 Dec. 2012 31 Dec. 2013 31 Dec. 2012 31 Dec. 2013 31 Dec. 2012 31 Dec. 2013 31 Dec. 2012
Receivables 375.9 345.0 174.8 152.2 22.6 24.0 761.0 765.1
Allowances for losses on loans and advances (specific loan loss provisions) 0.0 0.0 – 1.5 0.0 0.0 0.0 – 20.8 – 79.7
Financial instruments measured at fair value through profit or loss (net) – 13.3 34.6 7.2 13.1 0.0 0.5 44.5 61.9
Derivatives 6.1 4.7 6.9 12.9 0.0 0.5 41.1 58.3
Financial investments (AfS) 6.5 51.2 0.0 10.7 0.0 0.0 0.0 0.0
Revaluation reserve 0.0 – 0.2 0.0 – 0.2 0.0 0.0 0.0 0.0
Financial investments (LaR) 19.4 249.6 0.0 69.1 0.0 20.8 0.0 468.7 Total 388.5 680.4 180.5 245.1 22.6 45.2 784.7 1,216.0 Additional CDS information on the above item »Derivatives« CDS asset items 0.1 1.0 2.0 5.1 0.1 0.2 1.7 0.7
CDS liability items – 0.1 – 0.9 – 1.8 – 4.4 – 0.1 0.2 – 1.2 0.0
Nominals of CDS assets 5.0 15.0 225.7 553.3 12.0 25.0 156.5 222.0
Nominals of CDS liabilities 6.0 16.0 172.1 503.9 10.0 25.0 147.0 207.0
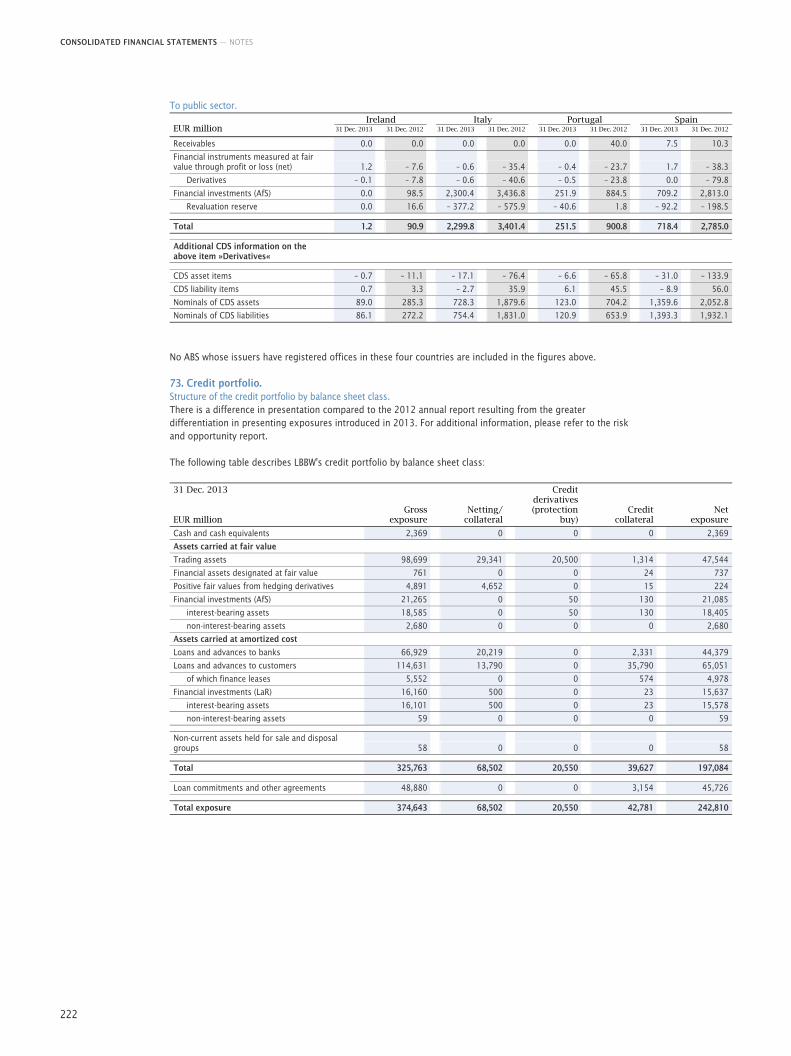
CONSOLIDATED FINANCIAL STATEMENTS — NOTES
222
To public sector. Ireland Italy Portugal Spain EUR million 31 Dec. 2013 31 Dec. 2012 31 Dec. 2013 31 Dec. 2012 31 Dec. 2013 31 Dec. 2012 31 Dec. 2013 31 Dec. 2012
Receivables 0.0 0.0 0.0 0.0 0.0 40.0 7.5 10.3
Financial instruments measured at fair value through profit or loss (net) 1.2 – 7.6 – 0.6 – 35.4 – 0.4 – 23.7 1.7 – 38.3
Derivatives – 0.1 – 7.8 – 0.6 – 40.6 – 0.5 – 23.8 0.0 – 79.8
Financial investments (AfS) 0.0 98.5 2,300.4 3,436.8 251.9 884.5 709.2 2,813.0
Revaluation reserve 0.0 16.6 – 377.2 – 575.9 – 40.6 1.8 – 92.2 – 198.5 Total 1.2 90.9 2,299.8 3,401.4 251.5 900.8 718.4 2,785.0 Additional CDS information on the above item »Derivatives« CDS asset items – 0.7 – 11.1 – 17.1 – 76.4 – 6.6 – 65.8 – 31.0 – 133.9
CDS liability items 0.7 3.3 – 2.7 35.9 6.1 45.5 – 8.9 56.0
Nominals of CDS assets 89.0 285.3 728.3 1,879.6 123.0 704.2 1,359.6 2,052.8
Nominals of CDS liabilities 86.1 272.2 754.4 1,831.0 120.9 653.9 1,393.3 1,932.1
No ABS whose issuers have registered offices in these four countries are included in the figures above.
73. Credit portfolio. Structure of the credit portfolio by balance sheet class. There is a difference in presentation compared to the 2012 annual report resulting from the greater differentiation in presenting exposures introduced in 2013. For additional information, please refer to the risk and opportunity report.
The following table describes LBBW's credit portfolio by balance sheet class:
31 Dec. 2013 EUR million
Gross exposure
Netting/collateral
Credit derivatives (protection
buy)
Credit collateral
Net exposure
Cash and cash equivalents 2,369 0 0 0 2,369
Assets carried at fair value
Trading assets 98,699 29,341 20,500 1,314 47,544
Financial assets designated at fair value 761 0 0 24 737
Positive fair values from hedging derivatives 4,891 4,652 0 15 224
Financial investments (AfS) 21,265 0 50 130 21,085
interest-bearing assets 18,585 0 50 130 18,405
non-interest-bearing assets 2,680 0 0 0 2,680
Assets carried at amortized cost
Loans and advances to banks 66,929 20,219 0 2,331 44,379
Loans and advances to customers 114,631 13,790 0 35,790 65,051
of which finance leases 5,552 0 0 574 4,978
Financial investments (LaR) 16,160 500 0 23 15,637
interest-bearing assets 16,101 500 0 23 15,578
non-interest-bearing assets 59 0 0 0 59 Non-current assets held for sale and disposal groups 58 0 0 0 58 Total 325,763 68,502 20,550 39,627 197,084 Loan commitments and other agreements 48,880 0 0 3,154 45,726 Total exposure 374,643 68,502 20,550 42,781 242,810
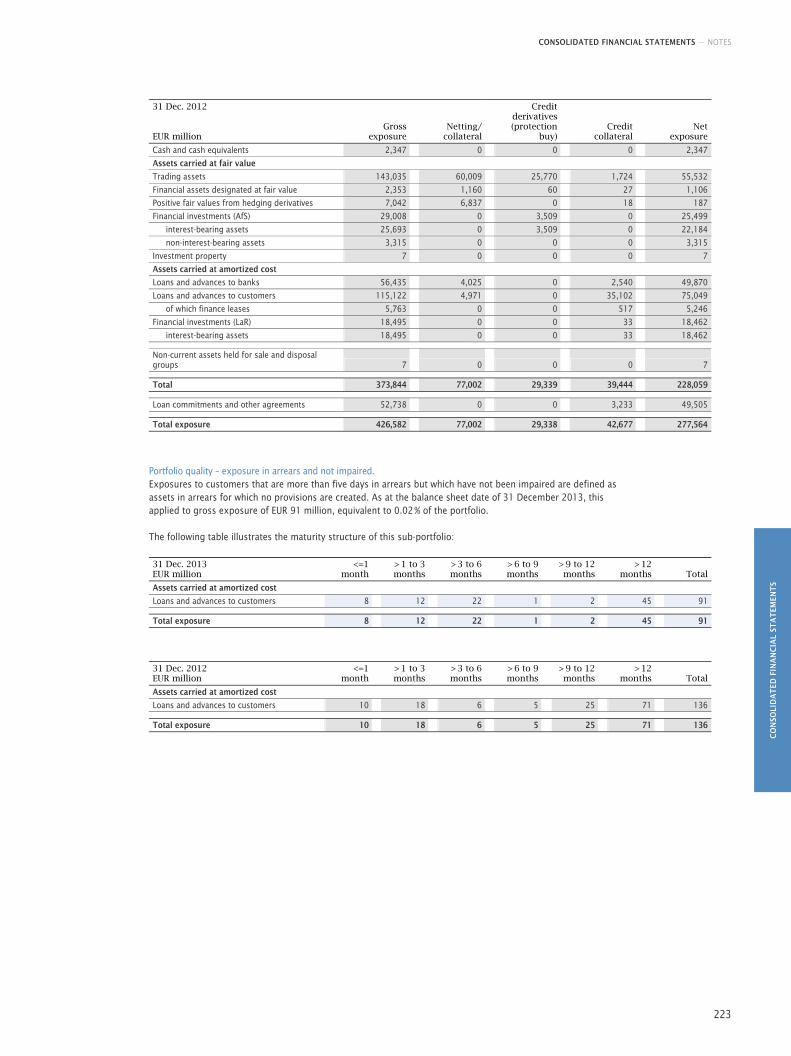
CONSOLIDATED FINANCIAL STATEMENTS — NOTES
CO
NSO
LID
AT
ED F
INA
NC
IAL
STA
TEM
ENT
S
223
31 Dec. 2012 EUR million
Gross exposure
Netting/collateral
Credit derivatives (protection
buy)
Credit collateral
Net exposure
Cash and cash equivalents 2,347 0 0 0 2,347
Assets carried at fair value
Trading assets 143,035 60,009 25,770 1,724 55,532
Financial assets designated at fair value 2,353 1,160 60 27 1,106
Positive fair values from hedging derivatives 7,042 6,837 0 18 187
Financial investments (AfS) 29,008 0 3,509 0 25,499
interest-bearing assets 25,693 0 3,509 0 22,184
non-interest-bearing assets 3,315 0 0 0 3,315
Investment property 7 0 0 0 7
Assets carried at amortized cost
Loans and advances to banks 56,435 4,025 0 2,540 49,870
Loans and advances to customers 115,122 4,971 0 35,102 75,049
of which finance leases 5,763 0 0 517 5,246
Financial investments (LaR) 18,495 0 0 33 18,462
interest-bearing assets 18,495 0 0 33 18,462 Non-current assets held for sale and disposal groups 7 0 0 0 7 Total 373,844 77,002 29,339 39,444 228,059 Loan commitments and other agreements 52,738 0 0 3,233 49,505 Total exposure 426,582 77,002 29,338 42,677 277,564
Portfolio quality – exposure in arrears and not impaired. Exposures to customers that are more than five days in arrears but which have not been impaired are defined as assets in arrears for which no provisions are created. As at the balance sheet date of 31 December 2013, this applied to gross exposure of EUR 91 million, equivalent to 0.02 % of the portfolio.
The following table illustrates the maturity structure of this sub-portfolio:
31 Dec. 2013 EUR million
<=1 month
> 1 to 3 months
> 3 to 6 months
> 6 to 9 months
> 9 to 12 months
> 12 months Total
Assets carried at amortized cost
Loans and advances to customers 8 12 22 1 2 45 91 Total exposure 8 12 22 1 2 45 91
31 Dec. 2012 EUR million
<=1 month
> 1 to 3 months
> 3 to 6 months
> 6 to 9 months
> 9 to 12 months
> 12 months Total
Assets carried at amortized cost
Loans and advances to customers 10 18 6 5 25 71 136 Total exposure 10 18 6 5 25 71 136
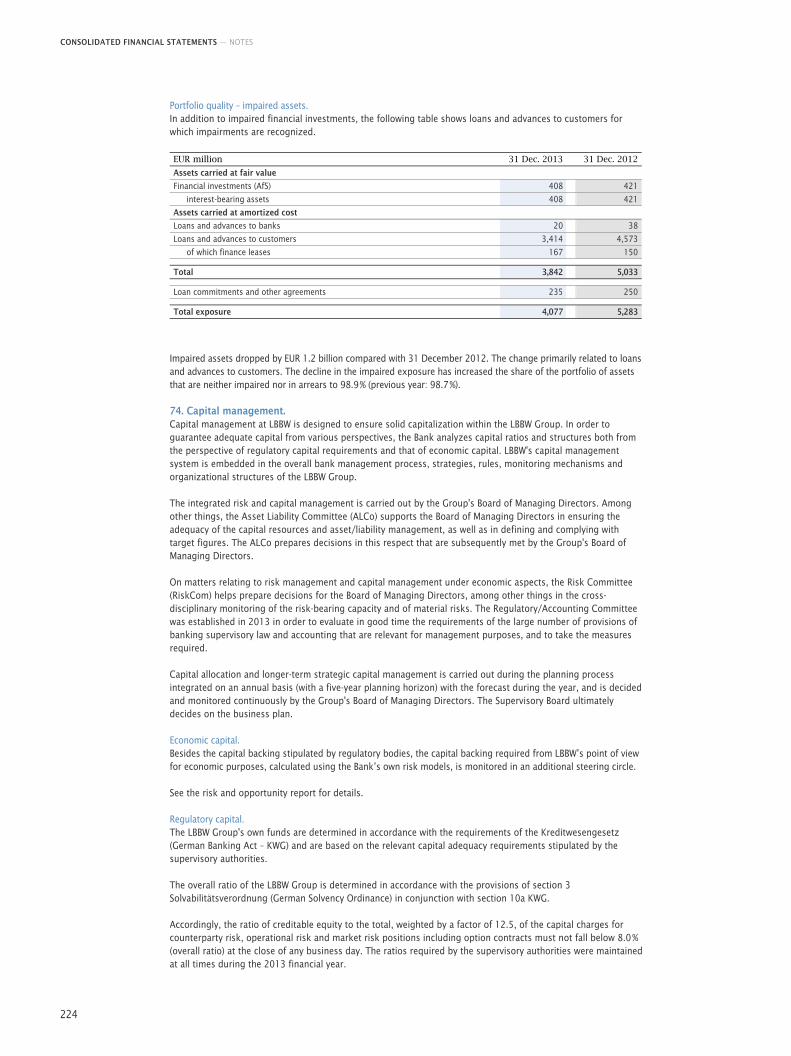
CONSOLIDATED FINANCIAL STATEMENTS — NOTES
224
Portfolio quality – impaired assets. In addition to impaired financial investments, the following table shows loans and advances to customers for which impairments are recognized.
EUR million 31 Dec. 2013 31 Dec. 2012
Assets carried at fair value
Financial investments (AfS) 408 421
interest-bearing assets 408 421
Assets carried at amortized cost
Loans and advances to banks 20 38
Loans and advances to customers 3,414 4,573
of which finance leases 167 150 Total 3,842 5,033 Loan commitments and other agreements 235 250 Total exposure 4,077 5,283
Impaired assets dropped by EUR 1.2 billion compared with 31 December 2012. The change primarily related to loans and advances to customers. The decline in the impaired exposure has increased the share of the portfolio of assets that are neither impaired nor in arrears to 98.9 % (previous year: 98.7 %).
74. Capital management. Capital management at LBBW is designed to ensure solid capitalization within the LBBW Group. In order to guarantee adequate capital from various perspectives, the Bank analyzes capital ratios and structures both from the perspective of regulatory capital requirements and that of economic capital. LBBW's capital management system is embedded in the overall bank management process, strategies, rules, monitoring mechanisms and organizational structures of the LBBW Group.
The integrated risk and capital management is carried out by the Group's Board of Managing Directors. Among other things, the Asset Liability Committee (ALCo) supports the Board of Managing Directors in ensuring the adequacy of the capital resources and asset/liability management, as well as in defining and complying with target figures. The ALCo prepares decisions in this respect that are subsequently met by the Group's Board of Managing Directors.
On matters relating to risk management and capital management under economic aspects, the Risk Committee (RiskCom) helps prepare decisions for the Board of Managing Directors, among other things in the cross-disciplinary monitoring of the risk-bearing capacity and of material risks. The Regulatory/Accounting Committee was established in 2013 in order to evaluate in good time the requirements of the large number of provisions of banking supervisory law and accounting that are relevant for management purposes, and to take the measures required.
Capital allocation and longer-term strategic capital management is carried out during the planning process integrated on an annual basis (with a five-year planning horizon) with the forecast during the year, and is decided and monitored continuously by the Group's Board of Managing Directors. The Supervisory Board ultimately decides on the business plan.
Economic capital. Besides the capital backing stipulated by regulatory bodies, the capital backing required from LBBW’s point of view for economic purposes, calculated using the Bank’s own risk models, is monitored in an additional steering circle.
See the risk and opportunity report for details.
Regulatory capital. The LBBW Group's own funds are determined in accordance with the requirements of the Kreditwesengesetz (German Banking Act – KWG) and are based on the relevant capital adequacy requirements stipulated by the supervisory authorities.
The overall ratio of the LBBW Group is determined in accordance with the provisions of section 3 Solvabilitätsverordnung (German Solvency Ordinance) in conjunction with section 10a KWG.
Accordingly, the ratio of creditable equity to the total, weighted by a factor of 12.5, of the capital charges for counterparty risk, operational risk and market risk positions including option contracts must not fall below 8.0 % (overall ratio) at the close of any business day. The ratios required by the supervisory authorities were maintained at all times during the 2013 financial year.
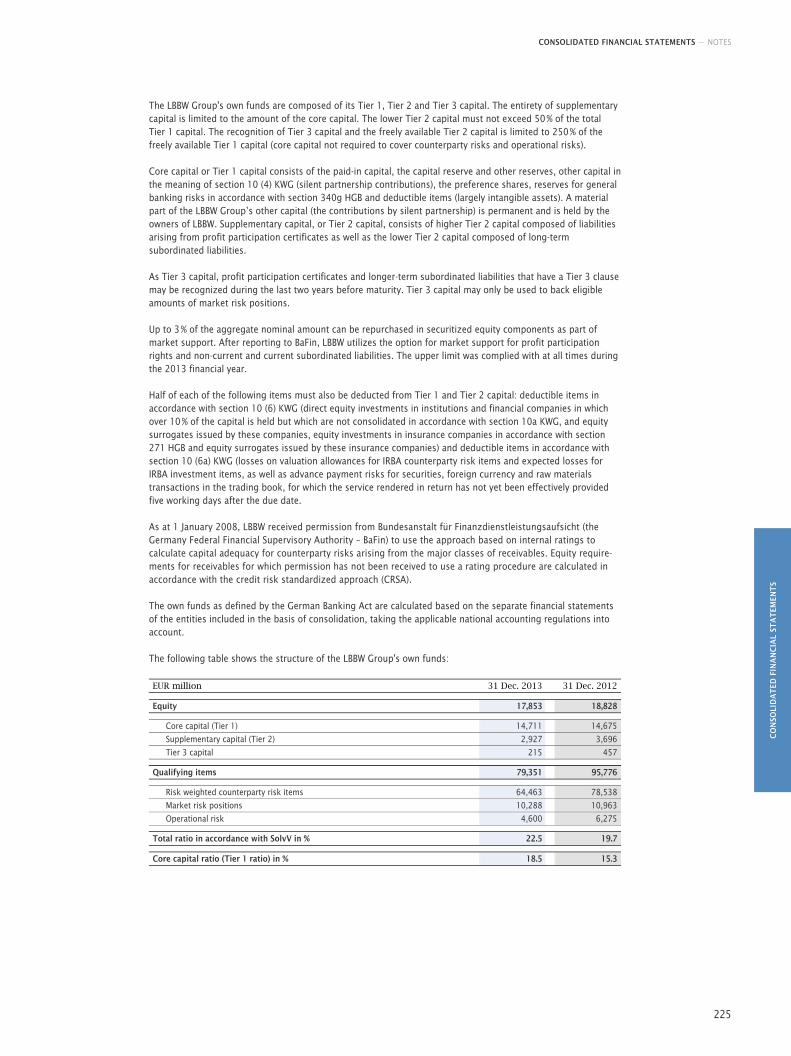
CONSOLIDATED FINANCIAL STATEMENTS — NOTES
CO
NSO
LID
AT
ED F
INA
NC
IAL
STA
TEM
ENT
S
225
The LBBW Group's own funds are composed of its Tier 1, Tier 2 and Tier 3 capital. The entirety of supplementary capital is limited to the amount of the core capital. The lower Tier 2 capital must not exceed 50 % of the total Tier 1 capital. The recognition of Tier 3 capital and the freely available Tier 2 capital is limited to 250 % of the freely available Tier 1 capital (core capital not required to cover counterparty risks and operational risks).
Core capital or Tier 1 capital consists of the paid-in capital, the capital reserve and other reserves, other capital in the meaning of section 10 (4) KWG (silent partnership contributions), the preference shares, reserves for general banking risks in accordance with section 340g HGB and deductible items (largely intangible assets). A material part of the LBBW Group’s other capital (the contributions by silent partnership) is permanent and is held by the owners of LBBW. Supplementary capital, or Tier 2 capital, consists of higher Tier 2 capital composed of liabilities arising from profit participation certificates as well as the lower Tier 2 capital composed of long-term subordinated liabilities.
As Tier 3 capital, profit participation certificates and longer-term subordinated liabilities that have a Tier 3 clause may be recognized during the last two years before maturity. Tier 3 capital may only be used to back eligible amounts of market risk positions.
Up to 3 % of the aggregate nominal amount can be repurchased in securitized equity components as part of market support. After reporting to BaFin, LBBW utilizes the option for market support for profit participation rights and non-current and current subordinated liabilities. The upper limit was complied with at all times during the 2013 financial year.
Half of each of the following items must also be deducted from Tier 1 and Tier 2 capital: deductible items in accordance with section 10 (6) KWG (direct equity investments in institutions and financial companies in which over 10 % of the capital is held but which are not consolidated in accordance with section 10a KWG, and equity surrogates issued by these companies, equity investments in insurance companies in accordance with section 271 HGB and equity surrogates issued by these insurance companies) and deductible items in accordance with section 10 (6a) KWG (losses on valuation allowances for IRBA counterparty risk items and expected losses for IRBA investment items, as well as advance payment risks for securities, foreign currency and raw materials transactions in the trading book, for which the service rendered in return has not yet been effectively provided five working days after the due date.
As at 1 January 2008, LBBW received permission from Bundesanstalt für Finanzdienstleistungsaufsicht (the Germany Federal Financial Supervisory Authority – BaFin) to use the approach based on internal ratings to calculate capital adequacy for counterparty risks arising from the major classes of receivables. Equity require-ments for receivables for which permission has not been received to use a rating procedure are calculated in accordance with the credit risk standardized approach (CRSA).
The own funds as defined by the German Banking Act are calculated based on the separate financial statements of the entities included in the basis of consolidation, taking the applicable national accounting regulations into account.
The following table shows the structure of the LBBW Group's own funds:
EUR million 31 Dec. 2013 31 Dec. 2012 Equity 17,853 18,828
Core capital (Tier 1) 14,711 14,675
Supplementary capital (Tier 2) 2,927 3,696
Tier 3 capital 215 457
Qualifying items 79,351 95,776
Risk weighted counterparty risk items 64,463 78,538
Market risk positions 10,288 10,963
Operational risk 4,600 6,275 Total ratio in accordance with SolvV in % 22.5 19.7 Core capital ratio (Tier 1 ratio) in % 18.5 15.3
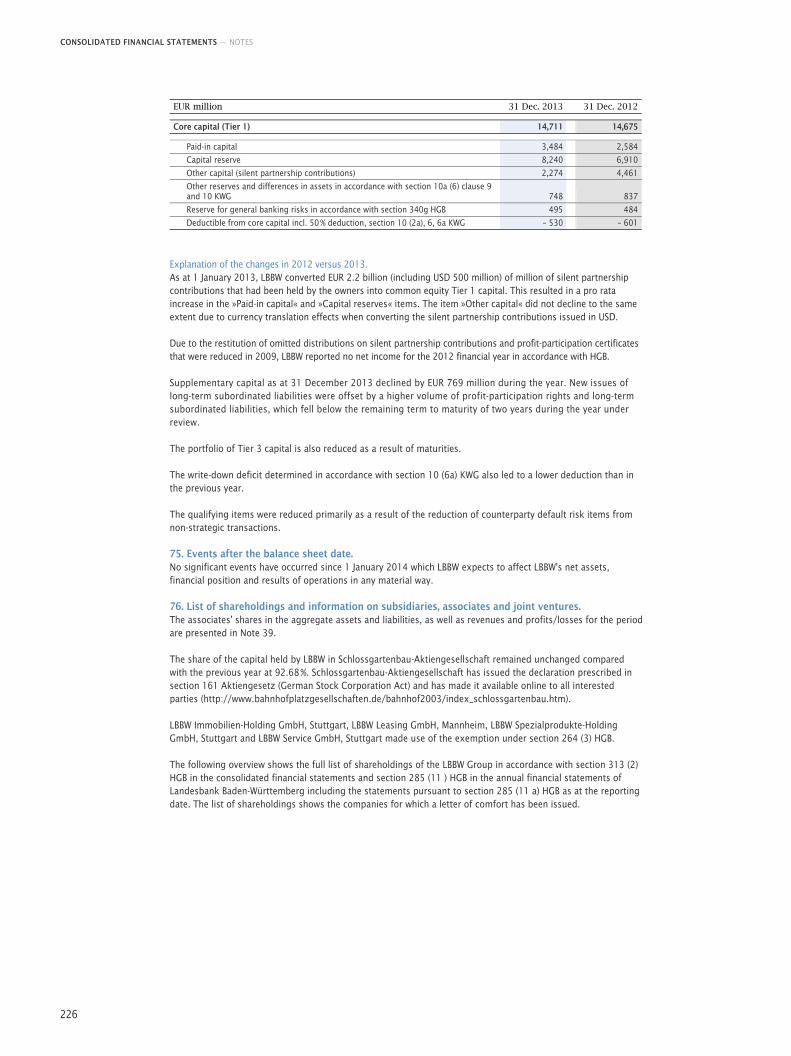
CONSOLIDATED FINANCIAL STATEMENTS — NOTES
226
EUR million 31 Dec. 2013 31 Dec. 2012 Core capital (Tier 1) 14,711 14,675
Paid-in capital 3,484 2,584
Capital reserve 8,240 6,910
Other capital (silent partnership contributions) 2,274 4,461
Other reserves and differences in assets in accordance with section 10a (6) clause 9 and 10 KWG 748 837
Reserve for general banking risks in accordance with section 340g HGB 495 484
Deductible from core capital incl. 50 % deduction, section 10 (2a), 6, 6a KWG – 530 – 601
Explanation of the changes in 2012 versus 2013. As at 1 January 2013, LBBW converted EUR 2.2 billion (including USD 500 million) of million of silent partnership contributions that had been held by the owners into common equity Tier 1 capital. This resulted in a pro rata increase in the »Paid-in capital« and »Capital reserves« items. The item »Other capital« did not decline to the same extent due to currency translation effects when converting the silent partnership contributions issued in USD.
Due to the restitution of omitted distributions on silent partnership contributions and profit-participation certificates that were reduced in 2009, LBBW reported no net income for the 2012 financial year in accordance with HGB.
Supplementary capital as at 31 December 2013 declined by EUR 769 million during the year. New issues of long-term subordinated liabilities were offset by a higher volume of profit-participation rights and long-term subordinated liabilities, which fell below the remaining term to maturity of two years during the year under review.
The portfolio of Tier 3 capital is also reduced as a result of maturities.
The write-down deficit determined in accordance with section 10 (6a) KWG also led to a lower deduction than in the previous year.
The qualifying items were reduced primarily as a result of the reduction of counterparty default risk items from non-strategic transactions.
75. Events after the balance sheet date. No significant events have occurred since 1 January 2014 which LBBW expects to affect LBBW's net assets, financial position and results of operations in any material way.
76. List of shareholdings and information on subsidiaries, associates and joint ventures. The associates' shares in the aggregate assets and liabilities, as well as revenues and profits/losses for the period are presented in Note 39.
The share of the capital held by LBBW in Schlossgartenbau-Aktiengesellschaft remained unchanged compared with the previous year at 92.68 %. Schlossgartenbau-Aktiengesellschaft has issued the declaration prescribed in section 161 Aktiengesetz (German Stock Corporation Act) and has made it available online to all interested parties (http://www.bahnhofplatzgesellschaften.de/bahnhof2003/index_schlossgartenbau.htm).
LBBW Immobilien-Holding GmbH, Stuttgart, LBBW Leasing GmbH, Mannheim, LBBW Spezialprodukte-Holding GmbH, Stuttgart and LBBW Service GmbH, Stuttgart made use of the exemption under section 264 (3) HGB.
The following overview shows the full list of shareholdings of the LBBW Group in accordance with section 313 (2) HGB in the consolidated financial statements and section 285 (11 ) HGB in the annual financial statements of Landesbank Baden-Württemberg including the statements pursuant to section 285 (11 a) HGB as at the reporting date. The list of shareholdings shows the companies for which a letter of comfort has been issued.
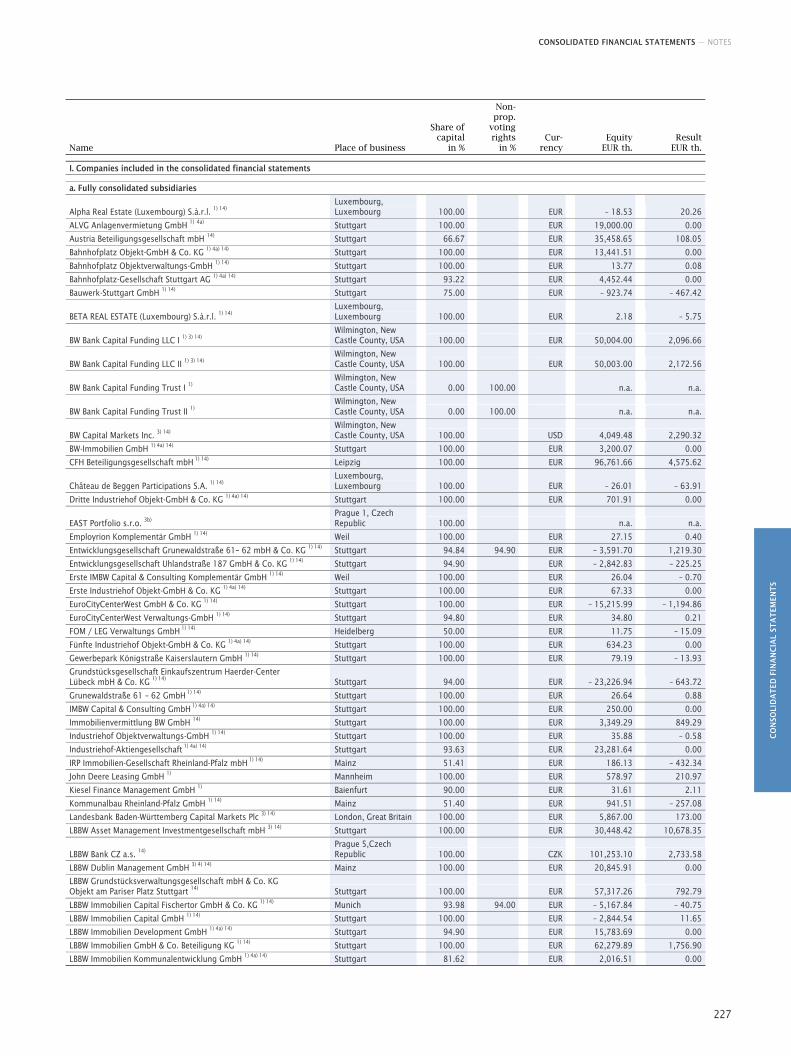
CONSOLIDATED FINANCIAL STATEMENTS — NOTES
CO
NSO
LID
AT
ED F
INA
NC
IAL
STA
TEM
ENT
S
227
Name Place of business
Share of capital
in %
Non-prop.
voting rights
in % Cur-
rency
Equity EUR th.
Result EUR th.
I. Companies included in the consolidated financial statements a. Fully consolidated subsidiaries
Alpha Real Estate (Luxembourg) S.à.r.l. 1) 14) Luxembourg, Luxembourg 100.00 EUR – 18.53 20.26
ALVG Anlagenvermietung GmbH 1) 4a) Stuttgart 100.00 EUR 19,000.00 0.00
Austria Beteiligungsgesellschaft mbH 14) Stuttgart 66.67 EUR 35,458.65 108.05
Bahnhofplatz Objekt-GmbH & Co. KG 1) 4a) 14) Stuttgart 100.00 EUR 13,441.51 0.00
Bahnhofplatz Objektverwaltungs-GmbH 1) 14) Stuttgart 100.00 EUR 13.77 0.08
Bahnhofplatz-Gesellschaft Stuttgart AG 1) 4a) 14) Stuttgart 93.22 EUR 4,452.44 0.00
Bauwerk-Stuttgart GmbH 1) 14) Stuttgart 75.00 EUR – 923.74 – 467.42
BETA REAL ESTATE (Luxembourg) S.à.r.l. 1) 14) Luxembourg, Luxembourg 100.00 EUR 2.18 – 5.75
BW Bank Capital Funding LLC I 1) 3) 14) Wilmington, New Castle County, USA 100.00 EUR 50,004.00 2,096.66
BW Bank Capital Funding LLC II 1) 3) 14) Wilmington, New Castle County, USA 100.00 EUR 50,003.00 2,172.56
BW Bank Capital Funding Trust I 1) Wilmington, New Castle County, USA 0.00 100.00 n.a. n.a.
BW Bank Capital Funding Trust II 1) Wilmington, New Castle County, USA 0.00 100.00 n.a. n.a.
BW Capital Markets Inc. 3) 14) Wilmington, New Castle County, USA 100.00 USD 4,049.48 2,290.32
BW-Immobilien GmbH 1) 4a) 14) Stuttgart 100.00 EUR 3,200.07 0.00
CFH Beteiligungsgesellschaft mbH 1) 14) Leipzig 100.00 EUR 96,761.66 4,575.62
Château de Beggen Participations S.A. 1) 14) Luxembourg, Luxembourg 100.00 EUR – 26.01 – 63.91
Dritte Industriehof Objekt-GmbH & Co. KG 1) 4a) 14) Stuttgart 100.00 EUR 701.91 0.00
EAST Portfolio s.r.o. 3b) Prague 1, Czech Republic 100.00 n.a. n.a.
Employrion Komplementär GmbH 1) 14) Weil 100.00 EUR 27.15 0.40
Entwicklungsgesellschaft Grunewaldstraße 61– 62 mbH & Co. KG 1) 14) Stuttgart 94.84 94.90 EUR – 3,591.70 1,219.30
Entwicklungsgesellschaft Uhlandstraße 187 GmbH & Co. KG 1) 14) Stuttgart 94.90 EUR – 2,842.83 – 225.25
Erste IMBW Capital & Consulting Komplementär GmbH 1) 14) Weil 100.00 EUR 26.04 – 0.70
Erste Industriehof Objekt-GmbH & Co. KG 1) 4a) 14) Stuttgart 100.00 EUR 67.33 0.00
EuroCityCenterWest GmbH & Co. KG 1) 14) Stuttgart 100.00 EUR – 15,215.99 – 1,194.86
EuroCityCenterWest Verwaltungs-GmbH 1) 14) Stuttgart 94.80 EUR 34.80 0.21
FOM / LEG Verwaltungs GmbH 1) 14) Heidelberg 50.00 EUR 11.75 – 15.09
Fünfte Industriehof Objekt-GmbH & Co. KG 1) 4a) 14) Stuttgart 100.00 EUR 634.23 0.00
Gewerbepark Königstraße Kaiserslautern GmbH 1) 14) Stuttgart 100.00 EUR 79.19 – 13.93
Grundstücksgesellschaft Einkaufszentrum Haerder-Center Lübeck mbH & Co. KG 1) 14) Stuttgart 94.00 EUR – 23,226.94 – 643.72
Grunewaldstraße 61 – 62 GmbH 1) 14) Stuttgart 100.00 EUR 26.64 0.88
IMBW Capital & Consulting GmbH 1) 4a) 14) Stuttgart 100.00 EUR 250.00 0.00
Immobilienvermittlung BW GmbH 14) Stuttgart 100.00 EUR 3,349.29 849.29
Industriehof Objektverwaltungs-GmbH 1) 14) Stuttgart 100.00 EUR 35.88 – 0.58
Industriehof-Aktiengesellschaft 1) 4a) 14) Stuttgart 93.63 EUR 23,281.64 0.00
IRP Immobilien-Gesellschaft Rheinland-Pfalz mbH 1) 14) Mainz 51.41 EUR 186.13 – 432.34
John Deere Leasing GmbH 1) Mannheim 100.00 EUR 578.97 210.97
Kiesel Finance Management GmbH 1) Baienfurt 90.00 EUR 31.61 2.11
Kommunalbau Rheinland-Pfalz GmbH 1) 14) Mainz 51.40 EUR 941.51 – 257.08
Landesbank Baden-Württemberg Capital Markets Plc 3) 14) London, Great Britain 100.00 EUR 5,867.00 173.00
LBBW Asset Management Investmentgesellschaft mbH 3) 14) Stuttgart 100.00 EUR 30,448.42 10,678.35
LBBW Bank CZ a.s. 14) Prague 5,Czech Republic 100.00 CZK 101,253.10 2,733.58
LBBW Dublin Management GmbH 3) 4) 14) Mainz 100.00 EUR 20,845.91 0.00
LBBW Grundstücksverwaltungsgesellschaft mbH & Co. KG Objekt am Pariser Platz Stuttgart 14) Stuttgart 100.00 EUR 57,317.26 792.79
LBBW Immobilien Capital Fischertor GmbH & Co. KG 1) 14) Munich 93.98 94.00 EUR – 5,167.84 – 40.75
LBBW Immobilien Capital GmbH 1) 14) Stuttgart 100.00 EUR – 2,844.54 11.65
LBBW Immobilien Development GmbH 1) 4a) 14) Stuttgart 94.90 EUR 15,783.69 0.00
LBBW Immobilien GmbH & Co. Beteiligung KG 1) 14) Stuttgart 100.00 EUR 62,279.89 1,756.90
LBBW Immobilien Kommunalentwicklung GmbH 1) 4a) 14) Stuttgart 81.62 EUR 2,016.51 0.00
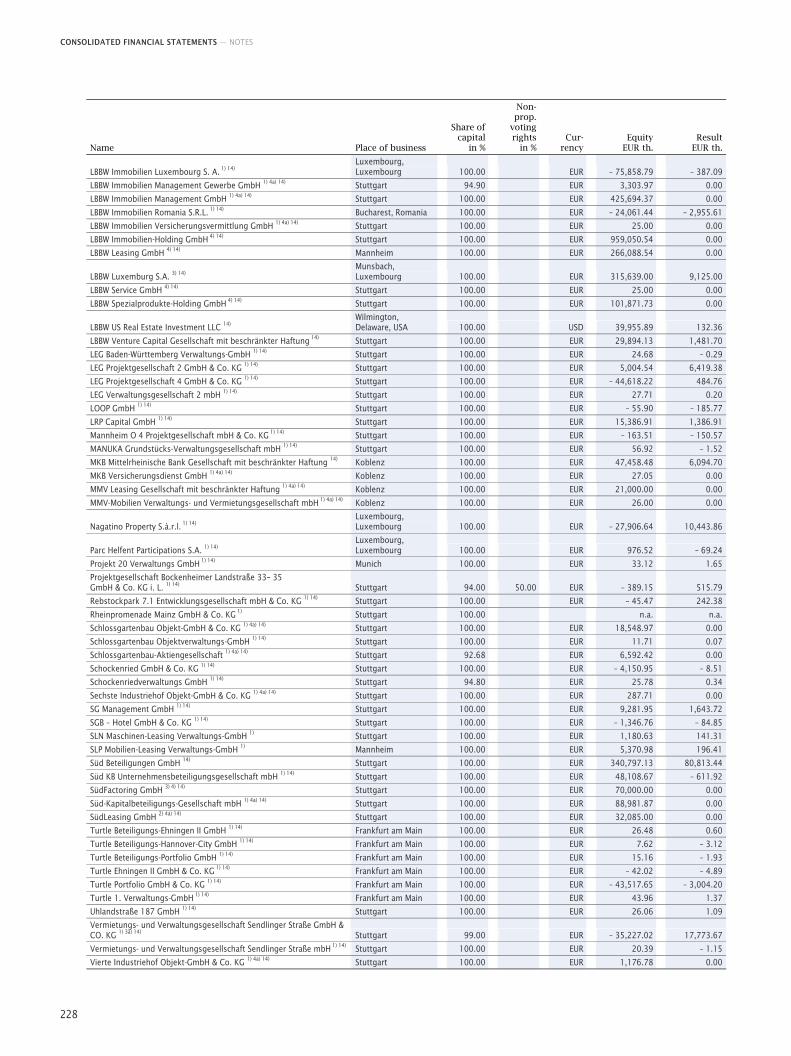
CONSOLIDATED FINANCIAL STATEMENTS — NOTES
228
Name Place of business
Share of capital
in %
Non-prop.
voting rights
in % Cur-
rency
Equity EUR th.
Result EUR th.
LBBW Immobilien Luxembourg S. A. 1) 14) Luxembourg, Luxembourg 100.00 EUR – 75,858.79 – 387.09
LBBW Immobilien Management Gewerbe GmbH 1) 4a) 14) Stuttgart 94.90 EUR 3,303.97 0.00
LBBW Immobilien Management GmbH 1) 4a) 14) Stuttgart 100.00 EUR 425,694.37 0.00
LBBW Immobilien Romania S.R.L. 1) 14) Bucharest, Romania 100.00 EUR – 24,061.44 – 2,955.61
LBBW Immobilien Versicherungsvermittlung GmbH 1) 4a) 14) Stuttgart 100.00 EUR 25.00 0.00
LBBW Immobilien-Holding GmbH 4) 14) Stuttgart 100.00 EUR 959,050.54 0.00
LBBW Leasing GmbH 4) 14) Mannheim 100.00 EUR 266,088.54 0.00
LBBW Luxemburg S.A. 3) 14) Munsbach, Luxembourg 100.00 EUR 315,639.00 9,125.00
LBBW Service GmbH 4) 14) Stuttgart 100.00 EUR 25.00 0.00
LBBW Spezialprodukte-Holding GmbH 4) 14) Stuttgart 100.00 EUR 101,871.73 0.00
LBBW US Real Estate Investment LLC 14) Wilmington, Delaware, USA 100.00 USD 39,955.89 132.36
LBBW Venture Capital Gesellschaft mit beschränkter Haftung 14) Stuttgart 100.00 EUR 29,894.13 1,481.70
LEG Baden-Württemberg Verwaltungs-GmbH 1) 14) Stuttgart 100.00 EUR 24.68 – 0.29
LEG Projektgesellschaft 2 GmbH & Co. KG 1) 14) Stuttgart 100.00 EUR 5,004.54 6,419.38
LEG Projektgesellschaft 4 GmbH & Co. KG 1) 14) Stuttgart 100.00 EUR – 44,618.22 484.76
LEG Verwaltungsgesellschaft 2 mbH 1) 14) Stuttgart 100.00 EUR 27.71 0.20
LOOP GmbH 1) 14) Stuttgart 100.00 EUR – 55.90 – 185.77
LRP Capital GmbH 1) 14) Stuttgart 100.00 EUR 15,386.91 1,386.91
Mannheim O 4 Projektgesellschaft mbH & Co. KG 1) 14) Stuttgart 100.00 EUR – 163.51 – 150.57
MANUKA Grundstücks-Verwaltungsgesellschaft mbH 1) 14) Stuttgart 100.00 EUR 56.92 – 1.52
MKB Mittelrheinische Bank Gesellschaft mit beschränkter Haftung 14) Koblenz 100.00 EUR 47,458.48 6,094.70
MKB Versicherungsdienst GmbH 1) 4a) 14) Koblenz 100.00 EUR 27.05 0.00
MMV Leasing Gesellschaft mit beschränkter Haftung 1) 4a) 14) Koblenz 100.00 EUR 21,000.00 0.00
MMV-Mobilien Verwaltungs- und Vermietungsgesellschaft mbH 1) 4a) 14) Koblenz 100.00 EUR 26.00 0.00
Nagatino Property S.à.r.l. 1) 14) Luxembourg, Luxembourg 100.00 EUR – 27,906.64 10,443.86
Parc Helfent Participations S.A. 1) 14) Luxembourg, Luxembourg 100.00 EUR 976.52 – 69.24
Projekt 20 Verwaltungs GmbH 1) 14) Munich 100.00 EUR 33.12 1.65
Projektgesellschaft Bockenheimer Landstraße 33– 35 GmbH & Co. KG i. L. 1) 14) Stuttgart 94.00 50.00 EUR – 389.15 515.79
Rebstockpark 7.1 Entwicklungsgesellschaft mbH & Co. KG 1) 14) Stuttgart 100.00 EUR – 45.47 242.38
Rheinpromenade Mainz GmbH & Co. KG 1) Stuttgart 100.00 n.a. n.a.
Schlossgartenbau Objekt-GmbH & Co. KG 1) 4a) 14) Stuttgart 100.00 EUR 18,548.97 0.00
Schlossgartenbau Objektverwaltungs-GmbH 1) 14) Stuttgart 100.00 EUR 11.71 0.07
Schlossgartenbau-Aktiengesellschaft 1) 4a) 14) Stuttgart 92.68 EUR 6,592.42 0.00
Schockenried GmbH & Co. KG 1) 14) Stuttgart 100.00 EUR – 4,150.95 – 8.51
Schockenriedverwaltungs GmbH 1) 14) Stuttgart 94.80 EUR 25.78 0.34
Sechste Industriehof Objekt-GmbH & Co. KG 1) 4a) 14) Stuttgart 100.00 EUR 287.71 0.00
SG Management GmbH 1) 14) Stuttgart 100.00 EUR 9,281.95 1,643.72
SGB – Hotel GmbH & Co. KG 1) 14) Stuttgart 100.00 EUR – 1,346.76 – 84.85
SLN Maschinen-Leasing Verwaltungs-GmbH 1) Stuttgart 100.00 EUR 1,180.63 141.31
SLP Mobilien-Leasing Verwaltungs-GmbH 1) Mannheim 100.00 EUR 5,370.98 196.41
Süd Beteiligungen GmbH 14) Stuttgart 100.00 EUR 340,797.13 80,813.44
Süd KB Unternehmensbeteiligungsgesellschaft mbH 1) 14) Stuttgart 100.00 EUR 48,108.67 – 611.92
SüdFactoring GmbH 3) 4) 14) Stuttgart 100.00 EUR 70,000.00 0.00
Süd-Kapitalbeteiligungs-Gesellschaft mbH 1) 4a) 14) Stuttgart 100.00 EUR 88,981.87 0.00
SüdLeasing GmbH 2) 4a) 14) Stuttgart 100.00 EUR 32,085.00 0.00
Turtle Beteiligungs-Ehningen II GmbH 1) 14) Frankfurt am Main 100.00 EUR 26.48 0.60
Turtle Beteiligungs-Hannover-City GmbH 1) 14) Frankfurt am Main 100.00 EUR 7.62 – 3.12
Turtle Beteiligungs-Portfolio GmbH 1) 14) Frankfurt am Main 100.00 EUR 15.16 – 1.93
Turtle Ehningen II GmbH & Co. KG 1) 14) Frankfurt am Main 100.00 EUR – 42.02 – 4.89
Turtle Portfolio GmbH & Co. KG 1) 14) Frankfurt am Main 100.00 EUR – 43,517.65 – 3,004.20
Turtle 1. Verwaltungs-GmbH 1) 14) Frankfurt am Main 100.00 EUR 43.96 1.37
Uhlandstraße 187 GmbH 1) 14) Stuttgart 100.00 EUR 26.06 1.09
Vermietungs- und Verwaltungsgesellschaft Sendlinger Straße GmbH & CO. KG 1) 3a) 14) Stuttgart 99.00 EUR – 35,227.02 17,773.67
Vermietungs- und Verwaltungsgesellschaft Sendlinger Straße mbH 1) 14) Stuttgart 100.00 EUR 20.39 – 1.15
Vierte Industriehof Objekt-GmbH & Co. KG 1) 4a) 14) Stuttgart 100.00 EUR 1,176.78 0.00
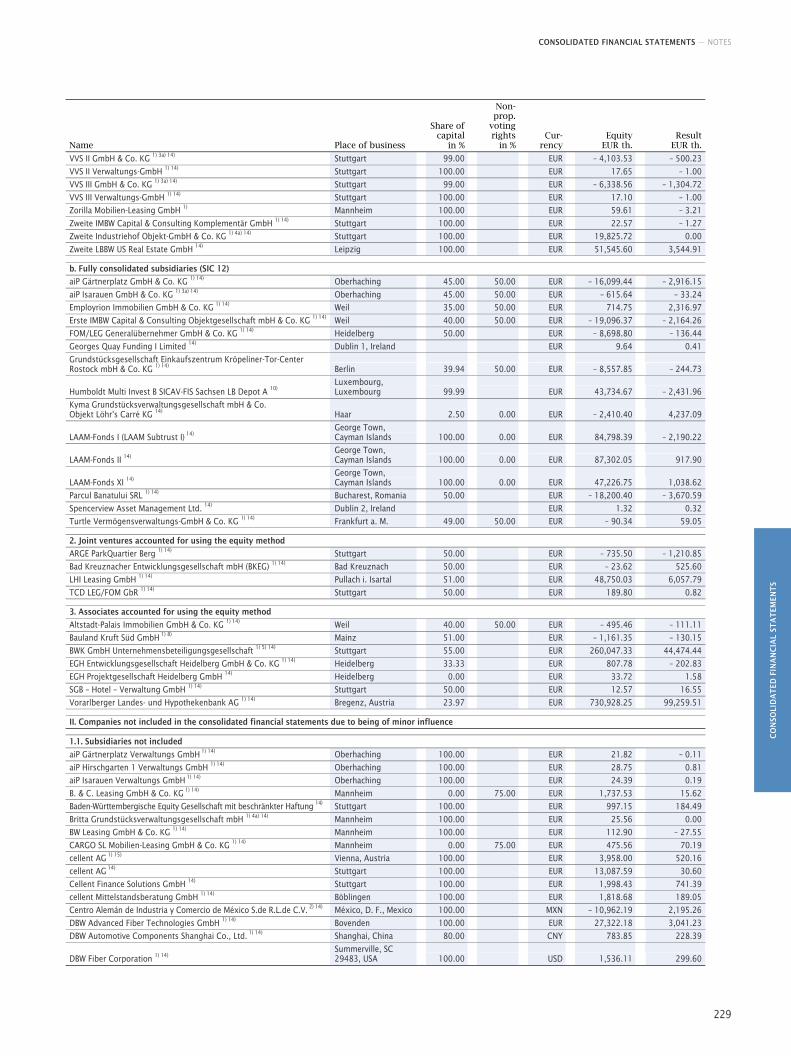
CONSOLIDATED FINANCIAL STATEMENTS — NOTES
CO
NSO
LID
AT
ED F
INA
NC
IAL
STA
TEM
ENT
S
229
Name Place of business
Share of capital
in %
Non-prop.
voting rights
in % Cur-
rency
Equity EUR th.
Result EUR th.
VVS II GmbH & Co. KG 1) 3a) 14) Stuttgart 99.00 EUR – 4,103.53 – 500.23
VVS II Verwaltungs-GmbH 1) 14) Stuttgart 100.00 EUR 17.65 – 1.00
VVS III GmbH & Co. KG 1) 3a) 14) Stuttgart 99.00 EUR – 6,338.56 – 1,304.72
VVS III Verwaltungs-GmbH 1) 14) Stuttgart 100.00 EUR 17.10 – 1.00
Zorilla Mobilien-Leasing GmbH 1) Mannheim 100.00 EUR 59.61 – 3.21
Zweite IMBW Capital & Consulting Komplementär GmbH 1) 14) Stuttgart 100.00 EUR 22.57 – 1.27
Zweite Industriehof Objekt-GmbH & Co. KG 1) 4a) 14) Stuttgart 100.00 EUR 19,825.72 0.00
Zweite LBBW US Real Estate GmbH 14) Leipzig 100.00 EUR 51,545.60 3,544.91 b. Fully consolidated subsidiaries (SIC 12) aiP Gärtnerplatz GmbH & Co. KG 1) 14) Oberhaching 45.00 50.00 EUR – 16,099.44 – 2,916.15
aiP Isarauen GmbH & Co. KG 1) 3a) 14) Oberhaching 45.00 50.00 EUR – 615.64 – 33.24
Employrion Immobilien GmbH & Co. KG 1) 14) Weil 35.00 50.00 EUR 714.75 2,316.97
Erste IMBW Capital & Consulting Objektgesellschaft mbH & Co. KG 1) 14) Weil 40.00 50.00 EUR – 19,096.37 – 2,164.26
FOM/LEG Generalübernehmer GmbH & Co. KG 1) 14) Heidelberg 50.00 EUR – 8,698.80 – 136.44
Georges Quay Funding I Limited 14) Dublin 1, Ireland EUR 9.64 0.41
Grundstücksgesellschaft Einkaufszentrum Kröpeliner-Tor-Center Rostock mbH & Co. KG 1) 14) Berlin 39.94 50.00 EUR – 8,557.85 – 244.73
Humboldt Multi Invest B SICAV-FIS Sachsen LB Depot A 10) Luxembourg, Luxembourg 99.99 EUR 43,734.67 – 2,431.96
Kyma Grundstücksverwaltungsgesellschaft mbH & Co. Objekt Löhr's Carré KG 14) Haar 2.50 0.00 EUR – 2,410.40 4,237.09
LAAM-Fonds I (LAAM Subtrust I) 14) George Town, Cayman Islands 100.00 0.00 EUR 84,798.39 – 2,190.22
LAAM-Fonds II 14) George Town, Cayman Islands 100.00 0.00 EUR 87,302.05 917.90
LAAM-Fonds XI 14) George Town, Cayman Islands 100.00 0.00 EUR 47,226.75 1,038.62
Parcul Banatului SRL 1) 14) Bucharest, Romania 50.00 EUR – 18,200.40 – 3,670.59
Spencerview Asset Management Ltd. 14) Dublin 2, Ireland EUR 1.32 0.32
Turtle Vermögensverwaltungs-GmbH & Co. KG 1) 14) Frankfurt a. M. 49.00 50.00 EUR – 90.34 59.05 2. Joint ventures accounted for using the equity method ARGE ParkQuartier Berg 1) 14) Stuttgart 50.00 EUR – 735.50 – 1,210.85
Bad Kreuznacher Entwicklungsgesellschaft mbH (BKEG) 1) 14) Bad Kreuznach 50.00 EUR – 23.62 525.60
LHI Leasing GmbH 1) 14) Pullach i. Isartal 51.00 EUR 48,750.03 6,057.79
TCD LEG/FOM GbR 1) 14) Stuttgart 50.00 EUR 189.80 0.82 3. Associates accounted for using the equity method Altstadt-Palais Immobilien GmbH & Co. KG 1) 14) Weil 40.00 50.00 EUR – 495.46 – 111.11
Bauland Kruft Süd GmbH 1) 8) Mainz 51.00 EUR – 1,161.35 – 130.15
BWK GmbH Unternehmensbeteiligungsgesellschaft 1) 5) 14) Stuttgart 55.00 EUR 260,047.33 44,474.44
EGH Entwicklungsgesellschaft Heidelberg GmbH & Co. KG 1) 14) Heidelberg 33.33 EUR 807.78 – 202.83
EGH Projektgesellschaft Heidelberg GmbH 14) Heidelberg 0.00 EUR 33.72 1.58
SGB – Hotel – Verwaltung GmbH 1) 14) Stuttgart 50.00 EUR 12.57 16.55
Vorarlberger Landes- und Hypothekenbank AG 1) 14) Bregenz, Austria 23.97 EUR 730,928.25 99,259.51 II. Companies not included in the consolidated financial statements due to being of minor influence 1.1. Subsidiaries not included aiP Gärtnerplatz Verwaltungs GmbH 1) 14) Oberhaching 100.00 EUR 21.82 – 0.11
aiP Hirschgarten 1 Verwaltungs GmbH 1) 14) Oberhaching 100.00 EUR 28.75 0.81
aiP Isarauen Verwaltungs GmbH 1) 14) Oberhaching 100.00 EUR 24.39 0.19
B. & C. Leasing GmbH & Co. KG 1) 14) Mannheim 0.00 75.00 EUR 1,737.53 15.62
Baden-Württembergische Equity Gesellschaft mit beschränkter Haftung 14) Stuttgart 100.00 EUR 997.15 184.49
Britta Grundstücksverwaltungsgesellschaft mbH 1) 4a) 14) Mannheim 100.00 EUR 25.56 0.00
BW Leasing GmbH & Co. KG 1) 14) Mannheim 100.00 EUR 112.90 – 27.55
CARGO SL Mobilien-Leasing GmbH & Co. KG 1) 14) Mannheim 0.00 75.00 EUR 475.56 70.19
cellent AG 1) 15) Vienna, Austria 100.00 EUR 3,958.00 520.16
cellent AG 14) Stuttgart 100.00 EUR 13,087.59 30.60
Cellent Finance Solutions GmbH 14) Stuttgart 100.00 EUR 1,998.43 741.39
cellent Mittelstandsberatung GmbH 1) 14) Böblingen 100.00 EUR 1,818.68 189.05
Centro Alemán de Industria y Comercio de México S.de R.L.de C.V. 2) 14) México, D. F., Mexico 100.00 MXN – 10,962.19 2,195.26
DBW Advanced Fiber Technologies GmbH 1) 14) Bovenden 100.00 EUR 27,322.18 3,041.23
DBW Automotive Components Shanghai Co., Ltd. 1) 14) Shanghai, China 80.00 CNY 783.85 228.39
DBW Fiber Corporation 1) 14) Summerville, SC 29483, USA 100.00 USD 1,536.11 299.60
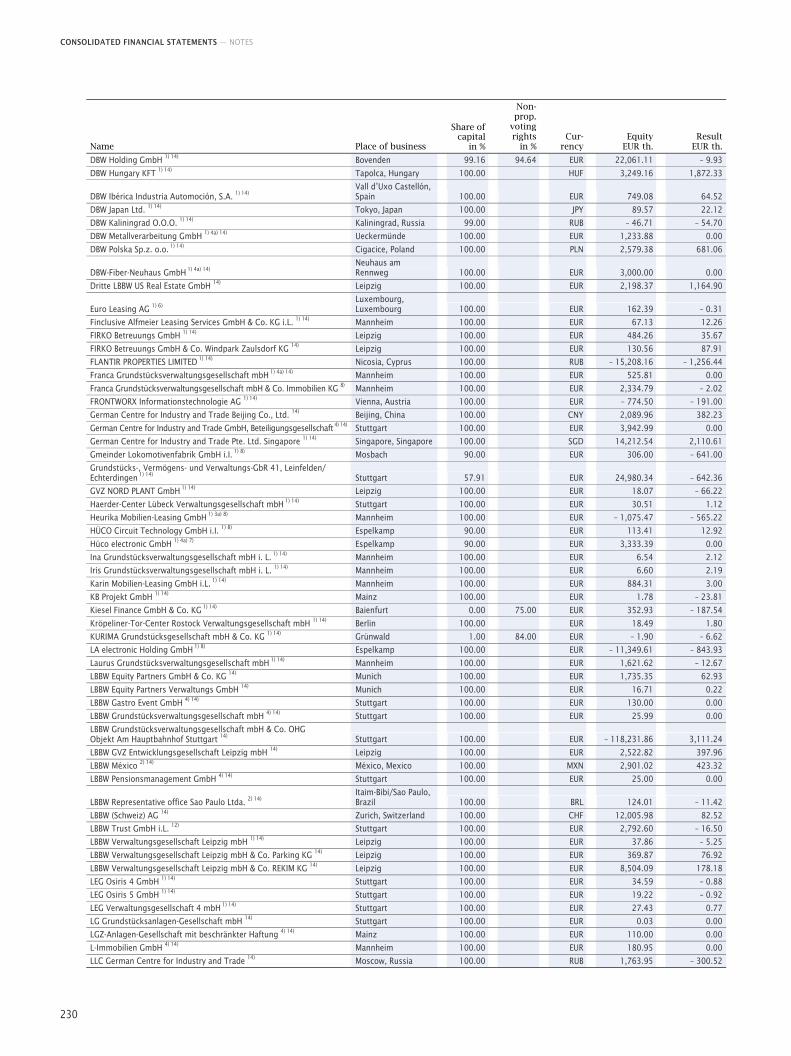
CONSOLIDATED FINANCIAL STATEMENTS — NOTES
230
Name Place of business
Share of capital
in %
Non-prop.
voting rights
in % Cur-
rency
Equity EUR th.
Result EUR th.
DBW Holding GmbH 1) 14) Bovenden 99.16 94.64 EUR 22,061.11 – 9.93
DBW Hungary KFT 1) 14) Tapolca, Hungary 100.00 HUF 3,249.16 1,872.33
DBW Ibérica Industria Automoción, S.A. 1) 14) Vall d’Uxo Castellón, Spain 100.00 EUR 749.08 64.52
DBW Japan Ltd. 1) 14) Tokyo, Japan 100.00 JPY 89.57 22.12
DBW Kaliningrad O.O.O. 1) 14) Kaliningrad, Russia 99.00 RUB – 46.71 – 54.70
DBW Metallverarbeitung GmbH 1) 4a) 14) Ueckermünde 100.00 EUR 1,233.88 0.00
DBW Polska Sp.z. o.o. 1) 14) Cigacice, Poland 100.00 PLN 2,579.38 681.06
DBW-Fiber-Neuhaus GmbH 1) 4a) 14) Neuhaus am Rennweg 100.00 EUR 3,000.00 0.00
Dritte LBBW US Real Estate GmbH 14) Leipzig 100.00 EUR 2,198.37 1,164.90
Euro Leasing AG 1) 6) Luxembourg, Luxembourg 100.00 EUR 162.39 – 0.31
Finclusive Alfmeier Leasing Services GmbH & Co. KG i.L. 1) 14) Mannheim 100.00 EUR 67.13 12.26
FIRKO Betreuungs GmbH 1) 14) Leipzig 100.00 EUR 484.26 35.67
FIRKO Betreuungs GmbH & Co. Windpark Zaulsdorf KG 14) Leipzig 100.00 EUR 130.56 87.91
FLANTIR PROPERTIES LIMITED 1) 14) Nicosia, Cyprus 100.00 RUB – 15,208.16 – 1,256.44
Franca Grundstücksverwaltungsgesellschaft mbH 1) 4a) 14) Mannheim 100.00 EUR 525.81 0.00
Franca Grundstücksverwaltungsgesellschaft mbH & Co. Immobilien KG 8) Mannheim 100.00 EUR 2,334.79 – 2.02
FRONTWORX Informationstechnologie AG 1) 14) Vienna, Austria 100.00 EUR – 774.50 – 191.00
German Centre for Industry and Trade Beijing Co., Ltd. 14) Beijing, China 100.00 CNY 2,089.96 382.23
German Centre for Industry and Trade GmbH, Beteiligungsgesellschaft 4) 14) Stuttgart 100.00 EUR 3,942.99 0.00
German Centre for Industry and Trade Pte. Ltd. Singapore 1) 14) Singapore, Singapore 100.00 SGD 14,212.54 2,110.61
Gmeinder Lokomotivenfabrik GmbH i.I. 1) 8) Mosbach 90.00 EUR 306.00 – 641.00
Grundstücks-, Vermögens- und Verwaltungs-GbR 41, Leinfelden/ Echterdingen 1) 14) Stuttgart 57.91 EUR 24,980.34 – 642.36
GVZ NORD PLANT GmbH 1) 14) Leipzig 100.00 EUR 18.07 – 66.22
Haerder-Center Lübeck Verwaltungsgesellschaft mbH 1) 14) Stuttgart 100.00 EUR 30.51 1.12
Heurika Mobilien-Leasing GmbH 1) 3a) 8) Mannheim 100.00 EUR – 1,075.47 – 565.22
HÜCO Circuit Technology GmbH i.I. 1) 8) Espelkamp 90.00 EUR 113.41 12.92
Hüco electronic GmbH 1) 4a) 7) Espelkamp 90.00 EUR 3,333.39 0.00
Ina Grundstücksverwaltungsgesellschaft mbH i. L. 1) 14) Mannheim 100.00 EUR 6.54 2.12
Iris Grundstücksverwaltungsgesellschaft mbH i. L. 1) 14) Mannheim 100.00 EUR 6.60 2.19
Karin Mobilien-Leasing GmbH i.L. 1) 14) Mannheim 100.00 EUR 884.31 3.00
KB Projekt GmbH 1) 14) Mainz 100.00 EUR 1.78 – 23.81
Kiesel Finance GmbH & Co. KG 1) 14) Baienfurt 0.00 75.00 EUR 352.93 – 187.54
Kröpeliner-Tor-Center Rostock Verwaltungsgesellschaft mbH 1) 14) Berlin 100.00 EUR 18.49 1.80
KURIMA Grundstücksgesellschaft mbH & Co. KG 1) 14) Grünwald 1.00 84.00 EUR – 1.90 – 6.62
LA electronic Holding GmbH 1) 8) Espelkamp 100.00 EUR – 11,349.61 – 843.93
Laurus Grundstücksverwaltungsgesellschaft mbH 1) 14) Mannheim 100.00 EUR 1,621.62 – 12.67
LBBW Equity Partners GmbH & Co. KG 14) Munich 100.00 EUR 1,735.35 62.93
LBBW Equity Partners Verwaltungs GmbH 14) Munich 100.00 EUR 16.71 0.22
LBBW Gastro Event GmbH 4) 14) Stuttgart 100.00 EUR 130.00 0.00
LBBW Grundstücksverwaltungsgesellschaft mbH 4) 14) Stuttgart 100.00 EUR 25.99 0.00
LBBW Grundstücksverwaltungsgesellschaft mbH & Co. OHG Objekt Am Hauptbahnhof Stuttgart 14) Stuttgart 100.00 EUR – 118,231.86 3,111.24
LBBW GVZ Entwicklungsgesellschaft Leipzig mbH 14) Leipzig 100.00 EUR 2,522.82 397.96
LBBW México 2) 14) México, Mexico 100.00 MXN 2,901.02 423.32
LBBW Pensionsmanagement GmbH 4) 14) Stuttgart 100.00 EUR 25.00 0.00
LBBW Representative office Sao Paulo Ltda. 2) 14) Itaim-Bibi/Sao Paulo, Brazil 100.00 BRL 124.01 – 11.42
LBBW (Schweiz) AG 14) Zurich, Switzerland 100.00 CHF 12,005.98 82.52
LBBW Trust GmbH i.L. 12) Stuttgart 100.00 EUR 2,792.60 – 16.50
LBBW Verwaltungsgesellschaft Leipzig mbH 1) 14) Leipzig 100.00 EUR 37.86 – 5.25
LBBW Verwaltungsgesellschaft Leipzig mbH & Co. Parking KG 14) Leipzig 100.00 EUR 369.87 76.92
LBBW Verwaltungsgesellschaft Leipzig mbH & Co. REKIM KG 14) Leipzig 100.00 EUR 8,504.09 178.18
LEG Osiris 4 GmbH 1) 14) Stuttgart 100.00 EUR 34.59 – 0.88
LEG Osiris 5 GmbH 1) 14) Stuttgart 100.00 EUR 19.22 – 0.92
LEG Verwaltungsgesellschaft 4 mbH 1) 14) Stuttgart 100.00 EUR 27.43 0.77
LG Grundstücksanlagen-Gesellschaft mbH 14) Stuttgart 100.00 EUR 0.03 0.00
LGZ-Anlagen-Gesellschaft mit beschränkter Haftung 4) 14) Mainz 100.00 EUR 110.00 0.00
L-Immobilien GmbH 4) 14) Mannheim 100.00 EUR 180.95 0.00
LLC German Centre for Industry and Trade 14) Moscow, Russia 100.00 RUB 1,763.95 – 300.52
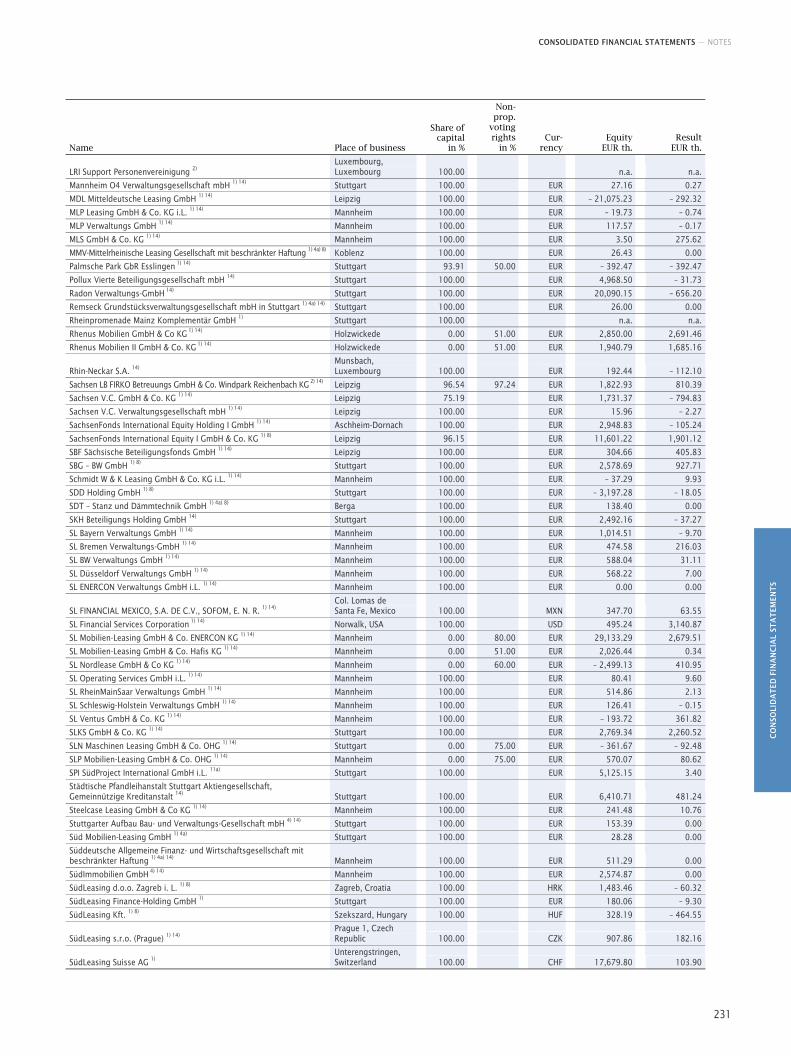
CONSOLIDATED FINANCIAL STATEMENTS — NOTES
CO
NSO
LID
AT
ED F
INA
NC
IAL
STA
TEM
ENT
S
231
Name Place of business
Share of capital
in %
Non-prop.
voting rights
in % Cur-
rency
Equity EUR th.
Result EUR th.
LRI Support Personenvereinigung 2) Luxembourg, Luxembourg 100.00 n.a. n.a.
Mannheim O4 Verwaltungsgesellschaft mbH 1) 14) Stuttgart 100.00 EUR 27.16 0.27
MDL Mitteldeutsche Leasing GmbH 1) 14) Leipzig 100.00 EUR – 21,075.23 – 292.32
MLP Leasing GmbH & Co. KG i.L. 1) 14) Mannheim 100.00 EUR – 19.73 – 0.74
MLP Verwaltungs GmbH 1) 14) Mannheim 100.00 EUR 117.57 – 0.17
MLS GmbH & Co. KG 1) 14) Mannheim 100.00 EUR 3.50 275.62
MMV-Mittelrheinische Leasing Gesellschaft mit beschränkter Haftung 1) 4a) 8) Koblenz 100.00 EUR 26.43 0.00
Palmsche Park GbR Esslingen 1) 14) Stuttgart 93.91 50.00 EUR – 392.47 – 392.47
Pollux Vierte Beteiligungsgesellschaft mbH 14) Stuttgart 100.00 EUR 4,968.50 – 31.73
Radon Verwaltungs-GmbH 14) Stuttgart 100.00 EUR 20,090.15 – 656.20
Remseck Grundstücksverwaltungsgesellschaft mbH in Stuttgart 1) 4a) 14) Stuttgart 100.00 EUR 26.00 0.00
Rheinpromenade Mainz Komplementär GmbH 1) Stuttgart 100.00 n.a. n.a.
Rhenus Mobilien GmbH & Co KG 1) 14) Holzwickede 0.00 51.00 EUR 2,850.00 2,691.46
Rhenus Mobilien II GmbH & Co. KG 1) 14) Holzwickede 0.00 51.00 EUR 1,940.79 1,685.16
Rhin-Neckar S.A. 14) Munsbach, Luxembourg 100.00 EUR 192.44 – 112.10
Sachsen LB FIRKO Betreuungs GmbH & Co. Windpark Reichenbach KG 2) 14) Leipzig 96.54 97.24 EUR 1,822.93 810.39
Sachsen V.C. GmbH & Co. KG 1) 14) Leipzig 75.19 EUR 1,731.37 – 794.83
Sachsen V.C. Verwaltungsgesellschaft mbH 1) 14) Leipzig 100.00 EUR 15.96 – 2.27
SachsenFonds International Equity Holding I GmbH 1) 14) Aschheim-Dornach 100.00 EUR 2,948.83 – 105.24
SachsenFonds International Equity I GmbH & Co. KG 1) 8) Leipzig 96.15 EUR 11,601.22 1,901.12
SBF Sächsische Beteiligungsfonds GmbH 1) 14) Leipzig 100.00 EUR 304.66 405.83
SBG – BW GmbH 1) 8) Stuttgart 100.00 EUR 2,578.69 927.71
Schmidt W & K Leasing GmbH & Co. KG i.L. 1) 14) Mannheim 100.00 EUR – 37.29 9.93
SDD Holding GmbH 1) 8) Stuttgart 100.00 EUR – 3,197.28 – 18.05
SDT – Stanz und Dämmtechnik GmbH 1) 4a) 8) Berga 100.00 EUR 138.40 0.00
SKH Beteiligungs Holding GmbH 14) Stuttgart 100.00 EUR 2,492.16 – 37.27
SL Bayern Verwaltungs GmbH 1) 14) Mannheim 100.00 EUR 1,014.51 – 9.70
SL Bremen Verwaltungs-GmbH 1) 14) Mannheim 100.00 EUR 474.58 216.03
SL BW Verwaltungs GmbH 1) 14) Mannheim 100.00 EUR 588.04 31.11
SL Düsseldorf Verwaltungs GmbH 1) 14) Mannheim 100.00 EUR 568.22 7.00
SL ENERCON Verwaltungs GmbH i.L. 1) 14) Mannheim 100.00 EUR 0.00 0.00
SL FINANCIAL MEXICO, S.A. DE C.V., SOFOM, E. N. R. 1) 14) Col. Lomas de Santa Fe, Mexico 100.00 MXN 347.70 63.55
SL Financial Services Corporation 1) 14) Norwalk, USA 100.00 USD 495.24 3,140.87
SL Mobilien-Leasing GmbH & Co. ENERCON KG 1) 14) Mannheim 0.00 80.00 EUR 29,133.29 2,679.51
SL Mobilien-Leasing GmbH & Co. Hafis KG 1) 14) Mannheim 0.00 51.00 EUR 2,026.44 0.34
SL Nordlease GmbH & Co KG 1) 14) Mannheim 0.00 60.00 EUR – 2,499.13 410.95
SL Operating Services GmbH i.L. 1) 14) Mannheim 100.00 EUR 80.41 9.60
SL RheinMainSaar Verwaltungs GmbH 1) 14) Mannheim 100.00 EUR 514.86 2.13
SL Schleswig-Holstein Verwaltungs GmbH 1) 14) Mannheim 100.00 EUR 126.41 – 0.15
SL Ventus GmbH & Co. KG 1) 14) Mannheim 100.00 EUR – 193.72 361.82
SLKS GmbH & Co. KG 1) 14) Stuttgart 100.00 EUR 2,769.34 2,260.52
SLN Maschinen Leasing GmbH & Co. OHG 1) 14) Stuttgart 0.00 75.00 EUR – 361.67 – 92.48
SLP Mobilien-Leasing GmbH & Co. OHG 1) 14) Mannheim 0.00 75.00 EUR 570.07 80.62
SPI SüdProject International GmbH i.L. 11a) Stuttgart 100.00 EUR 5,125.15 3.40
Städtische Pfandleihanstalt Stuttgart Aktiengesellschaft, Gemeinnützige Kreditanstalt 14) Stuttgart 100.00 EUR 6,410.71 481.24
Steelcase Leasing GmbH & Co KG 1) 14) Mannheim 100.00 EUR 241.48 10.76
Stuttgarter Aufbau Bau- und Verwaltungs-Gesellschaft mbH 4) 14) Stuttgart 100.00 EUR 153.39 0.00
Süd Mobilien-Leasing GmbH 1) 4a) Stuttgart 100.00 EUR 28.28 0.00
Süddeutsche Allgemeine Finanz- und Wirtschaftsgesellschaft mit beschränkter Haftung 1) 4a) 14) Mannheim 100.00 EUR 511.29 0.00
SüdImmobilien GmbH 4) 14) Mannheim 100.00 EUR 2,574.87 0.00
SüdLeasing d.o.o. Zagreb i. L. 1) 8) Zagreb, Croatia 100.00 HRK 1,483.46 – 60.32
SüdLeasing Finance-Holding GmbH 1) Stuttgart 100.00 EUR 180.06 – 9.30
SüdLeasing Kft. 1) 8) Szekszard, Hungary 100.00 HUF 328.19 – 464.55
SüdLeasing s.r.o. (Prague) 1) 14) Prague 1, Czech Republic 100.00 CZK 907.86 182.16
SüdLeasing Suisse AG 1) Unterengstringen, Switzerland 100.00 CHF 17,679.80 103.90
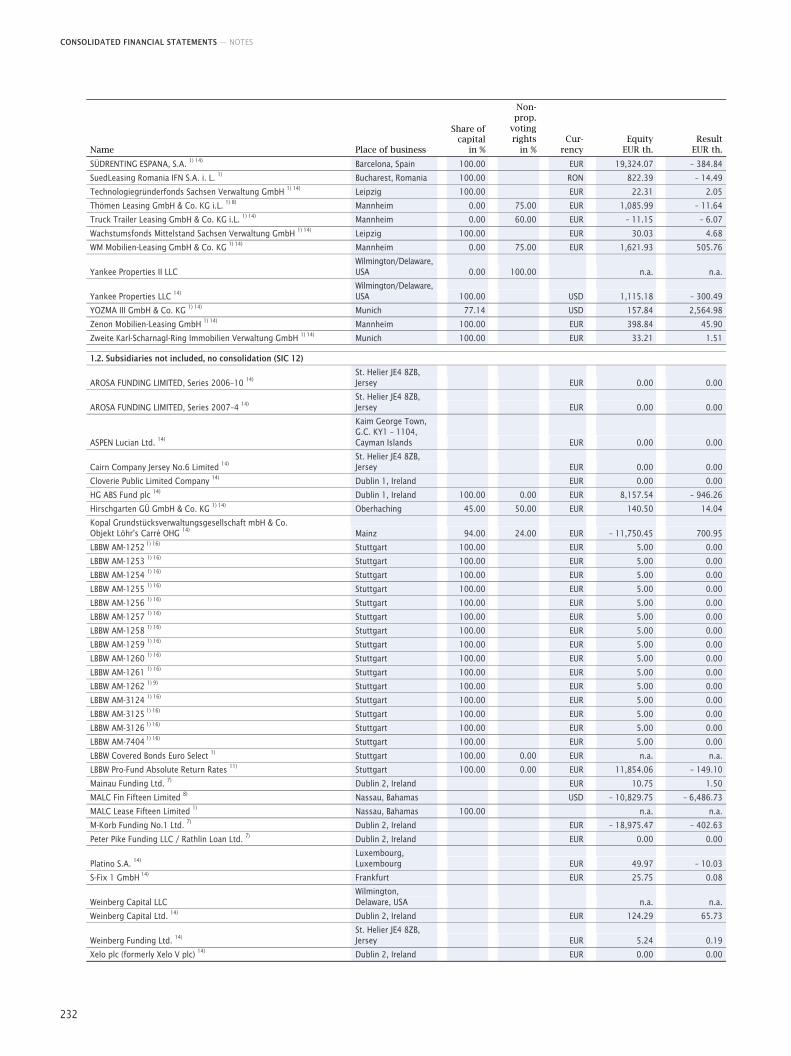
CONSOLIDATED FINANCIAL STATEMENTS — NOTES
232
Name Place of business
Share of capital
in %
Non-prop.
voting rights
in % Cur-
rency
Equity EUR th.
Result EUR th.
SÜDRENTING ESPANA, S.A. 1) 14) Barcelona, Spain 100.00 EUR 19,324.07 – 384.84
SuedLeasing Romania IFN S.A. i. L. 1) Bucharest, Romania 100.00 RON 822.39 – 14.49
Technologiegründerfonds Sachsen Verwaltung GmbH 1) 14) Leipzig 100.00 EUR 22.31 2.05
Thömen Leasing GmbH & Co. KG i.L. 1) 8) Mannheim 0.00 75.00 EUR 1,085.99 – 11.64
Truck Trailer Leasing GmbH & Co. KG i.L. 1) 14) Mannheim 0.00 60.00 EUR – 11.15 – 6.07
Wachstumsfonds Mittelstand Sachsen Verwaltung GmbH 1) 14) Leipzig 100.00 EUR 30.03 4.68
WM Mobilien-Leasing GmbH & Co. KG 1) 14) Mannheim 0.00 75.00 EUR 1,621.93 505.76
Yankee Properties II LLC Wilmington/Delaware, USA 0.00 100.00 n.a. n.a.
Yankee Properties LLC 14) Wilmington/Delaware, USA 100.00 USD 1,115.18 – 300.49
YOZMA III GmbH & Co. KG 1) 14) Munich 77.14 USD 157.84 2,564.98
Zenon Mobilien-Leasing GmbH 1) 14) Mannheim 100.00 EUR 398.84 45.90
Zweite Karl-Scharnagl-Ring Immobilien Verwaltung GmbH 1) 14) Munich 100.00 EUR 33.21 1.51 1.2. Subsidiaries not included, no consolidation (SIC 12)
AROSA FUNDING LIMITED, Series 2006–10 14) St. Helier JE4 8ZB, Jersey EUR 0.00 0.00
AROSA FUNDING LIMITED, Series 2007–4 14) St. Helier JE4 8ZB, Jersey EUR 0.00 0.00
ASPEN Lucian Ltd. 14)
Kaim George Town, G.C. KY1 – 1104, Cayman Islands EUR 0.00 0.00
Cairn Company Jersey No.6 Limited 14) St. Helier JE4 8ZB, Jersey EUR 0.00 0.00
Cloverie Public Limited Company 14) Dublin 1, Ireland EUR 0.00 0.00
HG ABS Fund plc 14) Dublin 1, Ireland 100.00 0.00 EUR 8,157.54 – 946.26
Hirschgarten GÜ GmbH & Co. KG 1) 14) Oberhaching 45.00 50.00 EUR 140.50 14.04
Kopal Grundstücksverwaltungsgesellschaft mbH & Co. Objekt Löhr's Carré OHG 14) Mainz 94.00 24.00 EUR – 11,750.45 700.95
LBBW AM-1252 1) 16) Stuttgart 100.00 EUR 5.00 0.00
LBBW AM-1253 1) 16) Stuttgart 100.00 EUR 5.00 0.00
LBBW AM-1254 1) 16) Stuttgart 100.00 EUR 5.00 0.00
LBBW AM-1255 1) 16) Stuttgart 100.00 EUR 5.00 0.00
LBBW AM-1256 1) 16) Stuttgart 100.00 EUR 5.00 0.00
LBBW AM-1257 1) 16) Stuttgart 100.00 EUR 5.00 0.00
LBBW AM-1258 1) 16) Stuttgart 100.00 EUR 5.00 0.00
LBBW AM-1259 1) 16) Stuttgart 100.00 EUR 5.00 0.00
LBBW AM-1260 1) 16) Stuttgart 100.00 EUR 5.00 0.00
LBBW AM-1261 1) 16) Stuttgart 100.00 EUR 5.00 0.00
LBBW AM-1262 1) 9) Stuttgart 100.00 EUR 5.00 0.00
LBBW AM-3124 1) 16) Stuttgart 100.00 EUR 5.00 0.00
LBBW AM-3125 1) 16) Stuttgart 100.00 EUR 5.00 0.00
LBBW AM-3126 1) 16) Stuttgart 100.00 EUR 5.00 0.00
LBBW AM-7404 1) 16) Stuttgart 100.00 EUR 5.00 0.00
LBBW Covered Bonds Euro Select 1) Stuttgart 100.00 0.00 EUR n.a. n.a.
LBBW Pro-Fund Absolute Return Rates 11) Stuttgart 100.00 0.00 EUR 11,854.06 – 149.10
Mainau Funding Ltd. 7) Dublin 2, Ireland EUR 10.75 1.50
MALC Fin Fifteen Limited 8) Nassau, Bahamas USD – 10,829.75 – 6,486.73
MALC Lease Fifteen Limited 1) Nassau, Bahamas 100.00 n.a. n.a.
M-Korb Funding No.1 Ltd. 7) Dublin 2, Ireland EUR – 18,975.47 – 402.63
Peter Pike Funding LLC / Rathlin Loan Ltd. 7) Dublin 2, Ireland EUR 0.00 0.00
Platino S.A. 14) Luxembourg, Luxembourg EUR 49.97 – 10.03
S-Fix 1 GmbH 14) Frankfurt EUR 25.75 0.08
Weinberg Capital LLC Wilmington, Delaware, USA n.a. n.a.
Weinberg Capital Ltd. 14) Dublin 2, Ireland EUR 124.29 65.73
Weinberg Funding Ltd. 14) St. Helier JE4 8ZB, Jersey EUR 5.24 0.19
Xelo plc (formerly Xelo V plc) 14) Dublin 2, Ireland EUR 0.00 0.00
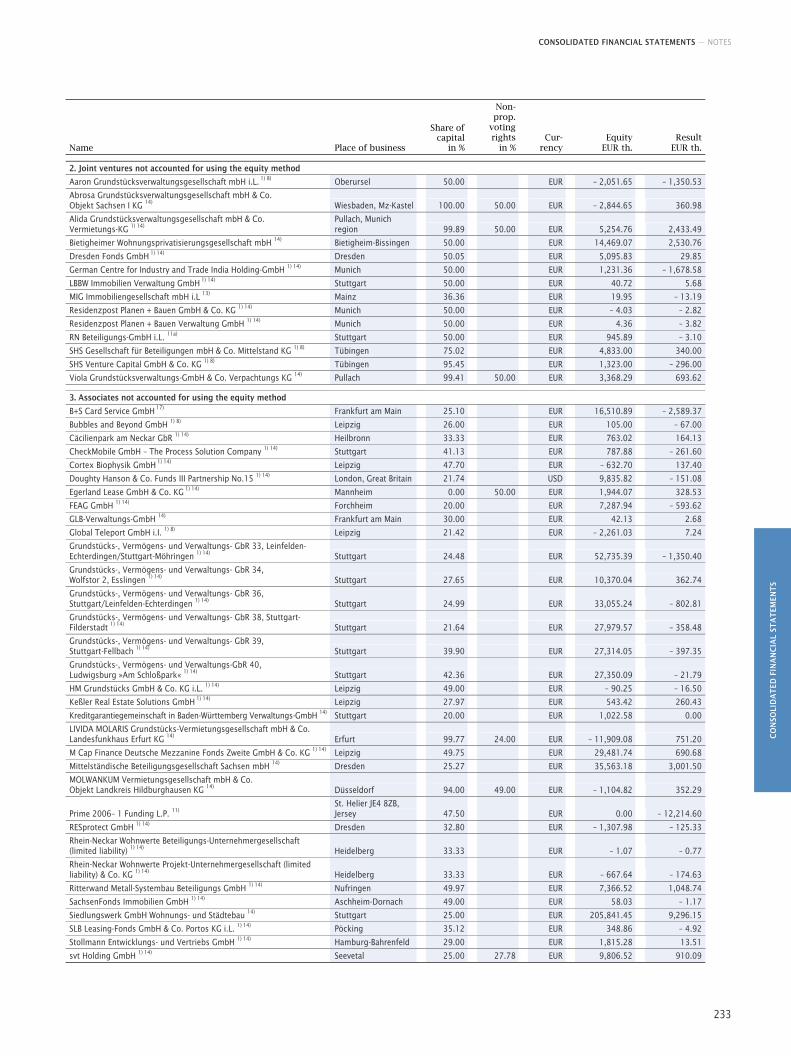
CONSOLIDATED FINANCIAL STATEMENTS — NOTES
CO
NSO
LID
AT
ED F
INA
NC
IAL
STA
TEM
ENT
S
233
Name Place of business
Share of capital
in %
Non-prop.
voting rights
in % Cur-
rency
Equity EUR th.
Result EUR th.
2. Joint ventures not accounted for using the equity method Aaron Grundstücksverwaltungsgesellschaft mbH i.L. 1) 8) Oberursel 50.00 EUR – 2,051.65 – 1,350.53
Abrosa Grundstücksverwaltungsgesellschaft mbH & Co. Objekt Sachsen I KG 14) Wiesbaden, Mz-Kastel 100.00 50.00 EUR – 2,844.65 360.98
Alida Grundstücksverwaltungsgesellschaft mbH & Co. Vermietungs-KG 1) 14)
Pullach, Munich region 99.89 50.00 EUR 5,254.76 2,433.49
Bietigheimer Wohnungsprivatisierungsgesellschaft mbH 14) Bietigheim-Bissingen 50.00 EUR 14,469.07 2,530.76
Dresden Fonds GmbH 1) 14) Dresden 50.05 EUR 5,095.83 29.85
German Centre for Industry and Trade India Holding-GmbH 1) 14) Munich 50.00 EUR 1,231.36 – 1,678.58
LBBW Immobilien Verwaltung GmbH 1) 14) Stuttgart 50.00 EUR 40.72 5.68
MIG Immobiliengesellschaft mbH i.L 13) Mainz 36.36 EUR 19.95 – 13.19
Residenzpost Planen + Bauen GmbH & Co. KG 1) 14) Munich 50.00 EUR – 4.03 – 2.82
Residenzpost Planen + Bauen Verwaltung GmbH 1) 14) Munich 50.00 EUR 4.36 – 3.82
RN Beteiligungs-GmbH i.L. 11a) Stuttgart 50.00 EUR 945.89 – 3.10
SHS Gesellschaft für Beteiligungen mbH & Co. Mittelstand KG 1) 8) Tübingen 75.02 EUR 4,833.00 340.00
SHS Venture Capital GmbH & Co. KG 1) 8) Tübingen 95.45 EUR 1,323.00 – 296.00
Viola Grundstücksverwaltungs-GmbH & Co. Verpachtungs KG 14) Pullach 99.41 50.00 EUR 3,368.29 693.62 3. Associates not accounted for using the equity method B+S Card Service GmbH 17) Frankfurt am Main 25.10 EUR 16,510.89 – 2,589.37
Bubbles and Beyond GmbH 1) 8) Leipzig 26.00 EUR 105.00 – 67.00
Cäcilienpark am Neckar GbR 1) 14) Heilbronn 33.33 EUR 763.02 164.13
CheckMobile GmbH – The Process Solution Company 1) 14) Stuttgart 41.13 EUR 787.88 – 261.60
Cortex Biophysik GmbH 1) 14) Leipzig 47.70 EUR – 632.70 137.40
Doughty Hanson & Co. Funds III Partnership No.15 1) 14) London, Great Britain 21.74 USD 9,835.82 – 151.08
Egerland Lease GmbH & Co. KG 1) 14) Mannheim 0.00 50.00 EUR 1,944.07 328.53
FEAG GmbH 1) 14) Forchheim 20.00 EUR 7,287.94 – 593.62
GLB-Verwaltungs-GmbH 14) Frankfurt am Main 30.00 EUR 42.13 2.68
Global Teleport GmbH i.I. 1) 8) Leipzig 21.42 EUR – 2,261.03 7.24
Grundstücks-, Vermögens- und Verwaltungs- GbR 33, Leinfelden-Echterdingen/Stuttgart-Möhringen 1) 14) Stuttgart 24.48 EUR 52,735.39 – 1,350.40
Grundstücks-, Vermögens- und Verwaltungs- GbR 34, Wolfstor 2, Esslingen 1) 14) Stuttgart 27.65 EUR 10,370.04 362.74
Grundstücks-, Vermögens- und Verwaltungs- GbR 36, Stuttgart/Leinfelden-Echterdingen 1) 14) Stuttgart 24.99 EUR 33,055.24 – 802.81
Grundstücks-, Vermögens- und Verwaltungs- GbR 38, Stuttgart-Filderstadt 1) 14) Stuttgart 21.64 EUR 27,979.57 – 358.48
Grundstücks-, Vermögens- und Verwaltungs- GbR 39, Stuttgart-Fellbach 1) 14) Stuttgart 39.90 EUR 27,314.05 – 397.35
Grundstücks-, Vermögens- und Verwaltungs-GbR 40, Ludwigsburg »Am Schloßpark« 1) 14) Stuttgart 42.36 EUR 27,350.09 – 21.79
HM Grundstücks GmbH & Co. KG i.L. 1) 14) Leipzig 49.00 EUR – 90.25 – 16.50
Keßler Real Estate Solutions GmbH 1) 14) Leipzig 27.97 EUR 543.42 260.43
Kreditgarantiegemeinschaft in Baden-Württemberg Verwaltungs-GmbH 14) Stuttgart 20.00 EUR 1,022.58 0.00
LIVIDA MOLARIS Grundstücks-Vermietungsgesellschaft mbH & Co. Landesfunkhaus Erfurt KG 14) Erfurt 99.77 24.00 EUR – 11,909.08 751.20
M Cap Finance Deutsche Mezzanine Fonds Zweite GmbH & Co. KG 1) 14) Leipzig 49.75 EUR 29,481.74 690.68
Mittelständische Beteiligungsgesellschaft Sachsen mbH 14) Dresden 25.27 EUR 35,563.18 3,001.50
MOLWANKUM Vermietungsgesellschaft mbH & Co. Objekt Landkreis Hildburghausen KG 14) Düsseldorf 94.00 49.00 EUR – 1,104.82 352.29
Prime 2006– 1 Funding L.P. 11) St. Helier JE4 8ZB, Jersey 47.50 EUR 0.00 – 12,214.60
RESprotect GmbH 1) 14) Dresden 32.80 EUR – 1,307.98 – 125.33
Rhein-Neckar Wohnwerte Beteiligungs-Unternehmergesellschaft (limited liability) 1) 14) Heidelberg 33.33 EUR – 1.07 – 0.77
Rhein-Neckar Wohnwerte Projekt-Unternehmergesellschaft (limited liability) & Co. KG 1) 14) Heidelberg 33.33 EUR – 667.64 – 174.63
Ritterwand Metall-Systembau Beteiligungs GmbH 1) 14) Nufringen 49.97 EUR 7,366.52 1,048.74
SachsenFonds Immobilien GmbH 1) 14) Aschheim-Dornach 49.00 EUR 58.03 – 1.17
Siedlungswerk GmbH Wohnungs- und Städtebau 14) Stuttgart 25.00 EUR 205,841.45 9,296.15
SLB Leasing-Fonds GmbH & Co. Portos KG i.L. 1) 14) Pöcking 35.12 EUR 348.86 – 4.92
Stollmann Entwicklungs- und Vertriebs GmbH 1) 14) Hamburg-Bahrenfeld 29.00 EUR 1,815.28 13.51
svt Holding GmbH 1) 14) Seevetal 25.00 27.78 EUR 9,806.52 910.09
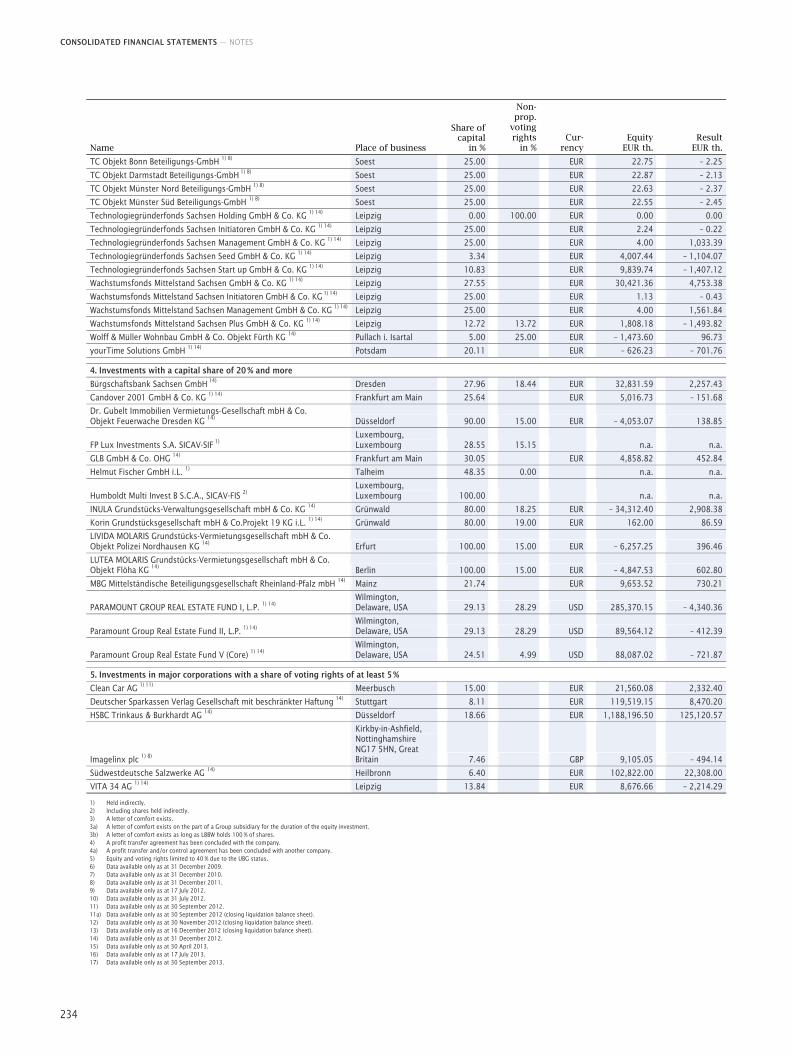
CONSOLIDATED FINANCIAL STATEMENTS — NOTES
234
Name Place of business
Share of capital
in %
Non-prop.
voting rights
in % Cur-
rency
Equity EUR th.
Result EUR th.
TC Objekt Bonn Beteiligungs-GmbH 1) 8) Soest 25.00 EUR 22.75 – 2.25
TC Objekt Darmstadt Beteiligungs-GmbH 1) 8) Soest 25.00 EUR 22.87 – 2.13
TC Objekt Münster Nord Beteiligungs-GmbH 1) 8) Soest 25.00 EUR 22.63 – 2.37
TC Objekt Münster Süd Beteiligungs-GmbH 1) 8) Soest 25.00 EUR 22.55 – 2.45
Technologiegründerfonds Sachsen Holding GmbH & Co. KG 1) 14) Leipzig 0.00 100.00 EUR 0.00 0.00
Technologiegründerfonds Sachsen Initiatoren GmbH & Co. KG 1) 14) Leipzig 25.00 EUR 2.24 – 0.22
Technologiegründerfonds Sachsen Management GmbH & Co. KG 1) 14) Leipzig 25.00 EUR 4.00 1,033.39
Technologiegründerfonds Sachsen Seed GmbH & Co. KG 1) 14) Leipzig 3.34 EUR 4,007.44 – 1,104.07
Technologiegründerfonds Sachsen Start up GmbH & Co. KG 1) 14) Leipzig 10.83 EUR 9,839.74 – 1,407.12
Wachstumsfonds Mittelstand Sachsen GmbH & Co. KG 1) 14) Leipzig 27.55 EUR 30,421.36 4,753.38
Wachstumsfonds Mittelstand Sachsen Initiatoren GmbH & Co. KG 1) 14) Leipzig 25.00 EUR 1.13 – 0.43
Wachstumsfonds Mittelstand Sachsen Management GmbH & Co. KG 1) 14) Leipzig 25.00 EUR 4.00 1,561.84
Wachstumsfonds Mittelstand Sachsen Plus GmbH & Co. KG 1) 14) Leipzig 12.72 13.72 EUR 1,808.18 – 1,493.82
Wolff & Müller Wohnbau GmbH & Co. Objekt Fürth KG 14) Pullach i. Isartal 5.00 25.00 EUR – 1,473.60 96.73
yourTime Solutions GmbH 1) 14) Potsdam 20.11 EUR – 626.23 – 701.76 4. Investments with a capital share of 20 % and more Bürgschaftsbank Sachsen GmbH 14) Dresden 27.96 18.44 EUR 32,831.59 2,257.43
Candover 2001 GmbH & Co. KG 1) 14) Frankfurt am Main 25.64 EUR 5,016.73 – 151.68
Dr. Gubelt Immobilien Vermietungs-Gesellschaft mbH & Co. Objekt Feuerwache Dresden KG 14) Düsseldorf 90.00 15.00 EUR – 4,053.07 138.85
FP Lux Investments S.A. SICAV-SIF 1) Luxembourg, Luxembourg 28.55 15.15 n.a. n.a.
GLB GmbH & Co. OHG 14) Frankfurt am Main 30.05 EUR 4,858.82 452.84
Helmut Fischer GmbH i.L. 1) Talheim 48.35 0.00 n.a. n.a.
Humboldt Multi Invest B S.C.A., SICAV-FIS 2) Luxembourg, Luxembourg 100.00 n.a. n.a.
INULA Grundstücks-Verwaltungsgesellschaft mbH & Co. KG 14) Grünwald 80.00 18.25 EUR – 34,312.40 2,908.38
Korin Grundstücksgesellschaft mbH & Co.Projekt 19 KG i.L. 1) 14) Grünwald 80.00 19.00 EUR 162.00 86.59
LIVIDA MOLARIS Grundstücks-Vermietungsgesellschaft mbH & Co. Objekt Polizei Nordhausen KG 14) Erfurt 100.00 15.00 EUR – 6,257.25 396.46
LUTEA MOLARIS Grundstücks-Vermietungsgesellschaft mbH & Co. Objekt Flöha KG 14) Berlin 100.00 15.00 EUR – 4,847.53 602.80
MBG Mittelständische Beteiligungsgesellschaft Rheinland-Pfalz mbH 14) Mainz 21.74 EUR 9,653.52 730.21
PARAMOUNT GROUP REAL ESTATE FUND I, L.P. 1) 14) Wilmington, Delaware, USA 29.13 28.29 USD 285,370.15 – 4,340.36
Paramount Group Real Estate Fund II, L.P. 1) 14) Wilmington, Delaware, USA 29.13 28.29 USD 89,564.12 – 412.39
Paramount Group Real Estate Fund V (Core) 1) 14) Wilmington, Delaware, USA 24.51 4.99 USD 88,087.02 – 721.87
5. Investments in major corporations with a share of voting rights of at least 5 % Clean Car AG 1) 11) Meerbusch 15.00 EUR 21,560.08 2,332.40
Deutscher Sparkassen Verlag Gesellschaft mit beschränkter Haftung 14) Stuttgart 8.11 EUR 119,519.15 8,470.20
HSBC Trinkaus & Burkhardt AG 14) Düsseldorf 18.66 EUR 1,188,196.50 125,120.57
Imagelinx plc 1) 8)
Kirkby-in-Ashfield, Nottinghamshire NG17 5HN, Great Britain 7.46 GBP 9,105.05 – 494.14
Südwestdeutsche Salzwerke AG 14) Heilbronn 6.40 EUR 102,822.00 22,308.00
VITA 34 AG 1) 14) Leipzig 13.84 EUR 8,676.66 – 2,214.29 1) Held indirectly. 2) Including shares held indirectly. 3) A letter of comfort exists. 3a) A letter of comfort exists on the part of a Group subsidiary for the duration of the equity investment. 3b) A letter of comfort exists as long as LBBW holds 100 % of shares. 4) A profit transfer agreement has been concluded with the company. 4a) A profit transfer and/or control agreement has been concluded with another company. 5) Equity and voting rights limited to 40 % due to the UBG status. 6) Data available only as at 31 December 2009. 7) Data available only as at 31 December 2010. 8) Data available only as at 31 December 2011. 9) Data available only as at 17 July 2012. 10) Data available only as at 31 July 2012. 11) Data available only as at 30 September 2012. 11a) Data available only as at 30 September 2012 (closing liquidation balance sheet). 12) Data available only as at 30 November 2012 (closing liquidation balance sheet). 13) Data available only as at 16 December 2012 (closing liquidation balance sheet). 14) Data available only as at 31 December 2012. 15) Data available only as at 30 April 2013. 16) Data available only as at 17 July 2013. 17) Data available only as at 30 September 2013.
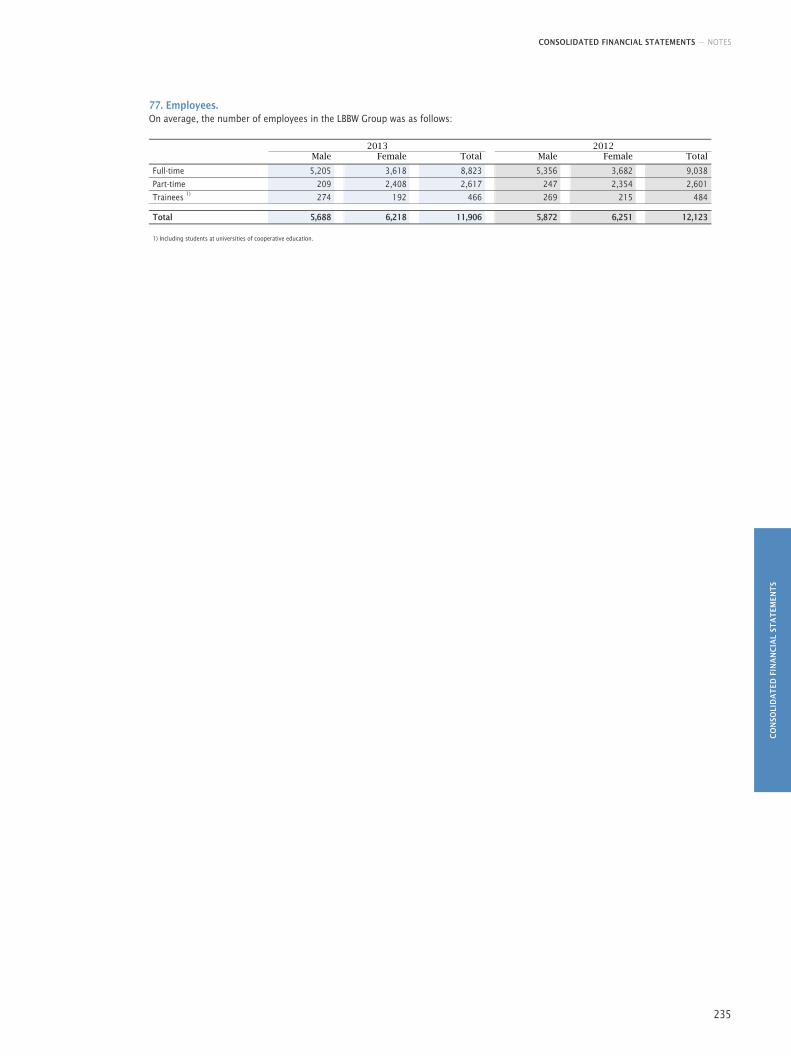
CONSOLIDATED FINANCIAL STATEMENTS — NOTES
CO
NSO
LID
AT
ED F
INA
NC
IAL
STA
TEM
ENT
S
235
77. Employees. On average, the number of employees in the LBBW Group was as follows:
2013 2012 Male Female Total Male Female Total
Full-time 5,205 3,618 8,823 5,356 3,682 9,038
Part-time 209 2,408 2,617 247 2,354 2,601
Trainees 1) 274 192 466 269 215 484 Total 5,688 6,218 11,906 5,872 6,251 12,123 1) Including students at universities of cooperative education.
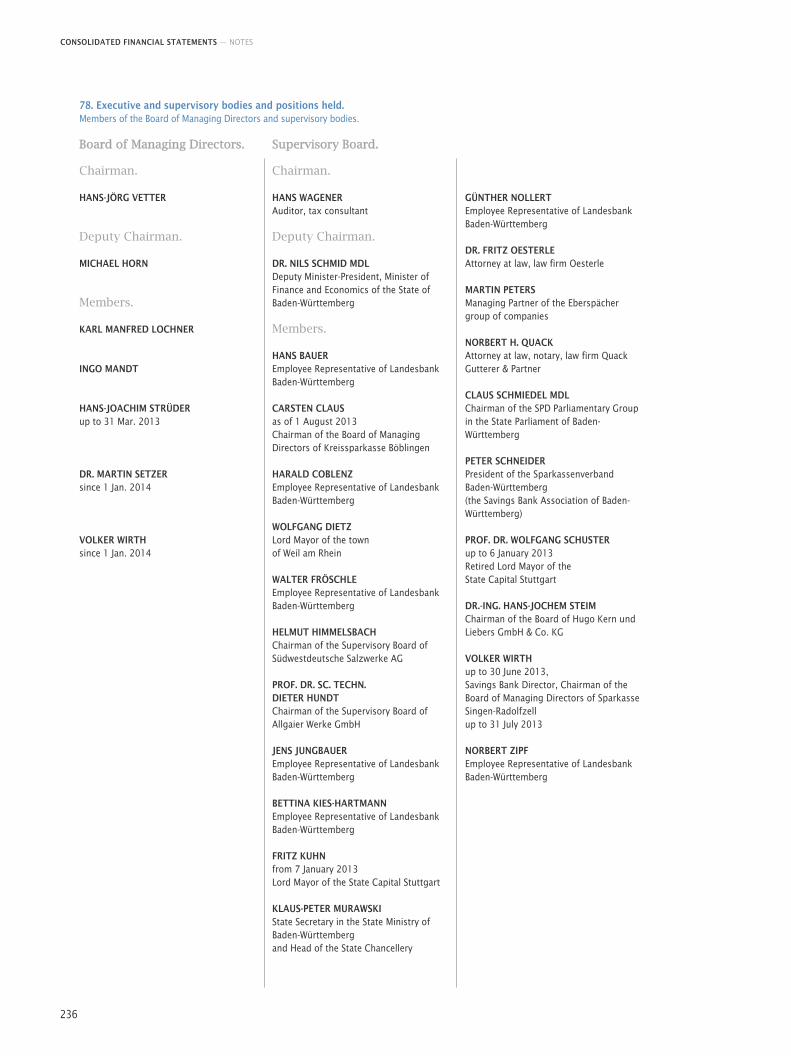
CONSOLIDATED FINANCIAL STATEMENTS — NOTES
236
78. Executive and supervisory bodies and positions held. Members of the Board of Managing Directors and supervisory bodies. Board of Managing Directors.
Chairman.
HANS-JÖRG VETTER
Deputy Chairman.
MICHAEL HORN
Members.
KARL MANFRED LOCHNER
INGO MANDT
HANS-JOACHIM STRÜDER up to 31 Mar. 2013
DR. MARTIN SETZER since 1 Jan. 2014
VOLKER WIRTH since 1 Jan. 2014
Supervisory Board.
Chairman.
HANS WAGENER Auditor, tax consultant
Deputy Chairman.
DR. NILS SCHMID MDL Deputy Minister-President, Minister of Finance and Economics of the State of Baden-Württemberg
Members.
HANS BAUER Employee Representative of Landesbank Baden-Württemberg
CARSTEN CLAUS as of 1 August 2013 Chairman of the Board of Managing Directors of Kreissparkasse Böblingen
HARALD COBLENZ Employee Representative of Landesbank Baden-Württemberg
WOLFGANG DIETZ Lord Mayor of the town of Weil am Rhein
WALTER FRÖSCHLE Employee Representative of Landesbank Baden-Württemberg
HELMUT HIMMELSBACH Chairman of the Supervisory Board of Südwestdeutsche Salzwerke AG
PROF. DR. SC. TECHN. DIETER HUNDT Chairman of the Supervisory Board of Allgaier Werke GmbH
JENS JUNGBAUER Employee Representative of Landesbank Baden-Württemberg
BETTINA KIES-HARTMANN Employee Representative of Landesbank Baden-Württemberg
FRITZ KUHN from 7 January 2013 Lord Mayor of the State Capital Stuttgart
KLAUS-PETER MURAWSKI State Secretary in the State Ministry of Baden-Württemberg and Head of the State Chancellery
GÜNTHER NOLLERT Employee Representative of Landesbank Baden-Württemberg
DR. FRITZ OESTERLE Attorney at law, law firm Oesterle
MARTIN PETERS Managing Partner of the Eberspächer group of companies
NORBERT H. QUACK Attorney at law, notary, law firm Quack Gutterer & Partner
CLAUS SCHMIEDEL MDL Chairman of the SPD Parliamentary Group in the State Parliament of Baden-Württemberg
PETER SCHNEIDER President of the Sparkassenverband Baden-Württemberg (the Savings Bank Association of Baden-Württemberg)
PROF. DR. WOLFGANG SCHUSTER up to 6 January 2013 Retired Lord Mayor of the State Capital Stuttgart
DR.-ING. HANS-JOCHEM STEIM Chairman of the Board of Hugo Kern und Liebers GmbH & Co. KG
VOLKER WIRTH up to 30 June 2013, Savings Bank Director, Chairman of the Board of Managing Directors of Sparkasse Singen-Radolfzell up to 31 July 2013
NORBERT ZIPF Employee Representative of Landesbank Baden-Württemberg
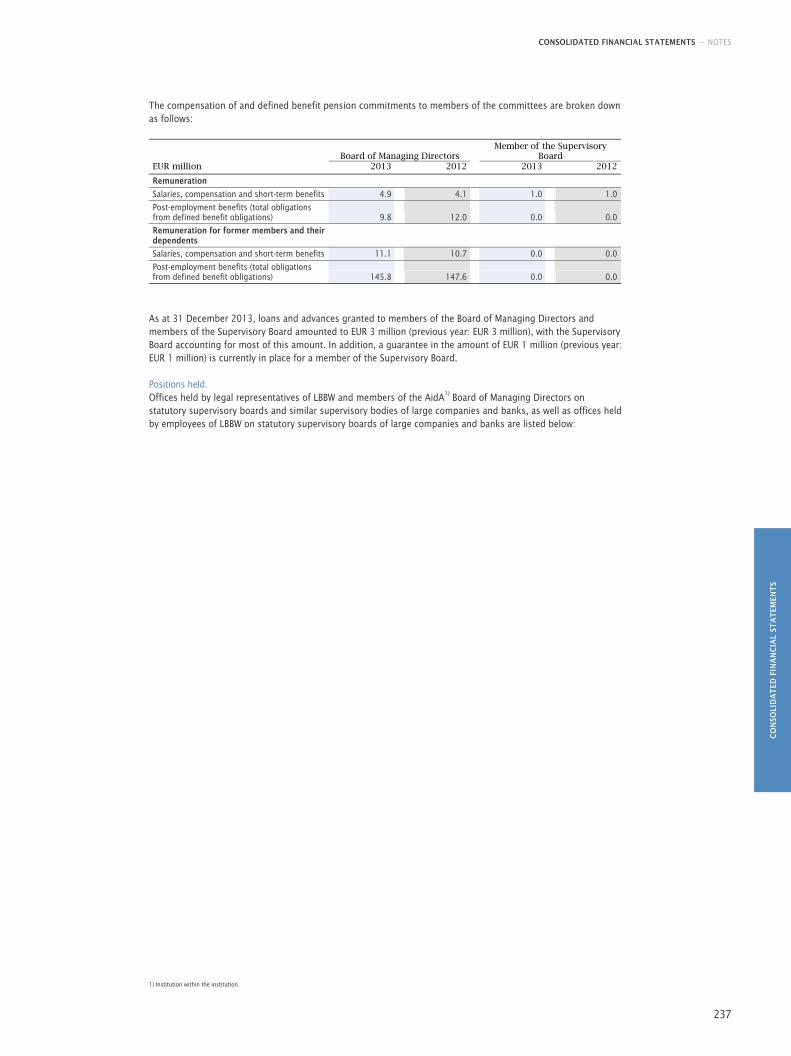
CONSOLIDATED FINANCIAL STATEMENTS — NOTES
CO
NSO
LID
AT
ED F
INA
NC
IAL
STA
TEM
ENT
S
237
The compensation of and defined benefit pension commitments to members of the committees are broken down as follows:
Board of Managing Directors Member of the Supervisory
Board EUR million 2013 2012 2013 2012
Remuneration
Salaries, compensation and short-term benefits 4.9 4.1 1.0 1.0
Post-employment benefits (total obligations from defined benefit obligations) 9.8 12.0 0.0 0.0
Remuneration for former members and their dependents
Salaries, compensation and short-term benefits 11.1 10.7 0.0 0.0
Post-employment benefits (total obligations from defined benefit obligations) 145.8 147.6 0.0 0.0
As at 31 December 2013, loans and advances granted to members of the Board of Managing Directors and members of the Supervisory Board amounted to EUR 3 million (previous year: EUR 3 million), with the Supervisory Board accounting for most of this amount. In addition, a guarantee in the amount of EUR 1 million (previous year: EUR 1 million) is currently in place for a member of the Supervisory Board.
Positions held. Offices held by legal representatives of LBBW and members of the AidA1) Board of Managing Directors on statutory supervisory boards and similar supervisory bodies of large companies and banks, as well as offices held by employees of LBBW on statutory supervisory boards of large companies and banks are listed below:
1) Institution within the institution.
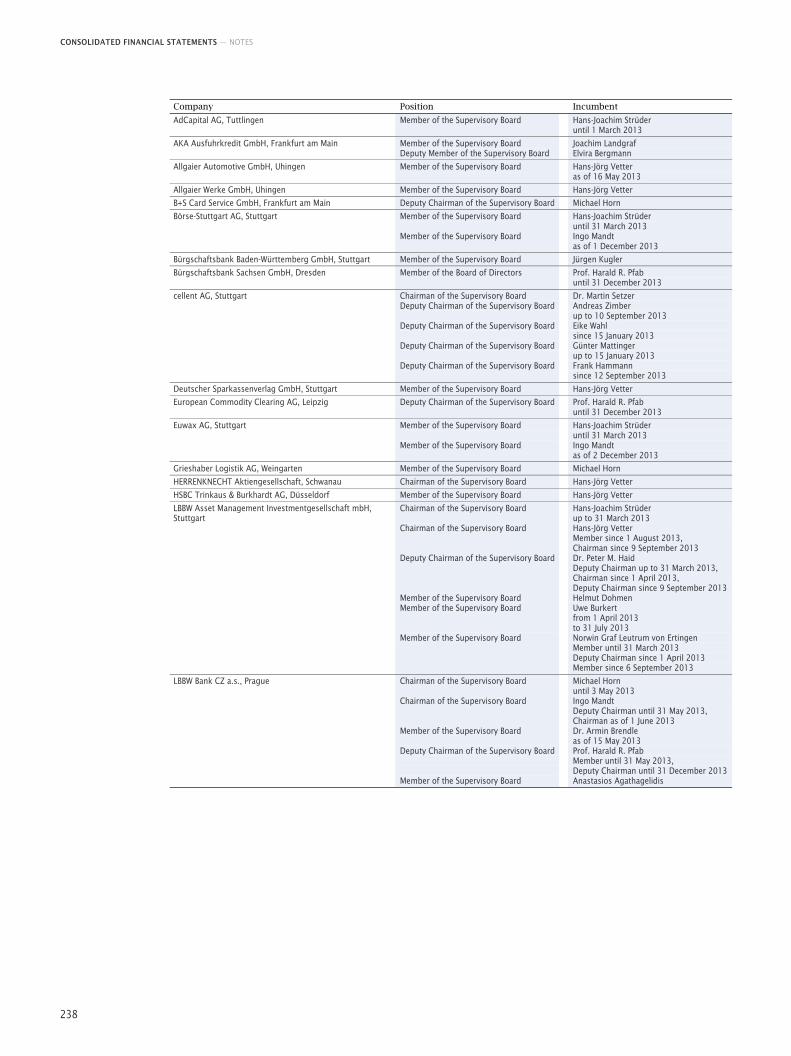
CONSOLIDATED FINANCIAL STATEMENTS — NOTES
238
Company Position Incumbent
AdCapital AG, Tuttlingen Member of the Supervisory Board
Hans-Joachim Strüder until 1 March 2013
AKA Ausfuhrkredit GmbH, Frankfurt am Main Member of the Supervisory Board Deputy Member of the Supervisory Board
Joachim Landgraf Elvira Bergmann
Allgaier Automotive GmbH, Uhingen Member of the Supervisory Board
Hans-Jörg Vetter as of 16 May 2013
Allgaier Werke GmbH, Uhingen Member of the Supervisory Board Hans-Jörg Vetter
B+S Card Service GmbH, Frankfurt am Main Deputy Chairman of the Supervisory Board Michael Horn
Börse-Stuttgart AG, Stuttgart Member of the Supervisory Board Member of the Supervisory Board
Hans-Joachim Strüder until 31 March 2013 Ingo Mandt as of 1 December 2013
Bürgschaftsbank Baden-Württemberg GmbH, Stuttgart Member of the Supervisory Board Jürgen Kugler
Bürgschaftsbank Sachsen GmbH, Dresden Member of the Board of Directors
Prof. Harald R. Pfab until 31 December 2013
cellent AG, Stuttgart Chairman of the Supervisory Board Deputy Chairman of the Supervisory Board Deputy Chairman of the Supervisory Board Deputy Chairman of the Supervisory Board Deputy Chairman of the Supervisory Board
Dr. Martin Setzer Andreas Zimber up to 10 September 2013 Eike Wahl since 15 January 2013 Günter Mattinger up to 15 January 2013 Frank Hammann since 12 September 2013
Deutscher Sparkassenverlag GmbH, Stuttgart Member of the Supervisory Board Hans-Jörg Vetter
European Commodity Clearing AG, Leipzig Deputy Chairman of the Supervisory Board
Prof. Harald R. Pfab until 31 December 2013
Euwax AG, Stuttgart Member of the Supervisory Board Member of the Supervisory Board
Hans-Joachim Strüder until 31 March 2013 Ingo Mandt as of 2 December 2013
Grieshaber Logistik AG, Weingarten Member of the Supervisory Board Michael Horn
HERRENKNECHT Aktiengesellschaft, Schwanau Chairman of the Supervisory Board Hans-Jörg Vetter
HSBC Trinkaus & Burkhardt AG, Düsseldorf Member of the Supervisory Board Hans-Jörg Vetter
LBBW Asset Management Investmentgesellschaft mbH, Stuttgart
Chairman of the Supervisory Board Chairman of the Supervisory Board Deputy Chairman of the Supervisory Board Member of the Supervisory Board Member of the Supervisory Board Member of the Supervisory Board
Hans-Joachim Strüder up to 31 March 2013 Hans-Jörg Vetter Member since 1 August 2013, Chairman since 9 September 2013 Dr. Peter M. Haid Deputy Chairman up to 31 March 2013, Chairman since 1 April 2013, Deputy Chairman since 9 September 2013Helmut Dohmen Uwe Burkert from 1 April 2013 to 31 July 2013 Norwin Graf Leutrum von Ertingen Member until 31 March 2013 Deputy Chairman since 1 April 2013 Member since 6 September 2013
LBBW Bank CZ a.s., Prague Chairman of the Supervisory Board Chairman of the Supervisory Board Member of the Supervisory Board Deputy Chairman of the Supervisory Board Member of the Supervisory Board
Michael Horn until 3 May 2013 Ingo Mandt Deputy Chairman until 31 May 2013, Chairman as of 1 June 2013 Dr. Armin Brendle as of 15 May 2013 Prof. Harald R. Pfab Member until 31 May 2013, Deputy Chairman until 31 December 2013Anastasios Agathagelidis
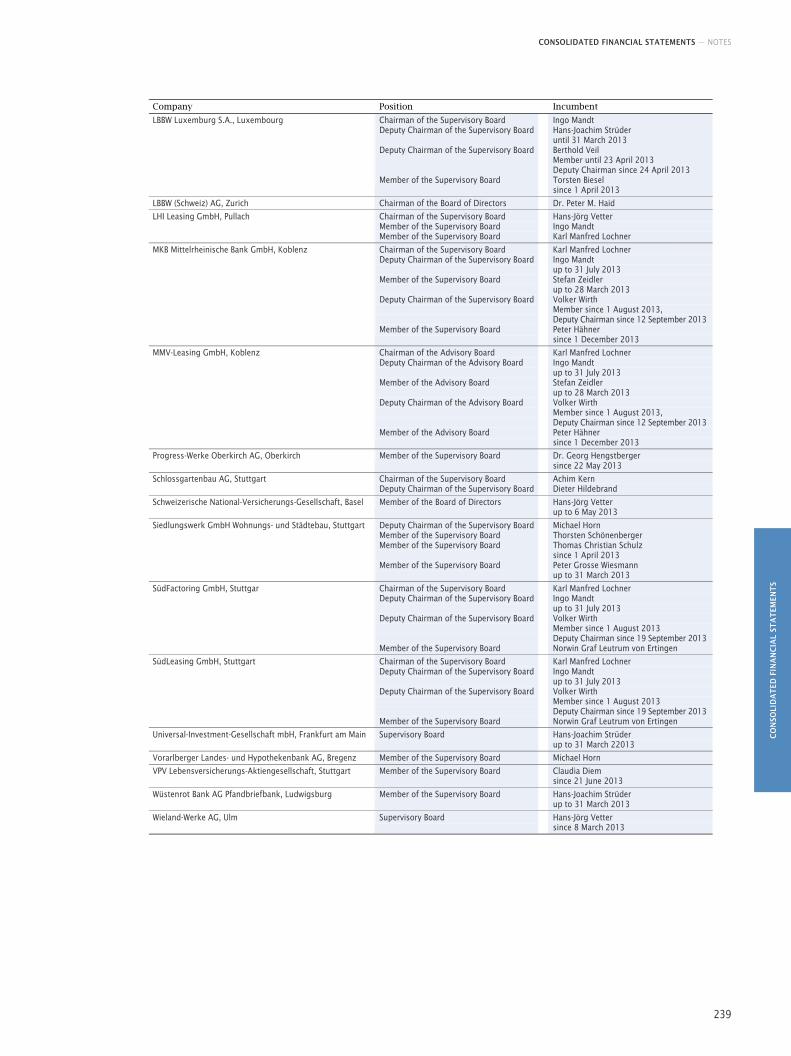
CONSOLIDATED FINANCIAL STATEMENTS — NOTES
CO
NSO
LID
AT
ED F
INA
NC
IAL
STA
TEM
ENT
S
239
Company Position Incumbent
LBBW Luxemburg S.A., Luxembourg Chairman of the Supervisory Board Deputy Chairman of the Supervisory Board Deputy Chairman of the Supervisory Board Member of the Supervisory Board
Ingo Mandt Hans-Joachim Strüder until 31 March 2013 Berthold Veil Member until 23 April 2013 Deputy Chairman since 24 April 2013 Torsten Biesel since 1 April 2013
LBBW (Schweiz) AG, Zurich Chairman of the Board of Directors
Dr. Peter M. Haid
LHI Leasing GmbH, Pullach Chairman of the Supervisory Board Member of the Supervisory Board Member of the Supervisory Board
Hans-Jörg Vetter Ingo Mandt Karl Manfred Lochner
MKB Mittelrheinische Bank GmbH, Koblenz Chairman of the Supervisory Board Deputy Chairman of the Supervisory Board Member of the Supervisory Board Deputy Chairman of the Supervisory Board Member of the Supervisory Board
Karl Manfred Lochner Ingo Mandt up to 31 July 2013 Stefan Zeidler up to 28 March 2013 Volker Wirth Member since 1 August 2013, Deputy Chairman since 12 September 2013 Peter Hähner since 1 December 2013
MMV-Leasing GmbH, Koblenz Chairman of the Advisory Board Deputy Chairman of the Advisory Board Member of the Advisory Board Deputy Chairman of the Advisory Board Member of the Advisory Board
Karl Manfred Lochner Ingo Mandt up to 31 July 2013 Stefan Zeidler up to 28 March 2013 Volker Wirth Member since 1 August 2013, Deputy Chairman since 12 September 2013Peter Hähner since 1 December 2013
Progress-Werke Oberkirch AG, Oberkirch Member of the Supervisory Board
Dr. Georg Hengstberger since 22 May 2013
Schlossgartenbau AG, Stuttgart Chairman of the Supervisory Board Deputy Chairman of the Supervisory Board
Achim Kern Dieter Hildebrand
Schweizerische National-Versicherungs-Gesellschaft, Basel Member of the Board of Directors
Hans-Jörg Vetter up to 6 May 2013
Siedlungswerk GmbH Wohnungs- und Städtebau, Stuttgart Deputy Chairman of the Supervisory BoardMember of the Supervisory Board Member of the Supervisory Board Member of the Supervisory Board
Michael Horn Thorsten Schönenberger Thomas Christian Schulz since 1 April 2013 Peter Grosse Wiesmann up to 31 March 2013
SüdFactoring GmbH, Stuttgar Chairman of the Supervisory Board Deputy Chairman of the Supervisory Board Deputy Chairman of the Supervisory Board Member of the Supervisory Board
Karl Manfred Lochner Ingo Mandt up to 31 July 2013 Volker Wirth Member since 1 August 2013 Deputy Chairman since 19 September 2013Norwin Graf Leutrum von Ertingen
SüdLeasing GmbH, Stuttgart Chairman of the Supervisory Board Deputy Chairman of the Supervisory Board Deputy Chairman of the Supervisory Board Member of the Supervisory Board
Karl Manfred Lochner Ingo Mandt up to 31 July 2013 Volker Wirth Member since 1 August 2013 Deputy Chairman since 19 September 2013Norwin Graf Leutrum von Ertingen
Universal-Investment-Gesellschaft mbH, Frankfurt am Main Supervisory Board
Hans-Joachim Strüder up to 31 March 22013
Vorarlberger Landes- und Hypothekenbank AG, Bregenz Member of the Supervisory Board
Michael Horn
VPV Lebensversicherungs-Aktiengesellschaft, Stuttgart Member of the Supervisory Board
Claudia Diem since 21 June 2013
Wüstenrot Bank AG Pfandbriefbank, Ludwigsburg Member of the Supervisory Board
Hans-Joachim Strüder up to 31 March 2013
Wieland-Werke AG, Ulm Supervisory Board
Hans-Jörg Vetter since 8 March 2013
240
Further information.
FURTHER INFORMATION — RESPONSIBILITY STATEMENT
FU
RT
HE
R I
NFO
RM
AT
ION
241
Responsibility statement.
To the best of our knowledge, and in accordance with the applicable financial reporting framework, the consolidated
financial statements give a true and fair view of the net assets, financial position and results of operations of the Group,
and the combined management report gives a true and fair view of the development and performance of the business
and the position of the Group, together with a description of the principal opportunities and risks associated with the
expected future development of the Group.
Stuttgart, Karlsruhe, Mannheim and Mainz, 4 March 2014
The Board of Managing Directors
HANS-JÖRG VETTER MICHAEL HORN
Chairman Deputy Chairman
DR. MARTIN SETZER INGO MANDT
VOLKER WIRTH KARL MANFRED LOCHNER
FURTHER INFORMATION — AUDITOR'S REPORT
242
Auditor's report.
»We have audited the consolidated financial statements prepared by Landesbank Baden-Württemberg, Stuttgart,
Karlsruhe, Mannheim and Mainz, comprising the income statement, total comprehensive income, balance sheet,
statement of changes in equity, cash flow statement and the notes to the financial statements, together with its report
on the position of the Company and the Group (combined management report) for the financial year from 1 January to
31 December 2013. The preparation of the consolidated financial statements and the combined management report in
accordance with IFRSs as adopted by the EU, and the additional requirements of German commercial law pursuant to
Section 315a (1) of the German Commercial Code [HGB] are the responsibility of the Company's Board of Managing
Directors. Our responsibility is to express an opinion on the consolidated financial statements and on the combined
management report based on our audit.
We conducted our audit of the consolidated financial statements in accordance with Section 317 of the German
Commercial Code [HGB] and the German generally accepted standards for the audit of financial statements promu-
lgated by the German Institute of Public Auditors (IDW). Those standards require that we plan and perform the audit
such that misstatements materially affecting the presentation of the net assets, financial position and results of
operations in the consolidated financial statements in accordance with the applicable financial reporting framework
and in the combined management report are detected with reasonable assurance. Knowledge of the business activities
and the economic and legal environment of the Group and expectations as to possible misstatements are taken into
account in the determination of audit procedures. The effectiveness of the accounting-related internal control system
and the evidence supporting the disclosures in the consolidated financial statements and the combined management
report are examined primarily on a test basis within the framework of the audit. The audit includes assessing the
annual financial statements of those entities included in consolidation, the determination of entities to be included in
consolidation, the accounting and consolidation principles used and significant estimates made by management, as
well as evaluating the overall presentation of the consolidated financial statements and the combined management
report. We believe that our audit provides a reasonable basis for our opinion.
Our audit has not led to any reservations.
In our opinion, based on the findings of our audit, the consolidated financial statements comply with IFRSs as
adopted by the EU, the additional requirements of German commercial law pursuant to Section 315a (1) of the
German Commercial Code [HGB] and give a true and fair view of the net assets, financial position and results of
operations of the Group in accordance with these requirements. The combined management report is consistent
with the consolidated financial statements and as a whole provides a suitable view of the Group’s position and
suitably presents the opportunities and risks of future development.«
Stuttgart, 11 March 2014
KPMG AG
Wirtschaftsprüfungsgesellschaft
KOCHOLL EISELE
Wirtschaftsprüfer Wirtschaftsprüfer
(German Public Auditor) (German Public Auditor)
FURTHER INFORMATION — NOTE REGARDING FORWARD-LOOKING STATEMENTS
FU
RT
HE
R I
NFO
RM
AT
ION
243
Note regarding forward-looking statements.
This Annual Report contains forward-looking statements. Forward-looking statements are identified by the use of words
such as »expect«, »intend«, »anticipate«, »plan«, »believe«, »assume«, »aim«, »estimate«, »will«, »shall«, »forecast« and
similar expressions. These statements are based on the current estimates and forecasts by the Board of Managing
Directors as well as on currently available information. Forward-looking statements are not deemed to be guarantees of
the future developments and results set out therein and involve a number of risks and uncertainties. If any of these or
other risks or uncertainties occur, or if the assumptions underlying any of these statements prove incorrect, the actual
results may differ materially from those expressed or implied by such statements.
The LBBW Group assumes no obligation to continuously update any forward-looking statements, as these are based
solely on the circumstances valid on the day of publication.
FURTHER INFORMATION — ADVISORY BOARD
244
Advisory Board of LBBW/BW-Bank.
PROF. DR. ULRICH ABSHAGEN until 31 December 2013 Sole shareholder of Heidelberg Innovation Fonds Management GmbH, Heidelberg
WILLEM G. VAN AGTMAEL Honorary Consul of the Kingdom of the Netherlands, Managing Shareholder of catalpa GmbH, Stuttgart
THOMAS ARTMANN Karlsruhe
DR. STEFAN ASENKERSCHBAUMER Deputy Chairman of Management of Robert Bosch GmbH, Gerlingen
HELMUT AURENZ Honorary Consul of Estonia, Senator h.c., Isny in Allgäu
BARBARA BAUER Member of the Board of Evangelische Landeskirche in Baden, Karlsruhe
HUBERTUS VON BAUMBACH Member of the Management of Boehringer Ingelheim GmbH, Ingelheim am Rhein
ALBERT BERNER Chairman of the Supervisory Board of Berner Gruppe, Künzelsau
DIETMAR BICHLER as of 1 January 2014 Chairman of the Board of Managing Directors of Bertrandt AG, Ehningen
DR. CHRISTOF BOSCH Königsdorf
PETER BOUDGOUST until 31 July 2013 Director of Südwestrundfunk, Stuttgart
PEER-MICHAEL DICK Lawyer, General Manager of SÜDWESTMETALL Verband der Metall- und Elektroindustrie Baden-Württemberg e. V., Stuttgart
DIPL.-KFM. WOLF-GERD DIEFFENBACHER Managing Shareholder of Dieffenbacher GmbH + Co. KG, Eppingen
RALF DIETER Chairman of the Board of Managing Directors of Dürr AG, Bietigheim-Bissingen
PROF. DR. RER. POL. ANDREAS DULGER Honorary Consul of the Republic of Paraguay, Chairman of the Management of ProMinent Dosiertechnik GmbH, Heidelberg
DR. HANS-ULRICH ENGEL Member of the Board of Managing Directors of BASF SE, Ludwigshafen
DIPL.-ING. LIC. OEC. KLAUS ENSINGER Managing Director of Ensinger GmbH Technische Kunststoffe, Nufringen
DR. ALEXANDER ERDLAND Chairman of the Board of Managing Directors of Wüstenrot & Württembergische AG, Stuttgart
DR. MARKUS FAULHABER Chairman of the Board of Managing Directors of Allianz Lebensversicherungs-AG, Stuttgart
PROF. E. H. KLAUS FISCHER Senator E. h. mult. Owner and Chairman of the Management of the fischer Group, fischer holding GmbH & Co. KG, Waldachtal
DR. WOLFGANG FISCHER Member of the Boards of Managing Directors of Stuttgarter Versicherungsgruppe, Stuttgart
PROF. DR. DR. H. C. MULT. WOLFGANG FRANZ until 31 December 2013 Mannheim
DR. WOLFRAM FREUDENBERG Chairman of the Board of Partners of Freudenberg & Co. KG, Weinheim
HANS-GEORG FREY Chairman of the Board of Managing Directors of Jungheinrich AG, Hamburg
DIPL.-KFM. KLAUS FURLER until 31 December 2013 Managing Partner of Koehler Holding GmbH & Co. KG, Stuttgart
DIPL.-KFM. HORST H. GEIDEL until 31 December 2013 Chairman of the Supervisory Board of Behr GmbH & Co. KG, Stuttgart
DR. JÜRGEN GUTBROD until 31 December 2013 Managing Shareholder of W. Kohlhammer GmbH, Stuttgart
DR. RAINER HÄGELE until 31 December 2013 Director General (retired), Stuttgart
THOMAS HANDTMANN as of 25 February 2013 Managing Director of Albert Handtmann Holding GmbH & Co. KG, Biberach
HANS-JOACHIM HAUG Director, Chairman of the Board of Managing Directors of Württembergische Gemeinde-Versicherung a.G., Stuttgart
DR. JOHANNES HAUPT Chairman of the Management/CEO of E.G.O. Elektro-Gerätebau GmbH, Oberderdingen
DIPL.-ING. BERNDT HELLER until 31 December 2013 Senator E. h., Chairman of the Supervisory Board of Gebr. Heller Maschinenfabrik GmbH, Nürtingen
HANS JOCHEN HENKE until 31 December 2013 Lawyer, State Secretary (retired), Stuttgart
DR. CHRISTOPHER HERMANN Chairman of the Board of Managing Directors of AOK Baden-Württemberg, Stuttgart
TILMANN HESSELBARTH Chairman of the Board of Managing Directors of LBS Landesbausparkasse Baden-Württemberg, Stuttgart
MICHAEL HIMMELSBACH Archiepiscopal Bishopric, Seat of the Freiburg Archdiocese, Freiburg i. Br.
DR.-ING. RAINER HOFMEISTER until 31 December 2013 Managing Partner of HGI Gewerbeimmobilien GmbH & Co. KG and Managing Director of industrie automation GmbH & Co. KG, Heidelberg
FURTHER INFORMATION — ADVISORY BOARD
FU
RT
HE
R I
NFO
RM
AT
ION
245
S. D. KRAFT ERBPRINZ ZU HOHENLOHE-OEHRINGEN
Fürst zu Hohenlohe-Oehringen'sche Verwaltung, Öhringen
S. H. KARL FRIEDRICH FÜRST VON HOHENZOLLERN LIC. RER. POL.
Company Group Fürst von Hohenzollern, Sigmaringen
FRANK B. JEHLE as of 1 January 2014 Deputy Chairman of the Management of MANN + HUMMEL Holding GmbH, Ludwigsburg
HARTMUT JENNER Chairman of the Management of Alfred Kärcher GmbH & Co. KG Reinigungssysteme, Winnenden
PROF. DR.-ING. HEINZ K. JUNKER Chairman of the Management of MAHLE GmbH, Stuttgart
DANIEL F. JUST as of 25 February 2013 Chairman of the Board of Managing Directors of Bayerische Versorgungskammer, Munich
HEINZ KÄLBERER until 31 December 2013 Lord Mayor (retired) of the Town of Vaihingen an der Enz
DIPL.-KFM. DIRK KALIEBE Member of the Board of Managing Directors of Heidelberger Druckmaschinen AG, Heidelberg
JOACHIM KALTMAIER Member of the Management of Würth-Gruppe, Künzelsau
DR. BERTRAM KANDZIORA as of 1 January 2014 Chairman of the Board of Managing Directors of Stihl AG, Waiblingen
DR. MARTIN KASTRUP Member of the Board and Head of Finance and IT at Evangelische Landeskirche in Württemberg, Stuttgart
DR. RER. POL. ERWIN KERN Chairman of the Board of Managing Directors of Kies und Beton AG Baden-Baden, Iffezheim
DR. HANS-EBERHARD KOCH Managing Director of Witzenmann GmbH, Pforzheim
PROF. DR. RENATE KÖCHER Managing Director of Institut für Demoskopie Allensbach Gesellschaft zum Studium der öffentlichen Meinung mbH, Allensbach am Bodensee
DIPL.-VOLKSWIRT STEFAN KÖLBL Chairman of the Boards of Managing Directors of DEKRA e.V./DEKRA AG, Stuttgart
THOMAS KÖLBL Member of the Board of Managing Directors of Südzucker AG, Mannheim/ Ochsenfurt, Mannheim
ANDREAS KOHM Shareholder of mail-order business Klingel K-Mail-Order GmbH & Co. KG, Pforzheim
DIETMAR KRAUSS Managing Director, Seat of the Rottenburg-Stuttgart Diocese, Rottenburg
DR.-ING. DIETER KRESS Managing Partner of MAPAL Präzisionswerkzeuge Dr. Kress KG, Aalen
HARALD KROENER Chairman of the Board of Managing Directors of Wieland-Werke AG, Ulm
DR. PETER KULITZ President of the Ulm Chamber of Industry and Commerce, Managing Partner of ESTA Apparatebau GmbH & Co. KG, Ulm
ANDREAS LAPP Honorary Consul of India, Chairman of the Board of Managing Directors of Lapp Holding AG, Stuttgart
VITTORIO LAZARIDIS City Councilor, Stuttgart
DIETER LEBZELTER as of 1 January 2014 Managing Director of IMS Gear GmbH, Donaueschingen
DR. PHIL. NICOLA LEIBINGER-KAMMÜLLER Chairman of the Management, Managing Partner of TRUMPF GmbH + Co. KG, Ditzingen
DR. HUBERT LIENHARD Chairman of the Management of Voith GmbH, Heidenheim
REINHARD LOHMANN as of 1 January 2014 Chairman of the Board of Managing Directors of Rethmann AG & Co. KG, Selm
DIETER MAIER until 31 December 2013 Stuttgart
DR. UTE MAIER Chairman of the Board of Managing Directors of Kassenzahnärztliche Vereinigung Baden-Württemberg, Tübingen
DIPL.-VOLKSWIRT DR. VOLKMAR MAIR until 31 December 2013 Chairman of the Advisory Board of MAIRDUMONT GmbH & Co. KG, Ostfildern
DR. HARALD MARQUARDT Managing Director of Marquardt GmbH, Rietheim-Weilheim
DR. FRANK MASTIAUX as of 1 January 2014 Chairman of the Board of Managing Directors of EnBW Energie Baden-Württemberg AG, Karlsruhe
DIPL.-KFM. MICHAEL MÖLLEKEN Member of the Board of Managing Directors of Festo AG & Co. KG, Esslingen
DR. HERBERT MÜLLER until 31 December 2013 Honorary Consul of Finland, Hessigheim
JOACHIM MÜLLER as of 1 January 2014 Member of the Board of Managing Directors of Bilfinger SE, Mannheim
DR. MICHAEL MÜNZING Managing Shareholder of Münzing Chemie GmbH, Heilbronn
KLAUS MUTSCHLER Zurich
ASS. JUR. HEINZ OHNMACHT Managing Director, Chairman of the Boards of Managing Directors of Badischer Gemeinde-Versicherungs-Verband, Badische Allgemeine Versicherung AG, Karlsruhe
DR. JOACHIM OTT until 31 December 2013 Chairman of the Management of Bilfinger Berger Facility Services GmbH, Neu-Isenburg
DR. WOLFGANG PALM Managing Partner of Papierfabrik Palm GmbH & Co. KG, Aalen
MARTIN PETERS CFO/Managing Partner of Eberspächer Group, Esslingen

FURTHER INFORMATION — ADVISORY BOARD
246
HANS H. PFEIFER City Councilor, Stuttgart
DIPL.-WIRTSCH.-ING. HANS DIETER PÖTSCH Member of the Board of Managing Directors of VOLKSWAGEN Aktiengesellschaft, Wolfsburg
MARTIN PUTSCH, MBA Managing Shareholder of RECARO Holding GmbH, Stuttgart
DR. RICHARD REBMANN Managing Director of Südwestdeutsche Medien Holding GmbH, Stuttgart
FRANK REIMOLD Director of Kommunaler Versorgungsverband Baden-Württemberg, Karlsruhe
DIPL.-BETRIEBSWIRT CLEMENS ROSENSTIEL until 31 December 2013 Friedenweiler
DIPL.-ING. ULRICH RUETZ until 31 December 2013 Ludwigsburg
DR. THOMAS SCHÄUBLE until 3 January 2013 Sole Managing Director of Badische Staatsbrauerei Rothaus AG, Grafenhausen-Rothaus
PROF. H. C. DIPL.-ING. KARL SCHLECHT Senator h.c., Chairman of the Board of Managing Directors of Karl Schlecht-Gemeinnützige Stiftung (K.S.G.), Aichtal
DIPL.-KFM. EDUARD SCHLEICHER Shareholder of SCHWENK Zement KG, Ulm
DR. STEFAN SCHMALE as of 1 January 2014 Managing Director of Paulaner Brauerei GmbH & Co. KG, Munich
DIPL.-BETRIEBSWIRT MARTIN SCHOMAKER Chairman of the Board of Managing Directors of R. Stahl AG, Waldenburg
DR. ROBERT SCHULER-VOITH Managing Shareholder of Mercura Capital GmbH, Munich
DIETER SCHWARZ General Manager of Unternehmensgruppe Schwarz, Neckarsulm
HEINZ SEIFFERT District Administrator of the District of Alb-Donau, Ulm
HUBERT SEITER President, Chairman of the Management of Deutsche Rentenversicherung Baden-Württemberg, Stuttgart
DR. ALEXANDER SELENT Deputy Chairman of the Board of Managing Directors of FUCHS PETROLUB AG, Mannheim
ARMIN SOHLER until 31 December 2013 Auditor/Accountant AHS-Treuhand+Consult GmbH, Heilbronn
DR. STEFAN SOMMER Chairman of the Board of Managing Directors of ZF Friedrichshafen AG, Friedrichshafen
THOMAS SPITZENPFEIL as of 1 January 2014 Member of the Board of Managing Directors of Carl Zeiss AG, Oberkochen
DR.-ING. HANS-JOCHEM STEIM Chairman of the Board of Directors of Hugo Kern und Liebers GmbH & Co., Schramberg
DIPL.-ING. HANS PETER STIHL Honorary Consul General of Singapore, Shareholder of STIHL Holding AG & Co. KG, Waiblingen
DR. H. C. MULT. SYBILL STORZ
until 31 December 2013 Managing Director of KARL STORZ GmbH & Co. KG, Tuttlingen
DR. H. C. ERWIN TEUFEL Minister-President (retired), Spaichingen
DIPL.-KFM. MARIO TRUNZER Managing Director of Liebherr-Werk Ehingen GmbH, Ehingen
BODO UEBBER Member of the Board of Managing Directors of Daimler AG, Stuttgart
DR. H. WERNER UTZ Chairman of the Board of Managing Directors of Uzin Utz AG, Ulm
UDO J. VETTER Shareholder of Vetter Pharma Fertigung GmbH & Co. KG, Ravensburg
HANS-PETER VILLIS until 31 December 2013 Castrop-Rauxel
OLIVER VOERSTER Managing Shareholder of Koch, Neff & Volckmar GmbH, Stuttgart
S. D. JOHANNES FÜRST ZU WALDBURGWOLFEGG UND WALDSEE Wolfegg
S. E. ERICH ERBGRAF VON WALDBURG-ZEIL Leutkirch
THEKLA WALKER City Councilor, Stuttgart
DIPL.-ING. SIEGFRIED WEISHAUPT until 31 December 2013 Managing Shareholder of Max Weishaupt GmbH, Schwendi
MATTHIAS WISSMANN until 31 December 2013 Minister (retired), Lawyer, President of Verband der Autombilindustrie e.V., Partner of law firm Wilmer Cutler Pickering Hale and Dorr LLP, Berlin
RUDOLF F. WOHLFARTH Chairman of the Management of Emil Frey Gruppe Deutschland, Stuttgart
DR. STEFAN WOLF as of 1 January 2014 Chairman of the Board of Managing Directors of ElringKlinger AG, Dettingen/Erms
ULRICH-BERND WOLFF VON DER SAHL Chairman of the Boards of Managing Directors of SV SparkassenVersicherung, Stuttgart
S. K. H. FRIEDRICH HERZOG VON WÜRTTEMBERG Friedrichshafen
DIPL.-ING. JÜRGEN ZEEB City Councilor, Stuttgart
DIPL.-VOLKSWIRT ARTHUR J. ZIMMERMANN Member of the Supervisory Board of Ernst Klett Aktiengesellschaft, Stuttgart
PROF. DR. DR. H. C. WALTHER ZÜGEL Stuttgart
FURTHER INFORMATION — CUSTOMER ADVISORY BOARD OF RHEINLAND-PFALZ BANK
FU
RT
HE
R I
NFO
RM
AT
ION
247
Customer Advisory Board of Rheinland-Pfalz Bank.
Chairman.
KARL MANFRED LOCHNER Member of the Board of Managing Directors of Landesbank Baden-Württemberg, Stuttgart
Members.
DIPL.-WIRTSCH.-ING. WOLFGANG BAUER Chairman of the Board of Managing Directors Dyckerhoff AG, Wiesbaden
BERNHARD BECK Spokesman of the Board of Managing Directors Veritas AG, Gelnhausen
DR. GERHARD F. BRAUN Chair of the Confederation of Business Associations in Rhineland-Palatinate, Mainz
KEVIN BROCK CFO JF Hillebrand Group AG, Mainz
DR. ALBERT CHRISTMANN Personally liable Partner Dr. August Oetker KG, Bielefeld
DIETMAR CLAUSEN CFO Zschimmer & Schwarz GmbH & Co. KG, Lahnstein
DR. KARL-HEINZ ENGEL Chief Executive Officer Hochwald Foods GmbH, Thalfang
KAI-UWE HEUER Executive member of the Board of Management DEG Alles für das Dach eG, Koblenz
ALBRECHT HORNBACH Chairman of the Board of Managing Directors Hornbach Holding Aktiengesellschaft, Neustadt an der Weinstrasse
DETLEF W. HÜBNER Member of the Board of Managing Directors, Chairman of the Management Board Deufol SE, Hofheim am Taunus
DIPL. OEC. AGR. FRED JUNG Member of the Board of Managing Directors Juwi Holding AG, Wörrstadt
DR. JOHANN CHRISTIAN MEIER Managing Director Schütz GmbH & Co. KgaA, Selters
WOLFGANG MOYSES Chairman of the Board of Managing Directors Simona AG, Kirn
ALFRED MÜLLER Managing Director Finance & Administration Bitburger Braugruppe GmbH, Bitburg
DR. RALF MURJAHN Chairman of the Management Deutsche Amphibolin-Werke von Robert Murjahn Stiftung & Co KG, Ober-Ramstadt
GEORG NOLTE Shareholder Nolte Group, Germersheim
RICHARD PATZKE Principal Managing Director Rheinhessen Chamber of Industry and Commerce, Mainz
KLAUS RÜBENTHALER Member of the Board of Managing Directors Schott AG, Mainz
UNIV.-PROF. DR. RER. NAT. HELMUT J. SCHMIDT President Technical University of Kaiserslautern, Kaiserslautern
PROF. DR. W. EDELFRIED SCHNEIDER, WP, STB Managing Partner Dr. Dienst & Partner GmbH & Co. KG Wirtschaftsprüfungsgesellschaft Steuerberatungsgesellschaft, Koblenz
DR. ERNST F. SCHRÖDER Personally liable Partner Dr. August Oetker KG, Bielefeld
CARSTEN SCHRUCK Executive member of the Board of Management Westfleisch eG, Münster
DR. MICHAEL SCHUPPLI Co-owner of, inter alia, Helvetic Grundbesitz Verwaltung GmbH, Wiesbaden
INGO STEINEL Managing Shareholder STEINEL GmbH, Herzebrock-Clarholz
PETER STEINER Auditor/tax consultant Wiesbaden
MARKUS STÜTTGEN CFO Raiffeisen Waren-Zentrale Rhein Main eG, Cologne
HANS JOACHIM SUCHAN Administrative Director ZDF Zweites Deutsches Fernsehen, Mainz
DIPL.-KFM. MORITZ J. WEIG Managing Director Moritz J. Weig GmbH & Co. KG, Mayen
ANTON WERHAHN Chairman of the Board of Managing Directors Wilh. Werhahn KG, Neuss
FURTHER INFORMATION — CUSTOMER ADVISORY BOARD SACHSEN BANK
248
Customary Advisory Board of Sachsen Bank.
Chairman.
MICHAEL HORN Deputy Chairman of the Board of Managing Directors of Landesbank Baden-Württemberg, Stuttgart
Members.
DR. ING. E. H. FRANK H. ASBECK Chairman of the Board of Managing Directors of SolarWorld AG, Bonn
LOTHAR BAUER Managing Director of Igepa Grosshandel GmbH, Landsberg
PROF. DR. RER. POL. HABIL. DR. H. C. ULRICH BLUM Holder of professorship in Economic Policy and Research at Martin Luther University Halle-Wittenberg, Halle
DR. FRANK BRINKEN CEO of StarragHeckert AG, Rorschacherberg, Switzerland
CARSTEN DIETMANN Managing Director of Dresdner Druck und Verlagshaus GmbH & Co. KG, Dresden
RÜDIGER GESERICK Chairman of the Management of SKW Stickstoffwerke Piesteritz GmbH, Lutherstadt Wittenberg
STEFFEN IRMSCHER Tax consultant Steuerkanzlei Irmscher & Freyboth, Dresden
MICHAEL KEITZ Managing Director of QSIL GmbH Quarzschmelze Ilmenau, Langewiesen
MARTIN KRENGEL Chairman of the Management of WEPA Industrieholding SE, Arnsberg
AXEL KRUPP Managing Director of Hermes Schleifkörper GmbH, Dresden
HENRY KULNICK Managing Director of Lorenz Nuss GmbH, Kreba-Neudorf
DR. FRANK LÖSCHMANN SisTeam Group, Dresden
PROF. DR.-ING. E. H. HANS J. NAUMANN Managing Shareholder of Niles-Simmons-Hegenscheidt GmbH, Chemnitz
FRANK ORSCHLER Managing Director of Königsee Implantate GmbH, Allendorf
DR.-ING. LUTZ PETERMANN Managing Director of FAM Magdeburger Förderanlagen und Baumaschinen GmbH, Magdeburg
HOLGER RAITHEL Managing Director of Kahla/Thüringen Porzellan GmbH, Kahla
UWE REINECKE Managing Director of Schmiedewerke Gröditz GmbH, Gröditz
JÜRGEN RIESTER Managing Director of GFC AntriebsSysteme GmbH, Coswig
MARTIN RÖDER Managing Shareholder of Gelenkwellenwerk Stadtilm GmbH, Stadtilm
BERNHARD ROTHENBERGER Managing Shareholder of Auerbachs Keller Rothenberger Betriebs GmbH, Leipzig
GÖRGE SCHEID Attorney at law/specialist in insolvency law, Leipzig
DIPL.-PHYS. ROBIN SCHILD President and CEO of VON ARDENNE GmbH, Dresden
CHRISTOPH SCHMELTER Managing Director of DMI GmbH & Co. KG, Münster
DR. ANDREAS SPERL Managing Director of Elbe Flugzeugwerke GmbH, Dresden
DIPL.-WIRT.-ING. WOLFGANG TOPF President of the Leipzig Chamber of Commerce and Industry, Leipzig
JÜRGEN TSCHIRNER Managing Director of LSL GmbH, Ein Unternehmen der Haufe Gruppe, Leipzig
THOMAS WEIDINGER Attorney at law, law firm Weidinger/Richtscheid Rechtsanwälte, Leipzig
DR.-ING. FLORIAN WENDT Managing Director of ACTech GmbH, Freiberg
249
FURTHER INFORMATION ON LANDESBANK BADEN-WÜRTTEMBERG
www.LBBW.de
PUBLISHER'S INFORMATION CERTIFICATIONS
Published by: Landesbank Baden-Württemberg Am Hauptbahnhof 2 70173 Stuttgart
Concept & Realization: Landesbank Baden-Württemberg created using FIRE.sys
The Annual Report was printed on environment- friendly paper.
www.LBBW.de [email protected]
Printing: W.Kohlhammer Druckerei GmbH + Co. KG, Stuttgart
The Annual Report is also available in German.
The LBBW Group at a glance.
Landesbank Baden-Württemberg (LBBW). As a universal and commercial bank, LBBW, together with its regional retail banks BW-Bank, Rheinland-Pfalz Bank, and Sachsen Bank, offers every type of business provided by a modern bank at around 200 branches and offices nationwide.
Strategically, LBBW focuses on its customer-oriented core business with growth prospects especially in the regions of Baden-Württemberg, Rhineland-Palatinate, and Saxony, and the respective neighboring regions. Business activities focus on corporate and private customers as well as the savings banks there. This is accompanied by efficient real estate financing and capital market products, which are also targeted at institutional customers. A further aspect of the business model is customer-oriented foreign business.
As the umbrella of the LBBW Group, LBBW (Bank) performs a controlling function within the Group. The management of large corporates operating across Germany and internationally, capital markets business, real estate financing and the Bank's function as the central bank for savings banks in Baden-Württemberg, Rhineland-Palatinate, and Saxony are also based here.
Baden-Württembergische Bank (BW-Bank). BW-Bank's customer portfolio comprises corporate and private customers primarily in the core market of Baden-Württemberg; it also selectively supports corporate customers in Bavaria. BW-Bank targets SMEs and wealthy private customers. In addition, it provides wealth management services for high-net-worth customers.
Within the state capital of Stuttgart BW-Bank acts as a municipal savings bank.
Rheinland-Pfalz Bank. Rheinland-Pfalz Bank focuses particularly on SME business in Rhineland-Palatinate, North-Rhine Westphalia and Hesse. It also addresses wealthy private customers in its core market of Rhineland-Palatinate and neighboring regions.
Sachsen Bank. The LBBW Group uses Sachsen Bank to pool its medium-sized corporate customer and wealthy private customer business in Saxony and the neighboring economic areas.
Additional Group companies. The range of services and products offered by LBBW is enhanced by subsidiaries specializing in specific business areas, such as leasing, factoring, asset management, real estate, and equity funding.
Landesbank Baden-Württemberg
Headquarters
Stuttgart
70144 Stuttgart, Germany
Am Hauptbahnhof 2
70173 Stuttgart, Germany
Phone +49 (0) 711 127-0
Fax +49 (0) 711 127-43544
www.LBBW.de
Karlsruhe
D-76245 Karlsruhe
Ludwig-Erhard-Allee 4
D-76131 Karlsruhe
Phone +49 (0) 721 142-0
Fax +49 (0) 721 142-23012
www.LBBW.de
Mannheim
P. O. Box 100352
D-68003 Mannheim
Augustaanlage 33
D-68165 Mannheim
Phone +49 (0) 621 428-0
Fax +49 (0) 621 428-72591
www.LBBW.de
Mainz
D-55098 Mainz
Grosse Bleiche 54–56
D-55116 Mainz
Phone +49 (0) 6131 64-37800
Fax +49 (0) 6131 64-35701
www.LBBW.de
Landesbank Baden-Württemberg


