Embed Size (px)
Citation preview
(incorporated in the Cayman Islands with limited liability)(Stock Code: 03900)
GREENTOWN CHINA HOLDINGS LIMITED
2013 Annual Report

Welcome to your home of Greentown. Walk into a world of luxury and style.
Transform your dreams into reality here.
From the minute you set foot on the majestic doorway that leads into the elegant hallway, you will be embraced by the luxury and grace of a bygone era.
Traditional style combined with contemporary detailing gives the place a personal
touch with a flair of splendour. Each unit is tastefully designed for home lovers who
have an eye for quality and beauty. Nestled in breathtaking landscaped gardens,
these homes allow you to experience the magical powers of nature in your own
private setting. Join the Greentown family and live the dream of many others today.
Find your home with Greentown and enjoy the luxury of life with peace of mind.
Corporate Profile 2
Corporate Information 4
Financial Highlights 6
Chairman’s Statement 10
CEO’s Report 12
Property Portfolio 14
Management Discussion and Analysis 16
Biographical Details of Directors and
Senior Management 32
Sustainability and Corporate Social
Responsibility 40
Investor Relations 44
Corporate Governance Report 50
Report of the Directors 56
Independent Auditor’s Report 76
Consolidated Financial Statements 77
Definition 176
Contents
G r e e n t o w n C h i n a H o l d i n g s L i m i t e d
Corporate Profile
2
Greentown China Holdings Limited is one of the leading property developers in the People’s Republic of China. It commands a leading position in the industry by leveraging on its quality properties. From 2005 to 2013, we have been ranked for nine consecutive years as one of “THE TOP 10 PROPERTY ENTERPRISES IN CHINA” jointly by four authoritative institutions, namely Enterprise Research Institute of the Development Research Center of the State Council, China Real Estate Association, Qinghua University Real Estate Research Center and China Index Institute.
In September 2013, Greentown was the only PRC real estate developer in the PRC to be named the “Top Brand in Customer Satisfaction”. Greentown received this honor at a press conference held by the “China Real Estate TOP 10 Research Team”, formed jointly by the Development Research Center of the State Council, the Institute of Real Estate Studies at Tsinghua University and the China Index Academy. The surveys conducted for this recognition covered 17 cities throughout China. Greentown came first on the basis of customer satisfaction in 15 major cities in which it operates. The results have shown that Greentown has a clear advantage in the areas of, among others, property services, quality of construction, project design, sales services and corporate reputation.
A n n u a l R e p o r t 2 0 1 3 3 / Corporate Profile
Since its establishment 19 years ago, the Group has been based in Zhejiang Province, one of the most economically vibrant provinces in the PRC. With property projects covering most of the economically prosperous cities in Zhejiang Province such as Hangzhou, Ningbo, Wenzhou, Taizhou, Shaoxing and other cities amongst the Top 100 national most competitive county-level cities in Zhejiang Province, the Group has a sizable operation scale and enjoys a wide recognition. Since the commencement of the Group’s national expansion strategy in 2000, the Group has successfully set foot in other major cities located in Yangtze River Delta, including Shanghai, Nanjing, Suzhou, Wuxi, Nantong and major cities in Bohai Rim Economic Belt, including Beijing, Tianjin, Qingdao, Jinan, Dalian and other provincial cities, such as Hefei in Anhui Province, Zhengzhou in Henan Province, Changsha in Hunan Province, and Urumqi in Xinj iang, which enabled the operating results to grow continuously and established an excellent brand image in various cities. Greentown focuses on the development
of superior-quality properties. Having continuously improved and enriched its product portfolio, Greentown now offers widely-received high quality housing types such as villa, flat mansion, low-rise apartment, high-rise apartment, urban complex, integrated community and commercial property.
On 8 June 2012, Wharf was introduced as a strategic shareholder of Greentown. The aggregate investment by Wharf amounted to approximately HK$5.1 billion (equivalent to approximately RMB4.16 billion), including the subscription of approximately 490 million placing shares and the subscription of PSCS (which has been redeemed in full in February 2014). As of 31 December 2013, Wharf (through i ts whol ly-owned subsid iary ) was interested in 24.32% of the total issued share capital of the Company.
In addition, Greentown entered into an agreement with Sunac on 22 June 2012, pursuant to which a joint venture, Shanghai Sunac Greentown Investment Holding Co., Ltd. (上海融創綠城投資控股有限公司), was established and held as to 50% by Greentown and 50% by Sunac, respectively.
T h e e s t a b l i s h m e n t o f s t r a t e g i c partnership with two powerful real estate developers from the PRC and Hong Kong clearly indicates that Greentown’s products and development abi l i ty are endorsed by professionals in the property industry, and their confidence in Greentown’s prospect.
On 31 December 2013, the premier land bank of the Greentown Group comprised a total GFA of over 38.89 million sqm, ensuring Greentown Group’s sustainable and steady development in the coming future. Leveraging on its quality human resources and highly-effective corporate management structure, Greentown has established a strong presence in all cities where it operates. The Group’s experience in developing numerous high-quality projects and outstanding operational capabilities have provided a strong momentum for its further expansion.
G r e e n t o w n C h i n a H o l d i n g s L i m i t e d
Corporate Information
4
Board of DirectorsExecutive DirectorsMr SONG Weiping (Chairman)Mr SHOU Bainian (Executive Vice Chairman)Mr LUO Zhaoming (Vice Chairman)Mr GUO JiafengMr CAO Zhounan
Non-Executive DirectorsMr NG Tin Hoi, StephenMr TSUI Yiu Cheung
Independent Non-Executive Directors
Mr JIA ShenghuaMr JIANG WeiMr KE HuanzhangMr SZE Tsai Ping, MichaelMr TANG ShidingMr HUI Wan Fai
Audit CommitteeMr SZE Tsai Ping, Michael (Chairman)Mr TSUI Yiu CheungMr JIA ShenghuaMr JIANG WeiMr TANG ShidingMr HUI Wan Fai
Nomination CommitteeMr SZE Tsai Ping, Michael (Chairman)Mr SHOU BainianMr TSUI Yiu CheungMr TANG ShidingMr HUI Wan Fai
Remuneration CommitteeMr JIA Shenghua (Chairman)Mr SHOU BainianMr NG Tin Hoi, StephenMr SZE Tsai Ping, Michael
Registered OfficeMaples Corporate Services LimitedPO Box 309, Ugland HouseSouth Church StreetGeorge Town, Grand CaymanKY1-1104, Cayman Islands
Share Registrar in Hong KongComputershare Hong Kong Investor
Services LimitedShops 1712–1716,17th Floor, Hopewell Centre183 Queen’s Road EastWanchai, Hong Kong
Share Registrar in Cayman IslandsRoyal Bank of Canada Trust Company
(Cayman) Limited4th Floor, Royal Bank House24 Shedden Road,George Town Grand CaymanKY1-1110 Cayman Islands
AuditorDeloitte Touche Tohmatsu
Legal Advisorsas to Hong Kong law:Ashurst Hong Kong
as to PRC law:Zhejiang T&C Law Firm
as to Cayman Islands law andBritish Virgin Islands law:
Maples and Calder
Company SecretaryMr FUNG Ching, Simon
Authorized RepresentativesMr SHOU BainianMr FUNG Ching, Simon
Principal BankersThe Bank of East Asia, LimitedStandard Chartered Bank (Hong Kong)
LimitedBank of China LimitedIndustrial and Commercial Bank of China
LimitedAgricultural Bank of China LimitedChina Construction Bank CorporationBank of Communications Co., Ltd.Shanghai Pudong Development Bank
Co., Ltd.China Everbright Bank Corporation
LimitedGuangdong Development Bank Co., Ltd.
A n n u a l R e p o r t 2 0 1 3 5 / Corporate Information
Hangzhou Headquarters10/F, Block A, Century PlazaNo. 1 Hangda RoadHangzhou, ZhejiangPRC(Postal code: 310007)
Principal Place of Business inHong KongRoom 1406–1408, New World Tower 116–18 Queen’s Road CentralHong Kong
Investor RelationsEmail: [email protected]: (852) 2523 3138Fax: (852) 2523 6608
Public RelationsHill + Knowlton Strategies AsiaEmail: [email protected]: (852) 2894 6321Fax: (852) 2576 1990
Stock CodeHKEx: 03900
Websiteswww.chinagreentown.comwww.greentownchina.com
G r e e n t o w n C h i n a H o l d i n g s L i m i t e d
Financial Highlights
6
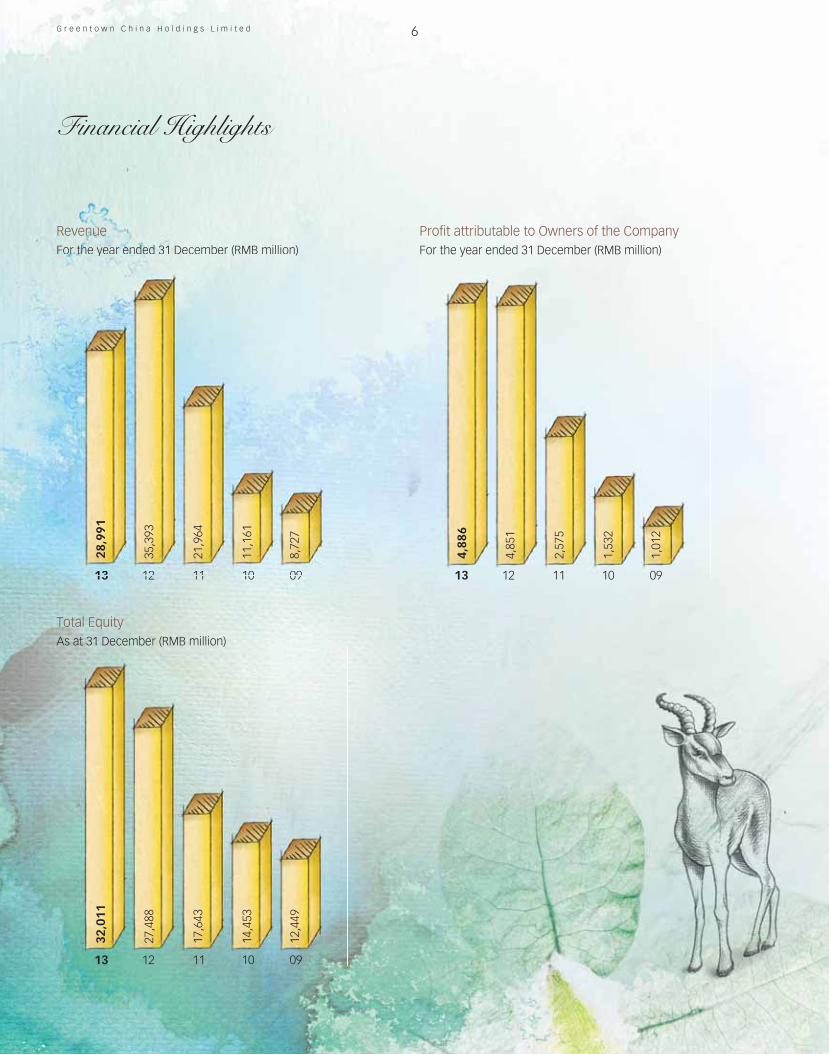
RevenueFor the year ended 31 December (RMB million)
Profit attributable to Owners of the CompanyFor the year ended 31 December (RMB million)
Total EquityAs at 31 December (RMB million)
13 12 11 10 09
13 12 11 10 09
13 12 11 10 09
yyyyyyyyyyy ((((((( ))))
1313133131313333 12121212121212212 111111111111111111 1010101010 0909090909
28,9
91
11,1
61
21,9
64
35,3
93
8,72
712
,449
14,4
53
17,6
43
27,4
88
32,0
11
1,01
2
1,53
2
2,57
5
4,85
1
4,88
6
A n n u a l R e p o r t 2 0 1 3 7 / Financial Highlights
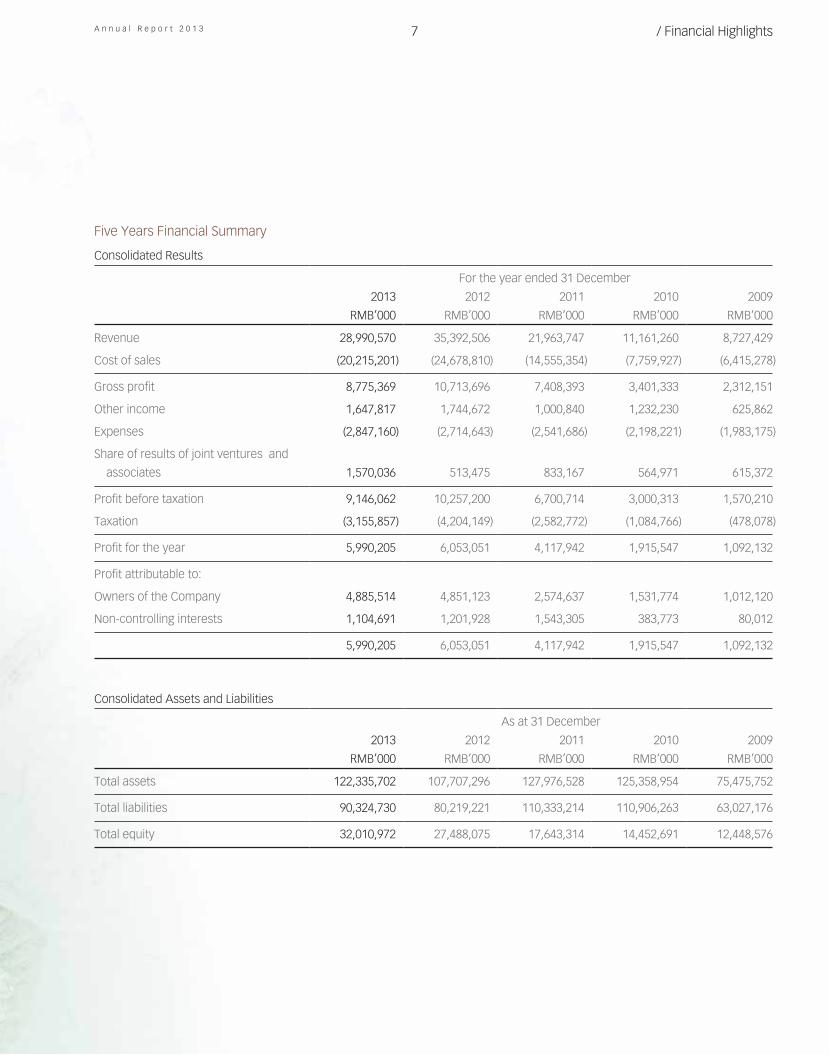
Five Years Financial Summary
Consolidated Results
For the year ended 31 December
2013 2012 2011 2010 2009
RMB’000 RMB’000 RMB’000 RMB’000 RMB’000
Revenue 28,990,570 35,392,506 21,963,747 11,161,260 8,727,429
Cost of sales (20,215,201) (24,678,810) (14,555,354) (7,759,927) (6,415,278)
Gross profit 8,775,369 10,713,696 7,408,393 3,401,333 2,312,151
Other income 1,647,817 1,744,672 1,000,840 1,232,230 625,862
Expenses (2,847,160) (2,714,643) (2,541,686) (2,198,221) (1,983,175)
Share of results of joint ventures and
associates 1,570,036 513,475 833,167 564,971 615,372
Profit before taxation 9,146,062 10,257,200 6,700,714 3,000,313 1,570,210
Taxation (3,155,857) (4,204,149) (2,582,772) (1,084,766) (478,078)
Profit for the year 5,990,205 6,053,051 4,117,942 1,915,547 1,092,132
Profit attributable to:
Owners of the Company 4,885,514 4,851,123 2,574,637 1,531,774 1,012,120
Non-controlling interests 1,104,691 1,201,928 1,543,305 383,773 80,012
5,990,205 6,053,051 4,117,942 1,915,547 1,092,132
Consolidated Assets and Liabilities
As at 31 December
2013 2012 2011 2010 2009
RMB’000 RMB’000 RMB’000 RMB’000 RMB’000
Total assets 122,335,702 107,707,296 127,976,528 125,358,954 75,475,752
Total liabilities 90,324,730 80,219,221 110,333,214 110,906,263 63,027,176
Total equity 32,010,972 27,488,075 17,643,314 14,452,691 12,448,576


Wuzhen Graceland
G r e e n t o w n C h i n a H o l d i n g s L i m i t e d
Chairman’s Statement
10
Let’s Keep up the Good Work in 2014!
Dear Shareholders,
How would you describe 2013? For everyone in Greentown, I think the year can be described as one of hardship, yet of great efforts.
The good old days of the property sector have become history and the tough market condition remains. While we have made immense efforts to change and to strive for a breakthrough, our collective efforts are still considered insigni�cant in changing the overall situation. Against th is backdrop, i t can be seen that achieving the results we attained was not easy. Our success can be attributed to the collective efforts of our employees who are particularly outstanding given the current dif�cult circumstances.
Greentown will continue to adhere to the principle of humanism and pursue its operational objectives of “exquisite quality and steady operation”. In terms of product categories, apart from the traditional residential business, urban complexes located in second and third-tier cities similar to Zhuji Greentown Plaza should become our key focus. Business – wise, we will continuously reinforce construction management following our initial accomplishments in that area , and a lso cont inue to develop elderly care service and “Cloud” services. We will continue to expand the serv ice scope of our products and raise their added value. During this process, both our mindset and management capabilities will encounter dif�cult challenges. Starting with the changes in the management team, we have to be resolute in enhancing our operational abilities. The management team’s abi l i t ies and dedicat ion are crucial to the survival and development of the Company. Managers at all levels, part icu lar ly the genera l managers for each project, must enhance their business operations awareness, master the sk i l l o f “do ing bus iness” , and improve their management capabilities in different aspects including product q u a l i t y , c o s t c o n t r o l a n d m a r k e t p o s i t i o n i n g , t o b e c o m e q u a l i � e d business operators. Strictly speaking, 050912 (i.e. construction commences within 5 months, project on sales within 9 months, receipt of sale proceeds covering the land premium within 12 months) should only be regarded as a minimum threshold for our project developments. To completely overcome our shortcomings in management, we have to make practical improvements to our operational capabilities, enhance our ef�ciency and maintain a smooth and fast pace of project development.
How shall we confront all the challenges in 2014? In short, we should leverage our positive energy. We must collaborate between teams, be proact ive and friendly, work with passion, encourage each other, and proceed with optimism…this positive energy has gathered much momentum to inspire others, and I hope everyone at Greentown can exemplify this in 2014.
Let us keep up the good work in 2014!
SONG WeipingChairman of the Board21 March 2014
N o m a t t e r h o w c h a l l e n g i n g t h e circumstances may be, we believe there is no reason or likelihood for human civilization to regress from a macro-historic perspective. For a country at a certain period of time, the market environment can be harsh and uncertain due to all sorts of dif�culties. However, who can usher in sunny days without dedication and hard work?

A n n u a l R e p o r t 2 0 1 3 11 / Chairman’s Statement
Our success is attributed to the efforts made by all of our employees andsuch efforts are especially prominent given how tough the current circumstances are.
G r e e n t o w n C h i n a H o l d i n g s L i m i t e d
CEO’s Report
12
Dear Shareholders,
In the first half of 2013, China’s economic development was exposed to the risk of a downturn due to shifts in internal and external demand. After taking up the office by the new government, a series of policies and measures focusing on structura l ad justments , s teady growth and reform promotion have been adopted, distributing reformed earnings and stimulating the market’s vitality. As a result, the national economy grew steadily at a moderate pace, following the implementation of the reform.
As a real estate developer, Greentown adheres to the s t ra tegy o f s tab le operations; constant monitoring and scrut in iz ing of any changes within and beyond the sector; and adoption of appropriate changes to adapt to economic reforms. From a polit ical perspect ive , the centra l and loca l governments have yet to relax their regulations of the real estate market under the currently evolving business cycle. In the second half of the year, austerity policies on real estate underwent a transition – from the simplest approach of uniform standards for all cities rolled out by the Central government, which resulted in unstable property markets in various cities – to specific standards manda ted by l oca l gove rnments . Examples include the “New National Five Measures” promulgated by the Central Government at the start of the year to the “Eight Measures of Shenzhen”, the “Seven Measures of Beijing”, the “Seven Measures of Shanghai” and the “Six Measures of Guangzhou” promulgated in Shenzhen, Bei j ing, Shanghai and Guangzhou, respectively. This let them adopt more ref ined, e f fect ive and targeted measures that were better
tailored for to local conditions and in turn truly corresponded to the austerity measures. Meanwhile, controls in tier-one cit ies have been t ightened but these remained more or less the same in the second and third-tier cities. Such a distinctive contrast demonstrates the geographical difference in the future trend of the real estate market.
From a market perspective, volatility in real estate price is heavily affected by supply and demand in the market. Generally driven by the release of pent-up demand in the region, both transaction volume and average property prices have steadily increased this year. Even so, distinctions can still be observed between different cities. In first and second-tier cities and in some second-tier cities, property price continued to shoot up due to limited supply, while demand remained robust. In contrast, demand in some third and fourth-tier cities was sluggish but supply has been significantly increased after various property developers having entered into these markets in the past few years. This led to the market nearing saturation and to greatly extended sales cycles for property development.
F r o m a c a p i t a l p e r s p e c t i v e , t h e extraordinarily low interest rates offered in the offshore capital market, attributed to the quantitative easing monetary policy adopted by various developed
countries such as the U.S. and Japan, has created favourable financing conditions for real estate developers suffering from onshore financing difficulties. Greentown has grasped the good opportunity of cheaper offshore financing through bond issuances and syndicated loans, and raised approximately US$2.0 billion during the year with an average interest rate of only 5.96%.
Such low-cost offshore financing provides PRC real estate developers with strong support for expansion and enables them to take a more aggressive approach in land auction, resulting in the frequent “new record-high price” land sale.
In response to all these new situations and changes, our management team has continued to take a positive view of the PRC real estate market in the long run, and focus on maintaining the quality of our products and services. On this basis, we scrutinized several key issues amid the current development process, and launched effective measures to reduce inventory, adjust structural changes and speed up the transformation. We recognized that the sales cycle has been extended and the level of inventory has been increasingly high. To tackle this, the Company believes that we should improve the strength and efforts of agencies’ transformation and increase the marketing awareness of all our staff in both depth and scope, so that we can
A n n u a l R e p o r t 2 0 1 3 13 / CEO’s Report
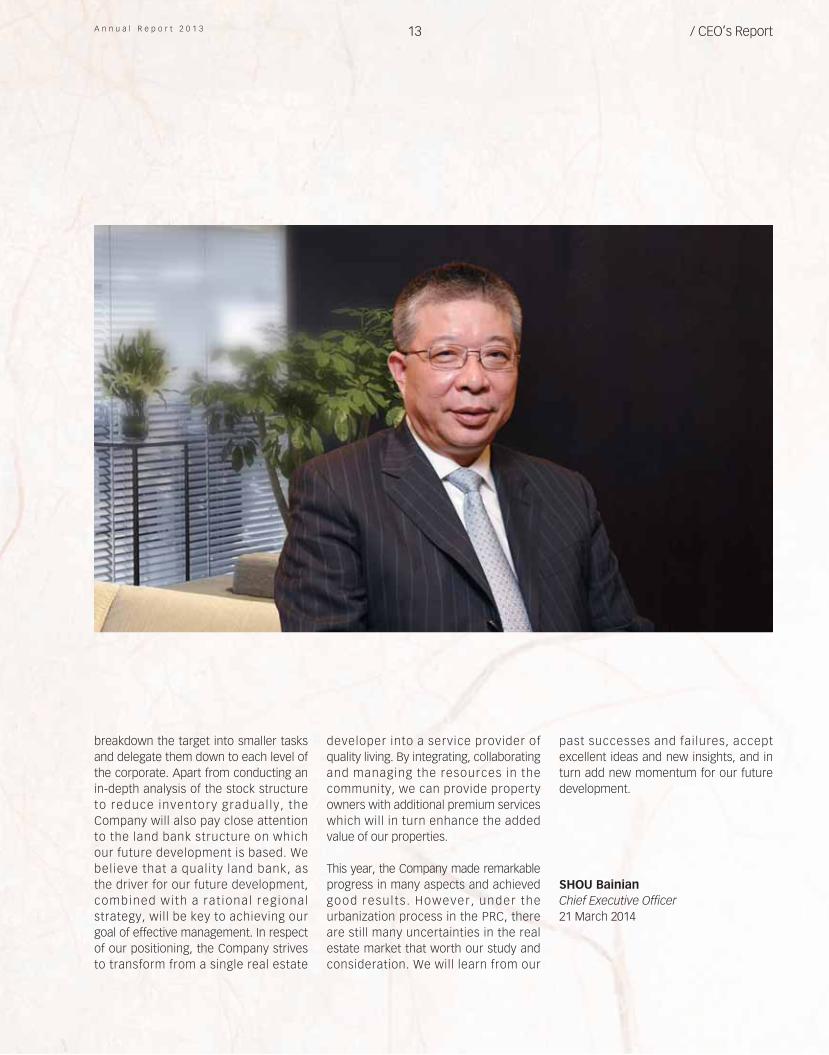
breakdown the target into smaller tasks and delegate them down to each level of the corporate. Apart from conducting an in-depth analysis of the stock structure to reduce inventory gradual ly , the Company will also pay close attention to the land bank structure on which our future development is based. We bel ieve that a qual ity land bank, as the driver for our future development, combined wi th a rat iona l reg iona l strategy, will be key to achieving our goal of effective management. In respect of our positioning, the Company strives to transform from a single real estate
developer into a service provider of quality living. By integrating, collaborating and managing the resources in the community, we can provide property owners with additional premium services which will in turn enhance the added value of our properties.
This year, the Company made remarkable progress in many aspects and achieved good resu l ts . However , under the urbanization process in the PRC, there are still many uncertainties in the real estate market that worth our study and consideration. We will learn from our
past successes and failures, accept excellent ideas and new insights, and in turn add new momentum for our future development.
SHOU BainianChief Executive Officer21 March 2014


1 / Property Portfolio
Property Portfolio
G r e e n t o w n C h i n a H o l d i n g s L i m i t e d 2 / Property Portfolio/ Property Portfolio
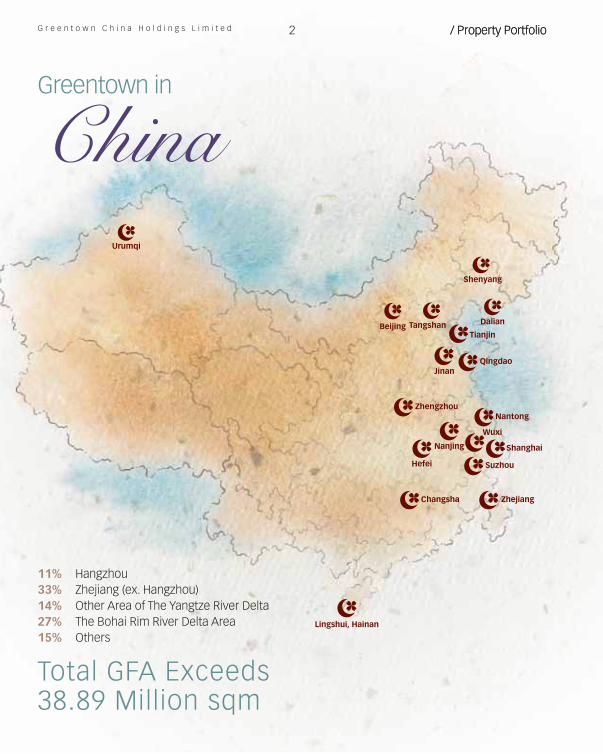
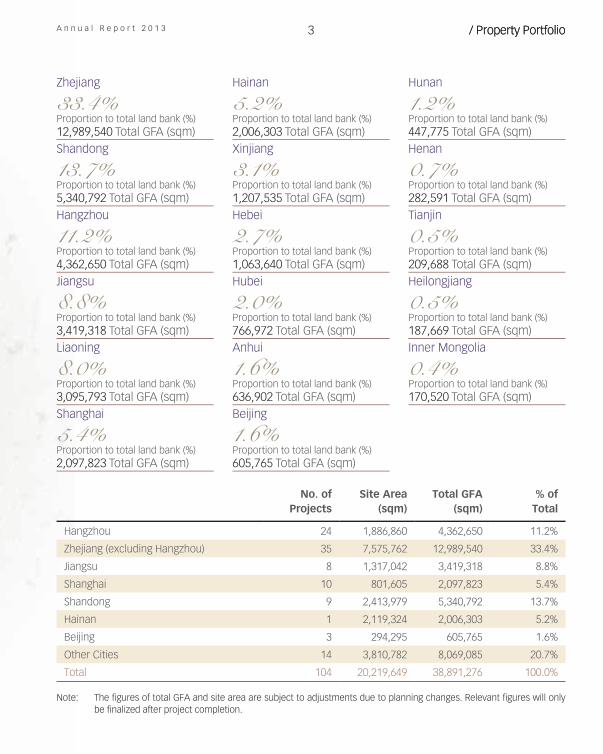
Total GFA Exceeds38.89 Million sqm
11% Hangzhou33% Zhejiang (ex. Hangzhou)14% Other Area of The Yangtze River Delta27% The Bohai Rim River Delta Area15% Others
ChinaGreentown in
Urumqi
Lingshui, Hainan
Shenyang
Dalian
TianjinBeijing Tangshan
Qingdao
Nantong
Jinan
Shanghai
Hefei
Changsha
Nanjing
Zhejiang
Suzhou
Zhengzhou
Wuxi
3A n n u a l R e p o r t 2 0 1 3 / Property Portfolio/ Property Portfolio
Zhejiang
33.4%Proportion to total land bank (%)12,989,540 Total GFA (sqm)Shandong
13.7%Proportion to total land bank (%)5,340,792 Total GFA (sqm)Hangzhou
11.2%Proportion to total land bank (%)4,362,650 Total GFA (sqm)Jiangsu
8.8%Proportion to total land bank (%)3,419,318 Total GFA (sqm)Liaoning
8.0%Proportion to total land bank (%)3,095,793 Total GFA (sqm)Shanghai
5.4%Proportion to total land bank (%)2,097,823 Total GFA (sqm)
Hainan
5.2%Proportion to total land bank (%)2,006,303 Total GFA (sqm)Xinjiang
3.1%Proportion to total land bank (%)1,207,535 Total GFA (sqm)Hebei
2.7%Proportion to total land bank (%)1,063,640 Total GFA (sqm)Hubei
2.0%Proportion to total land bank (%)766,972 Total GFA (sqm)Anhui
1.6%Proportion to total land bank (%)636,902 Total GFA (sqm)Beijing
1.6%Proportion to total land bank (%)605,765 Total GFA (sqm)
Hunan
1.2%Proportion to total land bank (%)447,775 Total GFA (sqm)Henan
0.7%Proportion to total land bank (%)282,591 Total GFA (sqm)Tianjin
0.5%Proportion to total land bank (%)209,688 Total GFA (sqm)Heilongjiang
0.5%Proportion to total land bank (%)187,669 Total GFA (sqm)Inner Mongolia
0.4%Proportion to total land bank (%)170,520 Total GFA (sqm)
No. ofProjects
Site Area(sqm)
Total GFA(sqm)
% ofTotal
Hangzhou 24 1,886,860 4,362,650 11.2%
Zhejiang (excluding Hangzhou) 35 7,575,762 12,989,540 33.4%
Jiangsu 8 1,317,042 3,419,318 8.8%
Shanghai 10 801,605 2,097,823 5.4%
Shandong 9 2,413,979 5,340,792 13.7%
Hainan 1 2,119,324 2,006,303 5.2%
Beijing 3 294,295 605,765 1.6%
Other Cities 14 3,810,782 8,069,085 20.7%
Total 104 20,219,649 38,891,276 100.0%
Note: The figures of total GFA and site area are subject to adjustments due to planning changes. Relevant figures will only be finalized after project completion.
G r e e n t o w n C h i n a H o l d i n g s L i m i t e d 4 / Property Portfolio/ Property Portfolio
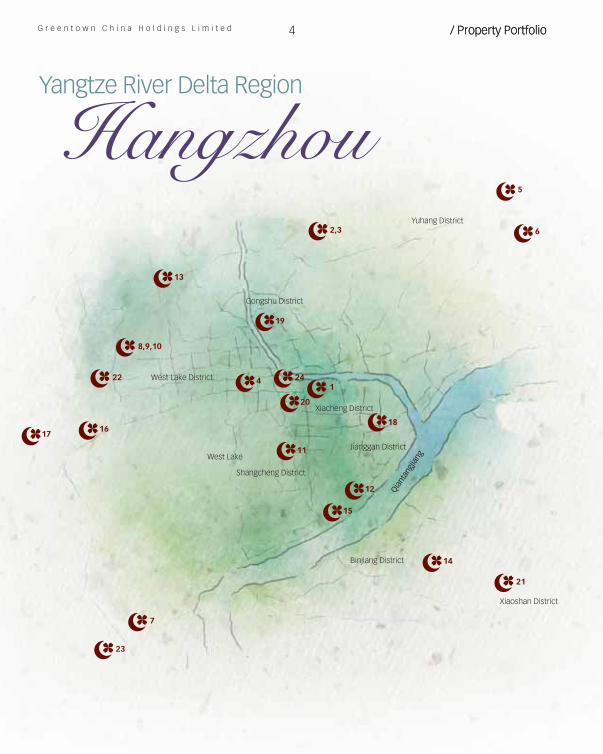
Hangzhou Yangtze River Delta Region
Qian
tang
jiang
Xiacheng District
West Lake
Shangcheng District
Binjiang District
Yuhang District
Gongshu District
18
14
21
2,3
5
6
13
1617
23
8,9,10
22 4
11
12
15
1
19
24
20
7
Xiaoshan District
Jianggan District
West Lake District
5A n n u a l R e p o r t 2 0 1 3 / Property Portfolio/ Property Portfolio
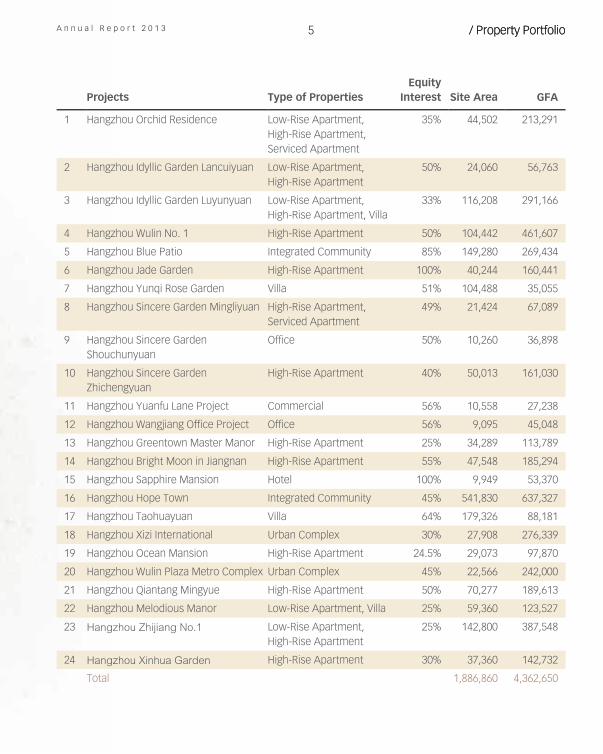
Projects Type of PropertiesEquity
Interest Site Area GFA
1 Hangzhou Orchid Residence Low-Rise Apartment, High-Rise Apartment, Serviced Apartment
35% 44,502 213,291
2 Hangzhou Idyllic Garden Lancuiyuan Low-Rise Apartment, High-Rise Apartment
50% 24,060 56,763
3 Hangzhou Idyllic Garden Luyunyuan Low-Rise Apartment, High-Rise Apartment, Villa
33% 116,208 291,166
4 Hangzhou Wulin No. 1 High-Rise Apartment 50% 104,442 461,607
5 Hangzhou Blue Patio Integrated Community 85% 149,280 269,434
6 Hangzhou Jade Garden High-Rise Apartment 100% 40,244 160,441
7 Hangzhou Yunqi Rose Garden Villa 51% 104,488 35,055
8 Hangzhou Sincere Garden Mingliyuan High-Rise Apartment, Serviced Apartment
49% 21,424 67,089
9 Hangzhou Sincere Garden Shouchunyuan
Office 50% 10,260 36,898
10 Hangzhou Sincere Garden Zhichengyuan
High-Rise Apartment 40% 50,013 161,030
11 Hangzhou Yuanfu Lane Project Commercial 56% 10,558 27,238
12 Hangzhou Wangjiang Office Project Office 56% 9,095 45,048
13 Hangzhou Greentown Master Manor High-Rise Apartment 25% 34,289 113,789
14 Hangzhou Bright Moon in Jiangnan High-Rise Apartment 55% 47,548 185,294
15 Hangzhou Sapphire Mansion Hotel 100% 9,949 53,370
16 Hangzhou Hope Town Integrated Community 45% 541,830 637,327
17 Hangzhou Taohuayuan Villa 64% 179,326 88,181
18 Hangzhou Xizi International Urban Complex 30% 27,908 276,339
19 Hangzhou Ocean Mansion High-Rise Apartment 24.5% 29,073 97,870
20 Hangzhou Wulin Plaza Metro Complex Urban Complex 45% 22,566 242,000
21 Hangzhou Qiantang Mingyue High-Rise Apartment 50% 70,277 189,613
22 Hangzhou Melodious Manor Low-Rise Apartment, Villa 25% 59,360 123,527
23 Hangzhou Zhijiang No.1 Low-Rise Apartment, High-Rise Apartment
25% 142,800 387,548
24 Hangzhou Xinhua Garden High-Rise Apartment 30% 37,360 142,732
Total 1,886,860 4,362,650
G r e e n t o w n C h i n a H o l d i n g s L i m i t e d 6 / Property Portfolio
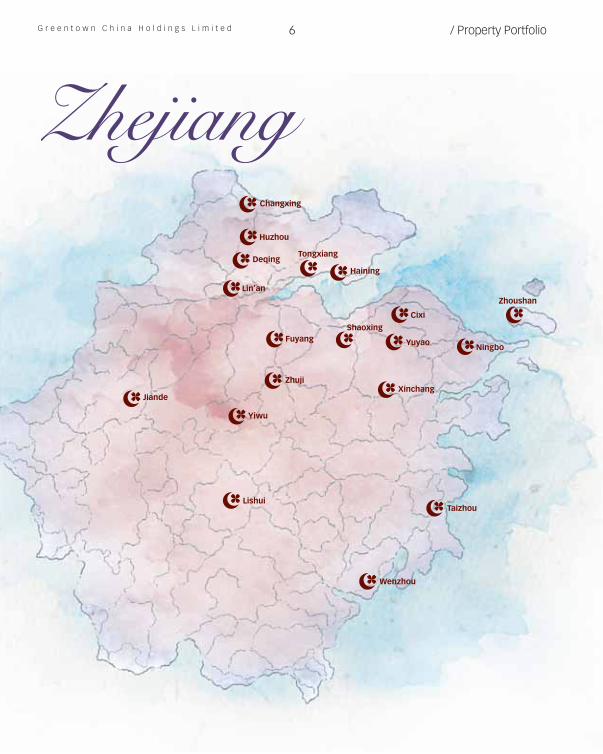
Zhejiang
Lin’an
DeqingHaining
Tongxiang
Ningbo
Lishui
Zhoushan
Wenzhou
Changxing
Jiande
Huzhou
FuyangShaoxing
Taizhou
Cixi
Zhuji
Yuyao
Yiwu
Xinchang
7A n n u a l R e p o r t 2 0 1 3 / Property Portfolio
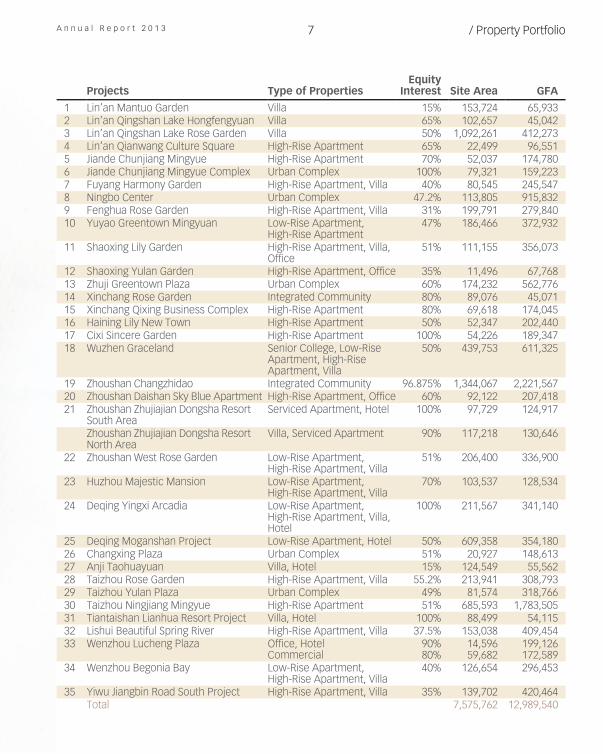
Projects Type of PropertiesEquity
Interest Site Area GFA 1 Lin’an Mantuo Garden Villa 15% 153,724 65,9332 Lin’an Qingshan Lake Hongfengyuan Villa 65% 102,657 45,0423 Lin’an Qingshan Lake Rose Garden Villa 50% 1,092,261 412,2734 Lin’an Qianwang Culture Square High-Rise Apartment 65% 22,499 96,5515 Jiande Chunjiang Mingyue High-Rise Apartment 70% 52,037 174,7806 Jiande Chunjiang Mingyue Complex Urban Complex 100% 79,321 159,2237 Fuyang Harmony Garden High-Rise Apartment, Villa 40% 80,545 245,5478 Ningbo Center Urban Complex 47.2% 113,805 915,8329 Fenghua Rose Garden High-Rise Apartment, Villa 31% 199,791 279,84010 Yuyao Greentown Mingyuan Low-Rise Apartment,
High-Rise Apartment47% 186,466 372,932
11 Shaoxing Lily Garden High-Rise Apartment, Villa, Office
51% 111,155 356,073
12 Shaoxing Yulan Garden High-Rise Apartment, Office 35% 11,496 67,76813 Zhuji Greentown Plaza Urban Complex 60% 174,232 562,77614 Xinchang Rose Garden Integrated Community 80% 89,076 45,07115 Xinchang Qixing Business Complex High-Rise Apartment 80% 69,618 174,04516 Haining Lily New Town High-Rise Apartment 50% 52,347 202,44017 Cixi Sincere Garden High-Rise Apartment 100% 54,226 189,34718 Wuzhen Graceland Senior College, Low-Rise
Apartment, High-Rise Apartment, Villa
50% 439,753 611,325
19 Zhoushan Changzhidao Integrated Community 96.875% 1,344,067 2,221,56720 Zhoushan Daishan Sky Blue Apartment High-Rise Apartment, Office 60% 92,122 207,41821 Zhoushan Zhujiajian Dongsha Resort
South AreaServiced Apartment, Hotel 100% 97,729 124,917
Zhoushan Zhujiajian Dongsha Resort North Area
Villa, Serviced Apartment 90% 117,218 130,646
22 Zhoushan West Rose Garden Low-Rise Apartment, High-Rise Apartment, Villa
51% 206,400 336,900
23 Huzhou Majestic Mansion Low-Rise Apartment, High-Rise Apartment, Villa
70% 103,537 128,534
24 Deqing Yingxi Arcadia Low-Rise Apartment, High-Rise Apartment, Villa, Hotel
100% 211,567 341,140
25 Deqing Moganshan Project Low-Rise Apartment, Hotel 50% 609,358 354,18026 Changxing Plaza Urban Complex 51% 20,927 148,61327 Anji Taohuayuan Villa, Hotel 15% 124,549 55,56228 Taizhou Rose Garden High-Rise Apartment, Villa 55.2% 213,941 308,79329 Taizhou Yulan Plaza Urban Complex 49% 81,574 318,76630 Taizhou Ningjiang Mingyue High-Rise Apartment 51% 685,593 1,783,50531 Tiantaishan Lianhua Resort Project Villa, Hotel 100% 88,499 54,11532 Lishui Beautiful Spring River High-Rise Apartment, Villa 37.5% 153,038 409,45433 Wenzhou Lucheng Plaza Office, Hotel
Commercial90%80%
14,59659,682
199,126172,589
34 Wenzhou Begonia Bay Low-Rise Apartment, High-Rise Apartment, Villa
40% 126,654 296,453
35 Yiwu Jiangbin Road South Project High-Rise Apartment, Villa 35% 139,702 420,464Total 7,575,762 12,989,540
G r e e n t o w n C h i n a H o l d i n g s L i m i t e d 8 / Property Portfolio
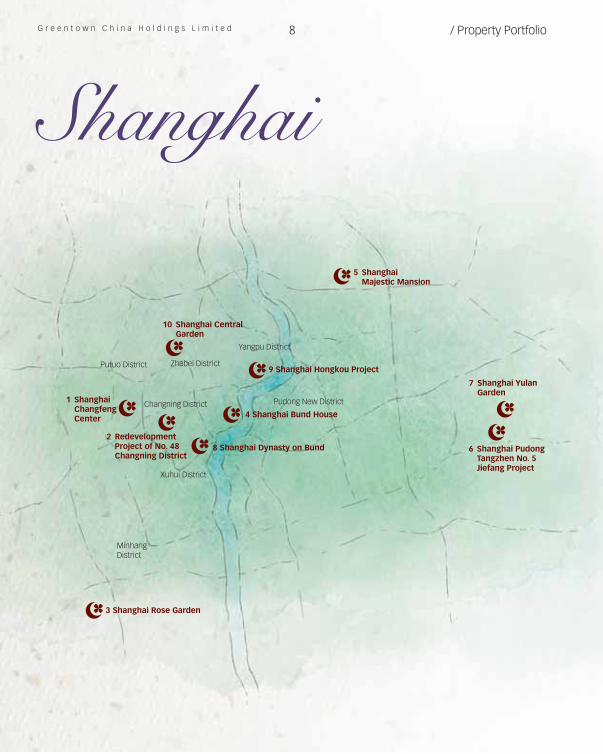
Shanghai
6 Shanghai Pudong Tangzhen No. 5 Jiefang Project
7 Shanghai Yulan Garden
5 Shanghai Majestic Mansion
8 Shanghai Dynasty on Bund
1 Shanghai Changfeng Center
3 Shanghai Rose Garden
4 Shanghai Bund House
9 Shanghai Hongkou Project
10 Shanghai Central Garden
2 Redevelopment Project of No. 48 Changning District
Yangpu District
Zhabei DistrictPutuo District
Changning District
Minhang District
Xuhui District
Pudong New District
9A n n u a l R e p o r t 2 0 1 3 / Property Portfolio
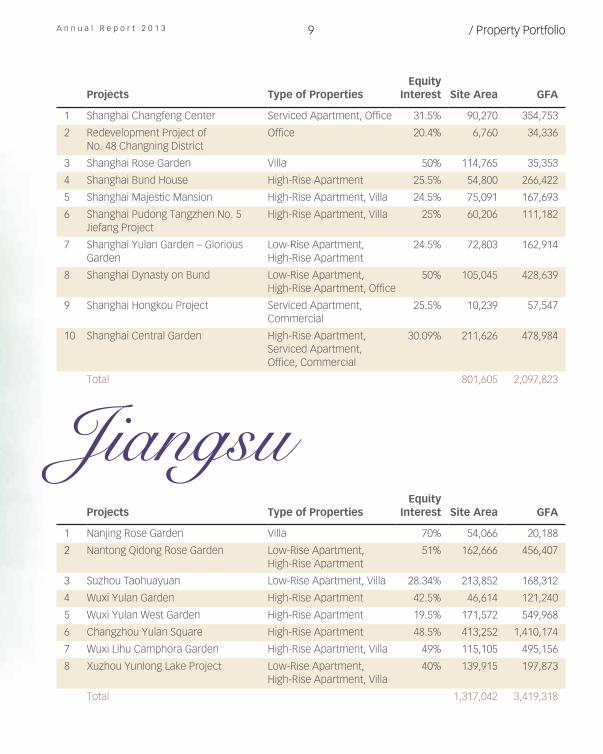
Projects Type of PropertiesEquity
Interest Site Area GFA
1 Shanghai Changfeng Center Serviced Apartment, Office 31.5% 90,270 354,753
2 Redevelopment Project of No. 48 Changning District
Office 20.4% 6,760 34,336
3 Shanghai Rose Garden Villa 50% 114,765 35,353
4 Shanghai Bund House High-Rise Apartment 25.5% 54,800 266,422
5 Shanghai Majestic Mansion High-Rise Apartment, Villa 24.5% 75,091 167,693
6 Shanghai Pudong Tangzhen No. 5Jiefang Project
High-Rise Apartment, Villa 25% 60,206 111,182
7 Shanghai Yulan Garden – Glorious Garden
Low-Rise Apartment, High-Rise Apartment
24.5% 72,803 162,914
8 Shanghai Dynasty on Bund Low-Rise Apartment, High-Rise Apartment, Office
50% 105,045 428,639
9 Shanghai Hongkou Project Serviced Apartment, Commercial
25.5% 10,239 57,547
10 Shanghai Central Garden High-Rise Apartment, Serviced Apartment, Office, Commercial
30.09% 211,626 478,984
Total 801,605 2,097,823
JiangsuProjects Type of Properties
Equity Interest Site Area GFA
1 Nanjing Rose Garden Villa 70% 54,066 20,188
2 Nantong Qidong Rose Garden Low-Rise Apartment, High-Rise Apartment
51% 162,666 456,407
3 Suzhou Taohuayuan Low-Rise Apartment, Villa 28.34% 213,852 168,312
4 Wuxi Yulan Garden High-Rise Apartment 42.5% 46,614 121,240
5 Wuxi Yulan West Garden High-Rise Apartment 19.5% 171,572 549,968
6 Changzhou Yulan Square High-Rise Apartment 48.5% 413,252 1,410,174
7 Wuxi Lihu Camphora Garden High-Rise Apartment, Villa 49% 115,105 495,156
8 Xuzhou Yunlong Lake Project Low-Rise Apartment, High-Rise Apartment, Villa
40% 139,915 197,873
Total 1,317,042 3,419,318
G r e e n t o w n C h i n a H o l d i n g s L i m i t e d 10 / Property Portfolio
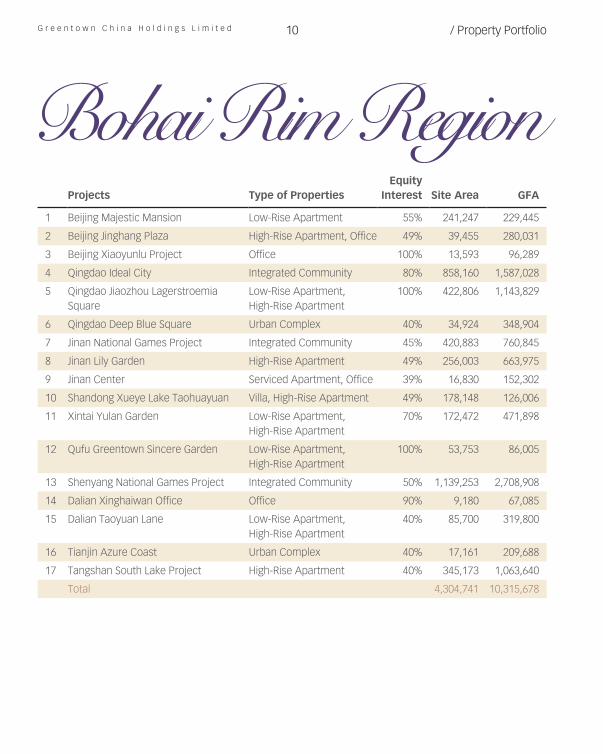
Bohai Rim RegionProjects Type of Properties
Equity Interest Site Area GFA
1 Beijing Majestic Mansion Low-Rise Apartment 55% 241,247 229,445
2 Beijing Jinghang Plaza High-Rise Apartment, Office 49% 39,455 280,031
3 Beijing Xiaoyunlu Project Office 100% 13,593 96,289
4 Qingdao Ideal City Integrated Community 80% 858,160 1,587,028
5 Qingdao Jiaozhou Lagerstroemia Square
Low-Rise Apartment, High-Rise Apartment
100% 422,806 1,143,829
6 Qingdao Deep Blue Square Urban Complex 40% 34,924 348,904
7 Jinan National Games Project Integrated Community 45% 420,883 760,845
8 Jinan Lily Garden High-Rise Apartment 49% 256,003 663,975
9 Jinan Center Serviced Apartment, Office 39% 16,830 152,302
10 Shandong Xueye Lake Taohuayuan Villa, High-Rise Apartment 49% 178,148 126,006
11 Xintai Yulan Garden Low-Rise Apartment, High-Rise Apartment
70% 172,472 471,898
12 Qufu Greentown Sincere Garden Low-Rise Apartment, High-Rise Apartment
100% 53,753 86,005
13 Shenyang National Games Project Integrated Community 50% 1,139,253 2,708,908
14 Dalian Xinghaiwan Office Office 90% 9,180 67,085
15 Dalian Taoyuan Lane Low-Rise Apartment, High-Rise Apartment
40% 85,700 319,800
16 Tianjin Azure Coast Urban Complex 40% 17,161 209,688
17 Tangshan South Lake Project High-Rise Apartment 40% 345,173 1,063,640
Total 4,304,741 10,315,678
11A n n u a l R e p o r t 2 0 1 3 / Property Portfolio/ Property Portfolio
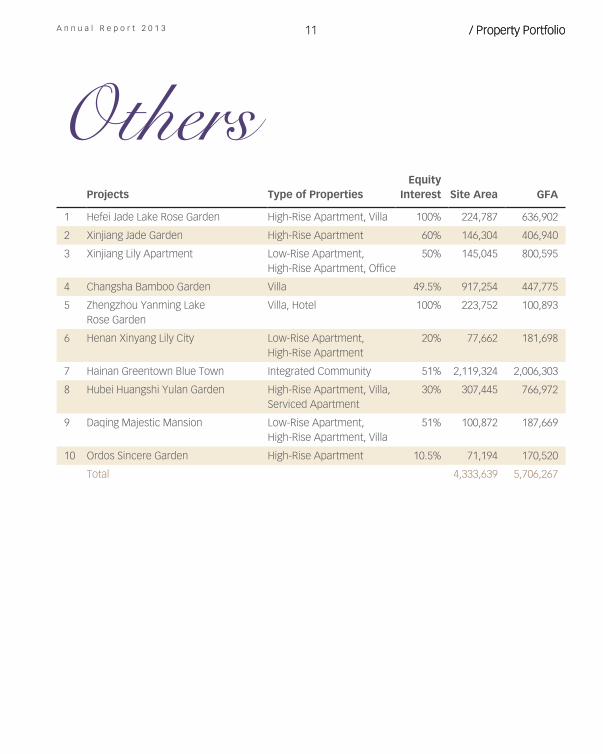
OthersProjects Type of Properties
Equity Interest Site Area GFA
1 Hefei Jade Lake Rose Garden High-Rise Apartment, Villa 100% 224,787 636,902
2 Xinjiang Jade Garden High-Rise Apartment 60% 146,304 406,940
3 Xinjiang Lily Apartment Low-Rise Apartment, High-Rise Apartment, Office
50% 145,045 800,595
4 Changsha Bamboo Garden Villa 49.5% 917,254 447,775
5 Zhengzhou Yanming Lake Rose Garden
Villa, Hotel 100% 223,752 100,893
6 Henan Xinyang Lily City Low-Rise Apartment, High-Rise Apartment
20% 77,662 181,698
7 Hainan Greentown Blue Town Integrated Community 51% 2,119,324 2,006,303
8 Hubei Huangshi Yulan Garden High-Rise Apartment, Villa, Serviced Apartment
30% 307,445 766,972
9 Daqing Majestic Mansion Low-Rise Apartment, High-Rise Apartment, Villa
51% 100,872 187,669
10 Ordos Sincere Garden High-Rise Apartment 10.5% 71,194 170,520
Total 4,333,639 5,706,267
16
OPERATIONS REVIEWIn line with the PRC Government’s increasing rationalization of its plan to p romote urban iza t ion and i t s measures to regulate the China’s real estate market, market players have continuously adjusted and adapted their respective strategies and direction to prevent signif icant f luctuations encountered by this sector in the past. In the past year, focusing on the principle of operational stability, Greentown has undertaken an in-depth self-rehabilitation of its operations in many aspects and achieved relatively satisfactory results.
Results OverviewIn 2013, the profit attributable to owners of the Company reached RMB4,886 million, representing an increase of RMB35 million or 0.7% over RMB4,851 million recorded in 2012. After deduction of post-tax effect of net gains from acquisitions and disposals, impairment losses or reversa l of impairment losses on some properties, and gain from changes in fair value of financial derivatives and gain from changes in
fair value of investment properties, the core profit attributable to owners of the Company reached RMB4,443 million, representing an increase of RMB186 million or 4.4% compared to RMB4,257 million recorded in 2012.
During the Year, the Company achieved basic earnings per share of RMB2.18, r e p r e s e n t i n g a 1 5 . 2 % d e c r e a s e compared to RMB2.57 per share in 2012, primarily due to the placing of approximately 490 million new shares to a wholly-owned subsidiary of Wharf in 2012 which in turn resulted in an increase in the weighted average number of ordinary shares of the Company in 2013.
Pre-sales in the YearFor the year ended 31 December 2013, Greentown Group ( including Greentown China Holdings Limited and its subsidiaries, together with its joint ventures and associates) recorded a total saleable area of 3.09 million sqm. Total pre-sales amounted to RMB65.1 billion (including subscription sales of RMB3.0 billion), which increase by 19.2%
from RMB54.6 billion and accounted for 118.4% of our annual sales target set at the beginning of 2013. Total pre-sales attributable to the Group amounted to RMB33.6 billion. The overall average selling price was RMB20,115 per sqm.
From Satisfaction to LoyaltyIn September 2013, Greentown was the only PRC real estate developer in the PRC to be named the “Top Brand in Customer Sat is fact ion” . Greentown received this honor at a press conference held by the “China Real Estate TOP 10 Research Team”, formed jointly by the Development Research Center of the State Council, the Institute of Real Estate Studies at Tsinghua University and the China Index Academy. The surveys conducted for this recognition covered 17 cities throughout China. Greentown came first on the basis of customer satisfaction in 15 major cities in which it operates. The results have shown that Greentown has a clear advantage in the areas of, among others, property services, quality of construction, project design, sales services and corporate reputation.
Management Discussion and Analysis
G r e e n t o w n C h i n a H o l d i n g s L i m i t e d
A n n u a l R e p o r t 2 0 1 3 17 / Management Discussion and Analysis
Following consecutive years of achieving high rankings in customer satisfaction surveys, the market has unanimously acknowledged our unrelenting pursuit of high quality of product and service. Through our own efforts, we hope to gradually transform our customers’ level of product satisfaction into loyalty to the “Greentown” brand. Accordingly, over the course of the Year, we have seized upon the great opportunity to improve products and services and maintain customer loyalty by listening to customers’ feedback and suggestions through our customer service centers and numerous other channels, and have conducted a comprehensive review of Greentown property owners’ major concerns. We listened to their thoughts and needs in a l l areas , inc lud ing landscape planning, residence design, material quality, construction technique, product preservation, and benchmarked ourselves against leading industry standards so as to satisfy the different requirements of our property owners to the largest extent. We are deeply aware that brand value does not entirely depend on the products provided – there are many real estate developers that can design and construct properties; the differentiating factor is our customers’ trust in and loyalty to the “Greentown” brand.
Tackling ChallengesAfter undergoing challenging times, real estate developers have become more sensitive to policy trends, market directions and customer needs and market consolidation has increased. To ensure that we achieve annual sales targets, we have made concerted efforts to organize and maintain our strengths, focus our superior resources and deploy our elite sales force to fully support and develop construction commencement,
pre-sale, delivery and other critical development stages of some of our key challenging projects. At the same time, we have constantly ensured that every project monitors its unsold property inventory systematically and, taking into account factors such as market conditions, customer demands and product positioning, implements targeted sales plans for different types of unsold property inventory. The effectiveness of our sales efforts was increased by waves of frenzied property purchases triggered by the imposition of the new 20% personal income tax pursuant to the “New National Five Measures” issued in the first half of the year and, in the second half of the year, by marketing campaigns (such as industry joint trade fairs, project on-site activit ies and seasonal customer gratitude activities) centered around the theme of “Beautiful Building, Beautiful Life” so as to enhance awareness and reputat ion of the “Greentown brand”.
Establishing Agency Sales EchelonSales agents played a crucial role in exceeding the Year’s annual sales target and our future development is even more dependent on strengthening these reserves. We are gradually optimizing our sales agency team structure by recruiting talented individuals with a good track record, strong potential and passion into our agency sales echelon to ensure the cont inuous growth of our sales team as well as steady improvement of our performance. The key members in the agency sales team, who will take on the Company’s most important assignments, have to meet our stringent requirements in various areas such as cultural alignment, responsibility, professional expertise and overall quality. In order to strengthen the specialist skills and overall quality of these staff
and fast track their career development by letting them take on key roles as soon as possible, the Company has focused on practical work experience and required the agency sales teams to strictly implement marketing and sales systems and ensured that there is a certain number of agency sales team members who conduct daily marketing activities and visit to the customers. The employment of the worst performing sales agent among those sales agents who failed to achieve their sales targets for three consecutive months will be terminated to ensure that a group of elite sales agents will emerge from the teams.
Land BankIn 2013, Greentown Group acquired 11 new land s i tes , wi th a GFA of approximately 3.36 million sqm of which approximately 1.35 million sqm was attributable to the Group. The newly added land sites’ total land premium amounted to approximately RMB24.3 billion. The majority of the land premium was paid by business partners, while only approximately RMB7.2 billion was required to be paid by the Group.
G r e e n t o w n C h i n a H o l d i n g s L i m i t e d 18 / Management Discussion and Analysis
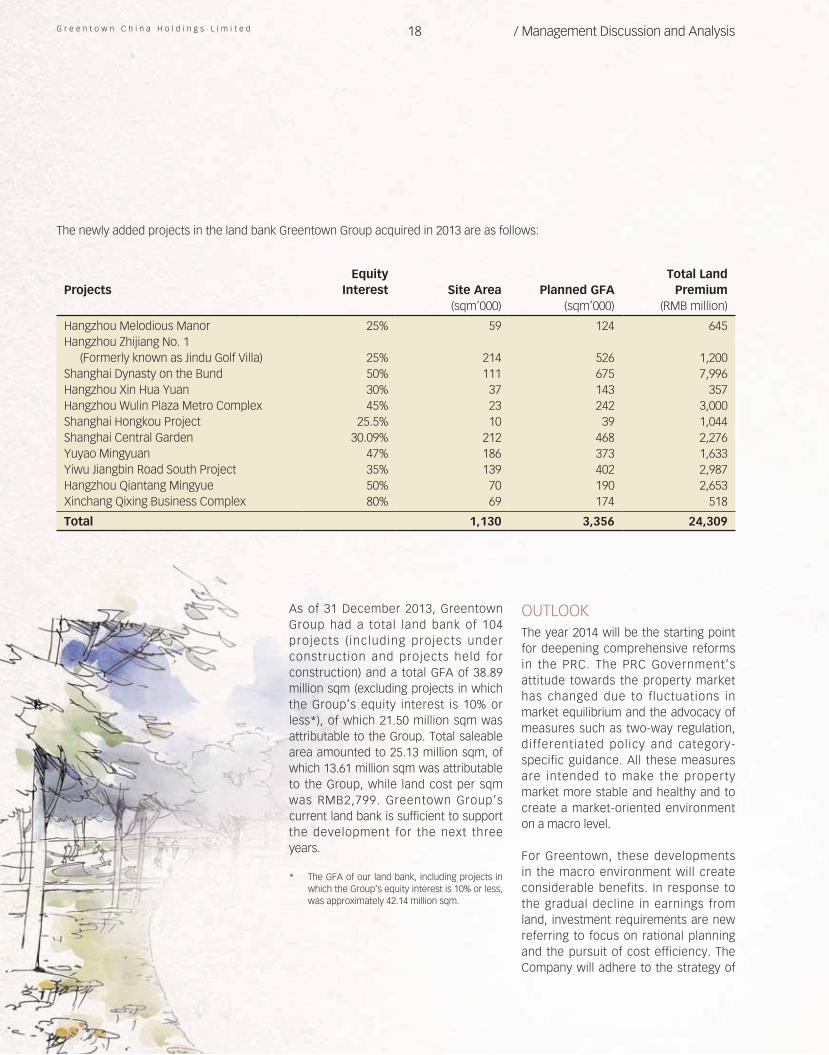
The newly added projects in the land bank Greentown Group acquired in 2013 are as follows:
ProjectsEquity
Interest Site Area Planned GFATotal Land
Premium(sqm’000) (sqm’000) (RMB million)
Hangzhou Melodious Manor 25% 59 124 645Hangzhou Zhijiang No. 1
(Formerly known as Jindu Golf Villa) 25% 214 526 1,200Shanghai Dynasty on the Bund 50% 111 675 7,996Hangzhou Xin Hua Yuan 30% 37 143 357Hangzhou Wulin Plaza Metro Complex 45% 23 242 3,000Shanghai Hongkou Project 25.5% 10 39 1,044Shanghai Central Garden 30.09% 212 468 2,276Yuyao Mingyuan 47% 186 373 1,633Yiwu Jiangbin Road South Project 35% 139 402 2,987Hangzhou Qiantang Mingyue 50% 70 190 2,653Xinchang Qixing Business Complex 80% 69 174 518 Total 1,130 3,356 24,309
As of 31 December 2013, Greentown Group had a total land bank of 104 projects ( including projects under construction and projects held for construction) and a total GFA of 38.89 million sqm (excluding projects in which the Group’s equity interest is 10% or less*), of which 21.50 million sqm was attributable to the Group. Total saleable area amounted to 25.13 million sqm, of which 13.61 million sqm was attributable to the Group, while land cost per sqm was RMB2,799. Greentown Group’s current land bank is sufficient to support the development for the next three years.
* The GFA of our land bank, including projects in which the Group’s equity interest is 10% or less, was approximately 42.14 million sqm.
OUTLOOKThe year 2014 will be the starting point for deepening comprehensive reforms in the PRC. The PRC Government’s attitude towards the property market has changed due to fluctuations in market equilibrium and the advocacy of measures such as two-way regulation, differentiated policy and category-specific guidance. All these measures are intended to make the property market more stable and healthy and to create a market-oriented environment on a macro level.
For Greentown, these developments in the macro environment will create considerable benefits. In response to the gradual decline in earnings from land, investment requirements are new referring to focus on rational planning and the pursuit of cost efficiency. The Company will adhere to the strategy of
A n n u a l R e p o r t 2 0 1 3 19 / Management Discussion and Analysis
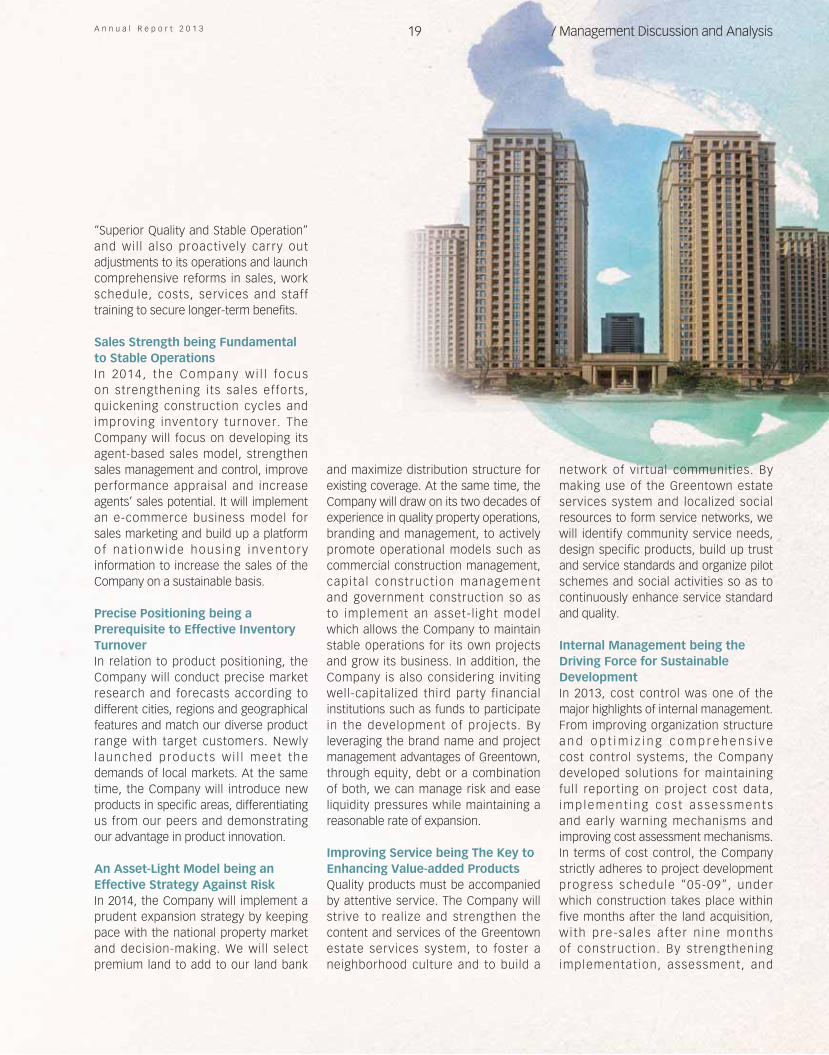
“Superior Quality and Stable Operation” and wil l also proactively carry out adjustments to its operations and launch comprehensive reforms in sales, work schedule, costs, services and staff training to secure longer-term benefits.
Sales Strength being Fundamental to Stable OperationsI n 2014 , the Company w i l l focus on strengthening its sales efforts, quickening construction cycles and improving inventory turnover. The Company will focus on developing its agent-based sales model, strengthen sales management and control, improve performance appraisal and increase agents’ sales potential. It will implement an e-commerce business model for sales marketing and build up a platform o f na t ionwide hous ing inventory information to increase the sales of the Company on a sustainable basis.
Precise Positioning being a Prerequisite to Effective Inventory TurnoverIn relation to product positioning, the Company will conduct precise market research and forecasts according to different cities, regions and geographical features and match our diverse product range with target customers. Newly launched products w i l l meet the demands of local markets. At the same time, the Company will introduce new products in specific areas, differentiating us from our peers and demonstrating our advantage in product innovation.
An Asset-Light Model being an Effective Strategy Against RiskIn 2014, the Company will implement a prudent expansion strategy by keeping pace with the national property market and decision-making. We will select premium land to add to our land bank
and maximize distribution structure for existing coverage. At the same time, the Company will draw on its two decades of experience in quality property operations, branding and management, to actively promote operational models such as commercial construction management, capi ta l construct ion management and government construction so as to implement an asset-l ight model which allows the Company to maintain stable operations for its own projects and grow its business. In addition, the Company is also considering inviting well-capitalized third party financial institutions such as funds to participate in the development of projects. By leveraging the brand name and project management advantages of Greentown, through equity, debt or a combination of both, we can manage risk and ease liquidity pressures while maintaining a reasonable rate of expansion.
Improving Service being The Key to Enhancing Value-added ProductsQuality products must be accompanied by attentive service. The Company will strive to realize and strengthen the content and services of the Greentown estate services system, to foster a neighborhood culture and to build a
network of virtual communities. By making use of the Greentown estate services system and localized social resources to form service networks, we will identify community service needs, design specific products, build up trust and service standards and organize pilot schemes and social activities so as to continuously enhance service standard and quality.
Internal Management being the Driving Force for Sustainable DevelopmentIn 2013, cost control was one of the major highlights of internal management. From improving organization structure a n d o p t i m i z i n g c o m p r e h e n s i v e cost control systems, the Company developed solutions for maintaining full reporting on project cost data, i m p l e m e n t i n g c o s t a s s e s s m e n t s and early warning mechanisms and improving cost assessment mechanisms. In terms of cost control, the Company strictly adheres to project development progress schedule “05-09”, under which construction takes place within five months after the land acquisition, wi th pre-sa les a f ter n ine months of construct ion. By strengthening implementat ion, assessment, and
G r e e n t o w n C h i n a H o l d i n g s L i m i t e d 20 / Management Discussion and Analysis
organizational intervention, the progress and efficiency of development projects a r e e x p e d i t e d . W e m e t i c u l o u s l y conduct preparatory work to ensure market research, product positioning, house design, and master planning are carried out before land is acquired. The other aspect of internal management l ies in the Company viewing staff development and improvement as our long-term driving force, using directional and guidance training in specialist, management and other areas to inspire and enthuse employees into promoting self-learning initiatives and to achieve efficiency and enhancement in execution. The Company is also in the process of reviewing a new system of compensation. While maintaining salaries in the first industry category, by linking evaluation mechanisms with performance, the staff appraisal system will be strengthened with objectives, t imelines, quantif iable factors and targets, which will provide improved staff support for the implementation of the Group’s strategy.
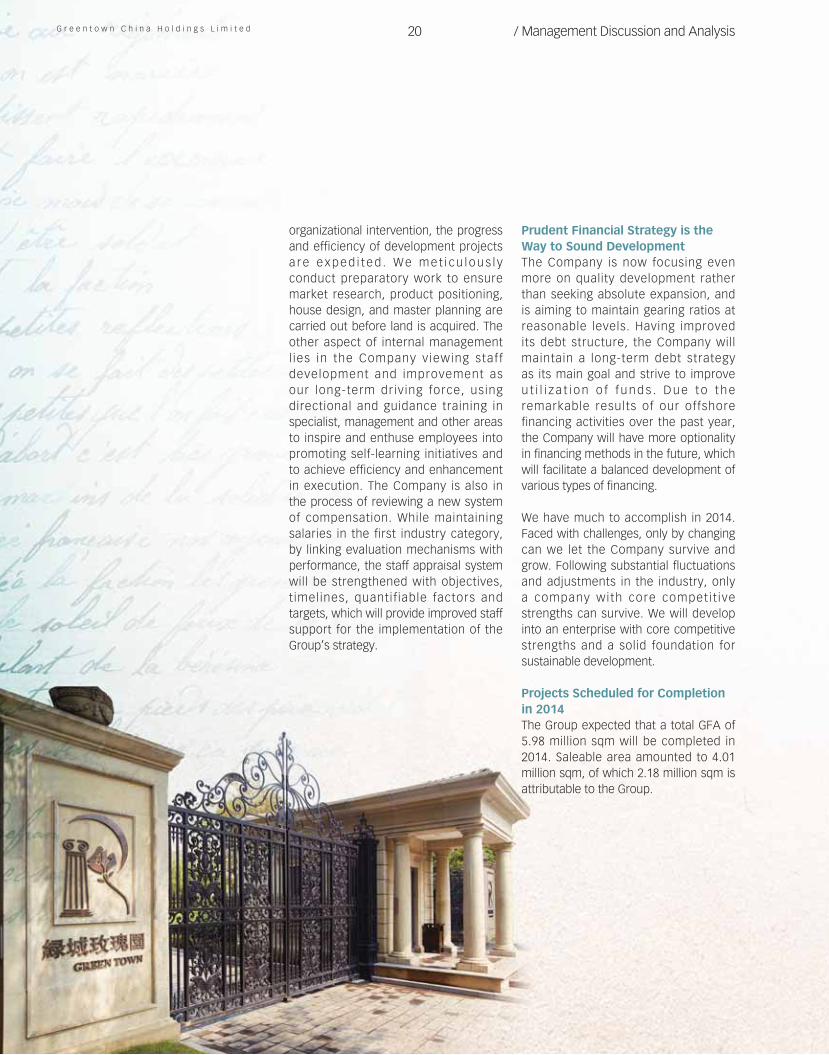
Prudent Financial Strategy is the Way to Sound DevelopmentThe Company is now focusing even more on quality development rather than seeking absolute expansion, and is aiming to maintain gearing ratios at reasonable levels. Having improved its debt structure, the Company will maintain a long-term debt strategy as its main goal and strive to improve u t i l i z a t i o n o f f u n d s . D u e t o t h e remarkable results of our offshore financing activities over the past year, the Company will have more optionality in financing methods in the future, which will facilitate a balanced development of various types of financing.
We have much to accomplish in 2014. Faced with challenges, only by changing can we let the Company survive and grow. Following substantial fluctuations and adjustments in the industry, only a company with core compet i t ive strengths can survive. We will develop into an enterprise with core competitive strengths and a solid foundation for sustainable development.
Projects Scheduled for Completion in 2014The Group expected that a total GFA of 5.98 million sqm will be completed in 2014. Saleable area amounted to 4.01 million sqm, of which 2.18 million sqm is attributable to the Group.
A n n u a l R e p o r t 2 0 1 3 21 / Management Discussion and Analysis
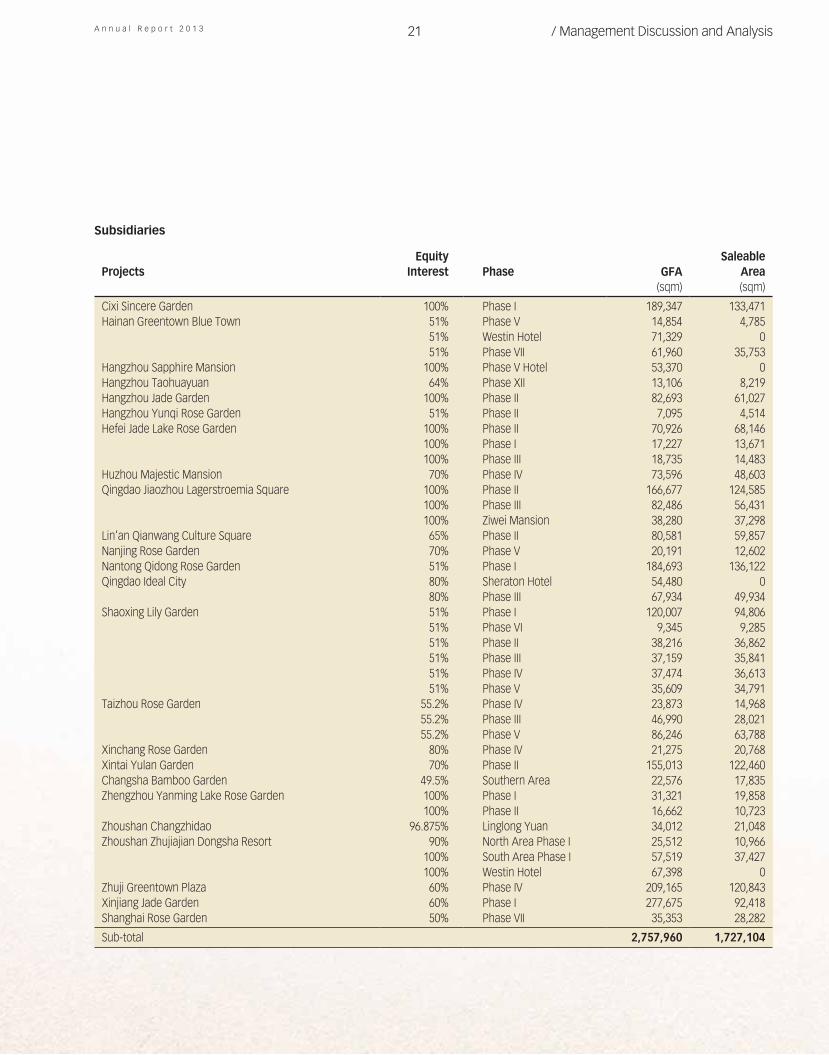
Subsidiaries
ProjectsEquity
Interest Phase GFASaleable
Area(sqm) (sqm)
Cixi Sincere Garden 100% Phase I 189,347 133,471Hainan Greentown Blue Town 51% Phase V 14,854 4,785
51% Westin Hotel 71,329 051% Phase VII 61,960 35,753
Hangzhou Sapphire Mansion 100% Phase V Hotel 53,370 0Hangzhou Taohuayuan 64% Phase XII 13,106 8,219Hangzhou Jade Garden 100% Phase II 82,693 61,027Hangzhou Yunqi Rose Garden 51% Phase II 7,095 4,514Hefei Jade Lake Rose Garden 100% Phase II 70,926 68,146
100% Phase I 17,227 13,671100% Phase III 18,735 14,483
Huzhou Majestic Mansion 70% Phase IV 73,596 48,603Qingdao Jiaozhou Lagerstroemia Square 100% Phase II 166,677 124,585
100% Phase III 82,486 56,431100% Ziwei Mansion 38,280 37,298
Lin’an Qianwang Culture Square 65% Phase II 80,581 59,857Nanjing Rose Garden 70% Phase V 20,191 12,602Nantong Qidong Rose Garden 51% Phase I 184,693 136,122Qingdao Ideal City 80% Sheraton Hotel 54,480 0
80% Phase III 67,934 49,934Shaoxing Lily Garden 51% Phase I 120,007 94,806
51% Phase VI 9,345 9,28551% Phase II 38,216 36,86251% Phase III 37,159 35,84151% Phase IV 37,474 36,61351% Phase V 35,609 34,791
Taizhou Rose Garden 55.2% Phase IV 23,873 14,96855.2% Phase III 46,990 28,02155.2% Phase V 86,246 63,788
Xinchang Rose Garden 80% Phase IV 21,275 20,768Xintai Yulan Garden 70% Phase II 155,013 122,460Changsha Bamboo Garden 49.5% Southern Area 22,576 17,835Zhengzhou Yanming Lake Rose Garden 100% Phase I 31,321 19,858
100% Phase II 16,662 10,723Zhoushan Changzhidao 96.875% Linglong Yuan 34,012 21,048Zhoushan Zhujiajian Dongsha Resort 90% North Area Phase I 25,512 10,966
100% South Area Phase I 57,519 37,427100% Westin Hotel 67,398 0
Zhuji Greentown Plaza 60% Phase IV 209,165 120,843Xinjiang Jade Garden 60% Phase I 277,675 92,418Shanghai Rose Garden 50% Phase VII 35,353 28,282 Sub-total 2,757,960 1,727,104
G r e e n t o w n C h i n a H o l d i n g s L i m i t e d 22 / Management Discussion and Analysis
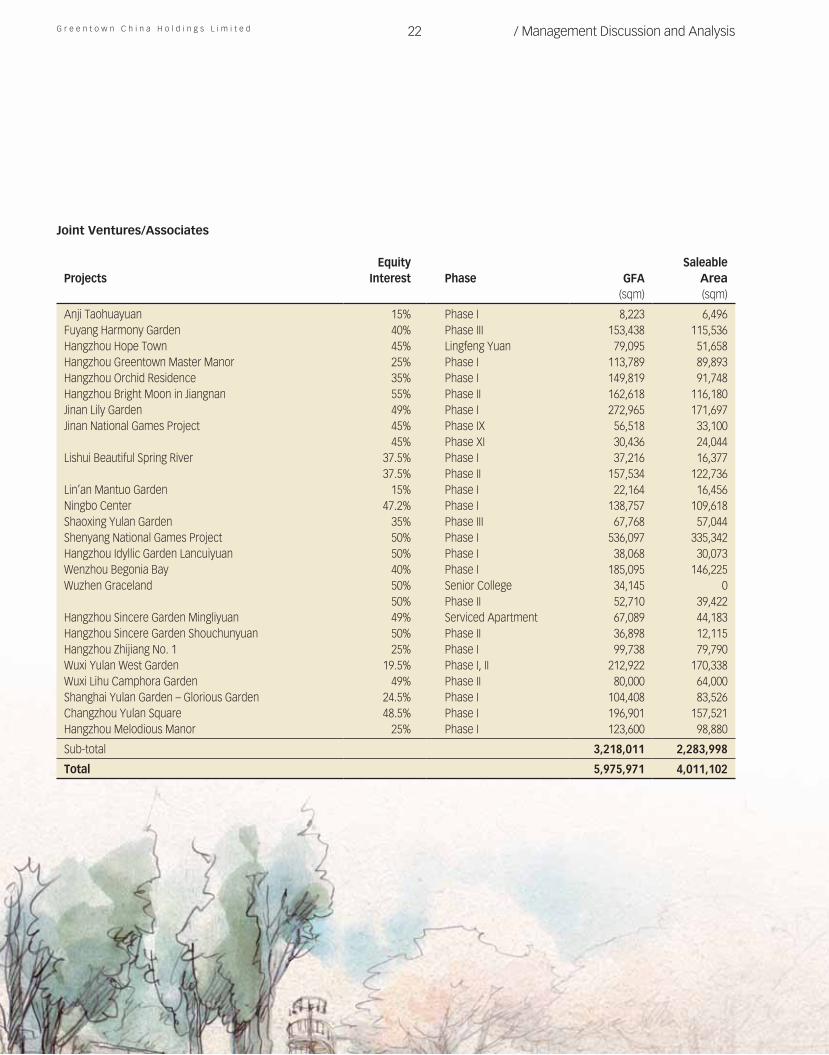
Joint Ventures/Associates
ProjectsEquity
Interest Phase GFASaleable
Area(sqm) (sqm)
Anji Taohuayuan 15% Phase I 8,223 6,496Fuyang Harmony Garden 40% Phase III 153,438 115,536Hangzhou Hope Town 45% Lingfeng Yuan 79,095 51,658Hangzhou Greentown Master Manor 25% Phase I 113,789 89,893Hangzhou Orchid Residence 35% Phase I 149,819 91,748Hangzhou Bright Moon in Jiangnan 55% Phase II 162,618 116,180Jinan Lily Garden 49% Phase I 272,965 171,697Jinan National Games Project 45% Phase IX 56,518 33,100
45% Phase XI 30,436 24,044Lishui Beautiful Spring River 37.5% Phase I 37,216 16,377
37.5% Phase II 157,534 122,736Lin’an Mantuo Garden 15% Phase I 22,164 16,456Ningbo Center 47.2% Phase I 138,757 109,618Shaoxing Yulan Garden 35% Phase III 67,768 57,044Shenyang National Games Project 50% Phase I 536,097 335,342Hangzhou Idyllic Garden Lancuiyuan 50% Phase I 38,068 30,073Wenzhou Begonia Bay 40% Phase I 185,095 146,225Wuzhen Graceland 50% Senior College 34,145 0
50% Phase II 52,710 39,422Hangzhou Sincere Garden Mingliyuan 49% Serviced Apartment 67,089 44,183Hangzhou Sincere Garden Shouchunyuan 50% Phase II 36,898 12,115Hangzhou Zhijiang No. 1 25% Phase I 99,738 79,790Wuxi Yulan West Garden 19.5% Phase I, II 212,922 170,338Wuxi Lihu Camphora Garden 49% Phase II 80,000 64,000Shanghai Yulan Garden – Glorious Garden 24.5% Phase I 104,408 83,526Changzhou Yulan Square 48.5% Phase I 196,901 157,521Hangzhou Melodious Manor 25% Phase I 123,600 98,880 Sub-total 3,218,011 2,283,998 Total 5,975,971 4,011,102
A n n u a l R e p o r t 2 0 1 3 23 / Management Discussion and Analysis
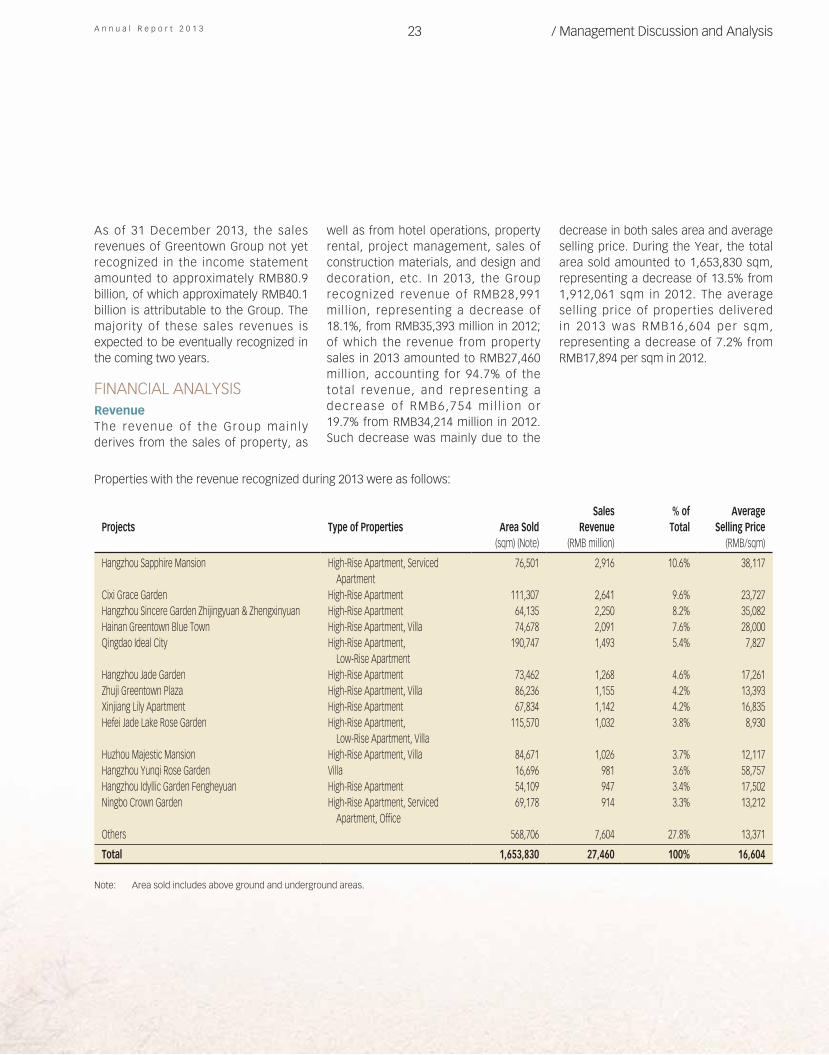
As of 31 December 2013, the sales revenues of Greentown Group not yet recognized in the income statement amounted to approximately RMB80.9 billion, of which approximately RMB40.1 billion is attributable to the Group. The majority of these sales revenues is expected to be eventually recognized in the coming two years.
FINANCIAL ANALYSISRevenueThe revenue of the Group main ly derives from the sales of property, as
well as from hotel operations, property rental, project management, sales of construction materials, and design and decoration, etc. In 2013, the Group recognized revenue of RMB28,991 million, representing a decrease of 18.1%, from RMB35,393 million in 2012; of which the revenue from property sales in 2013 amounted to RMB27,460 million, accounting for 94.7% of the total revenue, and representing a decrease o f RMB6,754 mi l l ion or 19.7% from RMB34,214 million in 2012. Such decrease was mainly due to the
decrease in both sales area and average selling price. During the Year, the total area sold amounted to 1,653,830 sqm, representing a decrease of 13.5% from 1,912,061 sqm in 2012. The average selling price of properties delivered in 2013 was RMB16,604 per sqm, representing a decrease of 7.2% from RMB17,894 per sqm in 2012.
Properties with the revenue recognized during 2013 were as follows:
Projects Type of Properties Area Sold Sales
Revenue % of
TotalAverage
Selling Price(sqm) (Note) (RMB million) (RMB/sqm)
Hangzhou Sapphire Mansion High-Rise Apartment, Serviced Apartment
76,501 2,916 10.6% 38,117
Cixi Grace Garden High-Rise Apartment 111,307 2,641 9.6% 23,727Hangzhou Sincere Garden Zhijingyuan & Zhengxinyuan High-Rise Apartment 64,135 2,250 8.2% 35,082Hainan Greentown Blue Town High-Rise Apartment, Villa 74,678 2,091 7.6% 28,000Qingdao Ideal City High-Rise Apartment,
Low-Rise Apartment190,747 1,493 5.4% 7,827
Hangzhou Jade Garden High-Rise Apartment 73,462 1,268 4.6% 17,261Zhuji Greentown Plaza High-Rise Apartment, Villa 86,236 1,155 4.2% 13,393Xinjiang Lily Apartment High-Rise Apartment 67,834 1,142 4.2% 16,835Hefei Jade Lake Rose Garden High-Rise Apartment,
Low-Rise Apartment, Villa115,570 1,032 3.8% 8,930
Huzhou Majestic Mansion High-Rise Apartment, Villa 84,671 1,026 3.7% 12,117Hangzhou Yunqi Rose Garden Villa 16,696 981 3.6% 58,757Hangzhou Idyllic Garden Fengheyuan High-Rise Apartment 54,109 947 3.4% 17,502Ningbo Crown Garden High-Rise Apartment, Serviced
Apartment, Office69,178 914 3.3% 13,212
Others 568,706 7,604 27.8% 13,371 Total 1,653,830 27,460 100% 16,604
Note: Area sold includes above ground and underground areas.
G r e e n t o w n C h i n a H o l d i n g s L i m i t e d 24 / Management Discussion and Analysis
During the Year, projects in Hangzhou achieved sales revenue of RMB11,350 million, accounting for 41.3% of the property sales, ranking first among all regions. Projects in Zhejiang area (excluding Hangzhou) achieved sales revenue of RMB7,143 million, accounting for 26.0%, ranking second. Projects in Shandong area achieved sales revenue of RMB2,214 million, accounting for 8.1%, ranking third.
During the Year, sales revenue of high-rise, low-rise apartment and serviced apartment reached RMB22,493 million, accounting for 82.0% of the property sales; sales revenue of villa reached RMB4,543 million, accounting for 16.5%; sales revenue of office reached RMB424 million, accounting for 1.5%.
During the Year, the Group achieved design and decorat ion revenue of RMB582 mi l l ion , represent ing an increase of RMB257 million or 79.1% from RMB325 million achieved in 2012. With the constant expansion of design and decoration business, the revenue from design and decoration will maintain sustainable growth.
The Group’s revenue from project management in 2013 amounted to RMB350 million, representing an increase of 37.3% from RMB255 million in 2012, mainly consisting of construction income of Greentown Property Construction Management Co., Ltd., a subsidiary of the Company. As the Group’s “asset-light” model moves forward, the revenue from project management will continue to grow.
During the Year, the Group’s revenue from hotel operations was RMB305 million, in line with RMB298 million in 2012.
During the Year, the Group’s rental income from investment properties was RMB114 million, in line with RMB111 million in 2012, mainly due to rental income from Oakwood Residence Beijing.
Gross Profit Margin from Property SalesDuring the Year, the Group’s gross profit from properties sales was RMB7,786 mill ion and the gross profit margin from property sales was 28.4%, slightly lower than 29.2% in 2012. Among the
properties delivered during the Year, the project of Hefei Jade Lake Rose Garden, which accounted for 3.8% of the total delivered properties, recorded a low gross profit margin due to its relatively low unit price when put on sales in prior year. In the meanwhile, a portion of the project of Qingdao Ideal City delivered in the Year was economically affordable houses, which was developed according to the requirement of the Government and the selling price was subject to the restriction of the local government. As a result, this property only achieved a gross profit margin of approximately 10%. After deduction of effects from Hefei Jade Lake Rose Garden and economically affordable houses of Qingdao Ideal City, the gross profit margin of properties sales was 29.7% during the Year.
Other IncomeOther income mainly included interest income, net foreign exchange gains, trust income, brand usage related income and government grants, etc. The Group realized other income of RMB728 million during the Year, representing a decrease of RMB273 million from RMB1,001 million in 2012, mainly due to a decrease in interest income. During the Year, the Group received interest income of RMB494 million, representing a decrease of RMB206 million from interest income of RMB700 million in 2012, mainly due to the decrease in interest due from related parties.
A n n u a l R e p o r t 2 0 1 3 25 / Management Discussion and Analysis
In 2013, the Group recorded a net foreign exchange gain of RMB90 million, significantly more than that of RMB26 million in 2012, mainly due to further appreciat ion of Renminbi and the increase in foreign currency borrowings and issuance of several senior notes denominated in US dollar. As at 31 December 2013, the Group had Hong Kong dollar bank borrowings of nil (as at 31 December 2012: HKD1,010 million), an outstanding US dollar bank borrowings of USD400 million (as at 31 December 2012: USD234 million), and senior notes totaling USD1,000 mil l ion (as at 31 December 2012: USD39 million).
Selling and Administrative ExpensesThe Group’s selling and administrative expenses during the Year amounted to RMB2,340 million, representing an increase of 13.1% from RMB2,069 million in 2012.
Human resource cost, which is the largest single expense item in selling and administrative expenses, amounted to RMB723 million in 2013 (2012: RMB668 million), representing an increase of 8.2% as compared with last year, mainly due to increase in number of management staff for an increased business scale in this year. Expenses in marketing,
advertising and sales and sales agency fees was RMB561 million, representing an increase of RMB154 million from RMB407 million in 2012. It was mainly due to the development and training exercises for project agents and more spending on marketing and promotion, and we ensured that internal staff and third-party intermediaries resources would be fully mobilized to maximize sales performance. In 2013, the daily operat ing expenses amounted to RMB664 million (2012: RMB611 million), up 8.7% as compared with last year, mainly due to a slightly increase in basic expenses including office expenses, travel expenses, ut i l i t ies fees and property management fees, rental fees, entertainment expenses, etc.
Financing CostDuring the Year, interest expenses recorded in the consolidated statement of profit or loss and other comprehensive income was RMB507 mill ion (2012: RMB564 mill ion). The total interest expenses during the Year was RMB2,431 million, representing a decrease of 30.2% from RMB3,481 million in 2012, mainly due to the significant decrease in the weighted average of loan balance outstanding during the year and the decrease in the weighted average
interest cost from 8.80% per annum in 2012 to 8.66% per annum during the Year. During the Year, the capitalized interest was RMB1,924 million, at a capitalization percentage of 79.1%, lower than the capitalization percentage of 83.8% in 2012.
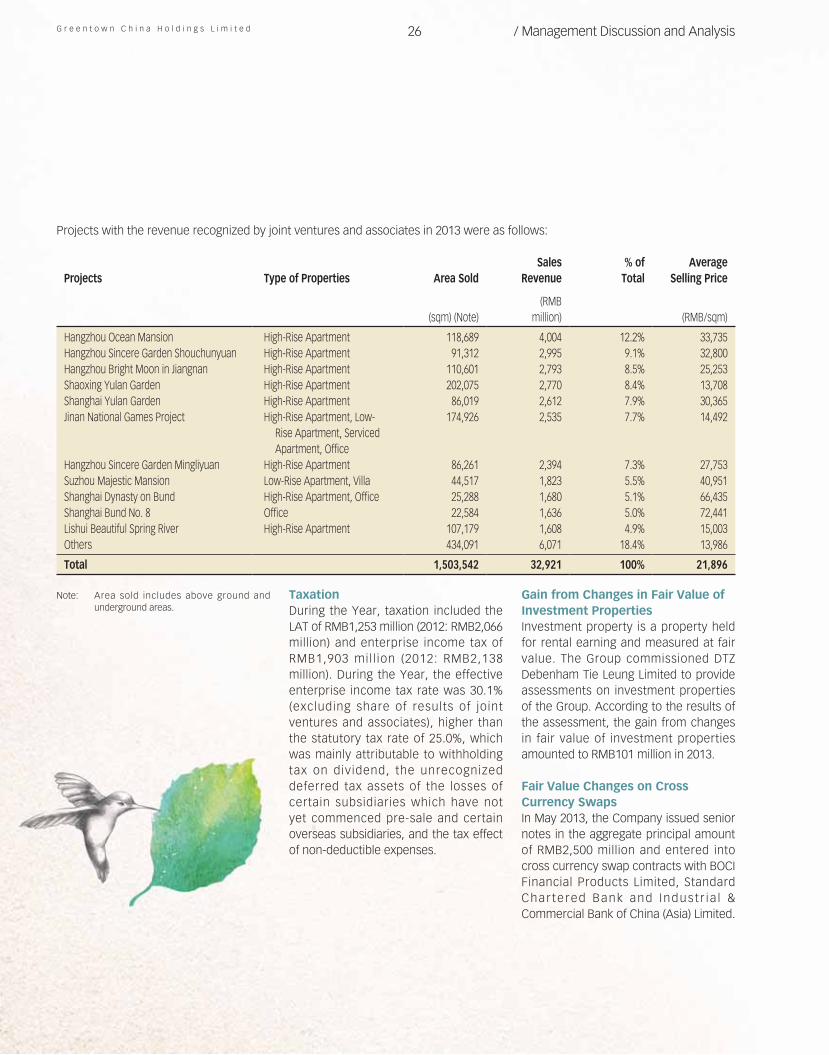
Share of Results of Joint Ventures and AssociatesDuring the Year, the Group’s share of results of joint ventures and associates was RMB1,570 million, representing an increase of RMB1,057 million or 2.1 times from RMB513 million in 2012, mainly due to more properties delivered by joint ventures and associates during the Year. During the Year, sales revenue from properties carried forward by joint ventures and associates was RMB32,921 million, representing an increase of 2.3 times from RMB9,849 million in 2012, mainly due to sold areas increased by 120.9% from 680,676 sqm in 2012 to 1,503,542 sqm and the average selling price increased significantly by 51.3% from RMB14,469 per sqm in 2012 to RMB21,896 per sqm.
G r e e n t o w n C h i n a H o l d i n g s L i m i t e d 26 / Management Discussion and Analysis
Projects with the revenue recognized by joint ventures and associates in 2013 were as follows:
Projects Type of Properties Area SoldSales
Revenue% of
TotalAverage
Selling Price
(sqm) (Note)(RMB
million) (RMB/sqm) Hangzhou Ocean Mansion High-Rise Apartment 118,689 4,004 12.2% 33,735Hangzhou Sincere Garden Shouchunyuan High-Rise Apartment 91,312 2,995 9.1% 32,800Hangzhou Bright Moon in Jiangnan High-Rise Apartment 110,601 2,793 8.5% 25,253Shaoxing Yulan Garden High-Rise Apartment 202,075 2,770 8.4% 13,708Shanghai Yulan Garden High-Rise Apartment 86,019 2,612 7.9% 30,365Jinan National Games Project High-Rise Apartment, Low-
Rise Apartment, Serviced Apartment, Office
174,926 2,535 7.7% 14,492
Hangzhou Sincere Garden Mingliyuan High-Rise Apartment 86,261 2,394 7.3% 27,753Suzhou Majestic Mansion Low-Rise Apartment, Villa 44,517 1,823 5.5% 40,951Shanghai Dynasty on Bund High-Rise Apartment, Office 25,288 1,680 5.1% 66,435Shanghai Bund No. 8 Office 22,584 1,636 5.0% 72,441Lishui Beautiful Spring River High-Rise Apartment 107,179 1,608 4.9% 15,003Others 434,091 6,071 18.4% 13,986 Total 1,503,542 32,921 100% 21,896
Note: Area sold includes above ground and underground areas.
TaxationDuring the Year, taxation included the LAT of RMB1,253 million (2012: RMB2,066 million) and enterprise income tax of RMB1,903 mil l ion (2012: RMB2,138 million). During the Year, the effective enterprise income tax rate was 30.1% (excluding share of results of joint ventures and associates), higher than the statutory tax rate of 25.0%, which was mainly attributable to withholding tax on dividend, the unrecognized deferred tax assets of the losses of certain subsidiaries which have not yet commenced pre-sale and certain overseas subsidiaries, and the tax effect of non-deductible expenses.
Gain from Changes in Fair Value of Investment PropertiesInvestment property is a property held for rental earning and measured at fair value. The Group commissioned DTZ Debenham Tie Leung Limited to provide assessments on investment properties of the Group. According to the results of the assessment, the gain from changes in fair value of investment properties amounted to RMB101 million in 2013.
Fair Value Changes on Cross Currency SwapsIn May 2013, the Company issued senior notes in the aggregate principal amount of RMB2,500 million and entered into cross currency swap contracts with BOCI Financial Products Limited, Standard Char te red Bank and Indus t r i a l & Commercial Bank of China (Asia) Limited.
A n n u a l R e p o r t 2 0 1 3 27 / Management Discussion and Analysis
The fair value changes on such cross currency swaps realized gain of RMB50 million during the Year.
Provision and Reversal of Provision for Impairment LossesThe restriction on property purchases and credit tightening policies imposed by the State increased the level of risk and uncertainties of China’s real estate market. In light of this, the Group commissioned DTZ Debenham Tie Leung Limited to provide assessments on properties held by the Group. According to the results of the assessment, Zhoushan Putuo Greentown Industry Investment Co., Ltd., a subsidiary of the Company, recognized a reversal of impairment provision of RMB61 million in 2013. In 2012, the Group’s subsidiary Xinchang Greentown Real Estate Co., Ltd. had provision for impairment losses of RMB81 million for its hotel properties.
In addit ion, the Group’s associate Wenzhou Greentown Rea l Es ta te Development Co., Ltd. recognized impairment losses of RMB64 million (2012: RMB233 million) for the properties under development and the Group’s joint venture Shenyang National Games Project Construction Co., Ltd. recognized impairment losses of RMB205 million for the properties under development.
Pre-sale DepositsPre-sale deposits represent the amounts received from the pre-sale of properties. The amounts will be recognized as sales revenue upon delivery of properties. As at 31 December 2013, the balance of pre-sale deposits of the Group was RMB23,428 million, representing a decrease of RMB5,420 mil l ion or 18.8% from RMB28,848 million as at 31 December 2012.
The pre-sale deposits of joint ventures
and associates was RMB42,726 million,
representing an increase of RMB6,214
million or 17.0% from RMB36,512 million
as at 31 December 2012.
Gain Relating to a Newly Acquired Joint VentureOn 16 April 2013, Shanghai Greentown
Woods Golf Villas Development Co., Ltd.
(“Greentown Woods”), a subsidiary of the
Company, entered into an equity transfer
agreement with Jindu Real Estate Group
Co., Ltd. (“Jindu Real Estate”), pursuant
to which Jindu Real Estate transfered its
50% equity in, and entire creditor’s right
owed by, Zhejiang Jinying Realty Co.,
Ltd. (“Zhejiang Jinying”) to Greentown
Woods at the consideration of RMB1,200
million. Zhejiang Jinying owns and is the
developer of the project of Hangzhou
Zhijiang No. 1. The acquisition enabled
Greentown Woods to generate a gain
of RMB704 mil l ion, increasing the
profit attributable to the owners of the
Company by RMB268 million.
Offshore FinancingIn addit ion to our excel lent sa les
performance in 2013, the adjustments
we made to our debt structure also met
our management’s expectations. Rating
agencies such as Moody’s and Standard
& Poor also positively responded and
confirmed our outstanding performance.
Moody ’s g radua l l y upgraded the
Company’s credit ratings from the
original Caa1 to B1, while Standard &
Poor upgraded the Company’s credit
rating from the original CCC+ to BB-.
Meanwhile, global capital market’s
extraordinarily low interest rates created
good conditions for us to improve our
debt structure, reduce financing costs
and operating risks, thereby creating
a positive cycle. Accordingly, in this
year, we spent significant efforts in
tapping offshore capital markets and
established good relationships and
communication channels with various
offshore banks, while at the same
time maintaining our existing onshore
financing channels. As of the end of
the Year, we have tapped offshore
capital markets through four fundraising
exercises in the form of senior notes
issuances, raising an aggregate amount
of approximately USD1.4 billion. These
notes are listed on the Stock Exchange.
In addition, we have conducted three
syndicated loan financing exercises
with major commercial banks in Hong
Kong, raising an aggregate amount of
approximately USD600 million. In 2013,
the Group raised offshore financings of
approximately USD2.0 billion (equivalent
to approximately RMB12.14 billion) in
total and our average offshore financing
cost has been lowered to approximately
5.96%.
The p roceeds f rom the o f f shore
financings were allocated and arranged
in a reasonable manner according
to actual requirement and so to the
maximum extent , to enhance the
efficiency of capital consumption and to
reduce circulation cost. The proceeds
were primarily used for repayment of
bank borrowings, project acquisition
and payment of land premium, payment
of contract fee and for general working
purposes.
G r e e n t o w n C h i n a H o l d i n g s L i m i t e d 28 / Management Discussion and Analysis
borrowings and amounts due from/to third parties denominated in foreign currencies, and the USD 1 billion senior notes issued in 2013 were denominated in US dollars, the Group was exposed to exchange rate risk. However, the Group’s operating cash flow and liquidity is not subject to significant influence from fluctuations in exchange rates. The Group did not enter into any foreign currency hedging arrangements as at 31 December 2013.
Financial GuaranteesThe Group provided financial guarantees to banks for mortgage facilities granted to buyers of the Group’s properties. As at 31 December 2013, such financial guarantees amounted to RMB17,625 mi l l ion (as at 31 December 2012: RMB17,144 million).
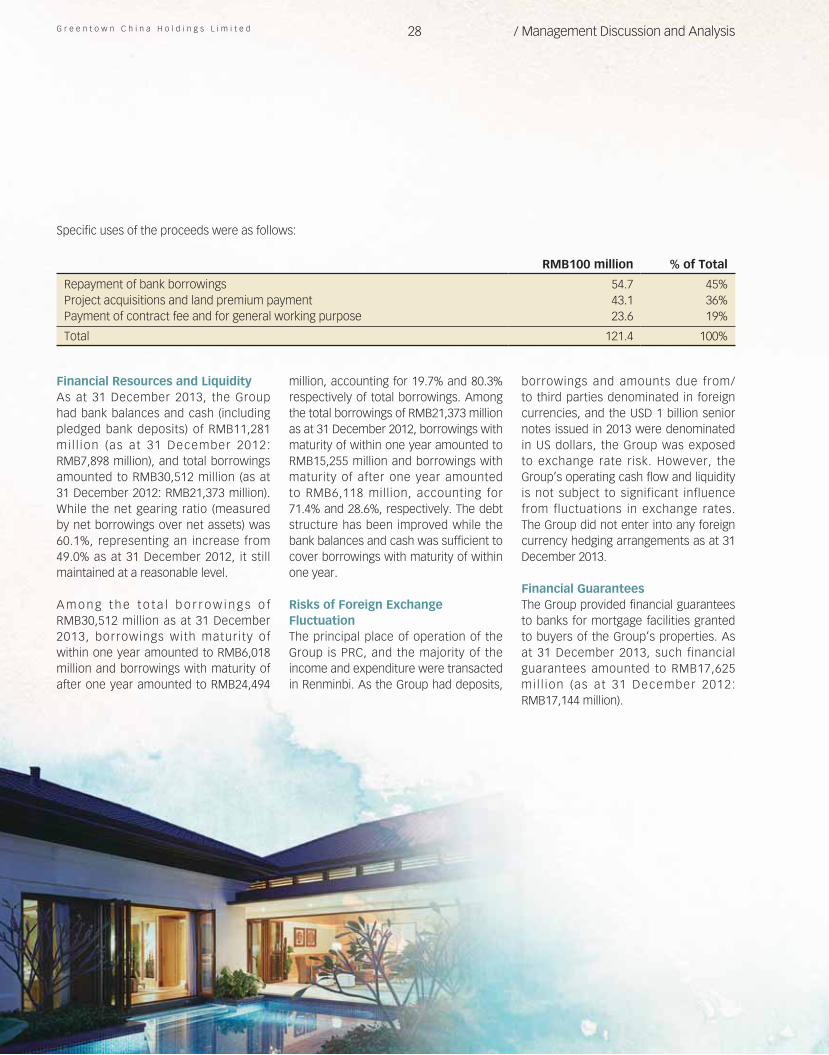
Specific uses of the proceeds were as follows:
RMB100 million % of Total Repayment of bank borrowings 54.7 45%Project acquisitions and land premium payment 43.1 36%Payment of contract fee and for general working purpose 23.6 19% Total 121.4 100%
Financial Resources and LiquidityAs at 31 December 2013, the Group had bank balances and cash (including pledged bank deposits) of RMB11,281 mi l l ion (as at 31 December 2012: RMB7,898 million), and total borrowings amounted to RMB30,512 million (as at 31 December 2012: RMB21,373 million). While the net gearing ratio (measured by net borrowings over net assets) was 60.1%, representing an increase from 49.0% as at 31 December 2012, it still maintained at a reasonable level.
A m o n g t h e t o t a l b o r r o w i n g s o f RMB30,512 million as at 31 December 2013, borrowings with maturity of within one year amounted to RMB6,018 million and borrowings with maturity of after one year amounted to RMB24,494
million, accounting for 19.7% and 80.3% respectively of total borrowings. Among the total borrowings of RMB21,373 million as at 31 December 2012, borrowings with maturity of within one year amounted to RMB15,255 million and borrowings with maturity of after one year amounted to RMB6,118 million, accounting for 71.4% and 28.6%, respectively. The debt structure has been improved while the bank balances and cash was sufficient to cover borrowings with maturity of within one year.
Risks of Foreign Exchange FluctuationThe principal place of operation of the Group is PRC, and the majority of the income and expenditure were transacted in Renminbi. As the Group had deposits,
A n n u a l R e p o r t 2 0 1 3 29 / Management Discussion and Analysis
Pledge of AssetsAs at 31 December 2013, the Group pledged buildings, hotels, construction in progress, prepaid lease payment, investment propert ies, propert ies for development, properties under development, completed properties for sale, pledged bank deposits, interests in joint ventures and interests in associates, with an aggregate carrying value of RMB22,725 million (as at 31 December 2012: RMB24,848 million) to secure general credit facilities granted by banks and other financial institutions to the Group.
Capital CommitmentsAs at 31 December 2013, the Group had contracted, but not provided for, capital expenditure commitments of RMB14,065 million (as at 31 December 2012: RMB15,276 million) in respect of properties for development, properties under development and construction in progress.
Capital Expenditure PlanIn consideration of the complicated and highly uncertain economic environment, the Group takes a prudent approach towards the use of funds to ensure the safety of the capital chain. There is currently no material capital expenditure plan.

Hainan GreentownBlue Town
32
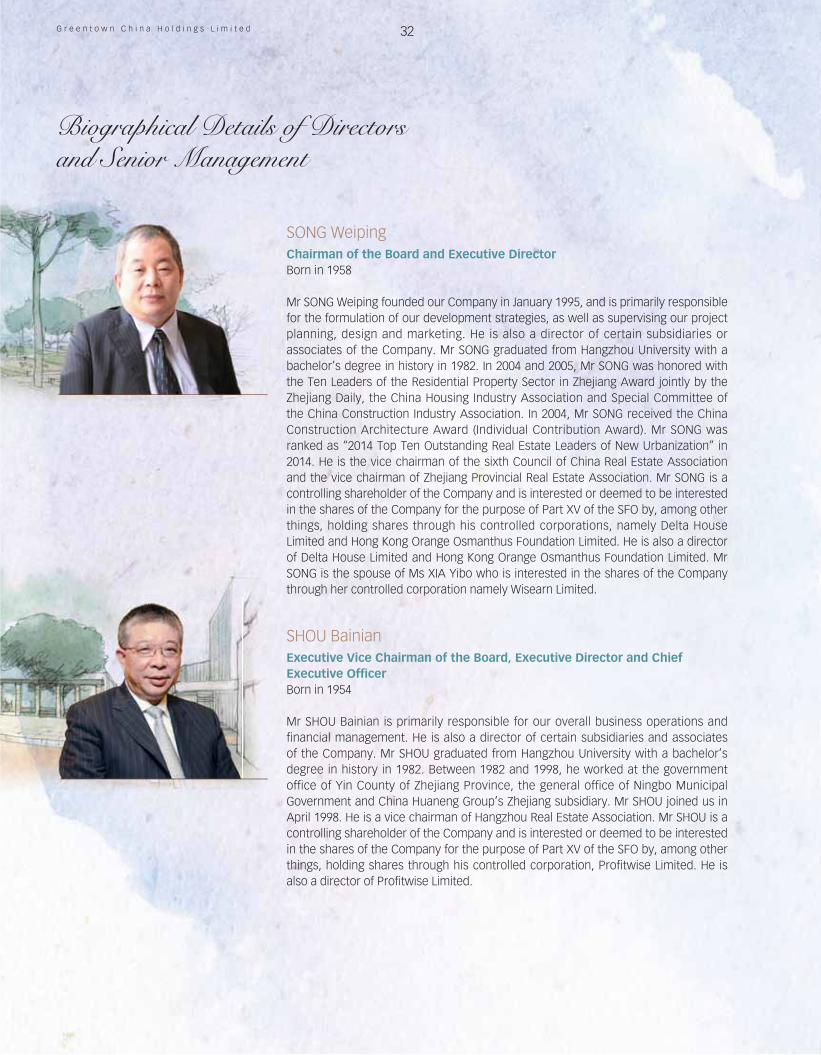
SONG WeipingChairman of the Board and Executive DirectorBorn in 1958
Mr SONG Weiping founded our Company in January 1995, and is primarily responsible for the formulation of our development strategies, as well as supervising our project planning, design and marketing. He is also a director of certain subsidiaries or associates of the Company. Mr SONG graduated from Hangzhou University with a bachelor’s degree in history in 1982. In 2004 and 2005, Mr SONG was honored with the Ten Leaders of the Residential Property Sector in Zhejiang Award jointly by the Zhejiang Daily, the China Housing Industry Association and Special Committee of the China Construction Industry Association. In 2004, Mr SONG received the China Construction Architecture Award (Individual Contribution Award). Mr SONG was ranked as “2014 Top Ten Outstanding Real Estate Leaders of New Urbanization” in 2014. He is the vice chairman of the sixth Council of China Real Estate Association and the vice chairman of Zhejiang Provincial Real Estate Association. Mr SONG is a controlling shareholder of the Company and is interested or deemed to be interested in the shares of the Company for the purpose of Part XV of the SFO by, among other things, holding shares through his controlled corporations, namely Delta House Limited and Hong Kong Orange Osmanthus Foundation Limited. He is also a director of Delta House Limited and Hong Kong Orange Osmanthus Foundation Limited. Mr SONG is the spouse of Ms XIA Yibo who is interested in the shares of the Company through her controlled corporation namely Wisearn Limited.
SHOU BainianExecutive Vice Chairman of the Board, Executive Director and Chief Executive OfficerBorn in 1954
Mr SHOU Bainian is primarily responsible for our overall business operations and financial management. He is also a director of certain subsidiaries and associates of the Company. Mr SHOU graduated from Hangzhou University with a bachelor’s degree in history in 1982. Between 1982 and 1998, he worked at the government office of Yin County of Zhejiang Province, the general office of Ningbo Municipal Government and China Huaneng Group’s Zhejiang subsidiary. Mr SHOU joined us in April 1998. He is a vice chairman of Hangzhou Real Estate Association. Mr SHOU is a controlling shareholder of the Company and is interested or deemed to be interested in the shares of the Company for the purpose of Part XV of the SFO by, among other things, holding shares through his controlled corporation, Profitwise Limited. He is also a director of Profitwise Limited.
G r e e n t o w n C h i n a H o l d i n g s L i m i t e d
Biographical Details of Directorsand Senior Management
A n n u a l R e p o r t 2 0 1 3 33 / Biographical Details of Directors and Senior Management
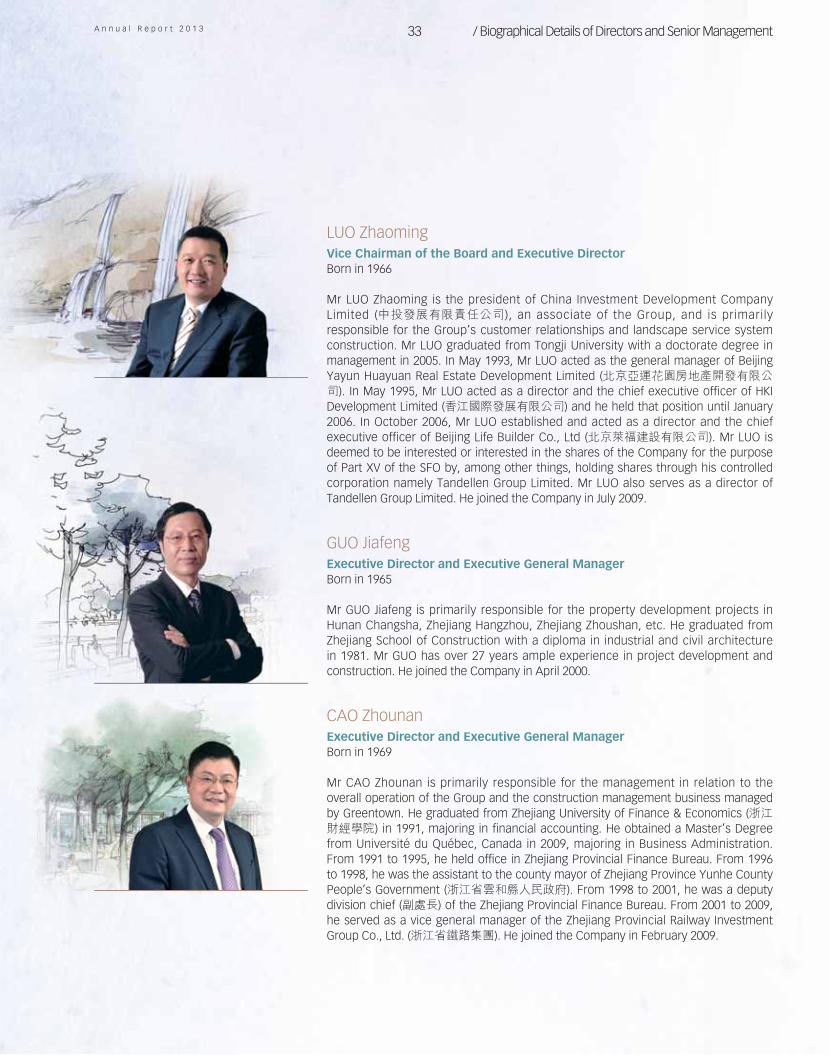
LUO ZhaomingVice Chairman of the Board and Executive DirectorBorn in 1966
Mr LUO Zhaoming is the president of China Investment Development Company Limited (中投發展有限責任公司), an associate of the Group, and is primarily responsible for the Group’s customer relationships and landscape service system construction. Mr LUO graduated from Tongji University with a doctorate degree in management in 2005. In May 1993, Mr LUO acted as the general manager of Beijing Yayun Huayuan Real Estate Development Limited (北京亞運花園房地產開發有限公司). In May 1995, Mr LUO acted as a director and the chief executive officer of HKI Development Limited (香江國際發展有限公司) and he held that position until January 2006. In October 2006, Mr LUO established and acted as a director and the chief executive officer of Beijing Life Builder Co., Ltd (北京萊福建設有限公司). Mr LUO is deemed to be interested or interested in the shares of the Company for the purpose of Part XV of the SFO by, among other things, holding shares through his controlled corporation namely Tandellen Group Limited. Mr LUO also serves as a director of Tandellen Group Limited. He joined the Company in July 2009.
GUO JiafengExecutive Director and Executive General ManagerBorn in 1965
Mr GUO Jiafeng is primarily responsible for the property development projects in Hunan Changsha, Zhejiang Hangzhou, Zhejiang Zhoushan, etc. He graduated from Zhejiang School of Construction with a diploma in industrial and civil architecture in 1981. Mr GUO has over 27 years ample experience in project development and construction. He joined the Company in April 2000.
CAO ZhounanExecutive Director and Executive General ManagerBorn in 1969
Mr CAO Zhounan is primarily responsible for the management in relation to the overall operation of the Group and the construction management business managed by Greentown. He graduated from Zhejiang University of Finance & Economics (浙江財經學院) in 1991, majoring in financial accounting. He obtained a Master’s Degree from Université du Québec, Canada in 2009, majoring in Business Administration. From 1991 to 1995, he held office in Zhejiang Provincial Finance Bureau. From 1996 to 1998, he was the assistant to the county mayor of Zhejiang Province Yunhe County People’s Government (浙江省雲和縣人民政府). From 1998 to 2001, he was a deputy division chief (副處長) of the Zhejiang Provincial Finance Bureau. From 2001 to 2009, he served as a vice general manager of the Zhejiang Provincial Railway Investment Group Co., Ltd. (浙江省鐵路集團). He joined the Company in February 2009.

34 G r e e n t o w n C h i n a H o l d i n g s L i m i t e d / Biographical Details of Directors and Senior Management
NG Tin Hoi, StephenNon-Executive DirectorBorn in 1952
Mr NG Tin Hoi, Stephen, has been deputy chairman and managing director of The Wharf (Holdings) Limited (stock code: 00004.HK) since 1994. He joined the Wharf Group in 1981 and became director and chief financial officer in 1987. He was appointed as managing director in May 1989 and deputy chairman in June 1994. Among the Wharf Group’s principal subsidiaries, he is the chairman of the board of directors of the following companies: Harbour Centre Development Limited (stock code: 00051.HK), i-CABLE Communications Limited (stock code: 01097.HK), Modern Terminals Limited, Wharf T&T Limited and The “Star” Ferry Company Limited.
Mr NG is also the deputy chairman of Wheelock and Company Limited (stock code: 00020.HK), and Chairman of Joyce Boutique Holdings Limited (stock code: 00647.HK). He is also the chairman of Wheelock Properties (Singapore) Limited, which is publicly listed in Singapore.
Mr NG was born and grew up in Hong Kong. He attended Ripon College in Ripon, Wisconsin, U.S.A. and the University of Bonn, Germany, from 1971 to 1975, and graduated with a major in mathematics. He is the vice chairman of The Hong Kong General Chamber of Commerce and a council member of the Employers’ Federation of Hong Kong. He was appointed as our non-executive director on 15 June 2012.
TSUI Yiu CheungNon-Executive DirectorBorn in 1946
Mr TSUI Yiu Cheung, is an executive director and the group chief financial officer of Wheelock and Company Limited (stock code: 00020.HK) and also of its listed subsidiary The Wharf (Holdings) Limited (stock code: 00004.HK). Mr TSUI joined Wheelock/Wharf group in 1996 and is presently a director of certain other subsidiaries of Wheelock, including Harbour Centre Development Limited (stock code: 00051.HK) and i-CABLE Communications Limited (stock code: 01097.HK), and Wheelock Properties (Singapore) Limited, which is listed in Singapore. He is also the vice chairman of Wheelock Properties Limited, formerly a publicly-listed company until it became a wholly-owned subsidiary of Wheelock in July 2010. Furthermore, Mr TSUI is a director of Joyce Boutique Holdings Limited (stock code: 00647.HK). Mr TSUI is a Fellow of The Association of Chartered Certified Accountants, The Hong Kong Institute of Certified Public Accountants, the Chartered Institute of Management Accountants, The Institute of Chartered Secretaries and Administrators and also a member of the Certified General Accountants Association of Canada. He was appointed as our non-executive director on 2 August 2012.
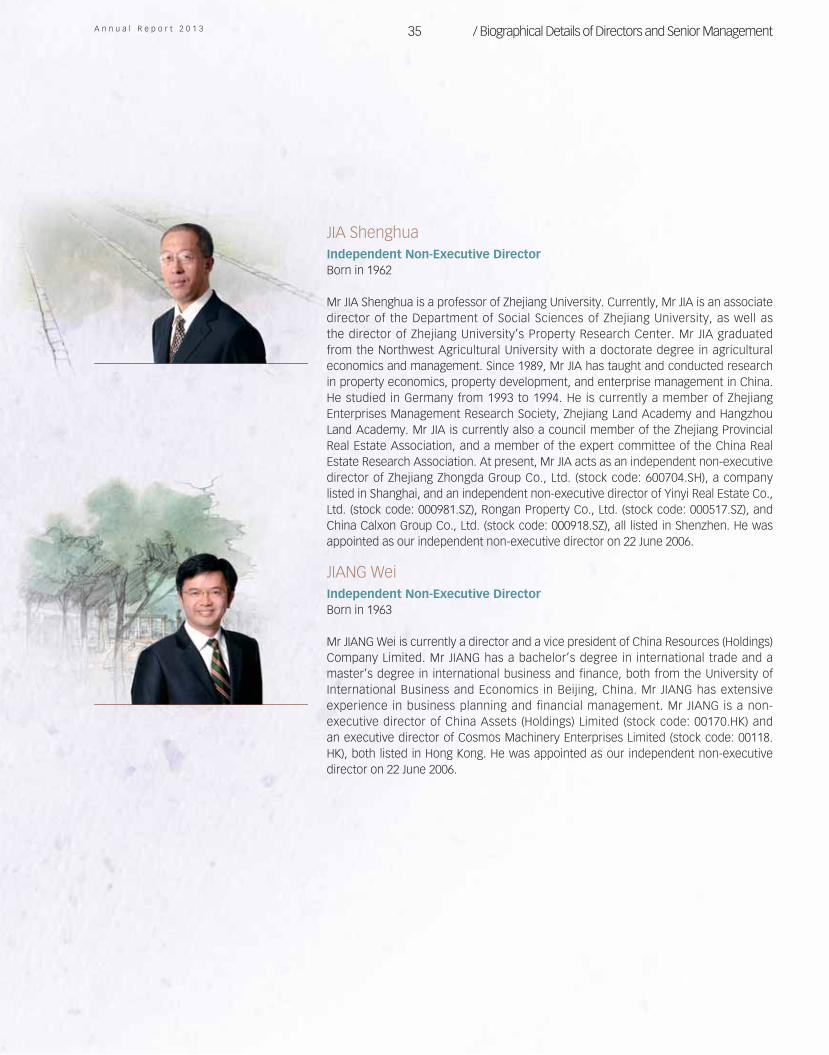
A n n u a l R e p o r t 2 0 1 3 35 / Biographical Details of Directors and Senior Management
JIA ShenghuaIndependent Non-Executive DirectorBorn in 1962
Mr JIA Shenghua is a professor of Zhejiang University. Currently, Mr JIA is an associate director of the Department of Social Sciences of Zhejiang University, as well as the director of Zhejiang University’s Property Research Center. Mr JIA graduated from the Northwest Agricultural University with a doctorate degree in agricultural economics and management. Since 1989, Mr JIA has taught and conducted research in property economics, property development, and enterprise management in China. He studied in Germany from 1993 to 1994. He is currently a member of Zhejiang Enterprises Management Research Society, Zhejiang Land Academy and Hangzhou Land Academy. Mr JIA is currently also a council member of the Zhejiang Provincial Real Estate Association, and a member of the expert committee of the China Real Estate Research Association. At present, Mr JIA acts as an independent non-executive director of Zhejiang Zhongda Group Co., Ltd. (stock code: 600704.SH), a company listed in Shanghai, and an independent non-executive director of Yinyi Real Estate Co., Ltd. (stock code: 000981.SZ), Rongan Property Co., Ltd. (stock code: 000517.SZ), and China Calxon Group Co., Ltd. (stock code: 000918.SZ), all listed in Shenzhen. He was appointed as our independent non-executive director on 22 June 2006.
JIANG WeiIndependent Non-Executive DirectorBorn in 1963
Mr JIANG Wei is currently a director and a vice president of China Resources (Holdings) Company Limited. Mr JIANG has a bachelor’s degree in international trade and a master’s degree in international business and finance, both from the University of International Business and Economics in Beijing, China. Mr JIANG has extensive experience in business planning and financial management. Mr JIANG is a non-executive director of China Assets (Holdings) Limited (stock code: 00170.HK) and an executive director of Cosmos Machinery Enterprises Limited (stock code: 00118.HK), both listed in Hong Kong. He was appointed as our independent non-executive director on 22 June 2006.
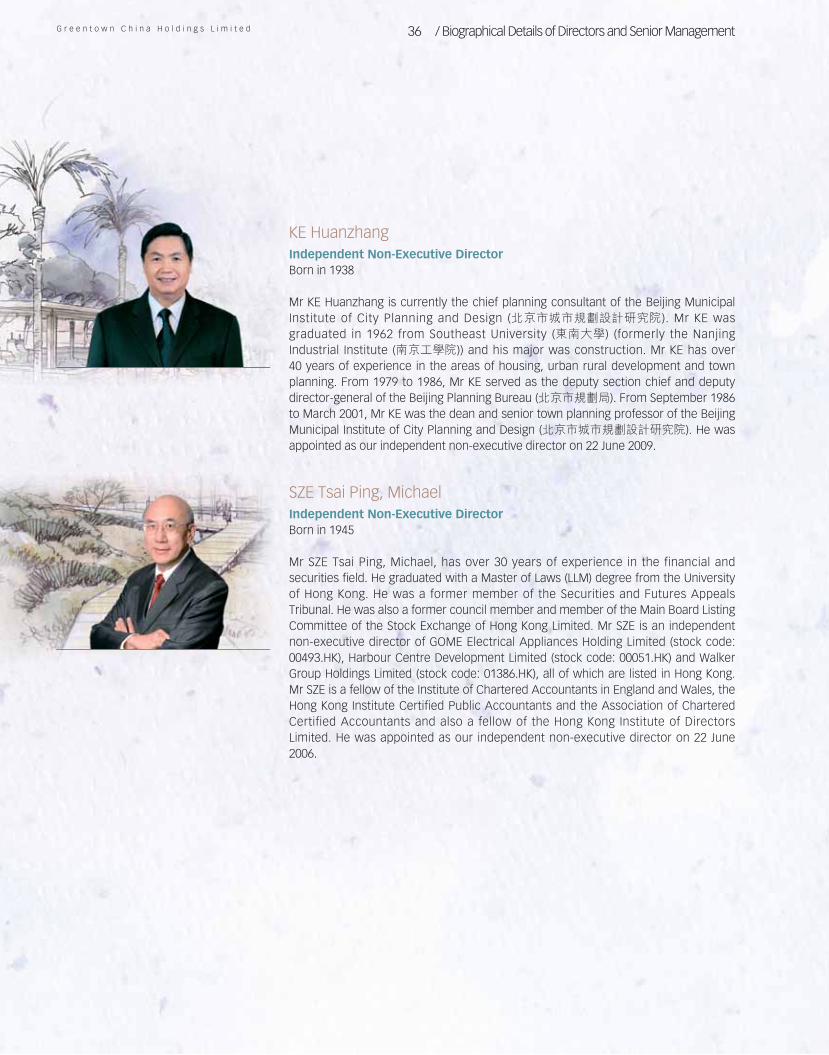
36 G r e e n t o w n C h i n a H o l d i n g s L i m i t e d / Biographical Details of Directors and Senior Management
KE HuanzhangIndependent Non-Executive DirectorBorn in 1938
Mr KE Huanzhang is currently the chief planning consultant of the Beijing Municipal Institute of City Planning and Design (北京市城市規劃設計研究院). Mr KE was graduated in 1962 from Southeast University (東南大學) (formerly the Nanjing Industrial Institute (南京工學院)) and his major was construction. Mr KE has over 40 years of experience in the areas of housing, urban rural development and town planning. From 1979 to 1986, Mr KE served as the deputy section chief and deputy director-general of the Beijing Planning Bureau (北京市規劃局). From September 1986 to March 2001, Mr KE was the dean and senior town planning professor of the Beijing Municipal Institute of City Planning and Design (北京市城市規劃設計研究院). He was appointed as our independent non-executive director on 22 June 2009.
SZE Tsai Ping, MichaelIndependent Non-Executive DirectorBorn in 1945
Mr SZE Tsai Ping, Michael, has over 30 years of experience in the financial and securities field. He graduated with a Master of Laws (LLM) degree from the University of Hong Kong. He was a former member of the Securities and Futures Appeals Tribunal. He was also a former council member and member of the Main Board Listing Committee of the Stock Exchange of Hong Kong Limited. Mr SZE is an independent non-executive director of GOME Electrical Appliances Holding Limited (stock code: 00493.HK), Harbour Centre Development Limited (stock code: 00051.HK) and Walker Group Holdings Limited (stock code: 01386.HK), all of which are listed in Hong Kong. Mr SZE is a fellow of the Institute of Chartered Accountants in England and Wales, the Hong Kong Institute Certified Public Accountants and the Association of Chartered Certified Accountants and also a fellow of the Hong Kong Institute of Directors Limited. He was appointed as our independent non-executive director on 22 June 2006.
A n n u a l R e p o r t 2 0 1 3 37 / Biographical Details of Directors and Senior Management
TANG ShidingIndependent Non-Executive DirectorBorn in 1942
Mr TANG Shiding is currently a consultant of Real Estate Association of China, and of Zhejiang Provincial Real Estate Association, and a specialist on the Comprehensive Real Estate Development Committee under the China Real Estate and Residence Research Society. Mr TANG served as the deputy director of Zhejiang Province Construction Department between 1992 and 2002. Mr TANG has also been a member of the Residential Guidance Working Committee of the China Civil Engineering Institute since December 2003. His publications include “Growth Pattern and Development Trend of the Real Estate Industry in Zhejiang”. He was appointed as our independent non-executive director on 22 June 2006.
HUI Wan FaiIndependent Non-Executive DirectorBorn in 1976
Mr HUI Wan Fai is the managing partner of PAG (formerly known as Pacific Alliance Group). Mr HUI has previously served The Blackstone Group as a managing director. Mr HUI was a managing director of Mellon HBV Alternative Strategies LLC, a New York based hedge fund under Mellon Bank, from 2005 to 2006 where he acted as head of distressed investment for China. Mr HUI obtained a Master’s degree in Business Administration from INSEAD in 2004 and a Master’s degree in International and Public Affairs from The University of Hong Kong in 2002. Mr HUI obtained a Bachelor’s degree in Business Administration from The University of Hong Kong in 1998. Mr HUI holds the qualifications of Certified public Accountant from the Association of Chartered Certified Accountants, United Kingdom, Chartered Financial Analyst from the CFA Institute, The United States of America and Associate of HKICS from the Hong Kong Institute of Chartered Secretaries, Hong Kong. He was appointed as an independent non-executive director of China Metro-Rural Holdings Limited (NYSE: CNR), which is listed in the USA in October 2012. He was appointed as our independent non-executive director on 1 April 2012.
38 G r e e n t o w n C h i n a H o l d i n g s L i m i t e d / Biographical Details of Directors and Senior Management
Senior ManagementFU Linj iang , born in 1958, i s an Executive General Manager of the Group. He is primarily responsible for overall operation and management of the Group. He graduated from Shanghai Institute of Electric Power with major in thermal dynamic engineering. He obtained a Master’s Degree from Maastricht School of Management in 2002, majoring in international business administration. He is a National Senior Professional Manager, senior engineer and senior economist. From 1980 to 2010, he held office as general manager, chairman, party secretary and other positions in large state-owned enterprises. From 2006 t i l l now, he has also been a professor in Shanghai Institute of Electric Power. He was a national labor model and a labor model in Zhejiang Province. He joined the Company in June 2010.
YING Guoyong, born in 1961, is an Executive General Manager of Greentown Real Estate Group Co., Ltd (綠城房地產集團有限公司), a principal subsidiary of the Group. He is primarily responsible for the development and management of our projects in Hangzhou Binjiang district, Linan, Zhejiang Deqing, Cixi, Lishui, Taizhou, Henan Zhengzhou, Shandong Xintai, etc. He graduated from Hangzhou University with a bachelor’s degree in law in 1985. Between 1985 to 2001, he worked in Zhejiang Province CPC. School, CPC Youth of Zhejiang Province Committee and Zhejiang Youth Travel Service Co. Ltd. He joined the Group in June 2001.
QIAN Xiaohua, born in 1963, is an Executive General Manager of Greentown Real Estate Group Co., Ltd (綠城房地產集團有限公司), a principal subsidiary of the Group. He is primarily responsible for the management of the Company’s commercial property development. He graduated from Beijing Institute of Aeronautics with a bachelor’s degree in solid mechanics in 1984 and from China-Europe International Business School with a master degree in business administration in 2002. From 1995 to 2005, he worked in Shanghai Midway Infrastructure (Holdings) Limited as a director and a chief executive officer. He joined the Group in February 2005.
YANG Zuoyong , born in 1962, is an Execut ive General Manager of Greentown Real Estate Group Co., Ltd (綠城房地產集團有限公司), a principal subsidiary of the Group. He is also the chairman and general manager of the following subsidiaries of the Group: Wenzhou Greentown Rea l Es ta te Development Company Limited, Zhuji Yuedu Properties Limited and Hangzhou Jinma Real Estate Co., Ltd. He graduated from China Communist Party School with major in finance and management in 1999. Between 1984 to 2006, Mr YANG held senior management positions in various government departments of Hangzhou City Westlake District. He joined the Group in January 2007.
WANG Hongbin , born in 1968, is an Execut ive General Manager of Greentown Real Estate Group Co., Ltd (綠城房地產集團有限公司), a principal subsidiary of the Group. He graduated from Tongji University in 1989 with a major in civil engineering. Between 1989 and 1997, he was employed by Zhoushan Real Estate Corporation. He joined the Group in January 1997, and worked as the senior officer of certain project companies of the Group. He is currently the chairman of Shanghai Sunac Greentown Investment Holding Company Limited (上海融創綠城投資控股有限公司), an associate of the Group.
KUO Xiaoming , born in 1972, i s an Execut ive General Manager of Greentown Real Estate Group Co., Ltd (綠城房地產集團有限公司), a principal subsidiary of the Group. He is primarily responsible for the development and administration of projects in Hangzhou, Xiangshan, Hainan and Daqing. Between 1996 and 1999, he was the project officer of the Group’s Hangzhou Jiuxi Rose Garden Project and the deputy manager of the engineering department. Between 1999 and 2007, he was the deputy manager of the engineering department, manager of the engineering department, assistant to general manager, deputy general manager and general manager of Hangzhou Taohuayuan Real Estate Development Co., Ltd., a subsidiary of the Group, Mr KUO is experienced in construction operation. He joined the Company in August 1996.
A n n u a l R e p o r t 2 0 1 3 39 / Biographical Details of Directors and Senior Management
HAN Bo, born in 1974, is an Executive General Manager of Greentown Real Estate Group Co., Ltd (綠城房地產集團有限公司), a principal subsidiary of the Group. He is primarily responsible for the Group’s construction system and product center and the development and administ rat ion of pro jects in Hangzhou and Thousand-Island Lake. He graduated from Zhejiang University with a bachelor’s degree in civil engineering in 1996. From 1996 to 1998, he worked i n Z h e j i a n g U r b a n C o n s t r u c t i o n Management Limited. Mr HAN joined the Group in November 1998 as the construction manager of Hangzhou Sweet Osmanthus Town Project and the construction director of Purple Osmanthus Garden Project. From 2001 to 2006, he was the deputy manager, manager, assistant general manager and deputy general manager of the engineering department of Hangzhou Greentown Real Estate Development Co., Ltd. (Chunjiang Huayue Project), a subsidiary of the Group. He has been the general manager of Zhejiang Jiahe Industrial Co., Ltd. (Lijiang Apartment), a subsidiary of the Group, since May 2006. Mr HAN serves various positions including the chairman of Zhejiang Greentown Decoration Management Co., Ltd. (浙江綠城裝飾工程管理有限公司) and the general manager of Zhejiang Greentown Landscape Consulting Co., Ltd. (浙江綠城景觀諮詢有限公司), both of which are subsidiaries of the Group.
FUNG Ching, Simon, born in 1969, is the Chief Financial Officer, Company Secretary and one of the authorised representatives of the Company. Prior to joining the Group in August 2010, Mr FUNG served as the chief financial officer and secretary to the board of directors of Baoye Group Company Limited (寶業集團股份有限公司), a company listed in Hong Kong (stock code: 02355.HK), between 2004 and 2010, and he worked in PricewaterhouseCoopers between 1994 and 2004. Mr FUNG has over 9 years of experience in managing finance and accounting functions, mergers and acquisit ions, fund raising and investor relations for PRC corporations listed in Hong Kong, and has 10 years of experience in auditing, accounting and business advisory with a “Big-4” internat ional account ing f i rm. Mr FUNG graduated from the Queensland University of Technology in Australia with a bachelor’s degree, majoring in accountancy. He is a fellow of the Hong Kong Institute of Certified Public Accountants and a fellow of the CPA Australia. Mr FUNG is currently an independent non-executive director of Hainan Meilan International Airport Company Limited (海南美蘭國際機場股份有限公司), a company listed in Hong Kong (stock code: 00357.HK), and he also serves as a non-executive director of Baoye Group Company Limited.
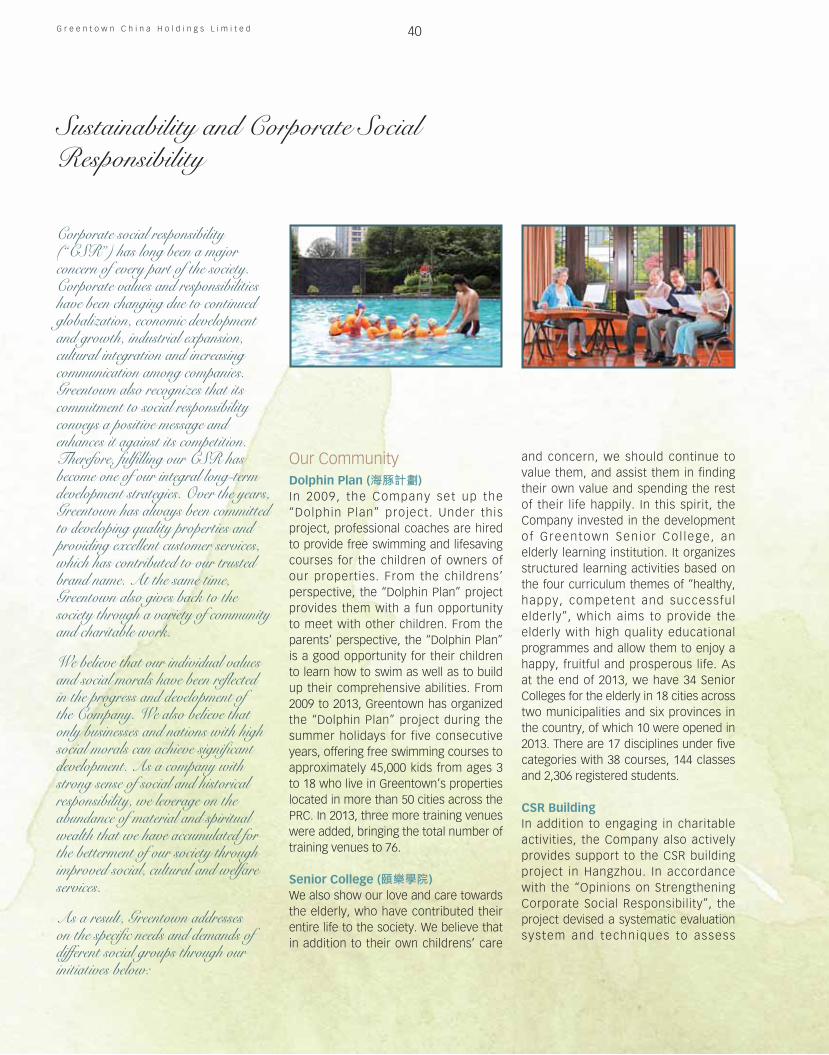
G r e e n t o w n C h i n a H o l d i n g s L i m i t e d
Sustainability and Corporate Social Responsibility
40
Corporate social responsibility (“CSR”) has long been a major concern of every part of the society. Corporate values and responsibilities have been changing due to continued globalization, economic development and growth, industrial expansion, cultural integration and increasing communication among companies. Greentown also recognizes that its commitment to social responsibility conveys a positive message and enhances it against its competition. Therefore, fulfilling our CSR has become one of our integral long-term development strategies. Over the years, Greentown has always been committed to developing quality properties and providing excellent customer services, which has contributed to our trusted brand name. At the same time, Greentown also gives back to the society through a variety of community and charitable work.
We believe that our individual values and social morals have been reflected in the progress and development of the Company. We also believe that only businesses and nations with high social morals can achieve significant development. As a company with strong sense of social and historical responsibility, we leverage on the abundance of material and spiritual wealth that we have accumulated for the betterment of our society through improved social, cultural and welfare services.
As a result, Greentown addresses on the specific needs and demands of different social groups through our initiatives below:
Our CommunityDolphin Plan (海豚計劃)In 2009, the Company set up the “Dolphin Plan” project. Under this project, professional coaches are hired to provide free swimming and lifesaving courses for the children of owners of our properties. From the childrens’ perspective, the “Dolphin Plan” project provides them with a fun opportunity to meet with other children. From the parents’ perspective, the “Dolphin Plan” is a good opportunity for their children to learn how to swim as well as to build up their comprehensive abilities. From 2009 to 2013, Greentown has organized the “Dolphin Plan” project during the summer holidays for five consecutive years, offering free swimming courses to approximately 45,000 kids from ages 3 to 18 who live in Greentown’s properties located in more than 50 cities across the PRC. In 2013, three more training venues were added, bringing the total number of training venues to 76.
Senior College (頤樂學院)We also show our love and care towards the elderly, who have contributed their entire life to the society. We believe that in addition to their own childrens’ care
and concern, we should continue to value them, and assist them in finding their own value and spending the rest of their life happily. In this spirit, the Company invested in the development o f Greentown Sen ior Co l lege , an elderly learning institution. It organizes structured learning activities based on the four curriculum themes of “healthy, happy, competent and successful elderly”, which aims to provide the elderly with high quality educational programmes and allow them to enjoy a happy, fruitful and prosperous life. As at the end of 2013, we have 34 Senior Colleges for the elderly in 18 cities across two municipalities and six provinces in the country, of which 10 were opened in 2013. There are 17 disciplines under five categories with 38 courses, 144 classes and 2,306 registered students.
CSR BuildingIn addition to engaging in charitable activities, the Company also actively provides support to the CSR building project in Hangzhou. In accordance with the “Opinions on Strengthening Corporate Social Responsibility”, the project devised a systematic evaluation system and techniques to assess
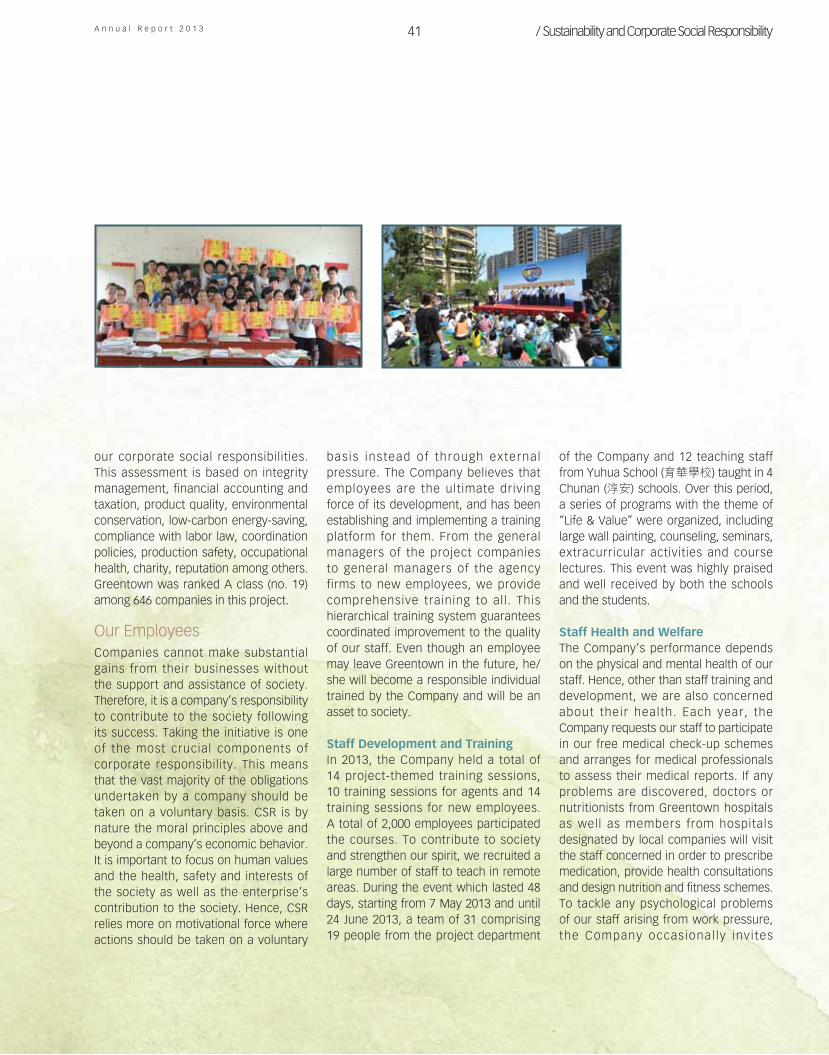
A n n u a l R e p o r t 2 0 1 3 41 / Sustainability and Corporate Social Responsibility
our corporate social responsibilities. This assessment is based on integrity management, financial accounting and taxation, product quality, environmental conservation, low-carbon energy-saving, compliance with labor law, coordination policies, production safety, occupational health, charity, reputation among others. Greentown was ranked A class (no. 19) among 646 companies in this project.
Our EmployeesCompanies cannot make substantial gains from their businesses without the support and assistance of society. Therefore, it is a company’s responsibility to contribute to the society following its success. Taking the initiative is one of the most crucial components of corporate responsibility. This means that the vast majority of the obligations undertaken by a company should be taken on a voluntary basis. CSR is by nature the moral principles above and beyond a company’s economic behavior. It is important to focus on human values and the health, safety and interests of the society as well as the enterprise’s contribution to the society. Hence, CSR relies more on motivational force where actions should be taken on a voluntary
basis instead of through external pressure. The Company believes that employees are the ultimate driving force of its development, and has been establishing and implementing a training platform for them. From the general managers of the project companies to general managers of the agency firms to new employees, we provide comprehensive training to all. This hierarchical training system guarantees coordinated improvement to the quality of our staff. Even though an employee may leave Greentown in the future, he/she will become a responsible individual trained by the Company and will be an asset to society.
Staff Development and TrainingIn 2013, the Company held a total of 14 project-themed training sessions, 10 training sessions for agents and 14 training sessions for new employees. A total of 2,000 employees participated the courses. To contribute to society and strengthen our spirit, we recruited a large number of staff to teach in remote areas. During the event which lasted 48 days, starting from 7 May 2013 and until 24 June 2013, a team of 31 comprising 19 people from the project department
of the Company and 12 teaching staff from Yuhua School (育華學校) taught in 4 Chunan (淳安) schools. Over this period, a series of programs with the theme of “Life & Value” were organized, including large wall painting, counseling, seminars, extracurricular activities and course lectures. This event was highly praised and well received by both the schools and the students.
Staff Health and WelfareThe Company’s performance depends on the physical and mental health of our staff. Hence, other than staff training and development, we are also concerned about their health. Each year, the Company requests our staff to participate in our free medical check-up schemes and arranges for medical professionals to assess their medical reports. If any problems are discovered, doctors or nutritionists from Greentown hospitals as well as members from hospitals designated by local companies will visit the staff concerned in order to prescribe medication, provide health consultations and design nutrition and fitness schemes. To tackle any psychological problems of our staff arising from work pressure, the Company occasional ly inv i tes
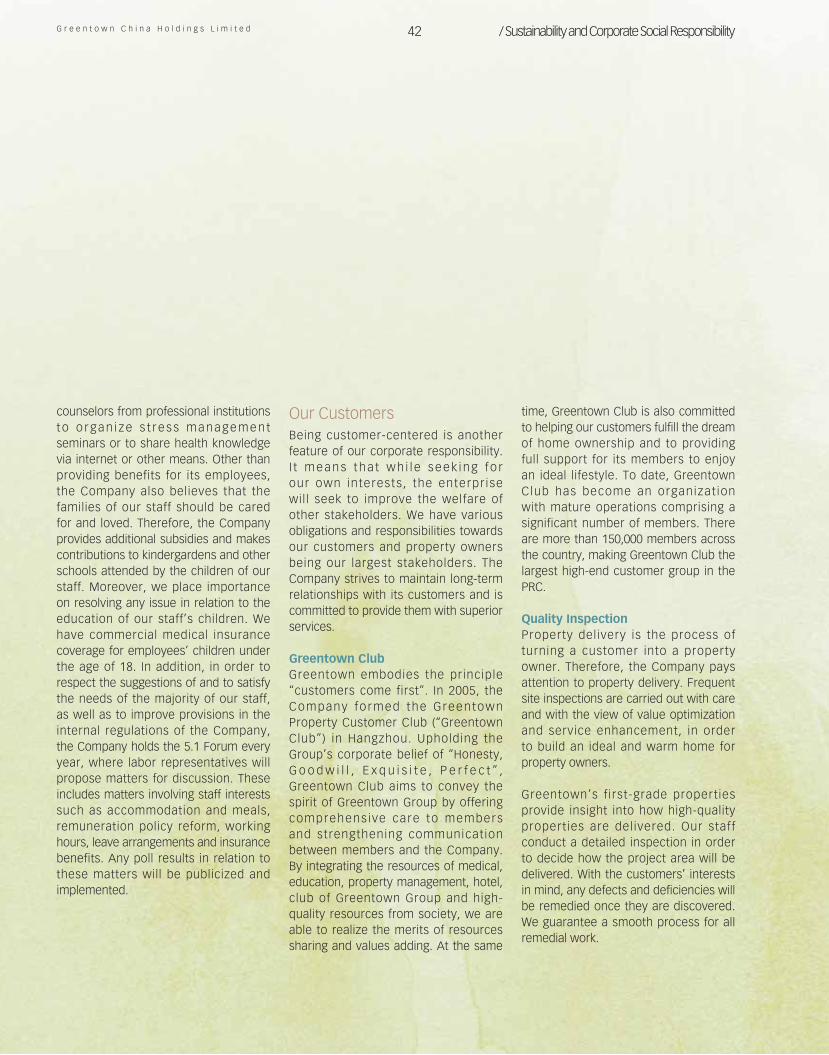
G r e e n t o w n C h i n a H o l d i n g s L i m i t e d 42 / Sustainability and Corporate Social Responsibility
counselors from professional institutions t o o r g a n i z e s t r e s s m a n a g e m e n t seminars or to share health knowledge via internet or other means. Other than providing benefits for its employees, the Company also believes that the families of our staff should be cared for and loved. Therefore, the Company provides additional subsidies and makes contributions to kindergardens and other schools attended by the children of our staff. Moreover, we place importance on resolving any issue in relation to the education of our staff’s children. We have commercial medical insurance coverage for employees’ children under the age of 18. In addition, in order to respect the suggestions of and to satisfy the needs of the majority of our staff, as well as to improve provisions in the internal regulations of the Company, the Company holds the 5.1 Forum every year, where labor representatives will propose matters for discussion. These includes matters involving staff interests such as accommodation and meals, remuneration policy reform, working hours, leave arrangements and insurance benefits. Any poll results in relation to these matters will be publicized and implemented.
Our CustomersBeing customer-centered is another feature of our corporate responsibility. I t m e a n s t h a t w h i l e s e e k i n g f o r our own interests, the enterpr ise will seek to improve the welfare of other stakeholders. We have various obligations and responsibilities towards our customers and property owners being our largest stakeholders. The Company strives to maintain long-term relationships with its customers and is committed to provide them with superior services.
Greentown ClubGreentown embodies the principle “customers come first”. In 2005, the Company fo rmed the Greentown Property Customer Club (“Greentown Club”) in Hangzhou. Upholding the Group’s corporate belief of “Honesty, G o o d w i l l , E x q u i s i t e , P e r f e c t ” , Greentown Club aims to convey the spirit of Greentown Group by offering comprehens ive care to members and strengthening communication between members and the Company. By integrating the resources of medical, education, property management, hotel, club of Greentown Group and high-quality resources from society, we are able to realize the merits of resources sharing and values adding. At the same
time, Greentown Club is also committed to helping our customers fulfill the dream of home ownership and to providing full support for its members to enjoy an ideal lifestyle. To date, Greentown Club has become an organizat ion with mature operations comprising a significant number of members. There are more than 150,000 members across the country, making Greentown Club the largest high-end customer group in the PRC.
Quality InspectionProperty delivery is the process of turning a customer into a property owner. Therefore, the Company pays attention to property delivery. Frequent site inspections are carried out with care and with the view of value optimization and service enhancement, in order to build an ideal and warm home for property owners.
Greentown’s f irst-grade properties provide insight into how high-quality properties are delivered. Our staff conduct a detailed inspection in order to decide how the project area will be delivered. With the customers’ interests in mind, any defects and deficiencies will be remedied once they are discovered. We guarantee a smooth process for all remedial work.
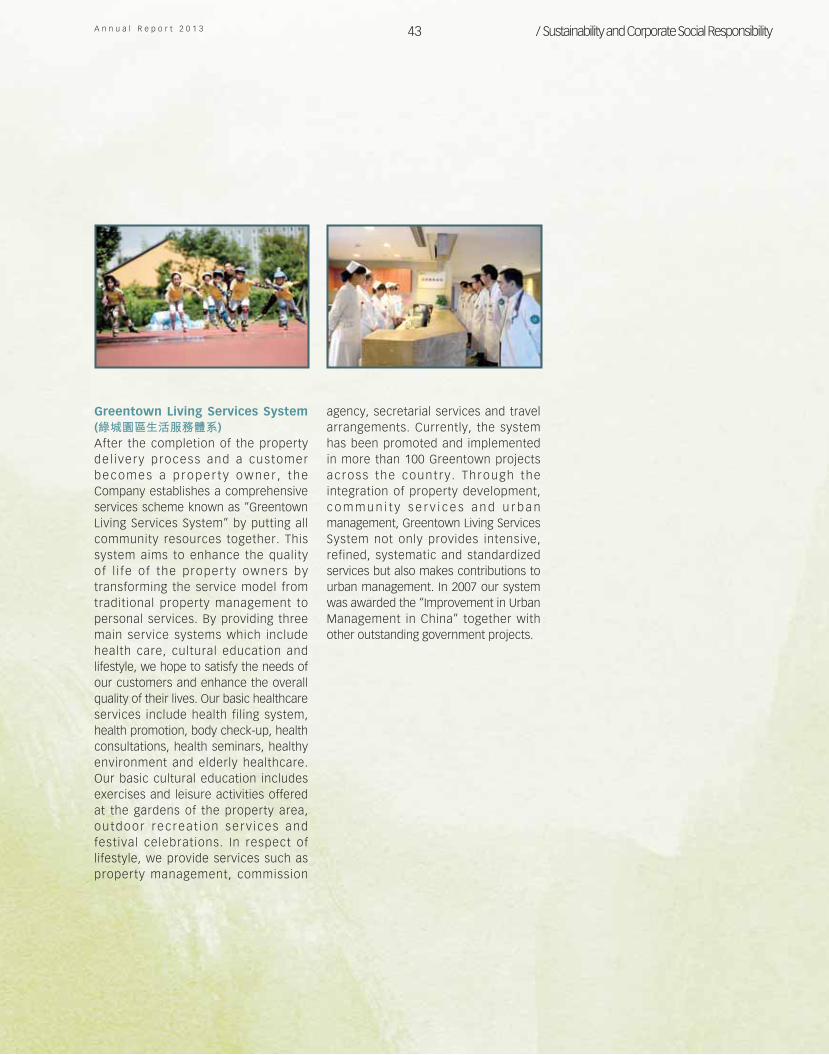
A n n u a l R e p o r t 2 0 1 3 43 / Sustainability and Corporate Social Responsibility
Greentown Living Services System (綠城園區生活服務體系)After the completion of the property de l ivery process and a customer b e c o m e s a p r o p e r t y o w n e r , t h e Company establishes a comprehensive services scheme known as “Greentown Living Services System” by putting all community resources together. This system aims to enhance the quality of l i fe of the property owners by transforming the service model from traditional property management to personal services. By providing three main service systems which include health care, cultural education and lifestyle, we hope to satisfy the needs of our customers and enhance the overall quality of their lives. Our basic healthcare services include health filing system, health promotion, body check-up, health consultations, health seminars, healthy environment and elderly healthcare. Our basic cultural education includes exercises and leisure activities offered at the gardens of the property area, ou tdoor rec rea t ion serv ices and festival celebrations. In respect of lifestyle, we provide services such as property management, commission
agency, secretarial services and travel arrangements. Currently, the system has been promoted and implemented in more than 100 Greentown projects across the count ry . Through the integration of property development, c o m m u n i t y s e r v i c e s a n d u r b a n management, Greentown Living Services System not only provides intensive, refined, systematic and standardized services but also makes contributions to urban management. In 2007 our system was awarded the “Improvement in Urban Management in China” together with other outstanding government projects.
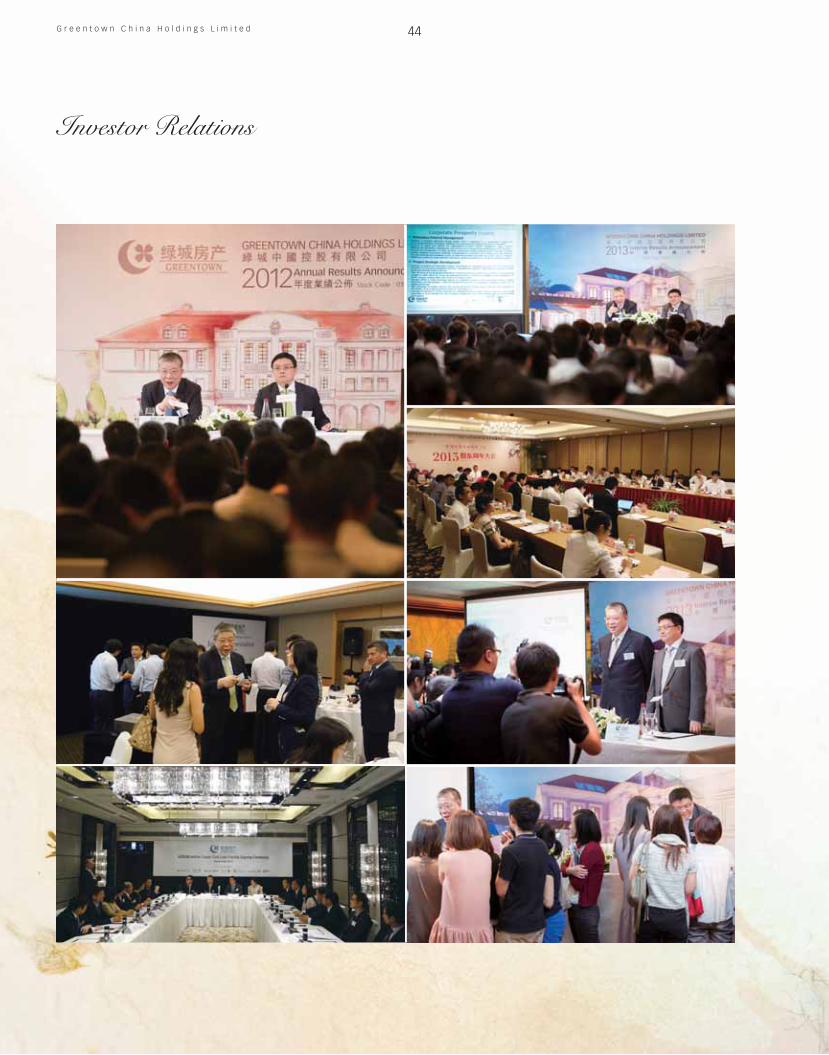
G r e e n t o w n C h i n a H o l d i n g s L i m i t e d
Investor Relations
44
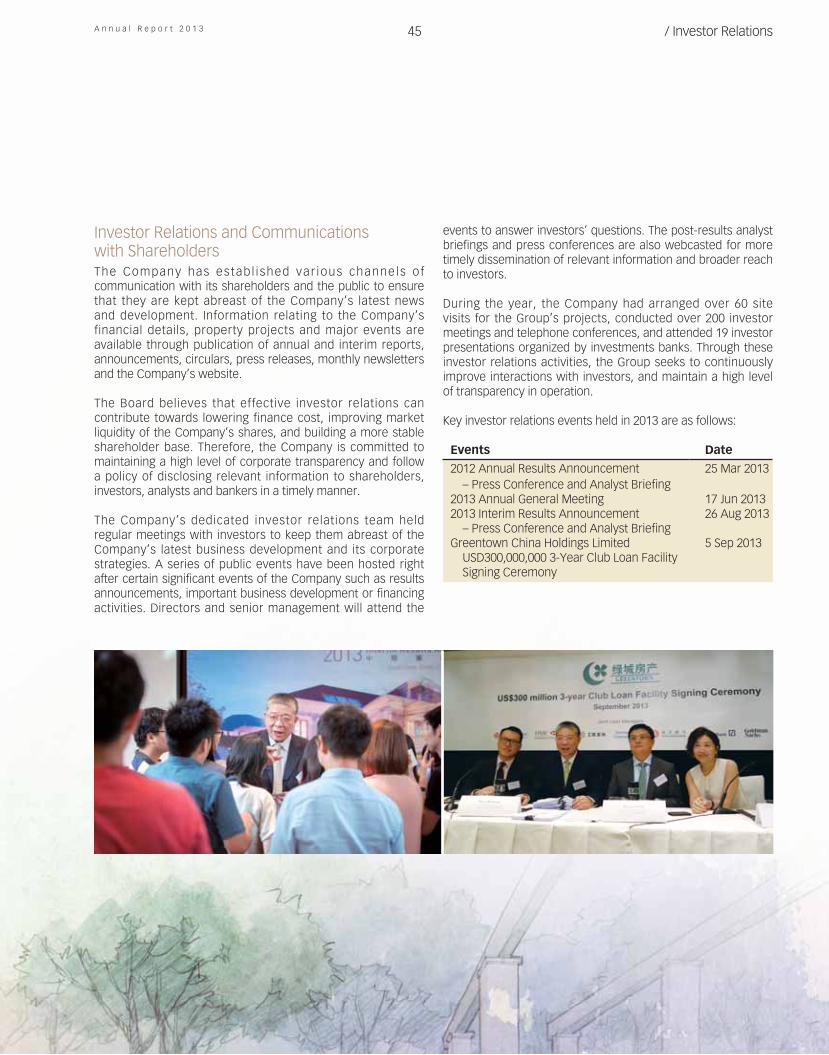
A n n u a l R e p o r t 2 0 1 3 45 / Investor Relations
Investor Relations and Communications with ShareholdersThe Company has es tab l i shed var ious channe ls o f communication with its shareholders and the public to ensure that they are kept abreast of the Company’s latest news and development. Information relating to the Company’s financial details, property projects and major events are available through publication of annual and interim reports, announcements, circulars, press releases, monthly newsletters and the Company’s website.
The Board believes that effective investor relations can contribute towards lowering finance cost, improving market liquidity of the Company’s shares, and building a more stable shareholder base. Therefore, the Company is committed to maintaining a high level of corporate transparency and follow a policy of disclosing relevant information to shareholders, investors, analysts and bankers in a timely manner.
The Company’s dedicated investor relations team held regular meetings with investors to keep them abreast of the Company’s latest business development and its corporate strategies. A series of public events have been hosted right after certain significant events of the Company such as results announcements, important business development or financing activities. Directors and senior management will attend the
events to answer investors’ questions. The post-results analyst briefings and press conferences are also webcasted for more timely dissemination of relevant information and broader reach to investors.
During the year, the Company had arranged over 60 site visits for the Group’s projects, conducted over 200 investor meetings and telephone conferences, and attended 19 investor presentations organized by investments banks. Through these investor relations activities, the Group seeks to continuously improve interactions with investors, and maintain a high level of transparency in operation.
Key investor relations events held in 2013 are as follows:
Events Date 2012 Annual Results Announcement 25 Mar 2013
– Press Conference and Analyst Briefing2013 Annual General Meeting 17 Jun 20132013 Interim Results Announcement 26 Aug 2013
– Press Conference and Analyst BriefingGreentown China Holdings Limited 5 Sep 2013
USD300,000,000 3-Year Club Loan FacilitySigning Ceremony
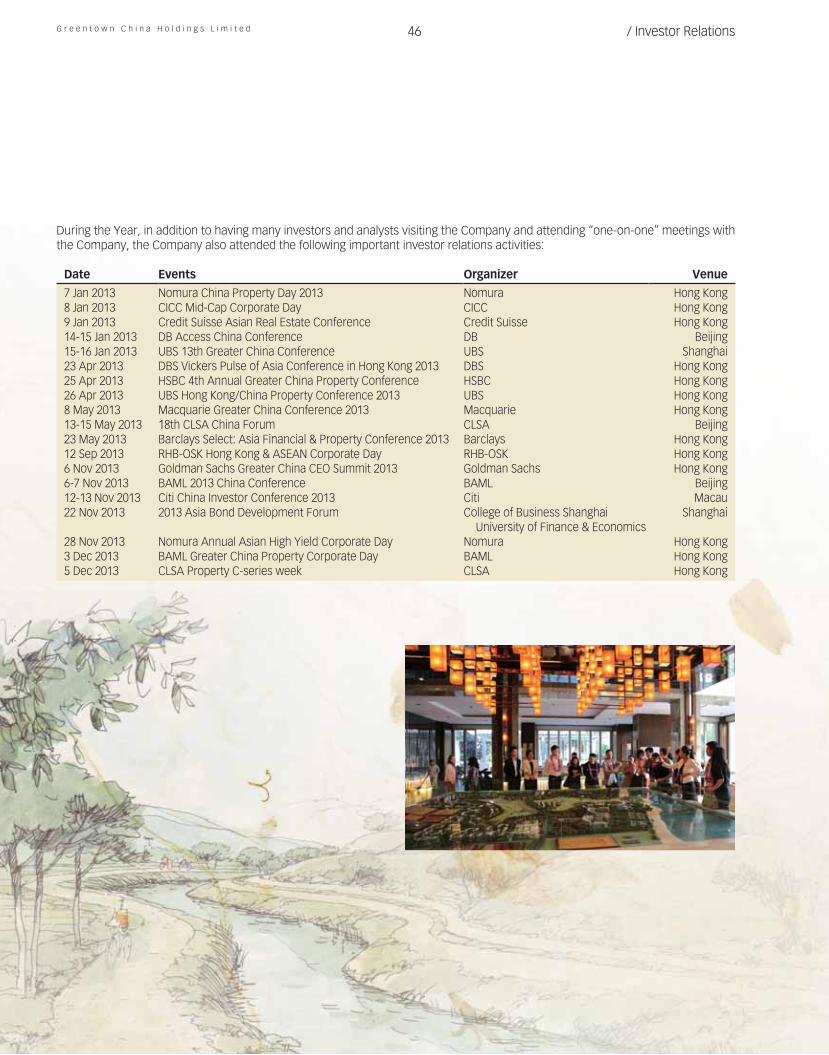
G r e e n t o w n C h i n a H o l d i n g s L i m i t e d 46 / Investor Relations
During the Year, in addition to having many investors and analysts visiting the Company and attending “one-on-one” meetings with the Company, the Company also attended the following important investor relations activities:
Date Events Organizer Venue 7 Jan 2013 Nomura China Property Day 2013 Nomura Hong Kong8 Jan 2013 CICC Mid-Cap Corporate Day CICC Hong Kong9 Jan 2013 Credit Suisse Asian Real Estate Conference Credit Suisse Hong Kong14-15 Jan 2013 DB Access China Conference DB Beijing15-16 Jan 2013 UBS 13th Greater China Conference UBS Shanghai23 Apr 2013 DBS Vickers Pulse of Asia Conference in Hong Kong 2013 DBS Hong Kong25 Apr 2013 HSBC 4th Annual Greater China Property Conference HSBC Hong Kong26 Apr 2013 UBS Hong Kong/China Property Conference 2013 UBS Hong Kong8 May 2013 Macquarie Greater China Conference 2013 Macquarie Hong Kong13-15 May 2013 18th CLSA China Forum CLSA Beijing23 May 2013 Barclays Select: Asia Financial & Property Conference 2013 Barclays Hong Kong12 Sep 2013 RHB-OSK Hong Kong & ASEAN Corporate Day RHB-OSK Hong Kong6 Nov 2013 Goldman Sachs Greater China CEO Summit 2013 Goldman Sachs Hong Kong6-7 Nov 2013 BAML 2013 China Conference BAML Beijing12-13 Nov 2013 Citi China Investor Conference 2013 Citi Macau22 Nov 2013 2013 Asia Bond Development Forum College of Business Shanghai
University of Finance & EconomicsShanghai
28 Nov 2013 Nomura Annual Asian High Yield Corporate Day Nomura Hong Kong3 Dec 2013 BAML Greater China Property Corporate Day BAML Hong Kong5 Dec 2013 CLSA Property C-series week CLSA Hong Kong
A n n u a l R e p o r t 2 0 1 3 47 / Investor Relations
In 2013, there were 23 investment banks which had issued research reports* on Greentown, 20 of which gave a rating of ‘buy’, 3 gave a rating of ‘neutral’.
Investment Bank Recommendation Research Report Deutsche Bank Buy
UBS Buy
Credit Suisse Buy
CICC Buy
Investment Bank Recommendation Research Report CCB International Buy
Goldman Sachs Buy
Citi Buy
First Shanghai Buy
* Each of these research reports, representing an independent outsider’s view on the Company which were independently produced by the writers and has not been verified or authorized by the Company, does not form part of this annual report and does not otherwise constitute any publication issued by, or any opinion, advice or view of, the Company.
G r e e n t o w n C h i n a H o l d i n g s L i m i t e d 48 / Investor Relations
Investment Bank Recommendation Research Report Haitong
InternationalBuy
Essence Buy
Fubon Bank Buy
RHB-OSK Buy
Investment Bank Recommendation Research Report Oriental Securities Buy
China Galaxy Buy
ABC International Buy
Huatai Securities Buy
A n n u a l R e p o r t 2 0 1 3 49 / Investor Relations
Investment Bank Recommendation Research Report HSBC Buy
BNP Paribas Buy
Mirae Asset Buy
Standard Chartered
BankBuy
Investment Bank Recommendation Research Report Jefferies Neutral
BOCOM
InternationalNeutral
ICBC Neutral
Our investor relations team will continue to enhance the quality of communication with its investors and maintain corporate transparency. To ensure easy access to the Company’s updated information, all of the Company’s published information including announcements, interim and annual reports, press releases, and monthly newsletters, are posted on the Company’s website www.chinagreentown.com in a timely manner. Interested party can also make enquiries by contacting the investor relations department at (+852 2523 3138) or by email to [email protected].
G r e e n t o w n C h i n a H o l d i n g s L i m i t e d
Corporate Governance Report
50
The Company believes that high corporate governance standards help enhance operational performance and the management’s accountability. The Board has always strived to comply with the principles of corporate governance and adopt sound corporate governance practices to meet legal and commercial standards, with a focus on internal control and fair, transparent and timely disclosure.
Throughout the year ended 31 December 2013, the Board considers that the Company has met the code provisions as set out in the corporate governance code (“Corporate Governance Code”) contained in Appendix 14 to the Rules Governing the Listing of Securities on the Stock Exchange (the “Listing Rules”).
(A) The Board of DirectorsThe Board takes responsibility to oversee all major matters of the Company, including the formulation and approval of all policy matters, strategies for development, internal control and risk management systems, and monitoring the performance of the senior management.
Executive DirectorsMr SONG Weiping (Chairman)Mr SHOU Bainian (Executive Vice Chairman)Mr LUO Zhaoming (Vice Chairman)Mr GUO JiafengMr CAO Zhounan
Non-Executive DirectorsMr NG Tin Hoi, StephenMr TSUI Yiu Cheung
Independent Non-Executive DirectorsMr JIA ShenghuaMr JIANG WeiMr KE HuanzhangMr SZE Tsai Ping, MichaelMr TANG ShidingMr HUI Wan Fai
Compliance with the Model Code for Securities Transactions by Directors of Listed IssuersThe Company has adopted the Model Code for Securities Transactions by directors of Listed Issuers as set out in Appendix 10 to the Listing Rules (“Model Code”) as the standard for securities transactions by the directors. The Company has made specific enquiries of all the directors and each of the directors confirmed that he has complied with the required standards set out in the Model Code throughout the year ended 31 December 2013. Relevant employees who are likely to be in possession of inside information of the Group are also subject to compliance with written guidelines on no less exacting terms than the Model Code.
Directors ’ Responsib i l i t ies for F inancia l StatementsThe directors acknowledge their responsibilities for preparing the financial statements of the Group in accordance with statutory requirements and applicable accounting standards. The respective responsibilities of the directors and the Company’s external auditors on the financial statements of the Group are set out in the “Independent Auditor’s Report” on page 76 of this annual report.
A n n u a l R e p o r t 2 0 1 3 51 / Corporate Governance Report
Chairman and Chief Executive OfficerIn order to reinforce their respective independence, accountability and responsibility, the role of the Chairman is separate from that of the Chief Executive Officer. The Chairman plays a leadership role and is responsible for the effective functioning of the Board in accordance with the good corporate governance practices adopted by the Company. He is also responsible for establishing corporate culture and developing strategies for the Company. The Chief Executive Officer focuses on developing and implementing policies approved and delegated by the Board. The Chief Executive Officer is also primarily responsible for the Group’s day-to-day management and operations, and the formulation of the organization structure, management systems, and internal control procedures and processes of the Group.
The Chairman of the Board is Mr SONG Weiping and the Chief Executive Officer of the Company is Mr SHOU Bainian.
Non-Executive DirectorsWharf is a strategic shareholder of Greentown. Our non-executive directors are Mr NG Tin Hoi, Stephen and Mr TSUI Yiu Cheung, who are representatives of the Wharf Group and are very experienced and reputable individuals in the industry. With their wealth of experience and knowledge, they are in a position to provide valuable and practicable opinions on the Group’s development and strategies. In addition, Mr NG Tin Hoi, Stephen is a member of our Investment Committee (alongside Mr SONG Weiping and Mr SHOU Bainian). The Investment Committee aims to provide guidance and supervision to us with respect to investment matters.
Independent Non-Executive DirectorsIndependent non-executive directors play a significant role in the Board by virtue of their independent judgment. Their views carry significant weight in the Board’s decision. In particular, they provide impartial and multi-perspective opinions on the Group’s development strategies, operational performance and internal control system. Every independent non-executive director possesses extensive academic,
professional and industry expertise and management experience. They provide professional advice to the Board according to the Group’s particular situation. For the year ended 31 December 2013, each of the independent non-executive directors has confirmed his independence to the Company in accordance with the Listing Rules.
Board Meetings and Shareholders MeetingThe Board meets regularly to discuss the overall strategy as well as the operation and financial performance of the Group. Directors may participate either in person or through video/telephone conferences. 11 Board meetings and 1 shareholders meetings were convened in 2013. The attendance of each individual director at these Board meetings and shareholders meetings is set out below:
Number of Board Meetings
Attended/Held in 2013
Number of Shareholders’
Meetings Attended/
Held in 2013 Executive DirectorsMr SONG Weiping
(Chairman)11/11 1/1
Mr SHOU Bainian (Executive Vice Chairman)
11/11 1/1
Mr LUO Zhaoming (Vice Chairman)
10/11 1/1
Mr GUO Jiafeng 11/11 1/1Mr CAO Zhounan 11/11 1/1
Non-Executive DirectorsMr NG Tin Hoi, Stephen 8/11 1/1Mr TSUI Yiu Cheung 8/11 1/1
Independent Non-Executive Directors
Mr JIA Shenghua 11/11 1/1Mr JIANG Wei 11/11 1/1Mr KE Huanzhang 11/11 1/1Mr SZE Tsai Ping, Michael 11/11 1/1Mr TANG Shiding 11/11 1/1Mr HUI Wan Fai 11/11 1/1
G r e e n t o w n C h i n a H o l d i n g s L i m i t e d 52 / Corporate Governance Report
All directors are provided with the relevant materials relating to the issues for discussion before the meetings. They have access to members of the senior management and the company secretary at all times and may seek independent professional advice at the Company’s expense. All directors have the opportunity to request to include new issues for discussion in the agenda for Board meetings. Notices of Board meetings are given to the directors within reasonable time before meeting and the procedures of Board meetings are conducted in compliance with the Articles of Association of the Company, as well as the relevant laws and regulations.
Appointments, Re-election and Removal of DirectorsEach of the executive directors, non-executive directors, independent non-executive directors has entered into a service contract or appointment letter with the Company for a specific term and the details of which, as well as the details of the appointment, re-election and removal of the directors are described in the sections headed “Report of the Directors – Directors” and “– Directors’ Service Contracts”.
Directors’ Continuous Professional DevelopmentEach of the directors has participated in continuous professional development in 2013 in compliance with the requirements of the Corporate Governance Code.
Board CommitteesThe Board has established the Audit Committee, the Nomination Committee and the Remuneration Committee (collectively, the “Board Committees”) with defined terms of reference. The terms of reference of the Board Committees are available on the websites of the Company and the Stock Exchange. The Board Committees are provided with sufficient resources to discharge their duties and, upon reasonable request, are able to seek independent professional advice in appropriate circumstances, at the Company’s expenses.
Audit CommitteeThe primary duties of the Audit Committee are to review and supervise the Group’s financial reporting procedures, internal control and risk management systems, review the internal audit scheme formulated by the Internal Audit Department of the Group and the reports submitted by the Internal Audit Department. It is also responsible for reviewing affairs related to the appointment, resignation and replacement of independent auditors, as well as assessing such auditors’ performance, degree of independence and objectivity and reasonableness of their audit fees, and providing relevant recommendations to the Board. All members of the Audit Committee are independent non-executive directors and non-executive directors. Members of the Audit Committee in the year ended 31 December 2013 were independent non-executive director Mr SZE Tsai Ping, Michael (Chairman), non-executive director Mr TSUI Yiu Cheung and independent non-executive directors Mr JIA Shenghua, Mr JIANG Wei, Mr TANG Shiding and Mr HUI Wan Fai.
The major tasks accomplished during the year include:
– reviewing the annual and interim results announcements , repor t s and f i nanc ia l statements of the Group;
– reviewing and providing recommendations on the accounting policies adopted by the Group and the accounting practices;
– monitoring the work of the Internal Audit Department of the Group and reviewing the internal audit reports;
– advising on material transactions of the Group and providing recommendations on related risks to management; and
– reviewing the audit fees of the auditors and recommending the fees for approval by the Board.
A n n u a l R e p o r t 2 0 1 3 53 / Corporate Governance Report
During the year ended 31 December 2013, the Audit Committee held 3 meetings. The attendance of each individual member at the Audit Committee meetings is set out below:
Number of Meetings
Attended/Held Independent Non-Executive DirectorsMr SZE Tsai Ping, Michael (Chairman) 3/3Mr JIA Shenghua 2/3Mr JIANG Wei 3/3Mr TANG Shiding 2/3Mr HUI Wan Fai 3/3
Non-Executive DirectorMr TSUI Yiu Cheung 3/3
Nomination CommitteeThe Nomination Committee is primarily responsible for considering and recommending to the Board suitably qualified persons to become members of the Board and is also responsible for reviewing the structure, size and composition of the Board on a regular basis and as required. Members of the Nomination Committee in the year ended 31 December 2013 were independent non-executive director Mr SZE Tsai Ping, Michael (Chairman), executive director Mr SHOU Bainian, non-executive director Mr TSUI Yiu Cheung, and independent non-executive directors Mr TANG Shiding and Mr HUI Wan Fai.
The Nomination Committee adopted certain criteria and procedures in the nomination of new directors. The major criteria include, among others, the candidate’s professional background, experience in the industry of the Group’s business and the past employment track record of the candidate.
During the year ended 31 December 2013, the Nomination Committee held 1 meeting. The attendance of each indiv idual member at the Nominat ion Committee meeting is set out below:
Number of Meetings
Attended/Held Independent Non-Executive DirectorsMr SZE Tsai Ping, Michael (Chairman) 1/1Mr TANG Shiding 1/1Mr HUI Wan Fai 1/1
Executive DirectorMr SHOU Bainian 1/1
Non-Executive DirectorMr TSUI Yiu Cheung 1/1
Remuneration CommitteeThe Remuneration Committee is responsible for making recommendations and proposals on directors’ remuneration and other benefits to the Board.
The remuneration of all directors is subject to regular monitoring by the Remuneration Committee to ensure that the level of their remuneration and compensation are reasonable. Members of the Remuneration Committee in the year ended 31 December 2013 were independent non-executive directors Mr JIA Shenghua (Chairman) and Mr SZE Tsai Ping, Michael, executive director Mr SHOU Bainian and non-executive director Mr NG Tin Hoi, Stephen.
G r e e n t o w n C h i n a H o l d i n g s L i m i t e d 54 / Corporate Governance Report
During the year ended 31 December 2013, the Remuneration Committee held 1 meeting. Members of the Remuneration Committee have assessed the performance of directors and reviewed the remuneration packages of the directors and the remuneration policies and structure of the Company, details of which are set out in the section headed “Report of the Directors – Human Resources”. The attendance of each individual member at the Remuneration Committee meeting is set out below:
Number of Meetings
Attended/Held Independent Non-Executive DirectorsMr JIA Shenghua (Chairman) 1/1Mr SZE Tsai Ping, Michael 1/1
Executive DirectorMr SHOU Bainian 1/1
Non-Executive DirectorMr NG Tin Hoi, Stephen 1/1
Corporate Governance FunctionsThe Board is responsible for determining the policy for the corporate governance of the Company and performing the corporate governance duties as follows:
• developing and reviewing the Company’s policies and practices on corporate governance and making recommendations to the Board on changes and updates;
• reviewing and monitoring the training and continuous professional development of the director and senior management;
• reviewing and monitoring the Company’s policies and practices on compliance with legal and regulatory requirements;
• developing, reviewing and monitoring the code of conduct and compliance manual (if any) applicable to employees and the directors;
• reviewing the Company’s compliance with the Corporate Governance Code and disclosure in the corporate governance report; and
• such other corporate governance duties and functions set out in the Corporate Governance Code (as amended from time to time) for which the Board are responsible.
Others – Investment CommitteePursuant to the investment agreement entered into between the Group, Wharf and its subsidiaries on 8 June 2012, the Company has established an Investment Committee and appointed three members, namely, the executive directors Mr SONG Weiping and Mr SHOU Bainian and non-executive director Mr NG Tin Hoi, Stephen (being the representative of Wharf Group), for the purpose of providing guidance and supervision to the Group with respect to investment matters. Any acquisition of land or investment in any property development project to be carried out by the Group shall be submitted to the Investment Committee for consideration. For so long as the net gearing ratio of the Company is 100% or above, a written consent is required to be obtained from the representative of Wharf Group.
(B) Financial Reporting and Internal ControlsFinancial ReportingThe Board, supported by the finance department, is responsible for the preparation of the financial statements of the Company and the Group. In the preparation of financial statements, International Financial Reporting Standards have been adopted and appropriate accounting policies have been consistently used and applied.
A n n u a l R e p o r t 2 0 1 3 55 / Corporate Governance Report
Independent AuditorDeloitte Touche Tohmatsu has been appointed as the Company’s independent auditor since 2004.
A breakdown of the remuneration received by the independent auditor for audit and non-audit services provided to the Company is as follows:
2013 2012Service Item (RMB’000) (RMB’000) Audit services (including
interim review) 5,140 5,040Non-audit services (mainly
issuance of comfort letters for senior notes and major transactions) 1,092 227
Total 6,232 5,267
The Audit Committee and the Board have agreed on the re-appointment of Deloitte Touche Tohmatsu as the independent auditor of the Group for 2014, and the proposal will be submitted for approval at the annual general meeting of the Company to be held on 27 June 2014 (Friday).
Internal ControlsThe Board is responsible for the internal control of the Group and reviewing its effectiveness. Procedures have been designed to safeguard company assets against unauthorized use or disposition, ensure the maintenance of proper accounting records for the provision of reliable financial information for internal use or for external publication, and ensure compliance with the applicable laws, rules and regulations. The directors have conducted a review of the effectiveness of the internal control system of the Group, and reviewed and monitored the Company’s internal management and operation during the year. The Internal Audit Department established by the Company has conducted random internal audit of the Company, its subsidiaries, joint ventures and associates. The work carried out by the Internal Audit Department includes ensuring that the internal control is in place and functions properly as intended.
The independent auditors will report to the Company on the weaknesses (if any) in the Group’s internal controls and accounting procedures which have come to their attention during the course of their audit work.
(C) Shareholder’s RightsAccording to the Articles of Association of the Company, shareholders shall have the right to request to convene an extraordinary general meeting (“EGM”) of the Company. Two or more shareholders holding in aggregate of not less than one-tenth (10%) of the paid up capital of the Company which carries the right of voting at the general meeting of the Company may send a written request to request for a EGM. The written requisition, duly signed by the shareholders concerned, must state the purposes of the meeting and must be deposited at the Hong Kong office of the Company.
Shareholders who wish to move a resolution at general meetings may follow the procedures set out in the preceding paragraph.
The Memorandum and Articles of Association is published on the Company’s website and the Stock Exchange’s website.
G r e e n t o w n C h i n a H o l d i n g s L i m i t e d
Report of the Directors
56
The Board presents its annual report and the audited consolidated financial statements of the Group for the year ended 31 December 2013 (the “Consolidated Financial Statements”) to the Shareholders.
Company IncorporationThe Company was incorporated and registered as an exempted company with limited liability in the Cayman Islands under the Companies Law (2004 Second Revision) of the Cayman Islands on 31 August 2005.
The shares of the Company were listed on the Main Board of the Stock Exchange on 13 July 2006.
Principal BusinessThe Company is an investment holding company. The activities of its subsidiaries, joint ventures and associates are set out in notes 40, 18 and 17, respectively to the Consolidated Financial Statements. There was no significant change in the nature of the Group’s principal business during the year ended 31 December 2013 (the “Year”).
Financial Positions and ResultsThe financial positions of the Group as at 31 December 2013 prepared in accordance with IFRS are set out in the Consolidated Statement of Financial Position on pages 78 to 79 of the annual report.
The results of the Group for the year ended 31 December 2013 prepared in accordance with IFRS are set out in the Consolidated Statement of profit or loss and other Comprehensive Income on page 77 of the annual report. A financial summary of the Group for the last five financial years is set out on page 7 of the annual report.
ReservesDetails of movements in reserves of the Group in 2013 are set out in the Consolidated Statement of Changes in Equity on pages 80 of the annual report.
DividendsThe Board recommends the payment of a final dividend of RMB0.43 per share for the year ended 31 December 2013 (the “2013 Final Dividend”) to the shareholders whose names appear on the Company’s register of members as of 9 July 2014 (Wednesday). Subject to shareholders’ approval at the annual general meeting of the Company (the “AGM”) to be held on 27 June 2014 (Friday), the 2013 Final Dividend will be paid on 18 July 2014 (Friday). No interim dividend was paid during the Year, therefore, the total dividend for the Year (subject to the aforesaid approval) is RMB0.43 per share.
Segment InformationThe reporting segments of the Group are as follows:
1 Property development
2 Hotel operations
3 Property investment
4 Others (including sale of construction materials, design and decoration, project management, etc.)
The segment information for the year ended 31 December 2013 is set out in note 7 to the Consolidated Financial Statements.

A n n u a l R e p o r t 2 0 1 3 57 / Report of the Directors
Property, Plant and EquipmentDetails of the movements in property, plant and equipment of the Group during the Year are set out in note 15 to the Consolidated Financial Statements.
Details of Share Offering and Placing
IPO Placement 1 Placement 2 Placement 3 Listing place Main Board of HKEx Main Board of HKEx Main Board of HKEx Main Board of HKExOffering/Placing price HK$8.22 per share HK$16.35 per share HK$5.20 per share HK$5.20 per shareListing date 13 July 2006 4 May 2007 15 June 2012 2 August 2012Number of issued shares 347,402,500 shares 141,500,000 shares 327,849,579 shares 162,113,714 shares
Share CapitalDetails of movements in the share capital of the Company during the Year are set out in note 28 to the Consolidated Financial Statements.
Sufficiency of Public FloatBased on the information that is publicly available to the Company and to the best of the directors’ knowledge, the Company has maintained a sufficient public float as required by the Listing Rules throughout the year ended 31 December 2013.
Perpetual Subordinated Convertible Callable SecuritiesDetails of movements during the Year in the 2012 perpetual subordinated convertible callable securities are set out in note 29 to the Consolidated Financial Statements.
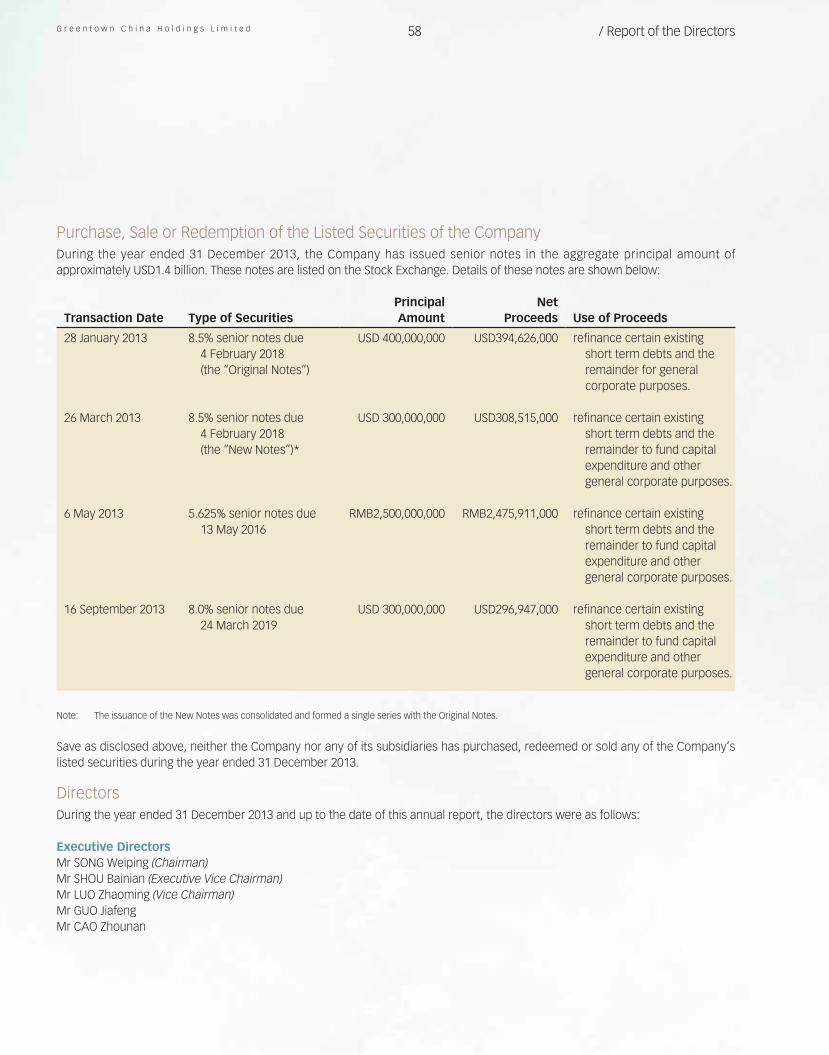
G r e e n t o w n C h i n a H o l d i n g s L i m i t e d 58 / Report of the Directors
Purchase, Sale or Redemption of the Listed Securities of the CompanyDuring the year ended 31 December 2013, the Company has issued senior notes in the aggregate principal amount of approximately USD1.4 billion. These notes are listed on the Stock Exchange. Details of these notes are shown below:
Transaction Date Type of SecuritiesPrincipal Amount
Net Proceeds Use of Proceeds
28 January 2013 8.5% senior notes due 4 February 2018 (the “Original Notes”)
USD 400,000,000 USD394,626,000 refinance certain existing short term debts and the remainder for general corporate purposes.
26 March 2013 8.5% senior notes due 4 February 2018 (the “New Notes”)*
USD 300,000,000 USD308,515,000 refinance certain existing short term debts and the remainder to fund capital expenditure and other general corporate purposes.
6 May 2013 5.625% senior notes due 13 May 2016
RMB2,500,000,000 RMB2,475,911,000 refinance certain existing short term debts and the remainder to fund capital expenditure and other general corporate purposes.
16 September 2013 8.0% senior notes due 24 March 2019
USD 300,000,000 USD296,947,000 refinance certain existing short term debts and the remainder to fund capital expenditure and other general corporate purposes.
Note: The issuance of the New Notes was consolidated and formed a single series with the Original Notes.
Save as disclosed above, neither the Company nor any of its subsidiaries has purchased, redeemed or sold any of the Company’s listed securities during the year ended 31 December 2013.
DirectorsDuring the year ended 31 December 2013 and up to the date of this annual report, the directors were as follows:
Executive DirectorsMr SONG Weiping (Chairman)Mr SHOU Bainian (Executive Vice Chairman)Mr LUO Zhaoming (Vice Chairman)Mr GUO JiafengMr CAO Zhounan
A n n u a l R e p o r t 2 0 1 3 59 / Report of the Directors
Non-executive DirectorsMr NG Tin Hoi, StephenMr TSUI Yiu Cheung
Independent Non-Executive DirectorsMr JIA ShenghuaMr JIANG WeiMr KE HuanzhangMr SZE Tsai Ping, MichaelMr TANG ShidingMr HUI Wan Fai
In accordance with Article 130 of the Company’s Articles of Association, one third of the directors for the time being or, if their number is not three or a multiple of three, the number nearest to but not less than one third shall retire from office by rotation provided that every director shall be subject to retirement by rotation at least once every three years. Mr SHOU Bainian, Mr LUO Zhaoming, Mr CAO Zhounan, Mr TANG Shiding and Mr HUI Wan Fai will retire at the AGM of the Company. Mr SHOU Bainian, Mr LUO Zhaoming, Mr CAO Zhounan and Mr HUI Wan Fai, being eligible in accordance with the Articles of Association, will offer themselves for re-election while Mr TANG Shiding does not seek for re-election.
Directors’ Service ContractsEach of the executive directors has entered into a service contract with the Company for an initial term of three years and shall continue thereafter until terminated by either party by giving not less than three months’ prior notice in writing.
Each of the non-executive directors and independent non-executive directors has been appointed by the Company for a term of three years.
Apart from the foregoing, no director proposed for re-election at the AGM has a service contract with the Company which is not determinable by the Company within one year without payment of compensation, other than statutory compensation.
Biographical Details of Directors and Senior ManagementBiographical details of the directors and senior management of the Group are set out on pages 32 to 39 of the annual report.
Remuneration of DirectorsThe remuneration of the directors is disclosed on an individual named basis in note 11 to the Consolidated Financial Statements.
Highest Paid IndividualsDuring the Year, the relevant information of the five individuals with the highest remuneration of the Group is disclosed in note 11 to the Consolidated Financial Statements.
Independence of Independent Non-executive DirectorsThe Board has obtained written confirmations from all independent non-executive directors concerning their independence in accordance with Rule 3.13 of the Listing Rules. The Board is in the opinion that the existing independent non-executive directors are independent based on the guidelines set out in Rule 3.13 of the Listing Rules.
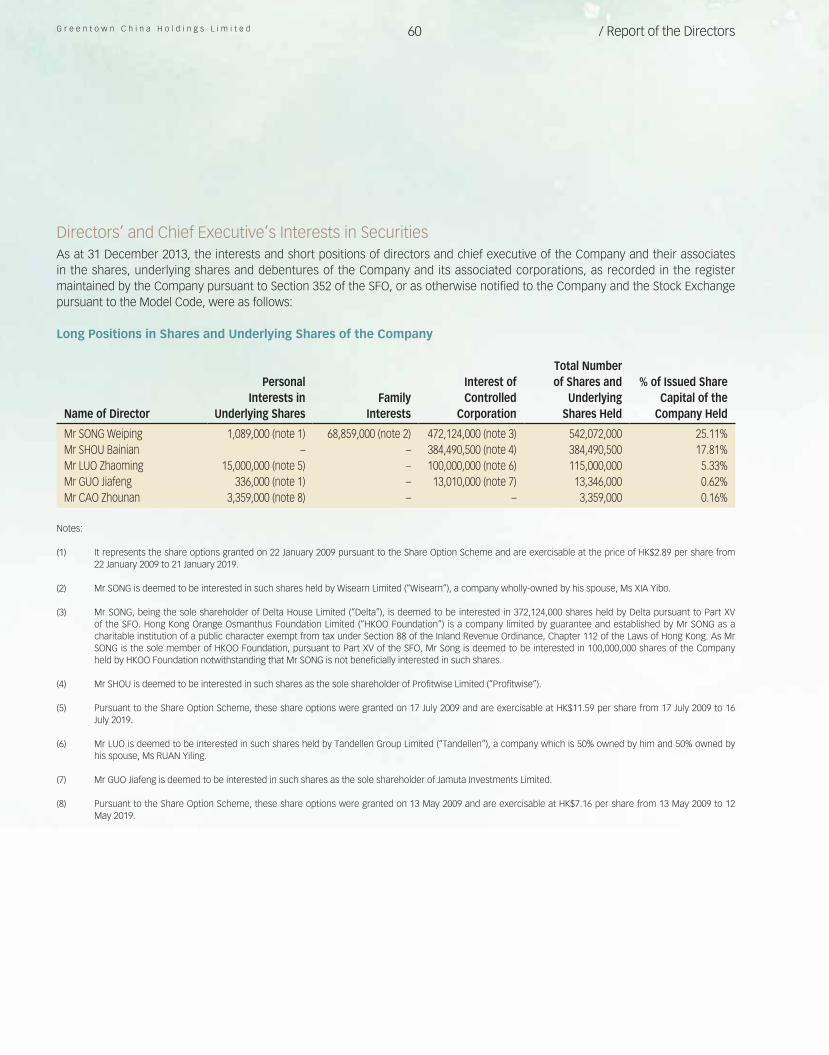
G r e e n t o w n C h i n a H o l d i n g s L i m i t e d 60 / Report of the Directors
Directors’ and Chief Executive’s Interests in SecuritiesAs at 31 December 2013, the interests and short positions of directors and chief executive of the Company and their associates in the shares, underlying shares and debentures of the Company and its associated corporations, as recorded in the register maintained by the Company pursuant to Section 352 of the SFO, or as otherwise notified to the Company and the Stock Exchange pursuant to the Model Code, were as follows:
Long Positions in Shares and Underlying Shares of the Company
Name of Director
PersonalInterests in
Underlying SharesFamily
Interests
Interest ofControlled
Corporation
Total Numberof Shares and
UnderlyingShares Held
% of Issued ShareCapital of the
Company Held Mr SONG Weiping 1,089,000 (note 1) 68,859,000 (note 2) 472,124,000 (note 3) 542,072,000 25.11%Mr SHOU Bainian – – 384,490,500 (note 4) 384,490,500 17.81%Mr LUO Zhaoming 15,000,000 (note 5) – 100,000,000 (note 6) 115,000,000 5.33%Mr GUO Jiafeng 336,000 (note 1) – 13,010,000 (note 7) 13,346,000 0.62%Mr CAO Zhounan 3,359,000 (note 8) – – 3,359,000 0.16%
Notes:
(1) It represents the share options granted on 22 January 2009 pursuant to the Share Option Scheme and are exercisable at the price of HK$2.89 per share from 22 January 2009 to 21 January 2019.
(2) Mr SONG is deemed to be interested in such shares held by Wisearn Limited (“Wisearn”), a company wholly-owned by his spouse, Ms XIA Yibo.
(3) Mr SONG, being the sole shareholder of Delta House Limited (“Delta”), is deemed to be interested in 372,124,000 shares held by Delta pursuant to Part XV of the SFO. Hong Kong Orange Osmanthus Foundation Limited (“HKOO Foundation”) is a company limited by guarantee and established by Mr SONG as a charitable institution of a public character exempt from tax under Section 88 of the Inland Revenue Ordinance, Chapter 112 of the Laws of Hong Kong. As Mr SONG is the sole member of HKOO Foundation, pursuant to Part XV of the SFO, Mr Song is deemed to be interested in 100,000,000 shares of the Company held by HKOO Foundation notwithstanding that Mr SONG is not beneficially interested in such shares.
(4) Mr SHOU is deemed to be interested in such shares as the sole shareholder of Profitwise Limited (“Profitwise”).
(5) Pursuant to the Share Option Scheme, these share options were granted on 17 July 2009 and are exercisable at HK$11.59 per share from 17 July 2009 to 16 July 2019.
(6) Mr LUO is deemed to be interested in such shares held by Tandellen Group Limited (“Tandellen”), a company which is 50% owned by him and 50% owned by his spouse, Ms RUAN Yiling.
(7) Mr GUO Jiafeng is deemed to be interested in such shares as the sole shareholder of Jamuta Investments Limited.
(8) Pursuant to the Share Option Scheme, these share options were granted on 13 May 2009 and are exercisable at HK$7.16 per share from 13 May 2009 to 12 May 2019.
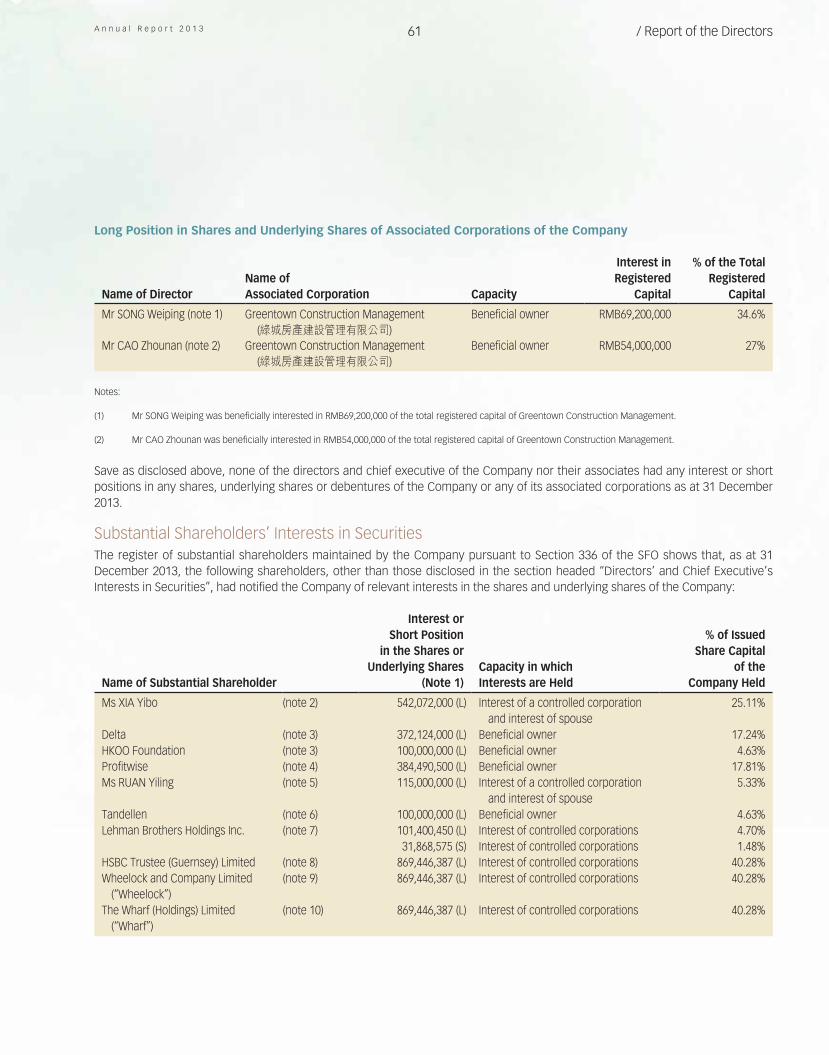
A n n u a l R e p o r t 2 0 1 3 61 / Report of the Directors
Long Position in Shares and Underlying Shares of Associated Corporations of the Company
Name of DirectorName ofAssociated Corporation Capacity
Interest inRegistered
Capital
% of the TotalRegistered
Capital Mr SONG Weiping (note 1) Greentown Construction Management
(綠城房產建設管理有限公司)Beneficial owner RMB69,200,000 34.6%
Mr CAO Zhounan (note 2) Greentown Construction Management(綠城房產建設管理有限公司)
Beneficial owner RMB54,000,000 27%
Notes:
(1) Mr SONG Weiping was beneficially interested in RMB69,200,000 of the total registered capital of Greentown Construction Management.
(2) Mr CAO Zhounan was beneficially interested in RMB54,000,000 of the total registered capital of Greentown Construction Management.
Save as disclosed above, none of the directors and chief executive of the Company nor their associates had any interest or short positions in any shares, underlying shares or debentures of the Company or any of its associated corporations as at 31 December 2013.
Substantial Shareholders’ Interests in SecuritiesThe register of substantial shareholders maintained by the Company pursuant to Section 336 of the SFO shows that, as at 31 December 2013, the following shareholders, other than those disclosed in the section headed “Directors’ and Chief Executive’s Interests in Securities”, had notified the Company of relevant interests in the shares and underlying shares of the Company:
Name of Substantial Shareholder
Interest orShort Position
in the Shares orUnderlying Shares
(Note 1)Capacity in whichInterests are Held
% of IssuedShare Capital
of theCompany Held
Ms XIA Yibo (note 2) 542,072,000 (L) Interest of a controlled corporation and interest of spouse
25.11%
Delta (note 3) 372,124,000 (L) Beneficial owner 17.24%HKOO Foundation (note 3) 100,000,000 (L) Beneficial owner 4.63%Profitwise (note 4) 384,490,500 (L) Beneficial owner 17.81%Ms RUAN Yiling (note 5) 115,000,000 (L) Interest of a controlled corporation
and interest of spouse5.33%
Tandellen (note 6) 100,000,000 (L) Beneficial owner 4.63%Lehman Brothers Holdings Inc. (note 7) 101,400,450 (L) Interest of controlled corporations 4.70%
31,868,575 (S) Interest of controlled corporations 1.48%HSBC Trustee (Guernsey) Limited (note 8) 869,446,387 (L) Interest of controlled corporations 40.28%Wheelock and Company Limited
(“Wheelock”)(note 9) 869,446,387 (L) Interest of controlled corporations 40.28%
The Wharf (Holdings) Limited(“Wharf”)
(note 10) 869,446,387 (L) Interest of controlled corporations 40.28%
G r e e n t o w n C h i n a H o l d i n g s L i m i t e d 62 / Report of the Directors
Notes:
(1) The letter “L” denotes a long position. The letter “S” denotes a short position.
(2) Ms XIA, being the sole shareholder of Wisearn, is deemed to be interested in 68,859,000 shares held by Wisearn pursuant to Part XV of the SFO. Ms XIA is the spouse of Mr SONG. Accordingly, pursuant to Part XV of the SFO, Ms XIA is also deemed to be interested in: (i) 372,124,000 shares held by Delta, a company of which Mr SONG is the sole shareholder, (ii) 100,000,000 shares held by HKOO Foundation, a charitable institution established by Mr SONG of which Mr SONG is the sole member (notwithstanding that neither Mr SONG nor Ms XIA is beneficially interested in those shares); and (iii) 1,089,000 share options of the Company held by Mr SONG. The aforesaid represents an aggregate of 542,072,000 shares.
(3) A company controlled by Mr SONG by virtue of SFO, details of which are disclosed above.
(4) A company controlled by Mr SHOU by virtue of SFO, details of which are disclosed above.
(5) Ms RUAN Yiling is deemed to be interested in 100,000,000 shares held by Tandellen, a company as to 50% owned by her and 50% owned by her spouse, Mr LUO, and deemed to be interested in 15,000,000 share options held by Mr LUO.
(6) A company controlled by Mr LUO Zhaoming by virtue of SFO, details of which are disclosed above.
(7) Lehman Brothers Holdings Inc., according to its disclosure of interest filing, is deemed to be interested in a total of 101,400,450(L) shares and 31,868,575(S) shares through its controlled corporations by virtue of SFO.
(8) HSBC Trustee (Guernsey) Limited is deemed to be interested in 869,446,387 shares through its controlled corporations, namely Wheelock, Wheelock Investments Limited, WF Investment Partners Limited, Wharf, Wharf China Holdings Limited, Target Smart Investments Limited (“Target Smart”) and Enzio Investments Limited (“Enzio”). Such deemed interest includes the deemed interest in the share by virtue of the PSCS. The PSCS has been redeemed in full post balance sheet date.
(9) Wheelock is deemed to be interested in 869,446,387 shares through its controlled corporations, namely Wheelock Investments Limited, WF Investment Partners Limited, Wharf, Wharf China Holdings Limited, Target Smart and Enzio. Such deemed interest includes the deemed interest in the share by virtue of the PSCS. As at 31 December 2013, Wharf (through Target Smart) held 524,851,793 shares, representing 24.32% of the Company’s total issued share capital. The PSCS has been redeemed in full post balance sheet date.
(10) Wharf is deemed to be interested in 869,446,387 shares through its controlled corporations, namely Wharf China Holdings Limited, Target Smart and Enzio. Such deemed interest includes the deemed interest in the share by virtue of the PSCS. As at 31 December 2013, Wharf (through Target Smart) held 524,851,793 shares, representing 24.32% of the Company’s total issued share capital. The PSCS has been redeemed in full post balance sheet date.
Save as disclosed above, the Company has not been notified of any other notifiable interests or short positions in the shares or underlying shares of the Company as at 31 December 2013.
Share Option SchemeThe Share Option Scheme was adopted pursuant to the shareholders’ resolution passed on 22 June 2006 for the primary purpose of providing incentives and/or reward to directors and employees of the Group and will expire on 21 June 2016. Under the Share Option Scheme, the Board may grant share options to eligible employees, including directors of the Company and its subsidiaries, to subscribe for shares in the Company.
The total number of shares in respect of which share options may be granted under the Share Option Scheme is not permitted to exceed 10% of the shares in issue at any point of time, without prior approval from the Company’s shareholders. The number of shares issued and to be issued in respect of which share options granted and may be granted to any individual in any one year is not permitted to exceed 1% of the shares in issue at any point of time, without prior approval from the Company’s shareholders. Share options granted to independent non-executive directors and substantial shareholders of the Company in excess of 0.1% of the Company’s share capital or with a value in excess of HK$5,000,000 must be approved in advance by the Company’s shareholders.
Share options may be exercised at any time from the date of grant of the share option to the expiry of the Share Option Scheme, unless otherwise specified in the Share Option Scheme. The exercise price is determined by the Board, and will not be less than the higher of (i) the closing price of the shares of the Company as stated in the Stock Exchange’s daily quotations sheet on the date of grant; (ii) the average of the closing prices of the shares of the Company as stated in the Stock Exchange’s daily quotation sheets for the five business days immediately preceding the date of grant; and (iii) the nominal value of the shares of the Company. Detailed terms of the Share Option Scheme are set out in note 33 to the Consolidated Financial Statements.
As at the date of this annual report, the total number of options available for issue under the Share Option Scheme represents 27,014,150 shares, or approximately 1.25% of the issued share capital of the Company.
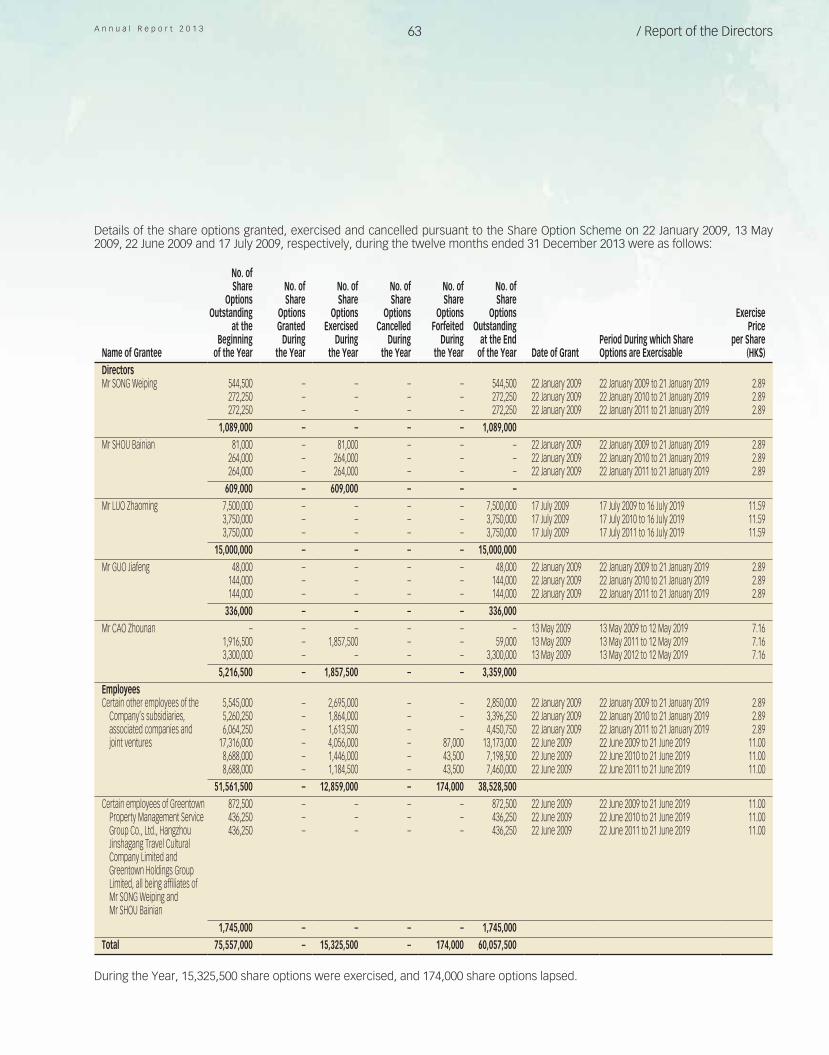
A n n u a l R e p o r t 2 0 1 3 63 / Report of the Directors
Details of the share options granted, exercised and cancelled pursuant to the Share Option Scheme on 22 January 2009, 13 May 2009, 22 June 2009 and 17 July 2009, respectively, during the twelve months ended 31 December 2013 were as follows:
Name of Grantee
No. of Share
Options Outstanding
at the Beginning
of the Year
No. of Share
Options Granted
During the Year
No. of Share
Options Exercised
During the Year
No. of Share
Options Cancelled
During the Year
No. of Share
Options Forfeited
During the Year
No. of Share
Options Outstanding
at the End of the Year Date of Grant
Period During which Share Options are Exercisable
Exercise Price
per Share (HK$)
DirectorsMr SONG Weiping 544,500 – – – – 544,500 22 January 2009 22 January 2009 to 21 January 2019 2.89
272,250 – – – – 272,250 22 January 2009 22 January 2010 to 21 January 2019 2.89272,250 – – – – 272,250 22 January 2009 22 January 2011 to 21 January 2019 2.89
1,089,000 – – – – 1,089,000 Mr SHOU Bainian 81,000 – 81,000 – – – 22 January 2009 22 January 2009 to 21 January 2019 2.89
264,000 – 264,000 – – – 22 January 2009 22 January 2010 to 21 January 2019 2.89264,000 – 264,000 – – – 22 January 2009 22 January 2011 to 21 January 2019 2.89
609,000 – 609,000 – – – Mr LUO Zhaoming 7,500,000 – – – – 7,500,000 17 July 2009 17 July 2009 to 16 July 2019 11.59
3,750,000 – – – – 3,750,000 17 July 2009 17 July 2010 to 16 July 2019 11.593,750,000 – – – – 3,750,000 17 July 2009 17 July 2011 to 16 July 2019 11.59
15,000,000 – – – – 15,000,000 Mr GUO Jiafeng 48,000 – – – – 48,000 22 January 2009 22 January 2009 to 21 January 2019 2.89
144,000 – – – – 144,000 22 January 2009 22 January 2010 to 21 January 2019 2.89144,000 – – – – 144,000 22 January 2009 22 January 2011 to 21 January 2019 2.89
336,000 – – – – 336,000 Mr CAO Zhounan – – – – – – 13 May 2009 13 May 2009 to 12 May 2019 7.16
1,916,500 – 1,857,500 – – 59,000 13 May 2009 13 May 2011 to 12 May 2019 7.163,300,000 – – – – 3,300,000 13 May 2009 13 May 2012 to 12 May 2019 7.16
5,216,500 – 1,857,500 – – 3,359,000 EmployeesCertain other employees of the
Company’s subsidiaries, associated companies and joint ventures
5,545,000 – 2,695,000 – – 2,850,000 22 January 2009 22 January 2009 to 21 January 2019 2.895,260,250 – 1,864,000 – – 3,396,250 22 January 2009 22 January 2010 to 21 January 2019 2.896,064,250 – 1,613,500 – – 4,450,750 22 January 2009 22 January 2011 to 21 January 2019 2.89
17,316,000 – 4,056,000 – 87,000 13,173,000 22 June 2009 22 June 2009 to 21 June 2019 11.008,688,000 – 1,446,000 – 43,500 7,198,500 22 June 2009 22 June 2010 to 21 June 2019 11.008,688,000 – 1,184,500 – 43,500 7,460,000 22 June 2009 22 June 2011 to 21 June 2019 11.00
51,561,500 – 12,859,000 – 174,000 38,528,500 Certain employees of Greentown
Property Management ServiceGroup Co., Ltd., Hangzhou Jinshagang Travel Cultural Company Limited and Greentown Holdings Group Limited, all being affiliates ofMr SONG Weiping andMr SHOU Bainian
872,500 – – – – 872,500 22 June 2009 22 June 2009 to 21 June 2019 11.00436,250 – – – – 436,250 22 June 2009 22 June 2010 to 21 June 2019 11.00436,250 – – – – 436,250 22 June 2009 22 June 2011 to 21 June 2019 11.00
1,745,000 – – – – 1,745,000
Total 75,557,000 – 15,325,500 – 174,000 60,057,500
During the Year, 15,325,500 share options were exercised, and 174,000 share options lapsed.
G r e e n t o w n C h i n a H o l d i n g s L i m i t e d 64 / Report of the Directors
Valuation of OptionsThe Company has been using the Binomial Valuation Model and the Black-Scholes Pricing Model (collectively, the “Models”) to value the share options granted. Details of the key parameters used in the Models and the corresponding fair values of the options granted in 2009 are set out in note 33 to the Consolidated Financial Statements.
Directors’ Interests in Contracts of SignificanceOther than as disclosed in note 37 to the Consolidated Financial Statements, no contract of significance to which the Company, its holding company or subsidiaries was a party and in which a director had a material interest, whether directly or indirectly, subsisted at the end of the year or at any time during the year ended 31 December 2013.
Connected Transactions and Continuing Connected TransactionsSignificant related party transactions entered into by the Group for the year ended 31 December 2013 are disclosed in note 37 to the Consolidated Financial Statements. Details of some of the said related party transactions, which also constituted connected transactions or continuing connected transactions of the Company required to be disclosed in accordance with Chapter 14A of the Listing Rules are listed as follows:
(A) Connected TransactionsIn 2013, the Group entered into certain connected transactions with the Wharf Group in relation to joint venture projects in China. Throughout the year ended 31 December 2013, Wharf (through its wholly-owned subsidiaries) was a substantial shareholder of the Company and therefore Wharf and its associates were connected persons of the Company under the Listing Rules. As of 31 December 2013, the Wharf Group was beneficially interested in 524,851,793 shares, representing 24.32% shareholding in the Company.
1.1 Joint Venture in DalianAs disclosed in the Company’s announcement dated 15 November 2012 and annual report for the year of 2012, the Company and Wharf entered into a framework agreement dated 15 November 2012 pursuant to which the Wharf Group and the Group agreed to jointly develop a piece of land in Dalian into residential properties on a 60:40 ownership basis through an investment holding company (namely Green Magic Investments Limited (“Green Magic”)) and a wholly-owned project company. The land is located at Buxin Lane, Taoyuan Area, Jiefang Road, Zhongshan District, Dalian, the PRC of about 85,700 sqm and land price of which is RMB2,028,000,000 (equivalent to approximately HK$2,526,000,000).
As disclosed by the Company subsequently on 2 May 2013, for the purpose of funding the land consideration and project development and construction costs, Green Magic and its wholly-owned project company obtained bank loan facilities of an aggregate amount of approximately HK$2,460,300,000. As requested by the lending banks, Wharf guaranteed the entire obligations under such bank loan facilities. Given that Green Magic is interested as to 60% by the Wharf Group and 40% by the Group, on 2 May 2013, the Company and its wholly-owned subsidiary Era Win Holdings Limited (“Era Win, 時凱控股有限公司”) (which holds 40% of the issued share capital of Green Magic) executed a share charge in favour of Wharf, pursuant to which the Company and Era Win agreed, among other things, to guarantee and secure 40% of the obligations under such bank loan facilities (i.e. proportional to the Group’s 40% equity interest in Green Magic) by charging its shares in Green Magic in favour of Wharf as security. The Group’s investment and commitment in Green Magic is subject to the reporting and announcement requirements under the Listing Rules.
A n n u a l R e p o r t 2 0 1 3 65 / Report of the Directors
1.2 Joint Venture in HangzhouAs disclosed in the Company’s announcement dated 18 December 2013 and circular dated 12 February 2014, the Company and Wharf entered into a framework agreement dated 18 December 2013 pursuant to which the Group and Wharf Group agreed to jointly develop a piece of land in Hangzhou into residential properties on a 50:50 ownership basis though an investment company (namely Magic Delight Limited (“Magic Delight, 麒愉有限公司”)) and a wholly-owned project company. The land is located in the Xiaoshan District of Hangzhou, the PRC of approximately 70,227 sqm and the land price of which is RMB2,576,000,000 (equivalent to approximately HK$3,297,280,000).
According to the agreement, in the event that any security is required for future external financing of Magic Delight and/or the project company and either Wharf or the Company as the contributing party agrees to provide guarantee and/or security in respect of more than 50% of such financing, the other party as the non-contributing party agrees (a) to procure its wholly-owned subsidiary holding shares in Magic Delight to execute a share charge over such shares in favour of the contributing party as counter-security for the non-contributing party’s pro-rated portion (i.e. 50%) of the obligations under such financing; and (b) to provide a counter-guarantee to the contributing party for the due observance and performance by its wholly-owned subsidiary of all the obligations under the share charge. As disclosed in the said announcement and circular, the payment of land consideration was partially funded by external financings with Wharf providing guarantee thereon in consideration of the Group providing counter-guarantee and security to the Wharf Group in accordance with the aforesaid terms (i.e. proportional to the Group’s 50% equity interest in Magic Delight).
The Group’s investment and commitment in Magic Delight is subject to the reporting, announcement and independent shareholders’ approval requirements under the Listing Rules. On 28 February 2014, the Company obtained the independent shareholders’ approval for the agreement and the transactions contemplated thereunder at an extraordinary general meeting of the Company.
(B) Continuing Connected TransactionsIn 2013, the Group had the following non-exempt continuing connected transactions (the “Non-exempt Continuing Connected Transactions”) within the meaning of Chapter 14A of the Listing Rules, and are subject to certain reporting requirements:
2.1 Properties Leasing AgreementsOn 20 January 2012, the Company and Greentown Holdings Group Limited* (綠城控股集團有限公司) (“Greentown Holdings Group”) entered into certain leasing agreements, pursuant to which Greentown Holdings Group leased to the Company certain premises and properties for general commercial uses (the “Commercial Properties”) and certain staff quarters (the “Staff Quarters”) as staff quarters of the Group for a term up to 31 December 2014 (the “Properties Leasing Agreements”).
The annual cap for the rent payable by the Company under the Properties Leasing Agreements for each of the three years ended 31 December 2014 is RMB8.63 million (as to RMB8.13 million for the Commercial Properties and RMB0.50 million for the Staff Quarters).
As Greentown Holdings Group is wholly-owned by Mr Song Weiping, Mr Shou Bainian and Ms Xia Yibo (the spouse of Mr Song Weiping) (collectively, the “Original Shareholders”), Greentown Holdings Group is a connected person of the Company and the transactions contemplated under the Properties Leasing Agreements constitute continuing connected transactions of the Company under Chapter 14A of the Listing Rules.
Details of the Properties Leasing Agreements were disclosed in the announcement of the Company dated 20 January 2012.
G r e e n t o w n C h i n a H o l d i n g s L i m i t e d 66 / Report of the Directors
2.2 Advertising Services AgreementOn 20 January 2012, the Company and Zhejiang Greentown Football Club Company Limited* (浙江綠城足球俱樂部有限公司) (“Greentown Football Club”) entered into an advertising services agreement (the “Advertising Services Agreement”), pursuant to which Greentown Football Club shall provide advertising services to the Company including advertising the Company’s “Greentown Real Estate” brand name at the football games and events participated by Greentown Football Club for a term up to 31 December 2014.
The annual cap for the aggregate annual advertising fees payable by the Company under the Advertising Services Agreement for each of the three years ending 31 December 2014 is RMB70 million.
As Greentown Football Club is a wholly-owned subsidiary of Greentown Holdings Group which is in turn wholly-owned by the Original Shareholders, Greentown Football Club is a connected person of the Company and the transactions contemplated under the Advertising Services Agreement constitute continuing connected transactions of the Company under Chapter 14A of the Listing Rules.
Details of the Advertising Services Agreement were disclosed in the announcement of the Company dated 20 January 2012.
2.3 Comprehensive Services AgreementOn 20 January 2012, the Company, the Original Shareholders and Greentown Holdings Group entered into a comprehensive services agreement in respect of the provision of interior decoration services, property management services, certain landscaping raw materials and hotel management services to the Company for a term up to 31 December 2014 (the “Comprehensive Services Agreement”).
(a) Interior Decoration ServicesPursuant to the Comprehensive Services Agreement, the Original Shareholders, through their associates, shall provide interior decoration services to the Company for the Company’s property developments upon terms not less favourable than those the Original Shareholders offer to any third parties from time to time. The Company is not obliged to engage such services exclusively or at all from the Original Shareholders. By serving three months’ prior written notice, the Company may terminate such services in respect of any of the Company’s projects. The annual cap for the fees in respect of interior decoration services payable by the Company under the Comprehensive Services Agreement for each of the three years ending 31 December 2014 is RMB10 million.
The provision of interior decoration services by the Original Shareholders through their associates under the Comprehensive Services Agreement constitute continuing connected transactions of the Company under Chapter 14A of the Listing Rules.
A n n u a l R e p o r t 2 0 1 3 67 / Report of the Directors
(b) Property Management ServicesPursuant to the Comprehensive Services Agreement, Greentown Holdings Group, through its associates, shall provide, among other services, pre-delivery property management services (including certain property management advisory services, security services and other related services) to the Company for the Company’s property developments upon terms not less favourable than those Greentown Holdings Group offers to any third parties from time to time. The Company is not obliged to engage such services exclusively or at all from Greentown Holdings Group. By serving three months’ prior written notice, the Company may terminate such services in respect of any of the Company’s projects. The annual caps for the fees in respect of the aforesaid property management services payable by the Company under the Comprehensive Services Agreement for the three years ending 31 December 2014 are RMB130 million, RMB180 million and RMB200 million, respectively.
(c) Supply of Landscaping Raw MaterialsPursuant to the Comprehensive Services Agreement, Greentown Holdings Group, through its associates, shall supply certain landscaping raw materials to the Company for the Company’s property developments upon terms not less favourable than those Greentown Holdings Group offers to any third parties from time to time. The Company is not obliged to purchase such landscaping raw materials exclusively or at all from Greentown Holdings Group. By serving three months’ prior written notice, the Company may terminate the purchase of such landscaping raw materials in respect of any specific supply contract. The annual cap for the costs in respect of the purchase of the aforesaid landscaping raw materials by the Company under the Comprehensive Services Agreement for each of the three years ending 31 December 2014 is RMB18 million.
(d) Hotel Management ServicesPursuant to the Comprehensive Services Agreement, Greentown Holdings Group, through its associates, shall provide, among other services, predelivery hotel management services (including certain advisory services and other related services) and post-delivery hotel management and operation services (including leasing business) to the Company for the Company’s hotel property development projects upon terms not less favourable than those Greentown Holdings Group offers to any third parties from time to time. The Company is not obliged to engage such services exclusively or at all from Greentown Holdings Group. By serving three months’ prior written notice, the Company may terminate such services in respect of any of the Company’s projects. The annual cap for the aforesaid hotel management services payable by the Company under the Comprehensive Services Agreement for each of the three years ending 31 December 2014 is RMB10 million.
As Greentown Holdings Group is wholly-owned by the Original Shareholders, Greentown Holdings Group is a connected person of the Company and the transactions contemplated in paragraphs (b) to (d) above constitute continuing connected transactions of the Company under Chapter 14A of the Listing Rules.
Details of the Comprehensive Services Agreement were disclosed in the announcement of the Company dated 20 January 2012.
G r e e n t o w n C h i n a H o l d i n g s L i m i t e d 68 / Report of the Directors
2.4 Educational Services Framework AgreementOn 20 January 2012, the Company and Zhejiang Greentown Education Investment Company Limited* (浙江綠城教育投資有限公司) (“Greentown Education”) entered into an educational services framework agreement for the provision of early educational participation services by Greentown Education to the Group in the Group’s development projects for a term up to 31 December 2014 (the “Educational Services Framework Agreement”) . The services provided by Greentown Education mainly include: (i) participating in and advising on the initial decoration proposals and decoration work for the nursery and primary schools in the development projects of the Group; and (ii) assisting the Group in developing interest classes and summer camps, and related promotional activities. The services are charged according to government determined or directed price or, in absence of such government determination or direction, at market price (including tender price) which may be charged by an independent third party under normal commercial terms in respect of the provision of similar services in the same area, the vicinity or the PRC. The services under the Educational Services Framework Agreement are not exclusive and the Group may engage other service providers for the same services. The Company may also terminate the services provided by Greentown Education by three months’ prior written notice. The annual cap for the fees in respect of the educational services payable by the Company under the Educational Services Framework Agreement for each of the three years ending 31 December 2014 is RMB10 million.
As Greentown Education is wholly-owned by the Original Shareholders, Greentown Education is a connected person of the Company and the transactions contemplated under the Educational Services Framework Agreement constitute continuing connected transactions of the Company under Chapter 14A of the Listing Rules.
Details of the Educational Services Framework Agreement were disclosed in the announcement of the Company dated 20 January 2012.
2.5 Health Management Services Framework AgreementOn 20 January 2012, the Company and Zhejiang Greentown Health Promotion Management Company Limited* (浙江綠城健康促進管理有限公司) (“Greentown Health”) entered into a health management services framework agreement for the provision of health management services to the Group for a term up to 31 December 2014 (the “Health Management Services Framework Agreement”). The services provided by Greentown Health mainly include: (i) establishing health management promotion centres for providing health management services; (ii) setting up a working group responsible for advising and coordinating the work relating to the health management promotion centres; (iii) organising various regular health activities; (iv) providing medical-related services according to demand; and (v) providing other paid services in addition to the package of health management services. The services are charged according to government determined or directed price or, in absence of such government determination or direction, at market price (including tender price) which may be charged by an independent third party under normal commercial terms in respect of the provision of similar services in the same area, the vicinity or the PRC. The services under the Health Management Services Framework Agreement are not exclusive and the Group may engage other service providers for the same services. The Company may also terminate the services provided by Greentown Health by three months’ prior written notice. The annual caps for the fees in respect of the health management services payable by the Company under the Health Management Services Framework Agreement for the three years ending 31 December 2014 are RMB25 million, RMB50 million and RMB50 million, respectively.
A n n u a l R e p o r t 2 0 1 3 69 / Report of the Directors
As Greentown Health is a non-wholly owned subsidiary of Greentown Holdings Group which is wholly-owned by the Original Shareholders, Greentown Health is a connected person of the Company and the transactions contemplated under the Health Management Services Framework Agreement constitute continuing connected transactions of the Company under Chapter 14A of the Listing Rules.
Details of the Health Management Services Framework Agreement were disclosed in the announcement of the Company dated 20 January 2012.
2.6 Healthcare Services Framework AgreementOn 20 January 2012, the Company and Zhejiang Greentown Hospital Investment Company Limited* (浙江綠城醫院投資有限公司) (“Greentown Hospital”) entered into a healthcare services framework agreement for the provision of healthcare services to the Group for a term up to 31 December 2014 (the “Healthcare Services Framework Agreement”). The services provided by Greentown Hospital mainly include: (i) providing healthcare and rehabilitation services; (ii) providing regular medical activities in respect of common or recurring diseases; (iii) establishing health database and developing health screening services; (iv) providing specific medical services; and (v) providing medical and living care services. The services are charged according to government determined or directed price or, in absence of such government determination or direction, at market price (including tender price) which may be charged by an independent third party under normal commercial terms in respect of the provision of similar services in the same area, the vicinity or the PRC. The services under the Healthcare Services Framework Agreement are not exclusive and the Group may engage other service providers for the same services. The Company may also terminate the services provided by Greentown Hospital by three months’ prior written notice. The annual caps for the fees in respect of healthcare services payable by the Company under the Healthcare Services Framework Agreement for the three years ending 31 December 2014 are RMB15 million, RMB16 million and RMB17 million, respectively.
As Greentown Hospital is controlled by the Original Shareholders, Greentown Hospital is a connected person of the Company and the transactions contemplated under the Healthcare Services Framework Agreement constitute continuing connected transactions of the Company under Chapter 14A of the Listing Rules.
Details of the Healthcare Services Framework Agreement were disclosed in the announcement of the Company dated 20 January 2012.
* For identification purposes only
G r e e n t o w n C h i n a H o l d i n g s L i m i t e d 70 / Report of the Directors
The annual amounts for each of the Non-exempt Continuing Connected Transactions for the year ended 31 December 2013 were as follows:
Transaction Amounts for the Year Ended 31 December 2013 RMB’000 Annual rental pursuant to the Properties Leasing Agreements 8,624
Advertising fees pursuant to the Advertising Services Agreement 70,000
Interior decoration service fees pursuant to the Comprehensive Services Agreement –
Property management service fees pursuant to the Comprehensive Services Agreement 102,230
Purchase of raw materials pursuant to the Comprehensive Services Agreement 7,956
Hotel management services fees pursuant to the Comprehensive Services Agreement 9,627
Educational services fees pursuant to the Educational Services Framework Agreement 69
Health management services fees pursuant to the Health Management Services Framework Agreement 1,118
Healthcare services fees pursuant to the Healthcare Services Framework Agreement 1,191
The independent non-executive directors of the Company have reviewed the Non-exempt Continuing Connected Transactions and confirmed that they were:
(a) entered into by members of the Group in the ordinary and usual course of its business;
(b) on normal commercial terms/on terms no less favourable to the Group than those available to (or from) independent third parties; and
(c) entered into in accordance with the relevant agreements governing them on terms that are fair and reasonable and in the interests of the shareholders of the Company as a whole.
The Company’s auditor was engaged to report on the Group’s continuing connected transactions in accordance with Hong Kong Standard on Assurance Engagements 3000 “Assurance Engagements Other Than Audits or Reviews of Historical Financial Information” and with reference to Practice Note 740 “Auditor’s Letter on Continuing Connected Transactions under the Hong Kong Listing Rules” issued by the Hong Kong Institute of Certified Public Accountants. The auditor has issued his unqualified letter containing his findings and conclusions in respect of the Non-Exempt Continuing Connected Transactions in accordance with Rule 14A.38 of the Listing Rules. A copy of the auditor’s letter has been provided by the Company to the Stock Exchange.
In the opinion of the directors, all the above transactions have been entered into in the ordinary course of the Group’s business and are conducted on normal commercial terms and are fair and reasonable and in the interest of the Company’s shareholders as a whole.
The directors confirm that it has complied with the disclosure requirements in accordance with Chapter 14A of the Listing Rules.
* For identification purposes only
A n n u a l R e p o r t 2 0 1 3 71 / Report of the Directors
Directors’ Interests In Competing BusinessDuring the Year and up to the date of this report, save as disclosed below, none of the directors is considered to have interest in a business which competes or is likely to compete, either directly or indirectly, with the business of the Group, as defined in the Listing Rules.
Greentown Holdings Group is engaged in various lines of businesses, including certain property development and sale. On 22 June 2006, Mr SONG Weiping, Mr SHOU Bainan, Ms XIA Yibo and Greentown Holdings Group entered into a deed of non-competition (the “Deed of Non-Competition”) with the Company to undertake that they will not, and shall procure their controlled affiliates (other than subsidiaries and associates of the Company) not to engage in any property development business (except for hotel development and property management) in the PRC, provided that Greentown Holdings Group may continue with the development and sale of the eight property projects (the “Non-inclusion Projects”). Pursuant to the Deed of Non-Competition, Greentown Holdings Group granted an option to the Company to acquire the Non-inclusion Projects. Details of the terms of the Deed of Non-Competition are described in the “Business Section” of the Company’s prospectus dated 30 June 2006.
Pursuant to the ordinary resolutions passed at the extraordinary general meeting held on 26 March 2007, three out of eight Non-inclusion Projects were acquired by the Company. During the year ended 31 December 2007, Greentown Holdings Group disposed one Non-inclusion Project to an independent third party. As at 31 December 2013, there are still four Non-inclusion Projects pursuant to the Deed of Non-Competition.
On 3 August 2010, Mr SONG Weiping, Greentown Real Estate and Shanghai Xinping Financial Consulting Firm (上海欣萍財務諮詢事務所) entered into a joint venture agreement for the establishment of Greentown Construction Management. Mr SONG Weiping has a 34.6% interest in Greentown Construction Management. The principal activities of the Greentown Construction Management are providing property construction management and advisory services in the PRC. The directors were of the view that the business activities of Greentown Construction Management may compete with that of the Group. A waiver from the Deed of Non-Competition in favour of Mr SONG Weiping was proposed by the directors and granted by the shareholders at the extraordinary general meeting of the Company held on 7 September 2010.
As at the date of this report, Mr LUO Zhaoming is a director and the vice chairman of Hangzhou Sino-Ocean Laifu Land Limited* (杭州遠洋萊福房地產開發有限公司), a company incorporated in the PRC that principally carries on the business of property development. Mr NG Tin Hoi, Stephen was appointed as a non-executive director of the Company on 15 June 2012. From the date of this appointment to the date of this report, Mr NG was also a director of Wheelock and Company Limited (listed on the Main Board of the Stock Exchange, stock code: 00020.HK) (“Wheelock”), Wharf (listed on the Main Board of the Stock Exchange, stock code: 00004.HK) and Harbour Centre Development Limited (listed on the Main Board of the Stock Exchange, stock code: 00051.HK) (“HCD”). Mr TSUI Yiu Cheung was appointed as a non-executive director of the Company on 2 August 2012. From the date of this appointment to the date of this report, Mr TSUI was also a director of Wheelock, Wharf and HCD. Mr SZE Tsai Ping, Michael, an independent non-executive director of the Company, is an independent non-executive director of HCD. Part of the businesses of Wheelock, Wharf and HCD are development and sales of properties as well as holding properties for lease. Therefore, the relevant businesses of those companies may cause competition with those of the Group. The above-mentioned companies outside the Group are managed by separate boards of directors and management, who are accountable for their respective stakeholders. The Board is of the view that the Group is capable of carrying on its business independently of, and at arm’s length from, the businesses of the above-mentioned companies.
G r e e n t o w n C h i n a H o l d i n g s L i m i t e d 72 / Report of the Directors
Major Customers and SuppliersThe aggregate sales attributable to the Group’s five largest customers were less than 30% of the Group’s total sales and the sales attributable to the Group’s largest customer were less than 10% of the Group’s total sales for the Year.
The aggregate purchases attributable to the Group’s five largest suppliers were less than 30% of the Group’s total purchases and the purchases attributable to the Group’s largest supplier were less than 10% of the Group’s total purchases for the Year.
At no time during the year ended 31 December 2013, a director, an associate of a director or a shareholder of the Company (who to the knowledge of the directors own more than 5% of the Company’s share capital) had any interest in any of the Group’s five largest suppliers or customers.
Pre-Emptive RightsThere are no provisions for pre-emptive rights under the Company’s Articles of Association, or the laws of the Cayman Islands, which would oblige the Company to offer new shares on a pro-rata basis to existing shareholders.
Human ResourcesAs at 31 December 2013, the Group employed a total of 4,928 employees (2012: 4,670). Employees were remunerated on the basis of their performance, experience and prevailing industry practices. The Group’s remuneration policies and packages were reviewed by the remuneration committee of the Company and the Board on a regular basis. As an incentive for the employees, bonuses and cash awards may also be given to the employees based on their individual performance evaluation.
The Company has adopted the Share Option Scheme as an incentive to directors and eligible employees. Details of the Share Option Scheme are set out in note 33 to the Consolidated Financial Statements.
Retirement Benefit SchemeThe Group has joined a mandatory provident fund scheme (“MPF Scheme”) for all employees in Hong Kong. The MPF Scheme is registered with the Mandatory Provident Fund Schemes Authority under the Mandatory Provident Fund Schemes Ordinance. The assets of the MPF Scheme are held separately from those of the Group in funds under the control of an independent trustee. Under the MPF Scheme, the employer and its employees are each required to make contributions to the MPF Scheme at rates specified in the rules.
The employees of the Group’s subsidiaries in the PRC are members of the state-managed retirement benefits schemes operated by the PRC government. The PRC subsidiaries are required to contribute a certain percentage of payroll costs to the retirement benefits schemes to fund the benefits. The only obligation of the Group with respect to the retirement benefits schemes is to make the specified contributions.
DonationsDuring the year ended 31 December 2013, the Group made charitable donations amounting to RMB6,139,000.
Post Balance Sheet EventsSubsequent to 31 December 2013, significant post balance sheet events of the Group occurred and their details are:
The Subordinated Perpetual Capital Securities in the aggregate principal amount of USD500 million was issued by Moon Wise Global Limited (月慧環球有限公司), a wholly-owned subsidiary of the Company, and guaranteed by the Company on 20 January 2014, with an initial distribution rate of 9% per annum. The listing of and permission to deal in such securities was approved by the Stock Exchange. The net proceeds from the issuance of the Subordinated Perpetual Capital Securities is approximately USD493,250,000,
A n n u a l R e p o r t 2 0 1 3 73 / Report of the Directors
which has been partly used in redeeming in full the PSCS of an aggregate principal amount of HKD2,550 million issued by Active Way Development Limited (a wholly-owned subsidiary of the Company) to a wholly-owned subsidiary of Wharf and the remaining balance of which will be used in refinancing certain existing short term debts and for general corporate purposes.
Annual General MeetingIt is proposed that AGM will be held on 27 June 2014 (Friday). A notice convening the AGM will be published and despatched to the shareholders of the Company in the manner as required by the Listing Rules in due course.
Closure of Register of MembersThe register of members of the Company will be closed during the following periods:
(i) from 24 June 2014 (Tuesday) to 27 June 2014 (Friday), both days inclusive, during which period no transfer of shares will be registered, for the purpose of ascertaining shareholders’ entitlement to attend and vote at the AGM. In order to be eligible to attend and vote at the AGM, all transfers accompanied by the relevant share certificates must be lodged with the Company’s branch share register in Hong Kong, Computershare Hong Kong Investor Services Limited at Shops 1712–1716, 17th Floor, Hopewell Center, 183 Queen’s Road East, Wanchai, Hong Kong for registration no later than 4:30 p.m. on 23 June 2014 (Monday); and
(ii) from 4 July 2014 (Friday) to 9 July 2014 (Wednesday), both days inclusive, during which period no transfer of shares will be registered, for the purpose of ascertaining shareholders’ entitlement to the proposed final dividend. In order to qualify for the proposed final dividend, all transfers accompanied by the relevant share certificates must be lodged with the Company’s branch share register in Hong Kong, Computershare Hong Kong Investor Services Limited at Shops 1712–1716, 17th Floor, Hopewell Center, 183 Queen’s Road East, Wanchai, Hong Kong for registration no later than 4:30 p.m. on 3 July 2014 (Thursday).
AuditorThe Consolidated Financial Statements of the Group for the year ended 31 December 2013 have been audited by Messrs. Deloitte Touche Tohmatsu. A resolution will be proposed at the forthcoming AGM to re-appoint Messrs. Deloitte Touche Tohmatsu as the auditor of the Company.
By order of the BoardChairmanSONG Weiping
21 March 2014

Nanjing Rose Garden
G r e e n t o w n C h i n a H o l d i n g s L i m i t e d
Independent Auditor’s Report
76
TO THE MEMBERS OF GREENTOWN CHINA HOLDINGS LIMITED(incorporated in the Cayman Islands with limited liability)
We have audited the consolidated financial statements of Greentown China Holdings Limited (the “Company”) and its subsidiaries (collectively referred to as the “Group”) set out on pages 77 to 175, which comprise the consolidated statement of financial position as at 31 December 2013, and the consolidated statement of profit or loss and other comprehensive income, consolidated statement of changes in equity and consolidated statement of cash flows for the year then ended, and a summary of significant accounting policies and other explanatory information.
Directors’ Responsibilities for the Consolidated Financial Statements
The directors of the Company are responsible for the preparation of consolidated financial statements that give a true and fair view in accordance with International Financial Reporting Standards and the disclosure requirements of the Hong Kong Companies Ordinance, and for such internal control as the directors determine is necessary to enable the preparation of consolidated financial statements that are free from material misstatement, whether due to fraud or error.
Auditor’s Responsibility
Our responsibility is to express an opinion on these consolidated financial statements based on our audit and to report our opinion solely to you, as a body, in accordance with our agreed terms of engagement, and for no other purpose. We do not assume responsibility towards or accept liability to any other person for the contents of this report. We conducted our audit in accordance with Hong Kong Standards on Auditing issued by the Hong Kong Institute of Certified Public Accountants. Those standards require that we comply with ethical requirements and plan and perform the audit to obtain reasonable assurance as to whether the consolidated financial statements are free from material misstatement.
An audit involves performing procedures to obtain audit evidence about the amounts and disclosures in the consolidated financial statements. The procedures selected depend on the auditor’s judgment, including the assessment of the risks of material misstatement of the consolidated financial statements, whether due to fraud or error. In making those risk assessments, the auditor considers internal control relevant to the entity’s preparation of the consolidated financial statements that give a true and fair view in order to design audit procedures that are appropriate in the circumstances, but not for the purpose of expressing an opinion on the effectiveness of the entity’s internal control. An audit also includes evaluating the appropriateness of accounting policies used and the reasonableness of accounting estimates made by the directors, as well as evaluating the overall presentation of the consolidated financial statements.
We believe that the audit evidence we have obtained is sufficient and appropriate to provide a basis for our audit opinion.
Opinion
In our opinion, the consolidated financial statements give a true and fair view of the state of affairs of the Group as at 31 December 2013 and of the Group’s profit and cash flows for the year then ended in accordance with International Financial Reporting Standards and have been properly prepared in accordance with the disclosure requirements of the Hong Kong Companies Ordinance.
Deloitte Touche TohmatsuCertified Public AccountantsHong Kong21 March 2014
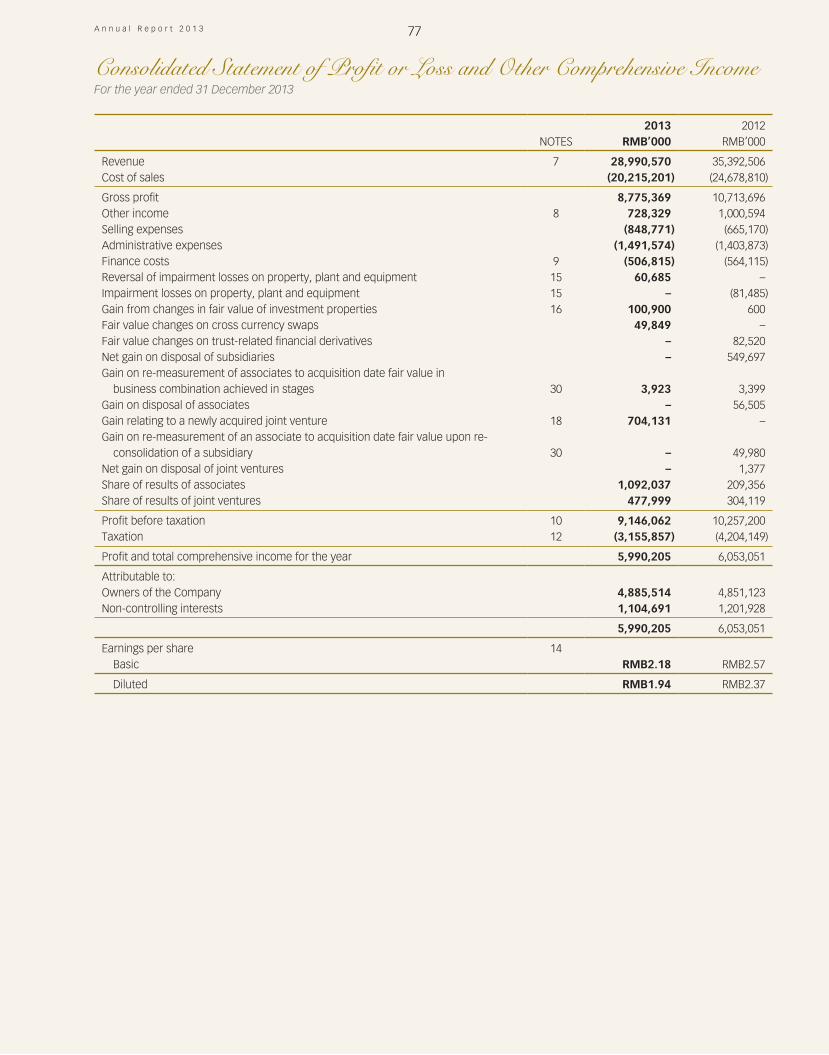
A n n u a l R e p o r t 2 0 1 3
For the year ended 31 December 2013
Consolidated Statement of Profit or Loss and Other Comprehensive Income
77
2013 2012
NOTES RMB’000 RMB’000 Revenue 7 28,990,570 35,392,506Cost of sales (20,215,201) (24,678,810) Gross profit 8,775,369 10,713,696Other income 8 728,329 1,000,594Selling expenses (848,771) (665,170)Administrative expenses (1,491,574) (1,403,873)Finance costs 9 (506,815) (564,115)Reversal of impairment losses on property, plant and equipment 15 60,685 –Impairment losses on property, plant and equipment 15 – (81,485)Gain from changes in fair value of investment properties 16 100,900 600Fair value changes on cross currency swaps 49,849 –Fair value changes on trust-related financial derivatives – 82,520Net gain on disposal of subsidiaries – 549,697Gain on re-measurement of associates to acquisition date fair value in
business combination achieved in stages 30 3,923 3,399Gain on disposal of associates – 56,505Gain relating to a newly acquired joint venture 18 704,131 –Gain on re-measurement of an associate to acquisition date fair value upon re-
consolidation of a subsidiary 30 – 49,980Net gain on disposal of joint ventures – 1,377Share of results of associates 1,092,037 209,356Share of results of joint ventures 477,999 304,119 Profit before taxation 10 9,146,062 10,257,200Taxation 12 (3,155,857) (4,204,149) Profit and total comprehensive income for the year 5,990,205 6,053,051 Attributable to:Owners of the Company 4,885,514 4,851,123Non-controlling interests 1,104,691 1,201,928
5,990,205 6,053,051 Earnings per share 14
Basic RMB2.18 RMB2.57 Diluted RMB1.94 RMB2.37
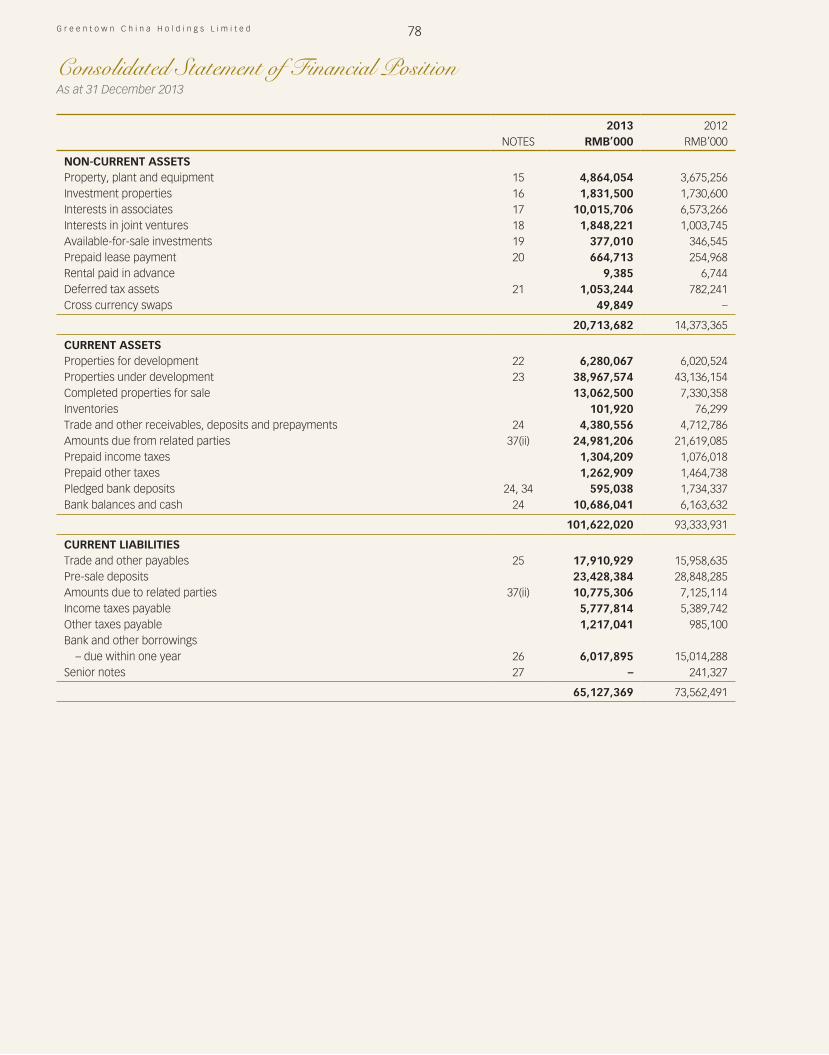
G r e e n t o w n C h i n a H o l d i n g s L i m i t e d
As at 31 December 2013
Consolidated Statement of Financial Position
78
2013 2012
NOTES RMB’000 RMB’000 NON-CURRENT ASSETSProperty, plant and equipment 15 4,864,054 3,675,256Investment properties 16 1,831,500 1,730,600Interests in associates 17 10,015,706 6,573,266Interests in joint ventures 18 1,848,221 1,003,745Available-for-sale investments 19 377,010 346,545Prepaid lease payment 20 664,713 254,968Rental paid in advance 9,385 6,744Deferred tax assets 21 1,053,244 782,241Cross currency swaps 49,849 –
20,713,682 14,373,365 CURRENT ASSETSProperties for development 22 6,280,067 6,020,524Properties under development 23 38,967,574 43,136,154Completed properties for sale 13,062,500 7,330,358Inventories 101,920 76,299Trade and other receivables, deposits and prepayments 24 4,380,556 4,712,786Amounts due from related parties 37(ii) 24,981,206 21,619,085Prepaid income taxes 1,304,209 1,076,018Prepaid other taxes 1,262,909 1,464,738Pledged bank deposits 24, 34 595,038 1,734,337Bank balances and cash 24 10,686,041 6,163,632
101,622,020 93,333,931 CURRENT LIABILITIESTrade and other payables 25 17,910,929 15,958,635Pre-sale deposits 23,428,384 28,848,285Amounts due to related parties 37(ii) 10,775,306 7,125,114Income taxes payable 5,777,814 5,389,742Other taxes payable 1,217,041 985,100Bank and other borrowings
– due within one year 26 6,017,895 15,014,288Senior notes 27 – 241,327
65,127,369 73,562,491
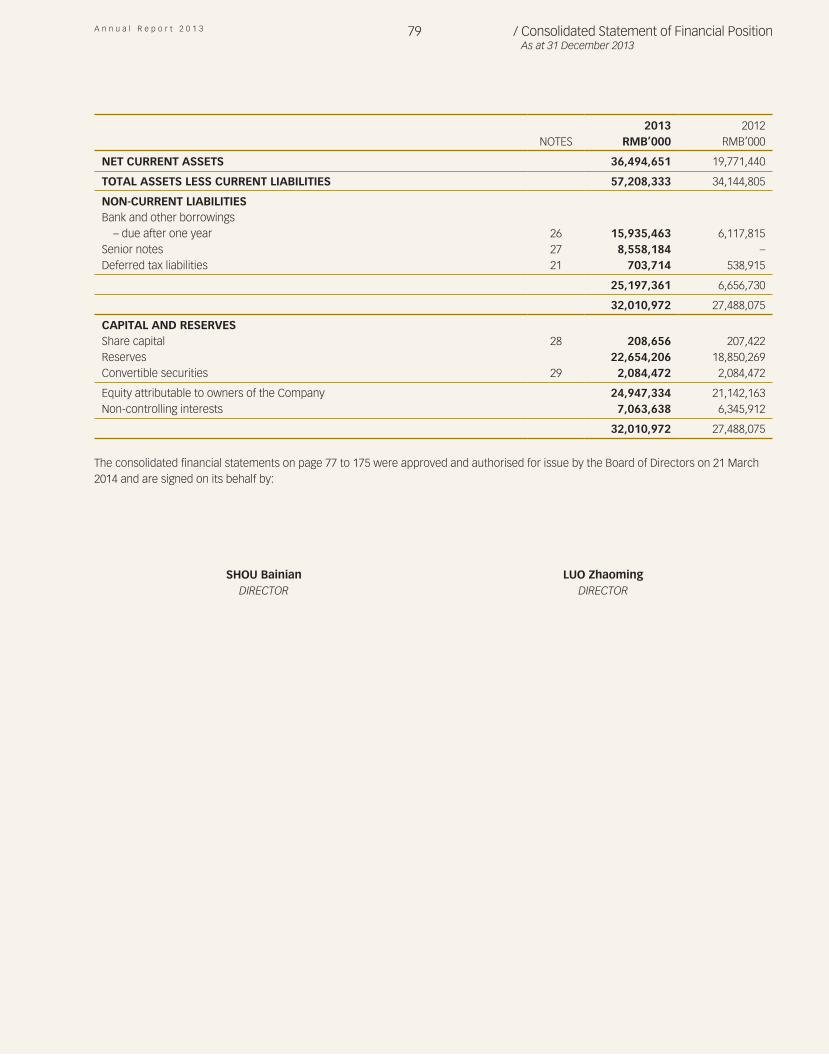
A n n u a l R e p o r t 2 0 1 3 79 / Consolidated Statement of Financial Position As at 31 December 2013
2013 2012
NOTES RMB’000 RMB’000 NET CURRENT ASSETS 36,494,651 19,771,440 TOTAL ASSETS LESS CURRENT LIABILITIES 57,208,333 34,144,805 NON-CURRENT LIABILITIESBank and other borrowings
– due after one year 26 15,935,463 6,117,815Senior notes 27 8,558,184 –Deferred tax liabilities 21 703,714 538,915
25,197,361 6,656,730 32,010,972 27,488,075
CAPITAL AND RESERVESShare capital 28 208,656 207,422Reserves 22,654,206 18,850,269Convertible securities 29 2,084,472 2,084,472 Equity attributable to owners of the Company 24,947,334 21,142,163Non-controlling interests 7,063,638 6,345,912
32,010,972 27,488,075
The consolidated financial statements on page 77 to 175 were approved and authorised for issue by the Board of Directors on 21 March 2014 and are signed on its behalf by:
SHOU Bainian LUO ZhaomingDIRECTOR DIRECTOR
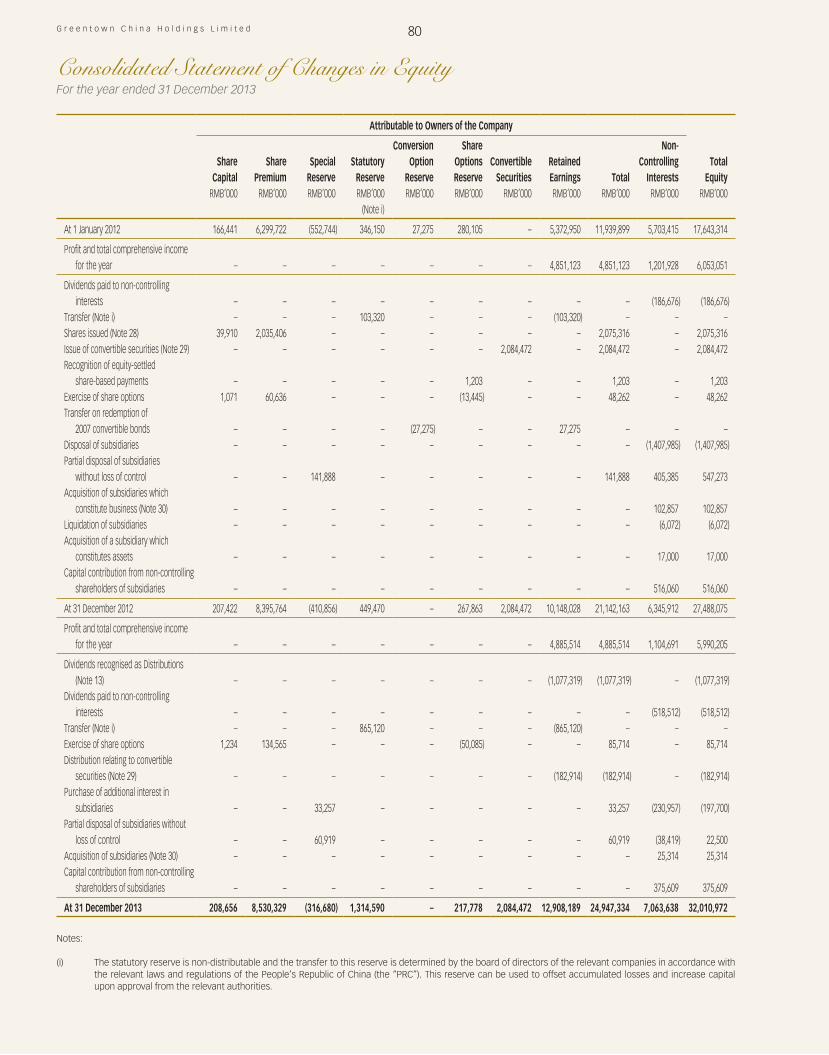
G r e e n t o w n C h i n a H o l d i n g s L i m i t e d
For the year ended 31 December 2013
Consolidated Statement of Changes in Equity
80
Attributable to Owners of the Company
Share Capital
Share Premium
Special Reserve
Statutory Reserve
Conversion Option
Reserve
Share Options
ReserveConvertible Securities
Retained Earnings Total
Non-Controlling
InterestsTotal
EquityRMB’000 RMB’000 RMB’000 RMB’000 RMB’000 RMB’000 RMB’000 RMB’000 RMB’000 RMB’000 RMB’000
(Note i) At 1 January 2012 166,441 6,299,722 (552,744) 346,150 27,275 280,105 – 5,372,950 11,939,899 5,703,415 17,643,314 Profit and total comprehensive income
for the year – – – – – – – 4,851,123 4,851,123 1,201,928 6,053,051 Dividends paid to non-controlling
interests – – – – – – – – – (186,676) (186,676)Transfer (Note i) – – – 103,320 – – – (103,320) – – –Shares issued (Note 28) 39,910 2,035,406 – – – – – – 2,075,316 – 2,075,316Issue of convertible securities (Note 29) – – – – – – 2,084,472 – 2,084,472 – 2,084,472Recognition of equity-settled
share-based payments – – – – – 1,203 – – 1,203 – 1,203Exercise of share options 1,071 60,636 – – – (13,445) – – 48,262 – 48,262Transfer on redemption of
2007 convertible bonds – – – – (27,275) – – 27,275 – – –Disposal of subsidiaries – – – – – – – – – (1,407,985) (1,407,985)Partial disposal of subsidiaries
without loss of control – – 141,888 – – – – – 141,888 405,385 547,273Acquisition of subsidiaries which
constitute business (Note 30) – – – – – – – – – 102,857 102,857Liquidation of subsidiaries – – – – – – – – – (6,072) (6,072)Acquisition of a subsidiary which
constitutes assets – – – – – – – – – 17,000 17,000Capital contribution from non-controlling
shareholders of subsidiaries – – – – – – – – – 516,060 516,060 At 31 December 2012 207,422 8,395,764 (410,856) 449,470 – 267,863 2,084,472 10,148,028 21,142,163 6,345,912 27,488,075 Profit and total comprehensive income
for the year – – – – – – – 4,885,514 4,885,514 1,104,691 5,990,205 Dividends recognised as Distributions
(Note 13) – – – – – – – (1,077,319) (1,077,319) – (1,077,319)Dividends paid to non-controlling
interests – – – – – – – – – (518,512) (518,512)Transfer (Note i) – – – 865,120 – – – (865,120) – – –Exercise of share options 1,234 134,565 – – – (50,085) – – 85,714 – 85,714Distribution relating to convertible
securities (Note 29) – – – – – – – (182,914) (182,914) – (182,914)Purchase of additional interest in
subsidiaries – – 33,257 – – – – – 33,257 (230,957) (197,700)Partial disposal of subsidiaries without
loss of control – – 60,919 – – – – – 60,919 (38,419) 22,500Acquisition of subsidiaries (Note 30) – – – – – – – – – 25,314 25,314Capital contribution from non-controlling
shareholders of subsidiaries – – – – – – – – – 375,609 375,609 At 31 December 2013 208,656 8,530,329 (316,680) 1,314,590 – 217,778 2,084,472 12,908,189 24,947,334 7,063,638 32,010,972
Notes:
(i) The statutory reserve is non-distributable and the transfer to this reserve is determined by the board of directors of the relevant companies in accordance with the relevant laws and regulations of the People’s Republic of China (the “PRC”). This reserve can be used to offset accumulated losses and increase capital upon approval from the relevant authorities.
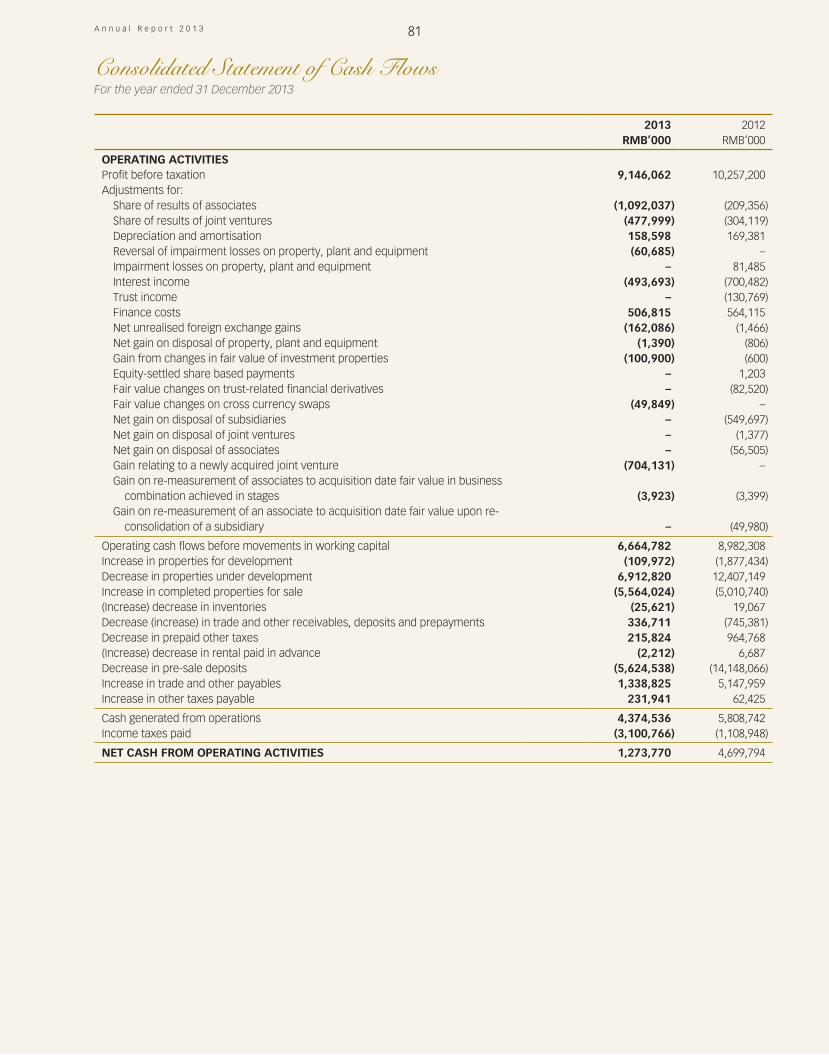
A n n u a l R e p o r t 2 0 1 3
For the year ended 31 December 2013
Consolidated Statement of Cash Flows
81
2013 2012
RMB’000 RMB’000 OPERATING ACTIVITIESProfit before taxation 9,146,062 10,257,200Adjustments for:
Share of results of associates (1,092,037) (209,356)Share of results of joint ventures (477,999) (304,119)Depreciation and amortisation 158,598 169,381Reversal of impairment losses on property, plant and equipment (60,685) –Impairment losses on property, plant and equipment – 81,485Interest income (493,693) (700,482)Trust income – (130,769)Finance costs 506,815 564,115Net unrealised foreign exchange gains (162,086) (1,466)Net gain on disposal of property, plant and equipment (1,390) (806)Gain from changes in fair value of investment properties (100,900) (600)Equity-settled share based payments – 1,203Fair value changes on trust-related financial derivatives – (82,520)Fair value changes on cross currency swaps (49,849) –Net gain on disposal of subsidiaries – (549,697)Net gain on disposal of joint ventures – (1,377)Net gain on disposal of associates – (56,505)Gain relating to a newly acquired joint venture (704,131) –Gain on re-measurement of associates to acquisition date fair value in business
combination achieved in stages (3,923) (3,399)Gain on re-measurement of an associate to acquisition date fair value upon re-
consolidation of a subsidiary – (49,980) Operating cash flows before movements in working capital 6,664,782 8,982,308Increase in properties for development (109,972) (1,877,434)Decrease in properties under development 6,912,820 12,407,149Increase in completed properties for sale (5,564,024) (5,010,740)(Increase) decrease in inventories (25,621) 19,067Decrease (increase) in trade and other receivables, deposits and prepayments 336,711 (745,381)Decrease in prepaid other taxes 215,824 964,768(Increase) decrease in rental paid in advance (2,212) 6,687Decrease in pre-sale deposits (5,624,538) (14,148,066)Increase in trade and other payables 1,338,825 5,147,959Increase in other taxes payable 231,941 62,425 Cash generated from operations 4,374,536 5,808,742Income taxes paid (3,100,766) (1,108,948) NET CASH FROM OPERATING ACTIVITIES 1,273,770 4,699,794
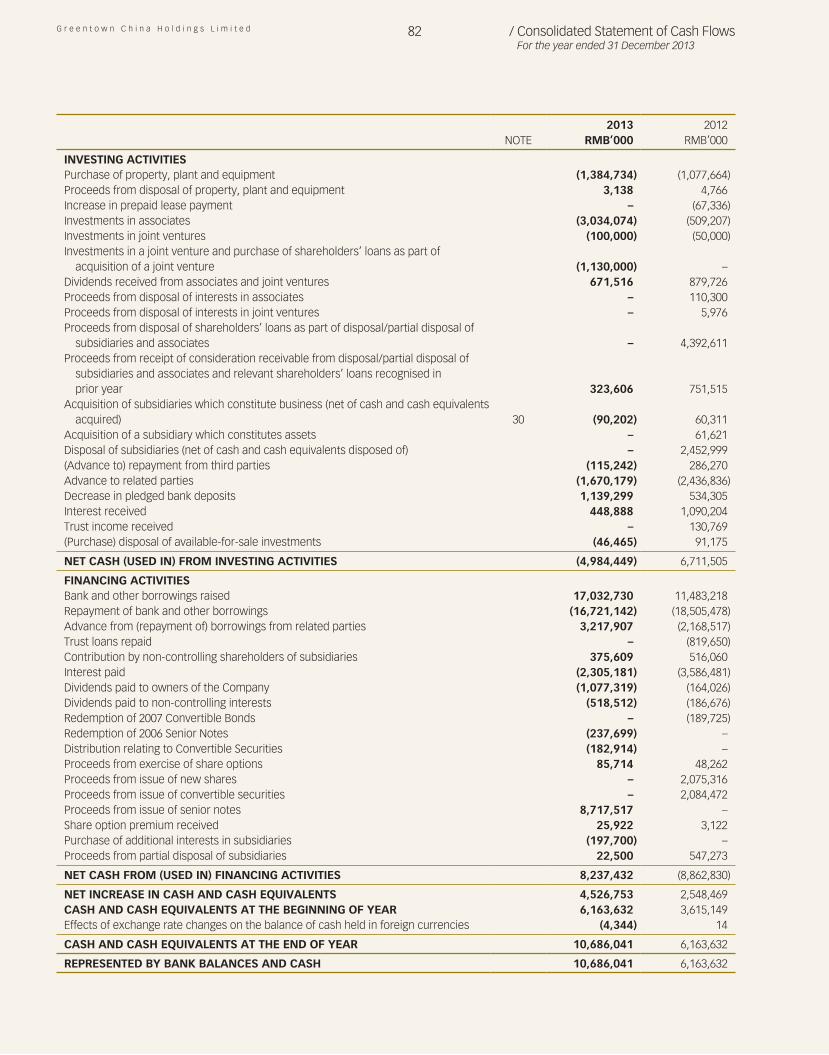
G r e e n t o w n C h i n a H o l d i n g s L i m i t e d 82 / Consolidated Statement of Cash FlowsFor the year ended 31 December 2013
2013 2012
NOTE RMB’000 RMB’000 INVESTING ACTIVITIESPurchase of property, plant and equipment (1,384,734) (1,077,664)Proceeds from disposal of property, plant and equipment 3,138 4,766Increase in prepaid lease payment – (67,336)Investments in associates (3,034,074) (509,207)Investments in joint ventures (100,000) (50,000)Investments in a joint venture and purchase of shareholders’ loans as part of
acquisition of a joint venture (1,130,000) –Dividends received from associates and joint ventures 671,516 879,726Proceeds from disposal of interests in associates – 110,300Proceeds from disposal of interests in joint ventures – 5,976Proceeds from disposal of shareholders’ loans as part of disposal/partial disposal of
subsidiaries and associates – 4,392,611Proceeds from receipt of consideration receivable from disposal/partial disposal of
subsidiaries and associates and relevant shareholders’ loans recognised in prior year 323,606 751,515
Acquisition of subsidiaries which constitute business (net of cash and cash equivalents acquired) 30 (90,202) 60,311
Acquisition of a subsidiary which constitutes assets – 61,621Disposal of subsidiaries (net of cash and cash equivalents disposed of) – 2,452,999(Advance to) repayment from third parties (115,242) 286,270Advance to related parties (1,670,179) (2,436,836)Decrease in pledged bank deposits 1,139,299 534,305Interest received 448,888 1,090,204Trust income received – 130,769(Purchase) disposal of available-for-sale investments (46,465) 91,175 NET CASH (USED IN) FROM INVESTING ACTIVITIES (4,984,449) 6,711,505 FINANCING ACTIVITIESBank and other borrowings raised 17,032,730 11,483,218Repayment of bank and other borrowings (16,721,142) (18,505,478)Advance from (repayment of) borrowings from related parties 3,217,907 (2,168,517)Trust loans repaid – (819,650)Contribution by non-controlling shareholders of subsidiaries 375,609 516,060Interest paid (2,305,181) (3,586,481)Dividends paid to owners of the Company (1,077,319) (164,026)Dividends paid to non-controlling interests (518,512) (186,676)Redemption of 2007 Convertible Bonds – (189,725)Redemption of 2006 Senior Notes (237,699) –Distribution relating to Convertible Securities (182,914) –Proceeds from exercise of share options 85,714 48,262Proceeds from issue of new shares – 2,075,316Proceeds from issue of convertible securities – 2,084,472Proceeds from issue of senior notes 8,717,517 –Share option premium received 25,922 3,122Purchase of additional interests in subsidiaries (197,700) –Proceeds from partial disposal of subsidiaries 22,500 547,273 NET CASH FROM (USED IN) FINANCING ACTIVITIES 8,237,432 (8,862,830) NET INCREASE IN CASH AND CASH EQUIVALENTS 4,526,753 2,548,469CASH AND CASH EQUIVALENTS AT THE BEGINNING OF YEAR 6,163,632 3,615,149Effects of exchange rate changes on the balance of cash held in foreign currencies (4,344) 14 CASH AND CASH EQUIVALENTS AT THE END OF YEAR 10,686,041 6,163,632 REPRESENTED BY BANK BALANCES AND CASH 10,686,041 6,163,632
A n n u a l R e p o r t 2 0 1 3
For the year ended 31 December 2013
Notes to the Consolidated Financial Statements
83
1. General
The Company was incorporated in the Cayman Islands on 31 August 2005 as an exempted company with limited liability under the Companies Law (2004 Revision) and its shares have been listed on the Main Board of The Stock Exchange of Hong Kong Limited (the “Stock Exchange”) with effect from 13 July 2006. The address of the registered office of the Company is disclosed in the section headed “Corporate Information” of the annual report.
The consolidated financial statements are presented in Renminbi (“RMB”), which is also the functional currency of the Company.
The Company is an investment holding company. The principal activity of its subsidiaries (together with the Company referred to as the “Group”) is the development for sale of residential properties in the PRC.
2. Application of New and Revised International Financial Reporting Standards (“IFRSs”)
New and Revised Standards and Interpretations Applied in the Current Year
In the current year, the Group has applied, for the first time, the following new and revised IFRSs issued by the International Accounting Standards Board (the “IASB”) that are effective for the Group’s financial year beginning on 1 January 2013.
Amendments to IFRSs Annual Improvements to IFRSs 2009–2011 CycleAmendments to IFRS 7 Disclosures – Offsetting Financial Assets and Financial LiabilitiesAmendments to IFRS 10,
IFRS 11 and IFRS 12Consolidated Financial Statements, Joint Arrangements and Disclosure of Interests in Other
Entities: Transition GuidanceIFRS 10 Consolidated Financial StatementsIFRS 11 Joint ArrangementsIFRS 12 Disclosure of Interests in Other EntitiesIFRS 13 Fair Value MeasurementIAS 19 (as revised in 2011) Employee BenefitsIAS 27 (as revised in 2011) Separate Financial StatementsIAS 28 (as revised in 2011) Investments in Associates and Joint VenturesAmendments to IAS 1 Presentation of Items of Other Comprehensive IncomeIFRIC 20 Stripping Costs in the Production Phase of a Surface Mine
Except as described below, the application of these new and revised IFRSs in the current year has had no material impact on the Group’s financial performance and positions for the current and prior years and/or on the disclosures set out in these consolidated financial statements.
Impact of the Application of IFRS 10
IFRS 10 replaces the parts of IAS 27 Consolidated and Separate Financial Statements that deal with consolidated financial statements and SIC-Int 12 Consolidation – Special Purpose Entities. IFRS 10 changes the definition of control such that an investor has control over an investee when a) it has power over the investee; b) it is exposed, or has rights, to variable returns from its involvement with the investee and c) has the ability to use its power to affect its returns. All three of these criteria must be met for an investor to have control over an investee. Previously, control was defined as the power to govern the financial and operating policies of an entity so as to obtain benefits from its activities. Additional guidance has been included in IFRS 10 to explain when an investor has control over an investee.
The directors had performed a detailed analysis of the impact of the application of IFRS 10, and confirmed the application of IFRS 10 in the current year has had no material impact on the Group’s financial performance and positions for the current and prior years set out in these consolidated financial statements.
G r e e n t o w n C h i n a H o l d i n g s L i m i t e d 84 / Notes to the Consolidated Financial StatementsFor the year ended 31 December 2013
2. Application of New and Revised International Financial Reporting Standards (“IFRSs”) (continued)
Impact of the Application of IFRS 11
IFRS 11 replaces IAS 31 Interests in Joint Ventures, and the guidance contained in a related interpretation, SIC-Int 13 jointly controlled entities – Non-Monetary Contributions by Venturers, has been incorporated in IAS 28 (as revised in 2011). IFRS 11 deals with how a joint arrangement of which two or more parties have joint control should be classified and accounted for. Under IFRS 11, there are only two types of joint arrangements – joint operations and joint ventures. The classification of joint arrangements under IFRS 11 is determined based on the rights and obligations of parties to the joint arrangements by considering the structure, the legal form of the arrangements, the contractual terms agreed by the parties to the arrangement, and, when relevant, other facts and circumstances. A joint operation is a joint arrangement whereby the parties that have joint control of the arrangement (i.e. joint operators) have rights to the assets, and obligations for the liabilities, relating to the arrangement. A joint venture is a joint arrangement whereby the parties that have joint control of the arrangement (i.e. joint venturers) have rights to the net assets of the arrangement. Previously, IAS 31 had three types of joint arrangements – jointly controlled entities, jointly controlled operations and jointly controlled assets. The classification of joint arrangements under IAS 31 was primarily determined based on the legal form of the arrangement (e.g. a joint arrangement that was established through a separate entity was classified as a jointly controlled entity).
The initial and subsequent accounting of joint ventures and joint operations are different. Investments in joint ventures are accounted for using the equity method (proportionate consolidation is no longer allowed). Investments in joint operations are accounted for such that each joint operator recognises its assets (including its share of any assets jointly held), its liabilities (including its share of any liabilities incurred jointly), its revenue (including its share of revenue from the sale of the output by the joint operation) and its expenses (including its share of any expenses incurred jointly). Each joint operator accounts for the assets and liabilities, as well as revenues and expenses, relating to its interest in the joint operation in accordance with the applicable standards.
The directors reviewed and assessed the classification of the Group’s investments in joint arrangements in accordance with the requirements of IFRS 11. The directors concluded that the Group’s investment in its joint arrangements which were classified as jointly controlled entities under IAS 31 and was accounted for using the equity method, should be classified as joint ventures under IFRS 11 and continue to accounted for using the equity method.
Impact of the Application of IFRS 12
IFRS 12 is a new disclosure standard and is applicable to entities that have interests in subsidiaries, joint arrangements, associates and/or unconsolidated structured entities. In general, the application of IFRS 12 has resulted in more extensive disclosures in the financial statements.
IFRS 13 Fair Value Measurement
The Group has applied IFRS 13 for the first time in the current year. IFRS 13 establishes a single source of guidance for fair value measurements and disclosures about fair value measurements. The scope of IFRS 13 is broad; the fair value measurement requirements of IFRS 13 apply to both financial instrument items and non-financial instrument items for which other IFRSs require or permit fair value measurements and disclosures about fair value measurements, except for share based payment transactions that are within the scope of IFRS 2 Share-based Payment, leasing transactions that are within the scope of IAS 17 Leases, and measurements that have some similarities to fair value but are not fair value (e.g. net realisable value for the purposes of measuring inventories or value in use for impairment assessment purposes).
IFRS 13 defines the fair value of an asset as the price that would be received to sell an asset (or paid to transfer a liability, in the case of determining the fair value of a liability) in an orderly transaction in the principal (or most advantageous) market at the measurement date under current market conditions. Fair value under IFRS 13 is an exit price regardless of whether that price is directly observable or estimated using another valuation technique. Also, IFRS 13 includes extensive disclosure requirements.
IFRS 13 requires prospective application from 1 January 2013. In addition, specific transitional provisions were given to entities such that they need not apply the disclosure requirements set out in the Standard in comparative information provided for periods before the initial application of the Standard.
A n n u a l R e p o r t 2 0 1 3 85 / Notes to the Consolidated Financial StatementsFor the year ended 31 December 2013
2. Application of New and Revised International Financial Reporting Standards (“IFRSs”) (continued)
IFRS 13 Fair Value Measurement (continued)
In accordance with these transitional provisions, the Group has not made any new disclosures required by IFRS 13 for the 2012 comparative period (see Notes 6(c), 16 for the 2013 disclosures). Other than the additional disclosures, the application of IFRS 13 has not had any material impact on the amounts recognised in the consolidated financial statements.
New and Revised Standards and Interpretations Issued But Not Yet Effective
The Group has not early applied the following new and revised IFRSs that have been issued but are not yet effective:
Amendments to IFRSs Annual Improvements to IFRSs 2010–2012 Cycle4
Amendments to IFRSs Annual Improvements to IFRSs 2011–2013 Cycle2
IFRS 9 Financial Instruments3
Amendments to IFRS 9 and IFRS 7 Mandatory Effective Date of IFRS 9 and Transition Disclosures3
Amendments to IFRS 10, IFRS 12 and IAS 27
Investment Entities1
Amendments to IAS 19 Defined Benefit Plans: Employee Contributions2
Amendments to IAS 32 Offsetting Financial Assets and Financial Liabilities1
Amendments to IAS 36 Recoverable Amount Disclosures for Non-Financial Assets1
Amendments to IAS 39 Novation of Derivatives and Continuation of Hedge Accounting1
IFRIC 21 Levies1
IFRS 14 Regulatory Deferral Accounts5
1 Effective for annual periods beginning on or after 1 January 20142 Effective for annual periods beginning on or after 1 July 2014.3 Available for application – the mandatory effective date will be determined when the outstanding phases of IFRS 9 are finalised.4 Effective for annual periods beginning on or after 1 July 2014, with limited exceptions.5 Effective for first annual IFRS financial statements beginning on or after 1 January 2016.
Annual Improvements to IFRSs 2010–2012 CycleThe Annual Improvements to IFRSs 2010-2012 Cycle include a number of amendments to various IFRSs, which are summarised below.
The amendments to IFRS 2 (i) change the definitions of ‘vesting condition’ and ‘market condition’; and (ii) add definitions for ‘performance condition’ and ‘service condition’ which were previously included within the definition of ‘vesting condition’. The amendments to IFRS 2 are effective for share-based payment transactions for which the grant date is on or after 1 July 2014.
The amendments to IFRS 3 clarify that contingent consideration that is classified as an asset or a liability should be measured at fair value at each reporting date, irrespective of whether the contingent consideration is a financial instrument within the scope of IFRS 9 or IAS 39 or a non-financial asset or liability. Changes in fair value (other than measurement period adjustments) should be recognised in profit and loss. The amendments to IFRS 3 are effective for business combinations for which the acquisition date is on or after 1 July 2014.
The amendments to IFRS 8 (i) require an entity to disclose the judgements made by management in applying the aggregation criteria to operating segments, including a description of the operating segments aggregated and the economic indicators assessed in determining whether the operating segments have ‘similar economic characteristics’; and (ii) clarify that a reconciliation of the total of the reportable segments’ assets to the entity’s assets should only be provided if the segment assets are regularly provided to the chief operating decision-maker.
The amendments to the basis for conclusions of IFRS 13 clarify that the issue of IFRS 13 and consequential amendments to IAS 39 and IFRS 9 did not remove the ability to measure short – term receivables and payables with no stated interest rate at their invoice amounts without discounting, if the effect of discounting is immaterial.
G r e e n t o w n C h i n a H o l d i n g s L i m i t e d 86 / Notes to the Consolidated Financial StatementsFor the year ended 31 December 2013
2. Application of New and Revised International Financial Reporting Standards (“IFRSs”) (continued)
New and Revised Standards and Interpretations Issued But Not Yet Effective (continued)
Annual Improvements to IFRSs 2010–2012 Cycle (continued)The amendments to IAS 16 and IAS 38 remove perceived inconsistencies in the accounting for accumulated depreciation/amortisation when an item of property, plant and equipment or an intangible asset is revalued. The amended standards clarify that the gross carrying amount is adjusted in a manner consistent with the revaluation of the carrying amount of the asset and that accumulated depreciation/amortisation is the difference between the gross carrying amount and the carrying amount after taking into account accumulated impairment losses.
The amendments to IAS 24 clarify that a management entity providing key management personnel services to a reporting entity is a related party of the reporting entity. Consequently, the reporting entity should disclose as related party transactions the amounts incurred for the service paid or payable to the management entity for the provision of key management personnel services. However, disclosure of the components of such compensation is not required.
The directors do not anticipate that the application of the amendments included in the Annual Improvements to IFRSs 2010-2012 Cycle will have a material effect on the Group’s consolidated financial statements.
Annual Improvements to IFRSs 2011-2013 CycleThe Annual Improvements to IFRSs 2011-2013 Cycle include a number of amendments to various IFRSs, which are summarised below.
The amendments to IFRS 3 clarify that the standard does not apply to the accounting for the formation of all types of joint arrangement in the financial statements of the joint arrangement itself.
The amendments to IFRS 13 clarify that the scope of the portfolio exception for measuring the fair value of a group of financial assets and financial liabilities on a net basis includes all contracts that are within the scope of, and accounted for in accordance with, IAS 39 or IFRS 9, even if those contracts do not meet the definitions of financial assets or financial liabilities within IAS 32.
The amendments to IAS 40 clarify that IAS 40 and IFRS 3 are not mutually exclusive and application of both standards may be required. Consequently, an entity acquiring investment property must determine whether:
(a) the property meets the definition of investment property in terms of IAS 40; and
(b) the transaction meets the definition of a business combination under IFRS 3.
The directors do not anticipate that the application of the amendments included in the Annual Improvements to IFRSs 2011-2013 Cycle will have a material effect on the Group’s consolidated financial statements.
IFRS 9 Financial InstrumentsIFRS 9 issued in 2009 introduces new requirements for the classification and measurement of financial assets. IFRS 9 was subsequently amended in 2010 to include the requirements for the classification and measurement of financial liabilities and for derecognition, and further amended in 2013 to include the new requirements for hedge accounting.
A n n u a l R e p o r t 2 0 1 3 87 / Notes to the Consolidated Financial StatementsFor the year ended 31 December 2013
2. Application of New and Revised International Financial Reporting Standards (“IFRSs”) (continued)
New and Revised Standards and Interpretations Issued But Not Yet Effective (continued)
IFRS 9 Financial Instruments (continued)Key requirements of IFRS 9 are described as follows:
• All recognised financial assets that are within the scope of IAS 39 Financial Instruments: Recognition and Measurement are subsequently measured at amortised cost or fair value. Specifically, debt investments that are held within a business model whose objective is to collect the contractual cash flows, and that have contractual cash flows that are solely payments of principal and interest on the principal outstanding are generally measured at amortised cost at the end of subsequent accounting periods. All other debt investments and equity investments are measured at their fair values at the end of subsequent reporting periods. In addition, under IFRS 9, entities may make an irrevocable election to present subsequent changes in the fair value of an equity investment (that is not held for trading) in other comprehensive income, with only dividend income generally recognised in profit or loss.
• With regard to the measurement of financial liabilities designated as at fair value through profit or loss, IFRS 9 requires that the amount of change in the fair value of the financial liability that is attributable to changes in the credit risk of that liability is presented in other comprehensive income, unless the recognition of the effects of changes in the liability’s credit risk in other comprehensive income would create or enlarge an accounting mismatch in profit or loss. Changes in fair value of financial liabilities attributable to changes in the financial liabilities’ credit risk are not subsequently reclassified to profit or loss. Under IAS 39, the entire amount of the change in the fair value of the financial liability designated as fair value through profit or loss was presented in profit or loss.
• The new general hedge accounting requirements retain the three types of hedge accounting. However, greater flexibility has been introduced to the types of transactions eligible for hedge accounting, specifically broadening the types of instruments that qualify for hedging instruments and the types of risk components of non-financial items that are eligible for hedge accounting. In addition, the effectiveness test has been overhauled and replaced with the principle of an ‘economic relationship’. Retrospective assessment of hedge effectiveness is also no longer required. Enhanced disclosure requirements about an entity’s risk management activities have also been introduced.
The directors anticipate that the adoption of IFRS 9 in the future may have impact on amounts reported in respect of the Group’s financial assets and financial liabilities. However, it is not practicable to provide a reasonable estimate of that effect until a detailed review has been completed.
Amendments to IFRS 10, IFRS 12 and IAS 27 Investment EntitiesThe amendments to IFRS 10 define an investment entity and require a reporting entity that meets the definition of an investment entity not to consolidate its subsidiaries but instead to measure its subsidiaries at fair value through profit or loss in its financial statements.
To qualify as an investment entity, a reporting entity is required to:
• obtain funds from one or more investors for the purpose of providing them with professional investment management services;
• commit to its investor(s) that its business purpose is to invest funds solely for returns from capital appreciation, investment income, or both; and
• measure and evaluate performance of substantially all of its investments on a fair value basis.
Consequential amendments have been made to IFRS 12 and IAS 27 to introduce new disclosure requirements for investment entities.
The directors of the Company do not anticipate that the investment entities amendments will have any effect on the Group’s consolidated financial statements as the Company is not an investment entity.
G r e e n t o w n C h i n a H o l d i n g s L i m i t e d 88 / Notes to the Consolidated Financial StatementsFor the year ended 31 December 2013
2. Application of New and Revised International Financial Reporting Standards (“IFRSs”) (continued)
New and Revised Standards and Interpretations Issued But Not Yet Effective (continued)
Amendments to IAS 32 Offsetting Financial Assets and Financial LiabilitiesThe amendments to IAS 32 clarify existing application issues relating to the offset of financial assets and financial liabilities requirements. Specifically, the amendments clarify the meaning of ‘currently has a legally enforceable right of set-off’ and ‘simultaneous realisation and settlement’.
The directors of the Company do not anticipate that the application of these amendments to IAS 32 will have a significant impact on the Group’s consolidated financial statements as the Group does not have any financial assets and financial liabilities that qualify for offset.
Amendments to IAS 36 Recoverable Amount Disclosures for Non-Financial AssetsThe amendments to IAS 36 remove the requirement to disclose the recoverable amount of a cash-generating unit (CGU) to which goodwill or other intangible assets with indefinite useful lives had been allocated when there has been no impairment or reversal of impairment of the related CGU. Furthermore, the amendments introduce additional disclosure requirements regarding the fair value hierarchy, key assumptions and valuation techniques used when the recoverable amount of an asset or CGU was determined based on its fair value less costs of disposal.
The directors of the Company do not anticipate that the application of these amendments to IAS 36 will have a significant impact on the Group’s consolidated financial statements.
Amendments to IAS 39 Novation of Derivatives and Continuation of Hedge AccountingThe amendments to IAS 39 provide relief from the requirement to discontinue hedge accounting when a derivative hedging instrument is novated under certain circumstances. The amendments also clarify that any change to the fair value of the derivative hedging instrument arising from the novation should be included in the assessment of hedge effectiveness.
The directors of the Company do not anticipate that the application of these amendments to IAS 39 will have any effect on the Group’s consolidated financial statements as the Group does not have any derivatives that are subject to novation.
IFRIC 21 LeviesIFRIC 21 Levies addresses the issue of when to recognise a liability to pay a levy. The Interpretation defines a levy, and specifies that the obligating event that gives rise to the liability is the activity that triggers the payment of the levy, as identified by legislation. The Interpretation provides guidance on how different levy arrangements should be accounted for, in particular, it clarifies that neither economic compulsion nor the going concern basis of financial statements preparation implies that an entity has a present obligation to pay a levy that will be triggered by operating in a future period.
The directors of the Company do not anticipate that the application of IFRIC 21 will have any effect on the Group’s consolidated financial statements as the Group does not have any levy.
3. Principal Accounting Policies
The consolidated financial statements have been prepared in accordance with International Financial Reporting Standards. In addition, the consolidated financial statements include applicable disclosures required by the Rules Governing the Listing of Securities on The Stock Exchange of Hong Kong Limited and by the Hong Kong Companies Ordinance.
The consolidated financial statements have been prepared on the historical cost basis except for certain financial instruments and investment properties, which are measured at fair values, as explained in the accounting policies set out below. Historical cost is generally based on the fair value of the consideration given in exchange for goods and services.
A n n u a l R e p o r t 2 0 1 3 89 / Notes to the Consolidated Financial StatementsFor the year ended 31 December 2013
3. Principal Accounting Policies (continued)
Fair value is the price that would be received to sell an asset or paid to transfer a liability in an orderly transaction between market participants at the measurement date, regardless of whether that price is directly observable or estimated using another valuation technique. In estimating the fair value of an asset or a liability, the Group takes into account the characteristics of the asset or liability if market participants would take those characteristics into account when pricing the asset or liability at the measurement date. Fair value for measurement and/or disclosure purposes in these consolidated financial statements is determined on such a basis, except for share-based payment transactions that are within the scope of IFRS 2 Share-based Payment, leasing transactions that are within the scope of IAS 17 Leases, and measurements that have some similarities to fair value but are not fair value, such as net realisable value in IAS 2 Inventories or value in use in IAS 36 Impairment of Assets.
In addition, for financial reporting purposes, fair value measurements are categorised into Level 1, 2 or 3 based on the degree to which the inputs to the fair value measurements are observable and the significance of the inputs to the fair value measurement in its entirety, which are described as follows:
• Level 1 inputs are quoted prices (unadjusted) in active markets for identical assets or liabilities that the entity can access at the measurement date;
• Level 2 inputs are inputs, other than quoted prices included within Level 1, that are observable for the asset or liability, either directly or indirectly; and
• Level 3 inputs are unobservable inputs for the asset or liability.
The principal accounting policies are set out below.
Basis of Consolidation
The consolidated financial statements incorporate the financial statements of the Company and entities controlled by the Company (its subsidiaries). Control is achieved when the Company:
• has power over the investee;
• is exposed, or has rights, to variable returns from its involvement with the investee; and
• has the ability to use its power to affect its returns.
The Group reassesses whether or not it controls an investee if facts and circumstances indicate that there are changes to one or more of the three elements of control listed above.
When the Group has less than a majority of the voting rights of an investee, it has power over the investee when the voting rights are sufficient to give it the practical ability to direct the relevant activities of the investee unilaterally. The Group considers all relevant facts and circumstances in assessing whether or not the Group’s voting rights in an investee are sufficient to give it power, including:
• the size of the Group’s holding of voting rights relative to the size and dispersion of holdings of the other vote holders;
• potential voting rights held by the Group, other vote holders or other parties;
• rights arising from other contractual arrangements; and
• any additional facts and circumstances that indicate that the Group has, or does not have, the current ability to direct the relevant activities at the time that decisions need to be made, including voting patterns at previous shareholders’ meetings.
G r e e n t o w n C h i n a H o l d i n g s L i m i t e d 90 / Notes to the Consolidated Financial StatementsFor the year ended 31 December 2013
3. Principal Accounting Policies (continued)
Basis of Consolidation (continued)
Consolidation of a subsidiary begins when the Group obtains control over the subsidiary and ceases when the Group loses control of the subsidiary. Specifically, income and expenses of a subsidiary acquired or disposed of during the year are included in the consolidated statement of profit or loss and other comprehensive income from the date the Group gains control until the date when the Group ceases to control the subsidiary.
Profit or loss and each item of other comprehensive income are attributed to the owners of the Company and to the non-controlling interests. Total comprehensive income of subsidiaries is attributed to the owners of the Company and to the non-controlling interests even if this results in the non-controlling interests having a deficit balance.
When necessary, adjustments are made to the financial statements of subsidiaries to bring their accounting policies into line with the Group’s accounting policies.
All intragroup assets and liabilities, equity, income, expenses and cash flows relating to transactions between members of the Group are eliminated in full on consolidation.
Changes in the Group’s Ownership Interests in Existing SubsidiariesChanges in the Group’s ownership interests in existing subsidiaries that do not result in the Group losing control over the subsidiaries are accounted for as equity transactions. The carrying amounts of the Group’s interests and the non-controlling interests are adjusted to reflect the changes in their relative interests in the subsidiaries. Any difference between the amount by which the non-controlling interests are adjusted and the fair value of the consideration paid or received is recognised directly in equity and attributed to owners of the Company.
When the Group loses control of a subsidiary, it (i) derecognises the assets (including any goodwill) and liabilities of the subsidiary at their carrying amounts at the date when control is lost, (ii) derecognises the carrying amount of any non-controlling interests in the former subsidiary at the date when control is lost (including any components of other comprehensive income attributable to them), and (iii) recognises the aggregate of the fair value of the consideration received and the fair value of any retained interest, with any resulting difference being recognise as a gain or loss in profit or loss attributable to the Group. When assets of the subsidiary are carried at revalued amounts or fair values and the related cumulative gain or loss has been recognised in other comprehensive income and accumulated in equity, the amounts previously recognised in other comprehensive income and accumulated in equity are accounted for as if the Group had directly disposed of the related assets (i.e. reclassified to profit or loss or transferred directly to retained earnings as specified by applicable IFRSs). The fair value of any investment retained in the former subsidiary at the date when control is lost is regarded as the fair value on initial recognition for subsequent accounting under IAS 39 Financial Instruments: Recognition and Measurement or, when applicable, the cost on initial recognition of an investment in a joint venture or an associate.
Business Combinations
Acquisitions of businesses are accounted for using the acquisition method. The consideration transferred in a business combination is measured at fair value, which is calculated as the sum of the acquisition-date fair values of the assets transferred by the Group, liabilities incurred by the Group to the former owners of the acquiree and the equity interests issued by the Group in exchange for control of the acquiree. Acquisition-related costs are generally recognised in profit or loss as incurred.
A n n u a l R e p o r t 2 0 1 3 91 / Notes to the Consolidated Financial StatementsFor the year ended 31 December 2013
3. Principal Accounting Policies (continued)
Business Combinations (continued)
At the acquisition date, the identifiable assets acquired and the liabilities assumed are recognised at their fair value, except that:
• deferred tax assets or liabilities and liabilities or assets related to employee benefit arrangements are recognised and measured in accordance with IAS 12 Income Taxes and IAS 19 Employee Benefits respectively;
• liabilities or equity instruments related to share-based payment arrangements of the acquiree or share-based payment arrangements of the Group entered into to replace share-based payment arrangements of the acquiree are measured in accordance with IFRS 2 Share-based Payment at the acquisition date (see the accounting policy below); and
• assets (or disposal groups) that are classified as held for sale in accordance with IFRS 5 Non-current Assets Held for Sale and Discontinued Operations are measured in accordance with that Standard.
Goodwill is measured as the excess of the sum of the consideration transferred, the amount of any non-controlling interests in the acquiree, and the fair value of the acquirer’s previously held equity interest in the acquiree (if any) over the net of the acquisition-date amounts of the identifiable assets acquired and the liabilities assumed. If, after re-assessment, the net of the acquisition-date amounts of the identifiable assets acquired and liabilities assumed exceeds the sum of the consideration transferred, the amount of any non-controlling interests in the acquiree and the fair value of the acquirer’s previously held interest in the acquiree (if any), the excess is recognised immediately in profit or loss as a bargain purchase gain.
Non-controlling interests that are present ownership interests and entitle their holders to a proportionate share of the entity’s net assets in the event of liquidation may be initially measured either at fair value or at the non-controlling interests’ proportionate share of the recognised amounts of the acquiree’s identifiable net assets. The choice of measurement basis is made on a transaction-by-transaction basis. Other types of non-controlling interests are measured at their fair value or, when applicable, on the basis specified in another Standard.
Where the consideration transferred by the Group in a business combination includes assets or liabilities resulting from a contingent consideration arrangement, the contingent consideration is measured at its acquisition-date fair value and considered as part of the consideration transferred in a business combination. Changes in the fair value of the contingent consideration that qualify as measurement period adjustments are adjusted retrospectively, with the corresponding adjustments made against goodwill. Measurement period adjustments are adjustments that arise from additional information obtained during the “measurement period” (which cannot exceed one year from the acquisition date) about facts and circumstances that existed at the acquisition date.
The subsequent accounting for changes in the fair value of the contingent consideration that do not qualify as measurement period adjustments depends on how the contingent consideration is classified. Contingent consideration that is classified as equity is not remeasured at subsequent reporting dates and its subsequent settlement is accounted for within equity. Contingent consideration that is classified as an asset or a liability is remeasured at subsequent reporting dates in accordance with IAS 39, or IAS 37 Provisions, Contingent Liabilities and Contingent Assets, as appropriate, with the corresponding gain or loss being recognised in profit or loss.
When a business combination is achieved in stages, the Group’s previously held equity interest in the acquiree is remeasured to fair value at the acquisition date (i.e. the date when the Group obtains control), and the resulting gain or loss, if any, is recognised in profit or loss. Amounts arising from interests in the acquiree prior to the acquisition date that have previously been recognised in other comprehensive income are reclassified to profit or loss where such treatment would be appropriate if that interest were disposed of.
If the initial accounting for a business combination is incomplete by the end of the reporting period in which the combination occurs, the Group reports provisional amounts for the items for which the accounting is incomplete. Those provisional amounts are adjusted during the measurement period (see above), or additional assets or liabilities are recognised, to reflect new information obtained about facts and circumstances that existed as of the acquisition date that, if known, would have affected the amounts recognised as of that date.
G r e e n t o w n C h i n a H o l d i n g s L i m i t e d 92 / Notes to the Consolidated Financial StatementsFor the year ended 31 December 2013
3. Principal Accounting Policies (continued)
Goodwill
Goodwill arising on an acquisition of a business is carried at cost as established at the date of acquisition of the business (see the accounting policy above) less accumulated impairment losses, if any.
For the purposes of impairment testing, goodwill is allocated to each of the Group’s cash-generating units (or groups of cash-generating units) that is expected to benefit from the synergies of the combination.
A cash-generating unit to which goodwill has been allocated is tested for impairment annually or more frequently when there is indication that the unit may be impaired. For goodwill arising on an acquisition in a reporting period, the cash-generating unit to which goodwill has been allocated is tested for impairment before the end of that reporting period. If the recoverable amount of the cash-generating unit is less than its carrying amount, the impairment loss is allocated first to reduce the carrying amount of any goodwill allocated to the unit and then to the other assets of the unit on a pro-rata basis based on the carrying amount of each asset in the unit. Any impairment loss for goodwill is recognised directly in profit or loss. An impairment loss recognised for goodwill is not reversed in subsequent periods.
On disposal of the relevant cash-generating unit, the attributable amount of goodwill is included in the determination of the amount of profit or loss on disposal.
Acquisition of Assets
When the Group acquires a subsidiary, a group of assets or net assets that does not constitute a business, the cost of the acquisition is allocated between the individual identifiable assets and liabilities in the group based on their relative fair values at the acquisition date. No goodwill will be recognised for acquisition of a subsidiary that is accounted for as acquisition of assets.
Investments in Associates and Joint Ventures
An associate is an entity over which the Group has significant influence. Significant influence is the power to participate in the financial and operating policy decisions of the investee but is not control or joint control over those policies.
A joint venture is a joint arrangement whereby the parties that have joint control of the arrangement have rights to the net assets of the joint arrangement. Joint control is the contractually agreed sharing of control of an arrangement, which exists only when decisions about the relevant activities require unanimous consent of the parties sharing control.
The results and assets and liabilities of associates and joint ventures are incorporated in these consolidated financial statements using the equity method of accounting. The financial statements of associates and joint ventures used for equity accounting purposes are prepared using uniform accounting policies as those of the Group for like transactions and events in similar circumstances. Under the equity method, an investment in an associate or a joint venture is initially recognised in the consolidated statement of financial position at cost and adjusted thereafter to recognise the Group’s share of the profit or loss and other comprehensive income of the associate or joint venture. When the Group’s share of losses of an associate or joint venture exceeds the Group’s interest in that associate or joint venture (which includes any long-term interests that, in substance, form part of the Group’s net investment in the associate or joint venture), the Group discontinues recognising its share of further losses. Additional losses are recognised only to the extent that the Group has incurred legal or constructive obligations or made payments on behalf of the associate or joint venture.
An investment in an associate or a joint venture is accounted for using the equity method from the date on which the investee becomes an associate or a joint venture. On acquisition of the investment in an associate or a joint venture, any excess of the cost of the investment over the Group’s share of the net fair value of the identifiable assets and liabilities of the investee is recognised as goodwill, which is included within the carrying amount of the investment. Any excess of the Group’s share of the net fair value of the identifiable assets and liabilities over the cost of the investment, after reassessment, is recognised immediately in profit or loss in the period in which the investment is acquired.
A n n u a l R e p o r t 2 0 1 3 93 / Notes to the Consolidated Financial StatementsFor the year ended 31 December 2013
3. Principal Accounting Policies (continued)
Investments in Associates and Joint Ventures (continued)
The requirements of IAS 39 are applied to determine whether it is necessary to recognise any impairment loss with respect to the Group’s investment in an associate or a joint venture. When necessary, the entire carrying amount of the investment (including goodwill) is tested for impairment in accordance with IAS 36 Impairment of Assets as a single asset by comparing its recoverable amount (higher of value in use and fair value less costs of disposal) with its carrying amount. Any impairment loss recognised forms part of the carrying amount of the investment. Any reversal of that impairment loss is recognised in accordance with IAS 36 to the extent that the recoverable amount of the investment subsequently increases.
The Group discontinues the use of the equity method from the date when the investment ceases to be an associate or a joint venture, or when the investment (or a portion thereof) is classified as held for sale. When the Group retains an interest in the former associate or joint venture and the retained interest is a financial asset, the Group measures the retained interest at fair value at that date and the fair value is regarded as its fair value on initial recognition in accordance with IAS 39. The difference between the carrying amount of the associate or joint venture at the date the equity method was discontinued, and the fair value of any retained interest and any proceeds from disposing of a part interest in the associate or joint venture is included in the determination of the gain or loss on disposal of the associate or joint venture. In addition, the Group accounts for all amounts previously recognised in other comprehensive income in relation to that associate or joint venture on the same basis as would be required if that associate or joint venture had directly disposed of the related assets or liabilities. Therefore, if a gain or loss previously recognised in other comprehensive income by that associate or joint venture would be reclassified to profit or loss on the disposal of the related assets or liabilities, the Group reclassifies the gain or loss from equity to profit or loss (as a reclassification adjustment) when the equity method is discontinued.
The Group continues to use the equity method when an investment in an associate becomes an investment in a joint venture or an investment in a joint venture becomes an investment in an associate. There is no remeasurement to fair value upon such changes in ownership interests.
When the Group reduces its ownership interest in an associate or a joint venture but the Group continues to use the equity method, the Group reclassifies to profit or loss the proportion of the gain or loss that had previously been recognised in other comprehensive income relating to that reduction in ownership interest if that gain or loss would be reclassified to profit or loss on the disposal of the related assets or liabilities.
When a group entity transacts with an associate or a joint venture of the Group (such as a sale or contribution of assets), profits and losses resulting from the transactions with the associate or joint venture are recognised in the Group’s consolidated financial statements only to the extent of interests in the associate or joint venture that are not related to the Group.
Revenue Recognition
Revenue is measured at the fair value of the consideration received or receivable and represents amounts received or receivable for goods sold and services provided in the normal course of business, net of discounts and sales-related taxes.
Revenue from sales of properties in the ordinary course of business is recognised when the respective properties have been completed and delivered to the buyers. Deposits received from pre-sales of properties are carried as pre-sale deposits.
Revenue from sales of other goods is recognised when the goods are delivered and title has passed.
Service income is recognised when services are provided.
Brand usage related income is recognised on sales or pre-sales of properties by brand users at agreed fee rates.
Interest income from a financial asset is accrued on a time basis, by reference to the principal outstanding and at the effective interest rate applicable, which is the rate that exactly discounts the estimated future cash receipts through the expected life of the financial asset to that asset’s net carrying amount on initial recognition.
The Group’s accounting policy for recognition of revenue from operating leases is described in the accounting policy for leasing below.
G r e e n t o w n C h i n a H o l d i n g s L i m i t e d 94 / Notes to the Consolidated Financial StatementsFor the year ended 31 December 2013
3. Principal Accounting Policies (continued)
Foreign Currencies
In preparing the financial statements of each individual group entity, transactions in currencies other than the functional currency of that entity (foreign currencies) are recorded in the respective functional currency (i.e. the currency of the primary economic environment in which the entity operates) at the rates of exchange prevailing on the dates of the transactions. At the end of the reporting period, monetary items denominated in foreign currencies are retranslated at the rates prevailing at that date. Non-monetary items that are measured in terms of historical cost in a foreign currency are not retranslated.
Exchange differences arising on the settlement of monetary items, and on the translation of monetary items, are recognised in profit or loss in the period in which they arise.
Borrowing Costs
Borrowing costs directly attributable to the acquisition, construction or production of qualifying assets, which are assets that necessarily take a substantial period of time to get ready for their intended use or sale, are added to the cost of those assets until such time as the assets are substantially ready for their intended use or sale. Investment income earned on the temporary investment of specific borrowings pending their expenditure on qualifying assets is deducted from the borrowing costs eligible for capitalisation.
All other borrowing costs are recognised in profit or loss in the year in which they are incurred.
Taxation
Income tax expense represents the sum of the tax currently payable and deferred tax.
The tax currently payable is based on taxable profit for the year. Taxable profit differs from “profit before taxation” as reported in the consolidated statement of profit or loss and other comprehensive income because it excludes items of income and expense that are taxable or deductible in other years and it further excludes items that are never taxable or deductible. The Group’s liability for current tax is calculated using tax rates that have been enacted or substantively enacted by the end of the reporting period.
Deferred tax is recognised on temporary differences between the carrying amounts of assets and liabilities in the consolidated financial statements and the corresponding tax bases used in the computation of taxable profit, and is accounted for using the balance sheet liability method. Deferred tax liabilities are generally recognised for all taxable temporary differences and deferred tax assets are recognised to the extent that it is probable that taxable profits will be available against which deductible temporary differences can be utilised. Such assets and liabilities are not recognised if the temporary difference arises from goodwill or from the initial recognition (other than in a business combination) of other assets and liabilities in a transaction that affects neither the taxable profit nor the accounting profit.
Deferred tax liabilities are recognised for taxable temporary differences arising on investments in subsidiaries and associates, and interests in joint ventures, except where the Group is able to control the reversal of the temporary difference and it is probable that the temporary difference will not reverse in the foreseeable future. Deferred tax assets arising from deductible temporary differences associated with such investments and interests are only recognised to the extent that it is probable that there will be sufficient taxable profits against which to utilise the benefits of the temporary differences and they are expected to reverse in the foreseeable future.
The carrying amount of deferred tax assets is reviewed at the end of the reporting period and reduced to the extent that it is no longer probable that sufficient taxable profits will be available to allow all or part of the asset to be recovered.
Deferred tax assets and liabilities are measured at the tax rates that are expected to apply in the period in which the liability is settled or the asset is realised, based on tax rates (and tax laws) that have been enacted or substantively enacted by the end of the reporting period. The measurement of deferred tax assets and liabilities reflects the tax consequences that would follow from the manner in which the Group expects, at the end of the reporting period, to recover or settle the carrying amount of its assets and liabilities.
A n n u a l R e p o r t 2 0 1 3 95 / Notes to the Consolidated Financial StatementsFor the year ended 31 December 2013
3. Principal Accounting Policies (continued)
Taxation (continued)
For the purposes of measuring deferred tax liabilities or deferred tax assets for investment properties that are measured using the fair value model, the carrying amounts of such properties are presumed to be recovered entirely through sale, unless the presumption is rebutted. The presumption is rebutted when the investment property is depreciable and is held within a business model whose objective is to consume substantially all of the economic benefits embodied in the investment property over time, rather than through sale. If the presumption is rebutted, deferred tax liabilities and deferred tax assets for such investment properties are measured in accordance with the above general principles set out in IAS 12 (i.e. based on the expected manner as to how the properties will be recovered).
Deferred tax is recognised in profit or loss, except when it relates to items that are recognised in other comprehensive income or directly in equity, in which case the deferred tax is also recognised in other comprehensive income or directly in equity respectively. Where current tax or deferred tax arises from the initial accounting for a business combination, the tax effect is included in the accounting for the business combination.
Government Grants
Government grants are not recognised until there is reasonable assurance that the Group will comply with the conditions attaching to them and that the grants will be received.
Government grants are recognised in profit or loss on a systematic basis over the periods in which the Group recognises as expenses the related costs for which the grants are intended to compensate. Government grants that are receivable as compensation for expenses or losses already incurred or for the purpose of giving immediate financial support to the Group with no future related costs are recognised in profit or loss in the period in which they become receivable.
Leasing
Leases are classified as finance leases whenever the terms of the lease transfer substantially all the risks and rewards of ownership to the lessee. All other leases are classified as operating leases.
The Group as LessorRental income from operating leases is recognised in profit or loss on a straight-line basis over the term of the relevant lease. Initial direct costs incurred in negotiating and arranging an operating lease are added to the carrying amount of the leased asset and recognised as an expense on a straight-line basis over the lease term.
The Group as LesseeOperating lease payments are recognised as an expense on a straight-line basis over the term of the relevant lease. Benefits received and receivable as an incentive to enter into an operating lease are recognised as a reduction of rental expense over the lease term on a straight-line basis.
Leasehold Land and BuildingsWhen a lease includes both land and building elements, the Group assesses the classification of each element as a finance lease or an operating lease separately based on the assessment as to whether substantially all the risks and rewards incidental to ownership of each element have been transferred to the Group. Specifically, the minimum lease payments (including any lump-sum upfront payments) are allocated between the land and the building elements in proportion to the relative fair values of the leasehold interests in the land element and building element of the lease at the inception of the lease.
To the extent the allocation of the lease payments can be made reliably, interest in leasehold land that is accounted for as an operating lease is presented as “prepaid lease payments” in the consolidated statement of financial position and is amortised over the lease term on a straight-line basis except for those that are classified and accounted for as investment properties under the fair value model. When the lease payments cannot be allocated reliably between the land and building elements, the entire lease is generally classified as a finance lease and accounted for as property, plant and equipment, unless it is clear that both elements are operating leases, in which case the entire lease is classified as an operating lease.
G r e e n t o w n C h i n a H o l d i n g s L i m i t e d 96 / Notes to the Consolidated Financial StatementsFor the year ended 31 December 2013
3. Principal Accounting Policies (continued)
Retirement Benefit Costs
The Group participates in state-managed retirement benefit schemes, which are defined contribution schemes, pursuant to which the Group pays a fixed percentage of its qualifying staff’s wages as contributions to the plans. Payments to such retirement benefit schemes are charged as an expense when employees have rendered service entitling them to the contributions.
Property, Plant and Equipment
Property, plant and equipment, including land and buildings held for use in the production or supply of goods or services, or for administrative purposes other than construction in progress, are stated in the consolidated statement of financial position at cost less accumulated depreciation and accumulated impairment losses.
Depreciation is recognised so as to write off the cost of items of property, plant and equipment other than construction in progress less their residual values over their estimated useful lives, using the straight-line method. The estimated useful lives, residual values and depreciation method are reviewed at the end of each reporting period, with the effect of any changes in estimate accounted for on a prospective basis.
Property, plant and equipment in the course of construction for production, supply or administrative purposes are carried at cost less any recognised impairment loss. Costs include professional fees and, for qualifying assets, borrowing costs capitalised in accordance with the Group’s accounting policy and, where appropriate, the amortisation of prepaid lease payments provided during the construction period. Such properties are classified to the appropriate category of property, plant and equipment when completed and ready for intended use. Depreciation of these assets, on the same basis as other property assets, commences when the assets are ready for their intended use.
An item of property, plant and equipment is derecognised upon disposal or when no future economic benefits are expected to arise from the continued use of the asset. Any gain or loss arising on the disposal or retirement of an item of property, plant and equipment is determined as the difference between the sales proceeds and the carrying amount of the asset and is recognised in profit or loss.
Investment Properties
Investment properties are properties (including the leasehold interest under an operating lease for a property which would otherwise meet the definition of an investment property) held to earn rentals and/or for capital appreciation.
Investment properties are initially measured at cost, including any directly attributable expenditure. Subsequent to initial recognition, investment properties are measured at their fair values using the fair value model. Gains or losses arising from changes in the fair value of investment property are included in profit or loss for the period in which they arise.
Construction costs incurred for investment properties under construction are capitalised as part of the carrying amount of the investment properties under construction.
An investment property is derecognised upon disposal or when the investment property is permanently withdrawn from use or no future economic benefits are expected from its disposals. Any gain or loss arising on derecognition of the asset (calculated as the difference between the net disposal proceeds and the carrying amount of the asset) is included in profit or loss in the year in which the item is derecognised.
Impairment of Tangible Assets
At the end of the reporting period, the Group reviews the carrying amounts of its tangible assets to determine whether there is any indication that those assets have suffered an impairment loss. If any such indication exists, the recoverable amount of the asset is estimated in order to determine the extent of the impairment loss, if any. When it is not possible to estimate the recoverable amount of an individual asset, the Group estimates the recoverable amount of the cash-generating unit to which the asset belongs. When a reasonable and consistent basis of allocation can be identified, corporate assets are also allocated to individual cash-generating units, or otherwise they are allocated to the smallest group of cash-generating units for which a reasonable and consistent allocation basis can be identified.
A n n u a l R e p o r t 2 0 1 3 97 / Notes to the Consolidated Financial StatementsFor the year ended 31 December 2013
3. Principal Accounting Policies (continued)
Impairment of Tangible Assets (continued)
Recoverable amount is the higher of fair value less costs of disposal and value in use. In assessing value in use, the estimated future cash flows are discounted to their present value using a pre-tax discount rate that reflects current market assessments of the time value of money and the risks specific to the asset for which the estimates of future cash flows have not been adjusted.
If the recoverable amount of an asset is estimated to be less than its carrying amount, the carrying amount of the asset is reduced to its recoverable amount. An impairment loss is recognised as an expense immediately.
Where an impairment loss subsequently reverses, the carrying amount of the asset is increased to the revised estimate of its recoverable amount, but so that the increased carrying amount does not exceed the carrying amount that would have been determined had no impairment loss been recognised for the asset in prior years. A reversal of an impairment loss is recognised as income immediately.
Properties for Development
Properties for development, representing leasehold land located in the PRC for development for future sale in the ordinary course of business, are stated at the lower of cost and net realisable value. Cost comprises the costs of land use rights and other directly attributable costs. Net realisable value represents the estimated selling price in the ordinary course of business less estimated costs of completion and the estimated costs necessary to make the sale. Properties for development are transferred to properties under development upon commencement of development.
Properties Under Development
Properties under development, representing leasehold land and buildings located in the PRC under development for future sale in the ordinary course of business, are stated at the lower of cost and net realisable value. Cost comprises the costs of land use rights, construction costs, borrowing costs capitalised and other direct development expenditure. Net realisable value represents the estimated selling price in the ordinary course of business less estimated costs of completion and the estimated costs necessary to make the sale. Properties under development are transferred to completed properties for sale upon completion of development.
Completed Properties for Sale
Completed properties for sale are stated at the lower of cost and net realisable value. Cost comprises the costs of land use rights, construction costs, borrowing costs capitalised and other direct development expenditure. Net realisable value represents the estimated selling price in the ordinary course of business less the estimated costs necessary to make the sale.
The Group transfers a property from completed properties for sale to investment property when there is a change of intention to hold the property to earn rentals or/and for capital appreciation rather than for sale in the ordinary course of business, which is evidenced by the commencement of an operating lease to another party. Any difference between the fair value of the property at the date of transfer and its previous carrying amount is recognised in profit or loss.
Inventories
Inventories other than properties for development, properties under development and completed properties for sale are stated at the lower of cost and net realisable value. Cost is calculated using the weighted average method.
Financial Instruments
Financial assets and financial liabilities are recognised on the consolidated statement of financial position when a group entity becomes a party to the contractual provisions of the instrument.
G r e e n t o w n C h i n a H o l d i n g s L i m i t e d 98 / Notes to the Consolidated Financial StatementsFor the year ended 31 December 2013
3. Principal Accounting Policies (continued)
Financial Instruments (continued)
Financial assets and financial liabilities are initially measured at fair value. Transaction costs that are directly attributable to the acquisition or issue of financial assets and financial liabilities (other than financial assets and financial liabilities at fair value through profit or loss) are added to or deducted from the fair value of the financial assets or financial liabilities, as appropriate, on initial recognition. Transaction costs directly attributable to the acquisition of financial assets or financial liabilities at fair value through profit or loss are recognised immediately in profit or loss.
Financial AssetsThe Group’s financial assets are classified into the following specified categories: financial assets at fair value through profit or loss (“FVTPL”), loans and receivables and available-for-sale financial assets. The classification depends on the nature and purpose of the financial assets and is determined at the time of initial recognition.
Effective Interest MethodThe effective interest method is a method of calculating the amortised cost of a financial asset and of allocating interest income over the relevant period. The effective interest rate is the rate that exactly discounts estimated future cash receipts (including all fees paid or received that form an integral part of the effective interest rate, transaction costs and other premiums or discounts) through the expected life of the financial asset, or, where appropriate, a shorter period to the net carrying amount on initial recognition.
Interest income is recognised on an effective interest basis.
Financial Assets at FVTPLFinancial assets are classified as at FVTPL when the financial asset is either held for trading or it is designated as at FVTPL.
A financial asset is classified as held for trading if:
• it has been acquired principally for the purpose of selling in the near term; or
• on initial recognition it is a part of a portfolio of identified financial instruments that the Group manages together and has a recent actual pattern of short-term profit-taking; or
• it is a derivative that is not designated and effective as a hedging instrument.
A financial asset other than a financial asset held for trading may be designated as at FVTPL upon initial recognition if:
• such designation eliminates or significantly reduces a measurement or recognition inconsistency that would otherwise arise; or
• the financial asset forms part of a group of financial assets or financial liabilities or both, which is managed and its performance is evaluated on a fair value basis, in accordance with the Group’s documented risk management or investment strategy, and information about the grouping is provided internally on that basis; or
• it forms part of a contract containing one or more embedded derivatives, and IAS 39 Financial Instruments: Recognition and Measurement permits the entire combined contract (asset or liability) to be designated as at FVTPL.
Financial assets at FVTPL are stated at fair value, with any gains or losses arising on remeasurement recognised in profit or loss. Fair value is determined in the manner described in Note 6(c).
A n n u a l R e p o r t 2 0 1 3 99 / Notes to the Consolidated Financial StatementsFor the year ended 31 December 2013
3. Principal Accounting Policies (continued)
Financial Instruments (continued)
Financial Assets (continued)Loans and ReceivablesLoans and receivables are non-derivative financial assets with fixed or determinable payments that are not quoted in an active market. Subsequent to initial recognition, loans and receivables (including trade and other receivables, amounts due from related parties, pledged bank deposits, bank balances and cash) are carried at amortised cost using the effective interest method, less any identified impairment losses (see accounting policy on impairment loss on financial assets below).
Available-for-sale Financial AssetsAvailable-for-sale financial assets are non-derivatives that are either designated or not classified as financial assets at FVTPL, loans and receivables or held-to-maturity investments.
Equity and debt securities held by the Group that are classified as available-for-sale and are traded in an active market are measured at fair value at the end of each reporting period. Changes in the carrying amount of available-for-sale monetary financial assets relating to interest income calculated using the effective interest method and dividends on available-for-sale equity investments are recognised in profit or loss. Other changes in the carrying amount of available-for-sale financial assets are recognised in other comprehensive income and accumulated under the heading of investments revaluation reserve. When the investment is disposed of or is determined to be impaired, the cumulative gain or loss previously accumulated in the investments revaluation reserve is reclassified to profit or loss (see the accounting policy in respect of impairment loss on financial assets below).
Dividends on available-for-sale equity instruments are recognised in profit or loss when the Group’s right to receive the dividends is established.
For available-for-sale equity investments that do not have a quoted market price in an active market and whose fair value cannot be reliably measured, they are measured at cost less any identified impairment losses at the end of the reporting period (see accounting policy on impairment loss on financial assets below).
Impairment of Financial AssetsFinancial assets are assessed for indicators of impairment at the end of the reporting period. Financial assets are considered to be impaired where there is objective evidence that, as a result of one or more events that occurred after the initial recognition of the financial asset, the estimated future cash flows of the financial assets have been affected.
For an available-for-sale equity investment, a significant or prolonged decline in the fair value of that investment below cost is considered to be objective evidence of impairment.
For all other financial assets, objective evidence of impairment could include:
• significant financial difficulty of the issuer or counterparty; or
• breach of contract, such as default or delinquency in interest or principal payments; or
• it becoming probable that the borrower will enter bankruptcy or financial re-organisation; or
• the disappearance of an active market for that financial asset because of financial difficulties.
For certain categories of financial assets, such as trade and other receivables, assets that are assessed not to be impaired individually are, in addition, assessed for impairment on a collective basis. Objective evidence of impairment for a portfolio of receivables could include the Group’s past experience of collecting payments, an increase in the number of delayed payments in the portfolio past the average credit period of 90 days, observable changes in national or local economic conditions that correlate with default on receivables.
G r e e n t o w n C h i n a H o l d i n g s L i m i t e d 100 / Notes to the Consolidated Financial StatementsFor the year ended 31 December 2013
3. Principal Accounting Policies (continued)
Financial Instruments (continued)
Financial Assets (continued)Impairment of Financial Assets (continued)For financial assets carried at amortised cost, the amount of the impairment loss recognised is the difference between the asset’s carrying amount and the present value of the estimated future cash flows discounted at the financial asset’s original effective interest rate.
For financial assets carried at cost, the amount of the impairment loss is measured as the difference between the asset’s carrying amount and the present value of the estimated future cash flows discounted at the current market rate of return for a similar financial asset. Such impairment loss will not be reversed in subsequent periods.
The carrying amount of the financial asset is reduced by the impairment loss directly for all financial assets with the exception of trade and other receivables, where the carrying amount is reduced through the use of an allowance account. Changes in the carrying amount of the allowance account are recognised in profit or loss. When a trade or other receivable is considered uncollectible, it is written off against the allowance account. Subsequent recoveries of amounts previously written off are credited to profit or loss.
When an available-for-sale financial asset is considered to be impaired, cumulative gains or losses previously recognised in other comprehensive income are reclassified to profit or loss in the period.
For financial assets measured at amortised cost, if, in a subsequent period, the amount of impairment loss decreases and the decrease can be related objectively to an event occurring after the impairment loss was recognised, the previously recognised impairment loss is reversed through profit or loss to the extent that the carrying amount of the asset at the date the impairment is reversed does not exceed what the amortised cost would have been had the impairment not been recognised.
In respect of available-for-sale equity investments, impairment losses previously recognised in profit or loss are not reversed through profit or loss. Any increase in fair value subsequent to an impairment loss is recognised in other comprehensive income. In respect of available-for-sale debt investments, impairment losses are subsequently reversed through profit or loss if an increase in the fair value of the investment can be objectively related to an event occurring after the recognition of the impairment loss.
Financial Liabilities and EquityDebt and equity instruments issued by a group entity are classified as either financial liabilities or as equity in accordance with substance of the contractual arrangements entered into and the definitions of a financial liability and an equity instrument.
An equity instrument is any contract that evidences a residual interest in the assets of the Group after deducting all of its liabilities. Equity instruments issued by the Group are recognised at the proceeds received, net of direct issue costs.
The Group’s financial liabilities are generally classified into financial liabilities at fair value through profit or loss (“FVTPL”) and other financial liabilities.
Effective Interest MethodThe effective interest method is a method of calculating the amortised cost of a financial liability and of allocating interest expense over the relevant period. The effective interest rate is the rate that exactly discounts estimated future cash payments (including all fees and points paid or received that form an integral part of the effective interest rate, transaction costs and other premiums or discounts) through the expected life of the financial liability, or, where appropriate, a shorter period, to the net carrying amount on initial recognition. Interest expense is recognised on an effective interest basis.
Financial Liabilities at Fair Value Through Profit or LossFinancial liabilities at FVTPL include financial liabilities held for trading.
A n n u a l R e p o r t 2 0 1 3 101 / Notes to the Consolidated Financial StatementsFor the year ended 31 December 2013
3. Principal Accounting Policies (continued)
Financial Instruments (continued)
Financial Liabilities and Equity (continued)Financial Liabilities at Fair Value Through Profit or Loss (continued)A financial liability is classified as held for trading if:
• it has been incurred principally for the purpose of repurchasing in the near future; or
• on initial recognition it is a part of a portfolio of identified financial instruments that the Group manages together and has a recent actual pattern of short-term profit-taking; or
• it is a derivative that is not designated and effective as a hedging instrument.
Financial liabilities at FVTPL are measured at fair value, with changes in fair value arising on remeasurement recognised directly in profit or loss in the period in which they arise. The net gain or loss recognised in profit or loss excludes any interest paid on the financial liabilities and is included in the other income item.
Other Financial LiabilitiesOther financial liabilities including bank and other borrowings, trade and other payables, amounts due to related parties, liability portion of senior notes are subsequently measured at amortised cost, using the effective interest method.
Senior NotesSenior notes issued by the Company that contain both liability and early redemption option (which is not closely related to the host contract) are classified separately into respective items on initial recognition. At the date of issue, both the liability and early redemption option components are recognised at fair value.
In subsequent periods, the liability component of the senior notes is carried at amortised cost using the effective interest method. The early redemption option is measured at fair value with changes in fair value recognised in profit or loss.
Transaction costs that relate to the issue of the senior notes are allocated to the liability and early redemption option components in proportion to their relative fair values. Transaction costs relating to the early redemption option are charged to profit or loss immediately. Transaction costs relating to the liability component are included in the carrying amount of the liability portion and amortised over the period of the senior notes using the effective interest method.
Equity InstrumentsEquity instruments issued by the Company are recorded at the proceeds received, net of direct issue costs.
Convertible SecuritiesConvertible securities with no contractual obligation to repay its principal or to pay any distribution are classified as equity. Respective distributions if and when declared are treated as equity dividends.
Embedded DerivativesDerivatives embedded in non-derivative host contracts are treated as separate derivatives when they meet the definition of a derivative, their risks and characteristics are not closely related to those of the host contracts and the host contracts are not measured at fair value with changes in fair value recognised in profit or loss.
Financial Guarantee ContractsA financial guarantee contract is a contract that requires the issuer to make specified payments to reimburse the holder for a loss it incurs because a specified debtor fails to make payment when due in accordance with the original or modified terms of a debt instrument. A financial guarantee contract issued by the Group and not designated as at fair value through profit or loss is recognised initially at its fair value. Subsequent to initial recognition, the Group measures the financial guarantee contract at the higher of: (i) the amount of obligation under the contract, as determined in accordance with IAS 37 Provisions, Contingent Liabilities and Contingent Assets; and (ii) the amount initially recognised less, when appropriate, cumulative amortisation recognised in accordance with the revenue recognition policy.
G r e e n t o w n C h i n a H o l d i n g s L i m i t e d 102 / Notes to the Consolidated Financial StatementsFor the year ended 31 December 2013
3. Principal Accounting Policies (continued)
Financial Instruments (continued)
DerecognitionThe Group derecognises a financial asset only when the contractual rights to the cash flows from the asset expire, or when it transfers the financial asset and substantially all the risks and rewards of ownership of the asset to another entity. If the Group neither transfers nor retains substantially all the risks and rewards of ownership and continues to control the transferred asset, the Group continues to recognise the asset to the extent of its continuing involvement and recognises an associated liability. If the Group retains substantially all the risks and rewards of ownership of a transferred financial asset, the Group continues to recognise the financial asset and also recognises a collateralised borrowing for the proceeds received. On derecognition of a financial asset, the difference between the asset’s carrying amount and the sum of the consideration received and receivable is recognised in profit or loss.
The Group derecognises a financial liability when, and only when, the Group’s obligations are discharged, cancelled or expire. The difference between the carrying amount of the financial liability derecognised and the consideration paid and payable is recognised in profit or loss.
Share-Based Payment Transactions
Equity-Settled Share-Based Payment TransactionsShare Options Granted to EmployeesThe fair value of services received determined by reference to the fair value of share options granted at the grant date is expensed on a straight-line basis over the vesting period, with a corresponding increase in equity (share options reserve). Share option premiums received or receivable from grantees are recognised in share options reserve.
At the end of the reporting period, the Group revises its estimates of the number of options that are expected to ultimately vest. The impact of the revision of the estimates during the vesting period, if any, is recognised in profit or loss such that the cumulative expense reflects the revised estimate, with a corresponding adjustment to share options reserve.
At the time when the share options are exercised, the amount previously recognised in share options reserve will be transferred to share premium. When the share options are forfeited after the vesting date or are still not exercised at the expiry date, the amount previously recognised in share options reserve will continue to be held in share options reserve.
4. Critical Accounting Judgements and Key Sources of Estimation Uncertainty
Critical Judgements in Applying Accounting Policies
The critical judgements, apart from those involving estimations (see below), that the directors have made in the process of applying the Group’s accounting policies and that have the most significant effect on the amounts recognised in the consolidated financial statements are disclosed below.
Deferred Taxation on Investment PropertiesFor the purposes of measuring deferred tax liabilities or deferred tax assets arising from investment properties that are measured using the fair value model, the directors have reviewed the Group’s investment property portfolios and concluded that the Group’s investment properties are not held under a business model whose objective is to consume substantially all of the economic benefits embodied in the investment properties over time, rather than through sale. Therefore, in measuring the Group’s deferred taxation on investment properties, the directors have determined that the presumption that the carrying amounts of investment properties measured using the fair value model are recovered entirely through sale is not rebutted. As a result, the Group has recognised deferred taxes of both enterprise income tax and land appreciation tax on changes in fair value of investment properties.
A n n u a l R e p o r t 2 0 1 3 103 / Notes to the Consolidated Financial StatementsFor the year ended 31 December 2013
4. Critical Accounting Judgements and Key Sources of Estimation Uncertainty (continued)
Key Sources of Estimation Uncertainty
The key assumptions concerning the future, and other key sources of estimation uncertainty at the end of the reporting period, that have a significant risk of causing a material adjustment to the carrying amounts of assets and liabilities within the next financial year are disclosed below.
Net Realisable Value for Properties for Development, Properties Under Development and Completed Properties for SaleProperties for development, properties under development and completed properties remaining unsold at the end of each reporting period are stated at the lower of cost and net realisable value.
Net realisable value for properties for development and properties under development is determined by reference to management estimates of the selling price based on prevailing market conditions, less applicable variable selling expenses and the anticipated costs to completion. Net realisable value for completed properties for sale is determined by reference to management estimates of the selling price based on prevailing market conditions, less applicable variable selling expenses. During the course of their assessment, management will also make reference to property valuations conducted by independent qualified professional valuers based on comparable market prices. Management are required to revise these estimates if there is a change in market condition or demand. If actual market conditions are less favourable than those projected by management, additional adjustments to the value of properties for development, properties under development and completed properties for sale may be required. As at 31 December 2013, the carrying amounts of properties for development, properties under development and completed properties for sale are RMB6,280,067,000 (2012: RMB6,020,524,000), RMB38,967,574,000 (2012: RMB43,136,154,000) and RMB13,062,500,000 (2012: RMB7,330,358,000) respectively (net of accumulated impairment loss of RMB nil (2012: RMB nil), RMB nil (2012: RMB143,867,000) and RMB nil (2012: RMB nil) respectively).
Fair Value of Investment PropertiesInvestment properties are carried in the consolidated statement of financial position at 31 December 2013 at their fair value of approximately RMB1,831,500,000 (2012: RMB1,730,600,000).
The fair value was based on valuation on these properties conducted by the independent qualified professional valuers using property valuation techniques which adopt the investment approach by capitalising the net rental income derived from the existing tenancies with due provision for the reversionary income potential of the property interests, or where appropriate, by direct comparison approach by making reference to comparable sales transactions as available in the relevant markets. Favourable or unfavourable changes to the assumptions such as rental yield and estimation of future rentals would result in changes in the fair value of the Group’s investment properties and corresponding adjustments to the amount of gain or loss reported in the consolidated statement of profit or loss and other comprehensive income.
Revision on the Estimates on Expected Cash Flows of the Shareholder’s Loan Made to Zhejiang JinyingWhen the Group revises its estimates of receipts of the shareholder’s loan, the Group shall adjust the carrying amount of the loan to reflect actual and revised estimated cash flows. The Group recalculates the carrying amount by computing the present value of estimated future cash flows at the loan’s original effective interest rate. The adjustment is recognised in profit or loss as income or expense.
As at 31 December 2013, the carrying amount of the shareholder’s loan made to Zhejiang Jinying is RMB1,732,137,000 (2012: nil).
Estimated Impairment of Trade and Other Receivables and Amounts Due From Related PartiesWhen there is objective evidence of impairment loss, the Group takes into consideration the estimation of future cash flows to determine impairment loss. The amount of the impairment loss is measured as the difference between the asset’s carrying amount and the present value of estimated future cash flows (excluding future credit losses that have not been incurred) discounted at the financial asset’s original effective interest rate (i.e. the effective interest rate computed at initial recognition). Where the actual future cash flows are less than expected, a material impairment loss may arise.
G r e e n t o w n C h i n a H o l d i n g s L i m i t e d 104 / Notes to the Consolidated Financial StatementsFor the year ended 31 December 2013
4. Critical Accounting Judgements and Key Sources of Estimation Uncertainty (continued)
Key Sources of Estimation Uncertainty (continued)
Land Appreciation TaxThe provision for Land Appreciation Tax (“LAT”) amounting to RMB2,717,856,000 (2012: RMB2,237,657,000) (included in income taxes payable) is estimated and made according to the requirements set forth in the relevant PRC tax laws and regulations. The actual LAT liabilities are subject to the determination by the tax authorities upon completion of the property development projects and the tax authorities might disagree with the basis on which the provision for LAT is calculated.
5. Capital Risk Management
The Group manages its capital to ensure that entities in the Group will be able to continue as a going concern while maximising the return to shareholders through the optimisation of the debt and equity balance. The Group’s overall strategy remains unchanged from prior year.
The capital structure of the Group consists of net debt, which includes the borrowings disclosed in Notes 26, 27 and 37(ii) (net of cash and cash equivalents), and capital and reserves.
The directors of the Company review the capital structure on a regular basis. As part of this review, the directors consider the cost of capital and the risks associated with each class of capital. The Group will balance its overall capital structure through the payment of dividends, new share issues and share buy-backs as well as the issue of new debt or the redemption of existing debt.
6. Financial Instruments
(a) Categories of Financial Instruments
2013 2012RMB’000 RMB’000
Financial assetsLoans and receivables (including cash and cash equivalents) 39,637,058 32,939,725Available-for-sale financial assets 377,010 346,545Cross currency swaps 49,849 –
Financial liabilitiesAmortised cost 59,048,601 44,192,216
(b) Financial Risk Management Objectives and Policies
The Group’s major financial instruments include available-for-sale investments, cross currency swaps, trade and other receivables, amounts due from related parties, pledged bank deposits, bank balances and cash, trade and other payables, amounts due to related parties, bank and other borrowings and senior notes. Details of the financial instruments are disclosed in respective notes. The risks associated with these financial instruments include market risk (currency risk and interest rate risk), credit risk and liquidity risk. The policies on how to mitigate these risks are set out below. The management manages and monitors these exposures to ensure appropriate measures are implemented on a timely and effective manner. There has been no significant change in the Group’s exposure to these risks or the manner in which it manages and measures risks.
Market Risk(i) Currency Risk
The Group has bank balances, other payables, other receivables, amounts due from related parties, bank and other borrowings and senior notes denominated in foreign currencies, which expose the Group to foreign currency risk.
A n n u a l R e p o r t 2 0 1 3 105 / Notes to the Consolidated Financial StatementsFor the year ended 31 December 2013
6. Financial Instruments (continued)
(b) Financial Risk Management Objectives and Policies (continued)
Market Risk (continued)(i) Currency Risk (continued)
The carrying amounts of the Group’s foreign currency denominated monetary assets and monetary liabilities at the end of the reporting period are as follows:
Liabilities Assets
2013 2012 2013 2012RMB’000 RMB’000 RMB’000 RMB’000
Hong Kong dollars (“HKD”) 424 818,959 93,017 456,264United States dollars (“USD”) 11,151,171 1,710,876 1,005,914 83,678
The Group does not use any derivative contracts to hedge against its exposure to currency risk.
Sensitivity AnalysisThe Group is mainly exposed to the fluctuations in exchange rates between RMB and HKD/USD. The exposure in HKD/USD arises mainly from the Group’s bank balances and cash, other receivables, other payables, bank and other borrowings, senior notes and amounts due from related parties.
The following table details the Group’s sensitivity to a 5% (2012: 5%) increase and decrease in RMB against the relevant foreign currencies. 5% represents management’s assessment of the reasonably possible change in foreign exchange rates. The sensitivity analysis includes only outstanding foreign currency denominated monetary items and adjusts their translation at the year end for a 5% change in foreign currency rates. A positive number below indicates an increase in post-tax profit where RMB strengthens 5% against the relevant currency. For a 5% weakening of RMB against the relevant currency, there would be an equal and opposite impact on post-tax profit.
HKD Impact USD Impact2013 2012 2013 2012
RMB’000 RMB’000 RMB’000 RMB’000 Profit or loss (3,472) 13,601 380,447 61,020
(ii) Interest Rate RiskThe Group is exposed to fair value interest rate risk in relation to fixed-rate bank deposits, amounts due from/to related parties, bank and other borrowings and senior notes (see Notes 24, 26, 27,and 37 for details).
The Group is also exposed to cash flow interest rate risk in relation to variable-rate bank deposits, amounts due from/to related parties and bank and other borrowings (see Notes 24, 26 and 37 for details).
The Group does not use any derivative contracts to hedge against its exposure to interest rate risk.
The Group’s exposures to interest rates on financial liabilities are detailed in the liquidity risk management section of this note.
G r e e n t o w n C h i n a H o l d i n g s L i m i t e d 106 / Notes to the Consolidated Financial StatementsFor the year ended 31 December 2013
6. Financial Instruments (continued)
(b) Financial Risk Management Objectives and Policies (continued)
Market Risk (continued)(ii) Interest Rate Risk (continued)
Sensitivity AnalysisThe sensitivity analyses below have been determined based on the exposure to market deposit and lending interest rates for non-derivative instruments. For variable-rate bank deposits, bank and other borrowings and amounts due from/to related parties, the analysis is prepared assuming the balances outstanding at the end of the reporting period were outstanding for the whole year. A 5 basis point (2012: 5 basis point) increase or decrease in market deposit interest rates and a 50 basis point (2012: 50 basis point) increase or decrease in market lending interest rates represent management’s assessment of the reasonably possible change in interest rates.
If the market deposit interest rates had been 5 basis points higher/lower and all other variables were held constant, the Group’s post-tax profit for the year ended 31 December 2013 would have increased/decreased by RMB3,918,000 (2012: increased/decreased by RMB2,311,000). This is mainly attributable to the Group’s exposure to interest rates on its variable-rate bank deposits.
If the market lending interest rates had been 50 basis points higher/lower and all other variables were held constant, the Group’s post-tax profit for the year ended 31 December 2013 would have decreased/increased by RMB51,823,000 (2012: decreased/increased by RMB62,522,000). This is mainly attributable to the Group’s exposure to interest rates on its variable-rate bank and other borrowings and amounts due from/to related parties.
Credit RiskAs at 31 December 2013, the Group’s maximum exposure to credit risk which will cause a financial loss to the Group due to failure to discharge an obligation by the counterparties and financial guarantees provided by the Group arises from:
• the carrying amount of the respective recognised financial assets as stated in the consolidated statement of financial position; and
• the amount of contingent liabilities disclosed in Note 36.
In order to minimise the credit risk, the management of the Group has delegated a team responsible for determination of credit limits, credit approvals and other monitoring procedures to ensure that follow-up action is taken to recover overdue trade debts, other receivables and amounts due from related parties. In addition, the Group reviews the recoverable amount of each overdue debt at the end of the reporting period to ensure that adequate impairment losses are made for irrecoverable amounts. To minimise the credit risk arising from customer mortgage guarantees, the Group has reserved the right to collect the properties sold to customers should they default on their mortgage payments and demanded the application for building ownership certificates by customers since these guarantees provided by the Group to the banks will be released upon receiving such certificates. To minimise the credit risk arising from guarantees provided to banks and other parties in respect of credit facilities utilised by joint ventures and associates, the Group has delegated a team responsible for assessing the credit standing of such entities and the limits to the guarantees to be provided. In this regard, the directors of the Company consider that the Group’s credit risk is significantly reduced.
The credit risk on liquid funds is limited because the counterparties are banks with high credit ratings assigned by international credit-rating agencies or with a good reputation.
The Group’s concentration of credit risk by geographical locations is mainly in the PRC. Other than the concentration of credit risk on liquid funds which are deposited with several large state-owned banks and commercial banks in the PRC, the Group does not have any other significant concentration of credit risk, with exposure spread over a number of counterparties and customers.
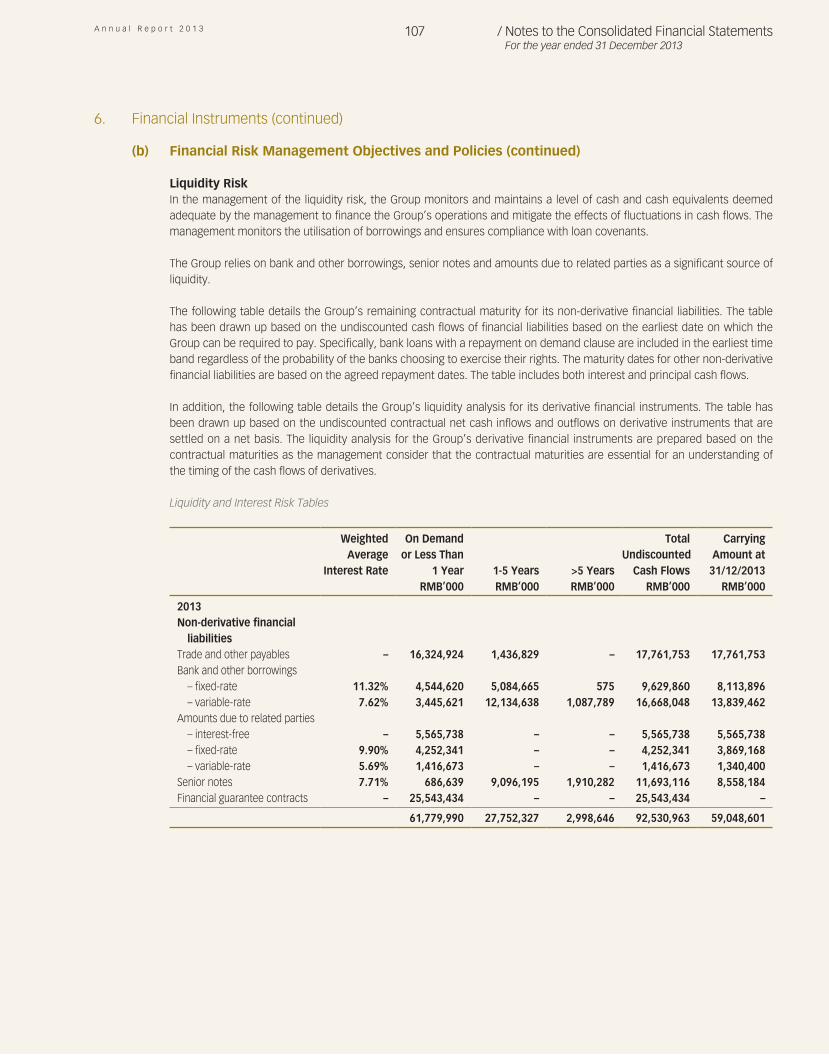
A n n u a l R e p o r t 2 0 1 3 107 / Notes to the Consolidated Financial StatementsFor the year ended 31 December 2013
6. Financial Instruments (continued)
(b) Financial Risk Management Objectives and Policies (continued)
Liquidity RiskIn the management of the liquidity risk, the Group monitors and maintains a level of cash and cash equivalents deemed adequate by the management to finance the Group’s operations and mitigate the effects of fluctuations in cash flows. The management monitors the utilisation of borrowings and ensures compliance with loan covenants.
The Group relies on bank and other borrowings, senior notes and amounts due to related parties as a significant source of liquidity.
The following table details the Group’s remaining contractual maturity for its non-derivative financial liabilities. The table has been drawn up based on the undiscounted cash flows of financial liabilities based on the earliest date on which the Group can be required to pay. Specifically, bank loans with a repayment on demand clause are included in the earliest time band regardless of the probability of the banks choosing to exercise their rights. The maturity dates for other non-derivative financial liabilities are based on the agreed repayment dates. The table includes both interest and principal cash flows.
In addition, the following table details the Group’s liquidity analysis for its derivative financial instruments. The table has been drawn up based on the undiscounted contractual net cash inflows and outflows on derivative instruments that are settled on a net basis. The liquidity analysis for the Group’s derivative financial instruments are prepared based on the contractual maturities as the management consider that the contractual maturities are essential for an understanding of the timing of the cash flows of derivatives.
Liquidity and Interest Risk Tables
Weighted
Average Interest Rate
On Demand or Less Than
1 Year 1-5 Years >5 Years
Total Undiscounted
Cash Flows
Carrying Amount at
31/12/2013RMB’000 RMB’000 RMB’000 RMB’000 RMB’000
2013Non-derivative financial
liabilitiesTrade and other payables – 16,324,924 1,436,829 – 17,761,753 17,761,753Bank and other borrowings
– fixed-rate 11.32% 4,544,620 5,084,665 575 9,629,860 8,113,896– variable-rate 7.62% 3,445,621 12,134,638 1,087,789 16,668,048 13,839,462
Amounts due to related parties– interest-free – 5,565,738 – – 5,565,738 5,565,738– fixed-rate 9.90% 4,252,341 – – 4,252,341 3,869,168– variable-rate 5.69% 1,416,673 – – 1,416,673 1,340,400
Senior notes 7.71% 686,639 9,096,195 1,910,282 11,693,116 8,558,184Financial guarantee contracts – 25,543,434 – – 25,543,434 –
61,779,990 27,752,327 2,998,646 92,530,963 59,048,601
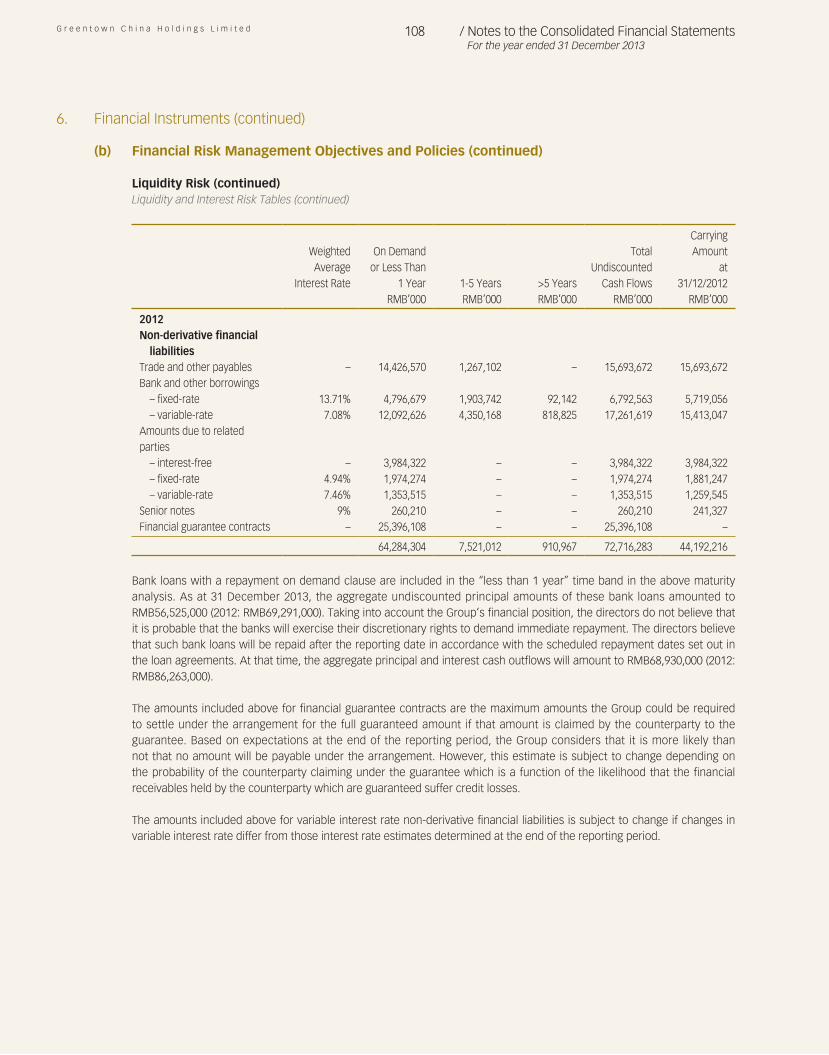
G r e e n t o w n C h i n a H o l d i n g s L i m i t e d 108 / Notes to the Consolidated Financial StatementsFor the year ended 31 December 2013
6. Financial Instruments (continued)
(b) Financial Risk Management Objectives and Policies (continued)
Liquidity Risk (continued)Liquidity and Interest Risk Tables (continued)
WeightedAverage
Interest Rate
On Demand or Less Than
1 Year 1-5 Years >5 Years
TotalUndiscounted
Cash Flows
CarryingAmount
at31/12/2012
RMB’000 RMB’000 RMB’000 RMB’000 RMB’000 2012Non-derivative financial
liabilitiesTrade and other payables – 14,426,570 1,267,102 – 15,693,672 15,693,672Bank and other borrowings
– fixed-rate 13.71% 4,796,679 1,903,742 92,142 6,792,563 5,719,056– variable-rate 7.08% 12,092,626 4,350,168 818,825 17,261,619 15,413,047
Amounts due to relatedparties
– interest-free – 3,984,322 – – 3,984,322 3,984,322– fixed-rate 4.94% 1,974,274 – – 1,974,274 1,881,247– variable-rate 7.46% 1,353,515 – – 1,353,515 1,259,545
Senior notes 9% 260,210 – – 260,210 241,327Financial guarantee contracts – 25,396,108 – – 25,396,108 –
64,284,304 7,521,012 910,967 72,716,283 44,192,216
Bank loans with a repayment on demand clause are included in the “less than 1 year” time band in the above maturity analysis. As at 31 December 2013, the aggregate undiscounted principal amounts of these bank loans amounted to RMB56,525,000 (2012: RMB69,291,000). Taking into account the Group’s financial position, the directors do not believe that it is probable that the banks will exercise their discretionary rights to demand immediate repayment. The directors believe that such bank loans will be repaid after the reporting date in accordance with the scheduled repayment dates set out in the loan agreements. At that time, the aggregate principal and interest cash outflows will amount to RMB68,930,000 (2012: RMB86,263,000).
The amounts included above for financial guarantee contracts are the maximum amounts the Group could be required to settle under the arrangement for the full guaranteed amount if that amount is claimed by the counterparty to the guarantee. Based on expectations at the end of the reporting period, the Group considers that it is more likely than not that no amount will be payable under the arrangement. However, this estimate is subject to change depending on the probability of the counterparty claiming under the guarantee which is a function of the likelihood that the financial receivables held by the counterparty which are guaranteed suffer credit losses.
The amounts included above for variable interest rate non-derivative financial liabilities is subject to change if changes in variable interest rate differ from those interest rate estimates determined at the end of the reporting period.
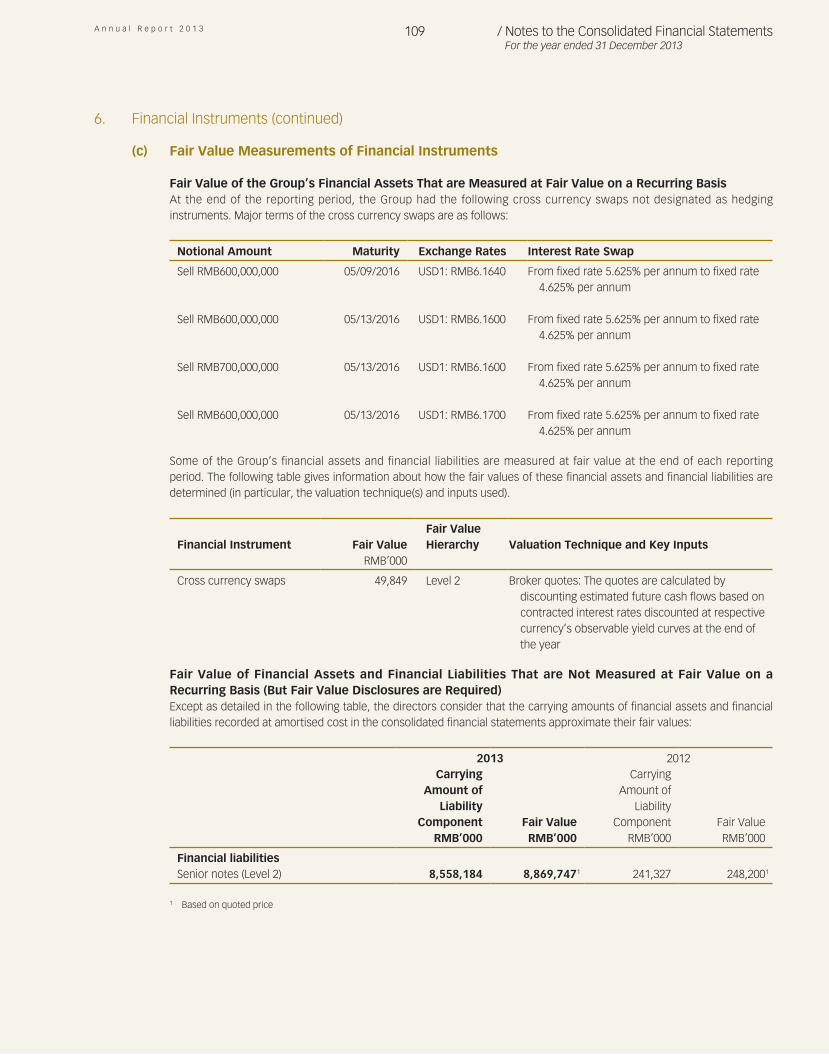
A n n u a l R e p o r t 2 0 1 3 109 / Notes to the Consolidated Financial StatementsFor the year ended 31 December 2013
6. Financial Instruments (continued)
(c) Fair Value Measurements of Financial Instruments
Fair Value of the Group’s Financial Assets That are Measured at Fair Value on a Recurring BasisAt the end of the reporting period, the Group had the following cross currency swaps not designated as hedging instruments. Major terms of the cross currency swaps are as follows:
Notional Amount Maturity Exchange Rates Interest Rate Swap Sell RMB600,000,000 05/09/2016 USD1: RMB6.1640 From fixed rate 5.625% per annum to fixed rate
4.625% per annum
Sell RMB600,000,000 05/13/2016 USD1: RMB6.1600 From fixed rate 5.625% per annum to fixed rate 4.625% per annum
Sell RMB700,000,000 05/13/2016 USD1: RMB6.1600 From fixed rate 5.625% per annum to fixed rate 4.625% per annum
Sell RMB600,000,000 05/13/2016 USD1: RMB6.1700 From fixed rate 5.625% per annum to fixed rate 4.625% per annum
Some of the Group’s financial assets and financial liabilities are measured at fair value at the end of each reporting period. The following table gives information about how the fair values of these financial assets and financial liabilities are determined (in particular, the valuation technique(s) and inputs used).
Financial Instrument Fair ValueFair ValueHierarchy Valuation Technique and Key Inputs
RMB’000 Cross currency swaps 49,849 Level 2 Broker quotes: The quotes are calculated by
discounting estimated future cash flows based on contracted interest rates discounted at respective currency’s observable yield curves at the end of the year
Fair Value of Financial Assets and Financial Liabilities That are Not Measured at Fair Value on a Recurring Basis (But Fair Value Disclosures are Required)Except as detailed in the following table, the directors consider that the carrying amounts of financial assets and financial liabilities recorded at amortised cost in the consolidated financial statements approximate their fair values:
2013 2012
CarryingAmount of
LiabilityComponent Fair Value
CarryingAmount of
LiabilityComponent Fair Value
RMB’000 RMB’000 RMB’000 RMB’000 Financial liabilitiesSenior notes (Level 2) 8,558,184 8,869,7471 241,327 248,2001
1 Based on quoted price
G r e e n t o w n C h i n a H o l d i n g s L i m i t e d 110 / Notes to the Consolidated Financial StatementsFor the year ended 31 December 2013
7. Revenue and Segment Information
An analysis of the Group’s revenue from its major products and services is as follows:
2013 2012
RMB’000 RMB’000 Property sales 27,460,381 34,214,430Hotel operations 305,340 298,476Project management 350,060 254,783Property rental income 113,864 111,480Design and decoration 581,651 324,800Sales of construction materials 63,172 104,320Other business 116,102 84,217
28,990,570 35,392,506
The chief operating decision-maker of the Group has been identified as the executive directors and certain senior management (collectively referred to as the “CODM”). Operating segments are determined based on the Group’s internal reports which are submitted to the CODM for performance assessment and resources allocation. This is also the basis upon which the Group is organised and managed.
The Group’s consolidated revenue and results are attributable to the market in the PRC (country of domicile) and almost all of the Group’s consolidated assets are located in the PRC. The Group has identified four reportable segments, namely property development, hotel operations, property investment and others segments.
The Group’s reportable segments under IFRS 8 are as follows:
1 Property development2 Hotel operations3 Property investment4 Others (including sales of construction materials, design and decoration, project management, etc.)
For the property development operations, the CODM reviews the financial information of each property development project, hence each property development project constitutes a separate operating segment. However, the property development projects possess similar economic characteristics, and are with similar development and selling activities as well as similar customer bases. Therefore, all property development projects are aggregated into one reportable segment for segment reporting purposes.
For the hotel operations, the CODM reviews the financial information of each hotel, hence each hotel constitutes a separate operating segment. However, the hotels possess similar economic characteristics, and are with similar development and selling activities as well as similar customer bases. Therefore, all hotels are aggregated into one reportable segment for segment reporting purposes.
For the property investment operations, the CODM reviews the financial information of each investment property, hence each investment property constitutes a separate operating segment. However, the investment properties possess similar economic characteristics, and are with similar development and selling activities as well as similar customer bases. Therefore, all investment properties are aggregated into one reportable segment for segment reporting purposes.
The CODM assesses the performance of the operating segments based on the post-tax profit of the group entities engaged in the respective segment activities, which includes share of results of joint ventures and associates and related finance costs. Financial information provided to the CODM is measured in a manner consistent with the accounting policies adopted in the preparation of the consolidated financial statements as described in Note 3.
Sales between segments are carried out on terms agreed between the counterparties.
No customers account for 10% or more of the Group’s revenue.
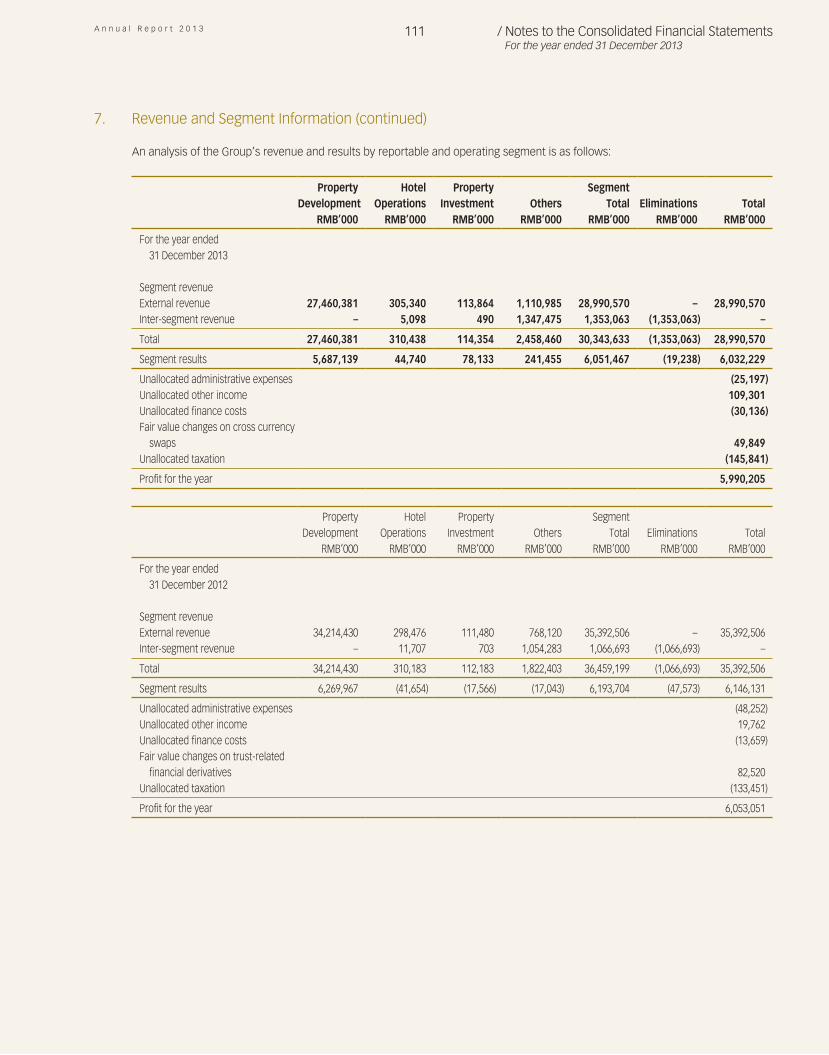
A n n u a l R e p o r t 2 0 1 3 111 / Notes to the Consolidated Financial StatementsFor the year ended 31 December 2013
7. Revenue and Segment Information (continued)
An analysis of the Group’s revenue and results by reportable and operating segment is as follows:
Property
DevelopmentHotel
OperationsProperty
Investment OthersSegment
Total Eliminations TotalRMB’000 RMB’000 RMB’000 RMB’000 RMB’000 RMB’000 RMB’000
For the year ended 31 December 2013
Segment revenueExternal revenue 27,460,381 305,340 113,864 1,110,985 28,990,570 – 28,990,570Inter-segment revenue – 5,098 490 1,347,475 1,353,063 (1,353,063) – Total 27,460,381 310,438 114,354 2,458,460 30,343,633 (1,353,063) 28,990,570 Segment results 5,687,139 44,740 78,133 241,455 6,051,467 (19,238) 6,032,229 Unallocated administrative expenses (25,197)Unallocated other income 109,301Unallocated finance costs (30,136)Fair value changes on cross currency
swaps 49,849Unallocated taxation (145,841) Profit for the year 5,990,205
Property
DevelopmentHotel
OperationsProperty
Investment OthersSegment
Total Eliminations TotalRMB’000 RMB’000 RMB’000 RMB’000 RMB’000 RMB’000 RMB’000
For the year ended 31 December 2012
Segment revenueExternal revenue 34,214,430 298,476 111,480 768,120 35,392,506 – 35,392,506Inter-segment revenue – 11,707 703 1,054,283 1,066,693 (1,066,693) – Total 34,214,430 310,183 112,183 1,822,403 36,459,199 (1,066,693) 35,392,506 Segment results 6,269,967 (41,654) (17,566) (17,043) 6,193,704 (47,573) 6,146,131 Unallocated administrative expenses (48,252)Unallocated other income 19,762Unallocated finance costs (13,659)Fair value changes on trust-related
financial derivatives 82,520Unallocated taxation (133,451) Profit for the year 6,053,051
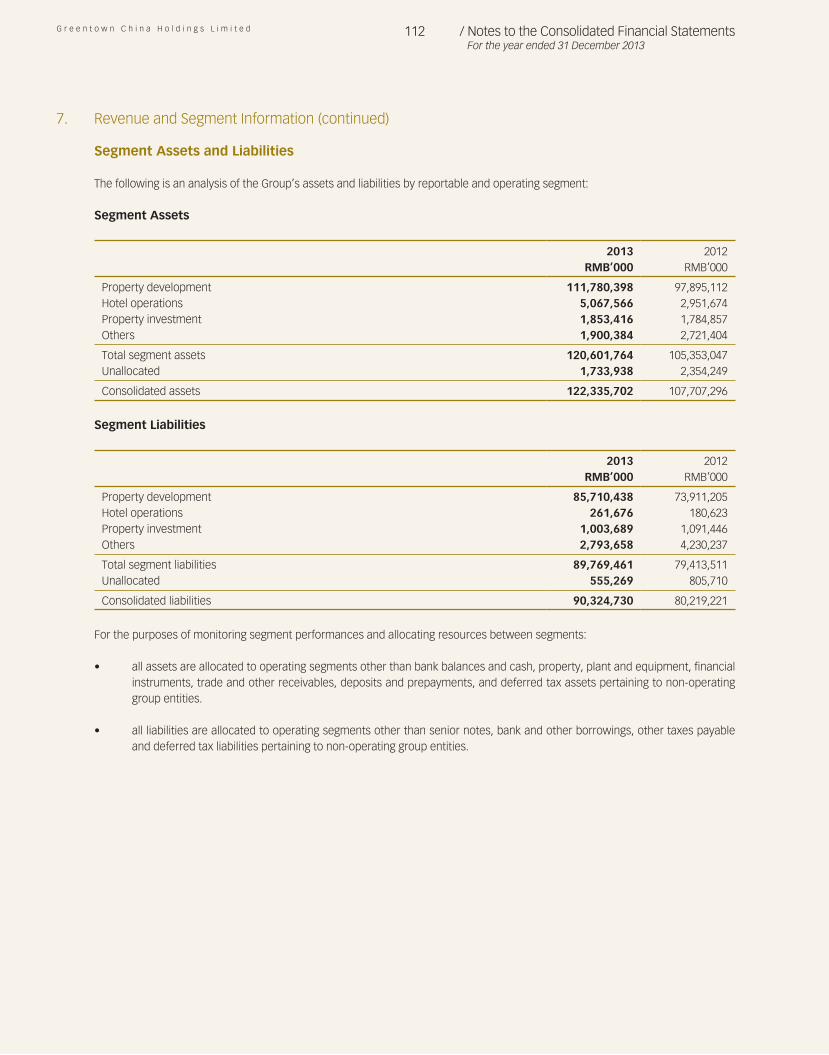
G r e e n t o w n C h i n a H o l d i n g s L i m i t e d 112 / Notes to the Consolidated Financial StatementsFor the year ended 31 December 2013
7. Revenue and Segment Information (continued)
Segment Assets and Liabilities
The following is an analysis of the Group’s assets and liabilities by reportable and operating segment:
Segment Assets
2013 2012
RMB’000 RMB’000 Property development 111,780,398 97,895,112Hotel operations 5,067,566 2,951,674Property investment 1,853,416 1,784,857Others 1,900,384 2,721,404 Total segment assets 120,601,764 105,353,047Unallocated 1,733,938 2,354,249 Consolidated assets 122,335,702 107,707,296
Segment Liabilities
2013 2012
RMB’000 RMB’000 Property development 85,710,438 73,911,205Hotel operations 261,676 180,623Property investment 1,003,689 1,091,446Others 2,793,658 4,230,237 Total segment liabilities 89,769,461 79,413,511Unallocated 555,269 805,710 Consolidated liabilities 90,324,730 80,219,221
For the purposes of monitoring segment performances and allocating resources between segments:
• all assets are allocated to operating segments other than bank balances and cash, property, plant and equipment, financial instruments, trade and other receivables, deposits and prepayments, and deferred tax assets pertaining to non-operating group entities.
• all liabilities are allocated to operating segments other than senior notes, bank and other borrowings, other taxes payable and deferred tax liabilities pertaining to non-operating group entities.
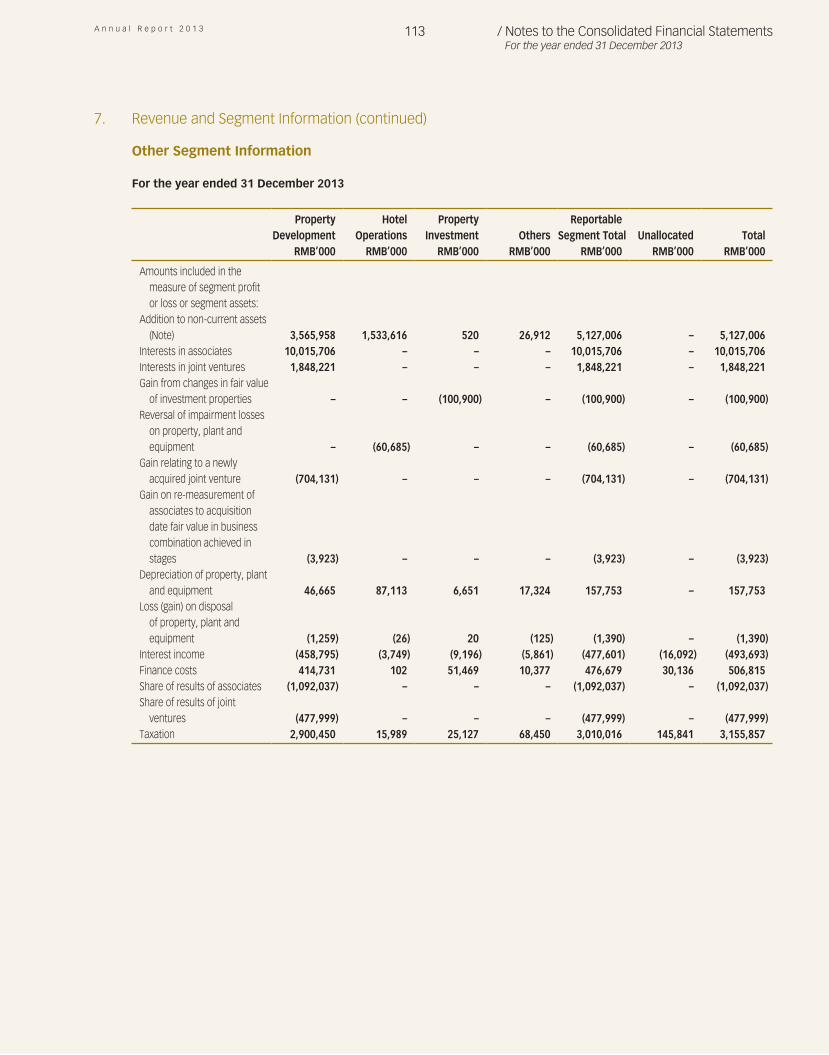
A n n u a l R e p o r t 2 0 1 3 113 / Notes to the Consolidated Financial StatementsFor the year ended 31 December 2013
7. Revenue and Segment Information (continued)
Other Segment Information
For the year ended 31 December 2013
Property
DevelopmentHotel
OperationsProperty
Investment OthersReportable
Segment Total Unallocated TotalRMB’000 RMB’000 RMB’000 RMB’000 RMB’000 RMB’000 RMB’000
Amounts included in the measure of segment profit or loss or segment assets:
Addition to non-current assets (Note) 3,565,958 1,533,616 520 26,912 5,127,006 – 5,127,006
Interests in associates 10,015,706 – – – 10,015,706 – 10,015,706Interests in joint ventures 1,848,221 – – – 1,848,221 – 1,848,221Gain from changes in fair value
of investment properties – – (100,900) – (100,900) – (100,900)Reversal of impairment losses
on property, plant and equipment – (60,685) – – (60,685) – (60,685)
Gain relating to a newly acquired joint venture (704,131) – – – (704,131) – (704,131)
Gain on re-measurement of associates to acquisition date fair value in business combination achieved in stages (3,923) – – – (3,923) – (3,923)
Depreciation of property, plant and equipment 46,665 87,113 6,651 17,324 157,753 – 157,753
Loss (gain) on disposal of property, plant and equipment (1,259) (26) 20 (125) (1,390) – (1,390)
Interest income (458,795) (3,749) (9,196) (5,861) (477,601) (16,092) (493,693)Finance costs 414,731 102 51,469 10,377 476,679 30,136 506,815Share of results of associates (1,092,037) – – – (1,092,037) – (1,092,037)Share of results of joint
ventures (477,999) – – – (477,999) – (477,999)Taxation 2,900,450 15,989 25,127 68,450 3,010,016 145,841 3,155,857
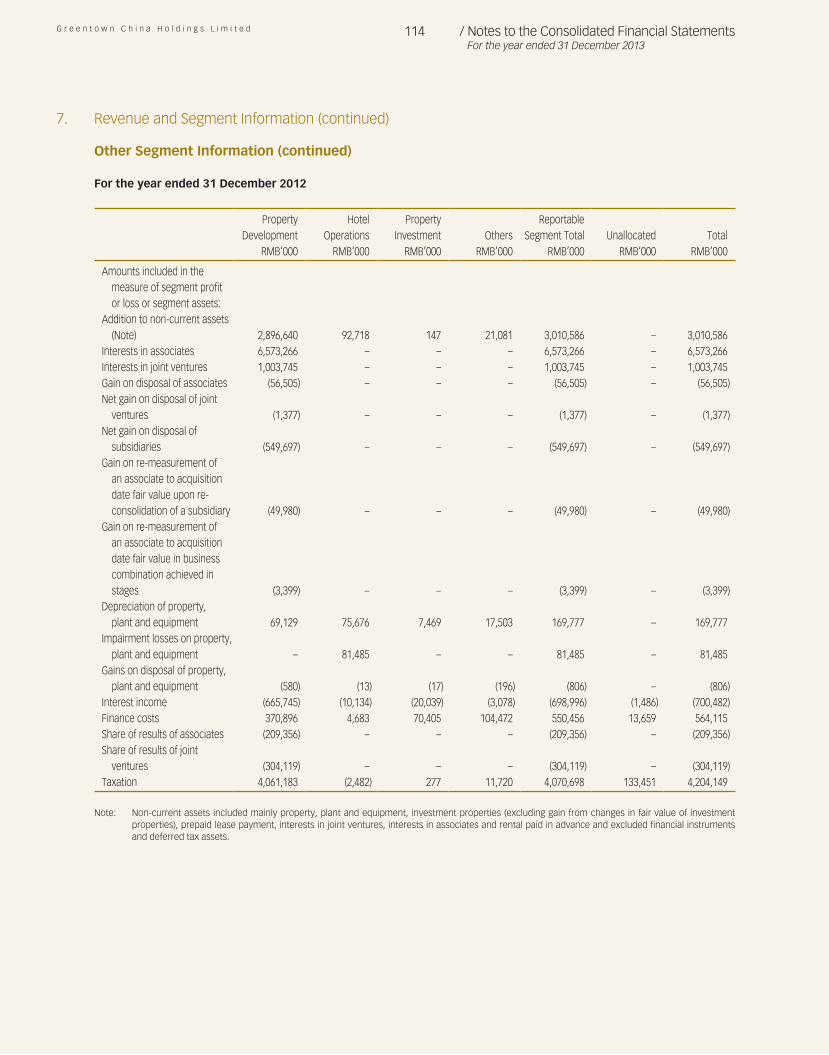
G r e e n t o w n C h i n a H o l d i n g s L i m i t e d 114 / Notes to the Consolidated Financial StatementsFor the year ended 31 December 2013
7. Revenue and Segment Information (continued)
Other Segment Information (continued)
For the year ended 31 December 2012
Property Hotel Property Reportable
Development Operations Investment Others Segment Total Unallocated TotalRMB’000 RMB’000 RMB’000 RMB’000 RMB’000 RMB’000 RMB’000
Amounts included in the measure of segment profit or loss or segment assets:
Addition to non-current assets (Note) 2,896,640 92,718 147 21,081 3,010,586 – 3,010,586
Interests in associates 6,573,266 – – – 6,573,266 – 6,573,266Interests in joint ventures 1,003,745 – – – 1,003,745 – 1,003,745Gain on disposal of associates (56,505) – – – (56,505) – (56,505)Net gain on disposal of joint
ventures (1,377) – – – (1,377) – (1,377)Net gain on disposal of
subsidiaries (549,697) – – – (549,697) – (549,697)Gain on re-measurement of
an associate to acquisition date fair value upon re-consolidation of a subsidiary (49,980) – – – (49,980) – (49,980)
Gain on re-measurement of an associate to acquisition date fair value in business combination achieved in stages (3,399) – – – (3,399) – (3,399)
Depreciation of property,plant and equipment 69,129 75,676 7,469 17,503 169,777 – 169,777
Impairment losses on property, plant and equipment – 81,485 – – 81,485 – 81,485
Gains on disposal of property, plant and equipment (580) (13) (17) (196) (806) – (806)
Interest income (665,745) (10,134) (20,039) (3,078) (698,996) (1,486) (700,482)Finance costs 370,896 4,683 70,405 104,472 550,456 13,659 564,115Share of results of associates (209,356) – – – (209,356) – (209,356)Share of results of joint
ventures (304,119) – – – (304,119) – (304,119)Taxation 4,061,183 (2,482) 277 11,720 4,070,698 133,451 4,204,149
Note: Non-current assets included mainly property, plant and equipment, investment properties (excluding gain from changes in fair value of investment properties), prepaid lease payment, interests in joint ventures, interests in associates and rental paid in advance and excluded financial instruments and deferred tax assets.
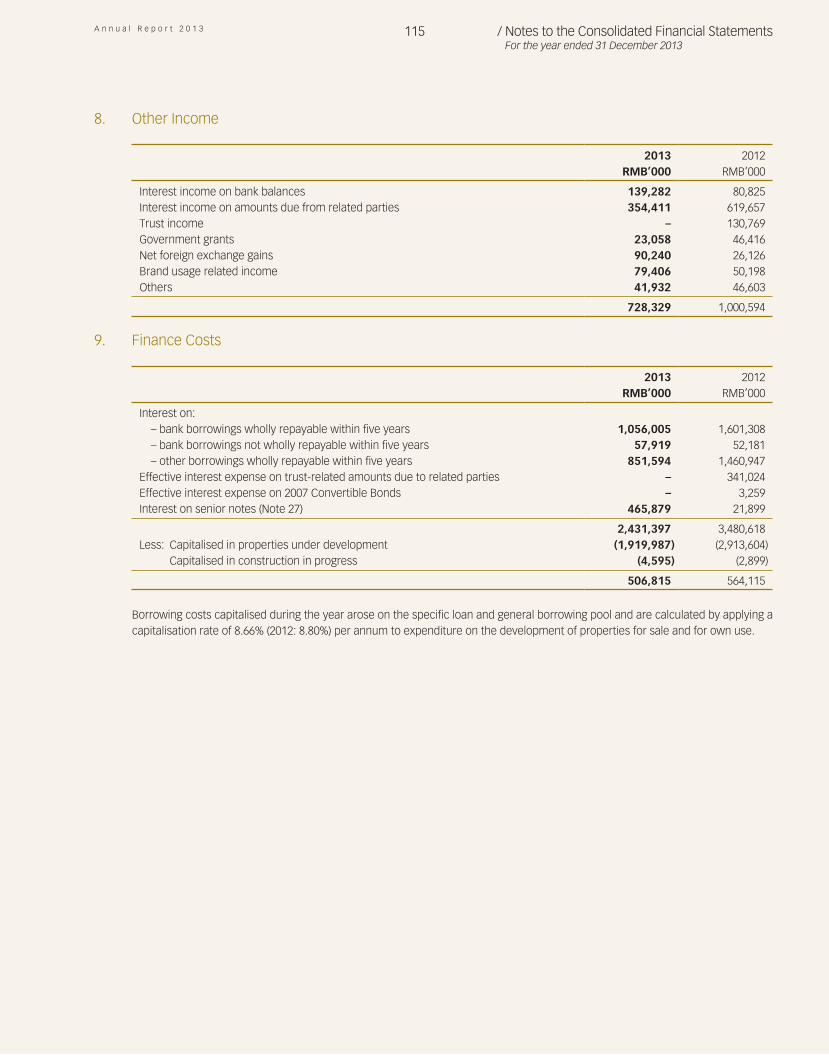
A n n u a l R e p o r t 2 0 1 3 115 / Notes to the Consolidated Financial StatementsFor the year ended 31 December 2013
8. Other Income
2013 2012RMB’000 RMB’000
Interest income on bank balances 139,282 80,825Interest income on amounts due from related parties 354,411 619,657Trust income – 130,769Government grants 23,058 46,416Net foreign exchange gains 90,240 26,126Brand usage related income 79,406 50,198Others 41,932 46,603
728,329 1,000,594
9. Finance Costs
2013 2012RMB’000 RMB’000
Interest on:– bank borrowings wholly repayable within five years 1,056,005 1,601,308– bank borrowings not wholly repayable within five years 57,919 52,181– other borrowings wholly repayable within five years 851,594 1,460,947
Effective interest expense on trust-related amounts due to related parties – 341,024Effective interest expense on 2007 Convertible Bonds – 3,259Interest on senior notes (Note 27) 465,879 21,899
2,431,397 3,480,618Less: Capitalised in properties under development (1,919,987) (2,913,604) Capitalised in construction in progress (4,595) (2,899)
506,815 564,115
Borrowing costs capitalised during the year arose on the specific loan and general borrowing pool and are calculated by applying a capitalisation rate of 8.66% (2012: 8.80%) per annum to expenditure on the development of properties for sale and for own use.
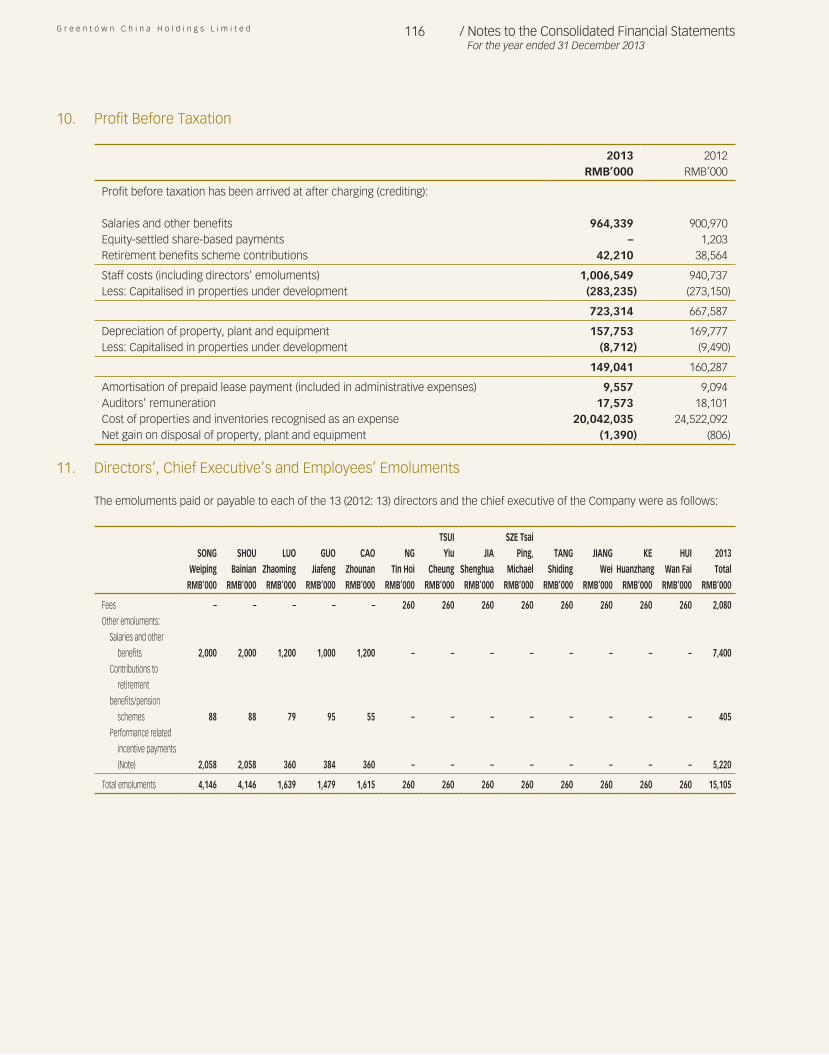
G r e e n t o w n C h i n a H o l d i n g s L i m i t e d 116 / Notes to the Consolidated Financial StatementsFor the year ended 31 December 2013
10. Profit Before Taxation
2013 2012RMB’000 RMB’000
Profit before taxation has been arrived at after charging (crediting):
Salaries and other benefits 964,339 900,970Equity-settled share-based payments – 1,203Retirement benefits scheme contributions 42,210 38,564 Staff costs (including directors’ emoluments) 1,006,549 940,737Less: Capitalised in properties under development (283,235) (273,150)
723,314 667,587 Depreciation of property, plant and equipment 157,753 169,777Less: Capitalised in properties under development (8,712) (9,490)
149,041 160,287 Amortisation of prepaid lease payment (included in administrative expenses) 9,557 9,094Auditors’ remuneration 17,573 18,101Cost of properties and inventories recognised as an expense 20,042,035 24,522,092Net gain on disposal of property, plant and equipment (1,390) (806)
11. Directors’, Chief Executive’s and Employees’ Emoluments
The emoluments paid or payable to each of the 13 (2012: 13) directors and the chief executive of the Company were as follows:
SONGWeiping
SHOUBainian
LUOZhaoming
GUOJiafeng
CAOZhounan
NGTin Hoi
TSUIYiu
CheungJIA
Shenghua
SZE TsaiPing,
MichaelTANG
ShidingJIANG
WeiKE
HuanzhangHUI
Wan Fai2013Total
RMB’000 RMB’000 RMB’000 RMB’000 RMB’000 RMB’000 RMB’000 RMB’000 RMB’000 RMB’000 RMB’000 RMB’000 RMB’000 RMB’000 Fees – – – – – 260 260 260 260 260 260 260 260 2,080Other emoluments:
Salaries and other
benefits 2,000 2,000 1,200 1,000 1,200 – – – – – – – – 7,400Contributions to
retirement
benefits/pension
schemes 88 88 79 95 55 – – – – – – – – 405Performance related
incentive payments
(Note) 2,058 2,058 360 384 360 – – – – – – – – 5,220 Total emoluments 4,146 4,146 1,639 1,479 1,615 260 260 260 260 260 260 260 260 15,105
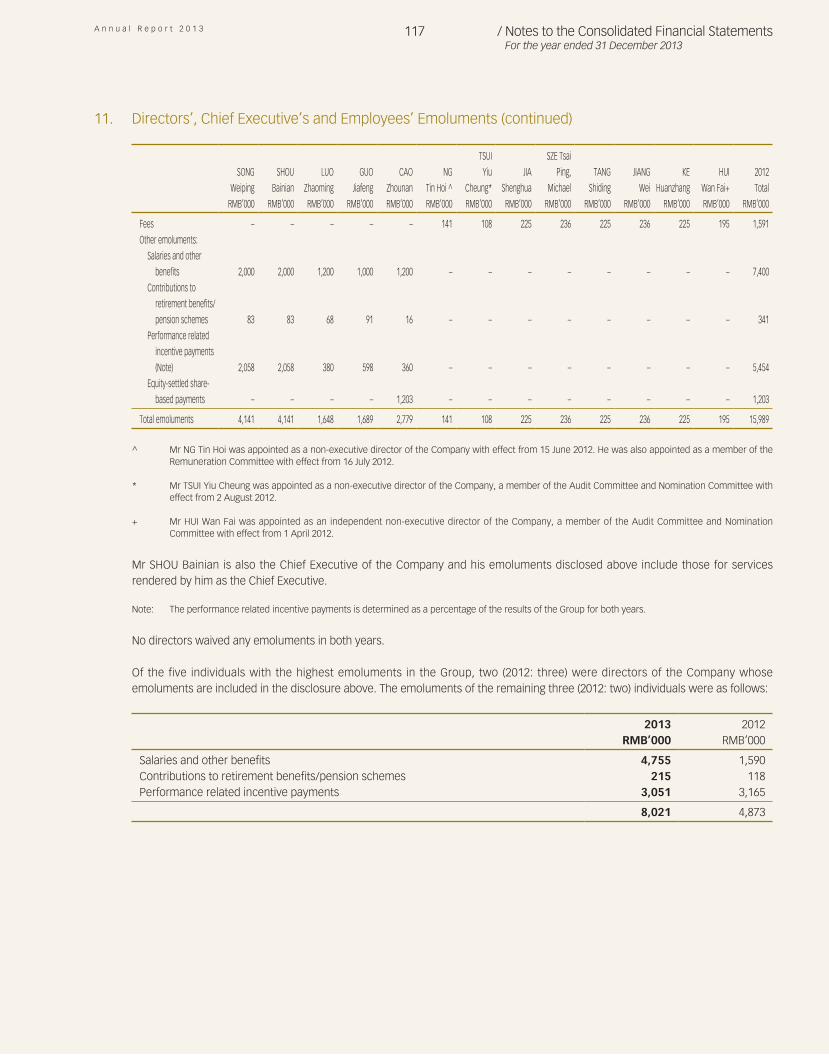
A n n u a l R e p o r t 2 0 1 3 117 / Notes to the Consolidated Financial StatementsFor the year ended 31 December 2013
11. Directors’, Chief Executive’s and Employees’ Emoluments (continued)
SONG
Weiping
SHOU
Bainian
LUO
Zhaoming
GUO
Jiafeng
CAO
Zhounan
NG
Tin Hoi ^
TSUI
Yiu
Cheung*
JIA
Shenghua
SZE Tsai
Ping,
Michael
TANG
Shiding
JIANG
Wei
KE
Huanzhang
HUI
Wan Fai+
2012
Total
RMB’000 RMB’000 RMB’000 RMB’000 RMB’000 RMB’000 RMB’000 RMB’000 RMB’000 RMB’000 RMB’000 RMB’000 RMB’000 RMB’000
Fees – – – – – 141 108 225 236 225 236 225 195 1,591
Other emoluments:
Salaries and other
benefits 2,000 2,000 1,200 1,000 1,200 – – – – – – – – 7,400
Contributions to
retirement benefits/
pension schemes 83 83 68 91 16 – – – – – – – – 341
Performance related
incentive payments
(Note) 2,058 2,058 380 598 360 – – – – – – – – 5,454
Equity-settled share-
based payments – – – – 1,203 – – – – – – – – 1,203 Total emoluments 4,141 4,141 1,648 1,689 2,779 141 108 225 236 225 236 225 195 15,989
^ Mr NG Tin Hoi was appointed as a non-executive director of the Company with effect from 15 June 2012. He was also appointed as a member of the Remuneration Committee with effect from 16 July 2012.
* Mr TSUI Yiu Cheung was appointed as a non-executive director of the Company, a member of the Audit Committee and Nomination Committee with effect from 2 August 2012.
+ Mr HUI Wan Fai was appointed as an independent non-executive director of the Company, a member of the Audit Committee and Nomination Committee with effect from 1 April 2012.
Mr SHOU Bainian is also the Chief Executive of the Company and his emoluments disclosed above include those for services rendered by him as the Chief Executive.
Note: The performance related incentive payments is determined as a percentage of the results of the Group for both years.
No directors waived any emoluments in both years.
Of the five individuals with the highest emoluments in the Group, two (2012: three) were directors of the Company whose emoluments are included in the disclosure above. The emoluments of the remaining three (2012: two) individuals were as follows:
2013 2012
RMB’000 RMB’000 Salaries and other benefits 4,755 1,590Contributions to retirement benefits/pension schemes 215 118Performance related incentive payments 3,051 3,165
8,021 4,873
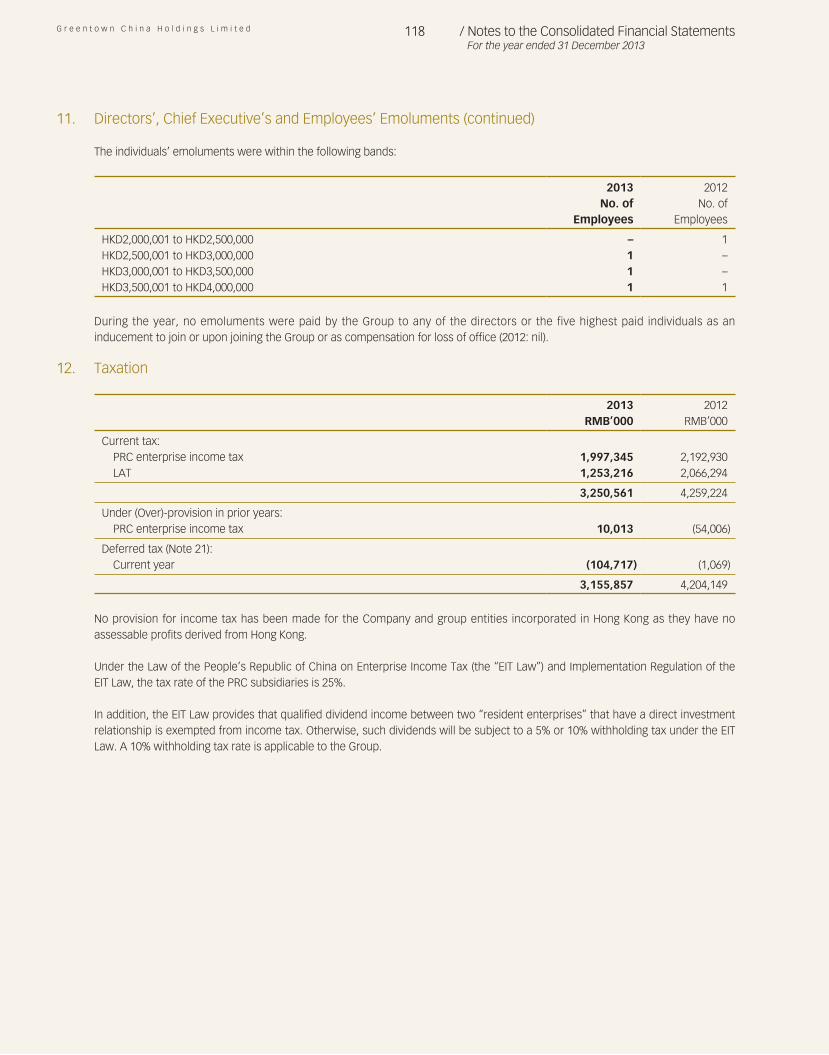
G r e e n t o w n C h i n a H o l d i n g s L i m i t e d 118 / Notes to the Consolidated Financial StatementsFor the year ended 31 December 2013
11. Directors’, Chief Executive’s and Employees’ Emoluments (continued)
The individuals’ emoluments were within the following bands:
2013
No. ofEmployees
2012No. of
Employees HKD2,000,001 to HKD2,500,000 – 1HKD2,500,001 to HKD3,000,000 1 –HKD3,000,001 to HKD3,500,000 1 –HKD3,500,001 to HKD4,000,000 1 1
During the year, no emoluments were paid by the Group to any of the directors or the five highest paid individuals as an inducement to join or upon joining the Group or as compensation for loss of office (2012: nil).
12. Taxation
2013 2012RMB’000 RMB’000
Current tax:PRC enterprise income tax 1,997,345 2,192,930LAT 1,253,216 2,066,294
3,250,561 4,259,224 Under (Over)-provision in prior years:
PRC enterprise income tax 10,013 (54,006) Deferred tax (Note 21):
Current year (104,717) (1,069) 3,155,857 4,204,149
No provision for income tax has been made for the Company and group entities incorporated in Hong Kong as they have no assessable profits derived from Hong Kong.
Under the Law of the People’s Republic of China on Enterprise Income Tax (the “EIT Law”) and Implementation Regulation of the EIT Law, the tax rate of the PRC subsidiaries is 25%.
In addition, the EIT Law provides that qualified dividend income between two “resident enterprises” that have a direct investment relationship is exempted from income tax. Otherwise, such dividends will be subject to a 5% or 10% withholding tax under the EIT Law. A 10% withholding tax rate is applicable to the Group.
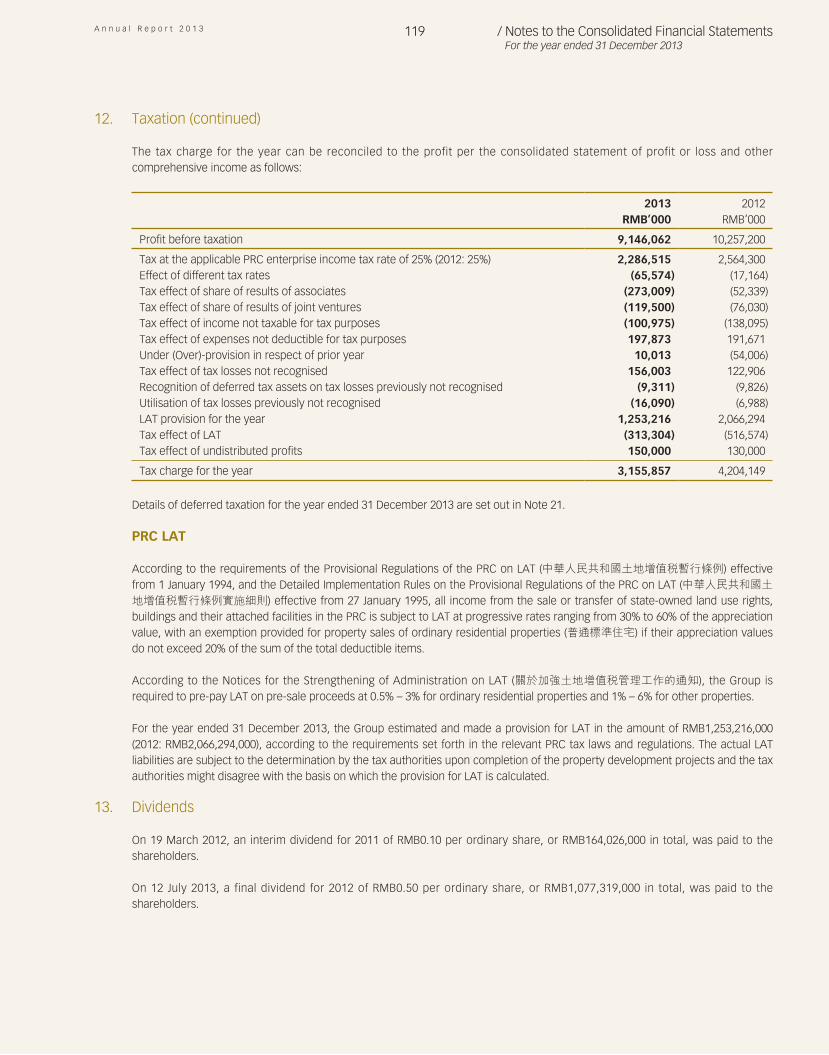
A n n u a l R e p o r t 2 0 1 3 119 / Notes to the Consolidated Financial StatementsFor the year ended 31 December 2013
12. Taxation (continued)
The tax charge for the year can be reconciled to the profit per the consolidated statement of profit or loss and other comprehensive income as follows:
2013 2012
RMB’000 RMB’000 Profit before taxation 9,146,062 10,257,200 Tax at the applicable PRC enterprise income tax rate of 25% (2012: 25%) 2,286,515 2,564,300Effect of different tax rates (65,574) (17,164)Tax effect of share of results of associates (273,009) (52,339)Tax effect of share of results of joint ventures (119,500) (76,030)Tax effect of income not taxable for tax purposes (100,975) (138,095)Tax effect of expenses not deductible for tax purposes 197,873 191,671Under (Over)-provision in respect of prior year 10,013 (54,006)Tax effect of tax losses not recognised 156,003 122,906Recognition of deferred tax assets on tax losses previously not recognised (9,311) (9,826)Utilisation of tax losses previously not recognised (16,090) (6,988)LAT provision for the year 1,253,216 2,066,294Tax effect of LAT (313,304) (516,574)Tax effect of undistributed profits 150,000 130,000 Tax charge for the year 3,155,857 4,204,149
Details of deferred taxation for the year ended 31 December 2013 are set out in Note 21.
PRC LAT
According to the requirements of the Provisional Regulations of the PRC on LAT (中華人民共和國土地增值稅暫行條例) effective from 1 January 1994, and the Detailed Implementation Rules on the Provisional Regulations of the PRC on LAT (中華人民共和國土地增值稅暫行條例實施細則) effective from 27 January 1995, all income from the sale or transfer of state-owned land use rights, buildings and their attached facilities in the PRC is subject to LAT at progressive rates ranging from 30% to 60% of the appreciation value, with an exemption provided for property sales of ordinary residential properties (普通標準住宅) if their appreciation values do not exceed 20% of the sum of the total deductible items.
According to the Notices for the Strengthening of Administration on LAT (關於加強土地增值稅管理工作的通知), the Group is required to pre-pay LAT on pre-sale proceeds at 0.5% – 3% for ordinary residential properties and 1% – 6% for other properties.
For the year ended 31 December 2013, the Group estimated and made a provision for LAT in the amount of RMB1,253,216,000 (2012: RMB2,066,294,000), according to the requirements set forth in the relevant PRC tax laws and regulations. The actual LAT liabilities are subject to the determination by the tax authorities upon completion of the property development projects and the tax authorities might disagree with the basis on which the provision for LAT is calculated.
13. Dividends
On 19 March 2012, an interim dividend for 2011 of RMB0.10 per ordinary share, or RMB164,026,000 in total, was paid to the shareholders.
On 12 July 2013, a final dividend for 2012 of RMB0.50 per ordinary share, or RMB1,077,319,000 in total, was paid to the shareholders.
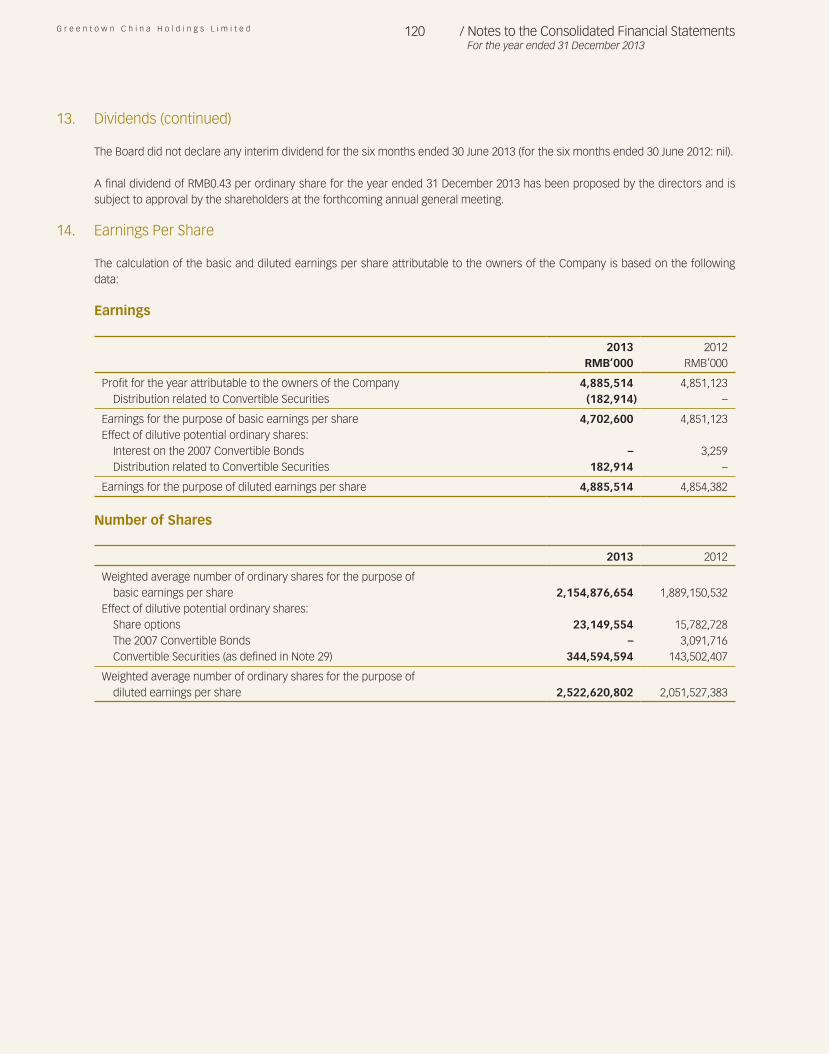
G r e e n t o w n C h i n a H o l d i n g s L i m i t e d 120 / Notes to the Consolidated Financial StatementsFor the year ended 31 December 2013
13. Dividends (continued)
The Board did not declare any interim dividend for the six months ended 30 June 2013 (for the six months ended 30 June 2012: nil).
A final dividend of RMB0.43 per ordinary share for the year ended 31 December 2013 has been proposed by the directors and is subject to approval by the shareholders at the forthcoming annual general meeting.
14. Earnings Per Share
The calculation of the basic and diluted earnings per share attributable to the owners of the Company is based on the following data:
Earnings
2013 2012RMB’000 RMB’000
Profit for the year attributable to the owners of the Company 4,885,514 4,851,123Distribution related to Convertible Securities (182,914) –
Earnings for the purpose of basic earnings per share 4,702,600 4,851,123Effect of dilutive potential ordinary shares:
Interest on the 2007 Convertible Bonds – 3,259Distribution related to Convertible Securities 182,914 –
Earnings for the purpose of diluted earnings per share 4,885,514 4,854,382
Number of Shares
2013 2012 Weighted average number of ordinary shares for the purpose of
basic earnings per share 2,154,876,654 1,889,150,532Effect of dilutive potential ordinary shares:
Share options 23,149,554 15,782,728The 2007 Convertible Bonds – 3,091,716Convertible Securities (as defined in Note 29) 344,594,594 143,502,407
Weighted average number of ordinary shares for the purpose ofdiluted earnings per share 2,522,620,802 2,051,527,383
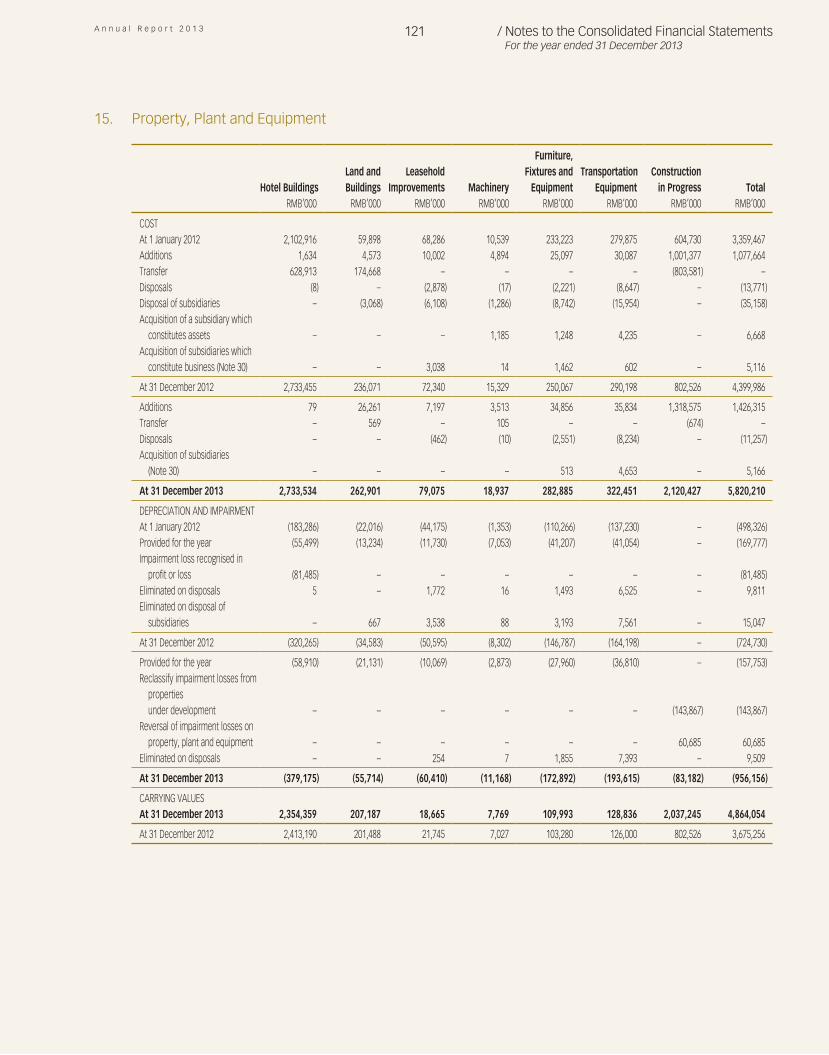
A n n u a l R e p o r t 2 0 1 3 121 / Notes to the Consolidated Financial StatementsFor the year ended 31 December 2013
15. Property, Plant and Equipment
Hotel BuildingsLand andBuildings
LeaseholdImprovements Machinery
Furniture,Fixtures and
EquipmentTransportation
EquipmentConstruction
in Progress TotalRMB’000 RMB’000 RMB’000 RMB’000 RMB’000 RMB’000 RMB’000 RMB’000
COSTAt 1 January 2012 2,102,916 59,898 68,286 10,539 233,223 279,875 604,730 3,359,467Additions 1,634 4,573 10,002 4,894 25,097 30,087 1,001,377 1,077,664Transfer 628,913 174,668 – – – – (803,581) –Disposals (8) – (2,878) (17) (2,221) (8,647) – (13,771)Disposal of subsidiaries – (3,068) (6,108) (1,286) (8,742) (15,954) – (35,158)Acquisition of a subsidiary which
constitutes assets – – – 1,185 1,248 4,235 – 6,668Acquisition of subsidiaries which
constitute business (Note 30) – – 3,038 14 1,462 602 – 5,116 At 31 December 2012 2,733,455 236,071 72,340 15,329 250,067 290,198 802,526 4,399,986 Additions 79 26,261 7,197 3,513 34,856 35,834 1,318,575 1,426,315Transfer – 569 – 105 – – (674) –Disposals – – (462) (10) (2,551) (8,234) – (11,257)Acquisition of subsidiaries
(Note 30) – – – – 513 4,653 – 5,166 At 31 December 2013 2,733,534 262,901 79,075 18,937 282,885 322,451 2,120,427 5,820,210 DEPRECIATION AND IMPAIRMENTAt 1 January 2012 (183,286) (22,016) (44,175) (1,353) (110,266) (137,230) – (498,326)Provided for the year (55,499) (13,234) (11,730) (7,053) (41,207) (41,054) – (169,777)Impairment loss recognised in
profit or loss (81,485) – – – – – – (81,485)Eliminated on disposals 5 – 1,772 16 1,493 6,525 – 9,811Eliminated on disposal of
subsidiaries – 667 3,538 88 3,193 7,561 – 15,047 At 31 December 2012 (320,265) (34,583) (50,595) (8,302) (146,787) (164,198) – (724,730) Provided for the year (58,910) (21,131) (10,069) (2,873) (27,960) (36,810) – (157,753)Reclassify impairment losses from
properties under development – – – – – – (143,867) (143,867)
Reversal of impairment losses on property, plant and equipment – – – – – – 60,685 60,685
Eliminated on disposals – – 254 7 1,855 7,393 – 9,509 At 31 December 2013 (379,175) (55,714) (60,410) (11,168) (172,892) (193,615) (83,182) (956,156) CARRYING VALUESAt 31 December 2013 2,354,359 207,187 18,665 7,769 109,993 128,836 2,037,245 4,864,054 At 31 December 2012 2,413,190 201,488 21,745 7,027 103,280 126,000 802,526 3,675,256
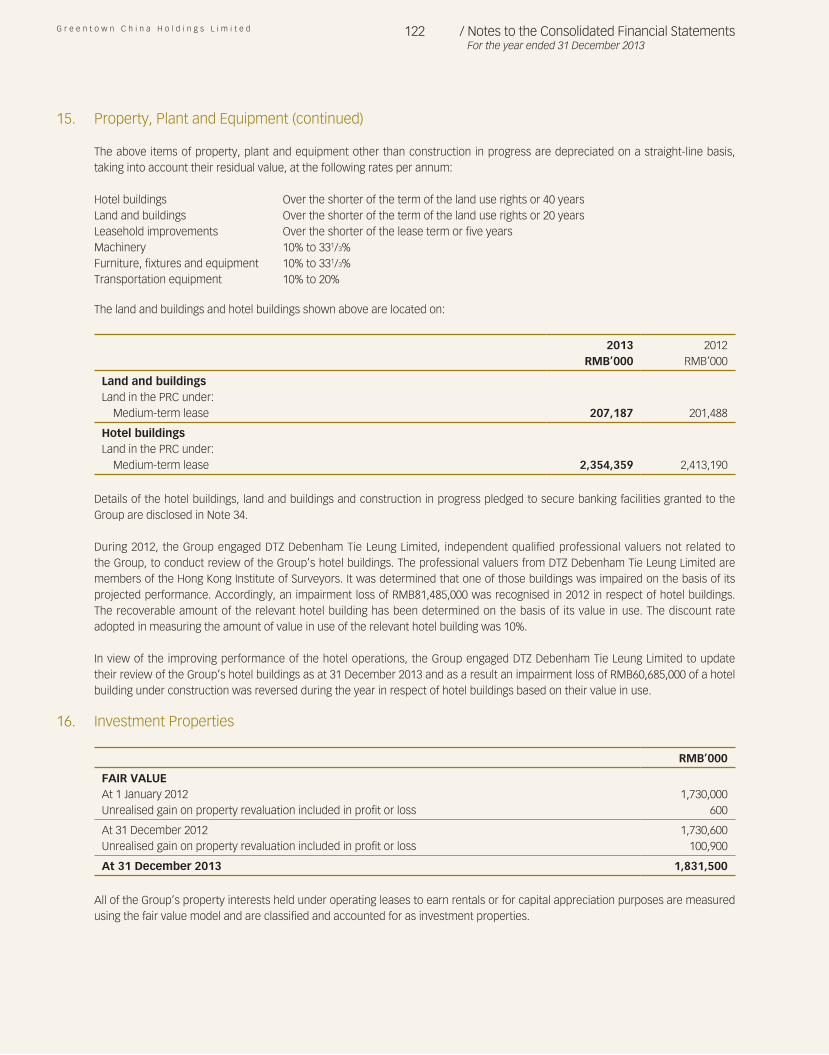
G r e e n t o w n C h i n a H o l d i n g s L i m i t e d 122 / Notes to the Consolidated Financial StatementsFor the year ended 31 December 2013
15. Property, Plant and Equipment (continued)
The above items of property, plant and equipment other than construction in progress are depreciated on a straight-line basis, taking into account their residual value, at the following rates per annum:
Hotel buildings Over the shorter of the term of the land use rights or 40 yearsLand and buildings Over the shorter of the term of the land use rights or 20 yearsLeasehold improvements Over the shorter of the lease term or five yearsMachinery 10% to 331/3%Furniture, fixtures and equipment 10% to 331/3%Transportation equipment 10% to 20%
The land and buildings and hotel buildings shown above are located on:
2013 2012
RMB’000 RMB’000 Land and buildingsLand in the PRC under:
Medium-term lease 207,187 201,488 Hotel buildingsLand in the PRC under:
Medium-term lease 2,354,359 2,413,190
Details of the hotel buildings, land and buildings and construction in progress pledged to secure banking facilities granted to the Group are disclosed in Note 34.
During 2012, the Group engaged DTZ Debenham Tie Leung Limited, independent qualified professional valuers not related to the Group, to conduct review of the Group’s hotel buildings. The professional valuers from DTZ Debenham Tie Leung Limited are members of the Hong Kong Institute of Surveyors. It was determined that one of those buildings was impaired on the basis of its projected performance. Accordingly, an impairment loss of RMB81,485,000 was recognised in 2012 in respect of hotel buildings. The recoverable amount of the relevant hotel building has been determined on the basis of its value in use. The discount rate adopted in measuring the amount of value in use of the relevant hotel building was 10%.
In view of the improving performance of the hotel operations, the Group engaged DTZ Debenham Tie Leung Limited to update their review of the Group’s hotel buildings as at 31 December 2013 and as a result an impairment loss of RMB60,685,000 of a hotel building under construction was reversed during the year in respect of hotel buildings based on their value in use.
16. Investment Properties
RMB’000 FAIR VALUEAt 1 January 2012 1,730,000Unrealised gain on property revaluation included in profit or loss 600 At 31 December 2012 1,730,600Unrealised gain on property revaluation included in profit or loss 100,900 At 31 December 2013 1,831,500
All of the Group’s property interests held under operating leases to earn rentals or for capital appreciation purposes are measured using the fair value model and are classified and accounted for as investment properties.
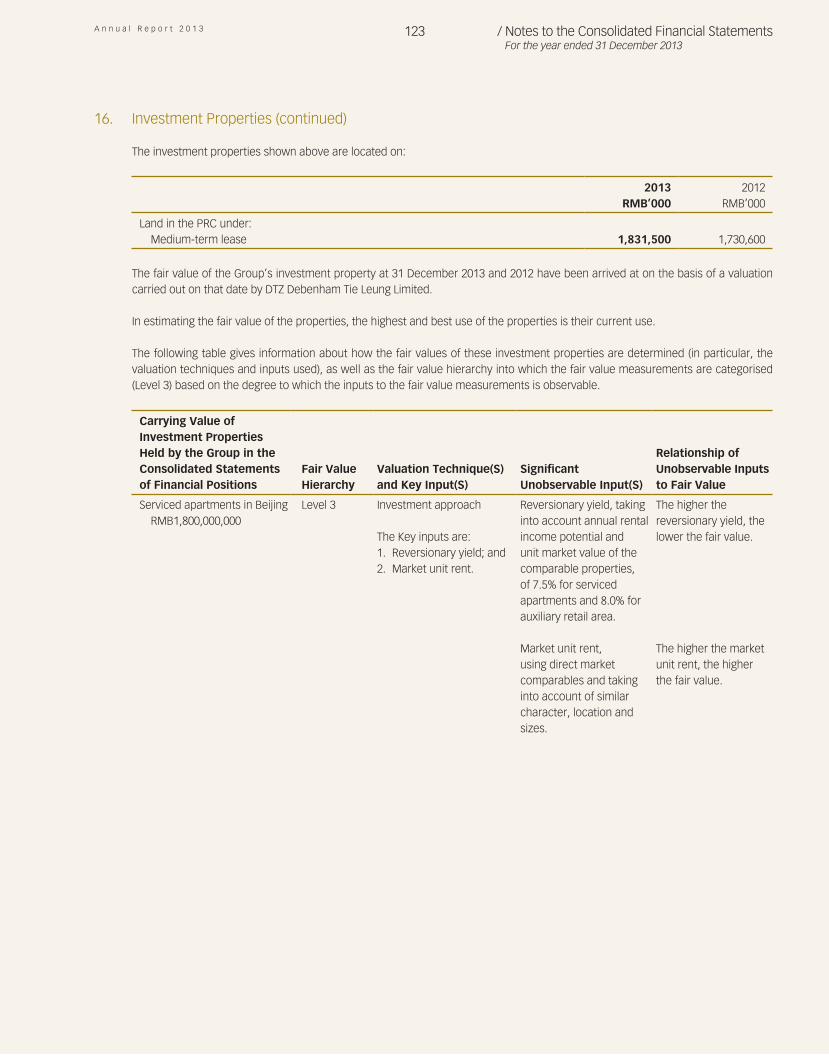
A n n u a l R e p o r t 2 0 1 3 123 / Notes to the Consolidated Financial StatementsFor the year ended 31 December 2013
16. Investment Properties (continued)
The investment properties shown above are located on:
2013 2012
RMB’000 RMB’000 Land in the PRC under:
Medium-term lease 1,831,500 1,730,600
The fair value of the Group’s investment property at 31 December 2013 and 2012 have been arrived at on the basis of a valuation carried out on that date by DTZ Debenham Tie Leung Limited.
In estimating the fair value of the properties, the highest and best use of the properties is their current use.
The following table gives information about how the fair values of these investment properties are determined (in particular, the valuation techniques and inputs used), as well as the fair value hierarchy into which the fair value measurements are categorised (Level 3) based on the degree to which the inputs to the fair value measurements is observable.
Carrying Value of Investment Properties Held by the Group in the Consolidated Statements of Financial Positions
Fair ValueHierarchy
Valuation Technique(S) and Key Input(S)
Significant Unobservable Input(S)
Relationship of Unobservable Inputs to Fair Value
Serviced apartments in Beijing RMB1,800,000,000
Level 3 Investment approach
The Key inputs are:1. Reversionary yield; and2. Market unit rent.
Reversionary yield, taking into account annual rental income potential and unit market value of the comparable properties, of 7.5% for serviced apartments and 8.0% for auxiliary retail area.
The higher the reversionary yield, the lower the fair value.
Market unit rent, using direct market comparables and taking into account of similar character, location and sizes.
The higher the market unit rent, the higher the fair value.
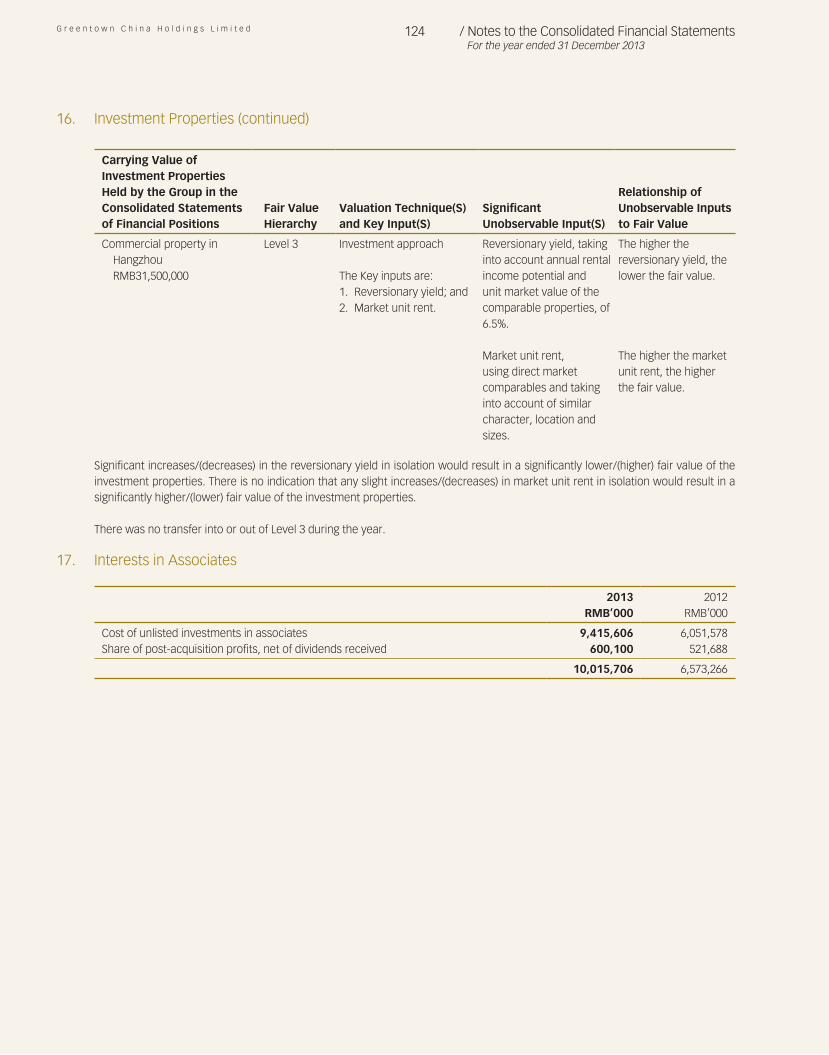
G r e e n t o w n C h i n a H o l d i n g s L i m i t e d 124 / Notes to the Consolidated Financial StatementsFor the year ended 31 December 2013
Carrying Value of Investment Properties Held by the Group in the Consolidated Statements of Financial Positions
Fair ValueHierarchy
Valuation Technique(S) and Key Input(S)
Significant Unobservable Input(S)
Relationship of Unobservable Inputs to Fair Value
Commercial property in Hangzhou RMB31,500,000
Level 3 Investment approach
The Key inputs are:1. Reversionary yield; and2. Market unit rent.
Reversionary yield, taking into account annual rental income potential and unit market value of the comparable properties, of 6.5%.
The higher the reversionary yield, the lower the fair value.
Market unit rent, using direct market comparables and taking into account of similar character, location and sizes.
The higher the market unit rent, the higher the fair value.
Significant increases/(decreases) in the reversionary yield in isolation would result in a significantly lower/(higher) fair value of the investment properties. There is no indication that any slight increases/(decreases) in market unit rent in isolation would result in a significantly higher/(lower) fair value of the investment properties.
There was no transfer into or out of Level 3 during the year.
17. Interests in Associates
2013 2012RMB’000 RMB’000
Cost of unlisted investments in associates 9,415,606 6,051,578Share of post-acquisition profits, net of dividends received 600,100 521,688
10,015,706 6,573,266
16. Investment Properties (continued)
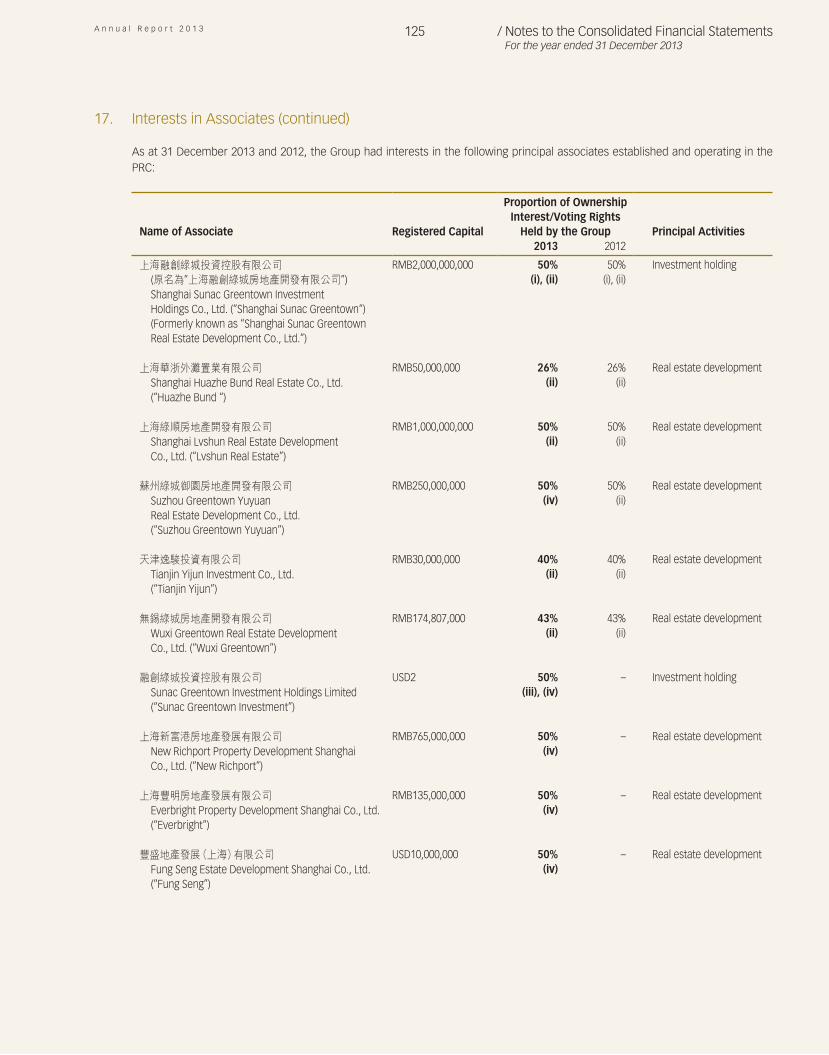
A n n u a l R e p o r t 2 0 1 3 125 / Notes to the Consolidated Financial StatementsFor the year ended 31 December 2013
17. Interests in Associates (continued)
As at 31 December 2013 and 2012, the Group had interests in the following principal associates established and operating in the PRC:
Name of Associate Registered Capital
Proportion of Ownership Interest/Voting Rights
Held by the Group Principal Activities2013 2012
上海融創綠城投資控股有限公司(原名為”上海融創綠城房地產開發有限公司”)Shanghai Sunac Greentown InvestmentHoldings Co., Ltd. (“Shanghai Sunac Greentown“)(Formerly known as “Shanghai Sunac GreentownReal Estate Development Co., Ltd.”)
RMB2,000,000,000 50%(i), (ii)
50%(i), (ii)
Investment holding
上海華浙外灘置業有限公司Shanghai Huazhe Bund Real Estate Co., Ltd.(“Huazhe Bund “)
RMB50,000,000 26%(ii)
26%(ii)
Real estate development
上海綠順房地產開發有限公司Shanghai Lvshun Real Estate DevelopmentCo., Ltd. (“Lvshun Real Estate”)
RMB1,000,000,000 50%(ii)
50%(ii)
Real estate development
蘇州綠城御園房地產開發有限公司Suzhou Greentown YuyuanReal Estate Development Co., Ltd.(“Suzhou Greentown Yuyuan”)
RMB250,000,000 50%(iv)
50%(ii)
Real estate development
天津逸駿投資有限公司Tianjin Yijun Investment Co., Ltd.(“Tianjin Yijun”)
RMB30,000,000 40%(ii)
40%(ii)
Real estate development
無錫綠城房地產開發有限公司Wuxi Greentown Real Estate DevelopmentCo., Ltd. (“Wuxi Greentown”)
RMB174,807,000 43%(ii)
43%(ii)
Real estate development
融創綠城投資控股有限公司Sunac Greentown Investment Holdings Limited(“Sunac Greentown Investment”)
USD2 50%(iii), (iv)
– Investment holding
上海新富港房地產發展有限公司New Richport Property Development Shanghai Co., Ltd. (“New Richport”)
RMB765,000,000 50%(iv)
– Real estate development
上海豐明房地產發展有限公司Everbright Property Development Shanghai Co., Ltd.(“Everbright”)
RMB135,000,000 50%(iv)
– Real estate development
豐盛地產發展(上海)有限公司Fung Seng Estate Development Shanghai Co., Ltd. (“Fung Seng”)
USD10,000,000 50%(iv)
– Real estate development
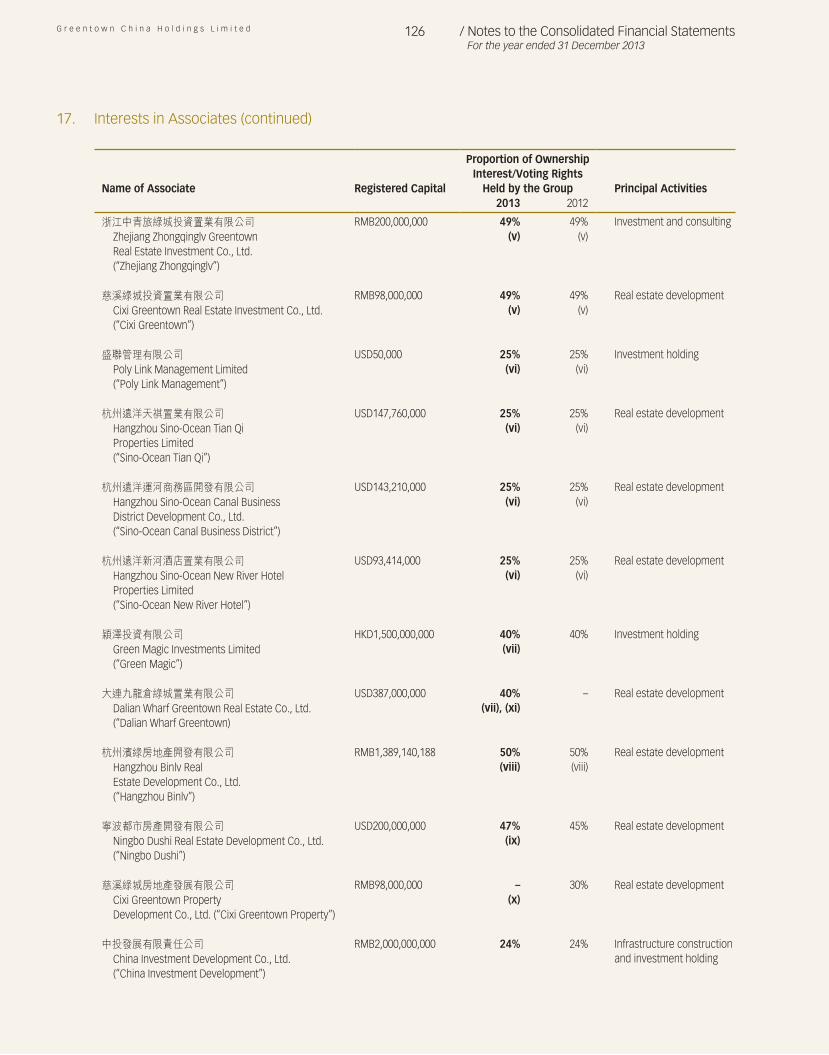
G r e e n t o w n C h i n a H o l d i n g s L i m i t e d 126 / Notes to the Consolidated Financial StatementsFor the year ended 31 December 2013
Name of Associate Registered Capital
Proportion of Ownership Interest/Voting Rights
Held by the Group Principal Activities2013 2012
浙江中青旅綠城投資置業有限公司Zhejiang Zhongqinglv GreentownReal Estate Investment Co., Ltd.(“Zhejiang Zhongqinglv”)
RMB200,000,000 49%(v)
49%(v)
Investment and consulting
慈溪綠城投資置業有限公司Cixi Greentown Real Estate Investment Co., Ltd.(“Cixi Greentown”)
RMB98,000,000 49%(v)
49%(v)
Real estate development
盛聯管理有限公司Poly Link Management Limited(“Poly Link Management”)
USD50,000 25%(vi)
25%(vi)
Investment holding
杭州遠洋天祺置業有限公司Hangzhou Sino-Ocean Tian QiProperties Limited(“Sino-Ocean Tian Qi”)
USD147,760,000 25%(vi)
25%(vi)
Real estate development
杭州遠洋運河商務區開發有限公司Hangzhou Sino-Ocean Canal BusinessDistrict Development Co., Ltd.(“Sino-Ocean Canal Business District”)
USD143,210,000 25%(vi)
25%(vi)
Real estate development
杭州遠洋新河酒店置業有限公司Hangzhou Sino-Ocean New River HotelProperties Limited(“Sino-Ocean New River Hotel”)
USD93,414,000 25%(vi)
25%(vi)
Real estate development
穎澤投資有限公司Green Magic Investments Limited(“Green Magic”)
HKD1,500,000,000 40%(vii)
40% Investment holding
大連九龍倉綠城置業有限公司Dalian Wharf Greentown Real Estate Co., Ltd.(“Dalian Wharf Greentown)
USD387,000,000 40%(vii), (xi)
– Real estate development
杭州濱綠房地產開發有限公司Hangzhou Binlv RealEstate Development Co., Ltd.(“Hangzhou Binlv”)
RMB1,389,140,188 50%(viii)
50%(viii)
Real estate development
寧波都市房產開發有限公司Ningbo Dushi Real Estate Development Co., Ltd.(“Ningbo Dushi”)
USD200,000,000 47%(ix)
45% Real estate development
慈溪綠城房地產發展有限公司Cixi Greentown PropertyDevelopment Co., Ltd. (“Cixi Greentown Property”)
RMB98,000,000 –(x)
30% Real estate development
中投發展有限責任公司China Investment Development Co., Ltd.(“China Investment Development”)
RMB2,000,000,000 24% 24% Infrastructure construction and investment holding
17. Interests in Associates (continued)
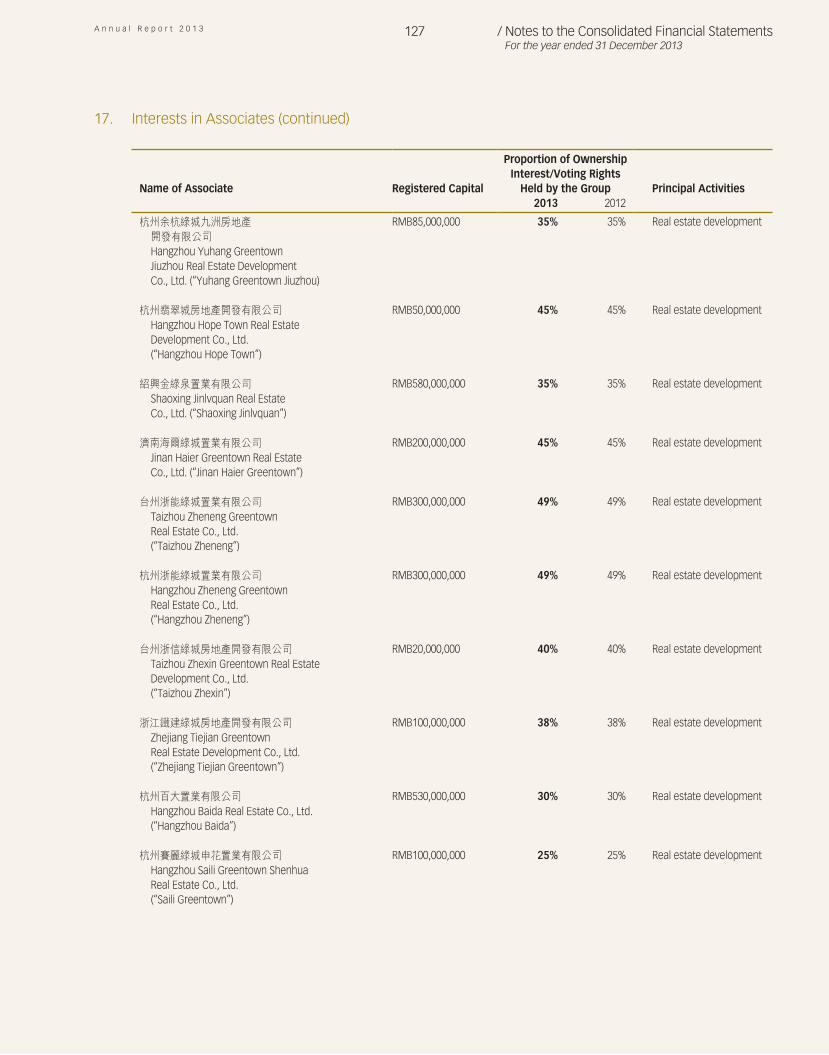
A n n u a l R e p o r t 2 0 1 3 127 / Notes to the Consolidated Financial StatementsFor the year ended 31 December 2013
Name of Associate Registered Capital
Proportion of Ownership Interest/Voting Rights
Held by the Group Principal Activities2013 2012
杭州余杭綠城九洲房地產開發有限公司Hangzhou Yuhang GreentownJiuzhou Real Estate DevelopmentCo., Ltd. (“Yuhang Greentown Jiuzhou)
RMB85,000,000 35% 35% Real estate development
杭州翡翠城房地產開發有限公司Hangzhou Hope Town Real EstateDevelopment Co., Ltd.(“Hangzhou Hope Town”)
RMB50,000,000 45% 45% Real estate development
紹興金綠泉置業有限公司Shaoxing Jinlvquan Real EstateCo., Ltd. (“Shaoxing Jinlvquan”)
RMB580,000,000 35% 35% Real estate development
濟南海爾綠城置業有限公司Jinan Haier Greentown Real EstateCo., Ltd. (“Jinan Haier Greentown”)
RMB200,000,000 45% 45% Real estate development
台州浙能綠城置業有限公司Taizhou Zheneng GreentownReal Estate Co., Ltd.(“Taizhou Zheneng”)
RMB300,000,000 49% 49% Real estate development
杭州浙能綠城置業有限公司Hangzhou Zheneng GreentownReal Estate Co., Ltd.(“Hangzhou Zheneng”)
RMB300,000,000 49% 49% Real estate development
台州浙信綠城房地產開發有限公司Taizhou Zhexin Greentown Real EstateDevelopment Co., Ltd.(“Taizhou Zhexin”)
RMB20,000,000 40% 40% Real estate development
浙江鐵建綠城房地產開發有限公司Zhejiang Tiejian GreentownReal Estate Development Co., Ltd.(“Zhejiang Tiejian Greentown”)
RMB100,000,000 38% 38% Real estate development
杭州百大置業有限公司Hangzhou Baida Real Estate Co., Ltd.(“Hangzhou Baida”)
RMB530,000,000 30% 30% Real estate development
杭州賽麗綠城申花置業有限公司Hangzhou Saili Greentown ShenhuaReal Estate Co., Ltd.(“Saili Greentown”)
RMB100,000,000 25% 25% Real estate development
17. Interests in Associates (continued)
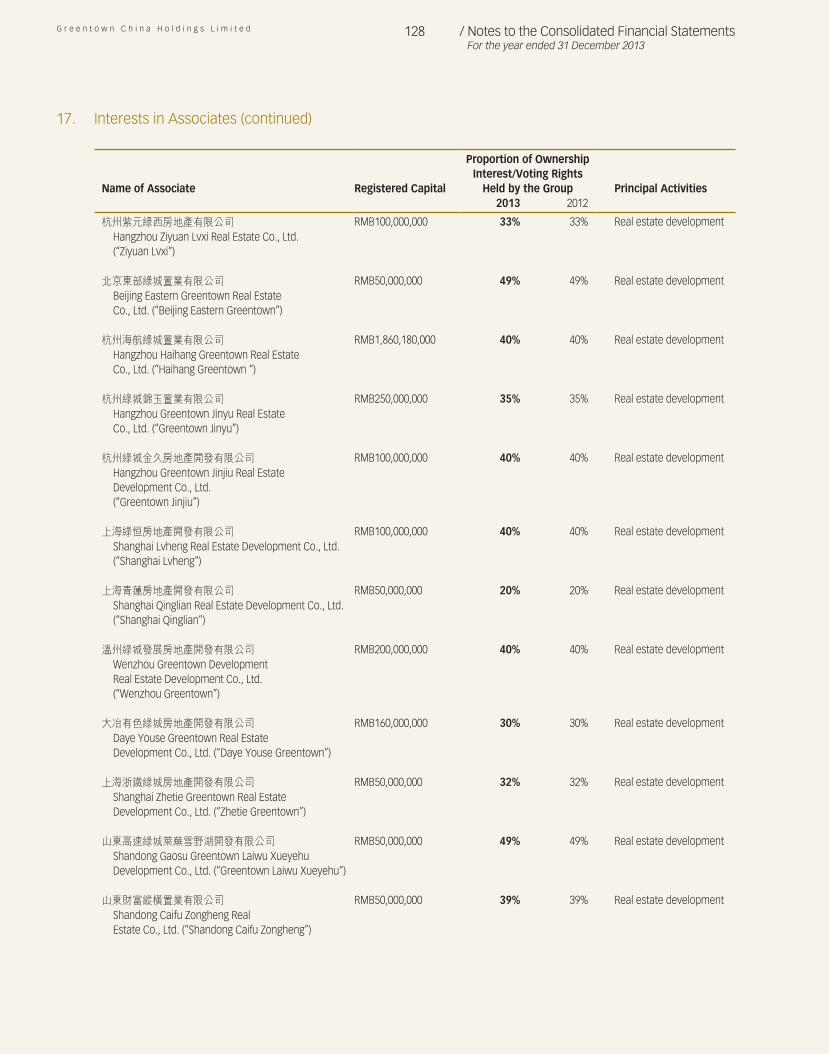
G r e e n t o w n C h i n a H o l d i n g s L i m i t e d 128 / Notes to the Consolidated Financial StatementsFor the year ended 31 December 2013
Name of Associate Registered Capital
Proportion of Ownership Interest/Voting Rights
Held by the Group Principal Activities2013 2012
杭州紫元綠西房地產有限公司Hangzhou Ziyuan Lvxi Real Estate Co., Ltd.(“Ziyuan Lvxi”)
RMB100,000,000 33% 33% Real estate development
北京東部綠城置業有限公司Beijing Eastern Greentown Real EstateCo., Ltd. (“Beijing Eastern Greentown”)
RMB50,000,000 49% 49% Real estate development
杭州海航綠城置業有限公司Hangzhou Haihang Greentown Real EstateCo., Ltd. (“Haihang Greentown “)
RMB1,860,180,000 40% 40% Real estate development
杭州綠城錦玉置業有限公司Hangzhou Greentown Jinyu Real EstateCo., Ltd. (“Greentown Jinyu”)
RMB250,000,000 35% 35% Real estate development
杭州綠城金久房地產開發有限公司Hangzhou Greentown Jinjiu Real EstateDevelopment Co., Ltd.(“Greentown Jinjiu”)
RMB100,000,000 40% 40% Real estate development
上海綠恒房地產開發有限公司Shanghai Lvheng Real Estate Development Co., Ltd.(“Shanghai Lvheng”)
RMB100,000,000 40% 40% Real estate development
上海青蓮房地產開發有限公司Shanghai Qinglian Real Estate Development Co., Ltd.(“Shanghai Qinglian”)
RMB50,000,000 20% 20% Real estate development
溫州綠城發展房地產開發有限公司Wenzhou Greentown DevelopmentReal Estate Development Co., Ltd.(“Wenzhou Greentown”)
RMB200,000,000 40% 40% Real estate development
大冶有色綠城房地產開發有限公司Daye Youse Greentown Real EstateDevelopment Co., Ltd. (“Daye Youse Greentown”)
RMB160,000,000 30% 30% Real estate development
上海浙鐵綠城房地產開發有限公司Shanghai Zhetie Greentown Real EstateDevelopment Co., Ltd. (“Zhetie Greentown”)
RMB50,000,000 32% 32% Real estate development
山東高速綠城萊蕪雪野湖開發有限公司Shandong Gaosu Greentown Laiwu XueyehuDevelopment Co., Ltd. (“Greentown Laiwu Xueyehu”)
RMB50,000,000 49% 49% Real estate development
山東財富縱橫置業有限公司Shandong Caifu Zongheng RealEstate Co., Ltd. (“Shandong Caifu Zongheng”)
RMB50,000,000 39% 39% Real estate development
17. Interests in Associates (continued)
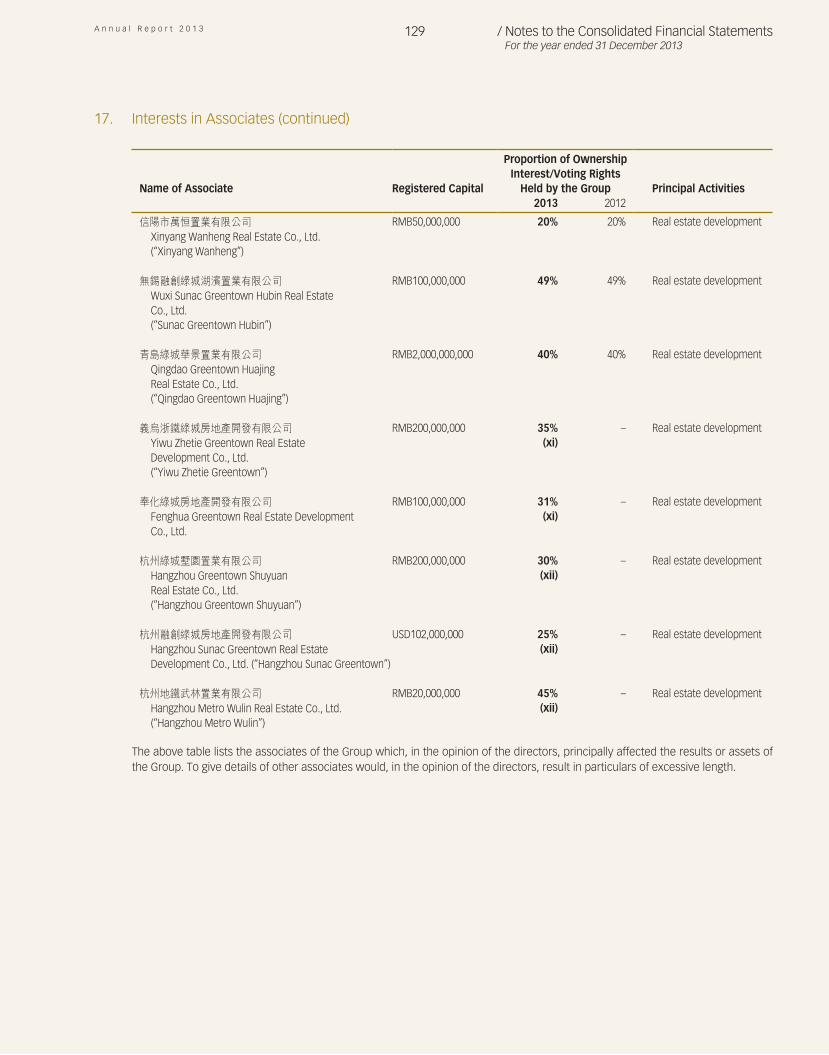
A n n u a l R e p o r t 2 0 1 3 129 / Notes to the Consolidated Financial StatementsFor the year ended 31 December 2013
Name of Associate Registered Capital
Proportion of Ownership Interest/Voting Rights
Held by the Group Principal Activities2013 2012
信陽市萬恒置業有限公司Xinyang Wanheng Real Estate Co., Ltd.(“Xinyang Wanheng”)
RMB50,000,000 20% 20% Real estate development
無錫融創綠城湖濱置業有限公司Wuxi Sunac Greentown Hubin Real EstateCo., Ltd.(“Sunac Greentown Hubin”)
RMB100,000,000 49% 49% Real estate development
青島綠城華景置業有限公司Qingdao Greentown HuajingReal Estate Co., Ltd.(“Qingdao Greentown Huajing”)
RMB2,000,000,000 40% 40% Real estate development
義烏浙鐵綠城房地產開發有限公司Yiwu Zhetie Greentown Real EstateDevelopment Co., Ltd.(“Yiwu Zhetie Greentown”)
RMB200,000,000 35%(xi)
– Real estate development
奉化綠城房地產開發有限公司Fenghua Greentown Real Estate Development Co., Ltd.
RMB100,000,000 31%(xi)
– Real estate development
杭州綠城墅園置業有限公司Hangzhou Greentown ShuyuanReal Estate Co., Ltd.(“Hangzhou Greentown Shuyuan”)
RMB200,000,000 30%(xii)
– Real estate development
杭州融創綠城房地產開發有限公司Hangzhou Sunac Greentown Real EstateDevelopment Co., Ltd. (“Hangzhou Sunac Greentown”)
USD102,000,000 25%(xii)
– Real estate development
杭州地鐵武林置業有限公司Hangzhou Metro Wulin Real Estate Co., Ltd. (“Hangzhou Metro Wulin”)
RMB20,000,000 45%(xii)
– Real estate development
The above table lists the associates of the Group which, in the opinion of the directors, principally affected the results or assets of the Group. To give details of other associates would, in the opinion of the directors, result in particulars of excessive length.
17. Interests in Associates (continued)
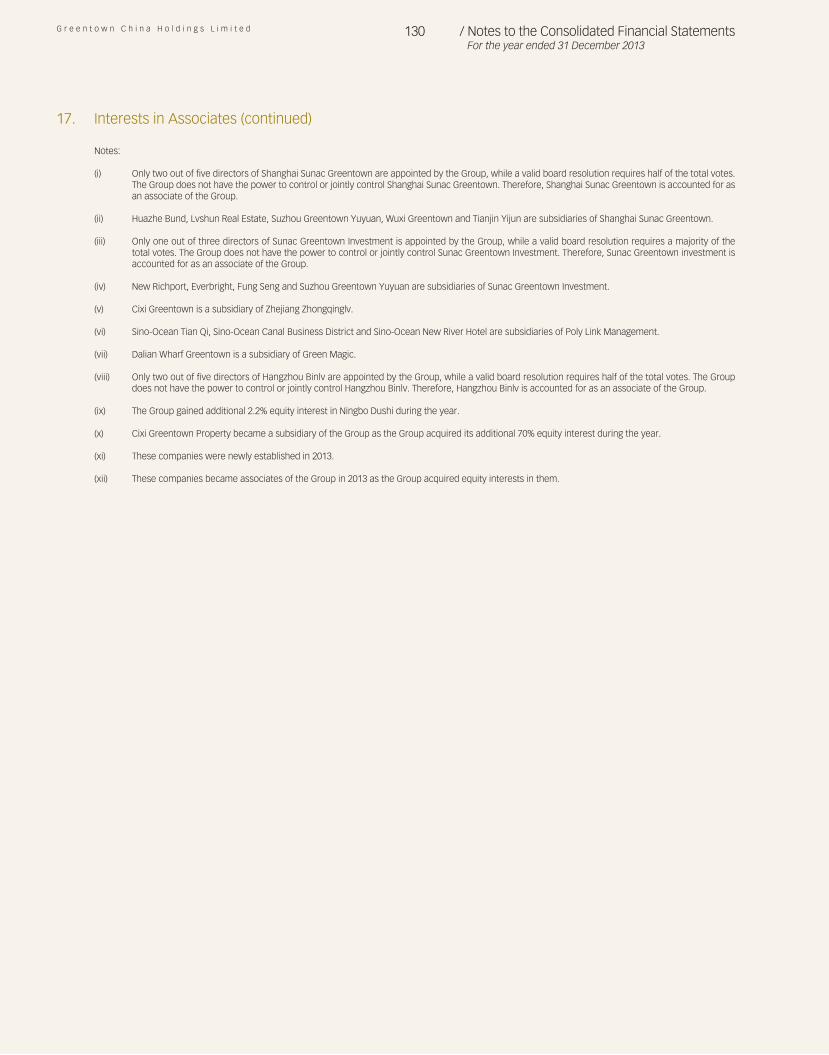
G r e e n t o w n C h i n a H o l d i n g s L i m i t e d 130 / Notes to the Consolidated Financial StatementsFor the year ended 31 December 2013
Notes:
(i) Only two out of five directors of Shanghai Sunac Greentown are appointed by the Group, while a valid board resolution requires half of the total votes. The Group does not have the power to control or jointly control Shanghai Sunac Greentown. Therefore, Shanghai Sunac Greentown is accounted for as an associate of the Group.
(ii) Huazhe Bund, Lvshun Real Estate, Suzhou Greentown Yuyuan, Wuxi Greentown and Tianjin Yijun are subsidiaries of Shanghai Sunac Greentown.
(iii) Only one out of three directors of Sunac Greentown Investment is appointed by the Group, while a valid board resolution requires a majority of the total votes. The Group does not have the power to control or jointly control Sunac Greentown Investment. Therefore, Sunac Greentown investment is accounted for as an associate of the Group.
(iv) New Richport, Everbright, Fung Seng and Suzhou Greentown Yuyuan are subsidiaries of Sunac Greentown Investment.
(v) Cixi Greentown is a subsidiary of Zhejiang Zhongqinglv.
(vi) Sino-Ocean Tian Qi, Sino-Ocean Canal Business District and Sino-Ocean New River Hotel are subsidiaries of Poly Link Management.
(vii) Dalian Wharf Greentown is a subsidiary of Green Magic.
(viii) Only two out of five directors of Hangzhou Binlv are appointed by the Group, while a valid board resolution requires half of the total votes. The Group does not have the power to control or jointly control Hangzhou Binlv. Therefore, Hangzhou Binlv is accounted for as an associate of the Group.
(ix) The Group gained additional 2.2% equity interest in Ningbo Dushi during the year.
(x) Cixi Greentown Property became a subsidiary of the Group as the Group acquired its additional 70% equity interest during the year.
(xi) These companies were newly established in 2013.
(xii) These companies became associates of the Group in 2013 as the Group acquired equity interests in them.
17. Interests in Associates (continued)
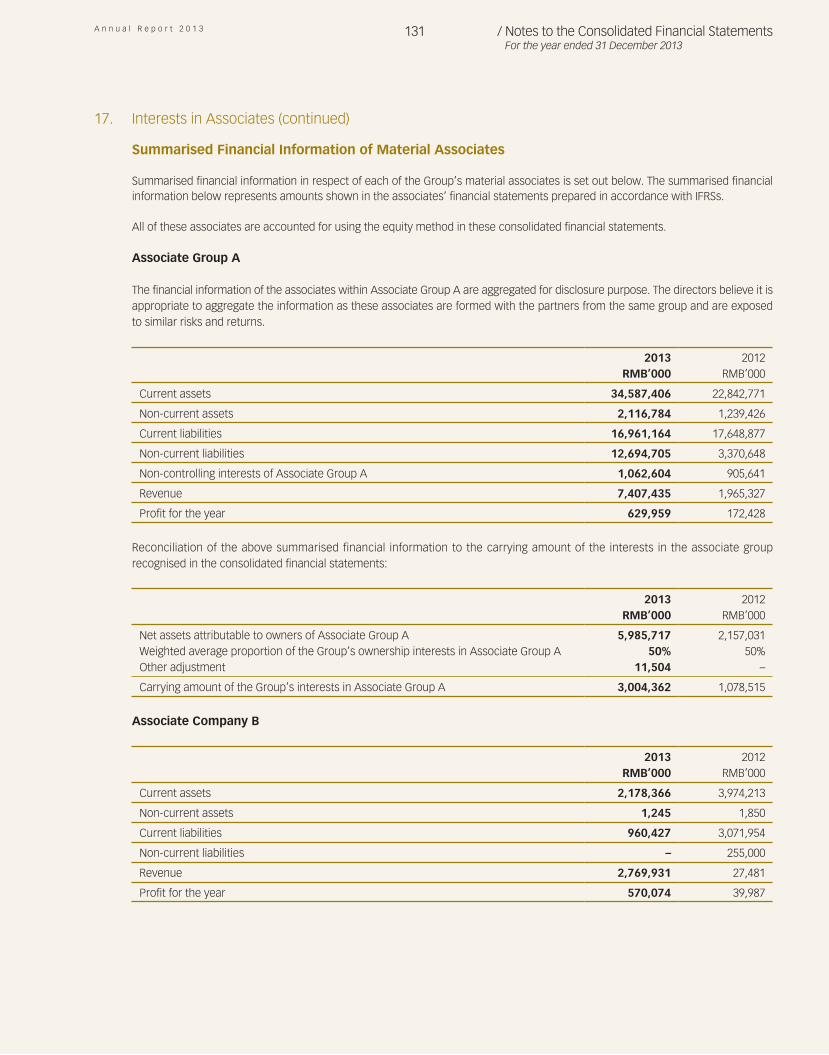
A n n u a l R e p o r t 2 0 1 3 131 / Notes to the Consolidated Financial StatementsFor the year ended 31 December 2013
17. Interests in Associates (continued)
Summarised Financial Information of Material Associates
Summarised financial information in respect of each of the Group’s material associates is set out below. The summarised financial information below represents amounts shown in the associates’ financial statements prepared in accordance with IFRSs.
All of these associates are accounted for using the equity method in these consolidated financial statements.
Associate Group A
The financial information of the associates within Associate Group A are aggregated for disclosure purpose. The directors believe it is appropriate to aggregate the information as these associates are formed with the partners from the same group and are exposed to similar risks and returns.
2013 2012
RMB’000 RMB’000 Current assets 34,587,406 22,842,771 Non-current assets 2,116,784 1,239,426 Current liabilities 16,961,164 17,648,877 Non-current liabilities 12,694,705 3,370,648 Non-controlling interests of Associate Group A 1,062,604 905,641 Revenue 7,407,435 1,965,327 Profit for the year 629,959 172,428
Reconciliation of the above summarised financial information to the carrying amount of the interests in the associate group recognised in the consolidated financial statements:
2013 2012
RMB’000 RMB’000 Net assets attributable to owners of Associate Group A 5,985,717 2,157,031Weighted average proportion of the Group’s ownership interests in Associate Group A 50% 50%Other adjustment 11,504 – Carrying amount of the Group’s interests in Associate Group A 3,004,362 1,078,515
Associate Company B
2013 2012
RMB’000 RMB’000 Current assets 2,178,366 3,974,213 Non-current assets 1,245 1,850 Current liabilities 960,427 3,071,954 Non-current liabilities – 255,000 Revenue 2,769,931 27,481 Profit for the year 570,074 39,987
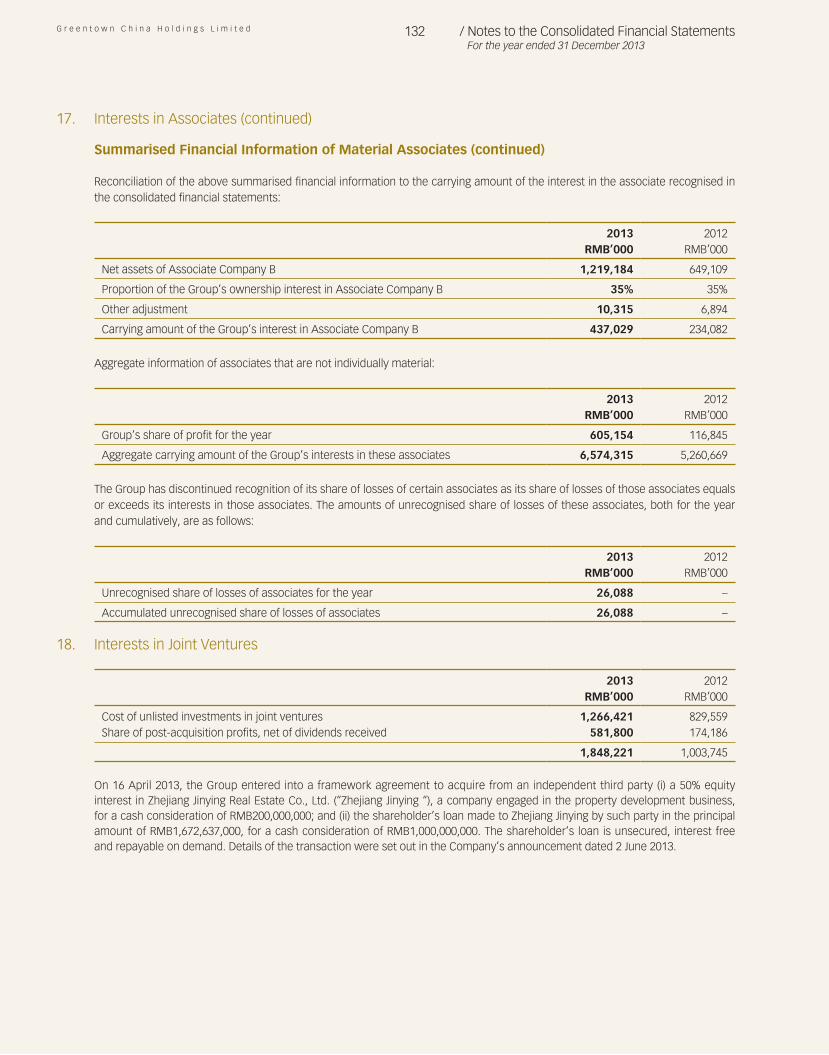
G r e e n t o w n C h i n a H o l d i n g s L i m i t e d 132 / Notes to the Consolidated Financial StatementsFor the year ended 31 December 2013
17. Interests in Associates (continued)
Summarised Financial Information of Material Associates (continued)
Reconciliation of the above summarised financial information to the carrying amount of the interest in the associate recognised in the consolidated financial statements:
2013 2012
RMB’000 RMB’000 Net assets of Associate Company B 1,219,184 649,109 Proportion of the Group’s ownership interest in Associate Company B 35% 35% Other adjustment 10,315 6,894 Carrying amount of the Group’s interest in Associate Company B 437,029 234,082
Aggregate information of associates that are not individually material:
2013 2012
RMB’000 RMB’000 Group’s share of profit for the year 605,154 116,845 Aggregate carrying amount of the Group’s interests in these associates 6,574,315 5,260,669
The Group has discontinued recognition of its share of losses of certain associates as its share of losses of those associates equals or exceeds its interests in those associates. The amounts of unrecognised share of losses of these associates, both for the year and cumulatively, are as follows:
2013 2012
RMB’000 RMB’000 Unrecognised share of losses of associates for the year 26,088 – Accumulated unrecognised share of losses of associates 26,088 –
18. Interests in Joint Ventures
2013 2012RMB’000 RMB’000
Cost of unlisted investments in joint ventures 1,266,421 829,559Share of post-acquisition profits, net of dividends received 581,800 174,186
1,848,221 1,003,745
On 16 April 2013, the Group entered into a framework agreement to acquire from an independent third party (i) a 50% equity interest in Zhejiang Jinying Real Estate Co., Ltd. (“Zhejiang Jinying “), a company engaged in the property development business, for a cash consideration of RMB200,000,000; and (ii) the shareholder’s loan made to Zhejiang Jinying by such party in the principal amount of RMB1,672,637,000, for a cash consideration of RMB1,000,000,000. The shareholder’s loan is unsecured, interest free and repayable on demand. Details of the transaction were set out in the Company’s announcement dated 2 June 2013.
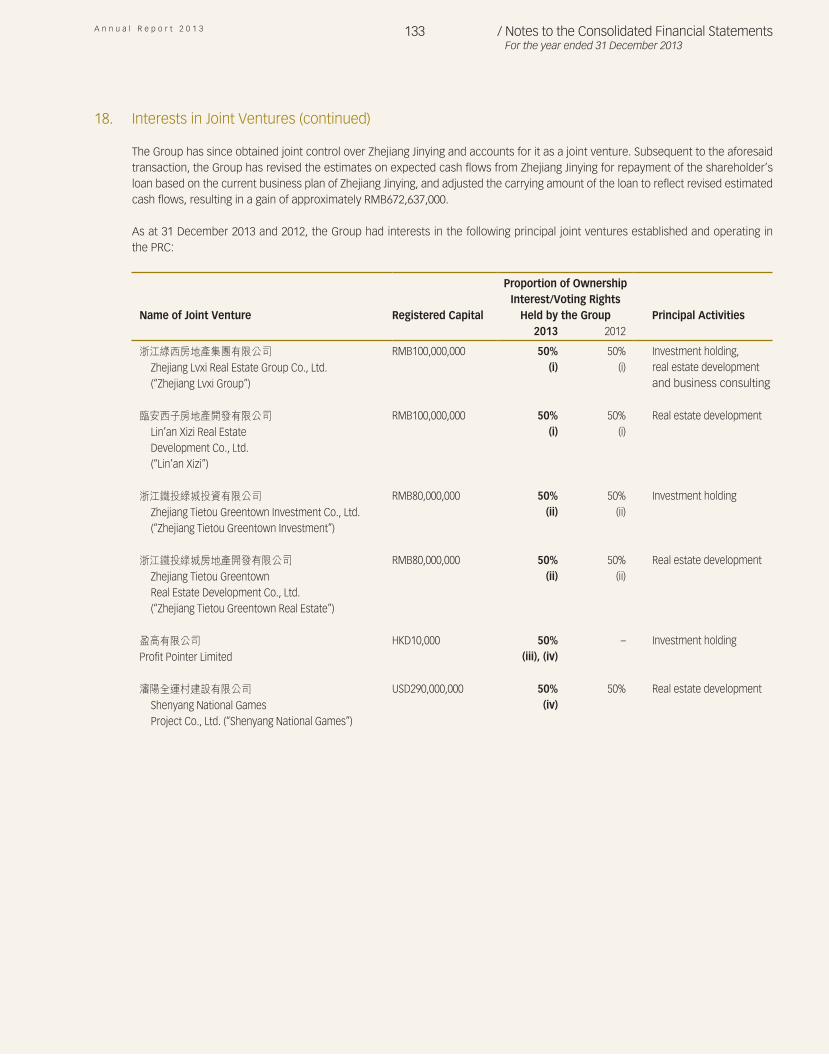
A n n u a l R e p o r t 2 0 1 3 133 / Notes to the Consolidated Financial StatementsFor the year ended 31 December 2013
18. Interests in Joint Ventures (continued)
The Group has since obtained joint control over Zhejiang Jinying and accounts for it as a joint venture. Subsequent to the aforesaid transaction, the Group has revised the estimates on expected cash flows from Zhejiang Jinying for repayment of the shareholder’s loan based on the current business plan of Zhejiang Jinying, and adjusted the carrying amount of the loan to reflect revised estimated cash flows, resulting in a gain of approximately RMB672,637,000.
As at 31 December 2013 and 2012, the Group had interests in the following principal joint ventures established and operating in the PRC:
Name of Joint Venture Registered Capital
Proportion of Ownership Interest/Voting Rights
Held by the Group Principal Activities2013 2012
浙江綠西房地產集團有限公司Zhejiang Lvxi Real Estate Group Co., Ltd.(“Zhejiang Lvxi Group”)
RMB100,000,000 50%(i)
50%(i)
Investment holding,real estate developmentand business consulting
臨安西子房地產開發有限公司Lin’an Xizi Real EstateDevelopment Co., Ltd.(“Lin’an Xizi”)
RMB100,000,000 50%(i)
50%(i)
Real estate development
浙江鐵投綠城投資有限公司Zhejiang Tietou Greentown Investment Co., Ltd.(“Zhejiang Tietou Greentown Investment”)
RMB80,000,000 50%(ii)
50%(ii)
Investment holding
浙江鐵投綠城房地產開發有限公司Zhejiang Tietou GreentownReal Estate Development Co., Ltd.(“Zhejiang Tietou Greentown Real Estate”)
RMB80,000,000 50%(ii)
50%(ii)
Real estate development
盈高有限公司Profit Pointer Limited
HKD10,000 50%(iii), (iv)
– Investment holding
瀋陽全運村建設有限公司Shenyang National GamesProject Co., Ltd. (“Shenyang National Games”)
USD290,000,000 50%(iv)
50% Real estate development
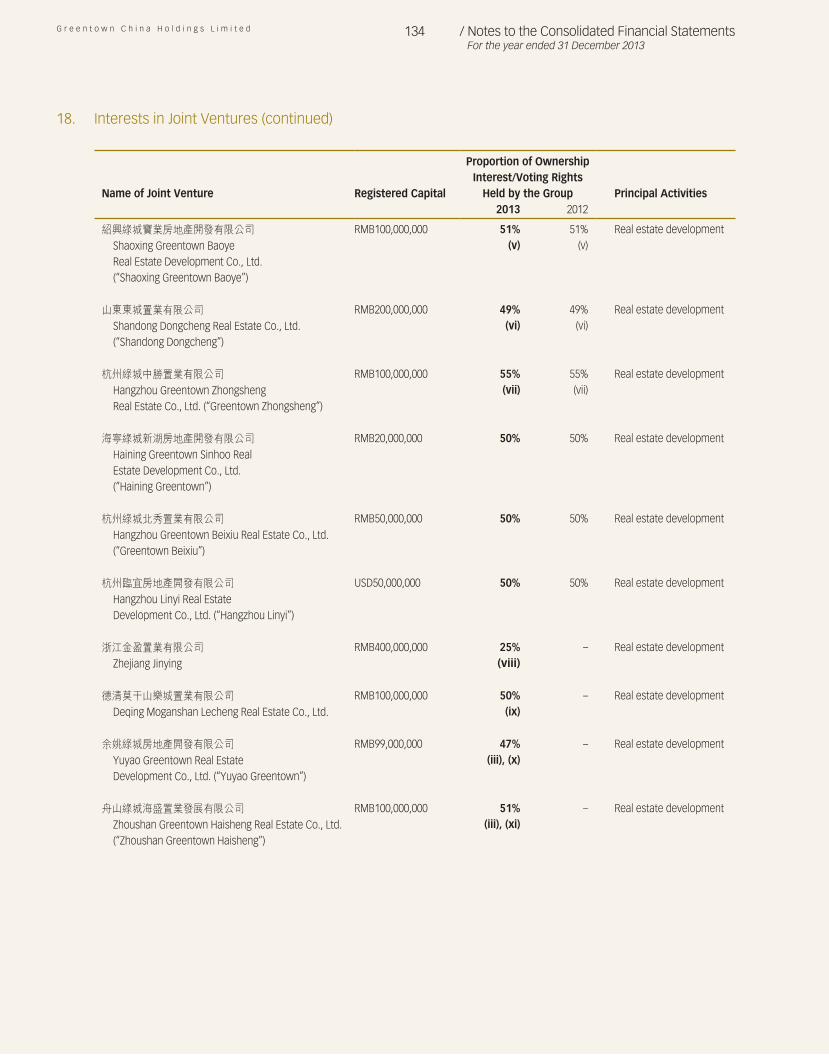
G r e e n t o w n C h i n a H o l d i n g s L i m i t e d 134 / Notes to the Consolidated Financial StatementsFor the year ended 31 December 2013
Name of Joint Venture Registered Capital
Proportion of Ownership Interest/Voting Rights
Held by the Group Principal Activities2013 2012
紹興綠城寶業房地產開發有限公司Shaoxing Greentown BaoyeReal Estate Development Co., Ltd.(“Shaoxing Greentown Baoye”)
RMB100,000,000 51%(v)
51%(v)
Real estate development
山東東城置業有限公司Shandong Dongcheng Real Estate Co., Ltd.(“Shandong Dongcheng”)
RMB200,000,000 49%(vi)
49%(vi)
Real estate development
杭州綠城中勝置業有限公司Hangzhou Greentown ZhongshengReal Estate Co., Ltd. (“Greentown Zhongsheng”)
RMB100,000,000 55%(vii)
55%(vii)
Real estate development
海寧綠城新湖房地產開發有限公司Haining Greentown Sinhoo RealEstate Development Co., Ltd.(“Haining Greentown”)
RMB20,000,000 50% 50% Real estate development
杭州綠城北秀置業有限公司Hangzhou Greentown Beixiu Real Estate Co., Ltd.(“Greentown Beixiu”)
RMB50,000,000 50% 50% Real estate development
杭州臨宜房地產開發有限公司Hangzhou Linyi Real EstateDevelopment Co., Ltd. (“Hangzhou Linyi”)
USD50,000,000 50% 50% Real estate development
浙江金盈置業有限公司Zhejiang Jinying
RMB400,000,000 25%(viii)
– Real estate development
德清莫干山樂城置業有限公司Deqing Moganshan Lecheng Real Estate Co., Ltd.
RMB100,000,000 50%(ix)
– Real estate development
余姚綠城房地產開發有限公司Yuyao Greentown Real EstateDevelopment Co., Ltd. (“Yuyao Greentown”)
RMB99,000,000 47%(iii), (x)
– Real estate development
舟山綠城海盛置業發展有限公司Zhoushan Greentown Haisheng Real Estate Co., Ltd.(“Zhoushan Greentown Haisheng”)
RMB100,000,000 51%(iii), (xi)
– Real estate development
18. Interests in Joint Ventures (continued)
A n n u a l R e p o r t 2 0 1 3 135 / Notes to the Consolidated Financial StatementsFor the year ended 31 December 2013
18. Interests in Joint Ventures (continued)
The above table lists the joint ventures of the Group which, in the opinion of the directors, principally affected the results or assets of the Group. To give details of other joint ventures would, in the opinion of the directors, result in particulars of excessive length.
Notes:
(i) Lin’an Xizi is a subsidiary of Zhejiang Lvxi Group.
(ii) Zhejiang Tietou Greentown Investment holds 100% equity interest in Zhejiang Tietou Greentown Real Estate.
(iii) These companies were newly established in 2013.
(iv) Shenyang National Games is a subsidiary of Profit Pointer Limited.
(v) Three out of five directors of Shaoxing Greentown Baoye are appointed by the Group, while a valid board resolution requires unanimous approval from all directors. Therefore, Shaoxing Greentown Baoye is accounted for as a joint venture of the Group.
(vi) Two out of five directors of Shandong Dongcheng are appointed by the Group and the remaining three directors by the other equity holder, while a valid board resolution requires four-fifths of the total votes. Decisions about relevant activities of Shandong Dongcheng require unanimous consent from the Group and the other equity holders. Therefore, Shandong Dongcheng is accounted for as a joint venture of the Group.
(vii) Three out of five directors of Greentown Zhongsheng are appointed by the Group and the remaining two directors by the other equity holder, while a valid board resolution requires four-fifths approval from the directors. Decisions about relevant activities of Greentown Zhongsheng require unanimous consent from the Group and the other equity holders. Therefore, Greentown Zhongsheng is accounted for as a joint venture of the Group.
(viii) Zhejiang Jinying became a joint venture of the Group in 2013 as Shanghai Greentown Woods Golf Villas Development Co., Ltd. acquired 50% equity interest in Zhejiang Jinying. Please refer to Note 18 for details. Shanghai Greentown Woods Golf Villas Development Co., Ltd. is a 50%-owned subsidiary of the Group.
(ix) The Company became a joint venture of the Group in 2013 as the Group acquired equity interest in it.
(x) Two out of five directors of Yuyao Greentown are appointed by the Group, while a valid board resolution requires unanimous approval from all directors. Therefore, Yuyao Greentown is accounted for as a joint venture of the Group.
(xi) Three out of five directors of Zhoushan Greentown Haisheng are appointed by the Group, while a valid board resolution requires two thirds above approval from all directors. Decisions about relevant activities of Zhoushan Greentown Haisheng require unanimous consent from the Group and the other equity holders. Therefore, Zhoushan Greentown Haisheng is accounted for as a joint venture of the Group.
Summarised Financial Information of Material Joint Ventures
Summarised financial information in respect of each of the Group’s material joint ventures is set out below. The summarised financial information below represents amounts shown in the joint ventures’ financial statements prepared in accordance with IFRSs.
The joint ventures are accounted for using the equity method in these consolidated financial statements.
G r e e n t o w n C h i n a H o l d i n g s L i m i t e d 136 / Notes to the Consolidated Financial StatementsFor the year ended 31 December 2013
18. Interests in Joint Ventures (continued)
Summarised Financial Information of Material Joint Ventures (continued)
Joint Venture Company A
2013 2012
RMB’000 RMB’000 Current assets 1,409,378 2,398,031 Non-current assets 17,658 5,703 Current liabilities 769,691 2,379,247 Non-current liabilities – –
The above amounts of assets and liabilities include the following:
2013 2012
RMB’000 RMB’000 Cash and cash equivalents 221,094 103,271 Current financial liabilities (excluding trade and other payables and provisions) – 350,000
2013 2012
RMB’000 RMB’000 Revenue 2,994,900 – Profit (loss) for the year 632,961 (1,157)
The above profit (loss) for the year include the following:
2013 2012
RMB’000 RMB’000 Depreciation and amortisation 634 634 Interest income 4,614 7,819 Income tax expense 255,372 (386)
Reconciliation of the above summarised financial information to the carrying amount of the interest in the joint venture recognised in the consolidated financial statements:
2013 2012
RMB’000 RMB’000 Net assets of Joint venture Company A 657,345 24,487 Proportion of the Group’s ownership interest in Joint venture Company A 50% 50% Other adjustments (701) (752) Carrying amount of the Group’s interest in Joint venture Company A 327,972 11,492
Joint Venture Company B
2013 2012
RMB’000 RMB’000 Current assets 3,045,103 2,112,840 Non-current assets 18,868 11,114 Current liabilities 2,582,859 793,552 Non-current liabilities 335,000 1,158,951
A n n u a l R e p o r t 2 0 1 3 137 / Notes to the Consolidated Financial StatementsFor the year ended 31 December 2013
18. Interests in Joint Ventures (continued)
Summarised Financial Information of Material Joint Ventures (continued)
Joint Venture Company B (continued)The above amounts of assets and liabilities include the followings:
2013 2012
RMB’000 RMB’000 Cash and cash equivalents 64,887 89,800 Current financial liabilities (excluding trade and other payables and provisions) 938,475 – Non-current financial liabilities (excluding trade and other payables and provisions) 335,000 1,158,951
2013 2012
RMB’000 RMB’000 Revenue – – Profit (loss) for the year (25,340) (16,280)
The above profit (loss) for the year include the following:
2013 2012
RMB’000 RMB’000 Depreciation and amortisation 841 651 Interest income 294 296 Income tax expense (7,334) (5,427)
Reconciliation of the above summarised financial information to the carrying amount of the interest in the joint venture recognised in the consolidated financial statements:
2013 2012
RMB’000 RMB’000 Net assets of Joint venture Company B 146,112 171,451 Proportion of the Group’s ownership interest in Joint venture Company B 49% 49% Effect of fair value adjustments at acquisition 285,432 285,432 Other adjustments 29,068 13,783 Carrying amount of the Group’s interest in Joint venture Company B 386,094 383,226
Aggregate Information of Joint Ventures That Are Not Individually Material
2013 2012RMB’000 RMB’000
Group’s share of profit for the year 173,935 312,674
The Group has discontinued recognition of its share of losses of certain joint ventures as its share of losses of those joint ventures equals or exceeds its interests in those joint ventures. The amounts of unrecognised share of losses of these joint ventures, both for the year and cumulatively, are as follows:
2013 2012
RMB’000 RMB’000 Unrecognised share of losses of joint ventures for the year 162,578 17,846 Accumulated unrecognised share of losses of joint ventures 241,495 78,917
G r e e n t o w n C h i n a H o l d i n g s L i m i t e d 138 / Notes to the Consolidated Financial StatementsFor the year ended 31 December 2013
19. Available-for-Sale Investments
Available-for-sale investments comprise:
2013 2012
RMB’000 RMB’000 Non-current portion:
Unlisted equity securities 377,010 346,545
The above unlisted equity securities were issued by private entities established in the PRC. The available-for-sale investments are measured at cost less impairment at the end of the reporting period because the range of reasonable fair value estimates is so significant that the directors are of the opinion that their fair values cannot be measured reliably.
20. Prepaid Lease Payment
2013 2012RMB’000 RMB’000
The Group’s prepaid lease payment comprises:
Leasehold land in the PRC:Medium-term lease 678,159 264,525
Analysed for reporting purposes as:Current asset (included in trade and other receivables) 13,446 9,557Non-current asset 664,713 254,968
678,159 264,525
21. Deferred Taxation
The following are the major deferred tax assets (liabilities) recognised and movements thereon during the current and prior years:
Temporary
Differenceson RevenueRecognitionand Related
Cost of SalesImpairment
Losses Tax LossesFair Value
AdjustmentsLat
ProvisionUndistributed
Profits Others TotalRMB’000 RMB’000 RMB’000 RMB’000 RMB’000 RMB’000 RMB’000 RMB’000
At 1 January 2012 10,142 52,890 399,580 (240,228) 298,285 (207,184) (19,857) 293,628(Charge) credit to profit
or loss 12,471 19,719 (223,475) 46,068 273,367 (130,000) 2,919 1,069Disposal of subsidiaries 6,509 (15,546) (42,334) – – – – (51,371) At 31 December 2012 29,122 57,063 133,771 (194,160) 571,652 (337,184) (16,938) 243,326(Charge) credit to profit
or loss 185,157 (15,663) (3,410) (21,475) 103,573 (150,000) 6,534 104,716Acquisition of
subsidiaries (Note 30) – – 1,488 – – – – 1,488 At 31 December 2013 214,279 41,400 131,849 (215,635) 675,225 (487,184) (10,404) 349,530
Others represent mainly deferred tax liabilities recognised in respect of temporary differences arising from accelerated tax depreciation.
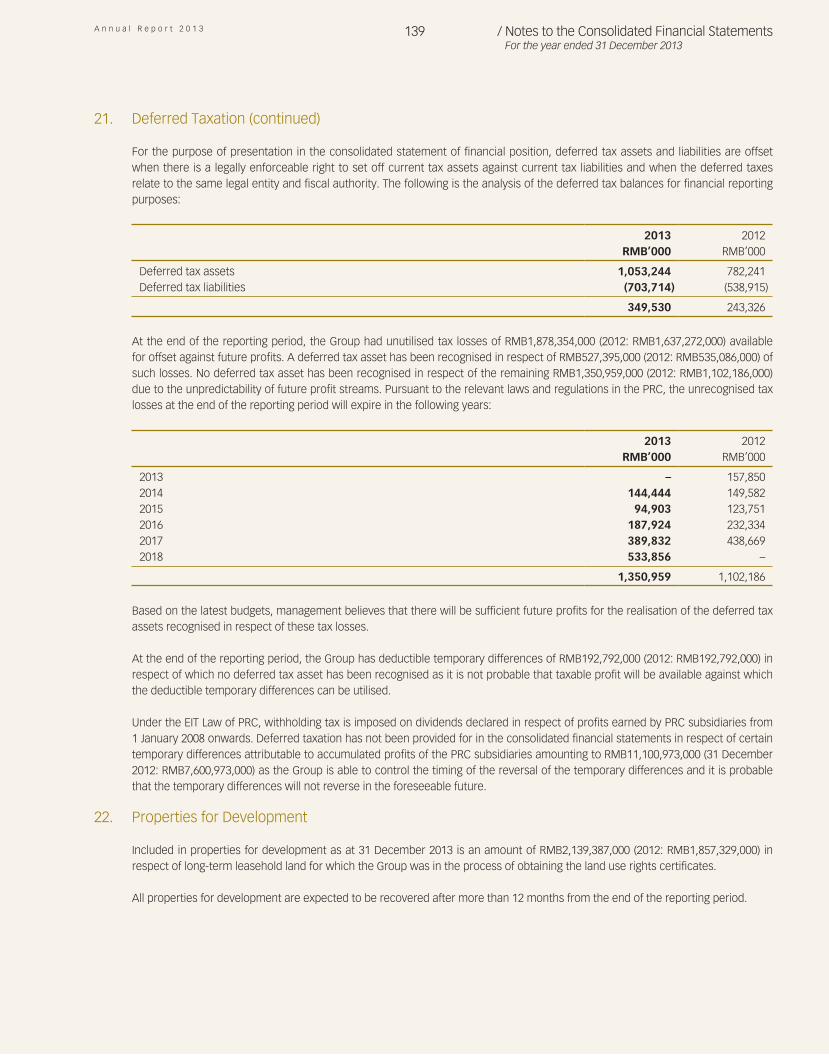
A n n u a l R e p o r t 2 0 1 3 139 / Notes to the Consolidated Financial StatementsFor the year ended 31 December 2013
21. Deferred Taxation (continued)
For the purpose of presentation in the consolidated statement of financial position, deferred tax assets and liabilities are offset when there is a legally enforceable right to set off current tax assets against current tax liabilities and when the deferred taxes relate to the same legal entity and fiscal authority. The following is the analysis of the deferred tax balances for financial reporting purposes:
2013 2012
RMB’000 RMB’000 Deferred tax assets 1,053,244 782,241Deferred tax liabilities (703,714) (538,915)
349,530 243,326
At the end of the reporting period, the Group had unutilised tax losses of RMB1,878,354,000 (2012: RMB1,637,272,000) available for offset against future profits. A deferred tax asset has been recognised in respect of RMB527,395,000 (2012: RMB535,086,000) of such losses. No deferred tax asset has been recognised in respect of the remaining RMB1,350,959,000 (2012: RMB1,102,186,000) due to the unpredictability of future profit streams. Pursuant to the relevant laws and regulations in the PRC, the unrecognised tax losses at the end of the reporting period will expire in the following years:
2013 2012
RMB’000 RMB’000 2013 – 157,8502014 144,444 149,5822015 94,903 123,7512016 187,924 232,3342017 389,832 438,6692018 533,856 –
1,350,959 1,102,186
Based on the latest budgets, management believes that there will be sufficient future profits for the realisation of the deferred tax assets recognised in respect of these tax losses.
At the end of the reporting period, the Group has deductible temporary differences of RMB192,792,000 (2012: RMB192,792,000) in respect of which no deferred tax asset has been recognised as it is not probable that taxable profit will be available against which the deductible temporary differences can be utilised.
Under the EIT Law of PRC, withholding tax is imposed on dividends declared in respect of profits earned by PRC subsidiaries from 1 January 2008 onwards. Deferred taxation has not been provided for in the consolidated financial statements in respect of certain temporary differences attributable to accumulated profits of the PRC subsidiaries amounting to RMB11,100,973,000 (31 December 2012: RMB7,600,973,000) as the Group is able to control the timing of the reversal of the temporary differences and it is probable that the temporary differences will not reverse in the foreseeable future.
22. Properties for Development
Included in properties for development as at 31 December 2013 is an amount of RMB2,139,387,000 (2012: RMB1,857,329,000) in respect of long-term leasehold land for which the Group was in the process of obtaining the land use rights certificates.
All properties for development are expected to be recovered after more than 12 months from the end of the reporting period.
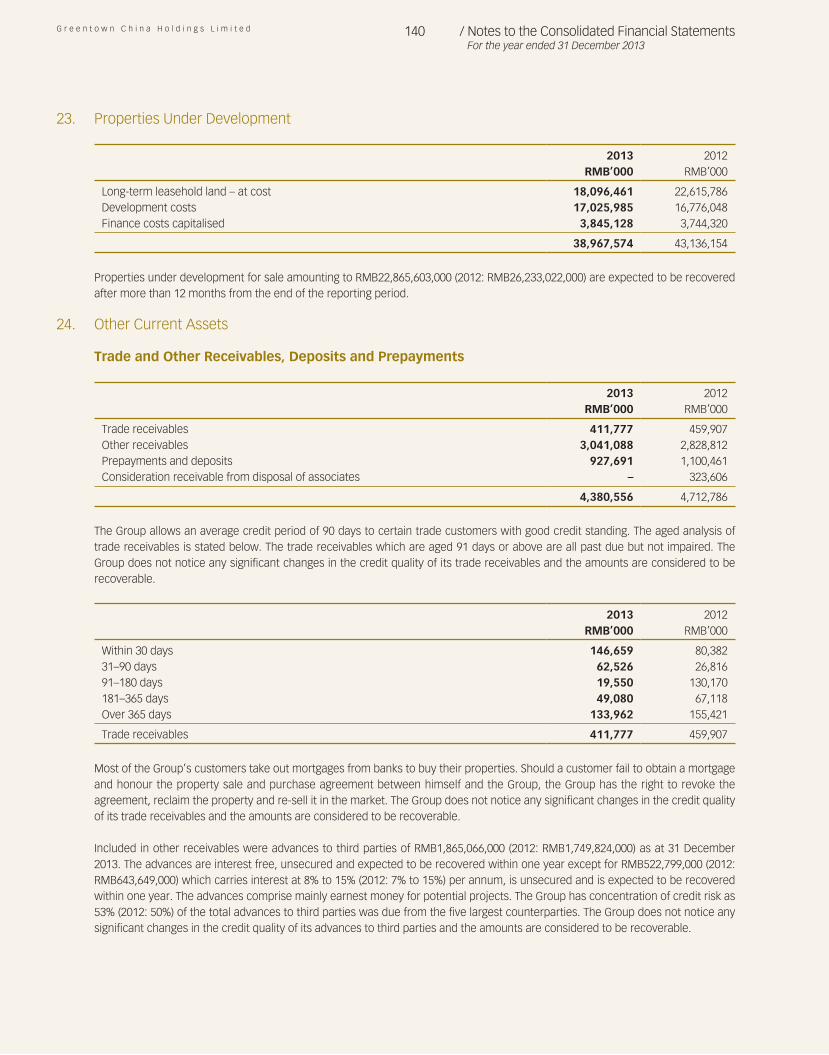
G r e e n t o w n C h i n a H o l d i n g s L i m i t e d 140 / Notes to the Consolidated Financial StatementsFor the year ended 31 December 2013
23. Properties Under Development
2013 2012RMB’000 RMB’000
Long-term leasehold land – at cost 18,096,461 22,615,786Development costs 17,025,985 16,776,048Finance costs capitalised 3,845,128 3,744,320
38,967,574 43,136,154
Properties under development for sale amounting to RMB22,865,603,000 (2012: RMB26,233,022,000) are expected to be recovered after more than 12 months from the end of the reporting period.
24. Other Current Assets
Trade and Other Receivables, Deposits and Prepayments
2013 2012RMB’000 RMB’000
Trade receivables 411,777 459,907Other receivables 3,041,088 2,828,812Prepayments and deposits 927,691 1,100,461Consideration receivable from disposal of associates – 323,606
4,380,556 4,712,786
The Group allows an average credit period of 90 days to certain trade customers with good credit standing. The aged analysis of trade receivables is stated below. The trade receivables which are aged 91 days or above are all past due but not impaired. The Group does not notice any significant changes in the credit quality of its trade receivables and the amounts are considered to be recoverable.
2013 2012
RMB’000 RMB’000 Within 30 days 146,659 80,38231–90 days 62,526 26,81691–180 days 19,550 130,170181–365 days 49,080 67,118Over 365 days 133,962 155,421 Trade receivables 411,777 459,907
Most of the Group’s customers take out mortgages from banks to buy their properties. Should a customer fail to obtain a mortgage and honour the property sale and purchase agreement between himself and the Group, the Group has the right to revoke the agreement, reclaim the property and re-sell it in the market. The Group does not notice any significant changes in the credit quality of its trade receivables and the amounts are considered to be recoverable.
Included in other receivables were advances to third parties of RMB1,865,066,000 (2012: RMB1,749,824,000) as at 31 December 2013. The advances are interest free, unsecured and expected to be recovered within one year except for RMB522,799,000 (2012: RMB643,649,000) which carries interest at 8% to 15% (2012: 7% to 15%) per annum, is unsecured and is expected to be recovered within one year. The advances comprise mainly earnest money for potential projects. The Group has concentration of credit risk as 53% (2012: 50%) of the total advances to third parties was due from the five largest counterparties. The Group does not notice any significant changes in the credit quality of its advances to third parties and the amounts are considered to be recoverable.
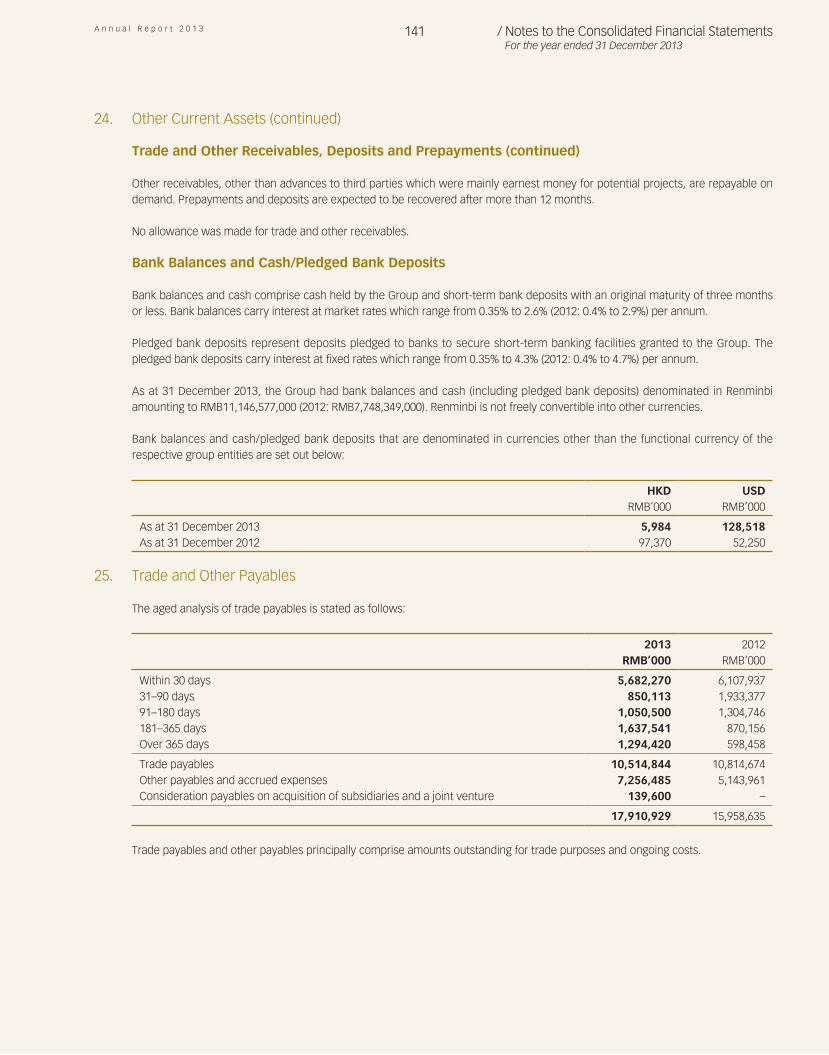
A n n u a l R e p o r t 2 0 1 3 141 / Notes to the Consolidated Financial StatementsFor the year ended 31 December 2013
24. Other Current Assets (continued)
Trade and Other Receivables, Deposits and Prepayments (continued)
Other receivables, other than advances to third parties which were mainly earnest money for potential projects, are repayable on demand. Prepayments and deposits are expected to be recovered after more than 12 months.
No allowance was made for trade and other receivables.
Bank Balances and Cash/Pledged Bank Deposits
Bank balances and cash comprise cash held by the Group and short-term bank deposits with an original maturity of three months or less. Bank balances carry interest at market rates which range from 0.35% to 2.6% (2012: 0.4% to 2.9%) per annum.
Pledged bank deposits represent deposits pledged to banks to secure short-term banking facilities granted to the Group. The pledged bank deposits carry interest at fixed rates which range from 0.35% to 4.3% (2012: 0.4% to 4.7%) per annum.
As at 31 December 2013, the Group had bank balances and cash (including pledged bank deposits) denominated in Renminbi amounting to RMB11,146,577,000 (2012: RMB7,748,349,000). Renminbi is not freely convertible into other currencies.
Bank balances and cash/pledged bank deposits that are denominated in currencies other than the functional currency of the respective group entities are set out below:
HKD USD
RMB’000 RMB’000 As at 31 December 2013 5,984 128,518As at 31 December 2012 97,370 52,250
25. Trade and Other Payables
The aged analysis of trade payables is stated as follows:
2013 2012
RMB’000 RMB’000 Within 30 days 5,682,270 6,107,93731–90 days 850,113 1,933,37791–180 days 1,050,500 1,304,746181–365 days 1,637,541 870,156Over 365 days 1,294,420 598,458 Trade payables 10,514,844 10,814,674Other payables and accrued expenses 7,256,485 5,143,961Consideration payables on acquisition of subsidiaries and a joint venture 139,600 –
17,910,929 15,958,635
Trade payables and other payables principally comprise amounts outstanding for trade purposes and ongoing costs.
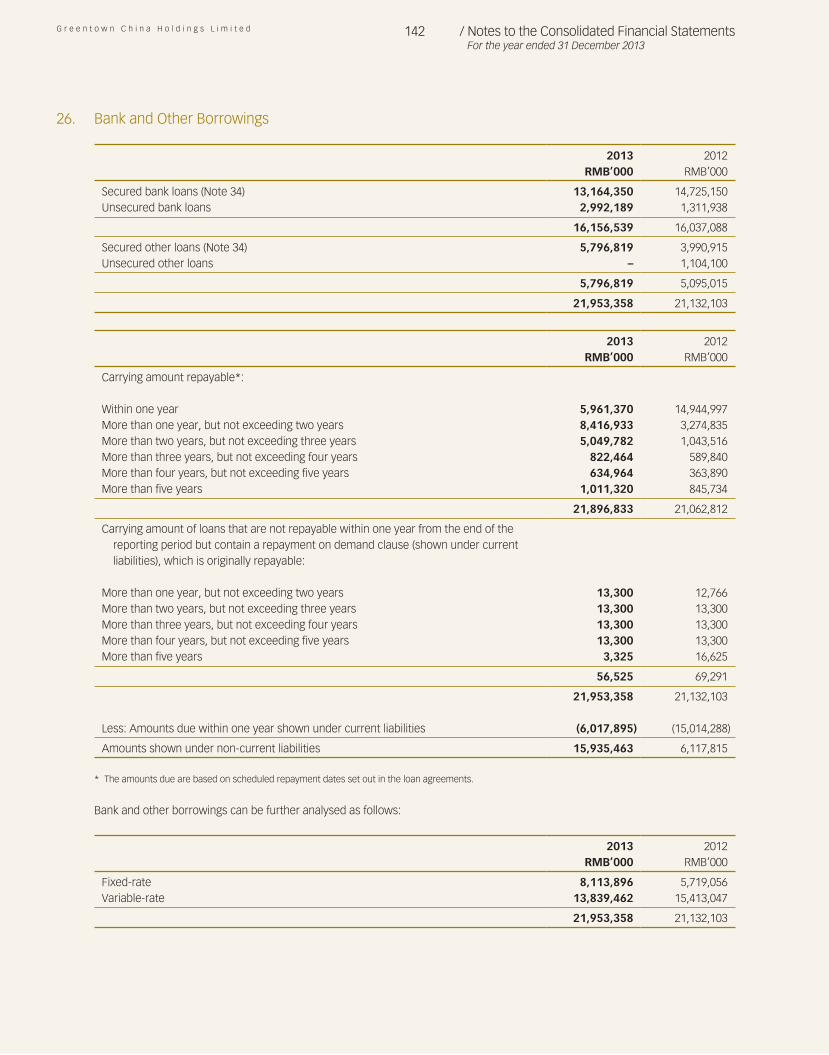
G r e e n t o w n C h i n a H o l d i n g s L i m i t e d 142 / Notes to the Consolidated Financial StatementsFor the year ended 31 December 2013
26. Bank and Other Borrowings
2013 2012RMB’000 RMB’000
Secured bank loans (Note 34) 13,164,350 14,725,150Unsecured bank loans 2,992,189 1,311,938
16,156,539 16,037,088 Secured other loans (Note 34) 5,796,819 3,990,915Unsecured other loans – 1,104,100
5,796,819 5,095,015 21,953,358 21,132,103
2013 2012
RMB’000 RMB’000 Carrying amount repayable*:
Within one year 5,961,370 14,944,997More than one year, but not exceeding two years 8,416,933 3,274,835More than two years, but not exceeding three years 5,049,782 1,043,516More than three years, but not exceeding four years 822,464 589,840More than four years, but not exceeding five years 634,964 363,890More than five years 1,011,320 845,734
21,896,833 21,062,812 Carrying amount of loans that are not repayable within one year from the end of the
reporting period but contain a repayment on demand clause (shown under current liabilities), which is originally repayable:
More than one year, but not exceeding two years 13,300 12,766More than two years, but not exceeding three years 13,300 13,300More than three years, but not exceeding four years 13,300 13,300More than four years, but not exceeding five years 13,300 13,300More than five years 3,325 16,625
56,525 69,291 21,953,358 21,132,103
Less: Amounts due within one year shown under current liabilities (6,017,895) (15,014,288) Amounts shown under non-current liabilities 15,935,463 6,117,815
* The amounts due are based on scheduled repayment dates set out in the loan agreements.
Bank and other borrowings can be further analysed as follows:
2013 2012
RMB’000 RMB’000 Fixed-rate 8,113,896 5,719,056Variable-rate 13,839,462 15,413,047
21,953,358 21,132,103
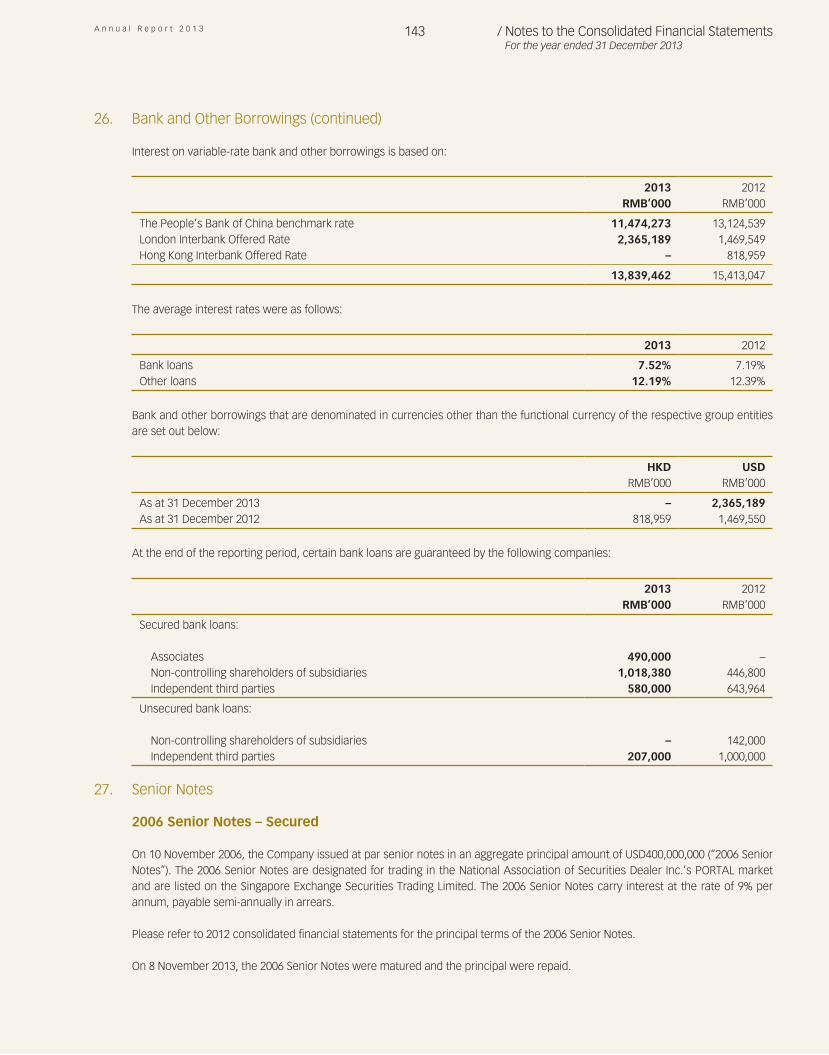
A n n u a l R e p o r t 2 0 1 3 143 / Notes to the Consolidated Financial StatementsFor the year ended 31 December 2013
26. Bank and Other Borrowings (continued)
Interest on variable-rate bank and other borrowings is based on:
2013 2012
RMB’000 RMB’000 The People’s Bank of China benchmark rate 11,474,273 13,124,539London Interbank Offered Rate 2,365,189 1,469,549Hong Kong Interbank Offered Rate – 818,959
13,839,462 15,413,047
The average interest rates were as follows:
2013 2012
Bank loans 7.52% 7.19%Other loans 12.19% 12.39%
Bank and other borrowings that are denominated in currencies other than the functional currency of the respective group entities are set out below:
HKD USD
RMB’000 RMB’000 As at 31 December 2013 – 2,365,189As at 31 December 2012 818,959 1,469,550
At the end of the reporting period, certain bank loans are guaranteed by the following companies:
2013 2012
RMB’000 RMB’000 Secured bank loans:
Associates 490,000 –Non-controlling shareholders of subsidiaries 1,018,380 446,800Independent third parties 580,000 643,964
Unsecured bank loans:
Non-controlling shareholders of subsidiaries – 142,000Independent third parties 207,000 1,000,000
27. Senior Notes
2006 Senior Notes – Secured
On 10 November 2006, the Company issued at par senior notes in an aggregate principal amount of USD400,000,000 (“2006 Senior Notes”). The 2006 Senior Notes are designated for trading in the National Association of Securities Dealer Inc.’s PORTAL market and are listed on the Singapore Exchange Securities Trading Limited. The 2006 Senior Notes carry interest at the rate of 9% per annum, payable semi-annually in arrears.
Please refer to 2012 consolidated financial statements for the principal terms of the 2006 Senior Notes.
On 8 November 2013, the 2006 Senior Notes were matured and the principal were repaid.
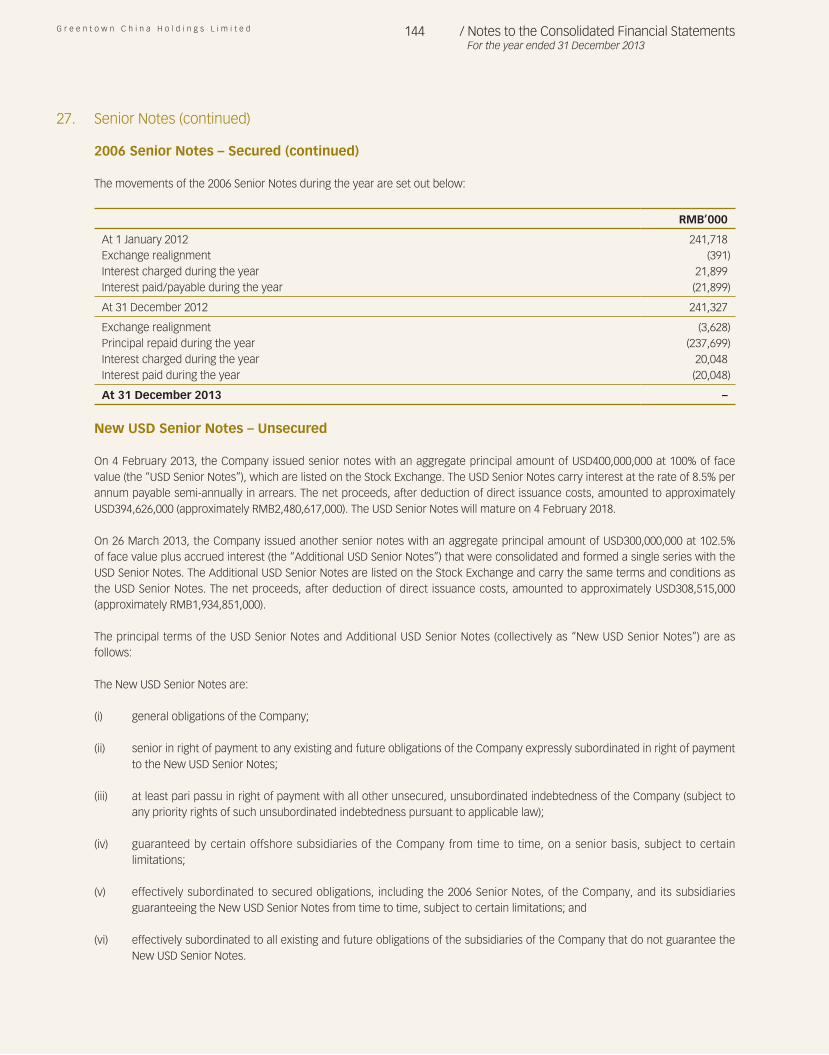
G r e e n t o w n C h i n a H o l d i n g s L i m i t e d 144 / Notes to the Consolidated Financial StatementsFor the year ended 31 December 2013
27. Senior Notes (continued)
2006 Senior Notes – Secured (continued)
The movements of the 2006 Senior Notes during the year are set out below:
RMB’000
At 1 January 2012 241,718Exchange realignment (391)Interest charged during the year 21,899Interest paid/payable during the year (21,899) At 31 December 2012 241,327 Exchange realignment (3,628)Principal repaid during the year (237,699)Interest charged during the year 20,048Interest paid during the year (20,048) At 31 December 2013 –
New USD Senior Notes – Unsecured
On 4 February 2013, the Company issued senior notes with an aggregate principal amount of USD400,000,000 at 100% of face value (the “USD Senior Notes”), which are listed on the Stock Exchange. The USD Senior Notes carry interest at the rate of 8.5% per annum payable semi-annually in arrears. The net proceeds, after deduction of direct issuance costs, amounted to approximately USD394,626,000 (approximately RMB2,480,617,000). The USD Senior Notes will mature on 4 February 2018.
On 26 March 2013, the Company issued another senior notes with an aggregate principal amount of USD300,000,000 at 102.5% of face value plus accrued interest (the “Additional USD Senior Notes”) that were consolidated and formed a single series with the USD Senior Notes. The Additional USD Senior Notes are listed on the Stock Exchange and carry the same terms and conditions as the USD Senior Notes. The net proceeds, after deduction of direct issuance costs, amounted to approximately USD308,515,000 (approximately RMB1,934,851,000).
The principal terms of the USD Senior Notes and Additional USD Senior Notes (collectively as “New USD Senior Notes”) are as follows:
The New USD Senior Notes are:
(i) general obligations of the Company;
(ii) senior in right of payment to any existing and future obligations of the Company expressly subordinated in right of payment to the New USD Senior Notes;
(iii) at least pari passu in right of payment with all other unsecured, unsubordinated indebtedness of the Company (subject to any priority rights of such unsubordinated indebtedness pursuant to applicable law);
(iv) guaranteed by certain offshore subsidiaries of the Company from time to time, on a senior basis, subject to certain limitations;
(v) effectively subordinated to secured obligations, including the 2006 Senior Notes, of the Company, and its subsidiaries guaranteeing the New USD Senior Notes from time to time, subject to certain limitations; and
(vi) effectively subordinated to all existing and future obligations of the subsidiaries of the Company that do not guarantee the New USD Senior Notes.
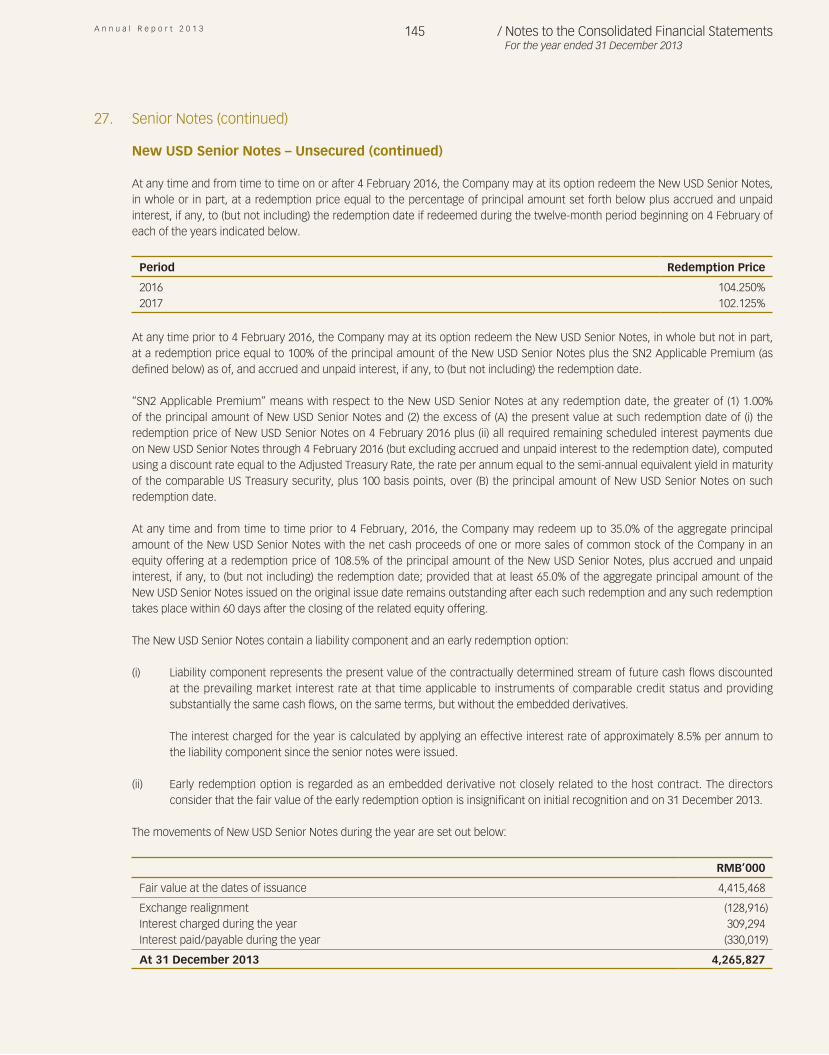
A n n u a l R e p o r t 2 0 1 3 145 / Notes to the Consolidated Financial StatementsFor the year ended 31 December 2013
27. Senior Notes (continued)
New USD Senior Notes – Unsecured (continued)
At any time and from time to time on or after 4 February 2016, the Company may at its option redeem the New USD Senior Notes, in whole or in part, at a redemption price equal to the percentage of principal amount set forth below plus accrued and unpaid interest, if any, to (but not including) the redemption date if redeemed during the twelve-month period beginning on 4 February of each of the years indicated below.
Period Redemption Price 2016 104.250%2017 102.125%
At any time prior to 4 February 2016, the Company may at its option redeem the New USD Senior Notes, in whole but not in part, at a redemption price equal to 100% of the principal amount of the New USD Senior Notes plus the SN2 Applicable Premium (as defined below) as of, and accrued and unpaid interest, if any, to (but not including) the redemption date.
“SN2 Applicable Premium” means with respect to the New USD Senior Notes at any redemption date, the greater of (1) 1.00% of the principal amount of New USD Senior Notes and (2) the excess of (A) the present value at such redemption date of (i) the redemption price of New USD Senior Notes on 4 February 2016 plus (ii) all required remaining scheduled interest payments due on New USD Senior Notes through 4 February 2016 (but excluding accrued and unpaid interest to the redemption date), computed using a discount rate equal to the Adjusted Treasury Rate, the rate per annum equal to the semi-annual equivalent yield in maturity of the comparable US Treasury security, plus 100 basis points, over (B) the principal amount of New USD Senior Notes on such redemption date.
At any time and from time to time prior to 4 February, 2016, the Company may redeem up to 35.0% of the aggregate principal amount of the New USD Senior Notes with the net cash proceeds of one or more sales of common stock of the Company in an equity offering at a redemption price of 108.5% of the principal amount of the New USD Senior Notes, plus accrued and unpaid interest, if any, to (but not including) the redemption date; provided that at least 65.0% of the aggregate principal amount of the New USD Senior Notes issued on the original issue date remains outstanding after each such redemption and any such redemption takes place within 60 days after the closing of the related equity offering.
The New USD Senior Notes contain a liability component and an early redemption option:
(i) Liability component represents the present value of the contractually determined stream of future cash flows discounted at the prevailing market interest rate at that time applicable to instruments of comparable credit status and providing substantially the same cash flows, on the same terms, but without the embedded derivatives.
The interest charged for the year is calculated by applying an effective interest rate of approximately 8.5% per annum to the liability component since the senior notes were issued.
(ii) Early redemption option is regarded as an embedded derivative not closely related to the host contract. The directors consider that the fair value of the early redemption option is insignificant on initial recognition and on 31 December 2013.
The movements of New USD Senior Notes during the year are set out below:
RMB’000
Fair value at the dates of issuance 4,415,468 Exchange realignment (128,916)Interest charged during the year 309,294Interest paid/payable during the year (330,019) At 31 December 2013 4,265,827
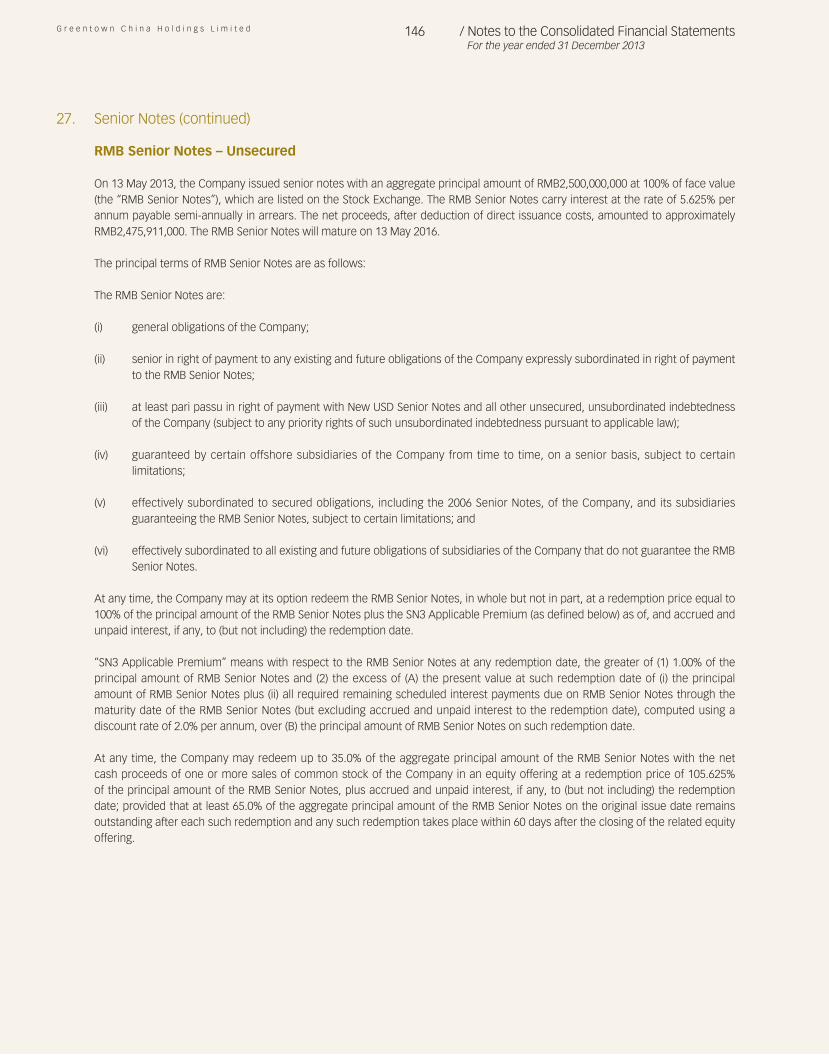
G r e e n t o w n C h i n a H o l d i n g s L i m i t e d 146 / Notes to the Consolidated Financial StatementsFor the year ended 31 December 2013
27. Senior Notes (continued)
RMB Senior Notes – Unsecured
On 13 May 2013, the Company issued senior notes with an aggregate principal amount of RMB2,500,000,000 at 100% of face value (the “RMB Senior Notes”), which are listed on the Stock Exchange. The RMB Senior Notes carry interest at the rate of 5.625% per annum payable semi-annually in arrears. The net proceeds, after deduction of direct issuance costs, amounted to approximately RMB2,475,911,000. The RMB Senior Notes will mature on 13 May 2016.
The principal terms of RMB Senior Notes are as follows:
The RMB Senior Notes are:
(i) general obligations of the Company;
(ii) senior in right of payment to any existing and future obligations of the Company expressly subordinated in right of payment to the RMB Senior Notes;
(iii) at least pari passu in right of payment with New USD Senior Notes and all other unsecured, unsubordinated indebtedness of the Company (subject to any priority rights of such unsubordinated indebtedness pursuant to applicable law);
(iv) guaranteed by certain offshore subsidiaries of the Company from time to time, on a senior basis, subject to certain limitations;
(v) effectively subordinated to secured obligations, including the 2006 Senior Notes, of the Company, and its subsidiaries guaranteeing the RMB Senior Notes, subject to certain limitations; and
(vi) effectively subordinated to all existing and future obligations of subsidiaries of the Company that do not guarantee the RMB Senior Notes.
At any time, the Company may at its option redeem the RMB Senior Notes, in whole but not in part, at a redemption price equal to 100% of the principal amount of the RMB Senior Notes plus the SN3 Applicable Premium (as defined below) as of, and accrued and unpaid interest, if any, to (but not including) the redemption date.
“SN3 Applicable Premium” means with respect to the RMB Senior Notes at any redemption date, the greater of (1) 1.00% of the principal amount of RMB Senior Notes and (2) the excess of (A) the present value at such redemption date of (i) the principal amount of RMB Senior Notes plus (ii) all required remaining scheduled interest payments due on RMB Senior Notes through the maturity date of the RMB Senior Notes (but excluding accrued and unpaid interest to the redemption date), computed using a discount rate of 2.0% per annum, over (B) the principal amount of RMB Senior Notes on such redemption date.
At any time, the Company may redeem up to 35.0% of the aggregate principal amount of the RMB Senior Notes with the net cash proceeds of one or more sales of common stock of the Company in an equity offering at a redemption price of 105.625% of the principal amount of the RMB Senior Notes, plus accrued and unpaid interest, if any, to (but not including) the redemption date; provided that at least 65.0% of the aggregate principal amount of the RMB Senior Notes on the original issue date remains outstanding after each such redemption and any such redemption takes place within 60 days after the closing of the related equity offering.
A n n u a l R e p o r t 2 0 1 3 147 / Notes to the Consolidated Financial StatementsFor the year ended 31 December 2013
27. Senior Notes (continued)
RMB Senior Notes – Unsecured (continued)
The RMB Senior Notes contain a liability component and an early redemption option:
(i) Liability component represents the present value of the contractually determined stream of future cash flows discounted at the prevailing market interest rate at that time applicable to instruments of comparable credit status and providing substantially the same cash flows, on the same terms, but without the embedded derivatives.
The interest charged for the year is calculated by applying an effective interest rate of approximately 5.9% per annum to the liability component since the senior notes were issued.
(ii) Early redemption option is regarded as an embedded derivative not closely related to the host contract. The directors consider that the fair value of the early redemption option is insignificant on initial recognition and on 31 December 2013.
The movements of RMB Senior Notes during the year are set out below:
RMB’000
Fair value at the dates of issuance 2,475,911 Interest charged during the year 94,148Interest paid/payable during the year (89,063) At 31 December 2013 2,480,996
Second USD Senior Notes – Unsecured
On 24 September 2013, the Company issued senior notes with an aggregate principal amount of USD300,000,000 at 100% of face value (the “Second USD Senior Notes”), which are listed on the Stock Exchange. The Second USD Senior Notes carry interest at the rate of 8.0% per annum payable semi-annually in arrears. The net proceeds, after deduction of direct issuance costs, amounted to approximately USD296,947,000 (approximately RMB1,826,138,000). The Second USD Senior Notes will mature on 24 March 2019.
The Second USD Senior Notes are:
(vii) general obligations of the Company;
(viii) senior in right of payment to any existing and future obligations of the Company expressly subordinated in right of payment to the Second USD Senior Notes;
(ix) at least pari passu in right of payment with New USD Senior Notes, RMB Senior Notes and all other unsecured, unsubordinated indebtedness of the Company (subject to any priority rights of such unsubordinated indebtedness pursuant to applicable law);
(x) guaranteed by certain offshore subsidiaries of the Company from time to time, on a senior basis, subject to certain limitations;
(xi) effectively subordinated to secured obligations, including the 2006 Senior Notes, of the Company, and its subsidiaries guaranteeing the Second USD Senior Notes from time to time, subject to certain limitations; and
(xii) effectively subordinated to all existing and future obligations of the subsidiaries of the Company that do not guarantee the Second USD Senior Notes.
G r e e n t o w n C h i n a H o l d i n g s L i m i t e d 148 / Notes to the Consolidated Financial StatementsFor the year ended 31 December 2013
27. Senior Notes (continued)
Second USD Senior Notes – Unsecured (continued)
At any time and from time to time on or after 24 March 2017, the Company may at its option redeem the Second USD Senior Notes, in whole or in part, at a redemption price equal to the percentage of principal amount set forth below plus accrued and unpaid interest, if any, to (but not including) the redemption date if redeemed during the twelve-month period beginning on 24 March of each of the years indicated below.
Period Redemption Price 2017 104%2018 102%
At any time prior to 24 March 2017, the Company may at its option redeem the Second USD Senior Notes, in whole but not in part, at a redemption price equal to 100% of the principal amount of the Second USD Senior Notes plus the SN4 Applicable Premium (as defined below) as of, and accrued and unpaid interest, if any, to (but not including) the redemption date.
“SN4 Applicable Premium” means with respect to the Second USD Senior Notes at any redemption date, the greater of (1) 1.00% of the principal amount of Second USD Senior Notes and (2) the excess of (A) the present value at such redemption date of (i) the redemption price of Second USD Senior Notes on 24 March 2017 plus (ii) all required remaining scheduled interest payments due on Second USD Senior Notes through 24 March 2017 (but excluding accrued and unpaid interest to the redemption date), computed using a discount rate equal to the Adjusted Treasury Rate, the rate per annum equal to the semi-annual equivalent yield in maturity of the comparable US Treasury security, plus 100 basis points, over (B) the principal amount of Second USD Senior Notes on such redemption date.
At any time and from time to time prior to 24 March 2017, the Company may redeem up to 35.0% of the aggregate principal amount of the Second USD Senior Notes with the net cash proceeds of one or more sales of common stock of the Company in an equity offering at a redemption price of 108% of the principal amount of the Second USD Senior Notes, plus accrued and unpaid interest, if any, to (but not including) the redemption date; provided that at least 65.0% of the aggregate principal amount of the Second USD Senior Notes issued on the original issue date remains outstanding after each such redemption and any such redemption takes place within 60 days after the closing of the related equity offering.
The Second USD Senior Notes contain a liability component and an early redemption option:
(i) Liability component represents the present value of the contractually determined stream of future cash flows discounted at the prevailing market interest rate at that time applicable to instruments of comparable credit status and providing substantially the same cash flows, on the same terms, but without the embedded derivatives.
The interest charged for the year is calculated by applying an effective interest rate of approximately 8.2% per annum to the liability component since the senior notes were issued.
(ii) Early redemption option is regarded as an embedded derivative not closely related to the host contract. The directors consider that the fair value of the early redemption option is insignificant on initial recognition and on 31 December 2013.
The movements of Second USD Senior Notes during the year are set out below:
RMB’000
Fair value at the dates of issuance 1,826,138 Exchange realignment (18,146)Interest charged during the year 42,389Interest payable during the year (39,020) At 31 December 2013 1,811,361
A n n u a l R e p o r t 2 0 1 3 149 / Notes to the Consolidated Financial StatementsFor the year ended 31 December 2013
27. Senior Notes (continued)
The summary of movements of all senior notes during the year is set out below:
RMB’000
At 1 January 2012 241,718Exchange realignment (391)Interest charged during the year 21,899Interest paid/payable during the year (21,899) At 31 December 2012 241,327 Fair value at the dates of issuance 8,717,517Exchange realignment (150,690)Principal repaid during the year (237,699)Interest charged during the year 465,879Interest paid/payable during the year (478,150) At 31 December 2013 8,558,184
28. Share Capital
Number of ShareShares Capital
HKD’000 AuthorisedOrdinary shares of HKD0.10 eachAt 31 December 2012 and 2013 10,000,000,000 1,000,000 Issued and fully paidOrdinary shares of HKD0.10 each
At 1 January 2012 1,640,022,897 164,002Exercise of share options 13,189,000 1,319Issuance of new shares (Note a) 327,849,579 32,785Issuance of new shares (Note b) 162,113,714 16,211
At 31 December 2012 2,143,175,190 214,317 Exercise of share options 15,325,500 1,533 At 31 December 2013 2,158,500,690 215,850
RMB’000
Shown on the consolidated statement of financial positionAs at 31 December 2013 208,656 As at 31 December 2012 207,422
Notes:
(a) On 15 June 2012, the Company issued and allotted 327,849,579 shares of HKD0.10 each to Target Smart Investments Limited (“Target Smart”), a wholly-owned subsidiary of The Wharf (Holdings) Limited (“Wharf”), a company listed on the Stock Exchange, at HKD5.20 per share pursuant to a subscription agreement dated 8 June 2012. The total consideration received amounted to approximately HKD 1,704,818,000 (equivalent to approximately RMB1,386,221,000).
(b) On 2 August 2012, the Company further allotted and issued 162,113,714 shares of HKD0.10 each to Target Smart at HKD5.20 per share pursuant to an investment agreement dated 8 June 2012. The total consideration received amounted to approximately HKD 842,991,000 (equivalent to approximately RMB689,095,000).
All shares issued during the year rank pari passu with other shares in issue in all respects.
G r e e n t o w n C h i n a H o l d i n g s L i m i t e d 150 / Notes to the Consolidated Financial StatementsFor the year ended 31 December 2013
29. Convertible Securities
Active Way Development Limited (“Active Way”), a wholly-owned subsidiary of the Company, issued the Hong Kong dollar denominated perpetual subordinated convertible callable securities (“Convertible Securities”) with an aggregate principal amount of HKD2,550,000,000 on 2 August 2012 to Enzio Investments Limited, a wholly-owned subsidiary of Wharf, pursuant to an investment agreement dated 8 June 2012. The Company has agreed to guarantee on a subordinated basis the due payment of all sums expressed to be payable by Active Way under the Convertible Securities. The Convertible Securities are convertible into a maximum of 344,594,594 new shares of the Company at an initial conversion price of HK$7.4 per share, subject to conversion price adjustments. The Convertible Securities are convertible at any time after the expiry of three years from the issue date, except if an offer is made to shareholders for all the outstanding shares of the Company or if a breach event occurs, in which case, the Convertible Securities may be converted at any time on or after the offer is formally announced in compliance with applicable rules and regulations or for so long as the breach event is continuing, as the case may be.
The Convertible Securities confer the holders a right to receive distribution at the applicable distribution rate from and including the issue date to but excluding and payable, on the first anniversary from the issue date, thereafter semi-annually in arrears. The distribution rate shall be (i) in respect of the period from, and including the issue date to, but excluding the 5th anniversary from the issue date, 9% per annum and (ii) in respect of the period from and including the 5th anniversary from the issue date to, but excluding the 10th anniversary from the issue date, 9% per annum plus 2% per annum and thereafter from, and including, each reset date falling after the 5th anniversary from the issue date to, but excluding, the immediately following reset date, the initial spread of 8.4% plus the applicable 5-year U.S. treasury rate plus 2% per annum. A reset date is defined as the fifth anniversary of the issue date and each day falling on the expiry of every five calendar years after the fifth anniversary of the issue date. The applicable 5-year U.S. treasury rate refers to the prevailing rate that represents the average for the week immediately prior to the date on which the reset is calculated as published by the Board of Governors of the U.S. Federal Reserve.
Active Way may at its sole discretion elect to defer any scheduled distribution to the next scheduled distribution payment date by giving prior written notice. Active Way may further defer any arrears of distribution following the foregoing notice requirement and is not subject to any limits as to the number of times distributions and arrears of distribution can be deferred. Any arrears of distribution and any additional distribution amount shall be extinguished upon any voluntary conversion by the holders of the Convertible Securities. Unless and until Active Way or the Company satisfies in full all outstanding arrears of distribution and any additional distribution amount, Active Way and the Company shall not declare or pay any dividends, distributions or make payment on, and will procure that no dividend or other payment is made on or redeem, reduce, cancel, buy-back or acquire for any consideration any share capital thereof (including preference shares) or parity securities.
As the Convertible Securities impose no contractual obligation on the Group to repay their principal or to pay any distributions, they do not meet the definition for classification as financial liabilities under IAS 32. As a result, the whole instrument is classified as equity, and distributions if and when declared are treated as equity dividends.
A distribution of RMB182,914,000 for the year ended 31 December 2013 has been paid by the Company.
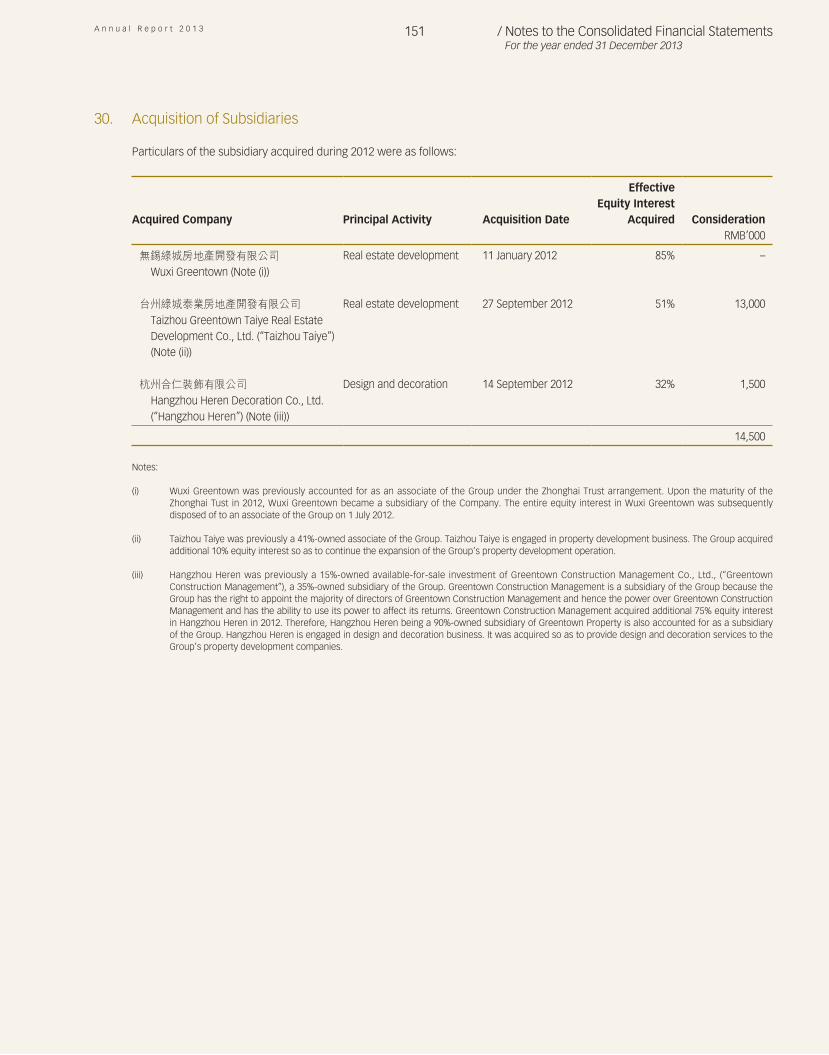
A n n u a l R e p o r t 2 0 1 3 151 / Notes to the Consolidated Financial StatementsFor the year ended 31 December 2013
30. Acquisition of Subsidiaries
Particulars of the subsidiary acquired during 2012 were as follows:
Acquired Company Principal Activity Acquisition Date
Effective Equity Interest
Acquired ConsiderationRMB’000
無錫綠城房地產開發有限公司Wuxi Greentown (Note (i))
Real estate development 11 January 2012 85% –
台州綠城泰業房地產開發有限公司Taizhou Greentown Taiye Real Estate Development Co., Ltd. (“Taizhou Taiye”) (Note (ii))
Real estate development 27 September 2012 51% 13,000
杭州合仁裝飾有限公司Hangzhou Heren Decoration Co., Ltd. (“Hangzhou Heren”) (Note (iii))
Design and decoration 14 September 2012 32% 1,500
14,500
Notes:
(i) Wuxi Greentown was previously accounted for as an associate of the Group under the Zhonghai Trust arrangement. Upon the maturity of the Zhonghai Tust in 2012, Wuxi Greentown became a subsidiary of the Company. The entire equity interest in Wuxi Greentown was subsequently disposed of to an associate of the Group on 1 July 2012.
(ii) Taizhou Taiye was previously a 41%-owned associate of the Group. Taizhou Taiye is engaged in property development business. The Group acquired additional 10% equity interest so as to continue the expansion of the Group’s property development operation.
(iii) Hangzhou Heren was previously a 15%-owned available-for-sale investment of Greentown Construction Management Co., Ltd., (“Greentown Construction Management”), a 35%-owned subsidiary of the Group. Greentown Construction Management is a subsidiary of the Group because the Group has the right to appoint the majority of directors of Greentown Construction Management and hence the power over Greentown Construction Management and has the ability to use its power to affect its returns. Greentown Construction Management acquired additional 75% equity interest in Hangzhou Heren in 2012. Therefore, Hangzhou Heren being a 90%-owned subsidiary of Greentown Property is also accounted for as a subsidiary of the Group. Hangzhou Heren is engaged in design and decoration business. It was acquired so as to provide design and decoration services to the Group’s property development companies.
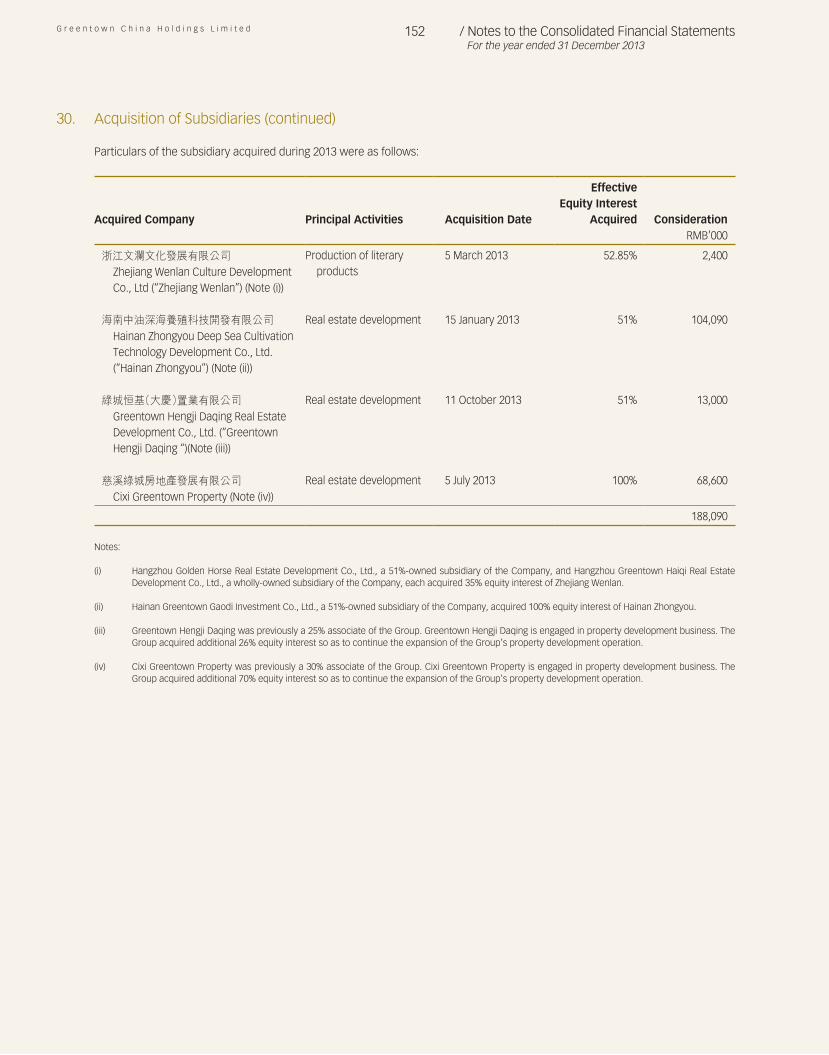
G r e e n t o w n C h i n a H o l d i n g s L i m i t e d 152 / Notes to the Consolidated Financial StatementsFor the year ended 31 December 2013
30. Acquisition of Subsidiaries (continued)
Particulars of the subsidiary acquired during 2013 were as follows:
Acquired Company Principal Activities Acquisition Date
Effective Equity Interest
Acquired ConsiderationRMB’000
浙江文瀾文化發展有限公司Zhejiang Wenlan Culture Development Co., Ltd (“Zhejiang Wenlan”) (Note (i))
Production of literary products
5 March 2013 52.85% 2,400
海南中油深海養殖科技開發有限公司Hainan Zhongyou Deep Sea Cultivation Technology Development Co., Ltd. (“Hainan Zhongyou”) (Note (ii))
Real estate development 15 January 2013 51% 104,090
綠城恒基(大慶)置業有限公司Greentown Hengji Daqing Real Estate Development Co., Ltd. (“Greentown Hengji Daqing “)(Note (iii))
Real estate development 11 October 2013 51% 13,000
慈溪綠城房地產發展有限公司Cixi Greentown Property (Note (iv))
Real estate development 5 July 2013 100% 68,600
188,090
Notes:
(i) Hangzhou Golden Horse Real Estate Development Co., Ltd., a 51%-owned subsidiary of the Company, and Hangzhou Greentown Haiqi Real Estate Development Co., Ltd., a wholly-owned subsidiary of the Company, each acquired 35% equity interest of Zhejiang Wenlan.
(ii) Hainan Greentown Gaodi Investment Co., Ltd., a 51%-owned subsidiary of the Company, acquired 100% equity interest of Hainan Zhongyou.
(iii) Greentown Hengji Daqing was previously a 25% associate of the Group. Greentown Hengji Daqing is engaged in property development business. The Group acquired additional 26% equity interest so as to continue the expansion of the Group’s property development operation.
(iv) Cixi Greentown Property was previously a 30% associate of the Group. Cixi Greentown Property is engaged in property development business. The Group acquired additional 70% equity interest so as to continue the expansion of the Group’s property development operation.
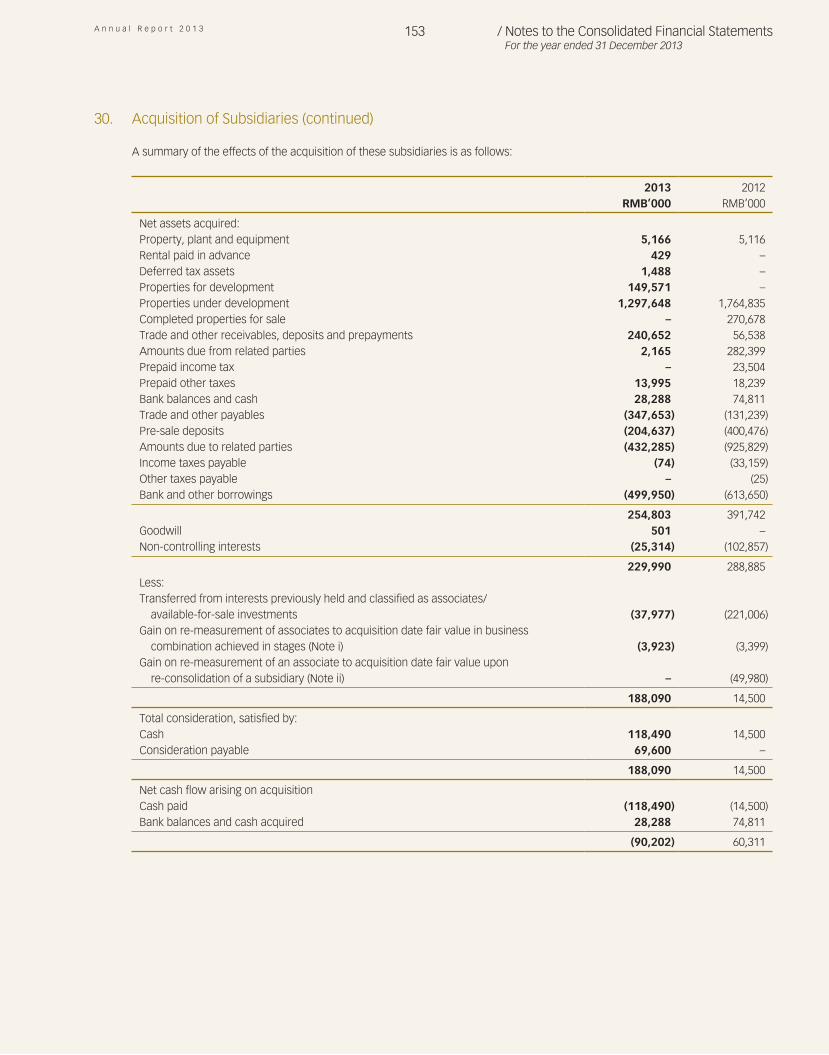
A n n u a l R e p o r t 2 0 1 3 153 / Notes to the Consolidated Financial StatementsFor the year ended 31 December 2013
30. Acquisition of Subsidiaries (continued)
A summary of the effects of the acquisition of these subsidiaries is as follows:
2013 2012
RMB’000 RMB’000 Net assets acquired:Property, plant and equipment 5,166 5,116Rental paid in advance 429 –Deferred tax assets 1,488 –Properties for development 149,571 –Properties under development 1,297,648 1,764,835Completed properties for sale – 270,678Trade and other receivables, deposits and prepayments 240,652 56,538Amounts due from related parties 2,165 282,399Prepaid income tax – 23,504Prepaid other taxes 13,995 18,239Bank balances and cash 28,288 74,811Trade and other payables (347,653) (131,239)Pre-sale deposits (204,637) (400,476)Amounts due to related parties (432,285) (925,829)Income taxes payable (74) (33,159)Other taxes payable – (25)Bank and other borrowings (499,950) (613,650)
254,803 391,742Goodwill 501 –Non-controlling interests (25,314) (102,857)
229,990 288,885Less:Transferred from interests previously held and classified as associates/
available-for-sale investments (37,977) (221,006)Gain on re-measurement of associates to acquisition date fair value in business
combination achieved in stages (Note i) (3,923) (3,399)Gain on re-measurement of an associate to acquisition date fair value upon
re-consolidation of a subsidiary (Note ii) – (49,980) 188,090 14,500
Total consideration, satisfied by:Cash 118,490 14,500Consideration payable 69,600 –
188,090 14,500 Net cash flow arising on acquisitionCash paid (118,490) (14,500)Bank balances and cash acquired 28,288 74,811
(90,202) 60,311

G r e e n t o w n C h i n a H o l d i n g s L i m i t e d 154 / Notes to the Consolidated Financial StatementsFor the year ended 31 December 2013
30. Acquisition of Subsidiaries (continued)
Note:
(i) The Group’s equity interest in Greentown Hengji Daqing and Cixi Greentown Property were remeasured to its fair value upon acquisition during the year, resulting in a gain of RMB2,584,000 and RMB1,339,000 respectively. There was a gain of RMB3,399,000 for the remeasurement of the Group’s equity interest in Taizhou Taiye in 2012.
(ii) The Group’s 85% equity interest in Wuxi Greentown, which was previously accounted for as an associate, was remeasured to its fair value upon the maturity of the Zhonghai Trust in 2012, resulting in a gain of RMB49,980,000.
The acquisition of Hainan Zhongyou has been accounted for as acquisition of assets and liabilities, which do not constitute a business. The acquisition of the other companies has been accounted for using the acquisition method. The effect of the acquisitions was presented together as the assets and liabilities acquired from Zhejiang Wenlan were not material in comparison to the assets and liabilities acquired from Greentown Hengji Daqing and Cixi Greentown Property.
The receivables acquired (which principally comprised trade and other receivables, deposits and prepayments, and amounts due from related parties) with a fair value of RMB242,817,000 at the date of acquisition had gross contractual amounts of RMB242,817,000, which were expected to be fully collected.
The non-controlling interest recognised at the acquisition date was measured by reference to the proportionate share of the recognised amounts of net assets of Zhejiang Wenlan, Greentown Hengji Daqing and Cixi Greentown Property and amounted to RMB25,314,000. The goodwill arising from the acquisition was subsequently written off in the current year.
Zhejiang Wenlan, Greentown Hengji Daqing and Cixi Greentown Property did not contribute any revenue to the Group between the date of acquisition and the end of the year.
Zhejiang Wenlan did not contribute any significant profit or loss to the Group between the date of acquisition and the end of the year. The losses attributable to Greentown Hengji Daqing and Cixi Greentown Property amounted to RMB6,932,000 and RMB2,925,000 respectively have been recognised in the Group’s profit for the year between the date of acquisition and the end of the year.
Had the acquisition of Zhejiang Wenlan, Greentown Hengji Daqing and Cixi Greentown Property been effected at 1 January 2013, the effect on the Group’s revenue and profit for the year ended 31 December 2013 would have been insignificant.
Acquisition-related costs were immaterial and had been excluded from the consideration transferred and had been recognised as an expense in the current year, within the Administrative expenses line item in the consolidated statement of profit or loss and other comprehensive income.
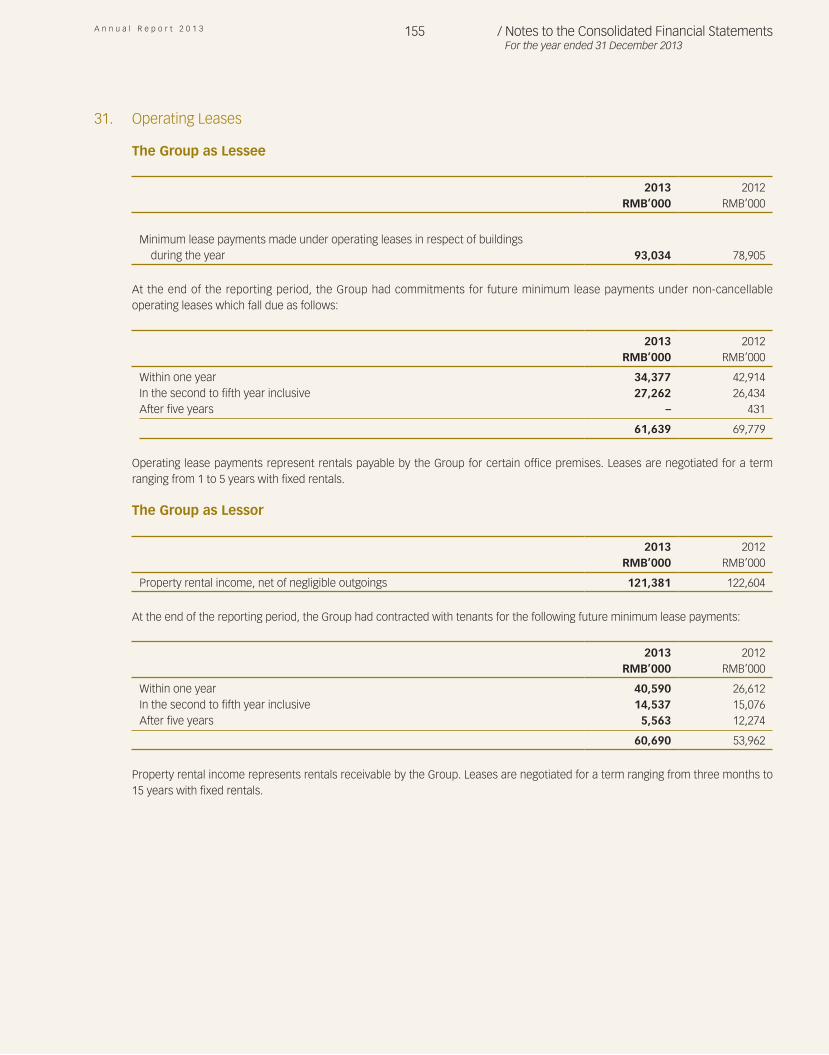
A n n u a l R e p o r t 2 0 1 3 155 / Notes to the Consolidated Financial StatementsFor the year ended 31 December 2013
31. Operating Leases
The Group as Lessee
2013 2012RMB’000 RMB’000
Minimum lease payments made under operating leases in respect of buildings during the year 93,034 78,905
At the end of the reporting period, the Group had commitments for future minimum lease payments under non-cancellable operating leases which fall due as follows:
2013 2012
RMB’000 RMB’000 Within one year 34,377 42,914In the second to fifth year inclusive 27,262 26,434After five years – 431
61,639 69,779
Operating lease payments represent rentals payable by the Group for certain office premises. Leases are negotiated for a term ranging from 1 to 5 years with fixed rentals.
The Group as Lessor
2013 2012RMB’000 RMB’000
Property rental income, net of negligible outgoings 121,381 122,604
At the end of the reporting period, the Group had contracted with tenants for the following future minimum lease payments:
2013 2012
RMB’000 RMB’000 Within one year 40,590 26,612In the second to fifth year inclusive 14,537 15,076After five years 5,563 12,274
60,690 53,962
Property rental income represents rentals receivable by the Group. Leases are negotiated for a term ranging from three months to 15 years with fixed rentals.
G r e e n t o w n C h i n a H o l d i n g s L i m i t e d 156 / Notes to the Consolidated Financial StatementsFor the year ended 31 December 2013
32. Commitments
2013 2012RMB’000 RMB’000
Commitments contracted for but not provided in the consolidated financial statements in respect of:
Properties for development and properties under development 14,038,730 15,079,597Construction in progress 25,855 196,766
14,064,585 15,276,363
In addition to the above, the Group’s share of the commitments of its joint ventures are as follows:
2013 2012
RMB’000 RMB’000 Contracted for but not provided in respect of properties for development and
properties under development 2,136,249 2,283,607
33. Share-based Payment Transactions
The Company’s share option scheme (the “Scheme”) was adopted pursuant to the shareholders’ resolution passed on 22 June 2006 for the primary purpose of providing incentives and/or reward to directors and employees of the Group and will expire on 21 June 2016. Under the Scheme, the Board of Directors of the Company may grant options to eligible employees, including directors of the Company and its subsidiaries, to subscribe for shares in the Company.
The total number of shares in respect of which options may be granted under the Scheme is not permitted to exceed 10% of the shares of the Company in issue at any point in time, without prior approval from the Company’s shareholders. The number of shares issued and to be issued in respect of which options granted and may be granted to any individual in any one year is not permitted to exceed 1% of the shares of the Company in issue at any point in time, without prior approval from the Company’s shareholders. Options granted to independent non-executive directors and substantial shareholders of the Company in excess of 0.1% of the Company’s share capital or with a value in excess of HKD5 million must be approved in advance by the Company’s shareholders.
Options may be exercised at any time from the date of grant of the share option to the expiry of the Scheme, unless otherwise specified in the Scheme. The exercise price is determined by the directors of the Company, and will not be less than the higher of (i) the closing price of the Company’s shares on the date of grant; (ii) the average closing price of the share for the five business dates immediately preceding the date of grant; and (iii) the nominal value of the Company’s shares.
A n n u a l R e p o r t 2 0 1 3 157 / Notes to the Consolidated Financial StatementsFor the year ended 31 December 2013
33. Share-based Payment Transactions (continued)
Details of specific categories of options granted in 2009 are as follows:
Date of Grant Vesting Period Exercise Period Exercise Price Fair Value
2009A 22/1/2009 22/1/2009-21/1/2011 22/1/2009-21/1/2019 HK$2.89 HK$1.192009B 13/5/2009 13/5/2009-12/5/2012 13/5/2009-12/5/2019 HK$7.16 HK$3.412009C 22/6/2009 22/6/2009-21/6/2011 22/6/2009-21/6/2019 HK$11.00 HK$4.712009D 17/7/2009 17/7/2009-16/7/2011 17/7/2009-16/7/2019 HK$11.59 HK$4.17
The closing prices of the Company’s shares on 22 January, 13 May, 22 June and 17 July 2009, the dates of grant, were HK$2.75, HK$7.16, HK$11.00 and HK$11.52 respectively.
The share options are exercisable during the following periods:
2009A(i) up to 50% of the share options granted to each grantee from 22 January 2009;(ii) up to 75% of the share options granted to each grantee at any time after the expiration of 12 months from 22 January 2009;
and(iii) all the remaining share options granted to each grantee at any time after the expiration of 24 months from 22 January 2009,
and in each case, not later than 21 January 2019.
2009B(i) up to 33% of the share options granted to each grantee from 13 May 2009;(ii) up to 67% of the share options granted to each grantee at any time after the expiration of 24 months from 13 May 2009;
and(iii) all the remaining share options granted to each grantee at any time after the expiration of 36 months from 13 May 2009,
and in each case, not later than 12 May 2019.
2009C(i) up to 50% of the share options granted to each grantee from 22 June 2009;(ii) up to 75% of the share options granted to each grantee at any time after the expiration of 12 months from 22 June 2009;
and(iii) all the remaining share options granted to each grantee at any time after the expiration of 24 months from 22 June 2009,
and in each case, not later than 21 June 2019.
2009D(i) up to 50% of the share options granted to each grantee from 17 July 2009;(ii) up to 75% of the share options granted to each grantee at any time after the expiration of 12 months from 17 July 2009;
and(iii) all the remaining share options granted to each grantee at any time after the expiration of 24 months from 17 July 2009,
and in each case, not later than 16 July 2019.
G r e e n t o w n C h i n a H o l d i n g s L i m i t e d 158 / Notes to the Consolidated Financial StatementsFor the year ended 31 December 2013
33. Share-based Payment Transactions (continued)
The following table discloses movements of the Company’s share options held by directors and employees during the year:
Option TypeOutstanding at 1/1/2013
Granted During Year
Exercised During Year
Forfeited During Year 31/12/2013
2009A 18,903,500 – (6,781,500) – 12,122,0002009B 5,216,500 – (1,857,500) – 3,359,0002009C 36,437,000 – (6,686,500) (174,000) 29,576,5002009D 15,000,000 – – – 15,000,000
75,557,000 – (15,325,500) (174,000) 60,057,500 Exercisable at the end
of the year 60,057,500 Weighted average exercise price HK$8.82 – HK$6.95 HK$11.00 HK$9.30
Option TypeOutstanding at 1/1/2012
Granted During Year
Exercised During Year
Forfeited During Year 31/12/2012
2009A 27,199,000 – (8,295,500) – 18,903,5002009B 10,000,000 – (4,783,500) – 5,216,5002009C 37,382,000 – (110,000) (835,000) 36,437,0002009D 15,000,000 – – – 15,000,000
89,581,000 – (13,189,000) (835,000) 75,557,000 Exercisable at the end
of the year 75,557,000 Weighted average exercise price HK$8.21 – HK$4.51 HK$11.00 HK$8.82
In respect of the share options exercised during the year, the weighted average share price at the dates of exercise is HK$15.36 (2012: HK$10.84).
HK$1.00 is payable for each acceptance of grant of share options. In addition, (i) in respect of the 2009A share options, certain grantees were required to pay an option premium of HK$1.00 per share option up front; and (ii) in respect of the 2009C share options, certain grantees were required to pay an option premium of HK$3.50 per share option in three annual instalments. As at 31 December 2013, share option premiums receivable amounting to RMB63,526,000 (2012: RMB89,448,000) were included in current other receivables according to the payment terms of the share option premiums.
The estimated fair values of the 2009A, 2009B, 2009C and 2009D share options at their respective dates of grant are RMB39,173,000, RMB30,023,000, RMB168,173,000 and RMB55,132,000 respectively.
A n n u a l R e p o r t 2 0 1 3 159 / Notes to the Consolidated Financial StatementsFor the year ended 31 December 2013
33. Share-based Payment Transactions (continued)
The following assumptions were used to calculate the fair values of the share options:
2009A 2009B 2009C 2009D Grant date share price HK$2.75 HK$7.16 HK$11.00 HK$11.52Exercise price HK$2.89 HK$7.16 HK$11.00 HK$11.59Expected life 10 years 10 years 10 years 5.1 yearsExpected volatility 58% 59% 59% 57%Dividend yield 2.81% 2.81% 4.16% 4.16%Risk-free interest rate 1.450% 2.372% 2.951% 1.79%
The Binomial model has been used to estimate the fair value of the 2009A, 2009B and 2009C share options. The Black-Scholes pricing model has been used to estimate the fair value of the 2009D share options. The variables and assumptions used in computing the fair value of the share options are based on the directors’ best estimate. Changes in variables and assumptions may result in changes in the fair value of the share options.
Expected volatility was determined by using the historical volatility of the share price of comparable listed companies over the most recent period. The expected life used in the model has been adjusted, based on management’s best estimate, for the effects of non-transferability, exercise restrictions and behavioural considerations.
The Group recognised the total expense of RMB1,203,000 for the year ended 31 December 2012 in relation to share options granted by the Company.
34. Pledge of Assets
At the end of the reporting period, the following assets were pledged to banks and other parties to secure credit facilities granted to the Group:
2013 2012
RMB’000 RMB’000 Land and buildings 16,317 32,807Hotel buildings 1,484,407 1,964,841Construction in progress 533,039 262,565Prepaid lease payment 470,343 229,419Properties for development 431,533 261,497Properties under development 15,843,475 17,540,720Completed properties for sale 1,201,163 900,363Investment properties 1,800,000 1,700,000Pledged bank deposits 595,038 1,734,337Interests in associates 255,270 177,232Interests in joint ventures 94,004 44,552
22,724,589 24,848,333
35. Retirement Benefits Plans
The employees of the Group’s subsidiaries in the PRC are members of the state-managed retirement benefits schemes operated by the PRC government. The PRC subsidiaries are required to contribute a certain percentage of payroll costs to the retirement benefits schemes to fund the benefits. The only obligation of the Group with respect to the retirement benefits schemes is to make the specified contributions.
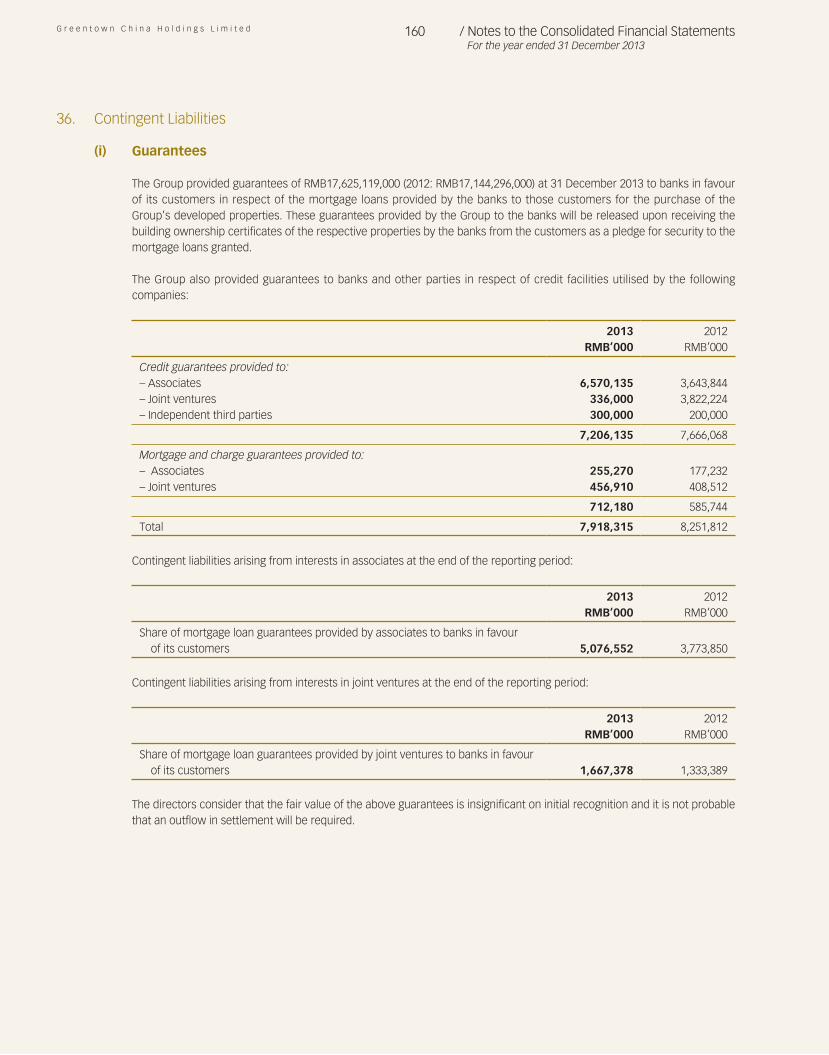
G r e e n t o w n C h i n a H o l d i n g s L i m i t e d 160 / Notes to the Consolidated Financial StatementsFor the year ended 31 December 2013
36. Contingent Liabilities
(i) Guarantees
The Group provided guarantees of RMB17,625,119,000 (2012: RMB17,144,296,000) at 31 December 2013 to banks in favour of its customers in respect of the mortgage loans provided by the banks to those customers for the purchase of the Group’s developed properties. These guarantees provided by the Group to the banks will be released upon receiving the building ownership certificates of the respective properties by the banks from the customers as a pledge for security to the mortgage loans granted.
The Group also provided guarantees to banks and other parties in respect of credit facilities utilised by the following companies:
2013 2012
RMB’000 RMB’000 Credit guarantees provided to:– Associates 6,570,135 3,643,844– Joint ventures 336,000 3,822,224– Independent third parties 300,000 200,000
7,206,135 7,666,068 Mortgage and charge guarantees provided to:– Associates 255,270 177,232– Joint ventures 456,910 408,512
712,180 585,744 Total 7,918,315 8,251,812
Contingent liabilities arising from interests in associates at the end of the reporting period:
2013 2012
RMB’000 RMB’000 Share of mortgage loan guarantees provided by associates to banks in favour
of its customers 5,076,552 3,773,850
Contingent liabilities arising from interests in joint ventures at the end of the reporting period:
2013 2012
RMB’000 RMB’000 Share of mortgage loan guarantees provided by joint ventures to banks in favour
of its customers 1,667,378 1,333,389
The directors consider that the fair value of the above guarantees is insignificant on initial recognition and it is not probable that an outflow in settlement will be required.
A n n u a l R e p o r t 2 0 1 3 161 / Notes to the Consolidated Financial StatementsFor the year ended 31 December 2013
36. Contingent Liabilities (continued)
(ii) Litigation against Zhejiang Fosun Commerce Development Limited (“Zhejiang Fosun”)
On 29 December 2011, Zhejiang Jiahe Industrial Co., Ltd. (“Greentown Jiahe”), a wholly-owned subsidiary of the Company, Shanghai Zendai Land Company Limited (“Shanghai Zendai Land”), a wholly-owned subsidiary of Shanghai Zendai Property Limited, a company listed on the Stock Exchange and an independent third party, and Shanghai Chang Ye Investment Management Consulting Co., Ltd. (“Shanghai Chang Ye”), a wholly-owned subsidiary of SOHO China Limited, entered into an agreement pursuant to which Shanghai Chang Ye had conditionally agreed to acquire, and (i) Greentown Jiahe had conditionally agreed to sell its 100% equity interest in Hangzhou Greentown Hesheng Investment Company (“Greentown Hesheng”) and its loan granted to Greentown Hesheng; and (ii) Shanghai Zendai Land had conditionally agreed to sell its 100% equity interest in Shanghai Zendai Wudaokou Property Company Limited (“Shanghai Zendai Wudaokou”) and its loan granted to Shanghai Zendai Wudaokou. Pursuant to a supplementary agreement dated 9 January 2012, the relevant parties agreed that Shanghai Chang Sheng Investment Management Consulting Co., Ltd (“Shanghai Chang Sheng”) should assume all rights, obligations and liabilities of Shanghai Chang Ye under the equity transfers and loan assignments. Greentown Hesheng and Shanghai Zendai Wudaokou owned 10% and 40% equity interests respectively in Shanghai Haizhimen Property Management Co., Ltd. (“Shanghai Haizhimen”), while Zhejiang Fosun, a wholly-owned subsidiary of Fosun International Limited, a company listed on the Stock Exchange, owned the remaining 50% equity interest in Shanghai Haizhimen. Shanghai Haizhimen indirectly owns 100% interest in a land parcel in Shanghai. The disposal of the 100% equity interest in Greentown Hesheng resulted in a gain of RMB115,330,000 to the Group in 2012.
On 30 May 2012, Zhejiang Fosun filed a civil suit to Shanghai No. 1 Intermediate People’s Court (the “Court”) and received a notification of acceptance from the Court, pursuant to which Zhejiang Fosun had initiated a civil action against the relevant parties to protect its pre-emptive rights in the above-mentioned indirect transfers of equity interests in Shanghai Haizhimen by asking for the transactions to be invalidated.
On 4 June 2012, the Group was served with a document of summons issued by the Court in relation to the civil action, pursuant to which Greentown Jiahe, among others, was named as a defendant.
On 29 November 2012, a preliminary trial was held at the Court. On 24 April 2013, the Court issued its preliminary judgment (the “Judgment”), granting orders for (among other things):
1. the invalidation of the agreement to transfer 100% equity interests in Shanghai Zendai Wudaokou and Greentown Hesheng respectively from Shanghai Zendai Land and Greentown Jiahe to Shanghai Chang Ye as stipulated under the agreement dated 29 December 2011;
2. the invalidation of the equity transfer agreement in relation to the transfer of 100% equity interests in Shanghai Zendai Wudaokou by Shanghai Zendai Land to Shanghai Chang Sheng (“Shanghai Zendai Wudaokou Transfer”) dated 29 December 2011;
3. the invalidation of the equity transfer agreement in relation to the transfer of 100% equity interests in Greentown Hesheng by Greentown Jiahe to Shanghai Chang Sheng (“Greentown Hesheng Transfer”) dated 12 January 2012; and
4. the restatement of the ownership of Shanghai Zendai Wudaokou and Greentown Hesheng back to the state before the Shanghai Zendai Wudaokou Transfer and Greentown Hesheng Transfer, respectively.
G r e e n t o w n C h i n a H o l d i n g s L i m i t e d 162 / Notes to the Consolidated Financial StatementsFor the year ended 31 December 2013
36. Contingent Liabilities (continued)
(ii) Litigation against Zhejiang Fosun Commerce Development Limited (“Zhejiang Fosun”) (continued)
The Company has reviewed the Judgment and SOHO China Limited had made an appeal to the Higher People’s Court of Shanghai in relation to the Judgment. As of the date of these financial statements, the second trial is in progress.
Having consulted with its legal advisers, the Company believes the Judgment cannot be enforced and will not become effective pending the results of the appeal. The Company considers that the Judgement does not have any material adverse effect on the operation of financial position of the Group.
(iii) Litigation against Ms Zhao Xingru (“Ms Zhao”)
On 26 and 27 July 2010, Greentown Real Estate entered into a cooperation agreement and a supplementary agreement (collectively the “Cooperation Agreements”) with Ms Zhao and Mr Zhou Dingwen (“Mr Zhou”), pursuant to which Greentown Real Estate acquired 60% of equity interest in Xinjiang Hongyuan Investment Co., Ltd. (“Xinjiang Hongyuan”) at a consideration of RMB25,500,000. The acquisition was completed on 29 July 2010. The acquisition was accounted for as an acquisition of assets and liabilities.
On 5 September 2011, the Group conditionally disposed of its entire 60% equity interest in Xinjiang Hongyuan to Shanghai Jiechen Investment Consulting Service Co., Ltd. (“Jiechen”) and commissioned Jiechen to manage such interest. Pursuant to a termination agreement dated 11 June 2012, the agreement dated 5 September 2011 in respect of the conditional disposal by the Group and the entrusting management of the Group’s entire 60% equity interest in Xinjiang Hongyuan to Jiechen was terminated.
On 5 November 2012, Ms Zhao filed a civil suit to Xinjiang Uygur Autonomous Region Urumqi Intermediate People’s Court (the “Urumqi Court”) and received a notification of acceptance from the Urumqi Court, pursuant to which Ms Zhao claimed, among other things, the above-mentioned disposal of equity interest in Xinjiang Hongyuan to Jiechen had injured her shareholder’s rights and thus requested that (i) the Cooperative Agreements be revoked; (ii) Greentown Real Estate pay Ms Zhao damages of RMB11,000,000; and (iii) Greentown Real Estate bear the litigation costs.
On 14 May 2013, a preliminary trial was held at the Urumqi Court, the Company and Ms Zhao were not able to reach a settlement through mediation.
On 3 March 2014, Ms Zhao had withdrawn the civil suit against the Group.
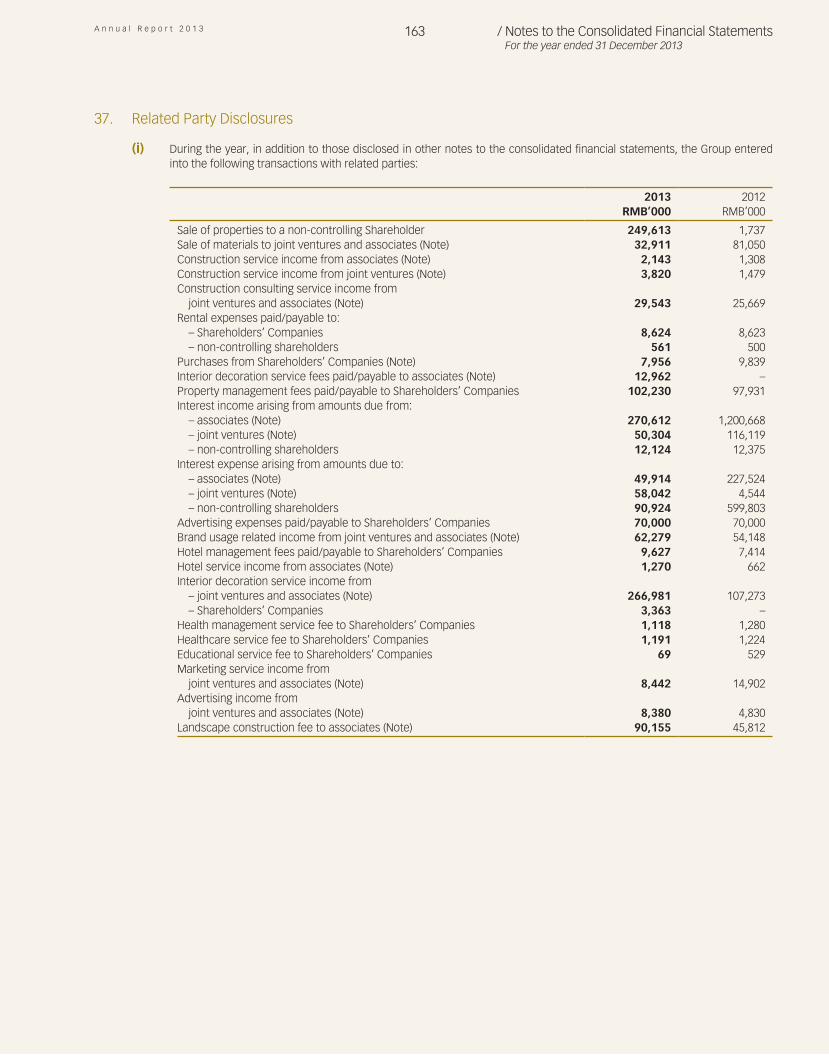
A n n u a l R e p o r t 2 0 1 3 163 / Notes to the Consolidated Financial StatementsFor the year ended 31 December 2013
37. Related Party Disclosures
(i) During the year, in addition to those disclosed in other notes to the consolidated financial statements, the Group entered into the following transactions with related parties:
2013 2012
RMB’000 RMB’000 Sale of properties to a non-controlling Shareholder 249,613 1,737Sale of materials to joint ventures and associates (Note) 32,911 81,050Construction service income from associates (Note) 2,143 1,308Construction service income from joint ventures (Note) 3,820 1,479Construction consulting service income from
joint ventures and associates (Note) 29,543 25,669Rental expenses paid/payable to:
– Shareholders’ Companies 8,624 8,623– non-controlling shareholders 561 500
Purchases from Shareholders’ Companies (Note) 7,956 9,839Interior decoration service fees paid/payable to associates (Note) 12,962 –Property management fees paid/payable to Shareholders’ Companies 102,230 97,931Interest income arising from amounts due from:
– associates (Note) 270,612 1,200,668– joint ventures (Note) 50,304 116,119– non-controlling shareholders 12,124 12,375
Interest expense arising from amounts due to:– associates (Note) 49,914 227,524– joint ventures (Note) 58,042 4,544– non-controlling shareholders 90,924 599,803
Advertising expenses paid/payable to Shareholders’ Companies 70,000 70,000Brand usage related income from joint ventures and associates (Note) 62,279 54,148Hotel management fees paid/payable to Shareholders’ Companies 9,627 7,414Hotel service income from associates (Note) 1,270 662Interior decoration service income from
– joint ventures and associates (Note) 266,981 107,273– Shareholders’ Companies 3,363 –
Health management service fee to Shareholders’ Companies 1,118 1,280Healthcare service fee to Shareholders’ Companies 1,191 1,224Educational service fee to Shareholders’ Companies 69 529Marketing service income from
joint ventures and associates (Note) 8,442 14,902Advertising income from
joint ventures and associates (Note) 8,380 4,830Landscape construction fee to associates (Note) 90,155 45,812
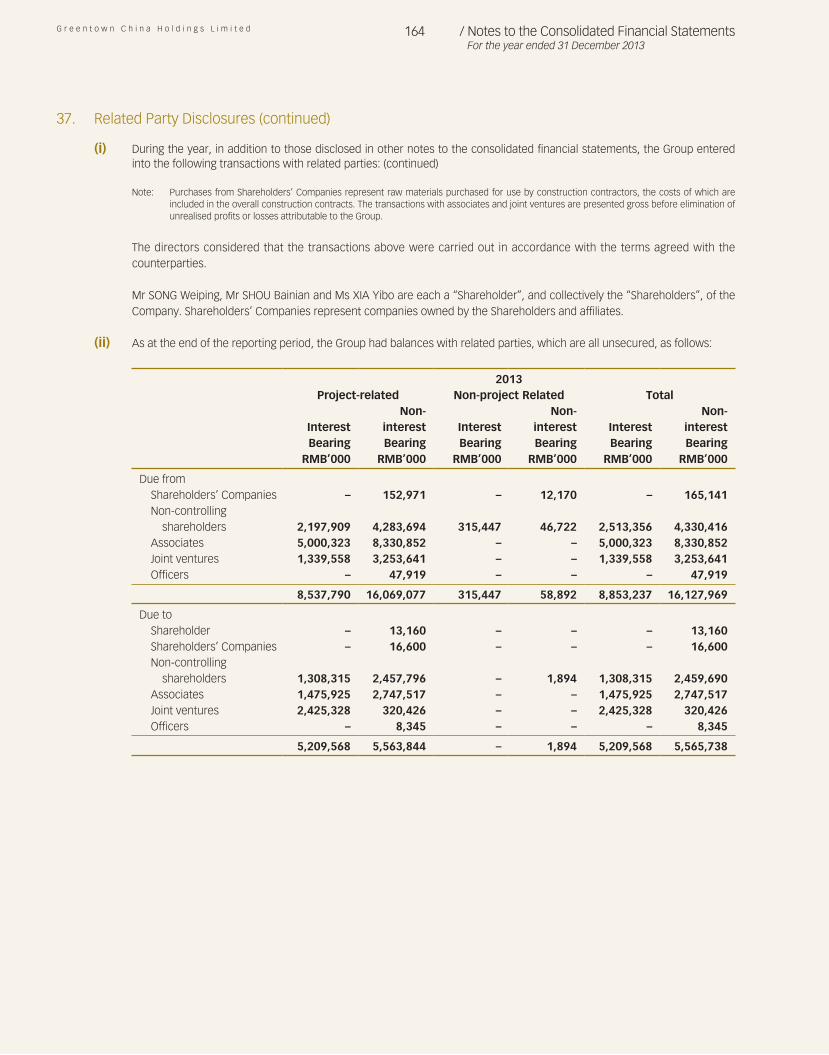
G r e e n t o w n C h i n a H o l d i n g s L i m i t e d 164 / Notes to the Consolidated Financial StatementsFor the year ended 31 December 2013
37. Related Party Disclosures (continued)
(i) During the year, in addition to those disclosed in other notes to the consolidated financial statements, the Group entered into the following transactions with related parties: (continued)
Note: Purchases from Shareholders’ Companies represent raw materials purchased for use by construction contractors, the costs of which are included in the overall construction contracts. The transactions with associates and joint ventures are presented gross before elimination of unrealised profits or losses attributable to the Group.
The directors considered that the transactions above were carried out in accordance with the terms agreed with the counterparties.
Mr SONG Weiping, Mr SHOU Bainian and Ms XIA Yibo are each a “Shareholder”, and collectively the “Shareholders”, of the Company. Shareholders’ Companies represent companies owned by the Shareholders and affiliates.
(ii) As at the end of the reporting period, the Group had balances with related parties, which are all unsecured, as follows:
2013
Project-related Non-project Related Total
Interest Bearing
Non-interest Bearing
Interest Bearing
Non-interest Bearing
Interest Bearing
Non-interest Bearing
RMB’000 RMB’000 RMB’000 RMB’000 RMB’000 RMB’000 Due from
Shareholders’ Companies – 152,971 – 12,170 – 165,141Non-controlling
shareholders 2,197,909 4,283,694 315,447 46,722 2,513,356 4,330,416Associates 5,000,323 8,330,852 – – 5,000,323 8,330,852Joint ventures 1,339,558 3,253,641 – – 1,339,558 3,253,641Officers – 47,919 – – – 47,919
8,537,790 16,069,077 315,447 58,892 8,853,237 16,127,969 Due to
Shareholder – 13,160 – – – 13,160Shareholders’ Companies – 16,600 – – – 16,600Non-controlling
shareholders 1,308,315 2,457,796 – 1,894 1,308,315 2,459,690Associates 1,475,925 2,747,517 – – 1,475,925 2,747,517Joint ventures 2,425,328 320,426 – – 2,425,328 320,426Officers – 8,345 – – – 8,345
5,209,568 5,563,844 – 1,894 5,209,568 5,565,738
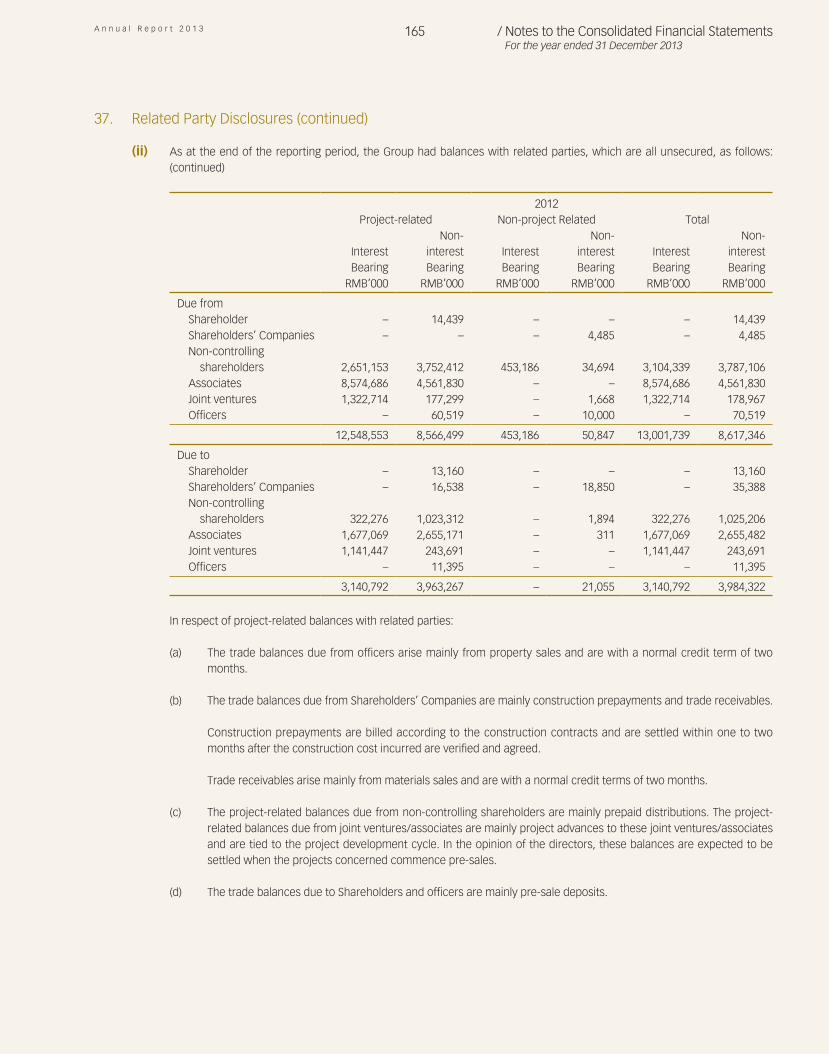
A n n u a l R e p o r t 2 0 1 3 165 / Notes to the Consolidated Financial StatementsFor the year ended 31 December 2013
37. Related Party Disclosures (continued)
(ii) As at the end of the reporting period, the Group had balances with related parties, which are all unsecured, as follows: (continued)
2012
Project-related Non-project Related Total
Interest Bearing
Non-interest
BearingInterest
Bearing
Non-interest
BearingInterest
Bearing
Non-interest
BearingRMB’000 RMB’000 RMB’000 RMB’000 RMB’000 RMB’000
Due fromShareholder – 14,439 – – – 14,439Shareholders’ Companies – – – 4,485 – 4,485Non-controlling
shareholders 2,651,153 3,752,412 453,186 34,694 3,104,339 3,787,106Associates 8,574,686 4,561,830 – – 8,574,686 4,561,830Joint ventures 1,322,714 177,299 – 1,668 1,322,714 178,967Officers – 60,519 – 10,000 – 70,519
12,548,553 8,566,499 453,186 50,847 13,001,739 8,617,346 Due to
Shareholder – 13,160 – – – 13,160Shareholders’ Companies – 16,538 – 18,850 – 35,388Non-controlling
shareholders 322,276 1,023,312 – 1,894 322,276 1,025,206Associates 1,677,069 2,655,171 – 311 1,677,069 2,655,482Joint ventures 1,141,447 243,691 – – 1,141,447 243,691Officers – 11,395 – – – 11,395
3,140,792 3,963,267 – 21,055 3,140,792 3,984,322
In respect of project-related balances with related parties:
(a) The trade balances due from officers arise mainly from property sales and are with a normal credit term of two months.
(b) The trade balances due from Shareholders’ Companies are mainly construction prepayments and trade receivables.
Construction prepayments are billed according to the construction contracts and are settled within one to two months after the construction cost incurred are verified and agreed.
Trade receivables arise mainly from materials sales and are with a normal credit terms of two months.
(c) The project-related balances due from non-controlling shareholders are mainly prepaid distributions. The project-related balances due from joint ventures/associates are mainly project advances to these joint ventures/associates and are tied to the project development cycle. In the opinion of the directors, these balances are expected to be settled when the projects concerned commence pre-sales.
(d) The trade balances due to Shareholders and officers are mainly pre-sale deposits.
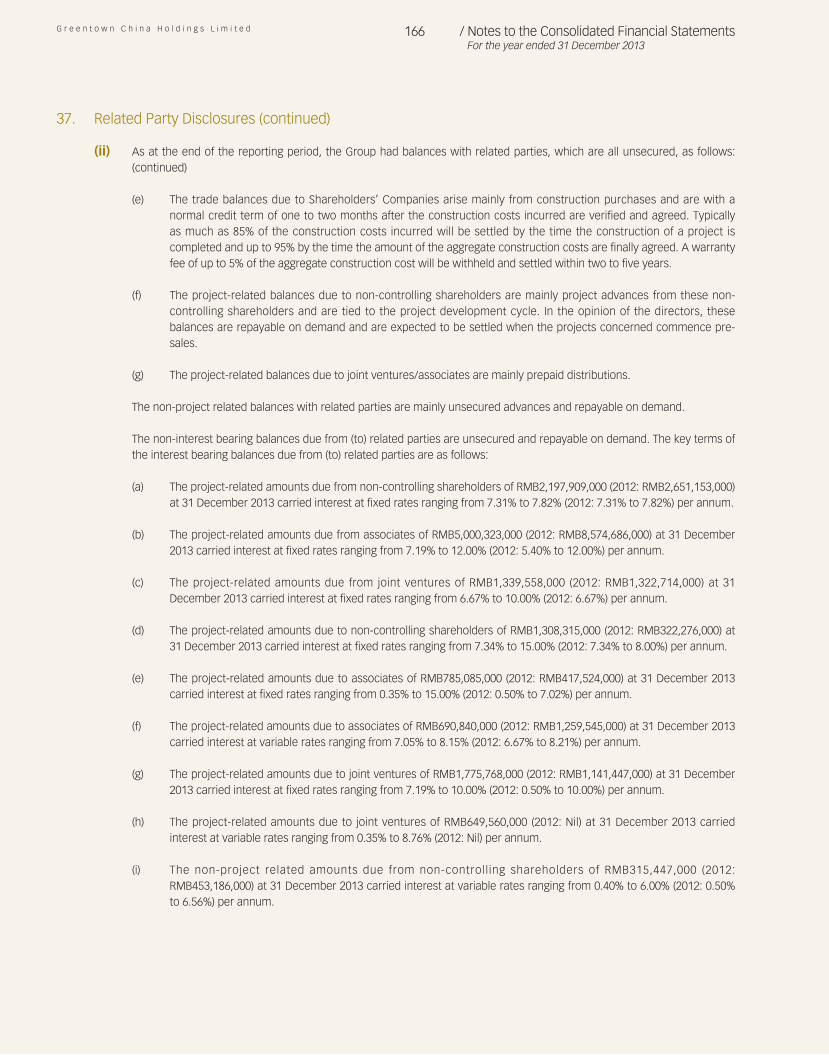
G r e e n t o w n C h i n a H o l d i n g s L i m i t e d 166 / Notes to the Consolidated Financial StatementsFor the year ended 31 December 2013
37. Related Party Disclosures (continued)
(ii) As at the end of the reporting period, the Group had balances with related parties, which are all unsecured, as follows: (continued)
(e) The trade balances due to Shareholders’ Companies arise mainly from construction purchases and are with a normal credit term of one to two months after the construction costs incurred are verified and agreed. Typically as much as 85% of the construction costs incurred will be settled by the time the construction of a project is completed and up to 95% by the time the amount of the aggregate construction costs are finally agreed. A warranty fee of up to 5% of the aggregate construction cost will be withheld and settled within two to five years.
(f) The project-related balances due to non-controlling shareholders are mainly project advances from these non-controlling shareholders and are tied to the project development cycle. In the opinion of the directors, these balances are repayable on demand and are expected to be settled when the projects concerned commence pre-sales.
(g) The project-related balances due to joint ventures/associates are mainly prepaid distributions.
The non-project related balances with related parties are mainly unsecured advances and repayable on demand.
The non-interest bearing balances due from (to) related parties are unsecured and repayable on demand. The key terms of the interest bearing balances due from (to) related parties are as follows:
(a) The project-related amounts due from non-controlling shareholders of RMB2,197,909,000 (2012: RMB2,651,153,000) at 31 December 2013 carried interest at fixed rates ranging from 7.31% to 7.82% (2012: 7.31% to 7.82%) per annum.
(b) The project-related amounts due from associates of RMB5,000,323,000 (2012: RMB8,574,686,000) at 31 December 2013 carried interest at fixed rates ranging from 7.19% to 12.00% (2012: 5.40% to 12.00%) per annum.
(c) The project-related amounts due from joint ventures of RMB1,339,558,000 (2012: RMB1,322,714,000) at 31 December 2013 carried interest at fixed rates ranging from 6.67% to 10.00% (2012: 6.67%) per annum.
(d) The project-related amounts due to non-controlling shareholders of RMB1,308,315,000 (2012: RMB322,276,000) at 31 December 2013 carried interest at fixed rates ranging from 7.34% to 15.00% (2012: 7.34% to 8.00%) per annum.
(e) The project-related amounts due to associates of RMB785,085,000 (2012: RMB417,524,000) at 31 December 2013 carried interest at fixed rates ranging from 0.35% to 15.00% (2012: 0.50% to 7.02%) per annum.
(f) The project-related amounts due to associates of RMB690,840,000 (2012: RMB1,259,545,000) at 31 December 2013 carried interest at variable rates ranging from 7.05% to 8.15% (2012: 6.67% to 8.21%) per annum.
(g) The project-related amounts due to joint ventures of RMB1,775,768,000 (2012: RMB1,141,447,000) at 31 December 2013 carried interest at fixed rates ranging from 7.19% to 10.00% (2012: 0.50% to 10.00%) per annum.
(h) The project-related amounts due to joint ventures of RMB649,560,000 (2012: Nil) at 31 December 2013 carried interest at variable rates ranging from 0.35% to 8.76% (2012: Nil) per annum.
(i) The non-project related amounts due from non-controlling shareholders of RMB315,447,000 (2012: RMB453,186,000) at 31 December 2013 carried interest at variable rates ranging from 0.40% to 6.00% (2012: 0.50% to 6.56%) per annum.
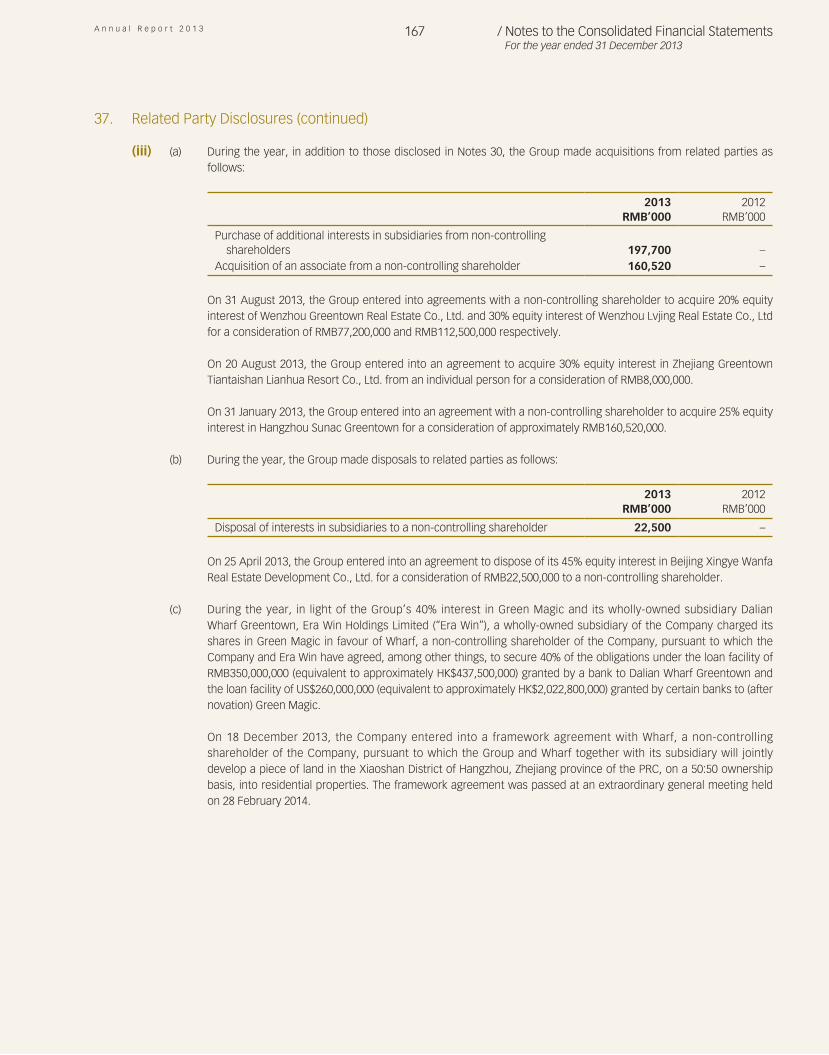
A n n u a l R e p o r t 2 0 1 3 167 / Notes to the Consolidated Financial StatementsFor the year ended 31 December 2013
37. Related Party Disclosures (continued)
(iii) (a) During the year, in addition to those disclosed in Notes 30, the Group made acquisitions from related parties as follows:
2013 2012
RMB’000 RMB’000 Purchase of additional interests in subsidiaries from non-controlling
shareholders 197,700 –Acquisition of an associate from a non-controlling shareholder 160,520 –
On 31 August 2013, the Group entered into agreements with a non-controlling shareholder to acquire 20% equity interest of Wenzhou Greentown Real Estate Co., Ltd. and 30% equity interest of Wenzhou Lvjing Real Estate Co., Ltd for a consideration of RMB77,200,000 and RMB112,500,000 respectively.
On 20 August 2013, the Group entered into an agreement to acquire 30% equity interest in Zhejiang Greentown Tiantaishan Lianhua Resort Co., Ltd. from an individual person for a consideration of RMB8,000,000.
On 31 January 2013, the Group entered into an agreement with a non-controlling shareholder to acquire 25% equity interest in Hangzhou Sunac Greentown for a consideration of approximately RMB160,520,000.
(b) During the year, the Group made disposals to related parties as follows:
2013 2012
RMB’000 RMB’000 Disposal of interests in subsidiaries to a non-controlling shareholder 22,500 –
On 25 April 2013, the Group entered into an agreement to dispose of its 45% equity interest in Beijing Xingye Wanfa Real Estate Development Co., Ltd. for a consideration of RMB22,500,000 to a non-controlling shareholder.
(c) During the year, in light of the Group’s 40% interest in Green Magic and its wholly-owned subsidiary Dalian Wharf Greentown, Era Win Holdings Limited (“Era Win”), a wholly-owned subsidiary of the Company charged its shares in Green Magic in favour of Wharf, a non-controlling shareholder of the Company, pursuant to which the Company and Era Win have agreed, among other things, to secure 40% of the obligations under the loan facility of RMB350,000,000 (equivalent to approximately HK$437,500,000) granted by a bank to Dalian Wharf Greentown and the loan facility of US$260,000,000 (equivalent to approximately HK$2,022,800,000) granted by certain banks to (after novation) Green Magic.
On 18 December 2013, the Company entered into a framework agreement with Wharf, a non-controlling shareholder of the Company, pursuant to which the Group and Wharf together with its subsidiary will jointly develop a piece of land in the Xiaoshan District of Hangzhou, Zhejiang province of the PRC, on a 50:50 ownership basis, into residential properties. The framework agreement was passed at an extraordinary general meeting held on 28 February 2014.
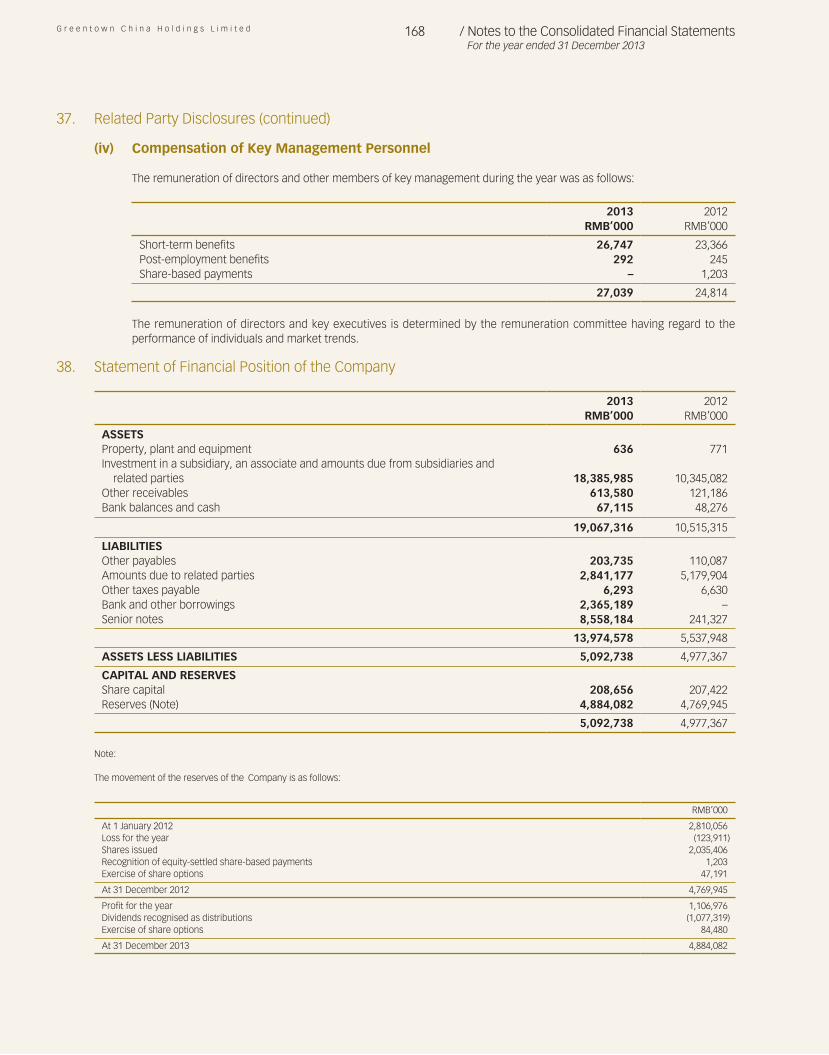
G r e e n t o w n C h i n a H o l d i n g s L i m i t e d 168 / Notes to the Consolidated Financial StatementsFor the year ended 31 December 2013
37. Related Party Disclosures (continued)
(iv) Compensation of Key Management Personnel
The remuneration of directors and other members of key management during the year was as follows:
2013 2012
RMB’000 RMB’000 Short-term benefits 26,747 23,366Post-employment benefits 292 245Share-based payments – 1,203
27,039 24,814
The remuneration of directors and key executives is determined by the remuneration committee having regard to the performance of individuals and market trends.
38. Statement of Financial Position of the Company
2013 2012RMB’000 RMB’000
ASSETSProperty, plant and equipment 636 771Investment in a subsidiary, an associate and amounts due from subsidiaries and
related parties 18,385,985 10,345,082Other receivables 613,580 121,186Bank balances and cash 67,115 48,276
19,067,316 10,515,315 LIABILITIESOther payables 203,735 110,087Amounts due to related parties 2,841,177 5,179,904Other taxes payable 6,293 6,630Bank and other borrowings 2,365,189 –Senior notes 8,558,184 241,327
13,974,578 5,537,948 ASSETS LESS LIABILITIES 5,092,738 4,977,367 CAPITAL AND RESERVESShare capital 208,656 207,422Reserves (Note) 4,884,082 4,769,945
5,092,738 4,977,367
Note:
The movement of the reserves of the Company is as follows:
RMB’000
At 1 January 2012 2,810,056Loss for the year (123,911)Shares issued 2,035,406Recognition of equity-settled share-based payments 1,203Exercise of share options 47,191 At 31 December 2012 4,769,945 Profit for the year 1,106,976Dividends recognised as distributions (1,077,319)Exercise of share options 84,480 At 31 December 2013 4,884,082
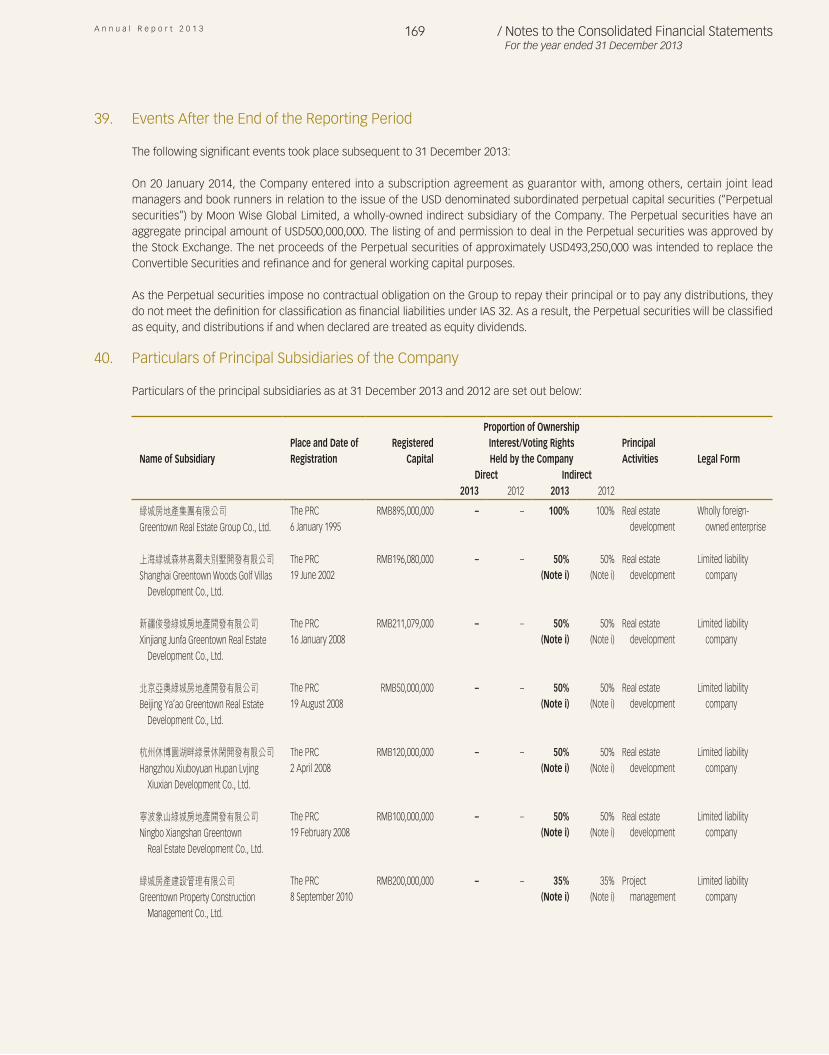
A n n u a l R e p o r t 2 0 1 3 169 / Notes to the Consolidated Financial StatementsFor the year ended 31 December 2013
39. Events After the End of the Reporting Period
The following significant events took place subsequent to 31 December 2013:
On 20 January 2014, the Company entered into a subscription agreement as guarantor with, among others, certain joint lead managers and book runners in relation to the issue of the USD denominated subordinated perpetual capital securities (“Perpetual securities”) by Moon Wise Global Limited, a wholly-owned indirect subsidiary of the Company. The Perpetual securities have an aggregate principal amount of USD500,000,000. The listing of and permission to deal in the Perpetual securities was approved by the Stock Exchange. The net proceeds of the Perpetual securities of approximately USD493,250,000 was intended to replace the Convertible Securities and refinance and for general working capital purposes.
As the Perpetual securities impose no contractual obligation on the Group to repay their principal or to pay any distributions, they do not meet the definition for classification as financial liabilities under IAS 32. As a result, the Perpetual securities will be classified as equity, and distributions if and when declared are treated as equity dividends.
40. Particulars of Principal Subsidiaries of the Company
Particulars of the principal subsidiaries as at 31 December 2013 and 2012 are set out below:
Name of SubsidiaryPlace and Date of Registration
Registered Capital
Proportion of Ownership Interest/Voting Rights Held by the Company
Principal Activities Legal Form
Direct Indirect2013 2012 2013 2012
綠城房地產集團有限公司Greentown Real Estate Group Co., Ltd.
The PRC 6 January 1995
RMB895,000,000 – – 100% 100% Real estate development
Wholly foreign-owned enterprise
上海綠城森林高爾夫別墅開發有限公司Shanghai Greentown Woods Golf Villas
Development Co., Ltd.
The PRC 19 June 2002
RMB196,080,000 – – 50%(Note i)
50%(Note i)
Real estate development
Limited liability company
新疆俊發綠城房地產開發有限公司Xinjiang Junfa Greentown Real Estate
Development Co., Ltd.
The PRC 16 January 2008
RMB211,079,000 – – 50%(Note i)
50%(Note i)
Real estate development
Limited liability company
北京亞奧綠城房地產開發有限公司Beijing Ya’ao Greentown Real Estate
Development Co., Ltd.
The PRC 19 August 2008
RMB50,000,000 – – 50%(Note i)
50%(Note i)
Real estate development
Limited liability company
杭州休博園湖畔綠景休閑開發有限公司Hangzhou Xiuboyuan Hupan Lvjing
Xiuxian Development Co., Ltd.
The PRC 2 April 2008
RMB120,000,000 – – 50%(Note i)
50%(Note i)
Real estate development
Limited liability company
寧波象山綠城房地產開發有限公司Ningbo Xiangshan Greentown
Real Estate Development Co., Ltd.
The PRC 19 February 2008
RMB100,000,000 – – 50%(Note i)
50%(Note i)
Real estate development
Limited liability company
綠城房產建設管理有限公司Greentown Property Construction
Management Co., Ltd.
The PRC 8 September 2010
RMB200,000,000 – – 35%(Note i)
35%(Note i)
Project management
Limited liability company
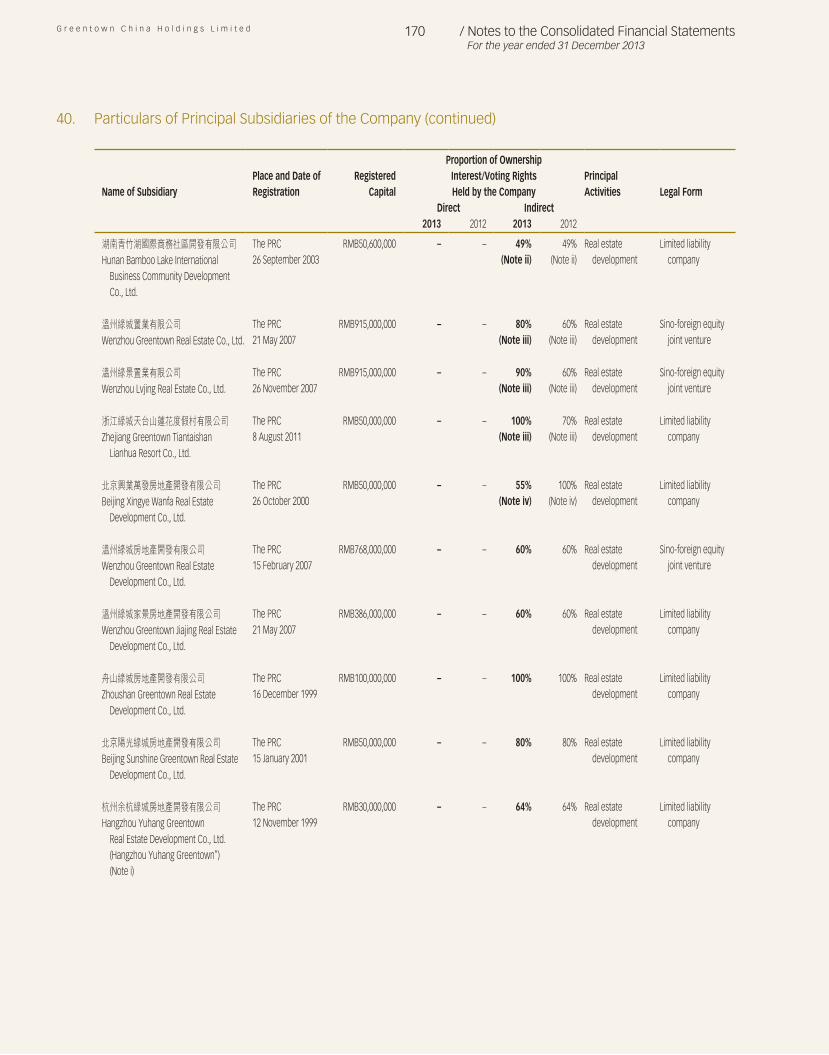
G r e e n t o w n C h i n a H o l d i n g s L i m i t e d 170 / Notes to the Consolidated Financial StatementsFor the year ended 31 December 2013
Name of SubsidiaryPlace and Date of Registration
Registered Capital
Proportion of Ownership Interest/Voting Rights Held by the Company
Principal Activities Legal Form
Direct Indirect2013 2012 2013 2012
湖南青竹湖國際商務社區開發有限公司Hunan Bamboo Lake International
Business Community Development Co., Ltd.
The PRC 26 September 2003
RMB50,600,000 – – 49%(Note ii)
49%(Note ii)
Real estate development
Limited liability company
溫州綠城置業有限公司Wenzhou Greentown Real Estate Co., Ltd.
The PRC 21 May 2007
RMB915,000,000 – – 80%(Note iii)
60%(Note iii)
Real estate development
Sino-foreign equity joint venture
溫州綠景置業有限公司Wenzhou Lvjing Real Estate Co., Ltd.
The PRC 26 November 2007
RMB915,000,000 – – 90%(Note iii)
60%(Note iii)
Real estate development
Sino-foreign equity joint venture
浙江綠城天台山蓮花度假村有限公司Zhejiang Greentown Tiantaishan
Lianhua Resort Co., Ltd.
The PRC 8 August 2011
RMB50,000,000 – – 100%(Note iii)
70%(Note iii)
Real estate development
Limited liability company
北京興業萬發房地產開發有限公司Beijing Xingye Wanfa Real Estate
Development Co., Ltd.
The PRC 26 October 2000
RMB50,000,000 – – 55%(Note iv)
100%(Note iv)
Real estate development
Limited liability company
溫州綠城房地產開發有限公司Wenzhou Greentown Real Estate
Development Co., Ltd.
The PRC 15 February 2007
RMB768,000,000 – – 60% 60% Real estate development
Sino-foreign equity joint venture
溫州綠城家景房地產開發有限公司Wenzhou Greentown Jiajing Real Estate
Development Co., Ltd.
The PRC 21 May 2007
RMB386,000,000 – – 60% 60% Real estate development
Limited liability company
舟山綠城房地產開發有限公司Zhoushan Greentown Real Estate
Development Co., Ltd.
The PRC 16 December 1999
RMB100,000,000 – – 100% 100% Real estate development
Limited liability company
北京陽光綠城房地產開發有限公司Beijing Sunshine Greentown Real Estate
Development Co., Ltd.
The PRC 15 January 2001
RMB50,000,000 – – 80% 80% Real estate development
Limited liability company
杭州余杭綠城房地產開發有限公司Hangzhou Yuhang Greentown
Real Estate Development Co., Ltd. (Hangzhou Yuhang Greentown”) (Note i)
The PRC 12 November 1999
RMB30,000,000 – – 64% 64% Real estate development
Limited liability company
40. Particulars of Principal Subsidiaries of the Company (continued)
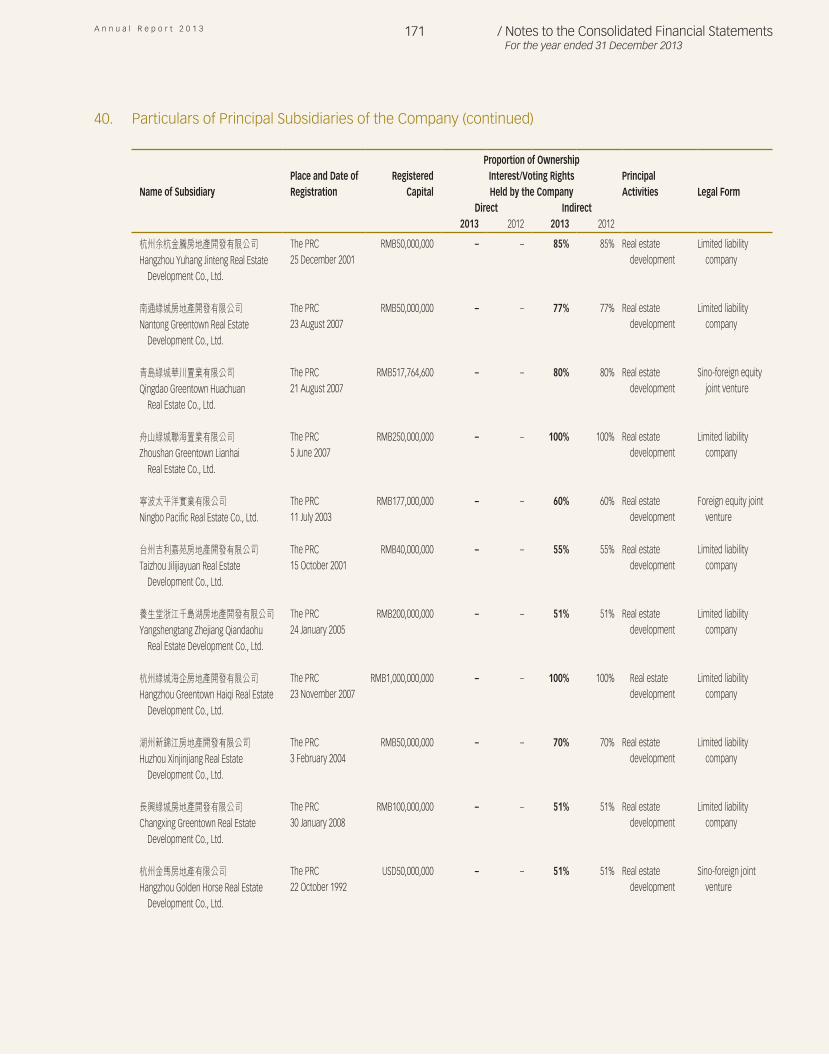
A n n u a l R e p o r t 2 0 1 3 171 / Notes to the Consolidated Financial StatementsFor the year ended 31 December 2013
Name of SubsidiaryPlace and Date of Registration
Registered Capital
Proportion of Ownership Interest/Voting Rights Held by the Company
Principal Activities Legal Form
Direct Indirect2013 2012 2013 2012
杭州余杭金騰房地產開發有限公司Hangzhou Yuhang Jinteng Real Estate
Development Co., Ltd.
The PRC 25 December 2001
RMB50,000,000 – – 85% 85% Real estate development
Limited liability company
南通綠城房地產開發有限公司Nantong Greentown Real Estate
Development Co., Ltd.
The PRC 23 August 2007
RMB50,000,000 – – 77% 77% Real estate development
Limited liability company
青島綠城華川置業有限公司Qingdao Greentown Huachuan
Real Estate Co., Ltd.
The PRC 21 August 2007
RMB517,764,600 – – 80% 80% Real estate development
Sino-foreign equity joint venture
舟山綠城聯海置業有限公司Zhoushan Greentown Lianhai
Real Estate Co., Ltd.
The PRC 5 June 2007
RMB250,000,000 – – 100% 100% Real estate development
Limited liability company
寧波太平洋實業有限公司Ningbo Pacific Real Estate Co., Ltd.
The PRC 11 July 2003
RMB177,000,000 – – 60% 60% Real estate development
Foreign equity joint venture
台州吉利嘉苑房地產開發有限公司Taizhou Jilijiayuan Real Estate
Development Co., Ltd.
The PRC 15 October 2001
RMB40,000,000 – – 55% 55% Real estate development
Limited liability company
養生堂浙江千島湖房地產開發有限公司Yangshengtang Zhejiang Qiandaohu
Real Estate Development Co., Ltd.
The PRC 24 January 2005
RMB200,000,000 – – 51% 51% Real estate development
Limited liability company
杭州綠城海企房地產開發有限公司Hangzhou Greentown Haiqi Real Estate
Development Co., Ltd.
The PRC 23 November 2007
RMB1,000,000,000 – – 100% 100% Real estate development
Limited liability company
湖州新錦江房地產開發有限公司Huzhou Xinjinjiang Real Estate
Development Co., Ltd.
The PRC 3 February 2004
RMB50,000,000 – – 70% 70% Real estate development
Limited liability company
長興綠城房地產開發有限公司Changxing Greentown Real Estate
Development Co., Ltd.
The PRC 30 January 2008
RMB100,000,000 – – 51% 51% Real estate development
Limited liability company
杭州金馬房地產有限公司Hangzhou Golden Horse Real Estate
Development Co., Ltd.
The PRC 22 October 1992
USD50,000,000 – – 51% 51% Real estate development
Sino-foreign joint venture
40. Particulars of Principal Subsidiaries of the Company (continued)
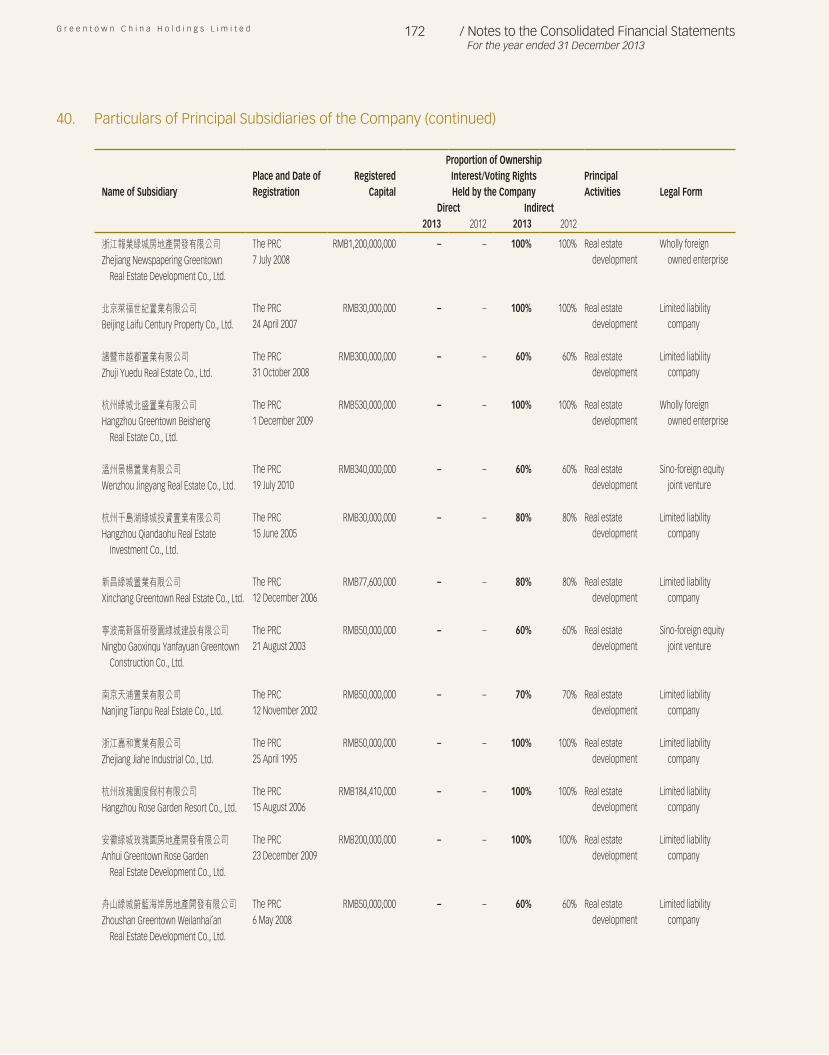
G r e e n t o w n C h i n a H o l d i n g s L i m i t e d 172 / Notes to the Consolidated Financial StatementsFor the year ended 31 December 2013
Name of SubsidiaryPlace and Date of Registration
Registered Capital
Proportion of Ownership Interest/Voting Rights Held by the Company
Principal Activities Legal Form
Direct Indirect2013 2012 2013 2012
浙江報業綠城房地產開發有限公司Zhejiang Newspapering Greentown
Real Estate Development Co., Ltd.
The PRC 7 July 2008
RMB1,200,000,000 – – 100% 100% Real estate development
Wholly foreign owned enterprise
北京萊福世紀置業有限公司Beijing Laifu Century Property Co., Ltd.
The PRC 24 April 2007
RMB30,000,000 – – 100% 100% Real estate development
Limited liability company
諸暨市越都置業有限公司Zhuji Yuedu Real Estate Co., Ltd.
The PRC 31 October 2008
RMB300,000,000 – – 60% 60% Real estate development
Limited liability company
杭州綠城北盛置業有限公司Hangzhou Greentown Beisheng
Real Estate Co., Ltd.
The PRC 1 December 2009
RMB530,000,000 – – 100% 100% Real estate development
Wholly foreign owned enterprise
溫州景楊置業有限公司Wenzhou Jingyang Real Estate Co., Ltd.
The PRC 19 July 2010
RMB340,000,000 – – 60% 60% Real estate development
Sino-foreign equity joint venture
杭州千島湖綠城投資置業有限公司Hangzhou Qiandaohu Real Estate
Investment Co., Ltd.
The PRC 15 June 2005
RMB30,000,000 – – 80% 80% Real estate development
Limited liability company
新昌綠城置業有限公司Xinchang Greentown Real Estate Co., Ltd.
The PRC 12 December 2006
RMB77,600,000 – – 80% 80% Real estate development
Limited liability company
寧波高新區研發園綠城建設有限公司Ningbo Gaoxinqu Yanfayuan Greentown
Construction Co., Ltd.
The PRC 21 August 2003
RMB50,000,000 – – 60% 60% Real estate development
Sino-foreign equity joint venture
南京天浦置業有限公司Nanjing Tianpu Real Estate Co., Ltd.
The PRC 12 November 2002
RMB50,000,000 – – 70% 70% Real estate development
Limited liability company
浙江嘉和實業有限公司Zhejiang Jiahe Industrial Co., Ltd.
The PRC 25 April 1995
RMB50,000,000 – – 100% 100% Real estate development
Limited liability company
杭州玫瑰園度假村有限公司Hangzhou Rose Garden Resort Co., Ltd.
The PRC 15 August 2006
RMB184,410,000 – – 100% 100% Real estate development
Limited liability company
安徽綠城玫瑰園房地產開發有限公司Anhui Greentown Rose Garden
Real Estate Development Co., Ltd.
The PRC 23 December 2009
RMB200,000,000 – – 100% 100% Real estate development
Limited liability company
舟山綠城蔚藍海岸房地產開發有限公司Zhoushan Greentown Weilanhai’an
Real Estate Development Co., Ltd.
The PRC 6 May 2008
RMB50,000,000 – – 60% 60% Real estate development
Limited liability company
40. Particulars of Principal Subsidiaries of the Company (continued)
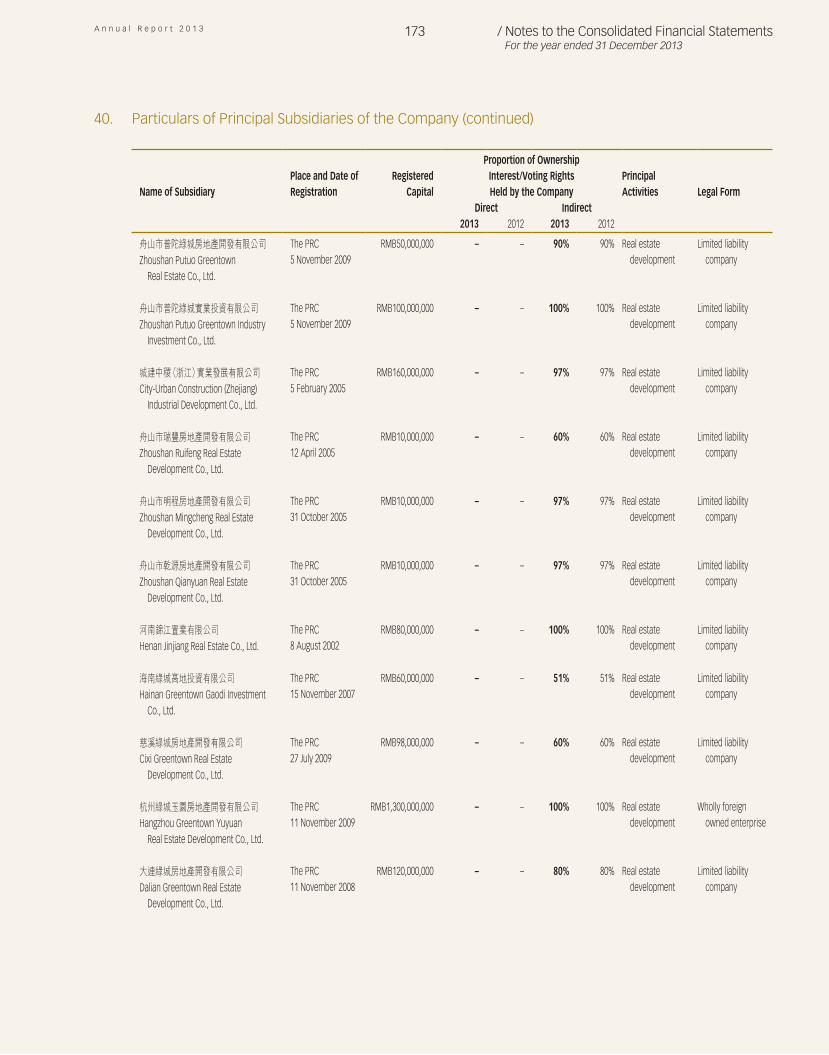
A n n u a l R e p o r t 2 0 1 3 173 / Notes to the Consolidated Financial StatementsFor the year ended 31 December 2013
Name of SubsidiaryPlace and Date of Registration
Registered Capital
Proportion of Ownership Interest/Voting Rights Held by the Company
Principal Activities Legal Form
Direct Indirect2013 2012 2013 2012
舟山市普陀綠城房地產開發有限公司Zhoushan Putuo Greentown
Real Estate Co., Ltd.
The PRC 5 November 2009
RMB50,000,000 – – 90% 90% Real estate development
Limited liability company
舟山市普陀綠城實業投資有限公司Zhoushan Putuo Greentown Industry
Investment Co., Ltd.
The PRC 5 November 2009
RMB100,000,000 – – 100% 100% Real estate development
Limited liability company
城建中稷(浙江)實業發展有限公司City-Urban Construction (Zhejiang)
Industrial Development Co., Ltd.
The PRC 5 February 2005
RMB160,000,000 – – 97% 97% Real estate development
Limited liability company
舟山市瑞豐房地產開發有限公司Zhoushan Ruifeng Real Estate
Development Co., Ltd.
The PRC 12 April 2005
RMB10,000,000 – – 60% 60% Real estate development
Limited liability company
舟山市明程房地產開發有限公司Zhoushan Mingcheng Real Estate
Development Co., Ltd.
The PRC 31 October 2005
RMB10,000,000 – – 97% 97% Real estate development
Limited liability company
舟山市乾源房地產開發有限公司Zhoushan Qianyuan Real Estate
Development Co., Ltd.
The PRC 31 October 2005
RMB10,000,000 – – 97% 97% Real estate development
Limited liability company
河南錦江置業有限公司Henan Jinjiang Real Estate Co., Ltd.
The PRC 8 August 2002
RMB80,000,000 – – 100% 100% Real estate development
Limited liability company
海南綠城高地投資有限公司Hainan Greentown Gaodi Investment
Co., Ltd.
The PRC 15 November 2007
RMB60,000,000 – – 51% 51% Real estate development
Limited liability company
慈溪綠城房地產開發有限公司Cixi Greentown Real Estate
Development Co., Ltd.
The PRC27 July 2009
RMB98,000,000 – – 60% 60% Real estate development
Limited liability company
杭州綠城玉園房地產開發有限公司Hangzhou Greentown Yuyuan
Real Estate Development Co., Ltd.
The PRC 11 November 2009
RMB1,300,000,000 – – 100% 100% Real estate development
Wholly foreign owned enterprise
大連綠城房地產開發有限公司Dalian Greentown Real Estate
Development Co., Ltd.
The PRC 11 November 2008
RMB120,000,000 – – 80% 80% Real estate development
Limited liability company
40. Particulars of Principal Subsidiaries of the Company (continued)
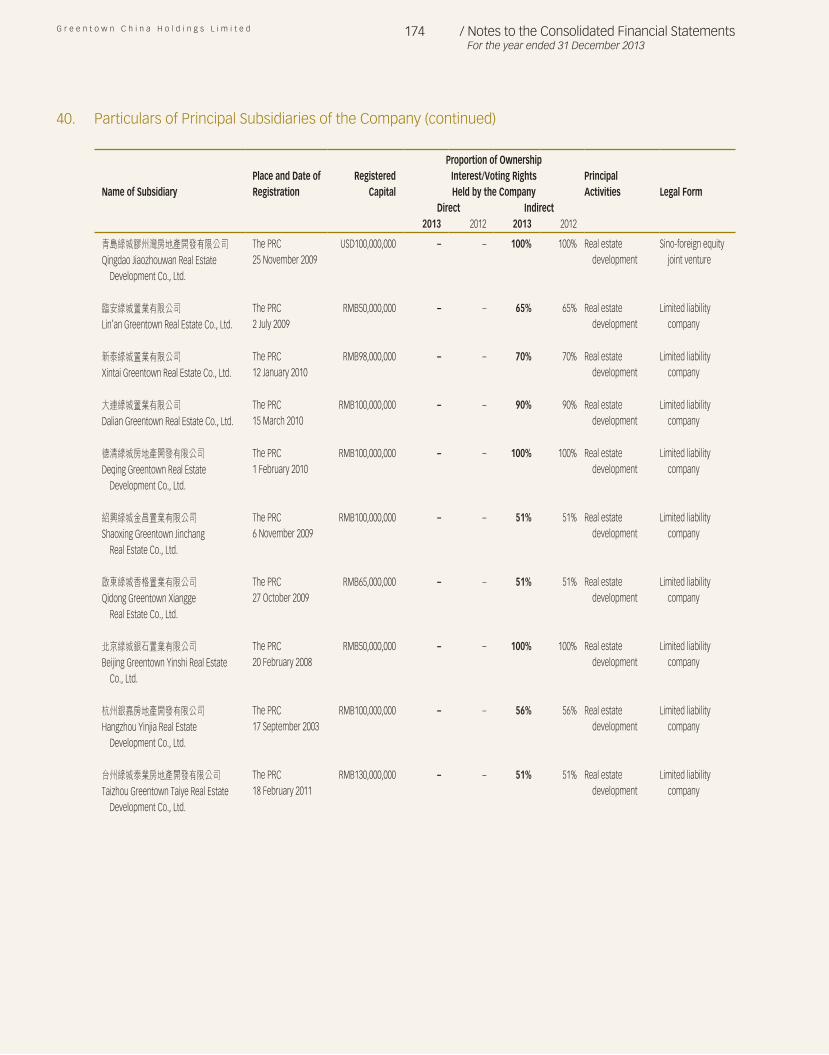
G r e e n t o w n C h i n a H o l d i n g s L i m i t e d 174 / Notes to the Consolidated Financial StatementsFor the year ended 31 December 2013
Name of SubsidiaryPlace and Date of Registration
Registered Capital
Proportion of Ownership Interest/Voting Rights Held by the Company
Principal Activities Legal Form
Direct Indirect2013 2012 2013 2012
青島綠城膠州灣房地產開發有限公司Qingdao Jiaozhouwan Real Estate
Development Co., Ltd.
The PRC 25 November 2009
USD100,000,000 – – 100% 100% Real estate development
Sino-foreign equity joint venture
臨安綠城置業有限公司Lin’an Greentown Real Estate Co., Ltd.
The PRC 2 July 2009
RMB50,000,000 – – 65% 65% Real estate development
Limited liability company
新泰綠城置業有限公司Xintai Greentown Real Estate Co., Ltd.
The PRC 12 January 2010
RMB98,000,000 – – 70% 70% Real estate development
Limited liability company
大連綠城置業有限公司Dalian Greentown Real Estate Co., Ltd.
The PRC 15 March 2010
RMB100,000,000 – – 90% 90% Real estate development
Limited liability company
德清綠城房地產開發有限公司Deqing Greentown Real Estate
Development Co., Ltd.
The PRC 1 February 2010
RMB100,000,000 – – 100% 100% Real estate development
Limited liability company
紹興綠城金昌置業有限公司Shaoxing Greentown Jinchang
Real Estate Co., Ltd.
The PRC6 November 2009
RMB100,000,000 – – 51% 51% Real estate development
Limited liability company
啟東綠城香格置業有限公司Qidong Greentown Xiangge
Real Estate Co., Ltd.
The PRC 27 October 2009
RMB65,000,000 – – 51% 51% Real estate development
Limited liability company
北京綠城銀石置業有限公司Beijing Greentown Yinshi Real Estate
Co., Ltd.
The PRC 20 February 2008
RMB50,000,000 – – 100% 100% Real estate development
Limited liability company
杭州銀嘉房地產開發有限公司Hangzhou Yinjia Real Estate
Development Co., Ltd.
The PRC 17 September 2003
RMB100,000,000 – – 56% 56% Real estate development
Limited liability company
台州綠城泰業房地產開發有限公司Taizhou Greentown Taiye Real Estate
Development Co., Ltd.
The PRC 18 February 2011
RMB130,000,000 – – 51% 51% Real estate development
Limited liability company
40. Particulars of Principal Subsidiaries of the Company (continued)
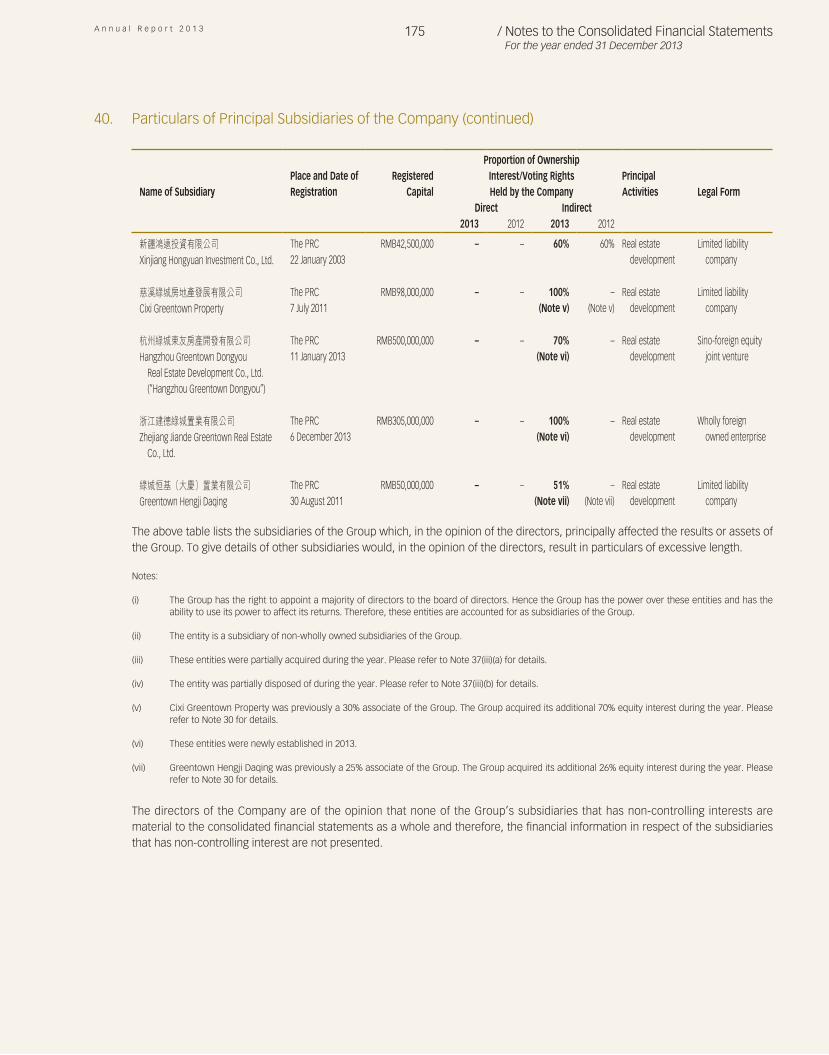
A n n u a l R e p o r t 2 0 1 3 175 / Notes to the Consolidated Financial StatementsFor the year ended 31 December 2013
Name of SubsidiaryPlace and Date of Registration
Registered Capital
Proportion of Ownership Interest/Voting Rights Held by the Company
Principal Activities Legal Form
Direct Indirect2013 2012 2013 2012
新疆鴻遠投資有限公司Xinjiang Hongyuan Investment Co., Ltd.
The PRC 22 January 2003
RMB42,500,000 – – 60% 60% Real estate development
Limited liability company
慈溪綠城房地產發展有限公司Cixi Greentown Property
The PRC 7 July 2011
RMB98,000,000 – – 100%(Note v)
–(Note v)
Real estate development
Limited liability company
杭州綠城東友房產開發有限公司Hangzhou Greentown Dongyou
Real Estate Development Co., Ltd. (“Hangzhou Greentown Dongyou”)
The PRC 11 January 2013
RMB500,000,000 – – 70%(Note vi)
– Real estate development
Sino-foreign equity joint venture
浙江建德綠城置業有限公司Zhejiang Jiande Greentown Real Estate
Co., Ltd.
The PRC 6 December 2013
RMB305,000,000 – – 100%(Note vi)
– Real estate development
Wholly foreignowned enterprise
綠城恒基(大慶)置業有限公司Greentown Hengji Daqing
The PRC30 August 2011
RMB50,000,000 – – 51%(Note vii)
–(Note vii)
Real estate development
Limited liability company
The above table lists the subsidiaries of the Group which, in the opinion of the directors, principally affected the results or assets of the Group. To give details of other subsidiaries would, in the opinion of the directors, result in particulars of excessive length.
Notes:
(i) The Group has the right to appoint a majority of directors to the board of directors. Hence the Group has the power over these entities and has the ability to use its power to affect its returns. Therefore, these entities are accounted for as subsidiaries of the Group.
(ii) The entity is a subsidiary of non-wholly owned subsidiaries of the Group.
(iii) These entities were partially acquired during the year. Please refer to Note 37(iii)(a) for details.
(iv) The entity was partially disposed of during the year. Please refer to Note 37(iii)(b) for details.
(v) Cixi Greentown Property was previously a 30% associate of the Group. The Group acquired its additional 70% equity interest during the year. Please refer to Note 30 for details.
(vi) These entities were newly established in 2013.
(vii) Greentown Hengji Daqing was previously a 25% associate of the Group. The Group acquired its additional 26% equity interest during the year. Please refer to Note 30 for details.
The directors of the Company are of the opinion that none of the Group’s subsidiaries that has non-controlling interests are material to the consolidated financial statements as a whole and therefore, the financial information in respect of the subsidiaries that has non-controlling interest are not presented.
40. Particulars of Principal Subsidiaries of the Company (continued)
G r e e n t o w n C h i n a H o l d i n g s L i m i t e d
Definition
176
In this annual report, unless the context otherwise requires, the following expressions have the following meanings:
Board The Board of Directors of the Company
Company/Greentown Greentown China Holdings Limited, a company incorporated in the Cayman Islands with limited liability, the shares of which are listed on the Main Board of the Stock Exchange
GFA Gross floor area
Greentown Construction Management
綠城房產建設管理有限公司 (Greentown Property Construction Management Co., Ltd.*)
Greentown Group Greentown China Holdings Limited and its subsidiaries together with its joint ventures and associates
Group Greentown China Holdings Limited and its subsidiaries
Listing Rules The Rules Governing the Listing of Securities on The Stock Exchange of Hong Kong Limited
Model Code Model Code for Securities Transactions by Directors of Listed Issuers as set out in Appendix 10 to the Listing Rules
PRC/China The People’s Republic of China
PSCS The Hong Kong dollar denominated perpetual subordinated convertible callable securities issued by Active Way Development Limited (being a wholly-owned subsidiary of the Company) with an aggregate principal amount of HK$2,550 million
SFO Securities and Futures Ordinance, Chapter 571 of the laws of Hong Kong
Share Option Scheme The share option scheme adopted by a resolution of the shareholders of the Company on 22 June 2006
sqm Square metres
Stock Exchange/HKEx The Stock Exchange of Hong Kong Limited
Sunac Sunac China Holdings Limited, a company incorporated in the Cayman Islands with limited liability, the shares of which are listed on the Main Board of the Stock Exchange (stock code: 01918)
Wharf The Wharf (Holdings) Limited, a company incorporated in Hong Kong with limited liability, the shares of which are listed on the Main Board of the Stock Exchange (stock code: 00004)
Wharf Group Wharf and its subsidiaries
the Year The year ended 31 December 2013
* For identification purposes only
GREENTOWN CHINA HOLDINGS LIMITED
Hangzhou Headquarters10/F, Block A, Century Plaza, No. 1 Hangda Road,Hangzhou, Zhejiang, PRC (Postcode: 310007)Tel: (86-571) 8898 8888 Fax: (86-571) 8790 1717
Hong Kong OfficeRm 1406-1408, New World Tower 116-18 Queen's Road Central, Hong KongTel: (852) 2523 3138 Fax: (852) 2523 6608
www.chinagreentown.com
Design and Production by: iOne Financial Press LimitedWebsite: www.ione.com.hk


