Embed Size (px)
Citation preview
Fortum Corporation January-June 2021 Half-year Financial Report
Contents
Strengthening the balance sheet and accelerating decarbonisation 3 Fortum’s President and CEO Markus Rauramo’s comments 4 Financial results 5 Financial position and cash flow 8 Segment reviews 9 Capital expenditures, divestments, and investments in shares 19 Operating and regulatory environment 21 Key drivers and risks 25 Outlook 26 Sustainability 27 Legal actions 27 Shares and share capital 31 Group personnel 31 Changes in the Group management 31 Authorisations of the Board 31 Events after the reporting period 32 Further information 32
Tables to the Half-year Financial Report
Condensed consolidated income statement 33 Condensed consolidated statement of comprehensive income 34 Condensed consolidated balance sheet 35 Condensed consolidated statement of changes in total equity 36 Condensed consolidated cash flow statement 38 Change in financial net debt 40 Capital risk management 40 Key figures 41 Notes to the condensed consolidated interim financial statements 42 Definitions and reconciliations of key figures 71 Market conditions and achieved power prices 76 Fortum’s production and sales volumes 77 Figures in brackets refer to the comparison period, i.e. the same period last year, unless otherwise stated.
Fortum Corporation January-June 2021 Half-year Financial Report
3
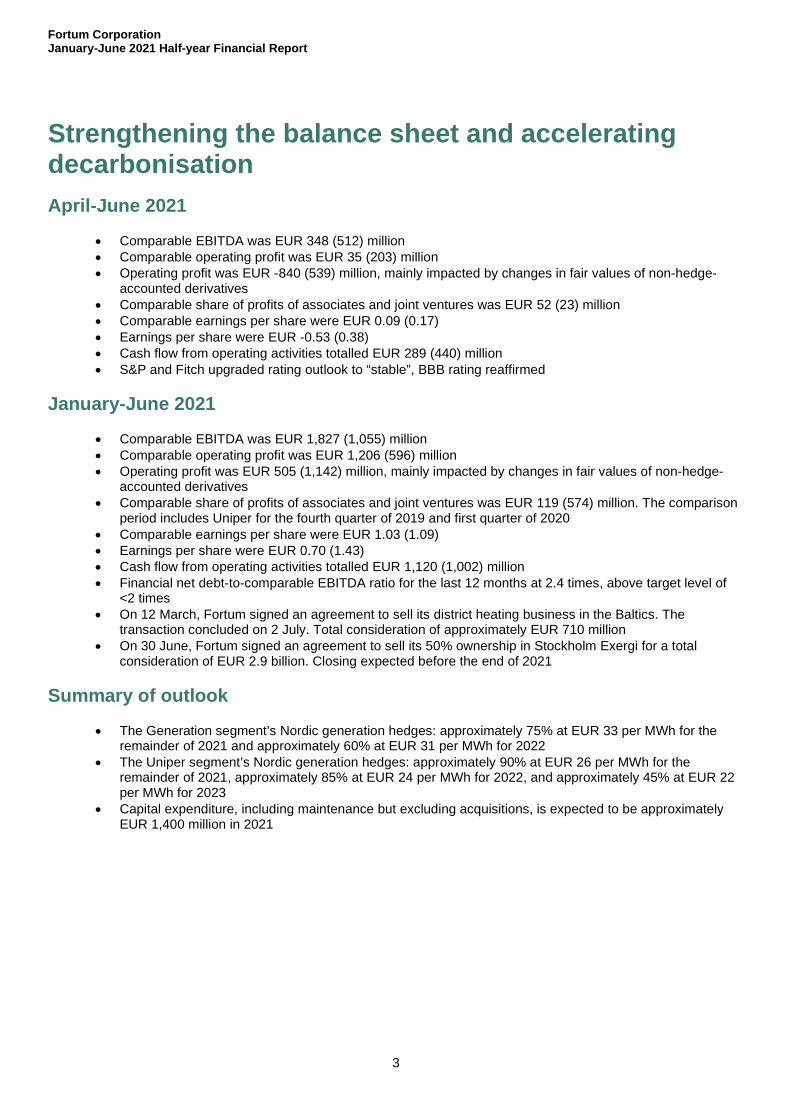
Strengthening the balance sheet and accelerating decarbonisation April-June 2021
• Comparable EBITDA was EUR 348 (512) million• Comparable operating profit was EUR 35 (203) million• Operating profit was EUR -840 (539) million, mainly impacted by changes in fair values of non-hedge-
accounted derivatives• Comparable share of profits of associates and joint ventures was EUR 52 (23) million• Comparable earnings per share were EUR 0.09 (0.17)• Earnings per share were EUR -0.53 (0.38)• Cash flow from operating activities totalled EUR 289 (440) million• S&P and Fitch upgraded rating outlook to “stable”, BBB rating reaffirmed
January-June 2021 • Comparable EBITDA was EUR 1,827 (1,055) million• Comparable operating profit was EUR 1,206 (596) million• Operating profit was EUR 505 (1,142) million, mainly impacted by changes in fair values of non-hedge-
accounted derivatives• Comparable share of profits of associates and joint ventures was EUR 119 (574) million. The comparison
period includes Uniper for the fourth quarter of 2019 and first quarter of 2020• Comparable earnings per share were EUR 1.03 (1.09)• Earnings per share were EUR 0.70 (1.43)• Cash flow from operating activities totalled EUR 1,120 (1,002) million• Financial net debt-to-comparable EBITDA ratio for the last 12 months at 2.4 times, above target level of
<2 times• On 12 March, Fortum signed an agreement to sell its district heating business in the Baltics. The
transaction concluded on 2 July. Total consideration of approximately EUR 710 million• On 30 June, Fortum signed an agreement to sell its 50% ownership in Stockholm Exergi for a total
consideration of EUR 2.9 billion. Closing expected before the end of 2021
Summary of outlook • The Generation segment’s Nordic generation hedges: approximately 75% at EUR 33 per MWh for the
remainder of 2021 and approximately 60% at EUR 31 per MWh for 2022• The Uniper segment’s Nordic generation hedges: approximately 90% at EUR 26 per MWh for the
remainder of 2021, approximately 85% at EUR 24 per MWh for 2022, and approximately 45% at EUR 22per MWh for 2023
• Capital expenditure, including maintenance but excluding acquisitions, is expected to be approximatelyEUR 1,400 million in 2021
Fortum Corporation January-June 2021 Half-year Financial Report
4
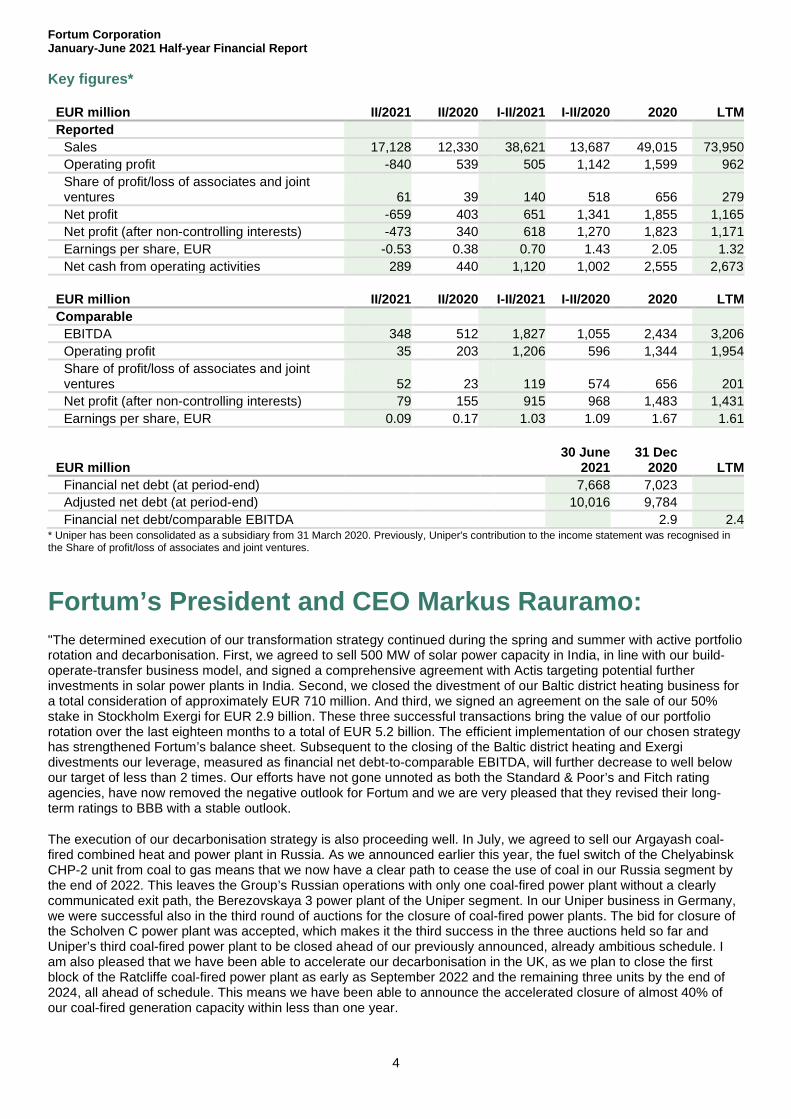
Key figures*
EUR million II/2021 II/2020 I-II/2021 I-II/2020 2020 LTM Reported
Sales 17,128 12,330 38,621 13,687 49,015 73,950 Operating profit -840 539 505 1,142 1,599 962 Share of profit/loss of associates and joint ventures 61 39 140 518 656 279 Net profit -659 403 651 1,341 1,855 1,165 Net profit (after non-controlling interests) -473 340 618 1,270 1,823 1,171 Earnings per share, EUR -0.53 0.38 0.70 1.43 2.05 1.32 Net cash from operating activities 289 440 1,120 1,002 2,555 2,673
EUR million II/2021 II/2020 I-II/2021 I-II/2020 2020 LTM Comparable
EBITDA 348 512 1,827 1,055 2,434 3,206 Operating profit 35 203 1,206 596 1,344 1,954 Share of profit/loss of associates and joint ventures 52 23 119 574 656 201 Net profit (after non-controlling interests) 79 155 915 968 1,483 1,431 Earnings per share, EUR 0.09 0.17 1.03 1.09 1.67 1.61
EUR million 30 June
2021 31 Dec
2020 LTM Financial net debt (at period-end) 7,668 7,023 Adjusted net debt (at period-end) 10,016 9,784 Financial net debt/comparable EBITDA 2.9 2.4
* Uniper has been consolidated as a subsidiary from 31 March 2020. Previously, Uniper's contribution to the income statement was recognised in the Share of profit/loss of associates and joint ventures.
Fortum’s President and CEO Markus Rauramo: "The determined execution of our transformation strategy continued during the spring and summer with active portfolio rotation and decarbonisation. First, we agreed to sell 500 MW of solar power capacity in India, in line with our build-operate-transfer business model, and signed a comprehensive agreement with Actis targeting potential further investments in solar power plants in India. Second, we closed the divestment of our Baltic district heating business for a total consideration of approximately EUR 710 million. And third, we signed an agreement on the sale of our 50% stake in Stockholm Exergi for EUR 2.9 billion. These three successful transactions bring the value of our portfolio rotation over the last eighteen months to a total of EUR 5.2 billion. The efficient implementation of our chosen strategy has strengthened Fortum’s balance sheet. Subsequent to the closing of the Baltic district heating and Exergi divestments our leverage, measured as financial net debt-to-comparable EBITDA, will further decrease to well below our target of less than 2 times. Our efforts have not gone unnoted as both the Standard & Poor’s and Fitch rating agencies, have now removed the negative outlook for Fortum and we are very pleased that they revised their long-term ratings to BBB with a stable outlook.
The execution of our decarbonisation strategy is also proceeding well. In July, we agreed to sell our Argayash coal-fired combined heat and power plant in Russia. As we announced earlier this year, the fuel switch of the Chelyabinsk CHP-2 unit from coal to gas means that we now have a clear path to cease the use of coal in our Russia segment by the end of 2022. This leaves the Group’s Russian operations with only one coal-fired power plant without a clearly communicated exit path, the Berezovskaya 3 power plant of the Uniper segment. In our Uniper business in Germany, we were successful also in the third round of auctions for the closure of coal-fired power plants. The bid for closure of the Scholven C power plant was accepted, which makes it the third success in the three auctions held so far and Uniper’s third coal-fired power plant to be closed ahead of our previously announced, already ambitious schedule. I am also pleased that we have been able to accelerate our decarbonisation in the UK, as we plan to close the first block of the Ratcliffe coal-fired power plant as early as September 2022 and the remaining three units by the end of 2024, all ahead of schedule. This means we have been able to announce the accelerated closure of almost 40% of our coal-fired generation capacity within less than one year.
Fortum Corporation January-June 2021 Half-year Financial Report
5
Due to seasonality, the second and third quarters are normally weaker than the winter quarters and this year was no exception. In addition, the comparable operating profit for the second quarter declined because Uniper’s Global Commodities business did not replicate the strong profits from the second quarter of 2020 and Uniper also experienced an intra-year phasing effect, due to the increase in the price for CO2 emission rights that shifted margins from the second quarter to the second half of 2021. The results of Fortum’s Generation segment benefitted from higher power prices and strong performance in physical optimisation, although the effect was dampened by the fairly high hedge levels. All other segments showed improving or stable results. The results of the first half of 2021 was strong thanks to the good results of Uniper and improvements in the Generation and City Solutions segments. With a comparable earnings per share of EUR 1.61 for the last twelve months and a strengthening balance sheet, Fortum is well equipped for the ongoing energy transition.
Fortum’s decarbonisation efforts are supported by the EU Commission’s ‘Fit for 55’ legislative package that guides the EU economy towards a 55% reduction in greenhouse gas emissions by 2030 and climate neutrality by 2050. The package is well in line with Fortum’s views and includes, among other measures, a tightening of the EU ETS and its expansion to maritime transport as well as ambitious targets for renewable hydrogen use. Carbon pricing will also be broadened to buildings and road transport, something we have long been advocating for. These measures are more challenging to implement than measures targeting large industrial installations, but they are necessary in order to reach the high climate ambitions of the EU, something that cannot be achieved by focusing only on the energy sector.
On 9 August, the IPCC – Intergovernmental Panel on Climate Change published a new report that reinforces the scientific basis of climate change and the human impact on it. It emphasises the urgency of climate action and the necessity for all mitigation and adaptation measures. In Fortum’s view, the findings of the report underline the importance of making full use of all CO2-free technologies in climate change mitigation."
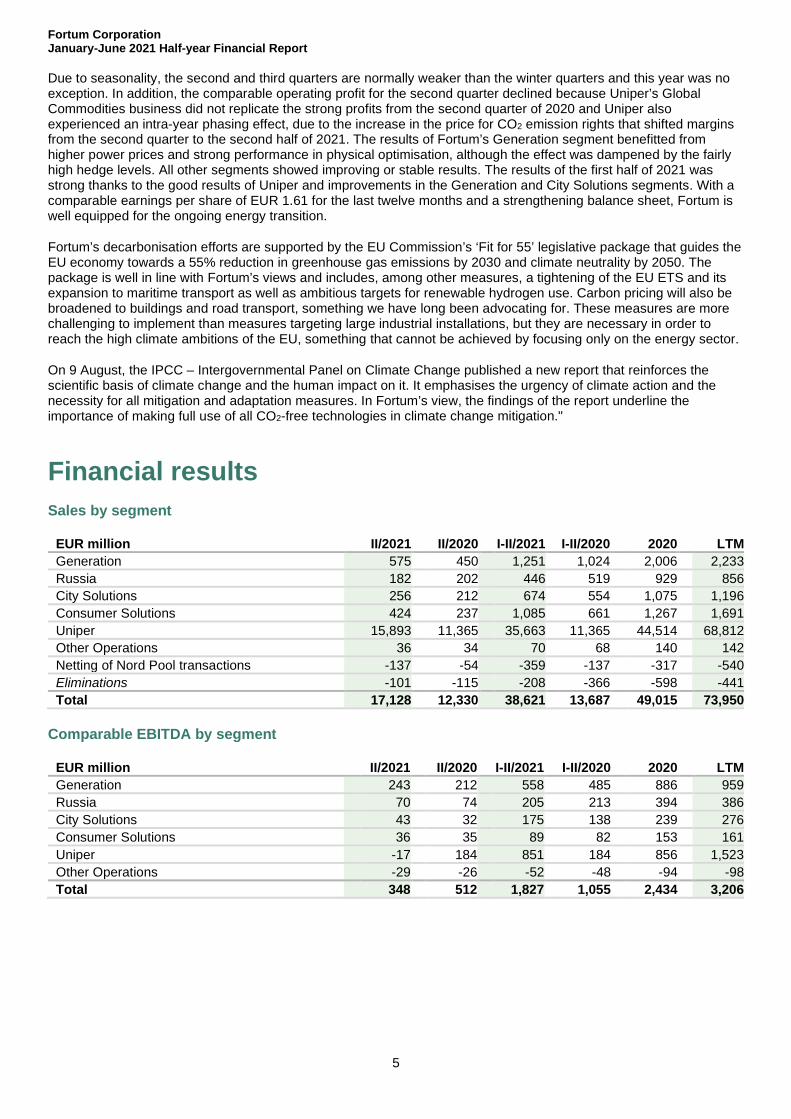
Financial results Sales by segment
EUR million II/2021 II/2020 I-II/2021 I-II/2020 2020 LTM Generation 575 450 1,251 1,024 2,006 2,233 Russia 182 202 446 519 929 856 City Solutions 256 212 674 554 1,075 1,196 Consumer Solutions 424 237 1,085 661 1,267 1,691 Uniper 15,893 11,365 35,663 11,365 44,514 68,812 Other Operations 36 34 70 68 140 142 Netting of Nord Pool transactions -137 -54 -359 -137 -317 -540 Eliminations -101 -115 -208 -366 -598 -441 Total 17,128 12,330 38,621 13,687 49,015 73,950
Comparable EBITDA by segment
EUR million II/2021 II/2020 I-II/2021 I-II/2020 2020 LTM Generation 243 212 558 485 886 959 Russia 70 74 205 213 394 386 City Solutions 43 32 175 138 239 276 Consumer Solutions 36 35 89 82 153 161 Uniper -17 184 851 184 856 1,523 Other Operations -29 -26 -52 -48 -94 -98 Total 348 512 1,827 1,055 2,434 3,206
Fortum Corporation January-June 2021 Half-year Financial Report
6
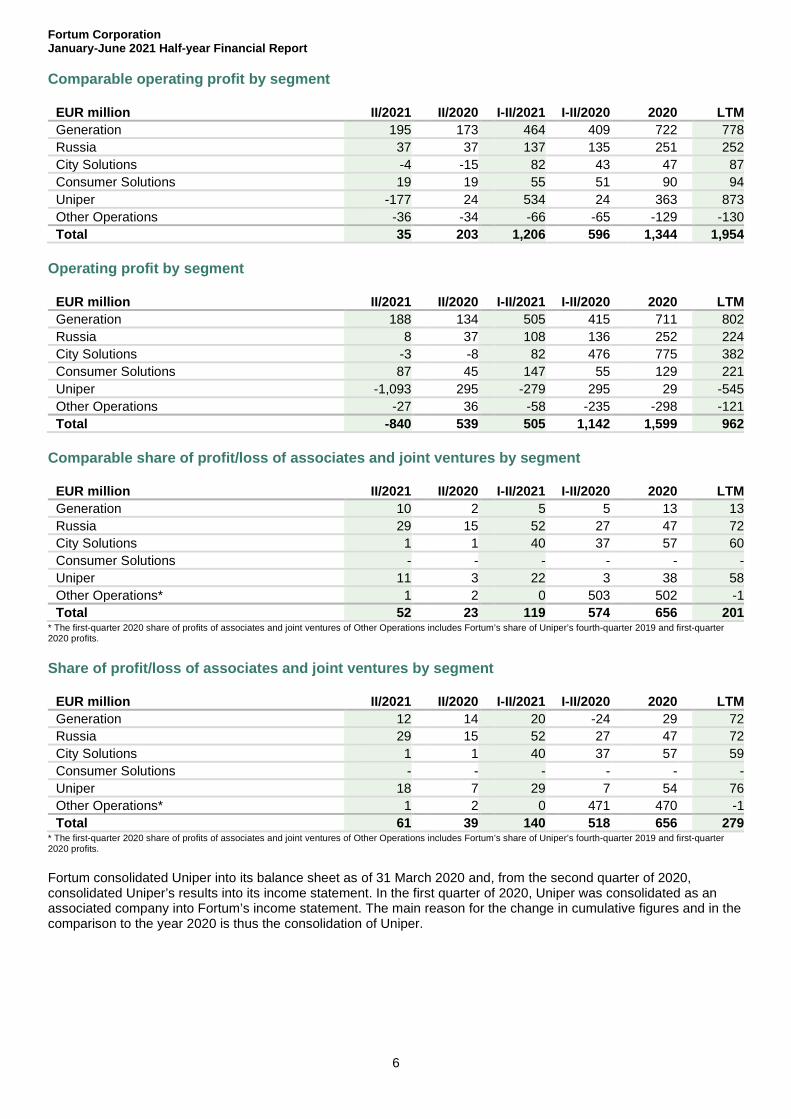
Comparable operating profit by segment
EUR million II/2021 II/2020 I-II/2021 I-II/2020 2020 LTM Generation 195 173 464 409 722 778 Russia 37 37 137 135 251 252 City Solutions -4 -15 82 43 47 87 Consumer Solutions 19 19 55 51 90 94 Uniper -177 24 534 24 363 873 Other Operations -36 -34 -66 -65 -129 -130 Total 35 203 1,206 596 1,344 1,954
Operating profit by segment
EUR million II/2021 II/2020 I-II/2021 I-II/2020 2020 LTM Generation 188 134 505 415 711 802 Russia 8 37 108 136 252 224 City Solutions -3 -8 82 476 775 382 Consumer Solutions 87 45 147 55 129 221 Uniper -1,093 295 -279 295 29 -545 Other Operations -27 36 -58 -235 -298 -121 Total -840 539 505 1,142 1,599 962
Comparable share of profit/loss of associates and joint ventures by segment
EUR million II/2021 II/2020 I-II/2021 I-II/2020 2020 LTM Generation 10 2 5 5 13 13 Russia 29 15 52 27 47 72 City Solutions 1 1 40 37 57 60 Consumer Solutions - - - - - - Uniper 11 3 22 3 38 58 Other Operations* 1 2 0 503 502 -1 Total 52 23 119 574 656 201
* The first-quarter 2020 share of profits of associates and joint ventures of Other Operations includes Fortum’s share of Uniper’s fourth-quarter 2019 and first-quarter 2020 profits.
Share of profit/loss of associates and joint ventures by segment
EUR million II/2021 II/2020 I-II/2021 I-II/2020 2020 LTM Generation 12 14 20 -24 29 72 Russia 29 15 52 27 47 72 City Solutions 1 1 40 37 57 59 Consumer Solutions - - - - - - Uniper 18 7 29 7 54 76 Other Operations* 1 2 0 471 470 -1 Total 61 39 140 518 656 279
* The first-quarter 2020 share of profits of associates and joint ventures of Other Operations includes Fortum’s share of Uniper’s fourth-quarter 2019 and first-quarter 2020 profits.
Fortum consolidated Uniper into its balance sheet as of 31 March 2020 and, from the second quarter of 2020, consolidated Uniper’s results into its income statement. In the first quarter of 2020, Uniper was consolidated as an associated company into Fortum’s income statement. The main reason for the change in cumulative figures and in the comparison to the year 2020 is thus the consolidation of Uniper.
Fortum Corporation January-June 2021 Half-year Financial Report
7
April-June 2021 Sales were EUR 17,128 (12,330) million.
Comparable operating profit was EUR 35 (203) million, mainly due to the lower results of Uniper’s Global Commodities business and an intra-year CO2 emission rights phasing effect that shifted margins from the second quarter of 2021 to the second half of 2021. The Group results were positively impacted by the higher achieved power price in the Generation segment and the improved results in Uniper’s European Generation business.
Operating profit for the period was impacted by EUR -875 (336) million of items affecting comparability, mainly due to changes in fair values of non-hedge-accounted derivatives of EUR -852 (154) million especially in the Uniper segment (Note 4).
Comparable share of profits of associates and joint ventures was EUR 52 (23) million (Note 12).
January-June 2021 Sales were EUR 38,621 (13,687) million.
Comparable operating profit was EUR 1,206 (596) million, mainly due to the consolidation of Uniper to the income statement. The Generation segment benefitted from the higher achieved power price and the City Solutions segment was supported by the clearly higher heat sales volumes in the first quarter.
Operating profit for the period was impacted by EUR -701 (546) million of items affecting comparability, mainly due to changes in fair values of non-hedge-accounted derivatives of EUR -687 (172) million especially in the Uniper segment. Items affecting comparability also includes the tax-exempt capital gain of EUR 50 million from the divestment of eight small hydropower plants in Sweden (Note 4).
Comparable share of profits of associates and joint ventures was EUR 119 (574) million (Note 12). The comparison period includes the comparable share of profit from Uniper based on Uniper’s fourth-quarter 2019 and first-quarter 2020 results.
Finance costs - net amounted to EUR -71 (65) million, i.e. was net finance income. Comparable finance costs - net amounted to EUR -29 (60) million. The change mainly comes from a positive effect of changes in discount rates on Other provisions in the Uniper segment.
Profit before income taxes was EUR 717 (1,595) million. Comparable profit before income taxes was EUR 1,354 (1,110) million.
Income tax expenses for the period totalled EUR 66 (254) million. Comparable income tax expenses were EUR 284 (119) million (Note 8).
Net profit was EUR 651 (1,341) million. Comparable net profit was EUR 915 (968) million after the deduction of adjusted non-controlling interest. Comparable net profit is adjusted for items affecting comparability, adjustments to share of profit of associates and joint ventures, net finance costs, and income tax expenses. The alternative performance measure (APM) ‘comparable net profit’ was introduced in the first quarter of 2021 to better reflect the underlying profitability (Notes 4.2 and 23).
Earnings per share were EUR 0.70 (1.43) and comparable earnings per share were EUR 1.03 (1.09).
For further details, see Segment reviews.
Fortum Corporation January-June 2021 Half-year Financial Report
8
Financial position and cash flow Cash flow In January-June 2021, net cash from operating activities increased by EUR 118 million to EUR 1,120 (1,002) million.
Net cash used in investing activities was EUR 1,979 (734) million. Capital expenditure increased by EUR 219 million to EUR 570 (351) million. Acquisition of shares, net of liquid funds, was EUR 205 (1,419) million. Acquisition of shares in the comparison period mainly relates to the acquisition of Uniper shares. Divestment of shares and capital returns of EUR 151 (783) million mainly include the divestments of the 80% stake in the Sørfjord wind park in Norway and eight small hydropower plants in Sweden. Divestment of shares in the comparison period mainly includes the divestment of the Joensuu district heating operations. The change in margin receivables was EUR -1,285 (235) million, following the higher market prices for commodities. The negative change in margin receivables was almost fully netted by the positive change in margin liabilities in the cash flow from financing activities.
Cash flow before financing activities was EUR -859 (268) million.
Proceeds from long-term liabilities were EUR 65 (2,477) million. In March 2020, Fortum drew a term loan of EUR 2,000 million and in May 2020 a bridge loan of EUR 300 million to finance the acquisition of shares in Uniper. The dividend, EUR 995 million, was paid on 7 May 2021. The change in margin liabilities was EUR 1,180 (-194) million, mainly due to the increases in market prices for commodities. The net decrease in liquid funds was EUR 588 (net increase 990) million.
Assets At the end of the reporting period, total assets amounted to EUR 87,600 (57,810 at the end of 2020) million. The increase from year-end mainly relates to derivative financial instruments in the Uniper segment resulting from higher market prices for commodities. Liquid funds at the end of the period were EUR 1,703 (2,308 at the end of 2020) million.
Equity Equity attributable to owners of the parent company totalled EUR 12,794 (12,953 at the end of 2020) million. The change from the year-end was mainly related to the net profit for the period of EUR 618 million and the positive impact of EUR 189 million from translation differences, offset by the dividend payment of EUR 995 million.
Financing At the end of the reporting period, financial net debt was EUR 7,668 (7,023 at the end of 2020) million and adjusted net debt EUR 10,016 (9,784 at the end of 2020) million.
At the end of the reporting period, the Group’s liquid funds totalled EUR 1,703 (2,308 at the end of 2020) million. Liquid funds include EUR 443 million related to the Uniper segment. The dividend, EUR 995 million, was paid on 7 May 2021.
In May 2021, Fortum repaid a maturing bond of EUR 500 million. The other short-term interest-bearing debt increased during the first half of the year by EUR 804 million from EUR 750 million to EUR 1,554, million mainly due to the use of commercial paper programmes.
At the end of the reporting period, Fortum had undrawn committed credit facilities amounting to EUR 5,000 million. The undrawn facilities consist of a EUR 1,450 million revolving credit facility maturing in November 2021 (with an option to extend the maturity by one year), a EUR 1,750 million revolving credit facility maturing in June 2023, and Uniper’s revolving credit facility of EUR 1,800 million, which matures in September 2025. In addition to the revolving credit facilities, Fortum has EUR 100 million of committed overdraft limits that are valid until further notice.
Financial net debt-to-comparable EBITDA ratio for the last 12 months was 2.4 times (2.9 at the end of 2020), which is above the target level of <2 times.
Fortum Corporation January-June 2021 Half-year Financial Report
9
On 28 June 2021, Fitch revised its long-term rating for Fortum to BBB, with a stable outlook (previously BBB with a negative outlook). The short-term rating is at the level F2. On 5 July 2021, Standard & Poor’s revised its long-term rating for Fortum to BBB, with a stable outlook (previously BBB with a negative outlook). The short-term rating is at the level A-2.
On 6 July 2021, Standard & Poor’s also revised its long-term rating for Uniper to BBB, with a stable outlook (previously BBB with a negative outlook).
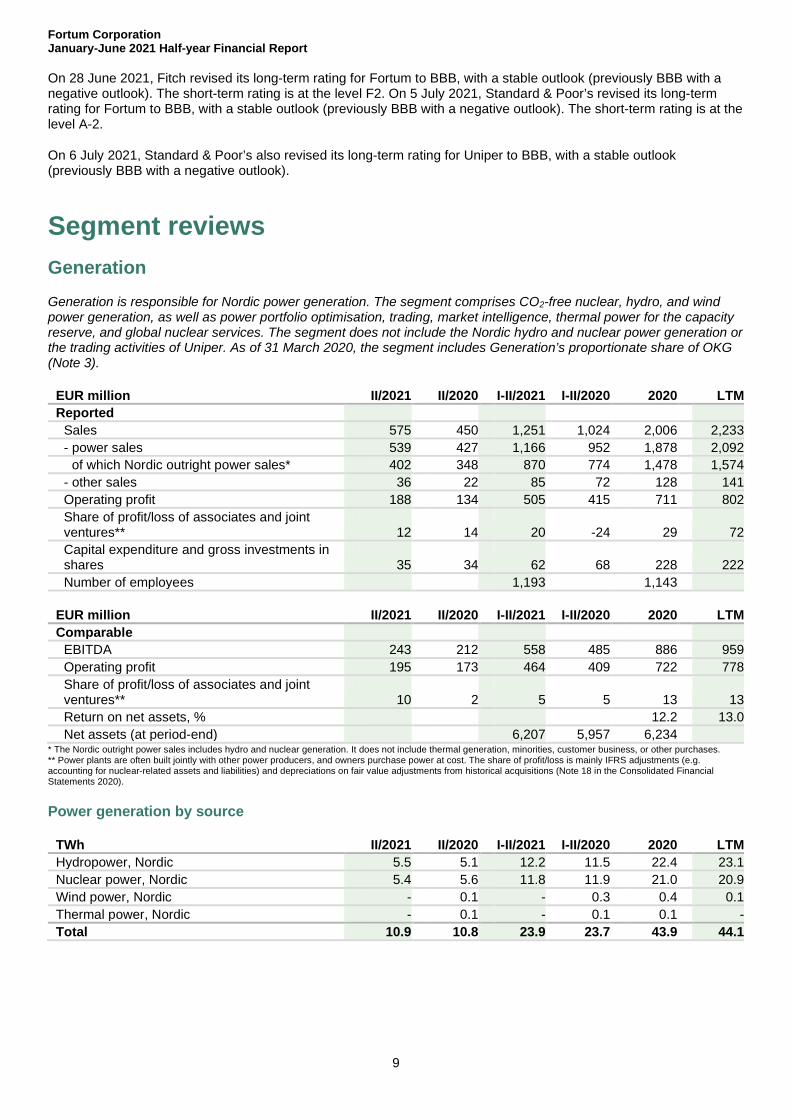
Segment reviews Generation Generation is responsible for Nordic power generation. The segment comprises CO2-free nuclear, hydro, and wind power generation, as well as power portfolio optimisation, trading, market intelligence, thermal power for the capacity reserve, and global nuclear services. The segment does not include the Nordic hydro and nuclear power generation or the trading activities of Uniper. As of 31 March 2020, the segment includes Generation’s proportionate share of OKG (Note 3).
EUR million II/2021 II/2020 I-II/2021 I-II/2020 2020 LTM Reported
Sales 575 450 1,251 1,024 2,006 2,233 - power sales 539 427 1,166 952 1,878 2,092
of which Nordic outright power sales* 402 348 870 774 1,478 1,574 - other sales 36 22 85 72 128 141 Operating profit 188 134 505 415 711 802 Share of profit/loss of associates and joint ventures** 12 14 20 -24 29 72 Capital expenditure and gross investments in shares 35 34 62 68 228 222 Number of employees 1,193 1,143
EUR million II/2021 II/2020 I-II/2021 I-II/2020 2020 LTM Comparable
EBITDA 243 212 558 485 886 959 Operating profit 195 173 464 409 722 778 Share of profit/loss of associates and joint ventures** 10 2 5 5 13 13 Return on net assets, % 12.2 13.0 Net assets (at period-end) 6,207 5,957 6,234
* The Nordic outright power sales includes hydro and nuclear generation. It does not include thermal generation, minorities, customer business, or other purchases. ** Power plants are often built jointly with other power producers, and owners purchase power at cost. The share of profit/loss is mainly IFRS adjustments (e.g. accounting for nuclear-related assets and liabilities) and depreciations on fair value adjustments from historical acquisitions (Note 18 in the Consolidated Financial Statements 2020).
Power generation by source
TWh II/2021 II/2020 I-II/2021 I-II/2020 2020 LTM Hydropower, Nordic 5.5 5.1 12.2 11.5 22.4 23.1 Nuclear power, Nordic 5.4 5.6 11.8 11.9 21.0 20.9 Wind power, Nordic - 0.1 - 0.3 0.4 0.1 Thermal power, Nordic - 0.1 - 0.1 0.1 - Total 10.9 10.8 23.9 23.7 43.9 44.1
Fortum Corporation January-June 2021 Half-year Financial Report
10
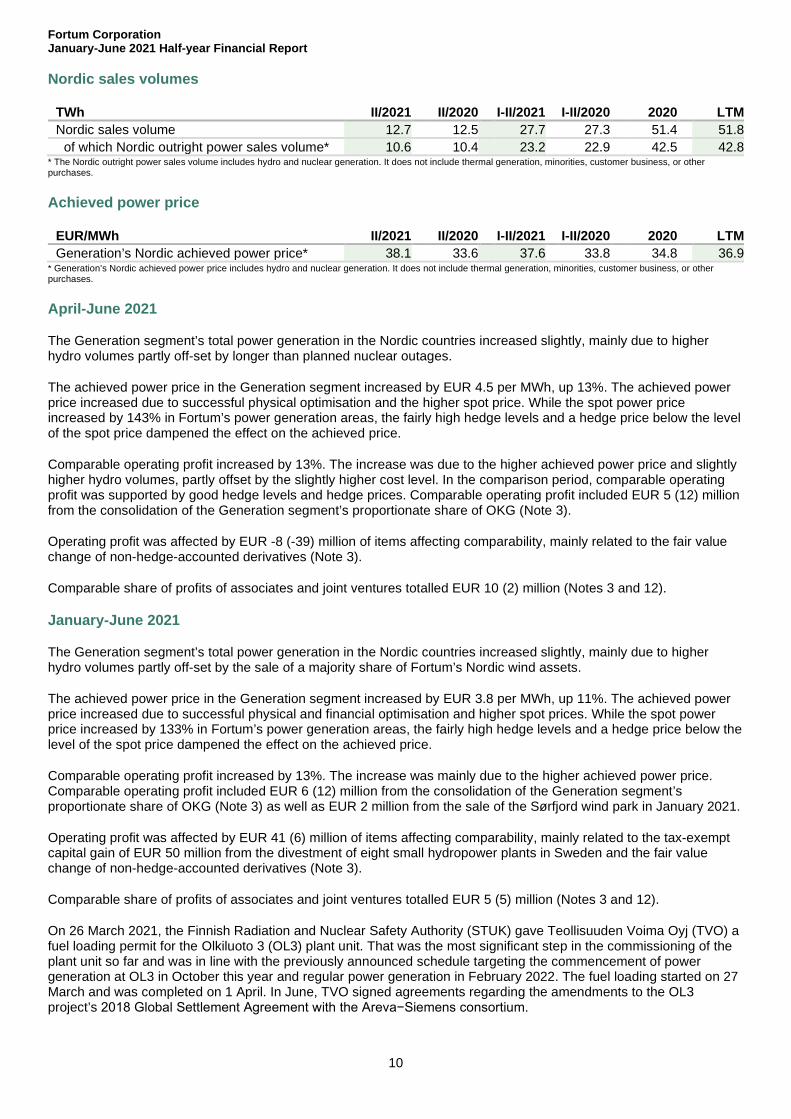
Nordic sales volumes
TWh II/2021 II/2020 I-II/2021 I-II/2020 2020 LTM Nordic sales volume 12.7 12.5 27.7 27.3 51.4 51.8
of which Nordic outright power sales volume* 10.6 10.4 23.2 22.9 42.5 42.8 * The Nordic outright power sales volume includes hydro and nuclear generation. It does not include thermal generation, minorities, customer business, or other purchases.
Achieved power price
EUR/MWh II/2021 II/2020 I-II/2021 I-II/2020 2020 LTM Generation’s Nordic achieved power price* 38.1 33.6 37.6 33.8 34.8 36.9
* Generation’s Nordic achieved power price includes hydro and nuclear generation. It does not include thermal generation, minorities, customer business, or other purchases.
April-June 2021
The Generation segment’s total power generation in the Nordic countries increased slightly, mainly due to higher hydro volumes partly off-set by longer than planned nuclear outages.
The achieved power price in the Generation segment increased by EUR 4.5 per MWh, up 13%. The achieved power price increased due to successful physical optimisation and the higher spot price. While the spot power price increased by 143% in Fortum’s power generation areas, the fairly high hedge levels and a hedge price below the level of the spot price dampened the effect on the achieved price.
Comparable operating profit increased by 13%. The increase was due to the higher achieved power price and slightly higher hydro volumes, partly offset by the slightly higher cost level. In the comparison period, comparable operating profit was supported by good hedge levels and hedge prices. Comparable operating profit included EUR 5 (12) million from the consolidation of the Generation segment’s proportionate share of OKG (Note 3).
Operating profit was affected by EUR -8 (-39) million of items affecting comparability, mainly related to the fair value change of non-hedge-accounted derivatives (Note 3).
Comparable share of profits of associates and joint ventures totalled EUR 10 (2) million (Notes 3 and 12).
January-June 2021
The Generation segment’s total power generation in the Nordic countries increased slightly, mainly due to higher hydro volumes partly off-set by the sale of a majority share of Fortum’s Nordic wind assets.
The achieved power price in the Generation segment increased by EUR 3.8 per MWh, up 11%. The achieved power price increased due to successful physical and financial optimisation and higher spot prices. While the spot power price increased by 133% in Fortum’s power generation areas, the fairly high hedge levels and a hedge price below the level of the spot price dampened the effect on the achieved price.
Comparable operating profit increased by 13%. The increase was mainly due to the higher achieved power price. Comparable operating profit included EUR 6 (12) million from the consolidation of the Generation segment’s proportionate share of OKG (Note 3) as well as EUR 2 million from the sale of the Sørfjord wind park in January 2021.
Operating profit was affected by EUR 41 (6) million of items affecting comparability, mainly related to the tax-exempt capital gain of EUR 50 million from the divestment of eight small hydropower plants in Sweden and the fair value change of non-hedge-accounted derivatives (Note 3).
Comparable share of profits of associates and joint ventures totalled EUR 5 (5) million (Notes 3 and 12).
On 26 March 2021, the Finnish Radiation and Nuclear Safety Authority (STUK) gave Teollisuuden Voima Oyj (TVO) a fuel loading permit for the Olkiluoto 3 (OL3) plant unit. That was the most significant step in the commissioning of the plant unit so far and was in line with the previously announced schedule targeting the commencement of power generation at OL3 in October this year and regular power generation in February 2022. The fuel loading started on 27 March and was completed on 1 April. In June, TVO signed agreements regarding the amendments to the OL3 project’s 2018 Global Settlement Agreement with the Areva−Siemens consortium.
Fortum Corporation January-June 2021 Half-year Financial Report
11
In April 2021, Fortum announced its second pilot for the use of batteries as energy storage at hydropower plants at Landaforsen power plant in Sweden. Batteries from plug-in hybrid cars and other batteries, 48 in total and with a combined storage of 1 MWh and capacity of 250 kW, are installed, extending the life of both the hydropower turbines and the batteries themselves.
In June 2021, Fortum and Uniper agreed on long-term cooperation covering external and internal cooperation in nuclear decommissioning services. The goal for the complementary capabilities is to develop a wider customer offering, reach a stronger market position, as well as ensure excellent performance in the Oskarshamn and Barsebäck decommissioning projects in Sweden.
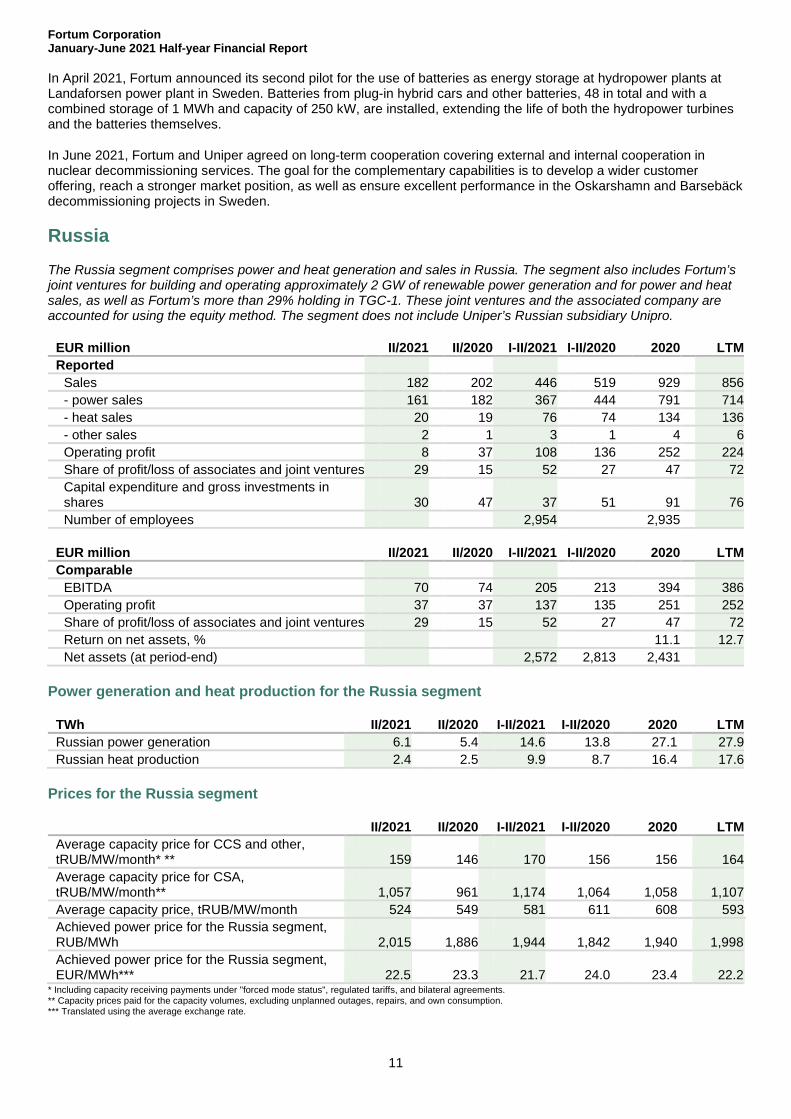
Russia The Russia segment comprises power and heat generation and sales in Russia. The segment also includes Fortum’s joint ventures for building and operating approximately 2 GW of renewable power generation and for power and heat sales, as well as Fortum’s more than 29% holding in TGC-1. These joint ventures and the associated company are accounted for using the equity method. The segment does not include Uniper’s Russian subsidiary Unipro.
EUR million II/2021 II/2020 I-II/2021 I-II/2020 2020 LTM Reported
Sales 182 202 446 519 929 856 - power sales 161 182 367 444 791 714 - heat sales 20 19 76 74 134 136 - other sales 2 1 3 1 4 6 Operating profit 8 37 108 136 252 224 Share of profit/loss of associates and joint ventures 29 15 52 27 47 72 Capital expenditure and gross investments in shares 30 47 37 51 91 76 Number of employees 2,954 2,935
EUR million II/2021 II/2020 I-II/2021 I-II/2020 2020 LTM Comparable
EBITDA 70 74 205 213 394 386 Operating profit 37 37 137 135 251 252 Share of profit/loss of associates and joint ventures 29 15 52 27 47 72 Return on net assets, % 11.1 12.7 Net assets (at period-end) 2,572 2,813 2,431
Power generation and heat production for the Russia segment
TWh II/2021 II/2020 I-II/2021 I-II/2020 2020 LTM Russian power generation 6.1 5.4 14.6 13.8 27.1 27.9 Russian heat production 2.4 2.5 9.9 8.7 16.4 17.6
Prices for the Russia segment
II/2021 II/2020 I-II/2021 I-II/2020 2020 LTM Average capacity price for CCS and other, tRUB/MW/month* ** 159 146 170 156 156 164 Average capacity price for CSA, tRUB/MW/month** 1,057 961 1,174 1,064 1,058 1,107 Average capacity price, tRUB/MW/month 524 549 581 611 608 593 Achieved power price for the Russia segment, RUB/MWh 2,015 1,886 1,944 1,842 1,940 1,998 Achieved power price for the Russia segment, EUR/MWh*** 22.5 23.3 21.7 24.0 23.4 22.2
* Including capacity receiving payments under "forced mode status", regulated tariffs, and bilateral agreements. ** Capacity prices paid for the capacity volumes, excluding unplanned outages, repairs, and own consumption. *** Translated using the average exchange rate.
Fortum Corporation January-June 2021 Half-year Financial Report
12
April-June 2021
Power generation volumes increased by 13% due to higher consumption following the economic recovery from the Covid-19 pandemic, including higher oil production, and high temperatures in the second quarter of 2021. Heat production volumes decreased by 4% due to warmer weather.
Sales decreased by 10%, or EUR 20 million, mainly due to the weaker Russian rouble. The effect of the change in the Russian rouble exchange rate was EUR -18 million.
Comparable operating profit was unchanged. The effect of the Capacity Supply Agreement (CSA) period ending for the Tyumen combined heat and power plant 1 (CHP) and Chelyabinsk CHP 3, as well as corrections to the CSA prices as a result of lower bond yields, was largely offset by three units entering the four-year period of higher CSA payments as well as higher power prices. The effect of the change in the Russian rouble exchange rate was marginal and amounted to EUR -2 million.
Operating profit was affected by a tax-deductible non-cash impairment of EUR 29 million in connection with the Argayash CHP plant divestment.
Comparable share of profits of associates and joint ventures totalled EUR 29 (15) million, including the share of profits of EUR 15 (17) million from TGC-1, the share of profits of EUR 14 (0) million from the joint ventures for renewables power generation, and the share of profits of the joint ventures for heat distribution of EUR 2 (-2) million. The share of profits for the joint ventures for renewable power generation includes a EUR 12 million gain from the transfer of the Kalmykia wind power park from the Fortum-Rusnano wind investment fund to Fortum’s joint venture with the Russian Direct Investment Fund (RDIF) (Notes 3 and 12).
January-June 2021
Power generation volumes increased by 6% due to higher consumption as a result of economic recovery from the Covid-19 pandemic, including higher oil production, and high temperatures in the second quarter of 2021. Heat production volumes increased by 14% due to the colder weather in the first quarter.
Sales decreased by 14%, or EUR 73 million, due to the weaker Russian rouble. The effect of the change in the Russian rouble exchange rate was EUR -75 million.
Comparable operating profit increased by 1%. The EUR 17 million positive effect of the sale of the 116-MW CSA backed solar power project to the Fortum-RDIF joint ventureand higher power prices more than offset the effect of the change in the Russian rouble exchange rate, EUR -23 million. The net effect of the changes to CSA payments was slightly negative; the changes derived from three units entering the four-year period of higher CSA payments, the CSA period ending for the Tyumen CHP 1 and Chelyabinsk CHP 3, as well as corrections to the CSA prices as a result of lower bond yields. The Covid-19 pandemic did not have any significant adverse effect on the Russia segment’s results for the first two quarters.
Operating profit was affected by a tax-deductible non-cash impairment of EUR 29 million in connection with the Argayash CHP plant divestment.
Comparable share of profits of associates and joint ventures totalled EUR 52 (27) million, including the share of profits of EUR 22 (18) million from TGC-1, the share of profits of EUR 20 (1) million from the joint ventures for renewables power generation, and the share of profits of EUR 9 (7) million of the joint ventures for heat distribution. The share of profits for the joint ventures for renewable power generation includes a EUR 12 million gain from the transfer of the Kalmykia wind power park from the Fortum-Rusnano wind investment fund to the Fortum-RDIF joint venture (Notes 3 and 12).
In June 2021, the Fortum-Rusnano wind investment fund (joint venture, Fortum's ownership 50%) made the investment decision on the construction of wind power parks with a total capacity of 237 MW in the Samara region in Russia.
In June 2021, Fortum signed four new Memorandums of Understanding (MoU) regarding green energy sales in Russia. The MoUs were signed with Novatek, Magnitogorsk Iron and Steel Works, Baker Hughes, and Shell. In July 2021, this was followed by the signing of an agreement with Mosenergosbyt for the supply of wind power to Sberbank’s offices in Nizhny Novgorod. The new agreements support Fortum’s strategy to partner with industrial and infrastructure customers to help them reduce the emissions of their operations.
Fortum Corporation January-June 2021 Half-year Financial Report
13
In June 2021, the Fortum-Rusnano wind investment fund sold the 200-MW Kalmykia wind parks to the Fortum-RDIF joint venture.
On 8 July 2021, Fortum signed an agreement to sell its Argayash coal-fired CHP to AO JSC Rusatom Smart Utilities. Following the decision to transition to gas at the Chelyabinsk CHP-2 earlier in 2021, this transaction will allow Fortum’s Russia division to discontinue its use of coal by the end of 2022 and reduce annual CO2 emissions by approximately 2 million tonnes. The power plant has only had a minor effect on Fortum’s EBITDA. The transaction is expected to be closed in the third quarter of 2021. In connection with the sale of the Argayash CHP plant, Fortum recorded a tax-deductible non-cash impairment of EUR 29 million in its second-quarter results.
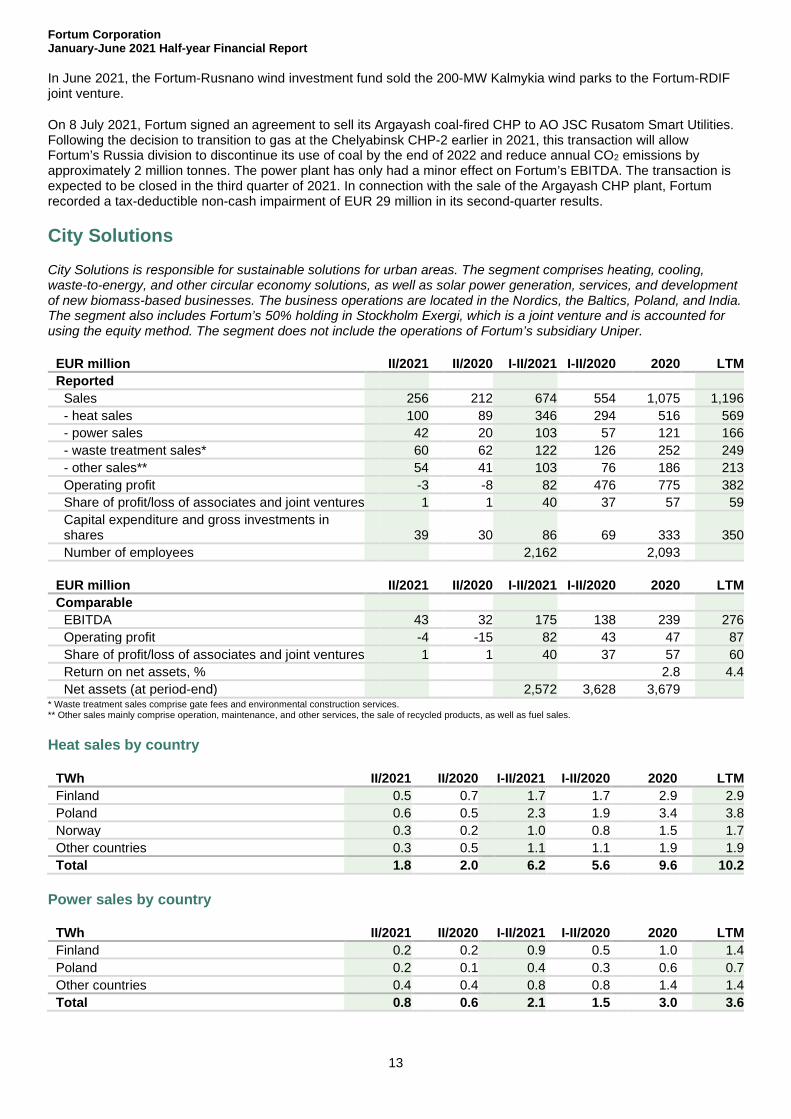
City Solutions City Solutions is responsible for sustainable solutions for urban areas. The segment comprises heating, cooling, waste-to-energy, and other circular economy solutions, as well as solar power generation, services, and development of new biomass-based businesses. The business operations are located in the Nordics, the Baltics, Poland, and India. The segment also includes Fortum’s 50% holding in Stockholm Exergi, which is a joint venture and is accounted for using the equity method. The segment does not include the operations of Fortum’s subsidiary Uniper.
EUR million II/2021 II/2020 I-II/2021 I-II/2020 2020 LTM Reported
Sales 256 212 674 554 1,075 1,196 - heat sales 100 89 346 294 516 569 - power sales 42 20 103 57 121 166 - waste treatment sales* 60 62 122 126 252 249 - other sales** 54 41 103 76 186 213 Operating profit -3 -8 82 476 775 382 Share of profit/loss of associates and joint ventures 1 1 40 37 57 59 Capital expenditure and gross investments in shares 39 30 86 69 333 350 Number of employees 2,162 2,093
EUR million II/2021 II/2020 I-II/2021 I-II/2020 2020 LTM Comparable
EBITDA 43 32 175 138 239 276 Operating profit -4 -15 82 43 47 87 Share of profit/loss of associates and joint ventures 1 1 40 37 57 60 Return on net assets, % 2.8 4.4 Net assets (at period-end) 2,572 3,628 3,679
* Waste treatment sales comprise gate fees and environmental construction services. ** Other sales mainly comprise operation, maintenance, and other services, the sale of recycled products, as well as fuel sales.
Heat sales by country
TWh II/2021 II/2020 I-II/2021 I-II/2020 2020 LTM Finland 0.5 0.7 1.7 1.7 2.9 2.9 Poland 0.6 0.5 2.3 1.9 3.4 3.8 Norway 0.3 0.2 1.0 0.8 1.5 1.7 Other countries 0.3 0.5 1.1 1.1 1.9 1.9 Total 1.8 2.0 6.2 5.6 9.6 10.2
Power sales by country
TWh II/2021 II/2020 I-II/2021 I-II/2020 2020 LTM Finland 0.2 0.2 0.9 0.5 1.0 1.4 Poland 0.2 0.1 0.4 0.3 0.6 0.7 Other countries 0.4 0.4 0.8 0.8 1.4 1.4 Total 0.8 0.6 2.1 1.5 3.0 3.6
Fortum Corporation January-June 2021 Half-year Financial Report
14
April-June 2021
Heat sales volumes decreased by 10%, mainly due to the different timing of the annual revisions at most of the waste-to-energy plants. The increase in power sales volumes was mainly due to the commissioning of a new solar power plant in India during the first and second quarter of 2021.
Comparable operating profit increased mainly as a result of higher power prices and 33% higher power sales volumes compared to the second quarter of 2020.
Operating profit was affected by EUR 0 (7) million of items affecting comparability.
Comparable share of profits of associates and joint ventures totalled EUR 1 (1) million, EUR -2 (-2) million of which is related to the share of profit of Stockholm Exergi (Notes 3 and 12).
January-June 2021
Heat sales volumes increased by 11%, as temperatures were close to normal during the period, compared to the very warm weather in the first quarter of 2020. The power sales volumes increased significantly, mainly supported by a different production mix in the Finnish heat business in the first quarter and the commissioning of a new solar power plant in India.
Comparable operating profit increased by 91% as a result of higher heat sales volumes in all heating areas, higher power prices, and higher Norwegian heat prices due to the price link between heat and power prices. The results were negatively impacted by structural changes, the most significant of which was the divestment of the Järvenpää district heating business with a EUR 3 million impact.
Operating profit was affected by EUR 0 (433) million of items affecting comparability. In 2020, the items affecting comparability included the tax-exempt capital gain of EUR 431 million from the divestments of the Joensuu district heating businesses (Note 3).
Comparable share of profits of associates and joint ventures totalled EUR 40 (37) million, EUR 31 (31) million of which is related to the share of profit of Stockholm Exergi (Notes 3 and 12).
On 12 March 2021, Fortum announced that it had signed an agreement to sell its district heating business in the Baltics to Partners Group. On 2 July 2021, Fortum concluded the sale. The total consideration of the sale amounted to approximately EUR 710 million. Fortum will record a tax-exempt capital gain of approximately EUR 250 million in the City Solutions segment’s third-quarter 2021 results.
On 17 June 2021, Fortum made the investment decision to expand its lithium-ion battery recycling capacity by building a new state-of-the-art hydrometallurgical plant in Harjavalta, Finland. The investment of approximately EUR 24 million will be a major step in increasing Fortum’s hydrometallurgical recycling capacity and enabling the production of sustainable battery chemicals. The new facility will be able to efficiently recover scarce metals from old electric vehicle lithium-ion batteries while also recycling various waste fractions derived throughout the battery supply chain.
On 22 June 2021, Fortum announced that it had signed an agreement to divest the 250-MW Pavagada II and the 250-MW Rajasthan solar power plants in India to Actis. The total consideration for the divestment on a debt and cash-free basis, including the effect of deconsolidation of the net debt, is expected to be approximately EUR 280 million, most of which will be recorded during 2021. The parties have also signed a comprehensive agreement targeting potential further investments in solar power plants in India.
On 30 June 2021, Fortum signed an agreement to sell its 50% ownership in the Swedish district heating and cooling company – Stockholm Exergi Holding AB (publ) – to a consortium comprising APG, Alecta, PGGM, Keva, and AXA. The total consideration is SEK 29.5 billion (EUR 2.9 billion) based on a 100% enterprise value of SEK 71.9 billion (EUR 7.1 billion). Fortum expects to record a tax-exempt capital gain of EUR 2.4 billion in the City Solutions segment’s results in connection with closing of the transaction. The transaction is subject to customary closing conditions and Fortum expects the closing to take place before the end of 2021. On 31 July 2020, Fortum announced its decision to assess strategic options, including possible divestment, of its 50% holding in Stockholm Exergi.
Fortum Corporation January-June 2021 Half-year Financial Report
15
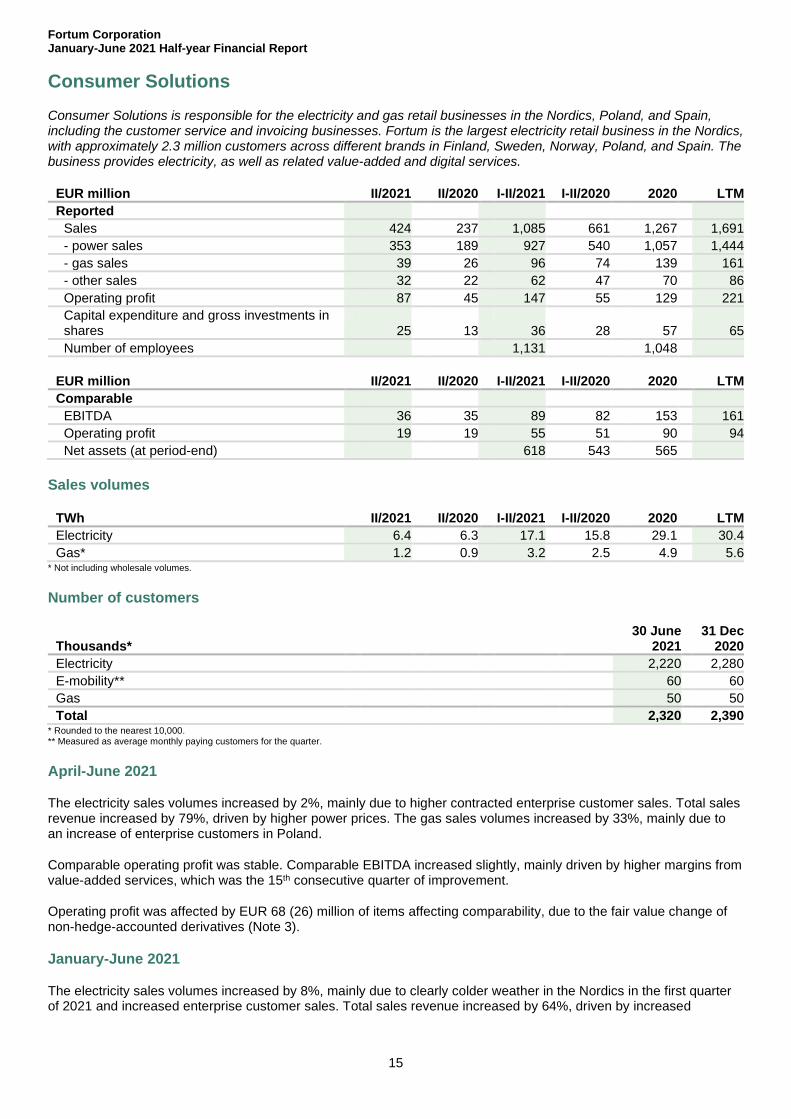
Consumer Solutions Consumer Solutions is responsible for the electricity and gas retail businesses in the Nordics, Poland, and Spain, including the customer service and invoicing businesses. Fortum is the largest electricity retail business in the Nordics, with approximately 2.3 million customers across different brands in Finland, Sweden, Norway, Poland, and Spain. The business provides electricity, as well as related value-added and digital services.
EUR million II/2021 II/2020 I-II/2021 I-II/2020 2020 LTM Reported
Sales 424 237 1,085 661 1,267 1,691 - power sales 353 189 927 540 1,057 1,444 - gas sales 39 26 96 74 139 161 - other sales 32 22 62 47 70 86 Operating profit 87 45 147 55 129 221 Capital expenditure and gross investments in shares 25 13 36 28 57 65 Number of employees 1,131 1,048
EUR million II/2021 II/2020 I-II/2021 I-II/2020 2020 LTM Comparable
EBITDA 36 35 89 82 153 161 Operating profit 19 19 55 51 90 94 Net assets (at period-end) 618 543 565
Sales volumes
TWh II/2021 II/2020 I-II/2021 I-II/2020 2020 LTM Electricity 6.4 6.3 17.1 15.8 29.1 30.4 Gas* 1.2 0.9 3.2 2.5 4.9 5.6
* Not including wholesale volumes.
Number of customers
Thousands* 30 June
2021 31 Dec
2020 Electricity 2,220 2,280 E-mobility** 60 60 Gas 50 50 Total 2,320 2,390
* Rounded to the nearest 10,000. ** Measured as average monthly paying customers for the quarter.
April-June 2021
The electricity sales volumes increased by 2%, mainly due to higher contracted enterprise customer sales. Total sales revenue increased by 79%, driven by higher power prices. The gas sales volumes increased by 33%, mainly due to an increase of enterprise customers in Poland.
Comparable operating profit was stable. Comparable EBITDA increased slightly, mainly driven by higher margins from value-added services, which was the 15th consecutive quarter of improvement.
Operating profit was affected by EUR 68 (26) million of items affecting comparability, due to the fair value change of non-hedge-accounted derivatives (Note 3).
January-June 2021
The electricity sales volumes increased by 8%, mainly due to clearly colder weather in the Nordics in the first quarter of 2021 and increased enterprise customer sales. Total sales revenue increased by 64%, driven by increased
Fortum Corporation January-June 2021 Half-year Financial Report
16
volumes and clearly higher prices in the Nordics compared to the previous year. The gas sales volumes increased by 28%, mainly due to an increase of enterprise customers in Poland. Several new digital services were launched during the first half of 2021, and new enterprise contracts were signed with customers in the energy, food processing, real-estate, and retail industries.
Comparable operating profit increased by 8%, mainly driven by higher margins from value-added services. The higher margins are a result of active development of the service offering and subsequent development of the business.
Operating profit was affected by EUR 92 (4) million of items affecting comparability, due to the fair value change of non-hedge-accounted derivatives (Note 3).
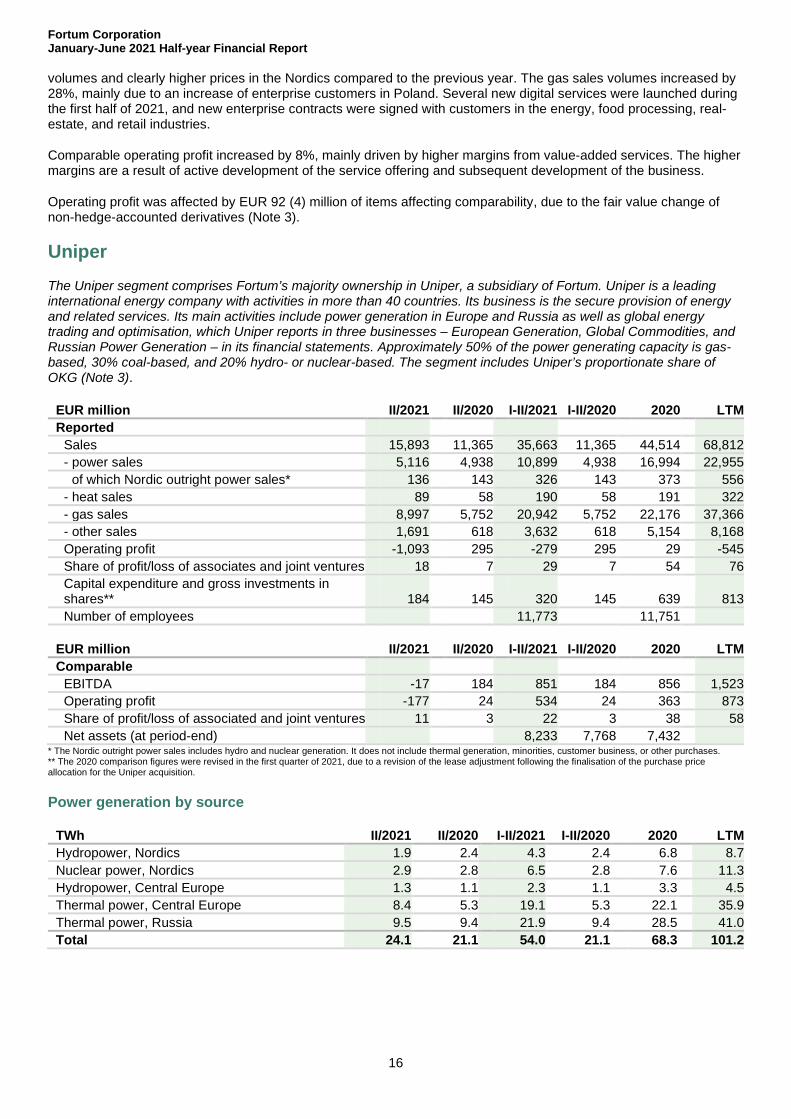
Uniper The Uniper segment comprises Fortum’s majority ownership in Uniper, a subsidiary of Fortum. Uniper is a leading international energy company with activities in more than 40 countries. Its business is the secure provision of energy and related services. Its main activities include power generation in Europe and Russia as well as global energy trading and optimisation, which Uniper reports in three businesses – European Generation, Global Commodities, and Russian Power Generation – in its financial statements. Approximately 50% of the power generating capacity is gas-based, 30% coal-based, and 20% hydro- or nuclear-based. The segment includes Uniper’s proportionate share of OKG (Note 3).
EUR million II/2021 II/2020 I-II/2021 I-II/2020 2020 LTM Reported
Sales 15,893 11,365 35,663 11,365 44,514 68,812 - power sales 5,116 4,938 10,899 4,938 16,994 22,955
of which Nordic outright power sales* 136 143 326 143 373 556 - heat sales 89 58 190 58 191 322 - gas sales 8,997 5,752 20,942 5,752 22,176 37,366 - other sales 1,691 618 3,632 618 5,154 8,168 Operating profit -1,093 295 -279 295 29 -545 Share of profit/loss of associates and joint ventures 18 7 29 7 54 76 Capital expenditure and gross investments in shares** 184 145 320 145 639 813 Number of employees 11,773 11,751
EUR million II/2021 II/2020 I-II/2021 I-II/2020 2020 LTM Comparable
EBITDA -17 184 851 184 856 1,523 Operating profit -177 24 534 24 363 873 Share of profit/loss of associated and joint ventures 11 3 22 3 38 58 Net assets (at period-end) 8,233 7,768 7,432
* The Nordic outright power sales includes hydro and nuclear generation. It does not include thermal generation, minorities, customer business, or other purchases. ** The 2020 comparison figures were revised in the first quarter of 2021, due to a revision of the lease adjustment following the finalisation of the purchase price allocation for the Uniper acquisition.
Power generation by source
TWh II/2021 II/2020 I-II/2021 I-II/2020 2020 LTM Hydropower, Nordics 1.9 2.4 4.3 2.4 6.8 8.7 Nuclear power, Nordics 2.9 2.8 6.5 2.8 7.6 11.3 Hydropower, Central Europe 1.3 1.1 2.3 1.1 3.3 4.5 Thermal power, Central Europe 8.4 5.3 19.1 5.3 22.1 35.9 Thermal power, Russia 9.5 9.4 21.9 9.4 28.5 41.0 Total 24.1 21.1 54.0 21.1 68.3 101.2
Fortum Corporation January-June 2021 Half-year Financial Report
17
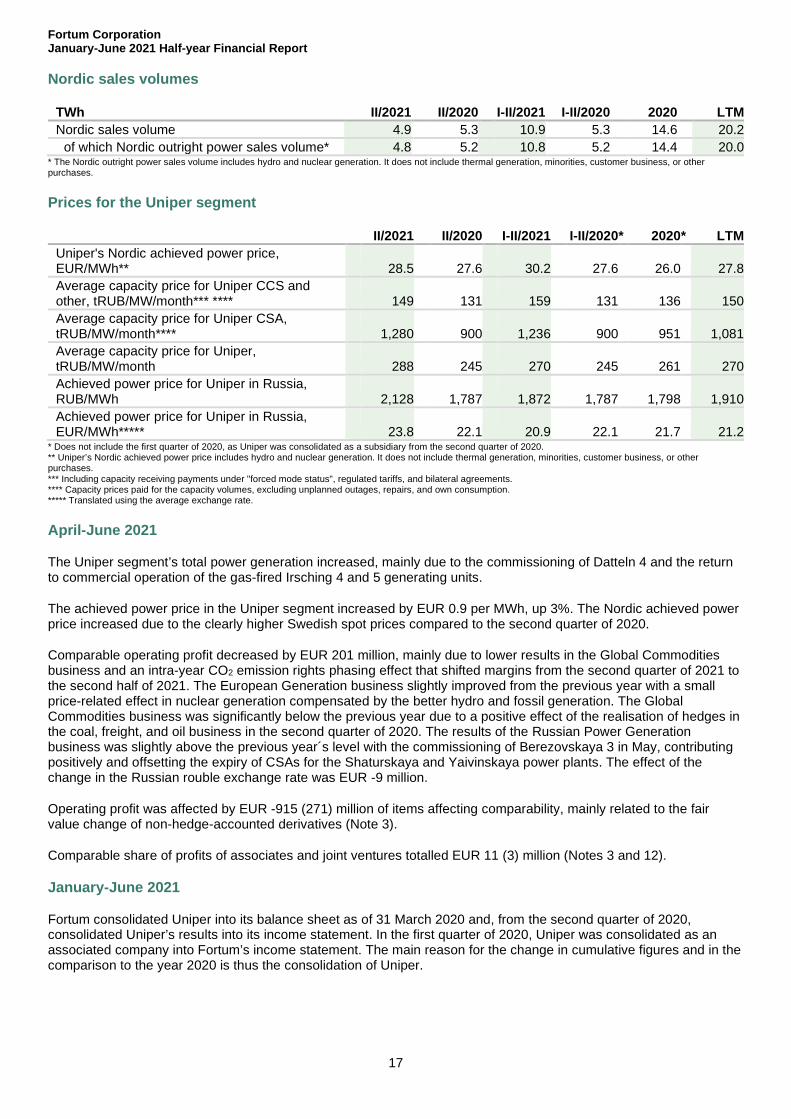
Nordic sales volumes
TWh II/2021 II/2020 I-II/2021 I-II/2020 2020 LTM Nordic sales volume 4.9 5.3 10.9 5.3 14.6 20.2
of which Nordic outright power sales volume* 4.8 5.2 10.8 5.2 14.4 20.0 * The Nordic outright power sales volume includes hydro and nuclear generation. It does not include thermal generation, minorities, customer business, or other purchases.
Prices for the Uniper segment
II/2021 II/2020 I-II/2021 I-II/2020 * 2020 * LTM Uniper's Nordic achieved power price, EUR/MWh** 28.5 27.6 30.2 27.6 26.0 27.8 Average capacity price for Uniper CCS and other, tRUB/MW/month*** **** 149 131 159 131 136 150 Average capacity price for Uniper CSA, tRUB/MW/month**** 1,280 900 1,236 900 951 1,081 Average capacity price for Uniper, tRUB/MW/month 288 245 270 245 261 270 Achieved power price for Uniper in Russia, RUB/MWh 2,128 1,787 1,872 1,787 1,798 1,910 Achieved power price for Uniper in Russia, EUR/MWh***** 23.8 22.1 20.9 22.1 21.7 21.2
* Does not include the first quarter of 2020, as Uniper was consolidated as a subsidiary from the second quarter of 2020. ** Uniper’s Nordic achieved power price includes hydro and nuclear generation. It does not include thermal generation, minorities, customer business, or other purchases. *** Including capacity receiving payments under "forced mode status", regulated tariffs, and bilateral agreements. **** Capacity prices paid for the capacity volumes, excluding unplanned outages, repairs, and own consumption. ***** Translated using the average exchange rate.
April-June 2021
The Uniper segment’s total power generation increased, mainly due to the commissioning of Datteln 4 and the return to commercial operation of the gas-fired Irsching 4 and 5 generating units.
The achieved power price in the Uniper segment increased by EUR 0.9 per MWh, up 3%. The Nordic achieved power price increased due to the clearly higher Swedish spot prices compared to the second quarter of 2020.
Comparable operating profit decreased by EUR 201 million, mainly due to lower results in the Global Commodities business and an intra-year CO2 emission rights phasing effect that shifted margins from the second quarter of 2021 to the second half of 2021. The European Generation business slightly improved from the previous year with a small price-related effect in nuclear generation compensated by the better hydro and fossil generation. The Global Commodities business was significantly below the previous year due to a positive effect of the realisation of hedges in the coal, freight, and oil business in the second quarter of 2020. The results of the Russian Power Generation business was slightly above the previous year´s level with the commissioning of Berezovskaya 3 in May, contributing positively and offsetting the expiry of CSAs for the Shaturskaya and Yaivinskaya power plants. The effect of the change in the Russian rouble exchange rate was EUR -9 million.
Operating profit was affected by EUR -915 (271) million of items affecting comparability, mainly related to the fair value change of non-hedge-accounted derivatives (Note 3).
Comparable share of profits of associates and joint ventures totalled EUR 11 (3) million (Notes 3 and 12).
January-June 2021
Fortum consolidated Uniper into its balance sheet as of 31 March 2020 and, from the second quarter of 2020, consolidated Uniper’s results into its income statement. In the first quarter of 2020, Uniper was consolidated as an associated company into Fortum’s income statement. The main reason for the change in cumulative figures and in the comparison to the year 2020 is thus the consolidation of Uniper.
Fortum Corporation January-June 2021 Half-year Financial Report
18
Power generation volumes were supported by better availability of the thermal fleet and the commissioning of Datteln 4 in the second quarter of 2020 and the return to commercial operation of the gas-fired Irsching 4 and 5 generating units.
Uniper recorded solid results for the first six months of 2021, albeit lower than the very strong performance in the first six months of 2020.
Supported by solid underlying performance, comparable operating profit amounted to EUR 534 (24) million. The effect of the change in the Russian rouble exchange rate was EUR -9 million.
The commissioning of the Datteln 4 coal-fired power plant at the end of May 2020 and the return to regular commercial operation of the Irsching 4 and 5 gas-fired power plant units in the fourth quarter of 2020 positively affected the results of the European Generation Business. In addition, higher revenues from the UK capacity market led to an increase in earnings compared with the prior year. The positive impact was partly offset by an intra-year CO2 emission right phasing effect that shifted margins from the first half of 2021 to the second half of 2021. In addition, in the fossil business, exceptionally positive margin contributions from the previous year could not be repeated.
The second-quarter results of the Global Commodities business were significantly below the previous year due to a positive effect of the realisation of hedges in the coal, freight, and oil business in the second quarter of 2020. This was partly offset by higher earnings from the international portfolio, which benefitted from unusual weather conditions in North America and from operations in Asia.
The Russian business contributed positively to the comparable operating profit of the Uniper segment. Negative foreign currency effects and the expiry of CSA payments for two units at the Shaturskaya and Jaivinskaya power plants were compensated by the commissioning of the Berezovskaya 3 power plant unit in May 2021 and the associated CSA payments and higher prices and volumes on the electricity market.
Operating profit was affected by EUR -813 (271) million of items affecting comparability, mainly related to EUR -766 (160) million of fair value change of non-hedge-accounted derivatives (Note 3).
Comparable share of profits of associates and joint-ventures totalled EUR 22 (3) million (Notes 3 and 12).
In March 2021, amendments to the Russian Strategic Investment Law were approved. Based on the law, Fortum is allowed to own 100% of Uniper, the majority owner of Unipro PJSC. In July 2021, Fortum withdrew its earlier submitted application for merger control approval from the Russian Federal Antimonopoly Service under the Competition Law to further analyse the requirements of the scope and content of the filing process.
On 1 April 2021, the German Federal Network Agency accepted the bid from the 757-MW Wilhelmshaven power plant as part of the second round of auctions for the closure of hard-coal-fired power plants. Power generation at the plant will end in December 2021, one year earlier than previously announced. Uniper announced plans to establish a German national hub for hydrogen in Wilhelmshaven. The plans include an import terminal for green ammonia, an ‘ammonia cracker’ for producing green hydrogen, and a 410-MW electrolysis plant, which, in combination with the import terminal, would be capable of supplying around 295,000 metric tonnes or 10% of the demand expected for the whole of Germany in 2030. Uniper is working on a feasibility study and no final investment decision has been made.
On 16 April 2021, Uniper announced it would seek a court ruling on the Dutch coal phase-out law, as it does not provide appropriate compensation for investments made. Uniper also has the ambition to convert the Maasvlakte site into an ecosystem for sustainable energy production.
On 27 April 2021, Fortum’s subsidiary Uniper published a stock exchange release (‘ad-hoc’) with a positive update of its result guidance for 2021. The release published by Uniper can be found on Uniper’s website.
On 1 June 2021, the German Federal Network Agency confirmed the essential status of the Heyden 4 hard-coal power plant as a reserve power plant until the end of September 2022.
In July 2021, the German Federal Network Agency accepted the bid from the 345-MW Scholven C power plant as part of the third round of auctions for the closure of hard-coal-fired power plants. The commercial power generation at the plant will end as early as the end of October 2022, slightly earlier than previously announced. This means that Uniper has now been selected in each of the three auctions to date and will take a total of 1,977 MW of hard coal capacity off the market ahead of schedule.
Fortum Corporation January-June 2021 Half-year Financial Report
19
On 4 August 2021, Uniper announced the decisions to accelerate the coal phase-out in the UK by closing one 500-MW unit of the Ratcliffe hard coal-fired power plant as early as the end of September 2022 and the closure of the remaining three units by the end of September 2024 at the latest.
For further information, see Uniper’s second-quarter 2021 results published on 11 August 2021.
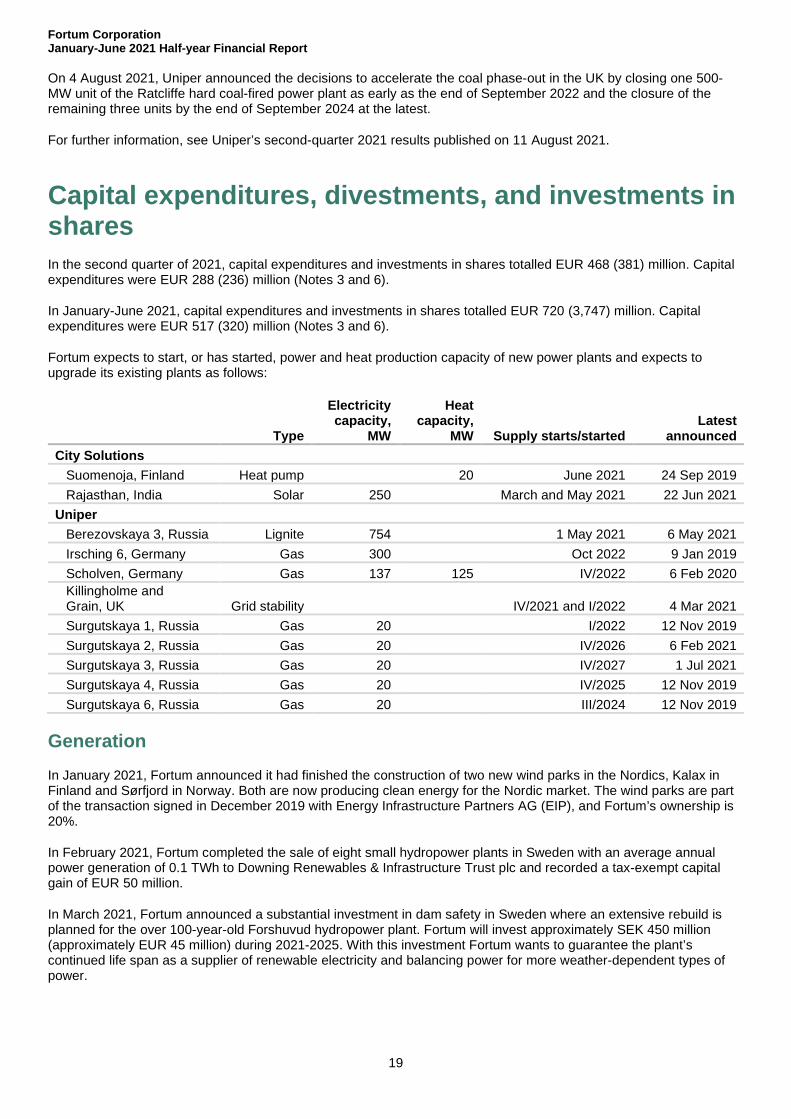
Capital expenditures, divestments, and investments in shares In the second quarter of 2021, capital expenditures and investments in shares totalled EUR 468 (381) million. Capital expenditures were EUR 288 (236) million (Notes 3 and 6).
In January-June 2021, capital expenditures and investments in shares totalled EUR 720 (3,747) million. Capital expenditures were EUR 517 (320) million (Notes 3 and 6).
Fortum expects to start, or has started, power and heat production capacity of new power plants and expects to upgrade its existing plants as follows:
Type
Electricity capacity,
MW
Heat capacity,
MW Supply starts/started Latest
announced City Solutions Suomenoja, Finland Heat pump 20 June 2021 24 Sep 2019 Rajasthan, India Solar 250 March and May 2021 22 Jun 2021 Uniper Berezovskaya 3, Russia Lignite 754 1 May 2021 6 May 2021 Irsching 6, Germany Gas 300 Oct 2022 9 Jan 2019 Scholven, Germany Gas 137 125 IV/2022 6 Feb 2020 Killingholme and Grain, UK Grid stability IV/2021 and I/2022 4 Mar 2021 Surgutskaya 1, Russia Gas 20 I/2022 12 Nov 2019 Surgutskaya 2, Russia Gas 20 IV/2026 6 Feb 2021 Surgutskaya 3, Russia Gas 20 IV/2027 1 Jul 2021 Surgutskaya 4, Russia Gas 20 IV/2025 12 Nov 2019 Surgutskaya 6, Russia Gas 20 III/2024 12 Nov 2019
Generation In January 2021, Fortum announced it had finished the construction of two new wind parks in the Nordics, Kalax in Finland and Sørfjord in Norway. Both are now producing clean energy for the Nordic market. The wind parks are part of the transaction signed in December 2019 with Energy Infrastructure Partners AG (EIP), and Fortum’s ownership is 20%.
In February 2021, Fortum completed the sale of eight small hydropower plants in Sweden with an average annual power generation of 0.1 TWh to Downing Renewables & Infrastructure Trust plc and recorded a tax-exempt capital gain of EUR 50 million.
In March 2021, Fortum announced a substantial investment in dam safety in Sweden where an extensive rebuild is planned for the over 100-year-old Forshuvud hydropower plant. Fortum will invest approximately SEK 450 million (approximately EUR 45 million) during 2021-2025. With this investment Fortum wants to guarantee the plant’s continued life span as a supplier of renewable electricity and balancing power for more weather-dependent types of power.
Fortum Corporation January-June 2021 Half-year Financial Report
20
Russia Together with its joint ventures in Russia, Fortum holds the largest portfolio of wind and solar power parks and projects in Russia, approximately 2 GW. Once operational, the wind and solar parks receive a guaranteed CSA price for a period of 15 years.
In 2017 and 2018, the Fortum-Rusnano wind investment fund (joint venture, Fortum's ownership 50%) won the right to build a total of 1,823 MW of wind capacity in CSA auctions. 600 MW of the wind capacity is operational, 732 MW under construction, and 491 MW under development. During the second half of 2020, the Fortum-Rusnano wind investment fund sold the 50-MW Ulyanovsk 2 and the 300-MW Rostov wind parks to the Fortum-RDIF joint venture. In June 2021, the Fortum-Rusnano wind investment fund additionally sold the 200-MW Kalmykia wind parks to the Fortum-RDIF joint venture.
In 2018 and 2019, Fortum won the right to build a total of 116 MW of solar capacity in CSA auctions. On 2 March 2021, Fortum announced it had decided to construct the solar power plant through the Fortum-RDIF joint venture. 78 MW of the capacity is expected to be commissioned in the fourth quarter of 2021 and the remaining part in the second half of 2022.
The investment decisions related to the solar and wind capacities won by Fortum and the Fortum-Rusnano wind investment fund in the Russian CSA auctions in 2017, 2018, and 2019 are made on a case-by-case basis. Fortum’s maximum equity commitment is RUB 15 billion.
On 4 June 2021, the Fortum-Rusnano wind investment fund made an investment decision on the construction of wind power parks with a total capacity of 237 MW in the Samara region in Russia. The investment decision follows the signing of a non-binding wider cooperation agreement between the wind investment fund and the Government of the Samara Region that envisages construction of wind parks with a total capacity of up to 300 MW in the region in 2022–2023. The wind parks in the Samara region are expected to be commissioned in the fourth quarter of 2022.
City Solutions On 12 March 2021, Fortum announced that it had signed an agreement to sell its district heating business in the Baltics to Partners Group. On 2 July 2021, Fortum concluded the sale. The total consideration of the sale amounted to approximately EUR 710 million. Fortum will record a tax-exempt capital gain of approximately EUR 250 million in the City Solutions segment’s third-quarter 2021 results.
On 19 March 2021, Fortum commissioned 150 MW of the 250-MW Rajasthan solar park in India. The remaining 100 MW was commissioned on 3 May 2021.
In June 2021, Fortum made the investment decision to expand its lithium-ion battery recycling capacity by building a new state-of-the-art hydrometallurgical plant in Harjavalta, Finland. The investment, estimated at EUR 24 million, will be a major step in increasing Fortum’s hydrometallurgical recycling capacity and enabling the production of sustainable battery chemicals. The plant is expected to be taken into operation in 2023. In March, Fortum’s hydrometallurgical battery recycling operations were shortlisted for the EU’s Innovation Fund for low-carbon technologies.
On 22 June 2021, Fortum announced that it had signed an agreement to divest the 250-MW Pavagada II and the 250-MW Rajasthan solar power plants in India to Actis. The total consideration for the divestment on a debt and cash-free basis, including the effect of deconsolidating of the net debt, is expected to be approximately EUR 280 million, most of which will be recorded during 2021.
On 30 June 2021, Fortum signed an agreement to sell its 50% ownership in the Swedish district heating and cooling company – Stockholm Exergi Holding AB (publ) – to a consortium comprising APG, Alecta, PGGM, Keva, and AXA. The total consideration is SEK 29.5 billion (EUR 2.9 billion) based on a 100% enterprise value of SEK 71.9 billion (EUR 7.1 billion). Fortum expects to record a tax-exempt capital gain of EUR 2.4 billion in the City Solutions segment’s results in connection with closing of the transaction. The transaction is subject to customary closing conditions. Fortum expects the closing to take place before the end of 2021. On 31 July 2020, Fortum announced its decision to assess strategic options, including possible divestment, of its 50% holding in Stockholm Exergi.
Fortum Corporation January-June 2021 Half-year Financial Report
21
Consumer Solutions In December 2020, Fortum decided to assess strategic options, including possible divestment, of its Consumer Solutions business. Based on initial assessments, this business has been identified as operations that could provide higher growth and value potential with an alternative ownership structure.
Uniper In February 2020, Uniper signed an agreement to sell its 58% stake in Schkopau, a lignite‐fired power plant in Saxony‐Anhalt in eastern Germany, to Saale Energie GmbH, a subsidiary of the Czech energy producer EPH, which owns 42%. The transfer of ownership will take place in October 2021.
Other Operations On 1 June 2021, Fortum signed an agreement to sell a majority share of its carbon removal startup Puro.earth to Nasdaq, a multinational financial services company. The partnership will create a shared ownership structure designed to accelerate Puro.earth’s global growth and long-term market development. Puro.earth, founded in 2019, has been developed to its current form under Fortum’s Valkea Growth Club. Puro.earth is the first marketplace to offer carbon removal from the atmosphere that is verifiable and tradable through an open, online platform. Unlike traditional carbon compensation, Puro.earth allows companies to neutralise their carbon footprint, beyond zero, by helping them source carbon removal to fulfil climate commitments.
Operating and regulatory environment European power markets In the second quarter of 2021, European power prices continued to rise, driven by strong gas and carbon prices. Even if Nordic power prices benefitted from this development to some extent, continued congestions in both export interconnectors and the internal Nordic grid had a visible impact causing widening price differences towards Continental Europe and between Nordic price areas.
According to preliminary statistics, power consumption in the Nordic countries was 90 (87) TWh during the second quarter of 2021. The higher power demand in the Nordics, compared to the second quarter of 2020, was caused by increased consumption in both the industrial and the non-industrial sectors. Temperatures were at the long-term average and half a degree below the level in the second quarter of 2020. During January-June 2021, power consumption in the Nordic countries was 210 (199) TWh.
In central western Europe (Germany, France, Austria, Switzerland, Belgium, and the Netherlands), the power consumption in the second quarter was 296 (265) TWh, according to preliminary statistics, which is in line with the pre-Covid-19 level power demand. During January-June 2021, power consumption in central western Europe was 653 (620) TWh.
In the long term, electricity is expected to continue to gain a higher share of total energy consumption. The growth rate, however, will largely be determined by the macroeconomic development in Europe and the Nordic countries. The rate of electrification of the industrial, transportation, and heating sectors is a key element determining the longer-term growth in electricity consumption.
At the beginning of the second quarter, the Nordic water reservoirs were at 55 TWh, which is 14 TWh above the long-term average and 3 TWh higher than one year earlier. High hydropower generation and below normal precipitation has lead to the normalisation of water reservoirs. At the end of the second quarter of 2021, the reservoirs were at 87 TWh, which is 3 TWh above the long-term average and 6 TWh lower than one year earlier.
In the second quarter of 2021, power prices were at a clearly higher level compared to one year ago. The average system spot price in Nord Pool was EUR 41.9 (5.6) per MWh. The average area price in Finland was EUR 46.3 (22.5) per MWh, in the SE3 area in Sweden (Stockholm) EUR 38.7 (15.1) per MWh, and in the SE2 area in Sweden (Sundsvall) EUR 33.1 (8.2) per MWh. In Germany, the average spot price in the second quarter of 2021 was EUR 60.3 (20.3) per MWh.
Fortum Corporation January-June 2021 Half-year Financial Report
22
In January-June 2021, the average system spot price in Nord Pool was EUR 42.0 (10.5) per MWh. The average area price in Finland was EUR 47.5 (23.2) per MWh, in the SE3 area in Sweden (Stockholm) EUR 42.2 (16.9) per MWh, and in the SE2 area in Sweden (Sundsvall) EUR 35.3 (11.9) per MWh. In Germany, the average spot price during January-June 2021 was EUR 55.0 (23.4) per MWh.
In early August 2021, the Nordic system electricity forward price on Nasdaq Commodities for the remainder of 2021 was around EUR 63 per MWh and for 2022 at around EUR 39 per MWh. The Nordic water reservoirs were at 88 TWh, which is about 9 TWh below the long-term average and 24 TWh lower than one year earlier. The German electricity forward price for the remainder of 2021 was around EUR 98 per MWh and for 2022 around EUR 83 per MWh.
European commodity markets In the second quarter of 2021, gas demand in central western Europe was 457 (380) TWh and 1,260 (1,110) TWh in January-June 2021. The central western European gas storage levels increased from 144 TWh at the beginning of the quarter to 233 TWh at the end of the quarter, which is 267 TWh lower than one year ago and 146 TWh lower than the five-year average (2016–2020).
The average gas spot price (TTF) during the second quarter of 2021 was EUR 25.1 (5.4) per MWh and EUR 21.8 (7.6) per MWh during January-June 2021. The 2022 forward price increased from EUR 18.1 per MWh at the beginning of the quarter to EUR 25.5 per MWh at the end of the quarter.
During the second quarter of 2021, the market sentiment for EUAs was strong. The price increased from EUR 42.5 per tonne at the beginning of the quarter to EUR 56.4 per tonne at the end of the quarter, which is EUR 29.4 per tonne higher than one year earlier.
The forward quotation for coal (ICE Rotterdam) for 2022 increased from USD 72.5 per tonne at the beginning of the quarter to USD 87.2 per tonne at the end of the quarter, which is USD 29.4 per tonne above the price one year earlier.
In early August 2021, the TTF forward price for gas for the remainder of 2021 was EUR 45 per MWh and for 2022 EUR 32 per MWh. The forward quotation for EUA’s for 2021 was at the level of EUR 56 per tonne. The forward price for coal (ICE Rotterdam) for the remainder of 2021 was USD 143 per tonne.
Russian power market Fortum’s Russia division operates thermal power plants mainly in the Tyumen and Khanty-Mansiysk area of western Siberia, where industrial production is dominated by the oil and gas industries, and in the Chelyabinsk area of the Urals, which is dominated by the metal industry. Uniper’s Russian subsidiary Unipro PJSC operates in the Smolensk, Moscow, Sverdlovsk, and Krasnoyarsk regions, as well as in the Khanty-Mansiysk Autonomous District.
The Russian market is divided into two price zones; Fortum’s Russia division operates in the first price zone (European and Urals part of Russia), while Uniper operates in both the first and second price zones.
According to preliminary statistics, Russian power consumption was 248 (232) TWh during the second quarter of 2021. The corresponding figure for the first price zone was 188 (176) TWh and for the second price zone 50 (48) TWh. The increase in consumption was caused by the abnormally hot temperatures in the second quarter of 2021 and economic recovery: the most negative effect of the Covid-19 pandemic and oil production restrictions were observed in May 2020. In January-June 2021, Russian power consumption was 544 (518) TWh. The corresponding figure for the first price zone was 412 (391) TWh and for the second price zone 110 (105) TWh.
In the second quarter of 2021, the average electricity spot price, excluding capacity prices, increased by 13% to RUB 1,315 (1,160) per MWh in the first price zone and decreased by 0.2% to RUB 900 (902) in the second price zone. The spot price in the Urals hub increased by 13% and was RUB 1,156 (1,021) per MWh. In January-June 2021, the average electricity spot price, excluding capacity prices, was RUB 1,337 (1,194) per MWh in the first price zone, RUB 909 (905) in the second price zone, and RUB 1,157 (1,044) per MWh in the Urals hub.
The Russian Government increased the gas price by 3% in July 2021.
In Russia, capacity payments based on CSA contracts are a key driver for earnings growth, as CSA payments are considerably higher than for capacities selected in Competitive Capacity Selection (CCS) auctions. Currently, Fortum’s Russia segment’s CSA capacity amounts to 1,926 MW, including 70 MW of solar and wind capacity. In
Fortum Corporation January-June 2021 Half-year Financial Report
23
addition to this, Fortum’s joint ventures for renewable power generation have a total of 1,939 MW of wind and solar capacity, 600 MW of which is operational, 848 MW is under construction, and 491 MW is under development. Correspondingly, Uniper’s CSA capacity amounts to 1,607 MW.
In addition, thermal power plants are entitled to clearly higher CSA payments starting approximately six years after commissioning (see tables below). In 2021, there was an increase in CSA payments for three units of Fortum’s Russia segment’s generation fleet and for one unit of Fortum’s Uniper segment’s generation fleet. After the CSA period ends, the units can receive CCS payments from CCS auctions. See the corresponding changes in the table below:
Fortum’s Russia segment’s units CSA starts Higher CSA starts CSA ends Tyumen CHP 1, unit 2 1 Feb 2011 1 Oct 2016 31 Dec 2020 Chelyabinsk CHP 3, unit 3 1 Jun 2011 1 Nov 2016 31 Dec 2020 Nyagan, unit 1 1 Apr 2013 1 Jan 2018 31 Dec 2021 Nyagan, unit 2 1 Dec 2013 1 Aug 2018 31 Dec 2022 Nyagan, unit 3 1 Jan 2015 1 Jan 2021 31 Dec 2025 Chelyabinsk CHP 4, unit 1 1 Dec 2015 1 Jan 2021 31 Dec 2024 Chelyabinsk CHP 4, unit 2 1 Mar 2016 1 Jan 2021 31 Dec 2024 Ulyanovsk* 1 Jan 2018 n/a 30 Nov 2031 Bugulchansk** Nov 2016 – Mar 2017 n/a Nov 2030 – Nov 2031 Pleshanovsk** 1 Mar 2017 n/a 30 Nov 2031 Grachevsk** 1 Mar 2017 n/a 30 Nov 2031
* Wind CSA. ** Solar CSA.
Fortum’s Uniper segment’s units CSA starts Higher CSA starts CSA ends Surgutskaya-2 GRES-2, unit 7 1 May 2011 1 May 2017 31 Jul 2021 Surgutskaya-2 GRES-2, unit 8 1 Jun 2011 1 Jun 2017 31 Aug 2021 Shaturskaya GRES, unit 7 1 Oct 2010 1 Oct 2016 31 Dec 2020 Yaivinskaya GRES, unit 5 1 Jan 2011 1 Jan 2017 31 Dec 2020 Berezovskaya GRES, unit 3* 1 Nov 2014 1 Nov 2020 31 Oct 2024 Surgutskaya-2 GRES-2, unit 1** Mar 2022 n/a Feb 2038 Surgutskaya-2 GRES-2, unit 2** Dec 2026 n/a Nov 2042 Surgutskaya-2 GRES-2, unit 3** Dec 2027 n/a Nov 2043 Surgutskaya-2 GRES-2, unit 4** Dec 2025 n/a Nov 2041 Surgutskaya-2 GRES-2, unit 6** Sep 2024 n/a Aug 2040
* Started receiving CSA payments from 1 May 2021 when returning to the market after repairs. ** Modernisation CSA 2.
Fortum’s Russia segment’s generation capacity not receiving CSA payments, totalling 2,953 MW, is allowed to participate in the annual CCS auctions. Uniper’s generation capacities allowed to participate in the CCS auction totalled 9,638 MW. The next CCS auction, for the year 2027, is expected to be held in November 2021.
Year 2020 2021 2022 2023 2024 2025 2026 CCS auction price, tRUB/MW/month, first price zone* 115 134 168 171 182 193 195 CCS auction price, tRUB/MW/month, second price zone* 191 225 264 267 279 303 299 Fortum’s Russia segment Selected in CCS auction, MW, first price zone 2,331 2,848 3,451 3,904 3,904 4,351 4,852 Fortum’s Uniper segment Selected in CCS auction, MW, first price zone 7,190 8,829 8,035 8,035 7,225 6,427 5,617 Selected in CCS auction, MW, second price zone 1,600 1,600 1,600 1,600 2,400 2,400 2,400
* Excluding inflation.
Fortum Corporation January-June 2021 Half-year Financial Report
24
In June 2018 and 2019, Fortum won the right to build 110 MW and 6 MW of solar capacity in CSA auctions. The power plants will receive a guaranteed CSA price for a period of 15 years, corresponding to approximately RUB 15,000 per MWh and RUB 14,000 per MWh, respectively. 78 MW of the capacity is expected to be commissioned in the fourth quarter of 2021 and the remaining part in the second half of 2022.
In June 2018, the Fortum-Rusnano wind investment fund won the right to build 823 MW of wind capacity in a CSA auction. The wind parks were to be commissioned during 2019-2023 and will receive a guaranteed CSA price corresponding to approximately RUB 7,000-8,000 per MWh for a period of 15 years.
In June 2017, the Fortum-Rusnano wind investment fund won the right to build 1,000 MW of wind capacity in a CSA auction. The wind parks were to be commissioned during 2018-2022 and will receive a guaranteed CSA price corresponding to approximately RUB 7,000-9,000 per MWh for a period of 15 years.
More detailed information about the market fundamentals is included in the tables at the end of the report.
Regulatory environment
‘Fit for 55’ legislative package published
On 14 July, the European Commission issued the long awaited ‘Fit for 55’ package that is expected to implement the ambitious climate target of a 55% reduction of greenhouse gas emissions by 2030 with the goal of achieving climate neutrality by 2050, as part of its Green Deal. This wide-encompassing package, including a dozen legislative proposals, is aimed at driving the transformation of European producing and consuming sectors towards net zero emitting activities.
Fortum welcomes the Commission’s extensive package as an important implementation step towards the EU’s climate neutrality objective and global leadership. We endorse the continued commitment to carbon pricing and the EU Emission Trading System (ETS) as the main instrument of the EU climate policy as well as the proposal to extend the ETS to buildings and road transport, starting with a separate trading scheme for those sectors. The package is well-aligned with Fortum’s priorities and strategic aim to drive the transition to a carbon-neutral economy. Going forward, it will be essential to adopt a cost-efficient and technology-neutral approach for the necessary transformation of the European economy.
The publication of the package is followed by a series of consultations with stakeholders and will enter the decision-making process before the European Parliament and the EU Council of Ministers after the summer.
Renewed Sustainable Finance Action Plan published
On 6 July, the European Commission adopted a ‘Strategy for financing the transition to a sustainable economy’ that sets out the next steps for the EU sustainable finance framework. Along with this communication, the European Commission also issued a legislative proposal on the European Green Bond standard and the final delegated act on the reporting obligation.
The work on the EU taxonomy continues with major forthcoming deliveries, such as the complementary delegated act on climate change focusing on nuclear and gas which were separated from the original taxonomy delegated act published in April 2021. The Commission is expected to issue the draft delegated act in the autumn, building upon the completion of the nuclear environmental assessment by the Commission’s Joint Research Center and specific expert committees. The Commission is also expected to publish the delegated act on the remaining environmental objectives, including circular economy, biodiversity, water and marine resources, as well as pollution prevention.
Fortum has consistently called for a thorough, science-based, and technology-neutral EU taxonomy that builds on the complementarity of technologies and their actual contribution to reducing climate change.
Fortum Corporation January-June 2021 Half-year Financial Report
25
Possible further delay in decision on the final nuclear waste repository in Sweden
The Swedish Government has decided to start a public consultation suggesting a separation of the intermediate nuclear waste storage application from the application of the final waste storage, in order to further postpone a decision on the final waste repository. Because the licensing process of the final repository has been delayed, the intermediate storage in Oskarshamn is becoming full. The nuclear power operators have therefore warned about the risks of major disruptions in the electricity supply already in spring 2024. When the intermediate storage becomes full, nuclear plants will no longer be able to get rid of their spent nuclear fuel and thus run the risk of not being able to further run the reactors. In order to avoid this situation, a Government decision is needed before 31 August 2021, as the continued permission processes are estimated to take about two years.
The intermediate storage and the final repository are connected in a coherent final repository system. For the municipality of Oskarshamn, it has always been important that the intermediate storage does not become a permanent solution. Therefore, the municipality does not approve a decision on increased capacity in the intermediate storage without having a decision for the final repository. The additional costs of the delayed decision for the nuclear owners are an estimated EUR 80 million per year.
Amendment of the German Climate Protection Act with significantly higher ambition
At the end of June, the German Federal Government passed an update of the Climate Protection Act that aims at reducing its greenhouse gases by at least 65% by 2030 and by 88% by 2040 (compared to 1990 levels). Under this revised Climate Act, Germany should be climate neutral by 2045 instead of 2050 following a ruling of the Federal Constitutional Court in March 2021 that deemed the previous Climate Protection Act of 2019 incompatible with fundamental rights.
Germany is facing the biggest technological shift and transformation in the energy sector since the early industrialisation times. This will require converting a large array of sectors, such as industry, heat, and mobility, into climate-neutral activities within 24 years while preserving international competitiveness and social cohesion.
This will be the main topic for the new Government after federal elections are held in mid-September 2021.
Key drivers and risks Fortum’s financial results are exposed to a number of financial, operational, strategic, and sustainability-related risks. Fortum is exposed to these risks both directly and indirectly through its subsidiaries, associated companies, and joint ventures. The principal associated companies and joint ventures are TVO, Forsmarks Kraftgrupp AB, Kemijoki Oy, TGC-1, and Stockholm Exergi AB. For more information, please see each respective company’s annual report.
On 26 March 2020, Fortum became the majority shareholder of Uniper. However, Uniper remains a separate listed company operating under German law and regulations with its own risk management systems. As per the end of the second quarter 2021, credit risk, market risk, legal risk, financial risk, and asset project risk are the major sources of uncertainty for Uniper’s financial performance. For more information about Uniper’s risk management systems and risk exposures, please see Uniper’s half-year 2021 report and annual report for 2020.
One of the key factors influencing Fortum’s business performance is the Nordic electricity wholesale price. In the Nordics, power prices exhibit significant short- and long-term variations on the back of several factors, including but not limited to weather conditions, outage patterns in production and transmission lines, CO2 emission allowance prices, fuel prices, and the supply-demand balance. Fortum uses hedging in order to limit the exposure to fluctuations in power prices and reports on the hedging levels quarterly (see ‘Outlook’).
For Fortum’s Russian businesses, the key drivers are economic growth, the rouble exchange rate, and the regulation of the power and heat business. A key profitability driver is the received payments based on the CSA contracts and CCS auctions. The main part of Fortum’s generation capacity built after 2007 is entitled to CSA payments for approximately 10 years after commissioning and approximately 15 years for renewable generation. The CSA payments are adjusted for, among other factors, the Government bond yield, the rate of return, the consumer price index (CPI), and earnings from the electricity-only (spot) market (done every three and six years after commissioning of a unit). In addition, thermal power plants are entitled to clearly higher CSA payments starting approximately six years after commissioning.
Fortum Corporation January-June 2021 Half-year Financial Report
26
Fortum has cash flows, assets, and liabilities in currencies other than the euro and is therefore exposed to fluctuations in exchange rates. Currency risk arises mainly from physical and financial trading of commodities, existing and new investments, external financing, as well as internal loans and shareholder loans within the Group. The main currency exposures are toward euro/Swedish krona, euro/Russian rouble, and euro/British pound sterling, arising from Fortum’s extensive operations in Sweden, Russia, and the United Kingdom.
Fortum and Uniper are committed to a rating of at least BBB flat. After the announced sale of Fortum’s 50% stake in Stockholm Exergi and improved market conditions, both Standard & Poor’s and Fitch credit rating agencies revised the outlook of Fortum’s BBB rating from “negative” to “stable” based on the improved credit metrics. The risk of a downgrade of Fortum’s credit rating is therefore lower than at year-end 2020. Subsequently, Standard & Poor’s also affirmed Uniper’s credit rating at BBB and lifted the outlook to stable. Uniper’s previous negative outlook reflected the outlook on the BBB rating of Fortum Group, which serves as a cap for Uniper’s S&P rating. A downgrade of the credit rating from the current BBB rating, in particular to below investment-grade level, could affect the access to capital markets, the cost of financing, and business operations. It could also negatively affect liquidity, as it would trigger counterparties’, especially in the trading business of Uniper, right to demand increased collateral, which would need to be provided via liquid assets or bank guarantees.
Fortum’s business activities include energy generation, storage, distribution, and control of operations, as well as the construction, modernisation, maintenance, and decommissioning of power plants or other energy industry facilities. Any unwanted operational event (which could be caused by e.g. technical failure, human or process error, natural disasters, sabotage, failure of key suppliers, or terrorist attack) can endanger personal safety or lead to environmental or physical damage, business interruptions, project delays, and possible third-party liability. The associated costs can be high, especially in the Group’s largest units and projects.
During 2020, the Covid-19 pandemic resulted in new and partly unexpected risks as societies and governments across the world implemented drastic measures to contain the spread of the disease. Although the impacts for Fortum have so far been limited, and the situation compared to the end of 2020 has improved, the risks related to a prolonged pandemic cannot be ruled out. The main risk factors include lower commodity prices and decreased demand, credit defaults and delayed payments, project delays, and increased risk of operational incidents or prolonged maintenance as a result of travel restrictions, absence of key personnel, as well as difficulties in obtaining key materials and spare parts. Fortum is closely monitoring the development of the pandemic and its potential impacts.
For further information about Fortum’s risks and risk management systems, see Fortum’s Annual Report for 2020.
Outlook Hedging At the end of June 2021, approximately 75% of the Generation segment’s estimated Nordic power sales volume was hedged at EUR 33 per MWh for the remainder of 2021 and approximately 60% at EUR 31 per MWh for 2022 (at the end of the first quarter of 2021: 55% at EUR 31 per MWh).
At the end of June 2021, approximately 90% of the Uniper segment’s estimated Nordic power sales volume was hedged at EUR 26 per MWh for the remainder of 2021, approximately 85% at EUR 24 per MWh for 2022 (at the end of the first quarter of 2021: 85% at EUR 24 per MWh), and approximately 45% at EUR 22 per MWh for 2023 (at the end of the first quarter of 2021: 35% at EUR 21 per MWh).
The reported hedge ratios are based on the hedges and power generation forecasts of the Generation segment and of the Uniper segment’s Nordic generation. The underlying generation assets and definition of hedges differ to some extent and thus are not fully comparable.
The reported hedge ratios may vary significantly, depending on Fortum’s and Uniper’s actions on the electricity derivatives markets. Hedges are mainly financial contracts, most of them electricity derivatives quoted on Nasdaq Commodities.
Fortum Corporation January-June 2021 Half-year Financial Report
27
Capital expenditure Fortum estimates its capital expenditure, including maintenance but excluding acquisitions, to be approximately EUR 1,400 million in 2021, of which the share of maintenance capital expenditure is estimated to be approximately EUR 700 million, well below the level of depreciation.
Generation The Generation segment’s achieved Nordic power price typically depends on factors such as hedge ratios, hedge prices, spot prices, availability and utilisation of Fortum’s flexible generation portfolio, as well as currency fluctuations. Excluding the potential effects from changes in the power generation mix (currently approximately 45 TWh), a EUR 1 per MWh change in the Generation segment’s achieved Nordic power price will result in an approximately EUR 45 million change in the segment’s annual comparable operating profit. The achieved power price also includes the results of optimisation of Fortum’s hydro and nuclear generation, as well as operations in the physical and financial commodity markets.
Russia In February 2021, the Wholesale Market Trading Administrator published data from 2020 regarding the rate of return and the CPI, which are used to calculate the CSA price for 2021. The CSA payments were revised downwards, mainly due to the lower Government bond yield (6.3% for 2021 vs. 7.6% for 2020). In 2021, in the Russia segment, the negative financial effect related to the ending of the CSA period of two production units is expected to exceed the positive effect of three units entering the four-year period of higher CSA payments.
Uniper Excluding the potential effects from changes in the power generation mix, a EUR 1 per MWh change in the Uniper segment’s power sales price for the outright generation (hydro and nuclear, currently approximately 25 TWh) will result in an approximately EUR 25 million change in the segment’s annual comparable operating profit. Uniper also has generation other than hydro and nuclear power, and the sensitivity for that generation is different and is not included in the previously mentioned sensitivity.
On 27 April 2021, Fortum’s subsidiary Uniper published a stock exchange release (‘ad-hoc’) with a positive update of its result guidance for 2021. With regard to Uniper, reference is made to the guidance that the company publishes quarterly.
Income taxation In 2021, the comparable effective income tax rate for Fortum is estimated to be in the range of 20-25%.
In June 2018, the Swedish Government decided to lower the Swedish corporate tax in two steps, from 22.0% to 21.4%, effective January 2019, and to 20.6%, effective January 2021.
Sustainability As the majority owner of Uniper, Fortum has consolidated Uniper as a subsidiary as of 31 March 2020. Uniper has its own sustainability processes, approach, and standalone interim and annual sustainability reporting.
In this interim report, selected sustainability key performance indicators that include Uniper are disclosed. Indicators following the same calculation principles have been consolidated and are disclosed as one figure. In cases where the
Fortum Corporation January-June 2021 Half-year Financial Report
28
definitions currently differ, only one figure for Fortum, excluding Uniper, is presented. No historical figures have been restated.
Fortum highlights the importance of decarbonisation and climate change mitigation, while at the same time the necessity to secure reliable and affordable energy for all. Fortum also gives balanced consideration in its operations to the promotion of energy efficiency and a circular economy, as well as its impacts on personnel and societies.
Based on the above-mentioned priorities, Fortum’s sustainability priority areas include:
Climate and resources Personnel and society
Climate change and GHG emissions Employee wellbeing, health and safety Business ethics and compliance
Emissions to air, land, and water Corporate governance Labour rights Energy efficiency Human rights Diversity and equal opportunity Security of supply Innovation and digitalisation Stakeholder engagement Water use Economic value creation Customer rights and satisfaction Biodiversity Circular economy
Fortum’s sustainability performance is monitored and disclosed in interim and annual reporting. Fortum publishes an annual Sustainability Report with more extensive information on Fortum’s sustainability performance.
Sustainability targets
Fortum updated its climate targets aligned with the goals of the Paris Agreement in December 2020 and is committed to carbon neutrality by 2050 at the latest. The target covers direct CO2 emissions (Scope 1) and indirect CO2 emissions (Scope 2 and 3). Fortum’s roadmap to reduce emissions in Europe has also been defined. Fortum is committed to at least a 50% CO2 reduction in emissions (Scope 1 and 2) in its European generation by 2030 (compared to base-year 2019) and to be carbon neutral by 2035 at the latest.
Scope 3 emissions play a significant role in Fortum’s total emissions. During 2021, Fortum will develop a target for the reduction of Scope 3 GHG emissions, addressing the indirect emissions from fossil fuel sales to end users.
Fortum has also set a target for biodiversity, addressing the year 2021. Fortum aims at conducting a minimum of 12 major voluntary measures that improve the living conditions of species and strengthen populations, covering all countries where Fortum has hydropower production. The projects focus on threatened species or habitats, in particular, and in 2021 are planned to include restoring aquatic and terrestrial habitats, improving fish migration and migratory fish populations, and combating invasive species.
For Fortum, excellence in safety is the foundation of the company’s business and an absolute prerequisite for efficient and interruption-free production. The company’s safety target is measured as Total Recordable Injury Frequency (TRIF), for own personnel and contractors, and the ambitious goal is <1.0 by the end of 2025. Fortum’s TRIF was 2.3 in 2020. Fortum also has a target for Lost Time Injury Frequency (LTIF): ≤1.2 in 2021.
Development of sustainability targets will continue in 2021, and Fortum aims to align targets also addressing other areas of sustainability in addition to climate, biodiversity, and safety.
During the first quarter of 2021, both Fortum and Uniper became supporters of the Task Force on Climate-related Financial Disclosures (TCFD). Fortum has a long-standing focus on mitigating climate change and adopted the reporting recommendations of the TCFD already starting from the financial year 2019.
Fortum has also decided to undertake a review of its lobbying activities and practices during 2021. The review will be published as a part of Fortum’s Sustainability Report in 2022, and thereafter on a yearly basis.
In the table below, Fortum reports its sustainability performance with selected key indicators.
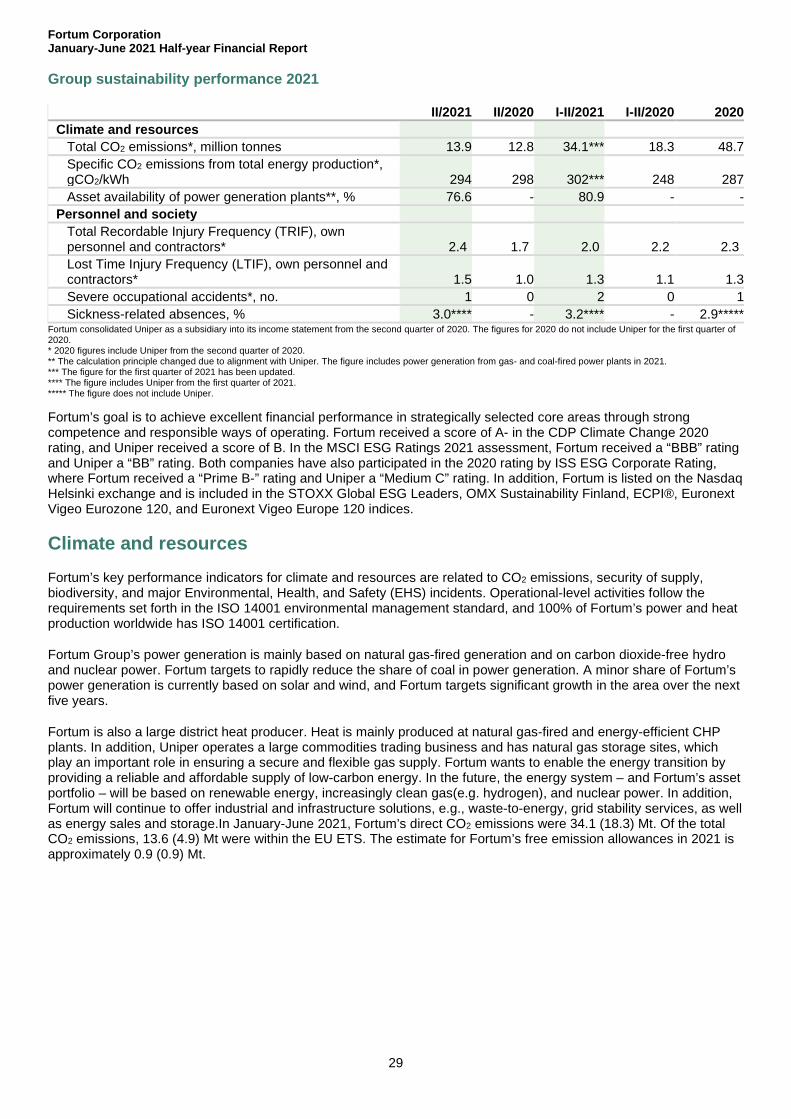
Fortum Corporation January-June 2021 Half-year Financial Report
29
Group sustainability performance 2021
II/2021 II/2020 I-II/2021 I-II/2020 2020 Climate and resources
Total CO2 emissions*, million tonnes 13.9 12.8 34.1*** 18.3 48.7 Specific CO2 emissions from total energy production*, gCO2/kWh 294 298 302*** 248 287 Asset availability of power generation plants**, % 76.6 - 80.9 - -
Personnel and society Total Recordable Injury Frequency (TRIF), own personnel and contractors* 2.4 1.7 2.0 2.2 2.3 Lost Time Injury Frequency (LTIF), own personnel and contractors* 1.5 1.0 1.3 1.1 1.3 Severe occupational accidents*, no. 1 0 2 0 1 Sickness-related absences, % 3.0**** - 3.2**** - 2.9*****
Fortum consolidated Uniper as a subsidiary into its income statement from the second quarter of 2020. The figures for 2020 do not include Uniper for the first quarter of 2020. * 2020 figures include Uniper from the second quarter of 2020. ** The calculation principle changed due to alignment with Uniper. The figure includes power generation from gas- and coal-fired power plants in 2021. *** The figure for the first quarter of 2021 has been updated. **** The figure includes Uniper from the first quarter of 2021. ***** The figure does not include Uniper. Fortum’s goal is to achieve excellent financial performance in strategically selected core areas through strong competence and responsible ways of operating. Fortum received a score of A- in the CDP Climate Change 2020 rating, and Uniper received a score of B. In the MSCI ESG Ratings 2021 assessment, Fortum received a “BBB” rating and Uniper a “BB” rating. Both companies have also participated in the 2020 rating by ISS ESG Corporate Rating, where Fortum received a “Prime B-” rating and Uniper a “Medium C” rating. In addition, Fortum is listed on the Nasdaq Helsinki exchange and is included in the STOXX Global ESG Leaders, OMX Sustainability Finland, ECPI®, Euronext Vigeo Eurozone 120, and Euronext Vigeo Europe 120 indices.
Climate and resources Fortum’s key performance indicators for climate and resources are related to CO2 emissions, security of supply, biodiversity, and major Environmental, Health, and Safety (EHS) incidents. Operational-level activities follow the requirements set forth in the ISO 14001 environmental management standard, and 100% of Fortum’s power and heat production worldwide has ISO 14001 certification.
Fortum Group’s power generation is mainly based on natural gas-fired generation and on carbon dioxide-free hydro and nuclear power. Fortum targets to rapidly reduce the share of coal in power generation. A minor share of Fortum’s power generation is currently based on solar and wind, and Fortum targets significant growth in the area over the next five years.
Fortum is also a large district heat producer. Heat is mainly produced at natural gas-fired and energy-efficient CHP plants. In addition, Uniper operates a large commodities trading business and has natural gas storage sites, which play an important role in ensuring a secure and flexible gas supply. Fortum wants to enable the energy transition by providing a reliable and affordable supply of low-carbon energy. In the future, the energy system – and Fortum’s asset portfolio – will be based on renewable energy, increasingly clean gas(e.g. hydrogen), and nuclear power. In addition, Fortum will continue to offer industrial and infrastructure solutions, e.g., waste-to-energy, grid stability services, as well as energy sales and storage.In January-June 2021, Fortum’s direct CO2 emissions were 34.1 (18.3) Mt. Of the total CO2 emissions, 13.6 (4.9) Mt were within the EU ETS. The estimate for Fortum’s free emission allowances in 2021 is approximately 0.9 (0.9) Mt.
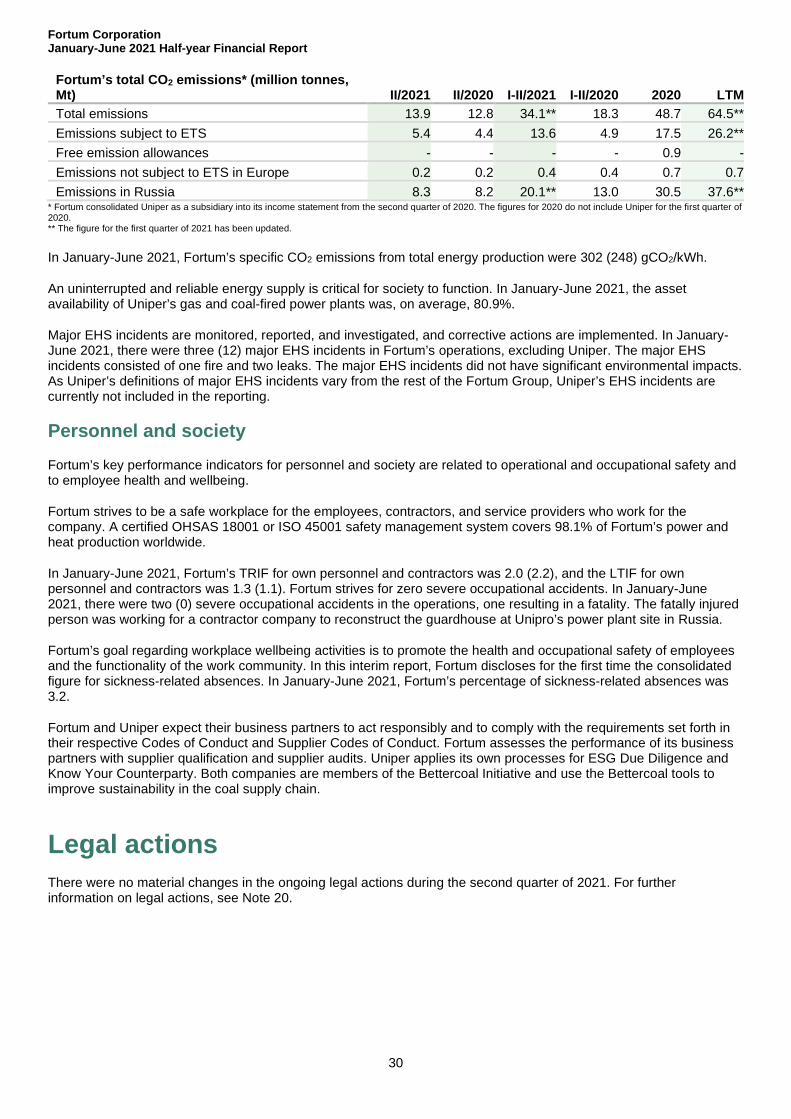
Fortum Corporation January-June 2021 Half-year Financial Report
30
Fortum’s total CO2 emissions* (million tonnes, Mt) II/2021 II/2020 I-II/2021 I-II/2020 2020 LTM Total emissions 13.9 12.8 34.1** 18.3 48.7 64.5** Emissions subject to ETS 5.4 4.4 13.6 4.9 17.5 26.2** Free emission allowances - - - - 0.9 - Emissions not subject to ETS in Europe 0.2 0.2 0.4 0.4 0.7 0.7 Emissions in Russia 8.3 8.2 20.1** 13.0 30.5 37.6**
* Fortum consolidated Uniper as a subsidiary into its income statement from the second quarter of 2020. The figures for 2020 do not include Uniper for the first quarter of 2020. ** The figure for the first quarter of 2021 has been updated.
In January-June 2021, Fortum’s specific CO2 emissions from total energy production were 302 (248) gCO2/kWh.
An uninterrupted and reliable energy supply is critical for society to function. In January-June 2021, the asset availability of Uniper’s gas and coal-fired power plants was, on average, 80.9%.
Major EHS incidents are monitored, reported, and investigated, and corrective actions are implemented. In January-June 2021, there were three (12) major EHS incidents in Fortum’s operations, excluding Uniper. The major EHS incidents consisted of one fire and two leaks. The major EHS incidents did not have significant environmental impacts. As Uniper’s definitions of major EHS incidents vary from the rest of the Fortum Group, Uniper’s EHS incidents are currently not included in the reporting.
Personnel and society Fortum’s key performance indicators for personnel and society are related to operational and occupational safety and to employee health and wellbeing.
Fortum strives to be a safe workplace for the employees, contractors, and service providers who work for the company. A certified OHSAS 18001 or ISO 45001 safety management system covers 98.1% of Fortum’s power and heat production worldwide.
In January-June 2021, Fortum’s TRIF for own personnel and contractors was 2.0 (2.2), and the LTIF for own personnel and contractors was 1.3 (1.1). Fortum strives for zero severe occupational accidents. In January-June 2021, there were two (0) severe occupational accidents in the operations, one resulting in a fatality. The fatally injured person was working for a contractor company to reconstruct the guardhouse at Unipro’s power plant site in Russia.
Fortum’s goal regarding workplace wellbeing activities is to promote the health and occupational safety of employees and the functionality of the work community. In this interim report, Fortum discloses for the first time the consolidated figure for sickness-related absences. In January-June 2021, Fortum’s percentage of sickness-related absences was 3.2.
Fortum and Uniper expect their business partners to act responsibly and to comply with the requirements set forth in their respective Codes of Conduct and Supplier Codes of Conduct. Fortum assesses the performance of its business partners with supplier qualification and supplier audits. Uniper applies its own processes for ESG Due Diligence and Know Your Counterparty. Both companies are members of the Bettercoal Initiative and use the Bettercoal tools to improve sustainability in the coal supply chain.
Legal actions There were no material changes in the ongoing legal actions during the second quarter of 2021. For further information on legal actions, see Note 20.
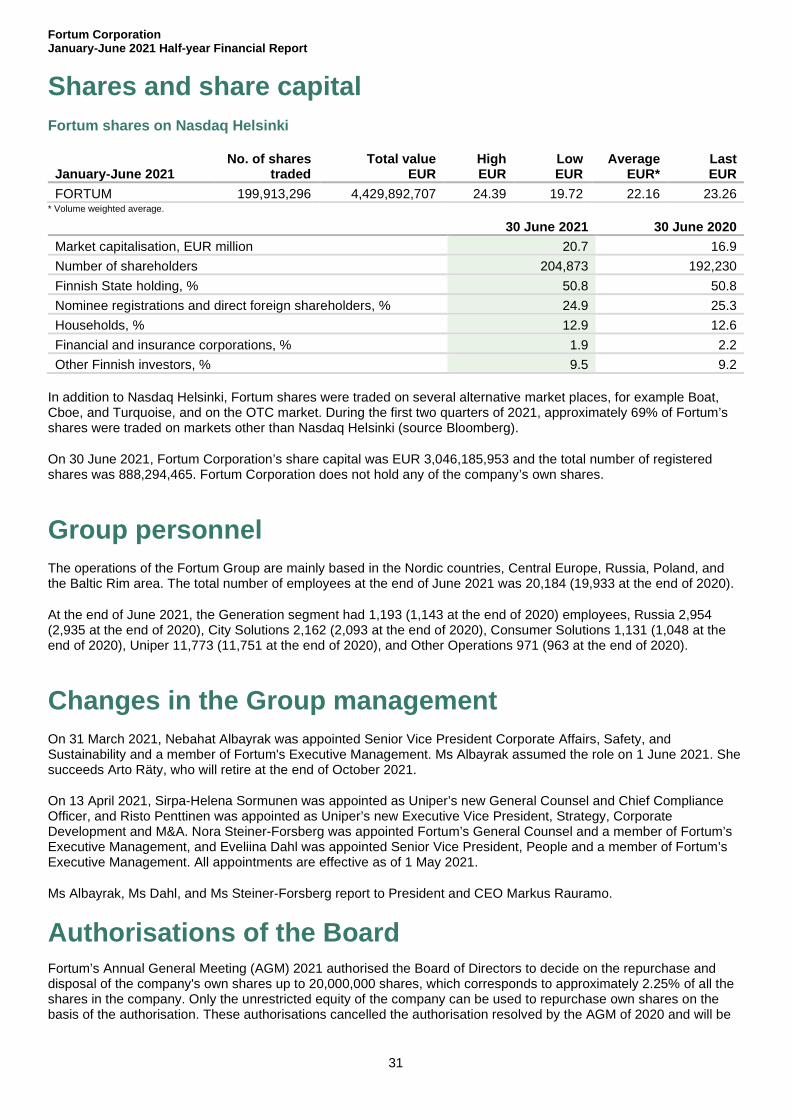
Fortum Corporation January-June 2021 Half-year Financial Report
31
Shares and share capital Fortum shares on Nasdaq Helsinki
January-June 2021 No. of shares
traded Total value
EUR High EUR
Low EUR
Average EUR*
Last EUR
FORTUM 199,913,296 4,429,892,707 24.39 19.72 22.16 23.26 * Volume weighted average.
30 June 2021 30 June 2020 Market capitalisation, EUR million 20.7 16.9 Number of shareholders 204,873 192,230 Finnish State holding, % 50.8 50.8 Nominee registrations and direct foreign shareholders, % 24.9 25.3 Households, % 12.9 12.6 Financial and insurance corporations, % 1.9 2.2 Other Finnish investors, % 9.5 9.2
In addition to Nasdaq Helsinki, Fortum shares were traded on several alternative market places, for example Boat, Cboe, and Turquoise, and on the OTC market. During the first two quarters of 2021, approximately 69% of Fortum’s shares were traded on markets other than Nasdaq Helsinki (source Bloomberg).
On 30 June 2021, Fortum Corporation’s share capital was EUR 3,046,185,953 and the total number of registered shares was 888,294,465. Fortum Corporation does not hold any of the company’s own shares.
Group personnel The operations of the Fortum Group are mainly based in the Nordic countries, Central Europe, Russia, Poland, and the Baltic Rim area. The total number of employees at the end of June 2021 was 20,184 (19,933 at the end of 2020).
At the end of June 2021, the Generation segment had 1,193 (1,143 at the end of 2020) employees, Russia 2,954 (2,935 at the end of 2020), City Solutions 2,162 (2,093 at the end of 2020), Consumer Solutions 1,131 (1,048 at the end of 2020), Uniper 11,773 (11,751 at the end of 2020), and Other Operations 971 (963 at the end of 2020).
Changes in the Group management On 31 March 2021, Nebahat Albayrak was appointed Senior Vice President Corporate Affairs, Safety, and Sustainability and a member of Fortum's Executive Management. Ms Albayrak assumed the role on 1 June 2021. She succeeds Arto Räty, who will retire at the end of October 2021.
On 13 April 2021, Sirpa-Helena Sormunen was appointed as Uniper’s new General Counsel and Chief Compliance Officer, and Risto Penttinen was appointed as Uniper’s new Executive Vice President, Strategy, Corporate Development and M&A. Nora Steiner-Forsberg was appointed Fortum’s General Counsel and a member of Fortum’s Executive Management, and Eveliina Dahl was appointed Senior Vice President, People and a member of Fortum’s Executive Management. All appointments are effective as of 1 May 2021.
Ms Albayrak, Ms Dahl, and Ms Steiner-Forsberg report to President and CEO Markus Rauramo.
Authorisations of the Board Fortum’s Annual General Meeting (AGM) 2021 authorised the Board of Directors to decide on the repurchase and disposal of the company's own shares up to 20,000,000 shares, which corresponds to approximately 2.25% of all the shares in the company. Only the unrestricted equity of the company can be used to repurchase own shares on the basis of the authorisation. These authorisations cancelled the authorisation resolved by the AGM of 2020 and will be
Fortum Corporation January-June 2021 Half-year Financial Report
32
effective until the next AGM and, in any event, no longer than for a period of 18 months. This authorisation has not been used by 17 August 2021.
In addition, the AGM authorised the Board of Directors to decide on contributions of a maximum of EUR 500,000 for charitable or similar purposes and to decide on the recipients, purposes, and other terms of the contributions. The authorisation will be effective until the next AGM. As of 17 August 2021, EUR 100,000 of this authorisation has been used.
Events after the reporting period On 8 July 2021, Fortum signed an agreement to sell its Argayash coal-fired CHP plant to AO JSC Rusatom Smart Utilities. Following the decision earlier in 2021 to transition to gas at the Chelyabinsk CHP-2, this transaction will allow the Russia Division to discontinue its use of coal by the end of 2022 and reduce annual CO2 emissions by approximately 2 million tonnes. The power plant has only had a minor effect on Fortum’s EBITDA. The parties have agreed not to disclose the sales price. The transaction is expected to be closed in the third quarter of 2021.
Espoo, 16 August 2021
Fortum Corporation Board of Directors
Further information:
Investor Relations and Financial Communications: Ingela Ulfves, tel. +358 40 515 1531, Måns Holmberg, tel. +358 44 518 1518, Rauno Tiihonen, tel. +358 10 453 6150, Carlo Beck, tel. +49 172 751 2480, Pirjo Lifländer, tel. +358 40 643 3317, and [email protected]
Media: Pauliina Vuosio, tel. +358 50 453 2383
The condensed Half-year Financial Report has been prepared in accordance with International Accounting Standard (IAS) 34, Interim Financial Reporting, as adopted by the EU. The Half-year financials have not been audited.
Financial calendar in 2021
Fortum will publish its January-September Interim Report on 12 November 2021 at approximately 9.00 EET
Uniper will publish its Financial Results January-September 2021 on 5 November 2021
Distribution:
Nasdaq Helsinki Key media www.fortum.com
More information, including detailed quarterly information, is available at www.fortum.com/investors
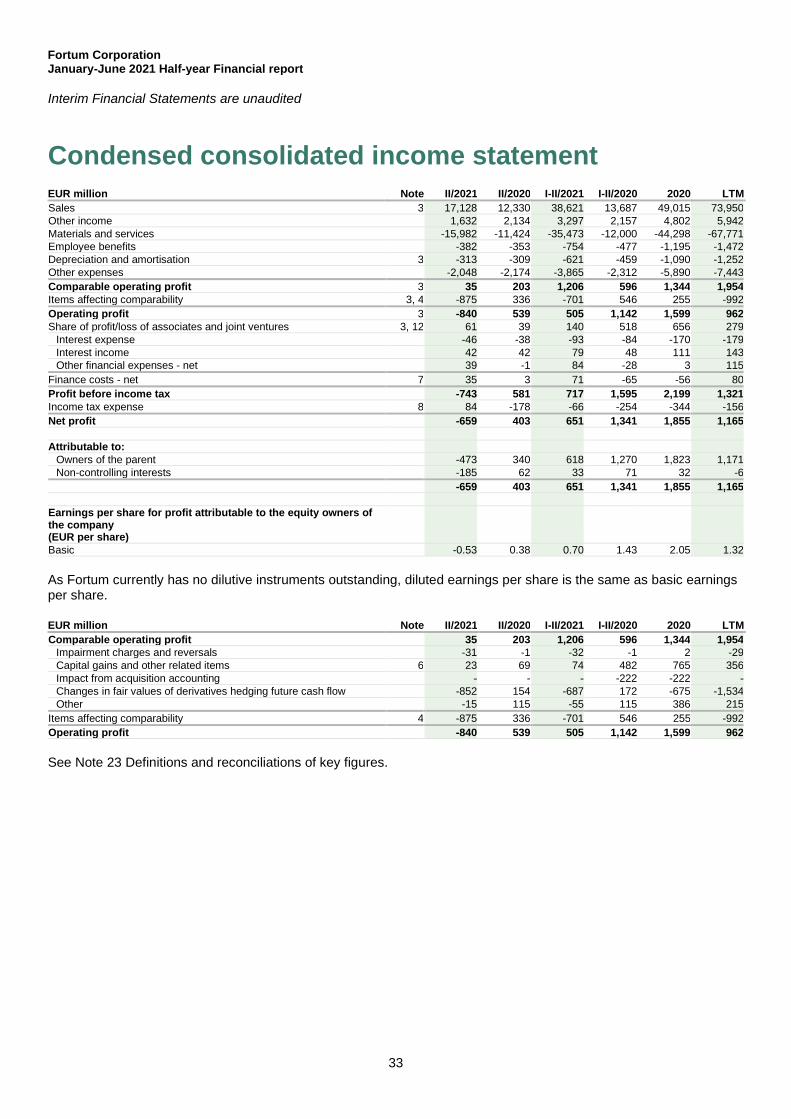
Fortum Corporation January-June 2021 Half-year Financial report
33
Interim Financial Statements are unaudited
Condensed consolidated income statement
EUR million Note II/2021 II/2020 I-II/2021 I-II/2020 2020 LTM Sales 3 17,128 12,330 38,621 13,687 49,015 73,950 Other income 1,632 2,134 3,297 2,157 4,802 5,942 Materials and services -15,982 -11,424 -35,473 -12,000 -44,298 -67,771 Employee benefits -382 -353 -754 -477 -1,195 -1,472 Depreciation and amortisation 3 -313 -309 -621 -459 -1,090 -1,252 Other expenses -2,048 -2,174 -3,865 -2,312 -5,890 -7,443 Comparable operating profit 3 35 203 1,206 596 1,344 1,954 Items affecting comparability 3, 4 -875 336 -701 546 255 -992 Operating profit 3 -840 539 505 1,142 1,599 962 Share of profit/loss of associates and joint ventures 3, 12 61 39 140 518 656 279
Interest expense -46 -38 -93 -84 -170 -179 Interest income 42 42 79 48 111 143 Other financial expenses - net 39 -1 84 -28 3 115
Finance costs - net 7 35 3 71 -65 -56 80 Profit before income tax -743 581 717 1,595 2,199 1,321 Income tax expense 8 84 -178 -66 -254 -344 -156 Net profit -659 403 651 1,341 1,855 1,165
Attributable to: Owners of the parent -473 340 618 1,270 1,823 1,171 Non-controlling interests -185 62 33 71 32 -6
-659 403 651 1,341 1,855 1,165
Earnings per share for profit attributable to the equity owners of the company (EUR per share) Basic -0.53 0.38 0.70 1.43 2.05 1.32
As Fortum currently has no dilutive instruments outstanding, diluted earnings per share is the same as basic earnings per share.
EUR million Note II/2021 II/2020 I-II/2021 I-II/2020 2020 LTM Comparable operating profit 35 203 1,206 596 1,344 1,954
Impairment charges and reversals -31 -1 -32 -1 2 -29 Capital gains and other related items 6 23 69 74 482 765 356 Impact from acquisition accounting - - - -222 -222 -Changes in fair values of derivatives hedging future cash flow -852 154 -687 172 -675 -1,534 Other -15 115 -55 115 386 215
Items affecting comparability 4 -875 336 -701 546 255 -992 Operating profit -840 539 505 1,142 1,599 962
See Note 23 Definitions and reconciliations of key figures.
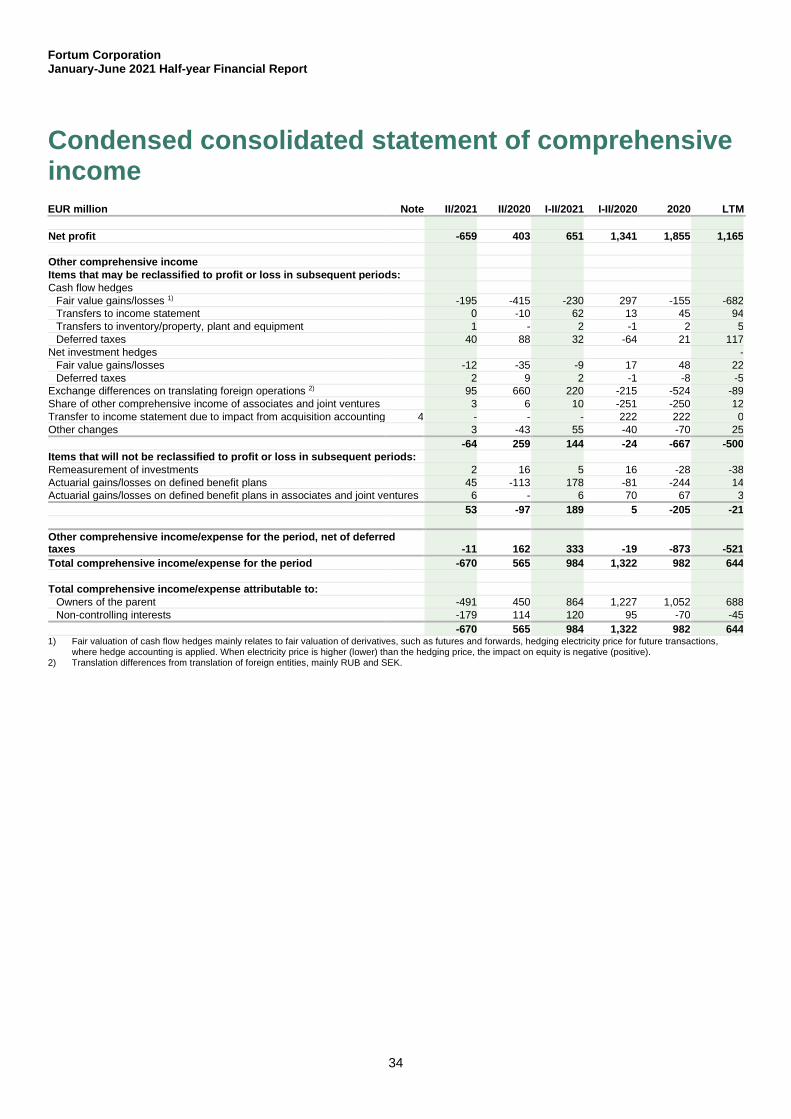
Fortum Corporation January-June 2021 Half-year Financial Report
34
Condensed consolidated statement of comprehensive income
EUR million Note II/2021 II/2020 I-II/2021 I-II/2020 2020 LTM
Net profit -659 403 651 1,341 1,855 1,165
Other comprehensive income Items that may be reclassified to profit or loss in subsequent periods: Cash flow hedges
Fair value gains/losses 1) -195 -415 -230 297 -155 -682 Transfers to income statement 0 -10 62 13 45 94 Transfers to inventory/property, plant and equipment 1 - 2 -1 2 5 Deferred taxes 40 88 32 -64 21 117
Net investment hedges - Fair value gains/losses -12 -35 -9 17 48 22 Deferred taxes 2 9 2 -1 -8 -5
Exchange differences on translating foreign operations 2) 95 660 220 -215 -524 -89 Share of other comprehensive income of associates and joint ventures 3 6 10 -251 -250 12 Transfer to income statement due to impact from acquisition accounting 4 - - - 222 222 0 Other changes 3 -43 55 -40 -70 25
-64 259 144 -24 -667 -500 Items that will not be reclassified to profit or loss in subsequent periods: Remeasurement of investments 2 16 5 16 -28 -38 Actuarial gains/losses on defined benefit plans 45 -113 178 -81 -244 14 Actuarial gains/losses on defined benefit plans in associates and joint ventures 6 - 6 70 67 3
53 -97 189 5 -205 -21
Other comprehensive income/expense for the period, net of deferred taxes -11 162 333 -19 -873 -521 Total comprehensive income/expense for the period -670 565 984 1,322 982 644
Total comprehensive income/expense attributable to: Owners of the parent -491 450 864 1,227 1,052 688 Non-controlling interests -179 114 120 95 -70 -45
-670 565 984 1,322 982 644 1) Fair valuation of cash flow hedges mainly relates to fair valuation of derivatives, such as futures and forwards, hedging electricity price for future transactions,
where hedge accounting is applied. When electricity price is higher (lower) than the hedging price, the impact on equity is negative (positive).2) Translation differences from translation of foreign entities, mainly RUB and SEK.
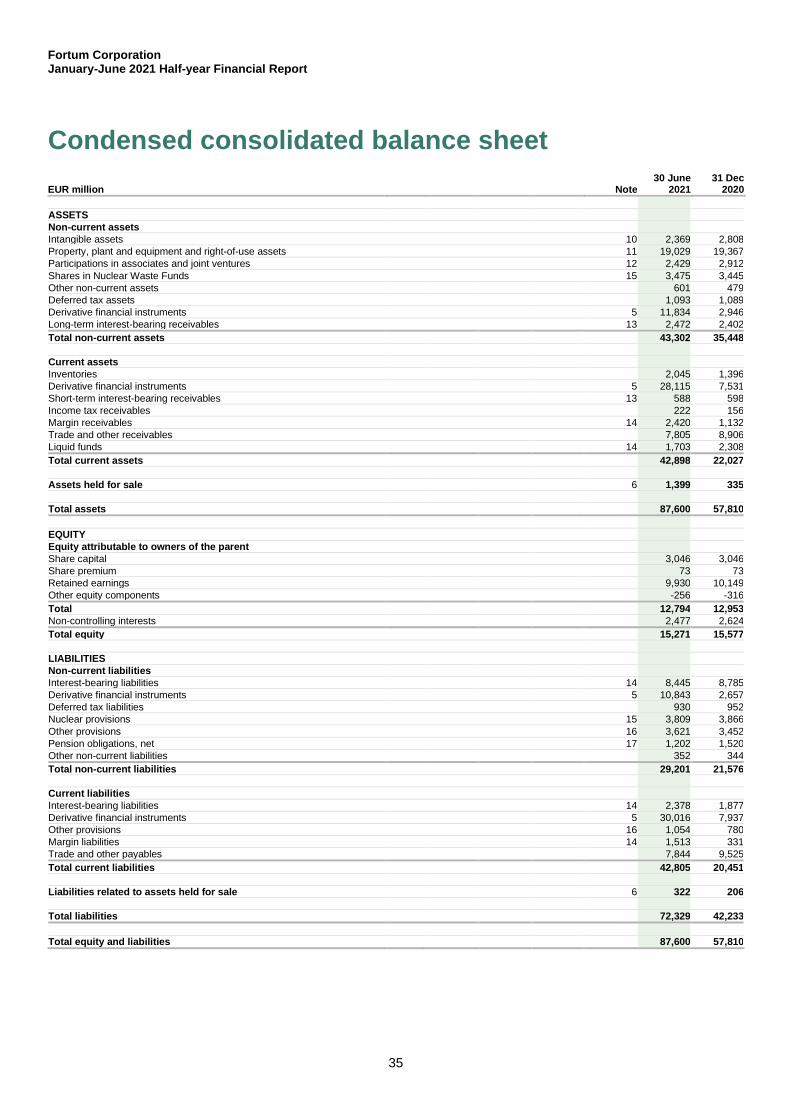
Fortum Corporation January-June 2021 Half-year Financial Report
35
Condensed consolidated balance sheet
EUR million Note 30 June
2021 31 Dec
2020
ASSETS Non-current assets Intangible assets 10 2,369 2,808 Property, plant and equipment and right-of-use assets 11 19,029 19,367 Participations in associates and joint ventures 12 2,429 2,912 Shares in Nuclear Waste Funds 15 3,475 3,445 Other non-current assets 601 479 Deferred tax assets 1,093 1,089 Derivative financial instruments 5 11,834 2,946 Long-term interest-bearing receivables 13 2,472 2,402 Total non-current assets 43,302 35,448
Current assets Inventories 2,045 1,396 Derivative financial instruments 5 28,115 7,531 Short-term interest-bearing receivables 13 588 598 Income tax receivables 222 156 Margin receivables 14 2,420 1,132 Trade and other receivables 7,805 8,906 Liquid funds 14 1,703 2,308 Total current assets 42,898 22,027
Assets held for sale 6 1,399 335
Total assets 87,600 57,810
EQUITY Equity attributable to owners of the parent Share capital 3,046 3,046 Share premium 73 73 Retained earnings 9,930 10,149 Other equity components -256 -316 Total 12,794 12,953 Non-controlling interests 2,477 2,624 Total equity 15,271 15,577
LIABILITIES Non-current liabilities Interest-bearing liabilities 14 8,445 8,785 Derivative financial instruments 5 10,843 2,657 Deferred tax liabilities 930 952 Nuclear provisions 15 3,809 3,866 Other provisions 16 3,621 3,452 Pension obligations, net 17 1,202 1,520 Other non-current liabilities 352 344 Total non-current liabilities 29,201 21,576
Current liabilities Interest-bearing liabilities 14 2,378 1,877 Derivative financial instruments 5 30,016 7,937 Other provisions 16 1,054 780 Margin liabilities 14 1,513 331 Trade and other payables 7,844 9,525 Total current liabilities 42,805 20,451
Liabilities related to assets held for sale 6 322 206
Total liabilities 72,329 42,233
Total equity and liabilities 87,600 57,810
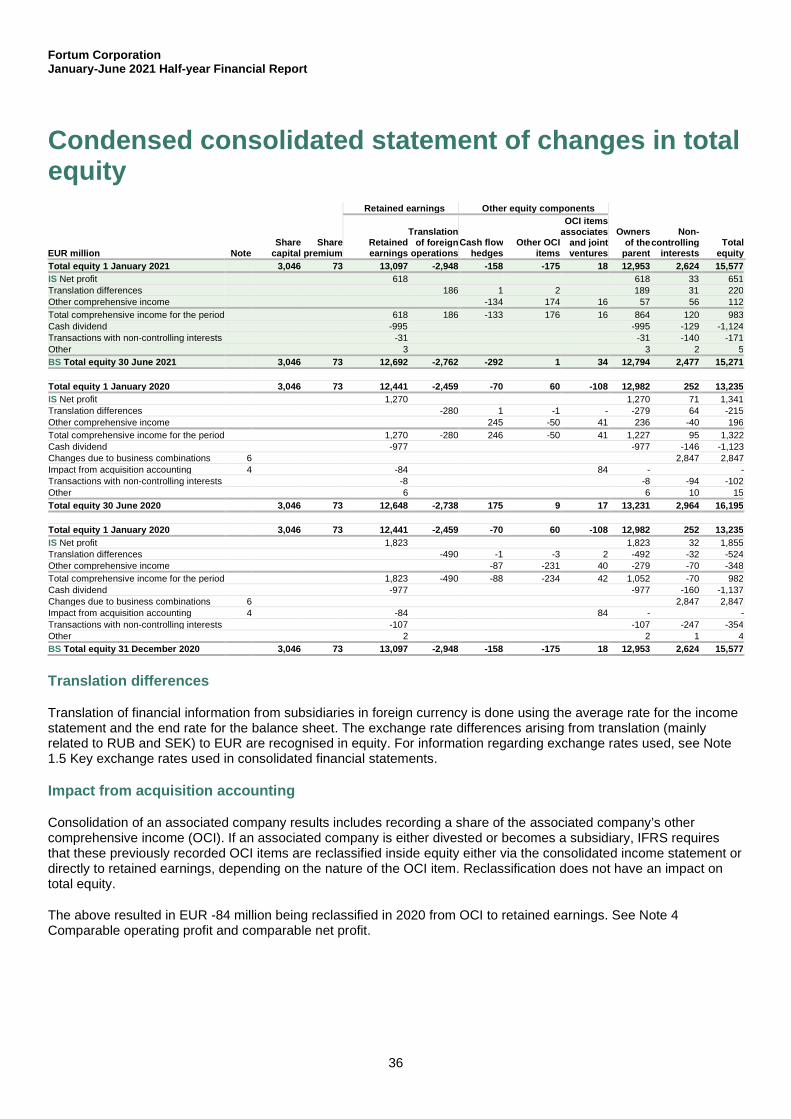
Fortum Corporation January-June 2021 Half-year Financial Report
36
Condensed consolidated statement of changes in total equity
Retained earnings Other equity components
EUR million Note Share
capital Share
premium Retained earnings
Translation of foreign
operations Cash flow
hedges Other OCI
items
OCI items associates
and joint ventures
Owners of the
parent
Non-controlling
interests Total
equity Total equity 1 January 2021 3,046 73 13,097 -2,948 -158 -175 18 12,953 2,624 15,577 IS Net profit 618 618 33 651 Translation differences 186 1 2 189 31 220 Other comprehensive income -134 174 16 57 56 112 Total comprehensive income for the period 618 186 -133 176 16 864 120 983 Cash dividend -995 -995 -129 -1,124Transactions with non-controlling interests -31 -31 -140 -171Other 3 3 2 5 BS Total equity 30 June 2021 3,046 73 12,692 -2,762 -292 1 34 12,794 2,477 15,271
Total equity 1 January 2020 3,046 73 12,441 -2,459 -70 60 -108 12,982 252 13,235 IS Net profit 1,270 1,270 71 1,341 Translation differences -280 1 -1 - -279 64 -215Other comprehensive income 245 -50 41 236 -40 196 Total comprehensive income for the period 1,270 -280 246 -50 41 1,227 95 1,322 Cash dividend -977 -977 -146 -1,123Changes due to business combinations 6 2,847 2,847 Impact from acquisition accounting 4 -84 84 - - Transactions with non-controlling interests -8 -8 -94 -102Other 6 6 10 15 Total equity 30 June 2020 3,046 73 12,648 -2,738 175 9 17 13,231 2,964 16,195
Total equity 1 January 2020 3,046 73 12,441 -2,459 -70 60 -108 12,982 252 13,235 IS Net profit 1,823 1,823 32 1,855 Translation differences -490 -1 -3 2 -492 -32 -524Other comprehensive income -87 -231 40 -279 -70 -348Total comprehensive income for the period 1,823 -490 -88 -234 42 1,052 -70 982 Cash dividend -977 -977 -160 -1,137Changes due to business combinations 6 2,847 2,847 Impact from acquisition accounting 4 -84 84 - - Transactions with non-controlling interests -107 -107 -247 -354Other 2 2 1 4 BS Total equity 31 December 2020 3,046 73 13,097 -2,948 -158 -175 18 12,953 2,624 15,577
Translation differences
Translation of financial information from subsidiaries in foreign currency is done using the average rate for the income statement and the end rate for the balance sheet. The exchange rate differences arising from translation (mainly related to RUB and SEK) to EUR are recognised in equity. For information regarding exchange rates used, see Note 1.5 Key exchange rates used in consolidated financial statements.
Impact from acquisition accounting
Consolidation of an associated company results includes recording a share of the associated company’s other comprehensive income (OCI). If an associated company is either divested or becomes a subsidiary, IFRS requires that these previously recorded OCI items are reclassified inside equity either via the consolidated income statement or directly to retained earnings, depending on the nature of the OCI item. Reclassification does not have an impact on total equity.
The above resulted in EUR -84 million being reclassified in 2020 from OCI to retained earnings. See Note 4 Comparable operating profit and comparable net profit.
Fortum Corporation January-June 2021 Half-year Financial Report
37
Cash flow hedges
The impact on equity attributable to owners of the parent from fair valuation of cash flow hedges mainly relates to fair valuation of derivatives, such as futures and forwards, hedging electricity price for future transactions, where hedge accounting is applied. When electricity price is higher (lower) than the hedging price, the impact on equity is negative (positive).
Cash dividends
A dividend for 2020 of EUR 1.12 per share, amounting to a total of EUR 995 million, was decided in the Annual General Meeting on 28 April 2021. The dividend was paid on 7 May 2021. See Note 9 Dividend per share.
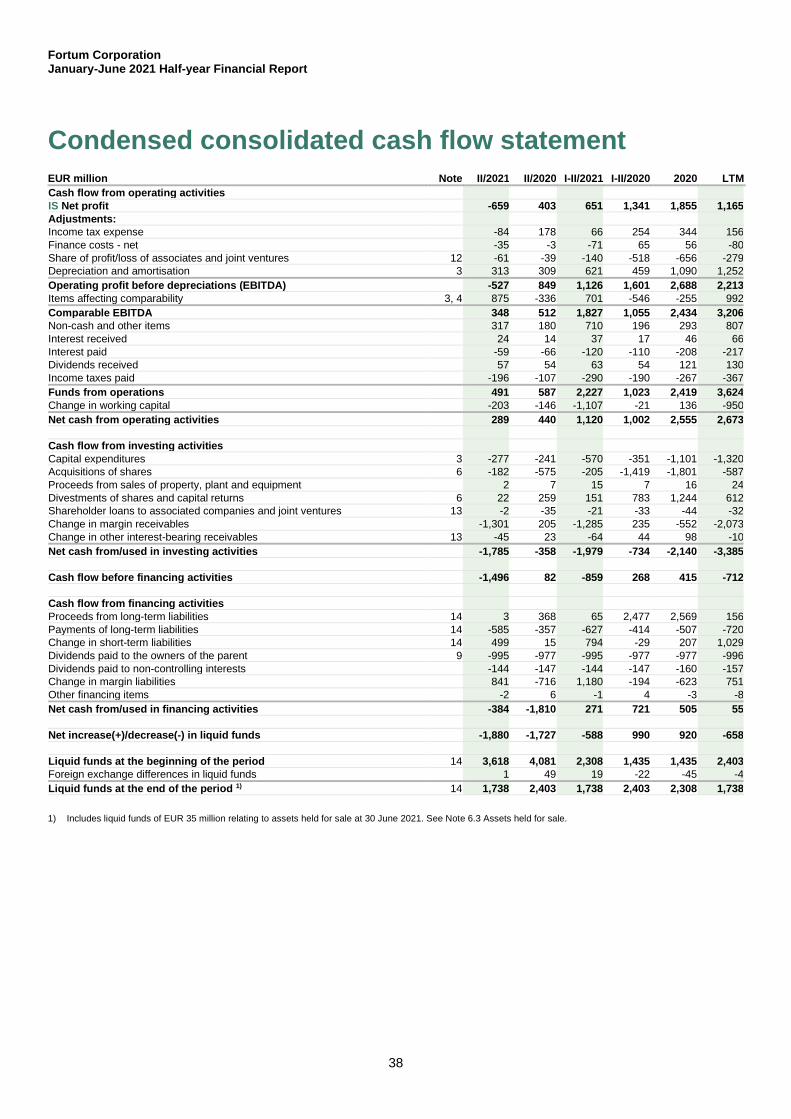
Fortum Corporation January-June 2021 Half-year Financial Report
38
Condensed consolidated cash flow statement
EUR million Note II/2021 II/2020 I-II/2021 I-II/2020 2020 LTM Cash flow from operating activities IS Net profit -659 403 651 1,341 1,855 1,165 Adjustments: Income tax expense -84 178 66 254 344 156 Finance costs - net -35 -3 -71 65 56 -80 Share of profit/loss of associates and joint ventures 12 -61 -39 -140 -518 -656 -279 Depreciation and amortisation 3 313 309 621 459 1,090 1,252 Operating profit before depreciations (EBITDA) -527 849 1,126 1,601 2,688 2,213 Items affecting comparability 3, 4 875 -336 701 -546 -255 992 Comparable EBITDA 348 512 1,827 1,055 2,434 3,206 Non-cash and other items 317 180 710 196 293 807 Interest received 24 14 37 17 46 66 Interest paid -59 -66 -120 -110 -208 -217 Dividends received 57 54 63 54 121 130 Income taxes paid -196 -107 -290 -190 -267 -367 Funds from operations 491 587 2,227 1,023 2,419 3,624 Change in working capital -203 -146 -1,107 -21 136 -950 Net cash from operating activities 289 440 1,120 1,002 2,555 2,673
Cash flow from investing activities Capital expenditures 3 -277 -241 -570 -351 -1,101 -1,320 Acquisitions of shares 6 -182 -575 -205 -1,419 -1,801 -587 Proceeds from sales of property, plant and equipment 2 7 15 7 16 24 Divestments of shares and capital returns 6 22 259 151 783 1,244 612 Shareholder loans to associated companies and joint ventures 13 -2 -35 -21 -33 -44 -32 Change in margin receivables -1,301 205 -1,285 235 -552 -2,073 Change in other interest-bearing receivables 13 -45 23 -64 44 98 -10 Net cash from/used in investing activities -1,785 -358 -1,979 -734 -2,140 -3,385
Cash flow before financing activities -1,496 82 -859 268 415 -712
Cash flow from financing activities Proceeds from long-term liabilities 14 3 368 65 2,477 2,569 156 Payments of long-term liabilities 14 -585 -357 -627 -414 -507 -720 Change in short-term liabilities 14 499 15 794 -29 207 1,029 Dividends paid to the owners of the parent 9 -995 -977 -995 -977 -977 -996 Dividends paid to non-controlling interests -144 -147 -144 -147 -160 -157 Change in margin liabilities 841 -716 1,180 -194 -623 751 Other financing items -2 6 -1 4 -3 -8 Net cash from/used in financing activities -384 -1,810 271 721 505 55
Net increase(+)/decrease(-) in liquid funds -1,880 -1,727 -588 990 920 -658
Liquid funds at the beginning of the period 14 3,618 4,081 2,308 1,435 1,435 2,403 Foreign exchange differences in liquid funds 1 49 19 -22 -45 -4 Liquid funds at the end of the period 1) 14 1,738 2,403 1,738 2,403 2,308 1,738
1) Includes liquid funds of EUR 35 million relating to assets held for sale at 30 June 2021. See Note 6.3 Assets held for sale.
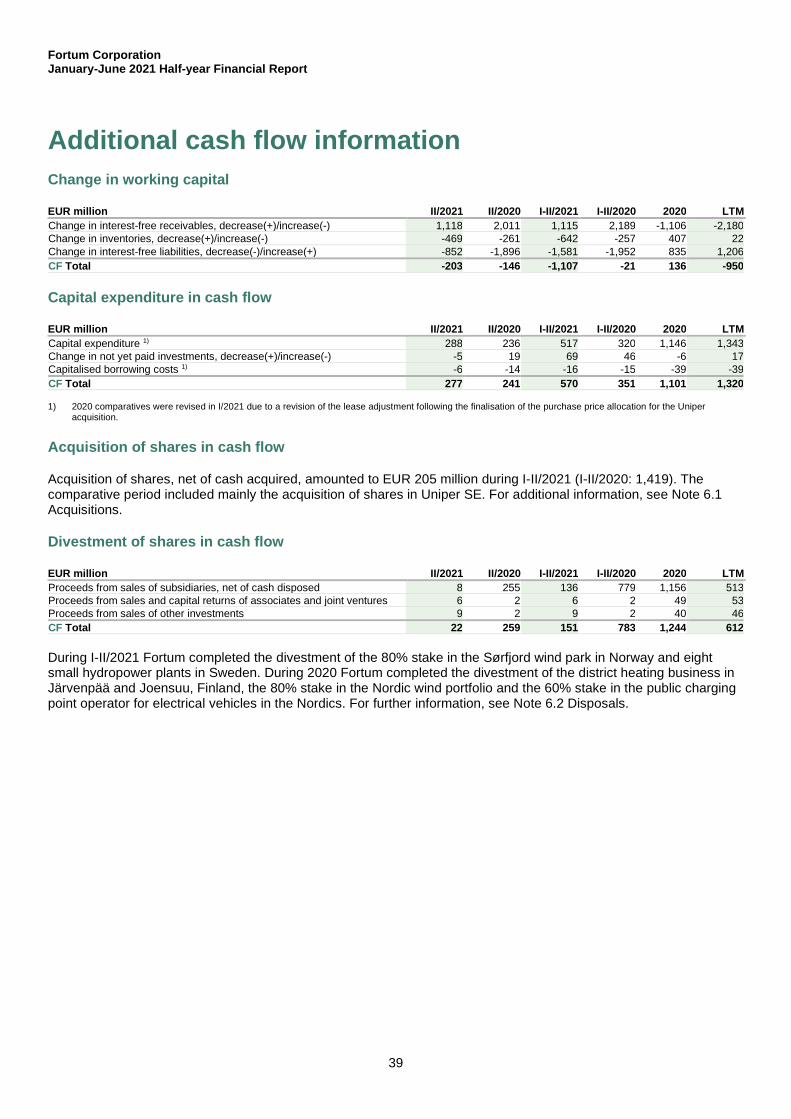
Fortum Corporation January-June 2021 Half-year Financial Report
39
Additional cash flow information Change in working capital
EUR million II/2021 II/2020 I-II/2021 I-II/2020 2020 LTM Change in interest-free receivables, decrease(+)/increase(-) 1,118 2,011 1,115 2,189 -1,106 -2,180 Change in inventories, decrease(+)/increase(-) -469 -261 -642 -257 407 22 Change in interest-free liabilities, decrease(-)/increase(+) -852 -1,896 -1,581 -1,952 835 1,206 CF Total -203 -146 -1,107 -21 136 -950
Capital expenditure in cash flow
EUR million II/2021 II/2020 I-II/2021 I-II/2020 2020 LTM Capital expenditure 1) 288 236 517 320 1,146 1,343 Change in not yet paid investments, decrease(+)/increase(-) -5 19 69 46 -6 17 Capitalised borrowing costs 1) -6 -14 -16 -15 -39 -39 CF Total 277 241 570 351 1,101 1,320
1) 2020 comparatives were revised in I/2021 due to a revision of the lease adjustment following the finalisation of the purchase price allocation for the Uniper acquisition.
Acquisition of shares in cash flow
Acquisition of shares, net of cash acquired, amounted to EUR 205 million during I-II/2021 (I-II/2020: 1,419). The comparative period included mainly the acquisition of shares in Uniper SE. For additional information, see Note 6.1 Acquisitions.
Divestment of shares in cash flow
EUR million II/2021 II/2020 I-II/2021 I-II/2020 2020 LTM Proceeds from sales of subsidiaries, net of cash disposed 8 255 136 779 1,156 513 Proceeds from sales and capital returns of associates and joint ventures 6 2 6 2 49 53 Proceeds from sales of other investments 9 2 9 2 40 46 CF Total 22 259 151 783 1,244 612
During I-II/2021 Fortum completed the divestment of the 80% stake in the Sørfjord wind park in Norway and eight small hydropower plants in Sweden. During 2020 Fortum completed the divestment of the district heating business in Järvenpää and Joensuu, Finland, the 80% stake in the Nordic wind portfolio and the 60% stake in the public charging point operator for electrical vehicles in the Nordics. For further information, see Note 6.2 Disposals.
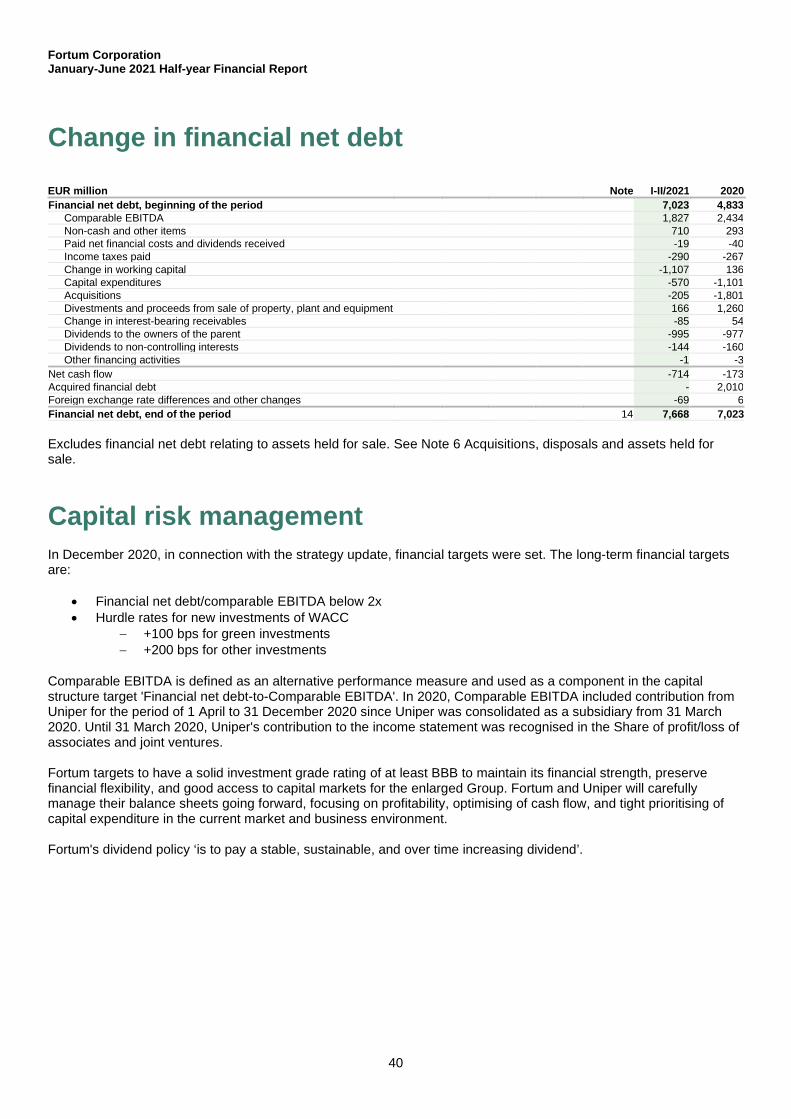
Fortum Corporation January-June 2021 Half-year Financial Report
40
Change in financial net debt
EUR million Note I-II/2021 2020 Financial net debt, beginning of the period 7,023 4,833
Comparable EBITDA 1,827 2,434 Non-cash and other items 710 293 Paid net financial costs and dividends received -19 -40 Income taxes paid -290 -267 Change in working capital -1,107 136 Capital expenditures -570 -1,101 Acquisitions -205 -1,801 Divestments and proceeds from sale of property, plant and equipment 166 1,260 Change in interest-bearing receivables -85 54 Dividends to the owners of the parent -995 -977 Dividends to non-controlling interests -144 -160 Other financing activities -1 -3
Net cash flow -714 -173 Acquired financial debt - 2,010 Foreign exchange rate differences and other changes -69 6 Financial net debt, end of the period 14 7,668 7,023 Excludes financial net debt relating to assets held for sale. See Note 6 Acquisitions, disposals and assets held for sale.
Capital risk management In December 2020, in connection with the strategy update, financial targets were set. The long-term financial targets are:
• Financial net debt/comparable EBITDA below 2x • Hurdle rates for new investments of WACC
− +100 bps for green investments − +200 bps for other investments
Comparable EBITDA is defined as an alternative performance measure and used as a component in the capital structure target 'Financial net debt-to-Comparable EBITDA'. In 2020, Comparable EBITDA included contribution from Uniper for the period of 1 April to 31 December 2020 since Uniper was consolidated as a subsidiary from 31 March 2020. Until 31 March 2020, Uniper's contribution to the income statement was recognised in the Share of profit/loss of associates and joint ventures. Fortum targets to have a solid investment grade rating of at least BBB to maintain its financial strength, preserve financial flexibility, and good access to capital markets for the enlarged Group. Fortum and Uniper will carefully manage their balance sheets going forward, focusing on profitability, optimising of cash flow, and tight prioritising of capital expenditure in the current market and business environment. Fortum's dividend policy ‘is to pay a stable, sustainable, and over time increasing dividend’.
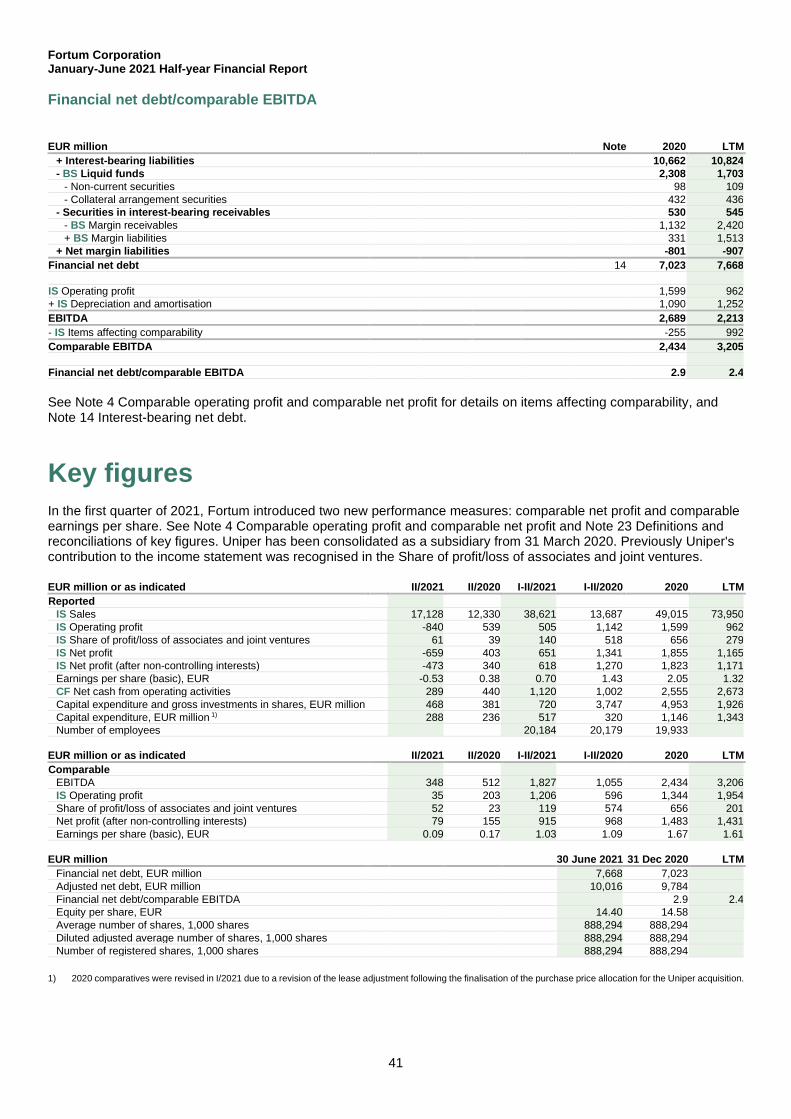
Fortum Corporation January-June 2021 Half-year Financial Report
41
Financial net debt/comparable EBITDA
EUR million Note 2020 LTM + Interest-bearing liabilities 10,662 10,824 - BS Liquid funds 2,308 1,703
- Non-current securities 98 109 - Collateral arrangement securities 432 436
- Securities in interest-bearing receivables 530 545 - BS Margin receivables 1,132 2,420 + BS Margin liabilities 331 1,513
+ Net margin liabilities -801 -907 Financial net debt 14 7,023 7,668
IS Operating profit 1,599 962 + IS Depreciation and amortisation 1,090 1,252 EBITDA 2,689 2,213 - IS Items affecting comparability -255 992 Comparable EBITDA 2,434 3,205
Financial net debt/comparable EBITDA 2.9 2.4
See Note 4 Comparable operating profit and comparable net profit for details on items affecting comparability, and Note 14 Interest-bearing net debt.
Key figures In the first quarter of 2021, Fortum introduced two new performance measures: comparable net profit and comparable earnings per share. See Note 4 Comparable operating profit and comparable net profit and Note 23 Definitions and reconciliations of key figures. Uniper has been consolidated as a subsidiary from 31 March 2020. Previously Uniper's contribution to the income statement was recognised in the Share of profit/loss of associates and joint ventures.
EUR million or as indicated II/2021 II/2020 I-II/2021 I-II/2020 2020 LTM Reported
IS Sales 17,128 12,330 38,621 13,687 49,015 73,950 IS Operating profit -840 539 505 1,142 1,599 962 IS Share of profit/loss of associates and joint ventures 61 39 140 518 656 279 IS Net profit -659 403 651 1,341 1,855 1,165 IS Net profit (after non-controlling interests) -473 340 618 1,270 1,823 1,171 Earnings per share (basic), EUR -0.53 0.38 0.70 1.43 2.05 1.32 CF Net cash from operating activities 289 440 1,120 1,002 2,555 2,673 Capital expenditure and gross investments in shares, EUR million 468 381 720 3,747 4,953 1,926 Capital expenditure, EUR million 1) 288 236 517 320 1,146 1,343 Number of employees 20,184 20,179 19,933
EUR million or as indicated II/2021 II/2020 I-II/2021 I-II/2020 2020 LTM Comparable
EBITDA 348 512 1,827 1,055 2,434 3,206 IS Operating profit 35 203 1,206 596 1,344 1,954 Share of profit/loss of associates and joint ventures 52 23 119 574 656 201 Net profit (after non-controlling interests) 79 155 915 968 1,483 1,431 Earnings per share (basic), EUR 0.09 0.17 1.03 1.09 1.67 1.61
EUR million 30 June 2021 31 Dec 2020 LTM Financial net debt, EUR million 7,668 7,023 Adjusted net debt, EUR million 10,016 9,784 Financial net debt/comparable EBITDA 2.9 2.4 Equity per share, EUR 14.40 14.58 Average number of shares, 1,000 shares 888,294 888,294 Diluted adjusted average number of shares, 1,000 shares 888,294 888,294 Number of registered shares, 1,000 shares 888,294 888,294
1) 2020 comparatives were revised in I/2021 due to a revision of the lease adjustment following the finalisation of the purchase price allocation for the Uniper acquisition.
Fortum Corporation January-June 2021 Half-year Financial Report
Notes to the condensed consolidated interim financial statements
42
Notes to the condensed consolidated interim financial statements
1. Significant accounting policies1.1 Basis of preparation The unaudited condensed interim financial statements have been prepared in accordance with International Accounting Standard (IAS) 34, Interim Financial Reporting, as adopted by the EU. The condensed interim financial report should be read in conjunction with the consolidated financial statements for the year ended 31 December 2020.
The figures in the consolidated interim financial statements have been rounded and consequently the sum of individual figures may deviate from the sum presented. Key figures have been calculated using exact figures.
Part of Fortum’s business operations are seasonal, with the comparable operating profit usually being higher for the first and fourth quarter of the year. Columns labelled as 'LTM' or 'last twelve months' present figures for twelve months preceding the reporting date. Fortum consolidated Uniper’s income statement from the second quarter of 2020, which is the main reason for the change in quarterly and LTM figures. Uniper was accounted for as an associated company until 31 March 2020.
The following symbols show which amounts in the notes reconcile to the items in the income statement, balance sheet and cash flow statement:
IS = Income statement BS = Balance sheet CF = Cash flow
Impact of Covid-19 on consolidated financial statements
Fortum has considered the potential impact of the Covid-19 pandemic on its business operations, and concluded the overall effect in the consolidated financial statements not to be significant.
During 2020, the Covid-19 pandemic resulted in new and partly unexpected risks as societies and governments across the world implemented drastic measures to contain the spread of the disease. Although the impacts for Fortum have so far been limited, and the situation compared to the end of 2020 has improved, the risks related to a prolonged pandemic cannot be ruled out. The main risk factors include lower commodity prices and decreased demand, credit defaults and delayed payments, project delays and increased risk of operational incidents or prolonged maintenance as a result of travel restrictions, absence of key personnel, as well as difficulties in obtaining key materials and spare parts. Fortum is closely monitoring the development of the pandemic and its potential impacts.
Fortum has assessed whether there are any indications for impairment based on internal and external sources of information, such as the effects of the Covid-19. Fortum does not currently foresee that Covid-19 would have such long-term effects that it would impact the overall values of its non-current assets, such as property, plant and equipment and intangible assets.
1.2 Uniper acquisition in 2020 On 8 October 2019, Fortum entered into agreements to acquire all the shares held by funds managed by Elliott Management Corporation and its affiliates (“Elliott”) and Knight Vinke Energy Advisors Limited and its affiliates (“Knight Vinke“). Control over Uniper was acquired on 26 March 2020. On 31 March 2020, Fortum consolidated the balance sheet of Uniper. The income statement impact from 26 March 2020 to 31 March 2020 was not material.
Fortum Corporation Notes to the condensed consolidated interim financial statements January-June 2021 Half-year Financial Report
43
Fortum’s consolidated stake in Uniper was 73.4% on 31 March 2020, and 76.1% on 31 December 2020. Uniper was accounted for as an associated company until 31 March 2020.
The purchase price accounting for the Uniper acquisition was completed on 31 March 2021. No further fair value adjustments were made to the purchase price allocation presented in the 31 December 2020 financial statements.
In IV/2020 Fortum presented the preliminary purchase price allocation for the Uniper acquisition, which resulted in adjustments to Uniper’s 31 March 2020 opening balance sheet. These adjustments led to the restatement of the previous quarters in 2020. Fair value adjustments made to Uniper’s 31 March 2020 opening balance sheet mainly related to property, plant and equipment and right-of-use assets, participations in associates and joint ventures, lease liabilities, other provisions, and deferred taxes. Increase in the value of property, plant and equipment resulted in additional depreciation (EUR 7 million in I-II/2021); and increase in the value of the lease liability (due to a lower discount rate) resulted in lower interest cost (EUR 6 million in I-II/2021). The lease adjustment was revised in I/2021 in connection with the finalisation of the purchase price allocation for the Uniper acquisition. Excess of the acquisition value over the fair value of Uniper’s net assets (EUR 515 million) is recognised as goodwill. See Note 6.1 Acquisitions.
In connection with the purchase price allocation, Fortum was also required to assess the circumstances giving rise to items recognised in Uniper segment’s income statement during the one-year window from the acquisition date. In I/2021, Fortum adjusted impairments (EUR 22 million) and reversals of impairments (EUR 12 million) from Uniper’s standalone income statement. These adjustments did not have an impact on Uniper’s 31 March 2020 opening balance sheet.
For more information on Uniper acquisition, see Note 1 Significant accounting policies in the 2020 consolidated financial statements.
1.3 Alternative performance measures
According to the ESMA Guidelines on Alternative Performance Measures, an Alternative Performance Measure (APM) is understood as a financial measure of historical or future financial performance, financial position, or cash flows, other than a financial measure defined or specified in the applicable financial reporting framework.
Fortum uses APMs, such as Comparable operating profit and Comparable EBITDA in the financial target setting and forecasting, management's follow-up of financial performance of segments and the Group, as well as for the allocation of resources in the Group's performance management process. Items affecting comparability are excluded from Comparable operating profit and Comparable EBITDA and disclosed separately in Fortum's consolidated income statement to support the transparency of underlying business performance when comparing results between periods.
Fortum’s long-term financial target for capital structure is Financial net debt to comparable EBITDA (see Capital risk management and Note 23 Definitions and reconciliations of key figures).
In the first quarter of 2021, Fortum introduced two new APMs to provide additional financial performance indicators to support meaningful comparison of underlying net profitability between periods.
• Comparable net profit is calculated as comparable operating profit +/- comparable share of profit/loss fromassociates and joint ventures +/- comparable finance costs – net +/- comparable income tax expense +/-comparable non-controlling interests
• Comparable earnings per share is calculated as comparable net profit divided by average number of sharesduring the period
See Note 4 Comparable operating profit and comparable net profit and Note 23 Definitions and reconciliations of key figures.
1.4 Accounting policies The same accounting policies that were applied in the preparation of the consolidated financial statements for the year ended 31 December 2020, have been applied in these condensed interim financial statements. New standards, amendments and interpretations effective from 1 January 2021 have not had a material impact on Fortum's consolidated financial statements.
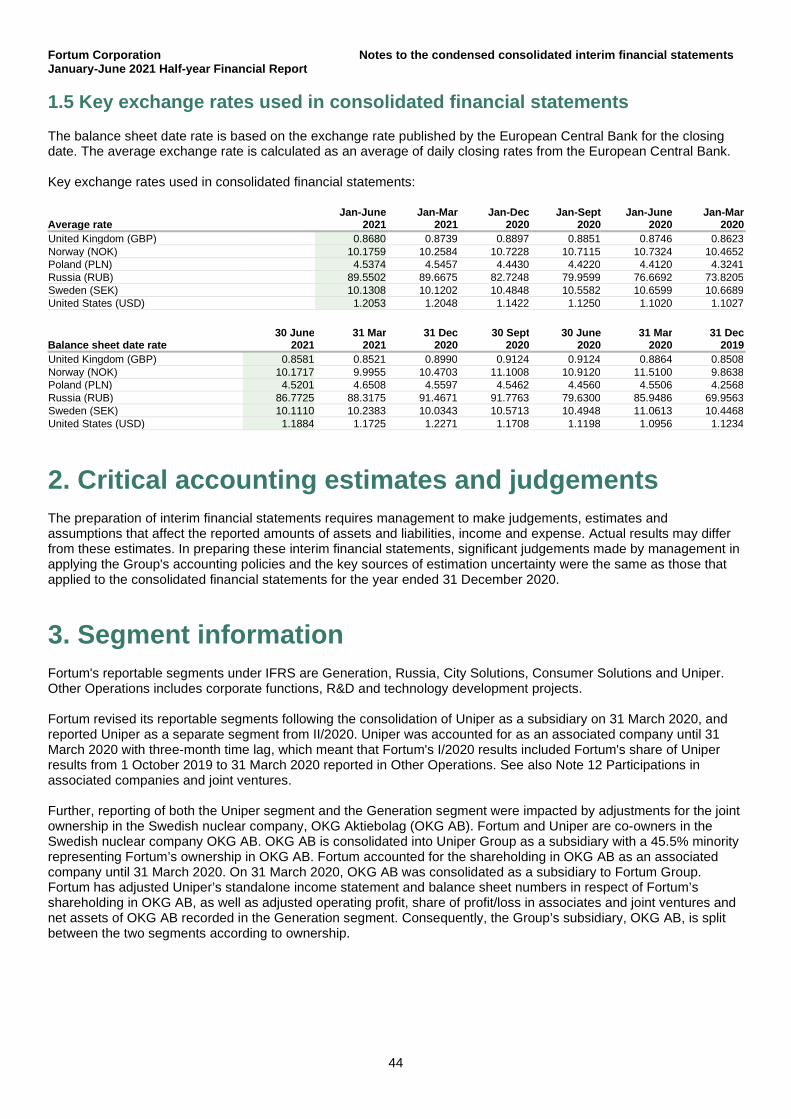
Fortum Corporation Notes to the condensed consolidated interim financial statements January-June 2021 Half-year Financial Report
44
1.5 Key exchange rates used in consolidated financial statements The balance sheet date rate is based on the exchange rate published by the European Central Bank for the closing date. The average exchange rate is calculated as an average of daily closing rates from the European Central Bank.
Key exchange rates used in consolidated financial statements:
Average rate Jan-June
2021 Jan-Mar
2021 Jan-Dec
2020 Jan-Sept
2020 Jan-June
2020 Jan-Mar
2020 United Kingdom (GBP) 0.8680 0.8739 0.8897 0.8851 0.8746 0.8623 Norway (NOK) 10.1759 10.2584 10.7228 10.7115 10.7324 10.4652 Poland (PLN) 4.5374 4.5457 4.4430 4.4220 4.4120 4.3241 Russia (RUB) 89.5502 89.6675 82.7248 79.9599 76.6692 73.8205 Sweden (SEK) 10.1308 10.1202 10.4848 10.5582 10.6599 10.6689 United States (USD) 1.2053 1.2048 1.1422 1.1250 1.1020 1.1027
Balance sheet date rate 30 June
2021 31 Mar
2021 31 Dec
2020 30 Sept
2020 30 June
2020 31 Mar
2020 31 Dec
2019 United Kingdom (GBP) 0.8581 0.8521 0.8990 0.9124 0.9124 0.8864 0.8508 Norway (NOK) 10.1717 9.9955 10.4703 11.1008 10.9120 11.5100 9.8638 Poland (PLN) 4.5201 4.6508 4.5597 4.5462 4.4560 4.5506 4.2568 Russia (RUB) 86.7725 88.3175 91.4671 91.7763 79.6300 85.9486 69.9563 Sweden (SEK) 10.1110 10.2383 10.0343 10.5713 10.4948 11.0613 10.4468 United States (USD) 1.1884 1.1725 1.2271 1.1708 1.1198 1.0956 1.1234
2. Critical accounting estimates and judgementsThe preparation of interim financial statements requires management to make judgements, estimates and assumptions that affect the reported amounts of assets and liabilities, income and expense. Actual results may differ from these estimates. In preparing these interim financial statements, significant judgements made by management in applying the Group's accounting policies and the key sources of estimation uncertainty were the same as those that applied to the consolidated financial statements for the year ended 31 December 2020.
3. Segment informationFortum's reportable segments under IFRS are Generation, Russia, City Solutions, Consumer Solutions and Uniper. Other Operations includes corporate functions, R&D and technology development projects.
Fortum revised its reportable segments following the consolidation of Uniper as a subsidiary on 31 March 2020, and reported Uniper as a separate segment from II/2020. Uniper was accounted for as an associated company until 31 March 2020 with three-month time lag, which meant that Fortum's I/2020 results included Fortum's share of Uniper results from 1 October 2019 to 31 March 2020 reported in Other Operations. See also Note 12 Participations in associated companies and joint ventures.
Further, reporting of both the Uniper segment and the Generation segment were impacted by adjustments for the joint ownership in the Swedish nuclear company, OKG Aktiebolag (OKG AB). Fortum and Uniper are co-owners in the Swedish nuclear company OKG AB. OKG AB is consolidated into Uniper Group as a subsidiary with a 45.5% minority representing Fortum’s ownership in OKG AB. Fortum accounted for the shareholding in OKG AB as an associated company until 31 March 2020. On 31 March 2020, OKG AB was consolidated as a subsidiary to Fortum Group. Fortum has adjusted Uniper’s standalone income statement and balance sheet numbers in respect of Fortum’s shareholding in OKG AB, as well as adjusted operating profit, share of profit/loss in associates and joint ventures and net assets of OKG AB recorded in the Generation segment. Consequently, the Group’s subsidiary, OKG AB, is split between the two segments according to ownership.
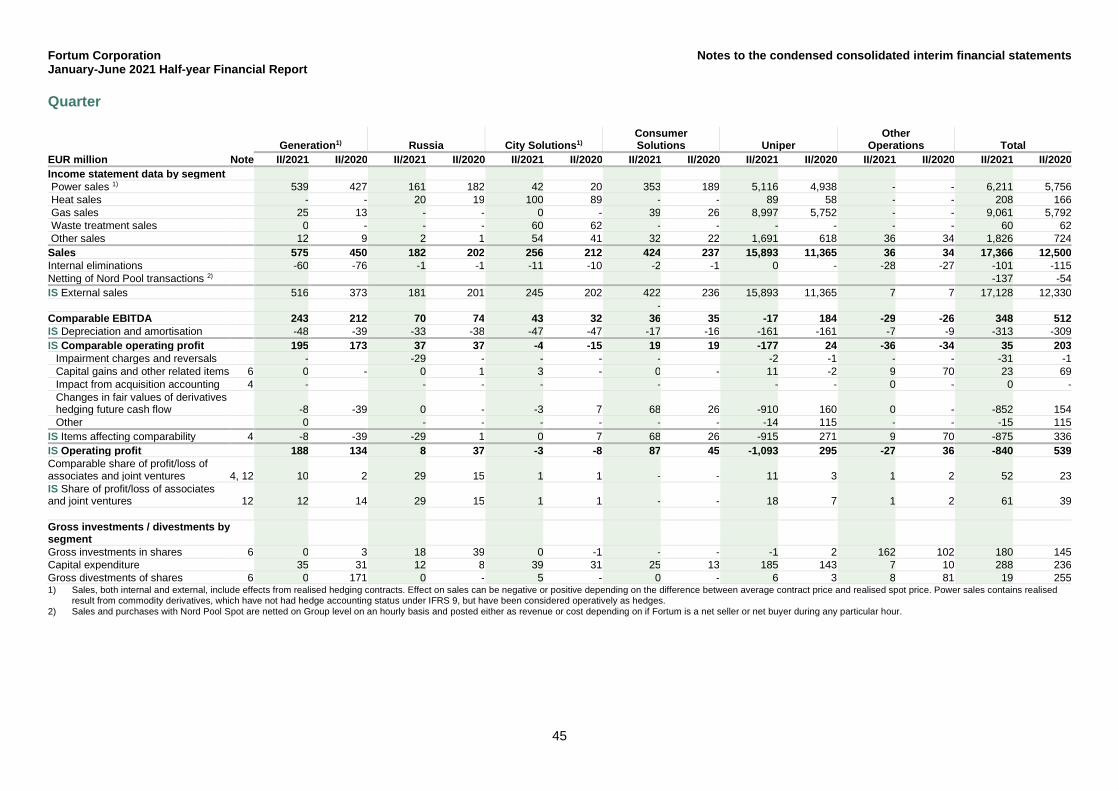
Fortum Corporation Notes to the condensed consolidated interim financial statements January-June 2021 Half-year Financial Report
45
Quarter
Generation1) Russia City Solutions1) Consumer Solutions Uniper
Other Operations Total
EUR million Note II/2021 II/2020 II/2021 II/2020 II/2021 II/2020 II/2021 II/2020 II/2021 II/2020 II/2021 II/2020 II/2021 II/2020 Income statement data by segment Power sales 1) 539 427 161 182 42 20 353 189 5,116 4,938 - - 6,211 5,756 Heat sales - - 20 19 100 89 - - 89 58 - - 208 166 Gas sales 25 13 - - 0 - 39 26 8,997 5,752 - - 9,061 5,792 Waste treatment sales 0 - - - 60 62 - - - - - - 60 62 Other sales 12 9 2 1 54 41 32 22 1,691 618 36 34 1,826 724 Sales 575 450 182 202 256 212 424 237 15,893 11,365 36 34 17,366 12,500 Internal eliminations -60 -76 -1 -1 -11 -10 -2 -1 0 - -28 -27 -101 -115 Netting of Nord Pool transactions 2) -137 -54 IS External sales 516 373 181 201 245 202 422 236 15,893 11,365 7 7 17,128 12,330
- Comparable EBITDA 243 212 70 74 43 32 36 35 -17 184 -29 -26 348 512 IS Depreciation and amortisation -48 -39 -33 -38 -47 -47 -17 -16 -161 -161 -7 -9 -313 -309 IS Comparable operating profit 195 173 37 37 -4 -15 19 19 -177 24 -36 -34 35 203
Impairment charges and reversals - -29 - - - - -2 -1 - - -31 -1 Capital gains and other related items 6 0 - 0 1 3 - 0 - 11 -2 9 70 23 69 Impact from acquisition accounting 4 - - - - - - - 0 - 0 - Changes in fair values of derivatives hedging future cash flow -8 -39 0 - -3 7 68 26 -910 160 0 - -852 154 Other 0 - - - - - - -14 115 - - -15 115
IS Items affecting comparability 4 -8 -39 -29 1 0 7 68 26 -915 271 9 70 -875 336 IS Operating profit 188 134 8 37 -3 -8 87 45 -1,093 295 -27 36 -840 539 Comparable share of profit/loss of associates and joint ventures 4, 12 10 2 29 15 1 1 - - 11 3 1 2 52 23 IS Share of profit/loss of associates and joint ventures 12 12 14 29 15 1 1 - - 18 7 1 2 61 39
Gross investments / divestments by segment Gross investments in shares 6 0 3 18 39 0 -1 - - -1 2 162 102 180 145 Capital expenditure 35 31 12 8 39 31 25 13 185 143 7 10 288 236 Gross divestments of shares 6 0 171 0 - 5 - 0 - 6 3 8 81 19 255 1) Sales, both internal and external, include effects from realised hedging contracts. Effect on sales can be negative or positive depending on the difference between average contract price and realised spot price. Power sales contains realised
result from commodity derivatives, which have not had hedge accounting status under IFRS 9, but have been considered operatively as hedges. 2) Sales and purchases with Nord Pool Spot are netted on Group level on an hourly basis and posted either as revenue or cost depending on if Fortum is a net seller or net buyer during any particular hour.
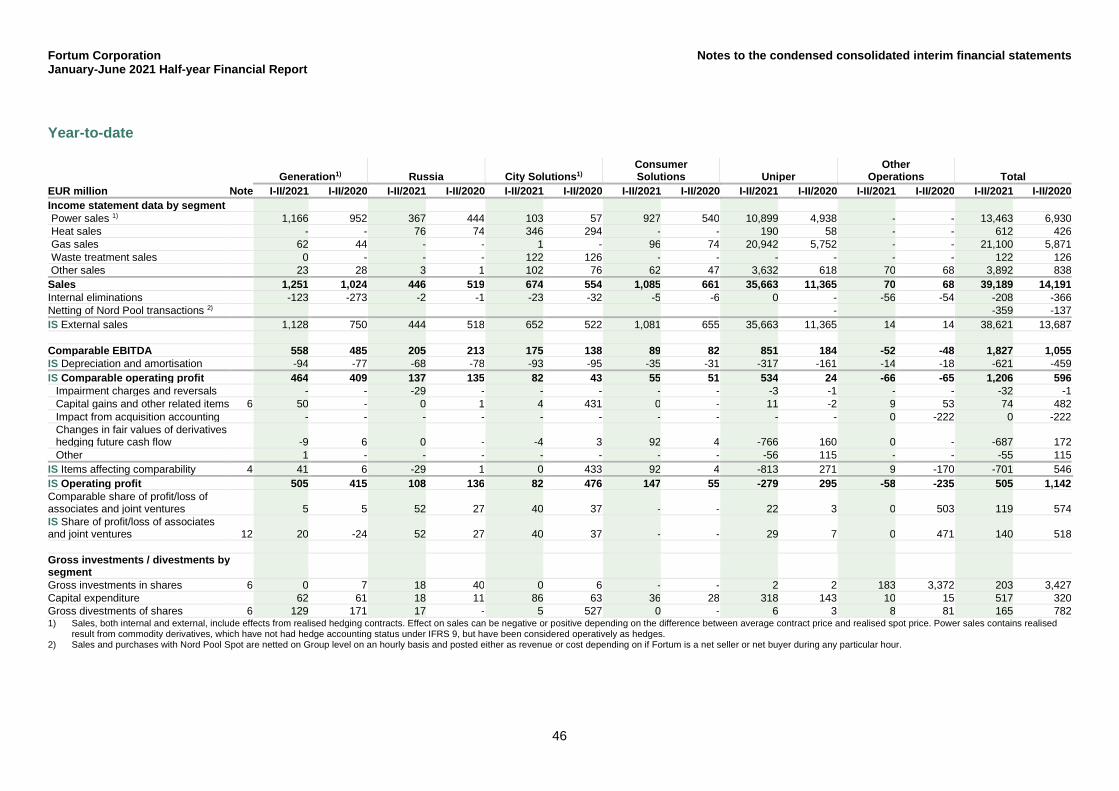
Fortum Corporation Notes to the condensed consolidated interim financial statements January-June 2021 Half-year Financial Report
46
Year-to-date
Generation1) Russia City Solutions1) Consumer Solutions Uniper
Other Operations Total
EUR million Note I-II/2021 I-II/2020 I-II/2021 I-II/2020 I-II/2021 I-II/2020 I-II/2021 I-II/2020 I-II/2021 I-II/2020 I-II/2021 I-II/2020 I-II/2021 I-II/2020 Income statement data by segment Power sales 1) 1,166 952 367 444 103 57 927 540 10,899 4,938 - - 13,463 6,930 Heat sales - - 76 74 346 294 - - 190 58 - - 612 426 Gas sales 62 44 - - 1 - 96 74 20,942 5,752 - - 21,100 5,871 Waste treatment sales 0 - - - 122 126 - - - - - - 122 126 Other sales 23 28 3 1 102 76 62 47 3,632 618 70 68 3,892 838 Sales 1,251 1,024 446 519 674 554 1,085 661 35,663 11,365 70 68 39,189 14,191 Internal eliminations -123 -273 -2 -1 -23 -32 -5 -6 0 - -56 -54 -208 -366 Netting of Nord Pool transactions 2) - -359 -137 IS External sales 1,128 750 444 518 652 522 1,081 655 35,663 11,365 14 14 38,621 13,687
Comparable EBITDA 558 485 205 213 175 138 89 82 851 184 -52 -48 1,827 1,055 IS Depreciation and amortisation -94 -77 -68 -78 -93 -95 -35 -31 -317 -161 -14 -18 -621 -459 IS Comparable operating profit 464 409 137 135 82 43 55 51 534 24 -66 -65 1,206 596
Impairment charges and reversals - - -29 - - - - - -3 -1 - - -32 -1 Capital gains and other related items 6 50 - 0 1 4 431 0 - 11 -2 9 53 74 482 Impact from acquisition accounting - - - - - - - - - - 0 -222 0 -222 Changes in fair values of derivatives hedging future cash flow -9 6 0 - -4 3 92 4 -766 160 0 - -687 172 Other 1 - - - - - - - -56 115 - - -55 115
IS Items affecting comparability 4 41 6 -29 1 0 433 92 4 -813 271 9 -170 -701 546 IS Operating profit 505 415 108 136 82 476 147 55 -279 295 -58 -235 505 1,142 Comparable share of profit/loss of associates and joint ventures 5 5 52 27 40 37 - - 22 3 0 503 119 574 IS Share of profit/loss of associates and joint ventures 12 20 -24 52 27 40 37 - - 29 7 0 471 140 518
Gross investments / divestments by segment Gross investments in shares 6 0 7 18 40 0 6 - - 2 2 183 3,372 203 3,427 Capital expenditure 62 61 18 11 86 63 36 28 318 143 10 15 517 320 Gross divestments of shares 6 129 171 17 - 5 527 0 - 6 3 8 81 165 782 1) Sales, both internal and external, include effects from realised hedging contracts. Effect on sales can be negative or positive depending on the difference between average contract price and realised spot price. Power sales contains realised
result from commodity derivatives, which have not had hedge accounting status under IFRS 9, but have been considered operatively as hedges.2) Sales and purchases with Nord Pool Spot are netted on Group level on an hourly basis and posted either as revenue or cost depending on if Fortum is a net seller or net buyer during any particular hour.
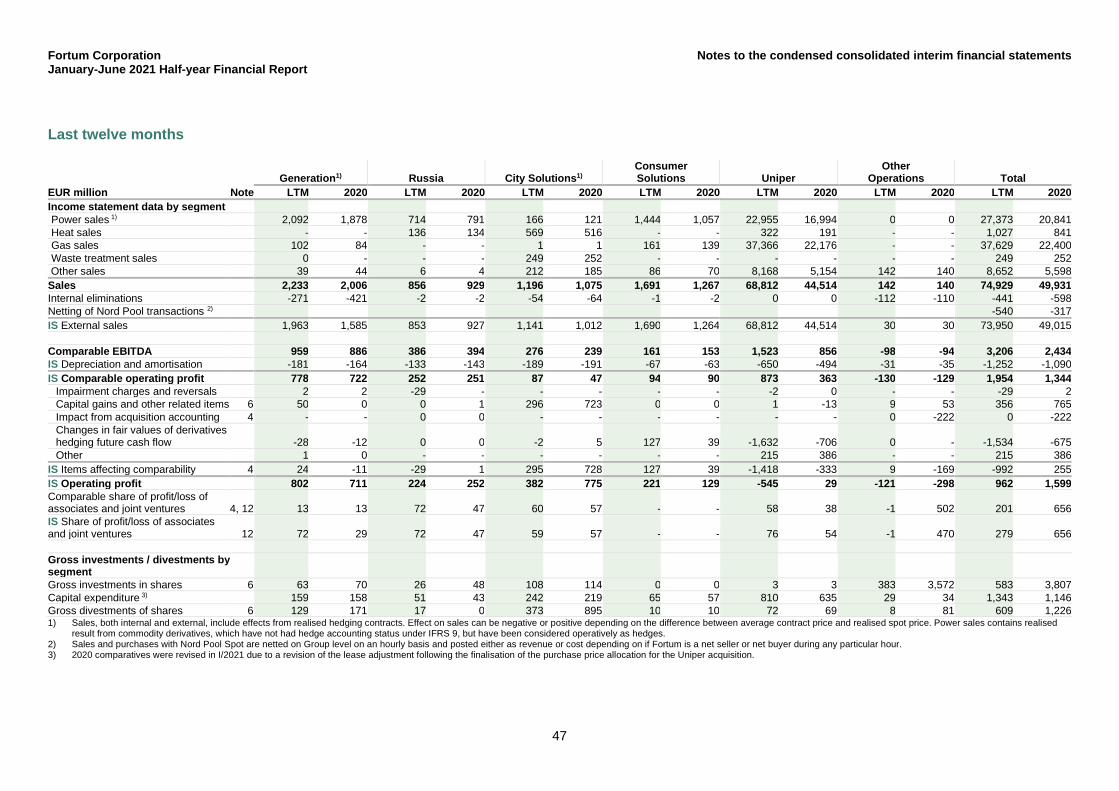
Fortum Corporation Notes to the condensed consolidated interim financial statements January-June 2021 Half-year Financial Report
47
Last twelve months
Generation1) Russia City Solutions1) Consumer Solutions Uniper
Other Operations Total
EUR million Note LTM 2020 LTM 2020 LTM 2020 LTM 2020 LTM 2020 LTM 2020 LTM 2020 Income statement data by segment Power sales 1) 2,092 1,878 714 791 166 121 1,444 1,057 22,955 16,994 0 0 27,373 20,841 Heat sales - - 136 134 569 516 - - 322 191 - - 1,027 841 Gas sales 102 84 - - 1 1 161 139 37,366 22,176 - - 37,629 22,400 Waste treatment sales 0 - - - 249 252 - - - - - - 249 252 Other sales 39 44 6 4 212 185 86 70 8,168 5,154 142 140 8,652 5,598 Sales 2,233 2,006 856 929 1,196 1,075 1,691 1,267 68,812 44,514 142 140 74,929 49,931 Internal eliminations -271 -421 -2 -2 -54 -64 -1 -2 0 0 -112 -110 -441 -598 Netting of Nord Pool transactions 2) -540 -317 IS External sales 1,963 1,585 853 927 1,141 1,012 1,690 1,264 68,812 44,514 30 30 73,950 49,015
Comparable EBITDA 959 886 386 394 276 239 161 153 1,523 856 -98 -94 3,206 2,434 IS Depreciation and amortisation -181 -164 -133 -143 -189 -191 -67 -63 -650 -494 -31 -35 -1,252 -1,090 IS Comparable operating profit 778 722 252 251 87 47 94 90 873 363 -130 -129 1,954 1,344
Impairment charges and reversals 2 2 -29 - - - - - -2 0 - - -29 2 Capital gains and other related items 6 50 0 0 1 296 723 0 0 1 -13 9 53 356 765 Impact from acquisition accounting 4 - - 0 0 - - - - - - 0 -222 0 -222 Changes in fair values of derivatives hedging future cash flow -28 -12 0 0 -2 5 127 39 -1,632 -706 0 - -1,534 -675 Other 1 0 - - - - - - 215 386 - - 215 386
IS Items affecting comparability 4 24 -11 -29 1 295 728 127 39 -1,418 -333 9 -169 -992 255 IS Operating profit 802 711 224 252 382 775 221 129 -545 29 -121 -298 962 1,599 Comparable share of profit/loss of associates and joint ventures 4, 12 13 13 72 47 60 57 - - 58 38 -1 502 201 656 IS Share of profit/loss of associates and joint ventures 12 72 29 72 47 59 57 - - 76 54 -1 470 279 656
Gross investments / divestments by segment Gross investments in shares 6 63 70 26 48 108 114 0 0 3 3 383 3,572 583 3,807 Capital expenditure 3) 159 158 51 43 242 219 65 57 810 635 29 34 1,343 1,146 Gross divestments of shares 6 129 171 17 0 373 895 10 10 72 69 8 81 609 1,226 1) Sales, both internal and external, include effects from realised hedging contracts. Effect on sales can be negative or positive depending on the difference between average contract price and realised spot price. Power sales contains realised
result from commodity derivatives, which have not had hedge accounting status under IFRS 9, but have been considered operatively as hedges.2) Sales and purchases with Nord Pool Spot are netted on Group level on an hourly basis and posted either as revenue or cost depending on if Fortum is a net seller or net buyer during any particular hour.3) 2020 comparatives were revised in I/2021 due to a revision of the lease adjustment following the finalisation of the purchase price allocation for the Uniper acquisition.
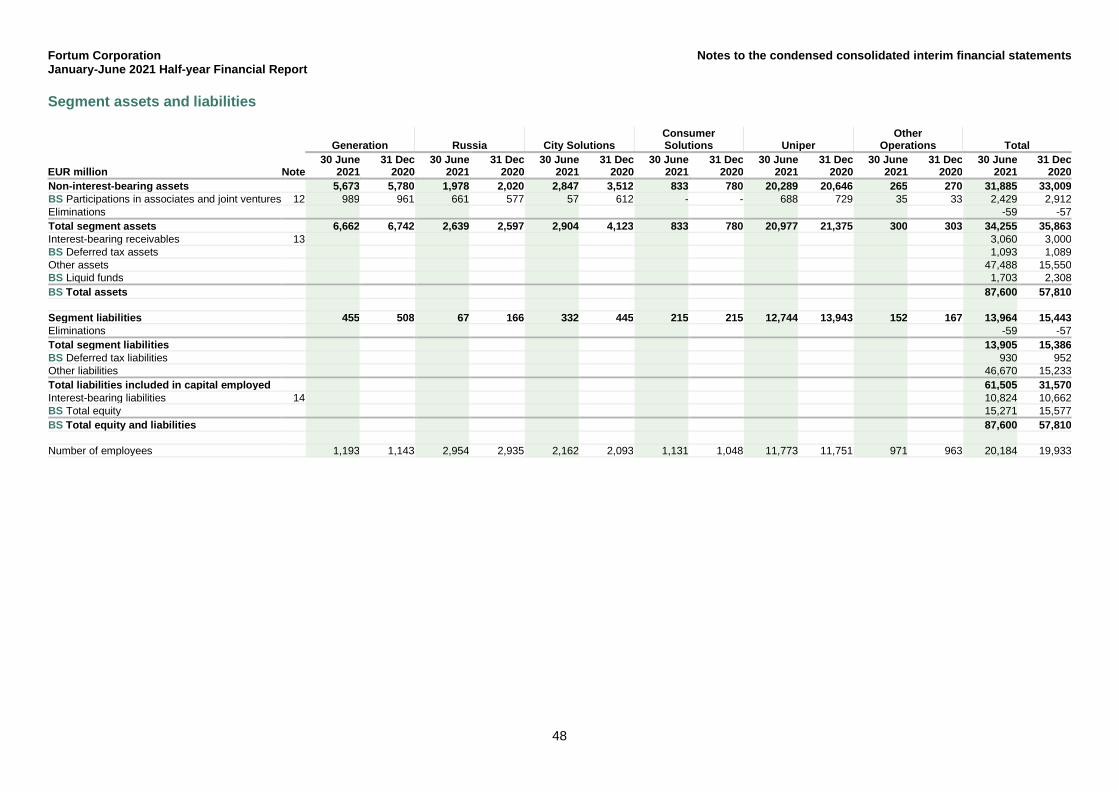
Fortum Corporation Notes to the condensed consolidated interim financial statements January-June 2021 Half-year Financial Report
48
Segment assets and liabilities
Generation Russia City Solutions Consumer Solutions Uniper
Other Operations Total
EUR million Note 30 June
2021 31 Dec
2020 30 June
2021 31 Dec
2020 30 June
2021 31 Dec
2020 30 June
2021 31 Dec
2020 30 June
2021 31 Dec
2020 30 June
2021 31 Dec
2020 30 June
2021 31 Dec
2020 Non-interest-bearing assets 5,673 5,780 1,978 2,020 2,847 3,512 833 780 20,289 20,646 265 270 31,885 33,009 BS Participations in associates and joint ventures 12 989 961 661 577 57 612 - - 688 729 35 33 2,429 2,912 Eliminations -59 -57 Total segment assets 6,662 6,742 2,639 2,597 2,904 4,123 833 780 20,977 21,375 300 303 34,255 35,863 Interest-bearing receivables 13 3,060 3,000 BS Deferred tax assets 1,093 1,089 Other assets 47,488 15,550 BS Liquid funds 1,703 2,308 BS Total assets 87,600 57,810
Segment liabilities 455 508 67 166 332 445 215 215 12,744 13,943 152 167 13,964 15,443 Eliminations -59 -57 Total segment liabilities 13,905 15,386 BS Deferred tax liabilities 930 952 Other liabilities 46,670 15,233 Total liabilities included in capital employed 61,505 31,570 Interest-bearing liabilities 14 10,824 10,662 BS Total equity 15,271 15,577 BS Total equity and liabilities 87,600 57,810
Number of employees 1,193 1,143 2,954 2,935 2,162 2,093 1,131 1,048 11,773 11,751 971 963 20,184 19,933
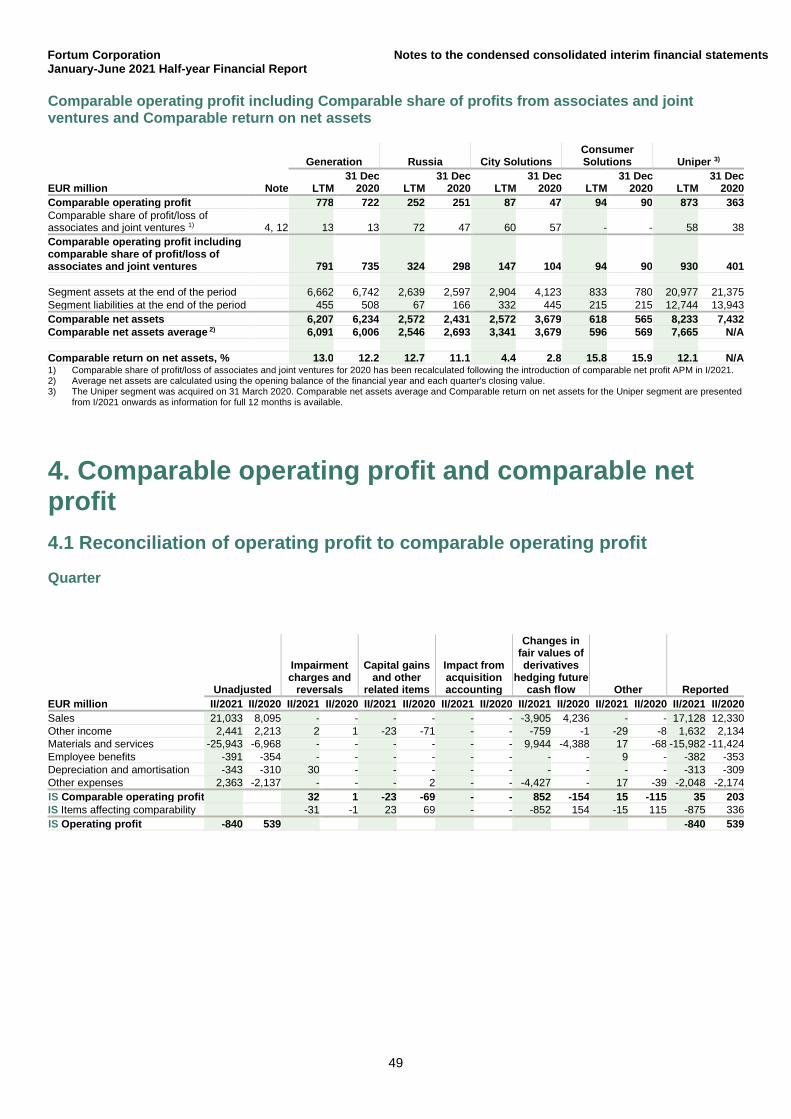
Fortum Corporation Notes to the condensed consolidated interim financial statements January-June 2021 Half-year Financial Report
49
Comparable operating profit including Comparable share of profits from associates and joint ventures and Comparable return on net assets
Generation Russia City Solutions Consumer Solutions Uniper 3)
EUR million Note LTM 31 Dec
2020 LTM 31 Dec
2020 LTM 31 Dec
2020 LTM 31 Dec
2020 LTM 31 Dec
2020 Comparable operating profit 778 722 252 251 87 47 94 90 873 363 Comparable share of profit/loss of associates and joint ventures 1) 4, 12 13 13 72 47 60 57 - - 58 38 Comparable operating profit including comparable share of profit/loss of associates and joint ventures 791 735 324 298 147 104 94 90 930 401
Segment assets at the end of the period 6,662 6,742 2,639 2,597 2,904 4,123 833 780 20,977 21,375 Segment liabilities at the end of the period 455 508 67 166 332 445 215 215 12,744 13,943 Comparable net assets 6,207 6,234 2,572 2,431 2,572 3,679 618 565 8,233 7,432 Comparable net assets average 2) 6,091 6,006 2,546 2,693 3,341 3,679 596 569 7,665 N/A
Comparable return on net assets, % 13.0 12.2 12.7 11.1 4.4 2.8 15.8 15.9 12.1 N/A 1) Comparable share of profit/loss of associates and joint ventures for 2020 has been recalculated following the introduction of comparable net profit APM in I/2021.2) Average net assets are calculated using the opening balance of the financial year and each quarter's closing value.3) The Uniper segment was acquired on 31 March 2020. Comparable net assets average and Comparable return on net assets for the Uniper segment are presented
from I/2021 onwards as information for full 12 months is available.
4. Comparable operating profit and comparable netprofit4.1 Reconciliation of operating profit to comparable operating profit
Quarter
Unadjusted
Impairment charges and
reversals
Capital gains and other
related items
Impact from acquisition accounting
Changes in fair values of derivatives
hedging future cash flow Other Reported
EUR million II/2021 II/2020 II/2021 II/2020 II/2021 II/2020 II/2021 II/2020 II/2021 II/2020 II/2021 II/2020 II/2021 II/2020 Sales 21,033 8,095 - - - - - - -3,905 4,236 - - 17,128 12,330 Other income 2,441 2,213 2 1 -23 -71 - - -759 -1 -29 -8 1,632 2,134 Materials and services -25,943 -6,968 - - - - - - 9,944 -4,388 17 -68 -15,982 -11,424 Employee benefits -391 -354 - - - - - - - - 9 - -382 -353 Depreciation and amortisation -343 -310 30 - - - - - - - - - -313 -309 Other expenses 2,363 -2,137 - - - 2 - - -4,427 - 17 -39 -2,048 -2,174 IS Comparable operating profit 32 1 -23 -69 - - 852 -154 15 -115 35 203 IS Items affecting comparability -31 -1 23 69 - - -852 154 -15 115 -875 336 IS Operating profit -840 539 -840 539
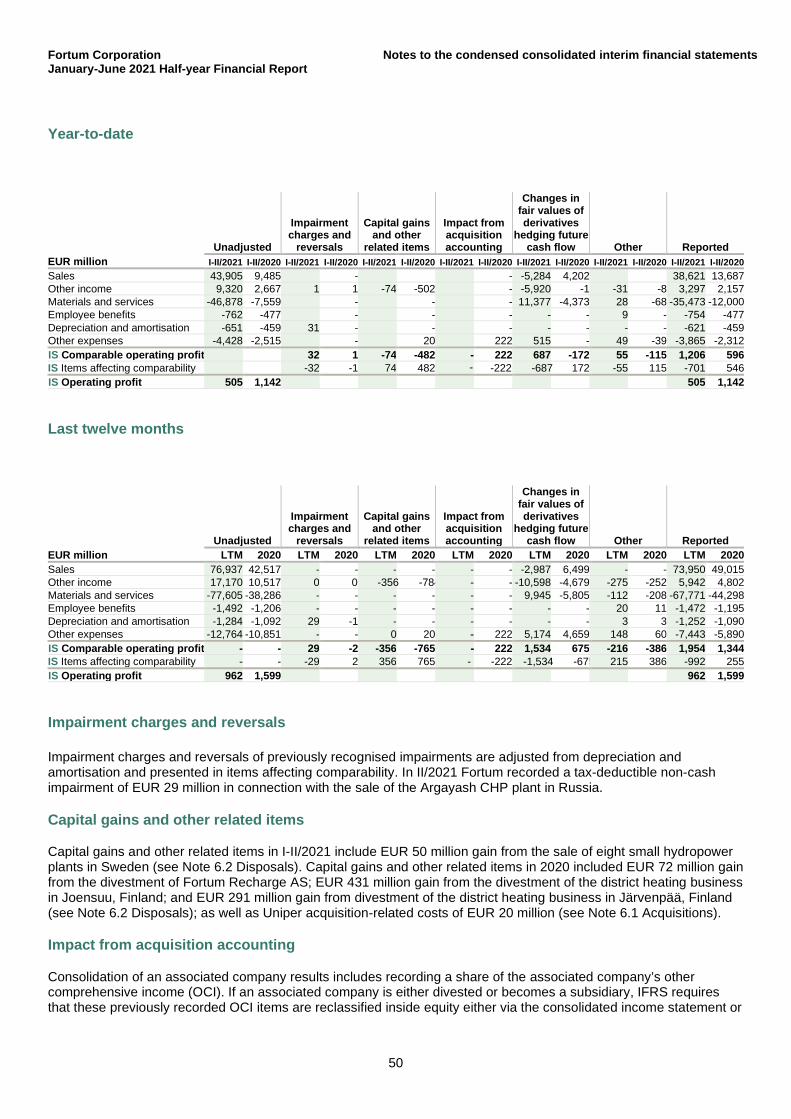
Fortum Corporation Notes to the condensed consolidated interim financial statements January-June 2021 Half-year Financial Report
50
Year-to-date
Unadjusted
Impairment charges and
reversals
Capital gains and other
related items
Impact from acquisition accounting
Changes in fair values of derivatives
hedging future cash flow Other Reported
EUR million I-II/2021 I-II/2020 I-II/2021 I-II/2020 I-II/2021 I-II/2020 I-II/2021 I-II/2020 I-II/2021 I-II/2020 I-II/2021 I-II/2020 I-II/2021 I-II/2020Sales 43,905 9,485 - - -5,284 4,202 38,621 13,687 Other income 9,320 2,667 1 1 -74 -502 - -5,920 -1 -31 -8 3,297 2,157 Materials and services -46,878 -7,559 - - - 11,377 -4,373 28 -68 -35,473 -12,000 Employee benefits -762 -477 - - - - - 9 - -754 -477 Depreciation and amortisation -651 -459 31 - - - - - - - -621 -459 Other expenses -4,428 -2,515 - 20 222 515 - 49 -39 -3,865 -2,312 IS Comparable operating profit 32 1 -74 -482 - 222 687 -172 55 -115 1,206 596 IS Items affecting comparability -32 -1 74 482 -222 -687 172 -55 115 -701 546 IS Operating profit 505 1,142 505 1,142
Last twelve months
Unadjusted
Impairment charges and
reversals
Capital gains and other
related items
Impact from acquisition accounting
Changes in fair values of derivatives
hedging future cash flow Other Reported
EUR million LTM 2020 LTM 2020 LTM 2020 LTM 2020 LTM 2020 LTM 2020 LTM 2020 Sales 76,937 42,517 - - - - - - -2,987 6,499 - - 73,950 49,015 Other income 17,170 10,517 0 0 -356 -784 - - -10,598 -4,679 -275 -252 5,942 4,802 Materials and services -77,605 -38,286 - - - - - - 9,945 -5,805 -112 -208 -67,771 -44,298 Employee benefits -1,492 -1,206 - - - - - - - - 20 11 -1,472 -1,195 Depreciation and amortisation -1,284 -1,092 29 -1 - - - - - - 3 3 -1,252 -1,090 Other expenses -12,764 -10,851 - - 0 20 - 222 5,174 4,659 148 60 -7,443 -5,890 IS Comparable operating profit - - 29 -2 -356 -765 - 222 1,534 675 -216 -386 1,954 1,344 IS Items affecting comparability - - -29 2 356 765 - -222 -1,534 -675 215 386 -992 255 IS Operating profit 962 1,599 962 1,599
Impairment charges and reversals
Impairment charges and reversals of previously recognised impairments are adjusted from depreciation and amortisation and presented in items affecting comparability. In II/2021 Fortum recorded a tax-deductible non-cash impairment of EUR 29 million in connection with the sale of the Argayash CHP plant in Russia.
Capital gains and other related items
Capital gains and other related items in I-II/2021 include EUR 50 million gain from the sale of eight small hydropower plants in Sweden (see Note 6.2 Disposals). Capital gains and other related items in 2020 included EUR 72 million gain from the divestment of Fortum Recharge AS; EUR 431 million gain from the divestment of the district heating business in Joensuu, Finland; and EUR 291 million gain from divestment of the district heating business in Järvenpää, Finland (see Note 6.2 Disposals); as well as Uniper acquisition-related costs of EUR 20 million (see Note 6.1 Acquisitions).
Impact from acquisition accounting
Consolidation of an associated company results includes recording a share of the associated company’s other comprehensive income (OCI). If an associated company is either divested or becomes a subsidiary, IFRS requires that these previously recorded OCI items are reclassified inside equity either via the consolidated income statement or
-
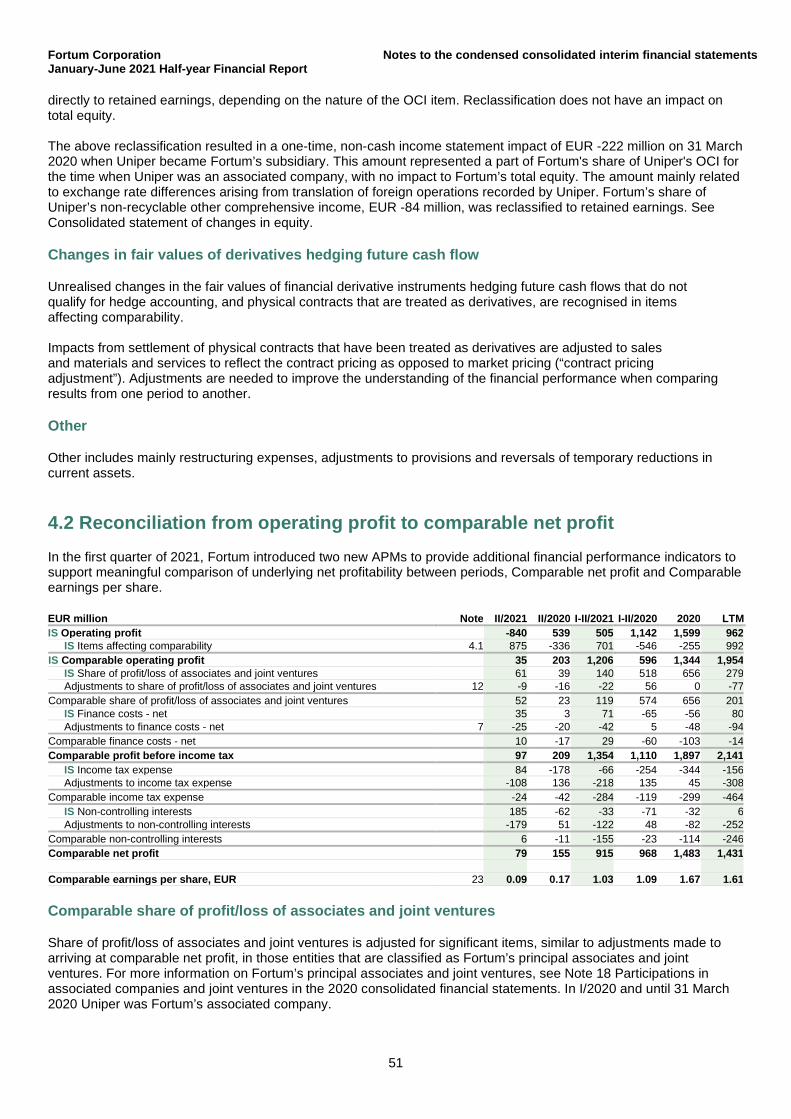
Fortum Corporation Notes to the condensed consolidated interim financial statements January-June 2021 Half-year Financial Report
51
directly to retained earnings, depending on the nature of the OCI item. Reclassification does not have an impact on total equity.
The above reclassification resulted in a one-time, non-cash income statement impact of EUR -222 million on 31 March 2020 when Uniper became Fortum’s subsidiary. This amount represented a part of Fortum's share of Uniper's OCI for the time when Uniper was an associated company, with no impact to Fortum’s total equity. The amount mainly related to exchange rate differences arising from translation of foreign operations recorded by Uniper. Fortum’s share of Uniper’s non-recyclable other comprehensive income, EUR -84 million, was reclassified to retained earnings. See Consolidated statement of changes in equity.
Changes in fair values of derivatives hedging future cash flow
Unrealised changes in the fair values of financial derivative instruments hedging future cash flows that do not qualify for hedge accounting, and physical contracts that are treated as derivatives, are recognised in items affecting comparability.
Impacts from settlement of physical contracts that have been treated as derivatives are adjusted to sales and materials and services to reflect the contract pricing as opposed to market pricing (“contract pricing adjustment”). Adjustments are needed to improve the understanding of the financial performance when comparing results from one period to another.
Other
Other includes mainly restructuring expenses, adjustments to provisions and reversals of temporary reductions in current assets.
4.2 Reconciliation from operating profit to comparable net profit In the first quarter of 2021, Fortum introduced two new APMs to provide additional financial performance indicators to support meaningful comparison of underlying net profitability between periods, Comparable net profit and Comparable earnings per share.
EUR million Note II/2021 II/2020 I-II/2021 I-II/2020 2020 LTM IS Operating profit -840 539 505 1,142 1,599 962
IS Items affecting comparability 4.1 875 -336 701 -546 -255 992 IS Comparable operating profit 35 203 1,206 596 1,344 1,954
IS Share of profit/loss of associates and joint ventures 61 39 140 518 656 279 Adjustments to share of profit/loss of associates and joint ventures 12 -9 -16 -22 56 0 -77
Comparable share of profit/loss of associates and joint ventures 52 23 119 574 656 201 IS Finance costs - net 35 3 71 -65 -56 80 Adjustments to finance costs - net 7 -25 -20 -42 5 -48 -94
Comparable finance costs - net 10 -17 29 -60 -103 -14 Comparable profit before income tax 97 209 1,354 1,110 1,897 2,141
IS Income tax expense 84 -178 -66 -254 -344 -156 Adjustments to income tax expense -108 136 -218 135 45 -308
Comparable income tax expense -24 -42 -284 -119 -299 -464 IS Non-controlling interests 185 -62 -33 -71 -32 6 Adjustments to non-controlling interests -179 51 -122 48 -82 -252
Comparable non-controlling interests 6 -11 -155 -23 -114 -246 Comparable net profit 79 155 915 968 1,483 1,431
Comparable earnings per share, EUR 23 0.09 0.17 1.03 1.09 1.67 1.61
Comparable share of profit/loss of associates and joint ventures
Share of profit/loss of associates and joint ventures is adjusted for significant items, similar to adjustments made to arriving at comparable net profit, in those entities that are classified as Fortum’s principal associates and joint ventures. For more information on Fortum’s principal associates and joint ventures, see Note 18 Participations in associated companies and joint ventures in the 2020 consolidated financial statements. In I/2020 and until 31 March 2020 Uniper was Fortum’s associated company.
Fortum Corporation Notes to the condensed consolidated interim financial statements January-June 2021 Half-year Financial Report
52
Comparable finance costs - net
Finance costs – net are adjusted for e.g. nuclear related items recognised in other financial expenses - net, fair value changes on financial items, as well as impairment charges and reversals of previously recorded impairment charges on financial items.
Comparable income tax expense
Income tax expense is adjusted for tax impacts on items affecting comparability, adjustments to finance costs – net, tax rate changes and other onetime adjustments.
See also Note 23 Definitions and reconciliations of key figures.
5. Financial risk management Fortum continues discussions with Uniper and reviews its risk management systems and policies for the combined Group. See Fortum Group's consolidated financial statements for the year ended 31 December 2020 for current financial risk management objectives and policies.
Fair value hierarchy information
Financial instruments that are measured in the balance sheet at fair value are presented according to following fair value measurement hierarchy:
Level 1: quoted prices (unadjusted) in active markets for identical assets or liabilities;
Level 2: inputs other than quoted prices included within Level 1 that are observable for the asset or liability, either directly (i.e. as prices) or indirectly (i.e. derived from prices);
Level 3: inputs for the asset or liability that is not based on observable market data (unobservable inputs).
See also accounting policies in the consolidated financial statements 2020, in Note 15 Financial assets and liabilities by fair value hierarchy.
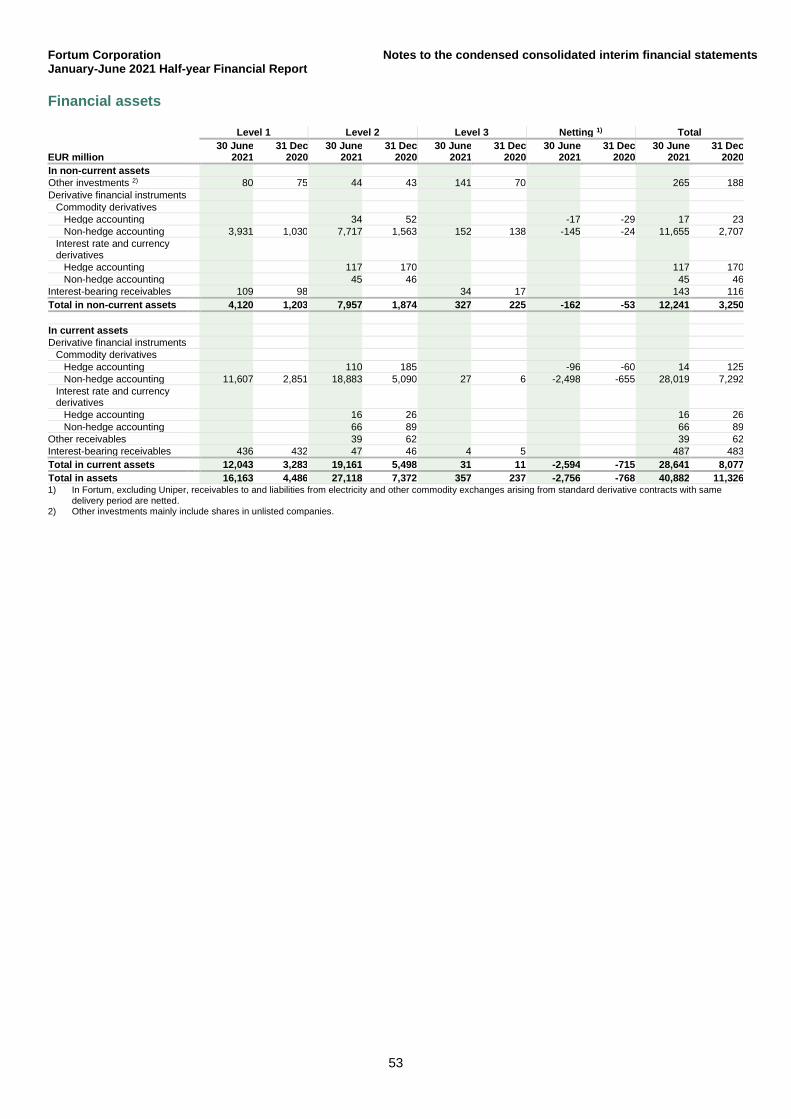
Fortum Corporation Notes to the condensed consolidated interim financial statements January-June 2021 Half-year Financial Report
53
Financial assets
Level 1 Level 2 Level 3 Netting 1) Total
EUR million 30 June
2021 31 Dec
2020 30 June
2021 31 Dec
2020 30 June
2021 31 Dec
2020 30 June
2021 31 Dec
2020 30 June
2021 31 Dec
2020 In non-current assets Other investments 2) 80 75 44 43 141 70 265 188 Derivative financial instruments
Commodity derivatives Hedge accounting 34 52 -17 -29 17 23 Non-hedge accounting 3,931 1,030 7,717 1,563 152 138 -145 -24 11,655 2,707
Interest rate and currency derivatives
Hedge accounting 117 170 117 170 Non-hedge accounting 45 46 45 46
Interest-bearing receivables 109 98 34 17 143 116 Total in non-current assets 4,120 1,203 7,957 1,874 327 225 -162 -53 12,241 3,250 In current assets Derivative financial instruments
Commodity derivatives Hedge accounting 110 185 -96 -60 14 125 Non-hedge accounting 11,607 2,851 18,883 5,090 27 6 -2,498 -655 28,019 7,292
Interest rate and currency derivatives
Hedge accounting 16 26 16 26 Non-hedge accounting 66 89 66 89
Other receivables 39 62 39 62 Interest-bearing receivables 436 432 47 46 4 5 487 483 Total in current assets 12,043 3,283 19,161 5,498 31 11 -2,594 -715 28,641 8,077 Total in assets 16,163 4,486 27,118 7,372 357 237 -2,756 -768 40,882 11,326 1) In Fortum, excluding Uniper, receivables to and liabilities from electricity and other commodity exchanges arising from standard derivative contracts with same
delivery period are netted. 2) Other investments mainly include shares in unlisted companies.
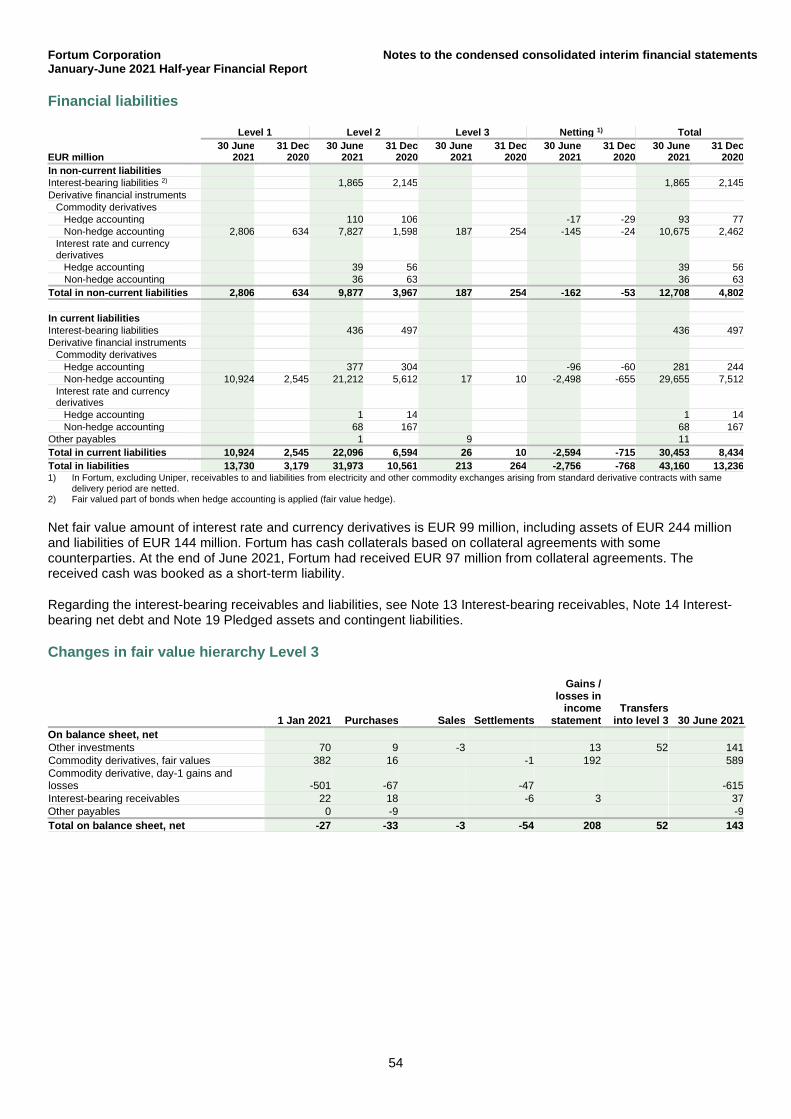
Fortum Corporation Notes to the condensed consolidated interim financial statements January-June 2021 Half-year Financial Report
54
Financial liabilities
Level 1 Level 2 Level 3 Netting 1) Total
EUR million 30 June
2021 31 Dec
2020 30 June
2021 31 Dec
2020 30 June
2021 31 Dec
2020 30 June
2021 31 Dec
2020 30 June
2021 31 Dec
2020 In non-current liabilities Interest-bearing liabilities 2) 1,865 2,145 1,865 2,145 Derivative financial instruments
Commodity derivatives Hedge accounting 110 106 -17 -29 93 77 Non-hedge accounting 2,806 634 7,827 1,598 187 254 -145 -24 10,675 2,462
Interest rate and currency derivatives
Hedge accounting 39 56 39 56 Non-hedge accounting 36 63 36 63
Total in non-current liabilities 2,806 634 9,877 3,967 187 254 -162 -53 12,708 4,802 In current liabilities Interest-bearing liabilities 436 497 436 497 Derivative financial instruments
Commodity derivatives Hedge accounting 377 304 -96 -60 281 244 Non-hedge accounting 10,924 2,545 21,212 5,612 17 10 -2,498 -655 29,655 7,512
Interest rate and currency derivatives
Hedge accounting 1 14 1 14 Non-hedge accounting 68 167 68 167
Other payables 1 9 11 Total in current liabilities 10,924 2,545 22,096 6,594 26 10 -2,594 -715 30,453 8,434 Total in liabilities 13,730 3,179 31,973 10,561 213 264 -2,756 -768 43,160 13,236 1) In Fortum, excluding Uniper, receivables to and liabilities from electricity and other commodity exchanges arising from standard derivative contracts with same
delivery period are netted. 2) Fair valued part of bonds when hedge accounting is applied (fair value hedge). Net fair value amount of interest rate and currency derivatives is EUR 99 million, including assets of EUR 244 million and liabilities of EUR 144 million. Fortum has cash collaterals based on collateral agreements with some counterparties. At the end of June 2021, Fortum had received EUR 97 million from collateral agreements. The received cash was booked as a short-term liability.
Regarding the interest-bearing receivables and liabilities, see Note 13 Interest-bearing receivables, Note 14 Interest-bearing net debt and Note 19 Pledged assets and contingent liabilities.
Changes in fair value hierarchy Level 3
1 Jan 2021 Purchases Sales Settlements
Gains / losses in
income statement
Transfers into level 3 30 June 2021
On balance sheet, net Other investments 70 9 -3 13 52 141 Commodity derivatives, fair values 382 16 -1 192 589 Commodity derivative, day-1 gains and losses -501 -67 -47 -615 Interest-bearing receivables 22 18 -6 3 37 Other payables 0 -9 -9 Total on balance sheet, net -27 -33 -3 -54 208 52 143
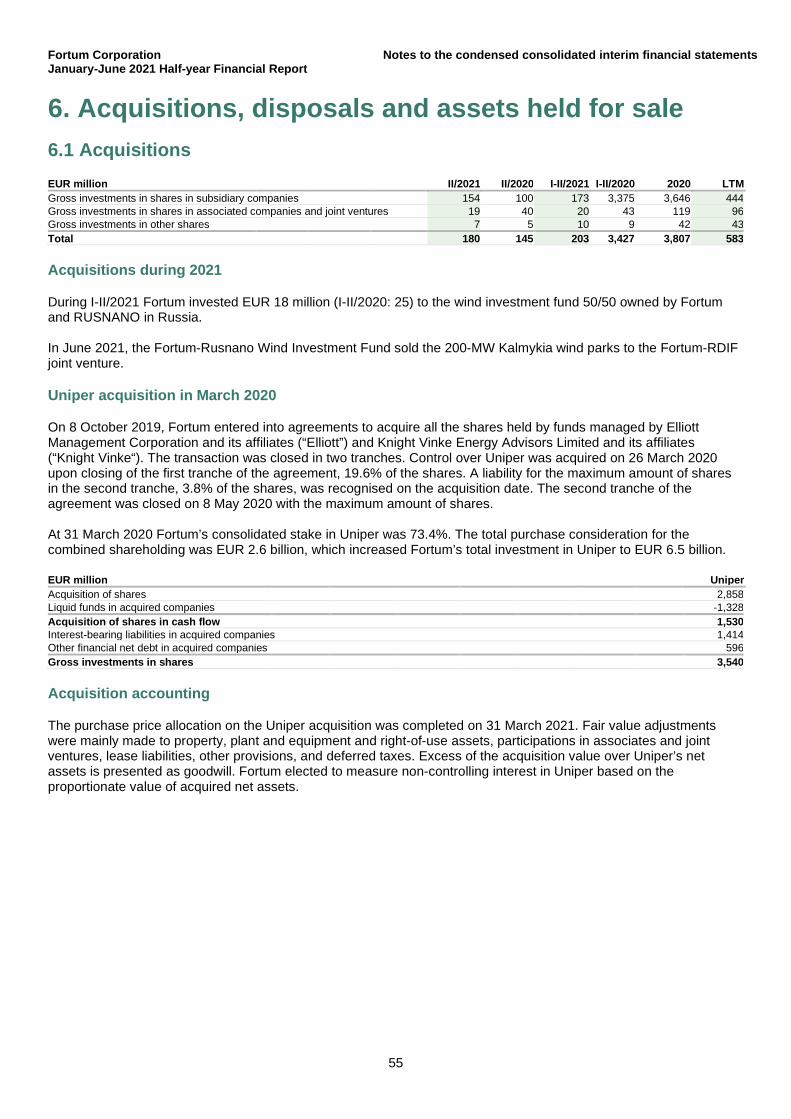
Fortum Corporation Notes to the condensed consolidated interim financial statements January-June 2021 Half-year Financial Report
55
6. Acquisitions, disposals and assets held for sale 6.1 Acquisitions
EUR million II/2021 II/2020 I-II/2021 I-II/2020 2020 LTM Gross investments in shares in subsidiary companies 154 100 173 3,375 3,646 444 Gross investments in shares in associated companies and joint ventures 19 40 20 43 119 96 Gross investments in other shares 7 5 10 9 42 43 Total 180 145 203 3,427 3,807 583
Acquisitions during 2021
During I-II/2021 Fortum invested EUR 18 million (I-II/2020: 25) to the wind investment fund 50/50 owned by Fortum and RUSNANO in Russia. In June 2021, the Fortum-Rusnano Wind Investment Fund sold the 200-MW Kalmykia wind parks to the Fortum-RDIF joint venture.
Uniper acquisition in March 2020
On 8 October 2019, Fortum entered into agreements to acquire all the shares held by funds managed by Elliott Management Corporation and its affiliates (“Elliott”) and Knight Vinke Energy Advisors Limited and its affiliates (“Knight Vinke“). The transaction was closed in two tranches. Control over Uniper was acquired on 26 March 2020 upon closing of the first tranche of the agreement, 19.6% of the shares. A liability for the maximum amount of shares in the second tranche, 3.8% of the shares, was recognised on the acquisition date. The second tranche of the agreement was closed on 8 May 2020 with the maximum amount of shares. At 31 March 2020 Fortum’s consolidated stake in Uniper was 73.4%. The total purchase consideration for the combined shareholding was EUR 2.6 billion, which increased Fortum’s total investment in Uniper to EUR 6.5 billion.
EUR million Uniper Acquisition of shares 2,858 Liquid funds in acquired companies -1,328 Acquisition of shares in cash flow 1,530 Interest-bearing liabilities in acquired companies 1,414 Other financial net debt in acquired companies 596 Gross investments in shares 3,540
Acquisition accounting
The purchase price allocation on the Uniper acquisition was completed on 31 March 2021. Fair value adjustments were mainly made to property, plant and equipment and right-of-use assets, participations in associates and joint ventures, lease liabilities, other provisions, and deferred taxes. Excess of the acquisition value over Uniper’s net assets is presented as goodwill. Fortum elected to measure non-controlling interest in Uniper based on the proportionate value of acquired net assets.
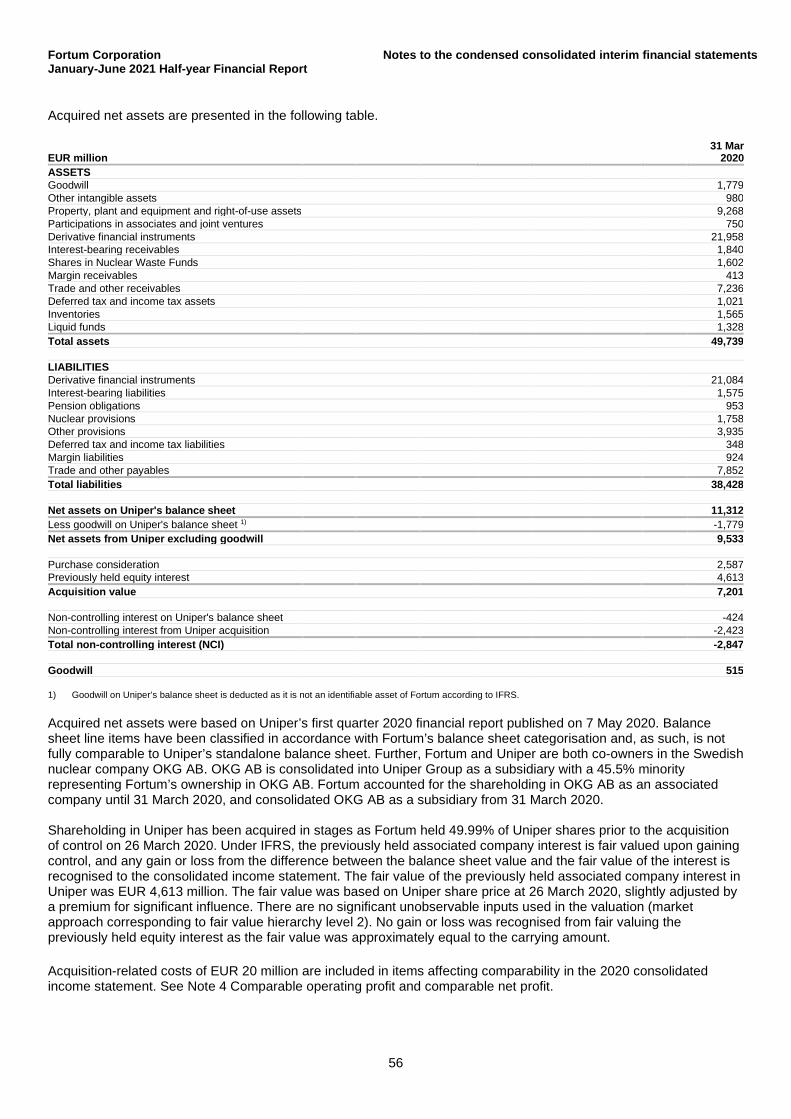
Fortum Corporation Notes to the condensed consolidated interim financial statements January-June 2021 Half-year Financial Report
56
Acquired net assets are presented in the following table.
EUR million 31 Mar
2020 ASSETS Goodwill 1,779 Other intangible assets 980 Property, plant and equipment and right-of-use assets 9,268 Participations in associates and joint ventures 750 Derivative financial instruments 21,958 Interest-bearing receivables 1,840 Shares in Nuclear Waste Funds 1,602 Margin receivables 413 Trade and other receivables 7,236 Deferred tax and income tax assets 1,021 Inventories 1,565 Liquid funds 1,328 Total assets 49,739 LIABILITIES Derivative financial instruments 21,084 Interest-bearing liabilities 1,575 Pension obligations 953 Nuclear provisions 1,758 Other provisions 3,935 Deferred tax and income tax liabilities 348 Margin liabilities 924 Trade and other payables 7,852 Total liabilities 38,428 Net assets on Uniper's balance sheet 11,312 Less goodwill on Uniper's balance sheet 1) -1,779 Net assets from Uniper excluding goodwill 9,533 Purchase consideration 2,587 Previously held equity interest 4,613 Acquisition value 7,201 Non-controlling interest on Uniper's balance sheet -424 Non-controlling interest from Uniper acquisition -2,423 Total non-controlling interest (NCI) -2,847 Goodwill 515 1) Goodwill on Uniper’s balance sheet is deducted as it is not an identifiable asset of Fortum according to IFRS. Acquired net assets were based on Uniper’s first quarter 2020 financial report published on 7 May 2020. Balance sheet line items have been classified in accordance with Fortum’s balance sheet categorisation and, as such, is not fully comparable to Uniper’s standalone balance sheet. Further, Fortum and Uniper are both co-owners in the Swedish nuclear company OKG AB. OKG AB is consolidated into Uniper Group as a subsidiary with a 45.5% minority representing Fortum’s ownership in OKG AB. Fortum accounted for the shareholding in OKG AB as an associated company until 31 March 2020, and consolidated OKG AB as a subsidiary from 31 March 2020. Shareholding in Uniper has been acquired in stages as Fortum held 49.99% of Uniper shares prior to the acquisition of control on 26 March 2020. Under IFRS, the previously held associated company interest is fair valued upon gaining control, and any gain or loss from the difference between the balance sheet value and the fair value of the interest is recognised to the consolidated income statement. The fair value of the previously held associated company interest in Uniper was EUR 4,613 million. The fair value was based on Uniper share price at 26 March 2020, slightly adjusted by a premium for significant influence. There are no significant unobservable inputs used in the valuation (market approach corresponding to fair value hierarchy level 2). No gain or loss was recognised from fair valuing the previously held equity interest as the fair value was approximately equal to the carrying amount. Acquisition-related costs of EUR 20 million are included in items affecting comparability in the 2020 consolidated income statement. See Note 4 Comparable operating profit and comparable net profit.
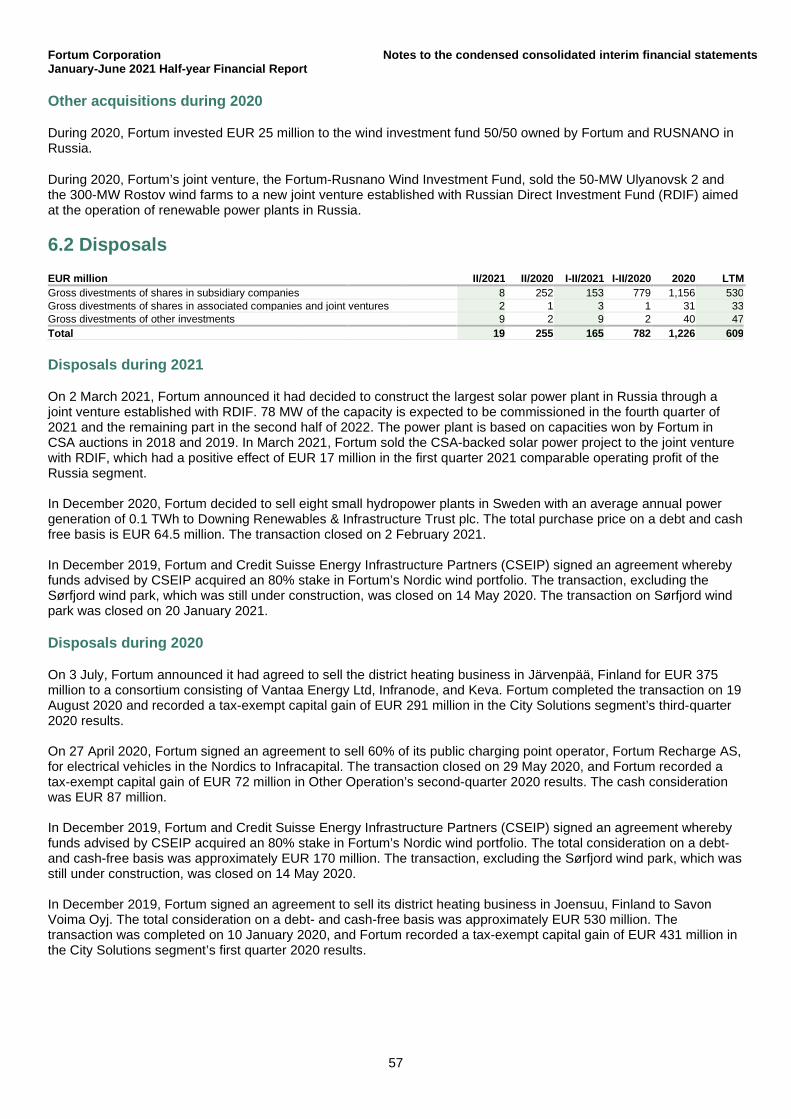
Fortum Corporation Notes to the condensed consolidated interim financial statements January-June 2021 Half-year Financial Report
57
Other acquisitions during 2020
During 2020, Fortum invested EUR 25 million to the wind investment fund 50/50 owned by Fortum and RUSNANO in Russia.
During 2020, Fortum’s joint venture, the Fortum-Rusnano Wind Investment Fund, sold the 50-MW Ulyanovsk 2 and the 300-MW Rostov wind farms to a new joint venture established with Russian Direct Investment Fund (RDIF) aimed at the operation of renewable power plants in Russia.
6.2 Disposals
EUR million II/2021 II/2020 I-II/2021 I-II/2020 2020 LTM Gross divestments of shares in subsidiary companies 8 252 153 779 1,156 530 Gross divestments of shares in associated companies and joint ventures 2 1 3 1 31 33 Gross divestments of other investments 9 2 9 2 40 47 Total 19 255 165 782 1,226 609
Disposals during 2021
On 2 March 2021, Fortum announced it had decided to construct the largest solar power plant in Russia through a joint venture established with RDIF. 78 MW of the capacity is expected to be commissioned in the fourth quarter of 2021 and the remaining part in the second half of 2022. The power plant is based on capacities won by Fortum in CSA auctions in 2018 and 2019. In March 2021, Fortum sold the CSA-backed solar power project to the joint venture with RDIF, which had a positive effect of EUR 17 million in the first quarter 2021 comparable operating profit of the Russia segment. In December 2020, Fortum decided to sell eight small hydropower plants in Sweden with an average annual power generation of 0.1 TWh to Downing Renewables & Infrastructure Trust plc. The total purchase price on a debt and cash free basis is EUR 64.5 million. The transaction closed on 2 February 2021. In December 2019, Fortum and Credit Suisse Energy Infrastructure Partners (CSEIP) signed an agreement whereby funds advised by CSEIP acquired an 80% stake in Fortum’s Nordic wind portfolio. The transaction, excluding the Sørfjord wind park, which was still under construction, was closed on 14 May 2020. The transaction on Sørfjord wind park was closed on 20 January 2021.
Disposals during 2020
On 3 July, Fortum announced it had agreed to sell the district heating business in Järvenpää, Finland for EUR 375 million to a consortium consisting of Vantaa Energy Ltd, Infranode, and Keva. Fortum completed the transaction on 19 August 2020 and recorded a tax-exempt capital gain of EUR 291 million in the City Solutions segment’s third-quarter 2020 results. On 27 April 2020, Fortum signed an agreement to sell 60% of its public charging point operator, Fortum Recharge AS, for electrical vehicles in the Nordics to Infracapital. The transaction closed on 29 May 2020, and Fortum recorded a tax-exempt capital gain of EUR 72 million in Other Operation’s second-quarter 2020 results. The cash consideration was EUR 87 million. In December 2019, Fortum and Credit Suisse Energy Infrastructure Partners (CSEIP) signed an agreement whereby funds advised by CSEIP acquired an 80% stake in Fortum’s Nordic wind portfolio. The total consideration on a debt- and cash-free basis was approximately EUR 170 million. The transaction, excluding the Sørfjord wind park, which was still under construction, was closed on 14 May 2020. In December 2019, Fortum signed an agreement to sell its district heating business in Joensuu, Finland to Savon Voima Oyj. The total consideration on a debt- and cash-free basis was approximately EUR 530 million. The transaction was completed on 10 January 2020, and Fortum recorded a tax-exempt capital gain of EUR 431 million in the City Solutions segment’s first quarter 2020 results.
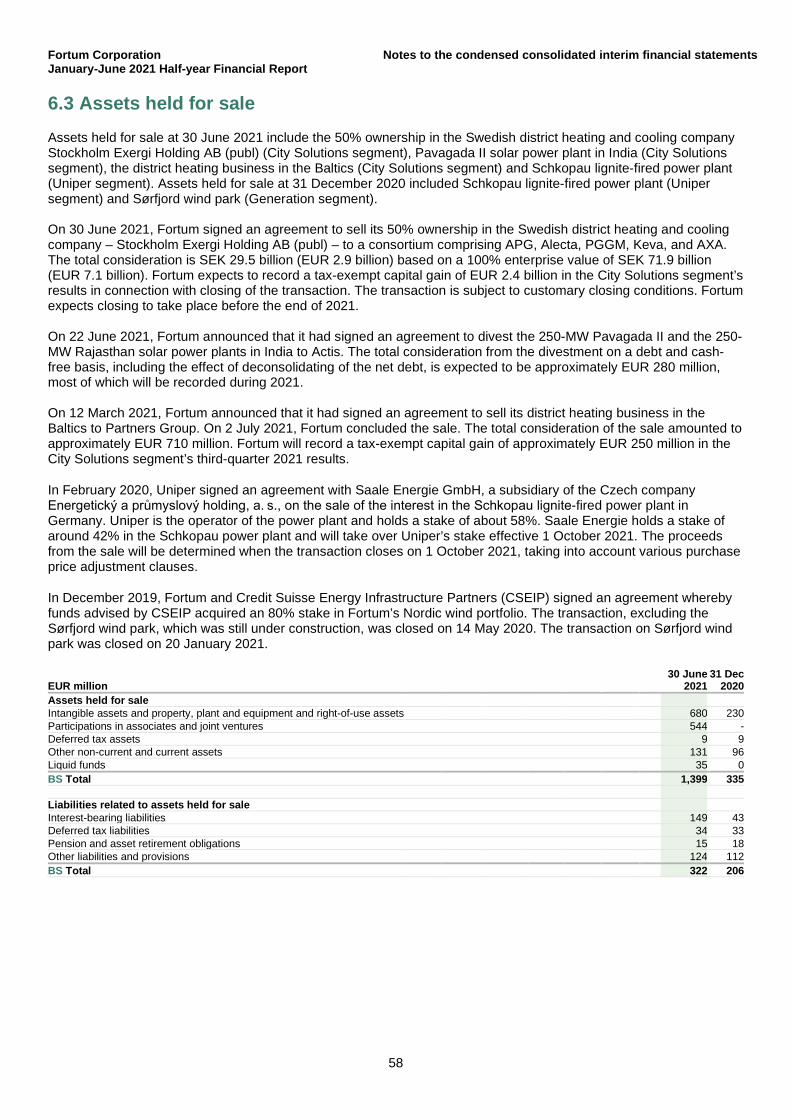
Fortum Corporation Notes to the condensed consolidated interim financial statements January-June 2021 Half-year Financial Report
58
6.3 Assets held for sale Assets held for sale at 30 June 2021 include the 50% ownership in the Swedish district heating and cooling company Stockholm Exergi Holding AB (publ) (City Solutions segment), Pavagada II solar power plant in India (City Solutions segment), the district heating business in the Baltics (City Solutions segment) and Schkopau lignite-fired power plant (Uniper segment). Assets held for sale at 31 December 2020 included Schkopau lignite-fired power plant (Uniper segment) and Sørfjord wind park (Generation segment). On 30 June 2021, Fortum signed an agreement to sell its 50% ownership in the Swedish district heating and cooling company – Stockholm Exergi Holding AB (publ) – to a consortium comprising APG, Alecta, PGGM, Keva, and AXA. The total consideration is SEK 29.5 billion (EUR 2.9 billion) based on a 100% enterprise value of SEK 71.9 billion (EUR 7.1 billion). Fortum expects to record a tax-exempt capital gain of EUR 2.4 billion in the City Solutions segment’s results in connection with closing of the transaction. The transaction is subject to customary closing conditions. Fortum expects closing to take place before the end of 2021. On 22 June 2021, Fortum announced that it had signed an agreement to divest the 250-MW Pavagada II and the 250-MW Rajasthan solar power plants in India to Actis. The total consideration from the divestment on a debt and cash-free basis, including the effect of deconsolidating of the net debt, is expected to be approximately EUR 280 million, most of which will be recorded during 2021. On 12 March 2021, Fortum announced that it had signed an agreement to sell its district heating business in the Baltics to Partners Group. On 2 July 2021, Fortum concluded the sale. The total consideration of the sale amounted to approximately EUR 710 million. Fortum will record a tax-exempt capital gain of approximately EUR 250 million in the City Solutions segment’s third-quarter 2021 results.
In February 2020, Uniper signed an agreement with Saale Energie GmbH, a subsidiary of the Czech company Energetický a průmyslový holding, a. s., on the sale of the interest in the Schkopau lignite-fired power plant in Germany. Uniper is the operator of the power plant and holds a stake of about 58%. Saale Energie holds a stake of around 42% in the Schkopau power plant and will take over Uniper’s stake effective 1 October 2021. The proceeds from the sale will be determined when the transaction closes on 1 October 2021, taking into account various purchase price adjustment clauses.
In December 2019, Fortum and Credit Suisse Energy Infrastructure Partners (CSEIP) signed an agreement whereby funds advised by CSEIP acquired an 80% stake in Fortum’s Nordic wind portfolio. The transaction, excluding the Sørfjord wind park, which was still under construction, was closed on 14 May 2020. The transaction on Sørfjord wind park was closed on 20 January 2021.
EUR million 30 June
2021 31 Dec
2020 Assets held for sale Intangible assets and property, plant and equipment and right-of-use assets 680 230 Participations in associates and joint ventures 544 - Deferred tax assets 9 9 Other non-current and current assets 131 96 Liquid funds 35 0 BS Total 1,399 335 Liabilities related to assets held for sale Interest-bearing liabilities 149 43 Deferred tax liabilities 34 33 Pension and asset retirement obligations 15 18 Other liabilities and provisions 124 112 BS Total 322 206
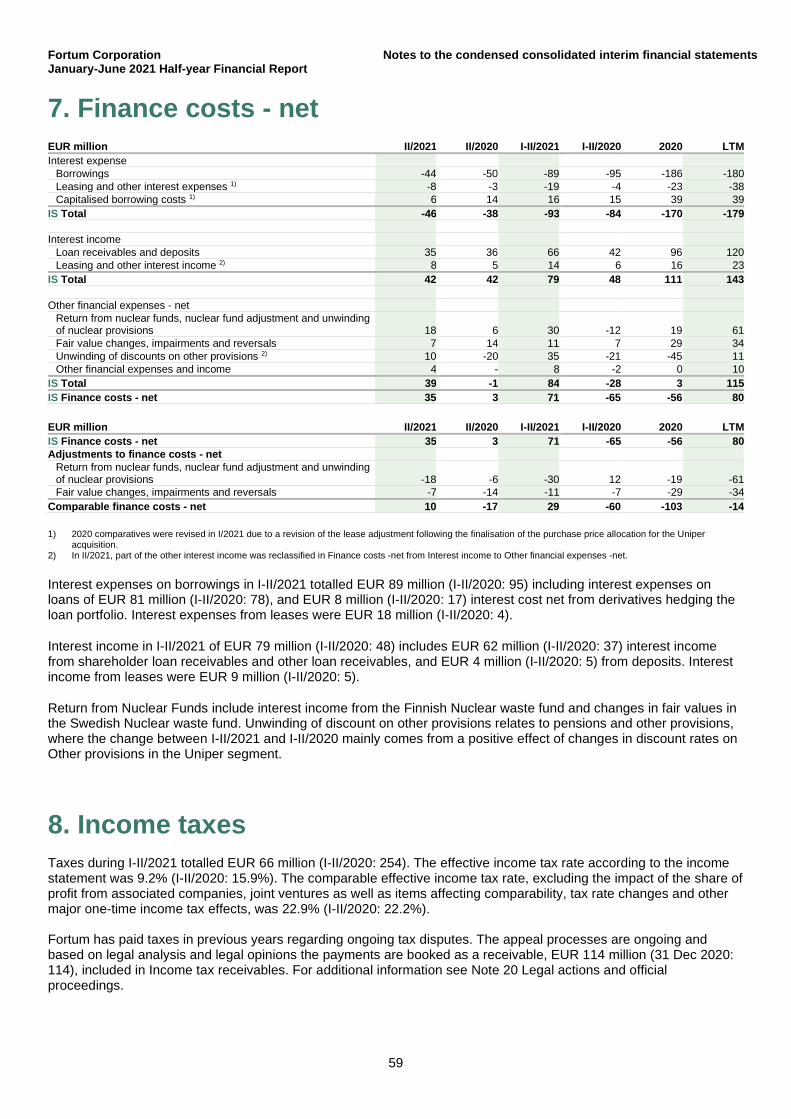
Fortum Corporation Notes to the condensed consolidated interim financial statements January-June 2021 Half-year Financial Report
59
7. Finance costs - net
EUR million II/2021 II/2020 I-II/2021 I-II/2020 2020 LTM Interest expense
Borrowings -44 -50 -89 -95 -186 -180 Leasing and other interest expenses 1) -8 -3 -19 -4 -23 -38 Capitalised borrowing costs 1) 6 14 16 15 39 39
IS Total -46 -38 -93 -84 -170 -179 Interest income
Loan receivables and deposits 35 36 66 42 96 120 Leasing and other interest income 2) 8 5 14 6 16 23
IS Total 42 42 79 48 111 143 Other financial expenses - net
Return from nuclear funds, nuclear fund adjustment and unwinding of nuclear provisions 18 6 30 -12 19 61 Fair value changes, impairments and reversals 7 14 11 7 29 34 Unwinding of discounts on other provisions 2) 10 -20 35 -21 -45 11 Other financial expenses and income 4 - 8 -2 0 10
IS Total 39 -1 84 -28 3 115 IS Finance costs - net 35 3 71 -65 -56 80
EUR million II/2021 II/2020 I-II/2021 I-II/2020 2020 LTM IS Finance costs - net 35 3 71 -65 -56 80 Adjustments to finance costs - net
Return from nuclear funds, nuclear fund adjustment and unwinding of nuclear provisions -18 -6 -30 12 -19 -61 Fair value changes, impairments and reversals -7 -14 -11 -7 -29 -34
Comparable finance costs - net 10 -17 29 -60 -103 -14 1) 2020 comparatives were revised in I/2021 due to a revision of the lease adjustment following the finalisation of the purchase price allocation for the Uniper
acquisition. 2) In II/2021, part of the other interest income was reclassified in Finance costs -net from Interest income to Other financial expenses -net.
Interest expenses on borrowings in I-II/2021 totalled EUR 89 million (I-II/2020: 95) including interest expenses on loans of EUR 81 million (I-II/2020: 78), and EUR 8 million (I-II/2020: 17) interest cost net from derivatives hedging the loan portfolio. Interest expenses from leases were EUR 18 million (I-II/2020: 4).
Interest income in I-II/2021 of EUR 79 million (I-II/2020: 48) includes EUR 62 million (I-II/2020: 37) interest income from shareholder loan receivables and other loan receivables, and EUR 4 million (I-II/2020: 5) from deposits. Interest income from leases were EUR 9 million (I-II/2020: 5).
Return from Nuclear Funds include interest income from the Finnish Nuclear waste fund and changes in fair values in the Swedish Nuclear waste fund. Unwinding of discount on other provisions relates to pensions and other provisions, where the change between I-II/2021 and I-II/2020 mainly comes from a positive effect of changes in discount rates on Other provisions in the Uniper segment.
8. Income taxes Taxes during I-II/2021 totalled EUR 66 million (I-II/2020: 254). The effective income tax rate according to the income statement was 9.2% (I-II/2020: 15.9%). The comparable effective income tax rate, excluding the impact of the share of profit from associated companies, joint ventures as well as items affecting comparability, tax rate changes and other major one-time income tax effects, was 22.9% (I-II/2020: 22.2%). Fortum has paid taxes in previous years regarding ongoing tax disputes. The appeal processes are ongoing and based on legal analysis and legal opinions the payments are booked as a receivable, EUR 114 million (31 Dec 2020: 114), included in Income tax receivables. For additional information see Note 20 Legal actions and official proceedings.
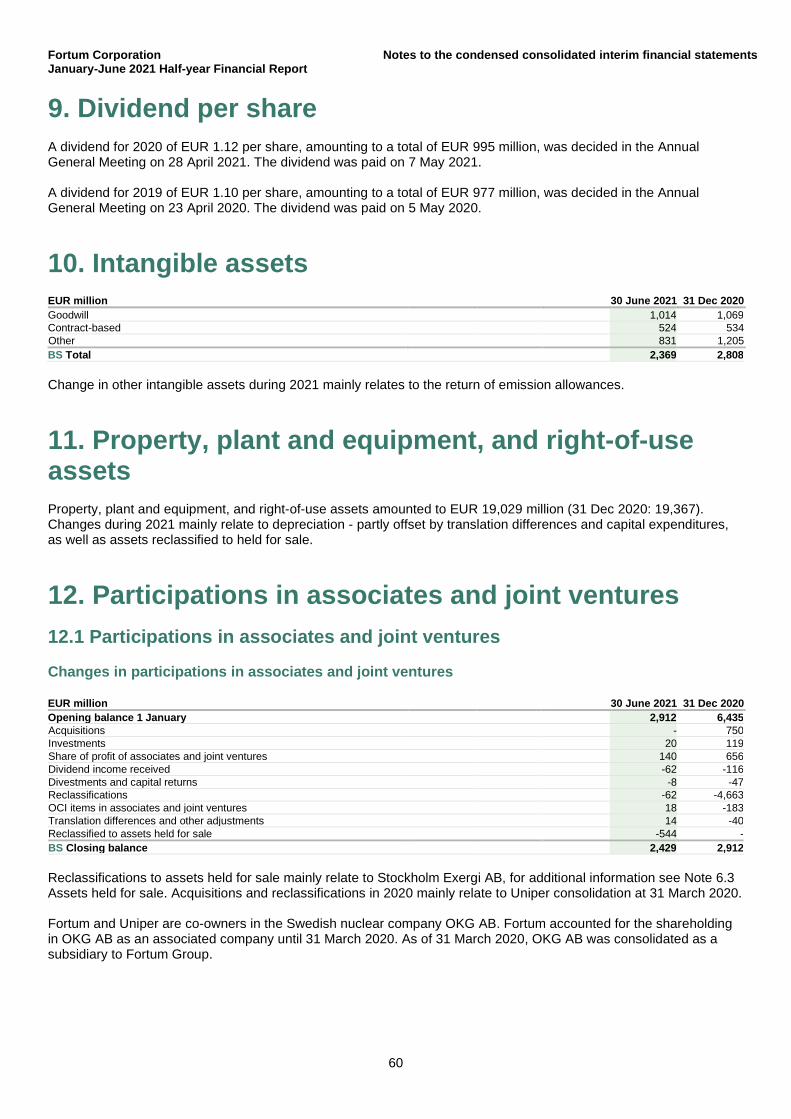
Fortum Corporation Notes to the condensed consolidated interim financial statements January-June 2021 Half-year Financial Report
60
9. Dividend per share A dividend for 2020 of EUR 1.12 per share, amounting to a total of EUR 995 million, was decided in the Annual General Meeting on 28 April 2021. The dividend was paid on 7 May 2021. A dividend for 2019 of EUR 1.10 per share, amounting to a total of EUR 977 million, was decided in the Annual General Meeting on 23 April 2020. The dividend was paid on 5 May 2020.
10. Intangible assets
EUR million 30 June 2021 31 Dec 2020 Goodwill 1,014 1,069 Contract-based 524 534 Other 831 1,205 BS Total 2,369 2,808 Change in other intangible assets during 2021 mainly relates to the return of emission allowances.
11. Property, plant and equipment, and right-of-use assets Property, plant and equipment, and right-of-use assets amounted to EUR 19,029 million (31 Dec 2020: 19,367). Changes during 2021 mainly relate to depreciation - partly offset by translation differences and capital expenditures, as well as assets reclassified to held for sale.
12. Participations in associates and joint ventures 12.1 Participations in associates and joint ventures
Changes in participations in associates and joint ventures
EUR million 30 June 2021 31 Dec 2020 Opening balance 1 January 2,912 6,435 Acquisitions - 750 Investments 20 119 Share of profit of associates and joint ventures 140 656 Dividend income received -62 -116 Divestments and capital returns -8 -47 Reclassifications -62 -4,663 OCI items in associates and joint ventures 18 -183 Translation differences and other adjustments 14 -40 Reclassified to assets held for sale -544 - BS Closing balance 2,429 2,912 Reclassifications to assets held for sale mainly relate to Stockholm Exergi AB, for additional information see Note 6.3 Assets held for sale. Acquisitions and reclassifications in 2020 mainly relate to Uniper consolidation at 31 March 2020. Fortum and Uniper are co-owners in the Swedish nuclear company OKG AB. Fortum accounted for the shareholding in OKG AB as an associated company until 31 March 2020. As of 31 March 2020, OKG AB was consolidated as a subsidiary to Fortum Group.
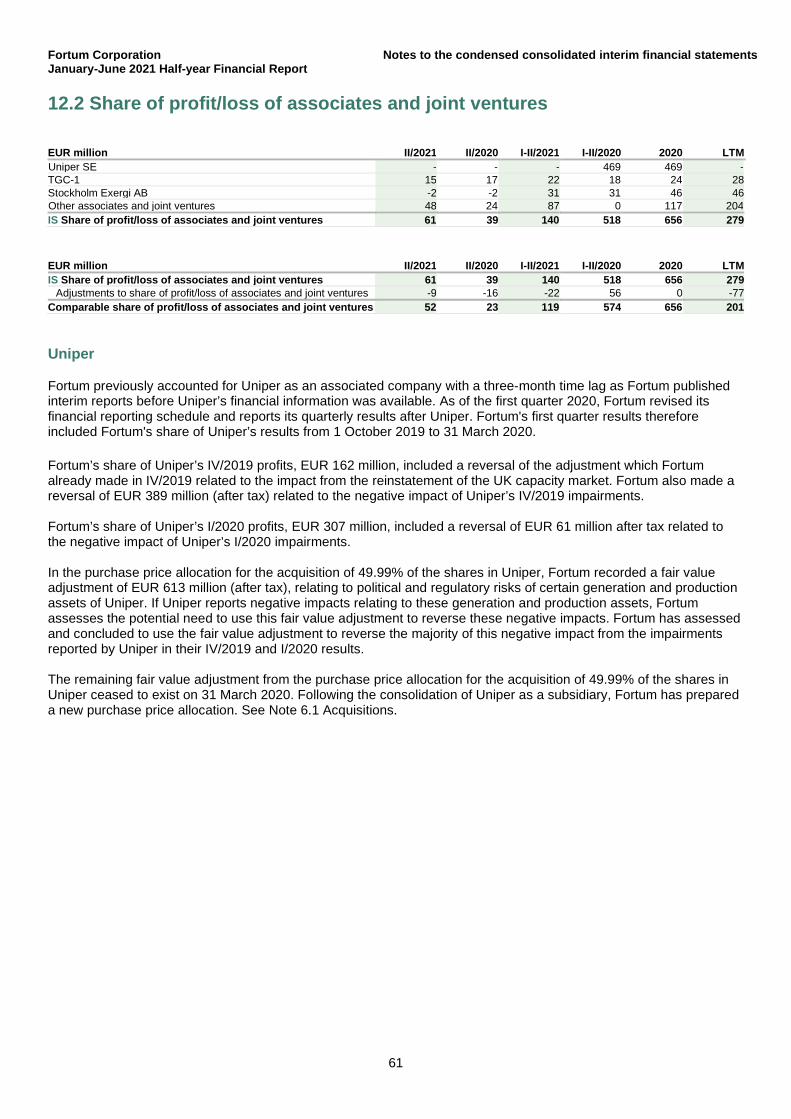
Fortum Corporation Notes to the condensed consolidated interim financial statements January-June 2021 Half-year Financial Report
61
12.2 Share of profit/loss of associates and joint ventures
EUR million II/2021 II/2020 I-II/2021 I-II/2020 2020 LTM Uniper SE - - - 469 469 - TGC-1 15 17 22 18 24 28 Stockholm Exergi AB -2 -2 31 31 46 46 Other associates and joint ventures 48 24 87 0 117 204 IS Share of profit/loss of associates and joint ventures 61 39 140 518 656 279
EUR million II/2021 II/2020 I-II/2021 I-II/2020 2020 LTM IS Share of profit/loss of associates and joint ventures 61 39 140 518 656 279
Adjustments to share of profit/loss of associates and joint ventures -9 -16 -22 56 0 -77 Comparable share of profit/loss of associates and joint ventures 52 23 119 574 656 201
Uniper
Fortum previously accounted for Uniper as an associated company with a three-month time lag as Fortum published interim reports before Uniper’s financial information was available. As of the first quarter 2020, Fortum revised its financial reporting schedule and reports its quarterly results after Uniper. Fortum's first quarter results therefore included Fortum's share of Uniper’s results from 1 October 2019 to 31 March 2020. Fortum’s share of Uniper’s IV/2019 profits, EUR 162 million, included a reversal of the adjustment which Fortum already made in IV/2019 related to the impact from the reinstatement of the UK capacity market. Fortum also made a reversal of EUR 389 million (after tax) related to the negative impact of Uniper’s IV/2019 impairments. Fortum’s share of Uniper’s I/2020 profits, EUR 307 million, included a reversal of EUR 61 million after tax related to the negative impact of Uniper’s I/2020 impairments. In the purchase price allocation for the acquisition of 49.99% of the shares in Uniper, Fortum recorded a fair value adjustment of EUR 613 million (after tax), relating to political and regulatory risks of certain generation and production assets of Uniper. If Uniper reports negative impacts relating to these generation and production assets, Fortum assesses the potential need to use this fair value adjustment to reverse these negative impacts. Fortum has assessed and concluded to use the fair value adjustment to reverse the majority of this negative impact from the impairments reported by Uniper in their IV/2019 and I/2020 results. The remaining fair value adjustment from the purchase price allocation for the acquisition of 49.99% of the shares in Uniper ceased to exist on 31 March 2020. Following the consolidation of Uniper as a subsidiary, Fortum has prepared a new purchase price allocation. See Note 6.1 Acquisitions.
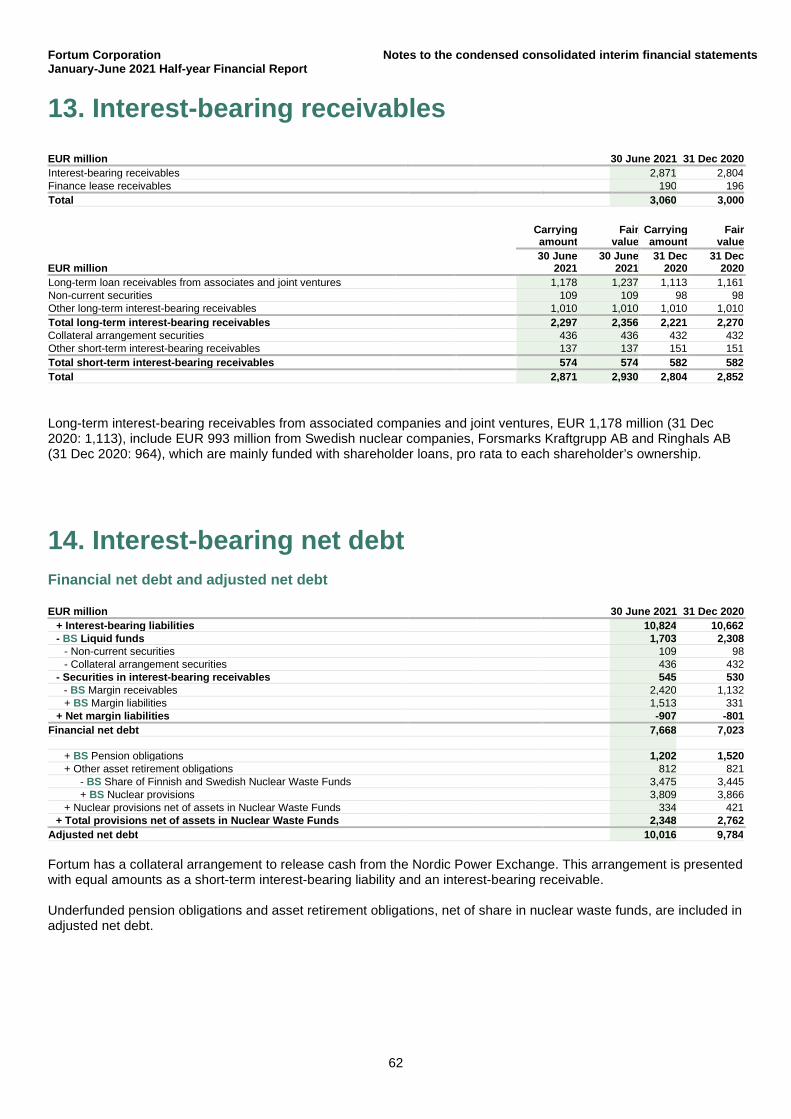
Fortum Corporation Notes to the condensed consolidated interim financial statements January-June 2021 Half-year Financial Report
62
13. Interest-bearing receivables
EUR million 30 June 2021 31 Dec 2020 Interest-bearing receivables 2,871 2,804 Finance lease receivables 190 196 Total 3,060 3,000
Carrying Fair Carrying Fair amount value amount value
EUR million 30 June
2021 30 June
2021 31 Dec
2020 31 Dec
2020 Long-term loan receivables from associates and joint ventures 1,178 1,237 1,113 1,161 Non-current securities 109 109 98 98 Other long-term interest-bearing receivables 1,010 1,010 1,010 1,010 Total long-term interest-bearing receivables 2,297 2,356 2,221 2,270 Collateral arrangement securities 436 436 432 432 Other short-term interest-bearing receivables 137 137 151 151 Total short-term interest-bearing receivables 574 574 582 582 Total 2,871 2,930 2,804 2,852
Long-term interest-bearing receivables from associated companies and joint ventures, EUR 1,178 million (31 Dec 2020: 1,113), include EUR 993 million from Swedish nuclear companies, Forsmarks Kraftgrupp AB and Ringhals AB (31 Dec 2020: 964), which are mainly funded with shareholder loans, pro rata to each shareholder’s ownership.
14. Interest-bearing net debt Financial net debt and adjusted net debt
EUR million 30 June 2021 31 Dec 2020 + Interest-bearing liabilities 10,824 10,662 - BS Liquid funds 1,703 2,308
- Non-current securities 109 98 - Collateral arrangement securities 436 432
- Securities in interest-bearing receivables 545 530 - BS Margin receivables 2,420 1,132 + BS Margin liabilities 1,513 331
+ Net margin liabilities -907 -801 Financial net debt 7,668 7,023
+ BS Pension obligations 1,202 1,520 + Other asset retirement obligations 812 821
- BS Share of Finnish and Swedish Nuclear Waste Funds 3,475 3,445 + BS Nuclear provisions 3,809 3,866
+ Nuclear provisions net of assets in Nuclear Waste Funds 334 421 + Total provisions net of assets in Nuclear Waste Funds 2,348 2,762
Adjusted net debt 10,016 9,784 Fortum has a collateral arrangement to release cash from the Nordic Power Exchange. This arrangement is presented with equal amounts as a short-term interest-bearing liability and an interest-bearing receivable. Underfunded pension obligations and asset retirement obligations, net of share in nuclear waste funds, are included in adjusted net debt.
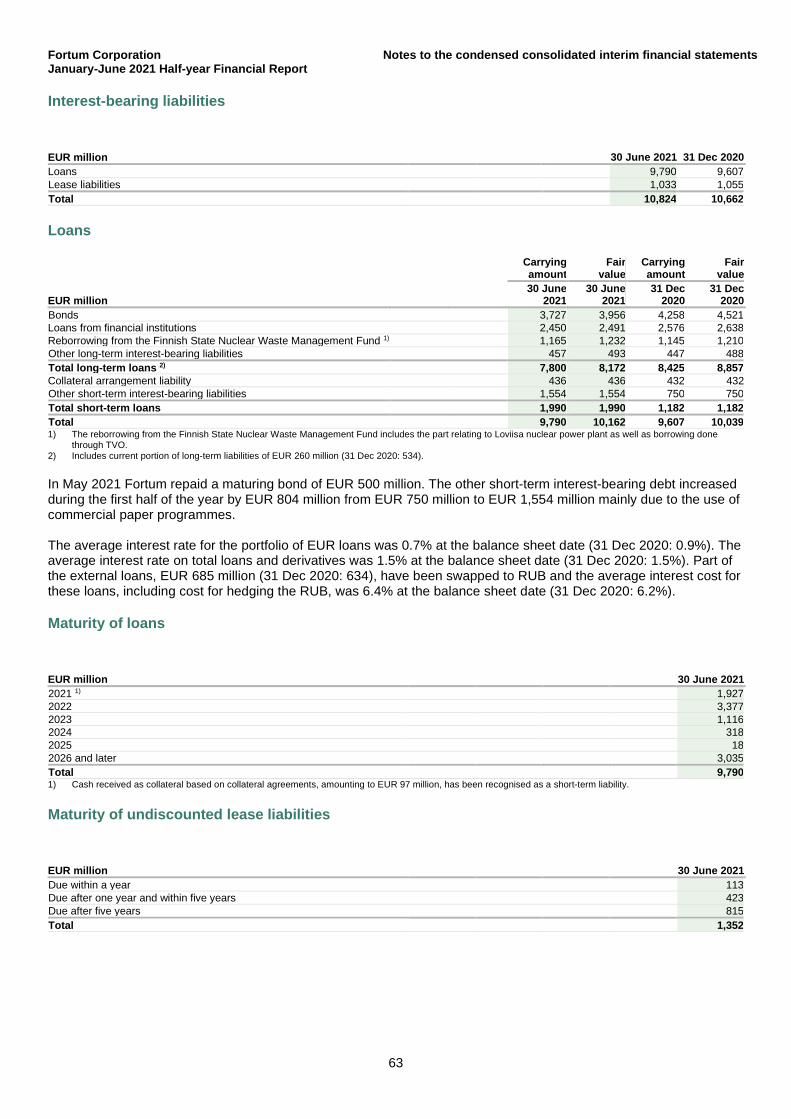
Fortum Corporation Notes to the condensed consolidated interim financial statements January-June 2021 Half-year Financial Report
63
Interest-bearing liabilities
EUR million 30 June 2021 31 Dec 2020 Loans 9,790 9,607 Lease liabilities 1,033 1,055 Total 10,824 10,662
Loans
Carrying Fair Carrying Fair amount value amount value
EUR million 30 June
2021 30 June
2021 31 Dec
2020 31 Dec
2020 Bonds 3,727 3,956 4,258 4,521 Loans from financial institutions 2,450 2,491 2,576 2,638 Reborrowing from the Finnish State Nuclear Waste Management Fund 1) 1,165 1,232 1,145 1,210 Other long-term interest-bearing liabilities 457 493 447 488 Total long-term loans 2) 7,800 8,172 8,425 8,857 Collateral arrangement liability 436 436 432 432 Other short-term interest-bearing liabilities 1,554 1,554 750 750 Total short-term loans 1,990 1,990 1,182 1,182 Total 9,790 10,162 9,607 10,039 1) The reborrowing from the Finnish State Nuclear Waste Management Fund includes the part relating to Loviisa nuclear power plant as well as borrowing done
through TVO. 2) Includes current portion of long-term liabilities of EUR 260 million (31 Dec 2020: 534). In May 2021 Fortum repaid a maturing bond of EUR 500 million. The other short-term interest-bearing debt increased during the first half of the year by EUR 804 million from EUR 750 million to EUR 1,554 million mainly due to the use of commercial paper programmes. The average interest rate for the portfolio of EUR loans was 0.7% at the balance sheet date (31 Dec 2020: 0.9%). The average interest rate on total loans and derivatives was 1.5% at the balance sheet date (31 Dec 2020: 1.5%). Part of the external loans, EUR 685 million (31 Dec 2020: 634), have been swapped to RUB and the average interest cost for these loans, including cost for hedging the RUB, was 6.4% at the balance sheet date (31 Dec 2020: 6.2%).
Maturity of loans
EUR million 30 June 2021 2021 1) 1,927 2022 3,377 2023 1,116 2024 318 2025 18 2026 and later 3,035 Total 9,790 1) Cash received as collateral based on collateral agreements, amounting to EUR 97 million, has been recognised as a short-term liability.
Maturity of undiscounted lease liabilities
EUR million
30 June 2021 Due within a year 113 Due after one year and within five years 423 Due after five years 815 Total 1,352
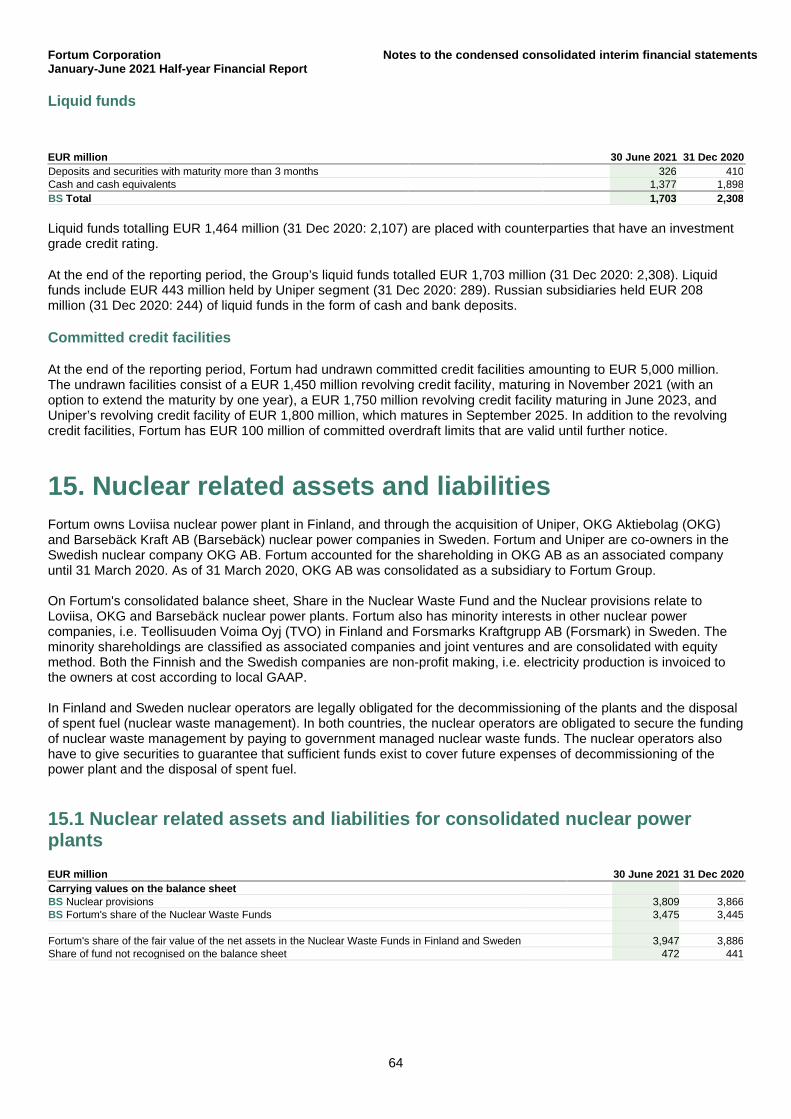
Fortum Corporation Notes to the condensed consolidated interim financial statements January-June 2021 Half-year Financial Report
64
Liquid funds
EUR million 30 June 2021 31 Dec 2020 Deposits and securities with maturity more than 3 months 326 410 Cash and cash equivalents 1,377 1,898 BS Total 1,703 2,308 Liquid funds totalling EUR 1,464 million (31 Dec 2020: 2,107) are placed with counterparties that have an investment grade credit rating.
At the end of the reporting period, the Group’s liquid funds totalled EUR 1,703 million (31 Dec 2020: 2,308). Liquid funds include EUR 443 million held by Uniper segment (31 Dec 2020: 289). Russian subsidiaries held EUR 208 million (31 Dec 2020: 244) of liquid funds in the form of cash and bank deposits.
Committed credit facilities
At the end of the reporting period, Fortum had undrawn committed credit facilities amounting to EUR 5,000 million. The undrawn facilities consist of a EUR 1,450 million revolving credit facility, maturing in November 2021 (with an option to extend the maturity by one year), a EUR 1,750 million revolving credit facility maturing in June 2023, and Uniper’s revolving credit facility of EUR 1,800 million, which matures in September 2025. In addition to the revolving credit facilities, Fortum has EUR 100 million of committed overdraft limits that are valid until further notice.
15. Nuclear related assets and liabilities Fortum owns Loviisa nuclear power plant in Finland, and through the acquisition of Uniper, OKG Aktiebolag (OKG) and Barsebäck Kraft AB (Barsebäck) nuclear power companies in Sweden. Fortum and Uniper are co-owners in the Swedish nuclear company OKG AB. Fortum accounted for the shareholding in OKG AB as an associated company until 31 March 2020. As of 31 March 2020, OKG AB was consolidated as a subsidiary to Fortum Group. On Fortum's consolidated balance sheet, Share in the Nuclear Waste Fund and the Nuclear provisions relate to Loviisa, OKG and Barsebäck nuclear power plants. Fortum also has minority interests in other nuclear power companies, i.e. Teollisuuden Voima Oyj (TVO) in Finland and Forsmarks Kraftgrupp AB (Forsmark) in Sweden. The minority shareholdings are classified as associated companies and joint ventures and are consolidated with equity method. Both the Finnish and the Swedish companies are non-profit making, i.e. electricity production is invoiced to the owners at cost according to local GAAP. In Finland and Sweden nuclear operators are legally obligated for the decommissioning of the plants and the disposal of spent fuel (nuclear waste management). In both countries, the nuclear operators are obligated to secure the funding of nuclear waste management by paying to government managed nuclear waste funds. The nuclear operators also have to give securities to guarantee that sufficient funds exist to cover future expenses of decommissioning of the power plant and the disposal of spent fuel.
15.1 Nuclear related assets and liabilities for consolidated nuclear power plants
EUR million 30 June 2021 31 Dec 2020 Carrying values on the balance sheet BS Nuclear provisions 3,809 3,866 BS Fortum's share of the Nuclear Waste Funds 3,475 3,445 Fortum's share of the fair value of the net assets in the Nuclear Waste Funds in Finland and Sweden 3,947 3,886 Share of fund not recognised on the balance sheet 472 441
Fortum Corporation Notes to the condensed consolidated interim financial statements January-June 2021 Half-year Financial Report
65
Nuclear provision and fund accounted for according to IFRS
Nuclear provisions include the provision for the decommissioning and the provision for the disposal of spent fuel. Provisions are based on the total cost estimate in which future costs are discounted to net present value.
The carrying value of nuclear provisions, calculated according to IAS 37, decreased by EUR 57 million compared to 31 December 2020, totalling EUR 3,809 million at 30 June 2021.
Fortum's share of the Nuclear Waste Funds are from an IFRS perspective overfunded by EUR 472 million, since Fortum's share of the Funds on 30 June 2021 was EUR 3,947 million and the carrying value on the balance sheet was EUR 3,475 million. The Fund on Fortum's balance sheet can at maximum be equal to the amount of the provisions according to IFRS. As long as the Fund is overfunded from an IFRS perspective, other financial expenses are adjusted positively if the provisions increase more than the Fund, and negatively if the provision decreases below the actual value of the fund.
Legal liability for Loviisa nuclear power plant
The legal liability on 30 June 2021, decided by the Ministry of Economic Affairs and Employment in November 2020, was EUR 1,208 million.
The legal liability is based on a cost estimate, which is updated every year; and a technical plan, which is updated every three years. The legal liability is determined by assuming that the decommissioning would start at the beginning of the year following the assessment year and discounting is not applied in determining the amount.
Fortum's share in the Finnish Nuclear Waste Management Fund
According to the Nuclear Energy Act, Fortum is obligated to contribute funds in full to the State Nuclear Waste Management Fund to cover the legal liability. Fortum contributes funds to the Finnish State Nuclear Waste Management Fund based on the yearly funding obligation target decided by the governmental authorities in connection with the decision of size of the legal liability. Based on the law, Fortum applied for a periodisation of the fund target, due to a change in the legal liability. The application was approved by the Ministry of Economic Affairs and Employment and the funding target for 2021 was confirmed at EUR 1,168 million in November 2020.
Borrowing from the State Nuclear Waste Management Fund
Participants in the Finnish State Nuclear Waste Management Fund are allowed to borrow from the fund according to certain rules. Fortum uses the right to borrow back and has pledged shares in Kemijoki Oy as security for the loans. The loans are renewed annually. See Note 14 Interest-bearing net debt and Note 19 Pledged assets and contingent liabilities.
OKG and Barsebäck nuclear power plants in Sweden
In Sweden, Svensk Kärnbränslehantering AB (SKB), a company owned by the nuclear operators, takes care of all nuclear waste management related activities on behalf of nuclear operators. SKB receives its funding from the Swedish Nuclear Waste Fund, which in turn is financed by the nuclear operators.
Nuclear waste fees and guarantees are normally updated every three years by governmental decision after a proposal from the Swedish Radiation Safety Authority (SSM). From September 2018, the proposal is prepared by the National Debt Office. The proposal is based on cost estimates done by SKB and the license holders. An updated technical plan for nuclear waste management was decided by SKB in September 2019 and was handed in to SSM in the end of III/2019. In December 2020 the Swedish government decided the waste fees and guarantees for 2021 only. A new decision is expected IV/2021 for years 2022-2023. Nuclear waste fees paid by licensees with a unit/units that are still in operation are currently based on future costs with the assumed lifetime of 50 years for each unit of a nuclear power plant. The fee is calculated in relation to the energy delivered and set as an amount of öre (1 öre = SEK 0,01) per kWh delivered. For Barsebäck, which have no units in operation, the fee is determined as a fixed fee in SEK per year.
Fortum Corporation Notes to the condensed consolidated interim financial statements January-June 2021 Half-year Financial Report
66
15.2 Nuclear power plants in associated companies and joint ventures Forsmark and TVO are non-profit making companies, i.e. electricity production is invoiced to the owners at cost. Invoiced cost is accounted according to local GAAP. In addition to the invoiced electricity production cost, Fortum makes IFRS adjustments to comply with Fortum's accounting principles. These adjustments include also Fortum's share of the companies' nuclear waste funds and nuclear provisions.
The tables below present the 100% figures relating to nuclear funds and provisions for the companies as well as Fortum's net share.
Nuclear related assets and liabilities relating to associated companies (100%)
30 June 2021 31 Dec 2020 Carrying values with Fortum assumptions Nuclear provisions 3,627 3,674 Share of the Nuclear Waste Fund 3,496 3,406
of which Fortum's net share consolidated with equity method -42 -59 Fortum's share of the fair value of the net assets in the Nuclear Waste Funds 1,135 880 Receivables from the waste fund that are overfunded (underfunded) from an IFRS perspective 35 14
of which TVO overfunded 77 73 TVO's legal liability, provision and share of the fund are based on same principles as described above for Loviisa nuclear power plant.
Participants in the Finnish State Nuclear Waste Management Fund are allowed to borrow from the fund according to certain rules. Fortum is using the right to reborrow funds through TVO based on its ownership. See more information in Note 14 Interest-bearing net debt. Forsmark’s provision and share of the fund are based on same principles as described above for OKG and Barsebäck nuclear power plants.
Status of TVO's Olkiluoto 3 project in Finland
Fortum is participating in the country's fifth nuclear power plant unit, Olkiluoto 3 (OL3), through the shareholding in Teollisuuden Voima Oyj (TVO) with an approximately 25% share representing some 400 MW in capacity. Olkiluoto 3 EPR (OL3 EPR), currently under construction, was procured as a fixed-price turnkey project from a consortium (Plant Supplier) formed by Areva GmbH, Areva NP SAS and Siemens AG. As stipulated in the plant contract, the consortium companies have joint and several liability for the contractual obligations. In March 2018, TVO signed a comprehensive settlement agreement with the plant supplier consortium companies Areva NP, Areva GmbH, and Siemens AG as well as with Areva Group parent company Areva SA, a company wholly owned by the French State. The settlement agreement concerned the completion of the OL3 EPR project and related disputes, and it entered into force in late March 2018. The supplier consortium companies committed to ensuring that the funds dedicated to the completion of the OL3 EPR project will be adequate and will cover all applicable guarantee periods, including setting up a trust mechanism funded by Areva companies to secure the financing of the costs of completion of the OL3 EPR project. During the period under review, the trust has been replenished in accordance with the terms of the agreement. During the period under review, TVO has according to the comprehensive settlement agreement recognized receivables from the plant supplier which have accumulated as compensation until the end of the period under review. The compensation decreases the historical costs of property, plant, and equipment in the balance sheet. TVO and the Areva−Siemens consortium negotiated since last summer on the terms of the OL3 EPR project completion. In addition, the Areva companies were preparing a financial solution which would ensure the necessary funding for the companies to complete the OL3 EPR project. The parties reached a consensus in their negotiations regarding the main principles of the OL3 EPR project completion in May 2021, and the agreements regarding the amendments to the OL3 EPR project 2018 Global Settlement Agreement (GSA) were signed on 2 June 2021.
Fortum Corporation Notes to the condensed consolidated interim financial statements January-June 2021 Half-year Financial Report
67
Key matters of the agreement are: • The Areva companies’ trust mechanism, established in the GSA of 2018, is to be replenished with approximately
EUR 600 million as of the beginning of January 2021. • Both parties are to cover their own costs as of July 2021 until end of February 2022. • In the case that the plant supplier consortium companies would not complete the OL3 EPR project until the end of
February 2022, they would pay an additional compensation for delays, depending on the date of completion. The Radiation and Nuclear Safety Authority (STUK) granted a fuel loading permit for the OL3 EPR plant unit on 26 March 2021, and the fuel loading was completed on 1 April 2021. The fuel loading means that OL3 EPR is now a nuclear power plant in use. STUK states in its permit decision that the OL3 EPR plant unit fulfils the safety requirements set for it, and its safety and emergency preparedness arrangements and measures are sufficient in order to load fuel into the reactor. According to the information received from the plant supplier on 30 July 2021, the start of electricity production of OL3 will be postponed to November 2021 and the regular electricity production to March 2022 due to extra turbine overhaul and inspection works.
16. Other provisions
EUR million 30 June 2021 31 Dec 2020 Supplier- and customer-related 1,398 948 Asset retirement 812 821 Power production-related 632 643 Gas distribution-related 378 378 Environmental remediation and similar 258 261 Personnel-related 220 247 Other 977 933 Total 4,675 4,232 BS Of which current provisions 1,054 780 BS Of which non-current provisions 3,622 3,452
17. Pension obligations Fortum Group has a number of pension schemes in accordance with local conditions and practices in the countries in which it operates, including defined benefit plans where the pension obligation is based on actuarial calculations using assumptions for discount rate, future salary and pension increases, inflation and mortality.
Changes during 2021 mainly relate to changes in discount rates and fair value of plan assets.
Net defined benefit liability
EUR million 30 June 2021 31 Dec 2020 Present value of defined benefit obligation 4,378 4,636 Fair value of plan assets 3,194 3,117 Net defined benefit liability 1,184 1,518
Of which Germany 1,042 1,350 Presented on the balance sheet as follows: BS Pension obligations, net 1,202 1,520 Pension assets in Other non-current assets 18 2
Fortum Corporation Notes to the condensed consolidated interim financial statements January-June 2021 Half-year Financial Report
68
Discount rates
The following discount rates have been used for the calculation of the present value of the defined benefit obligation:
% 30 June 2021 31 Dec 2020 Germany 1.2 0.8 United Kingdom 2.0 1.5 Finland 0.3 0.3
18. Capital and other commitments Capital and other commitments are contractual or regulatory obligations that are not recognised as liabilities on the balance sheet, or disclosed as contingent liabilities.
Capital commitments
EUR billion 30 June 2021 31 Dec 2020 Property, plant and equipment and intangible assets 0.7 0.8
Long-term purchase commitments
Fortum has long-term contractual purchase obligations of approximately EUR 81.4 billion at 30 June 2021 (31 Dec 2020: 113.1), of which EUR 8.6 billion is due within one year (31 Dec 2020: 6.3). These contracts are generally take-or-pay in nature and primarily relate to the purchase of natural gas. Price paid for natural gas is normally tied to market reference prices, as dictated by market conditions and the procurement behaviour of wholesale market customers. The conditions of these long-term contracts are reviewed at certain specific intervals (usually every three years) as part of contract negotiations and may thus change accordingly. The decrease in contractual purchase obligations is primarily attributable to the termination of a long-term LNG procurement contract.
Other commitments
Teollisuuden Voima Oyj (TVO) is building Olkiluoto 3, the nuclear power plant, which is funded through external loans, share issues and shareholder loans according to shareholders' agreement between the owners of TVO. At 30 June 2021, Fortum had EUR 232 million (31 Dec 2020: 232) outstanding receivables regarding Olkiluoto 3, and is additionally committed to providing at maximum EUR 100 million. TVO shareholder loan is classified as participation in joint ventures. For more information, see Note 15 Nuclear related assets and liabilities.
For more information on other commitments, see Note 34 Capital and other commitments of the consolidated financial statements 2020.
19. Pledged assets and contingent liabilities Fortum has issued direct and indirect guarantees and warranties on own behalf and on behalf of associated companies and joint ventures, which may obligate Fortum to make payments on the occurrence of certain events. For the Swedish nuclear companies there are two types of guarantees given. The Financing Amount is given to cover Fortum's share of the uncovered part in the Nuclear Waste Fund, assuming no further production and that no further nuclear waste fees are paid in. The uncovered amount is calculated by the authorities and is based on the difference between the expected costs and the funds to cover these costs at the time of the calculation. The Supplementary Amount constitutes a guarantee for deficits that can arise as a result of unplanned events. For more information see Note 15 Nuclear related assets and liabilities. Further, Fortum has pledged certain assets for debt and other commitments, both on own behalf and on behalf of others, including EUR 269 million (31 Dec 2020: 269) for shares pledged in Kemijoki Oy as a security for borrowing from the Finnish State Nuclear Waste Management Fund, and EUR 81 million (31 Dec 2020: 105) of real estate mortgages for the liability to the Finnish State Nuclear Waste Management Fund. In addition, Fortum has pledged
Fortum Corporation Notes to the condensed consolidated interim financial statements January-June 2021 Half-year Financial Report
69
EUR 436 million (31 Dec 2020: 495) of securities and cash for trading of electricity, gas and CO2 emission allowances, and EUR 182 million (31 Dec 2020: 275) of other real estate mortgages. For more information see Note 35 Pledged assets and contingent liabilities of the consolidated financial statements 2020.
20. Legal actions and official proceedings Various routine court actions, arbitration proceedings, tax and regulatory investigations and proceedings are currently pending against entities of the Group, and further actions or proceedings may be instituted or asserted in the future. Through the acquisition of Uniper, the Group is facing wider exposure, in addition to dispute under public law, this in particular includes legal actions and proceedings on contract amendments and price adjustments initiated in response to market upheavals and the changed economic situation in the gas and electricity sectors (also as a consequence of the energy transition) and concerning anticompetitive and fraudulent practices, as well as general commercial contract disputes. The aforementioned proceedings include several court and arbitration proceedings with major customers and major suppliers, also initiated in some instances by the Group, concerning contract amendments, price adjustments and payment disputes under long-term contracts for electricity, gas and storage capacity, also in response to the altered situation brought about by market upheavals, as well as disputes about reimbursements of costs and contract interpretation. In some of these cases, the validity of the price-adjustment clauses applied, and of the contracts in their entirety is in dispute. Long-term LNG and gas procurement contracts generally include the option for producers and importers to adjust the terms in line with changed market conditions. On this basis, the Group is currently involved in court and arbitration proceedings and continuously conducts extensive negotiations with producers. The possibility of further legal disputes cannot be excluded. Applying the provisions of IAS 37.92, Fortum is making no additional disclosures on the proceedings presented or on the associated risks or measures taken, particularly because such disclosure could prejudice their outcome. Furthermore, proceedings are pending concerning the clarification of regulatory requirements. Applying the provisions of IAS 37.92, Fortum is making no additional disclosures on the proceedings presented or on the associated risks or measures taken, particularly because such disclosure could prejudice their outcome. Public-law disputes are pending, in particular, in connection with the operating license for the hard-coal power plant in Datteln and in connection with financial compensation for the effects of the Dutch coal exit on the hard-coal power plant in Maasvlakte (MPP3). Applying the provisions of IAS 37.92, Fortum is making no additional disclosures on the proceedings presented or on the associated risks or measures taken, particularly because such disclosure could prejudice their outcome.
Tax cases in Belgium
On 16 June 2020, the Court of Appeal of Ghent, Belgium, ruled in favour of Fortum on Fortum's income tax assessments in Belgium for the year 2008. The decision concerns Fortum's Belgian financing company, Fortum EIF NV, which granted internal financing to a Swedish group company for financing of an acquisition in Russia. The Belgian tax authorities argued that Fortum EIF should not benefit from the notional interest deduction regime in Belgium and disagreed with the Court of Appeal ruling. In September 2020, the Belgian tax authorities filed an appeal to the Supreme Court. The additional taxes claimed for 2008 amount to EUR 36 million. Fortum has similar tax cases pending for the years 2009-2012 and expects the remaining years to follow the decisions for 2008. The disputed amount for years 2008-2012 totals EUR 114 million. All taxes have been paid and recognised as income tax receivables. Should the decision from the Court of Appeal of Ghent become final, the possible repayment of the disputed amounts of EUR 114 million would have a positive cash flow effect for Fortum.
Fortum Corporation Notes to the condensed consolidated interim financial statements January-June 2021 Half-year Financial Report
70
21. Related party transactions Related parties are described in more detail in the consolidated financial statements for the year ended 31 December 2020. On 31 March 2020, Uniper SE was reclassified from an associated company to a subsidiary. Transactions with Uniper Group companies are presented until 31 March 2020. In addition, transaction with any Uniper Group's related parties that have become Fortum Group's related parties through the acquisition are disclosed from 31 March 2020.
Transactions with associates and joint ventures
EUR million II/2021 II/2020 I-II/2021 I-II/2020 2020 LTM Sales 93 81 213 89 201 325 Purchases 273 139 460 240 624 844 Other income 286 - 322 - 89 411 Interest income on loan receivables 7 22 13 24 15 4
Balances with associates and joint ventures
EUR million 30 June 2021 31 Dec 2020 Long-term interest-bearing loan receivables 1,178 1,113 Trade and other receivables 146 307 Long-term loan payables 308 293 Short-term loan payables 63 - Trade and other payables 90 340 In addition, Fortum has long-term purchase commitments of approximately EUR 2.0 billion at 30 June 2021 from associates and joint ventures.
Other transactions with related parties
At the end of 2020 the Finnish State owned 50.76% of Fortum's shares. There has been no change in the number of shares the Finnish State owns in Fortum during 2021.
In June 2021, the Fortum-Rusnano Wind Investment Fund sold the 200-MW Kalmykia wind parks to the Fortum-RDIF joint venture.
On 2 March 2021, Fortum announced it had decided to construct the largest solar power plant in Russia through a joint venture established with RDIF. The power plant is based on capacities won by Fortum in CSA auctions in 2018 and 2019. In March 2021, Fortum sold the CSA-backed solar power project to the joint venture with RDIF. During 2020, Fortum’s joint venture, the Fortum-Rusnano Wind Investment Fund, sold the 50-MW Ulyanovsk 2 and the 300-MW Rostov wind farms to a new joint venture established with Russian Direct Investment Fund (RDIF) aimed at the operation of renewable power plants in Russia.
22. Events after the balance sheet date On 2 July 2021, Fortum concluded the sale of its district heating business in the Baltics to Partners Group. The total consideration of the sale amounted to approximately EUR 710 million and Fortum will record a tax-exempt capital gain of approximately EUR 250 million in the City Solutions segment’s third quarter 2021 results.
On 8 July 2021, Fortum signed an agreement to sell its Argayash coal-fired CHP plant to AO JSC Rusatom Smart utilities. The transaction is expected to be closed in the third quarter of 2021.
Fortum Corporation Notes to the condensed consolidated interim financial statements January-June 2021 Half-year Financial Report
71
23. Definitions and reconciliations of key figures Alternative performance measures
Business performance
Definition
Reason to use the measure Reference to
reconciliation Comparable EBITDA Operating profit + depreciations and
amortisations - items affecting comparability
Comparable EBITDA is representing the underlying cash flow generated by the total Group and segments. Used as a component in the capital structure target of Financial net debt to Comparable EBITDA.
Key ratios after cash flow statement
Comparable operating profit Operating profit - items affecting
comparability Comparable operating profit is used
in financial target setting and forecasting, management's follow up of financial performance and allocation of resources in the group's performance management process.
Income statement
Items affecting comparability Impairment charges and reversals +
capital gains and other related items + impact from acquisition accounting + changes in fair values of derivatives hedging future cash flow + other
Component used in calculating comparable operating profit and comparable EBITDA.
Income statement
Impairment charges and reversals
Impairment charges and related provisions (mainly dismantling), as well as the reversal of previously recorded impairment charges. Impairment charges are adjusted from depreciation and amortisation, and reversals from other income.
Component used in calculating comparable operating profit and comparable EBITDA.
Income statement
Capital gains and other related items
Capital gains and transaction costs from acquisitions, which are adjusted from other income and other expenses respectively. Profits from the capital recycling business model are presented in comparable operating profit because the business results are realised through divesting the shareholding, either partially or totally.
Component used in calculating comparable operating profit and comparable EBITDA.
Income statement
Impact from acquisition accounting
Non-cash accounting impact resulting from reclassifying part of Uniper's other comprehensive income to the income statement when Uniper was consolidated as a subsidiary.
Component used in calculating comparable operating profit and comparable EBITDA.
Income statement
Changes in fair values of derivatives hedging future cash flow
Effects from financial derivatives hedging future cash-flows where hedge accounting is not applied or own use exemption cannot be used according to IFRS 9, which are adjusted from other income or to sales and materials and services respectively when calculating Fortum's alternative performance measures.
Component used in calculating comparable operating profit and comparable EBITDA.
Income statement
Fortum Corporation Notes to the condensed consolidated interim financial statements January-June 2021 Half-year Financial Report
72
Business performance
Definition
Reason to use the measure Reference to
reconciliation Other Restructuring and cost management
expenses, and other miscellaneous non-operating items, which are adjusted mainly from materials and services or employee benefits.
Component used in calculating comparable operating profit and comparable EBITDA.
Income statement
Comparable share of profit/loss of associates and joint ventures
Share of profit/loss of associates and joint ventures +/- significant adjustments for share of profit /loss in principal associates and joint ventures.
Component used in calculating comparable net profit and comparable return on net assets.
Note 4 Comparable operating profit and comparable net profit
Comparable finance costs – net
Finance costs – net +/- return from nuclear funds, nuclear fund adjustment and unwinding of nuclear provisions +/- fair value changes on financial items +/- impairment charges and reversals of previously recorded impairment charges on financial items.
Component used in calculating comparable net profit.
Note 4 Comparable operating profit and comparable net profit
Comparable profit before income tax
Comparable operating profit +/- comparable share of profit/loss of associates and joint ventures +/- comparable finance costs – net.
Subtotal in comparable net profit calculation.
Note 4 Comparable operating profit and comparable net profit
Comparable income tax expense
Income tax expense excluding taxes on items affecting comparability, adjustments to finance costs – net, tax rate changes and other onetime adjustments.
Component used in calculating comparable net profit.
Note 4 Comparable operating profit and comparable net profit
Comparable net profit Comparable operating profit +/-
comparable share of profit/loss of associates and joint ventures +/- comparable finance costs - net +/- comparable income tax expense +/- comparable non-controlling interests.
Comparable net profit is used to provide additional financial performance indicators to support meaningful comparison of underlying net profitability between periods.
Note 4 Comparable operating profit and comparable net profit
Comparable return on net assets, %
Comparable operating profit + comparable share of profit /loss in associates and joint ventures
x 100
Comparable return on net assets is used in financial target setting and forecasting, management's follow up of financial performance and allocation of resources in the group's performance management process.
Note 3 Segment information
Comparable net assets average
Comparable net assets Non-interest-bearing assets - non-interest-
bearing liabilities - provisions (non-interest-bearing assets and liabilities do not include finance related items, tax and deferred tax and assets and liabilities from fair valuations of derivatives used for hedging future cash flows).
Comparable net assets is a component in Comparable return on net assets calculation where return on capital allocated directly to the businesses is measured.
Note 3 Segment information
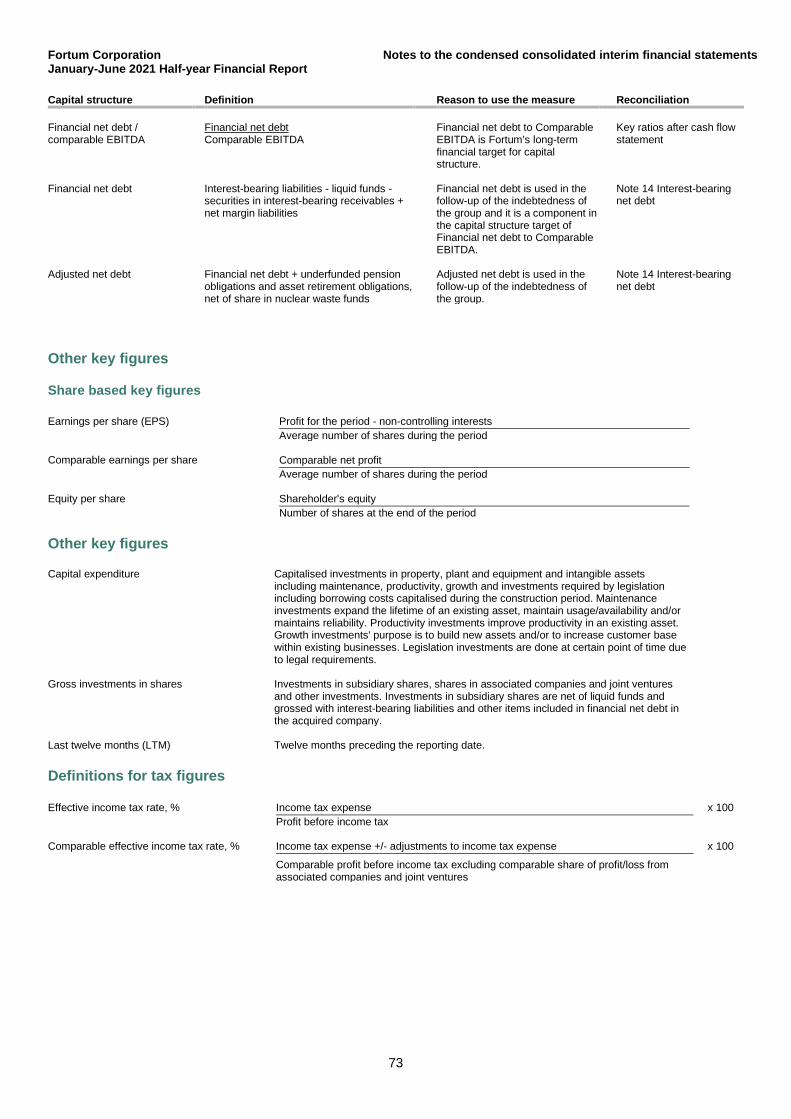
Fortum Corporation Notes to the condensed consolidated interim financial statements January-June 2021 Half-year Financial Report
73
Capital structure Definition Reason to use the measure Reconciliation Financial net debt / comparable EBITDA
Financial net debt Comparable EBITDA
Financial net debt to Comparable EBITDA is Fortum’s long-term financial target for capital structure.
Key ratios after cash flow statement
Financial net debt Interest-bearing liabilities - liquid funds -
securities in interest-bearing receivables + net margin liabilities
Financial net debt is used in the follow-up of the indebtedness of the group and it is a component in the capital structure target of Financial net debt to Comparable EBITDA.
Note 14 Interest-bearing net debt
Adjusted net debt Financial net debt + underfunded pension
obligations and asset retirement obligations, net of share in nuclear waste funds
Adjusted net debt is used in the follow-up of the indebtedness of the group.
Note 14 Interest-bearing net debt
Other key figures
Share based key figures
Earnings per share (EPS) Profit for the period - non-controlling interests Average number of shares during the period
Comparable earnings per share Comparable net profit
Average number of shares during the period
Equity per share Shareholder's equity
Number of shares at the end of the period
Other key figures
Capital expenditure Capitalised investments in property, plant and equipment and intangible assets including maintenance, productivity, growth and investments required by legislation including borrowing costs capitalised during the construction period. Maintenance investments expand the lifetime of an existing asset, maintain usage/availability and/or maintains reliability. Productivity investments improve productivity in an existing asset. Growth investments' purpose is to build new assets and/or to increase customer base within existing businesses. Legislation investments are done at certain point of time due to legal requirements.
Gross investments in shares Investments in subsidiary shares, shares in associated companies and joint ventures
and other investments. Investments in subsidiary shares are net of liquid funds and grossed with interest-bearing liabilities and other items included in financial net debt in the acquired company.
Last twelve months (LTM) Twelve months preceding the reporting date.
Definitions for tax figures
Effective income tax rate, % Income tax expense Profit before income tax
x 100
Comparable effective income tax rate, % Income tax expense +/- adjustments to income tax expense x 100
Comparable profit before income tax excluding comparable share of profit/loss from associated companies and joint ventures
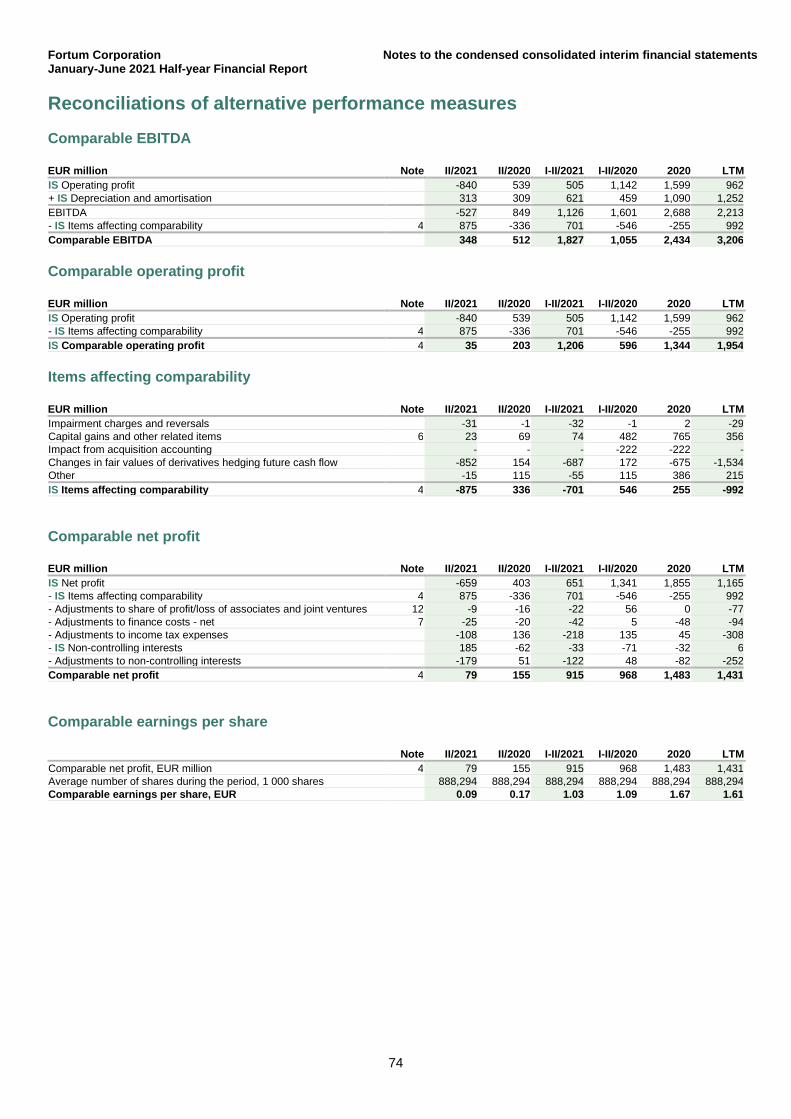
Fortum Corporation Notes to the condensed consolidated interim financial statements January-June 2021 Half-year Financial Report
74
Reconciliations of alternative performance measures
Comparable EBITDA
EUR million Note II/2021 II/2020 I-II/2021 I-II/2020 2020 LTM IS Operating profit -840 539 505 1,142 1,599 962 + IS Depreciation and amortisation 313 309 621 459 1,090 1,252 EBITDA -527 849 1,126 1,601 2,688 2,213 - IS Items affecting comparability 4 875 -336 701 -546 -255 992 Comparable EBITDA 348 512 1,827 1,055 2,434 3,206
Comparable operating profit
EUR million Note II/2021 II/2020 I-II/2021 I-II/2020 2020 LTM IS Operating profit -840 539 505 1,142 1,599 962 - IS Items affecting comparability 4 875 -336 701 -546 -255 992 IS Comparable operating profit 4 35 203 1,206 596 1,344 1,954
Items affecting comparability
EUR million Note II/2021 II/2020 I-II/2021 I-II/2020 2020 LTM Impairment charges and reversals -31 -1 -32 -1 2 -29 Capital gains and other related items 6 23 69 74 482 765 356 Impact from acquisition accounting - - - -222 -222 - Changes in fair values of derivatives hedging future cash flow -852 154 -687 172 -675 -1,534 Other -15 115 -55 115 386 215 IS Items affecting comparability 4 -875 336 -701 546 255 -992
Comparable net profit
EUR million Note II/2021 II/2020 I-II/2021 I-II/2020 2020 LTM IS Net profit -659 403 651 1,341 1,855 1,165 - IS Items affecting comparability 4 875 -336 701 -546 -255 992 - Adjustments to share of profit/loss of associates and joint ventures 12 -9 -16 -22 56 0 -77 - Adjustments to finance costs - net 7 -25 -20 -42 5 -48 -94 - Adjustments to income tax expenses -108 136 -218 135 45 -308 - IS Non-controlling interests 185 -62 -33 -71 -32 6 - Adjustments to non-controlling interests -179 51 -122 48 -82 -252 Comparable net profit 4 79 155 915 968 1,483 1,431
Comparable earnings per share
Note II/2021 II/2020 I-II/2021 I-II/2020 2020 LTM Comparable net profit, EUR million 4 79 155 915 968 1,483 1,431 Average number of shares during the period, 1 000 shares 888,294 888,294 888,294 888,294 888,294 888,294 Comparable earnings per share, EUR 0.09 0.17 1.03 1.09 1.67 1.61
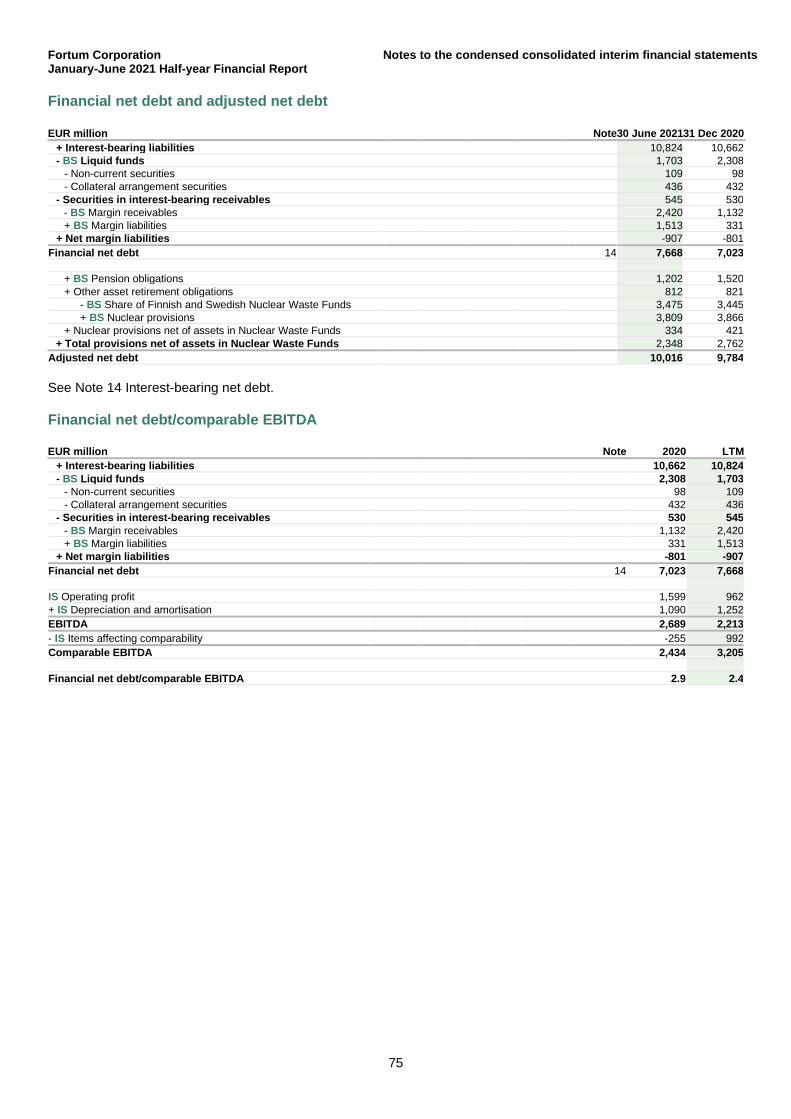
Fortum Corporation Notes to the condensed consolidated interim financial statements January-June 2021 Half-year Financial Report
75
Financial net debt and adjusted net debt
EUR million Note 30 June 2021 31 Dec 2020 + Interest-bearing liabilities 10,824 10,662 - BS Liquid funds 1,703 2,308
- Non-current securities 109 98 - Collateral arrangement securities 436 432
- Securities in interest-bearing receivables 545 530 - BS Margin receivables 2,420 1,132 + BS Margin liabilities 1,513 331
+ Net margin liabilities -907 -801 Financial net debt 14 7,668 7,023
+ BS Pension obligations 1,202 1,520 + Other asset retirement obligations 812 821
- BS Share of Finnish and Swedish Nuclear Waste Funds 3,475 3,445 + BS Nuclear provisions 3,809 3,866
+ Nuclear provisions net of assets in Nuclear Waste Funds 334 421 + Total provisions net of assets in Nuclear Waste Funds 2,348 2,762
Adjusted net debt 10,016 9,784 See Note 14 Interest-bearing net debt.
Financial net debt/comparable EBITDA
EUR million Note 2020 LTM + Interest-bearing liabilities 10,662 10,824 - BS Liquid funds 2,308 1,703
- Non-current securities 98 109 - Collateral arrangement securities 432 436
- Securities in interest-bearing receivables 530 545 - BS Margin receivables 1,132 2,420 + BS Margin liabilities 331 1,513
+ Net margin liabilities -801 -907 Financial net debt 14 7,023 7,668
IS Operating profit 1,599 962 + IS Depreciation and amortisation 1,090 1,252 EBITDA 2,689 2,213 - IS Items affecting comparability -255 992 Comparable EBITDA 2,434 3,205 Financial net debt/comparable EBITDA 2.9 2.4
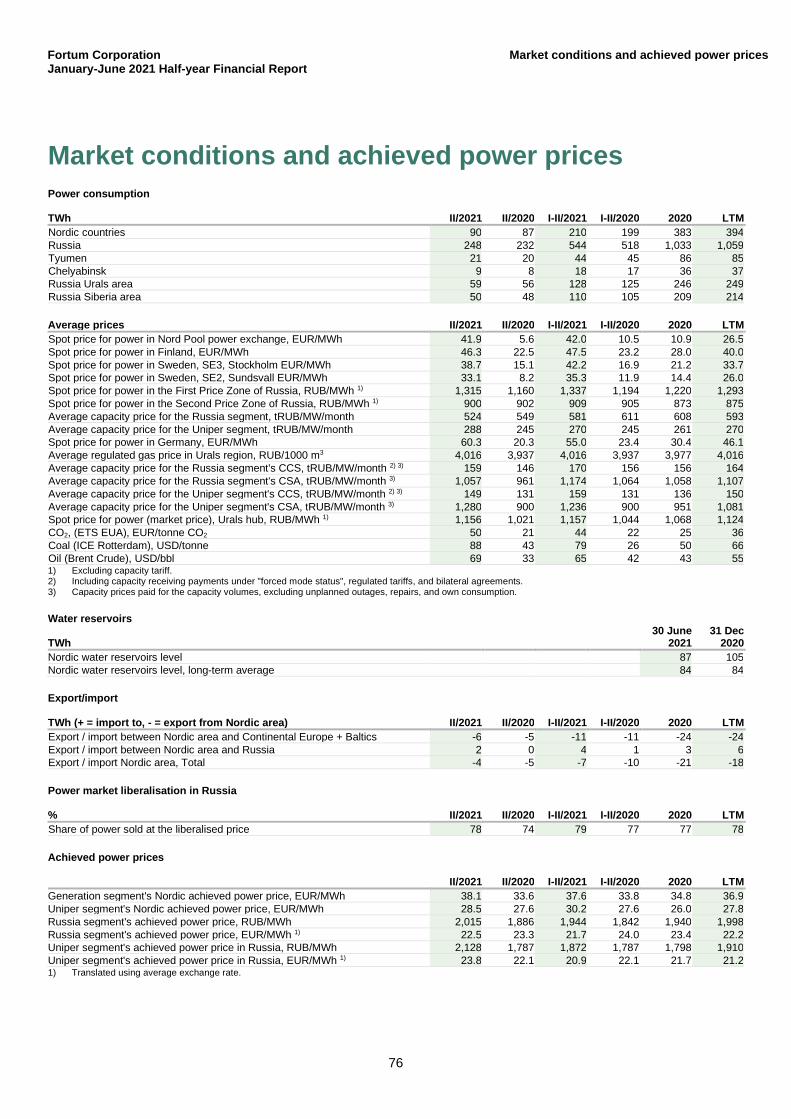
Fortum Corporation Market conditions and achieved power prices January-June 2021 Half-year Financial Report
76
Market conditions and achieved power prices
Power consumption TWh II/2021 II/2020 I-II/2021 I-II/2020 2020 LTM Nordic countries 90 87 210 199 383 394 Russia 248 232 544 518 1,033 1,059 Tyumen 21 20 44 45 86 85 Chelyabinsk 9 8 18 17 36 37 Russia Urals area 59 56 128 125 246 249 Russia Siberia area 50 48 110 105 209 214
Average prices II/2021 II/2020 I-II/2021 I-II/2020 2020 LTM Spot price for power in Nord Pool power exchange, EUR/MWh 41.9 5.6 42.0 10.5 10.9 26.5 Spot price for power in Finland, EUR/MWh 46.3 22.5 47.5 23.2 28.0 40.0 Spot price for power in Sweden, SE3, Stockholm EUR/MWh 38.7 15.1 42.2 16.9 21.2 33.7 Spot price for power in Sweden, SE2, Sundsvall EUR/MWh 33.1 8.2 35.3 11.9 14.4 26.0 Spot price for power in the First Price Zone of Russia, RUB/MWh 1) 1,315 1,160 1,337 1,194 1,220 1,293 Spot price for power in the Second Price Zone of Russia, RUB/MWh 1) 900 902 909 905 873 875 Average capacity price for the Russia segment, tRUB/MW/month 524 549 581 611 608 593 Average capacity price for the Uniper segment, tRUB/MW/month 288 245 270 245 261 270 Spot price for power in Germany, EUR/MWh 60.3 20.3 55.0 23.4 30.4 46.1 Average regulated gas price in Urals region, RUB/1000 m3 4,016 3,937 4,016 3,937 3,977 4,016 Average capacity price for the Russia segment's CCS, tRUB/MW/month 2) 3) 159 146 170 156 156 164 Average capacity price for the Russia segment's CSA, tRUB/MW/month 3) 1,057 961 1,174 1,064 1,058 1,107 Average capacity price for the Uniper segment's CCS, tRUB/MW/month 2) 3) 149 131 159 131 136 150 Average capacity price for the Uniper segment's CSA, tRUB/MW/month 3) 1,280 900 1,236 900 951 1,081 Spot price for power (market price), Urals hub, RUB/MWh 1) 1,156 1,021 1,157 1,044 1,068 1,124 CO2, (ETS EUA), EUR/tonne CO2 50 21 44 22 25 36 Coal (ICE Rotterdam), USD/tonne 88 43 79 26 50 66 Oil (Brent Crude), USD/bbl 69 33 65 42 43 55 1) Excluding capacity tariff. 2) Including capacity receiving payments under "forced mode status", regulated tariffs, and bilateral agreements. 3) Capacity prices paid for the capacity volumes, excluding unplanned outages, repairs, and own consumption.
Water reservoirs TWh
30 June 2021
31 Dec 2020
Nordic water reservoirs level 87 105 Nordic water reservoirs level, long-term average 84 84
Export/import TWh (+ = import to, - = export from Nordic area) II/2021 II/2020 I-II/2021 I-II/2020 2020 LTM Export / import between Nordic area and Continental Europe + Baltics -6 -5 -11 -11 -24 -24 Export / import between Nordic area and Russia 2 0 4 1 3 6 Export / import Nordic area, Total -4 -5 -7 -10 -21 -18
Power market liberalisation in Russia % II/2021 II/2020 I-II/2021 I-II/2020 2020 LTM Share of power sold at the liberalised price 78 74 79 77 77 78
Achieved power prices II/2021 II/2020 I-II/2021 I-II/2020 2020 LTM Generation segment's Nordic achieved power price, EUR/MWh 38.1 33.6 37.6 33.8 34.8 36.9 Uniper segment's Nordic achieved power price, EUR/MWh 28.5 27.6 30.2 27.6 26.0 27.8 Russia segment's achieved power price, RUB/MWh 2,015 1,886 1,944 1,842 1,940 1,998 Russia segment's achieved power price, EUR/MWh 1) 22.5 23.3 21.7 24.0 23.4 22.2 Uniper segment's achieved power price in Russia, RUB/MWh 2,128 1,787 1,872 1,787 1,798 1,910 Uniper segment's achieved power price in Russia, EUR/MWh 1) 23.8 22.1 20.9 22.1 21.7 21.2 1) Translated using average exchange rate.
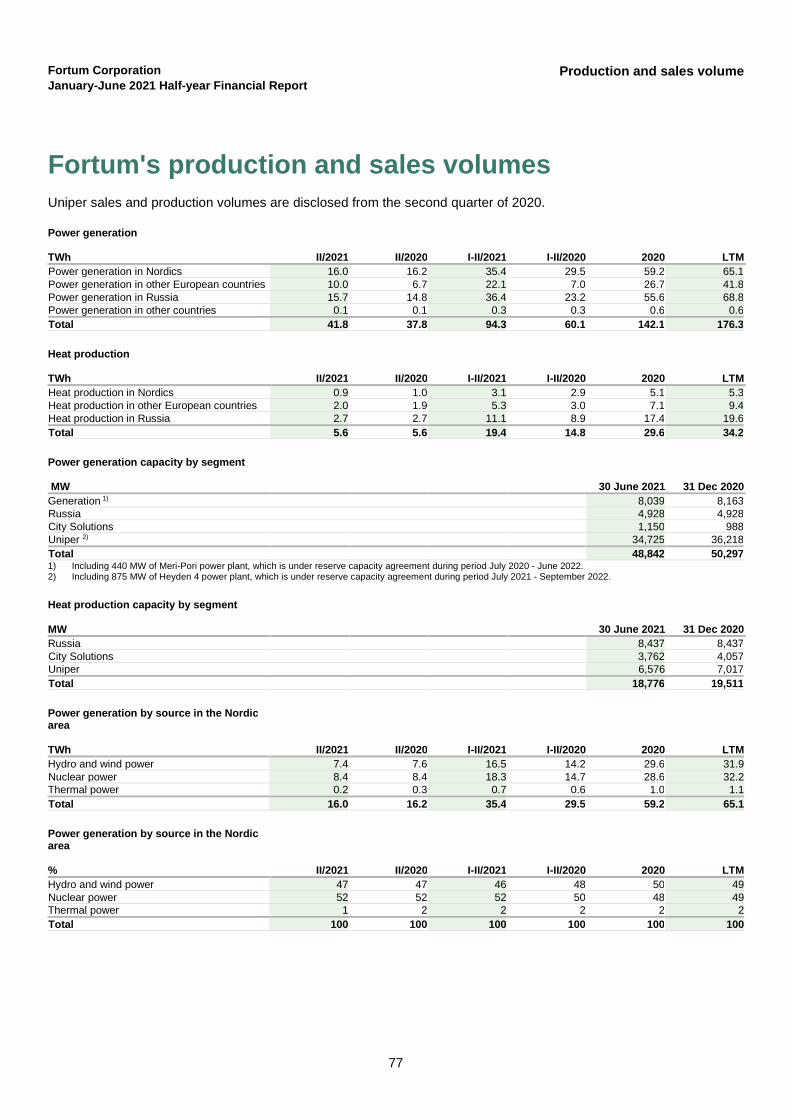
Fortum Corporation Production and sales volume January-June 2021 Half-year Financial Report
77
Fortum's production and sales volumes Uniper sales and production volumes are disclosed from the second quarter of 2020.
Power generation TWh II/2021 II/2020 I-II/2021 I-II/2020 2020 LTM Power generation in Nordics 16.0 16.2 35.4 29.5 59.2 65.1 Power generation in other European countries 10.0 6.7 22.1 7.0 26.7 41.8 Power generation in Russia 15.7 14.8 36.4 23.2 55.6 68.8 Power generation in other countries 0.1 0.1 0.3 0.3 0.6 0.6 Total 41.8 37.8 94.3 60.1 142.1 176.3
Heat production TWh II/2021 II/2020 I-II/2021 I-II/2020 2020 LTM Heat production in Nordics 0.9 1.0 3.1 2.9 5.1 5.3 Heat production in other European countries 2.0 1.9 5.3 3.0 7.1 9.4 Heat production in Russia 2.7 2.7 11.1 8.9 17.4 19.6 Total 5.6 5.6 19.4 14.8 29.6 34.2
Power generation capacity by segment MW 30 June 2021 31 Dec 2020 Generation 1) 8,039 8,163 Russia 4,928 4,928 City Solutions 1,150 988 Uniper 2) 34,725 36,218 Total 48,842 50,297 1) Including 440 MW of Meri-Pori power plant, which is under reserve capacity agreement during period July 2020 - June 2022. 2) Including 875 MW of Heyden 4 power plant, which is under reserve capacity agreement during period July 2021 - September 2022.
Heat production capacity by segment MW 30 June 2021 31 Dec 2020 Russia 8,437 8,437 City Solutions 3,762 4,057 Uniper 6,576 7,017 Total 18,776 19,511
Power generation by source in the Nordic area TWh II/2021 II/2020 I-II/2021 I-II/2020 2020 LTM Hydro and wind power 7.4 7.6 16.5 14.2 29.6 31.9 Nuclear power 8.4 8.4 18.3 14.7 28.6 32.2 Thermal power 0.2 0.3 0.7 0.6 1.0 1.1 Total 16.0 16.2 35.4 29.5 59.2 65.1
Power generation by source in the Nordic area % II/2021 II/2020 I-II/2021 I-II/2020 2020 LTM Hydro and wind power 47 47 46 48 50 49 Nuclear power 52 52 52 50 48 49 Thermal power 1 2 2 2 2 2 Total 100 100 100 100 100 100
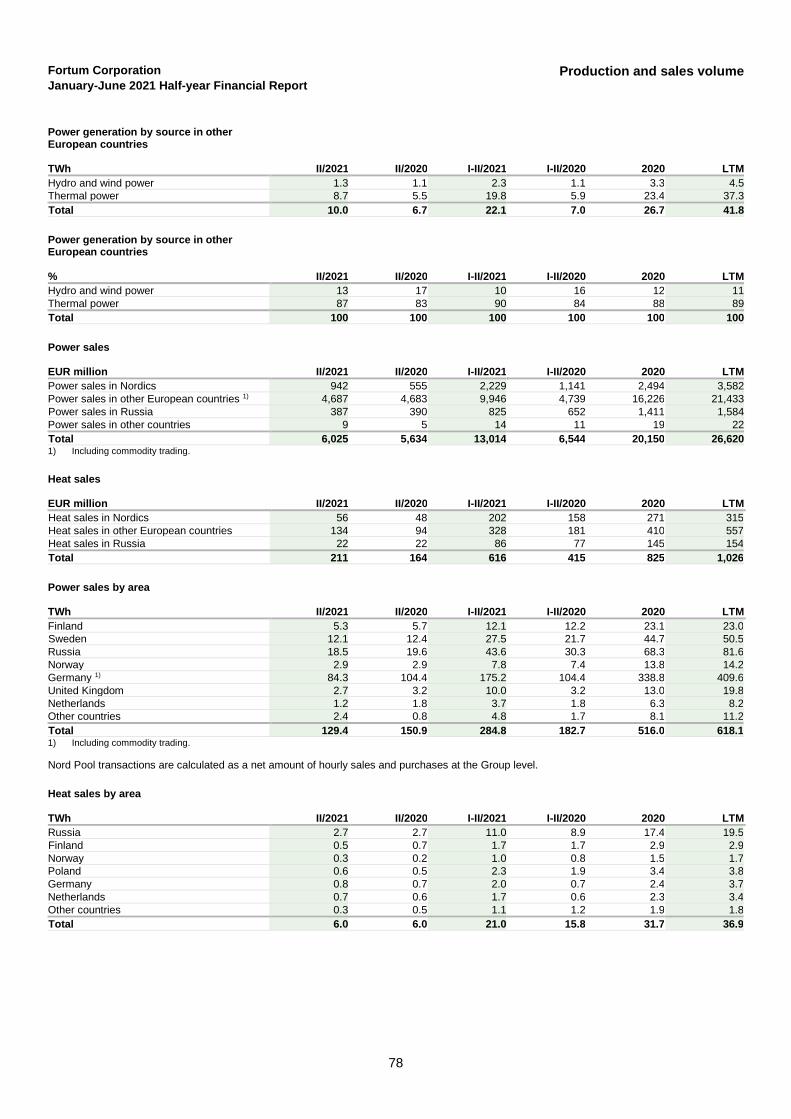
Fortum Corporation Production and sales volume January-June 2021 Half-year Financial Report
78
Power generation by source in other European countries TWh II/2021 II/2020 I-II/2021 I-II/2020 2020 LTM Hydro and wind power 1.3 1.1 2.3 1.1 3.3 4.5 Thermal power 8.7 5.5 19.8 5.9 23.4 37.3 Total 10.0 6.7 22.1 7.0 26.7 41.8
Power generation by source in other European countries % II/2021 II/2020 I-II/2021 I-II/2020 2020 LTM Hydro and wind power 13 17 10 16 12 11 Thermal power 87 83 90 84 88 89 Total 100 100 100 100 100 100
Power sales EUR million II/2021 II/2020 I-II/2021 I-II/2020 2020 LTM Power sales in Nordics 942 555 2,229 1,141 2,494 3,582 Power sales in other European countries 1) 4,687 4,683 9,946 4,739 16,226 21,433 Power sales in Russia 387 390 825 652 1,411 1,584 Power sales in other countries 9 5 14 11 19 22 Total 6,025 5,634 13,014 6,544 20,150 26,620 1) Including commodity trading.
Heat sales EUR million II/2021 II/2020 I-II/2021 I-II/2020 2020 LTM Heat sales in Nordics 56 48 202 158 271 315 Heat sales in other European countries 134 94 328 181 410 557 Heat sales in Russia 22 22 86 77 145 154 Total 211 164 616 415 825 1,026
Power sales by area TWh II/2021 II/2020 I-II/2021 I-II/2020 2020 LTM Finland 5.3 5.7 12.1 12.2 23.1 23.0 Sweden 12.1 12.4 27.5 21.7 44.7 50.5 Russia 18.5 19.6 43.6 30.3 68.3 81.6 Norway 2.9 2.9 7.8 7.4 13.8 14.2 Germany 1) 84.3 104.4 175.2 104.4 338.8 409.6 United Kingdom 2.7 3.2 10.0 3.2 13.0 19.8 Netherlands 1.2 1.8 3.7 1.8 6.3 8.2 Other countries 2.4 0.8 4.8 1.7 8.1 11.2 Total 129.4 150.9 284.8 182.7 516.0 618.1 1) Including commodity trading. Nord Pool transactions are calculated as a net amount of hourly sales and purchases at the Group level.
Heat sales by area TWh II/2021 II/2020 I-II/2021 I-II/2020 2020 LTM Russia 2.7 2.7 11.0 8.9 17.4 19.5 Finland 0.5 0.7 1.7 1.7 2.9 2.9 Norway 0.3 0.2 1.0 0.8 1.5 1.7 Poland 0.6 0.5 2.3 1.9 3.4 3.8 Germany 0.8 0.7 2.0 0.7 2.4 3.7 Netherlands 0.7 0.6 1.7 0.6 2.3 3.4 Other countries 0.3 0.5 1.1 1.2 1.9 1.8 Total 6.0 6.0 21.0 15.8 31.7 36.9


