Embed Size (px)
Citation preview
PRICE FOR PROFIT
Cost Plus vs Value Modelsby Marshall Atkinson
Modern Pricing Strategies for Decorated Apparel Shops
PRICE FOR PROFITCost Plus vs Value Models
My mission is to guide decorated apparel shops through the process of strategic change. Simply put, the goal is to elevate performance, focus on the future, and provide solution-based direction.
My role is to act as a trusted advisor, providing objective and results-oriented analysis, solutions and implementation.
This mission is expressed in my company motto:
Helping Shops Succeed
Learn more at atkinsontshirt.com
Copyright © 2018 Marshall Atkinson Consulting, LLC
Don’t get our lawyers involved.
Please don’t copy or reproduce any part of this document without written permission.
Thanks!
1 © 2018 Marshall atkinson consulting, llc
price for profit
PRICE FOR PROFITOne of the questions that shop owners constantly ask revolves around pricing. “Price check, is this too high?” or “Where do you start when building a price list?”
You’ve seen those questions in forums or industry support groups I’ll bet. Heck, you may have even posted that question yourself.
The idea behind this eBook is to give you a guideline to understand pricing strategies in today’s business environment. How you compete matters, and your pricing matters even more. You feel it, as that’s why those questions are consistently being posted.
While there are certainly many theories behind pricing, the goal here is to set up pricing models for your shop that will ensure profitability on orders. There isn’t any guessing when the strategy behind the price is tied to your shop’s data.
But before we get into that work, the first place to explore is understand where these pricing models come from. Which is best for what you do? Only you know the answer to that, but with the information contained in this eBook you can make a better informed decision.
As always, thanks for buying this book!
2 © 2018 Marshall atkinson consulting, llc
price for profit
COST PLUS vs VALUELet’s start the party by reviewing the difference between the Cost Plus and the Value pricing models. You may have seen these two before, but didn’t realize that they had names.
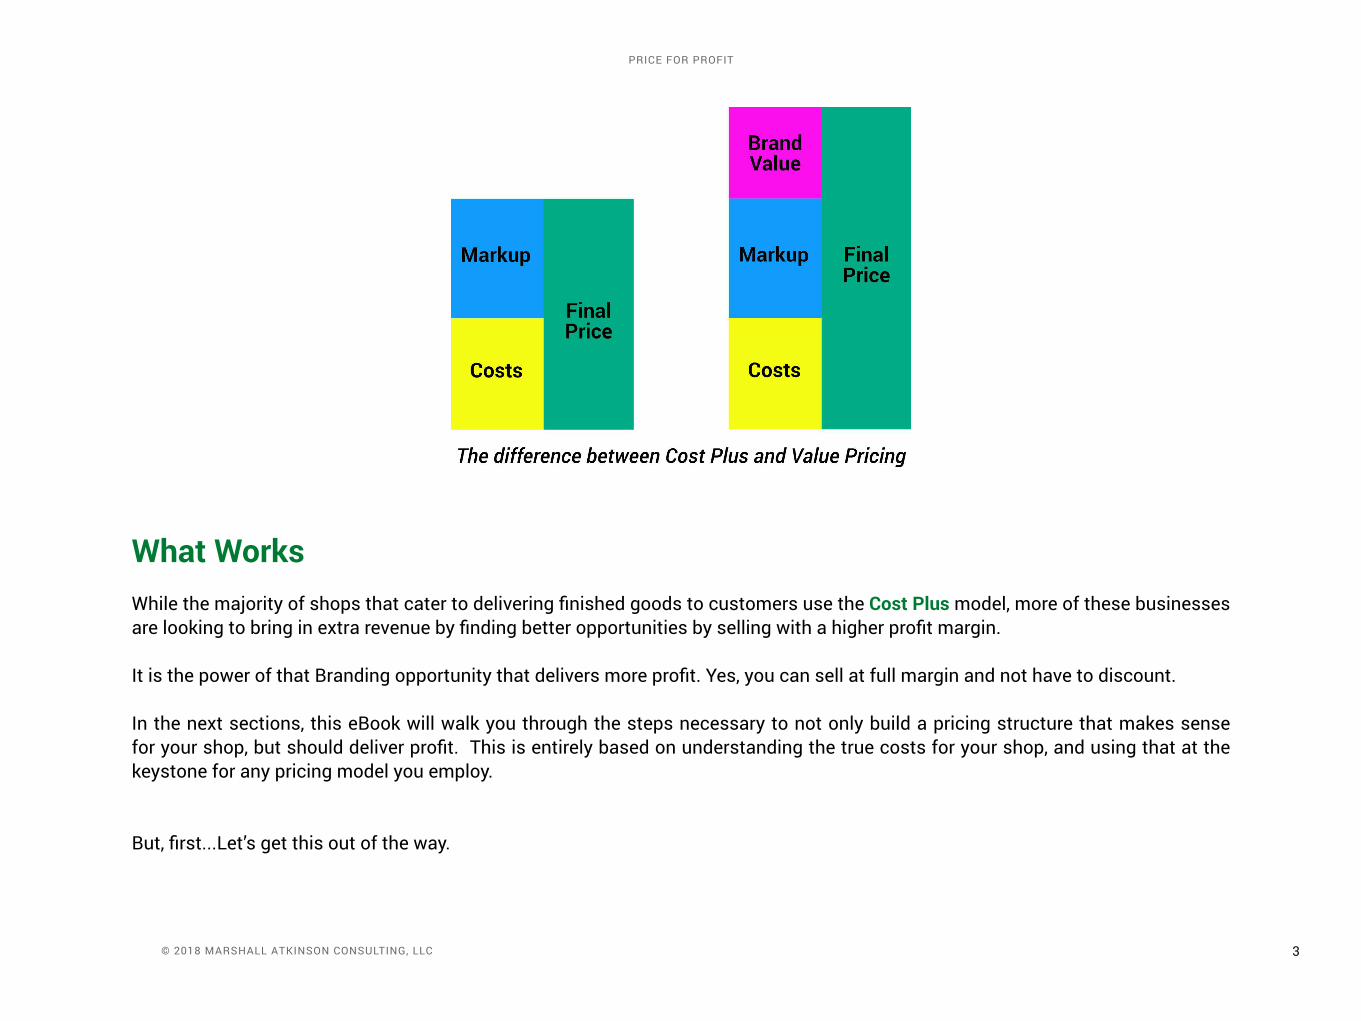
Cost PlusThis isn’t too hard to figure out as the price is derived from the costs for the item. Typically in this industry the cost of the garment is marked up by a standard percentage, and then the cost for decorating the item is added to it. The final sum of those two items equals the price given to the customer.
You’ve seen that I’m sure. Where shops get lost is when they second guess themselves, or worse use the “average of ten shops in our area” to build their pricing. We will get more into why that is an unbelievably bad idea later.
Value Pricing Believe it or not, this isn’t pricing your work at a discount. Rather Value Pricing is building your pricing strategy based on the perceived or estimated value that your customers have for your work. Sure, you still are going to use information to help drive the basic foundation for the price, but your Brand’s value adds a significant portion to the price.
You don’t have to sell with rock bottom pricing just because you are a garment decorator.
1
3 © 2018 Marshall atkinson consulting, llc
price for profit
What Works While the majority of shops that cater to delivering finished goods to customers use the Cost Plus model, more of these businesses are looking to bring in extra revenue by finding better opportunities by selling with a higher profit margin.
It is the power of that Branding opportunity that delivers more profit. Yes, you can sell at full margin and not have to discount.
In the next sections, this eBook will walk you through the steps necessary to not only build a pricing structure that makes sense for your shop, but should deliver profit. This is entirely based on understanding the true costs for your shop, and using that at the keystone for any pricing model you employ.
But, first...Let’s get this out of the way.
4 © 2018 Marshall atkinson consulting, llc
price for profit
What Doesn’t Work Simply doing anything with anyone else’s price list. The first step for many start up shops is to use the average of the prices of their competition, but come in with a small percentage pricing point underneath. That is a recipe for disaster. Here’s why. Because it does not take into consideration all of the unique costs and challenges to your own business.
A few years ago I was coaching a shop that had over a million dollars a year in sales. They were an extremely busy two automatic shop, but at the end of the year there wasn’t any profit for the owner. He couldn’t understand why.
Digging into the challenge, I asked a few questions and the main problem was the fact that his pricing was based on using an average of some nearby competitors. His rational was that he had to compete on price to get the business.
What he failed to take into consideration is that these other shops have entirely different ways of working. Their overhead was different. Labor, consumables and equipment were different. Not to mention one of the shops he used in his average went out of business.
It is flawed thinking to consider that pricing from shop to shop is an universal way of making money. Are you really trusting that your competitor knows what they are doing? Do you really think that everything about their shop is exactly equal to yours?
Don’t Take Shortcuts Longevity in this industry is entirely predicated on profitability. If your business isn’t profitable, you won’t be around long. This can be a hard business for some. Where do you think the inventory for those used equipment dealers comes from anyway?
Write and implement a solid Business Plan. Have an incredible Marketing strategy that aligns with your customer base. And, you guessed it, have a pricing structure that is based on your reality. Your costs. Your profit goals. Your math.
Which, frankly is hard to do. Because it takes time and effort. But hey, that’s what you are here for, right?
Next up are the sections that will walk you through how to develop a pricing strategy that works for you. Get your pencil ready!
5 © 2018 Marshall atkinson consulting, llc
price for profit
CALCULATING YOUR COSTSThe foundational tool that we are going to use to construct the price list is something called the Cost per Impression. An impression is simply the unit of work for this industry.
If you screen-print a 1 color left chest and a 6 color back that will equal two impressions. We do not use the number of colors in this total, but rest assured the costs associated with that are included along the way. Also, we are not including the cost of the apparel blanks either. We’ll work on that markup idea later.
Impressions works for embroidery, sublimation, direct to garment, heat press, and any other decoration method too. It is simply a standardized way at looking at what you are doing. The structure of this book is based on only screen-printing though. One thing at a time.
The Cost per Impression average for your shop constantly changes. It is an average, and this will be constructed by measuring data in four main areas for your company. I call these areas “Buckets”. The fifth Bucket is a Profit Bucket.
Let’s take a look at each Bucket, and what it takes to measure them. Then, there is a spreadsheet template for you to use to start calculating the Cost Per Impression average for your shop.
The 5 Bucket Method for Calculating Costs As I stated, each of these Buckets is a different cost center for your shop. Ideally, you should go back and grab five years worth of data for each, but three years will work. If you haven’t been in business that long, use what you have. If you are a start up business,
2
make sure that you have a detailed and specific understanding of all your potential costs for each Bucket. Yours will be an estimate, so once you get going you will need to use the actual production data and costs.
Bucket One: Overhead You probably have a good idea of what your Overhead costs are for your shop. To define these for our purpose, we want to calculate a total for each month per year, all of the recurring costs that are usually about the same every month. Here are some examples:
• Rent or Mortgage• Insurance• Equipment payments• Website• Recurring fees• Phone• Marketing• Waste disposal• Any recurring costs• Salaried employees (if you choose not to put this into the Labor Bucket)
Some of these costs will always be the same, while others may change a little bit from month to month. The idea with this Bucket is that these are costs that are structured that you basically pay all the time, no matter what.
Salaried employees are put into the Overhead Bucket by some shops because it’s a controlled expense. They would rather look at their Labor Bucket with only hourly employees included. Others, like the idea that all compensation is included in one Bucket, so they do it differently.
Whatever you choose to do, it doesn’t matter as long as you make your choice consistent.
Personally, I think having salaried employees in the Overhead Bucket works the best because I like to see the fluctuation with the Labor Bucket totals as only representing hourly workers.
6 © 2018 MARSHALL ATkINSON cONSuLTING, LLc
PRIcE fOR PROfIT
7 © 2018 Marshall atkinson consulting, llc
price for profit
Bucket Two: LaborAs mentioned above, this is the total of your hourly employees per month for each year. How much money are you spending to get orders completed? By tracking this constantly you will see patterns emerge. Not to mention you will be able to better anticipate problems.
Pull your records and total these per month, for each year; adding it all together into one sum:
• Total Hourly Pay• Total Hourly Overtime Pay• Optional - Salaried employees - (see the Overhead Bucket description above)
Bucket Three: Consumables Your consumables are all the items you buy to make the magic happen in your shop. This is everything, regardless of where you buy it.
Do you use a preferred vendor for ink, emulsion, thread or chemicals? Include that here. Maybe you bought some paper or markers at an office supply store. Include that too. What about batteries, light bulbs or hydraulic fluid? Yep, you guess it. It all goes into this total.
A frequent question that comes up is when or how to apply purchases. for example, if you bought something at the end of the month, but the order wasn’t produced until the following month, which month should the expenditure be recorded?
The answer is simple, whatever month the purchase was made is the month that you use.. Total all purchases for each month, per year.
It will all work out in the end.
8 © 2018 Marshall atkinson consulting, llc
price for profit
Bucket Four: Energy This Bucket looks at the total Energy used in your shop to produce the work. Gather up all of your utility bills. The Energy Bucket uses these areas for each month, for each year:
• Electric• Natural Gas• Water• Sewer• Propane
Just like with your Labor or Consumable Buckets, simply record the total costs for the month for that bill. If the electric bill is for february, but arrives in March, record the total cost for february.
Also note that sometimes the invoice from your supplier may carry over to the first week of the following month, so the bill won’t add up cleanly by month. That’s Ok. use the total for whichever month is the majority for the bill. We are dealing with averages, so the math will all work out in the end.
Bucket Five: Profit This is an extra Bucket that can help you realize some profit at the end of the year. Is it absolutely critical for you to use this Bucket? The answer is no. The most important part of this strategy is using the other four Buckets to calculate the Cost per Impression.
However, just like if you personally put a small amount of money into a savings account or a 401(k), adding an amount to the Bucket strategy can allocate money towards profit for your shop as it is included in the costing platform.
Here’s how it works. Looking back on your totals, what is the average number of impressions your shop has produced over the year? for example, let’s say the number is 376,433.
At the end of the year, what would a realistic profit goal for your shop be? And by realistic, don’t get too carried away. Choose
9 © 2018 Marshall atkinson consulting, llc
price for profit
something that makes sense. In our example, let’s say that the number is $50,000.
from there, it is a simple math equation. $50,000 / 376,433 = $0.13. Therefore, for this part of the 5 Bucket cost analysis, we would use $0.13 per impression to add to the total. That way, at the end of the year if your shop produced 376,433 impressions there would be $50,000 available as profit.
It is a “pay yourself first” strategy. Does this mean that’s all the profit? No. It is simply a way to make sure there is something there for you later.
So let’s take a look at an example shop’s data and then start loading your own to find your shop’s Cost per Impression.
Click Here to grab the Example Cost Spreadsheet.
This is a template that you will be able to use to input your own data to be able to calculate your Cost per Impression. But before you start loading your information, let’s take a look at the spreadsheet with a quick overview.
for starters, this information is just an example. I’m sure your shop’s data will be different. Don’t compare. Your results could be better, or they could be worse. Whatever your results, it is Ok because these are your results.
That’s the most important part. Just getting a handle on your own performance. The first step in changing anything is simply understanding the problem. That’s what we are doing here.
For each of the five buckets described above, you will see the corresponding cells on the worksheet with a data amount in each cell. With monetary totals, the number in the cell represents the total for whatever the category may be. for example, for Consumables that could represent purchases made from eleven different vendors. Just use the total for all eleven.
for Impressions, each cell per month represents the total amount of work completed per Impression for that particular month. Remember, an Impression is one decoration event. A order that has a left chest and a full back has two impressions. This is not the total amount of shirts decorated.
10 © 2018 Marshall atkinson consulting, llc
price for profit
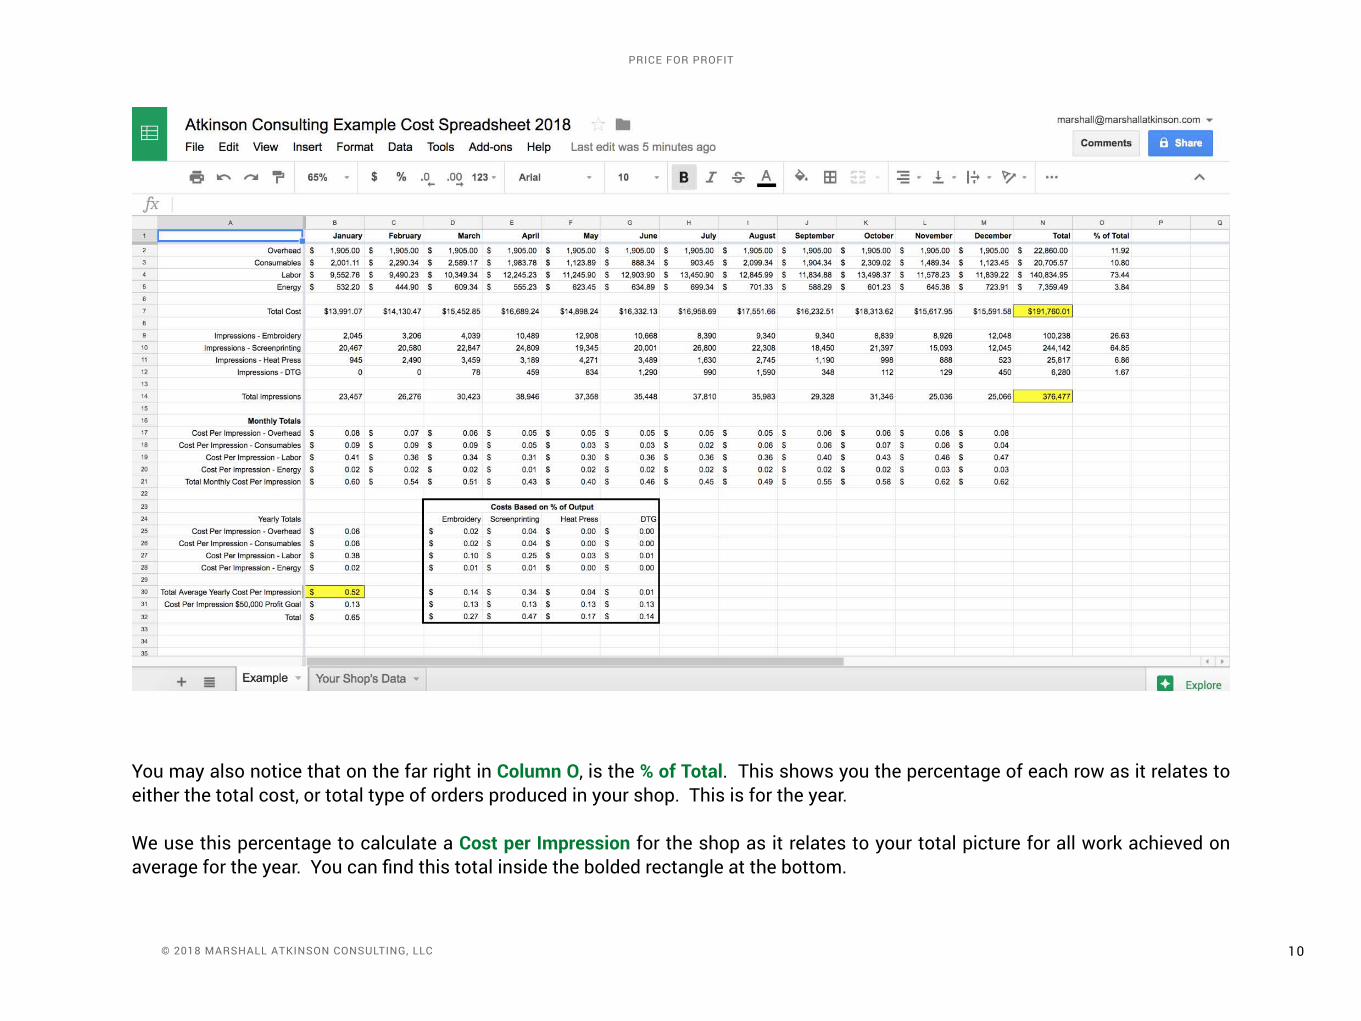
All totals are on the left of the worksheet. formulas created auto-calculate everything.
You may also notice that on the far right in Column O, is the % of Total. This shows you the percentage of each row as it relates to either the total cost, or total type of orders produced in your shop. This is for the year.
We use this percentage to calculate a Cost per Impression for the shop as it relates to your total picture for all work achieved on average for the year. You can find this total inside the bolded rectangle at the bottom.
11 © 2018 Marshall atkinson consulting, llc
price for profit
I’ve highlighted in yellow some key data points to keep track of for the year as you add information to the worksheet. These cells are B30, N7 and N14.
B30 is the current Cost Per Impression average total for your shop. As you enter information, this will change. At the end of the year, this cell will represent the total average for that year.
N7 is the total costs that it takes to run your shop. This is the sum of all of your Overhead, Labor, Consumables, and Energy Buckets.
N14 is the total Impressions, which represents all of the work your shop produces, regardless of decoration method.
keeping an eye on these three points as the year progresses can help you understand your shop’s performance. Want to improve? The first step in managing anything is measuring what’s going on. This worksheet is a great starting point for that benchmarking effort.
USING YOUR DATATo start building your own center for measuring your costs the first step is to gather your data. Warning...This frankly is a pain in the butt. It’s not easy. Most people will struggle with this, so I just want to throw that out there.
For best results, I would gather at least three years worth of this information, but five years is better. You want to see a track record and history. Some shops won’t have all of this. Or the information is stuck in a banker’s box underneath a bunch of who-knows-what.
3
12 © 2018 Marshall atkinson consulting, llc
price for profit
All I can say is do the best you can.
Here’s what you are going to need to do. for each Bucket, start sorting the bills, invoices, reports, or scraps of information into months and years.
I’ve done this multiple times and what worked best for me was to sort through everything by labeling file folders for each Bucket by each month and year at the top. When a new bit of information is located, make a copy or place the original in that particular folder.
Then, using a calculator total up the amounts. for long strings of numbers I always total the list twice. I’m clumsy with buttons.
Get all of the data ready, and then go to this next step.
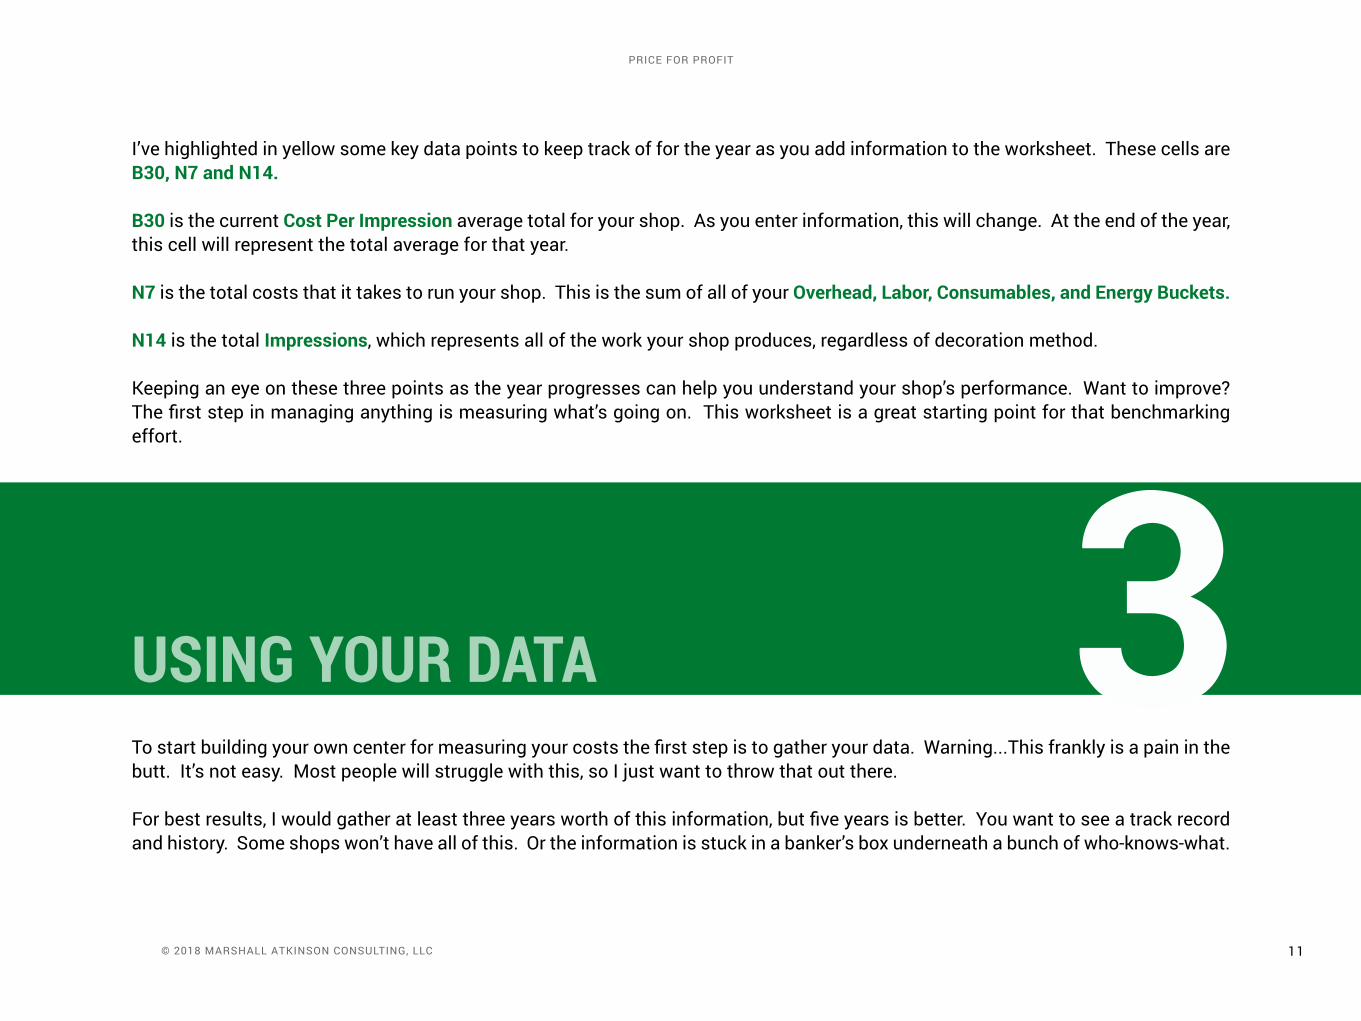
Open the Worksheet
The first step for you will be to customize this Sheet for your use. It is a template, so this will save it for your shop.
You can name it anything you want, but for our example, I’ve retitled it “Your Shop Cost Spreadsheet”.
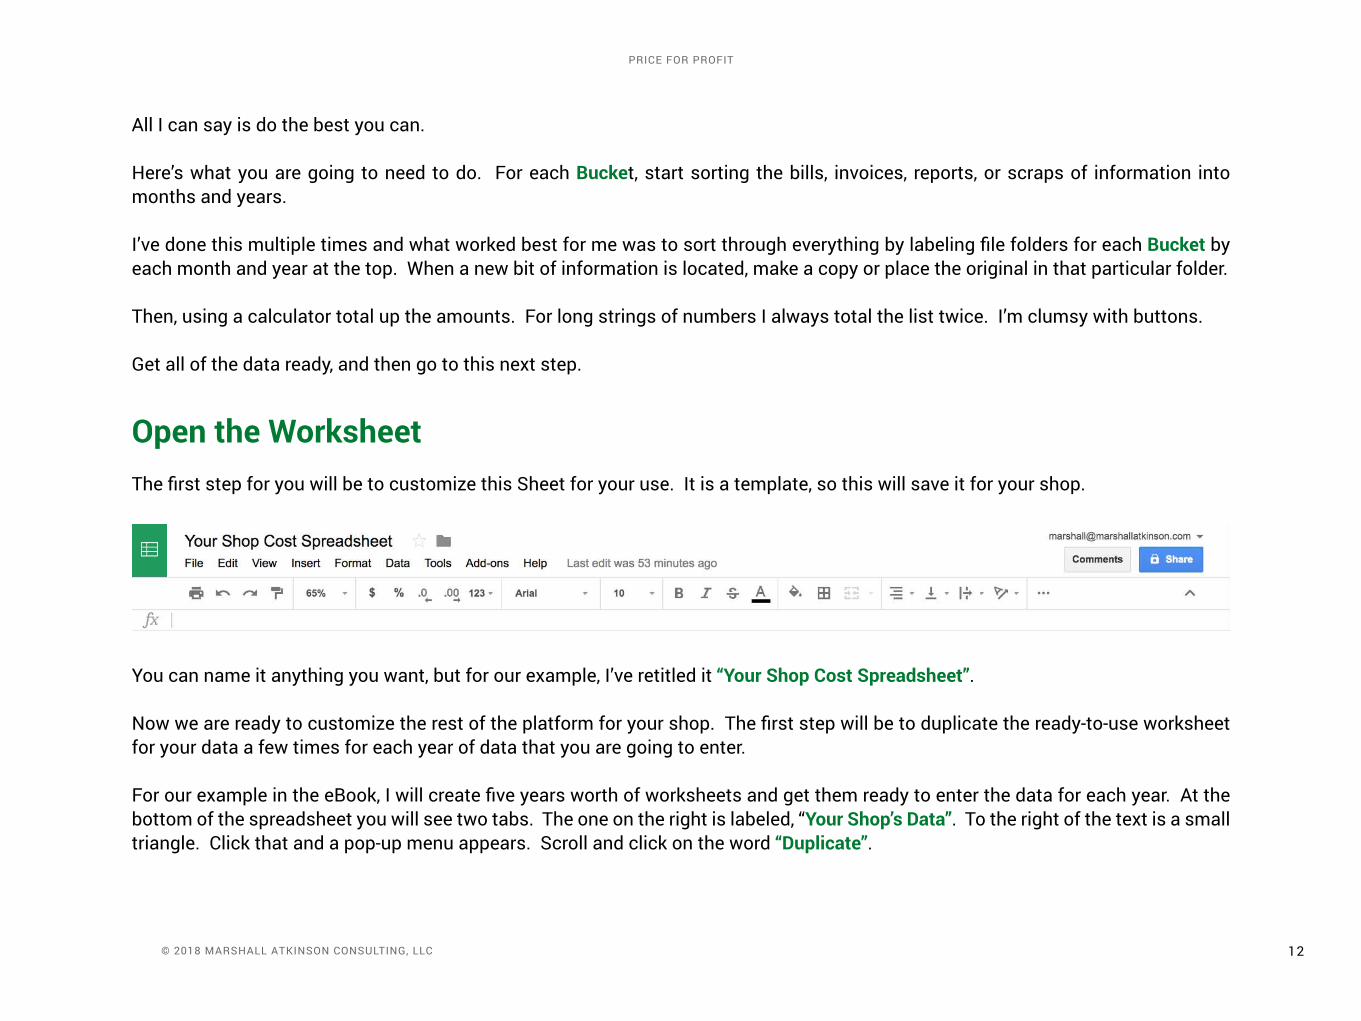
Now we are ready to customize the rest of the platform for your shop. The first step will be to duplicate the ready-to-use worksheet for your data a few times for each year of data that you are going to enter.
For our example in the eBook, I will create five years worth of worksheets and get them ready to enter the data for each year. At the bottom of the spreadsheet you will see two tabs. The one on the right is labeled, “Your Shop’s Data”. To the right of the text is a small triangle. click that and a pop-up menu appears. Scroll and click on the word “Duplicate”.
13 © 2018 Marshall atkinson consulting, llc
price for profit
Bingo! You just duplicated the worksheet. Now, repeat that same step three more times.
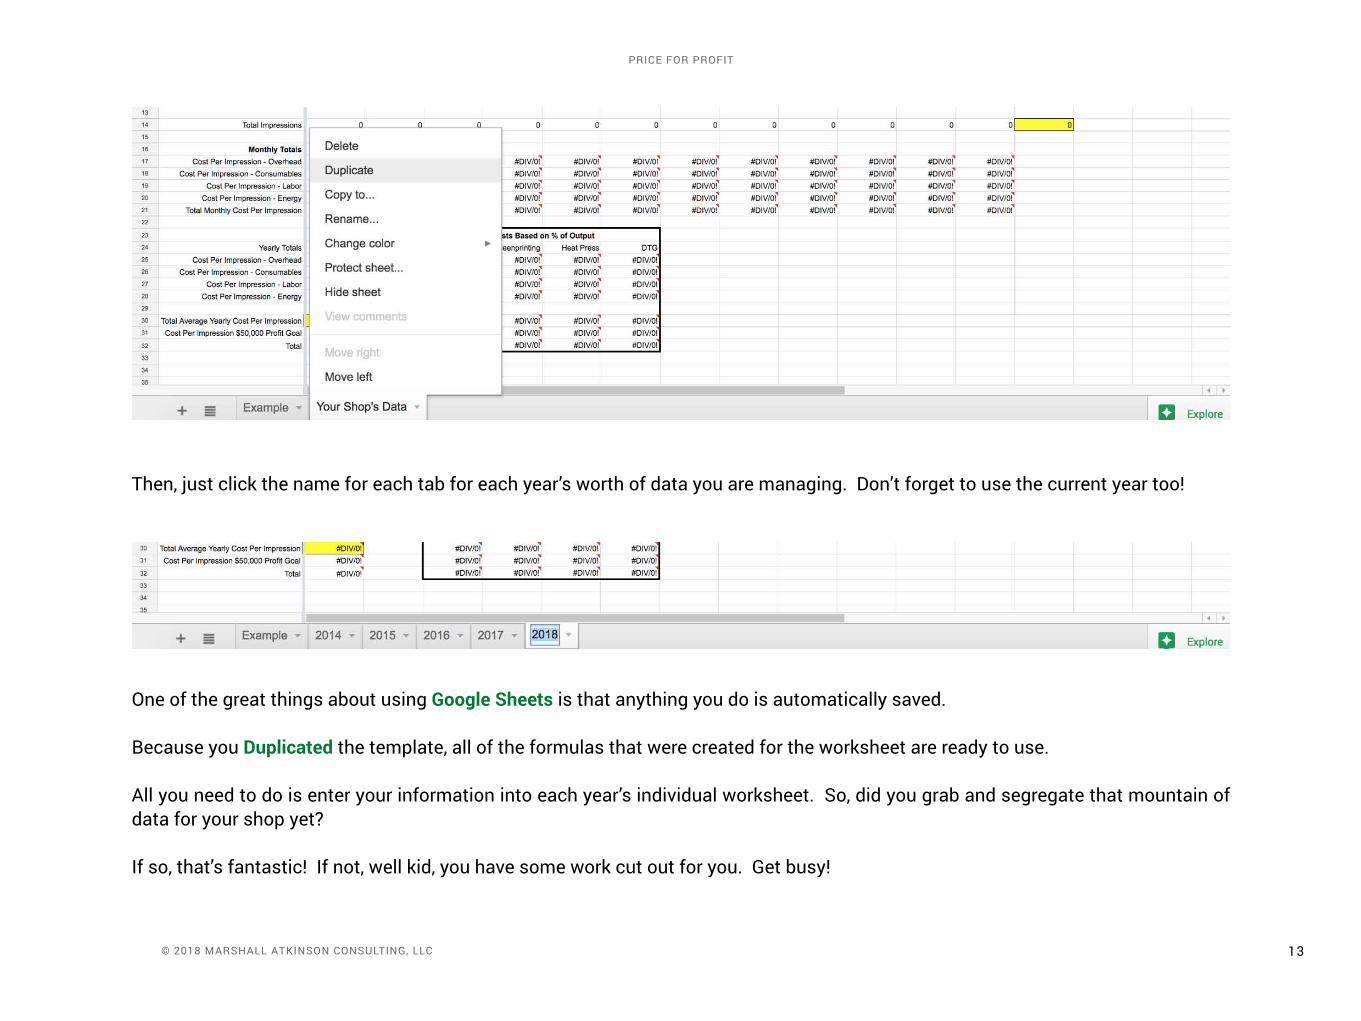
Then, just click the name for each tab for each year’s worth of data you are managing. Don’t forget to use the current year too!
One of the great things about using Google Sheets is that anything you do is automatically saved.
Because you Duplicated the template, all of the formulas that were created for the worksheet are ready to use.
All you need to do is enter your information into each year’s individual worksheet. So, did you grab and segregate that mountain of data for your shop yet?
If so, that’s fantastic! If not, well kid, you have some work cut out for you. Get busy!
14 © 2018 Marshall atkinson consulting, llc
price for profit
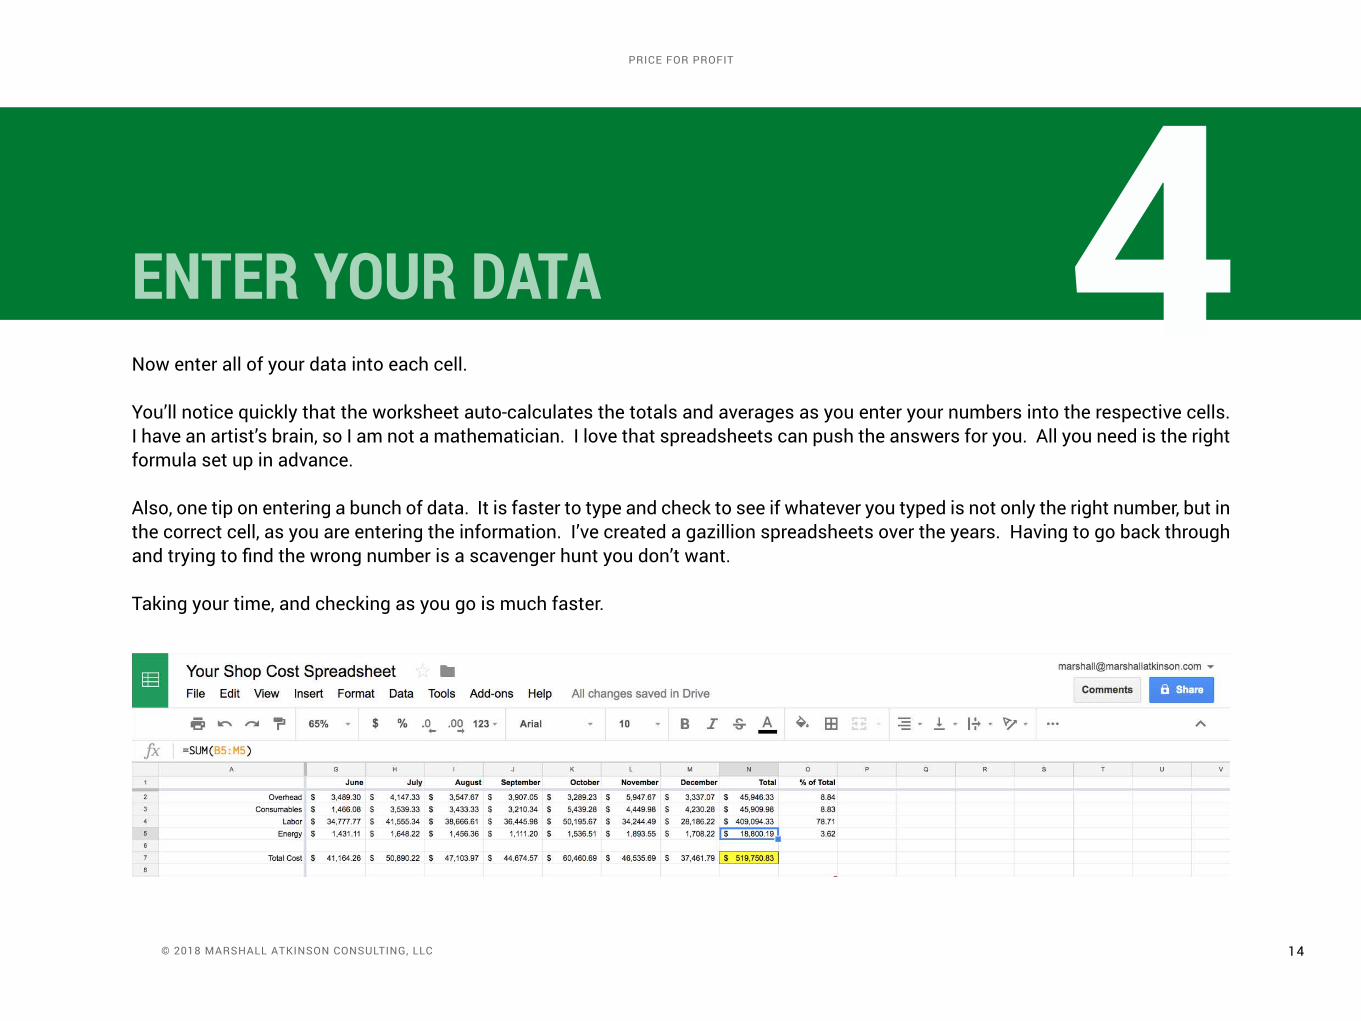
ENTER YOUR DATA Now enter all of your data into each cell.
You’ll notice quickly that the worksheet auto-calculates the totals and averages as you enter your numbers into the respective cells. I have an artist’s brain, so I am not a mathematician. I love that spreadsheets can push the answers for you. All you need is the right formula set up in advance.
Also, one tip on entering a bunch of data. It is faster to type and check to see if whatever you typed is not only the right number, but in the correct cell, as you are entering the information. I’ve created a gazillion spreadsheets over the years. Having to go back through and trying to find the wrong number is a scavenger hunt you don’t want.
Taking your time, and checking as you go is much faster.
4
15 © 2018 Marshall atkinson consulting, llc
price for profit
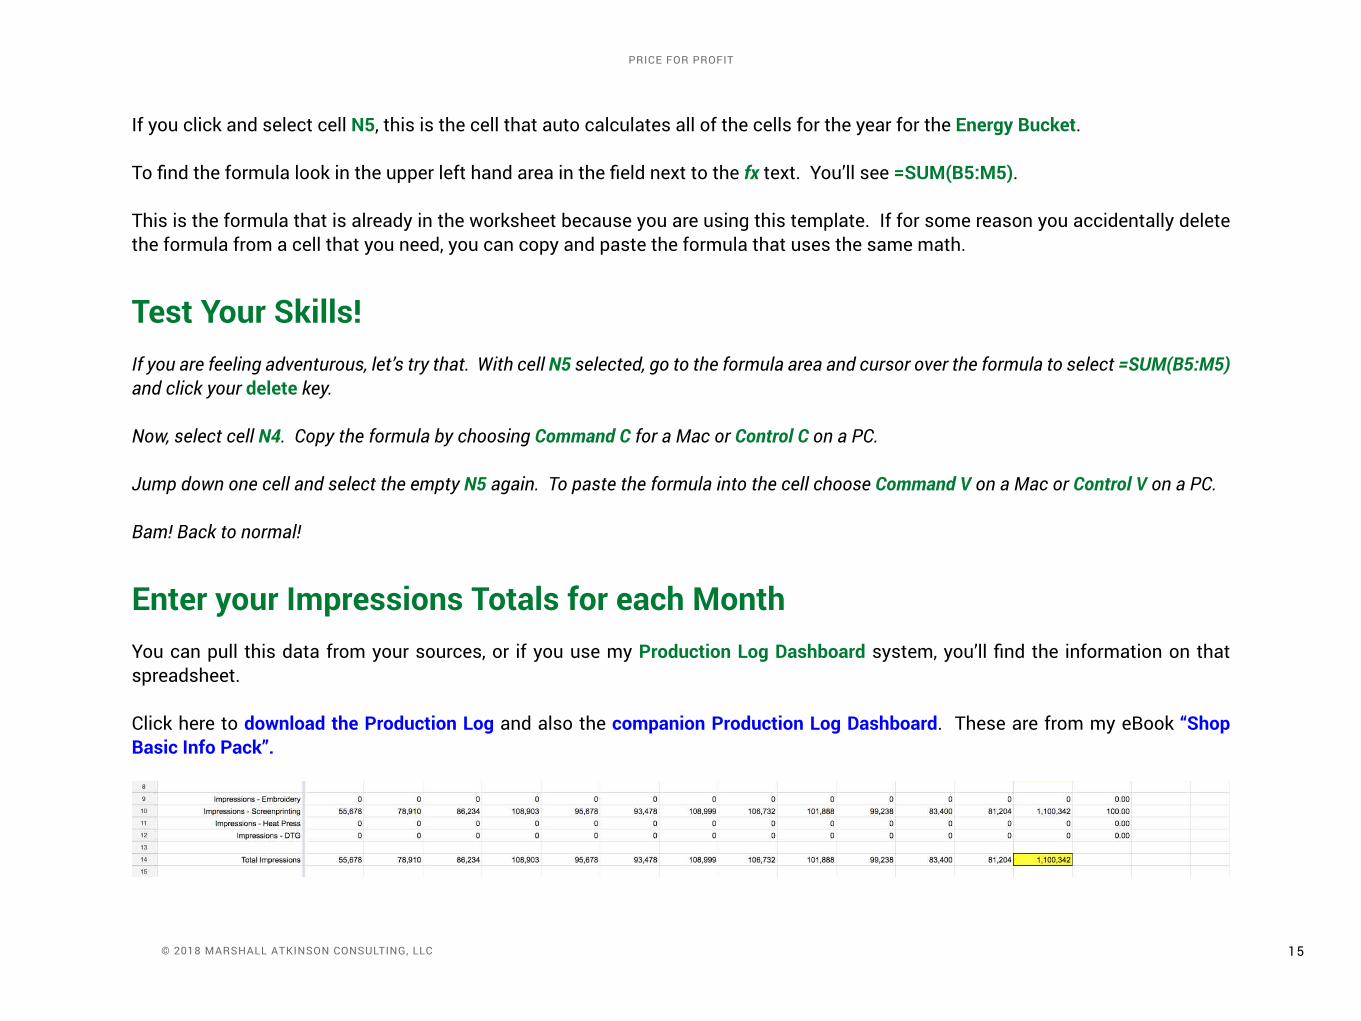
If you click and select cell N5, this is the cell that auto calculates all of the cells for the year for the Energy Bucket.
To find the formula look in the upper left hand area in the field next to the fx text. You’ll see =SUM(B5:M5).
This is the formula that is already in the worksheet because you are using this template. If for some reason you accidentally delete the formula from a cell that you need, you can copy and paste the formula that uses the same math.
Test Your Skills!If you are feeling adventurous, let’s try that. With cell N5 selected, go to the formula area and cursor over the formula to select =SUM(B5:M5) and click your delete key.
Now, select cell N4. Copy the formula by choosing Command C for a Mac or Control C on a PC.
Jump down one cell and select the empty N5 again. To paste the formula into the cell choose Command V on a Mac or Control V on a PC.
Bam! Back to normal!
Enter your Impressions Totals for each Month You can pull this data from your sources, or if you use my Production Log Dashboard system, you’ll find the information on that spreadsheet.
click here to download the Production Log and also the companion Production Log Dashboard. These are from my eBook “Shop Basic Info Pack”.
16 © 2018 Marshall atkinson consulting, llc
price for profit
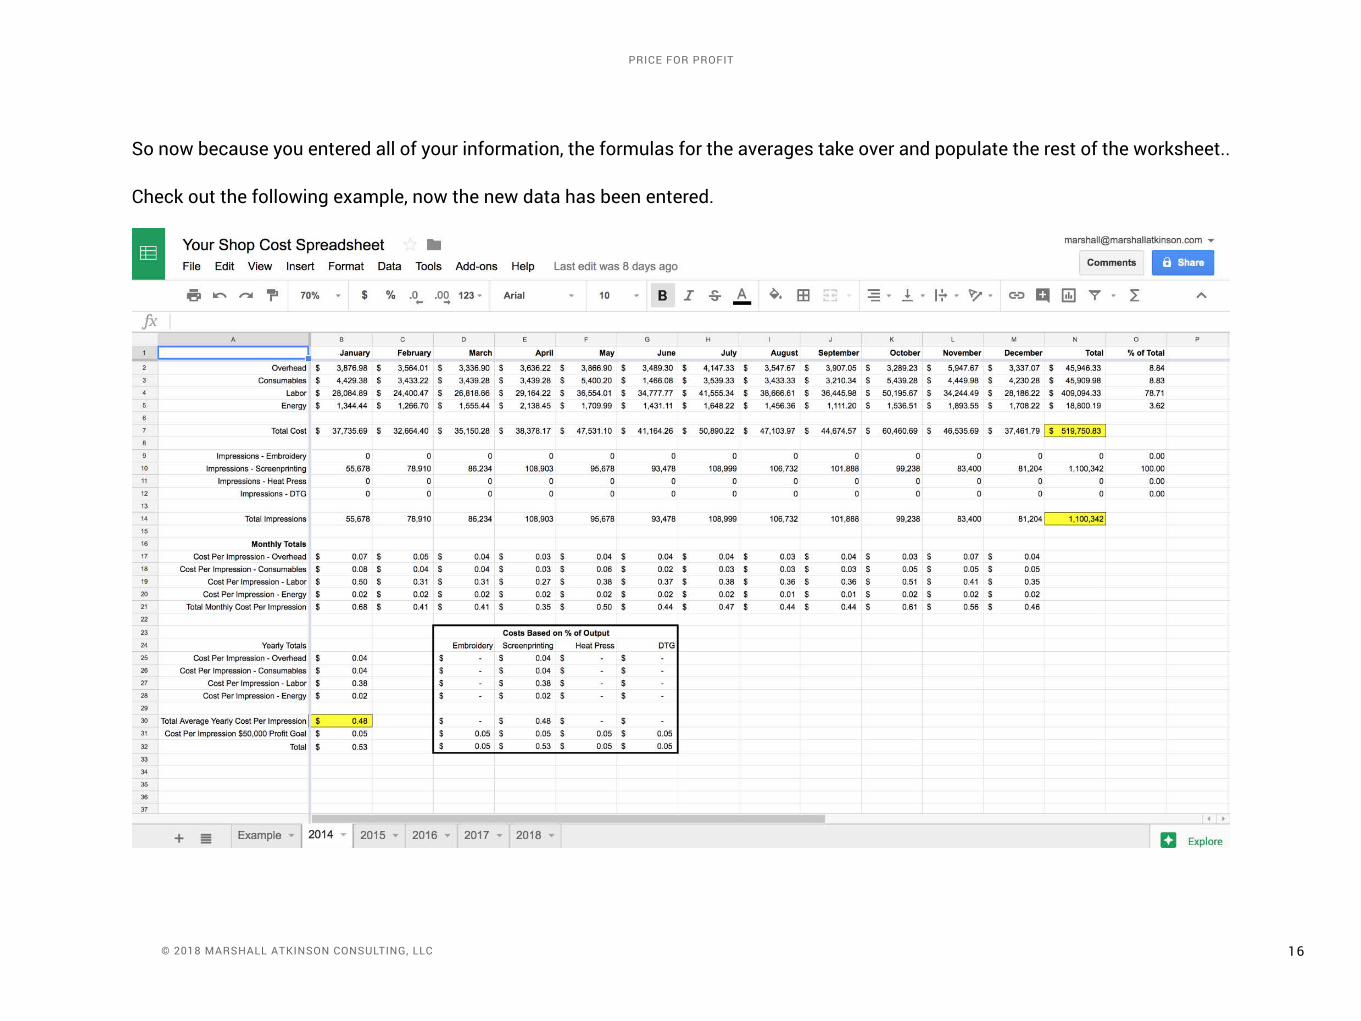
So now because you entered all of your information, the formulas for the averages take over and populate the rest of the worksheet..
check out the following example, now the new data has been entered.
17 © 2018 Marshall atkinson consulting, llc
price for profit
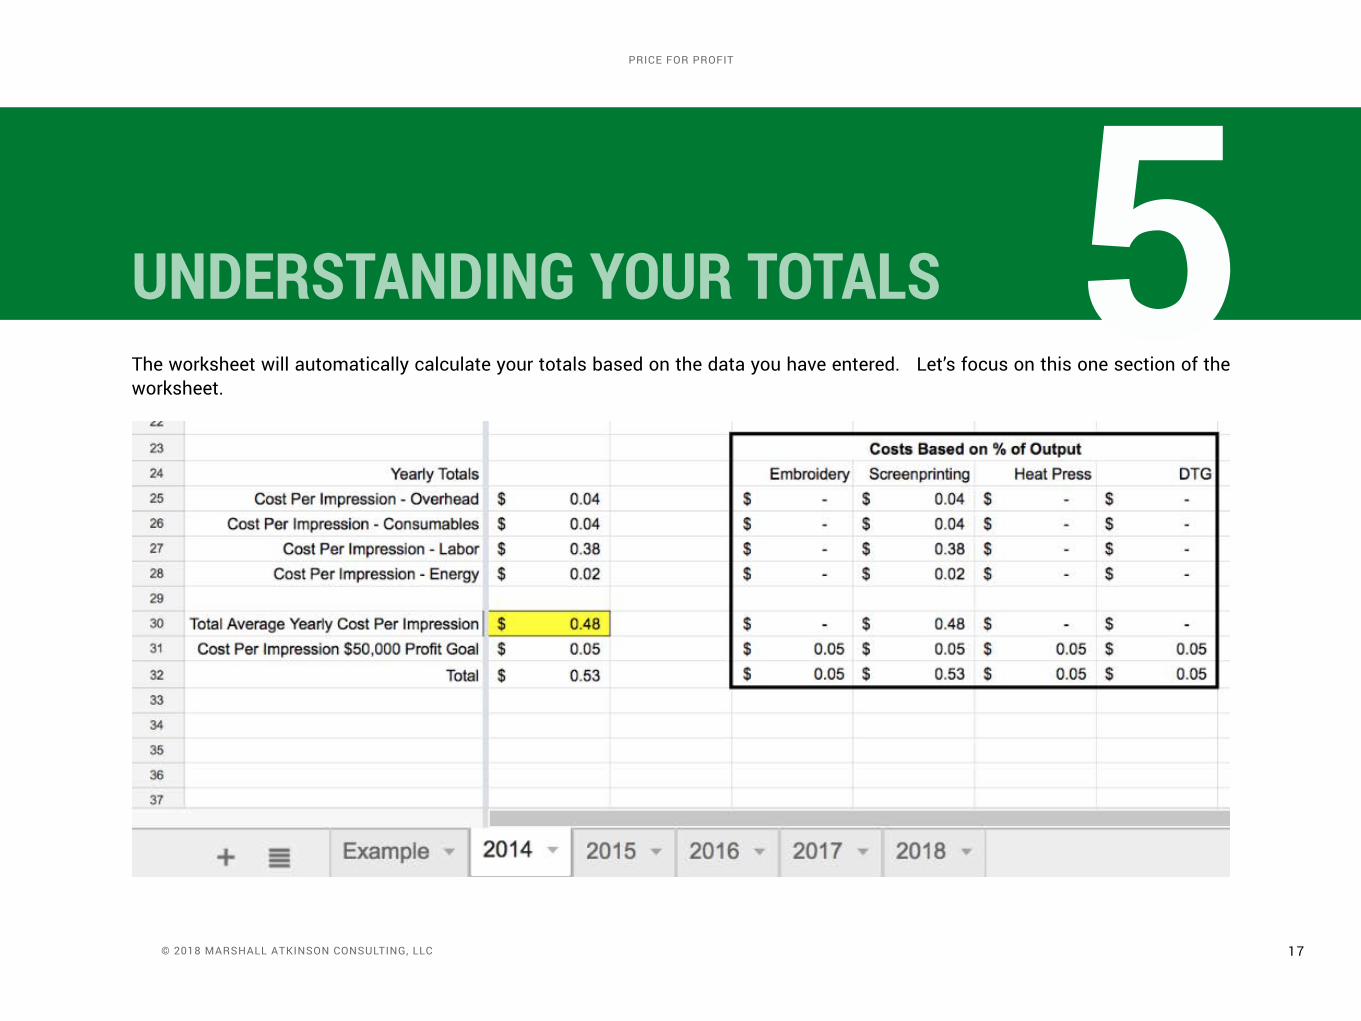
UNDERSTANDING YOUR TOTALSThe worksheet will automatically calculate your totals based on the data you have entered. Let’s focus on this one section of the worksheet.
5
18 © 2018 Marshall atkinson consulting, llc
price for profit
In our example, we can see that the average Cost Per Impression for the year for each of our Cost Buckets:
Overhead .............. $0.04consumables....... $0.04Labor..................... $0.38Energy................... $0.02 Total.. $0.48
This means that on average, this is what it costs us to complete that one production event for each of the four Cost Buckets we are measuring..
Totaling the Cost per Impression averages shows that for this example, it costs the shop $0.48 per impression on average to complete the work. The average for a two location job with a front and back would cost $0.96.
Please note: your results will be different. This is an example only. Do not misunderstand that your costs should total to be $0.48. Your numbers are your numbers. This exercise is built so you can comprehend what your actual costs are to run your shop.
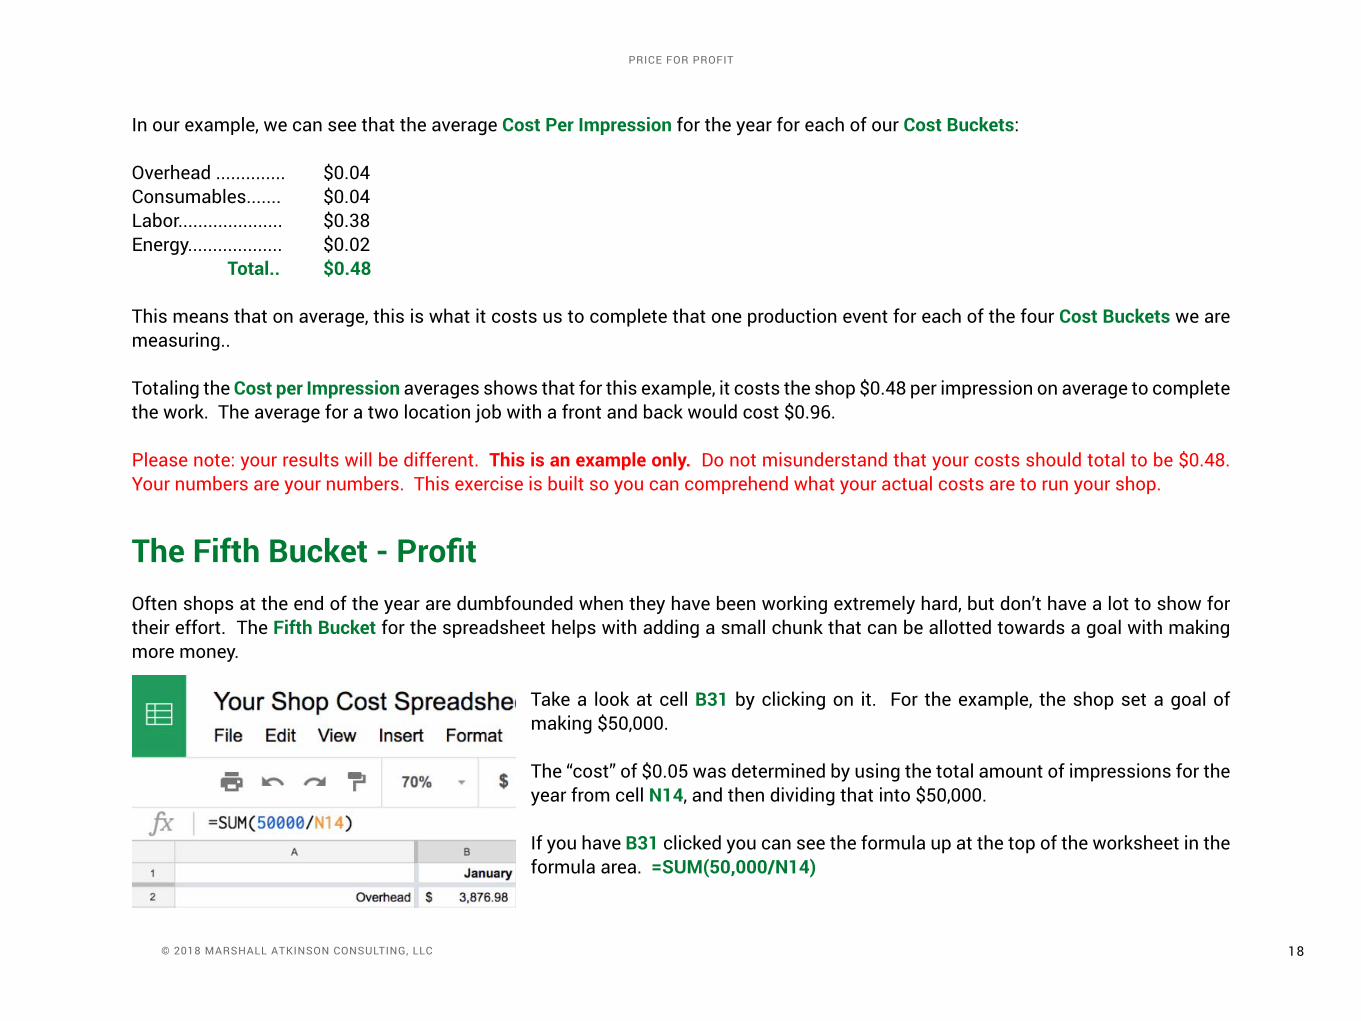
The Fifth Bucket - ProfitOften shops at the end of the year are dumbfounded when they have been working extremely hard, but don’t have a lot to show for their effort. The Fifth Bucket for the spreadsheet helps with adding a small chunk that can be allotted towards a goal with making more money.
Take a look at cell B31 by clicking on it. for the example, the shop set a goal of making $50,000.
The “cost” of $0.05 was determined by using the total amount of impressions for the year from cell N14, and then dividing that into $50,000.
If you have B31 clicked you can see the formula up at the top of the worksheet in the formula area. =SUM(50,000/N14)
19 © 2018 Marshall atkinson consulting, llc
price for profit
Does this guarantee that the shop will make $50,000 at the end of the year? Of course not. However, it does add that into the cost per Impression so you can set up and fund an account.
Change your Profit Goal TotalSo, let’s say you don’t want $50,000 to be your profit goal for the spreadsheet. Maybe you want it to be $25,000 or $100,000. What do you do then?
Easy. Simply select the cell B31 so that the formula shows in the area like in the above example. Then change the numerator in the formula to the profit goal you want to use.
for example, let’s say the shop wanted to use $100,000 instead of $50,000. click B31, so the formula shows in the area at the top.
choose 50,000 and change to 100,000.
In our example, the formula changes the result in cell B31 from $0.05 to $0.09 per impression.
Remember, if you use the Cost per Impression total from the previous years average as the basis for your pricing, and include the Profit Bucket number in your pricing calculations, you will need to hit at least the same number of impressions to achieve your goal.
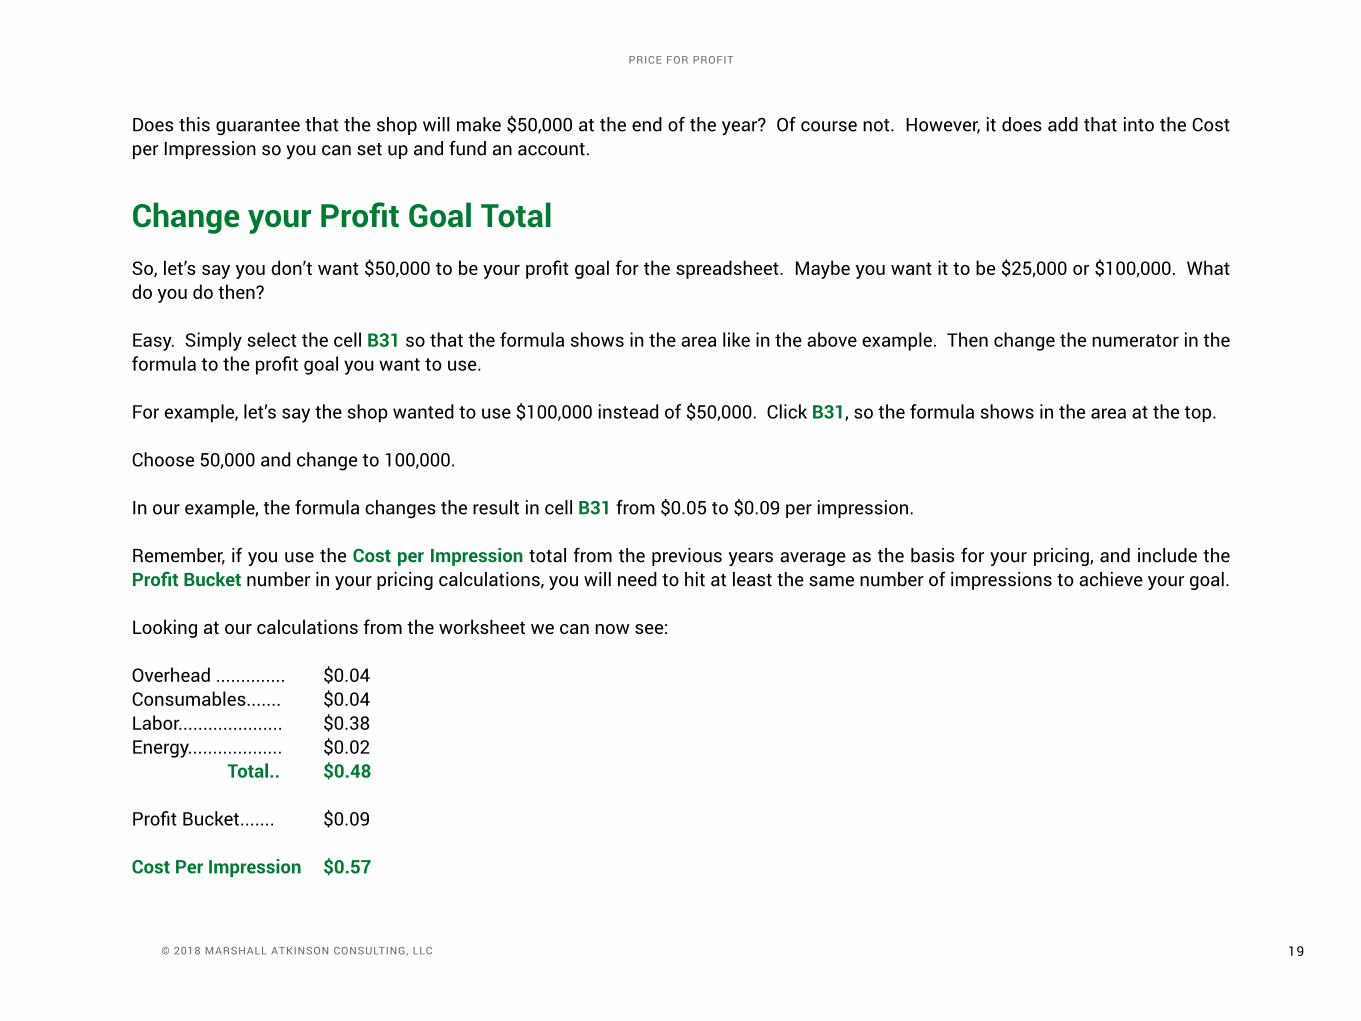
Looking at our calculations from the worksheet we can now see:
Overhead .............. $0.04consumables....... $0.04Labor..................... $0.38Energy................... $0.02 Total.. $0.48
Profit Bucket....... $0.09
Cost Per Impression $0.57
20 © 2018 Marshall atkinson consulting, llc
price for profit
COMPLETE THE WORKSHEETNow, complete the rest of the worksheet. In our example, so far we have only used one decoration method, screen-printing. To add more than one decoration method, simply fill out the cells for the total number of impressions decorated by the new method.
for our eBook example, I added impression totals for the year 2017. The shop has grown since the data we looked at previously from 2014.
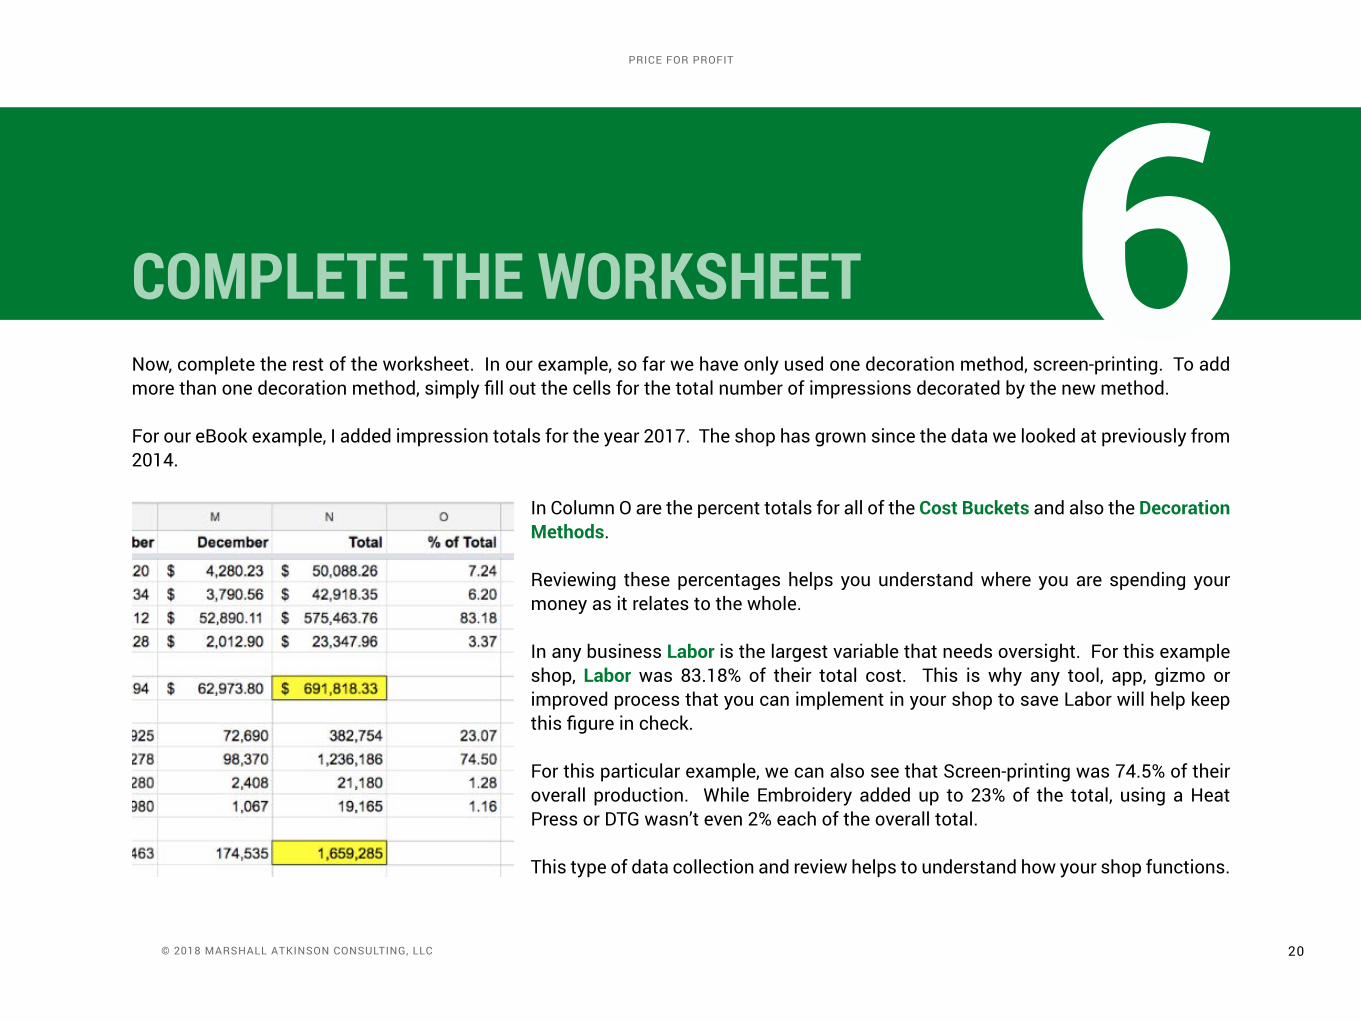
In column O are the percent totals for all of the Cost Buckets and also the Decoration Methods.
Reviewing these percentages helps you understand where you are spending your money as it relates to the whole.
In any business Labor is the largest variable that needs oversight. for this example shop, Labor was 83.18% of their total cost. This is why any tool, app, gizmo or improved process that you can implement in your shop to save Labor will help keep this figure in check.
for this particular example, we can also see that Screen-printing was 74.5% of their overall production. While Embroidery added up to 23% of the total, using a Heat Press or DTG wasn’t even 2% each of the overall total.
This type of data collection and review helps to understand how your shop functions.
6
21 © 2018 Marshall atkinson consulting, llc
price for profit
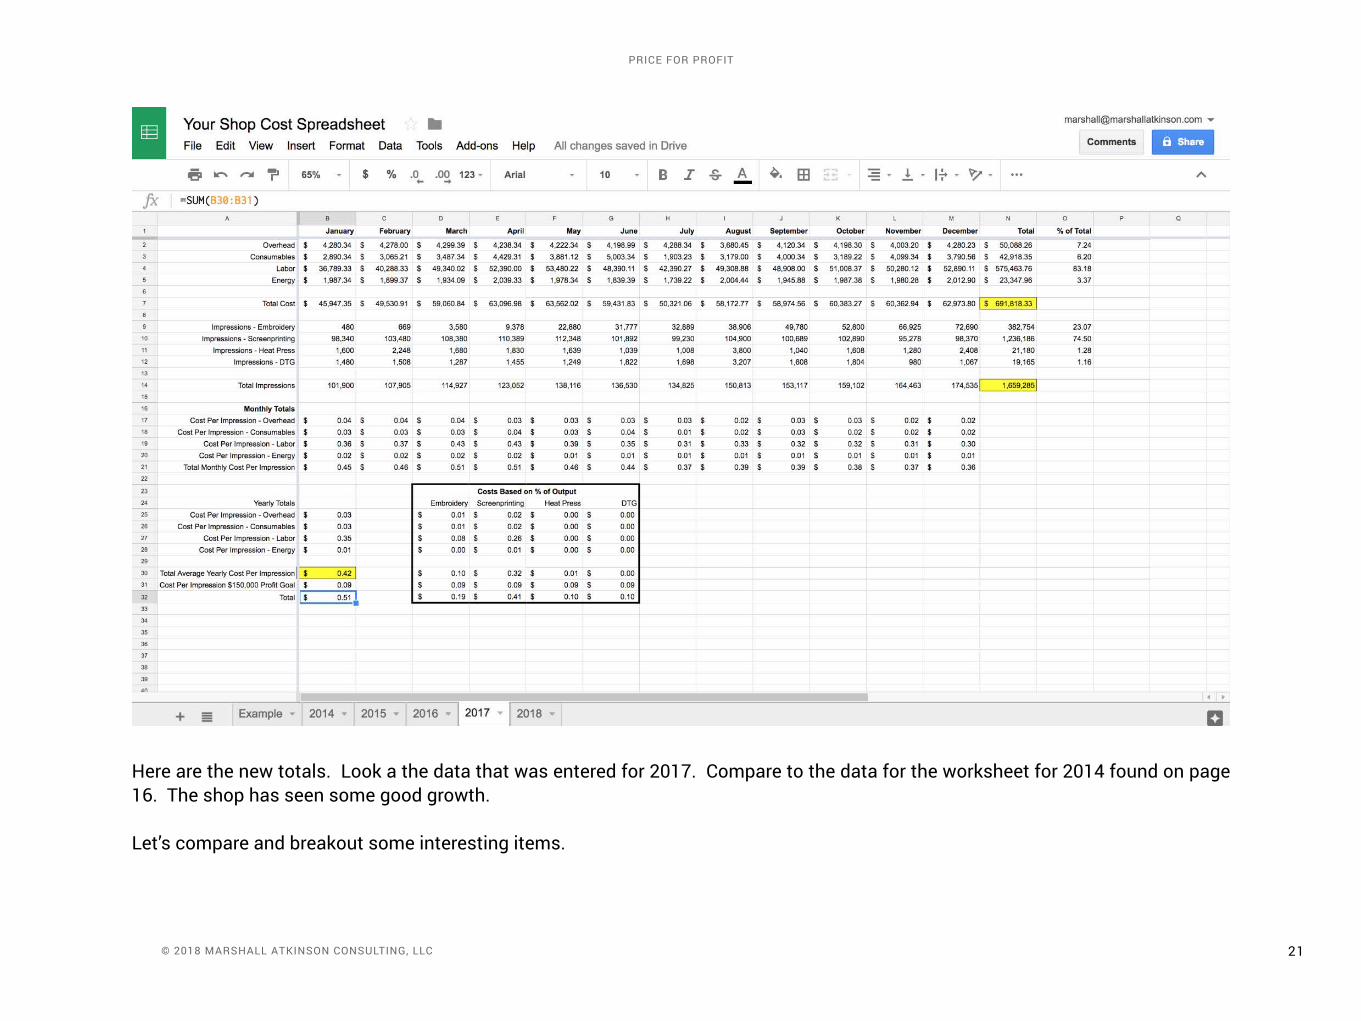
Here are the new totals. Look a the data that was entered for 2017. compare to the data for the worksheet for 2014 found on page 16. The shop has seen some good growth.
Let’s compare and breakout some interesting items.
22 © 2018 Marshall atkinson consulting, llc
price for profit
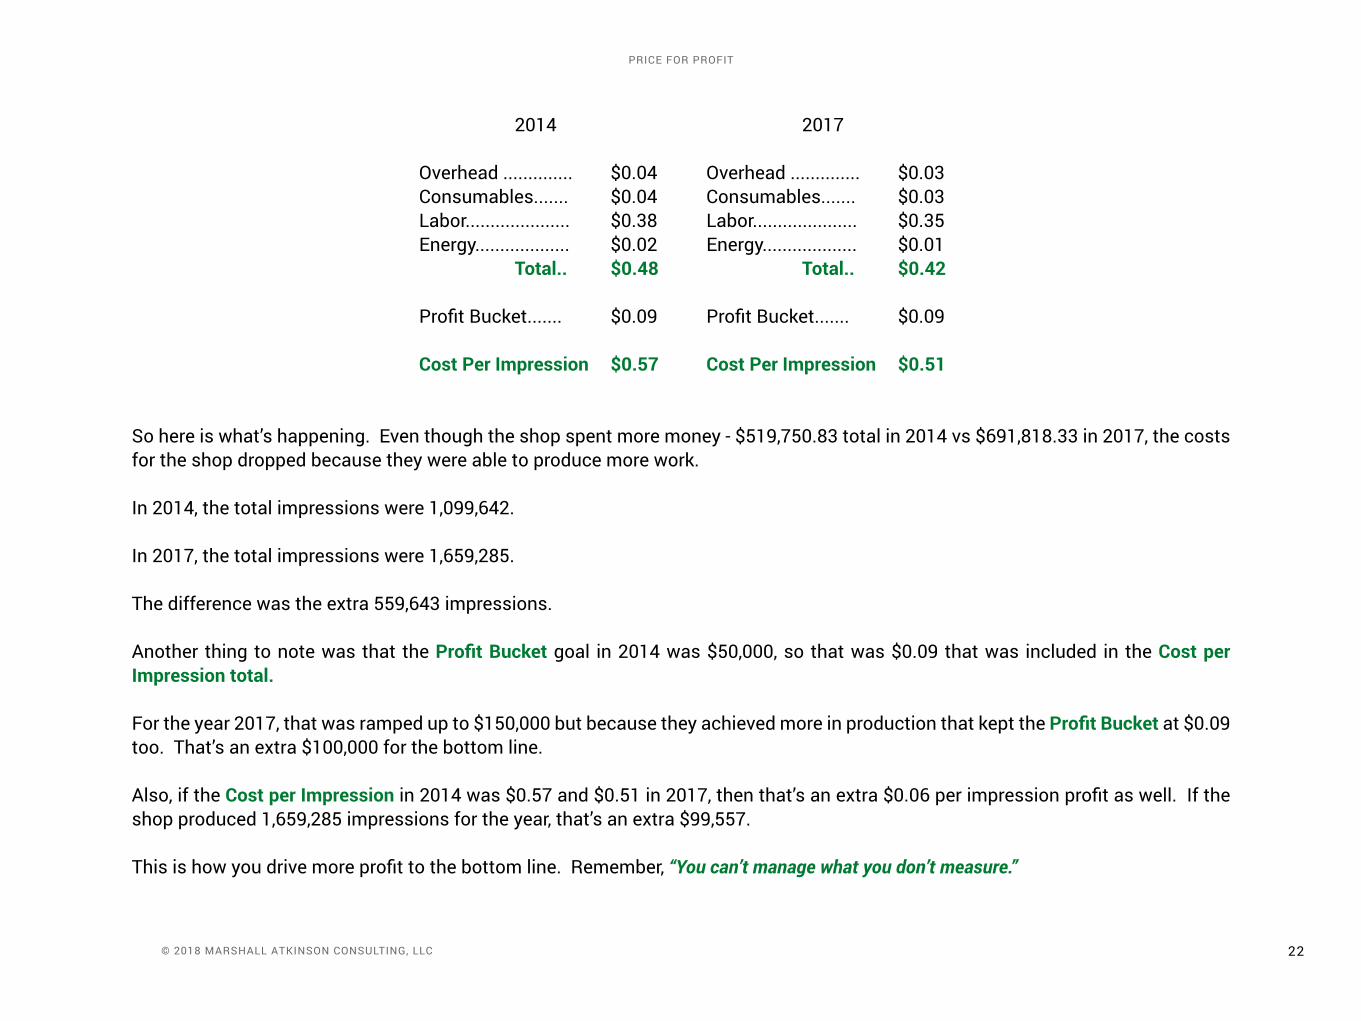
2014 2017
Overhead .............. $0.04 Overhead .............. $0.03 consumables....... $0.04 consumables....... $0.03 Labor..................... $0.38 Labor..................... $0.35 Energy................... $0.02 Energy................... $0.01 Total.. $0.48 Total.. $0.42
Profit Bucket....... $0.09 Profit Bucket....... $0.09
Cost Per Impression $0.57 Cost Per Impression $0.51
So here is what’s happening. Even though the shop spent more money - $519,750.83 total in 2014 vs $691,818.33 in 2017, the costs for the shop dropped because they were able to produce more work.
In 2014, the total impressions were 1,099,642.
In 2017, the total impressions were 1,659,285.
The difference was the extra 559,643 impressions.
Another thing to note was that the Profit Bucket goal in 2014 was $50,000, so that was $0.09 that was included in the Cost per Impression total.
for the year 2017, that was ramped up to $150,000 but because they achieved more in production that kept the Profit Bucket at $0.09 too. That’s an extra $100,000 for the bottom line.
Also, if the Cost per Impression in 2014 was $0.57 and $0.51 in 2017, then that’s an extra $0.06 per impression profit as well. If the shop produced 1,659,285 impressions for the year, that’s an extra $99,557.
This is how you drive more profit to the bottom line. Remember, “You can’t manage what you don’t measure.”
23 © 2018 Marshall atkinson consulting, llc
price for profit
CheckpointAt this point in the book you should have all of your data entered into the worksheets for each year. If you don’t, that’s Ok. Go back and get that work completed.
It’s up to you if you want to read further, but the exercises we are going to do will make more sense if you are using your own data.
I know it is a lot of work, but it is important to complete the tasks and use these tools properly.
If you get stuck, email me at [email protected]. I’m happy to help.
BUILDING YOUR PRICE LISTSo now it’s time to use this information we’ve built to construct a basic Price List that you can use to quote your customers easily. The benefit of doing it with this method is that the Price List will be based on your costs, and not anyone else’s.
Again, one of the surefire ways to not live up to your profit potential is to organize your sales efforts based on the average of other shop’s Price Lists. Those numbers are not applicable to your operation.
To get started there are a few things that you will need to know:
7
24 © 2018 Marshall atkinson consulting, llc
price for profit
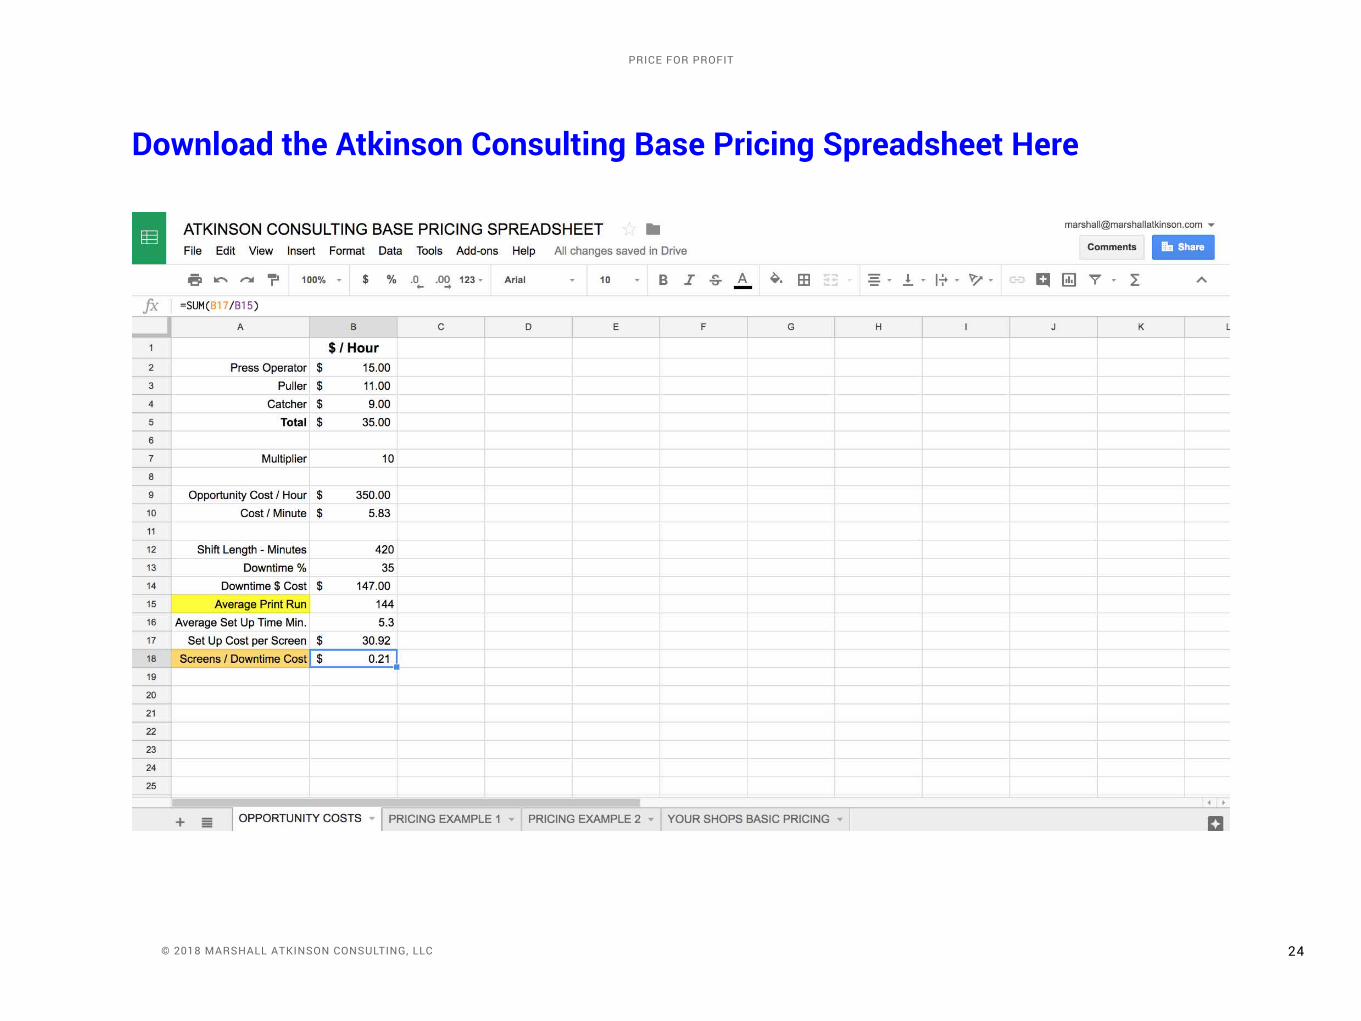
Download the Atkinson Consulting Base Pricing Spreadsheet Here
25 © 2018 Marshall atkinson consulting, llc
price for profit
We are going to use this to build the first part of our Pricing List which is the baseline costs. There are two items that we use for this.
The first is, as you can probably guess, your established Cost Per Impression for the previous year. Good work in getting that total!
The second is a formula that takes into consideration the average Labor Rate for a press, your Downtime %, and other factors. The Price List uses this as a value to help take into consideration all of the moments when you are not printing a shirt.
That way the chunk of your day that isn’t decorating is included in your prices.
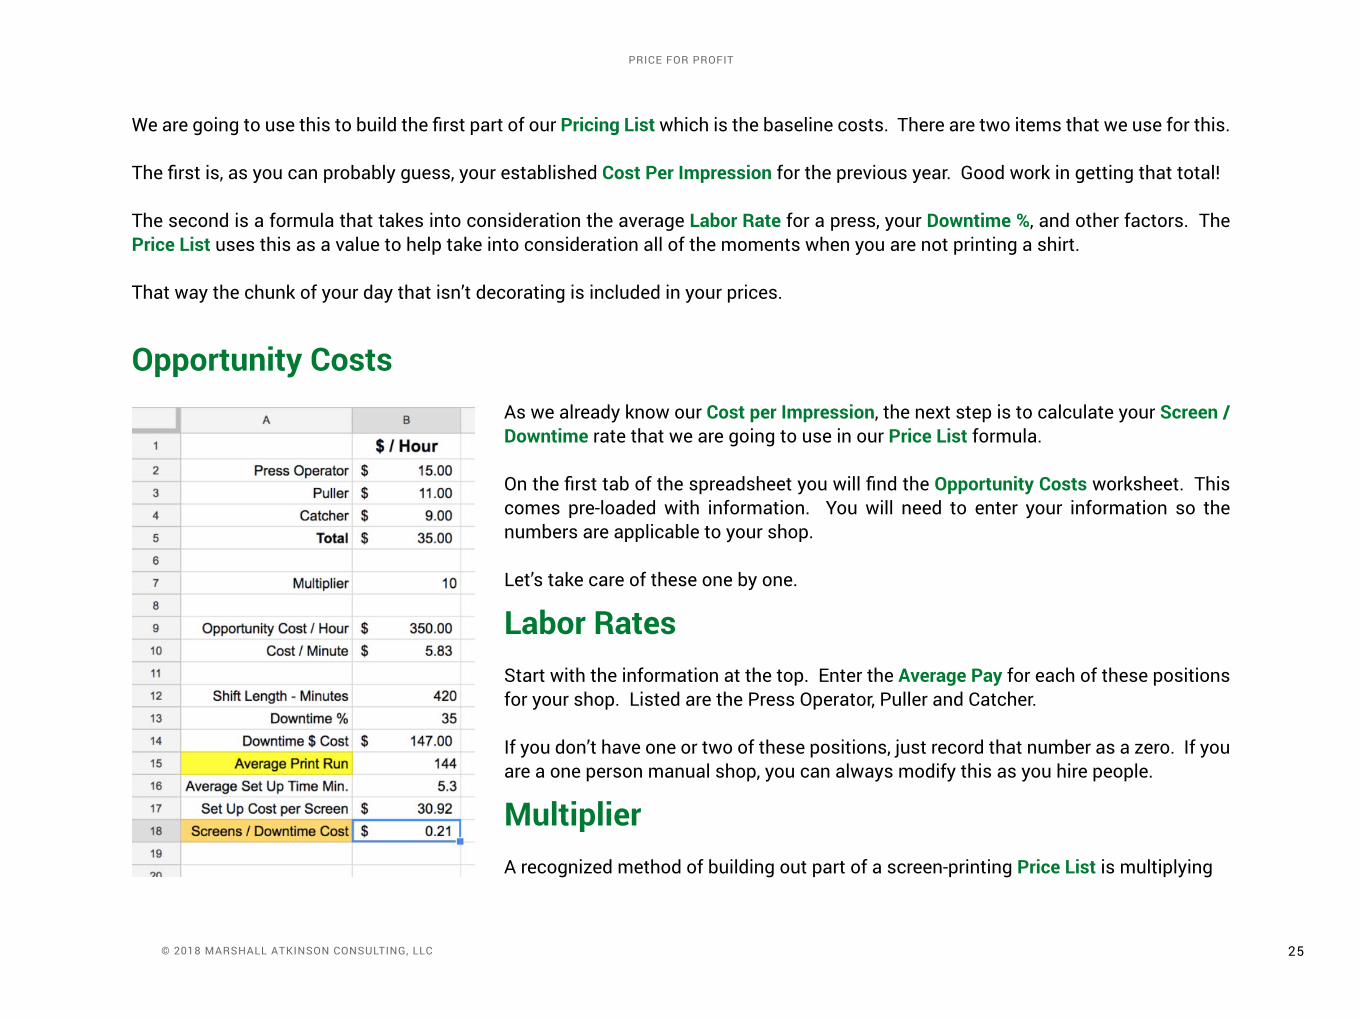
Opportunity CostsAs we already know our Cost per Impression, the next step is to calculate your Screen / Downtime rate that we are going to use in our Price List formula.
On the first tab of the spreadsheet you will find the Opportunity Costs worksheet. This comes pre-loaded with information. You will need to enter your information so the numbers are applicable to your shop.
Let’s take care of these one by one.
Labor RatesStart with the information at the top. Enter the Average Pay for each of these positions for your shop. Listed are the Press Operator, Puller and catcher.
If you don’t have one or two of these positions, just record that number as a zero. If you are a one person manual shop, you can always modify this as you hire people.
MultiplierA recognized method of building out part of a screen-printing Price List is multiplying
26 © 2018 Marshall atkinson consulting, llc
price for profit
the total Average Labor Rate by a number.
In this method, we use a multiplier of 10 to help construct the Price List. This can be any number you wish, so if you feel that using 8 or 12 makes more sense for you, that’s Ok. for the time being, leave it at 10.
Opportunity Cost / HourThis is the Average Labor Rate amount in B5 multiplied by the factor in cell B7. In our example, it is $350. We will be applying this number to use to create a value for the Downtime on the production floor. Remember, you are only making money when you are printing shirts.
By putting a value on this time and including it in our pricing, we can help offset those costs.
Opportunity Cost / MinuteThis is simply the calculation for our total Opportunity Cost is cell B9 divided by sixty minutes. We will use this information below.
Shift Length / MinutesThis is the total number of minutes that your production runs each day, not including breaks or lunch. In our example, we show 420 minutes. An eight hour shift with a thirty minute lunch and two fifteen minute breaks, totals seven hours. 7 x 60 = 420.
Downtime %This is the average percentage of the production day spent not printing shirts. This includes Set Up time and also regular Downtime when there is a problem.
This is where using a daily Production Log and keeping track of the data comes in handy.
27 © 2018 Marshall atkinson consulting, llc
price for profit
Downtime $ CostThis calculates out the estimated average daily cost of Downtime in your shop. We aren’t using it in the pricing calculations. But since we can show this, you now can make a note of it.
Keep this figure in your head so when you are on the production floor and your machines are not running for one reason or another, you’ll know what it is costing you. Just don’t let the steam escape from your ears like a cartoon character.
Average Print Run This is the basic average quantity of shirts ordered. On our example, we are using 144. The math works better if you are determining this actual number based on the orders your shop runs. Enter that number here in cell B15.
Average Set Up Time Min. This is the average number of minutes it takes your production crews to set up a job per screen. for example, if a three color job takes 20 minutes to register, the time per screen would be 6.66 minutes.
Again, the math works better if you are using accurate averages for how your shop runs. using the previously mentioned Production Log can help you track this time.
Set Up Cost Per Screen This is a calculation using the previously determined cost for Downtime in cell B10 multiplied by the Average Set Up Time Min number in cell B16. Yes, this number may look large. Remember, this is based on the opportunity cost you are losing per hour when you are not printing shirts.
28 © 2018 Marshall atkinson consulting, llc
price for profit
This is why all the work in production efficiency pays off if you can lower your screen set up times to be under five minutes per screen.
By the way, for shops that are not tracking this they usually think they are around five or six minutes per screen. When they start measuring, they are shocked when the number is closer to eight or nine minutes per screen. By the way, what’s yours?
Screens / Downtime Cost finally, we have it! This is the number that all of the previous math above boils down to. Here we take the total Set Up Cost Per Screen number in cell B17, and divide that by your shop’s Average Order Size.
We will use this number with our already established Cost per Impression as building blocks for the Price List.
What’s great about this number is that it takes into consideration the average Labor Rates, your production efficiency with Downtime, and the Average Order Size to calculate a cost you can use.
KEYSTONE CELLSNow, we are going to look at Pricing Example 1, and learn how to construct a Price List based on information we’ve built so far.
click over to the next tab at the bottom of the spreadsheet and so you can view this worksheet. Pricing Example 1 is already built, and
8
29 © 2018 Marshall atkinson consulting, llc
price for profit
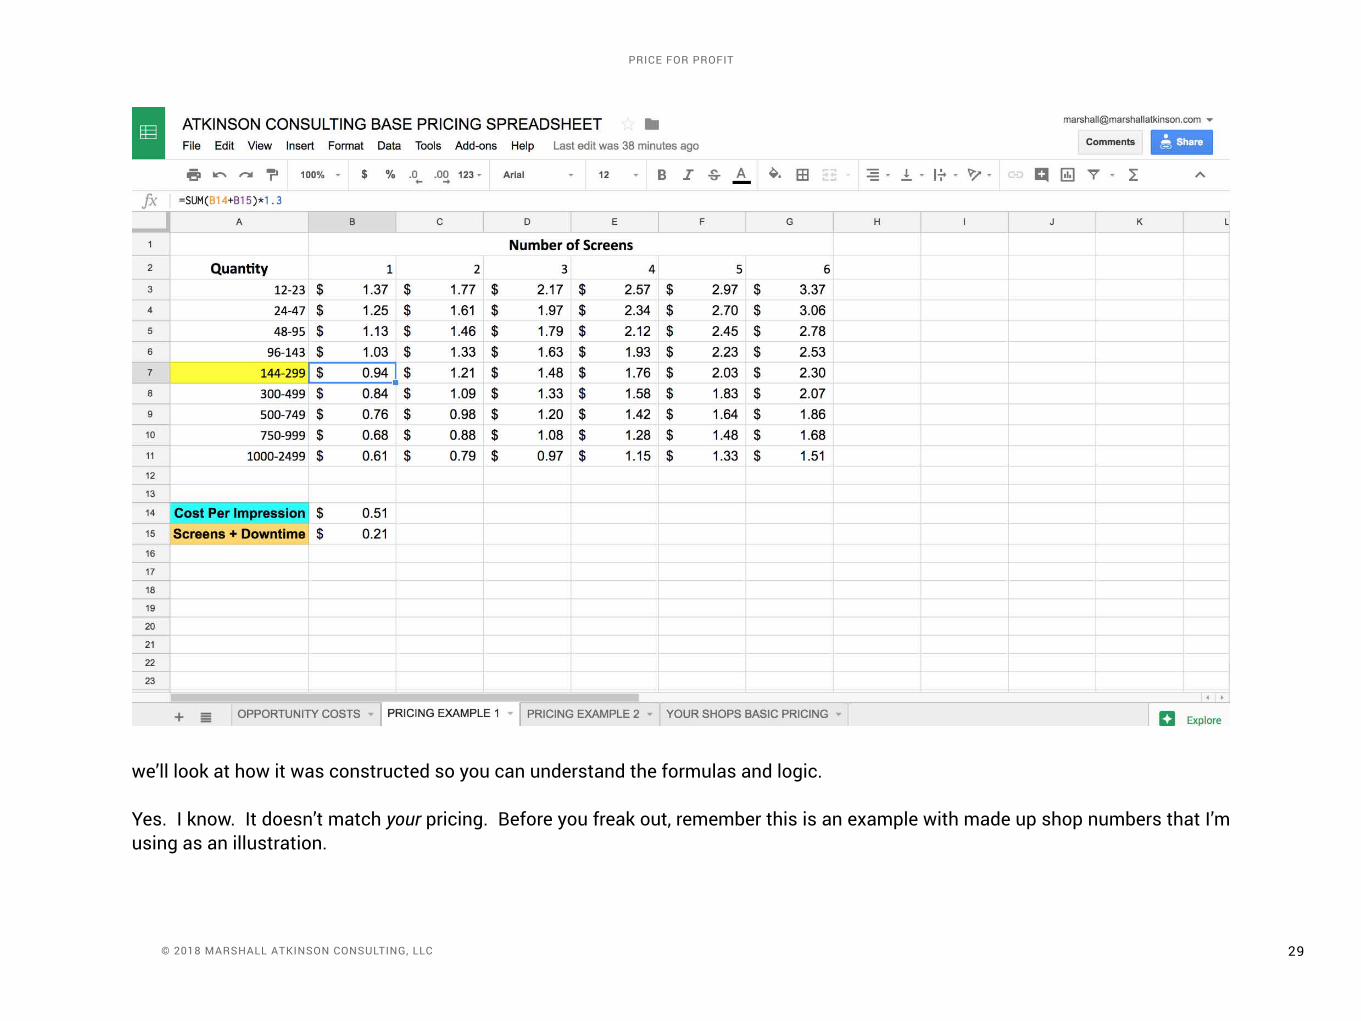
we’ll look at how it was constructed so you can understand the formulas and logic.
Yes. I know. It doesn’t match your pricing. Before you freak out, remember this is an example with made up shop numbers that I’m using as an illustration.
30 © 2018 Marshall atkinson consulting, llc
price for profit
Keystone The first, and probably most, important concept with this spreadsheet is that hinges on the number in cell B7. This is the Keystone Cell for the whole enchilada.
Let’s take a look at what this means.
for starters, remember when I asked about your average order size? This is the most common quantity for orders you process in your shop. for demonstration purposes we have this at 144. On the spreadsheet I’ve highlighted that row header in yellow.
This is important, because what if your shop’s most common order size is 100? Then instead of the Keystone Cell being B7, we would start one row up with B6.
The Price List Keystone starts with the most commonly ordered quantity. But for demonstration purposes we are going to use 144 as our starting point, and B7 as the Keystone Cell. Ya’ gotta start somewhere.
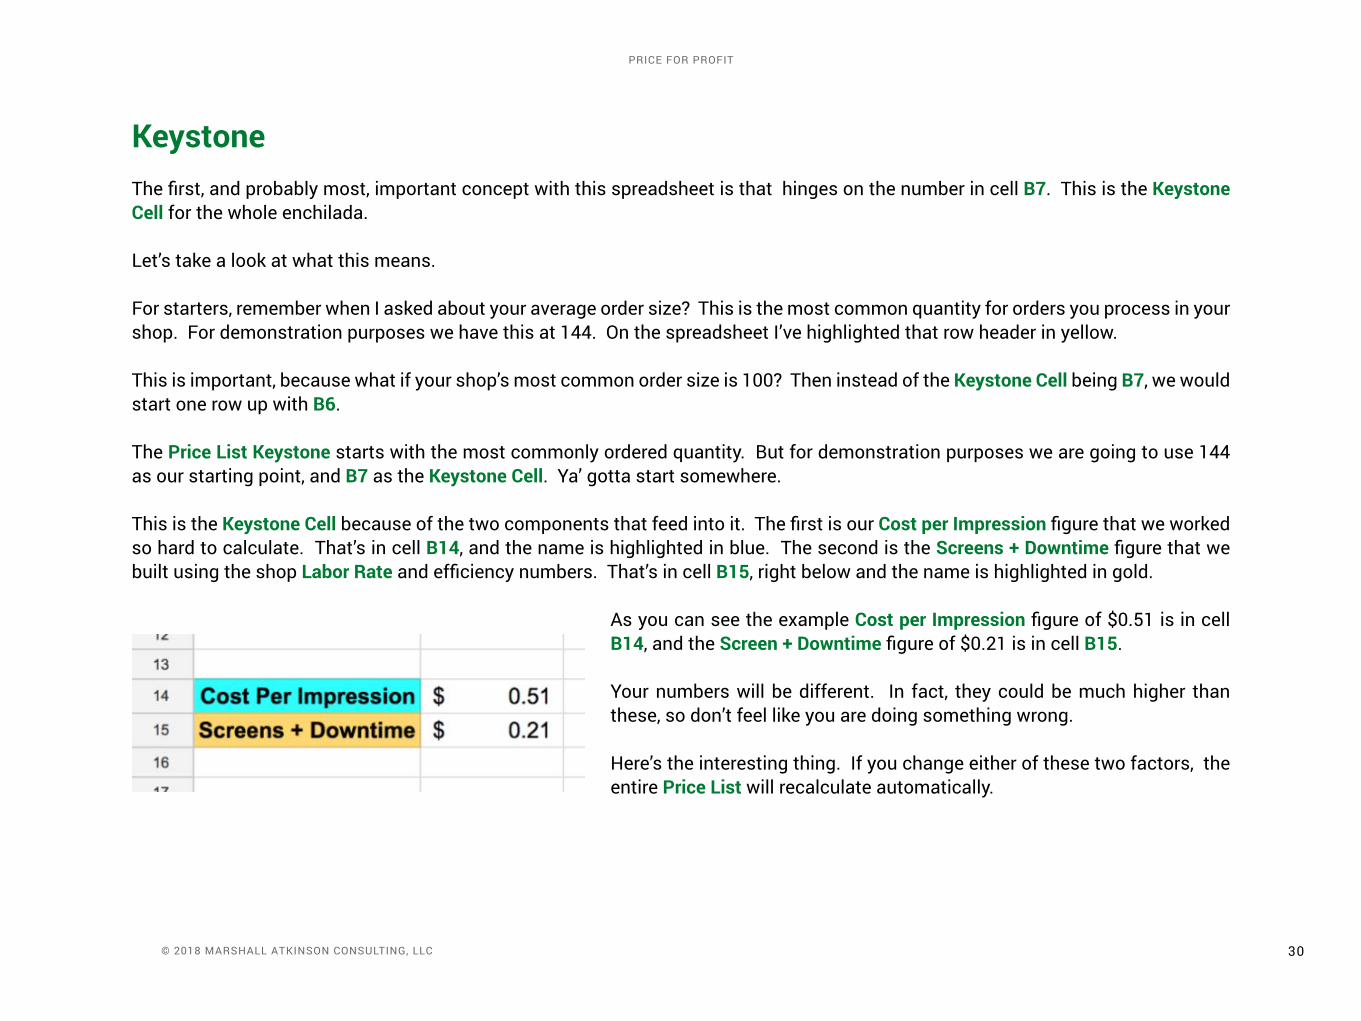
This is the Keystone Cell because of the two components that feed into it. The first is our Cost per Impression figure that we worked so hard to calculate. That’s in cell B14, and the name is highlighted in blue. The second is the Screens + Downtime figure that we built using the shop Labor Rate and efficiency numbers. That’s in cell B15, right below and the name is highlighted in gold.
As you can see the example Cost per Impression figure of $0.51 is in cell B14, and the Screen + Downtime figure of $0.21 is in cell B15.
Your numbers will be different. In fact, they could be much higher than these, so don’t feel like you are doing something wrong.
Here’s the interesting thing. If you change either of these two factors, the entire Price List will recalculate automatically.
31 © 2018 Marshall atkinson consulting, llc
price for profit
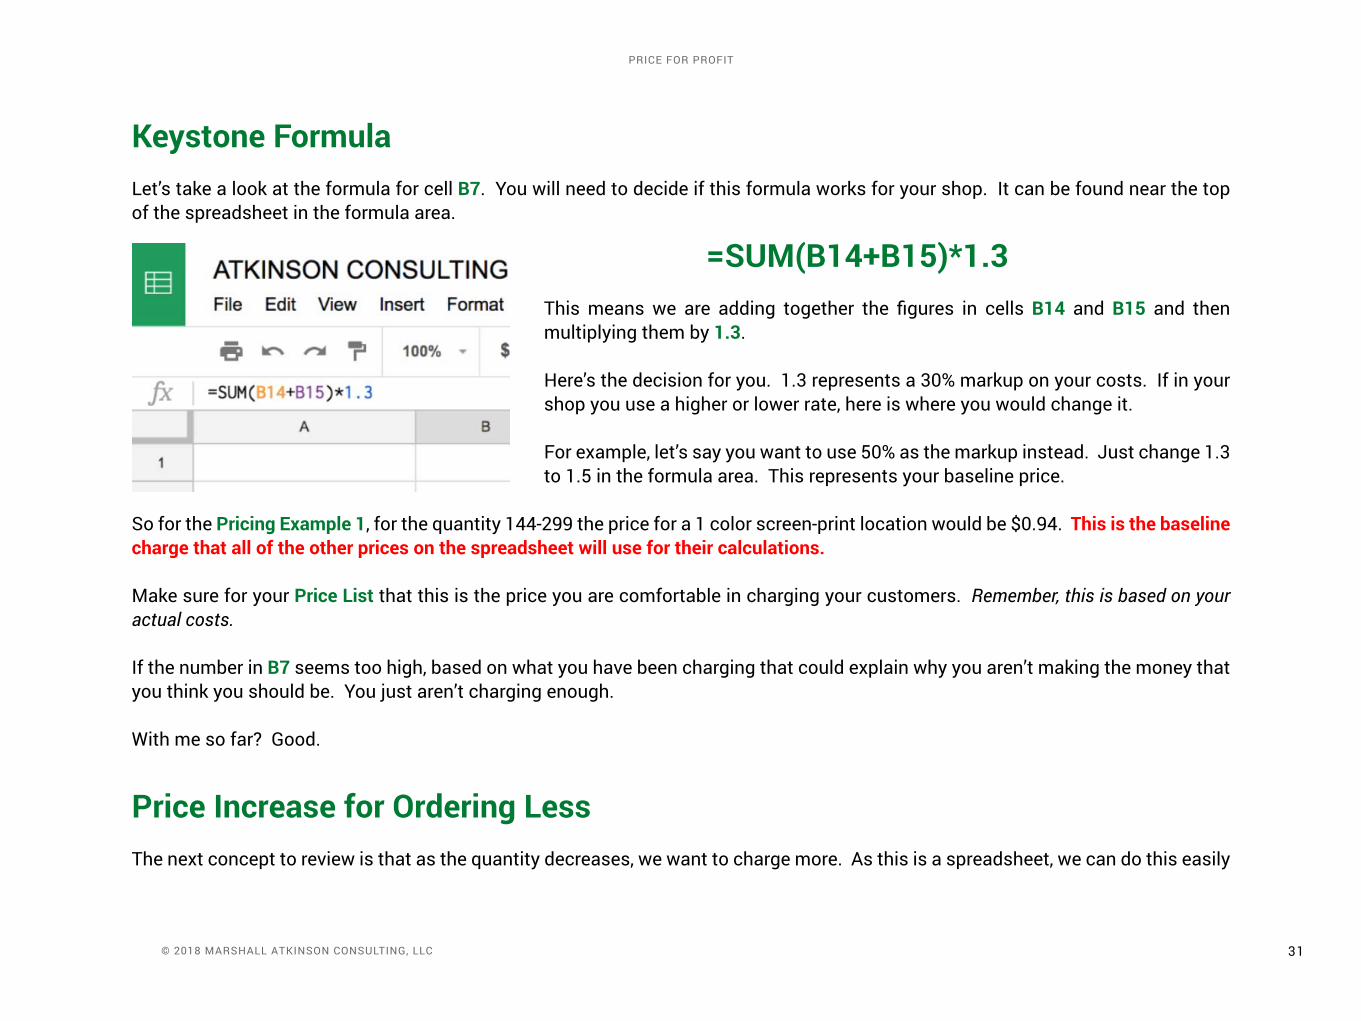
Keystone Formula Let’s take a look at the formula for cell B7. You will need to decide if this formula works for your shop. It can be found near the top of the spreadsheet in the formula area.
=SUM(B14+B15)*1.3 This means we are adding together the figures in cells B14 and B15 and then multiplying them by 1.3.
Here’s the decision for you. 1.3 represents a 30% markup on your costs. If in your shop you use a higher or lower rate, here is where you would change it.
for example, let’s say you want to use 50% as the markup instead. Just change 1.3 to 1.5 in the formula area. This represents your baseline price.
So for the Pricing Example 1, for the quantity 144-299 the price for a 1 color screen-print location would be $0.94. This is the baseline charge that all of the other prices on the spreadsheet will use for their calculations.
Make sure for your Price List that this is the price you are comfortable in charging your customers. Remember, this is based on your actual costs.
If the number in B7 seems too high, based on what you have been charging that could explain why you aren’t making the money that you think you should be. You just aren’t charging enough.
With me so far? Good.
Price Increase for Ordering Less The next concept to review is that as the quantity decreases, we want to charge more. As this is a spreadsheet, we can do this easily
32 © 2018 Marshall atkinson consulting, llc
price for profit
by using a formula.
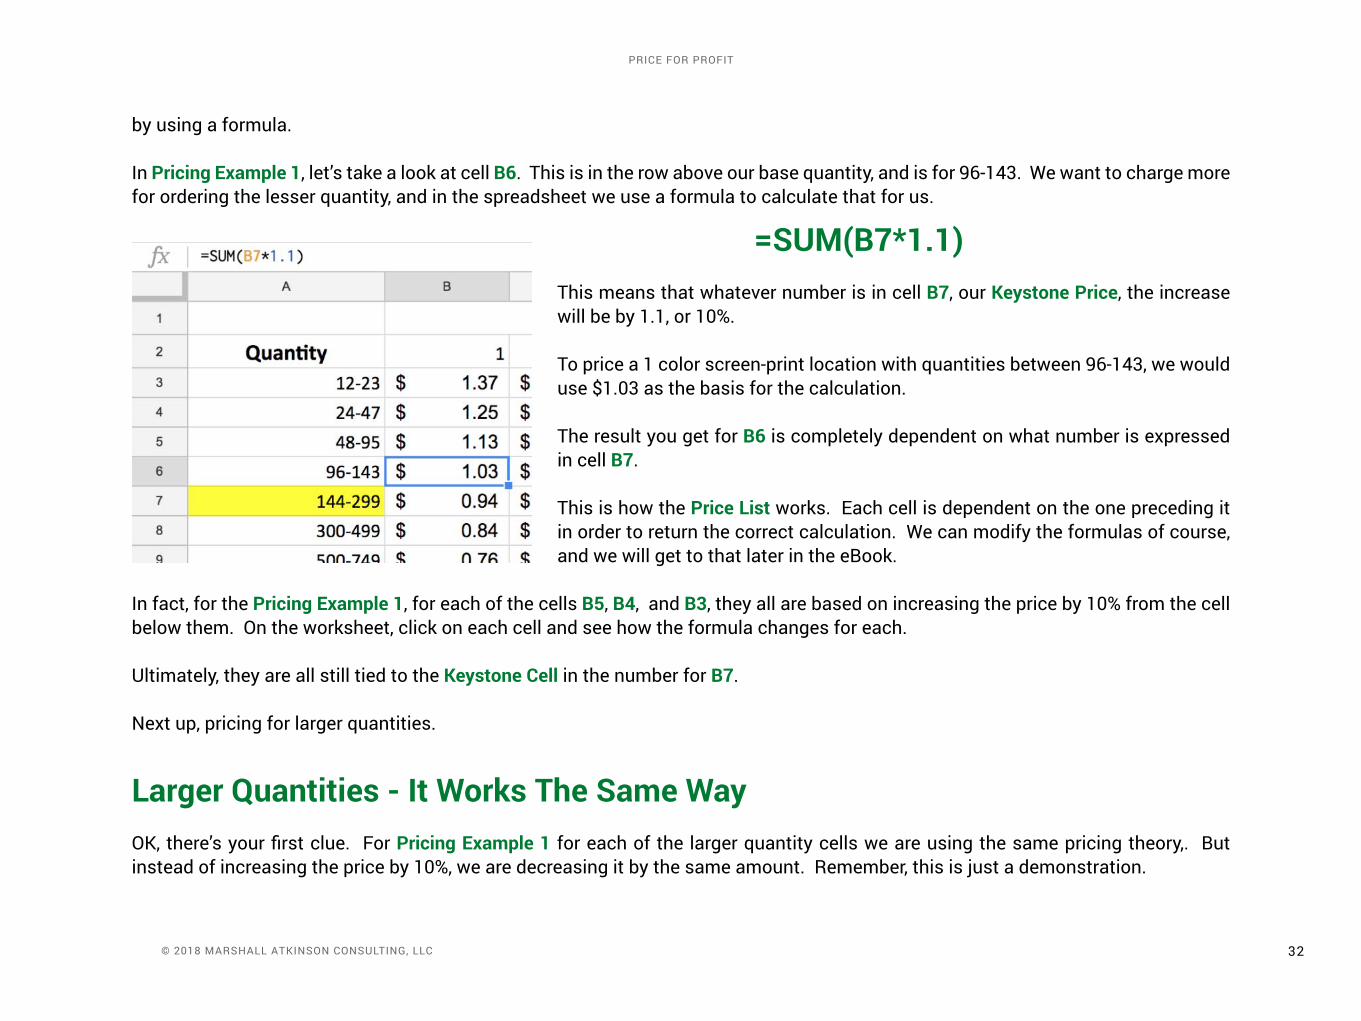
In Pricing Example 1, let’s take a look at cell B6. This is in the row above our base quantity, and is for 96-143. We want to charge more for ordering the lesser quantity, and in the spreadsheet we use a formula to calculate that for us.
=SUM(B7*1.1)This means that whatever number is in cell B7, our Keystone Price, the increase will be by 1.1, or 10%.
To price a 1 color screen-print location with quantities between 96-143, we would use $1.03 as the basis for the calculation.
The result you get for B6 is completely dependent on what number is expressed in cell B7.
This is how the Price List works. Each cell is dependent on the one preceding it in order to return the correct calculation. We can modify the formulas of course, and we will get to that later in the eBook.
In fact, for the Pricing Example 1, for each of the cells B5, B4, and B3, they all are based on increasing the price by 10% from the cell below them. On the worksheet, click on each cell and see how the formula changes for each.
ultimately, they are all still tied to the Keystone Cell in the number for B7.
Next up, pricing for larger quantities.
Larger Quantities - It Works The Same WayOK, there’s your first clue. For Pricing Example 1 for each of the larger quantity cells we are using the same pricing theory,. But instead of increasing the price by 10%, we are decreasing it by the same amount. Remember, this is just a demonstration.
33 © 2018 Marshall atkinson consulting, llc
price for profit
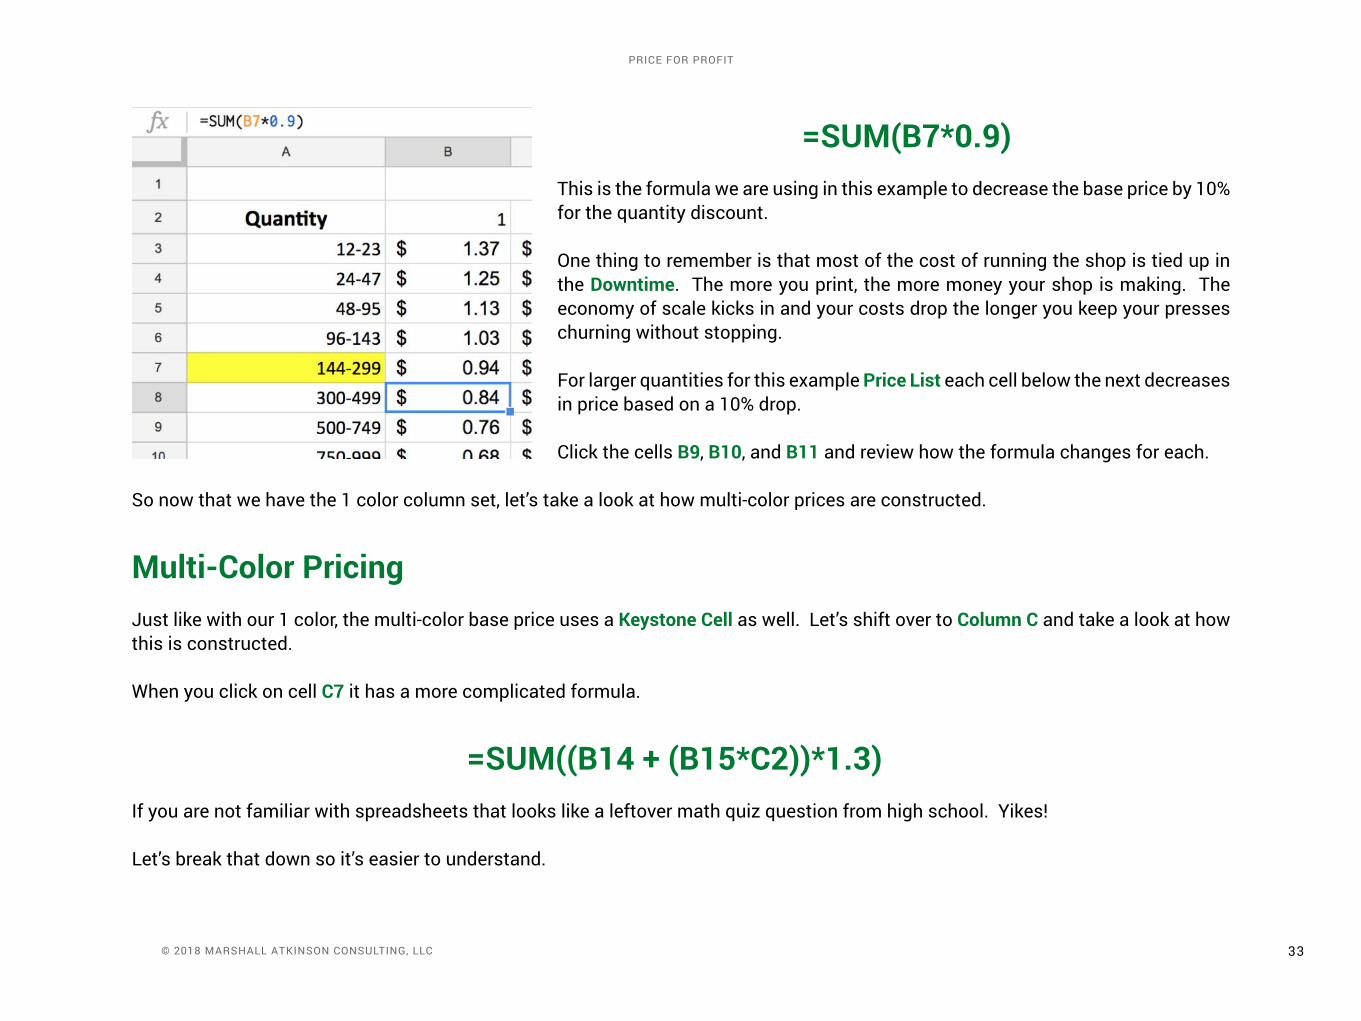
=SUM(B7*0.9)This is the formula we are using in this example to decrease the base price by 10% for the quantity discount.
One thing to remember is that most of the cost of running the shop is tied up in the Downtime. The more you print, the more money your shop is making. The economy of scale kicks in and your costs drop the longer you keep your presses churning without stopping.
for larger quantities for this example Price List each cell below the next decreases in price based on a 10% drop.
click the cells B9, B10, and B11 and review how the formula changes for each.
So now that we have the 1 color column set, let’s take a look at how multi-color prices are constructed.
Multi-Color PricingJust like with our 1 color, the multi-color base price uses a Keystone Cell as well. Let’s shift over to Column C and take a look at how this is constructed.
When you click on cell C7 it has a more complicated formula.
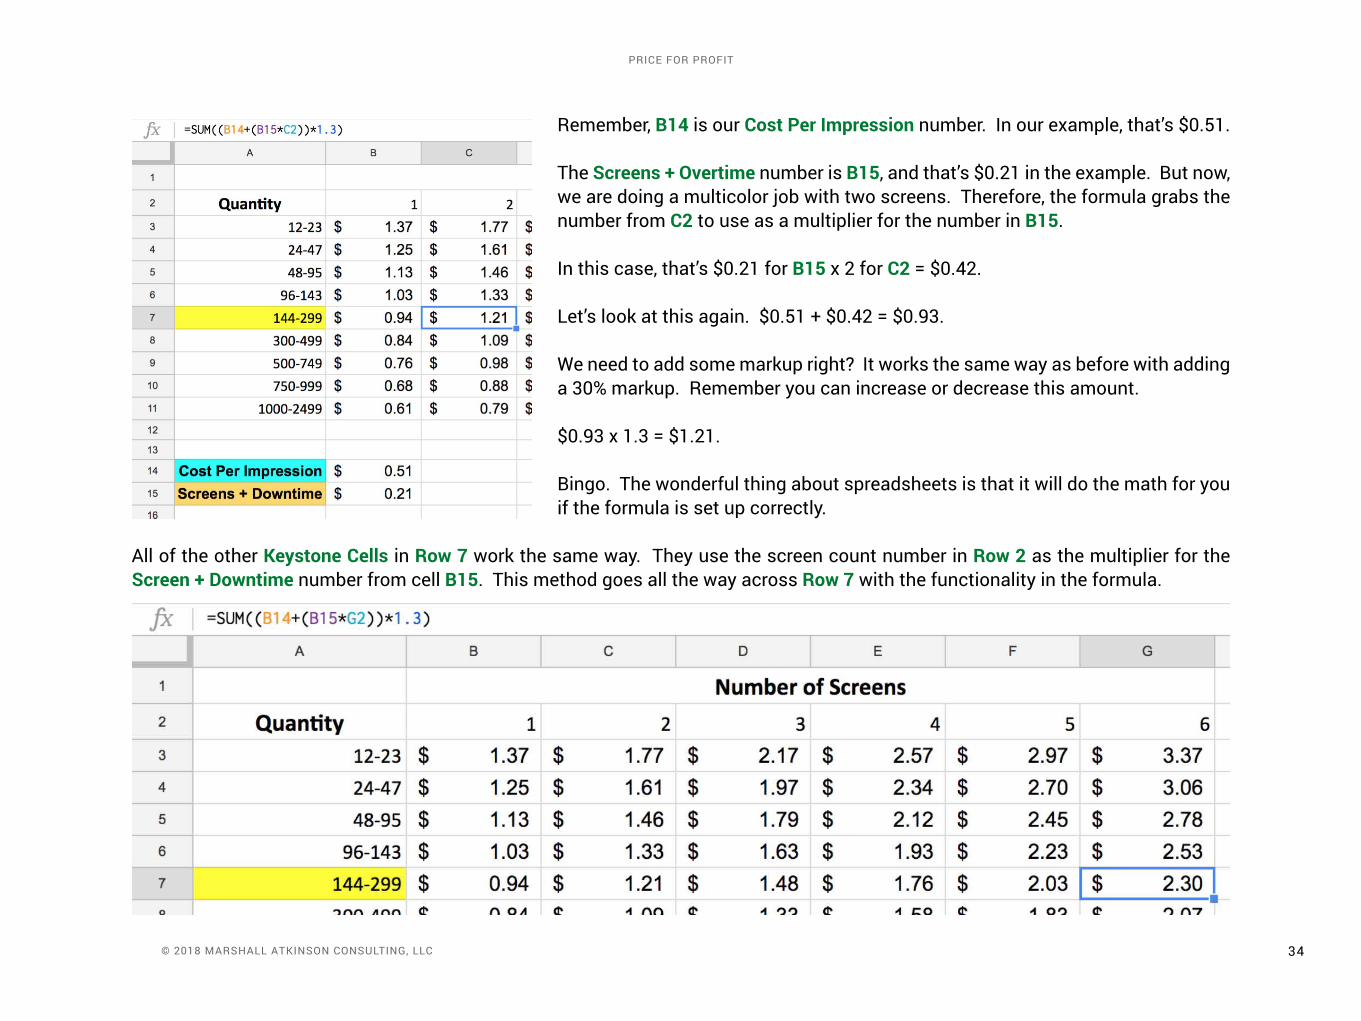
=SUM((B14 + (B15*C2))*1.3)If you are not familiar with spreadsheets that looks like a leftover math quiz question from high school. Yikes!
Let’s break that down so it’s easier to understand.
34 © 2018 Marshall atkinson consulting, llc
price for profit
Remember, B14 is our Cost Per Impression number. In our example, that’s $0.51.
The Screens + Overtime number is B15, and that’s $0.21 in the example. But now, we are doing a multicolor job with two screens. Therefore, the formula grabs the number from C2 to use as a multiplier for the number in B15.
In this case, that’s $0.21 for B15 x 2 for C2 = $0.42.
Let’s look at this again. $0.51 + $0.42 = $0.93.
We need to add some markup right? It works the same way as before with adding a 30% markup. Remember you can increase or decrease this amount.
$0.93 x 1.3 = $1.21.
Bingo. The wonderful thing about spreadsheets is that it will do the math for you if the formula is set up correctly.
All of the other Keystone Cells in Row 7 work the same way. They use the screen count number in Row 2 as the multiplier for the Screen + Downtime number from cell B15. This method goes all the way across Row 7 with the functionality in the formula.
35 © 2018 Marshall atkinson consulting, llc
price for profit
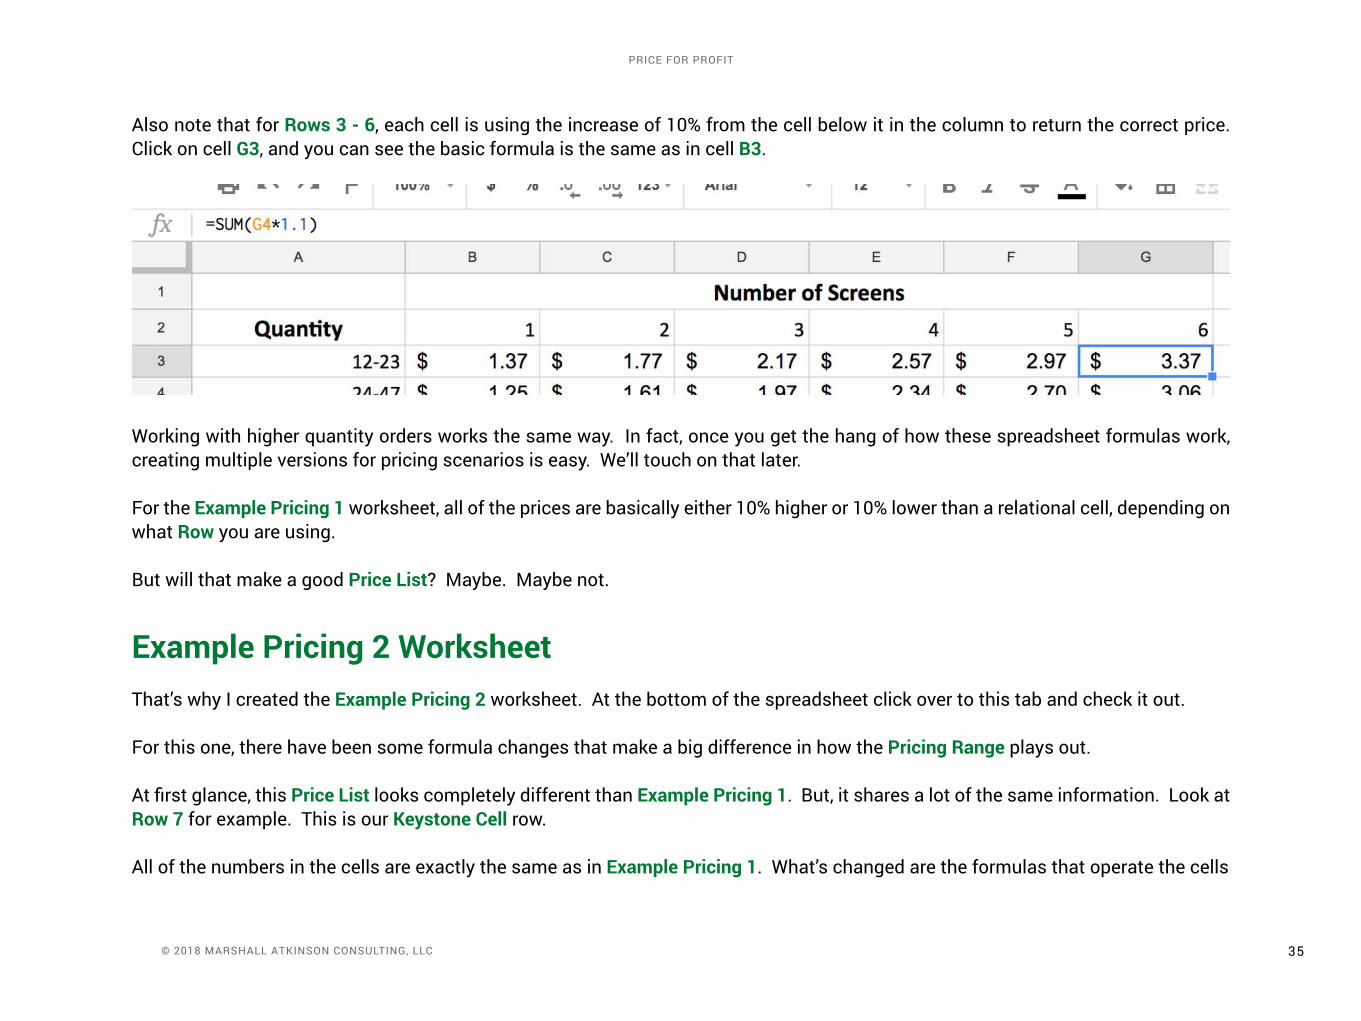
Also note that for Rows 3 - 6, each cell is using the increase of 10% from the cell below it in the column to return the correct price. click on cell G3, and you can see the basic formula is the same as in cell B3.
Working with higher quantity orders works the same way. In fact, once you get the hang of how these spreadsheet formulas work, creating multiple versions for pricing scenarios is easy. We’ll touch on that later.
for the Example Pricing 1 worksheet, all of the prices are basically either 10% higher or 10% lower than a relational cell, depending on what Row you are using.
But will that make a good Price List? Maybe. Maybe not.
Example Pricing 2 WorksheetThat’s why I created the Example Pricing 2 worksheet. At the bottom of the spreadsheet click over to this tab and check it out.
for this one, there have been some formula changes that make a big difference in how the Pricing Range plays out.
At first glance, this Price List looks completely different than Example Pricing 1. But, it shares a lot of the same information. Look at Row 7 for example. This is our Keystone Cell row.
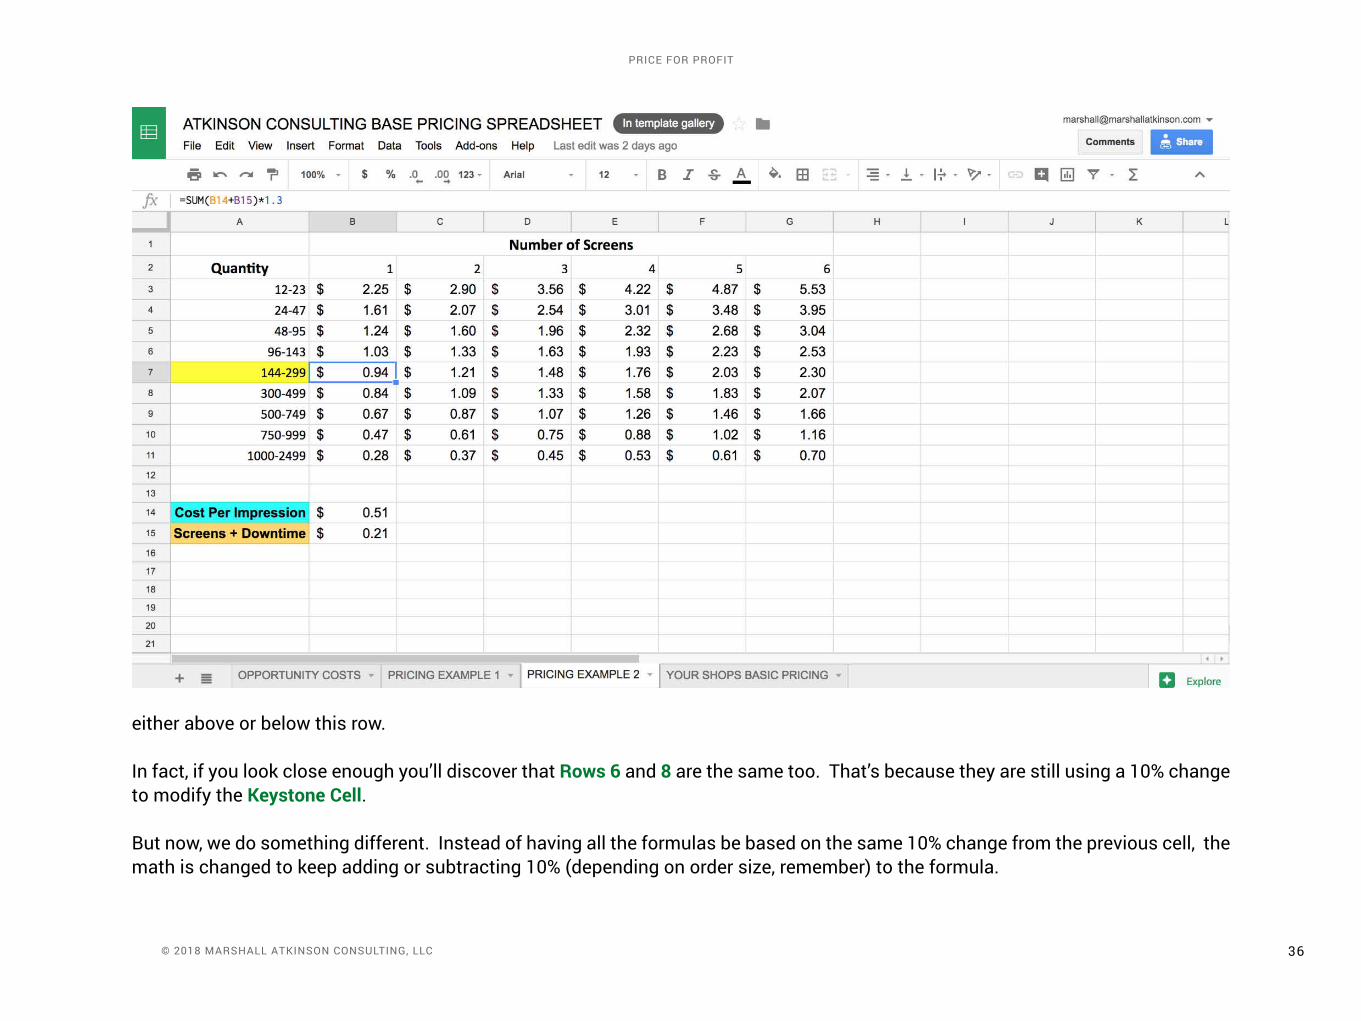
All of the numbers in the cells are exactly the same as in Example Pricing 1. What’s changed are the formulas that operate the cells
36 © 2018 Marshall atkinson consulting, llc
price for profit
either above or below this row.
In fact, if you look close enough you’ll discover that Rows 6 and 8 are the same too. That’s because they are still using a 10% change to modify the Keystone Cell.
But now, we do something different. Instead of having all the formulas be based on the same 10% change from the previous cell, the math is changed to keep adding or subtracting 10% (depending on order size, remember) to the formula.
37 © 2018 Marshall atkinson consulting, llc
price for profit
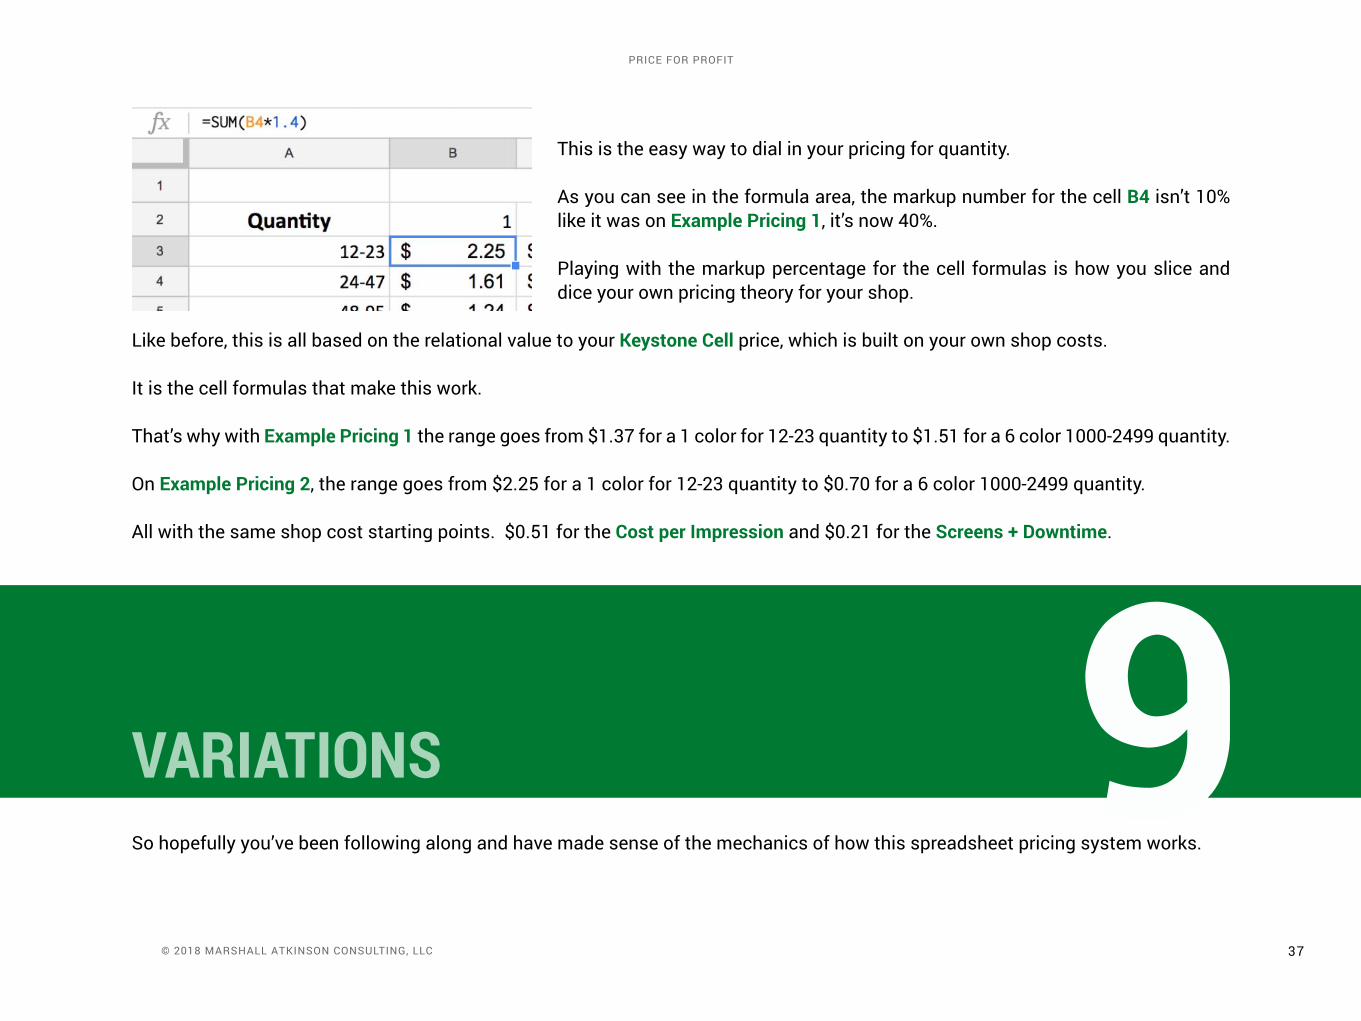
This is the easy way to dial in your pricing for quantity.
As you can see in the formula area, the markup number for the cell B4 isn’t 10% like it was on Example Pricing 1, it’s now 40%.
Playing with the markup percentage for the cell formulas is how you slice and dice your own pricing theory for your shop.
Like before, this is all based on the relational value to your Keystone Cell price, which is built on your own shop costs.
It is the cell formulas that make this work.
That’s why with Example Pricing 1 the range goes from $1.37 for a 1 color for 12-23 quantity to $1.51 for a 6 color 1000-2499 quantity.
On Example Pricing 2, the range goes from $2.25 for a 1 color for 12-23 quantity to $0.70 for a 6 color 1000-2499 quantity.
All with the same shop cost starting points. $0.51 for the Cost per Impression and $0.21 for the Screens + Downtime.
VARIATIONSSo hopefully you’ve been following along and have made sense of the mechanics of how this spreadsheet pricing system works.
9
38 © 2018 Marshall atkinson consulting, llc
price for profit
Now, here comes some advanced pricing strategies shops have been using with this tool. You absolutely don’t have to do things this way. But, I wanted to show a few points that may help you dial in your Price List so it works perfectly for your shop.
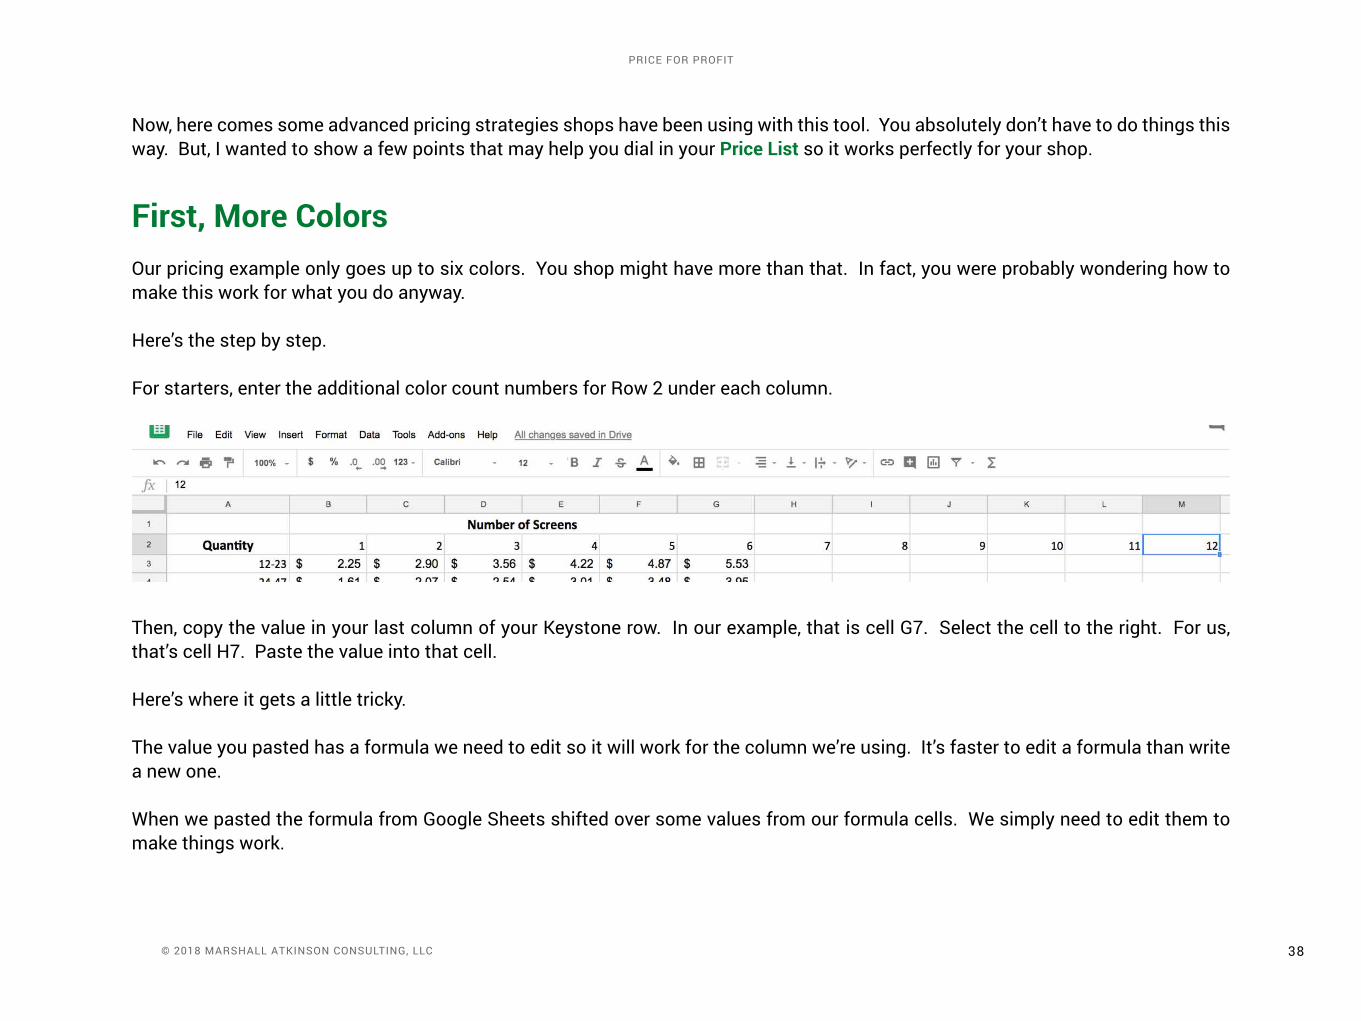
First, More ColorsOur pricing example only goes up to six colors. You shop might have more than that. In fact, you were probably wondering how to make this work for what you do anyway.
Here’s the step by step.
for starters, enter the additional color count numbers for Row 2 under each column.
Then, copy the value in your last column of your keystone row. In our example, that is cell G7. Select the cell to the right. for us, that’s cell H7. Paste the value into that cell.
Here’s where it gets a little tricky.
The value you pasted has a formula we need to edit so it will work for the column we’re using. It’s faster to edit a formula than write a new one.
When we pasted the formula from Google Sheets shifted over some values from our formula cells. We simply need to edit them to make things work.
39 © 2018 Marshall atkinson consulting, llc
price for profit
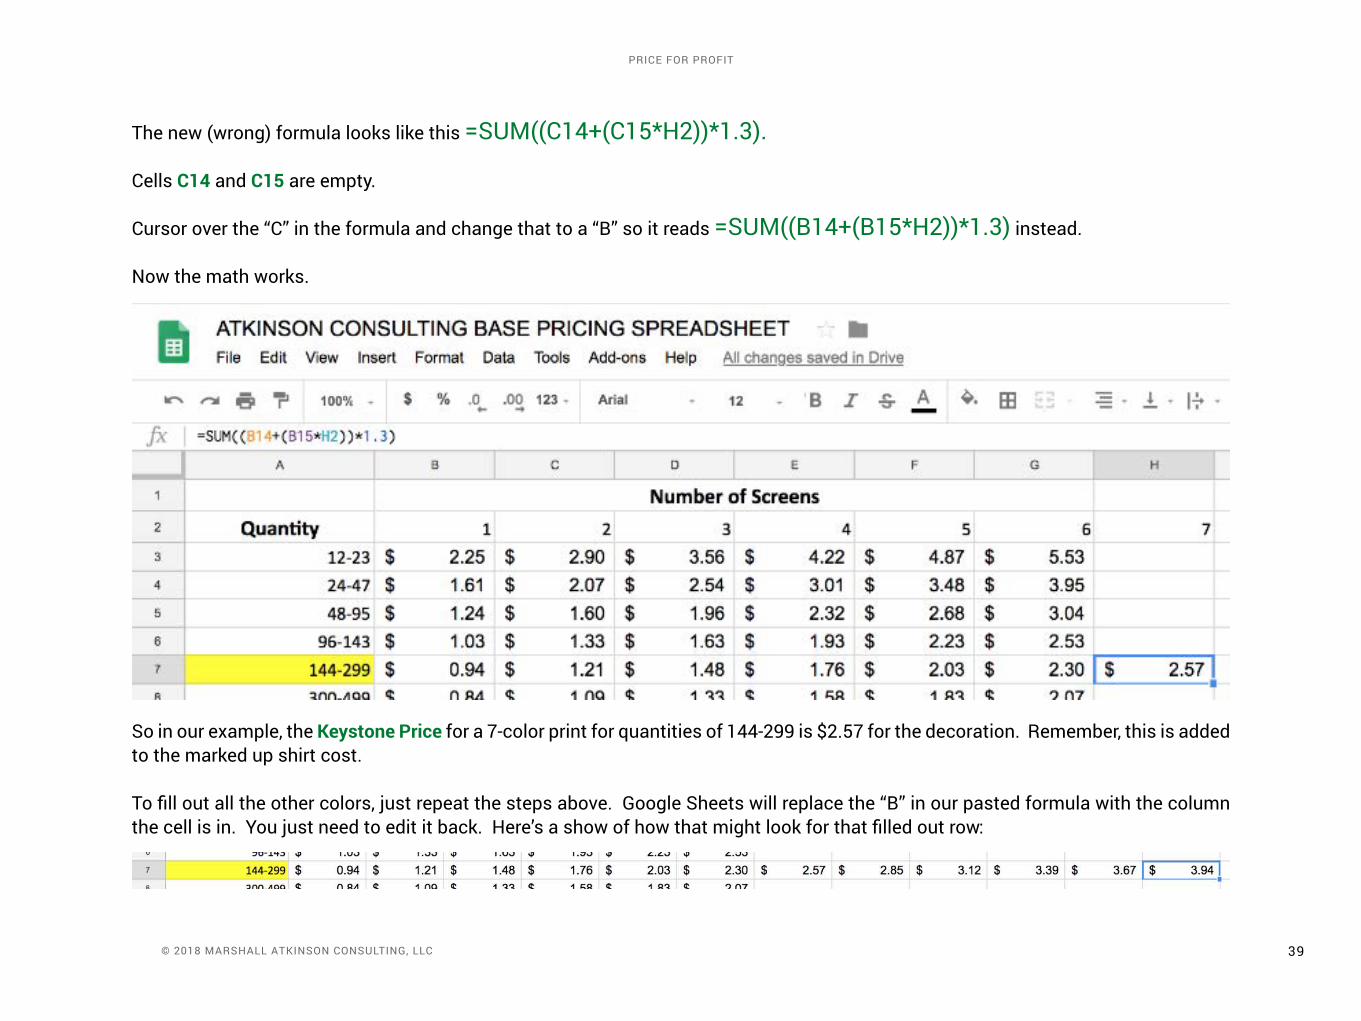
The new (wrong) formula looks like this =SuM((c14+(c15*H2))*1.3).
cells C14 and C15 are empty.
cursor over the “c” in the formula and change that to a “B” so it reads =SuM((B14+(B15*H2))*1.3) instead.
Now the math works.
So in our example, the Keystone Price for a 7-color print for quantities of 144-299 is $2.57 for the decoration. Remember, this is added to the marked up shirt cost.
To fill out all the other colors, just repeat the steps above. Google Sheets will replace the “B” in our pasted formula with the column the cell is in. You just need to edit it back. Here’s a show of how that might look for that filled out row:
40 © 2018 Marshall atkinson consulting, llc
price for profit
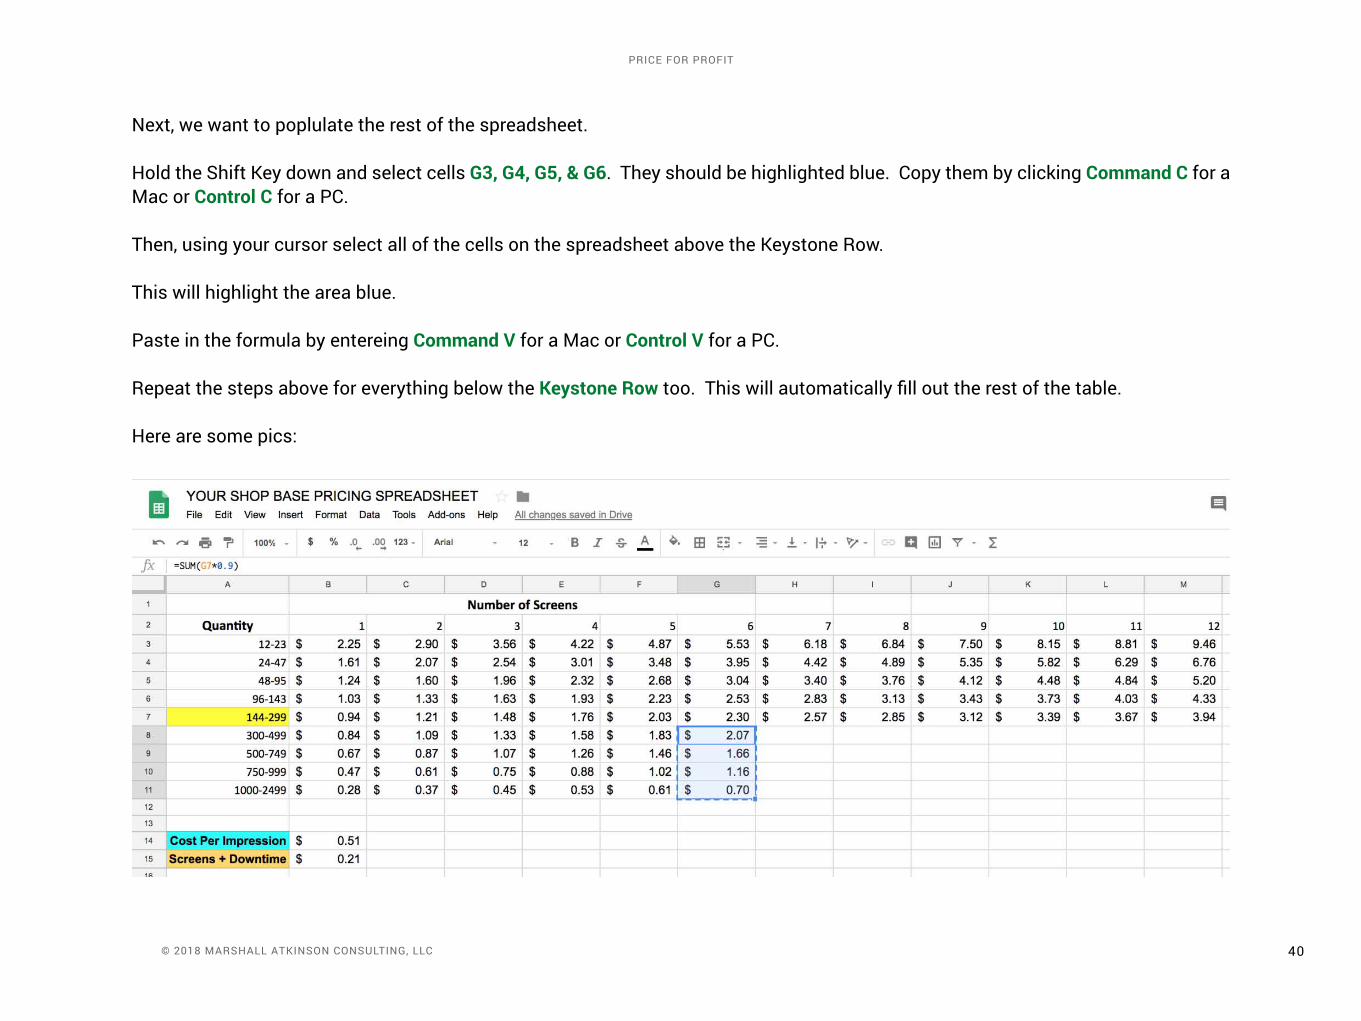
Next, we want to poplulate the rest of the spreadsheet.
Hold the Shift key down and select cells G3, G4, G5, & G6. They should be highlighted blue. copy them by clicking Command C for a Mac or Control C for a Pc.
Then, using your cursor select all of the cells on the spreadsheet above the keystone Row.
This will highlight the area blue.
Paste in the formula by entereing Command V for a Mac or Control V for a Pc.
Repeat the steps above for everything below the Keystone Row too. This will automatically fill out the rest of the table.
Here are some pics:
41 © 2018 Marshall atkinson consulting, llc
price for profit
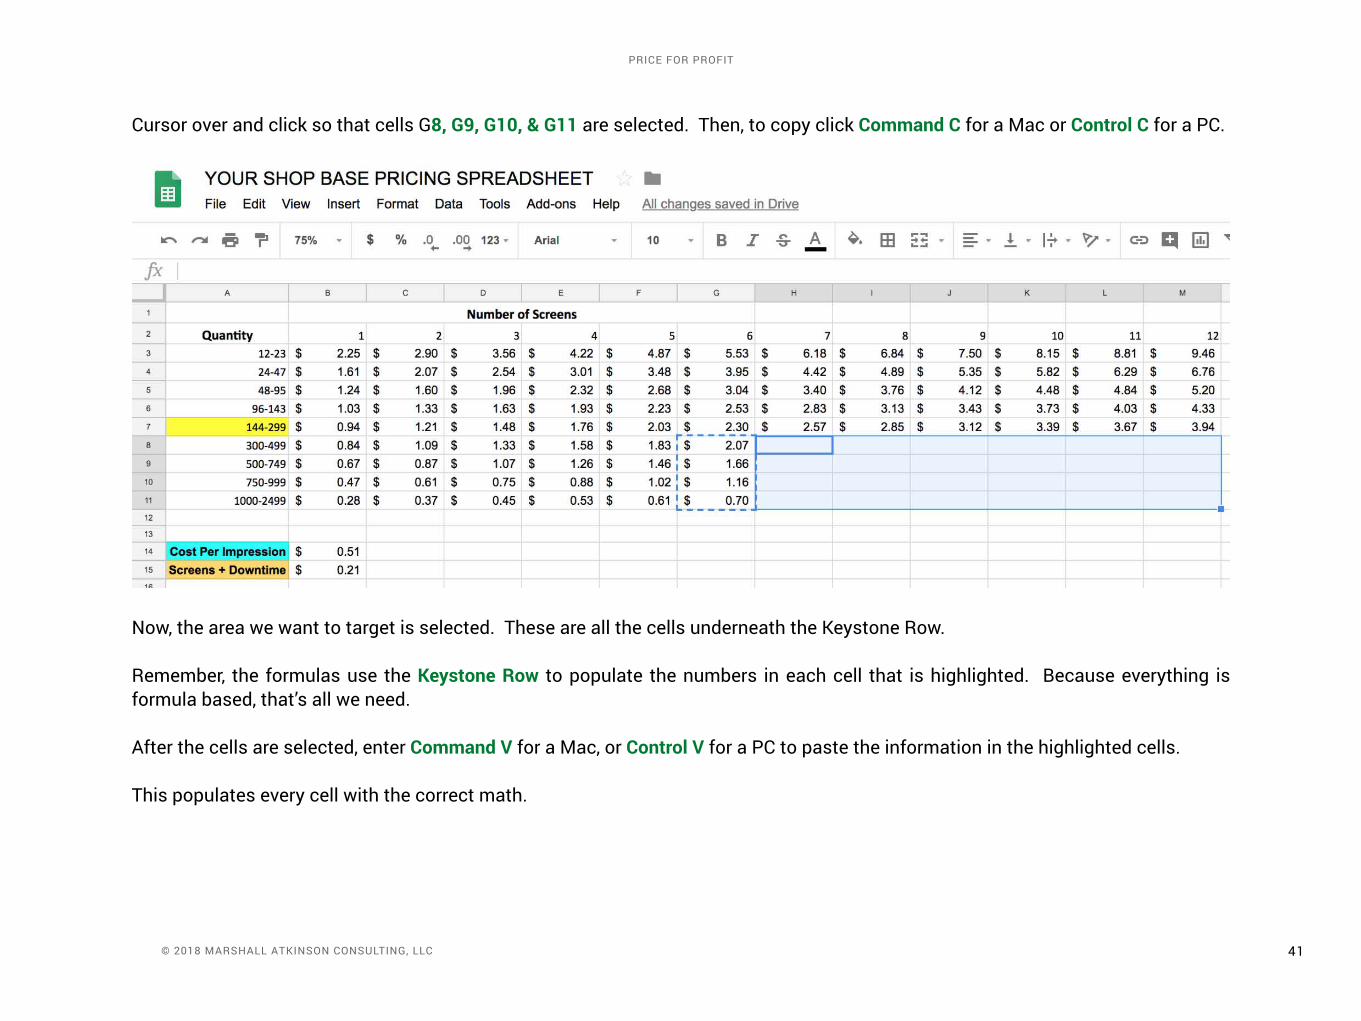
cursor over and click so that cells G8, G9, G10, & G11 are selected. Then, to copy click Command C for a Mac or Control C for a Pc.
Now, the area we want to target is selected. These are all the cells underneath the keystone Row.
Remember, the formulas use the Keystone Row to populate the numbers in each cell that is highlighted. Because everything is formula based, that’s all we need.
After the cells are selected, enter Command V for a Mac, or Control V for a Pc to paste the information in the highlighted cells.
This populates every cell with the correct math.
42 © 2018 Marshall atkinson consulting, llc
price for profit
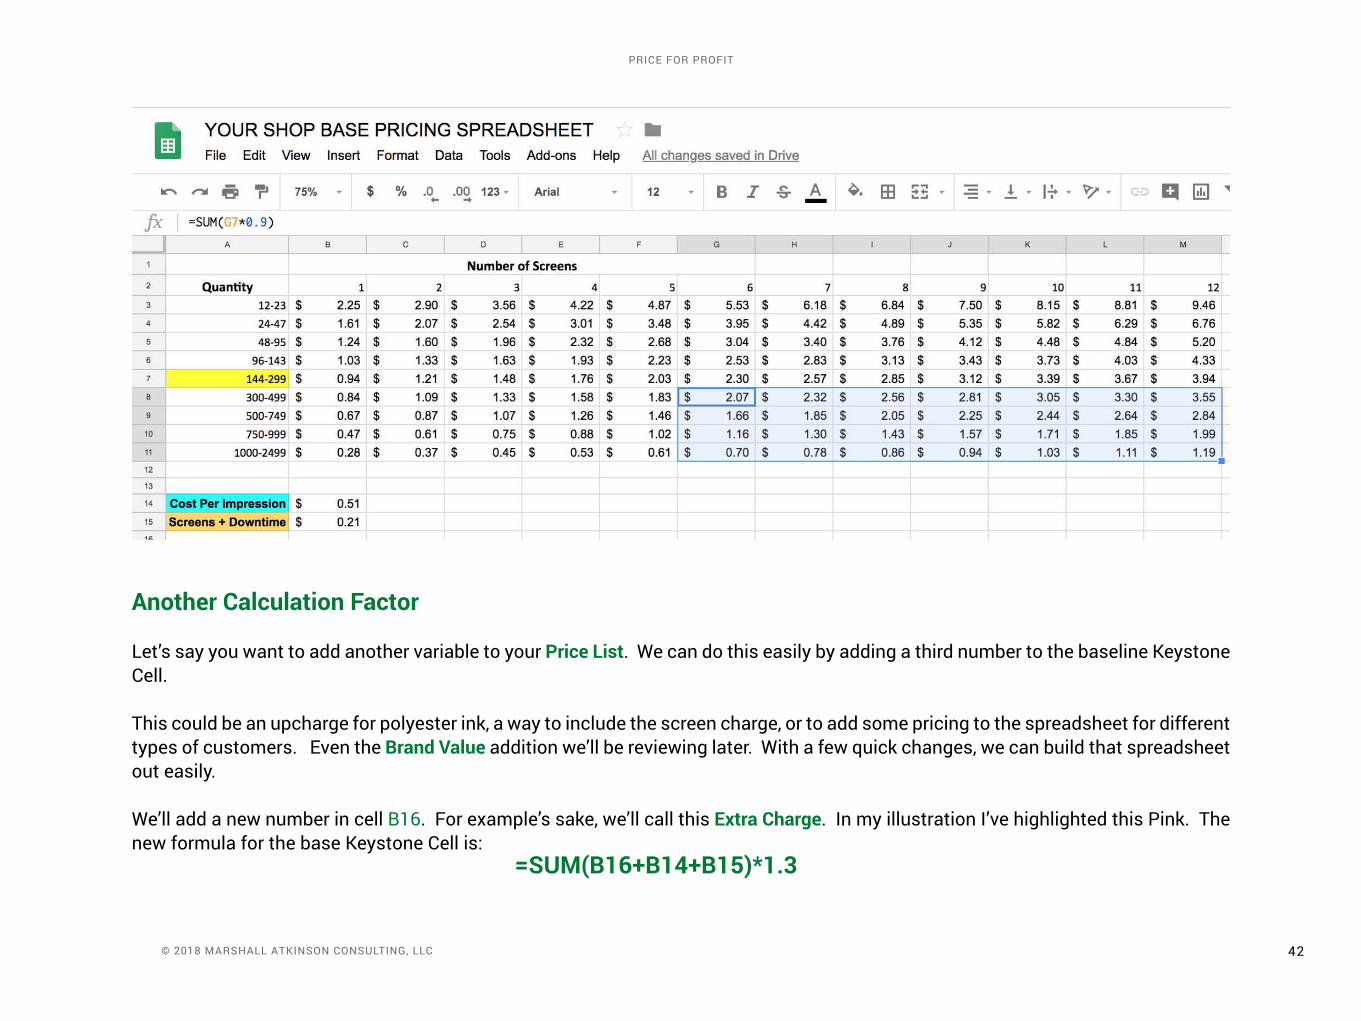
Another Calculation Factor
Let’s say you want to add another variable to your Price List. We can do this easily by adding a third number to the baseline keystone cell.
This could be an upcharge for polyester ink, a way to include the screen charge, or to add some pricing to the spreadsheet for different types of customers. Even the Brand Value addition we’ll be reviewing later. With a few quick changes, we can build that spreadsheet out easily.
We’ll add a new number in cell B16. for example’s sake, we’ll call this Extra Charge. In my illustration I’ve highlighted this Pink. The new formula for the base keystone cell is: =SUM(B16+B14+B15)*1.3
43 © 2018 Marshall atkinson consulting, llc
price for profit
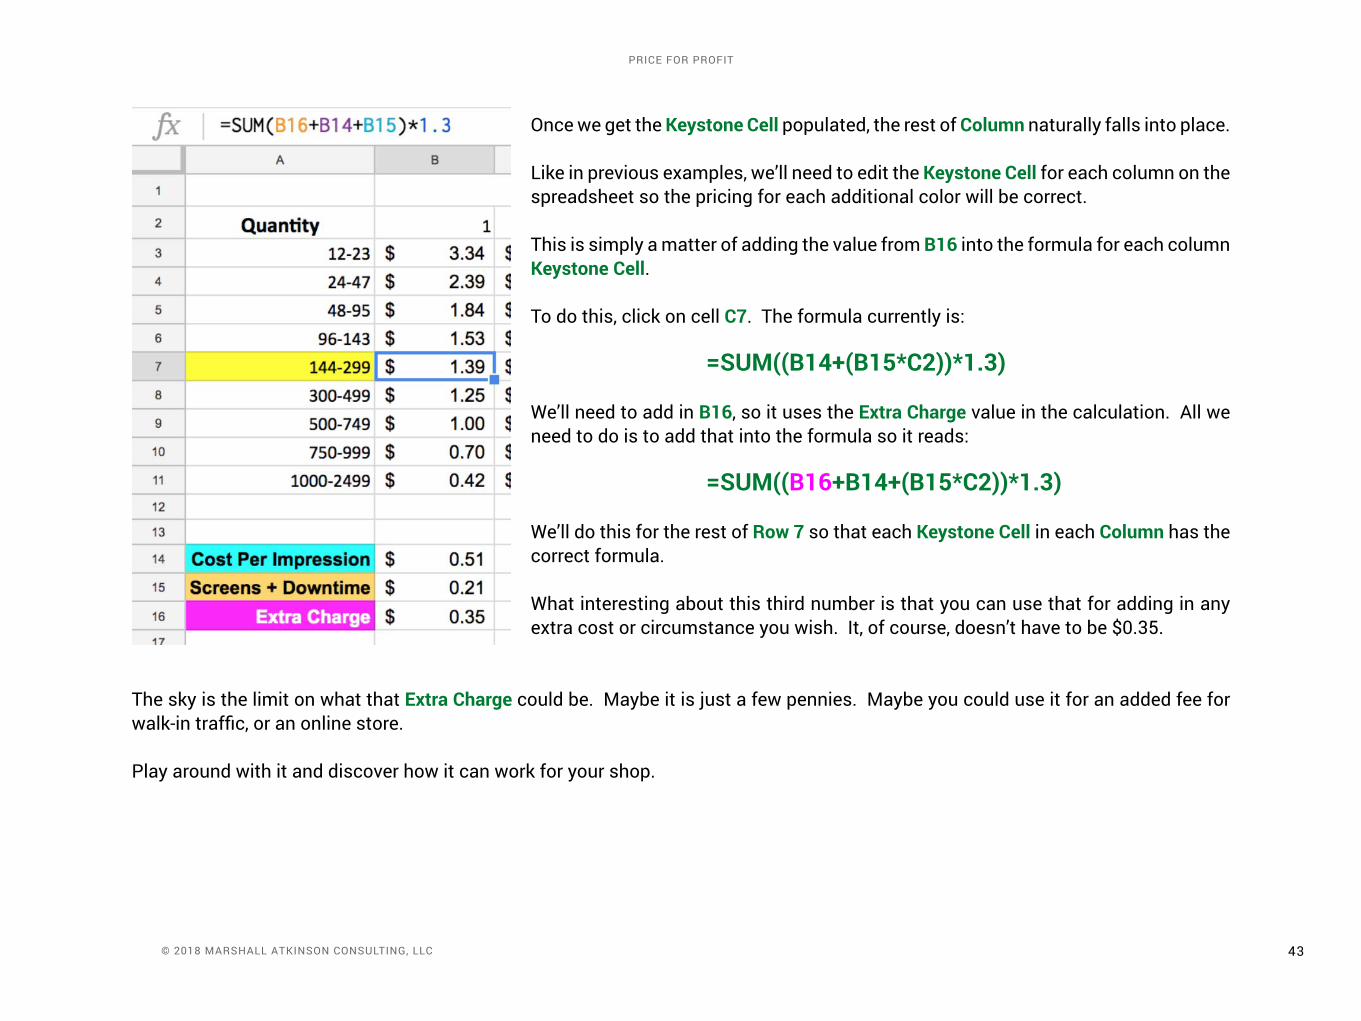
Once we get the Keystone Cell populated, the rest of Column naturally falls into place.
Like in previous examples, we’ll need to edit the Keystone Cell for each column on the spreadsheet so the pricing for each additional color will be correct.
This is simply a matter of adding the value from B16 into the formula for each column Keystone Cell.
To do this, click on cell C7. The formula currently is:
=SUM((B14+(B15*C2))*1.3)
We’ll need to add in B16, so it uses the Extra Charge value in the calculation. All we need to do is to add that into the formula so it reads:
=SUM((B16+B14+(B15*C2))*1.3)
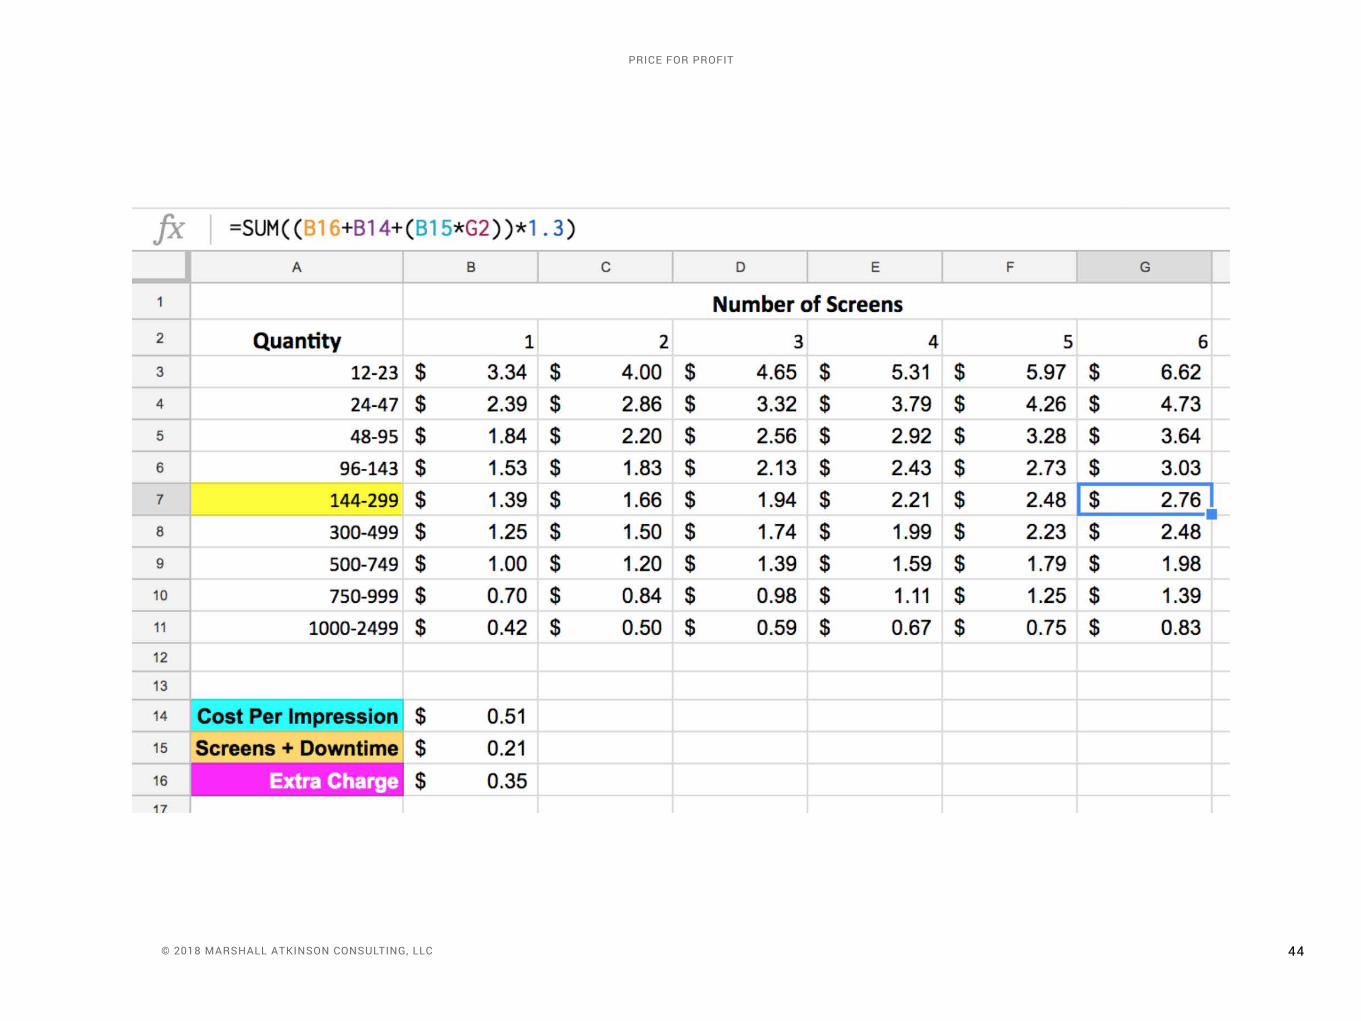
We’ll do this for the rest of Row 7 so that each Keystone Cell in each Column has the correct formula.
What interesting about this third number is that you can use that for adding in any extra cost or circumstance you wish. It, of course, doesn’t have to be $0.35.
The sky is the limit on what that Extra Charge could be. Maybe it is just a few pennies. Maybe you could use it for an added fee for walk-in traffic, or an online store.
Play around with it and discover how it can work for your shop.
44 © 2018 Marshall atkinson consulting, llc
price for profit
45 © 2018 Marshall atkinson consulting, llc
price for profit
ADDING IT UPSo now you have a basic way of calculating your Price List for screen-printing decoration. You are going to have to play around with the numbers to get them to work for you. change the variables in the formulas until the math is dialed into how you want to price jobs for your business. Most shops have two to four Price Lists for different business models they use.
The great thing is that this is using your shop’s costs, efficiencies, and real data to calculate the starting point for each Price List. It isn’t mumbo jumbo or some poor schmuck’s pricing you stole from the internet.
But what now?
The rest of the Cost Plus Pricing Model is using the shirt cost. After all, you’ll need to quote someone, right?
There are plenty of theories and suggestions on what to do with that idea. Some shops only mark up the cost of the blank by 30%. Other shops I know double the cost. Even others have different percentages based on what type of garment they are using.
Here’s the deal. There isn’t a right or wrong answer. It’s what works for you. The goal should be to mark up the blank as much as you possibly can. After all, that’s why you are in business. To make money.
Also, there are other charges that get thrown into the quoting process too. Some shops charge $15 per screen. Other’s might charge $25. Some don’t charge for screens at all.
Then there are other extras like changing out the neck labels, hangtagging or polybagging the shirts, and other order add-ons that you might encounter.
10
46 © 2018 Marshall atkinson consulting, llc
price for profit
A simple formula that you might use would be something like this:
(Shirt Cost x Mark Up %) + (Decoration Fee) + (Screen Charge) + (Extras) = Quoted Price
This is a typical Cost Plus type formula for calculating the price to quote your customer. Let’s play this out with some math that we have been working on and see if looks ok.
Our example quote is for 200 Yellow T-shirts. One color on the left chest and three colors on the back.
The shirts for the job are standard issue 100% cotton, and cost $1.87 from a major distributor. In our example, we mark up the shirts 40%, so the blank cost is $2.62 now.
Our example shop charges $20 per screen, so 3 x $20 = $60. $60/200 shirt quantity = $0.30.
using the Pricing Example 2 from the template, the one color left chest is $0.94, and the three color back is $1.48. Total Decoration fee is $2.42.
So using that same formula:
($2.62 Shirt) + ($2.42 Decoration) + ($0.30 Screens) + ($0.00 Extras) = $5.34 quoted price
But the great thing about this quote is that the math we’ve used to build it is based on the shops data and numbers.
If you have built out your spreadsheets, use a few jobs that you have taken and requote them with the new system. Do an assortment. Easy jobs. Hard jobs. Small quantity jobs. Ones on darks. Maybe a few sweatshirts, bandanas, or jacket orders.
Get a good mix. If the Price List doesn’t seem right, tweak it until you dial in the numbers by adjusting a few things.
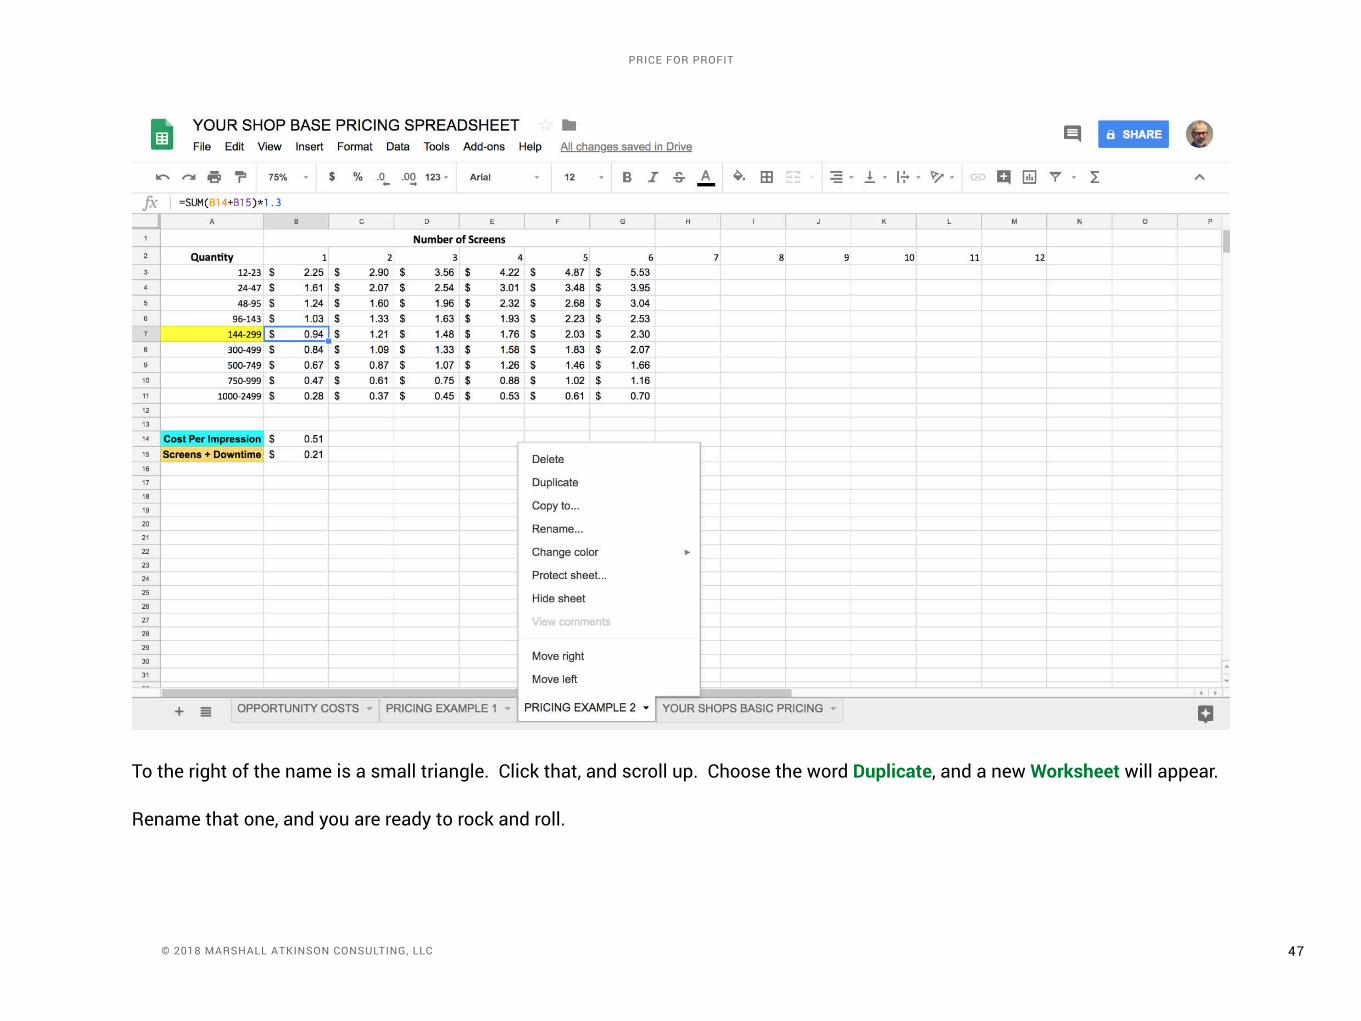
Instead of writing over a worksheet, I would highly recommend Duplicating a baseline one, and then modifying that. for a refresher, this is easy to do. At the bottom of the spreadsheet you’ll see the Worksheet tab names.
47 © 2018 Marshall atkinson consulting, llc
price for profit
To the right of the name is a small triangle. click that, and scroll up. choose the word Duplicate, and a new Worksheet will appear.
Rename that one, and you are ready to rock and roll.
48 © 2018 Marshall atkinson consulting, llc
price for profit
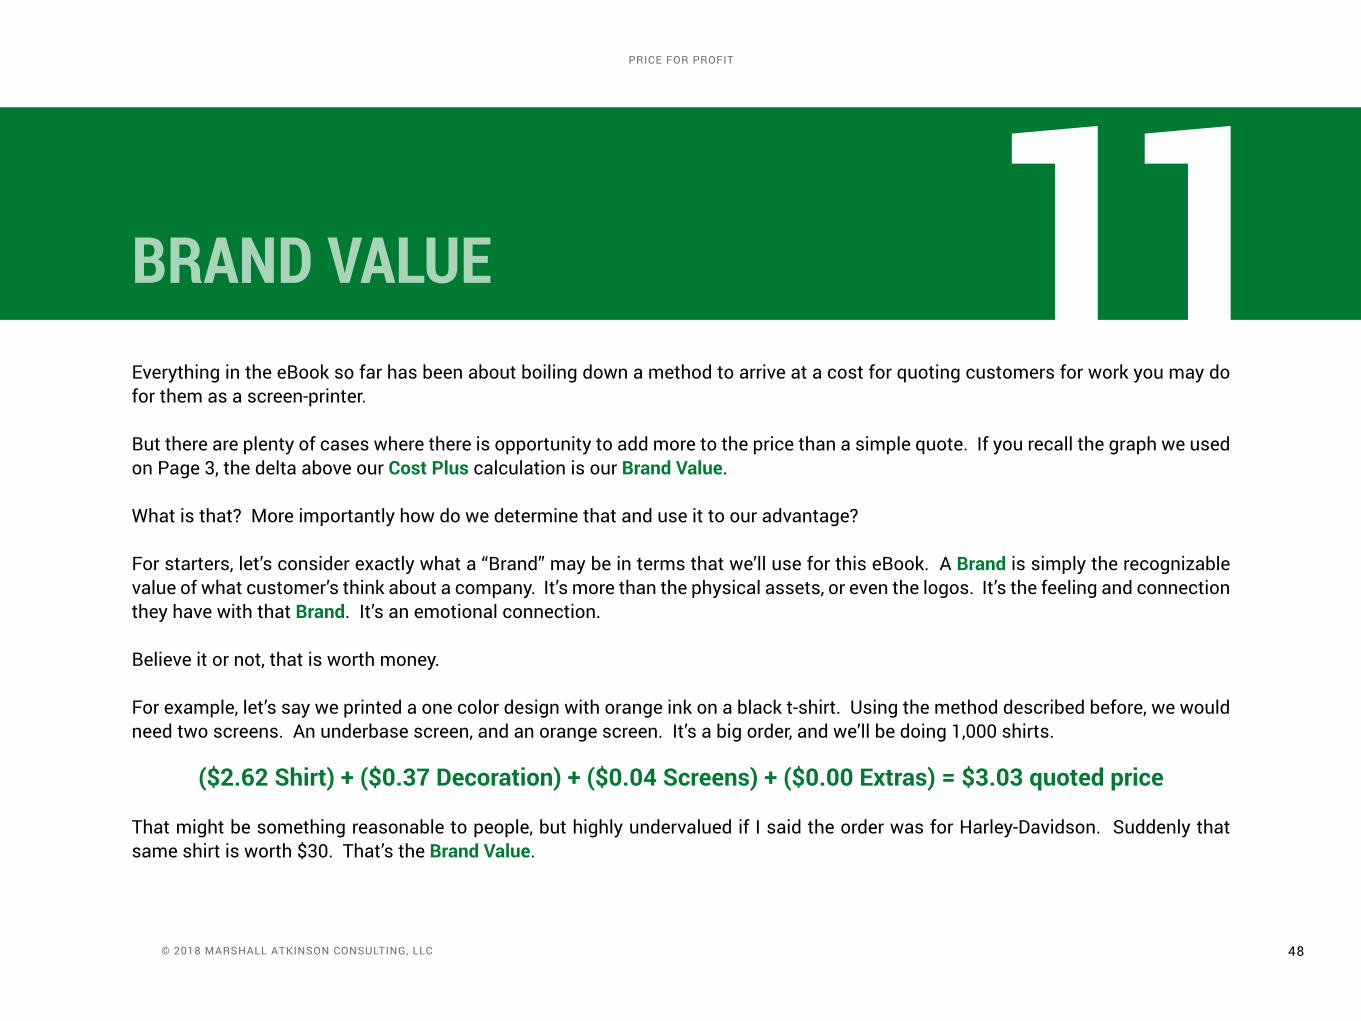
BRAND VALUEEverything in the eBook so far has been about boiling down a method to arrive at a cost for quoting customers for work you may do for them as a screen-printer.
But there are plenty of cases where there is opportunity to add more to the price than a simple quote. If you recall the graph we used on Page 3, the delta above our Cost Plus calculation is our Brand Value.
What is that? More importantly how do we determine that and use it to our advantage?
for starters, let’s consider exactly what a “Brand” may be in terms that we’ll use for this eBook. A Brand is simply the recognizable value of what customer’s think about a company. It’s more than the physical assets, or even the logos. It’s the feeling and connection they have with that Brand. It’s an emotional connection.
Believe it or not, that is worth money.
for example, let’s say we printed a one color design with orange ink on a black t-shirt. using the method described before, we would need two screens. An underbase screen, and an orange screen. It’s a big order, and we’ll be doing 1,000 shirts.
($2.62 Shirt) + ($0.37 Decoration) + ($0.04 Screens) + ($0.00 Extras) = $3.03 quoted price
That might be something reasonable to people, but highly undervalued if I said the order was for Harley-Davidson. Suddenly that same shirt is worth $30. That’s the Brand Value.
11
49 © 2018 Marshall atkinson consulting, llc
price for profit
But you aren’t Harley Davidson.
So, let’s try to work out how you can determine your Brand Value for your company. There are some key concepts to understand.
Price ElasticitySimply put, if you want to be able to obtain premium pricing, this is the key to understand where you fit in the marketplace. When customers demand for your work goes up, even when prices increase, your Brand enjoys a favorable Price Elasticity.
What you are creating hopefully resonates with your audience. So much in fact, that they will keep buying even after you raise prices.
A great way to determine your place in the market is to use comparisons, market surveys, and feedback from your customers. Remember, you aren’t selling ink on cotton. You are selling memories. You are selling attitudes about a lifestyle. Your creativity. Your problem solving skills.
Whatever the emotional connection is to your work is your “Extra”.
Premium Pricing AdvantageWhen you constantly have high Price Elasticity, you can demand a premium in the marketplace. This is simply how much people are willing to pay above what others might be charging for similar work.
The difference between your Brand and a lesser-known, but comparable brand is your Brand Value. If you multiply this difference in price by your total sales volume, you can calculate your Brand’s Market Position.
So, What Does This Mean?for example, let’s say you are a very well known designer. More than just any graphic artist out there, you have a following. As a business idea, you start a t-shirt company. The goal is to bring your creative flair, that already is extremely popular to the marketplace
50 © 2018 Marshall atkinson consulting, llc
price for profit
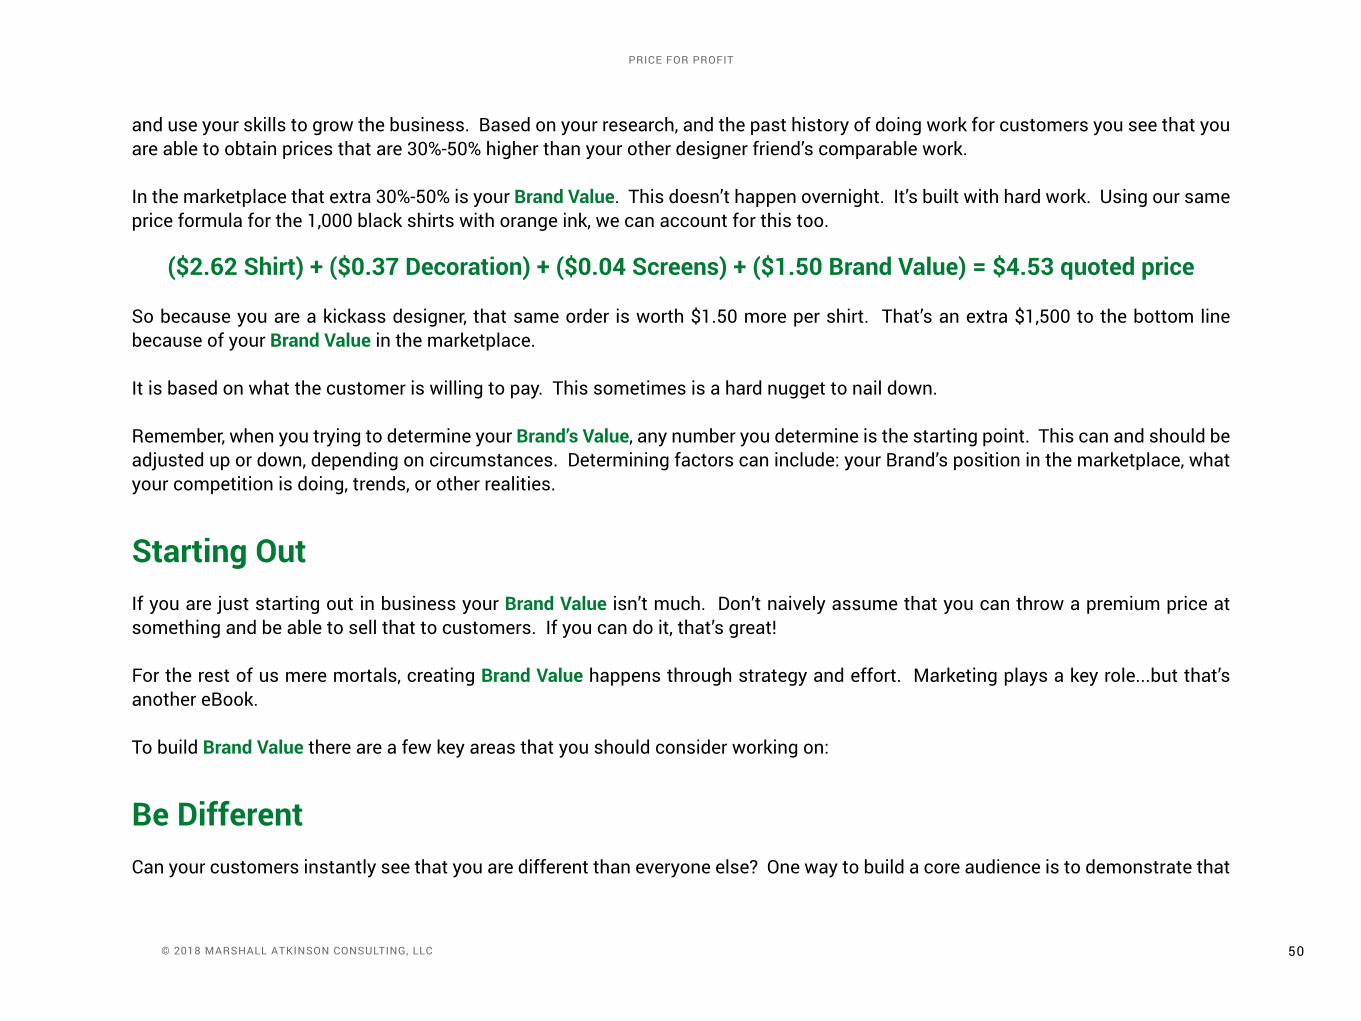
and use your skills to grow the business. Based on your research, and the past history of doing work for customers you see that you are able to obtain prices that are 30%-50% higher than your other designer friend’s comparable work.
In the marketplace that extra 30%-50% is your Brand Value. This doesn’t happen overnight. It’s built with hard work. using our same price formula for the 1,000 black shirts with orange ink, we can account for this too.
($2.62 Shirt) + ($0.37 Decoration) + ($0.04 Screens) + ($1.50 Brand Value) = $4.53 quoted price
So because you are a kickass designer, that same order is worth $1.50 more per shirt. That’s an extra $1,500 to the bottom line because of your Brand Value in the marketplace.
It is based on what the customer is willing to pay. This sometimes is a hard nugget to nail down.
Remember, when you trying to determine your Brand’s Value, any number you determine is the starting point. This can and should be adjusted up or down, depending on circumstances. Determining factors can include: your Brand’s position in the marketplace, what your competition is doing, trends, or other realities.
Starting OutIf you are just starting out in business your Brand Value isn’t much. Don’t naively assume that you can throw a premium price at something and be able to sell that to customers. If you can do it, that’s great!
for the rest of us mere mortals, creating Brand Value happens through strategy and effort. Marketing plays a key role...but that’s another eBook.
To build Brand Value there are a few key areas that you should consider working on:
Be Differentcan your customers instantly see that you are different than everyone else? One way to build a core audience is to demonstrate that
51 © 2018 Marshall atkinson consulting, llc
price for profit
you aren’t like everyone else. This could be in your creative approach to artwork. It could be your social mission that’s tied to your core business. Maybe it is with your your drive to be eco-friendly. can you offer packaged solution strategies, so your competition can’t line item discount your work?
What Is Your Mission?Strong brands clearly communicate what they are about. Think about the brands that you like personally. What drives that purchasing habit for you? How can your company build that same behavior?
Does the main reason you are in business align with your customer’s primary problem or need?
Continually Ask QuestionsDo you constantly make your customers happy? What can you do right now that will make them happier?
Do your customers believe that you care about them? How do you know?
Do you have an unfair advantage in the marketplace? Something that is difficult for the competition to clone or build?
Connect EmotionallyGreat brands don’t sell on benefits or price. They sell on emotion. Think about it, and then consider how your Brand connects with your customers. Are you selling on price, or an emotional connection to your work? Emotion Based Sales = Higher Value
Apple’s rise to dominance is more based on their marketing that they are different and cool, than about their products.
Mercedes-Benz ads feature the slogan “The Best, or Nothing”, as they market the status symbol for their cars.
“Have a Coke and a smile.” is not about the flavor of the soda, but the feeling of happiness.
52 © 2018 Marshall atkinson consulting, llc
price for profit
How are you marketing your brand?
Are you positioning your company based on an emotional response that will connect with your customers? Or, are you offering only advertising that you have hoodies on sale?
Is discounting your work building Brand Value? Be careful.
CLOSING THOUGHTSPricing is a unique animal. Every shop is different, as they serve distinctive markets, locations, and industries. What you bring to the table is completely unique to your situation.
This is why you need to organize your pricing structure based on your particular math.
As you’ve seen in the book, getting it set up is the hard part. Once you have built the engine and it’s working though, it becomes a repeatable process.
This is something you can train your staff to use. As your shop grows and changes with new infrastructure, equipment, and employee headcount, your math will change too. Especially if you are building Brand Value. Add that extra into your core pricing.
Gone are the days were people only used one set of pricing and they were stuck with it forever. companies all around you change their pricing constantly to make the best of their situation. You can too.
12
53 © 2018 Marshall atkinson consulting, llc
price for profit
THANKS!Thank you for reading this eBook. I hope that you found the contents helpful for your shop. But don’t stop at just reading the book. The key to making lasting change is implementing new ideas.
Not everything may go correctly the first time. Or the second. Keep plugging away and tweaking things. Try to get 1% better everyday.
If you need help along the way, that’s what I do. Reach out and contact me and let’s work together to solve your problems!
Got a burning question or problem that you need help with?feel free to email me at [email protected]