Embed Size (px)
Citation preview
Rankin & Associates, Consulting Assessment • Planning • Interventions
University of Missouri -Columbia
Campus Climate Research Study
September 2017
Rankin St Associates, Consulting
Rankin & Associates Consulting Campus Climate Assessment Project
University of Missouri-Columbia Report September 2017
Table of Contents Executive Summary i
Introduction i History of the Project i
Project Design and Campus Involvement ii University of Missouri-Columbia Participants lii Key Findings - Areas of Strength v Key Findings - Opportunities for Improvement viii Additional Key Findings - Student Respondents Perceived Academic Success....xiv
Conclusion xv Introduction 1
History of the Project 1 Project Design and Campus Involvement 2 Contextual Framework and Summary of Related Literature 3 Institutional Climate Within Campus Structures 4 Campus Climate and Student, Faculty, and Staff Success 4 Accessibility and Inclusivity 6 Campus Climate and Student Activism 7
Methodology 9 Conceptual Framework 9 Research Design 9
Results 14 Description of the Sample 14 Sample Characteristics 18
Campus Climate Assessment Findings 55 Comfort With the Climate at University of Missouri-Columbia 55 Barriers at University of Missouri-Columbia for Respondents With Disabilities ... 99 Barriers at University of Missouri-Columbia for Transspectrum Respondents 105 Personal Experiences of Exclusionary, Intimidating, Offensive, and/or Hostile
Conduct 108 Observations of Exclusionary, Intimidating, Offensive, and/or Hostile Conduct. 127
Faculty and Staff Perceptions of Climate 148 Perceptions of Employment Practices 148 Staff Respondents' Views on Workplace Climate and Work-Life Balance 159 Faculty/Senior Administrator with Faculty Rank Respondents' Views on Workplace Climate and Work-Life Balance 224 Employee Respondents Who Have Seriously Considered Leaving University of Missouri-Columbia 273 Summary 282
Rankin & Associates Consulting Campus Climate Assessment Project
University of Missouri-Columbia Report September 2017
Student Perceptions of Campus Climate 284 Students' Perceived Academic Success 284 Students' Perceptions of Campus Climate 293 Graduate Student/Professional Student/Post-Doctoral Scholar Respondents' Views on Advising and Departmental Support 336 Students Who Have Seriously Considered Leaving University of Missouri-Columbia 349 Summary 368
Institutional Actions 369
Summary 395
Next Steps 396
References 397
Appendices 403
Appendix A - Cross Tabulations by Selected Demographics 404
Appendix B - Data Tables 406
Appendix C - Comment Analyses (Questions #118, #119, and #120) 500
Appendix D - Survey: University of Missouri-Columbia Climate for Learning, Living, and Working 511
Rankin & Associates Consulting Campus Climate Assessment Project
University of Missouri-Columbia Report September 2017
Executive Summary Introduction History of the Project
University of Missouri-Columbia affirms that diversity and inclusion are crucial to the
intellectual vitality of the campus community, and that they engender academic engagement
where teaching, working, learning, and living take place in pluralistic communities of mutual
respect. Free exchange of different ideas and viewpoints in supportive environments encourage
students, faculty, and staff to develop the critical thinking and citizenship skills that will benefit
them throughout their lives.
University of Missouri-Columbia also is committed to fostering a caring community that
provides leadership for constructive participation in a diverse, multicultural world. As noted in
University of Missouri-Columbia's mission statement, "Our distinct mission, as Missouri's only
state-supported member of the Association of American Universities, is to provide all
Missourians the benefits of a world-class research university. We are stewards and builders of a
priceless state resource, a unique physical infrastructure and scholarly environment in which our
tightly interlocked missions of teaching, research, service and economic development work
together on behalf of all citizens. Students work side by side with some of the world's best
faculty to advance the arts and humanities, the sciences and the professions. Scholarship and
teaching are daily driven by a commitment to public service — the obligation to produce and
disseminate knowledge that will improve the quality of life in the state, the nation and the
world."1 To better understand the campus climate, the senior administration at University of
Missouri-Columbia recognized the need for a comprehensive tool that would provide campus
climate metrics for the experiences and perceptions of its students, faculty, and staff! During the
fall 2016 semester, University of Missouri-Columbia conducted a comprehensive survey of all
students, faculty, and staff to develop a better understanding of the learning, living, and working
environment 011 campus.
1 http: //missouri. edu/about/mission. php
1
Rankin & Associates Consulting Campus Climate Assessment Project
University of Missouri-Columbia Report September 2017
In May 2016, members of University of Missouri-Columbia worked with the University of
Missouri System to form the Systemwide Climate Study Team (SCST). The SCST was
composed of faculty, staff, and administrators across the entire University of Missouri System.
Ultimately, the University of Missouri System contracted with Rankin & Associates Consulting
(R&A) to conduct a campus-wide study entitled " University of Missouri - Columbia Climate
for Learning, Living, and Working." Data gathered via reviews of relevant University of
Missouri-Columbia literature and a campus-wide survey addressing the experiences and
perceptions of various constituent groups will be presented to the University of Missouri-
Columbia community. The community, upon receiving the report, will then come together to
develop and complete two or three action items by spring 2018.
Project Design and Campus Involvement
The conceptual model used as the foundation for University of Missouri-Columbia's assessment
of campus climate was developed by Smith et al. (1997) and modified by Rankin (2003). A
power and privilege perspective informs the model, one grounded in critical theory which
establishes that power differentials, both earned and unearned, are central to all human
interactions (Brookfield, 2005). Unearned power and privilege are associated with membership
in dominant social groups (Johnson, 2005) and influence systems of differentiation that
reproduce unequal outcomes. University of Missouri-Columbia's assessment was the result of a
comprehensive process to identify the strengths and challenges of campus climate, with a
specific focus on the distribution of power and privilege among differing social groups. This
report provides an overview of the results of the campus-wide survey.
In total, 9,952 people completed the survey. In the end, the University of Missouri-Columbia's
assessment was the result of a comprehensive process to identify the strengths and challenges of
the campus climate, with a specific focus on the distribution of power and privilege among
differing social groups at University of Missouri-Columbia.
li
Rankin & Associates Consulting Campus Climate Assessment Project
University of Missouri-Columbia Report September 2017
University of Missouri-Columbia Participants
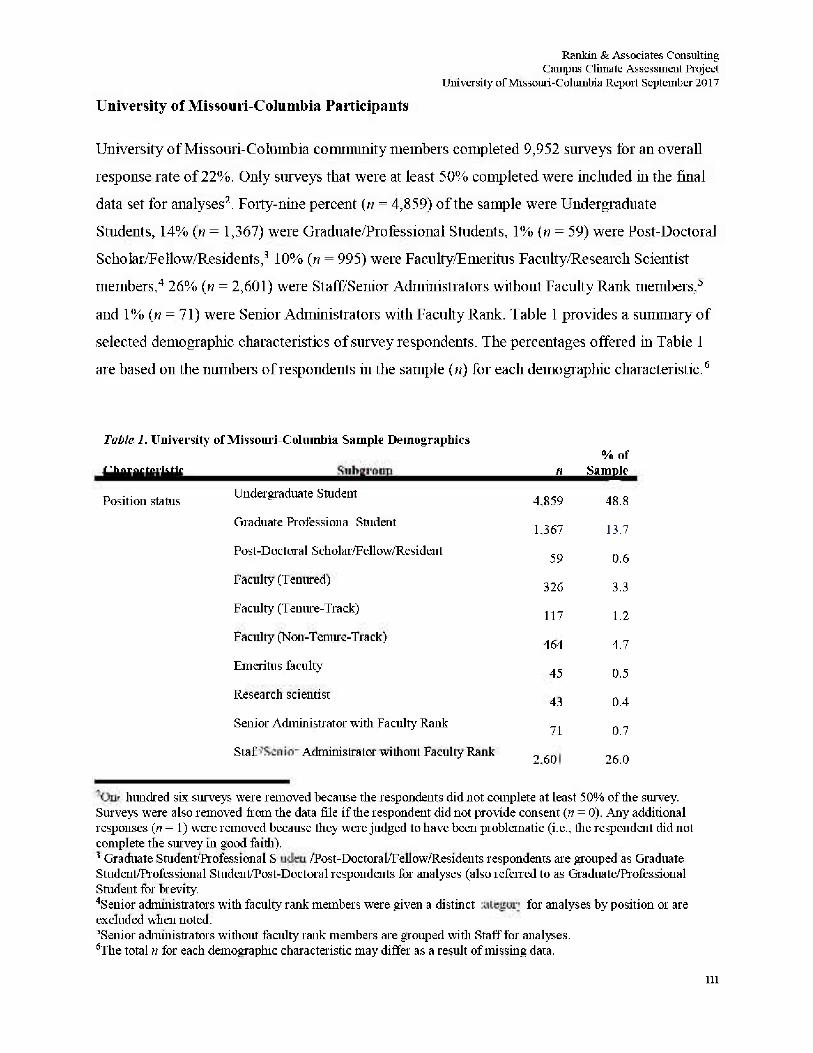
University of Missouri-Columbia community members completed 9,952 surveys for an overall
response rate of 22%. Only surveys that were at least 50% completed were included in the final
data set for analyses2. Forty-nine percent (n = 4,859) of the sample were Undergraduate
Students, 14% (w = 1,367) were Graduate/Professional Students, 1% (n = 59) were Post-Doctoral
Scholar/Fellow/Residents,3 10% (« = 995) were Faculty/Emeritus Faculty/Research Scientist
members,4 26% (n = 2,601) were Staff/Senior Administrators without Faculty Rank members,5
and 1% (n = 71) were Senior Administrators with Faculty Rank. Table 1 provides a summary of
selected demographic characteristics of survey respondents. The percentages offered hi Table 1
are based on the numbers of respondents in the sample (n) for each demographic characteristic.6
Table 1. University of Missouri-Columbia Sample Demographics
Characteristic
Position status
Subgroup n
% of Sample
Undergraduate Student 4,859 48.8 Graduate/ Professional Student 1,367 13.7 Post-Doctoral Scholar/Fellow/Resident 59 0.6 Faculty (Tenured) 326 3.3 Faculty (Tenure-Track) 117 1.2 Faculty (Non-Tenure-Track) 464 4.7 Emeritus faculty 45 0.5 Research scientist 43 0.4 Senior Administrator with Faculty Rank 71 0.7 Staff/Senior Administrator without Faculty Rank 2,601 26.0
One hundred six surveys were removed because the respondents did not complete at least 50% of the survey. Surveys were also removed from the data file if the respondent did not provide consent (n = 0). Any additional responses (n = 1) were removed because they were judged to have been problematic (i.e., the respondent did not complete the survey in good faith). 3 Graduate Student Professional Student/Post-Doctoral/Fellow/Residents respondents are grouped as Graduate Student/Professional Student Post-Doctoral respondents for analyses (also referred to as Graduate/Professional Student for brevity. 4 Senior administrators with faculty rank members were given a distinct category for analyses by position or are excluded when noted. 'Senior administrators without faculty rank members are grouped with Staff for analyses. sThe total n for each demographic characteristic may differ as a result of missing data.
Ill
Rankin & Associates Consulting Campus Climate Assessment Project
University of Missouri-Columbia Report September 2017
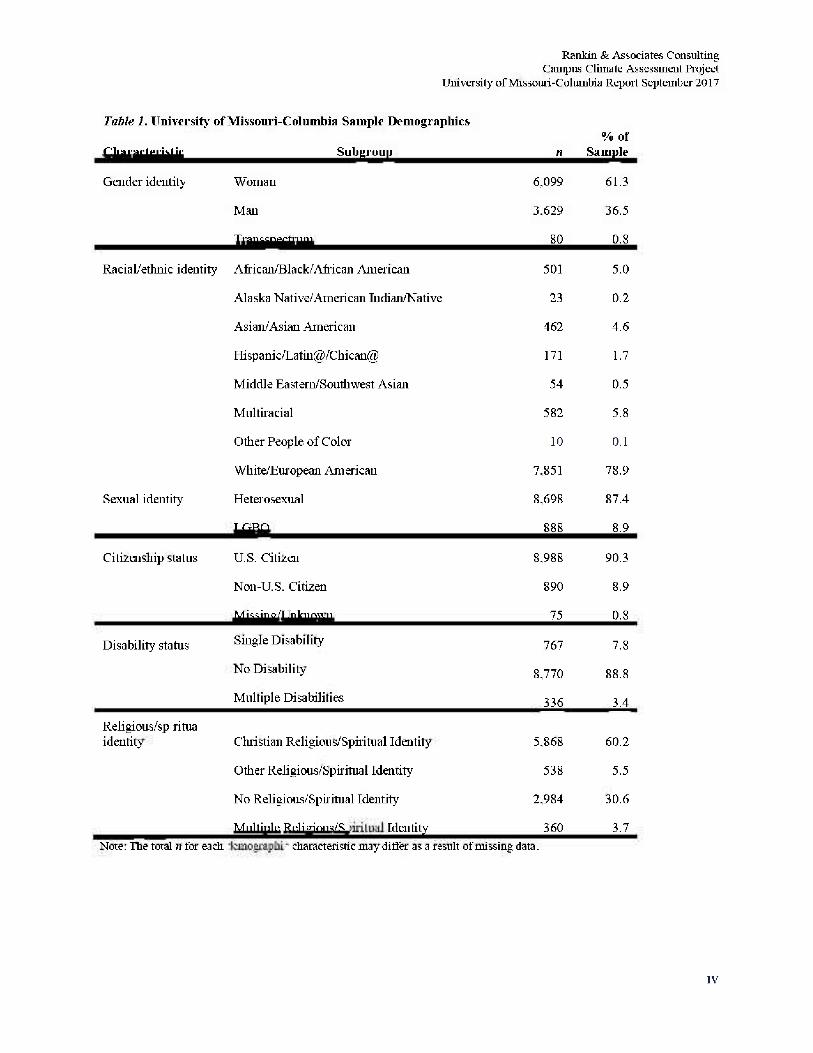
Table 1. University of Missouri-Columbia Sample Demographics % of
Characteristic Subgroup n Sample
Gender identity Woman 6,099 61.3
Man 3.629 36.5
Trans spectrum 80 0.8
Racial/ethnic identity African/Black/African American 501 5.0
Alaska Native/American Indian/Native 23 0.2
Asian/Asian American 462 4.6
Hispanic/Latin@/Cbican@ 171 1.7
Middle Eastern/Southwest Asian 54 0.5
Multiracial 582 5.8
Other People of Color 10 0.1
White/European American 7,851 78.9
Sexual identity Heterosexual 8,698 87.4
LGBQ 888 8.9
Citizenship status U.S. Citizen 8,988 90.3
Non-U. S. Citizen 890 8.9
Missing/Unknown 75 0.8
Disability status Single Disability 767 7.8
No Disability 8,770 88.8
Multiple Disabilities 336 3.4
Religious/spiritual identity Christian Religious/Spiritual Identity 5,868 60.2
Other Religious/Spiritual Identity 538 5.5
No Religious/Spiritual Identity 2,984 30.6
Multiple Religious/Spiritual Identity 360 3.7 Note: The total n for each demographic characteristic may differ as a result of missing data.
IV
Rankin & Associates Consulting Campus Climate Assessment Project
University of Missouri-Columbia Report September 2017
Key Findings - Areas of Strength
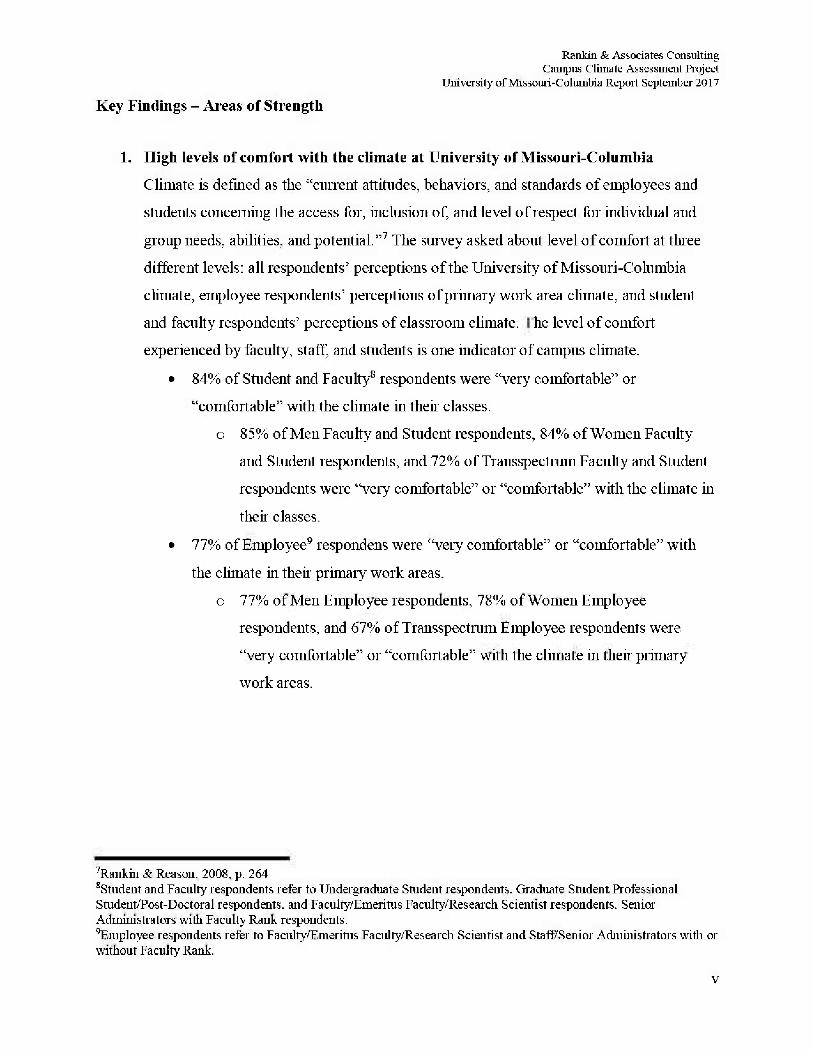
1. High levels of comfort with the climate at University of Missouri-Columbia Climate is defined as the "current attitudes, behaviors, and standards of employees and
students concerning the access for, inclusion of, and level of respect for individual and
group needs, abilities, and potential."7 The survey asked about level of comfort at three
different levels: all respondents' perceptions of the University of Missouri-Columbia
climate, employee respondents1 perceptions of primary work area climate, and student
and faculty respondents' perceptions of classroom climate. The level of comfort
experienced by faculty, staff, and students is one indicator of campus climate.
• 84% of Student and Faculty8 respondents were "very comfortable" or
"comfortable" with the climate in their classes.
o 85% of Men Faculty and Student respondents, 84% of Women Faculty
and Student respondents, and 72% of Transspectrum Faculty and Student
respondents were "very comfortable" or "comfortable" with the climate in
their classes.
• 77% of Employee9 respondents were "very comfortable" or "comfortable" with
the climate in their primary work areas.
o 77% of Men Employee respondents, 78% of Women Employee
respondents, and 67% of Transspectrum Employee respondents were
"very comfortable" or "comfortable" with the climate in their' primary
work areas.
'Rankin & Reason. 2008. p. 264 ^Student and Faculty respondents refer to Undergraduate Student respondents. Graduate Student/Professional Student/Post-Doctoral respondents, and Faculty/Emeritus Faculty/Research Scientist respondents. Senior Administrators with Faculty Rank respondents. ^Employee respondents refer to Faculty/Emeritus Faculty/Research Scientist and Staff/Senior Administrators with a ' without Faculty Rank.
V
Rankin & Associates Consulting Campus Climate Assessment Project
University of Missouri-Columbia Report September 2017
2. Faculty Respondents10 - Positive attitudes about faculty work
• 91% of Non-Tenure-Track respondents felt that research was valued by
University of Missouri-Columbia.
• 82% of Tenured and Tenure-Track Faculty respondents felt that research was
valued by University of Missouri-Columbia.
3. Staff Respondents11 - Positive attitudes about staff work
• 86% of Staff respondents thought their supervisors provided adequate support for
them to manage work-life balance.
• 84% of Staff respondents thought that they had colleagues/co-workers who gave
them job/career advice or guidance when they needed it and 76% thought that
they had supervisors and who gave them job/career advice or guidance when they
needed it.
• 85% of Staff respondents believed that they were given a reasonable time frame
to complete assigned responsibilities.
• 84% of Staff respondents believed that they had adequate resources to perform
their job duties.
4. Student12 Respondents - Positive attitudes about academic experiences The way students perceive and experience their campus climate influences their
performance and success in college.13 Research also supports the pedagogical value of a
diverse student body and faculty for improving learning outcomes.14 Attitudes toward
academic pursuits are one indicator of campus climate.
1 0 Faculty respondents refer to Faculty/Emeritus Faculty/Research Scientist respondents and Senior Administrators with Faculty Rank respondents.
Staff respondents refer to Staff Senior Administrators without Faculty Rank respondents. 1 2 Student respondents refer to Undergraduate Student respondents and Graduate Student/Professional Student/Post-Doctoral respondents. 13Pascarella & Terenzini. 2005 14Hale, 2004; Harper & Hurtado. 2007; Harper & Qua ye. 2004
VI
Rankin & Associates Consulting Campus Climate Assessment Project
University of Missouri-Columbia Report September 2017
Undergraduate, Graduate, and Professional Student/Post-Doctoral Scholar
respondents
o 73% of Undergraduate, Graduate, and Professional Student/Post-Doctoral
Scholar respondents felt valued by University of Missouri-Columbia
faculty while 71% felt valued by campus staff,
o 77% of Undergraduate, Graduate, and Professional Student/Post-Doctoral
Scholar respondents felt valued by faculty in the classroom,
o 70% of Undergraduate, Graduate, and Professional Student/Post-Doctoral
Scholar respondents had faculty whom they perceived as role models and
70% had other students whom they perceived as role models.
Graduate Student/Professional Student/Post-Doctoral Scholar respondents
o 95% of Graduate Student/Professional Student/Post-Doctoral Scholar
respondents thought that department staff members (other than advisors)
responded to emails, calls, or voicemails in a prompt manner,
o 92% of Graduate Student/Professional Student/Post-Doctoral Scholar
respondents felt that they received due credit for their research, writing,
and publishing (e.g., authorship order in published articles),
o 88% of Graduate Student/Professional Student/Post-Doctoral Scholar
respondents felt they had adequate access to their advisors, 80% of Graduate Student/Professional Student/Post-Doctoral Scholar
respondents were satisfied with the quality of advising they have received
from their departments.
v i i
Rankin & Associates Consulting Campus Climate Assessment Project
University of Missouri-Columbia Report September 2017
Key Findings - Opportunities for Improvement 1. Members of several constituent groups indicated that they experienced
exclusionary, intimidating, offensive, and/or hostile conduct. Several empirical studies reinforce the importance of the perception of non-
discriminatory environments for positive learning and developmental outcomes.15
Research also underscores the relationship between workplace discrimination and
subsequent productivity.16 The survey requested information 011 experiences of
exclusionary, intimidating, offensive, and/or hostile conduct.
• 19% of respondents indicated that they personally had experienced exclusionary,
intimidating, offensive, and/or hostile conduct.17
o 26% noted that the conduct was based 011 their gender/gender identity,
23% felt that it was based 011 their ethnicity, 21% felt that it was based on
their position status, and 20% felt that it was based 011 their racial identity
• Differences emerged based 011 gender/gender identity, position status, and
ethnicity:
o By gender identity, a higher percentage of Trans spectrum respondents
(36%) and Women respondents (20%) than Men respondents (16%)
indicated that they had experienced exclusionary, intimidating, offensive,
and/or hostile conduct.
• 61% of Trans spectrum respondents, 32% of Women respondents,
and 12% of Men respondents who indicated that they had
experienced exclusionary, intimidating, offensive, and/or hostile
conduct indicated that the conduct was based 011 their gender
identity.
o By position status18, 29% of Senior Administrator with Faculty Rank
respondents, 24% of Faculty/Emeritus Faculty/Research Scientist
15Aguirre & Messiiieo, 1997; Flowers & Pascarella. 1999: Pascarella & Terenzini. 2005: Wliitt, Edison. Pascarella. Terenzini. & Nora, 2001 "Silverschanz, Cortina, Konik. & Magley. 2008; Waldo, 1999 L7The literature 011 microaggressions is clear that this type of conduct has a negative influence 011 people who experience the conduct, even if they feel at the time that it had no impact (Sue, 2010; Yosso, Smith, Ceja, & Solorzano, 2009). 18Use of the word position, refers to position at the University of Missouri - Columbia
Vlll
Rankin & Associates Consulting Campus Climate Assessment Project
University of Missouri-Columbia Report September 2017
respondents, 23% of Staff respondents, 20% of Graduate/Professional
Student/Post-Doctoral respondents, and 16% of Undergraduate Student
respondents indicated that they had experienced this conduct.
• Of those respondents who noted that they had experienced this
conduct, 40% of Staff respondents, 25% of Senior Administrator
with Faculty Rank respondents, 23% of Faculty/Emeritus
Faculty/Research Scientist respondents, 23% of
Graduate/Professional Student/Postdoctoral respondents, and 4%
of Undergraduate Student respondents thought that the conduct
was based on their position status.
o By ethnicity, significant differences were noted in the percentages of
African/Black/African American (39%, n = 196), Asian/Asian American
(21%, n = 96), Hispanic/Latin@/Chican@ (25%, n = 43), Multiracial19
Respondents (27%, n = 156), Other Respondents of Color (24%, n = 21),
and White respondents (16%, n = 1,276) who believed that they had
experienced this conduct.
• Of those respondents who noted that they believed that they had
experienced this conduct, larger percentages of
African/Black/African American respondents (55%, n = 108),
Asian/Asian American respondents (68%, n = 65),
Hispanic/Latin@/Chican@ respondents (61%, n = 26), Other
Respondents of Color (43%, n = 9), and Multiracial respondents
(39%, n = 60) than White respondents (12%, n = 149) thought that
the conduct was based on their ethnicity/race.
Respondents were offered the opportunity to elaborate on their experiences of exclusionary,
intimidating, offensive, and/or hostile conduct at University of Missouri-Columbia. Eight
hundred thirty-two respondents contributed comments regarding these personal experiences.
Four themes emerged from their narratives: 1) racial issues/racism/reverse racism/protests, 2)
19 Per the LCST (see footnote 45 for a complete understanding of the acronym LCST), respondents who identified as a person of color and white or more than one racial identity were recorded as Multiracial.
LX
Rankin & Associates Consulting Campus Climate Assessment Project
University of Missouri-Columbia Report September 2017
inclusion concerns for women and LGBTQ people, 3) unhealthy and hostile dynamics, and 4)
fear of consequences/retaliation. Many respondents reported disrespect and exclusion with issues
related to harassment or exclusionary conduct. Several respondents from all constituent groups
noted concerns regarding incidents of diversity and inclusion. For Suident respondents, student
conduct emerged as a theme. Student respondents described issues related to harassment or
exclusionary conduct, where there are derogatory remarks, and slander, and sexual harassment.
2. Several constituent groups indicated that they were less comfortable with the overall campus climate, workplace climate, and classroom climate. Prior research on campus climate has focused on the experiences of faculty, staff and
students associated with historically under served social/community/affinity groups (e.g.,
women, People of Color, people with disabilities, first-generation students, veterans).20
Several groups at University of Missouri-Columbia indicated that they were less
comfortable than were their majority counterparts with the climates of the campus,
workplace, and classroom.
Campus Climate
• By position status: Graduate/Professional/Post-Doctoral Student respondents (19%),
Faculty/Emeritus Faculty/Research Scientist respondents (15%) and Staff respondents
(15%) were less "very comfortable" than Undergraduate Student respondents (20%)
and Senior Administrator with Faculty Rank respondents (21%) with the overall
climate at University-Missouri-Columbia.
• By racial identity: African/Black/African American (10%), Asian/Asian American
(12%), and Multiracial respondents (13%) were less 'Very comfortable" than White
respondents (19%), Other Respondents of Color (18%), and
Hispanic/Latin@/Chican@ (17%) with the overall climate at University-Missouri-
Columbia.
""Harper & Huitado, 2007: Halt & Fellaliaum. 2008; Norris. 1992; Rankin, 2003: Rankin & Reason, 2005; Worthington, Navarro, Loewy. & Hart, 2008
X
Rankin & Associates Consulting Campus Climate Assessment Project
University of Missouri-Columbia Report September 2017
• By sexual identity: LGBQ respondents (11%) were less "very comfortable" than
Heterosexual respondents (19%) with the overall climate at University-Missouri-
Columbia.
Workplace Climate
• By gender identity: Women Employee respondents (37%) and Transspectrum
Employee respondents (25%) were less "very comfortable" than Men Employee
respondents (51%) with the workplace climate at UM-Columbia.
• By racial identity: White Employee respondents (40%), Other Employee Respondents
of Color (32%), and Multiracial Employee respondents (33%) were more "very
comfortable" than African/Black/African American Employee respondents (23%),
Asian/Asian American Employee respondents (29%), and Hispanic/Latin@/Chican@
Employee respondents (26%) with the climate in their primary work areas at
University-Missouri-Columbia.
• By citizenship status: Employee respondents who were U.S. Citizens (39%) were
more "very comfortable" than Employee respondents who were Non-U.S. Citizens
(29%) with the workplace climate at University-Missouri-Columbia.
Classroom Climate
• By gender identity: Women Faculty and Student respondents (31%) and
Transspectrum Faculty and Student respondents (28%) were less "very comfortable"
than Men Faculty and Student respondents (42%) with the climate in their classes at
University-Missouri-Columbia.
• By racial identity: White Faculty and Students respondents (39%) were more "very
comfortable" than Multiracial Faculty and Student respondents (26%),
Hispanic/Latin@/Chican@ Faculty and Student respondents (25%), and Other
Faculty and Student Respondents of Color (22%). However, these groups were more
likely to be tcvery comfortable" with the climate in their classes than were
African/Black/African American Faculty and Student respondents (13%) and
Asian/Asian American Faculty and Student respondents (19%).
xr
Rankin & Associates Consulting Campus Climate Assessment Project
University of Missouri-Columbia Report September 2017
• By sexual identity: LGBQ respondents (25%) were less "very comfortable" than
Heterosexual respondents (36%) with the climate in their classes at University-
Missouri-Columbia.
• By undergraduate student entry status: Transfer Student respondents (49%) were less
"comfortable" than First-Year Student respondents (52%) with the climate in their
classes at University-Missouri-Columbia.
3. Employee21 Respondents - Challenges with work-life issues
• 60% of Faculty/Emeritus Faculty/Research Scientist respondents, 52% of Senior
Administrators with Faculty Rank, and 52% of Staff respondents had seriously
considered leaving University of Missouri-Columbia in the past year.
o 58% of those Faculty and Staff respondents who seriously considered
leaving did so because of financial reasons,
o 48% of those Faculty and Staff respondents who seriously considered
leaving indicated that they did so because of limited opportunities for
advancement.
• 27% observed unfair or unjust promotion, tenure, and/or reclassification, 20% of
Faculty and Staff respondents observed unjust hiring , and 14% observed
unfair/unjust disciplinary actions.
• 50% of Faculty respondents and 39% of Staff respondents noted that they believed
that people who have children or elder care were burdened with balancing work and
family responsibilities (e.g., evening and evenings programming, workload brought
home. University of Missouri-Columbia breaks not scheduled with school district
breaks).
• 55% of Staff respondents felt that a hierarchy existed within staff positions that
allowed some voices to be valued more than others.
2 1 Employee respondents refer to Faculty/Emeritus Faculty/ Research Scientist and Staff/Senior Administrators with or without Faculty Rank.
Xll
Rankin & Associates Consulting Campus Climate Assessment Project
University of Missouri-Columbia Report September 2017
4. Faculty22 Respondents - Challenges with faculty work
• 54% of Tenured and Tenure-Track Faculty respondents believed that they performed
more work to help students than did their colleagues.
• 46% of Non-Tenure-Track Faculty respondents felt pressured to do extra work that
was uncompensated.
• 45% of Tenured and Tenure-Track Faculty respondents noted that they believed that
they were burdened by service responsibilities (e.g., committee memberships,
departmental/program work assignments) beyond those of their colleagues with
similar performance expectations.
• 31% of Faculty respondents felt valued by University of Missouri-Columbia senior
administrators.
• 29% of Tenured and Tenure-Track Faculty respondents believed that they were
pressured to change their research/scholarship agenda to achieve tenure/promotion.
Six hundred twenty-eight Staff respondents contributed comments regarding their employment-
related experiences. The themes that emerged from these comments were overwhelming
workload, dissatisfaction with salary & benefits, and lack of professional development support.
Narratives made mention of inequity concerns regarding pay, more work and job responsibilities
without compensation or reclassification, and lack of a link between evaluation scores and pay
raises. Child care support was said to be wholly lacking or unfairly expensive.
Faculty respondents were provided the opportunity to elaborate 011 their experiences regarding
workplace climate. One hundred forty-one Faculty respondents elaborated 011 their survey
responses related to their sense of value at University of Missouri-Columbia. The themes that
emerged from their comments were input concerns and leadership. Faculty respondents noted
inclusion concerns for women, people with disabilities, and other minorities. Reflections 011
leadership pointed to a general sense of disconnect and disapproval with current leaders.
Respondents were discouraged by the current leadership practices which were noted as lacking
vision and commitment to truly change the culture at University of Missouri-Columbia.
^Faculty respondents refer to Senior Administrators with Faculty Rank and Faculty/Emerinis Faculty/Research Scientist respondents.
Rankin & Associates Consulting Campus Climate Assessment Project
University of Missouri-Columbia Report September 2017
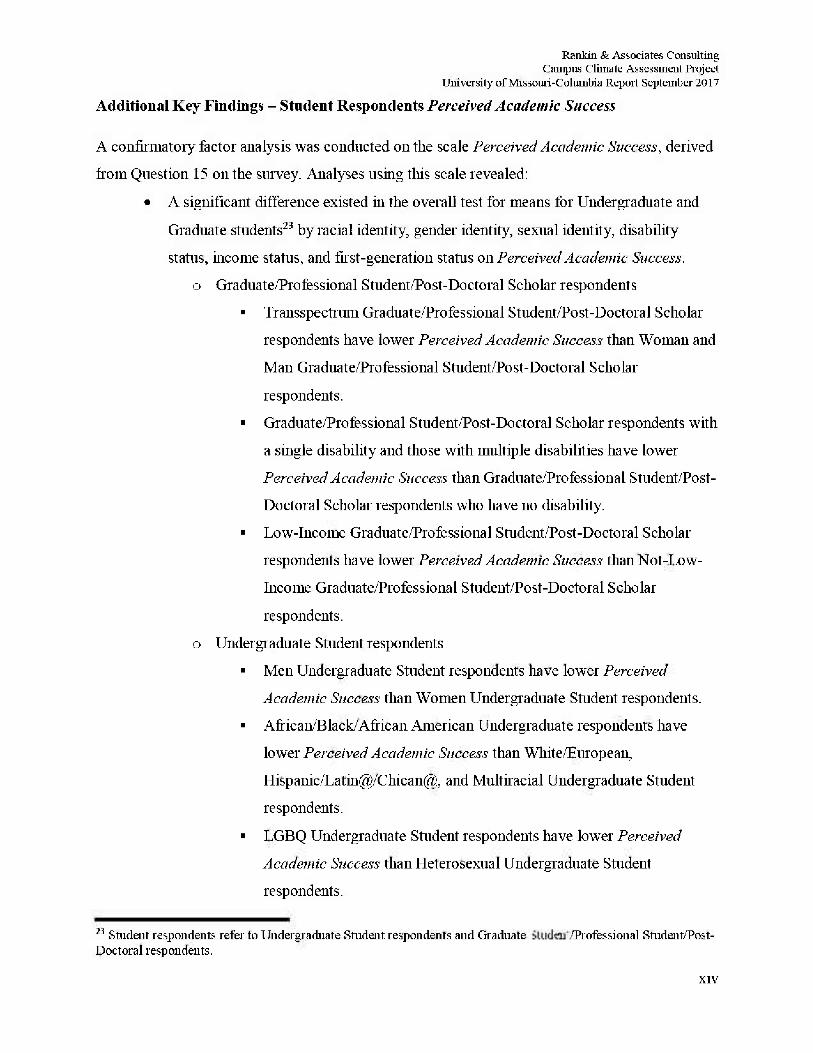
Additional Key Findings - Student Respondents Perceived Academic Success
A confirmatory factor analysis was conducted on the scale Perceived Academic Success, derived
from Question 15 oil the survey. Analyses using this scale revealed:
• A significant difference existed in the overall test for means for Undergraduate and
Graduate students23 by racial identity, gender identity, sexual identity, disability
status, income status, and first-generation status on Perceived Academic Success.
o Graduate/Professional Student/Post-Doctoral Scholar respondents
• Transspectrum Graduate/Professional Student/Post-Doctoral Scholar
respondents have lower Perceived Academic Success than Woman and
Man Graduate/Professional Student/Post-Doctoral Scholar
respondents.
• Graduate/Professional Student/Post-Doctoral Scholar respondents with
a single disability and those with multiple disabilities have lower
Perceived Academic Success than Graduate/Professional Student/Post-
Doctoral Scholar respondents who have no disability.
• Low-Income Graduate/Professional Student/Post-Doctoral Scholar
respondents have lower Perceived Academic Success than Not-Low-
Income Graduate/Professional Student/Post-Doctoral Scholar
respondents.
o Undergraduate Student respondents
• Men Undergraduate Student respondents have lower Perceived
Academic Success than Women Undergraduate Student respondents.
• African/Black/African American Undergraduate respondents have
lower Perceived Academic Success than White/European,
Hispanic/Latin@/Cliican@, and Multiracial Undergraduate Student
respondents.
• LGBQ Undergraduate Student respondents have lower Perceived
Academic Success than Heterosexual Undergraduate Student
respondents.
2 3 Student respondents refer to Undergraduate Student respondents and Graduate Student. Professional Student/Post-Doctoral respondents.
XIV
Rankin & Associates Consulting Campus Climate Assessment Project
University of Missouri-Columbia Report September 2017
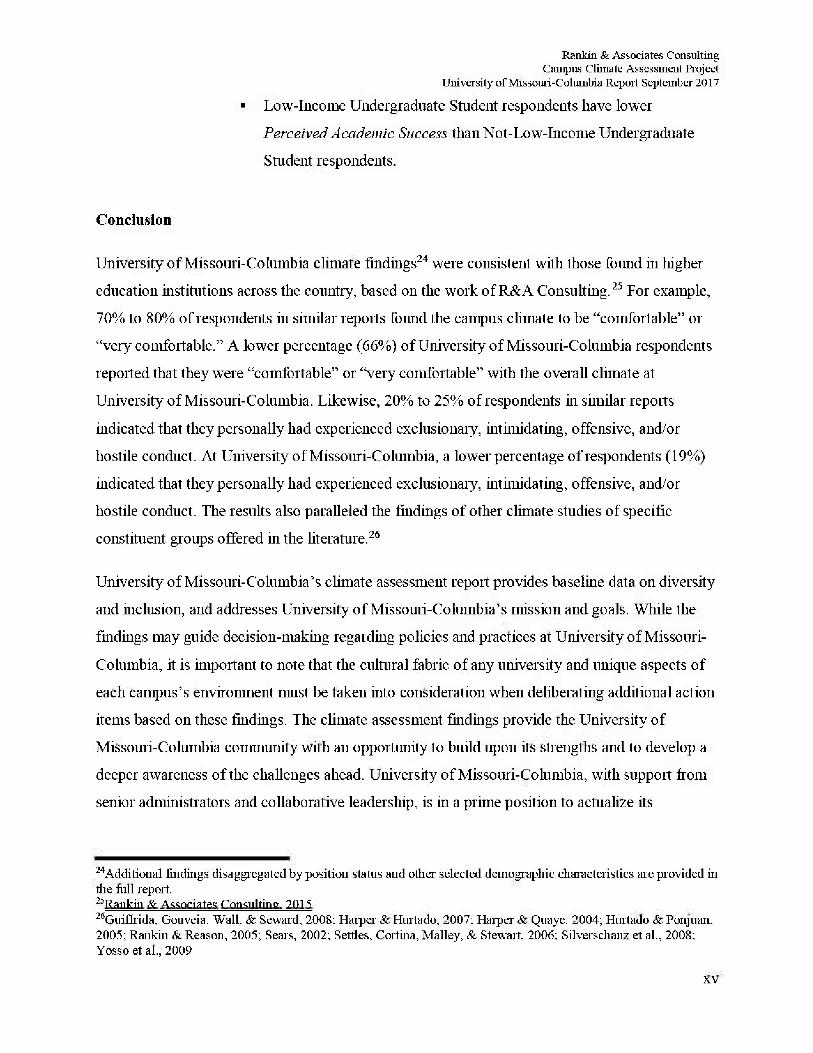
• Low-Income Undergraduate Student respondents have lower
Perceived Academic Success than Not-Low-Income Undergraduate
Student respondents.
Conclusion
University of Missouri-Columbia climate findings 24 were consistent with those found in higher-
education institutions across the country, based on the work of R&A Consulting.25 For example,
70% to 80% of respondents in similar reports found the campus climate to be "comfortable" or
"very comfortable." A lower percentage (66%) of University of Missouri-Columbia respondents
reported that they were "comfortable" or "very comfortable" with the overall climate at
University of Missouri-Columbia. Likewise, 20% to 25% of respondents in similar reports
indicated that they personally had experienced exclusionary, intimidating, offensive, and/or
hostile conduct. At University of Missouri-Columbia, a lower percentage of respondents (19%)
indicated that they personally had experienced exclusionary, intimidating, offensive, and/or
hostile conduct. The results also paralleled the findings of other climate studies of specific
constituent groups offered in the literature.26
University of Missouri-Columbia's climate assessment report provides baseline data on diversity
and inclusion, and addresses University of Missouri-Columbia's mission and goals. While the
findings may guide decision-making regarding policies and practices at University of Missouri-
Columbia, it is important to note that the cultural fabric of any university and unique aspects of
each campus's environment must be taken into consideration when deliberating additional action
items based on these findings. The climate assessment findings provide the University of
Missouri-Columbia community with an opportunity to build upon its strengths and to develop a
deeper awareness of the challenges ahead. University of Missouri-Columbia, with support from
senior administrators and collaborative leadership, is in a prime position to actualize its
24Additional findings disaggregated by position status and other selected demographic characteristics are provided in the full report. 23Rankin & Associates Consulting. 2015 2SGuif£rida, Gouveia. Wall, & Seward. 2008: Harper & Hurt a do. 2007: Harper & Quaye. 2004; Huitado & Ponjuan. 2005; Rankin & Reason, 2005; Sears, 2002; Settles, Cortina, Malley, & Stewart, 2006; Sflverschanz et al„ 2008; Yosso et al., 2009
XV
Rankin & Associates Consulting Campus Climate Assessment Project
University of Missouri-Columbia Report September 2017
commitment to promote an inclusive campus and to institute organizational structures that
respond to the needs of its dynamic campus community.
11
Rankin & Associates Consulting Campus Climate Assessment Project
University of Missouri-Columbia Report September 2017
Introduction
History of the Project
University of Missouri-Columbia affirms that diversity and inclusion are crucial to the intellectual
vitality of the campus community, and that they engender academic engagement where teaching,
working, learning, and living take place in pluralistic communities of mutual respect. Free exchange
of different ideas and viewpoints in supportive environments encourage students, faculty, and staff
to develop the critical thinking and citizenship skills that will benefit them throughout their lives.
University of Missouri-Columbia also is committed to fostering a caring community that provides
leadership for constructive participation in a diverse, multicultural world. As noted in University of
Missouri-Columbia's mission statement, "Our distinct mission, as Missouri's only state-supported
member of the Association of American Universities, is to provide all Missourians the benefits of a
world-class research university. We are stewards and builders of a priceless state resource, a unique
physical infrastructure and scholarly environment in which our tightly interlocked missions of
teaching, research, service and economic development work together on behalf of all citizens.
Students work side by side with some of the world's best faculty to advance the arts and
humanities, the sciences and the professions. Scholarship and teaching are daily driven by a
commitment to public service — the obligation to produce and disseminate knowledge that will
improve the quality of life in the state, the nation and the world."27 To better understand the campus
climate, the senior administration at University of Missouri-Columbia recognized the need for a
comprehensive tool that would provide campus climate metrics for the experiences and perceptions
of its students, faculty, and staff. During the fall 2016 semester, University of Missouri-Columbia
conducted a comprehensive survey of all students, faculty, and staff to develop a better
understanding of the learning, living, and working environment on campus.
In May 2016, members of University of Missouri-Columbia worked with the University of
Missouri System to form the Systemwide Climate Study Team (SCST). The SCST was composed
of faculty, staff, and administrators across the entire University of Missouri System. Ultimately, the
University of Missouri System contracted with Rankin & Associates Consulting (R&A) to conduct
2 1 http://inissouri.edii/aboiit/iiiission.plip
1
Rankin & Associates Consulting Campus Climate Assessment Project
University of Missouri-Columbia Report September 2017
a campus-wide study entitled " University of Missouri - Columbia Climate for Learning, Living,
and Working.'1 Data gathered via reviews of relevant University of Missouri-Columbia literature
and a campus-wide survey addressing the experiences and perceptions of various constituent groups
will be presented to the University of Missouri-Columbia community. The community, upon
receiving the report, will then come together to develop and complete two or three action items by
spring 2018.
Project Design and Campus Involvement
The conceptual model used as the foundation for University of Missouri-Columbia's assessment of
campus climate was developed by Smith et al. (1997) and modified by Rankin (2003). A power and
privilege perspective informs the model, one grounded in critical theory, which establishes that
power differentials, both earned and unearned, are central to all human interactions (Brookfield,
2005). Unearned power and privilege are associated with membership in dominant social groups
( Johnson, 2005) and influence systems of differentiation that reproduce unequal outcomes.
University of Missouri-Columbia's assessment was the result of a comprehensive process to
identify the strengths and challenges of campus climate, with a specific focus on the distribution of
power and privilege among differing social groups. This report provides an overview of the results
of the campus-wide survey.
In total, 9,952 people completed the survey. In the end, the University of Missouri-Columbia's
assessment was the result of a comprehensive process to identify the strengths and challenges of
campus climate, with a specific focus on the distribution of power and privilege among differing
social groups at University of Missouri-Columbia.
2
Rankin & Associates Consulting Campus Climate Assessment Project
University of Missouri-Columbia Report September 2017
Contextual Framework and Summary of Related Literature
More than two decades ago, the Carnegie Foundation for the Advancement of Teaching and the
American Council on Education (ACE) suggested that in order to build a vital community of
learning, a college or university must provide a climate where:
Intellectual life is central and where faculty and students work together to strengthen
teaching and learning, where freedom of expression is uncompromisingly protected and
where civility is powerfully affirmed, where the dignity of all individuals is affirmed and
where equality of opportunity is vigorously pursued, and where the well-being of each
member is sensitively supported (Boyer, 1990).
Not long afterward, the Association of American Colleges and Universities (AAC&U) (1995)
challenged higher education institutions "to affirm and enact a commitment to equality, fairness,
and inclusion" (p. xvi). AAC&U proposed that colleges and universities commit to "the task of
creating.. .inclusive educational environments in which all participants are equally welcome,
equally valued, and equally heard" (p. xxi). The report suggested that, to provide a foundation for a
vital community of learning, a primary duty of the academy is to create a climate grounded in the
principles of diversity, equity, and an ethic of justice for all individuals.
Hurtado (1992) and Harper & Hurtado (2007) focused on the history, compositional diversity,
organizational structure, psychological climate, and behavioral dimensions of campus communities
when considering climate. Building upon Harper's and Hurtado's work, Rankin and Reason (2008)
defined climate as:
The current attitudes, behaviors, standards, and practices of employees and students of an
institution. Because in our work we are particularly concerned about the climate for
individuals from traditionally under represented, marginalized, and under served groups we
focus particularly on those attitudes, behaviors, and standards/practices that concern the
access for, inclusion of and level of respect for individual and group needs, abilities, and
potential. Note that this definition includes the needs, abilities, and potential of all groups,
not just those who have been traditionally excluded or under served by our institutions (p.
264).
3
Rankin & Associates Consulting Campus Climate Assessment Project
University of Missouri-Columbia Repot September 2017
Institutional Climate Within Campus Structures
While many colleges and universities express that they are diverse, welcoming, and inclusive places
for all people, the literature on the experiences of individuals from marginalized communities in the
academy proposes that not all communities have felt welcomed and included on campus. For
example, racial climate scholars suggest that the academy is deeply rooted in white supremacy and
that higher education's history informs current practices (Patton, 2016). Patton (2016) challenged
higher education institutions to consider the ways in which their legacy of oppression, beyond race,
matters now and currently affects people from marginalized groups.
Milem, Chang, and Antonio (2005) proposed that, "Diversity must be carried out in intentional
ways in order to accrue the educational benefits for students and the institution. Diversity is a
process towards better learning rather than an outcome" (p. iv). Milem et aL further suggested that
for "diversity initiatives to be successful they must engage the entire campus community" (p. v). In
an exhaustive review of the literature on diversity in higher education, Smith (2009) offered that
diversity, like technology, was central to institutional effectiveness, excellence, and viability. Smith
also maintained that building a deep capacity for diversity requires the commitment of senior
leadership and support of all members of the academic community. Ingle (2005) recommended that
"good intentions be matched w7ith thoughtful planning and deliberate follow-through" for diversity
initiatives to be successful (p. 13).
Campus Climate and Student, Faculty, and Staff Success
Campus climate influences students' academic success and employees' professional success, in
addition to the social well-being of both groups. The literature also suggested that various identity
groups may perceive the campus climate differently and that their perceptions may adversely affect
working and learning outcomes (Chang, 2003; D'Augelli & Hershberger, 1993; Navarro,
Worthington, Hart, & Khairallah, 2009; Nelson-Laird & Niskode-Dossett, 2010; Rankin & Reason,
2005; Tynes, Rose, & Markoe, 2013; Worthington, Navarro, Lowey & Hart, 2008).
Several scholars found that when students of color perceive their campus environment as hostile,
outcomes such as persistence and academic performance are negatively affected (Guiffrida,
4
Rankin & Associates Consulting Campus Climate Assessment Project
University of Missouri-Columbia Report September 2017
Gouveia, Wall, & Seward, 2008; Hurtado & Ponjuan, 2005; Johnson, Soldner, Leonard, Alvarez,
Inkelas, Rowan, & Longerbeam, 2007; Solorzano, Ceja, & Yosso, 2000; Strayhom, 2013; Yosso,
Smith, Ceja & Solorzano, 2009). Several other empirical studies reinforced the importance of the
perception of non-discriminatory environments to positive student learning and developmental
outcomes (Aguirre & Messineo, 1997; Flowers & Pascarella. 1999; Gurin. Dey, Hurtado, & Gurin,
2002; Pascarella & Terenzini. 2005; Wliitt et al., 2001). Finally, research has supported the value of
a diverse student body and faculty on enhancing student learning outcomes and interpersonal and
psychosocial gains (Chang, Denson, Saenz, & Misa, 2006; Hale. 2004; Harper & Hurtado, 2007;
Harper & Quaye, 2004; Hurtado & Ponjuan, 2005; Pike & Kuh, 2006; Saenz, Ngai, & Hurtado,
2007).
The personal and professional development of faculty, administrators, and staff also are influenced
by the complex nature of the campus climate. Owing to racial discrimination within the campus
environment, faculty of color often report moderate to low job satisfaction (Turner, Myers, &
Creswell, 1999), high levels of stress related to their job (Smith & Witt, 1993), feelings of isolation
(Johnsrad & Sadao, 1998; Turner et al., 1999). and negative bias in the promotion and tenure
process (Patton & Catching, 2009; Villalpando & Delgado Bemal, 2002). For women faculty,
experiences with gender discrimination in the college environment influence their decisions to leave
their institutions (Gardner, 2013; Settles, Cortina. Malley, & Stewart, 2006). Lesbian, gay, bisexual,
and transgender (LGBT) faculty felt that their institutional climate forced them to hide their
marginalized identities if they wanted to avoid alienation and scrutiny from colleagues (Bilimoria &
Stewart, 2009). Therefore, it may come as no surprise that LGBTQ faculty members who judged
their campus climate more positively felt greater personal and professional support (Sears, 2002).
The literature that underscores the relationships between workplace encounters with prejudice and
lower health and well-being (i.e., anxiety, depression, and lower levels of life satisfaction and
physical health) and greater occupation dysfunction (i.e., organizational withdrawal; lower
satisfaction with work, coworkers, and supervisors), further substantiates the influence of campus
climate on employee satisfaction and subsequent productivity (Silverschanz et al, 2008).
In assessing campus climate and its influence on specific populations, it is important to understand
the complexities of identity and to avoid treating identities in isolation. Limited views of identity
5
Rankin & Associates Consulting Campus Climate Assessment Project
University of Missouri-Columbia Report September 2017
may prevent institutions from acknowledging the complexity of their faculty, staff, administration,
and students. Maramba & Museus (2011) agreed that an "overemphasis 011 a singular dimension of
students' [and other campus constituents'] identities can also limit the understandings generated by
climate and sense of belonging studies" (p. 95). Using an intersectional approach to research on
campus climate allows individuals and institutions to explore how multiple systems of privilege and
oppression operate within the environment to influence the perceptions and experiences of groups
and individuals with intersecting identities (see Griffin, Bennett, & Harris, 2011; Maramba &
Museus, 2011; Nelson-Laird & Niskode-Dossett, 2010; Patton, 2011; Pittman, 2010; Turner, 2002).
Discussing the campus climate in higher education for faculty, staff, administration, and students
requires the naming of specific identities (e.g., position within the institution, age, socioeconomic
status, disability, gender identity, racial identity, religious/spiritual identity, citizenship, political
affiliation, sexual identity) that may often times be avoided in the academy. In some cases, colleges
and universities encourage scholars and practitioners to operate within "acceptable" definitions of
social identities; such restriction, however, may maintain barriers against the possibilities of true
inclusion. To move beyond defining diversity only in terms of race and gender, and to support real
inclusion, each institution ought to define concepts, such as diversity, and the metrics by which they
will recognize when progress is made and goals met.
Accessibility and Inclusivity
Currently, institutions of higher education meet the requirements from the Americans with
Disabilities Act (ADA), yet many still provide the minimum support for community members of
various abilities (Pena, 2014). Institutions of higher education repeatedly overlook students and
employees with disabilities when addressing diversity challenges. Stodden (2015) asserts, "Often
students with disabilities are not a high priority for receiving support in accessing higher education.
Another indication of the anomalous position of students with disabilities among diverse
subpopulations is that they are often not included in the diversity initiatives provided by many
institutions of higher education to foster greater understanding of and connections between diverse
student subpopulations" (p. 3). When campuses move beyond the language of accommodations and
are accessible to all individuals, institutions then will become more inclusive of people of various
abilities.
6
Rankin & Associates Consulting Campus Climate Assessment Project
University of Missouri-Columbia Report September 2017
Frequently, the term accessibility is used only in the context of "disability." Understanding
accessibility in terms of disability alone limits the potential for institutions of higher education and
their constituents. Weiner (2016) shares the need to be cognizant and critical of scholarly work in
higher education, regardless of one's position and subject matter expertise, to create the most
welcoming campus climates. The possibility of positively affecting multiple constituents with one
policy change or newr initiative goes far beyond the disability community. When higher education
understands how shifting policies - for example, by providing open housing options - influences
community members' sense of comfort and belonging; mental, physical, and emotional health; and
social opportunities, then a single experience of a marginalized individual (e.g., someone with a
disability, someone who is genderqueer, someone with anxiety) does not have to be used as "the
reason" to resolve systemic inequity. Institutions of higher education can proactively create policies
and physical spaces for the diverse array of campus constituents to feel as safe as possible and to
persist at school and at work (Wessel, Jones, Markle, & Westfall, 2009).
Campus Climate and Student Activism Student activism in higher education is not new; rather, student activism is foundational in the
history of many institutions and also a "culmination of years of activism around inequality"
(Kingkade, Workneh, & Grenoble, 2015). Indeed, student activism built many advocacy and
identity centers and created etlmic studies programs (e.g., multicultural centers, LGBTQ centers,
African American Studies, Women & Gender Studies, Latinx Studies, Queer Studies, Disability
Studies).
Current national activist movements, such as #BlackLivesMatter and #NoDAPL, are deeply
connected to current day activism in education. "Links between the broader social context of what
is happening off-campus and students' on-campus activism have long been a means for students to
personalize, contextualize and make sense of what it means to pursue social change" (Bamhardt &
Reyes, p. 1, 2016). Very recently, the website thedemands.org shared The Black Liberation
Collective vision of "black students who are dedicated to transforming institutions of higher
education through unity, coalition building, direct action and political education" (thedemands.org,
2016).
7
Rankin & Associates Consulting Campus Climate Assessment Project
University of Missouri-Columbia Report September 2017
"Strident activism is an opportunity to scrutinize the campus contexts, conditions and social realities
that speak to underlying claims or grievances [of students, faculty members, and staff members]"
(Bamhardt & Reyes, p. 3, 2016). Naming inequities allows institutions to identify challenges and
opportunities to shift the institutional actions, policies, and climate so that all community members
feel honored, respected, and included. Additionally, naming social injustices and identifying
institutions3 oppressive behaviors, policies, and exclusive practices (as well as identifying
supportive behaviors, policies, and inclusive practices) exposes campuses' responsibilities for
shifting the climate towards equity and inclusion. The call to action to be resilient and authentic
when working towards justice from scholars (Ahmed, 2009) is one that encourages higher
education institutions to support a commitment to ensuring an evolving, intentional, and inclusive
campus climate that engages, honors, and respects multiple identities of faculty, staff,
administration, and student communities.
8
Rankin & Associates Consulting Campus Climate Assessment Project
University of Missouri-Columbia Report September 2017
Methodology
Conceptual Framework
R&A defines diversity as the "variety created in any society (and within any individual) by the
presence of different points of view and ways of making meaning, which generally flow from the
influence of different cultural, ethnic, and religious heritages, from the differences in how we
socialize women and men, and from the differences that emerge from class, age, sexual identity,
gender identity, ability, and other socially constructed characteristics."28 The conceptual model used
as the foundation for this assessment of campus climate was developed by Smith et aL (1997) and
modified by Rankin (2003).
Research Design
Survey Instrument. The survey questions were constructed based 011 the results of the work of
Rankin (2003) and with the assistance of the SCST. The SCST reviewed several drafts of the initial
survey proposed by R&A and vetted the questions to be contextually more appropriate for the
University of Missouri-Columbia population. The final University of Missouri-Columbia campus-
wide survey contained 120 questions,29 including open-ended questions for respondents to provide
commentary. The survey was designed so respondents could provide information about their
personal campus experiences, their perceptions of the campus climate, and their perceptions of
University of Missouri-Columbia's institutional actions, including administrative policies and
academic initiatives regarding diversity issues and concerns. The survey was available in both
online and pencil-and-paper formats. All survey responses were input into a secure-site database,
stripped of their IP addresses (for online responses), and then tabulated for appropriate analysis.
Sampling Procedure. University of Missouri-Columbia's Institutional Review Board (IRB)
reviewed the project proposal, including the survey instrument. The IRB director acknowledged
28Rankin & Associates Consulting (2015) adapted from AAC&U (1995). 29TO ensure reliability, evaluators must ensure that instruments are properly structured (questions and response choices must be worded in such a way that they elicit consistent responses) and administered in a consistent manner. The instrument was revised numerous times, defined critical terms, underwent expert evaluation of items, and checked for internal consistency.
9
Rankin & Associates Consulting Campus Climate Assessment Project
University of Missouri-Columbia Report September 2017
that the data collected from this quality improvement activity also could be used for research. The
IRB approved the project on August 27, 2016.
Prospective participants received an invitation from Henry "Hank" C. Foley, Interim Chancellor
that contained the URL link to the survey. Respondents were instructed that they were not required
to answer all questions and that they could withdraw from the survey at any time before submitting
their responses. The survey included information describing the purpose of the study, explaining the
survey instrument, and assuring the respondents of anonymity. Only surveys that were at least 50%
completed were included in the final data set.
Completed online surveys were submitted directly to a secure server, where any computer
information that might identify participants was deleted. Any comments provided by participants
also were separated from identifying information at submission so comments were not attributed to
any individual demographic characteristics.
Limitations. Two limitations existed to the generalizability of the data. The first limitation was that
respondents "self-selected" to participate hi the study. Self-selection bias, therefore, was possible.
This type of bias can occur because an individual's decision to participate may be correlated with
traits that affect the study, which could make the sample 11011-representative. For example, people
with strong opinions or substantial knowledge regarding climate issues on campus may have been
more apt to participate hi the study. The second limitation was response rates that were less than
30% for some groups. For groups with response rates less than 30%, caution is recommended when
generalizing the results to the entire constituent group.
Data Analysis. Survey data were analyzed to compare the responses (in raw numbers and
percentages) of various groups via SPSS (version 23.0). Missing data analyses (e.g., missing data
patterns, survey fatigue) were conducted and those analyses were provided to University of
Missouri-Columbia in a separate document. Descriptive statistics were calculated by salient group
memberships (e.g., gender identity, racial identity, position status) to provide additional information
regarding participant responses. Throughout much of this report, including the narrative and data
10
Rankin & Associates Consulting Campus Climate Assessment Project
University of Missouri-Columbia Repoit September 2017
tables within the narrative, information is presented using valid percentages.30 Actual percentages31
with missing or "no response" information may be found in the survey data tables in Appendix B.
The purpose for this discrepancy in reporting is to note the missing or "no response" data in the
appendices for institutional information while removing such data within the report for subsequent
cross tabulations and significance testing using the chi-square test for independence.
Chi-square tests provide only omnibus results; as such, they identify that significant differences
exist in the data table, but do not specify if differences exist between specific groups. Therefore,
these analyses included post-hoc investigations of statistically significant findings by conducting z-
tests between column proportions for each row in the chi-square contingency table, with a
Bonferroni adjustment for larger contingency tables. This approach is useful because it compares
individual cells to each other to determine if they are statistically different (Sharpe, 2015). Thus, the
data maybe interpreted more precisely by showing the source of the greatest discrepancies. The
statistically significant distinctions between groups are noted whenever possible throughout the
report.
Factor Analysis Methodology:
A confirmatory factor analysis was conducted on one scale embedded in Question 15 of the surveys
The scale, termed "Perceived Academic Success" for the purposes of this project, was developed
using Pascarella and Terenzini's (1980) Academic and Intellectual Development Scale. This scale
lias been used in a variety of studies examining student persistence. The first seven sub-questions of
Question 15 of the survey reflect the questions on this scale.
The questions in each scale were answered on a Tikert metric from strongly agree to strongly
disagree (scored 1 for strongly agree and 5 for strongly disagree). For the purposes of analysis,
Student respondents who did not answer all scale sub-questions were not included in the analysis.
Approximately 3% (2.7%) of all potential Student respondents were removed from the analysis
because of one or more missing responses.
3{>Valid percentages were derived using the total number of respondents to a particular item (i.e., missing data were excluded). 3LActual percentages were derived using the total number of survey respondents.
Rankin & Associates Consulting Campus Climate Assessment Project
University of Missouri-Columbia Repoit September 2017
A factor analysis was conducted oil the Perceived Academic Success scale utilizing principal axis
factoring. The factor loading of each item was examined to test whether the intended questions
combined to represent the underlying construct ofthe scale.32 One question from the scale (Q15_2)
did not hold as well with the construct and was removed; the scale used for analyses had six
questions rather than seven. The internal consistency reliability (Cronbach's alpha) ofthe scale was
0.866 (after removing the question noted above), which is high, meaning that the scale produces
consistent results. With Q15_2 included, Cronbach's alpha was only 0.794.
Factor Scores
The factor score for Perceived Academic Success was created by taking the average ofthe scores
for the six sub-questions in the factor. Each respondent that answered all the questions included in
the given factor was given a score on a five-point scale. Lower scores 011 Perceived Academic
Success factor suggests a student or constituent group is more academically sue cess fill.
Means Testing Methodology
After creating the factor scores for respondents based 011 the factor analysis, means were calculated.
Where s were of sufficient size, analyses were conducted to determine whether the means for the
Perceived Academic Success factor were different for first level categories in the following
demographic areas:
o Gender identity (Woman, Man, Transspectrum)
o Racial identity (Asian/Asian American, African/Black/African American,
Hispanic/Latin@/Chican@, Multiracial respondents, Other People of Color33 ,
White/European American)
o Sexual identity (LGBQ, Heterosexual)
o Disability status (Disability, No Disability, Multiple Disabilities)
o First-Generation status (First-Generation, Not-First-Generation)
3 2 Factor analysis is a particularly use fill technique for scale construction. It is used to determine how well a set of survey questions combine to measure a latent construct by measuring how similarly respondents answer those questions. 3 3 The LCST proposed six collapsed racial identity categories (White, African Black African American, Asian/Asian American, Hispanic/Latin@/Chican@, Other People of Color, and Multiracial). Per the LCST, the Other People of Color category included respondents who identified as Native Hawaiian. Pacific Islander, American Indian/Native, Alaskan Native, Middle Eastern, and Southwest Asian.
12
Rankin & Associates Consulting Campus Climate Assessment Project
University of Missouri-Columbia Repoit September 2017
o Income status (Low-Income, Not-Low-Income)
Wlien only two categories existed for the specified demographic variable (e.g., sexual identity) a t-
test for difference of means was used. If the difference hi means was significant, effect size was
calculated using Cohen's d. .Any moderate to large effects are noted. When the specific variable of
interest had more than two categories (e.g., racial identity), ANOVAs were run to determine
whether there were any differences. If the ANOVA was significant, post-hoc tests were run to
determine which differences between pairs of means were significant. Additionally, if the
difference in means was significant, effect size was calculated using Eta2 and any moderate to large
effects were noted.
Qualitative Comments
Several survey questions provided respondents the opportunity to describe their experiences at
University of Missouri-Columbia, elaborate upon then survey responses, and append additional
thoughts. It should be noted that aside from comments offered within Appendix C, all respondents
were primed to respond to questions immediately following a set of quantitative questions.
Comments were solicited to give voice to the data and to highlight areas of concern that might have
been missed hi the quantitative items of the survey. These open-ended comments were reviewed34
using standard methods of thematic analysis. R&A reviewers read all comments, and a list of
common themes was generated based 011 their analysis. Most themes reflected the issues addressed
in the survey questions and revealed in the quantitative data. Comments and quotes offered
throughout the body of this report are chosen to highlight broad concerns and are representative of
the themes that emerged from the data. This methodology does not reflect a comprehensive
qualitative study. Comments were not used to develop grounded hypotheses independent of the
quantitative data.
34Aiiy comments provided ill languages other than English were translated and incorporated into the qualitative analysis.
Rankin & Associates Consulting Campus Climate Assessment Project
University of Missouri-Columbia Repoit September 2017
Results
This section of the report provides a description of the sample demographics, measures of internal
reliability, and a discussion of validity. This section also presents the results per the project design,
which called for examining respondents' personal campus experiences, their perceptions of the
campus climate, and their perceptions of University of Missouri-Columbia's institutional actions,
including administrative policies and academic initiatives regarding climate.
Several analyses were conducted to determine whether significant differences existed 111 the
responses between participants from various demographic categories. Where significant differences
occurred, endnotes (denoted by lowercase Roman numeral superscripts) at the end of each section
of this report provide the results of the significance testing. The narrative also provides results from
descriptive analyses that were not statistically significant, yet were determined to be meaningful to
the climate at University of Missouri-Columbia.
Description of the Sample35
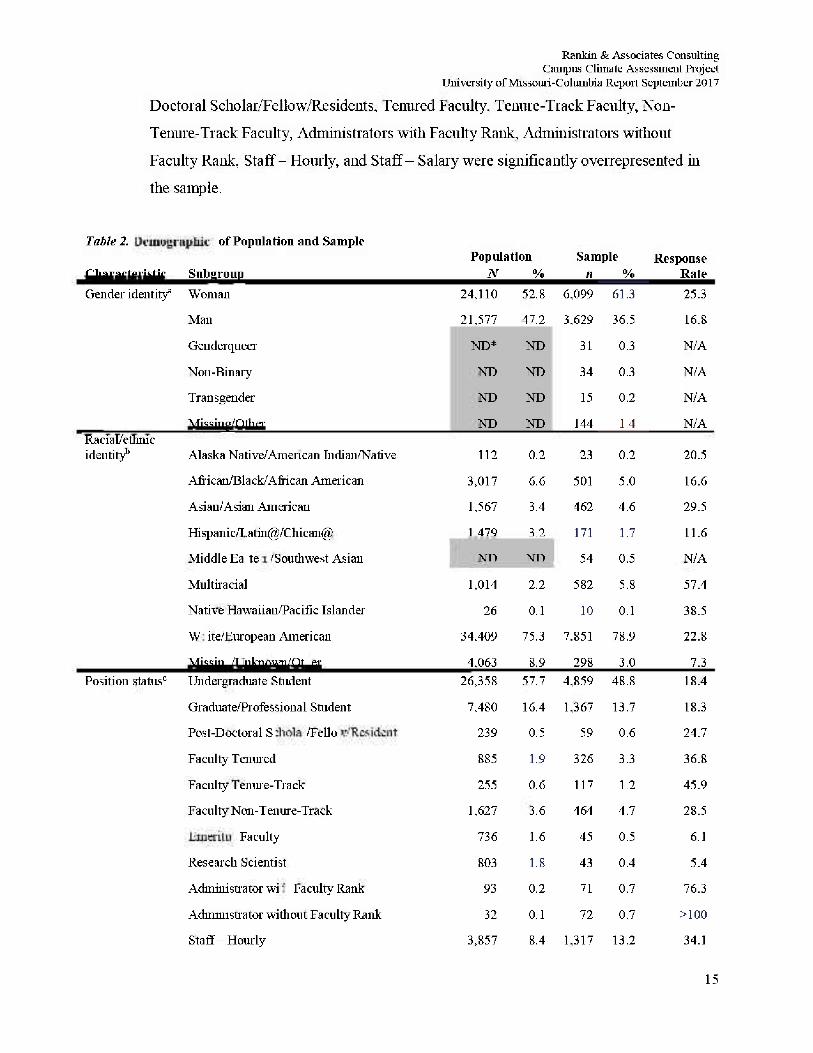
Nine thousand nine hundred ninety-two surveys were returned for a 22% overall response rate. The
sample and population figures, chi-square analyses,36 and response rates are presented in Table 2.
All analyzed demographic categories showed statistically significant differences between the
sample data and the population data as provided by University of Missouri-Columbia.
• Women were significantly overrepresented in the sample. Men were significantly
under represented in the sample.
• African/Black/African Americans, Hispanic/Latin@/Chican@s, and individuals whose
race/ethnicity was categorized as Missing/Unknown/Other were significantly
under represented in the sample. Asian/Asian Americans, White, and Multiracial
individuals were significantly overrepresented in the sample.
• Undergraduate Students, Graduate/Professional Students, Emeritus Faculty, Research
Scientists, and Staff- Union were significantly under represented in the sample. Post-
35A11 frequency tables are provided in Appendix B. 3sClii-square tests were conducted only on those categories that were response options in the survey and included in demographics provided by University of Missouri-Columbia.
14
Rankin & Associates Consulting Campus Climate Assessment Project
University of Missouri-Columbia Report September 2017
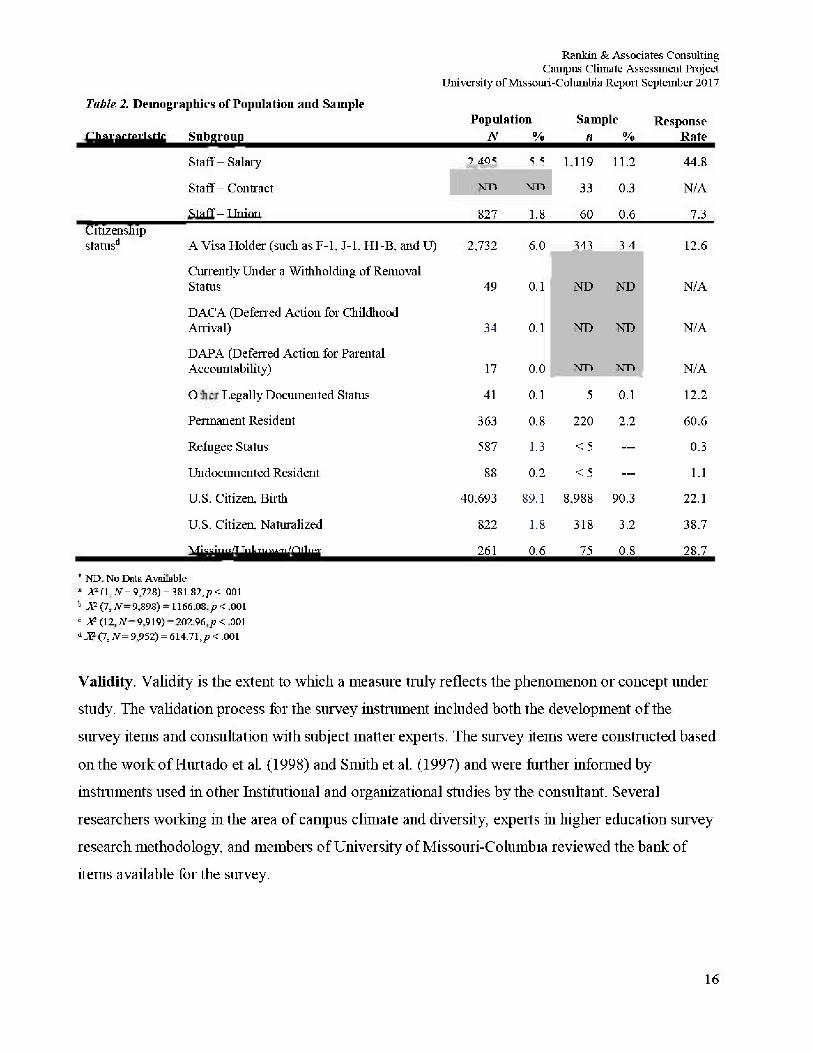
Doctoral Scholar/Fellow/Residents, Tenured Faculty, Tenure-Track Faculty, Non-
Tenure-Track Faculty, Administrators with Faculty Rank, Administrators without
Faculty Rank, Staff- Hourly, and Staff- Salary were significantly overrepresented in
the sample.
Table 2. Demographics of Population and Sample
Characteristic Subgroup Population
N % Sample
n % Response
Rate Gender identity3 Woman 24.110 52.8 6,099 61.3 25.3
Man 21.577 47.2 3,629 36.5 16.8
Genderqueer ND* ND 31 0.3 N/A
Non-Binary ND ND 34 0.3 N/A
Transgender ND ND 15 0.2 N/A
Missing/Other ND ND 144 1.4 N/A Racial/ethnic identity-1' Alaska Native/American Indian/Native 112 0.2 23 0.2 20.5
African/Black/African American 3,017 6.6 501 5.0 16.6
Asian/Asian American 1.567 3.4 462 4.6 29.5
Hispanic/Latin@/Chican@ 1.479 3.2 171 1.7 11.6
Middle Eastern Southwest Asian ND ND 54 0.5 N/A
Multiracial 1,014 2.2 582 5.8 57.4
Native Hawaiian/Pacific Islander 26 0.1 10 0.1 38.5
White/European American 34.409 75.3 7.851 78.9 22.8
Missing/Unknown/Other 4.063 8.9 298 3.0 7.3 Position status0 Undergraduate Student 26,358 57.7 4,859 48.8 18.4
Graduate/Professional Student 7.480 16.4 1,367 13.7 18.3
Post-DoctoralScholar/Fellow Resident 239 0.5 59 0.6 24.7
Faculty Tenured 885 1.9 326 3.3 36.8
Faculty Tenure-Track 255 0.6 117 1.2 45.9
Faculty Non-Tenure-Track 1.627 3.6 464 4.7 28.5
Emeritus Faculty 736 1.6 45 0.5 6.1
Research Scientist 803 1.8 43 0.4 5.4
Administrator with Faculty Rank 93 0.2 71 0.7 76.3
Administrator without Faculty Rank 32 0.1 72 0.7 >100
Staff- Hourly 3,857 8.4 1,317 13.2 34.1
15
Rankin & Associates Consulting Campus Climate Assessment Project
University of Missouri-Columbia Report September 2017
Table 2. Demographics of Population and Sample
Characteristic Subgroup Population
N % Sample
n % Response
Rate
Staff - Salary 2,495 5.5 1.119 11.2 44.8
Staff-Contract ND ND 33 0.3 N/A
Staff-Union 827 1.8 60 0.6 7.3 Citizenship status*1 A Visa Holder (such as F-l, J-L Hl-B. and U) 2.732 6.0 343 3.4 12.6
Currently Under a Withholding of Removal Status 49 0.1 ND ND N/A
DACA (Deferred Action for Childhood Arrival) 34 0.1 ND ND N/A
DAP A (Deferred Action for Parental Accountability) 17 0.0 ND ND N/A
Other Legally Documented Status 41 0.1 5 0.1 12.2
Permanent Resident 363 0.8 220 2.2 60.6
Refugee Status 587 1.3 <5 — 0.3
Undocumented Resident 88 0.2 <5 — 1.1
U.S. Citizen, Birth 40,693 89.1 8,988 90.3 22.1
U.S. Citizen, Naturalized 822 1.8 318 3.2 38.7
Missing/Unknown/Other 261 0.6 75 0.8 28.7
* ND: No Data Available a 9,728) = 381.82, p < .001 b X (7, JV= 9,898) = 1166.0S. jP < .001 c X (12,N= 9,919) = 202.96.jj < .001 d X (7, N= 9,952) = 614.71, < .001
Validity. Validity is the extent to which a measure truly reflects the phenomenon or concept under
study. The validation process for the survey instrument included both the development of the
survey items and consultation with subject matter experts. The survey items were constructed based
on the work of Hurtado et al. (1998) and Smith et al. (1997) and were further informed by
instruments used in other Institutional and organizational studies by the consultant. Several
researchers working in the area of campus climate and diversity, experts in higher education survey
research methodology, and members of University of Missouri-Columbia reviewed the bank of
items available for the survey.
16
Rankin & Associates Consulting Campus Climate Assessment Project
University of Missouri-Columbia Repoit September 2017
Content validity was ensured, given that the items and response choices arose from literature
reviews, previous surveys, and input from SCST members. Construct validity - the extent to which
scores on an instrument permit inferences about underlying traits, attitudes, and behaviors - should
be evaluated by examining the correlations of measures being evaluated with variables known to be
related to the construct. For this investigation, correlations ideally ought to exist between item
responses and known instances of exclusionary, intimidating, offensive, and/or hostile conduct, for
example. However, no reliable data to that effect were available. As such, attention was given to the
manner in which questions w7ere asked and response choices given. Items were constructed to be
non-biased, non-leading, and non-judgmental, and to preclude individuals from providing ''socially
acceptable" responses.
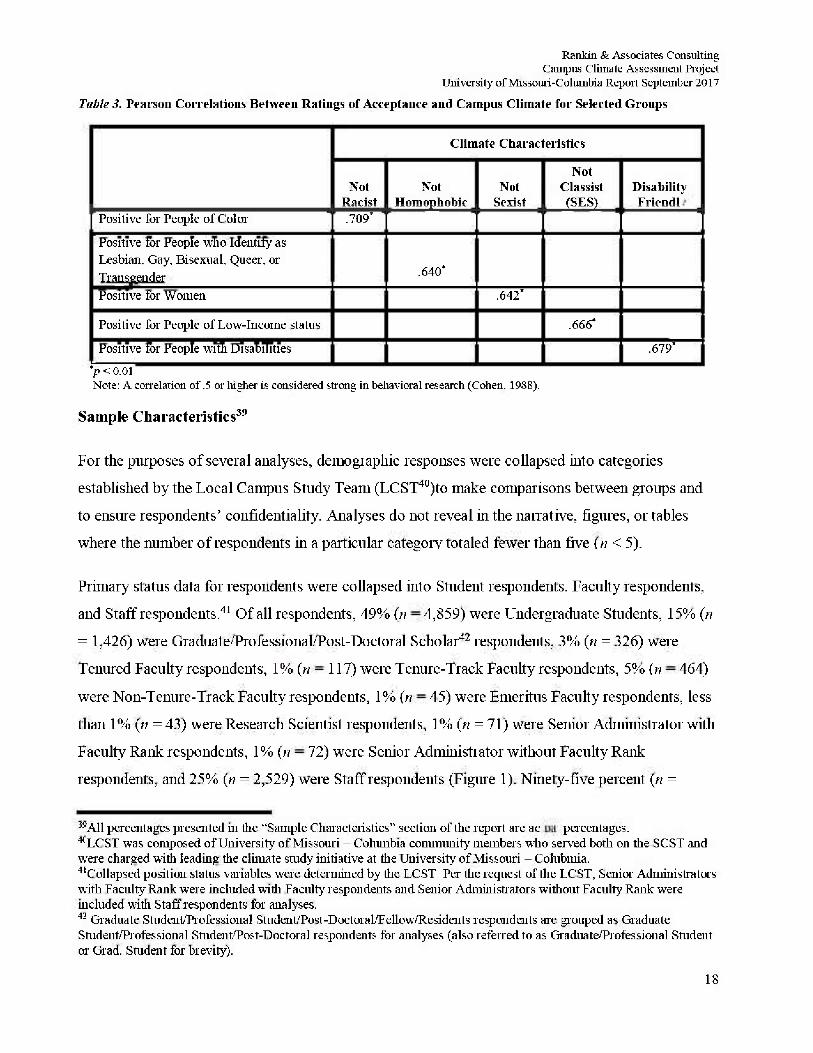
Reliability - Internal Consistency of Responses.37 Correlations between the responses to
questions about overall campus climate for various groups (survey Question 100) and to questions
that rated overall campus climate on various scales (survey Question 101) were moderate to strong
and statistically significant, indicating a positive relationship between answers regarding the
acceptance of various populations and the climate for those populations. The consistency of these
results suggests that the survey data were internally reliable. Pertinent correlation coefficients 38 are
provided in Table 3.
All correlations in the table were significantly different from zero at the .01 level. I11 other words, a
relationship existed between all selected pair s of responses.
A strong relationship (between .52 and .72) existed for all five pairs of variables: between Positive
for People of Color and Not Racist, between Positive for Lesbian, Gay, Bisexual, Queer, or
Transgender People and Not Homophobic, between Positive for Women and Not Sexist, between
Positive for People of Low-Income status and Not Classist (income status), and between Positive
for People with Disabilities and Disability-Friendly (not ableist).
"internal reliability* is a measure of reliability used to evaluate the degree to which different test items that probe the same construct produce similar results (Trochim, 2000). The correlation coefficient indicates the degree of linear relationship between two variables (Bartz. 1988). 38Pearson correlation coefficients indicate the degree to which two variables are related. A value of 1 signifies perfect correlation; 0 signifies no correlation.
17
Rankin & Associates Consulting Campus Climate Assessment Project
University of Missouri-Columbia Repoit September 2017
Table 3. Pearson Correlations Between Ratings of Acceptance and Campus Climate for Selected Groups
Climate Characteristics
Not Racist
Not Homophobic
Not Sexist
Not Classist (SES)
Disability FriendIy
Positive for People of Color .709*
Positive for People who Identify as Lesbian, Gay, Bisexual, Queer, or Transgender .640*
Positive for Women .642*
Positive for People of Low-Income status .666*
Positive for People with Disabilities .679*
*p < 0.01 Note: A correlation of .5 or higher is considered strong in behavioral research (Cohen. 1988).
Sample Characteristics39
For the purposes of several analyses, demographic responses were collapsed into categories
established by the Local Campus Study Team (LCST40)to make comparisons between groups and
to ensure respondents' confidentiality. Analyses do not reveal in the narrative, figures, or tables
where the number of respondents in a particular category totaled fewer than five ( n < 5).
Primary status data for respondents were collapsed into Student respondents, Faculty respondents,
and Staff respondents.41 Of all respondents, 49% (n = 4,859) were Undergraduate Students, 15% (n
= 1,426) were Graduate/Professional/Post-Doctoral Scholar42 respondents, 3% (n = 326) were
Tenured Faculty respondents, 1 % (n = 117) were Tenure-Track Faculty respondents, 5% (n = 464)
were Non-Tenure-Track Faculty respondents, 1% (n = 45) were Emeritus Faculty respondents, less
than 1% (n = 43) were Research Scientist respondents, 1% (n = 71) were Senior Administrator with
Faculty Rank respondents, 1% (n = 72) w7ere Senior Administrator without Faculty Rank
respondents, and 25% (n = 2,529) were Staff respondents (Figure 1). Ninety-five percent (n =
3 9All percentages presented in the ''Sample Characteristics" section of the report are actual ppercentages. 4{LCST was composed of University of Missouri - Columbia community members who served both on the SCST and were charged with leading the climate study initiative at the University of Missouri - Colubmia. 4LCollapsed position status variables were determined by the LCST. Per the request of the LCST, Senior Administrators with Faculty Rank were included with Faculty respondents and Senior Administrators without Faculty Rank were included with Staff respondents for analyses. 4 2 Graduate Student/Professional Student/Post-Doctoral/Fellow/Residents respondents are grouped as Graduate Student/Professional Student Post-Doctoral respondents for analyses (also referred to as Graduate/Professional Student or Grad. Student for brevity).
18
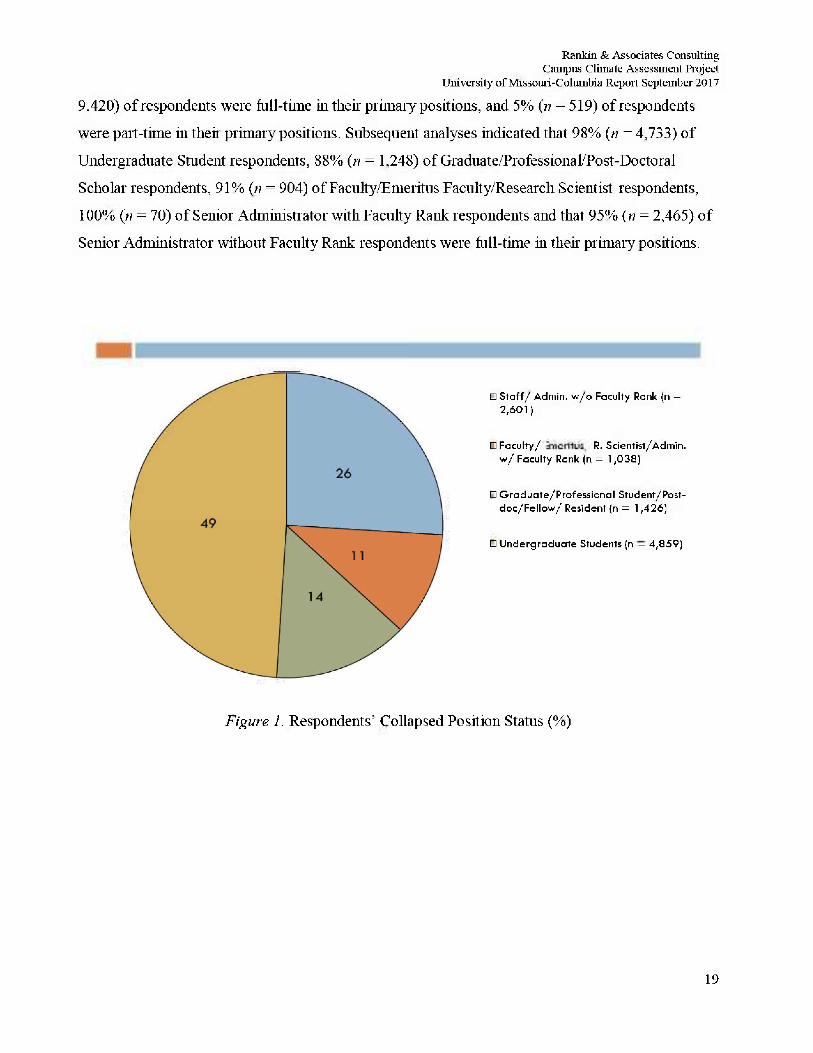
Rankin & Associates Consulting Campus Climate Assessment Project
University of Missouri-Columbia Repoit September 2017
9.420) of respondents were full-time in their primary positions, and 5% (n = 519) of respondents
were part-time in their primary positions. Subsequent analyses indicated that 98% (n = 4,733) of
Undergraduate Student respondents, 88% (n = 1,248) of Graduate/Professional/Post-Doctoral
Scholar respondents, 91% (n = 904) of Faculty/Emeritus Faculty/Research Scientist respondents,
100% (n = 70) of Senior Administrator with Faculty Rank respondents and that 95% (n = 2,465) of
Senior Administrator without Faculty Rank respondents were full-time in their primary positions.
Figure 1.
• S ta f f / Admin, w / o Faculty Rank (n — 2,601)
• Facul ty / Emeritus R. Scientist/Admin, w / Faculty Rank (n = 1,038)
• Graduate/Profess ional Student/Post-doc /Fe l l ow /Res iden t (n = 1,426)
• Undergraduate Students (n = 4 ,859)
Respondents' Collapsed Position Status (%)
19
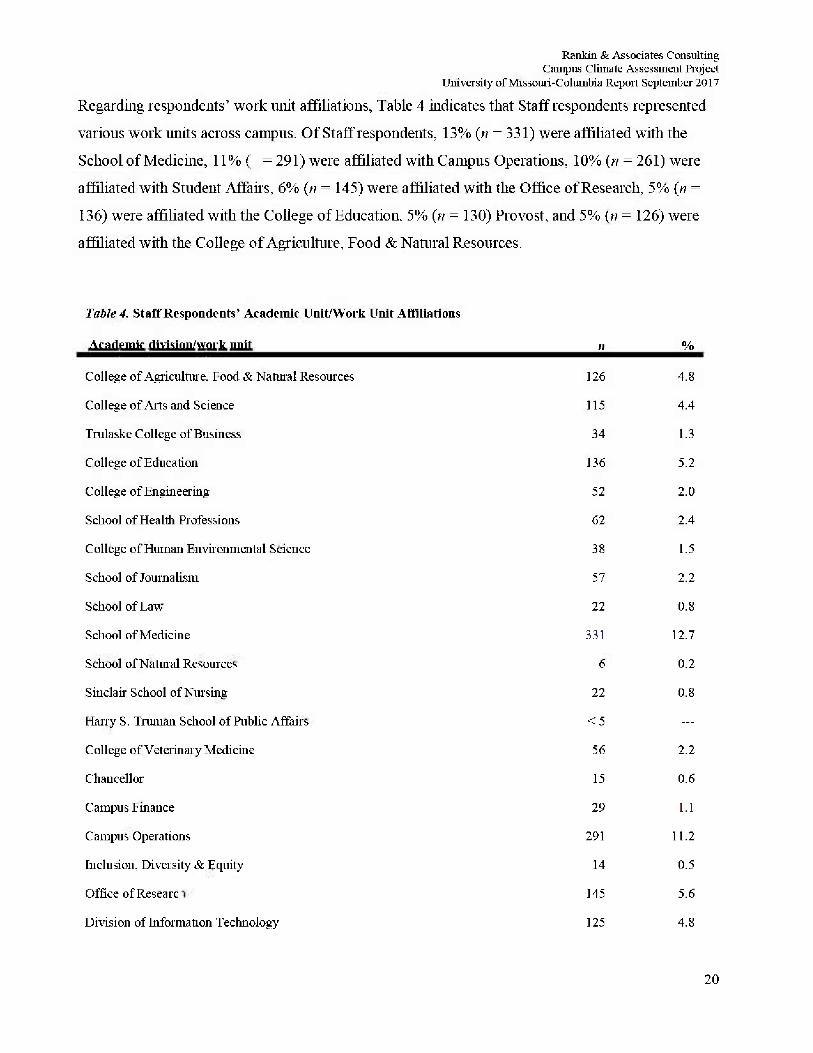
Rankin & Associates Consulting Campus Climate Assessment Project
University of Missouri-Columbia Repoit September 2017
Regarding respondents' work unit affiliations. Table 4 indicates that Staff respondents represented
various work units across campus. Of Staff respondents, 13% (n = 331) were affiliated with the
School of Medicine, 11% (n = 291) were affiliated with Campus Operations, 10% (n = 261) were
affiliated with Student Affairs, 6% (» = 145) were affiliated with the Office of Research, 5% (n =
136) were affiliated with the College of Education, 5% (n = 130) Provost, and 5% (n = 126) were
affiliated with the College of Agriculture, Food & Natural Resources.
Table 4. Staff Respondents' Academic Unit/Work Unit Affiliations
Academic division/work unit n %
College <£jf Agriculture, Food & Natural Resources 126 4.8
College of Arts and Science 115 4.4
Trulaske College of Business 34 1.3
College of Education 136 5.2
College of Engineering 52 2.0
School of Health Professions 62 2.4
College of Human Environmental Science 38 1.5
School of Journalism 57 2.2
School of Law 22 0.8
School of Medicine 331 12.7
School of Natural Resources 6 0.2
Sinclair School of Nursing 22 0.8
Harry S. Truman School of Public Affairs < 5 —
College of Veterinary Medicine 56 2.2
Chancellor 15 0.6
Campus Finance 29 1.1
Campus Operations 291 11.2
Inclusion, Diversity & Equity 14 0.5
Office of Research 145 5.6
Division of Information Technology 125 4.8
20
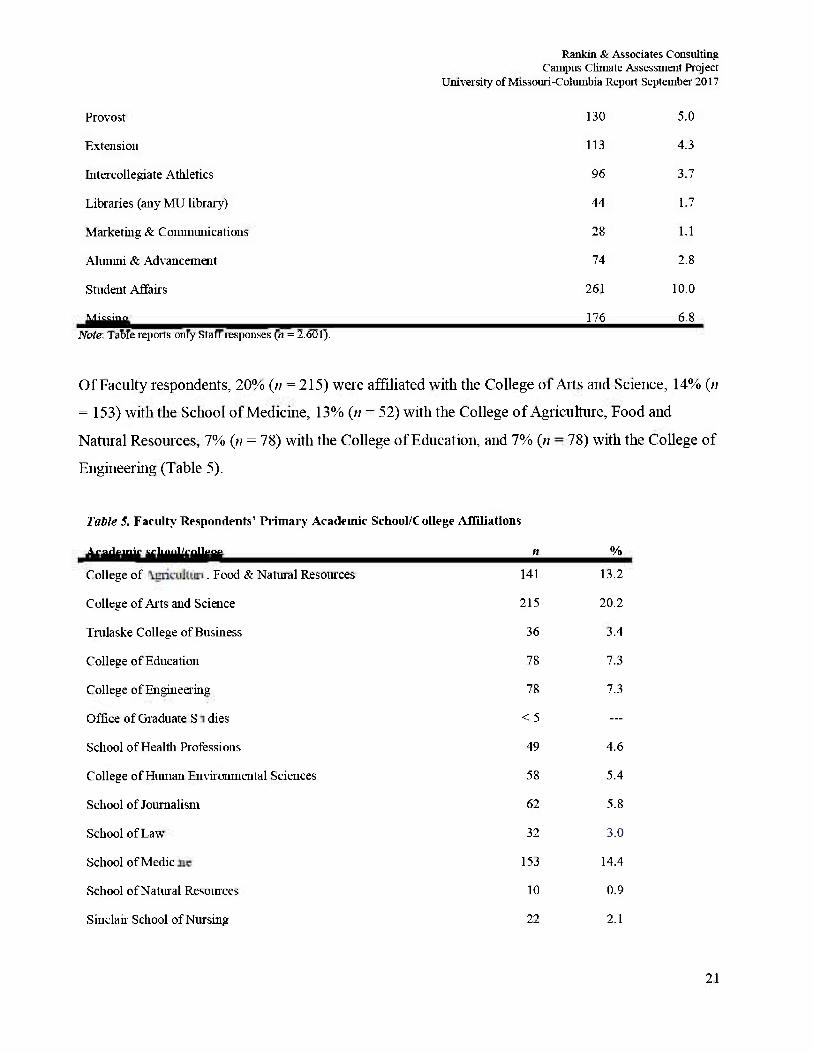
Rankin & Associates Consulting Campus Climate Assessment Project
University of Missouri-Columbia Repot September 2017
Provost 130 5.0
Extension 113 4.3
Intercollegiate Athletics 96 3.7
Libraries (any MU library) 44 1.7
Marketing & Communications 28 1.1
Alumni & Advancement 74 2.8
Student Affairs 261 10.0
Missing 176 6.8 Note: Table reports only Staff responses (n = 2.601).
Of Faculty respondents, 20% (n =215) were affiliated with the College of Aits and Science, 14% (?;
= 153) with the School of Medicine, 13% (n = 52) with the College of Agriculture, Food and
Natural Resources, 7% (n = 78) with the College of Education, and 7% (n = 78) with the College of
Engineering (Table 5).
Table 5. Faculty Respondents' Primary Academic School/College Affiliations
Academic school/college H % College of Agriculture, Food & Natural Resources 141 13.2
College of Arts and Science 215 20.2
Trulaske College of Business 36 3.4
College of Education 78 7.3
College of Engineering 78 7.3
Office of Graduate Studies < 5 —
School of Health Professions 49 4.6
College of Human Environmental Sciences 58 5.4
School of Journalism 62 5.8
School of Law 32 3.0
School of Medicine 153 14.4
School of Natural Resources 10 0.9
Sinclair School of Nursing 22 2,1
21
Rankin & Associates Consulting Campus Climate Assessment Project
University of Missouri-Columbia Repot September 2017
Harry S. Truman School of Public Affairs
College of Veterinary Medicine
Missing Note: Table reports only Faculty responses (n = 1,066).
More than half of the sample (61%, n = 6,099) were Women; 37% (/? = 3,629) were Men.43 Less
than one percent (n = 31) of respondents identified as Genderqueer, and less than one percent (n -
15) of respondents identified as Trans gender.44 Sixty-one respondents (< 1%) marked "a gender not
listed here" and offered identities such as "pineapple," "lizard, " "lamp, " "intergalactic," "attack
helicopter," "demi-girL," "demi-guy," "cis-hetero," "the king of the north," and "sir majesty".
The LCST decided to collapse Transgender, Non-Binary, Genderqueer, and "gender not listed here"
into the "Transspectruin" category (1%, n = 141).
13 1.2
50 4.7
65 6.1
43Xhe majority of respondents identified their birth sex as female (62%, n = 6,175), while 37% (/? = 3,691) of respondents identified as male and< 1 % (j? = 5) identified as intersex. Additionally, 60% (ti = 6,010) identified then gender expression as feminine, 36% (n = 3,572) as masculine, 1% (n = 128) as androgynous, and 1% (ti = 86) as "a gender not listed here." ^S elf-identification as transgender/trans* does not preclude identification as male or female, nor do all those who might fit the definition self-identify as transgender. Here, those who chose to self-identify as transgender have been reported separately in order to reveal the presence of a relatively new campus identity* that might otherwise have been overlooked.
22
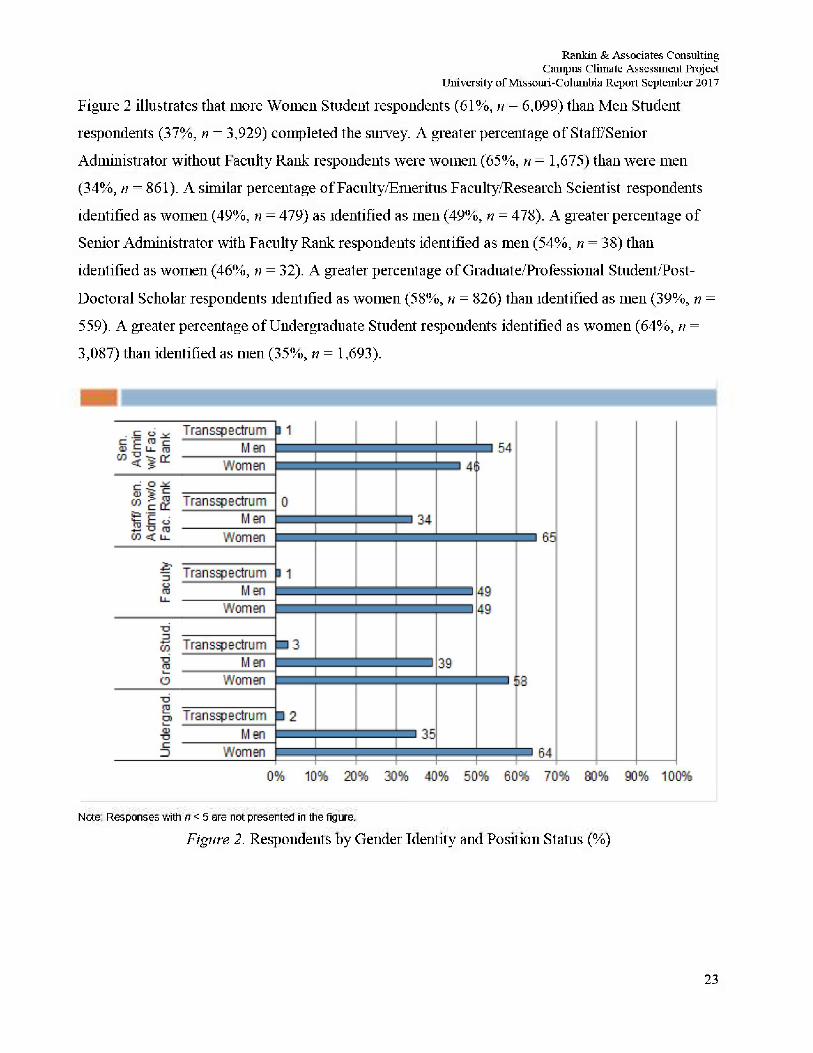
Rankin & Associates Consulting Campus Climate Assessment Project
University of Missouri-Columbia Repoit September 2017
Figure 2 illustrates that more Women Student respondents (61%, n = 6,099) than Men Student
respondents (37%, n = 3,929) completed the survey. A greater percentage of Staff/Senior
Administrator without Faculty Rank respondents were women (65%, n = 1,675) than were men
(34%, ti = 861). A similar percentage of Faculty/Emeritus Faculty/Research Scientist respondents
identified as women (49%, n = 479) as identified as men (49%, n = 478). A greater percentage of
Senior Administrator with Faculty Rank respondents identified as men (54%, n = 38) than
identified as women (46%, n = 32). A greater percentage of Graduate/Professional Student/Post-
Doctoral Scholar respondents identified as women (58%, n = 826) than identified as men (39%, n =
559). A greater percentage of Undergraduate Student respondents identified as women (64%, n =
3,087) than identified as men (35%, n = 1,693).
Note: Responses with n < 5 are not presented in the figure.
Figure 2. Respondents by Gender Identity and Position Status (%)
23
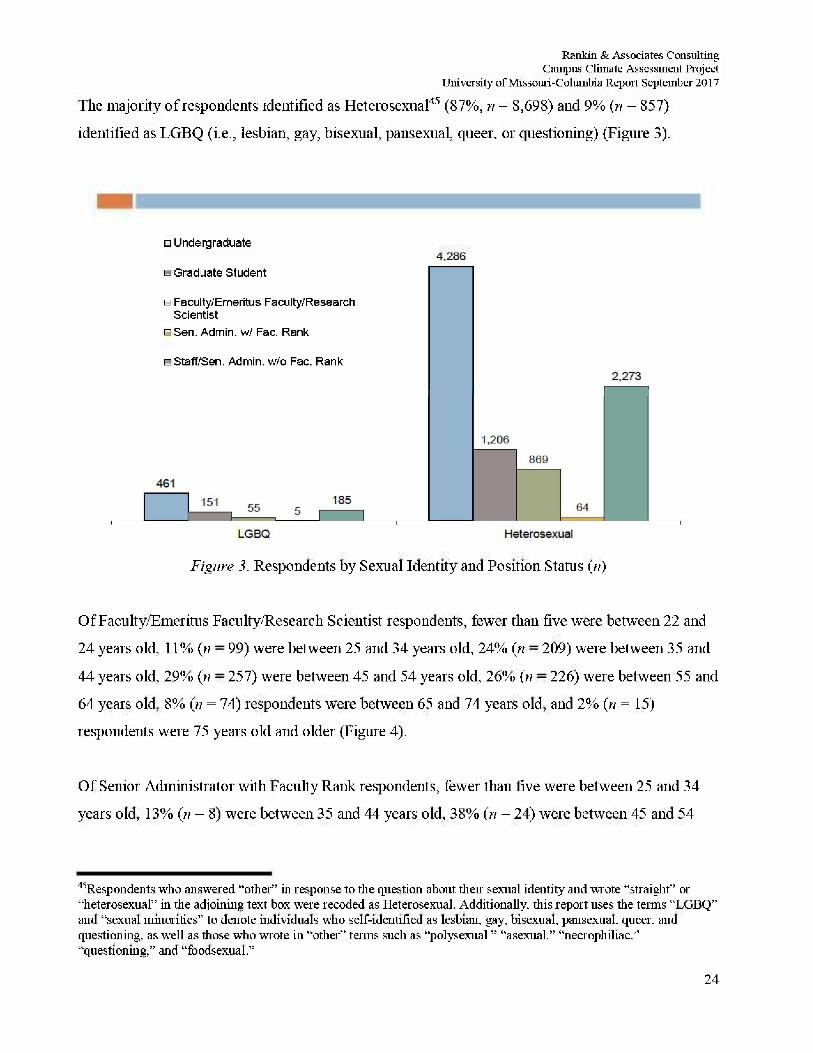
Rankin & Associates Consulting Campus Climate Assessment Project
University of Missouri-Columbia Report September 2017
The majority of respondents identified as Heterosexual45 (87%, n = 8,698) and 9% (n = 857)
identified as LGBQ (i.e., lesbian, gay, bisexual, pansexual, queer, or questioning) (Figure 3).
• Undergraduate
• Graduate Student
• Faculty/Emeritus Faculty/Re search Scientist
• Sen. Admin, w/ Fac. Rank
• Staff/Sen. Admin, w/o Fac. Rank
Figure 3. Respondents by Sexual Identity and Position Status (n)
Of Faculty/Emeritus Faculty/Research Scientist respondents, fewer than five were between 22 and
24 years old, 11% (n = 99) were between 25 and 34 years old, 24% (« = 209) were between 35 and
44 years old, 29% (n = 257) were between 45 and 54 years old, 26% (n = 226) were between 55 and
64 years old, 8% (n = 74) respondents were between 65 and 74 years old, and 2% (« = 15)
respondents were 75 years old and older (Figure 4).
Of Senior Administrator with Faculty Rank respondents, fewer than five were between 25 and 34
years old, 13% (n = 8) were between 35 and 44 years old, 38% (n = 24) were between 45 and 54
^Respondents who answered "other" in response to the question about then sexual identity and mote "straight" or "heterosexual" in the adjoining text box were recoded as Heterosexual. Additionally, this report uses the terms "LGBQ" and "sexual minorities" to denote individuals who self-identified as lesbian, gay, bisexual, pansexual. queer, and questioning, as well as those who wrote in "other" terms such as "polysexual" "asexual." "necropliiliac/' "questioning," and "foodsexual."
24
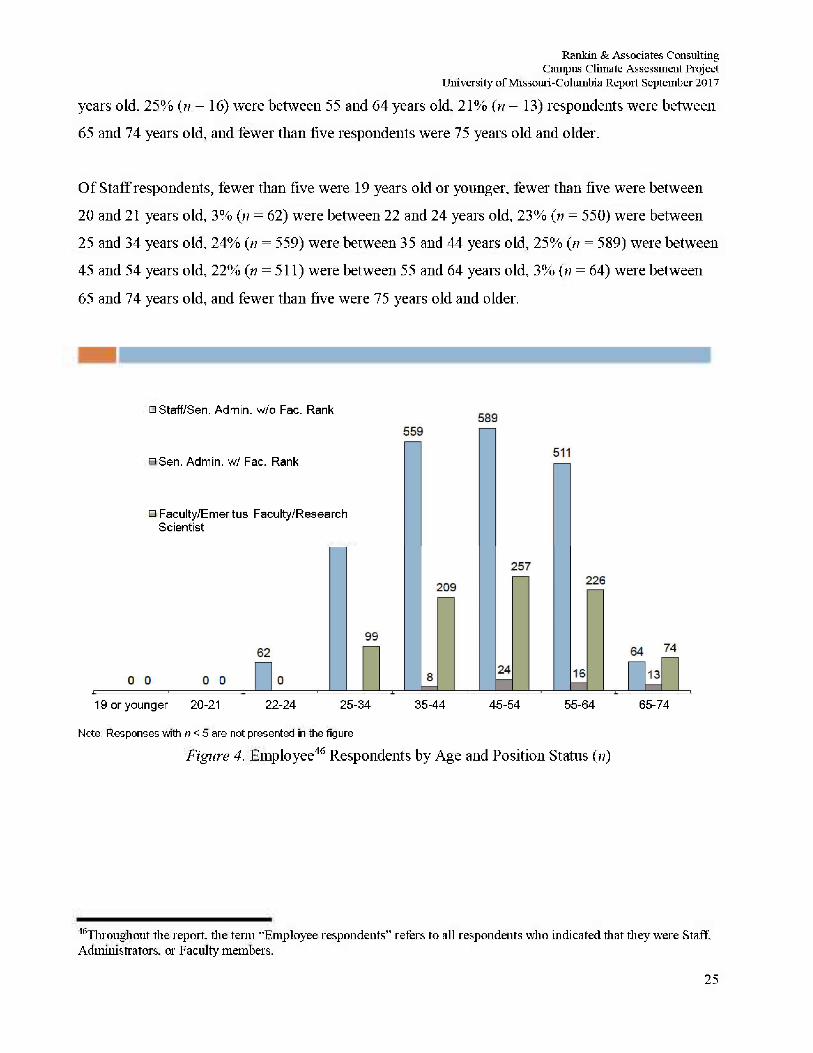
Rankin & Associates Consulting Campus Climate Assessment Project
University of Missouri-Columbia Report September 2017
years old. 25% (n = 16) were between 55 and 64 years old, 21% (n = 13) respondents were between
65 and 74 years old, and fewer than five respondents were 75 years old and older.
Of Staff respondents, fewer than five were 19 years old or younger, fewer than five were between
20 and 21 years old, 3% (n = 62) were between 22 and 24 years old, 23% (n = 550) were between
25 and 34 years old, 24% (» = 559) were between 35 and 44 years old, 25% (;? = 589) were between
45 and 54 years old, 22% (n = 511) were between 55 and 64 years old, 3% (n = 64) were between
65 and 74 years old, and fewer than five were 75 years old and older.
• Staff/Sen. Admin, w/o Fac. Rank
• Sen. Admin, w/ Fac. Rank
• Faculty/E merit us Faculty/Research Scientist
19 or younger 20-21 22-24 25-34 35-44 45-54 55-64 65-74
Note: Responses with n <5 are not presented in the figure
Figure 4. Employee46 Respondents by Age and Position Status ()?)
4SThroughout the report, the term "Employee respondents" refers to all respondents who indicated that they were Staff, Administrators, or Facility members.
25
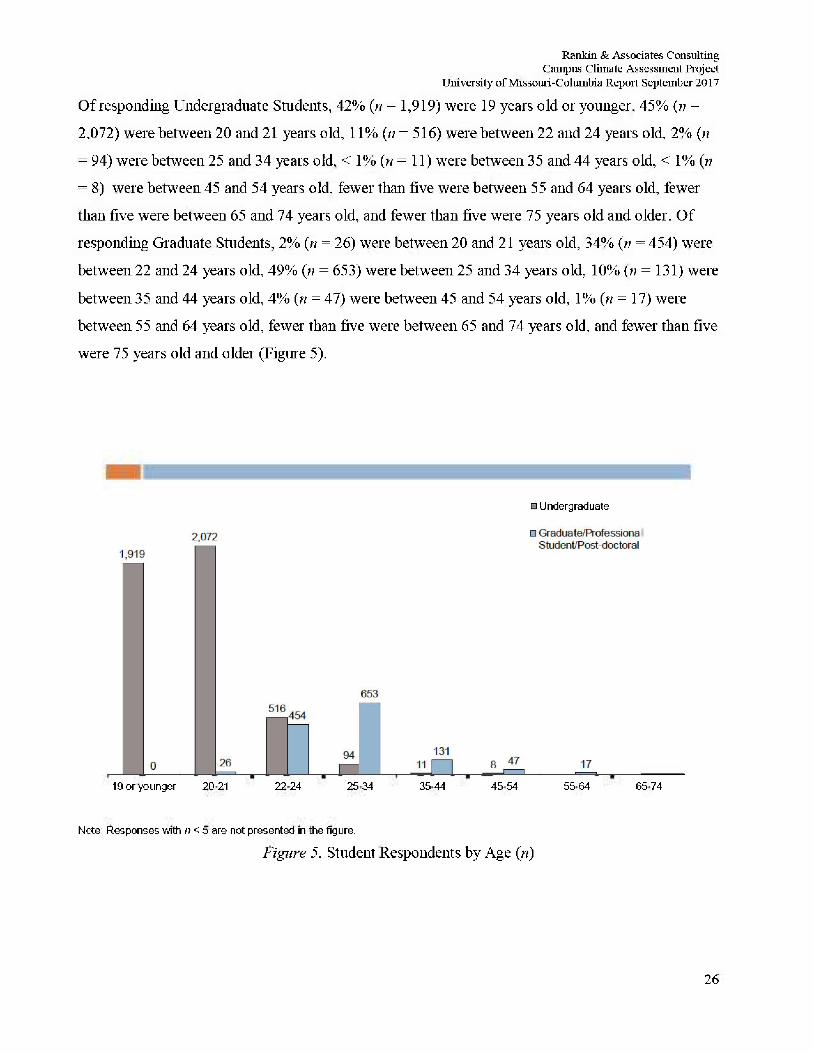
Rankin & Associates Consulting Campus Climate Assessment Project
University of Missouri-Columbia Report September 2017
Of responding Undergraduate Students, 42% (n = 1,919) were 19 years old or younger, 45% (?i =
2,072) were between 20 and 21 years old, 11% (» =516) were between 22 and 24 years old, 2% (/?
= 94) were between 25 and 34 years old, < 1% (n =11) were between 35 and 44 years old, < 1% («
= 8) were between 45 and 54 years old, fewer than five were between 55 and 64 years old, fewer
than five were between 65 and 74 years old, and fewer than five were 75 years old and older. Of
responding Graduate Students, 2% (n = 26) were between 20 and 21 years old, 34% (n = 454) were
between 22 and 24 years old, 49% (n = 653) were between 25 and 34 years old, 10% (n = 131) were
between 35 and 44 years old, 4% (n = 47) were between 45 and 54 years old, 1% (n = 17) were
between 55 and 64 years old, fewer than five were between 65 and 74 years old, and fewer than five
were 75 years old and older (Figure 5).
• Undergraduate
lOoryoungor 20-21 22-24 25-34 35-44 45-54 55-64 65-74
Note: Responses with /) < 5 are not presented in the figure.
Figure 5. Student Respondents by Age (n)
26
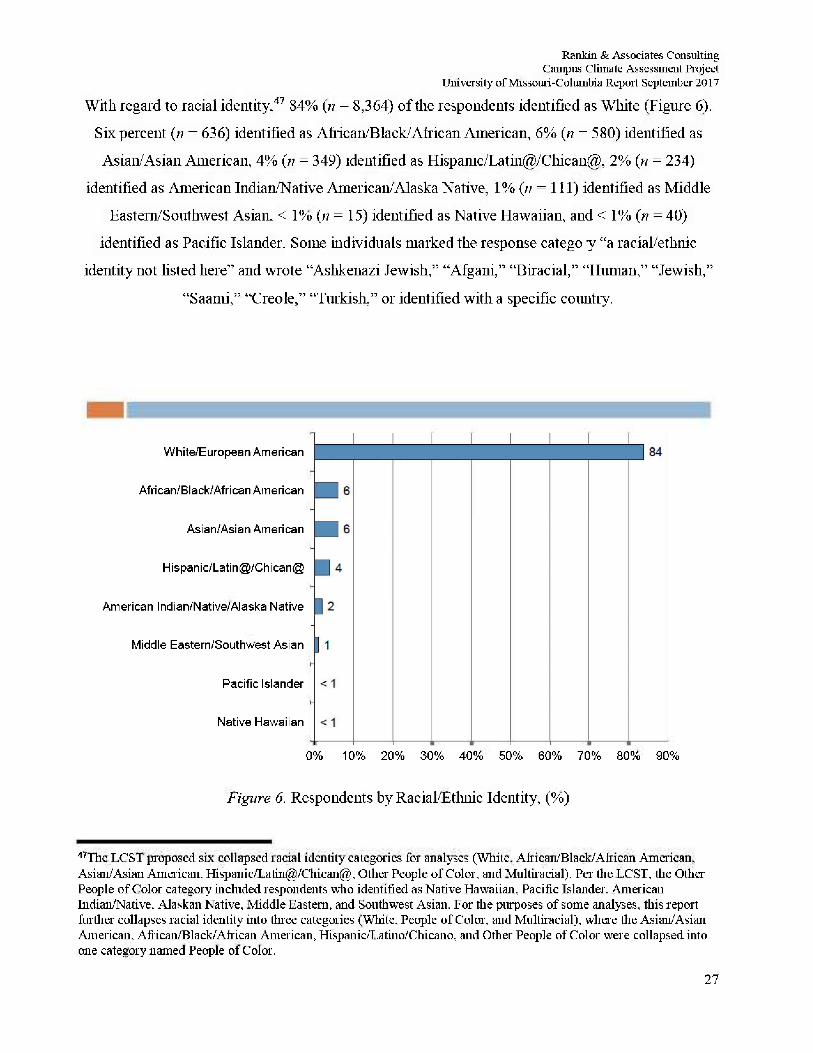
Rankin & Associates Consulting Campus Climate Assessment Project
University of Missouri-Columbia Repoit September 2017
With regard to racial identity.47 84% (n = 8,364) of the respondents identified as White (Figure 6).
Six percent (n = 636) identified as African/Black/African American, 6% (n = 580) identified as
Asian/Asian American, 4% (n = 349) identified as Hispamc/Latin@/Chican@, 2% (n = 234)
identified as American Indian/Native American/Alaska Native, 1% (n = 111) identified as Middle
Eastern/Southwest Asian. < 1% (n = 15) identified as Native Hawaiian, and < 1% (n = 40)
identified as Pacific Islander. Some individuals marked the response category "a racial/ethnic
identity not listed here" and wrote 'Aslikenazi Jewish," "Afgani," "Biracial," "Human," "Jewish,"
"Saami," "Creole," "Turkish," or identified with a specific country.
White/European American
African/Black/African American
Asian/Asian American
Hispanic/Latin@/Chican@
American Indian/Native/Alaska Native
Middle Eastern/Southwest Asian
Pacific Islander
Native Hawaiian
0% 10% 20% 30% 40% 50% 60% 70% 80% 90%
Figure 6. Respondents by Racial/Ethnic Identity, (%)
47The LCST proposed six collapsed racial identity categories for analyses (White, African/Black/African American, Asian/Asian American, Hispanic/Latin@/Chican@, Other People of Color, and Multiracial). Per the LCST, the Other People of Color category included respondents who identified as Native Hawaiian, Pacific Islander. American Indian/Native, Alaskan Native, Middle Eastern, and Southwest Asian. For the purposes of some analyses, this report further collapses racial identity into three categories (White, People of Color, and Multiracial), where the Asian/Asian American, African/Black/African American, Hispanic/Latino/Chicano, and Other People of Color were collapsed into one category named People of Color.
27
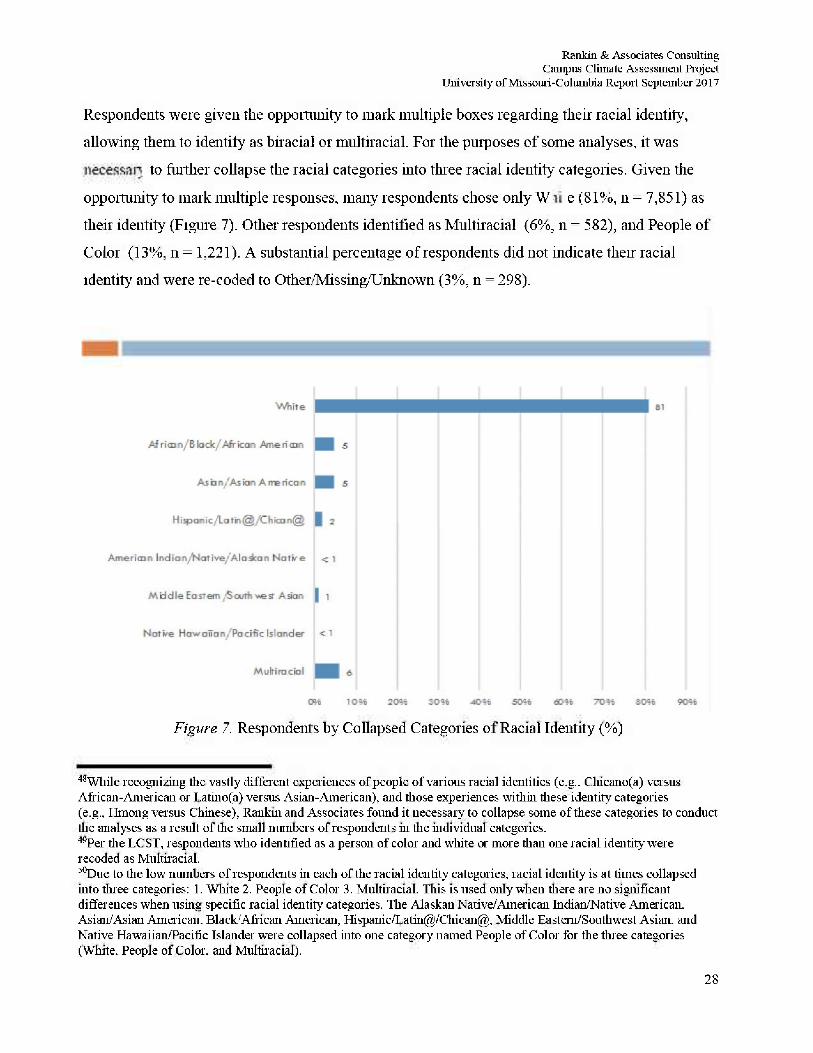
Rankin & Associates Consulting Campus Climate Assessment Project
University of Missouri-Columbia Report September 2017
Respondents were given the opportunity to mark multiple boxes regarding their racial identity,
allowing them to identify as biracial or multiracial. For the purposes of some analyses, it was
necessary to further collapse the racial categories into three racial identity categories. Given the
opportunity to mark multiple responses, many respondents chose only White (81%, 11 = 7,851) as
their identity (Figure 7). Other respondents identified as Multiracial (6%, n = 582), and People of
Color (13%, n = 1,221). A substantial percentage of respondents did not indicate then racial
identity and were re-coded to Other/Missing/Unknown (3%, 11 = 298).
Figure 7. Respondents by Collapsed Categories of Racial Identity (%)
4 8 While recognizing the vastly different experiences of people of various racial identities (e.g.. Cliicano(a) versus African-American or Latino(a) versus Asian-American), and those experiences within these identity categories (e.g., Hmong versus Chinese), Rankin and Associates found it necessary to collapse some of these categories to conduct the analyses as a result of the small numbers of respondents in the individual categories. 49Per the LCST, respondents who identified as a person of color and white or more than one racial identity were recoded as Multiracial. 3{>Due to the low numbers of respondents in each of the racial identity categories, racial identity is at times collapsed into three categories: 1. White 2. People of Color 3. Multiracial This is used only when there are no significant differences when using specific racial identity categories. Hie Alaskan Native/American Indian Native American. Asian/Asian American. Black African American, Hispanic/Latin@/Chican@, Middle Eastern/Southwest Asian, and Native Hawaiian/Pacific Islander were collapsed into one category named People of Color for the three categories (White. People of Color, and Multiracial).
28
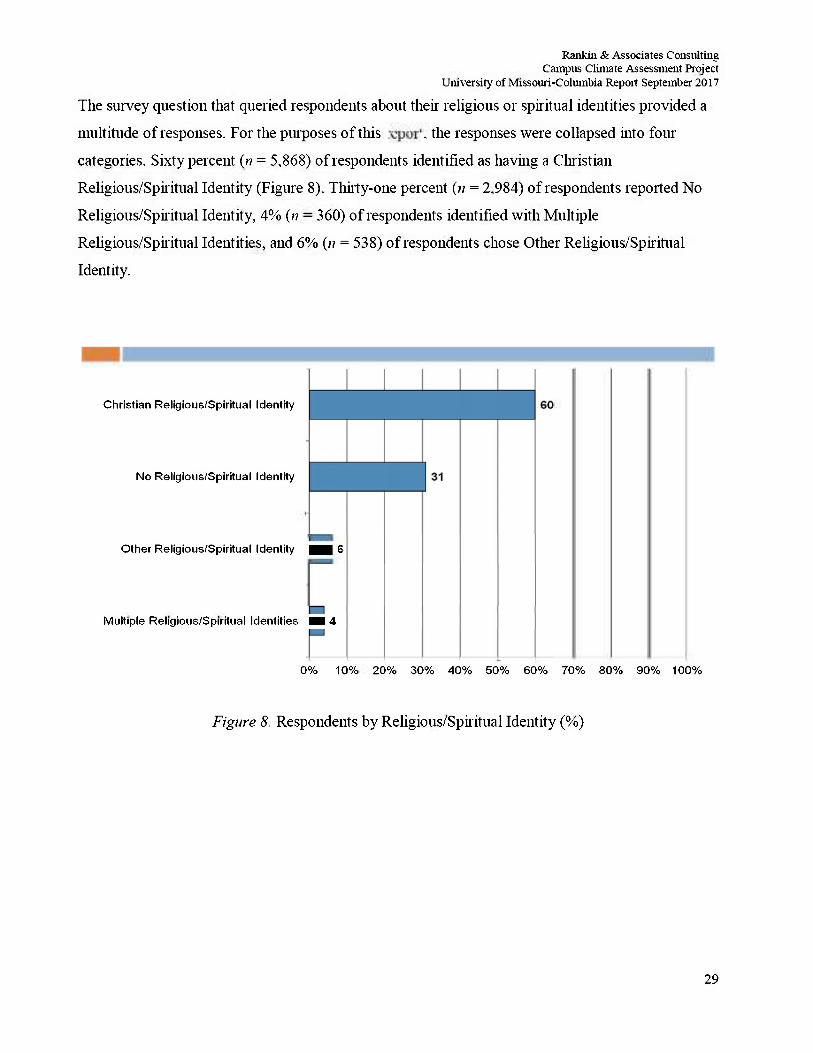
Rankin & Associates Consulting Campus Climate Assessment Project
University of Missouri-Columbia Repoit September 2017
The survey question that queried respondents about their religious or spiritual identities provided a
multitude of responses. For the purposes of this report, the responses were collapsed into four
categories. Sixty percent (n = 5,868) of respondents identified as having a Christian
Religious/Spiritual Identity (Figure 8). Thirty-one percent (n = 2,984) of respondents reported No
Religious/Spiritual Identity, 4% (n = 360) of respondents identified with Multiple
Religious/Spiritual Identities, and 6% (77 = 538) of respondents chose Other Religious/Spiritual
Identity.
Christian Religious/Spiritual Identity
No Religious/Spiritual Identity
Other Religious/Spiritual Identity 6
Multiple Religious/Spiritual Identities 4
0% 10% 20% 30% 40% 50% 60% 70% 80% 90% 100%
Figure 8. Respondents by Religious/Spiritual Identity (%)
29
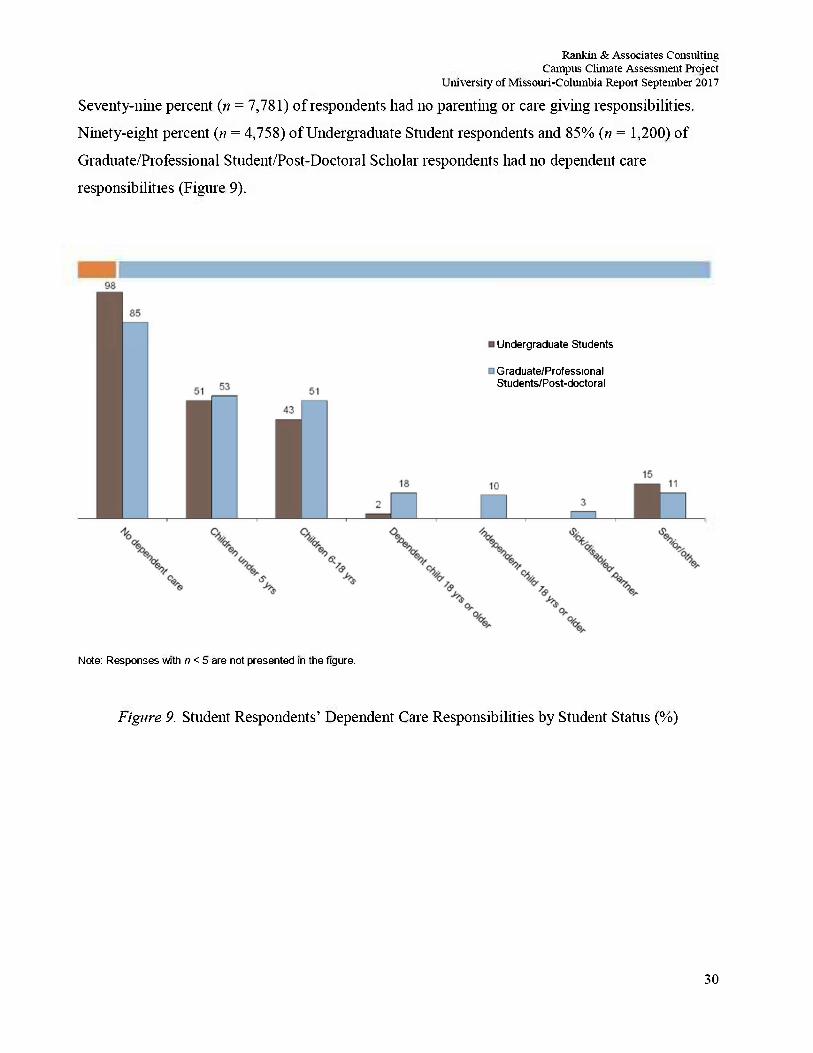
Rankin & Associates Consulting Campus Climate Assessment Project
University of Missouri-Columbia Repoit September 2017
Seventy-nine percent (ti = 7,781) of respondents had no parenting or care giving responsibilities.
Ninety-eight percent (m = 4,758) of Undergraduate Student respondents and 85% (n = 1,200) of
Graduate/Professional Student/Post-Doctoral Scholar respondents had no dependent care
responsibilities (Figure 9).
Undergraduate Students
Graduate/Professional Students/Post-doctoral
Note: Responses with n < 5 are not presented in the figure.
Figure 9. Student Respondents' Dependent Care Responsibilities by Student Status (%)
30
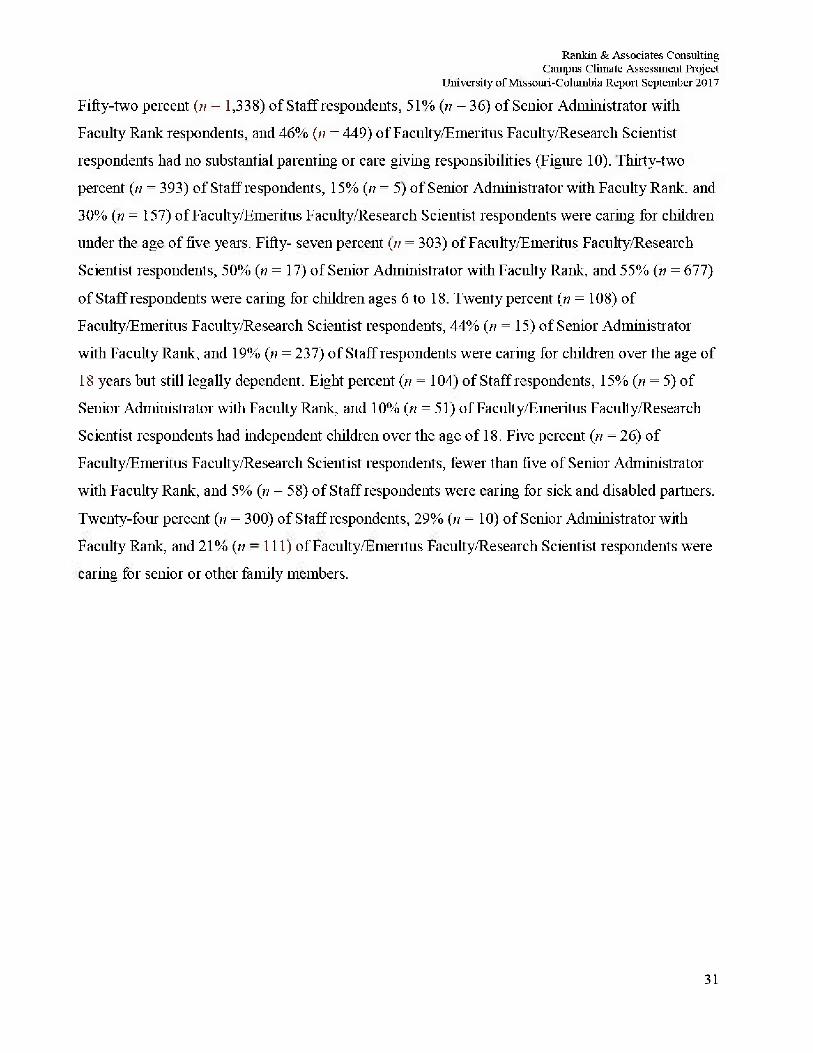
Rankin & Associates Consulting Campus Climate Assessment Project
University of Missouri-Columbia Report September 2017
Fifty-two percent (n = 1,338) of Staff respondents, 51% (n = 36) of Senior Administrator with
Faculty Rank respondents, and 46% (w = 449) of Faculty/Emeritus Faculty/Research Scientist
respondents had no substantial parenting or care giving responsibilities (Figure 10). Thirty-two
percent (n = 393) of Staff respondents, 15% (n = 5) of Senior Administrator with Faculty Rank, and
30% (n = 157) of Faculty/Emeritus Faculty/Research Scientist respondents were caring for children
under the age of five years. Fifty- seven percent (n = 303) of Faculty/Emeritus Faculty/Research
Scientist respondents, 50% (n = 17) of Senior Administrator with Faculty Rank, and 55% (n = 677)
of Staff respondents were caring for children ages 6 to 18. Twenty percent (« = 108) of
Faculty/Emeritus Faculty/Research Scientist respondents, 44% (n = 15) of Senior Administrator
with Faculty Rank, and 19% (n = 237) of Staff respondents were caring for children over the age of
18 years but still legally dependent. Eight percent (n = 104) of Staff respondents, 15% (n = 5) of
Senior Administrator with Faculty Rank, and 10% (n = 51) of Faculty/Emeritus Faculty/Research
Scientist respondents had independent children over the age of 18. Five percent (n = 26) of
Faculty/Emeritus Faculty/Research Scientist respondents, fewer than five of Senior Administrator
with Faculty Rank, and 5% (n = 58) of Staff respondents were caring for sick and disabled partners.
Twenty-four percent (n = 300) of Staff respondents, 29% (;/ = 10) of Senior Administrator with
Faculty Rank, and 21% (n = 111) of Faculty /Emeritus Faculty/Research Scientist respondents w7ere
caring for senior or other family members.
31
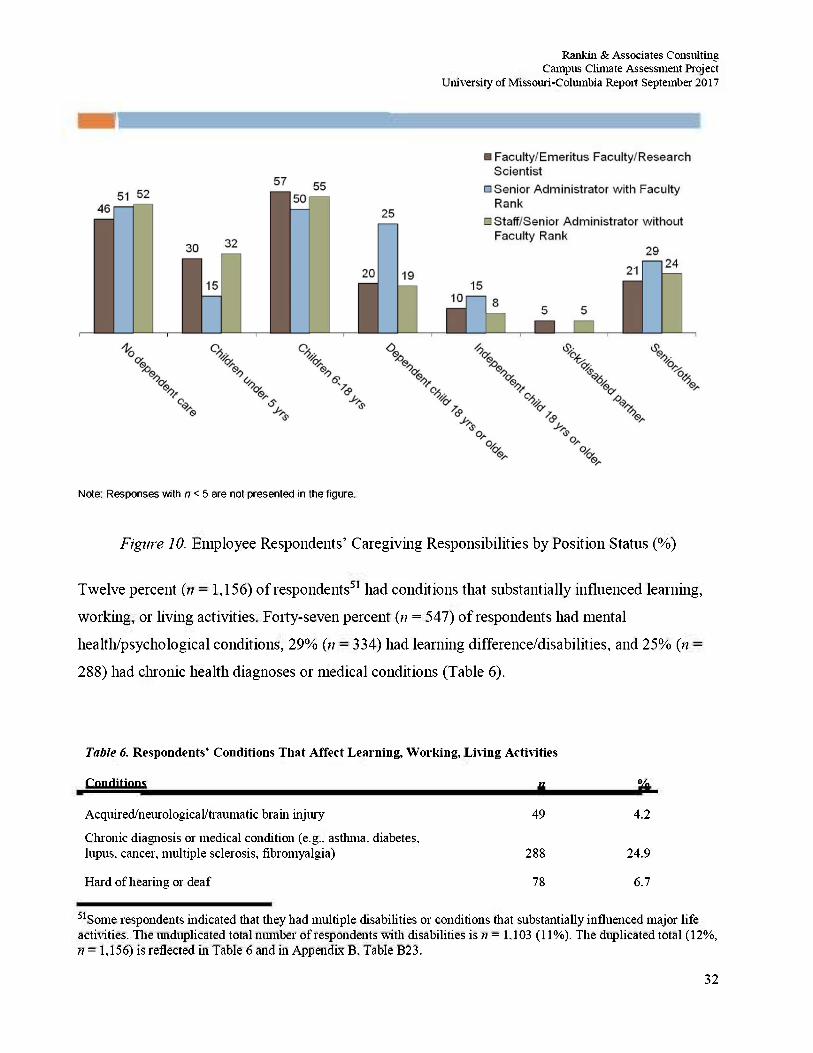
Rankin & Associates Consulting Campus Climate Assessment Project
University of Missouri-Columbia Report September 2017
Note: Responses with n < 5 are not presented in the figure.
Figure 10. Employee Respondents' Caregiving Responsibilities by Position Status (%)
Twelve percent (n = 1,156) of respondents51 had conditions that substantially influenced learning,
working, or living activities. Forty-seven percent (n = 547) of respondents had mental
health/psycho logical conditions, 29% (ti = 334) had learning difference/disabilities, and 25% (n =
288) had chronic health diagnoses or medical conditions (Table 6).
Table 6. Respondents' Conditions That Affect Learning, Working, Living Activities
Conditions n %
Acquired/neurological/traumatic brain injury 49 4.2
Chronic diagnosis or medical condition (e.g.. asthma, diabetes.
lupus, cancer, multiple sclerosis, fibromyalgia) 288 24.9
Hard of hearing or deaf 78 6.7 51Some respondents indicated that they had multiple disabilities or conditions that substantially influenced major life activities. The unduplicated total number of respondents with disabilities is » = 1.103 (11%). The duplicated total (12%, n = 1,156) is reflected in Table 6 and in Appendix B. Table B23.
32
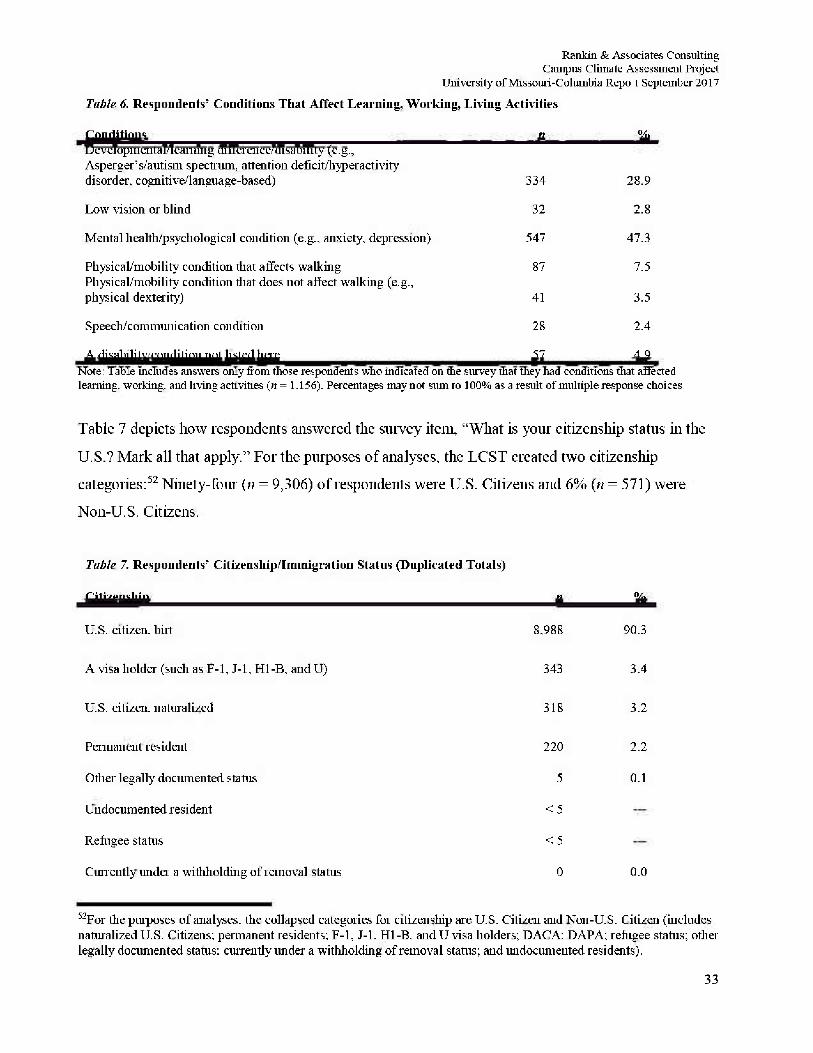
Rankin & Associates Consulting Campus Climate Assessment Project
University of Missouri-Columbia Repot September 2017
Table 6. Respondeuts' Conditions That Affect Learning, Working, Living Activities
Conditions n % Developmental/learning difference/disability (e.g., Asperger's/autism spectrum, attention deficit/hyperactivity disorder, cognitive/language-based) 334 28.9
Low vision or blind 32 2.8
Mental liealth/psycliological condition (e.g., anxiety, depression) 547 47.3
Physical/mobility condition that affects walking 87 7.5 Physic a 1/mobility condition that does not affect walking (e.g.,
physical dexterity) 41 3.5
Speech/communication condition 28 2.4
A disability', condition not listed here 57 4.9 Note: Table includes answers only from those respondents who indicated on the survey that they had conditions that affected learning, working, and living activities (n = 1.156). Percentages may not sum to 100% as a result of multiple response choices.
Table 7 depicts how respondents answered the survey item, "What is your citizenship status in the
U.S.? Mark all that apply." For the purposes of analyses, the LCST created two citizenship
categories:52 Ninety-four (;/ = 9,306) of respondents were U.S. Citizens and 6% (n = 571) were
Non-U.S. Citizens.
Table 7. Respondents' Citizen ship/Immigration Status (Duplicated Totals)
Citizenship n %
U.S. citizen, birth 8.988 90.3
A visa holder (such as F-l, J-l, Hl-B, and U) 343 3.4
U.S. citizen, naturalized 318 3.2
Permanent resident 220 2.2
Other legally documented status 5 0.1
Undocumented resident < 5
Refugee status < 5
Currently under a withholding of removal status 0 0.0
52For the purposes of analyses, the collapsed categories for citizenship are U.S. Citizen and Non-U.S. Citizen (includes naturalized U.S. Citizens; permanent residents; F-l, J-l. Hl-B. and U visa holders; DACA; DAPA; refugee status; other legally documented status; currently under a withholding of removal status; and undocumented residents).
33
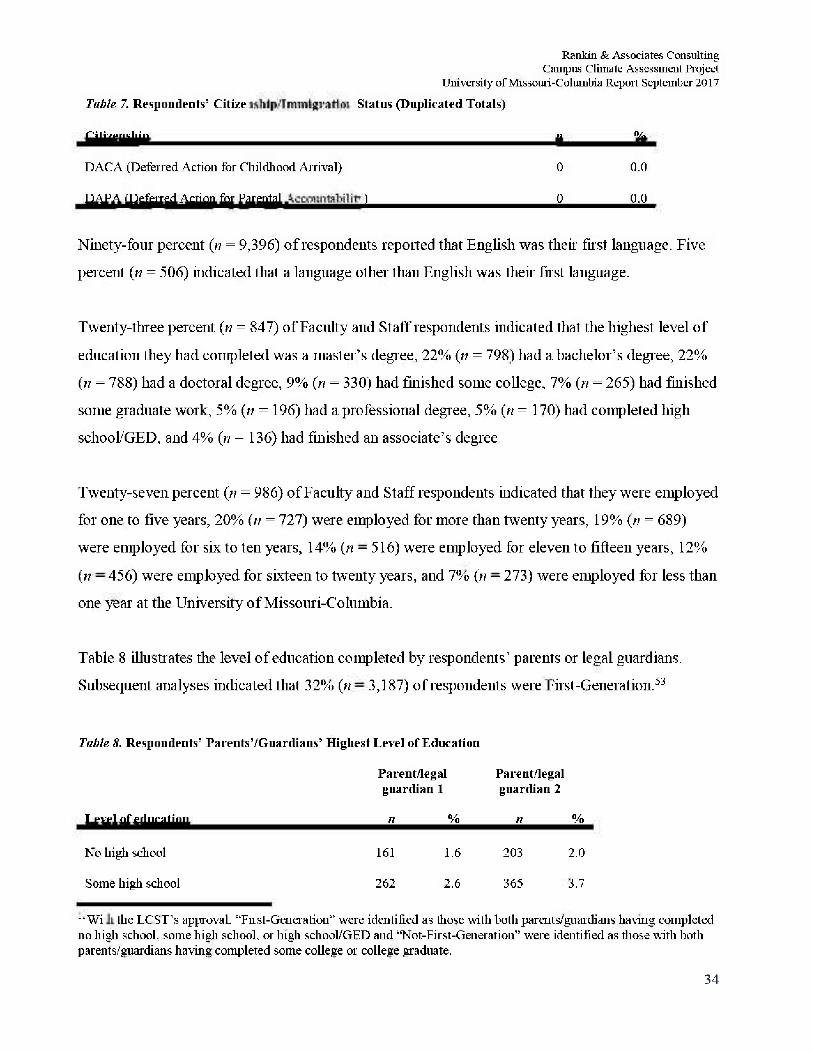
Rankin & Associates Consulting Campus Climate Assessment Project
University of Missouri-Columbia Repoit September 2017
Table 7. Respondents' Citizenship/Immigration Status (Duplicated Totals)
Citizenship n %
DACA (Deferred Action for Childhood Arrival) 0 0.0
PAPA (Deferred Action for Parental Accountability) 0 0.0
Ninety-four percent (n = 9,396) of respondents reported that English was their first language. Five
percent (n = 506) indicated that a language other than English was their first language.
Twenty-three percent (n = 847) of Faculty and Staff respondents indicated that the highest level of
education they had completed was a master's degree, 22% (« = 798) had a bachelor's degree, 22%
(n = 788) had a doctoral degree, 9% (n = 330) had finished some college, 7% (n = 265) had finished
some graduate work, 5% (« = 196) had a professional degree, 5% (n = 170) had completed high
school/GED, and 4% (n = 136) had finished an associate's degree.
Twenty-seven percent (n = 986) of Faculty and Staff respondents indicated that they were employed
for one to five years, 20% (ti = 727) were employed for more than twenty years, 19% (n = 689)
were employed for six to ten years, 14% (n = 516) were employed for eleven to fifteen years, 12%
(n = 456) were employed for sixteen to twenty years, and 7% (n = 273) were employed for less than
one year at the University of Missouri-Columbia.
Table 8 illustrates the level of education completed by respondents1 parents or legal guardians.
Subsequent analyses indicated that 32% (n = 3,187) of respondents were First-Generation.53
Table 8. Respondents' Pa rents'/Guardians' Highest Level of Education
Parent/legal Parent/legal guardian 1 guardian 2
Level of education n % n %
No high school 161 1.6 203 2.0
Some high school 262 2.6 365 3.7
"With the LCST's approval, "Fust-Generation" were identified as those with both parents/guardians having completed no high school, some high school, or high school/GED and "Not-First-Generation" were identified as those with both parents/guardians having completed some college or college graduate.
34
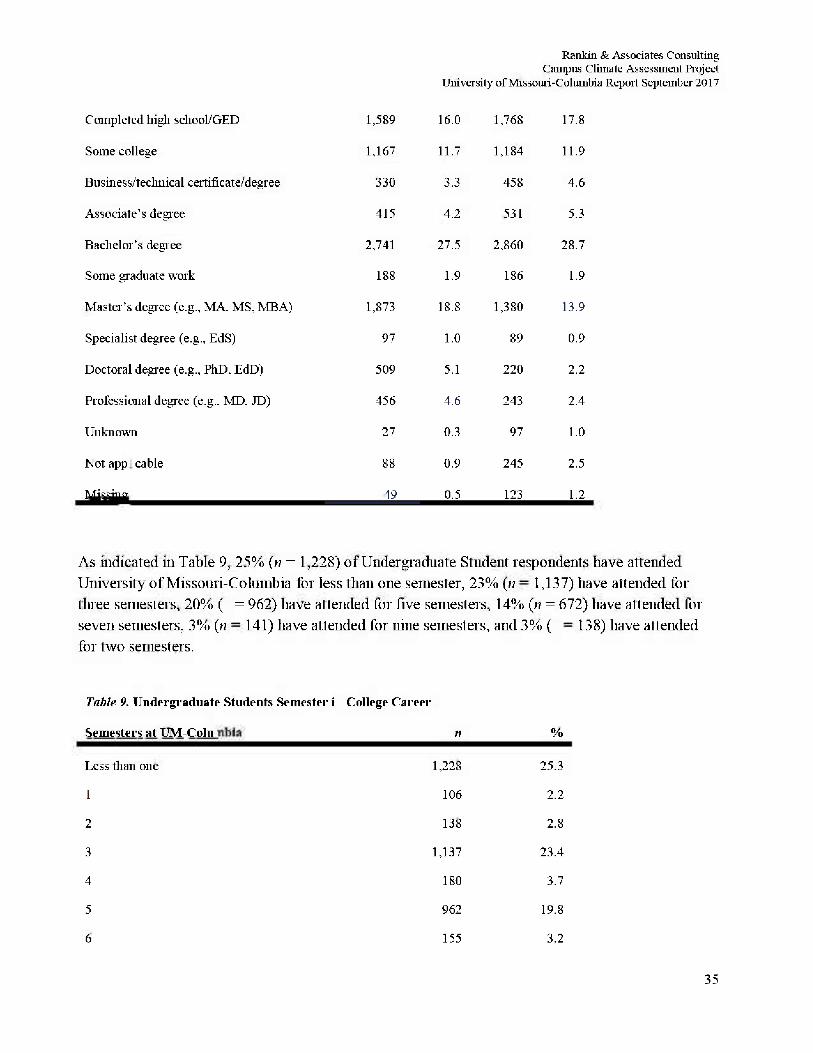
Rankin & Associates Consulting Campus Climate Assessment Project
University of Missouri-Columbia Repot September 2017
Completed high school/GED 1,589 16.0 1,768 17.8
Some college 1,167 11.7 1,184 11.9
Business/technical certificate/degree 330 3.3 458 4.6
Associate's degree 415 4.2 531 5.3
Bachelor's degree 2,741 27.5 2.860 28.7
Some graduate work 188 1.9 186 1.9
Master's degree (e.g., MA. MS, MBA) 1,873 18.8 1,380 13.9
Specialist degree (e.g., EdS) 97 1.0 89 0.9
Doctoral degree (e.g., PhD. EdD) 509 5.1 220 2.2
Professional degree (e.g.. MD. JD) 456 4.6 243 2.4
Unknown 27 0.3 97 1.0
Not applicable 88 0.9 245 2.5
Missing 49 0.5 123 1.2
As indicated in Table 9, 25% {n = 1,228) of Undergraduate Student respondents have attended University of Missouri-Columbia for less than one semester, 23% (n = 1,137) have attended for three semesters, 20% (n = 962) have attended for five semesters, 14% (n = 672) have attended for seven semesters, 3% (n = 141) have attended for nine semesters, and 3% (n = 138) have attended for two semesters.
Table 9. Undergraduate Students Semester in College Career
Semesters at UM-Columbia n %
Less than one 1,228 25.3
1 106 2.2
2 138 2.8
3 1,137 23.4
4 180 3.7
5 962 19.8
6 155 3.2
35
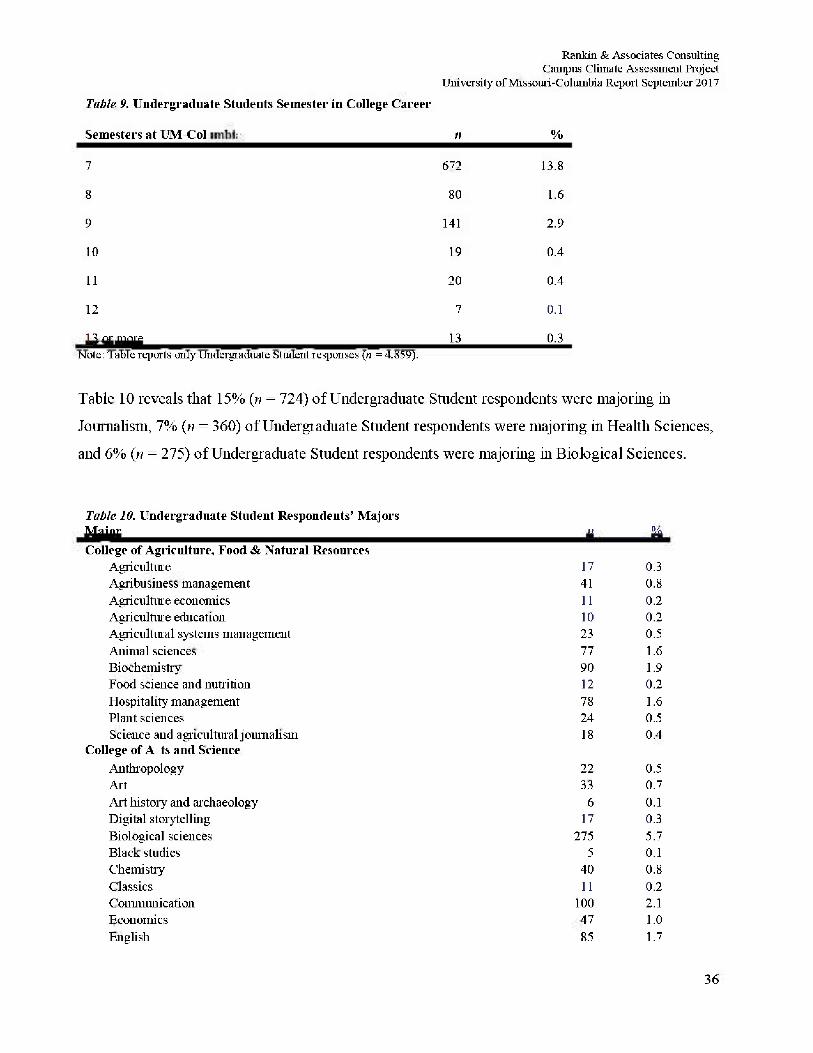
Rankin & Associates Consulting Campus Climate Assessment Project
University of Missouri-Columbia Repot September 2017
Table 9. Undergraduate Students Semester in College Career
Semesters at UM-Columbia n %
7 672 13.8
8 80 1.6
9 141 2.9
10 19 0.4
11 20 0.4
12 7 0.1
13 or more 13 0.3 Note: Table reports only Undergraduate Student responses (n = 4.859).
Table 10 reveals that 15% (n = 724) of Undergraduate Student respondents were majoring in
Journalism, 7% (n = 360) of Undergraduate Student respondents were majoring in Health Sciences,
and 6% (n = 275) of Undergraduate Student respondents were majoring in Biological Sciences.
Table 10. Undergraduate Student Respondents' Majors Major n % College of Agriculture, Food & Natural Resources
Agriculture 17 0.3 Agribusiness management 41 0.8 Agriculture economics 11 0.2 Agriculture education 10 0.2 Agricultural systems management 23 0.5 Animal sciences 77 1.6 Biochemistry 90 1.9 Food science and nutrition 12 0.2 Hospitality* management 78 1.6 Plant sciences 24 0.5 Science and agricultural journalism 18 0.4
College of Arts and Science Anthropology 22 0.5 Art 33 0.7 Art history and archaeology 6 0.1 Digital storytelling 17 0.3 Biological sciences 275 5.7 Black studies 5 0.1 Chemistry 40 0.8 Classics 11 0.2 Communication 100 2.1 Economics 47 1.0 English 85 1.7
36
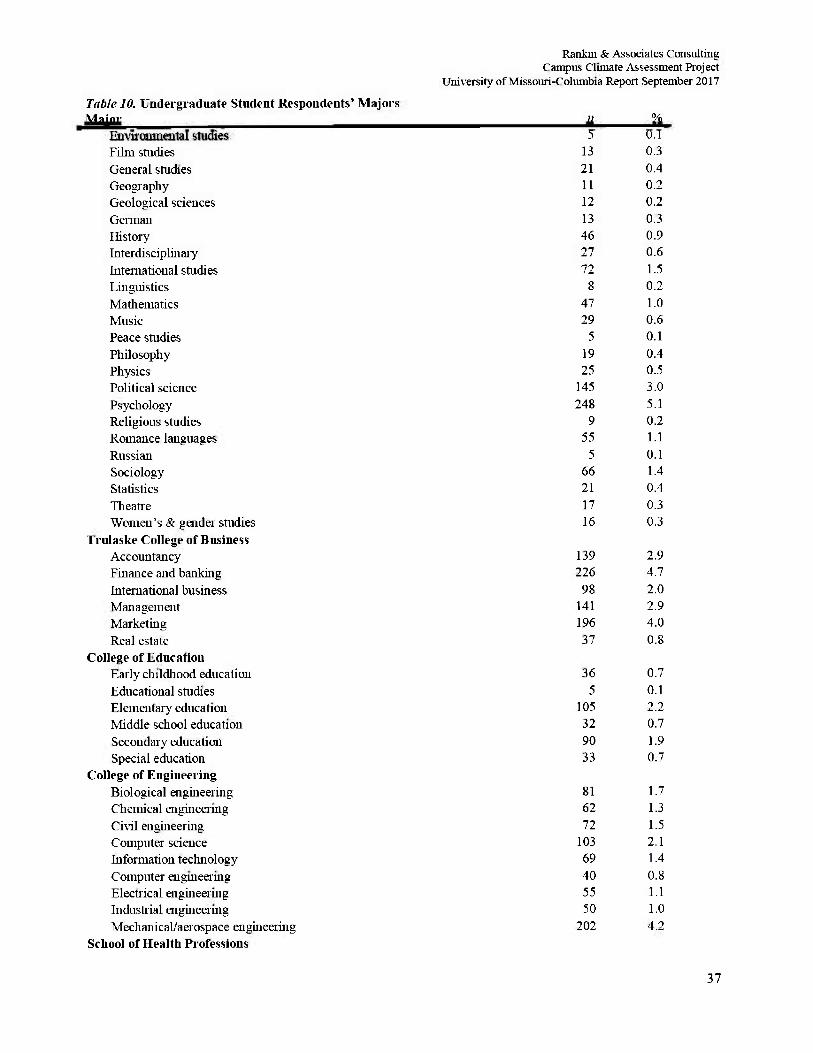
Rankin & Associates Consulting Campus Climate Assessment Project
University of Missouri-Columbia Repoit September 2017
Table 10. Undergraduate Student Respondents' Majors Major » %
Environmental studies 5 0.1 Film studies 13 0.3 General studies 21 0.4 Geography 11 0.2 Geological sciences 12 0.2 German 13 0.3 History 46 0.9 Interdisciplinary 27 0.6 International studies 72 1.5 Linguistics 8 0.2 Mathematics 47 1.0 Music 29 0.6 Peace studies 5 0.1 Philosophy 19 0.4 Physics 25 0.5 Political science 145 3.0 Psychology 248 5.1 Religious studies 9 0.2 Romance languages 55 1.1 Russian 5 0.1 Sociology 66 1.4 Statistics 21 0.4 Theatre 17 0.3 Women's & gender studies 16 0.3
Trulaske College of Business Accountancy 139 2.9 Finance and banking 226 4.7 International business 98 2.0 Management 141 2.9 Marketing 196 4.0 Real estate 37 0.8
College of Education Early childhood education 36 0.7 Educational studies 5 0.1 Elementary education 105 2.2 Middle school education 32 0.7 Secondary education 90 1.9 Special education 33 0.7
College of Engineering Biological engineering 81 1.7 Chemical engineering 62 1.3 Civil engineering 72 1.5 Computer science 103 2.1 Information technology 69 1.4 Computer engineering 40 0.8 Electrical engineering 55 1.1 Industrial engineering 50 1.0 Mechanical/aerospace engineering 202 4.2
School of Health Professions
37
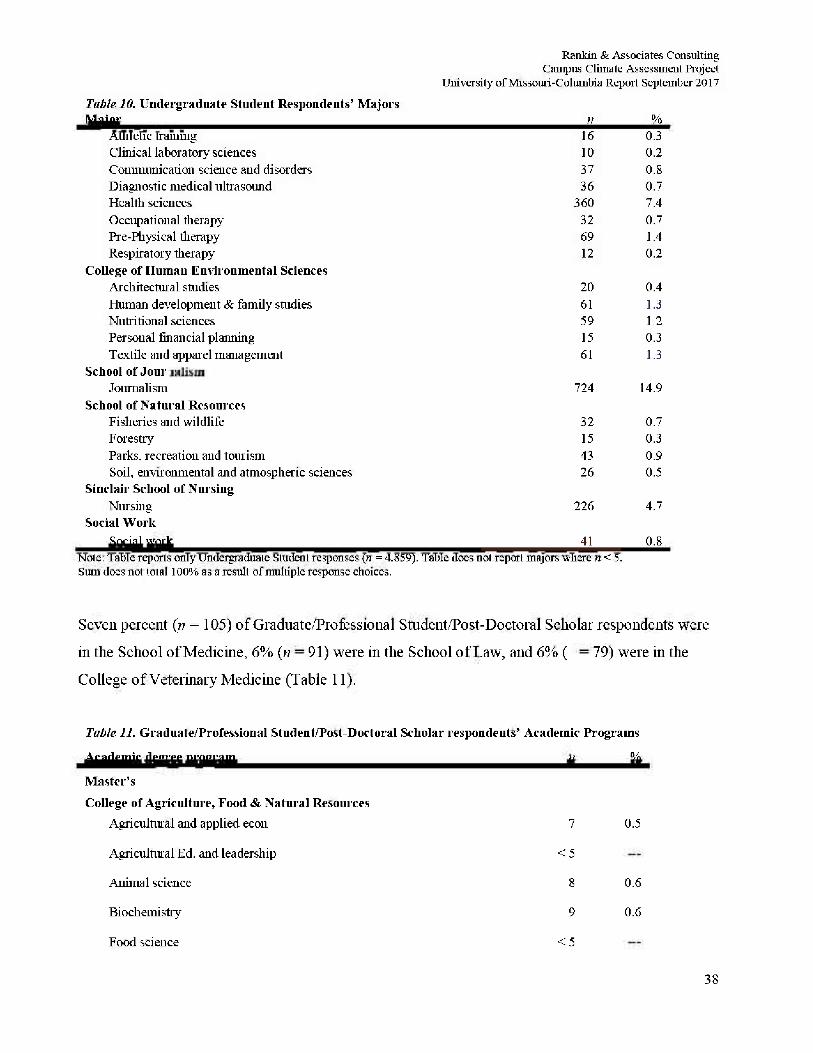
Rankin & Associates Consulting Campus Climate Assessment Project
University of Missouri-Columbia Repot September 2017
Table 10. Undergraduate Student Respondents' Majors Major n %
Athletic training 16 0.3 Clinical laboratory sciences 10 0.2 Communication science and disorders 37 0.8 Diagnostic medical ultrasound 36 0.7 Health sciences 360 7.4 Occupational therapy 32 0.7 Pre-Physical therapy 69 1.4 Respiratory therapy 12 0.2
College of Human Environmental Sciences Architectural studies 20 0.4 Human development & family studies 61 1.3 Nutritional sciences 59 1.2 Personal financial planning 15 0.3 Textile and apparel management 61 1.3
School of Journalism Journalism 724 14.9
School of Natural Resources Fisheries and wildlife 32 0.7 Forestry 15 0.3 Parks, recreation and tourism 43 0.9 Soil, environmental and atmospheric sciences 26 0.5
Sinclair School of Nursing Nursing 226 4.7
Social Work Social work 41 0.8
Note: Table reports only Undergraduate Student responses (n = 4.859). Table does not report majors where n < 5. Sum does not total 100% as a result of multiple response choices.
Seven percent (n = 105) of Graduate/Professional Student/Post-Doctoral Scholar respondents were
in the School of Medicine, 6% (n = 91) were in the School of Law, and 6% (n = 79) were in the
College of Veterinary Medicine (Table 11).
Table 11. Graduate/Professional Student/Post-Doctoral Scholar respondents' Academic Programs
Academic degree program n %
Master's College of Agriculture, Food & Natural Resources
Agricultural and applied econ 7 0.5
Agricultural Ed. and leadership < 5
Animal science 8 0.6
Biochemistry 9 0.6
Food science < 5
38
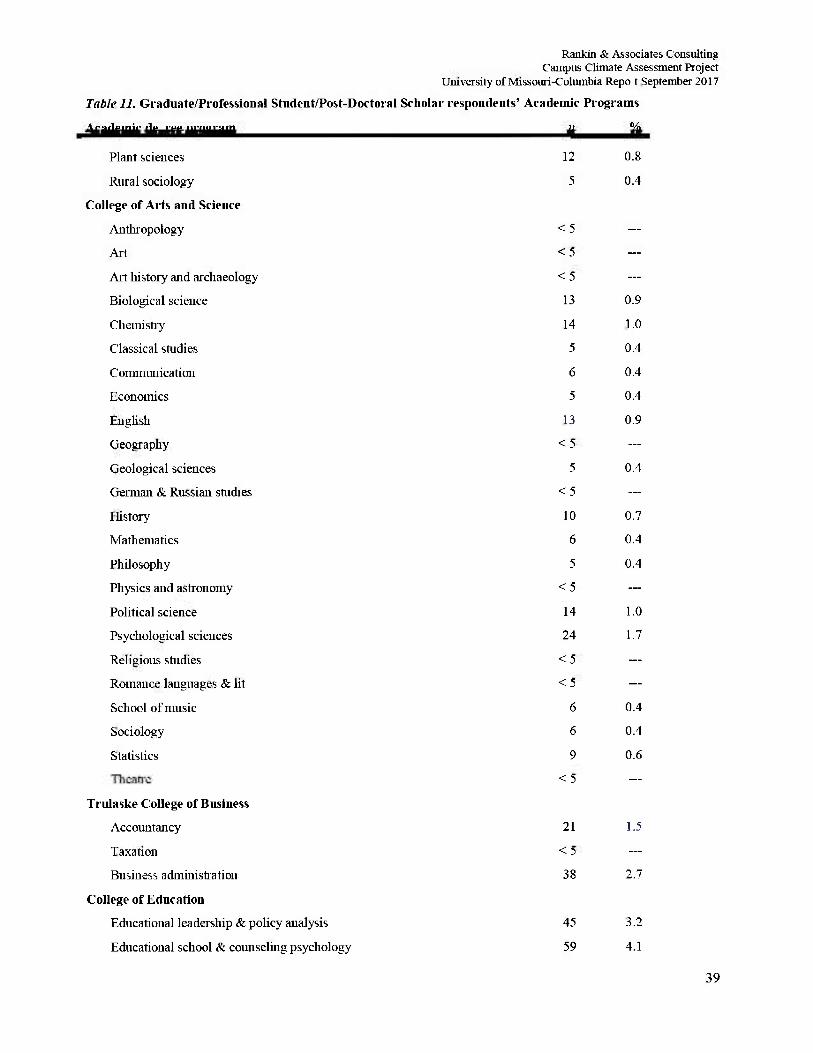
Rankin & Associates Consulting Campus Climate Assessment Project
University of Missouri-Columbia Repot September 2017
Table 11. Graduate/Professional Student/Post-Doctoral Scholar respondents' Academic Programs
Academic degree program n %
Plant sciences 12 0.8
Rural sociology 5 0.4
College of Arts and Science
Anthropology < 5 —
Art < 5 —
Ai1 history and archaeology < 5 —
Biological science 13 0.9
Chemistry 14 1.0
Classical studies 5 0.4
Communication 6 0.4
Economics 5 0.4
English 13 0.9
Geography < 5 —
Geological sciences 5 0.4
German & Russian studies < 5 —
History 10 0.7
Mathematics 6 0.4
Philosophy 5 0.4
Physics and astronomy < 5 —
Political science 14 1.0
Psychological sciences 24 1.7
Religious studies < 5 —
Romance languages & lit < 5 —
School of music 6 0.4
Sociology 6 0.4
Statistics 9 0.6 Theatre < 5 —
Trulaske College of Business
Accountancy 21 1.5
Taxation < 5 —
Business administration 38 2.7
College of Education
Educational leadership & policy analysis 45 3.2
Educational school & counseling psychology 59 4.1
39
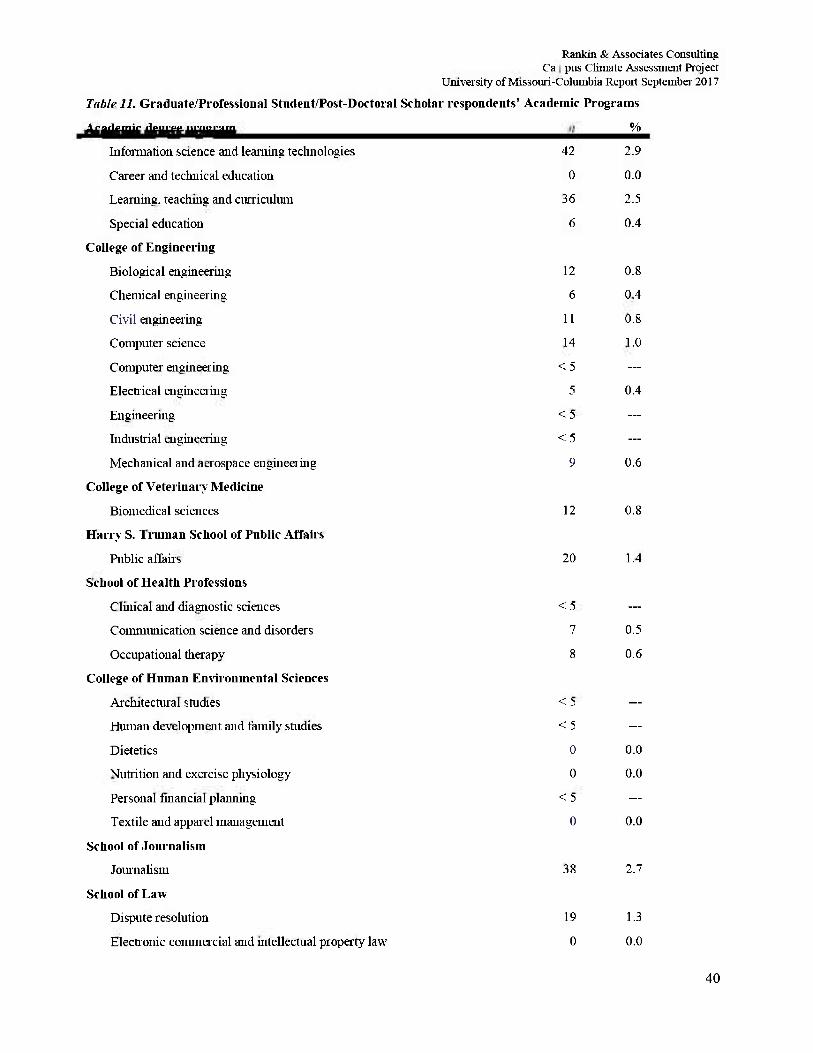
Rankin & Associates Consulting Campus Climate Assessment Project
University of Missouri-Columbia Report September 2017
Table 11. Graduate/Professional Student/Post-Doctoral Scholar respondents' Academic Programs
Academic degree program %
40
Information science and learning technologies 42 2.9
Career and technical education 0 0.0
Learning, teaching and curriculum 36 2.5
Special education 6 0.4
College of Engineering
Biological engineering 12 0.8
Chemical engineering 6 0.4
Civil engineering 11 0.8
Computer science 14 1.0
Computer engineering < 5 —
Electrical engineering 5 0.4
Engineering < 5 —
Industrial engineering < 5 —
Mechanical and aerospace engineering 9 0.6
College of Veterinary Medicine
Biomedical sciences 12 0.8
Harry S. Truman School of Public Affairs
Public affairs 20 1.4
School of Health Professions
Clinical and diagnostic sciences < 5 —
Communication science and disorders 7 0.5
Occupational therapy 8 0.6
College of Human Environmental Sciences
Architectural studies < 5 —
Human development and family studies < 5 —
Dietetics 0 0.0
Nutrition and exercise physiology 0 0.0
Personal financial planning < 5 —
Textile and apparel management 0 0.0
School of Journalism
Journalism 38 2.7
School of Law
Dispute resolution 19 1.3
Electronic commercial and intellectual property law 0 0.0
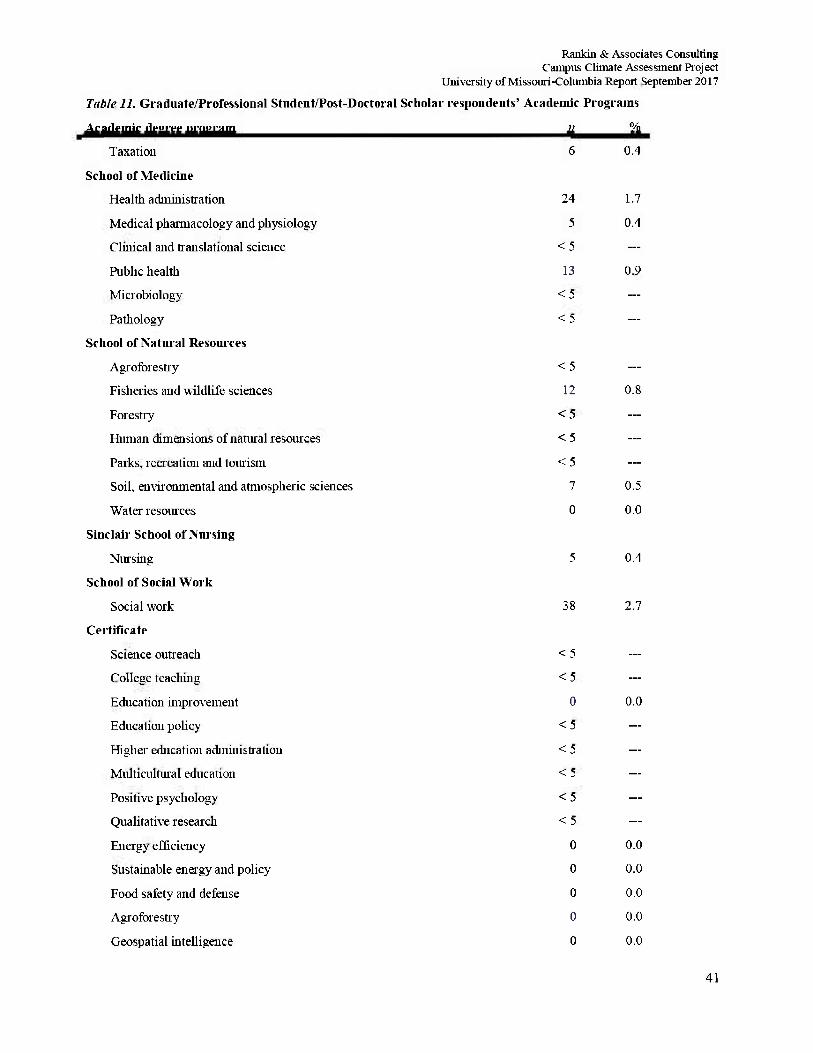
Rankin & Associates Consulting Campus Climate Assessment Project
University of Missouri-Columbia Repot September 2017
Table 11. Graduate/Professional Student/Post-Doctoral Scholar respondents' Academic Programs
Academic degree urogram n %
Taxation 6 0.4
School of Medicine
Health administration 24 1.7
Medical pharmacology and physiology 5 0.4
Clinical and translational science < 5 —
Public health 13 0.9
Microbiology < 5 —
Pathology < 5 —
School of Natural Resources
Agroforestty < 5 —
Fisheries and wildlife sciences 12 0.8
Forestry < 5 —
Human dimensions of natural resources < 5 —
Parks, recreation and tourism < 5 —
Soil, environmental and atmospheric sciences 7 0.5
Water resources 0 0.0
Sinclair School of Nursing
Nursing 5 0.4
School of Social Work
Social work 38 2.7
Certificate
Science outreach < 5 —
College teaching < 5 —
Education improvement 0 0.0
Education policy < 5 —
Higher education administration < 5 —
Multicultural education < 5 —
Positive psychology < 5 —
Qualitative research < 5 —
Energy efficiency 0 0.0
Sustainable energy and policy 0 0.0
Food safety and defense 0 0.0
Agroforestry 0 0.0
Geospatial intelligence 0 0.0
41
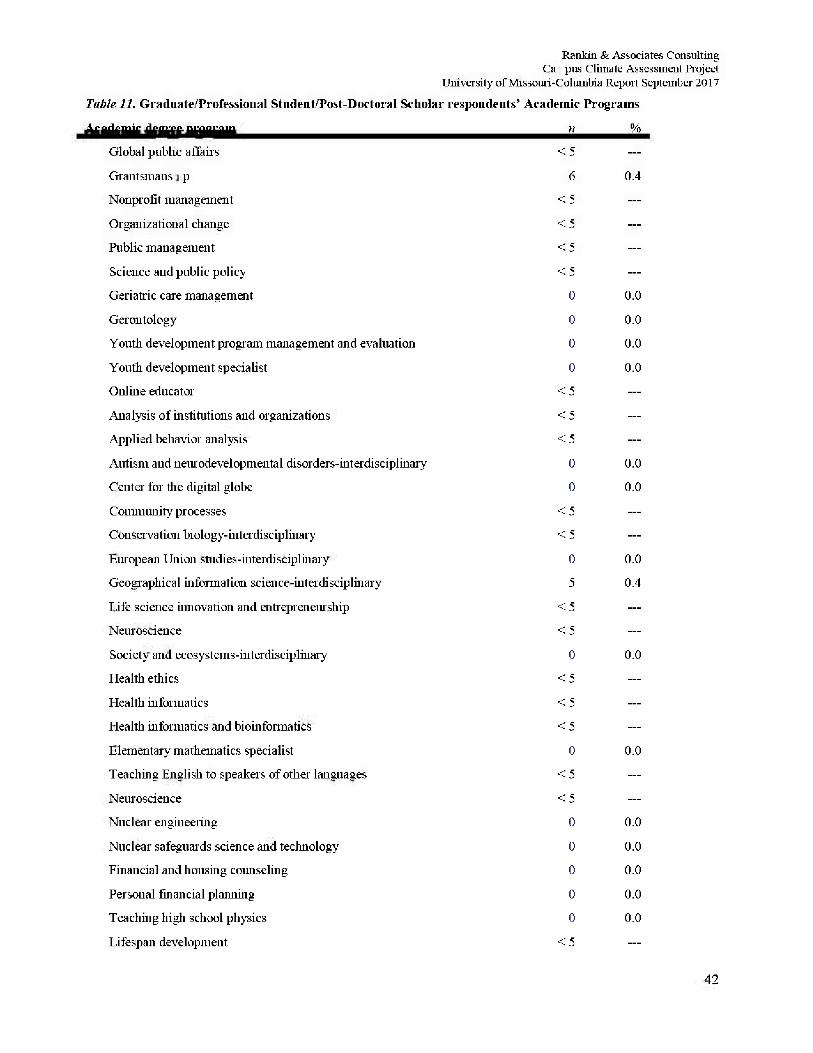
Rankin & Associates Consulting Campus Climate Assessment Project
University of Missouri-Columbia Report September 2017
Table 11. Graduate/Professional Student/Post-Doctoral Scholar respondents' Academic Programs
Academic degree program n %
Global public affairs < 5 —
Grantsmanship 6 0.4
Nonprofit management < 5 —
Organizational change < 5 —
Public management < 5 —
Science and public policy < 5 —
Geriatric care management 0 0.0
Gerontology 0 0.0
Youth development program management and evaluation 0 0.0
Youth development specialist 0 0.0
Online educator < 5 —
Analysis of institutions and organizations < 5 —
Applied behavior analysis < 5 —
Autism and neurodevelopmental disorders-interdisciplinary 0 0.0
Center for the digital globe 0 0.0
Community processes < 5 —
Conservation biology-interdisciplinary < 5 —
European Union studies-interdisciplinary 0 0.0
Geographical information science-interdisciplinary 5 0.4
Life science innovation and entrepreneur ship < 5 —
Netuoscience < 5 —
Society and ecosystems-interdisciplinary 0 0.0
Health ethics < 5 —
Health informatics < 5 —
Health informatics and bioinformatics < 5 —
Elementary mathematics specialist 0 0.0
Teaching English to speakers of other languages < 5 —
Netuoscience < 5 —
Nuclear engineering 0 0.0
Nuclear safeguards science and technology 0 0.0
Financial and housing counseling 0 0.0
Personal financial planning 0 0.0
Teaching high school physics 0 0.0
Lifespan development < 5 —
42
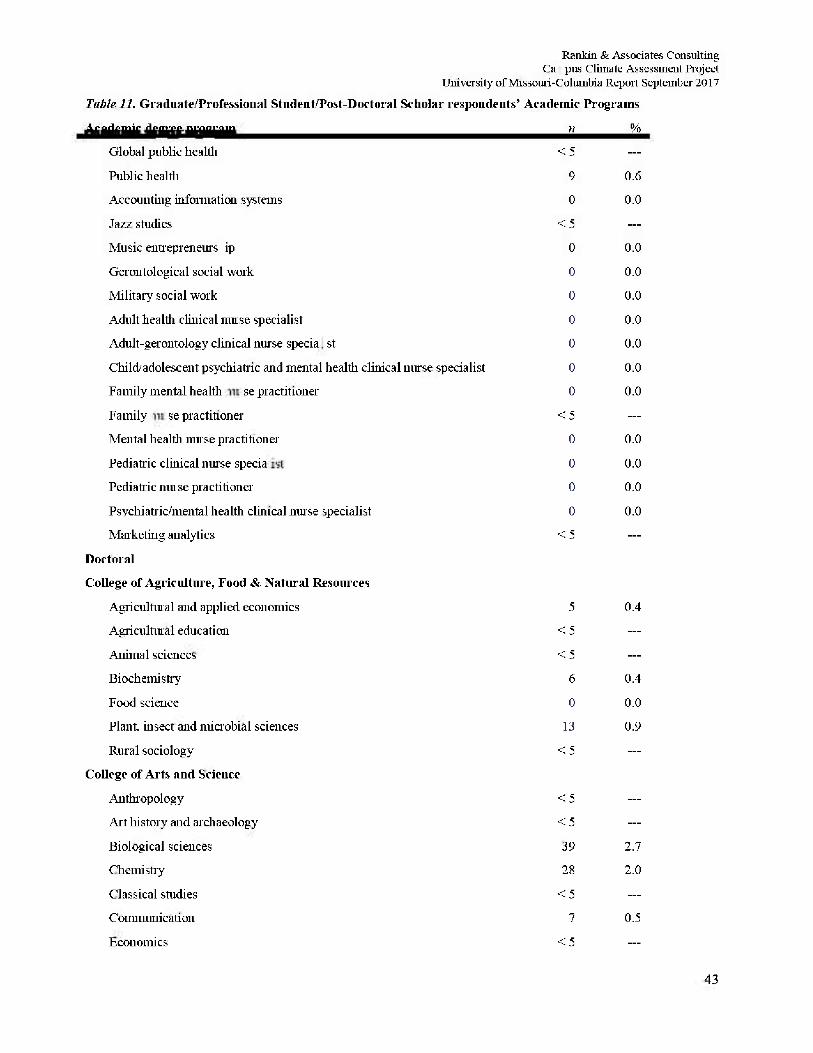
Rankin & Associates Consulting Campus Climate Assessment Project
University of Missouri-Columbia Report September 2017
Table 11. Graduate/Professional Student/Post-Doctoral Scholar respondents' Academic Programs
Academic degree prog ram n %
Global public health < 5 —
Public health 9 0.6
Accounting information systems 0 0.0
Jazz studies < 5 —
Music entrepreneurship 0 0.0
Gerontological social work 0 0.0
Military social work 0 0.0
Adult health clinical nurse specialist 0 0.0
Adult-gerontology clinical nurse specialist 0 0.0
Child; adolescent psychiatric and mental health clinical nurse specialist 0 0.0
Family mental health nurse practitioner 0 0.0
Family nurse practitioner < 5 —
Mental health nurse practitioner 0 0.0
Pediatric clinical nurse specialist 0 0.0
Pediatric muse practitioner 0 0.0
Psychiatric/mental health clinical nurse specialist 0 0.0
Marketing analytics < 5 —
Doctoral
College of Agriculture, Food & Natural Resources
Agricultural and applied economics 5 0.4
Agricultural education < 5 —
Animal sciences < 5 —
Biochemistry 6 0.4
Food science 0 0.0
Plant, insect and microbial sciences 13 0.9
Rural sociology < 5 —
College of Arts and Science
Anthropology < 5 —
Art history and archaeology < 5 —
Biological sciences 39 2.7
Chemistry 28 2.0
Classical studies < 5 —
Communication 7 0.5
Economics < 5
43
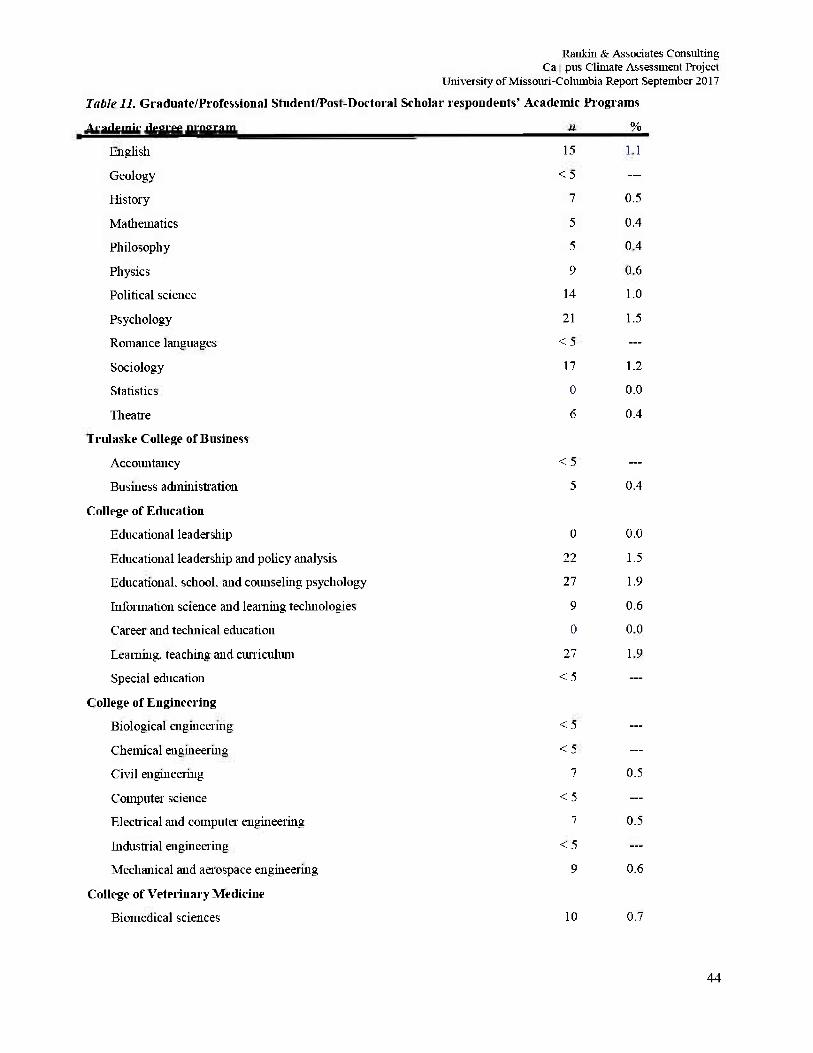
Rankin & Associates Consulting Campus Climate Assessment Project
University of Missouri-Columbia Report September 2017
Table 11. Graduate/Professional Student/Post-Doctoral Scholar respondents' Academic Programs
Academic degree program n %
English 15 1.1
Geology < 5 —
History 7 0.5
Mathematics 5 0.4
Philosophy 5 0.4
Physics 9 0.6
Political science 14 1.0
Psychology 21 1.5
Romance languages < 5 —
Sociology 17 1.2
Statistics 0 0.0
Theatre 6 0.4
Trulaske College of Business
Accountancy < 5 —
Business administration 5 0.4
College of Education
Educational leadership 0 0.0
Educational leadership and policy analysis 22 1.5
Educational, school, and counseling psychology 27 1.9
Information science and learning technologies 9 0.6
Career and technical education 0 0.0
Learning, teaching and curriculum 27 1.9
Special education < 5 —
College of Engineering
Biological engineering < 5 —
Chemical engineering < 5 —
Civil engineering 7 0.5
Computer science < 5 —
Electrical and computer engineering 7 0.5
Industrial engineering < 5 —
Mechanical and aerospace engineering 9 0.6
College of Veterinary Medicine
Biomedical sciences 10 0.7
44
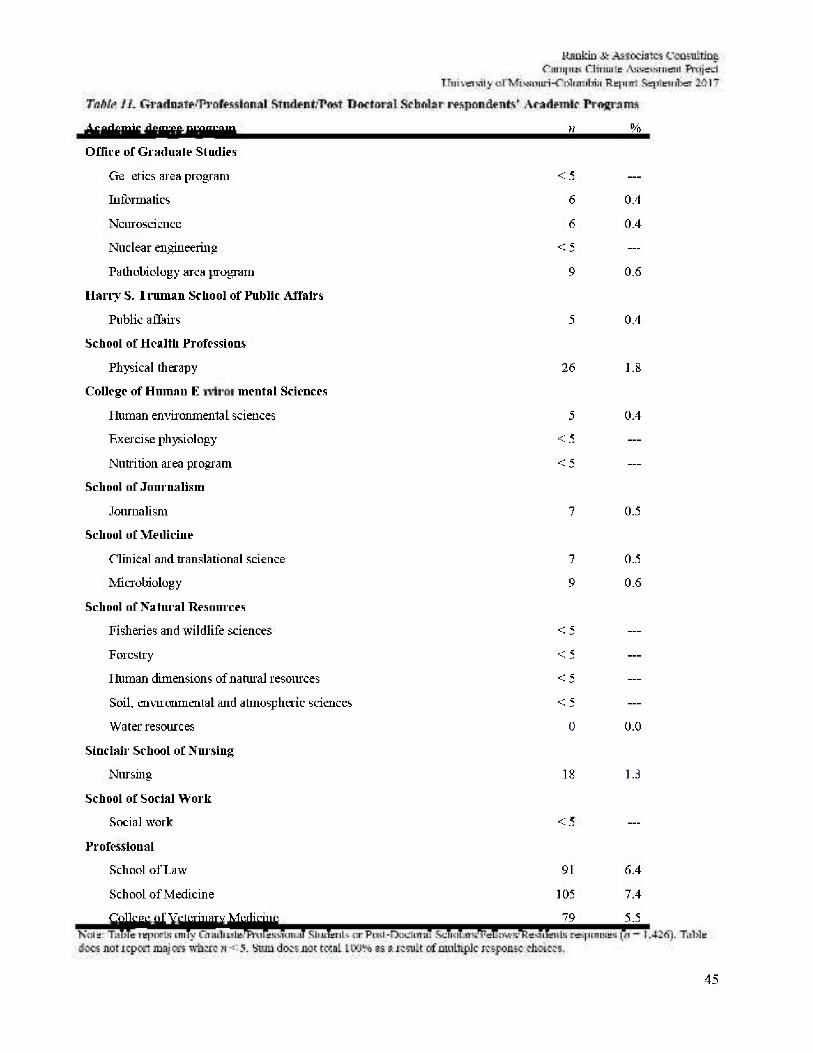
45
Academic degree program n %
Office of Graduate Studies
Genetics area program < 5 —
Informatics 6 0.4
Neuroscience 6 0.4
Nuclear engineering < 5 —
Patliobiology area program 9 0.6
Harry S. Truman School of Public Affairs
Public affairs 5 0.4
School of Health Professions
Physical therapy 26 1.8
College of Human Environmental Sciences
Human environmental sciences 5 0.4
Exercise physiology < 5 —
Nutrition area program < 5 —
School of Journalism
Journalism 7 0.5
School of Medicine
Clinical and translational science 7 0.5
Microbiology 9 0.6
School of Natural Resources
Fisheries and wildlife sciences < 5 —
Forestry < 5 —
Human dimensions of natural resources < 5 —
Soil, environmental and atmospheric sciences < 5 —
Water resources 0 0.0
Sinclair School of Nursing
Nursing 18 1.3
School of Social Work
Social work < 5 —
Professional
School of Law 91 6.4
School of Medicine 105 7.4
College of Veterinary Medicine 79 5.5
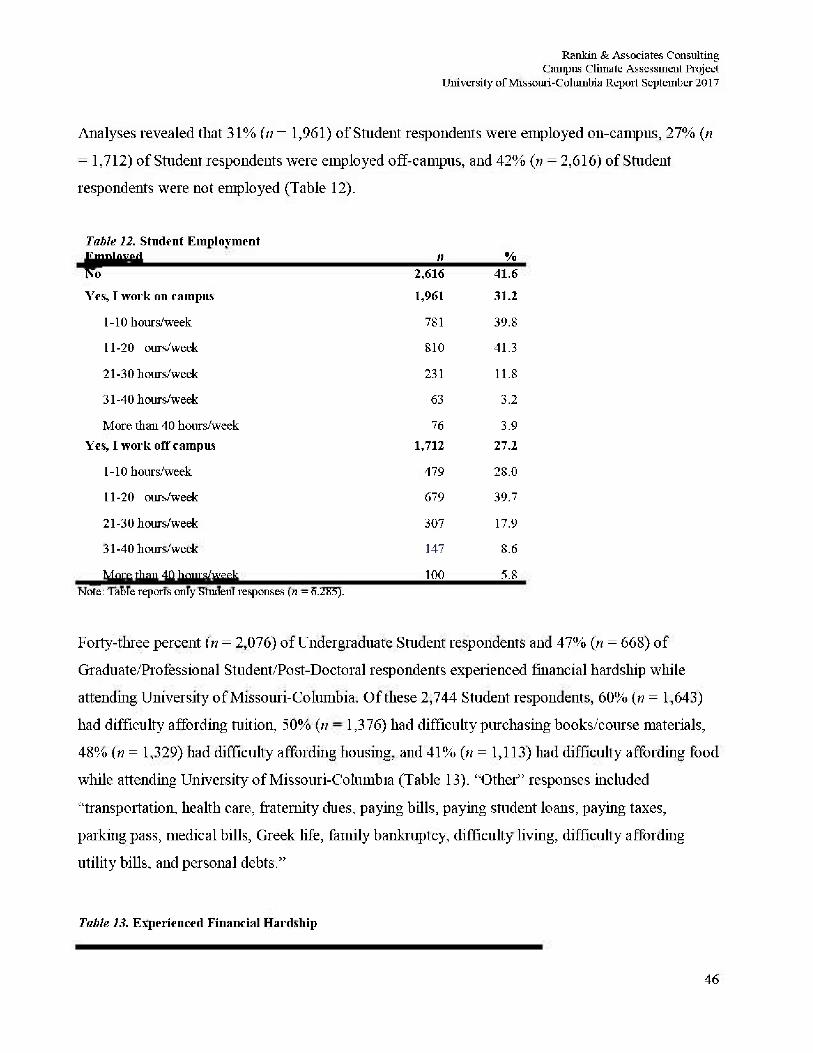
Rankin & Associates Consulting Campus Climate Assessment Project
University of Missouri-Columbia Repot September 2017
Analyses revealed that 31% (n = 1,961) of Student respondents were employed oil-campus, 27% (n
= 1,712) of Student respondents were employed off-campus, and 42% (ti = 2,616) of Student
respondents were not employed (Table 12).
Table 12. Student Employment Employed n % No 2,616 41.6 Yes, I work on campus 1,961 31.2
1-10 hours/week 781 39.8
11-20 hours/week 810 41.3
21-30 hours/week 231 11.8
31-40 hours/week 63 3.2
More than 40 hours/week 76 3.9 Yes, I work off campus 1,712 27.2
1-10 hours/week 479 28.0
11-20 hours/week 679 39.7
21-30 hours/week 307 17.9
31-40 hours/week 147 8.6
More than 40 hows/week 100 5.8 Note: Table reports only Student responses (n = 6.285).
Forty-three percent (ti = 2,076) of Undergraduate Student respondents and 47% (n = 668) of
Graduate/Professional Student/Post-Doctoral respondents experienced financial hardship while
attending University of Missouri-Columbia. Of these 2,744 Student respondents, 60% (« = 1,643)
had difficulty affording tuition, 50% (n = 1,376) had difficulty purchasing books/course materials,
48% (n = 1,329) had difficulty affording housing, and 41% (n = 1,113) had difficulty affording food
while attending University of Missouri-Columbia (Table 13). "Other" responses included
"transportation, health care, fraternity dues, paying bills, paying student loans, paying taxes,
parking pass, medical bills, Greek life, family bankruptcy, difficulty living, difficulty affording
utility bills, and personal debts."
Table 13. Experienced Financial Hardship
46
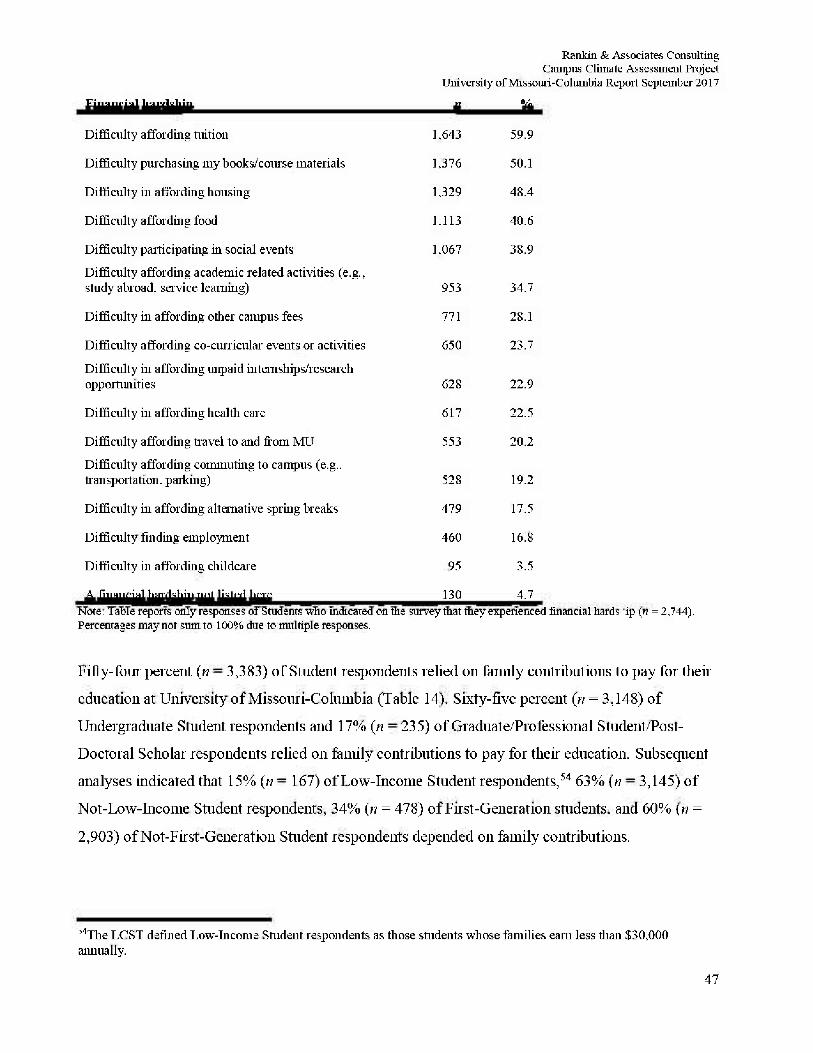
Rankin & Associates Consulting Campus Climate Assessment Project
University of Missouri-Columbia Report September 2017
Financial hardship n %
Difficulty affording tuition 1.643 59.9
Difficulty purchasing my books/course materials 1,376 50.1
Difficulty in affording housing 1,329 48.4
Difficulty affording food 1.113 40.6
Difficulty participating in social events 1.067 38.9
Difficulty affording academic related activities (e.g., study abroad, service learning) 953 34.7
Difficulty in affording other campus fees 771 28.1
Difficulty affording co-auricular events or activities 650 23.7
Difficulty in affording unpaid internships/research opportunities 628 22.9
Difficulty in affording health care 617 22.5
Difficulty affording travel to and from MU 553 20.2
Difficulty affording commuting to campus (e.g.. transportation, parking) 528 19.2
Difficulty in affording alternative spring breaks 479 17.5
Difficulty finding employment 460 16.8
Difficulty in affording childcare 95 3.5
A financial hardship not listed here 130 4.7 Note: Table reports only responses of Students who indicated on the survey that they experienced financial hardship (n = 2,744). Percentages may not sum to 100% due to multiple responses.
Fifty-four percent (n = 3,383) of Student respondents relied 011 family contributions to pay for their
education at University of Missouri-Columbia (Table 14). Sixty-five percent (n = 3,148) of
Undergraduate Student respondents and 17% (n = 235) of Graduate/Professional Student/Post-
Doctoral Scholar respondents relied on family contributions to pay for their education. Subsequent
analyses indicated that 15% (n = 167) of Low-Income Student respondents,54 63% (n = 3,145) of
Not-Low-Income Student respondents, 34% (;/ = 478) of First-Generation students, and 60% (n =
2,903) of Not-First-Generation Student respondents depended 011 family contributions.
?4The LCST defined Low-Income Student respondents as those students whose families earn less than $30,000 annually.
47
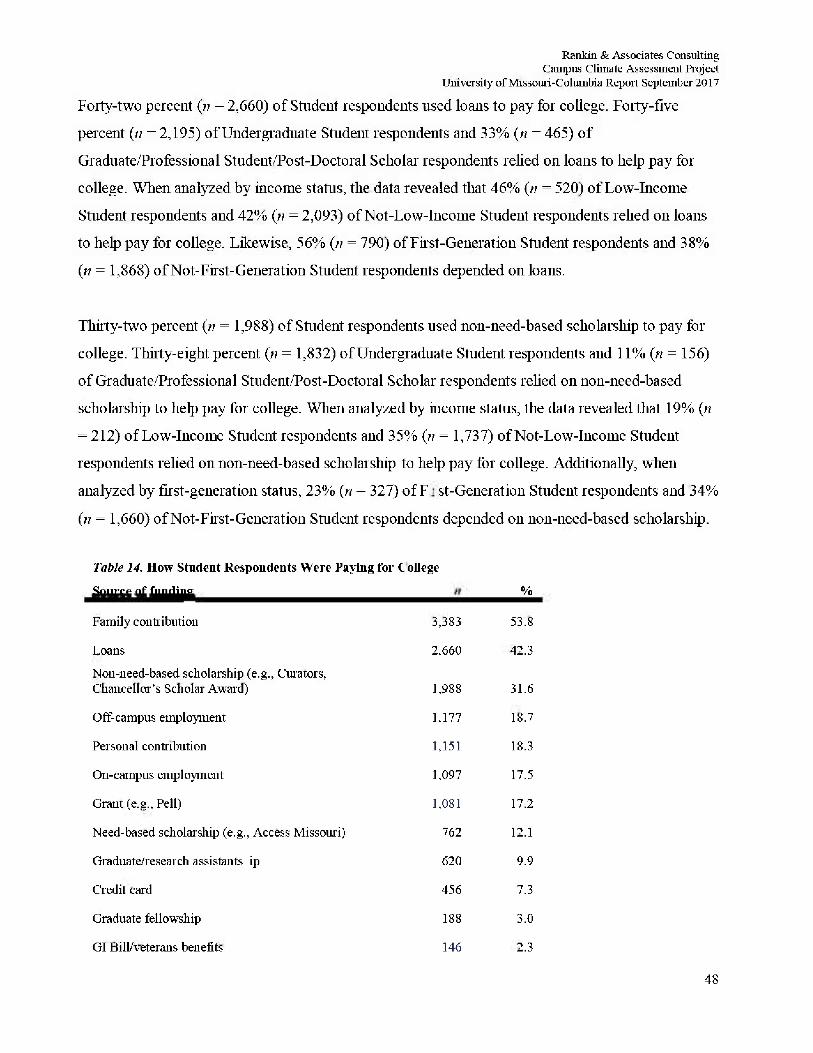
Rankin & Associates Consulting Campus Climate Assessment Project
University of Missouri-Columbia Repoit September 2017
Forty-two percent (ti = 2,660) of Student respondents used loans to pay for college. Forty-five
percent (;/ =2,195) of Undergraduate Student respondents and 33% (n = 465) of
Graduate/Professional Student/Post-Doctoral Scholar respondents relied on loans to help pay for
college. Wlien analyzed by income status, the data revealed that 46% (ti = 520) of Low-Income
Student respondents and 42% (n = 2,093) of Not-Low-Income Student respondents relied on loans
to help pay for college. Likewise, 56% (;/ = 790) of First-Generation Student respondents and 38%
(n = 1,868) of Not-First-Generation Student respondents depended on loans.
Thirty-two percent (ti = 1,988) of Student respondents used non-need-based scholarship to pay for
college. Thirty-eight percent (n = 1,832) of Undergraduate Student respondents and 11% (n = 156)
of Graduate/Professional Student/Post-Doctoral Scholar respondents relied on non-need-based
scholarship to help pay for college. When analyzed by income status, the data revealed that 19% (ti
= 212) of Low-Income Student respondents and 35% (ti = 1,737) of Not-Low-Income Student
respondents relied on non-need-based scholarship to help pay for college. Additionally, when
analyzed by first-generation status, 23% (n = 327) of First-Generation Student respondents and 34%
(n = 1,660) of Not-First-Generation Student respondents depended on non-need-based scholarship.
Table 14. How Student Respondents Were Paying for College
Source of funding n %
Family contribution 3,383 53.8
Loans 2.660 42.3
Non-need-based scholarship (e.g., Curators, Chancellor's Scholar Award) 1,988 31.6
Off-campus employment 1,177 18.7
Personal contribution 1,151 18.3
On-campus employment 1,097 17.5
Grant (e.g.. Pell) 1,081 17.2
Need-based scholarship (e.g., Access Missouri) 762 12.1
Graduate/research assistantship 620 9.9
Credit card 456 7.3
Graduate fellowship 188 3.0
GI Bill/veterans benefits 146 2.3
48
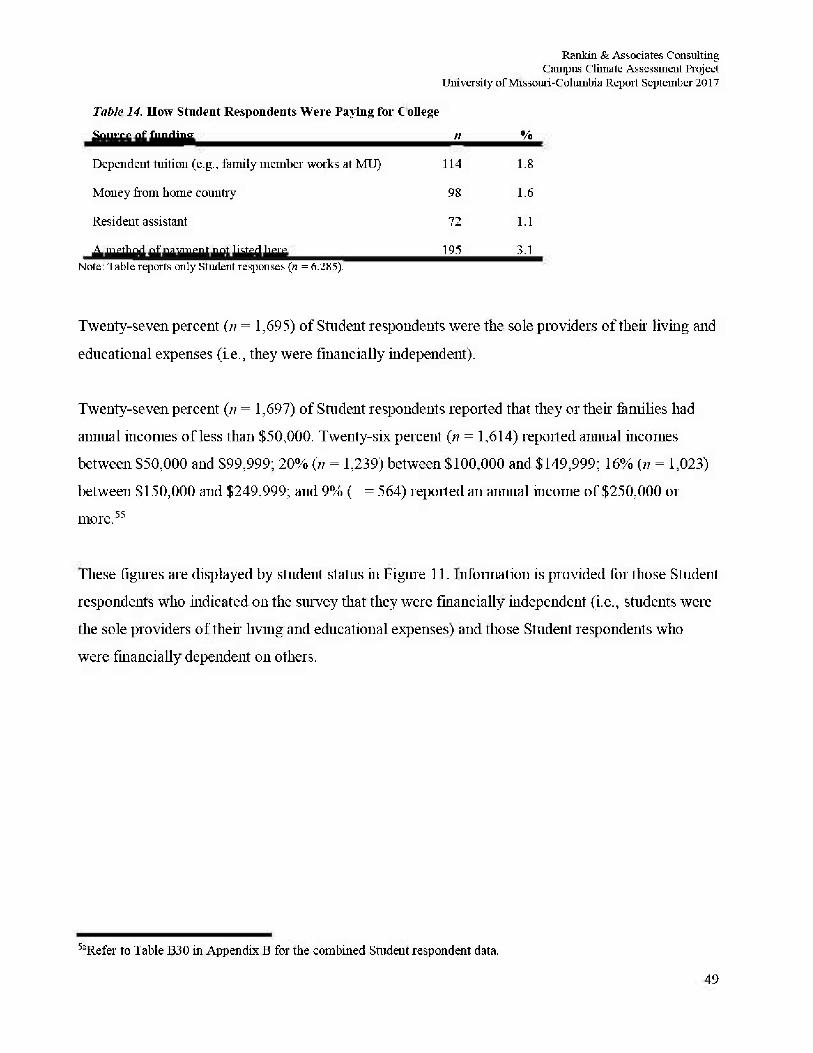
Rankin & Associates Consulting Campus Climate Assessment Project
University of Missouri-Columbia Repot September 2017
Table 14. How Student Respondents Were Paying for College
Source of funding n %
Dependent tuition (e.g., family member works at MU) 114 1.8
Money from home country 98 1.6
Resident assistant 72 1.1
A method of payment not Listed here 195 3.1 Note: Table reports only Student responses (n = 6.285).
Twenty-seven percent (n = 1,695) of Student respondents were the sole providers of their living and
educational expenses (i.e., they were financially independent).
Twenty-seven percent (n = 1,697) of Student respondents reported that they or their families had
annual incomes of less than $50,000. Twenty-six percent (n = 1,614) reported annual incomes
between $50,000 and $99,999; 20% (n = 1,239) between $100,000 and $149,999; 16% (n = 1,023)
between $150,000 and $249,999; and 9% (n = 564) reported an annual income of $250,000 or
more.55
These figures are displayed by student status in Figure 11. Information is provided for those Student
respondents who indicated on the survey that they were financially independent (i.e., students were
the sole providers of their living and educational expenses) and those Student respondents who
were financially dependent on others.
53Refer to Table B30 in Appendix B for the combined Student respondent data.
49
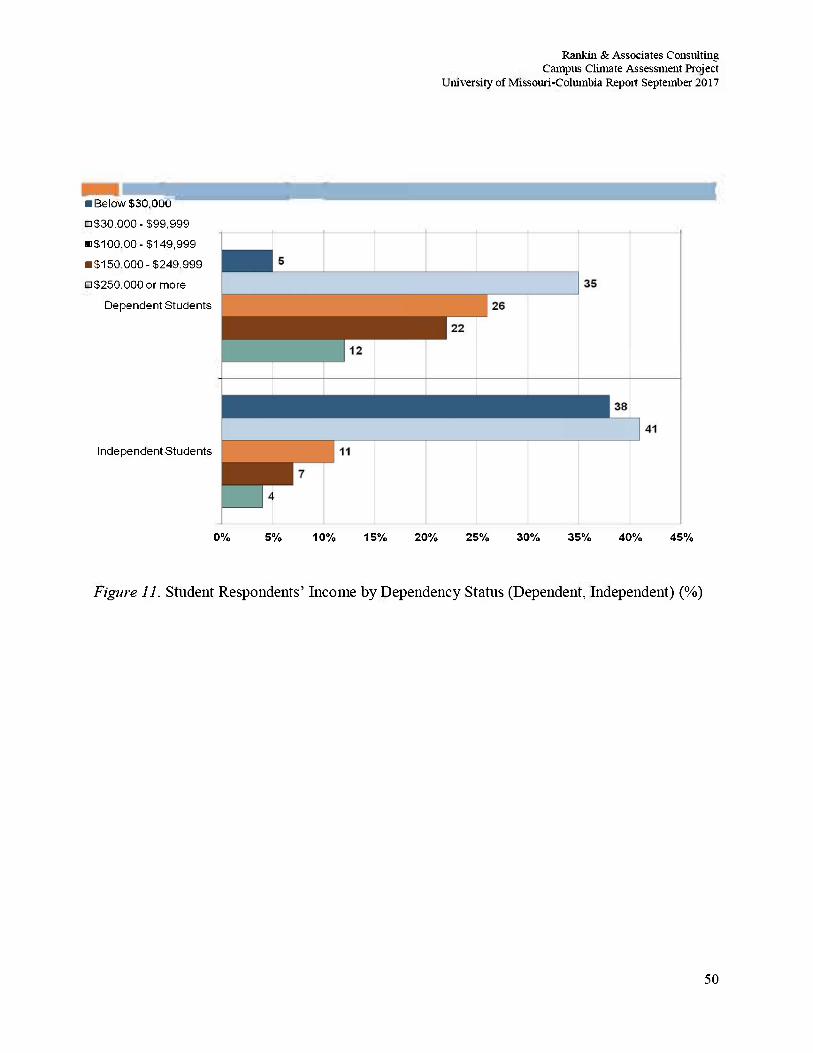
Rankin & Associates Consulting Campus Climate Assessment Project
University of Missouri-Columbia Repot September 2017
• Below $30,000 • $30,000- $99,999 • $100,00-$149,999 • $150,000-$249,999 • $250,000 or more
Dependent Students
Independent Students
0% 5% 10% 15% 20% 25% 30% 35% 40% 45%
Figure 11. Student Respondents' Income by Dependency Status (Dependent, Independent) (%)
50
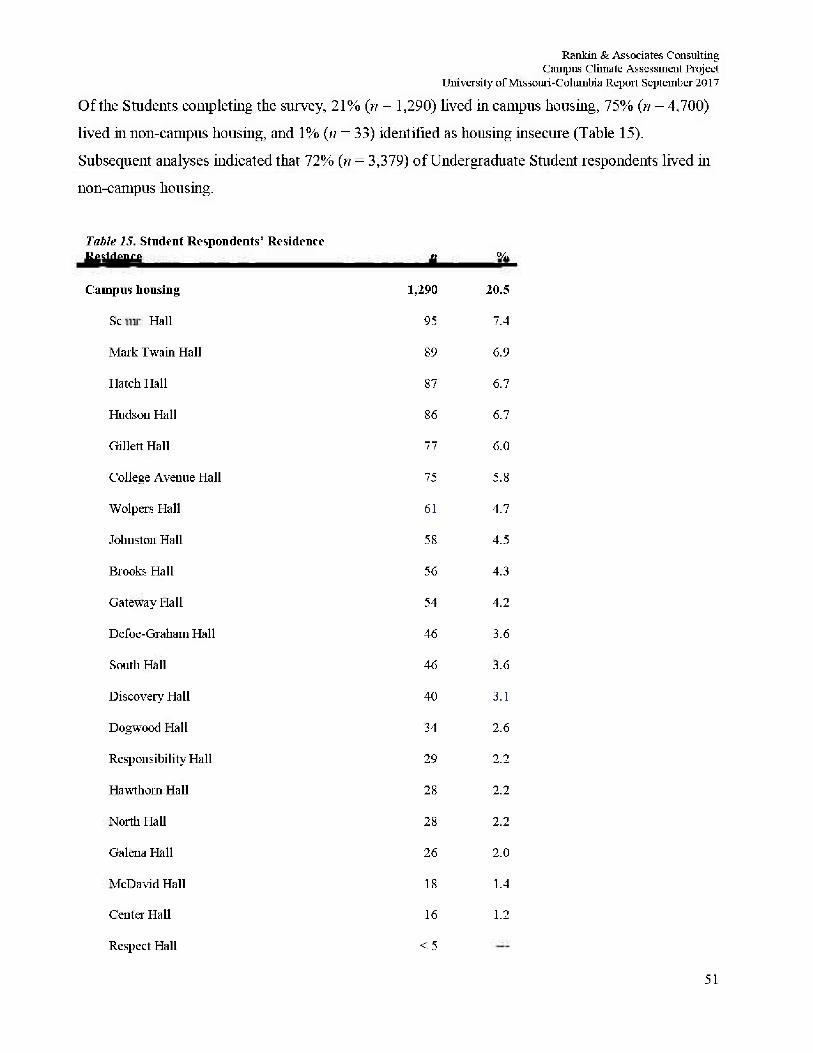
Rankin & Associates Consulting Campus Climate Assessment Project
University of Missouri-Columbia Report September 2017
Of the Students completing the survey, 21% (n = 1,290) lived in campus housing, 75% (n = 4,700)
lived in non-campus housing, and 1% (;/ = 33) identified as housing insecure (Table 15).
Subsequent analyses indicated that 72% (n = 3,379) of Undergraduate Student respondents lived in
non-campus housing.
Table 15. Student Respondents' Residence Residence n %
Campus housing 1,290 20.5
Schurz Hall 95 7.4
Mark Twain Hall 89 6.9
Hatch Hall 87 6.7
Hudson Hall 86 6.7
Gillett Hall 77 6.0
College Avenue Hall 75 5.8
Wolpers Hall 61 4.7
Johnston Hall 58 4.5
Brooks Hall 56 4.3
Gateway Hall 54 4.2
Defoe-Graham Hall 46 3.6
South Hall 46 3.6
Discovery Hall 40 3.1
Dogwood Hall 34 2.6
Responsibility Hall 29 2.2
Hawthorn Hall 28 2.2
North Hall 28 2.2
Galena Hall 26 2.0
McDavid Hall 18 1.4
Center Hall 16 1.2
Respect Hall < 5
51
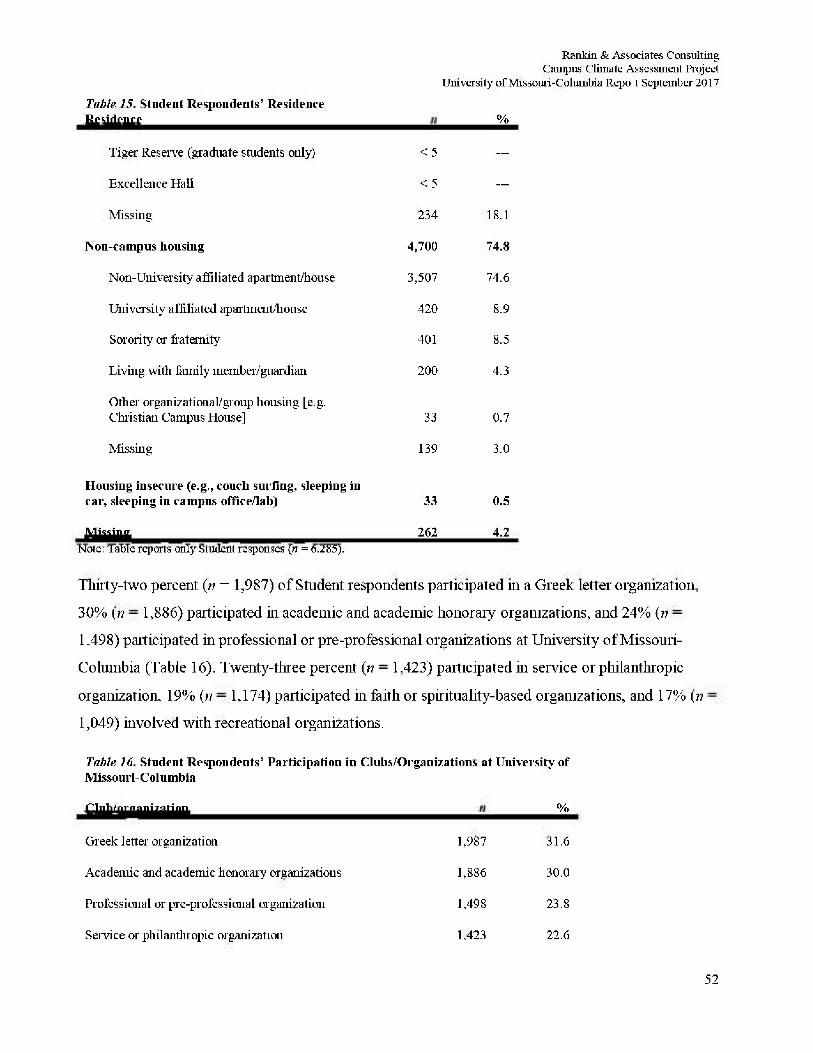
Table 15. Student Respondents' Residence Residence
Rankin & Associates Consulting Campus Climate Assessment Project
University of Missouri-Columbia Repot September 2017
%
Tiger Reserve (graduate students only) < 5 —
Excellence Hall < 5 —
Missing 234 18.1
Non-campus housing 4,700 74.8
Nan-University affiliated apartment/house 3,507 74.6
University affiliated apartment/house 420 8.9
Sorority or fraternity 401 8.5
Living with family member/guardian 200 4.3
Other organizational/group housing [e.g. Christian Campus House] 33 0.7
Missing 139 3.0
Housing insecure (e.g., couch surfing, sleeping in car, sleeping in campus office/lab) 33 0.5
Missing 262 4.2 Note: Table reports only Student responses (n = 6.285).
Thirty-two percent (n = 1,987) of Student respondents participated in a Greek letter organization,
30% (n = 1,886) participated in academic and academic honorary organizations, and 24% (n =
1.498) participated in professional or pre-professional organizations at University of Missouri-
Columbia (Table 16). Twenty-three percent (« = 1,423) participated in service or philanthropic
organization, 19% (;/ = 1,174) participated in faith or spirituality-based organizations, and 17% (n
1,049) involved with recreational organizations.
Table 16. Student Respondents' Participation in Clubs/Organizations at University of Missouri-Columbia
Club/organization %
Greek letter organization
Academic and academic honorary organizations
Professional or pre-professional organization
Service or philanthropic organization
1,987 31.6
1,886 30.0
1.498 23.8
1.423 22.6
52
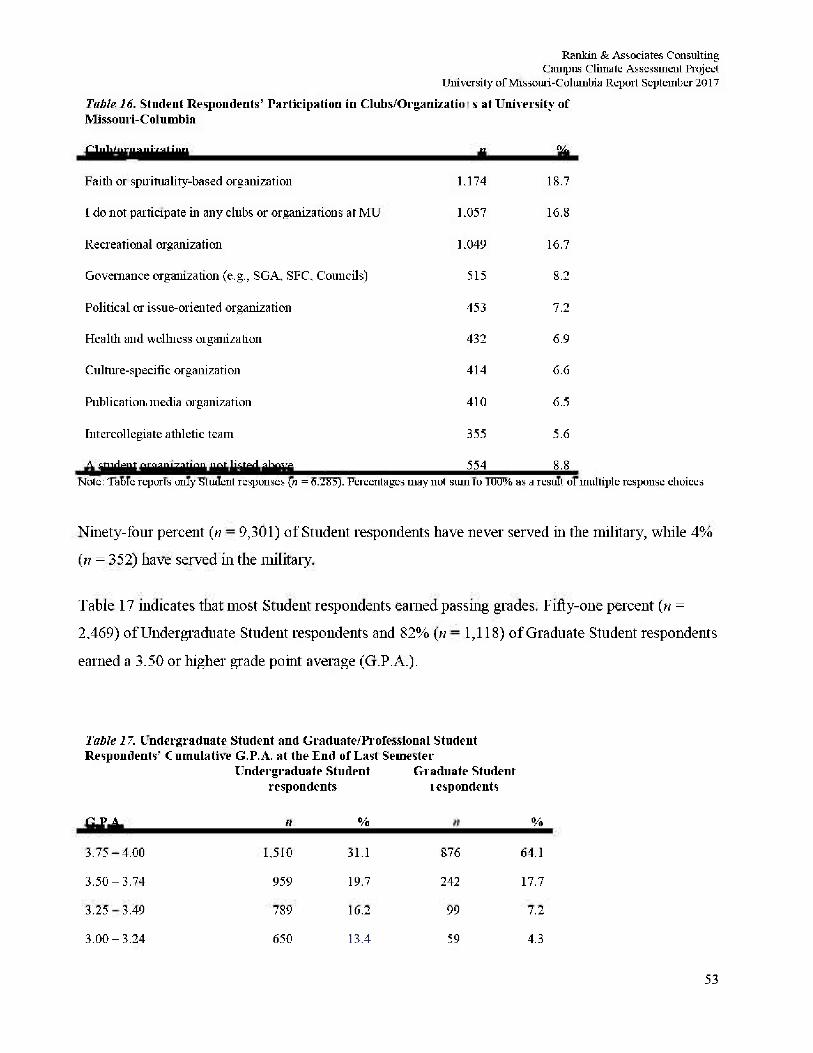
Rankin & Associates Consulting Campus Climate Assessment Project
University of Missouri-Columbia Repoit September 2017
Table 16. Student Respondents' Participation in Clubs/Organizations at University of Missouri-Columbia
Club/organization n %
Faith or spirituality-based organization 1.174 18.7
I do not participate in any clubs or organizations at MU 1,057 16.8
Recreational organization 1,049 16.7
Governance organization (e.g., SGA, SFC, Councils) 515 8.2
Political or issue-oriented organization 453 7.2
Health and wellness organization 432 6.9
Culture-specific organization 414 6.6
Publication/media organization 410 6.5
Intercollegiate athletic team 355 5.6
A student organization not listed above 554 8.8 Note: Table reports only Student responses (n = 6.285). Percentages may not sum to 100% as a result of multiple response choices.
Ninety-four percent (n = 9,301) of Student respondents have never served in the military, while 4%
(n = 352) have served in the military.
Table 17 indicates that most Student respondents earned passing grades. Fifty-one percent (n =
2.469) of Undergraduate Student respondents and 82% (n = 1,118) of Graduate Student respondents
earned a 3.50 or higher grade point average (G.P.A.).
Table 17. Undergraduate Student and Graduate/Professional Student Respondents' Cumulative G.P.A. at the End of Last Semester
Undergraduate Student Graduate Student respondents respondents
G.P.A. n % n
%
3.75-4.00 1,510 31.1 876 64.1
3.50-3.74 959 19.7 242 17.7
3.25-3.49 789 16.2 99 7.2
3.00-3.24 650 13.4 59 4.3
53
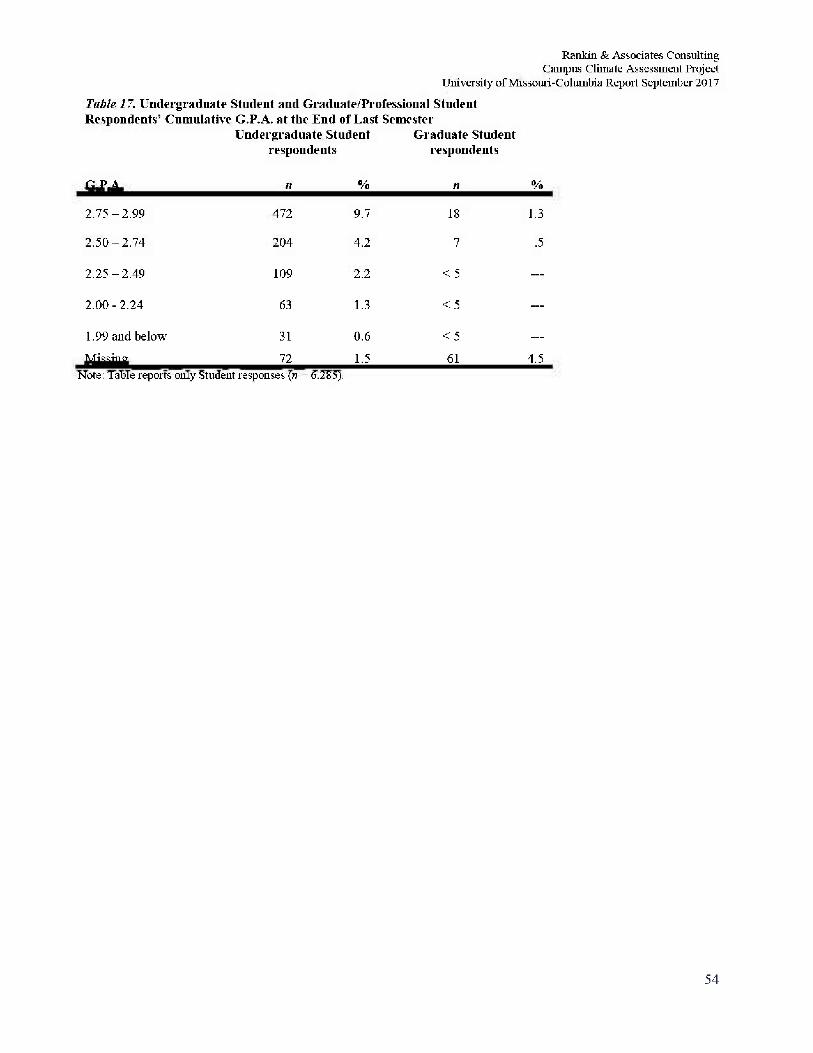
Rankin & Associates Consulting Campus Climate Assessment Project
University of Missouri-Columbia Report September 2017
Table 17. Undergraduate Student and Graduate/Professional Student Respondents' Cumulative G.P.A. at the End of Last Semester
Undergraduate Student Graduate Student respondents respondents
G.P.A. n % n %
2.75-2.99 472 9.7 18 1.3
2.50-2.74 204 4.2 7 .5
2.25-2.49 109 2.2 < 5 —
2.00-2.24 63 1.3 < 5 —
1.99 and below 31 0.6 < 5 —
Missing 72 1.5 61 4.5 Note: Table reports only Student responses (n = 6.285).
54
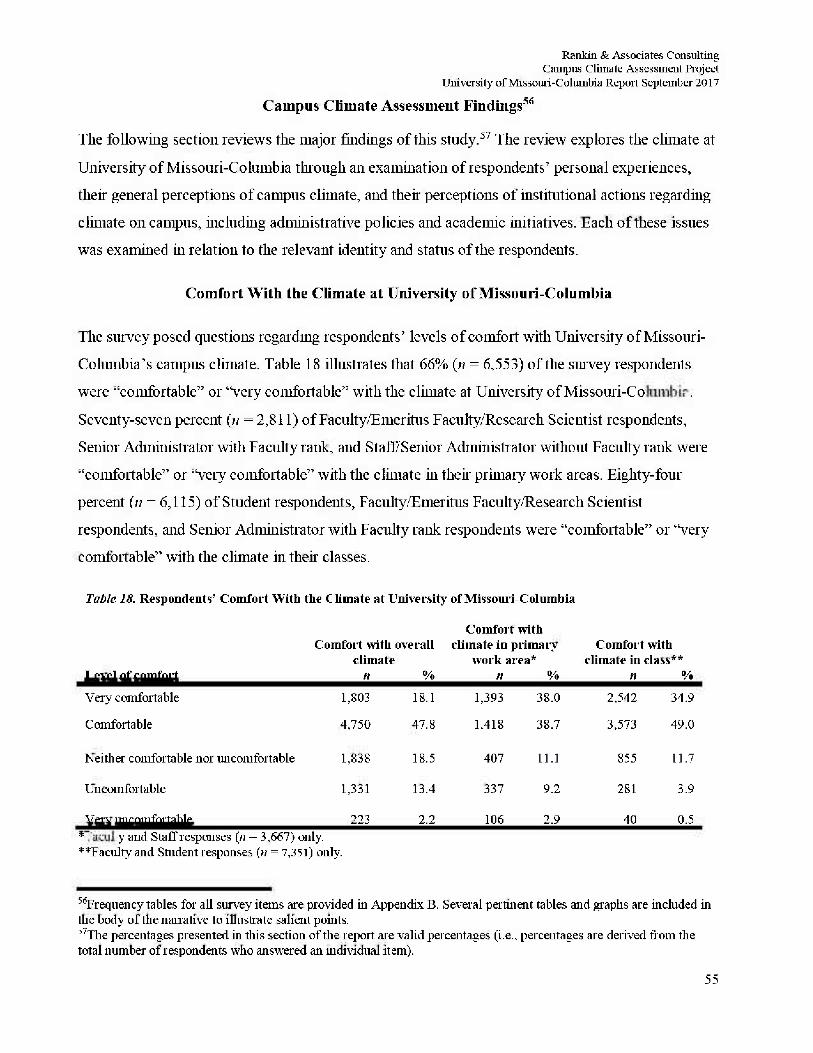
Rankin & Associates Consulting Campus Climate Assessment Project
University of Missouri-Columbia Repoit September 2017
Campus Climate Assessment Findings56
The following section reviews the major findings of this study.57 The review explores the climate at
University of Missouri-Columbia through an examination of respondents' personal experiences,
their general perceptions of campus climate, and their perceptions of institutional actions regarding
climate on campus, including administrative policies and academic initiatives. Each of these issues
was examined in relation to the relevant identity and status of the respondents.
Comfort With the Climate at University of Missouri-Columbia
The survey posed questions regarding respondents' levels of comfort with University of Missouri-
Columbia's campus climate. Table 18 illustrates that 66% (n = 6,553) of the survey respondents
were "comfortable" or "very comfortable" with the climate at University of Missouri-Columbia.
Seventy-seven percent (n = 2,811) of Faculty/Emeritus Faculty/Research Scientist respondents.
Senior Administrator with Faculty rank, and Staff/Senior Administrator without Faculty rank were
"comfortable" or "very comfortable" with the climate in their primary work areas. Eighty-four
percent (n = 6,115) of Student respondents, Faculty/Emeritus Faculty/Research Scientist
respondents, and Senior Administrator with Faculty rank respondents were "comfortable" or "very
comfortable" with the climate in their classes.
Table IS. Respondents' Comfort With the Climate at University of Missouri-Columbia
Comfort with Comfort with overall climate in primary Comfort with
climate work area* climate in class** Level of comfort
Comfort with overall climate
n %
Comfort with climate in primary
work area* n %
Comfort with climate in class**
n %
Very comfortable 1,803 18.1 1,393 38.0 2,542 34.9
Comfortable 4,750 47.8 1,418 38.7 3,573 49.0
Neither comfortable nor uncomfortable 1,838 18.5 407 11.1 855 11.7
Uncomfortable 1,331 13.4 337 9.2 281 3.9
Very mi comfortable 223 2.2 106 2.9 40 0.5 * Faculty}* and Staff responses (/? = 3,667) only. **Faculty and Student responses (ti = 7,351) only.
^Frequency tables for all survey items are provided in Appendix B. Several pertinent tables and graphs are included in the body of the narrative to illustrate salient points. ?7Fhe percentages presented in this section of the report are valid percentages (i.e., percentages are derived from the total number of respondents who answered an individual item).
55
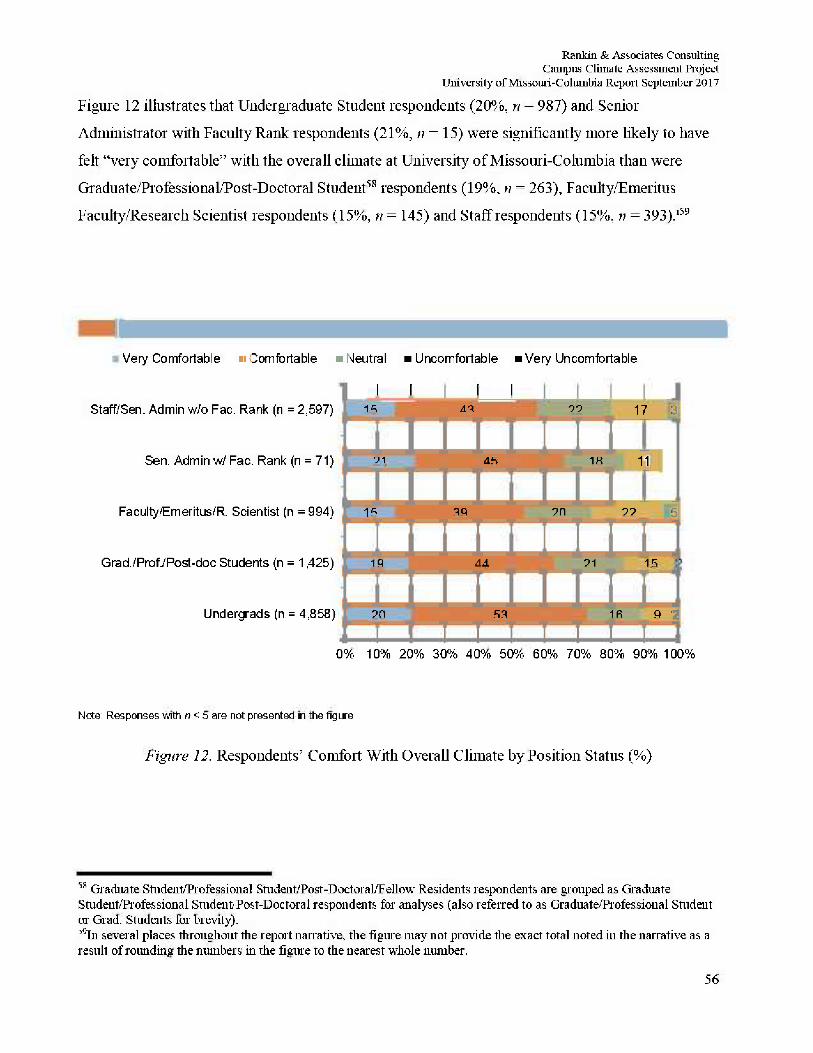
Rankin & Associates Consulting Campus Climate Assessment Project
University of Missouri-Columbia Repoit September 2017
Figure 12 illustrates that Undergraduate Student respondents (20%, n = 987) and Senior
Administrator with Faculty Rank respondents (21%, n = 15) were significantly more likely to have
felt "very comfortable" with the overall climate at University of Missouri-Columbia than were
Graduate/Professional/Post-Doctoral Student58 respondents (19%, n = 263), Faculty/Emeritus
Faculty/Research Scientist respondents (15%, n = 145) and Staff respondents (15%, n = 393).159
Very Comfortable • Comfortable • Neutral Uncomfortable »Very Uncomfortable
I I I I Staff/Sen. Admin w/o Fac. Rank (n = 2,597) 15 43 22 17 3
Sen. Admin w/ Fac. Rank (n = 71) 21 45 18 1 1
Faculty/Em eritus/R. Scientist (n = 994) 15 39 20 22 5
Grad./Prof./Post-doc Students (n = 1,425) 19 i 14 21 15
Undergrads (n = 4,858) 20 53 16 9 2
0% 10% 20% 30% 40% 50% 60% 70% 80% 90% 100%
Note: Responses with n <5 are not presented in the figure
Figure 12. Respondents' Comfort With Overall Climate by Position Status (%)
5 8 Graduate Student/Professional Student/Post-Doctoral/Fellow/Residents respondents are grouped as Graduate Student/Professional Student/Post-Doctoral respondents for analyses (also referred to as Graduate/Professional Student or Grad. Students for brevity). 39In several places throughout the report narrative, the figure may not provide the exact total noted in the narrative as a result of rounding the numbers in the figure to the nearest whole number.
56
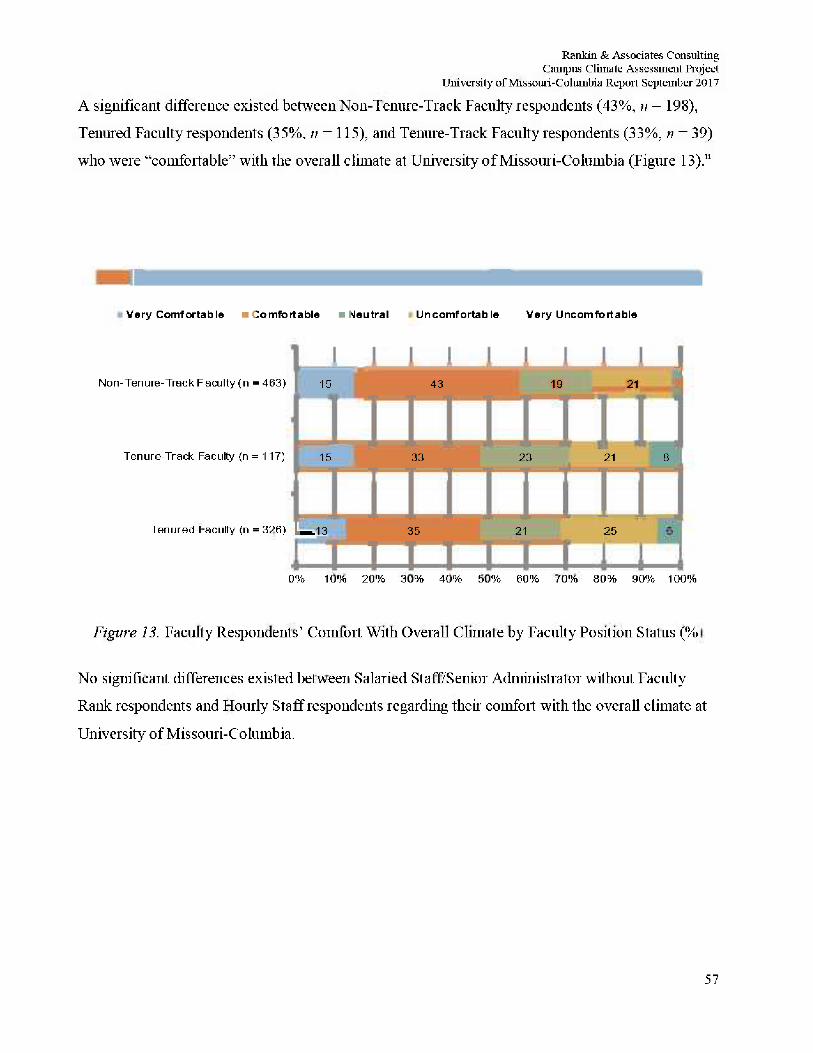
Rankin & Associates Consulting Campus Climate Assessment Project
University of Missouri-Columbia Repoit September 2017
A significant difference existed between Non-Tenure-Track Faculty respondents (43%, ?i = 198),
Tenured Faculty respondents (35%. n = 115), and Tenure-Track Faculty respondents (33%, n = 39)
who were "comfortable" with the overall climate at University of Missouri-Columbia (Figure 13).11
Very Comfortable i Comfortable • Neutral Uncomfortable Very Uncomfortable
Non-Tenure-Track Faculty (n = 463)
Tenure-Track Faculty (n = 117)
Tenured Faculty (n = 326) 13
15 43 19 21 2
15 33 23 21 8
13 35 21 25
0% 10% 20% 30% 40% 50% 60% 70% 80% 90% 100%
Figure 13. Faculty Respondents' Comfort With Overall Climate by Faculty Position Status (%
No significant differences existed between Salaried Staff/Senior Administrator without Faculty
Rank respondents and Hourly Staff respondents regarding their comfort with the overall climate at
University of Missouri-Columbia.
57
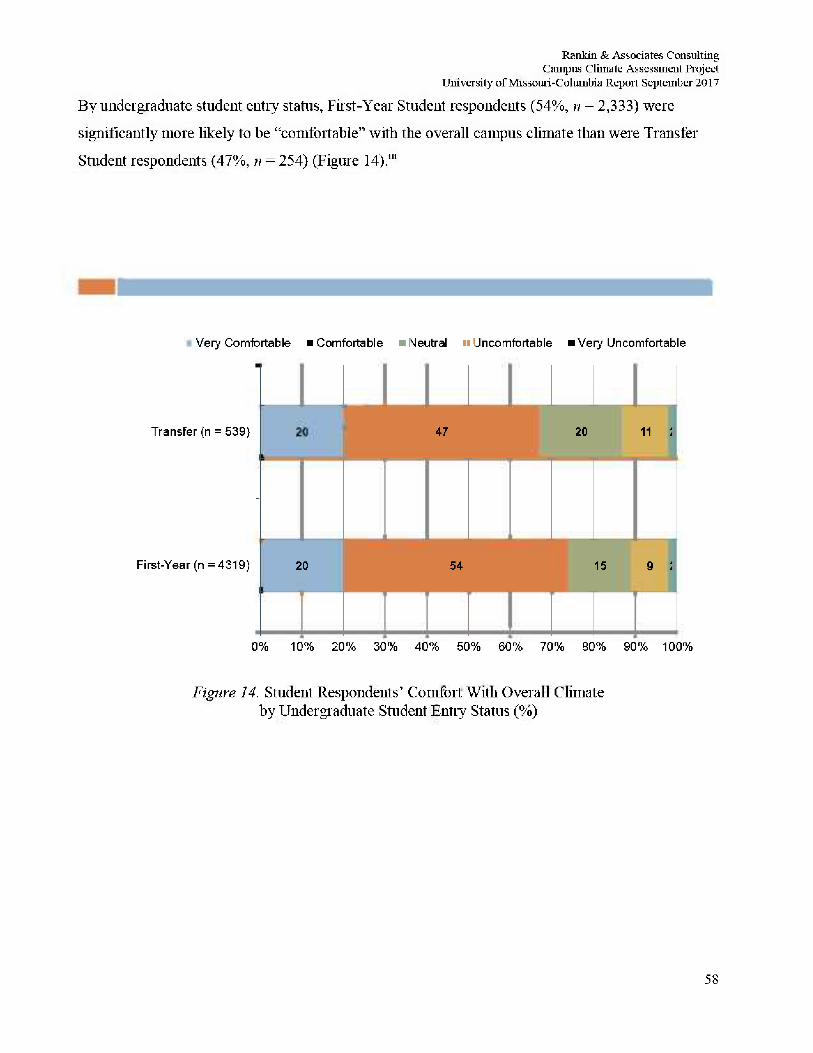
Rankin & Associates Consulting Campus Climate Assessment Project
University of Missouri-Columbia Report September 2017
By undergraduate student entry status, First-Year Student respondents (54%, n = 2,333) were
significantly more likely to be "comfortable" with the overall campus climate than were Transfer
Student respondents (47%, n = 254) (Figure 14).m
Very Comfortable •Comfortable • Neutral i Uncomfortable • Very Uncomfortable
Transfer (n = 539)
First-Year (n = 4319)
„ 20 11 2
-
20 54 15 9 2
0% 10% 20% 30% 40% 50% 60% 70% 80% 90% 100%
Figure 14. Student Respondents' Comfort With Overall Climate by Undergraduate Student Entry Status (%)
58
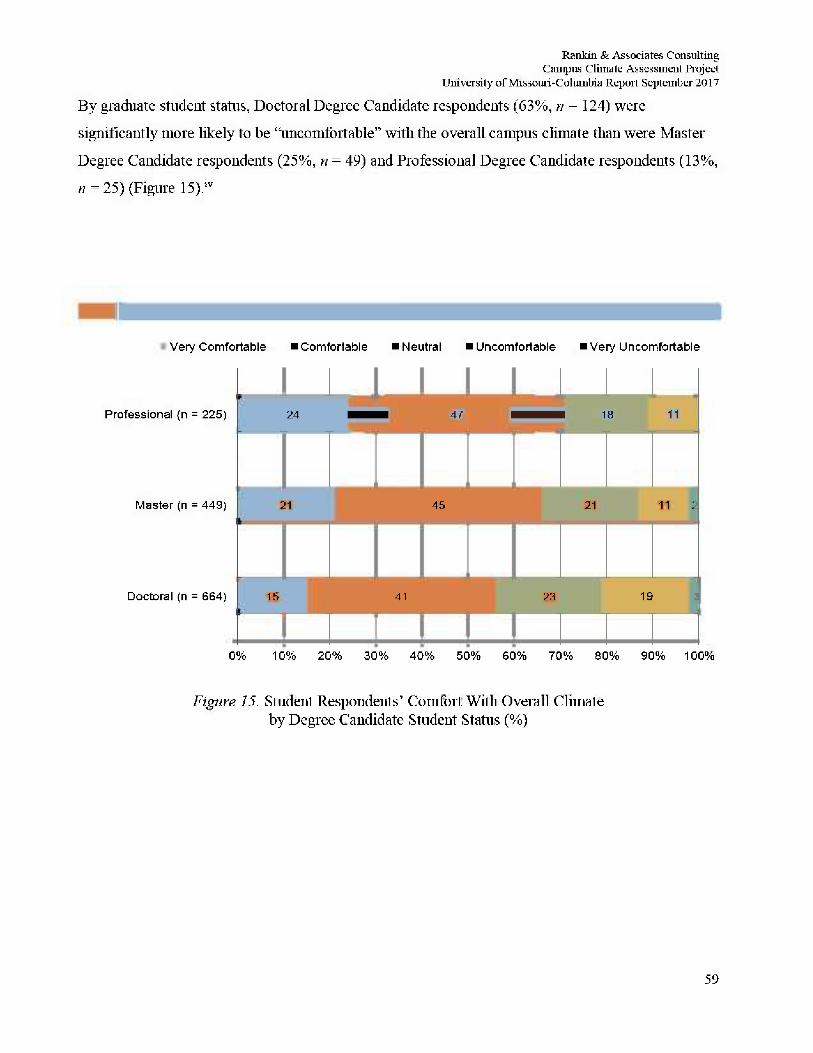
Rankin & Associates Consulting Campus Climate Assessment Project
University of Missouri-Columbia Report September 2017
By graduate student status, Doctoral Degree Candidate respondents (63%, n = 124) were
significantly more likely to be "uncomfortable" with the overall campus climate than were Master
Degree Candidate respondents (25%, n = 49) and Professional Degree Candidate respondents (13%,
n = 25) (Figure 15).1V
Very Comfortable "Comfortable "Neutral Uncomfortable "Very Uncomfortable
Professional (n = 225)
Master (n = 449)
Doctoral (n = 664)
Professional (n = 225)
Master (n = 449)
Doctoral (n = 664)
24 47 18 11 Professional (n = 225)
Master (n = 449)
Doctoral (n = 664)
Professional (n = 225)
Master (n = 449)
Doctoral (n = 664)
21 45 21 11 2
Professional (n = 225)
Master (n = 449)
Doctoral (n = 664)
Professional (n = 225)
Master (n = 449)
Doctoral (n = 664) 15 41 23 19 3
Professional (n = 225)
Master (n = 449)
Doctoral (n = 664)
0% 10% 20% 30% 40% 50% 60% 70% 80% 90% 100%
Figure 15. Student Respondents' Comfort With Overall Climate by Degree Candidate Student Status (%)
59
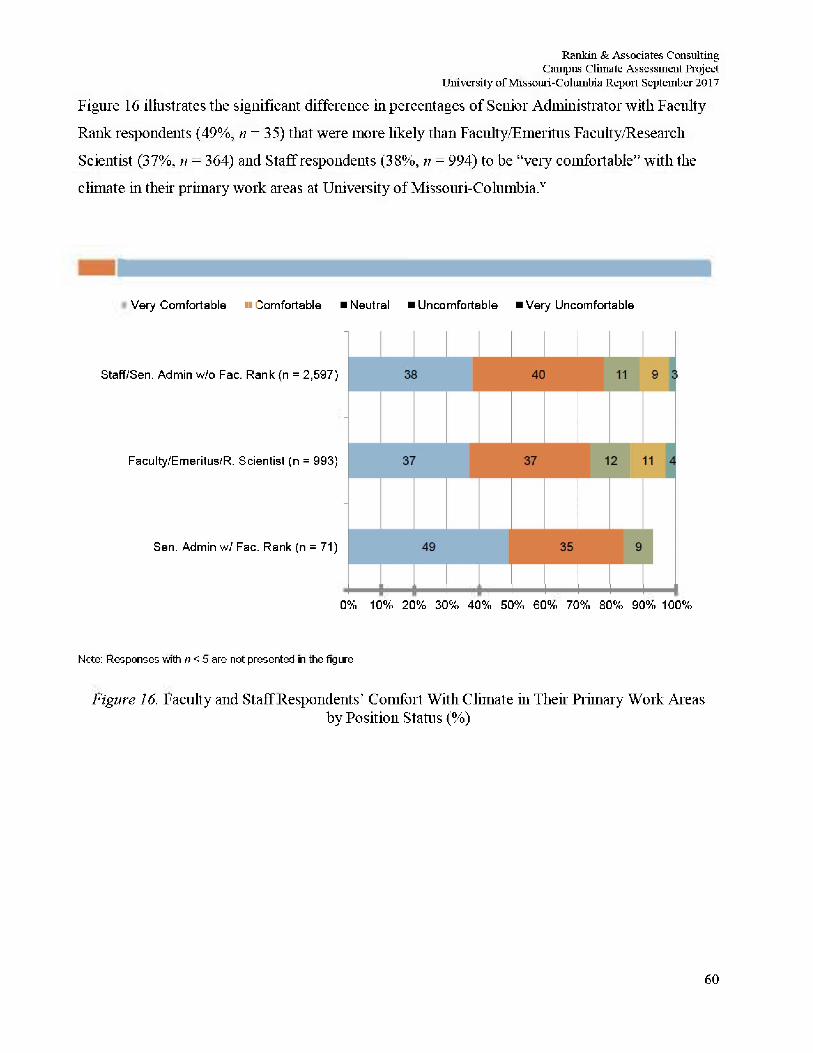
Rankin & Associates Consulting Campus Climate Assessment Project
University of Missouri-Columbia Repoit September 2017
Figure 16 illustrates the significant difference in percentages of Senior Administrator with Faculty
Rank respondents (49%, n = 35) that were more likely than Faculty/Emeritus Faculty/Research
Scientist (37%, n = 364) and Staff respondents (38%, n = 994) to be "very comfortable" with the
climate in their primary work areas at University of Missouri-Columbia.v
Very Comfortable i Comfortable Neutral "Uncomfortable "Very Uncomfortable
Staff/Sen. Admin w/o Fac. Rank {n = 2,597)
Faculty/Emeritus/R. Scientist (n = 993)
Sen. Admin w/ Fac. Rank (n = 71)
0% 10% 20% 30% 40% 50% 60% 70% 80% 90% 100%
Note: Responses with n <5 are not presented in the figure
Figure 16. Faculty and Staff Respondents' Comfort With Climate in Their Primary Work Areas by Position Status (%)
60
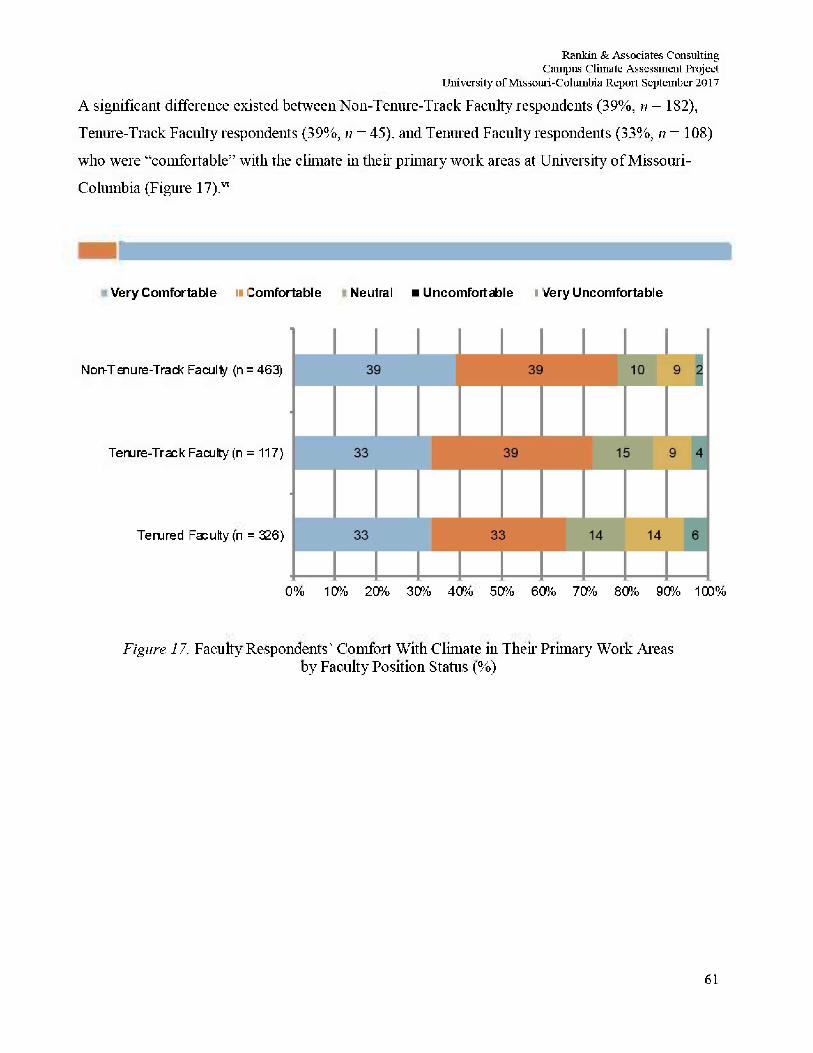
Rankin & Associates Consulting Campus Climate Assessment Project
University of Missouri-Columbia Report September 2017
A significant difference existed between Non-Tenure-Track Faculty respondents (39%, n = 182),
Tenure-Track Faculty respondents (39%, n = 45), and Tenured Faculty respondents (33%, n = 108)
who were "comfortable" with the climate in their primary work areas at University of Missouri-
Columbia (Figure 17).V1
Very Comfortable i Comfortable Neutral Uncomfortable Very Uncomfortable
Non-Tenure-Track Faculty (n = 463)
Tenure-Track Faculty (n = 117)
Tenured Faculty (n = 326)
0% 10% 20% 30% 40% 50% 60% 70% 80% 90% 100%
Figure 17. Faculty Respondents' Comfort With Climate in Their Primary Work Areas by Faculty Position Status (%)
61

Rankin & Associates Consulting Campus Climate Assessment Project
University of Missouri-Columbia Repoit September 2017
No significant differences existed between Salaried Staff/Senior Administrator without Faculty
Rank respondents and Hourly Staff respondents regarding their comfort in their primary work areas
at University of Missouri-Columbia.
A significantly higher percentage of Undergraduate Student respondents (51%, n = 2,487) than
Graduate/Professional/Post-Doctoral Student respondents (46%, n = 653), Faculty/Emeritus
Faculty/Research Scientist (43%, n = 408), and Senior Administrator w/Faculty Rank respondents
(39%, n = 25) were "comfortable" with the climate in their classes (Figure 18)™
Very Comfortable "Comfortable "Neutral "Uncomfortable "Very Uncomfortable
Sen. Admin, w/ Fac. Rank (n = 64)
Faculty/Erneritus/R. Scientist (n = 949)
Grad./Prof./Post-doc Students {n = 1422)
Undergraduate Students (n = 4856)
38 39 20
32 43 20 41
37 46 12 4 1
35 51 10 4
0% 10% 20% 30% 40% 50% 60% 70% 80% 90% 100%
Note: Responses with n <5 are not presented in the figure.
Figure 18. Faculty and Student Respondents' Comfort With Climate in Then Classes by Position Status (%)
62
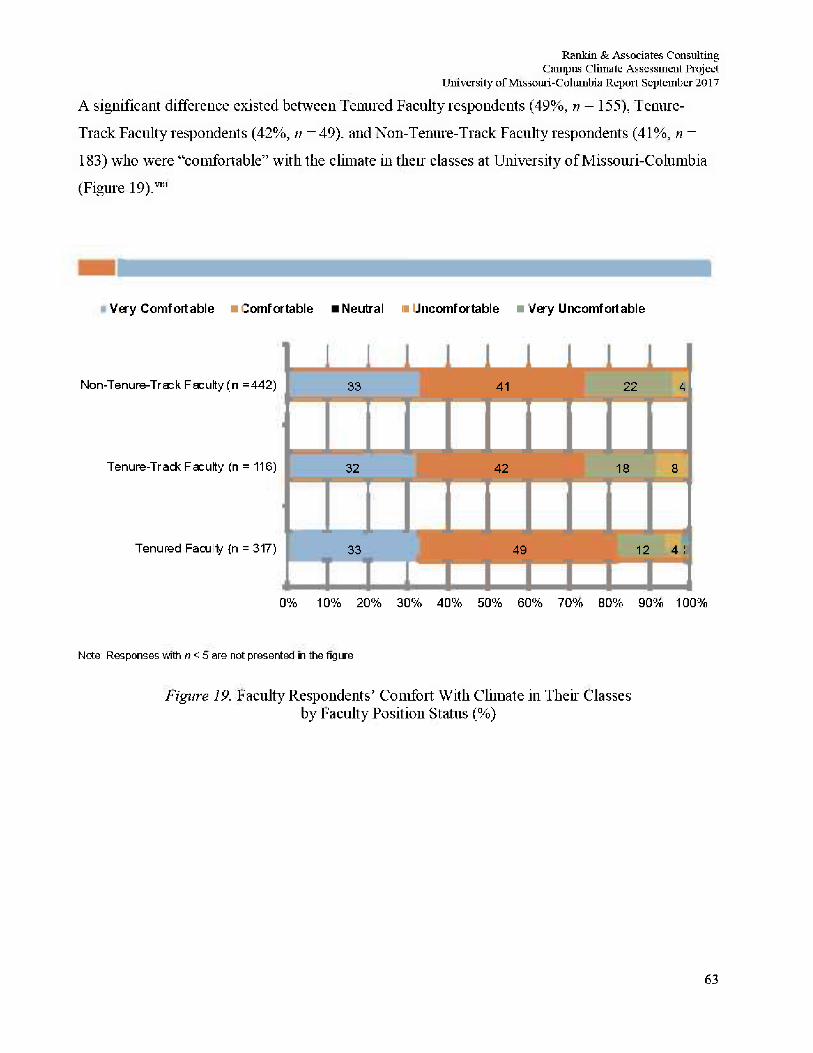
Rankin & Associates Consulting Campus Climate Assessment Project
University of Missouri-Columbia Repoit September 2017
A significant difference existed between Tenured Faculty respondents (49%, n = 155), Tenure-
Track Faculty respondents (42%, n = 49). and Non-Tenure-Track Faculty respondents (41%, n =
183) who were "comfortable" with the climate hi then classes at University of Missouri-Columbia
(Figure 19).*"
Very Comfortable • Comfortable Neutral i Uncomfortable • Very Uncomfortable
Non-Tenure-Track Faculty (n =442) 33 41 22 4
Tenure-Track Faculty (n = 116) 32 42 18 8
Tenured Faculty {n = 317) 33 49 12 4 2
0% 10% 20% 30% 40% 50% 60% 70% 80% 90% 100%
Note: Responses with n <5 are not presented in the figure
Figure 19. Faculty Respondents' Comfort With Climate in Their Classes by Faculty Position Status (%)
63
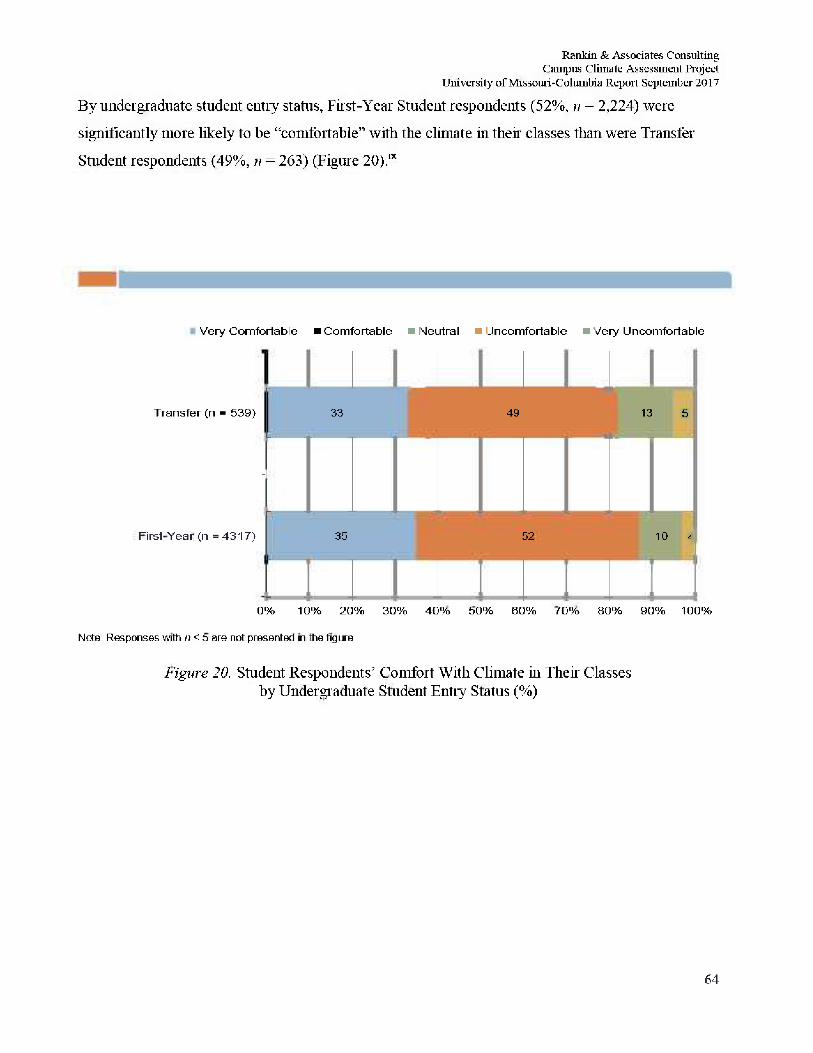
Rankin & Associates Consulting Campus Climate Assessment Project
University of Missouri-Columbia Report September 2017
By undergraduate student entry status, First-Year Student respondents (52%, ti = 2,224) were
significantly more likely to be "comfortable" with the climate in their classes than were Transfer
Student respondents (49%, n = 263) (Figure 20).LX
Very Comfortable • Comfortable I Neutral • Uncomfortable • Very Uncomfortable
Transfer (n = 5 3 9 )
First-Year (n = 4 3 1 7 )
33 49 13 5
-
35 52 10 4
0% 10% 20% 30% 40% 50% 60% 70% 80% 90% 100%
Note: Responses with /) < 5 are not presented in the figure
Figure 20. Student Respondents' Comfort With Climate in Their Classes by Undergraduate Student Entry Status (%)
64
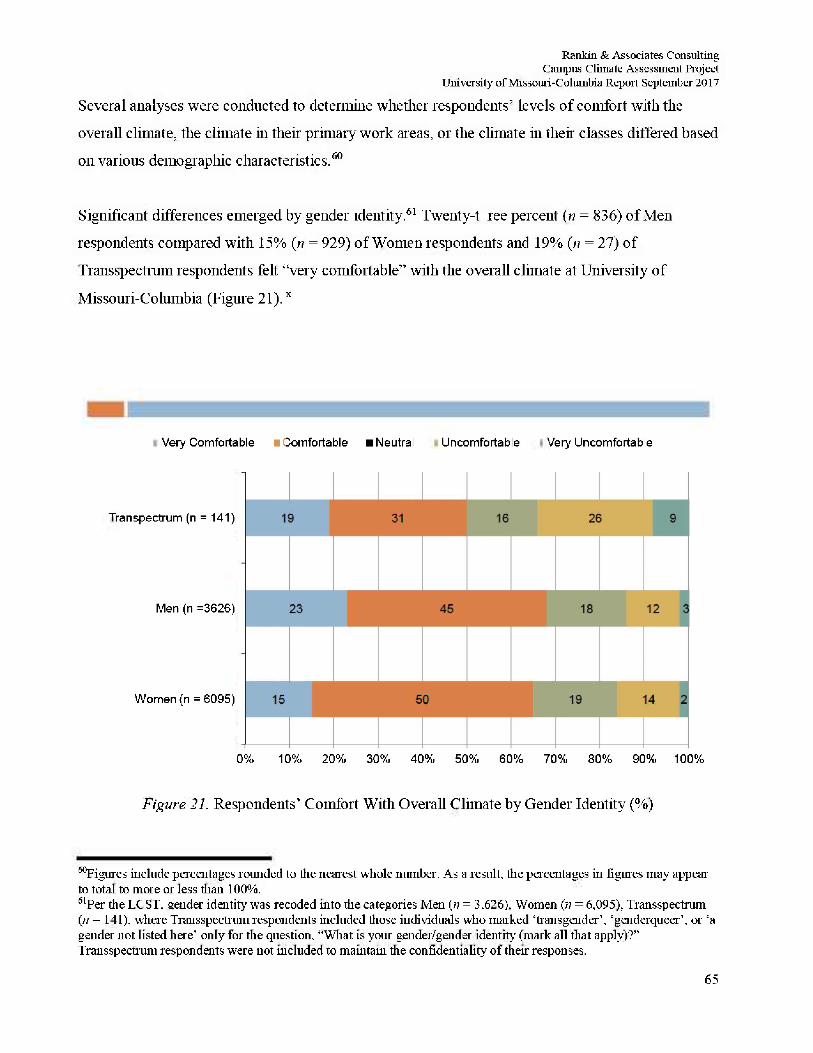
Rankin & Associates Consulting Campus Climate Assessment Project
University of Missouri-Columbia Repoit September 2017
Several analyses were conducted to determine whether respondents' levels of comfort with the
overall climate, the climate in their' primary work areas, or the climate in their classes differed based
on various demographic characteristics.60
Significant differences emerged by gender identity.61 Twenty-three percent (n = 836) of Men
respondents compared with 15% (n = 929) of Women respondents and 19% (ti = 27) of
Transspectrum respondents felt "very comfortable" with the overall climate at University of
Missouri-Columbia (Figure 21).K
Very Comfortable Comfortable Neutral Uncomfortable Very Uncomfortable
Transpectrum (n = 141)
Men (n =3626)
Women {n =6095)
0% 10% 20% 30% 40% 50% 60% 70% 80% 90% 100%
Figure 21. Respondents' Comfort With Overall Climate by Gender Identity (%)
f igures include percentages rounded to the nearest whole number. As a result, the percentages in figures may appear to total to more or less than 100%. 6 1 Per the LCST. seeder identity was recoded into the categories Men (w = 3.626). Women (n = 6,095), Transspectrum (ti = 141), where Transspectrum respondents included those individuals who marked 'transgender1. 'genderqueer\ or !a gender not listed here1 only for the question, "What is your gender/gender identity* (mark all that apply)?" Transspectrum respondents were not included to maintain the confidentiality of their responses.
65
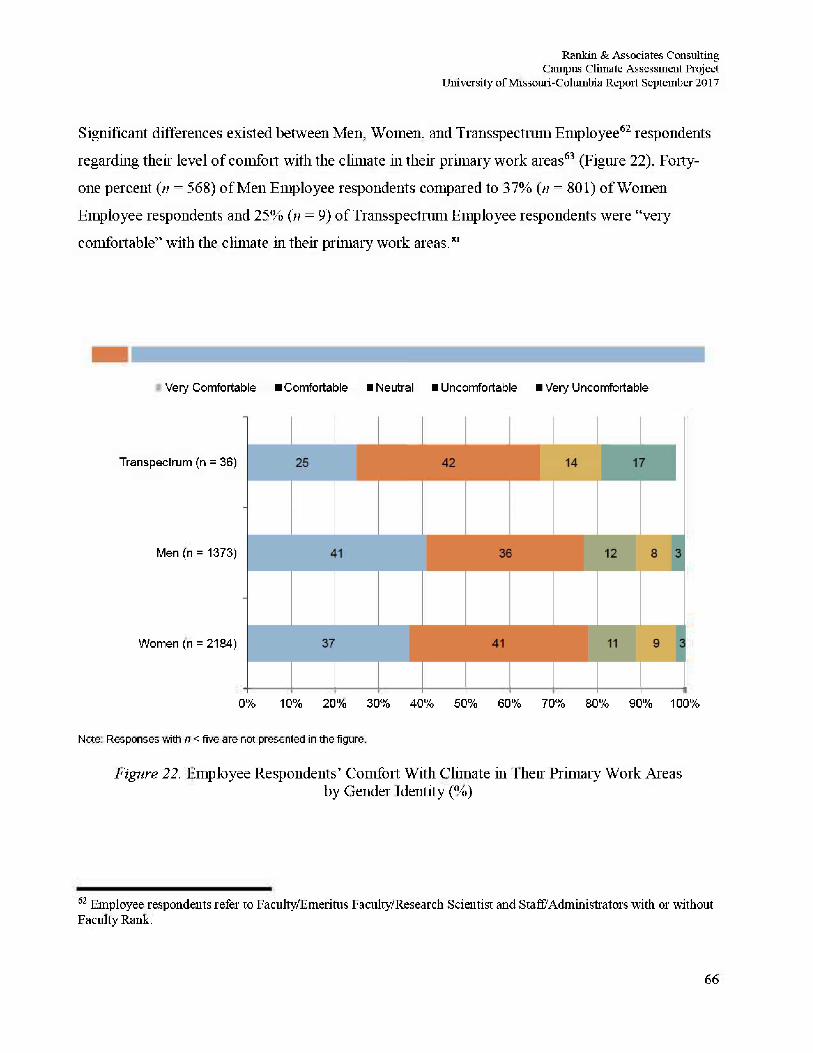
Rankin & Associates Consulting Campus Climate Assessment Project
University of Missouri-Columbia Report September 2017
Significant differences existed between Men, Women, and Transspectrum Employee62 respondents
regarding their level of comfort with the climate in their primary work areas63 (Figure 22). Forty-
one percent (« = 568) of Men Employee respondents compared to 37% (n = 801) of Women
Employee respondents and 25% (n = 9) of Transspectrum Employee respondents were "very
comfortable" with the climate in their' primary work areas. a
Very Comfortable •Comfortable • Neutral • Uncomfortable I Very Uncomfortable
Transpectrum (n = 36)
Men {n = 1373)
Women (n = 2184)
0% 10% 20% 30% 40% 50% 60% 70% 80% 90% 100%
Note: Responses with n < five are not presented in the figure.
Figure 22. Employee Respondents' Comfort With Climate hi Then Primary Work Areas by Gender Identity (%)
6 2 Employee respondents refer to Faculty/Emeritus Faculty/Re search Scientist and Staff?Administrators with or without Faculty Rank.
66
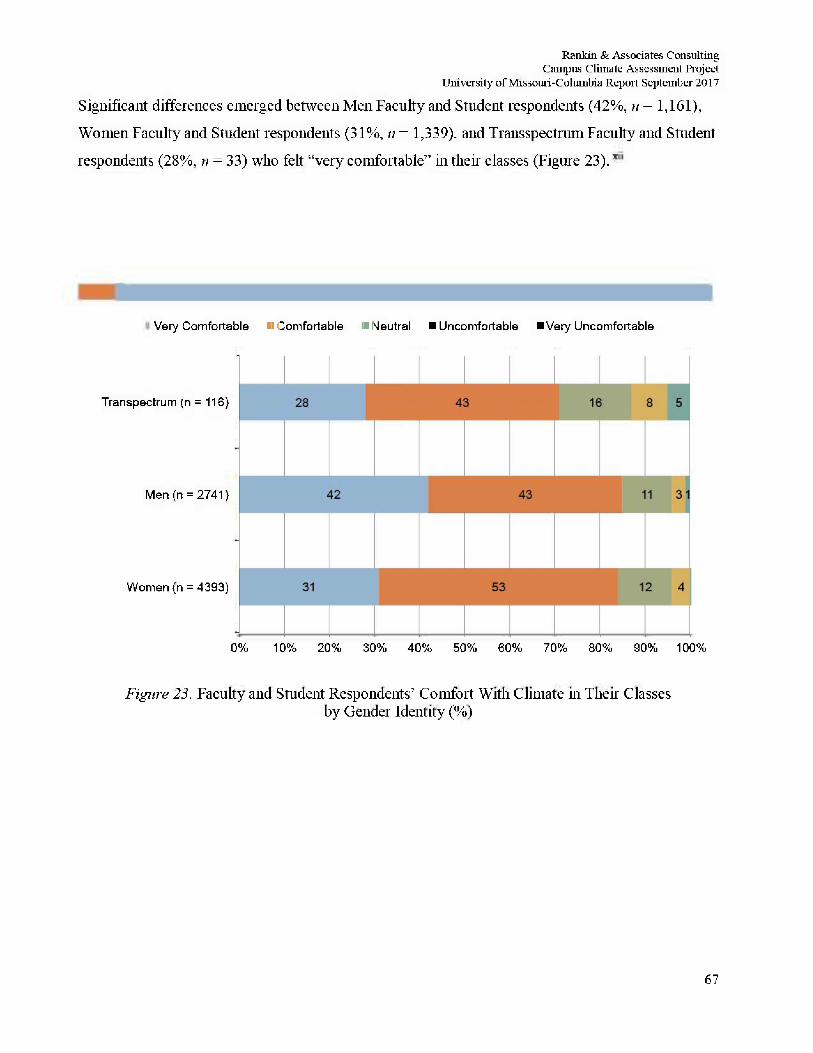
Rankin & Associates Consulting Campus Climate Assessment Project
University of Missouri-Columbia Report September 2017
Significant differences emerged between Men Faculty and Student respondents (42%, n =1,161),
Women Faculty and Student respondents (31%, n = 1,339). and Transspectrum Faculty and Student
respondents (28%, n = 33) who felt "very comfortable" hi their classes (Figure 23).
Very Comfortable • Comfortable I Neutral Uncomfortable "Very Uncomfortable
Transpectrum (n = 116}
Men (n = 2741}
Women {n = 4393)
0% 10% 20% 30% 40% 50% 60% 70% 80% 90% 100%
Figure 23. Faculty and Student Respondents' Comfort With Climate in Their Classes by Gender Identity (%)
67
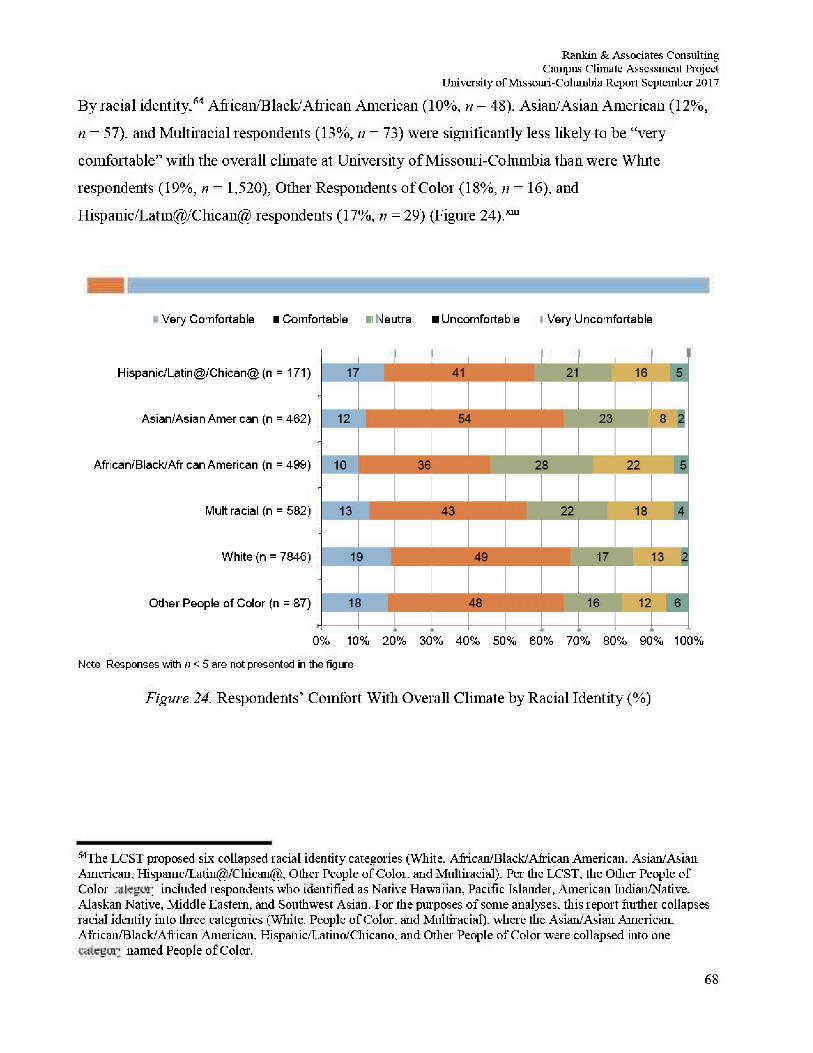
Rankin & Associates Consulting Campus Climate Assessment Project
University of Missouri-Columbia Report September 2017
B y racial ident i ty . 6 4 African/Black/African American (10%, n = 48), Asian/Asian American (12%,
n = 57). and Multiracial respondents (13%, n = 73) were significantly less likely to be "very
comfortable" with the overall climate at University of Missouri-Columbia than were White
respondents (19%, n = 1,520), Other Respondents of Color (18%, n = 16), and
Hispanic/Latm@/Chican@ respondents (17%, n = 29) (Figure 2 4 ) . ^
Very Comfortable iComfortable • Neutral •Uncomfortable Very Uncomfortable
Hispanic/Latin@/Chican@ (n = 171)
Asian/Asian American (n = 462)
African/Black/African American (n = 499)
Multiracial {n = 582)
White (n = 7846)
Other People of Color (n = 87)
0% 10% 20% 30% 40% 50% 60% 70% 80% 90% 100%
Note: Responses with /) < 5 are not presented in the figure
Figure 24. Respondents ' Comfort With Overall Climate by Racial Identity (%)
^The LCST proposed six collapsed racial identity categories (White. African/Black/African American. Asian/Asian American, Hispamc/Latin@/Chican@, Other People of Color, and Multiracial). Per the LCST, the Other People of Color category included respondents who identified as Native Hawaiian, Pacific Islander, American Indian/Native, Alaskan Native, Middle Eastern, and Southwest Asian. For the purposes of some analyses, this report further collapses racial identity into three categories (White. People of Color, and Multiracial), where the Asian/Asian American, Airican/Black/African American, Hispanic/Latino/Cliicano, and Other People of Color were collapsed into one
category named People of Color.
68
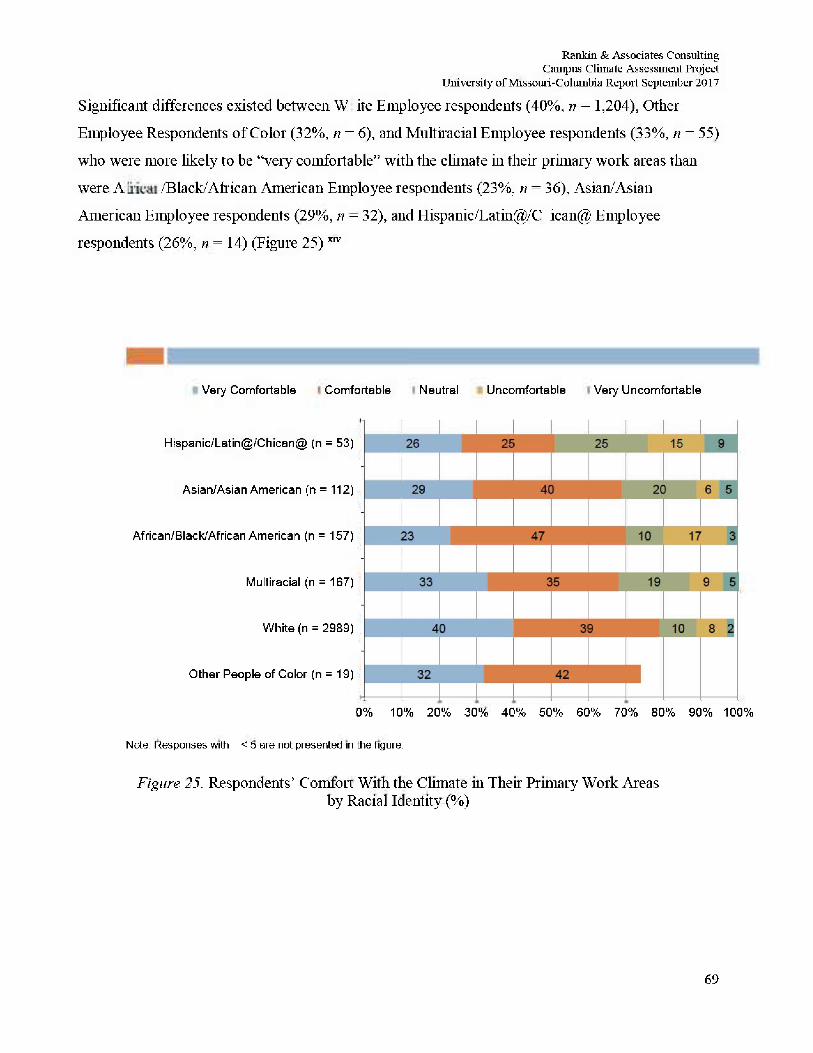
Rankin & Associates Consulting Campus Climate Assessment Project
University of Missouri-Columbia Report September 2017 Significant differences existed between White Employee respondents (40%, n = 1,204), Other
Employee Respondents of Color (32%, n = 6), and Multiracial Employee respondents (33%, n = 55)
who were more likely to be "very comfortable" with the climate in their primary work areas than
were Asian/Black/African American Employee respondents (23%, n = 36), Asian/Asian
American Employee respondents (29%, n = 32), and Hispanic/Latin@/Chican@ Employee
respondents (26%, n = 14) (Figure25)™
Very Comfortable Comfortable Neutral Uncomfortable Very Uncomfortable
Hispanic/Latin@/Chican@ (n = 53)
Asian/Asian American (n = 112)
African/Black/African American (n = 157)
Multiracial {n = 167)
White (n = 2989)
Other People of Color (n = 19)
0% 10% 20% 30% 40% 50% 60% 70% 80% 90% 100%
Note: Responses with n < 5 are not presented in the figure.
Figure 25. Respondents' Comfort With the Climate in Their Primary Work Areas by Racial Identity (%)
69
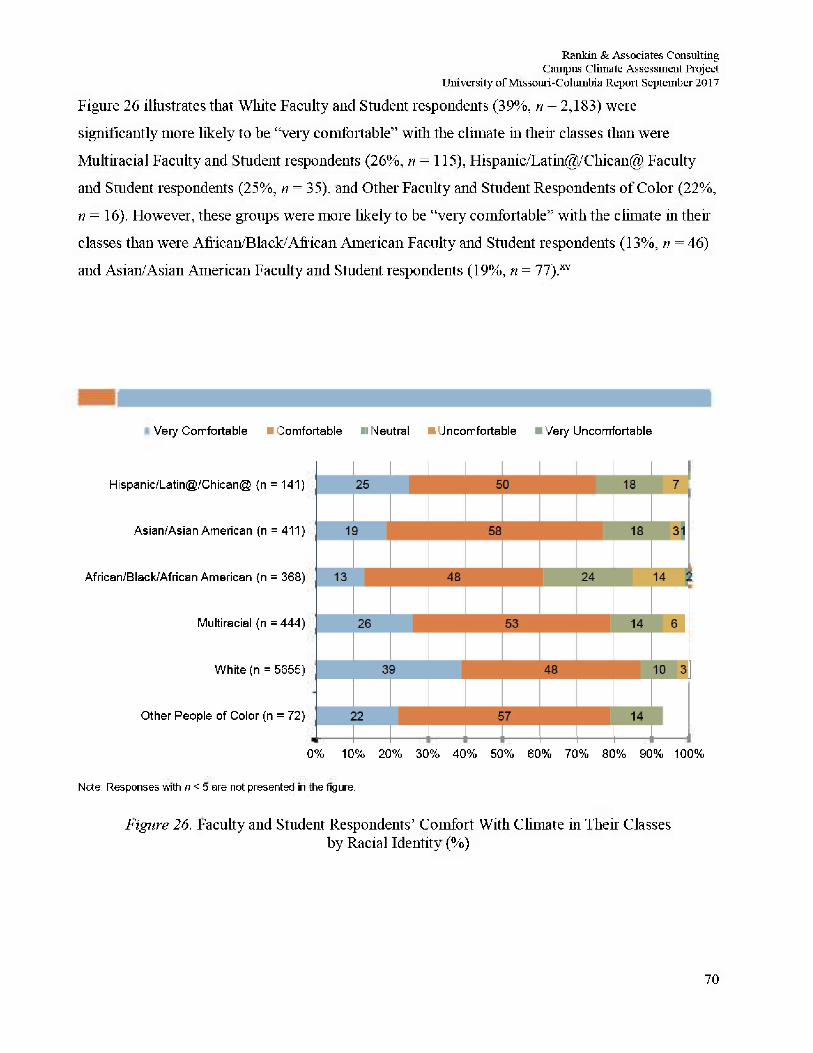
Rankin & Associates Consulting Campus Climate Assessment Project
University of Missouri-Columbia Report September 2017 Figure 26 illustrates that White Faculty and Student respondents (39%, n = 2,183) were
significantly more likely to be "very comfortable" with the climate in their classes than were
Multiracial Faculty and Student respondents (26%, n = 115), Hispanic/Latin@/Chican@ Faculty
and Student respondents (25%, n = 35), and Other Faculty and Student Respondents of Color (22%,
n = 16). However, these groups were more likely to be "very comfortable" with the climate in their
classes than were African/Black/African American Faculty and Student respondents (13%, n = 46)
and Asian/Asian American Faculty and Student respondents (19%, n = 77).™
Very Comfortable • Comfortable I Neutral • Uncomfortable • Very Uncomfortable
Hispanic/Latin@/Chican@ {n = 141)
Asian/Asian American (n = 411)
African/Black/African American (n = 368)
Multiracial {n = 444)
White (n = 5655)
Other People of Color (n = 72)
0% 10% 20% 30% 40% 50% 60% 70% 80% 90% 100%
Note: Responses with n < 5 are not presented in the figure.
Figure 26. Faculty and Student Respondents' Comfort With Climate in Their Classes by Racial Identity (%)
70
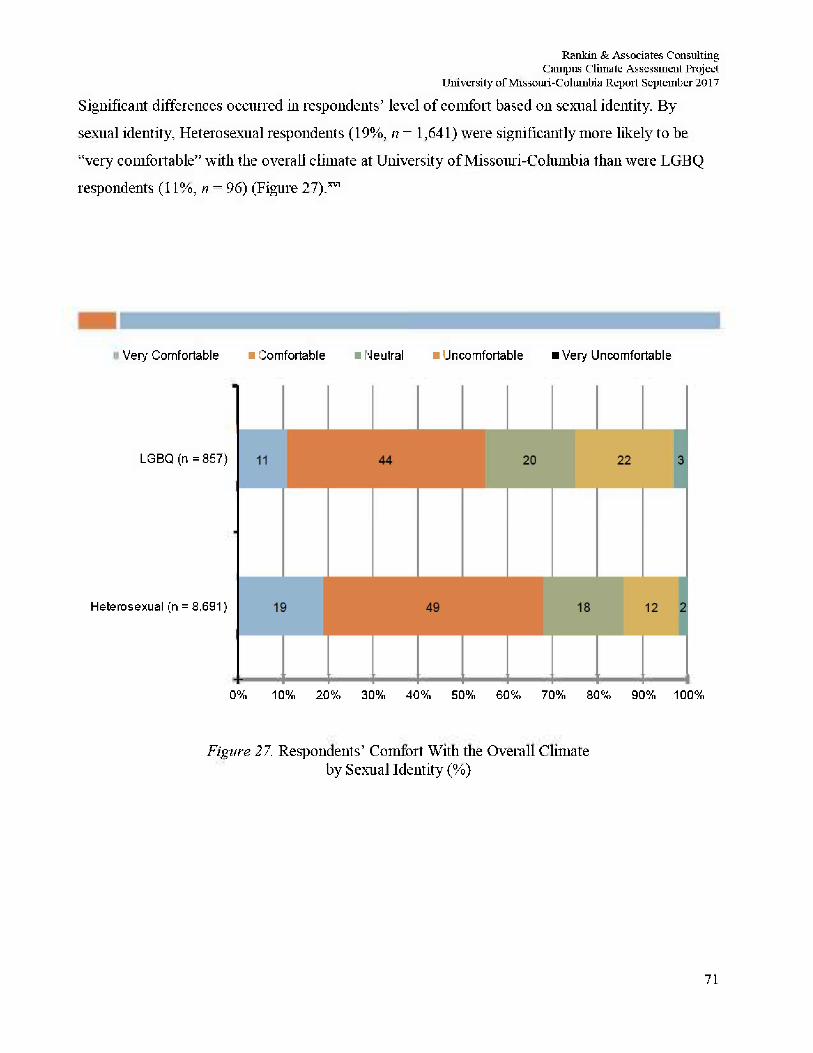
Rankin & Associates Consulting Campus Climate Assessment Project
University of Missouri-Columbia Report September 2017 Significant differences occurred in respondents' level of comfort based on sexual identity. By
sexual identity, Heterosexual respondents (19%, n = 1,641) were significantly more likely to be
"very comfortable" with the overall climate at University of Missouri-Columbia than were LGBQ
respondents (11%, n = 96) (Figure 27).™
Very Comfortable • Comfortable • Neutral • Uncomfortable • Very Uncomfortable
LGBQ (n =857}
Heterosexual (n = 8,691)
0% 10% 20% 30% 40% 50% 60% 70% 80% 90% 100%
Figure 27. Respondents' Comfort With the Overall Climate by Sexual Identity (%)
71
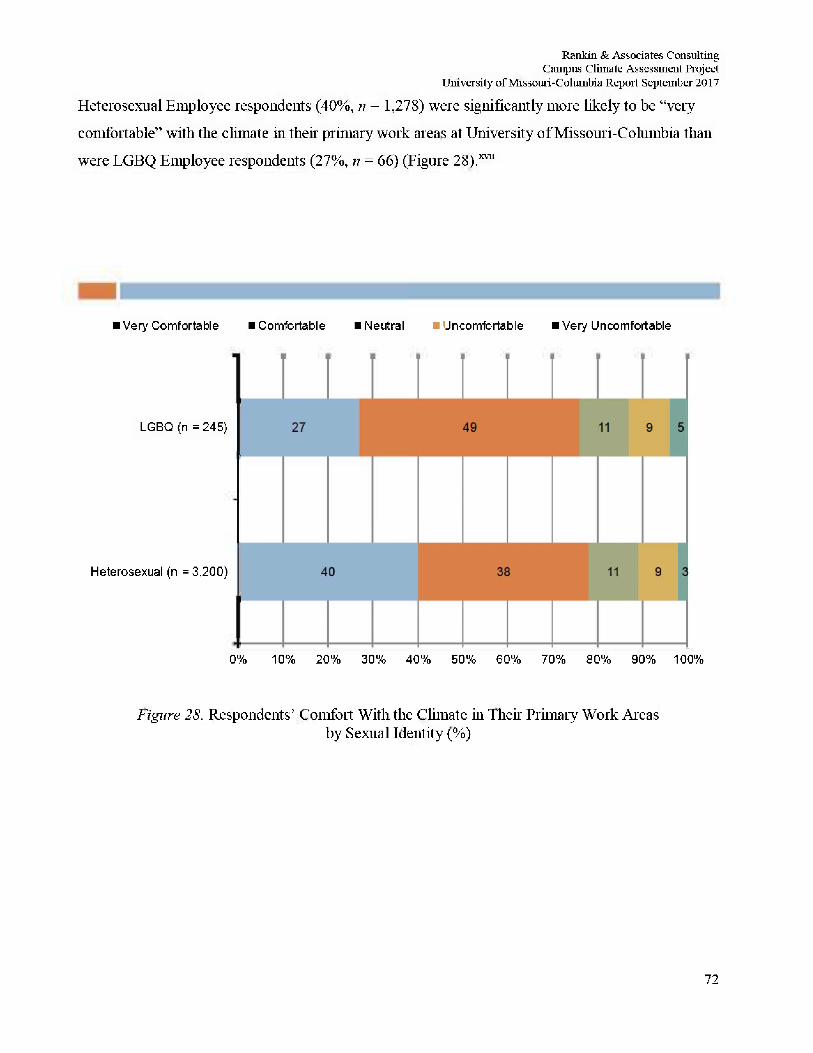
Rankin & Associates Consulting Campus Climate Assessment Project
University of Missouri-Columbia Report September 2017 Heterosexual Employee respondents (40%, n = 1,278) were significantly more likely to be "very
comfortable" with the climate in their primary work areas at University of Missouri-Columbia than
were LGBQ Employee respondents (27%, n = 66) (Figure 28).*™
liVery Comfortable •Comfortable iNeutral • Uncomfortable • Very Uncomfortable
LGBQ {n = 245)
Heterosexual (n =3,200)
0% 10% 20% 30% 40% 50% 60% 70% 80% 90% 100%
Figure 28. Respondents' Comfort With the Climate in Their Primary Work Areas by Sexual Identity (%)
72
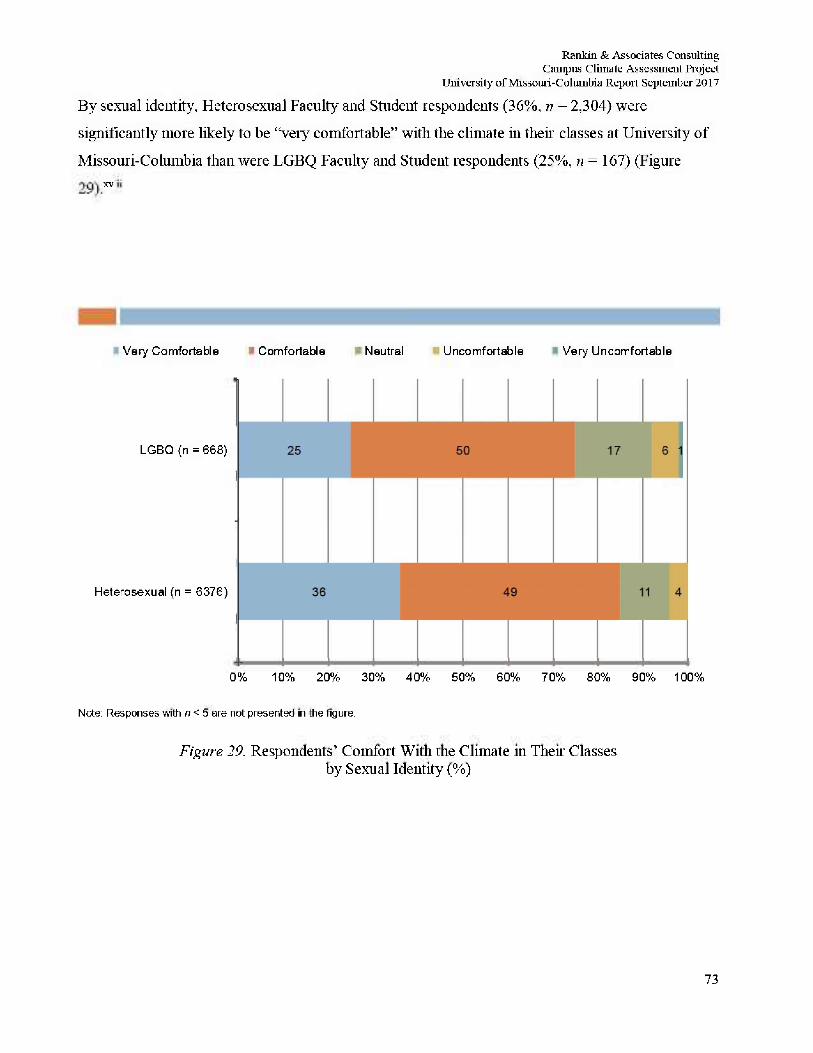
Rankin & Associates Consulting Campus Climate Assessment Project
University of Missouri-Columbia Repoit September 2017
By sexual identity. Heterosexual Faculty and Student respondents (36%, n = 2,304) were
significantly more likely to be "very comfortable" with the climate in their classes at University of
Missouri-Columbia than were LGBQ Faculty and Student respondents (25%, ti = 167) (Figure xviii
Very Comfortable Comfortable Neutral Uncomfortable Very Uncomfortable
LGBQ (n = 668)
Heterosexual {n = 6376)
0% 10% 20% 30% 40% 50% 60% 70% 80% 90% 100%
Note: Responses with n <5 are not presented in the figure.
Figure 29. Respondents' Comfort With the Climate in Their Classes by Sexual Identity (%)
73
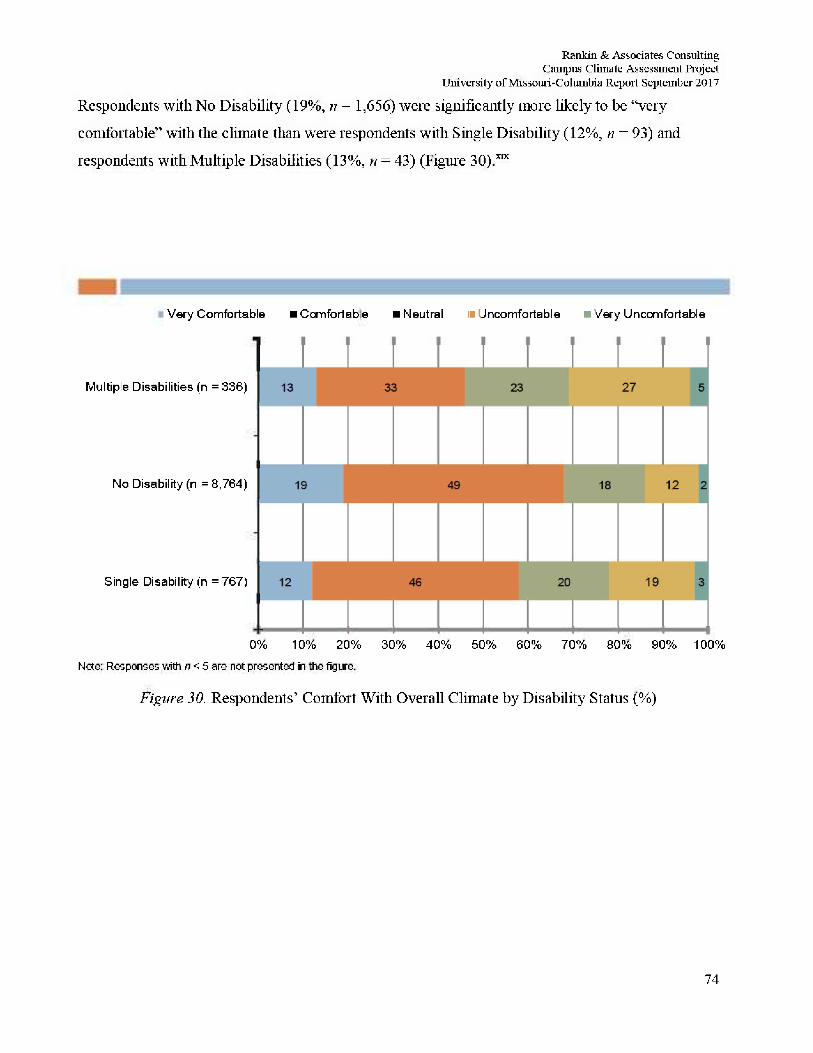
Rankin & Associates Consulting Campus Climate Assessment Project
University of Missouri-Columbia Report September 2017 Respondents with No Disability (19%, n = 1,656) were significantly more likely to be "very
comfortable" with the climate than were respondents with Single Disability (12%, n = 93) and
respondents with Multiple Disabilities (13%, n = 43) (Figure SO).5^
Very Comfortable •Comfortable • Neutral i Uncomfortable • Very Uncomfortable
Multiple Disabilities {n = 336)
No Disability (n =8,764)
Single Disability (n = 767)
0% 10% 20% 30% 40% 50% 60% 70% 80% 90% 100%
Note: Responses with n < 5 are not presented in the figure.
Figure 30. Respondents' Comfort With Overall Climate by Disability Status (%)
74
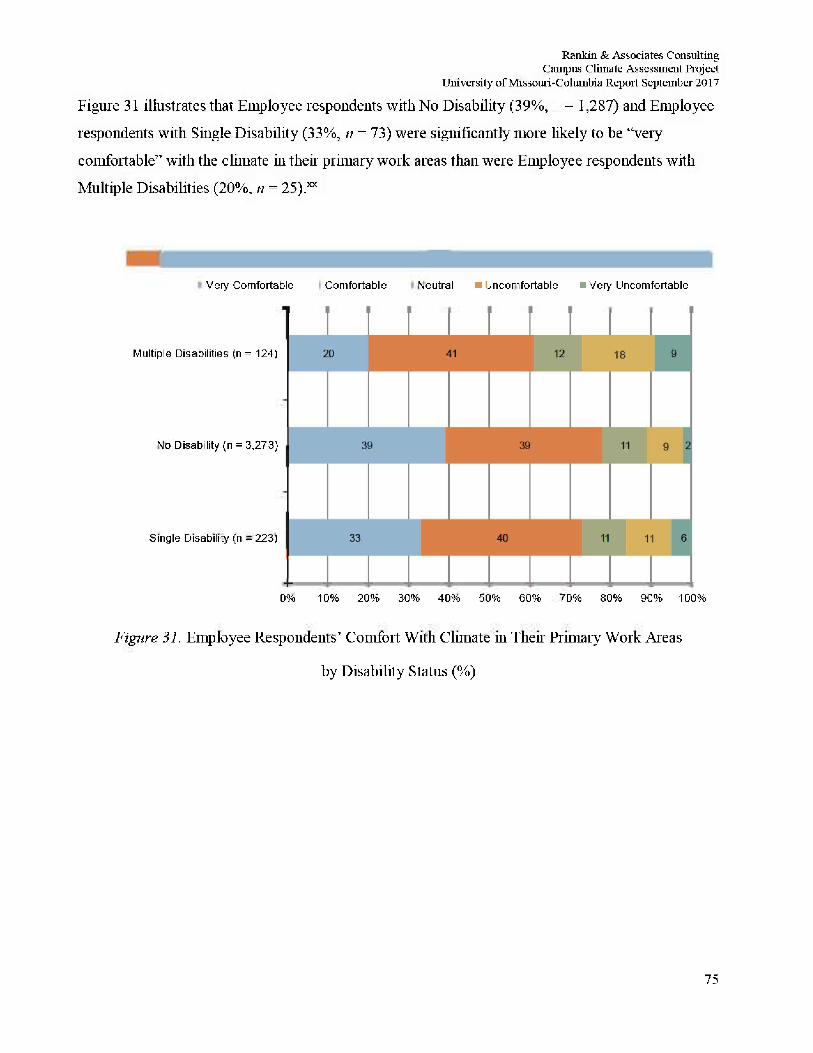
Rankin & Associates Consulting Campus Climate Assessment Project
University of Missouri-Columbia Report September 2017 Figure 31 illustrates that Employee respondents with No Disability (39%, n = 1,287) and Employee
respondents with Single Disability (33%, n = 73) were significantly more likely to be "very
comfortable" with the climate in their primary work areas than were Employee respondents with
Multiple Disabilities (20%, n = 25) **
Very Comfortable Comfortable Neutral • Uncomfortable • Very Uncomfortable
Multiple Disabilities (n = 124)
No Disability (n = 3,273)
Single Disability {in = 223)
0% 10% 20% 30% 40% 50% 60% 70% 80% 90% 100%
Figure 31. Employee Respondents' Comfort With Climate in Their Primary Work Areas
by Disability Status (%)
75
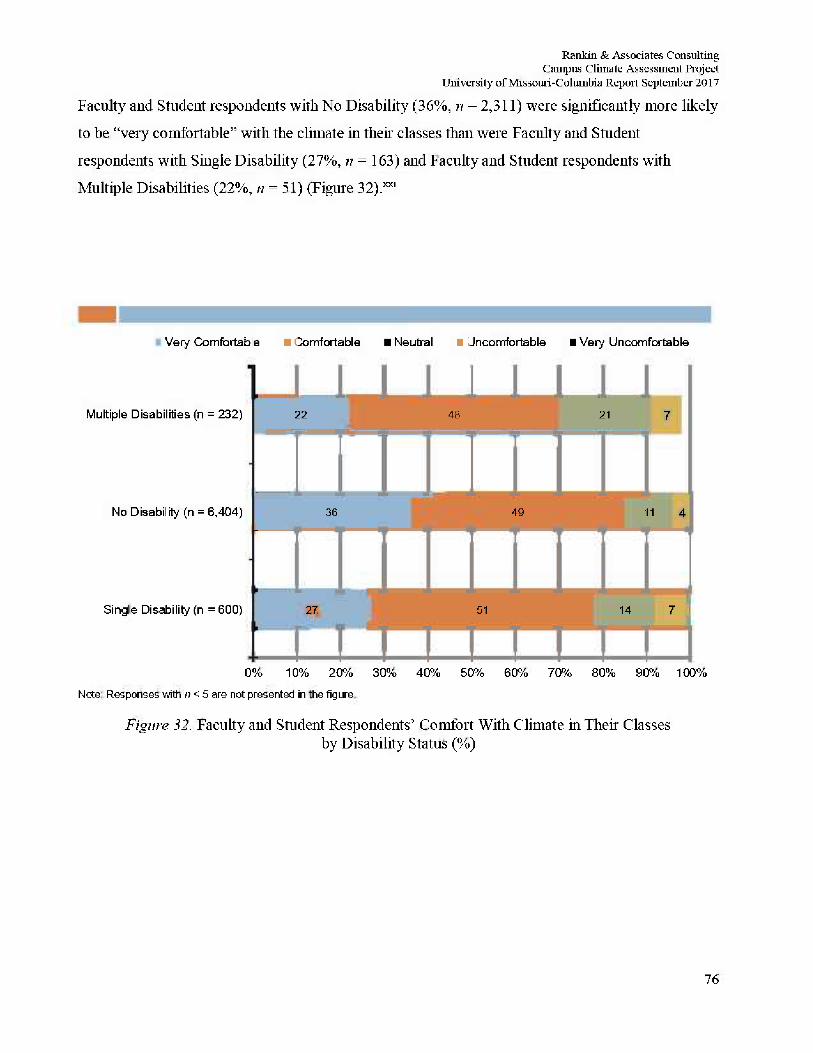
Rankin & Associates Consulting Campus Climate Assessment Project
University of Missouri-Columbia Repoit September 2017
Faculty and Student respondents with No Disability (36%, n = 2,311) were significantly more likely
to be "very comfortable" with the climate in their classes than were Faculty and Student
respondents with Single Disability (27%, n = 163) and Faculty and Student respondents with
Multiple Disabilities (22%, n = 51) (Figure 32).**
Very Comfortable • Comfortable I Neutral • Uncomfortable • Very Uncomfortable
Multiple Disabilities {n = 232)
No Disability (n = 6,404)
Single Disability (n = 600)
22 48 21 7
36 49 11 4
27 51 14 7 1
0% 10% 20% 30% 40% 50% 60% 70% 80% 90% 100%
Note: Responses with /) < 5 are not presented in the figure
Figure 32. Faculty and Student Respondents' Comfort With Climate in Their Classes by Disability Status (%)
76
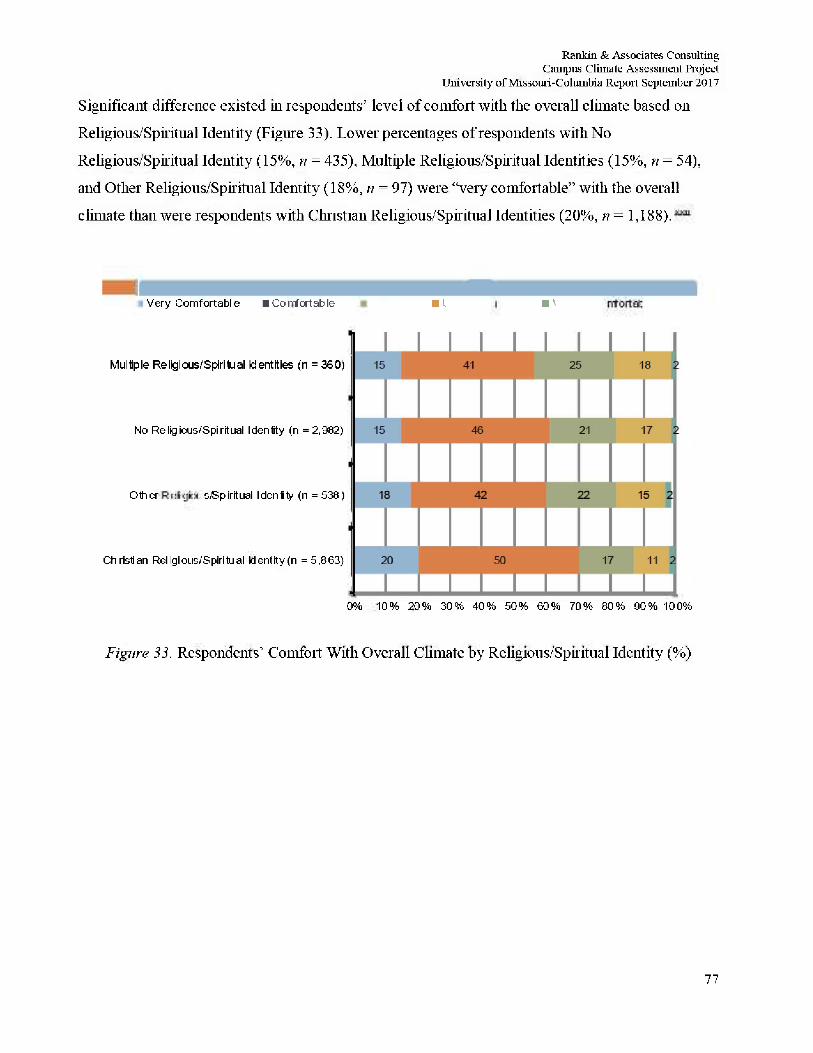
Rankin & Associates Consulting Campus Climate Assessment Project
University of Missouri-Columbia Repoit September 2017
Significant difference existed in respondents' level of comfort with the overall climate based on
Religious/Spiritual Identity (Figure 33). Lower percentages of respondents with No
Religious/Spiritual Identity (15%, n = 435), Multiple Religious/Spiritual Identities (15%, n = 54),
and Other Religious/Spiritual Identity (18%, n = 97) were "very comfortable" with the overall
climate than were respondents with Christian Religious/Spiritual Identities (20%, n = 1,188).
Very Comfortable •Comfortable NeutraI • Uncomfortable • Very Uncomforable
77
Multple Religious/Spiritual Identities (n = 360)
No Religious/Spiritual Identity (n = 2,982)
Other Religious sp i r i tua l Identity (n = 538)
Christian Religious/Spiritual Id entity (n = 5,863}
0% 10% 20% 30% 40% 50% 60% 70% 80% 90% 100%
Figure 33. Respondents' Comfort With Overall Climate by Religious/Spiritual Identity (%)
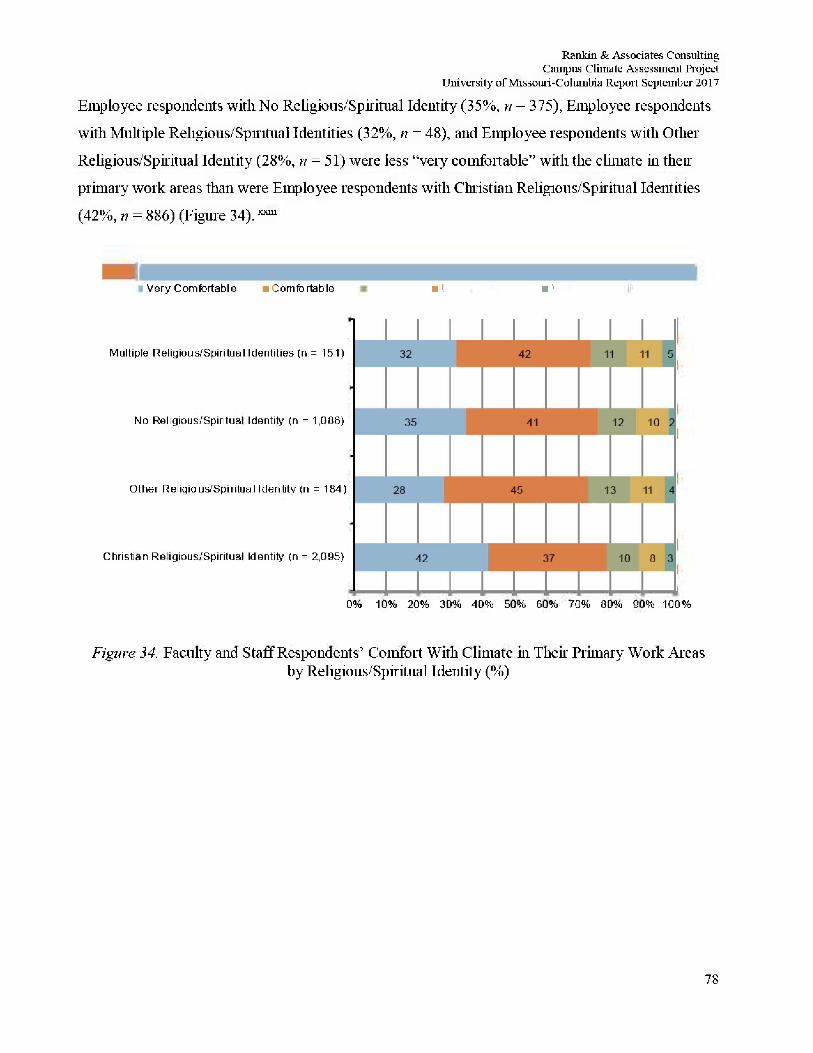
Rankin & Associates Consulting Campus Climate Assessment Project
University of Missouri-Columbia Repoit September 2017
Employee respondents with No Religious/Spiritual Identity (35%, n = 375), Employee respondents
with Multiple Religious/Spiritual Identities (32%, n = 48), and Employee respondents with Other
Religious/Spiritual Identity (28%, n = 51) were less "very comfortable" with the climate in then
primary work areas than were Employee respondents with Christian Religious/Spiritual Identities
(42%, n = 886) (Figure 34). ™
Very Comfortable • Comfortable
Multiple Religious/Spiritual Identities (n = 151)
No Religious/Spiritual Identity (n = 1,086)
Other Religious'Spiritual Identity (n = 184)
Christian Religious/Spiritual Identity (n = 2,095)
0% 10% 20% 30% 40% 50% 60% 70% 80% 90% 100%
Figure 34. Faculty and Staff Respondents' Comfort With Climate in Their Primary Work Areas by Religious/Spiritual Identity (%)
Neutral • Uncomfortable • Very Uncomfortable
78
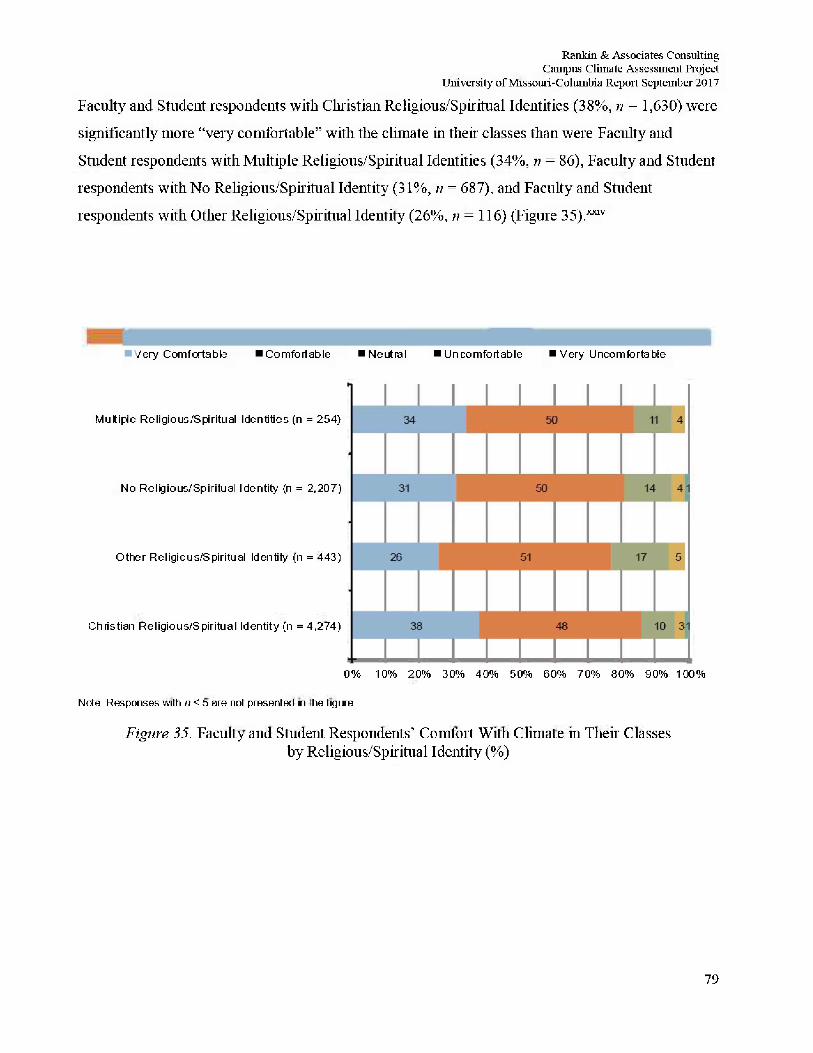
Rankin & Associates Consulting Campus Climate Assessment Project
University of Missouri-Columbia Repoit September 2017
Faculty and Student respondents with Christian Religious/Spiritual Identities (38%, n = 1,630) were
significantly more "very comfortable" with the climate in their classes than were Faculty and
Student respondents with Multiple Religious/Spiritual Identities (34%, n = 86), Faculty and Student
respondents with No Religious/Spiritual Identity (31%, n = 687), and Faculty and Student
respondents with Other Religious/Spiritual Identity (26%, n = 116) (Figure 35).XX1V
• Very Comfortabie •Comfortable •Neut ra l •Uncomfortable • Very Uncomfortable
Multiple Religious/Spiritual Identities (n = 254)
No Re I igio us/ Spiritual Identity (n = 2,207)
Other Religious/Spiritual Identity (n = 443)
Christian Religious/Spiritual Identity (n = 4,274)
0% 10% 20% 30% 40% 50% 60% 70% 80% 90% 100%
Note: Responses with /) < 5 are not presented in the figure
Figure 35. Faculty and Student Respondents' Comfort With Climate in Their Classes by Religious/Spiritual Identity (%)
79
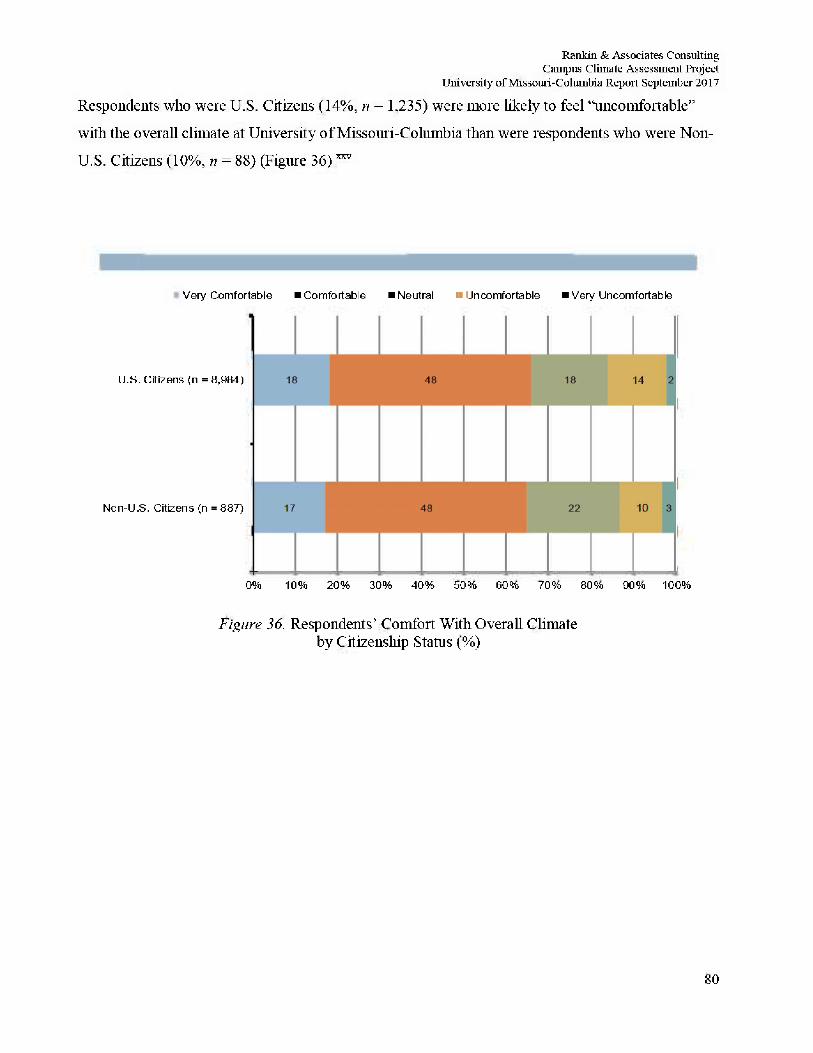
Rankin & Associates Consulting Campus Climate Assessment Project
University of Missouri-Columbia Report September 2017 Respondents who were U.S. Citizens (14%, n = 1,235) were more likely to feel "uncomfortable"
with the overall climate at University of Missouri-Co himbia than were respondents who were Non-
U.S. Citizens (10%, n = 88)(Figure 36)™'
Very Comfortable •Comfortable "Neutral • Uncomfortable "Very Uncomfortable
U.S. Citizens (n = 8,984)
Non-U.S. Citizens (n = 887}
0% 10% 20% 30% 40% 50% 60% 70% 80% 90% 100%
Figure 36. Respondents' Comfort With Overall Climate by Citizenship Status (%)
80
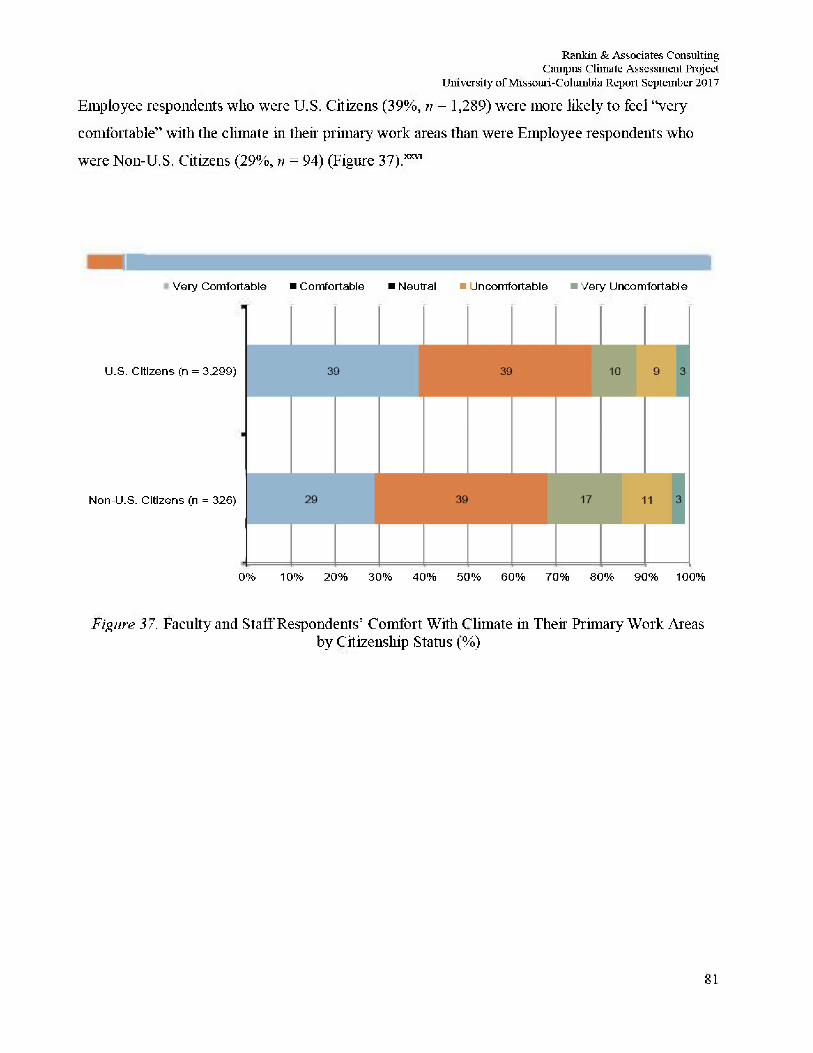
Rankin & Associates Consulting Campus Climate Assessment Project
University of Missouri-Columbia Repoit September 2017
Employee respondents who were U.S. Citizens (39%, n = 1,289) were more likely to feel 'Very
comfortable" with the climate in their primary work areas than were Employee respondents who
were Non-U.S. Citizens (29%, n = 94) (Figure 37).™
Very Comfortable • Comfortable • Neutral • Uncomfortable • Very Uncomfortable
U.S. Citizens (n = 3,299)
Non-U.S. Citizens (n = 326)
0% 10% 20% 30% 40% 50% 60% 70% 80% 90% 100%
Figure 37. Faculty and Staff Respondents' Comfort With Climate in Their Primary Work Areas by Citizenship Status (%)
81
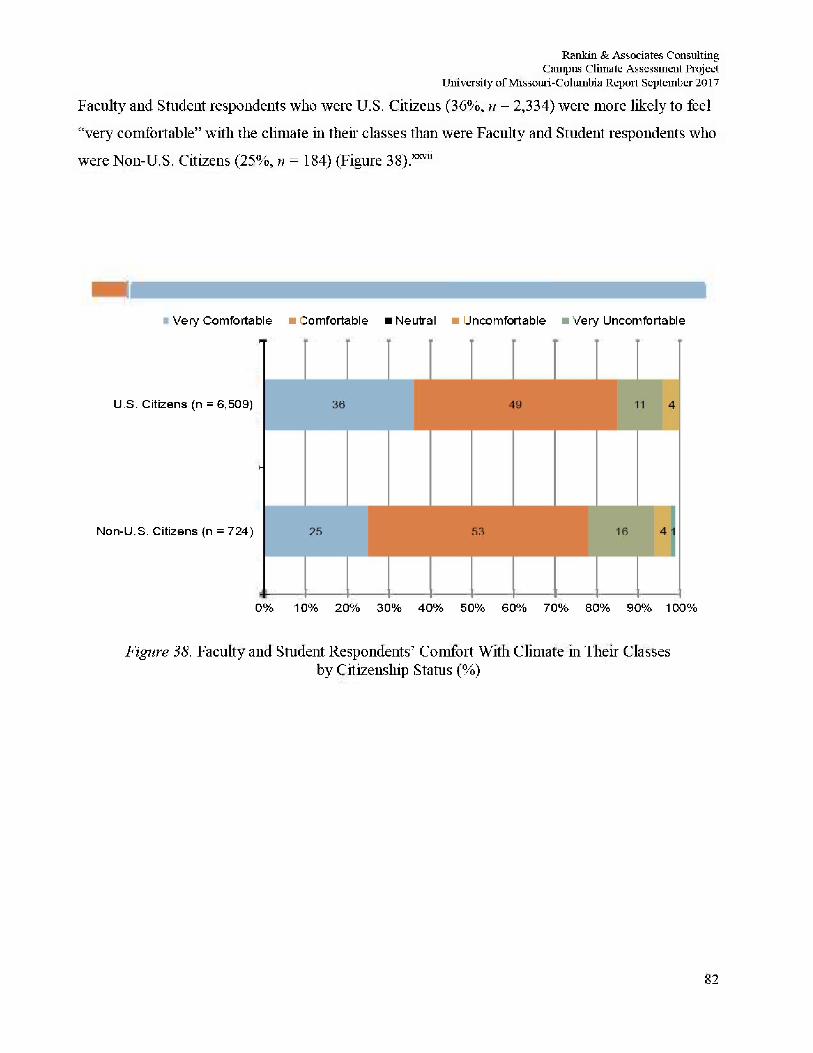
Rankin & Associates Consulting Campus Climate Assessment Project
University of Missouri-Columbia Report September 2017 Faculty and Student respondents who were U.S. Citizens (36%, n = 2,334) were more likely to feel
"very comfortable" with the climate in their classes than were Faculty and Student respondents who
were Non-U.S. Citizens (25%, n = 184) (Figure 38).™*
Very Comfortable • Comfortable • Neutral • Uncomfortable • Very Uncomfortable
U.S. Citizens (n = 6,509)
Non-U.S. Citizens {n = 724)
0% 10% 20% 30% 40% 50% 60% 70% 80% 90% 100%
Figure 38. Faculty and Student Respondents' Comfort With Climate in Their Classes by Citizenship Status (%)
82
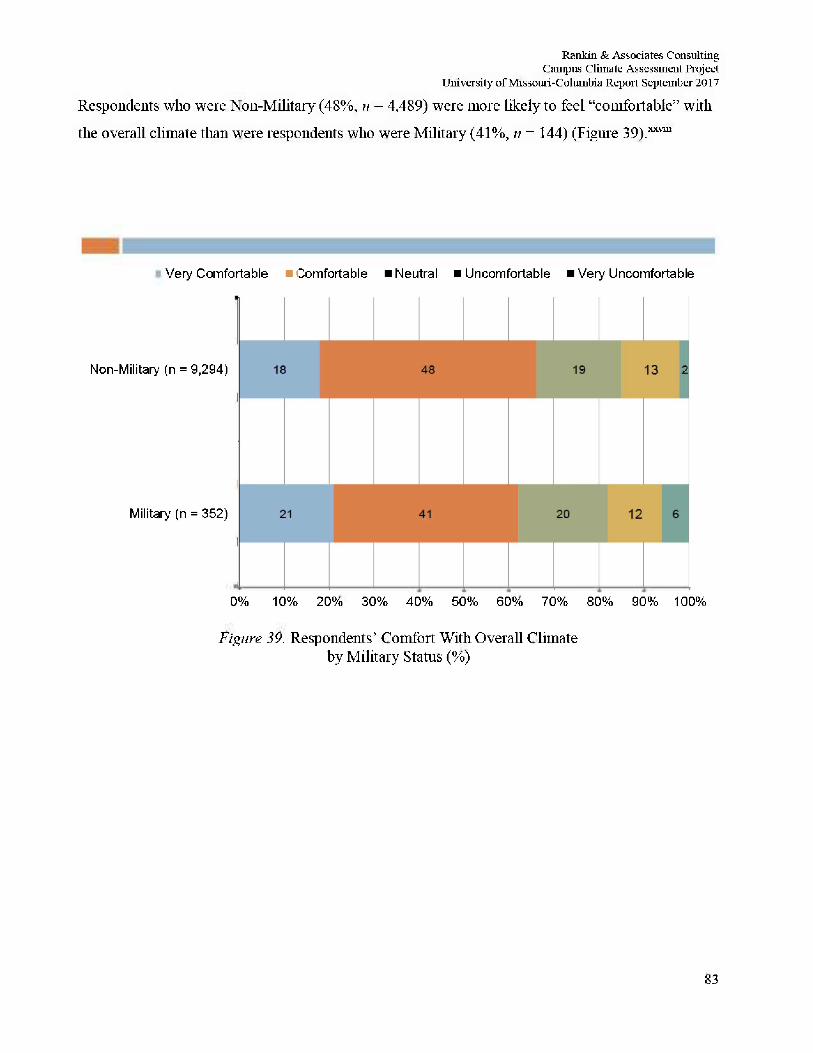
Rankin & Associates Consulting Campus Climate Assessment Project
University of Missouri-Columbia Repoit September 2017
Respondents who were Non-Military (48%, n = 4,489) were more likely to feel "comfortable" with
the overall climate than were respondents who were Military (41%, n = 144) (Figure 39) . x x v m
Very Comfortable • Comfortable • Neutral • Uncomfortable • Very Uncomfortable
Non-Military (n = 9,294)
Military (n = 352)
0% 10% 20% 30% 40% 50% 60% 70% 80% 90% 100%
Figure 39. Respondents' Comfort With Overall Climate by Military Status (%)
83
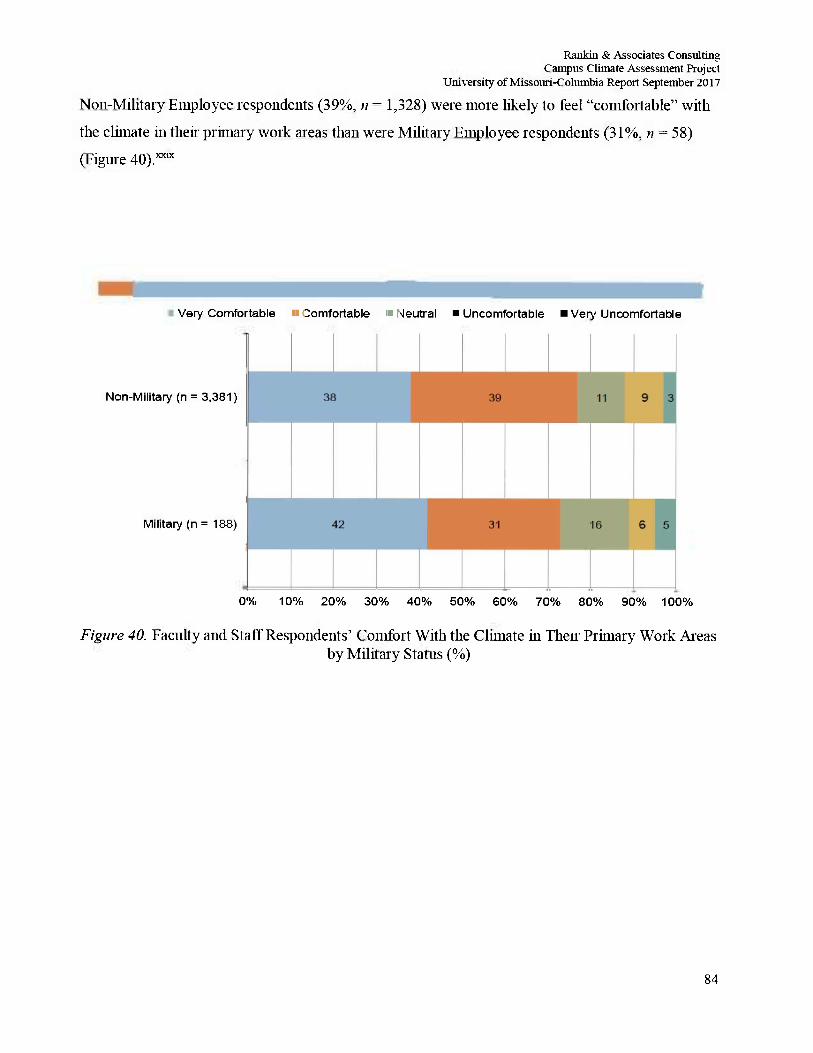
Rankin & Associates Consulting Campus Climate Assessment Project
University of Missouri-Columbia Report September 2017
Non-Military Employee respondents (39%, n = 1,328) were more likely to feel "comfortable" with
the climate in their primary work areas than were Military Employee respondents (31%, n = 58)
(Figure 40).XX1X
Very Comfortable • Comfortable i Neutral "Uncomfortable "Very Uncomfortable
Non-Military (n = 3,381)
Military (n = 188)
0% 10% 20% 30% 40% 50% 60% 70% 80% 90% 100%
Figure 40. Faculty and Staff Respondents' Comfort With the Climate in Then Primary Work Areas by Military Status (%)
84
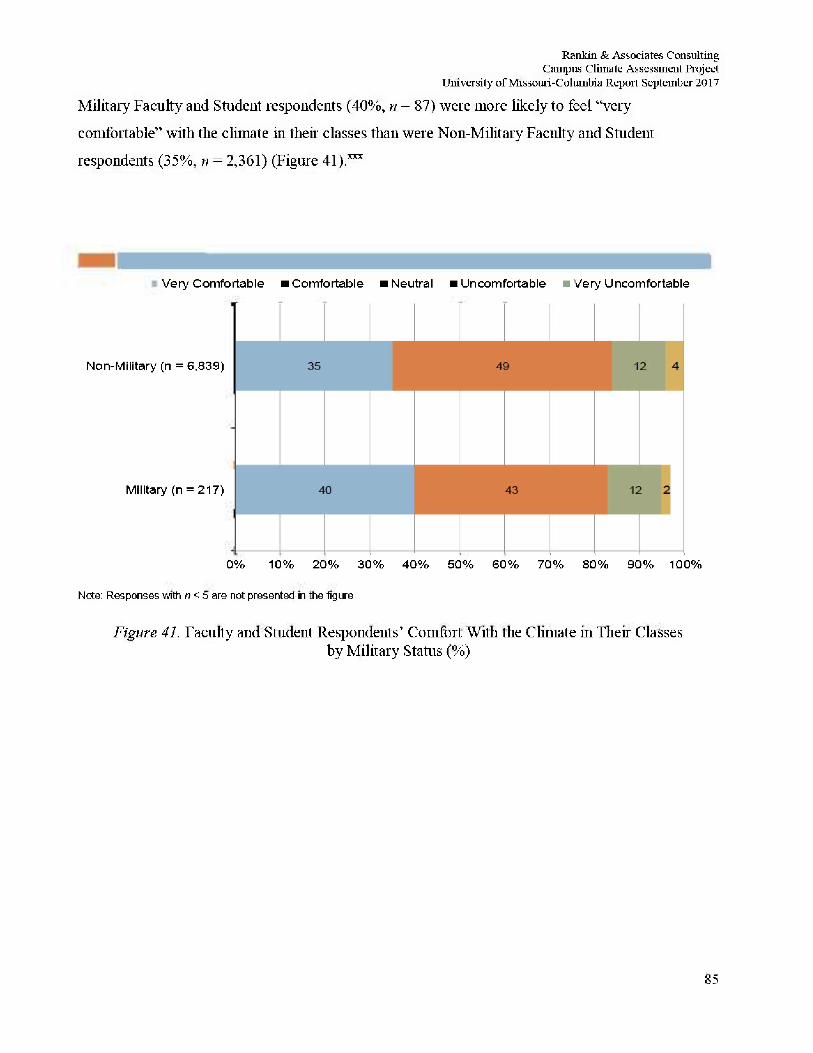
Rankin & Associates Consulting Campus Climate Assessment Project
University of Missouri-Columbia Report September 2017 Military Faculty and Student respondents (40%, n = 87) were more likely to feel "very
comfortable" with the climate in their classes than were Non-Military Faculty and Student
respondents (35%, n = 2,361) (Figure 41).x x x
Very Comfortable •Comfortable • Neutral Uncomfortable • Very Uncomfortable
Non-Military (n = 6,839)
Military (n = 217)
0% 10% 20% 30% 40% 50% 60% 70% 80% 90% 100%
Note: Responses with n <5 are not presented in the figure
Figure 41. Faculty and Student Respondents' Comfort With the Climate in Their Classes by Military Status (%)
85
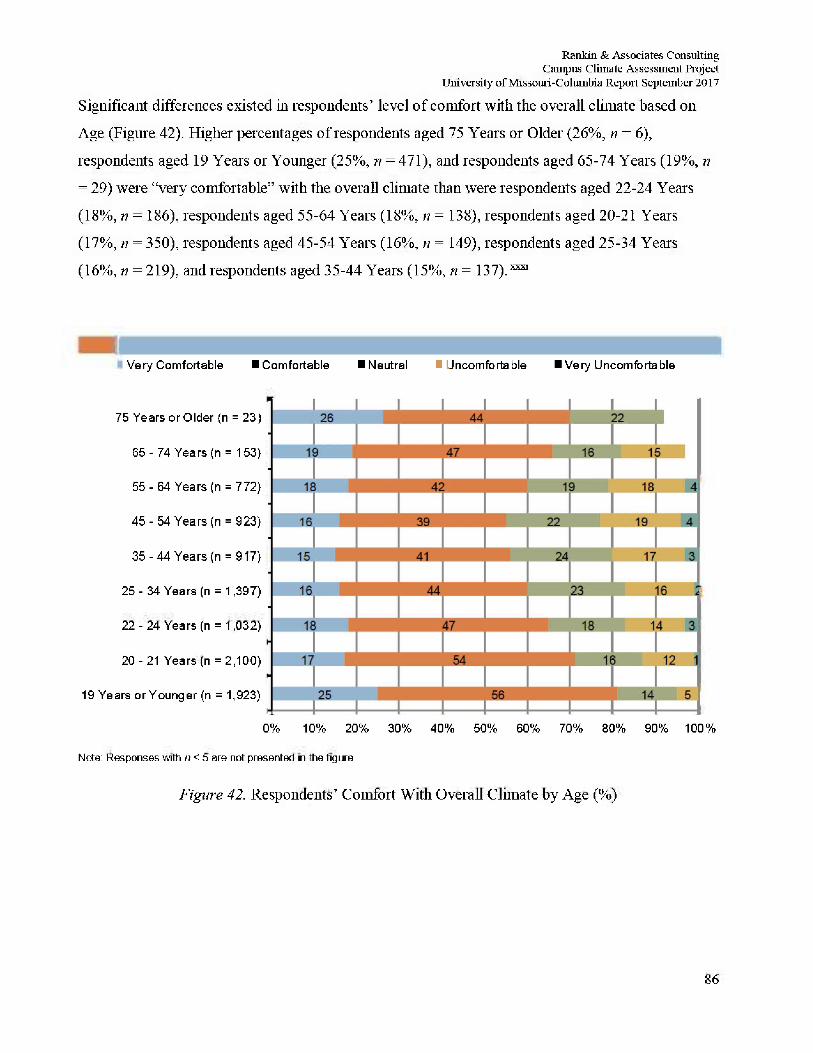
Rankin & Associates Consulting Campus Climate Assessment Project
University of Missouri-Columbia Report September 2017
Significant differences existed in respondents' level of comfort with the overall climate based on
Age (Figure 42). Higher percentages of respondents aged 75 Years or Older (26%, n = 6),
respondents aged 19 Years or Younger (25%, n = 471), and respondents aged 65-74 Years (19%, n
= 29) were "very comfortable" with the overall climate than were respondents aged 22-24 Years
(18%, n = 186), respondents aged 55-64 Years (18%, n = 138), respondents aged 20-21 Years
(17%, n = 350), respondents aged 45-54 Years (16%, n = 149), respondents aged 25-34 Years
(16%, n = 219), and respondents aged 35-44 Years (15%, n = 137).™
Very Comfortable •Comfortable ^Neutral • Uncomfortable IVery Uncomfortable
75 Years or Older {n = 23}
65- 74 Years (n = 153}
55- 64 Years (n = 772}
45- 54 Years (n = 923}
35 -44 Years (n = 917}
25 - 34 Years (n = 1,397)
22 -24 Years (n = 1,032)
20-21 Years (n =2,100)
19 Years orYounger (n = 1,923)
0% 10% 20% 30% 40% 50% 60% 70% 80% 90% 100%
Note: Responses with /) < 5 are not presented in the figure
Figure 42. Respondents' Comfort With Overall Climate by Age (%)
86
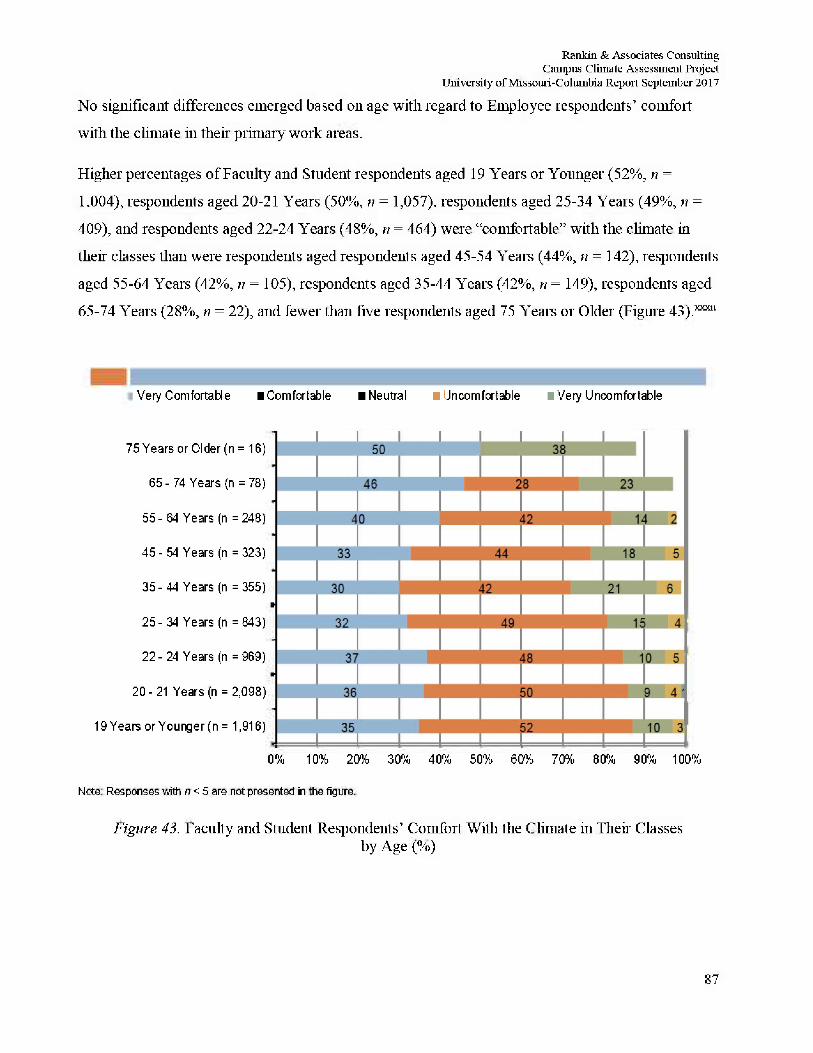
Rankin & Associates Consulting Campus Climate Assessment Project
University of Missouri-Columbia Report September 2017 No significant differences emerged based on age with regard to Employee respondents' comfort
with the climate in their primary work areas.
Higher percentages of Faculty and Student respondents aged 19 Years or Younger (52%, n =
1.004), respondents aged 20-21 Years (50%, n = 1,057). respondents aged 25-34 Years (49%, n =
409), and respondents aged 22-24 Years (48%, n = 464) were "comfortable" with the climate in
their classes than were respondents aged respondents aged 45-54 Years (44%, n = 142), respondents
aged 55-64 Years (42%, n = 105), respondents aged 35-44 Years (42%, n = 149), respondents aged
65-74 Years (28%, n = 22), and fewer than five respondents aged 75 Years or Older (Figure 43).XXX11
Very Comfortable iComfortable iNeutral • Uncomfortable • Very Uncomfortable
75 Years or Older(n = 16)
65 - 74 Years (n = 78)
55 - 64 Years (n = 248)
45- 54 Years (n = 323)
35 - 44 Years (n = 355)
25 - 34 Years (n = 843)
22 - 24 Years (n = 969)
20-21 Years (n = 2,098)
19Years orYounger(n= 1,916)
0% 10% 20% 30% 40% 50% 60% 70% 80% 90% 100%
Note: Responses with /) < 5 are not presented in the figure.
Figure 43. Faculty and Student Respondents' Comfort With the Climate in Their Classes by Age (%)
87
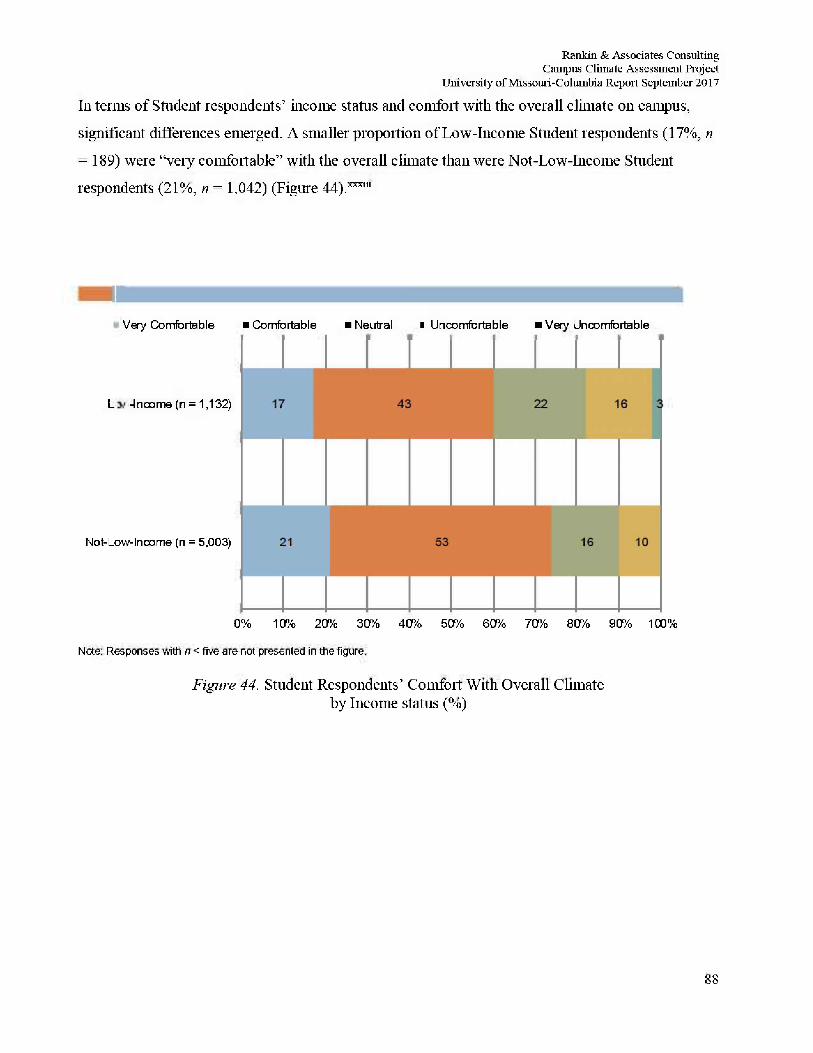
Rankin & Associates Consulting Campus Climate Assessment Project
University of Missouri-Columbia Repoit September 2017
111 terms of Student respondents' income status and comfort with the overall climate on campus,
significant differences emerged. A smaller proportion of Low-Income Student respondents (17%, n
= 189) were "very comfortable" with the overall climate than were Not-Low-Income Student
respondents (21%, n = 1,042) (Figure 44).XXX111
Very Comfortable "Comfortable "Neutral •Uncomfortable • Very Uncomfortable
Low-lncome (n = 1,132)
Not-Low-Income (n = 5,003)
8 8
0% 10% 20% 30% 40% 50% 60% 70% 80% 90% 100%
Note: Responses with n < five are not presented in the figure.
Figure 44. Student Respondents' Comfort With Overall Climate by Income status (%)
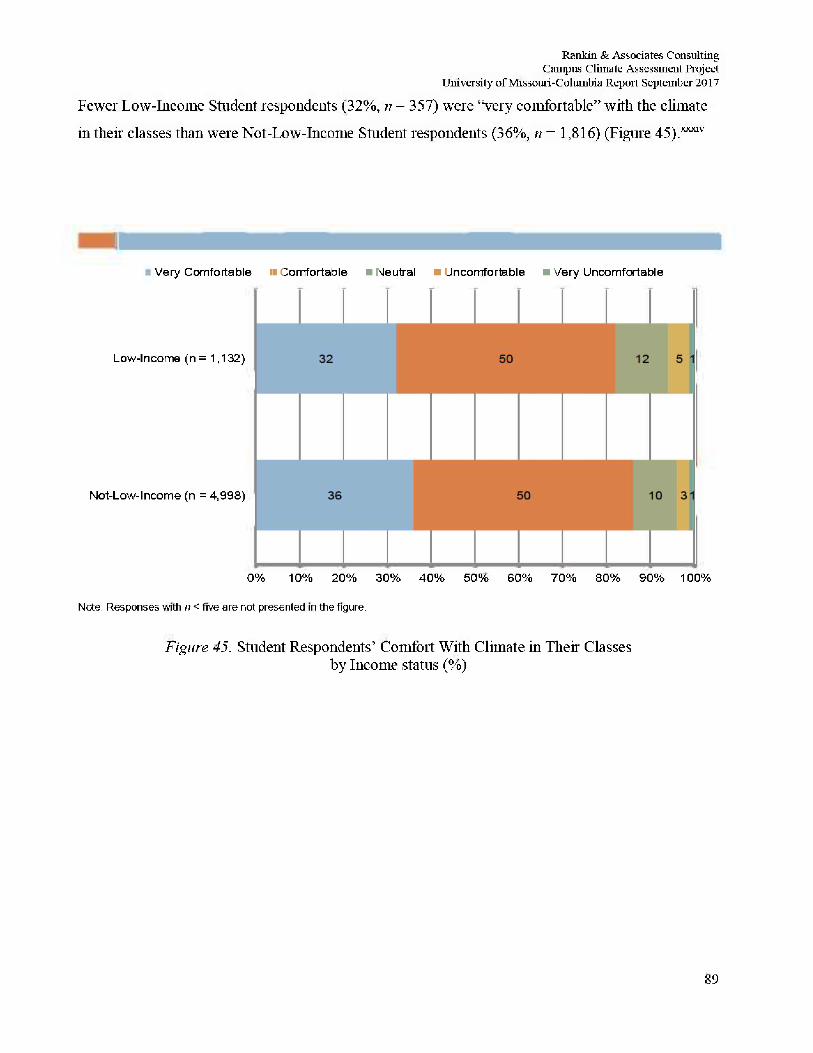
Rankin & Associates Consulting Campus Climate Assessment Project
University of Missouri-Columbia Repoit September 2017
Fewer Low-Income Student respondents (32%, n = 357) were "very comfortable" with the climate
hi their classes than were Not-Low-Income Student respondents (36%, n = 1,816) (Figure 45).X™T
Very Comfortable i Comfortable • Neutral i Uncomfortable • Very Uncomfortable
Low-Income (n = 1,132)
Not-Low-Income (n = 4,998)
0% 10% 20% 30% 40% 50% 60% 70% 80% 90% 100%
Note: Responses with /) < five are not presented in the figure.
Figure 45. Student Respondents' Comfort With Climate in Their Classes by Income status (%)
89
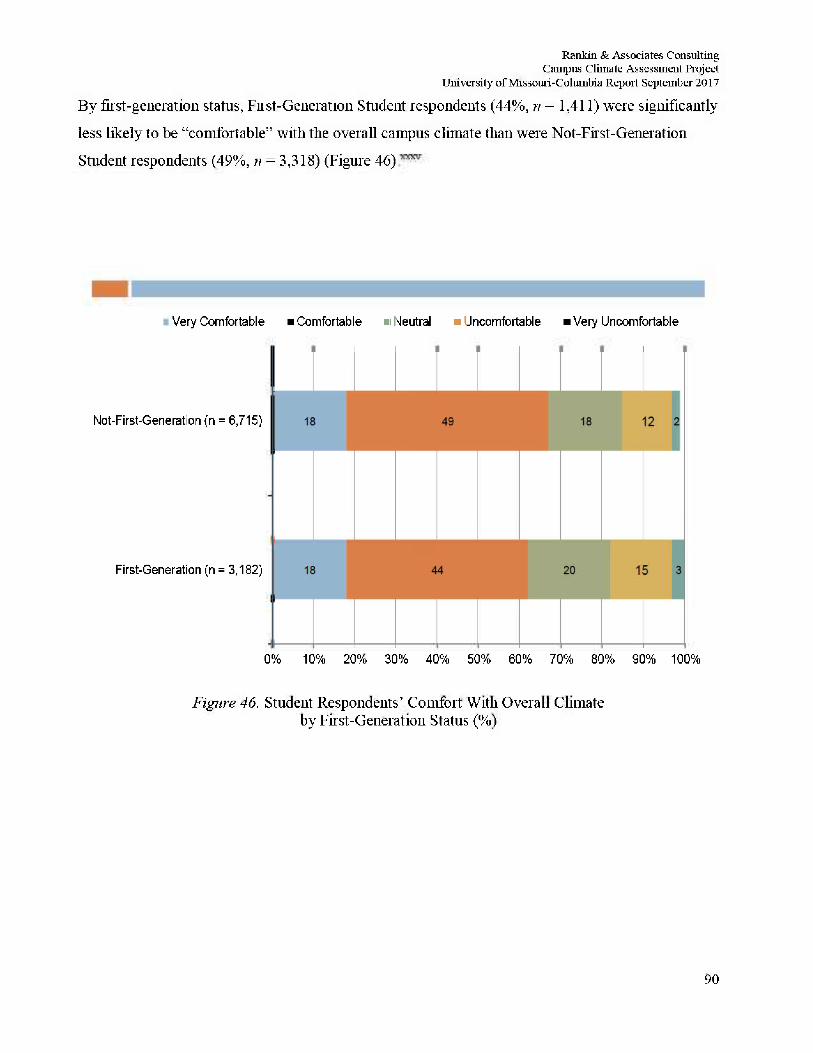
Rankin & Associates Consulting Campus Climate Assessment Project
University of Missouri-Columbia Report September 2017 By first-generation status, Fust-Generation Student respondents (44%, n = 1,411) were significantly
less likely to be "comfortable" with the overall campus climate than were Not-First-Generation
Student respondents (49%, n = 3,318) (Figure 46)
Very Comfortable Comfortable • Neutral • Uncomfortable • Very Uncomfortable
Not-First-Generation (n = 6,715)
First-Generation (n = 3,182)
0% 10% 20% 30% 40% 50% 60% 70% 80% 90% 100%
Figure 46. Student Respondents' Comfort With Overall Climate by First-Generation Status (%)
90
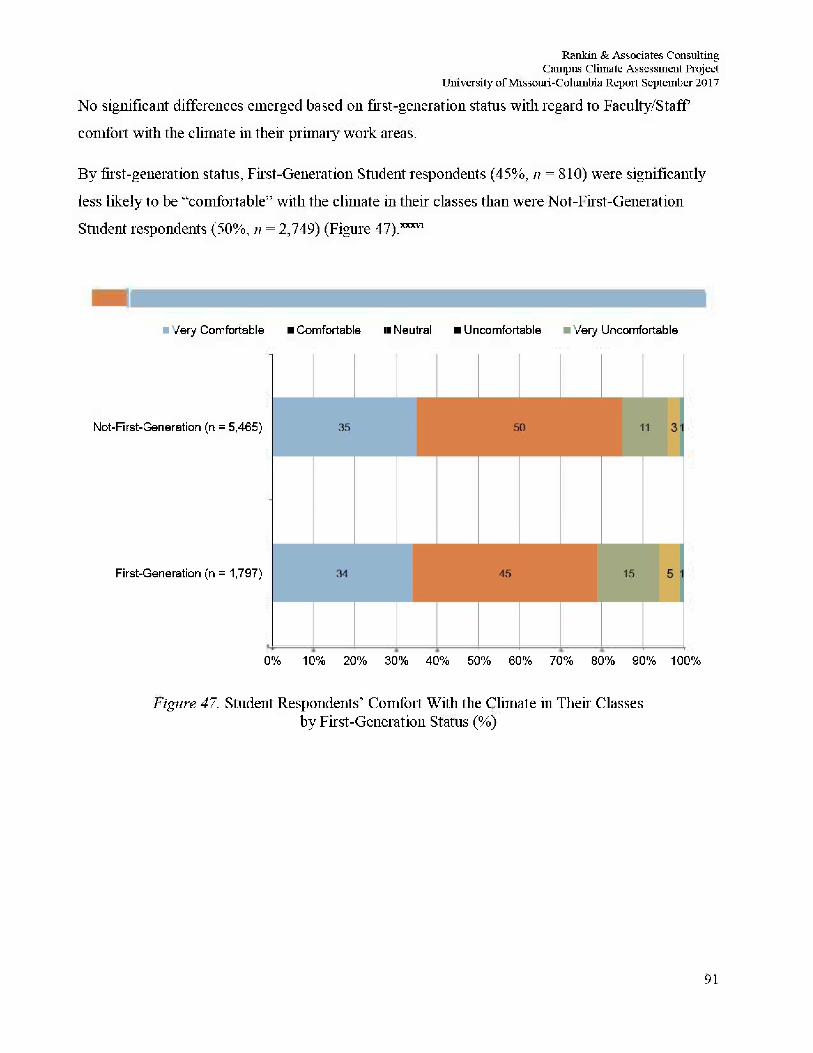
Rankin & Associates Consulting Campus Climate Assessment Project
University of Missouri-Columbia Repoit September 2017
No significant differences emerged based on first-generation status with regard to Faculty/Staff
comfort with the climate in their primary work areas.
By first-generation status, First-Generation Student respondents (45%, /? = 810) were significantly
less likely to be "comfortable" with the climate hi their classes than were Not-First-Generation
Student respondents (50%, n = 2,749) (Figure 47).XKXV1
• Very Comfortable •Comfortable iiNeutral Uncomfortable • Very Uncomfortable
Not-First-Generation (n = 5,465)
First-Generation (n = 1,797)
0% 10% 20% 30% 40% 50% 60% 70% 80% 90% 100%
Figure 47. Student Respondents' Comfort With the Climate in Their Classes by First-Generation Status (%)
91
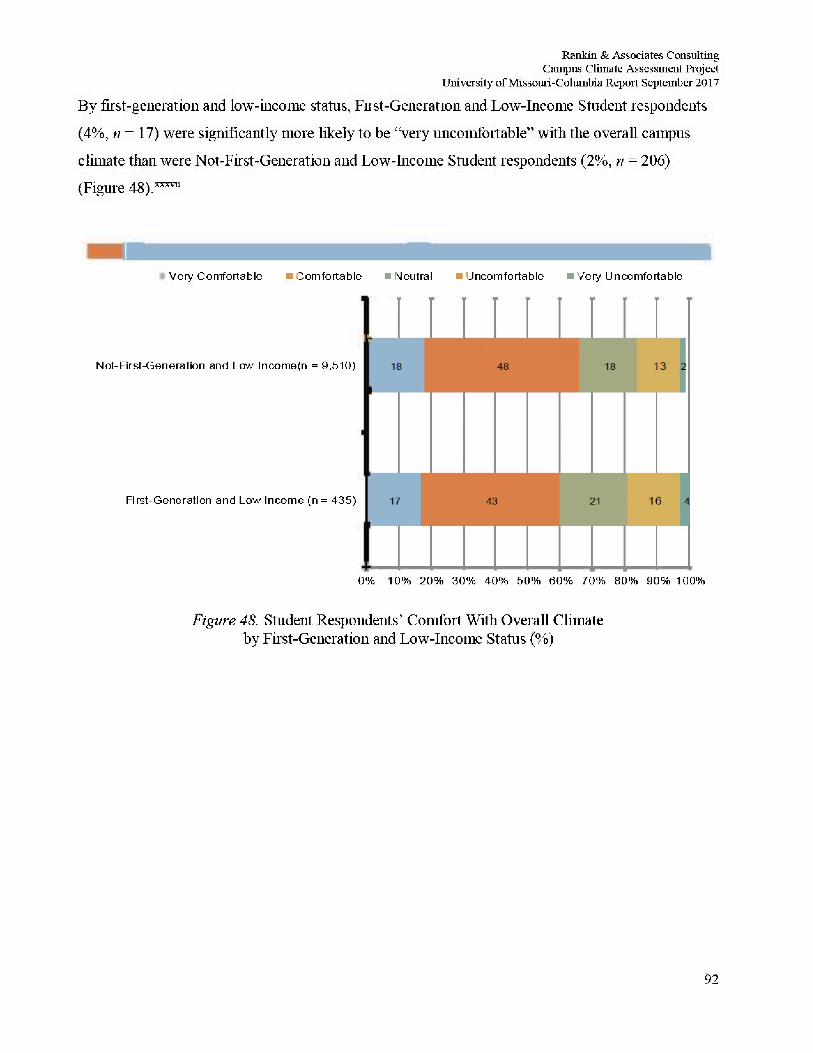
Rankin & Associates Consulting Campus Climate Assessment Project
University of Missouri-Columbia Repoit September 2017
By first-generation and low-income status, Fust-Generation and Low-Income Student respondents
(4%, n = 17) were significantly more likely to be "very uncomfortable" with the overall campus
climate than were Not-First-Generation and Low-Income Student respondents (2%, n = 206)
(Figure 4 8 ) . ™
Very Comfortable I Comfortable • Neutral • Uncomfortable • Very Uncomfortable
Not-First-Generation and Low Incomefn = 9,510)
First-Generation and Low Income (n = 435)
0% 10% 20% 30% 40% 50% 60% 70% 80% 90% 100%
Figure 48. Student Respondents' Comfort With Overall Climate by First-Generation and Low-Income Status (%)
92
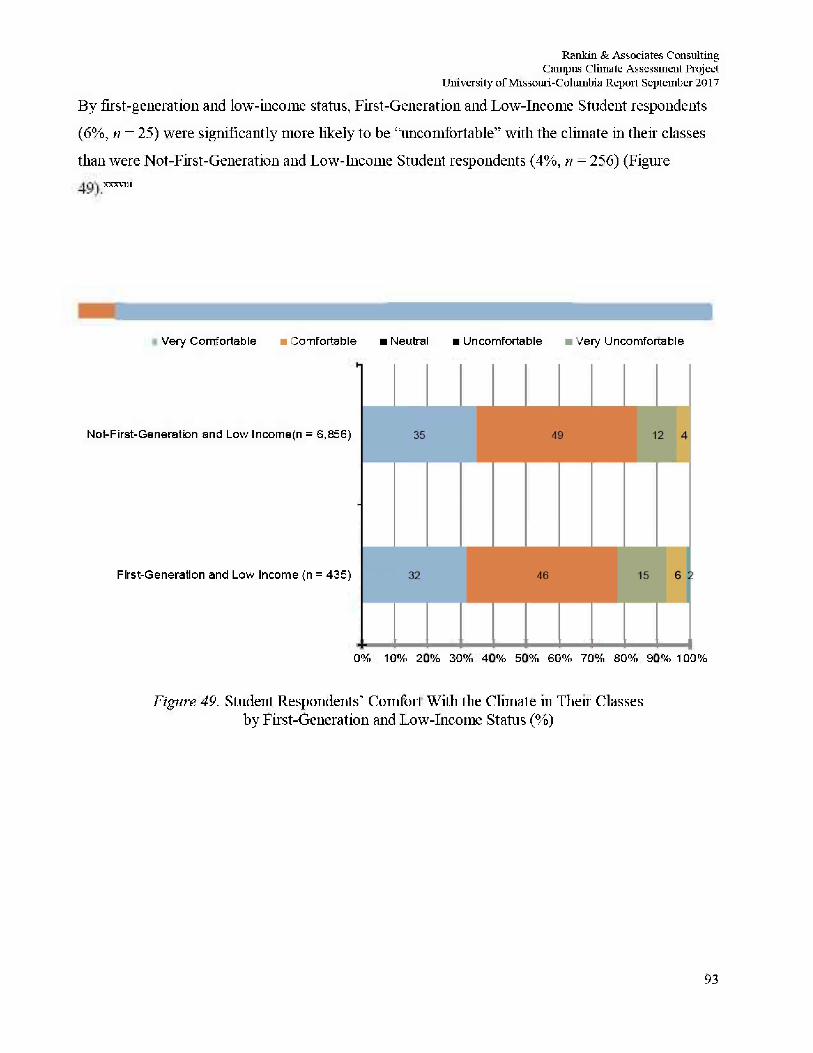
Rankin & Associates Consulting Campus Climate Assessment Project
University of Missouri-Columbia Repoit September 2017
By first-generation and low-income status, First-Generation and Low-Income Student respondents
(6%, n = 25) were significantly more likely to be "uncomfortable" with the climate in their classes
than were Not-First-Generation and Low-Income Student respondents (4%, n = 256) (Figure xxxvm
Very Comfortable • Comfortable k Neutral Uncomfortable • Very Uncomfortable
Not-First-Generatton and Low lncome(n = 6,856)
First-Generation and Low Income (n = 435)
0% 10% 20% 30% 40% 50% 60% 70% 80% 90% 100%
Figure 49. Student Respondents' Comfort With the Climate in Then Classes by First-Generation and Low-Income Status (%)
93
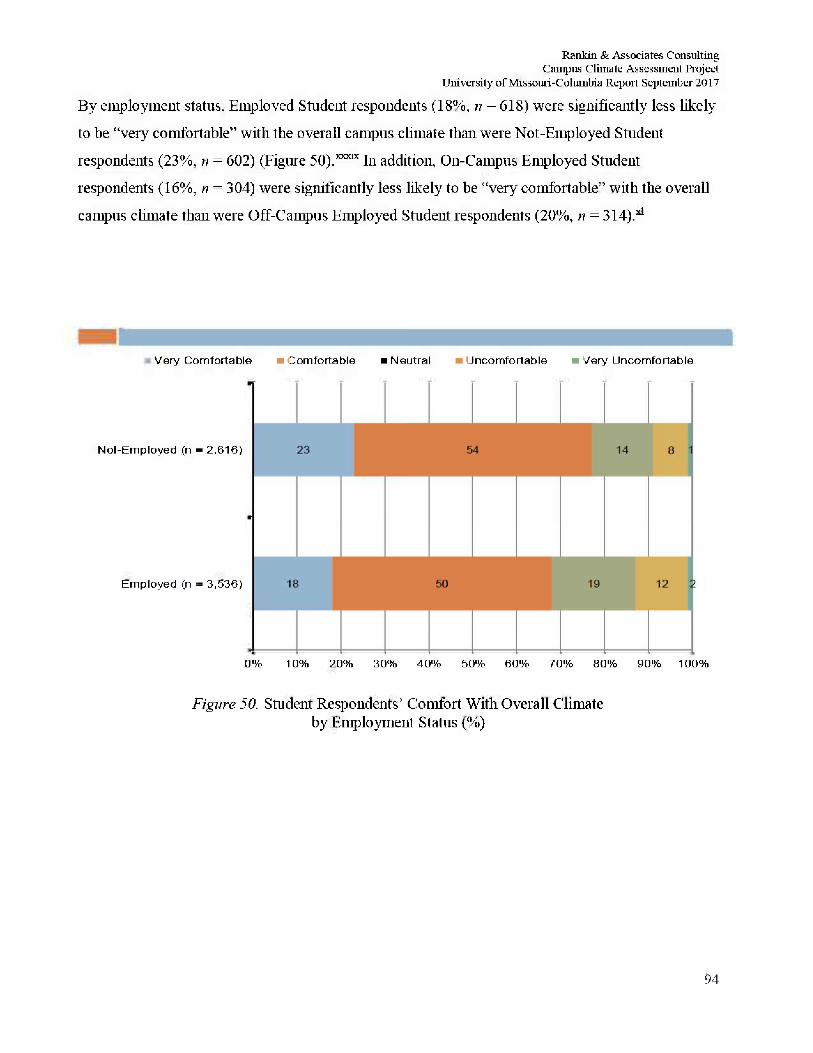
Rankin & Associates Consulting Campus Climate Assessment Project
University of Missouri-Columbia Repoit September 2017
By employment status. Employed Student respondents (18%, n = 618) were significantly less likely
to be "Very comfortable" with the overall campus climate than were Not-Employed Student
respondents (23%, n = 602) (Figure 50).KXX1X In addition, On-Campus Employed Student
respondents (16%, n = 304) were significantly less likely to be "very comfortable" with the overall
campus climate than were Off-Campus Employed Student respondents (20%, n = 314).*1
Very Comfortable • Comfortable • Neutral n Uncomfortable • Very Uncomfortable
Not-Employed (n = 2,616)
Employed (n = 3,536)
0% 10% 20% 30% 40% 50% 60% 70% 80% 90% 100%
Figure 50. Student Respondents' Comfort With Overall Climate by Employment Status (%)
94
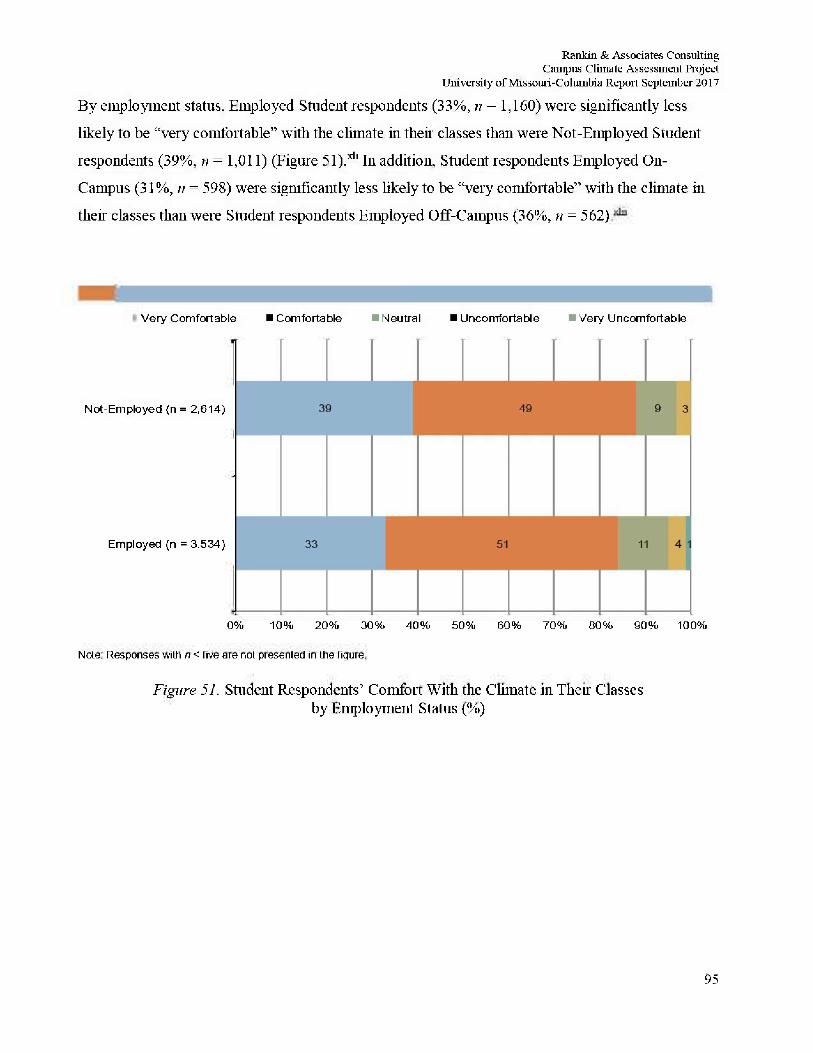
Rankin & Associates Consulting Campus Climate Assessment Project
University of Missouri-Columbia Repoit September 2017
By employment status. Employed Student respondents (33%, n = 1,160) were significantly less
likely to be "very comfortable" with the climate in their classes than were Not-Employed Student
respondents (39%, n = 1,011) (Figure SI).3111 In addition. Student respondents Employed On-
Campus (31 %, n = 598) were significantly less hkely to be "very comfortable" with the climate hi
their classes than were Student respondents Employed Off-Campus (36%, n = 562)
Very Comfortable B Comfortable • Neutral ^ Uncomfortable • Very Uncomfortable
Not-Employed (n =2 ,614)
Employed (n = 3,534)
0% 10% 20% 30% 40% 50% 60% 70% 80% 90% 100%
Note: Responses with n < five are not presented in the figure.
Figure 51. Student Respondents' Comfort With the Climate in Then Classes by Employment Status (%)
95
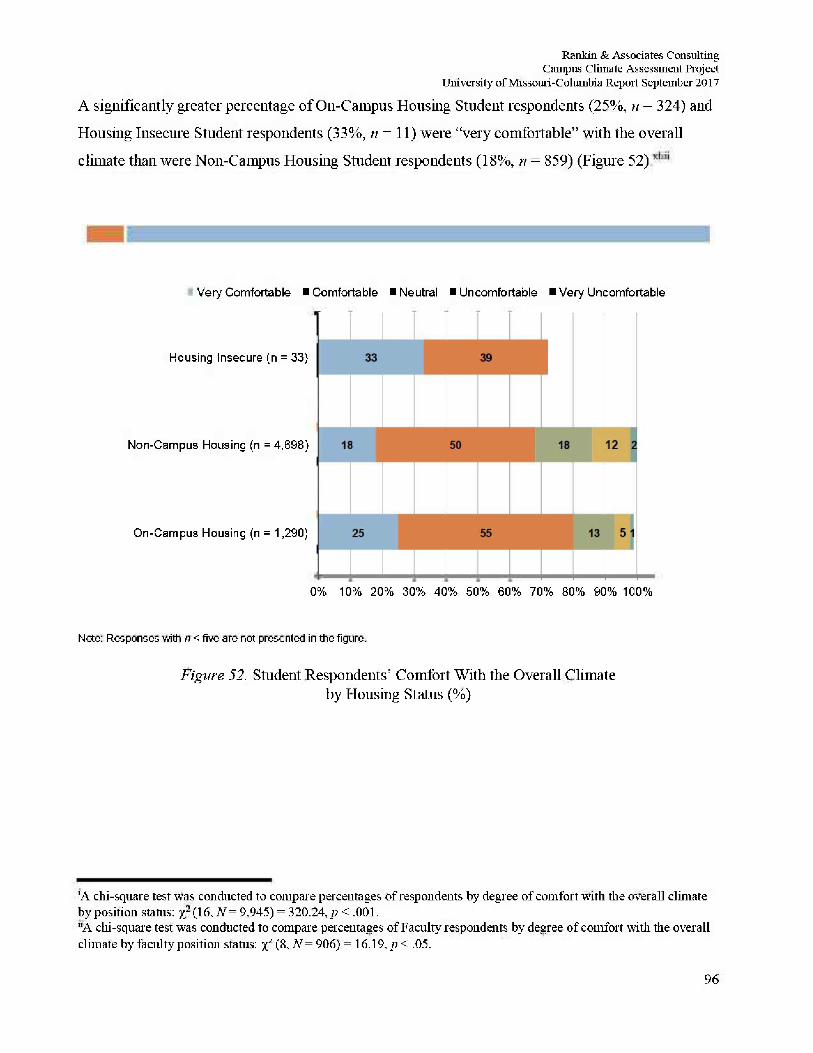
Rankin & Associates Consulting Campus Climate Assessment Project
University of Missouri-Columbia Report September 2017
A significantly greater percentage of Oil-Campus Housing Student respondents (25%, n = 324) and
Housing Insecure Student respondents (33%, n = 11) were "very comfortable" with the overall
climate than were Non-Campus Housing Student respondents (18%, n = 859) (Figure 52)
Very Comfortable • Comfortable "Neutral •Uncomfortable • Very Uncomfortable
Housing Insecure (n = 33)
Non-Campus Housing {n = 4,698)
On-Campus Housing (n = 1,290)
0% 10% 20% 30% 40% 50% 60% 70% 80% 90% 100%
Note: Responses with n < five are not presented in the figure.
Figure 52. Student Respondents' Comfort With the Overall Climate by Housing Status (%)
'A clii-square test was conducted to compare percentages of respondents by degree of comfort with the overall climate by position status: x2 (16. .V= 9,945) = 320.24,;; < .001. UA chi-square test was conducted to compare percentages of Faculty respondents by degree of comfort with the overall climate by faculty position stams: (8, N= 906) = 16.19. p < .05.
96
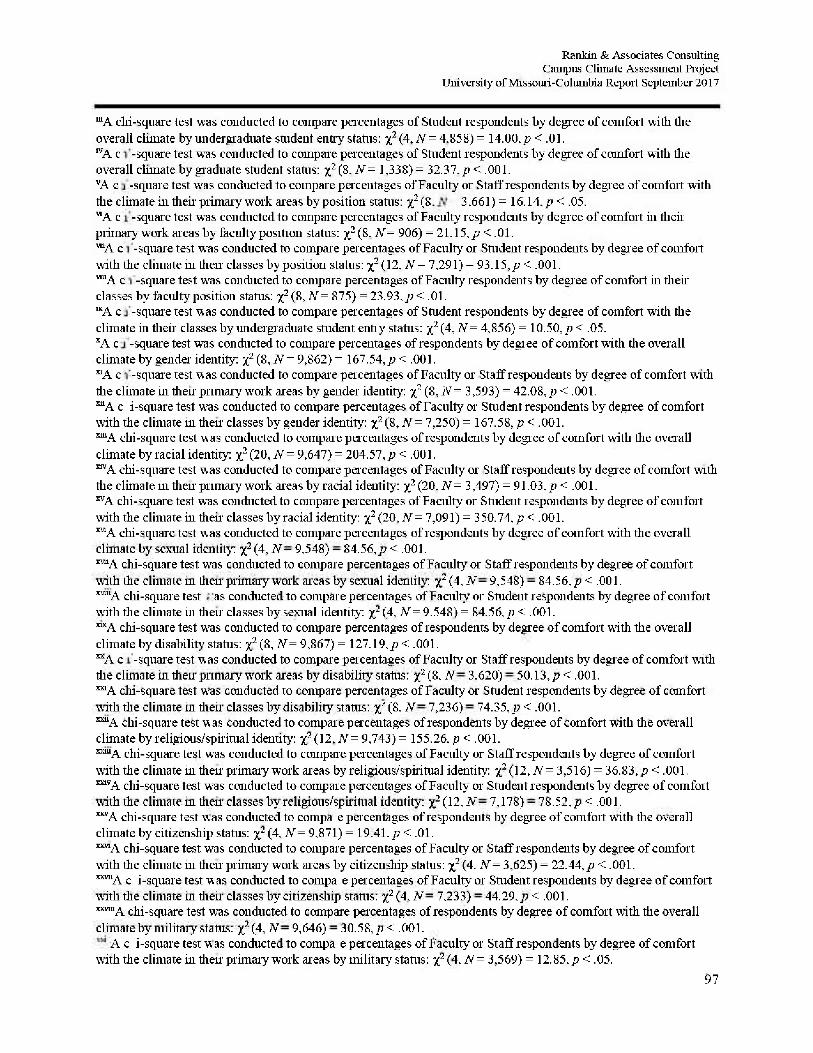
Rankin & Associates Consulting Campus Climate Assessment Project
University of Missouri-Columbia Report September 2017
m A chi-square test was conducted to compare percentages of Student respondents by degree of comfort with the overall climate by undergraduate student entry status: x2(4 ,N= 4,858) = 14.00. p < .01. 1VA chi-square test was conducted to compare percentages of Student respondents by degree of comfort with the overall climate by graduate student status: x1 (8- jV= 1.338)= 32.37./) < .001. VA chi-square test was conducted to compare percentages of Faculty or Staff respondents by degree of comfort with the climate in their primary work areas by position status: X2 ( 8 - 3 . 6 6 1 ) = 16.14./) < .05. 11A chi-square test was conducted to compare percentages of Faculty respondents by degree of comfort in their primary work areas by faculty position status: x2 (8, JV= 906) = 21.15./; < .01. ™A chi-square test was conducted to compare percentages of Faculty or Student respondents by degree of comfort with the climate in then classes by position status: x2 (12. N= 7,291) = 93.15,/; < .001. ™A chi-square test was conducted to compare percentages of Faculty respondents by degr ee of comfort in their classes by faculty position status: x2 (8, N= 875) = 23.93,/; < .01. LXA chi-square test was conducted to compare percentages of Student respondents by degree of comfort with the climate in their classes by under graduate student entry status: x2(4 ,N= 4,856) = 10.50,/) < .05. XA chi-square test was conducted to compare percentages of respondents by degree of comfort with the overall climate by gender identity: x2(S, 7V= 9,862) = 167.54,p<.001. '"A chi-square test was conducted to compare per centages of Faculty or Staff respondents by degree of comfort with the climate in their primary work areas by gender identity: x2 (8, JV= 3,593) = 42.08,/) < .001. ™A chi-square test was conducted to compare percentages of Faculty or Student respondents by degree of comfort with the climate in their classes by gender identity: %2(S,N= 7,250) = 167.58, p< .001. ™A chi-square test was conducted to compare percentages of respondents by degree of comfort with the overall climate by racial identity: x2 (20, N= 9,647)= 204.57,/; < .001. ™A chi-square test was conducted to compare percentages of Faculty or Staff respondents by degr ee of comfort with the climate in their primary work areas by racial identity: x2 (20. N= 3,497) = 91.03,/) < .001. ™A chi-square test was conducted to compare percentages of Faculty or Student respondents by degree of comfort with the climate in their classes by racial identity: x2 (20, N= 7,091) = 350.74,/; < .001. ™A chi-square test was conducted to compare percentages of respondents by degree of comfort with the overall climate by sexual identity: x2 (4, N= 9,548) = 84.56,/; < .001. ™A chi-square test was conducted to compare percentages of Faculty or Staff respondents by degree of comfort with the climate in then primary work areas by sexual identity: x2 (4. N= 9,548) = 84.56,/; < .001. x v m A chi-square test was conducted to compare percentages of Faculty or Student respondents by degree of comfort with the climate in their classes by sexual identity: x2(4. N = 9.548) = 84.56,/) < .001. ™A chi-square test was conducted to compare percentages of respondents by degree of comfort with the overall climate by disability status: %2 (8, N= 9,867) = 127.19,/) < .001. ^A chi-square test was conducted to compare percentages of Faculty or Staff respondents by degr ee of comfort with the climate in their primary work areas by disability status: x1 (8. N= 3,620) = 50.13,/; < .001. ^ A chi-square test was conducted to compare percentages of Faculty or Student respondents by degree of comfort with the climate in their classes by disability status: (8. N= 7,236) = 74.35,/; < .001. ™A chi-square test was conducted to compare percentages of respondents by degree of comfort with the overall climate by religious/spiritual identity: x2 (12, N= 9,743) = 155.26,/) < .001. """A chi-square test was conducted to compare percentages of Faculty or Staff respondents by degree of comfort with the climate in then primary work areas by religious/spiritual identity: y?(12,N= 3,516) = 36.83,/) < .001. ™VA chi-square test was conducted to compare percentages of Faculty or Student respondents by degree of comfort with the climate in their classes by religious/spiritual identity: y}{\2,N= 7,178) = 78.52,/; < .001. ™A chi-square test was conducted to compare percentages of respondents by degree of comfort with the overall climate by citizenship status: x2(4. N = 9,871) = 19.41./; < .01. ™A chi-square test was conducted to compare percentages of Faculty or Staff respondents by degree of comfort with the climate in then primary work areas by citizen ship status: x2 (4. N= 3,625)= 22.44, p < .001. ™"A chi-square test was conducted to compare percentages of Faculty or Student respondents by degr ee of comfort with the climate in their classes by citizenship status: x2 (4. N= 7,233) = 44.29, p < .001. """A chi-square test was conducted to compare percentages of respondents by degree of comfort with the overall climate by military status: x2 (4, N= 9,646) = 30.58,/) < .001.
A chi-square test was conducted to compare percentages of Faculty or Staff respondents by degree of comfort with the climate in then primary work areas by military status: x2 (4. N= 3,569) = 12.85,/) < .05.
97
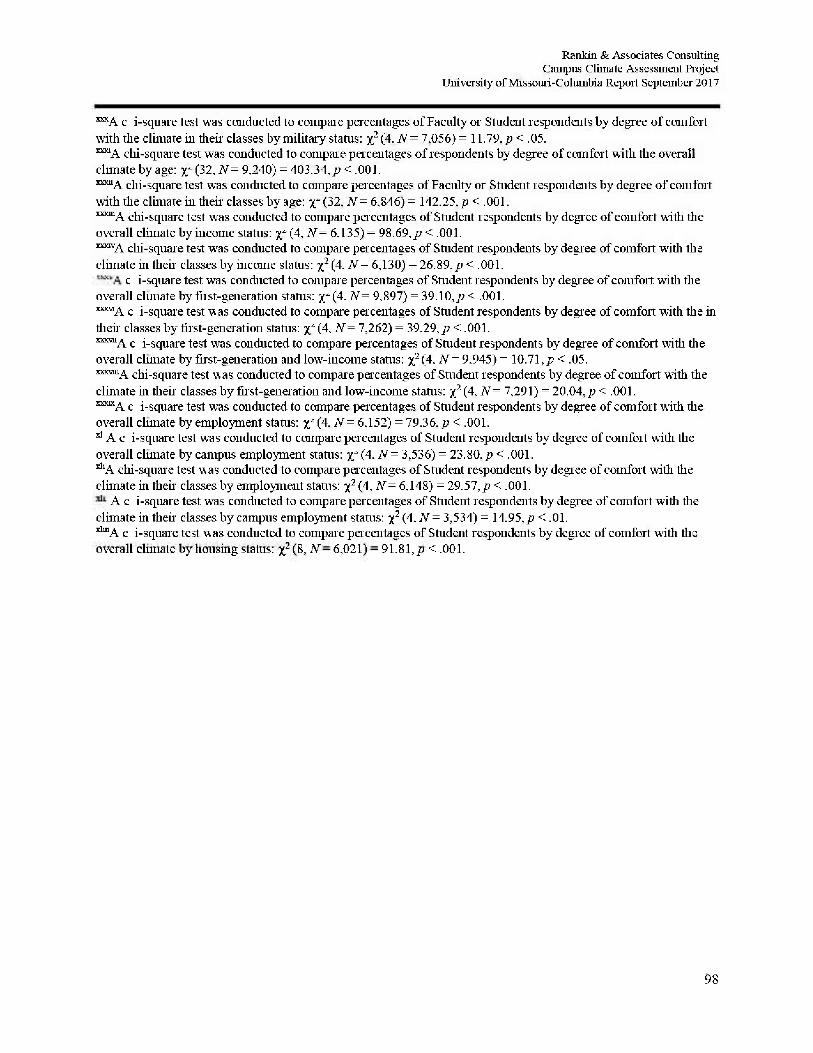
Rankin & Associates Consulting Campus Climate Assessment Project
University of Missouri-Columbia Report September 2017
^ A chi-square test was conducted to compare percentages of Faculty or Student respondents by degree of comfort with the climate in their classes by military status: %2(4. N= 7.056) = 11.79./) < .05. ^ A chi-square test was conducted to compare percentages of respondents by degree of comfort with the overall cInnate by age: X (32, N= 9.240) = 403.34. p < .001. XX™A chi-square test was conducted to compare percentages of Faculty or Student respondents by degree of comfort with the climate in their classes by age: X (32. N= 6.846) = 142.25. p < .001. XX™A chi-square test was conducted to compare percentages of Student respondents by degree of comfort with die overall climate by income status: X (4. Ar= 6,135)= 98.69,/; < .001. XXHVA chi-square test was conducted to compare percentages of Student respondents by degree of comfort with the climate in their classes by income status: y}{4, N= 6,130) = 26.89,/) < .001.
chi-square test was conducted to compare percentages of Student respondents by degree of comfort with the overall climate by fust-generation status: X (4. N= 9,897) = 39.10,/; < .001. ™*A chi-square test was conducted to compare percentages of Student respondents by degree of comfort with the in their classes by first-generation status: X (4- N= 7,262) = 39.29,/; < .001. ^ ^ A chi-square test was conducted to compare percentages of Student respondents by degree of comfort with the overall climate by first-generation and low-income status: x2(4, N= 9,945) = 10.71,/; < .05. ""•"A chi-square test was conducted to compare percentages of Student respondents by degree of comfort with the climate in their classes by first-generation and low-income status: %2(4, N= 7,291) = 20.04,/; < .001. XXX1XA chi-square test was conducted to compare percentages of Student respondents by degree of comfort with the overall climate by employment status: X (4. jV= 6,152) = 79.36,p< .001. ^ A chi-square test was conducted to compare percentages of Student respondents by degree of comfort with the overall climate by campus employment status: X (4. N = 3,536) = 23.80,/) < .001. ^'A chi-square test was conducted to compare percentages of Student respondents by degree of comfort with the climate in their classes by employment status: y2 (4. N= 6,148) = 29.57,/) < .001.
A chi-square test was conducted to compare percentages of Student respondents by degree of comfort with the climate in their classes by campus employment status: y2 (4. N= 3,534) = 14.95,/) < .01. ^ A chi-square test was conducted to compare percentages of Student respondents by degree of comfort with the overall climate by housing status: x2(8, N = 6,021) = 91.81,/) < .001.
98
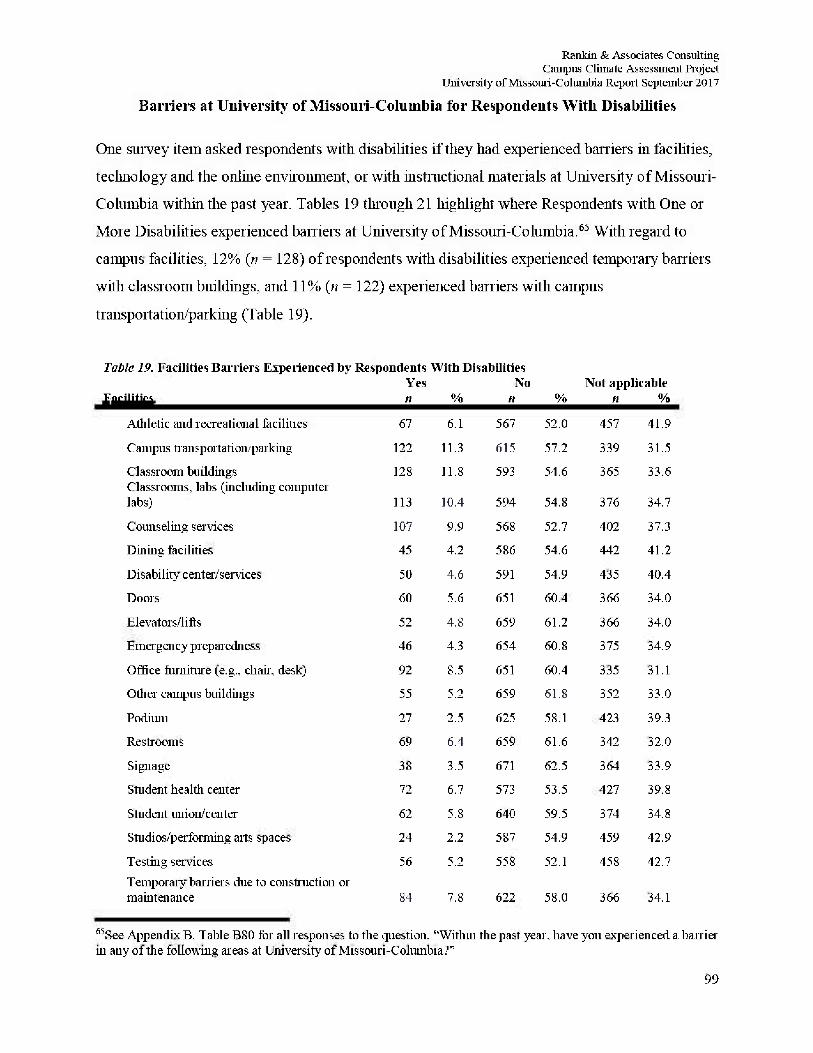
Rankin & Associates Consulting Campus Climate Assessment Project
University of Missouri-Columbia Report September 2017
Barriers at University of Missouri-Columbia for Respondents With Disabilities
One survey item asked respondents with disabilities if they had experienced barriers in facihties,
technology and the online environment, or with instructional materials at University of Missouri-
Columbia within the past year. Tables 19 through 21 highlight where Respondents with One or
More Disabilities experienced barriers at University of Missouri-Columbia.65 With regard to
campus facilities, 12% (n = 128) of respondents with disabilities experienced temporary barriers
with classroom buildings, and 11% (n = 122) experienced barriers with campus
transportation/parking (Table 19).
Table 19. Facilities Barriers Experienced by Respondents With Disabilities Yes No Not applicable
Facilities tl % n % n %
Athletic and recreational facilities 67 6.1 567 52.0 457 41.9
Campus trail spoliation, park ing 122 11.3 615 57.2 339 31.5
Classroom buildings 128 11.8 593 54.6 365 33.6 Classrooms, labs (including computer labs) 113 10.4 594 54.8 376 34.7
Counseling services 107 9.9 568 52.7 402 37.3
Dining facilities 45 4.2 586 54.6 442 41.2
Disability center/services 50 4.6 591 54.9 435 40.4
Doors 60 5.6 651 60.4 366 34.0
Elevators/lifts 52 4.8 659 61.2 366 34.0
Emergency preparedness 46 4.3 654 60.8 375 34.9
Office furniture (e.g., chair, desk) 92 8.5 651 60.4 335 31.1
Other campus buildings 55 5.2 659 61.8 352 33.0
Podium 27 2.5 625 58.1 423 39.3
Restrooms 69 6.4 659 61.6 342 32.0
Signage 38 3.5 671 62.5 364 33.9
Student health center 72 6.7 573 53.5 427 39.8
Student union/center 62 5.8 640 59.5 374 34.8
Studios/performing arts spaces 24 2.2 587 54.9 459 42.9
Festing services 56 5.2 558 52.1 458 42.7 Temporary barriers due to construction or maintenance 84 7.8 622 58.0 366 34.1
65See Appendix B. Fable B80 for all responses to the question, "Within the past year, have you experienced a barrier in any of the following areas at University of Missouri-Columbia?"
99
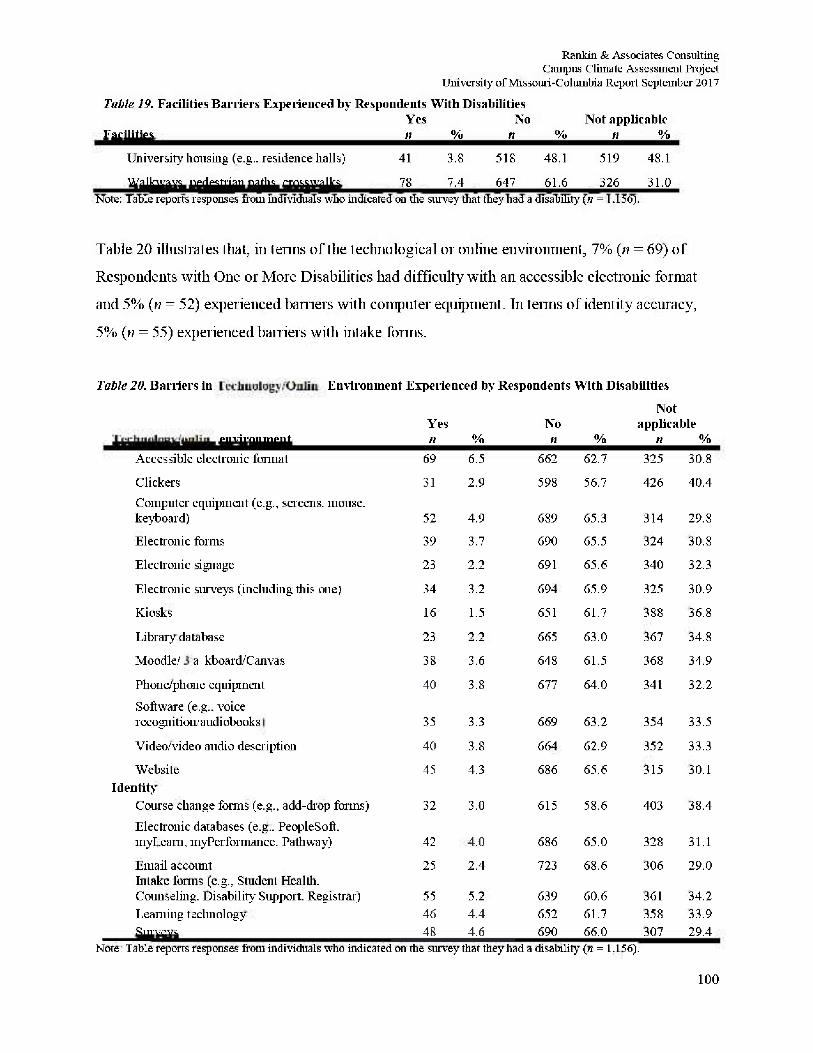
Rankin & Associates Consulting Campus Climate Assessment Project
University of Missouri-Columbia Report September 2017
Table 19. Facilities Barriers Experienced by Respondents With Disabilities Yes No Not applicable
Facilities ii % n % n % University housing (e.g.. residence halls) 41 3.8 518 48.1 519 48.1
Walkways, pedestrian paths, crosswalks 78 7.4 647 61.6 326 31.0 Note: Table reports responses from individuals who indicated on the survey that they had a disability (« = 1.156).
Table 20 illustrates that, hi terms of the techno logical or online environment, 7% (n = 69) of
Respondents with One or More Disabilities had difficulty with an accessible electronic format
and 5% (n = 52) experienced barriers with computer equipment. In terms of identity accuracy,
5% (n = 55) experienced barriers with intake forms.
Table 20. Barriers in technology/online Environment Experienced by Respondents With Disabilities
Not Yes No
Not applicable
Technology/online environment n % n % n % Accessible electronic format 69 6.5 662 62.7 325 30.8
Clickers 31 2.9 598 56.7 426 40.4 Computer equipment (e.g., screens, mouse. keyboard) 52 4.9 689 65.3 314 29.8 Electronic forms 39 3.7 690 65.5 324 30.8
Electronic signage 23 2.2 691 65.6 340 32.3
Electronic surveys (including this one) 34 3.2 694 65.9 325 30.9
Kiosks 16 1.5 651 61.7 388 36.8
Library database 23 2.2 665 63.0 367 34.8
Moodle. Blackboard/ Canvas 38 3.6 648 61.5 368 34.9
Phone/plicate equipment 40 3.8 677 64.0 341 32.2 Software (e.g., voice recognition audibobooks 35 3.3 669 63.2 354 33.5
Video/video audio description 40 3.8 664 62.9 352 33.3
Website 45 4.3 686 65.6 315 30.1 Identity
Course change forms (e.g., add-drop forms) 32 3.0 615 58.6 403 38.4 Electronic databases (e.g.. People So ft. niyLeam, myPerformance. Pathway) 42 4.0 686 65.0 328 31.1
Email account 25 2.4 723 68.6 306 29.0 Intake forms (e.g., Student Health. Counseling. Disability Support. Registrar) 55 5.2 639 60.6 361 34.2 Learning technology 46 4.4 652 61.7 358 33.9 Surveys 48 4.6 690 66.0 307 29.4
Note: Table reports responses from individuals who indicated on the survey that they had a disability (n = 1,156).
100
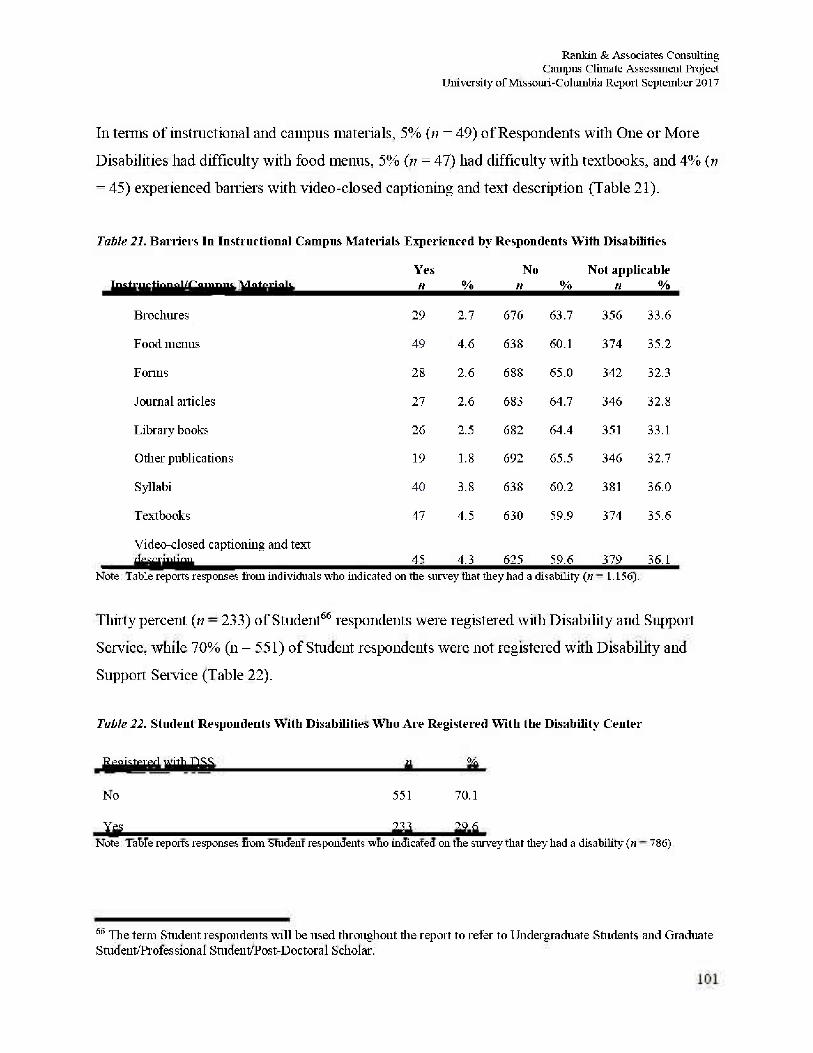
Rankin & Associates Consulting Campus Climate Assessment Project
University of Missouri-Columbia Report September 2017
In terms of instructional and campus materials, 5% (n =49) of Respondents with One or More
Disabilities had difficulty with food menus, 5% (n = 47) had difficulty with textbooks, and 4% (n
= 45) experienced barriers with video-closed captioning and text description (Table 21).
Table 21. Barriers In Instructional Campus Materials Experienced by Respondents With Disabilities
Instructional/Camp us Materials Yes n %
No n %
Not applicable n %
Brochures 29 2.7 616 63.7 356 33.6
Food menus 49 4.6 638 60.1 374 35.2
Forms 28 2.6 688 65.0 342 32.3
Journal articles 27 2.6 683 64.7 346 32.8
Library books 26 2.5 682 64.4 351 33.1
Other publications 19 1.8 692 65.5 346 32.7
Syllabi 40 3.8 638 60.2 381 36.0
Fextbooks 47 4.5 630 59.9 374 35.6
Video-closed captioning and text description 45 4.3 625 59.6 379 36.1
Note: Table reports responses from individuals who indicated on the survey that they had a disability (« = 1.156).
Thirty percent (n = 233) of Student66 respondents were registered with Disability and Support
Seivice, while 70% (n = 551) of Student respondents were not registered with Disability and
Support Service (Table 22).
Table 22. Student Respondents With Disabilities Who Are Registered With the Disability Center
Registered with DSS n %_
No 551 70.1
Yes 233 29.6 Note: Table reports responses from Student respondents who indicated on the survey that diey had a disability (« = 786).
6 6 The term Student respondents will be used throughout the report to refer to Undergraduate Students and Graduate Student/Professional Student Post-Doctoral Scholar.
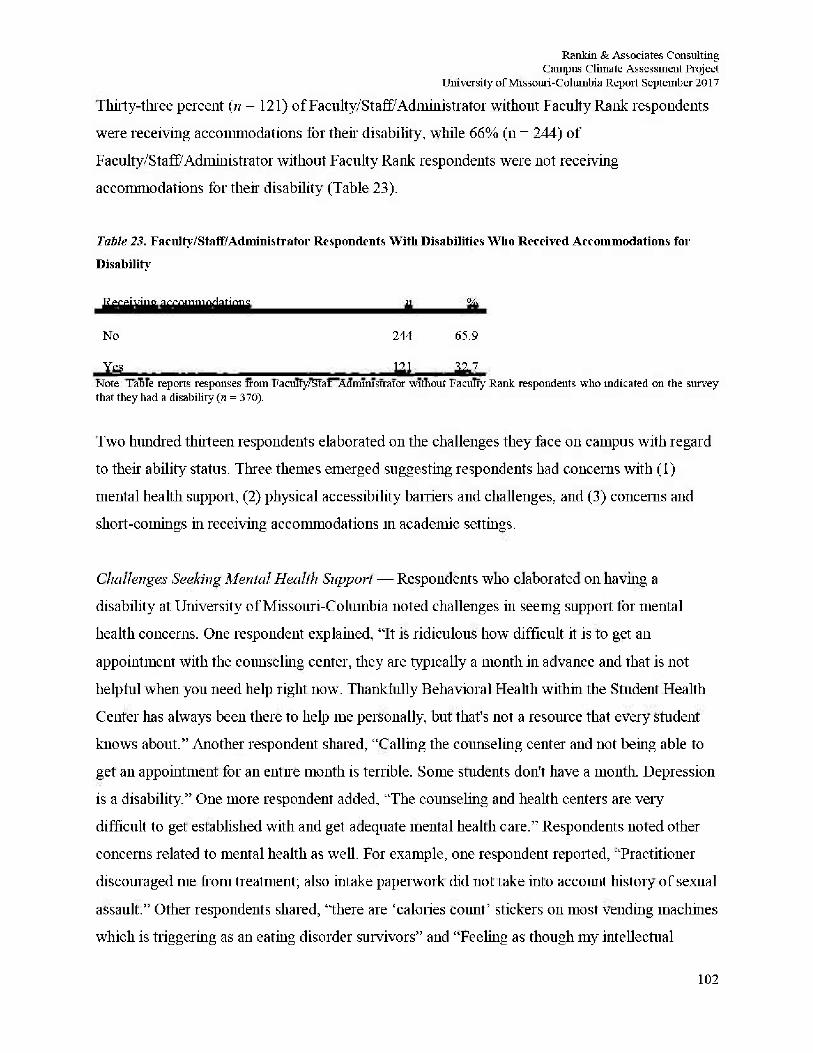
Rankin & Associates Consulting Campus Climate Assessment Project
University of Missouri-Columbia Report September 2017
Thirty-three percent (n = 121) of Faculty/StaffAdministrator without Faculty Rank respondents
were receiving accommodations for their disability, while 66% (n = 244) of
Faculty/Staff Administrator without Faculty Rank respondents were not receiving
accommodations for their disability (Table 23).
Table 23. Fac til ty /Staff/Ad minis tr a tor Respondents With Disabilities Who Received Accommodations for
Disability
Receiving accommodations n %
No 244 65.9
Yes 121 32.7 Note: Table reports responses from Faculty/Staff Administrator without Faculty Rank respondents who indicated on the survey that they had a disability (n = 3 70).
Two hundred thirteen respondents elaborated on the challenges they face 011 campus with regard
to their ability status. Three themes emerged suggesting respondents had concerns with (1)
mental health support, (2) physical accessibility barriers and challenges, and (3) concerns and
short-comings hi receiving accommodations in academic settings.
Challenges Seeking Mental Health Support — Respondents who elaborated 011 having a
disability at University of Missouri-Columbia noted challenges in seemg support for mental
health concerns. One respondent explained, "It is ridiculous how difficult it is to get an
appointment with the counseling center, they are typically a month in advance and that is not
helpful when you need help right now. Thankfully Behavioral Health within the Student Health
Center has always been there to help me personally, but that's not a resource that every student
knows about." Another respondent shared, "Calling the counseling center and not being able to
get an appointment for an entire month is terrible. Some students don't have a month. Depression
is a disability." One more respondent added, "The counseling and health centers are very
difficult to get established with and get adequate mental health care." Respondents noted other
concerns related to mental health as well. For example, one respondent reported, "Practitioner
discouraged me from treatment; also intake paperwork did not take into account histoiy of sexual
assault." Other respondents shared, "there are 'calories count' stickers on most vending machines
which is triggering as an eating disorder survivors" and "Feeling as though my intellectual
102
Rankin & Associates Consulting Campus Climate Assessment Project
University of Missouri-Columbia Report September 2017
freedom is neither valued nor protected by my institution has exacerbated my anxiety and
depression." Finally, one respondent elaborated, ''Had a unisex bathroom door not be able to
lock and had a male student walk in the bathroom with me in it. Created large amounts of
anxiety." Respondents who elaborated on their experiences seeking mental health support
described a lack of access. Respondents also noted other challenges for them on campus hi
relation to then mental health.
Physical Accessibility Barriers & Challenges — Respondents who elaborated 011 their
experiences navigating campus with a disability described challenges with physical accessibility
011 campus. Respondents noted challenges with elevators. For example, one respondent shared,
"Very simple, put signs up hi the main hallway of the Student Center with arrows showing where
the elevator is located. The elevator is in a very inconvenient location and there are absolutely
NO signs showing where it is." Another respondent added, "some of the elevators are hard to
locate or absent from buildings." One respondent explained, "It is difficult to get from one side
of campus to the other for meetings, events, etc. I have difficulty walking long distances. Wish
there was some type of transportation for staff to travel oil campus." Respondents noted other
concerns beyond elevators also. For example, one respondent reported, "The dooiways hi our
building are not regulation width so I can't get hi some rooms with my wheelchair." Other
concerns such as needs for "more left handed desks" or to be "well lit and ventilated rooms"
were noted as challenges. Respondents also expressed a desire for more accessibility hi the
library. One respondent elaborated, "Libraries NEED better hours. As someone who is in classes
full time, lias to work close to hill time, and lias ADD. I have nowhere to study." Another
respondent suggested, "there should be a service where library books are dropped off in offices
or offices can drop off/pick up library books." Respondents who elaborated on then' experiences
having a disability noted a lack of physical accessibility 011 campus.
Lack of Support For Testing & Course Material Accommodations — Respondents reported
challenges with "Student-Professor communication" regarding accommodations. Another
respondent added, "Trying to get accommodation for .ADD if you are 011 staff is difficult." One
respondent reported that a "teacher didn't tell the testing center or the testing center didn't let me
know" which led to challenges in taking an exam in one instance. Another respondent noted, "I
103
Rankin & Associates Consulting Campus Climate Assessment Project
University of Missouri-Columbia Report September 2017
just need my instructors to abide by my disability accommodation letter. Some do, some do not."
Regarding the process of receiving accommodations, one respondent noted, "the design of some
of the accommodations for the disabilities center is very unhelpful. As a person with
ADD/ADHD, there are numerous steps and places I have to go and forms to fill out just to get
the accommodation. This is veiy hard to do when you have attention-deficit." People whom self-
disclosed tearing impairments noted significant challenges in accessing course material and
other forms of communication. One respondent shared, "Phones in my workstations throughout
the hospital are far too quiet and cannot be amplified for louder speech. Loud speakers are far
from loud. Need more CC options in waiting rooms." Another respondent explained, "Some
training modules for HR training do not have subtitles. I am not hearing impaired but this is
inconvenient for me and problematic for employees who are hard of healing." On a positive
note, one respondent elaborated. "Closed Captioning is much improved on our campus thanks to
the work of Disability Services and .ADA people. They are very helpful and concerned.
Acoustics in buildings could be better. Eliminating background music and noise would be a
tremendous help." Respondents reported challenges receiving accommodations, particularly
those with hearing impairments.
104
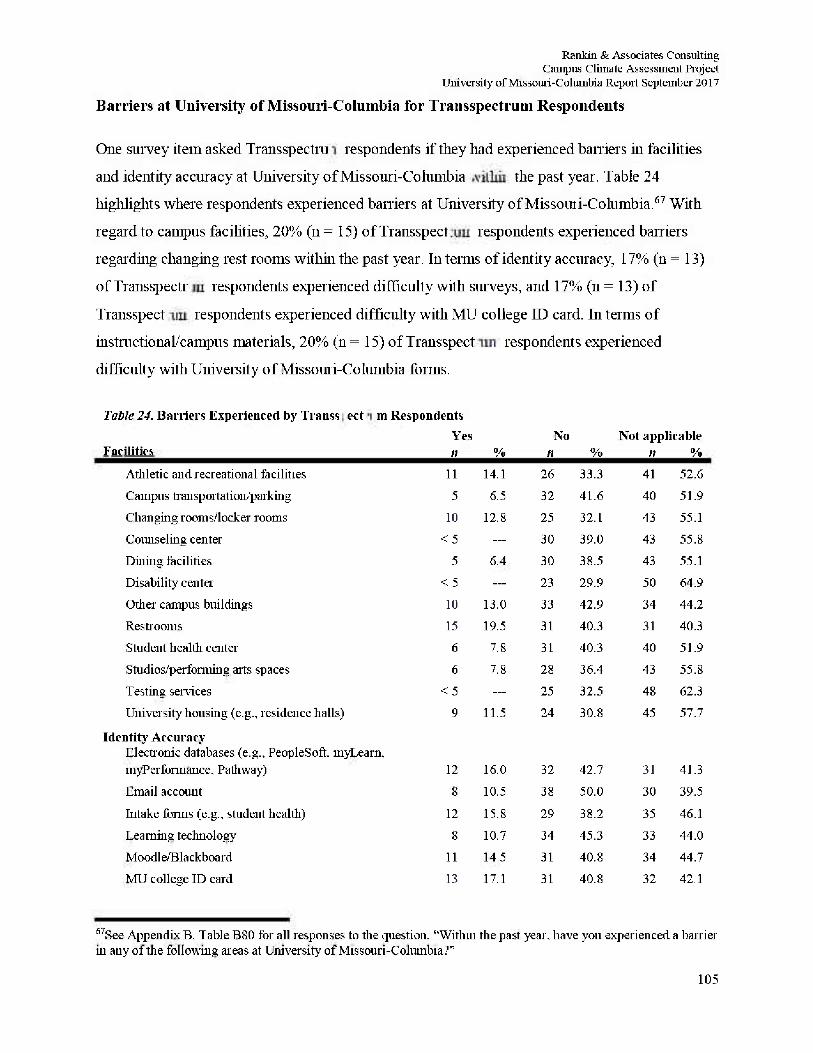
Rankin & Associates Consulting Campus Climate Assessment Project
University of Missouri-Columbia Report September 2017
Barriers at University of Missouri-Columbia for Transspectruin Respondents
One survey item asked Transspectrum respondents if they had experienced barriers in facilities
and identity accuracy at University of Missouri-Columbia within the past year. Table 24
highlights where respondents experienced barriers at University of Missomi-Columbia.67 With
regard to campus facilities, 20% (n = 15) of Transspectrum respondents experienced barriers
regarding changing rest rooms within the past year. In terms of identity accuracy, 17% (n = 13)
of Transspectrum respondents experienced difficulty with surveys, and 17% (n = 13) of
Transspectrum respondents experienced difficulty with MU college ID card. In terms of
instructional/campus materials, 20% (n = 15) of Transspectrum respondents experienced
difficulty with University of Missouri-Columbia forms.
Table 24. Barriers Experienced by Transspectrum Respondents
Facilities Yes tt %
No n %
Not applicable n %
Athletic and recreational facilities 11 14.1 26 33.3 41 52.6 Campus Iran spallation.:park ing 5 6.5 32 41.6 40 51.9 Changing rooms/locker rooms 10 12.8 25 32.1 43 55.1 Counseling center < 5 — 30 39.0 43 55.8 Dining facilities 5 6.4 30 38.5 43 55.1 Disability center < 5 — 23 29.9 50 64.9 Other campus buildings 10 13.0 33 42.9 34 44.2 Restrooms 15 19.5 31 40.3 31 40.3 Student health center 6 7.8 31 40.3 40 51.9 Studios/performing aits spaces 6 7.8 28 36.4 43 55.8 Testing services < 5 — 25 32.5 48 62.3 University housing (e.g., residence halls) 9 11.5 24 30.8 45 57.7
Identity Accuracy Electronic databases (e.g., PeopleSoft. myLearn, myPerformance, Pathway) 12 16.0 32 42.7 31 41.3 Email account 8 10.5 38 50.0 30 39.5 Intake forms (e.g., student health) 12 15.8 29 38.2 35 46.1 Learning technology 8 10.7 34 45.3 33 44.0 Moodl e/Bla ckboa rd 11 14.5 31 40.8 34 44.7 MU college ID card 13 17.1 31 40.8 32 42.1
S7See Appendix B. Table B80 for all responses to the question, "Within the past year, have you experienced a barrier in any of the following areas at University of Missouri-Columbia?"
105
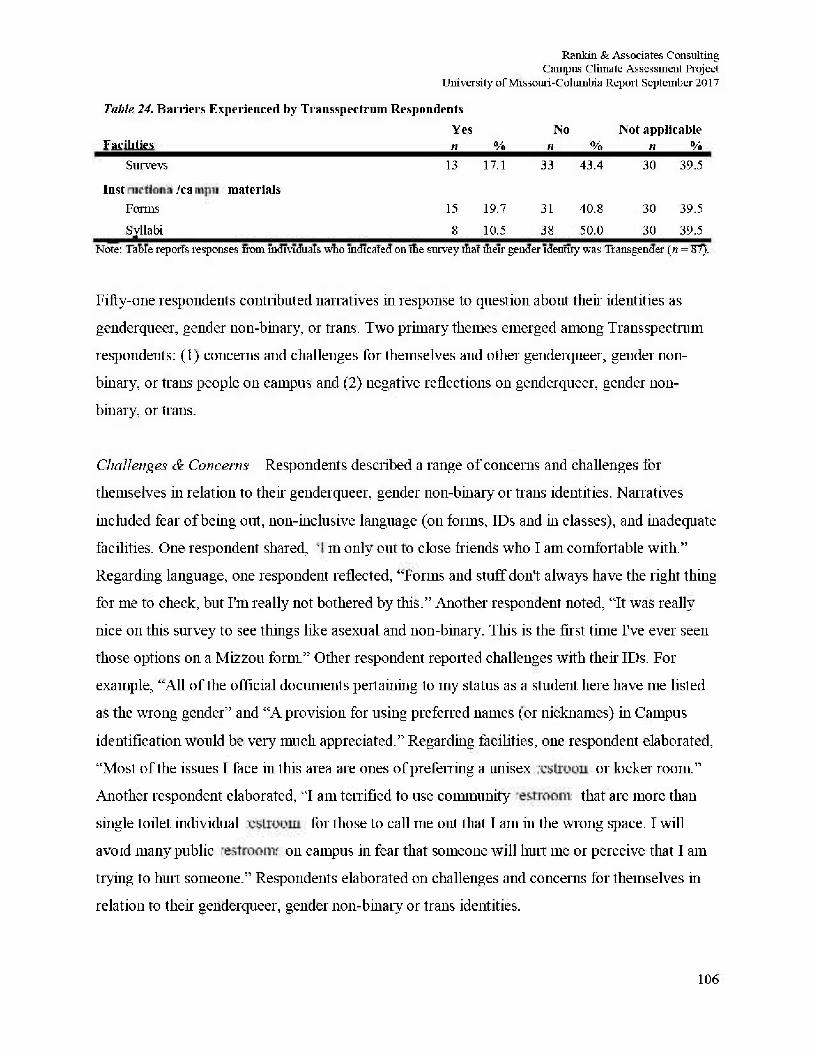
Rankin & Associates Consulting Campus Climate Assessment Project
University of Missouri-Columbia Report September 2017
Table 24. Barriers Experienced by Trans spectrum Respondents Yes No Not applicable
% n % n % FacUities n Surveys
Instructional/campus materials Forms
13 17.1
15 19.7 31
,1 33 43.4 30 39.5
40.8 30 39.5 Syllabi 8 10.5 38 50.0 30 39.5
Note: Table reports responses from individuals who indicated on the survey that their gender identity was Transgender (n = 87).
Fifty-one respondents contributed narratives in response to question about their identities as
genderqueer, gender non-binary, or trans. Two primary themes emerged among Trans spectrum
respondents: (1) concerns and challenges for themselves and other genderqueer, gender non-
binary, or trans people on campus and (2) negative reflections on genderqueer, gender non-
binary, or trans.
Challenges & Concents - Respondents described a range of concerns and challenges for
themselves in relation to their genderqueer, gender non-binary or trans identities. Narratives
included fear of being out, non-inclusive language (011 forms, IDs and in classes), and inadequate
facilities. One respondent shared, I'm only out to close friends who I am comfortable with."
Regarding language, one respondent reflected, "Forms and stuff don't always have the right thing
for me to check, but I'm really not bothered by this." Another respondent noted, "It was really
nice 011 this survey to see things like asexual and non-binary. This is the first time I've ever seen
those options on a Mizzou form." Other respondent reported challenges with their IDs. For
example, "All of the official documents pertaining to my status as a student here have me listed
as the wrong gender" and "A provision for using preferred names (or nicknames) in Campus
identification would be very much appreciated." Regarding facilities, one respondent elaborated,
"Most of the issues I face in this area are ones of preferring a unisex rest room or locker room."
Another respondent elaborated, "I am terrified to use community rest rooms that are more than
single toilet individual rest rooms for those to call me out that I am hi the wrong space. I will
avoid many public rest rooms on campus in fear that someone will hurt me or perceive that I am
trying to hurt someone." Respondents elaborated on challenges and concerns for themselves in
relation to their genderqueer, gender non-binary or trans identities.
106
Rankin & Associates Consulting Campus Climate Assessment Project
University of Missouri-Columbia Report September 2017
Frustration & Disapproval Towards Getulerqueer, Gender Non-binary, Or Trans Questions —
Some respondents who elaborated on the question for genderqueer, gender non-binary, or trans
identified people did not seem to share a genderqueer, gender non-binary, or trans identity but
rather had concerns and frustrations to voice. One respondent noted, "This institution spends too
much time trying to please too many subsets of people." Another respondent elaborated, "Treat
people as people and stop with the labels. Kids should not label themselves either." Similarly,
another respondent explained, "As a conservative I feel surveys like this are a waste of time and
money and do zero to advance my education. Surveys become a venue for those who have been
told they are victims to vent. Rubbish." Finally, another respondent added, "this ridiculous
hyper-PC approach lias gone too far." Other respondent correlated trans identities with mental
illness. For example, "Transgenderism is a mental disability" and "transgenderism is a mental
illness, and LGBT is not discriminated." Among the data gathered in response the question about
genderqueer, gender non-binary, or trans experiences, respondents expressed frustration and
disapproval.
107
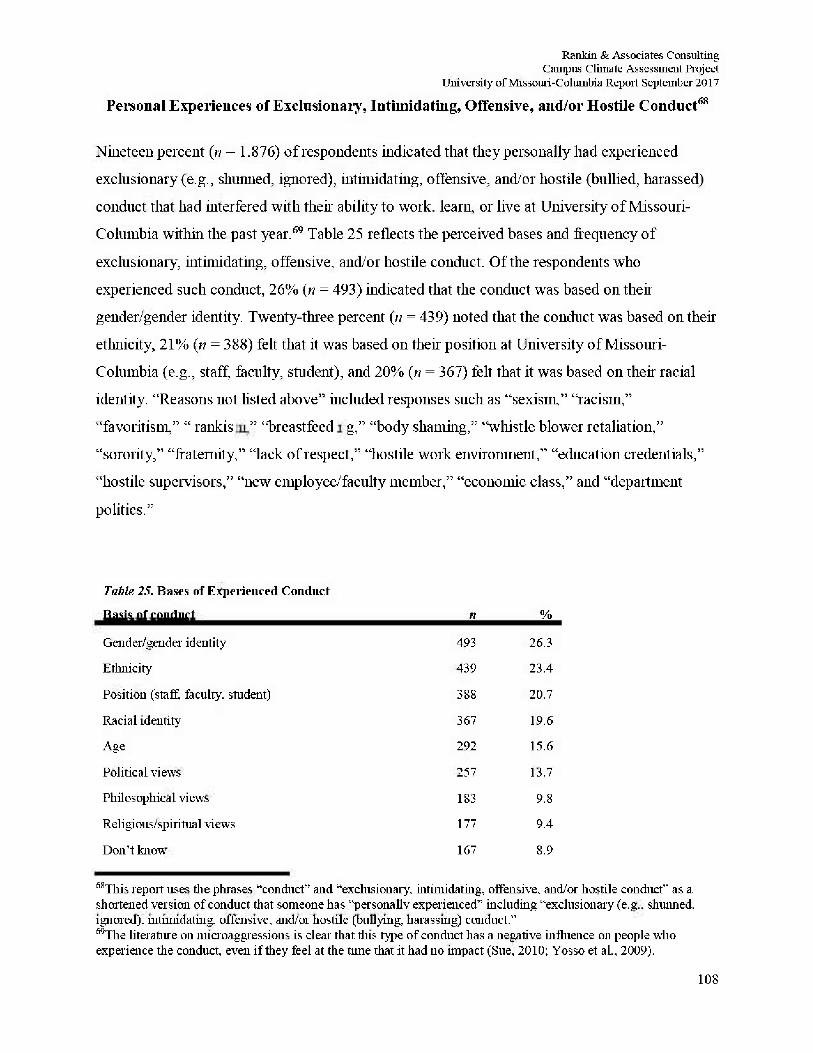
Rankin & Associates Consulting Campus Climate Assessment Project
University of Missouri-Columbia Report September 2017
Personal Experiences of Exclusionary, Intimidating, Offensive, and/or Hostile Conduct68
Nineteen percent (n = 1.876) of respondents indicated that they personally had experienced
exclusionary (e.g., shunned, ignored), intimidating, offensive, and/or hostile (bullied, harassed)
conduct that had interfered with their ability to work, learn, or live at University of Missouri-
Columbia within the past year.69 Table 25 reflects the perceived bases and frequency of
exclusionary, intimidating, offensive, and/or hostile conduct. Of the respondents who
experienced such conduct, 26% (n = 493) indicated that the conduct was based on their
gender/gender identity. Twenty-three percent (;/ = 439) noted that the conduct was based on their
ethnicity, 21% (n = 388) felt that it was based on their position at University of Missouri-
Columbia (e.g., staff, faculty, student), and 20% (n = 367) felt that it was based on their racial
identity. "Reasons not hsted above" included responses such as "sexism," "racism,"
"favoritism," " rankism" "breastfeeding," "body shaming," "whistle blower retaliation,"
"sorority," "fraternity," "lack of respect," "hostile work environment," "education credentials,"
"hostile supervisors," "new employee/faculty member," "economic class," and "department
politics."
Table 25. Bases of Experienced Conduct
Basis of conduct « %
Gender/gender identity 493 26.3
Ethnicity 439 23.4
Position (staff, faculty, student) 388 20.7
Racial identity 367 19.6
Age 292 15.6
Political views 257 13.7
Philosophical view's 183 9.8
Religious/spiritual views 177 9.4
Don't know 167 8.9
58This report uses the phrases "conduct" and "exclusionary, intimidating, offensive, and/or hostile conduct" as a shortened version of conduct that someone has "personally experienced" including "exclusionary (e.g., shunned, ignored), intimidating, offensive, and/or hostile (bullying, harassing) conduct." 59The literature on microaggressions is clear that this type of conduct has a negative influence on people who experience the conduct, even if they feel at the time that it had no impact (Sue, 2010; Yosso et al., 2009).
108
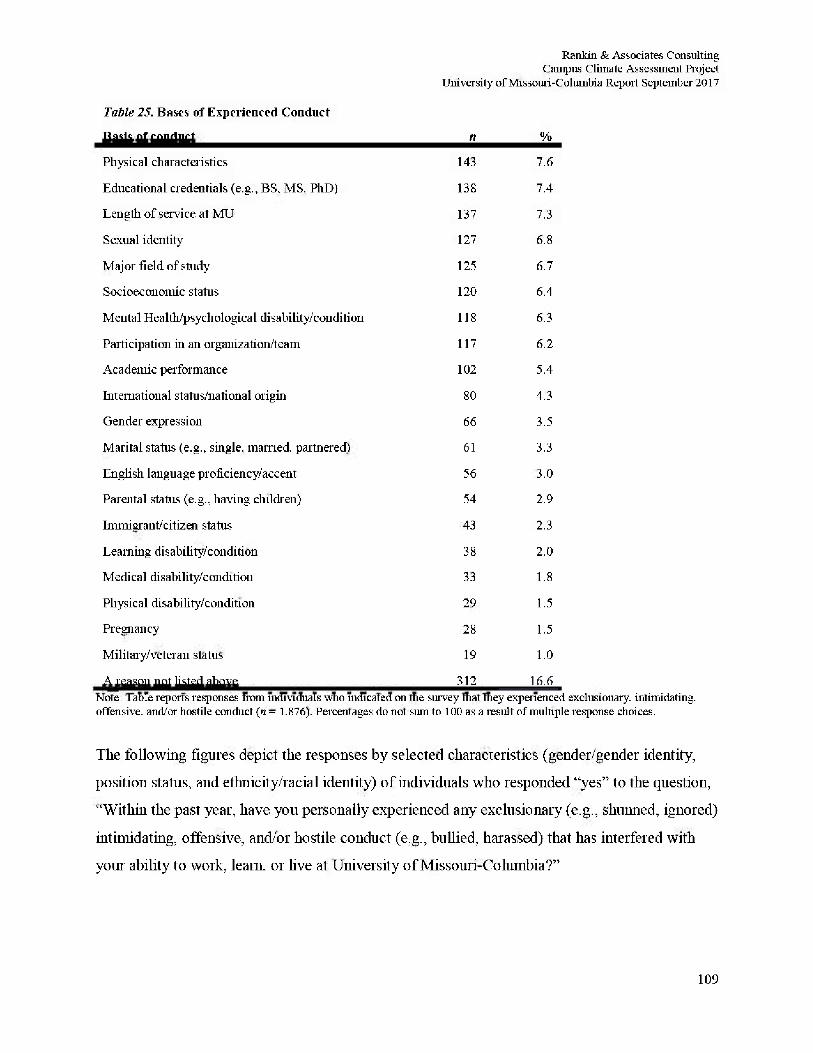
Rankin & Associates Consulting Campus Climate Assessment Project
University of Missouri-Columbia Report September 2017
Table 25. Bases of Experienced Conduct
Basis of conduct n %
Physical characteristics 143 7.6
Educational credentials (e.g., BS, MS, PhD) 138 7.4
Length of service at MU 137 7.3
Sexual identity 127 6.8
Major field of study 125 6.7
Socioeconomic status 120 6.4
Mental Health/psychological disability/condition 118 6.3
Participation in an organization/team 117 6.2
Academic performance 102 5.4
International status/national origin 80 4.3
Gender expression 66 3.5
Marital status (e.g., single, married, partnered) 61 3.3
English language proficiency/accent 56 3.0
Parental status (e.g., having children) 54 2.9
Immigrant/citizen status 43 2.3
Learning disability/condition 38 2.0
Medical disability/condition 33 1.8
Physical disability/condition 29 1.5
Pregnancy 28 1.5
Military/veteran status 19 1.0
A reason not listed above 312 16.6 Note: Table reports responses from individuals who indicated on the survey that they experienced exclusionary, intimidating, offensive, and/or hostile conduct (« = 1.876). Percentages do not stun to 100 as a result of multiple response choices.
The following figures depict the responses by selected characteristics (gender/gender identity,
position status, and ethnicity/racial identity) of individuals who responded "yes" to the question,
"Within the past year, have you personally experienced any exclusionary (e.g., shunned, ignored)
intimidating, offensive, and/or hostile conduct (e.g., bullied, harassed) that has interfered with
your ability to work, lea in. or live at University of Missouri-Columbia?"
109
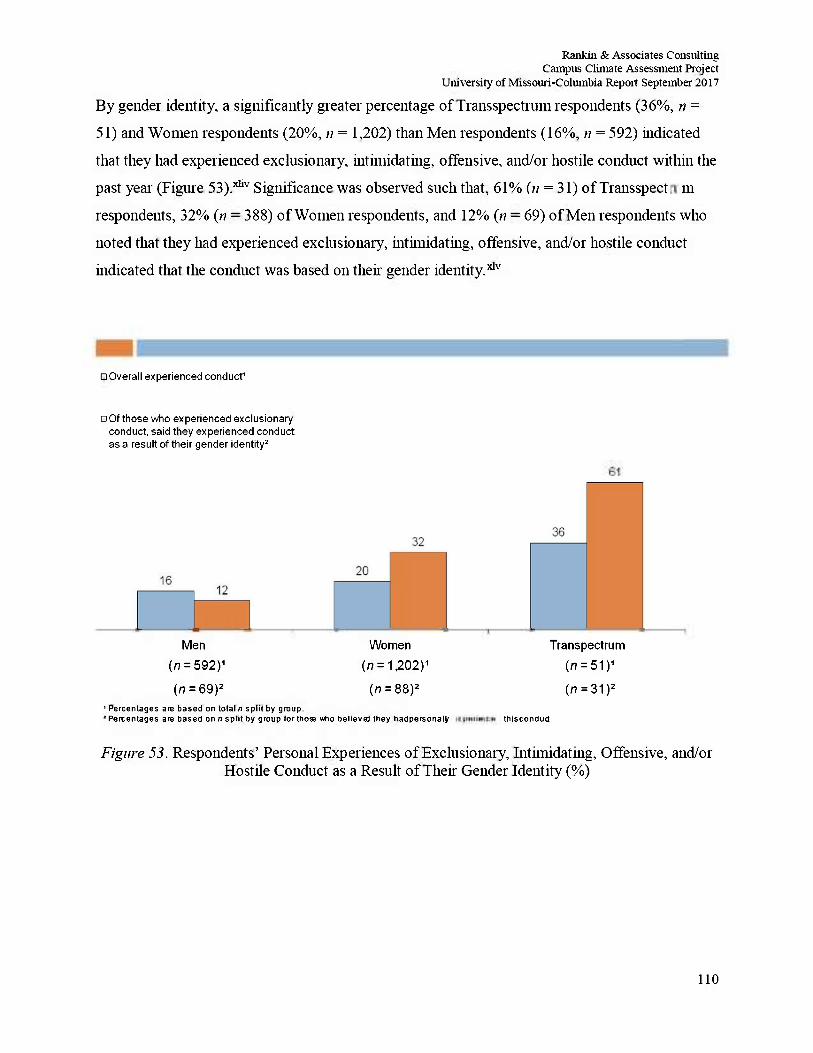
Rankin & Associates Consulting Campus Climate Assessment Project
University of Missouri-Columbia Report September 2017
By gender identity, a significantly greater percentage of Transspectrum respondents (36%, n =
51) and Women respondents (20%, n = 1,202) than Men respondents (16%, n = 592) indicated
that they had experienced exclusionary, intimidating, offensive, and/or hostile conduct within the
past year (Figure 53).3div Significance was observed such that, 61% in = 31) of Transspectrum
respondents, 32% (» = 388) of Women respondents, and 12% (» = 69) of Men respondents who
noted that they had experienced exclusionary, intimidating, offensive, and/or hostile conduct
indicated that the conduct was based on their gender identity.^'
• Overall experienced conduct1
• Of those who experienced exclusionary conduct, said they experienced conduct as a result of their gender identity2
Men
(n = 592)1
(n = 69)2
Women
[n = 1,202)1
(n = 88)2
Transpectrum
(a? = 51 )1
(n = 31)2
1 Percentages are based on total n split by group. 'Percentages are based on n split by group forthose \«rfio believed they hadpersonal experienced this condud
Figure 53. Respondents' Personal Experiences of Exclusionary, Intimidating, Offensive, and/or Hostile Conduct as a Result of Their Gender Identity (%)
110
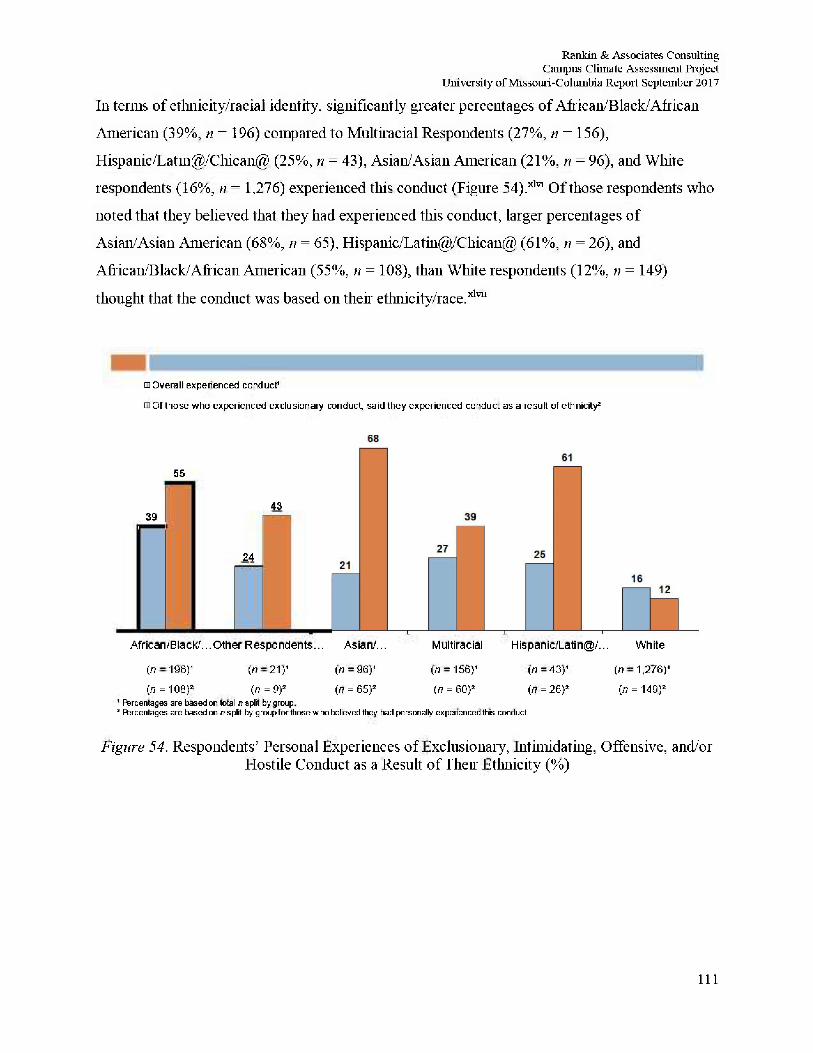
Rankin & Associates Consulting Campus Climate Assessment Project
University of Missouri-Columbia Report September 2017
111 terms of ethnicity/racial identity, significantly greater percentages of African/Black/African
American (39%, n = 196) compared to Multiracial Respondents (27%, ri = 156),
Hispanic/Latm@/Chican@ (25%, n = 43), Asian/Asian American (21%, n = 96), and White
respondents (16%, ti = 1,276) experienced this conduct (Figure 5 4 ) . ^ Of those respondents who
noted that they believed that they had experienced this conduct, larger percentages of
Asian/Asian American (68%, n = 65), Hispanic/Latin@/Chican@ (61%, n = 26), and
African/Black/African American (55%, n = 108), than White respondents (12%, n = 149)
thought that the conduct was based on their ethnicity/race.311™
• Overall experienced conduct'
• Of those who experienced exclusionary conduct, said they experienced conduct as a result of ethnicity2
55
39 43
24
African/Black/...Other Respondents... Asian/...
(n = 196)1 (n = 21)' (/) = 96)' (n = 65 )2
Multiracial
(n = 156)' (n = 60)2 (n = 108)2 (n = 9)2
1 Ftercentages are based or total n split by group. a Ftercentages are based or n spit by group for those who believed they had personally experienced this conduct.
Hispanic/Latin@/...
(n = 43)' (n =
(n = 26)2 (n
White
= l,276)1
= 149)2
Figure 54. Respondents' Personal Experiences of Exclusionary, Intimidating, Offensive, and/or Hostile Conduct as a Result of Then Ethnicity (%)
111
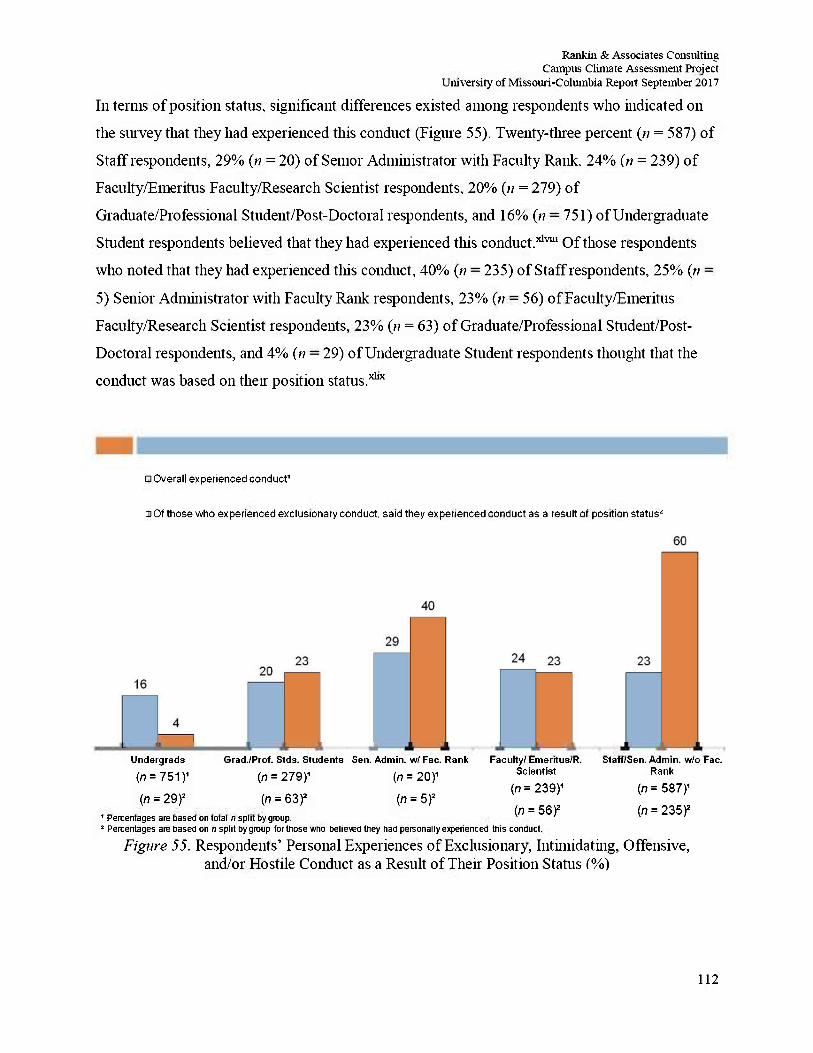
Rankin & Associates Consulting Campus Climate Assessment Project
University of Missouri-Columbia Report September 2017
In terms of position stams, significant differences existed among respondents who indicated on
the survey that they had experienced this conduct (Figure 55). Twenty-three percent (« = 587) of
Staff respondents, 29% (n = 20) of Senior Administrator with Faculty Rank, 24% (n = 239) of
Faculty/Emeritus Faculty/Research Scientist respondents, 20% (n = 279) of
Graduate/Professional Student/Post-Doctoral respondents, and 16% (// = 751) of Undergraduate
Student respondents believed that they had experienced this conduct.*1™ Of those respondents
who noted that they had experienced this conduct, 40% (;? = 235) of Staff respondents, 25% (n =
5) Senior Administrator with Faculty Rank respondents, 23% (n = 56) of Faculty/Emeritus
Faculty/Research Scientist respondents, 23% (/? = 63) of Graduate/Professional Student/Post-
Doctoral respondents, and 4% (ti = 29) of Undergraduate Student respondents thought that the
conduct was based on then" position s ta tus .^
• Overall experienced conduct1
• Of those who experienced exclusionary conduct, said they experienced conduct as a result of position status2
Undergrads Grad./Prof. Stds. Students Sen. Admin, wI Fac. Rank (n = 751 )1 (n = 279)1 (n=20)1
(n = 29 f (n = 63 f (n = 5 f
Faculty/ Emeritus/R. Scientist
(n = 239)1
(n = 56 f
Staff/Sen. Admin, w/o Fac. Rank
1 Percentages are based on total n split by group. ! Percentages are based on n split by group for those who believed they had personally experienced this conduct.
(n = 587)1
(n = 235f
Figure 55. Respondents' Personal Experiences of Exclusionary, Intimidating, Offensive, and/or Hostile Conduct as a Result of Their Position Status (%)
112
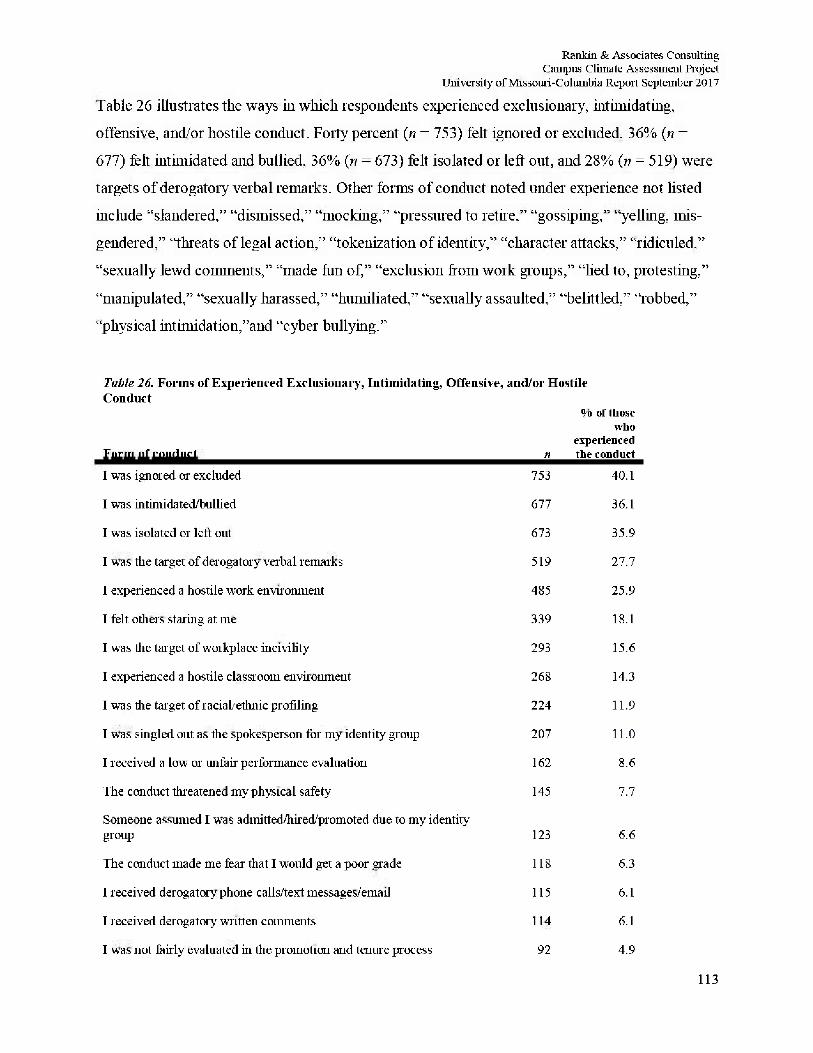
Rankin & Associates Consulting Campus Climate Assessment Project
University of Missouri-Columbia Report September 2017 Table 26 illustrates the ways in which respondents experienced exclusionary, intimidating,
offensive, and/or hostile conduct. Forty percent (n = 753) felt ignored or excluded, 36% (n =
677) felt intimidated and bullied, 36% (ti = 673) felt isolated or left out, and 28% (n = 519) were
targets of derogatory verbal remarks. Other forms of conduct noted under experience not listed
include "slandered," "dismissed," "mocking," "pressured to retire." "gossiping," "yelling, mis-
gendered," "threats of legal action," "tokenization of identity," "character attacks," "ridiculed,"
"sexually lewd comments," "made fun of," "exclusion from work groups," "lied to, protesting,"
"manipulated," "sexually harassed," "humiliated," "sexually assaulted," "belittled," "robbed,"
"physical intimidation,"and "cyber bullying."
Table 26. Forms of Experienced Exclusionary, Intimidating, Offensive, and/or Hostile Conduct
Form of conduct n
% of tliose who
experienced the conduct
I was ignored or excluded 753 40.1
I was intimidated bullied 677 36.1
I was isolated or left out 673 35.9
I was the target of derogatory verbal remarks 519 27.7
I experienced a hostile work environment 485 25.9
I felt others staring at me 339 18.1
I was the target of workplace incivility 293 15.6
I experienced a hostile classroom environment 268 14.3
I was the target of racial, ethnic profiling 224 11.9
I was singled out as the spokesperson for my identity group 207 11.0
I received a low or unfair performance evaluation 162 8.6
The conduct threatened my physical safety 145 7.7
Someone assumed I was admitted/hired/promoted due to my identity group 123 6.6
The conduct made me fear that I would get a poor grade 118 6.3
I received derogatory phone calls/text messages/email 115 6.1
I received derogatory written comments 114 6.1
I was not fairly evaluated in the promotion and tenure process 92 4.9
113
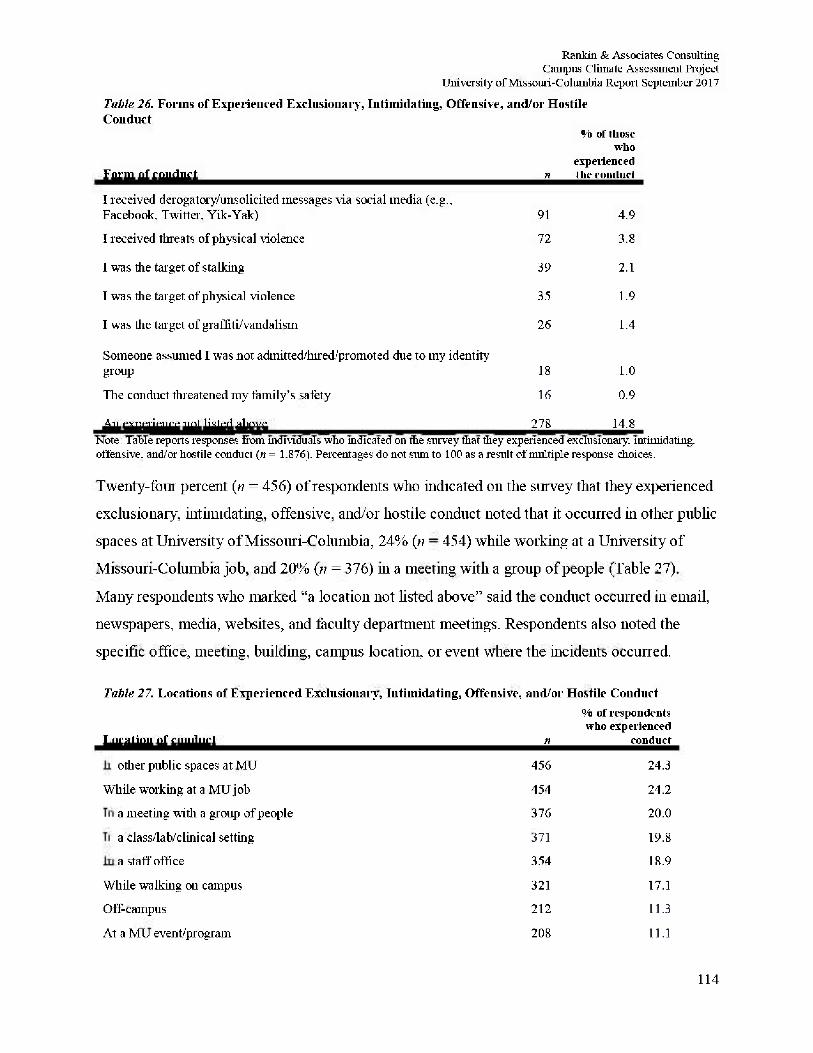
Rankin & Associates Consulting Campus Climate Assessment Project
University of Missouri-Columbia Report September 2017 Table 26. Forms of Experienced Exclusionary* Intimidating, Offensive, and/or Hostile Conduct
Form of conduct n
0/o of those who
experienced the conduct
I received derogatory/unsolicited messages via social media (e.g., Facebook, Twitter, Yik-Yak) 91 4.9
I received threats of physical violence 72 3.8
I was the target of stalking 39 2.1
I was the target of physical violence 35 1.9
I was the target of graffiti/vandalism 26 1.4
Someone assumed I was not admitted/hired promoted due to my identity* group 18 1.0
The conduct threatened my family's safety 16 0.9
An experience not listed above 278 14.8 Note: Table reports responses from individuals who indicated on the survey that they experienced exclusionary, intimidating, offensive, and/or hostile conduct (« = 1.876). Percentages do not sum to 100 as a result of multiple response choices.
Twenty-four percent (n = 456) of respondents who indicated 011 the survey that they experienced
exclusionary, intimidating, offensive, and/or hostile conduct noted that it occurred in other public
spaces at University of Missouri-Columbia, 24% (n = 454) while working at a University of
Missouri-Columbia job , and 20% (n = 376) hi a meeting with a group of people (Table 27).
M a n y respondents who marked "a location not listed above" said the conduct occurred in email,
newspapers, media, websites, and faculty department meetings. Respondents also noted the
specific office, meeting, building, campus location, or event where the incidents occurred.
Table 2 7. Locations of Experienced Exclusionary, Intimidating, Offensive, and/or Hostile Conduct
Location of conduct n
% of respondents who experienced
conduct
In other public spaces at MU 456 24.3
While working at a MU job 454 24.2
In a meeting with a group of people 376 20.0
In a class/lab/clinical setting 371 19.8
In a staff office 354 18.9
While walking 011 campus 321 17.1
Off-campus 212 11.3
At a MU event/program 208 11.1
114
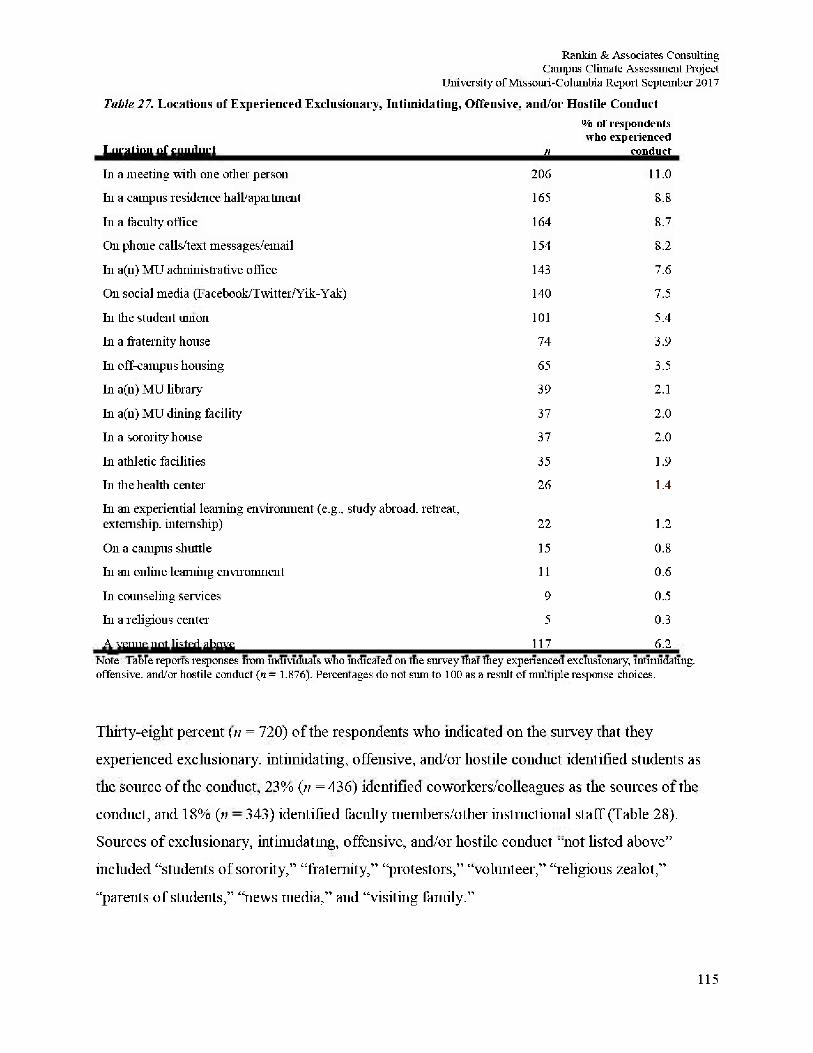
Rankin & Associates Consulting Campus Climate Assessment Project
University of Missouri-Columbia Report September 2017
Table 2 7. Locations of Experienced Exclusionary, Intimidating, Offensive, and/or Hostile Conduct
Location of conduct
In a meeting with one other person
o/6 c wh
n
206
if respondents o experienced
conduct
11.0
hi a campus residence hall/apartment 165 8.8
hi a faculty office 164 8.7
On plione calls/text messages/email 154 8.2
Li a(n) MU administrative office 143 7.6
On social media (Facebook/Twitter/Yik-Yak) 140 7.5
Li the smdent union 101 5.4
Li a fraternity house 74 3.9
Li off-campus housing 65 3.5
Li a(n) MU library 39 2.1
Li a(n) MU dining facility 37 2.0
Li a sorority house 37 2.0
Li athletic facilities 35 1.9
Li the health center 26 1.4
Li an experiential learning environment (e.g., study abroad, retreat, externsliip. internship) 22 1.2
On a campus shuttle 15 0.8
Li an online learning environment 11 0.6
Li counseling services 9 0.5
Li a religious center 5 0.3
A venue not listed above 117 6.2 Note: Table reports responses from individuals who indicated on the survey that they experienced exclusionary intimidating, offensive, and/or hostile conduct (« = 1.876). Percentages do not sum to 100 as a result of multiple response choices.
Thirty-eight percent (n = 720) of the respondents who indicated on the survey that they
experienced exclusionary, intimidating, offensive, and/or hostile conduct identified students as
the soiu'ce of the conduct, 23% (;/ = 436) identified coworkers/colleagues as the sources of the
conduct, and 18% (n = 343) identified faculty members/other instructional staff (Table 28).
Sources of exclusionary, intimidating, offensive, and/or hostile conduct "not hsted above"
included "students of sorority," "fraternity," "protestors," "volunteer," "religious zealot,"
"parents of students," "news media," and 'Visiting family."
115
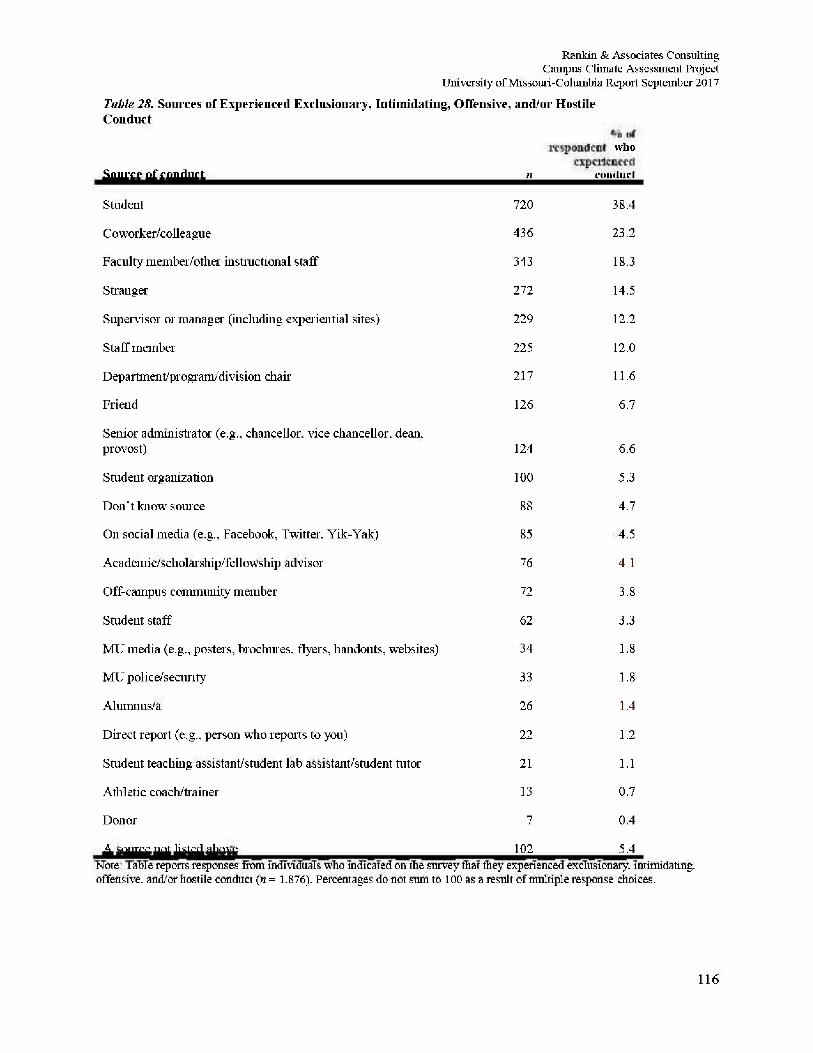
Rankin & Associates Consulting Campus Climate Assessment Project
University of Missouri-Columbia Report September 2017
Table 28. Sources of Experienced Exclusionary, Intimidating, Offensive, and/or Hostile Conduct
Source of conduct n
respondents who experienced
conduct
Student 720 38.4
C o worker/colleague 436 23.2
Faculty member/other instructional staff 343 18.3
Stranger 272 14.5
Supervisor or manager (including experiential sites) 229 12.2
Staff member 225 12.0
D epartment/program/ division chair 217 11.6
Friend 126 6.7
Senior administrator (e.g., chancellor, vice chancellor, dean, provost) 124 6.6
Student organization 100 5.3
Don't know source 88 4.7
On social media (e.g., Facebook, Twitter, Yik-Yak) 85 4.5
Academic/scholar ship/fel1owship advisor 76 4.1
Off-campus community member 72 3.8
Student staff 62 3.3
MU media (e.g., posters, brochures, flyers, handouts, websites) 34 1.8
MU police/security 33 1.8
Alumnus/a 26 1.4
Direct report (e.g., person who reports to you) 22 1.2
Student teaching assistant/student lab assistant/student tutor 21 1.1
Athletic coach/trainer 13 0.7
Donor 7 0.4
A source not listed above 102 5.4 Note: Table reports responses from individuals who indicated on the survey that they experienced exclusionary, intimidating, offensive, and/or hostile conduct (« = 1.876). Percentages do not sum to 100 as a result of multiple response choices.
116
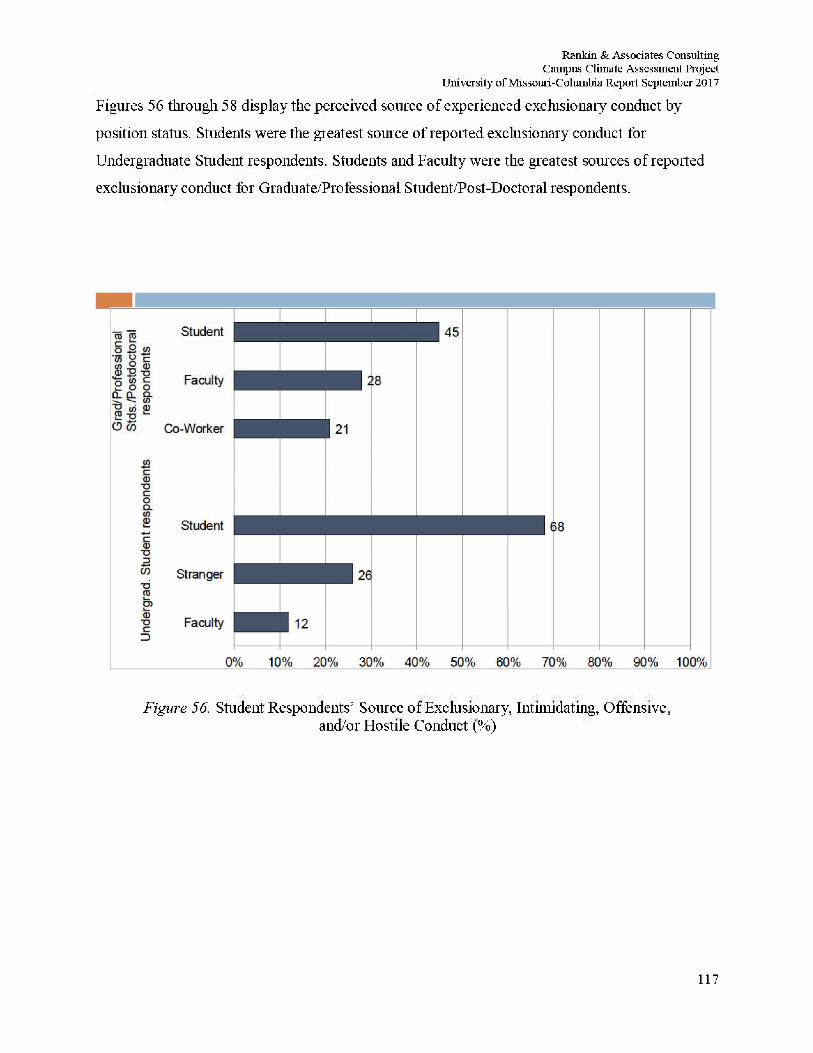
Rankin & Associates Consulting Campus Climate Assessment Project
University of Missouri-Columbia Report September 2017
Figures 56 through 58 display the perceived source of experienced exclusionary conduct by
position status. Students were the greatest source of reported exclusionary conduct for
Undergraduate Student respondents. Students and Faculty were the greatest sources of reported
exclusionary conduct for Graduate/Professional Student/Post-Doctoral respondents.
Figure 56. Student Respondents' Source of Exclusionary, Intimidating, Offensive, and/or Hostile Conduct (%)
117
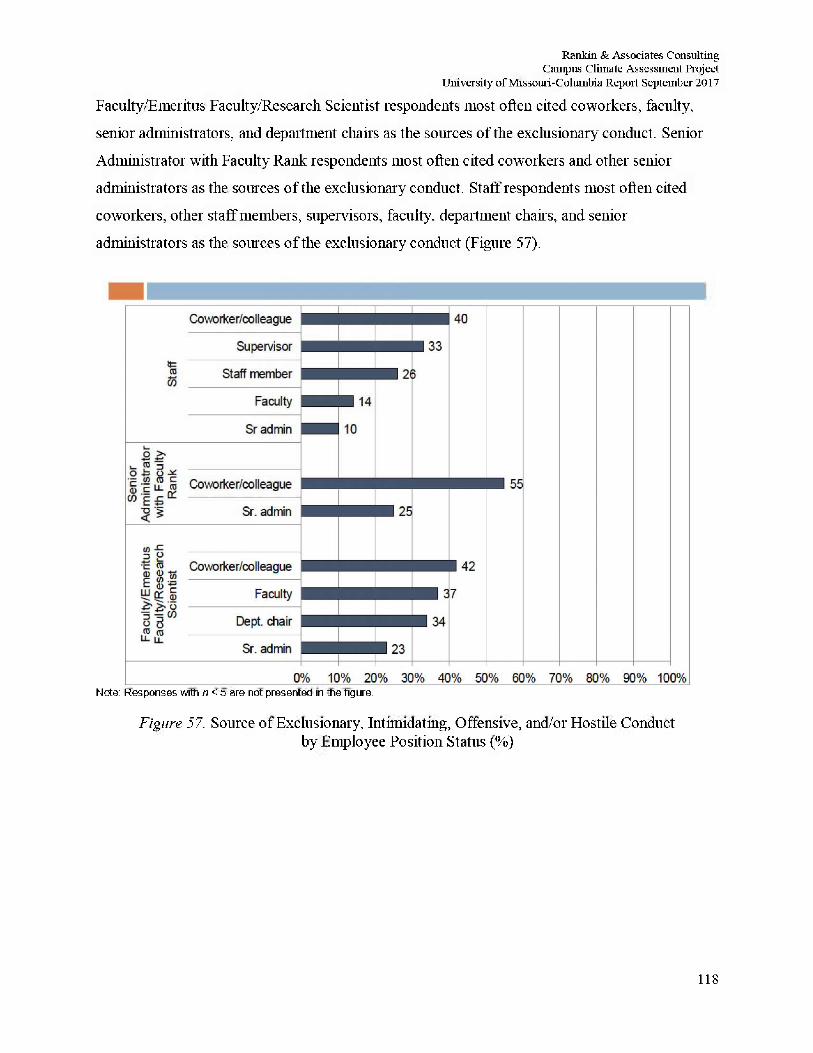
Rankin & Associates Consulting Campus Climate Assessment Project
University of Missouri-Columbia Report September 2017
Faculty/Emeritus Faculty/Research Scientist respondents most often cited coworkers, faculty,
senior administrators, and department chairs as the sources of the exclusionary conduct. Senior
Administrator with Faculty Rank respondents most often cited coworkers and other senior
administrators as the sources of the exclusionary conduct. Staff respondents most often cited
coworkers, other staff members, supervisors, faculty, department chairs, and senior
administrators as the sources of the exclusionary conduct (Figure 57).
Note: Responses with n < 5 are not presented in the figure.
Figure 57. Source of Exclusionary, Intimidating, Offensive, and/or Hostile Conduct by Employee Position Status (%)
118
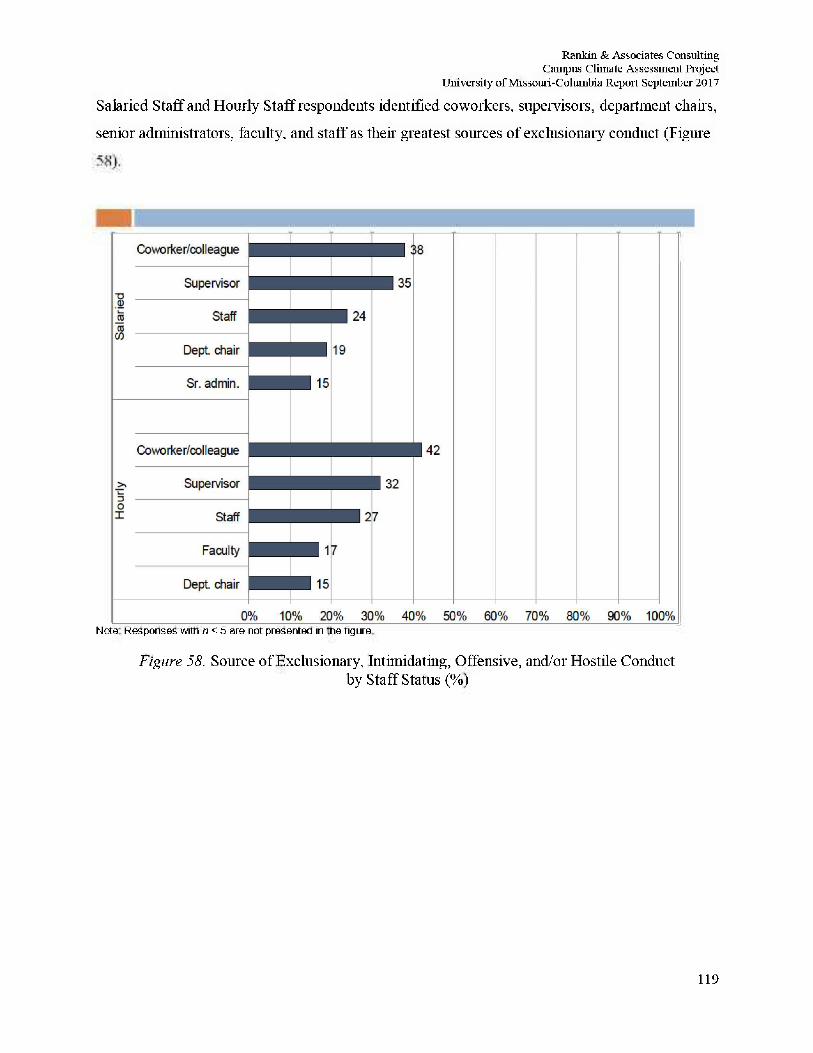
Rankin & Associates Consulting Campus Climate Assessment Project
University of Missouri-Columbia Report September 2017
Salaried Staff and Hourly Staff respondents identified coworkers, supervisors, department chairs,
senior administrators, faculty, and staff as their greatest sources of exclusionary conduct (Figure
Note: Responses with n <5 are not presented in the figure
Figure 58. Source of Exclusionary, Intimidating, Offensive, and/or Hostile Conduct by Staff Status (%)
119
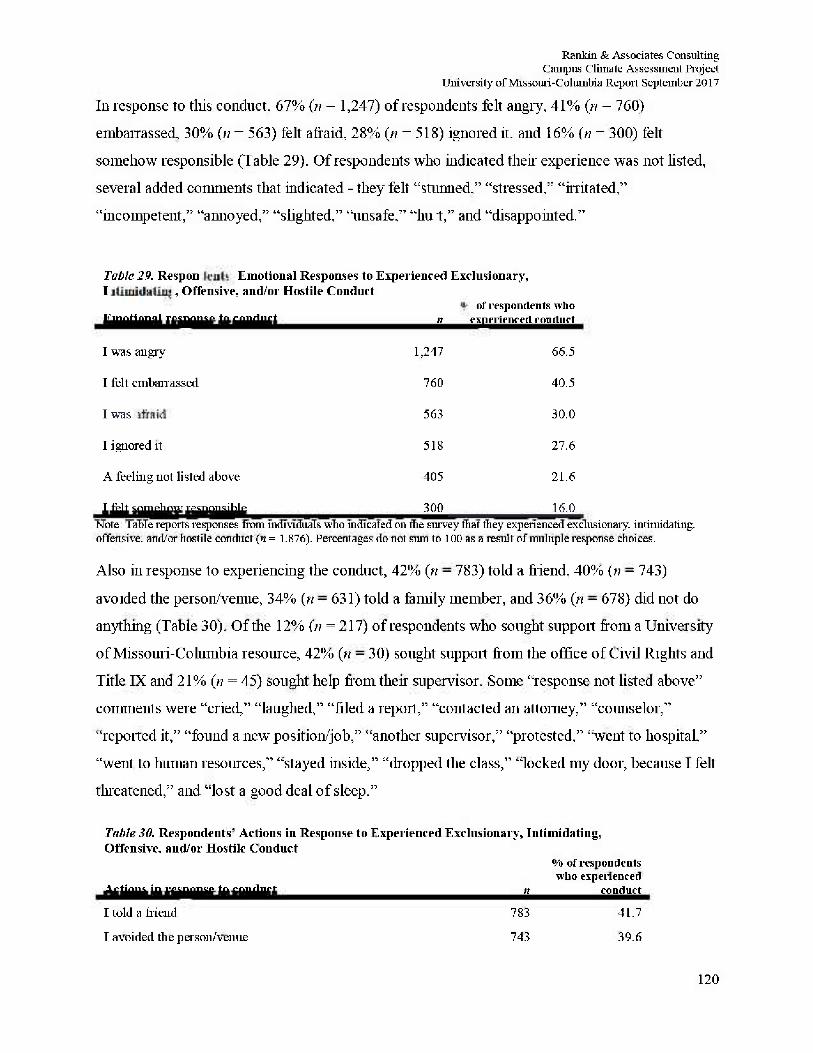
Rankin & Associates Consulting Campus Climate Assessment Project
University of Missouri-Columbia Report September 2017 In response to this conduct. 67% (n = 1,247) of respondents felt angry, 41% (;? = 760)
embarrassed, 30% (n = 563) felt afraid, 28% (n = 518) ignored it. and 16% (n = 300) felt
somehow responsible (Table 29). Of respondents who indicated their experience was not listed,
several added comments that indicated - they felt "stunned," "stressed," "irritated,"
"incompetent," "annoyed," "slighted," "unsafe," "hurt," and "disappointed."
Table 29. Respondents Emotional Responses to Experienced Exclusionary, Intimidating, Offensive, and/or Hostile Conduct
Emotional response to conduct it % of respondents who
experienced conduct
I was angry 1,247 66.5
I felt embarrassed 760 40.5
I was afraid 563 30.0
I ignored it 518 27.6
A feeling not listed above 405 21.6
I felt somehow responsible 300 16.0 Note: Table reports responses from individuals who indicated on the survey that they experienced exclusionary, intimidating, offensive, and/or hostile conduct (n = 1.876). Percentages do not sum to 100 as a result of multiple response choices.
Also in response to experiencing the conduct, 42% (n = 783) told a friend, 40% (n = 743)
avoided the person/venue, 34% (n = 631) told a family member, and 36% (n = 678) did not do
anything (Table 30). Of the 12% (n = 217) of respondents who sought support from a University
of Missouri-Columbia resource, 42% (n = 30) sought support from the office of Civil Rights and
Title IX and 21% (n = 45) sought help from their supervisor. Some "response not listed above"
comments were "cried," "laughed," "filed a report," "contacted an attorney," "counselor,"
"reported it," "found a new position/job," "another supervisor," "protested," "went to hospital,"
"went to human resources," "stayed inside," "dropped the class," "locked my door, because I felt
threatened," and "lost a good deal of sleep."
Table 30. Respondents' Actions in Response to Experienced Exclusionary, Intimidating, Offensive, and/or Hostile Conduct
°/» of respondents who experienced
Actions in response to conduct H conduct I told a friend 783 41.7
I avoided the person/venue 743 39.6
120
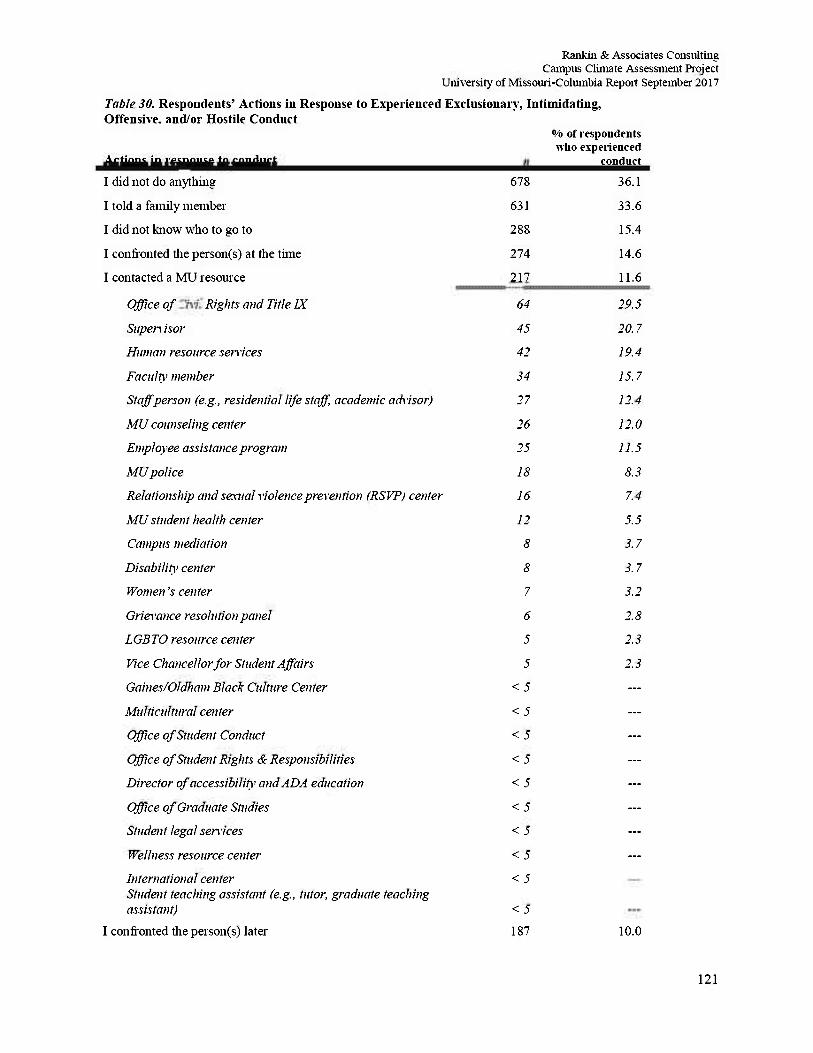
Rankin & Associates Consulting Campus Climate Assessment Project
University of Missouri-Columbia Report September 2017
Table 30. Respondents' Actions in Response to Experienced Exclusionary, Intimidating, Offensive, and/or Hostile Conduct
Actions in response to conduct
o/o of respondents who experienced
conduct I did not do anything 678 36.1
I told a family member 631 33.6
I did not know who to go to 288 15.4
I confronted the person(s) at the time 274 14.6
I contacted a MU resource 217 11.6
Office of civil Rights and Title IX 64 29.5
Supervisor 45 20.7
Human resource sen ices 42 19.4
Faculty member 34 15.7
Staff person (e.g., residential life staff, academic advisor) 27 12.4
MU counseling center 26 12.0
Employee assistance program 25 11.5
MU police 18 8.3
Relationship and sexual violence prevention (RSVP) center 16 7.4
MU student health center 12 5.5
Campus mediation 8 3.7
Disability center 8 3.7
Women's center 7 3.2
Grievance resolution panel 6 2.8
LGBTO resource center 5 2.3
Vice Chancellor for Student Affairs 5 2.3
Gaines/Oldham Black Culture Center < 5 ...
Multicultural center < 5 ...
Office of Student Conduct < 5 ...
Office of Student Rights & Responsibilities < 5 ...
Director of accessibility and ADA education < 5 ...
Office of Graduate Studies < 5 ...
Student legal senices < 5 ...
Wellness resource center < 5 ...
International center Student teaching assistant (e.g., tutor, graduate teaching assistant)
< 5
< 5 I confronted the person(s) later 187 10.0
121
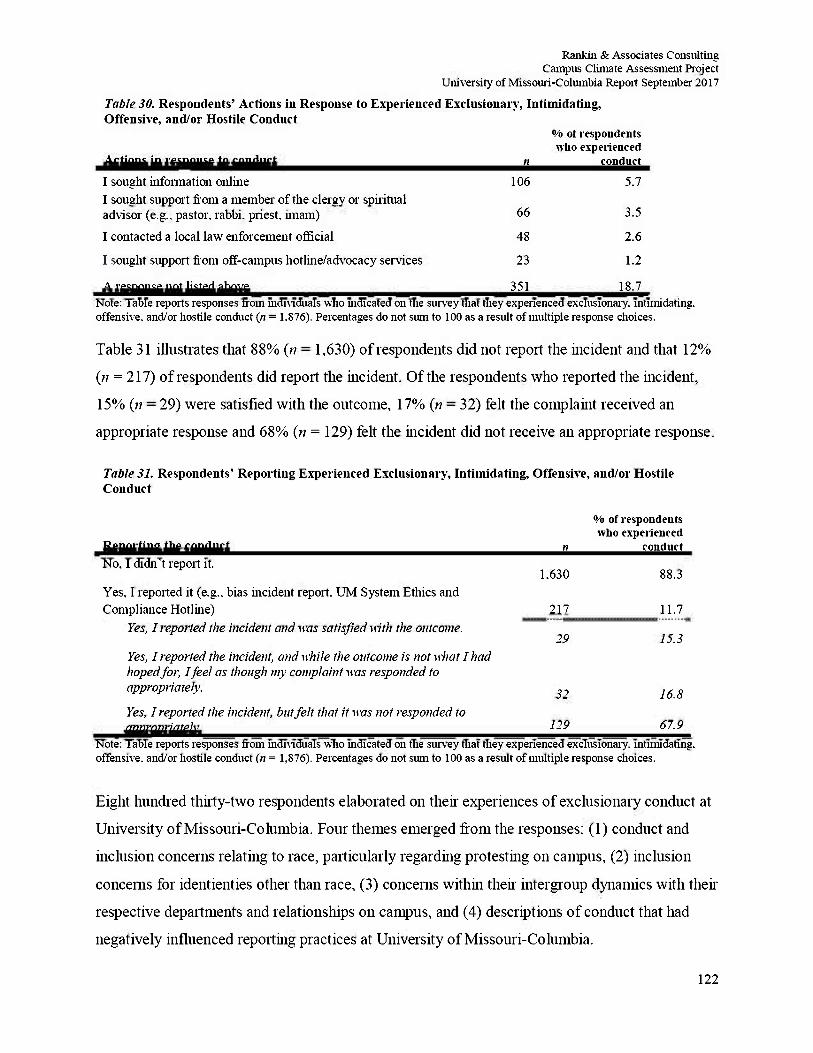
Rankin & Associates Consulting Campus Climate Assessment Project
University of Missouri-Columbia Report September 2017
Table 30. Respondents' Actions in Response to Experienced Exclusionary, Intimidating, Offensive, and/or Hostile Conduct
Actions in response to conduct I sought information online
0/0 ol whc
n 106
: respondents > experienced
conduct 5.7
I sought support from a member of the clergy or spiritual advisor (e.g.. pastor, rabbi, priest, imam) 66 3.5 I contacted a local law enforcement official 48 2.6 I sought support from off-campus hotline/advocacy services 23 1.2
A response not listed above 351 18.7 Note: Table reports responses from individuals who indicated on the survey that they experienced exclusionary, intimidating, offensive, and/or hostile conduct (n = 1.876). Percentages do not stun to 100 as a result of multiple response choices.
Table 31 illustrates that 88% (n = 1,630) of respondents did not report the incident and that 12%
(n = 217) of respondents did report the incident. Of the respondents who reported the incident,
15% (/? = 29) were satisfied with the outcome, 17% (n = 32) felt the complaint received an
appropriate response and 68% (n = 129) felt the incident did not receive an appropriate response.
Table 31. Respondents' Reporting Experienced Exclusionary, Intimidating, Offensive, and/or Hostile Conduct
Reporting the conduct No, I didn't report it.
°/0 0 whi
n
1.630
f respondents 3 experienced
conduct
88.3 Yes, I reported it (e.g.. bias incident report. UM System Ethics and Compliance Hotline) 217 11.7
Yes, I reported the incident and was satisfied with the outcome. 29 15.3
Yes, I reported the incident, and while the outcome is not what I had hopedfor, Ifeel as though my complaint was responded to appropriately. 32 16.8 Yes, I reported the incident, but felt that it was not responded to appropriately. 129 67.9
Note: Table reports responses from individuals who indicated on the survey that they experienced exclusionary, intimidating, offensive, and/or hostile conduct (n = 1,876). Percentages do not stun to 100 as a result of multiple response choices.
Eight hundred thirty-two respondents elaborated on their experiences of exclusionary conduct at
University of Missouri-Columbia. Four themes emerged from the responses: (1) conduct and
inclusion concerns relating to race, particularly regarding protesting on campus, (2) inclusion
concerns for identienties other than race, (3) concerns within their intergroup dynamics with their
respective departments and relationships on campus, and (4) descriptions of conduct that had
negatively influenced reporting practices at University of Missouri-Columbia.
122
Rankin & Associates Consulting Campus Climate Assessment Project
University of Missouri-Columbia Report September 2017
Racism, Reverse Racism &Protests - Race and racism was noted in more narratives than any
other identity or concern in respondent's elaborations on conduct at University of Missouri-
Columbia . The commentary on race included reports of racism (discrimination of people who
self-identified as black of people of color), reverse racism (discrimination of people who self-
identified as white) and narratives about racially motivated protests. Reports of conduct
displaying racism included racial slurs, threats and mirco aggressions. Regarding the use of racial
slurs, some respondent reported, 'I just feel like in 2016, I shouldn't have to be reminded that I'm
black by being called '[racial slur against African Americans]'" and "I was called a [racial slur
against African Americans] while walking down the street two times." Other respondents
reported threats, for example, 'threatened to shoot black people on Yik-Yak" and "I received an
email from an @aol account that was unknown to me. The email contained language with racial
slurs and racial charged statements."Others reported more subtle incidents. For example,"!
always feel excluded or sidelined in meeting s. This is especially the case when it is an all-white
group of people. As a person of colour, I feel ignored." Another respondent noted, "Across
campus there is an obvious racial divide and few seem to be willing to step over these boundaries
of color to establish a more inclusive community. "Other respondents who identified as white
described reverse racism. For example, respondents elaborated, I didn't feel safe in my
community because I was a Greek white student." Another respondent shared, "I have been
called names and have been yelled at and given dirty looks and stuff all the time whenever I say
anything regarding my life because apparently I have 'white privilege'." Other respondent s
echoed, "I Have been targeted by racial protesters like Black Lives Matter ,""I have been insulted
my being told that my silence is violence" and "I was made fun of for my parents higher SES
and southern, conservative values."Finally, many respondents who elaborated on race did so in
tandem with their reflections on the racially motivated protests that had taken place on campus.
One respondent noted, "I was being called a racist by all the protesters and no one in the
administration did anything about it." Other respondents shared, "The demonstration on campus
last me made feel personally threatened, threatened my family,and my family income." And,
"When the protests were going on I felt like I was racially profiled as racist because I am white."
One respondent summarized the tension, "Over the last year, there have been a lot of people that
have made assumptions about people of another race. It seems to me that there has been a lot of
racism on both sides of the spectrum. Everyone is hyper-sensitive and it has made
123
Rankin & Associates Consulting Campus Climate Assessment Project
University of Missouri-Columbia Report September 2017
for a tense work environment." Racially motivated conduct was described a significant concern
by respondents who elaborated on conduct at University of Missouri-Columbia.
Inclusion Concents for Women & LGBTQ People — Beyond the narratives addressing racially
driven exclusion and bias there were other inclusion concerns noted hi respondent's reflections
011 conduct. In particular, women and LGBTQ people were noted with concern among other
identities mentioned in more general inclusion concerns. One respondent noted, "Professor made
comments 011 how women couldn't do field work, classmates make comments about women (i.e
rape jokes) or mock other identities, etc." Another respondent added, "When I asked the
director why everyone got a raise except me he responded...that I may be starting a family and
wouldn't be worth investing in. He did not know but I was pregnant." Regarding LGTBQ
concerns, one respondent shared, "I had a friend tell me that she no longer wanted to hang out
with me because I was gay. I am also a female engineer and feel uncomfortable in a lot of my
classes." Other respondents noted, "Homophobic fraternity boys yelling shus," "I have heard
many slurs regarding sexuality and usage of language like that as jokes" and "hi one instance I
had someone write on my pronoun note so it said 'it' was my pronoun." More generally, one
respondent reflected, "They protect the white males 111 the organization who feel they have carte
blanche to dismiss and mistreat women and minorities." Another respondent reported, "I
believe I am being unfairly targeted because I support the principles of inclusion and diversity."
Inclusion concerns for women and LGBTQ people and other minorities 011 campus were noted
often in narratives addressing conduct at University of Missouri-Columbia.
Unhealthy and Unpleasant Relationship Dynamics — Respondents who elaborated conduct 111
the context of their working/academic relationships described unhealthy and hostile dynamics.
Faculty and professors were noted with concern. For example, one respondent shared, this
"faculty member is rude and does not know the first thing about how to speak to the office staff
and she is unkind, there are too many experiences to elaborate on." Another respondent
elaborated, "Two professors dislike each other. One professor associates me with the other
professor and pointedly ignores me whenever we see each other." Others connected a low sense
of belonging and value 011 campus with negative interactions. For example, one respondent
124
Rankin & Associates Consulting Campus Climate Assessment Project
University of Missouri-Columbia Report September 2017
explained, "When you have employees who are extremely frustrated with their jobs, work load,
and just the negative atmosphere from so many job cuts and lack of replacing positions when
people leave or retire it creates unhappy people and they are hateful and quick to complain and
be extremely hard to get to a point where they are team players." Another respondent elaborated
011 intergroup challenges, "she constantly interrupts with little 'tasks'. If I turn her down (because
it really is not my job), she gets angry, quits speaking to me, and pointedly avoids me whenever
possible." Another respondent added, "One of my staff members yell derogatory remarks at me
as they were leaving, but since there wasn't a witness, nothing was done." The data that
established this theme was wide ranging in context and perceived rationale but the notion that
these relationship dynamics were perceived as unhealthy and unpleasant.
Fear of Retaliation & Reporting — Respondents who elaborated oil conduct concerns noted fear
of retaliation and other barriers to reporting at University of Missouri-Columbia. For example,
one respondent shared, "If I say anything I will be noted as a trouble maker. So I would rather
keep it to myself." Other respondents echoed, "I do not feel safe elaborating" and "I am afraid of
retribution." Another respondent explained, "I did not report it because the student is a well-liked
and connected member of my class and I fear there would be social and possibly academic
retaliation." These narratives also noted a lack of faith in the repotting process including the
perception that reports would not be taken seriously and or nothing would come from repotting
efforts. One respondent noted, "If I did that, the reader of the account would ultimately
(according to experience) delegitimize me as well." Other respondents added rationales to why
they did not report previous incidents, for example, "Nothing will be done!" and "No. Nothing
can be done." Another respondent elaborated, "Discriminatory behavior is very subjective.
Complaining usually does not have favorable outcomes." Respondents who elaborated 011
conduct concerns described fears and a perceived low efficacy of reporting at University of
Missouri-Columbia.
^ A chi-square test was conducted to compare percentages of respondents who experienced exclusionary conduct by gender identity: x2 (2, N= 9.852) = 45.80,/; < .001. ^'A chi-square test was conducted to compare percentages of respondents who experienced exclusionary conduct based on gender by gender identity: x 2 (2 ,N= 1,845)= 118.51,/; < .001. ^ A chi-square test wras conducted to compare percentages of respondents who experienced exclusionary conduct by racial identity: %2 (5, N= 9,638) = 202.94,/; < .001.
125
Rankin & Associates Consulting Campus Climate Assessment Project
University of Missouri-Columbia Report September 2017
d™A chi-square test was conducted to compare percentages of respondents who experienced exclusionary conduct based on race by racial identity: %2(5.N= 1.788) = 370.86./) < .001. 5j™A chi-square test was conducted to compare percentages of respondents who experienced exclusionary conduct by position slants: x2 (4, N= 9.935) = 82.87./) < .001. ^ A chi-square test was conducted to compare percentages of respondents who experienced exclusionary conduct based on position by position status: 4. N= 1,876) = 265.47./) < .001.
126
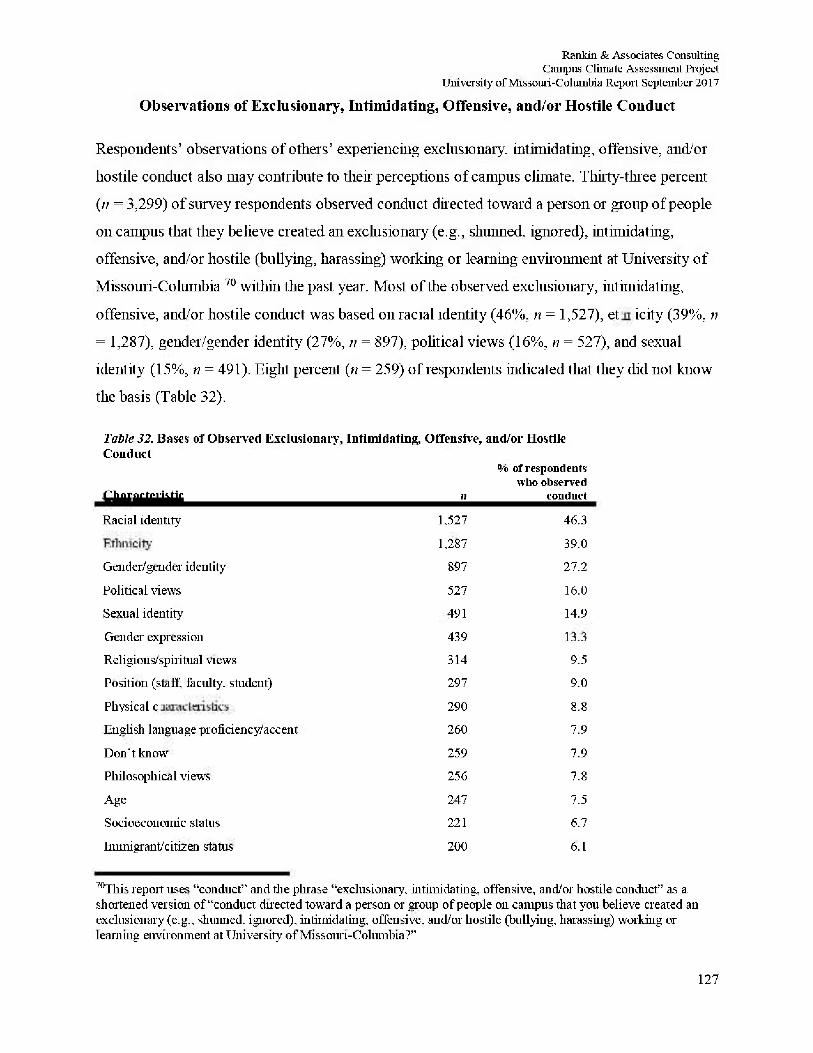
Rankin & Associates Consulting Campus Climate Assessment Project
University of Missouri-Columbia Repoit September 2017 Observations of Exclusionary, Intimidating, Offensive, and/or Hostile Conduct
Respondents' observations of others' experiencing exclusionary, intimidating, offensive, and/or
hostile conduct also may contribute to their perceptions of campus climate. Thirty-three percent
(;/ = 3,299) of survey respondents observed conduct directed toward a person or group of people
on campus that they believe created an exclusionary (e.g., shunned, ignored), intimidating,
offensive, and/or hostile (bullying, harassing) working or learning environment at University of
Missouri-Columbia 7 0 within the past year. Most of the observed exclusionary, intimidating,
offensive, and/or hostile conduct was based 011 racial identity (46%, n = 1,527), ethnicity (39%, n
= 1,287), gender/gender identity (27%, n = 897), political views (16%, n = 527), and sexual
identity (15%, n = 491). Eight percent (n = 259) of respondents indicated that they did not know
the basis (Table 32).
Table 32. Bases of Observed Exclusionary, Intimidating, Offensive, and/or Hostile Conduct
Characteristic
<¥a of respondeat® who observed
ft conduct
Racial identity* 1.527 46.3 Ethnicity 1,287 39.0
Gender/gender identity 897 27.2
Political views 527 16.0
Sexual identity 491 14.9
Gender expression 439 13.3
Religious/spiritual views 314 9.5
Position (staff, faculty, student) 297 9.0
Physical characteristics 290 8.8
English language proficiency/accent 260 7.9
Don't know 259 7.9
Philosophical views 256 7.8
Age 247 7.5
Socioeconomic status 221 6.7
Immigrant/citizen status 200 6.1
70This report uses "conduct'1 and the phrase "exclusionary, intimidating, offensive, and or hostile conduct" as a shortened version of "conduct directed toward a person or group of people 011 campus that you believe created an exclusionary (e.g., slimmed, ignored), intimidating, offensive, and/or hostile (bullying, harassing) working or learning environment at University of Missouri-Columbia?"
127
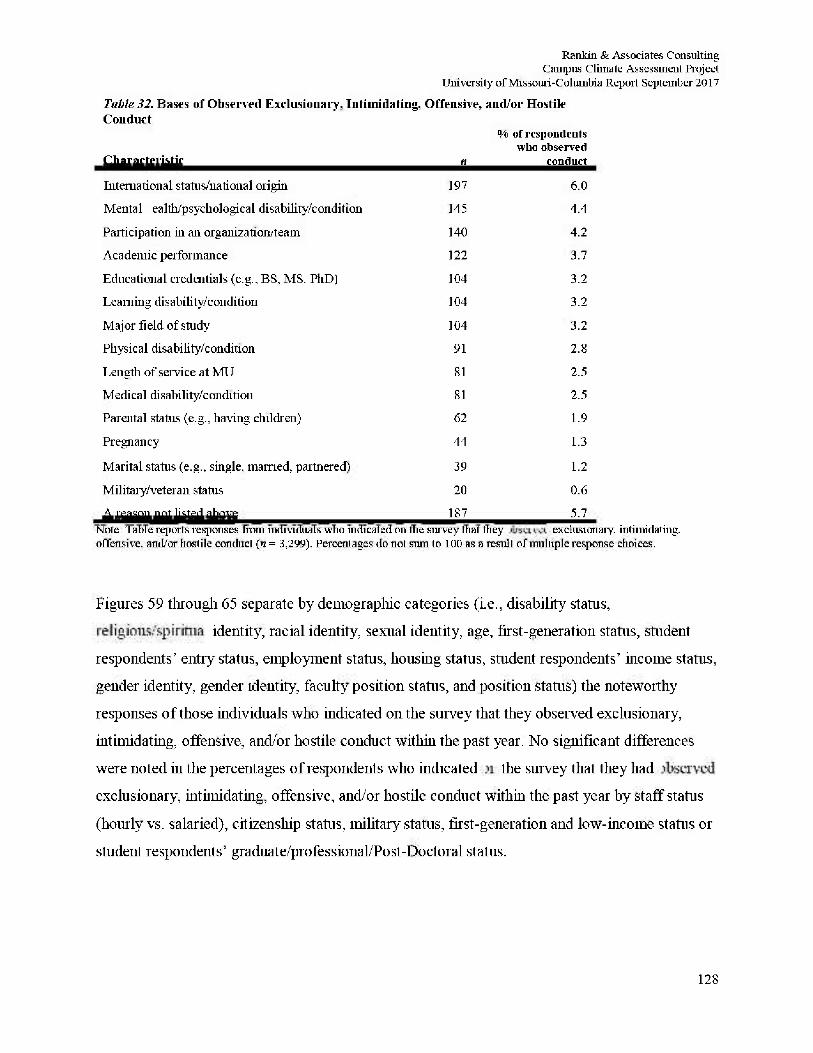
Rankin & Associates Consulting Campus Climate Assessment Project
University of Missouri-Columbia Report September 2017
Table 32. Bases of Observed Exclusionary, Intimidating, Offensive, and/or Hostile Conduct
Characteristic
%
«
of respondents who observed
conduct
International status/national origin 197 6.0
Mental health/psychological disability/condition 145 4.4
Participation in an organization'team 140 4.2
Academic performance 122 3.7
Educational credentials (e.g., BS, MS. PhD) 104 3.2
Learning disability/condition 104 3.2
Major field of study 104 3.2
Physical disability/condition 91 2.8
Length of service at MU 81 2.5
Medical disability/condition 81 2.5
Parental status (e.g., having children) 62 1.9
Pregnancy 44 1.3
Marital status (e.g., single, married, partnered) 39 1.2
Military/veteran status 20 0.6
A reason not listed above 187 5.7 Note: Table reports responses from individuals who indicated on the survey that they observed exclusionary, intimidating, offensive, and/or hostile conduct (n = 3,299). Percentages do not sum to 100 as a result of multiple response choices.
Figures 59 through 65 separate by demographic categories (i.e., disability status,
religious/spiritual identity, racial identity, sexual identity, age, first-generation status, student
respondents' entry status, employment status, housing status, student respondents' income status,
gender identity, gender identity, faculty position status, and position status) the noteworthy
responses of those individuals who indicated on the survey that they observed exclusionary,
intimidating, offensive, and/or hostile conduct within the past year. No significant differences
were noted in the percentages of respondents who indicated on the survey that they had observed
exclusionary, intimidating, offensive, and/or hostile conduct within the past year by staff status
(hourly vs. salaried), citizenship status, military status, first-generation and low-income status or
student respondents' graduate/professional/Post-Doctoral status.
128
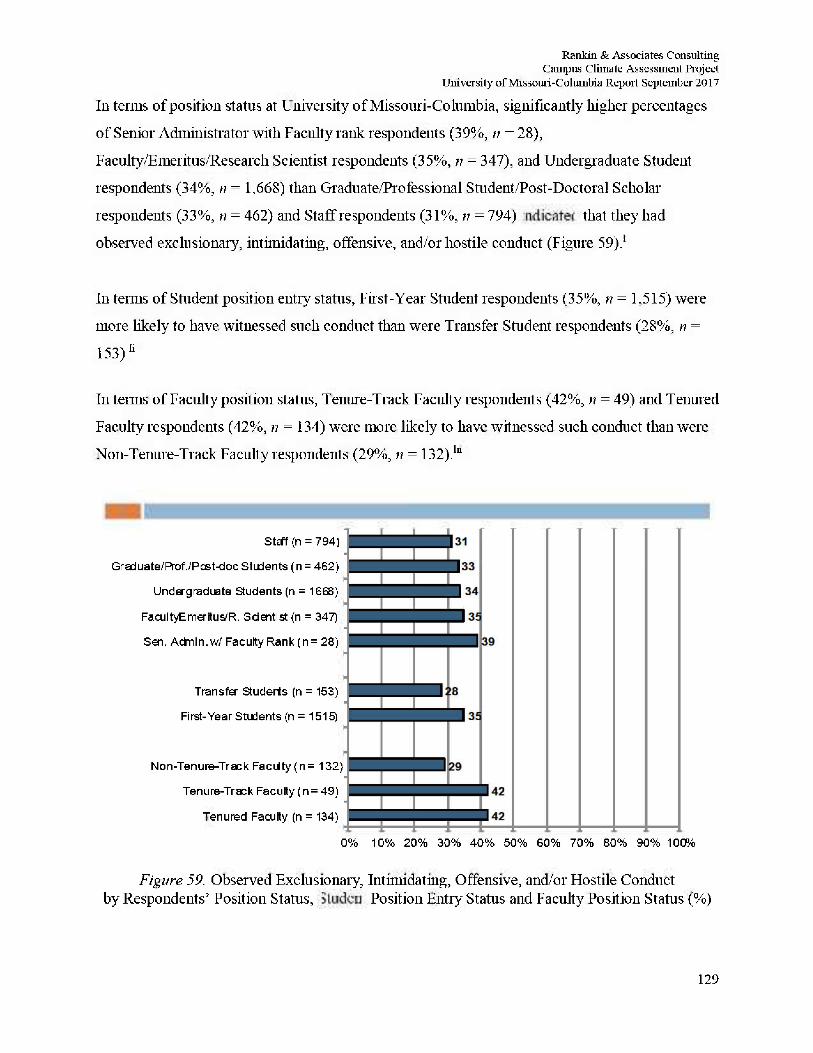
Rankin & Associates Consulting Campus Climate Assessment Project
University of Missouri-Columbia Report September 2017
111 terms of position status at University of Missouri-Columbia, significantly higher percentages
of Senior Administrator with Faculty rank respondents (39%, n = 28),
Faculty/Emeritus/Research Scientist respondents (35%, n = 347), and Undergraduate Student
respondents (34%, ti = 1,668) than Graduate/Professional Student/Post-Doctoral Scholar
respondents (33%, n = 462) and Staff respondents (31%, n = 794) indicated that they had
observed exclusionary, intimidating, offensive, and/or hostile conduct (Figure 59).1
In terms of Student position entry status, First-Year Student respondents (35%, n = 1,515) were
more likely to have witnessed such conduct than were Transfer Student respondents (28%, n =
153)*
In terms of Faculty position status, Tenure-Track Faculty respondents (42%, n = 49) and Tenured
Faculty respondents (42%, ti = 134) were more likely to have witnessed such conduct than were
Non-Tenure-Track Faculty respondents (29%, n = 132).lu
StEff (n = 794)
Graduate/Prof./Post-doc Students (n = 462)
Undergraduate Students (n = 1668)
FacultyEmeritus'R. Scientist (n = 347)
Sen. Admin, w/ Faculty Rank (n= 23)
Transfer Students (n = 153)
First-Year Students (n = 1515)
Non-Tenure-Track FacUty(n = 132)
Tenure-Track Faculty (n = 49)
Tenured Faculty (n = 134)
0% 10% 20% 30% 40% 50% 60% 70% 30% 90% 100%
Figure 59. Observed Exclusionary, Intimidating, Offensive, and/or Hostile Conduct by Respondents' Position Status, Student Position Entry Status and Faculty Position Status (%)
129
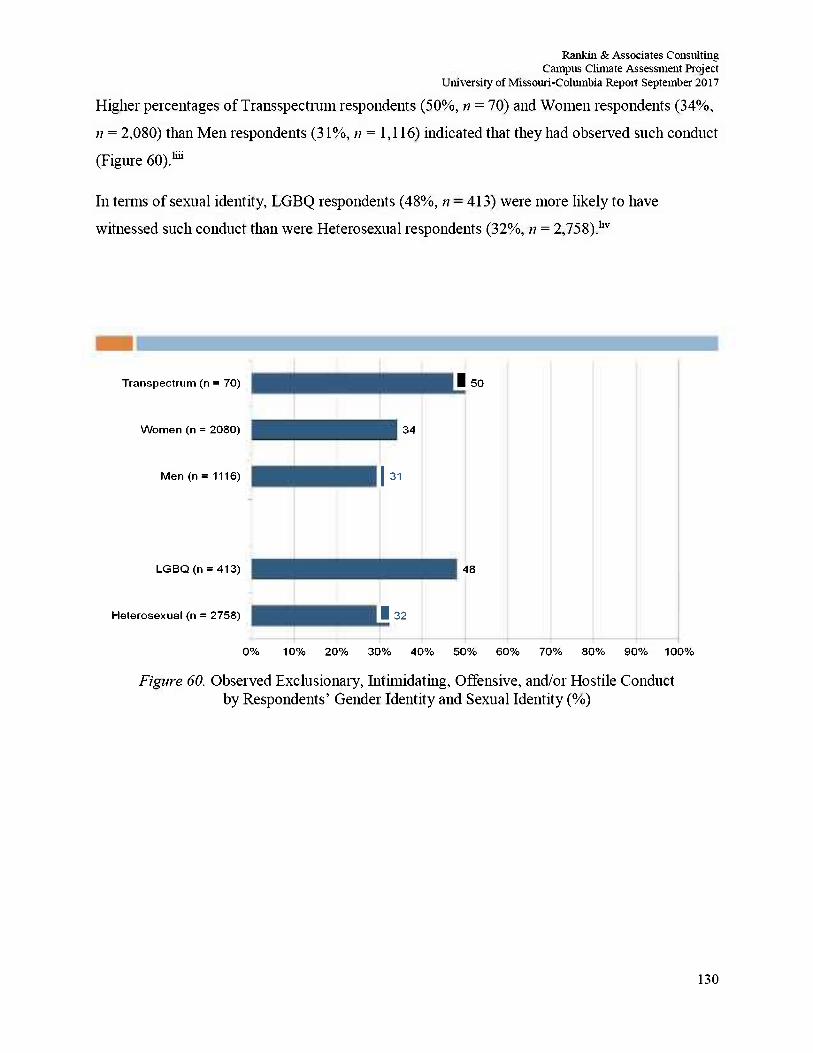
Rankin & Associates Consulting Campus Climate Assessment Project
University of Missouri-Columbia Report September 2017
Higher percentages of Transspectrum respondents (50%, ti = 70) and Women respondents (34%,
n = 2,080) than Men respondents (31%, n = 1,116) indicated that they had observed such conduct
(Figure 60) M
In terms of sexual identity, LGBQ respondents (48%, n = 413) were more likely to have
witnessed such conduct than were Heterosexual respondents (32%, n = 2,758). l iv
Transpectrum (n = 70)
Women (n = 2080)
Men (n = 1116)
LGBQ (n = 413)
Heterosexual (n = 2758)
1 50
34
1 31
48
1 32
0% 10% 20% 30% 40% 50% 60% 70% 80% 90% 100%
Figure 60. Observed Exclusionary, Intimidating, Offensive, and/or Hostile Conduct by Respondents' Gender Identity and Sexual Identity (%)
130
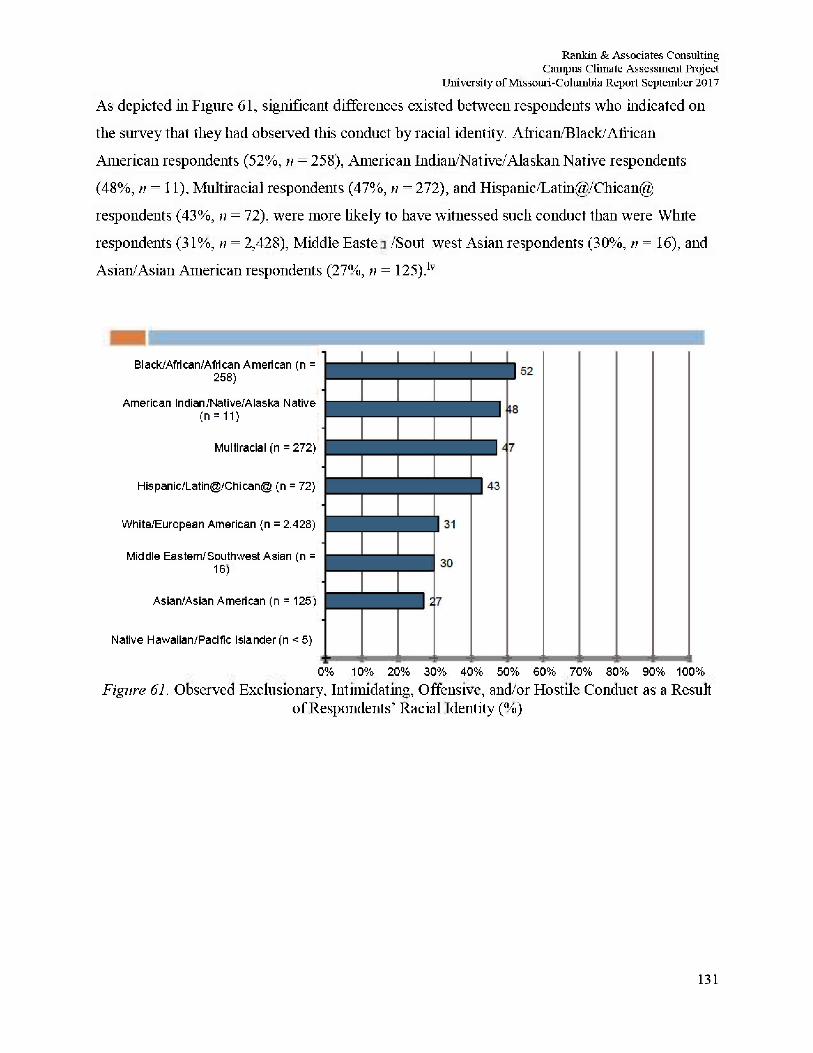
Rankin & Associates Consulting Campus Climate Assessment Project
University of Missouri-Columbia Report September 2017
As depicted in Figure 61, significant differences existed between respondents who indicated on
the survey that they had obseived this conduct by racial identity. African/Black/African
American respondents (52%, n = 258), American Indian/Native/Alaskan Native respondents
(48%, n = 11), Multiracial respondents (47%, n = 272), and Hispanic/Latin@/Chican@
respondents (43%, 11 = 72), were more likely to have witnessed such conduct than were White
respondents (31%, n = 2,428), Middle Easten/Soutthwest Asian respondents (30%, ri = 16), and
Asian/Asian American respondents (27%, n = 125).lv
Black/African/Africari American (n = 258)
American Indian/Native/Alaska Native (n = 11)
Multiracial (n = 272)
Hispanic/Latin@/Chican@ (n = 72)
White/European American (n = 2,428)
Middle Eastern/Southwest Asian (n = 16)
Asian/Asian American (n = 125)
Native Hawaiian/Padtie Islander (n < 5)
0% 10% 20% 30% 40% 50% 60% 70% 80% 90% 100% Figure 61. Observed Exclusionary, Intimidating, Offensive, and/or Hostile Conduct as a Result
of Respondents' Racial Identity (%)
131
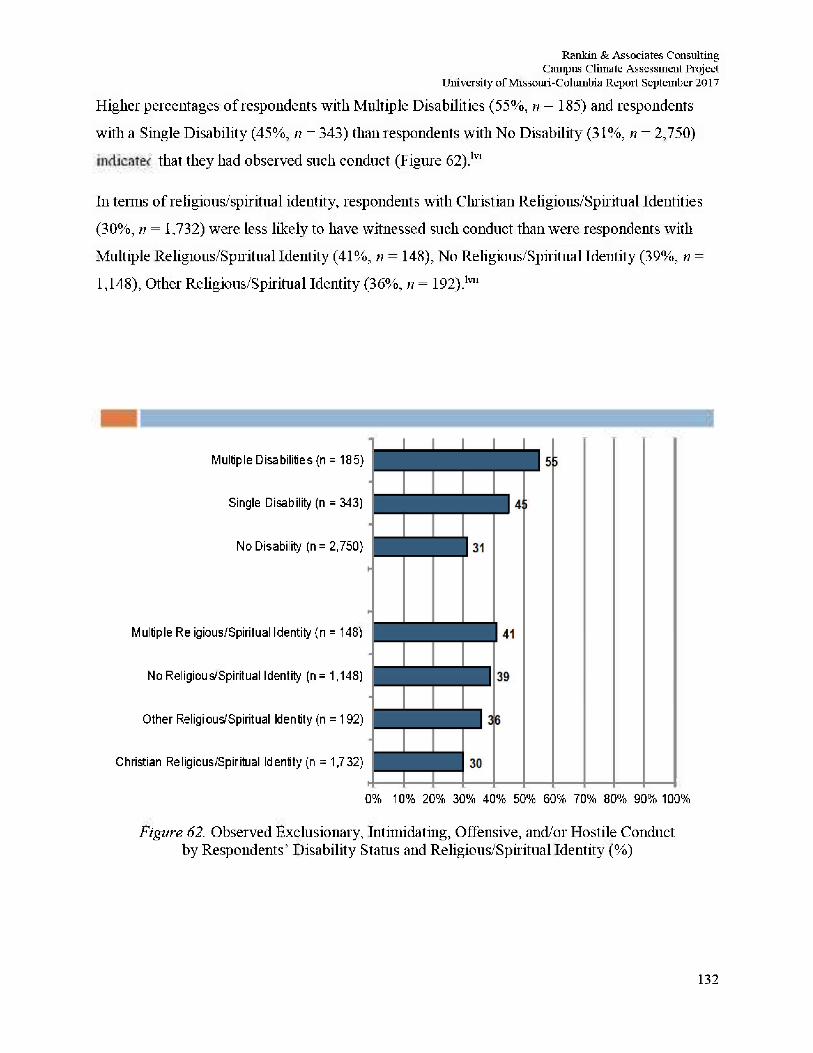
Rankin & Associates Consulting Campus Climate Assessment Project
University of Missouri-Columbia Report September 2017
Higher percentages of respondents with Multiple Disabilities (55%, n = 185) and respondents
with a Single Disability (45%, n = 343) than respondents with No Disability (31%, n = 2,750)
indicated that they had observed such conduct (Figure 62). lvi
In terms of religious/spiritual identity, respondents with Christian Religious/Spiritual Identities
(30%, vt = 1,732) were less likely to have witnessed such conduct than were respondents with
Multiple Religious/Spiritual Identity (41%, n = 148), No Religious/Spiritual Identity (39%, n =
1,148), Other Religious/Spiritual Identity (36%, n = 192) l v11
Multiple Disabilities (n = 185}
Single Disability (n = 343)
No Disability (n = 2,750}
Multiple Religious/Spiritual Identity (n = 148)
No Religious/Spiritual Identity (n = 1,148)
Other Religious/Spiritual Identity (n = 192)
Christian Religious/Spiritual Identity (n = 1,732)
0% 10% 20% 30% 40% 50% 60% 70% 80% 90% 100%
Figure 62. Observed Exclusionary, Intimidating, Offensive, and/or Hostile Conduct by Respondents' Disability Status and Religious/Spiritual Identity (%)
132
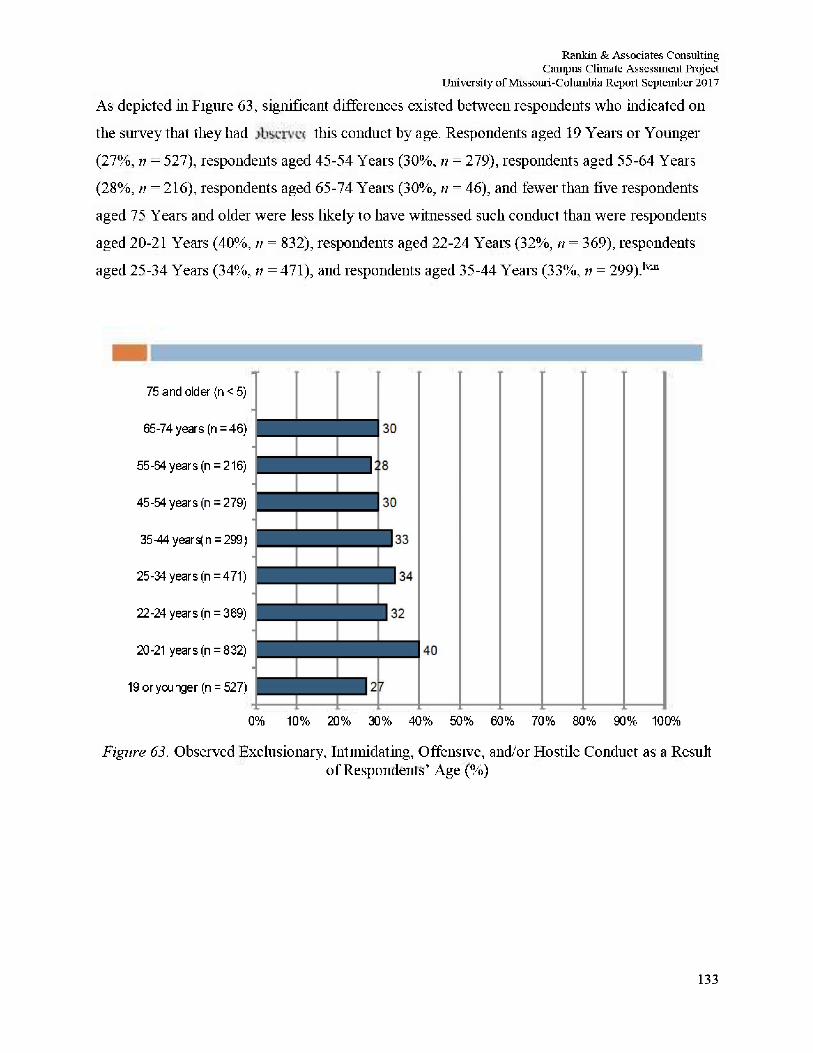
Rankin & Associates Consulting Campus Climate Assessment Project
University of Missouri-Columbia Report September 2017
As depicted in Figure 63, significant differences existed between respondents who indicated on
the survey that they had observed this conduct by age. Respondents aged 19 Years or Younger
(27%, n = 527), respondents aged 45-54 Years (30%, n = 279), respondents aged 55-64 Years
(28%, ti = 216), respondents aged 65-74 Years (30%, n = 46), and fewer than five respondents
aged 75 Years and older were less likely to have witnessed such conduct than were respondents
aged 20-21 Years (40%, n = 832), respondents aged 22-24 Years (32%, n = 369), respondents
aged 25-34 Years (34%, n = 471), and respondents aged 35-44 Years (33%, n = 299).1™
75 and older {n < 5)
65-74 years (n = 46)
55-64 years(n = 216)
45-54 years (n = 279)
35-44 years(n =299)
25-34 years(n = 471)
22-24 years (n = 369)
20-21 years (n = 832)
19 or younger (n = 527)
0% 10 % 20 % 30 % 40 % 50 % 60 % 70 % 80 % 90 % 10 0%
Figure 63. Observed Exclusionary, Intimidating, Offensive, and/or Hostile Conduct as a Result of Respondents' Age (%)
133
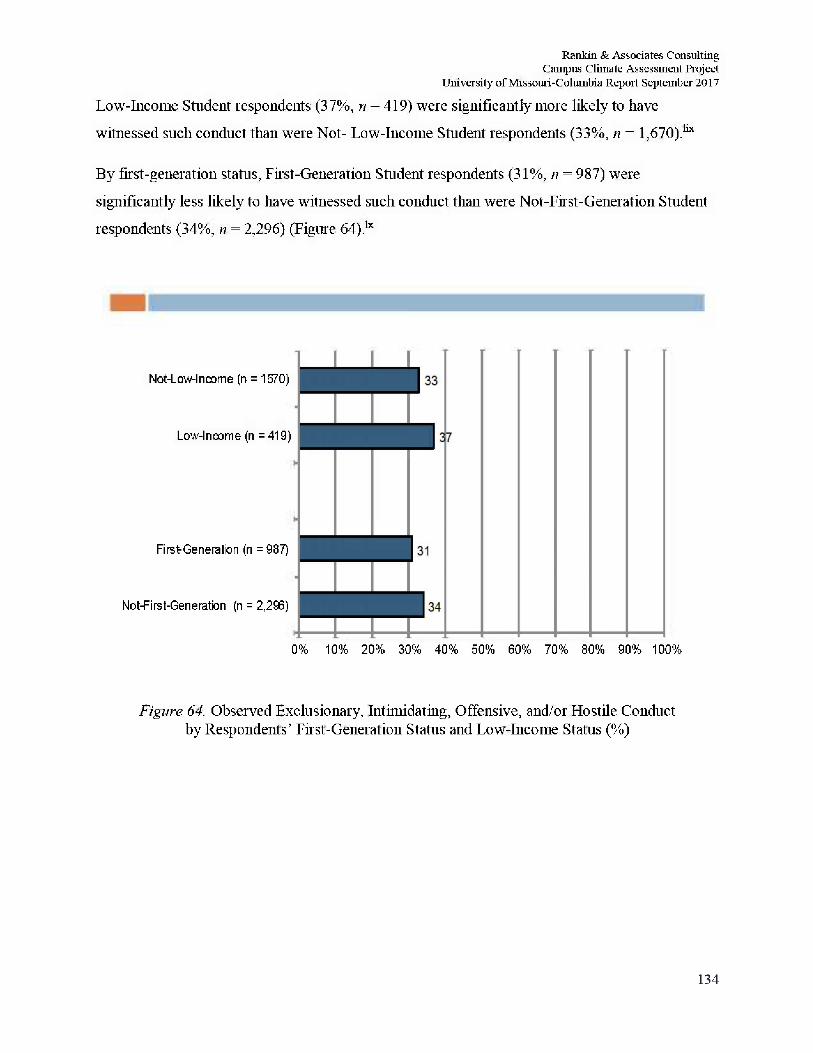
Rankin & Associates Consulting Campus Climate Assessment Project
University of Missouri-Columbia Report September 2017
Low-Income Student respondents (37%, n = 419) were significantly more likely to have
witnessed such conduct than were Not- Low-Income Student respondents (33%, n = l,670). l ix
By first-generation status, First-Generation Student respondents (31%, n = 987) were
significantly less likely to have witnessed such conduct than were Not-First-Generation Student
respondents (34%, n = 2,296) (Figure 64).Lx
Not-Low-Income (n = 1670)
Low-Income (n = 419)
First-Generation (n = 987)
Not-First-Generation (n = 2,296)
0% 10% 20% 30% 40% 50% 60% 70% 80% 90% 100%
Figure 64. Observed Exclusionary, Intimidating, Offensive, and/or Hostile Conduct by Respondents' First-Generation Status and Low-Income Status (%)
134
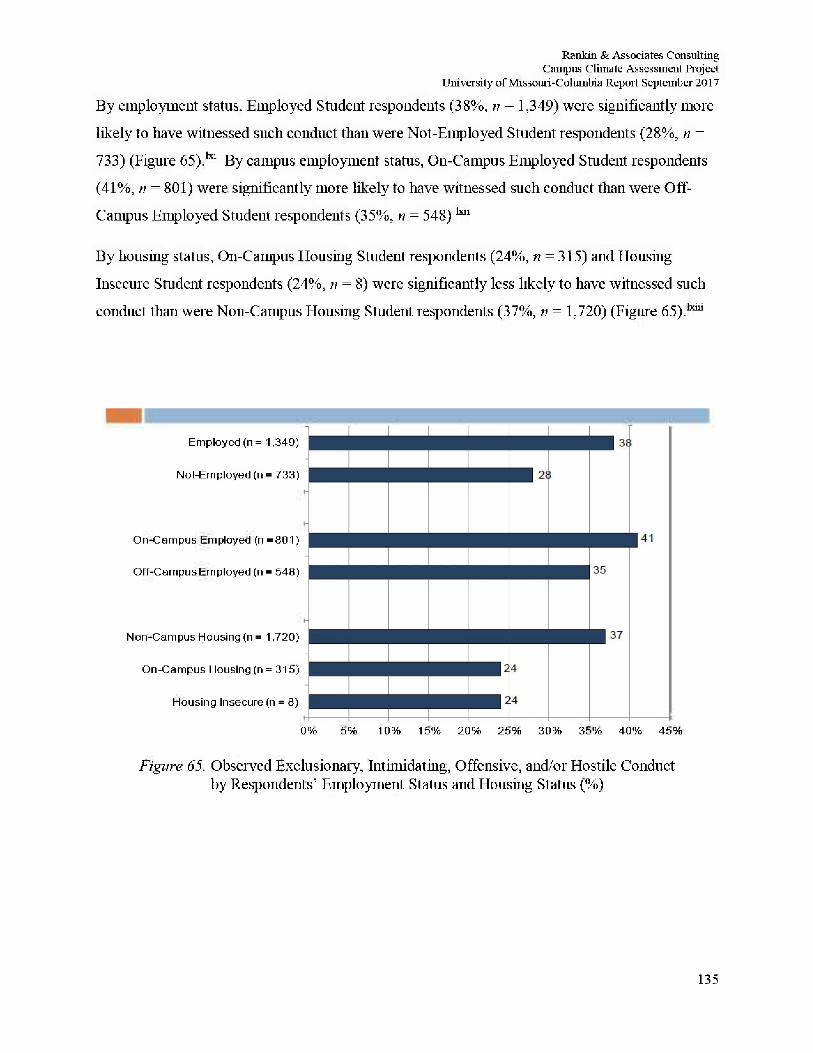
Rankin & Associates Consulting Campus Climate Assessment Project
University of Missouri-Columbia Report September 2017
By employment status. Employed Student respondents (38%, n = 1,349) were significantly more
likely to have witnessed such conduct than were Not-Employed Student respondents (28%, n =
733) (Figure 65).1x1 By campus employment status, Oil-Campus Employed Student respondents
(41%, w = 801) were significantly more likely to have witnessed such conduct than were Off-
Campus Employed Student respondents (35%, n = 548).1x11
By housing status, On-Campus Housing Student respondents (24%, n = 315) and Housing
Insecure Student respondents (24%, n = 8) were significantly less likely to have witnessed such
conduct than were Non-Campus Housing Student respondents (37%, n = 1,720) (Figure 65) .k i l i
Employed (n= 1,349)
Not-Employed (n = 733)
On-Campus Employed (n =801)
Off-Campus Employed (n = 548)
Non-Campus Housing (n = 1,720)
On-Campus Housing (n = 315)
Housing Insecure (n = 8)
0% 5% 10% 15% 20% 25% 30% 35% 40% 45%
Figure 65. Observed Exclusionary, Intimidating, Offensive, and/or Hostile Conduct by Respondents' Employment Status and Housing Status (%)
135
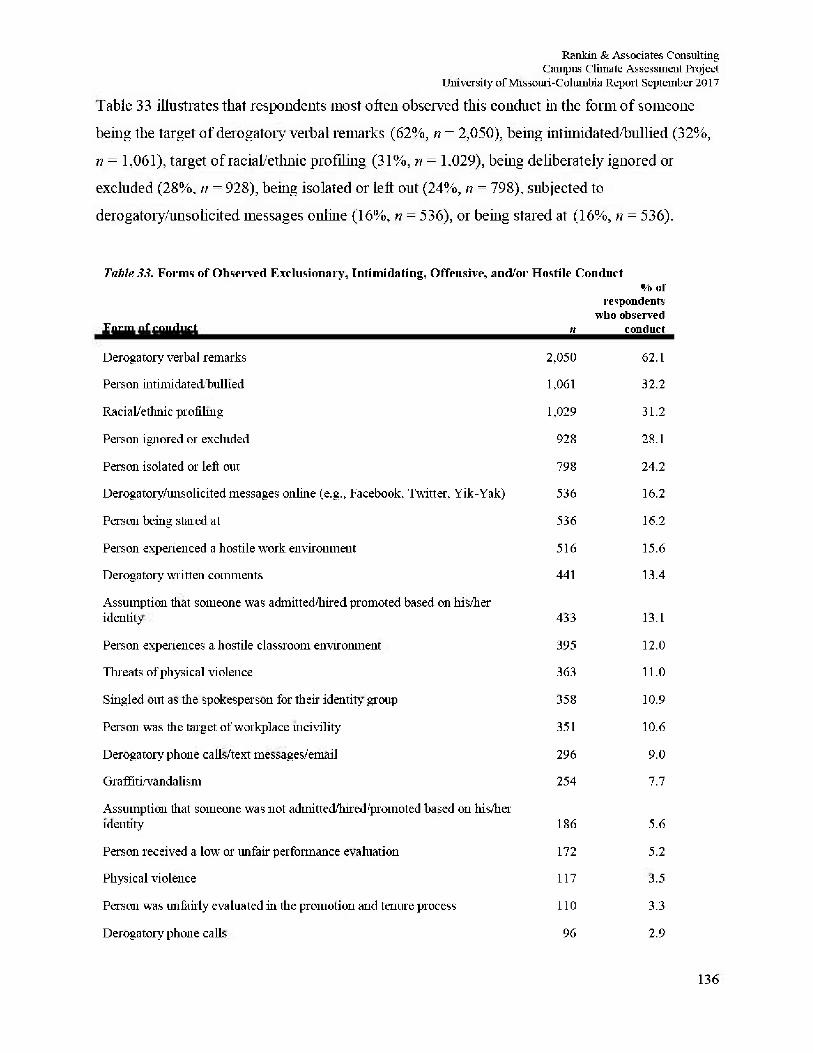
Rankin & Associates Consulting Campus Climate Assessment Project
University of Missouri-Columbia Report September 2017
Table 33 illustrates that respondents most often observed this conduct in the form of someone
being the target of derogatory verbal remarks (62%, n = 2,050), being intimidated/bullied (32%,
n = 1,061), target of racial/ethnic profiling (31%, n = 1,029), being deliberately ignored or
excluded (28%, n = 928), being isolated or left out (24%, n = 798), subjected to
derogatory/unsolicited messages online (16%, n = 536), or being stared at (16%, n = 536).
Table 33. Forms of Observed Exclusionary, Intimidating, Offensive, and/or Hostile Conduct
Form ofconduct n
% of respondents
who observed conduct
Derogatory verbal remarks 2,050 62.1
Person intimidated bullied 1,061 32.2
RaciaL ethnic profiling 1,029 31.2
Person ignored or excluded 928 28.1
Person isolated or left out 798 24.2
Derogatory/unsolicited messages online (e.g., Facebook. Twitter, Yik-Yak) 536 16.2
Person being stared at 536 16.2
Person experienced a hostile work environment 516 15.6
Derogatory written comments 441 13.4
Assumption that someone was admitted/hiredpromoted based on his/her identity 433 13.1
Person experiences a hostile classroom environment 395 12.0
Threats of physical violence 363 11.0
Singled out as the spokesperson for their identity* group 358 10.9
Person was the target of workplace incivility 351 10.6
Derogatory phone calls/text messages/email 296 9.0
Gr a ffiti. vanda li sm 254 7.7
Assumption that someone was not admitted hired promoted based on his/her identity 186 5.6
Person received a low or unfair performance evaluation 172 5.2
Physical violence 117 3.5
Person was unfairly evaluated in the promotion and tenure process 110 3.3
Derogatory phone calls 96 2.9
136
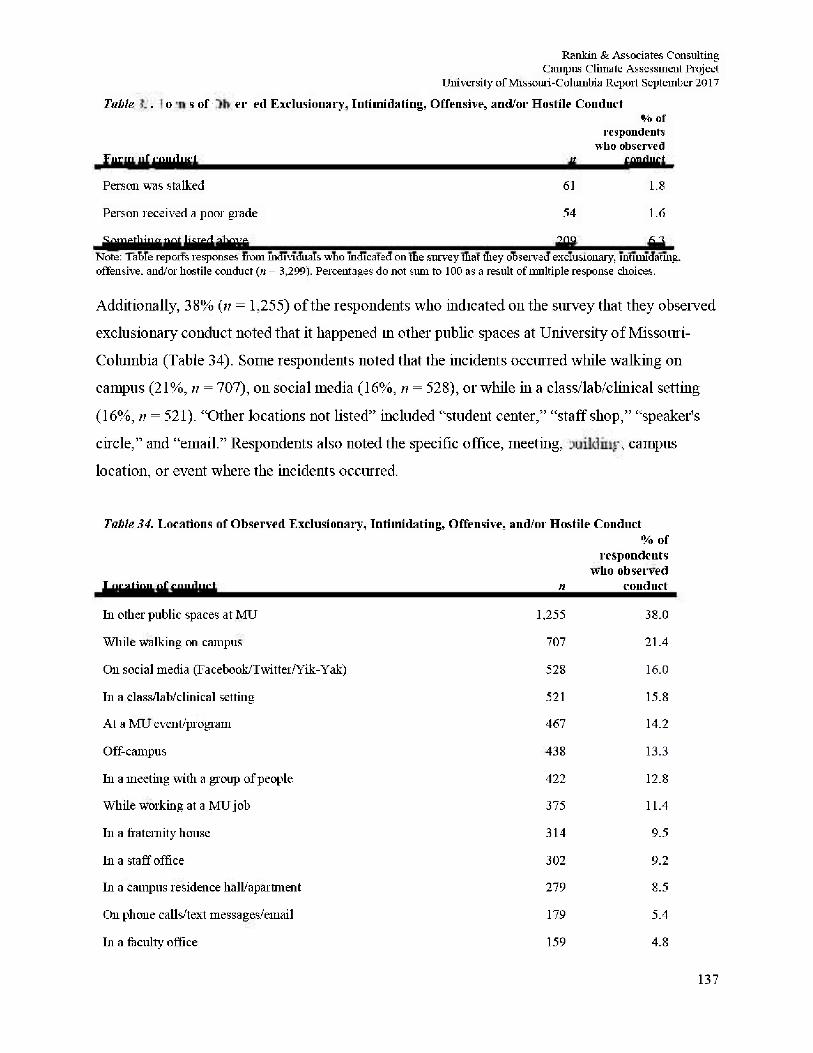
Rankin & Associates Consulting Campus Climate Assessment Project
University of Missouri-Columbia Report September 2017
Table . o s of e r e d Exclusionary, Intimidating, Offensive, and/or Hostile Conduct % of
respondents wlio observed
Form of conduct n conduct
Person was stalked 61 1.8
Person received a poor grade 54 1.6
Something not listed above 209 6.3 Note: Table reports responses from individuals who indicated on the survey that they observed exclusionary, intimidating, offensive, and/or hostile conduct (n = 3,299). Percentages do not stun to 100 as a result of multiple response choices.
Additionally, 38% (;/ = 1,255) of the respondents who indicated on the survey that they obseived
exclusionary conduct noted that it happened mother public spaces at University of Missouri-
Columbia (Table 34). Some respondents noted that the incidents occurred while walking on
campus (21%, n = 707), on social media (16%, n = 528), or while hi a class/lab/clhiical setting
(16%, n = 521). "Other locations not listed" included "student center," "staff shop," "speaker's
circle," and "email." Respondents also noted the specific office, meeting, building, campus
location, or event where the incidents occurred.
Table 34. Locations of Observed Exclusionary, Intimidating, Offensive, and/or Hostile Conduct % of
respondents who observed
Location of conduct n conduct
In other public spaces at MU 1,255 38.0
While walking on campus 707 21.4
On social media (Facebook/Twitter/Yik-Yak) 528 16.0
In a class/lab/clinical setting 521 15.8
At a MU event/program 467 14.2
Off-campus 438 13.3
In a meeting with a group of people 422 12.8
While working at a MU job 375 11.4
In a fraternity house 314 9.5
In a staff office 302 9.2
In a campus residence hall/apartment 279 8.5
On phone calls/text messages/email 179 5.4
In a faculty office 159 4.8
137
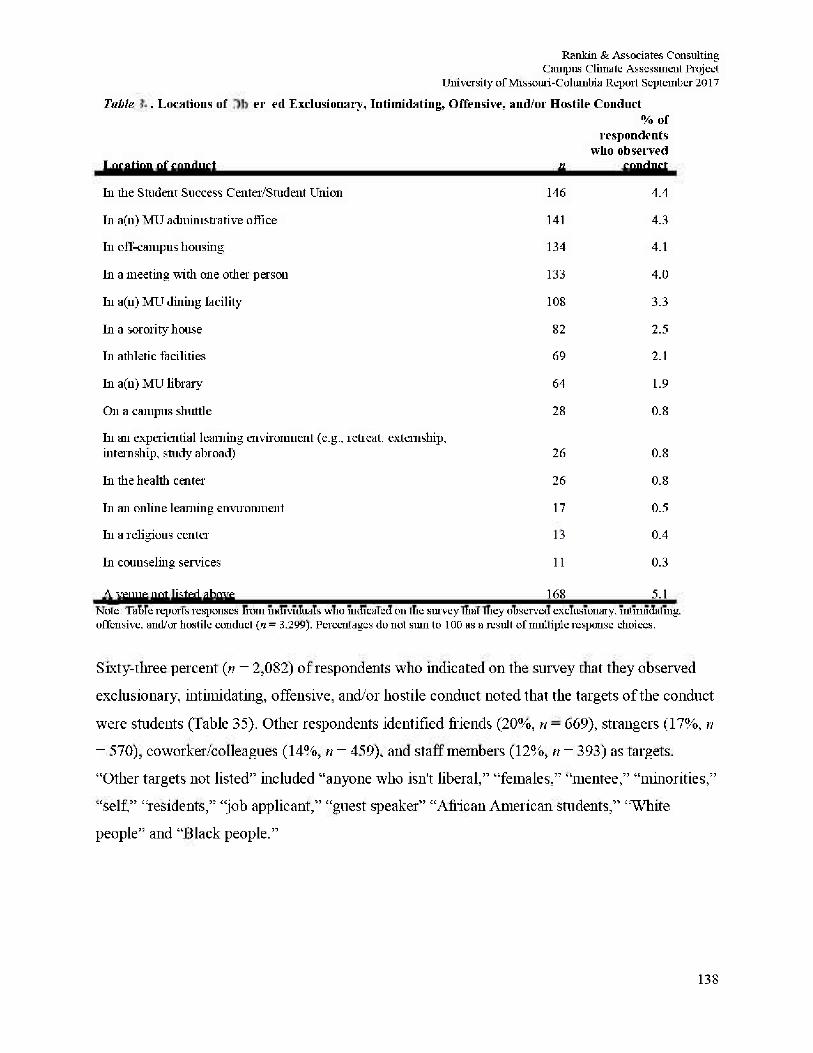
Rankin & Associates Consulting Campus Climate Assessment Project
University of Missouri-Columbia Report September 2017
Table . Locations of e r e d Exclusionary, Intimidating, Offensive, and/or Hostile Conduct % of
respondents who observed
Location of conduct n conduct
hi the Student Success Calter/Student Union 146 4.4
hi a(n) MU administrative office 141 4.3
hi off-campus housing 134 4.1
Li a meeting with one other person 133 4.0
Li a(n) MU dining facility 108 3.3
Li a sorority house 82 2.5
Li athletic facilities 69 2.1
Li a(n) MU library 64 1.9
On a campus shuttle 28 0.8
Li an experiential learning environment (e.g., retreat, extemship, internship, study abroad) 26 0.8
Li the health center 26 0.8
Li an online learning environment 17 0.5
Li a religious center 13 0.4
Li counseling services 11 0.3
A venue not listed above 168 5.1 Note: Table reports responses from individuals who indicated on the survey that they observed exclusionary, intimidating, offensive, and/or hostile conduct (n = 3.299). Percentages do not sum to 100 as a result of multiple response choices.
Sixty-three percent (n = 2,082) of respondents who indicated on the survey that they observed
exclusionary, intimidating, offensive, and/or hostile conduct noted that the targets of the conduct
were students (Table 35). Other respondents identified friends (20%, n = 669), strangers (17%, n
= 570), coworker/colleagues (14%, n = 459). and staff members (12%, n = 393) as targets.
"Other targets not listed" included "anyone who isn't liberal," "females," "mentee," "minorities,"
"self," "residents," "job applicant," "guest speaker" "African American students," "White
people" and "Black people."
138
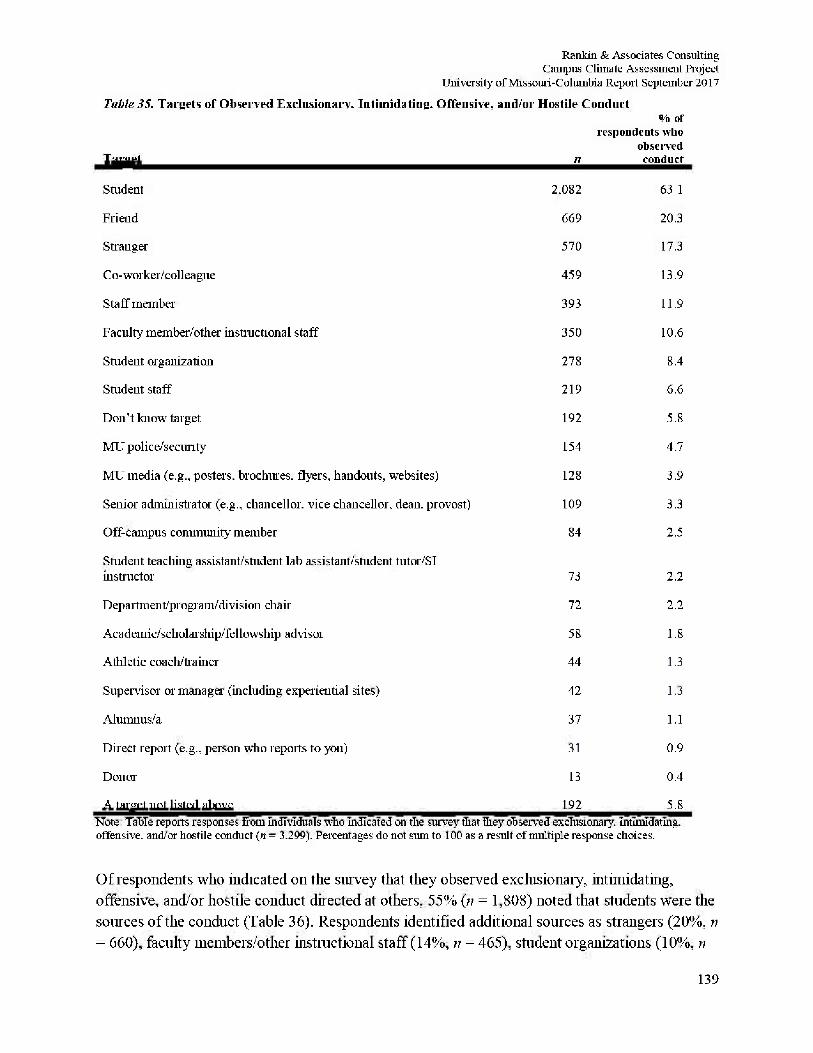
Rankin & Associates Consulting Campus Climate Assessment Project
University of Missouri-Columbia Report September 2017
Table 35. Targets of Observed Exclusionary. Intimidating. Offensive, and/or Hostile Conduct
Target n
% of respondents wlio
observed conduct
Student 2,082 63.1
Friend 669 20.3
Stranger 570 17.3
C o- worker/colleague 459 13.9
Staff member 393 11.9
Faculty member/other instructional staff 350 10.6
Student organization 278 8.4
Student staff 219 6.6
Don't know target 192 5.8
MU police/security 154 4.7
MU media (e.g., posters, broclmres, flyers, handouts, websites) 128 3.9
Senior administrator (e.g., chancellor, vice chancellor, dean, provost) 109 3.3
Off-campus community member 84 2.5
Student teaching assistant/student lab assistant/student tutor/Si instructor 73 2.2
DepartnieiU/program/di vision chair 72 2.2
Ac a demic/scholar ship/fel 1 owship advisor 58 1.8
Athletic coach/trainer 44 1.3
Supervisor or manager (including experiential sites) 42 1.3
Alumnus/a 37 1.1
Direct report (e.g., person who reports to you) 31 0.9
Donor 13 0.4
A target not listed above 192 5.8 Note: Table reports responses from individuals who indicated on the survey that they observed exclusionary, intimidating, offensive, and/or hostile conduct (n = 3.299). Percentages do not sum to 100 as a result of multiple response choices.
Of respondents who indicated 011 the survey that they observed exclusionary, intimidating, offensive, and/or hostile conduct directed at others, 55% (n = 1,808) noted that students were the sources of the conduct (Table 36). Respondents identified additional sources as strangers (20%, n = 660), faculty members/other instructional staff (14%, n = 465), student organizations (10%, n
139
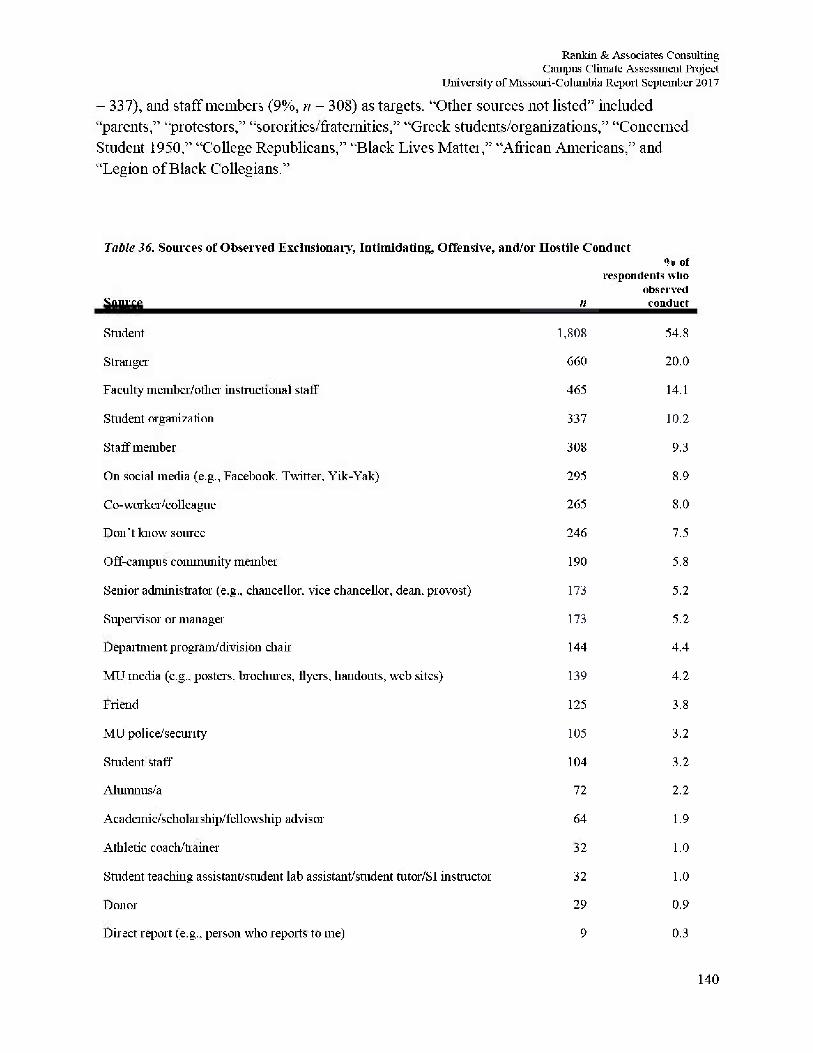
Rankin & Associates Consulting Campus Climate Assessment Project
University of Missouri-Columbia Report September 2017
= 337), and staff members (9%, n = 308) as targets. "Other sources not listed" included "parents," "protestors," "sororities/fraternities," "Greek students/organizations," "Concerned Student 1950," "College Republicans," "Black Lives Mat te l ," "African Americans," and "Legion of Black Collegians."
Table 36. Sources of Observed Exclusionary, Intimidating, Offensive, and/or Hostile Conduct ®/» of
respondents who observed
Source n
®/» of respondents who
observed conduct
Student 1,808 54.8
Stranger 660 20.0
Faculty member/other instructional staff 465 14.1
Student organization 337 10.2
Staff member 308 9.3
On social media (e.g., Facebook. Twitter, Yik-Yak) 295 8.9
C o- worker/colleague 265 8.0
Don't know source 246 7.5
Off-campus community member 190 5.8
Senior administrator (e.g., chancellor, vice chancellor, dean, provost) 173 5.2
Supervisor or manager 173 5.2
Department program/division chair 144 4.4
MU media (e.g., posters, brochures, flyers, handouts, web sites) 139 4.2
Friend 125 3.8
MU police/security 105 3.2
Student staff 104 3.2
Alumnus/a 72 2.2
Ac a demic/scholar ship/fell owship advi s or 64 1.9
Athletic coach/trainer 32 1.0
Student teaching assistant student lab assistant/student tutor/Si instructor 32 1.0
Donor 29 0.9
Direct report (e.g., person who reports to me) 9 0.3
140
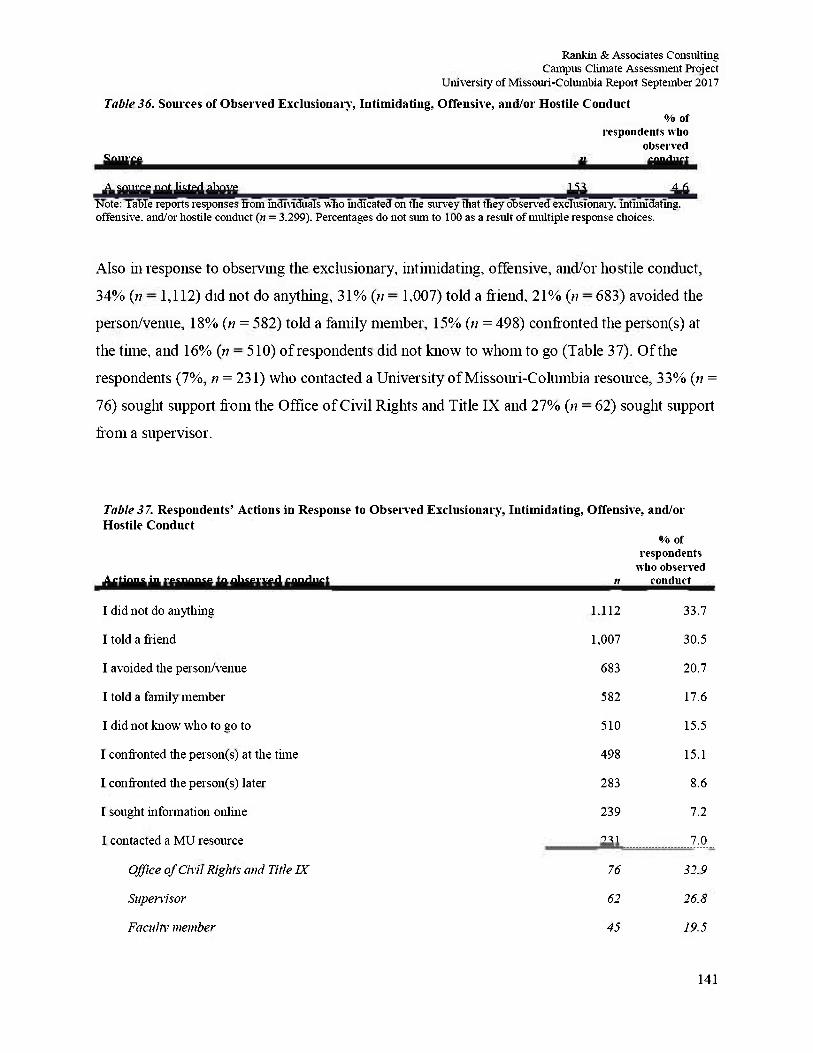
Rankin & Associates Consulting Campus Climate Assessment Project
University of Missouri-Columbia Report September 2017 Table 36. Sources of Observed Exclusionary, Intimidating, Offensive, and/or Hostile Conduct
®/o of respondents who
observed Source n conduct
A source not listed above 153 4.6 Note: Table reports responses from individuals who indicated on the survey that they obseived exclusionary, intimidating, offensive, and/or hostile conduct (n = 3.299). Percentages do not sum to 100 as a result of multiple response choices.
Also iu response to observing the exclusionary, intimidating, offensive, and/or hostile conduct,
34% (w = 1,112) did not do anything, 31% (w = 1,007) told a friend, 21% (« = 683) avoided the
person/venue, 18% (n = 582) told a family member, 15% (n = 498) confronted the person(s) at
the time, and 16% (n = 510) of respondents did not know to w h o m to go (Table 37). Of the
respondents (7%, n = 231) who contacted a University of Missouri-Columbia resource, 33% (n =
76) sought support from the Office of Civil Rights and Title IX and 27% (n = 62) sought support
from a supervisor.
Table 3 7. Respondents' Actions in Response to Observed Exclusionary, Intimidating, Offensive, and/or Hostile Conduct
Actions in response to observed conduct n
0/0 of respondents
who observed conduct
I did not do anything 1.112 33.7
I told a friend 1,007 30.5
I avoided the person/venue 683 20.7
I told a family member 582 17.6
I did not know who to go to 510 15.5
I confronted the person(s) at the time 498 15.1
I confronted the person(s) later 283 8.6
I sought information online 239 7.2
I contacted a MU resource 231 7.0
Office of Civil Rights and Title IX 76 32.9
Supervisor 62 26.8
Faculty member 45 19.5
141
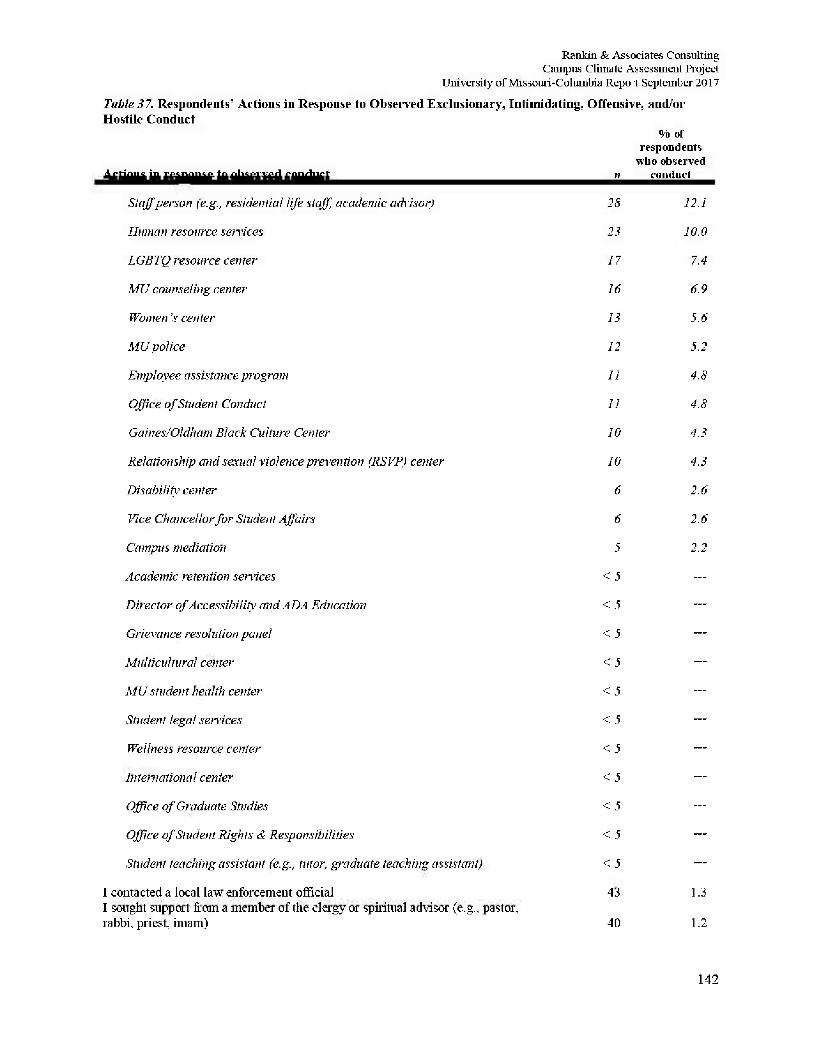
Rankin & Associates Consulting Campus Climate Assessment Project
University of Missouri-Columbia Repot September 2017 Table 37. Respondents' Actions in Response to Observed Exclusionary, Intimidating, Offensive, and/or Hostile Conduct
% of respondents
who observed Actions in response to observed conduct n conduct Actions in response to observed conduct n
% of respondeuts
who observed conduct
Staffperson (e.g., residential life staff, academic adv isor) 28 12.1
Human resource services 23 10.0
LGBTQ resource center 17 7.4
MU counseling center 16 6.9
Women's center 13 5.6
MU police 12 5.2
Employee assistance program 11 4.8
Office of Student Conduct 11 4.8
Gaines/Oldham Black Culture Center 10 4.3
Relationship and sexual violence prevention (RSVP) center 10 4.3
Disability center 6 2.6
Vice Chancellor for Student Affairs 6 2.6
Campus mediation 5 2.2
Academic retention services <5 . . .
Director of Accessibility and ADA Education <5 . . .
Grievance resolution panel <5 . . .
Multicultural center <5 . . .
MU student health center <5 . . .
Student legal senices <5 . . .
Wellness resource center <5 . . .
International center <5 . . .
Office of Graduate Studies <5 . . .
Office of Student Rights & Responsibilities <5 . . .
Student teaching assistant (e.g., tutor, graduate teaching assistant) <5 . . .
I contacted a local law enforcement official I sought support from a member of the clergy or spiritual advisor (e.g., pastor, rabbi, priest, imam)
43
40
1.3
1.2
142
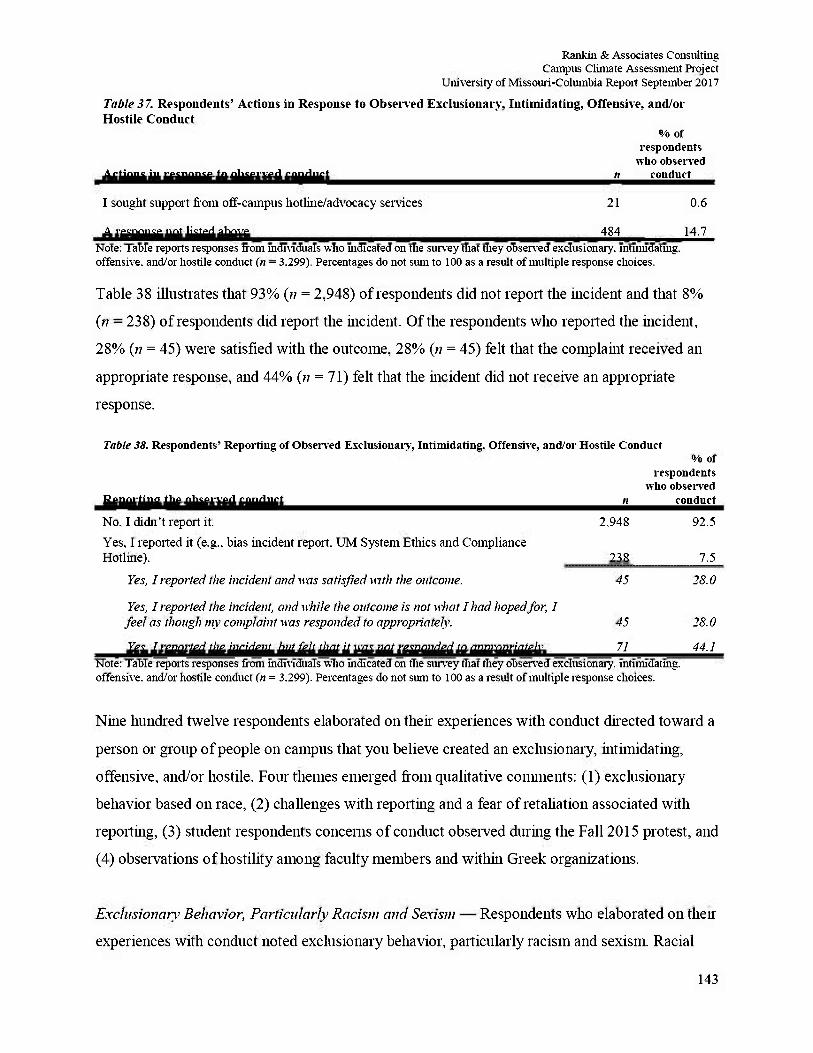
Rankin & Associates Consulting Campus Climate Assessment Project
University of Missouri-Columbia Report September 2017 Table 3 7. Respondents' Actions in Response to Obsei ved Exclusionary, Intimidating, Offensive, and/or Hostile Conduct
Actions in response to observed conduct n
o/o of respondents
who observed conduct
I sought support from off-campus hotline/advocacy senices 21 0.6
A response not listed above 484 14.7 Note: Table reports responses from individuals who indicated on the survey that they obseived exclusionary, intimidating, offensive, and/or hostile conduct (n = 3.299). Percentages do not sum to 100 as a result of multiple response choices.
Table 38 illustrates that 93% (n = 2,948) of respondents did not report the incident and that 8%
(n = 238) of respondents did report the incident. Of the respondents who reported the incident,
28% {n = 45) were satisfied with the outcome, 28% (» = 45) felt that the complaint received an
appropriate response, and 44% (n = 71) felt that the incident did not receive an appropriate
response.
Table 38. Respondents' Reporting of Observed Exclusionary, Intimidating, Offensive, and/or Hostile Conduct
Reporting the observed conduct n
o/o of respondents
who observed conduct
No, I didn't report it. 2.948 92.5
Yes, I reported it (e.g.. bias incident report. UM System Ethics and Compliance Hotline). 238 7.5
Yes, I reported the incident and was satisfied mth the outcome. 45 28.0
Yes, I reported the incident, and while the outcome is not what I had hoped for, I fee1 as though my complaint was responded to appropriately. 45 28.0
Yes, I reported the incident, but felt that it was not responded to appropriately. 71 44.1 Note: Table reports responses from individuals who indicated on the survey that they obseived exclusionary, intimidating, offensive, and/or hostile conduct (n = 3.299). Percentages do not stun to 100 as a result of multiple response choices.
Nine hundred twelve respondents elaborated on their experiences with conduct directed toward a
person or group of people on campus that you believe created an exclusionary, intimidating,
offensive, and/or hostile. Four themes emerged from qualitative comments: (1) exclusionary
behavior based on race, (2) challenges with reporting and a fear of retaliation associated with
reporting, (3) student respondents concerns of conduct obseived during the Fall 2015 protest, and
(4) observations of hostility among faculty members and within Greek organizations.
Exclusionary Behavior, Particularly Racistu arid Sexism — Respondents who elaborated on then"
experiences with conduct noted exclusionary behavior, particularly racism and sexism. Racial
143
Rankin & Associates Consulting Campus Climate Assessment Project
University of Missouri-Columbia Report September 2017
slurs such as "monkeys," thugs," "stupid black [misogynistic slur]," and the "[racial slur against
African Americans]" were reported. Respondents also noted, "Student contact information
ending up in the hands of a white supremacist organization without our consent." Another
respondent shared, "Student this semester said her two white roommates moved out of the dorm
(unannounced) neither wanted to have a black roommate.1' Another respondent elaborated, 'There
have been many instances where people whom are African American have been racially profiled
which makes me feel uncomfortable on this campus because it continues to happen and nothing
gets done about it." Regarding sexism, one respondent noted, "Two males dropping off a male
friend for class honking and hollering at a female on the sidewalk." Another respondent
explained, "Sexism is pervasive and difficult to prove. I've seen numerous cases, but the
perpetrators have been diligent at covering their tracks." Exclusionary and intimidating behavior
was also noted toward a range of other minorities on campus. One respondent shared, "Two
Jewish men were walking on campus wearing traditional clothing and a group of male students
stared at them, laughed at them, and one student yelled 'Shalom' at them in a mocking way."
Other respondent reported, "Students with disabilities are shunned," "My friend was bullied and
threatened because she is transgender"and "My boyfriend who is Asian has received racial
slurs by other students on the MU campus." Another respondent added, "Muslims are shunned,
particularly female Muslims." Another respondent elaborated, "I'm a gay man and I hear
homophobic comments like, 'No, he's a '[homophobic slur against men]' and 'they're disgusting'
on a semi-regular basis while walking on campus." Respondents who elaborated on conduct
reported exclusionary behavior directed at minorities at University of Missouri-Columbia.
Reporting Challenges and Fears -Respondents who elaborated on unacceptable conduct
described challenges and fears associated with the reporting process. Some respondents
elaborated on not feeling as though their efforts to report were followed up on. For example,one
respondent shared, "Nothing was done as far as an investigation and the University did not take
any action." Another respondent explained, 'I do not get information back on what happened to
the accused so I do not know if I am satisfied with the outcome or not." Other respondents
added,'It was swept under arug" and now, after reporting, "The complaint will go nowhere."
Other respondents echoed these sentiments. One respondent elaborated, "RSVPAitle IX offices
are a joke. Someone who has been sexually assaulted shouldn't be ignored by the people who
144
Rankin & Associates Consulting Campus Climate Assessment Project
University of Missouri-Columbia Report September 2017
LITERALLY get paid to respond to these situations." Other respondents associated a lack of
proper follow through with the campus power dynamics. For example, one respondent shared,
"The MU offices who handle complaints report to upper administration. Upper administration
protects abusers and thus encourage a hostile work environment." Another respondent added, "I
reported instances to the provost and title iX office. They covered these up as a dean, the provost
herself and senior faculty were involved." Fears were also described when respondents
addressing reporting hi their narratives about conduct. One respondent shared, "I did nothing hi
fear of it behig a target and/or retribution." Another respondent shared the negative impacts of
their observation of other's reporting that impacted their decision to not report, "As a result
multiple people have fled the lab and are worse off m then' careers because of the treatment they
received." Finally, one respondent posed, "You're kidding right? You think people who can and
will be retaliated agahist ought to stand up hi this environment? Look around and tell me how
that's worked out. It's unbelievable you'd even consider that to be one of our options."
Respondents who elaborated oil conduct described the reporting process as both risky and
fin it less.
Fall 2015 Protests — Respondents who elaborated oil then experiences with conduct directed
toward a person or group of people oil campus that you believe created an exclusionary,
intimidating, offensive, and/or hostile described the protests during the Fall of 2015.
Respondents reported the protests were "unsettling," "obnoxious, not polite," "a bit over the top"
and to be of a "VIOLENT NATURE." One respondent shared, "Dining the concerned student
1950 protest, I felt incredibly uncomfortable on campus as a white female student." Other
respondents elaborated on experiences they associated with the Concerned Student of 1950. For
example, "The bullying, intimidation, and racist attitude of concerned students 1950 is well
documented." .Another respondent noted, "The actions of the group: Concerned Students of
1950, lias made this campus a worse place to be." Another respondent explained, "In my view,
the entile incident was to stir up strife where there wasn't any. It was an attack on the entire
University and the individuals at the University. The actions taken since the event have not
benefited the campus rather they have caused a more hostile environment." Other respondent
elaborated on protests more generally. One respondent shared, "During the protest, a male, black
student and I (wlhte female) were talking outside of a building on campus. Students around one
145
Rankin & Associates Consulting Campus Climate Assessment Project
University of Missouri-Columbia Report September 2017
of the protest sites glared at us, made comments about how we shouldn't associate with each
other and that we were traitors to our race. "Another respondent explained, 'This campus is
very racially divided due to the protesters last year. They have made many people feel
uncomfortable and uninterested in their cause." One respondent reflected on the perceived
impacts of the protests, "Did you see what concerned student 1950 did to Tim Wolfe? How
pathetic. "Another respondent elaborated, ''You let a group of 30 individuals take down the
president of the university, the head football coach, and put the university 20 million dollars in
debt..." Respondents who elaborated on concerning conduct noted the protests of the fall of
2015.
Hostility & Disrespect (Greek Life and Faculty) -Respondents who elaborated ontheir
observations and experience with conduct noted a range of hostility, bullying and disrespectful
language. Greek Life was often noted in these narratives. One respondent reported, I see fights
in the downtown area and Greek town area all the time, whether over racial issues or just
masculinity fights over insignificant things." Another respondent shared, 'My sister was walking
back to the dorm we were staying in and 3 sorority girls walked by and laughed at her for no
reason and called her a 'fat [misogynistic slur]'." Respondents also reported racial biased
incidents associated with Greek like. For example, "on several occasion shearing different
members of at least two different fraternities use the [racial slur against African Americans]
when referring to black students." Another respondent noted,"IwitnessedDeltaUpsilonverbally
harass members of LBC activities committee. The police did nothing. They stood there and
watched. "Other respondents elaborated on faculty conduct, "faculty can be really nasty,"
"faculty do not treat staffwell"and "a faculty member [was]demeaning. "Another respondent
noted,"anissuewithafacultymemberwho bullies every staff person, undergraduate, GRA, and
volunteer that works for them."Other respondents elaborated on more general observations and
experience with hostility, bullying and disrespectful language. One respondent shared,
"Bullying takes place in my office on a regular basis,usually based on tenure within the
division/department."Other respondents added, "people calling others harsh words behind their
backs," "Hateful words based on opposing political views," ''people yellingateachother"and
someone who ''verbally attacked a freshmen." Some respondent reported inappropriate uses of
humor. For example, "S ome studentshave the tendency to make offensive comment sbut claim
that they're jokes" and "Students who tend to 'joke 'about certain 146
Rankin & Associates Consulting Campus Climate Assessment Project
University of Missouri-Columbia Report September 2017
tilings that aren't necessarily funny." Respondents who elaborated on conduct described hostility
and disrespect in many forms.
lA chi-square test was conducted to compare percentages of respondents who indicated that they observed exclusionary, intimidating, offensive, and or hostile conduct by position status: "/2 (4. N= 9,927) = 13.46. p < .01. UA chi-square test was conducted to compare percentages of respondents who indicated diat they observed exclusionary, intimidating, offensive, and/or hostile conduct by student entry status: x 2 ( l . N= 4,857) = 9.35, p < .01. ""A chi-square test was conducted to compare percentages of respondents who indicated that they observed exclusionary, intimidating, offensive, and/or hostile conduct by faculty position status: %2(2, N= 901) = 17.05,/) < .001. m A chi-square test was conducted to compare percentages of respondents who indicated that they observed exclusionary, intimidating, offensive, and/or hostile conduct by gender identity: %2(2, N= 9,848) = 29.47,p< .001. U vA chi-square test was conducted to compare percentages of respondents who indicated that they observed exclusionary, intimidating, offensive, and/or hostile conduct by sexual identity*: x 2 ( l , N = 9,538) = 95.96. p < .001. lvA chi-square test was conducted to compare percentages of respondents who observed exclusionary, intimidating, offensive, and/or hostile conduct by racial identity: x2 P , N = 9,634) = 159.98,/) < .001. h l A chi-square test was conducted to compare percentages of respondents who indicated that they observed exclusionary, intimidating, offensive, and/or hostile conduct by disability status: %2(2,N= 9,851) = 130.39,/) < .001. h l l A chi-square test was conducted to compare percentages of respondents who indicated that they observed exclusionary, intimidating, offensive, and/or hostile conduct by religious/spiritual identity x 2 (3, N = 9,731) = 84.83, pC.OOl. l v m A chi-square test was conducted to compare percentages of respondents who observed exclusionary, intimidating, offensive, and/or hostile conduct by age: x2 (8. N~ 9,230) = 88.03./J < .001. E xA chi-square test was conducted to compare percentages of Smdent respondents observed exclusionary intimidating, offensive, and/or hostile conduct by low-income status: x2 (1 • JV = 6,130) = 5.79,/? < .05. k A chi-square test was conducted to compare percentages of Smdent respondents observed exclusionary, intimidating, offensive, and/or hostile conduct by first-generation status: x2 (1. jV= 9,881) = 9.83. p < .01. LxlA chi-square test was conducted to compare percentages of Smdent respondents observed exclusionary intimidating, offensive, and/or hostile conduct by employment status: %2(1.N= 6,148) = 69.15,/? < .001. *™A chi-square test was conducted to compare percentages of Smdent respondents observed exclusionary, intimidating, offensive, and/or hostile conduct by campus employment status: "/2 (1, iV= 3,533) = 13.64. p < .001. Lx™A clii-square test was conducted to compare percentages of Smdent respondents observed exclusionary, intimidating, offensive, and/or hostile conduct by housing status: y} (2. N= 6.016) = 68.59,/) < .001.
147
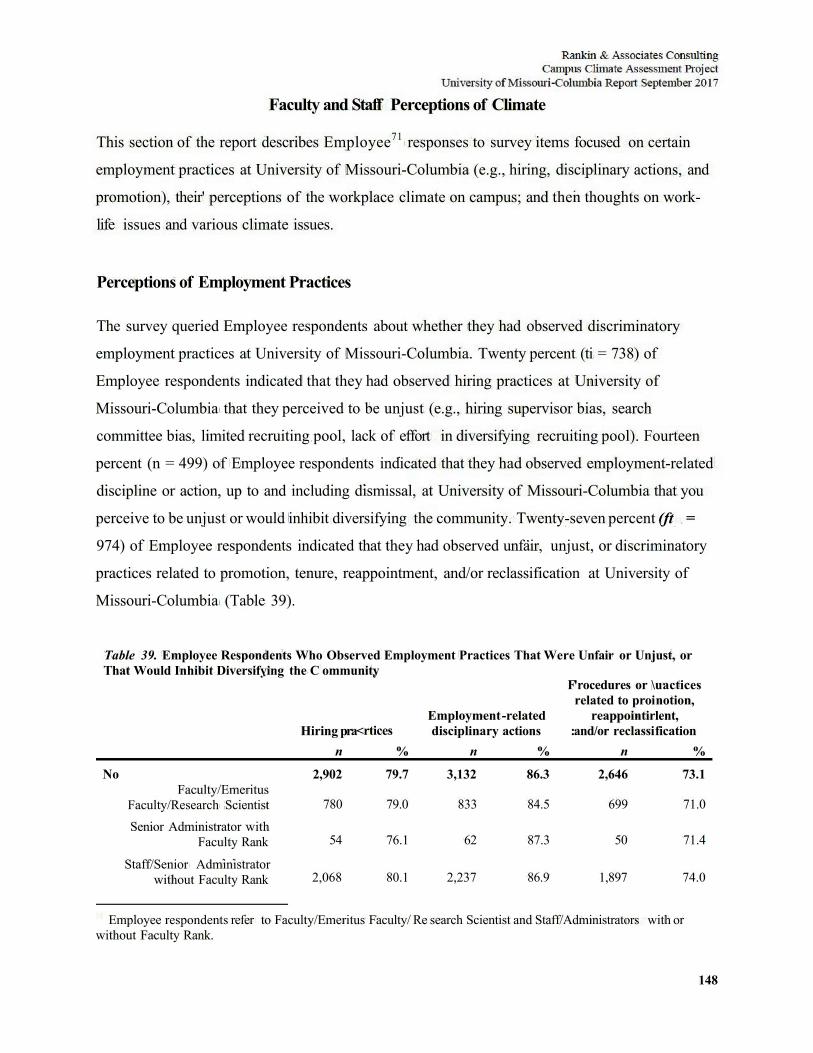
148
Faculty and Staff Perceptions of Climate
This section of the report describes Employee71 responses to survey items focused on certain
employment practices at University of Missouri-Columbia (e.g., hiring, disciplinary actions, and
promotion), their' perceptions of the workplace climate on campus; and then thoughts on work-
life issues and various climate issues.
Perceptions of Employment Practices
The survey queried Employee respondents about whether they had observed discriminatory
employment practices at University of Missouri-Columbia. Twenty percent (ti = 738) of
Employee respondents indicated that they had observed hiring practices at University of
Missouri-Columbia that they perceived to be unjust (e.g., hiring supervisor bias, search
committee bias, limited recruiting pool, lack of effort in diversifying recruiting pool). Fourteen
percent (n = 499) of Employee respondents indicated that they had observed employment-related
discipline or action, up to and including dismissal, at University of Missouri-Columbia that you
perceive to be unjust or would inhibit diversifying the community. Twenty-seven percent (ft =
974) of Employee respondents indicated that they had observed unfair, unjust, or discriminatory
practices related to promotion, tenure, reappointment, and/or reclassification at University of
Missouri-Columbia (Table 39).
Table 39. Employee Respondents Who Observed Employment Practices That Were Unfair or Unjust, or That Would Inhibit Diversifying the C ommunity
Hiring pra< n
rtices %
Employment disciplinary
n
F
-related actions :
%
'rocedures or \ related to proi
reappointir and/or reclassi
n
uactices notion, lent, fication
% No 2,902 79.7 3,132 86.3 2,646 73.1
Faculty/Emeritus Faculty/Research Scientist 780 79.0 833 84.5 699 71.0 Senior Administrator with
Faculty Rank 54 76.1 62 87.3 50 71.4
Staff/Senior Administrator without Faculty Rank 2,068 80.1 2,237 86.9 1,897 74.0
Employee respondents refer to Faculty/Emeritus Faculty/ Re search Scientist and Staff/Administrators with or without Faculty Rank.
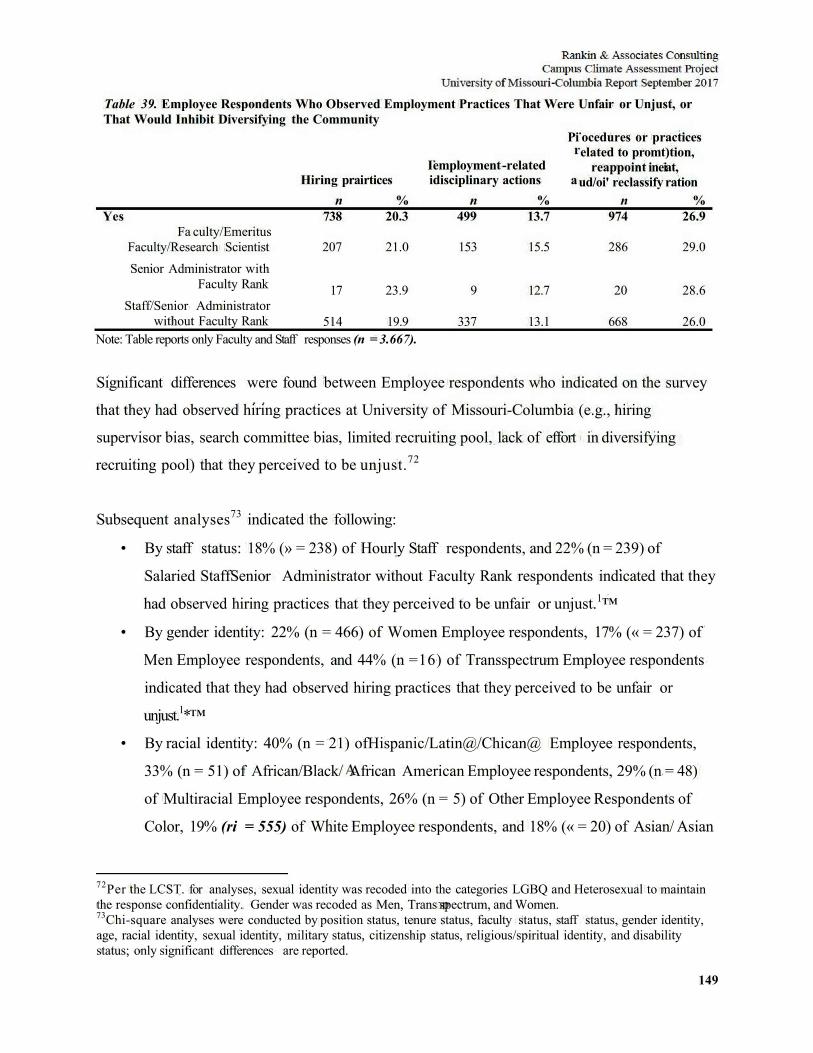
149
Table 39. Employee Respondents Who Observed Employment Practices That Were Unfair or Unjust, or That Would Inhibit Diversifying the Community
Hiring prai n
I rtices i
%
employment disciplinary
n
Pi
-related actions a
%
ocedures or pr elated to promt
reappoint inei ud/oi' reclassify
n
actices )tion, at, ration
% Yes 738 20.3 499 13.7 974 26.9
Fa culty/Emeritus Faculty/Research Scientist 207 21.0 153 15.5 286 29.0 Senior Administrator with
Faculty Rank 17 23.9 9 12.7 20 28.6 Staff/Senior Administrator
without Faculty Rank 514 19.9 337 13.1 668 26.0 Note: Table reports only Faculty and Staff responses (n = 3.667).
Significant differences were found between Employee respondents who indicated on the survey
that they had observed hiring practices at University of Missouri-Columbia (e.g., hiring
supervisor bias, search committee bias, limited recruiting pool, lack of effort in diversifying
recruiting pool) that they perceived to be unjust.72
Subsequent analyses73 indicated the following:
• By staff status: 18% (» = 238) of Hourly Staff respondents, and 22% (n = 239) of
Salaried StaffSenior Administrator without Faculty Rank respondents indicated that they
had observed hiring practices that they perceived to be unfair or unjust.1™
• By gender identity: 22% (n = 466) of Women Employee respondents, 17% (« = 237) of
Men Employee respondents, and 44% (n =16) of Transspectrum Employee respondents
indicated that they had observed hiring practices that they perceived to be unfair or
unjust.1*™
• By racial identity: 40% (n = 21) ofHispanic/Latin@/Chican@ Employee respondents,
33% (n = 51) of African/Black/ African American Employee respondents, 29% (n = 48)
of Multiracial Employee respondents, 26% (n = 5) of Other Employee Respondents of
Color, 19% (ri = 555) of White Employee respondents, and 18% (« = 20) of Asian/ Asian
72Per the LCST. for analyses, sexual identity was recoded into the categories LGBQ and Heterosexual to maintain the response confidentiality. Gender was recoded as Men, Trans spectrum, and Women. 73Chi-square analyses were conducted by position status, tenure status, faculty status, staff status, gender identity, age, racial identity, sexual identity, military status, citizenship status, religious/spiritual identity, and disability status; only significant differences are reported.
150
American Employee respondents indicated that tliey had observed lining practices that
they perceived to be unfair or unjust.1™
• By sexual identity: 19% (a = 612) of Heterosexual Employee respondents and 27% (n =
66) of LGBQ Employee respondents indicated that they had observed hiring practices
that they perceived to be unfair or unjust.1™1
• By religious/spiritual identity: 18% (w = 375) of Christian Religious/Spiritual Identity
Employee respondents, 22% (n = 40) of Other Religious/Spiritual Identity Employee
respondents, 22% (n = 243) of No Religious/Spiritual Identity Employee respondents,
and 26% (n = 38) of Multiple Religious/Spiritual Identities Employee respondents
indicated that they had observed hiring practices that they perceived to be unfair' or
unjust.1™
• By disability status: 18% (n = 600) of No Disability Employee respondents, 32% (n = 71)
of Single Disability Employee respondents, and 44% (n = 55) of Multiple Disabilities
Employee respondents indicated that they had observed hiring practices that they
perceived to be unfair' or unjust.1™
Of those Employee respondents (20%, n = 738) who indicated that they had observed
discriminatory hiring at University of Missouri-Columbia, 28% (n = 207) noted that it was based
on ethnicity, 24% (n = 177) on gender/gender identity, 24% (« = 176) on nepotism/cronyism,
23% (n = 169) on racial identity, and 22% (n = 164) on age.
Three hundred ten Faculty and Staff respondents elaborated on their perceptions about hiring at
University of Missouri-Cohimbia. Three themes emerged related to perceptions of unjust hiring
practices: (1) inclusion concerns, (2) reported incidents of nepotism and cronyism, and (3)
perceived reverse discrimination.
Inclusion Concerns — Respondents who elaborated on their perceptions of hiring practices noted
inclusion concern for a range of perceived minorities. One respondent explained, "hi filling a
recent open position in my office, my supervisor chose to not interview qualified male
applicants." The respondent continued on noting that their supervisor suggested that a male
would not work for that particular level of salary. Another respondent shared, "In a couple of
hiring situations, I witnessed biased in hiring local teaching professors who were
known without any effort to recruit/interview more-experienced or ethnic minority candidates."
Similarly, yet another respondent noted. L'I have served 011 search committees which eliminated
qualified minority candidates after face to face interview for 'not interviewing well' as code for
making interviewer uncomfortable." Other reports included; "Inappropriate comments were
made when discussing a female faculty candidate" and "If someone is difficult to understand, or
perceived to be difficult to understand based on their name, they are overlooked for more English
sounding names." Finally, one respondent described, "I heard supervisors laughing about a
transgendered [applicant] that interviewed for a position. While I do not know if that person was
qualified, I know they were granted an interview (which to me implies they were). I thought it
was rude, especially coming from supervisors in a public area." Respondents who elaborated 011
their perceptions of hiring practices described gender identity, race, ethnicity, and sex biases.
Nepotism & Cronyism — Respondent who elaborated 011 hiring practices at University of
Missouri-Columbia reported nepotism and cronyism. One respondent noted, "positions at MU
often seem to get filled by hiring an already-known person." Others added, "Nepotism is
rampant" and "widespread nepotism." Another respondent elaborated, "Several more qualified
candidates have been passed up for recent job openings within my division for people who were
friends/friendly with the head of the division." Similarly, another respondent reported, "Staff
member was hired because she was friends with the department chair, did not meet the
qualifications and was not recommended by the committee for hire." Other respondents
described other layers of identity based discrimination in tandem with their narratives about
nepotism and cronyism. For example, one respondent explained, "The hiring practices in my
division are unfair, discriminatory and, at times, illegal. Cronyism is rampant, as is
discrimination of all types." Another respondent shared, "There have been episodes of Nepotism
and Gender discrimination but if you bring them up, you are retaliated against." Respondents
who elaborated 011 their perceptions of hiring practices cited incident after incident of nepotism
and cronyism.
Reverse Discrimination — Respondents reported exclusion of \Vl11te people at University of
Missouri-Columbia. One respondent noted, "White males get discriminated against." Other
respondents reported, "A non-minority will be passed over for a less qualified minority" and
151
152
"men are passed over for support positions, specifically middle aged white males." The
perception that people have been hired based on diversity rather than merit was mentioned hi
many of the narratives that established this theme. For example, one respondent expressed, "An
employee should not be hired to compensate for perceived minority biases but only lin ed if they
are qualified for the job!" Another respondent stated, "Hire the people based upon qualification
not race or gender. All the positions I see lately lined are black or female." Other respondents
echoed similar observations of lining practices, including "Hiring faculty based on their
ethnicity, not their capability." Finally, respondents also explained their disapproval of these
practices. One respondent elaborated, "Hiring 011 the basis of diversity instead of merit is racist!"
Another respondent added, "Hiring people because of their race or sexual preference is wrong."
One respondent concluded their narrative describing perceived reverse discrimination of White
people with, ".ALL LIVES MATTER, NOT JUST BLACK LIVES." Respondents who
elaborated on their perceptions about hiring at University of Missouri-Columbia described
reverse discrimination of White people.
153
Twenty-seven percent (n = 974) of Faculty and Staff respondents indicated that they had
observed unjust promotion, tenure, reappointment, and/or reclassification practices at University
of Missouri-Columbia. Of those individuals, 21% (n = 201) believed that the unjust practices
were based on gender/gender identity, 18% (n = 177) on position, 17% (n = 168) on
nepotism/cronyism, and 15% (n = 146) on age.
Subsequent analyses74 indicated the following:
• By faculty status: 40% (n = 131) of Tenured Faculty respondents, 28% (n = 32) of
Tenure-Track Faculty respondents, and 21% (n = 98) of Non-Tenure-Track Faculty
respondents indicated that they had observed unjust promotion, tenure, reappointment,
and/or reclassification practices at University of Missouri-Co lumb ia.Lxx
• By racial identity: 46% (n = 24) ofHispanic/Latm@/Chican@ Employee respondents.
35% (n = 54) of African/Black/African American Employee respondents, 30% (n = 51)
of Multiracial Employee respondents, 28% (n = 5) of Other Employee Respondents of
Color, 25% (n = 752) of White Employee respondents, and 26% (n = 28) of Asian/ Asian
American Employee respondents indicated that they had observed unjust promotion,
tenure, reappointment, and/or reclassification practices at University of Missouri-
Co lunibia.1x33
• By religious/spiritual identity: 33% (n = 59) of Other Religious/Spiritual Identity
Employee respondents, 30% (n = 45) of Multiple Religious/Spiritual Identities Employee
respondents, 29% (n = 308) of No Religious/Spiritual Identity Employee respondents,
and 25% (n = 516) of Christian Religious/Spiritual Identity Employee respondents
indicated that they had observed unjust promotion, tenure, reappointment, and/or
reclassification practices at University of Missouri-Columbia.bak
• By disability status: 50% (n = 62) of Multiple Disabilities Employee respondents, 37% (n
= 81) of Single Disability Employee respondents, and 25% (n = 817) of No Disability
Employee respondents indicated that they had observed unjust promotion, tenure,
reappointment, and/or reclassification practices at University of Missouri-Columbia.bKU1
74Clii-square analyses were conducted by position status, tenure status, faculty status, staff status, gender identity, age, racial identity, sexual identity, military status, citizenship status, religious/spiritual identity, and disability status; only significant differences are reported.
154
Three hundred thirty Faculty and Staff respondent elaborated oil promotion, tenure,
reappointment and reclassification. Two major themes emerged from the data: (1) descriptions of
nepotism, cronyism and favoritism in hiring and promotion practices and (2) depictions of racism
and sexism.
Nepotism, Cronyism & Favoritism — Respondents who elaborated on promotion, tenure,
reappointment and reclassification noted favoritism in many forms. One respondent noted, "If a
faculty member is not liked by his/her department chair and faculty administration, the tenure
process becomes very difficult even if the faculty member has met all of the requir ed steps (and
gone beyond!)." Other respondents shared, "favoritism in the workplace" and "Faculty that are
liked by their colleagues are promoted faster. Decisions seem less based 011 research output and
more based 011 personalities." Another respondent noted, "Promotions hi my department are
largely based 011 who you know, how much you suck up to the head of the department and his
cronies." Other respondents echoed, "There are staff in positions that they are not qualified but
based 011 their personal relationships with certain staff, they receive promotions." Another
respondent shared, "Knowing the right person can ensure you get a position even if you aren't the
most qualified candidate." Respondents who elaborated 011 promotion practices and observations
noted nepotism, cronyism and favoritism.
Racism and Sexism — Respondents who elaborated 011 promotion, tenure, reappointment and
reclassification explained concerns about inclusion and unfair biases based on race and sex. One
respondent elaborated, "Promotions given to white males often. In some instances positions were
created and others were not give an opportunity top apply." Another respondent noted, "I11 our
dept, a woman pointed out to management that males were receiving higher pay and better
opportunities/projects. She was then denied for promotion and not given a clear path for how to
be promoted." Another respondent added, "Simply look at the pay difference between men and
women." Yet another respondent explamed, "My male co-worker and I are a fantastic example.
When it came time for promotion, all tilings equal, I tried to negotiate for a higher salary and
was shut down before I could even present a case...later when he was up for the same promotion,
he got...more than I did. Hie explanation is that he negotiated better." Other respondents
155
described racism. One respondent elaborated, "I observed a case where an African American
facility member who almost did not get tenure because his teaching evaluations were not high
although research shows that people of color overall experience lower evaluations than whites."
One respondent described a practice commonly known as the minority tax. They noted, "The
black faculty member and the female faculty are repeatedly enlisted to serve on committees and
other service oriented activities, etc. placing an unfair burden 011 their workload." Several
respondents reported both sexism and racism. For example, one respondent shared, "I've noticed
more men are promoted than women. Also, more white males are promoted than people of
color." Respondents who elaborated on promotion, tenure, reappointment and reclassification
reported both racism and sexism.
156
Fourteen percent (;/ = 499) of Employee respondents indicated that they had observed
employment-related disciplinary actions, up to and including dismissal that they perceived to be
unjust or that would inhibit diversifying the community. Of those individuals, 22% (n = 111)
believed that the discrimination was based on gender/gender identity, 22% (n = 110) oil age,
20% (n = 102) on job duties, and 17% (n = 86) on age.
Subsequent analyses75 indicated the following:
• By faculty status: 19% (n = 62) of Tenured Faculty respondents, 15% (n = 17) of Tenure-
Track Faculty respondents, and 13% (n = 60) of Non-Tenure-Track Faculty respondents
indicated that they had observed unjust employment-related disciplinary actions.1™'
• By racial identity: 26% (n = 41) of African/Black/African American Employee
respondents, 26% (n = 5) of Other Employee Respondents of Color, 24% (n = 12) of
Hispanic/Latin@/Chican@ Employee respondents. 21% (n = 36) of Multiracial
Employee respondents, 12% (n = 368) of White Employee respondents, and 6% (ri = 7)
of Asian/ Asian American Employee respondents indicated that they had observed unjust
employment-related disciplinary actions.^
• By religious/spiritual identity: 12% (n = 244) of Christian Religious/Spiritual Identity
Employee respondents, 15% (n = 164) of No Religious/Spiritual Identity respondents,
16% (n = 29) of Other Religious/Spiritual Identity Employee respondents, and 19% (n =
28) of Multiple Religious/Spiritual Identities Employee respondents indicated that they
had observed unjust employment-related disciplinary actions.1*™
• By disability status: 13% (ri = 413) ofNo Disability Employee respondents, 19% (n = 41)
of Single Disability Employee respondents, and 29% (n = 36) of Multiple Disabilities
Employee respondents indicated that they had obseived unjust employment-related
disciplinary actions.1^™1
One hundred ninety Employee respondents elaborated oil their perceptions of employment-
related disciplinary actions. Two themes emerged among the data related to unjust disciplinary
73Chi-square analyses were conducted by position status, tenure status, staff status, gender identity, age. racial identity, sexual identity, military status, citizenship status, religious/spiritual identity, and disability status; only significant differences are reported.
157
practices: (1) a perceived lack of due process and (2) identity based targeting and discrimination
concerns.
Lack Of Due Process & Adherence To Policy — Respondents who elaborated on their'
perceptions of employment-related disciplinary actions described incidences of discipline and
dismissal "without due process" and '"without apparent just cause" in a range of contexts.
Respondents noted, "There have been many unjustified layoffs and dismissals" and "dismissal
based 011 rumor and without verifying the facts." One respondent reported, "Writing up
employees with 110 proof of employee not performing their job duties." Several respondents
described specific events and people hi their narratives. The names have been removed from the
following quotes but their contributions are included here to provide greater insight into this
theme hi the data. For example, one respondent noted that one individual's "treatment makes
every faculty member at MU vulnerable." Another reported indicated that one of their peers was
"wrongfully terminated from Mizzou because senior Mizzou officials were afraid of the state
legislature." Others cited personal agendas being executed in employment-related disciplinary
actions, for example, "I observed a person being relieved of her responsibilities because a VC
didn't like the person." Similarly, another respondent explained, "I am pretty sure their dismissal
was personal in nature rather than for economic need of the department." Respondents noted
concerns with the lack of due process and adherence to policy in their reflections 011 disciplme
and dismissal practices. Respondents also perceived these actions to be motivated by personal
agendas and politics rather than the employees involved in the incidents cited.
Identity Based Targeting and Discrimination — Respondent who elaborated 011 their perceptions
of employment-related disciplinary actions noted identity based discrimination for a range of
identities. One respondent shared, "If you're not one of the guys, you become a target." Another
respondent echoed gender related concerns noting, "'We don't line men in staff positions. Those
are for women only' is frequently said by administration and department chairs." Other
respondents noted race, size and age as identities that are marginalized. For example, one
respondent elaborated, "People of color and women are judged more harshly than then
counterparts for their behavior." Another respondent shared, "Older, heavier people, especially
women, seem to be easily dismissed for promotion, hires." General commentary 011 minorities
158
was also reflected in the data. Respondents noted, "Minority faculty member not getting tenure"
and the "administration is hill of misogynists and bigots." Similarly, another respondent
explained, "If you're not male, middle aged, white, heterosexual and of a Christian faith- you will
be the victim of bias, much of it institutionalized and ignored when it occurs." Respondents who
elaborated on their perceptions of employment-related disciplinary actions described
discriminatory practices related to a range of perceived minorities at University of Missouri-
Columbia.
159
Staff Respondents' Views on Workplace Climate and Work-Life Balance
Several survey items queried Staff respondents76 about their opinions regarding work-life issues,
support, and resources available at University of Missouri-Columbia. Frequencies and significant
differences based on staff status (Hourly Staff and Salaried Staff Senior Administrator without
Faculty Rank),77 gender identity,78 racial identity,79 sexual identity,80 age, disability status,
citizenship status,81 military status, and religious/spiritual identity are provided in Tables 40
through 43.
Seventy-six percent (n = 1,969) of Staff respondents "strongly agreed" or "agreed" that they had
supervisors who gave them job/career advice or guidance when they needed it (Table 40).
Multiple Disabilities Staff respondents (20%, n = 19) and Single Disability Staff respondents
(11%, n = 18) were significantly more likely than No Disability Staff respondents (6%, n = 141)
to "strongly disagr ee" that they had supervisors who gave them job/career advice or guidance
when they needed it.
Eighty- four percent (n = 2,163) of Staff respondents "strongly agreed" or "agreed" that they had
colleagues/coworkers who gave them job/career advice or guidance when they needed it. People
7SStaff respondents refer to Staff?Senior Administrators without Faculty Rank respondents. 77Per the request of the LCST, Senior Administrators without Faculty Rank were included with Staff respondents for analyses by staff status. 78Per the LCST, gender identity was recoded into the categories Men (w = 3.629). Women (n = 6,099), Trans spectrum/Missing/Unknown (n = 141), where Trans spectrum respondents included those individuals who marked "transgender." 'Trans,'' or "genderqueer." "non-binary' only for the question, "What is your gender/gender identity (mark all that apply)?" Trans spectrum/Missing Unknown respondents were not included to maintain the confidentiality of their responses. 79The LCST proposed six collapsed racial identity categories (White. African/Black/'African American. Asian/Asian American, Hispanic/Latiii@/Chican@, Other People of Color, and Multiracial). Per the LCST, the Other People of Color category included respondents who identified as Native Hawaiian. Pacific Islander, American Indian/Native, Alaskan Native, Middle Eastern, and Southwest Asian. For the purposes of some analyses, this report further collapses racial identity into three categories (White, People of Color, and Multiracial), where the Asian/Asian American, African/Black/Afiican American, Hispanic/Latino. Chicano, and Other People of Color were collapsed into one category named People of Color. This is used only when there are no significant differences when using specific racial identity categories. Where possible, the racial identity groups are expanded and where necessary collapsed. 80Per the LCST. for all analyses, sexual identity was recoded into the categories LGBQ and Heterosexual to maintain response confidentiality. Gender was recoded as Men, Trans spectrum, and Women. 81For the purposes of analyses, the collapsed categories for citizenship are U.S. Citizen and Nan-U.S. Citizen (includes naturalized U.S. Citizens: permanent residents; F-l, J-l. Hl-B. and U visa holders: DACA; DAP A: refugee status; other legally documented status; currently under a withholding of removal status; and undocumented residents).
160
of Color and Multiracial Staff respondents82 (27%, n = 96) were significantly less likely than
White Staff respondents (33%, n = 701) to "strongly agree" that they had colleagues/coworkers
who gave them job/career advice or guidance when they needed it. Heterosexual Staff
respondents (3%, n = 57) were significantly less likely than LGBQ Staff respondents (7%, n =
12) to "strongly disagree" that they had colleagues/coworkers who gave them job/career advice
or guidance when they needed it. Single Disability Staff respondents (20%, n = 33) and Multiple
Disabilities Staff respondents (24%, n = 23) were significantly more likely than No Disability
Staff respondents (33%, n = 756) to "strongly agree" that they had colleagues/coworkers who
gave them job/career advice or guidance when they needed it.
Seventy percent (n = 1,794) of Staff respondents "strongly agreed" or "agreed" that they were
included in opportunities that would help their careers as much as others in similar positions.
Non-U.S. Citizen Staff respondents (14%, n = 22) were much more likely than U.S. Citizen Staff
respondents (8%, n = 181) to "strongly disagree" that they were included hi opportunities that
would help their careers as much as others in similar positions. Staff respondents of Color (11%,
n = 25) and Multiracial Staff respondents (15%, n = 20) were significantly more likely than
White Staff respondents (7%, n = 150) to "strongly disagree" that they were included in
opportunities that would help their careers as much as others in similar positions. Single
Disability Staff respondents (16%, n = 26) and Multiple Disabilities Staff respondents (16%, n =
15) were significantly more likely than No Disability Staff respondents (25%, n = 579) to
"strongly agree" that they were included in opportunities that w7ould help their careers as much
as others in similar positions.
S2For the purposes of some analyses, this report further collapses racial identity into two categories (White. People of Color and Multiracial), whore African/Biack/Afiican American, Asian/ Asian American, Hispanic/Latin@/Chican@, Native Hawaiian, Pacific Islander. American Indian/Native. Alaskan Native, Middle Eastern, and Southwest Asian, and Multiracial) were collapsed into one category named People of Color and Multiracial. This is used when the six-category or three-category collapsed racial identity groups are not significant.
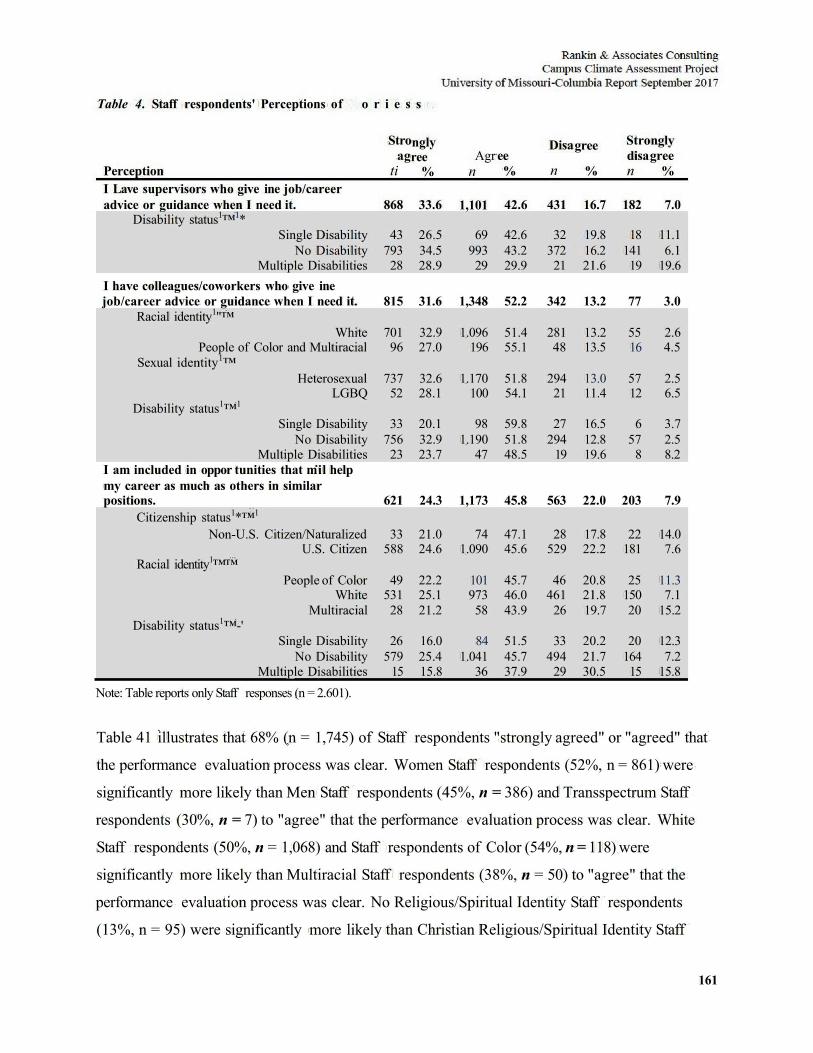
161
Table 4. Staff respondents' Perceptions of o r i e s s
Perception I Lave supervisors who give ine job/career
Stro ag
ti
ngly ree
% Agr
n ee %
Disa
n
gree
%
Stro disa n
ngly gree
%
advice or guidance when I need it. 868 33.6 1,101 42.6 431 16.7 182 7.0 Disability status1™1*
Single Disability 43 26.5 69 42.6 32 19.8 18 11.1 No Disability 793 34.5 993 43.2 372 16.2 141 6.1
Multiple Disabilities 28 28.9 29 29.9 21 21.6 19 19.6 I have colleagues/coworkers who give ine job/career advice or guidance when I need it. 815 31.6 1,348 52.2 342 13.2 77 3.0
Racial identity1"™ White 701 32.9 1.096 51.4 281 13.2 55 2.6
People of Color and Multiracial 96 27.0 196 55.1 48 13.5 16 4.5 Sexual identity1™
Heterosexual 737 32.6 1.170 51.8 294 13.0 57 2.5 LGBQ 52 28.1 100 54.1 21 11.4 12 6.5
Disability status1™1
Single Disability 33 20.1 98 59.8 27 16.5 6 3.7 No Disability 756 32.9 1.190 51.8 294 12.8 57 2.5
Multiple Disabilities 23 23.7 47 48.5 19 19.6 8 8.2 I am included in oppor tunities that mil help my career as much as others in similar positions. 621 24.3 1,173 45.8 563 22.0 203 7.9
Citizenship status1*™1
Non-U.S. Citizen/Naturalized 33 21.0 74 47.1 28 17.8 22 14.0 U.S. Citizen 588 24.6 1.090 45.6 529 22.2 181 7.6
Racial identity1™™ People of Color 49 22.2 101 45.7 46 20.8 25 11.3
White 531 25.1 973 46.0 461 21.8 150 7.1 Multiracial 28 21.2 58 43.9 26 19.7 20 15.2
Disability status1™-' Single Disability 26 16.0 84 51.5 33 20.2 20 12.3
No Disability 579 25.4 1.041 45.7 494 21.7 164 7.2 Multiple Disabilities 15 15.8 36 37.9 29 30.5 15 15.8
Note: Table reports only Staff responses (n = 2.601).
Table 41 illustrates that 68% (n = 1,745) of Staff respondents "strongly agreed" or "agreed" that
the performance evaluation process was clear. Women Staff respondents (52%, n = 861) were
significantly more likely than Men Staff respondents (45%, n = 386) and Transspectrum Staff
respondents (30%, n = 7) to "agree" that the performance evaluation process was clear. White
Staff respondents (50%, n = 1,068) and Staff respondents of Color (54%, n = 118) were
significantly more likely than Multiracial Staff respondents (38%, n = 50) to "agree" that the
performance evaluation process was clear. No Religious/Spiritual Identity Staff respondents
(13%, n = 95) were significantly more likely than Christian Religious/Spiritual Identity Staff
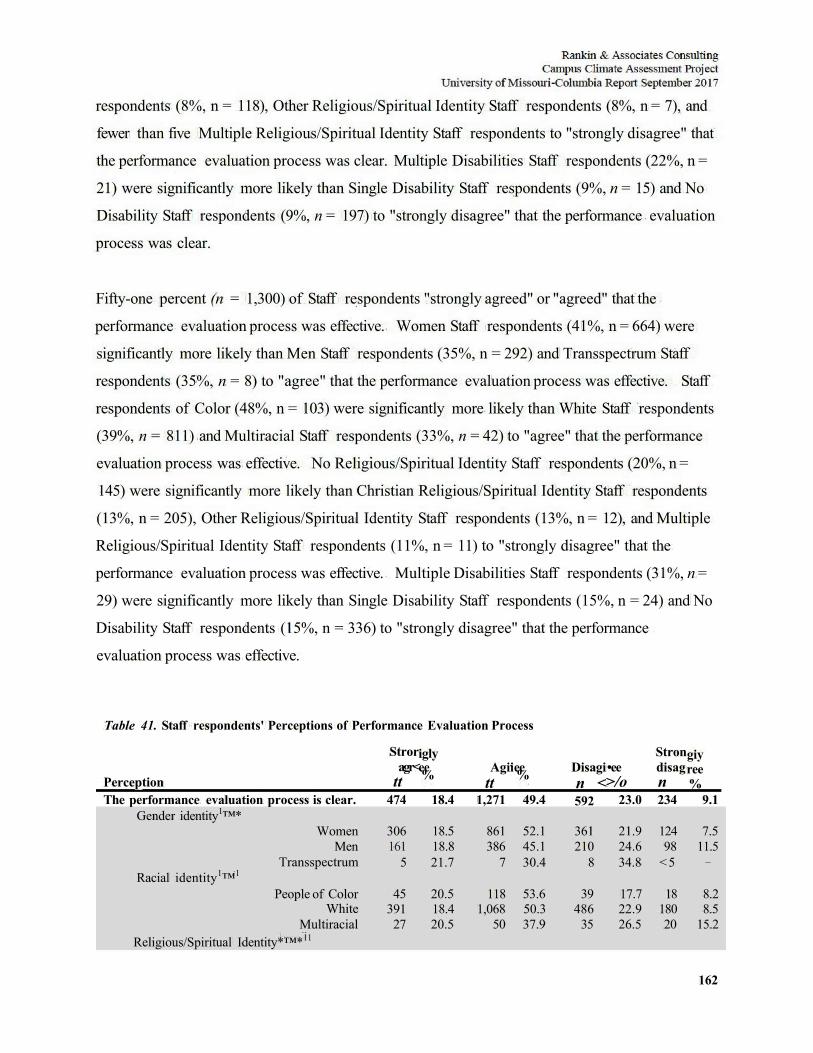
162
respondents (8%, n = 118), Other Religious/Spiritual Identity Staff respondents (8%, n = 7), and
fewer than five Multiple Religious/Spiritual Identity Staff respondents to "strongly disagree" that
the performance evaluation process was clear. Multiple Disabilities Staff respondents (22%, n =
21) were significantly more likely than Single Disability Staff respondents (9%, n = 15) and No
Disability Staff respondents (9%, n = 197) to "strongly disagree" that the performance evaluation
process was clear.
Fifty-one percent (n = 1,300) of Staff respondents "strongly agreed" or "agreed" that the
performance evaluation process was effective. Women Staff respondents (41%, n = 664) were
significantly more likely than Men Staff respondents (35%, n = 292) and Transspectrum Staff
respondents (35%, n = 8) to "agree" that the performance evaluation process was effective. Staff
respondents of Color (48%, n = 103) were significantly more likely than White Staff respondents
(39%, n = 811) and Multiracial Staff respondents (33%, n = 42) to "agree" that the performance
evaluation process was effective. No Religious/Spiritual Identity Staff respondents (20%, n =
145) were significantly more likely than Christian Religious/Spiritual Identity Staff respondents
(13%, n = 205), Other Religious/Spiritual Identity Staff respondents (13%, n = 12), and Multiple
Religious/Spiritual Identity Staff respondents (11%, n = 11) to "strongly disagree" that the
performance evaluation process was effective. Multiple Disabilities Staff respondents (31%, n =
29) were significantly more likely than Single Disability Staff respondents (15%, n = 24) and No
Disability Staff respondents (15%, n = 336) to "strongly disagree" that the performance
evaluation process was effective.
Table 41. Staff respondents' Perceptions of Performance Evaluation Process
Perception The performance evaluation process is clear.
Stror agr<
tt 474
igly ee %
18.4
Agii tt
1,271
ee %
49.4
Disagi n < 592
•ee >/o
23.0
Stron disag n 234
giy ree %
9.1 Gender identity1™*
Women 306 18.5 861 52.1 361 21.9 124 7.5 Men 161 18.8 386 45.1 210 24.6 98 11.5
Racial identity1™1 Transspectrum 5 21.7 7 30.4 8 34.8 < 5 —
People of Color 45 20.5 118 53.6 39 17.7 18 8.2 White 391 18.4 1,068 50.3 486 22.9 180 8.5
Multiracial Religious/Spiritual Identity*™*11
27 20.5 50 37.9 35 26.5 20 15.2
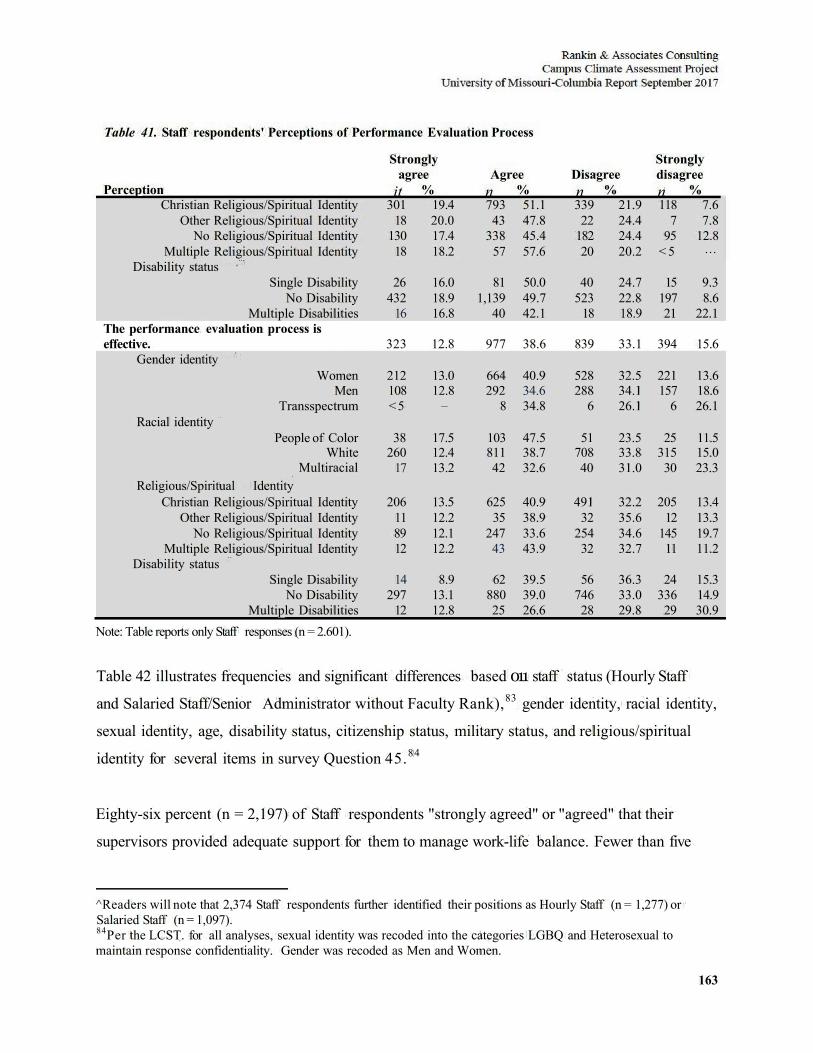
163
Table 41. Staff respondents' Perceptions of Performance Evaluation Process
Strongly Strongly agree Agree Disagree disagree
Perception it % n % n % n % Christian Religious/Spiritual Identity 301 19.4 793 51.1 339 21.9 118 7.6
Other Religious/Spiritual Identity 18 20.0 43 47.8 22 24.4 7 7.8 No Religious/Spiritual Identity 130 17.4 338 45.4 182 24.4 95 12.8
Multiple Religious/Spiritual Identity 18 18.2 57 57.6 20 20.2 < 5 . . .
Disability status Single Disability 26 16.0 81 50.0 40 24.7 15 9.3
No Disability 432 18.9 1,139 49.7 523 22.8 197 8.6 Multiple Disabilities 16 16.8 40 42.1 18 18.9 21 22.1
The performance evaluation process is effective. 323 12.8 977 38.6 839 33.1 394 15.6
Gender identity Women 212 13.0 664 40.9 528 32.5 221 13.6
Men 108 12.8 292 34.6 288 34.1 157 18.6 Transspectrum < 5 — 8 34.8 6 26.1 6 26.1
Racial identity People of Color 38 17.5 103 47.5 51 23.5 25 11.5
White 260 12.4 811 38.7 708 33.8 315 15.0 Multiracial 17 13.2 42 32.6 40 31.0 30 23.3
Religious/Spiritual Identity Christian Religious/Spiritual Identity 206 13.5 625 40.9 491 32.2 205 13.4
Other Religious/Spiritual Identity 11 12.2 35 38.9 32 35.6 12 13.3 No Religious/Spiritual Identity 89 12.1 247 33.6 254 34.6 145 19.7
Multiple Religious/Spiritual Identity 12 12.2 43 43.9 32 32.7 11 11.2 Disability status
Single Disability 14 8.9 62 39.5 56 36.3 24 15.3 No Disability 297 13.1 880 39.0 746 33.0 336 14.9
Multiple Disabilities 12 12.8 25 26.6 28 29.8 29 30.9 Note: Table reports only Staff responses (n = 2.601).
Table 42 illustrates frequencies and significant differences based 011 staff status (Hourly Staff
and Salaried Staff/Senior Administrator without Faculty Rank),83 gender identity, racial identity,
sexual identity, age, disability status, citizenship status, military status, and religious/spiritual
identity for several items in survey Question 45.84
Eighty-six percent (n = 2,197) of Staff respondents "strongly agreed" or "agreed" that their
supervisors provided adequate support for them to manage work-life balance. Fewer than five
^Readers will note that 2,374 Staff respondents further identified their positions as Hourly Staff (n = 1,277) or Salaried Staff (n = 1,097). 84Per the LCST. for all analyses, sexual identity was recoded into the categories LGBQ and Heterosexual to maintain response confidentiality. Gender was recoded as Men and Women.
164
Trans spectrum Staff respondents were significantly more likely than Men Staff respondents (4%,
n = 66) and Women Staff respondents (4%, n = 32) to "strongly disagree" that their supervisors
provided adequate support for them to manage work-life balance. Staff respondents of Color
(10%, w = 22) and Multiracial Staff respondents (16%, n = 21) were significantly more likely
than White Staff respondents (10%, n = 201) to "disagree" that their supervisors provided
adequate support for them to manage work-life balance. No Religious/Spiritual Identity Staff
respondents (13%, n = 96) w7ere significantly more likely than Christian Religious/Spiritual
Identity Staff respondents (9%, n = 134) to "disagree" that their supervisors provided adequate
support for them to manage work-life balance. Multiple Disabilities Staff respondents (10%, n =
10) were significantly more likely than Single Disability Staff respondents (6%, n = 9) and No
Disability Staff respondents (4%, n = 84) to "strongly disagree" that their supervisors provided
adequate support for them to manage work-life balance.
Eighteen percent (n = 451) of Staff respondents "strongly agreed" or "agreed" that people w7lio
do not have children were burdened with w7ork responsibilities beyond those w7ho do have
children. Heterosexual Staff respondents (12%, n = 260) were significantly less likely than
LGBQ Staff respondents (22%, n = 41) to "agree" that people who do not have children were
burdened with w7ork responsibilities beyond those who do have children. Other
Religious/Spiritual Identity Staff respondents (9%, n = 8) were significantly more likely than
Christian Religious/Spiritual Identity Staff respondents (4%, n = 59), No Religious/Spiritual
Identity Staff respondents (6%, n = 47), and Multiple Religious/Spiritual Identity Staff
respondents (7%, n = 7) to "strongly agree" that people who do not have children w7ere burdened
with work responsibilities beyond those who do have children.
Few Staff respondents (21%, n = 541) "strongly agreed" or "agreed" that they were burdened by
work responsibilities beyond those of their colleagues with similar performance expectations
(e.g., committee memberships, departmental/program work assignments). Hourly Staff
respondents (14%, n = 173) were significantly less likely than Salaried Staff/Senior
Administrator without Faculty Rank respondents (18%, n = 192) to "agree" that they were
burdened by work responsibilities beyond those of their colleagues with similar performance
expectations.
165
Forty percent (n = 1,024) of Staff respondents "strongly agreed" or "agreed" that they performed
more work than colleagues with similar performance expectations (e.g., formal and informal
mentoring or advising, helping with student groups and activities, providing other support).
Hourly Staff respondents (26%, n = 338) were significantly less likely than Salaried Staff'Senior
Administrator without Faculty Rank respondents (32%, n = 351) to "agree" that they performed
more work than colleagues with similar performance expectations. Women Staff respondents
(28%, n = 453) and Transspectruin Staff respondents (26%, n = 6) were significantly less likely
than Men Staff respondents (33%, n = 276) to "agree" that they performed more work than
colleagues with similar performance expectations. Heterosexual Staff respondents (49%, n =
1,089) were significantly more likely than LGBQ Staff respondents (40%, n = 73) to "disagree"
that they performed more work than colleagues with similar performance expectations.
Thirty-nine percent (n = 978) of Staff respondents "strongly agreed" or "agr eed" that people who
have children or elder care were burdened with balancing work and family responsibilities (e.g.,
evening and evenings programming, workload brought home, university breaks not scheduled
with school district breaks). Hourly Staff respondents (30%, n = 372) were significantly less
likely than Salaried Staff Senior Administrator without Faculty Rank respondents (35%, n = 379)
to "agree" that people who have children or elder care were burdened with balancing work and
family responsibilities. Women Staff respondents (48%, n = 767) and Transspectrum Staff
respondents (41%, n = 9) were significantly less likely than Men Staff respondents (54%, n =
443) to "disagree" that people who have children or elder care were burdened with balancing
work and family responsibilities. No Religious/Spiritual Identity Staff respondents (9%, n = 99)
and Multiple Religious/Spiritual Identity Staff respondents (16%, n = 15) were significantly
more Likely than Christian Religious/Spir itual Identity Staff respondents (6%, n = 83) and Other
Religious/Spiritual Identity Staff respondents (6%, n = 5) to "strongly agree" that people who
have children or elder care were burdened with balancing work and family responsibilities.
Single Disability Staff respondents (11%, n = 17) and Multiple Disabilities Staff respondents
(12%, n = 11) were significantly more likely than No Disability Staff respondents (7%, n = 145)
to "strongly agree" that people who have children or elder care were burdened with balancing
work and family responsibilities.
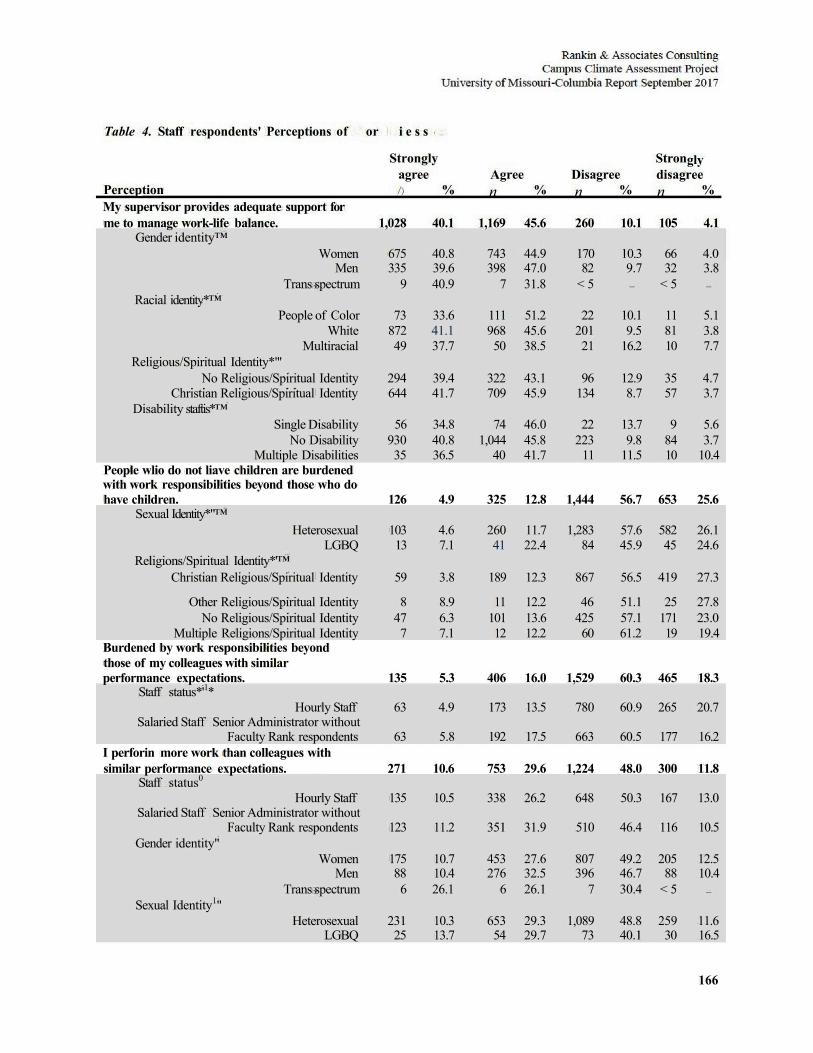
166
Table 4. Staff respondents' Perceptions of or i e s s
Strongly Stron gly agree Agree Disagree disagree
Perception /) % n % n % n % My supervisor provides adequate support for me to manage work-life balance. 1,028 40.1 1,169 45.6 260 10.1 105 4.1
Gender identity™ Women 675 40.8 743 44.9 170 10.3 66 4.0
Men 335 39.6 398 47.0 82 9.7 32 3.8 Trans spectrum 9 40.9 7 31.8 < 5 — < 5 —
Racial identity*™ People of Color 73 33.6 111 51.2 22 10.1 11 5.1
White 872 41.1 968 45.6 201 9.5 81 3.8 Multiracial 49 37.7 50 38.5 21 16.2 10 7.7
Religious/Spiritual Identity*"' No Religious/Spiritual Identity 294 39.4 322 43.1 96 12.9 35 4.7
Christian Religious/Spiritual Identity 644 41.7 709 45.9 134 8.7 57 3.7 Disability staftis*™
Single Disability 56 34.8 74 46.0 22 13.7 9 5.6 No Disability 930 40.8 1,044 45.8 223 9.8 84 3.7
Multiple Disabilities 35 36.5 40 41.7 11 11.5 10 10.4 People wlio do not liave children are burdened with work responsibilities beyond those who do have children. 126 4.9 325 12.8 1,444 56.7 653 25.6
Sexual Identity*"™ Heterosexual 103 4.6 260 11.7 1,283 57.6 582 26.1
LGBQ 13 7.1 41 22.4 84 45.9 45 24.6 Religions/Spiritual Identity*'™
Christian Religious/Spiritual Identity 59 3.8 189 12.3 867 56.5 419 27.3
Other Religious/Spiritual Identity 8 8.9 11 12.2 46 51.1 25 27.8 No Religious/Spiritual Identity 47 6.3 101 13.6 425 57.1 171 23.0
Multiple Religions/Spiritual Identity 7 7.1 12 12.2 60 61.2 19 19.4 Burdened by work responsibilities beyond those of my colleagues with similar performance expectations. 135 5.3 406 16.0 1,529 60.3 465 18.3
Staff status*'1* Hourly Staff 63 4.9 173 13.5 780 60.9 265 20.7
Salaried Staff Senior Administrator without Faculty Rank respondents 63 5.8 192 17.5 663 60.5 177 16.2
I perforin more work than colleagues with similar performance expectations. 271 10.6 753 29.6 1,224 48.0 300 11.8
Staff status0
Hourly Staff 135 10.5 338 26.2 648 50.3 167 13.0 Salaried Staff Senior Administrator without
Faculty Rank respondents 123 11.2 351 31.9 510 46.4 116 10.5 Gender identity"
Women 175 10.7 453 27.6 807 49.2 205 12.5 Men 88 10.4 276 32.5 396 46.7 88 10.4
Trans spectrum 6 26.1 6 26.1 7 30.4 < 5 —
Sexual Identity1" Heterosexual 231 10.3 653 29.3 1,089 48.8 259 11.6
LGBQ 25 13.7 54 29.7 73 40.1 30 16.5
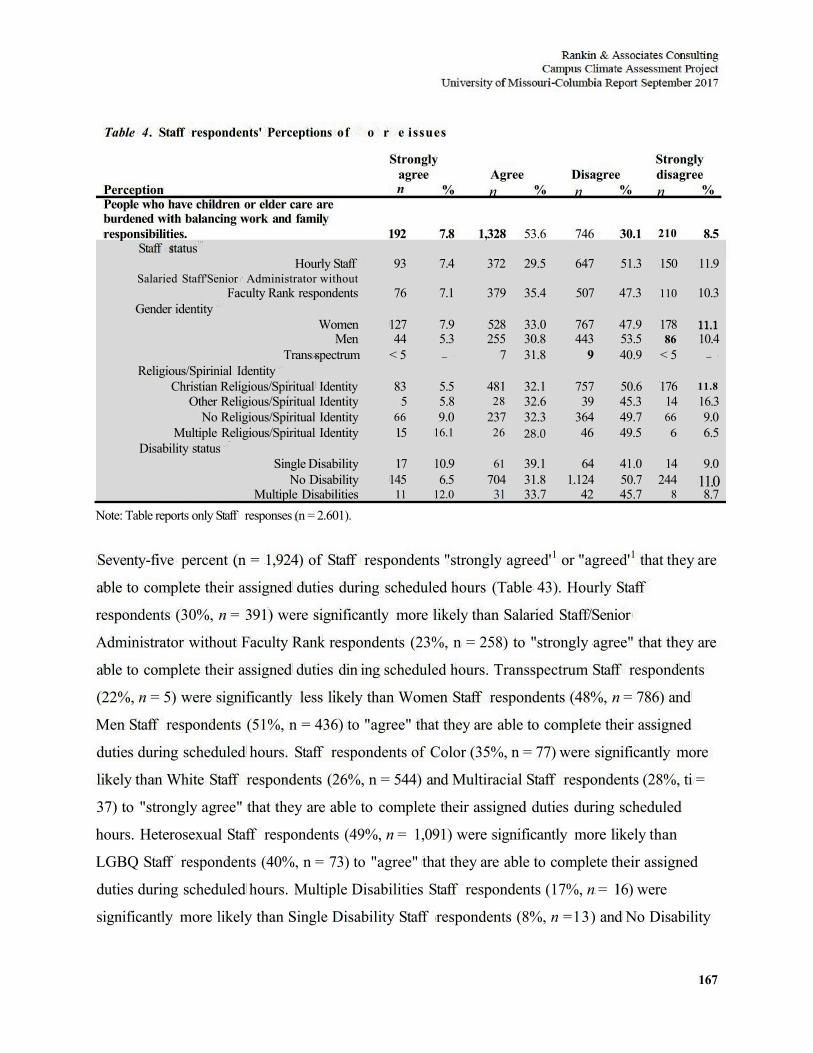
167
Table 4. Staff respondents' Perceptions of o r e issues
Strongly Strongly agree Agree Disagree disagree
Perception % n % n % n % People who have children or elder care are burdened with balancing work and family responsibilities. 192 7.8 1,328 53.6 746 30.1 210 8.5
Staff status Hourly Staff 93 7.4 372 29.5 647 51.3 150 11.9
Salaried Staff'Senior Administrator without Faculty Rank respondents 76 7.1 379 35.4 507 47.3 110 10.3
Gender identity Women 127 7.9 528 33.0 767 47.9 178 11.1
Men 44 5.3 255 30.8 443 53.5 86 10.4 Trans spectrum < 5 — 7 31.8 9 40.9 < 5 —
Religious/Spirinial Identity Christian Religious/Spiritual Identity 83 5.5 481 32.1 757 50.6 176 11.8
Other Religious/Spiritual Identity 5 5.8 28 32.6 39 45.3 14 16.3 No Religious/Spiritual Identity 66 9.0 237 32.3 364 49.7 66 9.0
Multiple Religious/Spiritual Identity 15 16.1 26 28.0 46 49.5 6 6.5 Disability status
Single Disability 17 10.9 61 39.1 64 41.0 14 9.0 No Disability 145 6.5 704 31.8 1.124 50.7 244 11.0
Multiple Disabilities 11 12.0 31 33.7 42 45.7 8 8.7 Note: Table reports only Staff responses (n = 2.601).
Seventy-five percent (n = 1,924) of Staff respondents "strongly agreed'1 or "agreed'1 that they are
able to complete their assigned duties during scheduled hours (Table 43). Hourly Staff
respondents (30%, n = 391) were significantly more likely than Salaried Staff/Senior
Administrator without Faculty Rank respondents (23%, n = 258) to "strongly agree" that they are
able to complete their assigned duties din ing scheduled hours. Transspectrum Staff respondents
(22%, n = 5) were significantly less likely than Women Staff respondents (48%, n = 786) and
Men Staff respondents (51%, n = 436) to "agree" that they are able to complete their assigned
duties during scheduled hours. Staff respondents of Color (35%, n = 77) were significantly more
likely than White Staff respondents (26%, n = 544) and Multiracial Staff respondents (28%, ti =
37) to "strongly agree" that they are able to complete their assigned duties during scheduled
hours. Heterosexual Staff respondents (49%, n = 1,091) were significantly more likely than
LGBQ Staff respondents (40%, n = 73) to "agree" that they are able to complete their assigned
duties during scheduled hours. Multiple Disabilities Staff respondents (17%, n = 16) were
significantly more likely than Single Disability Staff respondents (8%, n =13) and No Disability
168
Staff respondents (5%, n = 106) to "strongly disagree" that they are able to complete their
assigned duties during scheduled hours.
Twenty-six percent (n = 668) of Staff respondents "strongly agreed" or "agreed" that they were
pressured by departmental work requirements that occurred outside of normally scheduled hours.
Hourly Staff respondents (5%, n = 58) were significantly less likely than Salaried Staff/Senior
Administrator without Faculty Rank respondents (8%, n = 88) to "strongly agree" that they were
pressured by departmental work requirements that occurred outside of normally scheduled hours.
Men Staff respondents (9%, n = 72) were significantly more likely than Women Staff
respondents (5%, n = 84) to "strongly agree" that they w7ere pressured by departmental work
requirements that occurred outside of normally scheduled hours. Multiracial Staff respondents
(12%, n = 16) were significantly more likely than White Staff respondents (6%, n =131) and
Staff respondents ofColor (5%, n = 12) to "strongly agr ee" that they were pressured by
departmental work requirements that occurred outside of normally scheduled hours.
Eighty-five percent (ri = 2,190) of Staff respondents "strongly agreed" or "agreed" that they
believed that they were given a reasonable time frame to complete assigned responsibilities.
Transspectrum Staff respondents (35%, n = 8) were significantly more likely than Women Staff
respondents (12%, n = 204) and Men Staff respondents (11%, n = 96) to "disagree" that they
believed that they were given a reasonable time frame to complete assigned responsibilities.
Other Religious/Spiritual Identity Staff respondents (7%, n = 6) w7ere significantly more likely
than Christian Religious/Spiritual Identity Staff respondents (11%, n = 171), No
Religious/Spiritual Identity Staff respondents (15%, n = 108), and Multiple Religious/Spiritual
Identity Staff respondents (17%, n = 17) to "disagree" that they believed that they were given a
reasonable time frame to complete assigned responsibilities. Multiple Disabilities Staff
respondents (22%, n = 21) were significantly more likely than Single Disability Staff
respondents (15%, n = 24) and No Disability Staff respondents (12%, n = 266) to "disagree" that
they believed that they were given a reasonable time frame to complete assigned responsibilities.
More than half (57%, n = 1.457) of Staff respondents "strongly agreed" or "agreed" that their
workload increased without additional compensation as a result of other staff departures (e.g.,
169
retirement positions not filled). Transspectmm Staff respondents (32%, n = 7) and Men Staff
respondents (30%, n = 256) were significantly more likely than Women Staff respondents (25%,
ti = 408) to "strongly agree" that their workload increased without additional compensation as a
result of other staff departures. Staff respondents of Color (44%, n = 96) were significantly more
likely than White Staff respondents (33%, n = 711) and Multiracial Staff respondents (33%, n =
43) to "disagree" that their' workload increased without additional compensation as a result of
other staff departures. Multiple Disabilities Staff respondents (45%, n = 43) were significantly
more likely than Single Disability Staff respondents (26%, n = 42) and No Disability Staff
respondents (26%, n = 593) to "strongly agree" that their workload increased without additional
compensation as a result of other staff departures.
Sixty-five percent (n = 1,675) of Staff respondents "strongly agreed" or "agreed" that a hierarchy
existed within staff positions that allowed some voices to be valued more than others. People of
Color and Multiracial Staff respondents85 (28%, n = 98) were significantly more likely than
White Staff respondents (22%, n = 466) to "strongly agr ee" that a hierarchy existed within staff
positions that allowed some voices to be valued more than others. No Religious/Spiritual Identity
Staff respondents (45%, n = 334) were significantly more likely than Christian
Religious/Spiritual Identity Staff respondents (40%, n = 626) to "agree" that a hierarchy existed
within staff positions that allowed some voices to be valued more than others. Multiple
Disabilities Staff respondents (38%, n = 37) were significantly more likely than Single Disability
Staff respondents (29%, n = 47) and No Disability Staff respondents (22%, n = 502) to "strongly
agree" that a hierarchy existed within staff positions that allowed some voices to be valued more
than others.
Eighty-four percent (n = 2,148) of Staff respondents "strongly agreed" or "agreed" that they had
adequate resources to perform their job duties. Hourly Staff respondents (9%, n = 115) were
significantly more likely than Salaried Staff/Senior Administrator without Faculty Rank
respondents (6%, n = 66) to "strongly agree" that they had adequate resources to perform their
ssFor the purposes of some analyses, this report further collapses racial identity into two categories (White. People of Color and Multiracial), where African/Black/Afiican American, Asian/ Asian American, Hispanic/Latin@/Chican@, Native Hawaiian, Pacific Islander. American Indian/Native. Alaskan Native. Middle Eastern, and Southwest Asian, and Multiracial) were collapsed into one category named People of Color.amid Multiracial. This is used when the six-category or three-category collapsed racial identity groups are not significant.
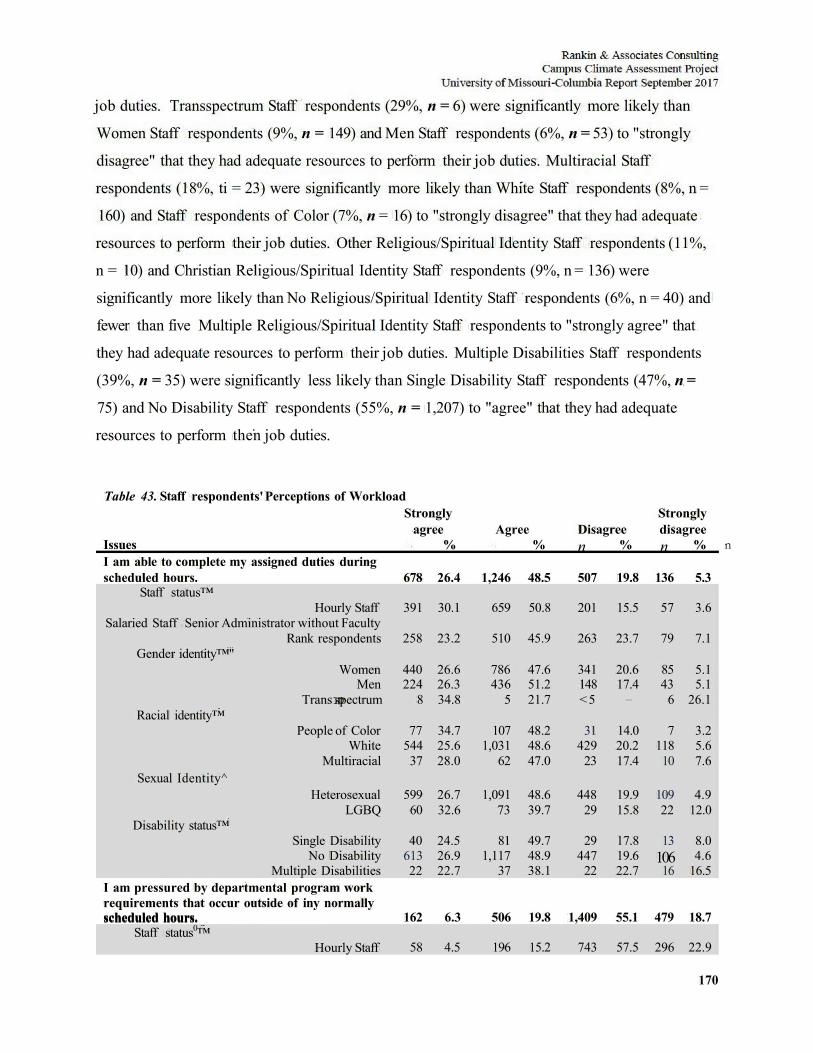
170
job duties. Transspectrum Staff respondents (29%, n = 6) were significantly more likely than
Women Staff respondents (9%, n = 149) and Men Staff respondents (6%, n = 53) to "strongly
disagree" that they had adequate resources to perform their job duties. Multiracial Staff
respondents (18%, ti = 23) were significantly more likely than White Staff respondents (8%, n =
160) and Staff respondents of Color (7%, n = 16) to "strongly disagree" that they had adequate
resources to perform their job duties. Other Religious/Spiritual Identity Staff respondents (11%,
n = 10) and Christian Religious/Spiritual Identity Staff respondents (9%, n = 136) were
significantly more likely than No Religious/Spiritual Identity Staff respondents (6%, n = 40) and
fewer than five Multiple Religious/Spiritual Identity Staff respondents to "strongly agree" that
they had adequate resources to perform their job duties. Multiple Disabilities Staff respondents
(39%, n = 35) were significantly less likely than Single Disability Staff respondents (47%, n =
75) and No Disability Staff respondents (55%, n = 1,207) to "agree" that they had adequate
resources to perform then job duties.
Table 43. Staff respondents' Perceptions of Workload Strongly Strongly
agree Agree Disagree disagree Issues n % n % n % n % I am able to complete my assigned duties during scheduled hours. 678 26.4 1,246 48.5 507 19.8 136 5.3
Staff status™ Hourly Staff 391 30.1 659 50.8 201 15.5 57 3.6
Salaried Staff Senior Administrator without Faculty Rank respondents 258 23.2 510 45.9 263 23.7 79 7.1
Gender identity™" Women 440 26.6 786 47.6 341 20.6 85 5.1
Men 224 26.3 436 51.2 148 17.4 43 5.1 Trans spectrum 8 34.8 5 21.7 < 5 — 6 26.1
Racial identity™ People of Color 77 34.7 107 48.2 31 14.0 7 3.2
White 544 25.6 1,031 48.6 429 20.2 118 5.6 Multiracial 37 28.0 62 47.0 23 17.4 10 7.6
Sexual Identity^ Heterosexual 599 26.7 1,091 48.6 448 19.9 109 4.9
LGBQ 60 32.6 73 39.7 29 15.8 22 12.0 Disability status™
Single Disability 40 24.5 81 49.7 29 17.8 13 8.0 No Disability 613 26.9 1,117 48.9 447 19.6 106 4.6
Multiple Disabilities 22 22.7 37 38.1 22 22.7 16 16.5 I am pressured by departmental program work requirements that occur outside of iny normally scheduled hours. scheduled hours.
Staff status0™ 162 6.3 506 19.8 1,409 55.1 479 18.7
Hourly Staff 58 4.5 196 15.2 743 57.5 296 22.9
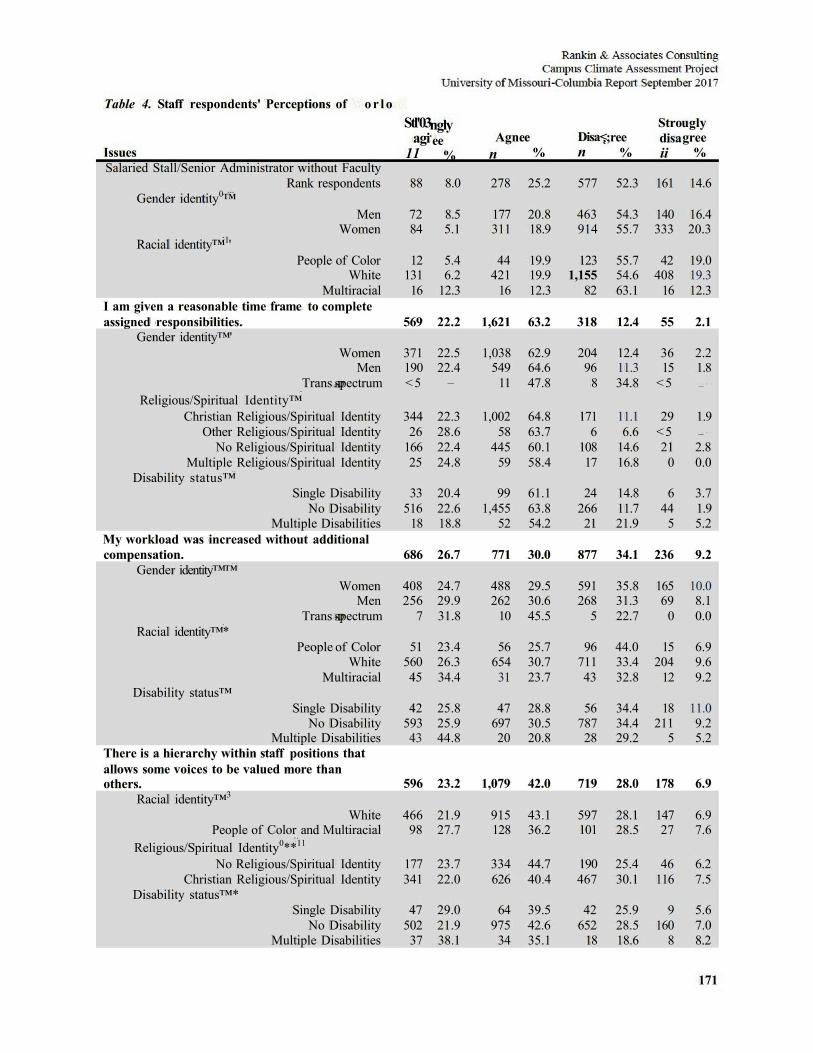
171
Table 4. Staff respondents' Perceptions of o r l o
Issues Salaried Stall/Senior Administrator without Faculty
Stl'03 agi
11
ngly ee
% Agn
n ee
% Disa< n
;ree %
Stro disa ii
ugly gree
%
Rank respondents 88 8.0 278 25.2 577 52.3 161 14.6 Gender identity0™
Men 72 8.5 177 20.8 463 54.3 140 16.4 Women 84 5.1 311 18.9 914 55.7 333 20.3
Racial identity™1' People of Color 12 5.4 44 19.9 123 55.7 42 19.0
White 131 6.2 421 19.9 1,155 54.6 408 19.3 Multiracial 16 12.3 16 12.3 82 63.1 16 12.3
I am given a reasonable time frame to complete assigned responsibilities. 569 22.2 1,621 63.2 318 12.4 55 2.1
Gender identity™' Women 371 22.5 1,038 62.9 204 12.4 36 2.2
Men 190 22.4 549 64.6 96 11.3 15 1.8 Trans spectrum < 5 — 11 47.8 8 34.8 < 5 —
Religious/Spiritual Identity™ Christian Religious/Spiritual Identity 344 22.3 1,002 64.8 171 11.1 29 1.9
Other Religious/Spiritual Identity 26 28.6 58 63.7 6 6.6 < 5 —
No Religious/Spiritual Identity 166 22.4 445 60.1 108 14.6 21 2.8 Multiple Religious/Spiritual Identity 25 24.8 59 58.4 17 16.8 0 0.0
Disability status™ Single Disability 33 20.4 99 61.1 24 14.8 6 3.7
No Disability 516 22.6 1,455 63.8 266 11.7 44 1.9 Multiple Disabilities 18 18.8 52 54.2 21 21.9 5 5.2
My workload was increased without additional compensation. 686 26.7 771 30.0 877 34.1 236 9.2
Gender identity™™ Women 408 24.7 488 29.5 591 35.8 165 10.0
Men 256 29.9 262 30.6 268 31.3 69 8.1 Trans spectrum 7 31.8 10 45.5 5 22.7 0 0.0
Racial identity™* People of Color 51 23.4 56 25.7 96 44.0 15 6.9
White 560 26.3 654 30.7 711 33.4 204 9.6 Multiracial 45 34.4 31 23.7 43 32.8 12 9.2
Disability status™ Single Disability 42 25.8 47 28.8 56 34.4 18 11.0
No Disability 593 25.9 697 30.5 787 34.4 211 9.2 Multiple Disabilities 43 44.8 20 20.8 28 29.2 5 5.2
There is a hierarchy within staff positions that allows some voices to be valued more than others. 596 23.2 1,079 42.0 719 28.0 178 6.9
Racial identity™3
White 466 21.9 915 43.1 597 28.1 147 6.9 People of Color and Multiracial 98 27.7 128 36.2 101 28.5 27 7.6
Religious/Spiritual Identity0**11
No Religious/Spiritual Identity 177 23.7 334 44.7 190 25.4 46 6.2 Christian Religious/Spiritual Identity 341 22.0 626 40.4 467 30.1 116 7.5
Disability status™* Single Disability 47 29.0 64 39.5 42 25.9 9 5.6
No Disability 502 21.9 975 42.6 652 28.5 160 7.0 Multiple Disabilities 37 38.1 34 35.1 18 18.6 8 8.2
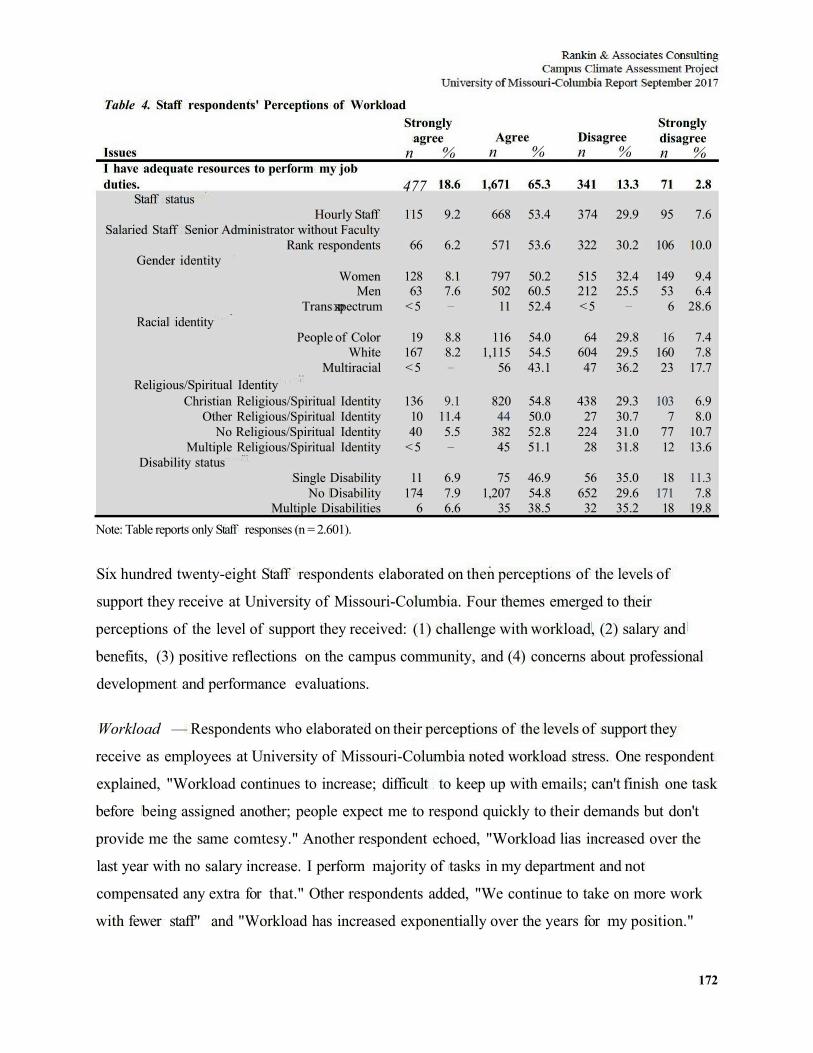
172
Table 4. Staff respondents' Perceptions of Workload
Issues
Strongly agree
n % Agree
n % Disagree n %
Strongly disagree n %
I have adequate resources to perform my job duties. 477 18.6 1,671 65.3 341 13.3 71 2.8
Staff status Hourly Staff 115 9.2 668 53.4 374 29.9 95 7.6
Salaried Staff Senior Administrator without Faculty Rank respondents 66 6.2 571 53.6 322 30.2 106 10.0
Gender identity Women 128 8.1 797 50.2 515 32.4 149 9.4
Men 63 7.6 502 60.5 212 25.5 53 6.4 Trans spectrum < 5 — 11 52.4 < 5 — 6 28.6
Racial identity People of Color 19 8.8 116 54.0 64 29.8 16 7.4
White 167 8.2 1,115 54.5 604 29.5 160 7.8 Multiracial < 5 — 56 43.1 47 36.2 23 17.7
Religious/Spiritual Identity Christian Religious/Spiritual Identity 136 9.1 820 54.8 438 29.3 103 6.9
Other Religious/Spiritual Identity 10 11.4 44 50.0 27 30.7 7 8.0 No Religious/Spiritual Identity 40 5.5 382 52.8 224 31.0 77 10.7
Multiple Religious/Spiritual Identity < 5 — 45 51.1 28 31.8 12 13.6 Disability status
Single Disability 11 6.9 75 46.9 56 35.0 18 11.3 No Disability 174 7.9 1,207 54.8 652 29.6 171 7.8
Multiple Disabilities 6 6.6 35 38.5 32 35.2 18 19.8 Note: Table reports only Staff responses (n = 2.601).
Six hundred twenty-eight Staff respondents elaborated on then perceptions of the levels of
support they receive at University of Missouri-Columbia. Four themes emerged to their
perceptions of the level of support they received: (1) challenge with workload, (2) salary and
benefits, (3) positive reflections on the campus community, and (4) concerns about professional
development and performance evaluations.
Workload — Respondents who elaborated on their perceptions of the levels of support they
receive as employees at University of Missouri-Columbia noted workload stress. One respondent
explained, "Workload continues to increase; difficult to keep up with emails; can't finish one task
before being assigned another; people expect me to respond quickly to their demands but don't
provide me the same comtesy." Another respondent echoed, "Workload lias increased over the
last year with no salary increase. I perform majority of tasks in my department and not
compensated any extra for that." Other respondents added, "We continue to take on more work
with fewer staff" and "Workload has increased exponentially over the years for my position."
173
One respondent suggested an option to reduce workload stress, "[I] Would love the campus to be
more open to work from home to help balance responsibilities. In our department our workload
increased significantly this year while we had 110 raises and also lost some benefits." Workload
stress was thematic hi narratives provided by respondents who elaborated 011 their perceptions of
the degree of support they receive as employees at University of Missouri-Columbia.
Dissatisfaction With Salary & Benefits — Respondents who elaborated on their perceptions of
support noted dissatisfaction with salary and benefits. One respondent generally noted, "Our pay
is too far below market value." Other respondents noted more specific concerns regarding
changes in workload without changes hi pay, no raises and poor benefits. Regarding changes hi
responsibilities without changes in pay, one respondent explained, "unequal duties 111 same
classification. 110 added resources for additional responsibilities, no compensation for additional
responsibilities." Other respondents added, "Not right when you get a job title change that is a
promotion with 110 raise, but are expected to do more" and "I was given a title promotion and 110
extra compensation for this." Another respondent addressed raises, "When I first started staff I
work with got title upgrades and pay increases and I asked if I was getting an increase and the
answer was 110 not at this time." Another respondent shared, "You have to able to find funds for
salary increases." Regarding benefits, respondent reported, "I do not believe that we should have
to pay for parking" and "Compared to other institutions where I have worked, the University of
Missouri offers less paid vacation and fewer university holidays." However, the most commonly
noted concern related to benefits was in reference to child care and support for parents.
Respondents noted, "Childcare unfairly expensive" and "Childcare support should be more
strongly emphasized." Another respondent explained, "Childcare on campus is not affordably
and incredibly limited. Zero paid maternity/paternity leave is a joke." Respondents who
elaborated 011 salary and benefits presented as dissatisfied overall.
Positive Reflections — The sentiment that "MU hi general is an excellent place to work" was
echoed by respondents who elaborated 011 their perceptions of the degree of support they receive
as employees. One respondent noted, "It's pretty easy. Treat us like we actually matter."
Respondents specifically mentioned appreciation for the flexibility oftheir respective supervisors
and managers. For example, respondents noted, "very flexible place to work" and "MU seems
174
pretty flexible for work-life balance." Another respondent added, "My immediate supervisor
provides me with the flexibility I need to balance work and home demands, but I am not aware
of institutional resources designed to help with those." Regarding dnect leadership, one
respondent shared, "My supervisors are great and provide me with all of the tools I need to do
my job." Other respondents noted, "My direct supervisor provides excellent job and career
advice" and "My manager is very supportive." Some respondents shared more general positive
reflections. For example, "love working at mu" and "I really enjoy the team I am working on."
Positive reflections were thematic in the data gathered on Staff respondents who elaborated on
their' perceptions of the levels of support they receive as employees.
Lack of Professional Development Support — Respondents who elaborated on their' perceptions
of the levels of support they receive as employees noted a lack of professional development
support. One respondent's narrative captured many layers of data hi this theme, "It is hard to
'move up' within the University for many staff members. I'm quite experienced hi my field and
make no more than an entry-level staff member does. I would like to have the opportunity to
move up to increase my pay, otheiwise I may end up having to leave Mizzou." Other
respondents noted challenges with networking internally at the University. For example, one
respondent shared, "I find it difficult to make networking connections/for mentorship
opportunities 011 campus." Another respondent elaborated, "I feel that many of my colleagues
with similar positions are given more opportunities to network and expand upon knowledge than
I am." Others associated the lack of professional development opportunities with the reported
neglect in the lack of performance evaluations they received. One respondent went in to detail, "I
have not had a performance evaluation for since 2009.1 do not get feedback from my supervisor
indicating I am either poor or excellent performance. I have heard from individuals that have
used the myPerformance system, this process is time-consuming and not all that helpful." Other
respondents reported, "I haven't had a workplace evaluation in probably 8-10 years" and "I recall
having an evaluation only once in my 24 years here." Finally, one respondent added, "Additional
dollars hivested in training for position would be a nice resource." Respondents who elaborated
011 their perceptions about employee support described professional development challenges,
particularly in networking and performance evaluations.
175
A chi-square test was conducted to compare percentages of Staff respondents who indicated that they had had observed luring practices that they perceived to be unfair or unjust or that would inhibit diversifying the community by staff status: x2 0 . N = 2.418) = 3.97 ,p< .05.
A chi-square test was conducted to compare percentages of Employee respondents who indicated that they had had observed hiring practices that they perceived to be unfair or unjust or that would inhibit diversifying the community by gender identity: x2 (2.7\T= 3,576) = 22.52, p < .001. L™A chi-square test was conducted to compare percentages of Employee respondents who indicated that they had had observed hiring practices that they perceived to be unfair or unjust or that would inhibit diversifying the community by racial identity: x2 (5, N= 3,481) = 40.80, p< .001. L V , 1 1 A chi-square test was conducted to compare percentages of Employee respondents who indicated that they had had observed hiring practices that they perceived to be unfair or unjust or that would inhibit diversifying the community by sexual identity: x2 (2, N= 3,481) = 27.52, p< .001. LV*™A chi-square test was conducted to compare percentages of Employee respondents who indicated that they had had observed hiring practices that they perceived to be unfair or unjust or that would inhibit diversifying the community by religious/spiritual identity: x2 (3. N= 3,500) = 12.23 , p < .01.
A chi-square test was conducted to compare percentages of Employee respondents who indicated that they had had observed hiring practices that they perceived to be unfair or unjust or that would inhibit diversifying the community by disability status: x2 (2, N= 3,602) = 69.03,;; < .001.
A chi-square test was conducted to compare percentages of Employee respondents who indicated that they had observed unjust promotion, tenure, reappointment, reclassification, and/or transfer practices by faculty status: y} (2, N= 898) = 33.64,p < .001.
A chi-square test was conducted to compare percentages of Employee respondents who indicated that they had observed unjust promotion, tenure, reappointment, reclassification, and/or transfer practices by racial identity: %2 (5, N = 3,462) = 19.63, p< .01.
A chi-square test was conducted to compare percentages of Employee respondents who indicated that they had observed unjust promotion, tenure, reappointment, reclassification, and/or transfer practices by religious/spirinial identity: %2 (3, N= 3,482) = 9.45,.p < .05.
A chi-squared test was conducted to compare percentages of Employee respondents who indicated that they had observed unjust promotion, tenure, reappointment, reclassification, and/or transfer practices by disability status: x2
(2, N= 3,582) = 48.62,/> < .001. A chi-square test was conducted to compare percentages of Employee respondents who indicated that they had
observed unfair, unjust, or discriminatory employment-related disciplinary actions by faculty status: %2 (2, N= 898) = 6.03,p < .05.
A chi-square test was conducted to compare percentages of Employee respondents who indicated that they had observed unfair, unjust, or discriminatory employment-related disciplinary actions by racial identity: y} (5, N= 3,475) = 45.80,/> < .001.
A chi-square test was conducted to compare percentages of Employee respondents who indicated that they had observed unfair, unjust, or discriminatory employment-related disciplinary actions by religious/spiritual identity: y} (3, N= 3,492) = 12.58,/> < .01. lxxvu chi-square test was conducted to compare percentages of Employee respondents who indicated that they had observed unfair, unjust, or discriminatory employment-related disciplinary actions by disability status: x2(2, N= 3,594) = 31.13,/> < .001.
A chi-square test was conducted to compare percentages of Staff respondents who indicated that they have supervisors who give them job/career advice or guidance when they need it by disability status: y}(6,N= 2,558) = 38.61, p<. 001.
A chi-square test was conducted to compare percentages of Staff respondents who indicated that they have colleagues/coworkers who give them job/career advice or guidance when they need it by racial identity: x2 (3, N= 2,489)= 8.06, p<. 05.
A chi-square test was conducted to compare percentages of Staff respondents who indicated that they have colleagues/coworkers who give them job/career advice or guidance when they need it by sexual identity: x2(3 , N = 2,443) = 11.13,/>< .05.
176
LX™A chi-square test was conducted to compare percentages of Staff respondents who indicated that they have colleagues/coworkers who give them job/career advice or guidance when they need it by disability status: y2(6.N= 2,558) = 28.25. p< .001.
A chi-square test was conducted to compare percentages of Staff respondents who indicated that they were included in opportunities that will help then career as much as others hi similar positions by citizenship status: x2 (3. N= 2,545) = 9.75, p< .05. L X X™A chi-square test was conducted to compare percentages of Staff respondents who indicated that they were included hi opportunities that will help then career as much as others hi similar positions by racial identity: y} (6, N = 2,468)= 15.59,/? < .05. A chi-square test was conducted to compare percentages of Staff respondents who indicated they were included hi opportunities that will help their career as much as others hi similar positions by disability status: y?(6,N= 2,536) = 27.47, p<. 001.
A chi-square test was conducted to compare percentages of Staff respondents who indicated that the performance evaluation process is clear by gender identity: x2 (6. N= 2,530) = 20.99, p < .01.
A chi-square test was conducted to compare percentages of Staff respondents who indicated that performance evaluation process is clear by racial identity: x2 (6. N= 2,477) = 14.86, p < .05. >™™A chi-square test was conducted to compare percentages of Staff respondents who indicated that the performance evaluation process is clear by religious/spiritual identity: y2(9,N= 2,485) = 25.55./) < .01.
A chi-square test was conducted to compare percentages of Staff respondents who indicated that the performance evaluation process is clear by disability status: %2(6,N= 2,548) = 20.96,p< .01. lxxxix chi-square test was conducted to compare percentages of Staff respondents who indicated that the performance evaluation process is effective by gender identity: X2 (6. N= 2,493) = 17.27,/) < .01.
A chi-square test was conducted to compare percentages of Staff respondents who indicated that performance evaluation process is effective by racial identity: y1 (6. N= 2,440) = 23.31./) < .01.
A chi-square test was conducted to compare percentages of Staff respondents who indicated that performance evaluation process is effective by religious/spiritual identity: y2 (9. N= 2,450) = 23.70, p < .01. X™A chi-square test was conducted to compare percentages of Staff respondents who indicated that performance evaluation process is effective by disability status: y2 (6. N= 2,510) = 21.33,/)<.01.
A chi-square test was conducted to compare percentages of Staff respondents who indicated that their supervisor provides adequate support for them to manage work-life balance by gender identity: y2(6,N= 2,523) = 12.92, p < .05.
A chi-square test was conducted to compare percentages of Staff respondents who indicated that their supervisor provides adequate support for them to manage work-life balance by racial identity: x2(6- N= 2,469) = 16.35. p < .05.
A chi-square test was conducted to compare percentages of Staff respondents who indicated that then supervisor provides adequate support for them to manage work-life balance by religious/spiritual identity: %2(3,N= 2,291) = 11.54,p<.01.
A chi-square test was conducted to compare percentages of Staff respondents who indicated that their supervisor provides adequate support for them to manage work-life balance by disability status: y2 (6, N= 2,538) = 15.77,p< .05. XC™A chi-square test was conducted to compare percentages of Staff respondents who indicated that people who do not have children are burdened with work responsibilities beyond those who do have children by sexual identity: %2
(3, N= 2,411) = 22.00,/> < .001.A chi-square test was conducted to compai e percentages of Staff respondents who indicated that people who do not have children are burdened with work responsibilities beyond those who do have children by religious/spiritual identity: %2(9. N= 2,466) = 17.34,p< .05.
A chi-square test was conducted to compare percentages of Staff respondents who indicated that they are burdened by work responsibilities beyond those of my colleagues with similar performance expectations by staff status: x2(3,^=2,376) = 13.52,/;<.01. CA chi-square test was conducted to compare percentages of Staff respondents who indicated that they perform more work than colleagues with similar performance expectations by staff status: y2 (3. N = 2,388) = 11.71. p < .01. AA chi-square test was conducted to compare percentages of Staff respondents who indicated that they perform more work than colleagues with similar performance expectations by gender identity: %2(6, N= 2,511)= 14.86,/) < .05.
177
™A chi-square test was conducted to compare percentages of Staff respondents who indicated that they perform more work than colleagues with similar performance expectations by sexual identity: x2 (3, N= 2,414)= 7.81./) < .05.
A chi-square test was conducted to compare percentages of Staff respondents who indicated that people who have children or elder care are burdened with balancing work and family responsibilities by staff status: %2 (3. N= 2.334)
9.51, p < .05. A chi-square test was conducted to compare percentages of Staff respondents who indicated that people who have
children or elder care are burdened with balancing work and family responsibilities by gender identity: x2(6, N= 2,450) ' 13.95, p < .05.
A chi-square test was conducted to compare percentages of Staff respondents who indicated that people who have children or elder care are burdened with balancing work and family responsibilities by religious/spiritual identity: %2
(9, N= 2,409) = 28.35, p < .01.A chi-square test was conducted to compare pei centages of Staff respondents who indicated that people who have children or elder care are burdened with balancing work and family responsibilities disability status: x2(6- jV= 2,465) = 13.78,/; < .05.
A chi-square test was conducted to compare percentages of Staff respondents who indicated that they are able to complete my assigned duties during scheduled horns by staff status: %2(3 ,N= 2,408) = 48.28, p < .001.
A chi-square test was conducted to compare percentages of Staff respondents who indicated that they are able to complete my assigned duties during scheduled horns by gender identity: x2 (6, N= 2,526) = 27.59, p < .001. ™A chi-square test was conducted to compare percentages of Staff respondents who indicated that they are able to complete my assigned duties during scheduled horns by racial identity: x2 (6. N= 2,476) = 14.00. p < .05.
A chi-square test was conducted to compare percentages of Staff respondents who indicated that they are able to complete my assigned duties during scheduled horns by sexual identity: y} (3, N= 2,431) = 22.47./) < .001. ™A chi-square test was conducted to compare percentages of Staff respondents who indicated that they are able to complete my assigned duties during scheduled horns by disability status: x2 (6- N= 2,543) = 30.84./) < .001.
A chi-square test was conducted to compare percentages of Staff respondents who indicated that they are pressured by departmental/program work requirements that occur outside of their normally scheduled horns by staff status: x2 (3, N= 2,397) = 66.62, p< .001.
A chi-square test was conducted to compare percentages of Staff respondents who indicated that they are pressured by departmental/program work requirements that occur outside of their normally scheduled horn s by gender identity: x2(3. N= 2,494)= 15.50,/; < .01. ™VA chi-square test was conducted to compare percentages of Staff respondents who indicated that they are pressured by departmental/program work requirements that occur outside of then normally scheduled hours by racial identity x2(6, N= 2,466) = 15.90./) < .05.
A chi-square test was conducted to compare percentages of Staff respondents who indicated that they are given a reasonable tune frame to complete assigned responsibilities by gender identity: y2 (6. N= 2,522)= 18.54,/) < .01. °™A chi-square test was conducted to compare percentages of Staff respondents who indicated that they are given a reasonable time frame to complete assigned responsibilities by religious/spiritual identity: x2(9. N= 2,478) = 18.01, p < .05.
A chi-square test was conducted to compare percentages of Staff respondents who indicated that they are given a reasonable tune frame to complete assigned responsibilities by disability status: %2(6,N= 2,539) = 17.63,/) < .01. CX™A chi-square test was conducted to compare percentages of Staff respondents who indicated that their workload was increased without additional compensation by gender identity: y}{6, N= 2,529) = 16.43, p < .05. C™A chi-square test was conducted to compare percentages of Staff respondents who indicated that their workload was increased without additional compensation by racial identity: y2 (6. N= 2,478) = 15.52,/) < .05.
A chi-square test was conducted to compare percentages of Staff respondents who indicated that their workload was increased without additional compensation by disability status: y?(6,N= 2,547) = 18.31,/) < .01. ™A chi-square test was conducted to compare percentages of Staff respondents who indicated that there is a hierarchy within staff positions that allows some voices to be valued more than others by racial identity: % 2 ( i ,N= 2,479) = 8.09,/; <.05.
A chi-square test was conducted to compare percentages of Staff respondents who indicated that there is a hierarchy within staff positions that allows some voices to be valued more than others by religious/spiritual identity: X2 (3, N= 2,297) = 8.04,/; < .05.
178
A chi-square test was conducted to compare percentages of Staff respondents who indicated that there is a hierarchy within staff positions that allows some voices to be valued more than others by disability status: y2 (6- N= 2,548) 19.12, p<.01. CX3avA chi-square test was conducted to compare percentages of Staff respondents who indicated that they have adequate resources to perform my job duties by staff status: y2 (3. jV= 2,317) = 10.32, p < .05.
A chi-square test was conducted to compare percentages of Staff respondents who indicated that they have adequate resources to perform my job duties by gender identity: y} (6. N= 2,440) = 37.28. p < .001.
A chi-square test was conducted to compare percentages of Staff respondents who indicated that they have adequate resources to perform my job duties by racial identity: y2 (6. N= 2,391) = 23.51. p < .01. ™™A chi-square test was conducted to compare percentages of Staff respondents who indicated that they have adequate resources to perform my job duties by religious/spiritual identity: y2 (9, N= 2,396) = 24.21, p < .01. ''^'"A chi-square test was conducted to compare percentages of Staff respondents who indicated that they have adequate resources to perform my job duties by disability status: y2 (6. N= 2,455) = 25.00,/) < .001.
179
Staff respondents' Feelings of Support and Value at University of Missouri-Columbia
One question in the survey queried Staff respondents about their opinions 011 various topics,
including their support from supervisors and University of Missouri-Columbia's benefits and
salary. Tables 44 to 54 illustrate Staff respondents responses to these items. Analyses were
conducted by staff status (Hourly or Salaried Staff Senior Administrator without Faculty Rank
respondents), gender identity, racial identity, sexual identity, age, disability status, citizenship
status, military status, and religious/spiritual identity; significant differences are presented in the
tables.86
Sixty-six percent (n = 1,705) of Staff respondents "strongly agreed" or "agreed" that University
of Missouri-Columbia provided them with resources to pursue training/professional development
opportunities (Table 44). Women Staff respondents (10%, n = 166) were much less likely than
Men Staff respondents (13%, n = 111) to "disagree" that they believed that University of
Missouri-Columbia provided them with resources to pursue training/professional development
opportunities. White Staff respondents (3%, n = 65) were significantly less likely than
Multiracial Staff respondents (8%, n = 10) and Staff respondents of Color (6%, n = 13) to
"strongly disagr ee" that they believed that University of Missouri-Columbia provided them with
resources to pursue training/professional development opportunities. Heterosexual Staff
respondents (49%, n= 1,111) were significantly more likely tlianLGBQ Staff respondents (41%,
n = 76) to "agree" that University of Missouri-Columbia provided them with resources to pursue
training/professional development opportunities. No Religious/Spiritual Identity Staff
respondents (15%, n= 111) were significantly less likely than Christian Religious/Spiritual
Identity Staff respondents (19%, n = 290) to "strongly agree" that University of Missouri-
Columbia provided them with resources to pursue training/professional development
opportunities. Multiple Disabilities Staff respondents (23%, n = 22) and Single Disability Staff
respondents (14%, n = 22) were significantly more likely than No Disability Staff respondents
(10%, n = 233) to "disagree" that University of Missouri-Columbia provided them with
resources to pursue training/professional development opportunities.
8SPer the LCST. for all analyses, sexual identity was recoded into the categories LGBQ and Heterosexual to maintain response confidentiality. Gender was recoded as Men, Trans spectrum, and Women.
180
Sixty-three percent (n = 1.610) of Staff respondents "strongly agreed" or "agreed" that their
supervisors provided them with resources to pursue training/professional development
opportunities. White Staff respondents (44%, n = 933) were significantly more likely than
Multiracial Staff respondents (33%, n = 44) and Staff respondents of Color (43%, n = 93) to
"agree" that their supervisors provided them with resources to pursue training/professional
development opportunities. No Religious/Spiritual Identity Staff respondents (40%, n = 302)
were significantly less likely than Christian Religious/Spiritual Identity Staff respondents (45%,
n = 691) to "agree" that their supervisors provided them with resources to pursue
training/professional development opportunities. No Disability Staff respondents (21%, n = 475)
were significantly more likely than Multiple Disabilities Staff respondents (16%, n = 15) and
Single Disability Staff respondents (13%, n = 21) to "strongly agree" that their supervisors
provided them with resources to pursue training/professional development opportunities.
Fifty-seven percent (n = 1,468) of Staff respondents "strongly agreed" or "agreed" that
University of Missouri-Columbia was supportive of taking extended leave (e.g., FMLA,
parental). Multiracial Staff respondents (11%, n = 14) and White Staff respondents (6%, n = 121)
were significantly more likely than Staff respondents of Color (3%, n = 6) to "disagree" that
University of Missouri-Columbia was supportive of taking extended leave. Heterosexual Staff
respondents (42%, n = 948) were significantly more likely than LGBQ Staff respondents (32%, n
= 58) to "agree" that University of Missouri-Columbia was supportive of taking extended leave.
No Religious/Spiritual Identity Staff respondents (13%, n = 96) were significantly less likely
than Christian Religious/Spiritual Identity Staff respondents (17%, n = 266) to "strongly agree"
that University of Missouri-Columbia was supportive of takhig extended leave. No Disability
Staff respondents (5%, n = 120) were significantly less likely than Multiple Disabilities Staff
respondents (11%, n = 11) and Single Disability Staff respondents (9%, n = 14) to "disagree"
that University of Missouri-Columbia was supportive of takhig extended leave.
Eighty percent (ri = 2,046) of Staff respondents "strongly agreed" or "agreed" that they believed
that their supervisors were supportive of their taking leave (e.g., vacation, parental, personal,
short-term disability). Hourly Staff respondents (6%, n = 80) were significantly more likely than
Salaried Staff/Senior Administrator without Faculty Rank respondents (3%, n = 38) to "disagree"
181
that they believed that their supervisors were supportive of their taking leave. Women Staff
respondents (14%, n = 232) and Transspectrum Staff respondents (21%, n = 5) were much less
likely than Men Staff respondents (9%, n = 80) to "neither agree nor disagr ee" that they believed
that their supervisors were supportive of their taking leave. U.S. Citizen Staff respondents (33%,
n = 794) were significantly more likely than Non-U. S. Citizen Staff respondents (22%, n = 35) to
"strongly agree" that they believed that their supervisors were supportive of their taking leave.
Multiracial Staff respondents (11%, n = 14) were significantly more likely than Staff respondents
of Color (5%, n = 11) and White Staff respondents (5%, n = 100) to "disagree" that they believed
that their supervisors were supportive of their taking leave. No Disability Staff respondents
(48%, n = 1,096) and Single Disability Staff respondents (48%, n = 75) were significantly more
likely than Multiple Disabilities Staff respondents (33%, n = 32) to "agree" that they believed
that their supervisors were supportive of their taking leave.
Few Staff respondents (8%, n = 201) "strongly agreed" or "agr eed" that staff hi their
department/program who used family accommodation (FMLA) policies were disadvantaged hi
promotion or evaluations. Hourly Staff respondents (13%, n = 165) were significantly less likely
than Salaried Staff/Senior Administrator without Faculty Rank respondents (16%, n = 173) to
"strongly disagr ee" that staff hi their department/program who used family accommodation
(FMLA) policies were disadvantaged in promotion or evaluations. Transspectrum Staff
respondents (21%, n = 5) were much more likely than Women Staff respondents (5%, n = 85)
and Men Staff respondents (6%, n = 54) to "agr ee" that staff hi then department/program who
used family accommodation (FMLA) policies were disadvantaged in promotion or evaluations.
Staff respondents of Color (6%, n= 12) and Multiracial Staff respondents (4%, n = 5) were
significantly more likely than White Staff respondents (2%, n = 39) to "strongly agree" that staff
in their department/program who used family accommodation (FMLA) policies were
disadvantaged in promotion or evaluations. Heterosexual Staff respondents (2%, n = 45) were
significantly less likely than LGBQ Staff respondents (6%, n = 10) to "strongly agree" that staff
in their department/program who used family accommodation (FMLA) pohcies were
disadvantaged in promotion or evaluations. No Disability Staff respondents (2%, n = 45) were
significantly less likely than Disability Staff respondents (4%, n = 10) to "strongly agree" that
182
staff ill their department/program who used family accommodation (FMLA) policies were
disadvantaged in promotion or evaluations.
Thirty-eight percent (n = 961) of Staff respondents "strongly agreed" or "agreed" that University
of Missouri-Columbia policies (e.g., FMLA) were fairly applied across University of Missouri-
Columbia. Christian Religious/Spiritual Identity Staff respondents (33%, n = 503) were
significantly more likely than Other Religious/Spiritual Identity Staff respondents (27%, n = 24),
No Religious/Spiritual Identity Staff respondents (22%, n = 163) and Multiple
Religious/Spiritual Identity Staff respondents (22%, n = 22) to "agree" that University of
Missouri-Columbia policies (e.g., FMLA) were fairly applied across University of Missouri-
Columbia. Multiple Disabilities Staff respondents (17%, n = 16) were significantly more likely
than Single Disability Staff respondents (6%, n = 10) and No Disability Staff respondents (4%, n
= 87) to "strongly disagree" that University of Missouri-Columbia policies (e.g., FMLA) were
fairly applied across University of Missouri-Cohuribia.
More than half of Staff respondents (52%, n = 1,336) "strongly agreed" or "agreed" that they
believed that University of Missouri-Columbia was supportive of flexible work schedules.
Multiracial Staff respondents (11%, n = 14) were significantly more likely than Staff respondents
of Color (5%, n = 12) and White Staff respondents (5%, n = 99) to "strongly disagree" that they
believed that University of Missouri-Columbia was supportive of flexible work schedules.
Heterosexual Staff respondents (5%, n = 102) were significantly less likely than LGBQ Staff
respondents (9%, n = 16) to "strongly disagree" that they believed that University of Missouri-
Columbia was supportive of flexible work schedules. No Religious/Spiritual Identity Staff
respondents (18%, n = 135) were significantly more likely than Christian Religious/Spiritual
Identity Staff respondents (14%, n = 210) to "disagree" that they believed that University of
Missouri-Columbia was supportive of flexible work schedules. Multiple Disabilities Staff
respondents (18%, n = 17) were significantly more likely than Single Disability Staff
respondents (6%, n = 10) and No Disability Staff respondents (5%, n = 103) to "strongly
disagree" that they believed that University of Missouri-Columbia was supportive of flexible
work schedules.
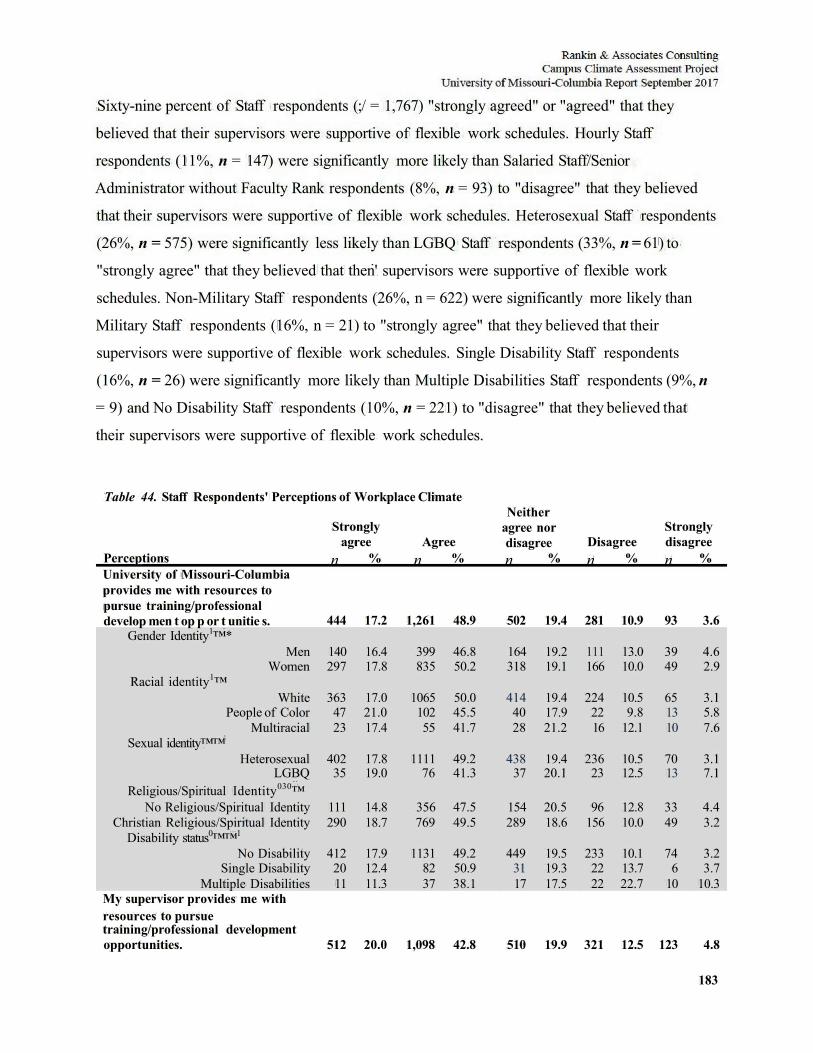
183
Sixty-nine percent of Staff respondents (;/ = 1,767) "strongly agreed" or "agreed" that they
believed that their supervisors were supportive of flexible work schedules. Hourly Staff
respondents (11%, n = 147) were significantly more likely than Salaried Staff/Senior
Administrator without Faculty Rank respondents (8%, n = 93) to "disagree" that they believed
that their supervisors were supportive of flexible work schedules. Heterosexual Staff respondents
(26%, n = 575) were significantly less likely than LGBQ Staff respondents (33%, n = 61) to
"strongly agree" that they believed that then' supervisors were supportive of flexible work
schedules. Non-Military Staff respondents (26%, n = 622) were significantly more likely than
Military Staff respondents (16%, n = 21) to "strongly agree" that they believed that their
supervisors were supportive of flexible work schedules. Single Disability Staff respondents
(16%, n = 26) were significantly more likely than Multiple Disabilities Staff respondents (9%, n
= 9) and No Disability Staff respondents (10%, n = 221) to "disagree" that they believed that
their supervisors were supportive of flexible work schedules.
Table 44. Staff Respondents' Perceptions of Workplace Climate
Strongly agree Agree
Neither agree nor disagree Disagree
Strongly disagree
Perceptions n % n % n % n % n % University of Missouri-Columbia provides me with resources to pursue training/professional develop men t op p or t unitie s. 444 17.2 1,261 48.9 502 19.4 281 10.9 93 3.6
Gender Identity1™* Men 140 16.4 399 46.8 164 19.2 111 13.0 39 4.6
Women 297 17.8 835 50.2 318 19.1 166 10.0 49 2.9 Racial identity1™
White 363 17.0 1065 50.0 414 19.4 224 10.5 65 3.1 People of Color 47 21.0 102 45.5 40 17.9 22 9.8 13 5.8
Multiracial 23 17.4 55 41.7 28 21.2 16 12.1 10 7.6 Sexual identity™™
Heterosexual 402 17.8 1111 49.2 438 19.4 236 10.5 70 3.1 LGBQ 35 19.0 76 41.3 37 20.1 23 12.5 13 7.1
Religious/Spiritual Identity030™ No Religious/Spiritual Identity 111 14.8 356 47.5 154 20.5 96 12.8 33 4.4
Christian Religious/Spiritual Identity 290 18.7 769 49.5 289 18.6 156 10.0 49 3.2 Disability status0™™1
No Disability 412 17.9 1131 49.2 449 19.5 233 10.1 74 3.2 Single Disability 20 12.4 82 50.9 31 19.3 22 13.7 6 3.7
Multiple Disabilities 11 11.3 37 38.1 17 17.5 22 22.7 10 10.3 My supervisor provides me with resources to pursue training/professional development opportunities. 512 20.0 1,098 42.8 510 19.9 321 12.5 123 4.8
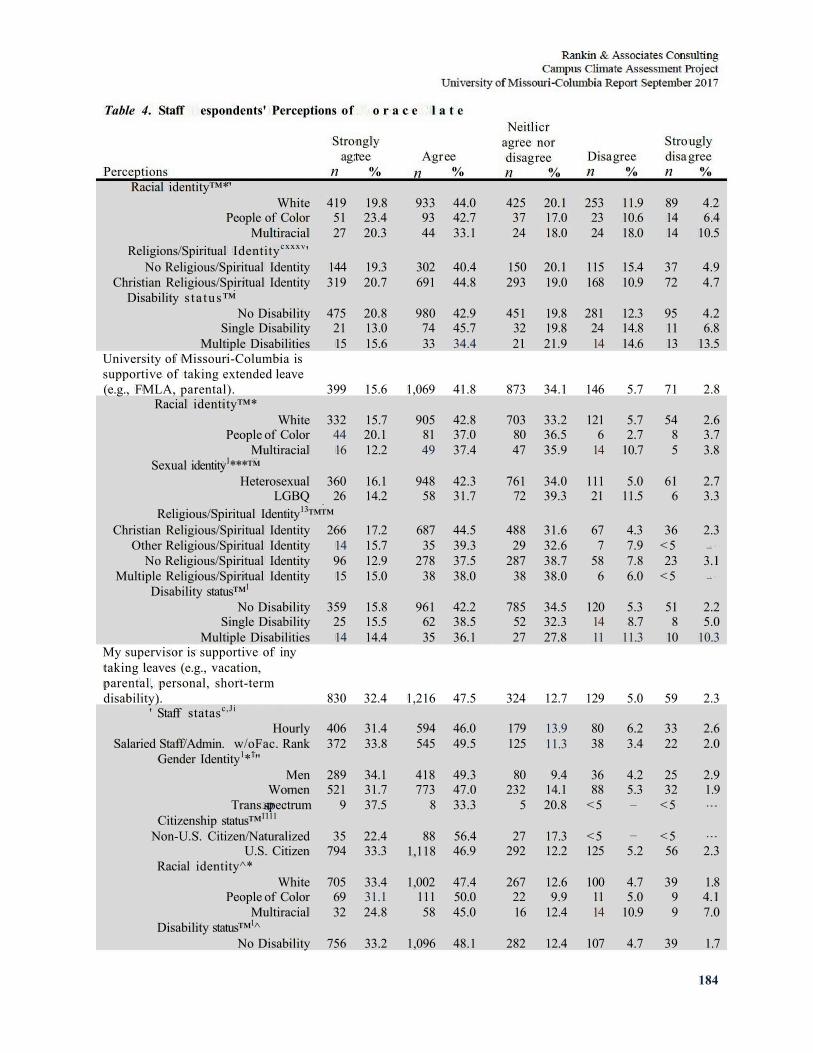
184
Table 4. Staff espondents' Perceptions of o r a c e l a t e
Perceptions Racial identity™*'
Stro ag:
n
nglv tee
% Agr
n ee
%
Neitl agree disag n
icr nor ree
% Disa n
gree %
Stro disa n
ugly gree
%
White 419 19.8 933 44.0 425 20.1 253 11.9 89 4.2 People of Color 51 23.4 93 42.7 37 17.0 23 10.6 14 6.4
Multiracial 27 20.3 44 33.1 24 18.0 24 18.0 14 10.5 Religions/Spiritual Identitycxxxv '
No Religious/Spiritual Identity 144 19.3 302 40.4 150 20.1 115 15.4 37 4.9 Christian Religious/Spiritual Identity 319 20.7 691 44.8 293 19.0 168 10.9 72 4.7
Disability s ta tus™ No Disability 475 20.8 980 42.9 451 19.8 281 12.3 95 4.2
Single Disability 21 13.0 74 45.7 32 19.8 24 14.8 11 6.8 Multiple Disabilities 15 15.6 33 34.4 21 21.9 14 14.6 13 13.5
University of Missouri-Columbia is supportive of taking extended leave (e.g., FMLA, parental). 399 15.6 1,069 41.8 873 34.1 146 5.7 71 2.8
Racial identity™* White 332 15.7 905 42.8 703 33.2 121 5.7 54 2.6
People of Color 44 20.1 81 37.0 80 36.5 6 2.7 8 3.7 Multiracial 16 12.2 49 37.4 47 35.9 14 10.7 5 3.8
Sexual identity1***™ Heterosexual 360 16.1 948 42.3 761 34.0 111 5.0 61 2.7
LGBQ 26 14.2 58 31.7 72 39.3 21 11.5 6 3.3 Religious/Spiritual Identity13™™
Christian Religious/Spiritual Identity 266 17.2 687 44.5 488 31.6 67 4.3 36 2.3 Other Religious/Spiritual Identity 14 15.7 35 39.3 29 32.6 7 7.9 < 5 —
No Religious/Spiritual Identity 96 12.9 278 37.5 287 38.7 58 7.8 23 3.1 Multiple Religious/Spiritual Identity 15 15.0 38 38.0 38 38.0 6 6.0 < 5 —
Disability status™1
No Disability 359 15.8 961 42.2 785 34.5 120 5.3 51 2.2 Single Disability 25 15.5 62 38.5 52 32.3 14 8.7 8 5.0
Multiple Disabilities 14 14.4 35 36.1 27 27.8 11 11.3 10 10.3 My supervisor is supportive of inv taking leaves (e.g., vacation, parental, personal, short-term disability). 830 32.4 1,216 47.5 324 12.7 129 5.0 59 2.3
' Staff statasc,Ji
Hourly 406 31.4 594 46.0 179 13.9 80 6.2 33 2.6 Salaried Staff/Admin. w/oFac. Rank 372 33.8 545 49.5 125 11.3 38 3.4 22 2.0
Gender Identity1*1" Men 289 34.1 418 49.3 80 9.4 36 4.2 25 2.9
Women 521 31.7 773 47.0 232 14.1 88 5.3 32 1.9 Trans spectrum 9 37.5 8 33.3 5 20.8 < 5 — < 5 . . .
Citizenship status™1111
Non-U.S. Citizen/Naturalized 35 22.4 88 56.4 27 17.3 < 5 — < 5 . . .
U.S. Citizen 794 33.3 1,118 46.9 292 12.2 125 5.2 56 2.3 Racial identity^*
White 705 33.4 1,002 47.4 267 12.6 100 4.7 39 1.8 People of Color 69 31.1 111 50.0 22 9.9 11 5.0 9 4.1
Multiracial 32 24.8 58 45.0 16 12.4 14 10.9 9 7.0 Disability status™1
No Disability 756 33.2 1,096 48.1 282 12.4 107 4.7 39 1.7
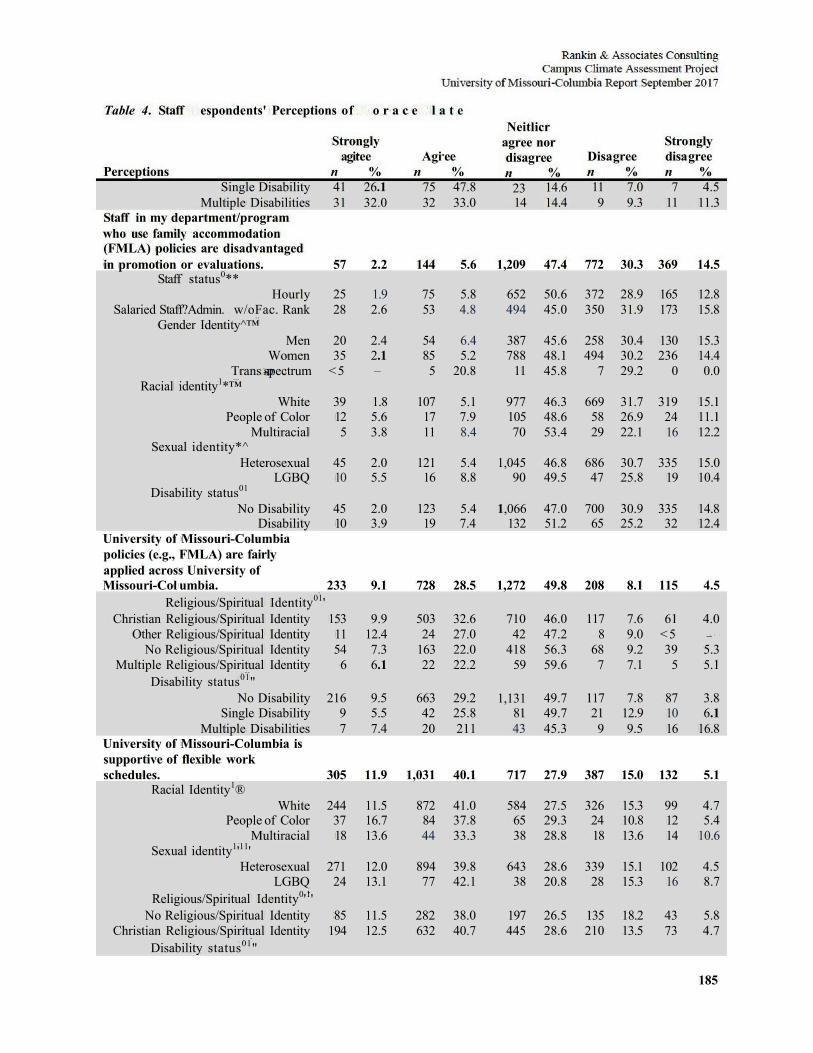
185
Table 4. Staff espondents' Perceptions of o r a c e l a t e
Perceptions Single Disability
Stro agi
n 41
ngly tee
% 26.1
Agi n
75
ee % 47.8
Neitl agree disag n
23
icr nor ree
% 14.6
Disa n 11
gree % 7.0
Stro disa n
7
ngly gree
% 4.5
Multiple Disabilities 31 32.0 32 33.0 14 14.4 9 9.3 11 11.3 Staff in my department/program who use family accommodation (FMLA) policies are disadvantaged in promotion or evaluations. 57 2.2 144 5.6 1,209 47.4 772 30.3 369 14.5
Staff status0** Hourly 25 1.9 75 5.8 652 50.6 372 28.9 165 12.8
Salaried Staff?Admin. w/oFac. Rank 28 2.6 53 4.8 494 45.0 350 31.9 173 15.8 Gender Identity^™
Men 20 2.4 54 6.4 387 45.6 258 30.4 130 15.3 Women 35 2.1 85 5.2 788 48.1 494 30.2 236 14.4
Trans spectrum <5 — 5 20.8 11 45.8 7 29.2 0 0.0 Racial identity1*™
White 39 1.8 107 5.1 977 46.3 669 31.7 319 15.1 People of Color 12 5.6 17 7.9 105 48.6 58 26.9 24 11.1
Multiracial 5 3.8 11 8.4 70 53.4 29 22.1 16 12.2 Sexual identity*^
Heterosexual 45 2.0 121 5.4 1,045 46.8 686 30.7 335 15.0 LGBQ 10 5.5 16 8.8 90 49.5 47 25.8 19 10.4
Disability status01
No Disability 45 2.0 123 5.4 1,066 47.0 700 30.9 335 14.8 Disability 10 3.9 19 7.4 132 51.2 65 25.2 32 12.4
University of Missouri-Columbia policies (e.g., FMLA) are fairly applied across University of Missouri-Col umbia. 233 9.1 728 28.5 1,272 49.8 208 8.1 115 4.5
Religious/Spiritual Identity01' Christian Religious/Spiritual Identity 153 9.9 503 32.6 710 46.0 117 7.6 61 4.0
Other Religious/Spiritual Identity 11 12.4 24 27.0 42 47.2 8 9.0 < 5 —
No Religious/Spiritual Identity 54 7.3 163 22.0 418 56.3 68 9.2 39 5.3 Multiple Religious/Spiritual Identity 6 6.1 22 22.2 59 59.6 7 7.1 5 5.1
Disability status01" No Disability 216 9.5 663 29.2 1,131 49.7 117 7.8 87 3.8
Single Disability 9 5.5 42 25.8 81 49.7 21 12.9 10 6.1 Multiple Disabilities 7 7.4 20 211 43 45.3 9 9.5 16 16.8
University of Missouri-Columbia is supportive of flexible work schedules. 305 11.9 1,031 40.1 717 27.9 387 15.0 132 5.1
Racial Identity1® White 244 11.5 872 41.0 584 27.5 326 15.3 99 4.7
People of Color 37 16.7 84 37.8 65 29.3 24 10.8 12 5.4 Multiracial 18 13.6 44 33.3 38 28.8 18 13.6 14 10.6
Sexual identity1'11' Heterosexual 271 12.0 894 39.8 643 28.6 339 15.1 102 4.5
LGBQ 24 13.1 77 42.1 38 20.8 28 15.3 16 8.7 Religious/Spiritual Identity0'1'
No Religious/Spiritual Identity 85 11.5 282 38.0 197 26.5 135 18.2 43 5.8 Christian Religious/Spiritual Identity 194 12.5 632 40.7 445 28.6 210 13.5 73 4.7
Disability status01"
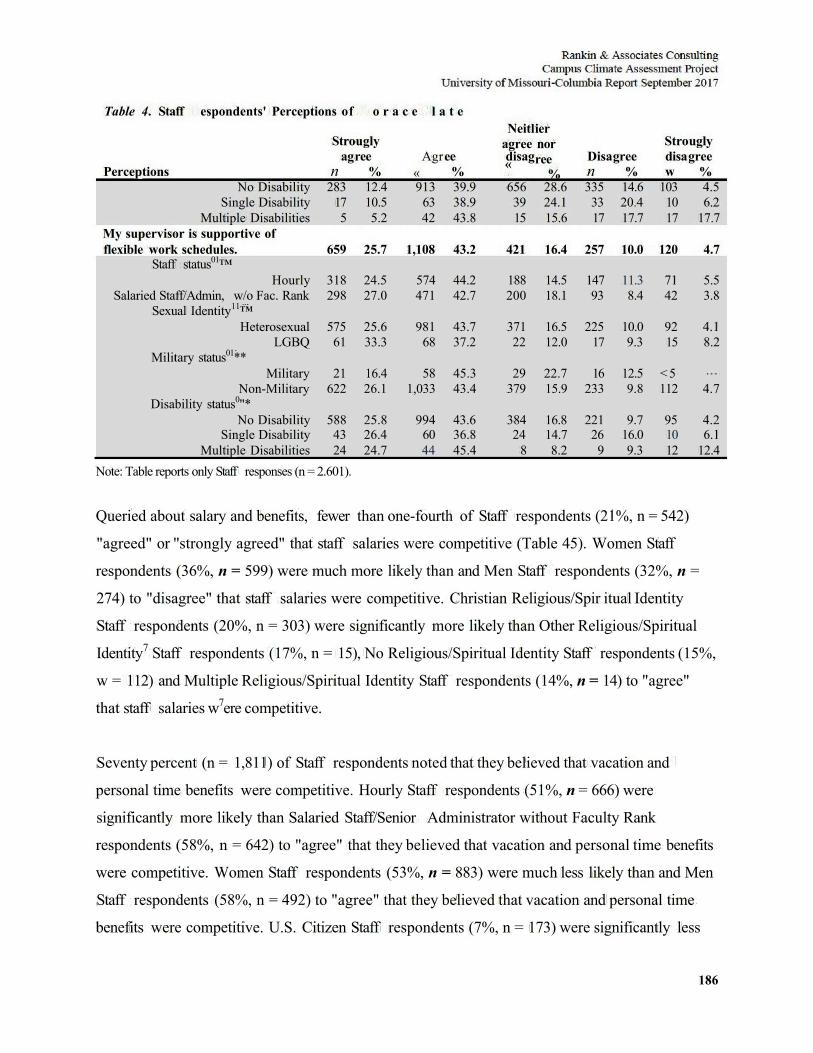
186
Table 4. Staff espondents' Perceptions of o r a c e l a t e
Perceptions
Stro ag
n
ugly ree
% Agr
« ee
%
Neitl agree disag «
ier nor ree
% Disa n
gree %
Stro disa w
ugly gree
% No Disability 283 12.4 913 39.9 656 28.6 335 14.6 103 4.5
Single Disability 17 10.5 63 38.9 39 24.1 33 20.4 10 6.2 Multiple Disabilities 5 5.2 42 43.8 15 15.6 17 17.7 17 17.7
My supervisor is supportive of flexible work schedules. 659 25.7 1,108 43.2 421 16.4 257 10.0 120 4.7
Staff status01™ Hourly 318 24.5 574 44.2 188 14.5 147 11.3 71 5.5
Salaried Staff/Admin, w/o Fac. Rank 298 27.0 471 42.7 200 18.1 93 8.4 42 3.8 Sexual Identity11™
Heterosexual 575 25.6 981 43.7 371 16.5 225 10.0 92 4.1 LGBQ 61 33.3 68 37.2 22 12.0 17 9.3 15 8.2
Military status01** Military 21 16.4 58 45.3 29 22.7 16 12.5 < 5 . . .
Non-Military 622 26.1 1,033 43.4 379 15.9 233 9.8 112 4.7 Disability status0"*
No Disability 588 25.8 994 43.6 384 16.8 221 9.7 95 4.2 Single Disability 43 26.4 60 36.8 24 14.7 26 16.0 10 6.1
Multiple Disabilities 24 24.7 44 45.4 8 8.2 9 9.3 12 12.4 Note: Table reports only Staff responses (n = 2.601).
Queried about salary and benefits, fewer than one-fourth of Staff respondents (21%, n = 542)
"agreed" or ''strongly agreed" that staff salaries were competitive (Table 45). Women Staff
respondents (36%, n = 599) were much more likely than and Men Staff respondents (32%, n =
274) to "disagree" that staff salaries were competitive. Christian Religious/Spir itual Identity
Staff respondents (20%, n = 303) were significantly more likely than Other Religious/Spiritual
Identity7 Staff respondents (17%, n = 15), No Religious/Spiritual Identity Staff respondents (15%,
w = 112) and Multiple Religious/Spiritual Identity Staff respondents (14%, n = 14) to "agree"
that staff salaries w7ere competitive.
Seventy percent (n = 1,811) of Staff respondents noted that they believed that vacation and
personal time benefits were competitive. Hourly Staff respondents (51%, n = 666) were
significantly more likely than Salaried Staff/Senior Administrator without Faculty Rank
respondents (58%, n = 642) to "agree" that they believed that vacation and personal time benefits
were competitive. Women Staff respondents (53%, n = 883) were much less likely than and Men
Staff respondents (58%, n = 492) to "agree" that they believed that vacation and personal time
benefits were competitive. U.S. Citizen Staff respondents (7%, n = 173) were significantly less
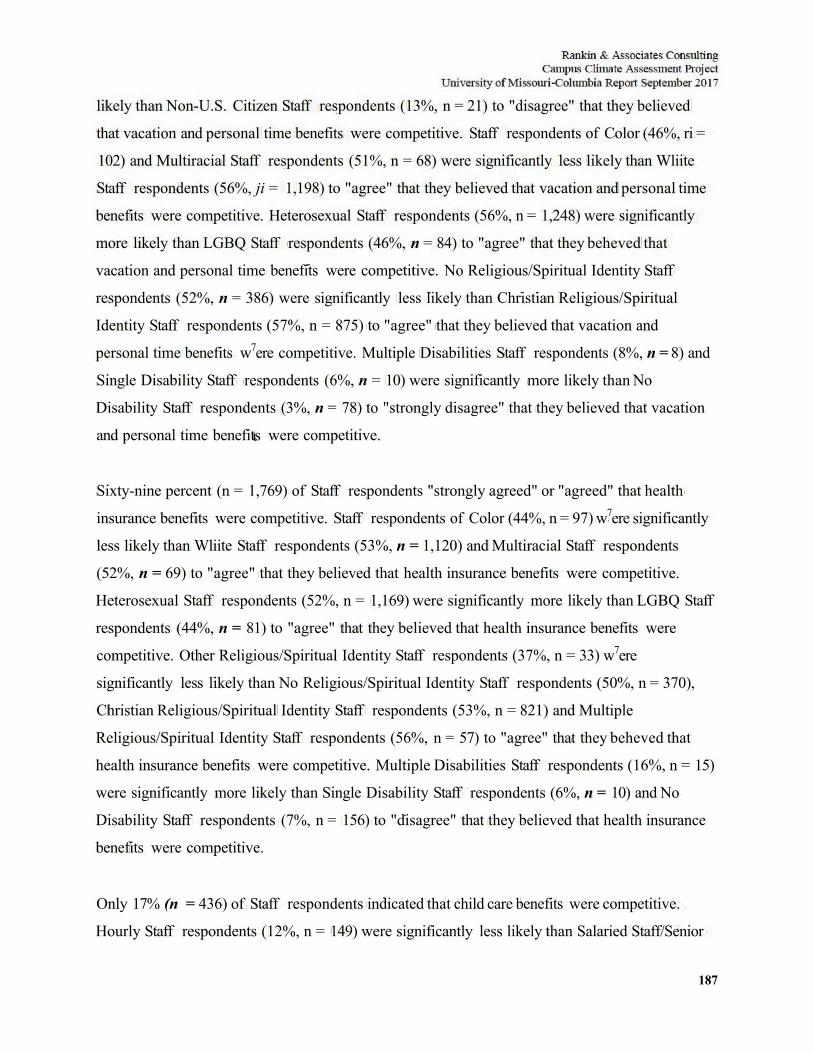
187
likely than Non-U.S. Citizen Staff respondents (13%, n = 21) to "disagree" that they believed
that vacation and personal time benefits were competitive. Staff respondents of Color (46%, ri =
102) and Multiracial Staff respondents (51%, n = 68) were significantly less likely than Wliite
Staff respondents (56%, ji = 1,198) to "agree" that they believed that vacation and personal time
benefits were competitive. Heterosexual Staff respondents (56%, n = 1,248) were significantly
more likely than LGBQ Staff respondents (46%, n = 84) to "agree" that they beheved that
vacation and personal time benefits were competitive. No Religious/Spiritual Identity Staff
respondents (52%, n = 386) were significantly less likely than Christian Religious/Spiritual
Identity Staff respondents (57%, n = 875) to "agree" that they believed that vacation and
personal time benefits w7ere competitive. Multiple Disabilities Staff respondents (8%, n = 8) and
Single Disability Staff respondents (6%, n = 10) were significantly more likely than No
Disability Staff respondents (3%, n = 78) to "strongly disagree" that they believed that vacation
and personal time benefits were competitive.
Sixty-nine percent (n = 1,769) of Staff respondents "strongly agreed" or "agreed" that health
insurance benefits were competitive. Staff respondents of Color (44%, n = 97) w7ere significantly
less likely than Wliite Staff respondents (53%, n = 1,120) and Multiracial Staff respondents
(52%, n = 69) to "agree" that they believed that health insurance benefits were competitive.
Heterosexual Staff respondents (52%, n = 1,169) were significantly more likely than LGBQ Staff
respondents (44%, n = 81) to "agree" that they believed that health insurance benefits were
competitive. Other Religious/Spiritual Identity Staff respondents (37%, n = 33) w7ere
significantly less likely than No Religious/Spiritual Identity Staff respondents (50%, n = 370),
Christian Religious/Spiritual Identity Staff respondents (53%, n = 821) and Multiple
Religious/Spiritual Identity Staff respondents (56%, n = 57) to "agree" that they beheved that
health insurance benefits were competitive. Multiple Disabilities Staff respondents (16%, n = 15)
were significantly more likely than Single Disability Staff respondents (6%, n = 10) and No
Disability Staff respondents (7%, n = 156) to "disagree" that they believed that health insurance
benefits were competitive.
Only 17% (n = 436) of Staff respondents indicated that child care benefits were competitive.
Hourly Staff respondents (12%, n = 149) were significantly less likely than Salaried Staff/Senior
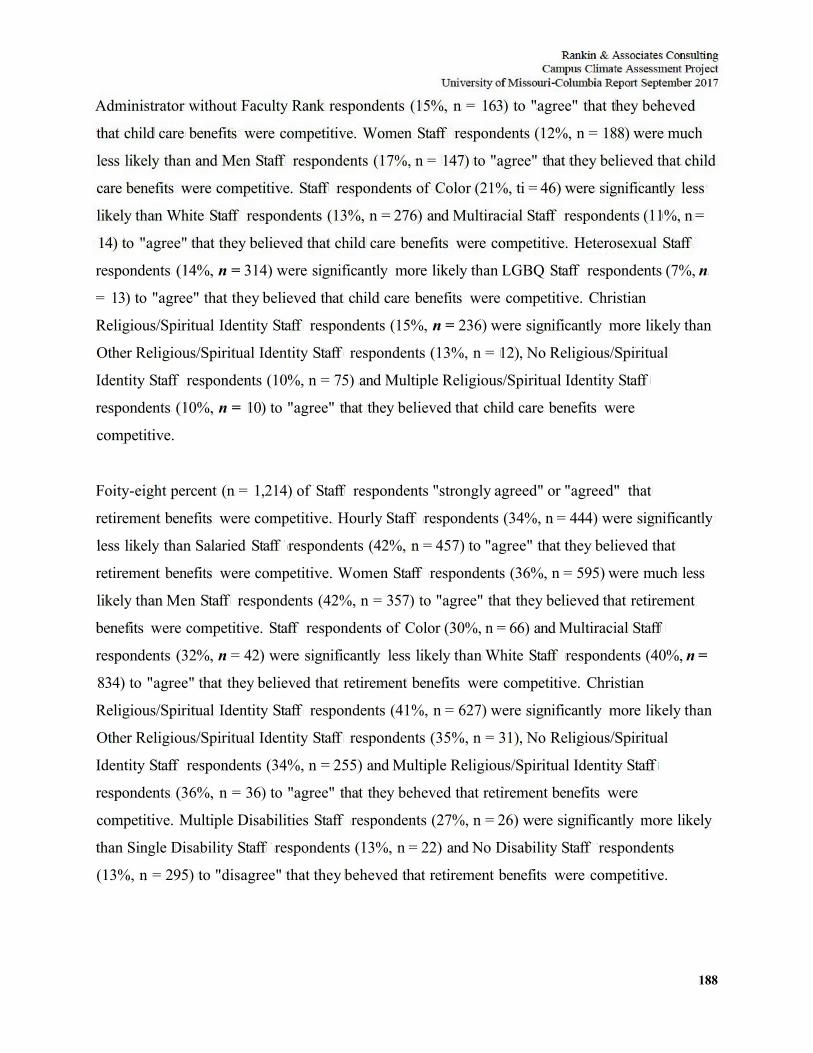
188
Administrator without Faculty Rank respondents (15%, n = 163) to "agree" that they beheved
that child care benefits were competitive. Women Staff respondents (12%, n = 188) were much
less likely than and Men Staff respondents (17%, n = 147) to "agree" that they believed that child
care benefits were competitive. Staff respondents of Color (21%, ti = 46) were significantly less
likely than White Staff respondents (13%, n = 276) and Multiracial Staff respondents (11%, n =
14) to "agree" that they believed that child care benefits were competitive. Heterosexual Staff
respondents (14%, n = 314) were significantly more likely than LGBQ Staff respondents (7%, n
= 13) to "agree" that they believed that child care benefits were competitive. Christian
Religious/Spiritual Identity Staff respondents (15%, n = 236) were significantly more likely than
Other Religious/Spiritual Identity Staff respondents (13%, n = 12), No Religious/Spiritual
Identity Staff respondents (10%, n = 75) and Multiple Religious/Spiritual Identity Staff
respondents (10%, n = 10) to "agree" that they believed that child care benefits were
competitive.
Foity-eight percent (n = 1,214) of Staff respondents "strongly agreed" or "agreed" that
retirement benefits were competitive. Hourly Staff respondents (34%, n = 444) were significantly
less likely than Salaried Staff respondents (42%, n = 457) to "agree" that they believed that
retirement benefits were competitive. Women Staff respondents (36%, n = 595) were much less
likely than Men Staff respondents (42%, n = 357) to "agree" that they believed that retirement
benefits were competitive. Staff respondents of Color (30%, n = 66) and Multiracial Staff
respondents (32%, n = 42) were significantly less likely than White Staff respondents (40%, n =
834) to "agree" that they believed that retirement benefits were competitive. Christian
Religious/Spiritual Identity Staff respondents (41%, n = 627) were significantly more likely than
Other Religious/Spiritual Identity Staff respondents (35%, n = 31), No Religious/Spiritual
Identity Staff respondents (34%, n = 255) and Multiple Religious/Spiritual Identity Staff
respondents (36%, n = 36) to "agree" that they beheved that retirement benefits were
competitive. Multiple Disabilities Staff respondents (27%, n = 26) were significantly more likely
than Single Disability Staff respondents (13%, n = 22) and No Disability Staff respondents
(13%, n = 295) to "disagree" that they beheved that retirement benefits were competitive.
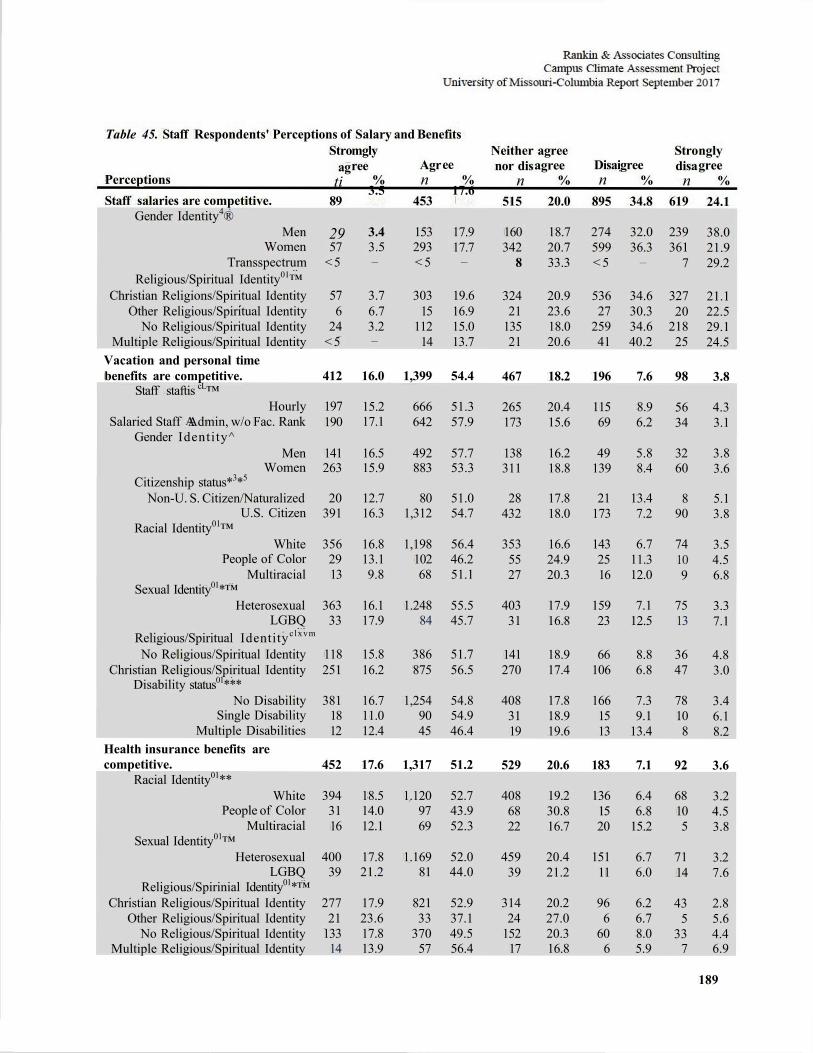
189
Table 45. Staff Respondents' Perceptions of Salary and Benefits
Perceptions Staff salaries are competitive.
Stro ag
ti 89
mgly ree
% 3.5
Agr n
453
ee %
17.6
Neither nor dis
n 515
agree agree
% 20.0
Disai n
895
gree %
34.8
Stro disa n
619
ngly gree
% 24.1
Gender Identity4® Men 29 3.4 153 17.9 160 18.7 274 32.0 239 38.0
Women 57 3.5 293 17.7 342 20.7 599 36.3 361 21.9 Transspectrum <5 — < 5 — 8 33.3 < 5 — 7 29.2
Religious/Spiritual Identity01™ Christian Religions/Spiritual Identity 57 3.7 303 19.6 324 20.9 536 34.6 327 21.1
Other Religious/Spiritual Identity 6 6.7 15 16.9 21 23.6 27 30.3 20 22.5 No Religious/Spiritual Identity 24 3.2 112 15.0 135 18.0 259 34.6 218 29.1
Multiple Religious/Spiritual Identity < 5 — 14 13.7 21 20.6 41 40.2 25 24.5 Vacation and personal time benefits are competitive. 412 16.0 1,399 54.4 467 18.2 196 7.6 98 3.8
Staff staftis cL™ Hourly 197 15.2 666 51.3 265 20.4 115 8.9 56 4.3
Salaried Staff Admin, w/o Fac. Rank 190 17.1 642 57.9 173 15.6 69 6.2 34 3.1 Gender Identity^
Men 141 16.5 492 57.7 138 16.2 49 5.8 32 3.8 Women 263 15.9 883 53.3 311 18.8 139 8.4 60 3.6
Citizenship status*3*5
Non-U. S. Citizen/Naturalized 20 12.7 80 51.0 28 17.8 21 13.4 8 5.1 U.S. Citizen 391 16.3 1,312 54.7 432 18.0 173 7.2 90 3.8
Racial Identity01™ White 356 16.8 1,198 56.4 353 16.6 143 6.7 74 3.5
People of Color 29 13.1 102 46.2 55 24.9 25 11.3 10 4.5 Multiracial 13 9.8 68 51.1 27 20.3 16 12.0 9 6.8
Sexual Identity01*™ Heterosexual 363 16.1 1.248 55.5 403 17.9 159 7.1 75 3.3
LGBQ 33 17.9 84 45.7 31 16.8 23 12.5 13 7.1 Religious/Spiritual Identityc lxvm
No Religious/Spiritual Identity 118 15.8 386 51.7 141 18.9 66 8.8 36 4.8 Christian Religious/Spiritual Identity 251 16.2 875 56.5 270 17.4 106 6.8 47 3.0
Disability status01*** No Disability 381 16.7 1,254 54.8 408 17.8 166 7.3 78 3.4
Single Disability 18 11.0 90 54.9 31 18.9 15 9.1 10 6.1 Multiple Disabilities 12 12.4 45 46.4 19 19.6 13 13.4 8 8.2
Health insurance benefits are competitive. 452 17.6 1,317 51.2 529 20.6 183 7.1 92 3.6
Racial Identity01** White 394 18.5 1.120 52.7 408 19.2 136 6.4 68 3.2
People of Color 31 14.0 97 43.9 68 30.8 15 6.8 10 4.5 Multiracial 16 12.1 69 52.3 22 16.7 20 15.2 5 3.8
Sexual Identity01™ Heterosexual 400 17.8 1.169 52.0 459 20.4 151 6.7 71 3.2
LGBQ 39 21.2 81 44.0 39 21.2 11 6.0 14 7.6 Religious/Spirinial Identity01*™
Christian Religious/Spiritual Identity 277 17.9 821 52.9 314 20.2 96 6.2 43 2.8 Other Religious/Spiritual Identity 21 23.6 33 37.1 24 27.0 6 6.7 5 5.6
No Religious/Spiritual Identity 133 17.8 370 49.5 152 20.3 60 8.0 33 4.4 Multiple Religious/Spiritual Identity 14 13.9 57 56.4 17 16.8 6 5.9 7 6.9
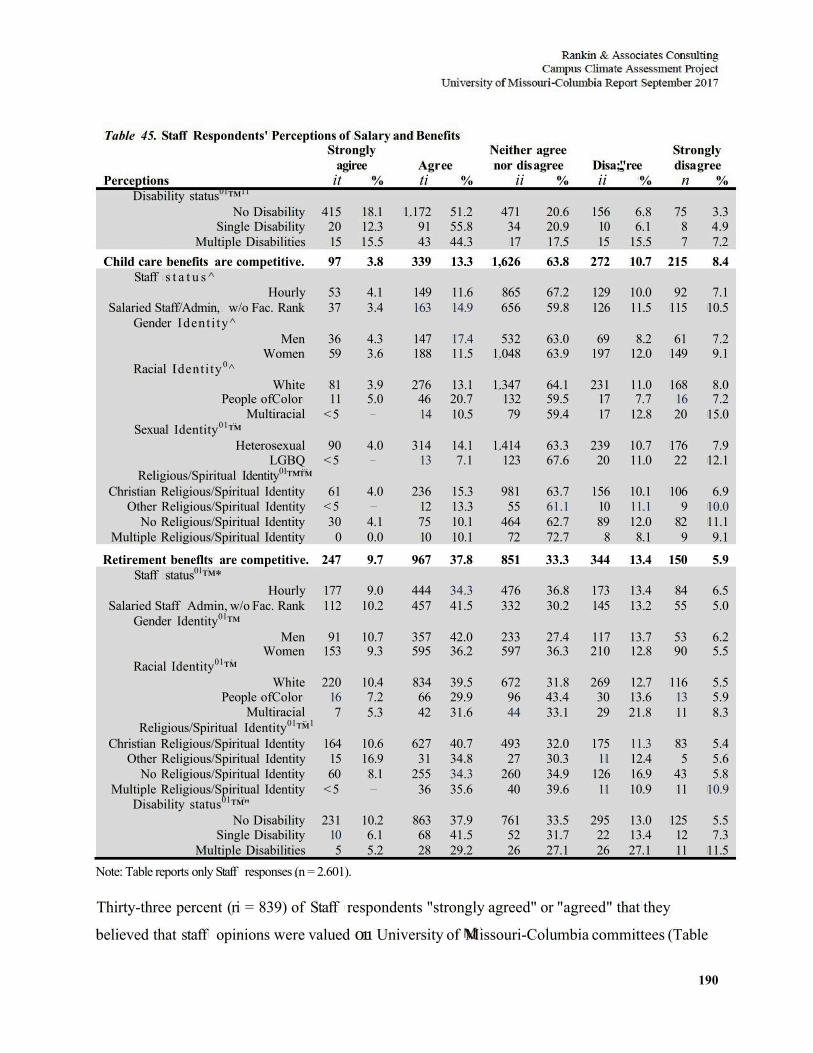
190
Table 45. Staff Respondents' Perceptions of Salary and Benefits
Perceptions
Stro agi it
ngly ree
% Agr ti
ee %
Neither nor dis
ii
agree agree
% Disa; ii
"ree %
Stro disa n
ngly gree
% Disability status01™11
No Disability 415 18.1 1.172 51.2 471 20.6 156 6.8 75 3.3 Single Disability 20 12.3 91 55.8 34 20.9 10 6.1 8 4.9
Multiple Disabilities 15 15.5 43 44.3 17 17.5 15 15.5 7 7.2 Child care benefits are competitive. 97 3.8 339 13.3 1,626 63.8 272 10.7 215 8.4
Staff s t a t u s ^ Hourly 53 4.1 149 11.6 865 67.2 129 10.0 92 7.1
Salaried Staff/Admin, w/o Fac. Rank 37 3.4 163 14.9 656 59.8 126 11.5 115 10.5 Gender Ident i ty^
Men 36 4.3 147 17.4 532 63.0 69 8.2 61 7.2 Women 59 3.6 188 11.5 1.048 63.9 197 12.0 149 9.1
Racial Identi ty 0^ White 81 3.9 276 13.1 1.347 64.1 231 11.0 168 8.0
People ofColor 11 5.0 46 20.7 132 59.5 17 7.7 16 7.2 Multiracial <5 — 14 10.5 79 59.4 17 12.8 20 15.0
Sexual Identity01™ Heterosexual 90 4.0 314 14.1 1.414 63.3 239 10.7 176 7.9
LGBQ <5 — 13 7.1 123 67.6 20 11.0 22 12.1 Religious/Spiritual Identity01™™
Christian Religious/Spiritual Identity 61 4.0 236 15.3 981 63.7 156 10.1 106 6.9 Other Religious/Spiritual Identity <5 — 12 13.3 55 61.1 10 11.1 9 10.0
No Religious/Spiritual Identity 30 4.1 75 10.1 464 62.7 89 12.0 82 11.1 Multiple Religious/Spiritual Identity 0 0.0 10 10.1 72 72.7 8 8.1 9 9.1
Retirement beneflts are competitive. 247 9.7 967 37.8 851 33.3 344 13.4 150 5.9 Staff status01™*
Hourly 177 9.0 444 34.3 476 36.8 173 13.4 84 6.5 Salaried Staff Admin, w/o Fac. Rank 112 10.2 457 41.5 332 30.2 145 13.2 55 5.0
Gender Identity01™ Men 91 10.7 357 42.0 233 27.4 117 13.7 53 6.2
Women 153 9.3 595 36.2 597 36.3 210 12.8 90 5.5 Racial Identity01™
White 220 10.4 834 39.5 672 31.8 269 12.7 116 5.5 People ofColor 16 7.2 66 29.9 96 43.4 30 13.6 13 5.9
Multiracial 7 5.3 42 31.6 44 33.1 29 21.8 11 8.3 Religious/Spiritual Identity01™1
Christian Religious/Spiritual Identity 164 10.6 627 40.7 493 32.0 175 11.3 83 5.4 Other Religious/Spiritual Identity 15 16.9 31 34.8 27 30.3 11 12.4 5 5.6
No Religious/Spiritual Identity 60 8.1 255 34.3 260 34.9 126 16.9 43 5.8 Multiple Religious/Spiritual Identity <5 — 36 35.6 40 39.6 11 10.9 11 10.9
Disability status01™" No Disability 231 10.2 863 37.9 761 33.5 295 13.0 125 5.5
Single Disability 10 6.1 68 41.5 52 31.7 22 13.4 12 7.3 Multiple Disabilities 5 5.2 28 29.2 26 27.1 26 27.1 11 11.5
Note: Table reports only Staff responses (n = 2.601).
Thirty-three percent (ri = 839) of Staff respondents "strongly agreed" or "agreed" that they
believed that staff opinions were valued 011 University of Missouri-Columbia committees (Table
191
46). Heterosexual Staff respondents (9%, n = 190) were significantly less likely than LGBQ Staff
respondents (14%, n = 25) to "strongly disagree'1 that they believed that staff opinions were
valued on University of Missouri-Columbia committees. Christian Religious/Spiritual Identity
Staff respondents (8%, n = 120) were significantly less likely than Other Religious/Spiritual
Identity Staff respondents (10%, n = 9), No Religious/Spiritual Identity Staff respondents (13%,
n = 94) and Multiple Religious/Spiritual Identity Staff respondents (9%, ri = 9) to "strongly
disagree" that they believed that staff opinions were valued on University of Missouri-Columbia
committees. Multiple Disabilities Staff respondents (29%, n = 27) were significantly more likely
than Single Disability Staff respondents (9%, n = 15) and No Disability Staff respondents (9%, n
= 199) to "strongly disagr ee" that they believed that staff opinions were valued on University of
Missouri-Columbia conmiittees.
Twenty-four percent (n = 616) of Staff respondents noted that they believed that staff opinions
were valued by University of Missouri-Columbia faculty. Christian Religious/Spiritual Identity
Staff respondents (12%, n = 185) were significantly less likely than Other Religious/Spiritual
Identity Staff respondents (12%, n = 11), No Religious/Spiritual Identity Staff respondents (17%,
n = 126) and Multiple Religious/Spiritual Identity Staff respondents (17%, n = 17) to "strongly
disagree" that they believed that staff opinions were valued by University of Missouri-Columbia
faculty. Multiple Disabilities Staff respondents (28%, n = 27) were significantly more likely than
Single Disability Staff respondents (18%, n = 29) and No Disability Staff respondents (13%, n =
297) to "strongly disagree" that they believed that staff opinions were valued by University of
Missouri-Columbia faculty.
Twenty-eight percent (n = 715) of Staff respondents noted that they believed that staff opinions
were valued by University of Missouri-Columbia administration. Heterosexual Staff respondents
(14%, n = 301) were significantly less likely than LGBQ Staff respondents (22%, n = 40) to
"strongly disagree" that they believed that staff opinions were valued by University of Missouri-
Columbia administration. Christian Religious/Spiritual Identity Staff respondents (26%, n = 402)
were significantly more likely than Other Religious/Spiritual Identity Staff respondents (24%, n
= 21), No Religious/Spiritual Identity Staff respondents (20%, n = 147) and Multiple
Religious/Spiritual Identity Staff respondents (16%, n = 16) to "agree" that they beheved that
192
staff opinions were valued by University of Missouri-Columbia administration. Multiple
Disabilities Staff respondents (15%, n = 14) and Single Disability Staff respondents (14%, n =
22) were significantly less likely than No Disability Staff respondents (25%, n = 558) to "agree"
that they believed that staff opinions were valued by University of Missouri-Columbia
administration.
Seventy-three percent (« = 1,873) of Staff respondents "strongly agreed" or "agreed" that they
believed that there were clear expectations of then responsibilities. Hourly Staff respondents
(18%, n = 232) were significantly more likely than Salaried Staff/Senior Administrator without
Faculty Rank respondents (15%, n = 162) to "strongly agree" that they believed that there were
clear expectations oftheir responsibilities. Women Staff respondents (18%, n = 290) were much
more likely than and Men Staff respondents (14%, n = 119) to "strongly agree" that they
believed that there were clear expectations of then responsibilities. No Religious/Spiritual
Identity Staff respondents (14%, n = 107) were significantly more likely than Christian
Religious/Spiritual Identity Staff respondents (9%, n = 145) to "disagree" that they believed that
there were clear expectations oftheir responsibilities. Multiple Disabilities Staff respondents
(12%, n = 11) were significantly more likely than No Disability Staff respondents (3%, n = 74)
and Single Disability Staff respondents (3%, n = 5) to "strongly disagree" that they believed that
there were clear expectations oftheir responsibilities.
Only 26% (n = 662) of Staff respondents "strongly agreed" or "agreed" there were clear
procedures on how they could advance at University of Missouri-Columbia. Hourly Staff
respondents (30%, n = 385) were significantly less likely than Salaried Staff/Senior
Administrator without Faculty Rank respondents (33%, n = 370) to "disagree" that they believed
that there were clear procedures on how they could advance at University of Missouri-Columbia.
Staff respondents of Color (10%, n = 21) were much more likely than Multiracial Staff
respondents (4%, n = 5) and White Staff respondents (5%, n = 105) to "strongly agree" that they
believed that there were clear procedures on how they could advance at University of Missouri-
Columbia. No Religious/Spiritual Identity Staff respondents (34%, n = 257) and Multiple
Religious/Spiritual Identity Staff respondents (39%, n = 39) were significantly more likely than
Other Religious/Spiritual Identity Staff respondents (20%, n = 18) and Christian
193
Religious/Spiritual Identity Staff respondents (29%, n = 455), to "disagree" that there were clear
procedures on how they could advance at University of Missouri-Columbia. Multiple Disabilities
Staff respondents (29%, n = 28) and Single Disability Staff respondents (21%, n = 34) were
significantly less likely than No Disability Staff respondents (13%, n = 301) to "strongly
disagree" that they believed that there were clear procedures on how they could advance at
University of Missouri-Columbia.
Thirty-seven percent (n = 947) of Staff respondents "strongly agreed" or "agreed" that they felt
positively about their career opportunities at University of Missouri-Columbia. Hourly Staff
respondents (27%, n = 354) were significantly less likely than Salaried Staff/Senior
Administrator without Faculty Rank respondents (31%, n = 343) to "agree" that they felt
positively about their career opportunities at University of Missouri-Columbia. Staff respondents
of Color (10%, n = 21) were much more likely than Multiracial Staff respondents (4%, n = 5)
and White Staff respondents (5%, n = 105) to "strongly agree" that they felt positively about
their career opportunities at University of Missouri-Columbia. No Religious/Spiritual Identity
Staff respondents (27%, n = 199) and Multiple Religious/Spiritual Identity Staff respondents
(26%, n = 26) were significantly more likely than Other Religious/Spiritual Identity Staff
respondents (21%, n = 19) and Christian Religious/Spiritual Identity Staff respondents (20%, n =
303) to "disagree" that they felt positively about then career opportunities at University of
Missouri-Columbia. Multiple Disabilities Staff respondents (25%, n = 24) and Single Disability
Staff respondents (19%, n = 31) were significantly more likely than No Disability Staff
respondents (10%, n = 230) to "strongly disagr ee" that they felt positively about their career
opportunities at University of Missouri-Columbia.
Fifty-nine percent (n = 1,518) of Staff respondents "strongly agr eed" or "agreed" that they would
recommend University of Missouri-Columbia as a good place to work. Women Staff respondents
(4%, ii = 62) were much less likely than Men Staff respondents (6%, n = 55) to "strongly
disagree" that they would recommend University of Missouri-Columbia as a good place to work.
White Staff respondents (47%, n = 996) and Staff respondents of Color (45%, n = 101) were
much more likely than Multiracial Staff respondents (35%, n = 47) to "agree" that they would
recommend University of Missouri-Columbia as a good place to work. Military Staff
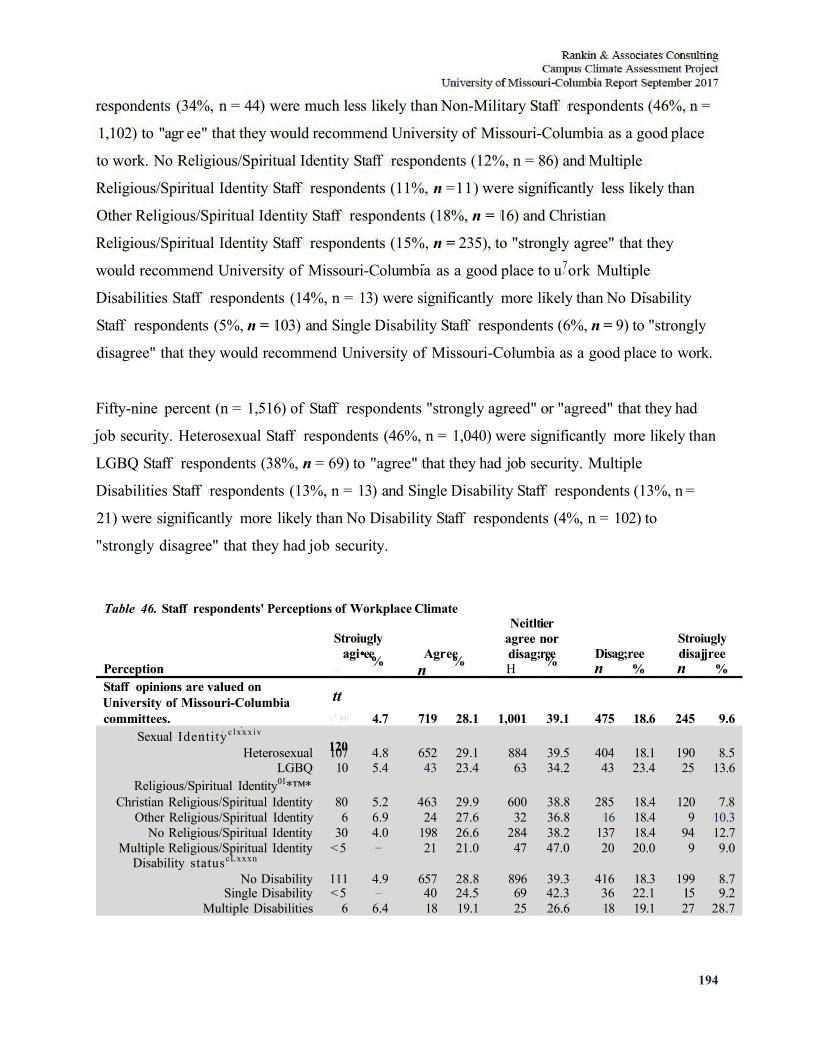
194
respondents (34%, n = 44) were much less likely than Non-Military Staff respondents (46%, n =
1,102) to "agr ee" that they would recommend University of Missouri-Columbia as a good place
to work. No Religious/Spiritual Identity Staff respondents (12%, n = 86) and Multiple
Religious/Spiritual Identity Staff respondents (11%, n =11) were significantly less likely than
Other Religious/Spiritual Identity Staff respondents (18%, n = 16) and Christian
Religious/Spiritual Identity Staff respondents (15%, n = 235), to "strongly agree" that they
would recommend University of Missouri-Columbia as a good place to u7ork Multiple
Disabilities Staff respondents (14%, n = 13) were significantly more likely than No Disability
Staff respondents (5%, n = 103) and Single Disability Staff respondents (6%, n = 9) to "strongly
disagree" that they would recommend University of Missouri-Columbia as a good place to work.
Fifty-nine percent (n = 1,516) of Staff respondents "strongly agreed" or "agreed" that they had
job security. Heterosexual Staff respondents (46%, n = 1,040) were significantly more likely than
LGBQ Staff respondents (38%, n = 69) to "agree" that they had job security. Multiple
Disabilities Staff respondents (13%, n = 13) and Single Disability Staff respondents (13%, n =
21) were significantly more likely than No Disability Staff respondents (4%, n = 102) to
"strongly disagree" that they had job security.
Table 46. Staff respondents' Perceptions of Workplace Climate
Perception Staff opinions are valued on University of Missouri-Columbia committees.
Stroi agi
tt
120
ugly •ee %
4.7
Agr n
719
ee %
28.1
Neitl agree disag H
1,001
tier nor ;ree %
39.1
Disag n
475
;ree %
18.6
Stroi disaj n
245
ugly jree
%
9.6 Sexual Identity c lxxx iv
Heterosexual 107 4.8 652 29.1 884 39.5 404 18.1 190 8.5 LGBQ 10 5.4 43 23.4 63 34.2 43 23.4 25 13.6
Religious/Spiritual Identity01*™* Christian Religious/Spiritual Identity 80 5.2 463 29.9 600 38.8 285 18.4 120 7.8
Other Religious/Spiritual Identity 6 6.9 24 27.6 32 36.8 16 18.4 9 10.3 No Religious/Spiritual Identity 30 4.0 198 26.6 284 38.2 137 18.4 94 12.7
Multiple Religious/Spiritual Identity <5 — 21 21.0 47 47.0 20 20.0 9 9.0 Disability statuscLxxxn
No Disability 111 4.9 657 28.8 896 39.3 416 18.3 199 8.7 Single Disability <5 — 40 24.5 69 42.3 36 22.1 15 9.2
Multiple Disabilities 6 6.4 18 19.1 25 26.6 18 19.1 27 28.7
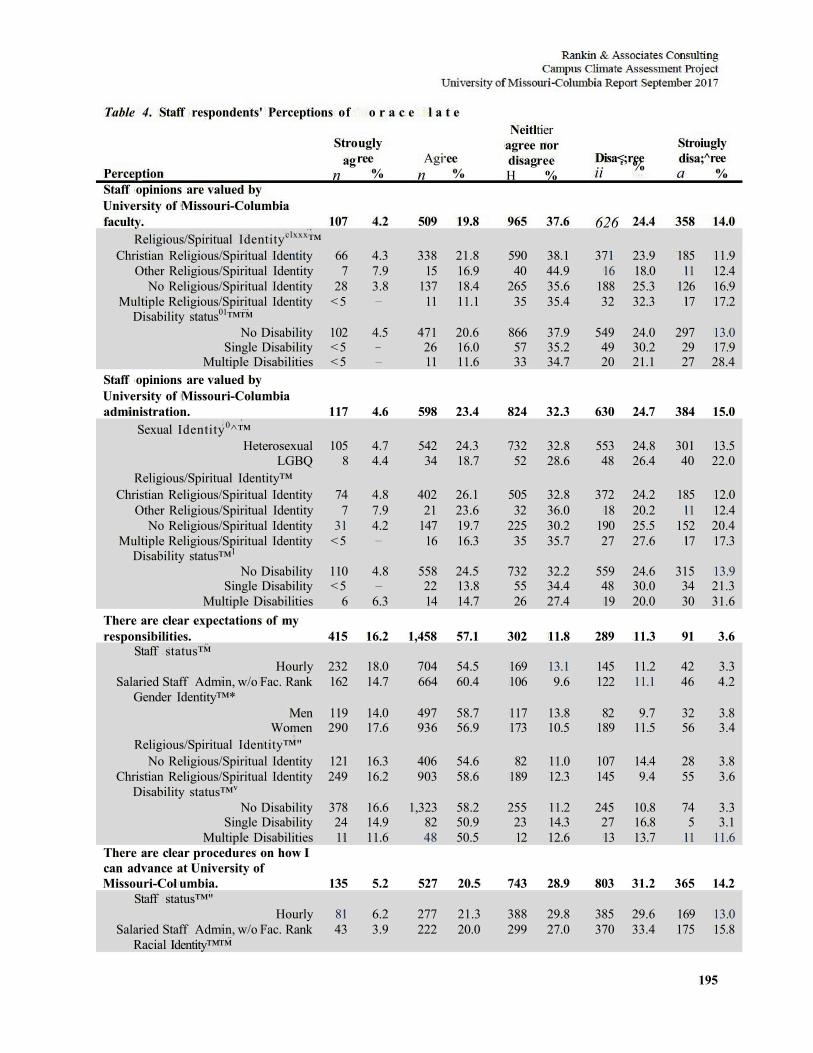
195
Table 4. Staff respondents' Perceptions of o r a c e l a t e
Perception Staff opinions are valued by
Stro ag
n
ugly ree
% Agi
n ee %
Neitl agree disag H
tier nor ree
% Disa< ii
;ree % Stroi disa; a
ugly ^ree
%
University of Missouri-Columbia faculty. 107 4.2 509 19.8 965 37.6 626 24.4 358 14.0
Religious/Spiritual Identityclxxx™ Christian Religious/Spiritual Identity 66 4.3 338 21.8 590 38.1 371 23.9 185 11.9
Other Religious/Spiritual Identity 7 7.9 15 16.9 40 44.9 16 18.0 11 12.4 No Religious/Spiritual Identity 28 3.8 137 18.4 265 35.6 188 25.3 126 16.9
Multiple Religious/Spiritual Identity <5 — 11 11.1 35 35.4 32 32.3 17 17.2 Disability status01™™
No Disability 102 4.5 471 20.6 866 37.9 549 24.0 297 13.0 Single Disability <5 — 26 16.0 57 35.2 49 30.2 29 17.9
Multiple Disabilities <5 — 11 11.6 33 34.7 20 21.1 27 28.4 Staff opinions are valued by University of Missouri-Columbia administration. 117 4.6 598 23.4 824 32.3 630 24.7 384 15.0
Sexual Identity0^™ Heterosexual 105 4.7 542 24.3 732 32.8 553 24.8 301 13.5
LGBQ 8 4.4 34 18.7 52 28.6 48 26.4 40 22.0 Religious/Spiritual Identity™
Christian Religious/Spiritual Identity 74 4.8 402 26.1 505 32.8 372 24.2 185 12.0 Other Religious/Spiritual Identity 7 7.9 21 23.6 32 36.0 18 20.2 11 12.4
No Religious/Spiritual Identity 31 4.2 147 19.7 225 30.2 190 25.5 152 20.4 Multiple Religious/Spiritual Identity <5 — 16 16.3 35 35.7 27 27.6 17 17.3
Disability status™1
No Disability 110 4.8 558 24.5 732 32.2 559 24.6 315 13.9 Single Disability <5 — 22 13.8 55 34.4 48 30.0 34 21.3
Multiple Disabilities 6 6.3 14 14.7 26 27.4 19 20.0 30 31.6 There are clear expectations of my responsibilities. 415 16.2 1,458 57.1 302 11.8 289 11.3 91 3.6
Staff status™ Hourly 232 18.0 704 54.5 169 13.1 145 11.2 42 3.3
Salaried Staff Admin, w/o Fac. Rank 162 14.7 664 60.4 106 9.6 122 11.1 46 4.2 Gender Identity™*
Men 119 14.0 497 58.7 117 13.8 82 9.7 32 3.8 Women 290 17.6 936 56.9 173 10.5 189 11.5 56 3.4
Religious/Spiritual Identity™" No Religious/Spiritual Identity 121 16.3 406 54.6 82 11.0 107 14.4 28 3.8
Christian Religious/Spiritual Identity 249 16.2 903 58.6 189 12.3 145 9.4 55 3.6 Disability status™v
No Disability 378 16.6 1,323 58.2 255 11.2 245 10.8 74 3.3 Single Disability 24 14.9 82 50.9 23 14.3 27 16.8 5 3.1
Multiple Disabilities 11 11.6 48 50.5 12 12.6 13 13.7 11 11.6 There are clear procedures on how I can advance at University of Missouri-Col umbia. 135 5.2 527 20.5 743 28.9 803 31.2 365 14.2
Staff status™" Hourly 81 6.2 277 21.3 388 29.8 385 29.6 169 13.0
Salaried Staff Admin, w/o Fac. Rank 43 3.9 222 20.0 299 27.0 370 33.4 175 15.8 Racial Identity™™
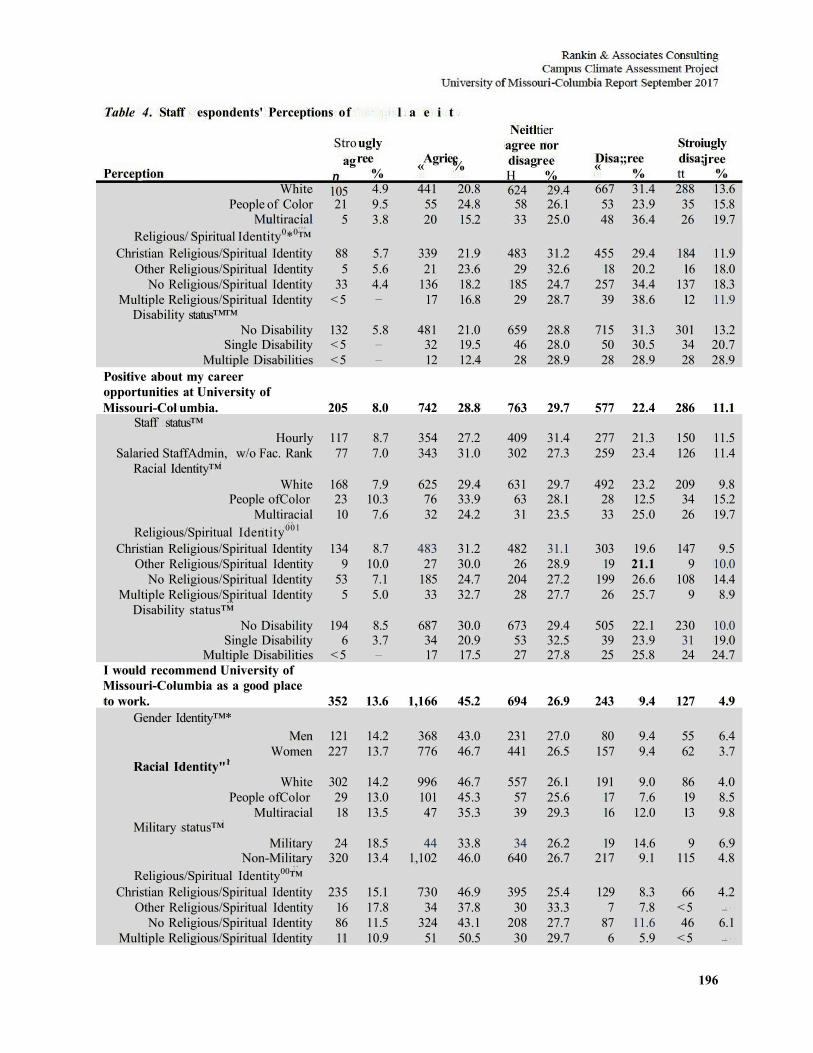
196
Table 4. Staff espondents' Perceptions of l a e i t
Perception White
Stro ag
n 105
ugly ree
% 4.9
Agri « 441
ee % 20.8
Neitl agree disag H 624
tier nor ree
% 29.4
Disa; « 667
;ree % 31.4
Stroi disa; tt 288
ugly jree
% 13.6
People of Color 21 9.5 55 24.8 58 26.1 53 23.9 35 15.8 Multiracial 5 3.8 20 15.2 33 25.0 48 36.4 26 19.7
Religious/ Spiritual Identity0*0™ Christian Religious/Spiritual Identity 88 5.7 339 21.9 483 31.2 455 29.4 184 11.9
Other Religious/Spiritual Identity 5 5.6 21 23.6 29 32.6 18 20.2 16 18.0 No Religious/Spiritual Identity 33 4.4 136 18.2 185 24.7 257 34.4 137 18.3
Multiple Religious/Spiritual Identity <5 — 17 16.8 29 28.7 39 38.6 12 11.9 Disability status™™
No Disability 132 5.8 481 21.0 659 28.8 715 31.3 301 13.2 Single Disability <5 — 32 19.5 46 28.0 50 30.5 34 20.7
Multiple Disabilities <5 — 12 12.4 28 28.9 28 28.9 28 28.9 Positive about my career opportunities at University of Missouri-Col umbia. 205 8.0 742 28.8 763 29.7 577 22.4 286 11.1
Staff status™ Hourly 117 8.7 354 27.2 409 31.4 277 21.3 150 11.5
Salaried StaffAdmin, w/o Fac. Rank 77 7.0 343 31.0 302 27.3 259 23.4 126 11.4 Racial Identity™
White 168 7.9 625 29.4 631 29.7 492 23.2 209 9.8 People ofColor 23 10.3 76 33.9 63 28.1 28 12.5 34 15.2
Multiracial 10 7.6 32 24.2 31 23.5 33 25.0 26 19.7 Religious/Spiritual Identity001
Christian Religious/Spiritual Identity 134 8.7 483 31.2 482 31.1 303 19.6 147 9.5 Other Religious/Spiritual Identity 9 10.0 27 30.0 26 28.9 19 21.1 9 10.0
No Religious/Spiritual Identity 53 7.1 185 24.7 204 27.2 199 26.6 108 14.4 Multiple Religious/Spiritual Identity 5 5.0 33 32.7 28 27.7 26 25.7 9 8.9
Disability status™ No Disability 194 8.5 687 30.0 673 29.4 505 22.1 230 10.0
Single Disability 6 3.7 34 20.9 53 32.5 39 23.9 31 19.0 Multiple Disabilities <5 — 17 17.5 27 27.8 25 25.8 24 24.7
I would recommend University of Missouri-Columbia as a good place to work. 352 13.6 1,166 45.2 694 26.9 243 9.4 127 4.9
Gender Identity™* Men 121 14.2 368 43.0 231 27.0 80 9.4 55 6.4
Women 227 13.7 776 46.7 441 26.5 157 9.4 62 3.7 Racial Identity"1
White 302 14.2 996 46.7 557 26.1 191 9.0 86 4.0 People ofColor 29 13.0 101 45.3 57 25.6 17 7.6 19 8.5
Multiracial 18 13.5 47 35.3 39 29.3 16 12.0 13 9.8 Military status™
Military 24 18.5 44 33.8 34 26.2 19 14.6 9 6.9 Non-Military 320 13.4 1,102 46.0 640 26.7 217 9.1 115 4.8
Religious/Spiritual Identity00™ Christian Religious/Spiritual Identity 235 15.1 730 46.9 395 25.4 129 8.3 66 4.2
Other Religious/Spiritual Identity 16 17.8 34 37.8 30 33.3 7 7.8 <5 —
No Religious/Spiritual Identity 86 11.5 324 43.1 208 27.7 87 11.6 46 6.1 Multiple Religious/Spiritual Identity 11 10.9 51 50.5 30 29.7 6 5.9 <5 —
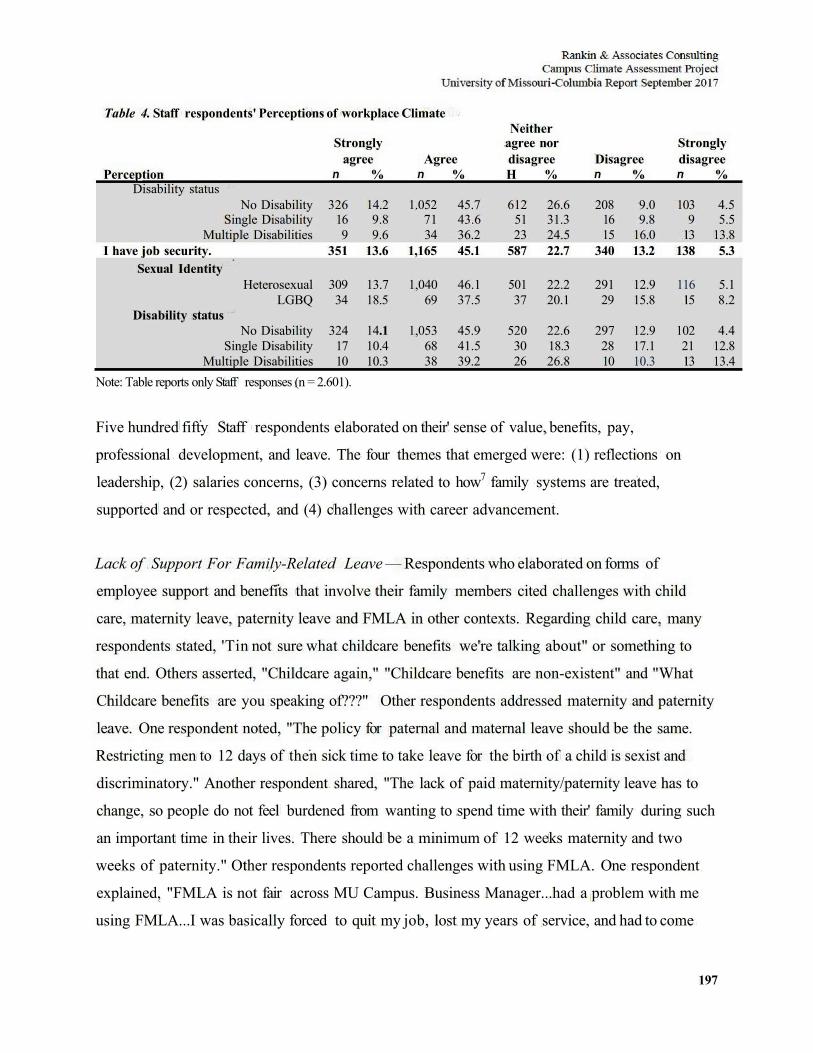
197
Table 4. Staff respondents' Perceptions of workplace Climate Neither
Strongly agree nor Strongly agree Agree disagree Disagree disagree
Perception n % n % H % n % n % Disability status
No Disability 326 14.2 1.052 45.7 612 26.6 208 9.0 103 4.5 Single Disability 16 9.8 71 43.6 51 31.3 16 9.8 9 5.5
Multiple Disabilities 9 9.6 34 36.2 23 24.5 15 16.0 13 13.8 I have job security. 351 13.6 1,165 45.1 587 22.7 340 13.2 138 5.3
Sexual Identity Heterosexual 309 13.7 1,040 46.1 501 22.2 291 12.9 116 5.1
LGBQ 34 18.5 69 37.5 37 20.1 29 15.8 15 8.2 Disability status
No Disability 324 14.1 1,053 45.9 520 22.6 297 12.9 102 4.4 Single Disability 17 10.4 68 41.5 30 18.3 28 17.1 21 12.8
Multiple Disabilities 10 10.3 38 39.2 26 26.8 10 10.3 13 13.4 Note: Table reports only Staff responses (n = 2.601).
Five hundred fifty Staff respondents elaborated on their' sense of value, benefits, pay,
professional development, and leave. The four themes that emerged were: (1) reflections on
leadership, (2) salaries concerns, (3) concerns related to how7 family systems are treated,
supported and or respected, and (4) challenges with career advancement.
Lack of Support For Family-Related Leave — Respondents who elaborated on forms of
employee support and benefits that involve their family members cited challenges with child
care, maternity leave, paternity leave and FMLA in other contexts. Regarding child care, many
respondents stated, 'Tin not sure what childcare benefits we're talking about" or something to
that end. Others asserted, "Childcare again," "Childcare benefits are non-existent" and "What
Childcare benefits are you speaking of???" Other respondents addressed maternity and paternity
leave. One respondent noted, "The policy for paternal and maternal leave should be the same.
Restricting men to 12 days of then sick time to take leave for the birth of a child is sexist and
discriminatory." Another respondent shared, "The lack of paid maternity/paternity leave has to
change, so people do not feel burdened from wanting to spend time with their' family during such
an important time in their lives. There should be a minimum of 12 weeks maternity and two
weeks of paternity." Other respondents reported challenges with using FMLA. One respondent
explained, "FMLA is not fair across MU Campus. Business Manager...had a problem with me
using FMLA...I was basically forced to quit my job, lost my years of service, and had to come
198
back and start over!" The respondent further suggested that the inequities were made more
apparent when they sought to use FMLA for a sick dependent family member. Another
respondent noted, "When my wife was diagnosed with [a serious illness] HR would not till out
FMLA forms and told me to use vacation.'1 Respondents who elaborated 011 family related leave
and support presented feelings reflecting lack of support.
Leadership Changes & Impacts — Respondents who elaborated 011 then experiences of
opporumities and support at University of Missouri-Columbia provided feedback 011 campus
leadership. In particular, respondents elaborated 011 how leadership changes have impacted them.
One respondent noted, "For the first time at MU, I do not feel supported by my supervisor and
do not feel secure in my job. I did not feel this way in my previous office before the top
administrators left MU." Another respondent explained, "This used to be a great place to work,
over the past few years the decline has been rapid. I know we are supposed to be sUipid but it's
lousy management that has put our University where it is today. Until higher management
changes are made we are 111 serious trouble." Another respondent elaborated, "Hie paucity of
'permanent' hires in senior positions, and the subsequent leadership void it has produced, has
contributed to u7hat many MU staff members have described to me as an acute lack of
confidence in the university's short to mid-range prospects." Other narratives about the impacts
of changes 111 leadership included, "Staff morale is at an all-time low," leaders causing "vast
amount of undue stress" and "a great deal of mistrust." One respondent reflected on leadership
and a recent initiative, Grow, "Poor leadership and lack of support are now being replaced with
GROW - a program where I interact with a web site and management still has 110 responsibility
or accountability for leadership." Respondents who elaborated 011 leadership expressed concerns
for themselves and the direction of the institution.
Inadequate Compensation — Respondents who elaborated on compensation noted "salaries are
not competitive." Some respondents compared themselves to others in higher education. One
respondent shared, "Salaries are low for the area (Columbia) and higher Ed. in general."
Another respondent added, "Staff salaries are not valued as faculty salaries are and it causes staff
to be discouraged and frustrated." Other respondents noted specific areas where their perceived
salaries to inadequate. One respondent noted, "Pay in my department is low so staff move 011 to
other departments." Another respondent expressed, "The salary of our part time workers 111 the
199
Concert Series is not competitive." Elaborating on the perceived competitiveness of
compensation, one respondent noted, "Salaries are so uncompetitive it's a shame and very
difficult to keep good people here." Another respondent added, "Competitive salaries? Not
hardly." Other respondents reported inequities. For example, one respondent noted, "As for
salary- we did not get a pay increase this year when the staff at the hospital did for the same
position and same work, it was not fan." Another respondent explained, "I am a woman and am
paid $20,000 a year less than my male counterpart hi my department. We have the same job title
and similar responsibilities." Respondents who elaborated oil pay and salaries described them as
insufficient.
Challenges With Advancement & Professional Development — Staff respondents who elaborated
on their opportunities for advancement and professional development described a lack these
opportunities. The sentiment that "There is no Opportunities to advance hi my job" was echoed
by other respondents. For example, other respondents shared, "There are little to 110 opportunities
to advance in my area, unless I leave my department" and "I cannot advance in my current
position unless I move departments or leave the university entirely." Other respondents noted
gaps hi understanding of how to advance. One respondent shared, "The path to career
advancement has never been made clear to me." Another respondent noted, "The performance
metrics have changed from year to year and have never been clearly set." Regarding professional
development and training, one respondent explained, "Only the 'higher ups' are given the
opportunity to attend training/professional developments." Other respondents noted challenges in
seeking these opportunities. For example, one respondent reported, "There are many training
opportunities but my department is short staffed and I feel guilty wanting (and ultimately I do not
go) to go the training." Another respondent noted, "I gave up 011 trying to get additional
computer training within campus computing. The last time I checked, I would have had to pay
$80 per course." One respondent perceived a lack of support based 011 their age, "I believe that
because I am an older employee, I am overlooked for professional development opportunities."
Finally, one respondent noted, "I would like more choice, input, and opportiunties hi the area of
professional development." Respondents who elaborated on their opportunities for advancement
and professional development expressed discontentment with the current opportunities and
practices hi place.
200
Question 106 on the survey queried Staff respondents about the degree to which they felt valued
at University of Missouri-Columbia. Frequencies and significant differences based oil staff status
(Hourly or Salaried Staff/Senior Administrator without Faculty Rank respondents), gender
identity, racial identity,87 age, sexual identity, disability status, citizenship status, military status,
religious/spiritual identity, and first-generation and low-income status are provided hi Tables 47
through 49.88
Eighty-two percent (n = 2,124) of Staff respondents "strongly agreed'1 or "agreed" that they felt
valued by coworkers in their department (Table 47). Women Staff respondents (8%, n = 125)
were much more likely than Men Staff respondents (4%, n = 34) to "disagree" that they felt
valued by coworkers in their department. Staff respondents ofColor (28%, ii = 64) were less
likely than White Staff respondents (35%, n = 748) and Multiracial Staff respondents (33%, n =
44) to "strongly agree" that they felt valued by coworkers in their department. No Disability
Staff respondents (1%, n = 28) were significantly less likely than Multiple Disabilities Staff
respondents (7%, n = 7) and Single Disability Staff respondents (5%, n = 8) to "strongly
disagree" that they felt valued by coworkers in their department.
Sixty-nine percent (n = 1,779) of Staff respondents "strongly agreed" or "agreed" that they felt
valued by coworkers outside of their department. Hourly Staff respondents (47%, n = 605) were
significantly less likely than Salaried StaffSenior Administrator without Faculty Rank
respondents (51%, n = 564) to "agree" that they felt valued by coworkers outside of their
department. Women Staff respondents (20%, n = 330) were significantly less likely than Men
Staff respondents (24%, n = 208) to "strongly agree" that they felt valued by coworkers outside
of their department. Staff respondents ofColor (3%, n = 6) were much more likely than White
87The LCST proposed six collapsed racial identity categories (White. African/Black/African American, Asian/Asian American, Hispanic/Latm@/Chican@, Other People of Color, and Multiracial), Per the LCST, the Other People of Color category included respondents who identified as Native Hawaiian, Pacific Islander, American Indian/Native, Alaskan Native. Middle Eastern, and Southwest Asian. For the purposes of some analyses, this report further collapses racial identity into three categories (White, People of Color, and Multiracial), where the Asian/Asian American, African/Black/African American. Hispanic,Tathio/Chicano, and Other People of Color were collapsed into one category named People of Color. 8SPer die LCST. for all analyses, sexual identity was recoded into the categories LGBQ and Heterosexual to maintain response confidentiality. Gender identity was recoded as Men, Transspectrum, and Women.
201
Staff respondents (1%, n = 16) to "strongly disagree" that they felt valued by coworkers outside
oftheir' department. Heterosexual Staff respondents (6%, n = 125) were significantly less likely
than LGBQ Staff respondents (14%, n = 25) to "disagree" that they felt valued by coworkers
outside oftheir department. Christian Religious/Spiritual Identity Staff respondents (24%, n =
363) were significantly more likely than Other Religious/Spiritual Identity Staff respondents
(19%, n = 17), No Religious/Spiritual Identity Staff respondents (18%, n = 134) and Multiple
Religious/Spiritual Identity Staff respondents (18%, n = 18) to "strongly agree" that they felt
valued by coworkers outside of their department. No Disability Staff respondents (48%, n =
1,009) and Single Disability Staff respondents (55%, n = 89) were significantly more likely than
Multiple Disabilities Staff respondents (39%, n = 38) to "agree" that they felt valued by
coworkers outside of their' department.
Seventy-six percent (» = 1,941) of Staff respondents "strongly agreed" or "agreed" that they felt
valued by their supervisors/managers. Multiracial Staff respondents (26%, n = 34) were much
less likely than Staff respondents ofColor (39%, n = 86) and White Staff respondents (39%, n =
818) to "agree" that they felt valued by then supervisors/managers. Non-Military Staff
respondents (38%, n = 915) were significantly more likely than Military Staff respondents (28%,
n = 36) to "strongly agree" that they felt valued by their supervisors/managers. No Disability
Staff respondents (7%, n = 160) were significantly less likely than Multiple Disabilities Staff
respondents (18%, n = 17) and Single Disability Staff respondents (15%, n = 24) to "disagr ee"
that they felt valued by their supervisors/managers.
Foity-eight percent (n = 1,222) of Staff respondents "strongly agreed" or "agreed" that they felt
valued by University of Missouri-Columbia students. Women Staff respondents (6%, n = 103)
were significantly less likely than Men Staff respondents (9%, n = 74) to "disagree" that they felt
valued by University of Missouri-Columbia students. No Religious/Spiritual Identity Staff
respondents (4%, n = 28) and Christian Religious/Spiritual Identity Staff respondents (2%, n =
25) were significantly more likely than fewer than five Other Religious/Spiritual Identity Staff
respondents and none of Multiple Religious/Spiritual Identity Staff respondents to "strongly
disagree" that they felt valued by University of Missouri-Columbia students. No Disability Staff
respondents (2%, n = 48) were significantly less likely than Multiple Disabilities Staff
202
respondents (6%, n = 6) and Single Disability Staff respondents (5%, n = 8) to "strongly
disagree" that they felt valued by University of Missouri-Go ltinib la students.
Less than half. 44% (n = 1,126) of Staff respondents "strongly agreed" or "agreed" that they felt
valued by University of Missouri-Columbia faculty. Christian Religious/Spiritual Identity Staff
respondents (36%, n = 549) were significantly more likely than No Religious/Spiritual Identity
Staff respondents (31%, n = 233), Other Religious/Spiritual Identity Staff respondents (26%, n =
23) and Multiple Religious/Spiritual Identity Staff respondents (30%, n = 30) to "agree" that they
felt valued by University of Missouri-Columbia faculty. Multiple Disabilities Staff respondents
(13%, n = 12) were significantly more likely than No Disability Staff respondents (3%, n = 76)
and Single Disability Staff respondents (7%, n = 11) to "strongly disagree" that they felt valued
by University of Missouri-Columbia faculty.
Twenty-eight percent (n = 724) of Staff respondents "strongly agreed" or "agreed" that they felt
valued by University of Missouri-Columbia senior administrators (e.g., chancellor, dean, vice
chancellor, provost). Hourly Staff respondents (18%, n = 227) were significantly less likely than
Salaried Staff/Senior Administrator without Faculty Rank respondents (23%, n = 254) to "agree"
that they felt valued by University of Missouri-Columbia senior administrators. Women Staff
respondents (19%, n = 307) were significantly less likely than Men Staff respondents (24%, n =
201) to "agree" that they felt valued by University of Missouri-Columbia senior administrators.
Wliite Staff/Senior Administrator without Faculty respondents (10%, n = 214) and Staff
respondents of Color (11%, n = 25) were significantly less likely than Multiracial Staff
respondents (20%, n = 26) to "strongly disagree" that they felt valued by University of Missouri-
Columbia senior administrators. Heterosexual Staff respondents (9%, n = 194) were significantly
more likely than LGBQ Staff respondents (4%, n = 8) to "strongly agree" that they felt valued by
University of Missouri-Columbia senior administrators. Christian Religious/Spiritual Identity
Staff respondents (10%, n = 150) and Multiple Religious/Spiritual Identity Staff respondents
(7%, ii = 7) were significantly more likely than No Religious/Spiritual Identity Staff respondents
(6%, ii = 43) and Other Religious/Spiritual Identity Staff respondents (6%, n = 5) to "strongly
agree" that they felt valued by University of Missouri-Columbia senior administrators. Multiple
Disabilities Staff respondents (5%, n = 5) and Single Disability Staff respondents (3%, n = 5)
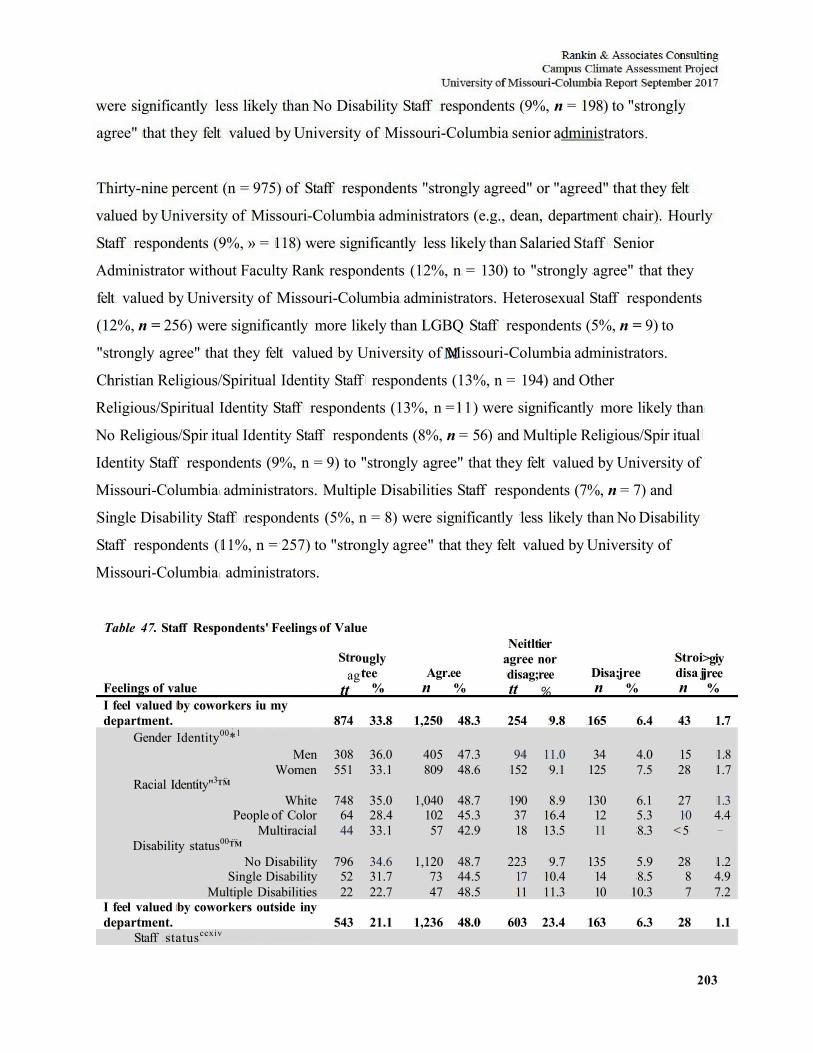
203
were significantly less likely than No Disability Staff respondents (9%, n = 198) to "strongly
agree" that they felt valued by University of Missouri-Columbia senior administrators
Thirty-nine percent (n = 975) of Staff respondents "strongly agreed" or "agreed" that they felt
valued by University of Missouri-Columbia administrators (e.g., dean, department chair). Hourly
Staff respondents (9%, » = 118) were significantly less likely than Salaried Staff Senior
Administrator without Faculty Rank respondents (12%, n = 130) to "strongly agree" that they
felt valued by University of Missouri-Columbia administrators. Heterosexual Staff respondents
(12%, n = 256) were significantly more likely than LGBQ Staff respondents (5%, n = 9) to
"strongly agree" that they felt valued by University of Missouri-Columbia administrators.
Christian Religious/Spiritual Identity Staff respondents (13%, n = 194) and Other
Religious/Spiritual Identity Staff respondents (13%, n =11) were significantly more likely than
No Religious/Spir itual Identity Staff respondents (8%, n = 56) and Multiple Religious/Spir itual
Identity Staff respondents (9%, n = 9) to "strongly agree" that they felt valued by University of
Missouri-Columbia administrators. Multiple Disabilities Staff respondents (7%, n = 7) and
Single Disability Staff respondents (5%, n = 8) were significantly less likely than No Disability
Staff respondents (11%, n = 257) to "strongly agree" that they felt valued by University of
Missouri-Columbia administrators.
Table 47. Staff Respondents' Feelings of Value
Feelings of value I feel valued by coworkers iu my department.
Stro ag
tt
874
ugly tee
%
33.8
Agr. n
1,250
ee %
48.3
Neitl agree disag tt
254
tier nor ;ree %
9.8
Disa; n
165
jree %
6.4
Stroi disa j n
43
>giy jree %
1.7 Gender Identity00*1
Men 308 36.0 405 47.3 94 11.0 34 4.0 15 1.8 Women 551 33.1 809 48.6 152 9.1 125 7.5 28 1.7
Racial Identity"3™ White 748 35.0 1,040 48.7 190 8.9 130 6.1 27 1.3
People of Color 64 28.4 102 45.3 37 16.4 12 5.3 10 4.4 Multiracial 44 33.1 57 42.9 18 13.5 11 8.3 <5 —
Disability status00™ No Disability 796 34.6 1,120 48.7 223 9.7 135 5.9 28 1.2
Single Disability 52 31.7 73 44.5 17 10.4 14 8.5 8 4.9 Multiple Disabilities 22 22.7 47 48.5 11 11.3 10 10.3 7 7.2
I feel valued by coworkers outside inv department. 543 21.1 1,236 48.0 603 23.4 163 6.3 28 1.1
Staff statusccxiv
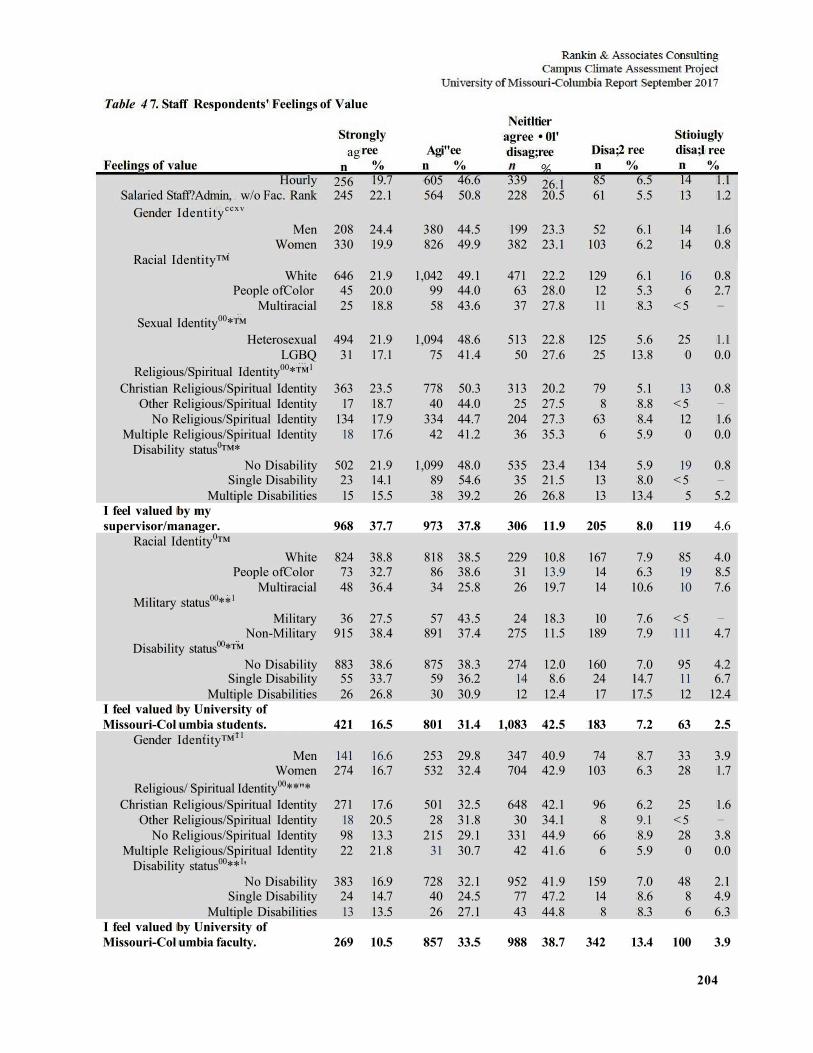
204
Table 4 7. Staff Respondents' Feelings of Value
Feelings of value Hourly
Stro ag
n 256
ngly ree
% 19.7
Agi" n 605
ee % 46.6
Neitl agree disag
339
tier • 01'
;ree % 26.1
Disa; n 85
2 ree %
6.5
Stioi disa; n 14
ugly I ree %
1.1 Salaried Staff?Admin, w/o Fac. Rank 245 22.1 564 50.8 228 20.5 61 5.5 13 1.2
Gender Identityccxv
Men 208 24.4 380 44.5 199 23.3 52 6.1 14 1.6 Women 330 19.9 826 49.9 382 23.1 103 6.2 14 0.8
Racial Identity™ White 646 21.9 1,042 49.1 471 22.2 129 6.1 16 0.8
People ofColor 45 20.0 99 44.0 63 28.0 12 5.3 6 2.7 Multiracial 25 18.8 58 43.6 37 27.8 11 8.3 <5 —
Sexual Identity00*™ Heterosexual 494 21.9 1,094 48.6 513 22.8 125 5.6 25 1.1
LGBQ 31 17.1 75 41.4 50 27.6 25 13.8 0 0.0 Religious/Spiritual Identity00*™1
Christian Religious/Spiritual Identity 363 23.5 778 50.3 313 20.2 79 5.1 13 0.8 Other Religious/Spiritual Identity 17 18.7 40 44.0 25 27.5 8 8.8 <5 —
No Religious/Spiritual Identity 134 17.9 334 44.7 204 27.3 63 8.4 12 1.6 Multiple Religious/Spiritual Identity 18 17.6 42 41.2 36 35.3 6 5.9 0 0.0
Disability status0™* No Disability 502 21.9 1,099 48.0 535 23.4 134 5.9 19 0.8
Single Disability 23 14.1 89 54.6 35 21.5 13 8.0 <5 —
Multiple Disabilities 15 15.5 38 39.2 26 26.8 13 13.4 5 5.2 I feel valued by my supervisor/manager. 968 37.7 973 37.8 306 11.9 205 8.0 119 4.6
Racial Identity0™ White 824 38.8 818 38.5 229 10.8 167 7.9 85 4.0
People ofColor 73 32.7 86 38.6 31 13.9 14 6.3 19 8.5 Multiracial 48 36.4 34 25.8 26 19.7 14 10.6 10 7.6
Military status00**1
Military 36 27.5 57 43.5 24 18.3 10 7.6 <5 —
Non-Military 915 38.4 891 37.4 275 11.5 189 7.9 111 4.7 Disability status00*™
No Disability 883 38.6 875 38.3 274 12.0 160 7.0 95 4.2 Single Disability 55 33.7 59 36.2 14 8.6 24 14.7 11 6.7
Multiple Disabilities 26 26.8 30 30.9 12 12.4 17 17.5 12 12.4 I feel valued by University of Missouri-Col umbia students. 421 16.5 801 31.4 1,083 42.5 183 7.2 63 2.5
Gender Identity™11
Men 141 16.6 253 29.8 347 40.9 74 8.7 33 3.9 Women 274 16.7 532 32.4 704 42.9 103 6.3 28 1.7
Religious/ Spiritual Identity00**"* Christian Religious/Spiritual Identity 271 17.6 501 32.5 648 42.1 96 6.2 25 1.6
Other Religious/Spiritual Identity 18 20.5 28 31.8 30 34.1 8 9.1 <5 —
No Religious/Spiritual Identity 98 13.3 215 29.1 331 44.9 66 8.9 28 3.8 Multiple Religious/Spiritual Identity 22 21.8 31 30.7 42 41.6 6 5.9 0 0.0
Disability status00**1' No Disability 383 16.9 728 32.1 952 41.9 159 7.0 48 2.1
Single Disability 24 14.7 40 24.5 77 47.2 14 8.6 8 4.9 Multiple Disabilities 13 13.5 26 27.1 43 44.8 8 8.3 6 6.3
I feel valued by University of Missouri-Col umbia faculty. 269 10.5 857 33.5 988 38.7 342 13.4 100 3.9
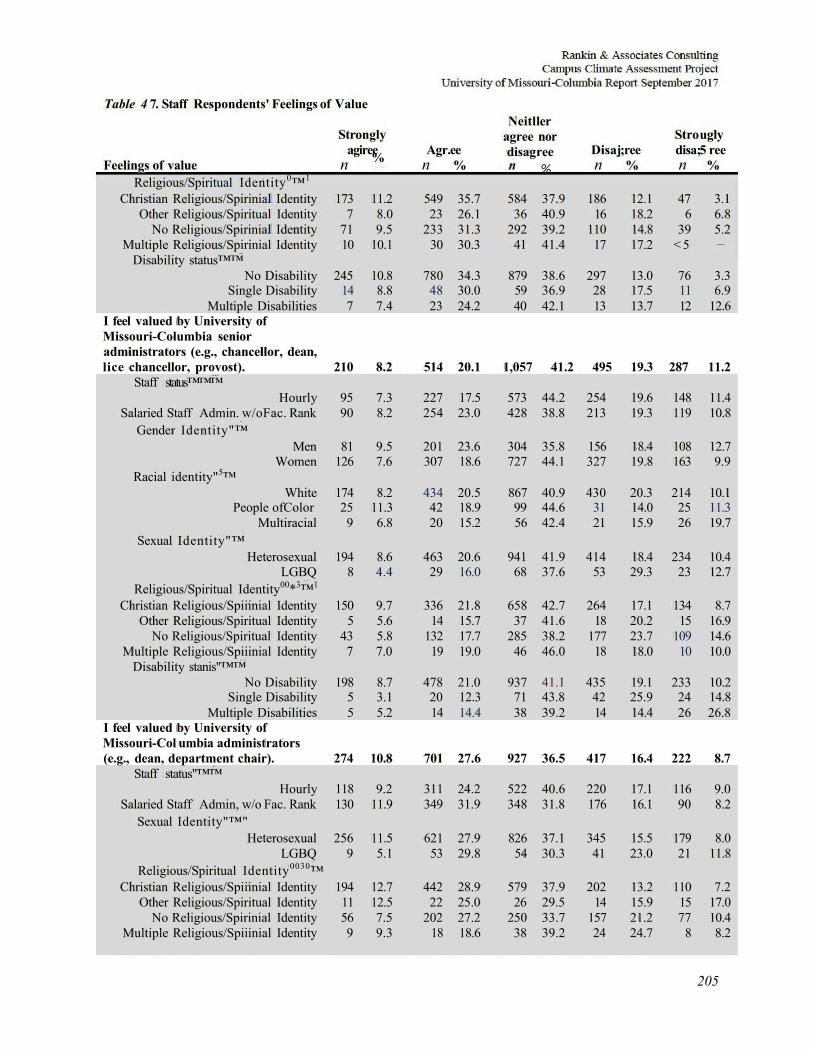
205
Table 4 7. Staff Respondents' Feelings of Value
Feelings of value Religious/Spiritual Identity0™1
Stro agi
n
ngly ree % Agr.
n ee %
Neitl agree disag
ler nor ree %
Disaj n
;ree %
Stro disa; n
ugly 5 ree
%
Christian Religious/Spirinial Identity 173 11.2 549 35.7 584 37.9 186 12.1 47 3.1 Other Religious/Spiritual Identity 7 8.0 23 26.1 36 40.9 16 18.2 6 6.8
No Religious/Spirinial Identity 71 9.5 233 31.3 292 39.2 110 14.8 39 5.2 Multiple Religious/Spirinial Identity 10 10.1 30 30.3 41 41.4 17 17.2 < 5 —
Disability status™™ No Disability 245 10.8 780 34.3 879 38.6 297 13.0 76 3.3
Single Disability 14 8.8 48 30.0 59 36.9 28 17.5 11 6.9 Multiple Disabilities 7 7.4 23 24.2 40 42.1 13 13.7 12 12.6
I feel valued by University of Missouri-Columbia senior administrators (e.g., chancellor, dean, lice chancellor, provost). 210 8.2 514 20.1 1,057 41.2 495 19.3 287 11.2
Staff status™™™ Hourly 95 7.3 227 17.5 573 44.2 254 19.6 148 11.4
Salaried Staff Admin. w/oFac. Rank 90 8.2 254 23.0 428 38.8 213 19.3 119 10.8 Gender Identity"™
Men 81 9.5 201 23.6 304 35.8 156 18.4 108 12.7 Women 126 7.6 307 18.6 727 44.1 327 19.8 163 9.9
Racial identity"5™ White 174 8.2 434 20.5 867 40.9 430 20.3 214 10.1
People ofColor 25 11.3 42 18.9 99 44.6 31 14.0 25 11.3 Multiracial 9 6.8 20 15.2 56 42.4 21 15.9 26 19.7
Sexual Identity"™ Heterosexual 194 8.6 463 20.6 941 41.9 414 18.4 234 10.4
LGBQ 8 4.4 29 16.0 68 37.6 53 29.3 23 12.7 Religious/Spiritual Identity00*3™1
Christian Religious/Spiiinial Identity 150 9.7 336 21.8 658 42.7 264 17.1 134 8.7 Other Religious/Spiritual Identity 5 5.6 14 15.7 37 41.6 18 20.2 15 16.9
No Religious/Spiritual Identity 43 5.8 132 17.7 285 38.2 177 23.7 109 14.6 Multiple Religious/Spiiinial Identity 7 7.0 19 19.0 46 46.0 18 18.0 10 10.0
Disability stanis"™™ No Disability 198 8.7 478 21.0 937 41.1 435 19.1 233 10.2
Single Disability 5 3.1 20 12.3 71 43.8 42 25.9 24 14.8 Multiple Disabilities 5 5.2 14 14.4 38 39.2 14 14.4 26 26.8
I feel valued by University of Missouri-Col umbia administrators (e.g., dean, department chair). 274 10.8 701 27.6 927 36.5 417 16.4 222 8.7
Staff status"™™ Hourly 118 9.2 311 24.2 522 40.6 220 17.1 116 9.0
Salaried Staff Admin, w/o Fac. Rank 130 11.9 349 31.9 348 31.8 176 16.1 90 8.2 Sexual Identity"™"
Heterosexual 256 11.5 621 27.9 826 37.1 345 15.5 179 8.0 LGBQ 9 5.1 53 29.8 54 30.3 41 23.0 21 11.8
Religious/Spiritual Identity0030™ Christian Religious/Spiiinial Identity 194 12.7 442 28.9 579 37.9 202 13.2 110 7.2
Other Religious/Spiritual Identity 11 12.5 22 25.0 26 29.5 14 15.9 15 17.0 No Religious/Spirinial Identity 56 7.5 202 27.2 250 33.7 157 21.2 77 10.4
Multiple Religious/Spiiinial Identity 9 9.3 18 18.6 38 39.2 24 24.7 8 8.2
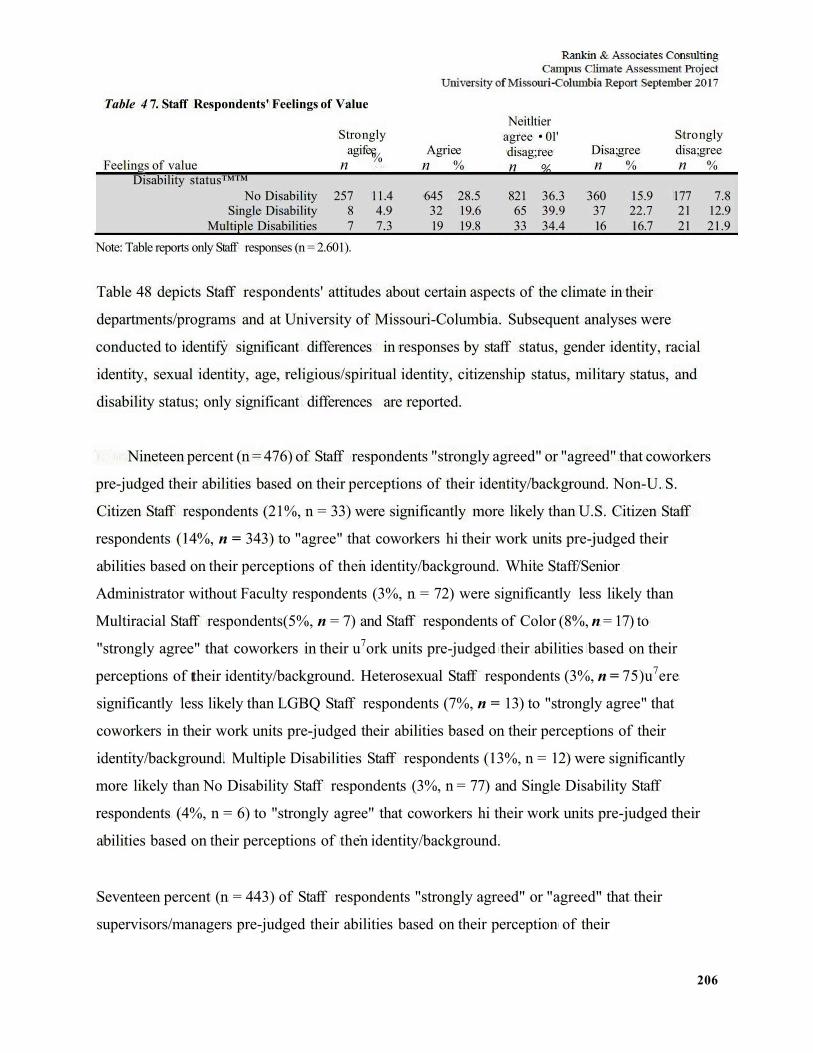
206
Table 4 7. Staff Respondents' Feelings of Value
Feelings of value Disability status™™
Stro agi
n
ngly fee % Agri
n ee %
Neitl agree disag n
tier • 01'
;ree %
Disa; n
gree %
Stro disa; n
ngly gree
%
No Disability 257 11.4 645 28.5 821 36.3 360 15.9 177 7.8 Single Disability 8 4.9 32 19.6 65 39.9 37 22.7 21 12.9
Multiple Disabilities 7 7.3 19 19.8 33 34.4 16 16.7 21 21.9 Note: Table reports only Staff responses (n = 2.601).
Table 48 depicts Staff respondents' attitudes about certain aspects of the climate in their
departments/programs and at University of Missouri-Columbia. Subsequent analyses were
conducted to identify significant differences in responses by staff status, gender identity, racial
identity, sexual identity, age, religious/spiritual identity, citizenship status, military status, and
disability status; only significant differences are reported.
Nineteen percent (n = 476) of Staff respondents "strongly agreed" or "agreed" that coworkers
pre-judged their abilities based on their perceptions of their identity/background. Non-U. S.
Citizen Staff respondents (21%, n = 33) were significantly more likely than U.S. Citizen Staff
respondents (14%, n = 343) to "agree" that coworkers hi their work units pre-judged their
abilities based on their perceptions of then identity/background. White Staff/Senior
Administrator without Faculty respondents (3%, n = 72) were significantly less likely than
Multiracial Staff respondents(5%, n = 7) and Staff respondents of Color (8%, n = 17) to
"strongly agree" that coworkers in their u7ork units pre-judged their abilities based on their
perceptions of their identity/background. Heterosexual Staff respondents (3%, n = 75)u7ere
significantly less likely than LGBQ Staff respondents (7%, n = 13) to "strongly agree" that
coworkers in their work units pre-judged their abilities based on their perceptions of their
identity/background. Multiple Disabilities Staff respondents (13%, n = 12) were significantly
more likely than No Disability Staff respondents (3%, n = 77) and Single Disability Staff
respondents (4%, n = 6) to "strongly agree" that coworkers hi their work units pre-judged their
abilities based on their perceptions of then identity/background.
Seventeen percent (n = 443) of Staff respondents "strongly agreed" or "agreed" that their
supervisors/managers pre-judged their abilities based on their perception of their
207
identity/background. Hourly Staff respondents (26%. n = 338) were significantly less likely than
Salaried Staff respondents (21%, n = 230) to "neither agr ee nor disagree" that their
supervisors/managers pre-judged their abilities based on their perception of then
identity/background. Non-U.S. Citizen Staff respondents (8%, n = 12) were significantly more
likely than U.S. Citizen Staff respondents (4%, n = 93) to "strongly agree" that their
supervisors/managers pre-judged their abilities based on their perception of then
identity/background. Staff respondents of Color (9%, n = 20) were significantly more likely than
Multiracial Staff respondents (5%, n = 7) and White Staff/Senior Administrator without Faculty
respondents (4%, n = 76) to "strongly agree" that their supervisors/managers pre-judged their
abilities based on their perception of then identity/background. Multiple Disabilities Staff
respondents (14%, n = 13) were significantly more likely than No Disability Staff respondents
(4%, ti = 84) and Single Disability Staff respondents (4%, n = 6) to "strongly agree" that their
supervisors/managers pre-judged their abilities based on their perception of their
identity/background.
Eighteen percent (« = 451) of Staff respondents "strongly agreed" or "agreed" that faculty
prejudged their' abilities based on their perception of then identity/background. Transspectrum
Staff respondents (22%, n = 5) were significantly more likely than Men Staff respondents (14%,
n= 117) and WomenStaff respondents (14%, n = 226) to "agree" that faculty prejudged their
abilities based on their perception of their identity/background. White Staff respondents (29%, n
= 610) were significantly more likely than Multiracial Staff/Senior Administrator without
Faculty Rank respondents (22%, n = 29) and Staff Senior Administrator without Faculty Rank
respondents of Color (21%, n = 46) to "disagree" that faculty pre-judged their abilities based on
their perception of their identity/background. Heterosexual Staff respondents (3%, n = 75) were
significantly less likely than LGBQ Staff respondents (7%, n = 12) to "strongly agree" that
faculty prejudged their abilities based on their perception of their identity/background. Multiple
Disabilities Staff respondents (14%, n = 13) were significantly more likely than No Disability
Staff respondents (3%, n = 73) and Single Disability Staff respondents (4%, n = 7) to "strongly
agree" that faculty prejudged their abilities based on their perception of their
identity/background.
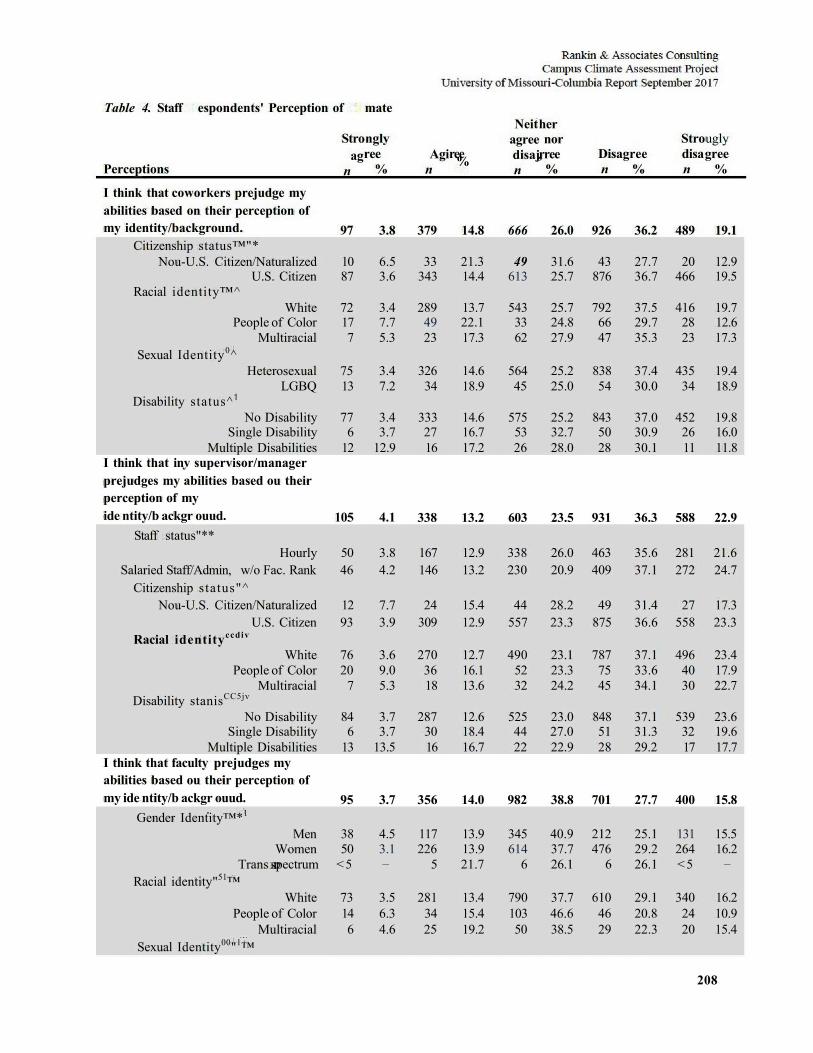
208
Table 4. Staff espondents' Perception of mate
Perceptions
I think that coworkers prejudge my
Stro ag
n
nglv ree
% Agi
n ree %
Neit agree disaj n
her nor
rree %
Disa n
gree %
Stro disa n
ugly gree
%
abilities based on their perception of my identity/background. 97 3.8 379 14.8 666 26.0 926 36.2 489 19.1
Citizenship status™"* Nou-U.S. Citizen/Naturalized 10 6.5 33 21.3 49 31.6 43 27.7 20 12.9
U.S. Citizen 87 3.6 343 14.4 613 25.7 876 36.7 466 19.5 Racial identity™^
White 72 3.4 289 13.7 543 25.7 792 37.5 416 19.7 People of Color 17 7.7 49 22.1 33 24.8 66 29.7 28 12.6
Multiracial 7 5.3 23 17.3 62 27.9 47 35.3 23 17.3 Sexual Identity0^
Heterosexual 75 3.4 326 14.6 564 25.2 838 37.4 435 19.4 LGBQ 13 7.2 34 18.9 45 25.0 54 30.0 34 18.9
Disability status^1
No Disability 77 3.4 333 14.6 575 25.2 843 37.0 452 19.8 Single Disability 6 3.7 27 16.7 53 32.7 50 30.9 26 16.0
Multiple Disabilities 12 12.9 16 17.2 26 28.0 28 30.1 11 11.8 I think that inv supervisor/manager prejudges my abilities based ou their perception of my ide ntity/b ackgr ouud. 105 4.1 338 13.2 603 23.5 931 36.3 588 22.9
Staff status"** Hourly 50 3.8 167 12.9 338 26.0 463 35.6 281 21.6
Salaried Staff/Admin, w/o Fac. Rank 46 4.2 146 13.2 230 20.9 409 37.1 272 24.7 Citizenship status"^
Nou-U.S. Citizen/Naturalized 12 7.7 24 15.4 44 28.2 49 31.4 27 17.3 U.S. Citizen 93 3.9 309 12.9 557 23.3 875 36.6 558 23.3
Racial identityccdiv
White 76 3.6 270 12.7 490 23.1 787 37.1 496 23.4 People of Color 20 9.0 36 16.1 52 23.3 75 33.6 40 17.9
Multiracial 7 5.3 18 13.6 32 24.2 45 34.1 30 22.7 Disability stanisCC5jv
No Disability 84 3.7 287 12.6 525 23.0 848 37.1 539 23.6 Single Disability 6 3.7 30 18.4 44 27.0 51 31.3 32 19.6
Multiple Disabilities 13 13.5 16 16.7 22 22.9 28 29.2 17 17.7 I think that faculty prejudges my abilities based ou their perception of my ide ntity/b ackgr ouud. 95 3.7 356 14.0 982 38.8 701 27.7 400 15.8
Gender Identity™*1
Men 38 4.5 117 13.9 345 40.9 212 25.1 131 15.5 Women 50 3.1 226 13.9 614 37.7 476 29.2 264 16.2
Trans spectrum <5 — 5 21.7 6 26.1 6 26.1 <5 —
Racial identity"51™ White 73 3.5 281 13.4 790 37.7 610 29.1 340 16.2
People of Color 14 6.3 34 15.4 103 46.6 46 20.8 24 10.9 Multiracial 6 4.6 25 19.2 50 38.5 29 22.3 20 15.4
Sexual Identity00"1™
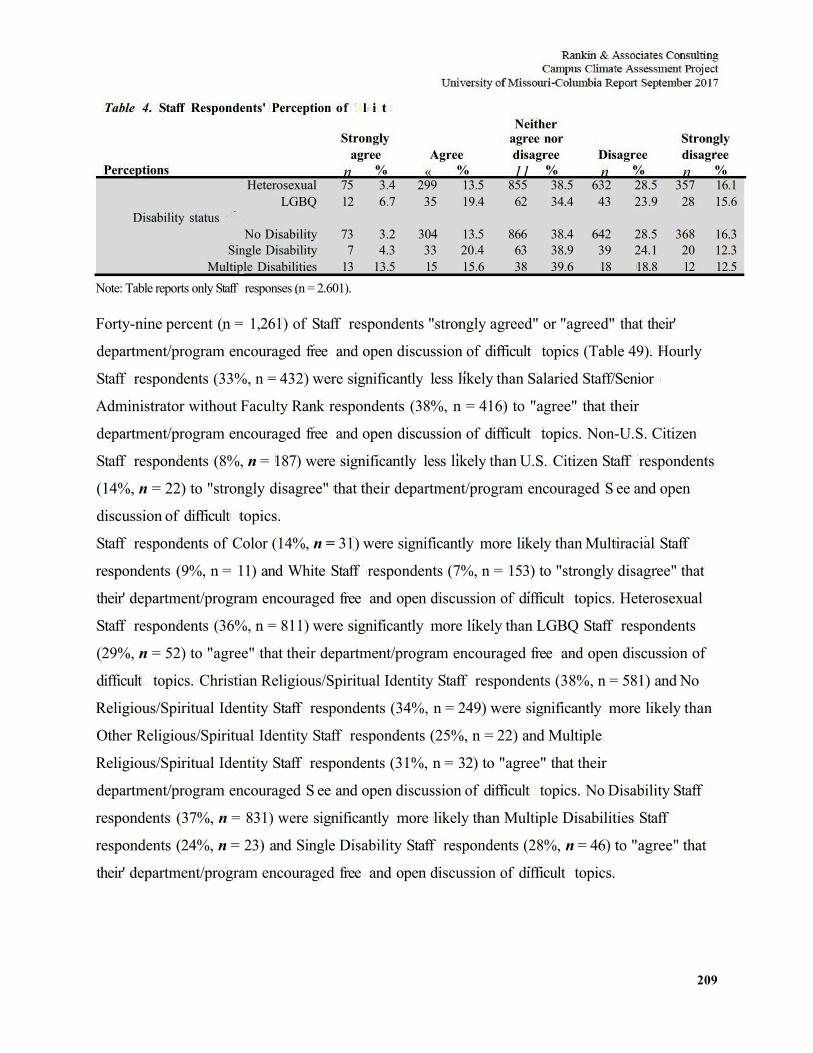
209
Table 4. Staff Respondents' Perception of l i t Neither
Strongly agree nor Strongly agree Agree disagree Disagree disagree
Perceptions n % « % 11 % n % n % Heterosexual 75 3.4 299 13.5 855 38.5 632 28.5 357 16.1
LGBQ 12 6.7 35 19.4 62 34.4 43 23.9 28 15.6 Disability status
No Disability 73 3.2 304 13.5 866 38.4 642 28.5 368 16.3 Single Disability 7 4.3 33 20.4 63 38.9 39 24.1 20 12.3
Multiple Disabilities 13 13.5 15 15.6 38 39.6 18 18.8 12 12.5 Note: Table reports only Staff responses (n = 2.601).
Forty-nine percent (n = 1,261) of Staff respondents "strongly agreed" or "agreed" that their'
department/program encouraged free and open discussion of difficult topics (Table 49). Hourly
Staff respondents (33%, n = 432) were significantly less likely than Salaried Staff/Senior
Administrator without Faculty Rank respondents (38%, n = 416) to "agree" that their
department/program encouraged free and open discussion of difficult topics. Non-U.S. Citizen
Staff respondents (8%, n = 187) were significantly less likely than U.S. Citizen Staff respondents
(14%, n = 22) to "strongly disagree" that their department/program encouraged S ee and open
discussion of difficult topics.
Staff respondents of Color (14%, n = 31) were significantly more likely than Multiracial Staff
respondents (9%, n = 11) and White Staff respondents (7%, n = 153) to "strongly disagree" that
their' department/program encouraged free and open discussion of difficult topics. Heterosexual
Staff respondents (36%, n = 811) were significantly more likely than LGBQ Staff respondents
(29%, n = 52) to "agree" that their department/program encouraged free and open discussion of
difficult topics. Christian Religious/Spiritual Identity Staff respondents (38%, n = 581) and No
Religious/Spiritual Identity Staff respondents (34%, n = 249) were significantly more likely than
Other Religious/Spiritual Identity Staff respondents (25%, n = 22) and Multiple
Religious/Spiritual Identity Staff respondents (31%, n = 32) to "agree" that their
department/program encouraged S ee and open discussion of difficult topics. No Disability Staff
respondents (37%, n = 831) were significantly more likely than Multiple Disabilities Staff
respondents (24%, n = 23) and Single Disability Staff respondents (28%, n = 46) to "agree" that
their' department/program encouraged free and open discussion of difficult topics.
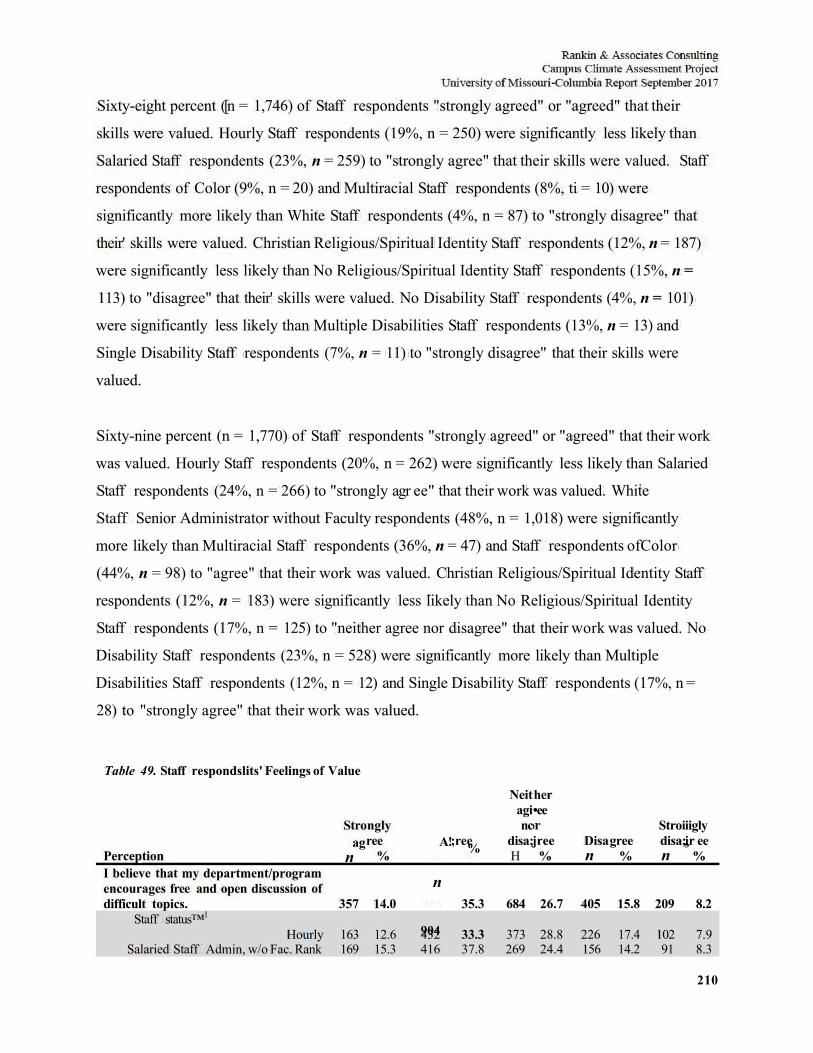
210
Sixty-eight percent ([n = 1,746) of Staff respondents "strongly agreed" or "agreed" that their
skills were valued. Hourly Staff respondents (19%, n = 250) were significantly less likely than
Salaried Staff respondents (23%, n = 259) to "strongly agree" that their skills were valued. Staff
respondents of Color (9%, n = 20) and Multiracial Staff respondents (8%, ti = 10) were
significantly more likely than White Staff respondents (4%, n = 87) to "strongly disagree" that
their' skills were valued. Christian Religious/Spiritual Identity Staff respondents (12%, n = 187)
were significantly less likely than No Religious/Spiritual Identity Staff respondents (15%, n =
113) to "disagree" that their' skills were valued. No Disability Staff respondents (4%, n = 101)
were significantly less likely than Multiple Disabilities Staff respondents (13%, n = 13) and
Single Disability Staff respondents (7%, n = 11) to "strongly disagree" that their skills were
valued.
Sixty-nine percent (n = 1,770) of Staff respondents "strongly agreed" or "agreed" that their work
was valued. Hourly Staff respondents (20%, n = 262) were significantly less likely than Salaried
Staff respondents (24%, n = 266) to "strongly agr ee" that their work was valued. White
Staff Senior Administrator without Faculty respondents (48%, n = 1,018) were significantly
more likely than Multiracial Staff respondents (36%, n = 47) and Staff respondents ofColor
(44%, n = 98) to "agree" that their work was valued. Christian Religious/Spiritual Identity Staff
respondents (12%, n = 183) were significantly less likely than No Religious/Spiritual Identity
Staff respondents (17%, n = 125) to "neither agree nor disagree" that their work was valued. No
Disability Staff respondents (23%, n = 528) were significantly more likely than Multiple
Disabilities Staff respondents (12%, n = 12) and Single Disability Staff respondents (17%, n =
28) to "strongly agree" that their work was valued.
Table 49. Staff respondslits' Feelings of Value
Perception I believe that my department/program encourages free and open discussion of difficult topics.
Stro ag
n
357
ngly ree
%
14.0
A!
n
904
;ree %
35.3
Neit agi nc
disa; H
684
her •ee
jree %
26.7
Disa n
405
gree %
15.8
Stroi disa; n
209
iigly ir ee
%
8.2 Staff status™1
Hourly 163 12.6 432 33.3 373 28.8 226 17.4 102 7.9 Salaried Staff Admin, w/o Fac. Rank 169 15.3 416 37.8 269 24.4 156 14.2 91 8.3
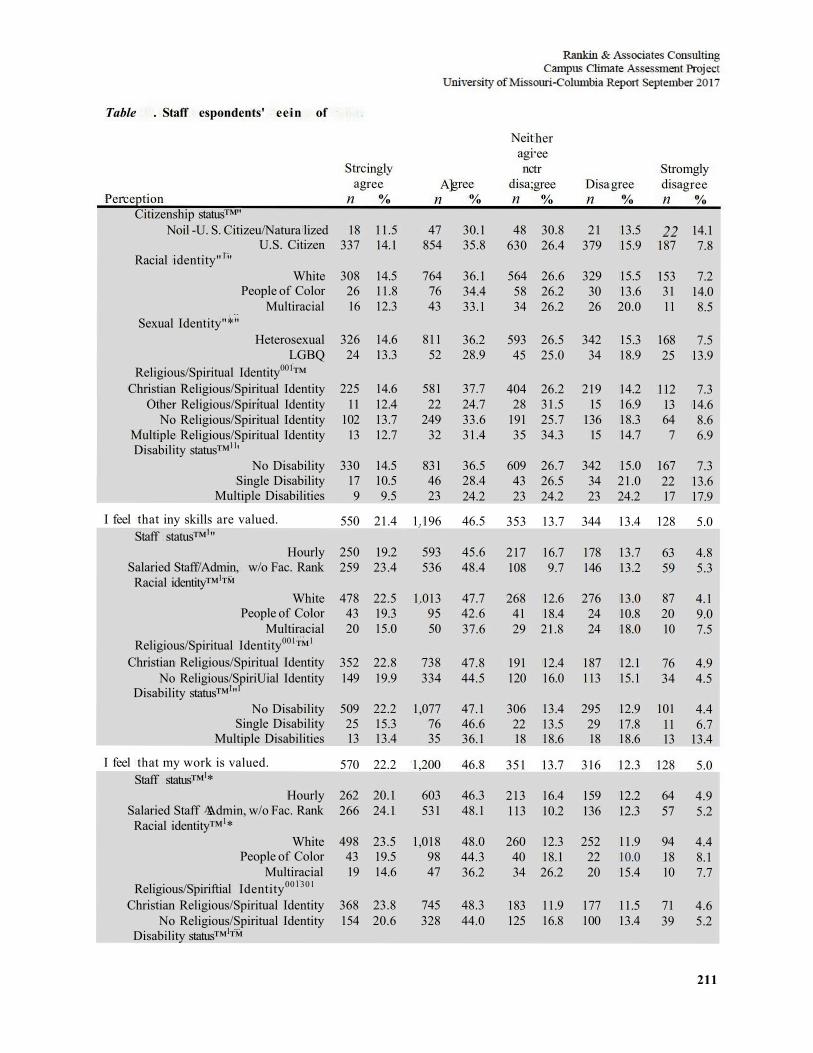
211
Table . Staff espondents' eein of
Perception Citizenship status™"
Strc ag
n
inglv ree
% A]
n gree
%
Neit agi nc
disa; n
her ee tr gree
% Disa n
gree %
Stro disa n
mgly gree
%
Noil -U. S. Citizeu/Natura lized 18 11.5 47 30.1 48 30.8 21 13.5 22 14.1 U.S. Citizen 337 14.1 854 35.8 630 26.4 379 15.9 187 7.8
Racial identity"1" White 308 14.5 764 36.1 564 26.6 329 15.5 153 7.2
People of Color 26 11.8 76 34.4 58 26.2 30 13.6 31 14.0 Multiracial 16 12.3 43 33.1 34 26.2 26 20.0 11 8.5
Sexual Identity"*" Heterosexual 326 14.6 811 36.2 593 26.5 342 15.3 168 7.5
LGBQ 24 13.3 52 28.9 45 25.0 34 18.9 25 13.9 Religious/Spiritual Identity001™
Christian Religious/Spiritual Identity 225 14.6 581 37.7 404 26.2 219 14.2 112 7.3 Other Religious/Spiritual Identity 11 12.4 22 24.7 28 31.5 15 16.9 13 14.6
No Religious/Spiritual Identity 102 13.7 249 33.6 191 25.7 136 18.3 64 8.6 Multiple Religious/Spiritual Identity 13 12.7 32 31.4 35 34.3 15 14.7 7 6.9 Disability status™11'
No Disability 330 14.5 831 36.5 609 26.7 342 15.0 167 7.3 Single Disability 17 10.5 46 28.4 43 26.5 34 21.0 22 13.6
Multiple Disabilities 9 9.5 23 24.2 23 24.2 23 24.2 17 17.9
I feel that iny skills are valued. 550 21.4 1.196 46.5 353 13.7 344 13.4 128 5.0 Staff status™1"
Hourly 250 19.2 593 45.6 217 16.7 178 13.7 63 4.8 Salaried Staff/Admin, w/o Fac. Rank 259 23.4 536 48.4 108 9.7 146 13.2 59 5.3 Racial identity™1™
White 478 22.5 1.013 47.7 268 12.6 276 13.0 87 4.1 People of Color 43 19.3 95 42.6 41 18.4 24 10.8 20 9.0
Multiracial 20 15.0 50 37.6 29 21.8 24 18.0 10 7.5 Religious/Spiritual Identity001™1
Christian Religious/Spiritual Identity 352 22.8 738 47.8 191 12.4 187 12.1 76 4.9 No Religious/SpiriUial Identity 149 19.9 334 44.5 120 16.0 113 15.1 34 4.5
Disability status™1"1
No Disability 509 22.2 1,077 47.1 306 13.4 295 12.9 101 4.4 Single Disability 25 15.3 76 46.6 22 13.5 29 17.8 11 6.7
Multiple Disabilities 13 13.4 35 36.1 18 18.6 18 18.6 13 13.4
I feel that my work is valued. 570 22.2 1,200 46.8 351 13.7 316 12.3 128 5.0 Staff status™1*
Hourly 262 20.1 603 46.3 213 16.4 159 12.2 64 4.9 Salaried Staff Admin, w/o Fac. Rank 266 24.1 531 48.1 113 10.2 136 12.3 57 5.2 Racial identity™1*
White 498 23.5 1,018 48.0 260 12.3 252 11.9 94 4.4 People of Color 43 19.5 98 44.3 40 18.1 22 10.0 18 8.1
Multiracial 19 14.6 47 36.2 34 26.2 20 15.4 10 7.7 Religious/Spiriftial Identity001301
Christian Religious/Spiritual Identity 368 23.8 745 48.3 183 11.9 177 11.5 71 4.6 No Religious/Spiritual Identity 154 20.6 328 44.0 125 16.8 100 13.4 39 5.2
Disability status™1™
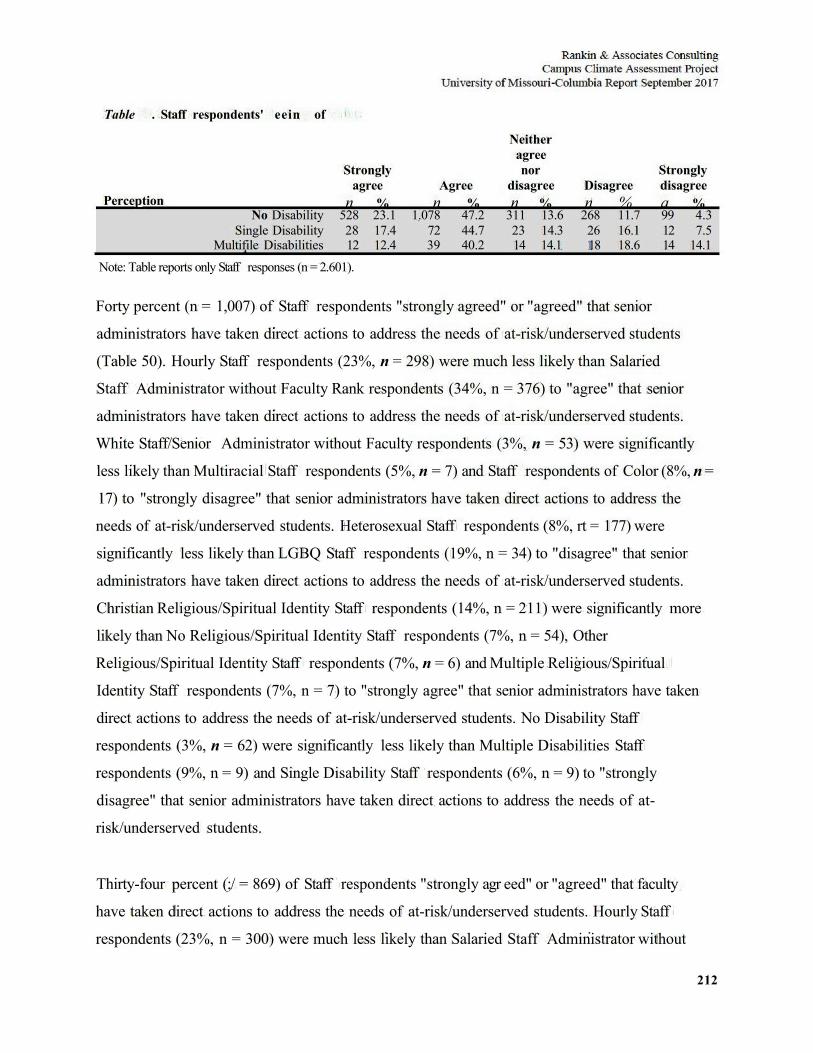
212
Neither agree
Strongly nor Strongly agree Agree disagree Disagree disagree
Perception n % n % n % n % a % No Disability 528 23.1 1.078 47.2 311 13.6 268 11.7 99 4.3
Single Disability Multifile Disabilities
28 17.4 12 12.4
72 44.7 39 40.2
23 14.3 14 14.1
26 16.1 18 18.6
12 7.5 14 14.1
Table . Staff respondents' eein of
Note: Table reports only Staff responses (n = 2.601).
Forty percent (n = 1,007) of Staff respondents "strongly agreed" or "agreed" that senior
administrators have taken direct actions to address the needs of at-risk/underserved students
(Table 50). Hourly Staff respondents (23%, n = 298) were much less likely than Salaried
Staff Administrator without Faculty Rank respondents (34%, n = 376) to "agree" that senior
administrators have taken direct actions to address the needs of at-risk/underserved students.
White Staff/Senior Administrator without Faculty respondents (3%, n = 53) were significantly
less likely than Multiracial Staff respondents (5%, n = 7) and Staff respondents of Color (8%, n =
17) to "strongly disagree" that senior administrators have taken direct actions to address the
needs of at-risk/underserved students. Heterosexual Staff respondents (8%, rt = 177) were
significantly less likely than LGBQ Staff respondents (19%, n = 34) to "disagree" that senior
administrators have taken direct actions to address the needs of at-risk/underserved students.
Christian Religious/Spiritual Identity Staff respondents (14%, n = 211) were significantly more
likely than No Religious/Spiritual Identity Staff respondents (7%, n = 54), Other
Religious/Spiritual Identity Staff respondents (7%, n = 6) and Multiple Religious/Spiritual
Identity Staff respondents (7%, n = 7) to "strongly agree" that senior administrators have taken
direct actions to address the needs of at-risk/underserved students. No Disability Staff
respondents (3%, n = 62) were significantly less likely than Multiple Disabilities Staff
respondents (9%, n = 9) and Single Disability Staff respondents (6%, n = 9) to "strongly
disagree" that senior administrators have taken direct actions to address the needs of at-
risk/underserved students.
Thirty-four percent (;/ = 869) of Staff respondents "strongly agr eed" or "agreed" that faculty
have taken direct actions to address the needs of at-risk/underserved students. Hourly Staff
respondents (23%, n = 300) were much less likely than Salaried Staff Administrator without
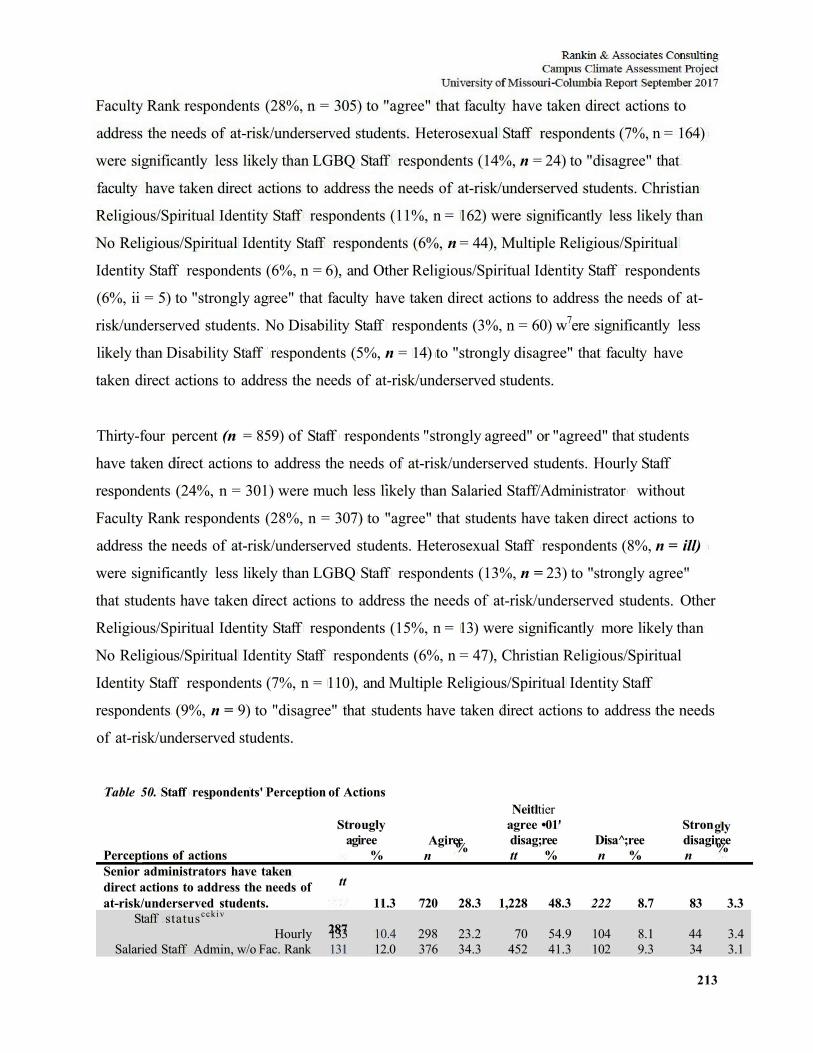
213
Faculty Rank respondents (28%, n = 305) to "agree" that faculty have taken direct actions to
address the needs of at-risk/underserved students. Heterosexual Staff respondents (7%, n = 164)
were significantly less likely than LGBQ Staff respondents (14%, n = 24) to "disagree" that
faculty have taken direct actions to address the needs of at-risk/underserved students. Christian
Religious/Spiritual Identity Staff respondents (11%, n = 162) were significantly less likely than
No Religious/Spiritual Identity Staff respondents (6%, n = 44), Multiple Religious/Spiritual
Identity Staff respondents (6%, n = 6), and Other Religious/Spiritual Identity Staff respondents
(6%, ii = 5) to "strongly agree" that faculty have taken direct actions to address the needs of at-
risk/underserved students. No Disability Staff respondents (3%, n = 60) w7ere significantly less
likely than Disability Staff respondents (5%, n = 14) to "strongly disagree" that faculty have
taken direct actions to address the needs of at-risk/underserved students.
Thirty-four percent (n = 859) of Staff respondents "strongly agreed" or "agreed" that students
have taken direct actions to address the needs of at-risk/underserved students. Hourly Staff
respondents (24%, n = 301) were much less likely than Salaried Staff/Administrator without
Faculty Rank respondents (28%, n = 307) to "agree" that students have taken direct actions to
address the needs of at-risk/underserved students. Heterosexual Staff respondents (8%, n = ill)
were significantly less likely than LGBQ Staff respondents (13%, n = 23) to "strongly agree"
that students have taken direct actions to address the needs of at-risk/underserved students. Other
Religious/Spiritual Identity Staff respondents (15%, n = 13) were significantly more likely than
No Religious/Spiritual Identity Staff respondents (6%, n = 47), Christian Religious/Spiritual
Identity Staff respondents (7%, n = 110), and Multiple Religious/Spiritual Identity Staff
respondents (9%, n = 9) to "disagree" that students have taken direct actions to address the needs
of at-risk/underserved students.
Table 50. Staff respondents' Perception of Actions
Perceptions of actions Senior administrators have taken direct actions to address the needs of at-risk/underserved students.
Stro agi
tt
287
ugly ree
%
11.3
Agi n
720
ree %
28.3
Neitl agree disag tt
1,228
tier •01'
;ree %
48.3
Disa^ n
222
;ree %
8.7
Stron disagi n
83
gly ree %
3.3 Staff statuscckiv
Hourly 133 10.4 298 23.2 70 54.9 104 8.1 44 3.4 Salaried Staff Admin, w/o Fac. Rank 131 12.0 376 34.3 452 41.3 102 9.3 34 3.1
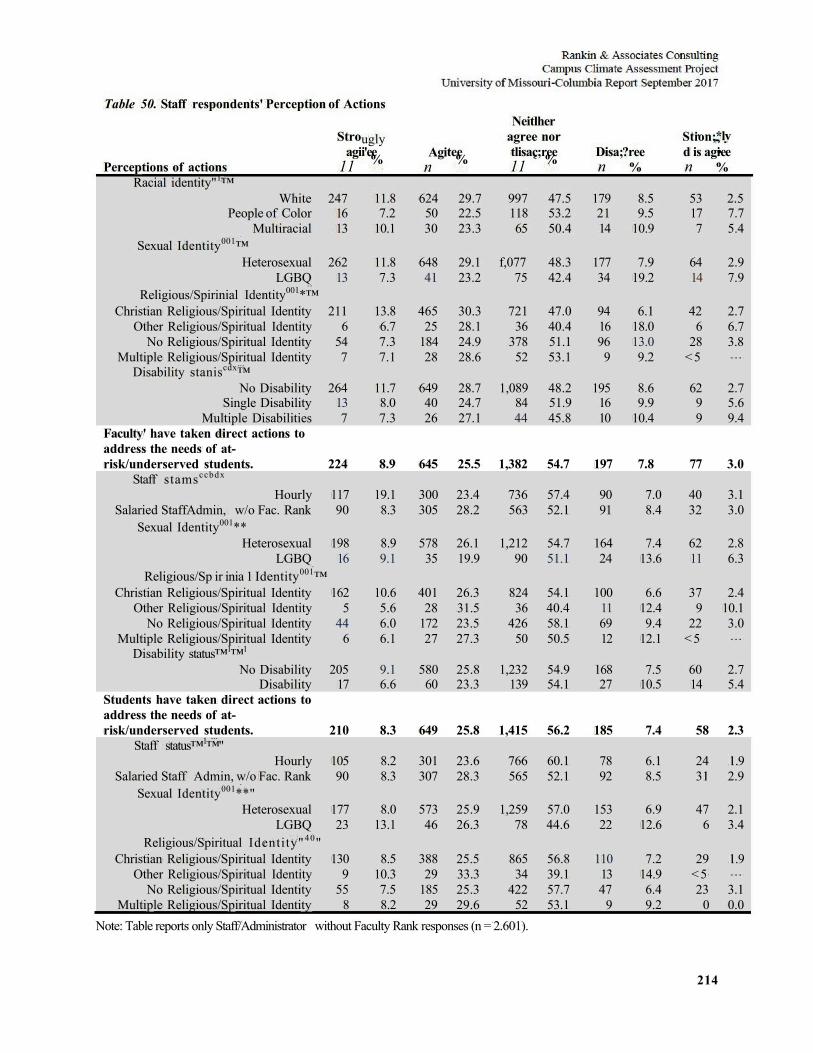
214
Table 50. Staff respondents' Perception of Actions
Perceptions of actions Racial identity"1™
Stro agi
11
ugly i'ee % Agi
n tee %
Neitl agree tlisac 11
her nor
;ree % Disa; n
?ree %
Stion; d is agi n
*lv •ee %
White 247 11.8 624 29.7 997 47.5 179 8.5 53 2.5 People of Color 16 7.2 50 22.5 118 53.2 21 9.5 17 7.7
Multiracial 13 10.1 30 23.3 65 50.4 14 10.9 7 5.4 Sexual Identity001™
Heterosexual 262 11.8 648 29.1 f,077 48.3 177 7.9 64 2.9 LGBQ 13 7.3 41 23.2 75 42.4 34 19.2 14 7.9
Religious/Spirinial Identity001*™ Christian Religious/Spiritual Identity 211 13.8 465 30.3 721 47.0 94 6.1 42 2.7
Other Religious/Spiritual Identity 6 6.7 25 28.1 36 40.4 16 18.0 6 6.7 No Religious/Spiritual Identity 54 7.3 184 24.9 378 51.1 96 13.0 28 3.8
Multiple Religious/Spiritual Identity 7 7.1 28 28.6 52 53.1 9 9.2 <5 . . .
Disability staniscdx™ No Disability 264 11.7 649 28.7 1,089 48.2 195 8.6 62 2.7
Single Disability 13 8.0 40 24.7 84 51.9 16 9.9 9 5.6 Multiple Disabilities 7 7.3 26 27.1 44 45.8 10 10.4 9 9.4
Faculty' have taken direct actions to address the needs of at-risk/underserved students. 224 8.9 645 25.5 1,382 54.7 197 7.8 77 3.0
Staff stamsccbdx
Hourly 117 19.1 300 23.4 736 57.4 90 7.0 40 3.1 Salaried StaffAdmin, w/o Fac. Rank 90 8.3 305 28.2 563 52.1 91 8.4 32 3.0
Sexual Identity001** Heterosexual 198 8.9 578 26.1 1,212 54.7 164 7.4 62 2.8
LGBQ 16 9.1 35 19.9 90 51.1 24 13.6 11 6.3 Religious/Sp ir inia 1 Identity001™
Christian Religious/Spiritual Identity 162 10.6 401 26.3 824 54.1 100 6.6 37 2.4 Other Religious/Spiritual Identity 5 5.6 28 31.5 36 40.4 11 12.4 9 10.1
No Religious/Spiritual Identity 44 6.0 172 23.5 426 58.1 69 9.4 22 3.0 Multiple Religious/Spiritual Identity 6 6.1 27 27.3 50 50.5 12 12.1 <5 . . .
Disability status™1™1
No Disability 205 9.1 580 25.8 1,232 54.9 168 7.5 60 2.7 Disability 17 6.6 60 23.3 139 54.1 27 10.5 14 5.4
Students have taken direct actions to address the needs of at-risk/underserved students. 210 8.3 649 25.8 1,415 56.2 185 7.4 58 2.3
Staff status™1™" Hourly 105 8.2 301 23.6 766 60.1 78 6.1 24 1.9
Salaried Staff Admin, w/o Fac. Rank 90 8.3 307 28.3 565 52.1 92 8.5 31 2.9 Sexual Identity001**"
Heterosexual 177 8.0 573 25.9 1,259 57.0 153 6.9 47 2.1 LGBQ 23 13.1 46 26.3 78 44.6 22 12.6 6 3.4
Religious/Spiritual Identity"40" Christian Religious/Spiritual Identity 130 8.5 388 25.5 865 56.8 110 7.2 29 1.9
Other Religious/Spiritual Identity 9 10.3 29 33.3 34 39.1 13 14.9 <5 . . .
No Religious/Spiritual Identity 55 7.5 185 25.3 422 57.7 47 6.4 23 3.1 Multiple Religious/Spiritual Identity 8 8.2 29 29.6 52 53.1 9 9.2 0 0.0
Note: Table reports only Staff/Administrator without Faculty Rank responses (n = 2.601).
215
Two hundred ninety-six respondents elaborated on their' sense of value as Staff respondents.
Three overall themes emerged: (1) not feeling valued consistently, (2) reverse discrimination,
and (3) experiences or observations of minorities being devalued on campus.
Lack of Feeling Valued — Respondents who elaborated on sense of value reported a low sense
of value and often hi tandem with inconsistent displays and experiences of value. One
respondent shared, "This was difficult to answer, some coworkers value me more than others.
Some faculty and administration prejudge more than others, it's not ah or none." Similarly,
another respondent noted, "We workers are not valued by many oil campus. Currently I feel
somewhat valued in my area, but by 110 one else." Others had less nuanced experiences of value.
Respondents reported, "People are viewed as cheap labor," staff are a 'dune a dozen' and can
easily be replaced" and "I have never felt so small and worthless than during my time at
Mizzou." Some narratives noted perceptions of changes in their sense of value hi recent years.
For example, one respondent expressed, "I used to feel very valued as an MU employee, but not
so much anymore. This is dir ectly linked to the change of top administrators." Another
respondent echoed, "I used to feel valued by colleagues and supervisors and campus leaders. It's
all changed in the last 3 years. It's a whole different world here." Lastly, respondents who
addressed their experiences at Extension noted what they perceived to be experiences unique to
their affiliation with Extension versus the main campus. One respondent explained, "In general,
Extension has not been valued or understood by Campus administrators without Extension
appointments." Respondents who elaborated on sense of value overall noted a lack of value in
their' experiences as Staff at University of Missouri-Columbia.
Reverse Discrimination — Respondents who elaborated on their perception of value reported
"Reverse discrimination lives here" hi many forms. Many narratives focused on the perception
that inclusion efforts have taken away from the majority. One respondent questioned, "Is
Affirmative Action racist? Should it be eliminated?" Other respondents noted, "Conservatives
and Christians need more support" and "MU has gone too far the other direction to make sine
everyone is included." Other respondents asserted that inclusion efforts lead to more cultural
divides. For example, one respondent explained, "The actions taken serve only to continue to
identify and classify and therefore separate and isolate rather than removing the need to identify
216
and classify therefore all are one. Classification logically separates." Other respondents
perceived the recent events on campus and advocacy related to race was fabricated and
unnecessary. For example, one respondent noted, "I think the students who choose to come here
need to just study, get their education, and quit finding problems where there are none." Finally,
some respondents noted their distaste for Black Live Matter efforts in tandem with other
concerns of reverse discrimination. Respondents noted. "I could puke every time I hear 'Black
Lives Matter'" and "I feel like Administration went overboard with the black hves matter
movement." Respondents who elaborated 011 value described a diminishing sense of their
personal value as a perceived result of more institutional emphasis 011 racial inclusion.
Concern For Underserved Communities and Minorities — Respondents who elaborated on their
perceptions of their value reflected concerns for minorities 011 campus. One respondent noted,
"We do a terrible job making sure all students in Missouri can access an education at this
institution. More should be done to provide financial and emotional support for economically
disadvantaged students." More specifically, another respondent shared, "There are many
underserved students not being adequately supported. Foster/Homeless youth for example."
Another respondent noted concerns specific to international students, "Our international students
sometimes seem to be undervalued by overlooking their dietary needs or their- lack of familiarity
with American customs, transportation, shopping." Narratives also included acknowledgement of
recent effort to support underserved communities and minorities. For example, one respondent
elaborated, "The administration has taken some measures to address the needs of at-
risk/underserved students, but I think they could do a lot more." One respondent also pointed out,
"not enough white faculty/staff students are actively engaged in improving the racial climate on
our campus, all the heavy lifting is done by persons of color, against often subtle but
considerable resistance, systems of oppression are deeply entrenched and rooted hi our brick-
and-mortar." Respondents who reflected 011 their sense of value displayed by University of
Missouri-Columbia noted concerns for minorities on campus.
A chi-square test was conducted to compare percentages of Staff respondents who indicated that UM-Columbia provides them with resources to pursue training/professional development opportunities by gender identity: y} (4, N = 2,518)= 11.01,p< .05.
217
A chi-square test was conducted to compare percentages of Staff respondents who indicated that UM-Columbia provides them with resources to pursue training/professional development opportunities by racial identity: x2( S- N= 2,487) = 15.90,/; < .05. CX™A chi-square test was conducted to compare percentages of Staff respondents indicated that UM-Columbia provides them with resources to pursue training/professional development opportunities by sexual identity: x2 (4. N
2,441) 10.91, p<.05. CXX™A chi-square test was conducted to compare percentages of Staff respondents who indicated that UM-Columbia provides them with resources to pursue training/professional development opportunities by religious/spiritual identity: %2 (4, N= 2,303) = 11.4S.J? < .05. cxxmi chi-square test was conducted to compare percentages of Staff respondents who indicated that UM-Columbia provides them with resources to pursue training/professional development opportunities by disability status: %2 (8, N = 2,557) = 35.49,/; < .001. CX™VA chi-square test was conducted to compare percentages of Staff respondents who indicated that their supervisors provides them with resources to pursue training/professional development opportunities by racial identity: x2(8. N= 2,470) = 22.27,p < .01. ™A chi-square test was conducted to compare percentages of Staff respondents who indicated that then supervisors provides them with resources to pursue training/professional development opportunities by religious/spiritual identity x2(4, N= 2,291) = 11.35./) < .05. ™™A chi-square test was conducted to compare percentages of Staff respondents who indicated that their supervisors provides them with resources to pursue training/professional development opportunities by disability status: x2 (8, N= 2,540) = 27.77,/; < .01. cxxx™A. chi-square test was conducted to compare percentages of Staff respondents who indicated that UM-Columbia is supportive of taking extended leave by racial identity: x2 (8. n= 2,465) = 17.26,p< .05. CXXX**™A chi-square test was conducted to compare percentages of Staff respondents indicated that UM-Columbia is supportive of taking extended leave by sexual identity: x2 (4. N= 2,424) = 19.79, p < .01. ™™A chi-square test was conducted to compare percentages of Staff respondents who indicated that UM-Columbia is supportive of taking extended leave by religious/spiritual identity: ( \2,N= 2,475) = 34.35,/) < .01. c x ]A chi-square test was conducted to compare percentages of Staff respondents who indicated that UM-Columbia is supportive of taking extended leave by disability status: x2 (8. N= 2,534) = 36.83, p < .001. c x ] lA chi-square test was conducted to compare percentages of Staff respondents who agreed that then supervisors are supportive of them taking leaves by staff status: %2( 4, N= 2,394) = 15.35,/; < .01.
A chi-square test was conducted to compare percentages of Staff respondents who agreed that their supervisors are supportive of them taking leaves by gender identity: x2 (8- n= 2,518)= 18.05,/) < .05. c x ] m A chi-square test was conducted to compare percentages of Staff respondents who agreed that their supervisors are supportive of them taking leaves by citizenship status: x2(4. N= 2,541) = 14.40,/? < .01. c x ] l vA chi-square test was conducted to compare percentages of Staff respondents who agreed that their supervisors are supportive of them taking leaves by racial identity*: x2 (4. N= 2,541) = 14.40,/? < .01. c x ] vA chi-square test was conducted to compare percentages of Staff respondents who agreed that their supervisors are supportive of them taking leaves by disability status: x2 (8 • N = 2,534) = 54.81,/) < .001. c x ] n A chi-square test was conducted to compare percentages of Staff respondents who agreed that staff in their department/program who use family accommodation (FMLA) policies are disadvantaged in promotion or evaluations by staff status: x2(4. N= 2,387) = 11.38,/) < .05. cx]™A chi-square test was conducted to compare percentages of Staff respondents who agreed that staff in their department/program who use family accommodation (FMLA) policies are disadvantaged in promotion or evaluations by gender identity: x2 (8. N= 2,511) = 16.13,/; < .05. cx]**™A chi-square test was conducted to compare percentages of Staff respondents who agreed that staff in their department/program who use family accommodation (FMLA) policies are disadvantaged in promotion or evaluations by racial identity: x2 (8, N= 2,458) = 27.21, p< .01. c x ] l xA chi-square test was conducted to compare percentages of Staff respondents who agreed that staff in their department/program who use family accommodation (FMLA) policies are disadvantaged in promotion or evaluations by sexual identity: x2 (4. n= 2.414) = 16.28./) < .01. A chi-square test was conducted to compare percentages of Staff respondents who agreed that staff in their
department/program who use family accommodation (FMLA) policies are disadvantaged in promotion or evaluations by disability status: x2 (4. N= 2,427) = 9.56,/) < .05.
218
A chi-square test was conducted to compare percentages of Staff respondents who indicated that UM-Columbia policies (e.g.. FMLA) are fairly applied across UM-Columbia by religious/spiritual identity: x2 (12, iV= 2,474) = 43.92. p < .001.
A chi-square test was conducted to compare percentages of Staff respondents who indicated that UM-Columbia policies (e.g.. FMLA) are fairly applied across UM-Columbia by disability status: y2 (8- N= 2.532) = 46.68./) < .001.
A chi-square test was conducted to compare percentages of Staff respondents who indicated that UM-Columbia is supportive of flexible work schedules by gender identity: x2 (8- N : 2,479)= 18.96. p < .05.
A chi-square test was conducted to compare percentages of Staff respondents who indicated that UM-Columbia is supportive of flexible work schedules sexual identity: x2(4, N= 2,432) — 10.27.7; < .05.
A chi-square test was conducted to compare percentages of Staff respondents who indicated that UM-Columbia is supportive of flexible work schedules by religious/spiritual identity: (4. N= 2,296) = 10.63, p < .05.
A chi-square test was conducted to compare percentages of Staff respondents who indicated that UM-Columbia is supportive of flexible work schedules by disability status: 2,548) = 46.80,/) < .001.
A chi-square test was conducted to compare percentages of Staff respondents who indicated that then supervisor is supportive of flexible work schedules by staff status: x2(4, N= 2,402) = 15.20./) < .01.
A chi-square test was conducted to compare percentages of Staff respondents who indicated that their supervisor is supportive of flexible work schedules by sexual identity: y2 (4. N= 2,427)= 14.18,/) < .01.
A chi-square test was conducted to compare percentages of Staff respondents who indicated that their supervisor is supportive of flexible work schedules by military status: x2(4, N= 2,507) = 9.52,/) < .05.
A chi-square test was conducted to compare percentages of Staff respondents who indicated that then supervisor is supportive of flexible work schedules by disability status: x2 (&,N= 2,542) = 26.75,/) < .01.
A chi-square test was conducted to compare e percentages of Staff respondents who indicated that staff salaries are competitive by gender identity: x2(8. N= 2,531) = 20.20,/) < .05.
A chi-square test was conducted to compare percentages of Staff respondents who indicated that staff salaries are competitive by religious/spirinial identity: x2 ( \2,N= 2,486) = 29.63,p < .01.
A chi-square test was conducted to compare e percentages of Staff respondents who indicated that vacation and personal tune benefits are competitive by staff status: y2 (4. N= 2.407) = 21.75,/) < .001.
A chi-square test was conducted to compare percentages of Staff respondents who indicated that vacation and personal tune benefits are competitive by gender identity: y1 (4. N= 2,508) = 9.53,/? < .05.
A chi-square test was conducted to compare percentages of Staff respondents who indicated that vacation and personal tune benefits are competitive by citizen ship status: y1 (4. N= 2,555) = 9.61. p < .05.
A chi-square test was conducted to compare e percentages of Staff respondents who indicated that vacation and personal tune benefits are competitive by racial identity: y2 (8. N= 2,478)= 31.39, p< .001. dx™A chi-square test was conducted to compare percentages of Staff respondents indicated that vacation and personal tune benefits are competitive by sexual identity: y2 (4. N= 2,432) = 16.70, p< .01. d ™ A chi-square test was conducted to compare e percentages of Staff respondents who indicated that vacation and personal tune benefits are competitive by religions/spiritual identity: y2 (4. N= 2,296) = 9.88,/) < .05.
A chi-square test was conducted to compare percentages of Staff respondents who indicated that vacation and personal tune benefits are competitive by disability status: x2(8, N= 2,548) = 18.87, p < .05.
A chi-square test was conducted to compare percentages of Staff respondents who indicated that health insurance benefits are competitive by racial identity: y2 (8. N= 2,479)= 36.91,/; < .001. A chi-square test was conducted to compare percentages of Staff respondents who indicated that health insurance benefits are competitive by sexual identity: y2 (4. N= 2,434) = 13.04,/; < .05.
A chi-square test was conducted to compare percentages of Staff respondents who indicated that health hisurance benefits are competitive by religious/spiritual identity: y2 (12, N= 2,489) = 21.55,/; < .05. cixxm^ chi-square test was conducted to compare percentages of Staff respondents who indicated that health insurance benefits are competitive by disability stats: x2 (8. N= 2,549) = 20.30,/; < .05. cteiiv^ chi-square test was conducted to compare percentages of Staff respondents who indicated that childcare benefits are competitive by staff status: y2 (4. N= 2,385) = 19.61, p< .01.
A chi-square test was conducted to compare percentages of Staff respondents who indicated that childcare benefits are competitive by gender identity: x2 (4, N= 2,486) = 25.29, p < .001. A chi-square test was conducted to compare percentages of Staff respondents who indicated that by racial identity: %2 (8. N= 2,458) = 22.51,p < .01.
219
cLxxvu chi-square test was conducted to compare percentages of Staff respondents who indicated that childcare benefits are competitive by sexual identity: x2 (4. N— 2.415) = 11.53,/? < .05.
A chi-square test was conducted to compare percentages of Staff respondents who indicated that childcare benefits are competitive by religious/spiritual identity: x2(12. N= 2,469) = 29.65, p < .01. cboax chi-square test was conducted to compare percentages of Staff respondents who indicated that retirement benefits are competitive by staff status: x2 (4. N= 2,395) = 19.05./? < .01
A chi-square test was conducted to compare percentages of Staff respondents who indicated that retirement benefits are competitive by gender identity: x2(4 ,N= 2,496) = 20.40. p < .001. dxxxi chi-square test was conducted to compare percentages of Staff respondents who indicated that retirement benefits are competitive by racial identity: x2 (8, n = 2,465) = 29.18,/; < .001.
A chi-square test was conducted to compare percentages of Staff respondents who indicated that retirement benefits are competitive by religious/spiritual identity: x2 (12, N= 2,476) = 38.90, p < .001.
A chi-square test was conducted to compare percentages of Staff respondents who indicated that retirement benefits are competitive by disability status: x2 (8. N= 2,535) = 28.22, p < .001.
A. chi-square test was conducted to compare percentages of Staff respondents who indicated that staff opinions were valued on UM-Columbia committees by sexual identity: x2(4. N= 2,421) = 10.90. p < .05.
A chi-square test was conducted to compare percentages of Staff respondents who indicated that staff opinions were valued on UM-Columbia committees by religious/spiritual identity: x2 (12. n = 2,478) = 21.77,/) < .05.
A chi-square test was conducted to compare percentages of Staff respondents who indicated that staff opinions were valued on UM-Columbia committees by disability status: y} (8. N= 2,536) = 50.77, p < .001.
A chi-square test was conducted to compare percentages of Staff respondents who indicated that staff opinions were valued on UM-Columbia faculty by religious/spiritual identity: ( \2,N= 2,482) = 27.78,/) < .01. cixxx™^ chi-square test was conducted to compare percentages of Staff respondents who indicated that staff opinions were valued on UM-Columbia faculty by disability status: %2(S,N= 2,542) = 31.37,/) < .001. dxxxix chi-square test was conducted to compare percentages of Staff respondents who indicated that staff opinions were valued on UM-Columbia administration by sexual identity: x2 (4. N= 2.415) = 11.94.p < .05.
A chi-square test was conducted to compare percentages of Staff respondents who indicated that staff opinions were valued on UM-Columbia administration by religious/spiritual identity: %2(12,N= 2,470) = 41.90,/) < .001.
A chi-square test was conducted to compare percentages of Staff respondents who indicated that staff opinions were valued on UM-Columbia administration by disability status: (8, N= 2,529)= 44.16,/) < .001.
A chi-square test was conducted to compare percentages of Staff respondents who indicated that are clear expectations of their responsibilities by staff status: y} (4. N= 2,392)= 14.89,/) < .01. CX™A chi-square test was conducted to compare parentages of Staff respondents who indicated that there are clear expectations of their responsibilities by gender identity: -/2 (4. N= 2,491)= 11.79,/) < .05. CXC1VA chi-square test was conducted to compare percentages of Staff respondents who indicated that there are clear expectations of their responsibilities by religious/spiritual identity: x2 (4. N= 2,285) = 13.38. p < .05.
A chi-square test was conducted to compare percentages of Staff respondents who indicated that there are clear expectations of their responsibilities by disability status: y2 (8. N = 2,531) = 28.37,/) < .001. ™™A chi-square test was conducted to compare percentages of Staff respondents who indicated that there are clear procedures on how they can advance at UM-Columbia by staff status: y2 (4. N= 2,409) = 14.59,/) < .01.
A chi-square test was conducted to compare percentages of Staff respondents who indicated that there are clear procedures on how they can advance at UM-Columbia by racial identity: y2 (8. N= 2,479) = 22.30,/) < .01.
A chi-square test was conducted to compare percentages of Staff respondents who indicated that there are clear procedures on how they can advance at UM-Columbia by religious/spiritual identity: y}{\2 ,N= 2,487) = 39.40,/) < .001.
A chi-square test was conducted to compare percentages of Staff respondents who indicated that there are clear procedures on how they can advance at UM-Columbia by disability status: y}(%,N= 2,549) = 34.46,/) < .001. CCA chi-square test was conducted to compare percentages of Staff respondents who indicated that they were positive about their career opportunities at UM-Columbia by staff status: y2 (4. N= 2,410) = 9.91./) < .05.
A chi-square test was conducted to compare percentages of Staff respondents who indicated that they were positive about their career opportunities at UM-Columbia by racial identity: y2 (8. N= 2,481) = 32.10,/) < .001.
A chi-square test was conducted to compare e percentages of Staff respondents who indicated that they were positive about then career opportunities at UM-Columbia by religious/spiritual identity: y?(\2,N= 2,489) = 37.29, p < .001.
220
A chi-square test was conducted to compare percentages of Staff respondents who indicated that they were positive about their career opportunities at UM-Columbia by disability* status: y} (8, n= 2,549) = 44.13. p < .001.
A chi-square test was conducted to compare percentages of Staff respondents who indicated that they would recommend UM-Columbia as a good place to work by gender identity: x2 (4. n= 2.518) = 10.68. p < .05.
A chi-square test was conducted to compare percentages of Staff respondents who indicated that they would recommend UM-Columbia as a good place to work by racial identity: x2 (8. N= 2,488) = 22.20, p < .01.
A chi-square test was conducted to compare percentages of Staff respondents who indicated that they would recommend UM-Columbia as a good place to work by military status: x2 (4. N= 2,524)= 11.59. p< .05.
A chi-square test was conducted to compare percentages of Staff respondents who indicated that they would recommend UM-Columbia as a good place to work by religious/spiritual identity: y} (i2, N= 2,497) = 25.24, p < .05.
A chi-square test was conducted to compare percentages of Staff respondents who indicated that they would recommend UM-Columbia as a good place to work by disability status: x2 (8, N= 2,558) = 27.68,/) < .01.
A chi-square test was conducted to compare percentages of Staff respondents who indicated that they have job security by sexual identity: y?(4,N= 2,441) = 9.81,/) < .05.
A chi-square test was conducted to compare percentages of Staff respondents who indicated that they have job security by disability status: x2 (8, N = 2,557) = 41.14, p < .001.
A chi-square test was conducted to compare e percentages of Staff respondents who indicated that they felt valued by coworkers hi then department at UM- Columbia by gender identity: x2 (4- N= 2,521) = 14.78,/) < .01.
A chi-square test was conducted to compare percentages of Staff respondents who indicated that they felt valued by coworkers hi then department at UM- Columbia by racial identity: x2 (8, N= 2,493) = 32.11, p < .001.
A chi-square test was conducted to compare e percentages of Staff respondents who indicated that they felt valued by coworkers hi then department at UM- Columbia by disability status: x2 (8. N= 2,563) = 40.17, p< .001.
A chi-square test was conducted to compare e percentages of Staff respondents who indicated that they felt valued by coworkers outside of then department at UM- Columbia by staff status: x2(4. N= 2.410) = 12.80. p < .05.
A chi-square test was conducted to compare percentages of Staff respondents who indicated that they felt valued by coworkers outside of then department at UM- Columbia by gender identity: N= 2,508)= 11.77,/) < .05.
A chi-square test was conducted to compare e percentages of Staff respondents who indicated they felt valued by coworkers outside of then department at UM- Columbia by racial identity: x2(8. N= 2,480) = 16.29,/) < .05.
A chi-square was conducted to compare percentages of Staff respondents who indicated that they felt valued by workers outside of then department at UM- Columbia by sexual identity: x2 (4, N= 2,432) = 25.82,/) < .001.
A chi-square test was conducted to compare percentages of Staff respondents who indicated that they felt valued by coworkers outside of their department at UM- Columbia by religious/spiritual identity: %2(12, N= 2,486) = 45.14,/;< .001.
A chi-square test was conducted to compare percentages of Staff respondents who indicated that they felt valued by coworkers outside of then department at UM- Columbia by disability status: %2(S,N= 2,549) = 36.41,/) < .001.
A chi-square test was conducted to compare percentages of Staff respondents who indicated they felt valued by their supervisor/manager by racial identity: x2 (S, n= 2,478) = 30.79,/) < .001.
aA chi-square test was conducted to compare percentages of Staff respondents who indicated they felt valued by their supervisor/manager by military status: x2 (4. N= 2.512) = 10.65,/; < .05.
A chi-square test was conducted to compare percentages of Staff respondents who indicated they felt valued by their supervisor/manager by disability status: x2 (8. N= 2,547) = 45.79,/) < .001.
A chi-square test was conducted to compare percentages of Staff respondents who indicated they felt valued by UM-Columbia students by gender identity: x2(4.A r= 2.489) = 17.32./) < .01.
A chi-square test was conducted to compare percentages of Staff respondents who indicated that they felt valued by UM-Columbia students by religious/spiritual identity: x2 (12. N= 2,468) = 32.84,/? < .01.
A chi-square test was conducted to compare percentages of Staff respondents who indicated that they felt valued by UM-Columbia students by disability status: x2(8.A r= 2.529) = 16.91,/; < .05.
A chi-square test was conducted to compare percentages of Staff respondents who indicated that they felt valued by UM-Columbia students by religious/spiritual identity: x2 (12. N= 2,468) = 32.84,/> < .01.
A chi-square test was conducted to compare percentages of Staff respondents who indicated that they felt valued by UM-Columbia students by disability status: x2 (8.JV= 2,529) = 16.91./) < .05.
A chi-square test was conducted to compare percentages of Staff respondents who indicated that they felt valued by UM-Columbia senior administrators by staff status: x2 (4. N= 2,401) = 13.98,/) < .01.
221
ccxxix ^ . square test was conducted to compare percentages of Staff respondents who indicated that they felt valued by UM-Columbia senior administrators by gender identity: x2 (4. N= 2,500) = 23.56, p < .001.
A chi-square test was conducted to compare percentages of Staff respondents who indicated that they felt valued by UM-Columbia senior administrators by racial identity: x2 (8. N= 2,473) = 21.06. p < .01. CCX™A chi-square test was conducted to compare percentages of Staff respondents who indicated that they felt valued by UM-Columbia senior administrators by sexual identity: x2 (4. N= 2,427)= 17.15, p < .01.
A chi-square test was conducted to compare percentages Staff respondents who indicated that they felt valued by UM- Columbia senior administrators by religious/spiritual identity: x2 (12. N= 2,477)= 49.67, p < .001. CCX3™A chi-square test was conducted to compare percentages of Staff respondents who indicated that they felt valued by UM-Columbia senior administrators by disability status: x2(8, N= 2,540) = 44.50. p < .001. CCX™VA chi-square test was conducted to compare percentages of Staff respondents who indicated that they felt valued by UM-Columbia administrators by staff status: x2 (4. N= 2,380) = 30.13./) < .001.
A chi-square test was conducted to compare percentages of Staff respondents who indicated that they felt valued by UM-Columbia administrators by sexual identity: x2 (4, N= 2,405)= 17.11,/) < .01. CCXX™A chi-square test was conducted to compare percentages Staff respondents who indicated that they felt valued by UM-Columbia administrators by religious/spiritual identity: y} (12, iV= 2,454) = 57.90,/? < .001. CCXXX™A chi-square test was conducted to compare percentages of Staff respondents who indicated that they felt valued by UM-Columbia administrators by disability status: x2 (8, n= 2,519) = 42.91,/) < .001. CCXXK™A chi-square test was conducted to compare percentages of Staff respondents who indicated that their coworkers in their work unit prejudge then abilities based on their perception of their identity/background by citizenship status: x2 (4, N= 2,540) = 16.24,/) < .01.
A chi-square test was conducted to compare percentages of Staff respondents who indicated that their coworkers in their work unit prejudge then abilities based on their perception of their identity/background by racial identity: %2(8. N= 2,467) = 29.68,p< .001.
A chi-square test was conducted to compare percentages of Staff respondents who indicated that their coworkers in their work unit prejudge their abilities based on their perception of their identity/background by sexual identity: y} (4,N= 2,418) = 11.48,/;< .05.
A chi-square test was conducted to compare percentages of Staff respondents who indicated that their coworkers in their work unit prejudge their abilities based on their perception of their identity/background by disability status: X2 (8, N= 2,535) = 32.39,/; < .001.
A chi-square test was conducted to compare percentages of Staff respondents who indicated that their supervisor/manager prejudge their abilities based on their perception of their identity/background by staff status: y} (4, N= 2,402) = 9.67,/; < .05. c c x ] m A chi-square test was conducted to compare percentages of Staff respondents who indicated that their supervisor/manager prejudge their abilities based on their perception of their identity/background by citizenship status: x2 (4, N= 2,548) = 10.72,/; < .05. c c x ] l vA chi-square test was conducted to compare percentages of Staff respondents who indicated that their supervisor/manager prejudge their abilities based on their perception of their identity/background by racial identity: X2 (8, N= 2,474) = 19.92,/; < .05. CCX]VA chi-square test was conducted to compare percentages of Staff respondents who indicated that their supervisor/manager prejudge their abilities based on their perception of their identity/background by disability status: X2(8,^=2,535) = 32.39,/;< .001. c c x ] n A chi-square test was conducted to compare percentages of Staff respondents who indicated that faculty prejudge their abilities based on their perception of their identity background by gender identity: y2(S,N= 2,496) = 22.66,/;< .01. ccxl™A chi-square test was conducted to compare percentages of Staff respondents who indicated that faculty prejudge their abilities based on then perception of their identity background by racial identity: %2(8,N= 2,445) = 22.17,/;< .01. CC5j™A chi-square test was conducted to compare percentages of Staff respondents who indicated that faculty prejudge their abilities based on then perception of their identity background by sexual identity: y}(4,N= 2,398) = 11.22,/;< .05.
A chi-square test was conducted to compare percentages of Staff respondents who indicated that faculty prejudge their abilities based on then perception of their identity background by disability status: 2,511) = 38.15,/;< .001.
222
"'A chi-square test was conducted to compare percentages of Staff respondents who indicated that they believed that their department/program encourages free and open discussion of difficult topics by staff status: -/2 (4. N= 2,397) = 14.95./><.01.
A chi-square test was conducted to compare percentages of Staff respondents who indicated that they believed that their department/program encourages free and open discussion of difficult topics by citizenship status: x2(4. N = 2,543) = 10.61,/) < .05. " "•"A chi-square test was conducted to compare percentages of Staff respondents who indicated that they believed that their department/program encourages free and open discussion of difficult topics by racial identity: x2(S, N= 2,469) = 15.87,/? < .05.
A chi-square test was conducted to compare percentages of Staff respondents who indicated that they believed that their department/program encourages free and open discussion of difficult topics by sexual identity: X 2(4. N= 2,420) = 12.74, p<. 05.
A chi-square test was conducted to compare percentages Staff respondents who indicated that they believed that then department/program encourages free and open discussion of difficult topics by religious/spirinial identity: y2
(12, N= 2,474) = 29.29,p < .05. A chi-square test was conducted to compare percentages of Staff respondents who indicated that they believed
that their department/program encourages free and open discussion of difficult topics by disability status: y} (8, N= 2,536) = 36.53, p<. 001.
A chi-square test was conducted to compare percentages of Staff respondents who indicated that they felt that their skills are valued by staff status: y2 (4, N= 2,409) = 27.60,/; < .001.
A chi-square test was conducted to compare percentages of Staff respondents who indicated that they felt that their skills are valued by racial identity: y2 (8, N= 2,478)= 35.26. p< .001.
A chi-square test was conducted to compare percentages Staff respondents who indicated that they felt that their skills are valued by religious/spiritual identity: y2 (4. N= 2,294) = 11.57,/; < .05.
A chi-square test was conducted to compare percentages of Staff respondents who indicated that they felt that their skills are valued by disability status: x2(8, N= 2,548) = 31.92,/; < .001.
A chi-square test was conducted to compare percentages of Staff respondents who indicated that they felt that then work is valued by staff status: y?(4.N= 2,404) = 21.31,/) < .001.
A chi-square test was conducted to compare percentages of Staff respondents who indicated that they felt that then work is valued by racial identity: y2 (8, N= 2,473) = 40.41,/; < .001.
A chi-square test was conducted to compare percentages Staff respondents who indicated that they felt that their work is valued by religious/spiritual identity: y1 (4. N= 2,290) = 15.19,/; < .01. C C B™A chi-square test was conducted to compare percentages of Staff respondents who indicated that they felt that then work is valued by disability status: y2 (8, N= 2.542) = 35.09./; < .001.
A chi-square test was conducted to compare percentages of Staff respondents who indicated that senior administrators have taken direct actions to address the needs o fat-risk/under served students by staff status: x2(4, N = 2,379) = 50.97,/; < .001.
A chi-square test was conducted to compare percentages of Staff respondents who indicated that senior administrators have taken direct actions to address the needs o fat-risk/under served students by racial identity: y2 (8. N= 2,451) = 30.40,/; < .001. ccL™A chi-square test was conducted to compare percentages of Staff respondents who indicated that senior administrators have taken direct actions to address the needs o fat-risk/under served students by sexual identity: x2(4, N= 2,405) = 42.56,/; < .001.
A chi-square test was conducted to compare percentages Staff respondents who indicated that they believed senior administrators have taken direct actions to address the needs of at-risk/underserved students by religions/spiritual identity: y2 (12, N= 2,460) = 71.95./; < .001.
A chi-square test was conducted to compare percentages of Staff respondents who indicated that senior administrators have taken direct actions to address the needs of at-risk/underserved students by disability status: x2
(S,N= 2,517) = 21.07,/; < .001. A chi-square test was conducted to compare percentages of Staff respondents who indicated that faculty have
taken direct actions to address the needs of at-risk/underserved students by staff status: x2(4. N= 2,364) = 10.31,/) < .05.
223
A chi-square test was conducted to compare percentages of Staff respondents who indicated that faculty have taken direct actions to address the needs of at-risk/underserved students by sexual identity: x2 (4- N= 2,390) = 17.25, p<.01.
A chi-square test was conducted to compare percentages Staff respondents who indicated that faculty have taken direct actions to address the needs of at-risk/underserved students by religious/spiritual identity: y2 (12. N= 2.445) = 49.67, p<. 001. cdx™A chi-square test was conducted to compare percentages of Staff respondents who indicated that faculty have taken direct actions to address the needs of at-risk/underserved students by disability status: y} (4, N= 2,502) = 10.94, p < .05.
A chi-square test was conducted to compare percentages of Staff respondents who indicated that students have taken direct actions to address the needs of at-risk/underserved students by staff status: x2(4. N= 2,359)= 18.59,/) < .01.
A chi-square test was conducted to compare percentages of Staff respondents who indicated that students have taken direct actions to address the needs of at-risk/underserved students by sexual identity: x2(4. N= 2,384) = 17.83,
A chi-squared test was conducted to compare percentages Staff respondents who indicated that students have taken direct actions to address the needs of at-risk/underserved students by religions/spiritual identity: x 2 0 2 , N= 2,439) = 22.61, p<. 05.
224
Faculty/Senior Administrator with Faculty Rank Respondents' Views on Workplace Climate and Work-Life Balance
Three survey items queried Faculty respondents89 (n = 1,066) about their opinions regarding
various issues specific to workplace climate and faculty work (Tables 51 through 57). Question
39 queried Tenured and Tenure-Track Faculty respondents (;/ = 443), Question 41 addressed
Non-Tenure-Track Faculty respondents (n = 464). and Question 43 addressed all Faculty
respondents. Chi-square analyses were conducted by position status, gender identity, racial
identity, sexual identity, age, religious/spiritual identity, citizenship status, military status, and
disability status; only significant differences are reported.90
Table 51 illustrates that the majority of Tenured and Tenure-Track Faculty respondents "strongly
agreed" or "agreed" that the criteria for tenure were clear (73%, n = 319). Tenured Faculty
respondents (4%, n = 14) were less likely than Tenure-Track Faculty Respondents (12%, n = 14)
to "strongly disagree" that the criteria for tenure were clear.
Fifty-seven percent (n = 248) of Tenured and Tenure-Track Faculty respondents "strongly
agreed" or "agreed" that tenure standards/promotion standards were applied equally to faculty in
their unit. Christian Religious/Spiritual Identity Faculty respondents (21%, n = 37) were
significantly more likely than No Religious/Spiritual Identity Faculty respondents (12%, n = 19)
to "strongly agree" that the tenure standards/promotion standards are apphed equally to faculty
in their unit.
Sixty-four percent (n = 270) of Tenured and Tenure-Track Faculty respondents "strongly agreed"
or "agreed" that they felt supported and mentored during the tenure-track years. Tenured Faculty
respondents (9%, n = 27) were more likely than Tenure-Track Faculty Respondents (16%, n =
18) to "strongly disagree" that they felt supported and mentored during the tenure-track years. A
higher percentage (47%, n = 173) of No Disability Faculty respondents compared with (26%, n =
85 Per the request of the LCST, Senior Administrators with Faculty Rank were included with Faculty/Emeritus faculty/research Scientist respondents by position status.
Per the LCST. for all analyses, sexual identity was recoded into the categories LGBQ and Heterosexual to maintain response confidentiality. Gender was recoded as Men, Trans spectrum, and Women.
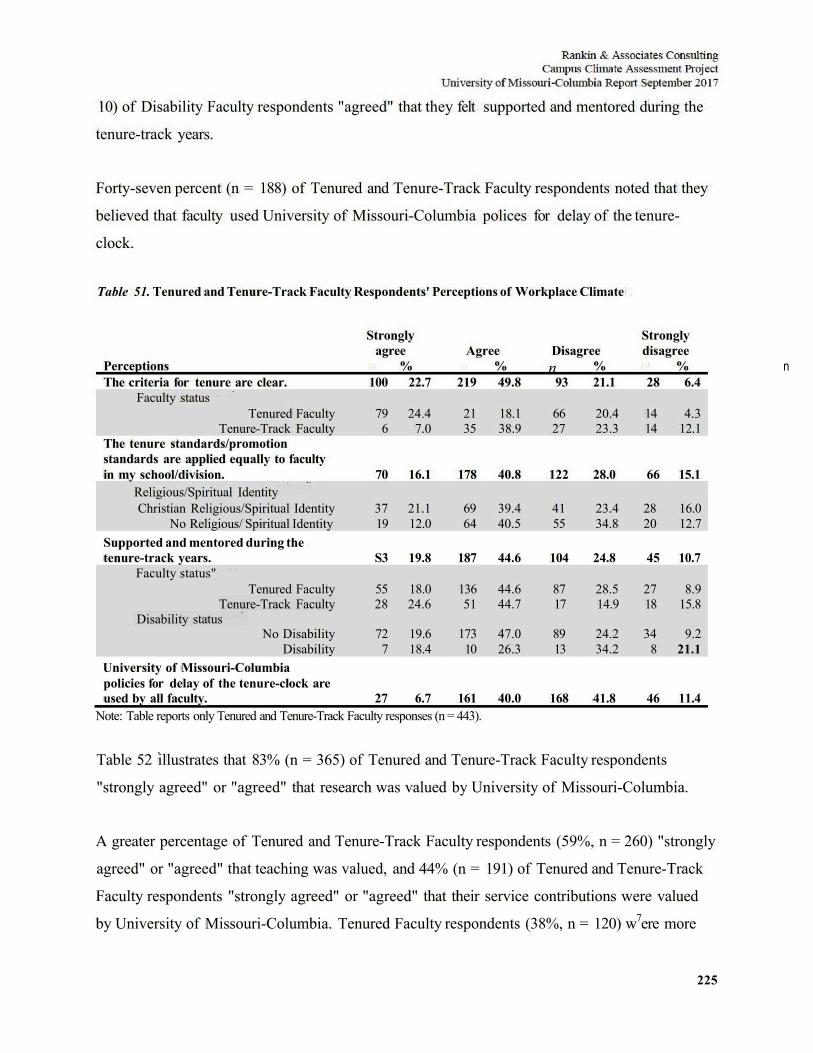
225
10) of Disability Faculty respondents "agreed" that they felt supported and mentored during the
tenure-track years.
Forty-seven percent (n = 188) of Tenured and Tenure-Track Faculty respondents noted that they
believed that faculty used University of Missouri-Columbia polices for delay of the tenure-
clock.
Table 51. Tenured and Tenure-Track Faculty Respondents' Perceptions of Workplace Climate
Strongly Strongly agree Agree Disagree disagree
Perceptions n % n % n % n % The criteria for tenure are clear. 100 22.7 219 49.8 93 21.1 28 6.4
Faculty status Tenured Faculty 79 24.4 21 18.1 66 20.4 14 4.3
Tenure-Track Faculty 6 7.0 35 38.9 27 23.3 14 12.1 The tenure standards/promotion standards are applied equally to faculty in my school/division. 70 16.1 178 40.8 122 28.0 66 15.1
Religious/Spiritual Identity Christian Religious/Spiritual Identity 37 21.1 69 39.4 41 23.4 28 16.0
No Religious/ Spiritual Identity 19 12.0 64 40.5 55 34.8 20 12.7 Supported and mentored during the tenure-track years. S3 19.8 187 44.6 104 24.8 45 10.7
Faculty status" Tenured Faculty 55 18.0 136 44.6 87 28.5 27 8.9
Tenure-Track Faculty 28 24.6 51 44.7 17 14.9 18 15.8 Disability status
No Disability 72 19.6 173 47.0 89 24.2 34 9.2 Disability 7 18.4 10 26.3 13 34.2 8 21.1
University of Missouri-Columbia policies for delay of the tenure-clock are used bv all faculty. 27 6.7 161 40.0 168 41.8 46 11.4
Note: Table reports only Tenured and Tenure-Track Faculty responses (n = 443).
Table 52 illustrates that 83% (n = 365) of Tenured and Tenure-Track Faculty respondents
"strongly agreed" or "agreed" that research was valued by University of Missouri-Columbia.
A greater percentage of Tenured and Tenure-Track Faculty respondents (59%, n = 260) "strongly
agreed" or "agreed" that teaching was valued, and 44% (n = 191) of Tenured and Tenure-Track
Faculty respondents "strongly agreed" or "agreed" that their service contributions were valued
by University of Missouri-Columbia. Tenured Faculty respondents (38%, n = 120) w7ere more
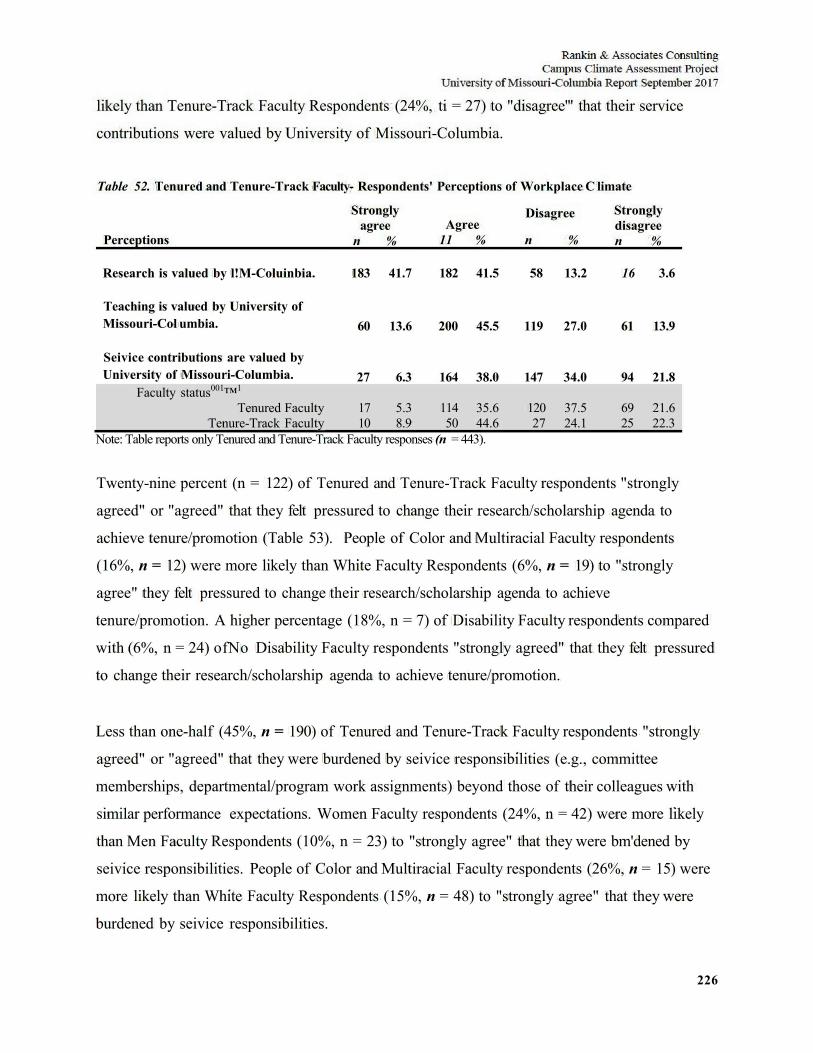
226
likely than Tenure-Track Faculty Respondents (24%, ti = 27) to "disagree''' that their service
contributions were valued by University of Missouri-Columbia.
Table 52. Tenured and Tenure-Track Faculty- Respondents' Perceptions of Workplace C limate
Perceptions
Strongly agree
n % Agree
11 %
Disagree
n %
Strongly disagree n %
Research is valued by l!M-Coluinbia. 183 41.7 182 41.5 58 13.2 16 3.6
Teaching is valued by University of Missouri-Col umbia. 60 13.6 200 45.5 119 27.0 61 13.9
Seivice contributions are valued by University of Missouri-Columbia. 27 6.3 164 38.0 147 34.0 94 21.8
Faculty status001™1
Tenured Faculty Tenure-Track Faculty
17 10
5.3 8.9
114 50
35.6 44.6
120 27
37.5 24.1
69 21.6 25 22.3
Note: Table reports only Tenured and Tenure-Track Faculty responses (n = 443).
Twenty-nine percent (n = 122) of Tenured and Tenure-Track Faculty respondents "strongly
agreed" or "agreed" that they felt pressured to change their research/scholarship agenda to
achieve tenure/promotion (Table 53). People of Color and Multiracial Faculty respondents
(16%, n = 12) were more likely than White Faculty Respondents (6%, n = 19) to "strongly
agree" they felt pressured to change their research/scholarship agenda to achieve
tenure/promotion. A higher percentage (18%, n = 7) of Disability Faculty respondents compared
with (6%, n = 24) ofNo Disability Faculty respondents "strongly agreed" that they felt pressured
to change their research/scholarship agenda to achieve tenure/promotion.
Less than one-half (45%, n = 190) of Tenured and Tenure-Track Faculty respondents "strongly
agreed" or "agreed" that they were burdened by seivice responsibilities (e.g., committee
memberships, departmental/program work assignments) beyond those of their colleagues with
similar performance expectations. Women Faculty respondents (24%, n = 42) were more likely
than Men Faculty Respondents (10%, n = 23) to "strongly agree" that they were bm'dened by
seivice responsibilities. People of Color and Multiracial Faculty respondents (26%, n = 15) were
more likely than White Faculty Respondents (15%, n = 48) to "strongly agree" that they were
burdened by seivice responsibilities.
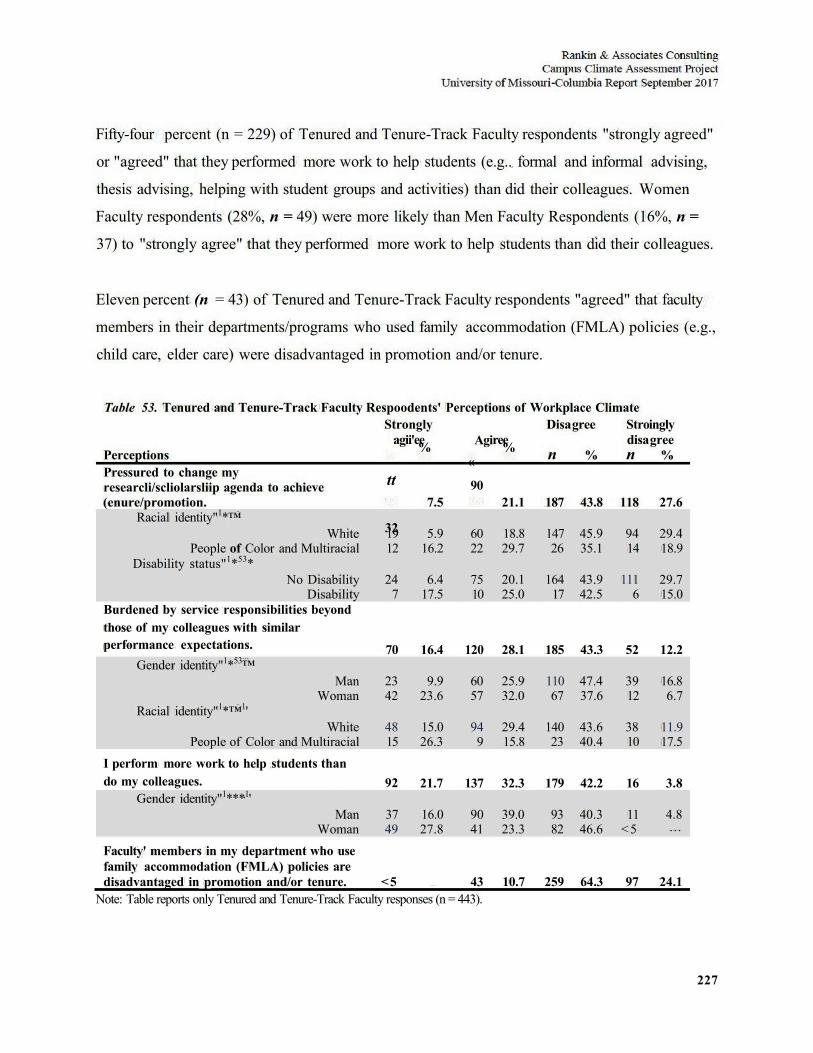
227
Fifty-four percent (n = 229) of Tenured and Tenure-Track Faculty respondents "strongly agreed"
or "agreed" that they performed more work to help students (e.g.. formal and informal advising,
thesis advising, helping with student groups and activities) than did their colleagues. Women
Faculty respondents (28%, n = 49) were more likely than Men Faculty Respondents (16%, n =
37) to "strongly agree" that they performed more work to help students than did their colleagues.
Eleven percent (n = 43) of Tenured and Tenure-Track Faculty respondents "agreed" that faculty
members in their departments/programs who used family accommodation (FMLA) policies (e.g.,
child care, elder care) were disadvantaged in promotion and/or tenure.
Table 53. Tenured and Tenure-Track Faculty Respoodents' Perceptions of Workplace Climate
Perceptions Pressured to change my researcli/scliolarsliip agenda to achieve (enure/promotion.
Stro agi
tt
32
ngly i'ee %
7.5
Agi «
90
ree %
21.1
Disa
n
187
gree
%
43.8
Stro disa n
118
ingly gree
%
27.6 Racial identity"1*™
White 19 5.9 60 18.8 147 45.9 94 29.4 People of Color and Multiracial 12 16.2 22 29.7 26 35.1 14 18.9
Disability status"1*53* No Disability 24 6.4 75 20.1 164 43.9 111 29.7
Disability 7 17.5 10 25.0 17 42.5 6 15.0 Burdened by service responsibilities beyond those of my colleagues with similar performance expectations. 70 16.4 120 28.1 185 43.3 52 12.2
Gender identity"1*53™ Man 23 9.9 60 25.9 110 47.4 39 16.8
Woman 42 23.6 57 32.0 67 37.6 12 6.7 Racial identity"1*™1'
White 48 15.0 94 29.4 140 43.6 38 11.9 People of Color and Multiracial 15 26.3 9 15.8 23 40.4 10 17.5
I perform more work to help students than do my colleagues. 92 21.7 137 32.3 179 42.2 16 3.8
Gender identity"1***1' Man 37 16.0 90 39.0 93 40.3 11 4.8
Woman 49 27.8 41 23.3 82 46.6 < 5 . . .
Faculty' members in my department who use family accommodation (FMLA) policies are disadvantaged in promotion and/or tenure. <5 — 43 10.7 259 64.3 97 24.1
Note: Table reports only Tenured and Tenure-Track Faculty responses (n = 443).
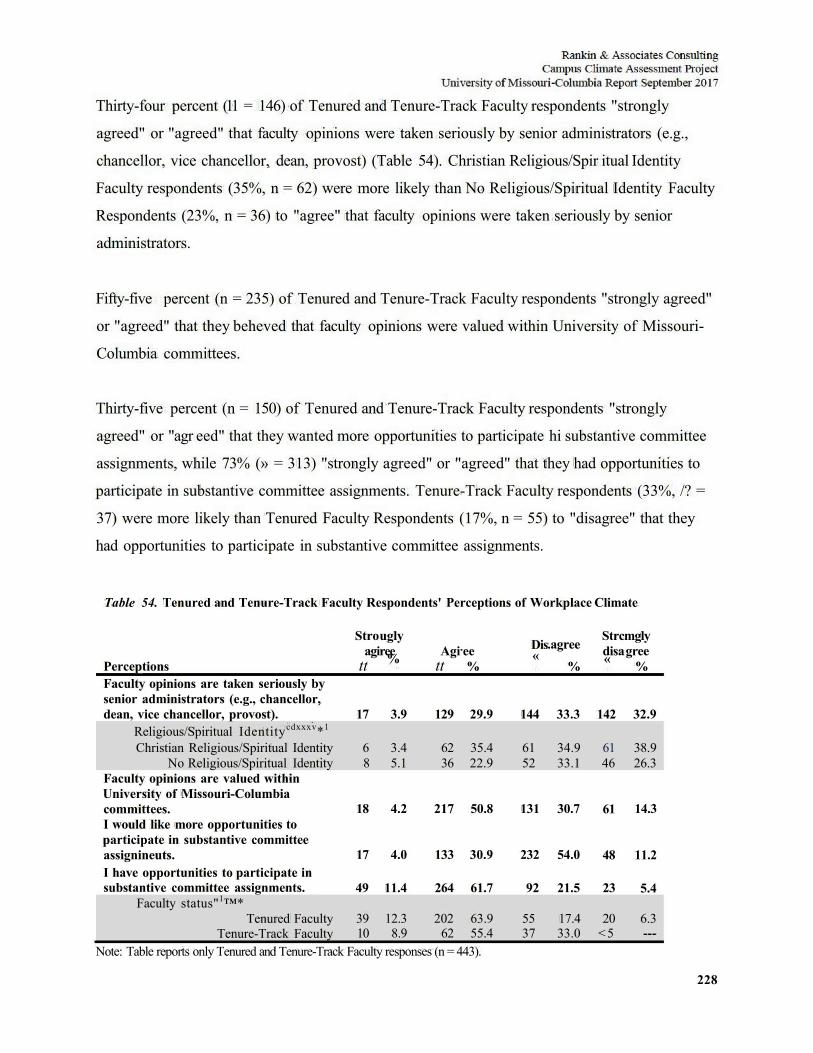
Thirty-four percent (11 = 146) of Tenured and Tenure-Track Faculty respondents "strongly
agreed" or "agreed" that faculty opinions were taken seriously by senior administrators (e.g.,
chancellor, vice chancellor, dean, provost) (Table 54). Christian Religious/Spir itual Identity
Faculty respondents (35%, n = 62) were more likely than No Religious/Spiritual Identity Faculty
Respondents (23%, n = 36) to "agree" that faculty opinions were taken seriously by senior
administrators.
Fifty-five percent (n = 235) of Tenured and Tenure-Track Faculty respondents "strongly agreed"
or "agreed" that they beheved that faculty opinions were valued within University of Missouri-
Columbia committees.
Thirty-five percent (n = 150) of Tenured and Tenure-Track Faculty respondents "strongly
agreed" or "agr eed" that they wanted more opportunities to participate hi substantive committee
assignments, while 73% (» = 313) "strongly agreed" or "agreed" that they had opportunities to
participate in substantive committee assignments. Tenure-Track Faculty respondents (33%, /? =
37) were more likely than Tenured Faculty Respondents (17%, n = 55) to "disagree" that they
had opportunities to participate in substantive committee assignments.
Table 54. Tenured and Tenure-Track Faculty Respondents' Perceptions of Workplace Climate
Perceptions Faculty opinions are taken seriously by senior administrators (e.g., chancellor, dean, vice chancellor, provost).
Stro agi
tt
17
ugly ree %
3.9
Agi tt
129
ee %
29.9
Dis «
144
.agree %
33.3
Strc disa «
142
mgly gree
%
32.9 Religious/Spiritual Identitycdxxxv*1
Christian Religious/Spiritual Identity 6 3.4 62 35.4 61 34.9 61 38.9 No Religious/Spiritual Identity
Faculty opinions are valued within University of Missouri-Columbia committees. I would like more opportunities to participate in substantive committee assignineuts. I have opportunities to participate in substantive committee assignments.
Faculty status"1™* Tenured Faculty
Tenure-Track Faculty
8
18
17
49
39 10
5.1
4.2
4.0
11.4
12.3 8.9
36
217
133
264
202 62
22.9
50.8
30.9
61.7
63.9 55.4
52
131
232
92
55 37
33.1
30.7
54.0
21.5
17.4 33.0
46
61
48
23
20 < 5
26.3
14.3
11.2
5.4
6.3
Note: Table reports only Tenured and Tenure-Track Faculty responses (n = 443).
228
229
One hundred thirty-seven Tenured and Tenure-Track Faculty respondents elaborated on their
perceptions of the workplace climate at University of Missouri. Two themes emerged in the data
collected on this question: (1) low sense value hi decision-making processes and (2)
inconsistencies in workplace practices.
Desire For More Influence In Decision Making — Tenured and Tenure-Track Faculty
respondents who elaborated on their perceptions of the workplace climate at University of
Missouri-Columbia described not having influence 011 decision making as a challenge. One
respondent noted, "Faculty opinions seem to matter very little. Money is the bottom line that
seems to drive all decisions hi my school and the university." Another respondent shared,
"Faculty opinions are not taken seriously by senior administrators." Other respondents described
their perceptions of the value of their input, for example, "Faculty are not provided with a true
voice about anything substantive. Committees/task forces are USUALLY a waste of time."
Another respondent echoed, "Faculty shared governance is a joke around here. Everything is so
top down, and outside of tenure and hiring, the faculty input is asked only 011 trivial issues."
Similarly, another respondent noted a superficial effort to acknowledge Faculty voices, "Holding
faculty forums/meetings to make it SEEM as if faculty input is valued only to result in the
administration do what they have already determined or decide upon 110 matter what faculty have
to say is seriously demoralizing." Faculty respondents who elaborated on then- perceptions of the
workplace climate at University of Missouri-Columbia expressed discontentment with the level
of value their opinions have right now and desire for more input in the future.
Inconsistencies — Tenured and Tenure-Track Faculty respondents who elaborated on their
perceptions of the workplace climate at University of Missouri-Columbia noted inconsistencies
in tenure and promotion, financial support, institutional agency and workload distribution.
Regarding tenure, one respondent noted, "there is some inherent ambiguity in that process."
Another respondent described tenure as "blatantly biased and the college level committees
should be revamped and the departmental committees should be given training in unbiased HR
and fair evaluation best practices." Another respondent added, 'Tenure across different schools
not equal. Expectations unrealistic." Other types of inconsistencies were noted as well. For
example, one respondent shared, "It appears that the University makes substantially more
230
investment in athletics than in research." Another respondent reported, "faculty are not held to
the same standards hi terms of workload, distribution of resources, responsibilities, etc. within
my department and college." Finally, one respondent described inconsistencies hi institutional
value and agency, "Tins is stupid; treats faculty as a monolithic group. The problem is some
faculty are treated preferentially and listened to, while others do not get same treatment." Faculty
respondents who elaborated on tliem perceptions of the workplace climate described a range of
inconsistencies in various contexts at University of Missouri-Columbia.
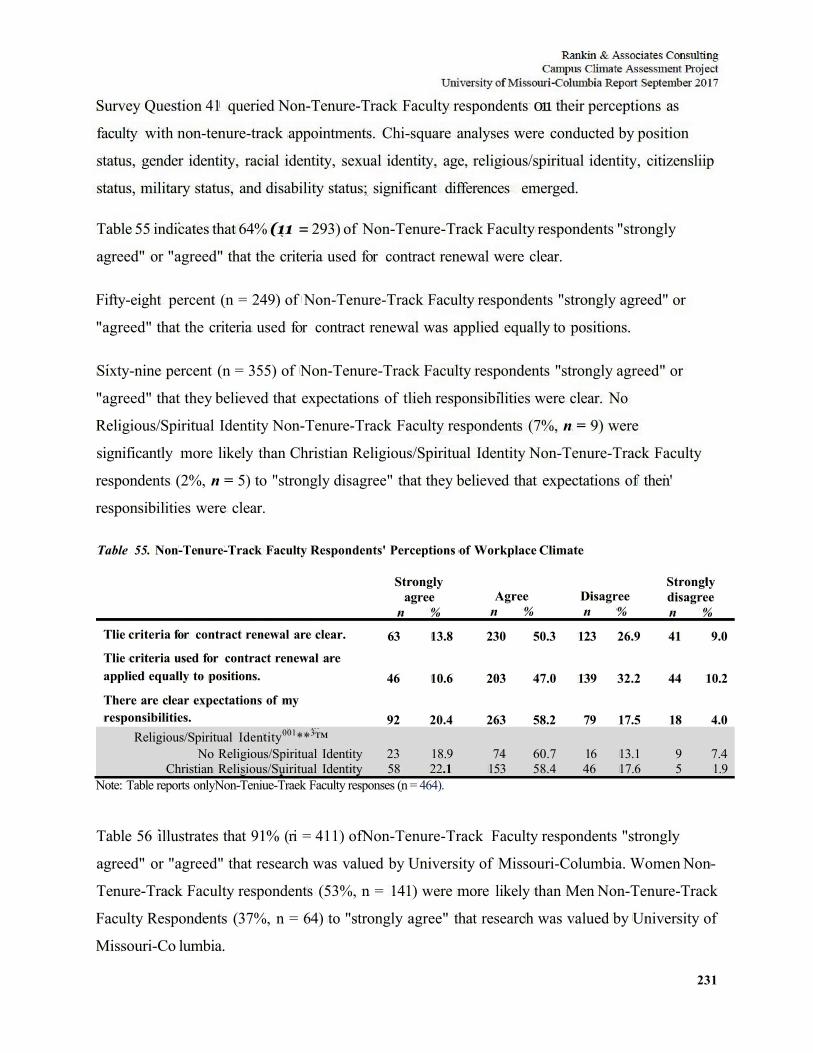
231
Survey Question 41 queried Non-Tenure-Track Faculty respondents 011 their perceptions as
faculty with non-tenure-track appointments. Chi-square analyses were conducted by position
status, gender identity, racial identity, sexual identity, age, religious/spiritual identity, citizensliip
status, military status, and disability status; significant differences emerged.
Table 55 indicates that 64% (11 = 293) of Non-Tenure-Track Faculty respondents "strongly
agreed" or "agreed" that the criteria used for contract renewal were clear.
Fifty-eight percent (n = 249) of Non-Tenure-Track Faculty respondents "strongly agreed" or
"agreed" that the criteria used for contract renewal was applied equally to positions.
Sixty-nine percent (n = 355) of Non-Tenure-Track Faculty respondents "strongly agreed" or
"agreed" that they believed that expectations of tlieh responsibilities were clear. No
Religious/Spiritual Identity Non-Tenure-Track Faculty respondents (7%, n = 9) were
significantly more likely than Christian Religious/Spiritual Identity Non-Tenure-Track Faculty
respondents (2%, n = 5) to "strongly disagree" that they believed that expectations of then'
responsibilities were clear.
Table 55. Non-Tenure-Track Faculty Respondents' Perceptions of Workplace Climate
Strongly agree
n % Agree
n % Disagree n %
Strongly disagree n %
Tlie criteria for contract renewal are clear. 63 13.8 230 50.3 123 26.9 41 9.0 Tlie criteria used for contract renewal are applied equally to positions. 46 10.6 203 47.0 139 32.2 44 10.2 There are clear expectations of my responsibilities. 92 20.4 263 58.2 79 17.5 18 4.0
Religious/Spiritual Identity001**3™ No Religious/Spiritual Identity
Christian Relisious/Suiritual Identity 23 58
18.9 22.1
74 153
60.7 58.4
16 46
13.1 17.6
9 5
7.4 1.9
Note: Table reports onlyNon-Teniue-Traek Faculty responses (n = 464).
Table 56 illustrates that 91% (ri = 411) ofNon-Tenure-Track Faculty respondents "strongly
agreed" or "agreed" that research was valued by University of Missouri-Columbia. Women Non-
Tenure-Track Faculty respondents (53%, n = 141) were more likely than Men Non-Tenure-Track
Faculty Respondents (37%, n = 64) to "strongly agree" that research was valued by University of
Missouri-Co lumbia.
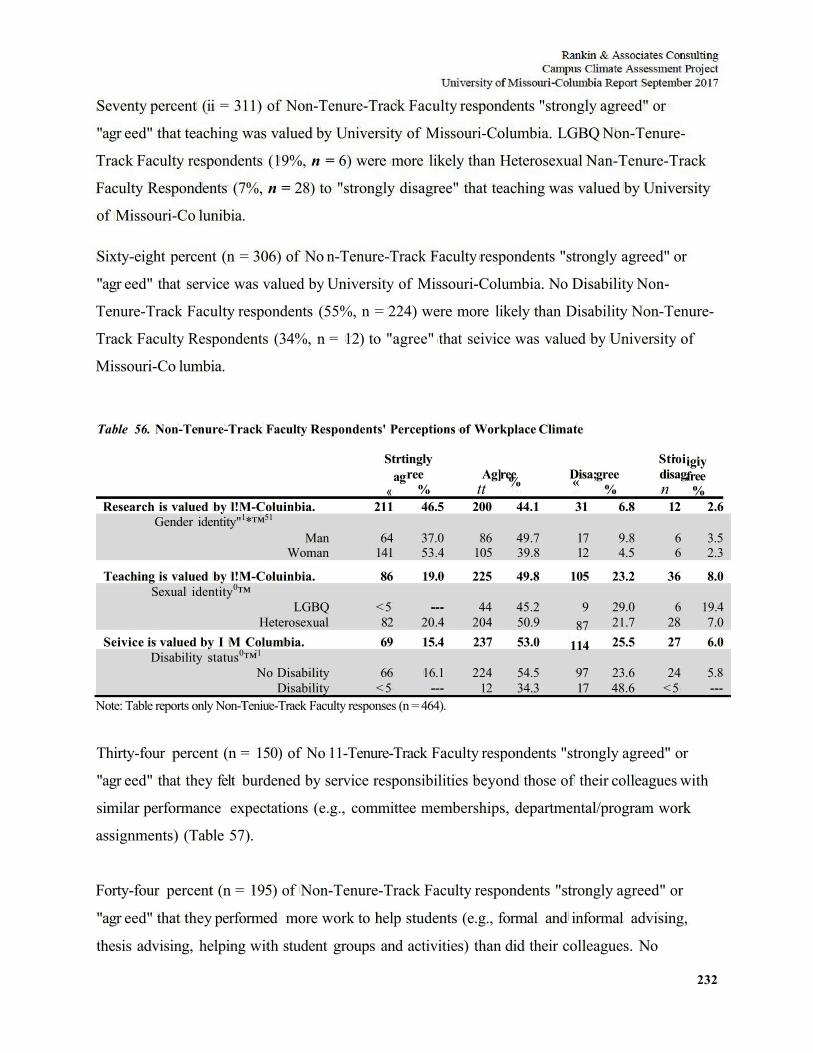
Seventy percent (ii = 311) of Non-Tenure-Track Faculty respondents "strongly agreed" or
"agr eed" that teaching was valued by University of Missouri-Columbia. LGBQ Non-Tenure-
Track Faculty respondents (19%, n = 6) were more likely than Heterosexual Nan-Tenure-Track
Faculty Respondents (7%, n = 28) to "strongly disagree" that teaching was valued by University
of Missouri-Co lunibia.
Sixty-eight percent (n = 306) of No n-Tenure-Track Faculty respondents "strongly agreed" or
"agr eed" that service was valued by University of Missouri-Columbia. No Disability Non-
Tenure-Track Faculty respondents (55%, n = 224) were more likely than Disability Non-Tenure-
Track Faculty Respondents (34%, n = 12) to "agree" that seivice was valued by University of
Missouri-Co lumbia.
Table 56. Non-Tenure-Track Faculty Respondents' Perceptions of Workplace Climate
Strt ag
«
ingly ree
% Ag]
tt ree % Disa; « gree
%
Stioi disag n
igiy free %
Research is valued by l!M-Coluinbia. 211 46.5 200 44.1 31 6.8 12 2.6 Gender identity"1*™51
Man 64 37.0 86 49.7 17 9.8 6 3.5 Woman
Teaching is valued by l!M-Coluinbia. Sexual identity0™
LGBQ Heterosexual
Seivice is valued by I M Columbia. Disability status0™1
No Disability Disability
141
86
< 5 82 69
66 < 5
53.4
19.0
20.4 15.4
16.1
105
225
44 204 237
224 12
39.8
49.8
45.2 50.9 53.0
54.5 34.3
12
105
9 87
114
97 17
4.5
23.2
29.0 21.7 25.5
23.6 48.6
6
36
6 28 27
24 < 5
2.3
8.0
19.4 7.0 6.0
5.8
Note: Table reports only Non-Teniue-Traek Faculty responses (n = 464).
Thirty-four percent (n = 150) of No 11-Tenure-Track Faculty respondents "strongly agreed" or
"agr eed" that they felt burdened by service responsibilities beyond those of their colleagues with
similar performance expectations (e.g., committee memberships, departmental/program work
assignments) (Table 57).
Forty-four percent (n = 195) of Non-Tenure-Track Faculty respondents "strongly agreed" or
"agr eed" that they performed more work to help students (e.g., formal and informal advising,
thesis advising, helping with student groups and activities) than did their colleagues. No
232
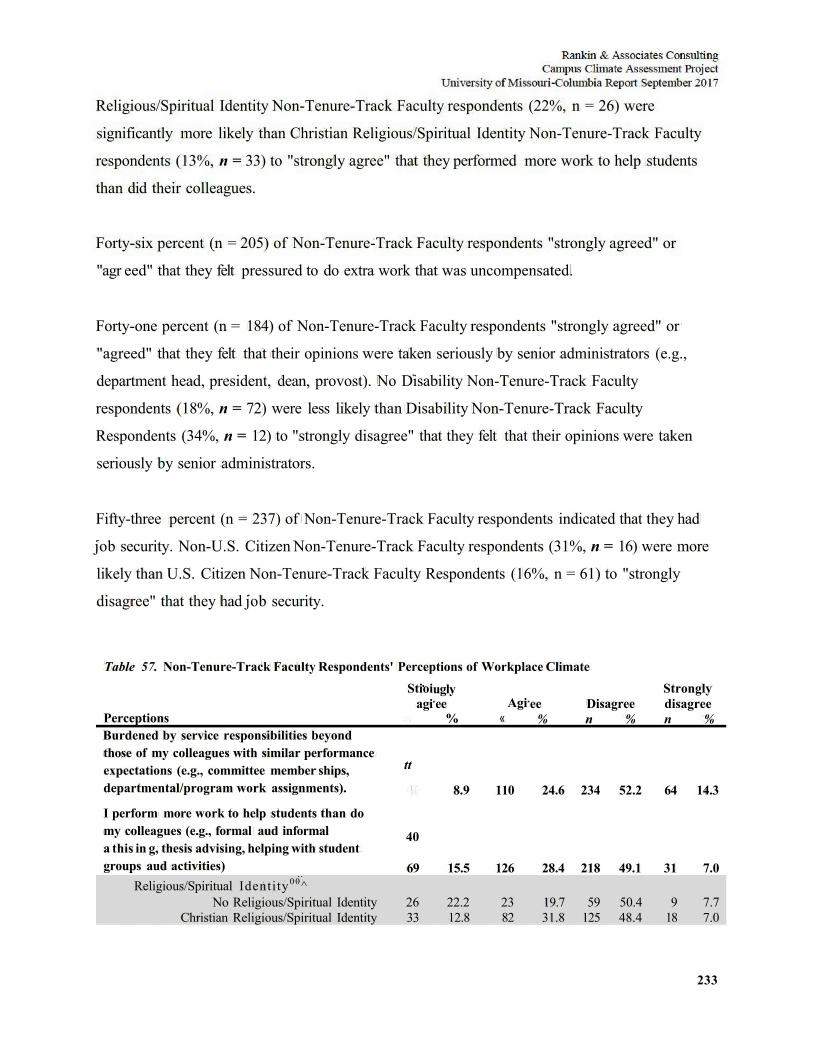
233
Religious/Spiritual Identity Non-Tenure-Track Faculty respondents (22%, n = 26) were
significantly more likely than Christian Religious/Spiritual Identity Non-Tenure-Track Faculty
respondents (13%, n = 33) to "strongly agree" that they performed more work to help students
than did their colleagues.
Forty-six percent (n = 205) of Non-Tenure-Track Faculty respondents "strongly agreed" or
"agr eed" that they felt pressured to do extra work that was uncompensated.
Forty-one percent (n = 184) of Non-Tenure-Track Faculty respondents "strongly agreed" or
"agreed" that they felt that their opinions were taken seriously by senior administrators (e.g.,
department head, president, dean, provost). No Disability Non-Tenure-Track Faculty
respondents (18%, n = 72) were less likely than Disability Non-Tenure-Track Faculty
Respondents (34%, n = 12) to "strongly disagree" that they felt that their opinions were taken
seriously by senior administrators.
Fifty-three percent (n = 237) of Non-Tenure-Track Faculty respondents indicated that they had
job security. Non-U.S. Citizen Non-Tenure-Track Faculty respondents (31%, n = 16) were more
likely than U.S. Citizen Non-Tenure-Track Faculty Respondents (16%, n = 61) to "strongly
disagree" that they had job security.
Table 57. Non-Tenure-Track Faculty Respondents' Perceptions of Workplace Climate
Perceptions Burdened by service responsibilities beyond those of my colleagues with similar performance expectations (e.g., committee member ships, departmental/program work assignments).
I perform more work to help students than do my colleagues (e.g., formal aud informal a this in g, thesis advising, helping with student groups aud activities)
Religious/Spiritual Identity 0 0^
Stioi agi
tt
40
69
ugly ee
%
8.9
15.5
Agi «
110
126
Strongly ee Disagree disagree
% n % n %
24.6 234 52.2 64 14.3
28.4 218 49.1 31 7.0
No Religious/Spiritual Identity 26 22.2 23 19.7 59 50.4 9 7.7 Christian Religious/Spiritual Identity 33 12.8 82 31.8 125 48.4 18 7.0
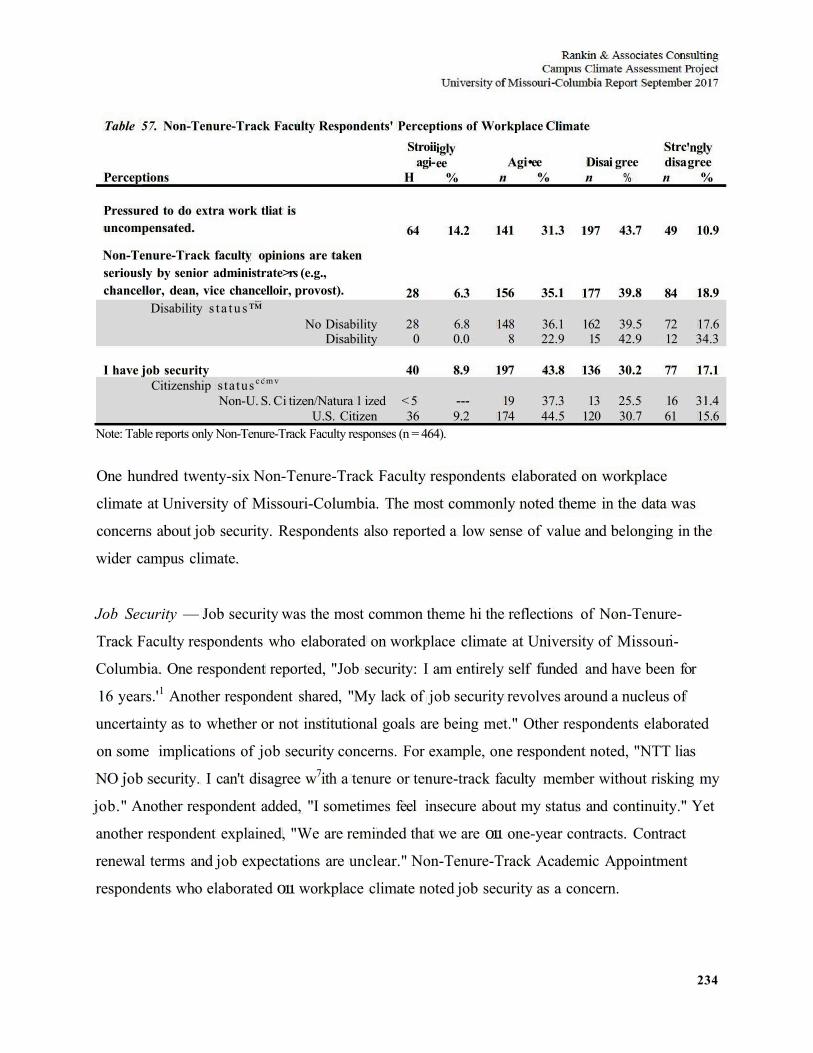
234
Table 57. Non-Tenure-Track Faculty Respondents' Perceptions of Workplace Climate
Perceptions
Pressured to do extra work tliat uncompensated.
Non-Tenure-Track faculty opin seriously by senior administrate chancellor, dean, vice chancelloi
Disability s t a t u s ™
is
ions are taken >rs (e.g., r, provost).
Stroii agi-
H
64
28
igly ee
%
14.2
6.3
Agi n
141
156
•ee %
31.3
35.1
Disa n
197
177
i gree %
43.7
39.8
Strc disa n
49
84
'ngly gree
%
10.9
18.9
No Disability 28 6.8 148 36.1 162 39.5 72 17.6
I have job security Citizenship s ta tus c c m v
Non-U. S. C
Disability
i tizen/Natura 1 ized U.S. Citizen
0
40
< 5 36
0.0
8.9
9.2
8
197
19 174
22.9
43.8
37.3 44.5
15
136
13 120
42.9
30.2
25.5 30.7
12
77
16 61
34.3
17.1
31.4 15.6
Note: Table reports only Non-Tenure-Track Faculty responses (n = 464).
One hundred twenty-six Non-Tenure-Track Faculty respondents elaborated on workplace
climate at University of Missouri-Columbia. The most commonly noted theme in the data was
concerns about job security. Respondents also reported a low sense of value and belonging in the
wider campus climate.
Job Security — Job security was the most common theme hi the reflections of Non-Tenure-
Track Faculty respondents who elaborated on workplace climate at University of Missoun-
Columbia. One respondent reported, "Job security: I am entirely self funded and have been for
16 years.'1 Another respondent shared, "My lack of job security revolves around a nucleus of
uncertainty as to whether or not institutional goals are being met." Other respondents elaborated
on some implications of job security concerns. For example, one respondent noted, "NTT lias
NO job security. I can't disagree w7ith a tenure or tenure-track faculty member without risking my
job." Another respondent added, "I sometimes feel insecure about my status and continuity." Yet
another respondent explained, "We are reminded that we are 011 one-year contracts. Contract
renewal terms and job expectations are unclear." Non-Tenure-Track Academic Appointment
respondents who elaborated 011 workplace climate noted job security as a concern.
235
Low Sense of Belonging and Value — Respondents who elaborated on workplace climate at
University of Missouri-Columbia described a low sense of belonging and value. Some
respondents reflected on how they themselves feel excluded from other Faculty. One respondent
noted, "Despite being fiill faculty, it has been made very clear that non-tenure track professors
are not truly faculty. Rather, we are "helpers" here to actually teach our students while tenure
track faculty have the more important responsibilities—governance and research." Another
respondent shared, "Even though I think the opinions of non-tenure-track faculty are valued a bit
more, in general, we are still treated as second class citizens, even after serving the institution for
decades." Other respondents described their perception of value by leadership, for example, "I do
not believe non-tenure track faculty are taken seriously by the administration in the college."
Another respondent noted, "Most non-tenure-track faculty feel as if the university regards them
as expendable. In our departments, we do the hon's share of the work and that goes unrecognized
and unappreciated." The sentiment that "we are disposable, 110 matter how good we are at what
we do" was widely echoed. Other respondents specifically described a disregard for then
teaching. One respondent noted, "School of Medicine is only about making money, not
teaching." Another respondent explained, "Teaching is valued, but not valued as highly as
research. Non-Tenure track faculty are not given time for scholarly activity even though it is
necessary for advancement. Scholarly activity outside of research is undervalued." Respondents
who elaborated 011 the workplace climate at University of Missouri-Columbia did not feel valued
by the institution as a whole.
236
Additionally, Faculty respondents were asked to rate the degree to which they agreed with a
series of 16 statements related to faculty workplace climate (Table 58). Chi-square analyses were
conducted by position status, gender identity, racial identity, sexual identity, age,
religious/spiritual identity, citizenship status, military status, and disability status; only
significant differences are repotted.
Foity-three percent (n = 418) of Faculty91 respondents "strongly agreed" or "agreed" that salaries
for tenure-track faculty positions were competitive. Non-Tenure-Track Faculty respondents
(53%, n = 207) and Tenure-Track Faculty respondents (43%, n = 49) were more likely than
Tenured Faculty respondents (16%, n = 51) to "agree" that salaries for tenure-track faculty
positions were competitive. Other Religious/Spiritual Identity Faculty respondents (32%, n =
28), No Religious/Spiritual Identity Faculty respondents (33%, n = 102) and Multiple
Religious/Spiritual Identity Faculty respondents (26%, n = 12) were significantly less likely than
Christian Religious/Spiritual Identity Faculty respondents (44%, n = 207) to "agree" that salaries
for tenure-track faculty positions were competitive.
Thirty-nine percent (n = 352) of Faculty respondents thought that salaries for adjunct faculty
were competitive. Non-Tenure-Track Faculty respondents (39%, n = 148) and Tenme-Track
Faculty respondents (38%, n = 37) were more likely than Tenured Faculty respondents (29%, n =
82) to "agree" that salaries for adjunct faculty were competitive. Women Faculty respondents
(31%, n = 134) were significantly less likely than Men Faculty respondents (41%, n = 180) to
"agree" that salaries for adjunct faculty were competitive. A significantly higher percentage
(45%, yt = 341) of U.S. Citizen Faculty respondents than (34%, n = 47) of Non-U.S. Citizen
Faculty respondents "disagreed" that salaries for adjunct faculty were competitive. Military
Faculty respondents (49%, n = 24) were more likely than Non-Military Faculty respondents
(35%, n = 291) to "agree" that salaries for adjunct faculty were competitive. Christian
Religious/Spiritual Identity Faculty respondents (43%, n = 192) were significantly more likely
than No Religious/Spiritual Identity Faculty respondents (29%, n = 85), Multiple
Religious/Spiritual Identity Faculty respondents (30%, n = 12), and Other Religious/Spiritual
91 Per the request of the LCST, Senior Administrators with Faculty Rank were included with Faculty/Emeritus faculty/research Scientist respondents by position status.
237
Identity Faculty respondents (23%, n = 19) to "agree" that salaries for adjunct faculty were
competitive.
Forty percent (ri = 380) of Faculty respondents thought that salaries for non-tenure-track faculty
were competitive. Women Faculty respondents (32%, n = 148) were significantly less likely than
Men Faculty respondents (40%, n = 185) to "agree" that salaries for non-tenure-track faculty
were competitive. Military Faculty respondents (50%, n = 27) were more likely than Non-
Military Faculty respondents (36%, n = 311) to "agree" that salaries for non-tenure-track faculty
were competitive. Christian Religious/Spiritual Identity Faculty respondents (40%, n = 190) and
Multiple Religious/Spiritual Identity Faculty respondents (40%, n = 16) were significantly more
likely than No Religious/Spiritual Identity Faculty respondents (32%, n = 97) and Other
Religious/Spiritual Identity Faculty respondents (25%, n = 22) to "agree" that salaries for 11011-
tenure-track faculty were competitive.
Eighty-one percent (« = 811) of Faculty respondents "strongly agreed" or "agreed" that health
insurance benefits were competitive. Non-Tenure-Track Faculty respondents (72%, n = 311) and
Tenure-Track Faculty respondents (68%, n = 77) were more likely than Tenured Faculty
respondents (59%, n = 185) to "agree" that health insurance benefits were competitive. Women
Faculty respondents (70%, n = 336) were significantly more likely than Men Faculty respondents
(64%, n = 312) to "agree" that health insurance benefits were competitive. White Faculty
respondents (68%, n = 546) were more likely than People ofColor and Multiracial Faculty
respondents (59%, n = 85) to "agree" that health insurance benefits were competitive. Christian
Religious/Spiritual Identity Faculty respondents (70%, n = 348) and Other Religious/Spiritual
Identity Faculty respondents (72%, n = 63) were significantly more likely than No
Religious/Spiritual Identity Faculty respondents (65%, n = 204) and Multiple Religious/Spiritual
Identity Faculty respondents (63%, n = 30) to "agree" that health insurance benefits were
competitive.
Fifty-four percent (;/ = 450) of Faculty respondents "strongly agreed" or "agreed" that child care
benefits were competitive. Non-Tenure-Track Faculty respondents (56%, n = 200) and Tenure-
Track Faculty Respondents (51 %, n = 48) were more likely than Tenured Faculty Respondents
(37%, n = 95) to "agree" that cliild care benefits were competitive. Christian Religious/Spiritual
Identity Faculty respondents (9%, n = 38) and Other Religious/Spiritual Identity Faculty
respondents (14%, n = 10) were significantly less likely than No Religious/Spiritual Identity
Faculty respondents (18%, n = 47) and Multiple Religious/Spiritual Identity Faculty respondents
(20%, ii = 8) to "strongly disagr ee" that child care benefits were competitive.
More than two-thirds (67%, n = 632) of Faculty respondents "strongly agreed" or "agreed" that
retirement/supplemental benefits were competitive. Faculty/Emeritus Faculty/Research Scientist
respondents (55%, n = 485) were significantly less likely than Senior Administrator with Faculty
Rank respondents (69%, n = 44) to "agree" that retirement/supplemental benefits w7ere
competitive. LGBQ Faculty respondents (19%, n = 10) were more likely than Heterosexual
Faculty respondents (8%, n = 65) to "strongly disagree" that retirement/supplemental benefits
were competitive. Christian Religious/Spiritual Identity Faculty respondents (6%, n = 29), Other
Religious/Spiritual Identity Faculty respondents (6%, n = 5), and No Religious/Spiritual Identity7
Faculty respondents (10%, n = 28) were significantly less likely than Multiple
Religious/Spiritual Identity Faculty respondents (22%, n = 10) to "strongly disagree" that
retirement/supplemental benefits were competitive. A significantly higher percentage (21%, n =
17) of Disability Faculty respondents than (7%, n = 63) of No Disability Faculty respondents
"strongly disagreed" that retirement/supplemental benefits were competitive.
Table 58. Faculty Respondents' Perceptions of Salary and Benefits
Perceptions
Strongly agree
n % Agree
n % Disagree n %
Strongly disagree n %
Salaries for tenure-track faculty positions are competitive. 53 5.5 365 37.6 376 38.8 176 18.1
Faculty status Tenured Faculty 7 2.2 51 15.9 140 43.8 122 38.1
Tenure-Track Faculty < 5 — 49 43.0 40 35.1 21 18.4 Non-Tenure-Track Faculty 28 7.1 207 52.5 144 36.5 15 3.8
Religious/Spiritual Identity Christian Religious/Spiritual Identity 29 6.1 207 43.6 185 38.9 54 11.4
Other Religious/Spiritual Identity < 5 — 28 31.8 41 46.6 15 17.0 No Religious/Spiritual Identity 15 4.8 102 32.9 116 37.4 77 24.8
Multiple Religious/Spiritual Identity < 5 — 12 25.5 21 44.7 12 25.5
Salaries for adjunct faculty are competitive. 30 3.3 322 35.7 398 44.1 153 16.9 Faculty status0™™
238
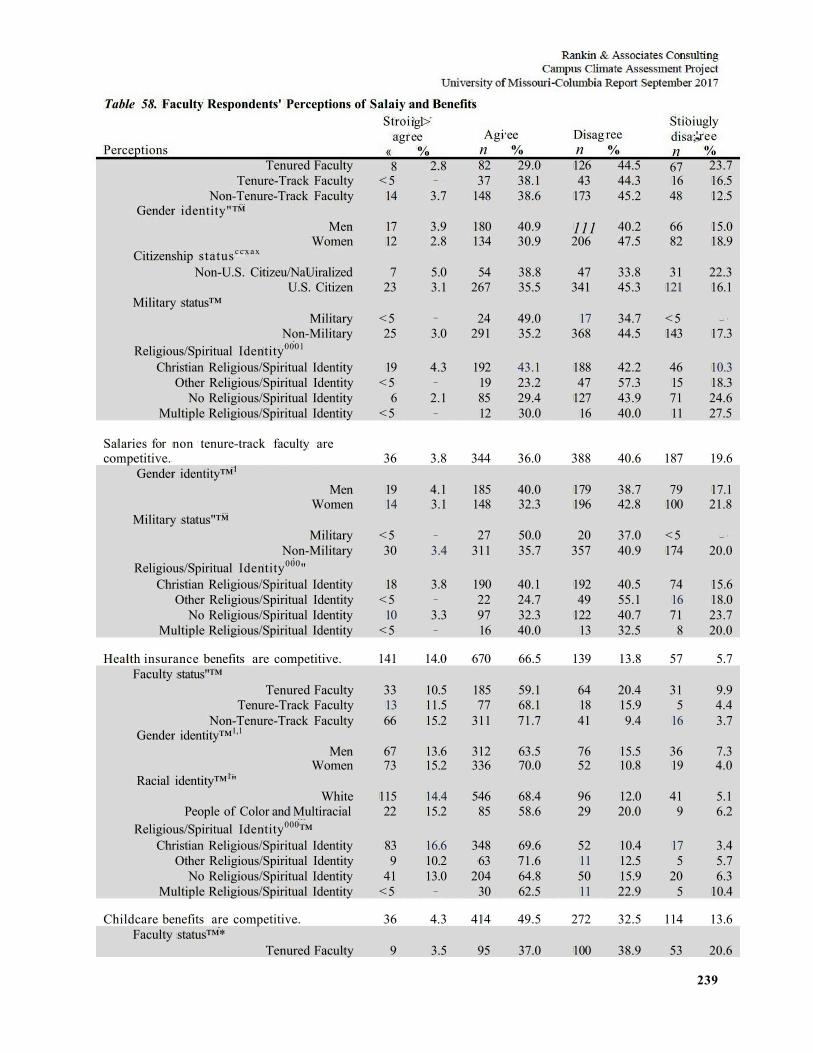
239
Table 58. Faculty Respondents' Perceptions of Salaiy and Benefits
Perceptions Tenured Faculty
Stroi agr
« 8
igl> ee %
2.8
Agi n 82
ee %
29.0
Disag n 126
ree %
44.5
Stioi disa; n 67
ugly 'ree
% 23.7
Tenure-Track Faculty < 5 — 37 38.1 43 44.3 16 16.5 Non-Tenure-Track Faculty 14 3.7 148 38.6 173 45.2 48 12.5
Gender identity"™ Men 17 3.9 180 40.9 111 40.2 66 15.0
Women 12 2.8 134 30.9 206 47.5 82 18.9 Citizenship statusccxax
Non-U.S. Citizeu/NaUiralized 7 5.0 54 38.8 47 33.8 31 22.3 U.S. Citizen 23 3.1 267 35.5 341 45.3 121 16.1
Military status™ Military < 5 — 24 49.0 17 34.7 < 5 —
Non-Military 25 3.0 291 35.2 368 44.5 143 17.3 Religious/Spiritual Identity0001
Christian Religious/Spiritual Identity 19 4.3 192 43.1 188 42.2 46 10.3 Other Religious/Spiritual Identity < 5 — 19 23.2 47 57.3 15 18.3
No Religious/Spiritual Identity 6 2.1 85 29.4 127 43.9 71 24.6 Multiple Religious/Spiritual Identity < 5 — 12 30.0 16 40.0 11 27.5
Salaries for non tenure-track faculty are competitive. 36 3.8 344 36.0 388 40.6 187 19.6
Gender identity™1
Men 19 4.1 185 40.0 179 38.7 79 17.1 Women 14 3.1 148 32.3 196 42.8 100 21.8
Military status"™ Military < 5 — 27 50.0 20 37.0 < 5 —
Non-Military 30 3.4 311 35.7 357 40.9 174 20.0 Religious/Spiritual Identity000"
Christian Religious/Spiritual Identity 18 3.8 190 40.1 192 40.5 74 15.6 Other Religious/Spiritual Identity < 5 — 22 24.7 49 55.1 16 18.0
No Religious/Spiritual Identity 10 3.3 97 32.3 122 40.7 71 23.7 Multiple Religious/Spiritual Identity < 5 — 16 40.0 13 32.5 8 20.0
Health insurance benefits are competitive. 141 14.0 670 66.5 139 13.8 57 5.7 Faculty status"™
Tenured Faculty 33 10.5 185 59.1 64 20.4 31 9.9 Tenure-Track Faculty 13 11.5 77 68.1 18 15.9 5 4.4
Non-Tenure-Track Faculty 66 15.2 311 71.7 41 9.4 16 3.7 Gender identity™1,1
Men 67 13.6 312 63.5 76 15.5 36 7.3 Women 73 15.2 336 70.0 52 10.8 19 4.0
Racial identity™1" White 115 14.4 546 68.4 96 12.0 41 5.1
People of Color and Multiracial 22 15.2 85 58.6 29 20.0 9 6.2 Religious/Spiritual Identity000™
Christian Religious/Spiritual Identity 83 16.6 348 69.6 52 10.4 17 3.4 Other Religious/Spiritual Identity 9 10.2 63 71.6 11 12.5 5 5.7
No Religious/Spiritual Identity 41 13.0 204 64.8 50 15.9 20 6.3 Multiple Religious/Spiritual Identity < 5 — 30 62.5 11 22.9 5 10.4
Childcare benefits are competitive. 36 4.3 414 49.5 272 32.5 114 13.6 Faculty status™*
Tenured Faculty 9 3.5 95 37.0 100 38.9 53 20.6
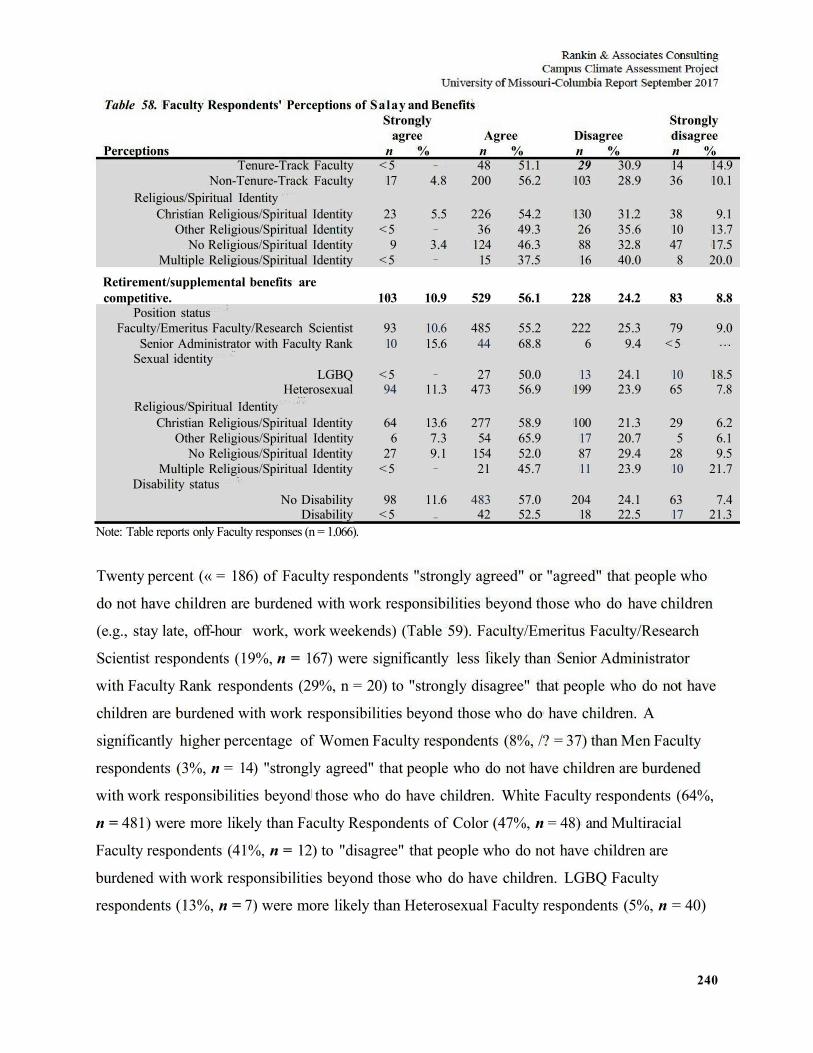
240
Table 58. Faculty Respondents' Perceptions of Salay and Benefits Strongly Strongly
agree Agree Disagree disagree Perceptions n % n % n % n %
Tenure-Track Faculty < 5 — 48 51.1 29 30.9 14 14.9 Non-Tenure-Track Faculty 17 4.8 200 56.2 103 28.9 36 10.1
Religious/Spiritual Identity Christian Religious/Spiritual Identity 23 5.5 226 54.2 130 31.2 38 9.1
Other Religious/Spiritual Identity < 5 — 36 49.3 26 35.6 10 13.7 No Religious/Spiritual Identity 9 3.4 124 46.3 88 32.8 47 17.5
Multiple Religious/Spiritual Identity < 5 — 15 37.5 16 40.0 8 20.0 Retirement/supplemental benefits are competitive. 103 10.9 529 56.1 228 24.2 83 8.8
Position status Faculty/Emeritus Faculty/Research Scientist 93 10.6 485 55.2 222 25.3 79 9.0
Senior Administrator with Faculty Rank 10 15.6 44 68.8 6 9.4 < 5 . . .
Sexual identity LGBQ < 5 — 27 50.0 13 24.1 10 18.5
Heterosexual 94 11.3 473 56.9 199 23.9 65 7.8 Religious/Spiritual Identity
Christian Religious/Spiritual Identity 64 13.6 277 58.9 100 21.3 29 6.2 Other Religious/Spiritual Identity 6 7.3 54 65.9 17 20.7 5 6.1
No Religious/Spiritual Identity 27 9.1 154 52.0 87 29.4 28 9.5 Multiple Religious/Spiritual Identity < 5 — 21 45.7 11 23.9 10 21.7
Disability status No Disability 98 11.6 483 57.0 204 24.1 63 7.4
Disability < 5 — 42 52.5 18 22.5 17 21.3 Note: Table reports only Faculty responses (n = 1.066).
Twenty percent (« = 186) of Faculty respondents "strongly agreed" or "agreed" that people who
do not have children are burdened with work responsibilities beyond those who do have children
(e.g., stay late, off-hour work, work weekends) (Table 59). Faculty/Emeritus Faculty/Research
Scientist respondents (19%, n = 167) were significantly less likely than Senior Administrator
with Faculty Rank respondents (29%, n = 20) to "strongly disagree" that people who do not have
children are burdened with work responsibilities beyond those who do have children. A
significantly higher percentage of Women Faculty respondents (8%, /? = 37) than Men Faculty
respondents (3%, n = 14) "strongly agreed" that people who do not have children are burdened
with work responsibilities beyond those who do have children. White Faculty respondents (64%,
n = 481) were more likely than Faculty Respondents of Color (47%, n = 48) and Multiracial
Faculty respondents (41%, n = 12) to "disagree" that people who do not have children are
burdened with work responsibilities beyond those who do have children. LGBQ Faculty
respondents (13%, n = 7) were more likely than Heterosexual Faculty respondents (5%, n = 40)
241
to "strongly agree''' that people who do not have children are burdened with work responsibilities
beyond those who do have children.
Fifty percent (n = 465) of Faculty respondents "strongly agreed" or "agreed" that people who
have children or elder care were burdened with balancing work and family responsibilities (e.g.,
evening and evenings programming, workload brought home, University of Missouri-Columbia
breaks not scheduled with school district breaks). Women Faculty respondents (15%, n = 68)
were significantly more likely than Men Faculty respondents (7%, n = 33) to "strongly agree"
that people who have children or elder care were burdened with balancing work and family
responsibilities. Faculty Respondents of Color (16%, n = 16) were more likely than White
Faculty respondents (6%, n = 43) to "strongly disagree" that people who have children or elder
care were burdened with balancing work and family responsibilities. Christian
Religious/Spiritual Identity Faculty respondents (35%, n = 161) were significantly less likely
than No Religious/Spiritual Identity Faculty respondents (45%, n = 135) to "agree" that people
who have children or elder care were burdened with balancing work and family responsibilities.
No Disability Faculty respondents (8%, n = 66) were significantly more likely than fewer than
five Disability Faculty respondents to "strongly disagree" that people who have children or elder
care were burdened with balancing work and family responsibilities.
Fifty percent (n = 474) of Faculty respondents "strongly agreed" or "agreed" that University of
Missouri-Columbia provided adequate resources to help them manage work-life balance (e.g.,
child care, wellness services, elder care, housing location assistance, transportation). Tenured
Faculty respondents (16%, n = 47) and Tenure-Track Faculty respondents (15%, n = 16) were
more likely than Non-Tenure-Track Faculty respondents (9%, n =37) to "strongly disagree" that
University of Missouri-Columbia provided adequate resources to help them manage work-life
balance. Women Faculty respondents (42%, n = 192) were significantly less likely than Men
Faculty respondents (50%, n = 229) to "agree" that University of Missouri-Columbia provided
adequate resources to help them manage work-life balance. A significantly higher percentage of
No Disability Faculty respondents (47%, n = 403) than of Disability Faculty respondents (32%, n
= 27) "agreed" that University of Missouri-Columbia provided adequate resources to help them
manage work-life balance.
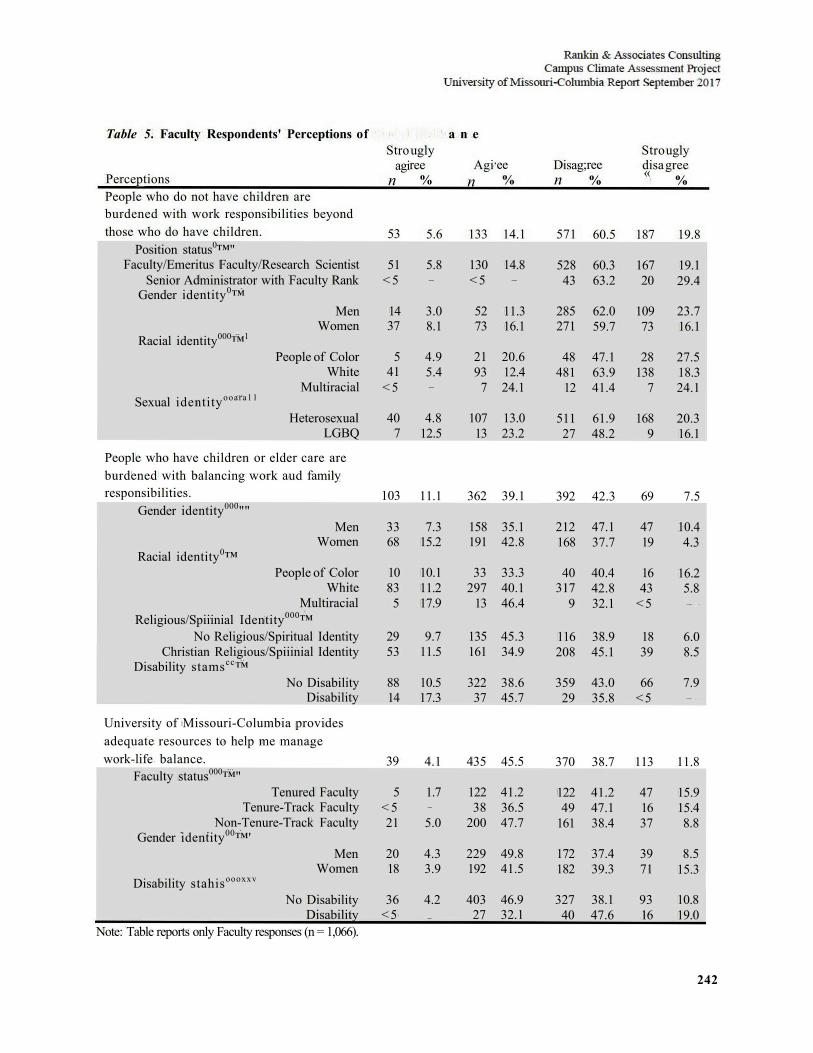
242
Table 5. Faculty Respondents' Perceptions of a n e
Perceptions People who do not have children are
Stro agi
n
ugly ree
% Agi
n ee %
Disag n
;ree %
Stro disa «
ugly gree
%
burdened with work responsibilities beyond those who do have children. 53 5.6 133 14.1 571 60.5 187 19.8
Position status0™" Faculty/Emeritus Faculty/Research Scientist 51 5.8 130 14.8 528 60.3 167 19.1
Senior Administrator with Faculty Rank < 5 — < 5 — 43 63.2 20 29.4 Gender identity0™
Men 14 3.0 52 11.3 285 62.0 109 23.7 Women 37 8.1 73 16.1 271 59.7 73 16.1
Racial identity000™1
People of Color 5 4.9 21 20.6 48 47.1 28 27.5 White 41 5.4 93 12.4 481 63.9 138 18.3
Multiracial < 5 — 7 24.1 12 41.4 7 24.1 Sexual identityooara11
Heterosexual 40 4.8 107 13.0 511 61.9 168 20.3 LGBQ 7 12.5 13 23.2 27 48.2 9 16.1
People who have children or elder care are burdened with balancing work aud family responsibilities. 103 11.1 362 39.1 392 42.3 69 7.5
Gender identity000"" Men 33 7.3 158 35.1 212 47.1 47 10.4
Women 68 15.2 191 42.8 168 37.7 19 4.3 Racial identity0™
People of Color 10 10.1 33 33.3 40 40.4 16 16.2 White 83 11.2 297 40.1 317 42.8 43 5.8
Multiracial 5 17.9 13 46.4 9 32.1 < 5 —
Religious/Spiiinial Identity000™ No Religious/Spiritual Identity 29 9.7 135 45.3 116 38.9 18 6.0
Christian Religious/Spiiinial Identity 53 11.5 161 34.9 208 45.1 39 8.5 Disability stamscc™
No Disability 88 10.5 322 38.6 359 43.0 66 7.9 Disability 14 17.3 37 45.7 29 35.8 < 5 —
University of Missouri-Columbia provides adequate resources to help me manage work-life balance. 39 4.1 435 45.5 370 38.7 113 11.8
Faculty status000™" Tenured Faculty 5 1.7 122 41.2 122 41.2 47 15.9
Tenure-Track Faculty < 5 — 38 36.5 49 47.1 16 15.4 Non-Tenure-Track Faculty 21 5.0 200 47.7 161 38.4 37 8.8
Gender identity00™' Men 20 4.3 229 49.8 172 37.4 39 8.5
Women 18 3.9 192 41.5 182 39.3 71 15.3 Disability stahisoooxxv
No Disability 36 4.2 403 46.9 327 38.1 93 10.8 Disability < 5 — 27 32.1 40 47.6 16 19.0
Note: Table reports only Faculty responses (n = 1,066).
243
As noted in Table 60, 72% (n = 719) of Faculty respondents "strongly agreed" or "agreed" that
they believed that their colleagues included them in opportunities that will help their career as
much as they do others in their position. Tenured Faculty respondents (10%, n = 31) were more
likely than fewer than five Non-Tenure-Track Faculty respondents and Tenure-Track Faculty
respondents (5%, n = 21) to "strongly disagree" that they believed that their colleagues included
them hi opportunities that will help their career as much as they do others hi their position. A
higher proportion of White Faculty respondents (60%, n = 475) and Multiracial Faculty
respondents (59%, n = 20) than Faculty Respondents ofColor (47%, n = 49) "agreed" that their
colleagues included them hi opportunities that will help their career as much as they do others in
their position. LGBQ Faculty respondents (13%, n = 8) were more likely than Heterosexual
Faculty respondents (5%, n = 46) to "strongly disagree" that their colleagues included them in
opportunities that will help their career as much as they do others hi their position. Christian
Religious/Spiritual Identity Faculty respondents (3%, n = 16) were significantly less likely than
Other Religious/Spiritual Identity Faculty respondents (8%, n = 7), No Religious/Spiritual
Identity Faculty respondents (9%, n = 27), and Multiple Religious/Spiritual Identity Faculty
respondents (15%, n = 7) to "strongly agree" that their colleagues included them in opportunities
that will help their career as much as they do others in their' position. A significantly higher
percentage of Disability Faculty respondents (12%, n = 10) than of No Disability Faculty
respondents (6%, n = 52) "strongly disagreed" that their colleagues included them in
opportunities that will help their career as much as they do others hi their position.
Sixty percent (n = 609) of Faculty respondents "strongly agreed" or "agreed" that they believed
that the performance evaluation process was clear.
Sixty-five percent (n = 655) of Faculty respondents "strongly agreed" or "agreed" that University
of Missouri-Columbia provided them with resources to pursue professional development (e.g.,
conferences, materials, research and course design, and traveling). Faculty/Emeritus
Faculty/Research Scientist respondents (12%, n = 117) were significantly less likely than Senior
Administrator with Faculty Rank respondents (26%, n = 18) to "strongly agree" that University
of Missouri-Columbia provided them with resources to pursue professional development.
Tenured Faculty respondents (8%, n = 24) were less likely than Non-Tenure-Track Faculty
244
respondents (15%, n = 67) and Tenure-Track Faculty respondents (16%, n = 17) to "strongly
agree" that University of Missouri-Columbia provided them with resources to pursue
professional development. Christian Religious/Spiritual Identity Faculty respondents (16%, n =
81) were significantly more likely than No Religious/Spiritual Identity Faculty respondents
(10%, n = 32) to "strongly agree" that University of Missouri-Columbia provided them with
resources to pursue professional development.
Sixty-one percent (w =615) of Faculty respondents "strongly agreed" or "agreed" that they were
positive about their career opportunities at University of Missouri-Columbia. Faculty/Emeritus
Faculty/Research Scientist respondents (10%, n = 98) were significantly less likely than Senior
Administrator with Faculty Rank respondents (19%, n = 13) to "strongly agree" that they were
positive about their career opportunities at University of Missouri-Columbia. A higher
proportion of Multiracial Faculty respondents (46%, n= 16) and Faculty Respondents of Color
(36%, n = 40) than White Faculty respondents (26%, n = 211) "disagreed" that they were
positive about their career opportunities at University of Missouri-Columbia. LGBQ Faculty
respondents (31%, n = 18) were less likely than Heterosexual Faculty respondents (52%, n =
462) to "agree" that they were positive about their career opportunities at University of Missouri-
Columbia. Christian Religious/Spiritual Identity Faculty respondents (7%, n = 35) were
significantly less likely than Other Religious/Spiritual Identity Faculty respondents (10%, n = 9),
No Religious/Spiritual Identity Faculty respondents (13%, n = 41), and Multiple
Religious/Spiritual Identity Faculty respondents (15%, n = 7) to "strongly disagree" that they
were positive about their career opportunities at University of Missouri-Columbia. A
significantly higher percentage of No Disability Faculty respondents (51%, n =468) than of
Single Disability Faculty respondents (42%, n = 25) and Multiple Disabilities Faculty
respondents (26%, n = 7) "agreed" that they were positive about their career opportunities at
University of Missouri-Columbia.
Sixty-three percent (n = 639) of Faculty respondents "strongly agreed" or "agreed" that they
would recommend University of Missouri-Columbia as a good place to work. Faculty/Emeritus
Faculty/Research Scientist respondents (11%, n = 106) were significantly less likely than Senior
Administrator with Faculty Rank respondents (25%, n = 18) to "strongly agree" that they would
245
recommend University of Missouri-Columbia as a good place to work. Tenured Faculty
respondents (35%, n = 109) were more likely than Non-Tenure-Track Faculty respondents (24%,
n = 109) and Tenure-Track Faculty respondents (22%, n = 24) to "disagree''' that they would
recommend University of Missouri-Columbia as a good place to work. A lower proportion of
Multiracial Faculty respondents (31%. n = 11) than White Faculty respondents (54%, n = 433)
and Faculty Respondents of Color (45%, n = 49) "agreed" that they would recommend
University of Missouri-Columbia as a good place to work. LGBQ Faculty respondents (36%, n =
21) were less likely than Heterosexual Faculty respondents (53%, n =470) to "agree" that they
would recommend University of Missouri-Columbia as a good place to work Christian
Religious/Spiritual Identity Faculty respondents (6%, n = 30) were significantly less likely than
Other Religious/Spiritual Identity Faculty respondents (10%, n = 9), No Religious/Spiritual
Identity Faculty respondents (13%, n = 43), and Multiple Religious/Spiritual Identity Faculty
respondents (13%, n = 6) to "strongly disagr ee" that they would recommend University of
Missouri-Columbia as a good place to work. A significantly lower percentage of No Disability
Faculty respondents (25%, n = 230) than of Single Disability Faculty respondents (48%, n = 29)
and Multiple Disabilities Faculty respondents (37%, n = 10) "disagreed" that they would
recommend University of Missouri-Columbia as a good place to work.
Sixty-nine percent (n = 705) of Faculty respondents "strongly agreed" or "agreed" that they had
job security. Tenured Faculty respondents (30%, n = 95) were more likely than Non-Tenure-
Track Faculty respondents (8%, n = 37) and Tenure-Track Faculty respondents (14%, n = 15) to
"strongly agree" that they had job security. Women Faculty respondents (16%, n = 77) were
significantly less likely than Men Faculty respondents (21%, n = 106) to "strongly agree" that
they had job security. A lower proportion of Faculty Respondents of Color and Multiracial
Faculty respondents (40%, n = 58) than White Faculty respondents (53%, n = 432) "agreed" that
they had job security. A significantly lower percentage of Single Disabihty Faculty respondents
(9%, h = 5) and No Disability Faculty respondents (9%, n = 82) than of Multiple Disabilities
Faculty respondents (36%, n = 10) "strongly disagreed" that they had job security.
Sixty-two percent ( ;/ = 600) of Faculty respondents "strongly agreed" or "agr eed" that they felt
that they have access to and support for grant funding. Faculty/Emeritus Faculty/Research
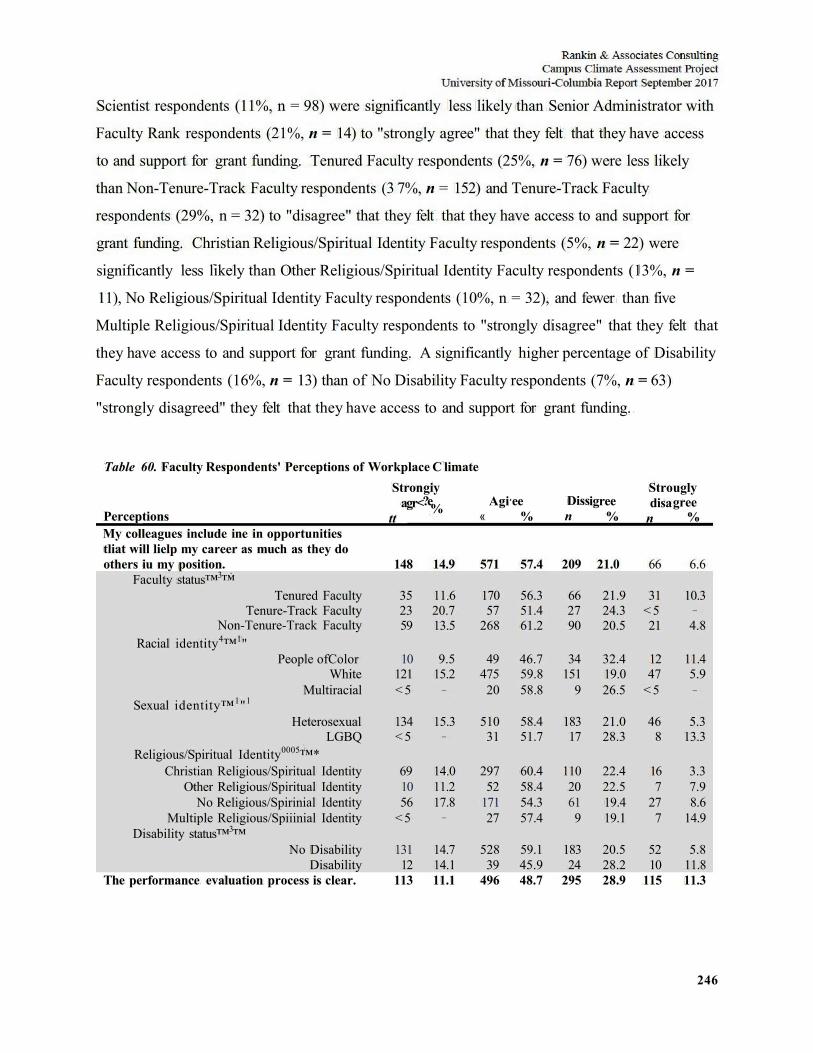
246
Scientist respondents (11%, n = 98) were significantly less likely than Senior Administrator with
Faculty Rank respondents (21%, n = 14) to "strongly agree" that they felt that they have access
to and support for grant funding. Tenured Faculty respondents (25%, n = 76) were less likely
than Non-Tenure-Track Faculty respondents (3 7%, n = 152) and Tenure-Track Faculty
respondents (29%, n = 32) to "disagree" that they felt that they have access to and support for
grant funding. Christian Religious/Spiritual Identity Faculty respondents (5%, n = 22) were
significantly less likely than Other Religious/Spiritual Identity Faculty respondents (13%, n =
11), No Religious/Spiritual Identity Faculty respondents (10%, n = 32), and fewer than five
Multiple Religious/Spiritual Identity Faculty respondents to "strongly disagree" that they felt that
they have access to and support for grant funding. A significantly higher percentage of Disability
Faculty respondents (16%, n = 13) than of No Disability Faculty respondents (7%, n = 63)
"strongly disagreed" they felt that they have access to and support for grant funding.
Table 60. Faculty Respondents' Perceptions of Workplace C limate
Perceptions My colleagues include ine in opportunities tliat will lielp my career as much as they do others iu my position.
Stron agr<
tt
148
giy ?e %
14.9
Agi «
571
ee %
57.4
Diss n
209
igree %
21.0
Stro disa
n
66
ugly gree
%
6.6 Faculty status™3™
Tenured Faculty 35 11.6 170 56.3 66 21.9 31 10.3 Tenure-Track Faculty 23 20.7 57 51.4 27 24.3 < 5 —
Non-Tenure-Track Faculty 59 13.5 268 61.2 90 20.5 21 4.8 Racial identity4™1"
People ofColor 10 9.5 49 46.7 34 32.4 12 11.4 White 121 15.2 475 59.8 151 19.0 47 5.9
Multiracial < 5 — 20 58.8 9 26.5 < 5 —
Sexual identity™1"1
Heterosexual 134 15.3 510 58.4 183 21.0 46 5.3 LGBQ < 5 — 31 51.7 17 28.3 8 13.3
Religious/Spiritual Identity0005™* Christian Religious/Spiritual Identity 69 14.0 297 60.4 110 22.4 16 3.3
Other Religious/Spiritual Identity 10 11.2 52 58.4 20 22.5 7 7.9 No Religious/Spirinial Identity 56 17.8 171 54.3 61 19.4 27 8.6
Multiple Religious/Spiiinial Identity < 5 — 27 57.4 9 19.1 7 14.9 Disability status™3™
No Disability 131 14.7 528 59.1 183 20.5 52 5.8 Disability 12 14.1 39 45.9 24 28.2 10 11.8
The performance evaluation process is clear. 113 11.1 496 48.7 295 28.9 115 11.3
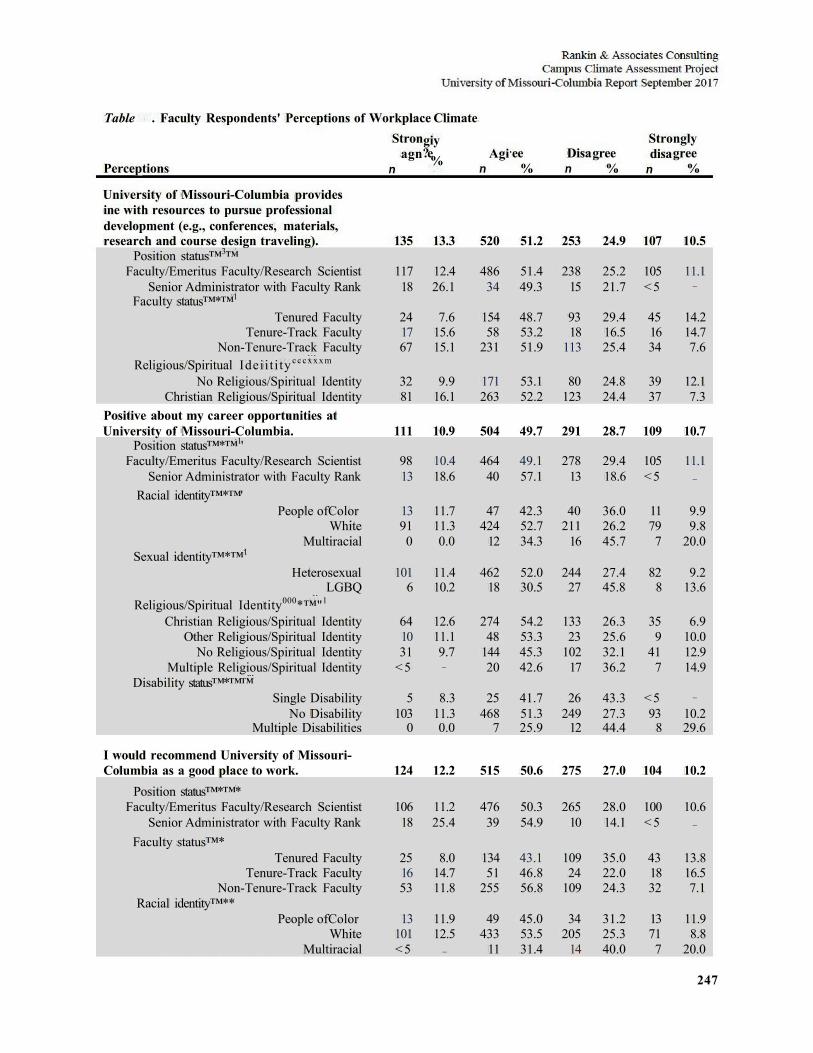
247
Table . Faculty Respondents' Perceptions of Workplace Climate
Perceptions
University of Missouri-Columbia provides
Stron agn
n
giy ?e % Agi
n ee
% Disa n
gree %
Stro disa
n
ngly gree
%
ine with resources to pursue professional development (e.g., conferences, materials, research and course design traveling). 135 13.3 520 51.2 253 24.9 107 10.5
Position status™3™ Faculty/Emeritus Faculty/Research Scientist 117 12.4 486 51.4 238 25.2 105 11.1
Senior Administrator with Faculty Rank 18 26.1 34 49.3 15 21.7 < 5 —
Faculty status™*™1
Tenured Faculty 24 7.6 154 48.7 93 29.4 45 14.2 Tenure-Track Faculty 17 15.6 58 53.2 18 16.5 16 14.7
Non-Tenure-Track Faculty 67 15.1 231 51.9 113 25.4 34 7.6 Religious/Spiritual Ideii t i ty c c c x x x m
No Religious/Spiritual Identity 32 9.9 171 53.1 80 24.8 39 12.1 Christian Religious/Spiritual Identity 81 16.1 263 52.2 123 24.4 37 7.3
Positive about my career opportunities at University of Missouri-Columbia. 111 10.9 504 49.7 291 28.7 109 10.7
Position status™*™1' Faculty/Emeritus Faculty/Research Scientist 98 10.4 464 49.1 278 29.4 105 11.1
Senior Administrator with Faculty Rank 13 18.6 40 57.1 13 18.6 < 5 —
Racial identity™*™' People ofColor 13 11.7 47 42.3 40 36.0 11 9.9
White 91 11.3 424 52.7 211 26.2 79 9.8 Multiracial 0 0.0 12 34.3 16 45.7 7 20.0
Sexual identity™*™1
Heterosexual 101 11.4 462 52.0 244 27.4 82 9.2 LGBQ 6 10.2 18 30.5 27 45.8 8 13.6
Religious/Spiritual Identity000*™"1
Christian Religious/Spiritual Identity 64 12.6 274 54.2 133 26.3 35 6.9 Other Religious/Spiritual Identity 10 11.1 48 53.3 23 25.6 9 10.0
No Religious/Spiritual Identity 31 9.7 144 45.3 102 32.1 41 12.9 Multiple Religious/Spiritual Identity < 5 — 20 42.6 17 36.2 7 14.9
Disability status™*™™ Single Disability 5 8.3 25 41.7 26 43.3 < 5 —
No Disability 103 11.3 468 51.3 249 27.3 93 10.2 Multiple Disabilities 0 0.0 7 25.9 12 44.4 8 29.6
I would recommend University of Missouri-Columbia as a good place to work. 124 12.2 515 50.6 275 27.0 104 10.2
Position status™*™* Faculty/Emeritus Faculty/Research Scientist 106 11.2 476 50.3 265 28.0 100 10.6
Senior Administrator with Faculty Rank 18 25.4 39 54.9 10 14.1 < 5 —
Faculty status™* Tenured Faculty 25 8.0 134 43.1 109 35.0 43 13.8
Tenure-Track Faculty 16 14.7 51 46.8 24 22.0 18 16.5 Non-Tenure-Track Faculty 53 11.8 255 56.8 109 24.3 32 7.1
Racial identity™** People ofColor 13 11.9 49 45.0 34 31.2 13 11.9
White 101 12.5 433 53.5 205 25.3 71 8.8 Multiracial < 5 — 11 31.4 14 40.0 7 20.0
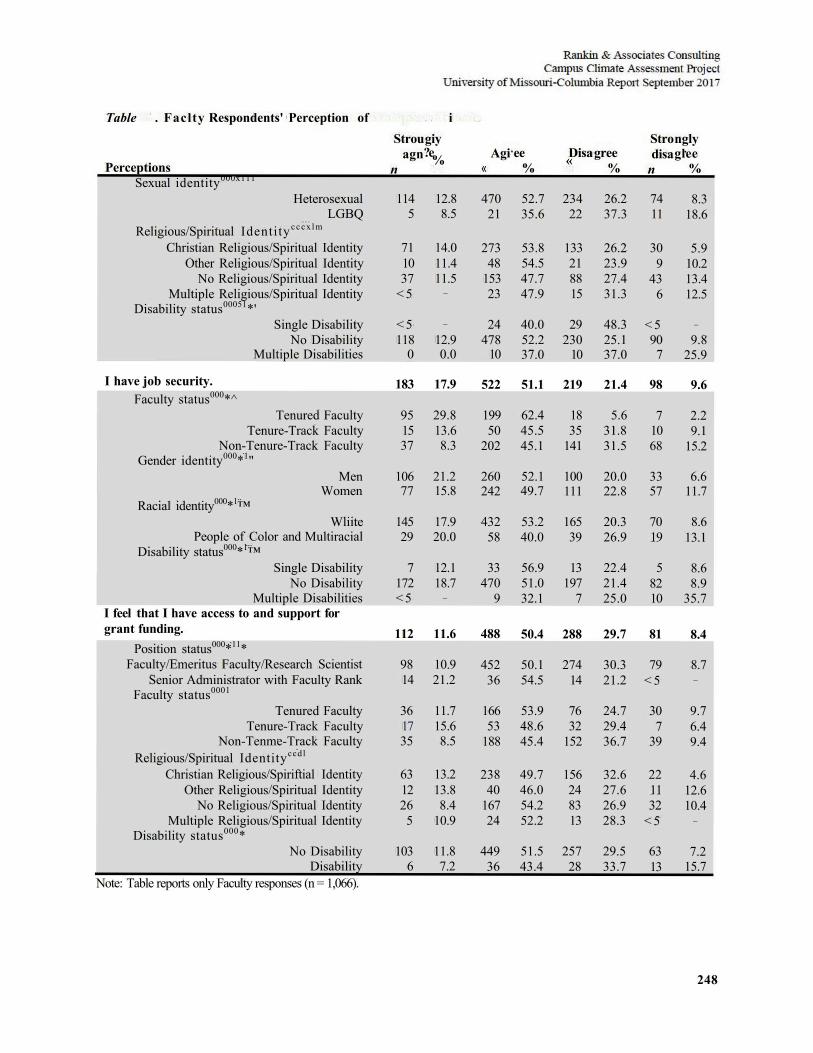
248
Table . Faclty Respondents' Perception of i
Perceptions Sexual identity000x111
Strou agn
n
giy ?e % Agi
« ee
% Disa « gree
%
Stro disa
n
ngly glee
%
Heterosexual 114 12.8 470 52.7 234 26.2 74 8.3 LGBQ 5 8.5 21 35.6 22 37.3 11 18.6
Religious/Spiritual Identity c c c x l m
Christian Religious/Spiritual Identity 71 14.0 273 53.8 133 26.2 30 5.9 Other Religious/Spiritual Identity 10 11.4 48 54.5 21 23.9 9 10.2
No Religious/Spiritual Identity 37 11.5 153 47.7 88 27.4 43 13.4 Multiple Religious/Spiritual Identity < 5 — 23 47.9 15 31.3 6 12.5
Disability status00051*' Single Disability < 5 — 24 40.0 29 48.3 < 5 —
No Disability 118 12.9 478 52.2 230 25.1 90 9.8 Multiple Disabilities 0 0.0 10 37.0 10 37.0 7 25.9
I have job security. 183 17.9 522 51.1 219 21.4 98 9.6 Faculty status000*^
Tenured Faculty 95 29.8 199 62.4 18 5.6 7 2.2 Tenure-Track Faculty 15 13.6 50 45.5 35 31.8 10 9.1
Non-Tenure-Track Faculty 37 8.3 202 45.1 141 31.5 68 15.2 Gender identity000*1"
Men 106 21.2 260 52.1 100 20.0 33 6.6 Women 77 15.8 242 49.7 111 22.8 57 11.7
Racial identity000*1™ Wliite 145 17.9 432 53.2 165 20.3 70 8.6
People of Color and Multiracial 29 20.0 58 40.0 39 26.9 19 13.1 Disability status000*1™
Single Disability 7 12.1 33 56.9 13 22.4 5 8.6 No Disability 172 18.7 470 51.0 197 21.4 82 8.9
Multiple Disabilities < 5 — 9 32.1 7 25.0 10 35.7 I feel that I have access to and support for grant funding. 112 11.6 488 50.4 288 29.7 81 8.4
Position status000*11* Faculty/Emeritus Faculty/Research Scientist 98 10.9 452 50.1 274 30.3 79 8.7
Senior Administrator with Faculty Rank 14 21.2 36 54.5 14 21.2 < 5 —
Faculty status0001
Tenured Faculty 36 11.7 166 53.9 76 24.7 30 9.7 Tenure-Track Faculty 17 15.6 53 48.6 32 29.4 7 6.4
Non-Tenme-Track Faculty 35 8.5 188 45.4 152 36.7 39 9.4 Religious/Spiritual Identityccdl
Christian Religious/Spiriftial Identity 63 13.2 238 49.7 156 32.6 22 4.6 Other Religious/Spiritual Identity 12 13.8 40 46.0 24 27.6 11 12.6
No Religious/Spiritual Identity 26 8.4 167 54.2 83 26.9 32 10.4 Multiple Religious/Spiritual Identity 5 10.9 24 52.2 13 28.3 < 5 —
Disability status000* No Disability 103 11.8 449 51.5 257 29.5 63 7.2
Disability 6 7.2 36 43.4 28 33.7 13 15.7 Note: Table reports only Faculty responses (n = 1,066).
249
Two hundred sixty-three Faculty respondents elaborated on their' opinions of their salaries,
benefits and career support at University of Missouri-Columbia. Tliree themes emerged from the
data: (1) salary concerns, (2) lack of support and access to resources, and (3) low morale
particularly with regard to views on campus leadership.
Dissatisfaction With Salary — Salary concerns were noted by respondents who elaborated on
their opinions of then salaries, benefits and career support at University of Missom i-Columbia.
Many respondents included internal comparisons and inconsistencies in their narratives
addressing salary dissatisfaction. For example, one respondent noted, "I am not compensated as
well as my colleagues hi other areas of the university." Another respondent elaborated, l'The
only competitive salaries at MU are those the administrators give themselves. Everyone else is
thoroughly shortchanged at every opportunity." Finally, another respondent explained, "Salary
disparities are very large across campus and within departments and divisions. Consistent salary
increases (COL) are not provided for many faculty and staff." Other respondents noted external
comparisons. For example, one respondent noted, "While the base salary is somewhat
competitive, access to summer funding is not competitive with the market." Another respondent
noted, "Salaries for clinical faculty are lower at MU than they are at community colleges or
dohig clinical work." Other respondents added, "Salary is not why someone would stay at MU,"
"Salaries have stagnated for years," and "MU faculty and staff salaries are among the lowest hi
the nation." Respondents who elaborated on their opinions of then salaries, benefits and career
support at University of Missouri-Columbia described dissatisfaction with their salaries.
Lack of Financial Resources and Grant Support — Respondents who elaborated on their
opinions of their' salaries, benefits and career support at University of Missouri-Columbia noted a
perceived lack of support financially, particularly in grant writing. The notion that "funding
opportunities were insufficient" was widely echoed. One respondent noted. "Grants given within
the university seem to go to a network of friends and spouses of committee members rather than
to wr iters of excellent proposals." Another respondent shared, "I get very little support,
especially around grants. Even if training is available, I camiot take time to attend given the rest
of my workload." Another respondent explained, "I have received no information or support
from my department chair about grant opportunities, and there are currently no grant writers
250
assigned to my division (that I know of)." Other respondent noted, "clinical practice needs
prevent full participation in getting gr and support" and "Grant funding is something faculty do
on their own without support." According to multiple reports, "grant support staff were all fired
two years ago" this gap hi support was reported as a fairly new development at University of
Missouri-Columbia.
Low Morale — Respondents who elaborated 011 their opinions of their salaries, benefits and
career support at University of Missouri-Columbia reflected low morale. Respondents explained,
"climate is somewhat toxic" and "This is a HORRIBLE place to work. Enough said." Other
respondents noted that they would not recommend University of Missouri-Columbia. For
example, one respondent stated, "I can no longer recommend MU as a good place to work."
Another respondent elaborated, "I would never recommend working here. Faculty needs are
ignored, benefits are cut, and every year we are asked to pay more for everything so salaries get
lower. Administration does not give a rat's ass." Regarding the hierarchy noted hi the previous
statement, other respondents echoed this report. One respondent shared, 'Teaching faculty are
second class" and "non-tenured faculty (upon which the institution depends more and more)
treated like dirt." Another respondent elaborated, "The non-tenure track faculty are not as
recognized for their contributions to the profession, only tenured track faculty are recognized."
Respondents who elaborated 011 their opinions of then salaries, benefits and career support at
University of Missouri-Columbia reflected generally poor morale.
251
Faculty respondents' attitudes about certain aspects of the climate in then
departments/programs and at University of Missouri-Columbia are shown hi tables 61 to 64.
Subsequent analyses were conducted to identify significant differences hi responses by gender
identity, racial identity, sexual identity, age, religious/spiritual identity, citizenship status,
military status, and disability status; only significant differences are reported.
Seventy percent (« = 740) of Faculty respondents "strongly agreed" or "agreed" that they felt
valued by faculty in their department/program (Table 61). Faculty/Emeritus Faculty/Research
Scientist respondents (30%, n = 297) were less likely than Senior Administrator with Faculty
Rank respondents (45%, n = 31) to "strongly agree" that they felt valued by faculty in their
department/program Tenure-Track Faculty respondents (29%, n = 34) were less likely than Non-
Tenure-Track Faculty respondents (40%, n = 184) and Tenured Faculty respondents (44%, n =
142) to "agree" that they felt valued by faculty in their department/program. Women Faculty
respondents (13%, n = 64) were more likely than Men Faculty respondents (9%, n = 44) to
"disagree" that they felt valued by faculty in their department/program. A larger percentage of
Non-U.S. Citizen Faculty respondents (21%, n = 34) than U.S. Citizen Faculty respondents
(13%, n = 109) "neither agree nor disagree" that they felt valued by faculty in their
department/program White Faculty respondents (33%, n = 277) were more likely than
Multiracial Faculty respondents (25%, n = 9) and Faculty Respondents ofColor (21%, n = 24) to
"strongly agree" that they felt valued by faculty in their department/program. A larger percentage
of LGBQ Faculty respondents (27%, n = 16) than Heterosexual Faculty respondents (13%, n =
117) "neither agree nor disagree" that they felt valued by faculty in their department/program.
Sixty-eight percent (n = 719) of Faculty respondents felt valued by their department/program
chairs. White Faculty respondents (39%, n = 328) were significantly more likely than Multiracial
Faculty respondents (29%, n = 10) and Faculty Respondents ofColor (24%, n = 27) to "strongly
agree" that they felt valued by their department/program chairs. A larger percentage of LGBQ
Faculty respondents (27%, n = 16) than Heterosexual Faculty respondents (13%, n = 123)
"neither agree nor disagree" that they felt valued by their department/program chairs.
92 Per the request of the LCST, Senior Administrators with Faculty Rank were included with Faculty/Emeritus Faculty/Researcli Scientist respondents by position status.
252
Sixty-six percent (n = 692) of Faculty respondents "strongly agreed" or "agreed" that they felt
valued by other faculty at University of Misso mi-Columbia. A larger percentage of LGBQ
Faculty respondents (36%, n =21) than Heterosexual Faculty respondents (22%, n = 199)
"neither agree nor disagree" that they felt valued by other faculty at University of Missouri-
Columbia. Although fewer than five each, larger percentages of Multiple Disabilities Faculty
respondents and Single Disability Faculty respondents than No Disability Faculty respondents
(2%, ii = 19) "strongly disagreed" that they felt valued by other faculty at University of
Missouri-Co lumbia.
Seventy-eight percent (n = 794) of Faculty respondents "strongly agreed" or "agreed" that they
felt valued by students hi the classroom. Faculty Respondents of Color and Multiracial Faculty
respondents (26%, n = 37) were significantly more likely than Wliite Faculty respondents (16%,
ii = 128) to "neither agree nor disagree" that they felt valued by students in the classroom.
Although fewer than five each, larger percentages of Disability Faculty respondents than No
Disability Faculty respondents "strongly disagreed" that they felt valued by students hi the
classroom.
Thirty-one percent (n = 321) of Faculty respondents "strongly agreed" or "agreed" that they felt
valued by University of Missouri-Columbia senior administrators (e.g., chancellor, dean, vice
chancellor, provost). Faculty/Emeritus Faculty/Research Scientist respondents (10%, n = 93)
were less likely than Senior Administrator with Faculty Rank respondents (24%, n = 17) to
"str ongly agree" that they felt valued by University of Missouri-Columbia senior administrators.
Tenured Faculty respondents (20%, 11 = 62) were more likely than Tenure-Track Faculty
Respondents (16%, n = 18) and Non-Tenure-Track Faculty Respondents (10%, n = 46) to
"strongly disagree" that they felt valued by University of Missouri-Columbia senior
administrators. Wliite Faculty respondents (21%, n = 174) and Faculty Respondents of Color
(24%, ii = 26) were significantly more likely than fewer than five Multiracial Faculty
respondents to "agree" that they felt valued by University of Missouri-Columbia senior
administrators. A larger percentage of LGBQ Faculty respondents (31%, n = 18) than
Heterosexual Faculty respondents (19%, n = 169) "disagreed" that they felt valued by University
of Missouri-Columbia senior administrators. No Religious/Spiritual Identity Faculty respondents
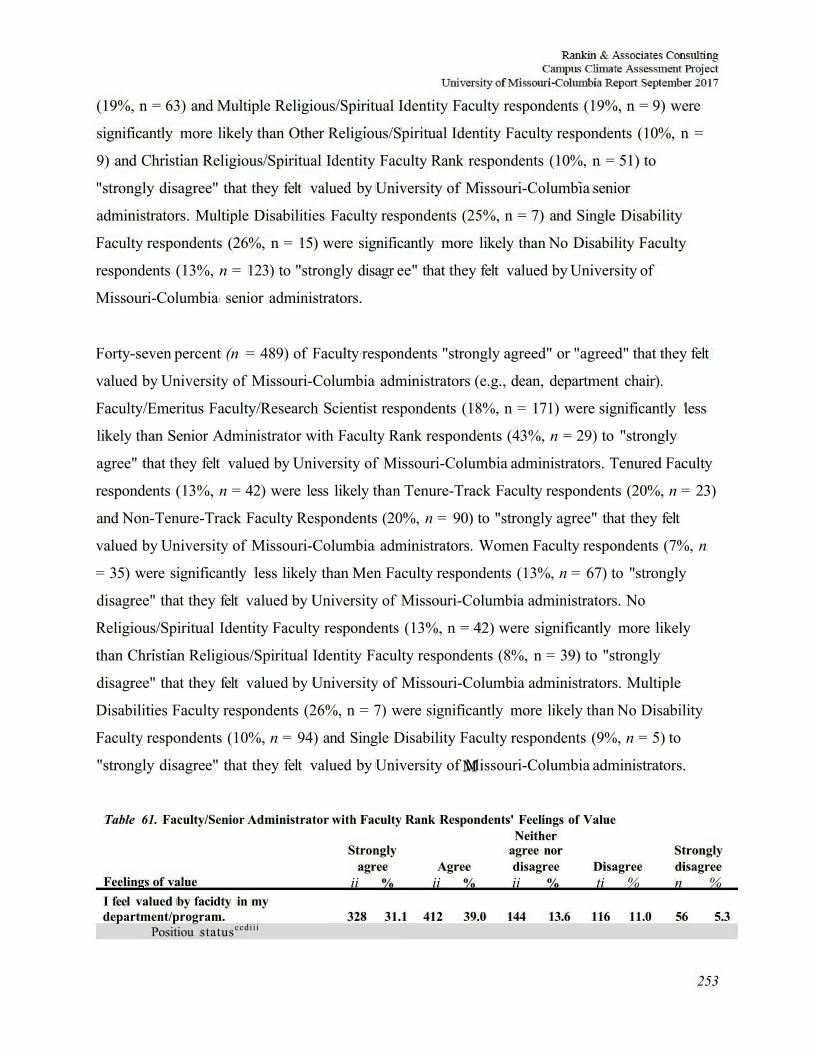
253
(19%, n = 63) and Multiple Religious/Spiritual Identity Faculty respondents (19%, n = 9) were
significantly more likely than Other Religious/Spiritual Identity Faculty respondents (10%, n =
9) and Christian Religious/Spiritual Identity Faculty Rank respondents (10%, n = 51) to
"strongly disagree" that they felt valued by University of Missouri-Columbia senior
administrators. Multiple Disabilities Faculty respondents (25%, n = 7) and Single Disability
Faculty respondents (26%, n = 15) were significantly more likely than No Disability Faculty
respondents (13%, n = 123) to "strongly disagr ee" that they felt valued by University of
Missouri-Columbia senior administrators.
Forty-seven percent (n = 489) of Faculty respondents "strongly agreed" or "agreed" that they felt
valued by University of Missouri-Columbia administrators (e.g., dean, department chair).
Faculty/Emeritus Faculty/Research Scientist respondents (18%, n = 171) were significantly less
likely than Senior Administrator with Faculty Rank respondents (43%, n = 29) to "strongly
agree" that they felt valued by University of Missouri-Columbia administrators. Tenured Faculty
respondents (13%, n = 42) were less likely than Tenure-Track Faculty respondents (20%, n = 23)
and Non-Tenure-Track Faculty Respondents (20%, n = 90) to "strongly agree" that they felt
valued by University of Missouri-Columbia administrators. Women Faculty respondents (7%, n
= 35) were significantly less likely than Men Faculty respondents (13%, n = 67) to "strongly
disagree" that they felt valued by University of Missouri-Columbia administrators. No
Religious/Spiritual Identity Faculty respondents (13%, n = 42) were significantly more likely
than Christian Religious/Spiritual Identity Faculty respondents (8%, n = 39) to "strongly
disagree" that they felt valued by University of Missouri-Columbia administrators. Multiple
Disabilities Faculty respondents (26%, n = 7) were significantly more likely than No Disability
Faculty respondents (10%, n = 94) and Single Disability Faculty respondents (9%, n = 5) to
"strongly disagree" that they felt valued by University of Missouri-Columbia administrators.
Table 61. Faculty/Senior Administrator with Faculty Rank Respondents' Feelings of Value Neither
Strongly agree nor Strongly agree Agree disagree Disagree disagree
Feelings of value ii % ii % ii % ti % n % I feel valued by facidty in my department/program. 328 31.1 412 39.0 144 13.6 116 11.0 56 5.3
Positiou statusccdii i
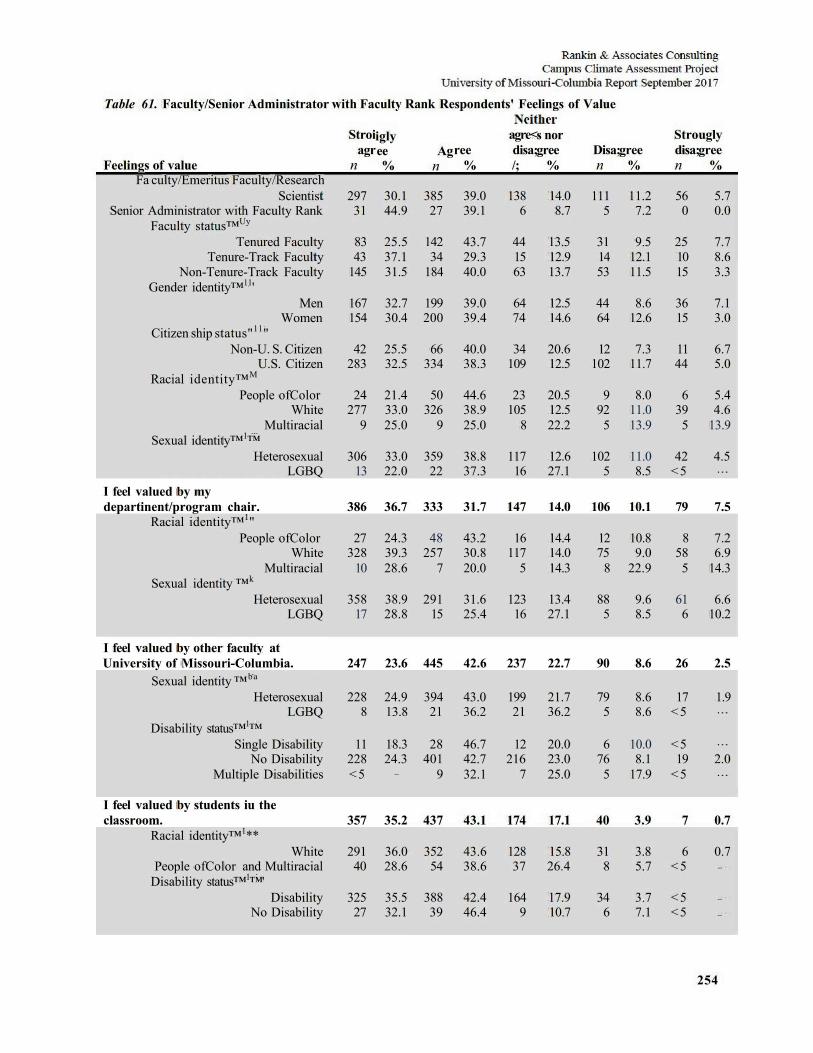
254
Table 61. Faculty/Senior Administrator with Faculty Rank Respondents' Feelings of Value
Feelings of value Fa culty/Emeritus Faculty/Research
Stroi agr
n
igly ee %
Ag n
ree %
agre< disa; /;
s nor gree
% Disa; n
gree %
Stro disa; n
ugly gree
%
Scientist 297 30.1 385 39.0 138 14.0 111 11.2 56 5.7 Senior Administrator with Faculty Rank 31 44.9 27 39.1 6 8.7 5 7.2 0 0.0
Faculty status™Uy
Tenured Faculty 83 25.5 142 43.7 44 13.5 31 9.5 25 7.7 Tenure-Track Faculty 43 37.1 34 29.3 15 12.9 14 12.1 10 8.6
Non-Tenure-Track Faculty 145 31.5 184 40.0 63 13.7 53 11.5 15 3.3 Gender identity™11'
Men 167 32.7 199 39.0 64 12.5 44 8.6 36 7.1 Women 154 30.4 200 39.4 74 14.6 64 12.6 15 3.0
Citizen ship status"11" Non-U. S. Citizen 42 25.5 66 40.0 34 20.6 12 7.3 11 6.7
U.S. Citizen 283 32.5 334 38.3 109 12.5 102 11.7 44 5.0 Racial identity™M
People ofColor 24 21.4 50 44.6 23 20.5 9 8.0 6 5.4 White 277 33.0 326 38.9 105 12.5 92 11.0 39 4.6
Multiracial 9 25.0 9 25.0 8 22.2 5 13.9 5 13.9 Sexual identity™1™
Heterosexual 306 33.0 359 38.8 117 12.6 102 11.0 42 4.5 LGBQ 13 22.0 22 37.3 16 27.1 5 8.5 < 5 . . .
I feel valued by my departinent/program chair. 386 36.7 333 31.7 147 14.0 106 10.1 79 7.5
Racial identity™1" People ofColor 27 24.3 48 43.2 16 14.4 12 10.8 8 7.2
White 328 39.3 257 30.8 117 14.0 75 9.0 58 6.9 Multiracial 10 28.6 7 20.0 5 14.3 8 22.9 5 14.3
Sexual identity ™k
Heterosexual 358 38.9 291 31.6 123 13.4 88 9.6 61 6.6 LGBQ 17 28.8 15 25.4 16 27.1 5 8.5 6 10.2
I feel valued by other faculty at University of Missouri-Columbia. 247 23.6 445 42.6 237 22.7 90 8.6 26 2.5
Sexual identity ™ba
Heterosexual 228 24.9 394 43.0 199 21.7 79 8.6 17 1.9 LGBQ 8 13.8 21 36.2 21 36.2 5 8.6 < 5 . . .
Disability status™1™ Single Disability 11 18.3 28 46.7 12 20.0 6 10.0 < 5 . . .
No Disability 228 24.3 401 42.7 216 23.0 76 8.1 19 2.0 Multiple Disabilities < 5 — 9 32.1 7 25.0 5 17.9 < 5 . . .
I feel valued by students iu the classroom. 357 35.2 437 43.1 174 17.1 40 3.9 7 0.7
Racial identity™1** White 291 36.0 352 43.6 128 15.8 31 3.8 6 0.7
People ofColor and Multiracial 40 28.6 54 38.6 37 26.4 8 5.7 < 5 —
Disability status™1™' Disability 325 35.5 388 42.4 164 17.9 34 3.7 < 5 —
No Disability 27 32.1 39 46.4 9 10.7 6 7.1 < 5 —
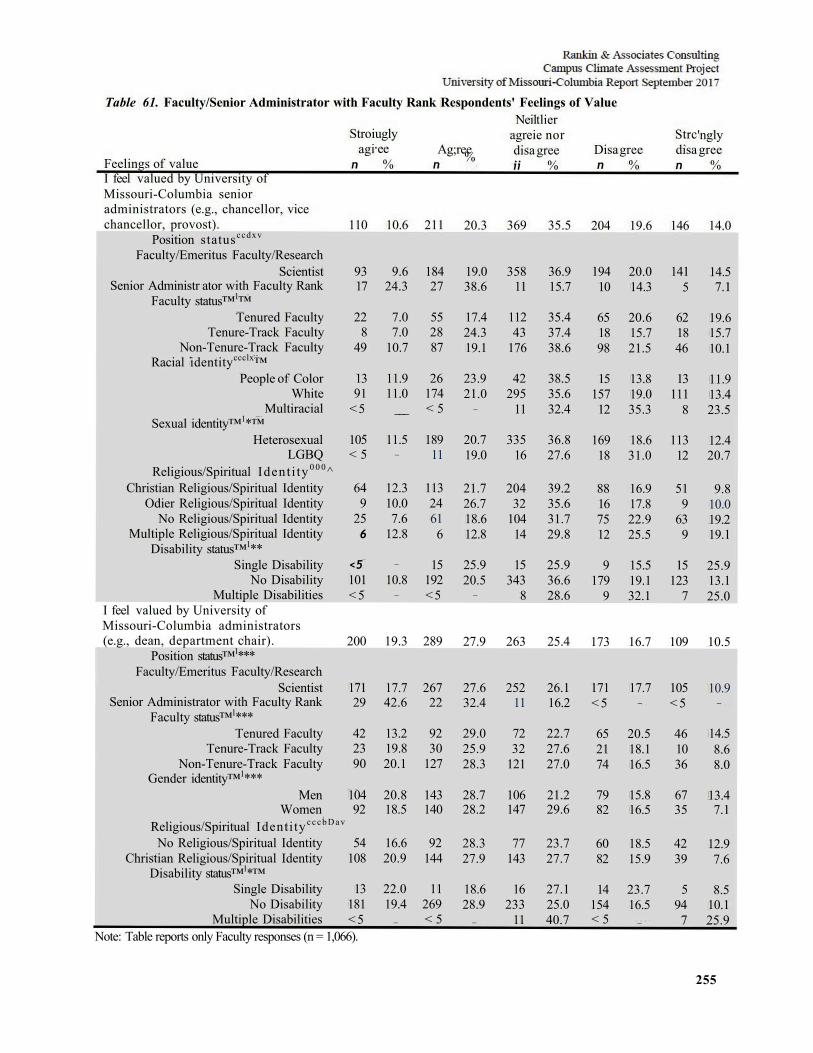
255
Table 61. Faculty/Senior Administrator with Faculty Rank Respondents' Feelings of Value
Feelings of value I feel valued by University of
Stroi agi
n
ugly ee %
Ag n
;ree %
Neil agrei disa ii
tlier e nor gree
% Disa n
gree %
Strc disa n
'ngly gree
%
Missouri-Columbia senior administrators (e.g., chancellor, vice chancellor, provost). 110 10.6 211 20.3 369 35.5 204 19.6 146 14.0
Position statusccdxv
Faculty/Emeritus Faculty/Research Scientist 93 9.6 184 19.0 358 36.9 194 20.0 141 14.5
Senior Administr ator with Faculty Rank 17 24.3 27 38.6 11 15.7 10 14.3 5 7.1 Faculty status™1™
Tenured Faculty 22 7.0 55 17.4 112 35.4 65 20.6 62 19.6 Tenure-Track Faculty 8 7.0 28 24.3 43 37.4 18 15.7 18 15.7
Non-Tenure-Track Faculty 49 10.7 87 19.1 176 38.6 98 21.5 46 10.1 Racial identityccclx™
People of Color 13 11.9 26 23.9 42 38.5 15 13.8 13 11.9 White 91 11.0 174 21.0 295 35.6 157 19.0 111 13.4
Multiracial < 5 ___ < 5 — 11 32.4 12 35.3 8 23.5 Sexual identity™1*™
Heterosexual 105 11.5 189 20.7 335 36.8 169 18.6 113 12.4 LGBQ < 5 — 11 19.0 16 27.6 18 31.0 12 20.7
Religious/Spiritual Ident i ty 0 0 0^ Christian Religious/Spiritual Identity 64 12.3 113 21.7 204 39.2 88 16.9 51 9.8
Odier Religious/Spiritual Identity 9 10.0 24 26.7 32 35.6 16 17.8 9 10.0 No Religious/Spiritual Identity 25 7.6 61 18.6 104 31.7 75 22.9 63 19.2
Multiple Religious/Spiritual Identity 6 12.8 6 12.8 14 29.8 12 25.5 9 19.1 Disability status™1**
Single Disability <5 — 15 25.9 15 25.9 9 15.5 15 25.9 No Disability 101 10.8 192 20.5 343 36.6 179 19.1 123 13.1
Multiple Disabilities < 5 — < 5 — 8 28.6 9 32.1 7 25.0 I feel valued by University of Missouri-Columbia administrators (e.g., dean, department chair). 200 19.3 289 27.9 263 25.4 173 16.7 109 10.5
Position status™1*** Faculty/Emeritus Faculty/Research
Scientist 171 17.7 267 27.6 252 26.1 171 17.7 105 10.9 Senior Administrator with Faculty Rank 29 42.6 22 32.4 11 16.2 < 5 — < 5 —
Faculty status™1*** Tenured Faculty 42 13.2 92 29.0 72 22.7 65 20.5 46 14.5
Tenure-Track Faculty 23 19.8 30 25.9 32 27.6 21 18.1 10 8.6 Non-Tenure-Track Faculty 90 20.1 127 28.3 121 27.0 74 16.5 36 8.0
Gender identity™1*** Men 104 20.8 143 28.7 106 21.2 79 15.8 67 13.4
Women 92 18.5 140 28.2 147 29.6 82 16.5 35 7.1 Religious/Spiritual Identity c c c b D a v
No Religious/Spiritual Identity 54 16.6 92 28.3 77 23.7 60 18.5 42 12.9 Christian Religious/Spiritual Identity 108 20.9 144 27.9 143 27.7 82 15.9 39 7.6
Disability status™1*™ Single Disability 13 22.0 11 18.6 16 27.1 14 23.7 5 8.5
No Disability 181 19.4 269 28.9 233 25.0 154 16.5 94 10.1 Multiple Disabilities < 5 — < 5 — 11 40.7 < 5 — 7 25.9
Note: Table reports only Faculty responses (n = 1,066).
256
Table 62 depicts Faculty respondents' attitudes about certain aspects of the climate in their
departments/programs and at University of Missouri-Columbia. Subsequent analyses were
conducted to identify significant differences hi responses by gender identity, citizenship status,
racial identity, sexual identity, religious/spiritual identity, and disability status; only significant
differences are reported93
Twenty-five percent (n = 254) of Faculty respondents "strongly agreed" or "agreed" that faculty
hi their departments/programs pre-judged their abilities based 011 their perception of their
identity/background. White Faculty respondents (17%, 11 = 137) were less likely than Faculty
Respondents of Color (27%, n = 29) and Multiracial Faculty respondents (31%, n = 11) to
"agree" that faculty hi their departments/programs pre- judged then abilities based 011 their
perception of their identity/background. Fewer than five Military Faculty respondents were
significantly less likely than Non-Military Faculty respondents (20%, n = 185) to "agree" that
faculty hi their departments/programs pre-judged their abilities based 011 their' perception of their
identity/background.
Nineteen percent (n = 193) of Faculty respondents "strongly agreed" or "agreed" that their
departments/program chairs pre-judged their abilities based on their perception of their
identity/background. A larger percentage of LGBQ Faculty respondents (27%, n = 16) than
Heterosexual Faculty respondents (13%, n = 116) "agreed" that their departments/program chairs
pre-judged their abilities based 011 their perception of their' identity/background.
Forty-four percent (n = 454) of Faculty respondents "strongly agreed" or "agreed" that
University of Missouri-Columbia encouraged free and open discussion of difficult topics.
Tenured Faculty respondents (5%, n = 17) were less likely than Tenure-Track Faculty
respondents (9%, n = 10) and Non-Tenure-Track Faculty respondents (12%, n = 55) to "strongly
agree" that University of Missouri-Columbia encouraged free and open discussion of difficult
topics. Other Religious/Spiritual Identity Staff respondents (13%, n = 12) and Christian
93Per tlie LCST. for all analyses, sexual identity was recoded into the categories LGBQ and Heterosexual to maintain response confidentiality. Gender was recoded as Men, Trans spectrum, and Women.
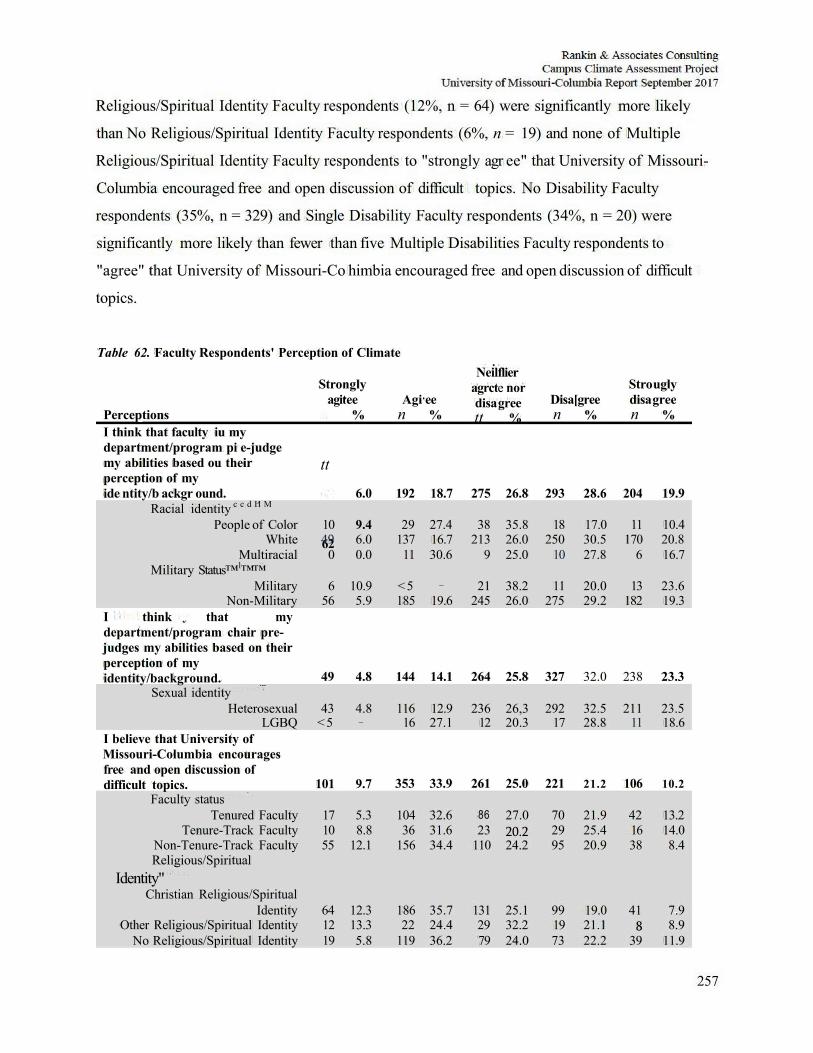
257
Religious/Spiritual Identity Faculty respondents (12%, n = 64) were significantly more likely
than No Religious/Spiritual Identity Faculty respondents (6%, n = 19) and none of Multiple
Religious/Spiritual Identity Faculty respondents to "strongly agr ee" that University of Missouri-
Columbia encouraged free and open discussion of difficult topics. No Disability Faculty
respondents (35%, n = 329) and Single Disability Faculty respondents (34%, n = 20) were
significantly more likely than fewer than five Multiple Disabilities Faculty respondents to
"agree" that University of Missouri-Co himbia encouraged free and open discussion of difficult
topics.
Table 62. Faculty Respondents' Perception of Climate
Perceptions I think that faculty iu my department/program pi e-judge my abilities based ou their perception of my ide ntity/b ackgr ound.
Stro agi
tt
62
ngly tee
%
6.0
Agi n
192
ee %
18.7
Neil agrct disa tt
275
flier e nor gree
%
26.8
Disa n
293
[gree %
28.6
Stro disa n
204
ugly gree
%
19.9 Racial identity c c d H M
People of Color 10 9.4 29 27.4 38 35.8 18 17.0 11 10.4 White 49 6.0 137 16.7 213 26.0 250 30.5 170 20.8
Multiracial 0 0.0 11 30.6 9 25.0 10 27.8 6 16.7 Military Status™1™™
Military 6 10.9 < 5 — 21 38.2 11 20.0 13 23.6 Non-Military 56 5.9 185 19.6 245 26.0 275 29.2 182 19.3
I think that my department/program chair pre-judges my abilities based on their perception of my identity/background. 49 4.8 144 14.1 264 25.8 327 32.0 238 23.3
Sexual identity Heterosexual 43 4.8 116 12.9 236 26,3 292 32.5 211 23.5
LGBQ <5 — 16 27.1 12 20.3 17 28.8 11 18.6 I believe that University of Missouri-Columbia encourages free and open discussion of difficult topics. 101 9.7 353 33.9 261 25.0 221 21.2 106 10.2
Faculty status Tenured Faculty 17 5.3 104 32.6 86 27.0 70 21.9 42 13.2
Tenure-Track Faculty 10 8.8 36 31.6 23 20.2 29 25.4 16 14.0 Non-Tenure-Track Faculty 55 12.1 156 34.4 110 24.2 95 20.9 38 8.4 Religious/Spiritual
Identity" Christian Religious/Spiritual
Identity 64 12.3 186 35.7 131 25.1 99 19.0 41 7.9 Other Religious/Spiritual Identity 12 13.3 22 24.4 29 32.2 19 21.1 8 8.9
No Religious/Spiritual Identity 19 5.8 119 36.2 79 24.0 73 22.2 39 11.9
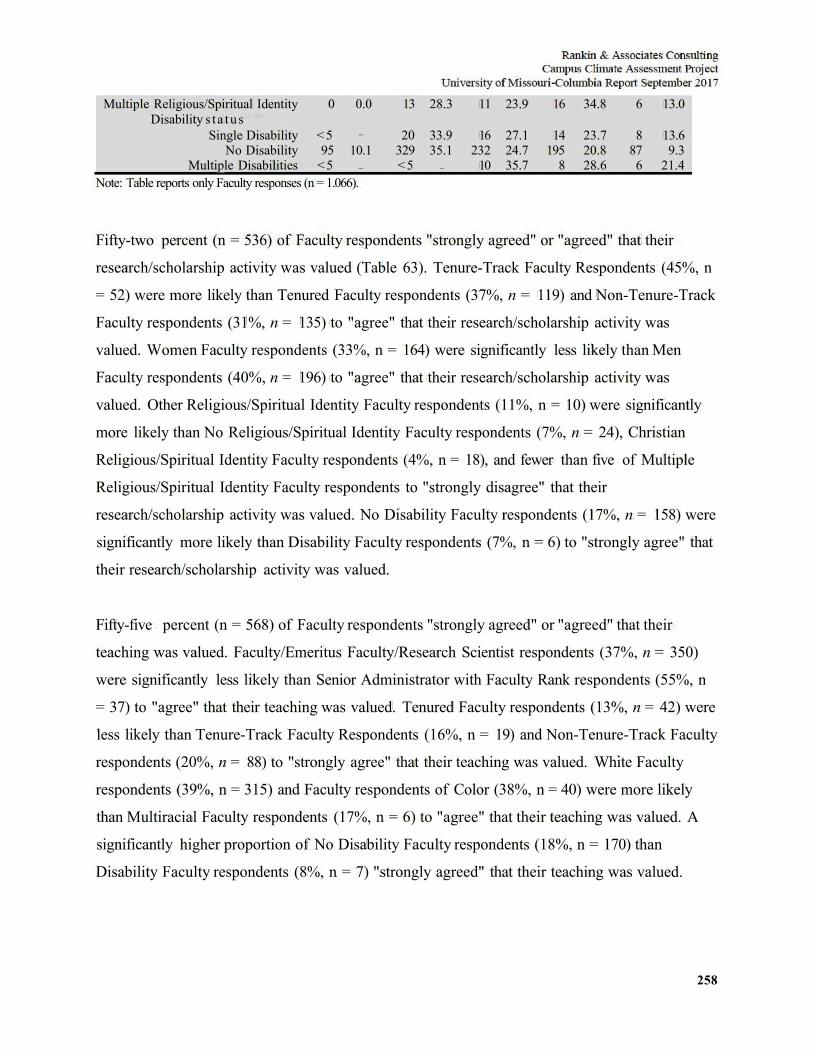
258
Multiple Religious/Spiritual Identity 0 0.0 13 28.3 11 23.9 16 34.8 6 13.0 Disability s t a tus
Single Disability < 5 — 20 33.9 16 27.1 14 23.7 8 13.6 No Disability 95 10.1 329 35.1 232 24.7 195 20.8 87 9.3
Multiple Disabilities <5 — < 5 — 10 35.7 8 28.6 6 21.4 Note: Table reports only Faculty responses (n = 1.066).
Fifty-two percent (n = 536) of Faculty respondents "strongly agreed" or "agreed" that their
research/scholarship activity was valued (Table 63). Tenure-Track Faculty Respondents (45%, n
= 52) were more likely than Tenured Faculty respondents (37%, n = 119) and Non-Tenure-Track
Faculty respondents (31%, n = 135) to "agree" that their research/scholarship activity was
valued. Women Faculty respondents (33%, n = 164) were significantly less likely than Men
Faculty respondents (40%, n = 196) to "agree" that their research/scholarship activity was
valued. Other Religious/Spiritual Identity Faculty respondents (11%, n = 10) were significantly
more likely than No Religious/Spiritual Identity Faculty respondents (7%, n = 24), Christian
Religious/Spiritual Identity Faculty respondents (4%, n = 18), and fewer than five of Multiple
Religious/Spiritual Identity Faculty respondents to "strongly disagree" that their
research/scholarship activity was valued. No Disability Faculty respondents (17%, n = 158) were
significantly more likely than Disability Faculty respondents (7%, n = 6) to "strongly agree" that
their research/scholarship activity was valued.
Fifty-five percent (n = 568) of Faculty respondents "strongly agreed" or "agreed" that their
teaching was valued. Faculty/Emeritus Faculty/Research Scientist respondents (37%, n = 350)
were significantly less likely than Senior Administrator with Faculty Rank respondents (55%, n
= 37) to "agree" that their teaching was valued. Tenured Faculty respondents (13%, n = 42) were
less likely than Tenure-Track Faculty Respondents (16%, n = 19) and Non-Tenure-Track Faculty
respondents (20%, n = 88) to "strongly agree" that their teaching was valued. White Faculty
respondents (39%, n = 315) and Faculty respondents of Color (38%, n = 40) were more likely
than Multiracial Faculty respondents (17%, n = 6) to "agree" that their teaching was valued. A
significantly higher proportion of No Disability Faculty respondents (18%, n = 170) than
Disability Faculty respondents (8%, n = 7) "strongly agreed" that their teaching was valued.
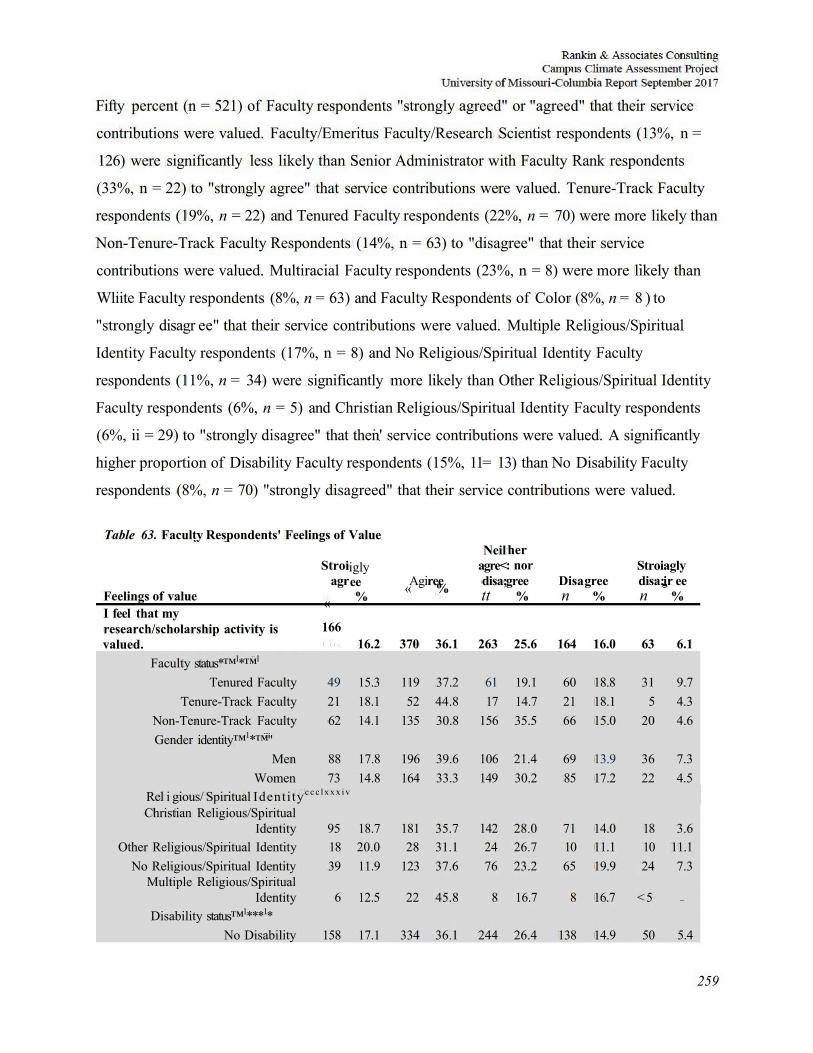
259
Fifty percent (n = 521) of Faculty respondents "strongly agreed" or "agreed" that their service
contributions were valued. Faculty/Emeritus Faculty/Research Scientist respondents (13%, n =
126) were significantly less likely than Senior Administrator with Faculty Rank respondents
(33%, n = 22) to "strongly agree" that service contributions were valued. Tenure-Track Faculty
respondents (19%, n = 22) and Tenured Faculty respondents (22%, n = 70) were more likely than
Non-Tenure-Track Faculty Respondents (14%, n = 63) to "disagree" that their service
contributions were valued. Multiracial Faculty respondents (23%, n = 8) were more likely than
Wliite Faculty respondents (8%, n = 63) and Faculty Respondents of Color (8%, n = 8 ) to
"strongly disagr ee" that their service contributions were valued. Multiple Religious/Spiritual
Identity Faculty respondents (17%, n = 8) and No Religious/Spiritual Identity Faculty
respondents (11%, n = 34) were significantly more likely than Other Religious/Spiritual Identity
Faculty respondents (6%, n = 5) and Christian Religious/Spiritual Identity Faculty respondents
(6%, ii = 29) to "strongly disagree" that then' service contributions were valued. A significantly
higher proportion of Disability Faculty respondents (15%, 11= 13) than No Disability Faculty
respondents (8%, n = 70) "strongly disagreed" that their service contributions were valued.
Table 63. Faculty Respondents' Feelings of Value
Feelings of value I feel that my research/scholarship activity is valued.
Stroi agr
«
166
igly ee %
16.2
Agi «
370
ree %
36.1
Neil agre< disa; tt
263
her : nor gree
%
25.6
Disa n
164
gree %
16.0
Stroi disa; n
63
agly ir ee
%
6.1 Faculty status*™1*™1
Tenured Faculty 49 15.3 119 37.2 61 19.1 60 18.8 31 9.7 Tenure-Track Faculty 21 18.1 52 44.8 17 14.7 21 18.1 5 4.3
Non-Tenure-Track Faculty 62 14.1 135 30.8 156 35.5 66 15.0 20 4.6 Gender identity™1*™"
Men 88 17.8 196 39.6 106 21.4 69 13.9 36 7.3 Women 73 14.8 164 33.3 149 30.2 85 17.2 22 4.5
Rel i gious/ Spiritual Identi ty c c c l x x x i v
Christian Religious/Spiritual Identity 95 18.7 181 35.7 142 28.0 71 14.0 18 3.6
Other Religious/Spiritual Identity 18 20.0 28 31.1 24 26.7 10 11.1 10 11.1 No Religious/Spiritual Identity 39 11.9 123 37.6 76 23.2 65 19.9 24 7.3
Multiple Religious/Spiritual Identity 6 12.5 22 45.8 8 16.7 8 16.7 < 5 —
Disability status™1***1* No Disability 158 17.1 334 36.1 244 26.4 138 14.9 50 5.4
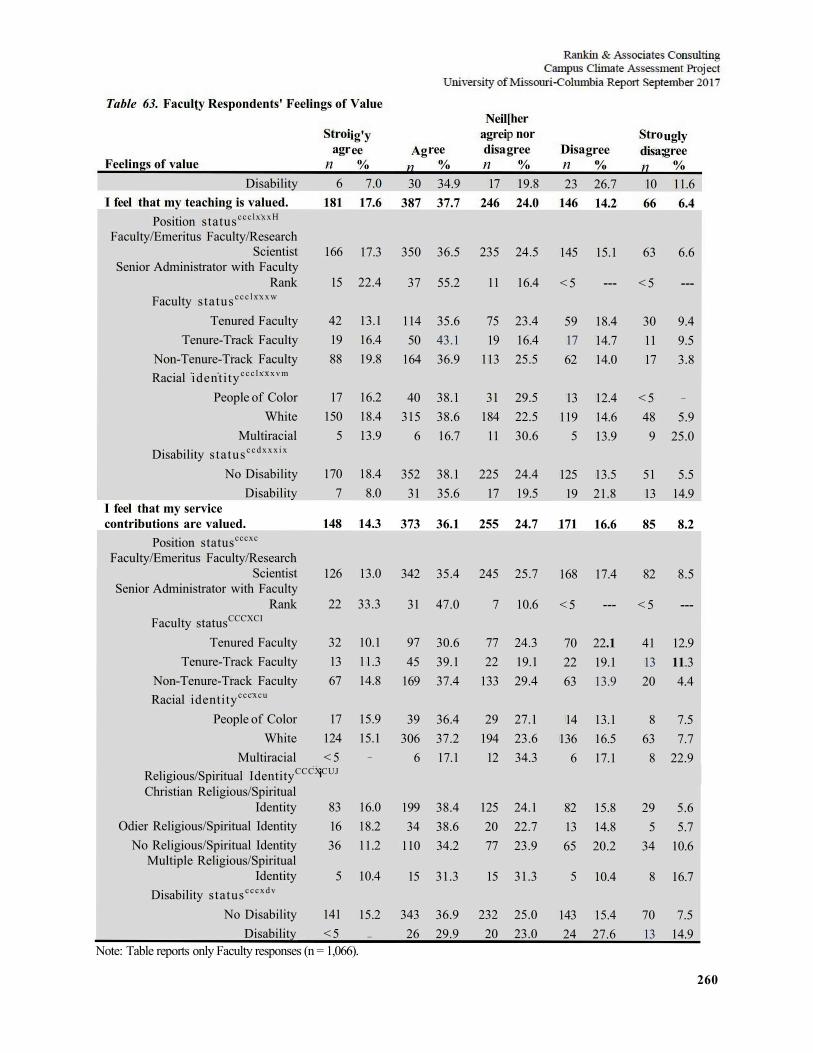
260
Table 63. Faculty Respondents' Feelings of Value
Feelings of value Disability
Stroi agr
n 6
ig'y ee %
7.0
Ag n 30
ree % 34.9
Neil agrei disa n 17
[her p nor gree
% 19.8
Disa n 23
gree % 26.7
Stro disa; n 10
ugly gree
% 11.6
I feel that my teaching is valued. 181 17.6 387 37.7 246 24.0 146 14.2 66 6.4 Position statusccc lxxxH
Faculty/Emeritus Faculty/Research Scientist
Senior Administrator with Faculty Rank
166
15
17.3
22.4
350
37
36.5
55.2
235
11
24.5
16.4
145
< 5
15.1 63
< 5
6.6
Faculty status c c c l x x x w
Tenured Faculty 42 13.1 114 35.6 75 23.4 59 18.4 30 9.4 Tenure-Track Faculty 19 16.4 50 43.1 19 16.4 17 14.7 11 9.5
Non-Tenure-Track Faculty 88 19.8 164 36.9 113 25.5 62 14.0 17 3.8 Racial identity ccc lxxxvm
People of Color 17 16.2 40 38.1 31 29.5 13 12.4 < 5 —
White 150 18.4 315 38.6 184 22.5 119 14.6 48 5.9 Multiracial 5 13.9 6 16.7 11 30.6 5 13.9 9 25.0
Disability status c c d x x x i x
No Disability 170 18.4 352 38.1 225 24.4 125 13.5 51 5.5 Disability 7 8.0 31 35.6 17 19.5 19 21.8 13 14.9
I feel that my service contributions are valued. 148 14.3 373 36.1 255 24.7 171 16.6 85 8.2
Position statuscccxc
Faculty/Emeritus Faculty/Research Scientist
Senior Administrator with Faculty Rank
126
22
13.0
33.3
342
31
35.4
47.0
245
7
25.7
10.6
168
< 5
17.4 82
< 5
8.5
Faculty statusCCCXCI
Tenured Faculty 32 10.1 97 30.6 77 24.3 70 22.1 41 12.9 Tenure-Track Faculty 13 11.3 45 39.1 22 19.1 22 19.1 13 11.3
Non-Tenure-Track Faculty 67 14.8 169 37.4 133 29.4 63 13.9 20 4.4 Racial identitycccxcu
People of Color 17 15.9 39 36.4 29 27.1 14 13.1 8 7.5 White 124 15.1 306 37.2 194 23.6 136 16.5 63 7.7
Multiracial < 5 — 6 17.1 12 34.3 6 17.1 8 22.9 Religious/Spiritual IdentityCCCXCUJ
Christian Religious/Spiritual Identity
i
83 16.0 199 38.4 125 24.1 82 15.8 29 5.6 Odier Religious/Spiritual Identity 16 18.2 34 38.6 20 22.7 13 14.8 5 5.7
No Religious/Spiritual Identity Multiple Religious/Spiritual
Identity
36
5
11.2
10.4
110
15
34.2
31.3
77
15
23.9
31.3
65
5
20.2
10.4
34
8
10.6
16.7 Disability statuscccxdv
No Disability 141 15.2 343 36.9 232 25.0 143 15.4 70 7.5 Disability <5 — 26 29.9 20 23.0 24 27.6 13 14.9
Note: Table reports only Faculty responses (n = 1,066).
261
Fifty percent (n = 511) of Faculty respondents "strongly agreed" or "agreed" that senior
administrators have taken direct actions to address the needs of at-risk/underserved students
(Table 64). Faculty/Emeritus Faculty/Research Scientist respondents (35%, n = 327) were
significantly less likely than Senior Administrator with Faculty Rank respondents (52%, n = 36)
to "agree" that senior administrators have taken direct actions to address the needs of at-
risk/underserved students. Non-Tenure-Track Faculty respondents (18%, n = 77) and Tenure-
Track Faculty Respondents (14%, n = 16) were more likely than Tenured Faculty respondents
(10%, n = 30) to "strongly agree" that senior administrators have taken direct actions to address
the needs of at-risk/underserved students. A larger percentage of U.S. Citizen Faculty
respondents (37%, n = 314) thanNon-U.S. Citizen Faculty respondents (28%, n = 45) "agreed"
that senior administrators have taken direct actions to address the needs of at-risk/underserved
students. Multiracial Faculty respondents (22%, n = 8) and Faculty Respondents ofColor (21%,
n = 22) were more likely than White Faculty respondents (13%, n = 104) to "disagree" that
senior administr ators have taken dir ect actions to address the needs of at-risk/underserved
students. A larger percentage of Heterosexual Faculty respondents (37%, n = 333) than LGBQ
Faculty respondents (24%, n = 14) "agreed" that senior administrators have taken direct actions
to addr ess the needs of at-risk/underserved students. Military Faculty respondents (52%, n = 29)
were significantly more likely than Non-Military Faculty respondents (35%, n = 325) to "agree"
that senior administrators have taken direct actions to address the needs of at-risk/underserved
students. Christian Religious/Spiritual Identity Faculty respondents (19%, n = 98) were
significantly more likely than Other Religious/Spiritual Identity Faculty respondents (7%, n = 6),
fewer than five Multiple Religious/Spiritual Identity Faculty respondents, and No
Religious/Spiritual Identity Faculty respondents (9%, n = 30) to "strongly agree" that senior
administrators have taken direct actions to address the needs of at-risk/underserved students.
Disability Faculty respondents (10%, n = 9) were significantly more likely than No Disability
Faculty respondents (4%, n = 37) to "strongly disagree" that senior administrators have taken
direct actions to address the needs of at-risk/underserved students.
Fifty-nine percent (n = 605) of Faculty respondents "strongly agreed" or "agreed" that faculty
have taken direct actions to address the needs of at-risk/underserved students. Multiracial Faculty
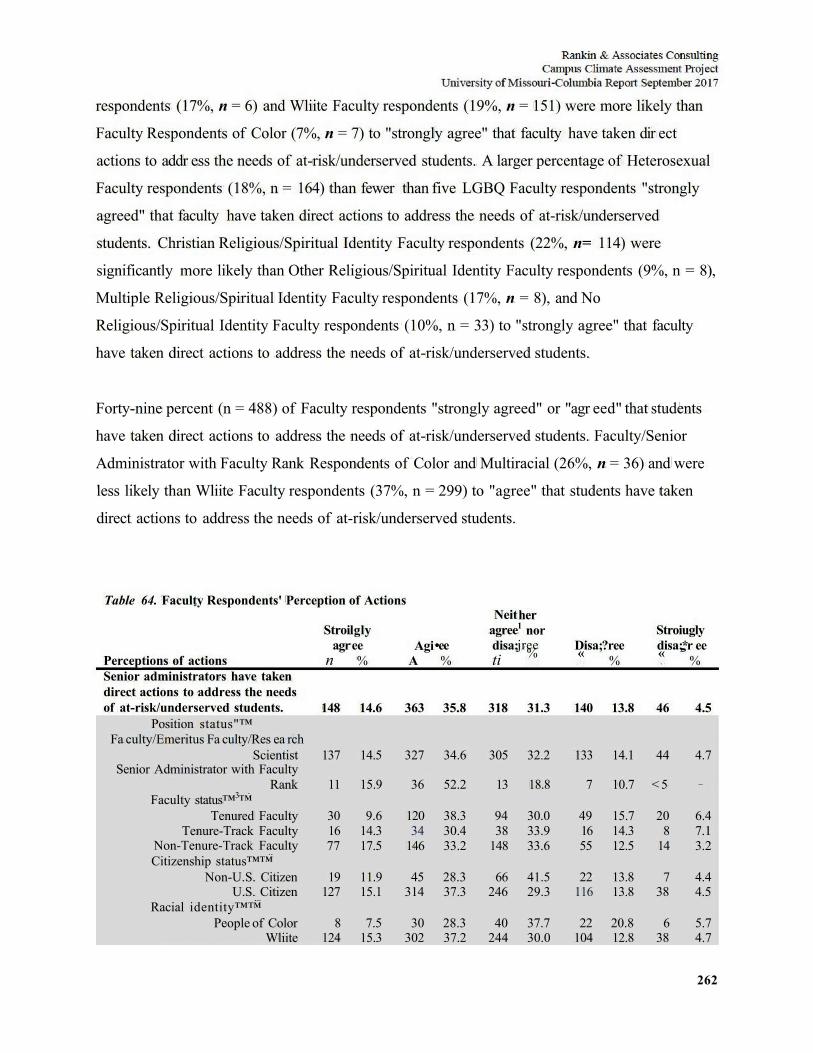
262
respondents (17%, n = 6) and Wliite Faculty respondents (19%, n = 151) were more likely than
Faculty Respondents of Color (7%, n = 7) to "strongly agree" that faculty have taken dir ect
actions to addr ess the needs of at-risk/underserved students. A larger percentage of Heterosexual
Faculty respondents (18%, n = 164) than fewer than five LGBQ Faculty respondents "strongly
agreed" that faculty have taken direct actions to address the needs of at-risk/underserved
students. Christian Religious/Spiritual Identity Faculty respondents (22%, n= 114) were
significantly more likely than Other Religious/Spiritual Identity Faculty respondents (9%, n = 8),
Multiple Religious/Spiritual Identity Faculty respondents (17%, n = 8), and No
Religious/Spiritual Identity Faculty respondents (10%, n = 33) to "strongly agree" that faculty
have taken direct actions to address the needs of at-risk/underserved students.
Forty-nine percent (n = 488) of Faculty respondents "strongly agreed" or "agr eed" that students
have taken direct actions to address the needs of at-risk/underserved students. Faculty/Senior
Administrator with Faculty Rank Respondents of Color and Multiracial (26%, n = 36) and were
less likely than Wliite Faculty respondents (37%, n = 299) to "agree" that students have taken
direct actions to address the needs of at-risk/underserved students.
Table 64. Faculty Respondents' Perception of Actions
Perceptions of actions Senior administrators have taken direct actions to address the needs of at-risk/underserved students.
Position status"™
Stroi agr
n
148
lgly ee %
14.6
Agi A
363
•ee %
35.8
Neit agree disa; ti
318
her 1 nor jree %
31.3
Disa; «
140
?ree %
13.8
Stroi disa; «
46
ugly *r ee
%
4.5
Fa culty/Emeritus Fa culty/Res ea rch Scientist 137 14.5 327 34.6 305 32.2 133 14.1 44 4.7
Senior Administrator with Faculty Rank 11 15.9 36 52.2 13 18.8 7 10.7 < 5 —
Faculty status™3™ Tenured Faculty 30 9.6 120 38.3 94 30.0 49 15.7 20 6.4
Tenure-Track Faculty 16 14.3 34 30.4 38 33.9 16 14.3 8 7.1 Non-Tenure-Track Faculty 77 17.5 146 33.2 148 33.6 55 12.5 14 3.2 Citizenship status™™
Non-U.S. Citizen 19 11.9 45 28.3 66 41.5 22 13.8 7 4.4 U.S. Citizen 127 15.1 314 37.3 246 29.3 116 13.8 38 4.5
Racial identity™™ People of Color 8 7.5 30 28.3 40 37.7 22 20.8 6 5.7
Wliite 124 15.3 302 37.2 244 30.0 104 12.8 38 4.7
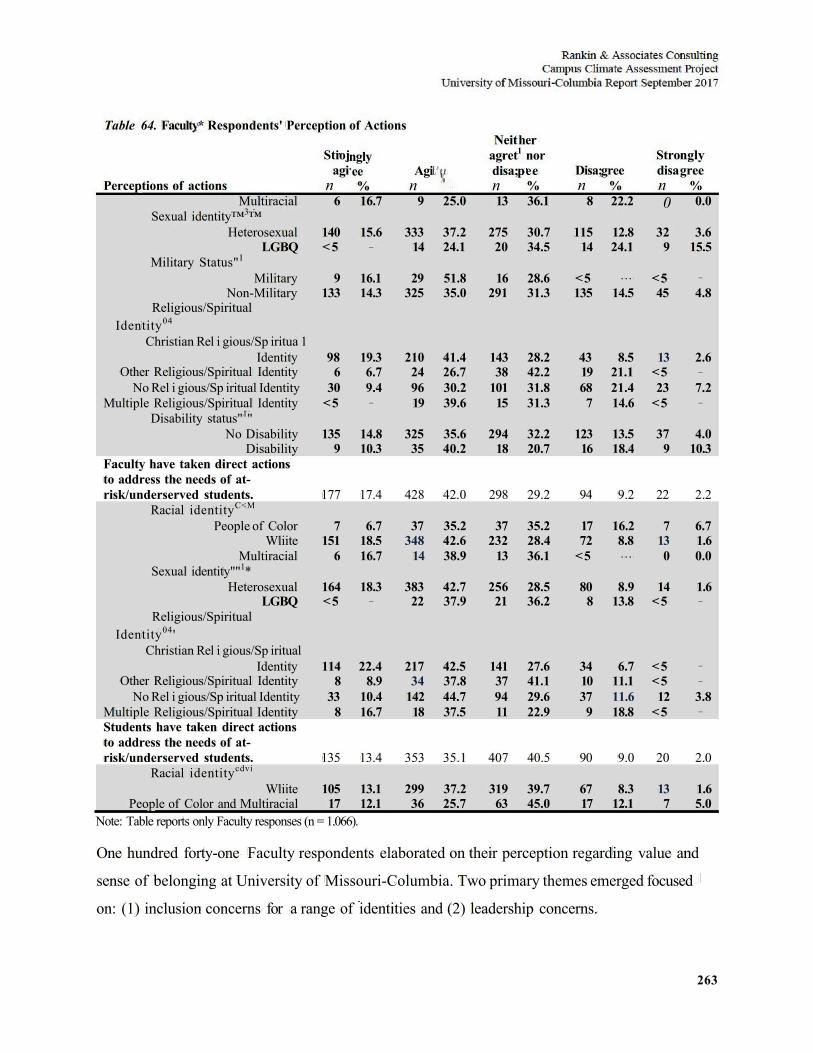
263
Table 64. Faculty* Respondents' Perception of Actions
Perceptions of actions
Stioj agi
n
ngly ee %
Agi n
L ' e e %
Neit agret disa; n
her 1 nor pee
% Disa; n
gree %
Stro disa n
ngly gree
% Multiracial 6 16.7 9 25.0 13 36.1 8 22.2 0 0.0
Sexual identity™3™ Heterosexual 140 15.6 333 37.2 275 30.7 115 12.8 32 3.6
LGBQ < 5 — 14 24.1 20 34.5 14 24.1 9 15.5 Military Status"1
Military 9 16.1 29 51.8 16 28.6 <5 . . . <5 —
Non-Military 133 14.3 325 35.0 291 31.3 135 14.5 45 4.8 Religious/Spiritual
Identity04
Christian Rel i gious/Sp iritua 1 Identity 98 19.3 210 41.4 143 28.2 43 8.5 13 2.6
Other Religious/Spiritual Identity 6 6.7 24 26.7 38 42.2 19 21.1 <5 —
No Rel i gious/Sp iritual Identity 30 9.4 96 30.2 101 31.8 68 21.4 23 7.2 Multiple Religious/Spiritual Identity <5 — 19 39.6 15 31.3 7 14.6 <5 —
Disability status"1" No Disability 135 14.8 325 35.6 294 32.2 123 13.5 37 4.0
Disability 9 10.3 35 40.2 18 20.7 16 18.4 9 10.3 Faculty have taken direct actions to address the needs of at-risk/underserved students. 177 17.4 428 42.0 298 29.2 94 9.2 22 2.2
Racial identityC<M
People of Color 7 6.7 37 35.2 37 35.2 17 16.2 7 6.7 Wliite 151 18.5 348 42.6 232 28.4 72 8.8 13 1.6
Multiracial 6 16.7 14 38.9 13 36.1 <5 . . . 0 0.0 Sexual identity""1*
Heterosexual 164 18.3 383 42.7 256 28.5 80 8.9 14 1.6 LGBQ <5 — 22 37.9 21 36.2 8 13.8 <5 —
Religious/Spiritual Identity04 '
Christian Rel i gious/Sp iritual Identity 114 22.4 217 42.5 141 27.6 34 6.7 <5 —
Other Religious/Spiritual Identity 8 8.9 34 37.8 37 41.1 10 11.1 <5 —
No Rel i gious/Sp iritual Identity 33 10.4 142 44.7 94 29.6 37 11.6 12 3.8 Multiple Religious/Spiritual Identity 8 16.7 18 37.5 11 22.9 9 18.8 <5 —
Students have taken direct actions to address the needs of at-risk/underserved students. 135 13.4 353 35.1 407 40.5 90 9.0 20 2.0
Racial identitycdvi
Wliite 105 13.1 299 37.2 319 39.7 67 8.3 13 1.6 People of Color and Multiracial 17 12.1 36 25.7 63 45.0 17 12.1 7 5.0
Note: Table reports only Faculty responses (n = 1.066).
One hundred forty-one Faculty respondents elaborated on their perception regarding value and
sense of belonging at University of Missouri-Columbia. Two primary themes emerged focused
on: (1) inclusion concerns for a range of identities and (2) leadership concerns.
264
Inclusion Concerns — Inclusion concerns for women, people with disabilities, and other
minorities were noted by respondents who elaborated on their perception regarding value and
sense of belonging. One respondent explained, "Persons with disabilities are unable to enter the
facility from all exterior doors. Parking is difficult and placed near trash dumpsters suggesting
unwelcoming value. Elevators don't always work. Signage is inadequate." Another respondent
noted concerns for women, "In the absence of a job offer from another institution, "everyone
knows" I (and others like me) are stuck here. Women are treated as second class members of the
community. Within my department the gender issues are embarrassing." Other respondents
addressed multiple identities. For example, one respondent shared, "Students have been, in the
majority, increasingly aware of how and why racism, sexism, and homophobia occurs. Faculty at
less aware. Those in administrative positions tend to enable racism/sexism to protect financial
interests." Another respondent elaborated, "MU decidhig to johi the SEC is a great analogy of
the climate and problems of this university. What decent person would choose to be more
conventionally 'southern*, racist, bigoted, mindlessly religious." Several respondents also
acknowledged their own privilege. For example, "I understand that as a white, native-born,
heterosexual male, I have occupied a privileged position at MU" and many of these narratives
also included concerns for those who do not have such privilege, "many others (especially those
from traditionally marginalized groups) have not had it as good as I have." Inclusion concerns
were thematic hi the data gathered from Faculty reflections 011 value and sense of belonging.
Leadership — Reflections 011 leadership pointed to a general sense of disconnect and disapproval
with current leaders. One respondent shared, "MU has and continues to lack the leadership,
vision or commitment to truly change the culture at MU!" Another respondent echoed, "Om'
institution is an embarrassment in how poorly our leadership responds to needs. From the most
basic (gender equality) to more complex issues- we uniformly do a poor job." Similarly, one
respondent explained, "MU senior administrators are the biggest problems. They pay lip service,
and are engaged in massive cover ups of their wrong doings." Other respondents elaborated 011
how they do not feel valued by leadership. One respondent noted, "I feel that my non-tenure-
track status lias limited how much administrators value me so that my feedback is not considered
as important." Another respondent expressed, "My departmental chair has become very
frustrated with the continued decline in University support." One respondent noted variations in
265
their perceptions of leadership on campus, "My college and department are fantastic. My
concern is with the senior administration and the climate of the campus, not my specific college
or department." Other respondents described leadership as "clueless," "weak," and "not as
forthcoming." Overall respondents presented as dissatisfied with and discouraged by the current
leadership practices.
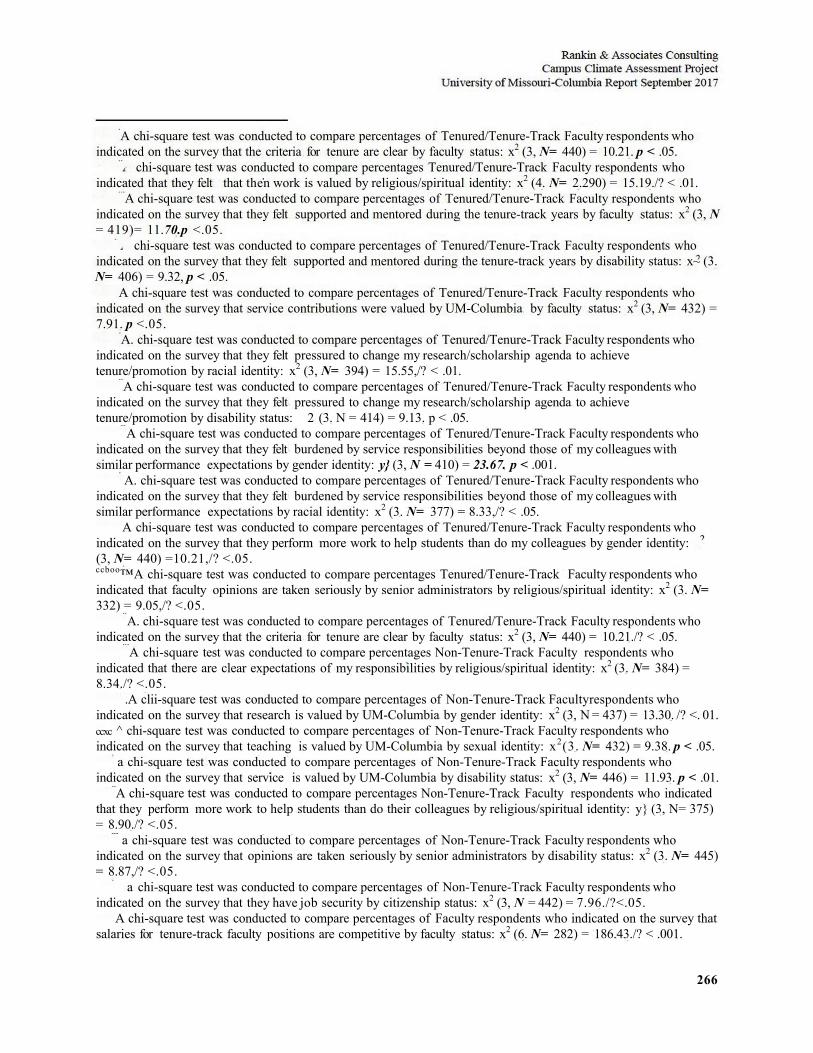
266
A chi-square test was conducted to compare percentages of Tenured/Tenure-Track Faculty respondents who indicated on the survey that the criteria for tenure are clear by faculty status: x2 (3, N= 440) = 10.21. p < .05.
chi-square test was conducted to compare percentages Tenured/Tenure-Track Faculty respondents who indicated that they felt that then work is valued by religious/spiritual identity: x2 (4. N= 2.290) = 15.19./? < .01.
A chi-square test was conducted to compare percentages of Tenured/Tenure-Track Faculty respondents who indicated on the survey that they felt supported and mentored during the tenure-track years by faculty status: x2 (3, N = 419)= 11.70.p <.05.
chi-square test was conducted to compare percentages of Tenured/Tenure-Track Faculty respondents who indicated on the survey that they felt supported and mentored during the tenure-track years by disability status: x~ (3. N= 406) = 9.32, p < .05.
A chi-square test was conducted to compare percentages of Tenured/Tenure-Track Faculty respondents who indicated on the survey that service contributions were valued by UM-Columbia by faculty status: x2 (3, N= 432) = 7.91. p <.05.
A. chi-square test was conducted to compare percentages of Tenured/Tenure-Track Faculty respondents who indicated on the survey that they felt pressured to change my research/scholarship agenda to achieve tenure/promotion by racial identity: x2 (3, N= 394) = 15.55,/? < .01.
A chi-square test was conducted to compare percentages of Tenured/Tenure-Track Faculty respondents who indicated on the survey that they felt pressured to change my research/scholarship agenda to achieve tenure/promotion by disability status: 2 (3. N = 414) = 9.13. p < .05.
A chi-square test was conducted to compare percentages of Tenured/Tenure-Track Faculty respondents who indicated on the survey that they felt burdened by service responsibilities beyond those of my colleagues with similar performance expectations by gender identity: y} (3, N = 410) = 23.67. p < .001.
A. chi-square test was conducted to compare percentages of Tenured/Tenure-Track Faculty respondents who indicated on the survey that they felt burdened by service responsibilities beyond those of my colleagues with similar performance expectations by racial identity: x2 (3. N= 377) = 8.33,/? < .05.
A chi-square test was conducted to compare percentages of Tenured/Tenure-Track Faculty respondents who indicated on the survey that they perform more work to help students than do my colleagues by gender identity: (3, N= 440) =10.21,/? <.05. ccboo™A chi-square test was conducted to compare percentages Tenured/Tenure-Track Faculty respondents who indicated that faculty opinions are taken seriously by senior administrators by religious/spiritual identity: x2 (3. N= 332) = 9.05,/? <.05.
A. chi-square test was conducted to compare percentages of Tenured/Tenure-Track Faculty respondents who indicated on the survey that the criteria for tenure are clear by faculty status: x2 (3, N= 440) = 10.21./? < .05.
A chi-square test was conducted to compare percentages Non-Tenure-Track Faculty respondents who indicated that there are clear expectations of my responsibilities by religious/spiritual identity: x2 (3. N= 384) = 8.34./? <.05.
.A clii-square test was conducted to compare percentages of Non-Tenure-Track Facultyrespondents who indicated on the survey that research is valued by UM-Columbia by gender identity: x2 (3, N = 437) = 13.30. /? <. 01. ccxc ^ chi-square test was conducted to compare percentages of Non-Tenure-Track Faculty respondents who indicated on the survey that teaching is valued by UM-Columbia by sexual identity: x2(3. N= 432) = 9.38. p < .05.
a chi-square test was conducted to compare percentages of Non-Tenure-Track Faculty respondents who indicated on the survey that service is valued by UM-Columbia by disability status: x2 (3, N= 446) = 11.93. p < .01.
A chi-square test was conducted to compare percentages Non-Tenure-Track Faculty respondents who indicated that they perform more work to help students than do their colleagues by religious/spiritual identity: y} (3, N= 375) = 8.90./? <.05.
a chi-square test was conducted to compare percentages of Non-Tenure-Track Faculty respondents who indicated on the survey that opinions are taken seriously by senior administrators by disability status: x2 (3. N= 445) = 8.87,/? <.05.
a chi-square test was conducted to compare percentages of Non-Tenure-Track Faculty respondents who indicated on the survey that they have job security by citizenship status: x2 (3, N = 442) = 7.96./?<.05.
A chi-square test was conducted to compare percentages of Faculty respondents who indicated on the survey that salaries for tenure-track faculty positions are competitive by faculty status: x2 (6. N= 282) = 186.43./? < .001.
267
A chi-square test was conducted to compare percentages of Faculty respondents who indicated on the survey that salaries for tenure-track faculty positions are competitive by religious/spiritual identity %2(9,N= 920) = 33.33, p<.001.
A clii-square test was conducted to compare percentages of Faculty respondents who indicated on the survey that salaries for adjunct faculty positions are competitive by faculty status: y2 (6. .V 763) = 18.30./) < .01.
A chi-square test was conducted to compare percentages of Faculty respondents who indicated on the survey that salaries for adjunct faculty positions are competitive by gender identity: x2 (3 - N= 874) = 11.49,/) < .01.
A clii-square test was conducted to compare percentages of Faculty respondents who indicated on the survey that salaries for adjunct faculty positions are competitive by citizenship status: x2 (3. N= 891) = 7.96,/) < .05.
A chi-square test was conducted to compare percentages of Faculty respondents who indicated on the survey that salaries for adjunct faculty positions are competitive by military status: "/2 (3. JVC= 876) = 9A5,p< .05.
A clii-square test was conducted to compare percentages of Faculty respondents who indicated on the survey that salaries for adjunct faculty positions are competitive by religious/spiritual identity: X2(9. N= 856) = 45.95./) < .001.
A clii-square test was conducted to compare percentages of Faculty respondents who indicated on the survey that salaries for non-tenure-track faculty positions are competitive by gender identity: y2 (3, N = 920) = 8.09,/> < .05.
A clii-square test was conducted to compare percentages of Faculty respondents who indicated on the survey that salaries for non-tenure-track faculty positions are competitive by military status: % 2 ( i ,N= 926) = 10.75,/) < .05.
A clii-square test was conducted to compare percentages of Faculty respondents who indicated on the survey that salaries for non-tenure-track faculty positions are competitive by religious/spiritual identity: y}(9,N= 903) = 20.15, p < .05.
A clii-square test was conducted to compare percentages of Faculty respondents who indicated on the survey that health insurance benefits are competitive by faculty status: x2(6, N= 860) = 35.43./? < .001.
A clii-square test was conducted to compare percentages of Faculty respondents who indicated on the survey that health insurance benefits are competitive by gender identity: y1 (3, N= 971) = 10.78,/) < .05.
A chi-square test was conducted to compare percentages of Faculty respondents who indicated on the survey that health insurance benefits are competitive by racial identity: %2(3,N= 943) = 7.96,/) < .05.
A clii-square test was conducted to compare percentages of Faculty respondents who indicated on the survey that health insurance benefits are competitive by religious/spiritual identity: y2 (9. N= 951) = 22.67, p< .01.
A chi-square test was conducted to compare percentages of Faculty respondents who indicated on the survey that childcare benefits are competitive by faculty status: y} (6. N= 707) = 28.29,/) < .001.
A clii-square test was conducted to compare percentages of Faculty respondents who indicated on the survey that childcare benefits are competitive by religious/spiritual identity: y2 (9. N= 798) = 19.06,/) < .05.
A chi-square test was conducted to compare percentages of Faculty respondents who indicated on the survey that retirement/supplemental benefits are competitive by position status: y2 (3. N = 943) = 10.08,/) < .05.
A clii-square test was conducted to compare percentages of Faculty respondents who indicated on the survey that retirement/supplemental benefits are competitive by sexual identity: x2 (3, N= 885) = 7.97, p < .05.
A clii-square test was conducted to compare percentages of Faculty respondents who indicated on the survey that retirement/supplemental benefits by religious/spiritual identity: y2 (9. N= 894) = 27.94,/) < .01.
A chi-square test was conducted to compare percentages of Faculty respondents who indicated on the survey that retirement/supplemental benefits by disability status: x2(3, N= 928) = 20.62, p< .001.
A clii-square test was conducted to compare percentages of Faculty respondents who indicated on the survey that people who do not have children are burdened with work responsibilities beyond those who do have children by position status: x2 (3, N= 944) = 9.31, p < .05.
A chi-square test was conducted to compare percentages of Faculty respondents who indicated on the survey that people who do not have children are burdened with work responsibilities beyond those who do have children by gender identity: x2 (3, N= 914) = 21.34,/) < .001.
a chi-square test was conducted to compare percentages of Faculty respondents who indicated on the survey that who indicated on tlie survey that people who do not have children are burdened with work responsibilities beyond those who do have children by racial identity: y1 (6. N= 884) = 18.36,/; < .01.
A chi-square test was conducted to compare percentages of Faculty respondents who indicated on tlie survey that who indicated on tlie survey that people who do not have children are burdened with work responsibilities beyond those who do have children by sexual identity: y2 (3, N= 882) = 11.91,/? < .01.
268
A clii-square test was conducted to compare percentages of Faculty respondents who indicated 011 the survey that who indicated 011 the survey that people who have children or elder care are burdened with balancing work and family responsibilities by gender identity: x2(3 ,N= 896) = 32.21, p< .001.
A chi-square test was conducted to compare percentages of Faculty respondents who indicated on the survey that people who have children or elder care are burdened with balancing work and family responsibilities by racial identity: x2 (6. N 867) = 17.37./) < .01.
A chi-square test was conducted to compare percentages of Faculty respondents who indicated 011 the survey that who have children or elder care are burdened with balancing work and family responsibilities by religious/spiritual identity: x2 (3, N= 759) = 8.56, p < .05.
A chi-square test was conducted to compare percentages of Faculty respondents who indicated on the survey that who have children or elder care are burdened with balancing work and family responsibilities by disability status: x2(3,iV=916) = 9.36,/?< .05.
A chi-square test was conducted to compare percentages of Faculty respondents who indicated on the survey that UM-Columbia provides adequate resources to help them manage work-life balance by faculty status: x2 (6, N= 819) = 20.59,p < .01.
A chi-square test was conducted to compare percentages of Faculty respondents who indicated on the survey that UM-Columbia provides adequate resources to help them manage work-life balance by gender identity: %2 (3, N = 923)= 12.94, p<. 01.
A chi-square test was conducted to compare percentages of Faculty respondents who indicated on the survey that UM-Columbia provides adequate resources to help them manage work-life balance by disability status: x2 (3, N = 943)= 11.69,p <.01.
A chi-square test was conducted to compare percentages of Faculty respondents who indicated on the survey that their colleagues include them in opportunities that will help then career as much as they do others hi my position by faculty* status: x2(6 ,N= 851) = 17.19,p< .01.
clii-square test was conducted to compare percentages of Faculty respondents who indicated on the survey that their colleagues include them hi opportunities that will help then career as much as they do others hi my position by racial identity: %2(6, N= 933) = 18.46,/) < .01. a chi-square test was conducted to compare percentages of Faculty respondents who indicated on the survey that who indicated on the survey that their colleagues include diem hi opportunities that will help their career as much as they do others in my position by sexual identity: %2(3,N= 933) = 11.03,/> < .05.
A clii-square test was conducted to compare percentages of Faculty respondents who indicated on the survey that their colleagues include them hi opportunities that will help their career as much as they do others in my position by religious/spiritual identity: y2 (9. N= 943) = 22.58,/; < .01.
A clii-square test was conducted to compare percentages of Faculty respondents who indicated on the survey that their colleagues include them hi opportunities that will help then career as much as they do others hi my position by disability status x2 (3, N= 979) = 8.89,/; < .05.
clii-square test was conducted to compare percentages of Faculty respondents who indicated on the survey that UM-Columbia provides them with resources to pursue professional development by position status: x2(3 ,N= 1,015) = 13.56,/; < .01.
chi-square test was conducted to compare percentages of Faculty respondents who indicated on the survey that UM-Columbia provides them with resources to pursue professional development by faculty status: X2 (6, N= 870) = 24.08,/; <.01.
A chi-square test was conducted to compare percentages of Faculty respondents who indicated on the survey that UM-Columbia provides them with resources to pursue professional development by religious/spiritual identity: X2 (3, N= 826)= 10.31,/; < .05.
A chi-square test was conducted to compare percentages of Faculty respondents who indicated on the survey that they were positive about my career opportunities at UM-Columbia by position status: y1 (3, N= 1,015) = 9.30,/) <.05.
A chi-square test was conducted to compare percentages of Faculty respondents who indicated on the survey that they were positive about my career opportunities at UM-Columbia by racial identity: y2 (6. N= 951) = 18.79,/) <.01.
chi-square test was conducted to compare percentages of Faculty respondents who indicated on the survey that who indicated on the survey that they were positive about my career opportunities at UM-Columbia by sexual identity: %2 (3. N= 948) = 12.69./> < .01.
269
clii-square test was conducted to compare percentages of Faculty respondents who indicated 011 the survey that they were positive about my career opportunities at UM-Columbia by religious/spiritual identity: %2(9,N= 961) = 18.60,/;< .05. a chi-square test was conducted to compare percentages of Faculty respondents who indicated 011 the survey that diey were positive about my career opportunities at UM-Columbia by disability status: y2 (6, JV= 1,000) = 25.50, p<. 001.
A chi-square test was conducted to compare peicentages of Faculty respondents who indicated on the survey that they would recommend UM-Columbia as a good place to work by position stanis: %2(i , N = 1,018) = 17.45,/; < .01.
A chi-square test was conducted to compare percentages of Faculty respondents who indicated on the survey that they would recommend UM-Columbia as a good place to work by faculty stanis: -/2 (6, N= 869) = 32.12,/) < .001.
A chi-square test was conducted to compai e percentages of Faculty respondents who indicated on the survey that tliey would recommend UM-Columbia as a good place to work by racial identity: %2(6,N= 954) = 13.57,/) < .05.
chi-square test was conducted to compare percentages of Faculty respondents who indicated on the survey that who indicated on the survey that they would recommend UM-Cohunbia as a good place to work by sexual identity: x2(3, N= 951) = 13.10,/) < .01.
A chi-square test was conducted to compai e percentages of Faculty respondents who indicated on the survey that tliey would recommend UM-Columbia as a good place to work by religious/spiritual identity: N= 964) = 18.20,/;< .05.
A chi-square test was conducted to compare percentages of Faculty respondents who indicated on the survey that tliey would recommend UM-Columbia as a good place to work by disability status: y?(6,N= 1,003) = 28.84,/) <.001.
A chi-square test was conducted to compare pei centages of Faculty respondents who indicated on the survey that they had job security by lkculty status: x2(6, N= 877)= 157.93,/) < .001.
A chi-square test was conducted to compare percentages of Faculty respondents who indicated on the survey that they had job security by gender identity: y2 (3. N = 986)= 12.07,/; < .01.
A chi-square test was conducted to compare pei centages of Faculty respondents who indicated on the survey that they had job security by racial identity x2(3, N= 957) = 9.65,/) < .05.
A clii-square test was conducted to compai e percentages of Faculty respondents who indicated on the survey that they had job security by disability status: %2 (6, N= 1,007) = 26.08,/) < .001.
chi-square test was conducted to compare pei centages of Faculty respondents who indicated on the survey that tliey feel that tliey have access to and support for giant funding by position status: x2(3 ,N=969) = 10.09, p < .05.
A chi-square test was conducted to compai e percentages of Faculty respondents who indicated on the survey that they feel that they have access to and support for grant ftinding by faculty stanis: x2(6, N= 831) = 16.68,/) < .05.
A chi-square test was conducted to compare pei centages of Faculty respondents who indicated on the survey that they feel that they have access to and support for grant ftinding by religious, spiritual identity: %2(9,N= 920) = 19.49,/? < .05.
A chi-square test was conducted to compare percentages of Faculty respondents who indicated on the survey that tliey feel that tliey have access to and support for giant funding by disability status: y2 (3, N = 955) = 9.62, p < .05.
A chi-square test was conducted to compare peicentages of Faculty respondents who felt valued by faculty in their department by position status: y2 (4. N= 1,056)= 10.75,/; < .05.
A chi-square test was conducted to compare pei centages of Faculty respondents who felt valued by faculty in their department by faculty status: x2 (8, N= 901)= 18.76,p< .05.
A clii-square test was conducted to compai e percentages of Faculty respondents who felt valued by faculty in their department by gender identity: y2 (4. N= 1,017) = 13.60,/; < .01.
A chi-square test was conducted to compare pei centages of Faculty respondents who felt valued by faculty in their department by citizenship stanis: y2 (4. N= 1,037) = 12.04,/) < .05.
A chi-square test was conducted to compare percentages of Faculty respondents who felt valued by faculty in their department by racial identity: x2(8, N= 987) = 20.96,/) < .01. a chisquare test was conducted to compare percentages of Faculty respondents who felt valued by faculty in their department by sexual identity: y2 (4. N= 985) = 11.09,/; < .05.
270
chi-square test was conducted to compare percentages of Faculty respondents who felt valued by the department/program chair in their department by racial identity: x2 (8, iV = 9 81} = 22.3 5, /) <. 01.
clii-square test was conducted to compare percentages of Faculty respondents who felt valued by the department/program chair in then department by sexual identity: %2(4,N= 980)= 10.64./) < .05.
chi-square test was conducted to compare percentages of Faculty respondents who felt valued by other faculty at University of Missouri-Columbia by sexual identity: x2(4. N= 975) = 1136, p < .05.
clii-square test was conducted to compare percentages of Faculty respondents who felt valued by other faculty at University of Missouri-Columbia by disability status: %2 (8, N— 1,028) = 16.55, p < .05.
chi-square test was conducted to compare percentages of Faculty respondents who felt valued by students hi the classroom by racial identity: x2 (4, N= 948) = 11.30,/) < .05.
A chi-square test was conducted to compare percentages of Faculty respondents who felt valued by students in the classroom by disability status: x2 (4. N= 999) = 15.89,/) < .01.
A chi-square test was conducted to compare percentages of Faculty respondents who felt valued by UM-Columbia senior administrators by position status: yj (4. N= 1,040) = 37.59,/; < .001.
A chi-square test was conducted to compare percentages of Faculty respondents who felt valued by UM-Columbia senior administrators by faculty status: x2 (8. N= 887) = 19.86,/; < .05.
clii-square test was conducted to compare percentages of Faculty respondents who felt valued by UM-Columbia senior administrators by racial identity: y1 (8. jV= 971) = 16.04./; < .05.
chi-square test was conducted to compare percentages of Faculty respondents who felt valued by UM-Columbia senior administrators by sexual identity: x2 (4. N= 969) = 13.45,/) < .01.
A chi-square test was conducted to compare percentages of Faculty respondents who UM-Columbia senior administrators leave by religious/spiritual identity: x2 (12, N= 985) = 31.98,/) < .01.
chi-square test was conducted to compare percentages of Faculty respondents who felt valued by UM-Columbia senior administrators by disability status: yj (8. N= 1,024)= 17.87,/) < .05.
A chi-square test was conducted to compare percentages of Faculty respondents who felt valued by UM-Columbia administrators by position status: %2(4, N= 1,034) = 33.17,/) < .001.
A clii-square test was conducted to compare percentages of Faculty respondents who felt valued by UM-Columbia administrators by faculty status: x2 (8, N= 881) = 16.68,/; < .05.
A chi-square test was conducted to compare percentages of Faculty respondents who felt valued by UM-Columbia administrators by gender identity: y2 (4. N=995)= 17.50,/; < .01.
A chi-square test was conducted to compare percentages of Faculty respondents who felt valued by UM-Columbia administrators by religious/spiritual identity: x2(4. N= 841) = 9.91,/; < .05.
A chi-square test was conducted to compare percentages of Faculty respondents who felt valued by UM-Columbia administrators by disability status: y2 (8, N= 1,017) = 17.39, p < .05.
a clii-square test was conducted to compare percentages of Faculty respondents who thought that faculty pre-judges then' abilities based on their perception oftheir identity/background by racial identity: x2(8, N= 961) = 27.60, p<. 01.
chi-square test was conducted to compare percentages of Faculty respondents who thought that faculty pre-judges then' abilities based on their perception of their identity/background by military status: x2(4. N= 998 ) = 11.17,/; < .05.
clii-square test was conducted to compare percentages of Faculty respondents who thought that their department/program chair pre-judges their abilities based on their perception of their identity/background by sexual identity: x2 (4, N= 957) = 9.66,/; < .05.
chi-square test was conducted to compare percentages of Faculty respondents who believed that UM-Columbia encourages free and open discussion of difficult topics by faculty status: x2(8, N= 887) = 17.39,/) < .05.
A chi-square test was conducted to compare percentages of Faculty respondents who believed that UM-Columbia encourages free and open discussion of difficult topics by religious/spiritual identity: x 2 0 2 , N= 986) = 29.57, p<. 01.
chi-square test was conducted to compare percentages of Faculty respondents who believed that UM-Columbia encourages free and open discussion of difficult topics by disability status: x2(8. N= 1,025) = 17.82,/) < .05.
A. clii-square test was conducted to compare percentages of Faculty respondents who felt that their research/scholarship activity is valued by faculty status: y2 (8. N= 875) = 43.16,/; < .001.
271
A chi-square test was conducted to compare percentages of Faculty respondents who felt that then re search/ scholarship activity is valued by gender identity: y?(4, N= 988) = 16.53, p< .01.
A. chi-square test was conducted to compare percentages of Faculty respondents who felt that then research/scholarship activity is valued by religious/spiritual identity: %2(12, N= 972) = 28.80,/) < .01.
A chi-square test was conducted to compare percentages of Facidty respondents who felt that then research'1 scholarship activity is valued by disability status: y2 (4. N= 1,010) = 18.34,/) < .01,
A chi-square test was conducted to compare percentages of Facidty respondents who felt that then teaching is valued by position status: x2(4. N= 1,026)= 17.05,/; < .01.
chi-square test was conducted to compare peicentages of Faculty respondents who felt that their teaching is valued by faculty status: %2 (8, N= 880) = 22.31, p < .01.
A chi-square test was conducted to compare percentages of Faculty respondents who felt that their teaching is valued by racial identity: x2(8 ,N= 957) = 28.99,p< .001.
clii-square test was conducted to compare percentages of Facidty respondents who felt that then teaching is valued by disability status: x2(4,7V"= 1,010) = 20.75,/) < .001.
A chi-square test was conducted to compare pei centages of Faculty respondents who felt that their service contributions are valued by position status: y1 (4. N= 1,032)= 33.02,/) < .001.
A chi-square test was conducted to compai e percentages of Facidty respondents who felt that their service contributions are valued by faculty status: y2 (8, N= 884) = 35.65,/; < .001.
A clii-square test was conducted to compare percentages of Facidty respondents who felt that then service contributions are valued by racial identity: x2 (8- N= 965) = 16.95,/) < .05.
A clii-square test was conducted to compai e percentages of Facidty respondents who felt that then service contributions are valued by religious/spiritual identity: y2 (12. N= 976) = 22.78,/) < .05.
A chi-square test was conducted to compare percentages of Faculty respondents who felt that their service contributions are valued by disability stahis: y1 (4. N= 1,016) = 19.99,/) < .01.
A chi-square test was conducted to compare pei centages of Faculty respondents who agreed that senior administrators have taken direct actions to address the needs of at-risk/underserved students by position status: y2 (4, N= 1,015)= 10.51,p< .05.
A clii-square test was conducted to compai e percentages of Facidty respondents who agreed that senior administrators have taken direct actions to address the needs of at-risk/underserved students by faculty stahis: N= 865) = 17.58,/; < .05.
A chi-square test was conducted to compare pei centages of Faculty respondents who agreed that senior administrators have taken direct actions to address the needs of at-risk/underserved students by citizenship status: y2
(4 ,N= 1,000) = 10.40, p<. 05. chi-square test was conducted to compare percentages of Faculty respondents who agreed that senior
administrators have taken direct actions to address the needs of at-risk/underserved students by racial identity: x2 (3 • N= 954) = 17.27,/; < .05.
A clii-square test was conducted to compare percentages of Facidty respondents who agreed that senior administrators have taken direct actions to address the needs of at-risk/underserved students by sexual identity: x2(4, N= 953) = 33.12,/) < .001. cd A chi-square test was conducted to compare percentages of Faculty respondents who agreed that senior administrators have taken direct actions to address the needs of at-risk/underserved students by military stahis: x2(4, N= 985) = 11.67,/) < .05.
A chi-square test was conducted to compare pei centages of Faculty respondents who agreed that senior administrators have taken direct actions to address the needs of at-risk/underserved students by religious/spiritual identity: x2(12, N= 963) = 70.05,/; < .001. c d " A chi-square test was conducted to compare percentages of Faculty respondents who agreed that senior administrators have taken direct actions to address the needs of at-risk/underserved students by disability status: x2
4, N= 1,001) = 13.17,/; < .05. cdiii ^ clii-square test was conducted to compare percentages of Facidty respondents who agreed that faculty have taken direct actions to address the needs of at-risk/underserved students by racial identity: x2(8, N= 957) = 28.49,/) <.001.
A dii-square test was conducted to compare percentages of Facidty respondents who agreed that faculty have taken direct actions to address the needs of at-risk/underserved students by sexual identity: x2(4, N= 955) = 10.81,/) < .05.
272
A chi-square test was conducted to compare percentages of Faculty respondents who agreed that faculty have taken direct actions to address tlie needs of at-risk/underserved students by religious/spiritual identity: X (12, N= 966) = 4 7 . 9 6 . < .001.
A clii-square test was conducted to compare percentages of Faculty respondents who agreed that students have taken direct actions to address tlie needs of at-risk/underserved students by racial identity: x2 (4- N= 943) = 13.71./) <.01.
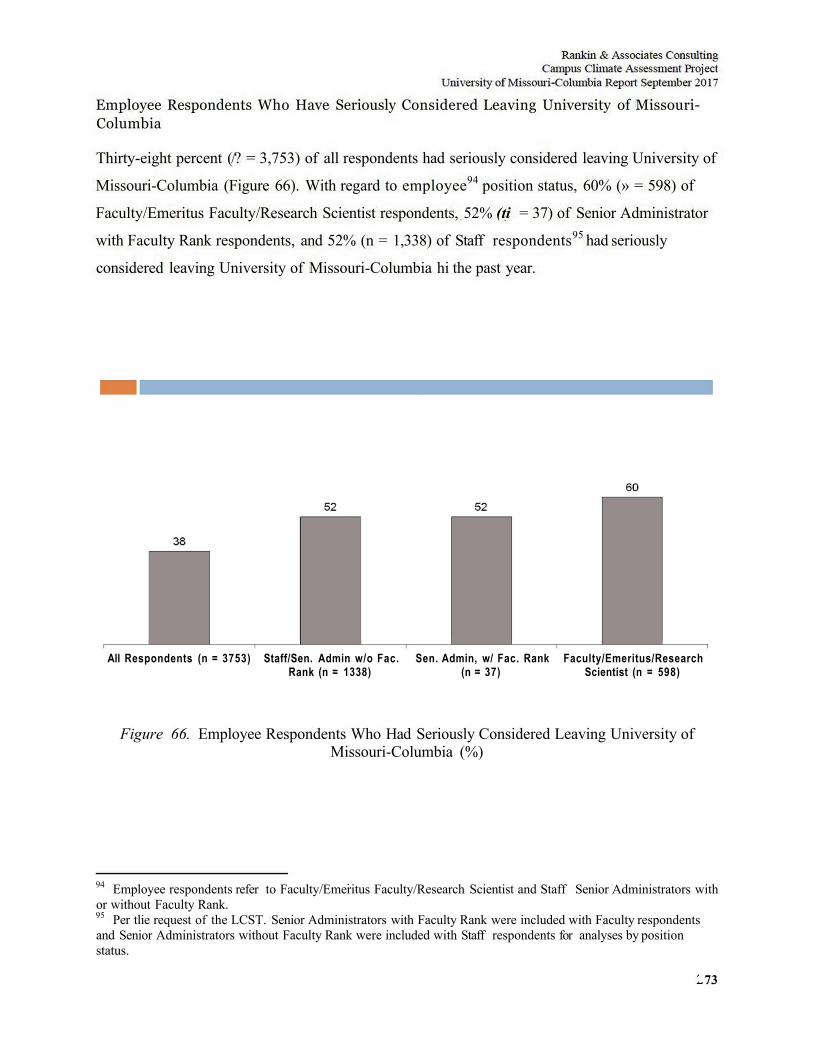
73
Employee Respondents Who Have Seriously Considered Leaving University of Missouri-Columbia
Thirty-eight percent (/? = 3,753) of all respondents had seriously considered leaving University of
Missouri-Columbia (Figure 66). With regard to employee94 position status, 60% (» = 598) of
Faculty/Emeritus Faculty/Research Scientist respondents, 52% (ti = 37) of Senior Administrator
with Faculty Rank respondents, and 52% (n = 1,338) of Staff respondents95 had seriously
considered leaving University of Missouri-Columbia hi the past year.
All Respondents (n = 3753) Staff/Sen. Admin w/o Fac. Sen. Admin, w/ Fac. Rank Faculty/Emeritus/Research Rank (n = 1338) (n = 37) Scientist (n = 598)
Figure 66. Employee Respondents Who Had Seriously Considered Leaving University of Missouri-Columbia (%)
94 Employee respondents refer to Faculty/Emeritus Faculty/Research Scientist and Staff Senior Administrators with or without Faculty Rank. 95 Per tlie request of the LCST. Senior Administrators with Faculty Rank were included with Faculty respondents and Senior Administrators without Faculty Rank were included with Staff respondents for analyses by position status.
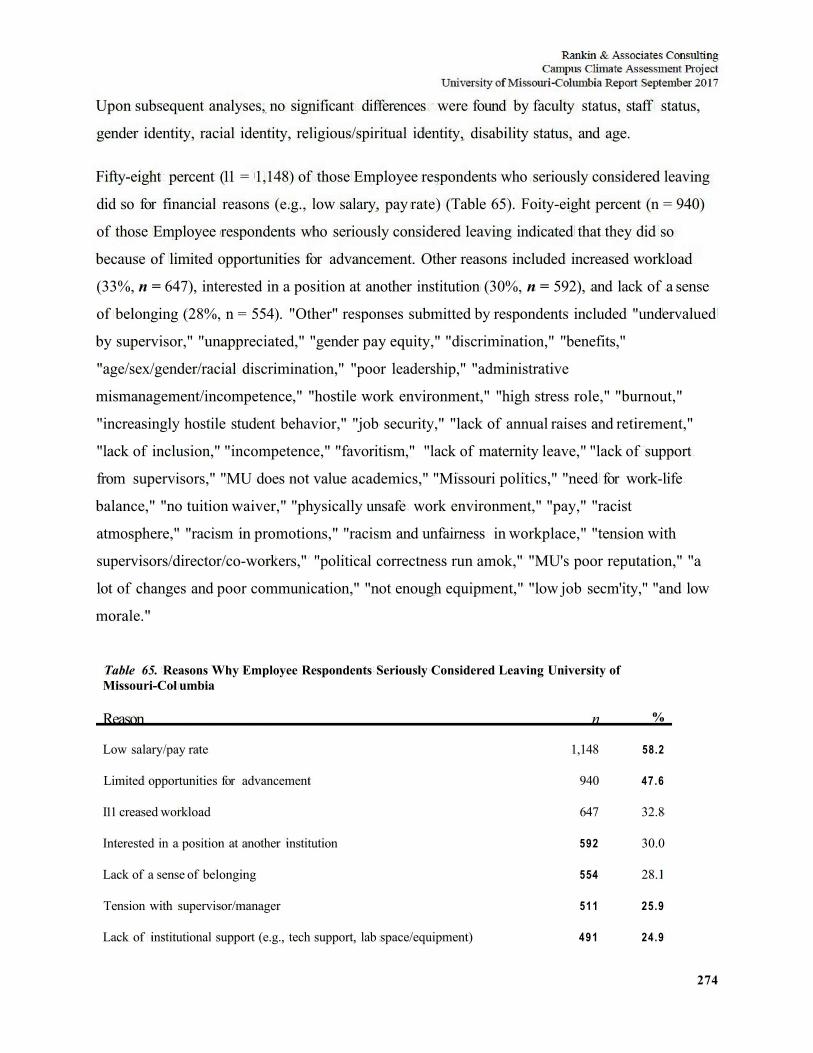
274
Upon subsequent analyses, no significant differences were found by faculty status, staff status,
gender identity, racial identity, religious/spiritual identity, disability status, and age.
Fifty-eight percent (11 = 1,148) of those Employee respondents who seriously considered leaving
did so for financial reasons (e.g., low salary, pay rate) (Table 65). Foity-eight percent (n = 940)
of those Employee respondents who seriously considered leaving indicated that they did so
because of limited opportunities for advancement. Other reasons included increased workload
(33%, n = 647), interested in a position at another institution (30%, n = 592), and lack of a sense
of belonging (28%, n = 554). "Other" responses submitted by respondents included "undervalued
by supervisor," "unappreciated," "gender pay equity," "discrimination," "benefits,"
"age/sex/gender/racial discrimination," "poor leadership," "administrative
mismanagement/incompetence," "hostile work environment," "high stress role," "burnout,"
"increasingly hostile student behavior," "job security," "lack of annual raises and retirement,"
"lack of inclusion," "incompetence," "favoritism," "lack of maternity leave," "lack of support
from supervisors," "MU does not value academics," "Missouri politics," "need for work-life
balance," "no tuition waiver," "physically unsafe work environment," "pay," "racist
atmosphere," "racism in promotions," "racism and unfairness in workplace," "tension with
supervisors/director/co-workers," "political correctness run amok," "MU's poor reputation," "a
lot of changes and poor communication," "not enough equipment," "low job secm'ity," "and low
morale."
Table 65. Reasons Why Employee Respondents Seriously Considered Leaving University of Missouri-Col umbia
Reason n %
Low salary/pay rate 1,148 58.2
Limited opportunities for advancement 940 47.6
I11 creased workload 647 32.8
Interested in a position at another institution 592 30.0
Lack of a sense of belonging 554 28.1
Tension with supervisor/manager 511 25.9
Lack of institutional support (e.g., tech support, lab space/equipment) 491 24.9
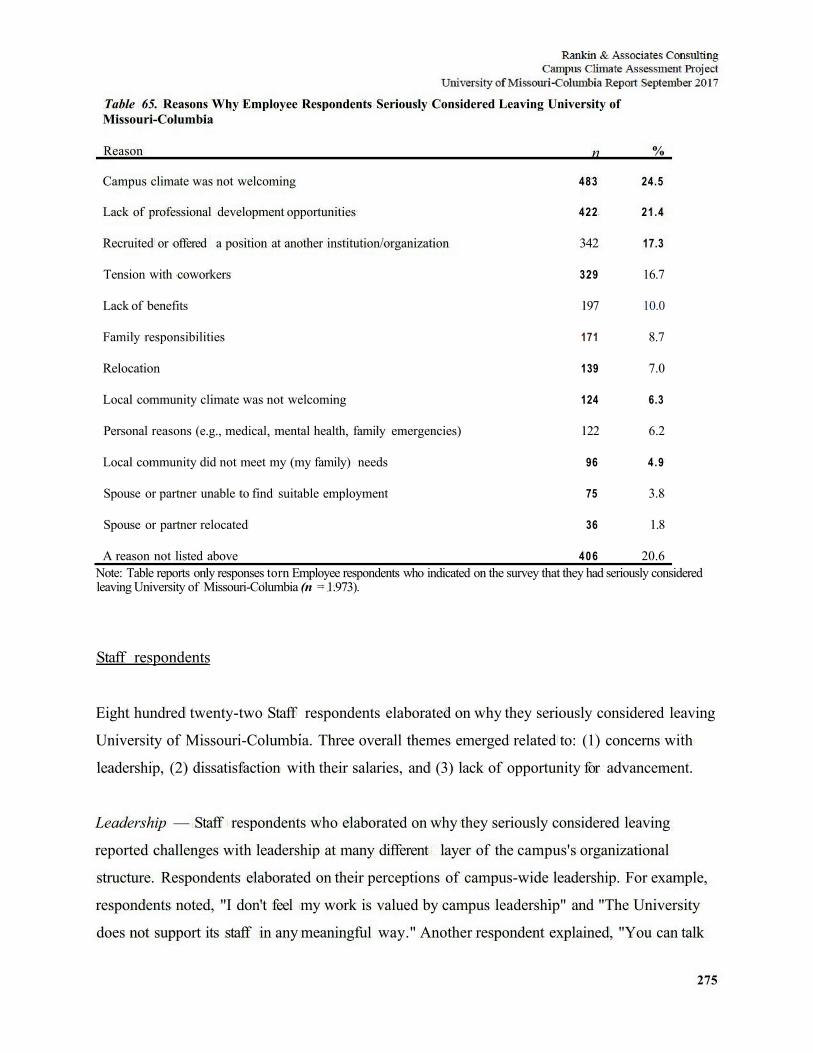
275
Table 65. Reasons Why Employee Respondents Seriously Considered Leaving University of Missouri-Columbia
Reason n %
Campus climate was not welcoming 483 24.5
Lack of professional development opportunities 422 21.4
Recruited or offered a position at another institution/organization 342 17.3
Tension with coworkers 329 16.7
Lack of benefits 197 10.0
Family responsibilities 171 8.7
Relocation 139 7.0
Local community climate was not welcoming 124 6.3
Personal reasons (e.g., medical, mental health, family emergencies) 122 6.2
Local community did not meet my (my family) needs 96 4 .9
Spouse or partner unable to find suitable employment 75 3.8
Spouse or partner relocated 36 1.8
A reason not listed above 406 20.6 Note: Table reports only responses torn Employee respondents who indicated on the survey that they had seriously considered leaving University of Missouri-Columbia (n = 1.973).
Staff respondents
Eight hundred twenty-two Staff respondents elaborated on why they seriously considered leaving
University of Missouri-Columbia. Three overall themes emerged related to: (1) concerns with
leadership, (2) dissatisfaction with their salaries, and (3) lack of opportunity for advancement.
Leadership — Staff respondents who elaborated on why they seriously considered leaving
reported challenges with leadership at many different layer of the campus's organizational
structure. Respondents elaborated on their perceptions of campus-wide leadership. For example,
respondents noted, "I don't feel my work is valued by campus leadership" and "The University
does not support its staff in any meaningful way." Another respondent explained, "You can talk
276
all you want about how much of the budget goes pay/benefits but in the end. when you continue
to cut raises, it sends a clear message of what is important. The University and upper
administration has to realize that this cannot continue." Other respondents reflected on the
leadership of their respective directors, deans and chairs. Respondents reported, "not being
supported by the dean of the school," "numerous unpleasant and unsettling conflicts with current
departmental director." and "Department Chair is creating a hostile environment for me." Other
respondents reflected 011 their managers and supervisors, "Upper management micromanage to
much," "Upper management would not listen," and "Treated disrespectfully/unfairly by my
supervisor." One respondent elaborated further, "Hie supervisor in our office was very passive-
aggressive, creating a very hostile work environment. Although I talked with multiple
supervisors and HR, nothing was ever done." Respondents who elaborated on why they seriously
considered leaving cited a range of challenges in their interactions and perceptions of various
types of leadership at University of Missouri-Columbia.
Salary — Staff respondents w7ho elaborated on why they seriously considered leaving University
of Missouri-Columbia cited salary dissatisfaction and no raises. Respondents noted, "we need a
raise," "No raises. Feels like a dead end job," "Terrible pay, very little monetary incentive to
stay" and "Low pay. Stagnant pay. General culture of mediocrity." One respondent noted salary
concerns hi tandem with concerns about benefits, "The pay is extremely low. benefits are
increasing each year with no adjustment to pay to compensate." Other respondents compared
their salaries to others or reported having received better offers. One respondent shared, "Was
solicited for a position at another university. Pay was much better." Another respondent noted,
"MU pay is falling behind the rest of the private jobs." Similarly, another respondent elaborated,
"The University's pay is very low compared to the private sector. But within my department, we
are paid the lowest in or titles across campus and expected to handle various job duties across
multiple campuses." Other respondents noted other financial concerns, including, "We work hi a
building that can't even supply us with hot water. We are severely underpaid because someone
decided across the board cuts were better." Speaking to the larger perception of value along with
a reflection 011 pay, one respondent expressed, "There have been several salary freezes during my
time at Mizzou; the staff feels undervalued in general." Respondents w7ho elaborated on why
they seriously considered leaving described feeling dissatisfied with their salaries.
277
Lack Of Professional Advancement Opportunities — Respondents who elaborated on why they
seriously considered leaving reported a lack professional advancement opportunities and
suspicious reports about how others get promoted at University of Missouri-Columbia. One
respondent shared, "There is no opportunity for personal or professional advancement at MU, at
least hi the area where I work." Other respondents echoed, "Thinking of moving as there is no
opportunity for advancement in my particular office' 1 and "There was 110 room for advancement
in the position I held." Respondents also reported a lack of opportunities to grow and be
stimulated professionally. One respondent noted. "There is 110 advancement path in my current
position and I am bored." Another respondent shared, "Looking for diversity and growth hi
professional experiences/responsibility." Other respondents elaborated on their perception of
suspicious and undeserving promotion practices. One respondent noted, "Slow advancements.
People get promoted for NOT dohig his/her jobs." Another respondent shared, "There is
absolutely 110 support or opportunities for professional development or advancement. The
climate is geared towards those who do not deseive promotions to be promoted." Similarly,
another respondent explained, "Positions are opening, but seem to be posted only as a
requirement when there was already a person hi place for the advancement." Respondents who
elaborated 011 why they seriously considered leaving described concerns about opportunities for
promotion or the lack there of.
Faculty/Emeritus Faculty/Research Scientist respondents
Three hundred fifty-three Faculty/Emeritus Faculty/Research Scientist respondents elaborated on
why they seriously considered leaving University of Missouri-Columbia. Similar to their staff
counterparts, thr ee themes also emerged: (1) low sense of belonging, (2) leadership concerns,
and (3) salary concerns.
Sense of Belonging — Faculty respondents who elaborated on why they seriously considered
leaving the University of Missouri-Columbia described a low sense of belonging. Respondents
noted, "Unwelcoming environment," "I have never fit hi at MU," and "climate is dismissive of
clinical and adjunct faculty." Another respondent expanded, "In the past year especially, the
278
campus climate seems less welcoming. With each year, I feel underappreciated hi my position.''1
Similarly, another respondent echoed, "I felt that my work was not being recognized or
supported. Colleagues were being petty and nasty.'1 Another respondent reported a recent change
hi the perceived lack acknowledgement, "Recently, within the past year or so, I have felt that my
work, performance, and dedication to my position at the University have not been appreciated or
properly recognized." Another respondent's answer, "No thanks - it would be ignored anyway,"
implied a perceived lack of value. Other respondents reported a low sense of belonging and
inclusion in relation to a range of minority identities. Noting race, respondents reported "racial
prejudice from some undergraduate students" and have received "racist comments 011
evaluation." Another respondent addressed sexism, "My section head discriminated against me
011 the basis of sex and also verbally harassed me." Other respondents elaborated on concerns
with multiple identities, "Persistent experience of cronyism, anti-intellectualism, sexism, racism,
homophobia, anti-Semitism, and exclusionary practices" and "observed discrimination because
of age, disability and national origin." Faculty respondents who elaborated on why they seriously
considered leaving University of Missouri-Columbia noted not feeling included and or a lack of
sense of belonging.
Leadership — Faculty respondents who elaborated on why they seriously considered leaving the
University of Missouri-Columbia noted leadership concerns involving their respective chairs and
or deans and the upper administration. One respondent shared, "Department Head and School
Director both create a hostile, uncomfortable environment for faculty." Other respondents added.
"Liar for a Dept Chair," "The Dean is not supportive" and "very negative attitudes displayed
from peers and the department chairman." Respondents who reflected 011 their perceptions of
leadership more broadly noted concern with the "lack of transparency in the upper
administration." Another respondent explained, "No trust in leadersliip. No vision, 110
transparency, unwillingness or inability to listen to out-groups (grad students and race issues) in
fall whose needs were not being met. We needed strong leaders who could listen and bring
people together but 110 one's (majority or minority) needs were being met." Another respondent
added, "Untrustworthy college leadership and campus leadersliip." Another addressed their'
opinion of leadership's investment in shared governance, "MU as an institution and as
represented by its administrators does not give even the appearance of caring about shared
279
governance or education." Respondents also noted the changes in leadership and perceived lack
of stability. For example, 'Interim everything at Mizzou" and "No hope or confidence in its
leadership." Respondents who elaborated on why they seriously considered leaving offered their
opinions 011 many layers of the campus leadership.
Low Pay & No Raises — Respondents who elaborated 011 why they seriously considered leaving
perceived their pay to be low and noted that as a motivating factor in tlieir choices to look for
other opportunities. One respondent shared, "MU is increasingly becoming the 'cheap university*.
Every August, we get httle or 110 raise and every October our benefits get cut." Other
respondents compared their salaries to that of peer institutions and reported that the "salaries
[were] below norms." Another respondent explained, "The salaries here are punitive. My
colleagues at other mid-west/mid-continental institutions in similar or same jobs earn $20K to
$30K more." Other respondents elaborated on the discouraging experience of not getting raises.
Respondents noted, "No merit increase" and "Pay is not tied to performance." Another
respondent echoed, "I sometimes feel like 110 matter how well I perform here, I'm stuck in the
same spot. Salaries are low by national standards and raises have gotten infrequent." One
respondent reflected 011 their perception of the campus wide financial challenges and their impact
011 Faculty, "Mizzou's financial woes are very concerning to non-tenure tr ack faculty. There
seems to be the possibility that we could be let go if finances are not turned around. Additionally,
with the financial woes, there is certainly no chance for a raise." Lastly, one respondent noted
benefit concerns in tandem with their reflections 011 their compensation, "Loss of health benefits
in retirement, and compressed salary (as an associate prof., salary is less than incoming assistant
professors). No raises for years." Respondents who elaborated 011 why they seriously considered
leaving MU described low pay and no raises as rationale and motivation to seek opportunities
elsewhere.
280
Senior Administrator with Facility Rank
Forty-seven Senior Administrator with Faculty Rank respondents provided a qualitative response
regarding why they seriously considered leaving University of Missouri-Columbia. Two themes
emerged: (1) leadership concerns and (2) salary concerns.
Leadership — Respondents who elaborated on why they seriously considered leaving described
concerns with leadership. Respondents noted, "Weak leadership," "Leadership instability,"
"Administration don't take responsibility for problems" and "leadership did not value nnddle
managers work." Another respondent cited a lack of leadership advancement opportunities,
"Very limited opportunities for developing leadership experience on campus, especially for
women." One respondent referenced the protests of 2015 hi relationship to their opinions of
leadership, "The events of last year and the impact on our institution are less about student
protests, and more about how the protests and other issues were mishandled by our institutional
leadership." Lastly, one respondent elaborated on their perspective on leadership, power and
change at University of Missouri-Columbia, "The State Legislature and Deans, not the Provost
and the Chancellor, run the institution. The organization is adverse to change." Though the
narratives ranged in subject matter, respondents who elaborated on w7hy they seriously
considered leaving reported concerns w7ith leadership.
Low Pay — Respondents who elaborated on why they seriously considered leaving reported
dissatisfaction with their pay in a variety of ways. One respondent noted discriminatory
practices, "Major gender pay and responsibility inequities at MU." Another respondent noted
salary concerns hi tandem with then reflections on leadership, "Low pay and leadership structure
in upper-administration (and concern as the where the university is going) were the primary
elements that made me seriously consider leaving MU." Another respondent reflected on their
on-boarding process, noting, "The salary offered was far below the national average and below
my predecessor, despite my 16 years of success with the program and my ability to generate
revenue was ignored." Other respondents reported only having a platform on which to ask for
increases in pay when being offered another opportunity, "The only time when MU cares about
you — in terms of salary increase — is when someone else cares about you (you go out and find
281
another job offer). Otherwise, we're not gonna give you a damn tiling!" One respondent reported
considering leaving when they were "offered a better position with considerably more pay."
Respondents who elaborated on why they seriously considered leaving noted low pay.
282
Summary
The results from this section suggest that most Employee respondents generally hold positive
attitudes about University of Missouri-Columbia pohcies and processes. Some University of
Missouri-Columbia employees had obseived unjust hiring (20%, n = 738), unjust disciplinary
actions (14%, ti = 499), or unjust promotion, tenure, and/or reclassification (27%, n = 974).
Gender/gender identity, ethnicity, age, bias, racial identity, education credentials, position, and
nepotism/cronyism were the top perceived bases for many of the reported discriminatory
employment practices.
The majority of Staff respondents "agreed" or "strongly agreed" that University of Missouri-
Columbia 84% (n = 2,148) and their supervisors 86% (« = 2,197) provided them with support
and resources. While 68% (n = 1,745) of Staff respondents agreed that the promotion process
was clear, fewer noted that they believed that the promotion process was effective (51%, n =
1,300). A majority 55% (n = 1,675) of Staff respondents felt that a hierarchy existed within staff
positions that allowed some voices to be valued more than others. A majority (75%, n = 1,924)
of Staff respondents felt that they are able to complete their assigned duties during scheduled
hours and 85% (ti = 2,190) believed that they were given a reasonable time frame to complete
assigned responsibilities.
The majority (73%, n = 319) of Tenured and Tenure-Track Faculty respondents "agreed" or
"strongly agreed" that the University of Missouri-Columbia tenure process was clear. Sixty-four
percent (;/ = 270) of Tenured and Tenure-Track Faculty respondents felt supported and mentored
during the tenure-track years. Eighty-two percent (n = 365) of Tenure-Track Faculty respondents
felt that their research and 59% (n = 260) that their teaching was valued by University of
Missouri-Columbia. Twenty-nine percent (n = 122) of Tenured and Tenure-Track Faculty
respondents "agreed" or "strongly agreed" that they felt pressured to change their
research/scholarship agenda to achieve tenure/promotion. Sixty-four percent (« = 293) of Non-
Tenure-Track Faculty respondents "strongly agreed" or "agreed" that the criteria used for
contract renewal were clear. Sixty-nine percent (n = 355) of Non-Tenure-Track Faculty
respondents "strongly agreed" or "agreed" that they believed that expectations of their
responsibilities were clear. Ninety-one percent (n = 411) ofNon-Tenure-Track Faculty
284
Student Perceptions of Campus Climate
This section of the report is dedicated to survey items that were specific to University of
Missouri-Columbia students. Several survey items queried Student96 respondents about their
academic experiences, their' general perceptions of the campus climate, and their comfort with
their' classes.
Students' Perceived Academic Success
Factor Analysis Methodology
A confirmatory factor analysis was conducted on one scale embedded in Question 15 of the
survey. The scale, termed "Perceived Academic Success" for the purposes of this project, was
developed using Pascarella and Terenzini's (1980) Academic, and Intellectual Development
Scale. This scale has been used in a variety of studies examining student persistence. The first
seven sub-questions of Question 15 of the survey reflect the questions on this scale.
The questions in each scale were answered on a Likert metric from strongly agree to strongly
disagree (scored 1 for strongly agree and 5 for strongly disagree). For the purposes of analysis,
Student respondents w7ho did not answer all scale sub-questions u7ere not included in the
analysis. Approximately three percent (2.7%) of all potential Student respondents were removed
from the analysis due to one or more missing responses.
A factor analysis was conducted on the Perceived Academic Success scale utilizing principal axis
factoring. The factor loading of each item was examined to test whether the intended questions
combined to represent the underlying construct of the scale.97 One question from the scale
(Q15_2) did not hold as well with the construct and was removed; the scale used for analyses
had six questions rather than seven. The internal consistency reliability (Cronbach's alpha) of the
scale was 0.866 (after removing the question noted above), which is high, meaning that the scale
produces consistent results. With Q15_2 included, Cronbach's alpha was only 0.794.
9 6 Student respondents refer to Under graduate Student respondents and Graduate Student. Professional StudentPost-Doctoral respondents. 9 Factor analysis is a particularly useful technique for scale construction. It is used to determine how well a set of survey questions combine to measure a latent construct by measuring how similarly respondents answer those questions.
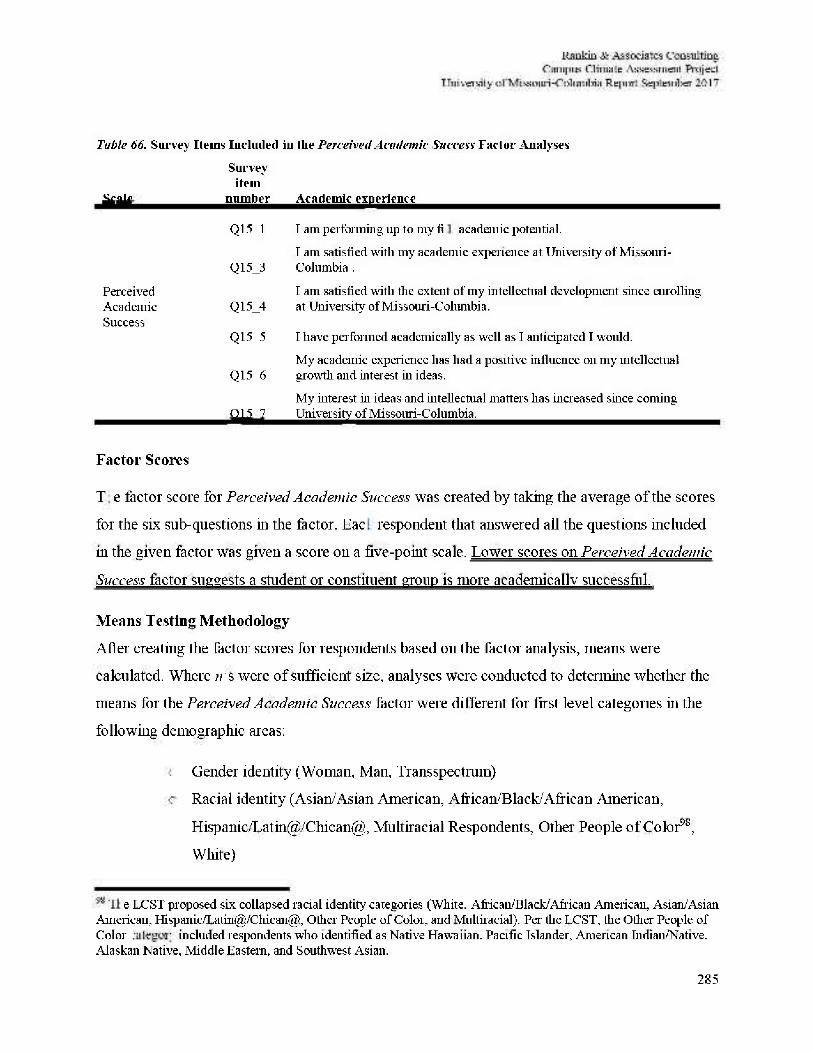
Table 66. Survey Items Included ill tlie Perceived Academic Success Factor Analyses
Scale
Survey item
number Academic experience
Q151 I am performing up to my full academic potential.
Q15_3 I am satisfied with my academic experience at University of Missouri-Columbia.
Perceived Academic Success
Q15_4
Q155
I am satisfied with the extent of my intellectual development since enrolling at University of Missouri-Columbia.
I have performed academically as well as I anticipated I would.
Q 1 5 6 My academic experience has had a positive influence 011 my intellectual growth and interest in ideas.
015 7 My interest in ideas and intellectual matters has increased since coming University of Missouri-Columbia.
Factor Scores
The factor score for Perceived Academic Success was created by taking the average of the scores
for the six sub-questions in the factor. Each respondent that answered all the questions included
in the given factor was given a score on a five-point scale. Lower scores on Perceived Academic
Success factor suggests a student or constituent group is more academically successful.
Means Testing Methodology After creating the factor scores for respondents based on the factor analysis, means were
calculated. Where its were of sufficient size, analyses were conducted to determine whether the
means for the Perceived Academic Success factor were different for first level categories in the
following demographic areas:
The LCST proposed six collapsed racial identity categories (White, African/Black African American, Asian/Asian American, Hispanic/Latin@/Chican@, Other People of Color, and Multiracial). Per the LCST, the Other People of Color category included respondents who identified as Native Hawaiian. Pacific Islander, American Indian/Native. Alaskan Native, Middle Eastern, and Southwest Asian.
Gender identity (Woman, Man, Transspectrum)
Racial identity (Asian/Asian American, African/Black/.African American,
Hispanic/Latin@/Chican@, Multiracial Respondents, Other People of Color98,
White)
285
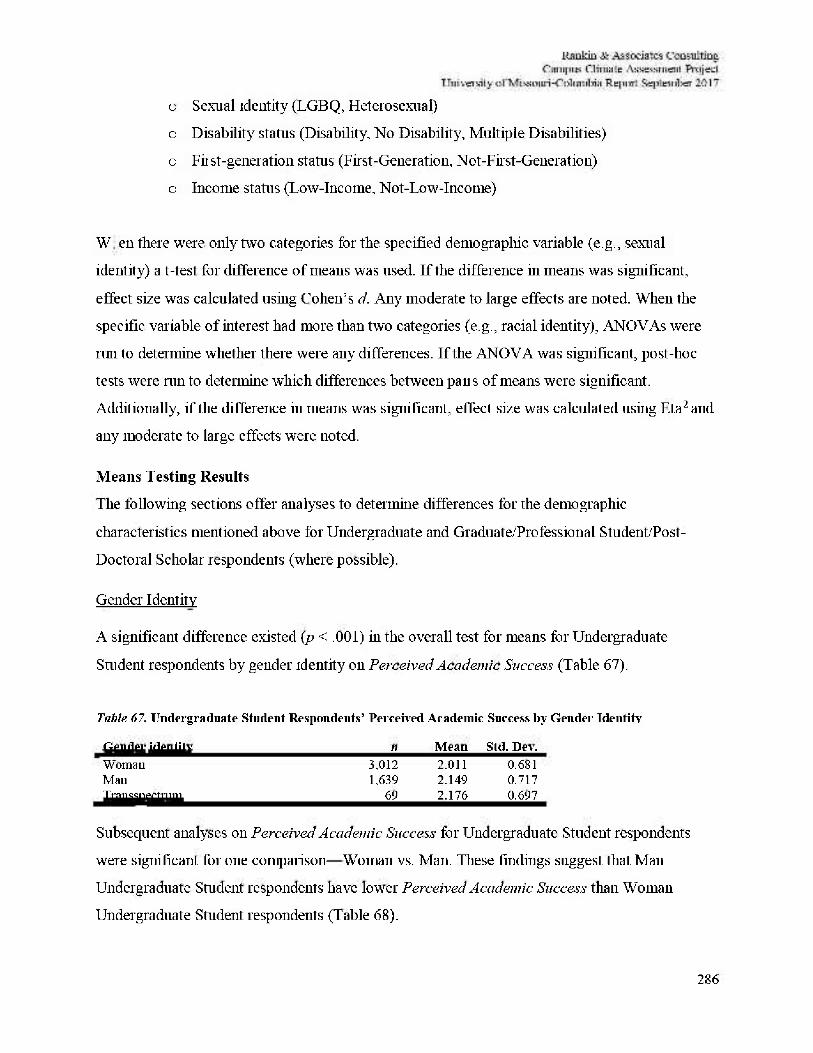
286
o Sexual identity (LGBQ, Heterosexual)
o Disability status (Disability. No Disability, Multiple Disabilities)
o First-generation status (First-Generation, Not-First-Generation)
o Income status (Low-Income, Not-Low-Income)
When there were only two categories for the specified demographic variable (e.g., sexual
identity) a t-test for difference of means was used. If the difference in means was significant,
effect size was calculated using Cohen's d. Any moderate to large effects are noted. When the
specific variable of interest had more than two categories (e.g., racial identity), ANOVAs were
run to determine whether there were any differences. If the ANOVA was significant, post-hoc
tests were run to determine which differences between pans of means were significant.
Additionally, if the difference in means was significant, effect size was calculated using Eta2 and
any moderate to large effects were noted.
Means Testing Results The following sections offer analyses to determine differences for the demographic
characteristics mentioned above for Undergraduate and Graduate/Professional Student/Post-
Doctoral Scholar respondents (where possible).
Gender Identity
A significant difference existed (p < .001) in the overall test for means for Undergraduate
Student respondents by gender identity 011 Perceived Academic Success (Table 67).
Table 67. Undergraduate Student Respondents' Perceived Academic Success by Gender Identity
Gender identity It Mean Std. Dev. Woman 3.012 2.011 0.681 Man 1.639 2.149 0.717 Transspectrum 69 2.176 0.697
Subsequent analyses 011 Perceived Academic Success for Undergraduate Student respondents
were significant for one comparison—Woman vs. Man. These findings suggest that Man
Undergraduate Student respondents have lower Perceived Academic Success than Woman
Undergraduate Student respondents (Table 68).
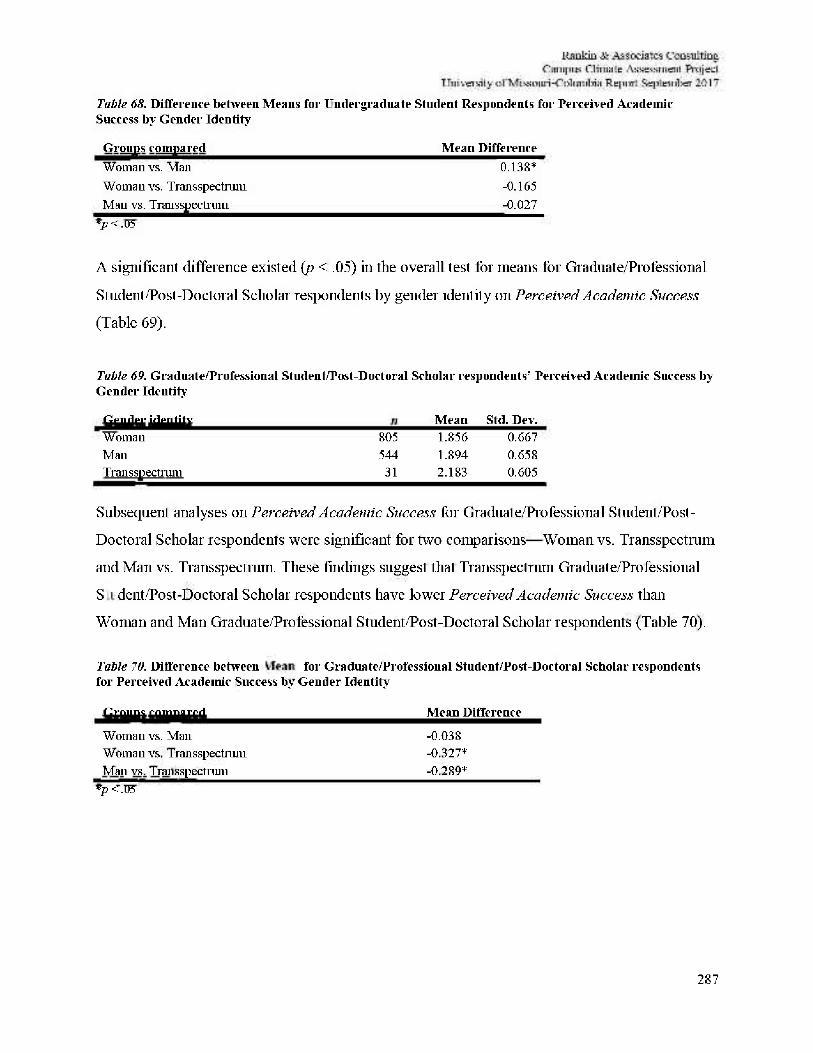
287
Table 68. Difference between Means for Undergraduate Student Respondents for Perceived Academic Success by Gender Identity
Groups compared Mean Difference Woman vs. Man 0.138* Woman vs. Transspectrum -0.165 Man vs. Transspectrum -0.027
*p< .05
A significant difference existed (p < .05) in the overall test for means for Graduate/Professional
Stirdent/Post-Doctoral Scholar respondents by gender identity on Perceived Academic Success
(Table 69).
Table 69. Graduate/Professional Student/Post-Doctoral Scholar respondents' Perceived Academic Success by Gender Identity
Gender identity n Mean Std. Dev. Woman 805 1.856 0.667 Man 544 1.894 0.658 Transspectrum 31 2.183 0.605
Subsequent analyses on Perceived Academic Success for Graduate/Professional Student/Post-
Doctoral Scholar respondents were significant for two comparisons—Woman vs. Transspectrum
and Man vs. Transspectrum. These findings suggest that Transspectrum Graduate/Professional
Student/Post-Doctoral Scholar respondents have lower Perceived Academic Success than
Woman and Man Graduate/Professional Student/Post-Doctoral Scholar respondents (Table 70).
Table 70. Difference between Means for Graduate/Professional Student/Post-Doctoral Scholar respondents for Perceived Academic Success by Gender Identity
Groups compared Mean Difference
Woman vs. Man -0.038 Woman vs. Transspectrum -0.327* Man vs. Transspectrum -0.289*
*p < .05
Groups compared Mean Difference Woman vs. Man -0.038 Woman vs. Transspectrum -0.327* Man vs. Transpectrum -0.289*
*p< .05
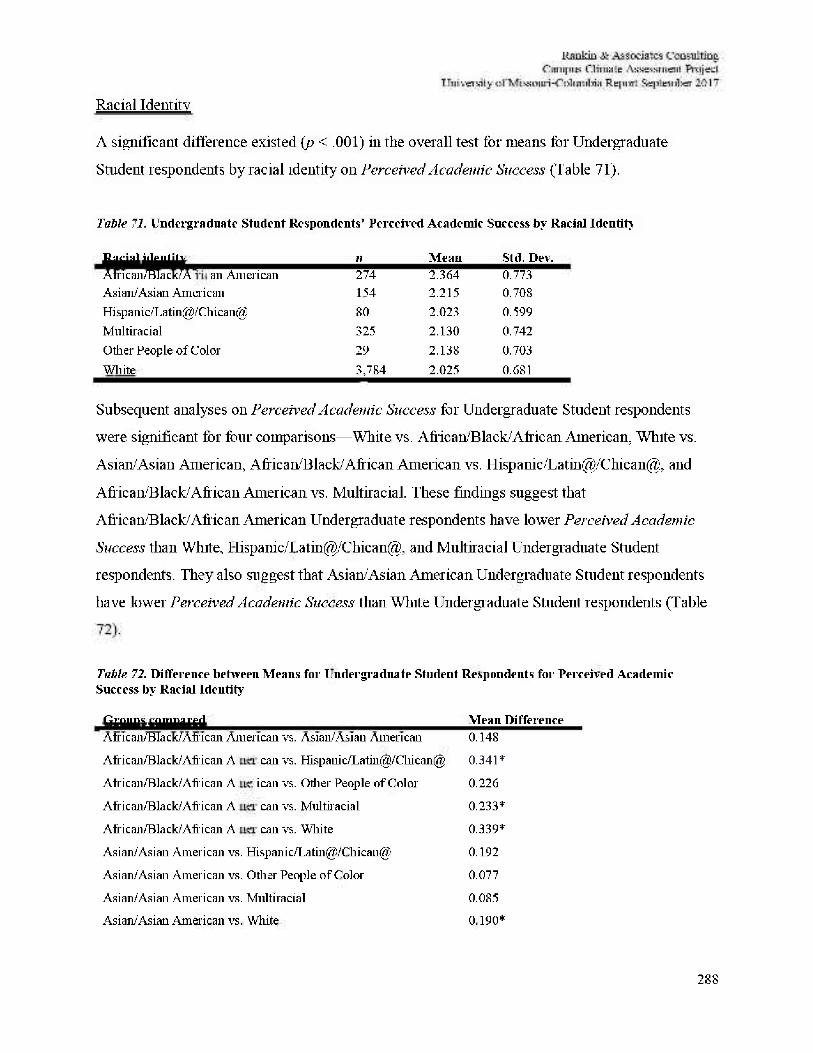
288
Racial Identity
A significant difference existed (p < .001) in the overall test for means for Undergraduate
Student respondents by racial identity on Perceived Academic Success (Table 71).
Table 71. Undergraduate Student Respondents' Perceived Academic Success by Racial Identity-
Racial identity // Mean Std. Dev. African Black/African American 274 2.364 0.773 Asian/Asian American 154 2.215 0.708 Hispanic/Latin@/Chican@ 80 2.023 0.599 Multiracial 325 2.130 0.742 Other People of Color 29 2.138 0.703 White 3,784 2.025 0.681
Subsequent analyses 011 Perceived Academic Success for Undergraduate Student respondents
were significant for four comparisons—White vs. African/Black/African American, White vs.
Asian/Asian American, African/Black/African American vs. Hispanic/Latin@/Chican@, and
African/Black/African American vs. Multiracial. These findings suggest that
African/Black/African American Undergraduate respondents have lower Perceived Academic
Success than White, Hispanic/Latin@/Chican@, and Multiracial Undergraduate Student
respondents. They also suggest that Asian/Asian American Undergraduate Student respondents
have lower Perceived Academic Success than White Undergraduate Student respondents (Table
Table 72. Difference between Means for Undergraduate Student Respondents for Perceived Academic Success by Racial Identity
Groups compared Mean Difference African/Blacks'African American vs. Asian/Asian American 0.148
African/Black/African American vs. Hispaiiic/Latin@/Chican@ 0.341*
African/Black/African American vs. Other People of Color 0.226
African/Black/African American vs. Multiracial 0.233*
African/Black/African American vs. White 0.339*
Asian/Asian American vs. Hispanic/Latin@/Chicau@ 0.192
Asian/Asian American vs. Other People of Color 0.077
Asian/Asian American vs. Multiracial 0.085 Asian/Asian American vs. White 0.190*
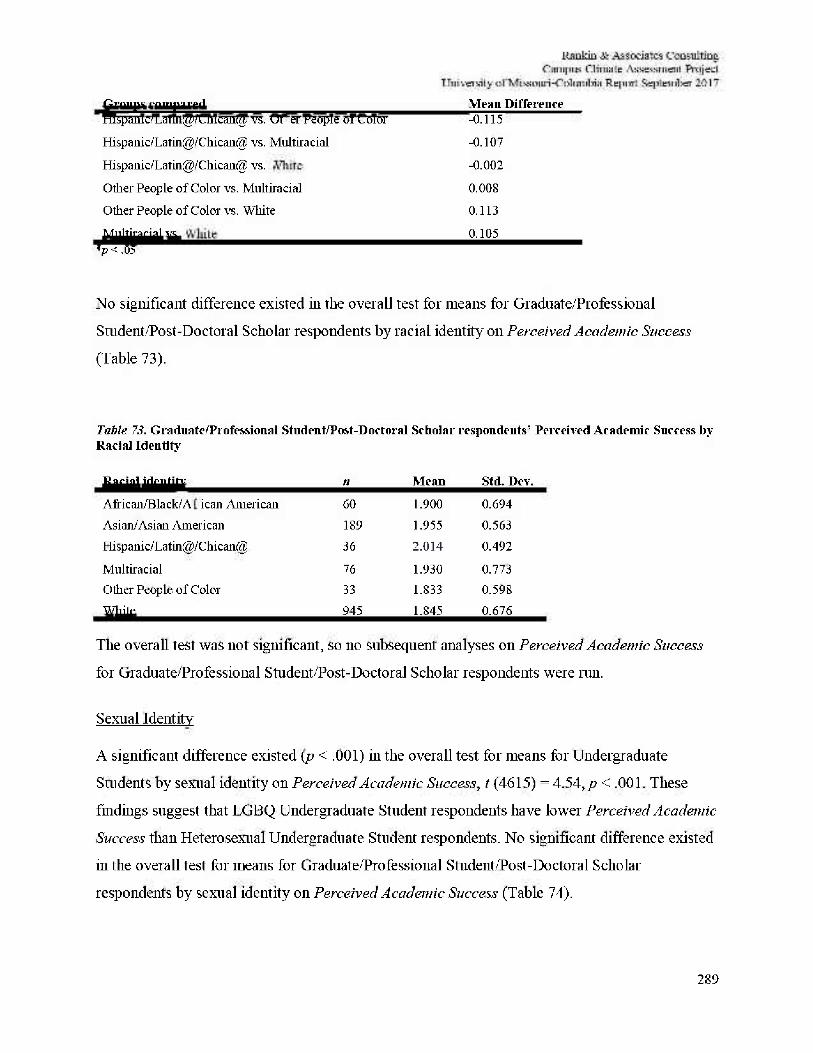
289
Groups compared Mean Difference Hispanic/Latin@/Chican@ vs. Other People of Color -0.115
Hispanic/Latin@/Chican@ vs. Multiracial -0.107
Hispanic/Latin@/Chican@ vs. White -0.002
Other People of Color to. Multiracial 0.008 Other People of Color to. White 0.113
Multiracial vs. White 0.105 *p < .05
No significant difference existed in the overall test for means for Graduate/Professional
Student/Post-Doctoral Scholar respondents by racial identity on Perceived Academic Success
(Table 73).
Table 73. Graduate/Professional Student/Post-Doctoral Scholar respondents' Perceived Academic Success by Racial Identity
Racial identity n Mean Std. Dev. Aifican/Black/African American 60 1.900 0.694 Asian/Asian American 189 1.955 0.563 Hispanic/Latin@/Chican@ 36 2.014 0.492
Multiracial 76 1.930 0.773 Other People of Color 33 1.833 0.598 White 945 1.845 0.676
The overall test was not significant, so no subsequent analyses on Perceived Academic Success
for Graduate/Professional Student/Post-Doctoral Scholar respondents were run.
Sexual Identity
A significant difference existed (p < .001) in the overall test for means for Undergraduate
Students by sexual identity on Perceived Academic Success, t (4615) = 4.54,/? < .001. These
findings suggest that LGBQ Undergraduate Student respondents have lower Perceived Academic
Success than Heterosexual Undergraduate Student respondents. No significant difference existed
in the overall test for means for Graduate/Professional Student/Post-Doctoral Scholar
respondents by sexual identity on Perceived Academic Success (Table 74).
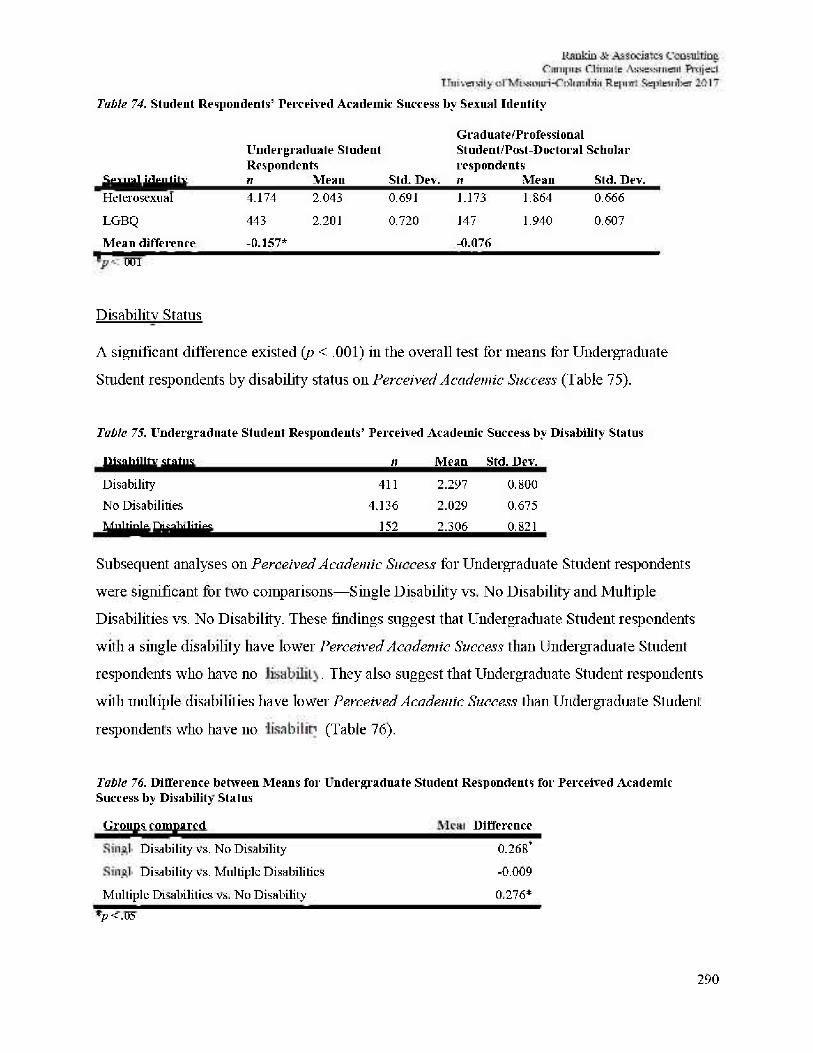
290
Table 74. Student Respondents' Perceived Academic Success by Sexual Identity
Sexual identity
Undergraduate Student Respondents a Mean Std. Dev.
Graduate/Professional Student/Post-Doctoral Scholar respondents n Mean Std. Dev.
Heterosexual 4.174 2.043 0.691 1.173 1.864 0.666
LGBQ 443 2.201 0.720 147 1.940 0.607 Mean difference -0.157* -0.076
001
Disability Status
A significant difference existed (p < .001) in the overall test for means for Undergraduate
Student respondents by disability status on Perceived Academic Success (Table 75).
Table 75. Undergraduate Student Respondents' Perceived Academic Success by Disability Status
Disability status It Mean Std. Dev. Disability* 411 2.297 0.800 No Disabilities 4.136 2.029 0.675 Multiple Disabilities 152 2.306 0.821
Subsequent analyses on Perceived Academic Success for Undergraduate Student respondents
were significant for two comparisons—Single Disability vs. No Disability and Multiple
Disabilities vs. No Disability. These findings suggest that Undergraduate Student respondents
with a single disability have lower Perceived Academic Success than Undergraduate Student
respondents who have no disability. They also suggest that Undergraduate Student respondents
with multiple disabilities have lower Perceived Academic Success than Undergraduate Student
respondents who have no disability (Table 76).
Table 76. Difference between Means for Undergraduate Student Respondents for Perceived Academic Success by Disability Status
Groups compared Mean Difference Single Disability vs. No Disability 0.268*
Single Disability vs. Multiple Disabilities -0.009
Multiple Disabilities vs. No Disability 0.276* *p< .05
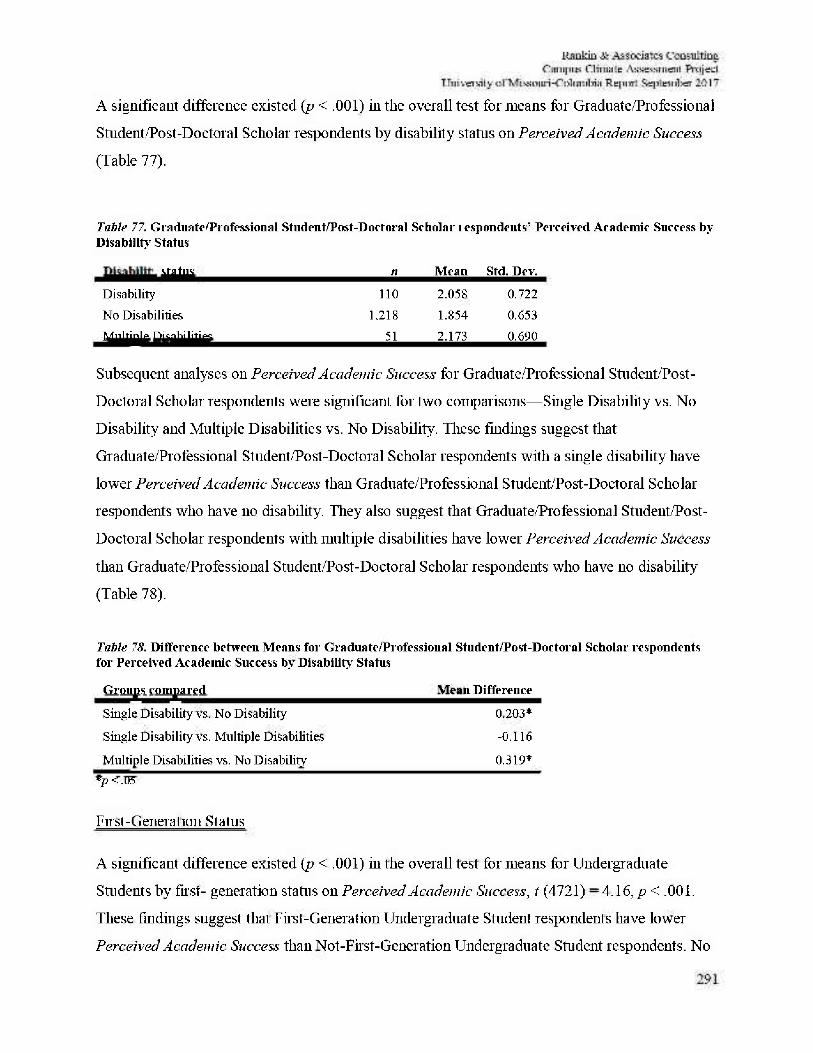
A significant difference existed {p < .001) in the overall test for means for Graduate/Professional
Student/Post-Doctoral Scholar respondents by disability status on Perceived Academic Success
(Table 77).
Table 77. Graduate/Professional Student/Post-Doctoral Scholar respondents' Perceived Academic Success by Disability7 Status
Disability status It Mean Std. Dev. Disability* 110 2.058 0.722 No Disabilities 1.218 1.854 0.653 Multiple Disabilities 51 2.173 0.690
Subsequent analyses on Perceived Academic Success for Graduate/Professional Student/Post-
Doctoral Scholar respondents were significant for two comparisons—Single Disability vs. No
Disability and Multiple Disabilities vs. No Disability. These findings suggest that
Graduate/Professional Student/Post-Doctoral Scholar respondents with a single disability have
lower Perceived Academic Success than Graduate/Professional Student/Post-Doctoral Scholar
respondents who have no disability. They also suggest that Graduate/Professional Student/Post-
Doctoral Scholar respondents with multiple disabilities have lower Perceived Academic Success
than Graduate/Professional Student/Post-Doctoral Scholar respondents who have no disability
(Table 78).
Table 78. Difference between Means for Graduate/Professional Student/Post-Doctoral Scholar respondents for Perceived Academic Success by Disability Status
Groups compared Mean Difference
Single Disability vs. No Disability 0.203*
Single Disability vs. Multiple Disabilities -0.116
Multiple Disabilities vs. No Disability 0.319* *p<. 05
First-Generation Status
A significant difference existed (p < .001) in the overall test for means for Undergraduate
Students by first- generation status oil Perceived Academic Success, t (4721) =4.16, p < .001.
These findings suggest that First-Generation Undergraduate Student respondents have lower
Perceived Academic Success than Not-First-Generation Undergraduate Student respondents. No
Groups compared Mean Difference Single Disability vs. No Disability 0.203*
Single Disability vs. Multiple Disabilities -0.116
Multiple Disabilities vs. No Disability 0.319* *p < .05
f irst-Geiieration Status
A significant difference existed (p < .001) in the overall test for means for Undergraduate
Students by fir st- generation status 011 Perceived Academic Success, t (4721) = 4.16, p < .001.
These findings suggest that First-Generation Undergraduate Student respondents have lower
Perceived Academic Success than Not-First-Generation Undergraduate Student respondents. No
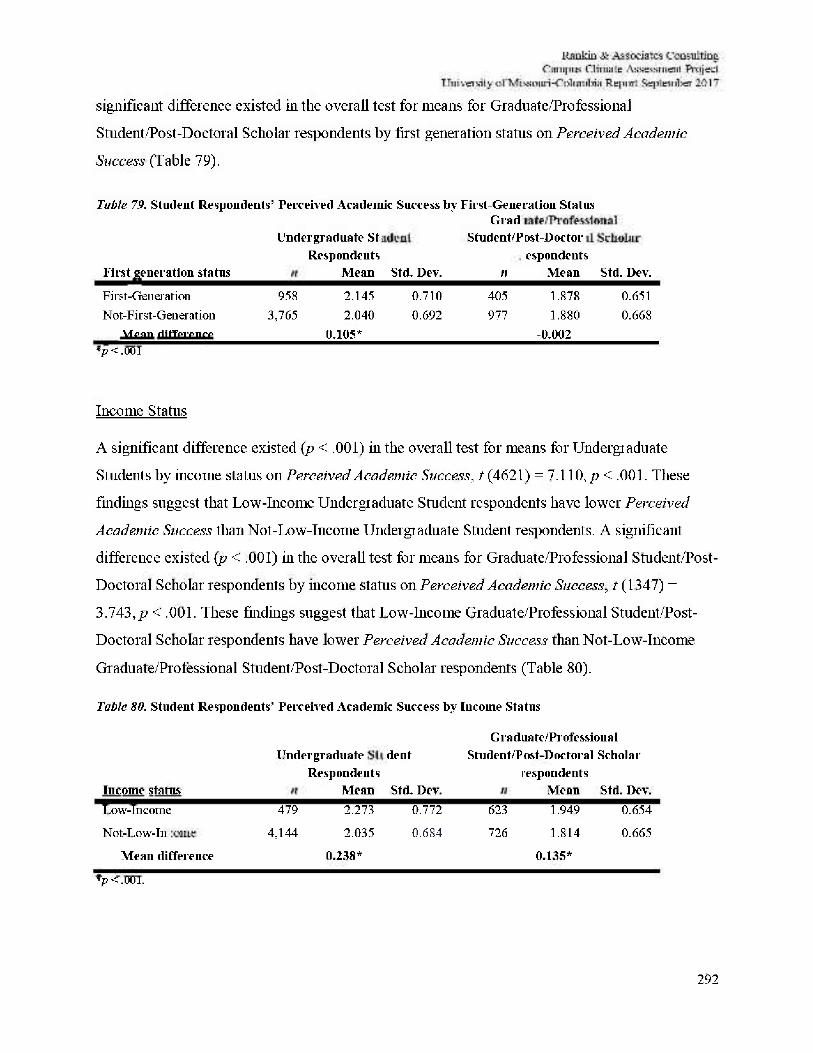
292
significant difference existed in the overall test for means for Graduate/Professional
Student/Post-Doctoral Scholar respondents by first generation status on Perceived Academic
Success (Table 79).
Table 79. Student Respondents' Perceived Academic Success by First-Gene ration Status
First generation status
Under I
n
graduate Student Respondents
Mean Std. Dev.
Graduate/Professional Student/Post-doctoral Scholar
n
Post-Doctor respondents
Mean Std. Dev.
First-Generation 958 2.145 0.710 405 1.878 0.651 Not-First-Generation 3,765 2.040 0.692 977 1.880 0.668
Mean difference 0.105* -0.002 *p< .001
Income Status
A significant difference existed (p < .001) in the overall test for means for Undergraduate
Students by income status on Perceived Academic Success, t (4621) = 7.110, p < .001. These
findings suggest that Low-Income Undergraduate Student respondents have lower Perceived
Academic Success than Not-Low-Income Undergraduate Student respondents. A significant
difference existed (p < .001) in the overall test for means for Graduate/Professional Student/Post-
Doctoral Scholar respondents by income status on Perceived Academic Success, t (1347) =
3.743,/? < .001. These findings suggest that Low-Income Graduate/Professional Student/Post-
Doctoral Scholar respondents have lower Perceived Academic Success than Not-Low-Income
Graduate/Professional Student/Post-Doctoral Scholar respondents (Table 80).
Table 80. Student Respondents' Perceived Academic Success by Income Status
Income status
Under I
n
graduate Respondents
Mean
Student
Std. Dev.
Graduate Student/P
n
uate/Profess Post-Doctora respondents
Mean
ional 1 Scholar
Std. Dev. Low-Income 479 2.273 0.772 623 1.949 0.654 Not-Low-Income 4,144 2.035 0.684 726 1.814 0.665
Mean difference 0.238* 0.135*
*p< .001.
293
Students' Perceptions of Campus Climate
One of the survey items asked Student respondents the degree to which they agr eed with fifteen
statements about their interactions with faculty, students, staff members, and senior
administrators at University of Missouri-Columbia. Seventy-three percent (n = 4,537) of Student
respondents felt valued by University of Missouri-Columbia faculty; 71% (n = 4,411) felt valued
by University of Missouri-Columbia staff; and 49% (n = 3,039) felt valued by University of
Missouri-Columbia senior administrators (e.g., chancellor, dean, vice chancellor, provost).
Frequencies and significant differences based on student status, gender identity," racial
identity100, sexual identity,101 religious/spiritual identity, citizenship status, disability status, age,
housing status, military status, employment status, family income status, income status, first-
generation and low-income status, and first-generation status are provided in Tables 81 through
Table 81 illustrates that 73% (ri = 4,537) of Student respondents "strongly agreed" or "agreed"
that they felt valued by University of Missouri-Columbia faculty. Several significant differences
were found among student groups. A significantly lower percentage of Undergraduate First Year
Student respondents (2%, n = 74) than Undergraduate Transfer Student respondents (4%, n = 20)
"strongly disagreed" that they felt valued by faculty. Transspectrum Student respondents (40%, n
= 42) were much less likely than Women Student respondents (51%, n = 1,977) and Men Student
respondents (46%, n = 1,023) to "agree" that they felt valued by faculty. A larger percentage of
Non-U.S. Citizen Student respondents (29%, n = 161) than U.S. Citizen Student respondents
(23%, n = 1,320) "strongly agr eed" that they felt valued by faculty. Student Respondents of
Color (3%, n = 22) and Multiracial Student respondents (4%, n = 17) were more likely than
White Student respondents (2%, n = 85) to "strongly disagree" that they felt valued by faculty.
Heterosexual Student respondents (25%, n = 1,333) were much more likely than LGBQ Student
"As noted earlier, per the LCST, gender identity was categorized to only Men, Transspectrum, and Women to maintain response confidentiality. ioo y ] l e LCST proposed three collapsed racial identity categories (White, People of Color, and Multiracial), where the Alaskan Native. American Indian/Native American, Asian/Asian American, African/Black/African American. Hispanic/Latino/Chicano, Middle Eastern, Southwest Asian, and Native Hawaiian/Pacific Islander were collapsed into one category named People of Color). Where possible, the racial identity groups are expanded and where necessary collapsed. 1 0 IAs noted earlier, per the LCST, sexual identity was categorized to only LGBQ and Heterosexual to maintain response confidentiality.
294
respondents (19%, n = 117) to "strongly agree" that they felt valued by faculty. A significantly
lower percentage of No Military Service Student respondents (8%, n = 460) than Military
Service Student respondents (14%, n = 23) "disagreed" that they felt valued by faculty. Not-
First-Generation Student respondents (50%, n = 2,416) were more likely than First-Generation
Student respondents (45%, n = 626) to "agree" that they felt valued by faculty. A higher
percentage (10%, n = 108) of Low-Income-Family Student respondents compared with (8%, n =
379) of Not-Low-Income-Family Student respondents "disagreed" that they felt valued by
faculty. A higher percentage (49%, n = 2,865) of Not-First Generation and Low-Income Student
respondents versus (42%, n = 181) of First-Generation and Low-Income Student respondents
"agr eed" that they felt valued by faculty. Twenty-six percent (n = 952) of Christian
Religious/Spiritual Identity Student respondents were more likely than 21% (n = 403) of No
Religious/Spiritual Identity Student respondents to "strongly agree" that they felt valued by
faculty. No Disability Student respondents (25%, n = 1,350) w7ere more likely than Multiple
Disabilities Student respondents (21%, n = 44) and Single Disability Student respondents (16%,
n = 89) to "strongly agree" that they felt valued by faculty. A lower percentage of Employed
Student respondents (23%, n = 805) than Not-Employed Student respondents (25%, n = 653)
"strongly agreed" that they felt valued by faculty. A larger percentage of fewer than five Housing
Insecure Student respondents and Non-Campus Student respondents (9%, n = 395) than On-
Campus Student respondents (6%, n = 12) "disagreed" that they felt valued by faculty.
Table 81 illustrates that 71% (ri = 4,411) of Student respondents "strongly agreed" or "agreed"
that they felt valued by University of Missouri-Columbia staff. Several significant differences
were found among student groups. A significantly lower percentage of Undergraduate First Year
Student respondents (2%, n = 71) than Undergraduate Transfer Student respondents (4%, n = 20)
"strongly disagreed" that they felt valued by staff. Women Student respondents (50%, n = 1,920)
were much more likely than Men Student respondents (45%, n = 1,003) and Transspectrum
Student respondents (40%, n = 42) to "agree" that they felt valued by staff. A larger percentage
of Non-U.S. Citizen Student respondents (27%, n = 149) than U.S. Citizen Student respondents
(23%, n = 1,283) "strongly agreed" that they felt valued by staff. Multiracial Student respondents
(3%, ii = 14) were more likely than Student Respondents of Color (2%, n = 20) and White
Student respondents (2%, n = 80) to "strongly disagree" that they felt valued by staff.
295
Heterosexual Student respondents (24%, n = 1,288) were much more Likely than LGBQ Student
respondents (19%, n= 116) to "strongly agree" that they felt valued by staff. A significantly
lower percentage of No Military Service Student respondents (7%, n = 417) than Military
Service Student respondents (14%, n = 22) "disagreed" that they felt valued by staff. Not-First-
Generation Student respondents (49%, n = 2,344) were more likely than First-Generation Student
respondents (45%, n = 621) to "agree" that they felt valued by staff. A higher percentage (9%, n
= 104) of Low-Income-Family Student respondents compared with (7%, n = 343) of Not-Low-
Income-Family Student respondents "disagreed" that they felt valued by staff. A higher
percentage (48%, n = 2,785) of Not-First Generation and Low-Income Student respondents
versus (43%, n = 185) of First-Generation and Low-Income Student respondents "agreed" that
they felt valued by staff. Twenty-five percent (n = 937) of Christian Religious/Spiritual Identity
Student respondents were much more likely than 22% (n = 77) of Other Religious/Spiritual
Identity Student respondents, 20% (n = 376) of No Religious/Spiritual Identity Student
respondents, and 20% (« = 42) of Multiple Religious/Spiritual Identity Student respondents to
"strongly agree" that they felt valued by staff. No Disability Student respondents (24%, n =
1,303) and Multiple Disabilities Student respondents (21%, n = 44) were more likely than Single
Disability Student respondents (16%, n = 85) to "strongly agree" that they felt valued by staff. A
higher percentage of Not-Employed Student respondents (25%, n = 631) than Employed Student
respondents (22%, n = 781) "strongly agreed" that they felt valued by staff. A smaller percentage
of On-Campus Student respondents (5%, n = 62) than Non-Campus Student respondents (8%, n
= 367) and Housing Insecure Student respondents (15%, n = 5) "disagreed" that they felt valued
by staff.
Forty-nine percent (n = 3,039) of Student respondents "strongly agreed" or "agreed" that they
felt valued by University of Missouri-Columbia senior administrators. Several significant
differences were found among student groups. A significantly lower percentage of
Undergraduate First Year Student respondents (5%, n = 212) than Undergraduate Transfer
Student respondents (8%, n = 41) "strongly disagreed" that they felt valued by senior
administrators. A significantly lower percentage of Doctoral degree candidate respondents (24%,
n = 155) than Master degree candidate respondents (26%, n =117) and Professional degree
candidate respondents (32%, n = 71) "agreed" that they felt valued by senior administrators.
296
Women Student respondents (33%, n = 1,294) and Men Student respondents (30%, n = 657)
were much more likely than Transspectrum Student respondents (17%, n = 17) to "agree" that
they felt valued by senior administrators. A larger percentage of Non-U.S. Citizen Student
respondents (23%, n = 128) than U.S. Citizen Student respondents (17%, n = 935) "strongly
agreed" that they felt valued by senior administrators. Student Respondents of Color (18%, n =
158) and White Student respondents (17%, n = 837) were more likely than Multiracial Student
respondents (13%, n = 53) to "strongly agree" that they felt valued by senior administrators.
Heterosexual Student respondents (18%, n = 976) were much more likely than LGBQ Student
respondents (11%, n = 66) to "strongly agree" that they felt valued by senior administrators. A
higher percentage (18%, n = 893) ofNot-Low-Income-Family Student respondents compared
with (14%, rt = 159) of Low-Income-Family Student respondents "strongly agreed" that they felt
valued by senior administrators. A higher percentage (32%, n = 1,865) ofNot-Fiist Generation
and Low-Income Student respondents versus (25%, n = 105) of First-Generation and Low-
Income Student respondents "agreed" that they felt valued by senior administrators. Twenty
percent (n = 730) of Christian Religious/Spiritual Identity Student respondents and 19% (n = 66)
of Other Religious/Spiritual Identity Student respondents were much more likely than 13% (n =
242) of No Religious/Spiritual Identity Student respondents and 13% (« = 27) of Multiple
Religious/Spiritual Identity Student respondents to "strongly agree" that they felt valued by
senior administrators. No Disability Student respondents (18%, n = 970) were more likely than
Multiple Disabilities Student respondents (15%, n = 32) and Single Disability Student
respondents (12%, n = 62) to "strongly agree" that they felt valued by senior administrators. A
higher percentage of Not-Employed Student respondents (20%, n = 518) than Employed Student
respondents (15%, n = 532) "strongly agreed" that they felt valued by senior administrators. A
larger percentage of On-Campus Student respondents (21%, n = 270) and Housing Insecure
Student respondents (21%, n = 7) than Non-Campus Student respondents (16%, rt = 745)
"strongly agreed" that they felt valued by senior administrators.
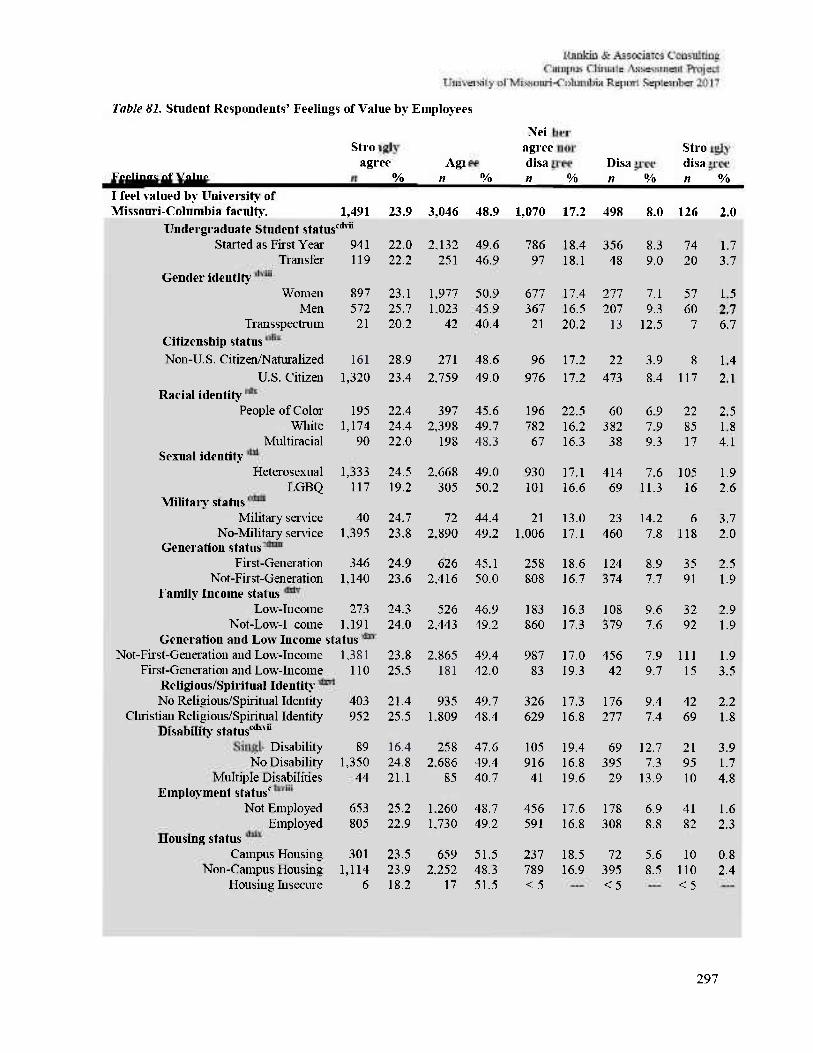
297
Table 81. Student Respondents' Feelings of Value by Employees
Feelings of Value I feel valued by University of Missouri-Columbia faculty.
Strongly agree
n
1,491
ee
% 23.9
Agree n
3,046
% 48.9
Neither agree nor disagree n
1,070
%
17.2
Disagree n
498
%
8.0
Strongly disagree n
126
%
2.0 Undergraduate Student status' cdvii
Started as First Year 941 22.0 2.132 49.6 786 18.4 356 8.3 74 1.7 Transfer 119 22.2 251 46.9 97 18.1 48 9.0 20 3.7
Gender identity Women 897 23.1 1,977 50.9 677 17.4 277 7.1 57 1.5
Men 572 25.7 1.023 45.9 367 16.5 207 9.3 60 2.7 Transspectrum 21 20.2 42 40.4 21 20.2 13 12.5 7 6.7
Citizenship status Non-U.S. Citizen/Naturalized 161 28.9 271 48.6 96 17.2 22 3.9 8 1.4
U.S. Citizen 1,320 23.4 2,759 49.0 976 17.2 473 8.4 117 2.1 Racial identity
People of Color 195 22.4 397 45.6 196 22.5 60 6.9 22 2.5 White 1,174 24.4 2,398 49.7 782 16.2 382 7.9 85 1.8
Multiracial 90 22.0 198 48.3 67 16.3 38 9.3 17 4.1 Sexual identity
Heterosexual 1,333 24.5 2.668 49.0 930 17.1 414 7.6 105 1.9 LGBQ 117 19.2 305 50.2 101 16.6 69 11.3 16 2.6
Military status Military service 40 24.7 72 44.4 21 13.0 23 14.2 6 3.7
No-Military service 1,395 23.8 2.890 49.2 1.006 17.1 460 7.8 118 2.0 Generation status
First-Generation 346 24.9 626 45.1 258 18.6 124 8.9 35 2.5 Not-First-Generation 1,140 23.6 2.416 50.0 808 16.7 374 7.7 91 1.9
Family Income status Low-Income 273 24.3 526 46.9 183 16.3 108 9.6 32 2.9
Not-Low-Income 1.191 24.0 2.443 49.2 860 17.3 379 7.6 92 1.9 Generation and Low Income status
Not-First-Generation and Low-Income 1.381 23.8 2.865 49.4 987 17.0 456 7.9 111 1.9 First-Generation and Low-Income 110 25.5 181 42.0 83 19.3 42 9.7 15 3.5
Religious/Spiritual Identity No Religious/Spiritual Identity 403 21.4 935 49.7 326 17.3 176 9.4 42 2.2
Christian Religious/Spiritual Identity 952 25.5 1.809 48.4 629 16.8 277 7.4 69 1.8 Disability statusc<taii
Single Disability 89 16.4 258 47.6 105 19.4 69 12.7 21 3.9 No Disability 1,350 24.8 2.686 49.4 916 16.8 395 7.3 95 1.7
Multiple Disabilities 44 21.1 85 40.7 41 19.6 29 13.9 10 4.8 Employment status'
Not Employed 653 25.2 1.260 48.7 456 17.6 178 6.9 41 1.6 Employed 805 22.9 1.730 49.2 591 16.8 308 8.8 82 2.3
Housing status Campus Housing 301 23.5 659 51.5 237 18.5 72 5.6 10 0.8
Non-Campus Housing 1,114 23.9 2.252 48.3 789 16.9 395 8.5 110 2.4 Housing Insecure 6 18.2 17 51.5 < 5 < 5 < 5
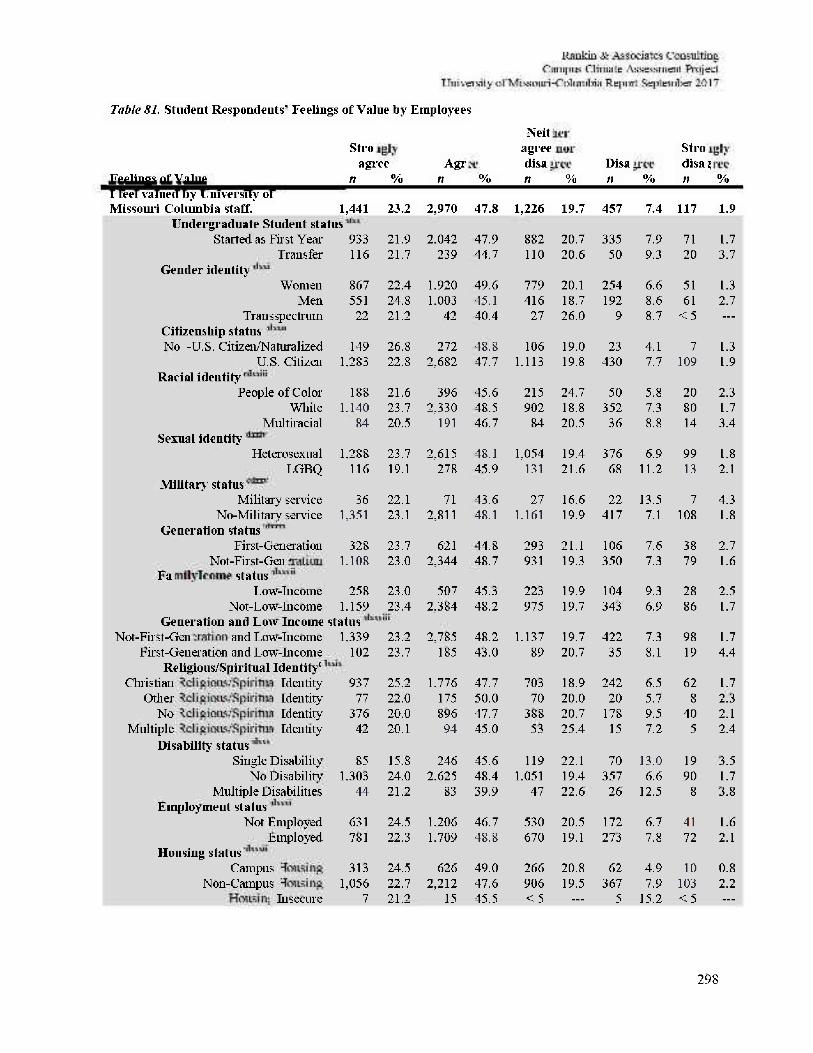
298
Table 81. Student Respondents' Feelings of Value by Employees
Feelings of Value I feel valued by University of Missouri-Columbia staff.
Strongly agree
n
1,441
ee % 23.2
Agree n
2,970
% 47.8
Neither agree nor disagree n
1,226
%
19.7
Disagree n
457
%
7.4
Strongly disagree n
117
; %
1.9 Undergraduate Student status
Started as First Year 933 21.9 2.042 47.9 882 20.7 335 7.9 71 1.7 Transfer 116 21.7 239 44.7 110 20.6 50 9.3 20 3.7
Gender identity Women 867 22.4 1.920 49.6 779 20.1 254 6.6 51 1.3
Men 551 24.8 1.003 45.1 416 18.7 192 8.6 61 2.7 Transspectrum 22 21.2 42 40.4 27 26.0 9 8.7 <5 . . .
Citizenship status Non-U.S. Citizen/Naturalized 149 26.8 272 48.8 106 19.0 23 4.1 7 1.3
U.S. Citizen 1.283 22.8 2,682 47.7 1.113 19.8 430 7.7 109 1.9 Racial identify
People of Color 188 21.6 396 45.6 215 24.7 50 5.8 20 2.3 White 1.140 23.7 2,330 48.5 902 18.8 352 7.3 80 1.7
Multiracial 84 20.5 191 46.7 84 20.5 36 8.8 14 3.4 Sexual identity
Heterosexual 1.288 23.7 2,615 48.1 1,054 19.4 376 6.9 99 1.8 LGBQ 116 19.1 278 45.9 131 21.6 68 11.2 13 2.1
Military status Military service 36 22.1 71 43.6 27 16.6 22 13.5 7 4.3
No-Military service 1,351 23.1 2,811 48.1 1.161 19.9 417 7.1 108 1.8 Generation status
First-Generation 328 23.7 621 44.8 293 21.1 106 7.6 38 2.7 Not-First-Generation 1.108 23.0 2,344 48.7 931 19.3 350 7.3 79 1.6
Family income status Low-Income 258 23.0 507 45.3 223 19.9 104 9.3 28 2.5
Not-Low-Income 1.159 23.4 2,384 48.2 975 19.7 343 6.9 86 1.7 Generation and Low-Income status
Not-First-Generation and Low-Income 1,339 23.2 2,785 48.2 1.137 19.7 422 7.3 98 1.7 First-Generation and Low-Income 102 23.7 185 43.0 89 20.7 35 8.1 19 4.4
Religious/Spiritual Identity1
Christian religious/spiritual Identity 937 25.2 1.776 47.7 703 18.9 242 6.5 62 1.7 Other religious/spiritual Identity 77 22.0 175 50.0 70 20.0 20 5.7 8 2.3
No religious/spiritual Identity 376 20.0 896 47.7 388 20.7 178 9.5 40 2.1 Multiple religious/spiritual Identity 42 20.1 94 45.0 53 25.4 15 7.2 5 2.4
Disability status Single Disability 85 15.8 246 45.6 119 22.1 70 13.0 19 3.5
No Disability 1,303 24.0 2,625 48.4 1,051 19.4 357 6.6 90 1.7 Multiple Disabilities 44 21.2 83 39.9 47 22.6 26 12.5 8 3.8
Employment status Not Employed 631 24.5 1.206 46.7 530 20.5 172 6.7 41 1.6
Employed 781 22.3 1.709 48.8 670 19.1 273 7.8 72 2.1 Housing status
Campus Housing 313 24.5 626 49.0 266 20.8 62 4.9 10 0.8 Non-Campus Housing 1,056 22.7 2,212 47.6 906 19.5 367 7.9 103 2.2
Housing Insecure 7 21.2 15 45.5 < 5 — 5 15.2 <5 . . .
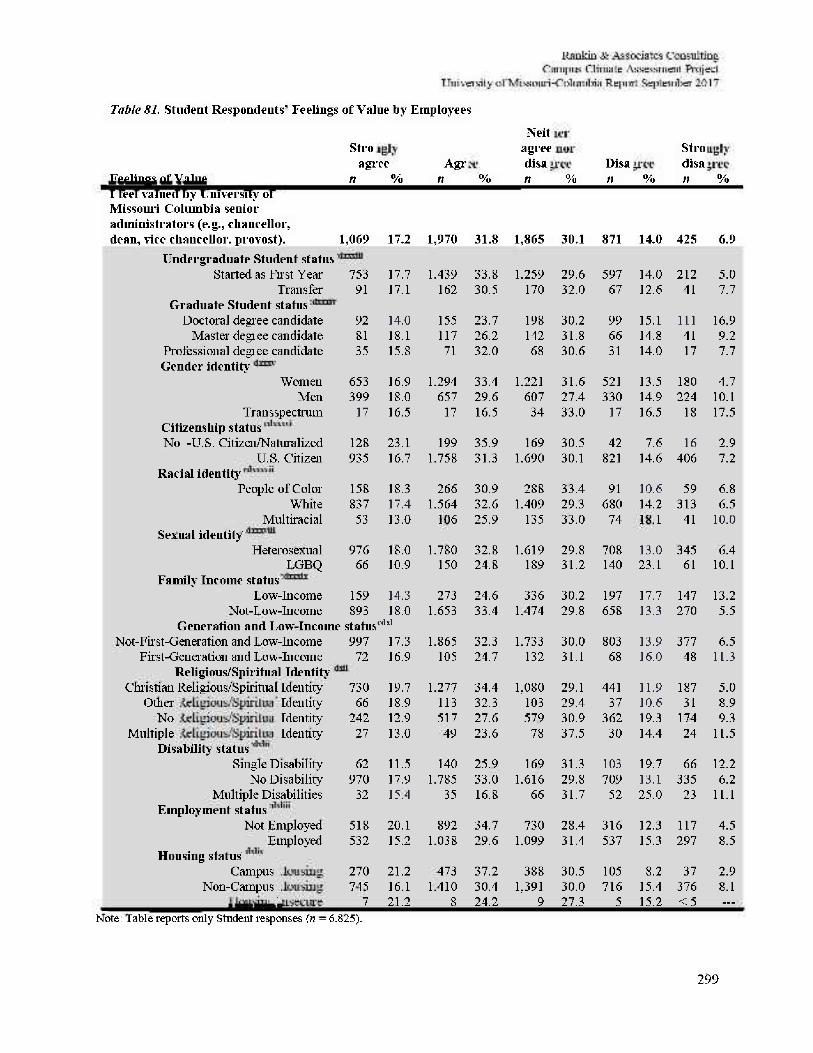
Table 81. Student Respondents' Feelings of Value by Employees
Feelings of Value I feel valued by University of Missouri-Columbia senior administrators (e.g., chancellor, dean, vice chancellor, provost).
Strongly agree
n
1,069
ee
%
17.2
Agree n
1,970
%
31.8
Neither agree nor disagree n
1,865
%
30.1
Disagree n
871
%
14.0
Strongly disagree n
425
%
6.9 Undergraduate Student status
Started as Fu st Year 753 17.7 1.439 33.8 1.259 29.6 597 14.0 212 5.0 Transfer 91 17.1 162 30.5 170 32.0 67 12.6 41 7.7
Graduate Student status Doctoral degree candidate 92 14.0 155 23.7 198 30.2 99 15.1 111 16.9
Master degree candidate 81 18.1 117 26.2 142 31.8 66 14.8 41 9.2 Professional degree candidate 35 15.8 71 32.0 68 30.6 31 14.0 17 7.7 Gender identity
Women 653 16.9 1.294 33.4 1.221 31.6 521 13.5 180 4.7 Men 399 18.0 657 29.6 607 27.4 330 14.9 224 10.1
Transspectrum 17 16.5 17 16.5 34 33.0 17 16.5 18 17.5 Citizenship status Non-U.S. Citizen/Naturalized 128 23.1 199 35.9 169 30.5 42 7.6 16 2.9
U.S. Citizen 935 16.7 1.758 31.3 1.690 30.1 821 14.6 406 7.2 Racial identify
People of Color 158 18.3 266 30.9 288 33.4 91 10.6 59 6.8 White 837 17.4 1.564 32.6 1.409 29.3 680 14.2 313 6.5
Multiracial 53 13.0 106 25.9 135 33.0 74 18.1 41 10.0 Sexual identify
Heterosexual 976 18.0 1.780 32.8 1.619 29.8 708 13.0 345 6.4 LGBQ 66 10.9 150 24.8 189 31.2 140 23.1 61 10.1
Family Income status Low-Income 159 14.3 273 24.6 336 30.2 197 17.7 147 13.2
Not-Low-Income 893 18.0 1.653 33.4 1.474 29.8 658 13.3 270 5.5 Generation and Low-Income status' :dxl
Not-First-Generation and Low-Income 997 17.3 1.865 32.3 1.733 30.0 803 13.9 377 6.5 First-Generation and Low-Income 72 16.9 105 24.7 132 31.1 68 16.0 48 11.3
Religious/Spiritual Identity Christian Religious/Spiritual Identity 730 19.7 1.277 34.4 1,080 29.1 441 11.9 187 5.0
Other religious/spiritual Identity 66 18.9 113 32.3 103 29.4 37 10.6 31 8.9 No religious/spiritual Identity 242 12.9 517 27.6 579 30.9 362 19.3 174 9.3
Multiple religious/spiritual Identity 27 13.0 49 23.6 78 37.5 30 14.4 24 11.5 Disability status
Single Disability 62 11.5 140 25.9 169 31.3 103 19.7 66 12.2 No Disability 970 17.9 1.785 33.0 1.616 29.8 709 13.1 335 6.2
Multiple Disabilities 32 15.4 35 16.8 66 31.7 52 25.0 23 11.1 Employment status
Not Employed 518 20.1 892 34.7 730 28.4 316 12.3 117 4.5 Employed 532 15.2 1,038 29.6 1.099 31.4 537 15.3 297 8.5
Housing status Campus Housing 270 21.2 473 37.2 388 30.5 105 8.2 37 2.9
Non-Campus Housing 745 16.1 1.410 30.4 1,391 30.0 716 15.4 376 8.1 Housing Insecure 7 21.2 8 24.2 9 27.3 5 15.2 <5 —
Note: Table reports only Student responses (n = 6.825).
299
300
Seventy-seven percent (n = 4,802) of Student respondents "strongly agr eed" or "agreed" that
they felt valued by University of Missouri-Columbia faculty in the classroom (Table 82).
Women Student respondents (1%, n = 39) were much less likely than Men Student respondents
(2%, n = 42) and Transspectrum Student respondents (5%, n = 5) to "strongly disagree" that they
felt valued by faculty in the classroom. Student Respondents of Color (23%, n = 195) and
Multiracial Student respondents (25%, n = 101) were less likely than White Student respondents
(27%, n = 1.313) to "strongly agree" that they felt valued by faculty in the classroom.
Heterosexual Student respondents (6%, n = 301) were much less likely than LGBQ Student
respondents (8%, n = 46) to "disagree" that they felt valued by faculty in the classroom. A
significantly lower percentage of No Military Service Student respondents (1%, n = 79) than
Military Service Student respondents (4%, n = 6) "strongly disagreed" that they felt valued by
faculty in the classroom. Not-First-Generation Student respondents (52%, n = 2,490) were more
likely than First-Generation Student respondents (48%, n = 661) to "agree" that they felt valued
by faculty in the classroom. A higher percentage (51%, n = 2,965) of Not-First-Generation and
Low-Income Student respondents versus (45%, n = 192) ofFirst-Generation and Low-Income
Student respondents "agreed" that they felt valued by faculty in the classroom. Twenty-eight
percent (n = 1,039) of Christian Religious/Spiritual Identity Student respondents were
significantly more likely to "strongly agree" that they felt valued by faculty in the classroom
compared to 24% (n = 442) of No Religious/Spiritual Identity Student respondents. No
Disability Student respondents (27%, n = 1,470) were more likely than Multiple Disabilities
Student respondents (23%, n = 49) and Single Disability Student respondents (21%, n = 115) to
"strongly agreed" that they felt valued by faculty in the classroom. A lower percentage of Not-
Employed Student respondents (5%, n = 125) than Employed Student respondents (7%, n = 226)
"disagreed" that they felt valued by faculty in the classroom. A smaller percentage of On-
Campus Student respondents (4%, n = 54) than Non-Campus Student respondents (6%, n = 281)
and fewer than five Housing hi secure Student respondents "disagreed" that they felt valued by
faculty in the classroom.
Sixty-eight percent (ti = 4.182) of Student respondents "strongly agr eed" or "agreed" that they
felt valued by other students in the classroom. A significantly higher percentage of
Undergraduate First Year Student respondents (20%, n = 857) than Undergraduate Transfer
301
Student respondents (17%, n = 88) "strongly agreed" that they felt valued by other students in
the classroom. Men Student respondents (24%, n = 530) were much more likely than Women
Student respondents (21%, n = 795) and Transspectrum Student respondents (20%, n = 20) to
"strongly agree" that they felt valued by other students hi the classroom. Student Respondents of
Color (16%, n = 134) and Multiracial Student respondents (17%, it = 69) were less likely than
White Student respondents (23%, n= 1,112) to "strongly agree" that they felt valued by other
students in the classroom. Heterosexual Student respondents (23%, n = 1,219) w7ere much more
likely than LGBQ Student respondents (15%, n = 91) to "strongly agree" that they felt valued by
other students in the classroom. Not-First-Generation Student respondents (23%, n = 1,077) were
more likely than First-Generation Student respondents (19%, n = 266) to "strongly agree" that
they felt valued by other students in the classroom. A lower percentage (1%, n = 49) of Not-
Low-Income Student respondents compared with (3%, n = 34) of Low-Income Student
respondents "strongly disagreed" that they felt valued by other students hi the classroom. A
higher percentage (47%, n = 2,675) of Not-First Generation and Low-Income Student
respondents versus (38%, n = 161) of First-Generation and Low-Income Student respondents
"agr eed" that they felt valued by other students in the classroom. Twenty-four percent (n = 887)
of Christian Religious/Spiritual Identity Student respondents and 23% (n = 81) of Other
Religious/Spiritual Identity Student respondents were much more likely than 17% (n = 324) of
No Religious/Spiritual Identity Student respondents and 21% (n = 44) of Multiple
Religious/Spiritual Identity Student respondents to "strongly agree" that they felt valued by other
students in the classroom. No Disability Student respondents (23%, n = 1,212) were more likely
than Multiple Disabilities Student respondents (18%, n = 37) and Single Disability Student
respondents (16%, n = 87) to "strongly agree" that they felt valued by other students in the
classroom. A higher percentage of Not-Employed Student respondents (23%, n = 600) than
Employed Student respondents (21%, n = 723) "strongly agreed" that they felt valued by other
students in the classroom. A larger percentage of Oil-Campus Student respondents (27%, n =
343) than Non-Campus Student respondents (23%, n = 1,078) and Housing Insecure Student
respondents (18%, n = 6) "neither agreed nor disagreed" that they felt valued by other students in
the classroom.
302
Sixty-four percent (n = 3,941) of Student respondents "strongly agreed'1 or "agreed" that they felt
valued by other students outside of the classroom. A significantly higher percentage of
Undergraduate First Year Student respondents (21%, n = 875) than Undergraduate Transfer
Student respondents (14%, n = 76) "strongly agreed" that they felt valued by other students
outside of the classroom. A significantly higher percentage of Doctoral degree candidate
respondents (41%, n = 265) and Professional degree candidate respondents (45%, n = 100) than
Master degree candidate respondents (33%, n = 148) "agreed" that they felt valued by other
students outside of the classroom. Women Student respondents (19%, n = 745) and
Transspectrum Student respondents (18%, n = 19) were less likely than Men Student respondents
(24%, « = 518) to "strongly agree" that they felt valued by other students outside of the
classroom. Student Respondents of Color (15%, n = 124) were significantly less likely than
White Student respondents (22%, n = 1,057) to "strongly agree" that they felt valued by other
students outside of the classroom. Heterosexual Student respondents (22%, n = 1,157) were more
likely than LGBQ Student respondents (15%, n = 88) to "strongly agree" that they felt valued by
other students outside of the classroom. A significantly lower percentage of Military Service
Student respondents (35%, n = 57) than No Military Service Student respondents (44%, n =
2,520) "agreed" that they felt valued by other students outside of the classroom. Not-First-
Generation Student respondents (22%, n = 1,042) were more likely than First-Generation Student
respondents (17%, n = 238) to "strongly agree" that they felt valued by other students outside of
the classroom. A lower percentage (18%, n = 198) of Low-Income-Family Student respondents
compared with (22%, n = 1,061) of Not-Low-Income-Family Student respondents "strongly
agreed" that they felt valued by other students outside of the classroom. A higher percentage
(44%, n = 2,517) of Not-First Generation and Low-Income Student respondents versus (33%, n =
140) of First-Generation and Low-Income Student respondents "agreed" that they felt valued by
other students outside of the classroom. Twenty-three percent (« = 855) of Christian
Religious/Spiritual Identity Student respondents, 23% (n = 78) of Other Religious/Spiritual
Identity Student respondents, and 20% (n = 42) of Multiple Religious/Spiritual Identity Student
respondents were more likely than 16% (;/ = 300) of No Religious/Spiritual Identity Student
respondents to "strongly agree" that they felt valued by other students outside of the classroom.
No Disability Student respondents (22%, n = 1,157) w7ere more likely than Multiple Disabilities
Student respondents (17%, n = 34) and Single Disability Student respondents (16%, n = 86) to
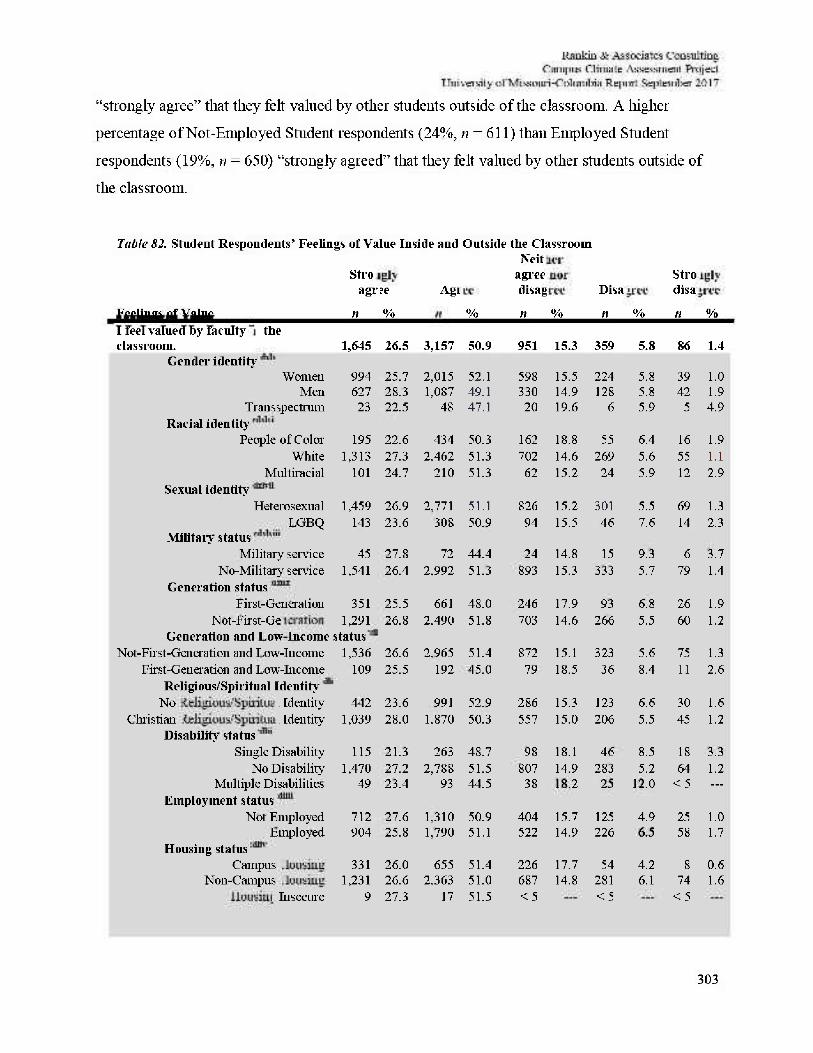
303
"strongly agree" that they felt valued by other students outside of the classroom. A higher
percentage of Not-Employed Student respondents (24%, n = 611) than Employed Student
respondents (19%, n = 650) "strongly agreed" that they felt valued by other students outside of
the classroom.
Table 82. Student Respondents' Feelings of Value Inside and Outside the Classroom
Feelings of Value I feel valued by faculty in the classroom.
Strongly agree
n
1,645
?e %
26.5
Agree
n
3,157
%
50.9
Neither agree nor disagree n
951
%
15.3
Disagree
n
359
%
5.8
Strongly disagree
n
86
%
1.4 Gender identify
Women 994 25.7 2,015 52.1 598 15.5 224 5.8 39 1.0 Men 627 28.3 1,087 49.1 330 14.9 128 5.8 42 1.9
Transspectrum 23 22.5 48 47.1 20 19.6 6 5.9 5 4.9 Racial identify
People of Color 195 22.6 434 50.3 162 18.8 55 6.4 16 1.9 White 1,313 27.3 2.462 51.3 702 14.6 269 5.6 55 1.1
Multiracial 101 24.7 210 51.3 62 15.2 24 5.9 12 2.9 Sexual identity
Heterosexual 1,459 26.9 2,771 51.1 826 15.2 301 5.5 69 1.3 LGBQ 143 23.6 308 50.9 94 15.5 46 7.6 14 2.3
Military status Military service 45 27.8 72 44.4 24 14.8 15 9.3 6 3.7
No-Military service 1,541 26.4 2.992 51.3 893 15.3 333 5.7 79 1.4 Generation status
First-Generation 351 25.5 661 48.0 246 17.9 93 6.8 26 1.9 Not-First-Generation 1,291 26.8 2.490 51.8 703 14.6 266 5.5 60 1.2
Generation and Low-Income status Not-First-Generation and Low-Income 1,536 26.6 2.965 51.4 872 15.1 323 5.6 75 1.3
First-Generation and Low-Income 109 25.5 192 45.0 79 18.5 36 8.4 11 2.6 Religious/Spiritual Identity
No religious/spiritual Identity 442 23.6 991 52.9 286 15.3 123 6.6 30 1.6 Christian religious/spiritual Identity 1,039 28.0 1.870 50.3 557 15.0 206 5.5 45 1.2
Disability status Single Disability 115 21.3 263 48.7 98 18.1 46 8.5 18 3.3
No Disability 1,470 27.2 2,788 51.5 807 14.9 283 5.2 64 1.2 Multiple Disabilities 49 23.4 93 44.5 38 18.2 25 12.0 < 5 —
Employment status Not Employed 712 27.6 1,310 50.9 404 15.7 125 4.9 25 1.0
Employed 904 25.8 1,790 51.1 522 14.9 226 6.5 58 1.7 Housing status
Campus Housing 331 26.0 655 51.4 226 17.7 54 4.2 8 0.6 Non-Campus Housing 1,231 26.6 2.363 51.0 687 14.8 281 6.1 74 1.6
Housing Insecure 9 27.3 17 51.5 < 5 < 5 <5
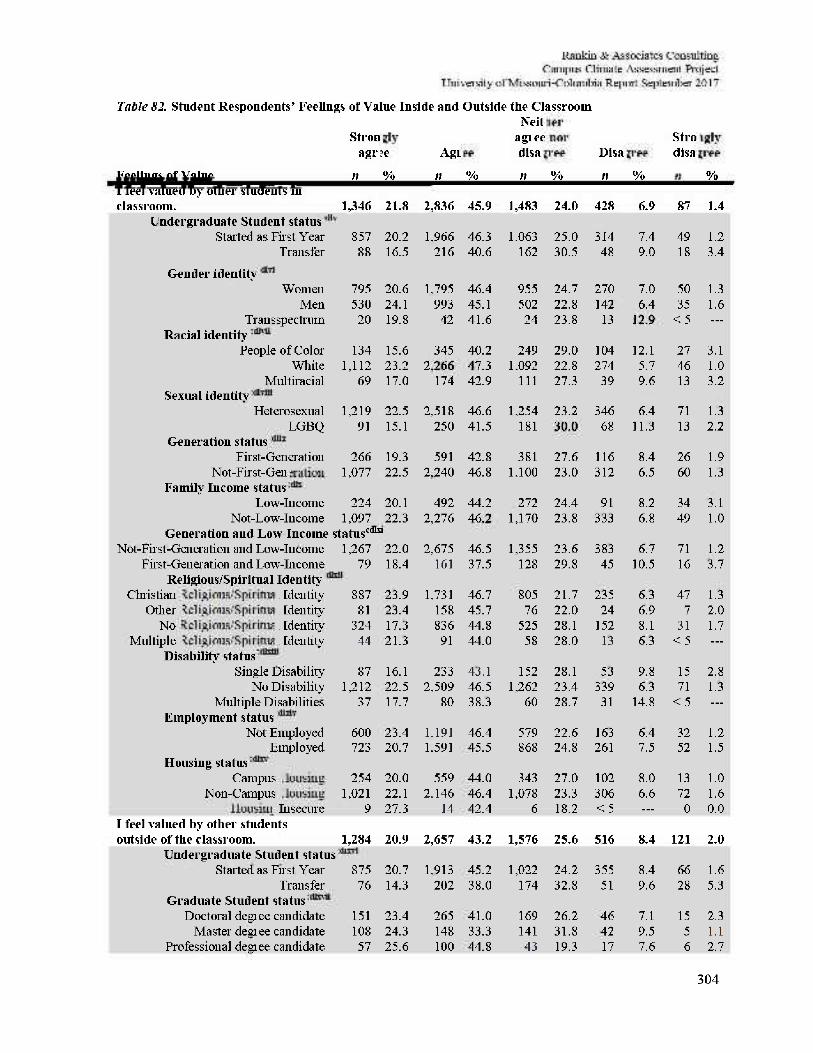
304
Table 82. Student Respondents' Feelings of Value Inside and Outside the Classroom
Feelings of Value I feel valued by other students in
Strongly agree
n ?e %
Agree n %
Neither agree nor disagree
n % Disagree n %
Strongly disagree
n %
classroom. 1,346 21.8 2,836 45.9 1,483 24.0 428 6.9 87 1.4 Undergraduate Student status
Started as First Year 857 20.2 1.966 46.3 1.063 25.0 314 7.4 49 1.2 Transfer 88 16.5 216 40.6 162 30.5 48 9.0 18 3.4
Gender identity Women 795 20.6 1.795 46.4 955 24.7 270 7.0 50 1.3
Men 530 24.1 993 45,1 502 22.8 142 6.4 35 1.6 Transspectrum 20 19.8 42 41.6 24 23.8 13 12.9 <5 —
Racial identity People of Color 134 15.6 345 40.2 249 29.0 104 12.1 27 3.1
White 1,112 23.2 2,266 47.3 1.092 22.8 274 5.7 46 1.0 Multiracial 69 17.0 174 42.9 111 27.3 39 9.6 13 3.2
Sexual identity Heterosexual 1,219 22.5 2,518 46.6 1.254 23.2 346 6.4 71 1.3
LGBQ 91 15.1 250 41.5 181 30.0 68 11.3 13 2.2 Generation status
First-Generation 266 19.3 591 42.8 381 27.6 116 8.4 26 1.9 Not-First-Generation 1,077 22.5 2,240 46.8 1.100 23.0 312 6.5 60 1.3
Family Income status Low-Income 224 20.1 492 44.2 272 24.4 91 8.2 34 3.1
Not-Low-Income 1,097 22.3 2,276 46.2 1,170 23.8 333 6.8 49 1.0 Generation and Low-Income status"1*1
Not-First-Generation and Low-Income 1,267 22.0 2,675 46.5 1,355 23.6 383 6.7 71 1.2 First-Generation and Low-Income 79 18.4 161 37.5 128 29.8 45 10.5 16 3.7
Religious/Spiritual Identity Christian religious/spiritual Identity 887 23.9 1.731 46.7 805 21.7 235 6.3 47 1.3
Other religious/spiritual Identity 81 23.4 158 45.7 76 22.0 24 6.9 7 2.0 No religious/spiritual Identity 324 17.3 836 44.8 525 28.1 152 8.1 31 1.7
Multiple religious/spiritual Identity 44 21.3 91 44.0 58 28.0 13 6.3 <5 . . .
Disability status Single Disability 87 16.1 233 43.1 152 28.1 53 9.8 15 2.8
No Disability 1,212 22.5 2.509 46.5 1,262 23.4 339 6.3 71 1.3 Multiple Disabilities 37 17.7 80 38.3 60 28.7 31 14.8 <5 . . .
Employment status Not Employed 600 23.4 1.191 46.4 579 22.6 163 6.4 32 1.2
Employed 723 20.7 1,591 45.5 868 24.8 261 7.5 52 1.5 Housing status
Campus Housing 254 20.0 559 44.0 343 27.0 102 8.0 13 1.0 Non-Campus Housing 1,021 22.1 2.146 46.4 1,078 23.3 306 6.6 72 1.6
Housing Insecure 9 27.3 14 42.4 6 18.2 < 5 . . . 0 0.0 I feel valued by other students outside of the classroom. 1,284 20.9 2,657 43.2 1,576 25.6 516 8.4 121 2.0
Undergraduate Student status Started as Fu st Year 875 20.7 1.913 45.2 1,022 24.2 355 8.4 66 1.6
Transfer 76 14.3 202 38.0 174 32.8 51 9.6 28 5.3 Graduate Student status
Doctoral degree candidate 151 23.4 265 41.0 169 26.2 46 7.1 15 2.3 Master degree candidate 108 24.3 148 33.3 141 31.8 42 9.5 5 1.1
Professional degree candidate 57 25.6 100 44.8 43 19.3 17 7.6 6 2.7
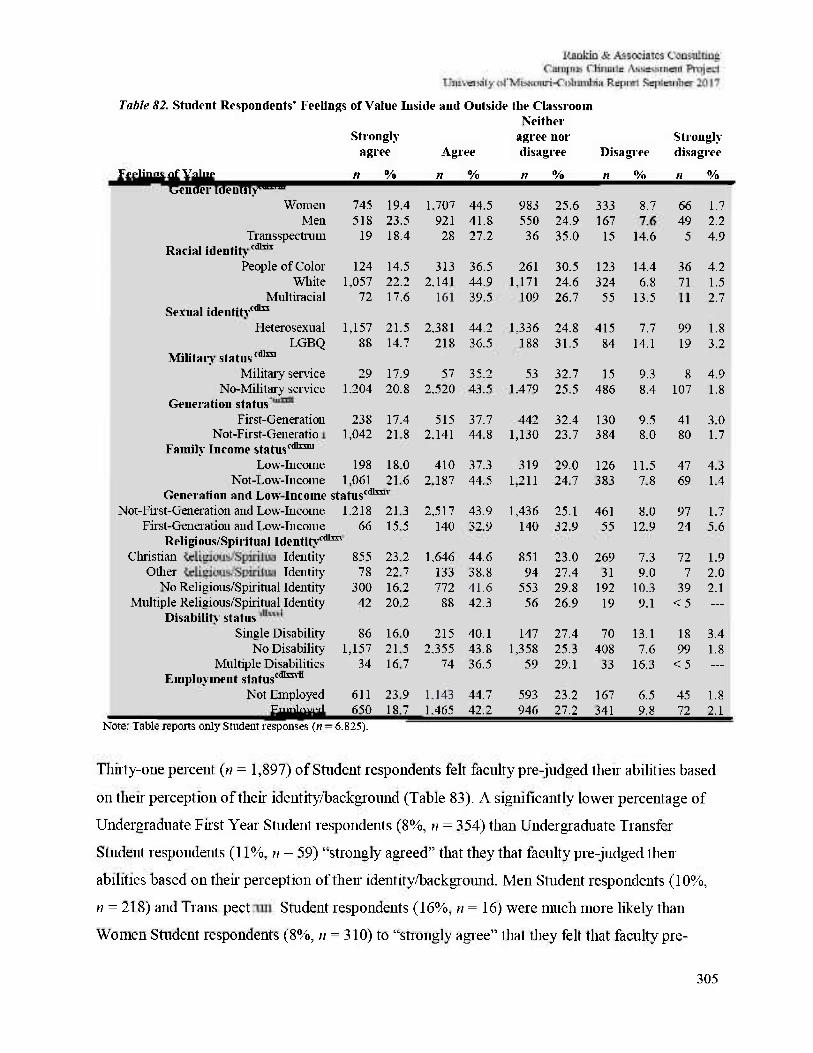
305
Table 82. Student Respondents' Feelings of Value Inside and Outside the Classroom
Strongly agree Agree
Neither agree nor disagree Disagree
Strongly disagree
Feelings of Value » % ti % n % n % n % Gender identity™1™1
Women 745 19.4 1,707 44.5 983 25.6 333 8.7 66 1.7 Men 518 23.5 921 41.8 550 24.9 167 7.6 49 2.2
Transspectrum 19 18.4 28 27.2 36 35.0 15 14.6 5 4.9 Racial identity"1**
People of Color 124 14.5 313 36.5 261 30.5 123 14.4 36 4.2 White 1,057 22.2 2.141 44.9 1,171 24.6 324 6.8 71 1.5
Multiracial 72 17.6 161 39.5 109 26.7 55 13.5 11 2.7 Sexual identity"1*1
Heterosexual 1,157 21.5 2.381 44.2 1,336 24.8 415 7.7 99 1.8 LGBQ 88 14.7 218 36.5 188 31.5 84 14.1 19 3.2
Military status"11™ Military sendee 29 17.9 57 35.2 53 32.7 15 9.3 8 4.9
No-Military sendee 1,204 20.8 2,520 43.5 1.479 25.5 486 8.4 107 1.8 Generation status
First-Generation 238 17.4 515 37.7 442 32.4 130 9.5 41 3.0 Not-First-Generation 1,042 21.8 2.141 44.8 1,130 23.7 384 8.0 80 1.7
Family Income status01"™" Low-Income 198 18.0 410 37.3 319 29.0 126 11.5 47 4.3
Not-Low-Income 1,061 21.6 2.187 44.5 1,211 24.7 383 7.8 69 1.4 Generation and Low-Income statusC("™v
Not-First-Generation and Low-Income 1,218 21.3 2,517 43.9 1,436 25.1 461 8.0 97 1.7 First-Generation and Low-Income 66 15.5 140 32.9 140 32.9 55 12.9 24 5.6
Religious/Spiritual Identity0*"™ Christian religious/spiritual Identity 855 23.2 1.646 44.6 851 23.0 269 7.3 72 1.9
Other religious/spiritual Identity 78 22.7 133 38.8 94 27.4 31 9.0 7 2.0 No Religious/Spiritual Identity 300 16.2 772 41.6 553 29.8 192 10.3 39 2.1
Multiple Religious/Spiritual Identity 42 20.2 88 42.3 56 26.9 19 9.1 < 5 —
Disability- status Single Disability 86 16.0 215 40.1 147 27.4 70 13.1 18 3.4
No Disability 1,157 21.5 2.355 43.8 1,358 25.3 408 7.6 99 1.8 Multiple Disabilities 34 16.7 74 36.5 59 29.1 33 16.3 < 5 —
Employment status""™* Not Employed 611 23.9 1.143 44.7 593 23.2 167 6.5 45 1.8
Employed 650 18.7 1.465 42.2 946 27.2 341 9.8 72 2.1 Note: Table reports only Student responses (n = 6.825).
Thirty-one percent (n = 1,897) of Student respondents felt faculty pre-judged then abilities based
on their perception of their identity/background (Table 83). A significantly lower percentage of
Undergraduate First Year Student respondents (8%, n = 354) than Undergraduate Transfer
Student respondents (11%, n = 59) "strongly agreed" that they that faculty pre-judged the li-
abilities based on their perception of then identity/background. Men Student respondents (10%,
n =218) and Transpectrum Student respondents (16%, n = 16) were much more likely than
Women Student respondents (8%, n = 310) to "strongly agree" that they felt that faculty pre-
306
judged their abilities based on their perception of then identity/background. A larger percentage
of Non-U. S. Citizen Student respondents (13%, n = 69) than U.S. Citizen Student respondents
(8%, n = 470) "strongly agreed'1 that they felt that faculty pre-judged their' abilities based on their'
perception of their' identity/background. Student Respondents of Color (13%, n = 110) were
more likely than White Student respondents (8%, n = 385) and Multiracial Student respondents
(9%, ii = 35) to "strongly agree" that they felt that faculty pre-judged then abilities based on their'
perception of their' identity/background. Heterosexual Student respondents (21%, n = 1,158)
were much less likely than LGBQ Student respondents (26%, n = 157) to "agree" that they felt
that faculty pre-judged their abilities based oil their perception of their identity/background. A
significantly lower percentage of Military Service Student respondents (22%, n = 35) than No
Military Service Student respondents (32%, n = 1,883) "disagreed" that they felt that faculty pre-
judged their abilities based oil their perception of then identity/background. Not-First-Generation
Student respondents (33%, n = 1,571) were more likely than First-Generation Student
respondents (28%, n = 389) to "disagree" that they felt that faculty pre-judged their abilities
based on their perception of their identity/background. A lower percentage (29%, n = 318) of
Low-Income-Family Student respondents compared with (32%, n = 1,591) of Not-Low-Income-
Family Student respondents "disagreed" that they felt that faculty pre-judged their abilities based
on their perception of their identity/background. A higher percentage (11%, n = 49) of First-
Generation and Low-Income Student respondents versus (9%, n = 496) of Not-First-Generation
and Low-Income Student respondents "strongly agreed" that they felt that faculty pre-judged
their abilities based oil then' perception of their' identity/background. Fourteen percent (« = 49) of
Other Religious/Spiritual Identity Student respondents were much more likely than 9% (« = 343)
of Christian Religious/Spiritual Identity Student respondents, 7% (n = 134) of No
Religious/Spiritual Identity Student respondents, and 8% (n = 16) of Multiple Religious/Spiritual
Identity7 Student respondents to "strongly agree" that they felt that faculty pre-judged their
abilities based oil their perception of their identity/background. No Disability Student
respondents (21%, n = 1,148) were less likely than Multiple Disabilities Student respondents
(24%, n = 50) and Single Disability Student respondents (27%, n = 147) to "agree" that they felt
that faculty pre-judged their abilities based oil then perception of their identity/background. A
lower percentage of Not-Employed Student respondents (19%, n = 481) than Employed Student
307
respondents (24%, n = 837) "agreed" that they felt that faculty pre-judged their abilities based on
their perception of then identity/background.
Twenty-eight percent (n = 1,729) of Student respondents felt staff pre-judged their abilities based
011 their perception of their identity/background. A significantly lower percentage of
Undergraduate First Year Student respondents (8%, n = 333) than Undergraduate Transfer
Student respondents (11%, n = 60) "strongly agreed" that they felt staff pre-judged their abilities
based on their perception of their identity/background. Men Student respondents (10%, n = 209)
and Transpectrum Student respondents (13%, n = 13) were much more likely than Women
Student respondents (8%, n = 290) to "strongly agree" that they felt that staff pre-judged their
abilities based on their perception of their identity/background. A larger percentage of Non-U. S.
Citizen Student respondents (12%, n = 64) than U.S. Citizen Student respondents (8%, n = 443)
"strongly agreed" that they felt that staff pre-judged their abilities based on their perception of
their identity/background. Student Respondents of Color (12%, n = 105) were more likely than
White Student respondents (8%, n = 363) and Multiracial Student respondents (7%, n = 28) to
"strongly agree" that they felt that staff pre-judged their abilities based on their perception of
their identity/background. Heterosexual Student respondents (19%, n = 1,043) were much less
likely than LGBQ Student respondents (23%, n = 140) to "agree" that they felt that staff pre-
judged their abilities based on their perception of their identity/background. A higher percentage
(33%, n = 1,594) of Not-Low-Income-Family Student respondents compared with (28%, n =
315) of Low-Income-Family Student respondents "disagreed" that they felt that staff pre-judged
their abilities based on their perception of their identity/background. A higher percentage (32%,
n = 1,850) of Not-First-Generation and Low-Income Student respondents versus (26%, n = 113)
of First-Generation and Low-Income Student respondents "disagreed" that they felt that staff
pre-judged their abilities based on their perception of then' identity/background. Fourteen percent
in = 48) of Other Religious/Spiritual Identity Student respondents were much more likely than
9% (n = 320) of Christian Religious/Spiritual Identity Student respondents, 7% (n = 130) of No
Religious/Spiritual Identity Student respondents, and 5% (n = 10) of Multiple Religious/Spiritual
Identity7 Student respondents to "strongly agree" that they felt that staff pre-judged then abilities
based on their perception of then identity/background. Single Disability Student respondents
(24%, n = 130) and Multiple Disabilities Student respondents (21%, n = 43) were more likely
308
than No Disability Strident respondents (19%, n = 1,037) to "agree" that they felt that staff pre-
judged their abilities based oil their perception of then identity/background. A lower percentage
of Not-Employed Student respondents (17%, n = 444) than Employed Student respondents
(21%, n = 739) "agreed" that they felt that staff pre-judged their' abilities based on their
perception of their identity/background.
Fifty-four percent (n = 3,361) of Student respondents noted that they believed that the campus
climate at University of Missouri-Columbia encourages free and open discussion of difficult
topics. A significantly lower percentage of Doctoral degree candidate respondents (13%, n = 81)
than Master degree candidate respondents (21%, n = 91) and Professional degree candidate
respondents (19%, n = 41) "strongly agreed" that the campus climate at University of Missouri-
Columbia encourages free and open discussion of difficult topics. Women Student respondents
(18%, n = 705) and Men Student respondents (19%, n = 428) were much more likely than
Transspectrum Student respondents (10%, n = 10) to "strongly agree" that they felt that the
campus climate at University of Missouri-Columbia encourages free and open discussion of
difficult topics. A significantly larger percentage of U.S. Citizen Student respondents (17%, n =
957) than Non-U.S. Citizen Student respondents (10%, n = 56) "disagreed" that they felt that that
the campus climate at University of Missouri-Columbia encourages free and open discussion of
difficult topics. Student Respondents of Color (32%, n = 279) and Multiracial Student
respondents (33%, n = 133) were less likely than White Student respondents (37%, n = 1,764) to
"agree" that they felt that the campus climate at University of Missouri-Columbia encourages
free and open discussion of difficult topics. Heterosexual Student respondents (19%, n = 1,045)
were much more likely than LGBQ Student respondents (11%, n = 66) to "strongly agree" that
they felt that the campus climate at University of Missouri-Columbia encourages free and open
discussion of difficult topics. A significantly lower percentage of No Military Service Student
respondents (8%, n = 473) than Military Service Student respondents (16%, n = 25) "strongly
disagreed" that they felt that the campus climate at University of Missouri-Columbia encourages
free and open discussion of difficult topics. A higher percentage (20%, n = 974) of Not-Low-
Income-Family Student respondents compared with (14%, n = 151) of Low-Income-Family
Student respondents "strongly agreed" that they felt that the campus climate at University of
Missouri-Columbia encourages free and open discussion of difficult topics. A higher percentage
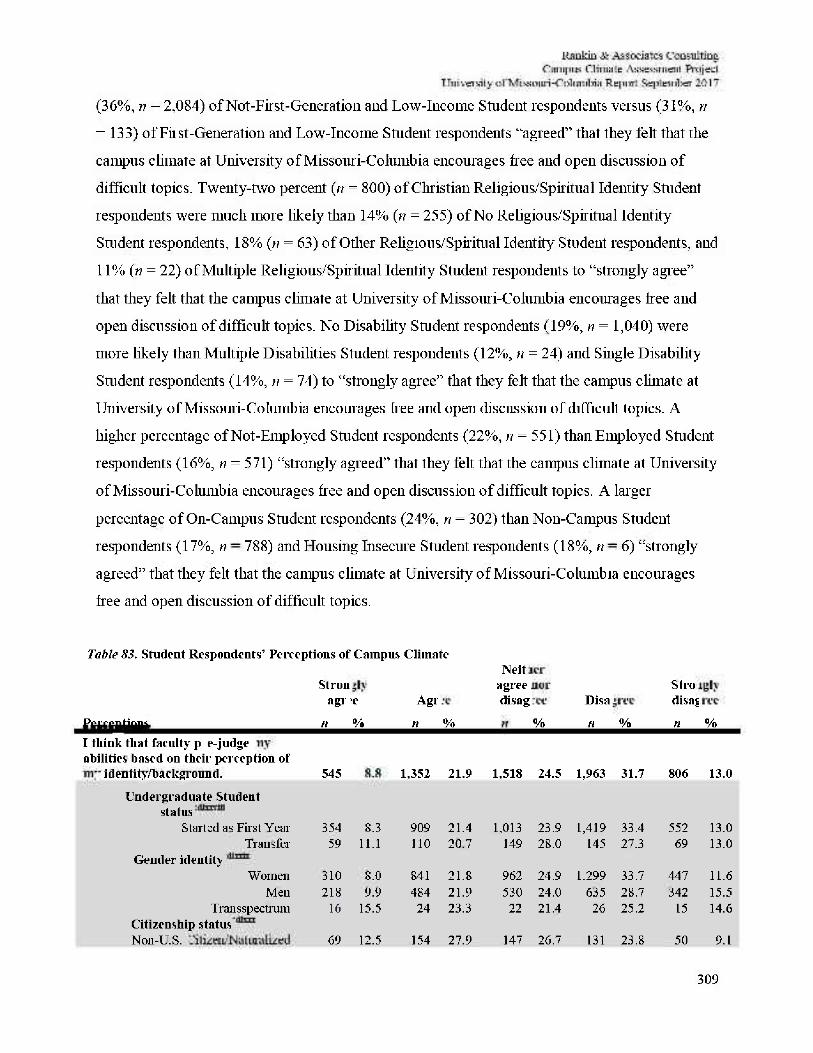
309
(36%, n = 2,084) of Not-First-Generation and Low-Income Student respondents versus (31%, n
= 133) of First-Generation and Low-Income Student respondents "agreed" that they felt that the
campus climate at University of Missouri-Columbia encourages free and open discussion of
difficult topics. Twenty-two percent (n = 800) of Christian Religious/Spiritual Identity Student
respondents were much more likely than 14% (n = 255) of No Religious/Spiritual Identity
Student respondents, 18% (n = 63) of Other Religious/Spiritual Identity Student respondents, and
11% (n = 22) of Multiple Religious/Spir itual Identity Student respondents to "strongly agree"
that they felt that the campus climate at University of Missouri-Columbia encourages free and
open discussion of difficult topics. No Disability Student respondents (19%, n = 1,040) were
more likely than Multiple Disabilities Student respondents (12%, n = 24) and Single Disability
Student respondents (14%, n = 74) to "strongly agree" that they felt that the campus climate at
University of Missouri-Columbia encourages free and open discussion of difficult topics. A
higher percentage of Not-Employed Student respondents (22%, n = 551) than Employed Student
respondents (16%, n = 571) "strongly agreed" that they felt that the campus climate at University
of Missouri-Columbia encourages free and open discussion of difficult topics. A larger
percentage of On-Campus Student respondents (24%, n = 302) than Non-Campus Student
respondents (17%, n = 788) and Housing Insecure Student respondents (18%, n = 6) "strongly
agreed" that they felt that the campus climate at University of Missouri-Columbia encourages
free and open discussion of difficult topics.
Table 83. Student Respondents' Perceptions of Campus Climate
Perceptions I think that faculty pre-judge my
Strongly agree
n
•e %
Agree
n %
Neither agree nor disagree n %
Disagree
n %
Strongly disagree
n %
abilities based on their perception of my identity/background. 545 8.8 1,352 21.9 1,518 24.5 1,963 31.7 806 13.0
Undergraduate Student status
Started as First Year 354 8.3 909 21.4 1,013 23.9 1,419 33.4 552 13.0 Transfer 59 11.1 110 20.7 149 28.0 145 27.3 69 13.0
Gender identity Women 310 8.0 841 21.8 962 24.9 1.299 33.7 447 11.6
Men 218 9.9 484 21.9 530 24.0 635 28.7 342 15.5 Trail s spectrum 16 15.5 24 23.3 22 21.4 26 25.2 15 14.6
Citizenship status Non-U.S. citizen/naturalized 69 12.5 154 27.9 147 26.7 131 23.8 50 9.1
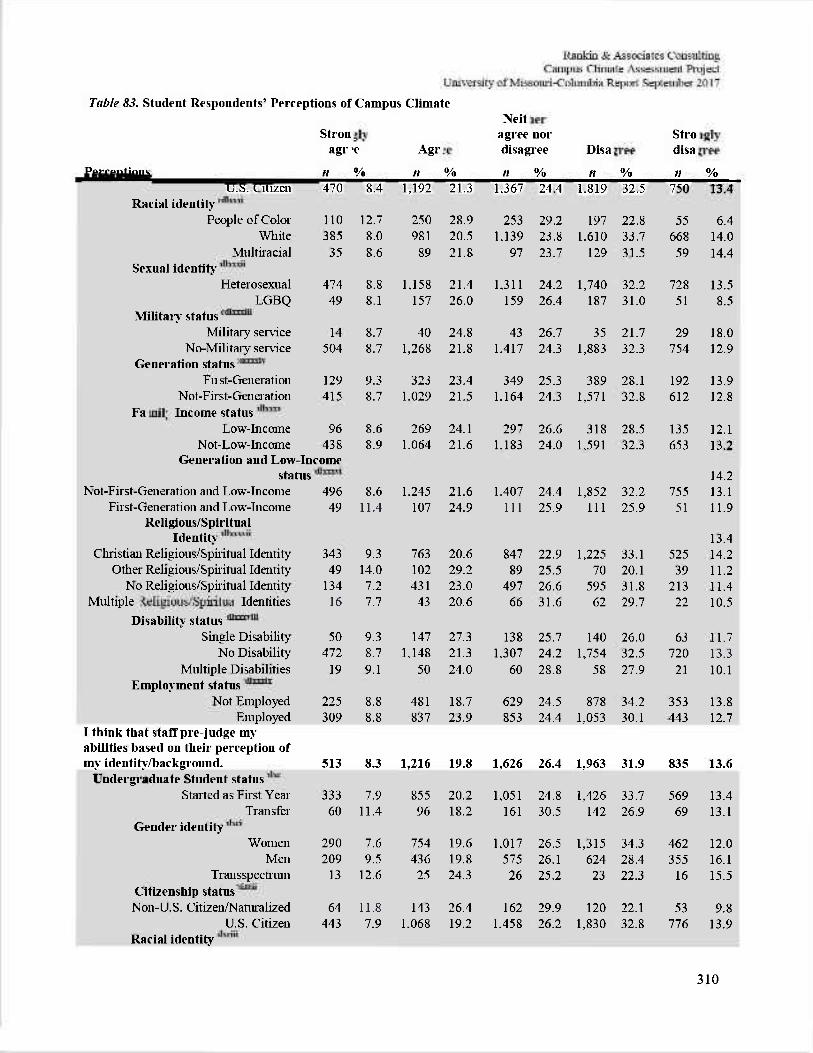
310
Table 83. Student Respondents' Perceptions of Campus Climate
Perceptions U.S. Citizen
Strongly agree
n 470
•e %
8.4
Agree n
1,192 % 21.3
Neither agree nor disagree n
1,367
nor ree % 24.4
Disagree n
1.819 % 32.5
Strongly disagree n
750 % 13.4
Racial identity People of Color 110 12.7 250 28.9 253 29.2 197 22.8 55 6.4
White 385 8.0 981 20.5 1.139 23.8 1.610 33.7 668 14.0 Multiracial 35 8.6 89 21.8 97 23.7 129 31.5 59 14.4
Sexual identity Heterosexual 474 8.8 1.158 21.4 1,311 24.2 1,740 32.2 728 13.5
LGBQ 49 8.1 157 26.0 159 26.4 187 31.0 51 8.5 Military status
Military service 14 8.7 40 24.8 43 26.7 35 21.7 29 18.0 No-Military service 504 8.7 1,268 21.8 1.417 24.3 1,883 32.3 754 12.9
Generation status Fust-Generation 129 9.3 323 23.4 349 25.3 389 28.1 192 13.9
Not-First-Generation 415 8.7 1.029 21.5 1.164 24.3 1,571 32.8 612 12.8 Family Income status
Low-Income 96 8.6 269 24.1 297 26.6 318 28.5 135 12.1 Not-Low-Income 438 8.9 1.064 21.6 1.183 24.0 1,591 32.3 653 13.2
Generation and Low-Income status 14.2
Not-First-Generation and Low-Income 496 8.6 1.245 21.6 1.407 24.4 1,852 32.2 755 13.1 Fir st- Generation and Low-Income 49 11.4 107 24.9 111 25.9 111 25.9 51 11.9
Religious/Spiritual Identity 13.4
Christian Religious/Spiritual Identity 343 9.3 763 20.6 847 22.9 1,225 33.1 525 14.2 Other Religious/Spiritual Identity 49 14.0 102 29.2 89 25.5 70 20.1 39 11.2
No Religious/Spiritual Identity 134 7.2 431 23.0 497 26.6 595 31.8 213 11.4 Multiple religious/spiritual Identities 16 7.7 43 20.6 66 31.6 62 29.7 22 10.5
Disability status Single Disability 50 9.3 147 27.3 138 25.7 140 26.0 63 11.7
No Disability 472 8.7 1.148 21.3 1,307 24.2 1,754 32.5 720 13.3 Multiple Disabilities 19 9.1 50 24.0 60 28.8 58 27.9 21 10.1
Employment status Not Employed 225 8.8 481 18.7 629 24.5 878 34.2 353 13.8
Employed 309 8.8 837 23.9 853 24.4 1,053 30.1 443 12.7 I think that staff pre judge my abilities based on their perception of my identity/background. 513 8.3 1,216 19.8 1,626 26.4 1,963 31.9 835 13.6
Undergraduate Student status Started as First Year 333 7.9 855 20.2 1.051 24.8 1,426 33.7 569 13.4
Transfer 60 11.4 96 18.2 161 30.5 142 26.9 69 13.1 Gender identity
Women 290 7.6 754 19.6 1.017 26.5 1,315 34.3 462 12.0 Men 209 9.5 436 19.8 575 26.1 624 28.4 355 16.1
Transspectrum 13 12.6 25 24.3 26 25.2 23 22.3 16 15.5 Citizenship status
Non-U. S. Citizen/Naturalized 64 11.8 143 26.4 162 29.9 120 22.1 53 9.8 U.S. Citizen 443 7.9 1.068 19.2 1.458 26.2 1,830 32.8 776 13.9
Racial identify
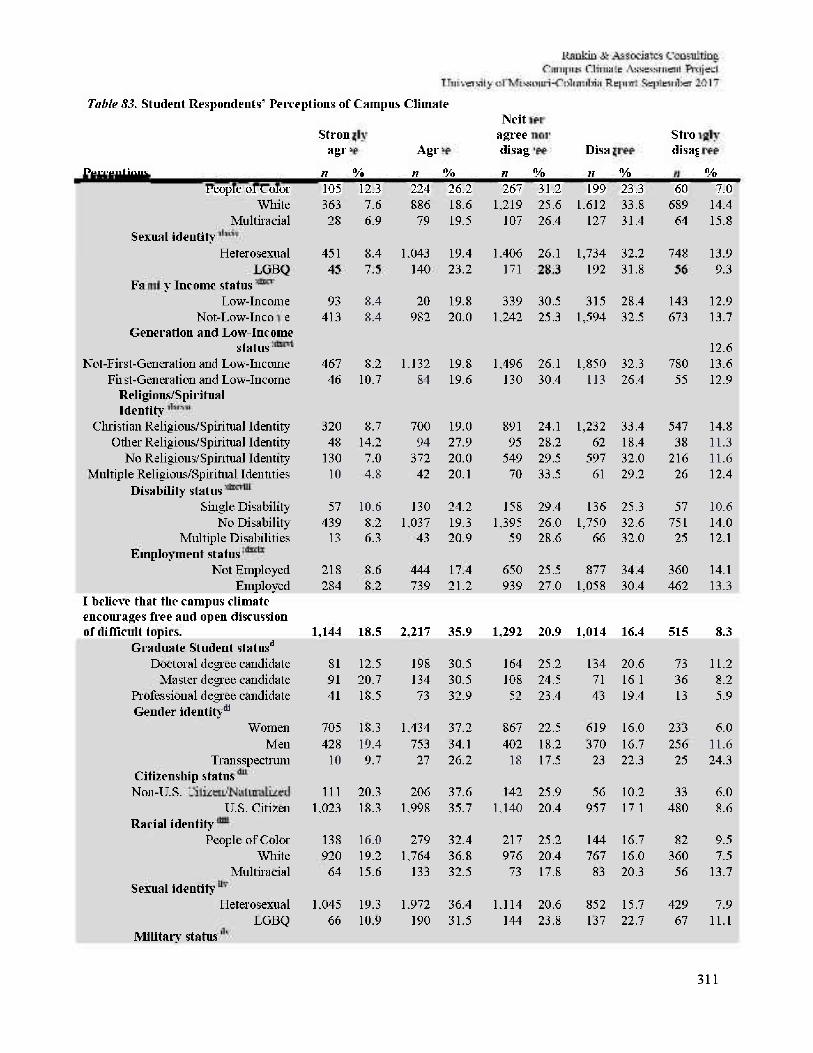
311
Table S3. Student Respondents' Perceptions of Campus Climate
Perceptions People of Color
Strongly agree
n 105
% 12.3
Agree n 224
% 26.2
Neither agree nor disagree n 267
% 31.2
Disagree n 199
% 23.3
Strongly disagree
n
60 %
7.0 White 363 7.6 886 18.6 1,219 25.6 1.612 33.8 689 14.4
Multiracial 28 6.9 79 19.5 107 26.4 127 31.4 64 15.8 Sexual identity
Heterosexual 451 8.4 1,043 19.4 1.406 26.1 1,734 32.2 748 13.9 LGBQ 45 7.5 140 23.2 171 28.3 192 31.8 56 9.3
Family Income status Low-Income 93 8.4 20 19.8 339 30.5 315 28.4 143 12.9
Not-Low-Income 413 8.4 982 20.0 1.242 25.3 1,594 32.5 673 13.7 Generation and Low-Income
status 12.6 Not-First-Generation and Low-Income 467 8.2 1.132 19.8 1.496 26.1 1,850 32.3 780 13.6
First-Generation and Low-Income 46 10.7 84 19.6 130 30.4 113 26.4 55 12.9 Religious/Spiritual Identity
Christian Religious/Spiritual Identity 320 8.7 700 19.0 891 24.1 1,232 33.4 547 14.8 Other Religious/Spiritual Identity 48 14.2 94 27.9 95 28.2 62 18.4 38 11.3
No Religious/Spiritual Identity 130 7.0 372 20.0 549 29.5 597 32.0 216 11.6 Multiple Religious/Spiritual Identities 10 4.8 42 20.1 70 33.5 61 29.2 26 12.4
Disability status Single Disability 57 10.6 130 24.2 158 29.4 136 25.3 57 10.6
No Disability 439 8.2 1.037 19.3 1,395 26.0 1,750 32.6 751 14.0 Multiple Disabilities 13 6.3 43 20.9 59 28.6 66 32.0 25 12.1
Employment status Not Employed 218 8.6 444 17.4 650 25.5 877 34.4 360 14.1
Employed 284 8.2 739 21.2 939 27.0 1,058 30.4 462 13.3 I believe that the campus climate encourages free and open discussion of difficult topics. 1,144 18.5 2,217 35.9 1,292 20.9 1,014 16.4 515 8.3
Graduate Student status'1
Doctoral degree candidate 81 12.5 198 30.5 164 25.2 134 20.6 73 11.2 Master degree candidate 91 20.7 134 30.5 108 24.5 71 16.1 36 8.2
Professional degree candidate 41 18.5 73 32.9 52 23.4 43 19.4 13 5.9 Gender identity131
Women 705 18.3 1.434 37.2 867 22.5 619 16.0 233 6.0 Men 428 19.4 753 34.1 402 18.2 370 16.7 256 11.6
Trail s spectrum 10 9.7 27 26.2 18 17.5 23 22.3 25 24.3 Citizenship status Non-U.S. citizen/naturalized 111 20.3 206 37.6 142 25.9 56 10.2 33 6.0
U.S. Citizen 1,023 18.3 1.998 35.7 1.140 20.4 957 17.1 480 8.6 Racial identify
People of Color 138 16.0 279 32.4 217 25.2 144 16.7 82 9.5 White 920 19.2 1.764 36.8 976 20.4 767 16.0 360 7.5
Multiracial 64 15.6 133 32.5 73 17.8 83 20.3 56 13.7 Sexual identify
Heterosexual 1.045 19.3 1.972 36.4 1.114 20.6 852 15.7 429 7.9 LGBQ 66 10.9 190 31.5 144 23.8 137 22.7 67 11.1
Military status
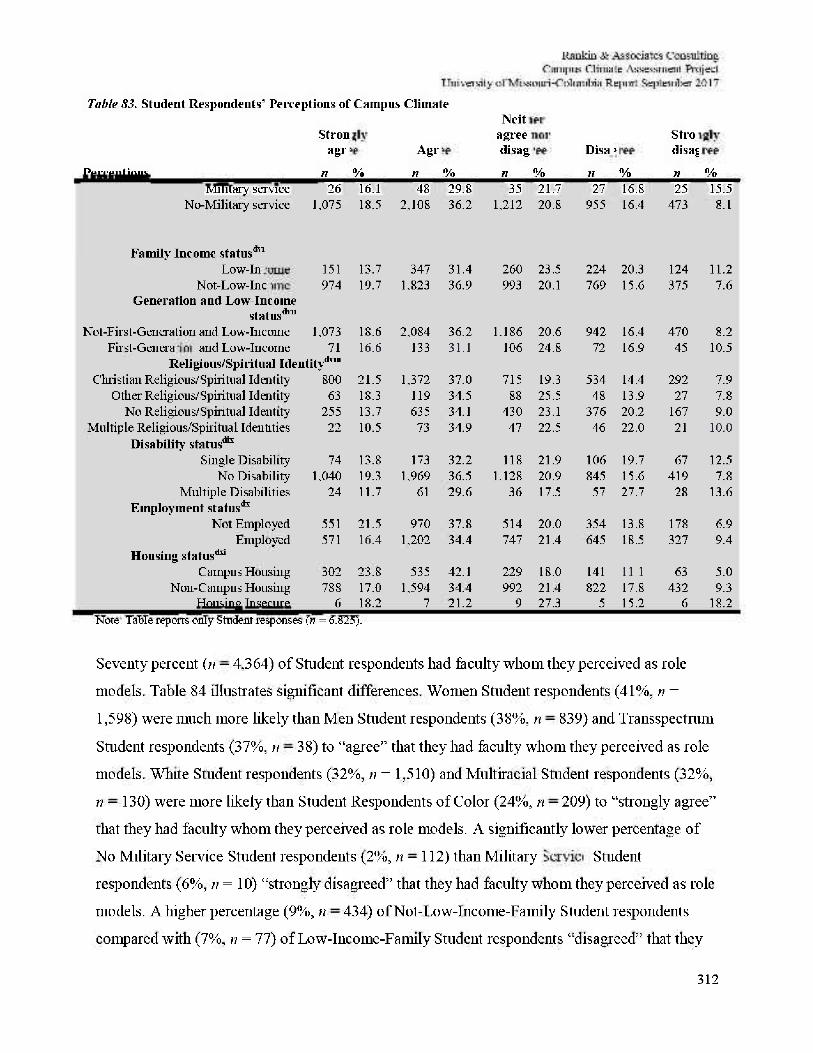
Table S3. Student Respondents' Perceptions of Campus Climate
Perceptions Military service
Strongly agree
n 26
% 16.1
Agree n 48
% 29.8
Neither agree nor disagree n
35 % 21.7
Disagree n 27
i
% 16.8
Strongly disagreee ti 25
%
15.5 No-Military service 1.075 18.5 2,108 36.2 1,212 20.8 955 16.4 473 8.1
Family Income status*1
Low-Income 151 13.7 347 31.4 260 23.5 224 20.3 124 11.2 Not-Low-Income 974 19.7 1.823 36.9 993 20.1 769 15.6 375 7.6
Generation and Low-Income status*"
Not-First-Generation and Low-Income 1,073 18.6 2,084 36.2 1.186 20.6 942 16.4 470 8.2 Fir st-Generation and Low-Income 71 16.6 133 31.1 106 24.8 72 16.9 45 10.5
Religious/Spiritual Identity*™ Christian Religious/Spiritual Identity 800 21.5 1,372 37.0 715 19.3 534 14.4 292 7.9
Other Religious/Spiritual Identity 63 18.3 119 34.5 88 25.5 48 13.9 27 7.8 No Religious/Spiritual Identity 255 13.7 635 34.1 430 23.1 376 20.2 167 9.0
Multiple Religious/Spiritual Identities 22 10.5 73 34.9 47 22.5 46 22.0 21 10.0 Disability status*1*
Single Disability 74 13.8 173 32.2 118 21.9 106 19.7 67 12.5 No Disability 1.040 19.3 1.969 36.5 1.128 20.9 845 15.6 419 7.8
Multiple Disabilities 24 11.7 61 29.6 36 17.5 57 27.7 28 13.6 Employment status**
Not Employed 551 21.5 970 37.8 514 20.0 354 13.8 178 6.9 Employed 571 16.4 1.202 34.4 747 21.4 645 18.5 327 9.4
Housing status'*1
Campus Housing 302 23.8 535 42.1 229 18.0 141 11.1 63 5.0 Non-Campus Housing 788 17.0 1,594 34.4 992 21.4 822 17.8 432 9.3
Housing Insecure 6 18.2 7 21.2 9 27.3 5 15.2 6 18.2 Note: Table reports only Student responses (n = 6.825).
Seventy percent (ti = 4,3 64) of Student respondents had faculty whom they perceived as role
models. Table 84 illustrates significant differences. Women Student respondents (41%, n =
1,598) were much more likely than Men Student respondents (38%, n = 839) and Transspectrum
Student respondents (37%, n = 38) to "agree" that they had faculty whom they perceived as role
models. White Student respondents (32%, n = 1,510) and Multiracial Student respondents (32%,
n = 130) were more likely than Student Respondents of Color (24%, n = 209) to "strongly agree"
that they had faculty whom they perceived as role models. A significantly lower percentage of
No Military Service Student respondents (2%, n = 112) than Military Service Student
respondents (6%, n = 10) "strongly disagreed" that they had faculty whom they perceived as role
models. A higher percentage (9%, n = 434) of Not-Low-Income-Family Student respondents
compared with (7%, n = 77) of Low-Income-Family Student respondents "disagreed" that they
312
313
had faculty whom they perceived as role models. A lower percentage (2%, n = 108) of Not-First-
Generation and Low-Income Student respondents versus (5%, n = 19) of First-Generation and
Low-Income Student respondents "strongly disagreed" that they had faculty whom they
perceived as role models. Thirty-nine percent (n = 1,438) of Christian Religious/Spiritual
Identity Student respondents and 40% (ti = 82) of Multiple Religious/Spiritual Identity Student
respondents were much less likely than 43% (n = 150) of Other Religious/Spiritual Identity
Student respondents and 42% (n = 792) of No Religious/Spiritual Identity Student respondents to
"agree" that they had faculty whom they perceived as role models. A lower percentage of Not-
Employed Student respondents (28%, n = 709) than Employed Student respondents (32%, n =
1,134) "strongly agr eed" that they had faculty whom they perceived as role models. A lower
percentage of On-Campus Student respondents (23%, n = 293) than Non-Campus Student
respondents (33%, n = 1,505) and Housing Insecure Student respondents (36%, n = 12) "strongly
agreed" that they had faculty whom they perceived as role models.
Fifty-nine percent (n = 3,631) of Student respondents had staff whom they perceived as role
models. A significantly higher percentage of Undergraduate First Year Student respondents
(36%, n = 1,548) than Undergraduate Transfer Student respondents (30%, n = 161) "agreed" that
they had staff whom they perceived as role models. Women Student respondents (37%, n =
1,411) and Men Student respondents (33%, n = 736) were much more likely than Transspectrum
Student respondents (26%, n = 27) to "agree" that they had staff whom they perceived as role
models. Student Respondents of Color (19%, n = 167) were significantly more likely than White
Student respondents (24%, n = 1,156) and Multiracial Student respondents (26%, n = 106) to
"strongly agree" that they had staff whom they perceived as role models. Heterosexual Student
respondents (36%, n = 1,939) were much more likely than LGBQ Student respondents (31%, n =
187) to "agree" that they had staff whom they perceived as role models. A significantly lower
percentage of No Military Service Student respondents (2%, n = 130) than Military Service
Student respondents (7%, n = 12) "strongly disagreed" that they had staff whom they perceived
as role models. A higher percentage (24%, n = 1,188) of Not-Low-Income-Family Student
respondents compared with (21%, n = 236) of Low-Income-Family Student respondents
"strongly agreed" that they had staff whom they perceived as role models. A higher percentage
(5%, ti = 21) of Fir st-Generation and Low-Income Student respondents versus (2%, n = 126) of
314
Not-First-Generation and Low-Income Student respondents "strongly disagreed" that they had
staff whom they perceived as role models. Twenty percent (o = 377) of No Religious/Spiritual
Identity7 Strident respondents were much less likely than 26% (n = 89) of Other
Religious/Spiritual Identity Student respondents, 25% (n = 929) of Christian Religious/Spiritual
Identity Student respondents, and 25% (ti = 52) of Multiple Religious/Spiritual Identity Student
respondents to "strongly agree" that they had staff whom they perceived as role models. A higher
percentage of No Disability Student respondents (36%, n = 1,932) than Disability Student
respondents (32%, n = 236) "agreed" that they had staff whom they perceived as role models. A
higher percentage of Not-Employed Student respondents (29%, n = 750) than Employed Student
respondents (26%, n = 899) "neither agree nor disagreed" that they had staff whom they
perceived as role models. A larger percentage of Housing Insecure Student respondents (30%, n
= 10) than On-Campus Student respondents (20%, n = 258) and Non-Campus Student
respondents (24%, n = 1,124) "strongly agreed" that they had staff whom they perceived as role
models.
Seventy percent (n = 4,336) of Student Respondents who had other students whom they
perceived as role models. A significantly higher percentage of Undergraduate First Year Student
respondents (31 %, n = 1,297) than Undergraduate Transfer Student respondents (17%, n = 92)
"strongly agreed" that they had other students whom they perceived as role models.
Transspectrum Student respondents (10%, n = 10) were much more likely than Men Student
respondents (4%, n = 88) and Women Student respondents (2%, n = 69) to "strongly disagree"
that they had other students whom they perceived as role models. A lower percentage of Non-
U.S. Citizen Student respondents (22%, n = 119) than U.S. Citizen Student respondents (30%, n
= 1,657) "strongly agreed" that they had other students whom they perceived as role models.
Student Respondents of Color (21%, n = 183) w7ere less likely than White Student respondents
(30%, n = 1,448) and Multiracial Student respondents (32%, n = 128) to "strongly agree" that
they had other students whom they perceived as role models. Heterosexual Student respondents
(42%, n = 2,268) were much more likely than LGBQ Student respondents (37%, n = 222) to
"agree" that they had other students whom they perceived as role models. A significantly lower
percentage of No Military Service Student respondents (3%, n = 150) than Military Service
Student respondents (9%, n = 14) "strongly disagreed" that they had other students whom they
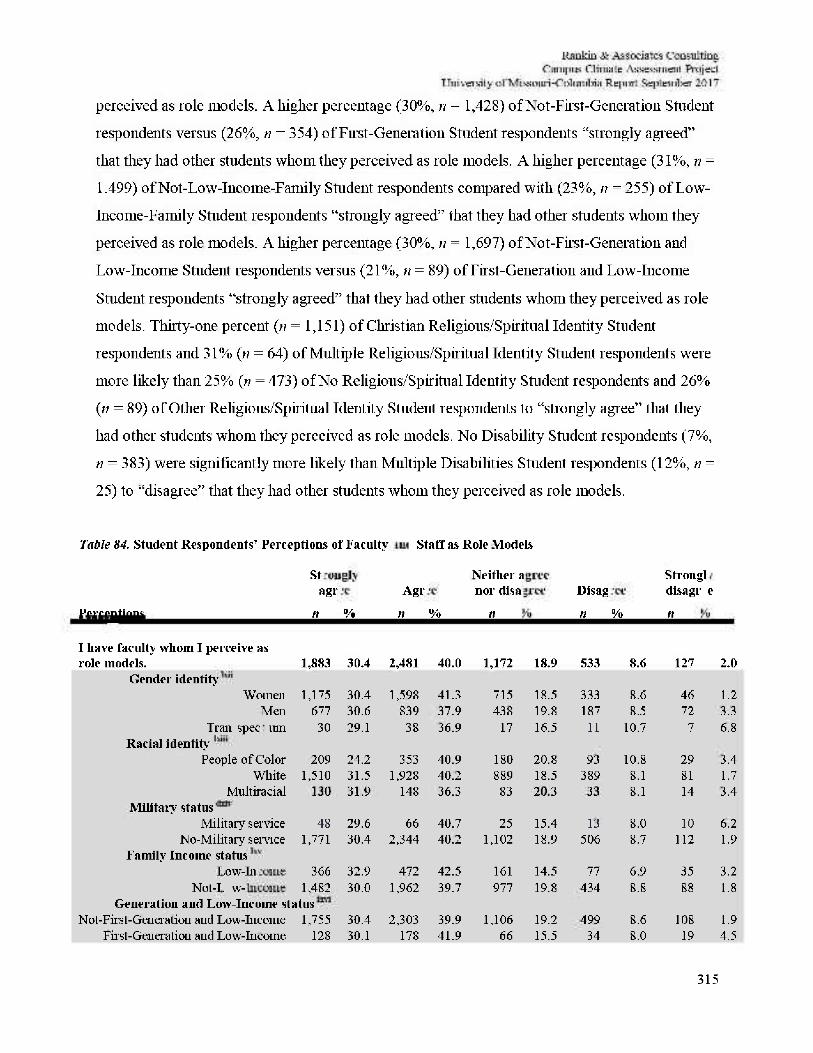
315
perceived as role models. A higher percentage (30%, n = 1,428) of Not-First-Generation Student
respondents versus (26%, n = 354) of Fust-Generation Student respondents "strongly agreed"
that they had other students whom they perceived as role models. A higher percentage (31%, ti =
1.499) of Not-Low-Income-Family Student respondents compared with (23%, n = 255) of Low-
Income-Family Student respondents "strongly agr eed" that they had other students whom they
perceived as role models. A higher percentage (30%, n = 1,697) of Not-First-Generation and
Low-Income Student respondents versus (21%, n = 89) of First-Generation and Low-Income
Student respondents "strongly agreed" that they had other students whom they perceived as role
models. Thirty-one percent (n = 1,151) of Christian Religious/Spiritual Identity Student
respondents and 31% (n = 64) of Multiple Religious/Spiritual Identity Student respondents w7ere
more likely than 25% (n = 473) of No Religious/Spiritual Identity Student respondents and 26%
(n = 89) of Other Religious/Spiritual Identity Student respondents to "strongly agree" that they
had other students whom they perceived as role models. No Disability Student respondents (7%,
n = 383) were significantly more likely than Multiple Disabilities Student respondents (12%, n =
25) to "disagree" that they had other students whom they perceived as role models.
Table 84. Student Respondents' Perceptions of Faculty and Staff as Role Models
Perceptions
I have faculty whom I perceive as role models.
Strongly agree
n
1,883
%
30.4
Agree n
2,481
%
40.0
Neither agree nor disagree
n
1,172 18.9
Disagee
n 533
%
8.6
Strongly disagree
n
127
e
2.0 Gender identity
Women 1,175 30.4 1,598 41.3 715 18.5 333 8.6 46 1.2 Men 677 30.6 839 37.9 438 19.8 187 8.5 72 3.3
Transpectrum 30 29.1 38 36.9 17 16.5 11 10.7 7 6.8 Racial identity7
People of Color 209 24.2 353 40.9 180 20.8 93 10.8 29 3.4 White 1,510 31.5 1,928 40.2 889 18.5 389 8.1 81 1.7
Multiracial 130 31.9 148 36.3 83 20.3 33 8.1 14 3.4 Military status
Military service 48 29.6 66 40.7 25 15.4 13 8.0 10 6.2 No-Military service 1,771 30.4 2,344 40.2 1,102 18.9 506 8.7 112 1.9
Family Income status Low-Income 366 32.9 472 42.5 161 14.5 77 6.9 35 3.2
Not-Low-income 1,482 30.0 1,962 39.7 977 19.8 434 8.8 88 1.8 Generation and Low-Income status
Not-First-Generation and Low-Income 1,755 30.4 2,303 39.9 1,106 19.2 499 8.6 108 1.9 Fir st-Generation and Low-Income 128 30.1 178 41.9 66 15.5 34 8.0 19 4.5
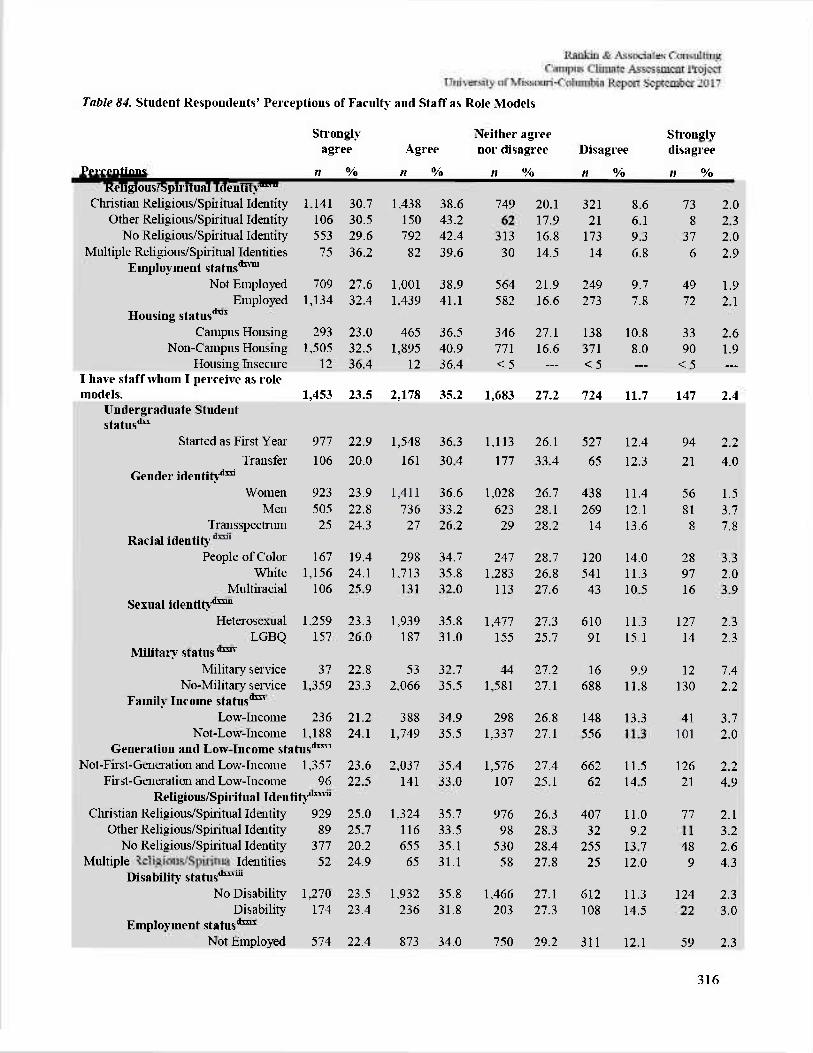
316
Table 84. Student Respondents' Perceptions of Faculty- and Staff as Role Models
Strongly Neither agree Strongly agree Agree nor disagree Disagree disagree
Perceptions n % n % n % n % n % Religions/Spiritual Identity"3™
Christian Religious/Spiritual Identity 1.141 30.7 1.438 38.6 749 20.1 321 8.6 73 2.0 Other Religious/Spiritual Identity 106 30.5 150 43.2 62 17.9 21 6.1 8 2.3
No Religious/Spiritual Identity 553 29.6 792 42.4 313 16.8 173 9.3 37 2.0 Multiple Religious/Spiritual Identities 75 36.2 82 39.6 30 14.5 14 6.8 6 2.9
Employment status4"™ Not Employed 709 27.6 1,001 38.9 564 21.9 249 9.7 49 1.9
Employed 1,134 32.4 1.439 41.1 582 16.6 273 7.8 72 2.1 Housing status"15"
Campus Housing 293 23.0 465 36.5 346 27.1 138 10.8 33 2.6 Non-Campus Housing 1,505 32.5 1,895 40.9 771 16.6 371 8.0 90 1.9
Housing Insecure 12 36.4 12 36.4 < 5 — < 5 — <5 —
I have staff whom I perceive as role models. 1,453 23.5 2,178 35.2 1,683 27.2 724 11.7 147 2.4
Undergraduate Student status411
Started as First Year 977 22.9 1,548 36.3 1,113 26.1 527 12.4 94 2.2 Transfer 106 20.0 161 30.4 177 33.4 65 12.3 21 4.0
Gender identi ty^ Women 923 23.9 1,411 36.6 1,028 26.7 438 11.4 56 1.5
Men 505 22.8 736 33.2 623 28.1 269 12.1 81 3.7 Transspectrum 25 24.3 27 26.2 29 28.2 14 13.6 8 7.8
Racial identity ^ People of Color 167 19.4 298 34.7 247 28.7 120 14.0 28 3.3
White 1,156 24.1 1,713 35.8 1,283 26.8 541 11.3 97 2.0 Multiracial 106 25.9 131 32.0 113 27.6 43 10.5 16 3.9
Sexual identity -™ Heterosexual 1,259 23.3 1,939 35.8 1,477 27.3 610 11.3 127 2.3
LGBQ 157 26.0 187 31.0 155 25.7 91 15.1 14 2.3 Military status <1™V
Military service 37 22.8 53 32.7 44 27.2 16 9.9 12 7.4 No-Military service 1,359 23.3 2,066 35.5 1,581 27.1 688 11.8 130 2.2
Family Income status4™ Low-Income 236 21.2 388 34.9 298 26.8 148 13.3 41 3.7
Not-Low-Income 1,188 24.1 1,749 35.5 1,337 27.1 556 11.3 101 2.0 Generation and Low-Income status4™1
Not-First-Generation and Low-Income 1,357 23.6 2,037 35.4 1,576 27.4 662 11.5 126 2.2 First-Generation and Low-Income 96 22.5 141 33.0 107 25.1 62 14.5 21 4.9
Religious/Spiritual Identity4™" Christian Religious/Spiritual Identity 929 25.0 1,324 35.7 976 26.3 407 11.0 77 2.1
Other Religious/Spiritual Identity 89 25.7 116 33.5 98 28.3 32 9.2 11 3.2 No Religious/Spiritual Identity 377 20.2 655 35.1 530 28.4 255 13.7 48 2.6
Multiple religious/spiritual Identities 52 24.9 65 31.1 58 27.8 25 12.0 9 4.3 Disability status4™®
No Disability 1,270 23.5 1,932 35.8 1,466 27.1 612 11.3 124 2.3 Disability 174 23.4 236 31.8 203 27.3 108 14.5 22 3.0
Employment status4™1
Not Employed 574 22.4 873 34.0 750 29.2 311 12.1 59 2.3
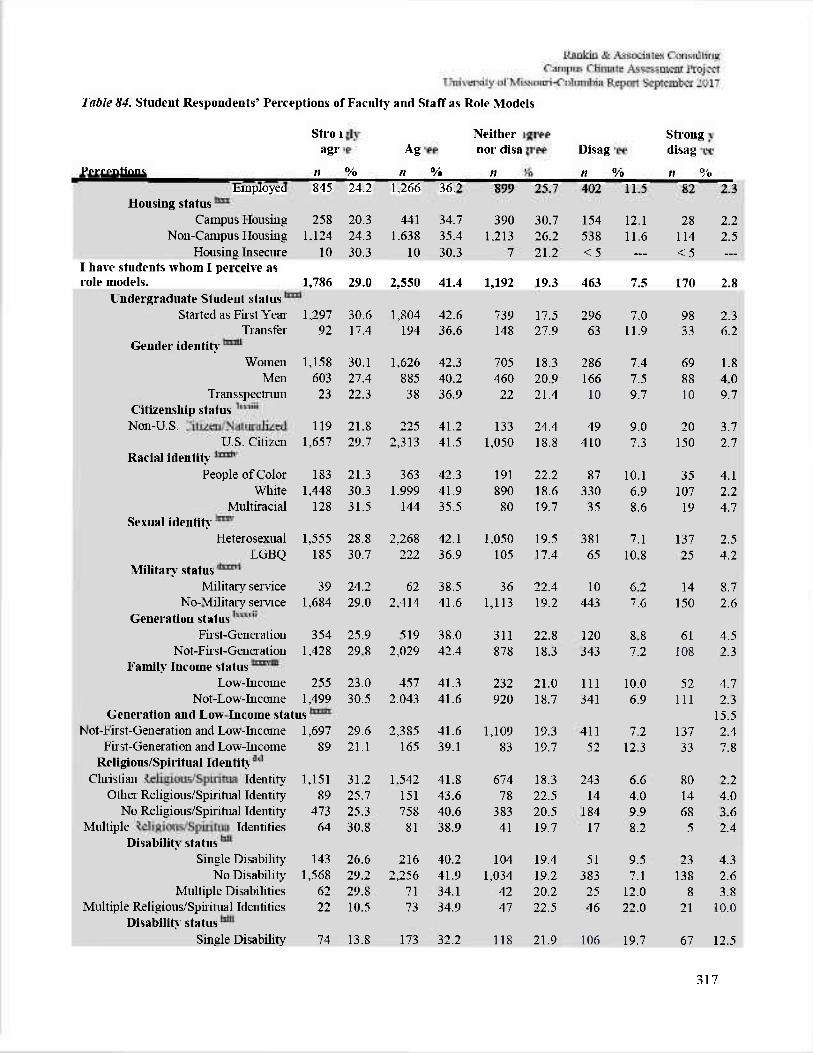
317
Table 84. Student Respondents' Perceptions of Faculty and Staff as Role Models
Perceptions Employed
Strongly agree
n 845
i
% 24.2
Agree
n 1,266
%
36.2
Neither agree nor disagree
n 899
=
25.7
Disagree
M 402
% 11.5
Strongly disagree
n f 82
•b
2.3 Housing status
Campus Housing 258 20.3 441 34.7 390 30.7 154 12.1 28 2.2 Non-Campus Housing 1.124 24.3 1.638 35.4 1,213 26.2 538 11.6 114 2.5
Housing Insecure 10 30.3 10 30.3 7 21.2 < 5 — < 5 —
I have students whom I perceive as role models. 1,786 29.0 2,550 41.4 1,192 19.3 463 7.5 170 2.8
Undergraduate Student status Started as First Year 1,297 30.6 1,804 42.6 739 17.5 296 7.0 98 2.3
Transfer 92 17.4 194 36.6 148 27.9 63 11.9 33 6.2 Gender identity
Women 1,158 30.1 1,626 42.3 705 18.3 286 7.4 69 1.8 Men 603 27.4 885 40.2 460 20.9 166 7.5 88 4.0
Transspectrum 23 22.3 38 36.9 22 21.4 10 9.7 10 9.7 Citizenship status Non-U. S. citizen/naturalized 119 21.8 225 41.2 133 24.4 49 9.0 20 3.7
U.S. Citizen 1,657 29.7 2,313 41.5 1,050 18.8 410 7.3 150 2.7 Racial identity
People of Color 183 21.3 363 42.3 191 22.2 87 10.1 35 4.1 White 1,448 30.3 1.999 41.9 890 18.6 330 6.9 107 2.2
Multiracial 128 31.5 144 35.5 80 19.7 35 8.6 19 4.7 Sexual identity
Heterosexual 1,555 28.8 2,268 42.1 1.050 19.5 381 7.1 137 2.5 LGBQ 185 30.7 222 36.9 105 17.4 65 10.8 25 4.2
Military status Military service 39 24.2 62 38.5 36 22.4 10 6.2 14 8.7
No-Military service 1,684 29.0 2,414 41.6 1,113 19.2 443 7.6 150 2.6 Generation status
First-Generation 354 25.9 519 38.0 311 22.8 120 8.8 61 4.5 Not-First-Generation 1,428 29.8 2,029 42.4 878 18.3 343 7.2 108 2.3
Family Income status Low-Income 255 23.0 457 41.3 232 21.0 111 10.0 52 4.7
Not-Low-Income 1,499 30.5 2.043 41.6 920 18.7 341 6.9 111 2.3 Generation and Low-Income status 15.5
Not-First-Geueration and Low-Income 1,697 29.6 2,385 41.6 1,109 19.3 411 7.2 137 2.4 First-Generation and Low-Income 89 21.1 165 39.1 83 19.7 52 12.3 33 7.8
Religious/Spiritual Identity Christian religious/spiritual Identity 1,151 31.2 1.542 41.8 674 18.3 243 6.6 80 2.2
Other Religious/Spiritual Identity 89 25.7 151 43.6 78 22.5 14 4.0 14 4.0 No Religious/Spiritual Identity 473 25.3 758 40.6 383 20.5 184 9.9 68 3.6
Multiple religious/spiritual Identities 64 30.8 81 38.9 41 19.7 17 8.2 5 2.4 Disability status
Single Disability 143 26.6 216 40.2 104 19.4 51 9.5 23 4.3 No Disability 1,568 29.2 2,256 41.9 1,034 19.2 383 7.1 138 2.6
Multiple Disabilities 62 29.8 71 34.1 42 20.2 25 12.0 8 3.8 Multiple Religious/Spiritual Identities 22 10.5 73 34.9 47 22.5 46 22.0 21 10.0
Disability status Single Disability 74 13.8 173 32.2 118 21.9 106 19.7 67 12.5
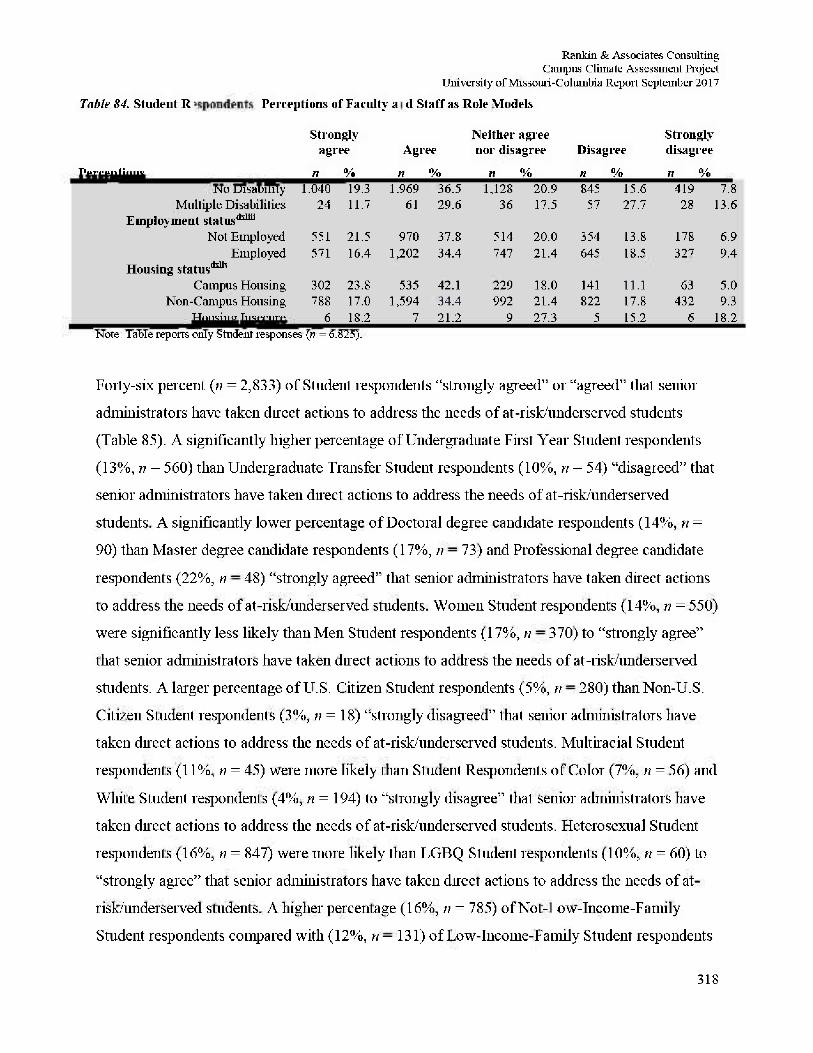
318
Rankin & Associates Consulting Campus Climate Assessment Project
University of Missouri-Columbia Repoit September 2017
Table 84. Student Respondents Perceptions of Faculty and Staff as Role Models
Strongly Neither agree Strongly agr ee Agr ee nor disagree Disagree disagree
Perceptions n % n % n % M % n % No Disability 1.040 19.3 1.969 36.5 1,128 20.9 845 15.6 419 7.8
Multiple Disabilities 24 11.7 61 29.6 36 17.5 57 27.7 28 13.6 Employment status'™*
Not Employed 551 21.5 970 37.8 514 20.0 354 13.8 178 6.9 Employed 571 16.4 1,202 34.4 747 21.4 645 18.5 327 9.4
Housing s ta tus^ 1
Campus Housing 302 23.8 535 42.1 229 18.0 141 11.1 63 5.0 Non-Campus Housing 788 17.0 1,594 34.4 992 21.4 822 17.8 432 9.3
Housing Insecure 6 18.2 7 21.2 9 27.3 5 15.2 6 18.2 Note: Table reports only Student responses (n = 6.825).
Forty-six percent (n = 2,833) of Student respondents "strongly agreed" or "agreed" that senior administrators have taken direct actions to address the needs of at-risk/underserved students (Table 85). A significantly higher percentage of Undergraduate First Year Student respondents (13%, n = 560) than Undergraduate Transfer Student respondents (10%, n = 54) "disagreed" that senior administrators have taken direct actions to address the needs of at-risk/underserved students. A significantly lower percentage of Doctoral degree candidate respondents (14%, n = 90) than Master degree candidate respondents (17%, n = 73) and Professional degree candidate respondents (22%, n = 48) "strongly agreed" that senior administrators have taken direct actions to address the needs of at-risk/underserved students. Women Student respondents (14%, n = 550) were significantly less likely than Men Student respondents (17%, n = 370) to "strongly agree" that senior administrators have taken direct actions to address the needs of at-risk/underserved students. A larger percentage of U.S. Citizen Student respondents (5%, n = 280) than Non-U. S. Citizen Student respondents (3%, n = 18) "strongly disagreed" that senior administrators have taken direct actions to address the needs of at-risk/underserved students. Multiracial Student respondents (11%, n = 45) were more likely than Student Respondents of Color (7%, n = 56) and White Student respondents (4%, n = 194) to "strongly disagree" that senior administrators have taken direct actions to address the needs of at-risk/underserved students. Heterosexual Student respondents (16%, n = 847) were more likely than LGBQ Student respondents (10%, n = 60) to "strongly agree" that senior administrators have taken direct actions to address the needs of at-risk/underserved students. A higher percentage (16%, n = 785) of Not-low-Income-Family Student respondents compared with (12%, n = 131) of Low-Income-Family Student respondents
319
"strongly agreed" that senior administrators have taken direct actions to address the needs of at-
risk/underserved students. A higher percentage (31%, n = 1,795) of Not-First-Generation and
Low-Income Student respondents versus (24%, n = 104) of First-Generation and Low-Income
Student respondents "agreed" that senior administrators have taken direct actions to address the
needs of at-risk/underserved students. Eighteen percent (;/ = 656) of Christian Religious/Spiritual
Identity Student respondents and 15% (n = 51) of Other Religious/Spiritual Identity Student
respondents were much more likely than 11% (n = 197) of No Religious/Spiritual Identity
Student respondents and 13% (n = 26) of Multiple Religious/Spiritual Identity Student
respondents to "strongly agree" that senior administrators have taken direct actions to address the
needs of at-risk/underserved students. No Disability Student respondents (16%, n = 844) were
more likely than Multiple Disabilities Student respondents (14%, n = 28) and Single Disability
Student respondents (10%, n = 55) to "strongly agree" that senior administrators have taken
direct actions to address the needs of at-risk/underserved students. A higher percentage of Not-
Employed Student respondents (18%, n = 449) than Employed Student respondents (13%, n =
469) "strongly agreed" that senior administrators have taken direct actions to address the needs
of at-risk/underserved students. A larger percentage of Non-Campus Student respondents (15%,
n = 669) than On-Campus Student respondents (9%, n = 110) and fewer than five Housing
Insecure Student respondents "disagreed" that senior administrators have taken direct actions to
address the needs of at-risk/underserved students.
Fifty-three percent (« = 3,264) of Student respondents "strongly agr eed" or "agreed" that faculty
have taken direct actions to address the needs of at-risk/underserved students. Transspectrum
Student respondents (22%, n = 23) w7ere less likely than Women Student respondents (36%, n =
1,391) and Men Student respondents (37%, n = 826) to "agree" that faculty have taken direct
actions to address the needs of at-risk/underserved students. Student Respondents of Color (12%,
n = 102) and Multiracial Student respondents (14%, n = 56) were more likely than White Student
respondents (9%, n = 425) to "disagree" that faculty have taken direct actions to address the
needs of at-risk/underserved students. Heterosexual Student respondents (17%, n = 908) were
much more likely than LGBQ Student respondents (13%, n = 79) to "strongly agree" that faculty
have taken direct actions to address the needs of at-risk/underserved students. A higher
percentage (37%, n = 1,834) of Not-Low-Income-Family Student respondents compared with
320
(34%, n = 372) of Low-Income-Family Student respondents "agreed" that faculty have taken
direct actions to address the needs of at-risk/underserved students. A lower percentage (3%, n =
158) of Not-First-Generation and Low-Income Student respondents versus (7%, n = 31) of First-
Generation and Low-Income Student respondents "strongly disagreed" that faculty have taken
direct actions to address the needs of at-risk/underserved students. Nineteen percent (n = 685) of
Christian Religious/ Spiritual Identity Student respondents, 17% (n = 58) of Other
Religious/Spiritual Identity Student respondents, and 16% (n = 33) of Multiple
Religious/Spiritual Identity Student respondents were much more likely than 13% (n = 236) of
No Religious/Spiritual Identity Student respondents to "strongly agree" that faculty have taken
direct actions to address the needs of at-risk/underserved students. No Disability Student
respondents (17%, n = 912) were more likely than Multiple Disabilities Student respondents
(15%, ii = 32) and Single Disability Student respondents (12%, n = 66) to "strongly agree" that
faculty have taken direct actions to address the needs of at-risk/underserved students. A higher
percentage of Not-Employed Student respondents (18%, n = 460) than Employed Student
respondents (15%, n = 539) "strongly agreed" that faculty have taken direct actions to address
the needs of at-risk/underserved students. A lower percentage of On-Campus Student
respondents (7%, n = 85) than Non-Campus Student respondents (10%, n = 476) and fewer than
five Housing Insecure Student respondents "disagreed" that faculty have taken direct actions to
address the needs of at-risk/underserved students.
Fifty-six percent (n = 3,430) of Student respondents "strongly agreed" or "agr eed" that students
have taken direct actions to address the needs of at-risk/underserved students. A significantly
higher percentage of Undergraduate First Year Student respondents (38%, n = 1,616) than
Undergraduate Transfer Student respondents (29%, n = 156) "agreed" that students have taken
direct actions to address the needs of at-risk/underserved students. Transspectrum Student
respondents (12%, n = 12) and Women Student respondents (9%, n = 348) w7ere more likely than
Men Student respondents (7%, n = 151) to "disagree" that students have taken direct actions to
address the needs of at-risk/underserved students. Student Respondents of Color (4%, n = 38)
and Multiracial Student respondents (7%, n = 30) were more likely than White Student
respondents (2%, n = 105) to "strongly disagree" that students have taken direct actions to
address the needs of at-risk/underserved students. Heterosexual Student respondents (8%, n =
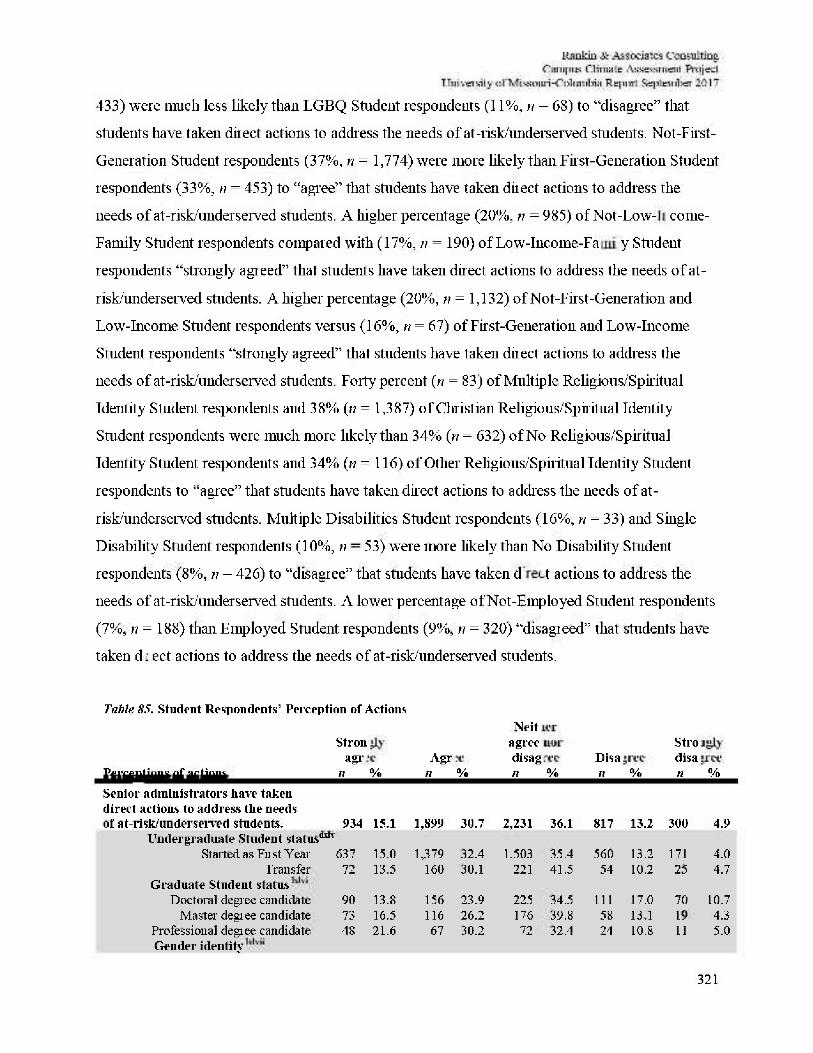
321
433) were much less likely than LGBQ Student respondents (11%, n = 68) to "disagree" that
students have taken direct actions to address the needs of at-risk/underserved students. Not-First-
Generation Student respondents (37%, n = 1,774) were more likely than First-Generation Student
respondents (33%, ti = 453) to "agree" that students have taken direct actions to address the
needs of at-risk/underserved students. A higher percentage (20%, n = 985) of Not-Low-income-
Family Student respondents compared with (17%, n = 190) of Low-Income-Family Student
respondents "strongly agr eed" that students have taken direct actions to addr ess the needs of at-
risk/underserved students. A higher percentage (20%, n = 1,132) of Not-First-Generation and
Low-Income Student respondents versus (16%, n = 67) of First-Generation and Low-Income
Student respondents "strongly agreed" that students have taken direct actions to address the
needs of at-risk/underserved students. Forty percent (n = 83) of Multiple Religious/Spiritual
Identity Student respondents and 38% (;/ = 1,387) of Christian Religious/Spiritual Identity
Student respondents were much more likely than 34% (n = 632) of No Religious/Spiritual
Identity Student respondents and 34% (n =116) of Other Religious/Spiritual Identity Student
respondents to "agr ee" that students have taken direct actions to address the needs of at-
risk/underserved students. Multiple Disabilities Student respondents (16%, n = 33) and Single
Disability Student respondents (10%, n = 53) were more likely than No Disability Student
respondents (8%, n = 426) to "disagree" that students have taken direct actions to address the
needs of at-risk/underserved students. A lower percentage of Not-Employed Student respondents
(7%, ii = 188) than Employed Student respondents (9%, n = 320) "disagreed" that students have
taken direct actions to address the needs of at-risk/underserved students.
Table 85. Student Respondents' Perception of Actions
Perceptions of actions Senior administrators have taken direct actions to address the needs of at-risk/underserved students.
Strongly agree
n
934
%
15.1
Agree n
1,899
%
30.7
Neither agree nor disagree n
2,231
%
36.1
Disagree n
817
%
13.2
Strongly disagree n
300
%
4.9 Under graduate Student status1**
Started as Fust Year' 637 15.0 1,379 32.4 1.503 35.4 560 13.2 171 4.0 Transfer 72 13.5 160 30.1 221 41.5 54 10.2 25 4.7
Graduate Student status Doctoral degree candidate 90 13.8 156 23.9 225 34.5 111 17.0 70 10.7
Master degree candidate 73 16.5 116 26.2 176 39.8 58 13.1 19 4.3 Professional degree candidate 48 21.6 67 30.2 72 32.4 24 10.8 11 5.0 Gender identity
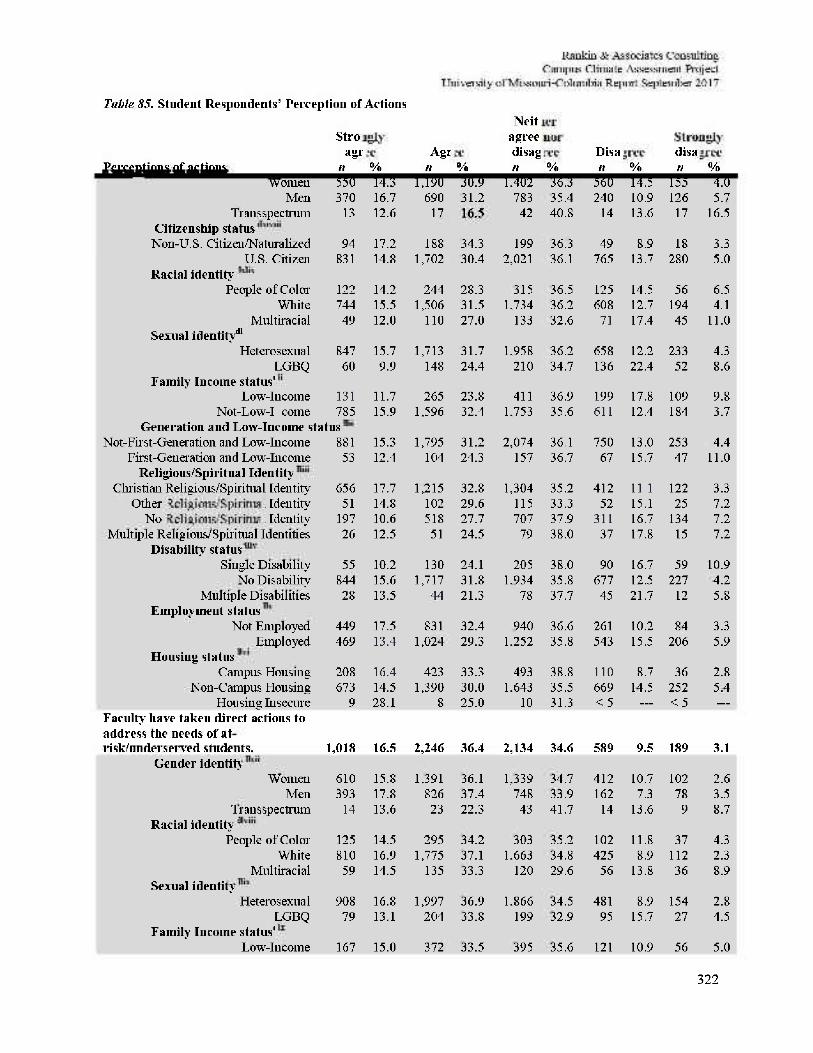
Table 85. Student Respondents' Perception of Actions
Perceptions of actions
Strongly agree
n % Agree
n %
Neither agree nor disagree n
% Disagree n %
Strongly disagree n
% Women 550 14.3 1,190 30.9 1.402 36.3 560 14.5 155 4.0
Men 370 16.7 690 31.2 783 35.4 240 10.9 126 5.7 Transspectrum 13 12.6 17 16.5 42 40.8 14 13.6 17 16.5
Citizenship status Non-U.S. Citizen/Naturalized 94 17.2 188 34.3 199 36.3 49 8.9 18 3.3
U.S. Citizen 831 14.8 1,702 30.4 2,021 36.1 765 13.7 280 5.0 Racial identify
People of Color 122 14.2 244 28.3 315 36.5 125 14.5 56 6.5 White 744 15.5 1,506 31.5 1.734 36.2 608 12.7 194 4.1
Multiracial 49 12.0 110 27.0 133 32.6 71 17.4 45 11.0 Sexual identify 41
Heterosexual 847 15.7 1,713 31.7 1.958 36.2 658 12.2 233 4.3 LGBQ 60 9.9 148 24.4 210 34.7 136 22.4 52 8.6
Family Income status' Low-Income 131 11.7 265 23.8 411 36.9 199 17.8 109 9.8
Not-Low-Income 785 15.9 1,596 32.4 1.753 35.6 611 12.4 184 3.7 Generation and Low-Income status
Not-First-Generation and Low-Income 881 15.3 1,795 31.2 2,074 36.1 750 13.0 253 4.4 First-Generation and Low-Income 53 12.4 104 24.3 157 36.7 67 15.7 47 11.0
Religious/Spiritual Identity Christian Religious/Spiritual Identity 656 17.7 1,215 32.8 1,304 35.2 412 11.1 122 3.3
Other religious/spiritual Identity 51 14.8 102 29.6 115 33.3 52 15.1 25 7.2 No religious/spiritual Identity 197 10.6 518 27.7 707 37.9 311 16.7 134 7.2
Multiple Religious/Spiritual Identities 26 12.5 51 24.5 79 38.0 37 17.8 15 7.2 Disability status
Single Disability 55 10.2 130 24.1 205 38.0 90 16.7 59 10.9 No Disability 844 15.6 1,717 31.8 1.934 35.8 677 12.5 227 4.2
Multiple Disabilities 28 13.5 44 21.3 78 37.7 45 21.7 12 5.8 Employment status
Not Employed 449 17.5 831 32.4 940 36.6 261 10.2 84 3.3 Employed 469 13.4 1,024 29.3 1.252 35.8 543 15.5 206 5.9
Housing status Campus Housing 208 16.4 423 33.3 493 38.8 110 8.7 36 2.8
Non-Campus Housing 673 14.5 1,390 30.0 1.643 35.5 669 14.5 252 5.4 Housing Insecure 9 28.1 8 25.0 10 31.3 <5 — <5 —
Faculty have taken direct actions to address the needs of at-risk/underserved students. 1,018 16.5 2,246 36.4 2,134 34.6 589 9.5 189 3.1
Gender identity Women 610 15.8 1,391 36.1 1,339 34.7 412 10.7 102 2.6
Men 393 17.8 826 37.4 748 33.9 162 7.3 78 3.5 Transspectrum 14 13.6 23 22.3 43 41.7 14 13.6 9 8.7
Racial identify People of Color 125 14.5 295 34.2 303 35.2 102 11.8 37 4.3
White 810 16.9 1,775 37.1 1.663 34.8 425 8.9 112 2.3 Multiracial 59 14.5 135 33.3 120 29.6 56 13.8 36 8.9
Sexual identity Heterosexual 908 16.8 1,997 36.9 1.866 34.5 481 8.9 154 2.8
LGBQ 79 13.1 204 33.8 199 32.9 95 15.7 27 4.5 Family Income status'
Low-Income 167 15.0 372 33.5 395 35.6 121 10.9 56 5.0
322
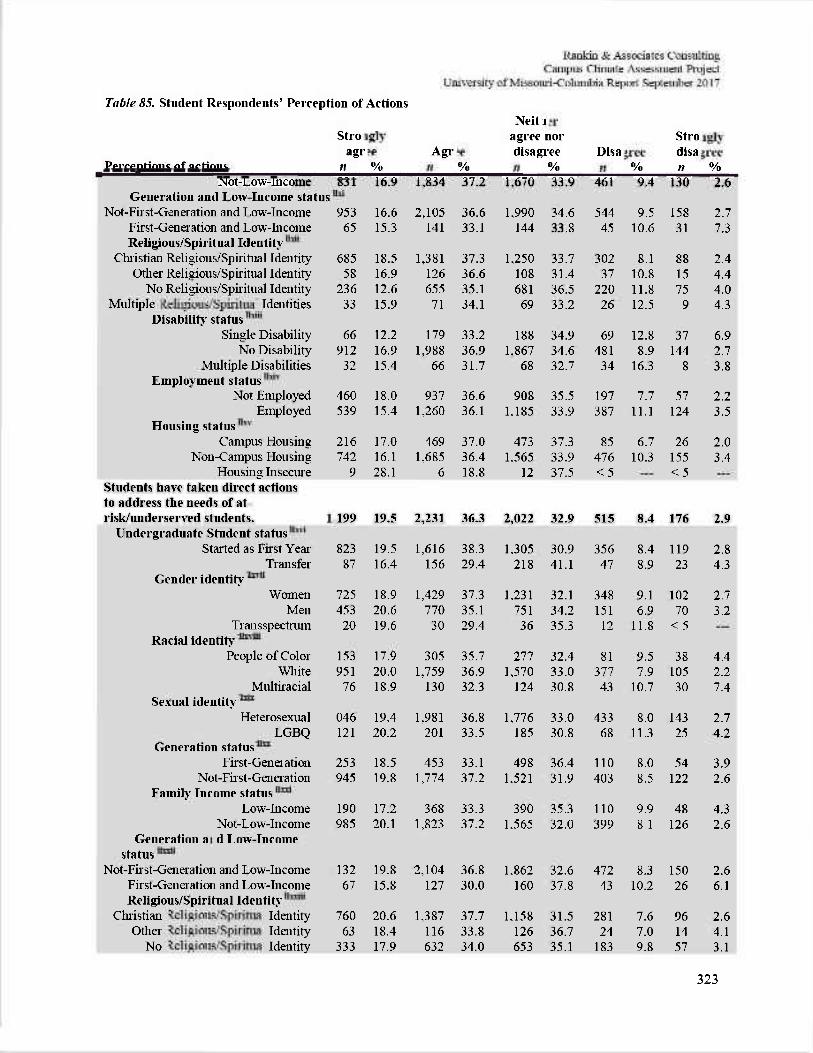
323
Table 55. Student Respondents' Perception of Actions
Perceptions of actions Not-Low-Income
Strongly agree
n 831
% 16.9
Agree n
1,834 % 37.2
Neither agree nor disagree
n 1,670
l nor ree % 33.9
Disagree n
461 %
9.4
Strongly disagree n
130 % 2.6
Generation and Low-Income status Not-First-Generation and Low-Income 953 16.6 2,105 36.6 1,990 34.6 544 9.5 158 2.7
First-Generation and Low-Income 65 15.3 141 33.1 144 33.8 45 10.6 31 7.3 Religious/Spiritual Identity
Christian Religious/Spiritual Identity 685 18.5 1,381 37.3 1.250 33.7 302 8.1 88 2.4 Other Religious/Spiritual Identity 58 16.9 126 36.6 108 31.4 37 10.8 15 4.4
No Religious/Spiritual Identity 236 12.6 655 35.1 681 36.5 220 11.8 75 4.0 Multiple religious/spiritual Identities 33 15.9 71 34.1 69 33.2 26 12.5 9 4.3
Disability status Single Disability 66 12.2 179 33.2 188 34.9 69 12.8 37 6.9
No Disability 912 16.9 1,988 36.9 1.867 34.6 481 8.9 144 2.7 Multiple Disabilities 32 15.4 66 31.7 68 32.7 34 16.3 8 3.8
Employment status Not Employed 460 18.0 937 36.6 908 35.5 197 7.7 57 2.2
Employed 539 15.4 1,260 36.1 1.185 33.9 387 11.1 124 3.5 Housing st a tils
Campus Housing 216 17.0 469 37.0 473 37.3 85 6.7 26 2.0 Non-Campus Housing 742 16.1 1,685 36.4 1.565 33.9 476 10.3 155 3.4
Housing Insecure Students have taken direct actions to address the needs of at-risk/underserved students.
Undergraduate Student status Started as First Year'
Transfer Gender identity
Women Men
Transspectrum Racial identity
People of Color White
Multiracial Sexual identity
Heterosexual LGBQ
Generation status First-Generation
Not-First-Generation Family Income status
Low-Income Not-Low-Income
Generation and Low-Income status
Not-First-Generation and Low-Income First-Generation and Low-Income Religious/Spiritual Identity
Christian religious/spiritual Identity Other religious/spiritual Identity
No religious/spiritual Identity
9
1,199
823 87
725 453 20
153 951 76
1,046 121
253 945
190 985
1,132 67
760 63
333
28.1
19.5
19.5 16.4
18.9 20.6 19.6
17.9 20.0 18.9
19.4 20.2
18.5 19.8
17.2 20.1
19.8 15.8
20.6 18.4 17.9
6
2,231
1,616 156
1,429 770 30
305 1,759
130
1,981 201
453 1,774
368 1,823
2,104 127
1,387 116 632
18.8
36.3
38.3 29.4
37.3 35.1 29.4
35.7 36.9 32.3
36.8 33.5
33.1 37.2
33.3 37.2
36.8 30.0
37.7 33.8 34.0
12
2,022
1.305 218
1.231 751 36
277 1.570
124
1.776 185
498 1.521
390 1.565
1.862 160
1.158 126 653
37.5
32.9
30.9 41.1
32.1 34.2 35.3
32.4 33.0 30.8
33.0 30.8
36.4 31.9
35.3 32.0
32.6 37.8
31.5 36.7 35.1
< 5
515
356 47
348 151
12
81 377 43
433 68
110 403
110 399
472 43
281 24
183
8.4
8.4 8.9
9.1 6.9
11.8
9.5 7.9
10.7
8.0 11.3
8.0 8.5
9.9 8.1
8.3 10.2
7.6 7.0 9.8
< 5
176
119 23
102 70
< 5
38 105 30
143 25
54 122
48 126
150 26
96 14 57
2.9
2.8 4.3
2.7 3.2
4.4 2.2 7.4
2.7 4.2
3.9 2.6
4.3 2.6
2.6 6.1
2.6 4.1 3.1
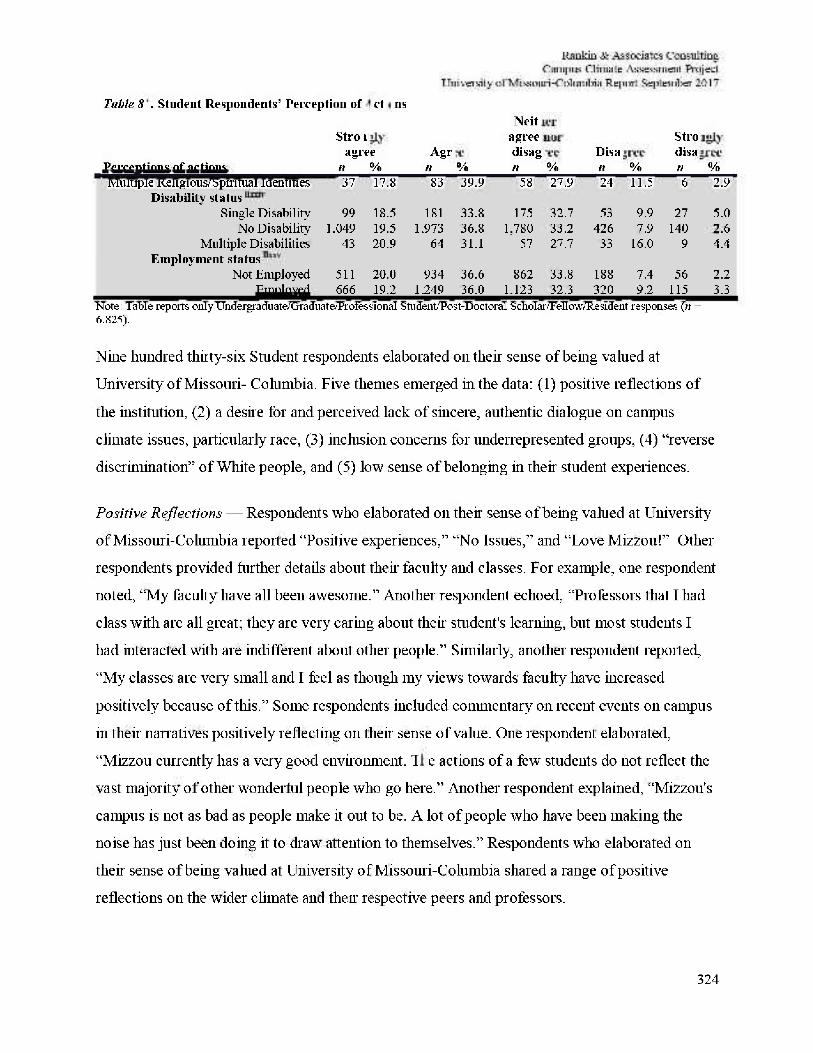
324
Table 8. Student Respondents' Perception of c t n s
Perceptions of actions Multiple Religious/Spiritual Identities
Strongly agree
n 37
i ee % 17.8
Agree n 83
% 39.9
Neither agree nor disagree n
58 % 27.9
Disagree n 24
% 11.5
Strongly disagree n 6
% 2.9
Disability status Single Disability 99 18.5 181 33.8 175 32.7 53 9.9 27 5.0
No Disability 1,049 19.5 1.973 36.8 1,780 33.2 426 7.9 140 2.6 Multiple Disabilities 43 20.9 64 31.1 57 27.7 33 16.0 9 4.4
Employment status Not Employed 511 20.0 934 36.6 862 33.8 188 7.4 56 2.2
Employed 666 19.2 1.249 36.0 1.123 32.3 320 9.2 115 3.3 Note: Table reports only Undergraduate/Graduate/Professional Student/Post-Doctoral Scholar/Fellow/Resident responses (« = 6.825).
Nine hundred thirty-six Student respondents elaborated 011 their sense of being valued at
University of Missouri- Columbia. Five themes emerged in the data: (1) positive reflections of
the institution, (2) a desire for and perceived lack of sincere, authentic dialogue on campus
climate issues, particularly race, (3) inclusion concerns for underrepresented groups, (4) "reverse
discrimination" of White people, and (5) low sense of belonging in their student experiences.
Positive Reflections — Respondents who elaborated 011 their sense of being valued at University
of Missouri-Columbia reported "Positive experiences," "No Issues," and "Love Mizzou!" Other
respondents provided further details about their faculty and classes. For example, one respondent
noted, "My faculty have all been awesome." Another respondent echoed, "Professors that I had
class with are all great; they are very caring about their student's learning, but most students I
had interacted with are indifferent about other people." Similarly, another respondent reported,
"My classes are very small and I feel as though my views towards faculty have increased
positively because of this." Some respondents included commentary 011 recent events 011 campus
in their narratives positively reflecting on their sense of value. One respondent elaborated,
"Mizzou currently has a very good environment. The actions of a few students do not reflect the
vast majority of other wonderful people who go here." Another respondent explained, "Mizzou's
campus is not as bad as people make it out to be. A lot of people who have been making the
noise has just been doing it to draw attention to themselves." Respondents who elaborated 011
their sense of being valued at University of Missouri-Columbia shared a range of positive
reflections 011 the wider climate and their respective peers and professors.
Rankin & Associates Consulting Campus Climate Assessment Project
University of Missouri-Columbia Report September 2017
Desire For (And Current Lack Of Tolerance In) Difficult Dialogues — Respondents who
elaborated oil their sense of being valued at University of Missouri-Columbia described a lack of
opportunity for difficult dialogue on campus, concurrent with a desire to cultivate these
opportunities. Some respondents emphasized then fears associated with such dialogues. For
example, "If you have a different opinion than the majority of people hear on campus, you are
not encouraged to have open discussions about them." Another respondent echoed, "In regards to
acceptance of political views, I find there is acceptance within a narrow window of acceptable
American political ideology but not outside of that." Specifically noting race, one respondent
shared, "I think that Is very difficult to express your opinion oil racial issues on campus. I believe
in freedom of speech and feel it has been violated." Another respondent described their desire for
discussion, "I'm a liberal, but safe spaces are the opposite of liberalism Be safe in your dorm
room, but be ready to discuss hi public. This university is a symbol for hypersensitivity and is
regressing the advancements made by people who truly want liberal change in this country."
Similarly, another respondent summarized, "I don't feel that the climate allows everyone to
express how they're feeling about difficult topics. Everyone is walking on egg shells w7hen it
comes to discussing the hard topics because nobody wants their words to be twisted or
misconstrued into something negative when it's not intended to be." Other respondents were less
receptive to and invested in these dialogues on campus and associated this survey with such
efforts. For example, "How about we focus 011 the academic education of the students instead of
worrying so much about their perceived 'sense of value'?" Another respondent simply stated,
"Focus 011 being an academic institution." Respondents who elaborated 011 their sense of being
valued at University of Missouri-Columbia generally described a current of lack of tolerance hi
difficult dialogues and desire to improve this, however, these notions did not go uncontested by
the respondents w7ho think this is not the university's job.
Inclusion Concerns For Minorities — Narratives addressing student's sense of value included
concerns of the range of identities at University of Missouri-Columbia. Sexism was noted as a
standalone concern and in tandem with concerns about sexual assault. For example, one
respondent noted, "Mizzou seems to have been created for w7hite men of high social status
(which it was back hi the day) but this is still readily apparent now. Aforementioned men now
run the politics of this campus and of our state, and do not represent the best interests of Mizzou
325
Rankin & Associates Consulting Campus Climate Assessment Project
University of Missouri-Columbia Report September 2017
students in either setting. I do not feel valued as a Mizzou student." Another respondent shared,
'I'm a woman in engineering. Most of my professors and classmates are male. I've encountered
small acts of sexism from both groups." Regarding sexual assault, one respondent noted, "Rape
and sexual assault are a huge problem on campus, but the victims don't usually report it because
they are embarrassed and they believe nothing will be done except to tarnish their reputations
and drag out the pain." Another respondent explained, 'I think a great deal needs to be done in
relation to sexual violence on and around campus. The sexist attitudes and behaviors must be
addressed." Other respondents noted concerns for LGBTQ people, for example, one respondent
elaborated, "I'm a gay man and I hear homophobic comments like, 'No, he's a [homophobic slur
against men]' and 'They're disgusting' on a semi-regular basis while walking on campus." Other
respondents noted students of color as identity of concern. For example, one respondent shared,
"I know the University is trying to improve acceptance and tolerance, but I don't think enough is
being done for students of color. "Another respondent added, "Need to increase minorities in
honors college as I feel singled out being the only one in my classes. That is why I have not
taken many beyond the requirement. "Respondents who elaborated on their sense of being
valued at the University of Missouri noted inclusion concerns for a range of identities.
Discrimination Against White People -Respondents who elaborated on their sense of being
valued at University of Missouri-Columbia reported "reverse discrimination "in narratives that
either included self-identifying as White or referring to the experiences of White people. One
respondent explained, "I'm an American I can say what I like. Until I see a black student kicked
out of the university for saying [racial slurs against white people] I'll keep saying literally
anything I want because you can't penalize one group for 'hate speech' and not the others. So if
I want to say [racial slur against African Americans] I fucking will because it's just a goddamn
word." Another respondent shared, "This whole 'diversity'push is in reality a way to 1)
demonize whites, and 2) create division and segregation. Giving special treatment to non
whites, singling out white people as 'privileged' actually makes whites victims of racism." One
respondent concluded their narrative with "The campus isn't racist, fuck off "Another
respondent noted, "Fucking liberals are blinded by all of your bullshit. White middle class
makes kids are hurt the most by the current financial aid and admittance systems." Further,
another respondent shared, "it is frustrating to have the myth of 'systemic racism and
oppression 'thrown around and popularized as fact." Other respondents noted
326
Rankin & Associates Consulting Campus Climate Assessment Project
University of Missouri-Columbia Report September 2017
perceived challenges with going against the grain, white shaming and alienating the majority.
One respondent noted, "Try being a white middle class male who doesn't agree with all the
things going on, then see if you actually feel discriminated against." Another respondent
elaborated, "White shaming will not fix racism against blacks, LEARN!" Finally, another
respondent shared, "We are too worried about being inclusive for everyone and hi the end we
alienate the majority." Respondents who elaborated on their sense of being valued at University
of Missouri-Columbia noted concern for White Students.
Low Sense Of Belonging — Respondents who elaborated 011 their sense of value described a low
sense of belonging. Students described their peers as "everybody only thinks about themselves,"
"students only care about themselves" and "The kids suck." Other respondents elaborated 011
their opinions of faculty. For example, one respondent noted, "faculty do not appreciate the
students and feel that they are a time waste." Another respondent shared, "Just do not feel valued
by some of the faculty teachers here at MU." One respondent addressed for Faculty and
Students, "Professors and students don't really care w7ho you are." The notion that individuals did
not feel known, seen or cared for was widely echoed. Other respondents added, "sometimes you
can just feel like a number" or "Just a cog in the machine." One respondent elaborated further, "I
feel like the University makes money off of me. And that's what I feel the most." Similarly,
another respondent added, "I feel like senior administrators at this institution and most other
major universities see student's value hi dollar signs." Some respondents expressed a low sense
of value with a low perception of the value of their contribution to the survey. One respondent
elaborated, "This probably doesn't even get read by anyone so if you actually care then call me
into an office." Respondents who elaborated 011 their sense of value did not perceive a high
sense of value at Students of University of Missouri-Columbia.
327
Rankin & Associates Consulting Campus Climate Assessment Project
University of Missouri-Columbia Report September 2017
A cki-square test was conducted to compare percentages of Student respondents who felt valued by UM-Columbia faculty by undergraduate student status: 2 (4. N = 4,815) = 10.80. p < .05.
A chi-square test was conducted to compare percentages of Student respondents who felt valued by UM-Columbia faculty by gender identity: %2 (8. N = 6.218) = 48.16. p <. 001.
A chi-square test was conducted to compare percentages of Student respondents who felt valued by UM-Columbia faculty by citizenship status: x2 (4- N= 6.194) = 19.90. /? < .01. c d x A clii-square test was conducted to compare percentages of Student respondents who felt valued by UM-Columbia faculty by racial identity: x2 (8. N= 6.101) = 35.61,/? < .001. c d x iA chi-square test was conducted to compare percentages of Student respondents who felt valued by UM-Columbia faculty by sexual identity: y} (4. N= 6.058) = 17.47./? < .01. c d x u A chi-square test was conducted to compare percentages of Student respondents who felt valued by UM-Columbia faculty by military service status: yj (4. N= 6.031) = 12.57. p < .05. c d x m A chi-square test was conducted to compare percentages of Student respondents who felt valued by UM-Columbia faculty by generation status: x2 (4. N= 6.618) = 12.36.p< .05. c d M VA chi-square test was conducted to compare percentages of Student respondents who felt valued by UM-Columbia faculty by family income status: 2 (4. N = 6.087) = 10.63, p < .05. c d x v A chi-square test was conducted to compare percentages of Student respondents who felt valued by UM-Columbia faculty by generation and low income status: x2 (4- N= 6.231) = 12.81. p < .05. c d x v lA chi-square test was conducted to compare percentages of Student respondents who felt valued by UM-Columbia faculty by religious/spiritual identity: y} (4. N= 5.618) = 15.93,/? < .01. cdx™A chi-square test was conducted to compare percentages of Student respondents who felt valued by UM-Columbia faculty by disability status: x2 (8- N= 6.193) = 68.24./? < .001. cdx™>A chi-square test was conducted to compare percentages of Student respondents who felt valued by UM-Columbia faculty by employment status: 2 (4. N = 6,104) = 14.83. p < .01. c d x i x A chi-square test was conducted to compare percentages of Shident respondents who felt valued by UM-Columbia faculty by housing status: x2 (8. N= 5.972) = 36.58./? < .001. cdxx ^ chi-square test was conducted to compare percentages of Student respondents who felt valued by UM-Columbia stafifby undergraduate shident status: 2 (4. N = 4.798) = 13.13, p < .05. c d x x i A chi-square test was conducted to compare percentages of Shident respondents who felt valued by UM-Columbia stafifby gender identity: x2 (8. N= 6.198) = 40.43./? < .001. cdx x"A clii-square test was conducted to compare percentages of Shident respondents who felt valued by UM-Columbia stafifby citizenship status: x2 (4. N= 6.174) = 13.47./? < .01. cdxxmY chi-square test was conducted to compare percentages of Shident respondents who felt valued by UM-Columbia stafifby racial identity: x2 (8. N= 6.082) = 28.90./? < .001. cdxxivY chi-square test was conducted to compare percentages of Shident respondents who felt valued by UM-Columbia stafifby sexual identity: x2 (4. N= 6.038) = 20.85,p < .001. c d x x v A clii-square test was conducted to compare percentages of Shident respondents who felt valued by UM-Columbia stafifby militaiy service status: y} (4. N= 6.011) = 15.38./? < .01. c d x x v l A chi-square test was conducted to compare percentages of Shident respondents who felt valued by UM-Columbia stafifby generation stahis: y} (4. N= 6.198) = 12.48./? < .05. c d x x v u A clii-square test was conducted to compai e pei centages of Shident respondents who felt valued by UM-Columbia stafifby family income stahis: y} (4. N= 6.067) = 11.39,/? < .05. cdxxviiiA. clii-square test was conducted to compare percentages of Shident respondents who felt valued by UM-Columbia stafifby generation and low income stahis: x2 (4, N= 6.211) = 18.63./? < .01. c d 3 0 d xA clii-square test was conducted to compai e pei centages of Shident respondents who felt valued by UM-Columbia stafifby religious/spiritual identity: y} (12. N= 6.157) = 40.26./? < .001. c d x x x A chi-square test was conducted to compare percentages of Shident respondents who felt valued by UM-Columbia stafifby disability stahis: y} (8. N= 6.173) = 68.67./? < .001. c d x x x l A clii-square test was conducted to compai e pei centages of Shident respondents who felt valued by UM-Columbia stafifby employment stahis: y} (4. N= 6.085) = 10.1 l.p < .05. c d x x x u A clii-square test was conducted to compare percentages of Shident respondents who felt valued by UM-Columbia stafifby housing stahis: x2 (8. N= 5.954) = 32.90,/? < .001.
328
Rankin & Associates Consulting Campus Climate Assessment Project
University of Missouri-Columbia Report September 2017
cdxx™A chi-square test was conducted to compare percentages of Student respondents who felt valued by UM-Columbia senior administrators by undergraduate student status: x2 (4. N= 4,791)= 9.95, p < .05. c d x x x n A chi-square test was conducted to compare percentages of Student respondents who felt valued by UM-Columbia senior administrators by graduate student status: x2 (8, N = 1,324)= 25.64./) < .01. c d r a v A clii-square test was conducted to compare percentages of Student respondents who felt valued by UM-Columbia senior administrators by gender identity: x2 (8. N= 6.189)= 105.04./) < .001. cdxx™A chi-square test was conducted to compare percentages of Student respondents who felt valued by UM-Columbia senior administrators by citizenship status: x2 (4 N = 6.164) = 47.33,/) < .001. cdxxK™A chi-square test was conducted to compare percentages of Student respondents who felt valued by UM-Columbia senior administrators by racial identity: x2 (8, N= 6,074) = 34.93,/) < .001. cdxxx™A chi-square test was conducted to compare percentages of Student respondents who felt valued by UM-Columbia senior administrators by sexual identity: x2 <4- N= 6,034) = 77.62, p< .001. cdxx™A chi-square test was conducted to compare percentages of Student respondents who felt valued by UM-Columbia senior administrators by family income status: x2(4, N= 6,060) = 121.89,/) < .001. c < b JA chi-square test was conducted to compare percentages of Student respondents who felt valued by UM-Columbia senior administrators by generation and low income status: x2 <4- N= 6,200) = 21.70,/) < .001. c d x ] lA chi-square test was conducted to compare percentages of Student respondents who felt valued by UM-Columbia senior administrators by religious/spiritual identity: x2(12, N= 6,147) = 159.01,/) < .001. c d x J u A chi-square test was conducted to compare percentages of Student respondents who felt valued by UM-Columbia senior administrators by disability status: x2 (S- 6,163)= 98.09,/) < .001. c d x ] m A chi-square test was conducted to compare percentages of Student respondents who felt valued by UM-Columbia senior administrators by employment status: x2 (4, N= 6,076) = 80.74,/) < .001. c d x ] l vA chi-square test was conducted to compare percentages of Student respondents who felt valued by UM-Columbia senior administrators by housing status: %2(S,N= 5,944) = 107.72,/; < .001. c d x ] v A chi-square test was conducted to compare percentages of Student respondents who felt valued by faculty in the classroom by gender identity: x2 (8, N = 6,186) = 25.79,/; < .01. c d x ] n A chi-square test was conducted to compare percentages of Student respondents who felt valued by valued by faculty in the classroom by racial identity: y} (8. n= 6,072) = 26.53,/)<,01. c<bJ™A chi-square test was conducted to compare percentages of Student respondents who felt valued by faculty in the classroom in the classroom by sexual identity*: y} (4, N= 6,031) = 10.50,/) < .05. c<bJ™A chi-square test was conducted to compare percentages of Student respondents who felt valued by faculty in the classroom by military service status: (4. N= 6,000)= 11.15,/) < .05. cdxtaA. chi-square test was conducted to compare percentages of Student respondents who felt valued by faculty in the classroom by generation status: x 2 (4 ,N= 6,187) = 17.01,/) < .01. c d lA chi-square test was conducted to compare percentages of Student respondents who felt valued by faculty in the classroom by generation and low income status: x2 (4. N= 6,198) = 16.55,/; < .01. c d U A chi-square test was conducted to compare percentages of Student respondents who felt valued by faculty in the classroom by religious/spiritual identity: x2 (4. N= 5,589) = 14.27,/; < .01. c d U lA chi-square test was conducted to compare percentages of Student respondents who felt valued by faculty in the classroom by disability status: x2(8, N= 6,161) = 54.72,/) < .001. c d M A chi-square test was conducted to compare percentages of Student respondents who felt valued by faculty in the classroom by employment status: x2 (4. N= 6,076) = 14.17,/; < .01. c d U v A chi-square test was conducted to compare percentages of Student respondents who felt valued by faculty in the classroom by housing status: N = 5,943) = 25.80,/; < .01. c d l vA chi-square test was conducted to compare percentages of Student respondents who felt valued by other students in the classroom by undergraduate student status: 4,781) = 30.37,/) < .001. c d h l A chi-square test was conducted to compare percentages of Student respondents who felt valued by other students hi the classroom by gender identity: y1 (8. n= 6.168) = 18.20,/) < .05. cdi™^ . square test was conducted to compare percentages of Student respondents who felt valued by other students hi the classroom by racial identity: x2 (8- N = 6,055) = 128.60, p < .001.
A. clii-square test was conducted to compare percentages of Student respondents who felt valued by other students hi the classroom by sexual identity: x2 (4. N= 6,011) = 48.99,/; < .001. c d E x A chi-square test was conducted to compare percentages of Student respondents who felt valued by other students hi the classroom by generation status: x2 (4. N= 6,169) = 26.91,/) < .001.
329
Rankin & Associates Consulting Campus Climate Assessment Project
University of Missouri-Columbia Report September 2017
c d k A chi-square test was conducted to compare percentages of Student respondents who felt valued by other students in the classroom by family income status: y1 (4- N= 6.038) = 33.50, p < .001. c d b a A chi-square test was conducted to compare percentages of Student respondents who felt valued by other students in the classroom by generation and low income status: x2(4, N= 6.180) = 42.08./) < .001. cdh™A clii-square test was conducted to compare percentages of Student respondents who felt valued by other students in the classroom by religious/spiritual identity: y} (12. N= 6.126)= 59.07. p < .001. cdi™A chi-square test was conducted to compare percentages of Student respondents who felt valued by other students in the classroom by disability status: x2(S. N 6.142) 58.81, p < .001. c d b d v A chi-square test was conducted to compare percentages of Student respondents who felt valued by other students in the classroom by employment status: x2 (4. N= 6,060) = 11.63,/) < .05. c d l x v A chi-square test was conducted to compare percentages of Student respondents who felt valued by other students in the classroom by housing status: x2 (8. N= 5,927) = 16.52, p < .05. cdL™A chi-square test was conducted to compare percentages of Student respondents who felt valued by other students outside of the classroom by undergraduate student status: x2 (4- N= 4,762)= 62.15, p < .001. cdixm^ chi-square test was conducted to compare percentages of Student respondents who felt valued by other students outside of the classroom by graduate student status: 1,313) = 19.89. p < .05. c d b™A clii-square test was conducted to compare percentages of Student respondents who felt valued by other students outside of the classroom by gender identity: (8. N= 6,142) = 37.09,/; < .001. cdkixA. chi-square test was conducted to compare percentages of student respondents who felt valued by other students outside of the classroom by racial identity: y} (8. n= 6,029)= 138.53,/; < .001. cdLxxA. chi-square test was conducted to compare percentages of Student respondents who felt valued by other students outside of the classroom by sexual identity: y1 (4. N= 5,985)= 59.54,/) < .001. cdteii chi-square test was conducted to compare percentages of Student respondents who felt valued by other students outside of the classroom by military service status: x 2 (4, N= 5,958) = 14.26, p< .01. c<Ux™A clii-square test was conducted to compare percentages of Student respondents who felt valued by other students outside of the classroom by generation status: %2 (4,N= 6,143) = 65.97,/) < .001. c d b D n n A chi-square test was conducted to compare percentages of Student respondents who felt valued by other
student s outside of the classroom by family income status: x2(4, n= 6.011) = 75.67. p < .001. cdLxav chi-square test was conducted to compare percentages of Student respondents who felt valued by other
students outside of the classroom by generation and low income status: x2 (4, N= 6,154) = 69.65, p < .001. Chi-square test was conducted to compare percentages of Student respondents who felt valued by other
students outside of the classroom by religious/spiritual identity: x2(12, N= 6,100) = 71.25,/) < .001. cdixxvi clii-square test was conducted to compare percentages of Student respondents who felt valued by other students outside of the classroom by disability status: y2 (8. n = 6.116) = 5 3.49, /) < . 001. cdixxvuA. clii-square test was conducted to compare percentages of Student respondents who felt valued by other
students outside of the classroom by employment status: (4, N= 6,033 ) = 50.14. p < .001. cdLxxvm clii-square test was conducted to compare percentages of Student respondents who thought that faculty pre-judged their abilities based on their perception of their identity, background by undergraduate student status: x2 (4, N = 4,779)= 13.10,/;< .05. cdixaxA. clii-square test was conducted to compare percentages of Student respondents who thought that faculty pre-judged their abilities based on then perception of their identity, background by gender identity: x2(S- iV= 6.171) = 40.44,p <.001. cdbcxxA. clii-square test was conducted to compare percentages of Student respondents who thought that faculty pre-judged their abilities based on then perception of their identity, background by citizenship status: %2(4,N= 6,149) = 40.17,p <.001. cdixxxiA. clhi-square test was conducted to compare percentages of Student respondents who thought that faculty pre-judged their abilities based on then perception of their identity/background by racial identity: x2 (8, N = 6,057) = 111.67, p < .001. cdLxxxuA. clii-square test was conducted to compare percentages of Student respondents who thought that faculty pre-judged their abilities based on then perception of their identity/background by sexual identity: x2 (4, N= 6,014) = 17.28, p<. 01. c<Uxx™A chi-square test was conducted to compare percentages of Student respondents who thought that faculty pre-judged their abilities based on then perception of their identity/background by military service status: y2 (4, N= 5,978) = 9.60,/; <.05.
330
331
cdLxxxn'A. chi-square test was conducted to compare percentages of Student respondents who thought that faculty pre-judged their abilities based on their perception of their identity/back ground by generation status: %2(4. N= 6,173) = 11.02,/»fsL05. c d L x x x vA chi-square test was conducted to compare percentages of Student respondents who thought that faculty pre-judged their abilities based 011 their perception of their identity/background by family income status: x2 (4. N= 6,044) = 10.29,/? < .05. cdbK™A chi-square test was conducted to compare percentages of Student respondents thought that faculty pre-judged their abilities based 011 their perception of their identity/background by generation and low income status: y} (4,N 6,184) ^ 11.36./j<.05. cdixxsniA. chi-square test was conducted to compare percentages of Student respondents who thought that faculty pre-judged their abilities based on their perception of their identity/background by religious/spiritual identity: y?(\2 , N = 6,131) = 68.97,/? < .001. cdixx*™^ chi-square test was conducted to compare percentages of Student respondents who thought that faculty pre-judged their abilities based on then perception of their identity background by disability status: % i(8,N= 6,147) = 20.86, /?<.01. cdixxxixA. chi-square test was conducted to compare percentages of Student respondents who thought that faculty pre-judged their abilities based on then perception of their identity background by employment status: x2(4, N= 6,061) = 21.52,p< .001. c d x c A chi-square test was conducted to compare percentages of Student respondents who thought that staff pre-judged their abilities based on their perception of their identity/background by undergraduate student status: x2 (4, N = 4,762) = 20.46, p < .001. odKC1A chi-square test was conducted to compare parentages of Student respondents who thought that staff pre-judged their abilities based on then perception of their identity/background by gender identity: x2(S- N= 6,140) = 45.74,p< .001. cdx™A chi-square test was conducted to compare percentages of Student respondents who thought that staff pre-judged their abilities based on then perception of their identity/background by citizenship status: %2(4,N= 6,117) = 48.47, p<. 001. cdx™A chi-square test was conducted to compare percentages of Student respondents who thought that staff pre-judged their abilities based on then perception of their identity/background by racial identity: y} (8, N= 6,029) = 106.78./? <.001. c d x c l v A chi-square test was conducted to compare percentages of Student respondents who thought that staff pre-judged their abilities based on then perception of their identity/background by sexual identity: %2 (4, N= 5,986) = 1 4 . 2 1 , 0 1 . c d x c v A chi-square test was conducted to compare percentages of Student respondents who thought that staff pre-judged their abilities based on then perception of their identity/background by family income status: y} (4, N= 6,014)= 14.71, p<. 01. c d x c n A chi-square test was conducted to compare percentages of Student respondents who thought that staff pre-judged their abilities based on their perception of their identity/background by generation and low income status: y} (4, N= 6,153) = 10.46,/? < .05. cdxc™A chi-square test was conducted to compare percentages of Student respondents who thought that staff pre-judged their abilities based on their perception of their identity/background by religious/spiritual identity: , N = 6,100) = 85.92,/? < .001. cdxc™A chi-square test was conducted to compare percentages of Student respondents who thought that staff pre-judged their abilities based on then perception of their identity'background by disability status: x2(8, N = 6,116) = 25.64,/? < .001. c d x c L XA chi-square test was conducted to compare percentages of Student respondents thought that staff pre-judged their abilities based on then perception of then identity/background by employment status: x2 (4, N= 6,031) = 20.55,/? <.001. dA chi-square test was conducted to compare percentages of Student respondents who noted that they believed that the campus climate at UM-Columbia encourages free and open discussion of difficult topics by graduate student status: x2(8,-W= l,312) = 21.16,/?< .01. ""A chi-square test was conducted to compare percentages of Student respondents who noted that they believed that the campus climate at UM-Columbia encourages free and open discussion of difficult topics by gender identity: x2
(8, N= 6,170)= 111.20,/j < .001.
332
d"A chi-square test was conducted to compare percentages of Student respondents who noted that they believed that the campus climate at UM-Columbia encourages flee and open discussion of difficult topics by citizenship status: X2(4. N= 6.146) = 27.\5,p< .001. d m A clii-square test was conducted to compare percentages of Student respondents who noted that they believed that the campus climate at UM-Columbia encourages flee and open discussion of difficult topics by racial identity: y1
(&,N— 6,056) = 45.23,/; < .001. d l vA clii-square test was conducted to compare percentages of Student respondents who noted that they believed that the campus climate at UM-Columbia encourages free and open discussion of difficult topics by sexual identity: y} (4,N= 6,016) = 49.70,p< .001. d vA chi-square test was conducted to compare percentages of Student respondents who noted that they believed that the campus climate at UM-Columbia encourages fi.ee and open discussion of difficult topics by military service status: x2(4 ,N= 5,984) = 12.63, p < .05. d v iA clii-square test was conducted to compare percentages of Student respondents who noted that they believed that the campus climate at UM-Columbia encourages free and open discussion of difficult topics by family income status: x2(4,N= 6.040) = 57.01,p< .001. d v u A chi-square test was conducted to compare percentages of Student respondents who noted that they believed that the campus climate at UM-Columbia encourages free and open discussion of difficult topics by generation and low income status: y?{4,N= 6,182) = 9.84,/; < .05. d v m A clii-square test was conducted to compare percentages of Student respondents who noted that they believed that the campus climate at UM-Columbia encourages free and open discussion of difficult topics by religious/spiritual identity: x2(12, N= 6,130) = 98.28,/) < .001. dLXA chi-square test was conducted to compare percentages of Student respondents who noted that they believed that the campus climate at UM-Columbia encourages free and open discussion of difficult topics by disability status: y2
(8, N= 6,145) = 60.96,/? < .001. d x A clii-square test was conducted to compare percentages of Student respondents who noted that they believed that the campus climate at UM-Columbia encourages free and open discussion of difficult topics by employment status: X2(4, N= 6,059) = 57.03,/;< .001. d n A chi-square test was conducted to compare percentages of Student respondents who noted that they believed that the campus climate at UM-Columbia encourages free and open discussion of difficult topics UM-Columbia by housing status: %2(S,N= 5,931)= 102.59./) < .001. d x l lA clii-square test was conducted to compare percentages of Student respondents who had faculty whom they perceived as role models by gender identity: x2 (8, N= 6,183) = 48.01,/; < .001. d™A chi-square test was conducted to compare percentages of Student respondents who had faculty whom they perceived as role models by racial identity: %2(&,N= 6,069) = 37.39,/; < .001. d n v A clii-square test was conducted to compare percentages of Student respondents who had faculty whom they perceived as role models by military service status: y1 (4. N= 5,997) = 15.13,/; < .01. d x v A clii-square test was conducted to compare percentages of Student respondents who had faculty whom they perceived as role models by family income status: y1 (4. N= 6,054) = 29.84,/) < .001. d™A chi-square test was conducted to compare percentages of Student respondents who had faculty whom they perceived as role models by generation and low income status: y1 (4. N= 6,196) = 16.40,/; < .01. dx™A clii-square test was conducted to compare percentages of Student respondents who had faculty whom they perceived as role models by religious/spiritual identity: x2 (12, N= 6,114) = 23.28,/) < .05. dx™A chi-square test was conducted to compare percentages of Student respondents who had faculty whom they perceived as role models by employment status: y1 (4. N= 6,072) = 41.53,/; < .001. d™A clii-square test was conducted to compare percentages of Student respondents who had faculty whom they perceived as role models by housing status: y1 (8, N= 5,940) = 109.23, p < .001. d x x A chi-square test was conducted to compare percentages of Student respondents who had staff whom they perceived as role models by undergraduate student status: y?(4,N= 4,789) = 21.79,/) < .001. d x 3 aA clii-square test was conducted to compare percentages of Student respondents who had staff whom they perceived as role models by gender identity: y2 (8. N= 6,173) = 52.16,/; < .001. dx™A clii-square test was conducted to compare percentages of Student respondents who had staff whom they perceived as role models by racial identity: %2(&,N= 6,059) = 24.94, p < .01. d x x m A clii-square test was conducted to compare percentages of Student respondents who had staff whom they perceived as role models by sexual identity: y}(4,N= 6,016) = 12.61,/) < .05.
333
d x 3 a vA clii-square test was conducted to compare percentages of Student respondents who had staff whom they perceived as role models by military service status: x2 (4. N= 5,986}= 18.65.7; < .01. d x x v A chi-square test was conducted to compare percentages of Student respondents who had staff whom they perceived as role models by family income status: x2 (4. N= 6,042) = 16.89./) < .01. dx™A chi-square test was conducted to compare percentages of Student respondents who had staff whom they perceived as role models by generation and low income status: y} (4. N= 6,185) = 17.17,/? < .01. dxxvu chi-square test was conducted to compare percentages of Student respondents who had staff whom they perceived as role models by religious/spiritual identity: x2 (12, N= 6.133) = 32.54,/) < .01. d x x v m A clii-square test was conducted to compare percentages of Student respondents who had staff whom they perceived as role models by disability status: x2 (4, N= 6,147) = 9.93,p < .05. d™A chi-square test was conducted to compare percentages of Student respondents who had staff whom they perceived as role models by employment status: x2 (4- N= 6,061) = 11.28,/; < .05. d x x x A chi-square test was conducted to compare percentages of Student respondents who had staff whom they perceived as role models by housing status: x2(8, N = 5,931) = 22.24, p < .01. dx™A chi-square test was conducted to compare percentages of Student respondents who had students whom they perceived as role models by undergraduate student status: x2 (4- JV= 4,764) = 101.45,/; < .001. dxx™A chi-square test was conducted to compare percentages of Student respondents who had students whom they perceived as role models by gender identity: x2(X 6,149) = 56.74,/; < .001. dxx™A chi-square test was conducted to compare percentages of Student respondents who had students whom they perceived as role models by citizenship status: x2(4 ,N= 6,126) = 22.08,/; < .001. dx™vA clii-square test was conducted to compare percentages of Student respondents who had students whom they perceived as role models by racial identity: x2 (&,N= 6,039) = 56.61, p < .001. d x x x v A chi-square test was conducted to compare percentages of Student respondents who had students whom they perceived as role models by sexual identity: x 2 (4 ,N= 5,993) = 20.67,/) < .001. dxx™A clii-square test was conducted to compare percentages of Student respondents who had students whom they perceived as role models by military service status: %2 (4, N= 5,965) = 24.12, p < .001. dxxx™A. clii-square test was conducted to compare percentages of Student respondents who had students whom they perceived as role models by generation status: x2 (4, N= 6,151) = 43.95,/) < .001. dxxx™A clii-square test was conducted to compare percentages of Student respondents who had students whom they perceived as role models by family income status: x2(4. N= 6,021) = 51.00,/) < .001. dxxxixA. clii-square test was conducted to compare percentages of Student respondents who had students whom they perceived as role models by generation and low income status: x2 (4. N= 6.161) = 66.33./) < .001. d x ]A chi-square test was conducted to compare percentages of Student respondents who had students whom they perceived as role models by religious/spiritual identity: x2 (12, N= 6,110) = 58.54,/) < .001. d x ] lA clii-square test was conducted to compare percentages of Student respondents who had students whom they perceived as role models by disability status: x2(8, N= 6,124) = 20.11,/) < .05. d x J u A chi-square test was conducted to compare percentages of Student respondents who noted that they believed that the campus climate at UM-Columbia encourages free and open discussion of difficult topics by disability status: x2
(8, N= 6,145) = 60.96,/> < .001. d x ] m A clii-square test was conducted to compare percentages of Student respondents who noted that they believed that tlie campus climate at UM-Columbia encourages free and open discussion of difficult topics by employment status: x2 (4, N= 6,059) = 57.03,/; < .001. dl]™A chi-square test was conducted to compare percentages of Student respondents who noted that they believed that tlie campus climate at UM-Columbia encourages free and open discussion of difficult topics UM-Columbia by housing status: x 2 ( 8 , ^ = 5,931)= 102.59,/) < .001. d x ] vA chi-square test was conducted to compare percentages of Student respondents who thought that senior administrators had taken direct actions to address the needs of at-risk/undetserved students by undergraduate student status: x2 (4, N= 4,782) = 10.40,/; < .05.
d x ] n A clii-square test was conducted to compare percentages of Student respondents who thought that senior administrators had taken direct actions to address the needs of a t-risk/undet served students by graduate student status: 1,316) = 34.23,p< .001 dx]™A chi-square test was conducted to compare percentages of Student respondents who thought that senior administrators had taken direct actions to address the needs of at-risk/imderserved students by gender identity: y_2 (8. N= 6,169) = 66.16, p< .001.
334
dxl™A chi-square test was conducted to compare percentages of Student respondents who thought that senior administrators had taken direct actions to address die needs of at-risk/underserved students by citizenship status: X (4, N= 6.147) = 15.69,/? < .01. d x J l xA chi-square test was conducted to compare percentages of Student respondents who thought that senior administrators had taken direct actions to address die needs of at-risk/underserved students by racial identity: y} (8, N 6,056)- 59.95,<.001. •"A chi-square test was conducted to compare percentages of Student respondents who thought that senior administrators had taken direct actions to address die needs of at-risk/underserved students by sexual identity: x2 (4, N 6,015) 86.20, 001.
chi-square test was conducted to compare percentages of Student respondents who thought that senior administrators had taken direct actions to address the needs of at-risk/underserved students by family income status: X2 (4, N= 6,044) = 121.46,/? < .001. •""A chi-square test was conducted to compare percentages of Student respondents who thought that senior administrators had taken direct actions to address the needs of at-risk/underserved students by generation and low income status: y2(4,N= 6.181) = 46.13./) < .001. """A chi-square test was conducted to compare percentages of Student respondents who thought that senior administrators had taken direct actions to address the needs of at-risk/underserved students by religious/spiritual identity: %2 (12, N= 6,129) = 138.76,/? < .001. d U vA chi-square test was conducted to compare percentages of Student respondents who thought that senior administrators had taken direct actions to address the needs of at-risk/underserved students by disability status: /_2 (8. N= 6,145) = 90.97,/? < .001. d l vA chi-square test was conducted to compare percentages of Student respondents thought that senior administrators had taken direct actions to address the needs of at-risk/underserved students by employment status: X 2(4. N= 6,059) = 74.47,/?< .001. d h l A chi-square test was conducted to compare percentages of Student respondents who thought that senior administrators had taken direct actions to address the needs of at-risk/underserved students by housing status: x2 (3 • N= 5,929) = 54.70,/? < .001. d h l l A chi-square test was conducted to compare percentages of Student respondents who thought that faculty had taken direct actions to address the needs of at-risk/underserved students by gender identity: x2 (8, N= 6,164) = 44.98,/?< .001. d l v m A chi-square test was conducted to compare percentages of Student respondents who thought that faculty had taken driect actions to address the needs of at-risk/underserved students by racial identity: X2(S, N= 6,053) = 81.11, /><.001. d U xA chi-square test was conducted to compare percentages of Student respondents who thought that faculty had taken direct actions to address the needs of at-risk/underserved students by sexual identity: x2(4, N= 6,010) = 37.64, /><.001. d k A chi-square test was conducted to compare percentages of Student respondents who thought that faculty had taken direct actions to address the needs of at-risk/underserved students by family income status : x2(4. N = 6,037) = 25.24,/? <.001. dLxlA chi-square test was conducted to compare percentages of Student respondents thought that faculty had taken direct actions to address the needs of at-risk/underserved students by generation and low income status: x2 (4, N= 6,176) = 28.93,/? < .001. d L x uA chi-square test was conducted to compare percentages of Student respondents who thought that faculty had taken direct actions to address the needs of at-risk/underserved students by religious/spiritual identity: x 2 ( l 2,N= 6,125) = 65.58,/? < .001. dLxl l lA chi-square test was conducted to compare percentages of Student respondents who thought that faculty had taken direct actions to address the needs of at-risk/underserved students by disability :status y} (8. N= 6,139) = 56.69,/?<,001. d b a v A chi-square test was conducted to compare percentages of Student respondents who thought that faculty had taken direct actions to address the needs of at-risk/underserved students s by employment :status y} (4, N= 6,054) = 33.10,/?<.001. d k v A chi-square test was conducted to compare percentages of Student respondents who thought that faculty had taken direct actions to address the needs of at-risk/underserved students by housing status: x2(S- N= 5,924) = 28.93, /><.001.
335
dL™A chi-square test was conducted to compare percentages of Student respondents who thought that students had taken direct actions to address the needs of at-risk/underserved students undergraduate student status: %2 (4, N= 4,750) = 31.24,/? < .001. ™™A chi-square test was conducted to compare percentages of Student respondents who thought that senior administrators had taken direct actions to address the needs of at-risk/underserved students by gender identity: %2 (8. N = 6,132) = 18.73,/; < .05. dLx™A. chi-square test was conducted to compare percentages of Student respondents who thought that students had taken direct actions to address the needs of at-risk/underserved students by racial identity: x2 (8, jV= 6.019) = 53.72. p < .001. dL™A chi-square test was conducted to compare percentages of Student respondents who thought that students had taken direct actions to address the needs of at-risk/underserved students by sexual identity: x2(4, N= 5.979) = 13.82, p < .05. d l x x A clii-square test was conducted to compare percentages of Student respondents who thought that students had taken direct actions to address the needs of at-risk/underserved students by generation status: x2(4. N = 6,133) = 19.77,p< .01. dlx;£1A chi-square test was conducted to compare percentages of Student respondents who thought that students had taken direct actions to address the needs of at-risk/underserved students by family income status: x2(4 , N = 6,004) = 24.02,/; <.001. <Ux™A chi-square test was conducted to compare percentages of Student respondents who thought that students had taken direct actions to address the needs of at-risk/underserved students by generation and low income status: x2 (4, N= 6,143) = 30.23,/; < .001. <Ux™1A chi-square test was conducted to compare percentages of Student respondents who thought that students had taken direct actions to address the needs of at-risk/underserved students by religions/spiritual identity: x2(12 , N = 6,091) = 32.87,/; < .01. <Uxm*A chi-square test was conducted to compare percentages of Student respondents who thought that students had taken direct actions to address the needs of at-risk/underserved students by disability status: y2 (8. N= 6,109) = 33.83,/; <.001. d l x x v A chi-square test was conducted to compare percentages of Student respondents who thought that students had taken direct actions to address the needs of at-risk/underserved students by employment status: x2(4, jV= 6,024) = 14.05,/? < .01.
336
Graduate Student/Professional Student/Post-Doctoral Scholar_Respondents' Views on Advising and Departmental Support
Three survey items queried Graduate Student/Professional Student/Post-Doctoral Scholar
respondents102 (n = 1.426) about their opinions regarding various issues specific to advising and
departmental support (Tables 86 through 88). Chi-square analyses were conducted by graduate
student status, gender identity, racial identity, sexual identity, age, military status,
religious/spiritual identity, employment status, income status, housing status, citizenship status,
generation status, and disability status; only significant differences are reported.103
Table 86 illustrates that the majority of Graduate Student/Professional Student/Post-Doctoral
Scholar respondents104 "strongly agreed" or "agreed" that they were satisfied with the quality of
advising they have received from their departments (80%, n = 1,126). Doctoral Degree
Candidate respondents (38%, n = 249) and Master Degree Candidate respondents (32%, n = 144)
were much more likely than Professional Degree Candidate respondents (27%, n = 61) to
"strongly agree" that they were satisfied with the quality of advising they have received from
their departments. Women Graduate Student respondents (18%, n = 150) and Transspectrum
Graduate Student respondents (27%, n = 9) were much more likely than Men Graduate Student
respondents (10%, n = 54) to "disagree" that they were satisfied with the quality of advising they
have received from their departments. Multiracial Graduate Student respondents (30%, n = 23)
and White Graduate Student respondents (32%, n = 310) were significantly less likely than
Graduate Student Respondents of Color (40%, n = 127) to "strongly agree" that they were
satisfied with the quality of advising they have received from their departments. Multiple
Disabilities Graduate Student respondents (14%, n = 7) were significantly more likely than
Single Disability Graduate Student Respondents (8%, n = 9) and No Disability Graduate Student
respondents (4%, n = 55) to "strongly disagree" that they w7ere satisfied with the quality of
advising they have received from their departments. Not-Employed Graduate Student
respondents (3%, n = 13) were significantly less likely than Employed Graduate Student
102Iii the following analysis. Graduate student. Professional Student Post-Doctoral Scholar/Fellow. Resident respondents are also referred to as Graduate Student respondents for brevity. L03Per die SCST, for all analyses, sexual identity was recoded into the categories LGBQ and Heterosexual to maintain response confidentiality. Gender was recoded as Men, Trans spectrum, and Women. 1 0 4 hi the following analysis. Graduate student. Professional Student Post-Doctoral Scholar/Fellow. Resident respondents are referred to as Graduate student respondents for brevity.
337
respondents (6%, n = 56) to "strongly disagree" that they were satisfied with the quality of
advising they have received from their departments.
Eighty-eight percent (n = 1,238) of Graduate Student respondents "strongly agreed" or "agr eed"
that they felt they had adequate access to then advisors. Professional Degree Candidate
respondents (52%, n= 115) and Master Degree Candidate respondents (47%, n = 211) were
much more likely than Doctoral Degree Candidate respondents (41%, ti = 273) to "agree" that
they felt they had adequate access to their advisors. Transspectrum Graduate Student respondents
(21%, n = 7) were much more likely than Men Graduate Student respondents (7%, n = 41) and
Women Graduate Student respondents (11%, n = 92) to "disagree" that they felt they had
adequate access to their advisors. Non-U.S. Citizen/Naturalized Graduate Student respondents
(52%, n = 152) were much more likely than U.S. Citizen Graduate Student respondents (41%, n
= 450) to "strongly agree" that they felt they had adequate access to their advisors. Multiracial
Graduate Student respondents (48%, n = 36) and Graduate Student Respondents of Color (53%,
n = 168) were significantly more likely than White Graduate Student respondents (40%, n = 384)
to "strongly agree" that they felt they had adequate access to their advisors. Single Disability
Graduate Student respondents (4%, n = 7) were significantly more likely than No Disability
Graduate Student Respondents of Color (2%, n = 25) to "strongly disagree" that they felt they
had adequate access to their advisors.
Eighty-one percent (ti = 1.133) of Graduate Student respondents "strongly agr eed" or "agreed"
that their advisors provided clear expectations. Professional Degree Candidate respondents (25%,
ti = 55) and Master Degree Candidate respondents (33%, n = 145) were much less likely than
Doctoral Degree Candidate respondents (40%, n = 260) to "strongly agree" that their advisors
provided clear expectations. Transspectrum Graduate Student respondents (27%, n = 9) and
Women Graduate Student respondents (32%, n = 262) were much less likely than Men Graduate
Student respondents (39%, n = 216) to "strongly agree" that their advisors provided clear
expectations. Non-U.S. Citizen Graduate Student respondents (42%, n = 123) were much more
likely than U.S. Citizen Graduate Student respondents (33%, n = 361) to "strongly agree" that
their advisors provided clear expectations. Graduate Student Respondents of Color (45%, n =
141) were significantly more likely than Multiracial Graduate Student respondents (36%, n = 27)
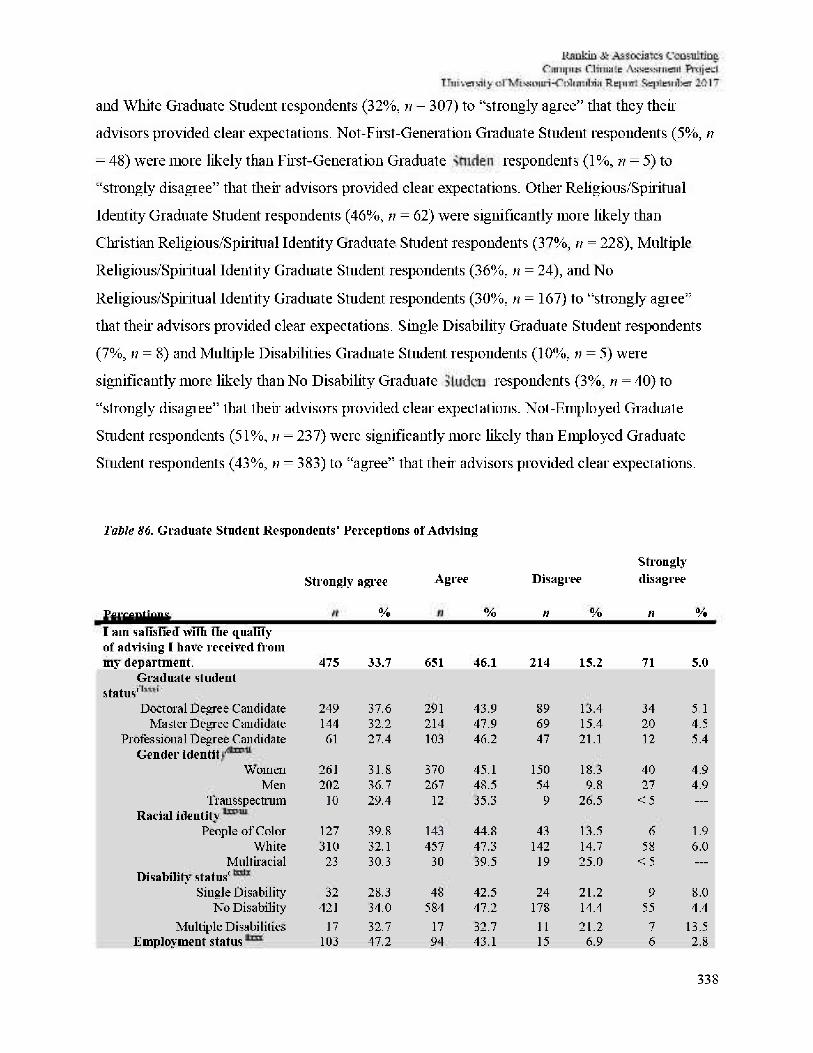
338
and White Graduate Student respondents (32%, n = 307) to "strongly agree" that they their
advisors provided clear expectations. Not-First-Generation Graduate Student respondents (5%, n
= 48) were more likely than First-Generation Graduate Student respondents (1%, n = 5) to
"strongly disagree" that their advisors provided clear expectations. Other Religious/Spiritual
Identity Graduate Student respondents (46%, n = 62) were significantly more likely than
Christian Religious/Spiritual Identity Graduate Student respondents (37%, n = 228), Multiple
Religious/Spiritual Identity Graduate Student respondents (36%, n = 24), and No
Religious/Spiritual Identity Graduate Student respondents (30%, n = 167) to "strongly agree"
that their advisors provided clear expectations. Single Disability Graduate Student respondents
(7%, ii = 8) and Multiple Disabilities Graduate Student respondents (10%, n = 5) were
significantly more likely than No Disability Graduate student respondents (3%, n = 40) to
"strongly disagree" that their advisors provided clear expectations. Not-Employed Graduate
Student respondents (51%, n = 237) were significantly more likely than Employed Graduate
Student respondents (43%, n = 383) to "agree" that their advisors provided clear expectations.
Table 86. Graduate Student Respondents' Perceptions of Advising
Strongly Strongly agree Agree Disagree disagree
Perceptions n % n % n % n % I am satisfied with the quality of advising I have received from my department. 475 33.7 651 46.1 214 15.2 71 5.0
Graduate student status'
Doctoral Degree Candidate 249 37.6 291 43.9 89 13.4 34 5.1 Master Degree Candidate 144 32.2 214 47.9 69 15.4 20 4.5
Professional Degree Candidate 61 27.4 103 46.2 47 21.1 12 5.4 Gander identity
Women 261 31.8 370 45.1 150 18.3 40 4.9 Men 202 36.7 267 48.5 54 9.8 27 4.9
Trans spectrum 10 29.4 12 35.3 9 26.5 < 5 —
Racial identity People of Color 127 39.8 143 44.8 43 13.5 6 1.9
White 310 32.1 457 47.3 142 14.7 58 6.0 Multiracial 23 30.3 30 39.5 19 25.0 < 5 —
Disability status1
Single Disability 32 28.3 48 42.5 24 21.2 9 8.0 No Disability 421 34.0 584 47.2 178 14.4 55 4.4
Multiple Disabilities 17 32.7 17 32.7 11 21.2 7 13.5 Employment status 103 47.2 94 43.1 15 6.9 6 2.8
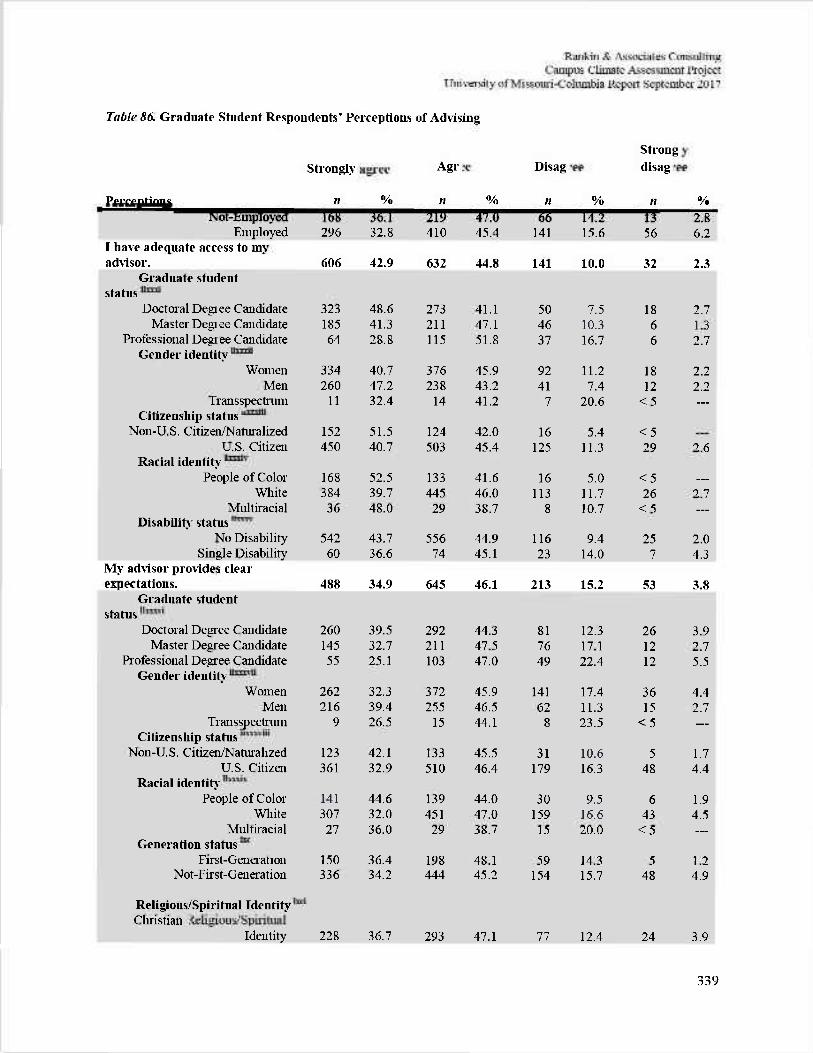
339
Table 86. Graduate Student Respondents* Perceptions of Advising
Perceptions
Strongly agree
n %
Agree
n %
Disagree
n %
Strongly disagree
n
;
% Not-Employed 168 36.1 219 47.0 66 14.2 13 2.8
Employed 296 32.8 410 45.4 141 15.6 56 6.2 I have adequate access to my advisor. 606 42.9 632 44.8 141 10.0 32 2.3
Graduate student status
Doctoral Degree Candidate 323 48.6 273 41.1 50 7.5 18 2.7 Master Degree Candidate 185 41.3 211 47.1 46 10.3 6 1.3
Professional Degree Candidate Gender identity
64 28.8 115 51.8 37 16.7 6 2.7
Women 334 40.7 376 45.9 92 11.2 18 2.2 Men 260 47.2 238 43.2 41 7.4 12 2.2
Transspectrum Citizenship status
11 32.4 14 41.2 7 20.6 < 5 —
Non-U.S. Citizen/Naturalized 152 51.5 124 42.0 16 5.4 < 5 U.S. Citizen
Racial identity 450 40.7 503 45.4 125 11.3 29 2.6
People of Color 168 52.5 133 41.6 16 5.0 < 5 —
White 384 39.7 445 46.0 113 11.7 26 2.7 Multiracial 36 48.0 29 38.7 8 10.7 < 5
Disability status No Disability 542 43.7 556 44.9 116 9.4 25 2.0
Single Disability 60 36.6 74 45.1 23 14.0 7 4.3 My advisor provides clear expectations. 488 34.9 645 46.1 213 15.2 53 3.8
Graduate student status
Doctoral Degree Candidate 260 39.5 292 44.3 81 12.3 26 3.9 Master Degree Candidate 145 32.7 211 47.5 76 17.1 12 2.7
Professional Degree Candidate 55 25.1 103 47.0 49 22.4 12 5.5 Gender identity
Women 262 32.3 372 45.9 141 17.4 36 4.4 Men 216 39.4 255 46.5 62 11.3 15 2.7
Transspectrum 9 26.5 15 44.1 8 23.5 < 5 —
Citizenship status Non-U.S. Citizen/Naturalized 123 42.1 133 45.5 31 10.6 5 1.7
U.S. Citizen 361 32.9 510 46.4 179 16.3 48 4.4 Racial identity
People of Color 141 44.6 139 44.0 30 9.5 6 1.9 White 307 32.0 451 47.0 159 16.6 43 4.5
Multiracial 27 36.0 29 38.7 15 20.0 < 5 Generation status
First-Generation 150 36.4 198 48.1 59 14.3 5 1.2 Not-First-Geueration 336 34.2 444 45.2 154 15.7 48 4.9
Religious/Spiritual Identity Christian religious/spiritual
Identity 228 36.7 293 47.1 77 12.4 24 3.9
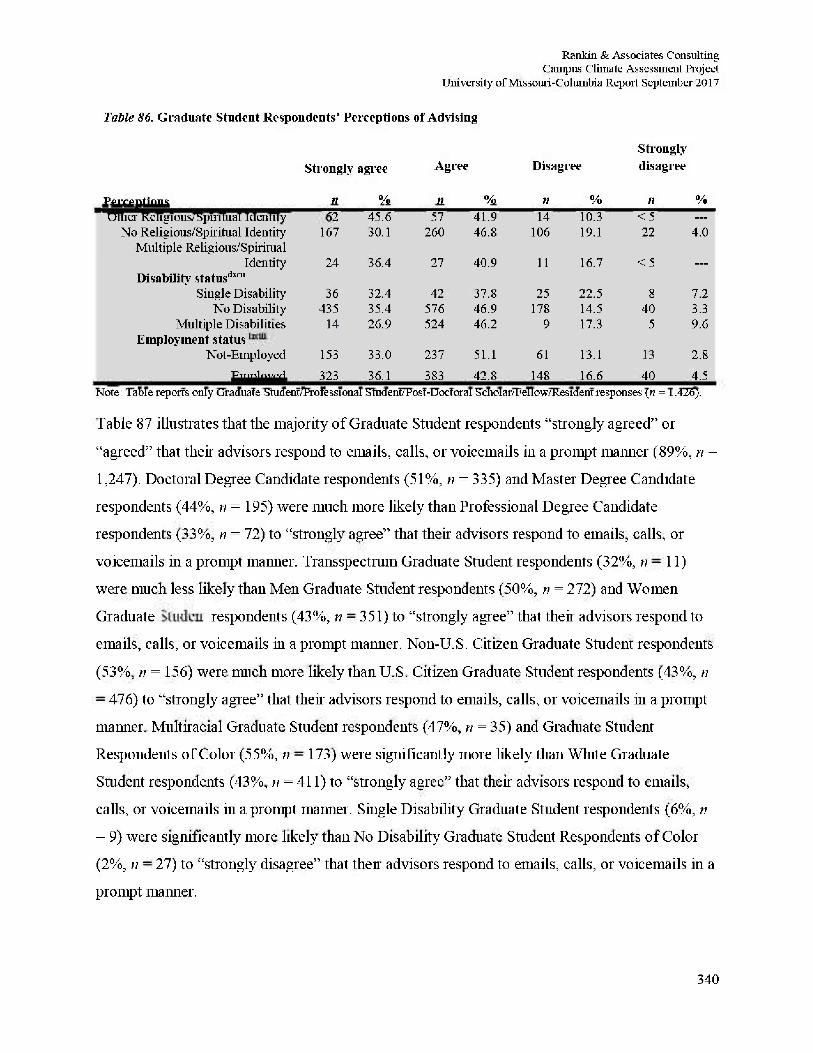
Rankin & Associates Consulting Campus Climate Assessment Project
University of Missouri-Columbia Report September 2017
Table 86. Graduate Student Respondents * Perceptions of Advising
Strongly agree Agree
Perceptions » % " %
Disagree
n %
Strongly disagree
n % Other Religious/Spiritual Identity 62 45.6 57 41.9 14 10.3 <5 —
No Religious/Spiritual Identity 167 30.1 260 46.8 106 19.1 22 4.0 Multiple Religious/Spiritual
Identity 24 36.4 27 40.9 11 16.7 < 5 —
Disability status1*™ Single Disability 36 32.4 42 37.8 25 22.5 8 7.2
No Disability 435 35.4 576 46.9 178 14.5 40 3.3 Multiple Disabilities 14 26.9 524 46.2 9 17.3 5 9.6
Employment status Not-Employed 153 33.0 237 51.1 61 13.1 13 2.8
Employed 323 36.1 383 42.8 148 16.6 40 4.5 Note: Table reports only Graduate Student/Professional Student/Post-Doctoral Scholar/Fellow/Resident responses (n = 1.426).
Table 87 illustrates that the majority of Graduate Student respondents "strongly agreed'1 or
"agreed" that their advisors respond to emails, calls, or voicemails in a prompt manner (89%, n =
1,247). Doctoral Degree Candidate respondents (51%, n = 335) and Master Degree Candidate
respondents (44%, n = 195) were much more likely than Professional Degree Candidate
respondents (33%, n = 72) to "strongly agree" that their advisors respond to emails, calls, or
voicemails in a prompt manner. Transspectrum Graduate Student respondents (32%, n = 11)
were much less likely than Men Graduate Student respondents (50%, n = 272) and Women
Graduate Student respondents (43%, n = 351) to "strongly agree" that their advisors respond to
emails, calls, or voicemails in a prompt maimer. Non-U.S. Citizen Graduate Student respondents
(53%, n = 156) were much more likely than U.S. Citizen Graduate Student respondents (43%, n
= 476) to "strongly agree" that their advisors respond to emails, calls, or voicemails in a prompt
manner. Multiracial Graduate Student respondents (47%, n = 35) and Graduate Student
Respondents of Color (55%, n = 173) were significantly more likely than White Graduate
Student respondents (43%, n = 411) to "strongly agree" that their advisors respond to emails,
calls, or voicemails in a prompt manner. Single Disability Graduate Student respondents (6%, n
= 9) were significantly more likely than No Disability Graduate Student Respondents of Color
(2%, ii = 27) to "strongly disagree" that their advisors respond to emails, calls, or voicemails in a
prompt manner.
340
341
Likewise, 93% (n = 1.310) of Graduate Student respondents strongly agreed or agreed that
department faculty members (other than advisors) respond to emails, calls, or voicemails in a
prompt manner. Non-U.S. Citizen Graduate Student respondents (49%, ti = 142) were much
more likely than U.S. Citizen Graduate Student respondents (37%, ti = 410) to "strongly agree"
that department faculty members (other than advisors) respond to emails, calls, or voicemails in a
prompt manner. Respondents of Color and Multiracial105 Graduate Student (47%, n = 186) were
significantly more likely than White Graduate Student respondents (37%, n = 355) to "strongly
agree" that department faculty members (other than advisors) respond to emails, calls, or
voicemails in a prompt manner. Low-Income Graduate Student respondents (58%, n = 367) were
much more likely than Not-Low-Income Graduate Student respondents (49%, n = 365) to
"agree" that department faculty members (other than advisors) respond to emails, calls, or
voicemails in a prompt manner. Single Disability Graduate Student respondents (13%, n = 21)
were significantly more likely than No Disability Graduate Student respondents (5%, n = 61) to
"disagree" that department faculty members (other than advisors) respond to emails, calls, or
voicemails in a prompt manner.
Ninety-five percent (n = 1,333) of Graduate Student respondents "strongly agr eed" or "agreed"
that department staff members (other than advisors) respond to emails, calls, or voicemails in a
prompt manner. Professional Degree Candidate respondents (39%, n = 87) and Master Degree
Candidate respondents (40%, n = 177) were significantly less likely than Doctoral Degree
Candidate respondents (51%, n = 334) to "strongly agree" that department staff members (other
than advisors) respond to emails, calls, or voicemails in a prompt manner. Women Graduate
Student respondents (42%, n = 341) were significantly less likely than Men Graduate Student
respondents (49%, n = 269) to "strongly agree" that department staff members (other than
advisors) respond to emails, calls, or voicemails in a prompt manner. Single Disability Graduate
Student respondents (8%, n = 13) were significantly more likely than No Disability Graduate
1{bFor the purposes of some analyses, this report further collapses racial identity into two categories (White, People of Color and Multiracial), where African/Black/Afiican American, Asian/Asian American, Hispanic/Latin@/Chican@, Native Hawaiian, Pacific Islander. American Indian Native. Alaskan Native, Middle Eastern, and Southwest Asian, and Multiracial) were collapsed into one category named People of Color.and Multiracial. This is used when the six-category or three-category collapsed racial identity* groups are not significant.
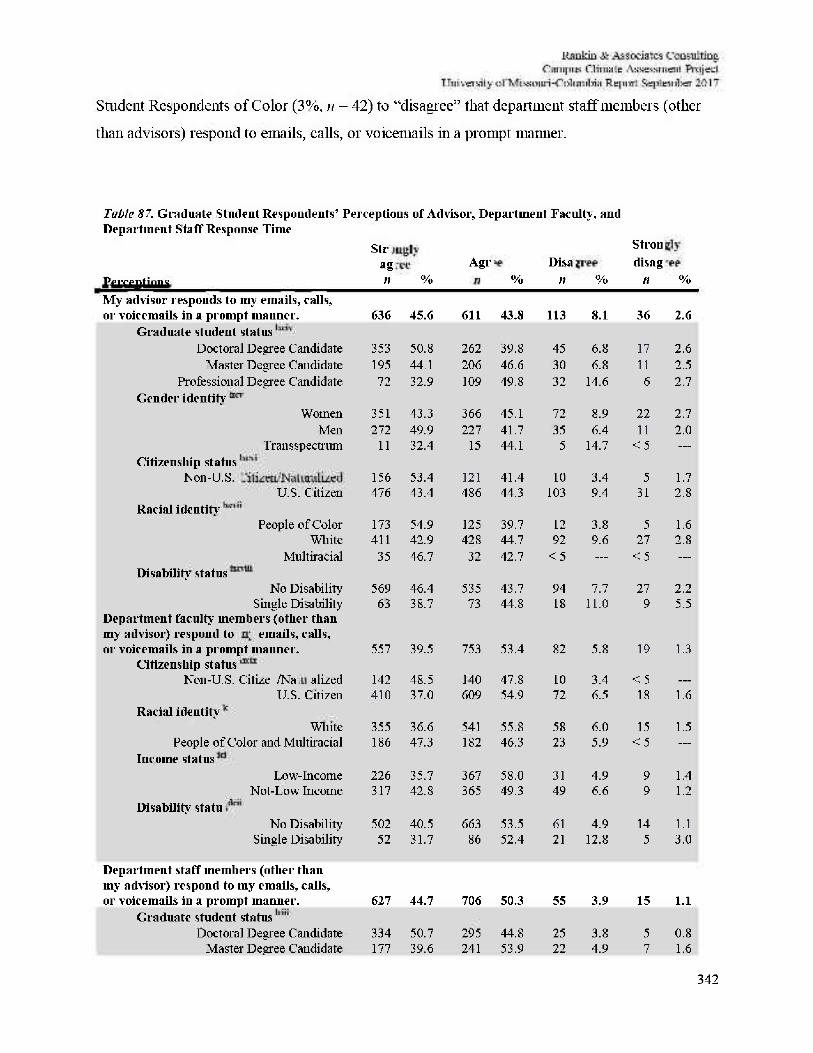
342
Student Respondents of Color (3%, n = 42) to "disagree" that department staff members (other
than advisors) respond to emails, calls, or voicemails in a prompt manner.
Table 87. Graduate Student Respondents' Perceptions of Advisor, Department Faculty, and Department Staff Response Time
Perceptions My advisor responds to my emails, calls,
Strongly agree n %
Agree n %
Disagree n %
Strongly disagree
n %
oi' voicemails in a prompt manner. 636 45.6 611 43.8 113 8.1 36 2.6 Graduate student status
Doctoral Degree Candidate 353 50.8 262 39.8 45 6.8 17 2.6 Master Degree Candidate 195 44.1 206 46.6 30 6.8 11 2.5
Professional Degree Candidate 72 32.9 109 49.8 32 14.6 6 2.7 Gender identity
Women 351 43.3 366 45.1 72 8.9 22 2.7 Men 272 49.9 227 41.7 35 6.4 11 2.0
Trail s spectrum 11 32.4 15 44.1 5 14.7 < 5 —
Citizenship status Non-U.S. citizen/naturalized 156 53.4 121 41.4 10 3.4 5 1.7
U.S. Citizen 476 43.4 486 44.3 103 9.4 31 2.8 Racial identify
People ofColor 173 54.9 125 39.7 12 3.8 5 1.6 White 411 42.9 428 44.7 92 9.6 27 2.8
Multiracial 35 46.7 32 42.7 < 5 . . . < 5 —
Disability status No Disability 569 46.4 535 43.7 94 7.7 27 2.2
Single Disability 63 38.7 73 44.8 18 11.0 9 5.5 Department faculty members (other than my advisor) respond to my emails, calls, oi' voicemails in a prompt manner. 557 39.5 753 53.4 82 5.8 19 1.3
Citizenship status Non-U.S. Citizen/Naturalized 142 48.5 140 47.8 10 3.4 < 5 —
U.S. Citizen 410 37.0 609 54.9 72 6.5 18 1.6 Racial identity
White 355 36.6 541 55.8 58 6.0 15 1.5 People of Color and Multiracial 186 47.3 182 46.3 23 5.9 < 5 —
Income status Low-Income 226 35.7 367 58.0 31 4.9 9 1.4
Not-Low Income 317 42.8 365 49.3 49 6.6 9 1.2 Disability status
No Disability 502 40.5 663 53.5 61 4.9 14 1.1 Single Disability 52 31.7 86 52.4 21 12.8 5 3.0
Department staff members (other than my advisor) respond to my emails, calls, or voicemails in a prompt manner. 627 44.7 706 50.3 55 3.9 15 1.1
Graduate student status Doctoral Degree Candidate 334 50.7 295 44.8 25 3.8 5 0.8
Master Degree Candidate 177 39.6 241 53.9 22 4.9 7 1.6
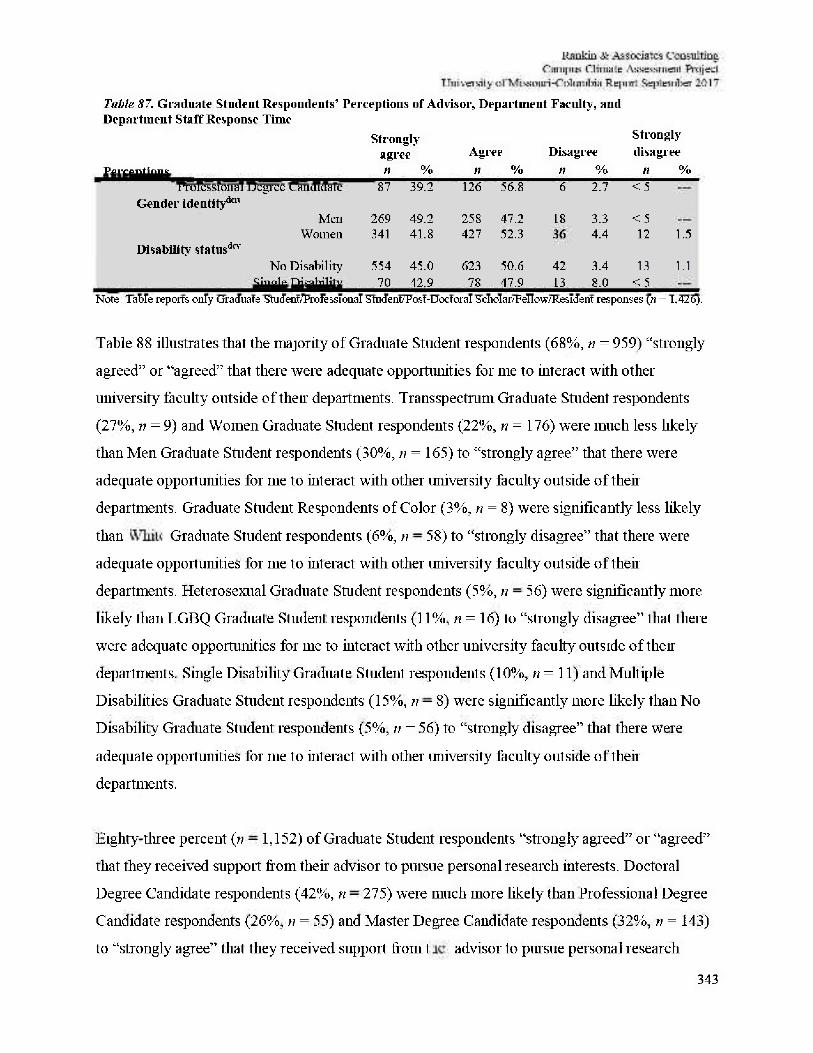
343
Table 87. Graduate Student Respondents' Perceptions of Advisor, Department Faculty, and Department Staff Response Time
Strongly agree Agree Disagree
Strongly disagree
Perceptions it % n % n % n % Professional Degree Candidate 87 39.2 126 56.8 6 2.7 <5
Gender identity"™ Men 269 49.2 258 47.2 18 3.3 <5
Women 341 41.8 427 52.3 36 4.4 12 1.5 Disability status4"
No Disability 554 45.0 623 50.6 42 3.4 13 1.1 Single Disability 70 42.9 78 47.9 13 8.0 <5
Note: Table reports only Graduate Student/Professional Student/Post-Doctoral Scholar/Fellow/Resident responses (n = 1,426).
Table 88 illustrates that the majority of Graduate Student respondents (68%, n = 959) "strongly
agreed" or "agreed" that there were adequate opportunities for me to interact with other
university faculty outside of then departments. Transspectmm Graduate Student respondents
(27%, n =9) and Women Graduate Student respondents (22%, n = 176) were much less likely
than Men Graduate Student respondents (30%, n = 165) to "strongly agree" that there were
adequate opportunities for me to interact with other university faculty outside of their
departments. Graduate Student Respondents of Color (3%, n = 8) were significantly less likely
than White Graduate Student respondents (6%, n = 58) to "strongly disagree" that there w7ere
adequate opportunities for me to interact with other university faculty outside of their
departments. Heterosexual Graduate Student respondents (5%, n = 56) were significantly more
likely than LGBQ Graduate Student respondents (11%, n = 16) to "strongly disagree" that there
were adequate opportunities for me to interact with other university faculty outside of then
departments. Single Disability Graduate Student respondents (10%, n =11) and Multiple
Disabilities Graduate Student respondents (15%, n = 8) were significantly more likely than No
Disability Graduate Student respondents (5%, n = 56) to "strongly disagree" that there were
adequate opportunities for me to interact with other university faculty outside of their
departments.
Eighty-three percent (n = 1,152) of Graduate Student respondents "strongly agreed" or "agreed"
that they received support from their advisor to pursue personal research interests. Doctoral
Degree Candidate respondents (42%, n = 275) were much more likely than Professional Degree
Candidate respondents (26%, n = 55) and Master Degree Candidate respondents (32%, n = 143)
to "strongly agree" that they received support from there advisor to pursue personal research
344
interests. Non-U.S. Citizen Graduate Student respondents (42%, n = 123) were much more likely
than U.S. Citizen Graduate Student respondents (34%, n = 374) to "strongly agree" that they
received support from then advisor to pursue personal research interests. Multiracial Graduate
Student respondents (40%, n = 30) and Graduate Student Respondents of Color (42%, n = 134)
were significantly more likely than White Graduate Student respondents (34%, n = 325) to
"strongly agree" that they received support from their advisor to pursue personal research
interests. Single Disability Graduate Student respondents (29%, n = 32) and Multiple Disabilities
Graduate Student respondents (31%, n = 16) w7ere significantly less likely than No Disability
Graduate Student respondents (37%, n = 451) to "strongly agree" that they received support from
their advisor to pursue personal research interests. On-Campus Employed Graduate Student
respondents (39%, n = 259) were more likely than Off-Campus Employed Graduate Student
Respondents (31%, n = 72) to "strongly agree" that they received support from their advisor to
pursue personal research interests.
Ninety-two percent (n = 1,258) of Graduate Student respondents "strongly agreed" or "agreed"
that they received due credit for their research, writing, and publishing (e.g., authorship order hi
published articles). Doctoral Degree Candidate respondents (44%, n = 283) were much more
likely than Professional Degree Candidate respondents (30%, n = 63) and Master Degree
Candidate respondents (34%, n = 146) to "strongly agree" that they received due credit for their
research, writing, and publishing. Single Disability Graduate Student respondents (4%, n = 7)
were significantly more likely than No Disability Graduate Student respondents (1%, n= 15) to
"strongly disagree" that they received due credit for their research, writing, and publishing. On-
Campus Employed Graduate Student respondents (5%, n = 34) were less likely than Off-Campus
Employed Graduate Student Respondents (10%, n = 23) to "disagree" that they received due
credit for their research, writing, and publishing.
Eighty-three percent in = 1,152) of Graduate Student respondents "strongly agreed" or "agr eed"
that department faculty members encouraged them to produce publications and present research.
Doctoral Degree Candidate respondents (46%, n = 307) were much more likely than Professional
Degree Candidate respondents (26%, n = 56) and Master Degree Candidate respondents (28%, n
= 125) to "strongly agree" that department faculty members encouraged them to produce
345
publications and present research. Multiracial Graduate student respondents (19%, n = 14) and
White Graduate Student respondents (16%, n = 151) were significantly more likely than
Graduate Student Respondents of Color (9%, n = 29) to "disagree" that department faculty
members encouraged them to produce publications and present research. Gn-Campus Employed
Graduate Student respondents (39%, n = 259) were more likely than Off-Campus Employed
Graduate Student respondents (32%, n = 73) to "strongly agree" that department faculty
members encouraged them to produce publications and present research.
Seventy-five percent (n = 1,037) of Graduate Student respondents "strongly agr eed" or "agreed"
that their department has provided them opportunities to serve the department or university hi
various capacities outside of teaching or research. Women Graduate Student respondents (26%, n
= 209) and Transspectrum Graduate Student respondents (19%, n = 6) w7ere much less likely
than Men Graduate Student respondents (33%, n = 180) to "strongly agree" that their' department
lias provided them opportunities to serve the department or university hi various capacities
outside of teaching or research.
Ninety percent (TI = 1,253) of Graduate Student respondents "strongly agr eed" or "agreed" that
they felt comfortable sharing their professional goals w7ith their advisor. Men Graduate Student
respondents (5%, n = 26) and fewer than five Transspectrum Graduate Student respondents were
much less likely than Women Graduate Student respondents (10%, n = 78) to "disagree" that
they felt comfortable sharing their professional goals with their advisor. U.S. Citizen Graduate
Student respondents (3%, n = 31) were much more likely than fewer than five Non-U.S. Citizen
Graduate Student respondents to "strongly disagree" that they felt comfortable sharing their
professional goals with their advisor. First-Generation Graduate Student respondents (49%, n =
202) w7ere more likely than Not-First-Generation Graduate Student respondents (42%, n = 410)
to "agree" that they felt comfortable sharing their professional goals with their advisor.
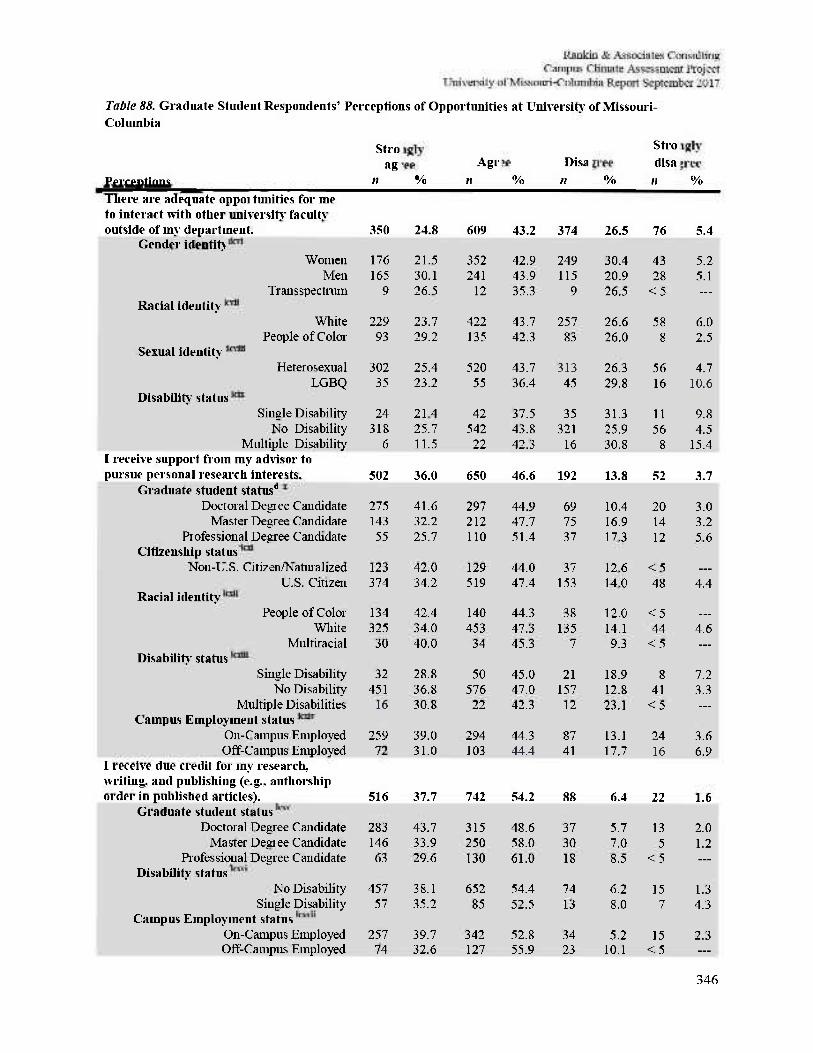
346
Table 88. Graduate Student Respondents' Perceptions of Opportunities at University of Missouri-Columbia
Perceptions There are adequate opportunities for me
Strongly agree
n % Agree
n % Disagree
n %
Strongly disagree ii %
to interact with other university faculty outside of my department. 350 24.8 609 43.2 374 26.5 76 5.4
Gender identity Women 176 21.5 352 42.9 249 30.4 43 5.2
Men 165 30.1 241 43.9 115 20.9 28 5.1 Transspectrum 9 26.5 12 35.3 9 26.5 < 5 —
Racial identity White 229 23.7 422 43.7 257 26.6 58 6.0
People of Color 93 29.2 135 42.3 83 26.0 8 2.5 Sexual identity
Heterosexual 302 25.4 520 43.7 313 26.3 56 4.7 LGBQ 35 23.2 55 36.4 45 29.8 16 10.6
Disability status Single Disability 24 21.4 42 37.5 35 31.3 11 9.8
No Disability 318 25.7 542 43.8 321 25.9 56 4.5 Multiple Disability 6 11.5 22 42.3 16 30.8 8 15.4
I receive support from my advisor to pursue personal research interests. 502 36.0 650 46.6 192 13.8 52 3.7
Graduate student status4
Doctoral Degree Candidate 275 41.6 297 44.9 69 10.4 20 3.0 Master Degree Candidate 143 32.2 212 47.7 75 16.9 14 3.2
Professional Degree Candidate 55 25.7 110 51.4 37 17.3 12 5.6 Citizenship status
Non-U.S. Citizen/Naturalized 123 42.0 129 44.0 37 12.6 < 5 —
U.S. Citizen 374 34.2 519 47.4 153 14.0 48 4.4 Racial identity
People of Color 134 42.4 140 44.3 38 12.0 < 5 —
White 325 34.0 453 47.3 135 14.1 44 4.6 Multiracial 30 40.0 34 45.3 7 9.3 < 5 —
Disability- status Single Disability 32 28.8 50 45.0 21 18.9 8 7.2
No Disability 451 36.8 576 47.0 157 12.8 41 3.3 Multiple Disabilities 16 30.8 22 42.3 12 23.1 < 5 —
Campus Employment status Oil-Campus Employed 259 39.0 294 44.3 87 13.1 24 3.6 Off-Campus Employed 72 31.0 103 44.4 41 17.7 16 6.9
I receive due credit for my research, writing, and publishing (e.g., authorship order in published articles). 516 37.7 742 54.2 88 6.4 22 1.6
Graduate student status Doctoral Degree Candidate 283 43.7 315 48.6 37 5.7 13 2.0
Master Degree Candidate 146 33.9 250 58.0 30 7.0 5 1.2 Professional Degree Candidate 63 29.6 130 61.0 18 8.5 < 5
Disability status No Disability 457 38.1 652 54.4 74 6.2 15 1.3
Single Disability 57 35.2 85 52.5 13 8.0 7 4.3 Campus Employment status
On-Campus Employed 257 39.7 342 52.8 34 5.2 15 2.3 Off-Campus Employed 74 32.6 127 55.9 23 10.1 < 5 —
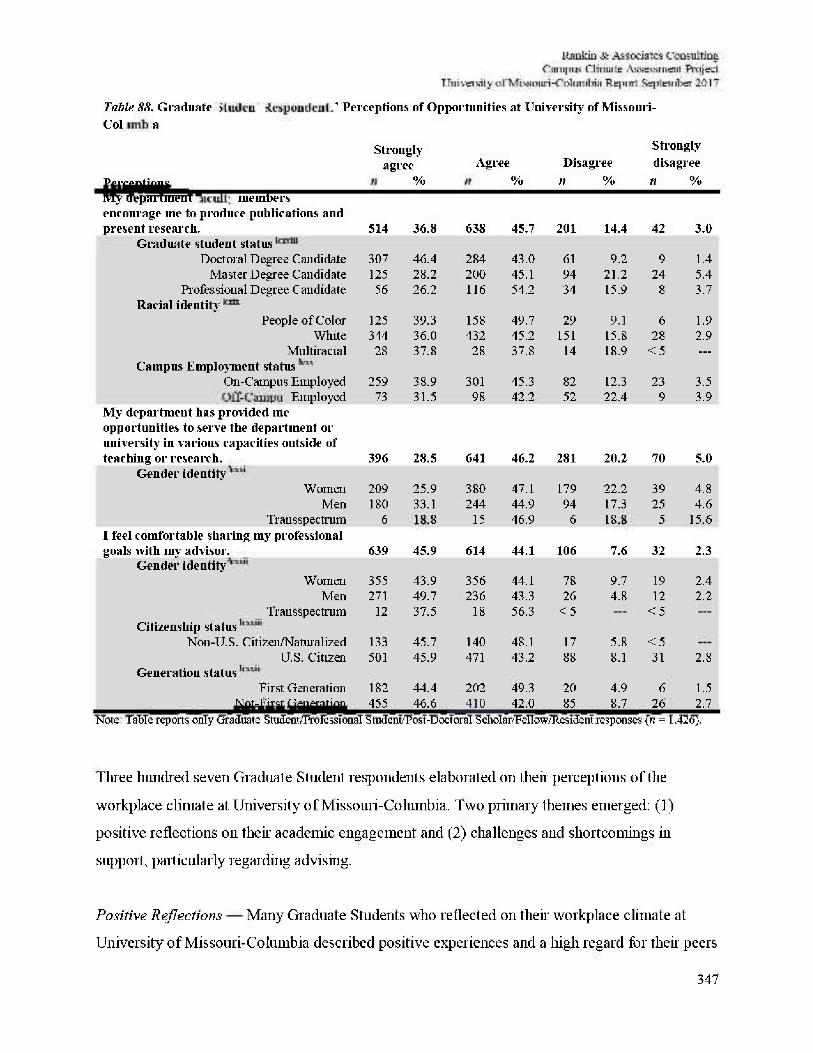
347
Table 88. Graduate Student Respondents' Perceptions of Opportunities at University of Missouri-Columbia
Strongly agree Agree Disagree
Strongly disagree
Perceptions n % n % n % n % My department faculty members encourage ine to produce publications and present research. 514 36.8 638 45.7 201 14.4 42 3.0
Graduate student status Doctoral Degree Candidate 307 46.4 284 43.0 61 9.2 9 1.4
Master Degree Candidate 125 28.2 200 45.1 94 21.2 24 5.4 Professional Degree Candidate
Racial identity 56 26.2 116 54.2 34 15.9 8 3.7
People of Color 125 39.3 158 49.7 29 9.1 6 1.9 White 344 36.0 432 45.2 151 15.8 28 2.9
Multiracial 28 37.8 28 37.8 14 18.9 < 5 . . . Campus Employment status
On-Campus Employed 259 38.9 301 45.3 82 12.3 23 3.5 off-campus Employed 73 31.5 98 42.2 52 22.4 9 3.9
My department has provided me opportunities to serve the department or university in various capacities outside of teaching or research. 396 28.5 641 46.2 281 20.2 70 5.0
Gander identity Women 209 25.9 380 47.1 179 22.2 39 4.8
Men 180 33.1 244 44.9 94 17.3 25 4.6 Transspectrum 6 18.8 15 46.9 6 18.8 5 15.6
I feel comfortable sharing my professional goals with my advisor. 639 45.9 614 44.1 106 7.6 32 2.3
Gander identity Women 355 43.9 356 44.1 78 9.7 19 2.4
Men 271 49.7 236 43.3 26 4.8 12 2.2 Transspectrum
Citizenship status Non-U.S. Citizen/Naturalized
12
133
37.5
45.7
18
140
56.3
48.1
< 5
17 5.8
< 5
< 5 U.S. Citizen 501 45.9 471 43.2 88 8.1 31 2.8
Generation status First Generation 182 44.4 202 49.3 20 4.9 6 1.5
Not-First Generation 455 46.6 410 42.0 85 8.7 26 2.7 Note: Table reports only Graduate Student/Professional Student/Post-Doctoral Scholar/Fellow/Resident responses (n = 1.426).
Three hundred seven Graduate Student respondents elaborated on their perceptions of the
workplace climate at University of Missouri-Columbia. Two primary themes emerged: (1)
positive reflections on their academic engagement and (2) challenges and shortcomings in
support, particularly regarding advising.
Positive Reflections — Many Graduate Students who reflected 011 their workplace climate at
University of Missouri-Columbia described positive experiences and a high regard for their peers
348
and programs. One respondent noted, "Everyone at Mizzou is very friendly. My department has
been nothing but supportive of my goals." Another respondent shared, "I believe that being hi
the ELPA program has been a great experience. All of the faculty and my advisor have been very
supportive." Others reflected positively 011 their departments and programs also. For example,
one respondent elaborated, "All of the faculty at the law school is extremely open and
welcoming. They all really care about us as students and want us to succeed." Another
respondent noted, "It is delightful to be in the College of Education and Special Education
department where my professional and personal qualities are valued and respected." Another
respondent reflected, "I have always felt supported and above all respected as a student and a
human being by my department, CoE. The faculty and staff are a class act." Graduate Students
who reflected 011 their workplace climate at the University of Missouri largely had positive
feelings to share.
Perceived Lack of Support and Poor Advising — Graduate Students who elaborated 011 not
feeling support and or poorly advised used words like "worthless" and a "travesty" to described
their experiences. One respondent explained, "In a word, Meh. I have friends who are doing
post-do cs/graduate at other academic institutions and as whole I would say they feel much more
'fully' supported by the institution in terms of helping create a positive w7ork environment."
Another respondent noted, "My department offers 110 opportunities to develop as a student
except to take classes and do research." Regarding advising, respondents reported, "The advising
system at Mizzou Law is laughable" and "unhelpful." Another respondent shared, "The advisor
to which I was assigned retired, and I have not found a new advisor." One respondent offered,
"My issue is not with my personal advisor, who is an excellent person, but hi the advising
process and communication hi general." Lastly, another respondent noted, "My advisor was
assigned to me by the school, but we do not have any interests or goals hi common. In addition,
he was extremely difficult to get a hold of and uncommunicative in person." Graduate Students
noted unmet expectations regarding support and 111 particular with related to advising.
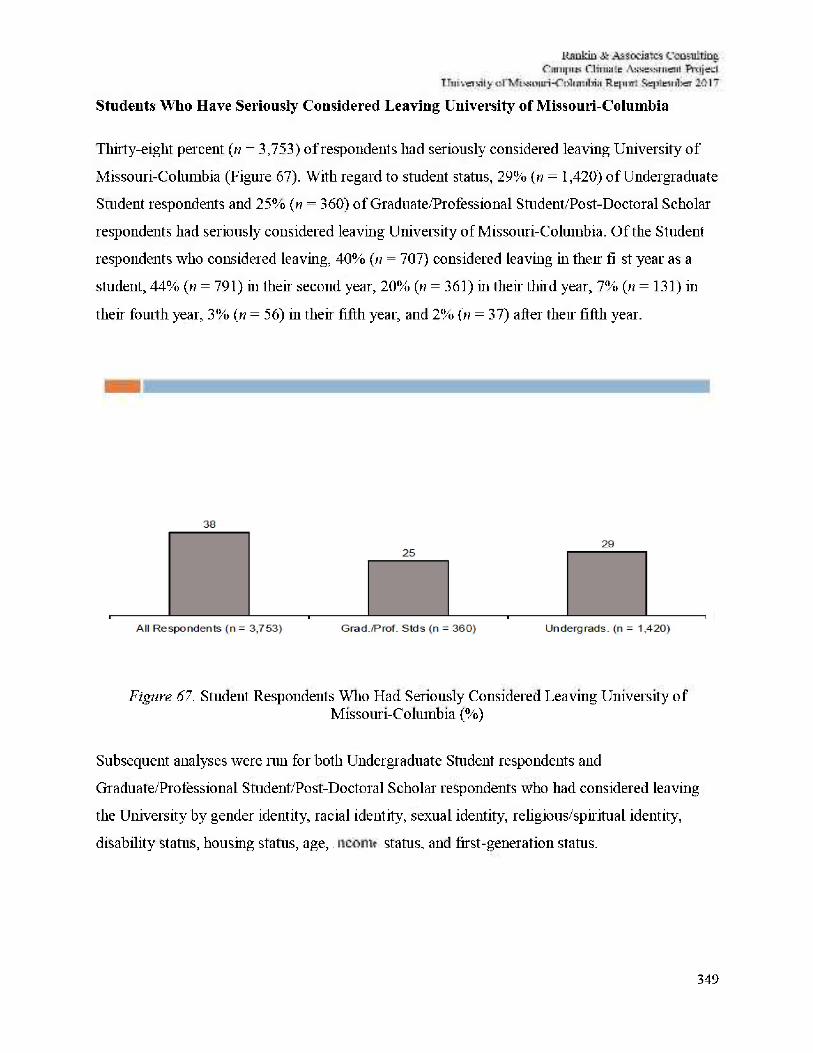
349
Students Who Have Seriously Considered Leaving University of Missouri-Columbia
Thirty-eight percent (w = 3,753) of respondents had seriously considered leaving University of
Missouri-Columbia (Figure 67). With regard to student status, 29% (n = 1,420) of Undergraduate
Student respondents and 25% (n = 360) of Graduate/Professional Student/Post-Doctoral Scholar
respondents had seriously considered leaving University of Missouri-Columbia. Of the Student
respondents who considered leaving, 40% (n = 707) considered leaving hi then first year as a
student, 44% (n = 791) in their second year, 20% (n = 361) hi their third year, 7% (n = 131) in
their fourth year, 3% (n = 56) in their fifth year, and 2% (n = 37) after then fifth year.
Figure 67. Student Respondents Who Had Seriously Considered Leaving University of Missouri-Columbia (%)
Subsequent analyses were run for both Undergraduate Student respondents and
Graduate/Professional Student/Post-Doctoral Scholar respondents who had considered leaving
the University by gender identity, racial identity, sexual identity, religious/spiritual identity7,
disability status, housing status, age, income status, and first-generation status.
350
Significant results for Undergraduate Student respondents indicated that:
• By gender identity: 27% (n = 840) of Women Undergraduate Student respondents, 32%
(n = 547) of Men Undergraduate Student respondents, and 41% (n = 29) of
Transspectrum Undergraduate Student respondents considered leaving the University of
Missouri-Columbia.
• By racial identity: 27% (n = 1,029) of White Undergraduate Student respondents, 42% (n
= 235) of Undergraduate Student Respondents of Color, and 39% (TI = 130) of Multiracial
Undergraduate Student respondents considered leaving the University of Mis sour l-
Cohrmbia.
• By sexual identity: 40% (n = 185) of LGBQ Undergraduate Student respondents, 28% (n
= 1,188) of Heterosexual Undergraduate Student respondents, and 35% (n = 7) of
Asexual Undergraduate Student respondents considered leaving the University of
Missouri-Columbia.
• By military status: 44% (n = 56) of Military Undergraduate Student respondents and 28%
(n = 1,312) of Not-Military Undergraduate Students considered leaving the University of
Missouri-Columbia.
• By first generation and low income status: 38% (n = 89) of First-Generation and Low-
Income Undergraduate Student respondents and 29% (n = 1,331) of Not-First-Generation
and Low-Income Undergraduate Students considered leaving the University of Missouri-
Columbia.
• By religious/spiritual identity: 35% (n = 76) of Other Religious/Spiritual Identity
Undergraduate Student respondents, 34% (n = 48) of Multiple Religious/Spiritual
Identity Undergraduate Student respondents, 32% (n = 421) of No Religious/Spiritual
Identity Undergraduate Student respondents, and 28% (;/ = 863) of Christian
Religious/Spiritual Identity Undergraduate Student respondents considered leaving the
University of Missouri-Columbia.dcxxx
• By disability status: 39% (;/ = 167) of Undergr aduate Student respondents with Single
Disability, 45% (TI = 71) of Undergraduate Student respondents with Multiple
Disabilities, and 28% (n = 1,176) of Undergraduate Student respondents with No
Disability considered leaving the University of Missouri-Co himbia.dt3! m
351
• By employment status: 25% (n = 536) of Not-Employed Undergraduate Student
respondents and 32% (ri = 851) of Employed Undergraduate Students considered leaving
the University of Missouri-Columbia.'dcxxx11
• By housing status: 23% (n = 286) of On-Campus Housing Undergraduate Student
respondents, 32% (it = 1,064) of Non-Campus Housing Undergraduate Students, and
42% (it = 10) of Housing Insecure Undergraduate Students considered leaving the
University of Missouri-Columbia.dcxxxm
Significant results for Graduate Student respondents indicated that:
• By graduate student status: 20% (n = 44) of Professional Degree Candidate respondents,
23% (« = 103) of Master Degree Candidate respondents, and 29% (rt = 190) of Doctoral
Degree Candidate respondents considered leaving the University of Missouri^
Columbia.*™
• By income status: 29% (n = 187) of Low-Income Graduate Student respondents and 22%
(it = 162) of Not-Low-Income Graduate Students considered leaving the University of
Missouri-Columbia.dcxxxv
• By religious/spiritual identity: 25% (n = 35) of Other Religious/Spiritual Identity
Graduate Student respondents, 36% (n = 24) of Multiple Religious/Spiritual Identity
Graduate Student respondents, 28% (n = 157) of No Religious/Spiritual Identity Graduate
Student respondents, and 21% (n = 134) of Christian Religious/Spiritual Identity
Graduate Student respondents considered leaving the University ofMissouri-
Columbia.*™
• By disability status: 38% (n = 42) of Graduate Student respondents with Single
Disability, 42% (it = 22) of Graduate Student respondents with Multiple Disabilities, and
24% (it = 294) of Graduate Student respondents with No Disability considered leaving
the University of Missouri-Columbia.4™™
• By employment status: 20% (n = 92) of Not-Employed Graduate Student respondents
and 28% (it = 253) of Employed Graduate Students considered leaving the University of
Missouri-Columbia.*™™
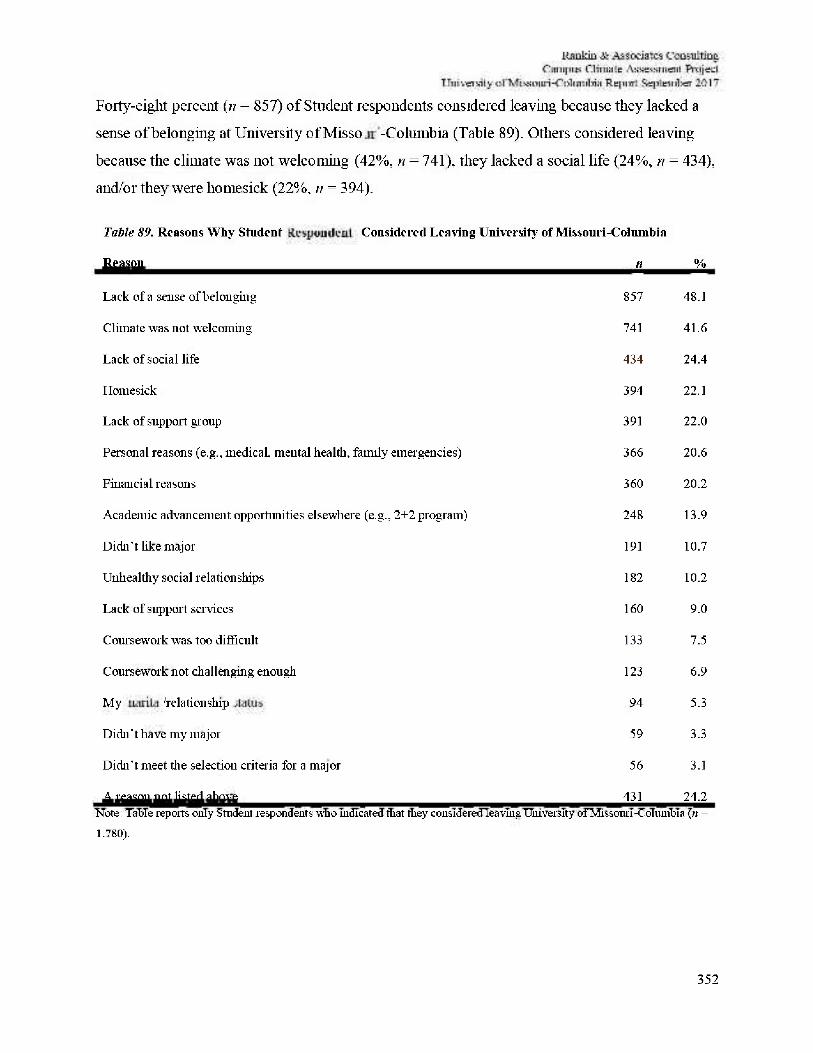
352
Forty-eight percent (11 = 857) of Student respondents considered leaving because they lacked a
sense of belonging at University of Missouri-Columbia (Table 89). Others considered leaving
because the climate was not welcoming (42%, n = 741), they lacked a social life (24%, n = 434),
and/or they were homesick (22%, n = 394).
Table 89. Reasons Why Student Respondents Considered Leaving University of Missouri-Columbia
Reason n %
Lack of a sense of belonging 857 48.1
Climate was not welcoming 741 41.6
Lack of social life 434 24.4
Homesick 394 22.1
Lack of support group 391 22.0
Personal reasons (e.g.. medical, mental health, family emergencies) 366 20.6
Financial reasons 360 20.2
Academic advancement opportunities elsewhere (e.g., 2+2 program) 248 13.9
Didn't like major 191 10.7
Unhealthy social relationships 182 10.2
Lack of support services 160 9.0
Coursework was too difficult 133 7.5
Coursework not challenging enough 123 6.9
My marital relationship status 94 5.3
Didn't have my major 59 3.3
Didn't meet the selection criteria for a major 56 3.1
A reason not listed above 431 24.2 Note: Table reports only Student respondents who indicated that they considered leaving University of Missouri-Columbia (n = 1.780).
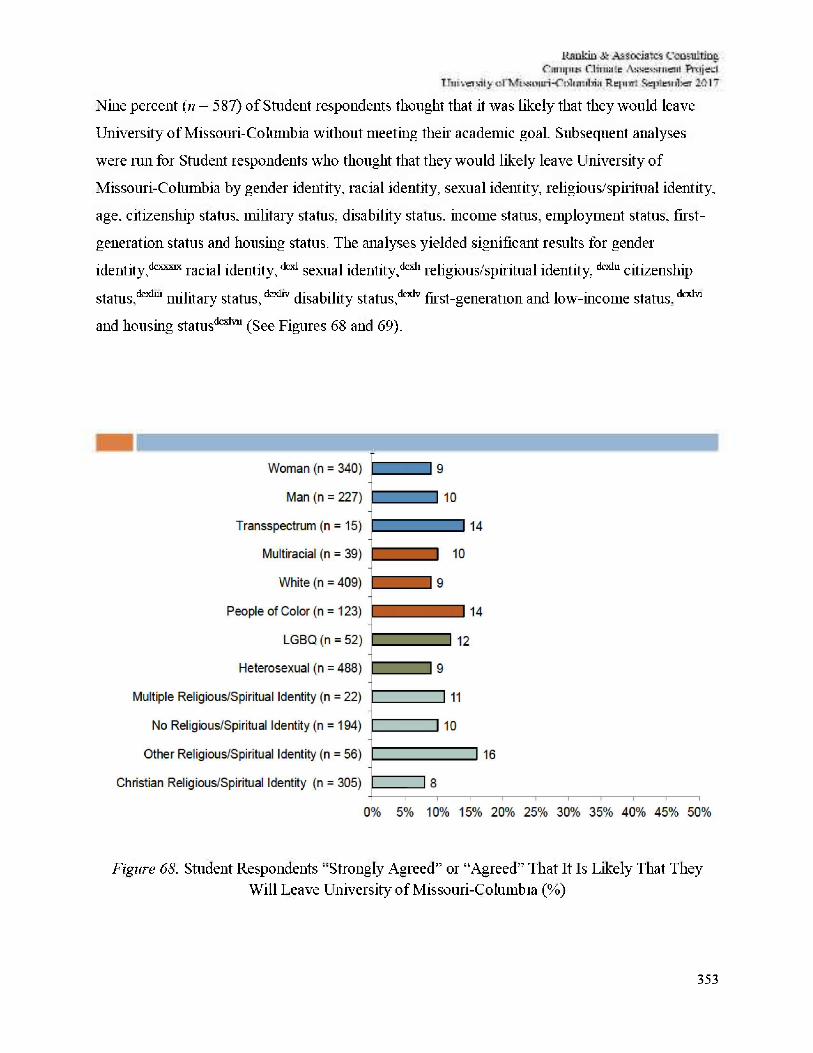
353
Nine percent (ii = 587) of Student respondents thought that it was likely that they would leave
University of Missouri-Columbia without meeting their academic goal. Subsequent analyses
were run for Student respondents who thought that they would likely leave University of
Missouri-Columbia by gender identity, racial identity, sexual identity, religious/spiritual identity,
age. citizenship status, military status, disability status, income status, employment status, fust-
generation status and housing status. The analyses yielded significant results for gender
identity,dcxxxix racial identity, l t a l sexual identity,4*11 religious/spiritual identity,4x111 citizenship
status,4*1111 military status,4 x h v disability status,dcxlv first-generation and low-income status,dcxlvi
and housing status4*1™ (See Figures 68 and 69).
Figure 68. Student Respondents "Strongly Agreed" or "Agreed" That It Is Likely That They Will Leave University ofMissouri-Columbia (%)
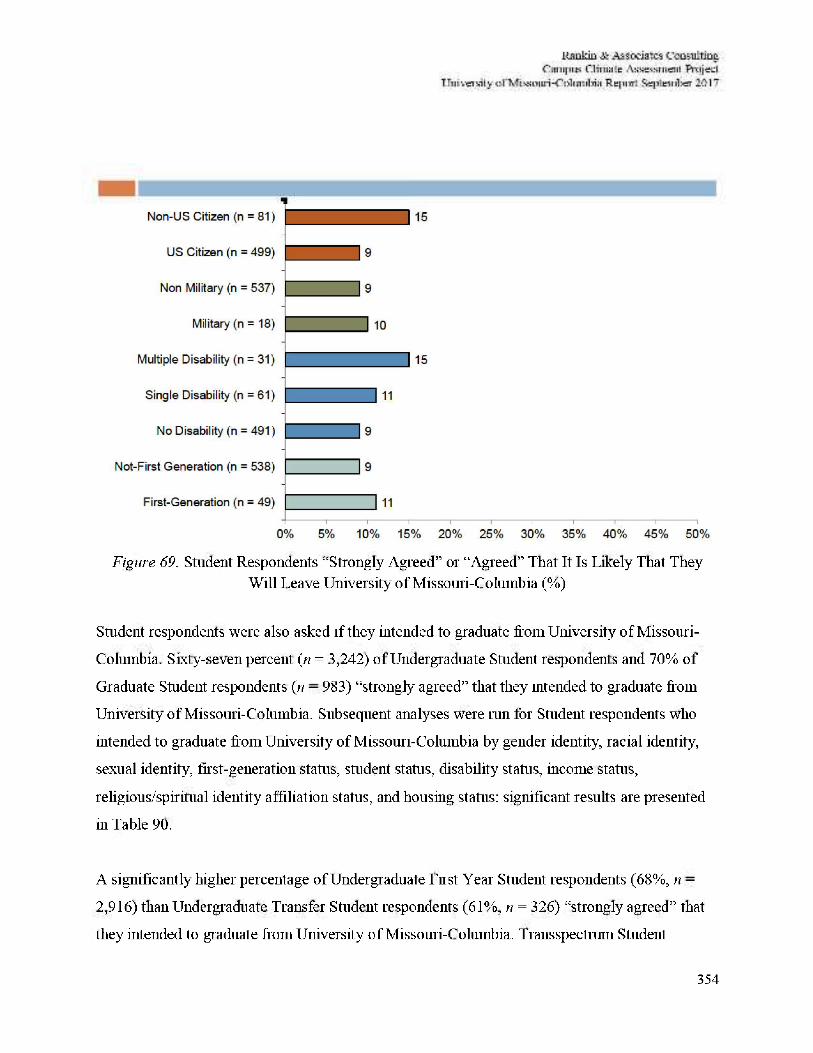
354
Figure 69. Student Respondents "Strongly Agreed" or "Agreed" That It Is Likely That They Will Leave University of Missouri-Columbia (%)
Student respondents were also asked if they intended to graduate from University of Missouri-
Columbia. Sixty-seven percent (n = 3,242) of Undergraduate Student respondents and 70% of
Graduate Student respondents (n = 983) "strongly agreed" that they intended to graduate from
University of Missouri-Columbia. Subsequent analyses were run for Student respondents who
intended to graduate from University of Missouri-Columbia by gender identity, racial identity,
sexual identity, first-generation status, student status, disability status, income status,
religious/spiritual identity affiliation status, and housing status; significant results are presented
in Table 90.
A significantly higher percentage of Undergraduate Fust Year Student respondents (68%, n =
2,916) than Undergraduate Transfer Student respondents (61%, n = 326) "strongly agreed" that
they intended to graduate from University of Missouri-Columbia. Transspectmm Student
355
respondents (64%, n = 66) and Men Student respondents (64%, n = 1,425) were much less likely
than Women Student respondents (70%, n = 2,729) to "strongly agree" that they intended to
graduate from University of Missouri-Columbia. A larger percentage of U.S. Citizen Student
respondents (69%, n 3,883) than Non-U.S. Citizen Student respondents (58%, n 319)
"strongly agreed" that they intended to graduate from University of Missouri-Columbia. Student
Respondents of Color (59%, n = 510) and Multiracial Student respondents (64%, n = 262) were
less likely than White Student respondents (70%, n = 3,381) to "strongly agree" that they
intended to graduate from University of Missouri-Columbia. Heterosexual Student respondents
(< 1%, n = 24) were much less likely than LGBQ Student respondents (1%, n = 8) to "strongly
disagree" that they intended to graduate from University of Missouri-Columbia. Not-First-
Generation Student respondents (69%, n = 3,315) were more likely than First-Generation Student
respondents (65%, n = 903) to "strongly agree" that they intended to graduate from University of
Missouri-Columbia. A higher percentage (7%, n = 29) of First-Generation and Low-Income
Student respondents versus (4%, n = 238) of Not-First-Generation and Low-Income Student
respondents "neither agreed nor disagreed" that they intended to graduate from University of
Missouri-Columbia. Seven percent (ti = 26) of Other Religious/Spiritual Identity Student
respondents were much more likely than 4% (;/ = 137) of Christian Religious/Spiritual Identity
Student respondents, 5% (n = 91) of No Religious/Spiritual Identity Student respondents, and 5%
(n = 11) of Multiple Religious/Spiritual Identity Student respondents to "neither agree nor
disagree" that they intended to graduate from University of Missouri-Columbia. No Disability
Student respondents (4%, n = 216) w7ere less likely than Single Disability Student respondents
(7%, ii = 36) to "neither agree nor disagree" that they intended to graduate from University of
Missouri-Columbia. A larger percentage of Housing Insecure Student respondents (75%, n = 24)
and Non-Campus Student respondents (70%, n = 3,240) than On-Campus Student respondents
(62%, ii = 795) "strongly agr eed" that they intended to graduate from University of Missouri-
Columbia.
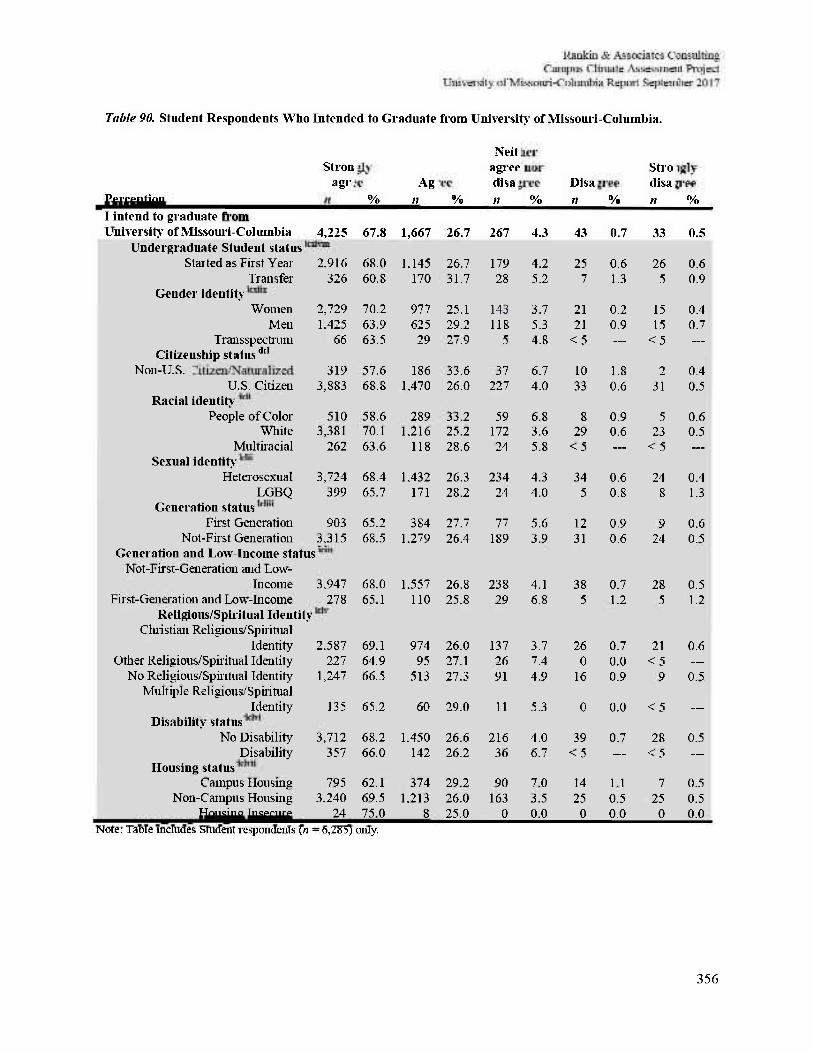
Table 90. Student Respondents Who Intended to Graduate from University of Missouri-Columbia.
Perception I intend to graduate from University of Missouri-Columbia
Strongly agree
4,225
% 67.8
Agree n
1,667
%
26.7
Neither agree nor disagree n
267
%
4.3
Disagree n
43
%
0.7
Strongly disagree n
33
%
0.5 Undergraduate Student status
Started as First Year- 2,916 68.0 1,145 26.7 179 4.2 25 0.6 26 0.6 Transfer 326 60.8 170 31.7 28 5.2 7 1.3 5 0.9
Gender identity Women 2,729 70.2 977 25.1 143 3.7 21 0.2 15 0.4
Men 1.425 63.9 625 29.2 118 5.3 21 0.9 15 0.7 Transspectrum 66 63.5 29 27.9 5 4.8 < 5 — < 5 —
Citizenship statusdcl
Non-U.S. citizen/naturalized 319 57.6 186 33.6 37 6.7 10 1.8 2 0.4 U.S. Citizen 3,883 68.8 1.470 26.0 227 4.0 33 0.6 31 0.5
Racial identity People of Color 510 58.6 289 33.2 59 6.8 8 0.9 5 0.6
White 3,381 70.1 1.216 25.2 172 3.6 29 0.6 23 0.5 Multiracial 262 63.6 118 28.6 24 5.8 < 5 < 5
Sexual identity Heterosexual 3,724 68.4 1.432 26.3 234 4.3 34 0.6 24 0.4
LGBQ 399 65.7 171 28.2 24 4.0 5 0.8 8 1.3 Generation status
First Generation 903 65.2 384 27.7 77 5.6 12 0.9 9 0.6 Not-First Generation 3,315 68.5 1.279 26.4 189 3.9 31 0.6 24 0.5
Generation and Low Income status Not-First-Generation and Low-
Income 3.947 68.0 1.557 26.8 238 4.1 38 0.7 28 0.5 First-Generation and Low-Income 278 65.1 110 25.8 29 6.8 5 1.2 5 1.2
Religious/Spiritual Identity Christian Religious/Spiritual
Identity 2,587 69.1 974 26.0 137 3.7 26 0.7 21 0.6 Other Religious/Spiritual Identity 227 64.9 95 27.1 26 7.4 0 0.0 < 5 —
No Religious/Spiritual Identity 1,247 66.5 513 27.3 91 4.9 16 0.9 9 0.5 Multiple Religious/Spiritual
Identity 135 65.2 60 29.0 11 5.3 0 0.0 < 5 —
Disability7 status No Disability 3,712 68.2 1.450 26.6 216 4.0 39 0.7 28 0.5
Disability 357 66.0 142 26.2 36 6.7 < 5 — < 5 ___ Housing status
Campus Housing 795 62.1 374 29.2 90 7.0 14 1.1 7 0.5 Non-Campus Housing 3.240 69.5 1.213 26.0 163 3.5 25 0.5 25 0.5
Housing Insecure 24 75.0 8 25.0 0 0.0 0 0.0 0 0.0 Note: Table includes Student respondents (n = 6,285) only.
356
357
Undergraduate Students
Eight hundred three Undergraduate Student respondents elaborated on why they seriously
considered leaving University of Missouri-Columbia. Four themes emerged: (1) academic
concerns, (2) experiences of the protests during the Fall of 2015, (3) exclusion and hostility
targeted at underrepresented groups oil campus, and (4) general sense of belonging challenges
with making friends and building community.
Academic Concerns — Student respondents who elaborated on why they seriously considered
leaving University of Missouri-Columbia described short-comings in their academic experiences.
Respondents reported challenges with their professors. For example, respondents noted, "faculty
is demeaning and tries to beat you down" and "I hate my professors. I feel like I learn nothing
from them." Another respondent shared, "My professors spend more their spouting their beliefs
than teaching facts in class." Another respondent elaborated, "The professors barely speak
English and don't understand what they are teaching, let alone help any students struggling."
Others reported, "often felt isolated when it came to coursework and assistance from professors"
and the professors were discouraging and made me feel like I was wasting my time."
Respondents who noted academic concerns, generally perceived there w7ere "Better opportunities
elsewhere," particularly for engineering students. For example, respondents noted, "more hands
on engineering courses" and "a better ranked engineering program." Some respondents reflected
on the quality of the courses and academic workload. Respondents shared a range of opinions,
including, "Some of the classes w7ere seriously difficult and unnecessary." Conversely, another
respondent added, "All the classes I take are super easy. I have either an A or a B in all my
classes without putting forth much effort." Another respondent commented, "Some classes are
taught by a TA or grad student who doesn't know how to teach." Finally, some respondents
simply did not feel intellectually stimulated. For example, one respondent noted. "I don't feel that
I've grown intellectually since being here." Another respondent elaborated, "I felt that MU was
not a very studious campus. A lot of students are interested in partying but I am most interested
in my academic education." Respondents w7ho elaborated on w7hy they seriously considered
leaving noted concerns and challenges with professors, coursework and the intellectual culture.
358
Experience Of The Protests During The Fall Of 2015 -Respondents who elaborated on why
they seriously considered leaving University of Missouri-Columbia noted the protests during fall
of 2015. Respondents described the protests as "the university was held hostage by a group of
individuals protesting several unsubstantiated and unproved incidents." Other respondents
elaborated on their perceptions of the people who protested, ''black students threatening the
safety of all other non-black students" and "a small minority of loud, obnoxious, students, who
feel they have a sense of entitlement because they're 'different'." Another respondent described
the people who protested as "a bunch of no good shitheads hijacked our mid-tier university and
made us look like a liberal [homophobic slur against men] shit-show to the entire world."
Respondents noted some of the perceived impacts of the protests including a loss of class time,
harm to MU's reputation, and a lack of safety. One respondent shared, "After the protests that
occurred last year, a lot of my classes lost focus for the next few weeks." Another respondent
added, "class got canceled for a whole week which made me very upset."Regarding the
reputation of the school, respondents explained, "All of the protests and stuff going on around
campus was making the school look and feel like a terrible learning environment." Another
respondent elaborated, 'Their actions did untold damage to the reputation of the University and
have hugely devalued my degree as a whole. "Other respondents reported a sense of hostility
towards them as a result of the protests. One respondent noted, "With all the protests and unrest
on campus in fall 2015 I felt that there was a lot of hostility towards myself and others like me."
Another respondent shared, "With all of the protests here on campus last year, I did not feel safe
on campus." Respondents who elaborated on why they seriously considered leaving cited the
protests during Fall of 2015 and the perceived negative impacts on the campus climate as reason
why they considered leaving the institution.
Identity-based Exclusion & Hostility -Respondents who elaborated on why they seriously considered leaving described a lack of inclusion of minorities on campus. Respondents noted, "Minorities of all types are viewed as whiny," "Racism, sexism, bickering students on social media," and "Mizzou welcoming nor understanding for anyone than white students." Another respondent explained, "discrimination here is out of control and minority students don't seem to be welcomed and it seems like there is a lot of talk about things being done but nothing is actually being done." Other respondents reported observing "people who said offensive things
359
to minority students." Respondents described hostility directed at Black people on campus. For
example,"Blackpeoplewerethreatenedoncampus,andtheschoolbarelydidanythingabout
it." Other respondents noted hostile language, 'White people are still calling black people on
campus [racial slur against African Americans] and nothing has been seriously done about it"
and "I got called a[racial slur against African Americans] in...my dorm. "Regarding one's
sense of safety,respondents reported threats. One respondentnoted,"[ along with all other
African American students on MU campus received death threats via YIKYAK." Another
respondent shared," feel I'm not welcome here and it hurts to know that there are people on
this campus that hate me and want to hurt me physically/emotionally just because I'm a black
female." Other racial identities noted concerns as well. One respondent shared," felt as though
I wasn't respected amongst my peers because I am a Latina woman." Another respondent
elaborated,"! didn't feel like I belonged as an Asian American. "Respondents also described the
campus as "not LGBT-friendly. "One respondent reported, "Homophobic slurs yelled a lot
downtown, not a LGBT-friendly environment." Another respondent explained,"Notvery
inviting for gay people.This has more to do with culture of the Midwest/Missouri than the
university ."Finally, one more respondent shared, "I was physically and verbally assaulted for
my sexuality and race." Respondents who elaborated on why they seriously considered leaving
cited exclusion and hostility directed at minorities.
General Challenges Sense of Belonging -Respondents who elaborated on why they seriously
considered leaving described general challenges with making friends and fitting in. One
respondent explained, "I feel like I don't fit in and people are exclusive and I'm not in a sorority
soIhave no support group, people are notwelcoming"Another respondent explained,"I had a
difficult time finding my place at Mizzou. I always found myself choosing between one social
setting to another, in which neither Iwas fully immersed" Other respondent reflected
specifically on their challenges with making friends. Respondents shared,"Ifeltlikeeveryone
else was making friend s and I was not making friends" and " felt like I had no friends and
wouldn't be able to make any. It was something new for me." Another respondent added, "I just
did not feel like I belonged here. I had a difficult time making friends. Also, the campus did not
feel very diverse."Respondentsalsodescribed loneliness. Onerespondentnoted,"Ifelt lonely
because making close friends to confide in was difficult at such a large school." Another
respondent elaborated, "Loneliness and a feeling of not belonging. I had come to Mizzou 359
360
thinking I would be in a sorority, and when I was released from recruitment, it sent me back into
a depression I had gotten over the year before." Other respondents reflected on their relationship
to the wider institution. For example, one respondent shared, "Felt insignificant hi the huge
student body." Another respondent explained, "I felt that I did not have as much school pride as
so many of my friends at other schools. They all fell in love with then schools and I found
myself disliking Mizzou more and more as last year progressed." Respondents who elaborated
011 why they seriously considered leaving reported struggling to building lasting social
connections and deepen their sense of belonging at University of Missouri-Columbia.
Graduate students
Two hundred and twenty-four Graduate Student respondents elaborated 011 w7hy they seriously
considered leaving. Three themes emerged within the data: (1) challenging relationships with
advisors and faculty, (2) inclusion concerns for a range of demographic identities, and (3) ways
in which the protests during the Fall of 2015 impacted their sense of belonging.
Advisors & Faculty — Respondents who elaborated 011 why they seriously considered leaving
reported poor relationships and interactions with advisors and Faculty. Respondents described
Faculty as "unmotivated," "weak" and "openly xenophobic and sexist." Another respondent
shared, "Negative interactions with white tenured faculty member. I was told, 'minority students
are always looking for a hand out. Just work hard like everyone else!'" Another respondent
added, "It is disheartening to have a professor provide little support to questions that are asked,
verbally criticize and humiliate students in the online format or in any class." Regarding
advising, one respondent explained, "My adviser, frankly, is a terrible person hi general, and an
even more terrible mentor. He has done nothing to help me progress toward completion of my
degree, grow as a scientist, or develop professionally." Another respondent shared, "Dining my
first year as a doctoral student I did not find the support to accommodate to the new7 environment
and my advisor was disappointing." One other respondent reflected poorly 011 then advisor, "The
school is surely not first-rate and my graduate advisor was/is not willing to work together 011 a
meaningful project." The statement that "I experienced little support from faculty and other
students" was widely echoed. One respondent elaborated, "My department at times lias been
361
unable or unwilling to support its students - sometimes this has been demonstrated by
dismissiveness toward health or financial issues, other times simply through the lack of faculty
that does not allow for a broader scope of ideas, methods, and mentorship with students."
Respondents who elaborated oil why they seriously considered leaving noted unfavorable
opinions of their' respective advisors and Faculty.
Inclusion Concerns — Respondents who elaborated 011 why they seriously considered leaving
explained that University of Missouri-Columbia "didn't feel very inclusive." Other respondents
generally reflected, the "lack of inclusivity was affecting both my school work and my emotional
wellbeing" and "environment does not seem inclusive or supportive." Racism and discrimination
of LGBTQ people was noted most often. Respondents reflected, "the racist and homophobic
climate present 011 campus" and "climate hostile to non-Caucasian, no 11-traditional students, and
the LGBQT community." Addressing LGBTQ concerns, one respondent noted, "Not a strong
commitment to LGBT issues and inclusion while I was a graduate student at MU." Another
respondent shared, "I am transgender, and there is very little sense of queer community for
graduate students 011 campus." Other respondents reported 'Too much racial tension." Another
respondent elaborated, "Missouri as a whole is much more racist than anywhere I've ever lived. I
am in an interracial relationship; my husband is a minority. My husband has been called horrible
names and people have even refused to talk to him." Concerns for other identities included,
"difficult to be a white Hispanic male in this University," "There is very little Jewish community
011 campus," and "Literally had a professor tell me I should give up because of my disability."
One respondent shared a poor interaction with the Title IX Office, "I am not just seriously
considering leaving, I AM leaving...I reported my professor to the Title IX Office for
discriminating against ...female [employees] and creating a hostile work environment for
everyone and nothing was done.. .This place is toxic and the administration prefers to give lip
service to actually addressing the issues. They only care about appearances and optics, not their
students." Finally, one respondent shared their outlook 011 the future of inclusion at University of
Missouri-Columbia, "I have 110 faith 111 MU's ability to fix cultural or climate issues. We've been
talking for years and it hasn't helped." Respondents who elaborated on why they seriously
considered leaving noted inclusion concerns for many different minorities on campus.
362
Experiences & Perceived Impacts Of The Protests — Respondents who elaborated on why they
seriously considered leaving cited the protests during the Fall of 2015 as part of their' rationale
for wanting to leave University of Missouri-Columbia. Respondents noted, "Protests on campus
were unacceptable and unsettling," "Mizzou is an embarrassment due to what happened last fall"
and the "concerned students 1950 and the handling of the situation was obscene." Another
respondent elaborated further, "I was ashamed of Mizzou's response to student protests.
Watching the football team and a single student — a very wealthy student — hold the university
hostage was embarrassing." Some respondents reflected on the protests in relation to their own
racial identity. One respondent shared, "After last year during the CS1950 protests. I felt
attacked as a white person for not openly supporting their cause." Another respondent expressed,
"As a white student I supported the movement that went on during the fall 2015 semester, but
since I was white I was often disrespected because of my color." One respondent articulated a
sense of fear that was noted hi this theme of the data also, "My first semester at Mizzou was last
fall when the campus climate was extremely scary for me. I identify as a White person, but I was
still scared with what was going oil. I ended up leaving Columbia for two days the night of the
most intense threats because I wasn't sure what was going to happen." Another respondent
elaborated oil how the impacts of the protests impacted their opinions of campus leaders,
"Essentially, the protests that were going on and the amount of support for them made me feel
like I didn't belong, as I do not agree with how the protests were being conducted, and the feet
that Tim Wolfe was forced to resign showed me that the higher-ups would give into any
illegitimate protests that certain types of people would make." Respondents who elaborated on
why they seriously considered leaving offered insights into how some students experienced the
protests during the fall of 2015 and the impact on Graduate Students.
dfcv.i clii-square test was conducted to compare percentages of Graduate. Professional Student respondents who indicated oil the survey that they were satisfied with the quality of advising they have received from their department by graduate student status: y1 (6. N= 1,333) = 13 41. < .05. dfcv.iiA. clii-square test was conducted to compare percentages of Graduate/Professional Student respondents who indicated oil the survey that tliey were satisfied with the quality of advising they have received from their department by gender identity: %2(6,N= 1,405) = 23.82,/; < .01. dtxxvm chi-square test was conducted to compare peicentages of Graduate/Professional Student respondents who indicated oil the survey that tliey were satisfied with the quality of advising they have received from their department by racial identity: y2 (6. N= 1,362) = 19.46,/) < .01.
dxc™A clu-square test was conducted to compare percentages of Graduate/Professional Student respondents who indicated 011 the survey that their advisor responds to their emails, calls, or voicemails hi a prompt manner by racial identity: %2(6.N= 1,348) = 22.94./; < .01. dxc™A chi-square test was conducted to compare percentages of Graduate/Professional Student respondents who indicated 011 the survey that tlieir advisor responds to their emails, calls, or voicemails in a prompt manner by disability status: x2(3. jV= 1,388)= 10.09, p< .05. d x c l x A chi-square test was conducted to compare percentages of Graduate/Professional Student respondents who indicated 011 the survey that department faculty members (other than my advisor) respond to their emails, calls, or voicemails in a prompt manner by citizenship status: X2 (3. N = 1,402) = 16.55,/? < .01. d cA chi-square test was conducted to compare percentages of Graduate/Professional Student respondents who indicated 011 the survey that department faculty members (other than my advisor) respond to then emails, calls, or voicemails in a prompt manner by racial identity: x2(6, N= 1,348) = 22.94,/; < .01. d c lA chi-square test was conducted to compare percentages of Graduate/Professional Student respondents who indicated 011 the survey that department faculty members (other than my advisor) respond to then emails, calls, or voicemails in a prompt maimer by income status: x2 (3, N= 1,373) = 11.03,/) < .05. d™A chi-square test was conducted to compare percentages of Graduate/Professional Student respondents who indicated 011 the survey department faculty members (other than my advisor) respond to their emails, calls, or voicemails in a prompt manner by disability status: x2(3, N= 1,404) = 22.22, p < .001. d™A chi-square test was conducted to compare percentages of Graduate/Professional Student respondents who indicated 011 the survey that department staff members (other than my advisor) respond to their emails, calls, or voicemails in a prompt maimer by graduate student status: x2 (6- N= 1,328) = 19.92, p < .01. d c l vA chi-square test was conducted to compare percentages of Graduate/Professional Student respondents who indicated 011 the survey that department staff members (other dian my advisor) respond to their emails, calls, or voicemails in a prompt manner by gender identity: x2 (3. N= 1,363) = 10.66,/) < .05. d c vA chi-square test was conducted to compare percentages of Graduate/Professional Student respondents who indicated 011 the survey department staff members (other than my advisor) respond to their emails, calls, or voicemails in a prompt manner by disability status: x2(3, N= 1,395) = 8.00,/) < .05. d™A chi-square test was conducted to compare percentages of Graduate/Professional Student respondents who indicated 011 the survey that there are adequate opportunities for me to interact with other university faculty outside of my department by gender identity: x2 (6. N= 1,403) = 24.00,/) < .01. ''""A chi-square test was conducted to compare percentages of Graduate/Professional Student respondents who indicated 011 the survey that there are adequate opportunities for me to interact with other university faculty outside of my department by racial identity: y}(3,N= 1,285) = 8.68,/) < .05. ^ ^ A chi-square test was conducted to compare percentages of Graduate/Professional Student respondents who indicated 011 the survey that there are adequate opportunities for me to interact with other university faculty outside of my department by sexual identity: x2 (3. N = 1,342) = 11.19,/) < .05. d a x A chi-square test was conducted to compare percentages of Graduate/Professional Student respondents who indicated 011 the survey that there are adequate opportunities for me to interact with other university faculty outside of my department by disability status: x2 (6. N= 1,401) = 22.54. p < .01. d c x A chi-square test was conducted to compare percentages of Graduate/Professional Student respondents who indicated 011 the survey that they receive support from then advisor to pursue personal research interests by graduate student status: x2(6. N= 1,319) = 29.16,/) < .001. d™A chi-square test wras conducted to compare percentages of Graduate/Professional Student respondents who indicated 011 the survey that they receive support from their advisor to pursue personal research interests by citizenship status: x 2 ( 3 , ^ = 1,387)= 10.44,/) < .05. *™A chi-square test was conducted to compare percentages of Graduate/Professional Student respondents who indicated 011 the survey that they receive support from their advisor to pursue personal research interests by racial identity: %2 (6, N= 1,348) = 14.48,/; < .05. dc5™A chi-square test wras conducted to compare percentages of Graduate/Professional Student respondents who indicated 011 the survey that they receive support from their advisor to pursue personal research interests by disability status: x2(6 ,N= 1,388)= 12.90,/; < .05. d™vA chi-square test wras conducted to compare percentages of Graduate/Professional Student respondents who indicated 011 the survey that they received support from my advisor to pursue personal research interests by campus employment status: %2(3 1N= 896) = 9.62,/) < .01.
d c x v A chi-square test was conducted to compare peicentages of Graduate/Professional Student respondents wlio indicated 011 the survey that they receive due credit for my research, writing, and publishing (e.g., authorship order hi published articles by graduate student status: y}{6,N= 1.292) = 21.88.7; < .01. dG™A chi-square test was conducted to compai e percentages of Graduate/Professional Student respondents who indicated 011 the survey that they receive due credit for my research, writing, and publishing (e.g., authorship older hi published articles by disability status: x2(3 ,N= 1.360} = 9.50. p < .05. dcx™A chi-square test was conducted to compare peicentages of Graduate/Professional Student respondents who indicated 011 the survey that they received due credit for research, writing, and publishing (e.g., authorship order hi published articles).by campus employment status: x 2 (3 .N= 875) = 9.50,/) < .05. dc;™A clii-square test was conducted to compai e percentages of Graduate/Professional Student respondents who indicated 011 the survey that their department faculty members encourage them to pioduce publications and present research by graduate student status: %2(6,N= 1,318) = 77.81, p < .001. dc™A chi-square test was conducted to compare peicentages of Giaduate. Professional Student respondents wlio indicated 011 the survey that their department faculty members encourage them to pioduce publications and present research by racial identity: x2(6. N= 1,347) = 14.16. p < .05. d c x x A clii-square test was conducted to compai e percentages of Graduate/Professional Student respondents who indicated 011 the survey that department faculty members encourage them to pioduce publications and present research by campus employment status: x2 (3. N = 897) = 14.75,/; < .01. d c x 5 aA chi-square test was conducted to compare peicentages of Giaduate. Professional Student respondents wlio indicated 011 the survey that their department has provided them opportunities to serve the department or university hi various capacities outside of teaching or research by gender identity: x2 (6- N= 1,382) = 18.70, p < .01. *™A chi-square test was conducted to compai e peicentages of Graduate/Professional Student respondents who indicated 011 the survey that they feel comfortable sharing their professional goals with their advisor by gender identity: %2(6, N= 1,385) = 15.26,p< .05. d c x x m A chi-square test was conducted to compare peicentages of Giaduate. Professional Student respondents wlio indicated 011 the survey that they feel comfortable sharing their professional goals with their advisor by citizenship status: %2(3,N= 1,382) = 8.96,/) < .05. d c x m A chi-square test was conducted to compare peicentages of Giaduate. Professional Student respondents wlio indicated 011 the survey that they feel comfortable sharing their professional goals with their advisor by generation status: y?{l,N= 1,386) = 11.15,/;< .05. d c x x v A chi-square test wras conducted to compare percentages of Undeigraduate Student respondents who indicated that they seriously considered leaving University ofMissouri-Columbia by gender identity: x2(2, N= 4,849) = 18.67,/; < .05. dcxxu ^ clii-square test was conducted to compare percentages of Undergraduate Student respondents who indicated that they seriously considered leaving University ofMissouri-Columbia by racial identity: x2 (2, N= 4,773) = 73.70, p < .01. d c 5 a M 1 A chi-square test wras conducted to compare percentages of Undergraduate Student respondents who indicated that they seriously considered leaving University ofMissouri-Columbia by sexual identity: %2 (2, N= 4,765) = 31.46,/; < .001. *™™A chi-square test was conducted to compare peicentages of Undergraduate Student respondents wlio hidicated that they seriously considered leaving University of Missouri-Columbia by military status: %2(1,N= 4,691) = 13.56, /)<.001. d c x 5 £ KA chi-square test wras conducted to compai e percentages of Undergraduate Student respondents who indicated that they seriously considered leaving University of Missouri-Columbia by first generation and low income status: X2 (1, N= 4,857) = 8.90,/; < .01. d c x x x A clii-square test was conducted to compare percentages of Undergraduate Student respondents who indicated that they seriously considered leaving University ofMissouri-Columbia by religious/spiritual identity: x2(3 , N = 4,822)= 13.86, p<. 001. dcxxxi ^ chi-square test wras conducted to compare percentages of Undergraduate Snident respondents who hidicated that they seriously considered leaving University ofMissouri-Columbia by disability status: x2(2. N= 4,827) = 41.90,/><.001. dcxxxiiA. clii-square test was conducted to compare peicentages of Undergraduate Snident respondents who indicated that they seriously considered leaving University of Missouri-Columbia by employment status: x2 (1,-^=4,771) = 31.30,/; <.001.
dixxix chi-square test was conducted to compare percentages of Graduate/Professional Student respondents who indicated oil the survey that they were satisfied with the quality of advising they have received from their department by disability status: X (6. N= 1,403)= 18.20./) < .01 d L x x xA chi-square test was conducted to compare percentages of Graduate/Professional Student respondents who indicated oil the survey that they were satisfied with the quality of advising they have received from tlieh department by employment staftis: -/} (3. N= 1,369) = 8.67,/; < .01. dLx™A chi-square test was conducted to compai e percentages of Graduate/Professional Student respondents who indicated oil the survey that they have adequate access to my advisor by graduate student status: x ffi N= 1,334) = 37.06,p< .001. dJxxsii chi-square test was conducted to compare percentages of Graduate/Professional Student respondents who indicated on the survey that they have adequate access to my advisor by gender identity: %2(6,N= 1,405) = 15.39,/) <.05. <Uxx™A clii-square test was conducted to compai e percentages of Graduate/Professional Student respondents who indicated on the survey that they have adequate access to my advisor by citizenship status: x2(3 ,N= 1,402) = 17.62,
p < .01. dixxxiv clii-square test was conducted to compai e percentages of Graduate/Professional Student respondents who indicated on the survey that they have adequate access to my advisor by racial identity: X 2(6. N= 1,363) = 25.25, p <.001. < U x x x vA chi-square test was conducted to compare peicentages of Graduate/Professional Student respondents who indicated on the survey that they have adequate access to my advisor by disability status: y} (3. N= 1,403) = 8.13,/) < .05. dlxx™A clii-square test was conducted to compai e percentages of Graduate/Professional Student respondents who indicated on the survey that their advisor provide clear expectations by graduate student status: X 2 (6, N= 1,322) = 26.09,/><.001. dLxxxaiA. clii-square test was conducted to compare peicentages of Graduate/Professional Student respondents who indicated on the survey that their advisor provide clear expectations by gender identity: %2(6,N= 1,393) = 18.20,/) <.01. dixxx™^ chi-square test was conducted to compaie percentages of Graduate/Professional Student respondents who indicated on the survey that their advisor provide clear expectations by citizenship status: x 2 (3 ,N= 1,390) = 14.92, /) < .01. dbcxxixA. clii-square test was conducted to compare peicentages of Graduate/Professional Student respondents who indicated on the survey that their advisor provide clear expectations by racial identity: y?(6, N= 1,351) = 25.74, p < .001. d x c A chi-square test was conducted to compare peicentages of Graduate/Professional Student respondents who indicated on the survey that their advisor provide clear expectations by generation status: x 2 (3 ,N= 1,394) = 11.57, /) < .01. dKC1A clii-square test was conducted to compai e percentages of Graduate/Professional Student respondents who indicated on the survey that their advisor provide clear expectations by religious/spiritual identity: y1 (9. N= 1,379) = 22.77,p< .01. dx™A chi-square test was conducted to compare peicentages of Graduate. Professional Student respondents who indicated on the survey that their advisor provide clear expectations by disability status: y2 (6, N= 1,392) = 16.46, p < .05. dx™A chi-square test was conducted to compare percentages of Graduate/Professional Student respondents who indicated on the survey that they were satisfied with the quality of advising they have received from their department by employment status: x2(3 ,N= 1,358) =9.90, p <.01. dKCl vA chi-square test wras conducted to compai e pei centages of Graduate/Professional Student respondents who indicated on the survey that their advisor responds to tlieir emails, calls, or voicemails hi a prompt maimer by graduate student status: %2(6,N= 1,320) = 30.74,/) < .001. d x c v A chi-square test was conducted to compare pei centages of Graduate/Professional Student respondents who indicated on the survey that their advisor responds to tlieir emails, calls, or voicemails hi a prompt maimer by gender identity: %2 (6, N= 1,390) = 15.57,p < .05. dx™A chi-square test wras conducted to compai e pei centages of Graduate/Professional Student respondents who indicated on the survey that their advisor responds to tlieir emails, calls, or voicemails hi a prompt maimer by citizenship status: x 2 ( 3 , ^ = 1,388)= 16.72,/) < .01.
366
dcxx™A chi-square test was conducted to compare percentages of Undergraduate Studeut respondents who indicated that they seriously considered leaving University of Missouri-Columbia by housing status: y} (2. N = 4.664) = 36.78, p < .001. d c x x x n A chi-square test was conducted to compare percentages of Graduate/Professional Student respondents who indicated that tliey seriously considered leaving University of Missouri-Columbia by graduate student status: y2 (2, N 1,336) : : 9.01, p < .05. dcxxxv chi-square test was conducted to compare peicentages of Graduate/Professional Student respondents who indicated that they seriously considered leaving University of Missouri-Columbia by income status: y2 (1. N= 1,385) = 11.03,/? < .01. don™ chi-square test was conducted to compare percentages of Graduate/Professional Student respondents who indicated that they seriously considered leaving University of Missouri-Columbia by religious/spiritual identity: y2
(3,N= 1,402) = 11.38,/; < .05. dcxxxm ^ clii-square test was conducted to compare percentages of Graduate/Professional Student respondents who indicated that they seriously considered leaving University of Missouri-Columbia by disability status: y2 (2, N= 1,415)= 18.92, p<. 001. dcxxx™A chi-square test was conducted to compare percentages of Graduate/Professional Student respondents who indicated that they seriously considered leaving University of Missouri-Columbia by employment status: y1 (1, N= 1379)= 11.26, p<. 01. dcxxxix ^ clii-square test was conducted to compare percentages of Student respondents who thought it was likely they would leave MU without meeting their goal by gender identity: x2(8, N= 6,250) = 41.24, p< .001. d o J A clii-square test was conducted to compare peicentages of Student respondents who thought it was likely they would leave MU without meeting their goal by racial identity: y2 (S,N= 6,133) = 58.18,/) < .001. d a J l A clii-square test was conducted to compare percentages of Student respondents who thought it was likely they would leave MU without meeting their goal by sexual identity: y1 (4, N= 6,085) = 1471, p< .01. d c x J u A clii-square test was conducted to compare peicentages of Student respondents who thought it was likely tliey would leave MU without meeting their goal by religious identity: y1 (12. iV= 6,209) = 51.16, p< .001. d c x l m A chi-square test was conducted to compai e percentages of Shident respondents who thought it was likely they would leave MU without meeting their goal by citizen ship status: y1 (4. N= 6,228) = 32.19./? < .001. d c x ] l vA chi-square test was conducted to compai e percentages of Student respondents who thought it was likely they would leave MU without meeting their goal by military status: y2 (4. N= 6,062) = 31.04,/) < .001. d c x ] v A clii-square test was conducted to compare peicentages of Student respondents who thought it was likely tliey would leave MU without meeting their goal by disability stahis: y2 (8. N= 6,229) = 47.36,/) < .001. d c x ] n A chi-square test was conducted to compai e pei centages of Student respondents who thought it was likely tliey would leave MU without meeting their goal by first-generation and low-income stahis: x 2 (8 ,N= 6,133) = 58.18,/) <.001. doJ™A clii-square test was conducted to compare peicentages of Student respondents who thought it was likely they would leave MU without meeting their goal by housing status: y2 (8. N= 6,005) = 20.01,/? < .05. d o J™A clii-square test was conducted to compai e percentages of Student respondents who intended to graduate from University of Missouri-Columbia by under graduate student status: y2 (4. N= 4,827) = 13.83,/? < .01. dcxJuA. clii-square test was conducted to compare peicentages of Student respondents who intended to graduate from University of Missouri-Columbia by gender identity: y2 (8, N= 6,220) = 42.96,/) < .001. d d A chi-square test was conducted to compai e percentages of Student respondents who intended to graduate from University of Missouri-Columbia by citizenship status: %2(4, N= 6,198) = 35.59,/) < .001. d c U A clii-square test was conducted to compare peicentages of Student respondents who intended to graduate from University of Missouri-Columbia by racial identity: y2 (8. N= 6,104)= 58.61,/) < .001. d c l i iA clii-square test was conducted to compai e percentages of Student respondents who intended to graduate from University of Missouri-Columbia by sexual identity: y2 (4. N= 6,055)= 9.73,/; < .05. d c M A clii-square test was conducted to compare peicentages of Student respondents who intended to graduate from University of Missouri-Columbia by generation status: x2(4 ,N= 6,223) = 10.58,/; < .05. d c U v A clii-square test was conducted to compare peicentages of Student respondents who intended to graduate from University of Missouri-Columbia by generation and low income stahis: y2 (4. N= 6,235) = 12.49,/) < .05. d c l vA clii-square test was conducted to compai e percentages of Student respondents who intended to graduate from University of Missouri-Columbia by religious.:'spiritual identity: y2(12,N= 6,178) = 21.59,/) < .05.
367
d c l v iA chi-square test was conducted to compare percentages of Student respondents who intended to graduate from University of Missouri-Columbia by disability status: %2(4,N= 6,197) = 10.53,/) < .05. d c l v u A chi-square test was conducted to compare percentages of Student respondents who intended to graduate frran University of Missouri-Columbia by housing status: x2 (8. N= 5,976) = 48.41, p < .001.
368
Summary
For the most part, Student responses to a variety of items indicated that they held then' academic
and intellectual experiences and their interactions with faculty and other students at University of
Missouri-Columbia in a very positive light.
The majority of Student respondents felt valued by faculty (73%, n = 4,537), staff (71%, n =
4.411), and other students (68%, n = 4,182) hi the classroom, but fewer felt valued by senior
administration (49%, n = 3,039). Student respondents also thought that University of Missouri-
Columbia faculty (70%, n = 4,364), staff(59%, n = 3,631), and other students (70%, n = 4,336)
were role models. Fifty-four percent (n = 3,361) of Student respondents believed that the campus
climate at University of Missouri-Columbia encouraged free and open discussion of difficult
topics.
Thirty-one percent (« = 1,897) of Student respondents felt faculty pre-judged then abilities based
oil their perception of then identity/background and (28%, n = 1,729) felt pre-judged by staff
Forty-six percent (n = 2,833) of Student respondents thought that senior administrators, 53% (n =
3,264) faculty, and 56% (n = 3,430) students have taken direct actions to address the needs of at-
risk/underserved students.
Twenty-nine percent (n = 1,420) of Undergraduate Student respondents and 25% (n = 360) of
Graduate/Professional Student/Post-Doctoral Scholar respondents had seriously considered
leaving University of Missouri-Columbia.
Rankin & Associates Consulting Campus Climate Assessment Project
University of Missouri-Columbia Report September 2017
Institutional Actions
In addition to campus constituents' personal experiences and perceptions of the campus climate, the number and quality of University of Missouri-Co himbiars diversity-related actions may be perceived either as promoting a positive campus climate or impeding it. As the following data suggest, respondents hold divergent opinions about the degree to which University of Missomi-Columbia does, and should, promote diversity to shape campus climate.
The survey asked Faculty respondents106 (n = 1,066) to indicate how they thought various initiatives influenced the climate at University of Missouri-Columbia if they were currently available and how, if they were not currently available, those initiatives would influence the climate if they were available (Table 91). Respondents were asked to decide whether the institutional actions positively or negatively influenced the climate, or if they have no influence on the climate.
Seventy-five percent (n = 666) of the Faculty respondents thought that flexibility for calculating the tenure clock was available and 25% (n = 221) of Faculty respondents thought that flexibility for calculating the tenure clock was not available. Seventy percent (n = 464) of the Faculty respondents who thought that such flexibility was available believed it positively influenced the climate and 65% (n = 143) of Faculty respondents who did not think it was available thought it would positively influence the climate if it were available.
Sixty-four percent (n = 580) of the Faculty respondents thought that recognition and rewards for including diversity issues in courses across the curriculum were available and 37% (n = 333) of Faculty respondents thought that they were not available. Fifty-eight percent (n = 335) of the Faculty respondents who thought that recognition and rewards for including diversity issues in courses across the curriculum were available believed that they positively influenced the climate and 68% (n = 226) of Faculty respondents who thought they were not available thought recognition and rewards for including diversity issues in courses across the curriculum would positively influence the climate if they were available.
106 Per the request of the LCST, Administrators with Faculty Rank were not included with Faculty respondents by position status.
369
370
Eighty-four percent (;/ = 784) of the Faculty respondents thought that diversity and inclusion training for faculty was available at University of Missouri-Columbia and 16% (n = 154) of Faculty respondents thought that it was not available. Fifty-seven percent (n = 443) of the Faculty respondents who thought that diversity and inclusion training for faculty was available believed it positively influenced the climate and 57% (;/ = 87) of Faculty respondents who did not think it was available thought it would positively influence the climate if it were available.
Sixty-one percent (n = 558) of the Faculty respondents thought that tool kits for faculty to create an inclusive classroom environment were available and 39% (n = 361) of Faculty respondents thought that such tool kits were not available. Fifty-nine percent (n = 329) of the Faculty respondents who thought that tool kits for faculty to create an inclusive classroom environment were available believed they positively influenced the climate and 74% (?i = 266) of Faculty respondents who did not think they were available thought they would positively influence the climate if they were available.
Sixty percent (« = 545) of the Faculty respondents thought that supervisory training for faculty was available and 40% (n = 367) of Faculty respondents thought that it was not available. Fifty-seven percent (n = 309) of the Faculty respondents who thought that supervisory training for faculty was available believed it positively influenced the climate and 69% ( n = 254) of Faculty respondents who did not think supervisory training for faculty was available thought it would positively influence the climate if it were available.
Eighty-five percent (n = 784) of the Faculty respondents thought that access to counseling for people who had experienced harassment was available and 15% (n = 137) of Faculty respondents thought that such counseling was not available. Eighty-six percent (n = 672) of the Faculty respondents who thought that access to counseling for people who had experienced harassment was available believed it positively influenced the climate and 80% (n = 109) of Faculty respondents who did not think it was available thought it would positively influence the climate if it were available.
371
Seventy-five percent (n = 707) of the Faculty respondents thought that mentorship for new faculty was available and 25% (n = 233) of Faculty respondents thought that faculty mentorship was not available. Eighty-nine percent (n = 628) of the Faculty respondents who thought that mentorship for new faculty was available believed it positively influenced the climate and 87% (n = 203) of Faculty respondents who did not think it was available thought it would positively influence the climate if it were available.
Seventy-three percent (n = 677) of the Faculty respondents thought that a clear process to resolve conflicts was available and 27% (« = 246) of Faculty respondents thought that such a process was not available. Eighty-five percent (n = 578) of the Faculty respondents who thought that a clear process to resolve conflicts was available believed it positively influenced the climate and 88% (n = 216) of Faculty respondents who did not think it was available thought it would positively influence the climate if it were available.
Seventy-four percent (n = 670) of the Faculty respondents thought that a fan process to resolve conflicts was available and 27% (n = 241) of Faculty respondents thought that such a process was not available. Eighty-nine percent (n = 593) of the Faculty respondents who thought that a fair process to resolve conflicts was available believed it positively influenced the climate and 90% (n = 216) of Faculty respondents who did not think it was available thought it would positively influence the climate if it were available.
Fifty-seven percent (n = 516) of the Faculty respondents thought that including diversity-related professional experiences as one of the criteria for hiring of staff faculty was available and 43% (n = 396) of Faculty respondents thought that it was not available at University of Missouri-Columbia. Forty-seven percent (n = 241) of the Faculty respondents who thought that including diversity-related professional experiences as both one of the criteria for hiring of staff/faculty was available believed it positively influenced the climate and 55% (n = 217) of Faculty respondents who did not think it was available thought it would positively influence the climate if it were available.
372
Sixty-six percent (n = 606) of the Faculty respondents thought that diversity and inclusion training for search, promotion, and tenure committees was available at University of Missouri-Columbia and 34% (n = 315) of Faculty respondents thought that diversity and inclusion training for search, promotion, and tenure committees was not available. Fifty-nine percent (n = 356) of the Faculty respondents who thought that diversity and inclusion training for search, promotion, and tenure committees was available believed it positively influenced the climate and 69% (« = 216) of Faculty respondents who did not think it was available thought it would positively influence the climate if it were available.
Fifty-nine percent (n = 542) of the Faculty respondents thought that career-span development opportunities for faculty at all ranks were available and 41% (n = 371) of Faculty respondents thought that they were not available. Seventy-seven percent (n = 415) of the Faculty respondents who thought that career-span development opportunities for faculty at all ranks were available believed they positively influenced the climate and 86% (n = 318) of Faculty respondents who did not tlunk they available thought they would positively influence the climate if they were available.
Fifty-one percent (» = 464) of the Faculty respondents thought that affordable child care was available at University of Missouri-Columbia and 49% (n = 447) of Faculty respondents thought that it was not available. Seventy-two percent (n = 336) of the Faculty respondents who thought that affordable child care was available believed it positively influenced the climate and 85% (n = 378) of Faculty respondents who did not think it was available thought it would positively influence the climate if it were available.
Sixty-two percent (n = 559) of the Faculty respondents thought that support/resources for spouse/partner employment were available and 38% (n = 345) of Faculty respondents thought that they were not available. Seventy-three percent (n = 405) of the Faculty respondents who thought that support/resources for spouse/partner employment were available believed they positively influenced the climate and 85% (n = 293) of Faculty respondents who did not think they was available thought they would positively influence the climate if they were available.
373
Sixty-two percent (n = 551) of the Faculty respondents thought that support via constituent-based support groups were available and 38% (n = 342) of Faculty respondents thought that they were not available. Sixty-four percent (n = 354) of the Faculty respondents who thought that support via constituent-based support groups were available believed they positively influenced the climate and 77% (H = 263) of Faculty respondents who did not tlunk they was available thought they would positively influence the climate if they were available.
Sixty-four percent (n = 582) of the Faculty respondents thought that a location for informal networking was available at University of Missouri-Columbia and 36% (ti = 323) of Faculty respondents thought that it was not available. Fifty-eight percent (n = 336) of the Faculty respondents who thought that a location for informal networking was available believed it positively influenced the climate and 69% (« = 223) of Faculty respondents who did not think it was available thought it would positively influence the climate if it were available.
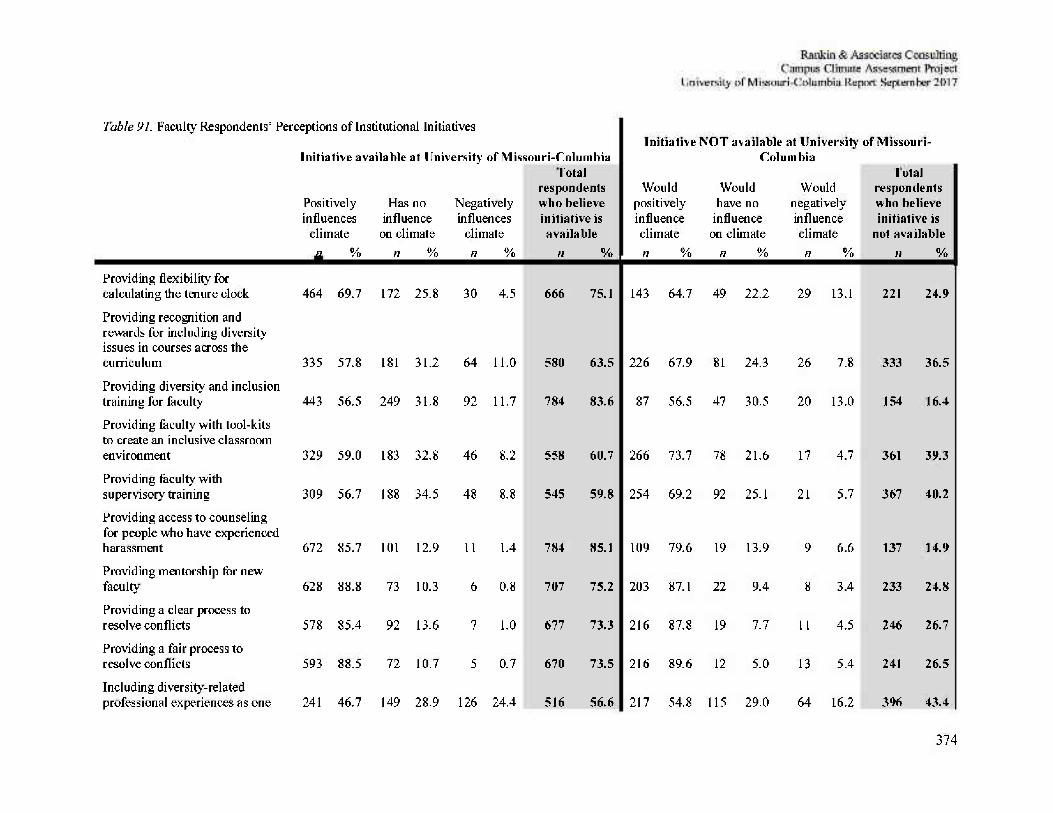
374
Table 91. Faculty Respondents' Perceptions of Institutional Initiatives
Initiative available at University of Missouri-Columbia Initiative NOT available at University of Missouri-
Columbia
Positively influences
climate
Has no influence on climate
Negatively influences
climate
Total respondents who believe initiative is available
Would positively influence climate
Would have no
influence on climate
Would negatively influence climate
Total respondents who believe initiative is
not available n % n % n % n % n % n % n % n %
Providing flexibility for calculating the tenure clock 464 69.7 172 25.8 30 4.5 666 75.1 143 64.7 49 22.2 29 13.1 221 24.9
Providing recognition and rewards for including diversity issues in courses across the curriculum 335 57.8 181 31.2 64 11.0 580 63.5 226 67.9 81 24.3 26 7.8 333 36.5
Providing diversity and inclusion training for faculty 443 56.5 249 31.8 92 11.7 784 83.6 87 56.5 47 30.5 20 13.0 154 16.4
Providing faculty with tool-kits to create an inclusive classroom environment 329 59.0 183 32.8 46 8.2 558 60.7 266 73.7 78 21.6 17 4.7 361 39.3
Providing faculty with supervisory training 309 56.7 188 34.5 48 8.8 545 59.8 254 69.2 92 25.1 21 5.7 367 40.2
Providing access to counseling for people who have experienced harassment 672 85.7 101 12.9 11 1.4 784 85.1 109 79.6 19 13.9 9 6.6 137 14.9
Providing mentorship for new faculty 628 88.8 73 10.3 6 0.8 707 75.2 203 87.1 22 9.4 8 3.4 233 24.8
Providing a clear process to resolve conflicts 578 85.4 92 13.6 7 1.0 677 73.3 216 87.8 19 7.7 11 4.5 246 26.7
Providing a fair process to resolve conflicts 593 88.5 72 10.7 5 0.7 670 73.5 216 89.6 12 5.0 13 5.4 241 26.5
Including diversity-related professional experiences as one 241 46.7 149 28.9 126 24.4 516 56.6 217 54.8 115 29.0 64 16.2 396 43.4
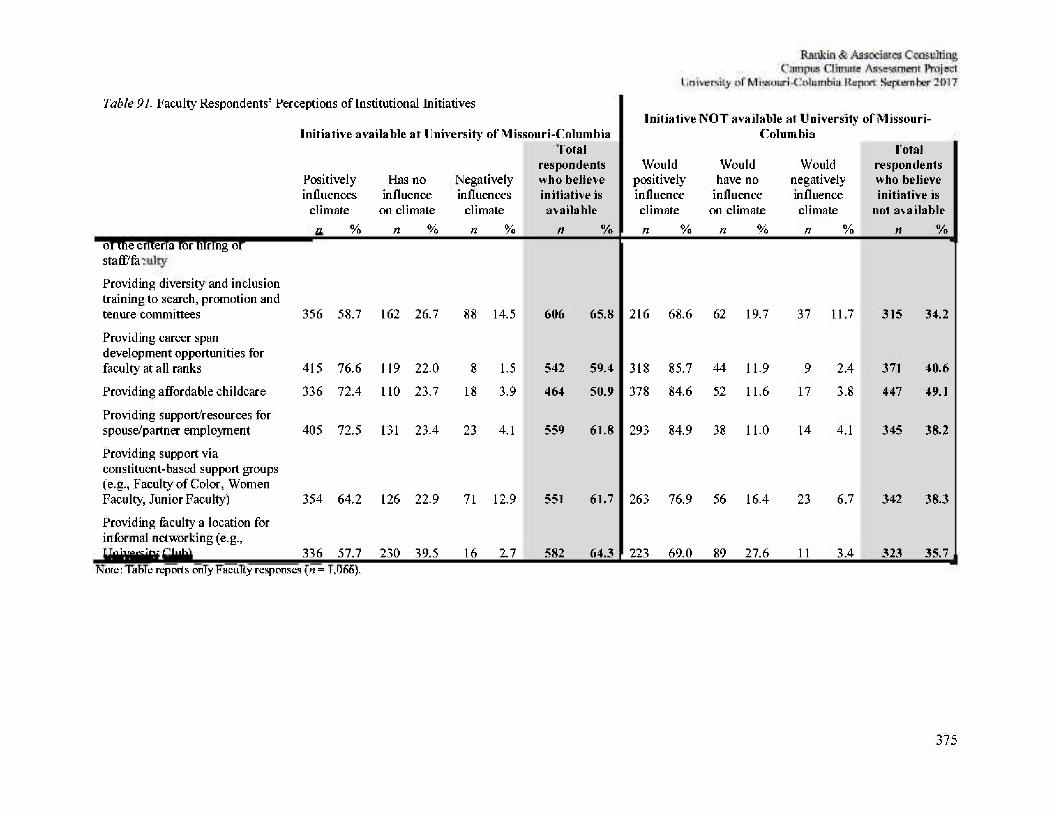
375
Table 91. Faculty Respondents' Perceptions of Institutional Initiatives
Initiative available at University of Missouri-Columbia Initiative NOT available at University of Missouri-
Columbia
Positively influences
climate
Has no influence
on climate
Negatively influences
climate
Total respondents who believe initiative is available
Would positively influence climate
Would have no
influence on climate
Would negatively influence climate
Total respondents who believe initiative is
not available n % n % n % n % n % n % n % n %
of the criteria for hiring of staff/faulty
Providing diversity and inclusion training to search, promotion and tenure committees 356 58.7 162 26.7 88 14.5 606 65.8 216 68.6 62 19.7 37 11.7 315 34.2
Providing career span development opportunities for faculty at all ranks 415 76.6 119 22.0 8 1.5 542 59.4 318 85.7 44 11.9 9 2.4 371 40.6
Providing affordable childcare 336 72.4 110 23.7 18 3.9 464 50.9 378 84.6 52 11.6 17 3.8 447 49.1
Providing support/resources for spouse/partner employment 405 72.5 131 23.4 23 4.1 559 61.8 293 84.9 38 11.0 14 4.1 345 38.2 Providing support via constituent-based support groups (e.g., Faculty of Color, Women Faculty, Junior Faculty) 354 64.2 126 22.9 71 12.9 551 61.7 263 76.9 56 16.4 23 6.7 342 38.3
Providing faculty a location for informal networking (e.g., University Club) 336 57.7 230 39.5 16 2.7 582 64.3 223 69.0 89 27.6 11 3.4 323 35.7
Note: Table reports only Faculty responses (n = 1,066).
376
One hundred thirty-three Faculty respondents elaborated on their opinions of institutional actions. Two overall themes emerged: (1) criticism of the current diversity training initiatives and (2) perceptions of reverse discrimination as a result of recent institutional actions and emphasis on inclusion.
Critiques Of Diversity Training — Respondents who elaborated on institutional initiatives offered critiques and challenges to the current diversity training practices and policies. Respondents commented 011 the online trainings. One respondent explained, "Meaningful diversity training, etc, might be nice. This online bullshit every year is stupid." Another respondent noted, "Imposition of required online diversity training modules on faculty has created a lot of anger'." Other respondents expressed a desire for less training and perceived low efficacy of the current training. For example, one respondent shared, "OMG please stop with the diversity and inclusion emphasis already." Another respondent elaborated, "The diversity and inclusion training is unfortunately a joke. I have participated in various programs since 1919 (yes, really) and it has no impact." Particularly noting the lack of desired impact and effectiveness of trainings, one respondent explained, "Making people attend workshops or online programs 011 racial diversity negatively influences the climate. It should be a choice and not forced." One respondent echoed this sentiment, noting, "Why is one suggestion always more training. I have so many certificates for this and that and I am not sine it changes much. New ways are needed." Respondents who elaborated on institutional initiatives described shortcomings of the diversity training currently in place.
Reverse Discrimination — Respondents who elaborated 011 their opinions about institutional initiatives reported reverse discrimination of self identified White people or observations of the White community at the University of Missouri. One respondent shared, "We need to be cautious of over-reacting and creating an atmosphere of reverse discrimination." Another respondent noted, "Any favoritism to minorities or "special groups" is the same as racism." Yet another respondent explained, "People not visibly fitting into the minority category are now being discriminated against." Other respondents perceived a lack of institutional support for White people. One respondent questioned, "what about whites - provide support for colored but not whites?????" Another respondent noted. "It becomes very til ing to hear certain people are bom
377
into privilege and therefore their accomplishments are unearned and they are perpetual racists and can never be a victim because they are not protected." Lastly, one respondent explained. "The minority is always concerned and usually blame the majority for then plight instead of moving forward and improving their lives." Respondents reported a range of perceived negative impacts of discrimination of White people.
378
The survey asked Staff respondents107 (n = 2,601) to respond regarding similar initiatives, which are listed in Table 92. Ninety-two percent (n = 2,249) of the Staff respondents thought that diversity and inclusivity training for staff was available at University of Missouri-Columbia and 8% (n = 198) of Staff respondents thought that it was not available. Sixty-two percent (n = 1,393) of the Staff respondents who thought that diversity and inclusivity training for staff was available believed it positively influenced the climate and 54% (n = 107) of Staff respondents who did not think it was available thought it would positively influence the climate if it were available.
Ninety percent (« = 2,184) of the Staff respondents thought that access to counseling for people who had experienced harassment was available at University of Missouri-Columbia and 10% (n = 233) of Staff respondents thought that such access to counseling was not available. Eighty-four percent (;/ = 1,844) of the Staff respondents who thought that access to counseling for people who had experienced harassment was available believed it positively influenced the climate and 63% (n = 146) of Staff respondents who did not think it was available thought it would positively influence the climate if it were available.
Eighty-one percent (« = 1.948) of the Staff respondents thought that supervisory training for supervisors/managers was available and 19% (n = 458) of Staff respondents thought that such training was not available. Eighty-one percent (n = 1,583) of the Staff respondents who thought that supervisory training for supervisors/managers was available believed it positively influenced the climate and 84% (;/ = 384) of Staff respondents who did not think it was available thought it would positively influence the climate if it were available.
Seventy-seven percent (n = 1,817) of the Staff respondents thought that supervisory training for faculty was available and 23% (n = 533) of Staff respondents thought that such training was not available. Eighty percent (n = 1,447) of the Staff respondents who thought that supervisory training for faculty was available believed it positively influenced the climate and 84% (n = 449)
107 per request of the LCST, Senior Administrators without Faculty Rank were included with Staff respondents for analyses by staff status.
379
of Staff respondents who did not think it was available thought it would positively influence the climate if it were available.
Sixty-five percent (n = 1,545) of the Staff respondents thought that mentorship for new staff was available and 35% (n = 843) of Staff respondents thought that staff mentorship was not available. Eighty-three percent ( n = 1,281) of the Staff respondents who thought that mentorship for new staff was available beheved it positively influenced the climate and 87% (n = 734) of Staff respondents who did not think it was available thought it would positively influence the climate if it were available.
Seventy-nine percent (n = 1,870) of the Staff respondents thought that a clear process to resolve conflicts was available at University of Missouri-Columbia and 21% (n = 493) of Staff respondents thought that such a process was not available. Eighty-tliree percent (n = 1,544) of the Staff respondents who thought that a clear process to resolve conflicts was available believed it positively influenced the climate and 85% (n = 419) of Staff respondents who did not tliink it was available thought it would positively influence the climate if it were available.
Seventy-nine percent (n = 1,860) of the Staff respondents thought that a fair process to resolve conflicts was available at University of Missouri-Columbia and 21% (n = 501) of Staff respondents thought that such a process was not available. Eighty-five percent (n = 1,580) of the Staff respondents who thought that a fair process to resolve conflicts was available believed it positively influenced the climate and 85% (n = 425) of Staff respondents who did not tliink it was available thought it would positively influence the climate if it were available.
Seventy-two percent (n = 1,688) of the Staff respondents thought that including diversity-related professional experiences as one of the criteria for lining of staff/faculty was available and 28% (n = 643) of Staff respondents thought that it was not available. Fifty-three (n = 898) of the Staff respondents who thought that including diversity-related professional experiences as one of the criteria for hiring of staff/faculty was available believed it positively influenced the climate and 60% (n = 384) of Staff respondents who did not tlunk it was available thought it would positively influence the climate if it were available.
380
Seventy-nine percent (n = 1,898) of the Staff respondents thought that career development opportunities for staff were available and 21% (n =491) of Staff respondents thought that they were not available. Eighty-six percent (n = 1,631) of the Staff respondents who thought that career development opportunities for staff were available believed it positively iirfluenced the climate and 87% (?? = 425) of Staff respondents who did not think such opportunities were available thought it would positively influence the climate if they were available.
Fifty-seven percent (n = 1,338) of the Staff respondents thought that affordable child care was available at University of Missouri-Columbia and 43% (n = 1,020) of Staff respondents thought that it was not available. Seventy-six percent (n = 1,019) of the Staff respondents who thought that affordable child care was available believed it positively influenced the climate and 85% (n = 868) of Staff respondents who did not think it was available thought it would positively influence the climate if it were available.
Sixty-one percent (n = 1.404) of the Staff respondents thought that support/resources for spouse/partner employment were available and 39% (n = 911) of Staff respondents thought that they were not available. Sixty-seven percent (n = 945) of the Staff respondents who thought that support/resources for spouse/partner employment were available believed it positively influenced the climate and 77% (n = 703) of Staff respondents who did not think they were available thought they would positively influence the climate if they were available.
Sixty-six percent (n = 1,516) of the Staff respondents thought that support via constituent-based support groups was available and 34% (n = 785) of Staff respondents thought that it was not available. Fifty-nine percent (« = 888) of the Staff respondents who thought that support via constituent-based support groups was available believed it positively influenced the climate and 69% (n = 544) of Staff respondents who did not tlunk it was available thought it would positively influence the climate if they were available.
Sixty-three percent (n = 1.473) of the Staff respondents thought that a location for informal networking for staff was available and 37% (n = 854) of Staff respondents thought that it was not
381
available. Fifty-nine percent (;/ = 865) of the Staff respondents who thought that a location for informal networking for staff was available believed it positively influenced the climate and 71% (n = 606) of Staff respondents who did not think it was available thought it would positively influence the climate if they were available.
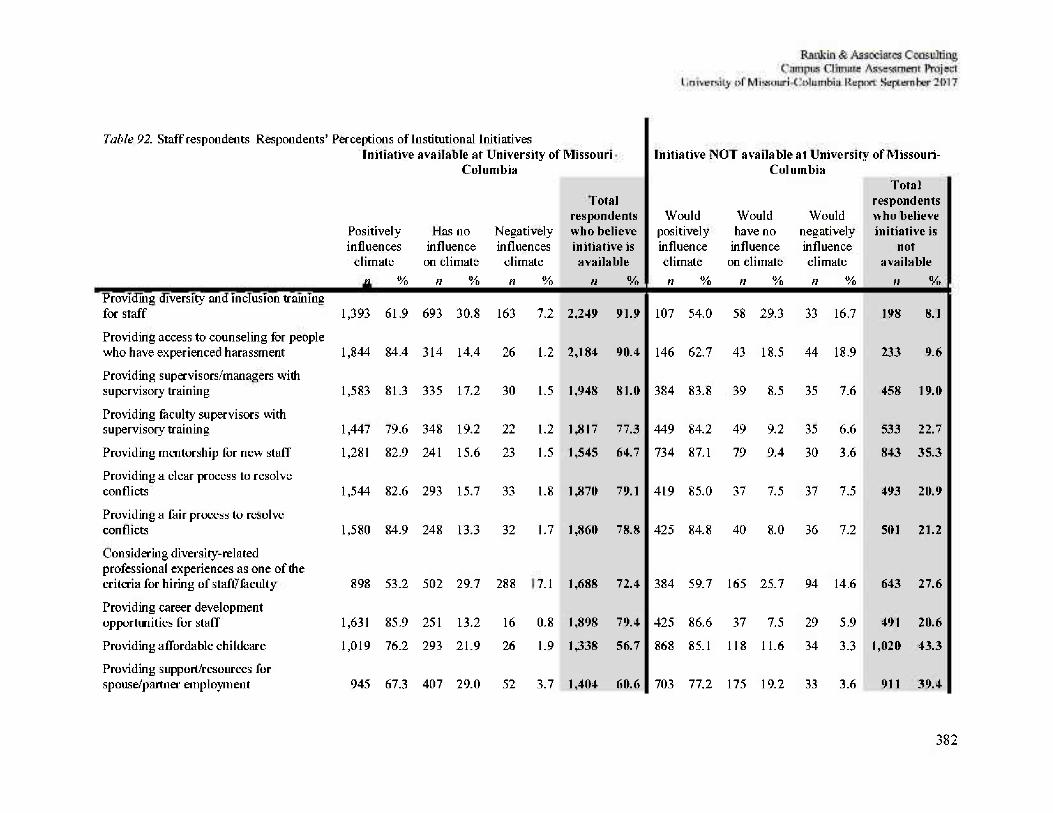
382
Table 92. Staff respondents Respondents' Perceptions of Institutional Initiatives Initiative available at University of Missouri
Columbia Initiative NOT available at University of Missouri-
Columbia
Positively influences
climate
Has no influence on climate
Negatively influences
climate
Total respondents who believe initiative is available
Would positively influence climate
Would have no
influence on climate
Would negatively influence climate
Total respondents who believe initiative is
not available
n % n % n % n % n % n % n % n % Providing diversity and inclusion training for staff 1,393 61.9 693 30.8 163 7.2 2,249 91.9 107 54.0 58 29.3 33 16.7 198 8.1
Providing access to counseling for people who have experienced harassment 1,844 84.4 314 14.4 26 1.2 2,184 90.4 146 62.7 43 18.5 44 18.9 233 9.6 Providing supervisors/managers with supervisory training 1,583 81.3 335 17.2 30 1.5 1,948 81.0 384 83.8 39 8.5 35 7.6 458 19.0
Providing faculty supervisors with supervisory training 1,447 79.6 348 19.2 22 1.2 1,817 77.3 449 84.2 49 9.2 35 6.6 533 22.7
Providing mentorship for new staff 1,281 82.9 241 15.6 23 1.5 1,545 64.7 734 87.1 79 9.4 30 3.6 843 35.3 Providing a clear process to resolve conflicts 1,544 82.6 293 15.7 33 1.8 1,870 79.1 419 85.0 37 7.5 37 7.5 493 20.9
Providing a fair process to resolve conflicts 1,580 84.9 248 13.3 32 1.7 1,860 78.8 425 84.8 40 8.0 36 7.2 501 21.2
Considering diversity-related professional experiences as one of the criteria for hiring of stafl7faculty 898 53.2 502 29.7 288 7.1 1,688 72.4 384 59.7 165 25.7 94 14.6 643 27.6
Providing career development opportunities for staff 1,631 85.9 251 13.2 16 0.8 1,898 79.4 425 86.6 37 7.5 29 5.9 491 20.6
Providing affordable childcare 1,019 76.2 293 21.9 26 1.9 1,338 56.7 868 85.1 118 11.6 34 3.3 1,020 43.3 Providing support/resources for spouse/partner employment 945 67.3 407 29.0 52 3.7 1,404 60.6 703 77.2 175 19.2 33 3.6 911 39.4
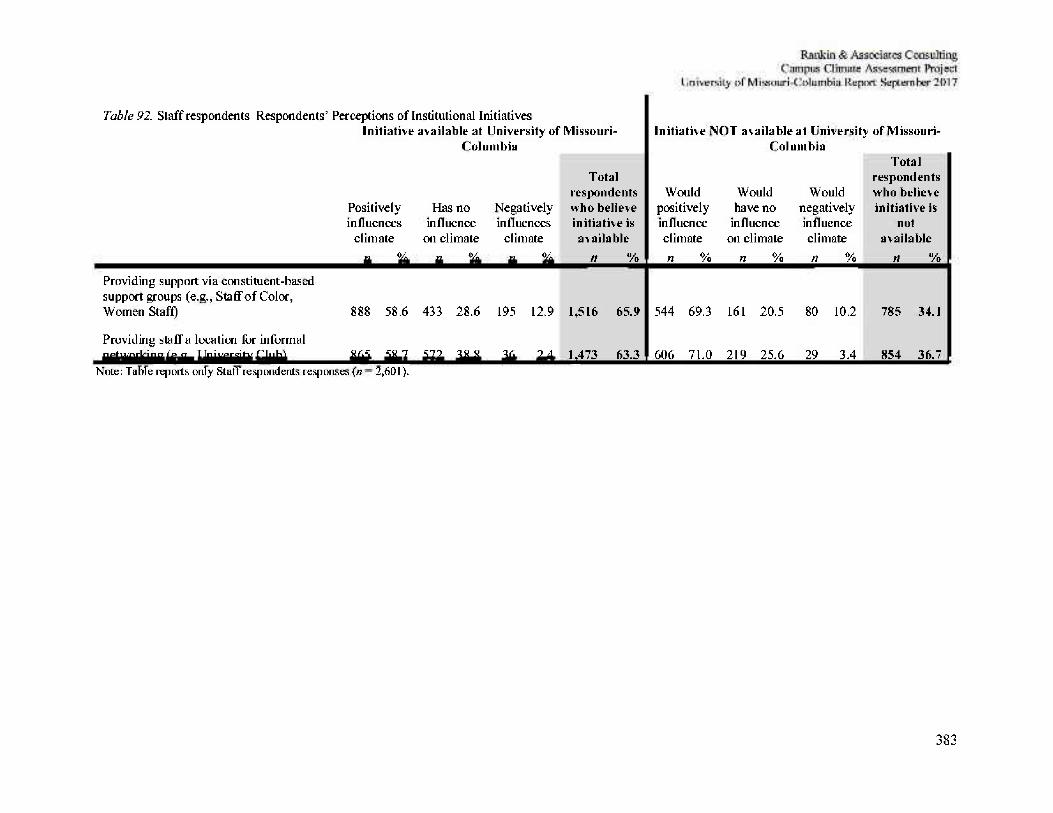
383
Table 92. Staff respondents Respondents' Perceptions of Institutional Initiatives Initiative available at University of Missouri-
Columbia Initiative NOT available at University of Missouri-
Columbia
Positively Has no Negatively influences influence influences
climate on climate climate n % n % n %
Total respondents who believe initiative is available
n %
Would Would Would positively have no negatively influence influence influence climate on climate climate n % n % n %
Total respondents who believe initiative is
not available
n % Providing support via constituent-based support groups (e.g., Staff of Color,
Women Staff) 888 58.6 433 28.6 195 12.9
Providing staff a location for informal networking (e.g., University Club) 865 58.7 572 38.8 36 2.4
1,516 65.9
1,473 63.3
544 69.3 161 20.5 80 10.2
606 71.0 219 25.6 29 3.4
785 34.1
854 36.7 Note: Table reports only Staff respondents responses {n = 2,601).
384
Three hundred two Staff respondents elaborated on their' opinions of institutional actions. Two themes also emerged: (1) criticism of diversity training initiatives and suggestions for improvement and (2) perceived negative impacts of the current level of emphasis on diversity.
Critiques Of Diversity Training — Staff respondents who elaborated on their' opinions of institutional actions offered a wide range of criticism of diversity training initiatives and suggestions for improvement. One respondent elaborated, "It appears the response to most surveys trickle down to the staff becoming required to take additional diversity/inclusion training. Perhaps, this is NOT where all the issues lay. Students and faculty need this same training. But mandatory training does not in and of itself correct issues that occm\" Another respondent stressed the perceived need for student training, "Inclusion training is needed for all students, particularly the ones that are current students because that is where all of the problems are coming from." Other respondents elaborated 011 the delivery and perceived impact of diversity training. One respondent noted, "In lieu of online diversity training, it would be more valuable to have some in-person training through small group discussions or a mentor program." Another respondent added, "I feel that diversity "training" has little effect, especially if it's an online power point people will click through mindlessly." Similarly, another respondent explained, "I wholeheartedly support diversity educational opportunities but please stop calling it training. No one enjoys training and the word implies it's something that's required or forced. Also, the required video seminars and quizzes are completely worthless." Some respondents elaborated 011 the perception that diversity training is not needed altogether. For example, one respondent noted, "I will repeat myself- WE DON'T NEED DIVERSITY AND INCLUSION TRAINING AT MU- You people let yourselves be buffaloed by a bunch of people craving attention and who did not lodge a single specific complaint." Another respondent shared, "I don't think we should be forced to take training for issues a few have caused." Respondents who elaborated 011 their opinions of institutional actions noted concerns with the current diversity training practices and hopes for changes to those practices in the future.
Less Focus On Diversity & Perceived Minorities — Respondents who elaborated 011 their
opinions of institutional actions described the perception that focus less on diversity would improve the climate. One respondent shared, "When we separate people into different races,
385
sexes, sexual orientation - we see them as separate. If we want to stop the segr egation - then stop seeing and treating each other as different. Treat each person as one race - the Human Race..." Another respondent echoed do "not segregate campus into groups." Another respondent reported, "I disagree with anything that continues to segregate. I do not want to be hi a group just for women. I want to feel equal with my male peers." Further, other respondents cautioned, "You are fanni ng the flames of racism" and fostering "division and exclusion by separating people into groups and singling out one group against the other." One respondent explained, "I think all this focus on diversity and inclusion is making the climate worse. No one feels comfortable. Soon 110 one will speak to each other for fear of offending someone. Way too sensitive about everything." Finally, one respondent questioned, "Is Affirmative Action considered institutional racism? Should it be eliminated?" Respondents who elaborated 011 their opinions of institutional actions reported concerns and perceived negative impacts of the current level of emphasis 011 diversity.
386
Student respondents (n = 6,285) also were asked to respond regarding a similar list of initiatives, provided in Table 93. Eighty-seven percent (« = 5,127) of the Student respondents thought that diversity and inclusivity training for students was available at University of Missouri-Columbia and 13% (n = 743) of Student respondents thought that it was not available. Fifty-seven percent (n = 2,940) of the Student respondents who thought that diversity and inclusivity training for students was available believed it positively influenced the climate and 60% (n = 442) of Student respondents who did not think it was available thought it would positively influence the climate if it were available.
Eighty-eight percent (n = 5,097) of the Student respondents thought that diversity and inclusivity training for staff was available at University of Missouri-Columbia and 13% (n = 729) of Student respondents thought that it was not available. Sixty-seven percent (n = 3,408) of the Student respondents who thought that that diversity and inclusivity training for staff was available believed it positively influenced the climate and 70% (n = 510) of Student respondents who did not think it was available thought it would positively influence the climate if it were available.
Eighty-seven percent (n = 5,035) of the Student respondents thought that diversity and inclusivity training for faculty was available at University of Missouri-Columbia and 13% (n = 731) of Student respondents thought that it was not available. Sixty-eight percent (n = 3,400) of the Student respondents who thought that that diversity and inclusivity training for faculty was available believed it positively influenced the climate and 72% (n = 529) of Student respondents who did not think it was available thought it would positively influence the climate if it were available.
Seventy-eight percent (« = 4,470) of the Student respondents thought that a person to address student complaints of bias by faculty/staff in learning environments (e.g., classrooms, labs) was available and 23% (n = 1,296) of Student respondents thought that such a person was not available. Seventy-two percent (n = 3,228) of the Student respondents who thought that a person to address student complaints of bias by faculty/staff in learning environments was available believed such a resource positively influenced the climate and 77% (n = 994) of Student
387
respondents who did not think such a person was available thought one would positively influence the climate if one were available.
Seventy-six percent (ri = 4.376) of the Student respondents thought that a person to address student complaints of bias by other students in learning environments was available and 24% (n = 1,371) of Student respondents thought that such a resource was not available. Seventy percent (n = 3,077) of the Student respondents who thought that a person to address student complaints of bias by other students in learning environments was available believed that resource positively influenced the climate and 74% (n = 1,008) of Student respondents who did not think such a person was available thought one would positively influence the climate if one were available.
Seventy-five percent (n = 4,291) of the Student respondents thought that increasing opportunities for cross-cultural dialogue among students were available and 25% (n = 1,440) of Student respondents thought that increasing opportunities for dialogue were not available. Seventy-six percent (n = 3,242) of the Student respondents who thought that increasing opportunities for cross-cultural dialogue among students were available believed they positively influenced the climate and 82% (n = 1,187) of Student respondents who did not think they were available thought they would positively influence the climate if they were available.
Similarly, 74% (n = 4,230) of the Student respondents thought that increasing opportunities for cross-cultural dialogue between faculty, staff, and students were available at University of Missouri-Columbia and 26% (n = 1,490) of Student respondents thought that increasing opportunities for dialogue were not available. Seventy-five percent (n = 3,191) of the Student respondents who thought that increasing opportunities for cross-cultural dialogue between faculty, staff, and students were available believed they positively influenced the climate and 83% (n = 1,240) of Student respondents who did not think they were available thought they would positively influence the climate if they were available.
Seventy-four percent (n = 4,215) of the Student respondents thought that incorporating issues of diversity and cross-cultural competence more effectively into the curriculum was available at University of Missouri-Columbia and 26% (n = 1,500) of Student respondents thought that it was
388
not available. Sixty-six percent (n = 2,788) of the Student respondents who thought that incorporating issues of diversity and cross-cultural competence more effectively into the curriculum was available believed it positively influenced the climate and 72% (n = 1,086) of Student respondents who did not think it was available thought it would positively influence the climate if it were available.
Seventy-nine percent (n = 4,516) of the Student respondents thought that effective faculty mentorship of students was available and 21% (n = 1,189) of Student respondents thought that it was not available. Eighty-two percent (« = 3,694) of the Student respondents who thought that effective faculty mentorship of students was available believed it positively influenced the climate and 84% (n = 996) of Student respondents who did not think it was available thought faculty mentorship of students would positively influence the climate if it were available.
Eighty-seven percent (n = 4,976) of the Student respondents thought that effective academic advising was available at University of Missouri-Columbia and 13% (n =727) of Student respondents thought that it was not available. Eighty-five percent (n = 4,207) of the Student respondents who thought that effective academic advising was available believed it positively influenced the climate and 83% (n = 606) of Student respondents who did not think it was available thought effective academic advising would positively influence the climate if it were available.
Eighty-four percent (n = 4,796) of the Student respondents thought that diversity training for student staff (e.g., student union, resident assistants) was available and 16% (n = 907) of Student respondents thought that it was not available. Sixty-six percent (n = 3,161) of the Student respondents who thought that diversity training for student staff (e.g., student union, resident assistants) was available believed it positively influenced the climate and 73% (n = 660) of Student respondents who did not think it was available thought it would positively influence the climate at University of Missouri-Columbia if it were available.
Sixty-six percent (n = 3,776) of the Student respondents thought that affordable child care was available and 34% (« = 1,920) of Student respondents thought that it was not available. Seventy
389
percent (« = 2,659) of the Strident respondents who thought that affordable child care was available believed it positively influenced the climate and 80% (/? = 1,529) of Student respondents who did not think it was available thought it would positively influence the climate at University of Missouri-Columbia if it were available.
Sixty-seven percent (n = 3,781) of the Student respondents thought that adequate child care was available and 33% (« = 1,885) of Student respondents thought that it was not available. Seventy-two percent (n = 2,727) of the Student respondents who thought that adequate child care was available believed it positively influenced the climate and 80% (n = 1,504) of Student respondents who did not think it was available thought it would positively influence the climate at University of Missouri-Columbia if it were available.
Sixty-eight percent (n = 3,843) of the Student respondents thought that support/resources for spouse/partner employment were available and 32% (n = 1,835) of Student respondents thought that they were not available. Seventy-one percent (n = 2,713) of the Student respondents who thought that support/resources for spouse/partner employment were available believed it positively influenced the climate and 76% (n = 1,385) of Student respondents who did not think they were available thought they would positively influence the climate if they were available.
Eighty-one percent (n = 4,600) of the Student respondents thought that adequate social space for students was available and 19% (n = 1.101) of Student respondents thought that it was not available. Seventy-seven percent (« = 3,518) of the Student respondents who thought that adequate social space for students was available believed it positively influenced the climate and 75% (n = 824) of Student respondents who did not think it was available thought it would positively influence the climate if they were available.
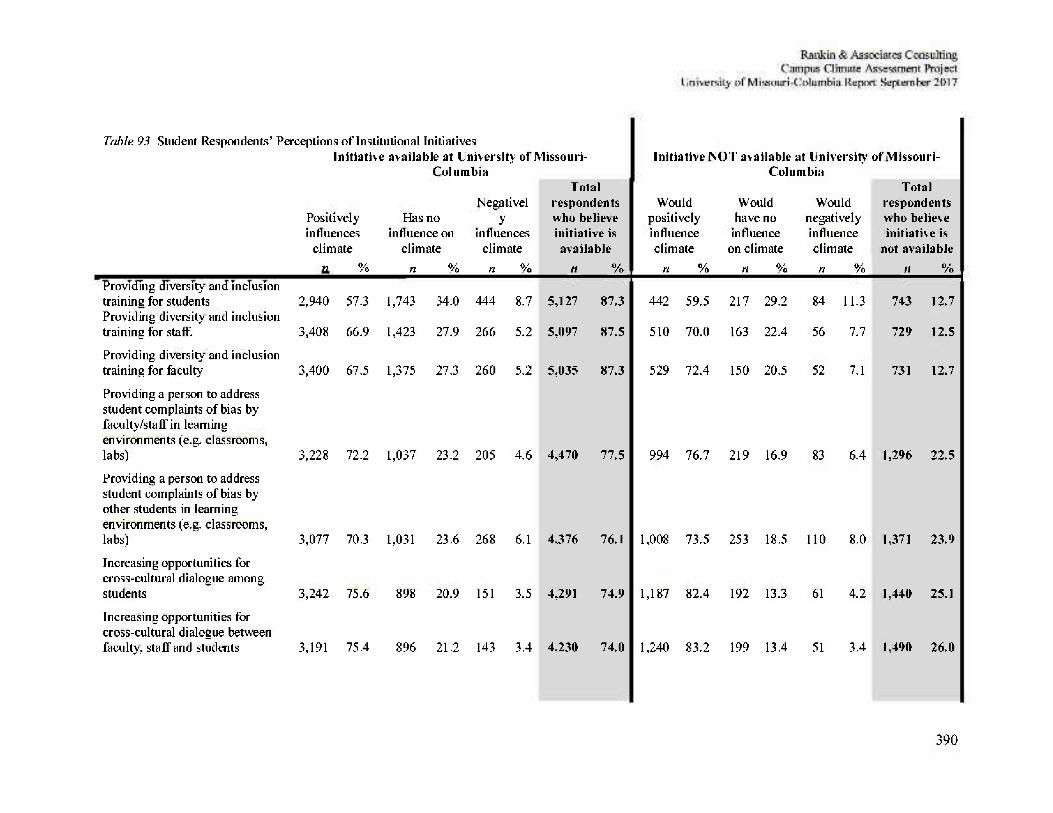
390
Table 93. Student Respondents' Perceptions of Institutional Initiatives Initiative available at University of Missouri-
Columbia Initiative NOT available at University
Columbia of Missouri-
Positively influences
climate
Has no influence on
climate
Negatively
influences climate
Total respondents who believe initiative is available
Would positively influence climate
Would have no
influence on climate
Would negatively influence climate
Total respondents who believe initiative is
not available n % n % n % n % n % n % n % // %
Providing diversity and inclusion training for students Providing diversity and inclusion training for staff.
2,940
3,408
57.3
66.9
1,743
1,423
34.0
27.9
444
266
8.7
5.2
5,127
5,097
87.3
87.5
442 59.5
510 70.0
217 29.2
163 22.4
84
56
11.3
7.7
743 12.7
729 12.5
Providing diversity and inclusion training for faculty 3,400 67.5 1,375 27.3 260 5.2 5,035 87.3 529 72.4 150 20.5 52 7.1 731 12.7
Providing a person to address student complaints of bias by faculty/staff in learning environments (e.g. classrooms, labs) 3,228 72.2 1,037 23.2 205 4.6 4,470 77.5 994 76.7 219 16.9 83 6.4 1,296 22.5
Providing a person to address student complaints of bias by other students in learning environments (e.g. classrooms, labs) 3,077 70.3 1,031 23.6 268 6.1 4376 76.1 1,008 73.5 253 18.5 110 8.0 1,371 23.9
Increasing opportunities for cross-cultural dialogue among students 3,242 75.6 898 20.9 151 3.5 4,291 74.9 1,187 82.4 192 13.3 61 4.2 1,440 25.1
Increasing opportunities for cross-cultural dialogue between faculty, staff and students 3,191 75.4 896 21.2 143 3.4 4,230 74.0 1,240 83.2 199 13.4 51 3.4 1,490 26.0
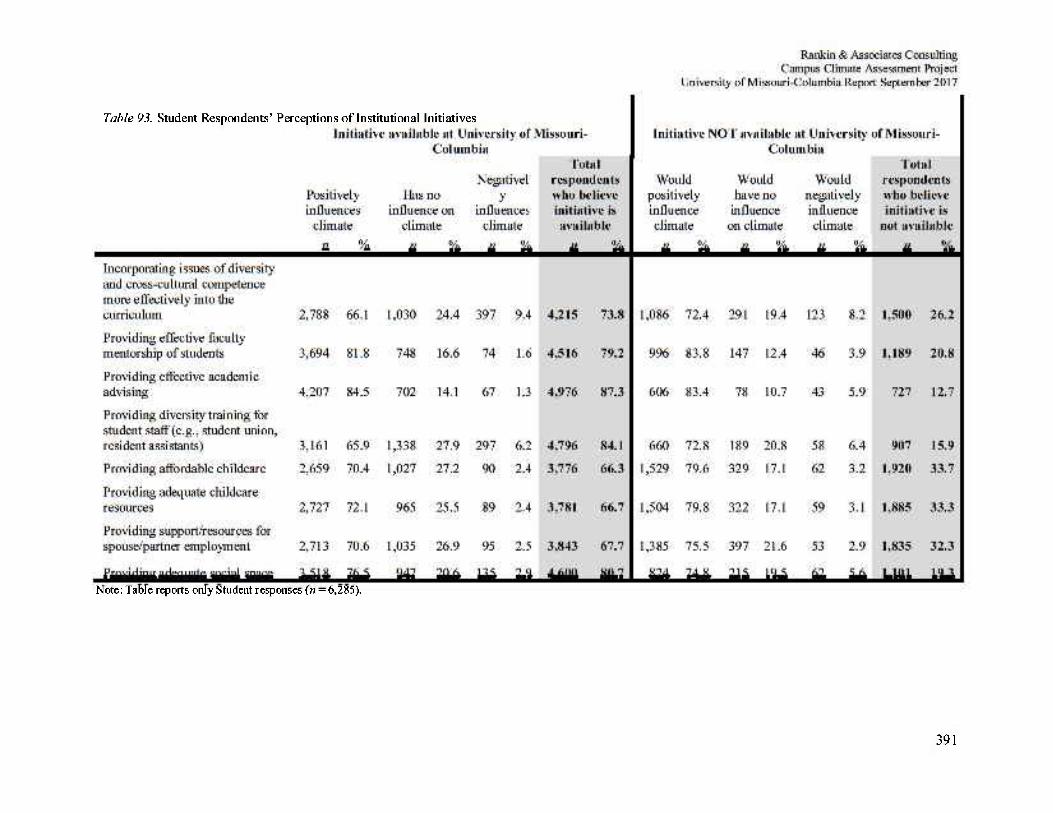
391
Table 93. Student Respondents' Perceptions of Institutional Initiatives
Note: Table reports only Student responses (n = 6,285).
392
Six bundled seven Student respondents elaborated on their opinions of institutional actions. Three overall themes emerged from Student respondents: (1) concerns about current diversity training practices, (2) the perceived lack of effectiveness hi current support systems, and (3) perceived reverse discrimination.
Concerns About Diversity Training — Some respondents described perceived short-comings in tandem with the online platform of delivery. Respondents shared, "AN ONLINE MODULE DOES NOT END RACISM, SEXISM OR IGNORANCE" and "They come from their hometowns and families with certain biases that I don't think an online training would change." Other respondents noted concerns about diversity training and allocation of financial resource to do so. One respondent noted, "Forcing students to attend and pay for 'diversity training' will only aggravate them." Another respondent echoed, "Diversity and inclusion training is unfortunately a waste of time and money for the University." Other respondents simply did not have any faith in diversity training to inspire growth or change. For example, one respondent elaborated, "Having a mandatory diversity and inclusion training is a great way to get students to learn about what is going on and what to do, but it most likely will not impact change." Similarly, other respondents shared, "People will still maintain their values they were raised on," "Nothing will change people, If they are racist, they are racist" and "You won't change people who don't care." Some respondents offered suggestions that they thought would make diversity training efforts more effective. One respondent explained, "The best way to get past any of these incidents is understanding the opposing side. Not just hearing the opposing side: understanding it." Another respondent noted, "The people that want to use the programs will and the people who are forced to use them not take them seriously." Finally, one respondent summarized the contributions and concerns of many with the statement: "Universities need to balance student's First Amendment free speech rights with creating an environment where all students can thrive. I don't know how that happens, but good luck y'all."
Unaware Of & Perceived Ineffective Support Systems — Respondents who elaborated on their'
opinions of institutional actions noted that they were often "unaware" or "unsure" if the items listed in the question were available. Respondents reflected, "I am not sine about a lot of that stuff" and "I am not sine to what degree many of these are available at MU." Another
393
respondent explained, "I'm honestly not sure which, if any, of these initiatives are available at Mizzou but they would all be help fill. It seems as if we might have less than satisfactory versions of some of them Doing anything half-ass is a waste of time though." Other respondents noted specific areas where the support systems hi place were not perceived as effective. One respondent shared, "The academic advising needs some major work, more people that know what they are doing." Another respondent echoed, "The academic advising really truly sucks." Other respondents noted, "affordable 011 campus childcare for professors and students" and "Please address child care at the University. Every campus needs a facility that can care for children." Other respondents added, "We should be more concerned with job placement" and "Support for spouse health care for a student who is already paying his health care from his own pocket." Respondents who elaborated 011 their opinions of institutional actions largely confessed to be unaware of what support systems were available or not. Additionally, respondents reported a perceived lack of effectiveness of several of the current support systems in place.
Reverse Discrimination — Respondents who elaborated 011 their opinions of institutional actions noted perceptions of reverse discrimination and perceived negative impacts of identity-based support and awareness. Some respondents described discrimination against White people. One respondent explained, "Right now, only certain demographics are free to express their opinions. White males risk being labeled as sexist/racist, which makes them afraid to even attempt to discuss sensitive topics. This increases hostility and perpetuates divide and exclusion." Another respondent added, "Mizzou has dealt way too much with appealing to minorities while totally disregarding white students." Other respondent reported efforts addressing inclusion actually have the inverse impact, for example, "I think that surveys like this make the racism problem worse." Another respondent added, "Forced "appreciation" of diversity makes students who have had little previous interaction (or exclusively negative interaction) MORE biased towards outgroups." Other respondents displayed strong feelings towards inclusion efforts. Respondents noted, "You don't need a safe space, grow up," "People are sick of the university trying to be so politically correct" and "I feel as though it is unnecessary to pander to every student group that thinks there is an issue." These sentiments were acknowledged other respondents who seemed to not share their beliefs by recognize their presence 011 campus. One respondent elaborated. "Sometimes when we tiy to push things like the Citizenship at MU, there is a giant backlash
394
from kids who complain that there is no white, male, christian, upper middle class help and I disagree with them, but they are still there and I don't know how to combine their' wants with whats best for everyone." Another respondent acknowledged, I think institutional action must be taken, and at present, there is a small but vocal minority claiming 'reverse racism' or something else as ridiculous, who oppose diversity training, etc. and the administration often seems to cow to that group." Respondents who elaborated on their opinions of institutional actions reported a range of concerns and perceptions about the impact of identity-based support and awareness.
395
Summary
Perceptions of University of Missouri-Columbia's actions and initiatives contribute to the way individuals think and feel about the climate in which they work and learn. The findings in this section suggest that respondents generally agreed that the actions cited in the survey have, or would have, a positive influence 011 the campus climate. Notably, some Faculty, Staff, and Student respondents indicated that some of the initiatives were not available 011 University of Missouri-Columbia's campus. If, in fact, these initiatives are available, University of Missouri-Columbia would benefit from better publicizing all that the University of Missouri-Columbia offers to positively influence the campus climate.
Rankin & Associates Consulting Campus Climate Assessment Project
University of Missouri-Columbia Report September 2017
Summary
Perceptions of University of Missouri-Columbia's actions and initiatives contribute to the way
individuals think and feel about the climate in which they work and learn. The findings in this
section suggest that respondents generally agreed that the actions cited in the survey have, or
would have, a positive influence 011 the campus climate. Notably, some Faculty, Staff, and
Student respondents indicated that some of the initiatives were not available 011 University of
Missouri-Columbia's campus. If, in fact, these initiatives are available, University of Missouri-
Columbia would benefit from better publicizing all that the University of Missouri-Columbia
offers to positively influence the campus climate.
395
Rankin & Associates Consulting Campus Climate Assessment Project
University of Missouri-Columbia Report September 2017
Next Steps
Embarking 011 this campus-wide assessment is further evidence of University of Missouri-
Columbia's commitment to ensuring that all members of the community live in an environment
that nurtures a culture of inclusiveness and respect. The primary purpose of this report was to
assess the climate within University of Missouri-Columbia, including how members of the
community felt about issues related to inclusion and work-life issues. At a minimum, the results
add empirical data to the current knowledge base and provide more information on the
experiences and perceptions for several sub-populations within the University of Missouri-
Columbia community. However, assessments and reports are not enough. A projected plan to
develop strategic actions and a subsequent implementation plan are critical to improving the
campus climate. Failure to use the assessment data to build on the successes and address the
challenges uncovered in the report will undermine the commitment offered by University of
Missouri-Columbia community members at the outset of this project. Also, as recommended by
University of Missouri-Columbia's senior leadership, the assessment process should be repeated
regularly to respond to an ever-changing climate and to assess the influence of the actions
initiated as a result of the current assessment.
396
Rankin & Associates Consulting Campus Climate Assessment Project
University of Missouri-Columbia Report September 2017
References
Aguirre, A., & Messineo, M. (1997). Racially motivated incidents in higher education: What do
they say about the campus climate for minority students? Equity & Excellence in
Education, 30(2), 26-30.
Ahmed, S. (2009). Embodying diversity: Problems and paradoxes for black feminists. Race
Ethnicity and Education, 12( 1), 41-52.
Association of American Colleges and Universities (AAC&U). (1995). The drama of diversity
and democracy. Washington, DC: Association of American Colleges and Universities.
Bamhardt, C. L. (2014). Campus-based organizing: Tactical repertoires of contemporary student
movements: Campus-based organizing. New Directions for Higher Education,
2014(167), 43-58.
Bamhardt, C. L. & Reyes, K. (2016). Embracing Student Activism. Higher Education Today:
American Council on Education.
Bartz, A. E. (1988). Basic statistical concepts. New York: Macmillan.
Bilimoria, D., & Stewart, A.J. (2009). "Don't ask, don't tell": The academic climate for lesbian,
gay. bisexual, and transgender faculty in science and engineering. National Women's
Studies Association Journal, 21(2), 85-103.
Boyer, E. (1990). Campus life: In search of community. Princeton, NJ: The Carnegie Foundation
for the Advancement of Teaching.
Brookfield, S. D. (2005). The Power of Critical Theory: Liberating Adult Learning and
Teaching. San Diego, CA: Jossey-Bass.
Chang, M.J. (2003). Racial differences in viewpoints about contemporary issues among entering
college students: Fact or fiction? NASPA Journal, 40(5), 55-71.
Chang, M. J., Denson, N., Saenz, V., & Misa, K. (2006). The educational benefits of sustaining
cross-racial interaction among undergraduates. Journal of Higher Education, 77(3), 430-
455.
Cohen, J., Cohen, P., West, S. G., & Aiken. L. S. (2003). Applied Multiple
Regression/Correlation Analysis for the Behavioral Sciences (3rd. ed.). Mahwah, NJ:
Lawrence Erlbaum Associates.
D Augelli, A. R., & Hersliberger, S. L. (1993). African American undergraduates on a
predominantly White campus: Academic factors, social networks, and campus climate.
397
Rankin & Associates Consulting Campus Climate Assessment Project
University of Missouri-Columbia Report September 2017
Journal of Negro Education, 62(1), 67-81.
Flowers, L., & Pa sea re 11a, E. (1999). Cognitive effects of college racial composition on African
American students after 3 years of college. Journal of College Student Development, 40,
669-611.
Gardner, S. K. (2013). Women and faculty departures from a striving institution: Between a rock
and a hard place. The Review of Higher Education, 36(3), 349-370.
Griffin, K.A., Bennett, J.C., & Hams, J. (2011). Analyzing gender differences in Black faculty
marginalization through a sequential mixed methods design. In S. Museus & K. Griffin,
(Eds.), New Directions for Institutional Research, No. 151, (pp. 45-61). San Francisco,
CA: Jossey-Bass.
Guiffrida, D., Gouveia, A., Wall, A., & Seward, D. (2008). Development and validation of the
Need for Relatedness at College Questionnaire (V/RC-Q). Journal of Diversity/ in Higher
Education, 7(4), 251-261.
Gurin, P., Dey, E. L.. Hurtado, S., & Gurin, G. (2002). Diversity and higher education: Theory
and impact on educational outcomes. Harvard Educational Review, 72, 330-365.
Hale, F. W. (2004). What makes racial diversity work in higher education: Academic leaders
present successful policies and strategies: Stylus Publishing, LLC.
Harper, S., & Hurtado, S. (2007). Nine themes in campus racial climates and implications for
institutional transformation. New Directions for Student Services, 2007(120), 7-24.
Harper, S. R., & Quaye, S. J. (2004). Taking seriously the evidence regarding the effects of
diversity on student learning in the college classroom: A call for faculty accountability.
UrbanEd, 2(2), 43-47.
Hurtado, S. (1992). The campus racial climate: Contexts of conflict. The Journal of Higher
Education, 63(5), 539-569.
Hurtado, S., & Ponjuan, L. (2005). Latino educational outcomes and the campus climate. Journal
of Hispanic Higher Education, 4(3), 235-251.
Ingle, G. (2005). Will your campus diversity initiative work? Academe, 91(5), 6-10.
Johnson, A. (2005). Privilege, power, and difference (2nd ed.). Boston. MA: McGraw-Hill.
Johnson, D. R., Soldner, M., Leonard, J., Alvarez, P.. Inkelas, K. K., Rowan, K. H., &
Longerbeam S. (2007). Examining sense of belonging among first-year undergraduates
398
Rankin & Associates Consulting Campus Climate Assessment Project
University of Missouri-Columbia Report September 2017
from different racial/ethnic groups. Journal of College Student Development, 48(5), 525—
542.
Johnsrad, L. K., & Sadao. K. C. (1998). The common experience of "otherness": Ethnic and
racial minority faculty. The Review of Higher Education, 21(4), 315-342.
Kmgkade. T., Workneli, L., & Grenoble, R. (2015, Nov. 16). Campus Racism Protests Didn't
Come Out of Nowhere, and They Aren't Going Away Quickly. The Huffington Post:
College. Retrieved from http://www.hiiffmgtonpost.com/entiy/campus-racism-protests-
didnt-come-out-of-nowhere us 56464a87e4b08cda3488bfb4
Maramba, D.C. & Museus, S.I). (2011). The utility of using mixed-methods and
intersectionality approaches in conducting research on Filipino American students'
experiences with the campus climate and on sense of belonging. In S. Museus & K.
Griffin, (Eds.), New Directions for Institutional Research, No. 151, (pp. 93-101). San
Francisco, CA: Jossey-Bass.
Milem, J., Chang, M . & Antonio, A. (2005). Making diversity work on campus: A research
based perspective. Washington, DC: Association of American Colleges and Universities.
Navarro, R.L., Worthington, R.L., Hart, J., & Khairallah, T. (2009). Liberal and conservative
ideology, experiences with harassment, and perceptions of campus climate. Journal of
Diversity in Higher Education, 2(2), 78-90.
Nelson-Laird, T. & Niskode-Dossett, A.S. (2010). How gender and race moderate the effect of
interaction across difference on student perceptions of the campus environment. The
Review of Higher Education, iJ(3), 333-356.
Norris, W. P. (1992). Liberal attitudes and homophobic acts: the paradoxes of homosexual
experience in a liberal institution. Journal of Homosexuality, 22(3), 81-120.
Pascarella, E. T., & Terenzini, P. T. (1980). Predicting freshman persistence and voluntary
dropout decisions from a theoretical model. The Journal of Higher Education, 57(1), 60-
75.
Pascarella, E. T., & Terenzini, P. T. (2005). How college affects students: A third decade of
research (Vol. 2). San Diego: Jossey-Bass.
Pena, E. V. (2014). Marginalization of published scholarship on students with disabilities in
higher education journals. Journal of College Student Development, 55, 30-40.
Patton, L. D. (2016). Disrupting post secondary prose: Toward a critical race theoiy ofhigher
399
Rankin & Associates Consulting Campus Climate Assessment Project
University of Missouri-Columbia Report September 2017
education. Urban Education, 51(3), 315.
Patton, L.D. (2011). Perspectives 011 identity, disclosure, and the campus environment among
African American gay and bisexual men at one historically Black college. Journal of
College Student Development, 52(1), 77-100.
Patton, L. D., & Catching, C. (2009). Teaching while Black; Narratives of African American
student affairs faculty. International Journal of Qualitative Studies in Education, 22(6),
713-728.
Pittman, C.T. (2010). Race and gender oppression in the classroom. The experiences of women
faculty of color with White male students. Teaching Sociology, 3S(3), 183-196.
Pike, G. R., & Kuli, G. D. (2006). Relationships among structural diversity, informal peer
interactions, and perceptions oftlie campus environment. Review of Higher Education,
29(A), 425-450.
Rankin & Associates Consulting. (2016, January 5). Recent Clients. Retrieved from
http ://www. rankin-consult ing.com/ c lients.
Rankin, S. (2003). Campus climate for LGBT people: A national perspective. New York:
NGLTF Policy Institute.
Rankin, S., & Reason, R. (2005). Differing perceptions: How students of color and white
students perceive campus climate for miderrepresented groups. Journal of Student
College Development, 46(Y), 43-61.
Rankin, S., & Reason. R. (2008). Transformational tapestry model: A comprehensive approach
to transforming campus climate. Journal of Diversity in Higher Education, 7(4), 262-
274.
Saenz, V. B., Nagi, H. N., & Hurtado, S. (2007). Factors influencing positive interactions across
race for African American, Asian American, Latino, and White college students."
Research in Higher Education, 45(1), 1-38.
Sears, J. T. (2002). The institutional climate for Lesbian, Gay and Bisexual education faculty.
Journal of Homosexuality, 45(\), 11—37.
Settles, I. H., Cortina, L. M., Malley, J., & Stewart, A. J. (2006). The climate for women in
academic science: The good, the bad, and the changeable. Psychology? of Women
Quarterly, 30(1), 47-58. doi: 10.111 l/j,1471-6402.2006.00261.x .
Shaipe, D. (2015). Your chi-square test is statistically significant: Now what? Practical
400
Rankin & Associates Consulting Campus Climate Assessment Project
University of Missouri-Columbia Report September 2017
Assessment, Research & Evaluation, 20(8).
Sliverschanz. P., Cortina, L.. Konik, J., & Magley, V. (2008). Slurs, snubs, and queer jokes:
Incidence and impact of heterosexist harassment in academia. Sex Roles, 55(3-4), 179-
191.
Smith, D. (2009). Diversity's promise for higher education: Making it work. Baltimore: Johns
Hopkins Press.
Smith, D. G., Gerbick, G. L , Figueroa, M. A., Watkins, G. H., Levitan, T., Moore, L. C.,
Figueroa, B. (1997). Diversity> works: The emerging picture of how students benefit.
Washington, DC: Association of American Colleges and Universities.
Smith, E., & Witt, S. L. (1993). A comparative study of occupational stress among African
American and White faculty: A research note. Research in Higher Education, 34(2),
229-241.
Solorzano, D. G., Ceja, M., & Yosso, T. J. (2000). Critical race theory, racial microaggressions,
and campus racial climate: The experiences of African American college students.
Journal of Negro Education, 69( 1), 60-73.
Stodden, R. A. (2015). Supporting students with disabilities in higher education in the USA: 30
years of advocacy. Center on Disability Studies: University of Hawaii at Manoa.
Strayhom, T.L. (2013). Measuring race and gender difference in undergraduate perceptions of
campus climate and intentions to leave college: An analysis in Black and White. Journal
of Student Affairs Research and Practice, 50(2), 115-132.
Sue, D. W. (2010). Microaggressions in every-day life: Race, gender, and sexual orientation.
Hoboken. NJ: Wiley.
The Demands. (2016). Retreived fromwwvv.thedemands.org.
Trochim, W. (2000). The research methods knowledge base (2nd ed.). Cincinnati, OH: Atomic
Dog.
Tynes, B.M., Rose, C.A., & Markoe, S.L. (2013). Extending campus life to the internet: Social
media, discrimination, and perceptions of racial climate. Journal of Diversity in Higher
Education, 6(2), 102-114.
Turner, C. S. V. (2002). "Women of color in academe: Living with multiple marginality." The
Journal of Higher Education, 73(1): 74-93.
401
Rankin & Associates Consulting Campus Climate Assessment Project
University of Missouri-Columbia Report September 2017
Turner, C. S. V., Myers. S. L., & Creswell, J. W. (1999). Exploring underrepresentation: The
case of faculty of color in the Midwest. The. Journal of Higher Education, 70(1), 27-59.
Villalpando, O., & Delgado Bemal, D. (2002). A critical race theory analysis of barriers that
impede the success of faculty of color. In W. A. Smith, P. G. Altbach, & K. Lomotey
(Eds.), The racial crisis in American higher education: Continuing challenges for the
twenty-first century, (pp. 243-270). Albany, NY: State University of New York Press.
Weiner, D. (2016, Nov. 21). Intersectional Politics and Accessibility. The Huffmgton Post.
Retrieved from http7/www.huffingtonpost.com/diane-r-wiener-phd-
lmsw/intersectionality-not-ius b 12934036.html.
Wessel, R. D., Jones, J. A , Markle, L., & Westfall, C. (2009). Retention and graduation of
students with disabilities: Facilitating student success. Journal of Postsecondary
Education and Disability, 21, 116-125.
Whitt, E. J., Edison, M. I., Pascarella, E. T., Terenzini, P. T., & Nora, A. (2001). Influences on
students' openness to diversity and challenge in the second and thir d years of college.
The Journal of Higher Education, 72(2), 172—204.
Worthington, R. L., Navarro, R. L., Loewy, M., & Hart, J. L. (2008). Color-blind racial attitudes,
social dominance orientation, racial-ethnic group membership and college students'
perceptions of campus climate. Journal of Diversity in Higher Education 7(1), 8-19.
Yosso, T. J., Smith, W. A , Ceja, M., & Solorzano, D. G. (2009). Critical race theory, racial
microaggressions, and campus racial climate for Latina/o undergraduates. Harvard
Educational Review, 79(4), 659-690, 781, 785-786.
402
Rankin & Associates Consulting Campus Climate Assessment Project
University of Missouri-Columbia Report September 2017
Appendices
Appendix A - Cross Tabulations by Selected Demographics
Appendix B - Data Tables
Appendix C - Comment Analyses (Questions #118, #119, and #120)
Appendix D - Survey: University of Missouri-Columbia Climate for Learning, Living, and Working
403
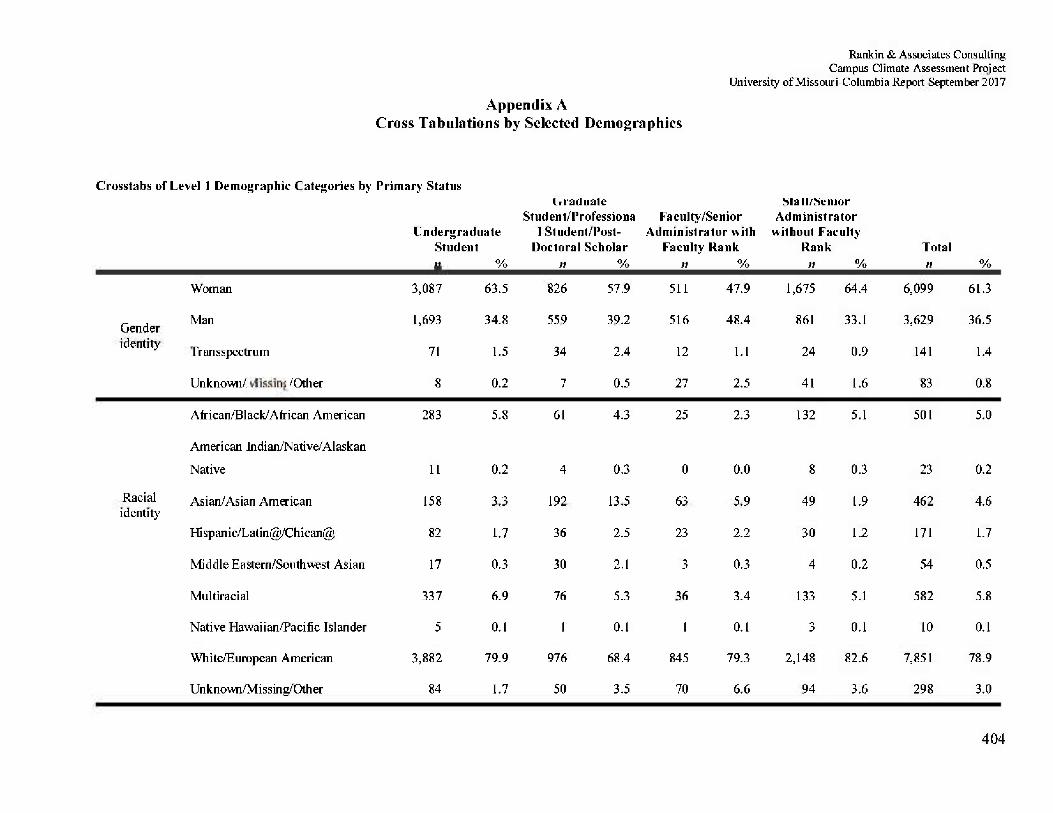
Rankin & Associates Consulting Campus Climate Assessment Project
University of Missouri-Columbia Report September 2017
Appendix A Cross Tabulations by Selected Demographics
Crosstabs of Level 1 Demographic Categories by Primary Status
Undergraduate Student
liraduate Studcnt/Professiona
1 Student/Post-Doctoral Scholar
Faculty/Senior Administrator with
Faculty Rank
Mali/Senior Administrator
without Faculty Rank
Undergraduate Student
liraduate Studcnt/Professiona
1 Student/Post-Doctoral Scholar
Faculty/Senior Administrator with
Faculty Rank
Mali/Senior Administrator
without Faculty Rank
Undergraduate Student
liraduate Studcnt/Professiona
1 Student/Post-Doctoral Scholar
Faculty/Senior Administrator with
Faculty Rank
Mali/Senior Administrator
without Faculty Rank
Undergraduate Student
liraduate Studcnt/Professiona
1 Student/Post-Doctoral Scholar
Faculty/Senior Administrator with
Faculty Rank
Mali/Senior Administrator
without Faculty Rank Total
n % n % n % n % n %
Gender identity
Woman 3,087 63.5 826 57.9 511 47.9 1,675 64.4 6,099 61.3
Gender identity
Man 1,693 34.8 559 39.2 516 48.4 861 33.1 3,629 36.5 Gender identity
Trans spectrum 71 1.5 34 2.4 12 1.1 24 0.9 141 1.4
Gender identity
Unknown/Missing/Other 8 0.2 7 0.5 27 2.5 41 1.6 83 0.8
Racial identity
African/Black/African American 283 5.8 61 4.3 25 2.3 132 5.1 501 5.0
Racial identity
American Indian/Native/Alaskan
Racial identity
Native 11 0.2 4 0.3 0 0.0 8 0.3 23 0.2
Racial identity
Asian/Asian American 158 3.3 192 13.5 63 5.9 49 1.9 462 4.6 Racial identity Racial identity
Hispanic/Latin@/Chican@ 82 1.7 36 2.5 23 2.2 30 1.2 171 1.7
Racial identity
Middle Eastern/Southwest Asian 17 0.3 30 2.1 3 0.3 4 0.2 54 0.5
Racial identity
Multiracial 337 6.9 76 5.3 36 3.4 133 5.1 582 5.8
Racial identity
Native Hawaii an/Pacific Islander 5 0.1 1 0.1 1 0.1 3 0.1 10 0.1
Racial identity
White/European American 3,882 79.9 976 68.4 845 79.3 2,148 82.6 7,851 78.9
Racial identity
Unknown/Missing/Other 84 1.7 50 3.5 70 6.6 94 3.6 298 3.0
404
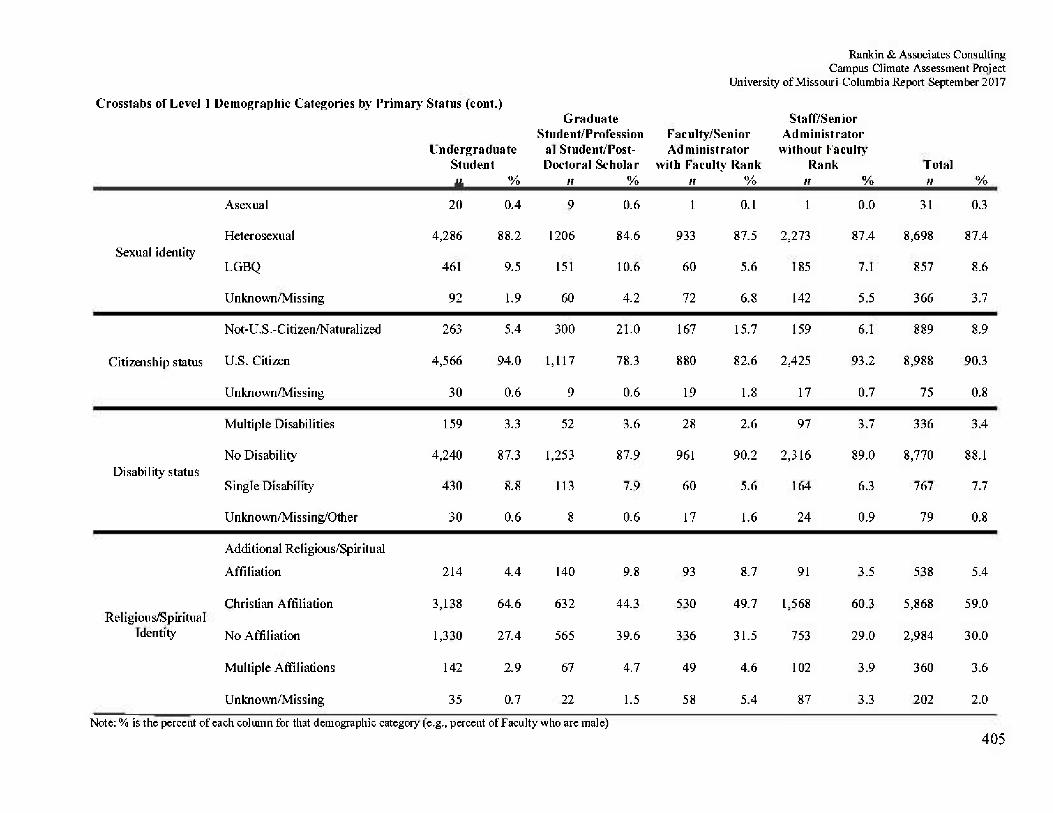
Rankin & Associates Consulting Campus Climate Assessment Project
University of Missouri-Columbia Report September 2017
Crosstabs of Level 1 Demographic Categories by Primary Status (cont.) Graduate
Student/Profession al Student/Fost-Doetoral Scholar
Staff/Senior Administrator
without Faculty Total
Graduate Student/Profession
al Student/Fost-Doetoral Scholar
Kac ulty/Sen id-Ad ininistrator
with Faculty Rank
Staff/Senior Administrator
without Faculty Total
Undergraduate
Graduate Student/Profession
al Student/Fost-Doetoral Scholar
Kac ulty/Sen id-Ad ininistrator
with Faculty Rank
Staff/Senior Administrator
without Faculty Total Student
Graduate Student/Profession
al Student/Fost-Doetoral Scholar
Kac ulty/Sen id-Ad ininistrator
with Faculty Rank Rank Total n % II % n % n % ii %
Asexual 20 0.4 9 0.6 1 0.1 1 0.0 31 0.3
Heterosexual 4,286 88.2 1206 84.6 933 87.5 2,273 87.4 8,698 87.4 Sexual identity
LGBQ 461 9.5 151 10.6 60 5.6 185 7.1 857 8.6
Unknown/Missing 92 1.9 60 4.2 72 6.8 142 5.5 366 3.7
Not-U. S.-Citizen/Naturalized 263 5.4 300 21.0 167 15.7 159 6.1 889 8.9
Citizenship status U.S. Citizen 4,566 94.0 1,117 78.3 880 82.6 2,425 93.2 8,988 90.3
Unknown/Missing 30 0.6 9 0.6 19 1.8 17 0.7 75 0.8
Multiple Disabilities 159 3.3 52 3.6 28 2.6 97 3.7 336 3.4
No Disability 4,240 87.3 1,253 87.9 961 90.2 2,316 89.0 8,770 88.1 Disability status
Single Disability 430 8.8 113 7.9 60 5.6 164 6.3 767 7.7
Unknown/Missing/Other 30 0.6 8 0.6 17 1.6 24 0.9 79 0.8
Additional Religious/Spiritual
Affdiation 214 4.4 140 9.8 93 8.7 91 3.5 538 5.4
Christian Affiliation 3,138 64.6 632 44.3 530 49.7 1,568 60.3 5,868 59.0 Religious/Spiritual
3,138 1,568 5,868
Identity No Affiliation 1,330 27.4 565 39.6 336 31.5 753 29.0 2,984 30.0
Multiple Affiliations 142 2.9 67 4.7 49 4.6 102 3.9 360 3.6
Unknown/Missing 35 0.7 22 1.5 58 5.4 87 3.3 202 2.0
Note; % is the percent of each column for that demographic category (e.g., percent of Faculty who are male) 405
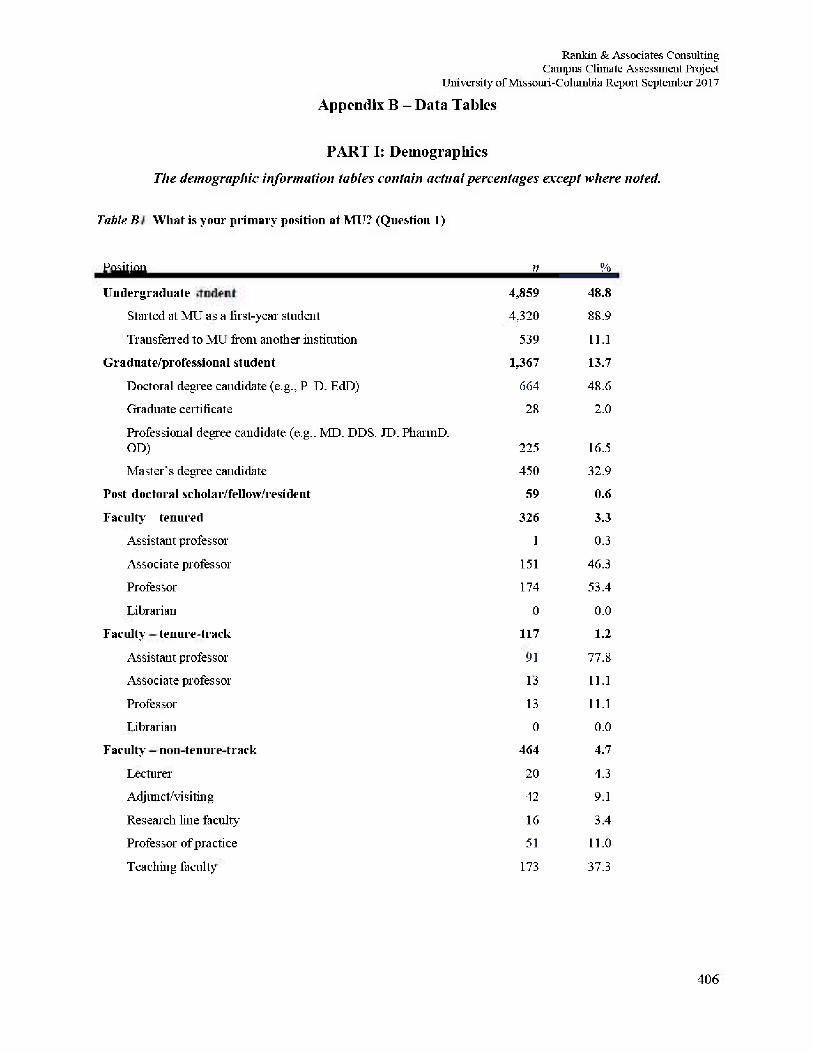
Rankin & Associates Consulting Campus Climate Assessment Project
University of Missouri-Columbia Repoit September 2017
Appendix B - Data Tables
PART I: Demographics The demographic information tables contain actual percentages except where noted.
Table B1. What is your primary position at MU? (Question 1)
Position n %
Undergraduate student 4,859 48.8 Started at MU as a first-year student 4,320 88.9
Transferred to MU from another institution 539 11.1 Graduate/professional student 1,367 13.7
Doctoral degree candidate (e.g., PhD. EdD) 664 48.6
Graduate certificate 28 2.0
Professional degree candidate (e.g.. MD. DDS. JD. PharmD. OD) 225 16.5
Master's degree candidate 450 32.9
Postdoctoral scholar/fellow/resident 59 0.6
Faculty - tenured 326 3.3 Assistant professor 1 0.3
Associate professor 151 46.3
Professor 174 53.4
Librarian 0 0.0
Faculty - tenure-track 117 1.2
Assistant professor 91 77.8
Associate professor 13 11.1
Professor 13 11.1
Librarian 0 0.0
Faculty - non-tenure-track 464 4.7
Lecturer 20 4.3
Adjunct/visiting 42 9.1
Research line faculty 16 3.4
Professor of practice 51 11.0
Teaching faculty 173 37.3
406
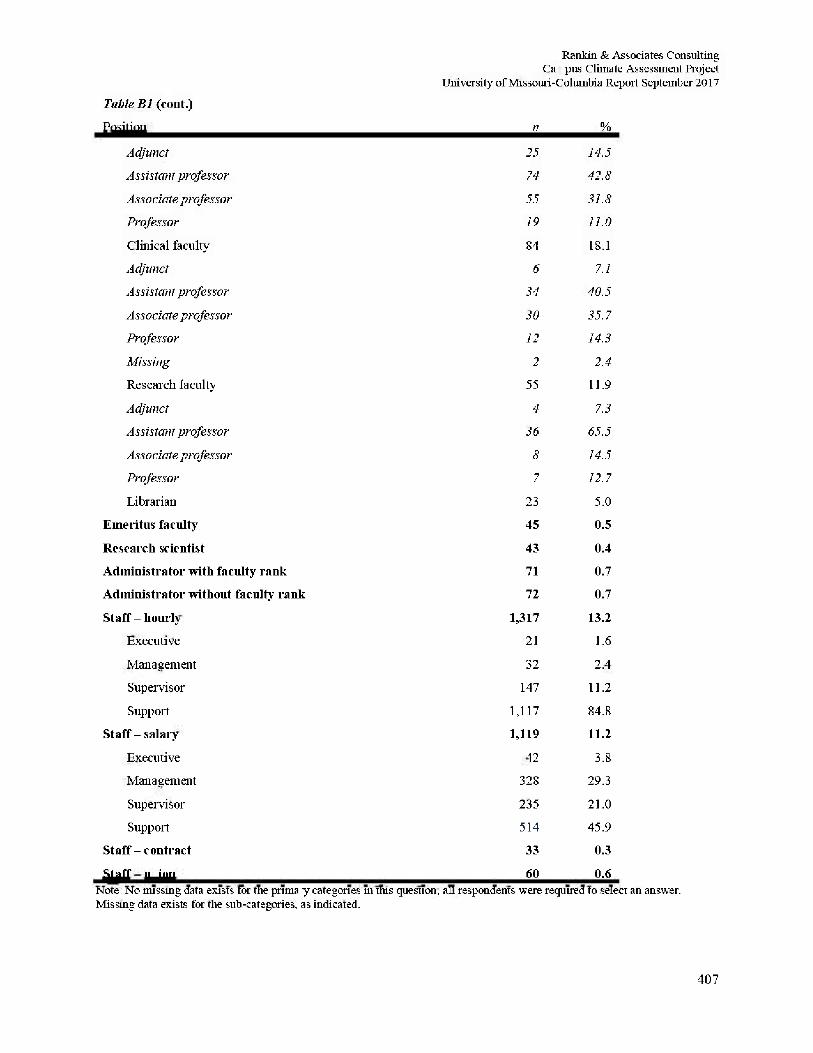
Rankin & Associates Consulting C a p u s Climate Assessment Project
University of Missouri-Columbia Repot September 2017
Table B1 (cont.)
Position n %
Adjunct 25 14.5
Assistant professor 74 42.8
Associate professor 55 31.8
Professor 19 11.0
Clinical faculty 84 18.1
Adjunct 6 7.1
Assistant professor 34 40.5
Associate professor 30 35.7
Professor 12 14.3
Missing 2 2.4
Research faculty 55 11.9
Adjunct 4 7.3
Assistant professor 36 65.5
Associate professor 8 14.5
Professor 7 12.7
Librarian 23 5.0
Emeritus faculty 45 0.5
Research scientist 43 0.4 Administrator with faculty rank 71 0.7 Administrator without faculty rank 72 0.7
Staff-hourly 1,317 13.2 Executive 21 1.6
Management 32 2.4
Supervisor 147 11.2
Support 1,117 84.8
Staff - salary 1,119 11.2
Executive 42 3.8
Management 328 29.3
Supervisor 235 21.0
Support 514 45.9
Staff - contract 33 0.3
Staff - union 60 0.6 Note: No missing data exists for the primary categories in this question; all respondents were required to select an answer. Missing data exists for the sub-categories, as indicated.
407
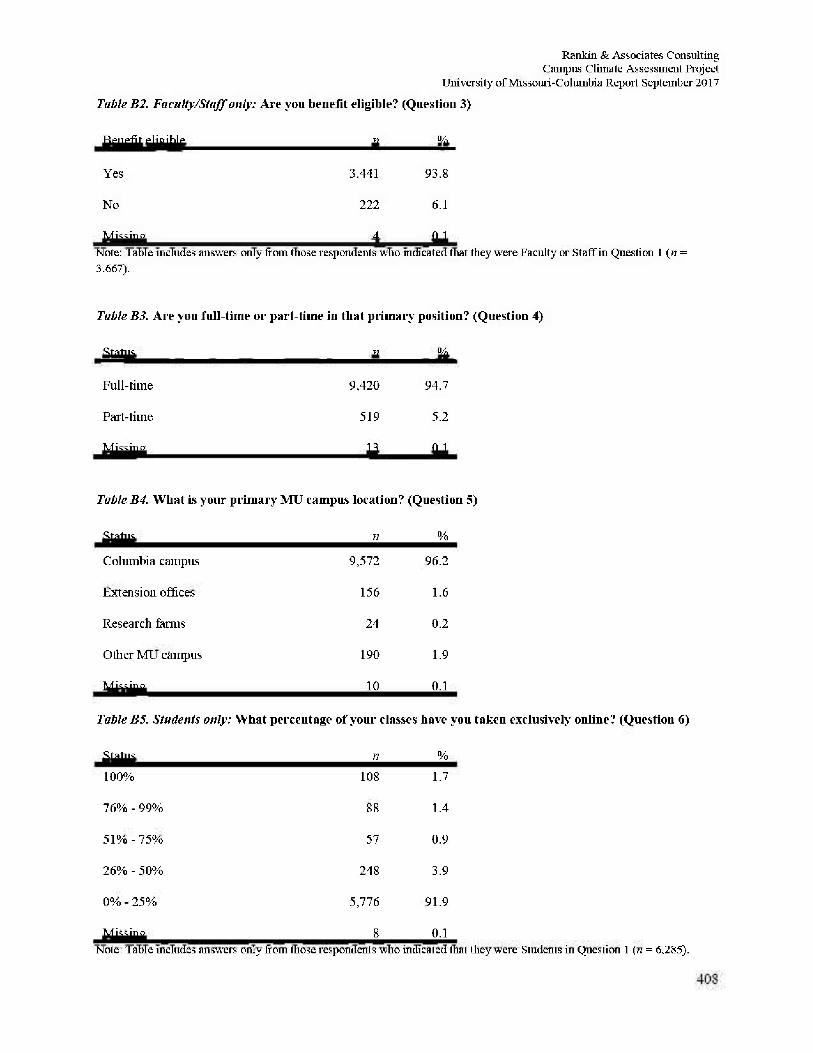
Rankin & Associates Consulting Campus Climate Assessment Project
University of Missouri-Columbia Report September 2017
Table B2. Faculty/Staff only: Are you benefit eligible? (Question 3)
Benefit eligible n %_
Yes 3,441 93.8
No 222 6.1
Missing 4 0.1 Note: Table includes answers only from those respondents who indicated that they were Faculty or Staff in Question 1 {n = 3.667).
Table B3. Are you full-time or part-time in that primary position? (Question 4)
Status n %_
Full-time 9,420 94.7
Part-time 519 5.2
Missing 13 0.1
Table B4. What is your primary MU campus location? (Question 5)
Status n % Status n %
Columbia campus 9,572 96.2
Extension offices 156 1.6
Research farms 24 0.2
Other MU campus 190 1.9
Missing 10 0.1
Table B5. Students only: What percentage of your classes have you taken exclusively online? (Question 6)
Status n % 100% 108 1.7
76% - 99% 88 1.4
51%-75% 57 0.9
26% - 50% 248 3.9
0% - 25% 5,776 91.9
Missing 8 0.1 Note: Table includes answers only from those respondents who indicated that they were Students in Question 1 (n = 6,285).
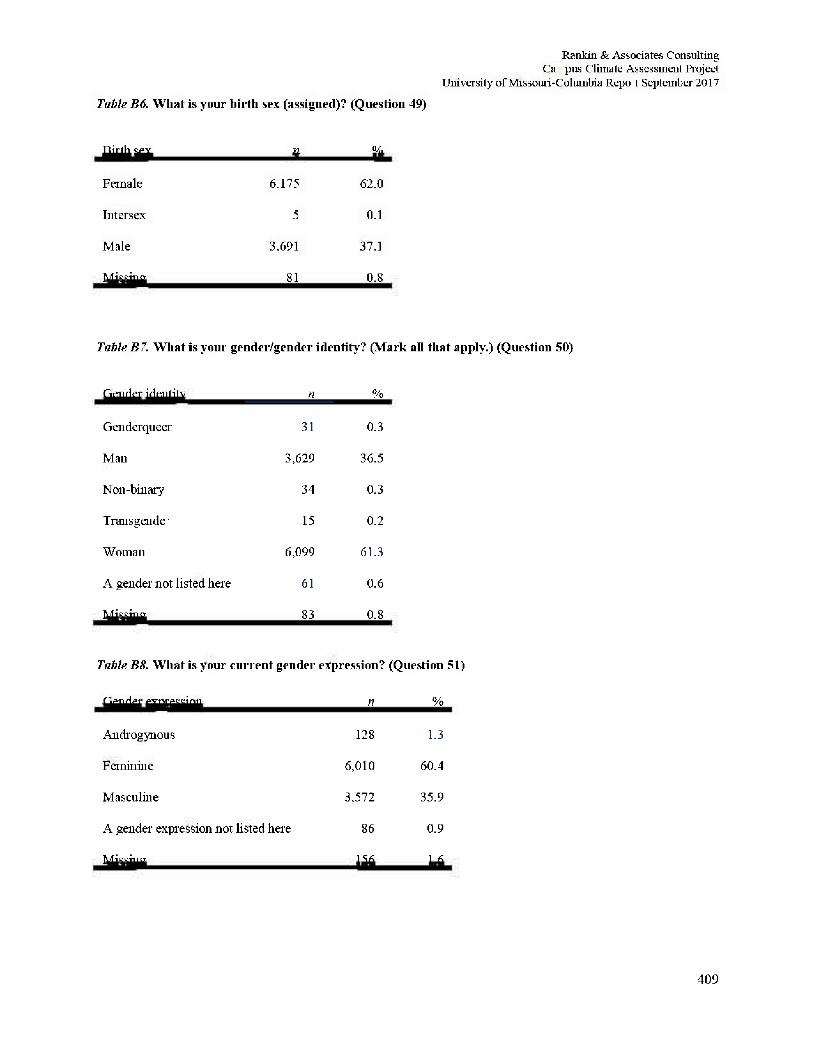
Rankin & Associates Consulting C a p u s Climate Assessment Project
University of Missouri-Columbia Repot September 2017
Table B6. What is your birth sex (assigned)? (Question 49)
Birth sex n %
Female 6.175 62.0
Intersex 5 0.1
Male 3.691 37.1
Missing 81 0.8
Table B 7. What is your gentler/gender identity? (Mark all that apply.) (Question 50)
Gender identity n %
Genderqueer 31 0.3
Mao 3,629 36.5
Non-binary 34 0.3
Transgender' 15 0.2
Woman 6,099 61.3
A gender not listed here 61 0.6
Missing 83 0.8
Table B8. What is your current gender expression? (Question 51)
Gender expression li %
Androgynous 128 1.3
Feminine 6,010 60.4
Masculine 3,572 35.9
A gender expression not listed here 86 0.9
Missing 156 1.6
409
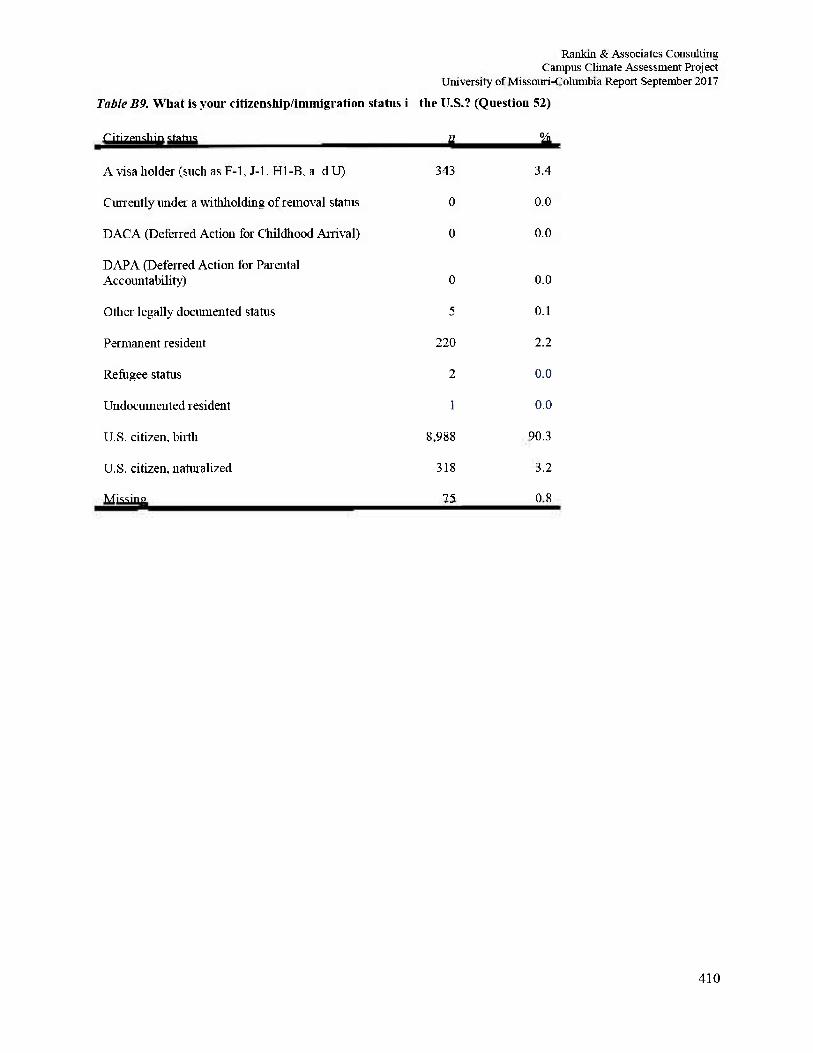
Rankin & Associates Consulting Campus Climate Assessment Project
University of Missouri-Columbia Report September 2017
Table B9. What is your citizenship/immigration status in the U.S.? (Question 52)
Citizenship status n %
A visa holder (such as F-l, J-l. Hl-B. and U) 343 3.4
Currently under a withholding of removal status 0 0.0
DACA (Deferred Action for Childhood Arrival) 0 0.0
DAPA (Deferred Action for Parental Accountability) 0 0.0
Other legally documented status 5 0.1
Permanent resident 220 2.2
Refugee status 2 0.0
Undocumented resident 1 0.0
U.S. citizen, birth 8,988 90.3
U.S. citizen, naturalized 318 3.2
Missing 75 0.8
410
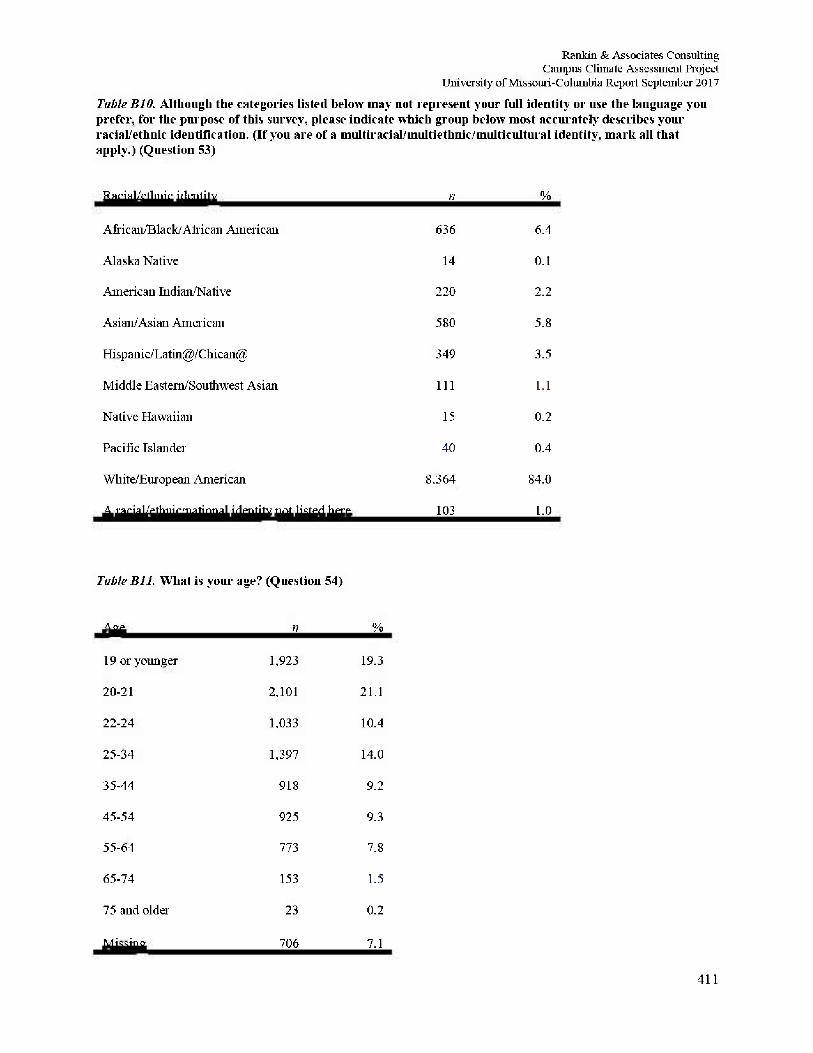
Rankin & Associates Consulting Campus Climate Assessment Project
University of Missouri-Columbia Report September 2017 Table BIO. Although the categories listed below inay not represent your full identity or use the language you prefer, for the purpose of this survey, please indicate which group below most accurately describes your racial/ethuic identification. (If you are of a multiracial/multiethnic/multicultural identity, mark all that apply.) (Question 53)
Racial/etlmic identity 11 %
African/Black'Air i c ail American 636 6.4
Alaska Native 14 0.1
American Indian/Native 220 2.2
Asian/Asian American 580 5.8
Hispanic/Latin@/Chican@ 349 3.5
Middle Eastern/Southwest Asian 111 1.1
Native Hawaiian 15 0.2
Pacific Islander 40 0.4
White/European American 8.364 84.0
A raciaL ethnic, national identity not listed here 103 1.0
Table Bll. What is your age? (Question 54)
Age n %
19 or younger 1,923 19.3
20-21 2.101 21.1
22-24 1.033 10.4
25-34 1,397 14.0
35-44 918 9.2
45-54 925 9.3
55-64 773 7.8
65-74 153 1.5
75 and older 23 0.2
Missing 706 7.1
411
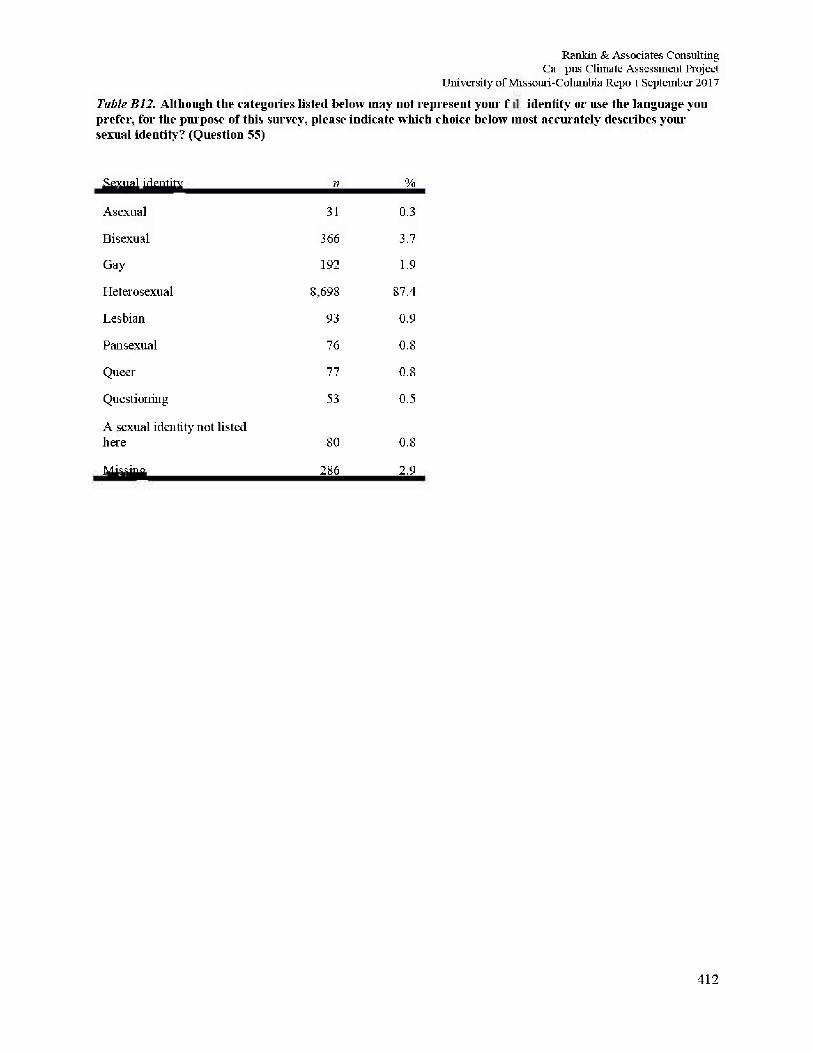
Rankin & Associates Consulting C a p u s Climate Assessment Project
University of Missouri-Columbia Repot September 2017
Table B12. Although the categories listed below may not represent your full identity or use the language you prefer, for the purpose of this survey, please indicate which choice below most accurately describes your sexual identity? (Question 55)
Sexual identity n %
Asexual 31 0.3
Bisexual 366 3.7
Gay 192 1.9
Heterosexual 8,698 87.4
Lesbian 93 0.9
Pan sexual 76 0.8
Queer 77 0.8
Questioning 53 0.5
A sexual identity not listed here 80 0.8
Missing 286 2.9
412
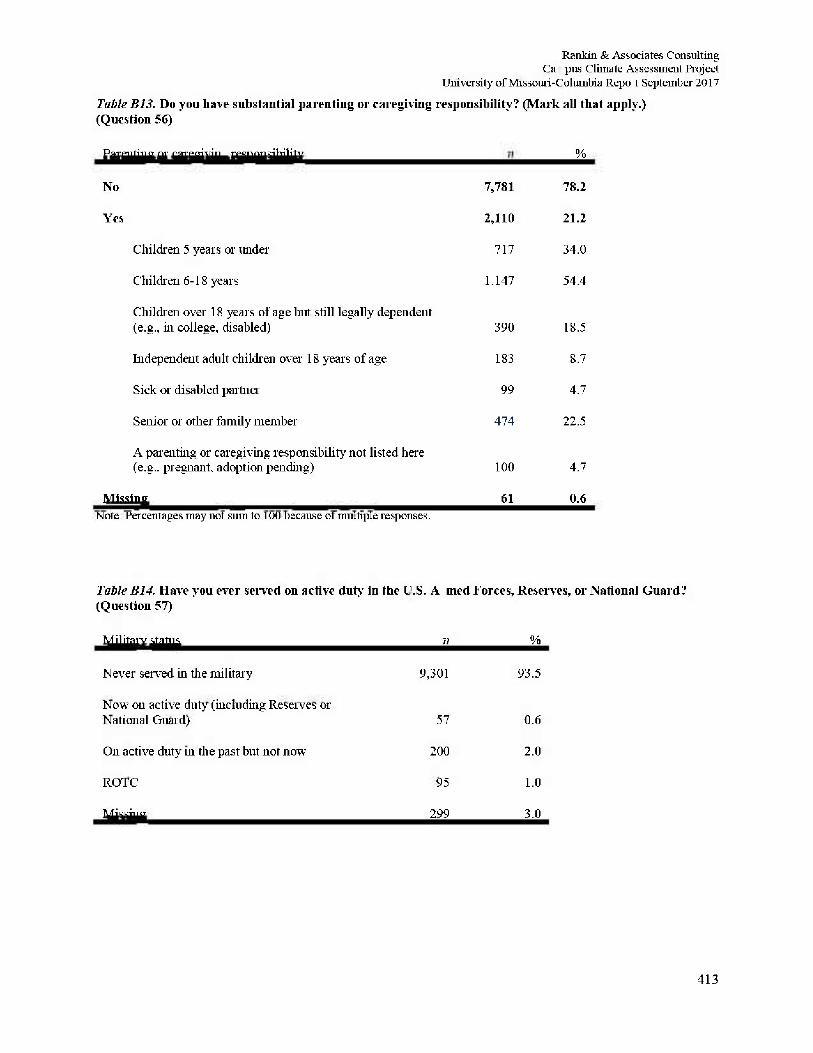
Rankin & Associates Consulting C a p u s Climate Assessment Project
University of Missouri-Columbia Repot September 2017
Table B13. Do you have substantial parenting or care giving responsibility? (Mark all that apply.) (Question 56)
Parenting or caregiving responsibility %
No 7,781 78.2
Yes 2,110 21.2
Children 5 years or under 111 34.0
Children 6-18 years 1,147 54.4
Children over 18 years of age but still legally dependent (e.g., in college, disabled) 390 18.5
Independent adult children over 18 years of age 183 8.7
Sick or disabled partner 99 4.7
Senior or other family member 474 22.5
A parenting or caregiving responsibility not listed here (e.g.. pregnant, adoption pending) 100 4.7
Missing 61 0.6 Note: Percentages may not sum to 100 because of multiple responses.
Table B14. Have you ever served on active duty in the U.S. Armed Forces, Reserves, or National Guard? (Question 57)
Military status n %
Never served in the military 9,301 93.5
Now on active duty (including Reserves or National Guard) 57 0.6
On active duty in the past but not now 200 2.0
ROTC 95 1.0
Missing 299 3.0
413
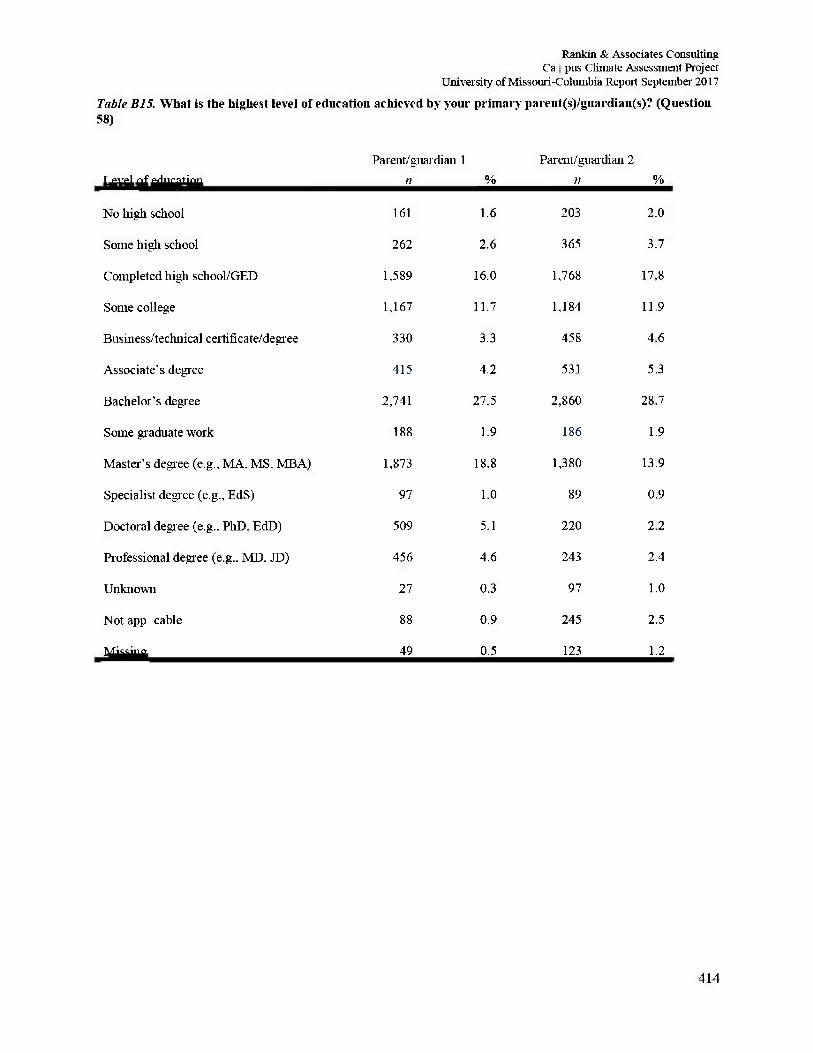
Rankin & Associates Consulting C a p u s Climate Assessment Project
University of Missouri-Columbia Repot September 2017
Table B15. What is the highest level of education achieved by your primary pareut(s)/guardiau(s)? (Question 58)
Level of education Parent/guardian 1
ti % Parent/guardian 2
n %
No high school 161 1.6 203 2.0
Some high school 262 2.6 365 3.7
Completed high school/GED 1,589 16.0 1,768 17.8
Some college 1,167 11.7 1,184 11.9
Business/technical certificate/degree 330 3.3 458 4.6
Associate's degree 415 4.2 531 5.3
Bachelor's degree 2,741 27.5 2,860 28.7
Some graduate work 188 1.9 186 1.9
Master's degree (e.g., MA, MS. MBA) 1,873 18.8 1,380 13.9
Specialist degree (e.g., EdS) 97 1.0 89 0.9
Doctoral degree (e.g.. PhD. EdD) 509 5.1 220 2.2
Professional degree (e.g.. MD. JD) 456 4.6 243 2.4
Unknown 27 0.3 97 1.0
Not applicable 88 0.9 245 2.5
Missing 49 0.5 123 1.2
414
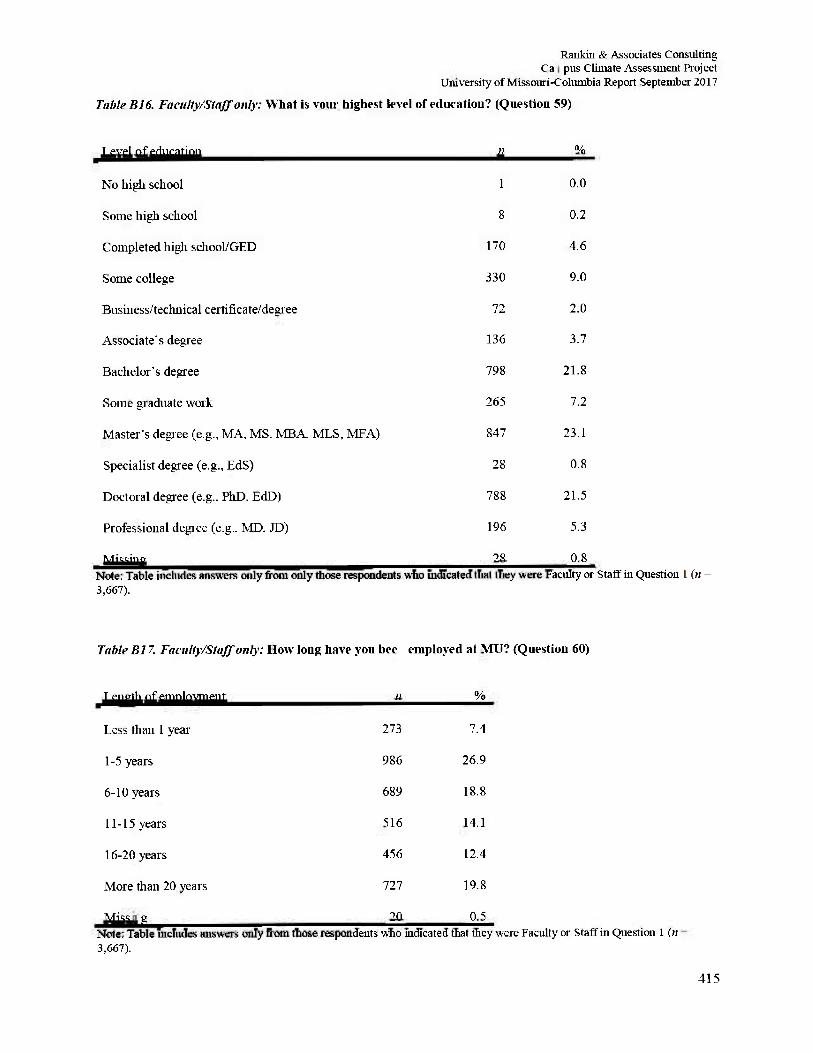
Rankin & Associates Consulting C a p u s Climate Assessment Project
University of Missouri-Columbia Repot September 2017
Table B16. Faculty/Staff only: What is your highest level of education? (Question 59)
Level of education n % Level of education n %
No high school 1 0.0
Some high school 8 0.2
Completed high school/GED 170 4.6
Some college 330 9.0
Business/technical certificate/degree 72 2.0
Associate's degree 136 3.7
Bachelor's degree 798 21.8
Some graduate work 265 7.2
Master's degree (e.g., MA, MS. MBA. MLS, MFA) 847 23.1
Specialist degree (e.g., EdS) 28 0.8
Doctoral degree (e.g.. PhD. EdD) 788 21.5
Professional degree (e.g.. MD. JD) 196 5.3
Missing 28 0.8 Note: Table includes answers only from only those respondents who indicated that they were Faculty or Staff in Question 1 (n = 3,667).
Table B17. Faculty/Staff only: How long have you been employed at MU? (Question 60)
Length of employment 71 %
Less than 1 year 273 7.4
1-5 years 986 26.9
6-10 years 689 18.8
11-15 years 516 14.1
16-20 years 456 12.4
More than 20 years 727 19.8
Missing 20 0.5 Note: Table includes answers only from those respondents who indicated that they were Faculty or Staff in Question 1 (n = 3,661).
415
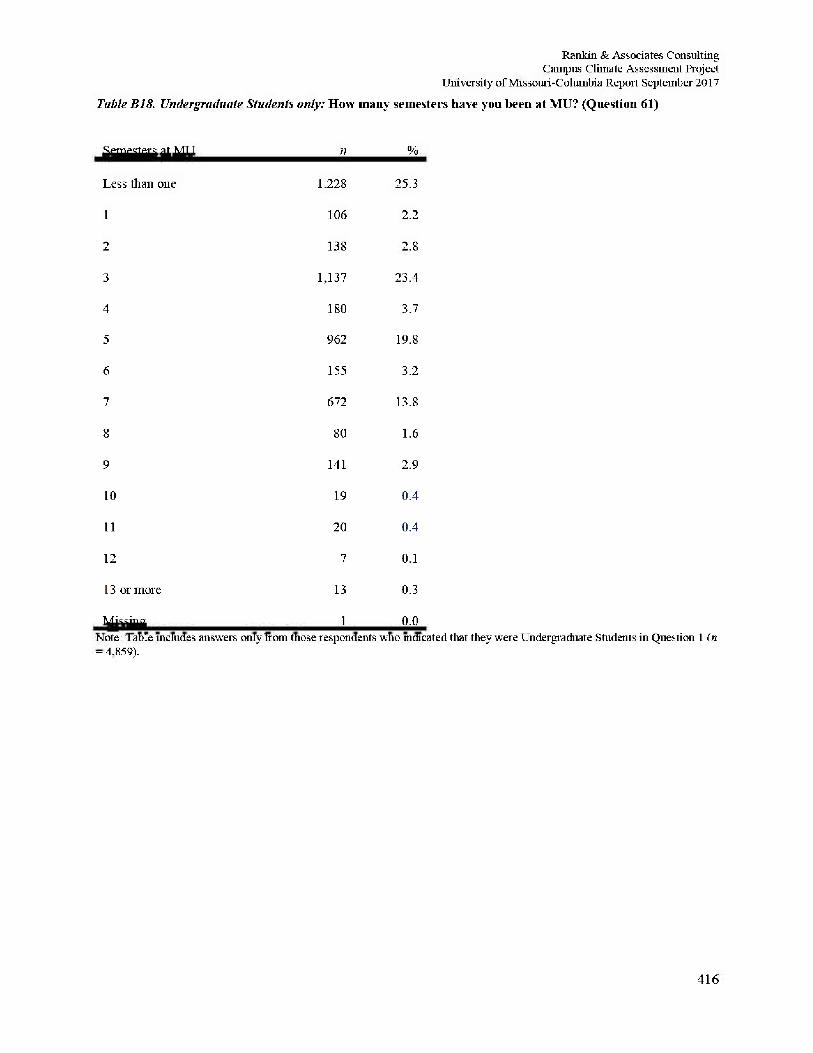
Rankin & Associates Consulting Campus Climate Assessment Project
University of Missouri-Columbia Report September 2017
Table BIS. Undergraduate Students only: How mauy semesters have you been at MU? (Question 61)
Semesters at MU n %
Less than one 1,228 25.3
1 106 2.2
2 138 2.8
3 1,137 23.4
4 180 3.7
5 962 19.8
6 155 3.2
7 672 13.8
8 80 1.6
9 141 2.9
10 19 0.4
11 20 0.4
12 7 0.1
13 or more 13 0.3
Missing 1 0.0 Note: Table includes answers only from those respondents who indicated that they were Undergraduate Students in Question 1 (n = 4.859).
416
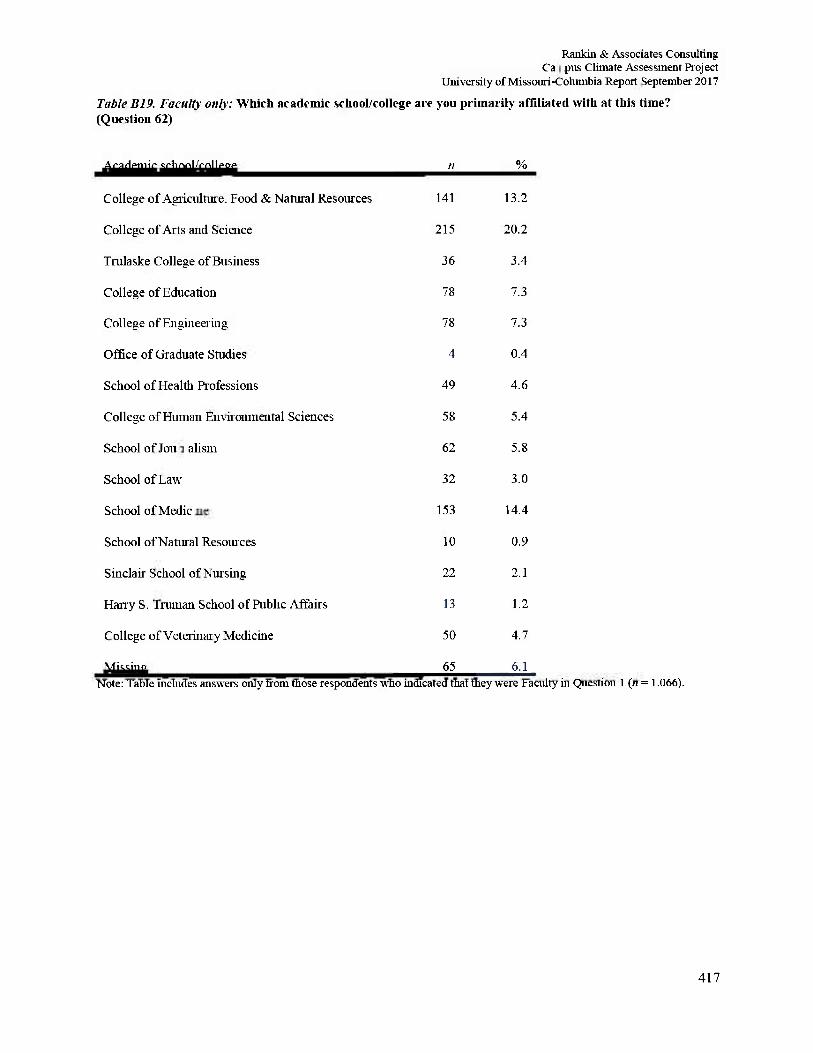
Rankin & Associates Consulting C a p u s Climate Assessment Project
University of Missouri-Columbia Repot September 2017
Table B19. Faculty only: Which academic school/college are you primarily affiliated with at this time? (Question 62)
Academic school/college n %
College of Agriculture. Food & Natural Resources 141 13.2
College of Arts and Science 215 20.2
Trulaske College of Business 36 3.4
College of Education 78 7.3
College of Engineering 78 7.3
Office of Graduate Studies 4 0.4
School of Health Professions 49 4.6
College of Human Environmental Sciences 58 5.4
School of Journalism 62 5.8
School of Law 32 3.0
School of Medicine 153 14.4
School of Natural Resources 10 0.9
Sinclair School of Nursing 22 2.1
Harry S. Truman School of Public .Affairs 13 1.2
College of Veterinary Medicine 50 4.7
Missing 65 6.1 Note: Table includes answers only from those respondents who indicated that they were Faculty in Question 1 (n = 1.066).
417
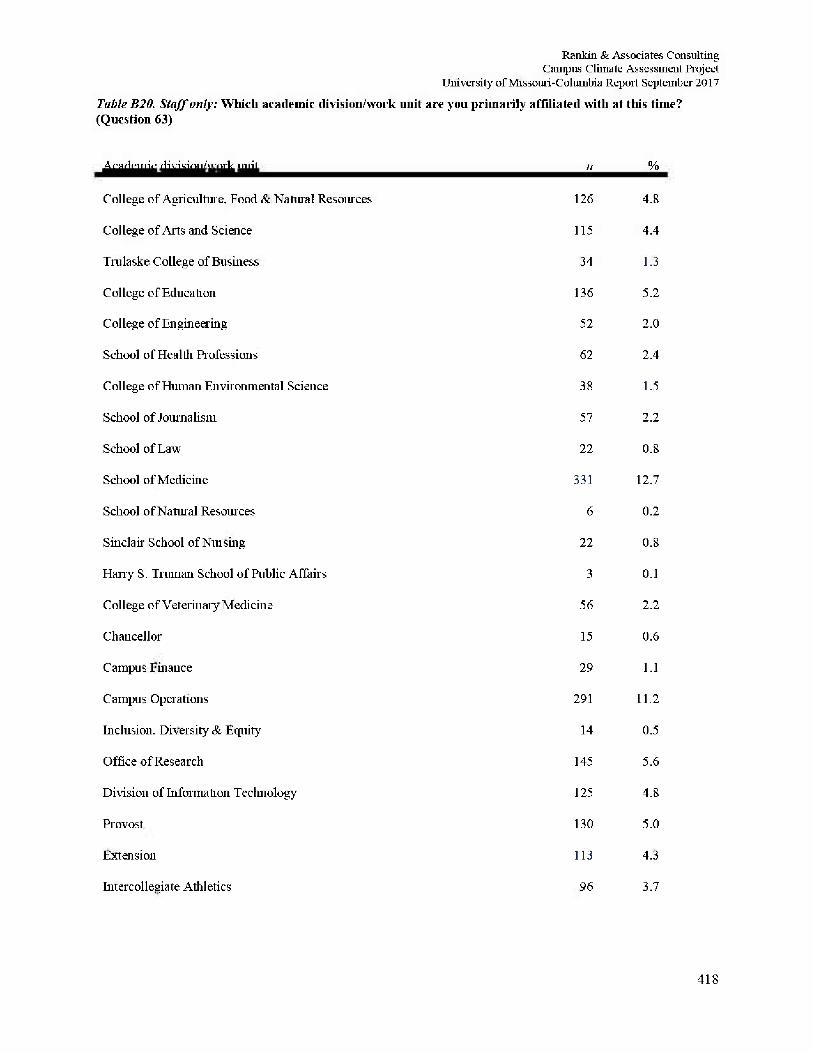
Rankin & Associates Consulting Campus Climate Assessment Project
University of Missouri-Columbia Report September 2017
Table B20. Staff only: Which academic division/work unit are you primarily affiliated with at this time? (Question 63)
Academic division/work unit n %
College of Agriculture, Food & Natural Resources 126 4.8
College of Arts and Science 115 4.4
Trulaske College of Business 34 1.3
College of Education 136 5.2
College of Engineering 52 2.0
School of Health Professions 62 2.4
College of Human Environmental Science 38 1.5
School of Journalism 57 2.2
School of Law 22 0.8
School of Medicine 331 12.7
School ofNatural Resources 6 0.2
Sinclair School ofNiusing 22 0.8
Harry S. Truman School of Public Affairs 3 0.1
College of Veterinary Medicine 56 2.2
Chancellor 15 0.6
Campus Finance 29 1.1
Campus Operations 291 11.2
Inclusion. Diversity & Equity 14 0.5
Office ofResearcli 145 5.6
Division of Information Technology 125 4.8
Provost 130 5.0
Extension 113 4.3
Intercollegiate Athletics 96 3.7
418
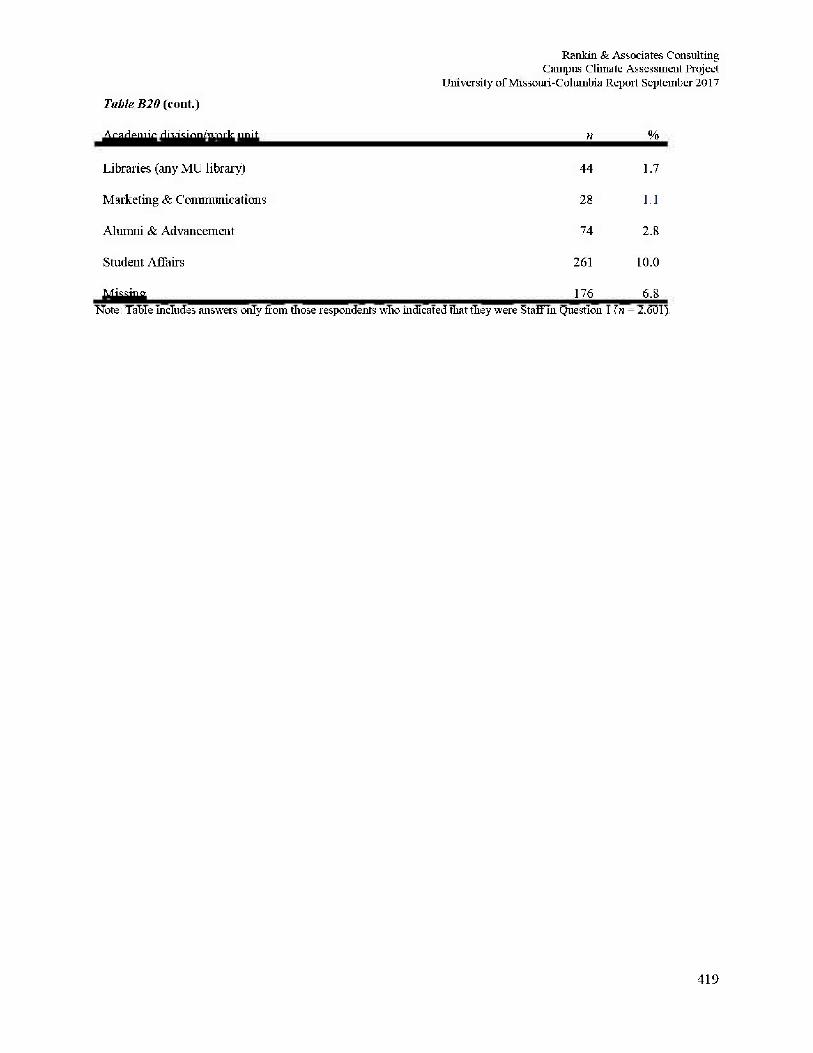
Rankin & Associates Consulting Campus Climate Assessment Project
University of Missouri-Columbia Report September 2017
Table B20 (cout.)
Academic division/work unit n %
Libraries (any MU library) 44 1.7
Marketing & Communications 28 1.1
Alumni & Advancement 74 2.8
Student Affairs 261 10.0
Missing 176 6.8 Note: Table includes answers only from those respondents who indicated that they were Staff in Question 1 (n = 2.601).
419
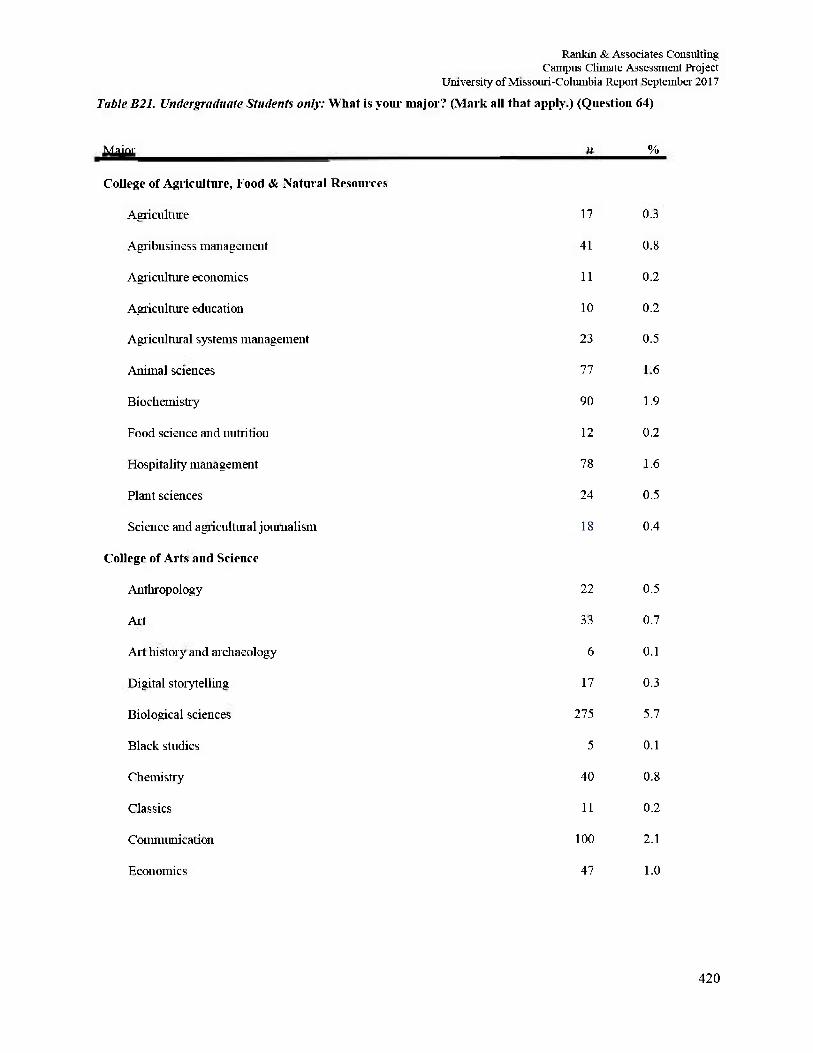
Rankin & Associates Consulting Campus Climate Assessment Project
University of Missouri-Columbia Report September 2017
Table B21. Undergraduate Students only: Wliat is your major? (Mark all that apply.) (Question 64)
Major ii %
College of Agriculture, Food & Natural Resources
Agriculture 17 0.3
Agribusiness management 41 0.8
Agriculture economics 11 0.2
Agriculture education 10 0.2
Agricultural systems management 23 0.5
Animal sciences 77 1.6
Biochemistry 90 1.9
Food science and nutrition 12 0.2
Hospitality management 78 1.6
Plant sciences 24 0.5
Science and agricultural journalism 18 0.4
College of Arts and Science
Anthropology 22 0.5
Art 33 0.7
Art history and archaeology 6 0.1
Digital storytelling 17 0.3
Biological sciences 275 5.7
Black studies 5 0.1
Chemistry 40 0.8
Classics 11 0.2
Communication 100 2.1
Economics 47 1.0
420
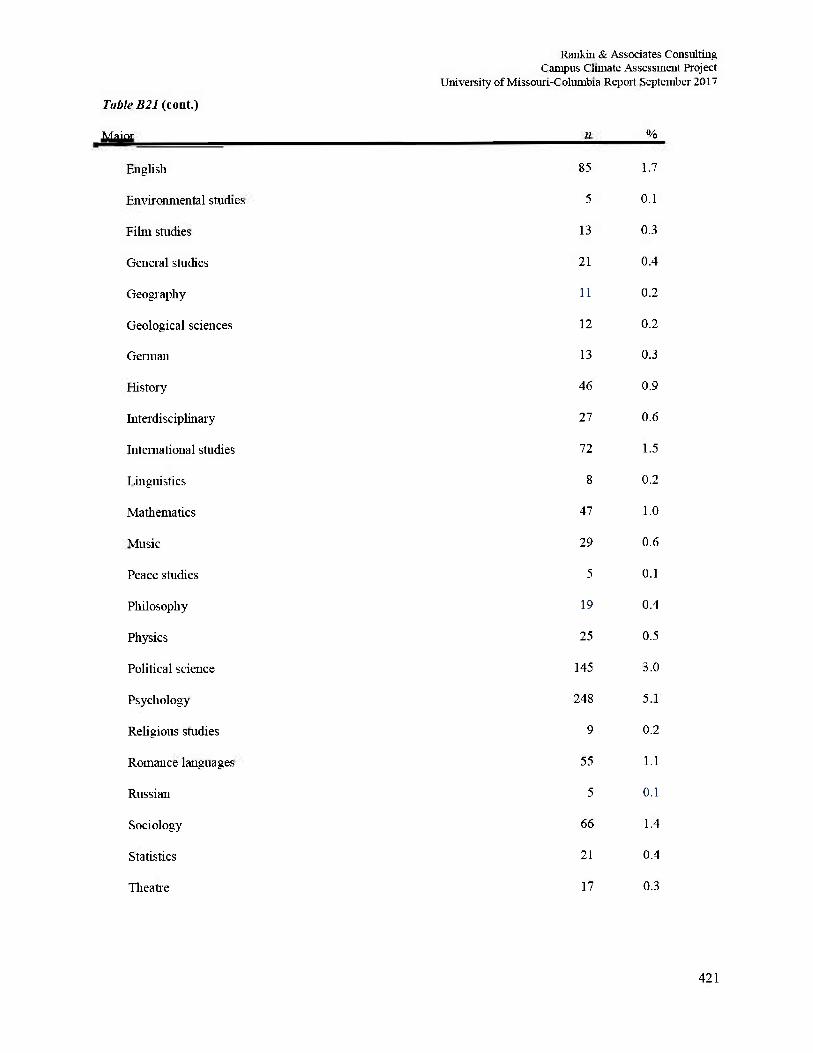
Rankin & Associates Consulting Campus Climate Assessment Project
University of Missouri-Columbia Report September 2017
Table B21 (coot.)
Major n %
English 85 1.7
Environmental studies 5 0.1
Film studies 13 0.3
General studies 21 0.4
Geography 11 0.2
Geological sciences 12 0.2
German 13 0.3
History 46 0.9
Interdisciplinary 27 0.6
International studies 72 1.5
Linguistics 8 0.2
Mathematics 47 1.0
Music 29 0.6
Peace studies 5 0.1
Philosophy 19 0.4
Physics 25 0.5
Political science 145 3.0
Psychology 248 5.1
Religious studies 9 0.2
Romance languages 55 1.1
Russian 5 0.1
Sociology 66 1.4
Statistics 21 0.4
Theatre 17 0.3
421
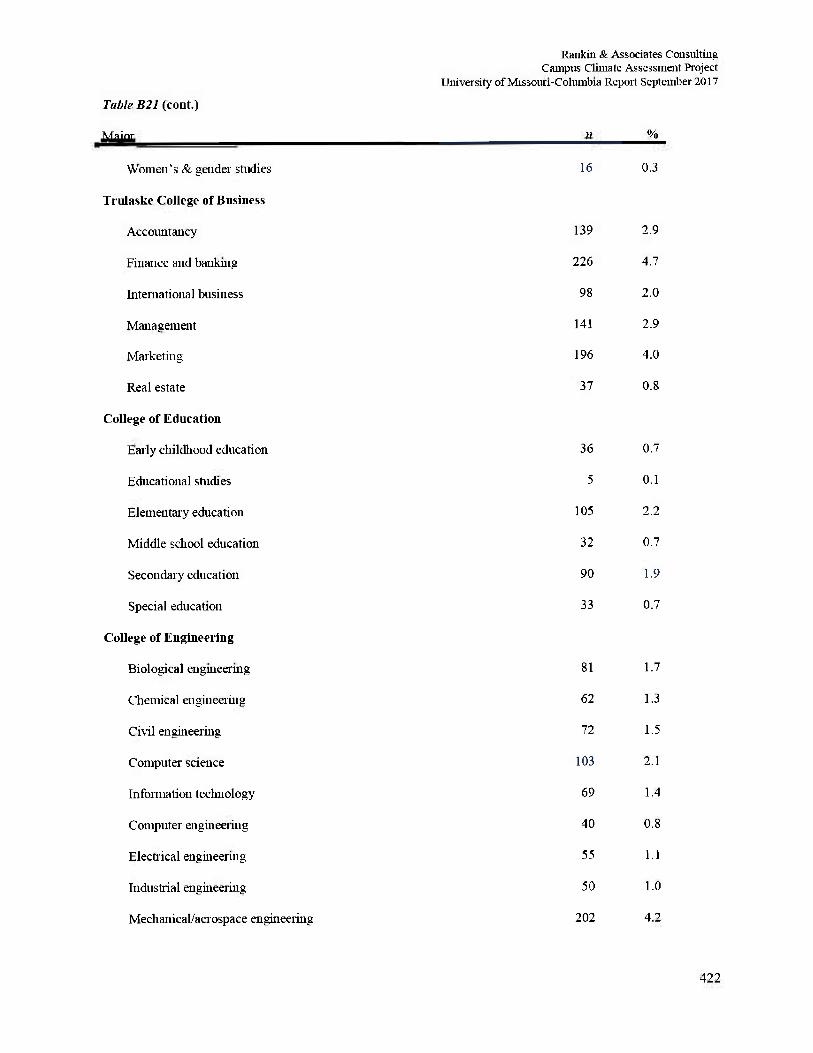
Rankin & Associates Consulting Campus Climate Assessment Project
University of Missouri-Columbia Report September 2017
Table B21 (cont.)
Major n %
Women's & gender studies 16 0.3
Trulaske College of Business
Accountancy 139 2.9
Finance and banking 226 4.7
International business 98 2.0
Management 141 2.9
Marketing 196 4.0
Real estate 37 0.8
College of Education
Early childhood education 36 0.7
Educational studies 5 0.1
Elementary education 105 2.2
Middle school education 32 0.7
Secondary education 90 1.9
Special education 33 0.7
College of Engineering
Biological engineering 81 1.7
Chemical engineering 62 1.3
Civil engineering 72 1.5
Computer science 103 2.1
Information technology 69 1.4
Computer engineering 40 0.8
Electrical engineering 55 1.1
Industrial engineering 50 1.0
Mechanical/aerospace engineering 202 4.2
422
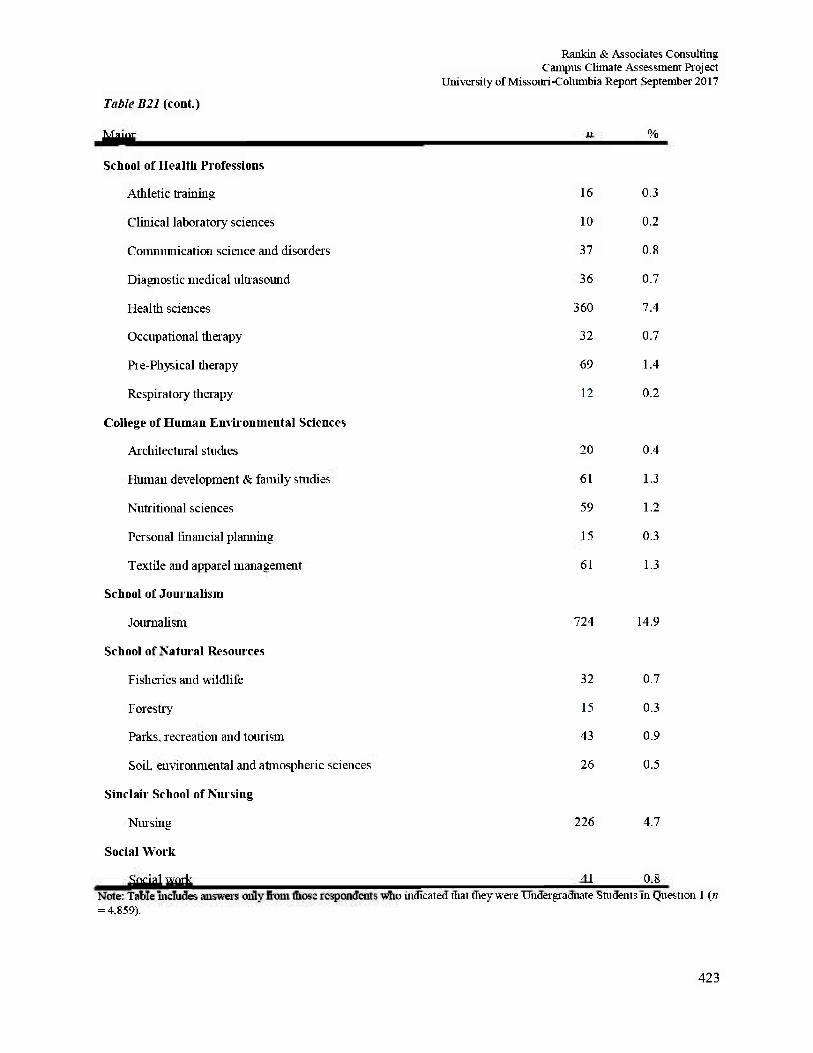
Rankin & Associates Consulting Campus Climate Assessment Project
University of Missouri-Columbia Report September 2017
Table B21 (cont.)
Major n %
School of Health Professions
Athletic training 16 0.3
Clinical laboratory sciences 10 0.2
Communication science and disorders 37 0.8
Diagnostic medical ultrasound 36 0.7
Health sciences 360 7.4
Occupational therapy 32 0.7
Pie-Physical therapy 69 1.4
Respiratory therapy 12 0.2
College of Human Emir on mental Sciences
Architectural studies 20 0.4
Human development & family studies 61 1.3
Nutritional sciences 59 1.2
Personal financial planning 15 0.3
Textile and apparel management 61 1.3
School of Journalism
Journalism 724 14.9
School of Natural Resources
Fisheries and wildlife 32 0.7
Forestry 15 0.3
Parks, recreation and tourism 43 0.9
Soil, environmental and atmospheric sciences 26 0.5
Sinclair School of Nursing
Nursing 226 4.7
Social Work
Social work 41 0.8 Note: Table includes answers only from those respondents who indicated that they were Undergraduate Students in Question 1 (n = 4.859).
423
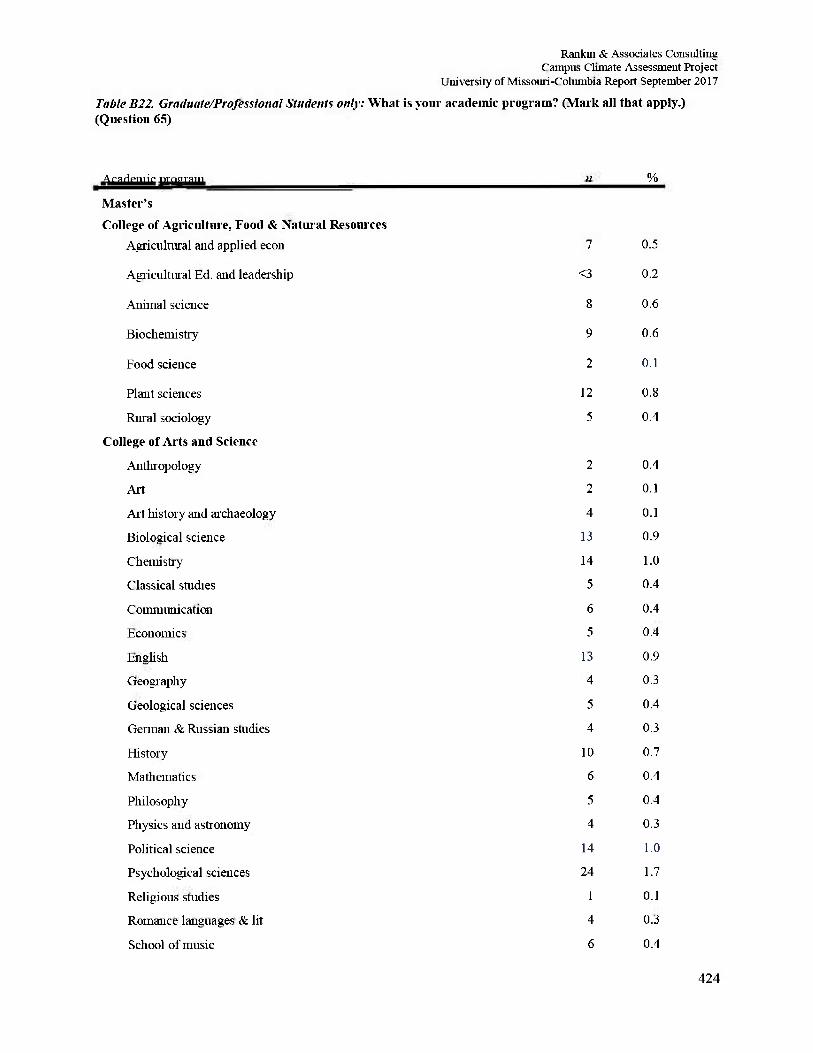
Rankin & Associates Consulting Campus Climate Assessment Project
University of Missouri-Columbia Report September 2017
Table B22. Graduate/Professional Students only: What is your academic program? (Mark all that apply.) (Question 65)
Academic program n %
Master's College of Agriculture, Food & Natural Resources
Agricultural and applied econ 1 0.5
Agricultural Ed. and leadership <3 0.2
Animal science 8 0.6
Biochemistry 9 0.6
Food science 2 0.1
Plant sciences 12 0.8
Rural sociology 5 0.4
College of Arts and Science
Anthropology 2 0.4
Art 2 0.1
Art history and archaeology 4 0.1
Biological science 13 0.9
Chemistry 14 1.0
Classical studies 5 0.4
Communication 6 0.4
Economics 5 0.4
English 13 0.9
Geography 4 0.3
Geological sciences 5 0.4
German & Russian studies 4 0.3
History 10 0.7
Mathematics 6 0.4
Philosophy 5 0.4
Physics and astronomy 4 0.3
Political science 14 1.0
Psychological sciences 24 1.7
Religious studies 1 0.1
Romance languages & lit 4 0.3
School of music 6 0.4
424
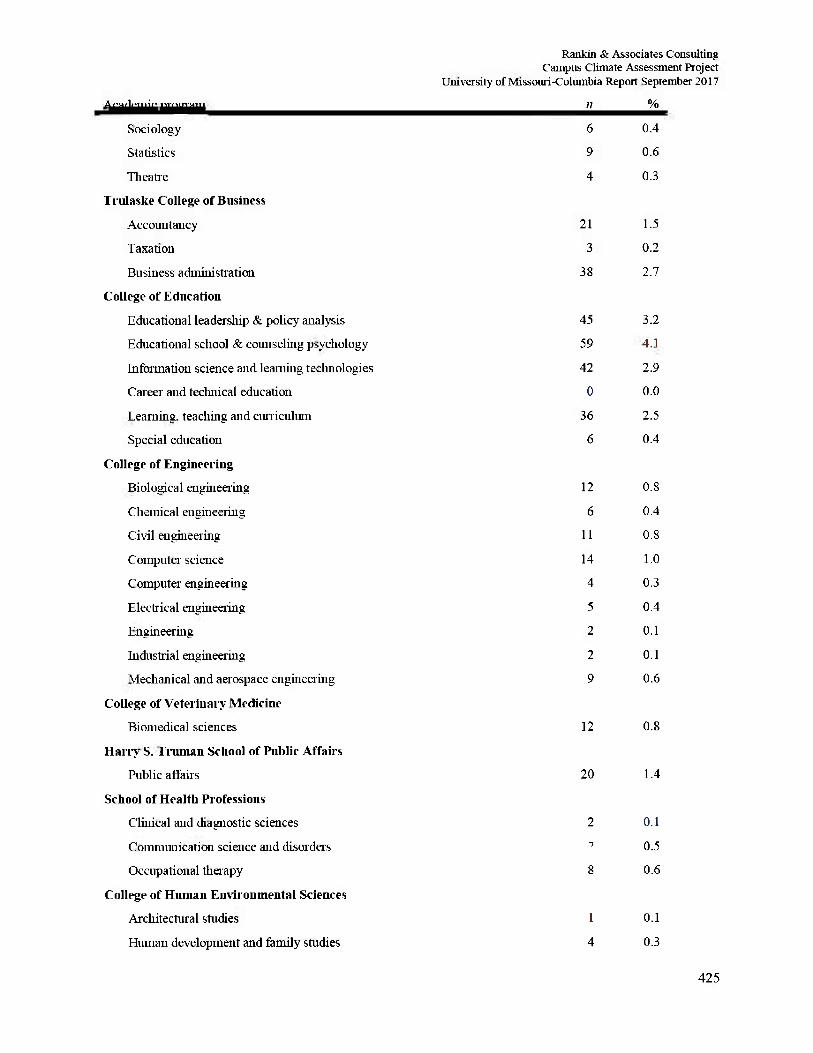
Rankin & Associates Consulting Campus Climate Assessment Project
University of Missouri-Columbia Report September 2017
Academic program n %
Sociology 6 0.4
Statistics 9 0.6
Theatre 4 0.3
Trulaske College of Business
Accountancy 21 1.5
Taxation 3 0.2
Business administration 38 2.7
College of Education
Educational leadership & policy analysis 45 3.2
Educational school & counseling psychology 59 4.1
Information science and learning technologies 42 2.9
Career and technical education 0 0.0
Learning, teaching and curriculum 36 2.5
Special education 6 0.4
College of Engineering
Biological engineering 12 0.8
Chemical engineering 6 0.4
Civil engineering 11 0.8
Computer science 14 1.0
Computer engineering 4 0.3
Electrical engineering 5 0.4
Engineering 2 0.1
Industrial engineering 2 0.1
Mechanical and aerospace engineering 9 0.6
College of Veterinary Medicine
Biomedical sciences 12 0.8
Harry S. Truman School of Public Affairs
Public affairs 20 1.4
School of Health Professions
Clinical and diagnostic sciences 2 0.1
Communication science and disorders 7 0.5
Occupational therapy 8 0.6
College of Human Environ mental Sciences
Architectural studies 1 0.1
Human development and family studies 4 0.3
425
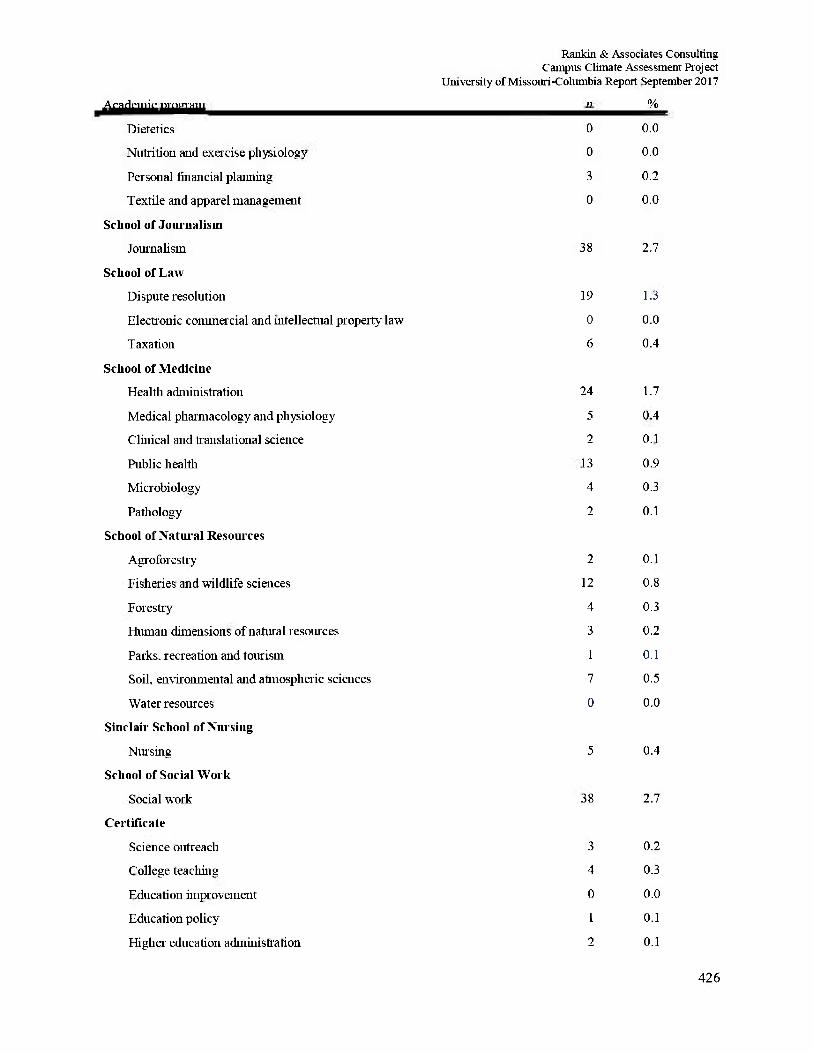
Rankin & Associates Consulting Campus Climate Assessment Project
University of Missouri-Columbia Report September 2017
Academic program n %
Dietetics 0 0.0
Nutrition and exercise physiology 0 0.0
Personal financial planning 3 0.2
Textile and apparel management 0 0.0
School of Journalism
Journalism 38 2.7
School of Law
Dispute resolution 19 1.3
Electronic commercial and intellectual property law 0 0.0
Taxation 6 0.4
School of Medicine
Health administration 24 1.7
Medical pharmacology and physiology 5 0.4
Clinical and translational science 2 0.1
Public health 13 0.9
Microbiology 4 0.3
Pathology 2 0.1
School of Natural Resources
Agroforestry 2 0.1
Fisheries and wildlife sciences 12 0.8
Forestry 4 0.3
Human dimensions of natural resources 3 0.2
Parks, recreation and tourism 1 0.1
Soil, environmental and atmospheric sciences 7 0.5
Water resources 0 0.0
Sinclair School of Nursing
Nursing 5 0.4
School of Social Work
Social work 38 2.7
Certificate
Science outreach 3 0.2
College teaching 4 0.3
Education improvement 0 0.0
Education policy 1 0.1
Higher education administration 2 0.1
426
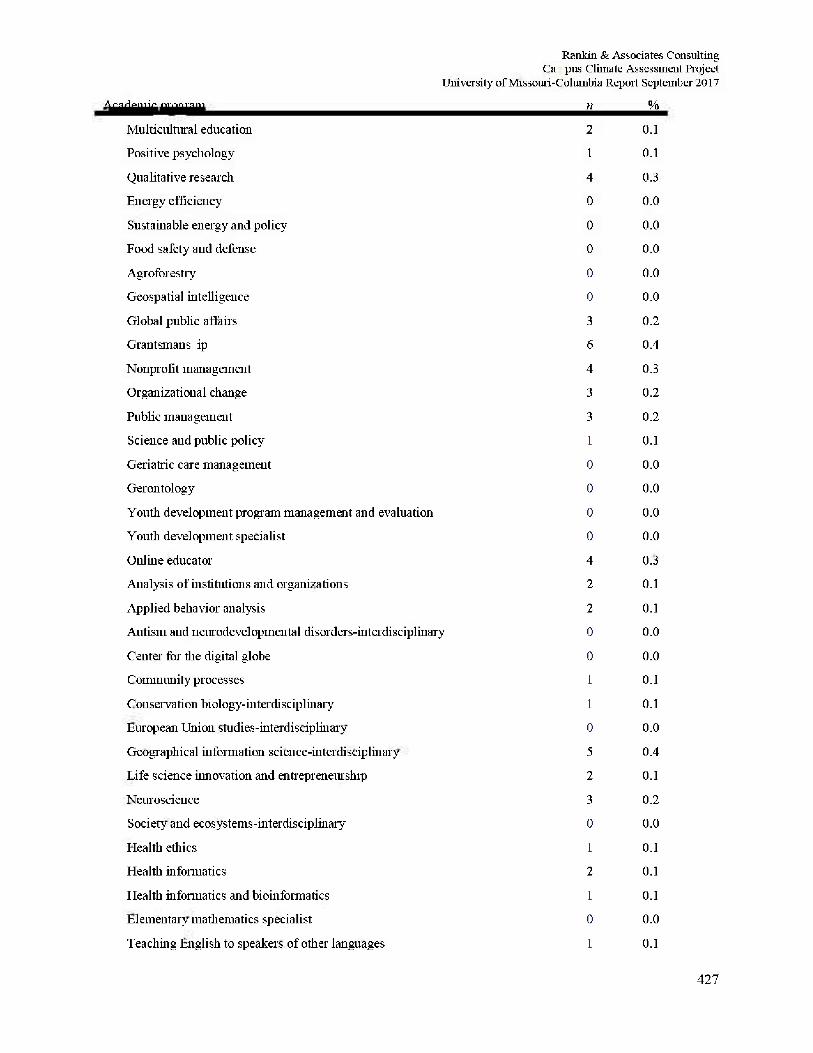
Rankin & Associates Consulting C a p u s Climate Assessment Project
University of Missouri-Columbia Repot September 2017
Academic program n %
Multicultural education 2 0.1
Positive psychology 1 0.1
Qualitative research 4 0.3
Energy efficiency 0 0.0
Sustainable energy and policy 0 0.0
Food safety and defense 0 0.0
Agroforestry 0 0.0
Geospatial intelligence 0 0.0
Global public affairs 3 0.2
Grant smanship 6 0.4
Nonprofit management 4 0.3
Organizational change 3 0.2
Public management 3 0.2
Science and public policy 1 0.1
Geriatric care management 0 0.0
Gerontology 0 0.0
Youth development program management and evaluation 0 0.0
Youth development specialist 0 0.0
Online educator 4 0.3
Analysis of institutions and organizations 2 0.1
Applied behavior analysis 2 0.1
Autism and neurodevelopmental disorders-interdisciplinary 0 0.0
Center for the digital globe 0 0.0
Community processes 1 0.1
Con serva tion biology-interdisciplinary 1 0.1
European Union studies-interdisciplinary 0 0.0
Geographical information science-interdisciplinary 5 0.4
Life science innovation and entrepreneur ship 2 0.1
Nemoscience 3 0.2
Society and ecosystems-interdisciplinary 0 0.0
Health ethics 1 0.1
Health informatics 2 0.1
Health informatics and bioin forma tics 1 0.1
Elementary mathematics specialist 0 0.0
Teaching English to speakers of other languages 1 0.1
427
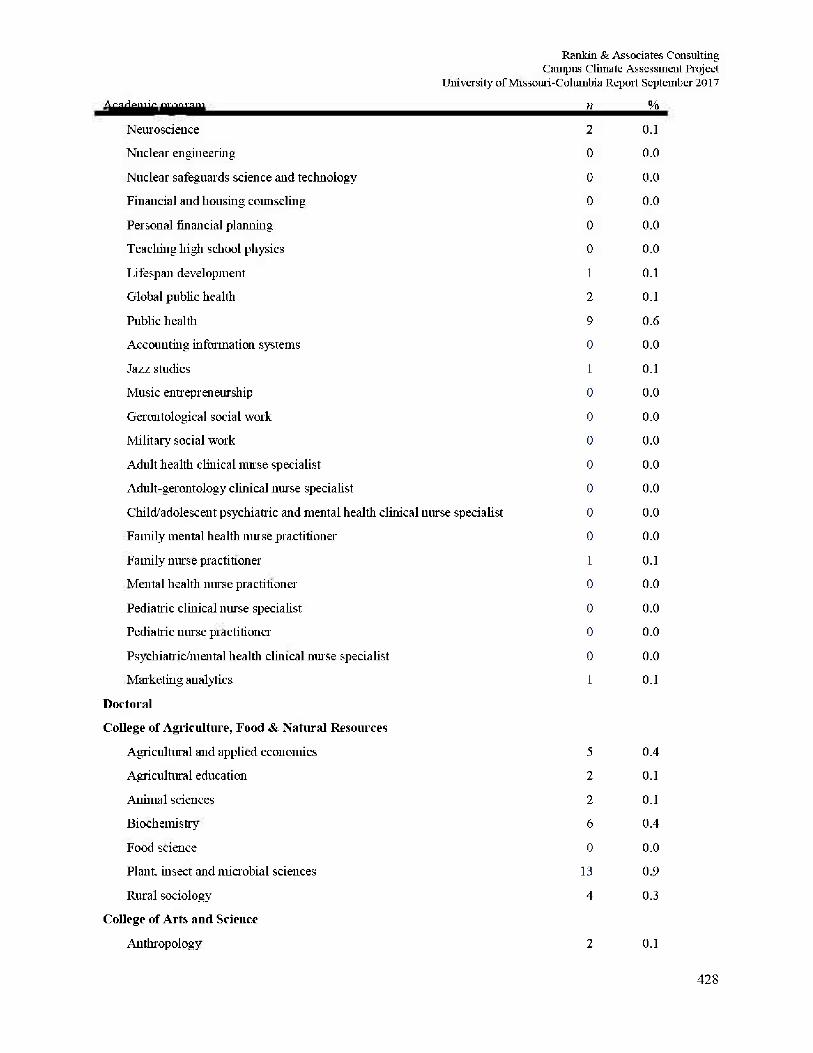
Rankin & Associates Consulting Campus Climate Assessment Project
University of Missouri-Columbia Report September 2017
Academic program n %
Neuroscience 2 0.1
Nuclear engineering 0 0.0
Nuclear safeguards science and technology 0 0.0
Financial and housing counseling 0 0.0
Personal financial planning 0 0.0
Teaching high school physics 0 0.0
Lifespan development 1 0.1
Global public health 2 0.1
Public health 9 0.6
Accounting information systems 0 0.0
Jazz studies 1 0.1
Music entrepreneur ship 0 0.0
Gerontological social work 0 0.0
Military social work 0 0.0
Adult health clinical nurse specialist 0 0.0
Adult-gerontology clinical nurse speciahst 0 0.0
Child adolescent psychiatric and mental health clinical nurse specialist 0 0.0
Family mental health muse practitioner 0 0.0
Family nurse practitioner 1 0.1
Mental health nurse practitioner 0 0.0
Pediatric clinical nurse speciahst 0 0.0
Pediatric nurse practitioner 0 0.0
Psychiatric/mental health clinical nurse speciahst 0 0.0
Marketing analytics 1 0.1
Doctoral
College of Agriculture, Food & Natural Resources
Agricultural and applied economics 5 0.4
Agricultural education 2 0.1
Animal sciences 2 0.1
Biochemistry 6 0.4
Food science 0 0.0
Plant, insect and microbial sciences 13 0.9
Rural sociology 4 0.3
College of Arts and Science
Anthropology 2 0.1
428
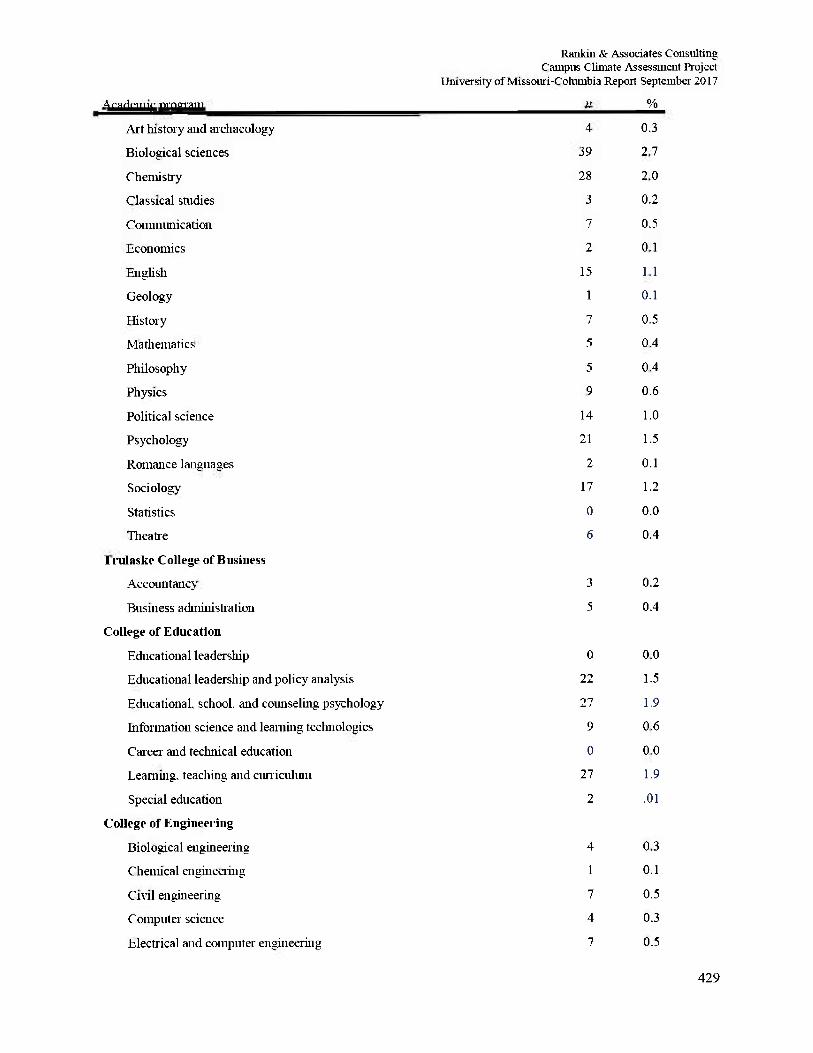
Rankin & Associates Consulting Campus Climate Assessment Project
University of Missouri-Columbia Report September 2017
Academic program n %
Art history and archaeology 4 0.3
Biological sciences 39 2.7
Chemistry 28 2.0
Classical studies 3 0.2
Communication 7 0.5
Economics 2 0.1
English 15 1.1
Geology 1 0.1
History 7 0.5
Mathematics 5 0.4
Philosophy 5 0.4
Physics 9 0.6
Political science 14 1.0
Psychology 21 1.5
Romance languages 2 0.1
Sociology 17 1.2
Statistics 0 0.0
Theatre 6 0.4
Trulaske College of Business
Accountancy 3 0.2
Business administration 5 0.4
College of Education
Educational leadership 0 0.0
Educational leadership and policy analysis 22 1.5
Educational, school, and counseling psychology 27 1.9
Information science and learning technologies 9 0.6
Career and technical education 0 0.0
Learning, teaching and curriculum 27 1.9
Special education 2 .01
College of Engineering
Biological engineering 4 0.3
Chemical engineering 1 0.1
Civil engineering 7 0.5
Computer science 4 0.3
Electrical and computer engineering 7 0.5
429
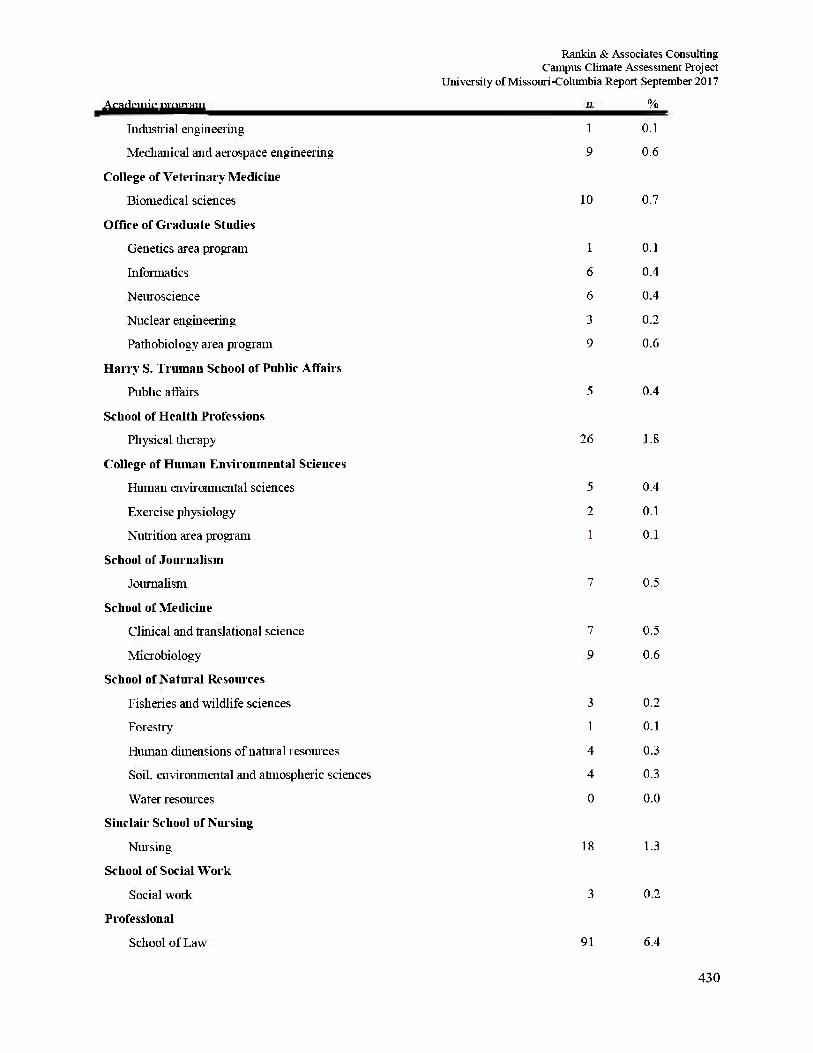
Rankin & Associates Consulting Campus Climate Assessment Project
University of Missouri-Columbia Report September 2017
Academic program n %
Industrial engineering 1 0.1
Mechanical and aerospace engineering 9 0.6
College of Veterinary Medicine
Biomedical sciences 10 0.7
Office of Graduate Studies
Genetics area program 1 0.1
Informatics 6 0.4
Neuroscience 6 0.4
Nuclear engineering 3 0.2
Pathobiology area program 9 0.6
Harry S. Truman School of Public Affairs
Public affairs 5 0.4
School of Health Professions
Physical therapy 26 1.8
College of Human Environmental Sciences
Human environmental sciences 5 0.4
Exercise physiology 2 0.1
Nutrition area program 1 0.1
School of Journalism
Journalism 7 0.5
School of Medicine
Clinical and translational science 7 0.5
Microbiology 9 0.6
School of Natural Resources
Fisheries and wildlife sciences 3 0.2
Forestry 1 0.1
Human dimensions of natural resources 4 0.3
Soil, environmental and atmospheric sciences 4 0.3
Water resources 0 0.0
Sinclair School of Nursing
Nursing 18 1.3
School of Social Work
Social work 3 0.2
Professional
School of Law 91 6.4
430
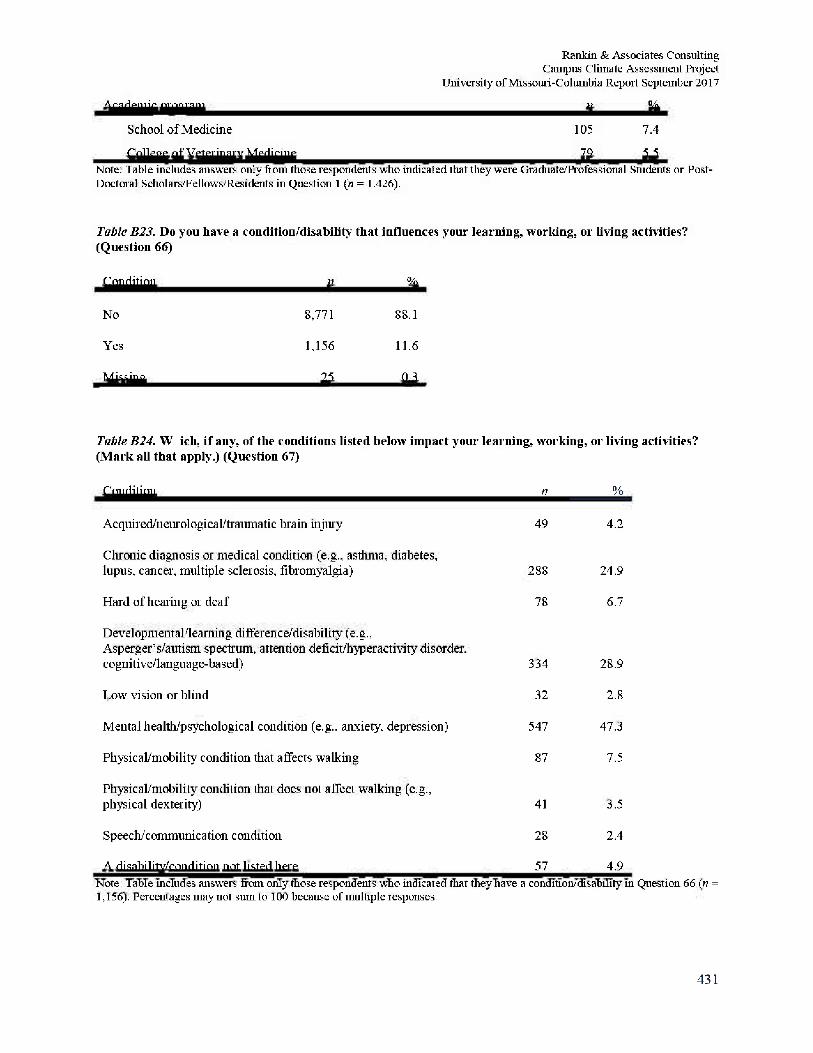
Rankin & Associates Consulting Campus Climate Assessment Project
University of Missouri-Columbia Report September 2017
Academic program n %
School of Medicine 105 7.4
College of Veterinary Medicine 79 5.5 Note: Table includes answers only flout those respondents who indicated that they were Graduate/Professional Students or Post-Doctoral Scholars/Fellows/Residents in Question 1 (n = 1.426).
Table B23. Do yon have a condition/disability that influences your learning, working, or living activities? (Question 66)
Condition n %
No 8,771 88.1
Yes 1,156 11.6
Missing 25 03_
Table B24. Which, if any, of the conditions listed below impact your learning, working, or living activities? (Mark all that apply.) (Question 67)
431
Condition n %
Acquired/neurological/traumatic brain injury 49 4.2
Chronic diagnosis or medical condition (e.g., asthma, diabetes, lupus, cancer, multiple sclerosis, fibromyalgia) 288 24.9
Hard of heal ing or deaf 78 6.7
Developmental learning difference/disability (e.g., Asperger's/autism spectrum, attention deficit/hyperactivity disorder. cognitive/language-based) 334 28.9
Low vision or blind 32 2.8
Mental health psychological condition (e.g., anxiety, depression) 547 47.3
Physical/mobility condition that affects walking 87 7.5
Physical/mobility condition that does not affect walking (e.g., physical dexterity) 41 3.5
Speech/comrnunication condition 28 2.4
A disability/condition not listed here 57 4.9 Note: Table includes answers from only those respondents who indicated that they have a condition/disability in Question 66 (n = 1,156). Percentages may not sum to 100 because of multiple responses.
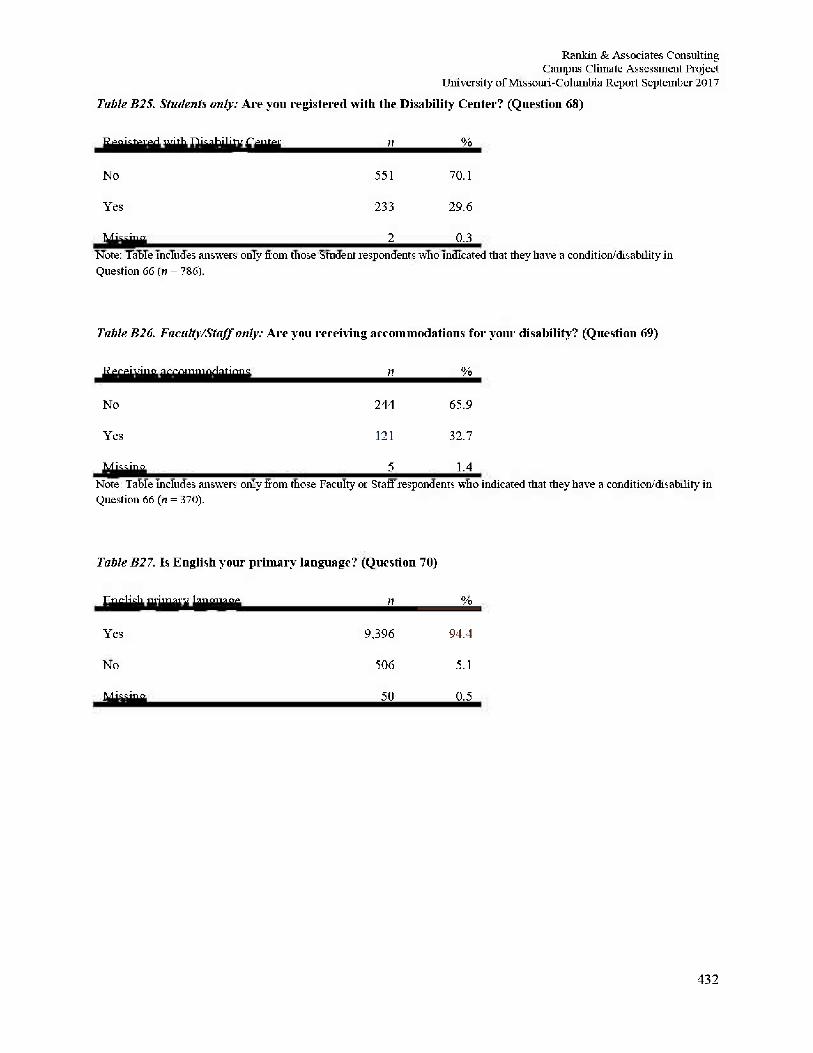
Rankin & Associates Consulting Campus Climate Assessment Project
University of Missouri-Columbia Report September 2017
Table B25. Students only: Are you registered with the Disability Ceuter? (Question 68)
Registered with Disability Center n %
No 551 70,1
Yes 233 29.6
Missing 2 0.3 Note: Table includes answers only from those Student respondents who indicated that they have a condition/disability in Question 66 (n = 786).
Table B26. Faculty/Staff only: Are you receiving accommodations for your disability? (Question 69)
Receiving accommodations n %
No 244 65.9
Yes 121 32.7
Missing 5 1.4 Note: Table includes answers only from those Faculty or Staff respondents who indicated that they have a condition/disability in Question 66 (n = 370).
Table B27. Is English your primary language? (Question 70)
English primary language n %
Yes 9.396 94.4
No 506 5.1
Mis sin a 50 0.5
432
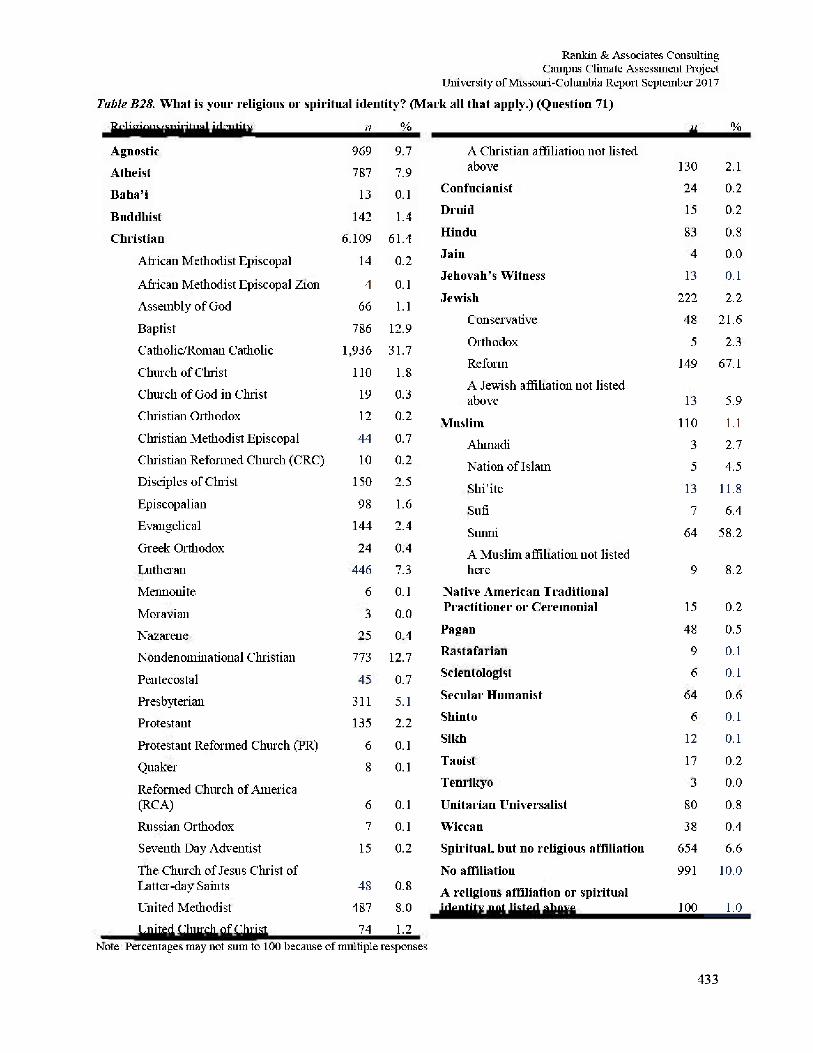
Rankin & Associates Consulting Campus Climate Assessment Project
University of Missouri-Columbia Report September 2017
Table B28. What is your religious or spiritual identity? (Mark all that apply.) (Question 71) Religious/spiritual identity n %
Agnostic 969 9.7 Atheist 787 7.9 Baha'i 13 0.1 Buddhist 142 1.4 Christian 6.109 61.4
African Methodist Episcopal 14 0.2
African Methodist Episcopal Zion 4 0.1 Assembly of God 66 1.1 Baptist 786 12.9 Catholic/Roman Catholic 1,936 31.7 Church of Christ 110 1.8 Church of God in Christ 19 0.3 Christian Orthodox 12 0.2 Christian Methodist Episcopal 44 0.7 Christian Reformed Church (CRC) 10 0.2 Disciples of Christ 150 2.5 Episcopalian 98 1.6 Evangelical 144 2.4 Greek Orthodox 24 0.4 Lutheran 446 7.3 Meimonite 6 0.1 Moravian 3 0.0 Nazarene 25 0.4 Nondenominational Christian 773 12.7 Pentecostal 45 0.7 Presbyterian 311 5.1 Protestant 135 2.2 Protestant Reformed Church (PR) 6 0.1 Quaker 8 0.1 Reformed Church of America (RCA) 6 0.1 Russian Orthodox 7 0.1 Seventh Day Adventist 15 0.2 The Church of Jesus Christ of Latter-day S a hits 48 0.8 United Methodist 487 8.0 United Church of Christ 74 1.2
n %
A Christian affiliation not listed above 130 2.1
Confucianist 24 0.2 Druid 15 0.2 Hindu 83 0.8 Jain 4 0.0 Jehovah's Witness 13 0.1 Jewish 222 2.2
Conservative 48 21.6 Orthodox 5 2.3 Reform 149 67.1 A Jewish affiliation not listed above 13 5.9
Muslim 110 1.1 Ahmadi 3 2.7 Nation of Islam 5 4.5 Shi'ite 13 11.8 Sufi 7 6.4 Sunni 64 58.2 A Muslim affiliation not listed here 9 8.2
Native American Traditional Practitioner or Ceremonial 15 0.2 Pagan 48 0.5 Rastafarian 9 0.1 Scientologist 6 0.1 Secular Humanist 64 0.6 Shinto 6 0.1 Sikh 12 0.1 Taoist 17 0.2 Tenrikyo 3 0.0 Unitarian Universalis 80 0.8 Wiccan 38 0.4 Spiritual, but no religious affiliation 654 6.6 No affiliation 991 10.0 A religious affiliation or spiritual identity uot listed above 100 1.0
Note: Percentages may not sum to 100 because of multiple responses.
433
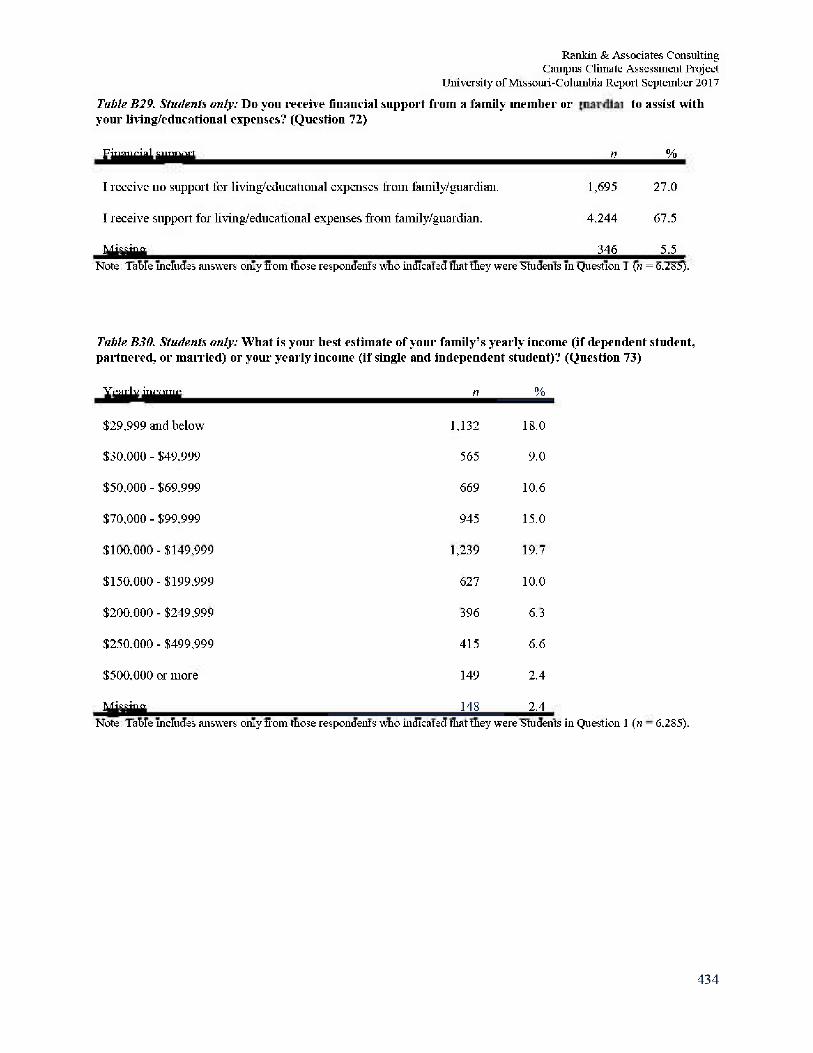
Rankin & Associates Consulting Campus Climate Assessment Project
University of Missouri-Columbia Report September 2017
Table B29. Students only: Do you receive financial support from a family member or guardian to assist with your living/educational expenses? (Question 72)
Financial support n %
I receive no support for living/educational expenses from family/guardian. 1,695 27.0
I receive support for living/educational expenses from family/guardian. 4.244 67.5
Missing 346 5.5 Note: Table includes answers only from those respondents who indicated that they were Students in Question 1 (n = 6,285).
Table B30. Students only: What is your best estimate of your family's yearly income (if dependent student, partnered, or married) or your yearly income (if single and independent student)? (Question 73)
Yearly income n %
$29,999 and below 1,132 18.0
$30,000 - $49,999 565 9.0
$50,000 - $69,999 669 10.6
$70,000 - $99,999 945 15.0
$100,000-$149,999 1,239 19.7
$150,000-$199,999 627 10.0
$200,000 - $249,999 396 6.3
$250,000 - $499,999 415 6.6
$500,000 or more 149 2.4
Missing 148 2.4 Note: Table includes answers only front those respondents who indicated that they were Students in Question 1 (n = 6,285).
434
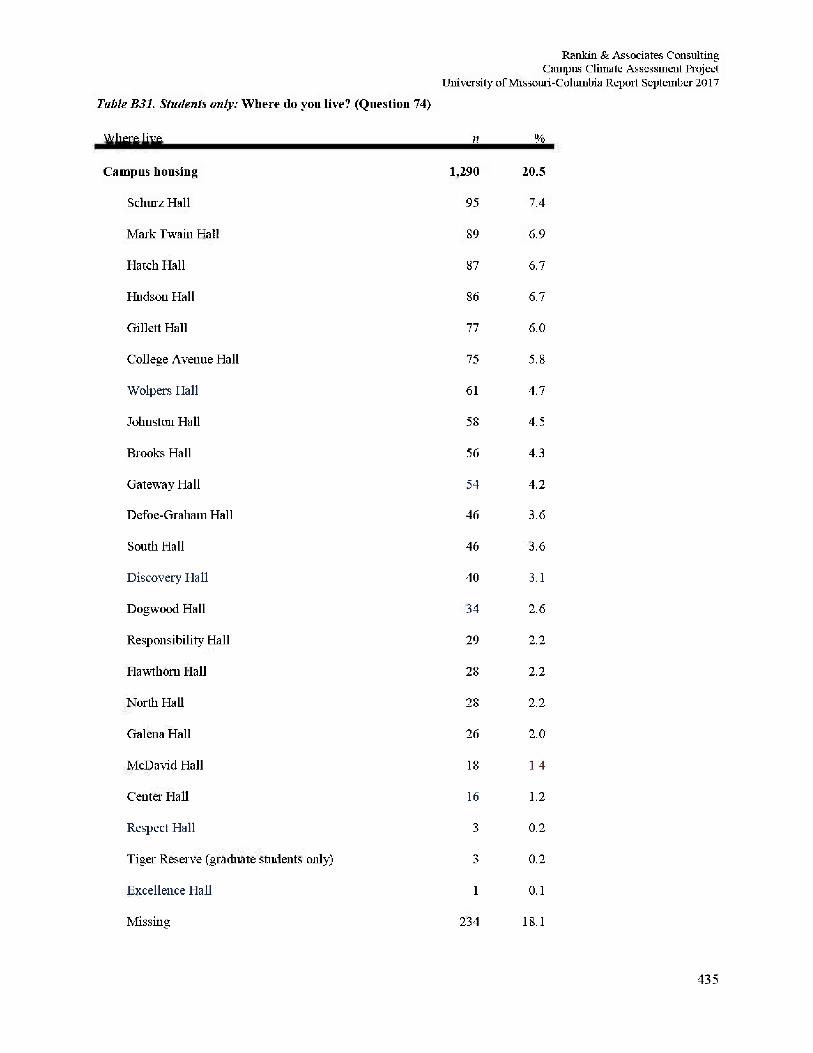
Rankin & Associates Consulting Campus Climate Assessment Project
University of Missouri-Columbia Report September 2017
Table B31. Students only: Where do you live? (Question 74)
Where live h %
Camp us housing 1,290 20.5
Schurz Hall 95 7.4
Mark Twain Hall 89 6.9
Hatch Hall 87 6.7
Hudson Hall 86 6.7
Gillett Hall 77 6.0
College Avenue Hall 75 5.8
Wolpers Hall 61 4.7
Johnston Hall 58 4.5
Brooks Hall 56 4.3
Gateway Hall 54 4.2
Defoe-Graham Hall 46 3.6
South Hall 46 3.6
Discovery Hall 40 3.1
Dogwood Hall 34 2.6
Responsibility Hall 29 2.2
Hawthorn Hall 28 2.2
North Hall 28 2.2
Galena Hall 26 2.0
McDavid Hall 18 1.4
Center Hall 16 1.2
Respect Hall 3 0.2
Tiger Reserve (graduate students only) 3 0.2
Excellence Hall 1 0.1
Missing 234 18.1
435
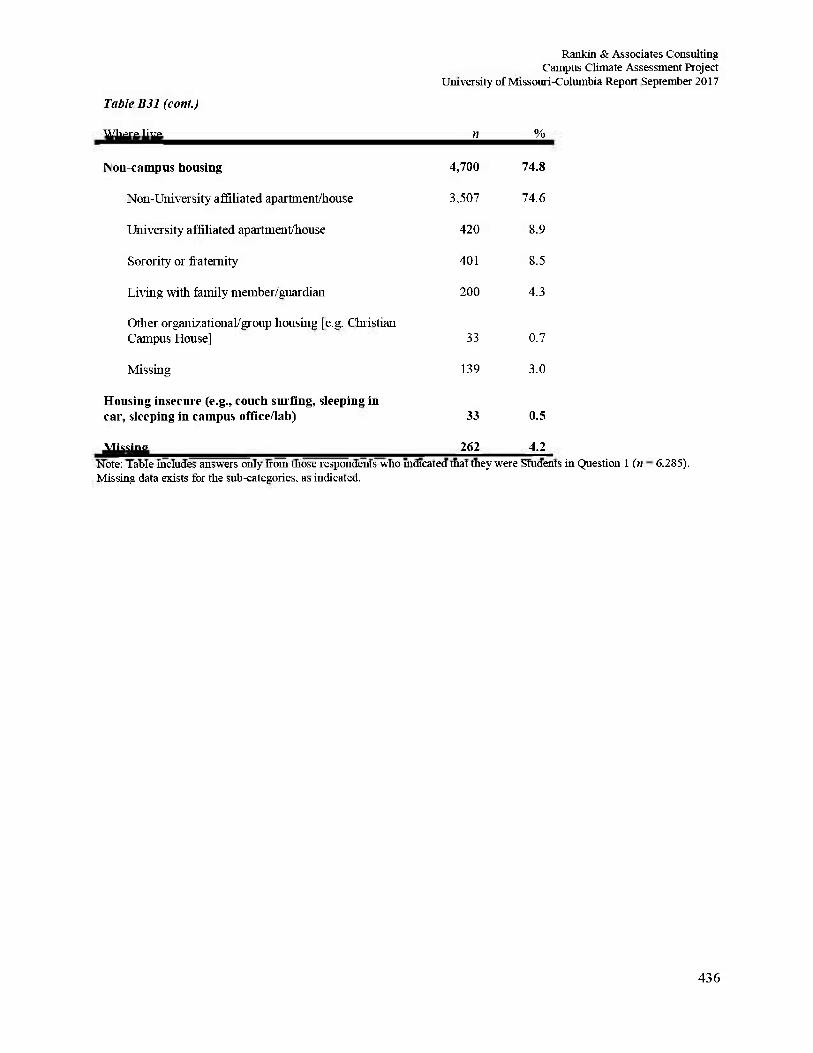
Rankin & Associates Consulting Campus Climate Assessment Project
University of Missouri-Columbia Report September 2017
Table B31 (cont.)
Where live n %
Non-campus housing 4,700 74.8
Non-University affiliated apartment/house 3.507 74.6
University affiliated apartment/house 420 8.9
Sorority or fraternity 401 8.5
Living with family member/guardian 200 4.3
Other organizational/group housing [e.g. Christian Campus House] 33 0.7
Missing 139 3.0
Housing insecure (e.g., couch surfing, sleeping in car, sleeping in campus office/lab) 33 0.5
Missing 262 4.2 Note: Table includes answers only from those respondents who indicated that they were Students in Question 1 (n = 6.285). Missing data exists for the sub-categories, as indicated.
436
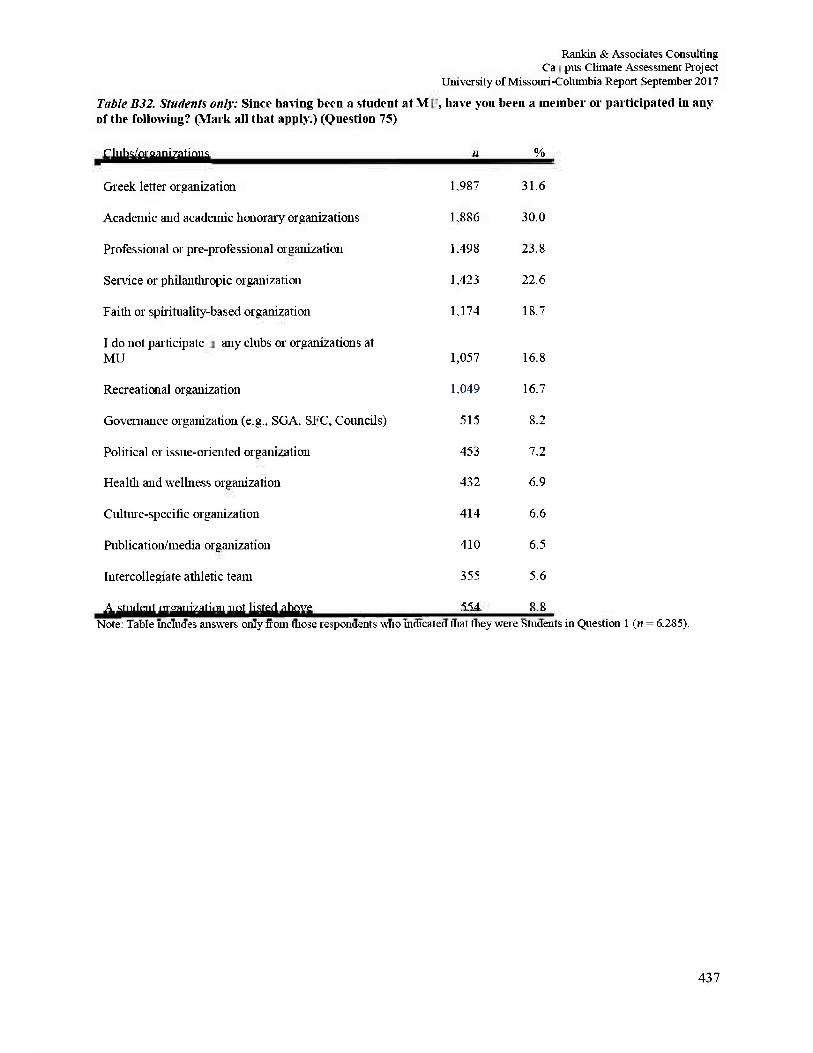
Rankin & Associates Consulting C a p u s Climate Assessment Project
University of Missouri-Columbia Repot September 2017
Table B32. Students only: Since having been a student at MU, have you been a member or participated in any of the following? (Mark all that apply.) (Question 75)
Clubs/organizations
Greek letter organization
11
1,987
% 31.6
Academic and academic honorary organizations 1,886 30.0
Professional or pre-professional organization 1.498 23.8
Service or philanthropic organization 1,423 22.6
Faith or spirituality-based organization 1.174 18.7
I do not participate in any clubs or organizations at MU 1,057 16.8
Recreational organization 1.049 16.7
Governance organization (e.g., SGA, SFC, Councils) 515 8.2
Political or issue-oriented organization 453 7.2
Health and wellness organization 432 6.9
Culture-specific organization 414 6.6
Publication/media organization 410 6.5
Intercollegiate athletic team 355 5.6
A student organization not listed above 554 8.8 Note: Table includes answers only from those respondents who indicated that they were Students in Question 1 (n = 6.285).
437
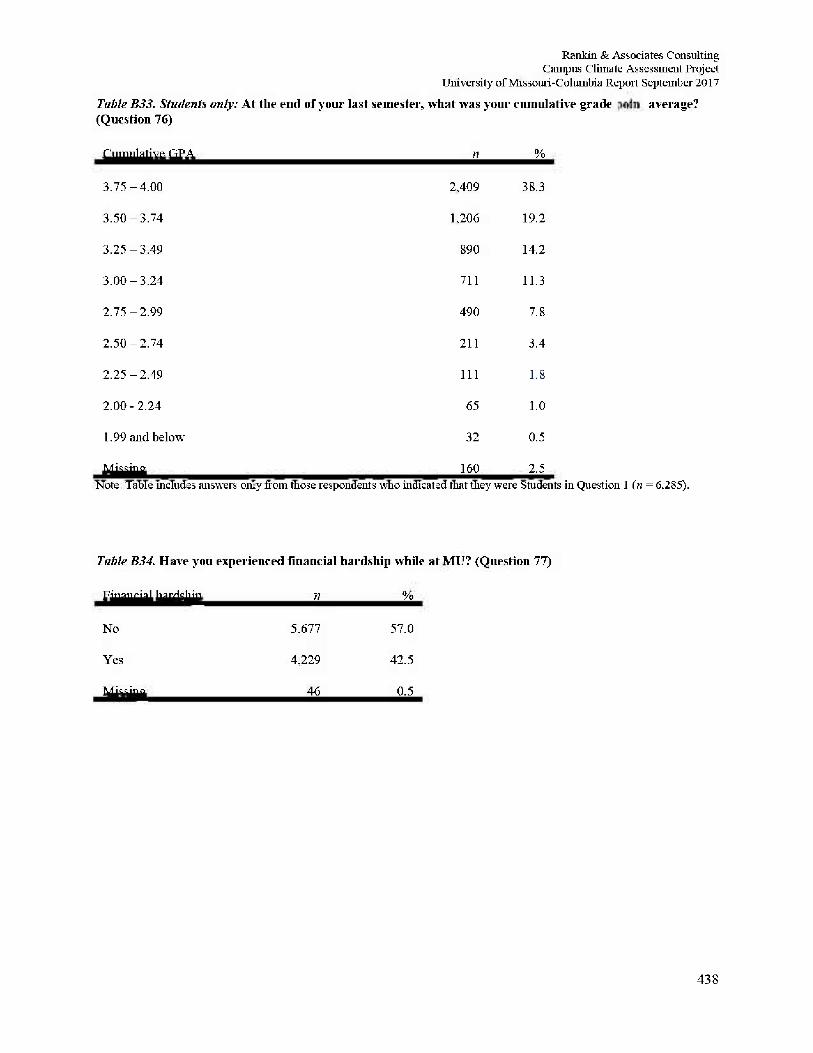
Rankin & Associates Consulting Campus Climate Assessment Project
University of Missouri-Columbia Report September 2017
Table B33. Students only: At the end of your last semester, what was your cumulative grade point average? (Question 76)
Cumulative GPA
3.75-4.00
n
2,409
% 38.3
3.50-3.74 1,206 19.2
3.25-3.49 89 0 14.2
3.00-3.24 711 11.3
2.75-2.99 490 7.8
2.50-2.74 211 3.4
2.25-2.49 111 1.8
2.00-2.24 65 1.0
1.99 and below 32 0.5
Missing 160 2.5 Note: Table includes answers only from those respondents who indicated that they were Students in Question 1 (n = 6,285).
438
Table B34. Have you experienced financial hardship while at MU? (Question 77)
Financial hardship T1 %
No 5.677 57.0
Yes 4,229 42.5
Missing 46 0.5
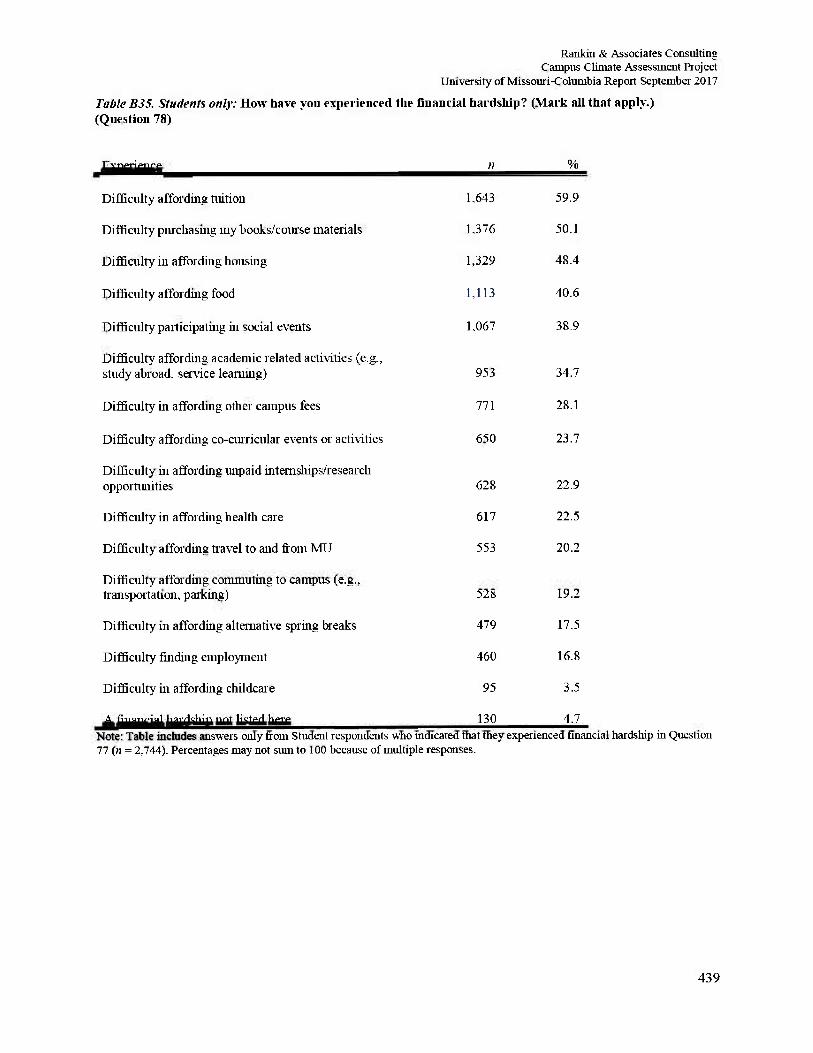
Rankin & Associates Consulting Campus Climate Assessment Project
University of Missouri-Columbia Report September 2017
Table B35. Students only: How have you experienced the financial hardship? (Mark all that apply.) (Question 78)
Experience n %
Difficulty affording tuition 1.643 59.9
Difficulty purchasing my books/course materials 1.376 50.1
Difficulty in affording housing 1,329 48.4
Difficulty affording food 1,113 40.6
Difficulty participating in social events 1,067 38.9
Difficulty affording academic related activities (e.g., study abroad, service learning) 953 34.7
Difficulty in affording other campus fees 771 28.1
Difficulty affording co-curricular events or activities 650 23.7
Difficulty in affording unpaid internships/research opportunities 628 22.9
Difficulty in affording health care 617 22.5
Difficulty affording travel to and from MU 553 20.2
Difficulty affording commuting to campus (e.g., transportation, parking) 528 19.2
Difficulty in affording alternative spring breaks 479 17.5
Difficulty finding employment 460 16.8
Difficulty in affording childcare 95 3.5
A financial hardship not listed here 130 4.7 Note: Table includes answers only from Student respondents who indicated that they experienced financial hardship in Question 77 (n = 2,744). Percentages may not sum to 100 because of multiple responses.
439
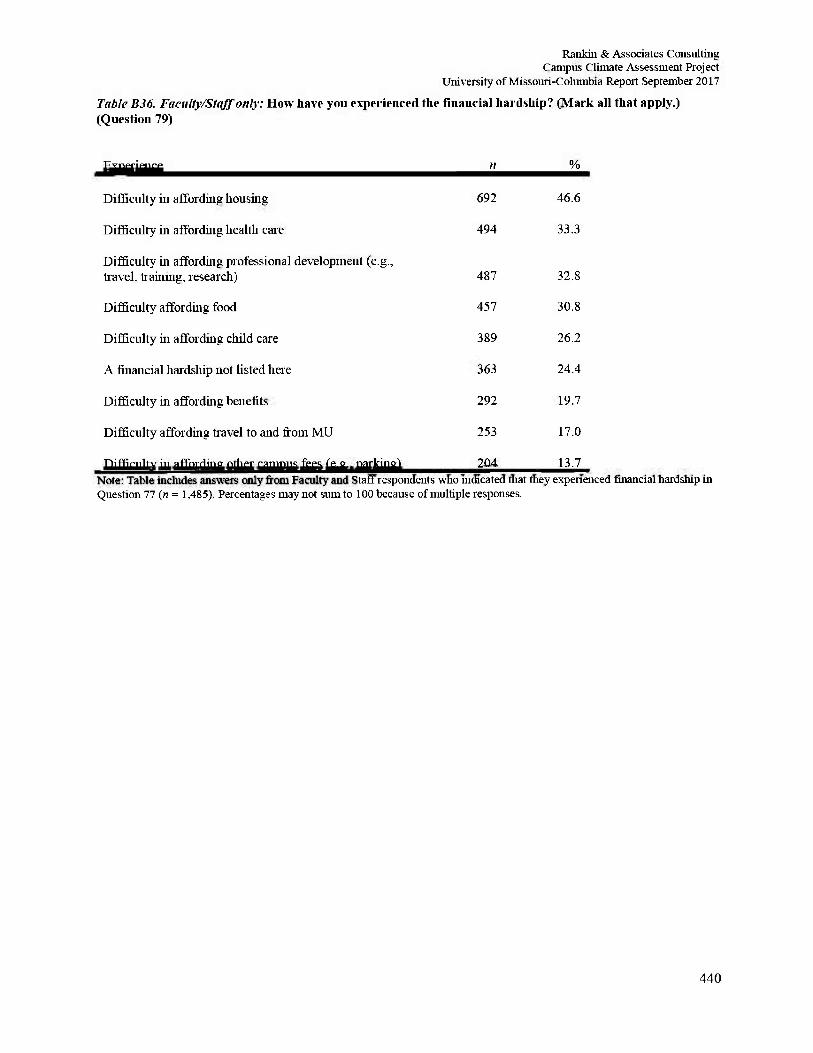
Rankin & Associates Consulting Campus Climate Assessment Project
University of Missouri-Columbia Report September 2017
Table B36. Faculty/Staff only: How liave you experienced the fiuaucial hardship? (Mark all that apply.) (Question 79)
Experience n %
Difficulty hi affording housing 692 46.6
Difficulty hi affording health care 494 33.3
Difficulty in affording professional development (e.g., travel, training, research) 487 32.8
Difficulty affording food 457 30.8
Difficulty hi affording child care 389 26.2
A financial hardship not listed here 363 24.4
Difficulty hi affording benefits 292 19.7
Difficulty affording travel to and from MU 253 17.0
Difficulty hi affording other campus fees (e.g.. parking) 204 13.7 Note: Table includes answers only from Faculty and Staff respondents who indicated that they experienced financial hardship hi Question 77 (n = 1.485). Percentages may not sum to 100 because of multiple responses.
440
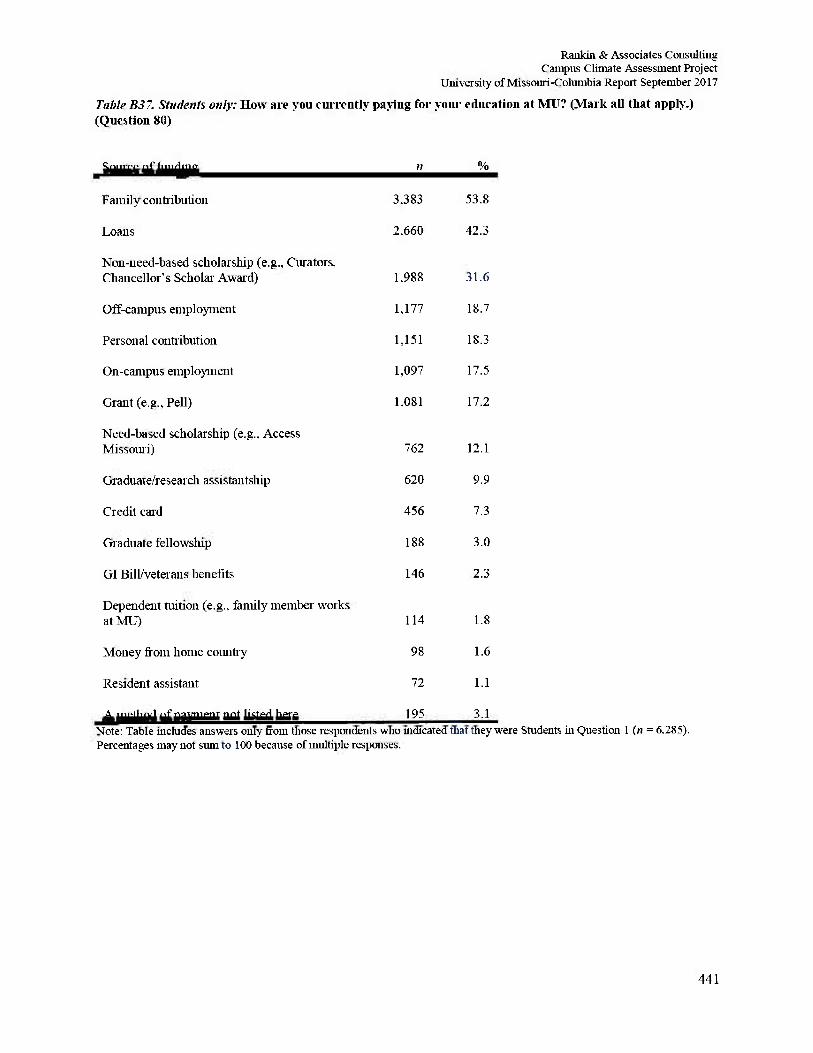
Rankin & Associates Consulting Campus Climate Assessment Project
University of Missouri-Columbia Report September 2017
Table B37. Students only: How are you currently paying for your education at MU? (Mark all that apply.) (Question 80)
Source of funding n %
Family contribution 3,383 53.8
Loans 2,660 42.3
Non-need-based scholarship (e.g., Curators, Chancellor's Scholar Award) 1.988 31.6
Off-campus employment 1,177 18.7
Personal contribution 1,151 18.3
On-campus employment 1,097 17.5
Grant (e.g., Pell) 1.081 17.2
Need-based scholarship (e.g.. Access Missouri) 762 12.1
Graduate/research assistantship 620 9.9
Credit card 456 7.3
Graduate fellowship 188 3.0
GI Bill/veterans benefits 146 2.3
Dependent tuition (e.g., family member works at MU) 114 1.8
Money from home country 98 1.6
Resident assistant 72 1.1
A method of payment not listed here 195 3.1 Note: Table includes answers only from those respondents who indicated that they were Students in Question 1 (n = 6.285). Percentages may not sum to 100 because of multiple responses.
441
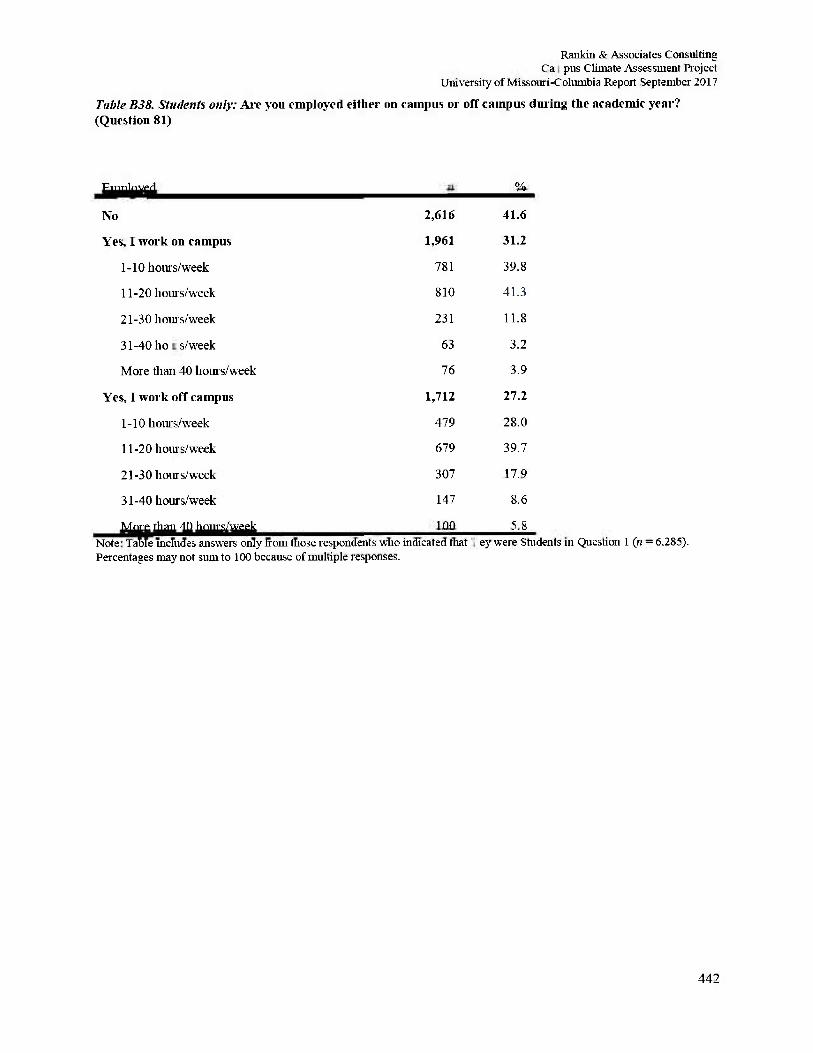
Rankin & Associates Consulting C a p u s Climate Assessment Project
University of Missouri-Columbia Repot September 2017
Table B38. Students only: Are you employed either on campus or off campus during the academic year? (Question 81)
Employed %
No 2,616 41.6
Yes, I work on campus 1,961 31.2
1-10 hours/week 781 39.8
11-20 hours/week 810 41.3
21-30 hours/week 231 11.8
31-40 hours/week 63 3.2
More than 40 hours/week 76 3.9
Yes, I work off campus 1,712 27.2
1-10 hours/week 479 28.0
11-20 hours/week 679 39.7
21-30 hours/week 307 17.9
31-40 hours/week 147 8.6
More titan 40 hours/week 100 5.8 Note: Table includes answers only from those respondents who indicated that they were Students in Question 1 (n = 6.285). Percentages may not stun to 100 because of multiple responses.
442
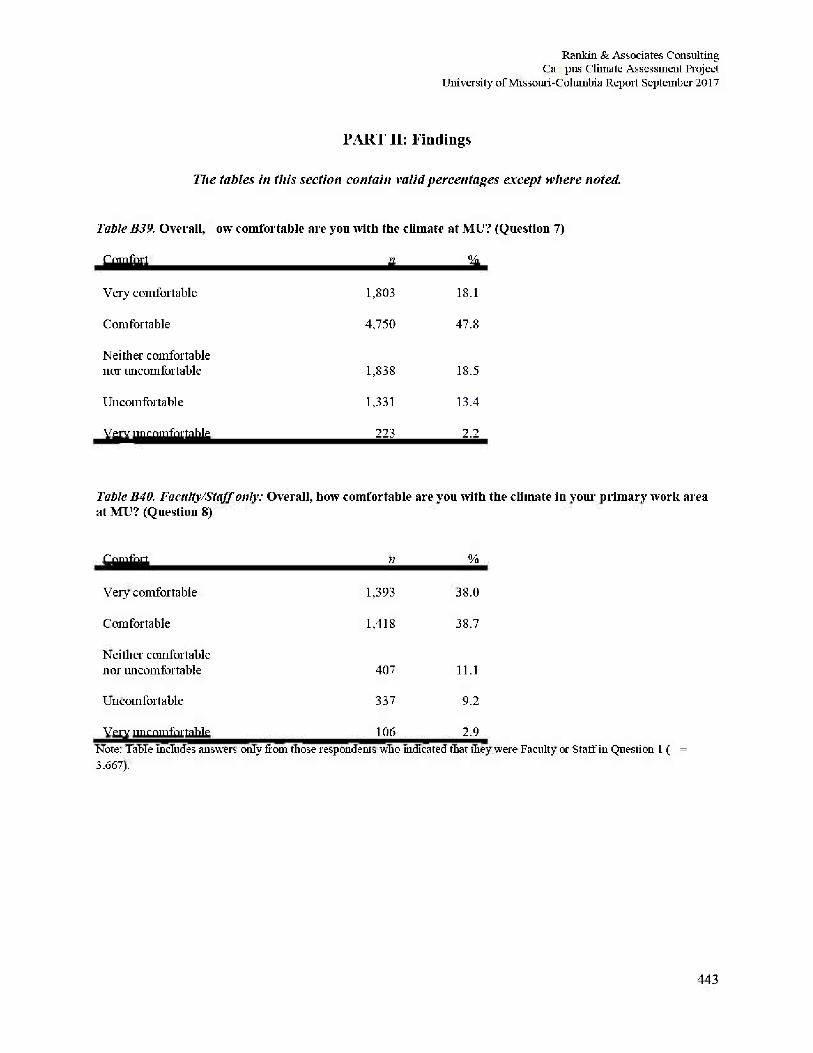
Rankin & Associates Consulting C a p u s Climate Assessment Project
University of Missouri-Columbia Repot September 2017
PART II: Findings
The tables in this section contain valid percentages except where noted.
Table B39. Overall, how comfortable are you with the climate at ML1? (Question 7)
Comfort n % Comfort
Very comfortable
n
1,803
% 18.1
Comfortable 4,750 47.8
Neither comfortable nor uncomfortable 1,838 18.5
Uncomfortable 1,331 13.4
Very uncomfortable 223 2.2
Table B40. Faculty/Staff only: Overall, how comfortable are you with the climate in your primary work area at MU? (Question 8)
Comfort n %
Very comfortable 1,393 38.0
Comfortable 1,418 38.7
Neither comfortable nor uncomfortable 407 11.1
Uncomfortable 337 9.2
Very uncomfortable 106 2.9 Note: Table includes answers only from those respondents who indicated that they were Faculty or Staff in Question 1 (n = 3.667).
443
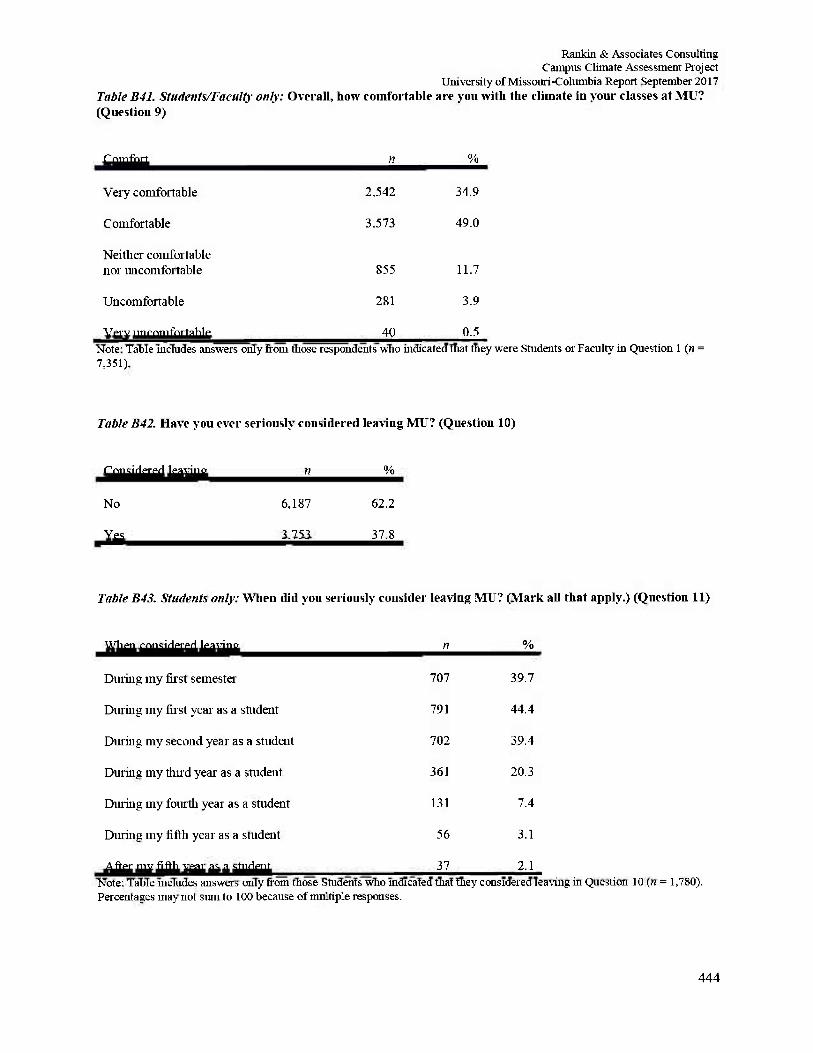
Rankin & Associates Consulting Campus Climate Assessment Project
University of Missouri-Columbia Report September 2017 V J l i l V V l l J l l J f i I T l l O J V L U 1 X" — V 1
Table B41. Students/Faculty only: Overall, how comfortable are you with the climate in your classes at MU? (Question 9)
Comfort n %
Very comfortable 2.542 34.9
Comfortable 3,573 49.0
Neither comfortable nor uncomfortable 855 11.7
Uncomfortable 281 3.9
Very uncomfortable 40 0.5 Note: Table includes answers only from those respondents who indicated that they were Students or Faculty in Question 1 (« = 7,351).
Table B42. Have you ever seriously considered leaving MU? (Question 10)
Considered leaving n %
No 6,187 62.2
Yes 3,753 37.8
Table B43. Students only: When did you seriously consider leaving MU? (Mark all that apply.) (Question 11)
When considered leaving n %
Duting my first semester 707 39.7
During my first year as a student 791 44.4
During my second year as a student 702 39.4
During my thu d year as a student 361 20.3
During my fourth year as a student 131 7.4
Duting my fifth year as a student 56 3.1
After my fifth year as a student 37 2.1 Note: Table includes answers only from those Students who indicated that they considered leaving in Question 10 (n = 1,780). Percentages may not sum to 100 because of multiple responses.
444
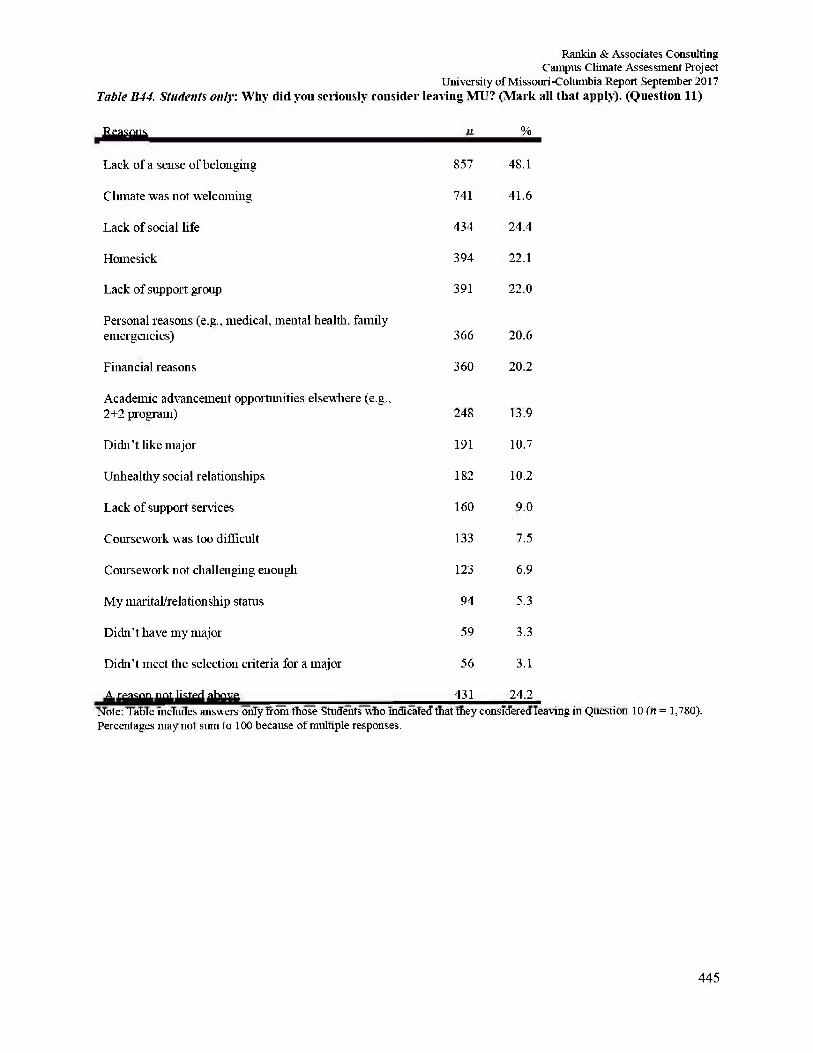
Rankin & Associates Consulting Campus Climate Assessment Project
University of Missouri-Columbia Report September 2017 Table B44. Students only: Why did you seriously consider leaving MU? (Mark all that apply). (Question 11)
Reasons n %
Lack of a sense of belonging 857 48.1
CInnate was not welcoming 741 41.6
Lack of social life 434 24.4
Homesick 394 22.1
Lack of support group 391 22.0
Personal reasons (e.g., medical, mental health, family emergencies) 366 20.6
Financial reasons 360 20.2
Academic advancement opportunities elsewhere (e.g., 2+2 program) 248 13.9
Didn't like major 191 10.7
Unhealdiy social relationships 182 10.2
Lack of support services 160 9.0
Coursework was too difficult 133 7.5
Coursework not challenging enough 123 6.9
My marital/relationship status 94 5.3
Didn't have my major 59 3.3
Didn't meet the selection criteria for a major 56 3.1
A reason not listed above 431 24.2 Note: Table includes answers only from those Students who indicated that they considered leaving in Question 10 (n = 1,780). Percentages may not sum to 100 because of multiple responses.
445
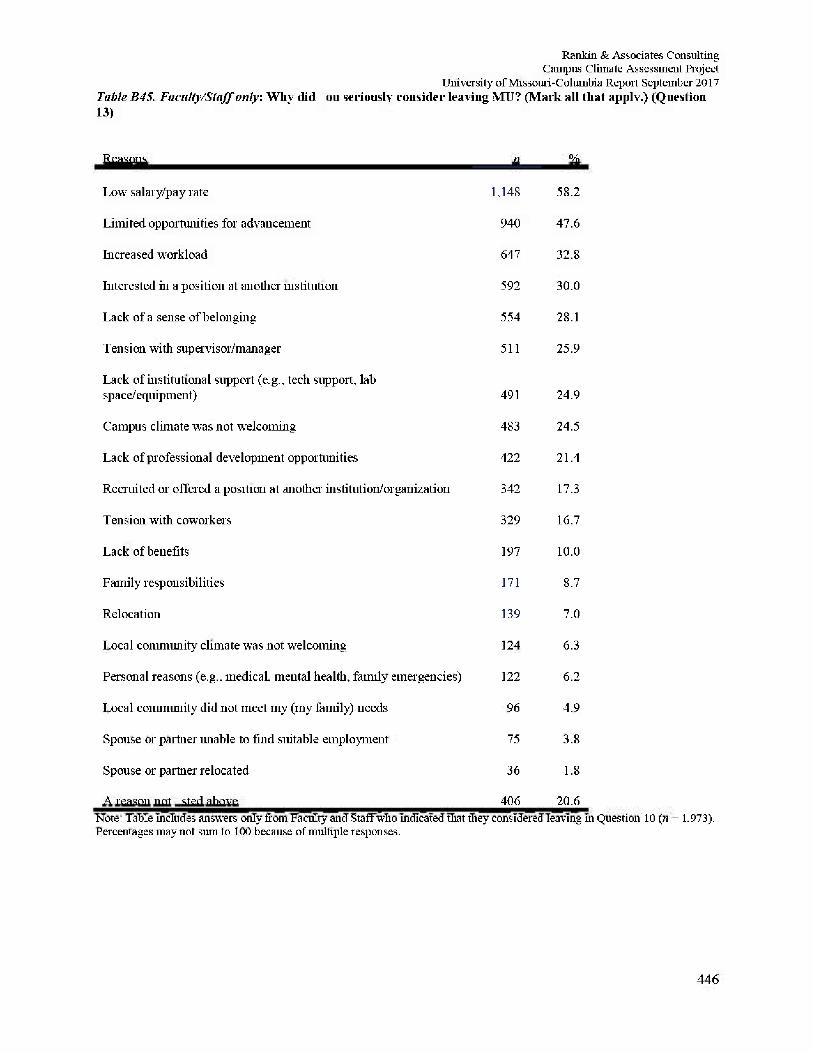
Rankin & Associates Consulting Campus Climate Assessment Project
University of Missouri-Columbia Report September 2017 Table B45. Faculty/Staff only. Why did you seriously consider leaving MU? (Mark all that applv.) (Question 13)
Reasons n %
Low salary/pay rate 1.148 58.2
Limited opportunities for advancement 940 47.6
Increased workload 647 32.8
Interested hi a position at another institution 592 30.0
Lack of a sense of belonging 554 28.1
Tension with supervisor/manager 511 25.9
Lack of institutional support (e.g., tech support, lab space/equipment) 491 24.9
Campus climate was not welcoming 483 24.5
Lack of professional development opportunities 422 21.4
Recruited or offered a position at another institution/organization 342 17.3
Tension with coworkers 329 16.7
Lack of benefits 197 10.0
Family responsibilities 171 8.7
Relocation 139 7.0
Local community climate was not welcoming 124 6.3
Personal reasons (e.g.. medical, mental health, family emergencies) 122 6.2
Local community did not meet my (my family) needs 96 4.9
Spouse or partner unable to find suitable employment 75 3.8
Spouse or partner relocated 36 1.8
A reason not listed above 406 20.6 Note: Table includes answers only from Faculty and Staff who indicated that they considered leaving in Question 10 (« = 1.973). Percentages may not sum to 100 because of multiple responses.
446
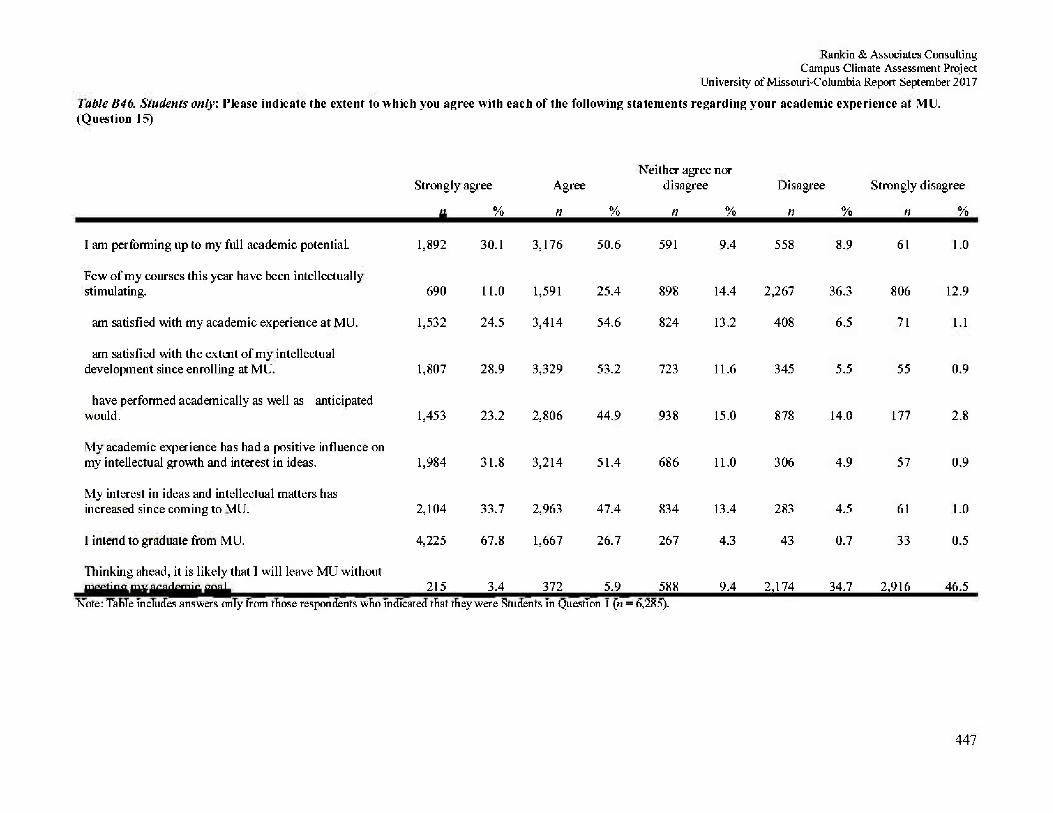
Rankin & Associates Consulting Campus Climate Assessment Project
University of Missouri-Columbia Report September 2017
Table B46. Students only. Please indicate the extent to which you agree with each of the following statements regarding your academic experience at MU. (Question 15)
Strongly agree Agree Neither agree nor
disagree Disagree Strongly disagree
n % n % n % n % n %
I am performing up to my full academic potential. 1,892 30.1 3,176 50.6 591 9.4 558 8.9 61 1.0
Few of my courses this year have been intellectually stimulating. 690 11.0 1,591 25.4 898 14.4 2,267 36.3 806 12.9
I am satisfied with my academic experience at MU. 1,532 24.5 3,414 54.6 824 13.2 408 6.5 71 1.1
I am satisfied with the extent of my intellectual development since enrolling at MU. 1,807 28.9 3,329 53.2 723 11.6 345 5.5 55 0.9
I have performed academically as well as I anticipated I would. 1,453 23.2 2,806 44.9 938 15.0 878 14.0 177 2.8
My academic experience has had a positive influence on my intellectual growth and interest in ideas. 1,984 31.8 3,214 51.4 686 11.0 306 4.9 57 0.9
My interest in ideas and intellectual matters has increased since coming to MU. 2,104 33.7 2,963 47.4 834 13.4 283 4.5 61 1.0
I intend to graduate from MU. 4,225 67.8 1,667 26.7 267 4.3 43 0.7 33 0.5
Thinking ahead, it is likely that I will leave MU without meeting my academic goal. 215 3.4 372 5.9 588 9.4 2,174 34.7 2,916 46.5
Note: Table includes answers only from those respondents who indicated that they were Students in Question 1 {n = 6,285).
447
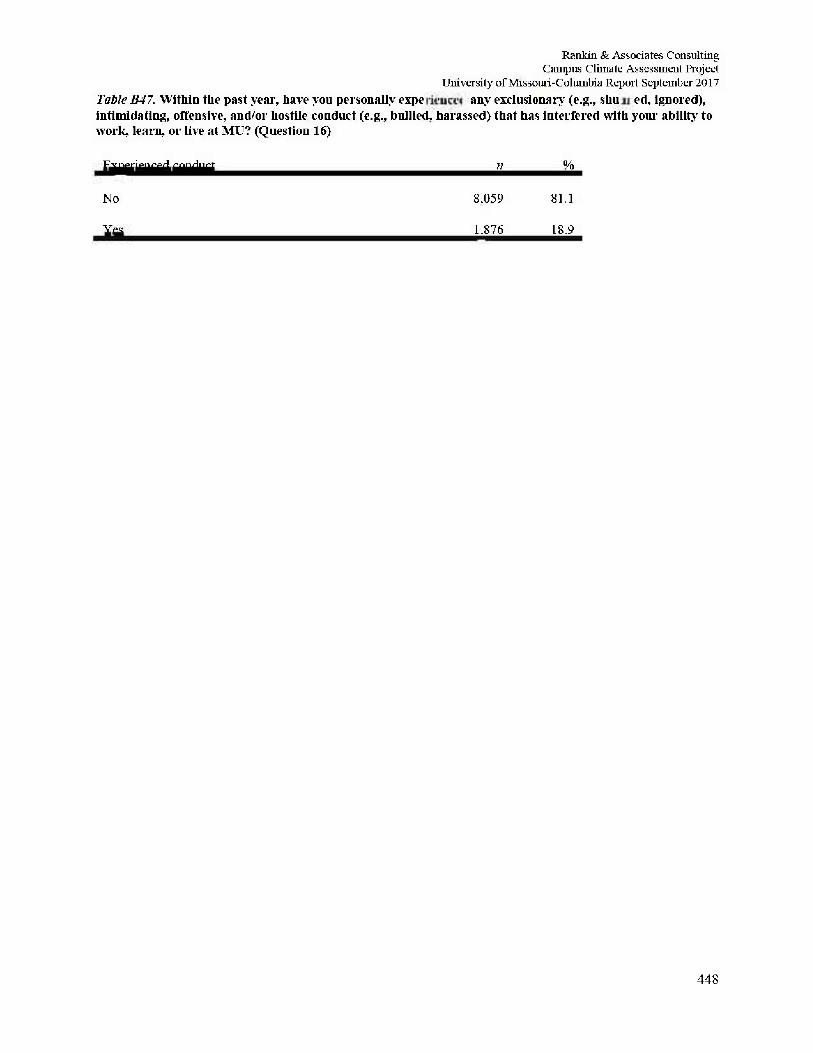
Rankin & Associates Consulting Campus Climate Assessment Project
University of Missouri-Columbia Report September 2017 Table B47. Within the past year, have you personally experienced any exclusionary (e.g., shunned, ignored), intimidating, offensive, and/or hostile conduct (e.g., bullied, harassed) that has interfered with your ability to work, learn, or live at MU? (Question 16)
448
Experienced conduct 71 %
No 8,059 81.1
Yes 1,876 18.9
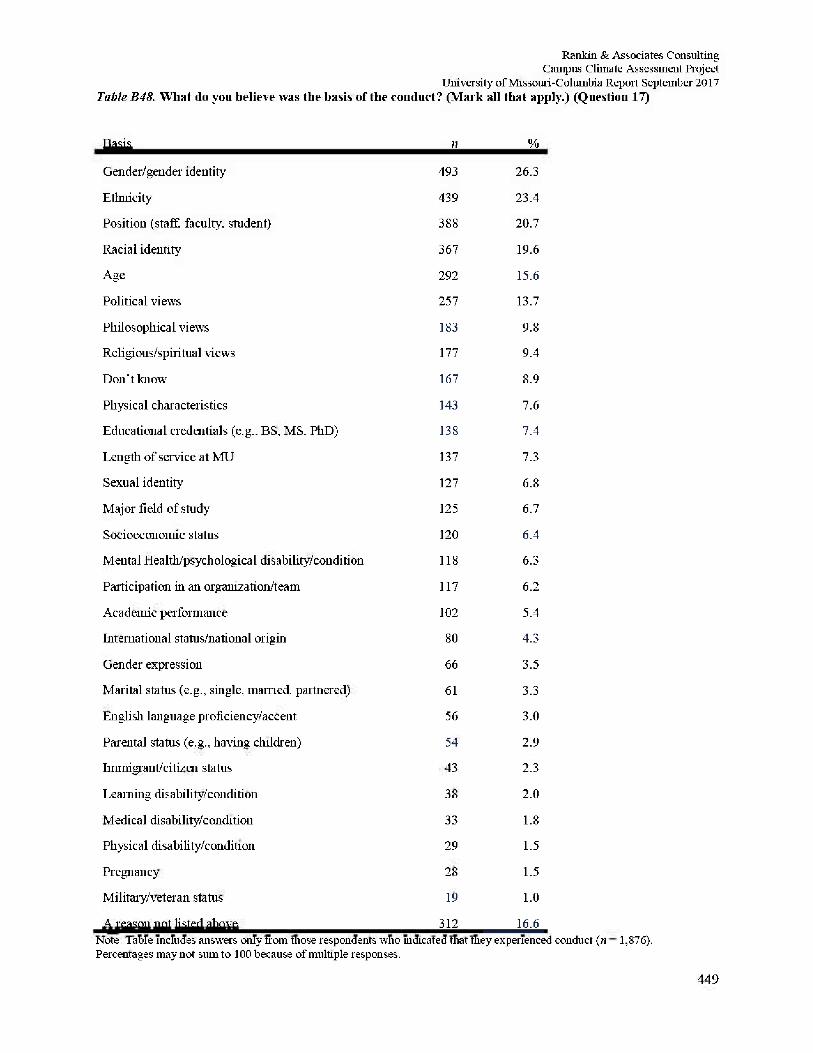
Rankin & Associates Consulting Campus Climate Assessment Project
University of Missouri-Columbia Report September 2017 Table B48. What do you believe was the basis of the conduct? (Mark all that apply.) (Question 17)
Basis n %
Gender/gender identity 493 26.3
Ethnicity 439 23.4
Position (staff, faculty, student) 388 20.7
Racial identity 367 19.6
Age 292 15.6
Political view's 257 13.7
Philosophical view's 183 9.8
Religious/spiritual views 177 9.4
Don't know 167 8.9
Physical characteristics 143 7.6
Educational credentials (e.g.. BS, MS. PhD) 138 7.4
Length of service at MU 137 7.3
Sexual identity 127 6.8
Major field of study 125 6.7
Socioeconomic status 120 6.4
Mental Health/psychological disability/condition 118 6.3
Participation hi an organization/team 117 6.2
Academic performance 102 5.4
International status/national origin 80 4.3
Gender expression 66 3.5
Marital status (e.g., single, married, partnered) 61 3.3
English language proficiency/accent 56 3.0
Parental status (e.g., having children) 54 2.9
Immigrant/citizen status 43 2.3
Learning disability/condition 38 2.0
Medical disability/condition 33 1.8
Physical disability/condition 29 1.5
Pregnancy 28 1.5
Military/veteran status 19 1.0
A reason not hsted above 312 16.6 Note: Table includes answers only from those respondents who indicated that they experienced conduct (« = 1,876). Percentages may not sum to 100 because of multiple responses.
449
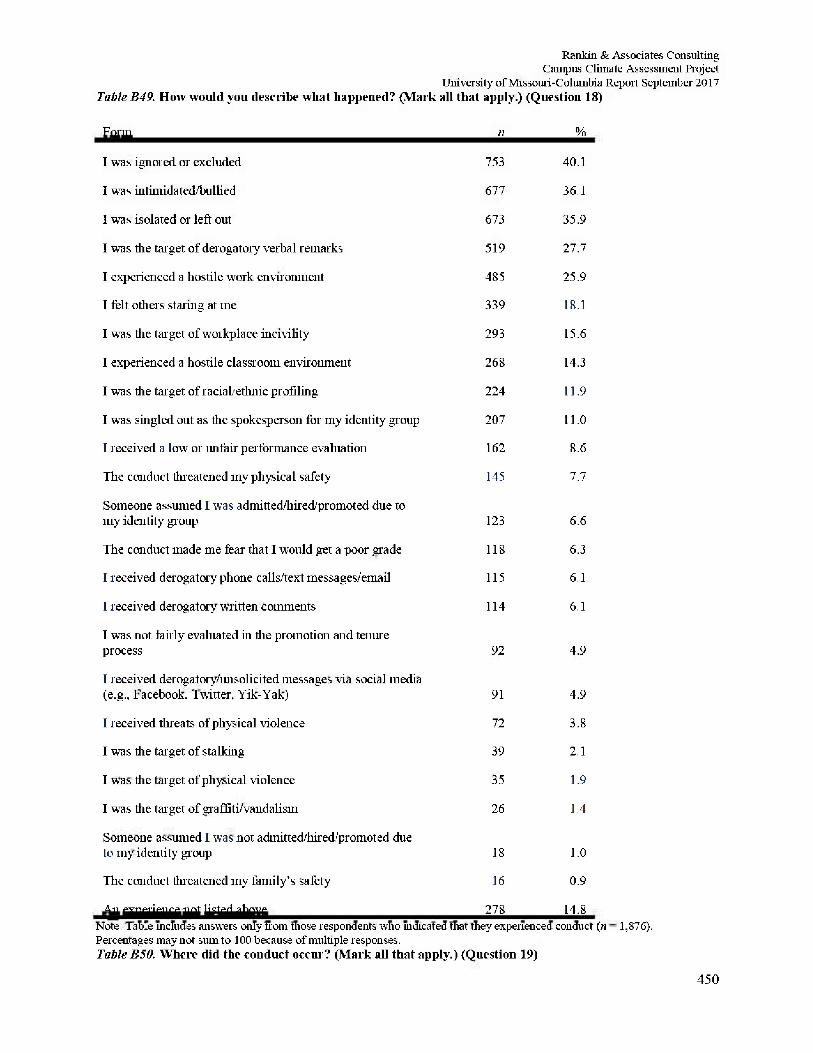
Rankin & Associates Consulting Campus Climate Assessment Project
University of Missouri-Columbia Repoit September 2017 Table B49. How would you describe what happened? (Mark all that apply.) (Question 18)
Form
I was ignored or excluded
n
753
% 40.1
I was intinii da ted/bullied 677 36.1
I was isolated or left out 673 35.9
I was the target of derogatory verbal remarks 519 27.7
I experienced a hostile work environment 485 25.9
I felt others staring at me 339 18.1
I was the target of workplace incivility 293 15.6
I experienced a hostile classroom environment 268 14.3
I was the target of racial, ethnic profiling 224 11.9
I was singled out as the spokesperson for my identity group 207 11.0
I received a low or unfair performance evaluation 162 8.6
The conduct threatened my physical safety 145 7.7
Someone assumed I was admitted/hired promoted due to my identity group 123 6.6
The conduct made me fear that I would get a poor grade 118 6.3
I received derogatory phone calls/text messages/email 115 6.1
I received derogatory written comments 114 6.1
I was not fair ly evaluated in the promotion and tenure process 92 4.9
I received derogatory/unsolicited messages via social media (e.g., Facebook. Twitter, Yik-Yak) 91 4.9
I received threats of physical violence 72 3.8
I was the target of stalking 39 2.1
I was the target of physical violence 35 1.9
I was the target of graffiti/vandalism 26 1.4
Someone assumed I was not admitted/hired promoted due to my identity* group 18 1.0
The conduct threatened my family's safety 16 0.9
An experience not listed above 278 14.8 Note: Table includes answers only from those respondents who indicated that they experienced conduct (« = 1,876). Percentages may not stun to 100 because of multiple responses. Table B50. Where did the conduct occur? (Mark all that apply.) (Question 19)
450
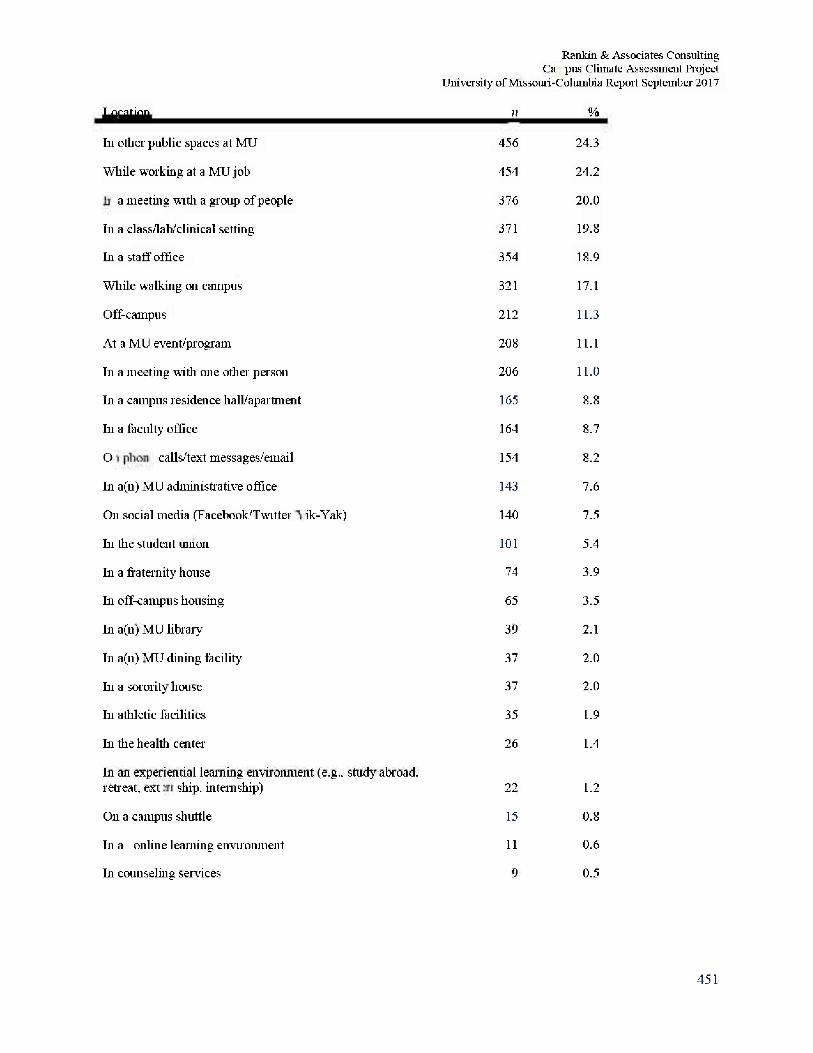
Rankin & Associates Consulting C a p u s Climate Assessment Project
University of Missouri-Columbia Repot September 2017
451
Location n %
In other public spaces at MU 456 24.3
While working at a MU job 454 24.2
In a meeting with a group of people 376 20.0
In a class/lab/clinical setting 371 19.8
In a staff office 354 18.9
While walking on campus 321 17.1
Off-campus 212 11.3
At a MU event/program 208 11.1
In a meeting with one other person 206 11.0
In a campus residence hall/apartment 165 8.8
In a faculty office 164 8.7
On phone calls/text messages/email 154 8.2
In a(n) MU administrative office 143 7.6
On social media (Facebook'Twitter Yik-Yak) 140 7.5
In the student union 101 5.4
In a fraternity house 74 3.9
In off-campus housing 65 3.5
In a(n) MU library 39 2.1
In a(n) MU dining facility 37 2.0
In a sorority house 37 2.0
In athletic facilities 35 1.9
In the health center 26 1.4
In an experiential learning environment (e.g., study abroad, retreat, externship, internship) 22 1.2
Oil a campus shuttle 15 0.8
In an online learning environment 11 0.6
In counseling services 9 0.5
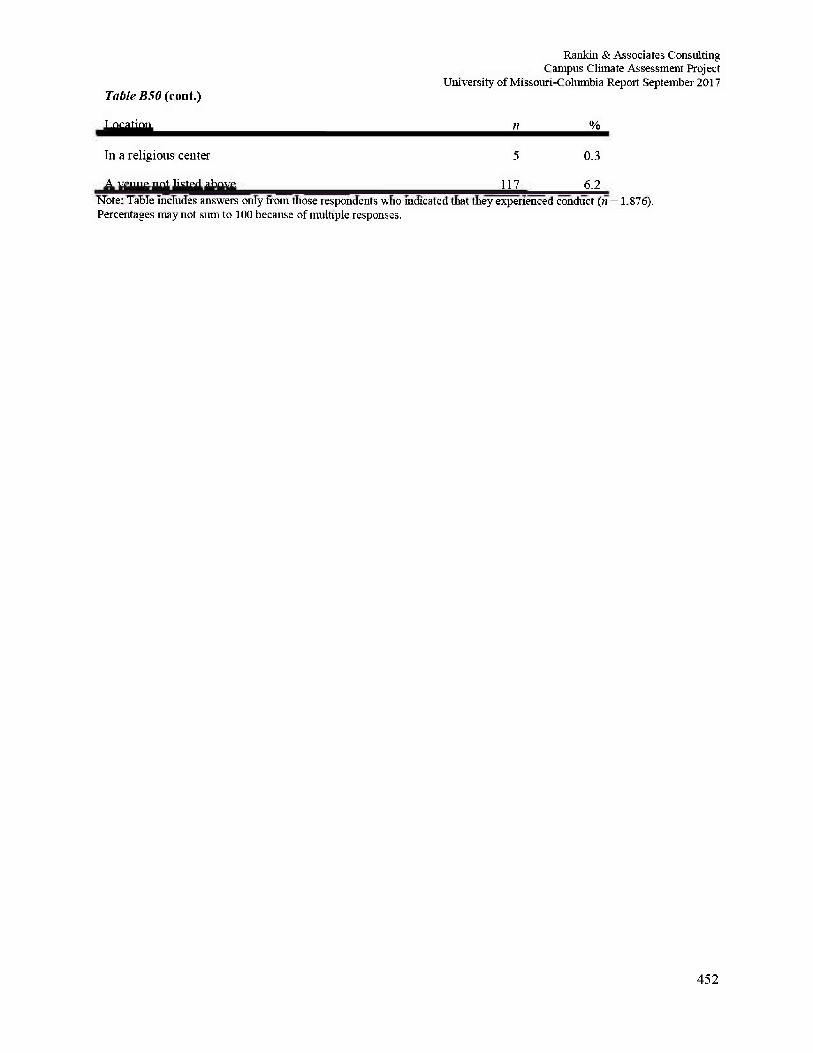
Rankin & Associates Consulting Campus Climate Assessment Project
University of Missouri-Columbia Report September 2017 Table B50 (cont.)
Location n %
In a religious center 5 0.3
A venue not listed above 117 6.2 Note: Table includes answers only from those respondents who indicated that they experienced conduct (n = 1.876). Percentages may not sum to 100 because of multiple responses.
452
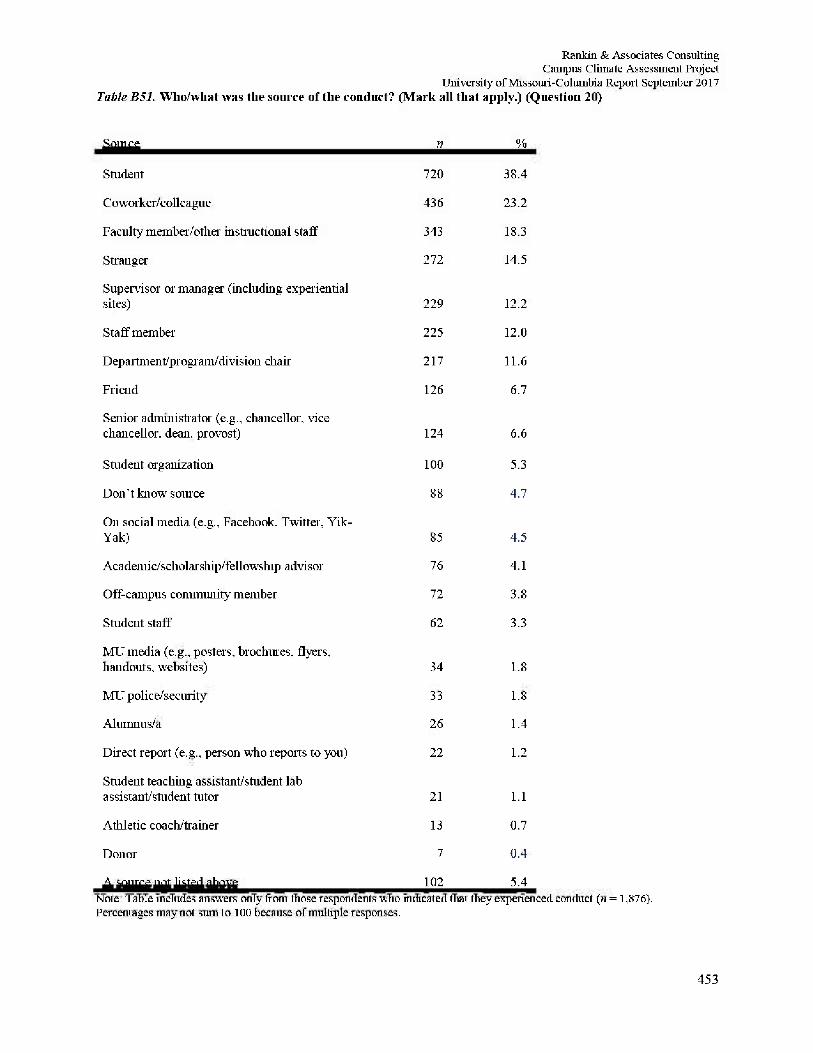
Rankin & Associates Consulting Campus Climate Assessment Project
University of Missouri-Columbia Report September 2017 Table B51. Who/what was the source of the conduct? (Mark all that apply.) (Question 20)
Somce n %
Student 720 38.4
C o worker/collea gue 436 23.2
Faculty member/other instructional staff 343 18.3
Stranger 272 14.5
Supervisor or manager (including experiential sites) 229 12.2
Staff member 225 12.0
Departmenl/program/division chair 217 11.6
Friend 126 6.7
Senior administrator (e.g., chancellor, vice chancellor, dean, provost) 124 6.6
Student organization 100 5.3
Don't know source 88 4.7
On social media (e.g., Facebook Twitter, Yik-Yak) 85 4.5
Academic/scholarship/fellowship advi s or 76 4.1
Off-campus community member 72 3.8
Student staff 62 3.3
MU media (e.g., posters, brochures, flyers, handouts, wrebsites) 34 1.8
MU police/security 33 1.8
Alumnus/a 26 1.4
Direct report (e.g., person who reports to you) 22 1.2
Student teaching assistant/student lab assistant/student tutor 21 1.1
Athletic coach/trainer 13 0.7
Donor 7 0.4
A source not hsted above 102 5.4 Note: Table includes answers only from those respondents who indicated that they experienced conduct (n = 1,876). Percentages may not sum to 100 because of multiple responses.
453
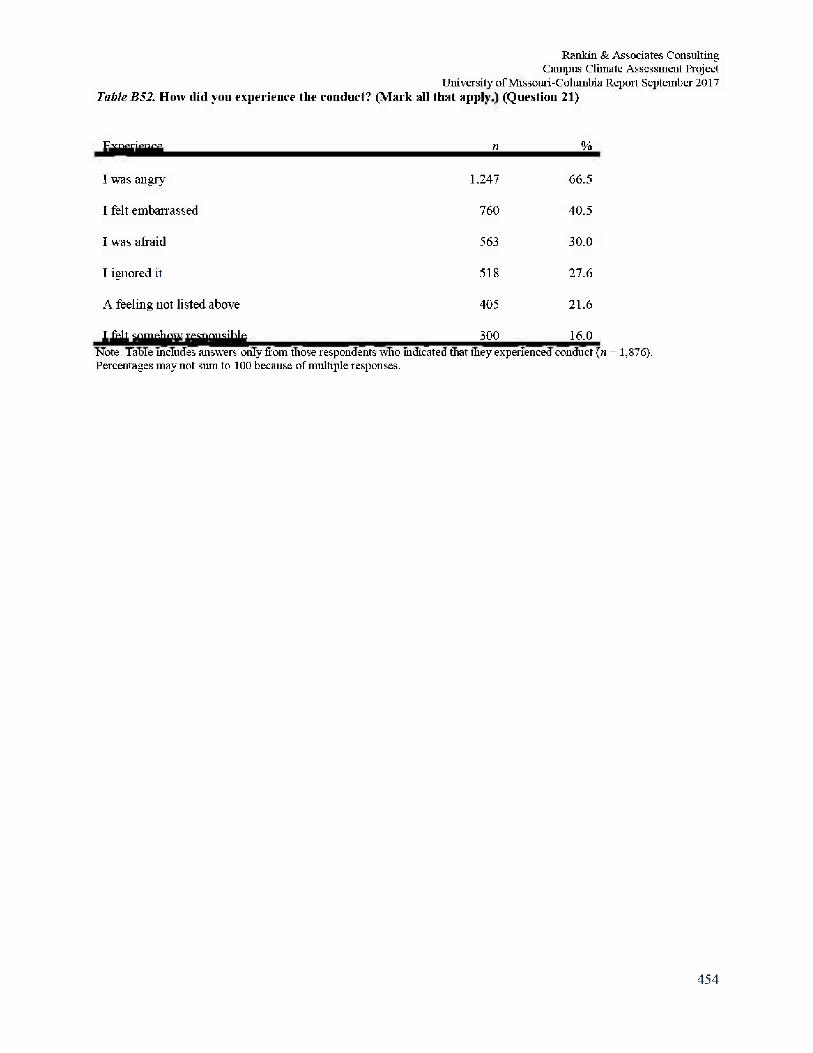
Rankin & Associates Consulting Campus Climate Assessment Project
University of Missouri-Columbia Report September 2017 Table B52. How did you experience the conduct? (Mark all that apply.) (Question 21)
Experience n %
I was angry 1.247 66.5
I felt embarrassed 760 40.5
I was afraid 563 30.0
I ignored it 518 27.6
A feel hi g not listed above 405 21.6
I felt somehow responsible 300 16.0 Note: Table includes answers only from those respondents who indicated that they experienced conduct (« = 1,876). Percentages may not sum to 100 because of multiple responses.
454
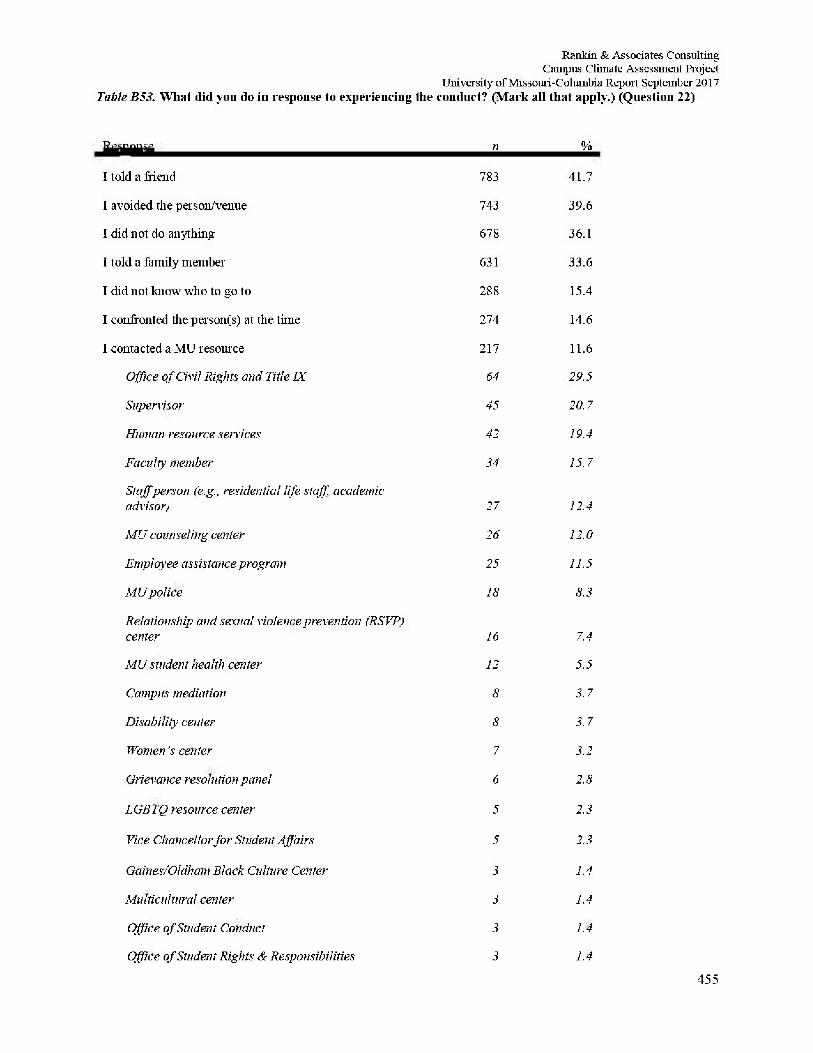
Rankin & Associates Consulting Campus Climate Assessment Project
University of Missouri-Columbia Repoit September 2017 Table B53. What did you do in response to experiencing the conduct? (Mark all that apply.) (Question 22)
Response n %
I told a friend 783 41.7
I avoided the person/venue 743 39.6
I did not do anything 678 36.1
I told a family member 631 33.6
I did not know who to go to 288 15.4
I confronted the person(s) at the time 274 14.6
I contacted a MU resource 217 11.6
Office of Civil Rights and Title IX 64 29.5
Supervisor 45 20.7
Human resource services 42 19.4
Faculty member 34 15.7
Staff person (e.g., residential life staff, academic advisor) 27 12.4
MU counseling center 26 12.0
Employee assistance program 25 11.5
MU police 18 8.3
Relationship and sexual violence prevention (RSVP) center 16 7.4
MU student health center 12 5.5
Campus mediation 8 3.7
Disability center 8 3.7
Women's center 7 3.2
Grievance resolution panel 6 2.8
LGBTQ resource center 5 2.3
Vice Chancellor for Student Affairs 5 2.3
Gaines/Oldham Black Culture Center 3 1.4
Multicultural center 3 1.4
Office of Student Conduct 3 1.4
Office of Student Rights & Responsibilities 3 1.4 455
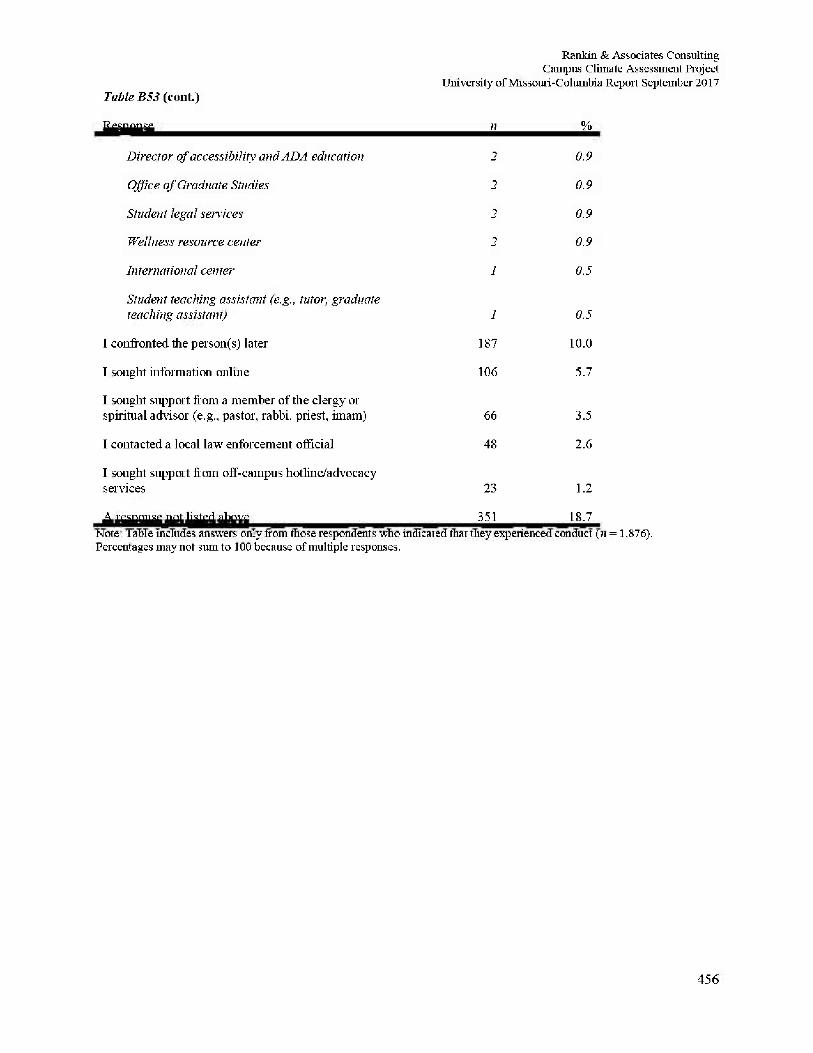
Rankin & Associates Consulting Campus Climate Assessment Project
University of Missouri-Columbia Report September 2017 Table B53 (coiit.)
Response n %
Director of accessibility and ADA education 2 0.9
Office of Graduate Studies 2 0.9
Student legal seirices 2 0.9
Wellness resource center 2 0.9
International center 1 0.5
Student teaching assistant (e.g., tutor, graduate teaching assistant) 1 0.5
I confronted the person(s) later 187 10.0
I sought information online 106 5.7
I sought support from a member of the clergy or spiritual advisor (e.g., pastor, rabbi, priest, imam) 66 3.5
I contacted a local law enforcement official 48 2.6
I sought support from off-campus hotline/advocacy services 23 1.2
A response not listed above 351 18.7 Note: Table includes answers only from those respondents who indicated that they experienced conduct (n = 1,876). Percentages may not sum to 100 because of multiple responses.
456
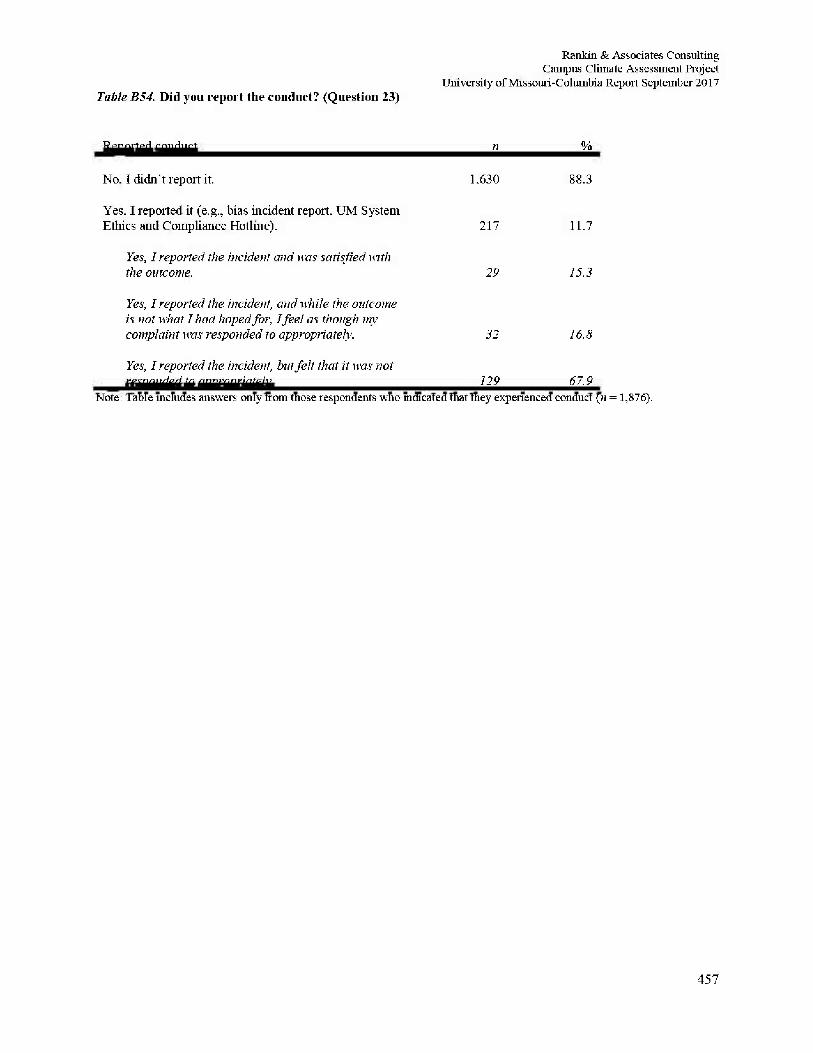
Rankin & Associates Consulting Campus Climate Assessment Project
University of Missouri-Columbia Report September 2017 Table B54. Did you report the conduct? (Question 23)
Reported conduct n %
No, I didn't report it. 1,630 88.3
Yes. I reported it (e.g., bias incident report, UM System Ethics and Compliance Hotline). 217 11.7
Yes, I reported the incident and ivas satisfied mth the outcome. 29 15.3
Yes, I reported the incident, and while the outcome is not what I had hoped for, I feel as though my complaint was responded to appropriately. 32 16.8
Yes, I reported the incident, but felt that it um not responded to appropriately. 129 67.9
Note: Table includes answers only from those respondents who indicated that they experienced conduct (« = 1,876).
457
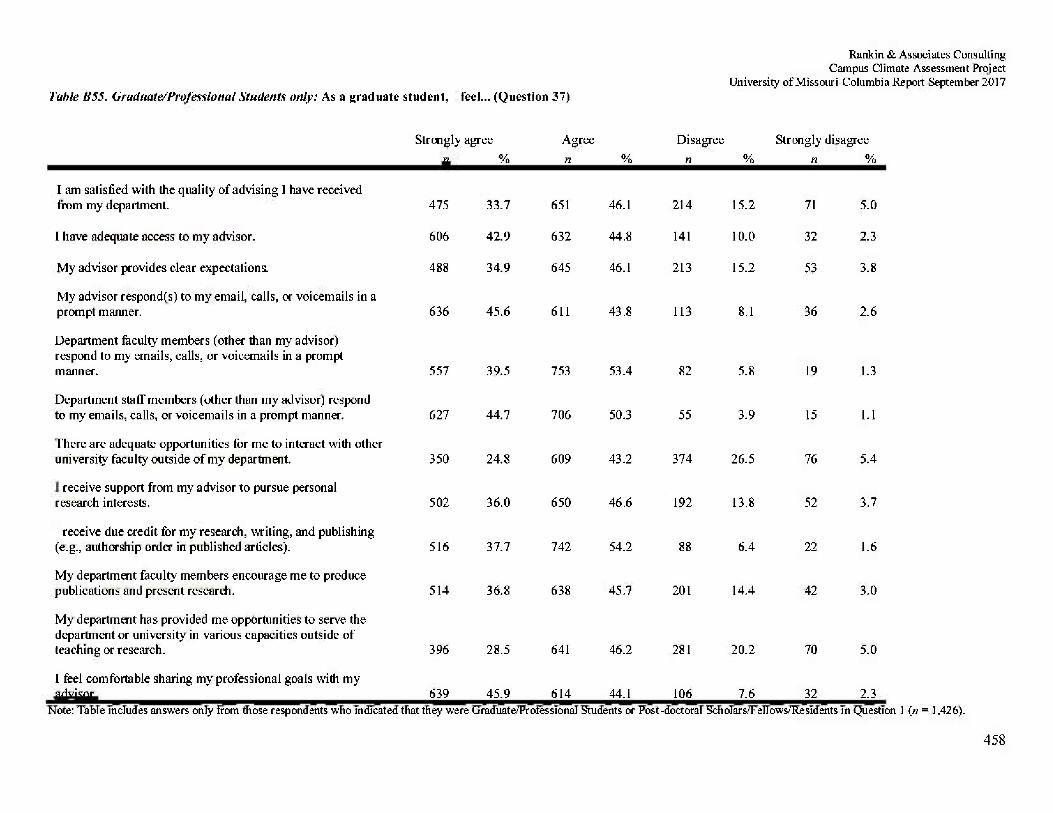
Rankin & Associates Consulting Campus Climate Assessment Project
University of Missouri-Columbia Report September 2017 Table B55. Graduate/Professional Students only: As a graduate student, I feel... (Question 37)
Strongly agree Agree Disagree Strongly disagree n % n % n % n %
I am satisfied with the quality of advising I have received from my department. 475 33.7 651 46.1 214 15.2 71 5.0
I have adequate access to my advisor. 606 42.9 632 44.8 141 10.0 32 2.3
My advisor provides clear expectations. 488 34.9 645 46.1 213 15.2 53 3.8
My advisor respond(s) to my email, calls, or voicemails in a prompt manner. 636 45.6 611 43.8 113 8.1 36 2.6
Department faculty members (other than my advisor) respond to my emails, calls, or voicemails in a prompt manner. 557 39.5 753 53.4 82 5.8 19 1.3
Department staff members (other than my advisor) respond to my emails, calls, or voicemails in a prompt manner. 627 44.7 706 50.3 55 3.9 15 1.1
There are adequate opportunities for me to interact with other university faculty outside of my department. 350 24.8 609 43.2 374 26.5 76 5.4
I receive support from my advisor to pursue personal research interests. 502 36.0 650 46.6 192 13.8 52 3.7
I receive due credit for my research, writing, and publishing (e.g., authorship order in published articles). 516 37.7 742 54.2 88 6.4 22 1.6
My department faculty members encourage me to produce publications and present research. 514 36.8 638 45.7' 201 14.4 42 3.0
My department has provided me opportunities to serve the department or university in various capacities outside of teaching or research. 396 28.5 641 46.2 281 20.2 70 5.0
1 feel comfortable sharing my professional goals with my advisor. 639 45.9 614 44.1 106 7.6 32 2.3
Note: Table includes answers only from those respondents who indicated that they were Graduate/Professional Students or Post-doctoral Scholars/Fellows/Residents in Question I {n = 1,426).
458
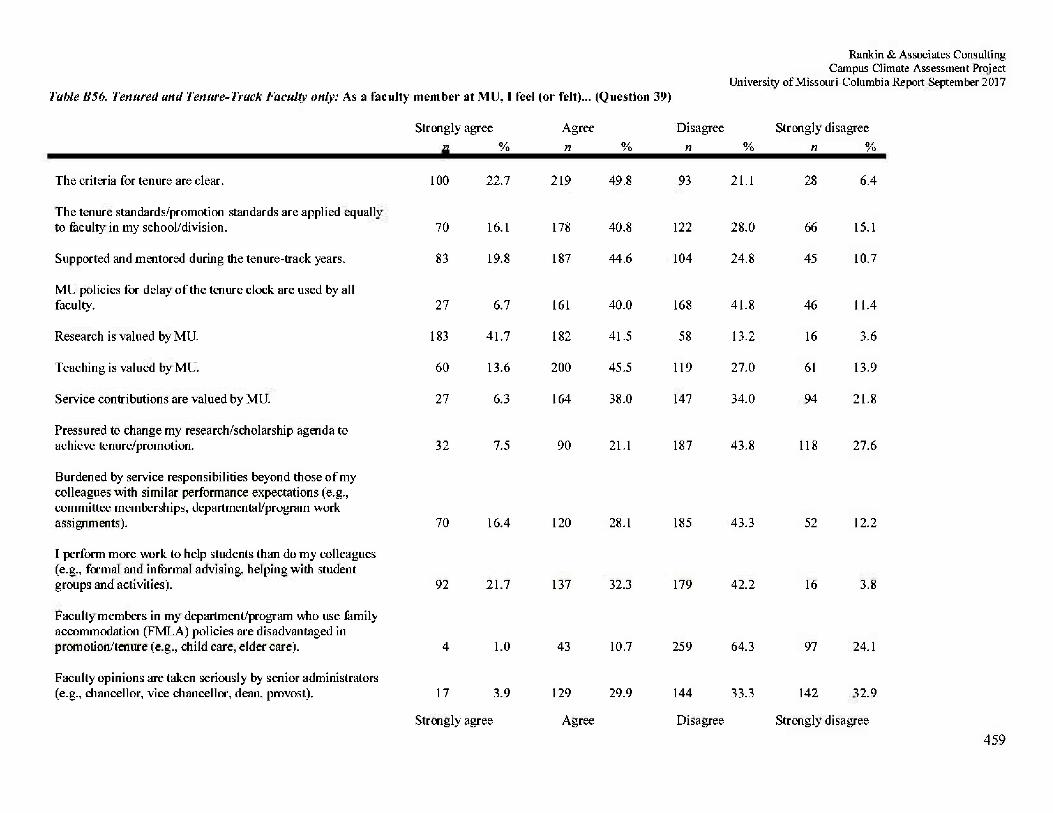
Rankin & Associates Consulting Campus Climate Assessment Project
University of Missouri-Columbia Report September 2017 Table B56. Tenured and Tenure-Truck Faculty only: As a faculty member at MU, I feel (or felt)... (Question 39)
The criteria for tenure are clear.
Strongly i n
100
igree %
22.7
Agree n
219
% 49.8
Disagree n
93
% 21.1
Strongly di n
28
sagree %
6.4
The tenure standards/promotion standards are applied equally to faculty in my school/division. 70 16.1 178 40.8 122 28.0 66 15.1
Supported and mentored during the tenure-track years. 83 19.8 187 44.6 104 24.8 45 10.7
MU policies for delay of the tenure clock are used by all faculty. 27 6.7 161 40.0 168 41.8 46 11.4
Research is valued by MU. 183 41.7 182 41.5 58 13.2 16 3.6
Teaching is valued by MU. 60 13.6 200 45.5 119 27.0 61 13.9
Service contributions are valued by MU. 27 6.3 164 38.0 147 34.0 94 21.8
Pressured to change my research/scholarship agenda to achieve tenure/promotion. 32 7.5 90 21.1 187 43.8 118 27.6
Burdened by service responsibilities beyond those of my colleagues with similar performance expectations (e.g., committee memberships, departmental/program work assignments). 70 16.4 120 28.1 185 43.3 52 12.2
I perform more work to help students than do my colleagues (e.g., formal and informal advising, helping with student groups and activities). 92 21.7 137 32.3 179 42.2 16 3.8
Faculty members in my department/program who use family accommodation (FMLA) policies are disadvantaged in promotion/tenure (e.g., child care, elder care). 4 1.0 43 10.7 259 64.3 97 24.1
Faculty opinions are taken seriously by senior administrators (e.g., chancellor, vice chancellor, dean, provost). 17 3.9 129 29.9 144 33.3 142 32.9
Strongly agree Agree Disagree Strongly disagree 459
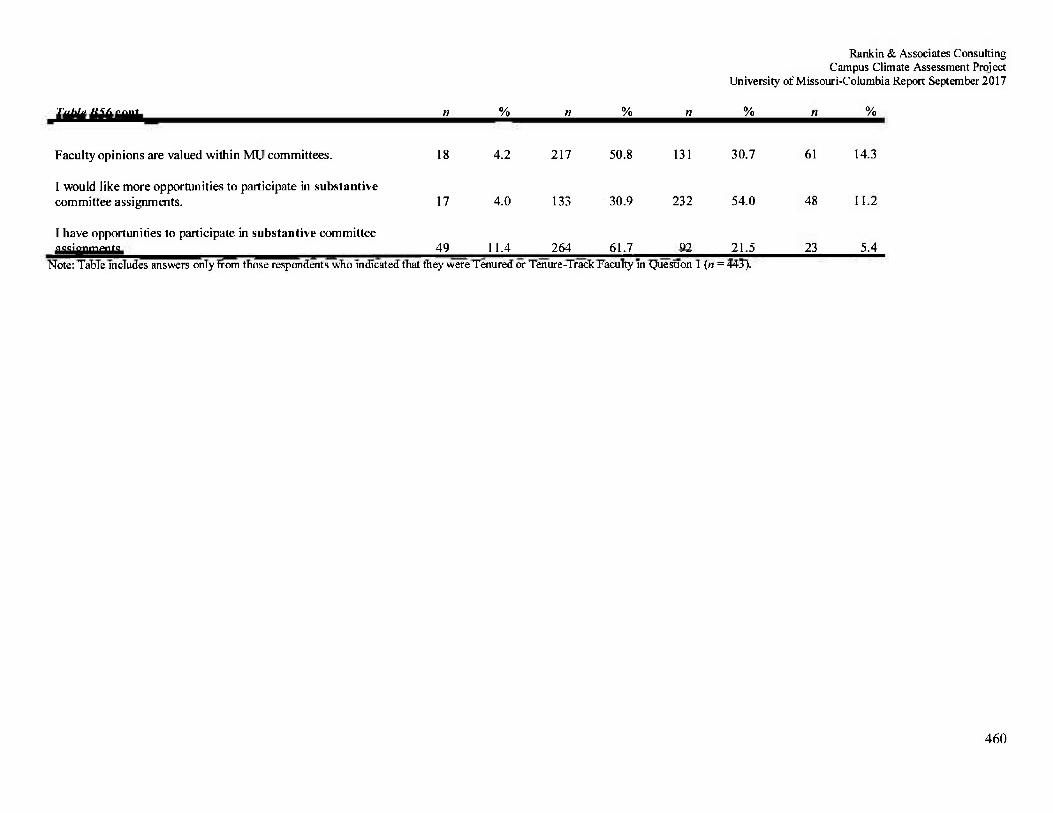
Rankin & Associates Consulting Campus Climate Assessment Project
University of Missouri-Columbia Report September 2017
Table B56 cont. n % n % n % n %
Faculty opinions are valued within MU committees. 18 4.2 217 50.8 131 30.7 61 14.3
I would like more opportunities to participate in substantive committee assignments. 17 4.0 133 30.9 232 54.0 48 11.2
I have opportunities to participate in substantive committee assignments. 49 11.4 264 61.7 92 21.5 23 5.4
Note: Table includes answers only from those respondents who indicated that they were Tenured or Tenure-Track Faculty in Question 1 (w = 443).
460
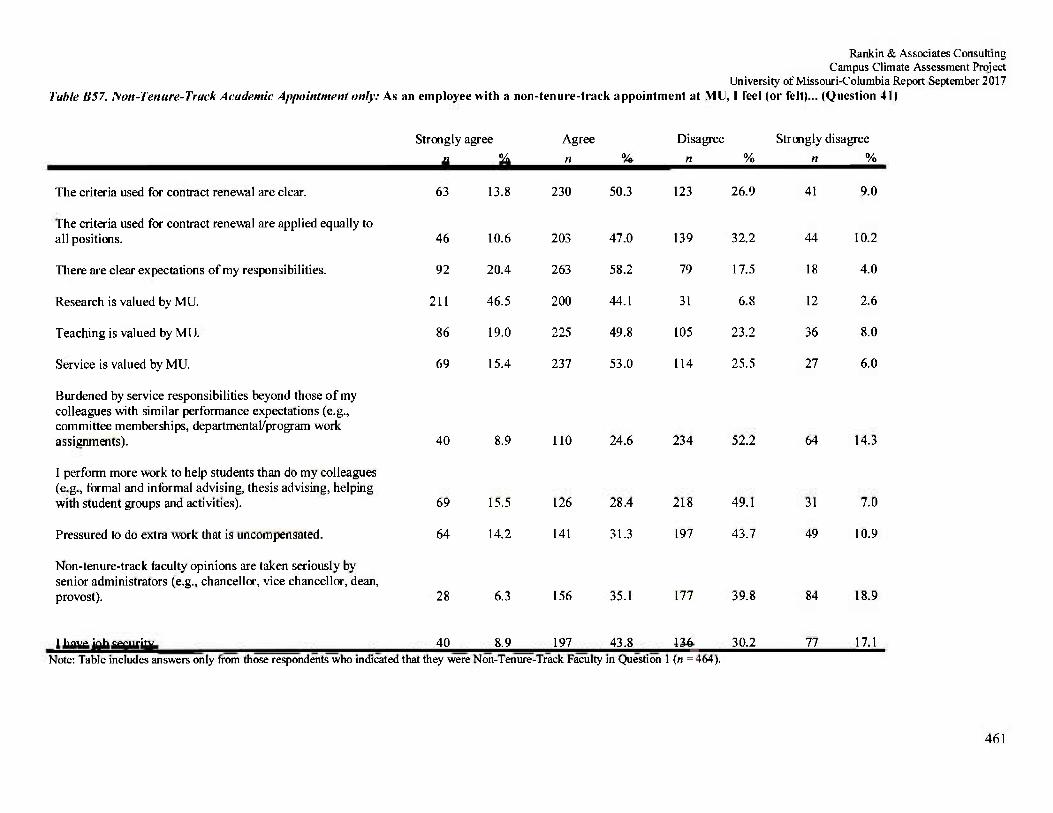
Rankin & Associates Consulting Campus Climate Assessment Project
University of Missouri-Columbia Report September 2017 Table B57. Non-Tenure-Truck Academic Appointment only: As an employee with a non-tenure-track appointment at MU, I feel (or felt)... (Question 41)
Strongly agree n %
Agree n %
Disagree n %
Strongly disagree n %
The criteria used for contract renewal are clear. 63 13.8 230 50.3 123 26.9 41 9.0
The criteria used for contract renewal are applied equally to all positions. 46 10.6 203 47.0 139 32.2 44 10.2
There are clear expectations of my responsibilities. 92 20.4 263 58.2 79 17.5 18 4.0
Research is valued by MU. 211 46.5 200 44.1 31 6.8 12 2.6
Teaching is valued by MU. 86 19.0 225 49.8 105 23.2 36 8.0
Service is valued by MU. 69 15.4 237 53.0 114 25.5 27 6.0
Burdened by service responsibilities beyond those of my colleagues with similar performance expectations (e.g., committee memberships, departmental/program work assignments). 40 8.9 110 24.6 234 52.2 64 14.3
I perform more work to help students than do my colleagues (e.g., formal and informal advising, thesis advising, helping with student groups and activities). 69 15.5 126 28.4 218 49.1 31 7.0
Pressured to do extra work that is uncompensated. 64 14.2 141 31.3 197 43.7 49 10.9
Non-tenure-track faculty opinions are taken seriously by senior administrators (e.g., chancellor, vice chancellor, dean, provost). 28 6.3 156 35.1 177 39.8 84 18.9
I have job security. 40 8.9 197 43.8 136 30.2 77 17.1 Note: Table includes answers only from those respondents who indicated that they were Non-Tenure-Track Faculty in Question 1 (n = 464).
461
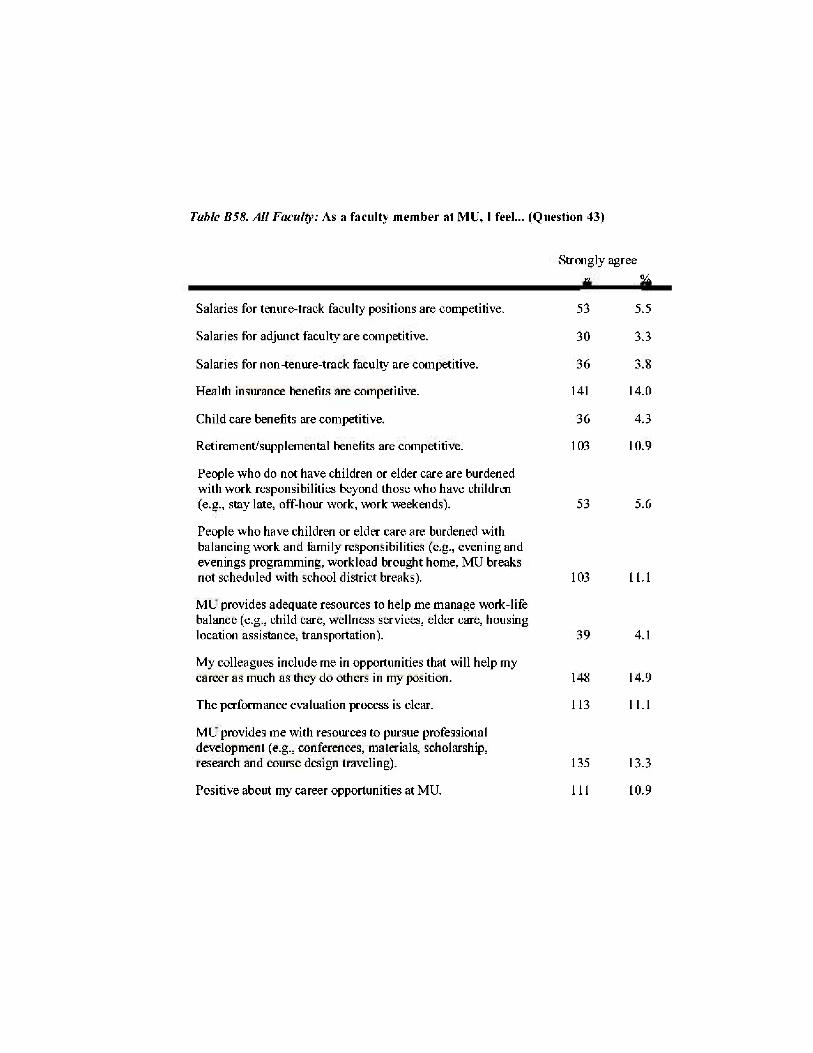
Table B5S. All Faculty: As a faculty member at MU, I feel... (Question 43)
Strongly agree n %
Salaries for tenure-track faculty positions are competitive. 53 5.5
Salaries for adjunct faculty are competitive. 30 3.3
Salaries for non-tenure-track faculty are competitive. 36 3.8
Health insurance benefits are competitive. 141 14.0
Child care benefits are competitive. 36 4.3
Retirement/supplemental benefits are competitive. 103 10.9
People who do not have children or elder care are burdened with work responsibilities beyond those who have children (e.g., stay late, off-hour work, work weekends). 53 5.6
People who have children or elder care are burdened with balancing work and family responsibilities (e.g., evening and evenings programming, workload brought home, MU breaks not scheduled with school district breaks). 103 11.1
MU provides adequate resources to help me manage work-life balance (e.g., child care, wellness services, elder care, housing location assistance, transportation). 39 4.1
My colleagues include me in opportunities that will help my career as much as they do others in my position. 148 14.9
The performance evaluation process is clear. 113 11.1
MU provides me with resources to pursue professional development (e.g., conferences, materials, scholarship, research and course design traveling). 135 13.3
Positive about my career opportunities at MU 111 10.9
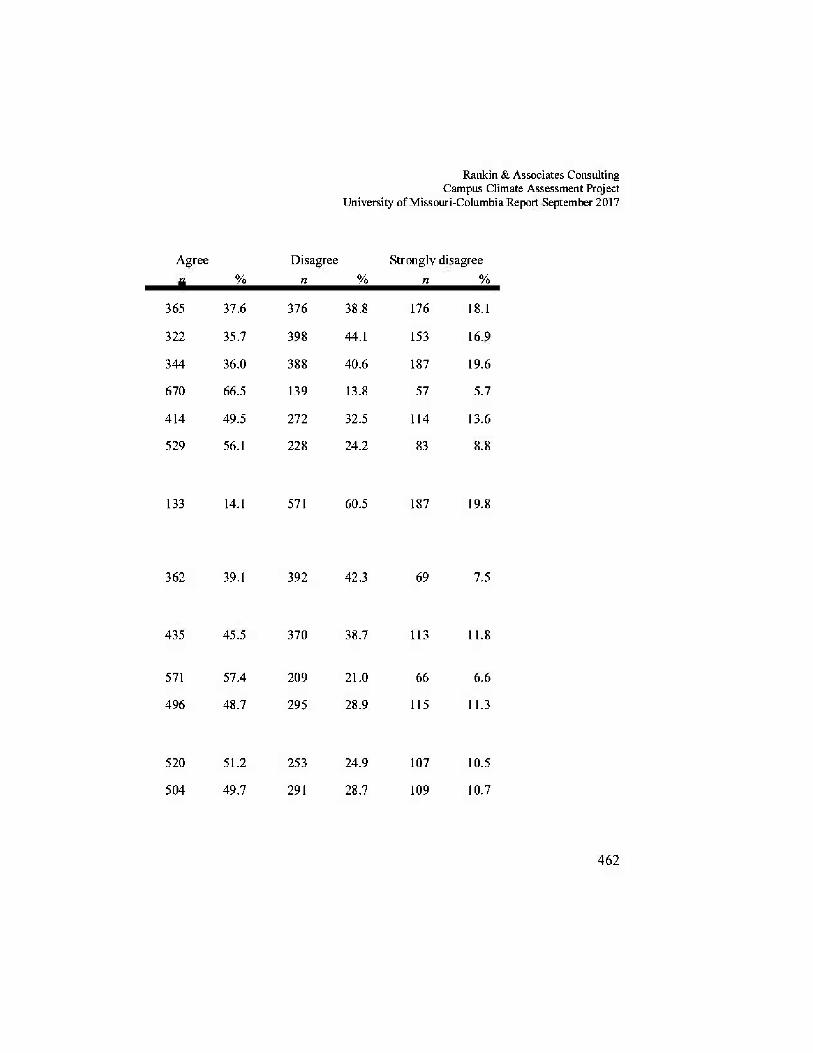
Rankin & Associates Consulting Campus Climate Assessment Project
University of Missouri-Columbia Report September 2017
Agree Disagree Strongly disagree n % n % n %
365 37.6 376 38.8 176 18.1
322 35.7 398 44.1 153 16.9
344 36.0 388 40.6 187 19.6
670 66.5 139 13.8 57 5.7
414 49.5 272 32.5 114 13.6
529 56.1 228 24.2 83 8.8
133 14.1 571 60.5 187 19.8
362 39.1 392 42.3 69 7.5
435 45.5 370 38.7 113 11.8
571 57.4 209 21.0 66 6.6
496 48.7 295 28.9 115 11.3
520 51.2 253 24.9 107 10.5
504 49.7 291 28.7 109 10.7
462
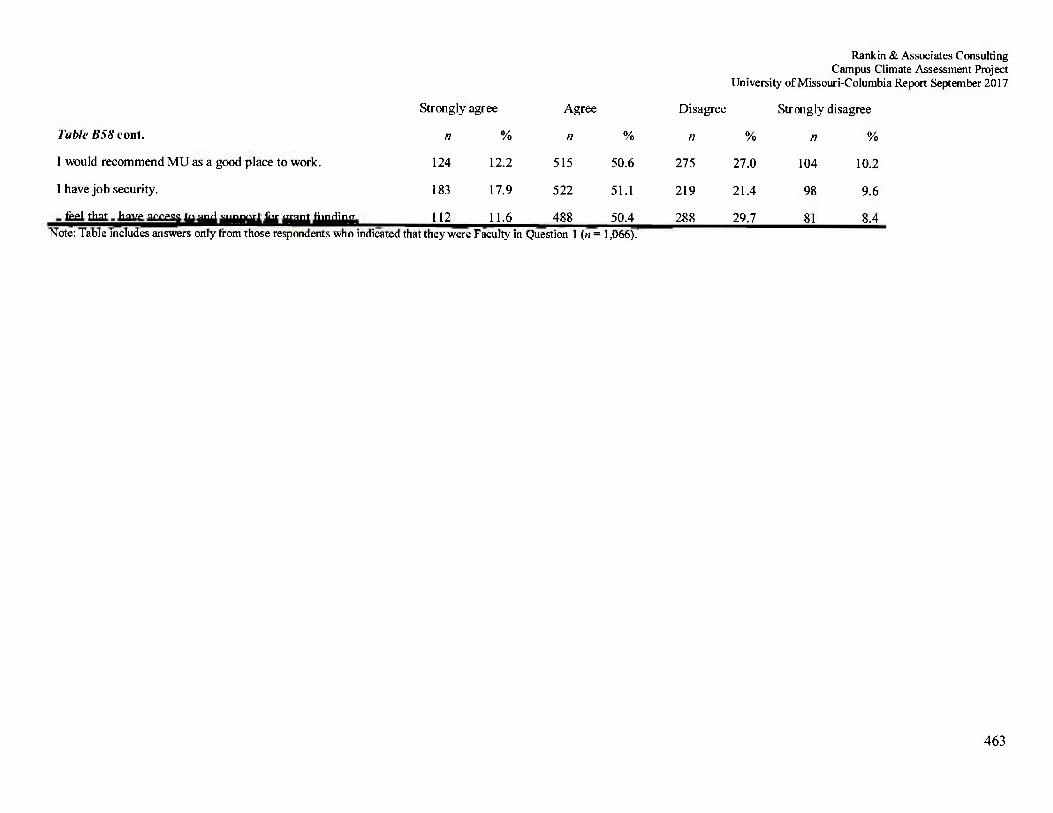
Rankin & Associates Consulting Campus Climate Assessment Project
University of Missouri-Columbia Report September 2017
Strongly agree Agree Disagree Strongly disagree
Table B5S cont. n % n % n % n %
I would recommend MU as a good place to work. 124 12.2 515 50.6 275 27.0 104 10.2
I have job security. 183 17.9 522 51.1 219 21.4 98 9.6
I feel that I have access to and support for grant funding. 112 11.6 488 50.4 288 29.7 81 8.4 Note: Table includes answers only from those respondents who indicated that they were Faculty in Question 1 (n = 1,066).
463
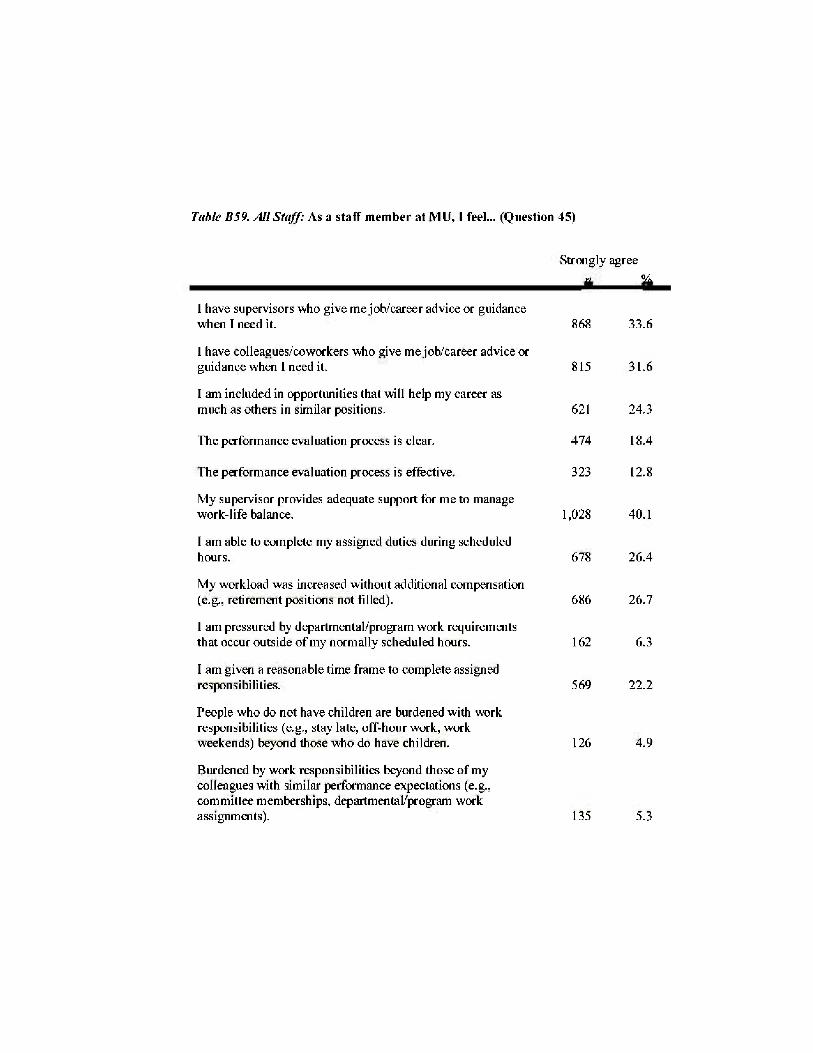
Table B59. All Staff: As a staff member at MU, I feel™ (Question 45)
Strongly agree n %
1 have supervisors who give me job/career advice or guidance when I need it. 868 33.6
1 have col leagues/co workers who give me job/career advice or guidance when 1 need it. 815 31.6
I am included in opportunities that will help my career as much as others in similar positions. 621 24.3
The performance evaluation process is clear. 474 18.4
The performance evaluation process is effective. 323 12.8
My supervisor provides adequate support for me to manage work-life balance. 1,028 40.1
I am able to complete my assigned duties during scheduled hours. 678 26.4
My workload was increased without additional compensation (e.g., retirement positions not filled). 686 26.7
1 am pressured by departmental/program work requirements that occur outside of my normally scheduled hours. 162 6.3
I am given a reasonable time frame to complete assigned responsibilities. 569 22.2
People who do not have children are burdened with work responsibilities (e.g., stay late, off-hour work, work weekends) beyond those who do have children. 126 4.9
Burdened by work responsibilities beyond those of my colleagues with similar performance expectations (e.g., committee memberships, departmental/program work assignments). 135 5.3
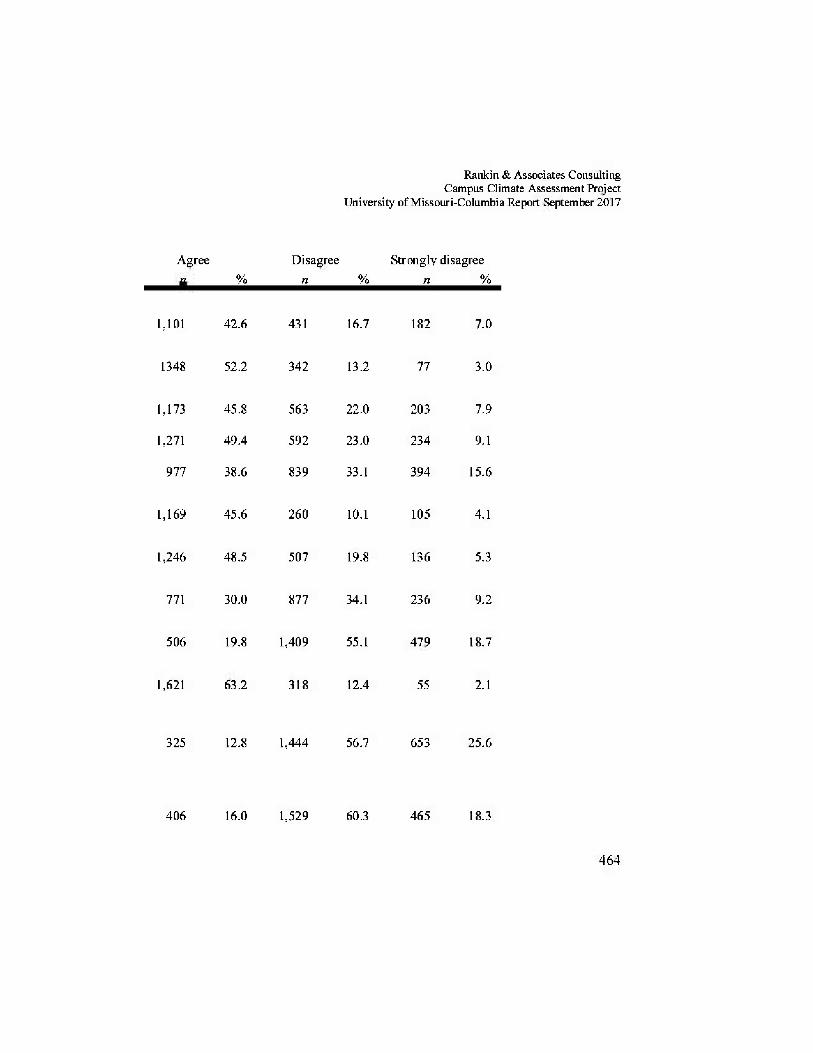
Rankin & Associates Consulting Campus Climate Assessment Project
University of Missouri-Columbia Report September 2017
Agree n %
Disagree n %
Strongly disagree n %
1,101 42.6 431 16.7 182 7.0
1348 52.2 342 13.2 77 3.0
1,173 45.8 563 22.0 203 7.9
1,271 49.4 592 23.0 234 9.1
977 38.6 839 33.1 394 15.6
1,169 45.6 260 10.1 105 4.1
1,246 48.5 507 19.8 136 5.3
771 30.0 877 34.1 236 9.2
506 19.8 1,409 55.1 479 18.7
1,621 63.2 318 12.4 55 2.1
325 12.8 1,444 56.7 653 25.6
406 16.0 1,529 60.3 465 18.3
464
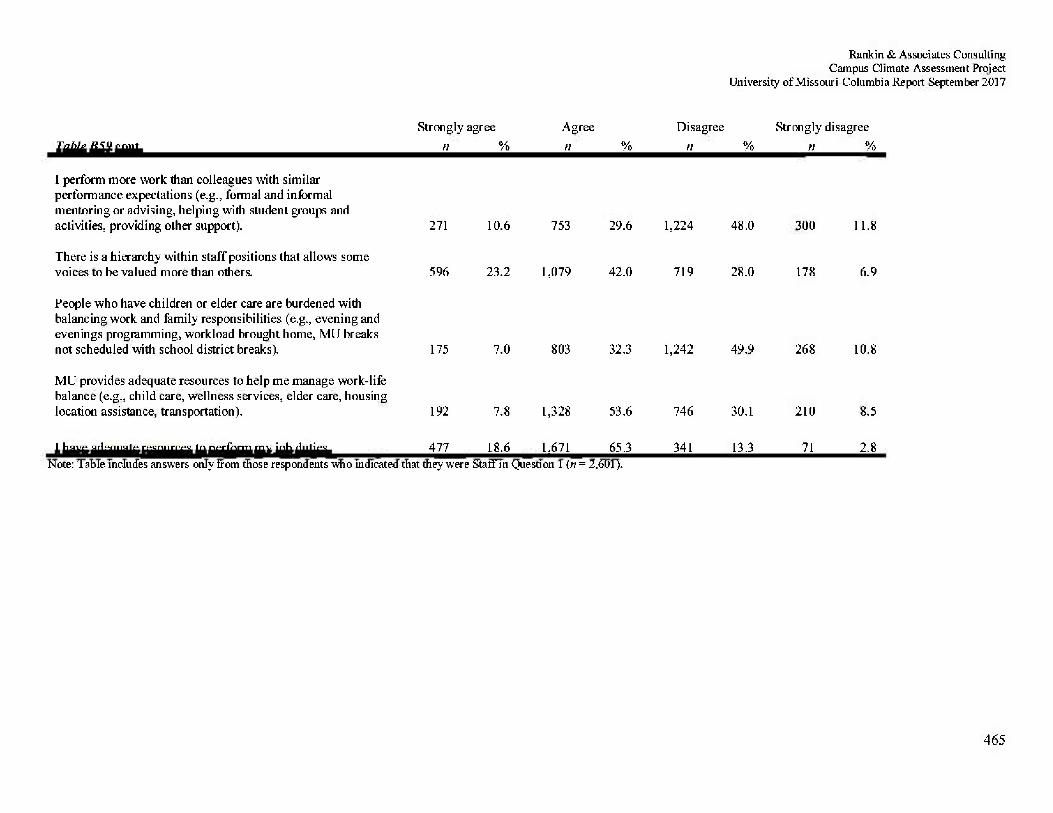
Rankin & Associates Consulting Campus Climate Assessment Project
University of Missouri-Columbia Report September 2017
Table B59 cont. Strongly agree
n % Agree n %
Disagree n %
Strongly disagree n %
I perform more work than colleagues with similar performance expectations (e.g., formal and informal mentoring or advising, helping with student groups and activities, providing other support). 271 10.6 753 29.6 1,224 48.0 300 11.8
There is a hierarchy within staff positions that allows some voices to be valued more than others. 5% 23.2 1,079 42.0 719 28.0 178 6.9
People who have children or elder care are burdened with balancing work and family responsibilities (e.g., evening and evenings programming, workload brought home, MU breaks not scheduled with school district breaks). 175 7.0 803 32.3 1,242 49.9 268 10.8
MU provides adequate resources to help me manage work-life balance (e.g., child care, wellness services, elder care, housing location assistance, transportation). 192 7.8 1,328 53.6 746 30.1 210 8,5
1 have adequate resources to perform my job duties. All 18.6 1,671 65.3 341 13.3 71 2.8 Note: Table includes answers only from those respondents who indicated that they were Staff in Question 1 In = 2,601).
465
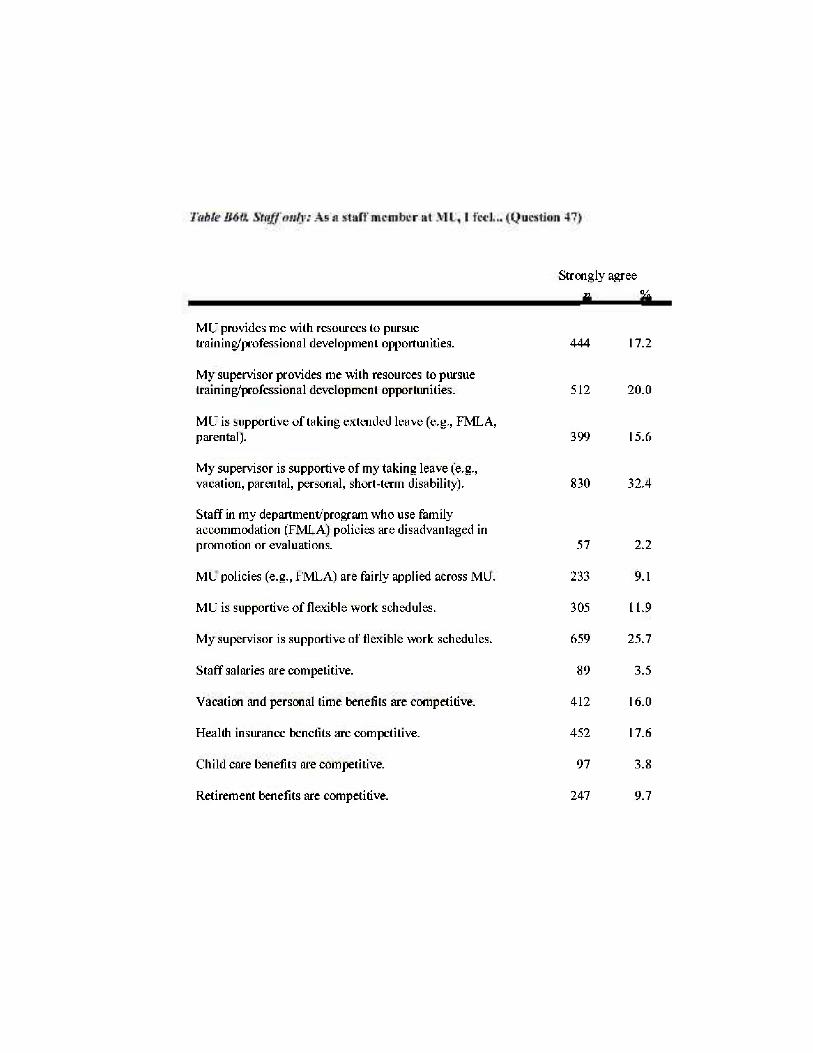
Strongly agree n %
MU provides me with resources to pursue training/professional development opportunities. 444 17.2
My supervisor provides me with resources to pursue training/professional development opportunities. 512 20.0
MU is supportive of taking extended leave (e.g., FMLA, parental). 399 15.6
My supervisor is supportive of my taking leave (e.g., vacation, parental, personal, short-term disability). 830 32.4
Staff in my department/program who use family accommodation (FMLA) policies are disadvantaged in promotion or evaluations. 57 2.2
MU policies (e.g., FMLA) are fairly applied across MU. 233 9.1
MU is supportive of flexible work schedules. 305 11.9
My supervisor is supportive of flexible work schedules. 659 25.7
Staff salaries are competitive. 89 3.5
Vacation and personal time benefits are competitive. 412 16.0
Health insurance benefits are competitive. 452 17.6
Child care benefits are competitive. 97 3.8
Retirement benefits are competitive. 247 9.7
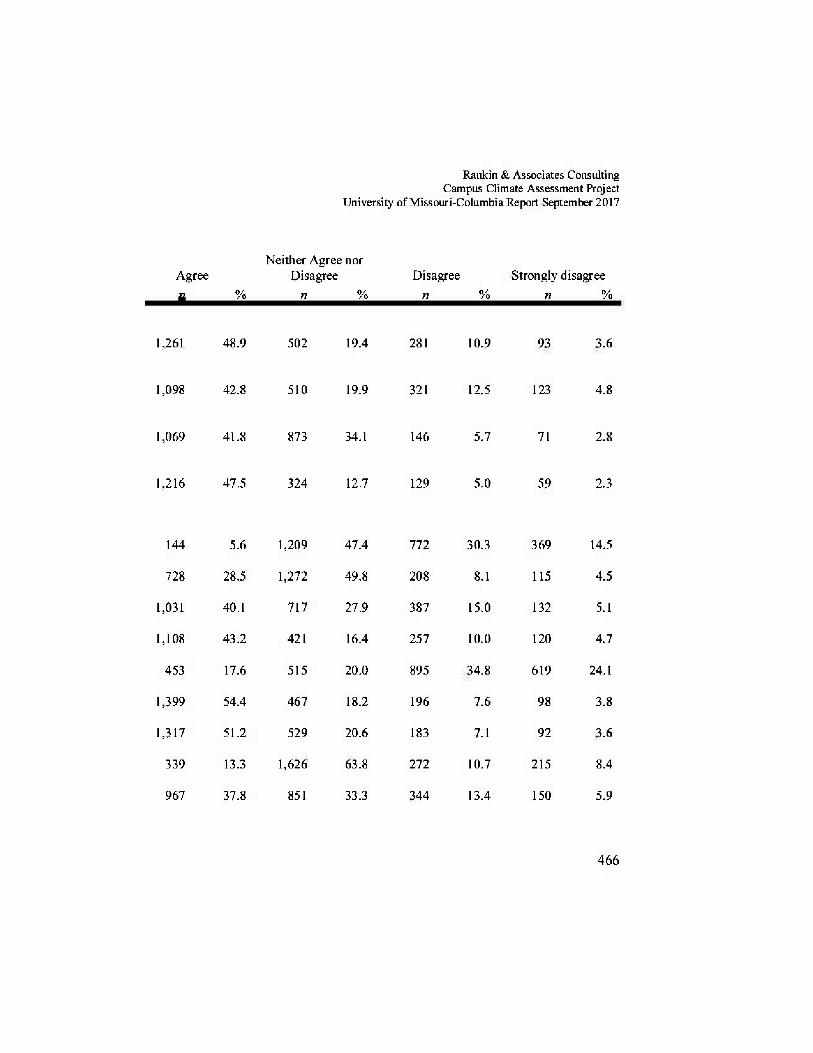
Rankin & Associates Consulting Campus Climate Assessment Project
University of Missouri-Columbia Report September 2017
Agree n %
Neither Agree Disagree
n
nor
% Disagree
n % Strongly disagree
n %
1,261 48.9 502 19.4 281 10.9 93 3.6
1,098 42.8 510 19.9 321 12.5 123 4.8
1,069 41.8 873 34.1 146 5.7 71 2.8
1,216 47.5 324 12.7 129 5.0 59 2.3
144 5.6 1,209 47.4 772 30.3 369 14.5
728 28.5 1,272 49.8 208 8.1 115 4.5
1,031 40.1 717 27.9 387 15.0 132 5.1
1,108 43.2 421 16.4 257 10.0 120 4.7
453 17.6 515 20.0 895 34.8 619 24.1
1,399 54.4 467 18.2 196 7.6 98 3.8
1,317 51.2 529 20.6 183 7.1 92 3.6
339 13.3 1,626 63.8 272 10.7 215 8.4
967 37.8 851 33.3 344 13.4 150 5.9
466
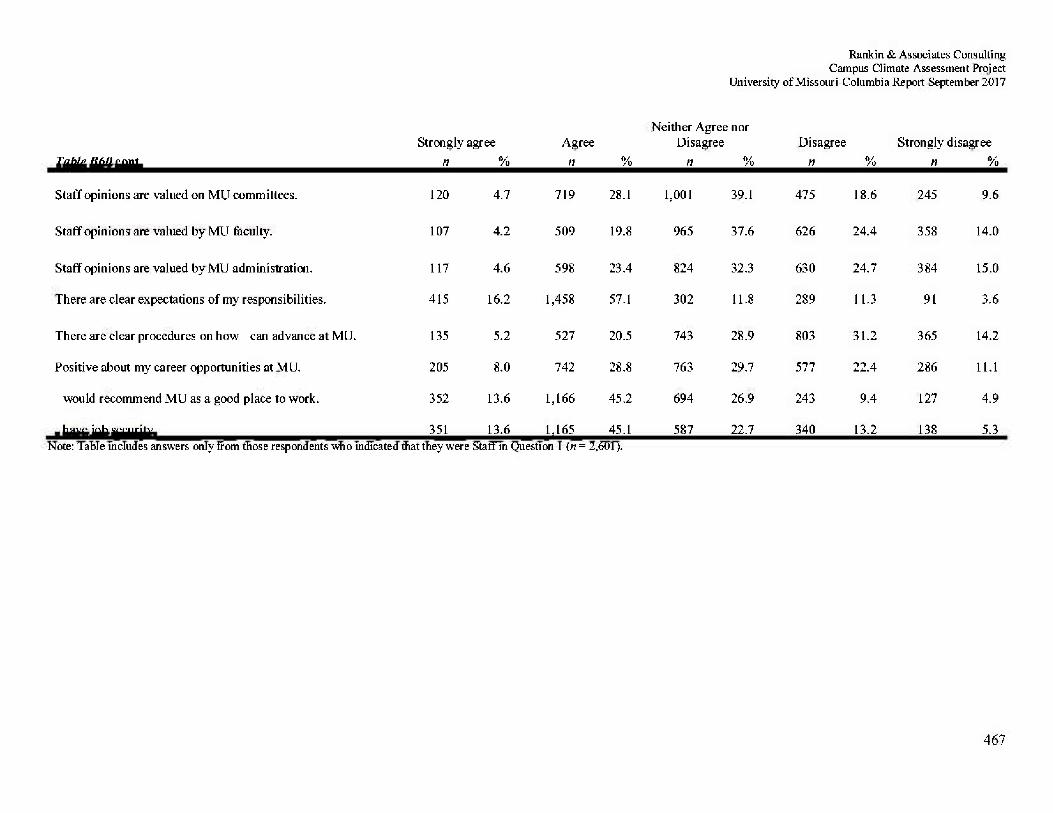
Rankin & Associates Consulting Campus Climate Assessment Project
University of Missouri-Columbia Report September 2017
Table B60 cont. Strongly agree
n % Agree n %
Neither Agree Disagree
n
nor
% Disagree
n % Strongly disagree
n %
Staff opinions are valued on MU committees. 120 4.7 719 28.1 1,001 39.1 475 18.6 245 9.6
Staff opinions are valued by MU faculty. 107 4.2 509 19.8 965 37.6 626 24.4 358 14.0
Staff opinions are valued by MU administration. 117 4.6 598 23.4 824 32.3 630 24.7 384 15.0
There are clear expectations of my responsibilities. 415 16.2 1,458 57.1 302 11.8 289 11.3 91 3.6
There are clear procedures on how I can advance at MU. 135 5.2 527 20.5 743 28.9 803 31.2 365 14.2
Positive about my career opportunities at MU. 205 8.0 742 28.8 763 29.7 577 22.4 286 11.1
I would recommend MU as a good place to work. 352 13.6 1,166 45.2 694 26.9 243 9.4 127 4.9
I have job security. 351 13.6 1,165 45.1 587 22.7 340 13.2 138 5.3 Note: Table includes answers only from those respondents who indicated that they were Staff in Question 1 In = 2,601).
467
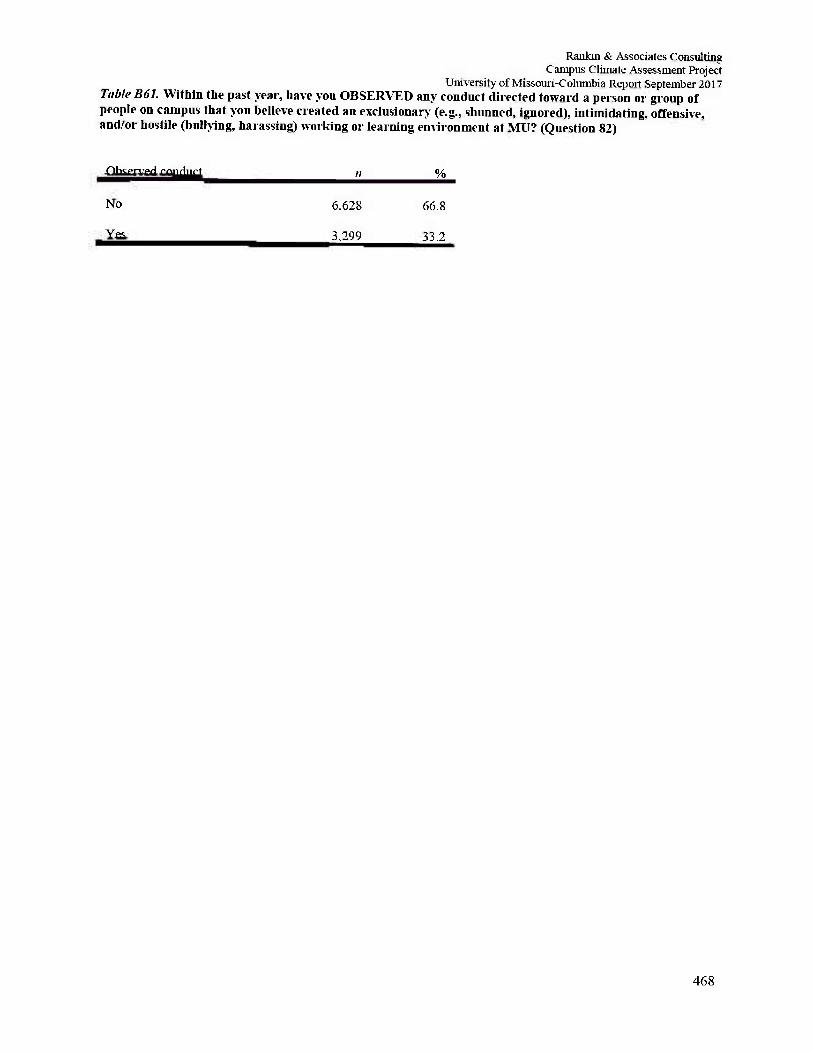
Rankin & Associates Consulting Campus Climate Assessment Project
University of Missouri-Columbia Report September 2017 Table B61. Within the past year, have you OBSERYTD any conduct directed toward a person or group of people on campus that you believe created an exclusionary (e.g., shunned, ignored), intimidating, offensive, and/or hostile (bullying, harassing) working or learning environment at Mil? (Question 82)
468
Observed conduct n %
No 6.628 66.8
Yes 3.299 33.2
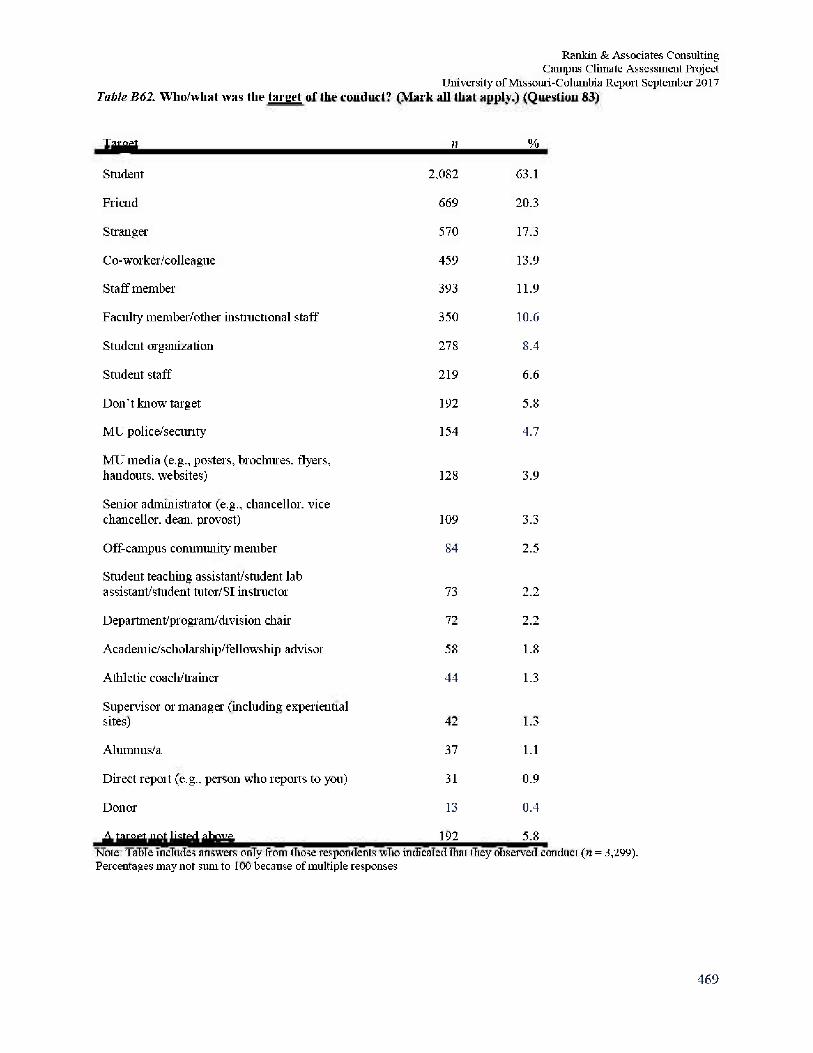
Rankin & Associates Consulting Campus Climate Assessment Project
University of Missouri-Columbia Repoit September 2017 Table B62. Who/what was the target of the conduct? (Mark all that apply.) (Question S3)
Target ii %
Student 2,082 63.1
Friend 669 20.3
Stranger 570 17.3
C o- worker/collea gue 459 13.9
Staff member 393 11.9
Faculty member/other instructional staff 350 10.6
Student organization 278 8.4
Student staff 219 6.6
Don't know target 192 5.8
MU police/security 154 4.7
MU media (e.g., posters, brochures, flyers, handouts, websites) 128 3.9
Senior administrator (e.g., chancellor, vice chancellor, dean, provost) 109 3.3
Off-campus community member 84 2.5
Student teaching assistant/student lab assistant/student tutor/SI instructor 73 2.2
Department/program/drvision chair 72 2.2
Ac a demic/scholar ship/fel 1 owship advisor 58 1.8
Athletic coach/trainer 44 1.3
Supervisor or manager (including experiential sites) 42 1.3
Alumnus/a 37 1.1
Direct repoit (e.g., person who reports to you) 31 0.9
Donor 13 0.4
A target not listed above 192 5.8 Note: Table includes answers only from those respondents who indicated that they observed conduct (n = 3,299). Percentages may not sum to 100 because of multiple responses.
469
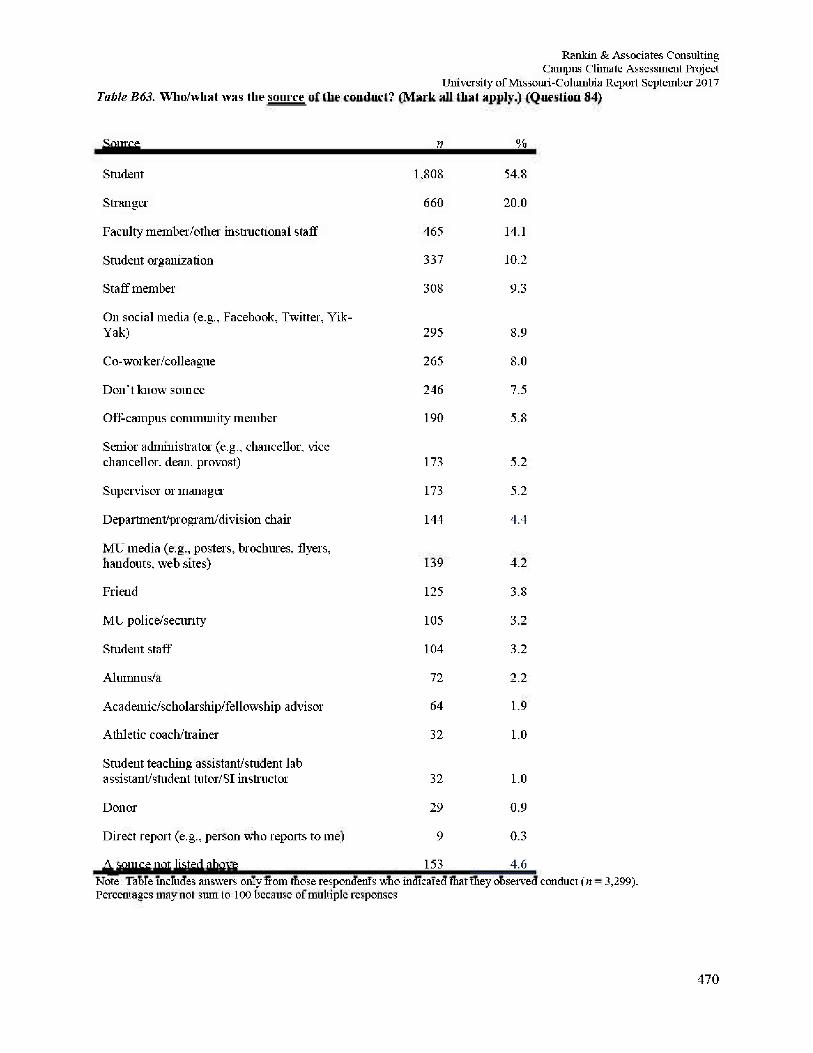
Rankin & Associates Consulting Campus Climate Assessment Project
University of Missouri-Columbia Report September 2017 Table B63. Who/what was the source of the Conduct? (Mark all that apply.) (Question 84)
Source n %
Student 1,808 54.8
Stranger 660 20.0
Faculty member/other instructional staff 465 14.1
Student organization 337 10.2
Staff member 308 9.3
On social media (e.g., Facebook, Twitter, Yik-Yak) 295 8.9
C o- worker/collea gue 265 8.0
Don't know somce 246 7.5
Off-campus community member 190 5.8
Senior administrator (e.g., chancellor, vice chancellor, dean, provost) 173 5.2
Supervisor or manager 173 5.2
Departmenl/program/division chair 144 4.4
MU media (e.g., posters, brochures, flyers, handouts, web sites) 139 4.2
Friend 125 3.8
MU police/security 105 3.2
Student staff 104 3.2
Alumnus/a 72 2.2
Ac a demic/scholar ship/fel 1 owship advi s or 64 1.9
Athletic coach/trainer 32 1.0
Student teaching assistant/student lab assistant/student tutor/SI instructor 32 1.0
Donor 29 0.9
Direct report (e.g., person who reports to me) 9 0.3
A somce not hsted above 153 4.6 Note: Table includes answers only from those respondents who indicated that tliey observed conduct (n = 3,299). Percentages may not sum to 100 because of multiple responses.
470
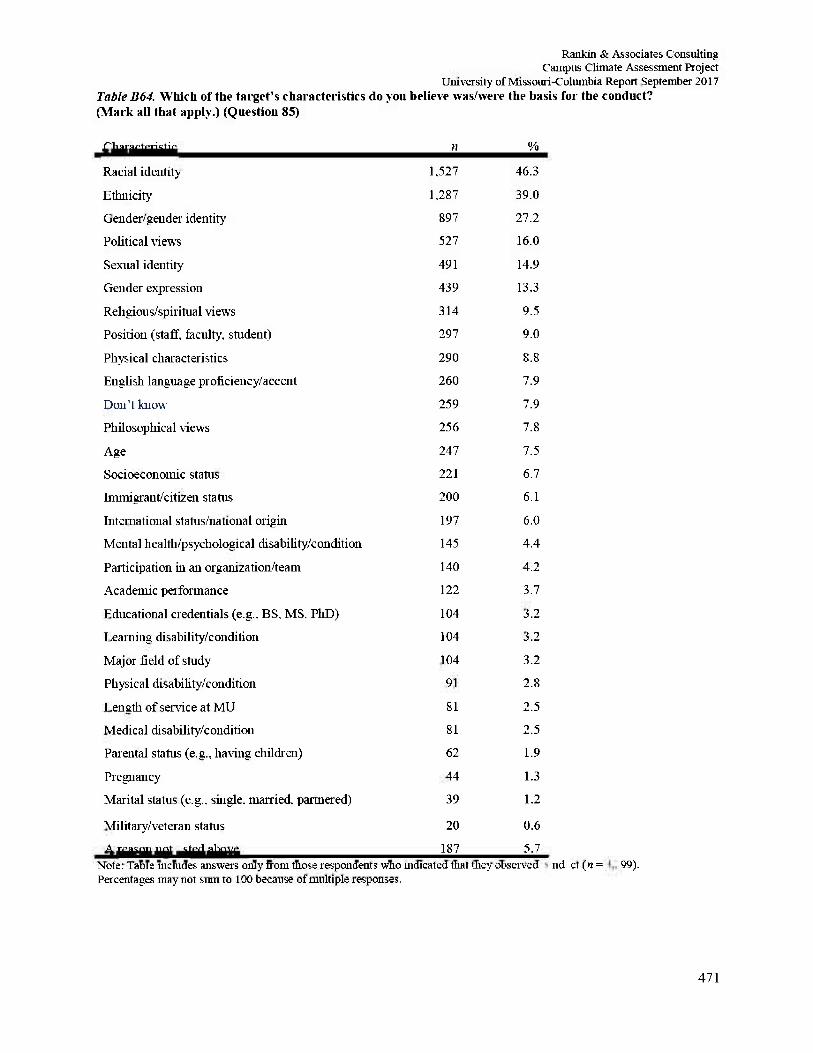
Rankin & Associates Consulting Campus Climate Assessment Project
University of Missouri-Columbia Report September 2017 Table B64. Which of the target's characteristics do you believe was/were the basis for the conduct? (Mark all that apply.) (Question 85)
Characteristic n %
Racial identity 1,527 46.3
Ethnicity 1,287 39.0
Gender/gender identity 897 27.2
Political views 527 16.0
Sexual identity 491 14.9
Gender expression 439 13.3
Religious/spiritual views 314 9.5
Position (staff, faculty, student) 297 9.0
Physical characteristics 290 8.8
English language proficiency/accent 260 7.9
Don't know 259 7.9
Philosophical views 256 7.8
Age 247 7.5
Socioeconomic status 221 6.7
Immigrant/citizen status 200 6.1
International status/national origin 197 6.0
Mental health/psychological disability/condition 145 4.4
Participation hi an organization/team 140 4.2
Academic performance 122 3.7
Educational credentials (e.g., BS. MS. PhD) 104 3.2
Learning disability/condition 104 3.2
Major field of study 104 3.2
Physical disability/condition 91 2.8
Length of service at MU 81 2.5
Medical disability/condition 81 2.5
Parental status (e.g., having children) 62 1.9
Pregnancy 44 1.3
Marital status (e.g.. single, married, partnered) 39 1.2
Military/veteran status 20 0.6
A reason not listed above 187 5.7 Note: Table includes answers only from those respondents who indicated that they observed ndc t (n = 99).Percentages may not sum to 100 because of multiple responses.
471
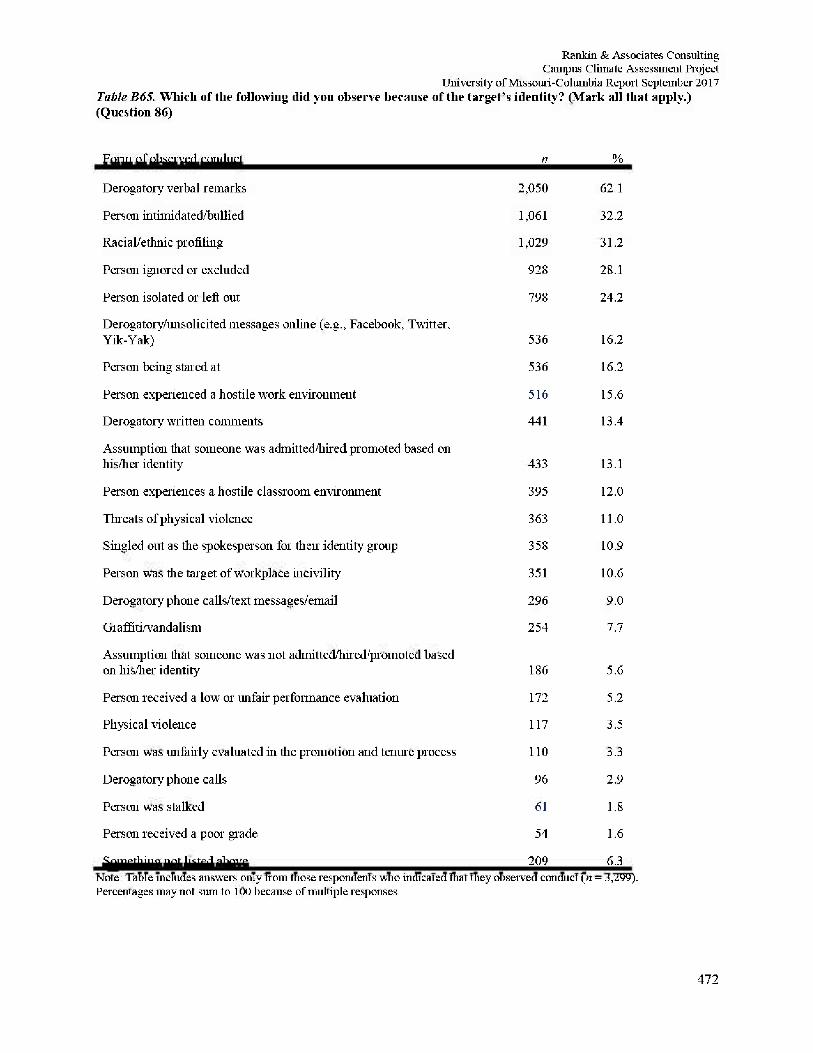
Rankin & Associates Consulting Campus Climate Assessment Project
University of Missouri-Columbia Report September 2017 Table B65. Which of the following did you observe because of the target's identity? (Mark ail that apply.) (Question 86)
Form of observed conduct n %
Derogatory verbal remarks 2,050 62.1
Person intimidated/bullied 1,061 32.2
Racial/ethnic profiling 1,029 31.2
Person ignored or excluded 928 28.1
Person isolated or left out 798 24.2
Derogatory/unsolicited messages online (e.g., Facebook, Twitter, Yik-Yak) 536 16.2
Person being stared at 536 16.2
Person experienced a hostile work environment 516 15.6
Derogatory written comments 441 13.4
Assumption that someone was admitted/hiredpromoted based on his/her identity 433 13.1
Person experiences a hostile classroom environment 395 12.0
Threats of physical violence 363 11.0
Singled out as the spokesperson for then identity group 358 10.9
Person was the target of workplace incivility 351 10.6
Derogatory phone calls/text messages/email 296 9.0
Gia ffiti. vanda li sm 254 7.7
Assumption that someone was not admitted hired promoted based on his/her identity 186 5.6
Person received a low or unfair performance evaluation 172 5.2
Physical violence 117 3.5
Person was unfairly evaluated in the promotion and tenure process 110 3.3
Derogatory phone calls 96 2.9
Person was stalked 61 1.8
Person received a poor grade 54 1.6
Something not listed above 209 6.3 Note: Table includes answers only from those respondents who indicated that they observed conduct (n = 3,299). Percentages may not sum to 100 because of multiple responses.
472
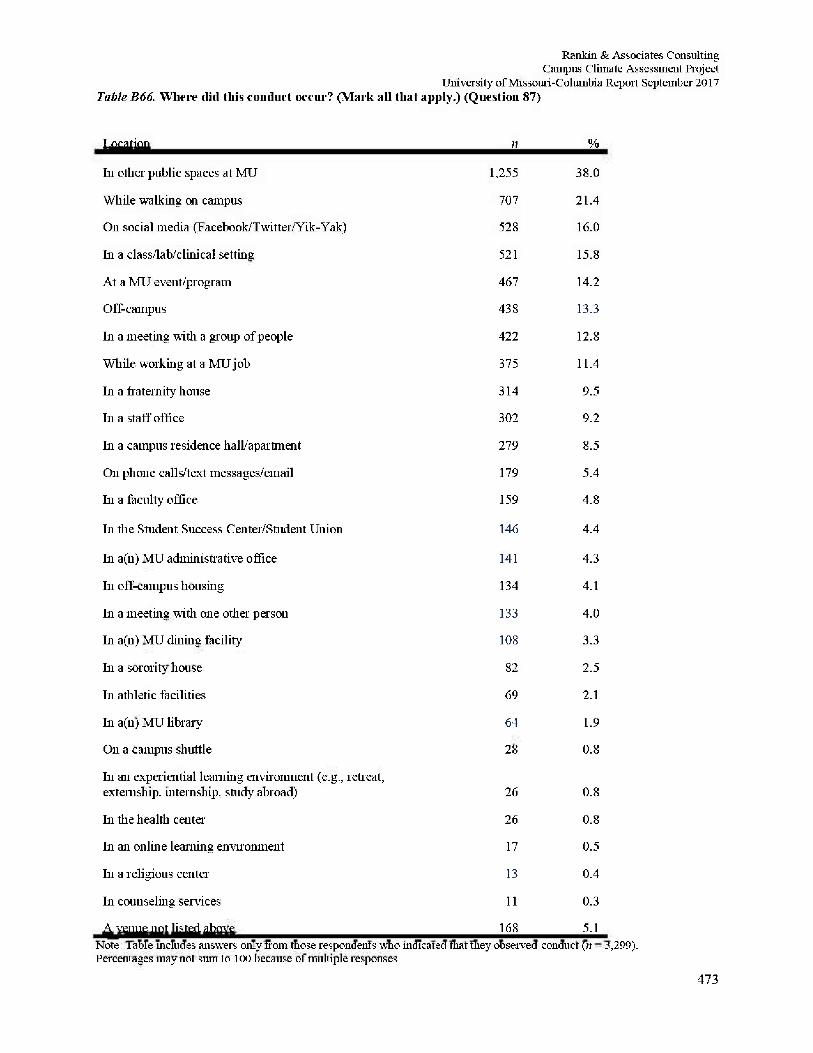
Rankin & Associates Consulting Campus Climate Assessment Project
University of Missouri-Columbia Repoit September 2017 Table B66. Where did this conduct occur? (Mark all that apply.) (Question 87)
Location n %
hi other public spaces at MU 1,255 38.0
While walking on campus 707 21.4
On social media (Fac ebook'T witter/Yik-Yak) 528 16.0
hi a class/lab/clinical setting 521 15.8
At a MU event/program 467 14.2
Off-campus 438 13.3
In a meeting with a group of people 422 12.8
While working at a MU job 375 11.4
In a fraternity house 314 9.5
In a staff office 302 9.2
In a campus residence hall/apartment 279 8.5
On phone calls/text messages/email 179 5.4
In a faculty office 159 4.8
In the Student Success Center/Student Union 146 4.4
In a(n) MU administrative office 141 4.3
In off-campus housing 134 4.1
In a meeting with one other person 133 4.0
In a(n) MU dining facility 108 3.3
In a sorority house 82 2.5
In athletic facilities 69 2.1
In a(n) MU library 64 1.9
On a campus shuttle 28 0.8
In an experiential learning environment (e.g., retreat, externsliip. internship, study abroad) 26 0.8
In the health center 26 0.8
In an online learning environment 17 0.5
In a religious center 13 0.4
In counseling services 11 0.3
A venue not listed above 168 5.1 Note: Table includes answers only from those respondents who indicated that they observed conduct (n = 3,299). Percentages may not sum to 100 because of multiple responses.
473
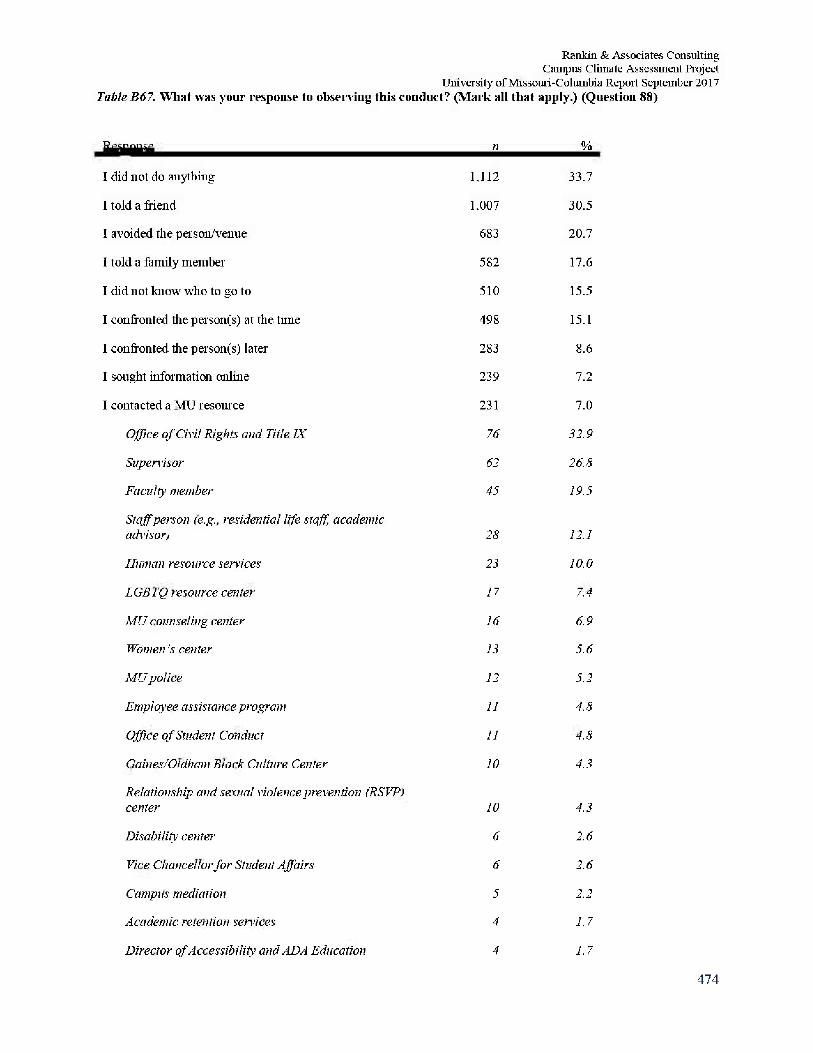
Rankin & Associates Consulting Campus Climate Assessment Project
University of Missouri-Columbia Report September 2017 Table B67. What was your response to observing this conduct? (Mark all that apply.) (Question 88)
Response n %
I did not do anything 1.112 33.7
I told a friend 1.007 30.5
I avoided the per son/venue 683 20.7
I told a family member 582 17.6
I did not know who to go to 510 15.5
I confronted the person(s) at the tune 498 15.1
I confronted the person(s) later 283 8.6
I sought information online 239 7.2
I contacted a MU resource 231 7.0
Office of Civil Rights and Title IX 76 32.9
Supervisor 62 26.8
Faculty member 45 19.5
Staffperson (e.g., residential life staff, academic advisor) 28 12.1
Human resource services 23 10.0
LGBTQ resource center 17 7.4
MU counseling center 16 6.9
Women's center 13 5.6
MU police 12 5.2
Employee assistance program 11 4.8
Office of Student Conduct 11 4.8
Gaines/Oldham Black Culture Center 10 4.3
Relationship and sexual violence prevention (RSVP) center 10 4.3
Disability center 6 2.6
Vice Chancellor for Student Affairs 6 2.6
Campus mediation 5 2.2
Academic retention services 4 1.7
Director of Accessibility and ADA Education 4 1.7
474
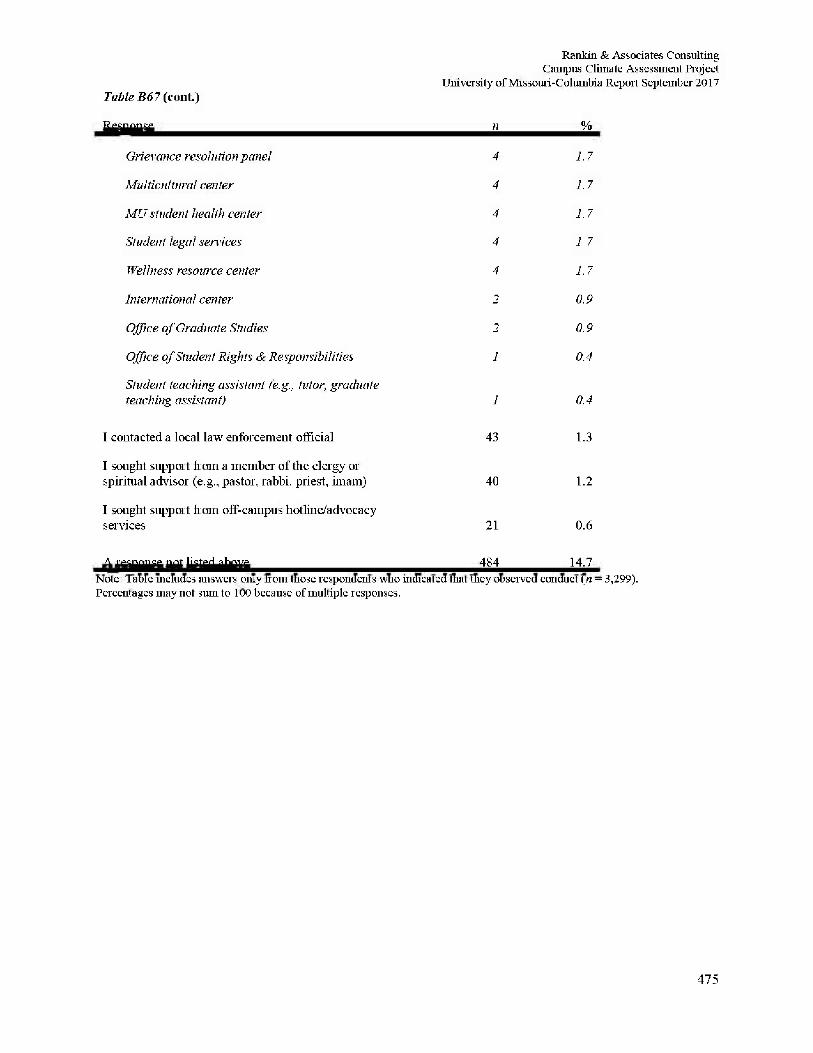
Rankin & Associates Consulting Campus Climate Assessment Project
University of Missouri-Columbia Repoit September 2017 Table B67{ coiit.)
Response n %
Grievance resolution panel 4 1.7
Multicultural center 4 1.7
MU student health center 4 1.7
Student legal services 4 17
Wellness resource center 4 1.7
International center 2 0.9
Office of Graduate Studies 2 0.9
Office of Student Rights & Responsibilities 1 0.4
Student teaching assistant (e.g., tutor, graduate teaching assistant) 1 0.4
I contacted a local law enforcement official 43 1.3
I sought support from a member of the clergy or spiritual advisor (e.g., pastor, rabbi, priest, imam) 40 1.2
I sought support from off-campus hotline/advocacy services 21 0.6
A response not listed above 484 14.7 Note: Table includes answers only from those respondents who indicated that they observed conduct (n = 3,299). Percentages may not sum to 100 because of multiple responses.
475

Rankin & Associates Consulting Campus Climate Assessment Project
University of Missouri-Columbia Repoit September 2017 Table B68. Did you report the conduct? (Question 89)
Reported conduct n %
No, I didn't report it. 2,948 92.5
Yes. I reported it (e.g., bias incident report, UM System Ethics and Compliance Hotline). 238 7.5
Yes, I reported the incident and was satisfied with the outcome. 45 28.0
Yes, I reported the incident, and while the outcome is not what I had hoped for, I feel as though my complaint was responded to appropriately. 45 28.0
Yes, I reported the incident, but felt that it lira not responded to appropriately. 71 44.1
Note: Table includes answers only from those respondents who indicated that they observed conduct (n = 3,299). Percentages may not sum to 100 because of multiple responses.
476
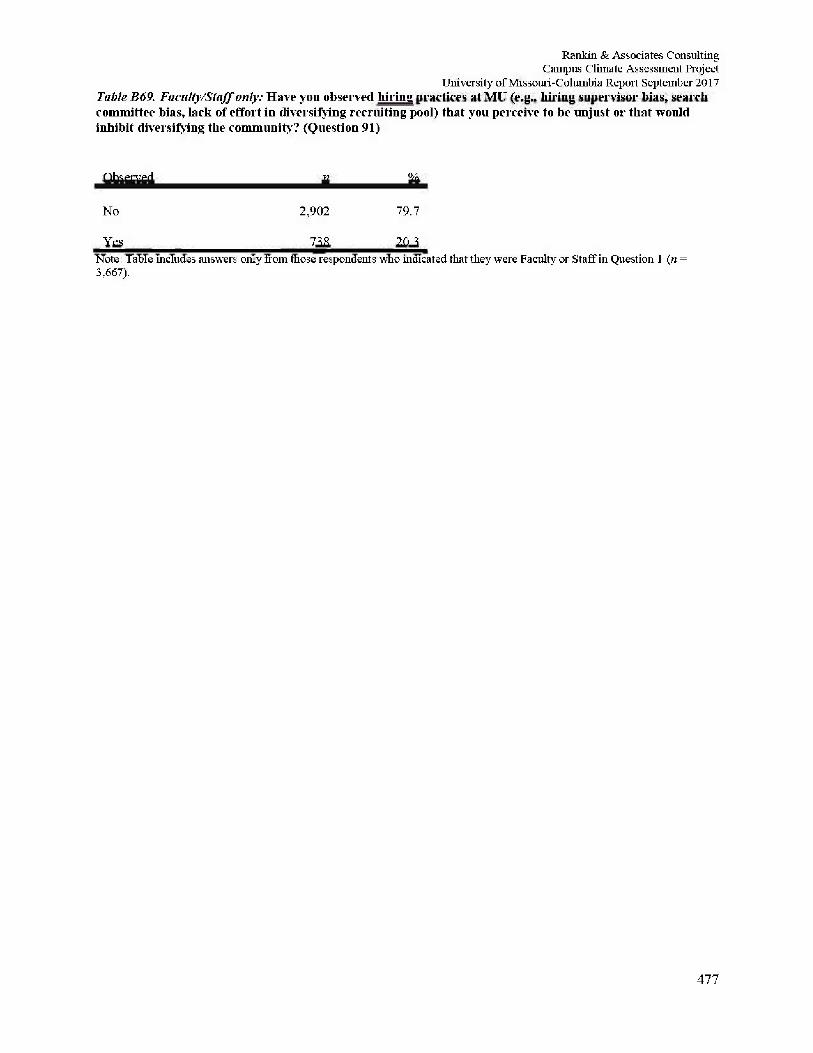
Rankin & Associates Consulting Campus Climate Assessment Project
University of Missouri-Columbia Report September 2017 Table B69. Faculty/Staff only: Have you observed hiring practices at MU (e.g.. hiring supervisor bias, search committee bias, lack of effort in diversifying recruiting pool) that you perceive to be unjust or that would inhibit diversifying the community? (Question 91)
Observed n %
No 2,902 79.7
Yes 738 20.3 Note: Table includes answers only from those respondents who indicated that they were Faculty or Staff in Question 1 (« = 3,667).
All
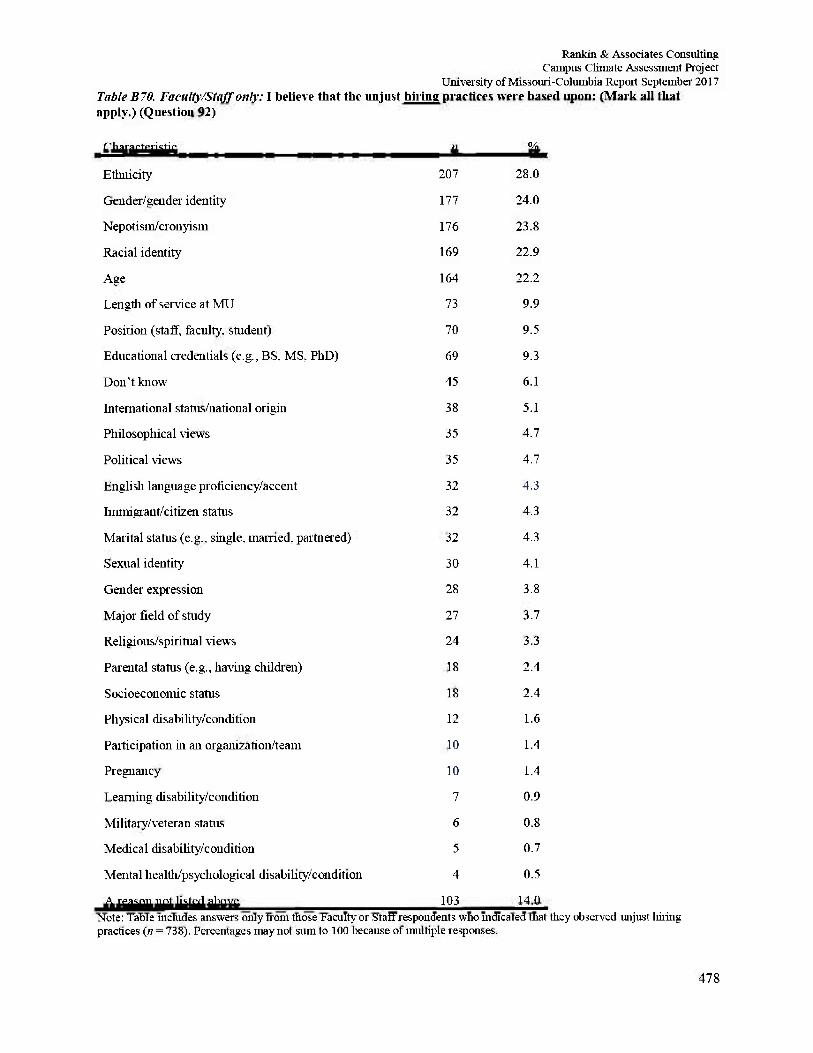
Rankin & Associates Consulting Canipns Climate Assessment Project
University of Missouri-Columbia Report September 2017 Table B 70. Faculty/Staff only: I believe that the unjust hiring practices were based upon: (Mark all that apply.) (Question 92)
Characteristic n % Characteristic
Ethnicity
n
207
% 28.0
Gender/gender identity 177 24.0
Nepotism/cronyism 176 23.8
Racial identity 169 22.9
Age 164 22.2
Length of service at MU 73 9.9
Position (staff, faculty, student) 70 9.5
Educational credentials (e.g., BS, MS, PhD) 69 9.3
Don't know 45 6.1
International status/national origin 38 5.1
Philosophical views 35 4.7
Political views 35 4.7
English language proficiency/accent 32 4.3
Immigrant/citizen status 32 4.3
Marital status (e.g., single, married, partnered) 32 4.3
Sexual identity 30 4.1
Gender expression 28 3.8
Major field of study 27 3.7
Religious/spiritual views 24 3.3
Parental status (e.g., having children) 18 2.4
Socioeconomic status 18 2.4
Physical disability/condition 12 1.6
Participation in an organization/team 10 1.4
Pregnancy 10 1.4
Learning disability/condition 7 0.9
Military/veteran status 6 0.8
Medical disability/condition 5 0.7
Mental health/psychological disability/condition 4 0.5
A reason not listed above 103 14.0 Note: Table includes answers only from those Faculty or Staff respondents who indicated that they observed unjust hiring practices (m = 738). Percentages may not stun to 100 because of multiple responses.
478
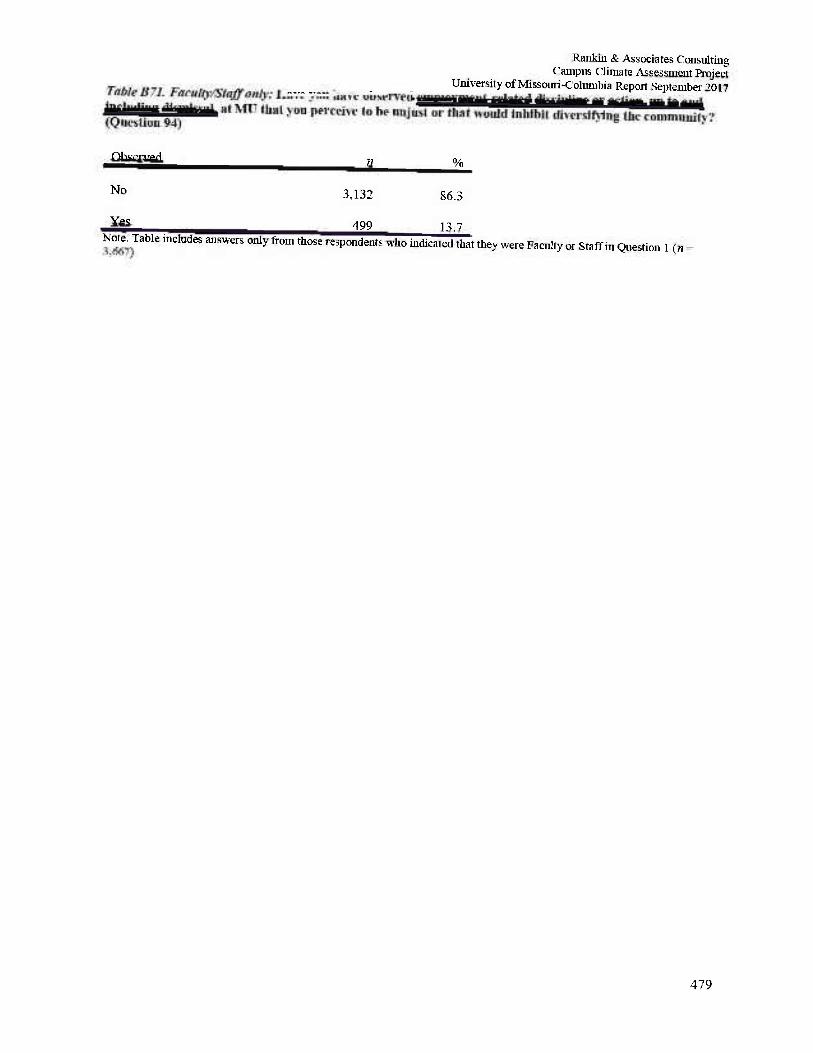
Rankin & Associates Consulting Canipus Climate Assessment Project
University of Missouri-Columbia Report September 2017 University of Missouri-Columbia Report September 2(
479
Observed n %
No 3,132 86.3
Yes 499 13.7 Note. Table includes answers only from those respondents who indicated that they were Faculty or Staff in Question 1 (« =
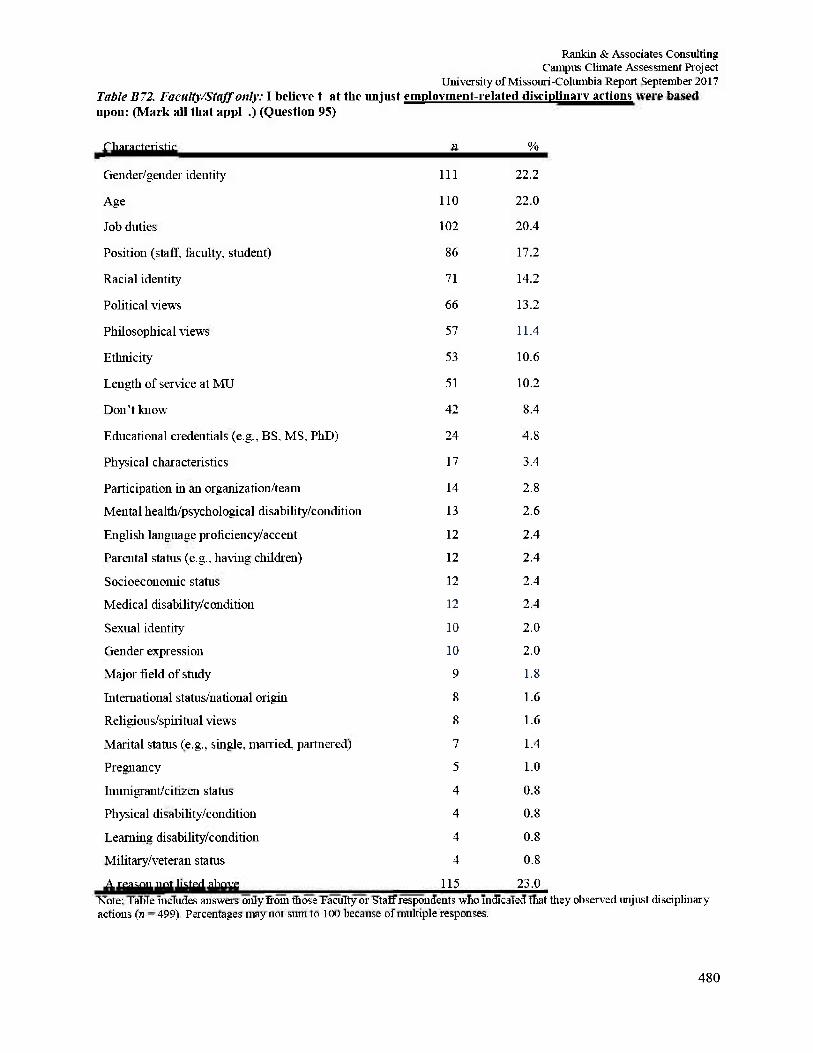
Rankin & Associates Consulting Campus Climate Assessment Project
University of Missouri-Columbia Report September 2017 Table B72. Faculty/Staff only: I believe that the unjust employment related disciplinary actions were based upon: (Mark all that apply.) (Question 95)
Characteristic
Gender/gender identity
n
111
% 22.2
Age 110 22.0
Job duties 102 20.4
Position (staff, faculty, student) 86 17.2
Racial identity* 71 14.2
Political views 66 13.2
Philosophical views 57 11.4
Ethnicity 53 10.6
Length of service at MU 51 10.2
Don't know 42 8.4
Educational credentials (e.g., BS, MS, PhD) 24 4.8
Physical characteristics 17 3.4
Participation in an organization/team 14 2.8
Mental health/psychological disability/condition 13 2.6
English language proficiency/accent 12 2.4
Parental status (e.g.. having children) 12 2.4
Socioeconomic status 12 2.4
Medical disability/condition 12 2.4
Sexual identity 10 2.0
Gender expression 10 2.0
Major field of study 9 1.8
International status/national origin 8 1.6
Religious/spiritual views 8 1.6
Marital status (e.g., single, married, partnered) 7 1.4
Pregnancy 5 1.0
Immigrant/citizen status 4 0.8
Physical disability/condition 4 0.8
Learning disability/condition 4 0.8
Military/veteran status 4 0.8
A reason not listed above 115 23.0 Note: Table includes answers only from those Faculty or Staff respondents who indicated that they observed unjust disciplinary actions (n = 499). Percentages may not sum to 100 because of multiple responses.
480
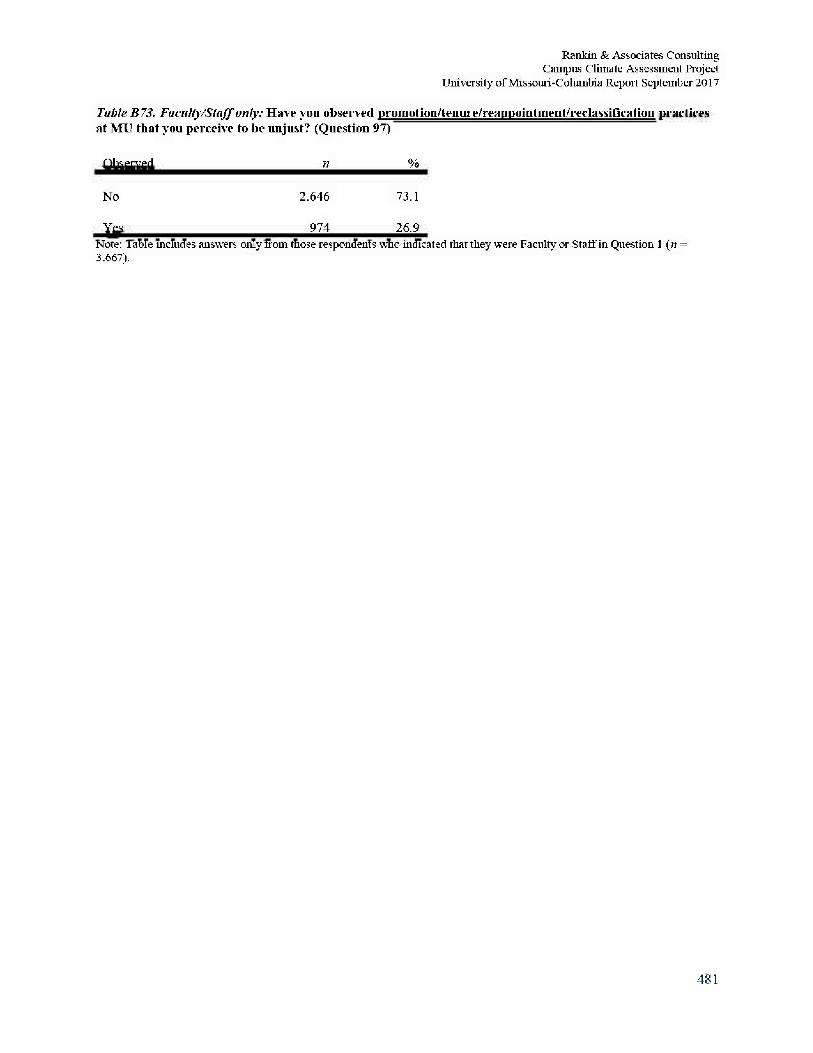
Rankin & Associates Consulting Campus Climate Assessment Project
University of Missouri-Columbia Repoit September 2017
Table B 73. Faculty/Staff only: Have you observed p rom ot ion/te nine/reap p oi ntment/r ec lassific a tion practices at MU that you perceive to be unjust? (Question 97)
Observed 77 %
No 2.646 73.1
Yes 974 26.9 Note: Table includes answers only from those respondents who indicated that they were Faculty or Staff in Question 1 (n = 3.667).
481
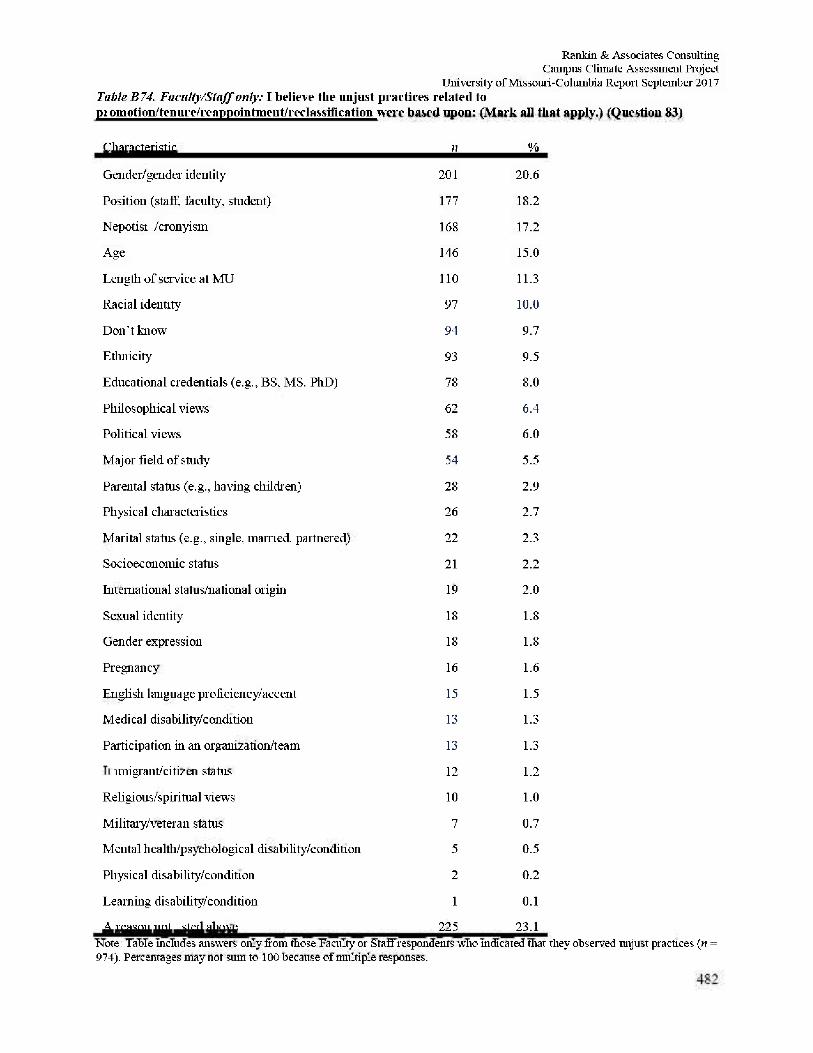
Rankin & Associates Consulting Campus Climate Assessment Project
University of Missouri-Columbia Repoit September 2017 Table B 74. Faculty/Staff only: I believe the unjust practices related to mom oti on/ten ure/re appoint men t/r eel a ssific a tion we re based upon: (Mark all that apply.) (Question 83)
Characteristic n %
Gender/gender identity 201 20.6
Position (staff, faculty, student) 177 18.2
Nepotisim/ cronyi sm 168 17.2
Age 146 15.0
Length of service at MU 110 11.3
Racial identity 97 10.0
Don't know 94 9.7
Ethnicity 93 9.5
Educational credentials (e.g., BS, MS. PhD) 78 8.0
Philosophical view's 62 6.4
Political view's 58 6.0
Major field of study 54 5.5
Parental status (e.g., having children) 28 2.9
Physical characteristics 26 2.7
Marital status (e.g., single, married, partnered) 22 2.3
Socioeconomic status 21 2.2
International status/national origin 19 2.0
Sexual identity 18 1.8
Gender expression 18 1.8
Pregnancy 16 1.6
English language proficiency/accent 15 1.5
Medical disability/condition 13 1.3
Participation hi an organization/team 13 1.3
imigrant/citizen status 12 1.2
Religious/spiritual views 10 1.0
Military/veteran status 7 0.7
Mental health/psychological disability/condition 5 0.5
Physical disability/condition 2 0.2
Learning disability/condition 1 0.1
A reason not listed above 225 23.1 Note: Table includes answers only from those Faculty or Staff respondents who indicated that they observed unjust practices (n = 974). Percentages may not sum to 100 because of multiple responses.
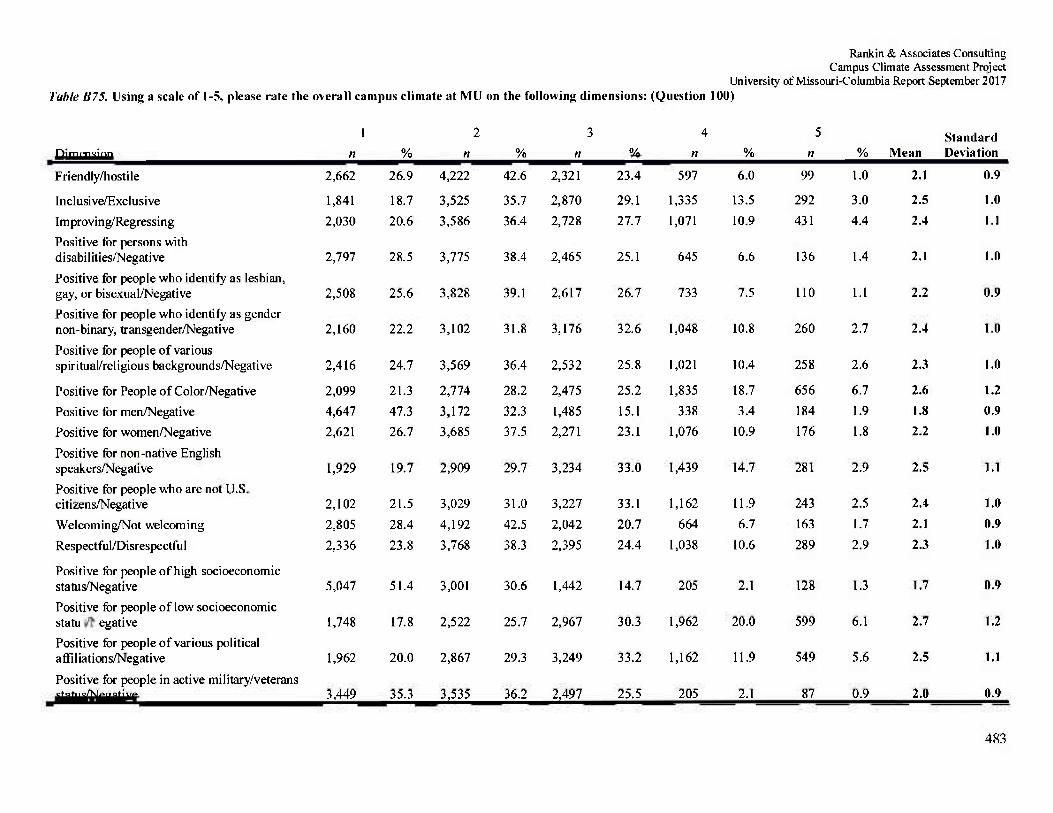
Rankin & Associates Consulting Campus Climate Assessment Project
University of Missouri-Columbia Report September 2017 Table B75. Using a scale of 1-5, please rate the overall campus climate at M l on the following dimensions: (Question 100)
1 2 3 4 5 Standard Dimension n % n % n % n % n % Mean Deviation
Friendly/hostile 2,662 26.9 4,222 42.6 2,321 23.4 597 6.0 99 1.0 2.1 0.9
Inclusive/Exclusive 1,841 18.7 3,525 35.7 2,870 29.1 1,335 13.5 292 3.0 2.5 1.0 Improving/Regressing 2,030 20.6 3,586 36.4 2,728 27.7 1,071 10.9 431 4.4 2.4 1.1 Positive for persons with disabilities/Negative 2,797 28.5 3,775 38.4 2,465 25.1 645 6.6 136 1.4 2.1 1.0 Positive for people who identify as lesbian, gay, or bisexual/Negative 2,508 25.6 3,828 39.1 2,617 26.7 733 7.5 110 1.1 2.2 0.9 Positive for people who identify as gender non-binary, transgender/Negative 2,160 22.2 3,102 31.8 3,176 32.6 1,048 10.8 260 2.7 2.4 1.0 Positive for people of various spiritual/religious backgrounds/Negative 2,416 24.7 3,569 36.4 2,532 25.8 1,021 10.4 258 2.6 2.3 1.0
Positive for People of Color/Negative 2,099 21.3 2,774 28.2 2,475 25.2 1,835 18.7 656 6.7 2.6 1.2 Positive for men/Negative AMI 47.3 3,172 32.3 1,485 15.1 338 3.4 184 1.9 1.8 0.9 Positive for women/Negative 2,621 26.7 3,685 37.5 2,271 23.1 1,076 10.9 176 1.8 2.2 1.0 Positive for non-native English speakers/Negative 1,929 19.7 2,909 29.7 3,234 33.0 1,439 14.7 281 2.9 2.5 1.1 Positive for people who are not U.S. citizens/Negative 2,102 21.5 3,029 31.0 3,227 33.1 1,162 11.9 243 2.5 2.4 1.0 Welcoming/Not welcoming 2,805 28.4 4,192 42.5 2,042 20.7 664 6.7 163 1.7 2.1 0.9 Respectful/Disrespectful 2,336 23.8 3,768 38.3 2,395 24.4 1,038 10.6 289 2.9 2.3 1.0
Positive for people of high socioeconomic status/Negative 5,047 51.4 3,001 30.6 1,442 14.7 205 2.1 128 1.3 1.7 0.9 Positive for people of low socioeconomic status/Negative 1,748 17.8 2,522 25.7 2,967 30.3 1,962 20.0 599 6.1 2.7 1.2 Positive for people of various political affiliations/Negative 1,962 20.0 2,867 29.3 3,249 33.2 1,162 11.9 549 5.6 2.5 1.1 Positive for people in active military/veterans status/Negative 3,449 35.3 3,535 36.2 2,497 25.5 205 2.1 87 0.9 2.0 0.9
483
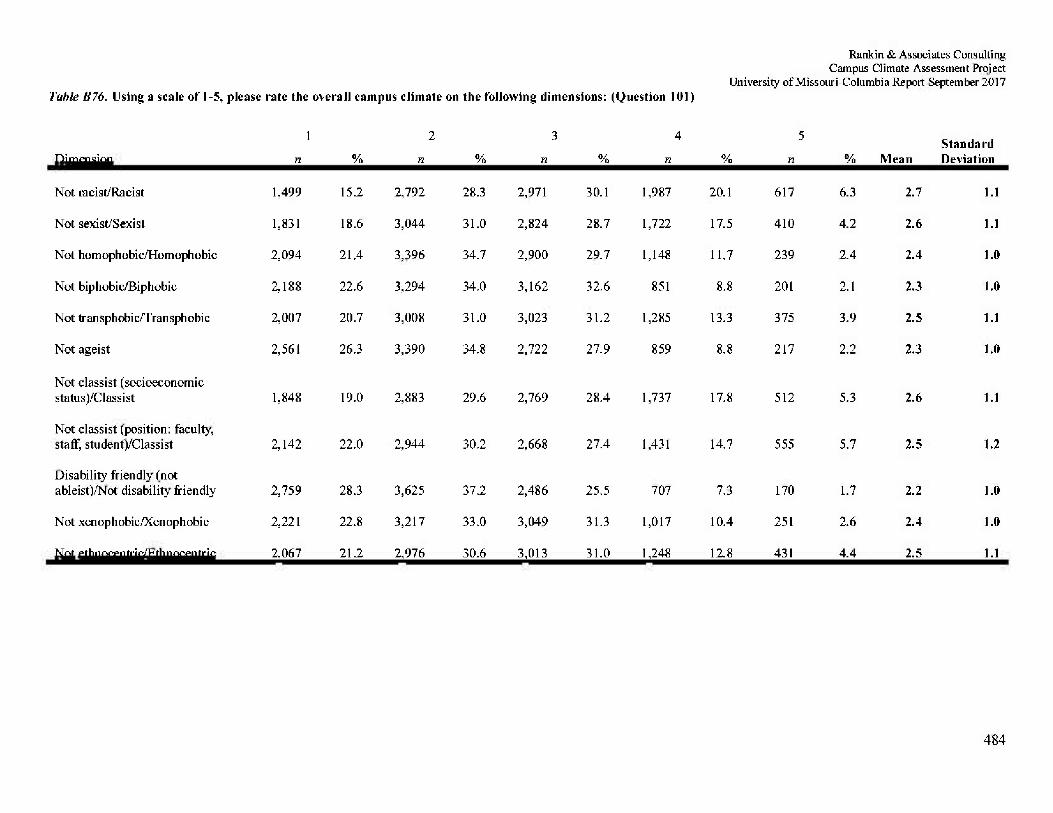
Table B76. Using a scale of 1-5, please rate the overall campus climate on the following dimensions: (Question 101)
Rankin & Associates Consulting Campus Climate Assessment Project
University of Missouri-Columbia Report September 2017
Dimension 1
n % 2
n % 3
n % 4
n % 5
n % Mean Standard Deviation
Not racist/Racist 1,499 15.2 2,792 28.3 2,971 30.1 1,987 20.1 617 6.3 2.7 1.1
Not sexist/Sexist 1,831 18.6 3,044 31.0 2,824 28.7 1,722 17.5 410 4.2 2.6 1.1
Not homophobic/Homophobic 2,094 21.4 3,396 34.7 2,900 29.7 1,148 11.7 239 2.4 2.4 1.0
Not biphobic/Biphobic 2,188 22.6 3,294 34.0 3,162 32.6 851 8.8 201 2.1 2.3 1.0
Not transphobic/Transphobic 2,007 20.7 3,008 31.0 3,023 31.2 1,285 13.3 375 3.9 2.5 1.1
Not ageist 2,561 26.3 3,390 34.8 2,722 27.9 859 8.8 217 2.2 2.3 1.0
Not classist (socioeconomic status)/Classist 1,848 19.0 2,883 29.6 2,769 28.4 1,737 17.8 512 5.3 2.6 1.1
Not classist (position: faculty, staff, student)/Classist 2,142 22.0 2,944 30.2 2,668 27.4 1,431 14.7 555 5.7 2.5 1.2
Disability friendly (not ableist)/Not disability friendly 2,759 28.3 3,625 37.2 2,486 25.5 707 7.3 170 1.7 2.2 1.0
Not xenophobic/Xenophobic 2,221 22.8 3,217 33.0 3,049 31.3 1,017 10.4 251 2.6 2.4 1.0
Not ethnocentric/Ethnocentric 2,067 21.2 2,976 30.6 3,013 31.0 1,248 12.8 431 4.4 2.5 1.1
484
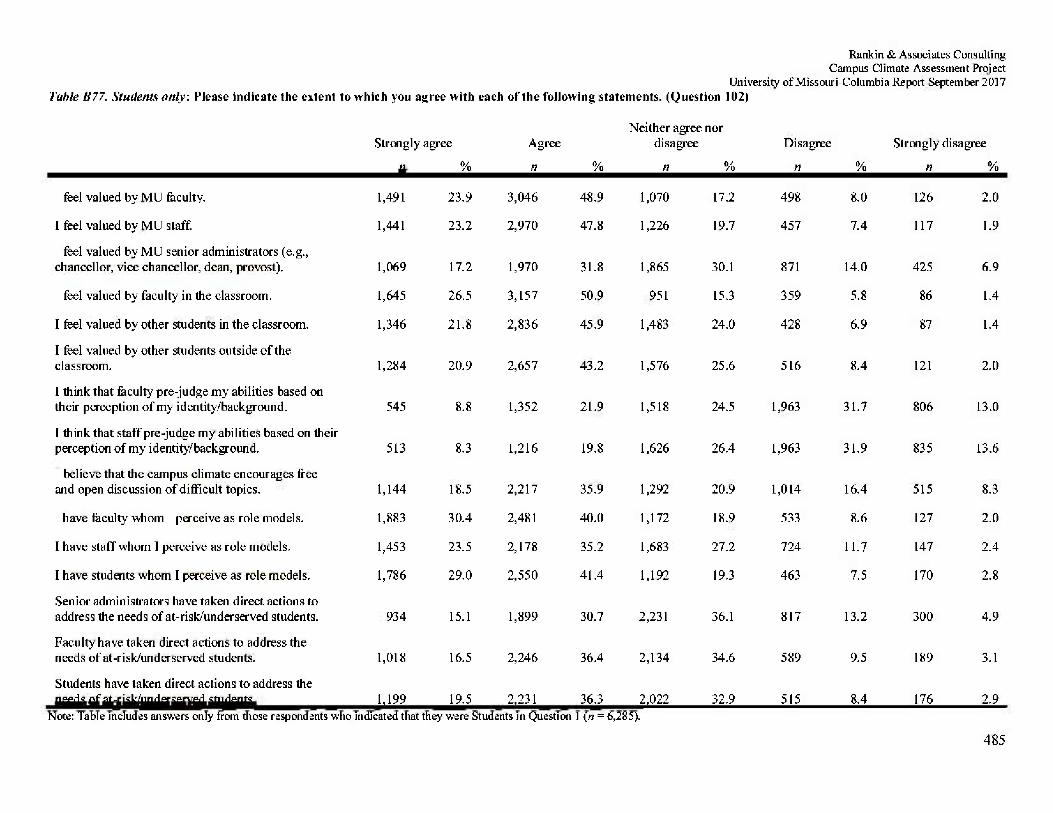
Rankin & Associates Consulting Campus Climate Assessment Project
University of Missouri-Columbia Report September 2017 Table B77. Students only. Please indicate the extent to which you agree with each of the following statements. (Question 102)
Strongly agree Agree Neither agree
disagree nor
Disagree Strongly disagree
n % n % n % n % n %
I feel valued by MU faculty. 1,491 23.9 3,046 48.9 1,070 17.2 498 8.0 126 2.0
I feel valued by MU staff. 1,441 23.2 2,970 47.8 1,226 19.7 457 7.4 117 1.9
I feel valued by MU senior administrators (e.g., chancellor, vice chancellor, dean, provost). 1,069 17.2 1,970 31.8 1,865 30.1 871 14.0 425 6.9
I feel valued by faculty in the classroom. 1,645 26.5 3,157 50.9 951 15.3 359 5.8 86 1.4
I feel valued by other students in the classroom. 1,346 21.8 2,836 45.9 1,483 24.0 428 6.9 87 1.4
I feel valued by other students outside of the classroom. 1,284 20.9 2,657 43.2 1,576 25.6 516 8.4 121 2.0
1 think that faculty pre-judge my abilities based on their perception of my identity/background. 545 8.8 1,352 21.9 1,518 24.5 1,963 31.7 806 13.0
I think that staff pre-judge my abilities based on their perception of my identity/back ground. 513 8.3 1,216 19.8 1,626 26.4 1,963 31.9 835 13.6
I believe that the campus climate encourages free and open discussion of difficult topics. 1,144 18.5 2,217 35.9 1,292 20.9 1,014 16.4 515 8.3
I have faculty whom I perceive as role models. 1,883 30.4 2,481 40.0 1,172 18.9 533 8.6 127 2.0
I have staff whom I perceive as role models. 1,453 23.5 2,178 35.2 1,683 27.2 724 11.7 147 2.4
I have students whom I perceive as role models. 1,786 29.0 2,550 41.4 1,192 19.3 463 7.5 170 2.8
Senior administrators have taken direct actions to address the needs of at-risk/under served students. 934 15.1 1,899 30.7 2,231 36.1 817 13.2 300 4.9
Faculty have taken direct actions to address the needs of at-risk/underserved students. 1,018 16.5 2,246 36.4 2,134 34.6 589 9.5 189 3.1
Students have taken direct actions to address the needs of at-risk/underserved students. 1,199 19.5 2,231 36.3 2,022 32.9 515 8.4 176 2.9
Note: Table includes answers only from those respondents who indicated that they were Students in Question I (n = 6,285).
485
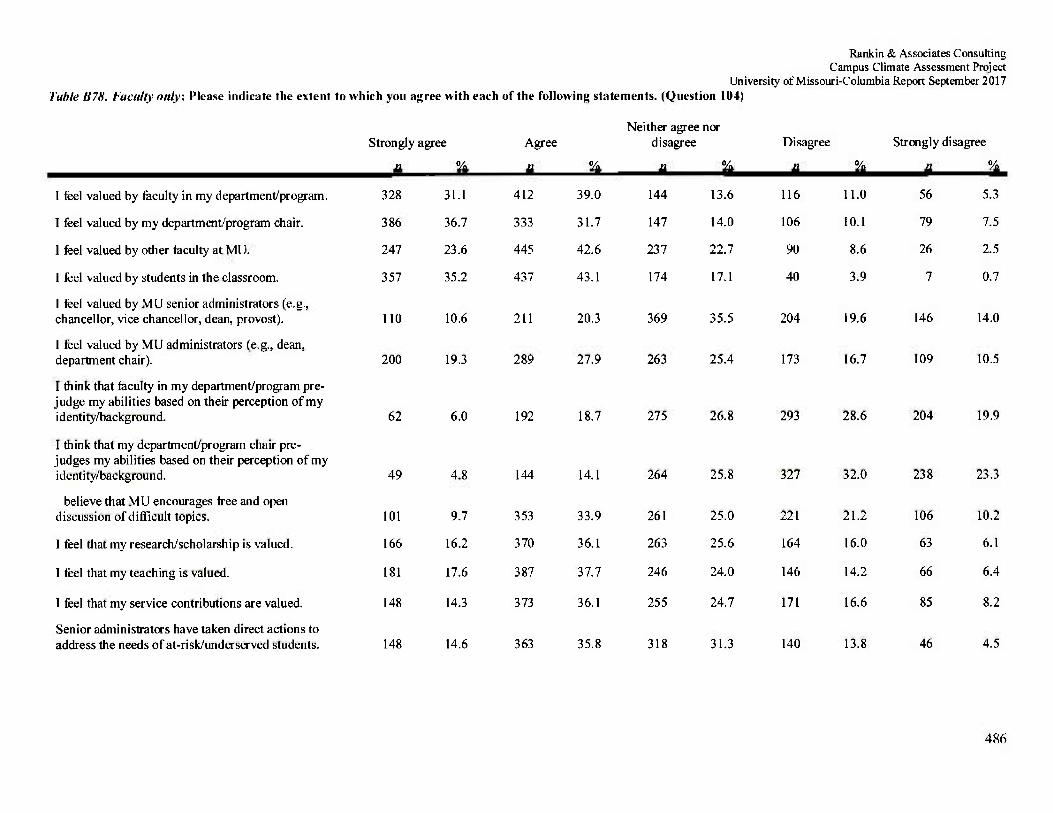
Rankin & Associates Consulting Campus Climate Assessment Project
University of Missouri-Columbia Report September 2017 Table B78. Faculty only: Please indicate the extent to which you agree with each of the following statements. (Question 104)
Neither agree nor Strongly agree Agree disagree Disagree Strongly disagree
n % n % n % n % n %
I feel valued by faculty in my department/program. 328 31.1 412 39.0 144 13.6 116 11.0 56 5.3
I feel valued by my department/program chair. 386 36.7 333 31.7 147 14.0 106 10.1 79 7.5
1 feel valued by other faculty at MU. 247 23.6 445 42.6 237 22.7 90 8.6 26 2.5
I feel valued by students in the classroom. 357 35.2 437 43.1 174 17.1 40 3.9 7 0.7
I feel valued by MU senior administrators (e.g., chancellor, vice chancellor, dean, provost). 110 10.6 211 20.3 369 35.5 204 19.6 146 14.0
I feel valued by MU administrators (e.g., dean, department chair). 200 19.3 289 27.9 263 25.4 173 16.7 109 10.5
I think that faculty in my department/program pre-judge my abilities based on their perception of my identity/background. 62 6.0 192 18.7 275 26.8 293 28.6 204 19.9
I think that my department/program chair pre-judges my abilities based on their perception of my identity/background. 49 4.8 144 14.1 264 25.8 327 32.0 238 23.3
I believe that MU encourages free and open discussion of difficult topics. 101 9.7 353 33.9 261 25.0 221 21.2 106 10.2
I feel that my research/scholarship is valued. 166 16.2 370 36.1 263 25.6 164 16.0 63 6.1
I feel that my teaching is valued. 181 17.6 387 37.7 246 24.0 146 14.2 66 6.4
I feel that my service contributions are valued. 148 14.3 373 36.1 255 24.7 171 16.6 85 8.2
Senior administrators have taken direct actions to address the needs of at-risk/underserved students. 148 14.6 363 35.8 318 31.3 140 13.8 46 4.5
486
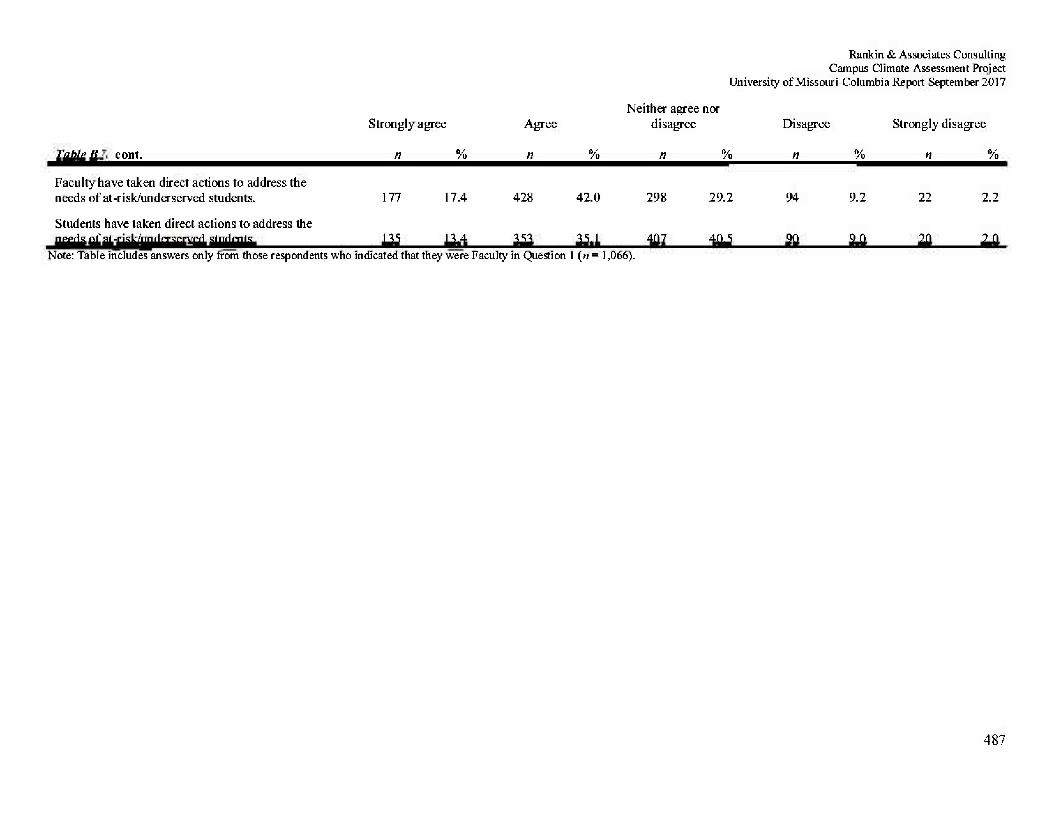
Rankin & Associates Consulting Campus Climate Assessment Project
University of Missouri-Columbia Report September 2017
Neither agree nor
Strongly agree Agree disagree Disagree Strongly disagree
Table B78 cont. n % n % n % n % « % Faculty have taken direct actions to address the
needs of at-risk/underserved students. 177 17.4 428 42.0 298 29.2 94 9.2 22 2.2
Students have taken direct actions to address the needs of at-risk/underserved students. 135 13A 353 35 A 407 405 90 9^ 20 2.0
Note: Table includes answers only from those respondents who indicated that they were Faculty in Question I (n = 1,066).
487
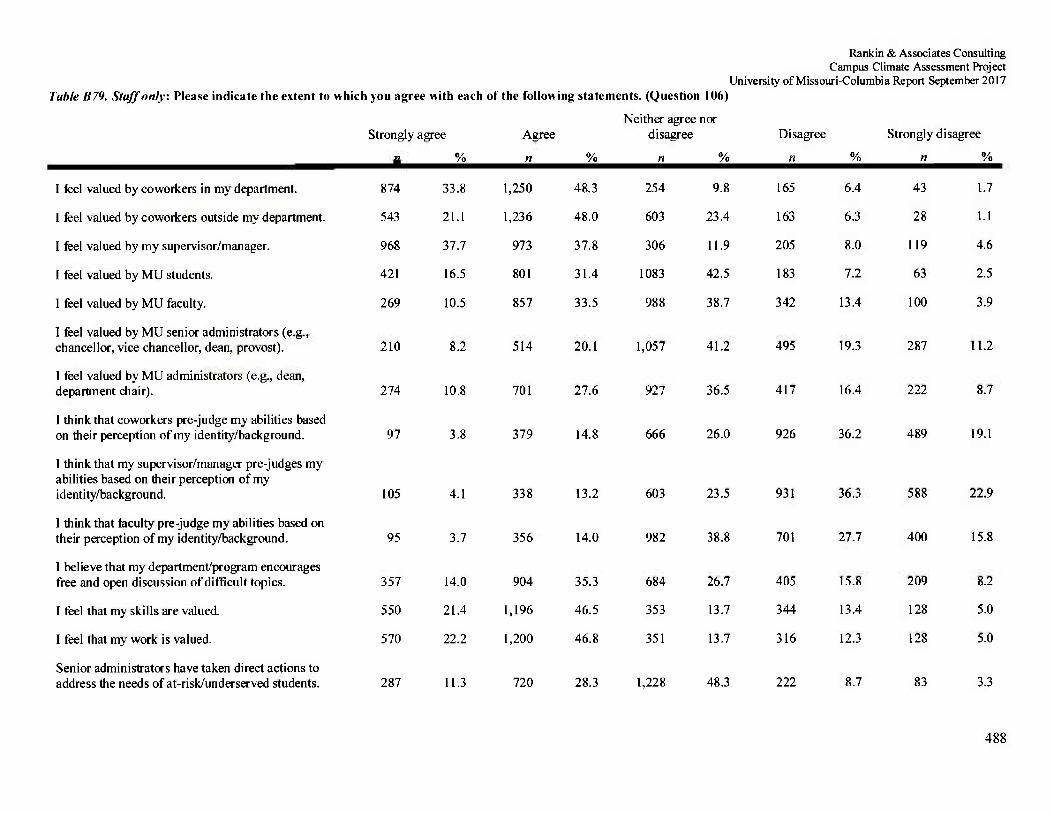
Rankin & Associates Consulting Campus Climate Assessment Project
University of Missouri-Columbia Report September 2017 Table B79. Staff only: Please indicate the extent to which you agree with each of the following statements. (Question 106)
Neither agree nor Strongly agree Agree disagree Disagree Strongly disagree
n % n % n % n % n %
I feel valued by coworkers in my department. 874 33.8 1,250 48.3 254 9.8 165 6.4 43 1.7
I feel valued by coworkers outside my department. 543 21.1 1,236 48.0 603 23.4 163 6.3 28 1.1
I feel valued by my supervisor/manager. 968 37.7 973 37.8 306 11.9 205 8.0 119 4.6
1 feel valued by MU students. 421 16.5 801 31.4 1083 42.5 183 7.2 63 2.5
I feel valued by MU faculty. 269 10.5 857 33.5 988 38.7 342 13.4 100 3.9
I feel valued by MU senior administrators (e.g., chancellor, vice chancellor, dean, provost). 210 8.2 514 20.1 1,057 41.2 495 19.3 287 11.2
1 feel valued by MU administrators (e.g., dean, department chair). 274 10.8 701 27.6 927 36.5 417 16.4 222 8.7
I think that coworkers pre-judge my abilities based on their perception of my identity/background. 97 3.8 379 14.8 666 26.0 926 36.2 489 19.1
I think that my supervisor/manager pre-judges my abilities based on their perception of my identity/background. 105 4.1 338 13.2 603 23.5 931 36.3 588 22.9
I think that faculty pre-judge my abilities based on their perception of my identity/background. 95 3.7 356 14.0 982 38.8 701 27.7 400 15.8
1 believe that my department/program encourages free and open discussion of difficult topics. 357 14.0 904 35.3 684 26.7 405 15.8 209 8.2
1 feel that my skills are valued. 550 21.4 1,196 46.5 353 13.7 344 13.4 128 5.0
I feel that my work is valued. 570 22.2 1,200 46.8 351 13.7 316 12.3 128 5.0
Senior administrators have taken direct actions to address the needs of at-risk/underserved students. 287 11.3 720 28.3 1,228 48.3 222 8.7 83 3.3
488
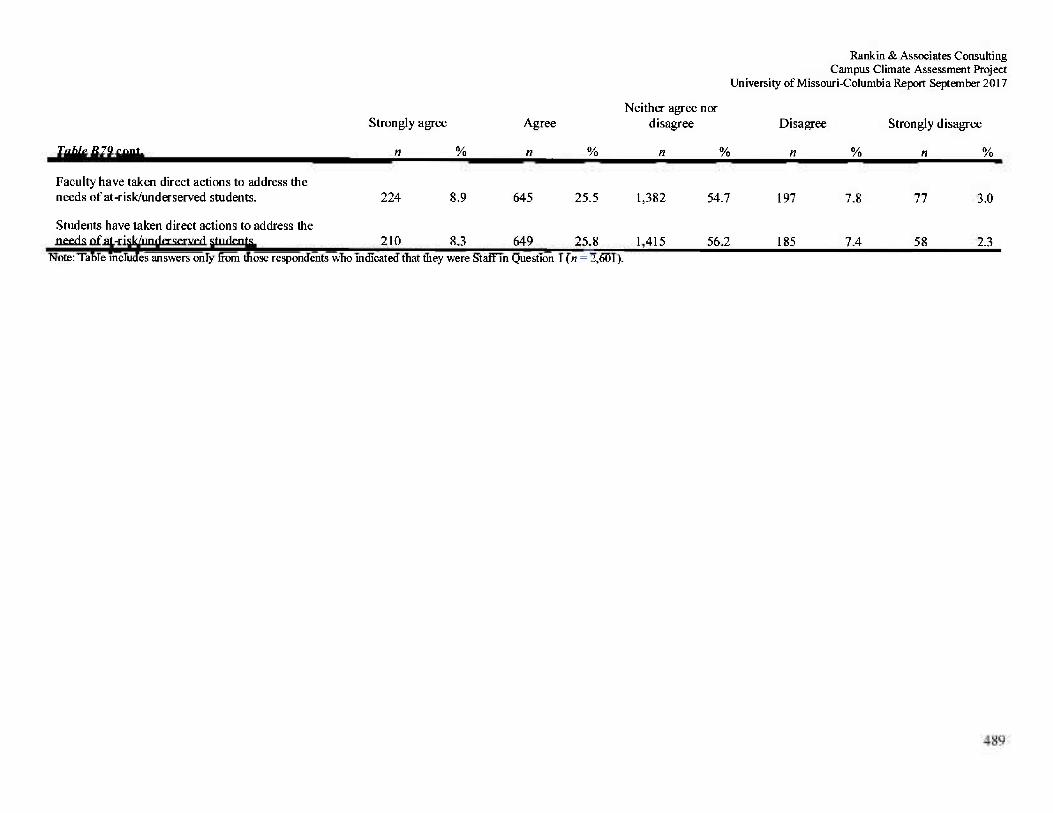
Rankin & Associates Consulting Campus Climate Assessment Project
University of Missouri-Columbia Report September 2017
Strongly agree Agree Neither agree nor
disagree Disagree Strongly disagree
Table B79 cont. n % n % « % n % n %
Faculty have taken direct actions to address the needs of at-risk/underserved students. 224 8.9 645 25.5 1,382 54.7 197 7.8 77 3.0
Students have taken direct actions to address the needs of at-risk/underserved students. 210 8.3 649 25.8 1,415 56.2 185 7.4 58 2.3
Note: Table includes answers only from those respondents who indicated that they were Staff in Question 1 (n = 2,601).
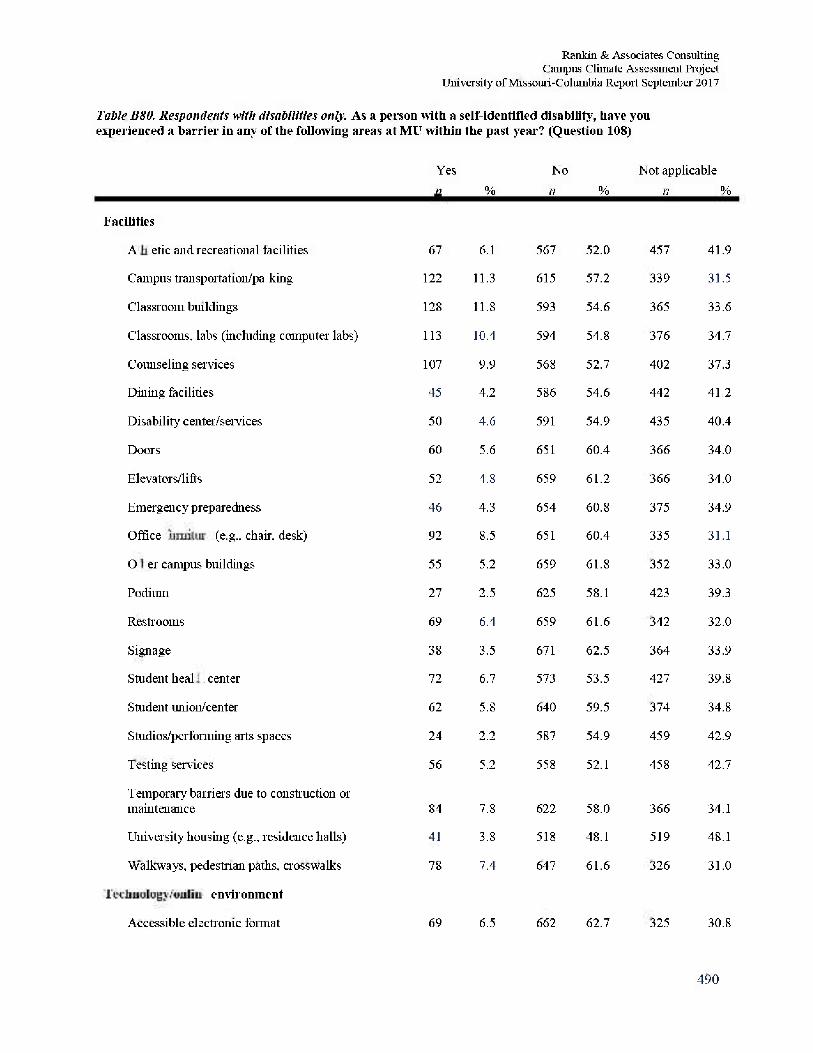
Rankin & Associates Consulting Campus Climate Assessment Project
University of Missouri-Columbia Report September 2017
Table B80. Respondents with disabilities only. As a person with a self-identified disability, Leave you experienced a barrier in any of the following areas at MU within the past year? (Question 108)
Facilities
Athletic and recreational facilities
Yes n
67
%
6.1
No n
567
%
52.0
Not appli n
457
cable
%
41.9
Campus trailsportation/parking 122 11.3 615 57.2 339 31.5
Classroom buildings 128 11.8 593 54.6 365 33.6
Classrooms, labs (including computer labs) 113 10.4 594 54.8 376 34.7
Counseling services 107 9.9 568 52.7 402 37.3
Dining facilities 45 4.2 586 54.6 442 41.2
Disability center/services 50 4.6 591 54.9 435 40.4
Doors 60 5.6 651 60.4 366 34.0
Elevators/lifts 52 4.8 659 61.2 366 34.0
Emergency preparedness 46 4.3 654 60.8 375 34.9
Office furniture (e.g.. chair, desk) 92 8.5 651 60.4 335 31.1
Other campus buildings 55 5.2 659 61.8 352 33.0
Podium 27 2.5 625 58.1 423 39.3
Restrooms 69 6.4 659 61.6 342 32.0
Signage 38 3.5 671 62.5 364 33.9
Student health center 72 6.7 573 53.5 427 39.8
Student union/center 62 5.8 640 59.5 374 34.8
Studios/performing aits spaces 24 2.2 587 54.9 459 42.9
Testing services 56 5.2 558 52.1 458 42.7
Temporary barriers due to construction or maintenance 84 7.8 622 58.0 366 34.1
University housing (e.g., residence halls) 41 3.8 518 48.1 519 48.1
Walkways, pedestrian paths, crosswalks 78 7.4 647 61.6 326 31.0
Technology/online environment
Accessible electronic format 69 6.5 662 62.7 325 30.8
490
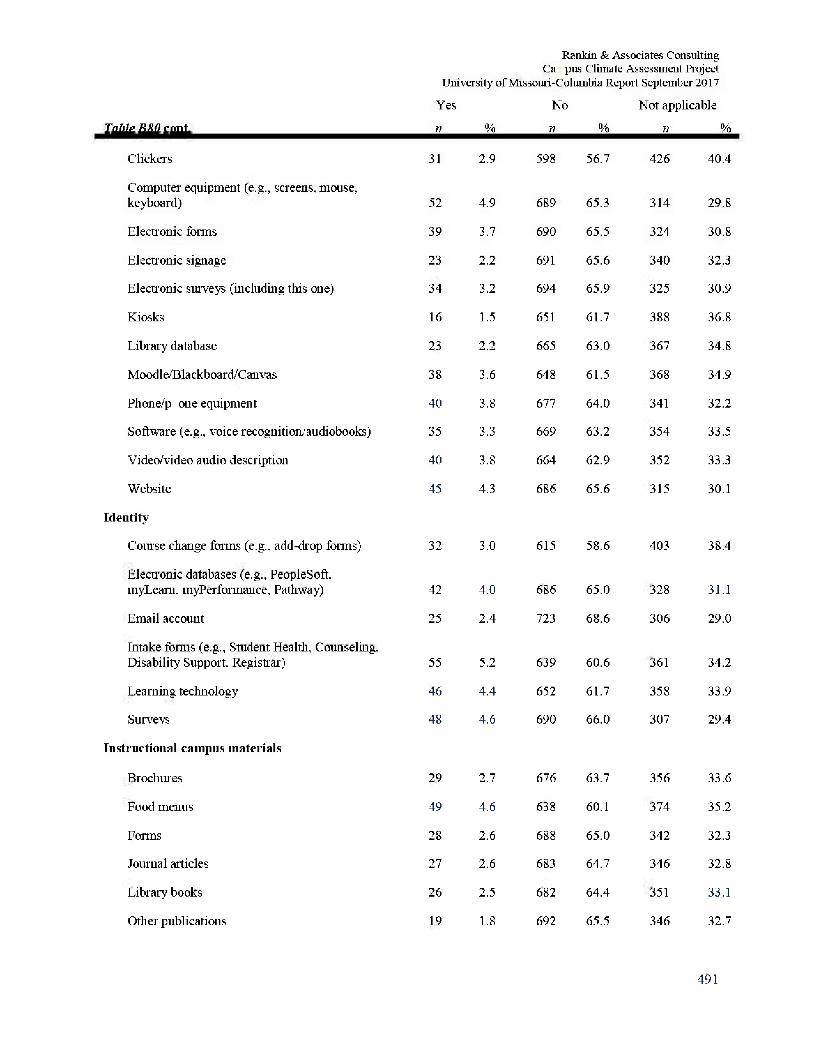
Rankin & Associates Consulting C a p u s Climate Assessment Project
University of Missouri-Columbia Repoit September 2017
Yes No Not apphcable
Table B80 coot. n % n % n %
Clickers 31 2.9 598 56.7 426 40.4
Computer equipment (e.g., screens, mouse, keyboard) 52 4.9 689 65.3 314 29.8
Electronic forms 39 3.7 690 65.5 324 30.8
Electronic signage 23 2.2 691 65.6 340 32.3
Electronic surveys (including this one) 34 3.2 694 65.9 325 30.9
Kiosks 16 1.5 651 61.7 388 36.8
Library database 23 2.2 665 63.0 367 34.8
Moodl e/Blackboa rd Canva s 38 3.6 648 61.5 368 34.9
Phone/phone equipment 40 3.8 677 64.0 341 32.2
Software (e.g., voice recognition audiobooks) 35 3.3 669 63.2 354 33.5
Video/video audio description 40 3.8 664 62.9 352 33.3
Website 45 4.3 686 65.6 315 30.1
Identity
Course change forms (e.g., add-drop forms) 32 3.0 615 58.6 403 38.4
Electronic databases (e.g., PeopleSoft. myLeam. myPerformance, Pathway) 42 4.0 686 65.0 328 31.1
Email account 25 2.4 723 68.6 306 29.0
Intake forms (e.g.. Student Health, Counseling, Disability Support. Registrar) 55 5.2 639 60.6 361 34.2
Learning technology 46 4.4 652 61.7 358 33.9
Surveys 48 4.6 690 66.0 307 29.4
Instruction ale a mp us materials
Brochures 29 2.7 676 63.7 356 33.6
Food menus 49 4.6 638 60.1 374 35.2
Forms 28 2.6 688 65.0 342 32.3
Journal articles 27 2.6 683 64.7 346 32.8
Library books 26 2.5 682 64.4 351 33.1
Other publications 19 1.8 692 65.5 346 32.7
491
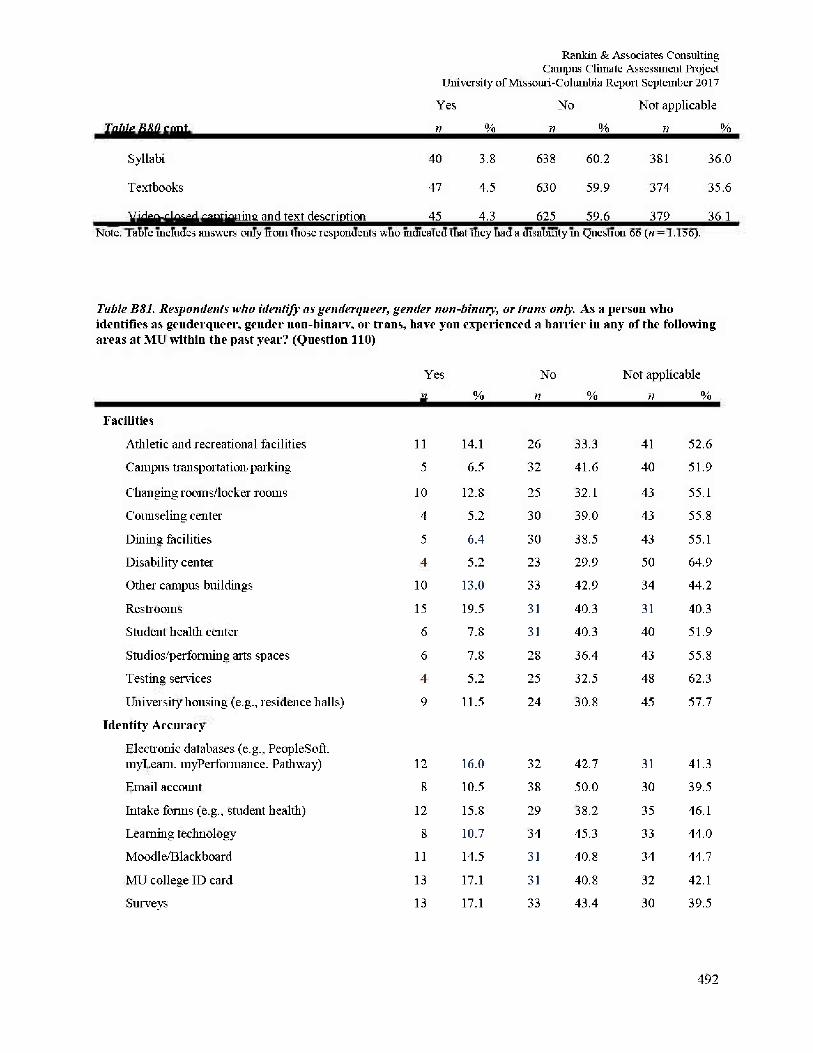
Rankin & Associates Consulting Campus Climate Assessment Project
University of Missouri-Columbia Repoit September 2017
Yes No Not applicable Table B80 cont. n % n % n %
Syllabi 40 3.8 638 60.2 381 36.0
Textbooks 47 4.5 630 59.9 374 35.6
Video-closed capti< zaiiiis and text des< :ription 45 4.3 625 59.6 379 36.1 Note: Table includes answers only from those respondents who indicated that they had a disability in Question 66 (n = 1.156).
Table B81. Respondents who identify as genderqueer, gender non-binary, or trans only. As a person who identifies as genderqueer, gender non-binarv, or trans, have you experienced a barrier in any of the following areas at MU within the past year? (Question 110)
Yes No Not applicable n % n % n %
Facilities
Athletic and recreational facilities 11 14.1 26 33.3 41 52.6
Campus trail sportationpar king 5 6.5 32 41.6 40 51.9
Changing rooms/locker rooms 10 12.8 25 32.1 43 55.1
Coimseling center 4 5.2 30 39.0 43 55.8
Dining facilities 5 6.4 30 38.5 43 55.1
Disability center 4 5.2 23 29.9 50 64.9
Other campus buildings 10 13.0 33 42.9 34 44.2
Restrooms 15 19.5 31 40.3 31 40.3
Student health center 6 7.8 31 40.3 40 51.9
Studios.''performing arts spaces 6 7.8 28 36.4 43 55.8
Testing services 4 5.2 25 32.5 48 62.3
University housing (e.g., residence halls) 9 11.5 24 30.8 45 57.7
Identity Accuracy
Electronic databases (e.g., PeopleSoft. myLeam. myPerformance. Pathway) 12 16.0 32 42.7 31 41.3
Email account 8 10.5 38 50.0 30 39.5
Intake forms (e.g., student health) 12 15.8 29 38.2 35 46.1
Learning technology 8 10.7 34 45.3 33 44.0
Moodl e/Bla ckboa rd 11 14.5 31 40.8 34 44.7
MU college ID card 13 17.1 31 40.8 32 42.1
Surveys 13 17.1 33 43.4 30 39.5
492
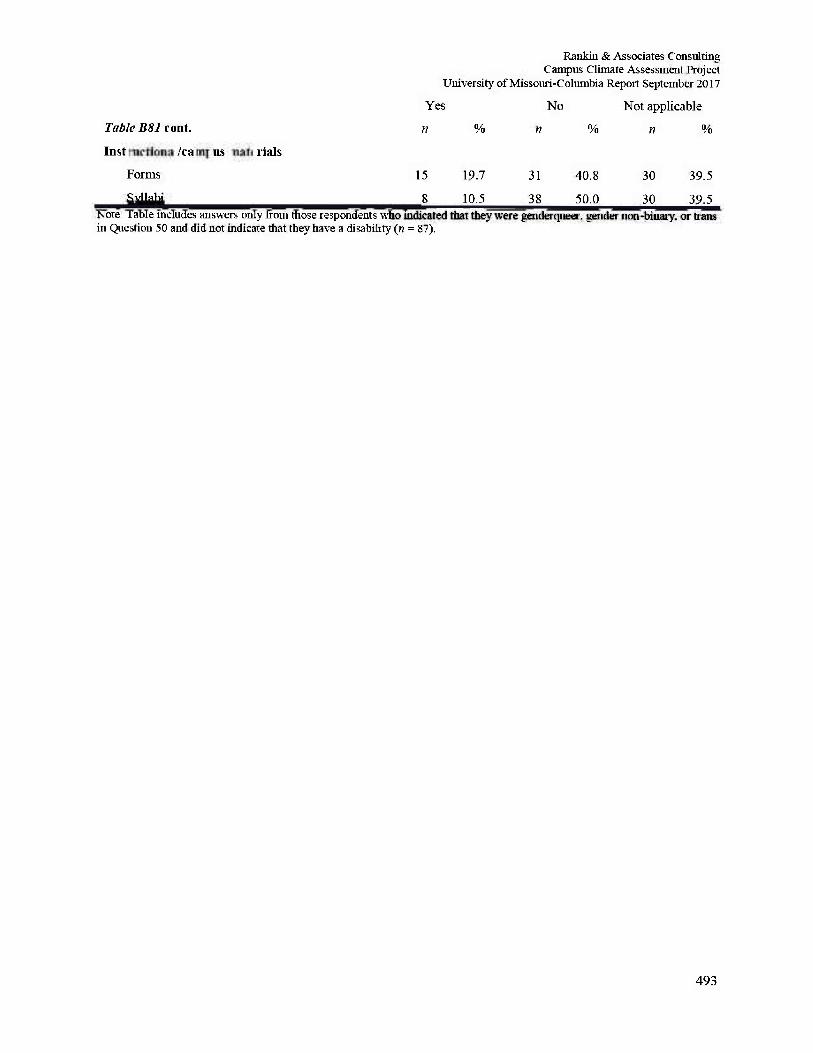
493
Rankin & Associates Consulting Campus Climate Assessment Project
University of Missouri-Columbia Report September 2017
Yes No Not applicable
Table B81 cont. n % n % n %
Instructional/campus materials
Forms 15 19.7 31 40.8 30 39.5
Syllabi 8 10.5 38 50.0 30 39.5 Note: Table includes answers only from those respondents who indicated that they were genderqueer. gender non-binary, or dans in Question 50 and did not indicate that they have a disability (n = 87).
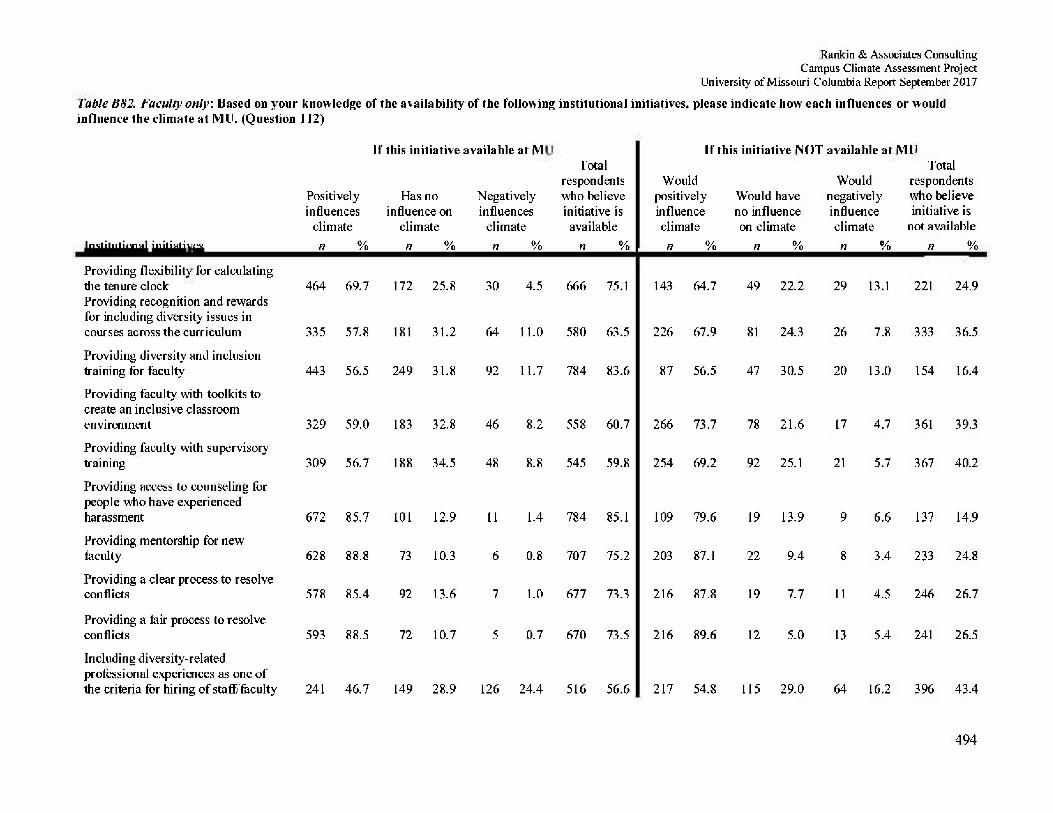
Rankin & Associates Consulting Campus Climate Assessment Project
University of Missouri-Columbia Report September 2017
Table BH2. Faculty only. Based on your knowledge of the availability of the following institutional initiatives, please indicate how each influences or would influence the climate at ML). (Question 112)
If this initiative available at MU If this initiative (NOT available at ML) Total
respondents who believe initiative is available
Total respondents who believe initiative is
not available
Total respondents who believe initiative is available
Would positively influence climate
Would negatively influence climate
Total respondents who believe initiative is
not available
Positively influences
climate
Has no influence on
climate
Negatively influences
climate
Total respondents who believe initiative is available
Would positively influence climate
Would have no influence on climate
Would negatively influence climate
Total respondents who believe initiative is
not available Institutional initiatives n % n % n % n % n % n % n % n % Providing flexibility for calculating the tenure clock 464 69.7 172 25.8 30 4.5 666 75.1 143 64.7 49 22.2 29 13.1 221 24.9 Providing recognition and rewards for including diversity issues in courses across the curriculum 335 57.8 181 31.2 64 11.0 580 63.5 226 67.9 81 24.3 26 7.8 333 36.5
Providing diversity and inclusion training for faculty 443 56.5 249 31.8 92 11.7 784 83.6 87 56.5 47 30.5 20 13.0 154 16.4
Providing faculty with toolkits to create an inclusive classroom environment 329 59.0 183 32.8 46 8.2 558 60.7 266 73.7 78 21.6 17 4.7 361 39.3
Providing faculty with supervisory training 309 56.7 188 34.5 48 8.8 545 59.8 254 69.2 92 25.1 21 5.7 367 40.2
Providing access to counseling for people who have experienced harassment 672 85.7 101 12.9 11 1.4 784 85.1 109 79.6 19 13.9 9 6.6 137 14.9
Providing mentorship for new faculty 628 88.8 73 10.3 6 0.8 707 75.2 203 87.1 22 9.4 8 3.4 233 24.8
Providing a clear process to resolve conflicts 578 85.4 92 13.6 7 1.0 677 73.3 216 87.8 19 7.7 11 4.5 246 26.7
Providing a fair process to resolve conflicts 593 88.5 72 10.7 5 0.7 670 73.5 216 89.6 12 5.0 13 5.4 241 26.5
Including diversity-related professional experiences as one of the criteria for hiring of staff/faculty 241 46.7 149 28.9 126 24.4 516 56.6 217 54.8 115 29.0 64 16.2 396 43.4
494
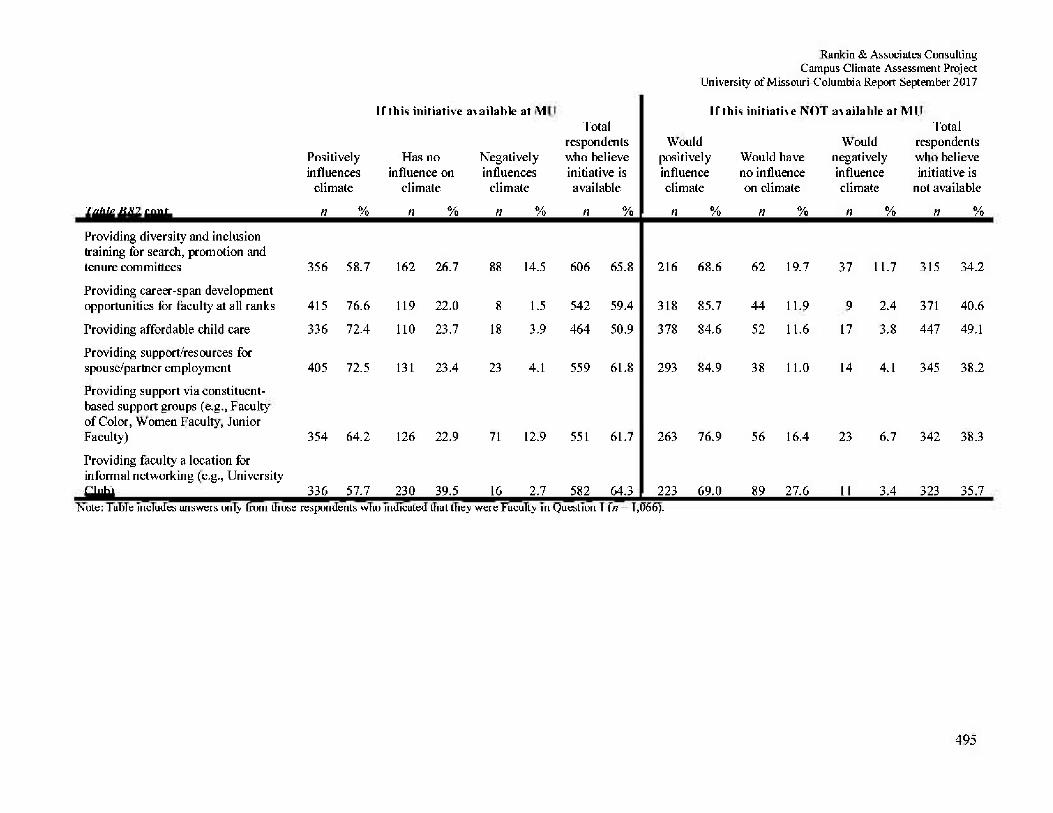
Rankin & Associates Consulting Campus Climate Assessment Project
University of Missouri-Columbia Report September 2017
If this initiative available at MU If this initiative NOT available at Mil Total Total
respondents Would Would respondents Positively Has no Negatively who believe positively Would have negatively who believe influences influence on influences initiative is influence no influence influence initiative is
climate climate climate available climate on climate climate not available
Table BS2 cont. n % n % n % n % n % n % « % n %
Providing diversity and inclusion training for search, promotion and tenure committees 356 58.7 162 26.7 88 14.5 606 65.8 216 68.6 62 19.7 37 11.7 315 34.2 Providing career-span development opportunities for faculty at all ranks 415 76.6 119 22.0 8 1.5 542 59.4 318 85.7 44 11.9 9 2.4 371 40.6
Providing affordable child care 336 72.4 110 23.7 18 3.9 464 50.9 378 84.6 52 11.6 17 3.8 447 49.1
Providing support/resources for spouse/partner employment 405 72.5 131 23.4 23 4.1 559 61.8 293 84.9 38 11.0 14 4.1 345 38.2
Providing support via constituent-based support groups (e.g., Faculty of Color, Women Faculty, Junior Faculty) 354 64.2 126 22.9 71 12.9 551 61.7 263 76.9 56 16.4 23 6.7 342 38.3
Providing faculty a location for informal networking (e.g., University Club) 336 57.7 230 39.5 16 2.7 582 64.3 223 69.0 89 27.6 11 3.4 323 35.7
Note: Table includes answers only from those respondents who indicated that they were Faculty in Question 1 (n = 1,066).
495
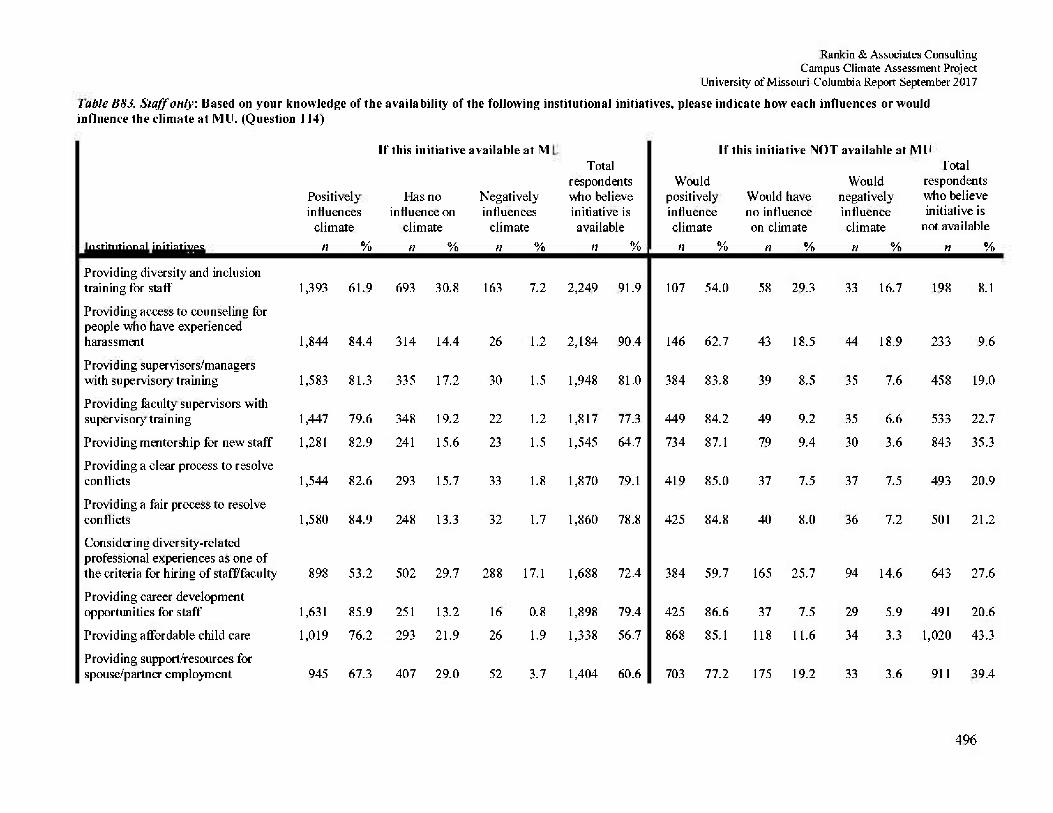
Rankin & Associates Consulting Campus Climate Assessment Project
University of Missouri-Columbia Report September 2017
Table B83. Staff only. Based on your knowledge of the availability of the following institutional initiatives, please indicate how each influences or would influence the climate at ML). (Question 114)
Positively influences
climate
If this initiative available at MU
Has no Negatively influence on influences
climate climate
Total respondents who believe initiative is available
If this initiative NOT available at MLi Total
Would Would respondents positively Would have negatively who believe influence no influence influence initiative is climate on climate climate not available
Institutional initiatives n % n % n % n % n % n % n % « %
Providing diversity and inclusion training for staff 1,393 61.9 693 30.8 163 7.2 2,249 91.9 107 54.0 58 29.3 33 16.7 198 8.1
Providing access to counseling for people who have experienced harassment 1,844 84.4 314 14.4 26 1.2 2,184 90.4 146 62.7 43 18.5 44 18.9 233 9.6
Providing supervisors/managers with supervisory training 1,583 81.3 335 17.2 30 1.5 1,948 81.0 384 83.8 39 8.5 35 7.6 458 19.0
Providing faculty supervisors with supervisory training 1,447 79.6 348 19.2 22 1.2 1,817 77.3 449 84.2 49 9.2 35 6.6 533 22.7
Providing mentorship for new staff 1,281 82.9 241 15.6 23 1.5 1,545 64.7 734 87.1 79 9.4 30 3.6 843 35.3
Providing a clear process to resolve conflicts 1,544 82.6 293 15.7 33 1.8 1,870 79.1 419 85.0 37 7.5 37 7.5 493 20.9
Providing a fair process to resolve conflicts 1,580 84.9 248 13.3 32 1.7 1,860 78.8 425 84.8 40 8.0 36 7.2 501 21.2
Considering diversity-related professional experiences as one of the criteria for hiring of staff faculty 898 53.2 502 29.7 288 17.1 1,688 72.4 384 59.7 165 25.7 94 14.6 643 27.6
Providing career development opportunities for staff 1,631 85.9 251 13.2 16 0.8 1,898 79.4 425 86.6 37 7.5 29 5.9 491 20.6
Providing affordable child care 1,019 76.2 293 21.9 26 1.9 1,338 56.7 868 85.1 118 11.6 34 3.3 1,020 43.3
Providing support/resources for spouse/partner employment 945 67.3 407 29.0 52 3.7 1,404 60.6 703 77.2 175 19.2 33 3.6 911 39.4
496
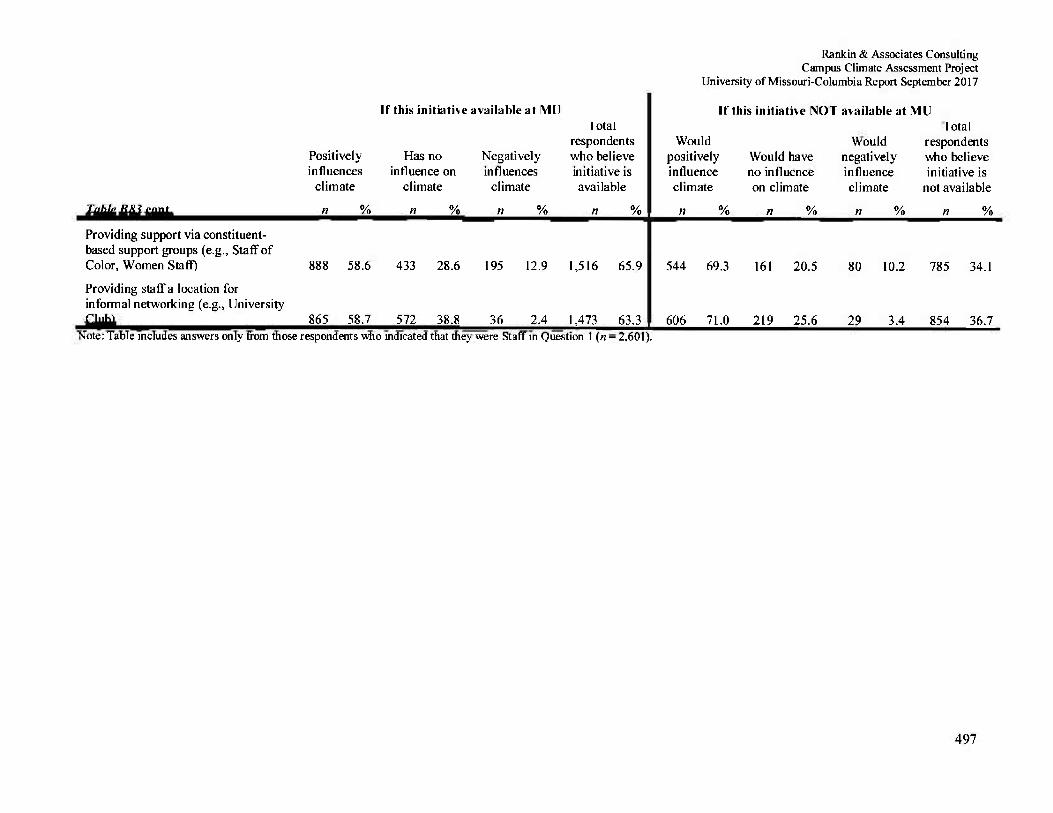
Rankin & Associates Consulting Campus Climate Assessment Project
University of Missouri-Columbia Report September 2017
If this initiative available at MU If this initiative NOT available at MU
Positively influences
climate
Has no influence on
climate
Negatively influences
climate
lotal respondents who believe initiative is available
Would positively influence climate
Would have no influence on climate
Would negatively influence climate
lotal respondents who believe initiative is
not available Table BS3 cont. n % n % n % n % n % n % n % n % Providing support via constituent-based support groups (e.g., Staff of Color, Women Staff) 888 58.6 433 28.6 195 12.9 1,516 65.9 544 69.3 161 20.5 80 10.2 785 34.1 Providing staff a location for informal networking (e.g., University Club) 865 58.7 572 38.8 36 2.4 1,473 63.3 606 71.0 219 25.6 29 3.4 854 36.7
Note: Table includes answers only from those respondents who indicated that they were Staff in Question 1 (n = 2,601).
497
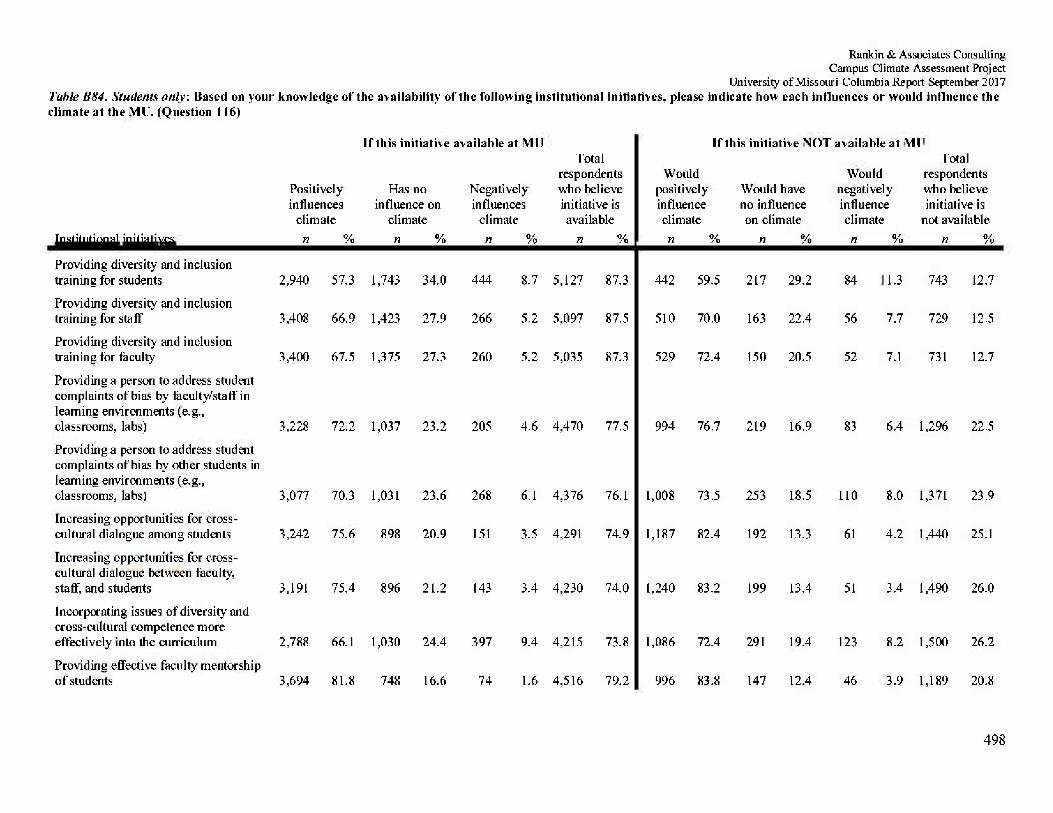
Rankin & Associates Consulting Campus Climate Assessment Project
University of Missouri-Columbia Report September 2017 Table BH4. Students only: Based on your knowledge of the availability of the following institutional initiatives, please indicate how each influences or would influence the climate at the MU. (Question 116)
Positively influences
climate
If this initiative available at MU
Has no Negatively influence on influences
climate climate
Total respondents who believe initiative is available
If this initiative NOT available at Mil Total
Would Would respondents positively Would have negatively who believe influence no influence influence initiative is climate on climate climate not available
Institutional initiatives n % n % n % n % n % n % n % n % Providing diversity and inclusion training for students 2,940 57.3 1,743 34.0 444 8.7 5,127 87.3 442 59.5 217 29.2 84 1.3 743 12.7
Providing diversity and inclusion training for staff 3,408 66.9 1,423 27.9 266 5.2 5,097 87.5 510 70.0 163 22.4 56 7.7 729 12.5
Providing diversity and inclusion training for faculty 3,400 67.5 1,375 27.3 260 5.2 5,035 87.3 529 72.4 150 20.5 52 7.1 731 12.7
Providing a person to address student complaints of bias by faculty/staff in learning environments (e.g., classrooms, labs) 3,228 72.2 1,037 23.2 205 4.6 4,470 77.5 994 76.7 219 16.9 83 6.4 1,296 22.5
Providing a person to address student complaints of bias by other students in learning environments (e.g., classrooms, labs) 3,077 70.3 1,031 23.6 268 6.1 4,376 76.1 1,008 73.5 253 18.5 110 8.0 1,371 23.9
fncreasing opportunities for cross-cultural dialogue among students 3,242 75.6 898 20.9 151 3.5 4,291 74.9 1,187 82.4 192 13.3 61 4.2 1,440 25.1
Increasing opportunities for cross-cultural dialogue between faculty, staff, and students 3,191 75.4 896 21.2 143 3.4 4,230 74.0 1,240 83.2 199 13.4 51 3.4 1,490 26.0
Incorporating issues of diversity and cross-cultural competence more effectively into the curriculum 2,788 66.1 1,030 24.4 397 9.4 4,215 73.8 1,086 72.4 291 19.4 123 8.2 1,500 26.2
Providing effective faculty mentorship of students 3,694 81.8 748 16.6 74 1.6 4,516 79.2 996 83.8 147 12.4 46 3.9 1,189 20.8
498
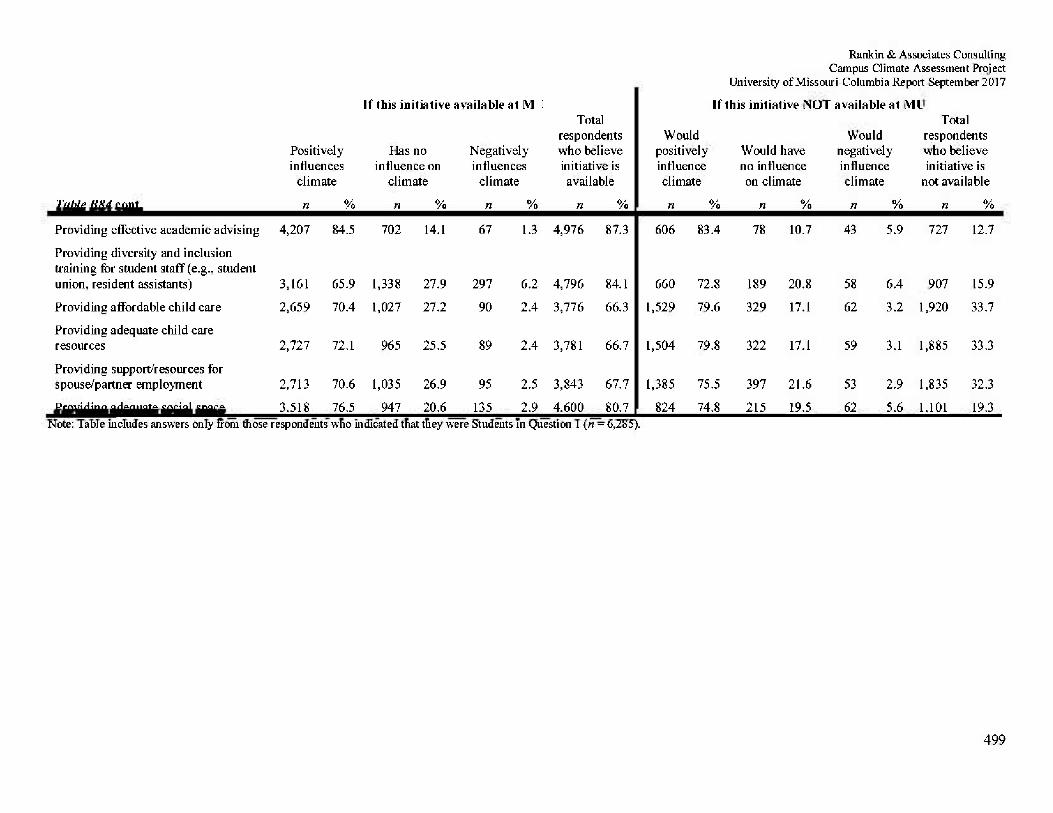
If this initiative available at MU!
Rankin & Associates Consulting Campus Climate Assessment Project
University of Missouri-Columbia Report September 2017
If this initiative NOT available at ML1
499
Positively influences
climate
Has no influence on
climate
Negatively influences
climate
Total respondents who believe initiative is available
Would positively influence climate
Would have no influence on climate
Would negatively influence climate
Total respondents who believe initiative is
not available
Table BH4 eont. n % n % n % n % n % n % n % n %
Providing effective academic advising 4,207 84.5 702 14.1 67 1.3 4,976 87.3 606 83.4 78 10.7 43 5.9 727 12.7
Providing diversity and inclusion training for student staff (e.g., student union, resident assistants) 3,161 65.9 1,338 27.9 297 6.2 4,796 84.1 660 72.8 189 20.8 58 6.4 907 15.9
Providing affordable child care 2,659 70.4 1,027 27.2 90 2.4 3,776 66.3 1,529 79.6 329 17.1 62 3.2 1,920 33.7
Providing adequate child care resources 2,727 72.1 965 25.5 89 2.4 3,781 66.7 1,504 79.8 322 17.1 59 3.1 1,885 33.3
Providing s upporfresources for spouse/partner employment 2,713 70.6 1,035 26.9 95 2.5 3,843 67.7 1,385 75.5 397 21.6 53 2.9 1,835 32.3
Providins adequate social space 3.518 76.5 947 20.6 135 2.9 4.600 80.7 824 74.8 215 19.5 62 5.6 1.101 19.3 Note: Table includes answers only from those respondents who indicated that they were Students in Question 1 (n = 6,285).
Rankin & Associates Consulting Campus Climate Assessment Project
University of Missouri-Columbia Report September 2017
Appendix C Comment Analyses (Questions #118, #119, and #120)
The 9,952 surveys submitted for the University of Missouri-Columbia climate assessment
contained respondents' responses to open-ended questions found throughout the survey. In
addition to these open-ended questions, follow-up questions were embedded hi the survey so that
respondents could provide more detail about their answers to specific survey questions.
Responses to follow-up questions were included in the body of the report This appendix
summarizes the comments submitted for the final three survey questions (Questions 118, 119,
and 120) and provides examples of remarks that were echoed by multiple respondents. If
comments were related to previous follow-up questions, the comments were added to the
relevant section of the report narrative and therefore, are not reflected in this appendix.
Campus and Community Difference
Three thousand eight hundred eighty-nine respondents elaborated on if then experiences on
campus were different from their experiences in the community surrounding campus. Two
primary themes emerged: (1) perceptions of similar experiences on and off campus and (2)
perceptions of experiences as different, primarily noting the campus community as more
inclusive.
Campus and community perceived as the same - Respondents who elaborated on how
experiences on campus were different from their experiences in the community most often
described them as the same. The vast majority of these responses were short, "not different", "no
differences", "same", or simply "no." Other respondents elaborated more. One respondent
shared, "No the community and campus reflect one another." Another respondent echoed, "No
they're very similar." Some respondents noted poor reflections on both the campus and the
community, "No—both are mostly uncomfortable" and "No, as a persons of color there are no
safe parts of Columbia or Mizzou." One respondent expressed, "No, Columbia, Missouri is a
place frill of white people, and so is Mizzou." Some respondents reflected positively on both
environments, "No, everywhere is pretty similar and just a great atmosphere" and "I feel
comfortable anywhere." Respondents who elaborated on how experiences on campus were
Rankin & Associates Consulting Campus Climate Assessment Project
University of Missouri-Columbia Report September 2017
different from their experiences in the community most often reported no differences between
the two environments.
Campus wore inclusive - Respondents who elaborated 011 how experiences on campus were
different from their experiences hi the community described the campus as more inclusive. One
respondent acknowledged discrimination of minorities hi Columbia hi contrast to the lack of
such observations 011 campus, "I have not experienced racism/sexism/ageism/religious
discrimination, but I'm a white cis-gendered male, it exists in Columbia, and in the state of
Missouri, but I don't really see it on campus at Mizzou." Other respondents reported, "I have
seen more racism off campus, than 011 campus" and "I rarely step foot off campus for the sole
reason of avoiding racism from the locals." Another respondent shared, hi reference to
Columbia, "If you are gay, transgendered, black or a woman here you are screwed. So much hate
and this needs to stop." One respondent noted, "On campus I'm much more likely to be treated
with reduced scrutiny and increased friendliness regardless of my gender presentation, which is
very nice." Another respondent explained, "On campus, I've never had to deal with explicit
racism, but in the community I have. I was out to eat with a diverse group of friends, but our
group had more black people than white. A guy drove by in his car and said something like: he
hated black people and we need to get out of here. For the black people, it was sad that it didn't
surprise us, but the white people in the group were shocked and angry that someone would say
that." Other respondents also noted similar concerns 011 campus, "I think that Columbia deals
with bias and racism both on campus and in the community." Other respondents noted, "Campus
tends to be more tolerant, but still isn't great" and "Campus typically feels like a safer place than
some of the surrounding areas, especially at night." \Vl11le some respondents noted inclusion
concerns for both the campus and community, the majority of inclusion related concerns in this
data reported the local community to be less inclusive than the campus climate.
501
Rankin & Associates Consulting Campus Climate Assessment Project
University of Missouri-Columbia Report September 2017
Recommendations for Improving the Climate at Missouri-Columbia
Four thousand sixty-seven respondents offered suggestions for improving the climate at
University of Missouri-Columbia. Five themes emerged from the data: (1) respondents suggested
less support for and emphasis oil identity-based initiatives, (2) respondents suggest
improvements for the current diversity training efforts, (3) respondents expressed a desire for
more opportunities for dialogue and building community with people who are different from
themselves, (4) respondents noted a perceived need to be more positive and optimistic regarding
the recent events on campus and current culture, and (5) respondents noted suggestions for
campus leadership.
Less identity-based support and emphasis - Respondents who elaborated on suggestions for
improving the climate advocated for less identity-based support and emphasis. Examples of these
general sentiments included: "Treat everyone EQUALLY", "Inclusiveness for all", and "Remove
all references to gender/race/ethnicity. Treat all as equals!!!" Other respondents described more
specific concerns. For example, respondents noted the perception that some identities were given
advantage because of inclusion efforts. One respondent suggested "not favoring others because
they are in a special class, allowing them to have to have lower work standards." Another
respondent noted, "We all need to be treated the same no matter our sex, color, pohtical views,
etc. No one should have a leg up for any reason other than experience and qualifications." Some
respondents who suggested all people be treated fairly, perceived that people reporting racism
were the source of problems. For example, one respondent noted, "Treat ah people fairly,
regardless of race. Do not give hi to groups that are actively crying racism all the time when it is
usually them that are causing the problem." Other respondents suggested people stop dialogues
about race. One respondent shared, "The best way to improve the climate is to stop talking about
it. If no one talked about different races and we all treated each other the same, there would be
no racism." Another respondent echoed a similar sentiment with an encouragement to focus on
academics, "Stay focused on providing a quality academic experience for ALL students. ALL
students matter." Finally, some narratives described the perception that only white people are
held accountable on race issues and suggested that this practice end. For example, one
respondent explained, "I think racism happens in both white and black populations, but only
502
Rankin & Associates Consulting Campus Climate Assessment Project
University of Missouri-Columbia Report September 2017
whites get punished." Respondents who elaborated on suggestions for improving the climate
noted a desire for more emphasis on "all" and sameness instead of an emphasis on differences.
Suggestions regarding current training efforts - Respondents who elaborated on suggestions for
improving the climate noted a range of suggestions and critiques of current training efforts.
Some respondents suggested mandatory diversity training. For example, "make a diversity
training requirement" and "Definitely diversity training for students, staff, and faculty." Another
respondent elaborated, "require something like the Citizenship training for current students not
just the new students. Make it mandatory like it was for the incoming students." Conversely,
some respondents expressed a desire for 110 mandatory diversity training. For example, one
respondent noted, "Stop making new students take 'diversity training.' Most students like myself
do not care what or who you are or where you came from. We just want to go about our business
and not have everything revolve around race and to have it constantly shoved in our faces."
Another respondent echoed, "Don't push diversity training too hard because I feel like for people
who know right from wrong." Other respondents commented 011 the quality and perceived
efficacy of the current trainings available 011 campus. One respondent reported, "the workshops
offered that I have attended through the DEI office have been great." Conversely, one respondent
expressed, "DIVERSIFY AND INCLUSION TRAINING FOR ALL STUDENTS THAT ISN'T
JUST A JOKE HOUR LONG TUTORIAL." Another respondent explained, "Absolutely,
meaningful diversity training, not idiotic multiple-click online tests would be a start. I've seen
tons of confederate flags and baseball caps and what-not. Clearly these symbols hurt people of
color and I honestly think some students have 110 idea how what they choose to wear on their
heads or fly of the back of the $45K pickup truck that dad bought them affects people around
them." Finally, some respondents described the fear that "bringing attention to diversity through
training and promotion only serves to further divide people based 011 their unique differences,
rather than bring them together." Another respondent noted, "Eliminate the egregious hypocrisy
inherent in initiatives such as faculty/student diversity training. They aim to fix problems that are
not flxable by their methods, and in fact only exacerbate those problems." Respondents who
elaborated 011 their suggestions for improvement noted a range of suggestions and critiques of
current diversity training.
503
Rankin & Associates Consulting Campus Climate Assessment Project
University of Missouri-Columbia Report September 2017
Desire for dialogue and community building - Respondents who elaborated 011 their suggestions
for improving the climate suggested more opportunities for dialogue and community building
with people different from them. Some respondents succinctly noted, "Just talk about it",
"Simply be open", "Face to face discussions" and "discourse, more of it. moderated, continued."
Another respondent suggested openness with some expectations, "Promote open expression of
civilly rendered opinions." Another respondent explained, "Allow everyone to speak their minds
and allow7 people to disagree. It is ok to disagree in thought. The problem is when deliberate
action occurs to interfere with an individual's ability to be themselves. Everyone does not have to
like everyone or even get along, they just have to be civil and respectful." Other respondents
expressed a desire for more hi comparison opportunities for dialogue with the current frequency
of these opportunities previously. For example, one respondent elaborated. "More classes that
talk about climate" and "More cross- cultural awareness and understanding training." Some
respondents described a fear of being vulnerable in difficult dialogues. Respondents elaborated,
"Having more ways for people to openly talk about issues without fear of a dangerous reaction"
and "Encourage open dialogue without fear of upsetting a diverse group of people." One
respondent expressed a desire for in academic settings, "More discussion based classes, less
lectures. More circular structure for active discussion can bring up different things that will help
learning and improve climate." Other respondents suggested, "Hold more inclusive events" and
"More cross-cultural events for students." Respondents who elaborated on their suggestions for
improving the climate desired more opportunities for discourse in tandem with the perception
that these opportunities w7ould foster community building.
More positivity and optimism - Respondents who elaborated 011 their suggestions for improving
the climate suggested "highlighting positive experiences at MU" and generally being more
positive. One respondent elaborated, "The majority of MU is very satisfied with the climate.
Emphasis should be placed 011 that satisfaction instead of highlighting the smaller number of
issues. In other words, focus more 011 the good topics at MU, and quit focusing 011 the
negativity." Another respondent emphatically noted, "BE POSITIVE. REWARD GOOD
BEHAVIOR AND PRODUCTIVE EMPLOYEES. ALWAYS CONVEY THE POSITIVE AND
TREMENDOUS ACCOMPLISHMENTS OF FACULTY, STAFF, STUDENTS .AND
ATHLETES." Some respondent noted their pleas for more emphasis on positivity in tandem with
504
Rankin & Associates Consulting Campus Climate Assessment Project
University of Missouri-Columbia Report September 2017
comments about recent events, particularly regarding racial tension. One respondent expressed.
"Stop beating ourselves...look at our positives as well as our negatives." Another respondent
explained, "Stop addressing the fact that Mizzou is a racial campus. Start showing people that we
can come together as a community to achieve greater goals and that we can be the campus we
grew to know and love before all of the badness affected Mizzou." Other respondents perceived
the racial concerns to have been addressed and desire to move on and focus on the positives.
"The climate is fine as it is now. but if more groups like CS1950 show up without a legitimate
reason and reasonable demands the school should not respond to these terroristic groups." More
generally, another respondent suggested positive reinforcement, "Quit focusing 011 negatives and
start using the positives as the bar for expectations. Make a big deal out of and reward what we
want us to be. Enforce what we already have instead of ADDING superfluous duplication to it."
Another respondent echoed, "Positive reinforcement, offering appreciation in words and gifts,
sharing staffs successes and making a big deal out of it. Building employees UP!" Another
respondent shared, "MU is a great school and place to work. I hate that all the good things
happening here are not shared more. It seems the constant publicity focuses only 011 the bad."
Others simply stated, "I love my work environment" and "MU does a great job." Respondents
who elaborated 011 their suggestions for improving the climate desire more positivity and
optimism at the University of Missouri.
Suggestions for leadership - Respondents who elaborated 011 their suggestions for improving the
climate noted a range of ideas and hopes for campus leadership. The most noted sub-theme
within the narrative addressing leadership was the desire for a more diverse leadership team.
Respondents noted, "Increase the diversity of the administrators" and "Increase representational
racial, ethnic, and gender diversity in senior administrators, deans, directors, and managers."
Another respondent noted this matter with appreciation. "I think the university has taken some
very positive action since the turmoil of 2015 -1 think increasing the number of administrators
and faculty from under-represented minorities is desirable and will attract a more diverse student
body, leading to a better climate." Other suggestions for leadership included a desire to be heard,
providing stability, being accountable and transparent communication. Regarding the desire for
leadership to listen, one respondent noted, "I think it is very important that administrators listen
to grad students and faculty." Another respondent shared gratitude for the space to be heard.
505
Rankin & Associates Consulting Campus Climate Assessment Project
University of Missouri-Columbia Report September 2017
"The biggest improvement this year is the feet that everyone is willing to talk about issues that
arise. You won't find all universities or communities doing that." In light of the leadership
changes, some respondents noted a lack of continuity and asserted the need for "a stable
leadership group" and "solid leadership." Accountability from leadership was also addressed, "It
has to start from the top. Senior administrators need to be held accountable for their actions and
attitudes." Finally, regarding transparent communication, respondents suggested, "Transparent
communication from administration" and "More communication with senior administrators."
One respondent shared an optimistic reflection, "I believe we are 011 the right path with current
leadership." Similarly, another respondent optimistically suggested, "Just a general focus on
continuously improving campus climate for everyone including administrators, employees, and
students." Respondents who elaborated 011 improving the climate noted suggestions for
leadership including more diversity, stability, accountability and communication.
Description of Experiences or Additional Thoughts
One thousand four hundred five respondents elaborated 011 other comments that they did not
have a chance to provide previously hi the survey. Five themes emerged in the data gathered in
response to this question: (1) positive reflections on University of Missouri- Columbia, (2)
perceived negative impacts of the current level of emphasis 011 DIVERSITY, (3) reflections 011
the survey itself, (4) leadership concerns, and (5) elaborations 011 inclusion concerns.
Positive Reflections - Respondents who elaborated 011 their survey responses noted, "All good",
"Great questions", and "Thank you!" among their positive reflections. One respondent positively
reflected, "I think the climate of this campus is pretty good. I feel welcomed and included in
everything." Another respondent explained, "Mizzou has a long row to hoe, but it's also frill of
people willing to shoulder the work. May they succeed." Other respondents reported, "Campus is
definitely improving" and "I love this University it has given so much to me, my family and I
have seen so many students learn and grow and take their education and apply it hi ways that
make the world a better place." Another respondent shared, "I love Mizzou so much, even
though we have had our ups and downs within the past year, this school means the world to me
and I will continue to see the best in it." Similarly, another respondent noted, "I love Mizzou,
although it lias gone through a lot 111 this last year I feel like it will only go up from here. We will
Rankin & Associates Consulting Campus Climate Assessment Project
University of Missouri-Columbia Report September 2017
come out stronger and more inclusive and an overall better university." One respondent noted
appreciation of the institution's commitment to the community and their commitment to MU.
"Everyone lias different experiences, but I am satisfied. MU is working hard to address
everyone's issues. I'll support the university. Good luck." Respondents who elaborated 011 their
survey responses had positive and hope fill shares to add to the survey data.
Reflections on being white - Respondents who elaborated 011 their survey responses provided
narratives addressing their perceptions of what it is like being White at the University of
Missouri. Some respondents described challenges with being assumed to be racist. One
respondent defended, "A few people 011 campus are giving an entire demographic a bad name.
Not all white people are racist." Another respondent asserted, "All races matter, not just white
and black people." Respondents who self-identified as White described reverse discrimination
and disapproval of the pressure to be politically correct in tandem with reflections 011 being
White. For example, one respondent explained, "Am thankful for this confidential survey and
having the opportunity to make known how reverse discrimination is affecting the climate at this
institution. Forced diversity is implying that all whites are bad people and it only makes racial
tensions worse." Another respondent noted, "As a white male I feel like I am treated unfairly. I
grew up in a time where everyone is equal under the law. The only 'social' differences I have
seen is that women and minorities get access to benefits and money I am not eligible to receive."
Similarly, another respondent shared, "I believe the culture of pohtical correctness is not only
hurting the world as a whole, but campus climate. We need to understand that words are just
that; words." Other respondents described their \Vl11te11ess in relationship to their privilege. One
respondent stated, "As a White female, I feel mostly privileged." Another respondent explained,
"I have 110 issues with the climate 011 campus when it comes to race, gender, sexual orientation,
etc. That may be because I am a white heterosexual." Another respondent reported, "I am a white
woman and have not experienced discrimination personally, however the incidents that black
students/staff/faculty have experienced make me uncomfortable about Mizzou's environment."
Echoing the concern for non-white people, one respondent elaborated, "I feel that MU is a
generally 11011 welcoming and sometimes hostile environment for non-White students."
Respondents who elaborated 011 their survey responses address perceived challenges and
privileges associated with being White at the University of Missouri.
507
Rankin & Associates Consulting Campus Climate Assessment Project
University of Missouri-Columbia Report September 2017
Survey feedback - Respondents who elaborated 011 their survey responses provided positive and
negative feedback on the survey itself Respondents who offered positive reflections noted. "I
think the survey served its purpose" and "I thought this was a very inclusive survey." Another
respondent elaborated, "Good survey. A bit long, but in my eyes it was worth it to complete.
This is an important issue." One more respondent added, "Conducting this survey is a great step
towards improving campus! I appreciate the concern that you have, it makes me feel like
someone is actually listening." Another respondent echoed, "I love this type of thing, but this
survey was too long for me to answer every question meaningfully." Other respondents critiqued
the survey, "'climate' is not the correct term to use" and "Awful survey. Too many questions.
Waste of time and money." Another respondent reported, "survey did not adequately address
feelings about the impact of the economic climate at MU - layoffs and no raises for staff due to
enrollment and donor response to handling of past unrest." Another respondent added, "This
survey is a joke. Are you going to pretend anyone really cares?" Another respondent asserted,
"You're going to use this survey to say the climate is racist and it w7on't be accurate." Other
respondents provided suggestions 011 what to do, or not do, with the survey results. One
respondent noted, "I think that open-verbal conversations with willing participants would
provide more value than just this survey. I think that should be a focus for information gathering
011 this topic." Another respondent pleaded, "Please do not create another task force or initiative.
Most departments are under-staffed, there is no extra money for new endeavors. Let's just get
back to focusing on providing students with an education they can use hi this world." Finally,
one respondent offered, "Amazing job constructing this survey. Questions were w7orded properly
and friendly for all. Thank you. I hope to see something actually come about this." Respondents
who elaborated on their survey responses noted feedback 011 the survey itself and hopes that it
will have an impact 011 the campus community.
Scars from past leadership and skepticism about future leaders — Respondents who elaborated
011 their survey responses described their' impression of previous leadership and concerns about
the future of leadership on campus. Some respondents described the ways they believed they had
been hurt and failed by previous leadership. One respondent noted, "The previous administration
handled two things horribly: race and AAU reorientation. Now, students and faculty are
508
Rankin & Associates Consulting Campus Climate Assessment Project
University of Missouri-Columbia Report September 2017
demoralized." Another respondent explained. "I am appalled by the lack of leadersliip by this
schools administration. We will be rebuilding for years but the scars will last forever of what the
'leaders' did to our institution." Referencing the past indifferently, one respondent shared, "I feel
like Administration is doing too much to right wrongs, and they are bringing down Greek Life
because of it. They need to start supporting every student organization equally." Noting the
anticipated changes ahead hi leadersliip respondents reflected, "The secrecy of the presidential
search is excessive. Without revealing candidates' names and present employment, some
information should be available to UM faculty and staff" Other respondents noted leadership
concerns hi tandem with concerns about this survey. One respondent shared, "Surveys can often
be used to push an agenda, rather than to do a true needs assessment. I can't tell which this one
really is. Lack of trust of leadership will sink us all..." Another respondent explained, "I doubt
any change will come from this survey. The administration will cherry pick the data like they
have with previous climate surveys. They are dragging their feet because they don't actually want
to change anything, they just want people to be quiet and accept the status quo." Finally, one
respondent noted, "Mizzou's leadership needs to show that they are open to diversity and
inclusion before we can expect students to do the same." Respondents who elaborated oil their
survey responses described a need for healing the relationship between leadersliip and the
campus community.
Inclusion concerns - Respondents who elaborated oil then survey responses noted concerns for a
wide range of layers of identities including, ability status, size, sexuality, gender identity, gender,
age and race. One respondent pleaded, "Always provide closed captions if making a video 011
MU page. Train staffs to learn the basic of ASL and other languages. Try to include everyone."
Another respondent reported, "As a large person. I have noticed discrimination against me
because of that. It's not severe or intolerable but there is discrimination from some towards
people who are overweight." Some respondents addressed their LGBTQ identities and noted "the
general climate still seems very gender and sexually normative." Another respondent explained,
"As a queer woman, I experience increased and targeted sexual harassment. I seem to be
sexualized more than my straight fellow women are. Sexual harassment in general is a
reoccurring problem I face on this campus that needs to be addressed." Additionally, another
respondent added, "I am friends with multiple people 011 Facebook who identify as homosexual
509
Rankin & Associates Consulting Campus Climate Assessment Project
University of Missouri-Columbia Report September 2017
or transgender. I am used to seeing posts by them commenting how they were verbally abused
that day on Mizzou campus." Regarding gender, respondents reported, "Being a woman working
on campus is bad. ... Being an older, disabled woman on campus is a death for any hope of
advancement at MU" and "I feel the particular lab I work hi has specific sexist tendencies, e.g.
males do not do dishes, they have a tendency to be offered field assignments more than women."
Racism was also noted by respondents who elaborated oil this question, for example, "Missouri
was a slave state and unfortunately, there are still a few people 011 campus that think it is
acceptable to disrespect African Americans." Another respondent explained, "MU's problems 011
this topic are long-standing and deeply rooted, as far back as the history of Boone county and
central Missouri as a slave-holding area before the Civil War. It's essentially an insoluble
problem; if we really want tolerance, we have to leave." More broadly, one respondent noted, "I
have noticed discrimination in regards to sex, ses, race, religion, immigration status, and political
ideology." Another respondent shared, "I want my friends/strangers/faculty to stop hurting
because people are getting away with racism sexism ableism, transphobia, homophobia, etc."
Respondents who elaborated 011 their survey response described inclusion concerns for many
perceived minorities hi the current campus climate.
510
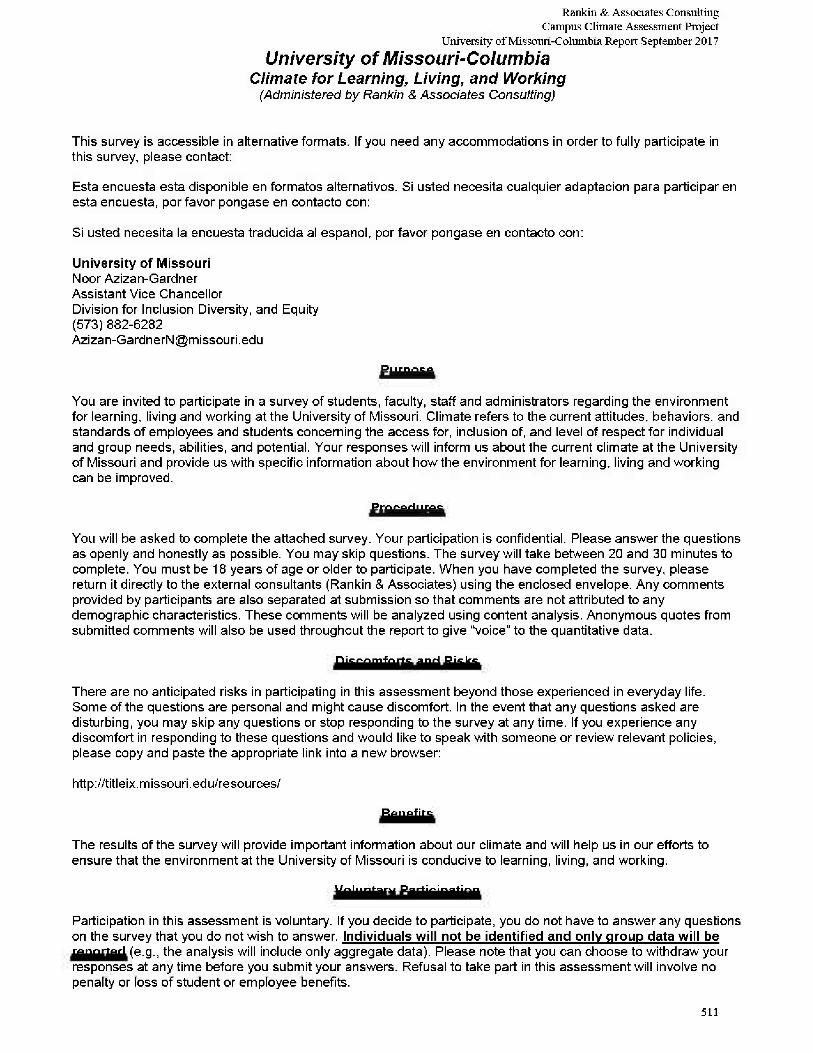
Rankin & Associates Consulting Campus Climate Assessment Project
University of Missouri-Columbia Report September 2017
University of Missouri-Columbia Climate for Learning, Living, and Working
(Administered by Rankin & Associates Consulting)
This survey is accessible in alternative formats. If you need any accommodations in order to fully participate in this survey, please contact:
Esta encuesta esta disponible en formatos alternatives. Si usted necesita cualquier adaptacion para participar en esta encuesta, por favor pongase en contacto con:
Si usted necesita la encuesta traducida al espanol, por favor pongase en contacto con:
University of Missouri Noor Azizan-Gardner Assistant Vice Chancellor Division for Inclusion Diversity, and Equity (573) 882-6282 [email protected]
Purpose
You are invited to participate in a survey of students, faculty, staff and administrators regarding the environment for learning, living and working at the University of Missouri. Climate refers to the current attitudes, behaviors, and standards of employees and students concerning the access for, inclusion of, and level of respect for individual and group needs, abilities, and potential. Your responses will inform us about the current climate at the University of Missouri and provide us with specific information about how the environment for learning, living and working can be improved.
Procedures
You will be asked to complete the attached survey. Your participation is confidential. Please answer the questions as openly and honestly as possible. You may skip questions. The survey will take between 20 and 30 minutes to complete. You must be 18 years of age or older to participate. When you have completed the survey, please return it directly to the external consultants (Rankin & Associates) using the enclosed envelope. Any comments provided by participants are also separated at submission so that comments are not attributed to any demographic characteristics. These comments will be analyzed using content analysis. Anonymous quotes from submitted comments will also be used throughout the report to give "voice" to the quantitative data.
Discomforts and Risks
There are no anticipated risks in participating in this assessment beyond those experienced in everyday life. Some of the questions are personal and might cause discomfort. In the event that any questions asked are disturbing, you may skip any questions or stop responding to the survey at any time. If you experience any discomfort in responding to these questions and would like to speak with someone or review relevant policies, please copy and paste the appropriate link into a new browser:
http://titleix.missouri.edu/resources/
Benefits
The results of the survey will provide important information about our climate and will help us in our efforts to ensure that the environment at the University of Missouri is conducive to learning, living, and working.
Voluntary Participation
Participation in this assessment is voluntary. If you decide to participate, you do not have to answer any questions on the survey that you do not wish to answer. Individuals will not be identified and only group data will be reported (e.g., the analysis will include only aggregate data). Please note that you can choose to withdraw your responses at any time before you submit your answers. Refusal to take part in this assessment will involve no penalty or loss of student or employee benefits.
511
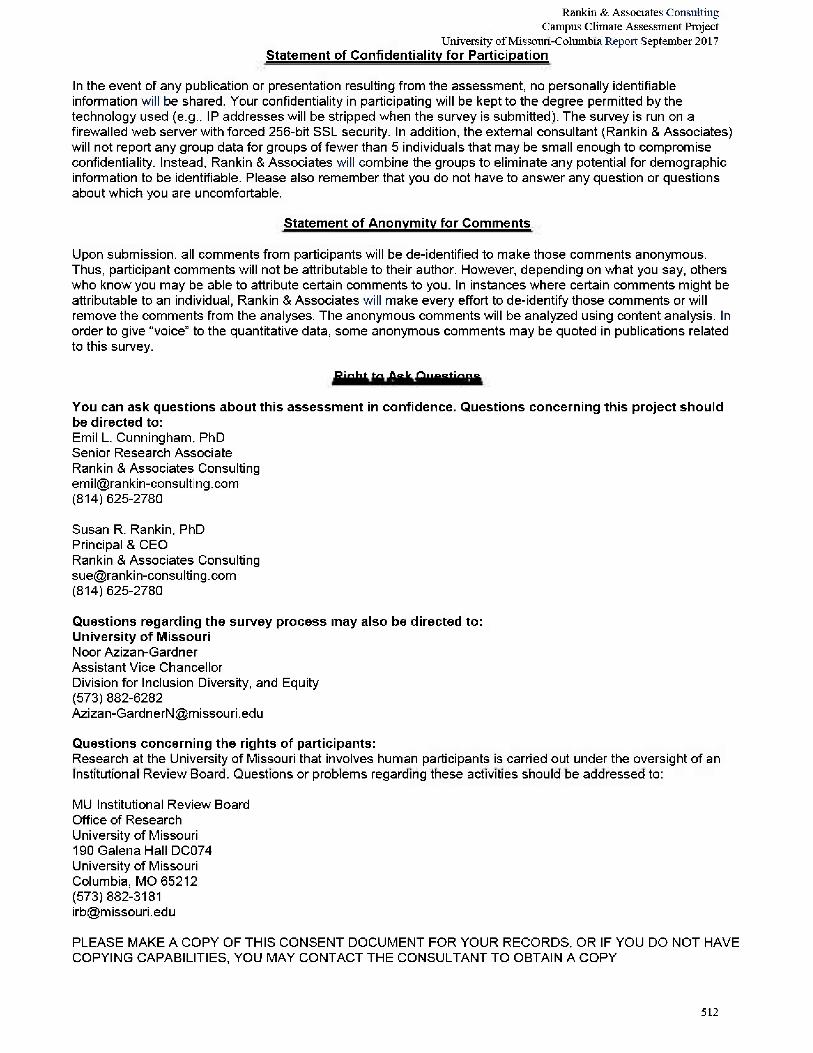
Rankin & Associates Consulting Campus Climate Assessment Project
University of Missouri-Columbia Report September 2017 Statement of Confidentiality for Participation
In the event of any publication or presentation resulting from the assessment, no personally identifiable information will be shared. Your confidentiality in participating will be kept to the degree permitted by the technology used (e.g., IP addresses will be stripped when the survey is submitted). The survey is run on a firewalled web server with forced 256-bit SSL security. In addition, the external consultant (Rankin & Associates) will not report any group data for groups of fewer than 5 individuals that may be small enough to compromise confidentiality. Instead, Rankin & Associates will combine the groups to eliminate any potential for demographic information to be identifiable. Please also remember that you do not have to answer any question or questions about which you are uncomfortable.
Statement of Anonymity for Comments
Upon submission, all comments from participants will be de-identified to make those comments anonymous. Thus, participant comments will not be attributable to their author. However, depending on what you say, others who know you may be able to attribute certain comments to you. In instances where certain comments might be attributable to an individual, Rankin & Associates will make every effort to de-identify those comments or will remove the comments from the analyses. The anonymous comments will be analyzed using content analysis. In order to give "voice" to the quantitative data, some anonymous comments may be quoted in publications related to this survey.
Right to Ask Questions
You can ask questions about this assessment in confidence. Questions concerning this project should be directed to: Emil L. Cunningham, PhD Senior Research Associate Rankin & Associates Consulting [email protected] (814) 625-2780
Susan R. Rankin, PhD Principal & CEO Rankin & Associates Consulting [email protected] (814) 625-2780
Questions regarding the survey process may also be directed to: University of Missouri Noor Azizan-Gardner Assistant Vice Chancellor Division for Inclusion Diversity, and Equity (573) 882-6282 [email protected]
Questions concerning the rights of participants: Research at the University of Missouri that involves human participants is carried out under the oversight of an Institutional Review Board. Questions or problems regarding these activities should be addressed to:
MU Institutional Review Board Office of Research University of Missouri 190 Galena Hall DC074 University of Missouri Columbia, MO 65212 (573)882-3181 [email protected]
PLEASE MAKE A COPY OF THIS CONSENT DOCUMENT FOR YOUR RECORDS, OR IF YOU DO NOT HAVE COPYING CAPABILITIES, YOU MAY CONTACT THE CONSULTANT TO OBTAIN A COPY
512
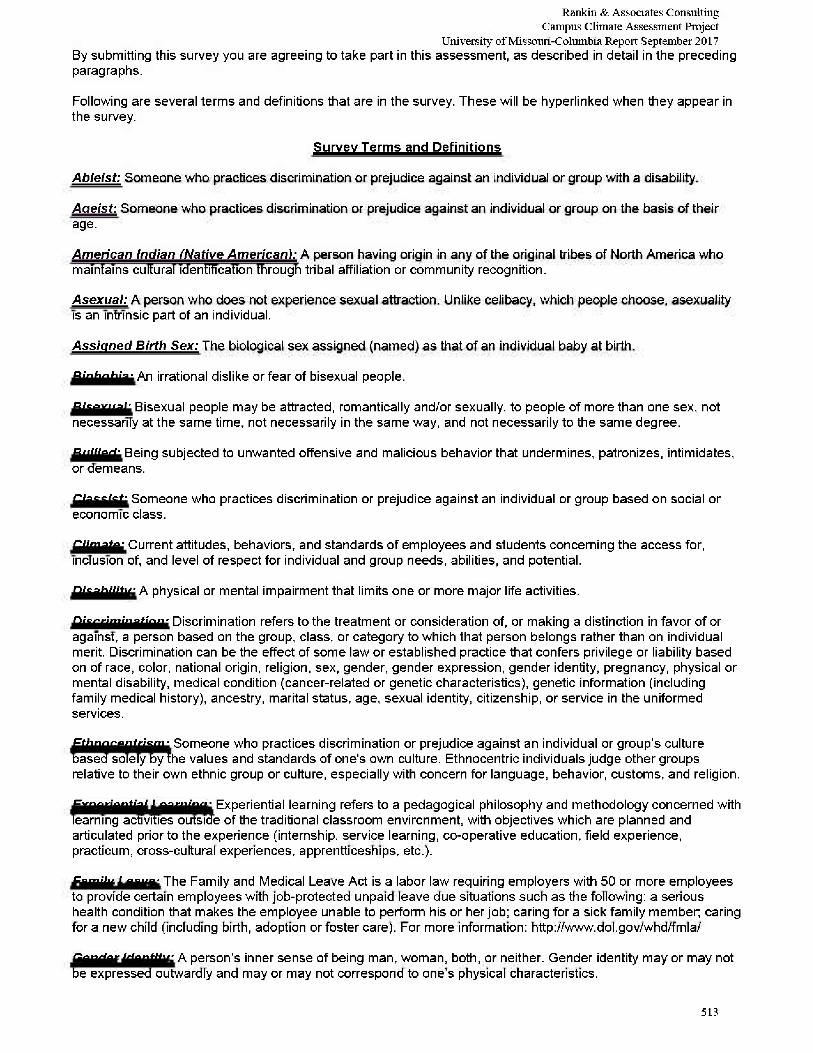
Rankin & Associates Consulting Campus Climate Assessment Project
University of Missouri-Columbia Report September 2017 By submitting this survey you are agreeing to take part in this assessment, as described in detail in the preceding paragraphs.
Following are several terms and definitions that are in the survey. These will be hyperlinked when they appear in the survey.
Survey Terms and Definitions
Ableist : Someone who practices discrimination or prejudice against an individual or group with a disability.
Aaeist : Someone who practices discrimination or prejudice against an individual or group on the basis of their age.
American Indian (Native American) : A person having origin in any of the original tribes of North America who maintains cultural identification through tribal affiliation or community recognition.
Asexual : A person who does not experience sexual attraction. Unlike celibacy, which people choose, asexuality is an intrinsic part of an individual.
Assigned Birth Sex: The biological sex assigned (named) as that of an individual baby at birth.
Biphobia : An irrational dislike or fear of bisexual people.
Bisexual : Bisexual people may be attracted, romantically and/or sexually, to people of more than one sex, not necessarily at the same time, not necessarily in the same way, and not necessarily to the same degree.
Bullied : Being subjected to unwanted offensive and malicious behavior that undermines, patronizes, intimidates, or demeans.
Classist : Someone who practices discrimination or prejudice against an individual or group based on social or economic class.
Climate : Current attitudes, behaviors, and standards of employees and students concerning the access for, inclusion of, and level of respect for individual and group needs, abilities, and potential.
Disability : A physical or mental impairment that limits one or more major life activities.
Discrimination : Discrimination refers to the treatment or consideration of, or making a distinction in favor of or against, a person based on the group, class, or category to which that person belongs rather than on individual merit. Discrimination can be the effect of some law or established practice that confers privilege or liability based on of race, color, national origin, religion, sex, gender, gender expression, gender identity, pregnancy, physical or mental disability, medical condition (cancer-related or genetic characteristics), genetic information (including family medical history), ancestry, marital status, age, sexual identity, citizenship, or service in the uniformed services.
Ethnocentrism : Someone who practices discrimination or prejudice against an individual or group's culture based solely by the values and standards of one's own culture. Ethnocentric individuals judge other groups relative to their own ethnic group or culture, especially with concern for language, behavior, customs, and religion.
Experiential Learning : Experiential learning refers to a pedagogical philosophy and methodology concerned with learning activities outside of the traditional classroom environment, with objectives which are planned and articulated prior to the experience (internship, service learning, co-operative education, field experience, practicum, cross-cultural experiences, apprenticeships, etc.).
Family Leave: The Family and Medical Leave Act is a labor law requiring employers with 50 or more employees to provide certain employees with job-protected unpaid leave due situations such as the following: a serious health condition that makes the employee unable to perform his or her job; caring for a sick family member; caring for a new child (including birth, adoption or foster care). For more information: http://www.dol.gov/whd/fmla/
Gender Identity : A person's inner sense of being man, woman, both, or neither. Gender identity may or may not be expressed outwardly and may or may not correspond to one's physical characteristics.
513
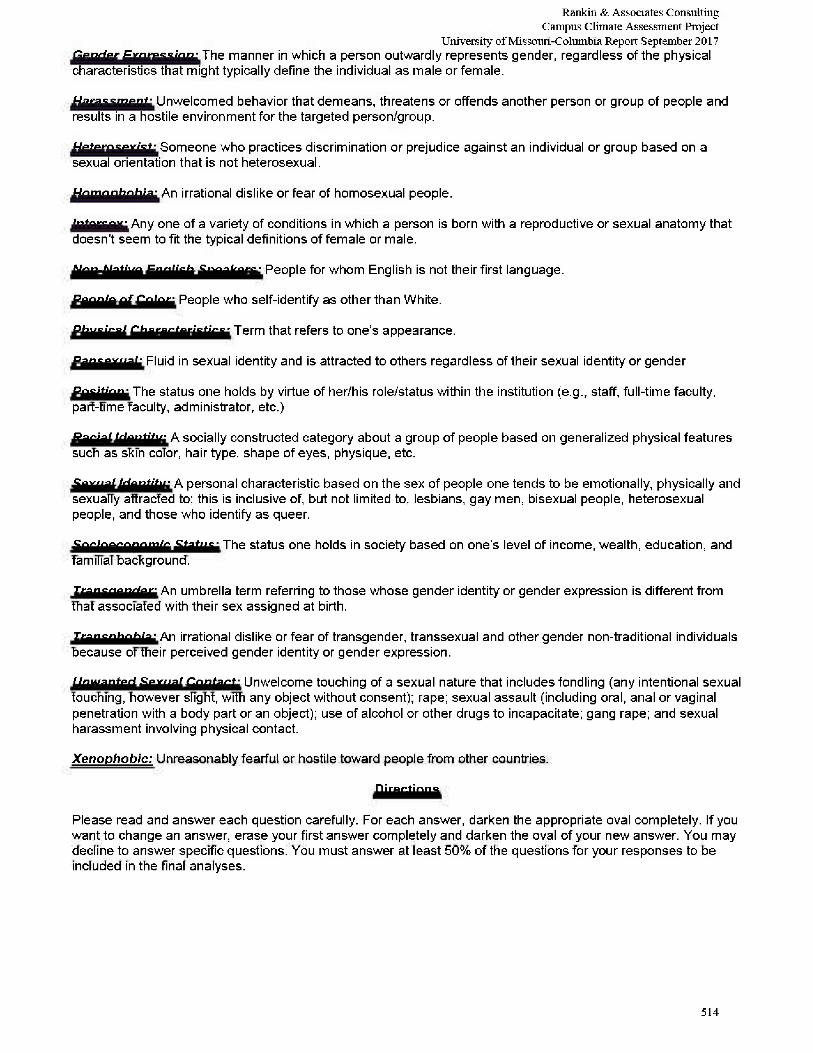
Rankin & Associates Consulting Campus Climate Assessment Project
University of Missouri-Columbia Report September 2017 Gender Expression : The manner in which a person outwardly represents gender, regardless of the physical characteristics that might typically define the individual as male or female.
Harassment : Unwelcomed behavior that demeans, threatens or offends another person or group of people and results in a hostile environment for the targeted person/group.
Heterosexist : Someone who practices discrimination or prejudice against an individual or group based on a sexual orientation that is not heterosexual.
Homophobia: An irrational dislike or fear of homosexual people.
Intersex : Any one of a variety of conditions in which a person is born with a reproductive or sexual anatomy that doesn't seem to fit the typical definitions of female or male.
Non-Native English Speakers : People for whom English is not their first language.
People of Color : People who self-identify as other than White.
Physical Characteristics : Term that refers to one's appearance.
Pansexual : Fluid in sexual identity and is attracted to others regardless of their sexual identity or gender
Position : The status one holds by virtue of her/his role/status within the institution (e.g., staff, full-time faculty, part-time faculty, administrator, etc.)
Racial Identity : A socially constructed category about a group of people based on generalized physical features such as skin color, hair type, shape of eyes, physique, etc.
Sexual Identity : A personal characteristic based on the sex of people one tends to be emotionally, physically and sexually attracted to; this is inclusive of, but not limited to, lesbians, gay men, bisexual people, heterosexual people, and those who identify as queer.
Socioeconomic Status : The status one holds in society based on one's level of income, wealth, education, and familial background.
Transqender : An umbrella term referring to those whose gender identity or gender expression is different from that associated with their sex assigned at birth.
Transphobia : An irrational dislike or fear of transgender, transsexual and other gender non-traditional individuals because of their perceived gender identity or gender expression.
Unwanted Sexual Contact : Unwelcome touching of a sexual nature that includes fondling (any intentional sexual touching, however slight, with any object without consent); rape; sexual assault (including oral, anal or vaginal penetration with a body part or an object); use of alcohol or other drugs to incapacitate; gang rape; and sexual harassment involving physical contact.
Xenophobic : Unreasonably fearful or hostile toward people from other countries.
Directions
Please read and answer each question carefully. For each answer, darken the appropriate oval completely. If you want to change an answer, erase your first answer completely and darken the oval of your new answer. You may decline to answer specific questions. You must answer at least 50% of the questions for your responses to be included in the final analyses.
514
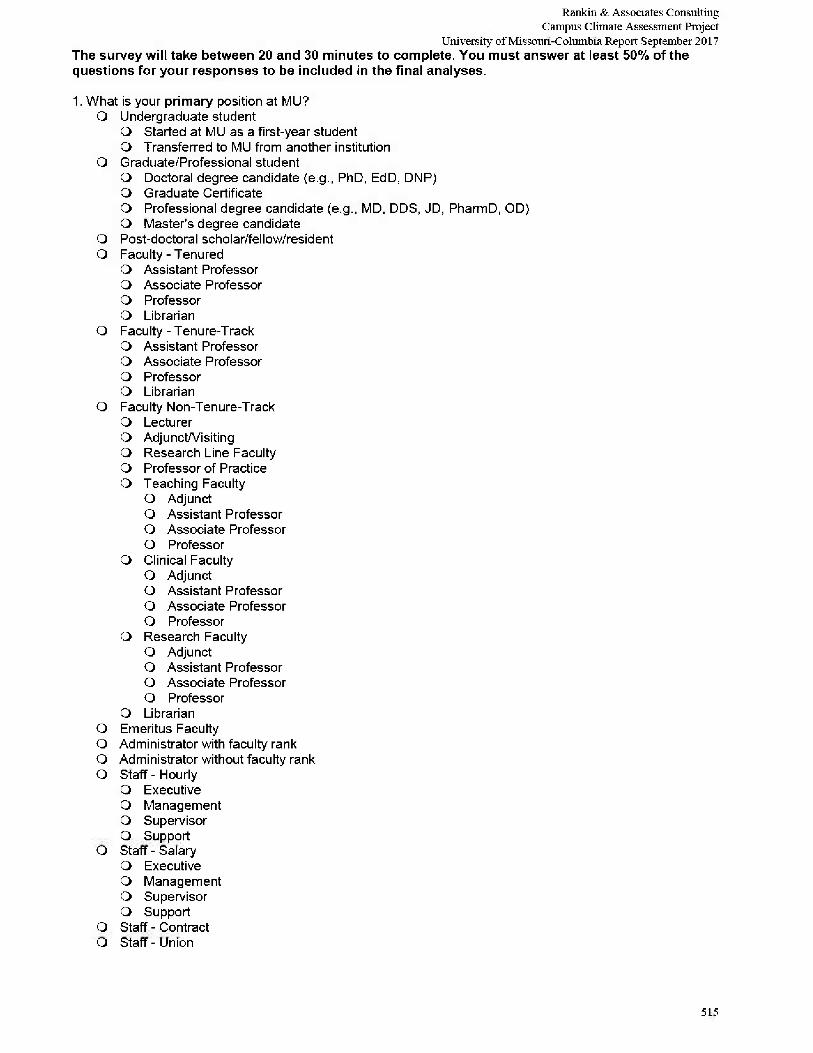
Rankin & Associates Consulting Campus Climate Assessment Project
University of Missouri-Columbia Report September 2017 The survey will take between 20 and 30 minutes to complete. You must answer at least 50% of the questions for your responses to be included in the final analyses.
1. What is your primary position at MU? O Undergraduate student
O Started at MU as a first-year student O Transferred to MU from another institution
O Graduate/Professional student O Doctoral degree candidate (e.g., PhD, EdD, DNP) O Graduate Certificate O Professional degree candidate (e.g., MD, DDS, JD, PharmD, OD) O Master's degree candidate
O Post-doctoral scholar/fellow/resident O Faculty - Tenured
O Assistant Professor O Associate Professor O Professor O Librarian
O Faculty - Tenure-Track O Assistant Professor O Associate Professor O Professor O Librarian
O Faculty Non-Tenure-Track O Lecturer O Adjunct/Visiting O Research Line Faculty O Professor of Practice O Teaching Faculty
O Adjunct O Assistant Professor O Associate Professor O Professor
O Clinical Faculty O Adjunct O Assistant Professor O Associate Professor O Professor
O Research Faculty O Adjunct O Assistant Professor O Associate Professor O Professor
O Librarian O Emeritus Faculty O Administrator with faculty rank O Administrator without faculty rank O Staff-Hourly
O Executive O Management O Supervisor O Support
O Staff-Salary O Executive O Management O Supervisor O Support
O Staff - Contract O Staff-Union
515
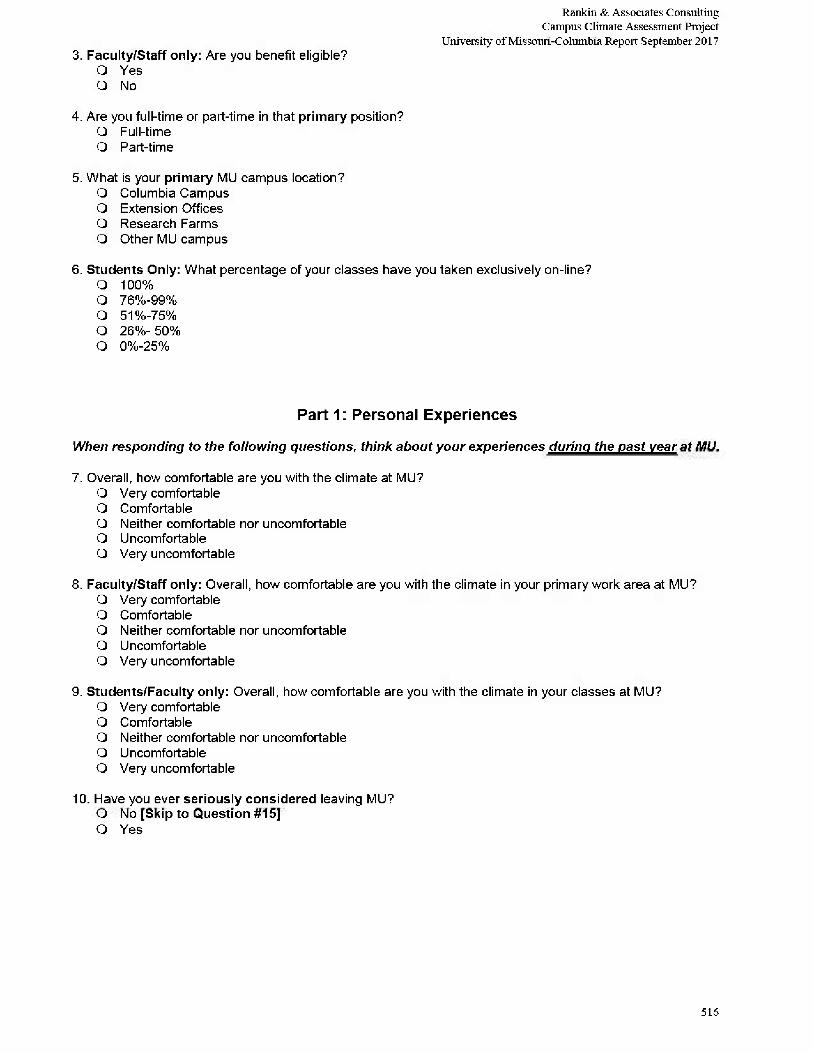
Rankin & Associates Consulting Campus Climate Assessment Project
University of Missouri-Columbia Report September 2017 3. Faculty/Staff only: Are you benefit eligible?
O Yes O No
4. Are you full-time or part-time in that primary position? O Full-time O Part-time
5. What is your primary MU campus location? O Columbia Campus O Extension Offices O Research Farms O Other MU campus
6. Students Only: What percentage of your classes have you taken exclusively on-line? O 100% O 76%-99% O 51%-75% O 26%-50% O 0%-25%
Part 1: Personal Experiences When responding to the following questions, think about your experiences during the past year at MU.
7. Overall, how comfortable are you with the climate at MU? O Very comfortable O Comfortable Q Neither comfortable nor uncomfortable O Uncomfortable O Very uncomfortable
8. Faculty/Staff only: Overall, how comfortable are you with the climate in your primary work area at MU? O Very comfortable O Comfortable O Neither comfortable nor uncomfortable O Uncomfortable O Very uncomfortable
9. Students/Faculty only: Overall, how comfortable are you with the climate in your classes at MU? O Very comfortable O Comfortable O Neither comfortable nor uncomfortable O Uncomfortable O Very uncomfortable
10. Have you ever seriously considered leaving MU? O No [Skip to Question #15] O Yes
516
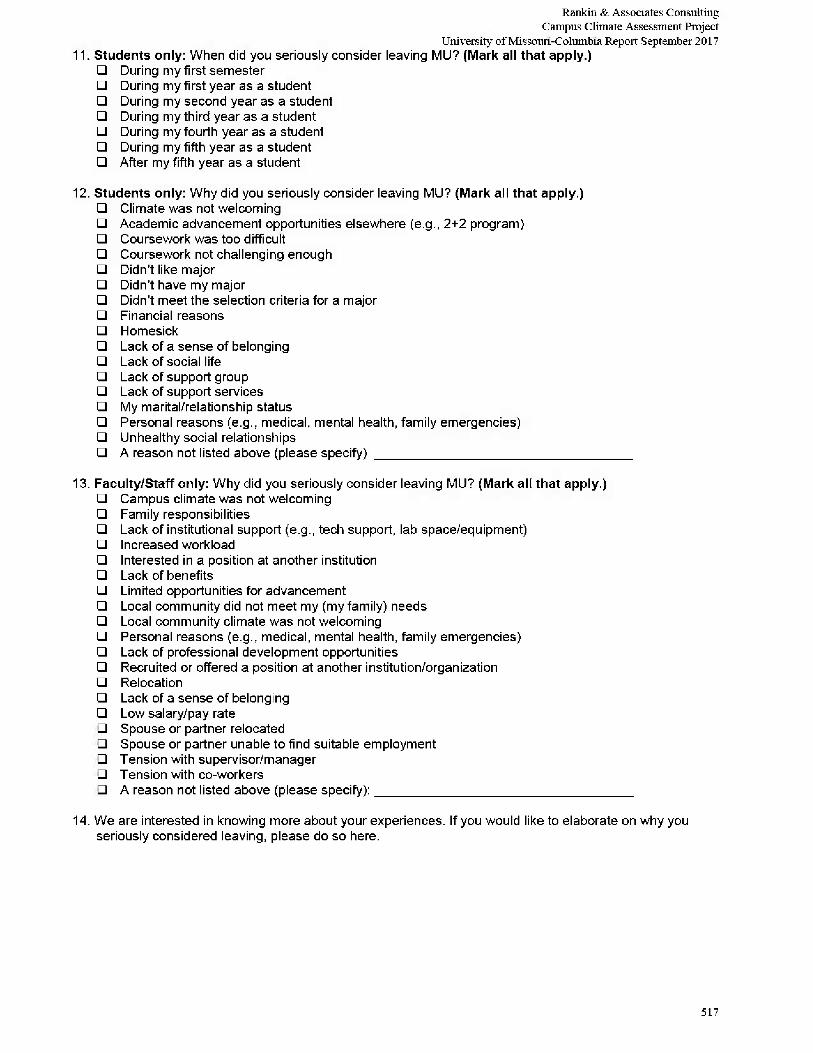
Rankin & Associates Consulting Campus Climate Assessment Project
University of Missouri-Columbia Report September 2017 11. Students only: When did you seriously consider leaving MU? (Mark all that apply.)
• During my first semester • During my first year as a student • During my second year as a student • During my third year as a student • During my fourth year as a student • During my fifth year as a student • After my fifth year as a student
12. Students only: Why did you seriously consider leaving MU? (Mark all that apply.) • Climate was not welcoming • Academic advancement opportunities elsewhere (e.g., 2+2 program) • Coursework was too difficult • Coursework not challenging enough • Didn't like major • Didn't have my major • Didn't meet the selection criteria for a major • Financial reasons • Homesick • Lack of a sense of belonging • Lack of social life • Lack of support group • Lack of support services • My marital/relationship status • Personal reasons (e.g., medical, mental health, family emergencies) • Unhealthy social relationships • A reason not listed above (please specify):
13. Faculty/Staff only: Why did you seriously consider leaving MU? (Mark all that apply.) • Campus climate was not welcoming • Family responsibilities • Lack of institutional support (e.g., tech support, lab space/equipment) • Increased workload • Interested in a position at another institution • Lack of benefits • Limited opportunities for advancement • Local community did not meet my (my family) needs • Local community climate was not welcoming • Personal reasons (e.g., medical, mental health, family emergencies) • Lack of professional development opportunities • Recruited or offered a position at another institution/organization • Relocation • Lack of a sense of belonging • Low salary/pay rate • Spouse or partner relocated • Spouse or partner unable to find suitable employment • Tension with supervisor/manager • Tension with co-workers • A reason not listed above (please specify):
14. We are interested in knowing more about your experiences. If you would like to elaborate on why you seriously considered leaving, please do so here.
517
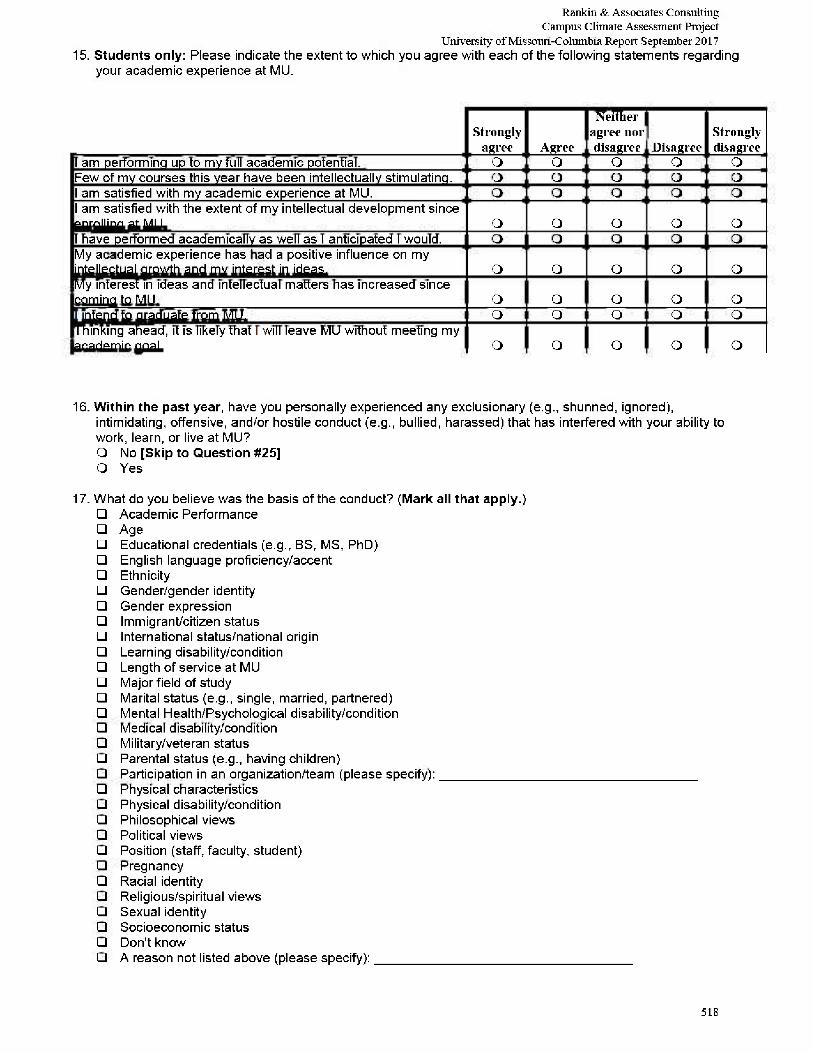
Rankin & Associates Consulting Campus Climate Assessment Project
University of Missouri-Columbia Report September 2017 15. Students only: Please indicate the extent to which you agree with each of the following statements regarding
your academic experience at MU.
Neither Strongly
agree Agree agree nor disagree Disagree
Strongly disagree
1 am performing up to my full academic potential. O O O O O Few of my courses this year have been intellectually stimulating. O O O o O 1 am satisfied with my academic experience at MU. o O o o o 1 am satisfied with the extent of my intellectual development since enrolling at MU. o O o o o 1 have performed academically as well as 1 anticipated 1 would. o O o o o My academic experience has had a positive influence on my intellectual growth and my interest in ideas. o O o o o My interest in ideas and intellectual matters has increased since coming to MU. o O o o o 1 intend to graduate from MU. o O o o o Thinking ahead, it is likely that 1 will leave MU without meeting my academic goal. o O o o o
16. Within the past year, have you personally experienced any exclusionary (e.g., shunned, ignored), intimidating, offensive, and/or hostile conduct (e.g., bullied, harassed) that has interfered with your ability to work, learn, or live at MU? O No [Skip to Question #25] O Yes
17. What do you believe was the basis of the conduct? (Mark all that apply.) • Academic Performance • Age • Educational credentials (e.g., BS, MS, PhD) • English language proficiency/accent • Ethnicity • Gender/gender identity • Gender expression • Immigrant/citizen status • International status/national origin • Learning disability/condition • Length of service at MU • Major field of study • Marital status (e.g., single, married, partnered) • Mental Health/Psychological disability/condition • Medical disability/condition • Military/veteran status • Parental status (e.g., having children) • Participation in an organization/team (please specify): • Physical characteristics • Physical disability/condition • Philosophical views • Political views • Position (staff, faculty, student) • Pregnancy • Racial identity • Religious/spiritual views • Sexual identity • Socioeconomic status • Don't know • A reason not listed above (please specify):
518
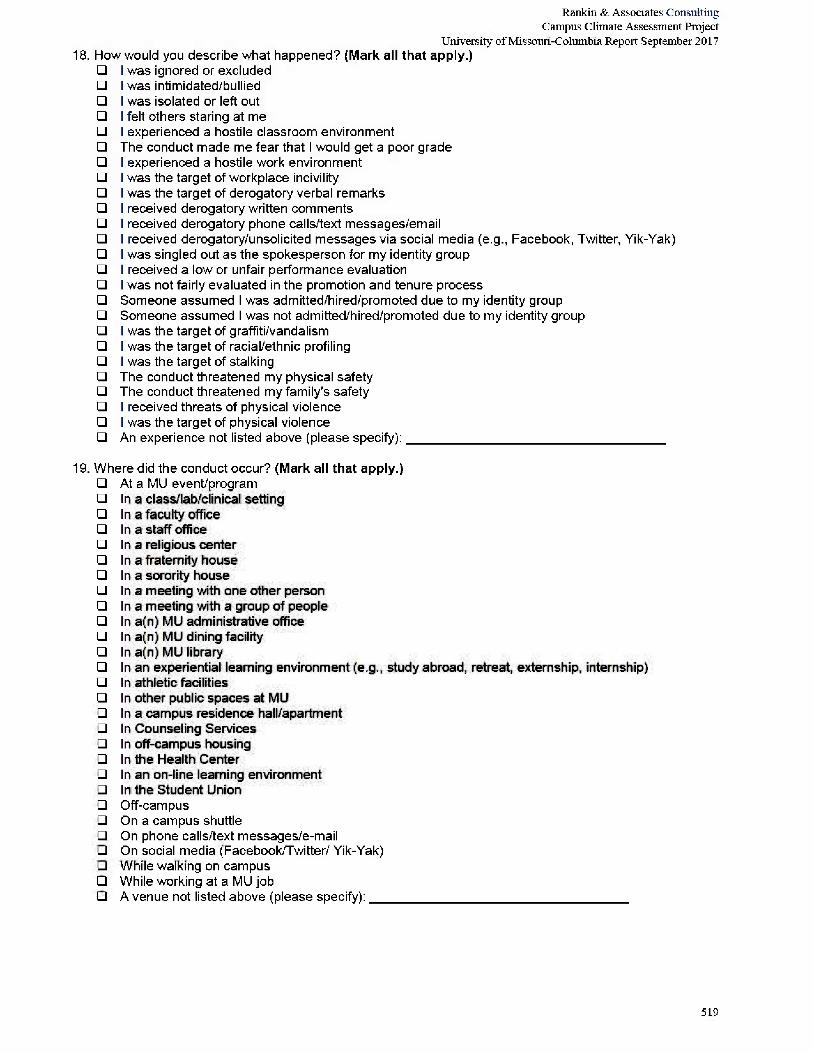
Rankin & Associates Consulting Campus Climate Assessment Project
University of Missouri-Columbia Report September 2017 18. How would you describe what happened? (Mark all that apply.)
• I was ignored or excluded • I was intimidated/bullied • I was isolated or left out • I felt others staring at me • I experienced a hostile classroom environment • The conduct made me fear that I would get a poor grade • I experienced a hostile work environment • I was the target of workplace incivility • I was the target of derogatory verbal remarks • I received derogatory written comments • ! received derogatory phone calls/text messages/email • I received derogatory/unsolicited messages via social media (e.g., Facebook, Twitter, Yik-Yak) • I was singled out as the spokesperson for my identity group • I received a low or unfair performance evaluation • I was not fairly evaluated in the promotion and tenure process • Someone assumed I was admitted/hired/promoted due to my identity group • Someone assumed I was not admitted/hired/promoted due to my identity group • I was the target of graffiti/vandalism • I was the target of racial/ethnic profiling • I was the target of stalking • The conduct threatened my physical safety • The conduct threatened my family's safety • I received threats of physical violence • I was the target of physical violence • An experience not listed above (please specify):
19. Where did the conduct occur? (Mark all that apply.) • At a MU event/program • In a class/lab/clinical setting • In a faculty office • In a staff office • In a religious center • In a fraternity house • In a sorority house • In a meeting with one other person • In a meeting with a group of people • In a(n) MU administrative office • In a(n) MU dining facility • In a(n) MU library • In an experiential learning environment (e.g., study abroad, retreat, externship, internship) • In athletic facilities • In other public spaces at MU • In a campus residence hall/apartment • In Counseling Services • In off-campus housing • In the Health Center • In an on-line learning environment • In the Student Union • Off-campus • On a campus shuttle • On phone calls/text messages/e-mail • On social media (Facebook/Twitter/ Yik-Yak) • While walking on campus • While working at a MU job • A venue not listed above (please specify):
519
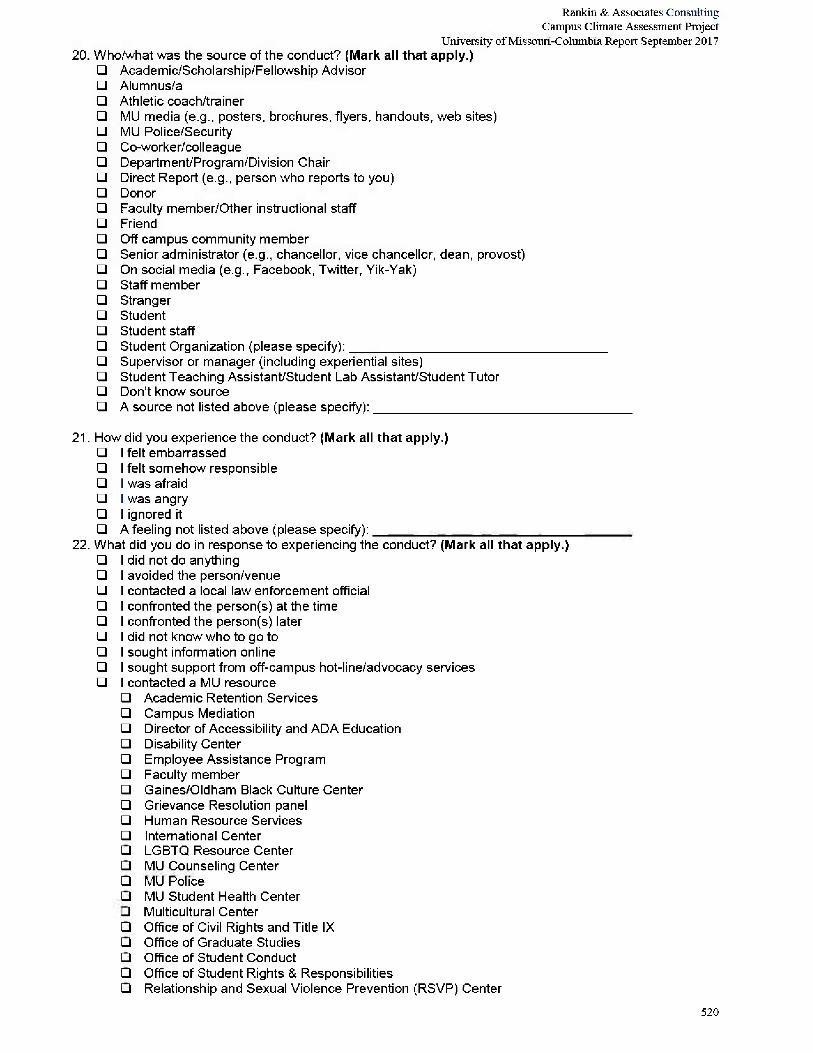
Rankin & Associates Consulting Campus Climate Assessment Project
University of Missouri-Columbia Report September 2017 20. Who/what was the source of the conduct? (Mark all that apply.)
• Academic/Scholarship/Fellowship Advisor • Alumnus/a • Athletic coach/trainer • MU media (e.g., posters, brochures, flyers, handouts, web sites) • MU Poiice/Security • Co-worker/colleague • Department/Program/Division Chair • Direct Report (e.g., person who reports to you) • Donor • Faculty member/Other instructional staff • Friend • Off campus community member • Senior administrator (e.g., chancellor, vice chancellor, dean, provost) • On social media (e.g., Facebook, Twitter, Yik-Yak) • Staff member • Stranger • Student • Student staff • Student Organization (please specify): • Supervisor or manager (including experiential sites) • Student Teaching Assistant/Student Lab Assistant/Student Tutor • Don't know source • A source not listed above (please specify):
21. How did you experience the conduct? (Mark all that apply.) • I felt embarrassed • I felt somehow responsible • I was afraid • I was angry • I ignored it • A feeling not listed above (please specify):
22. What did you do in response to experiencing the conduct? (Mark all that apply.) • I did not do anything • I avoided the person/venue • I contacted a local law enforcement official • I confronted the person(s) at the time • I confronted the person(s) later • I did not know who to go to • I sought information online • I sought support from off-campus hot-line/advocacy services • I contacted a MU resource
• Academic Retention Services • Campus Mediation • Director of Accessibility and ADA Education • Disability Center • Employee Assistance Program • Faculty member • Gaines/Oldham Black Culture Center • Grievance Resolution panel • Human Resource Services • International Center • LGBTQ Resource Center • MU Counseling Center
• MU Police • MU Student Health Center • Multicultural Center • Office of Civil Rights and Title IX • Office of Graduate Studies • Office of Student Conduct • Office of Student Rights & Responsibilities
• Relationship and Sexual Violence Prevention (RSVP) Center
520
Rankin & Associates Consulting Campus Climate Assessment Project
University of Missouri-Columbia Report September 2017 • Student teaching assistant (e.g., tutor, graduate teaching assistant) • Staff person (e.g., Residential Life staff, academic advisor) • Student Legal Services • Supervisor • Vice Chancellor for Student Affairs • Wellness Resource Center • Women's Center
• I told a family member • 1 told a friend • I sought support from a member of the clergy or spiritual advisor (e.g., pastor, rabbi, priest, imam) • A response not listed above (please specify):
23. Did you report the conduct? O No, I did not report it O Yes, I reported it (e.g., bias incident report, UM System Ethics and Compliance Hotline)
O Yes, I reported the incident and was satisfied with the outcome O Yes, I reported the incident, and while the outcome is not what I had hoped for, I feel as though my
complaint was responded to appropriately O Yes, I reported the incident, but felt that it was not responded to appropriately
24. We are interested in knowing more about your experience. If you would like to elaborate on your experiences, please do so here.
If you have experienced any discomfort in responding to these questions and would like to speak with someone, please contact one of the resources that are offered on the following web site:
http://titleix.missouri.edu/resources
521
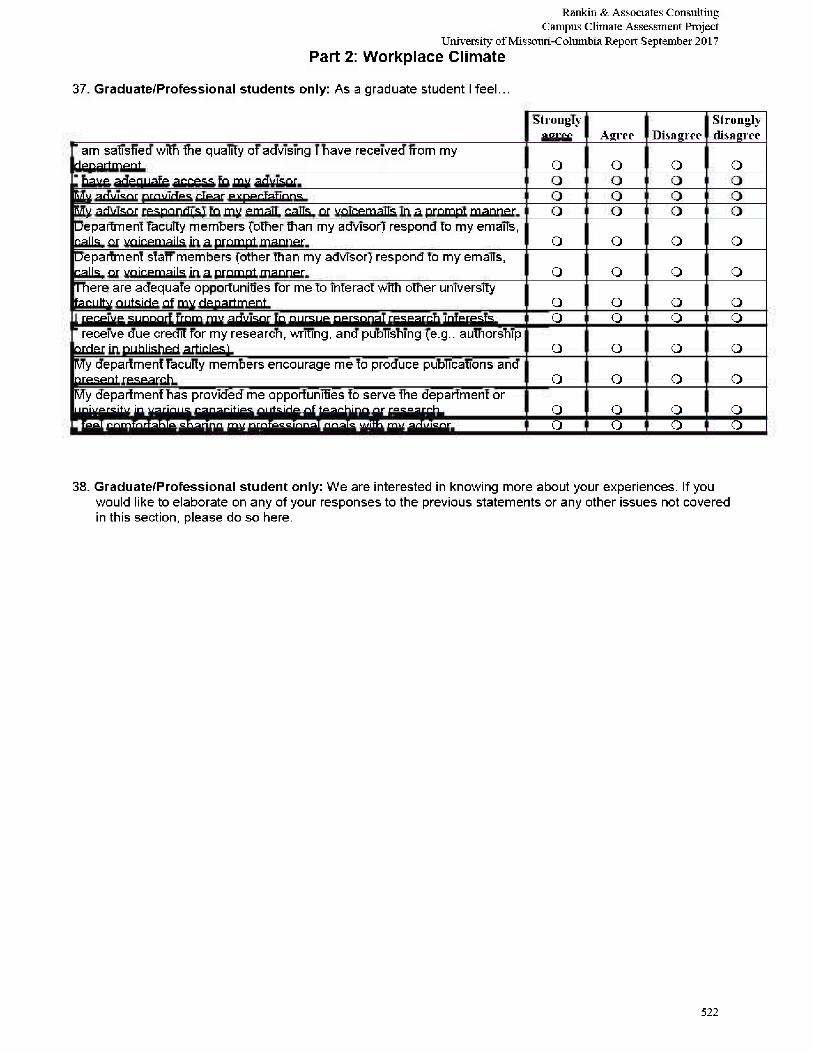
Rankin & Associates Consulting Campus Climate Assessment Project
University of Missouri-Columbia Report September 2017 Part 2: Workplace Climate
37. Graduate/Professional students only: As a graduate student I feel...
Strongly agree Agree Disagree
Strongly disagree
I am satisfied with the quality of advising 1 have received from my department. O O O O
i have adequate access to my advisor. O O o O My advisor provides clear expectations. O o o o My advisor respond(s) to my email, calls, or voicemails in a prompt manner. O o o o Department faculty members (other than my advisor) respond to my emails, calls, or voicemails in a prompt manner. O o o o Department staff members (other than my advisor) respond to my emails, calls, or voicemails in a prompt manner. O o o o There are adequate opportunities for me to interact with other university faculty outside of my department. O o o o
I receive support from my advisor to pursue personal research interests. O o o o I receive due credit for my research, writing, and publishing (e.g., authorship
order in published articles). O o o o My department faculty members encourage me to produce publications and present research. O o o o My department has provided me opportunities to serve the department or university in various capacities outside of teaching or research. O o o o
I feel comfortable sharing my professional goals with my advisor. O o o o
38. Graduate/Professional student only: We are interested in knowing more about your experiences. If you would like to elaborate on any of your responses to the previous statements or any other issues not covered in this section, please do so here.
522
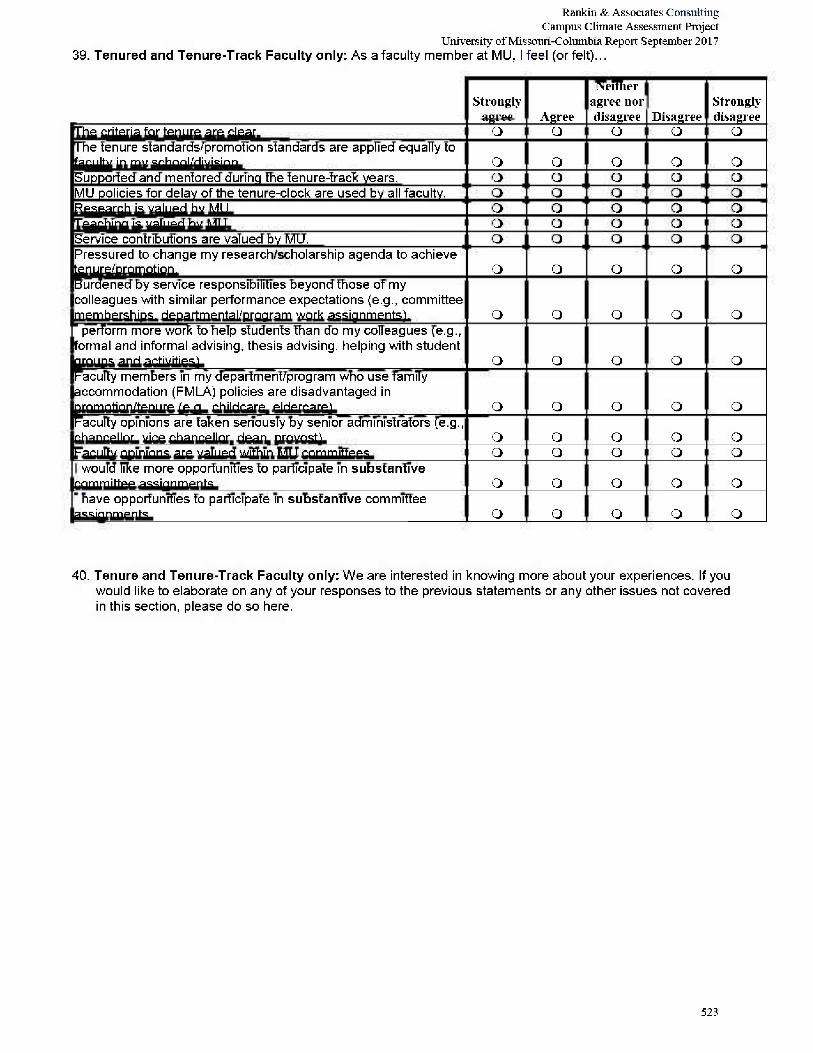
Rankin & Associates Consulting Campus Climate Assessment Project
University of Missouri-Columbia Report September 2017 39. Tenured and Tenure-Track Faculty only: As a faculty member at MU, I feel (or felt)...
Strongly agree Agree
Neither agree nor disagree Disagree
Strongly disagree
The criteria for tenure are clear. O O O O O The tenure standards/promotion standards are applied equally to faculty in my school/division. O O O o o Supported and mentored during the tenure-track years. o O o o o MU policies for delay of the tenure-clock are used by all faculty. o O o o o Research is valued by MU. o O o o o Teaching is valued by MU. o O o o o Service contributions are valued by MU. o O o o o Pressured to change my research/scholarship agenda to achieve tenure/promotion. o O o o o Burdened by service responsibilities beyond those of my colleagues with similar performance expectations (e.g., committee memberships, departmental/program work assignments). o O o o o
I perform more work to help students than do my colleagues (e.g., formal and informal advising, thesis advising, helping with student groups and activities). o O o o o Faculty members in my department/program who use family accommodation (FMLA) policies are disadvantaged in promotion/tenure (e.g., childcare, eldercare). o O o o o Faculty opinions are taken seriously by senior administrators (e.g., chancellor, vice chancellor, dean, provost). o O o o o Faculty opinions are valued within MU committees. o O o o o
I would like more opportunities to participate in substantive committee assignments. o O o o o
I have opportunities to participate in substantive committee assignments. o O o o o
40. Tenure and Tenure-Track Faculty only: We are interested in knowing more about your experiences. If you would like to elaborate on any of your responses to the previous statements or any other issues not covered in this section, please do so here.
523
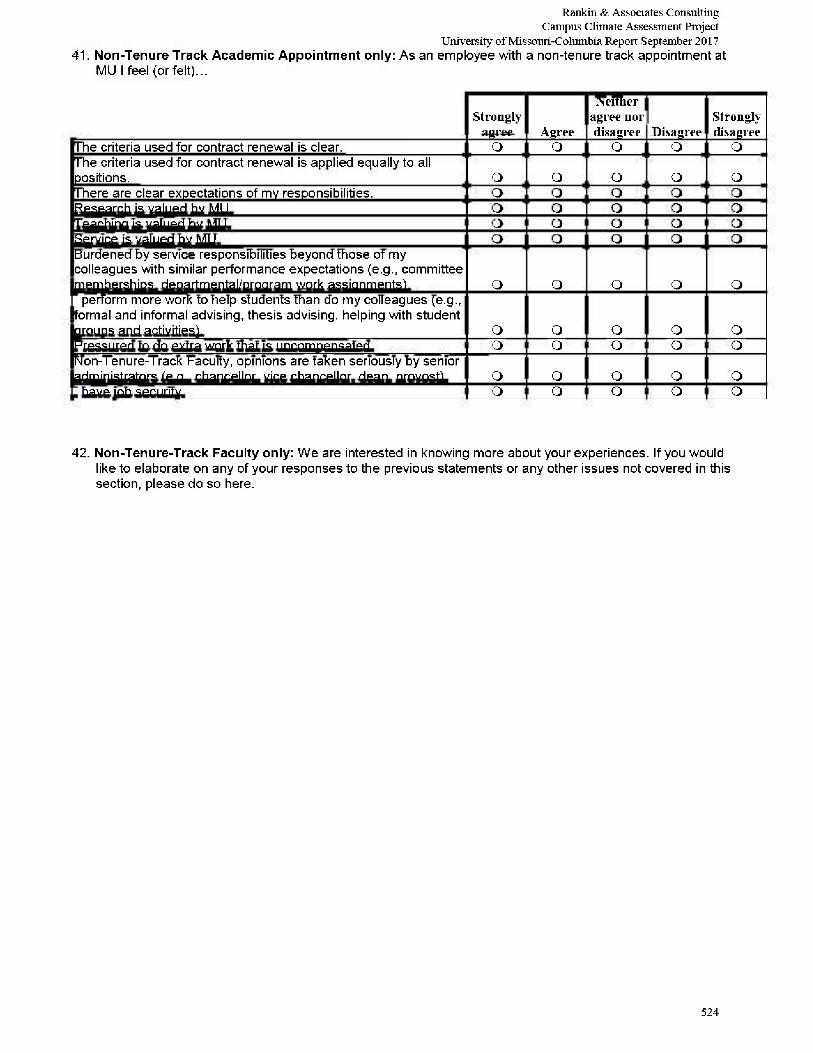
Rankin & Associates Consulting Campus Climate Assessment Project
University of Missouri-Columbia Report September 2017 41. Non-Tenure Track Academic Appointment only: As an employee with a non-tenure track appointment at
MU I feel {or felt)...
Neither Strongly
agree Agree agree nor disagree Disagree
Strongly disagree
The criteria used for contract renewal is clear. O O O O O The criteria used for contract renewal is applied equally to all positions. O O O o O There are clear expectations of my responsibilities. o O o o o Research is valued by MU. o O o o o Teaching is valued by MU. o O o o o Service is valued by MU. o O o o o Burdened by service responsibilities beyond those of my colleagues with similar performance expectations (e.g., committee memberships, departmental/program work assignments). o O o o o
I perform more work to help students than do my colleagues (e.g., formal and informal advising, thesis advising, helping with student groups and activities). o O o o o Pressured to do extra work that is uncompensated. o O o o o Non-Tenure-Track Faculty, opinions are taken seriously by senior administrators (e.g., chancellor, vice chancellor, dean, provost). o O o o o
I have job security. o O o o o
42. Non-Tenure-Track Faculty only: We are interested in knowing more about your experiences. If you would like to elaborate on any of your responses to the previous statements or any other issues not covered in this section, please do so here.
524
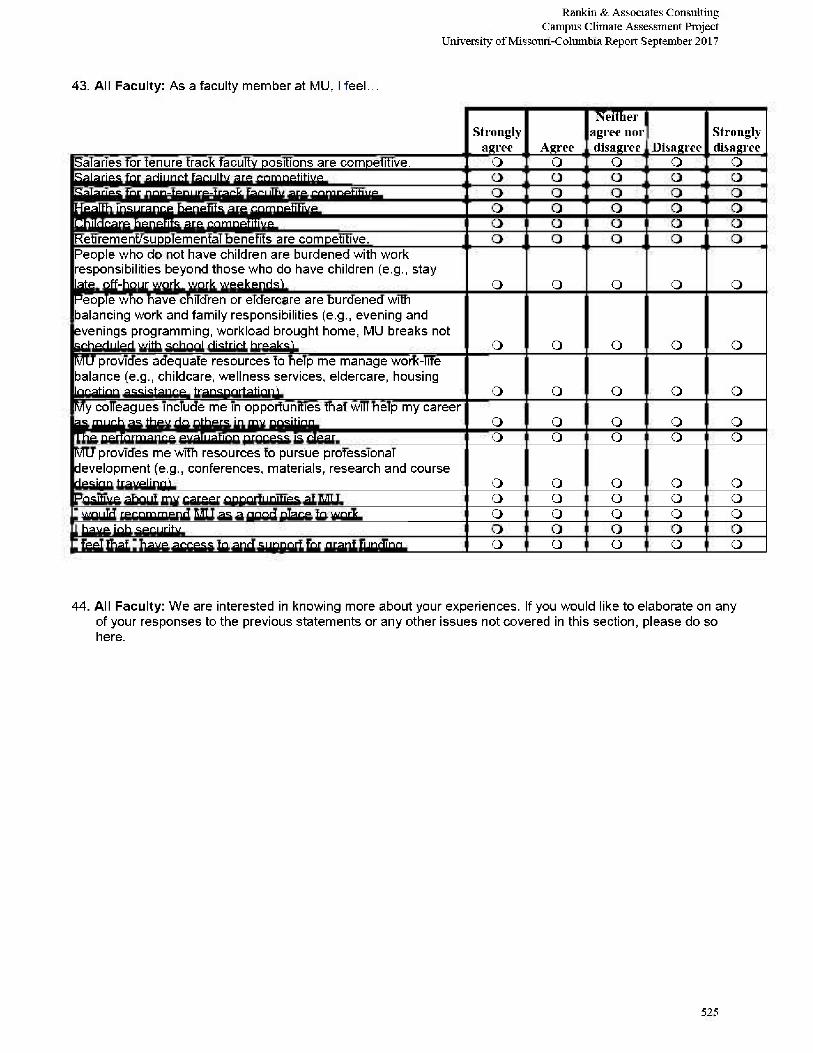
Rankin & Associates Consulting Campus Climate Assessment Project
University of Missouri-Columbia Report September 2017
43. All Faculty: As a faculty member at MU, I feel...
Neither Strongly
agree Agree agree nor disagree Disagree
Strongly disagree
Salaries for tenure track faculty positions are competitive. O O O O O Salaries for adjunct faculty are competitive. O O O o o Salaries for non-tenure-track faculty are competitive. o O o o o Health insurance benefits are competitive. o O o o o Childcare benefits are competitive. o O o o o Retirement/supplemental benefits are competitive. o O o o o People who do not have children are burdened with work responsibilities beyond those who do have children (e.g., stay late, off-hour work, work weekends). o O o o o People who have children or eldercare are burdened with balancing work and family responsibilities (e.g., evening and evenings programming, workload brought home, MU breaks not scheduled with school district breaks). o O o o o MU provides adequate resources to help me manage work-life balance (e.g., childcare, wellness services, eldercare, housing location assistance, transportation). o O o o o My colleagues include me in opportunities that will help my career as much as they do others in my position. o O o o o The performance evaluation process is clear. o O o o o MU provides me with resources to pursue professional development (e.g., conferences, materials, research and course design traveling). o O o o o Positive about my career opportunities at MU. o O o o o
I would recommend MU as a good place to work. o O o o o I have job security. o O o o o I feel that I have access to and support for grant funding. o O o o o
44. All Faculty: We are interested in knowing more about your experiences. If you would like to elaborate on any of your responses to the previous statements or any other issues not covered in this section, please do so here.
525
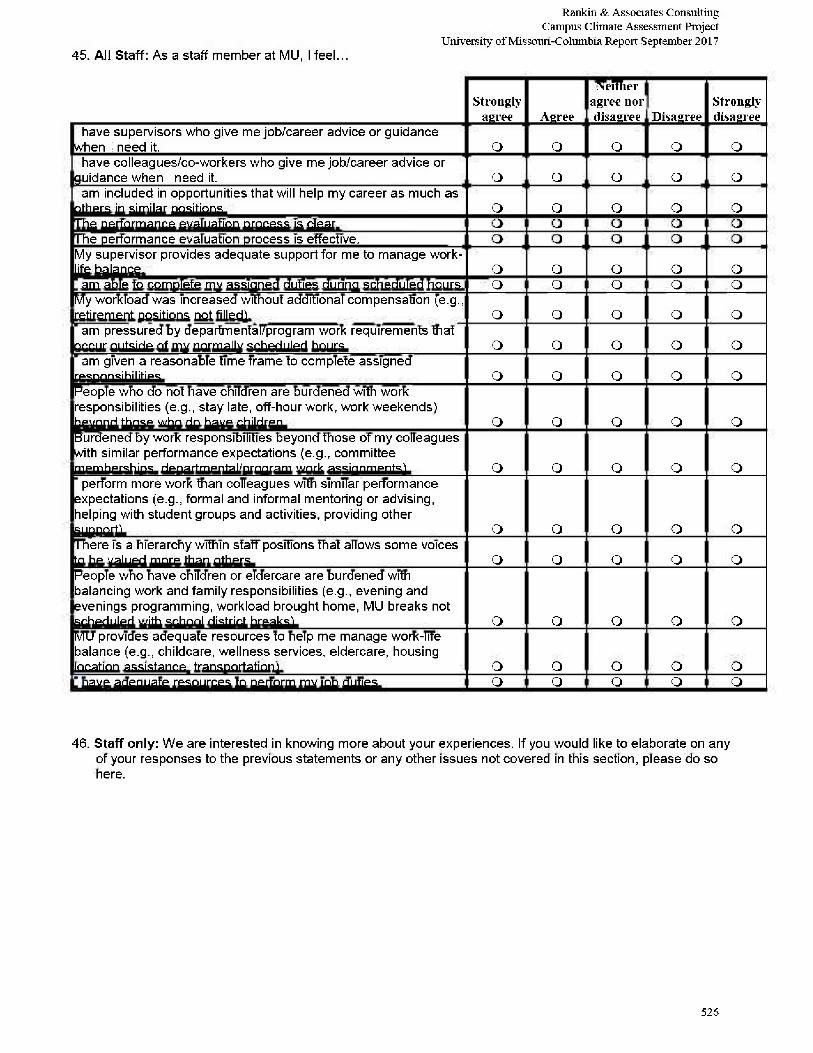
Rankin & Associates Consulting Campus Climate Assessment Project
University of Missouri-Columbia Report September 2017 45. All Staff: As a staff member at MU, I feel...
Neither Strongly
agree Agree agree nor disagree Disagree
Strongly disagree
I have supervisors who give me job/career advice or guidance when I need it. O O O O O
I have colleagues/co-workers who give me job/career advice or guidance when I need it. O O O o o
I am included in opportunities that will help my career as much as others in similar positions. o O o o o The performance evaluation process is clear. o O o o o The performance evaluation process is effective. o O o o o My supervisor provides adequate support for me to manage work-life balance. o O o o o
I am able to complete my assigned duties during scheduled hours. o O o o o My workload was increased without additional compensation (e.g., retirement positions not filled). o O o o o
I am pressured by departmental/program work requirements that occur outside of my normally scheduled hours. o O o o o
I am given a reasonable time frame to complete assigned responsibilities. o O o o o People who do not have children are burdened with work responsibilities (e.g., stay late, off-hour work, work weekends) beyond those who do have children. o O o o o Burdened by work responsibilities beyond those of my colleagues with similar performance expectations (e.g., committee memberships, departmental/program work assignments). o O o o o
I perform more work than colleagues with similar performance expectations (e.g., formal and informal mentoring or advising, helping with student groups and activities, providing other support). o O o o o There is a hierarchy within staff positions that allows some voices to be valued more than others. o O o o o People who have children or eldercare are burdened with balancing work and family responsibilities (e.g., evening and evenings programming, workload brought home, MU breaks not scheduled with school district breaks). o O o o o MU provides adequate resources to help me manage work-life balance (e.g., childcare, wellness services, eldercare, housing location assistance, transportation). o O o o o
I have adequate resources to perform my job duties. o O o o o
46. Staff only: We are interested in knowing more about your experiences. If you would like to elaborate on any of your responses to the previous statements or any other issues not covered in this section, please do so here.
526
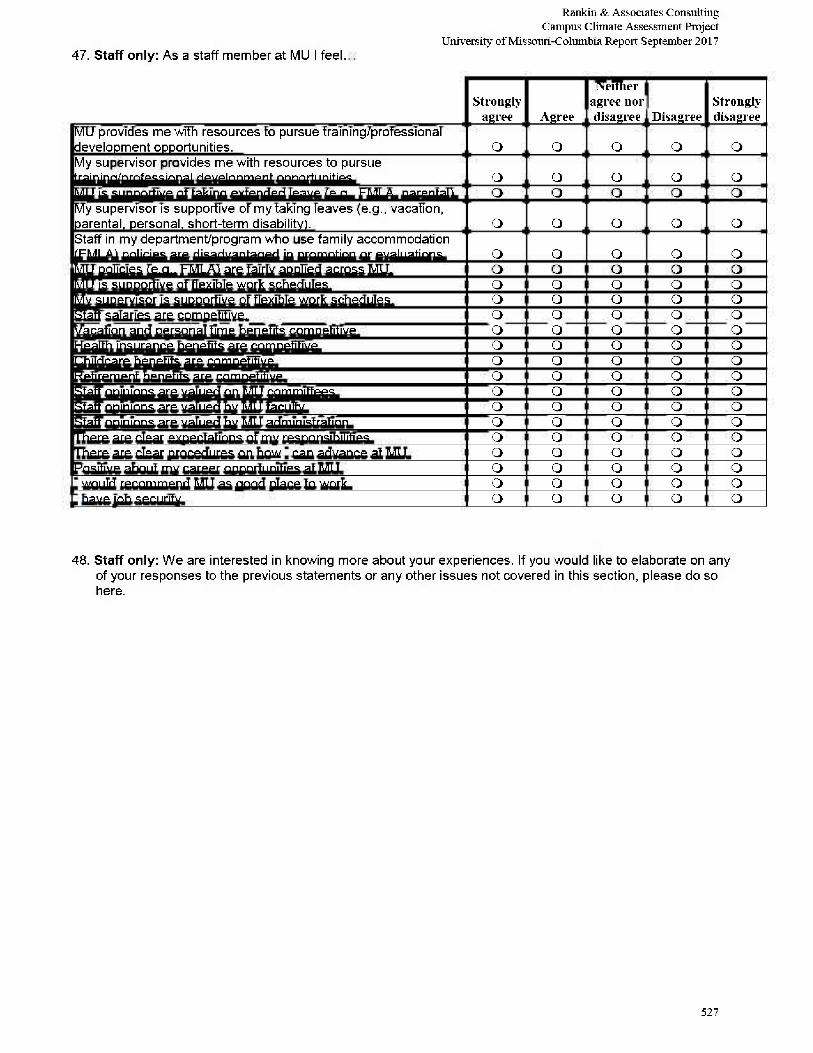
47. Staff only: As a staff member at MU I feel.
Rankin & Associates Consulting Campus Climate Assessment Project
University of Missouri-Columbia Report September 2017
Strongly agree Agree
Neither agree nor disagree Disagree
Strongly disagree
MU provides me with resources to pursue training/professional development opportunities. O O O O O My supervisor provides me with resources to pursue training/professional development opportunities. O O O o o MU is supportive of taking extended leave (e.g., FMLA, parental). o O o o o My supervisor is supportive of my taking leaves (e.g., vacation, parental, personal, short-term disability). o O o o o Staff in my department/program who use family accommodation (FMLA) policies are disadvantaged in promotion or evaluations. o O o o o MU policies (e.g., FMLA) are fairly applied across MU. o O o o o MU is supportive of flexible work schedules. o O o o o My supervisor is supportive of flexible work schedules. o O o o o Staff salaries are competitive. o O o o o Vacation and personal time benefits competitive. o O o o o Health insurance benefits are competitive. o O o o o Childcare benefits are competitive. o O o o o Retirement benefits are competitive. o O o o o Staff opinions are valued on MU committees. o O o o o Staff opinions are valued by MU faculty. o O o o o Staff opinions are valued by MU administration. o o o o o There are clear expectations of my responsibilities. o o o o o There are clear procedures on how I can advance at MU. o o o o o Positive about my career opportunities at MU. o o o o o
I would recommend MU as good place to work. o o o o o I have job security. o o o o o
48. Staff only: We are interested in knowing more about your experiences. If you would like to elaborate on any of your responses to the previous statements or any other issues not covered in this section, please do so here.
527
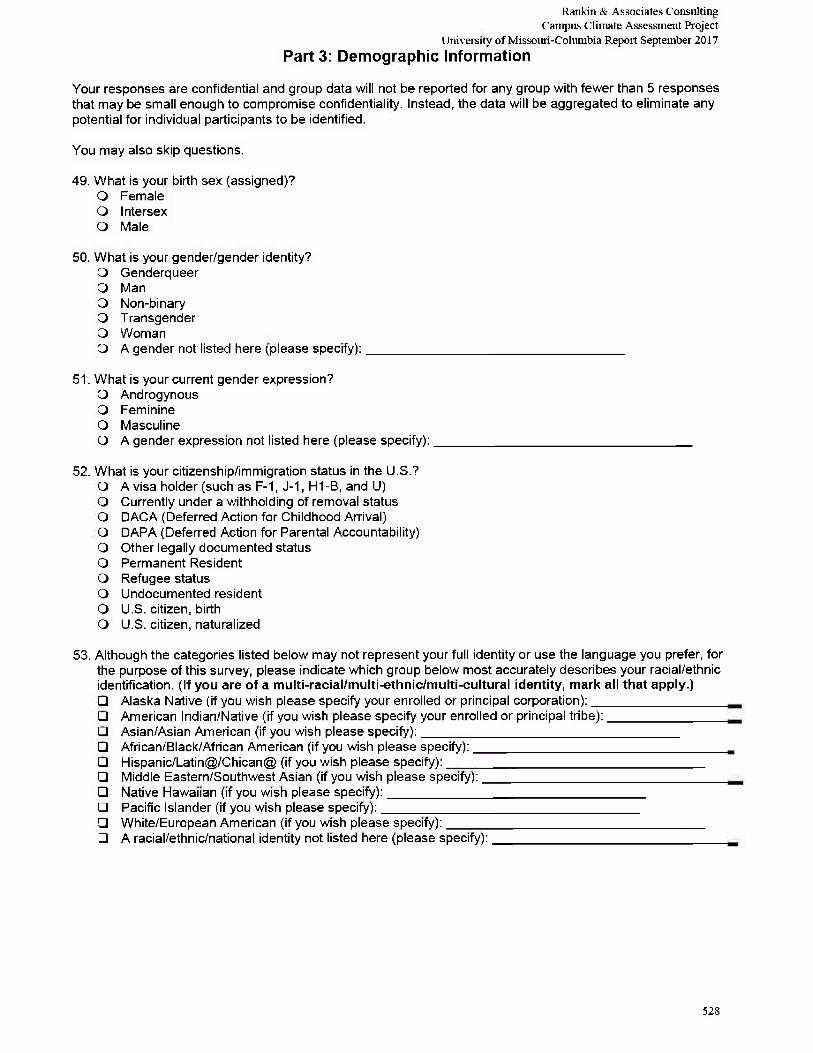
Rankin & Associates Consulting Campus Climate Assessment Project
University of Missouri-Columbia Report September 2017 Part 3: Demographic Information
Your responses are confidential and group data will not be reported for any group with fewer than 5 responses that may be small enough to compromise confidentiality. Instead, the data will be aggregated to eliminate any potential for individual participants to be identified.
You may also skip questions.
49. What is your birth sex (assigned)? Q Female O Intersex O Male
50. What is your gender/gender identity? O Genderqueer O Man Q Non-binary Q Transgender Q Woman Q A gender not listed here (please specify):
51. What is your current gender expression? O Androgynous O Feminine O Masculine O A gender expression not listed here (please specify):
52. What is your citizenship/immigration status in the U.S.? O A visa holder (such as F-1, J-1, H1 -B, and U) Q Currently under a withholding of removal status Q DACA (Deferred Action for Childhood Arrival) Q DAPA (Deferred Action for Parental Accountability) Q Other legally documented status Q Permanent Resident O Refugee status O Undocumented resident Q U.S. citizen, birth O U.S. citizen, naturalized
53. Although the categories listed below may not represent your full identity or use the language you prefer, for the purpose of this survey, please indicate which group below most accurately describes your racial/ethnic identification. (If you are of a multi-racial/multi-ethnic/multi-cultural identity, mark all that apply.) • Alaska Native (if you wish please specify your enrolled or principal corporation): • American Indian/Native (if you wish please specify your enrolled or principal tribe): • Asian/Asian American (if you wish please specify): • African/Black/African American (if you wish please specify): • Hispanic/Latin@/Chican@ (if you wish please specify): • Middle Eastern/Southwest Asian (if you wish please specify): • Native Hawaiian (if you wish please specify): • Pacific Islander (if you wish please specify): • White/European American (if you wish please specify): • A racial/ethnic/national identity not listed here (please specify):
528
Rankin & Associates Consulting Campus Climate Assessment Project
University of Missouri-Columbia Report September 2017 54. What is your age?
O 18 O 19 O 20 O 21 O 22 O 23 O 24 O 25 O 26 O 27 O 28 O 29 O 30 O 31 O 32 O 33 O 34 O 35 O 36 O 37 O 38
O 39 O 40 O 41 O 42 O 43 O 44 O 45 O 46 O 47 O 48 O 49 O 50 O 51 O 52 O 53 O 54 O 55 O 56 O 57 O 58 O 59
O 60 O 61 O 62 O 63 O 64 O 65 O 66 O 67 O 68 O 69 O 70 O 71 O 72 O 73 O 74 O 75 O 76 O 77 O 78 O 79 O 80
O 81 O 82 O 83 O 84 O 85 O 86 O 87 O 88 O 89 O 90 O 91 O 92 O 93 O 94 O 95 O 96 O 97 O 98 O 99
55. Although the categories listed below may not represent your full identity or use the language you prefer, for the purpose of this survey, please indicate which choice below most accurately describes your sexual identity? O Bisexual O Gay O Heterosexual O Lesbian O Pansexual O Queer O Questioning O A sexual identity not listed here (please specify):
56. Do you have substantial parenting or caregiving responsibility? O No O Yes (Mark all that apply.)
• Children 5 years or under • Children 6-18 years • Children over 18 years of age, but still legally dependent (e.g., in college, disabled) • Independent adult children over 18 years of age • Sick or disabled partner • Senior or other family member • A parenting or caregiving responsibility not listed here (e.g., pregnant, adoption pending) (please
57. Have you ever served on active duty in the U.S. Armed Forces, Reserves, or National Guard? O Never served in the military O Now on active duty (including Reserves or National Guard) O On active duty in the past, but not now O ROTC
specify):
529
Rankin & Associates Consulting Campus Climate Assessment Project
University of Missouri-Columbia Report September 2017 58. What is the highest level of education achieved by your primary parent(s)/guardian(s)?
59. Faculty/Staff only: What is your highest level of education? Q No high school Q Some high school O Completed high school/GED O Some college O Business/Technical certificate/degree O Associate's degree
O Bachelor's degree O Some graduate work O Master's degree (e.g., MA MS, MBA, MLS, MFA) O Specialist degree (e.g., EdS)
O Doctoral degree (e.g., PhD, EdD) O Professional degree (e.g., MD, JD)
60. Faculty/Staff only: How long have you been employed at MU? O Less than 1 year O 1 -5 years O 6-10 years O 11-15 years O 16-20 years O More than 20 years
61. Undergraduate Students only: How many semesters have you been at MU? O Less than one O 1 Q 2 Q 3 Q 4 O 5 O 6 O 7 O 8 O 9 O 10 O 11 O 12 O 13 or more
Parent/Guardian 1: Q No high school Q Some high school Q Completed high school/GED Q Some college O Business/Technical certificate/degree Q Associate's degree Q Bachelor's degree O Some graduate work O Master's degree (e.g., MA, MS, MBA) O Specialist degree (e.g.,EdS) O Doctoral degree (e.g., PhD, EdD) Q Professional degree (e.g., MD, JD) Q Unknown Q Not applicable
Parent/Guardian 2: Q Not applicable Q No high school Q Some high school Q Completed high school/GED Q Some college Q Business/Technical certificate/degree Q Associate's degree O Bachelor's degree O Some graduate work O Master's degree (e.g., MA, MS, MBA) O Specialist degree (e.g.,EdS) O Doctoral degree (e.g., PhD, EdD) Q Professional degree (e.g., MD, JD) O Unknown
530
Rankin & Associates Consulting Campus Climate Assessment Project
University of Missouri-Columbia Report September 2017 62. Faculty only: Which academic school/college are you primarily affiliated with at this time?
O College of Agriculture, Food & Natural Resources O College of Arts and Science O Trulaske College of Business O College of Education O College of Engineering O Office of Graduate Studies O School of Health Professions
O College of Human Environmental Sciences O School of Journalism O School of Law O School of Medicine O School of Natural Resources
O Sinclair School of Nursing O Harry S. Truman School of Public Affairs O College of Veterinary Medicine
63. Staff only: Which academic division/work unit are you primarily affiliated with at this time? O College of Agriculture, Food & Natural Resources O College of Arts and Science O Trulaske College of Business O College of Education O College of Engineering O School of Health Professions O College of Human Environmental Science
O School of Journalism O School of Law O School of Medicine O School of Natural Resources O Sinclair School of Nursing O Harry S. Truman School of Public Affairs O College of Veterinary Medicine
O Chancellor O Campus Finance O Campus Operations O Inclusion, Diversity & Equity O Office of Research
O Division of Information Technology O Provost O Extension O Intercollegiate Athletics O Libraries (any MU library) O Marketing & Communications
O Alumni & Advancement O Student Affairs
64. Undergraduate Students only: What is your major? (Mark all that apply.) College of Agriculture, Food & Natural Resources • Agriculture • Agribusiness Management • Agriculture Economics • Agriculture Education • Agricultural Systems Management • Animal Sciences • Biochemistry • Food Science and Nutrition • Hospitality Management • Plant Sciences • Science and Agricultural Journalism College of Arts and Science • Anthropology • Art
531
• Art History and Archaeology • Digital Storytelling • Biological Sciences • Black Studies • Chemistry • Classics • Communication • Economics • English • Environmental Studies • Film Studies • General Studies • Geography • Geological Sciences • German • History • Interdisciplinary • International Studies • Linguistics • Mathematics • Music • Peace Studies • Philosophy • Physics • Political Science • Psychology • Religious Studies • Romance Languages • Russian • Sociology • Statistics • Theatre • Women's & Gender Studies Trulaske College of Business • Accountancy • Finance and Banking • International Business • Management • Marketing • Real Estate College of Education • Early Childhood Education • Educational Studies • Elementary Education • Middle School Education • Secondary Education • Special Education College of Engineering • Biological Engineering • Chemical Engineering • Civil Engineering • Computer Science • Information Technology • Computer Engineering • Electrical Engineering • Industrial Engineering • Mechanical/Aerospace Engineering School of Health Professions • Athletic Training • Clinical Laboratory Sciences • Communication Science and Disorders • Diagnostic Medical Ultrasound
Rankin & Associates Consulting Campus Climate Assessment Project
University of Missouri-Columbia Report September 2017
532
• Health Sciences • Occupational Therapy • Pre-Physical Therapy • Respiratory Therapy College of Human Environmental Sciences • Architectural Studies • Human Development & Family Studies • Nutritional Sciences • Personal Financial Planning • Textile and Apparel Management School of Journalism • Journalism School of Natural Resources • Fisheries and Wildlife • Forestry • Parks, Recreation and Tourism • Soil, Environmental and Atmospheric Sciences Sinclair School of Nursing • Nursing Social Work • Social Work
65. Graduate/Professional Students only: What is your academic program? (Mark all that apply.) Masters • Agricultural and Applied Econ • Agricultural Ed and Leadership • Animal Science • Biochemistry • Food Science • Plant Sciences College of Agriculture, Food & Natural Resources • Rural Sociology • Anthropology • Art • Art History and Archaeology • Biological Science • Chemistry College of Arts and Science • Classical Studies • Communication • Economics • English • Geography • Geological Sciences Trulaske College of Business • German & Russian Studies • History • Mathematics • Philosophy • Physics and Astronomy • Political Science College of Education • Psychological Sciences • Religious Studies • Romance Languages & Lit • School of Music • Sociology • Statistics College of Engineering • Theatre • Accountancy • Taxation
Rankin & Associates Consulting Campus Climate Assessment Project
University of Missouri-Columbia Report September 2017
533
Rankin & Associates Consulting Campus Climate Assessment Project
University of Missouri-Columbia Report September 2017 • Business Administration • Educational Leadership & Policy Analysis • Educational School & Counseling Psychology College of Veterinary Medicine • Information Science and Learning Technologies • Career and Technical Education • Learning, Teaching and Curriculum • Special Education • Biological Engineering • Chemical Engineering Harry S. Truman School of Public Affairs • Civil Engineering • Computer Science • Computer Engineering • Electrical Engineering • Engineering • Industrial Engineering School of Health Professions • Mechanical and Aerospace Engineering • Biomedical Sciences • Public Affairs • Clinical and Diagnostic Sciences • Communication Science and Disorders • Occupational Therapy College of Human Environmental Sciences • Architectural Studies • Human Development and Family Studies • Dietetics • Nutrition and Exercise Physiology • Personal Financial Planning • Textile and Apparel Management School of Journalism • Journalism • Dispute Resolution • Electronic Commercial and Intellectual Property Law • Taxation • Health Administration • Medical Pharmacology and Physiology School of Law • Clinical and Translational Science • Public Health • Microbiology • Pathology • Agroforestry • Fisheries and Wildlife Sciences School of Medicine • Forestry • Human Dimensions of Natural Resources • Parks, Recreation and Tourism • Soil, Environmental and Atmospheric Sciences • Water Resources • Nursing School of Natural Resources • Social Work • Science Outreach • College Teaching • Education Improvement • Education Policy • Higher Education Administration Sinclair School of Nursing • Multicultural Education • Positive Psychology
534
• Qualitative Research • Energy Efficiency • Sustainable Energy and Policy • Food Safety and Defense School of Social Work • Agroforestry • Geospatial Intelligence • Global Public Affairs • Grantsmanship • Nonprofit Management • Organizational Change Certificate • Public Management • Science and Public Policy • Geriatric Care Management • Gerontology • Youth Development Program Management and Evaluation • Youth Development Specialist Doctoral • Online Educator • Analysis of Institutions and Organizations • Applied Behavior Analysis • Autism and Neurodevelopmental Disorders-Interdisciplinary • Center For The Digital Globe • Community Processes College of Agriculture, Food & Natural Resources • Conservation Biology-Interdisciplinary • European Union Studies-Interdisciplinary • Geographical Information Science- Interdisciplinary • Life Science Innovation and Entrepreneurship • Neuroscience • Society and Ecosystems-Interdisciplinary College of Arts and Science • Health Ethics • Health Informatics • Health Informatics and Bioinformatics • Elementary Mathematics Specialist • Teaching English to Speakers of Other Languages • Neuroscience Trulaske College of Business • Nuclear Engineering • Nuclear Safeguards Science and Technology • Financial and Housing Counseling • Personal Financial Planning • Teaching High School Physics • Lifespan Development College of Education • Global Public Health • Public Health • Accounting Information Systems • Jazz Studies • Music Entrepreneurship • Gerontological Social Work College of Engineering • Military Social Work • Adult Health Clinical Nurse Specialist • Adult-Gerontology Clinical Nurse Specialist • Child/Adolescent Psychiatric and Mental Health Clinical Nurse Specialist • Family Mental Health Nurse Practitioner • Family Nurse Practitioner College of Veterinary Medicine • Mental Health Nurse Practitioner
Rankin & Associates Consulting Campus Climate Assessment Project
University of Missouri-Columbia Report September 2017
535
• Pediatric Clinical Nurse Specialist • Pediatric Nurse Practitioner • Psychiatric/Mental Health Clinical Nurse Specialist • Marketing Analytics • Agricultural and Applied Economics Office of Graduate Studies • Agricultural Education • Animal Sciences • Biochemistry • Food Science • Plant, Insect and Microbial Sciences • Rural Sociology Harry S. Truman School of Public Affairs • Anthropology • Art History and Archaeology • Biological Sciences • Chemistry • Classical Studies • Communication School of Health Professions • Economics • English • Geology • History • Mathematics • Philosophy College of Human Environmental Sciences • Physics • Political Science • Psychology • Romance Languages • Sociology • Statistics School of Journalism • Theatre • Accountancy • Business Administration • Educational Leadership • Educational Leadership and Policy Analysis • Educational, School, and Counseling Psychology School of Medicine • Information Science and Learning Technologies • Career and Technical Education • Learning, Teaching and Curriculum • Special Education • Biological Engineering • Chemical Engineering School of Natural Resources • Civil Engineering • Computer Science • Electrical and Computer Engineering • Industrial Engineering • Mechanical and Aerospace Engineering • Biomedical Sciences Sinclair School of Nursing • Genetics Area Program • Informatics • Neuroscience • Nuclear Engineering • Pathobiology Area Program • Public Affairs School of Social Work
Rankin & Associates Consulting Campus Climate Assessment Project
University of Missouri-Columbia Report September 2017
536
• Physical Therapy • Human Environmental Sciences • Exercise Physiology • Nutrition Area Program • Journalism • Clinical and Translational Science Professional • Microbiology • Fisheries and Wildlife Sciences • Forestry • Human Dimensions of Natural Resources • Soil, Environmental and Atmospheric Sciences • Water Resources • Nursing • Social Work • School of Law • School of Medicine • College of Veterinary Medicine
66. Do you have a condition/disability that influences your learning, working or living activities? O No [Skip to Question #68] O Yes
67. Which, if any, of the conditions listed below impact your learning, working or living activities? (Mark all that apply.) • Acquired/Neurological/Traumatic Brain Injury • Chronic Diagnosis or Medical Condition (e.g., Asthma, Diabetes, Lupus, Cancer, Multiple Sclerosis,
Fibromyalgia) • Hard of Hearing or Deaf • Developmental/Learning Difference/Disability (e.g., Asperger's/Autism Spectrum, Attention
Deficit/Hyperactivity Disorder, Cognitive/Language-based) • Low Vision or Blind • Mental Health/Psychological Condition (e.g., anxiety, depression) • Physical/Mobility condition that affects walking • Physical/Mobility condition that does not affect walking (e.g. physical dexterity) • Speech/Communication Condition • A disability/condition not listed here (please specify):
68. Students only: Are you registered with the Disability Center O No O Yes
69. Faculty/Staff: Are you receiving accommodations for your disability? O No O Yes
70. Is English your primary language? O No O Yes
71. What is your religious or spiritual identity? (Mark all that apply.) • Agnostic • Atheist • Baha'i • Buddhist • Christian
• African Methodist Episcopal • African Methodist Episcopal Zion • Assembly of God • Baptist • Catholic/Roman Catholic • Church of Christ
Rankin & Associates Consulting Campus Climate Assessment Project
University of Missouri-Columbia Report September 2017
537
Rankin & Associates Consulting Campus Climate Assessment Project
University of Missouri-Columbia Report September 2017
• Church of God in Christ • Christian Orthodox • Christian Methodist Episcopal • Christian Reformed Church (CRC) • Disciples of Christ
• Episcopalian • Evangelical • Greek Orthodox • Lutheran • Mennonite • Moravian • Nazarene • Nondenominational Christian • Pentecostal • Presbyterian
• Protestant • Protestant Reformed Church (PR) • Quaker • Reformed Church of America (RCA) • Russian Orthodox • Seventh Day Adventist
• The Church of Jesus Christ of Latter-day Saints • United Methodist • United Church of Christ • A Christian affiliation not listed above (please specify):
• Confucian ist • Druid • Hindu • Jain • Jehovah's Witness • Jewish
• Conservative • Orthodox • Reform • A Jewish affiliation not listed here (please specify):
• Muslim • Ahmadi • Nation of Islam • Shi ite • Sufi • Sunni • A Muslim affiliation not listed here (please specify):
• Native American Traditional Practitioner or Ceremonial • Pagan • Rastafarian • Scientologist • Secular Humanist • Shinto • Sikh • Taoist • Tenrikyo • Unitarian Universalist • Wiccan • Spiritual, but no religious affiliation • No affiliation • A religious affiliation or spiritual identity not listed above (please specify):
538
Rankin & Associates Consulting Campus Climate Assessment Project
University of Missouri-Columbia Report September 2017 72. Students only: Do you receive financial support from a family member or guardian to assist with your
living/educational expenses? O I receive no support for living/educational expenses from family/guardian. O I receive support for living/educational expenses from family/guardian.
73. Students only: What is your best estimate of your family's yearly income (if dependent student, partnered, or married) or your yearly income (if single and independent student)? O $29,999 and below O $30,000 - $49,999 O $50,000 - $69,999 O $70,000 - $99,999 O $100,000-$149,999 O $150,000-$199,999 O $200,000 - $249,999 O $250,000 - $499,999 O $500,000 or more
74. Students only: Where do you live? O Campus housing
O Brooks Hall O Center Hall O College Avenue Hall O Defoe-Graham Hall O Discovery Hall O Dogwood Hall O Excellence Hall O Galena Hall O Gateway Hall O Gillett Hall O Hatch Hall O Hawthorn Hall O Hudson Hall O Johnston Hall O Mark Twain Hall O McDavid Hall O North Hall O Respect Hall O Responsibility Hall O Schurz Hall O South Hall O Tiger Reserve (graduate students only) O Wolpers Hall
O Non-campus housing O University affiliated apartment/house O Non-University affiliated apartment/house O Living with family member/guardian O Sorority or fraternity O Other organizational/group housing [e.g. Christian Campus House]
O Housing Insecure (e.g., couch surfing, sleeping in car, sleeping in campus office/lab)
539
Rankin & Associates Consulting Campus Climate Assessment Project
University of Missouri-Columbia Report September 2017 75. Students only: Since having been a student at MU, have you been a member or participated in any of the
following? (Mark all that apply.) • I do not participate in any clubs or organizations at MU • Academic and academic honorary organizations • Culture-specific organization • Faith or spirituality-based organization • Governance organization (e.g., SGA, SFC, Councils) • Greek letter organization • Health and wellness organization • Intercollegiate athletic team • Political or issue-oriented organization • Professional or pre-professional organization • Publication/media organization • Recreational organization • Service or philanthropic organization • A student organization not listed above (please specify):
76. Students only: At the end of your last semester, what was your cumulative grade point average? o 3.75 -4.00 o 3.50 -3.74 o 3.25 -3.49 o 3.00 -3.24 o 2.75 -2.99 o 2.50 -2.74 o 2.25 -2.49 o 2.00 -2.24 o 1.99 and below
77. Have you experienced financial hardship while at MU? Q No [Skip to Question #80] Q Yes
78. Students only: How have you experienced the financial hardship? (Mark all that apply.) • Difficulty affording tuition • Difficulty purchasing my books/course materials • Difficulty participating in social events • Difficulty affording food • Difficulty affording co-curricular events or activities • Difficulty affording academic related activities (e.g., study abroad, service learning) • Difficulty in affording unpaid internships/research opportunities • Difficulty in affording alternative spring breaks • Difficulty affording travel to and from MU • Difficulty affording commuting to campus (e.g., transportation, parking) • Difficulty in affording housing • Difficulty in affording health care • Difficulty in affording childcare • Difficulty in affording other campus fees • Difficulty finding employment • A financial hardship not listed here (please specify):
79. Faculty/Staff only: How have you experienced the financial hardship? (Mark all that apply.) • Difficulty affording food • Difficulty affording travel to and from MU • Difficulty in affording benefits • Difficulty in affording housing • Difficulty in affording health care • Difficulty in affording childcare • Difficulty in affording professional development (e.g., travel, training, research) • Difficulty in affording other campus fees (e.g., parking) • A financial hardship not listed here (please specify):
540
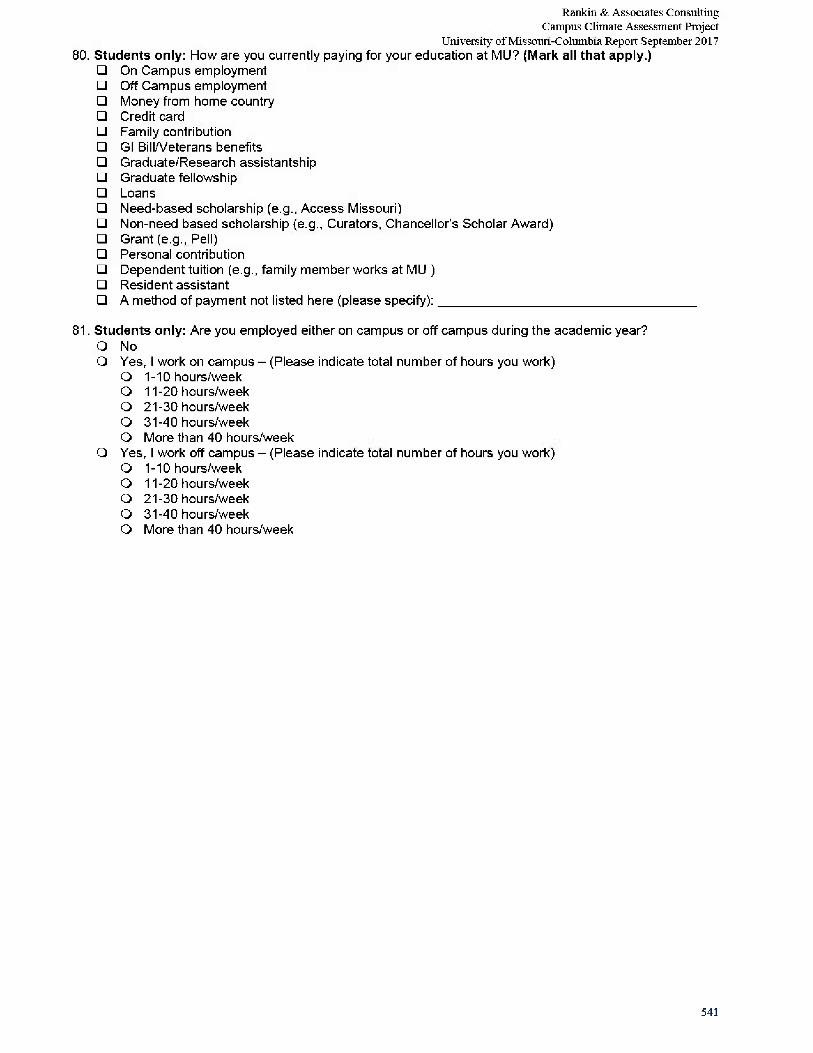
Rankin & Associates Consulting Campus Climate Assessment Project
University of Missouri-Columbia Report September 2017 80. Students only: How are you currently paying for your education at MU? (Mark all that apply.)
• On Campus employment • Off Campus employment • Money from home country • Credit card • Family contribution • Gl Bill/Veterans benefits • Graduate/Research assistantship • Graduate fellowship • Loans • Need-based scholarship (e.g., Access Missouri) • Non-need based scholarship (e.g., Curators, Chancellor's Scholar Award) • Grant (e.g., Pell) • Personal contribution • Dependent tuition (e.g., family member works at MU ) • Resident assistant • A method of payment not listed here (please specify):
81. Students only: Are you employed either on campus or off campus during the academic year? O No O Yes, I work on campus - (Please indicate total number of hours you work)
O 1-10 hours/week O 11-20 hours/week O 21-30 hours/week O 31-40 hours/week O More than 40 hours/week
O Yes, I work off campus - (Please indicate total number of hours you work) O 1-10 hours/week O 11-20 hours/week O 21-30 hours/week O 31-40 hours/week O More than 40 hours/week
541
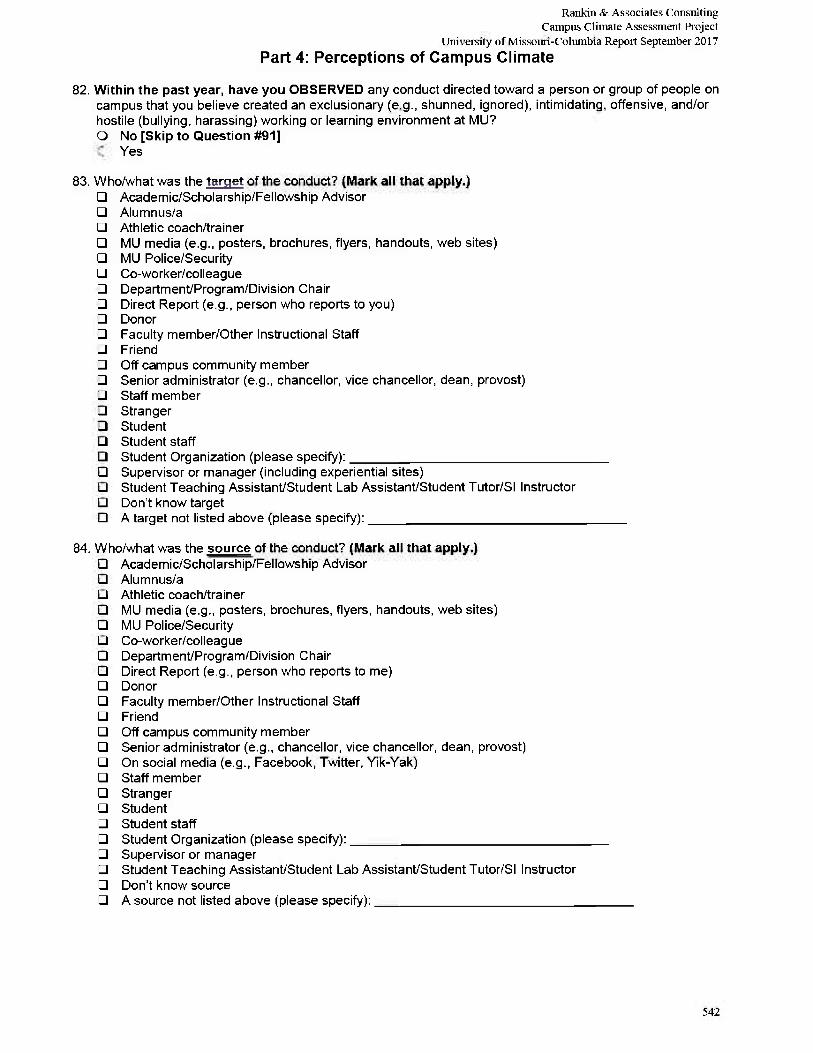
Rankin & Associates Consulting Campus Climate Assessment Project
University of Missouri-Columbia Report September 2017 Part 4: Perceptions of Campus Climate
82. Within the past year, have you OBSERVED any conduct directed toward a person or group of people on campus that you believe created an exclusionary (e.g., shunned, ignored), intimidating, offensive, and/or hostile (bullying, harassing) working or learning environment at MU? O No [Skip to Question #91]
O Yes
83. Who/what was the target of the conduct? (Mark all that apply.) • Academic/Scholarship/Fellowship Advisor • Alumnus/a • Athletic coach/trainer • MU media (e.g., posters, brochures, flyers, handouts, web sites) • MU Police/Security • Co-worker/colleague • Department/Program/Division Chair • Direct Report (e.g., person who reports to you) • Donor • Faculty member/Other Instructional Staff • Friend • Off campus community member • Senior administrator (e.g., chancellor, vice chancellor, dean, provost) • Staff member • Stranger • Student • Student staff • Student Organization (please specify): • Supervisor or manager (including experiential sites) • Student Teaching Assistant/Student Lab Assistant/Student Tutor/SI Instructor • Don't know target • A target not listed above (please specify):
84. Who/what was the source of the conduct? (Mark all that apply.) • Academic/Scholarship/Fellowship Advisor • Alumnus/a • Athletic coach/trainer • MU media (e.g., posters, brochures, flyers, handouts, web sites) • MU Police/Security • Co-worker/colleague • Department/Program/Division Chair • Direct Report (e.g., person who reports to me) • Donor • Faculty member/Other Instructional Staff • Friend • Off campus community member • Senior administrator (e.g., chancellor, vice chancellor, dean, provost) • On social media (e.g., Facebook, Twitter, Yik-Yak) • Staff member • Stranger • Student • Student staff • Student Organization (please specify): • Supervisor or manager • Student Teaching Assistant/Student Lab Assistant/Student Tutor/SI Instructor • Don't know source • A source not listed above (please specify):
542
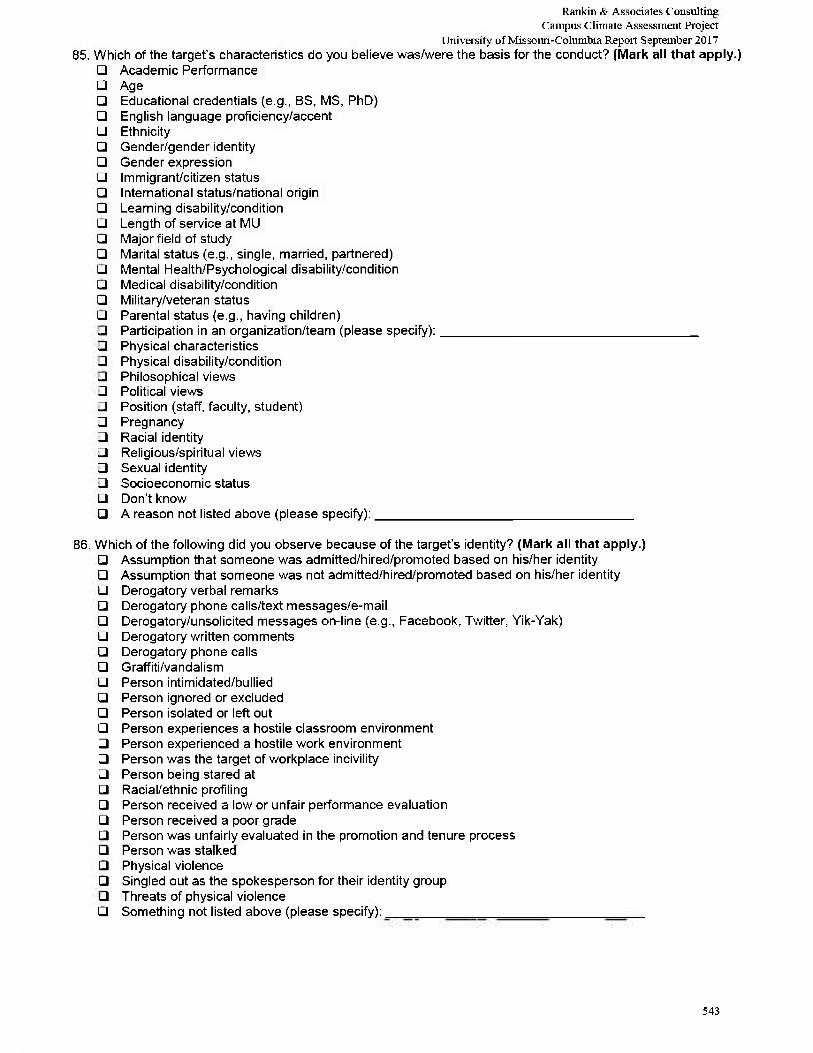
Rankin & Associates Consulting Campus Climate Assessment Project
University of Missouri-Columbia Report September 2017 85. Which of the target's characteristics do you believe was/were the basis for the conduct? (Mark all that apply.)
• Academic Performance • Age • Educational credentials (e.g., BS, MS, PhD) • English language proficiency/accent • Ethnicity • Gender/gender identity • Gender expression • Immigrant/citizen status • International status/national origin • Learning disability/condition • Length of service at MU • Major field of study • Marital status {e.g., single, married, partnered) • Mental Health/Psychological disability/condition • Medical disability/condition • Military/veteran status • Parental status (e.g., having children) • Participation in an organization/team (please specify): • Physical characteristics • Physical disability/condition • Philosophical views • Political views • Position (staff, faculty, student) • Pregnancy • Racial identity • Religious/spiritual views • Sexual identity • Socioeconomic status • Don't know • A reason not listed above (please specify):
86. Which of the following did you observe because of the target's identity? (Mark all that apply.) • Assumption that someone was admitted/hired/promoted based on his/her identity • Assumption that someone was not admitted/hired/promoted based on his/her identity • Derogatory verbal remarks • Derogatory phone calls/text messages/e-mail • Derogatory/unsolicited messages on-line (e.g., Facebook, Twitter, Yik-Yak) • Derogatory written comments • Derogatory phone calls • Graffiti/vandalism • Person intimidated/bullied • Person ignored or excluded • Person isolated or left out • Person experiences a hostile classroom environment • Person experienced a hostile work environment • Person was the target of workplace incivility • Person being stared at • Racial/ethnic profiling • Person received a low or unfair performance evaluation • Person received a poor grade • Person was unfairly evaluated in the promotion and tenure process • Person was stalked • Physical violence • Singled out as the spokesperson for their identity group • Threats of physical violence • Something not listed above (please specify):
543
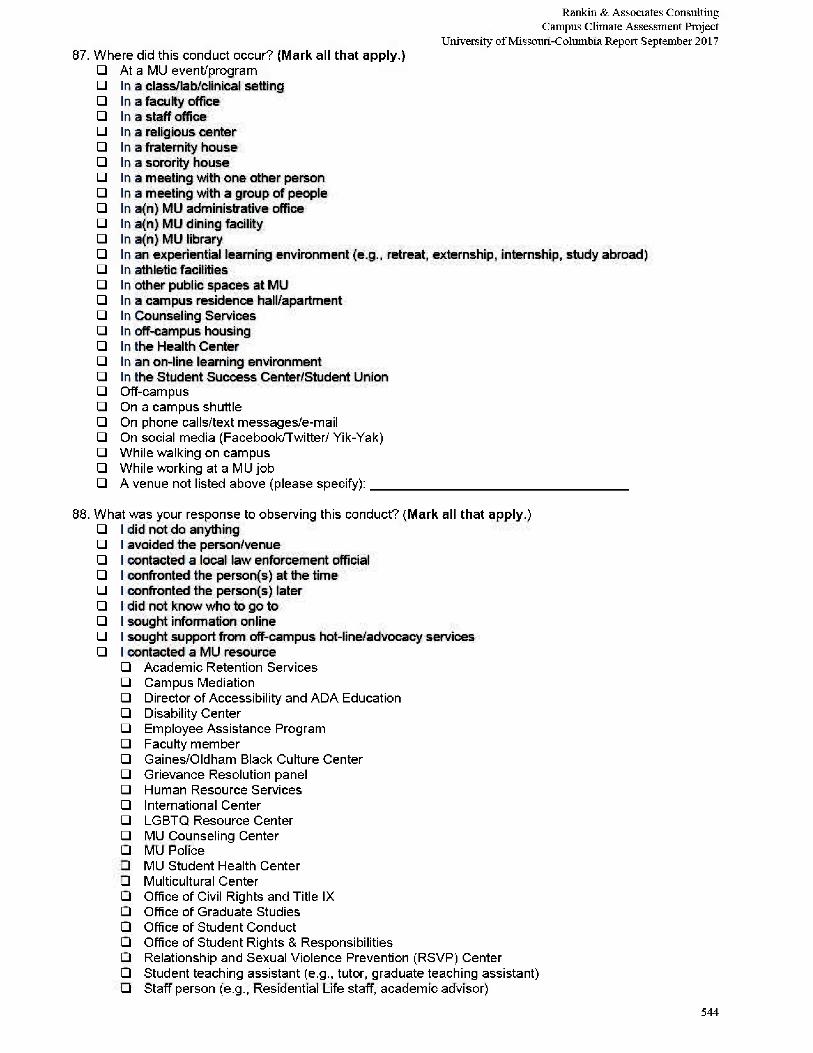
Rankin & Associates Consulting Campus Climate Assessment Project
University of Missouri-Columbia Report September 2017 87. Where did this conduct occur? (Mark all that apply.)
• At a MU event/program • In a class/lab/clinical setting • In a faculty office • In a staff office • In a religious center • In a fraternity house • In a sorority house • In a meeting with one other person • In a meeting with a group of people • In a(n) MU administrative office • In a(n) MU dining facility • In a(n) MU library • In an experiential learning environment (e.g., retreat, externship, internship, study abroad) • In athletic facilities • In other public spaces at MU • In a campus residence hall/apartment • In Counseling Services • In off-campus housing • In the Health Center • In an on-line learning environment • In the Student Success Center/Student Union • Off-campus • On a campus shuttle • On phone calls/text messages/e-mail • On social media (Facebook/Twitter/ Yik-Yak) • While walking on campus • While working at a MU job • A venue not listed above (please specify):
88. What was your response to observing this conduct? (Mark all that apply.) • I did not do anything • I avoided the person/venue • I contacted a local law enforcement official • I confronted the person(s) at the time • I confronted the person(s) later • I did not know who to go to • I sought information online • I sought support from off-campus hot-line/advocacy services • I contacted a MU resource
• Academic Retention Services • Campus Mediation • Director of Accessibility and ADA Education • Disability Center • Employee Assistance Program • Faculty member • Gaines/Oldham Black Culture Center • Grievance Resolution panel • Human Resource Services • International Center • LGBTQ Resource Center • MU Counseling Center • MU Police • MU Student Health Center • Multicultural Center • Office of Civil Rights and Title IX • Office of Graduate Studies • Office of Student Conduct • Office of Student Rights & Responsibilities
• Relationship and Sexual Violence Prevention (RSVP) Center • Student teaching assistant (e.g., tutor, graduate teaching assistant) • Staff person (e.g., Residential Life staff, academic advisor)
544
Rankin & Associates Consulting Campus Climate Assessment Project
University of Missouri-Columbia Report September 2017 • Student Legal Services • Supervisor • Vice Chancellor for Student Affairs • Wellness Resource Center • Women's Center
• I told a family member • I told a friend • I sought support from a member of the clergy or spiritual advisor (e.g., pastor, rabbi, priest, imam) • A response not listed above (please specify):
89. Did you report the conduct? O No, I didn't report it O Yes, I reported it (e.g., bias incident report, UM System Ethics and Compliance Hotline)
O Yes, I reported the incident and was satisfied with the outcome O Yes, I reported the incident, and while the outcome is not what I had hoped for, I feel as though my
complaint was responded to appropriately O Yes, I reported the incident, but felt that it was not responded to appropriately
90. We are interested in knowing more about your experiences. If you wish to elaborate on your observations of conduct directed toward a person or group of people on campus that you believe created an exclusionary, intimidating, offensive, and/or hostile working or learning environment, please do so here.
545
Rankin & Associates Consulting Campus Climate Assessment Project
University of Missouri-Columbia Report September 2017 91. Faculty/Staff only: Have you observed hiring practices at MU (e.g., hiring supervisor bias, search committee
bias, lack of effort in diversifying recruiting pool) that you perceive to be unjust or that would inhibit diversifying the community? O No [Skip to Question #94]
O Yes
92. Faculty/Staff only: I believe that the unjust hiring practices were based upon...(Mark all that apply). • Age • Educational credentials (e.g., BS, MS, PhD) • English language proficiency/accent • Ethnicity • Gender/gender identity • Gender expression • Immigrant/citizen status • International status/national origin • Learning disability/condition • Length of service at MU • Major field of study • Marital status (e.g., single, married, partnered) • Mental Health/Psychological disability/condition • Medical disability/condition • Military/veteran status • Nepotism/cronyism • Parental status (e.g., having children) • Participation in an organization/team (please specify): • Physical disability/condition • Philosophical views • Political views • Position (staff, faculty, student) • Pregnancy • Racial identity • Religious/spiritual views • Sexual identity • Socioeconomic status • Don't know • A reason not listed above (please specify):
93. Faculty/Staff only: We are interested in knowing more about your experiences. If you wish to elaborate on your observations of unjust hiring practices, please do so here.
546
Rankin & Associates Consulting Campus Climate Assessment Project
University of Missouri-Columbia Report September 2017 94. Faculty/ Staff only: Have you observed employment-related discipline or action, up to and including
dismissal, at MU that you perceive to be unjust or would inhibit diversifying the community? O No [Skip to Question #97] O Yes
95. Faculty/Staff only: I believe that the unjust employment-related disciplinary actions were based \ upon...(Mark all that apply.) • Age • Educational credentials (e.g., MS, PhD) • English language proficiency/accent • Ethnicity • Gender/gender identity • Gender expression • Immigrant/citizen status • International status/national origin • Job duties • Learning disability/condition • Length of service at MU • Major field of study • Marital status (e.g., single, married, partnered) • Mental Health/Psychological disability/condition • Medical disability/condition • Military/veteran status • Parental status (e.g., having children) • Participation in an organization/team (please specify): • Physical characteristics • Physical disability/condition • Philosophical views • Political views • Position (staff, faculty, student) • Pregnancy • Racial identity • Religious/spiritual views • Sexual identity • Socioeconomic status • Don't know • A reason not listed above (please specify):
96. Faculty/Staff only: We are interested in knowing more about your experiences. If you wish to elaborate on your observations of employment-related discipline or action, up to and including dismissal practices, please do so here.
547
Rankin & Associates Consulting Campus Climate Assessment Project
University of Missouri-Columbia Report September 2017 97. Faculty/Staff only: Have you observed promotion/tenure/reappointment/reclassificatio n practices at MU
that you perceive to be unjust? O No [Skip to Question #10] O Yes
98. Faculty/Staff only: I beiieve the unjust behavior, procedures, or employment practices related to promotion/tenure/reappointment/reclassificatio n were based upon... (Mark all that apply.) • Age • Educational credentials (e.g., MS, PhD) • English language proficiency/accent • Ethnicity • Gender/gender identity • Gender expression • Immigrant/citizen status • International status/national origin • Learning disability/condition • Length of service at MU • Major field of study • Marital status (e.g., single, married, partnered) • Mental Health/Psychological disability/condition • Medical disability/condition • Military/veteran status • Nepotism/cronyism • Parental status (e.g., having children) • Participation in an organization/team (please specify): • Physical characteristics • Physical disability/condition • Philosophical views • Political views • Position (staff, faculty, student) • Pregnancy • Racial identity • Religious/spiritual views • Sexual identity • Socioeconomic status • Don't know • A reason not listed above (please specify):
99. Faculty/Staff only: We are interested in knowing more about your experiences. If you wish to elaborate on your observations of unjust behavior, procedures, or employment practices related to promotion/tenure/reappointment/reclassification, please do so here.
548
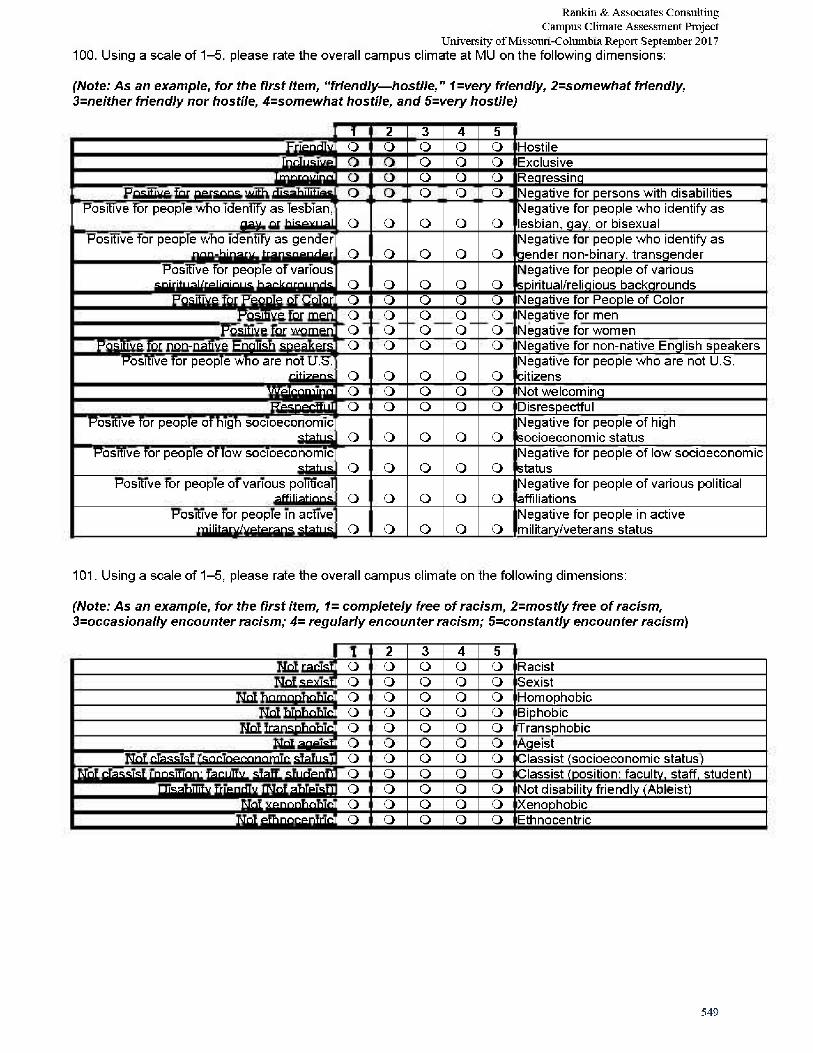
Rankin & Associates Consulting Campus Climate Assessment Project
University of Missouri-Columbia Report September 2017 100. Using a scale of 1-5, please rate the overall campus climate at MU on the following dimensions:
(Note: As an example, for the first item, "friendly—hostile," 1 =very friendly, 2=somewhat friendly, 3=neither friendly nor hostile, 4=somewhat hostile, and 5=very hostile)
1 2 3 4 5 Friendly O o o o o Hostile
Inclusive O o o o o Exclusive Improving o o o o o Regressing
Positive for persons with disabilities o o o o o Negative for persons with disabilities Positive for people who identify as lesbian,
gay, or bisexual o o o o o Negative for people who identify as lesbian, gay, or bisexual
Positive for people who identify as gender non-binary, transgender o o o o o
Negative for people who identify as gender non-binary, transgender
Positive for people of various spiritual/religious backgrounds o o o o o
Negative for people of various spiritual/religious backgrounds
Positive for People of Color o o o o o Negative for People of Color Positive for men o o o o o Negative for men
Positive for women o o o o o Negative for women Positive for non-native English speakers o o o o o Negative for non-native English speakers
Positive for people who are not U.S. citizens o o o o o
Negative for people who are not U.S. citizens
Welcoming o o o o o Not welcoming Respectful o o o o o Disrespectful
Positive for people of high socioeconomic status o o o o o
Negative for people of high socioeconomic status
Positive for people of low socioeconomic status o o o o o
Negative for people of low socioeconomic status
Positive for people of various political affiliations o o o o o
Negative for people of various political affiliations
Positive for people in active military/veterans status o o o o o
Negative for people in active military/veterans status
101. Using a scale of 1-5, please rate the overall campus climate on the following dimensions:
(Note: As an example, for the first item, 1= completely free of racism, 2=mostly free of racism, 3=occasionally encounter racism; 4= regularly encounter racism; 5=constantly encounter racism)
1 2 3 4 5 Not racist O o o o o Racist Not sexist O o o o o Sexist
Not homophobic o o o o o Homophobic Not biphobic o o o o o Biphobic
Not transphobic o o o o o Transphobic Not ageist o o o o o Ageist
Not classist (socioeconomic status) o o o o o Classist (socioeconomic status) Not classist (position: faculty, staff, student) o o o o o Classist (position: faculty, staff, student)
Disability friendly (Not ableist) o o o o o Not disability friendly (Ableist) Not xenophobic o o o o o Xenophobic
Not ethnocentric o o o o o Ethnocentric
549
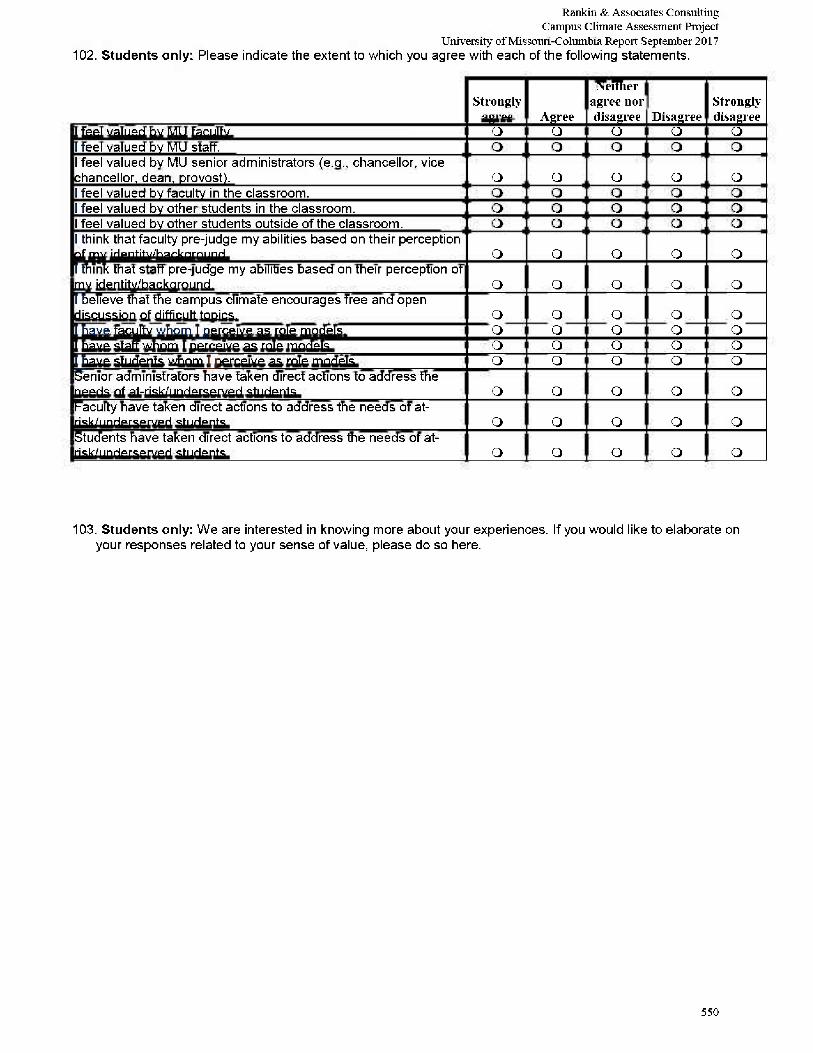
Rankin & Associates Consulting Campus Climate Assessment Project
University of Missouri-Columbia Report September 2017 102. Students only: Please indicate the extent to which you agree with each of the following statements.
Neither Strongly agree nor Strongly
agree Agree disagree Disagree disagree I feel valued by MU faculty. O O O O O I feel valued by MU staff. O O O o o I feel valued by MU senior administrators (e.g., chancellor, vice chancellor, dean, provost). o O o o o I feel valued by faculty in the classroom. o O o o o I feel valued by other students in the classroom. o O o o o I feel valued by other students outside of the classroom. o O o o o I think that faculty pre-judge my abilities based on their perception of my identity/background. o O o o o I think that staff pre-judge my abilities based on their perception of my identity/background. o O o o o I believe that the campus climate encourages free and open discussion of difficult topics. o O o o o I have faculty whom I perceive as role models. o O o o o I have staff whom I perceive as role models. o O o o o I have students whom I perceive as role models. o O o o o Senior administrators have taken direct actions to address the needs of at-risk/underserved students. o O o o o Faculty have taken direct actions to address the needs of at-risk/underserved students. o O o o o Students have taken direct actions to address the needs of at-risk/underserved students. o O o o o
103. Students only: We are interested in knowing more about your experiences. If you would like to elaborate on your responses related to your sense of value, please do so here.
550
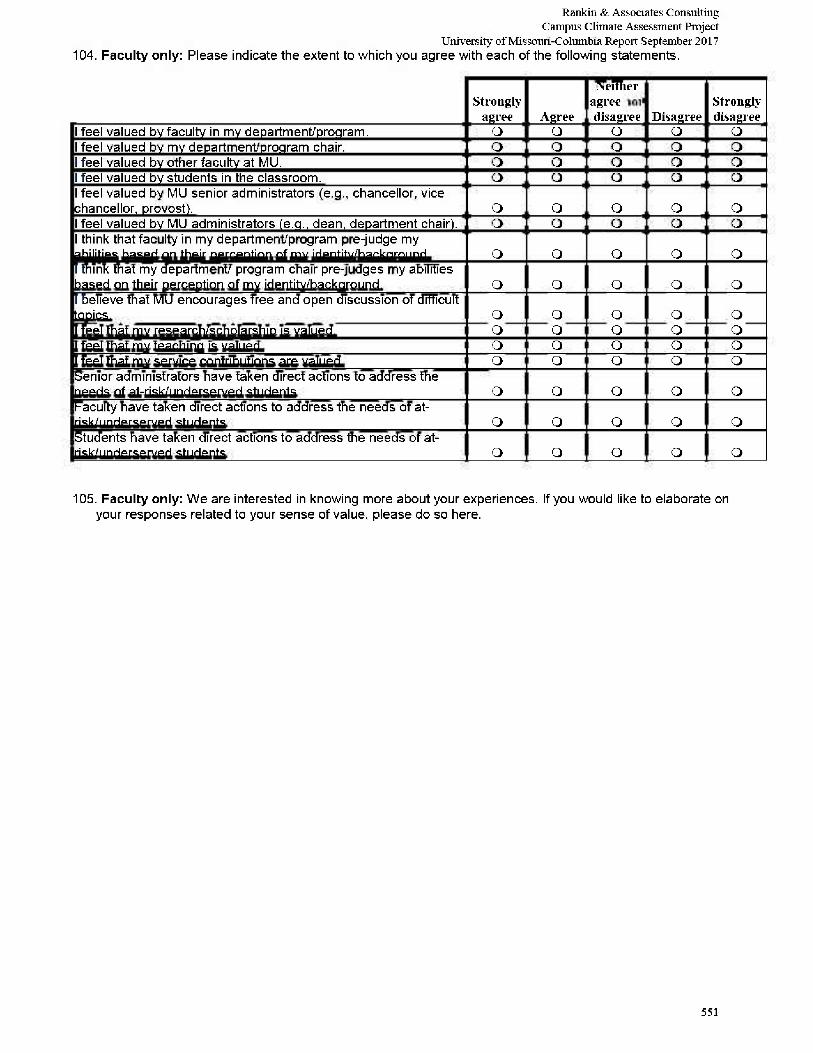
Rankin & Associates Consulting Campus Climate Assessment Project
University of Missouri-Columbia Report September 2017 104. Faculty only: Please indicate the extent to which you agree with each of the following statements.
Neither Strongly
agree Agree agree nor
disagree Disagree Strongly disagree
I feel valued by faculty in my department/program. O O O O O I feel valued by my department/program chair. O O O o o I feel valued by other faculty at MU. o O o o o I feel valued by students in the classroom. o O o o o 1 feel valued by MU senior administrators (e.g., chancellor, vice chancellor, provost). o O o o o I feel valued by MU administrators (e.g., dean, department chair). o O o o o 1 think that faculty in my department/program pre-judge my abilities based on their perception of my identity/background. o O o o o 1 think that my department/ program chair pre-judges my abilities based on their perception of my identity/background. o O o o o 1 believe that MU encourages free and open discussion of difficult topics. o O o o o 1 feel that my research/scholarship is valued. o O o o o 1 feel that my teaching is valued. o O o o o 1 feel that my service contributions are valued. o O o o o Senior administrators have taken direct actions to address the needs of at-risk/underserved students o O o o o Faculty have taken direct actions to address the needs of at-risk/underserved students o O o o o Students have taken direct actions to address the needs of at-risk/underserved students o O o o o
105. Faculty only: We are interested in knowing more about your experiences. If you would like to elaborate on your responses related to your sense of value, please do so here.
551
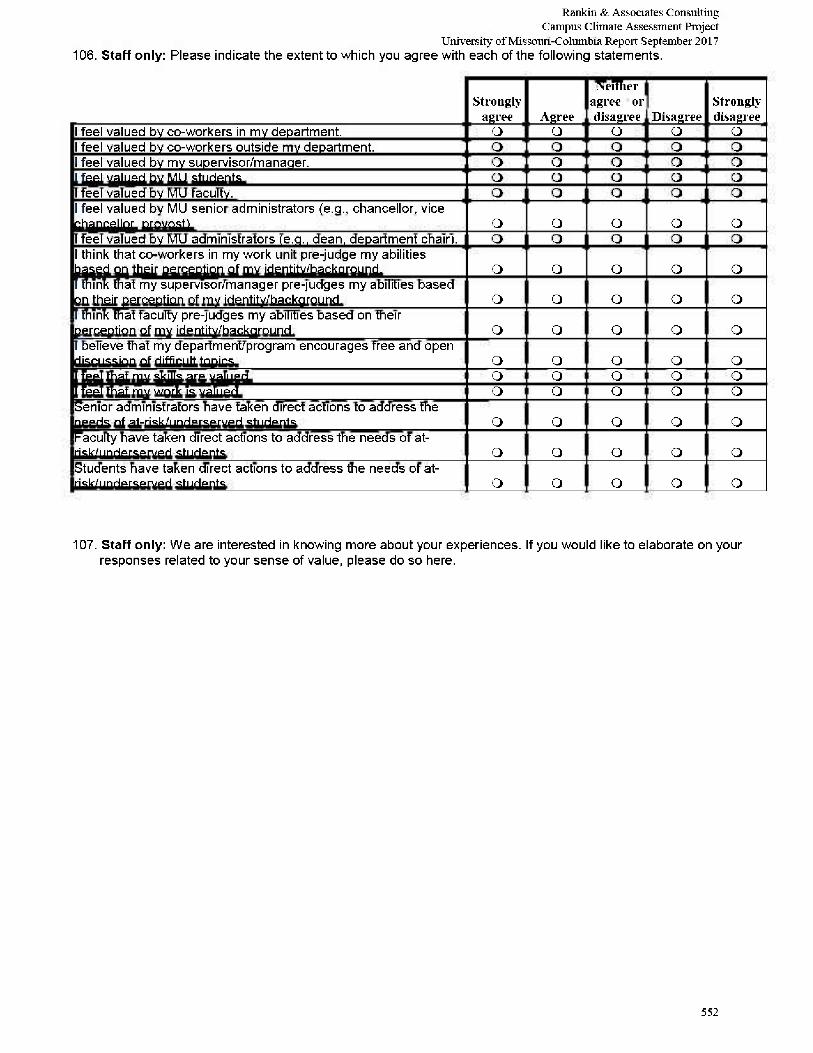
Rankin & Associates Consulting Campus Climate Assessment Project
University of Missouri-Columbia Report September 2017 106. Staff only: Please indicate the extent to which you agree with each of the following statements.
Neither Strongly
agree Agree agree nor disagree Disagree
Strongly disagree
I feel valued by co-workers in my department. O O O O O I feel valued by co-workers outside my department. O O O o o I feel valued by my supervisor/manager. o O o o o I feel valued by MU students. o O o o o I feel valued by MU faculty. o O o o o I feel valued by MU senior administrators (e.g., chancellor, vice chancellor, provost). o O o o o I feel valued by MU administrators (e.g., dean, department chair). o O o o o I think that co-workers in my work unit pre-judge my abilities based on their perception of my identity/background. o O o o o I think that my supervisor/manager pre-judges my abilities based on their perception of my identity/background. o O o o o I think that faculty pre-judges my abilities based on their perception of my identity/background. o O o o o I believe that my department/program encourages free and open discussion of difficult topics. o O o o o I feel that my skills are valued. o O o o o I feel that my work is valued. o O o o o Senior administrators have taken direct actions to address the needs of at-risk/underserved students o O o o o Faculty have taken direct actions to address the needs of at-risk/underserved students o O o o o Students have taken direct actions to address the needs of at-risk/underserved students o O o o o
107. Staff only: We are interested in knowing more about your experiences. If you would like to elaborate on your responses related to your sense of value, please do so here.
552
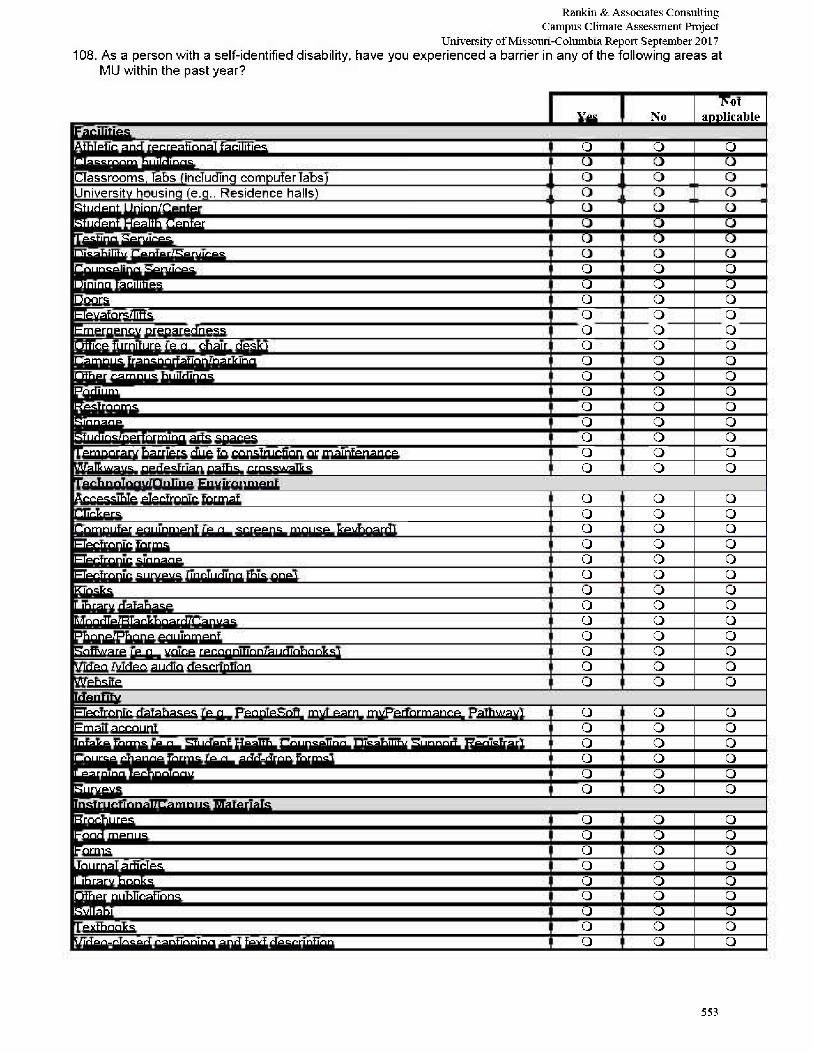
Rankin & Associates Consulting Campus Climate Assessment Project
University of Missouri-Columbia Report September 2017 108. As a person with a self-identified disability, have you experienced a barrier in any of the following areas at
MU within the past year?
Not Yes No applicable
Facilities Athletic and recreational facilities O o O Classroom buildings O o O Classrooms, labs (including computer labs) O o O University housing (e.g., Residence halls) O o O Student Union/Center O o O Student Health Center O o O Testing Services O o o Disability Center/Services O o o Counseling Services O o o Dining facilities O o o Doors O o o Elevators/lifts O o o Emergency preparedness O o o Office furniture (e.g., chair, desk) O o o Campus transportation/parking O o o Other campus buildings O o o Podium O o o Restrooms O o o Signage O o o Studios/performing arts spaces O o o Temporary barriers due to construction or maintenance O o o Walkways, pedestrian paths, crosswalks O o o Technology/Online Environment Accessible electronic format O o o Clickers O o o Computer equipment (e.g., screens, mouse, keyboard) O o o Electronic forms o o o Electronic signage o o o Electronic surveys (including this one) o o o Kiosks o o o Library database o o o Moodle/Blackboard/Canvas o o o Phone/Phone equipment o o o Software (e.g., voice recognition/audiobooks) o o o Video /video audio description o o o Website o o o Identity Electronic databases (e.g., PeopleSoft, myLearn, myPerformance, Pathway) o o o Email account o o o Intake forms (e.g., Student Health, Counseling, Disability Support, Registrar) o o o Course change forms (e.g., add-drop forms) o o o Learning technology o o o Surveys o o o Instructional/Campus Materials Brochures o o o Food menus o o o Forms o o o Journal articles o o o Library books o o o Other publications o o o Syllabi o o o Textbooks o o o Video-closed captioning and text description o o o
553
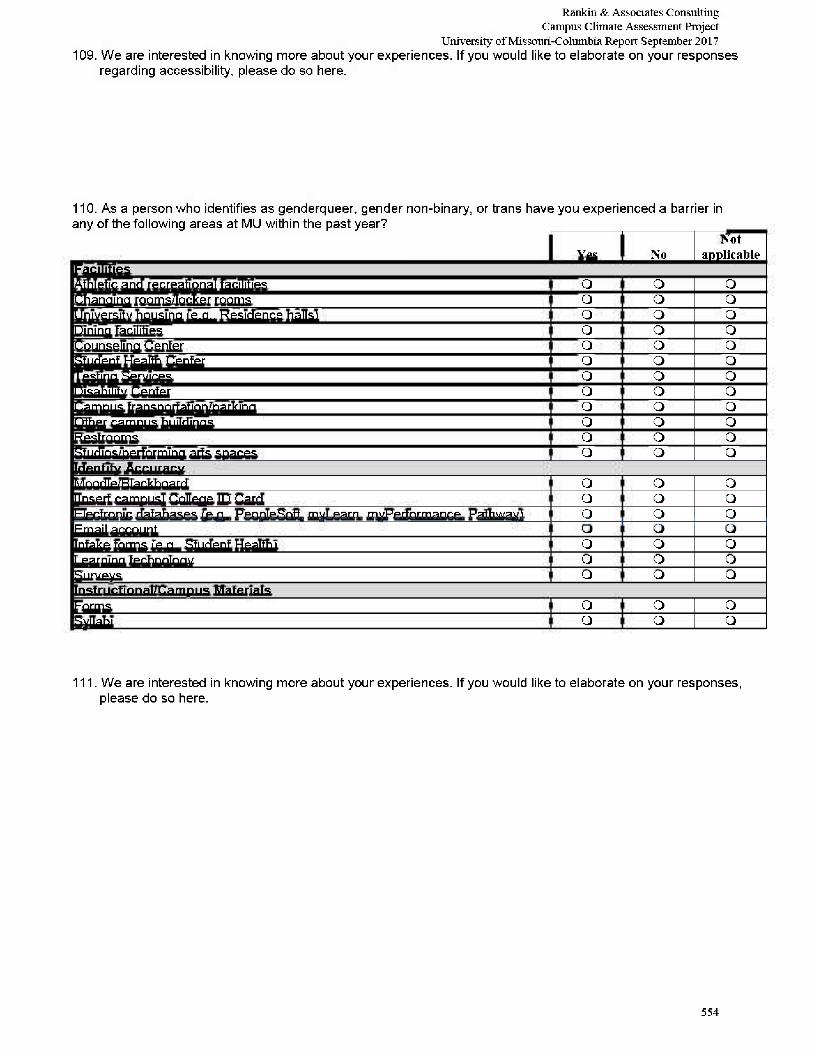
Rankin & Associates Consulting Campus Climate Assessment Project
University of Missouri-Columbia Report September 2017 109. We are interested in knowing more about your experiences. If you would like to elaborate on your responses
regarding accessibility, please do so here.
110. As a person who identifies as genderqueer, gender non-binary, or trans have you experienced a barrier in any of the following areas at MU within the past year?
Not Yes No applicable
Facilities Athletic and recreational facilities O o O Changing rooms/locker rooms O o O University housing (e.g., Residence halls) O o O Dining facilities O o O Counseling Center O o O Student Health Center O o O Testing Services O o O Disability Center O o O Campus transportation/parking O o O Other campus buildings O o O Restrooms O o O Studios/performing arts spaces O o O Identity Accuracy Moodle/Blackboard O o O [Insert campus] College ID Card O o O Electronic databases (e.g., PeopleSoft, myLearn, myPerformance. Pathway) O o O Email account O o O Intake forms (e.g., Student Health) O o O Learning technology O o O Surveys O o o Instructional/Campus Materials Forms O o o Syllabi O o o
111. We are interested in knowing more about your experiences. If you would like to elaborate on your responses, please do so here.
554
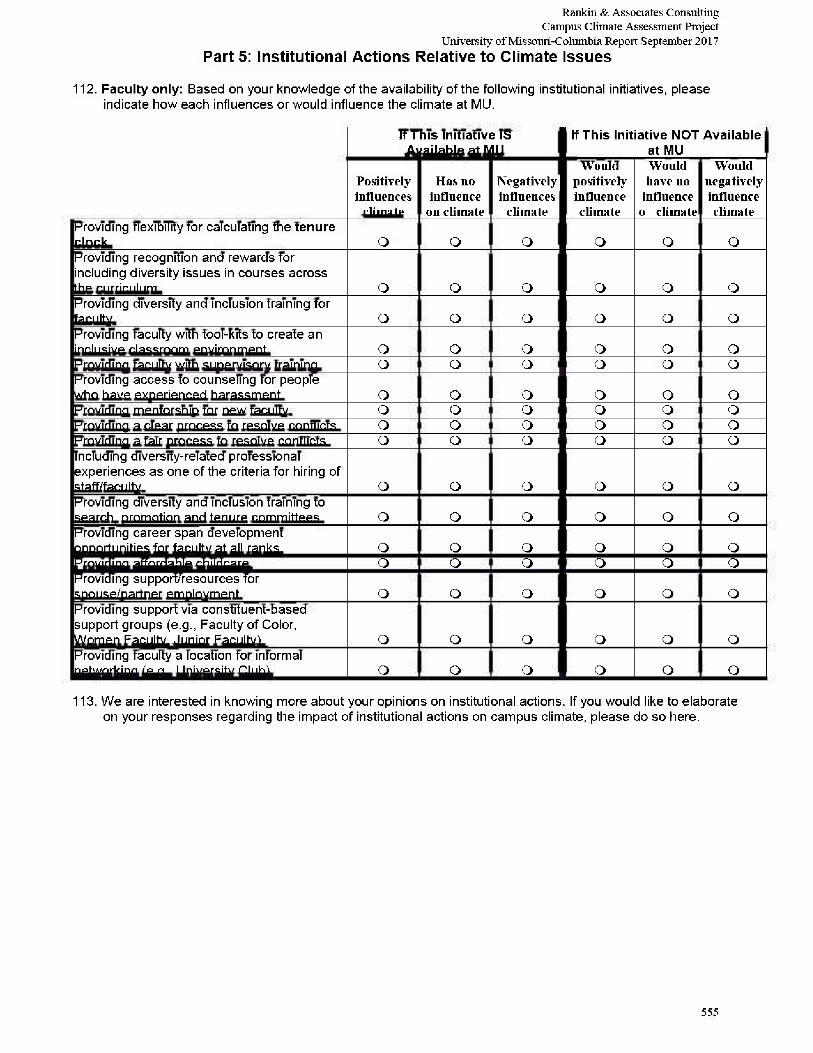
Rankin & Associates Consulting Campus Climate Assessment Project
University of Missouri-Columbia Report September 2017 Part 5: Institutional Actions Relative to Climate Issues
112. Faculty only: Based on your knowledge of the availability of the following institutional initiatives, please indicate how each influences or would influence the climate at MU.
If This Initiative IS If This Initiative NOT Available Available at MU at MU
Would Would Would Positively influences
Has 110 influence
Negatively influences
positively influence
have no influence
negatively influence
climate on climate climate climate on climate climate Providing flexibility for calculating the tenure clock. O O O O O O Providing recognition and rewards for including diversity issues in courses across the curriculum. O O O O o o Providing diversity and inclusion training for faculty. o o o o o o Providing faculty with tool-kits to create an inclusive classroom environment. o o o o o o Providing faculty with supervisory training. o o o o o o Providing access to counseling for people who have experienced harassment. o o o o o o Providing mentorship for new faculty. o o o o o o Providing a clear process to resolve conflicts. o o o o o o Providing a fair process to resolve conflicts. o o o o o o Including diversity-related professional experiences as one of the criteria for hiring of staff/faculty. o o o o o o Providing diversity and inclusion training to search, promotion and tenure committees. o o o o o o Providing career span development opportunities for faculty at all ranks. o o o o o o Providing affordable childcare. o o o o o o Providing support/resources for spouse/partner employment. o o o o o o Providing support via constituent-based support groups (e.g., Faculty of Color, Women Faculty, Junior Faculty). o o o o o o Providing faculty a location for informal networking (e.g., University Club). o o o o o o 113. We are interested in knowing more about your opinions on institutional actions. If you would like to elaborate
on your responses regarding the impact of institutional actions on campus climate, please do so here.
555
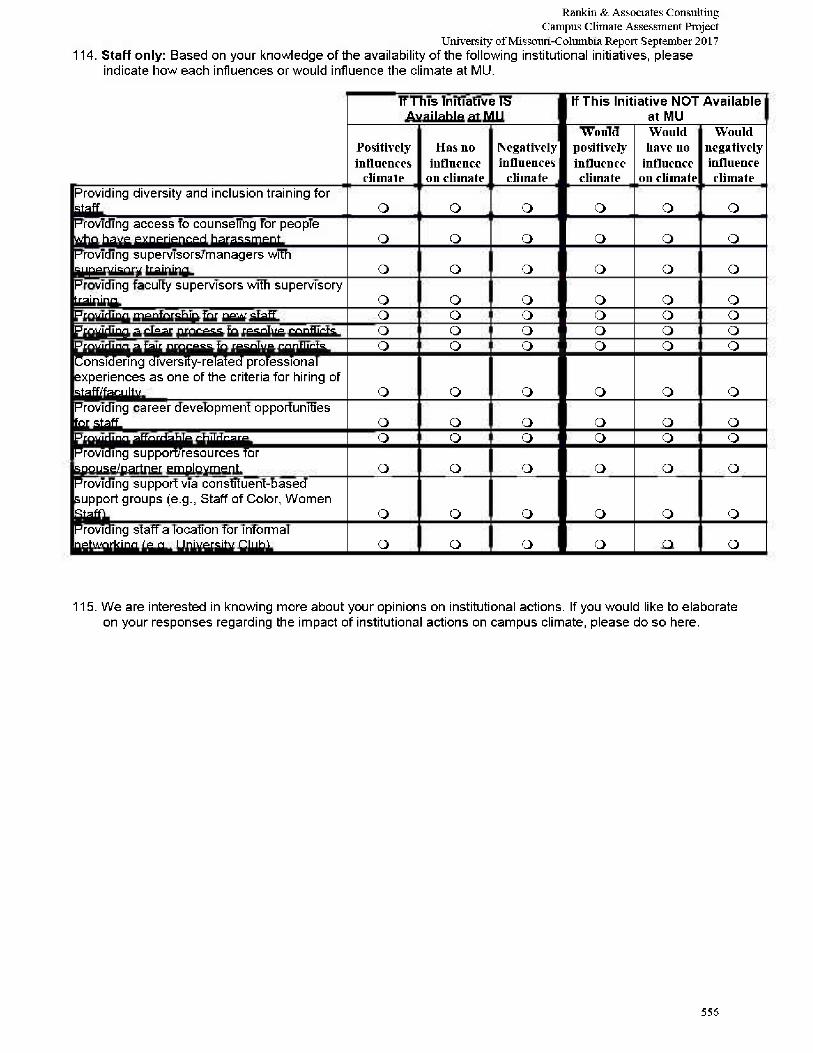
Rankin & Associates Consulting Campus Climate Assessment Project
University of Missouri-Columbia Report September 2017 114. Staff only: Based on your knowledge of the availability of the following institutional initiatives, please
indicate how each influences or would influence the climate at MU.
If This Initiative IS Available at MU
If This Initiative NOT Available at MU
Positively influences
climate
Has no influence
on climate
Negatively influences
cliinate
Would positively influence cliinate
Would have no
influence on cliinate
Would negatively influence cliinate
Providing diversity and inclusion training for staff. O O O O O O Providing access to counseling for people who have experienced harassment. O O O O O O Providing supervisors/managers with supervisory training. o o o o o o Providing faculty supervisors with supervisory training. o o o o o o Providing mentorship for new staff. o o o o o o Providing a clear process to resolve conflicts. o o o o o o Providing a fair process to resolve conflicts. o o o o o o Considering diversity-related professional experiences as one of the criteria for hiring of staff/faculty. o o o o o o Providing career development opportunities for staff. o o o o o o Providing affordable childcare. o o o o o o Providing support/resources for spouse/partner employment. o o o o o o Providing support via constituent-based support groups (e.g., Staff of Color, Women Staff). o o o o o o Providing staff a location for informal networking (e.g., University Club). o o o o o o
115. We are interested in knowing more about your opinions on institutional actions. If you would like to elaborate on your responses regarding the impact of institutional actions on campus climate, please do so here.
556
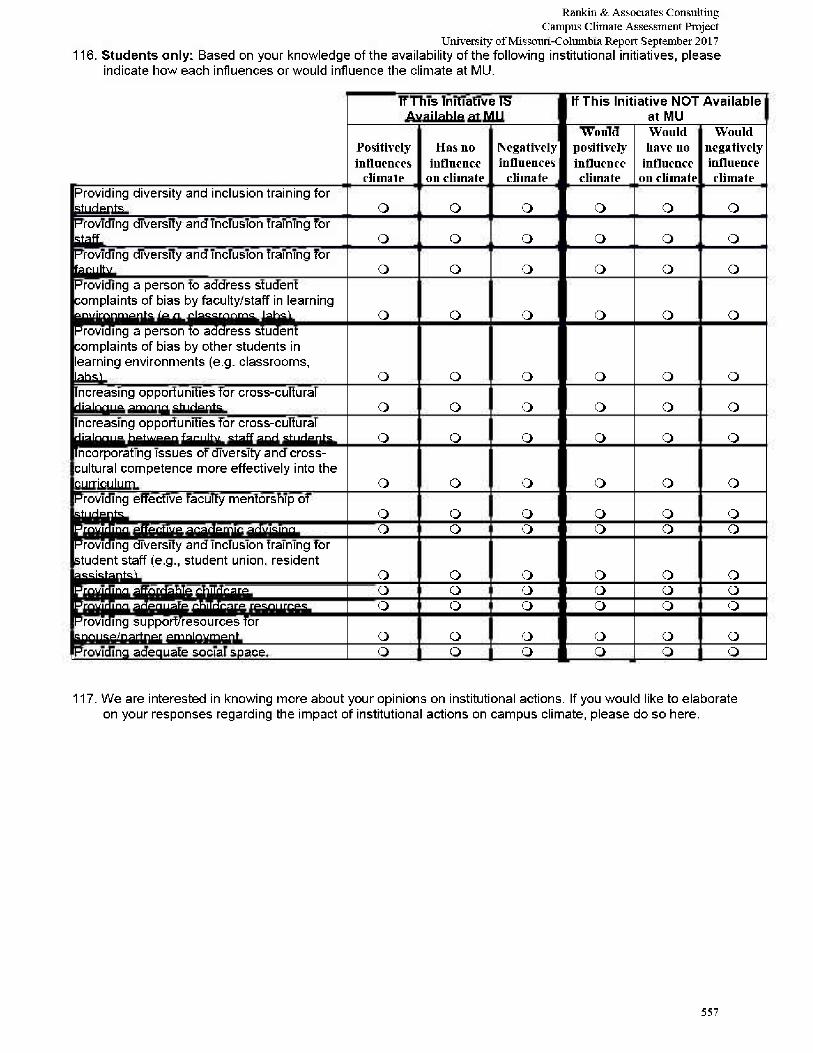
Rankin & Associates Consulting Campus Climate Assessment Project
University of Missouri-Columbia Report September 2017 116. Students only: Based on your knowledge of the availability of the following institutional initiatives, please
indicate how each influences or would influence the climate at MU.
If This Initiative IS Available at MU
If This Initiative NOT Available at MU
Positively influences
climate
Has no influence
on climate
Negatively influences
cliinate
Would positively influence cliinate
Would have no
influence on cliinate
Would negatively influence cliinate
Providing diversity and inclusion training for students. O O O O O O Providing diversity and inclusion training for staff. O O O O O O Providing diversity and inclusion training for faculty. o o o o o o Providing a person to address student complaints of bias by faculty/staff in learning environments (e.g. classrooms, labs). o o o o o o Providing a person to address student complaints of bias by other students in learning environments (e.g. classrooms, labs). o o o o o o Increasing opportunities for cross-cultural dialogue among students. o o o o o o Increasing opportunities for cross-cultural dialogue between faculty, staff and students. o o o o o o Incorporating issues of diversity and cross-cultural competence more effectively into the curriculum. o o o o o o Providing effective faculty mentorship of students. o o o o o o Providing effective academic advising. o o o o o o Providing diversity and inclusion training for student staff (e.g., student union, resident assistants). o o o o o o Providing affordable childcare. o o o o o o Providing adequate childcare resources. o o o o o o Providing support/resources for spouse/partner employment. o o o o o o Providing adequate social space. o o o o o o
117. We are interested in knowing more about your opinions on institutional actions. If you would like to elaborate on your responses regarding the impact of institutional actions on campus climate, please do so here.
557
Rankin & Associates Consulting Campus Climate Assessment Project
University of Missouri-Columbia Report September 2017 Part 6: Your Additional Comments
118. Are your experiences on campus different from those you experience in the community surrounding campus? If so, how are these experiences different?
119. Do you have any specific recommendations for improving the climate for living, learning, and working at MU?
120. This survey has asked you to reflect upon a large number of issues related to the campus climate and your experiences in this climate, using a multiple-choice format. If you wish to elaborate upon any of your survey responses or further describe your experiences, you are encouraged to do so in the space provided below.
558
Rankin & Associates Consulting Campus Climate Assessment Project
University of Missouri-Columbia Report September 2017 THANK YOU FOR YOUR PARTICIPATION IN THIS SURVEY
To thank all members of the MU community for their participation in this survey, you have an opportunity to win an award.
Submitting your contact information for a survey award is optional. No survey information is connected to entering your information.
To be eligible to win a survey award, please follow the instructions below. A random drawing, per the guidelines offered below, will be held for an opportunity to win one of the following:
Drawings will be held every Tuesday the survey is open. Six iPad minis Mizzou Store gift cards Starbucks gift cards
A grand prize awarded at the close of the survey period. Free parking in your assigned lot for one year
By providing your information below, your information will be entered for an opportunity to win an aforementioned award. Please know that in providing your information you are in no way linked or identified with the survey information collected here. The separation between the survey and drawing websites ensures your confidentiality.
O Faculty O Staff O Student
Name:
E-mail address:
Awards will be reported in accordance with IRS regulations. Please consult with your tax professional if you have questions.
We recognize that answering some of the questions on this survey may have been difficult for people.
If you have experienced any discomfort in responding to these questions and would like to speak with someone, please navigate to the link below and contact the appropriate resource:
https://www.umsystem.edu/ums/hr/support_resources_for_faculty_and_staff
559


