Embed Size (px)
Citation preview

PRESENTATION
TO ANALYSTS
FINANCIAL
RESULTS Q1 FY 2020
August 14, 2019
2
Highlights
Financial Performance
Business Performance
Treasury Operations
Asset Quality
Capital
Prompt Corrective Action Matrix
Digital Banking & Financial Inclusion
IDBI-LIC Synergy
Content
3
Highlights
4
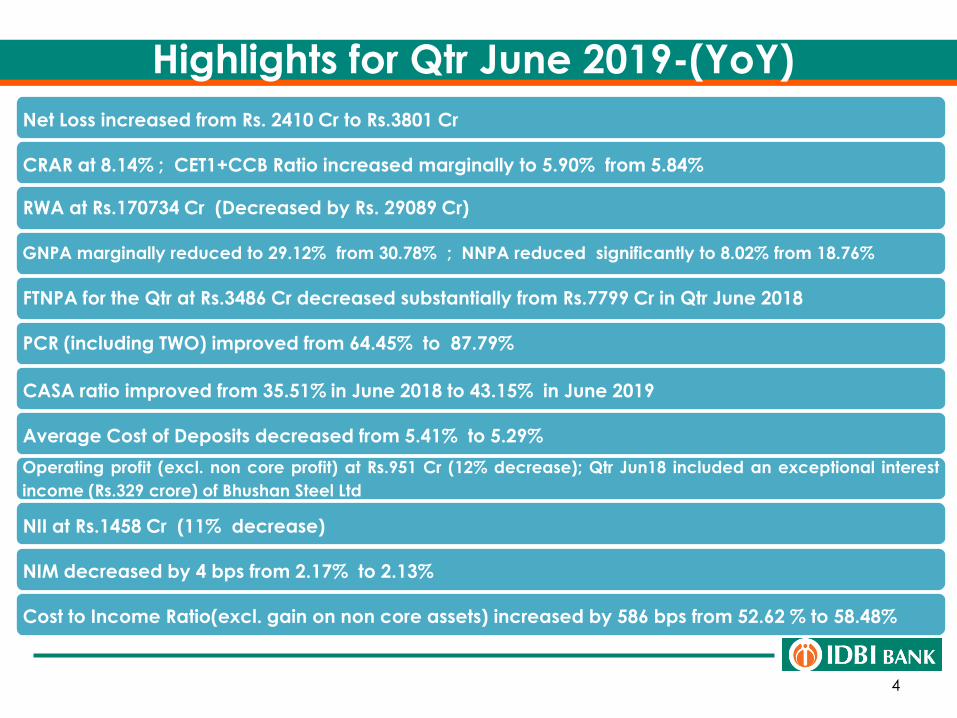
Net Loss increased from Rs. 2410 Cr to Rs.3801 Cr
CRAR at 8.14% ; CET1+CCB Ratio increased marginally to 5.90% from 5.84%
RWA at Rs.170734 Cr (Decreased by Rs. 29089 Cr)
GNPA marginally reduced to 29.12% from 30.78% ; NNPA reduced significantly to 8.02% from 18.76%
FTNPA for the Qtr at Rs.3486 Cr decreased substantially from Rs.7799 Cr in Qtr June 2018
PCR (including TWO) improved from 64.45% to 87.79%
CASA ratio improved from 35.51% in June 2018 to 43.15% in June 2019
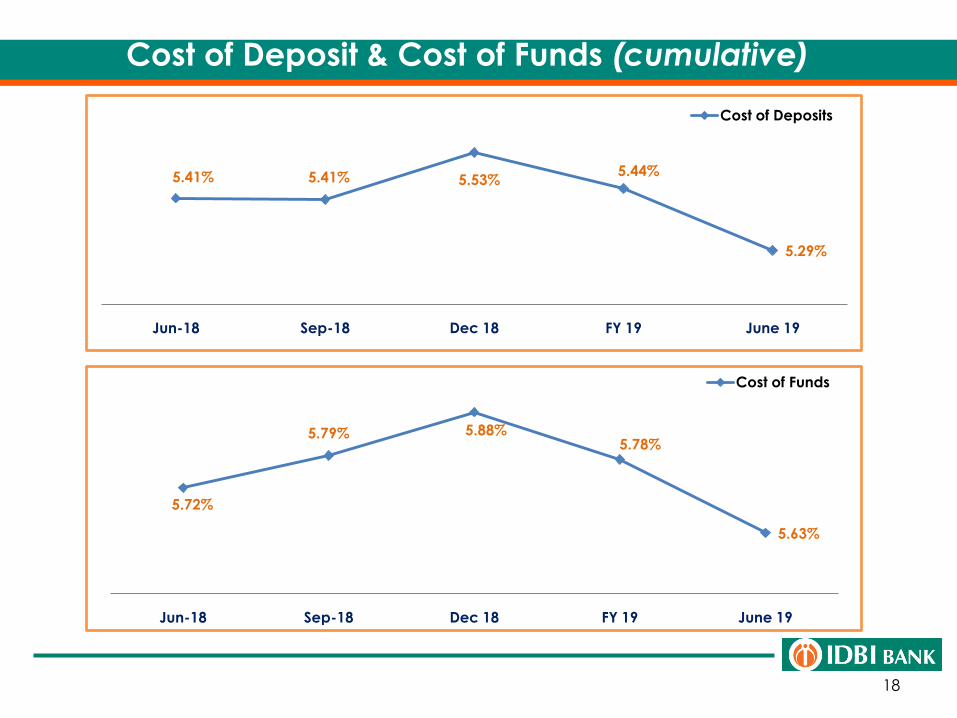
Average Cost of Deposits decreased from 5.41% to 5.29%
Operating profit (excl. non core profit) at Rs.951 Cr (12% decrease); Qtr Jun18 included an exceptional interest
income (Rs.329 crore) of Bhushan Steel Ltd
NII at Rs.1458 Cr (11% decrease)
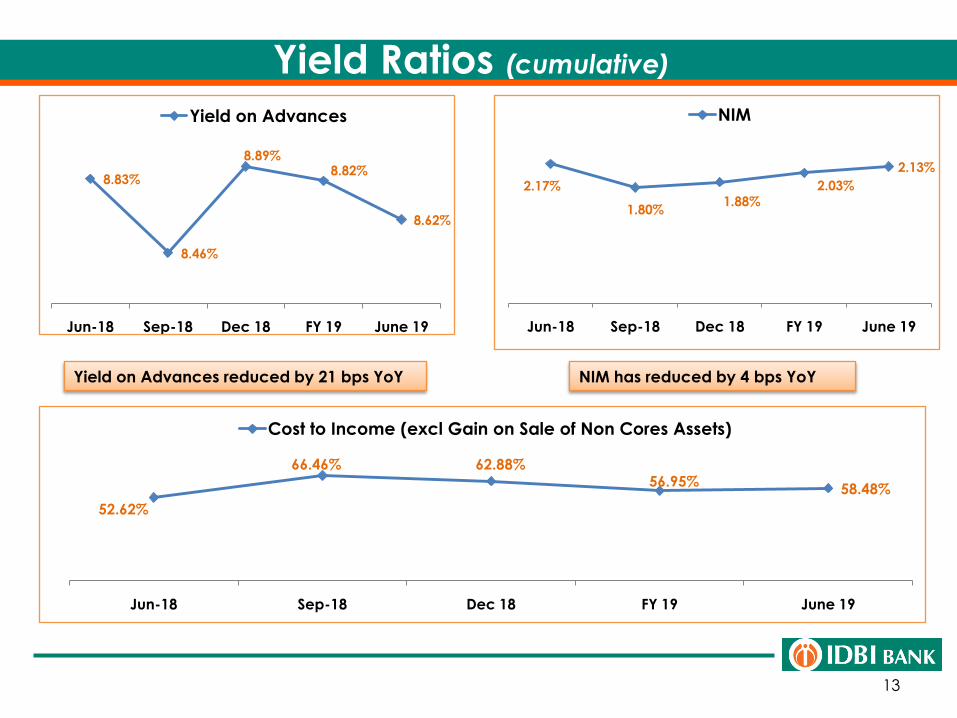
NIM decreased by 4 bps from 2.17% to 2.13%
Cost to Income Ratio(excl. gain on non core assets) increased by 586 bps from 52.62 % to 58.48%
Highlights for Qtr June 2019-(YoY)
5
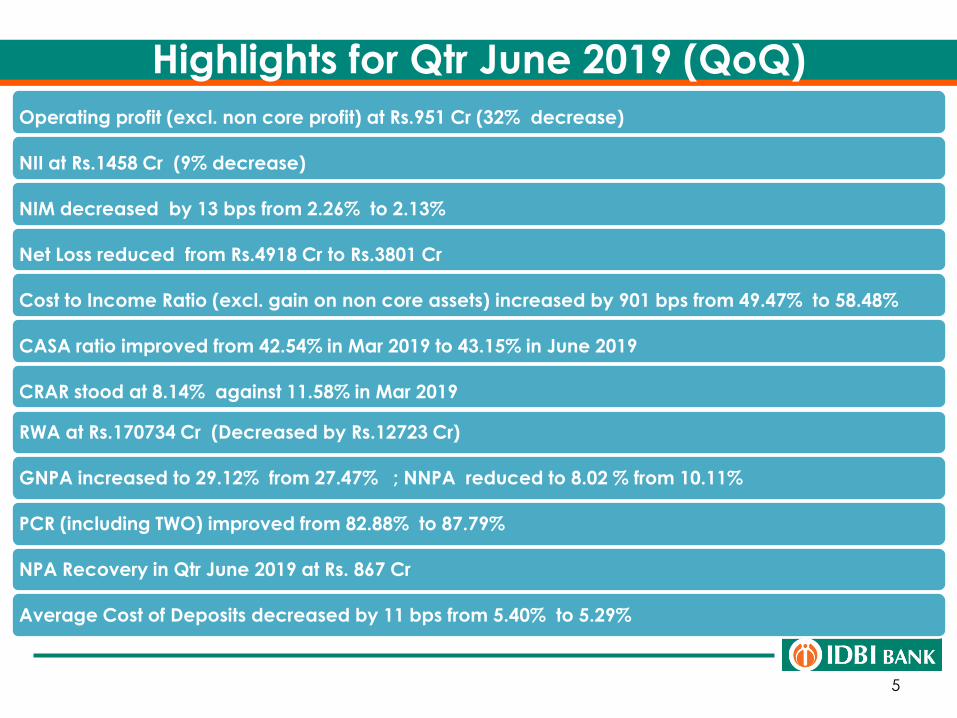
Operating profit (excl. non core profit) at Rs.951 Cr (32% decrease)
NII at Rs.1458 Cr (9% decrease)
NIM decreased by 13 bps from 2.26% to 2.13%
Net Loss reduced from Rs.4918 Cr to Rs.3801 Cr
Cost to Income Ratio (excl. gain on non core assets) increased by 901 bps from 49.47% to 58.48%
CASA ratio improved from 42.54% in Mar 2019 to 43.15% in June 2019
CRAR stood at 8.14% against 11.58% in Mar 2019
RWA at Rs.170734 Cr (Decreased by Rs.12723 Cr)
GNPA increased to 29.12% from 27.47% ; NNPA reduced to 8.02 % from 10.11%
PCR (including TWO) improved from 82.88% to 87.79%
NPA Recovery in Qtr June 2019 at Rs. 867 Cr
Average Cost of Deposits decreased by 11 bps from 5.40% to 5.29%
Highlights for Qtr June 2019 (QoQ)
6
Financial Performance
7
Profit & Loss
ParticularsQuarter ended Variance
(Y-o-Y) %
Variance
(Q-o-Q) %FY19
Jun-18 Mar-19 June-19
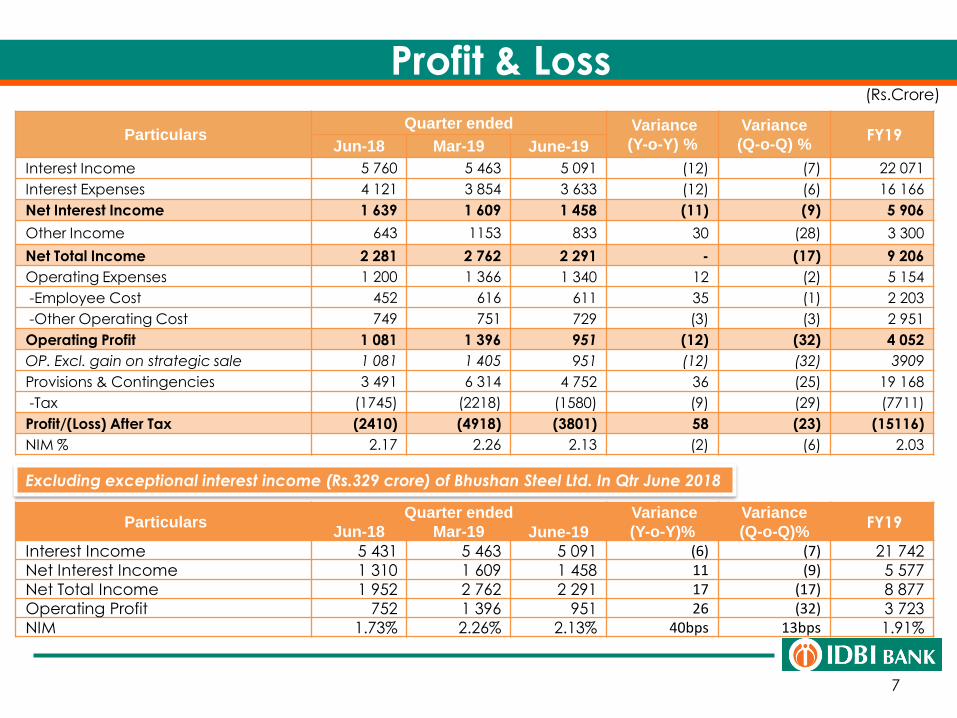
Interest Income 5 760 5 463 5 091 (12) (7) 22 071
Interest Expenses 4 121 3 854 3 633 (12) (6) 16 166
Net Interest Income 1 639 1 609 1 458 (11) (9) 5 906
Other Income 643 1153 833 30 (28) 3 300
Net Total Income 2 281 2 762 2 291 - (17) 9 206
Operating Expenses 1 200 1 366 1 340 12 (2) 5 154
-Employee Cost 452 616 611 35 (1) 2 203
-Other Operating Cost 749 751 729 (3) (3) 2 951
Operating Profit 1 081 1 396 951 (12) (32) 4 052
OP. Excl. gain on strategic sale 1 081 1 405 951 (12) (32) 3909
Provisions & Contingencies 3 491 6 314 4 752 36 (25) 19 168
-Tax (1745) (2218) (1580) (9) (29) (7711)
Profit/(Loss) After Tax (2410) (4918) (3801) 58 (23) (15116)
NIM % 2.17 2.26 2.13 (2) (6) 2.03
(Rs.Crore)
ParticularsQuarter ended Variance
(Y-o-Y)%
Variance
(Q-o-Q)%FY19
Jun-18 Mar-19 June-19
Interest Income 5 431 5 463 5 091 (6) (7) 21 742
Net Interest Income 1 310 1 609 1 458 11 (9) 5 577
Net Total Income 1 952 2 762 2 291 17 (17) 8 877
Operating Profit 752 1 396 951 26 (32) 3 723
NIM 1.73% 2.26% 2.13% 40bps 13bps 1.91%
Excluding exceptional interest income (Rs.329 crore) of Bhushan Steel Ltd. In Qtr June 2018
8
Total Income
Particulars
Quarter ended FY Ended
Jun-18 Mar-19 Jun-19Variance
(Y-o-Y)%
Variance
(Q-o-Q)%Mar-19
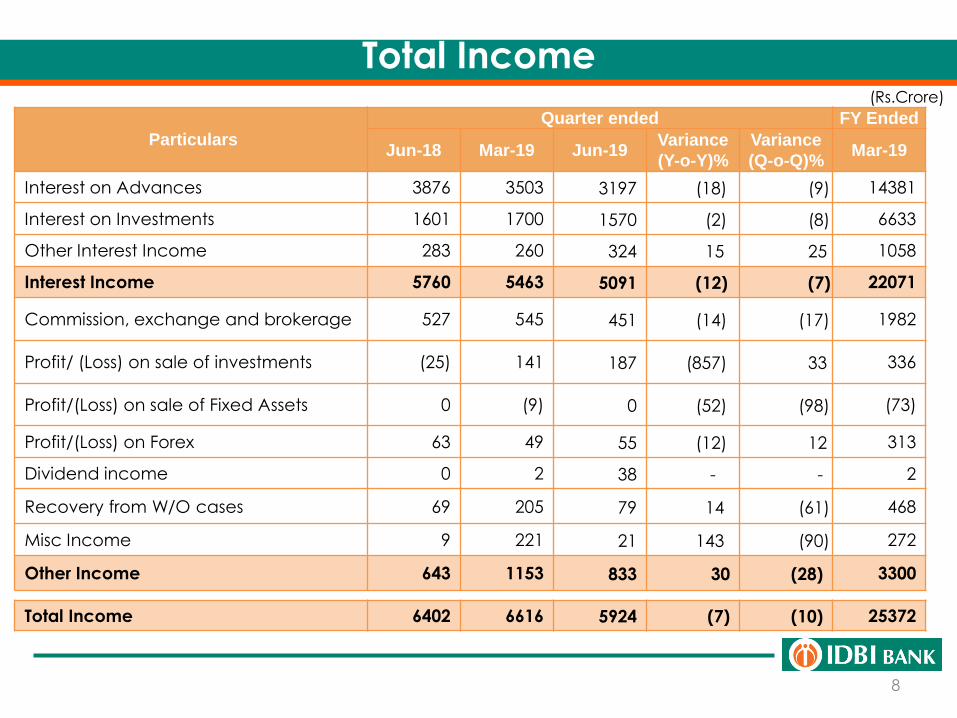
Interest on Advances 3876 3503 3197 (18) (9) 14381
Interest on Investments 1601 1700 1570 (2) (8) 6633
Other Interest Income 283 260 324 15 25 1058
Interest Income 5760 5463 5091 (12) (7) 22071
Commission, exchange and brokerage 527 545 451 (14) (17) 1982
Profit/ (Loss) on sale of investments (25) 141 187 (857) 33 336
Profit/(Loss) on sale of Fixed Assets 0 (9) 0 (52) (98) (73)
Profit/(Loss) on Forex 63 49 55 (12) 12 313
Dividend income 0 2 38 - - 2
Recovery from W/O cases 69 205 79 14 (61) 468
Misc Income 9 221 21 143 (90) 272
Other Income 643 1153 833 30 (28) 3300
(Rs.Crore)
Total Income 6402 6616 5924 (7) (10) 25372
9
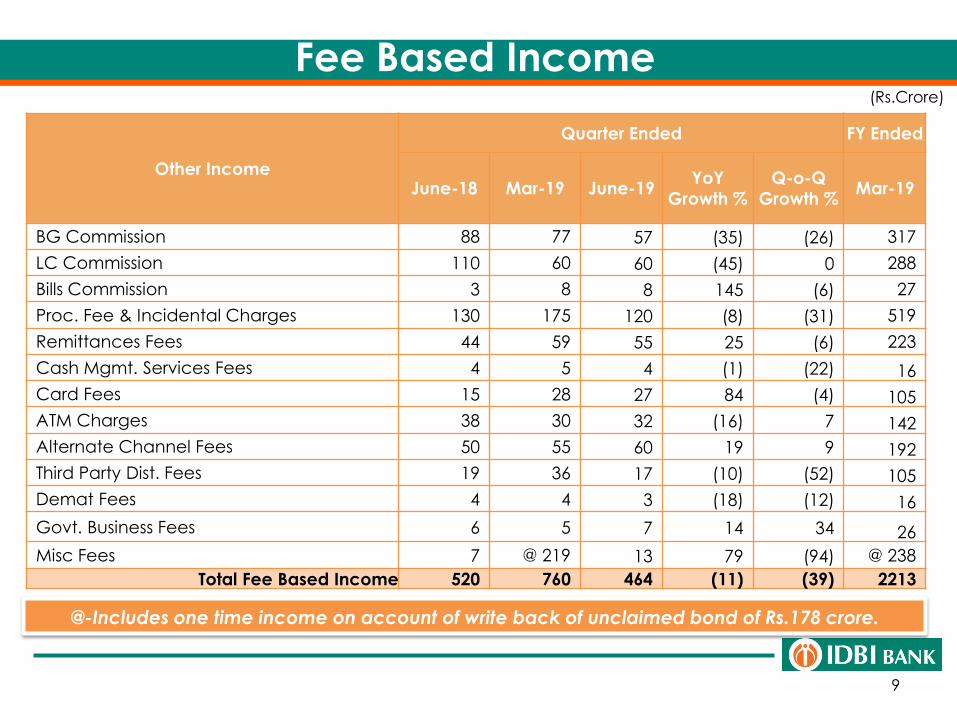
Fee Based Income(Rs.Crore)
Other Income
Quarter Ended FY Ended
June-18 Mar-19 June-19YoY
Growth %
Q-o-Q
Growth %Mar-19
BG Commission 88 77 57 (35) (26) 317
LC Commission 110 60 60 (45) 0 288
Bills Commission 3 8 8 145 (6) 27
Proc. Fee & Incidental Charges 130 175 120 (8) (31) 519
Remittances Fees 44 59 55 25 (6) 223
Cash Mgmt. Services Fees 4 5 4 (1) (22) 16
Card Fees 15 28 27 84 (4) 105
ATM Charges 38 30 32 (16) 7 142
Alternate Channel Fees 50 55 60 19 9 192
Third Party Dist. Fees 19 36 17 (10) (52) 105
Demat Fees 4 4 3 (18) (12) 16
Govt. Business Fees 6 5 7 14 34 26
Misc Fees 7 @ 219 13 79 (94) @ 238
Total Fee Based Income 520 760 464 (11) (39) 2213
@-Includes one time income on account of write back of unclaimed bond of Rs.178 crore.
10
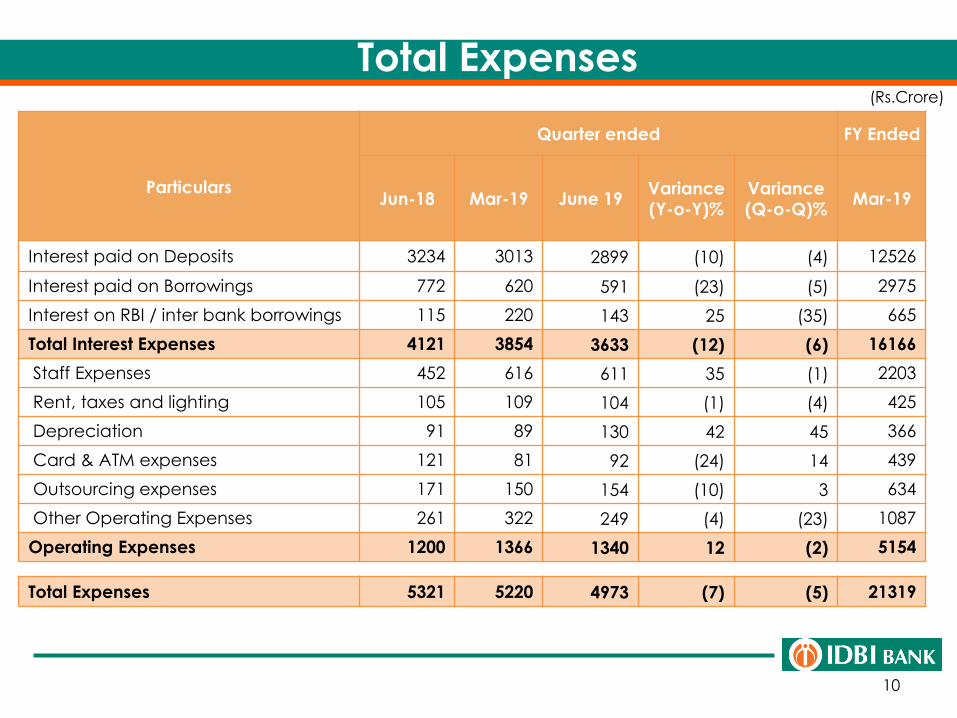
Total Expenses(Rs.Crore)
Particulars
Quarter ended FY Ended
Jun-18 Mar-19 June 19Variance
(Y-o-Y)%
Variance
(Q-o-Q)%Mar-19
Interest paid on Deposits 3234 3013 2899 (10) (4) 12526
Interest paid on Borrowings 772 620 591 (23) (5) 2975
Interest on RBI / inter bank borrowings 115 220 143 25 (35) 665
Total Interest Expenses 4121 3854 3633 (12) (6) 16166
Staff Expenses 452 616 611 35 (1) 2203
Rent, taxes and lighting 105 109 104 (1) (4) 425
Depreciation 91 89 130 42 45 366
Card & ATM expenses 121 81 92 (24) 14 439
Outsourcing expenses 171 150 154 (10) 3 634
Other Operating Expenses 261 322 249 (4) (23) 1087
Operating Expenses 1200 1366 1340 12 (2) 5154
Total Expenses 5321 5220 4973 (7) (5) 21319
11
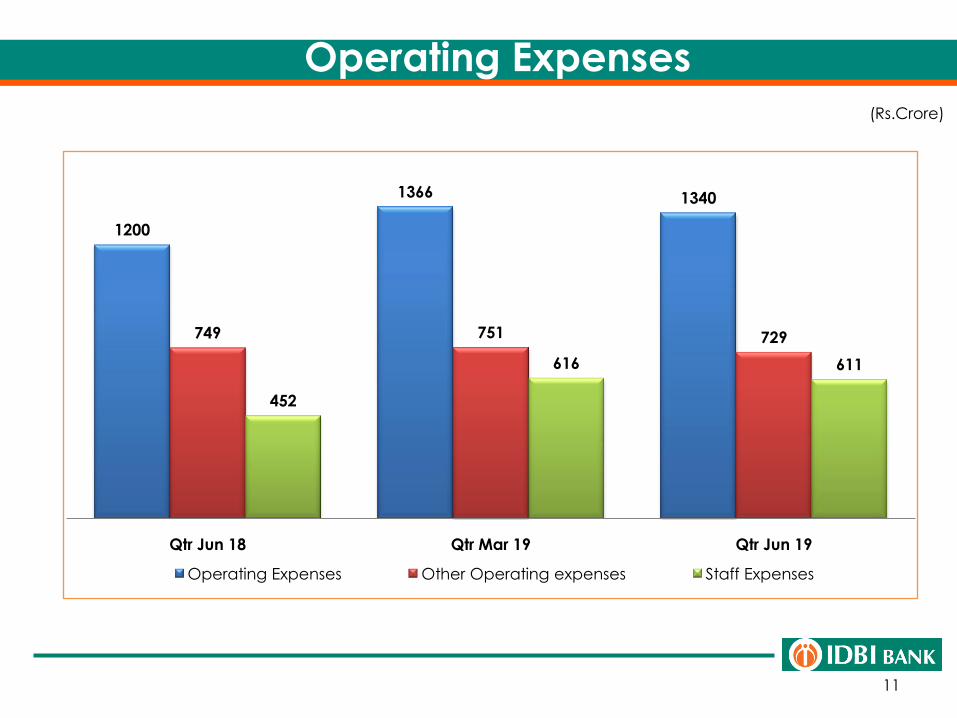
Operating Expenses(Rs.Crore)
1200
1366 1340
749 751 729
452
616 611
Qtr Jun 18 Qtr Mar 19 Qtr Jun 19
Operating Expenses Other Operating expenses Staff Expenses
12
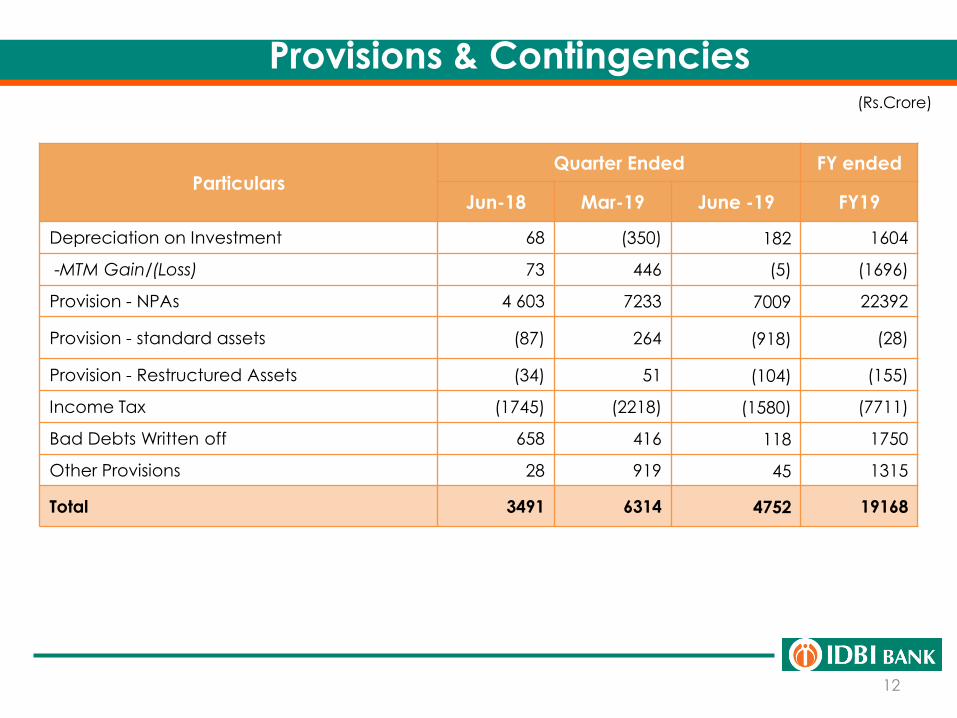
Provisions & Contingencies
ParticularsQuarter Ended FY ended
Jun-18 Mar-19 June -19 FY19
Depreciation on Investment 68 (350) 182 1604
-MTM Gain/(Loss) 73 446 (5) (1696)
Provision - NPAs 4 603 7233 7009 22392
Provision - standard assets (87) 264 (918) (28)
Provision - Restructured Assets (34) 51 (104) (155)
Income Tax (1745) (2218) (1580) (7711)
Bad Debts Written off 658 416 118 1750
Other Provisions 28 919 45 1315
Total 3491 6314 4752 19168
(Rs.Crore)
13
Yield Ratios (cumulative)
Yield on Advances reduced by 21 bps YoY NIM has reduced by 4 bps YoY
8.83%
8.46%
8.89%8.82%
8.62%
Jun-18 Sep-18 Dec 18 FY 19 June 19
Yield on Advances
2.17%
1.80%1.88%
2.03%
2.13%
Jun-18 Sep-18 Dec 18 FY 19 June 19
NIM
52.62%
66.46% 62.88%56.95%
58.48%
Jun-18 Sep-18 Dec 18 FY 19 June 19
Cost to Income (excl Gain on Sale of Non Cores Assets)
14
Business Performance
15
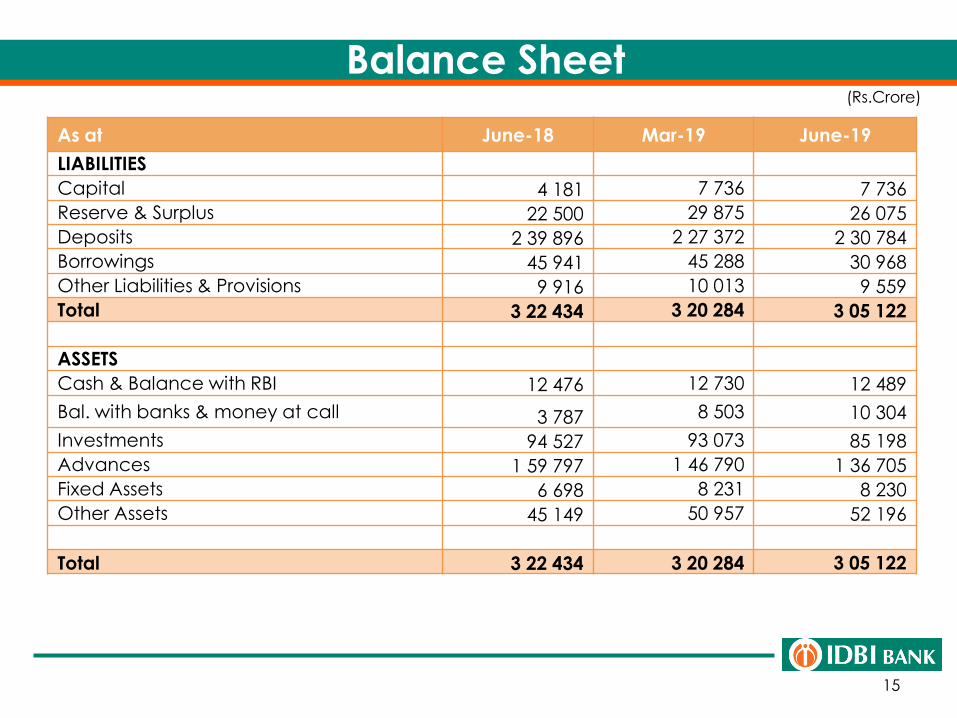
Balance Sheet
As at June-18 Mar-19 June-19
LIABILITIES
Capital 4 181 7 736 7 736
Reserve & Surplus 22 500 29 875 26 075
Deposits 2 39 896 2 27 372 2 30 784
Borrowings 45 941 45 288 30 968
Other Liabilities & Provisions 9 916 10 013 9 559
Total 3 22 434 3 20 284 3 05 122
ASSETS
Cash & Balance with RBI 12 476 12 730 12 489
Bal. with banks & money at call 3 787 8 503 10 304
Investments 94 527 93 073 85 198
Advances 1 59 797 1 46 790 1 36 705
Fixed Assets 6 698 8 231 8 230
Other Assets 45 149 50 957 52 196
Total 3 22 434 3 20 284 3 05 122
(Rs.Crore)
16
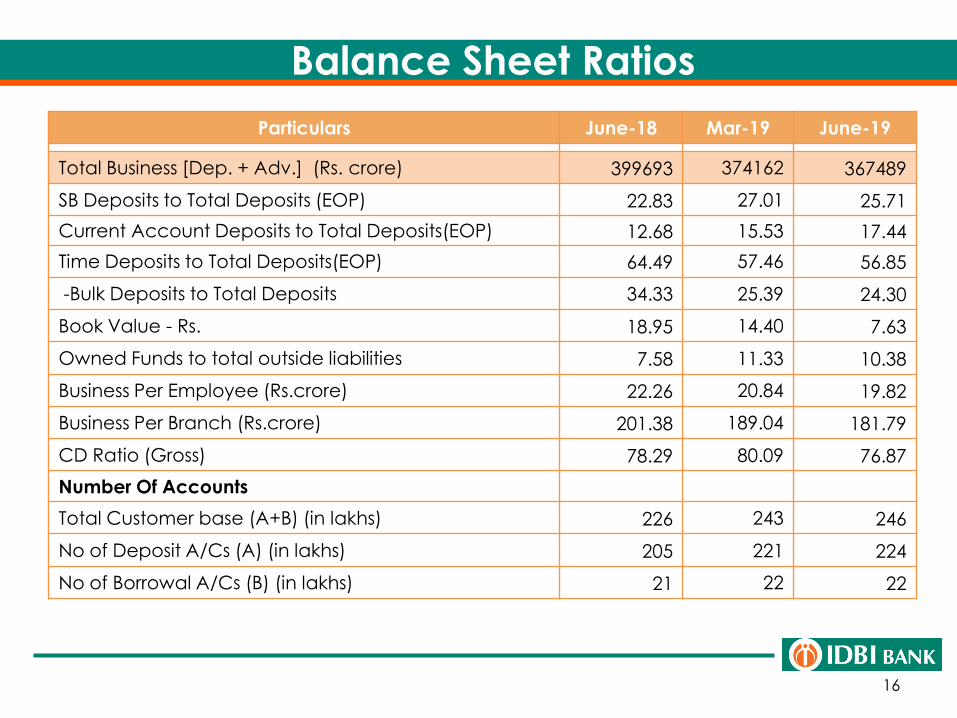
Balance Sheet Ratios
Particulars June-18 Mar-19 June-19
Total Business [Dep. + Adv.] (Rs. crore) 399693 374162 367489
SB Deposits to Total Deposits (EOP) 22.83 27.01 25.71
Current Account Deposits to Total Deposits(EOP) 12.68 15.53 17.44
Time Deposits to Total Deposits(EOP) 64.49 57.46 56.85
-Bulk Deposits to Total Deposits 34.33 25.39 24.30
Book Value - Rs. 18.95 14.40 7.63
Owned Funds to total outside liabilities 7.58 11.33 10.38
Business Per Employee (Rs.crore) 22.26 20.84 19.82
Business Per Branch (Rs.crore) 201.38 189.04 181.79
CD Ratio (Gross) 78.29 80.09 76.87
Number Of Accounts
Total Customer base (A+B) (in lakhs) 226 243 246
No of Deposit A/Cs (A) (in lakhs) 205 221 224
No of Borrowal A/Cs (B) (in lakhs) 21 22 22
17
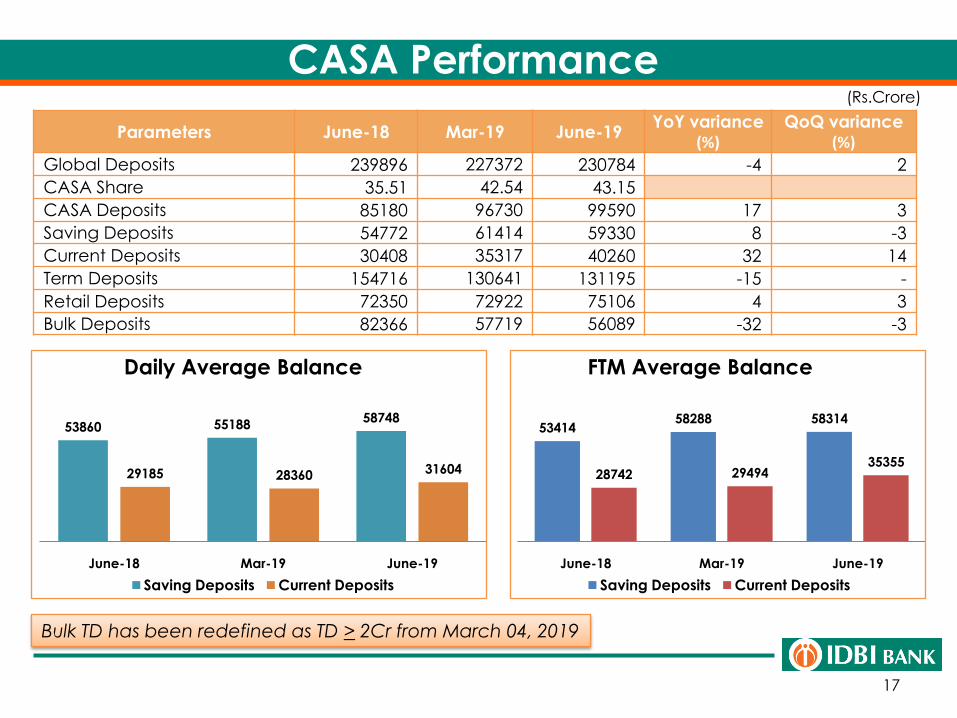
CASA Performance
Parameters June-18 Mar-19 June-19YoY variance
(%)QoQ variance
(%)
Global Deposits 239896 227372 230784 -4 2
CASA Share 35.51 42.54 43.15
CASA Deposits 85180 96730 99590 17 3
Saving Deposits 54772 61414 59330 8 -3
Current Deposits 30408 35317 40260 32 14
Term Deposits 154716 130641 131195 -15 -
Retail Deposits 72350 72922 75106 4 3
Bulk Deposits 82366 57719 56089 -32 -3
(Rs.Crore)
Bulk TD has been redefined as TD > 2Cr from March 04, 2019
53860 5518858748
29185 28360 31604
June-18 Mar-19 June-19
Daily Average Balance
Saving Deposits Current Deposits
5341458288 58314
28742 2949435355
June-18 Mar-19 June-19
FTM Average Balance
Saving Deposits Current Deposits
18
Cost of Deposit & Cost of Funds (cumulative)
5.41% 5.41% 5.53%5.44%
5.29%
Jun-18 Sep-18 Dec 18 FY 19 June 19
Cost of Deposits
5.72%
5.79% 5.88%5.78%
5.63%
Jun-18 Sep-18 Dec 18 FY 19 June 19
Cost of Funds
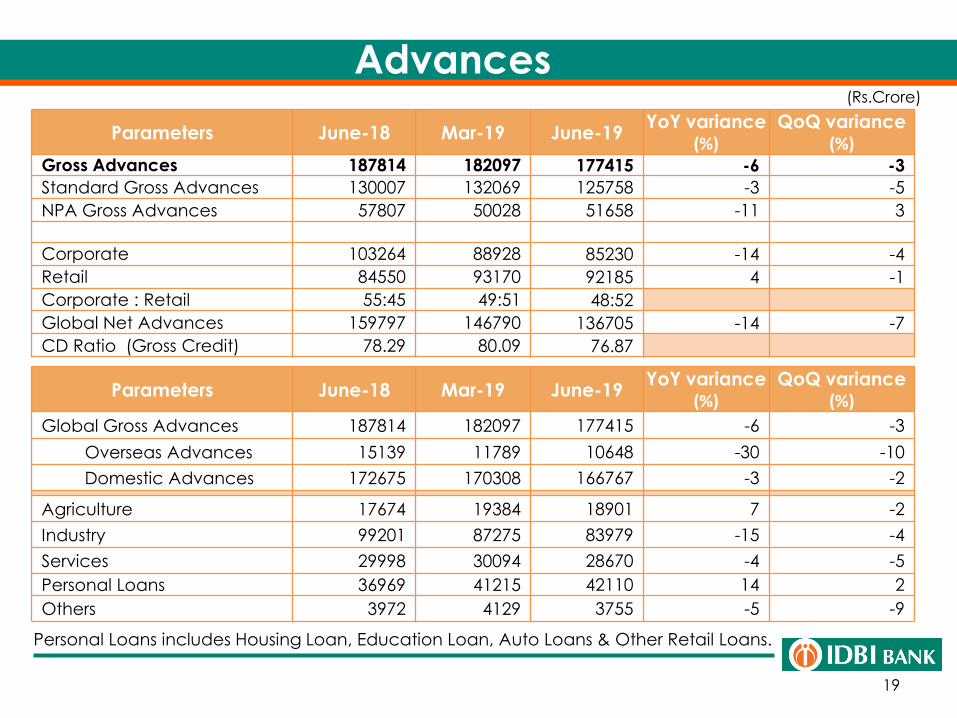
19
Advances(Rs.Crore)
Parameters June-18 Mar-19 June-19YoY variance
(%)QoQ variance
(%)Gross Advances 187814 182097 177415 -6 -3
Standard Gross Advances 130007 132069 125758 -3 -5
NPA Gross Advances 57807 50028 51658 -11 3
Corporate 103264 88928 85230 -14 -4
Retail 84550 93170 92185 4 -1
Corporate : Retail 55:45 49:51 48:52
Global Net Advances 159797 146790 136705 -14 -7
CD Ratio (Gross Credit) 78.29 80.09 76.87
Parameters June-18 Mar-19 June-19YoY variance
(%)QoQ variance
(%)
Global Gross Advances 187814 182097 177415 -6 -3
Overseas Advances 15139 11789 10648 -30 -10
Domestic Advances 172675 170308 166767 -3 -2
Agriculture 17674 19384 18901 7 -2
Industry 99201 87275 83979 -15 -4
Services 29998 30094 28670 -4 -5
Personal Loans 36969 41215 42110 14 2
Others 3972 4129 3755 -5 -9
Personal Loans includes Housing Loan, Education Loan, Auto Loans & Other Retail Loans.
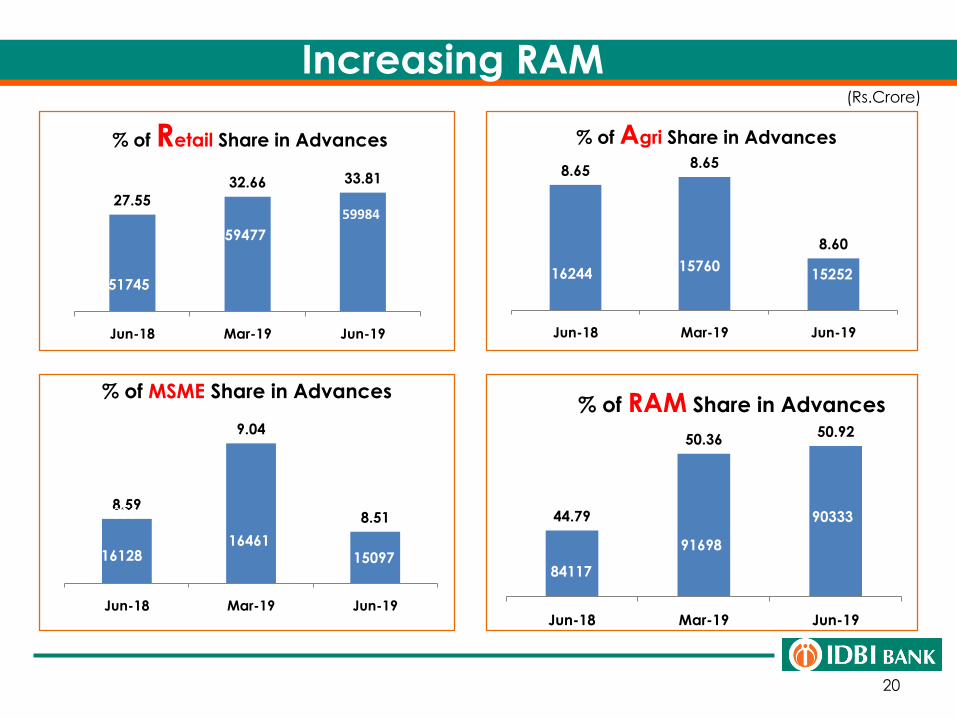
20
Increasing RAM(Rs.Crore)
27.55
32.66 33.81
Jun-18 Mar-19 Jun-19
% of Retail Share in Advances
51745
59477
59984
8.658.65
8.60
Jun-18 Mar-19 Jun-19
% of Agri Share in Advances
157601525216244
8.59
9.04
8.51
Jun-18 Mar-19 Jun-19
% of MSME Share in Advances
18089
164611509716128
44.79
50.3650.92
Jun-18 Mar-19 Jun-19
% of RAM Share in Advances
84117
91698
90333
21
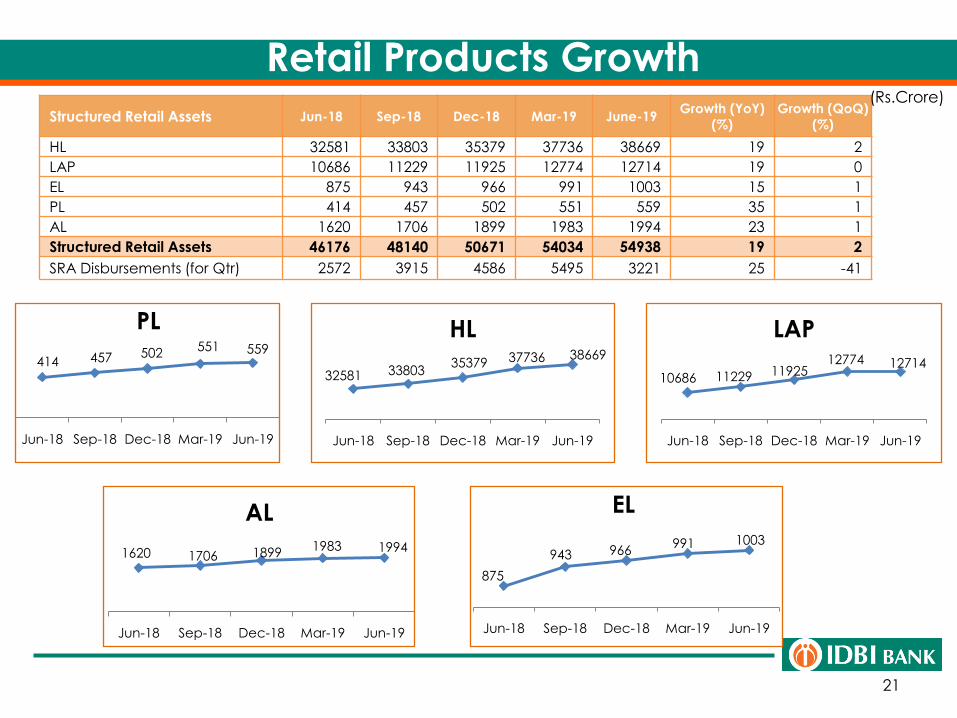
Retail Products Growth
Structured Retail Assets Jun-18 Sep-18 Dec-18 Mar-19 June-19Growth (YoY)
(%)
Growth (QoQ)
(%)
HL 32581 33803 35379 37736 38669 19 2
LAP 10686 11229 11925 12774 12714 19 0
EL 875 943 966 991 1003 15 1
PL 414 457 502 551 559 35 1
AL 1620 1706 1899 1983 1994 23 1
Structured Retail Assets 46176 48140 50671 54034 54938 19 2
SRA Disbursements (for Qtr) 2572 3915 4586 5495 3221 25 -41
(Rs.Crore)
414 457 502551 559
Jun-18 Sep-18 Dec-18 Mar-19 Jun-19
PL
32581 3380335379 37736 38669
Jun-18 Sep-18 Dec-18 Mar-19 Jun-19
HL
10686 11229 1192512774 12714
Jun-18 Sep-18 Dec-18 Mar-19 Jun-19
LAP
1620 1706 18991983 1994
Jun-18 Sep-18 Dec-18 Mar-19 Jun-19
AL
875
943 966991 1003
Jun-18 Sep-18 Dec-18 Mar-19 Jun-19
EL
22
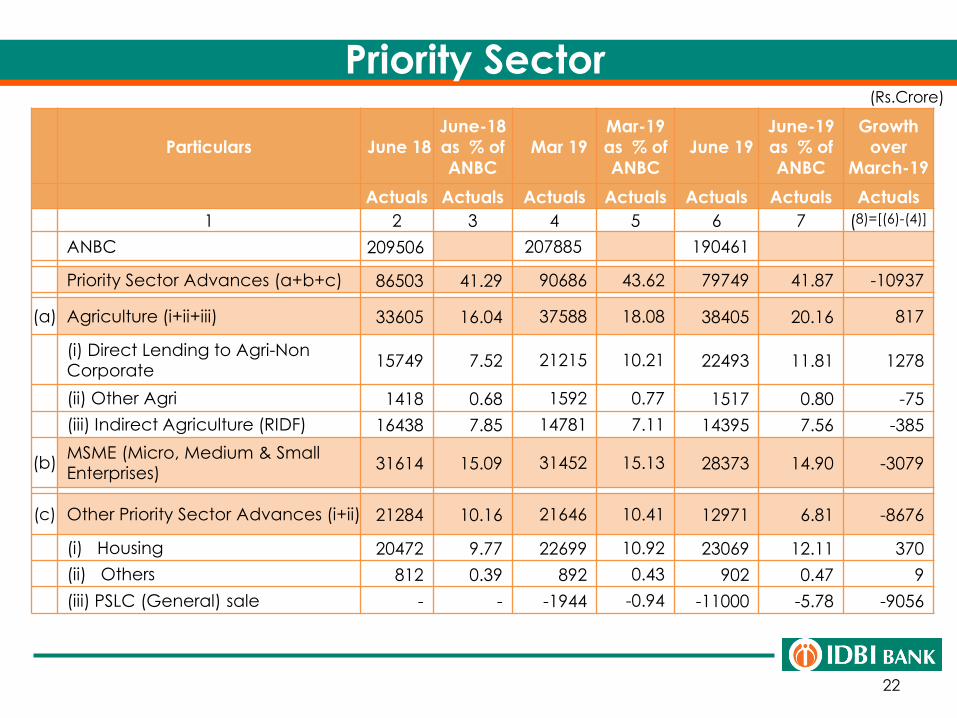
Priority Sector
Particulars June 18
June-18
as % of
ANBC
Mar 19
Mar-19
as % of
ANBC
June 19
June-19
as % of
ANBC
Growth
over
March-19
Actuals Actuals Actuals Actuals Actuals Actuals Actuals
1 2 3 4 5 6 7 (8)=[(6)-(4)]
ANBC 209506 207885 190461
Priority Sector Advances (a+b+c) 86503 41.29 90686 43.62 79749 41.87 -10937
(a) Agriculture (i+ii+iii) 33605 16.04 37588 18.08 38405 20.16 817
(i) Direct Lending to Agri-Non Corporate
15749 7.52 21215 10.21 22493 11.81 1278
(ii) Other Agri 1418 0.68 1592 0.77 1517 0.80 -75
(iii) Indirect Agriculture (RIDF) 16438 7.85 14781 7.11 14395 7.56 -385
(b)MSME (Micro, Medium & Small Enterprises)
31614 15.09 31452 15.13 28373 14.90 -3079
(c) Other Priority Sector Advances (i+ii) 21284 10.16 21646 10.41 12971 6.81 -8676
(i) Housing 20472 9.77 22699 10.92 23069 12.11 370
(ii) Others 812 0.39 892 0.43 902 0.47 9
(iii) PSLC (General) sale - - -1944 -0.94 -11000 -5.78 -9056
(Rs.Crore)
23
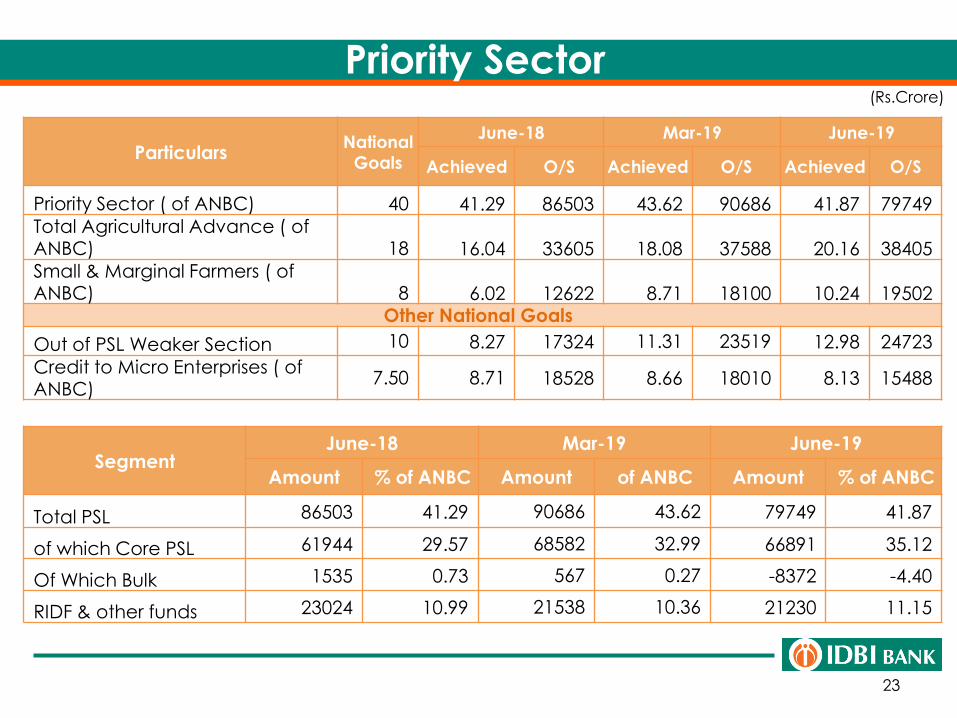
Priority Sector
ParticularsNational
Goals
June-18 Mar-19 June-19
Achieved O/S Achieved O/S Achieved O/S
Priority Sector ( of ANBC) 40 41.29 86503 43.62 90686 41.87 79749Total Agricultural Advance ( of ANBC) 18 16.04 33605 18.08 37588 20.16 38405Small & Marginal Farmers ( of ANBC) 8 6.02 12622 8.71 18100 10.24 19502
Other National Goals
Out of PSL Weaker Section 10 8.27 17324 11.31 23519 12.98 24723
Credit to Micro Enterprises ( of ANBC)
7.50 8.71 18528 8.66 18010 8.13 15488
(Rs.Crore)
SegmentJune-18 Mar-19 June-19
Amount % of ANBC Amount of ANBC Amount % of ANBC
Total PSL 86503 41.29 90686 43.62 79749 41.87
of which Core PSL 61944 29.57 68582 32.99 66891 35.12
Of Which Bulk 1535 0.73 567 0.27 -8372 -4.40
RIDF & other funds 23024 10.99 21538 10.36 21230 11.15
24
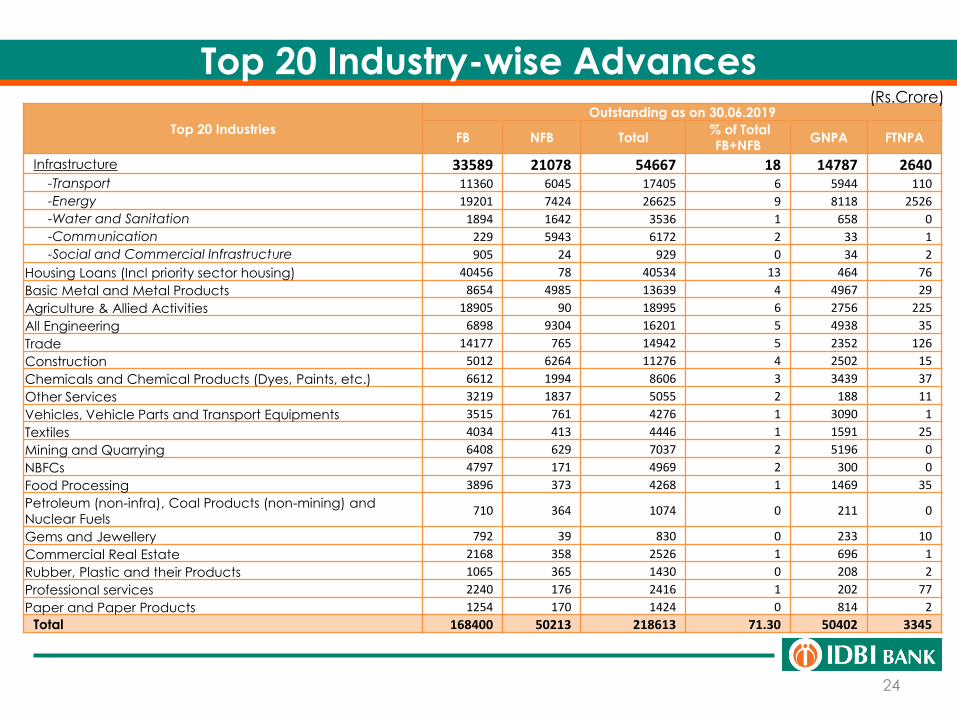
Top 20 Industry-wise Advances
Top 20 Industries
Outstanding as on 30.06.2019
FB NFB Total% of Total
FB+NFBGNPA FTNPA
Infrastructure 33589 21078 54667 18 14787 2640-Transport 11360 6045 17405 6 5944 110
-Energy 19201 7424 26625 9 8118 2526
-Water and Sanitation 1894 1642 3536 1 658 0
-Communication 229 5943 6172 2 33 1
-Social and Commercial Infrastructure 905 24 929 0 34 2
Housing Loans (Incl priority sector housing) 40456 78 40534 13 464 76
Basic Metal and Metal Products 8654 4985 13639 4 4967 29
Agriculture & Allied Activities 18905 90 18995 6 2756 225
All Engineering 6898 9304 16201 5 4938 35
Trade 14177 765 14942 5 2352 126
Construction 5012 6264 11276 4 2502 15
Chemicals and Chemical Products (Dyes, Paints, etc.) 6612 1994 8606 3 3439 37
Other Services 3219 1837 5055 2 188 11
Vehicles, Vehicle Parts and Transport Equipments 3515 761 4276 1 3090 1
Textiles 4034 413 4446 1 1591 25
Mining and Quarrying 6408 629 7037 2 5196 0
NBFCs 4797 171 4969 2 300 0
Food Processing 3896 373 4268 1 1469 35
Petroleum (non-infra), Coal Products (non-mining) and
Nuclear Fuels710 364 1074 0 211 0
Gems and Jewellery 792 39 830 0 233 10
Commercial Real Estate 2168 358 2526 1 696 1
Rubber, Plastic and their Products 1065 365 1430 0 208 2
Professional services 2240 176 2416 1 202 77
Paper and Paper Products 1254 170 1424 0 814 2
Total 168400 50213 218613 71.30 50402 3345
(Rs.Crore)

25
Treasury Operations
26
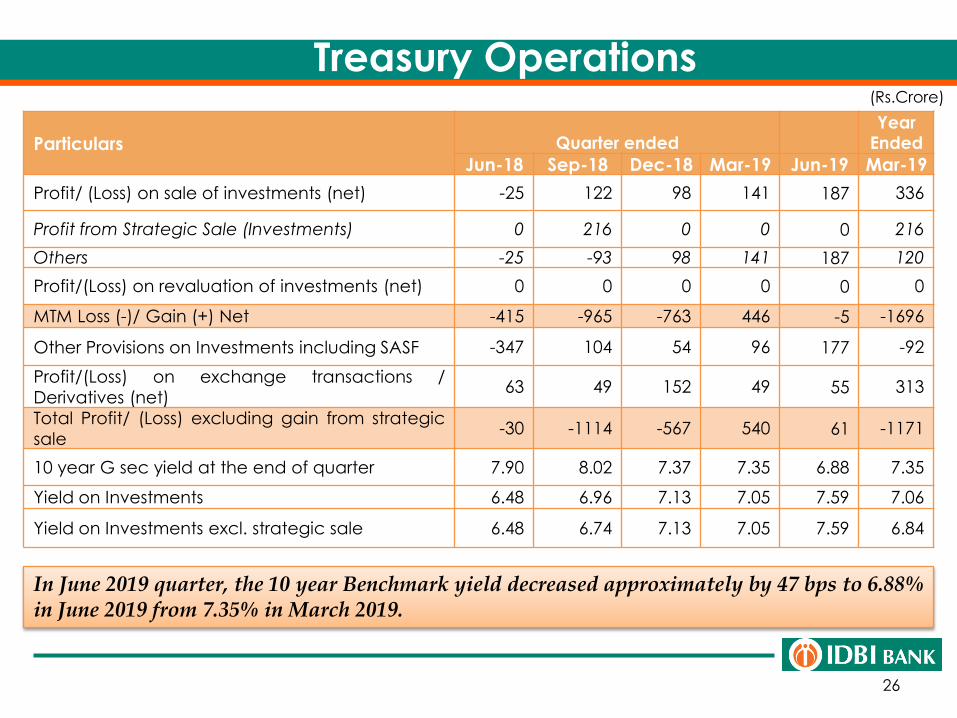
In June 2019 quarter, the 10 year Benchmark yield decreased approximately by 47 bps to 6.88%in June 2019 from 7.35% in March 2019.
Treasury Operations
Particulars Quarter endedYear
Ended
Jun-18 Sep-18 Dec-18 Mar-19 Jun-19 Mar-19
Profit/ (Loss) on sale of investments (net) -25 122 98 141 187 336
Profit from Strategic Sale (Investments) 0 216 0 0 0 216
Others -25 -93 98 141 187 120
Profit/(Loss) on revaluation of investments (net) 0 0 0 0 0 0
MTM Loss (-)/ Gain (+) Net -415 -965 -763 446 -5 -1696
Other Provisions on Investments including SASF -347 104 54 96 177 -92
Profit/(Loss) on exchange transactions /
Derivatives (net)63 49 152 49 55 313
Total Profit/ (Loss) excluding gain from strategic
sale-30 -1114 -567 540 61 -1171
10 year G sec yield at the end of quarter 7.90 8.02 7.37 7.35 6.88 7.35
Yield on Investments 6.48 6.96 7.13 7.05 7.59 7.06
Yield on Investments excl. strategic sale 6.48 6.74 7.13 7.05 7.59 6.84
(Rs.Crore)
27
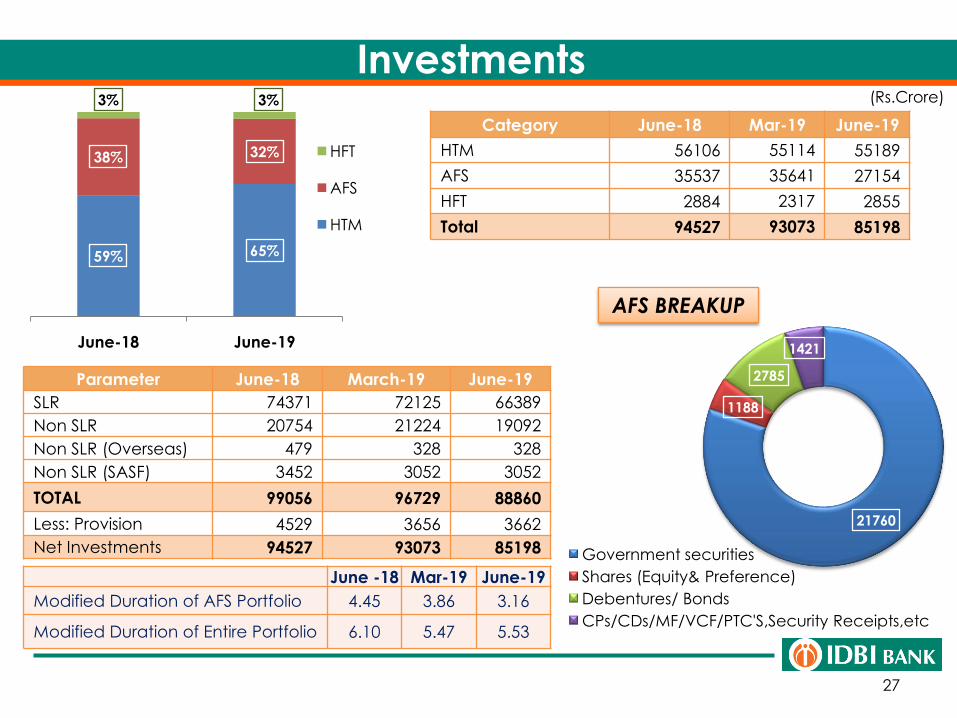
Investments
June -18 Mar-19 June-19
Modified Duration of AFS Portfolio 4.45 3.86 3.16
Modified Duration of Entire Portfolio 6.10 5.47 5.53
Category June-18 Mar-19 June-19
HTM 56106 55114 55189
AFS 35537 35641 27154
HFT 2884 2317 2855
Total 94527 93073 85198
Parameter June-18 March-19 June-19
SLR 74371 72125 66389
Non SLR 20754 21224 19092
Non SLR (Overseas) 479 328 328
Non SLR (SASF) 3452 3052 3052
TOTAL 99056 96729 88860
Less: Provision 4529 3656 3662
Net Investments 94527 93073 85198
(Rs.Crore)
59% 65%
38% 32%
3% 3%
June-18 June-19
HFT
AFS
HTM
21760
1188
2785
1421
Government securities
Shares (Equity& Preference)
Debentures/ Bonds
CPs/CDs/MF/VCF/PTC'S,Security Receipts,etc
AFS BREAKUP
28
Asset Quality
29
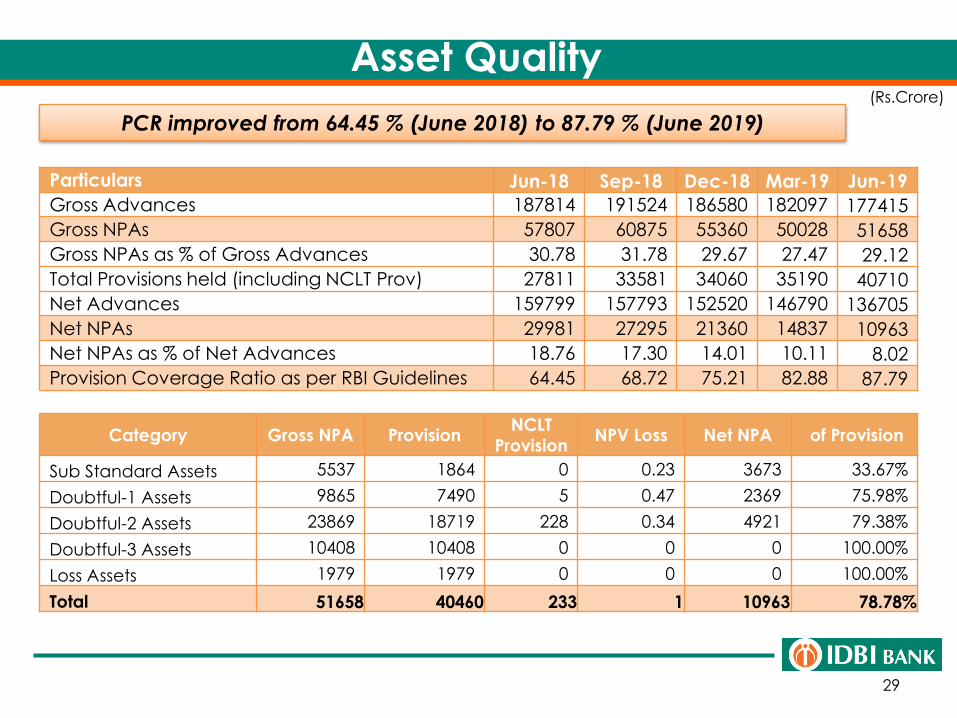
PCR improved from 64.45 % (June 2018) to 87.79 % (June 2019)
Asset Quality
Particulars Jun-18 Sep-18 Dec-18 Mar-19 Jun-19
Gross Advances 187814 191524 186580 182097 177415
Gross NPAs 57807 60875 55360 50028 51658
Gross NPAs as % of Gross Advances 30.78 31.78 29.67 27.47 29.12
Total Provisions held (including NCLT Prov) 27811 33581 34060 35190 40710
Net Advances 159799 157793 152520 146790 136705
Net NPAs 29981 27295 21360 14837 10963
Net NPAs as % of Net Advances 18.76 17.30 14.01 10.11 8.02
Provision Coverage Ratio as per RBI Guidelines 64.45 68.72 75.21 82.88 87.79
(Rs.Crore)
Category Gross NPA ProvisionNCLT
ProvisionNPV Loss Net NPA of Provision
Sub Standard Assets 5537 1864 0 0.23 3673 33.67%
Doubtful-1 Assets 9865 7490 5 0.47 2369 75.98%
Doubtful-2 Assets 23869 18719 228 0.34 4921 79.38%
Doubtful-3 Assets 10408 10408 0 0 0 100.00%
Loss Assets 1979 1979 0 0 0 100.00%
Total 51658 40460 233 1 10963 78.78%
30
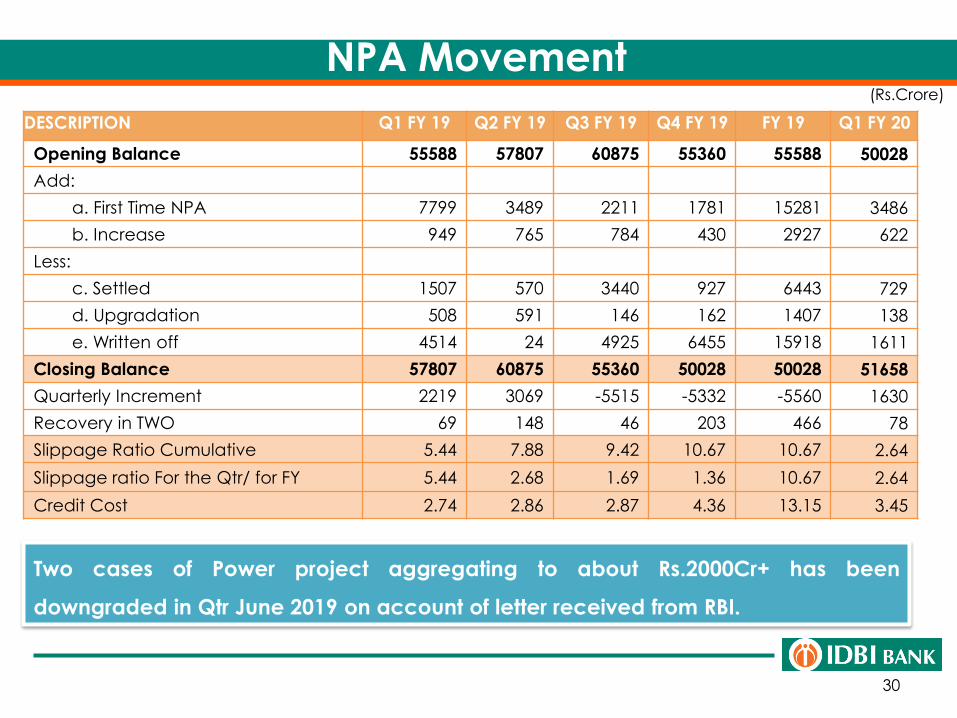
NPA Movement
DESCRIPTION Q1 FY 19 Q2 FY 19 Q3 FY 19 Q4 FY 19 FY 19 Q1 FY 20
Opening Balance 55588 57807 60875 55360 55588 50028
Add:
a. First Time NPA 7799 3489 2211 1781 15281 3486
b. Increase 949 765 784 430 2927 622
Less:
c. Settled 1507 570 3440 927 6443 729
d. Upgradation 508 591 146 162 1407 138
e. Written off 4514 24 4925 6455 15918 1611
Closing Balance 57807 60875 55360 50028 50028 51658
Quarterly Increment 2219 3069 -5515 -5332 -5560 1630
Recovery in TWO 69 148 46 203 466 78
Slippage Ratio Cumulative 5.44 7.88 9.42 10.67 10.67 2.64
Slippage ratio For the Qtr/ for FY 5.44 2.68 1.69 1.36 10.67 2.64
Credit Cost 2.74 2.86 2.87 4.36 13.15 3.45
(Rs.Crore)
Two cases of Power project aggregating to about Rs.2000Cr+ has been
downgraded in Qtr June 2019 on account of letter received from RBI.
31
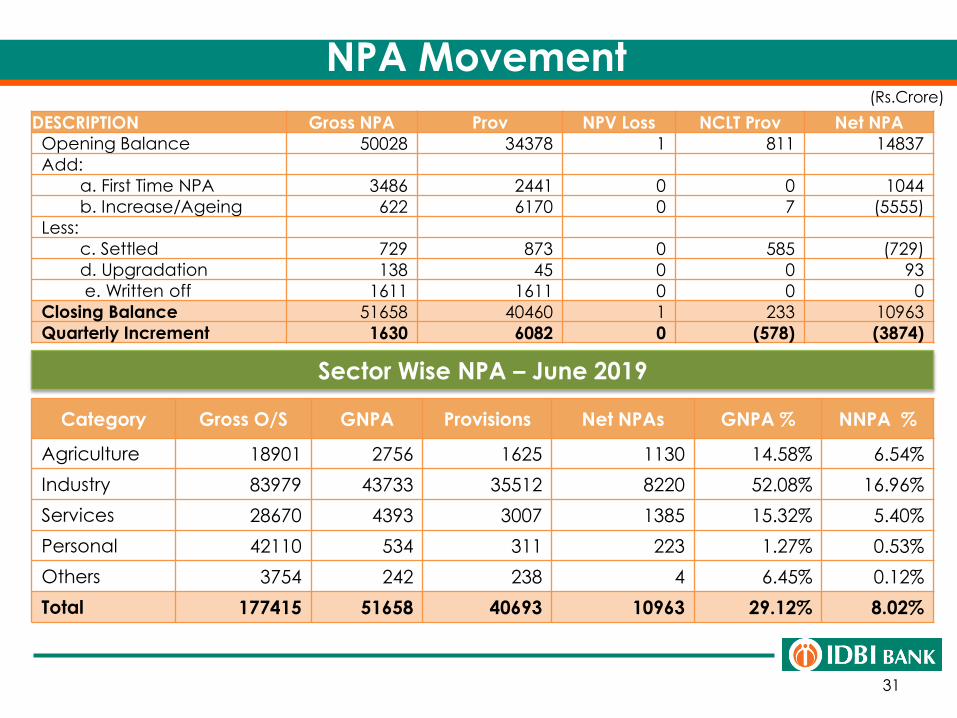
NPA Movement
Category Gross O/S GNPA Provisions Net NPAs GNPA % NNPA %
Agriculture 18901 2756 1625 1130 14.58% 6.54%
Industry 83979 43733 35512 8220 52.08% 16.96%
Services 28670 4393 3007 1385 15.32% 5.40%
Personal 42110 534 311 223 1.27% 0.53%
Others 3754 242 238 4 6.45% 0.12%
Total 177415 51658 40693 10963 29.12% 8.02%
(Rs.Crore)
Sector Wise NPA – June 2019
DESCRIPTION Gross NPA Prov NPV Loss NCLT Prov Net NPA
Opening Balance 50028 34378 1 811 14837
Add:
a. First Time NPA 3486 2441 0 0 1044
b. Increase/Ageing 622 6170 0 7 (5555)
Less:
c. Settled 729 873 0 585 (729)
d. Upgradation 138 45 0 0 93
e. Written off 1611 1611 0 0 0
Closing Balance 51658 40460 1 233 10963
Quarterly Increment 1630 6082 0 (578) (3874)
32
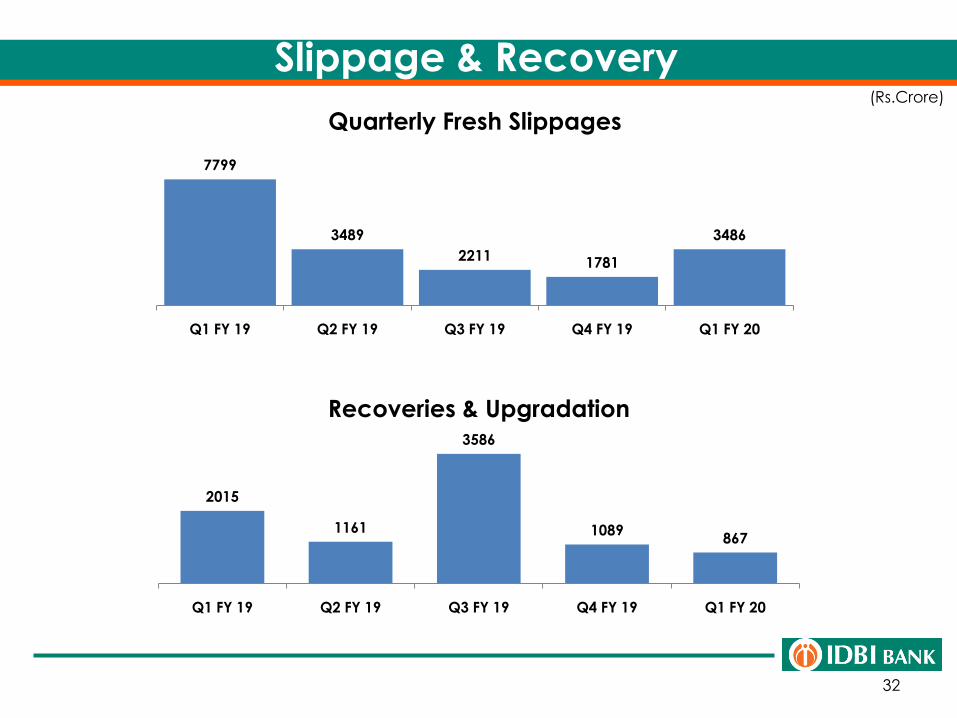
Slippage & Recovery(Rs.Crore)
7799
3489
2211 1781
3486
Q1 FY 19 Q2 FY 19 Q3 FY 19 Q4 FY 19 Q1 FY 20
Quarterly Fresh Slippages
2015
1161
3586
1089867
Q1 FY 19 Q2 FY 19 Q3 FY 19 Q4 FY 19 Q1 FY 20
Recoveries & Upgradation
33
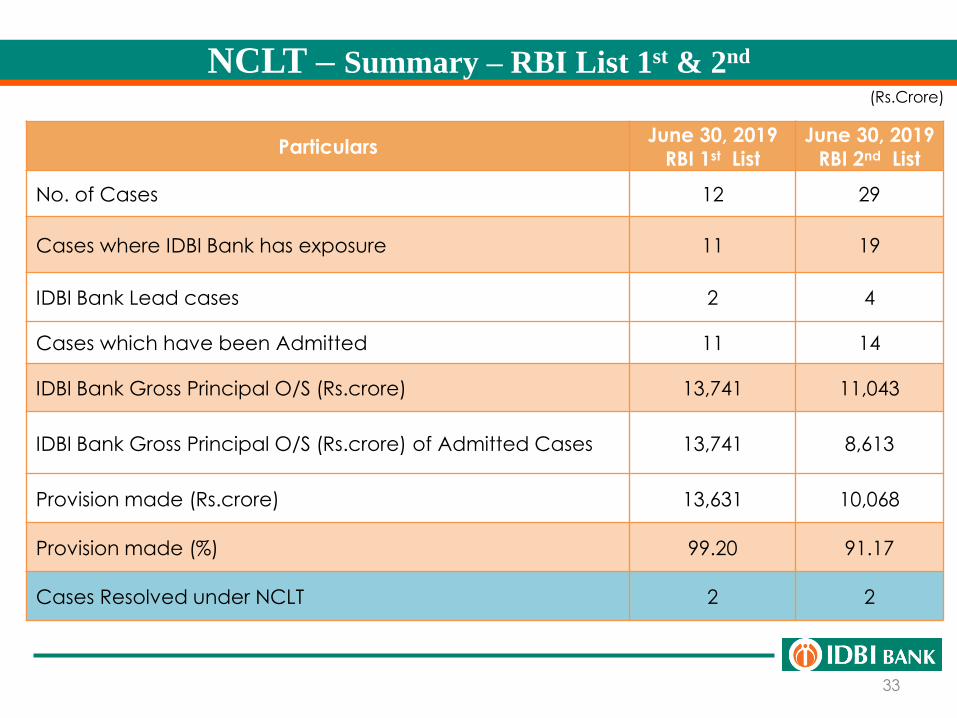
NCLT – Summary – RBI List 1st & 2nd
ParticularsJune 30, 2019
RBI 1st List June 30, 2019
RBI 2nd List
No. of Cases 12 29
Cases where IDBI Bank has exposure 11 19
IDBI Bank Lead cases 2 4
Cases which have been Admitted 11 14
IDBI Bank Gross Principal O/S (Rs.crore) 13,741 11,043
IDBI Bank Gross Principal O/S (Rs.crore) of Admitted Cases 13,741 8,613
Provision made (Rs.crore) 13,631 10,068
Provision made (%) 99.20 91.17
Cases Resolved under NCLT 2 2
(Rs.Crore)
34
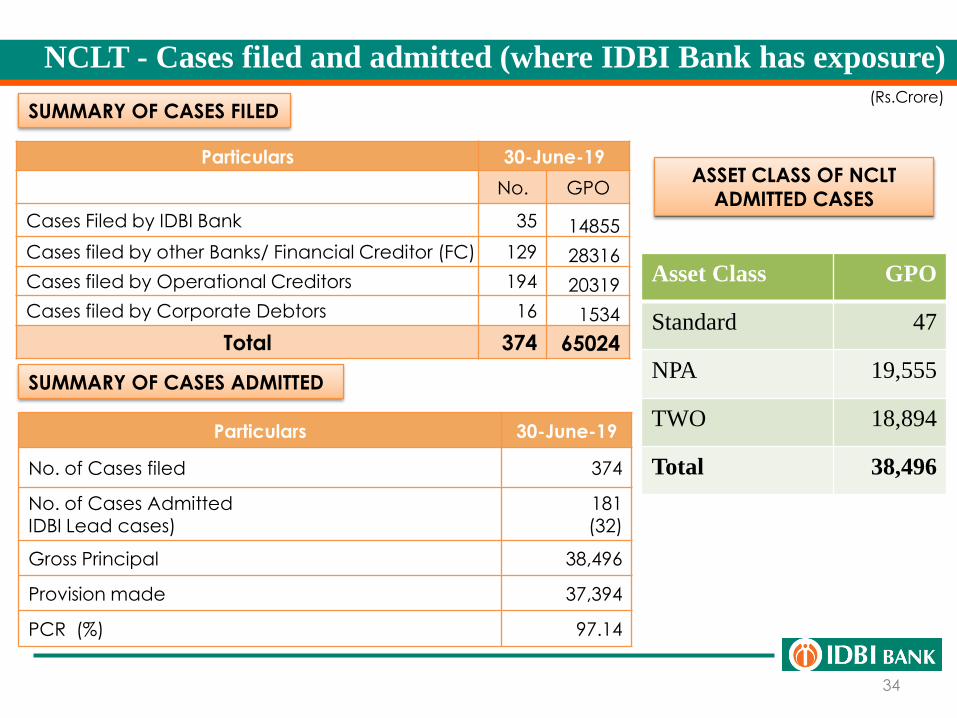
NCLT - Cases filed and admitted (where IDBI Bank has exposure)
Asset Class GPO
Standard 47
NPA 19,555
TWO 18,894
Total 38,496
Particulars 30-June-19
No. GPO
Cases Filed by IDBI Bank 35 14855
Cases filed by other Banks/ Financial Creditor (FC) 129 28316
Cases filed by Operational Creditors 194 20319
Cases filed by Corporate Debtors 16 1534
Total 374 65024
SUMMARY OF CASES FILED
SUMMARY OF CASES ADMITTED
Particulars 30-June-19
No. of Cases filed 374
No. of Cases AdmittedIDBI Lead cases)
181(32)
Gross Principal 38,496
Provision made 37,394
PCR (%) 97.14
ASSET CLASS OF NCLT
ADMITTED CASES
(Rs.Crore)
35
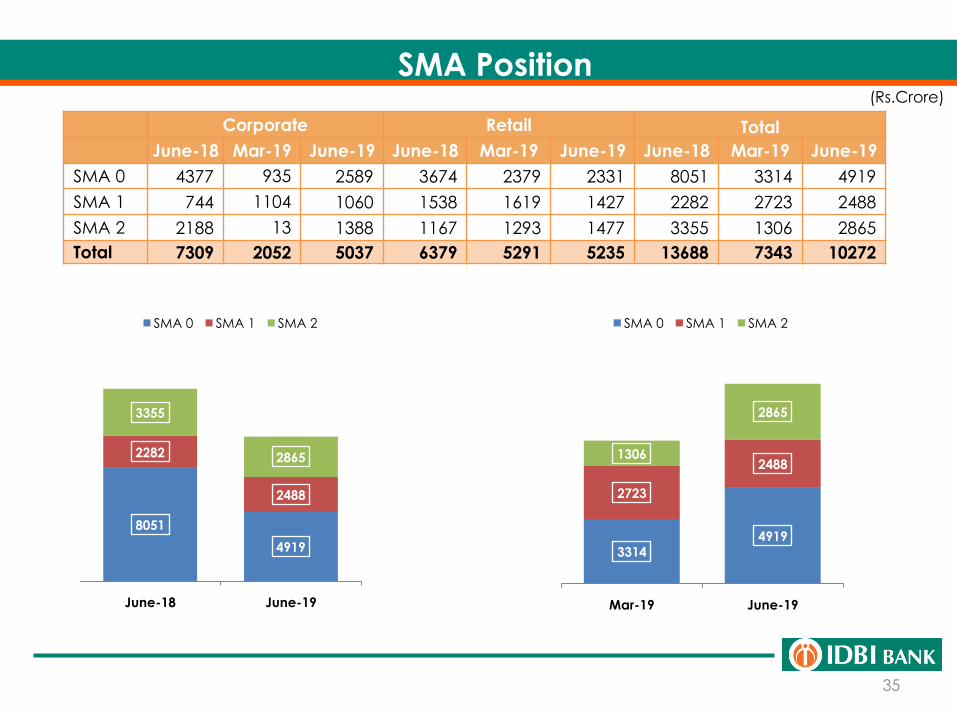
SMA Position
Corporate Retail Total
June-18 Mar-19 June-19 June-18 Mar-19 June-19 June-18 Mar-19 June-19
SMA 0 4377 935 2589 3674 2379 2331 8051 3314 4919
SMA 1 744 1104 1060 1538 1619 1427 2282 2723 2488
SMA 2 2188 13 1388 1167 1293 1477 3355 1306 2865
Total 7309 2052 5037 6379 5291 5235 13688 7343 10272
(Rs.Crore)
8051
4919
2282
2488
3355
2865
June-18 June-19
SMA 0 SMA 1 SMA 2
33144919
2723
24881306
2865
Mar-19 June-19
SMA 0 SMA 1 SMA 2
36
Capital
37
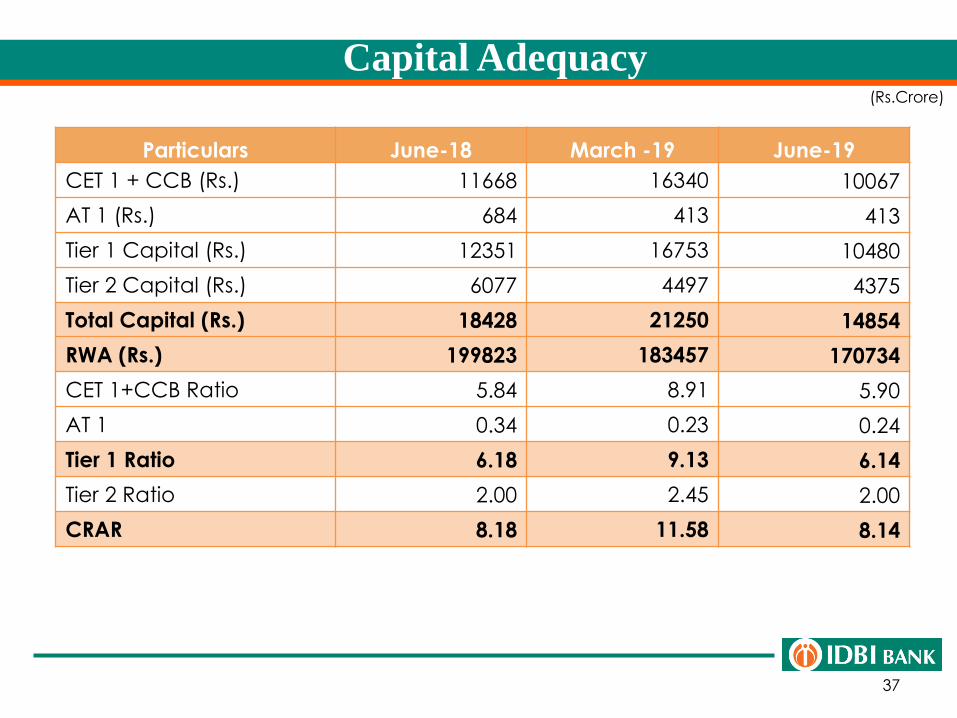
Capital Adequacy
Particulars June-18 March -19 June-19
CET 1 + CCB (Rs.) 11668 16340 10067
AT 1 (Rs.) 684 413 413
Tier 1 Capital (Rs.) 12351 16753 10480
Tier 2 Capital (Rs.) 6077 4497 4375
Total Capital (Rs.) 18428 21250 14854
RWA (Rs.) 199823 183457 170734
CET 1+CCB Ratio 5.84 8.91 5.90
AT 1 0.34 0.23 0.24
Tier 1 Ratio 6.18 9.13 6.14
Tier 2 Ratio 2.00 2.45 2.00
CRAR 8.18 11.58 8.14
(Rs.Crore)
38
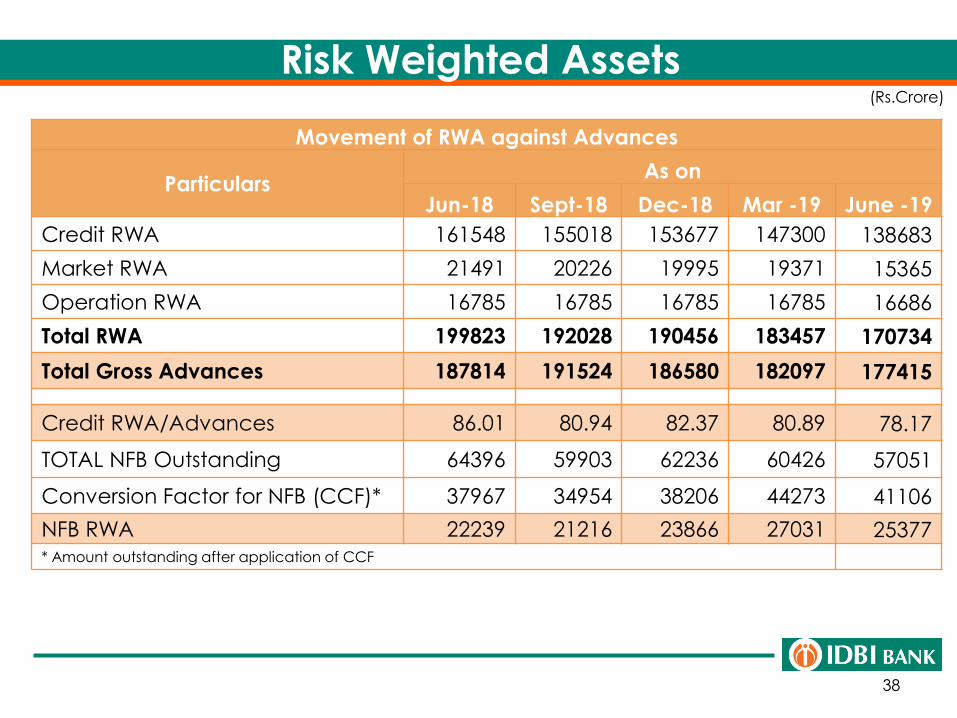
Risk Weighted Assets
Movement of RWA against Advances
ParticularsAs on
Jun-18 Sept-18 Dec-18 Mar -19 June -19
Credit RWA 161548 155018 153677 147300 138683
Market RWA 21491 20226 19995 19371 15365
Operation RWA 16785 16785 16785 16785 16686
Total RWA 199823 192028 190456 183457 170734
Total Gross Advances 187814 191524 186580 182097 177415
Credit RWA/Advances 86.01 80.94 82.37 80.89 78.17
TOTAL NFB Outstanding 64396 59903 62236 60426 57051
Conversion Factor for NFB (CCF)* 37967 34954 38206 44273 41106
NFB RWA 22239 21216 23866 27031 25377* Amount outstanding after application of CCF
(Rs.Crore)
39
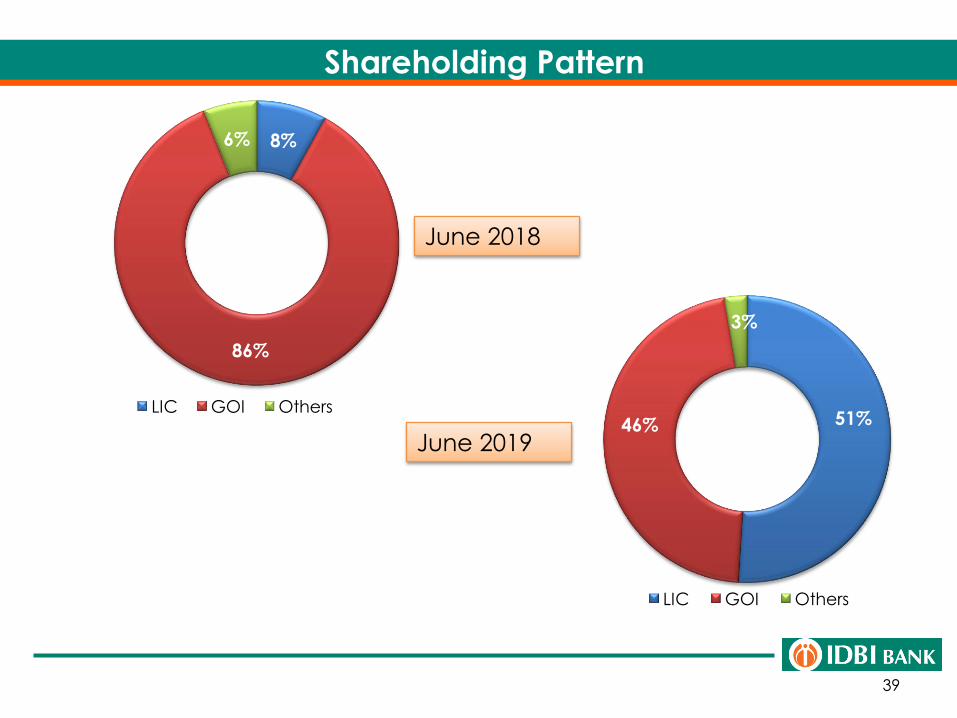
Shareholding Pattern
June 2018
June 2019
8%
86%
6%
LIC GOI Others51%46%
3%
LIC GOI Others

40
Prompt Corrective Action Matrix
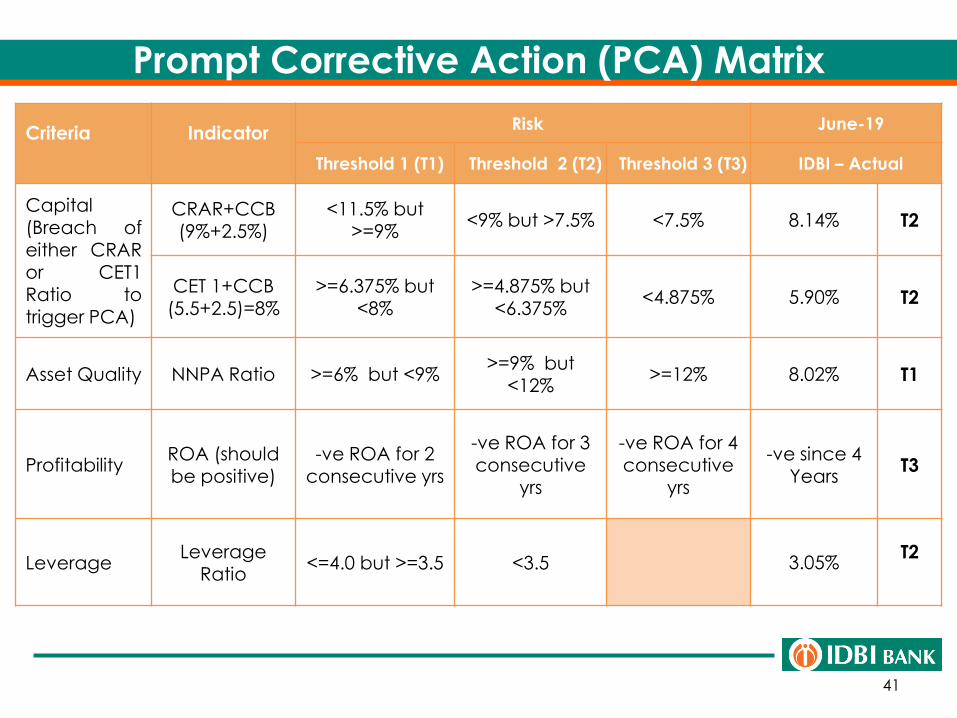
Prompt Corrective Action (PCA) Matrix
41
Criteria IndicatorRisk June-19
Threshold 1 (T1) Threshold 2 (T2) Threshold 3 (T3) IDBI – Actual
Capital(Breach ofeither CRARor CET1Ratio to
trigger PCA)
CRAR+CCB(9%+2.5%)
<11.5% but >=9%
<9% but >7.5% <7.5% 8.14% T2
CET 1+CCB
(5.5+2.5)=8%>=6.375% but
<8%>=4.875% but
<6.375% <4.875% 5.90% T2
Asset Quality NNPA Ratio >=6% but <9% >=9% but
<12% >=12% 8.02% T1
ProfitabilityROA (should be positive)
-ve ROA for 2 consecutive yrs
-ve ROA for 3 consecutive
yrs
-ve ROA for 4 consecutive
yrs
-ve since 4 Years
T3
LeverageLeverage
Ratio<=4.0 but >=3.5 <3.5 3.05%
T2
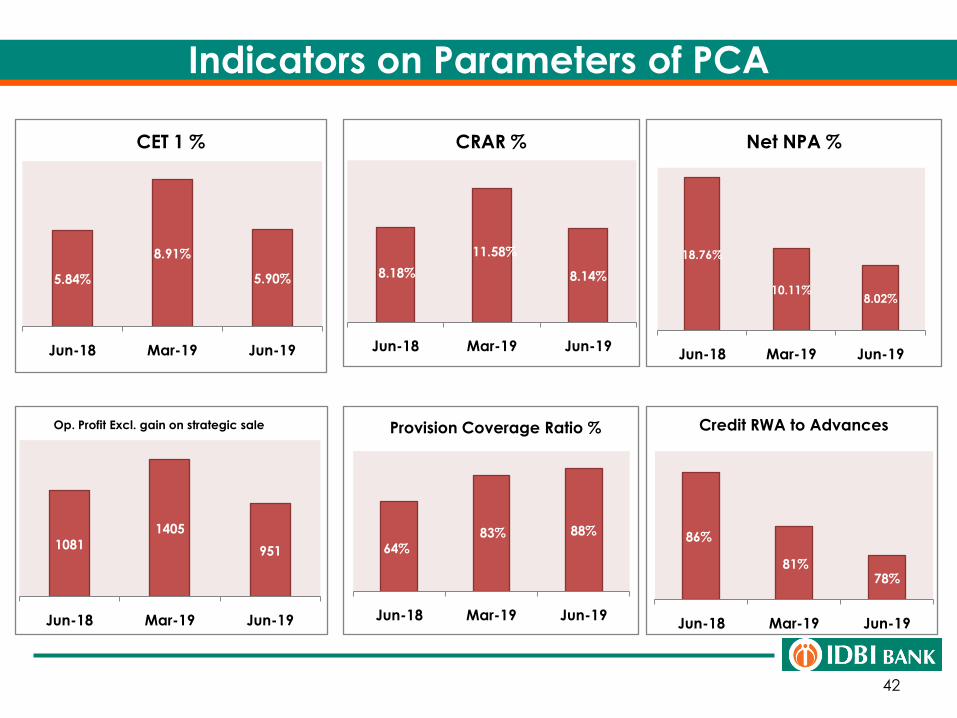
Indicators on Parameters of PCA
42
5.84%
8.91%
5.90%
Jun-18 Mar-19 Jun-19
CET 1 %
8.18%
11.58%
8.14%
Jun-18 Mar-19 Jun-19
CRAR %
18.76%
10.11%8.02%
Jun-18 Mar-19 Jun-19
Net NPA %
1081
1405
951
Jun-18 Mar-19 Jun-19
Op. Profit Excl. gain on strategic sale
64%83% 88%
Jun-18 Mar-19 Jun-19
Provision Coverage Ratio %
86%
81%78%
Jun-18 Mar-19 Jun-19
Credit RWA to Advances
43
Digital Banking & Financial Inclusion
44
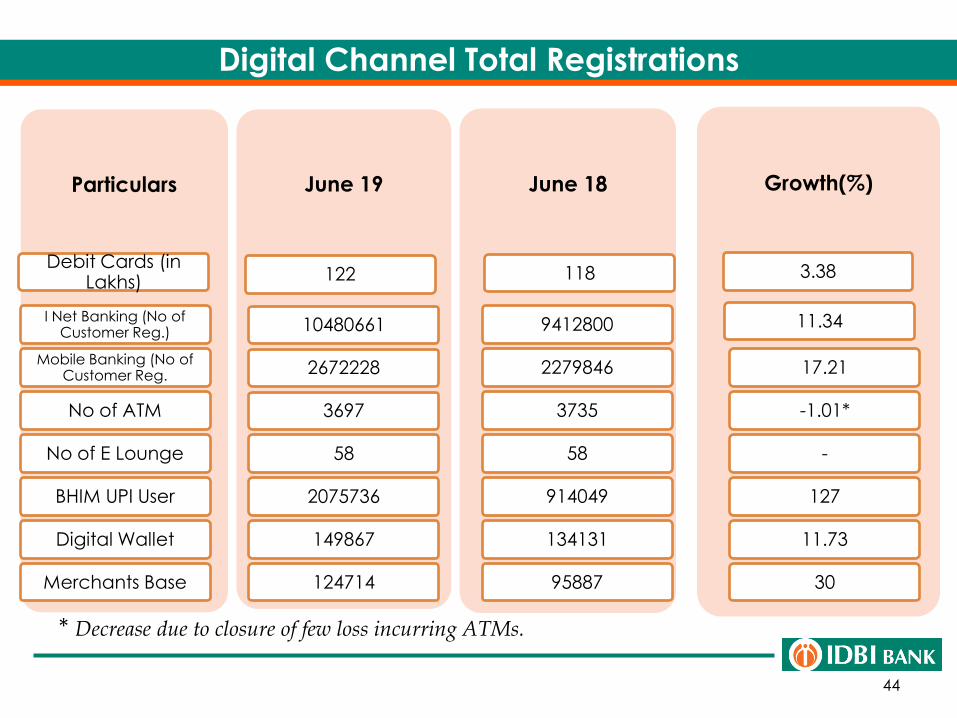
Particulars
Debit Cards (in Lakhs)
I Net Banking (No of Customer Reg.)
Mobile Banking (No of Customer Reg.
No of ATM
No of E Lounge
BHIM UPI User
Digital Wallet
Merchants Base
June 19
122
10480661
2672228
3697
58
2075736
149867
124714
June 18
118
9412800
2279846
3735
58
914049
134131
95887
Growth(%)
3.38
11.34
17.21
-1.01*
-
127
11.73
30
Digital Channel Total Registrations
* Decrease due to closure of few loss incurring ATMs.
45
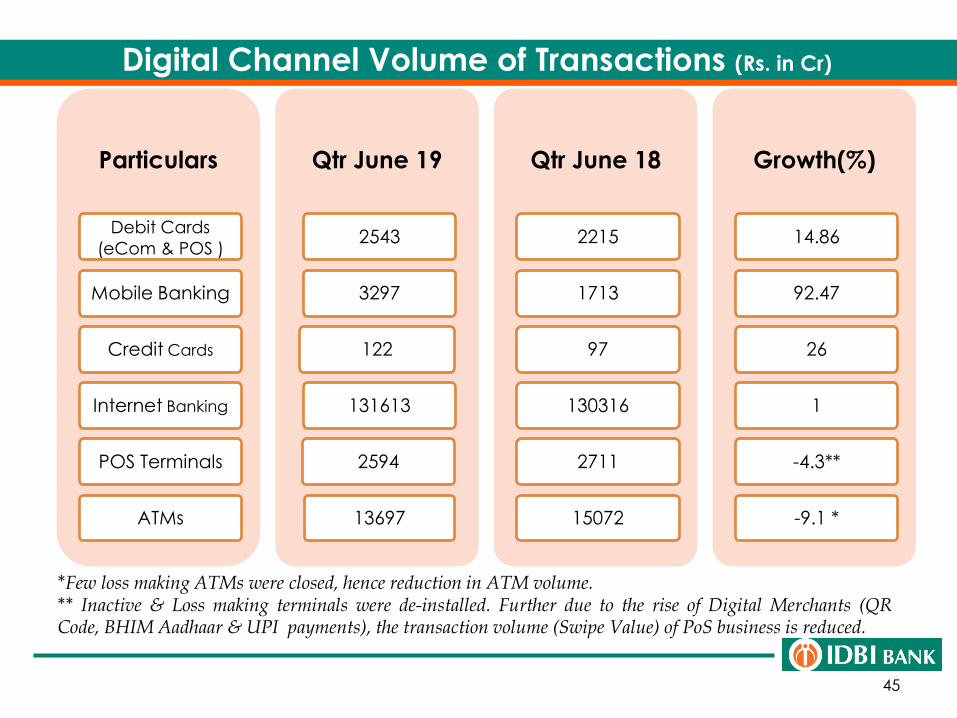
Digital Channel Volume of Transactions (Rs. in Cr)
Particulars
ATMs
Debit Cards
(eCom & POS )
Credit Cards
POS Terminals
Internet Banking
Mobile Banking
Qtr June 19
13697
2543
122
2594
131613
3297
Qtr June 18
15072
2215
97
2711
130316
1713
Growth(%)
-9.1 *
14.86
26
-4.3**
1
92.47
*Few loss making ATMs were closed, hence reduction in ATM volume.** Inactive & Loss making terminals were de-installed. Further due to the rise of Digital Merchants (QRCode, BHIM Aadhaar & UPI payments), the transaction volume (Swipe Value) of PoS business is reduced.
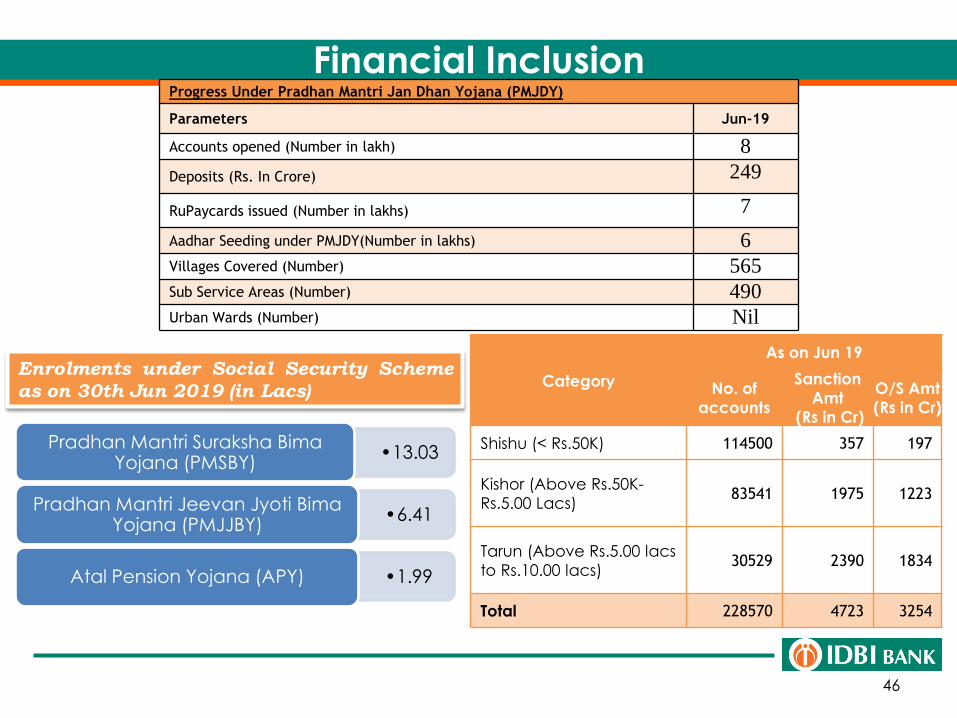
Financial Inclusion
46
Category
As on Jun 19
No. of
accounts
Sanction
Amt
(Rs in Cr)
O/S Amt
(Rs in Cr)
Shishu (< Rs.50K) 114500 357 197
Kishor (Above Rs.50K-
Rs.5.00 Lacs)83541 1975 1223
Tarun (Above Rs.5.00 lacs
to Rs.10.00 lacs)30529 2390 1834
Total 228570 4723 3254
Enrolments under Social Security Scheme
as on 30th Jun 2019 (in Lacs)
•13.03Pradhan Mantri Suraksha Bima
Yojana (PMSBY)
•6.41Pradhan Mantri Jeevan Jyoti Bima
Yojana (PMJJBY)
•1.99Atal Pension Yojana (APY)
Progress Under Pradhan Mantri Jan Dhan Yojana (PMJDY)
Parameters Jun-19
Accounts opened (Number in lakh) 8
Deposits (Rs. In Crore) 249
RuPaycards issued (Number in lakhs) 7
Aadhar Seeding under PMJDY(Number in lakhs) 6
Villages Covered (Number) 565
Sub Service Areas (Number) 490
Urban Wards (Number) Nil
47
IDBI-LIC Synergy
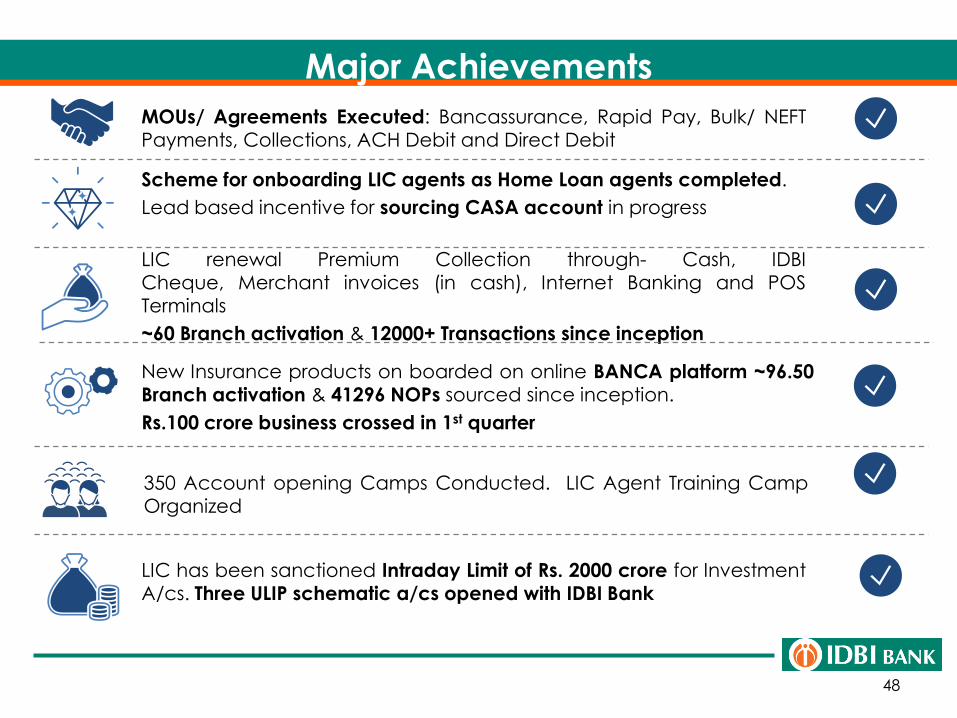
LIC renewal Premium Collection through- Cash, IDBI
Cheque, Merchant invoices (in cash), Internet Banking and POS
Terminals
~60 Branch activation & 12000+ Transactions since inception
New Insurance products on boarded on online BANCA platform ~96.50
Branch activation & 41296 NOPs sourced since inception.
Rs.100 crore business crossed in 1st quarter
LIC has been sanctioned Intraday Limit of Rs. 2000 crore for Investment
A/cs. Three ULIP schematic a/cs opened with IDBI Bank
Scheme for onboarding LIC agents as Home Loan agents completed.
Lead based incentive for sourcing CASA account in progress
MOUs/ Agreements Executed: Bancassurance, Rapid Pay, Bulk/ NEFT
Payments, Collections, ACH Debit and Direct Debit
48
Major Achievements
350 Account opening Camps Conducted. LIC Agent Training Camp
Organized
49