Embed Size (px)
Citation preview
Q4 FY 2016
2
Disclaimer: Certain statements contained in this presentation may be statements
of future expectations and other forward-looking statements that are based on
third party sources and involve known and unknown risks and uncertainties.
Forward-looking statements contained in this presentation regarding past trends
or activities should not be taken as a representation that such trends or activities
will continue in the future. There is no obligation to update or revise any forward-
looking statements, whether as a result of new information, future events or
otherwise. You should not place undue reliance on forward-looking statements,
which speak only as of the date of this presentation. Please also refer to the
statements of unconsolidated, consolidated and segmental result required by
Indian regulations that has been filed with stock exchanges in India.
Analyst Presentation – Q4 FY16

IDBI Bank’s Forte
3
Strong Brand Value
Significant player in domestic
Debt Syndication
Leading provider of Long Term Finance
Growing Branch
Network
Diversified customer
base
Ranks 37th amongst
top 50 brands across
country/sectors
(Interbrand Rankings)
Completed 150
mandates till date
aggregating ` 2.70
lakh crore
Apex role in creating
industrial &
infrastructural base
in the country
Branches -1846
ATMs -3310
Presence in 1377
locations
Corporate and
Retail customer base
of over 3000+ and
6.5 million+
As per Brand Trust Report 2015, Bank ranked 5th in BFSI Category & 2nd in PSU Category only after SBI.
Analyst Presentation – Q4 FY16
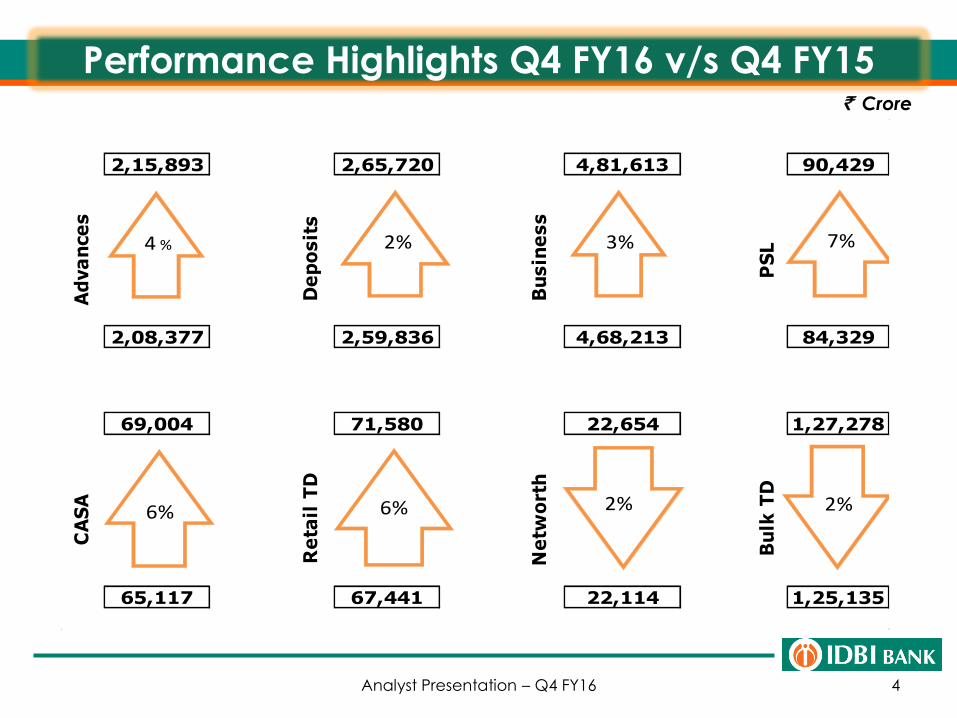
Performance Highlights Q4 FY16 v/s Q4 FY15
4
` Crore
Analyst Presentation – Q4 FY16
2,15,893 2,65,720 4,81,613 90,429
4
2,08,377 2,59,836 4,68,213 84,329
69,004 71,580 22,654 1,27,278
65,117 67,441 22,114 1,25,135
Ad
va
nce
s
De
po
sit
s
Bu
sin
ess
PS
LB
ulk
TD
CA
SA
Re
tail
TD
Ne
two
rth
2%4 % 3% 7%
6% 6% 2% 2%
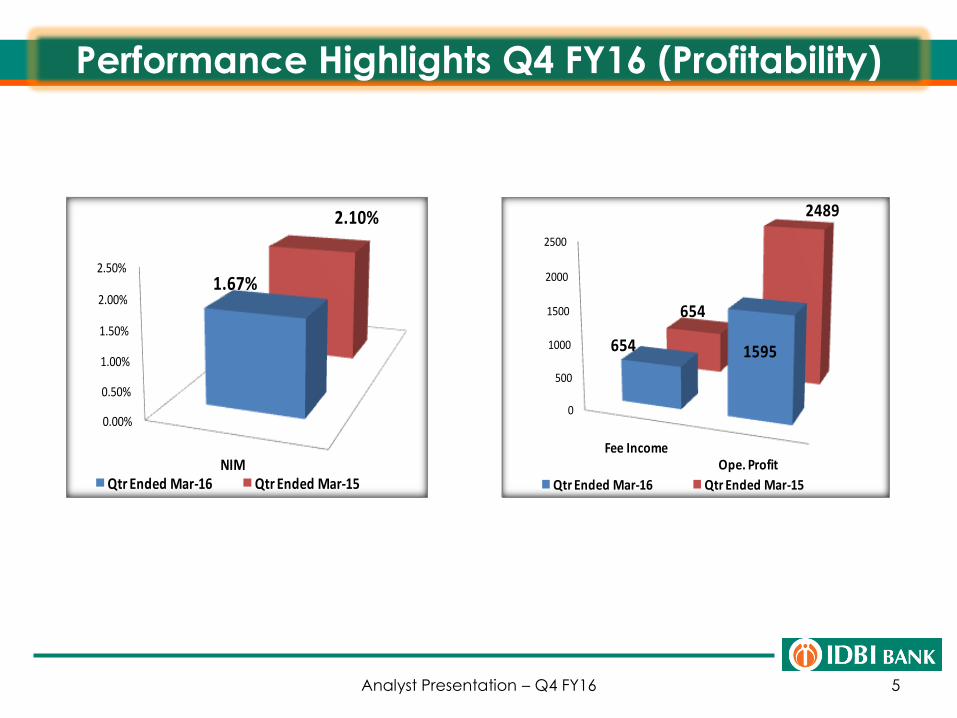
Performance Highlights Q4 FY16 (Profitability)
5Analyst Presentation – Q4 FY16
0.00%
0.50%
1.00%
1.50%
2.00%
2.50%
NIM
1.67%
2.10%
Qtr Ended Mar-16 Qtr Ended Mar-15
0
500
1000
1500
2000
2500
Fee IncomeOpe. Profit
654 1595
654
2489
Qtr Ended Mar-16 Qtr Ended Mar-15
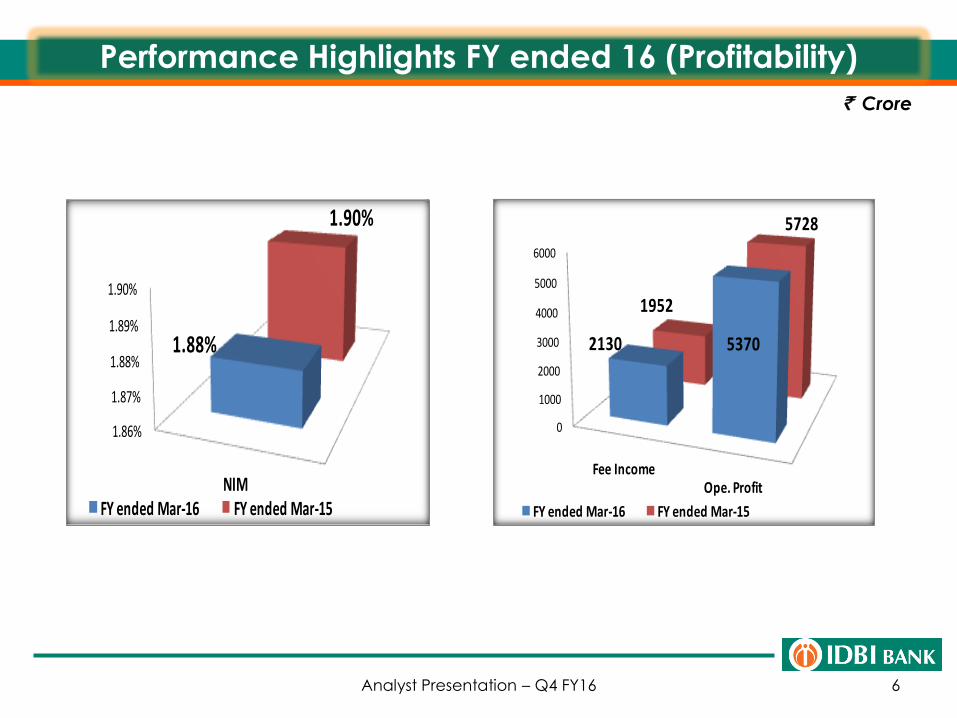
Performance Highlights FY ended 16 (Profitability)
6
` Crore
Analyst Presentation – Q4 FY16
1.86%
1.87%
1.88%
1.89%
1.90%
NIM
1.88%
1.90%
FY ended Mar-16 FY ended Mar-15
0
1000
2000
3000
4000
5000
6000
Fee IncomeOpe. Profit
2130 5370
1952
5728
FY ended Mar-16 FY ended Mar-15
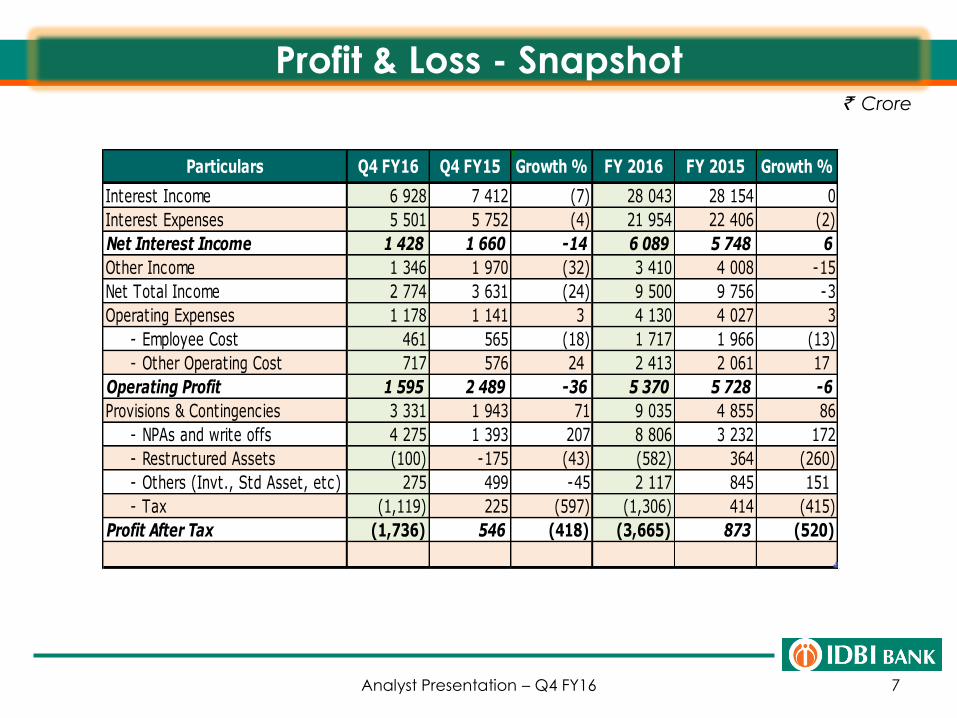
Profit & Loss - Snapshot
7
` Crore
Analyst Presentation – Q4 FY16
Particulars Q4 FY16 Q4 FY15 Growth % FY 2016 FY 2015 Growth %
Interest Income 6 928 7 412 (7) 28 043 28 154 0
Interest Expenses 5 501 5 752 (4) 21 954 22 406 (2)
Net Interest Income 1 428 1 660 -14 6 089 5 748 6
Other Income 1 346 1 970 (32) 3 410 4 008 -15
Net Total Income 2 774 3 631 (24) 9 500 9 756 -3
Operating Expenses 1 178 1 141 3 4 130 4 027 3
- Employee Cost 461 565 (18) 1 717 1 966 (13)
- Other Operating Cost 717 576 24 2 413 2 061 17
Operating Profit 1 595 2 489 -36 5 370 5 728 -6
Provisions & Contingencies 3 331 1 943 71 9 035 4 855 86
- NPAs and write offs 4 275 1 393 207 8 806 3 232 172
- Restructured Assets (100) -175 (43) (582) 364 (260)
- Others (Invt., Std Asset, etc) 275 499 -45 2 117 845 151
- Tax (1,119) 225 (597) (1,306) 414 (415)
Profit After Tax (1,736) 546 (418) (3,665) 873 (520)
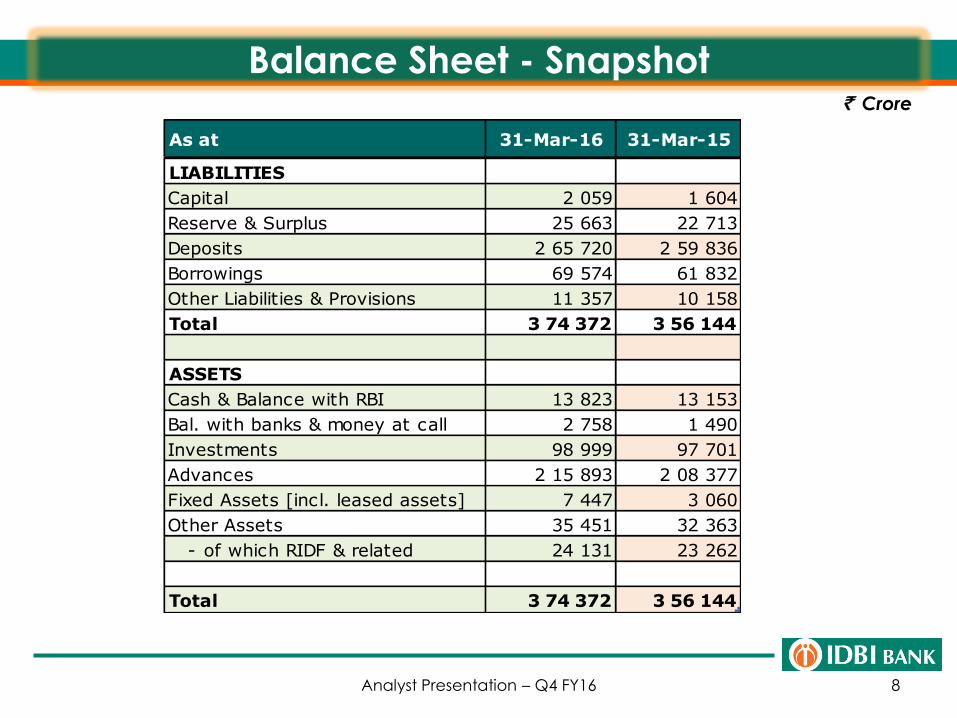
Balance Sheet - Snapshot
8
` Crore
Analyst Presentation – Q4 FY16
As at 31-Mar-16 31-Mar-15
LIABILITIES
Capital 2 059 1 604
Reserve & Surplus 25 663 22 713
Deposits 2 65 720 2 59 836
Borrowings 69 574 61 832
Other Liabilities & Provisions 11 357 10 158
Total 3 74 372 3 56 144
ASSETS
Cash & Balance with RBI 13 823 13 153
Bal. with banks & money at call 2 758 1 490
Investments 98 999 97 701
Advances 2 15 893 2 08 377
Fixed Assets [incl. leased assets] 7 447 3 060
Other Assets 35 451 32 363
- of which RIDF & related 24 131 23 262
Total 3 74 372 3 56 144
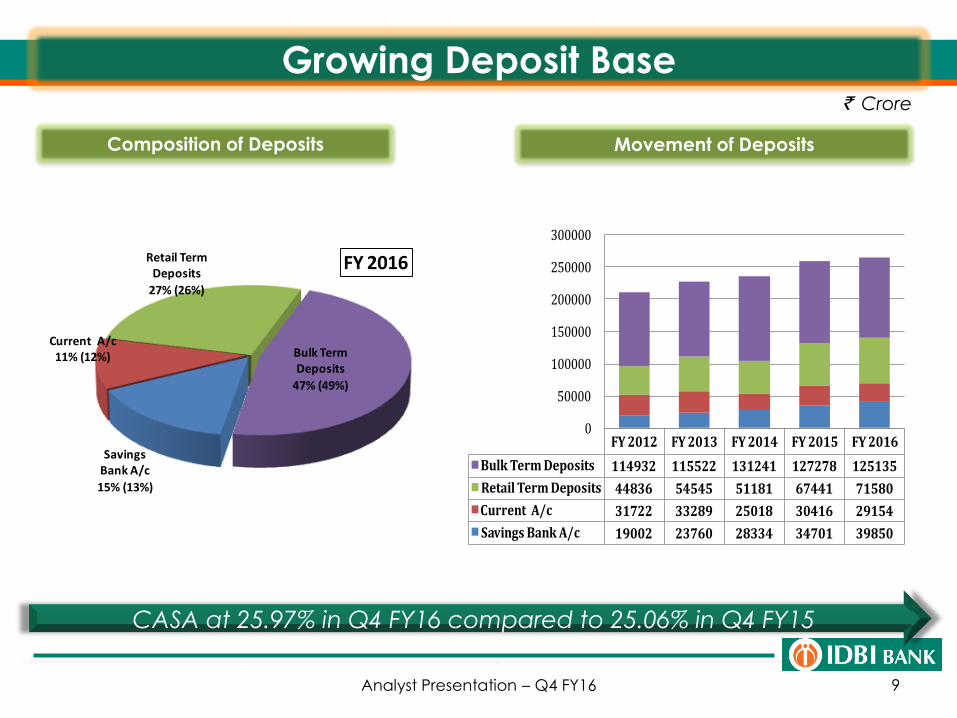
Growing Deposit Base
9
CASA at 25.97% in Q4 FY16 compared to 25.06% in Q4 FY15
Composition of Deposits Movement of Deposits
` Crore
Analyst Presentation – Q4 FY16
FY 2012 FY 2013 FY 2014 FY 2015 FY 2016
Bulk Term Deposits 114932 115522 131241 127278 125135
Retail Term Deposits 44836 54545 51181 67441 71580
Current A/c 31722 33289 25018 30416 29154
Savings Bank A/c 19002 23760 28334 34701 39850
0
50000
100000
150000
200000
250000
300000
Savings Bank A/c
15% (13%)
Current A/c11% (12%)
Retail Term Deposits
27% (26%)
Bulk Term Deposits
47% (49%)
FY 2016
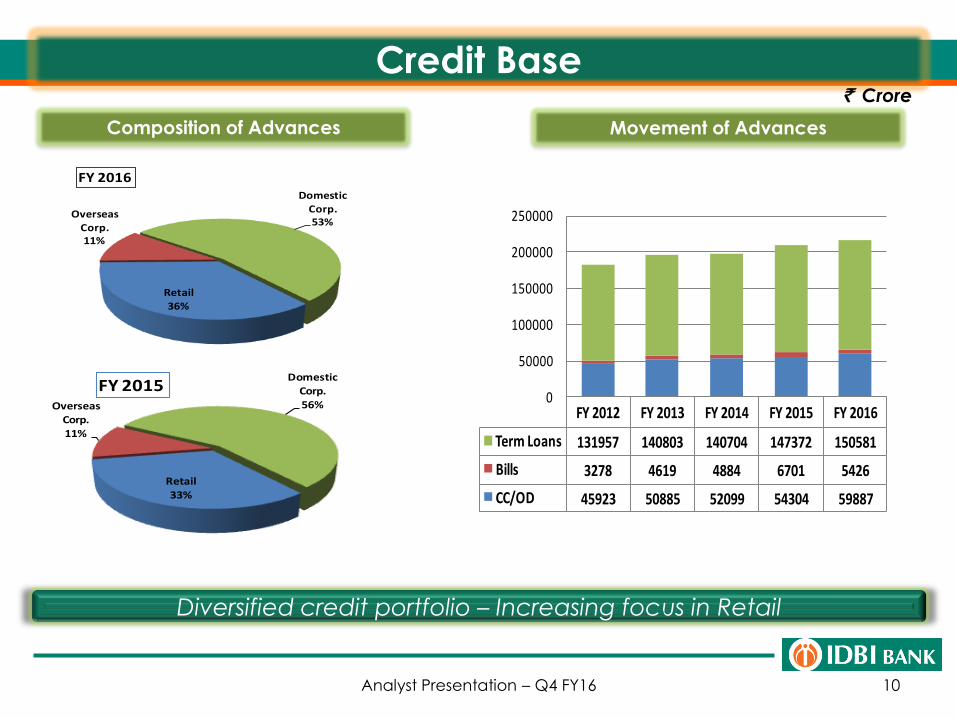
Credit Base
10
Diversified credit portfolio – Increasing focus in Retail
Composition of Advances Movement of Advances
` Crore
Analyst Presentation – Q4 FY16
FY 2012 FY 2013 FY 2014 FY 2015 FY 2016
Term Loans 131957 140803 140704 147372 150581
Bills 3278 4619 4884 6701 5426
CC/OD 45923 50885 52099 54304 59887
0
50000
100000
150000
200000
250000
Retail
33%
Overseas Corp.11%
Domestic Corp.56%
FY 2015
Retail36%
Overseas Corp.11%
Domestic Corp. 53%
FY 2016
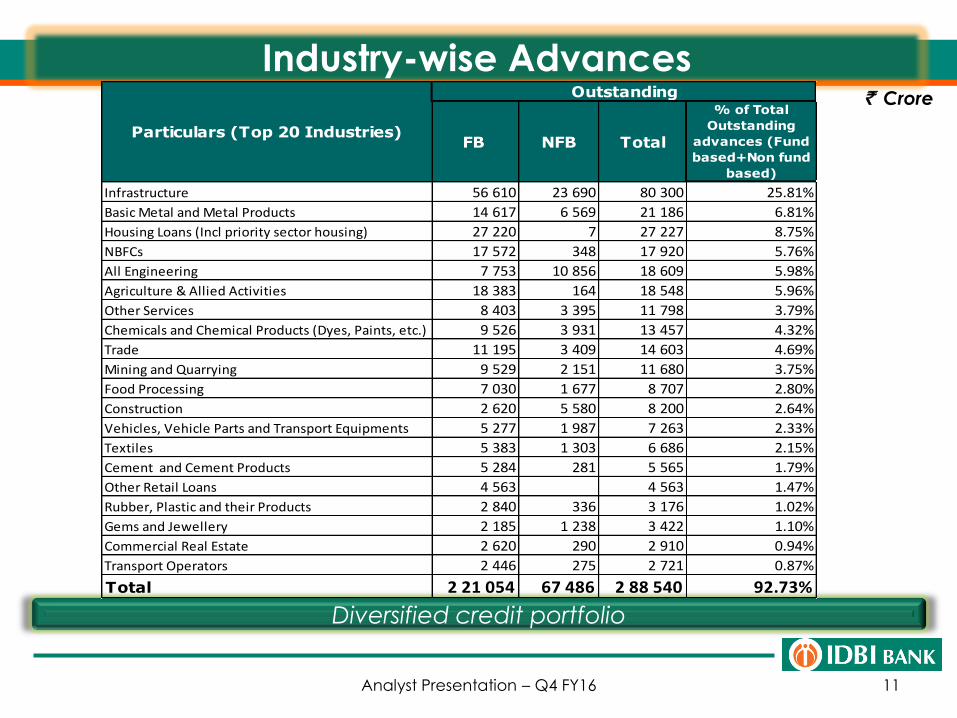
Industry-wise Advances
11
Diversified credit portfolio
` Crore
Analyst Presentation – Q4 FY16
FB NFB Total
% of Total
Outstanding
advances (Fund
based+Non fund
based)
Infrastructure 56 610 23 690 80 300 25.81%
Basic Metal and Metal Products 14 617 6 569 21 186 6.81%
Housing Loans (Incl priority sector housing) 27 220 7 27 227 8.75%
NBFCs 17 572 348 17 920 5.76%
All Engineering 7 753 10 856 18 609 5.98%
Agriculture & Allied Activities 18 383 164 18 548 5.96%
Other Services 8 403 3 395 11 798 3.79%
Chemicals and Chemical Products (Dyes, Paints, etc.) 9 526 3 931 13 457 4.32%
Trade 11 195 3 409 14 603 4.69%
Mining and Quarrying 9 529 2 151 11 680 3.75%
Food Processing 7 030 1 677 8 707 2.80%
Construction 2 620 5 580 8 200 2.64%
Vehicles, Vehicle Parts and Transport Equipments 5 277 1 987 7 263 2.33%
Textiles 5 383 1 303 6 686 2.15%
Cement and Cement Products 5 284 281 5 565 1.79%
Other Retail Loans 4 563 4 563 1.47%
Rubber, Plastic and their Products 2 840 336 3 176 1.02%
Gems and Jewellery 2 185 1 238 3 422 1.10%
Commercial Real Estate 2 620 290 2 910 0.94%
Transport Operators 2 446 275 2 721 0.87%
Total 2 21 054 67 486 2 88 540 92.73%
Particulars (Top 20 Industries)
Outstanding
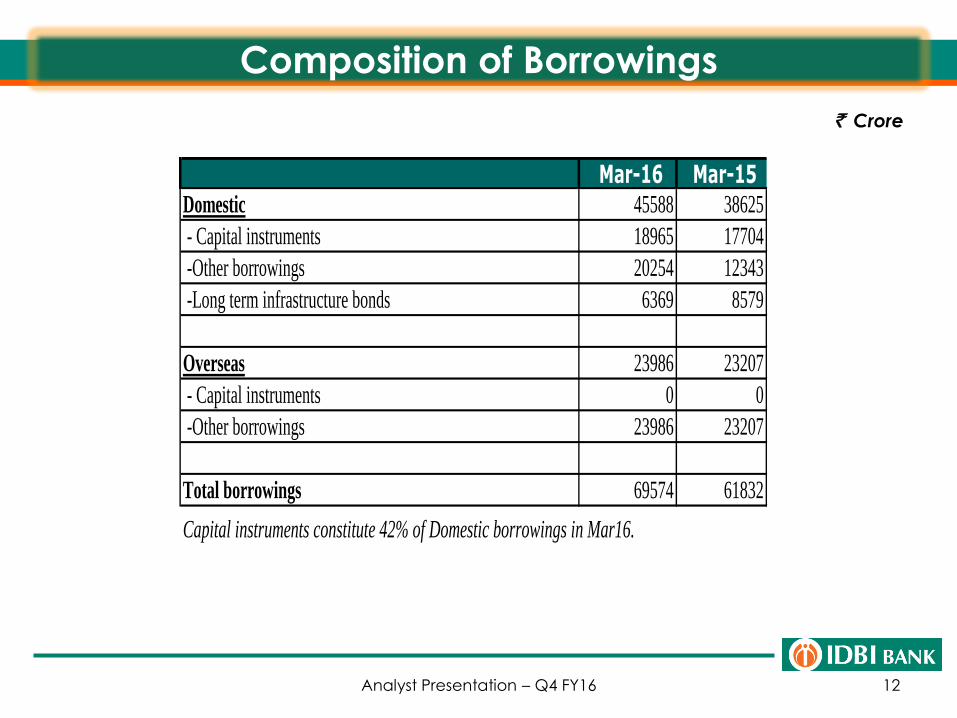
Composition of Borrowings
12
` Crore
Analyst Presentation – Q4 FY16
Mar-16 Mar-15Domestic 45588 38625
- Capital instruments 18965 17704
-Other borrowings 20254 12343
-Long term infrastructure bonds 6369 8579
Overseas 23986 23207
- Capital instruments 0 0
-Other borrowings 23986 23207
Total borrowings 69574 61832
Capital instruments constitute 42% of Domestic borrowings in Mar16.
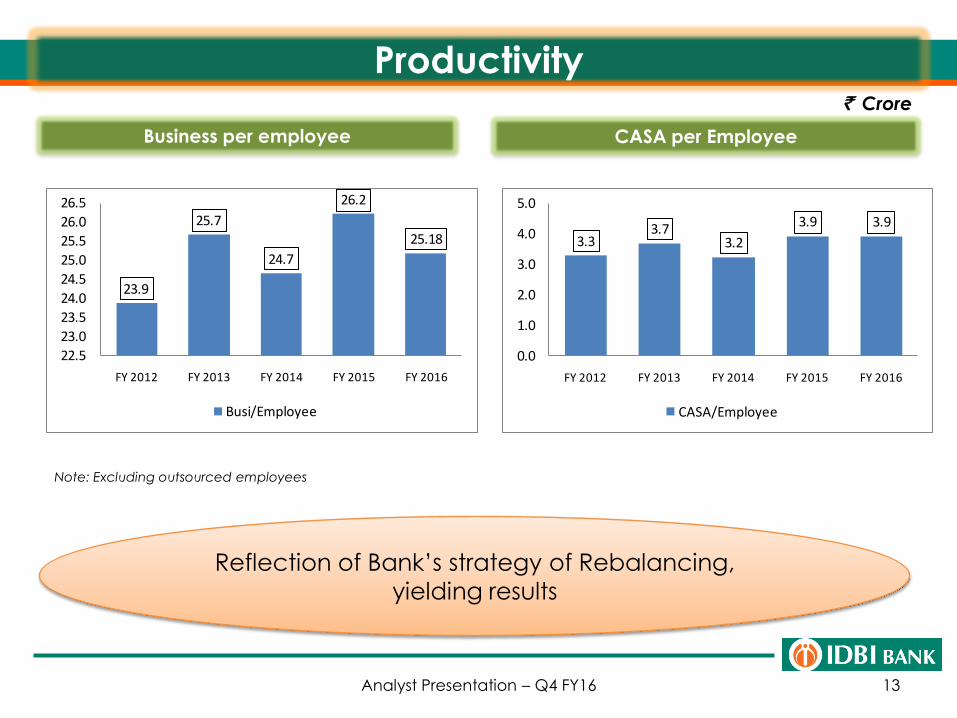
Productivity
13
Reflection of Bank’s strategy of Rebalancing,
yielding results
Business per employee CASA per Employee
` Crore
Note: Excluding outsourced employees
Analyst Presentation – Q4 FY16
23.9
25.7
24.7
26.2
25.18
22.5
23.0
23.5
24.0
24.5
25.0
25.5
26.0
26.5
FY 2012 FY 2013 FY 2014 FY 2015 FY 2016
Busi/Employee
3.33.7
3.2
3.9 3.9
0.0
1.0
2.0
3.0
4.0
5.0
FY 2012 FY 2013 FY 2014 FY 2015 FY 2016
CASA/Employee
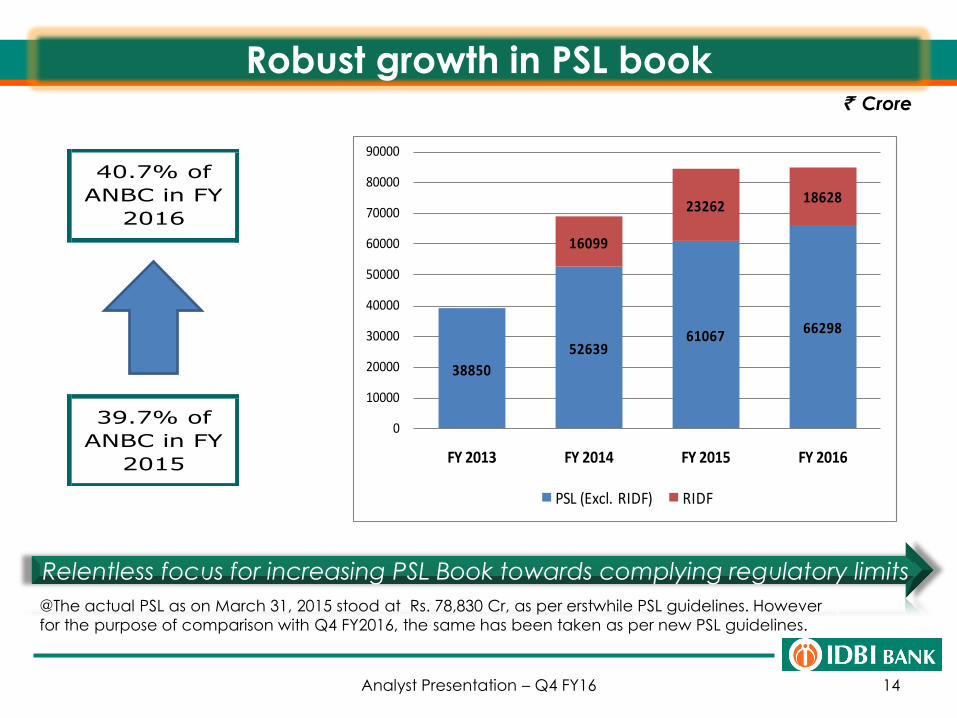
Robust growth in PSL book
14
Relentless focus for increasing PSL Book towards complying regulatory limits
` Crore
@The actual PSL as on March 31, 2015 stood at Rs. 78,830 Cr, as per erstwhile PSL guidelines. However
for the purpose of comparison with Q4 FY2016, the same has been taken as per new PSL guidelines.
Analyst Presentation – Q4 FY16
38850
5263961067
66298
16099
2326218628
0
10000
20000
30000
40000
50000
60000
70000
80000
90000
FY 2013 FY 2014 FY 2015 FY 2016
PSL (Excl. RIDF) RIDF
40.7% of
ANBC in FY
2016
39.7% of
ANBC in FY
2015
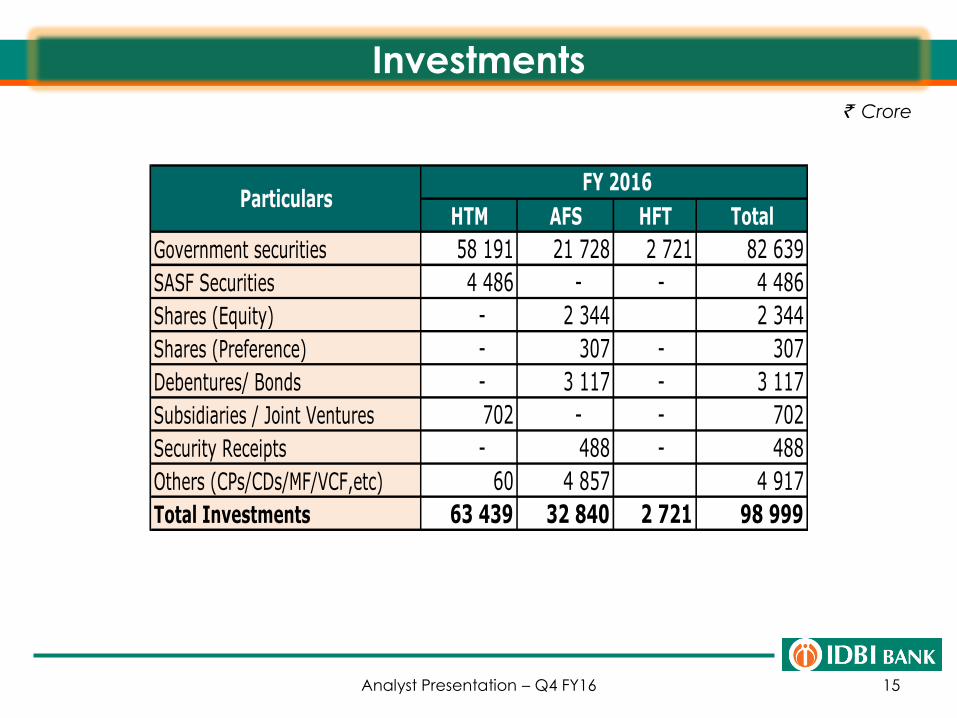
Investments
15
` Crore
Analyst Presentation – Q4 FY16
HTM AFS HFT Total
Government securities 58 191 21 728 2 721 82 639
SASF Securities 4 486 - - 4 486
Shares (Equity) - 2 344 2 344
Shares (Preference) - 307 - 307
Debentures/ Bonds - 3 117 - 3 117
Subsidiaries / Joint Ventures 702 - - 702
Security Receipts - 488 - 488
Others (CPs/CDs/MF/VCF,etc) 60 4 857 4 917
Total Investments 63 439 32 840 2 721 98 999
FY 2016Particulars
Major Strategic Stakes
16
Pivotal role in developing Institutions and financial architecture of the country
Analyst Presentation – Q4 FY16
17
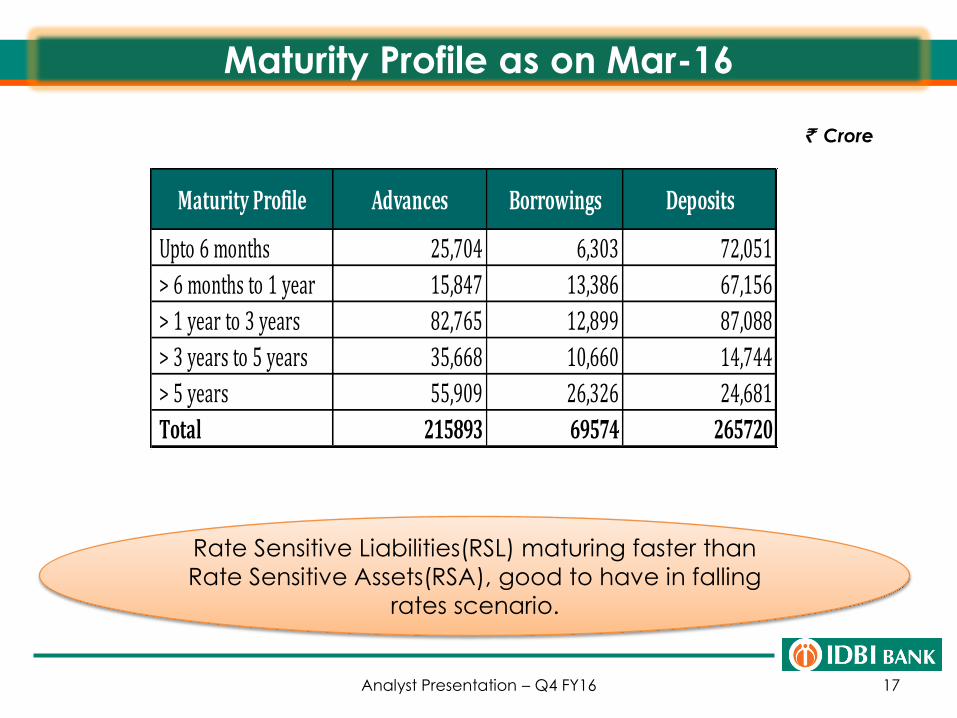
Maturity Profile as on Mar-16
` Crore
Rate Sensitive Liabilities(RSL) maturing faster than
Rate Sensitive Assets(RSA), good to have in falling
rates scenario.
Analyst Presentation – Q4 FY16
Maturity Profile Advances Borrowings Deposits
Upto 6 months 25,704 6,303 72,051
> 6 months to 1 year 15,847 13,386 67,156
> 1 year to 3 years 82,765 12,899 87,088
> 3 years to 5 years 35,668 10,660 14,744
> 5 years 55,909 26,326 24,681
Total 215893 69574 265720
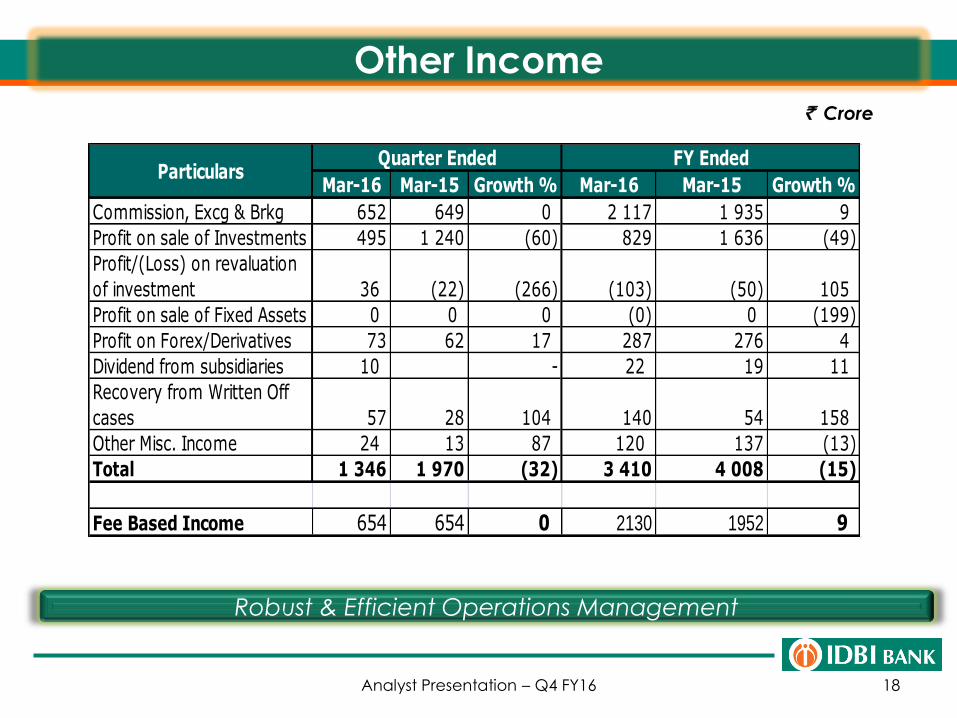
Other Income
18
Robust & Efficient Operations Management
` Crore
Analyst Presentation – Q4 FY16
Mar-16 Mar-15 Growth % Mar-16 Mar-15 Growth %
Commission, Excg & Brkg 652 649 0 2 117 1 935 9
Profit on sale of Investments 495 1 240 (60) 829 1 636 (49)
Profit/(Loss) on revaluation
of investment 36 (22) (266) (103) (50) 105
Profit on sale of Fixed Assets 0 0 0 (0) 0 (199)
Profit on Forex/Derivatives 73 62 17 287 276 4
Dividend from subsidiaries 10 - 22 19 11
Recovery from Written Off
cases 57 28 104 140 54 158
Other Misc. Income 24 13 87 120 137 (13)
Total 1 346 1 970 (32) 3 410 4 008 (15)
Fee Based Income 654 654 0 2130 1952 9
ParticularsQuarter Ended FY Ended
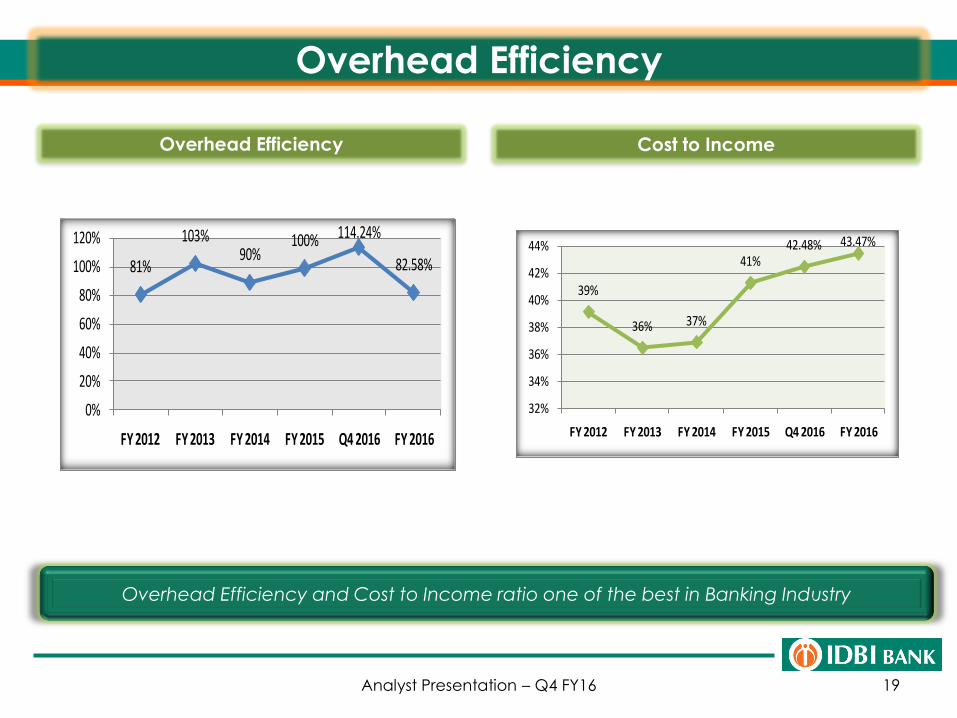
Overhead Efficiency
19
Overhead Efficiency and Cost to Income ratio one of the best in Banking Industry
Overhead Efficiency Cost to Income
Analyst Presentation – Q4 FY16
81%
103%90%
100% 114.24%
82.58%
0%
20%
40%
60%
80%
100%
120%
FY 2012 FY 2013 FY 2014 FY 2015 Q4 2016 FY 2016
39%
36% 37%
41%42.48% 43.47%
32%
34%
36%
38%
40%
42%
44%
FY 2012 FY 2013 FY 2014 FY 2015 Q4 2016 FY 2016
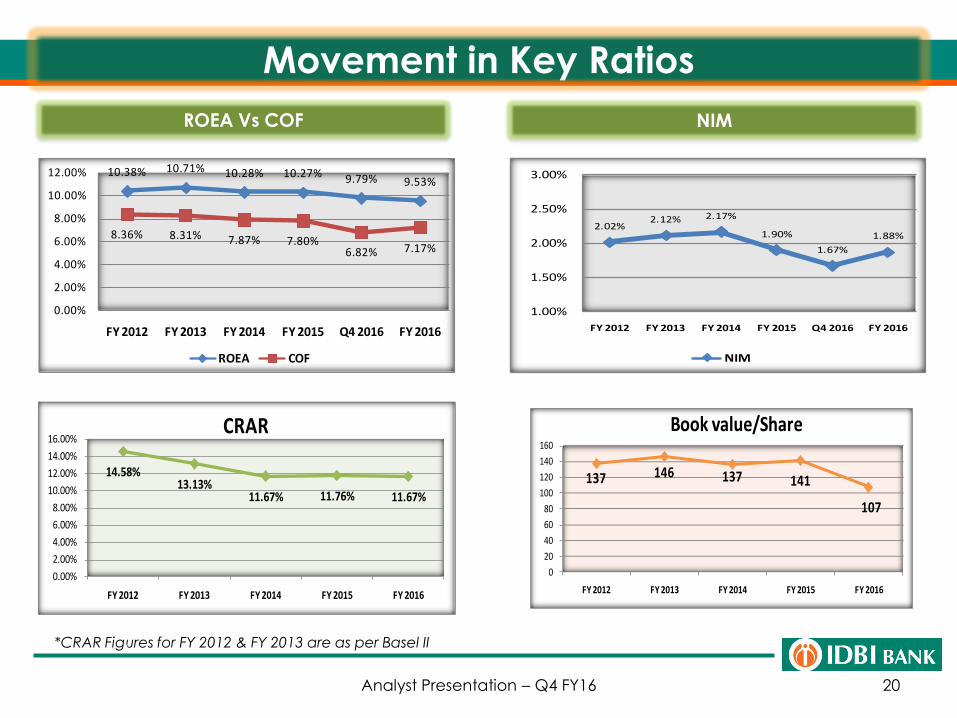
Movement in Key Ratios
20
ROEA Vs COF NIM
*CRAR Figures for FY 2012 & FY 2013 are as per Basel II
Analyst Presentation – Q4 FY16
10.38% 10.71% 10.28% 10.27% 9.79% 9.53%
8.36% 8.31% 7.87% 7.80%6.82% 7.17%
0.00%
2.00%
4.00%
6.00%
8.00%
10.00%
12.00%
FY 2012 FY 2013 FY 2014 FY 2015 Q4 2016 FY 2016
ROEA COF
2.02%2.12% 2.17%
1.90%
1.67%
1.88%
1.00%
1.50%
2.00%
2.50%
3.00%
FY 2012 FY 2013 FY 2014 FY 2015 Q4 2016 FY 2016
NIM
14.58%13.13%
11.67% 11.76% 11.67%
0.00%
2.00%
4.00%
6.00%
8.00%
10.00%
12.00%
14.00%
16.00%
FY 2012 FY 2013 FY 2014 FY 2015 FY 2016
CRAR
137 146 137 141
107
0
20
40
60
80
100
120
140
160
FY 2012 FY 2013 FY 2014 FY 2015 FY 2016
Book value/Share
Movement in Key Ratios
21
` Crore
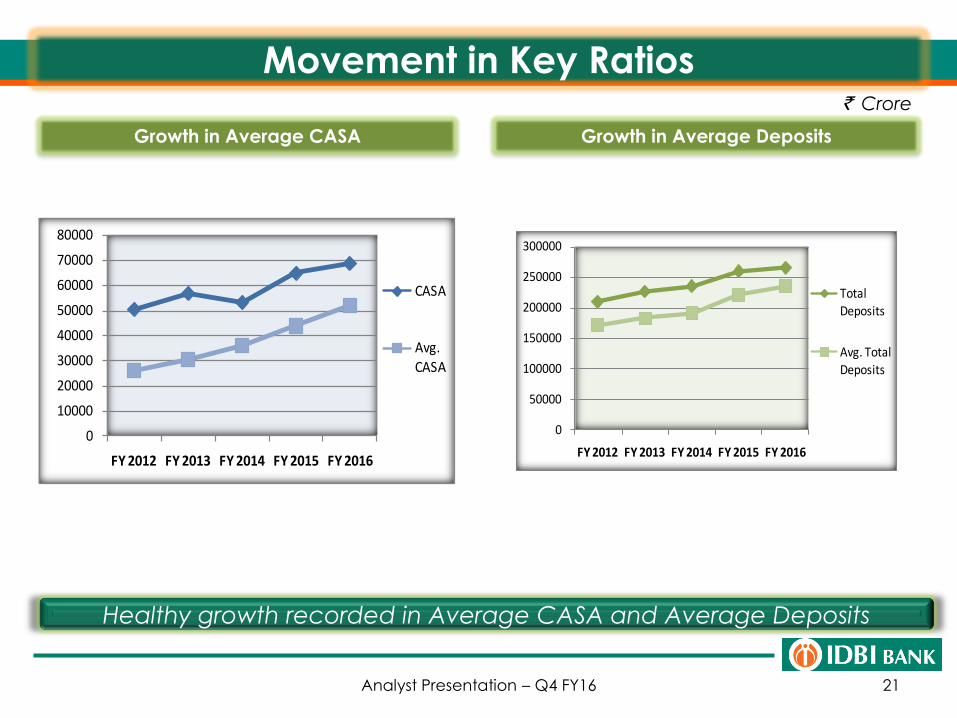
Growth in Average CASA Growth in Average Deposits
Healthy growth recorded in Average CASA and Average Deposits
Analyst Presentation – Q4 FY16
0
10000
20000
30000
40000
50000
60000
70000
80000
FY 2012 FY 2013 FY 2014 FY 2015 FY 2016
CASA
Avg.
CASA
0
50000
100000
150000
200000
250000
300000
FY 2012 FY 2013 FY 2014 FY 2015 FY 2016
Total Deposits
Avg. Total Deposits
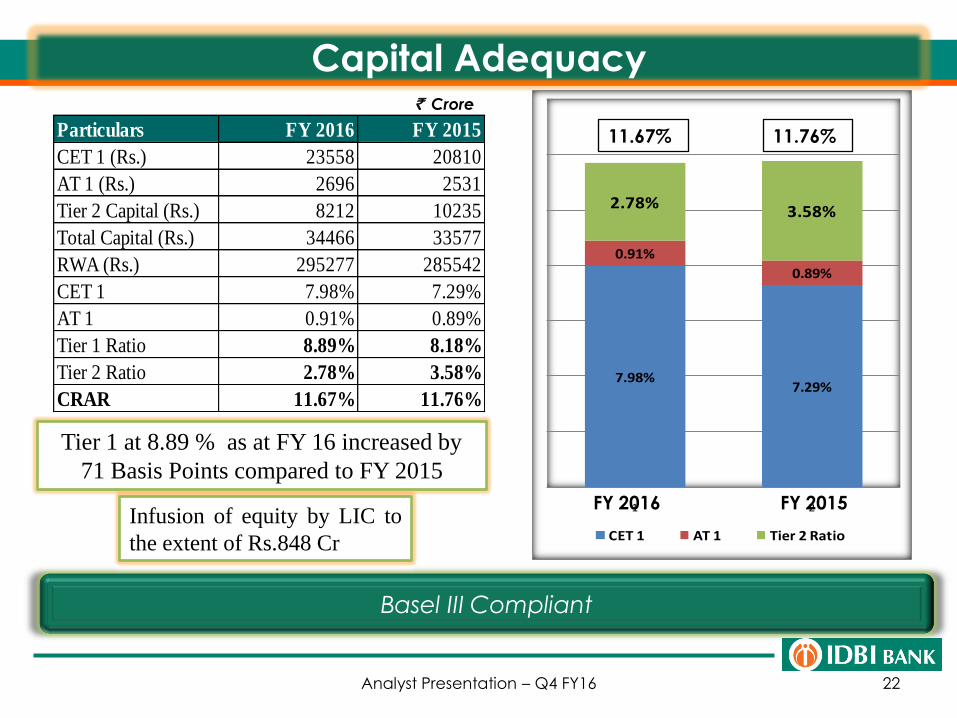
Capital Adequacy
22
Basel III Compliant
Tier 1 at 8.89 % as at FY 16 increased by
71 Basis Points compared to FY 2015
Analyst Presentation – Q4 FY16
Infusion of equity by LIC to
the extent of Rs.848 Cr
` Crore
Particulars FY 2016 FY 2015
CET 1 (Rs.) 23558 20810
AT 1 (Rs.) 2696 2531
Tier 2 Capital (Rs.) 8212 10235
Total Capital (Rs.) 34466 33577
RWA (Rs.) 295277 285542
CET 1 7.98% 7.29%
AT 1 0.91% 0.89%
Tier 1 Ratio 8.89% 8.18%
Tier 2 Ratio 2.78% 3.58%
CRAR 11.67% 11.76%
7.98%7.29%
0.91%
0.89%
2.78%3.58%
1 2
CET 1 AT 1 Tier 2 Ratio
11.67% 11.76%
FY 2016 FY 2015
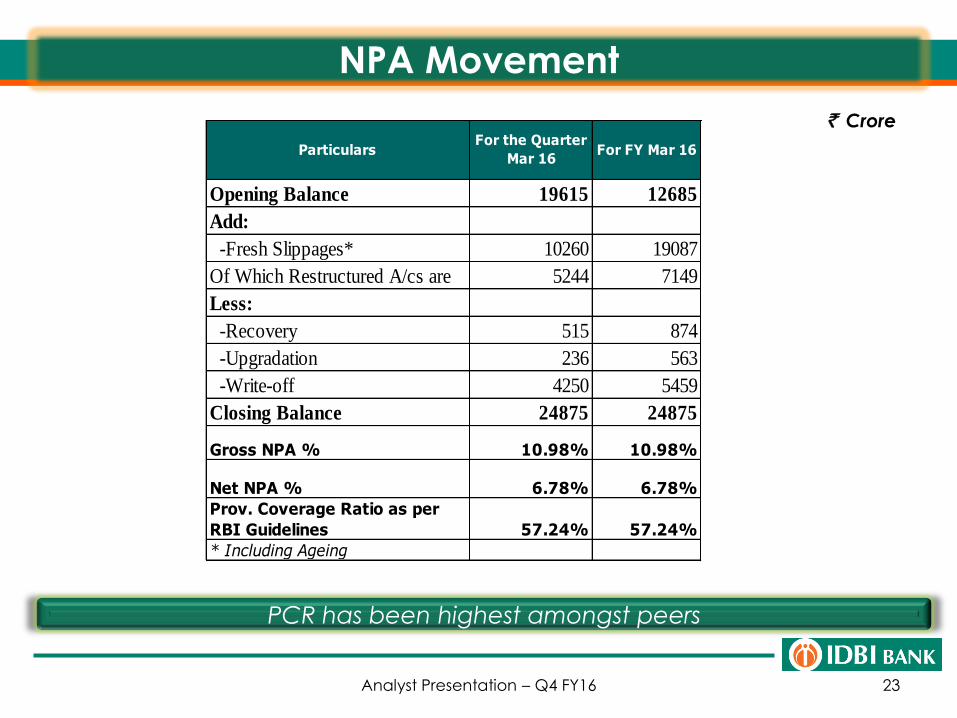
NPA Movement
23
PCR has been highest amongst peers
` Crore
Analyst Presentation – Q4 FY16
Opening Balance 19615 12685
Add:
-Fresh Slippages* 10260 19087
Of Which Restructured A/cs are 5244 7149
Less:
-Recovery 515 874
-Upgradation 236 563
-Write-off 4250 5459
Closing Balance 24875 24875
Gross NPA % 10.98% 10.98%
Net NPA % 6.78% 6.78%
Prov. Coverage Ratio as per
RBI Guidelines 57.24% 57.24%
* Including Ageing
ParticularsFor the Quarter
Mar 16For FY Mar 16
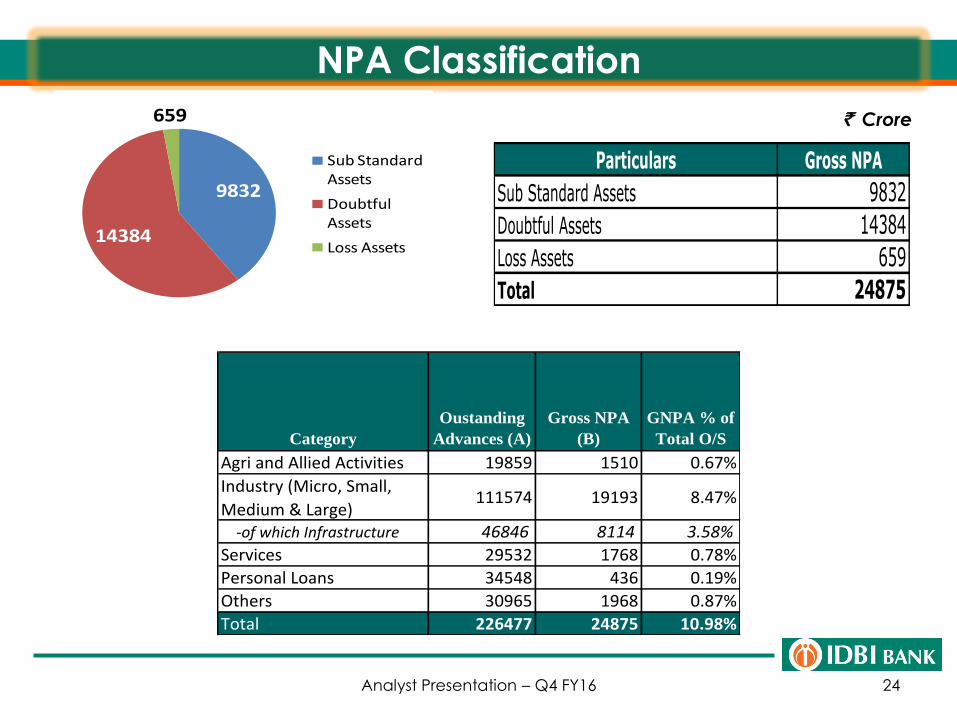
NPA Classification
24
` Crore
Analyst Presentation – Q4 FY16
Category
Oustanding
Advances (A)
Gross NPA
(B)
GNPA % of
Total O/S
Agri and Allied Activities 19859 1510 0.67%
Industry (Micro, Small,
Medium & Large)111574 19193 8.47%
-of which Infrastructure 46846 8114 3.58%
Services 29532 1768 0.78%
Personal Loans 34548 436 0.19%
Others 30965 1968 0.87%
Total 226477 24875 10.98%
Particulars Gross NPA
Sub Standard Assets 9832
Doubtful Assets 14384
Loss Assets 659
Total 24875
9832
14384
659
Sub Standard Assets
Doubtful Assets
Loss Assets
25
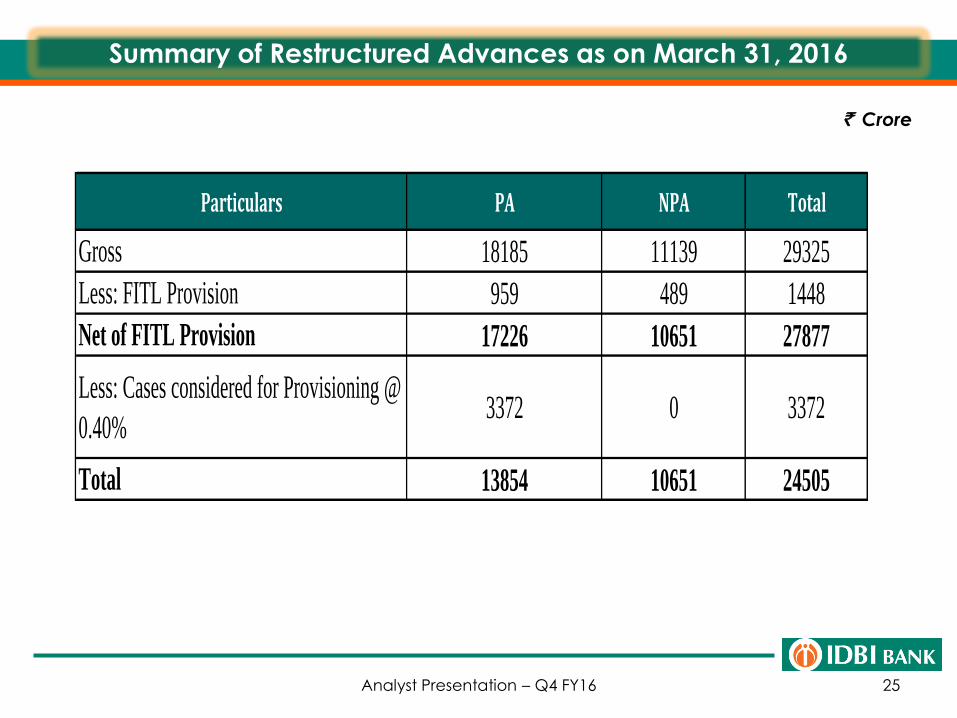
Summary of Restructured Advances as on March 31, 2016
` Crore
Analyst Presentation – Q4 FY16
Particulars PA NPA Total
Gross 18185 11139 29325
Less: FITL Provision 959 489 1448
Net of FITL Provision 17226 10651 27877
Less: Cases considered for Provisioning @
0.40%3372 0 3372
Total 13854 10651 24505
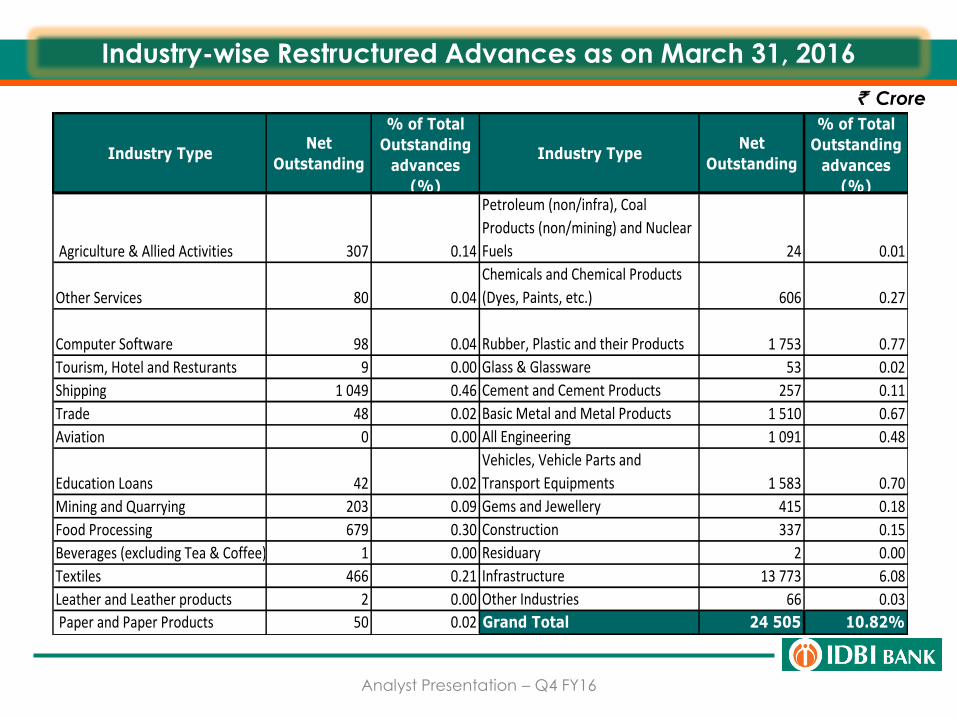
Industry-wise Restructured Advances as on March 31, 2016
` Crore
Analyst Presentation – Q4 FY16
Industry TypeNet
Outstanding
% of Total
Outstanding
advances
(%)
Industry TypeNet
Outstanding
% of Total
Outstanding
advances
(%)
Agriculture & Allied Activities 307 0.14
Petroleum (non/infra), Coal
Products (non/mining) and Nuclear
Fuels 24 0.01
Other Services 80 0.04
Chemicals and Chemical Products
(Dyes, Paints, etc.) 606 0.27
Computer Software 98 0.04 Rubber, Plastic and their Products 1 753 0.77
Tourism, Hotel and Resturants 9 0.00 Glass & Glassware 53 0.02
Shipping 1 049 0.46 Cement and Cement Products 257 0.11
Trade 48 0.02 Basic Metal and Metal Products 1 510 0.67
Aviation 0 0.00 All Engineering 1 091 0.48
Education Loans 42 0.02
Vehicles, Vehicle Parts and
Transport Equipments 1 583 0.70
Mining and Quarrying 203 0.09 Gems and Jewellery 415 0.18
Food Processing 679 0.30 Construction 337 0.15
Beverages (excluding Tea & Coffee) and Tobacco 1 0.00 Residuary 2 0.00
Textiles 466 0.21 Infrastructure 13 773 6.08
Leather and Leather products 2 0.00 Other Industries 66 0.03
Paper and Paper Products 50 0.02 Grand Total 24 505 10.82%
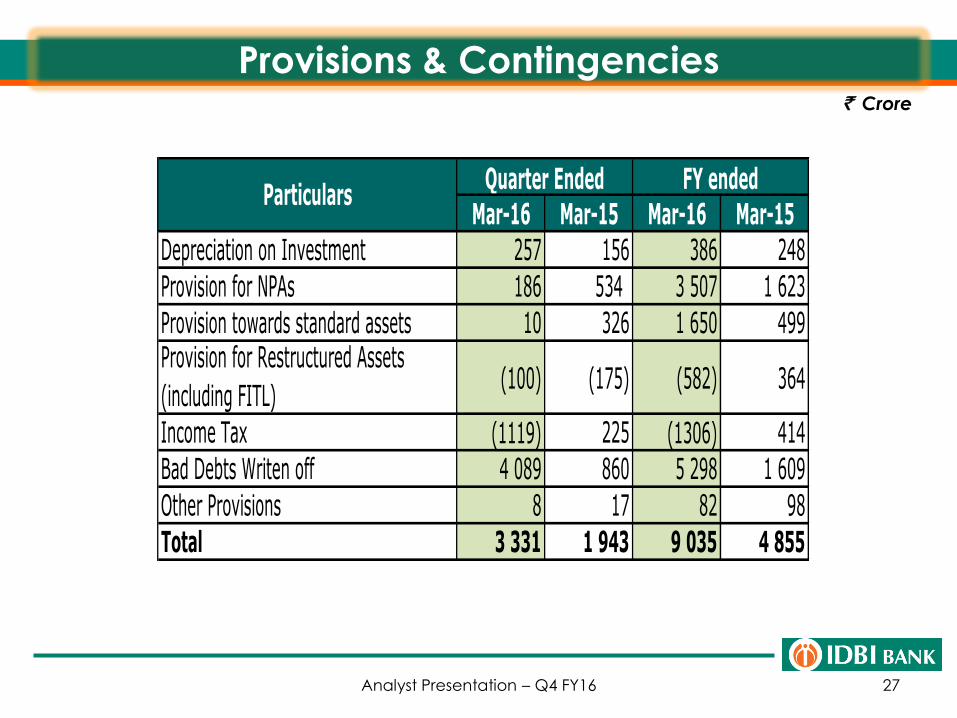
Provisions & Contingencies
27
` Crore
Analyst Presentation – Q4 FY16
Mar-16 Mar-15 Mar-16 Mar-15
Depreciation on Investment 257 156 386 248
Provision for NPAs 186 534 3 507 1 623
Provision towards standard assets 10 326 1 650 499Provision for Restructured Assets
(including FITL)(100) (175) (582) 364
Income Tax (1119) 225 (1306) 414
Bad Debts Writen off 4 089 860 5 298 1 609
Other Provisions 8 17 82 98
Total 3 331 1 943 9 035 4 855
Quarter Ended FY endedParticulars
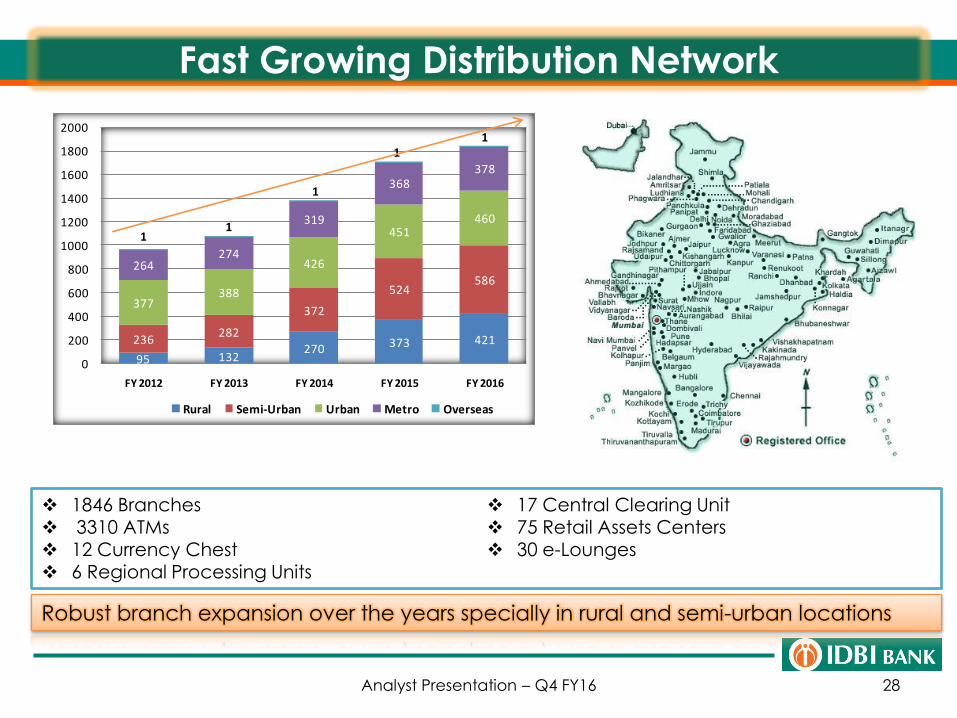
Fast Growing Distribution Network
28
Robust branch expansion over the years specially in rural and semi-urban locations
1846 Branches 3310 ATMs
12 Currency Chest 6 Regional Processing Units
17 Central Clearing Unit 75 Retail Assets Centers
30 e-Lounges
Analyst Presentation – Q4 FY16
95 132270 373 421236
282
372
524586
377388
426
451460
264274
319
368378
11
1
11
0
200
400
600
800
1000
1200
1400
1600
1800
2000
FY 2012 FY 2013 FY 2014 FY 2015 FY 2016
Rural Semi-Urban Urban Metro Overseas
Awards & Accolades
29
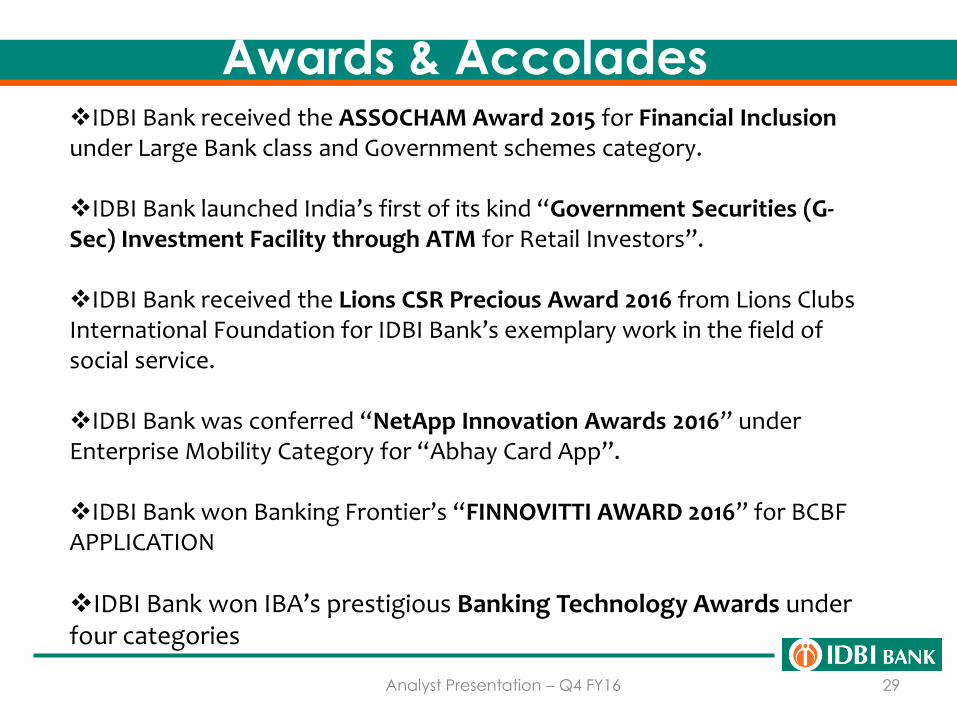
IDBI Bank received the ASSOCHAM Award 2015 for Financial Inclusionunder Large Bank class and Government schemes category.
IDBI Bank launched India’s first of its kind “Government Securities (G-Sec) Investment Facility through ATM for Retail Investors”.
IDBI Bank received the Lions CSR Precious Award 2016 from Lions Clubs International Foundation for IDBI Bank’s exemplary work in the field of social service.
IDBI Bank was conferred “NetApp Innovation Awards 2016” under Enterprise Mobility Category for “Abhay Card App”.
IDBI Bank won Banking Frontier’s “FINNOVITTI AWARD 2016” for BCBF APPLICATION
IDBI Bank won IBA’s prestigious Banking Technology Awards under four categories
Analyst Presentation – Q4 FY16
Strategies & Way Forward
30
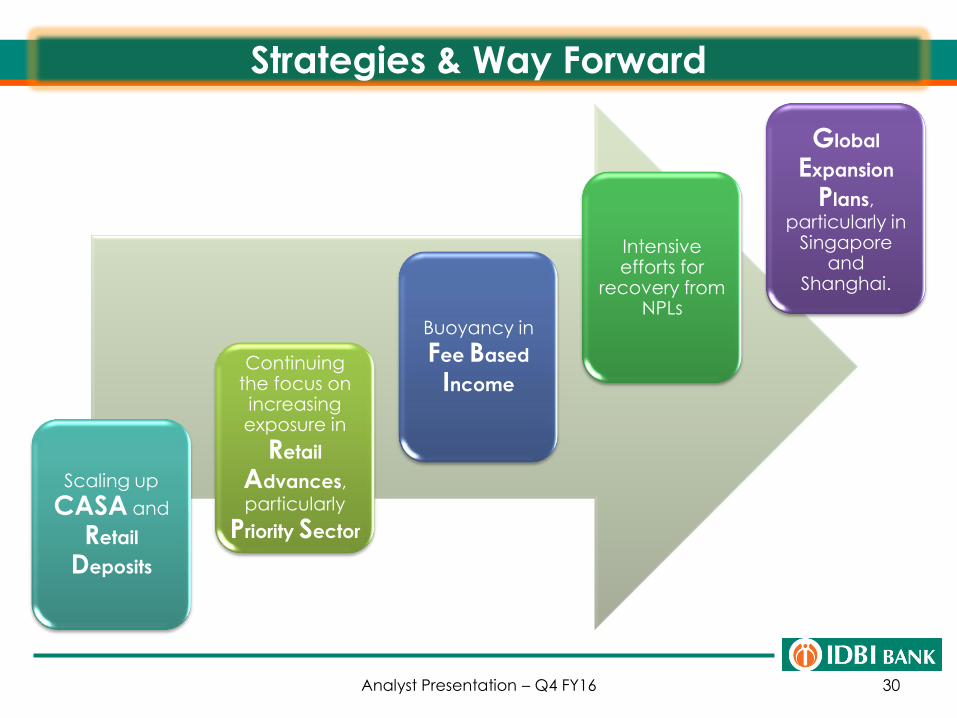
Continuing the focus on increasing exposure in
Retail
Advances, particularly
Priority Sector
Intensive efforts for
recovery from NPLs
Scaling up
CASA and
Retail
Deposits
Buoyancy in
Fee Based
Income
Global
Expansion
Plans,
particularly in Singapore
and Shanghai.
Analyst Presentation – Q4 FY16
31Analyst Presentation – Q4 FY16