Embed Size (px)
Citation preview
Comprehensive Income Disclosures and Analysts’Valuation Judgments
D. Eric HirstAssociate Professor &
KPMG Peat Marwick Faculty FellowUniversity of Texas at Austin
CBA 4M.202, Austin, TX 78712-1172e-mail: [email protected]
Patrick E. HopkinsAssistant ProfessorIndiana University
1309 E. 10th Street, Bloomington, IN 47405-1701e-mail: [email protected]
February 1998
Comments desired.
We thank Rob Bloomfield, Karl Hackenbrack, Adam Koch, Lisa Koonce, Charles Lee, BobLibby, Laureen Maines, Bill Messier, Jamie Pratt, Jerry Salamon, Jim Wahlen, the workshopparticipants at Cornell University, the University of Florida, the University of Illinois, IndianaUniversity, and Virginia Tech University and participants at the IU-NDU-PU Summer ResearchConference, the Eighth Annual Conference on Financial Economics and Accounting, and theUniversity of Texas Summer Brownbag Workshop for their valuable comments. Lynette Woodprovided research assistance and the Research Foundation of the Institute of Chartered FinancialAnalysts, the University of Texas at Austin Faculty Research Council, and the KPMG PeatMarwick Foundation provided generous financial support. This study would have beenimpossible without the assistance of the individual financial analysts and portfolio managers whounselfishly donated their time and effort to this project.
Comprehensive Income Disclosures and Analysts’ Valuation Judgments
1. Introduction
This paper investigates whether clear disclosure of comprehensive income (CI) and its
components facilitates detection of earnings management by buy-side financial analysts and
predictably affects their common-stock price judgments. Financial reporting standards allow
companies considerable flexibility in determining which accounts are aggregated into the
individual line items in the primary financial statements. Because of the difficulty inherent in
assessing the relevance and persistence of these amounts, users of financial accounting
information often must sort through voluminous footnotes and non-financial information to
effectively forecast the future earnings, cash flows, or intrinsic value of a company. This wide
dispersion of value-relevant information increases the direct and indirect cost of valuation
activities and has led user groups like the Association for Investment Management and Research
(AIMR, 1993) and Robert Morris Associates (AICPA 1994) to recommend a number of changes
in the financial reporting model.
In June 1997, the FASB issued Statement of Financial Accounting Standards (SFAS)
No. 130—Reporting Comprehensive Income (FASB 1997) in response to the AIMR’s call for
clearer CI reporting (AIMR 1993).1 The standard requires firms to disclose CI and its
components in a statement with the same prominence as the basic financial statements. A strict
interpretation of the efficient markets hypothesis suggests that this simple reformatting of the
financial statements (i.e., there are no new recognition or measurement rules included in SFAS
No. 130) will have no effect on financial statement users’ judgments. However, research in
psychology has shown that information will not be used unless it is both available and readily
1 Comprehensive income is defined in Statement of Financial Accounting Concepts No. 6—Element of FinancialStatements (FASB 1985a) as “the change in equity [net assets] of a business enterprise during a period fromtransactions and other events and circumstances from nonowner sources. It includes all changes in equity during aperiod except those resulting from investments by owners and distributions to owners” (paragraph 70).
2
processable (i.e., clear). Therefore, we argue that analysts’ valuation judgments will be affected
by the clarity of disclosure of value relevant information.
In this study, we experimentally investigate whether CI disclosuresas required by SFAS
No. 130influence financial analysts’ estimates of the value of a company that actively
manages earnings through its available-for-sale marketable securities portfolio. Available-for-
sale marketable securities are reported at fair value on the balance sheet and holding gains and
losses for these securities are reported directly in stockholders’ equity until these gains and
losses are realized through a sale. By carefully timing the sales of these investment securities,
management has the ability to manage reported net income. SFAS No. 130 requires explicit
disclosure of all comprehensive income activity and, therefore, incorporates the unrealized and
realized activity for marketable securities into the primary financial statements, potentially
increasing their clarity.
Hirst and Hopkins (1997) (HH) found that buy-side financial analysts have difficulty
adjusting their valuation judgments to take into account earnings management through the
available-for-sale marketable securities portfolio. Specifically, HH report that analysts’ stock
price judgments were significantly higher when a company with no growth in core earnings
maintained steady growth in reported net income by sellingand subsequently
repurchasingpreviously appreciated available-for-sale marketable securities. We believe this
result is not surprising given the variety of possible ways a company can manage its earnings,
the non-trivial effort required in detecting any of these activities, and the difficulty in
distinguishing earnings management from other events (see for example, Dechow, Sabino, and
Sloan 1997). Consistent with this view, the AIMR was openly critical of the fair market value
accounting promulgated in SFAS No. 115—Accounting for Certain Investments in Debt and
Equity Securities (FASB 1993). The professional analysts’ organization maintained that the
standard was an improvement in neither recognition nor measurement of marketable securities
gains and losses. They proposed that clear disclosure of marketable securities gains and losses in
3
a statement of performance should make “gains trading ... evident to an astute analyst who looks
closely ... at an institution’s sources of earnings” (AIMR 1993, 41).
The income-statement-type (IS) disclosures originally proposed in the FASB’s Exposure
Draft: Reporting Comprehensive Income (1996a) were consistent with the prescription of the
AIMR and likely would have made marketable-securities-based earnings management much
easier to detect. That is, clear disclosure of CI and its components in a statement of performance
would have made this type of earnings management more transparent and, therefore, less likely
that earnings management would influence analysts’ valuation judgments as they were in HH.
However, the final standard issued by the FASB allows reporting of CI and its components in
any of the primary financial statements. Preliminary evidence suggests that many companies will
disclose this information in the statement of changes in owners’ equity (SCOE). Because
financial analysts regard the SCOE among the least useful components of the annual report
(Brown 1997), and because the statement is not generally viewed as a statement of performance,
this disclosure may be less effective than IS disclosure.
We report the results of an experiment in which buy-side financial analysts estimate the price
of a company’s publicly traded common stock using two types of CI disclosure (IS CI
disclosure, SCOE CI disclosure) and compare those prices to the judgments (without explicit CI
disclosure) reported in HH. Following HH, we also manipulate whether the company engages in
earnings management (the company either sold or continued to hold available-for-sale
marketable securities that experienced holding gains in prior periods). The results confirm our
expectation that clear IS disclosure of CI and its components is effective in enhancing the
transparency of the company’s earnings management activities and reducing analysts’ valuation
judgments to the same level as those observed for an identical firm that does not manage its
earnings. Further, the results suggest that disclosure of CI and its components in the SCOE is not
as effective as IS disclosure in revealing earnings management and reducing analysts’ stock-
price judgments. Supplemental analyses reveal that in the presence of earnings management, IS
4
CI disclosure leads to different beliefs about the likelihood of earnings growth and of the quality
of financial reporting than does SCOE CI disclosure.
This study provides useful evidence to the FASB as they continue to address disclosure
effectiveness and CI-related issues. Our data suggest that the separate CI disclosures originally
proposed in the FASB’s Exposure Draft (FASB 1996a) are effective in revealing active earnings
management through the marketable securities portfolio. However, the data suggest that the
SCOE disclosure allowed by SFAS No. 130 (FASB 1997)and likely to be adopted by the
majority of US companiesis not as effective at revealing this type of active earnings
management. This contribution is consistent with the call for ex ante evidence about the possible
effects of the newly issued accounting standard (Beresford and Johnson 1995).
Further, we directly investigate whether the “transparency” of financial disclosure has a
predictable, measurable effect on analysts’ stock price judgments. Arthur Levitt, Chairman of
the SEC, suggested that transparency and comparability are the two primary attributes of “high
quality” accounting standards (Levitt 1997). Our results suggest that clear disclosure of CI and
its components in a statement of performance results in a higher level of transparency than
disclosure of the same information in the SCOE. Further, this pattern of results suggests that the
FASB’s original proposal (FASB 1996a) might have yielded a higher quality accounting
standard than the SCOE CI reporting allowed by SFAS No. 130 (FASB 1997).
The remainder of the paper is organized as follows. The next section describes our
theoretical framework and develops three testable hypotheses. The third and fourth sections
describe the experimental design and results, respectively. The final section provides concluding
comments.
2. Theory and Hypotheses
2.1 COMPREHENSIVE INCOME DISCLOSURE
Statement of Financial Accounting Concepts (SFAC) No. 1—Objectives of Financial
Reporting by Business Enterprises (FASB 1978) states that “[t]he primary focus of financial
5
reporting is information about an enterprise’s performance provided by measures of earnings and
its components” (par. 43). In determining the components that are reported as earnings of an
enterprise, the FASB, and its predecessor, the Accounting Principles Board (APB), state that
they have adhered to the “all-inclusive” concept of net income (see FASB 1984a, par. 35;
Beresford, Johnson and Reither 1996, p. 69).2 In apparent conflict with this concept, the FASB
has issued a number of accounting standards that allow certain significant performance-related
changes in the net assets of a company to be reported directly as an adjustment of owners’ equity
(i.e., without being included in the income statement). For example, SFAS No. 115 (FASB
1993) requires that marketable equity securities be reported at fair value. However, holding
gains and losses for available-for-sale securities can be recognized directly in owners’ equity. Of
course, this treatment avoids recognition of these changes as components of a statement of
performanceat least until such securities are sold and the gains and losses are realizedand
appears to contradict the all-inclusive concept of net income.3
The Association for Investment Management and Research has expressed concern over this
apparent divergence from the all-inclusive concept. For example, the AIMR report, Financial
Reporting in the 1990s and Beyond (1993) notes that a considerable amount of effort is
necessary to locate all income items that may be relevant to the valuation of a firm (p. 88).4
Illustrating the disparity in disclosure of these items, Smith and Reither (1996) document great
diversity in reporting practices for these non-income-statement performance items. For example,
they note that companies vary widely in their disclosure of the cumulative holding gains and
2 The all-inclusive income concept predates the APB and the FASB by many years (e.g., Executive Committee ofthe American Accounting Association 1936, Paton and Littleton 1940). An explicit discussion of this concept bystandard setters can be found in APB Opinion No. 30: Reporting the Results of Operations Reporting the Effectsof Disposal of a Segment of a Business, and Extraordinary, Unusual, and Infrequently Occurring Events andTransactions (1973, par. 4-5).3 Similar standards include SFAS No. 52: Foreign Currency Translation (FASB 1981), SFAS No. 80: Accountingfor Futures Contracts (FASB 1984b); and SFAS No. 87: Employers’ Accounting for Pensions (FASB 1985b).Preliminary discussions of the treatment of unrealized gains and losses on other financial instruments indicate thatfuture standards may also adopt this “dirty surplus” approach.4 These data need to be generated by financial statement analysis. The underlying items are not currently brokenout by major financial databases such as Compustat.
6
losses related to available-for-sale securities (i.e., the equity component defined by SFAS No.
115). Common practices include reporting these accumulated holding gains and losses as a
separate account on the balance sheet or aggregating them with other equity accounts including
other capital, paid-in capital, retained earnings, and the ubiquitous “other.” Because of the effort
necessary to locate these off-income-statement performance components, the AIMR suggested
that “[f]inancial statement users need, in one place, all the data reporting an enterprise’s
economic activity, which they may then sort out to suit their own purposes” (AIMR 1993, 64).5
That is, they want clear disclosure of CI and its components.
In anticipation of expanded fair-market-value reporting for financial instruments and in
response to the concerns expressed by the AIMR and others, the FASB added the CI project to
its technical agenda (Johnson and Reither 1995, 7). The scope of the project was limited to
presentation issues related to where and how CI was to be displayed and did not include
recognition and measurement issues related to the individual components of CI (Johnson and
Reither 1995, 9). The FASB tentatively concluded that CI was to be recognized in a stand-alone
performance statementeither combined with the traditional income statement or as a separate
statement of CIpresented with the same prominence as the primary financial statements
(FASB 1996a). After considering the opposing views expressed by financial statement preparers
during the public-comment period, the FASB decided to allow presentation of CI in any
statement with the same prominence as the basic financial statements (FASB 1997, par. 22).6
Although financial statement users have supported the issuance of SFAS No. 130, many
preparers have expressed concern over the new CI disclosures. The primary complaint forwarded
5 Support for a separate all-inclusive income statement has come from a number of other parties, including SECChief Accountant, Michael Sutton (Sutton and Johnson 1993). Furthermore, the newly reissued InternationalAccounting Standard 1 (effective July 1, 1998) requires that primary financial statements report comprehensiveincome.6 Although the FASB did not require a specific format for displaying the components of CI, the Board expressed apreference for the disclosure of CI in a statement of performance format (FASB 1997, par. 23). Board membersand staff have indicated in private conversations that they expect most companies to comply with SFAS No. 130by reporting CI in the statement of changes in owners’ equity.
7
by these constituents is that the new standard will make financial statements more confusing
because it requires reporting multiple performance measures (Zweig 1997, 108). For example,
General Electric’s comment letter to the FASB maintained that CI, “in stark contrast to the
promise of its name, corresponds more closely to a random number than to enterprise
performance. But we believe equally strongly that, for a while at least, “comprehensive” income
will be looked to as a performance indicator, to the detriment of other measures in financial
statements that actually do reflect performance of the enterprise and its management.”7 Further,
because of the volatility inherent in the items that compose other-CI, critics of the standard
suggest that its disclosure will lead to increased perception of a firm’s risk.8 Finally, a number
comment letters to the FASB suggested that the components of CI are already available in the
annual reportalbeit in a disaggregated collection of financial statement and footnote
disclosuresand would be redundant if presented among the basic financial statements. As
described in the following section, psychology research suggests that the aggregation and
reporting of comprehensive income and its components can have a predictable effect on
analysts’ valuation judgments.
2.2 THE EFFECT OF COMPREHENSIVE INCOME DISCLOSURE
7 Interestingly, GE was one of the companies singled out by one of the study participants (an analyst with 17 yearsof experience and $1 billion of assets under management). When asked to comment on how “non-recurring items”affect the process of equity security valuation, he responded, “Accountants have done such a bad job with non-recurring items that net income is a joke. Any smart analyst will use alternative valuation measures. The financialstatements of companies like Coke and GE that use frequent “non-recurring” charges are a nationalembarrassment and should be outlawed by the SEC if the accountants can’t make the necessary changes.”8 Banks and financial institutions were particularly in opposition to the standard. Consider the response of FirstUnion Corporation.
... First Union’s comprehensive income, as defined in the Exposure Draft, and related earnings per sharefor the three months ended June 30, 1996 would have been 40% lower than reported income and earningsper share. The significant reduction in income could be construed by an ill-informed or ill-advisedinvestor as indicative of some fundamental underlying problem. Quite to the contrary the significantreduction in comprehensive income is the result of a well documented and proven asset-liability strategythat is intended to minimize present and future volatility that results from market changes, primarilyinterest rates. The reason that comprehensive income does not reflect the aggregate asset-liability strategyis because the concept is fatally flawed in that only selected economic assets, liabilities and derivativesare included.
8
HH report that analysts have difficulty valuing companies in the presence of active earnings
management. In that study, HH compare analyst valuation judgments across three conditions: no
earnings management (NEM), earnings management (EM), and increased revenues (IR). The
NEM and EM firms were identical except the EM firm recognized previous periods’ holding
gains on its available-for-sale securities by selling a portion of its marketable equity securities
portfolio in the current year and repurchasing securities of equal value. Under SFAS No. 115,
the holding gains on these securities are recorded as an increase in owners’ equity and are
recognized in the income statement only when they are sold. This rule allowed the EM firm to
maintain its 11 percent per-year growth in net income by selling some of its previously
appreciated marketable equity securities. However, the NEM firm continued to hold these
securities and reported virtually no growth in net income over the same period. Thus, although
the firms’ (unreported) CIs were the same and flat, their reported NIs differed.
HH found that buy-side equity analysts valued the EM firm significantly higher than the
NEM firm.9 Further, the IR firm was included in the study to provide a baseline against which to
compare the EM and NEM price judgments. Specifically, the IR firm was designed to have
exactly the same 11 percent per-year growth in earnings as the EM firm (thus, the same pattern
of NI); however, this increase was caused by an increase in revenues instead of sales of
marketable securities. Thus, the IR firm had an increasing pattern of (unreported) CI and the EM
firm had a flat pattern of (unreported) CI. The increase in revenues in the IR condition was
expected to be valued as a more persistent source of earnings than gains recognized through the
sale of marketable securities. As Jiambalvo (1996, 40) notes, “sales of securities ... are examples
of investment decisions that might be motivated primarily by the desire to increase reported
9 HH investigated differences in analysts’ stock-price judgments and did not identify a single correct stock pricefor the company’s outstanding common stock. The higher EM stock price judgments might be consideredappropriate if analysts believed management was signaling a shift in risk for their portfolio of equity investmentsor if management used the proceeds of their securities sales to invest in higher net present value projects.However, HH’s analysis of analysts’ written explanations for their stock price judgments supports neither of theseexplanations (i.e., no analysts in the EM condition mention a shift in risk or return as a result of the sale ofmarketable securities).
9
earnings, rather than by the desire to increase firm value.” However, HH found that financial
analysts valued the EM firm at approximately the same per share price as the IR firm. The EM
and NEM stock-price judgments from HH are reproduced in the left column of Panel A of Table
1.
Why didn’t analysts detect this particular type of earnings management? One reason might
be that in natural settings such activity does not exist. That seems unlikely. Numerous articles in
the business press and an established body of accounting research has investigated and discussed
earnings management (e.g., Healy 1985; Jones 1991; Cahan 1992; Dechow, Sloan, and Sweeney
1995, 1996). Indeed, one of the reasons for SFAS No. 115 was to reduce the level of “cherry
picking” (i.e., the practice of selling securities with gains and holding those with unrealized
losses with the purpose of reporting higher net income). During the debate over SFAS No. 115,
then-chairman of the SEC Richard Breeden was quoted as saying, “we have seen significant
abuse of managed earnings. Too often companies buy securities with an intent to hold them as
investments, and then miraculously, when they rise in value, the companies decide it’s time to
sell them. Meanwhile, their desire to hold those securities that are falling in value grows ever
stronger. So companies report the gains and hide the losses” (Weschler Linden, 1990). Writing
in Barron’s, Staubus (1992) cynically explained the business community’s stand against market-
value accounting noting, “historical cost accounting for securities permits a management, within
limits and in the short run, to report the net income and net worth it pleases, regardless of what
has happened to its investments in the market. Who would willingly abandon such a privilege?”
Furthermore, the available-for-sale classification leads to balance sheet but not income statement
changes. According to Staubus, “the gains or losses since acquisition need not be reported on the
income statement until management chooses to pick the cherries by making sales. Management
(manipulation?) of earnings will still be the order of the day.”
A plausible reason for the observed difference in analysts’ valuation judgments is that these
judgments are produced under great uncertainty and there are myriad means by which a
10
company can manage its earnings. In the face of the difficulty of financial statement analysis,
limited cognitive resources (i.e., bounded rationality), and judgment uncertainty, investigation of
the opportunistic sales of marketable securities may not be warranted in every analysis task.10
Further, the large number of companies followed and owned (e.g., analysts participating in this
study owned a mean of 66 and a median of 40 companies) by a typical buy-side equity analyst
realistically precludes an exhaustive investigation of earnings management opportunities for all
companies that are followed. Finally, there is a growing belief that sell-side analysts cannot be
counted on for penetrating and unbiased financial statement analysis (Hirst, Koonce and Simko
1995; Lin and McNichols 1997; McGee 1997).
Reither and Smith (1996) confirm the difficulty of detecting marketable-securities-related
earnings management by noting that SFAS No. 115 disclosures are highly inconsistent across
companies. Further, Staubus (1992) suggests that advocating “full dependence on [footnote]
disclosures recognizes neither the staffing levels of regulatory bodies, the regulatory power of
sunshine, nor the distaste many depositors, policyholders and stockholders have for financial-
statement analysis.”
Imhoff, Lipe, and Wright (1995) investigated the difficulty of incorporating value relevant
footnote information into stock prices in a lease accounting context. Specifically, they examine
the adequacy of footnote versus financial-statement disclosure and suggest that policy decisions
resulting in disclosure-only reporting requirements may produce inefficient behavior by capital
market participants because they may resort to overly simplistic heuristics. They argue further
that policymakers should not infer that the existence of sophisticated analysts ensures
equilibrium prices that accurately reflect the economic substance of financial statement
disclosures, regardless of their form. Based on their analyses, they conclude that “[t]he form of
10 Fridson (1997) argues that aggressive reporting may go undetected because the incentives of professional moneymanagers are not designed to lead them to expend the effort needed to uncover it. Because fund managers areevaluated relative to their peers, they are effectively penalized for missing big price run-ups (regardless of their‘bubble’ qualities) if other managers own a highflying stock and are rarely penalized if a stock held by mostmanagers suddenly implodes.
11
disclosures and the ease with which they may be used to modify recognized amounts appear to
be important.” Harper, Mister, and Strawser (1987, 1991) draw similar conclusions in a pension
accounting context.
Research in psychology and human information processing provides a basis for expecting the
clarity of CI disclosure format to influence the valuation judgments of analysts. In particular,
many studies suggest that changes in display characteristics can affect judgment and decision
behavior. For example, Johnson, Payne and Bettman (1988) find that presentation of an
uncertain outcome in a hard-to-process fractional format (e.g., 536/670) results in significantly
more preference reversals than presentation of the uncertain outcome in an easier-to-process
decimal format (e.g., .8).11 Further, Sanbonmatsu, Kardes, Posavac, and Houghton (1997) find
that direct presentation of decision-relevant information increases the chances it actually will be
used. Finally, Russo (1977) suggests that explicitly summarizing information that already is
available can increase the use of that information and can affect economic behavior.
Specifically, he documents a significant shift to inexpensive grocery items when per-unit price
information, which already was posted on grocery store shelves, was posted in order of
increasing prices on lists made available to shoppers. Russo (1978, 194) notes that “it is not
sufficient that the information be available; it must also be processable.”
2.3 HYPOTHESES
Although financial reporting rules mandate the disclosure of enough information to detect
earnings management through the timing of sales of available for sale marketable securities,
psychology research suggests that Imhoff, Lipe, and Wright’s (1995) views about the form of
disclosure may be descriptive. Therefore, the analysts in HH may have had difficulty
recognizing earnings management when its source was not summarized in a separate and more-
11 Preference reversals are obtained by presenting an uncertain choice to subjects in two contextually different, butlogically equivalent, formats. The reversal is obtained when subjects seemingly irrationally prefer a differentalternative when only the context (i.e., the way the question is asked) has changed. It is interesting to note that theuse of monetary incentives does not mitigate the preference reversal phenomenon (Grether and Plott 1979).
12
easily processed statement of financial performance. This difficulty may have resulted in the
significantly higher stock prices assigned to the EM company.12 Therefore, as illustrated in Panel
A of Figure 1, we propose the following alternative-form hypothesis about the possible effect of
SFAS No. 130 disclosure on analysts’ valuation judgments.
H1: Compared to no disclosure of comprehensive income, in the presence of upward
earnings management, clear disclosure of CI and its components with the IS will
reduce analysts’ stock price judgments to the same level as NEM stock price judgments
and NEM stock price judgments will not be affected by CI disclosure.
H1 considers two levels of disclosure clarity: the current (unclear) disclosure regime and the
clear CI disclosure with the IS. Although the FASB (1997) explicitly encourages companies to
disclose CI information “below a total for net income in a statement that reports the results of
operations or in a separate statement of comprehensive income that begins with net income”
(par. 23), this format is not required. The final version of SFAS No. 130 allows companies to
choose where they disclose CI and its components and firms may include the new CI disclosure
in the statement of changes in owners’ equity (SCOE). Indeed, based on the negative response to
the new standard by the financial statement preparers, it is likely that many companies may
include the new disclosure in the SCOE under “total non-owner changes in equity” or some
other nondescript heading (MacDonald 1997).13 Furthermore, at least one major accounting firm
provided clients with implicit guidance suggesting that elements of other CI be disclosed in the
SCOE.14
12 This discussion refers specifically to the financial analysis task included in the experiment in HH. Of course, notall earnings management should be construed as value reducing. The results of HH suggest that analysts valuedthe EM firm at a higher price than the NEM firm because the subjects did not fully process the opportunistic saleof marketable securities, not because they perceived a risk- or return-relevant signal through management’sdecision to sell the securities.13 The FASB heard public testimony from representatives of the business community and received 277 commentletters related to the CI project, the majority of which were negative.14 Coopers & Lybrand L.L.P. (1997) observed, “In response to constituents’ concerns, the [FASB] decided not torequire companies to display ... comprehensive income and its components in a statement of financialperformance. This decision permits an enterprise to utilize a statement of changes in equity to display thecomponents of comprehensive income in lieu of a statement of financial performance ...” (emphasis added).
13
An important assumption underlying the psychology theory that motivates H1 is that
financial analysts actually process and use the new CI information. Although this is likely in the
case of clear income statement disclosure, the assumption may not be descriptive in the case of
SCOE disclosure. Consistent with Brown’s (1997) observation that analysts regard the SCOE as
one of the least useful annual report disclosures, the information contained in the SCOE may be
largely ignored. In addition, SCOE disclosure of CI and its components does not highlight the
relationship between CI and net income as does CI disclosure with the IS. Therefore, the SCOE
format likely to be chosen by a majority of companies may mitigate the effect of CI disclosure
on analysts’ valuation judgments. This leads to the following alternative-form hypothesis:
H2: In the presence of upward EM, disclosure of CI in the SCOE will cause analysts’
valuation judgments to fall between the valuation judgments observed when there is no
CI disclosure and when CI is disclosed in the income statement.
In addition, consistent with the NEM relation predicted in H1, we do not expect CI disclosure
to have an effect on analysts’ stock-price judgments when the information is presented in the
SCOE. This leads to the following alternative-form hypothesis:
H3: In the presence of NEM, disclosure of CI in the SCOE will cause analysts’ valuation
judgments to be no different from the valuation judgments observed when there is no
CI disclosure and when CI is disclosed in the income statement.
3. Experiment
To investigate the effect of clear reporting of comprehensive income on equity analysts’
valuation judgments, we designed and conducted a 3 X 2 between-subjects experiment.
Participants were 96 buy-side equity-security analysts and portfolio managers.15 On average, the
study participants had 14 years of experience as financial analysts (82% were CFAs) and spent
an average of 44% of their time on equity-security analysis and another 43% on portfolio
15 All participants were individually recruited from the 1997 Association for Investment Management andResearch Membership Directory (AIMR 1996) on the basis of their self-reported job descriptions. After securingtheir agreement to participate, the materials were distributed, via overnight mail, to 134 analysts, yielding a 72percent response rate. No early/late respondent differences were noted.
14
management. The average portfolio under their management was $438 million (median $143
million) and included 66 companies (median 40). Their employers had an average of $9.7 billion
(median $845 million) assets under management.
The first independent variable was the financial-reporting format of CI. This variable was
operationalized as (1) pre-SFAS No. 130 format where CI is not explicitly disclosed (No-CI), (2)
disclosure of CI in the SCOE (CI-SCOE), or (3) separate disclosure of CI in a statement
following the income statement (CI-IS).16 Participants assigned to the No-CI condition were
provided with financial statements that did not explicitly disclose the components of CI.
However, they could determine the activity in the marketable securities account if they examined
details reported in the cash flow statement and in the balance sheet or the statement of changes in
stockholders’ equity. Participants assigned to the CI-IS condition were provided the same
financial statements except that a reconciliation of net income to CI appeared immediately
following the income statement. The reconciliation clearly indicated components of
comprehensive income including pre- and post-tax unrealized gains on marketable securities and
the reversal of gains previously recognized in comprehensive income (but not the income
statement). Participants assigned to the CI-SCOE condition were provided the same financial
statements as the CI-IS participants except the other-CI information was provided in the SCOE.
Materials in the CI conditions were constructed so as to be consistent with SFAS No. 130
reporting requirements.
The second independent variable was the level of earnings management engaged in by the
company described in the case. The company engaged in either a high or low level of
opportunistic timing of sales of available-for-sale securities. These conditions are referred to as
the earnings management (EM) and no earnings management (NEM) conditions, respectively. In
16 Data for the No-CI conditions is a subset of the data included in HH. The purpose of that study was toinvestigate analysts’ use of earnings information in their valuation judgments and did not investigate earnings-disclosure format. These data are reported in the present study to provide baseline conditions against which tocompare the CI disclosure alternatives and are included by permission of the Research Foundation of Institute ofChartered Financial Analysts.
15
the EM condition the company sold (and subsequently repurchased) enough marketable
securities to ensure an 11% growth trend in net income. In the NEM condition, these sales did
not occur. Consequently, in this condition, the company reported three years of essentially flat
net income. However, CI was the same in all EM and NEM conditions. In addition, the ending
balance sheets were identical across these conditions. Therefore, in theory, any valuation
differences should be the result of differences in analysts’ perceptions of future abnormal
earnings and growth in book value (see Feltham and Ohlson 1995; Ohlson 1995).
The materials in the study consisted of two parts, a stock price valuation task followed by
post-experiment questions. The company-specific information in the case was for a hypothetical
company in the electronic measurement and testing instruments industry (SIC 3825). This
information was based on an actual company listed on the American Stock Exchange. We
selected the industry and company on which the materials are based through a search of the 1995
Compustat P/S/T database. In particular, we searched for companies that experienced a
significant increase in the balance of unrealized gains and losses in marketable equity securities
(data item 238) as compared to reported net income.17 We obtained the company’s financial
statements via Lexis/Nexis and modified them to incorporate the independent variables
investigated in this study.
Participants were provided with background information about a company, its industry,
industry average price-earnings ratios and ranges, and summary historical financial
information.18 This was followed by a stylized press release (as disseminated by Bloomberg
Financial Services) reporting the company’s annual earnings. The press release also included the
current year’s financial statements and a summary of significant accounting policies. After
reviewing the industry and company background information, and the company’s financial
statements as included in the press release, participants were asked to provide an estimate of the
17 A significant increase in this item number suggests a high level of comprehensive income relative to netincome.18 The price-earnings ratio data was provided to indicate a reasonable range within which the company’s stockprice might fall. An actual stock price was not provided in the materials.
16
value of the company’s common stock. Participants also were asked to provide a description of
the manner in which they determined the stock price. Following these questions, subjects
responded to a series of questions about the financial information in the case, several
manipulation check questions, and provided demographic information.
4. Results
4.1 MANIPULATION AND OTHER CHECKS
We asked participants whether the company reported a measure called ‘comprehensive
income’ in its financial statements. As expected, participants were much more likely to indicate
that CI was reported in the CI-IS conditions (94%) than in the No-CI conditions (9%).
Interestingly, only 50% of participants in the CI-SCOE conditions indicated that CI had been
reported.19 This finding is consistent with the concern that information relegated to the SCOE
will not be as widely used as information associated with the IS (i.e., consistent with analysts’
responses in Brown 1997).
We also asked participants to indicate the rate of annual growth in the reported net income of
the company. We found that overall, the level of perceived earnings growth was higher
(t = 16.61, p = .000) in the EM conditions (mean = 10.22 percent, s.d. 2.41) than in the NEM
conditions (mean = 1.84 percent, s.d. 2.40). This suggests that analysts noticed the different
levels of increase in net income associated with each of the earnings management conditions.
Other data indicate that variables that should not have been perceived as different across
earnings management conditions, as expected, did not differ. We found no cross-condition
differences in perceptions about management’s competence (p = .257), the company’s financial
condition (recall that the balance sheets were the sameaside from the presentation of
cumulative other CIacross conditions) (p = .539), or the company’s ability to pay its debts as
they come due (p = .744).
4.2 EXPERIMENTAL RESULTS
19 The results of our hypothesis tests do not change when we exclude analysts who did not correctly answer the CImanipulation-check question.
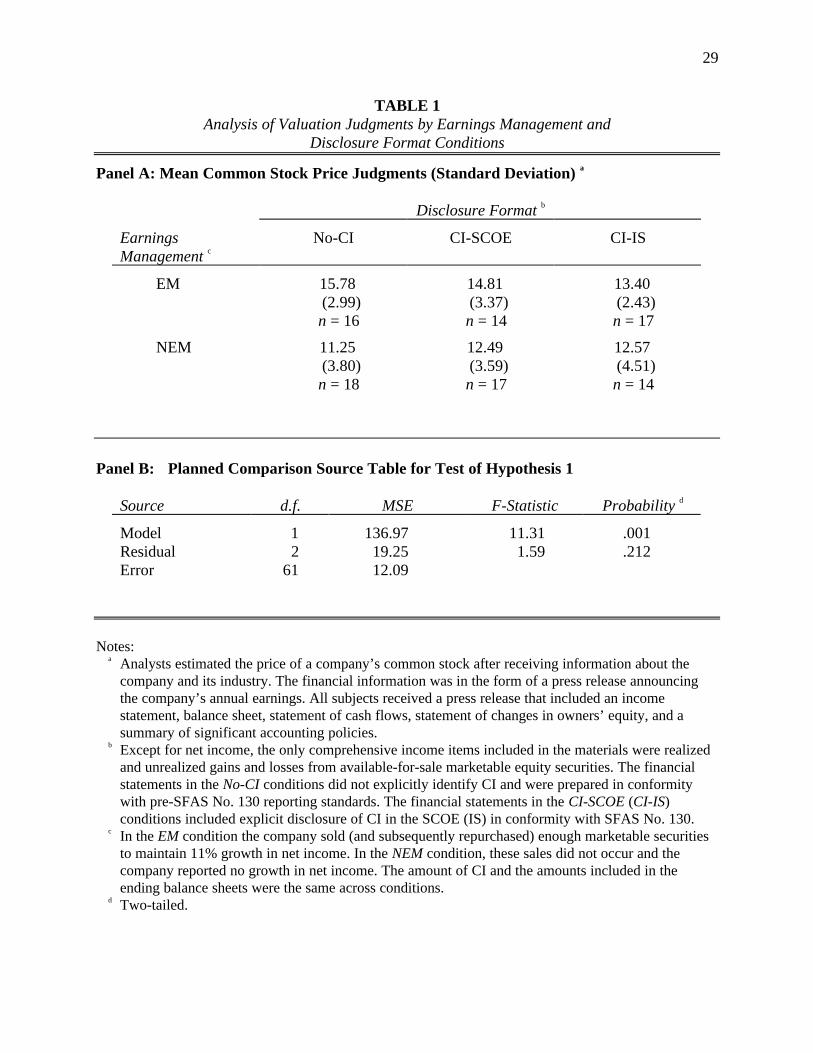
17
Our main dependent variable is analysts’ valuation of the common stock of the company.
Panel A of Table 1 presents the descriptive and inferential statistics. Because we make specific
directional predictions for a subset of the possible comparisons, we report contrasts within the
overall ANOVA. Where post-hoc comparisons are made, Fisher PLSD adjustments are made for
family-wise error rates.
H1 predicts that compared to no disclosure of CI, disclosure of CI with the income statement
will reduce analysts’ stock price judgments in the presence of earnings management but will not
affect these judgments in the presence of no earnings management. To test this hypothesis, we
perform planned comparisons for ordinal interactions as suggested by Buckless and Ravenscroft
(1990). First, we determine whether the valuation judgments are greater in the EM No-CI
condition (mean = 15.78 dollars per share) than the “overall mean” in the EM CI-IS, NEM No-
CI, and NEM CI-IS conditions (mean = 12.41). As reported in panel B of Table 1, this contrast
yields a significant difference (F1,61 = 11.31, p = .001). To mitigate the possibility that one of the
conditions within the “overall mean” is causing this difference, a semi-omnibus F-test was
conducted on the NEM No-CI, NEM CI-IS, and EM CI-IS cells. The results of this test suggest
that analysts did not value the company differently across those cells (F2,61 = 1.59, p > .2). Taken
together and as predicted, the results suggest that clear SFAS No. 130 disclosures included in a
separate statement of performance are effective in reducing analysts’ valuation judgments in the
presence of strategic timing of the sale of marketable securities. Furthermore, when management
does not engage in strategic timing of securities sales, CI disclosure has no effect on analysts’
valuation judgments.20
20 A less precise alternative to the planned-comparison analysis proposed by Buckless and Ravenscroft (1990) is toperform a standard 3X2 ANOVA and to individually investigate the components of the interaction. The overallearnings management by disclosure format interaction is significant (MS = 28.18, F2,90= 2.32, p = .052, one-tailed).Within this interaction, the planned comparison between the EM No-CI and NEM No-CI conditions is significantat p = .000 (one-tailed). Further, the planned comparison between the EM CI-IS and the NEM CI-IS conditionsreveals no statistical difference (p > .25, one tailed). The results of these more-general tests yield the sameconclusion as our single planned comparison of H1.
18
H2 predicts that in the presence of upward EM, disclosure of CI in the SCOE will cause
analysts’ valuation judgments to fall between the valuation judgments observed when there is no
CI disclosure and when CI is disclosed in the income statement. This suggests that the order of
the valuation judgments, in the presence of upward EM, should be (in decreasing order) EM No-
CI, EM CI-SCOE, and EM CI-IS. The Jonckheere test for ordered alternatives (Siegel and
Castellan, 1988) allows us to test for this relationship. Testing the null hypothesis that the three
cells are equal against the alternative that EM No-CI ≥ EM CI-SCOE ≥ EM CI-IS with at least
one strict inequality (>), we find that the cells are indeed in the predicted order (J* = 2.15,
p = .016).
H3 predicts that in the presence of NEM, disclosure of CI in the SCOE will cause analysts’
valuation judgments to be no different than the valuation judgments observed when there is no
CI disclosure and when CI is disclosed in the IS. Here we predict no order effect for disclosure
format within the NEM cells. As expected, the results of a semi-omnibus F-test on the three
NEM conditions suggest that these mean valuation judgments are not different (F2,46 < 1). This
suggests that the NEM cells are unaffected by the disclosure or non-disclosure of CI.
Further analysis of the CI-SCOE conditions is warranted because of concernsexpressed in
the dissent to SFAS No. 130 by FASB members Cope and Fosterthat allowing entities to
disclose items of other CI in the SCOE “will do little to enhance their visibility and will
diminish their perceived importance” (p. 10). Within the overall 3 X 2 ANOVA, a planned
comparison of stock-price judgments between the EM CI-SCOE condition (mean = 14.81) and
the NEM CI-SCOE condition (mean = 12.49) reveals a significant difference (p = .034, one-
tailed). The persistence of a difference between valuation judgments in the EM and NEM
conditions when CI is disclosed in the SCOE lends support to the concerns expressed by the
dissenting Board members. Specifically, SCOE disclosure of CI was not as effective as IS
disclosure in mitigating the difference between EM and NEM valuation judgments. The
following section investigates analysts’ non-valuation-based perceptions that may have caused
the differential effect of disclosing CI in the IS versus the SCOE.
19
4.3 OTHER ANALYSES
As noted in the discussion of manipulation checks, we asked analysts to indicate whether
management disclosed an item called “comprehensive income.” Within the EM treatment, 8
analysts (61 percent) in the CI-SCOE condition and 16 analysts (94 percent) in the CI-IS
condition correctly answered this question. Further, within the NEM conditions, 7 analysts
(41 percent) in the CI-SCOE and 13 analysts (93 percent) in the CI-IS correctly answered this
question. A Pearson 2 statistic for these frequencies suggests that there is an association
between the format of CI disclosure (i.e., IS versus SCOE) and analysts’ correctly recalling the
disclosure of comprehensive income (χ2 = 44.64, df = 2, p = .000). This result suggests that
analysts are more likely to notice CI information when it is included in a separate statement of
performance as compared to disclosure in the SCOE.
We also asked participants to rate various attributes of the company’s financial data on 15-
point scales. In particular, they rated the quality of 1997 net income (very low-very high), the
clarity of the financial statements (not at all clear-very clear), the reliability of the financial
statements (very unreliable-very reliable) and the manner in which the financials portrayed the
company’s overall long-term financial performance (very misleading-very truthful). A Cronbach
coefficient alpha score of .78 confirms that the joint effect of CI format and earnings
management manipulations are highly correlated for these items. Therefore, we constructed a
composite measure of “perceived financial reporting quality” (PFRQ) by taking a simple average
of the four measures. As reported in Panel A of Table 2, the PFRQ was equal in all conditions
but the EM-CI-IS condition. Specifically, the level of PFRQ was considered significantly lower
(t = 3.89, p = .000) in the EM-CI-IS condition (mean = 7.0, s.d. = 1.82) than in the average of
the other five conditions (mean = 9.0, s.d. = 1.90). A semi-omnibus F-test conducted across the
five conditions other than the EM-CI-IS condition suggests that analysts did not value the
company’s reporting quality differently across those cells (F < .5).
20
Immediately after analysts made their stock price judgments, they explained how they
arrived at their judgments. Based on analysis of these explanations, many analysts appear to have
used an earnings-based multiple (e.g., P/E) to arrive at their common-stock price judgments.
Analysts’ assessment of earnings is an important component of this approach because it is an
explicit input into the P/E ratio. However, analysts’ assessment of the future earnings growth of
the company also is important because it helps determine the relationship between price and
earnings (i.e., the multiple). As reported in Panel B of Table 2, analysts’ rated, on a 15-point
scale (very low-very high), the company’s ability to sustain earnings growth significantly higher
(t = 2.44, p = .017) in the EM No-CI condition (mean = 8.63) than the NEM No-CI condition
(mean = 6.37). In contrast, analysts perceived no difference (t < .1) between the EM CI-IS
condition (mean = 5.41) and the NEM CI-IS condition (mean = 5.47). Further, analysts in the
SCOE conditions rated the company’s ability to sustain earnings growth more like the No-CI
conditions than the IS conditions. Specifically, analysts’ ratings were significantly higher (t =
3.43, p = .001) in the EM CI-SCOE condition (mean = 9.04) than the NEM CI-SCOE condition
(mean = 5.69).
These results help explain why valuation differences across EM and NEM conditions were
observed in the No-CI and CI-SCOE conditions but were eliminated in the CI-IS condition. Only
when analysts perceived lower reporting quality and future growth (i.e., EM-CI-IS) did they
value the stock of the company engaging in earnings management lower. Our findings also are
consistent the AIMR’s position that clear disclosure of CI and its components can help analysts
assess the overall quality of a company’s net income and adjust their valuation judgments for
different sources of earnings (e.g., marketable-securities holding gains).
Finally, content analysis of analysts’ stock price explanations provides further evidence that
the hypothetical company was perceived differently across conditions. In particular, only 13% of
subjects in the EM-No-CI condition mentioned the slow growth in the company’s revenues.
Across the remaining five conditions, the percentage ranged from 41% to 71% (mean = 47%).
21
This suggests that participants in the EM-No-CI condition focused on reported net income and
not its components. In the other EM conditions, it was more apparent that earnings were
increasing due to marketable securities transactions. Nonetheless, although the slow top-line
growth was observed in the EM-CI-SCOE condition, it did not result in stock-price judgments
equal to those in the NEM-CI-SCOE condition. This is consistent with Russo’s (1977)
proposition that information needs to be available and processable. This intermediate level of
clarity may not be sufficient to ensure CI information is processable.
5. Summary and Discussion
In this study, we investigated whether two-types of CI disclosureIS and SCOEaffect the
judgments of buy-side equity analysts when they estimate the stock price of a company that
upwardly manages its net income through its available-for-sale marketable securities portfolio.
More specifically, we investigate whether clear disclosure is effective in mitigating the upward
bias in common stock price judgments observed in the presence of earnings management in Hirst
and Hopkins (1997). Consistent with our expectations (H1), clear disclosure of CI and its
components in a separate statement of performance made earnings management more
transparent and resulted in significantly lower stock price judgments than the No-CI judgments
reported in HH. Further, these CI-IS stock price judgments were not different from the prices
observed where management did not sell its previously appreciated, available-for-sale
marketable securities (i.e., the NEM-No-CI and NEM-IS conditions).
Consistent with our expectation for the EM analysts (H2), the CI-SCOE price judgments
were between the No-CI and CI-IS judgments. Further, we find that CI disclosure has no effect
on analysts’ stock price judgments in the absence of earnings management (H3). Interestingly,
post hoc analyses suggest that SCOE presentation of CI and its components does not eliminate
the difference between stock price judgments in the EM and NEM conditions. Supplemental
analyses indicate that when CI is disclosed in the SCOE, and a company is upwardly managing
its earnings, perceived financial reporting quality and ability to sustain future growth are the
22
same as when CI is not disclosed. Only when CI is disclosed in a separate statement of
performance do these perceptions (and equity security valuations) differ.
This study has implications for accounting standard setters, accounting educators, and users
and preparers of financial accounting information. First, in response to the call for such research
(Beresford and Johnson 1995), this study provides ex ante evidence for one of the possible
effects of CI reporting. Although the CI reporting standard already has been issued, the Board
has indicated that it will continue to consider CI-related issues and presently is in the latter
stages of a project that likely will add another item to the determination of CI (see FASB
1996b). Our findings suggest that CI SCOE disclosure is not as effective in communicating
value relevant information as the originally proposed CI IS disclosure.
This study also provides an example of Bonner’s (1997) framework for judgment and
decision-making (JDM) research. In the framework, she suggests that researchers should identify
a judgment or decision that needs improvement, determine the source of the JDM deficiency
(e.g., person, task, and/or environment), and then propose a way to mitigate the judgment or
decision problem. The final prescription of her framework is that the JDM study be carried out
only if the proposed judgment or decision aid can be implemented in practice. Consistent with
the framework, we show how the difference in stock price judgments between the EM and NEM
conditions in HH can be mitigated. Our findings suggest that detection of EM through the
available-for-sale portfolio may be costly and that clear disclosure of marketable-securities’
holding gains and losses in a separate statement of performance can be effective in mitigating the
price differences across EM and NEM conditions.
Another contribution of this study is that it investigates the impact of different forms of
accounting disclosure on analysts’ valuation judgments.21 Analysts are financial intermediaries
who are important consumers of accounting information. This study extends Hopkins (1996) and
21 Note that we did not vary the recognition of other-CI items, only the format of their disclosure. For acomprehensive discussion of the recognition versus disclosure issue see Bernard and Schipper (1994).
23
suggests that fundamental variation in the way accounting information is presented can have a
measurable impact on analysts’ stock price estimates. For many investors, these estimates are an
important input in the process that culminates with a security purchase or sale decision.
Specifically, it is the comparison of a stock’s estimated value to its current or expected trading
price that likely leads to buy, sell or hold decisions.
Of course, this study includes a number of features that limit its generalizability to natural
settings. First, the stock price judgments reported in this paper are simple averages across
analysts in each condition. Therefore, we do not claim that these prices are representative of the
prices that would be obtained after organized trading activity. Nonetheless, we believe analysts’
valuation judgments are an important input to this process and warrant careful investigation. To
the extent other institutional or trading-related factors affect price, these price judgments may
not be indicative of market-determined prices. However, laboratory markets studies have found
that market aggregation of rational individual-level data is not guaranteed to result in complete
information revelation (e.g., Bloomfield and Libby [1996]).
We also limited the amount of information provided to each analyst. Therefore, this study
does not investigate the extent to which analysts ordinarily would obtain value-relevant
information from another source. Survey results suggest that buy-side analysts obtain
information from many sources, including company management and other analysts (SRI
International [1987]). Our decision to limit the amount of information was made to construct a
task that could be completed in a reasonable amount of time and to increase the likelihood of
analysts’ participation.
Offsetting these potential limitations are several important features of our experiment. First,
the participants, buy-side equity analysts and portfolio managers, are well suited for the
valuation task included in the study. Second, the high response rate testifies to the relevance of
the materials to their day-to-day activities and their attention to the task. Given the other
demands on their time, the number of stocks they typically own and follow, and the types of

24
valuation methods they use on a regular basis (compared with the methods they used in our
study), we have reason to believe the data are highly reliable.
25
References
Association for Investment Management and Research (AIMR). Financial Reporting in the1990’s and Beyond. Charlottesville, VA, 1993.
Beresford, D. R., and L. T. Johnson. “Interactions Between the FASB and the AcademicCommunity.” Accounting Horizons. (December 1995): 108-117.
Beresford, D. R., L. T. Johnson, and C. L. Reither. “Is a Second Income Statement Needed?”Journal of Accountancy. (April 1996): 69-72.
Bernard, V., and Schipper, K. “Recognition and Disclosure in Financial Reporting.” Workingpaper. University of Chicago, 1994
Bloomfield, R., and R. Libby. “Market Reactions to Differentially Available Information in theLaboratory.” Journal of Accounting Research (Autumn 1996): 183-208.
Bonner, S. E. Judgment and Decision-Making Research in Accounting, monograph in progress.1997
Brown, P. R. “Financial Data and Decision Making by Sell-Side Analysts.” The Journal ofFinancial Statement Analysis. (Spring 1997): 43-48.
Buckless, F. A., and S. P. Ravenscroft. “Contrast Coding: A Refinement of ANOVA inBehavioral Analysis.” The Accounting Review. (October 1990): 933-945.
Cahan, S. F. “The Effect of Antitrust Investigations on Discretionary Accruals: A Refined Testof the Political-Cost Hypothesis.” The Accounting Review (January 1992): 77-95.
Coopers & Lybrand L.L.P. Monthly Financial Reporting Release: Accounting and AuditingDevelopments. (July) New York, NY, 1997.
Dechow, P., R. Sloan; and A. Sweeney. “Detecting Earnings Management.” The AccountingReview (April 1995): 193-225.
Dechow, P., R. Sloan; and A. Sweeney. “Causes and Consequences of Earnings Manipulation:An Analysis of Firms Subject to Enforcement Actions by the SEC.” ContemporaryAccounting Research (Spring 1996): 1-37.
Dechow, P., J. Sabino, and R. Sloan. “Implications of Nondiscretionary Accruals for EarningsManagement and Market-Based Research.” Working paper. University of Michigan, 1997.
Executive Committee of the American Accounting Association. “A tentative statement ofaccounting principles underlying corporate financial statements.” Accounting Review . (June1936): 187-191.

26
Feltham, G. A. and J. A. Ohlson. “Valuation and Clean Surplus Accounting for Operating andFinancial Activities.” Contemporary Accounting Research (Spring 1995): 689-731.
Financial Accounting Standards Board. Statement of Accounting Concepts (SFAC) No. 1:Objectives of Financial Reporting by Business Enterprises. Stamford, CT: FASB. 1978.
Financial Accounting Standards Board. Statement of Financial Accounting Standards No. 52:Foreign Currency Translation. Stamford, CT: FASB, 1981.
Financial Accounting Standards Board. Statement of Accounting Concepts (SFAC) No. 5:Recognition and Measurement in Financial Statements of Business Enterprises. Stamford,CT: FASB, 1984a.
Financial Accounting Standards Board. Statement of Financial Accounting Standards No. 80:Accounting for Futures Contracts. Stamford, CT: FASB, 1984b.
Financial Accounting Standards Board. Statement of Accounting Concepts (SFAC) No. 6:Elements of Financial Statements. Stamford, CT: FASB, 1985a.
Financial Accounting Standards Board. Statement of Financial Accounting Standards No. 87:Employers’ Accounting for Pensions. Stamford, CT: FASB, 1985b.
Financial Accounting Standards Board. Statement of Financial Accounting Standards No. 115,Accounting for Certain Investments in Debt and Equity Securities. Norwalk, CT: FASB,1993.
Financial Accounting Standards Board. Exposure Draft: Reporting Comprehensive Income.Norwalk, CT: FASB, 1996a.
Financial Accounting Standards Board. Exposure Draft: Accounting for Derivatives and SimilarFinancial Instruments and for Hedging Activities. Norwalk, CT: FASB, 1996b.
Financial Accounting Standards Board. Statement of Financial Accounting Standards No. 130:Reporting Comprehensive Income. Norwalk, CT: FASB, 1997.
Fridson, M. S. “Revenue Precognition and Other Forms of Aggression.” The Journal ofFinancial Statement Analysis (Fall 1997): 55-59.
Grether, D., and C. Plott. “Economic Theory of Choice and the Preference ReversalPhenomenon.” American Economic Review (1979) : 623-638.
Harper, R. M., W. G. Mister, and J. R. Strawser. “The Impact of New Pension Disclosure Ruleson Perceptions of Debt.” Journal of Accounting Research (Autumn 1987): 327-330.
27
Harper, R. M., W. G. Mister, and J. R. Strawser. “The Effect of Recognition Versus Disclosureof Unfunded Postretirement Benefits on Lenders’ Perceptions of Debt.” Accounting Horizons(September 1991): 50-56.
Healy, P. M. “The Effect of Bonus Schemes on Accounting Decisions.” Journal of Accountingand Economics (1/3 1985): 85-107.
Hirst, D. E., L. Koonce, and P. J. Simko. “Investor Reaction to Financial Analysts’ ResearchReports.” Journal of Accounting Research (Autumn 1995): 335-352.
Hirst, D. E., and P. E. Hopkins. 1997. Earnings: Measurement, Disclosure, and the Impact onEquity Valuation. Monograph (in progress) for the Research Foundation of the Institute ofChartered Financial Analysts.
Hopkins, P. E. . “The Effect of Financial Statement Classification of Hybrid FinancialInstruments on Financial Analysts’ Stock Price Judgments.” Journal of Accounting Research34. (Supplement 1996): 33-50.
Imhoff, E. A., R. C. Lipe, and D. W. Wright. “Is Footnote Disclosure an Adequate Alternativeto Financial Statement Recognition?” Journal of Financial Statement Analysis. (Fall 1995):70-81.
Jiambalvo, J. Discussion of “Causes and Consequences of Earnings Manipulation: An Analysisof Firms Subject to Enforcement Actions by the SEC.” Contemporary Accounting Research(Spring 1996): 37-47.
Johnson, E. J., J. W. Payne, and J. R. Bettman. “Information Displays and PreferenceReversals.” Organizational Behavior and Human Decision Processes 42. (August 1988):1-21.
Johnson, L. T., and C. L. Reither. “Reporting Comprehensive Income.” Financial AccountingSeries FASB Viewpoints. (No. 155-A: November 28, 1995): Norwalk, CT: FASB.
Jones, J. J. “Earnings Management During Import Relief Investigations.” Journal of AccountingResearch (Autumn 1991): 193-228.
Levitt, A. “The Importance of High Quality Accounting Standards.” Speech to the Inter-American Development Bank (September 26, 1997): Washington, D.C.
Lin, H-w. and M. F. McNichols. “Underwriting Relationships and Analysts’ Earnings Forecastsand Investment Recommendations. “Working paper. Stanford University, 1997.
MacDonald, E. “FASB Rule Will Offer Walk on Wild Side.” The Wall Street Journal.(September 30, 1997): C1.
28
McGee, S. “After Oracle Misfire, Wall Street’s Research Is Blasted.” The Wall Street Journal.(December 11, 1997): C1.
Ohlson, J. A.. “Earnings, Book Values, and Dividends in Equity Valuation.” ContemporaryAccounting Research (Spring 1995): 661-687.
Paton, W. A., and A. C. Littleton. An Introduction to Corporate Accounting Standards.American Accounting Association. Sarasota, FL: AAA, 1940.
Russo, J. E. “The Value of Unit Price Information.” Journal of Marketing Research 13, (May1977): 193-201.
Sanbonmatsu, D. M., F. R. Kardes, S. S. Posavac, and D.C. Houghton. “Contextual Influenceson Judgment Based on Limited Information.” Organizational Behavior and Human DecisionProcesses. (March 1997): 251-264.
Siegel, S. and N. J. Castellan. Nonparametric Statistics for the Behavioral Sciences. SecondEdition. New York, N.Y.: McGraw-Hill Book Company, 1988.
Smith, P. A. and C. L. Reither. “Comprehensive Income and the Effect of Reporting It.”Financial Analysts Journal. (November/December 1996): 14-19.
SRI International. Investor Information Needs and the Annual Report. Morristown, New Jersey:Financial Executives Research Foundation, 1987.
Staubus, G. J. “Cherry Pickers’ Friend.” Barron’s. (December 7, 1992): 16-17.
Sutton, M., and J. Johnson. “Current Values: Finding a Way Forward.” Financial Executive 9.(January-February 1993): 39-43.
Wechsler Linden, D. “If Life Is Volatile, Account For It.” Forbes. (November 12 1990): 114.
Zweig, P. “Corporate America is fed up with the FASB.” Business Week. (April 21, 1997): 108-110.
29
TABLE 1Analysis of Valuation Judgments by Earnings Management and
Disclosure Format Conditions
Panel A: Mean Common Stock Price Judgments (Standard Deviation) a
Disclosure Format b
EarningsManagement c
No-CI CI-SCOE CI-IS
EM 15.78(2.99)n = 16
14.81(3.37)n = 14
13.40(2.43)n = 17
NEM 11.25(3.80)n = 18
12.49(3.59)n = 17
12.57(4.51)n = 14
Panel B: Planned Comparison Source Table for Test of Hypothesis 1
Source d.f. MSE F-Statistic Probability d
Model 1 136.97 11.31 .001Residual 2 19.25 1.59 .212Error 61 12.09
Notes:a Analysts estimated the price of a company’s common stock after receiving information about the
company and its industry. The financial information was in the form of a press release announcingthe company’s annual earnings. All subjects received a press release that included an incomestatement, balance sheet, statement of cash flows, statement of changes in owners’ equity, and asummary of significant accounting policies.
b Except for net income, the only comprehensive income items included in the materials were realizedand unrealized gains and losses from available-for-sale marketable equity securities. The financialstatements in the No-CI conditions did not explicitly identify CI and were prepared in conformitywith pre-SFAS No. 130 reporting standards. The financial statements in the CI-SCOE (CI-IS)conditions included explicit disclosure of CI in the SCOE (IS) in conformity with SFAS No. 130.
c In the EM condition the company sold (and subsequently repurchased) enough marketable securitiesto maintain 11% growth in net income. In the NEM condition, these sales did not occur and thecompany reported no growth in net income. The amount of CI and the amounts included in theending balance sheets were the same across conditions.
d Two-tailed.
30
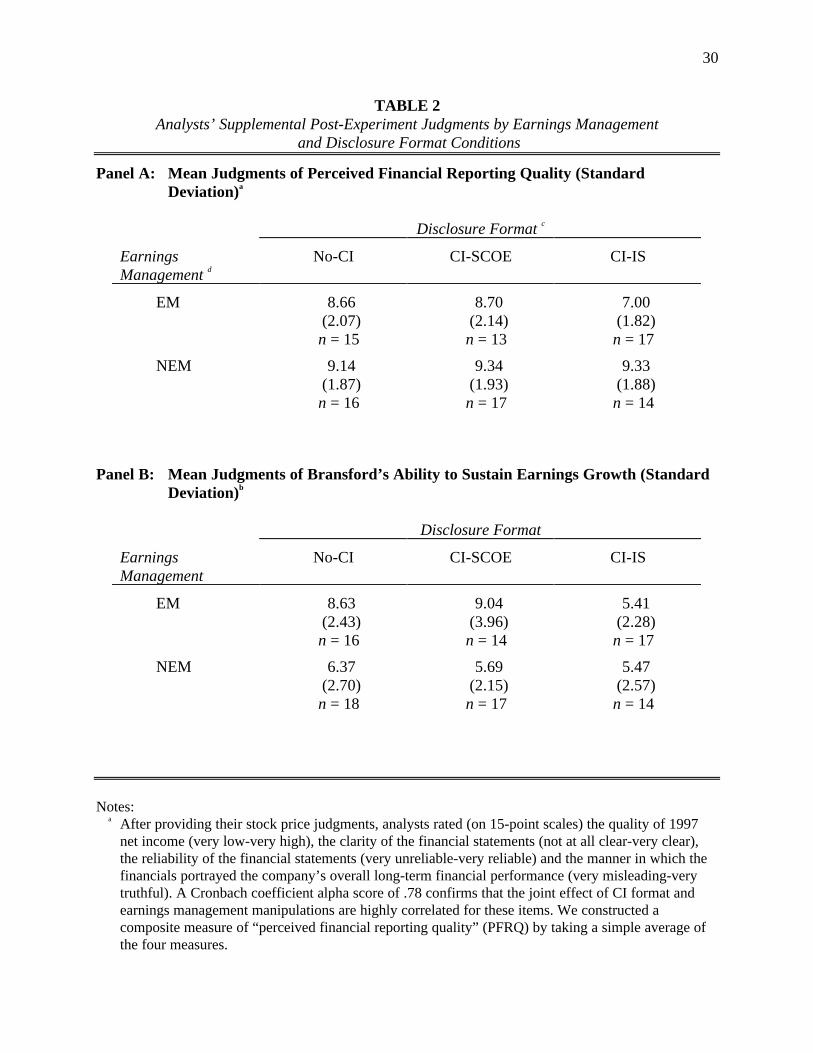
TABLE 2Analysts’ Supplemental Post-Experiment Judgments by Earnings Management
and Disclosure Format Conditions
Panel A: Mean Judgments of Perceived Financial Reporting Quality (StandardDeviation)a
Disclosure Format c
EarningsManagement d
No-CI CI-SCOE CI-IS
EM 8.66(2.07)n = 15
8.70(2.14)n = 13
7.00(1.82)n = 17
NEM 9.14(1.87)n = 16
9.34(1.93)n = 17
9.33(1.88)n = 14
Panel B: Mean Judgments of Bransford’s Ability to Sustain Earnings Growth (StandardDeviation)b
Disclosure Format
EarningsManagement
No-CI CI-SCOE CI-IS
EM 8.63(2.43)n = 16
9.04(3.96)n = 14
5.41(2.28)n = 17
NEM 6.37(2.70)n = 18
5.69(2.15)n = 17
5.47(2.57)n = 14
Notes:a After providing their stock price judgments, analysts rated (on 15-point scales) the quality of 1997
net income (very low-very high), the clarity of the financial statements (not at all clear-very clear),the reliability of the financial statements (very unreliable-very reliable) and the manner in which thefinancials portrayed the company’s overall long-term financial performance (very misleading-verytruthful). A Cronbach coefficient alpha score of .78 confirms that the joint effect of CI format andearnings management manipulations are highly correlated for these items. We constructed acomposite measure of “perceived financial reporting quality” (PFRQ) by taking a simple average ofthe four measures.

31
b After providing their stock price judgments, analysts assessed (on a 15-point scale, very low-veryhigh) the company’s “ability to sustain growth in net income in the future.”
c Refer to Table 1 for a description of the independent variables.
32
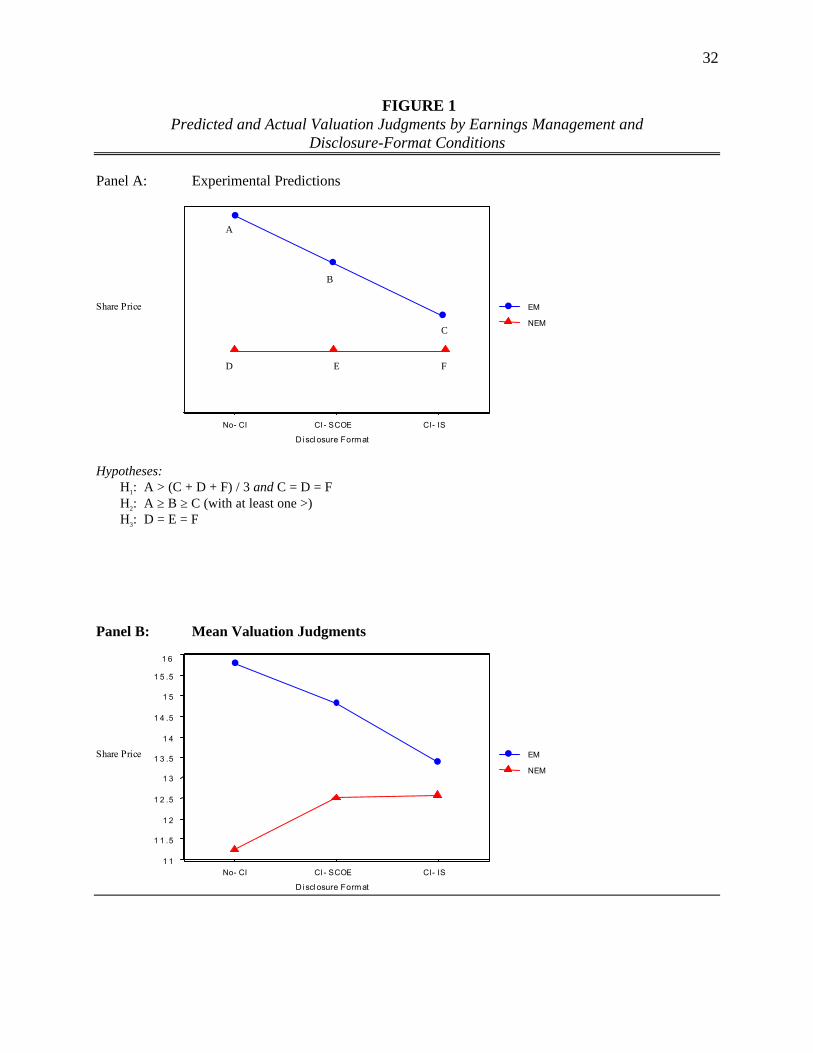
FIGURE 1Predicted and Actual Valuation Judgments by Earnings Management and
Disclosure-Format Conditions
Panel A: Experimental Predictions
Share Price
No- CI CI - SCOE
Discl osure Format
CI- IS
NEM
EM
D E F
A
B
C
Hypotheses:H1: A > (C + D + F) / 3 and C = D = FH2: A ≥ B ≥ C (with at least one >)H3: D = E = F
Panel B: Mean Valuation Judgments
1 1
1 1 .5
1 2
1 2 .5
1 3
1 3 .5
1 4
1 4 .5
1 5
1 5 .5
1 6
Share Price
No- CI CI - SCOE
Discl osure Format
CI- IS
NEM
EM

33


