Embed Size (px)
Citation preview
*Corresponding author. Tel.: #34-968-364710; fax: #34-968-364147.
E-mail address: [email protected] (M. Castillo).
International Dairy Journal 10 (2000) 551}562
Predicting cutting and clotting time of coagulating goat's milk usingdi!use re#ectance: e!ect of pH, temperature and enzyme concentration
M. Castillo!,*, F.A. Payne", C.L. Hicks#, M.B. Lopez!!Department of Food Technology, University of Murcia, E-30071, Murcia, Spain
"Department of Biosystems and Agricultural Engineering, University of Kentucky, Lexington, KY 40546, USA#Department of Animal Sciences, University of Kentucky, Lexington, KY 40546, USA
Received 30 September 1999; accepted 16 July 2000
Abstract
A di!use re#ectance sensor, which used optical "bres and near-infrared radiation (NIR) at 880 nm, was used to monitor goat's milkcoagulation. A randomised block design replicated three times was utilized to test the e!ects of pH, temperature and enzymeconcentration on di!use re#ectance parameters. Milk pH was adjusted to three levels (5.5, 6.0 and 6.5) and coagulated at threedi!erent temperatures (28, 32 and 363C), using three enzyme concentrations (0.020, 0.035 and 0.050 mL kg~1 of milk). A linear cuttingtime prediction equation, ¹
#65"b¹
.!9, was found to predict visual cutting time with a standard error of prediction of 84.5 s and an
R2 of 0.9785. b was a!ected by pH, temperature and enzyme concentration. The di!use re#ectance parameter (¹.!9
) was stronglycorrelated to the Berridge clotting time (R2"0.9913). Parameters generated from the di!use re#ectance pro"les, with the exception ofresponse-based parameters, were found to be a function of coagulation rate. ( 2001 Elsevier Science Ltd. All rights reserved.
Keywords: Di!use re#ectance; Cutting time; Clotting time; Goat's milk; Rennet
1. Introduction
Coagulum is usually cut in cheese plants after a prede-termined enzymatic reaction time has elapsed or uponthe operator's judgement of cutting time based on subjec-tive evaluation of textural and visual properties of thecurd. Cutting the curd after a predetermined time isquestionable because factors that a!ect curd "rmnesscould cause a variation in the optimum cutting time(Gunasekaran & Ay, 1996). Cutting the curd by relyingon the subjective judgement of the operator can be accu-rate and acceptable if the evaluation is made properly(Hori, 1985). If the gel is too "rm at cutting time, syneresiswill be retarded, resulting in a high moisture cheese. If thecurd is cut too soft then cheese yield will be decreased asa result of increased loss of fat and curd "nes in the whey(Hori, 1985; Payne, Hicks, & Shen, 1993a). These reasonssuggest the importance of an objective method for
optimal cutting time determination in cheesemaking.Determination of the optimum cutting time is more im-portant for the small and less-automated cheese plantstypical of goat cheese production, because of the largecompositional variation between milk batches and thelarge variation in coagulation process (van Hooydonk& van den Berg, 1988).
Complete automation of cheese production awaits de-velopment of an on-line method that predicts the visualcutting time. An automated system is needed to re"ne thecheesemaking process, resulting in maximised yield, in-creased quality and improved homogeneity of cheese(Payne, 1995; Gunasekaran & Ay, 1996). Several devicesand instruments have been employed for monitoringcoagulation parameters and/or used to determine opti-mum "rmness for cutting the curd. Numerous mechan-ical curd "rmness testers have been proposed to measuremilk coagulation parameters in cheese vats (Richardson,Okigbo, & Thorpe, 1985; Ustunol & Hicks, 1990;McMahon & Brown, 1982). Most of the devices de-scribed above exposed the curd to stress and deformationor even disrupt the curd during measurement and are notpractical for on-line applications where continuousmonitoring is required.
0958-6946/01/$ - see front matter ( 2001 Elsevier Science Ltd. All rights reserved.PII: S 0 9 5 8 - 6 9 4 6 ( 0 0 ) 0 0 0 8 6 - 8
Various non-destructive devices have been proposedfor determining optimal cutting time and/or monitoringthe whole process of milk curd formation (Hori, 1985;Gunasekaran & Ay, 1994, 1996). Several methods basedon optical properties of milk have also been used tofollow coagulation (Guthy & Novak, 1977; Hardy& Fanni, 1981; McMahon, Brown, & Ernstrom, 1984a).More recently, changes in di!use re#ectance during cow'smilk coagulation were monitored using a "bre opticprobe (Payne, Madangopal, Hicks, & Shearer 1990). Us-tunol, Hicks, Payne, and Milton (1993), using a "breoptic probe operating at 950 nm, found that the max-imum value of the slope of di!use re#ectance curve versustime increased as enzyme concentration and temperatureincreased and pH decreased. Scher and Hardy (1993)studied the evolution of casein micelle mean size andturbidity after adding rennet. They found that both tur-bidity and mean size of casein initially decreased afteradding rennet and was followed by an increase in bothturbidity and particle size.
Payne, Hicks, Madangopal, and Shearer (1993b) foundthat the maximum of the "rst derivative of the re#ectancepro"le (¹
.!9) was strongly correlated to the cutting time
(¹#65
) for cow milk cheese production. Payne (1995) de-termined that cutting time could be predicted using thealgorithm
¹#65
"b¹.!9
, (1)
where b was a constant. In practice, b was selected tomatch the cheese plant operator's selection of cuttingtime with the predicted cutting time. Eleya, Banon, andHardy (1995) studied the acid coagulation of milk fromcows, goats and sheep at various temperatures by a tur-bidimetric method based on light re#ection. Goat's milkwhen compared to cow's milk contains less casein, aboutthe same amounts of Ca and Mg, less inorganic P, anda particularly high proportion of NPN (non-protein ni-trogen) (11.5%). Turbidity of goat's milk gels, at the sametemperature, was less than for cow's milk. Dybowska andFujio (1996a, b) used a colorimeter for monitoring theacid-induced milk gelation. Increasing temperatures andacidulant concentration enhanced onset of gelation andrate of aggregation/gelation. Recently, Lochte-Watson,Payne, Gates, and Hicks (1998) studied the e!ect of pH,fat, protein and calcium on di!use re#ectance of milkbetween 350 and 990 nm. Crofcheck, Payne, and Nokes(1999), monitored di!use re#ectance changes during cot-tage cheese production in a manufacturing facility.A model containing ¹
.!9and s (the time between the "rst
and second derivative maxima) predicted the operatorselected cutting time with a standard error of 6.4 min.
Clotting time is usually de"ned as the time from en-zyme addition until the observation of graininess or#ecks in a revolving bottle, or test tube. A number ofresearchers have investigated the relationship betweenclotting time and objective parameters generated from
instruments based on optical principles. Korolczuk,Maubois, and Loheac (1986) found a strong correlationbetween the time of in#ection point of refractometriccurves and the gelation time calculated from viscosimet-ric curves. McMahon and Brown (1990) measured cha-nges in light scattering at 600 nm in coagulating milk.They observed that true gelation time corresponded tothe in#ection point of turbidity plots.
Cow's milk has been studied more extensively thangoat's milk because of its larger commercial importance.A recent increase in consumption of dairy products (espe-cially cheese) from goats has motivated further researchinto goat's milk processing (Eleya et al., 1995).
The goals of this study were to:
1. Monitor changes in di!use re#ectance during the co-agulation process of goat's milk, using a "bre opticsensor.
2. Determine if clotting and cutting time could be pre-dicted based on parameters generated from the re#ec-tance pro"le.
3. Analyse the e!ect of pH, temperature and enzymeconcentration on time-based, response-based, andmixed-based parameters.
2. Material and methods
2.1. Experimental designs
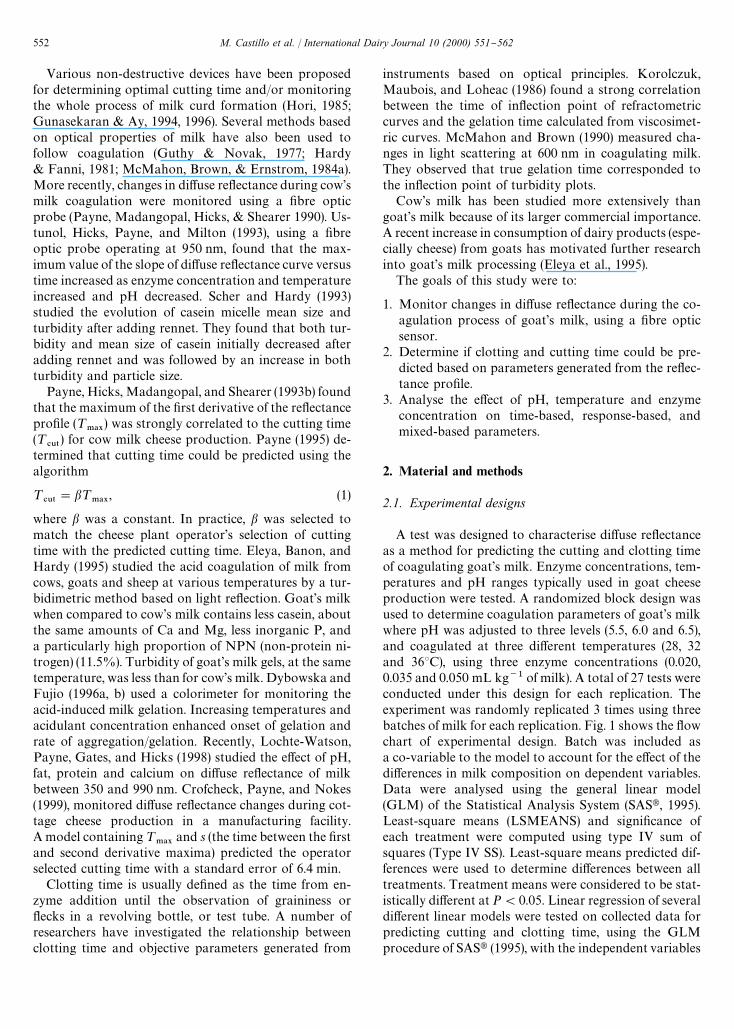
A test was designed to characterise di!use re#ectanceas a method for predicting the cutting and clotting timeof coagulating goat's milk. Enzyme concentrations, tem-peratures and pH ranges typically used in goat cheeseproduction were tested. A randomized block design wasused to determine coagulation parameters of goat's milkwhere pH was adjusted to three levels (5.5, 6.0 and 6.5),and coagulated at three di!erent temperatures (28, 32and 363C), using three enzyme concentrations (0.020,0.035 and 0.050 mL kg~1 of milk). A total of 27 tests wereconducted under this design for each replication. Theexperiment was randomly replicated 3 times using threebatches of milk for each replication. Fig. 1 shows the #owchart of experimental design. Batch was included asa co-variable to the model to account for the e!ect of thedi!erences in milk composition on dependent variables.Data were analysed using the general linear model(GLM) of the Statistical Analysis System (SASt, 1995).Least-square means (LSMEANS) and signi"cance ofeach treatment were computed using type IV sum ofsquares (Type IV SS). Least-square means predicted dif-ferences were used to determine di!erences between alltreatments. Treatment means were considered to be stat-istically di!erent at P(0.05. Linear regression of severaldi!erent linear models were tested on collected data forpredicting cutting and clotting time, using the GLMprocedure of SASt (1995), with the independent variables
552 M. Castillo et al. / International Dairy Journal 10 (2000) 551}562
Fig. 1. Flow diagram of procedure for testing coagulation of goat's milk.
in combination with dependent variables generated fromthe di!use re#ectance pro"le.
2.2. Enzyme
The coagulating enzyme was recombinant chymosin(EC 3.4.23.4, isozyme B) supplied by Chr. Hansen's La-boratory Inc. (Milwaukee, WI). Enzyme concentrations(E
0) of 0.020, 0.035 and 0.050 mL kg~1 of milk were
selected which gave clotting times of 5}45 min as ob-served by formation of #ocks on the wall of a test tube(IDF Standard 110A: 1987). Before every replication,recombinant chymosin was used to prepare a standar-
dised enzyme solution by diluting the enzyme in sodiumacetate bu!er at pH 5.5 and refrigerated at 23C to main-tain the strength of the enzyme. These enzyme dilutionswere standardised so that 10 mL of solution would de-liver 0.04, 0.07 and 0.10 mL of recombinant chymosin to2 kg of goat's milk. Fifty microlitres of the standardisedenzyme dilutions delivered 2.0]10~4, 3.5]10~4 and5.0]10~4 mL of recombinant chymosin to 10 mL ofgoat's milk which was used to determine clotting time intest tubes. The dilution e!ect due to the addition of theenzyme into the milk samples was 5]10~3 in both thesamples used to measure di!use re#ectance pro"les andsamples used to measure clotting time.
M. Castillo et al. / International Dairy Journal 10 (2000) 551}562 553
2.3. Goat+s milk preparation and pH adjustment
Thirty-litre batches of goat's milk from two goat herdsin Eastern Kentucky were collected and mixed on theMonday and Wednesday of each test week during Octo-ber and November, 1998. Each goat herd was less than 20in number. The milk was stored at 23C and pasteurisedfor 30 min at 653C on the day after collection. MilkoscanFT 120 (Foss North America, Minneapolis, MN) wasused to determine protein, fat, lactose, and total solids ofmilk with a reported accuracy of41.0% (% CV). Onebatch of goat's milk was used to prepare 12 test samples.A constant proportion of anhydrous calcium chloride(156 mg kg~1 of milk) diluted in de-ionised water wasadded to the weighed sample of goat's milk. A constantdilution rate was assured by adding de-ionised water fora total added volume of 40 mL. The milk was stirred andstored in a cooler until the temperature reached 23C.A linear regression between mL of 1 M HCl dilution andpH was conducted at 23C and used to predict the amountof acid needed to adjust the pH of milk to 5.5, 6.0 and 6.5levels. Milk samples of 2.1 kg were placed into glasscontainers, and the acid was added at 23C, with continu-ous stirring. The milk was then stored in a 23C cooleruntil used. A "nal pH adjustment was made before co-agulation at 23C by adding either 1.0 M HCl or 1.0 M
NaOH. A constant sample dilution was maintained byusing de-ionised water as needed to bring the total vol-ume added (HCl, NaOH and/or de-ionised water) to80 mL kg~1 of milk. The samples were then heated to thedesired coagulation temperature and split in two por-tions. One portion (2 kg) was used in a 2 L vat to monitordi!use re#ectance of the coagulating milk and the re-mainder (in aliquots of 10 mL) used to determine clottingtime. The pH of the milk in the vat was measured at thetest temperature. All pH measurements were performedusing a pH electrode (BN 8104 Orion Research Inc.,Boston, MA) connected to an expandable ion analyser(EA 940, Orion Research Inc., Boston, MA). The pHmeter had a sensitivity of$0.01 pH units and was calib-rated using a two-point calibration method. Standardbu!er solutions were used (Bu!er salt 7.00, and Bu!ersalt 4.01; Orion Research Inc., Boston, MA) at 223C.
2.4. Clotting time measurements
Berridge clotting time (¹#-05
) of each goat's milksample was measured using the International IDF Stan-dard 110A: 1987. The clotting time of each sample wasmeasured "ve times and the average reported as thesample clotting time. In order to compare clotting timewith di!use re#ectance parameters, a minor change in theIDF method was made. The amount of enzyme added toeach test tube was 50 lL (23C) instead of 1 mL as speci-"ed in the standard to assure the same dilution in the testtubes as in the reaction vat (2 L). Sample temperature
was controlled using a circulating water bath (Lauda,RM 20, Brinkman Instrument Inc.) having a controlaccuracy of $0.013C. Milk temperature was measuredwith a precision thermistor (model 5831 A, Omega En-gineering, Stanford, CT, resolution $0.013C; accuracy$0.23C).
2.5. Monitoring diwuse reyectance proxles
The reaction vat for the re#ectance measurement wasa stainless-steel vat (15 cm]13.3 cm]15 cm) havinga removable lid, which was used during testing to reduceevaporative cooling. Sample temperature was controlledusing a circulating water bath as described previously.Milk temperature was measured with a precision thermi-stor mentioned above. Goat's milk was weighed(2000$0.1 g), warmed using a microwave oven to 0.13Cabove the target test temperature, placed into the reac-tion vat and allowed to thermally equilibrate. The periodof time after milk heating and enzyme addition wastypically 20 min. The water bath and milk temperatureswere measured before enzyme addition to con"rm thatthey were in thermal equilibrium. Ten millilitres of thestandardised enzyme preparation (23C) was added to themilk and stirred thoroughly with a spatula for 30 s.Re#ectance measurements were started simultaneouslywith enzyme addition to the milk. Di!use re#ectance ofcoagulating goat's milk was monitored using a "bre opticsensor. The "bre optic sensor (Model 3 CoAguLite, Re-#ectronics, Inc., Lexington, KY) consisted of one 600 lmdiameter "bre for light emission into the milk and one600 lm diameter "bre for transmitting backscatteredlight from the milk to the photodetector. The "bres werespaced 1.20 mm apart. An infrared LED light (880 nm)was used as the light source and a Texas InstrumentsTSL 245 detector was used to measure re#ected light.The sensor had a 4}20 mA output that was droppedacross a 250 ) resistor to give a 1}5 V signal. The dataacquisition portion of the system consisted of a personalcomputer (486, 33 MHz) equipped with a DAS 802 ana-log to digital board (Keithley-Metabyte, Cleveland, OH)and programmed for data acquisition using Visual Basic4.0 (Microsoft Corporation, Redmond, WA) and VTX1.1 (Keithley-Metabyte, Cleveland, OH).
A normalised re#ectance pro"le was generated foreach sample. The re#ectance voltage was collected every2 s with an average recorded every 6 s. The voltage signalwas zeroed to 1 V by placing a black rubber stopper overthe distal tip of the probe to block all re#ected light. Thesensor gain was calibrated to give a 1.5 V signal response(corrected for the 1.0 V zero) when placed in goat's milk.A re#ectance ratio (R) was calculated by dividing thecorrected voltage output from the sensor by the averageof the "rst 10 voltage data points (1 min of data) collectedafter enzyme addition. The "rst derivative (dR/dt) of there#ectance ratio pro"le was calculated using 4 min of the
554 M. Castillo et al. / International Dairy Journal 10 (2000) 551}562
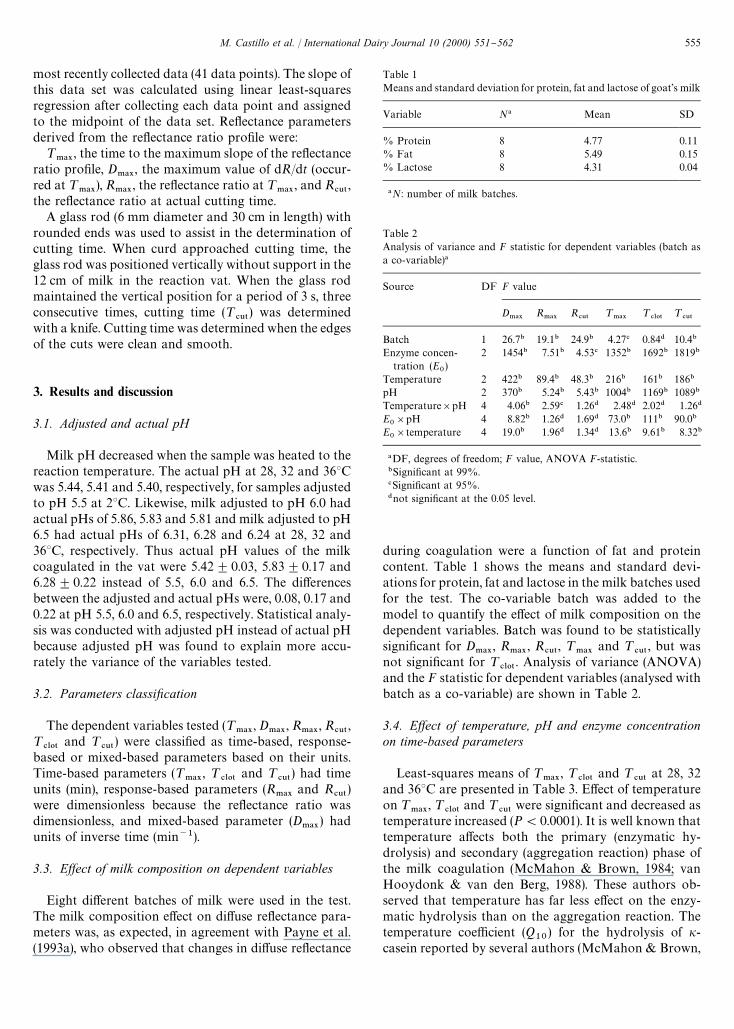
Table 1Means and standard deviation for protein, fat and lactose of goat's milk
Variable N! Mean SD
% Protein 8 4.77 0.11% Fat 8 5.49 0.15% Lactose 8 4.31 0.04
!N: number of milk batches.
Table 2Analysis of variance and F statistic for dependent variables (batch asa co-variable)!
Source DF F value
D.!9
R.!9
R#65
¹.!9
¹#-05
¹#65
Batch 1 26.7" 19.1" 24.9" 4.27# 0.84$ 10.4"
Enzyme concen-tration (E
0)
2 1454" 7.51" 4.53# 1352" 1692" 1819"
Temperature 2 422" 89.4" 48.3" 216" 161" 186"
pH 2 370" 5.24" 5.43" 1004" 1169" 1089"
Temperature]pH 4 4.06" 2.59# 1.26$ 2.48$ 2.02$ 1.26$
E0]pH 4 8.82" 1.26$ 1.69$ 73.0" 111" 90.0"
E0]temperature 4 19.0" 1.96$ 1.34$ 13.6" 9.61" 8.32"
!DF, degrees of freedom; F value, ANOVA F-statistic."Signi"cant at 99%.#Signi"cant at 95%.$not signi"cant at the 0.05 level.
most recently collected data (41 data points). The slope ofthis data set was calculated using linear least-squaresregression after collecting each data point and assignedto the midpoint of the data set. Re#ectance parametersderived from the re#ectance ratio pro"le were:
¹.!9
, the time to the maximum slope of the re#ectanceratio pro"le, D
.!9, the maximum value of dR/dt (occur-
red at ¹.!9
), R.!9
, the re#ectance ratio at ¹.!9
, and R#65
,the re#ectance ratio at actual cutting time.
A glass rod (6 mm diameter and 30 cm in length) withrounded ends was used to assist in the determination ofcutting time. When curd approached cutting time, theglass rod was positioned vertically without support in the12 cm of milk in the reaction vat. When the glass rodmaintained the vertical position for a period of 3 s, threeconsecutive times, cutting time (¹
#65) was determined
with a knife. Cutting time was determined when the edgesof the cuts were clean and smooth.
3. Results and discussion
3.1. Adjusted and actual pH
Milk pH decreased when the sample was heated to thereaction temperature. The actual pH at 28, 32 and 363Cwas 5.44, 5.41 and 5.40, respectively, for samples adjustedto pH 5.5 at 23C. Likewise, milk adjusted to pH 6.0 hadactual pHs of 5.86, 5.83 and 5.81 and milk adjusted to pH6.5 had actual pHs of 6.31, 6.28 and 6.24 at 28, 32 and363C, respectively. Thus actual pH values of the milkcoagulated in the vat were 5.42$0.03, 5.83$0.17 and6.28$0.22 instead of 5.5, 6.0 and 6.5. The di!erencesbetween the adjusted and actual pHs were, 0.08, 0.17 and0.22 at pH 5.5, 6.0 and 6.5, respectively. Statistical analy-sis was conducted with adjusted pH instead of actual pHbecause adjusted pH was found to explain more accu-rately the variance of the variables tested.
3.2. Parameters classixcation
The dependent variables tested (¹.!9
, D.!9
, R.!9
, R#65
,¹
#-05and ¹
#65) were classi"ed as time-based, response-
based or mixed-based parameters based on their units.Time-based parameters (¹
.!9, ¹
#-05and ¹
#65) had time
units (min), response-based parameters (R.!9
and R#65
)were dimensionless because the re#ectance ratio wasdimensionless, and mixed-based parameter (D
.!9) had
units of inverse time (min~1).
3.3. Ewect of milk composition on dependent variables
Eight di!erent batches of milk were used in the test.The milk composition e!ect on di!use re#ectance para-meters was, as expected, in agreement with Payne et al.(1993a), who observed that changes in di!use re#ectance
during coagulation were a function of fat and proteincontent. Table 1 shows the means and standard devi-ations for protein, fat and lactose in the milk batches usedfor the test. The co-variable batch was added to themodel to quantify the e!ect of milk composition on thedependent variables. Batch was found to be statisticallysigni"cant for D
.!9, R
.!9, R
#65, ¹
.!9and ¹
#65, but was
not signi"cant for ¹#-05
. Analysis of variance (ANOVA)and the F statistic for dependent variables (analysed withbatch as a co-variable) are shown in Table 2.
3.4. Ewect of temperature, pH and enzyme concentrationon time-based parameters
Least-squares means of ¹.!9
, ¹#-05
and ¹#65
at 28, 32and 363C are presented in Table 3. E!ect of temperatureon ¹
.!9, ¹
#-05and ¹
#65were signi"cant and decreased as
temperature increased (P(0.0001). It is well known thattemperature a!ects both the primary (enzymatic hy-drolysis) and secondary (aggregation reaction) phase ofthe milk coagulation (McMahon & Brown, 1984; vanHooydonk & van den Berg, 1988). These authors ob-served that temperature has far less e!ect on the enzy-matic hydrolysis than on the aggregation reaction. Thetemperature coe$cient (Q
10) for the hydrolysis of i-
casein reported by several authors (McMahon & Brown,
M. Castillo et al. / International Dairy Journal 10 (2000) 551}562 555
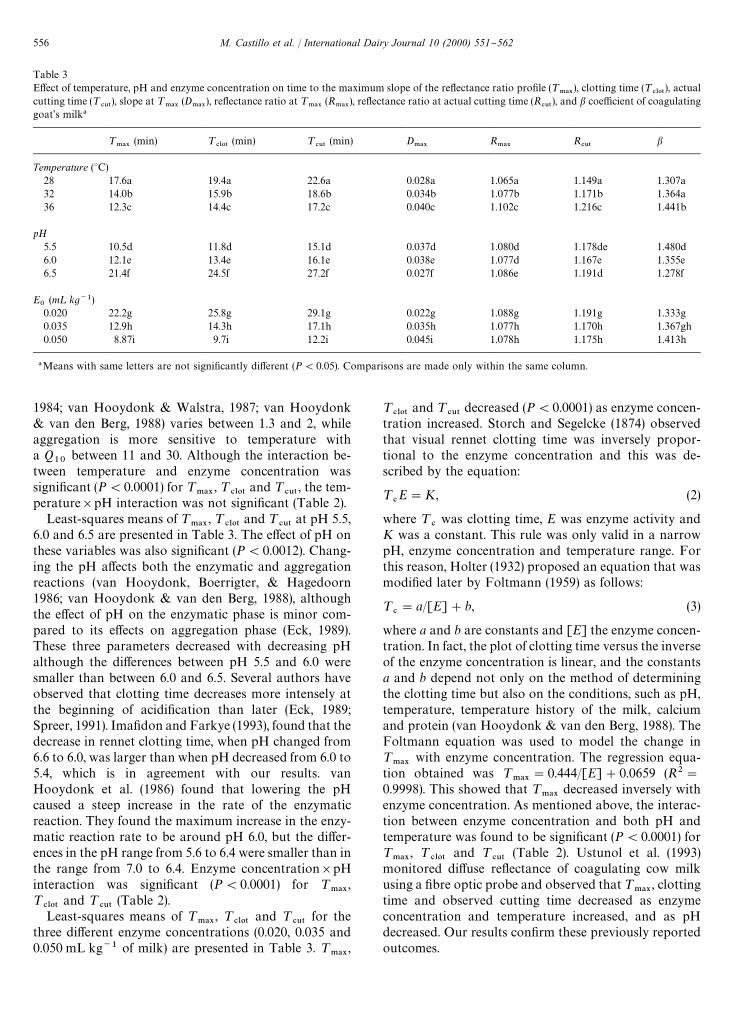
Table 3E!ect of temperature, pH and enzyme concentration on time to the maximum slope of the re#ectance ratio pro"le (¹
.!9), clotting time (¹
#-05), actual
cutting time (¹#65
), slope at ¹.!9
(D.!9
), re#ectance ratio at ¹.!9
(R.!9
), re#ectance ratio at actual cutting time (R#65
), and b coe$cient of coagulatinggoat's milk!
¹.!9
(min) ¹#-05
(min) ¹#65
(min) D.!9
R.!9
R#65
b
Temperature (3C)28 17.6a 19.4a 22.6a 0.028a 1.065a 1.149a 1.307a32 14.0b 15.9b 18.6b 0.034b 1.077b 1.171b 1.364a36 12.3c 14.4c 17.2c 0.040c 1.102c 1.216c 1.441b
pH5.5 10.5d 11.8d 15.1d 0.037d 1.080d 1.178de 1.480d6.0 12.1e 13.4e 16.1e 0.038e 1.077d 1.167e 1.355e6.5 21.4f 24.5f 27.2f 0.027f 1.086e 1.191d 1.278f
E0
(m¸ kg~1)0.020 22.2g 25.8g 29.1g 0.022g 1.088g 1.191g 1.333g0.035 12.9h 14.3h 17.1h 0.035h 1.077h 1.170h 1.367gh0.050 8.87i 9.7i 12.2i 0.045i 1.078h 1.175h 1.413h
!Means with same letters are not signi"cantly di!erent (P(0.05). Comparisons are made only within the same column.
1984; van Hooydonk & Walstra, 1987; van Hooydonk& van den Berg, 1988) varies between 1.3 and 2, whileaggregation is more sensitive to temperature witha Q
10between 11 and 30. Although the interaction be-
tween temperature and enzyme concentration wassigni"cant (P(0.0001) for ¹
.!9, ¹
#-05and ¹
#65, the tem-
perature]pH interaction was not signi"cant (Table 2).Least-squares means of ¹
.!9, ¹
#-05and ¹
#65at pH 5.5,
6.0 and 6.5 are presented in Table 3. The e!ect of pH onthese variables was also signi"cant (P(0.0012). Chang-ing the pH a!ects both the enzymatic and aggregationreactions (van Hooydonk, Boerrigter, & Hagedoorn1986; van Hooydonk & van den Berg, 1988), althoughthe e!ect of pH on the enzymatic phase is minor com-pared to its e!ects on aggregation phase (Eck, 1989).These three parameters decreased with decreasing pHalthough the di!erences between pH 5.5 and 6.0 weresmaller than between 6.0 and 6.5. Several authors haveobserved that clotting time decreases more intensely atthe beginning of acidi"cation than later (Eck, 1989;Spreer, 1991). Ima"don and Farkye (1993), found that thedecrease in rennet clotting time, when pH changed from6.6 to 6.0, was larger than when pH decreased from 6.0 to5.4, which is in agreement with our results. vanHooydonk et al. (1986) found that lowering the pHcaused a steep increase in the rate of the enzymaticreaction. They found the maximum increase in the enzy-matic reaction rate to be around pH 6.0, but the di!er-ences in the pH range from 5.6 to 6.4 were smaller than inthe range from 7.0 to 6.4. Enzyme concentration]pHinteraction was signi"cant (P(0.0001) for ¹
.!9,
¹#-05
and ¹#65
(Table 2).Least-squares means of ¹
.!9, ¹
#-05and ¹
#65for the
three di!erent enzyme concentrations (0.020, 0.035 and0.050 mL kg~1 of milk) are presented in Table 3. ¹
.!9,
¹#-05
and ¹#65
decreased (P(0.0001) as enzyme concen-tration increased. Storch and Segelcke (1874) observedthat visual rennet clotting time was inversely propor-tional to the enzyme concentration and this was de-scribed by the equation:
¹#E"K, (2)
where ¹#
was clotting time, E was enzyme activity andK was a constant. This rule was only valid in a narrowpH, enzyme concentration and temperature range. Forthis reason, Holter (1932) proposed an equation that wasmodi"ed later by Foltmann (1959) as follows:
¹#"a/[E]#b, (3)
where a and b are constants and [E] the enzyme concen-tration. In fact, the plot of clotting time versus the inverseof the enzyme concentration is linear, and the constantsa and b depend not only on the method of determiningthe clotting time but also on the conditions, such as pH,temperature, temperature history of the milk, calciumand protein (van Hooydonk & van den Berg, 1988). TheFoltmann equation was used to model the change in¹
.!9with enzyme concentration. The regression equa-
tion obtained was ¹.!9
"0.444/[E]#0.0659 (R2"
0.9998). This showed that ¹.!9
decreased inversely withenzyme concentration. As mentioned above, the interac-tion between enzyme concentration and both pH andtemperature was found to be signi"cant (P(0.0001) for¹
.!9, ¹
#-05and ¹
#65(Table 2). Ustunol et al. (1993)
monitored di!use re#ectance of coagulating cow milkusing a "bre optic probe and observed that ¹
.!9, clotting
time and observed cutting time decreased as enzymeconcentration and temperature increased, and as pHdecreased. Our results con"rm these previously reportedoutcomes.
556 M. Castillo et al. / International Dairy Journal 10 (2000) 551}562
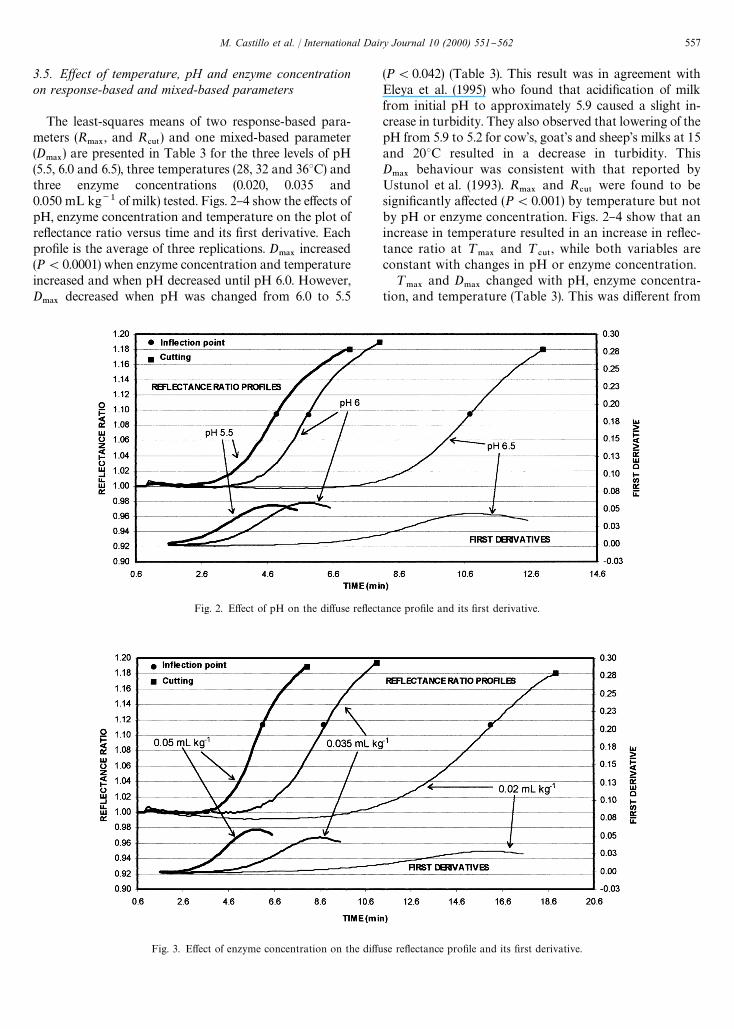
Fig. 3. E!ect of enzyme concentration on the di!use re#ectance pro"le and its "rst derivative.
Fig. 2. E!ect of pH on the di!use re#ectance pro"le and its "rst derivative.
3.5. Ewect of temperature, pH and enzyme concentrationon response-based and mixed-based parameters
The least-squares means of two response-based para-meters (R
.!9, and R
#65) and one mixed-based parameter
(D.!9
) are presented in Table 3 for the three levels of pH(5.5, 6.0 and 6.5), three temperatures (28, 32 and 363C) andthree enzyme concentrations (0.020, 0.035 and0.050 mL kg~1 of milk) tested. Figs. 2}4 show the e!ects ofpH, enzyme concentration and temperature on the plot ofre#ectance ratio versus time and its "rst derivative. Eachpro"le is the average of three replications. D
.!9increased
(P(0.0001) when enzyme concentration and temperatureincreased and when pH decreased until pH 6.0. However,D
.!9decreased when pH was changed from 6.0 to 5.5
(P(0.042) (Table 3). This result was in agreement withEleya et al. (1995) who found that acidi"cation of milkfrom initial pH to approximately 5.9 caused a slight in-crease in turbidity. They also observed that lowering of thepH from 5.9 to 5.2 for cow's, goat's and sheep's milks at 15and 203C resulted in a decrease in turbidity. ThisD
.!9behaviour was consistent with that reported by
Ustunol et al. (1993). R.!9
and R#65
were found to besigni"cantly a!ected (P(0.001) by temperature but notby pH or enzyme concentration. Figs. 2}4 show that anincrease in temperature resulted in an increase in re#ec-tance ratio at ¹
.!9and ¹
#65, while both variables are
constant with changes in pH or enzyme concentration.¹
.!9and D
.!9changed with pH, enzyme concentra-
tion, and temperature (Table 3). This was di!erent from
M. Castillo et al. / International Dairy Journal 10 (2000) 551}562 557
Fig. 4. E!ect of temperature on the di!use re#ectance pro"le and its "rst derivative.
the behaviour observed in R.!9
and R#65
, which werea!ected only by temperature. This fact means that a sig-ni"cant change in ¹
.!9and D
.!9resulting from either
a change in pH or a change in enzyme concentrationcould be produced without a signi"cant variation inR
.!9and R
#65values.
¹.!9
, the time to the maximum slope of the re#ectanceratio pro"le, and D
.!9, the maximum value of dR/dt,
depend on the coagulation rate. In contrast, R.!9
andR
#65do not depend on milk coagulation rate. It is well
known that the rate of coagulation depends on pH andenzyme concentration, so that changes in pH or enzymeconcentration a!ect ¹
.!9and D
.!9but do not a!ect
R.!9
and R#65
. McMahon et al. (1984a) monitored theapparent absorbance of undiluted milk during coagula-tion. They suggested that if "nal apparent absorbancecorresponds to the extent of gel crosslinking, then vary-ing the enzyme activity (and thus the coagulation time)would not a!ect the "nal apparent absorbance but onlythe rate at which it was attained. Scher and Hardy (1993)observed that turbidity 45 min after addition of rennettended to stabilise, suggesting one constant value of tur-bidity at the end of aggregation. A similar concept wasreported by Eleya et al. (1995) who suggested that theformation of a continuous network could be related tothe "nal stabilisation of turbidity at a maximum value.This hypothesis could explain why changes in pH andenzyme concentration do not a!ect R
.!9and R
#65(Figs. 2 and 3), but it cannot explain the e!ect of temper-ature on these variables (Fig. 4). One possible reason forthis behaviour could be that pH and enzyme concentra-tion induce changes in the casein micelle structure andsize during milk coagulation and, as a result, thesechanges indirectly a!ect re#ectance measurement. How-ever, temperature could a!ect the di!use re#ectance
measurement both directly, with an increase in re#ec-tance with temperature, and indirectly, bringing aboutstructural changes in casein micelles in the same way aspH and temperature.
Di!erent authors reported that the scattering of lightin milk depends upon the number and size of casein andfat particles, the wavelength of incident radiation, and thedi!erence in refractive index between the di!erent kindsof particles and solvents (Payne et al., 1993b; Lochte-Watson et al., 1998). In addition, Jou, Llebot, and PeH rez(1994) found that the refractive index (n) depends on bothdensity and temperature of milk. Matissek, Schnepel, andSteiner (1998) and Walstra and Jenness (1987) reportedthat n is highly dependent upon the composition of themedium, the wavelength and the temperature. As a result,the changes in R
.!9and R
#65with temperature could
result from a temperature e!ect on the re#ectance of themilk. Since R
.!9and R
#65are ratios, a temperature e!ect
that decreases the re#ectance measurement with temper-ature would increase the calculated ratios. This couldexplain the di!erence between the magnitudes of thepro"les in Fig. 4 for di!erent temperatures. It is hypothe-sised that a correction to the di!use re#ectance signal fortemperature would show that R
.!9and R
#65are not
a function of temperature. If this hypothesis is true, itwould partially explain why response-based parametersare not good predictors of cutting and clotting time.
3.6. Algorithm development for cutting time prediction
The time-based parameter ¹.!9
was used to obtaina multiple linear regression model for predicting cuttingtime using the independent variables (pH, temperature,and enzyme concentration). The mean and standard de-viation of each variable are shown in Table 4. Regression
558 M. Castillo et al. / International Dairy Journal 10 (2000) 551}562
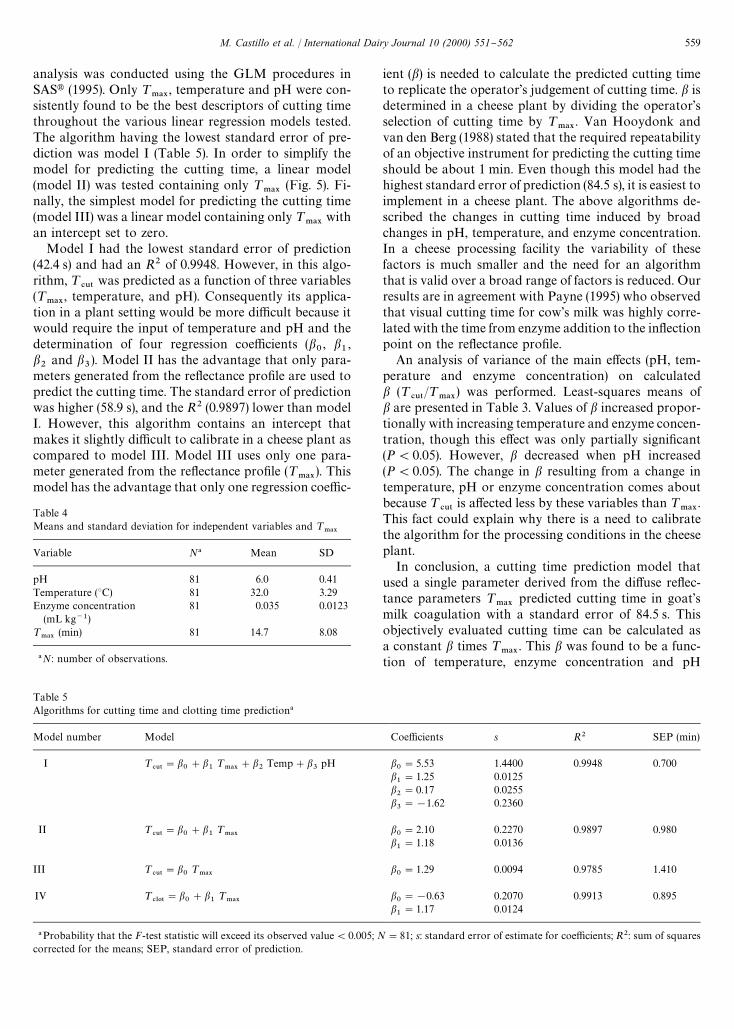
Table 5Algorithms for cutting time and clotting time prediction!
Model number Model Coe$cients s R2 SEP (min)
I ¹#65
"b0#b
1¹
.!9#b
2Temp#b
3pH b
0"5.53 1.4400 0.9948 0.700
b1"1.25 0.0125
b2"0.17 0.0255
b3"!1.62 0.2360
II ¹#65
"b0#b
1¹
.!9b0"2.10 0.2270 0.9897 0.980
b1"1.18 0.0136
III ¹#65
"b0¹
.!9b0"1.29 0.0094 0.9785 1.410
IV ¹#-05
"b0#b
1¹
.!9b0"!0.63 0.2070 0.9913 0.895
b1"1.17 0.0124
!Probability that the F-test statistic will exceed its observed value(0.005; N"81; s: standard error of estimate for coe$cients; R2: sum of squarescorrected for the means; SEP, standard error of prediction.
Table 4Means and standard deviation for independent variables and ¹
.!9
Variable N! Mean SD
pH 81 6.0 0.41Temperature (3C) 81 32.0 3.29Enzyme concentration
(mL kg~1)81 0.035 0.0123
¹.!9
(min) 81 14.7 8.08
!N: number of observations.
analysis was conducted using the GLM procedures inSASt (1995). Only ¹
.!9, temperature and pH were con-
sistently found to be the best descriptors of cutting timethroughout the various linear regression models tested.The algorithm having the lowest standard error of pre-diction was model I (Table 5). In order to simplify themodel for predicting the cutting time, a linear model(model II) was tested containing only ¹
.!9(Fig. 5). Fi-
nally, the simplest model for predicting the cutting time(model III) was a linear model containing only ¹
.!9with
an intercept set to zero.Model I had the lowest standard error of prediction
(42.4 s) and had an R2 of 0.9948. However, in this algo-rithm, ¹
#65was predicted as a function of three variables
(¹.!9
, temperature, and pH). Consequently its applica-tion in a plant setting would be more di$cult because itwould require the input of temperature and pH and thedetermination of four regression coe$cients (b
0, b
1,
b2
and b3). Model II has the advantage that only para-
meters generated from the re#ectance pro"le are used topredict the cutting time. The standard error of predictionwas higher (58.9 s), and the R2 (0.9897) lower than modelI. However, this algorithm contains an intercept thatmakes it slightly di$cult to calibrate in a cheese plant ascompared to model III. Model III uses only one para-meter generated from the re#ectance pro"le (¹
.!9). This
model has the advantage that only one regression coe$c-
ient (b) is needed to calculate the predicted cutting timeto replicate the operator's judgement of cutting time. b isdetermined in a cheese plant by dividing the operator'sselection of cutting time by ¹
.!9. Van Hooydonk and
van den Berg (1988) stated that the required repeatabilityof an objective instrument for predicting the cutting timeshould be about 1 min. Even though this model had thehighest standard error of prediction (84.5 s), it is easiest toimplement in a cheese plant. The above algorithms de-scribed the changes in cutting time induced by broadchanges in pH, temperature, and enzyme concentration.In a cheese processing facility the variability of thesefactors is much smaller and the need for an algorithmthat is valid over a broad range of factors is reduced. Ourresults are in agreement with Payne (1995) who observedthat visual cutting time for cow's milk was highly corre-lated with the time from enzyme addition to the in#ectionpoint on the re#ectance pro"le.
An analysis of variance of the main e!ects (pH, tem-perature and enzyme concentration) on calculatedb (¹
#65/¹
.!9) was performed. Least-squares means of
b are presented in Table 3. Values of b increased propor-tionally with increasing temperature and enzyme concen-tration, though this e!ect was only partially signi"cant(P(0.05). However, b decreased when pH increased(P(0.05). The change in b resulting from a change intemperature, pH or enzyme concentration comes aboutbecause ¹
#65is a!ected less by these variables than ¹
.!9.
This fact could explain why there is a need to calibratethe algorithm for the processing conditions in the cheeseplant.
In conclusion, a cutting time prediction model thatused a single parameter derived from the di!use re#ec-tance parameters ¹
.!9predicted cutting time in goat's
milk coagulation with a standard error of 84.5 s. Thisobjectively evaluated cutting time can be calculated asa constant b times ¹
.!9. This b was found to be a func-
tion of temperature, enzyme concentration and pH
M. Castillo et al. / International Dairy Journal 10 (2000) 551}562 559
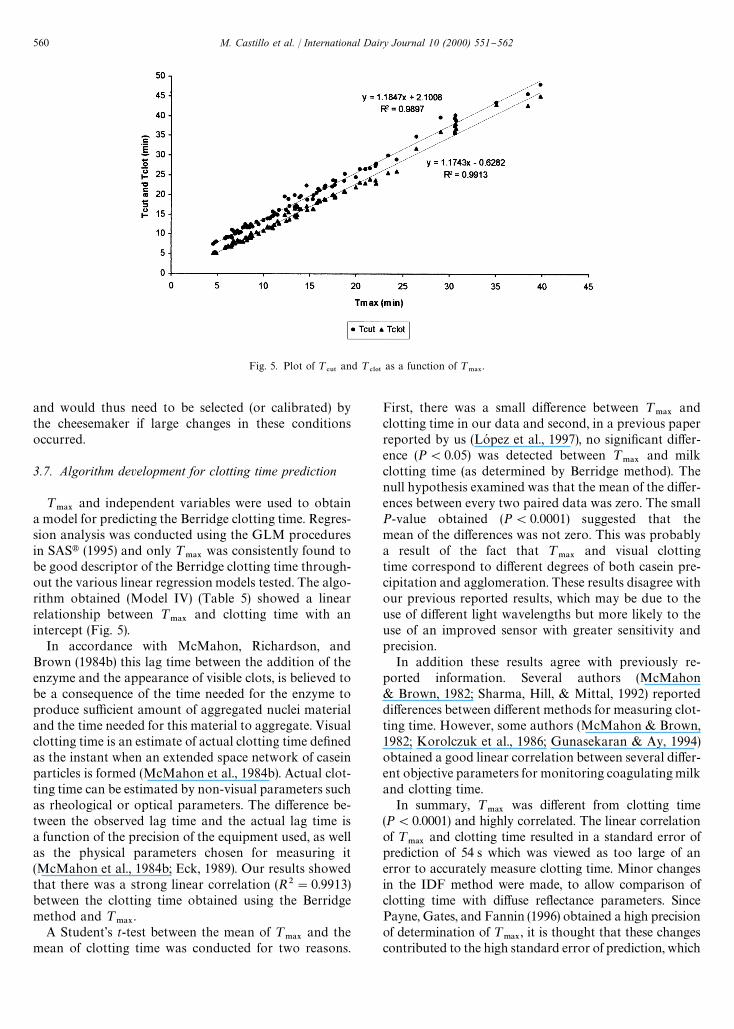
Fig. 5. Plot of ¹#65
and ¹#-05
as a function of ¹.!9
.
and would thus need to be selected (or calibrated) bythe cheesemaker if large changes in these conditionsoccurred.
3.7. Algorithm development for clotting time prediction
¹.!9
and independent variables were used to obtaina model for predicting the Berridge clotting time. Regres-sion analysis was conducted using the GLM proceduresin SASt (1995) and only ¹
.!9was consistently found to
be good descriptor of the Berridge clotting time through-out the various linear regression models tested. The algo-rithm obtained (Model IV) (Table 5) showed a linearrelationship between ¹
.!9and clotting time with an
intercept (Fig. 5).In accordance with McMahon, Richardson, and
Brown (1984b) this lag time between the addition of theenzyme and the appearance of visible clots, is believed tobe a consequence of the time needed for the enzyme toproduce su$cient amount of aggregated nuclei materialand the time needed for this material to aggregate. Visualclotting time is an estimate of actual clotting time de"nedas the instant when an extended space network of caseinparticles is formed (McMahon et al., 1984b). Actual clot-ting time can be estimated by non-visual parameters suchas rheological or optical parameters. The di!erence be-tween the observed lag time and the actual lag time isa function of the precision of the equipment used, as wellas the physical parameters chosen for measuring it(McMahon et al., 1984b; Eck, 1989). Our results showedthat there was a strong linear correlation (R2"0.9913)between the clotting time obtained using the Berridgemethod and ¹
.!9.
A Student's t-test between the mean of ¹.!9
and themean of clotting time was conducted for two reasons.
First, there was a small di!erence between ¹.!9
andclotting time in our data and second, in a previous paperreported by us (LoH pez et al., 1997), no signi"cant di!er-ence (P(0.05) was detected between ¹
.!9and milk
clotting time (as determined by Berridge method). Thenull hypothesis examined was that the mean of the di!er-ences between every two paired data was zero. The smallP-value obtained (P(0.0001) suggested that themean of the di!erences was not zero. This was probablya result of the fact that ¹
.!9and visual clotting
time correspond to di!erent degrees of both casein pre-cipitation and agglomeration. These results disagree withour previous reported results, which may be due to theuse of di!erent light wavelengths but more likely to theuse of an improved sensor with greater sensitivity andprecision.
In addition these results agree with previously re-ported information. Several authors (McMahon& Brown, 1982; Sharma, Hill, & Mittal, 1992) reporteddi!erences between di!erent methods for measuring clot-ting time. However, some authors (McMahon & Brown,1982; Korolczuk et al., 1986; Gunasekaran & Ay, 1994)obtained a good linear correlation between several di!er-ent objective parameters for monitoring coagulating milkand clotting time.
In summary, ¹.!9
was di!erent from clotting time(P(0.0001) and highly correlated. The linear correlationof ¹
.!9and clotting time resulted in a standard error of
prediction of 54 s which was viewed as too large of anerror to accurately measure clotting time. Minor changesin the IDF method were made, to allow comparison ofclotting time with di!use re#ectance parameters. SincePayne, Gates, and Fannin (1996) obtained a high precisionof determination of ¹
.!9, it is thought that these changes
contributed to the high standard error of prediction, which
560 M. Castillo et al. / International Dairy Journal 10 (2000) 551}562
suggests that ¹.!9
could be useful for measuring theenzymatic activity of enzymes for milk coagulation.
4. Conclusions
Several linear models for predicting cutting time andclotting time were tested. Models containing ¹
.!9accu-
rately predicted both visual cutting time and Berridgeclotting time. Linear regression coe$cient (b) of the cut-ting time prediction equation increased proportionallywith increasing temperature or enzyme concentrationand decreased proportionally as pH increased. Time-based and mixed-based parameters generated from thedi!use re#ectance pro"le were a function of coagulationrate, which varied with temperature, enzyme concentra-tion and pH. Response-based parameters were nota function of coagulation rate when change in di!usere#ectance was due to changing pH or enzyme concen-tration. This may have been due to a relatively smallrange of variation. Response-based parameters changedwith temperature, but this change could result from thee!ect of temperature on di!use re#ectance. Use of optical"bres to measure changes in di!use re#ectance was foundto be an accurate and objective method for monitoringthe progress of goat's milk coagulation.
Acknowledgements
This study would have been impossible withoutthe close collaboration between the Department of Bio-systems and Agricultural Engineering, University ofKentucky and the Department of Food Technology,University of Murcia. In addition we are grateful to theSeH neca Project (00694/cv/99) and a Predoctoral Grantfrom the University of Murcia for the "nancial supportwhich enabled the project to go ahead.
References
Crofcheck, C. L., Payne, F. A., & Nokes, S. E. (1999). Predicting thecutting time of cottage cheese using light backscatter measurements.Transactions of the ASAE, 42(4), 1039}1045.
Dybowska, B. E., & Fujio, Y. (1996a). A new method for measuringacid-induced milk gelation. Milchwissenschaft, 5(3), 130}134.
Dybowska, B. E., & Fujio, Y. (1996b). E!ect of temperature andglucono-d-lactone (GDL) concentration on milk aggregation andgelation process as revealed by optical method. Milchwissenschaft,51(10), 557}560.
Eck, A. (1989). El queso. Barcelona: Omega.Eleya, M. M. O., Banon, S. D., & Hardy, J. (1995). A comparative study
of pH and temperature e!ects on the acidic coagulation of milks fromcows, goats, and sheep. Journal of Dairy Science, 78, 2675}2682.
Foltmann, B. (1959). On the enzymatic and the coagulation stages ofthe renneting process. 15th International Dairy Congress, vol. 2,London, pp. 655}661.
Gunasekaran, S., & Ay, C. (1994). Evaluating milk coagulation withultrasonics. Food Technology, 48, 74}78.
Gunasekaran, S., & Ay, C. (1996). Milk coagulation cut-time determina-tion using ultrasonics. Journal of Food Process Engineering, 19, 63}73.
Guthy, K., & Novak, G. (1977). Observations on the primary phase ofmilk coagulation by rennet under standardized conditions. Journalof Dairy Research, 44, 363}366.
Hardy, J., & Fanni, J. (1981). Application of re#ection photometry tothe measurement of milk coagulation. Journal of Food Science, 46,1956}1957.
Holter, H. (1932). Uber die Labwirkung. Biochemistre Zeitschrift, 255,160}188.
Hori, T. (1985). Objective measurements of the process of curd forma-tion during rennet treatment of milk by the Hot Wire method.Journal of Food Science, 50(4), 911}917.
IDF (1987). Determination of the clotting time of milk to which a milk-clotting enzyme solution has been added. Brussels, Belgium: Interna-tional Dairy Federation, International Standard 110A, Appendix A.
Ima"don, G. I., & Farkye, N. Y. (1993). Rennet coagulability of high-heat treated milk in#uenced by time of pH adjustment. Journal ofFood Science, 58(6), 1300}1302.
Jou, D., Llebot, J. E., & PeH rez, C. (1994). Fisica para cienaas de la vida.Madrid: Mc Graw-Hill-Interamericana de Espan8 a.
Korolczuk, J., Maubois, J. L., & Loheac, J. (1986). Suivi de la coagula-tion-preH sure du lait a l'aide d'un nouveau capteur reH fractomeH trique.Le Lait, 66(4), 327}339.
Lochte-Watson, K. R., Payne, F. A., Gates, R. S., & Hicks, C. L. (1998).E!ects of pH, protein, fat, and calcium on di!use re#ectance of milk.Transactions of tha ASAE, 41(3), 701}707.
LoH pez, M. B., JordaH n, M. J., Luna, A., Ban8 oH n, S., Garrido, M. D.,& Laencina, J. (1997). Di!use re#ectance pro"les of goat's milkduring coagulation by various enzymes. Food Science and Techno-logy International, 3, 299}301.
Matissek, R., Schnepel, F. M., & Steiner, G. (1998). Ana& lisis de losalimentos: Fundamentos, me& todos, aplicaciones. Zaragoza: Acribia.
McMahon, D. J., & Brown, R. J. (1982). Evaluation of Formagraph forcomparing rennet solutions. Journal of Dairy Science, 65, 1639}1642.
McMahon, D. J., & Brown, R. J. (1984). Enzymic coagulation of caseinmicelles: A review. Journal of Dairy Science, 67, 919}929.
McMahon, D. J., Brown, R. J., & Ernstrom, C. A. (1984a). Enzymiccoagulation of milk casein micelles. Journal of Dairy Science, 67,745}748.
McMahon, D. J., Richardson, G. H., & Brown, R. J. (1984b). Enzymicmilk coagulation: Role of equations involving coagulation time andcurd "rmness in describing coagulation. Journal of Dairy Science, 67,1185}1193.
McMahon, D. J., & Brown, R. J. (1990). Development of surfacefunctionality of casein particles as the controlling parameter ofenzymic milk coagulation. Colloids and Surfaces, 44, 263}279.
Payne, F. A., Madangopal, S., Hicks, C. L., & Shearer, S. A. (1990).Fiber optic milk coagulation sensor for cut-time detection. Proceed-ings of the Food Processing Automation Conference AEAE, St. Joseph,MI.
Payne, F. A., Hicks, C. L., & Shen, P. S. (1993a). Predicting optimalcutting time of coagulating milk using di!use re#ectance. Journal ofDairy Science, 76, 48}61.
Payne, F. A., Hicks, C. L., Madangopal, S., & Shearer, S. A. (1993b).Fiber optic sensor for predicting the cutting time of coagulatingmilk for cheese production. Transactions of the ASAE, 36(3), 841}847.
Payne, F. A. (1995). Automatic control of coagulum cutting in cheesemanufacturing. Transactions of the ASAE, 11(5), 691}697.
Payne, F. A., Gates, R. S., & Fannin, B. L. (1996). Measurementprecision for a "ber optic di!use re#ectance sensor. Transactions ofthe ASAE, 39(6), 2193}2198.
Richardson, G. H., Okigbo, L. M., & Thorpe, J. D. (1985). Instrumentfor measuring milk coagulation in the cheese vats. Journal of DairyScience, 68, 32}36.
M. Castillo et al. / International Dairy Journal 10 (2000) 551}562 561
SAS. (1995). Statistical Analysis System, Rel. 6.11. Cary, NC: SASInstitute.
Scher, J., & Hardy, J. (1993). Study of the evolution of casein micelle sizedistribution after renneting by means of quasielastic light scattering.The Australian Journal of Dairy Technology, 48, 62}65.
Sharma, S. K., Hill, A. R., & Mittal, G. S. (1992). Evaluation of methodsto measure coagulation time of ultra"ltered milk. Milchwissenschaft,47(11), 701}704.
Spreer, E. (1991). Lactologn&a industrial. Zaragoza: Acribia.Storch, V., Segelcke. T. (1874). Milchforsch, Milchprax. 3:997 (Cited by
McMahon, D. J., & Brown, R. J. (1983). Milk coagulation time:linear relationship with inverse of rennet activity. Journal of Dairyscience, 66, 341}344).
Ustunol, Z., & Hicks, C. L. (1990). E!ect of a coagulation monitoringdevice on experimental cheese yield. Journal of Dairy Science,73, 1}7.
Ustunol, Z., Hicks, C. L., Payne, F. A., & Milton, K. (1993). E!ect ofpH, temperature and enzyme concentration on di!use re#ectancepro"les of coagulating milk. Italian Journal of Food Science, 2,107}114.
van Hooydonk, A. C. M., Boerrigter, I. J., & Hagedoorn, H. G. (1986).pH-Induced physico-chemical changes of casein micelles in milkand their e!ect on renneting. 2. E!ect of pH on renneting of milk.Netherlands Milk Dairy Journal, 40, 297}313.
van Hooydonk, A. C. M., & Walstra, P. (1987). Interpretation of thekinetics of the renneting reaction in milk. Netherlands Milk DairyJournal, 41, 19}47.
van Hooydonk, A.C.M., van den Berg, G. (1988). Control and determina-tion of the curd-setting during cheesemaking. Brussels, Belgium: Inter-national Dairy Federation, Bulletin 225.
Walstra, P., Jenness, D. (1987). QumHmica y fmH sica lactoloH gica. In Algunaspropiedades (pp. 164}186). Zaragoza, Espan8 a: Acribia.
562 M. Castillo et al. / International Dairy Journal 10 (2000) 551}562


![Music, Sound and Silence in A Goat's Song […] A sister is a](https://img.dokumen.tips/doc/110x75/63284463051fac18490ea679/music-sound-and-silence-in-a-goats-song-a-sister-is-a-.jpg)


