Embed Size (px)
Citation preview

NRC Publications Archive (NPArC)Archives des publications du CNRC (NPArC)
Practical Range Camera CalibrationBeraldin, Jean-Angelo; El-Hakim, Sabry; Cournoyer, Luc
Contact us / Contactez nous: [email protected].
http://nparc.cisti-icist.nrc-cnrc.gc.ca/npsi/jsp/nparc_cp.jsp?lang=frL’accès à ce site Web et l’utilisation de son contenu sont assujettis aux conditions présentées dans le site
Web page / page Web
http://nparc.cisti-icist.nrc-cnrc.gc.ca/npsi/ctrl?action=rtdoc&an=5763839&lang=enhttp://nparc.cisti-icist.nrc-cnrc.gc.ca/npsi/ctrl?action=rtdoc&an=5763839&lang=fr
LISEZ CES CONDITIONS ATTENTIVEMENT AVANT D’UTILISER CE SITE WEB.
READ THESE TERMS AND CONDITIONS CAREFULLY BEFORE USING THIS WEBSITE.
Access and use of this website and the material on it are subject to the Terms and Conditions set forth athttp://nparc.cisti-icist.nrc-cnrc.gc.ca/npsi/jsp/nparc_cp.jsp?lang=en
1
�
�
; ;
x y z � � ��
Abstract
o o
1 2 8
3
o o
Practical Range Camera Calibration
1 Introduction
NRC 35064{SPIE{Vol.2067 Videometrics II (1993), pp.21{31.
1
J.-A. Beraldin, S. F. El-Hakim, and L. CournoyerInstitute for Information TechnologyNational Research Council of Canada
Ottawa, Canada K1A 0R6
This paper presents a calibration procedure adapted to a range camera intended for space applications. The rangecamera, which is based upon an auto-synchronized triangulation scheme, can measure objects from about 0.5 m to100 m. The �eld of view is 30 30 . Objects situated at distances beyond 10 m can be measured with the help ofcooperative targets. Such a large volume of measurement presents signi�cant challenges to a precise calibration. Atwo- step methodology is proposed. In the �rst step, the close-range volume (from 0.5 m to 1.5 m) is calibrated usingan array of targets positioned at known locations in the �eld of view of the range camera. A large number of targets areevenly spaced in that �eld of view because this is the region of highest precision. In the second step, several targets arepositioned at distances greater than 1.5 m with the help of an accurate theodolite and electronic distance measuringdevice. This second step will not be discussed fully here. The internal and external parameters of a model of the rangecamera are extracted with an iterative nonlinear simultaneous least-squares adjustment method. Experimental resultsobtained for a close-range calibration suggest a precision along the , and axes of 200 m, 200 m, and 250 m,respectively, and a bias of less than 100 m in all directions.
In many disciplines of science, there is one that is certainly common to all, that is, the science of measurement, ormetrology. As one seeks to measure a physical quantity (variable) either to inform, e.g., temperature, to predict ,e.g.,weather patterns, or to give some indication of the validity of a theory, the most accurate data are always sought. Onething must �rst be de�ned, that is, what one means by most accurate. For some, it may mean an absolute measurementtaken in comparison to some prede�ned standard. For others, it may just be a relative measurement. The process bywhich a measurable quantity is obtained should be as free as possible of systematic errors (bias) and should providethe highest level of precision (spread centered around an average value). Usually, these characteristics are also givenwith some level of con�dence, e.g., con�dence intervals or probability density functions.
As a technology that encompasses many disciplines of the physical sciences, digital 3-D imaging must also relyupon metrology. Among the many noncontact techniques proposed to extract 3-D information from a scene, activetriangulation is used in applications as diverse as measurement and reproduction of objects, inspection of printedcircuit boards, and automatic robot welding . An innovative approach, based on triangulation using a synchronizedscanning scheme, was introduced by Rioux to allow very large �elds of view with small triangulation angles, withoutcompromising on precision. A 3-D surface map is captured by scanning a laser beam onto a scene along two orthogonaldirections. Owing to the shape of the coordinate system spanned by the measured variables, the resultant imagesare not compatible with coordinate systems used by most geometric image processing algorithms. An unambiguoustransformation (one-to-one) or, in other words, a re-mapping of these variables to a more common coordinate systemlike a rectangular system is therefore required. The process of measuring the original variables to a high level ofcon�dence and the determination of the re-mapping function is known as camera calibration.
This paper presents a calibration procedure adapted to a range camera intended for space applications. Withthis camera, position and orientation of objects can be measured when they are within a �eld of view of 30 30and with corresponding range from about 0.5 m to 100 m. Such a large volume of measurement presents signi�cantchallenges to a precise calibration. A two-step methodology is proposed to calibrate this range camera at close andfar range. The details of the range camera are presented in Section 2. Section 3 highlights the advantages of thesynchronized scanning scheme over conventional triangulation. It includes an analytical treatment of the synchronizedgeometry, where the projective transformation equations of this optical arrangement for single and dual scan axes arepresented. These equations are used in Section 4 as design tools to characterize the spatial precision and establish
1
a)
Known Geometrical
Featureor
Target
Tracking F.O.V. (~ 1°)130 Measurements / s
(Position / Attitude)
Searching F.O.V. (~ 30°)1 - 10 s Search Time
Laser Scanner
High PrecisionPointing
b)
: �
�
�
o o
4
5
3.1 Conventional Active Triangulation
2 Laser Range Camera for Space Applications
3 Range Camera Equations
Range camera: (a) photograph, (b) real-time tracking of satellites.Figure 1:
a calibration procedure. The precision and accuracy assessments of the range camera and the proposed calibrationmethod are described in Section 5. Experimental results obtained from a close-range calibration are presented. Finally,a discussion follows in Section 6 of several advantages and limitations of the analysis and of the proposed technique.Conclusions appear in Section 7.
The laser range camera is shown in Figure 1a. This range camera can operate in either a variable resolution modeor a raster type mode. In the variable resolution mode, as illustrated in Figure 1b, the laser scanner tracks targets andgeometrical features of objects located within a �eld of view of 30 30 and with corresponding range from about 0.5 mto 100 m. For objects located at distances greater than 10 m, cooperative targets on their surfaces are required forgood signal-to-noise ratio . The range camera uses two high-speed galvanometers to steer the laser beam to any spatiallocation within the �eld of view of the camera. A compact and versatile dual-galvanometer controller was designedspeci�cally for this task. Each axis can be addressed by more than 16 bits with a step response of 1 8 s over wideangles even though the mirrors are quite large. This increase in speed and versatility over the original manufacturedcontroller allows the generation of Lissajous patterns for tracking of objects at a refresh rate of up to 130 Hz.
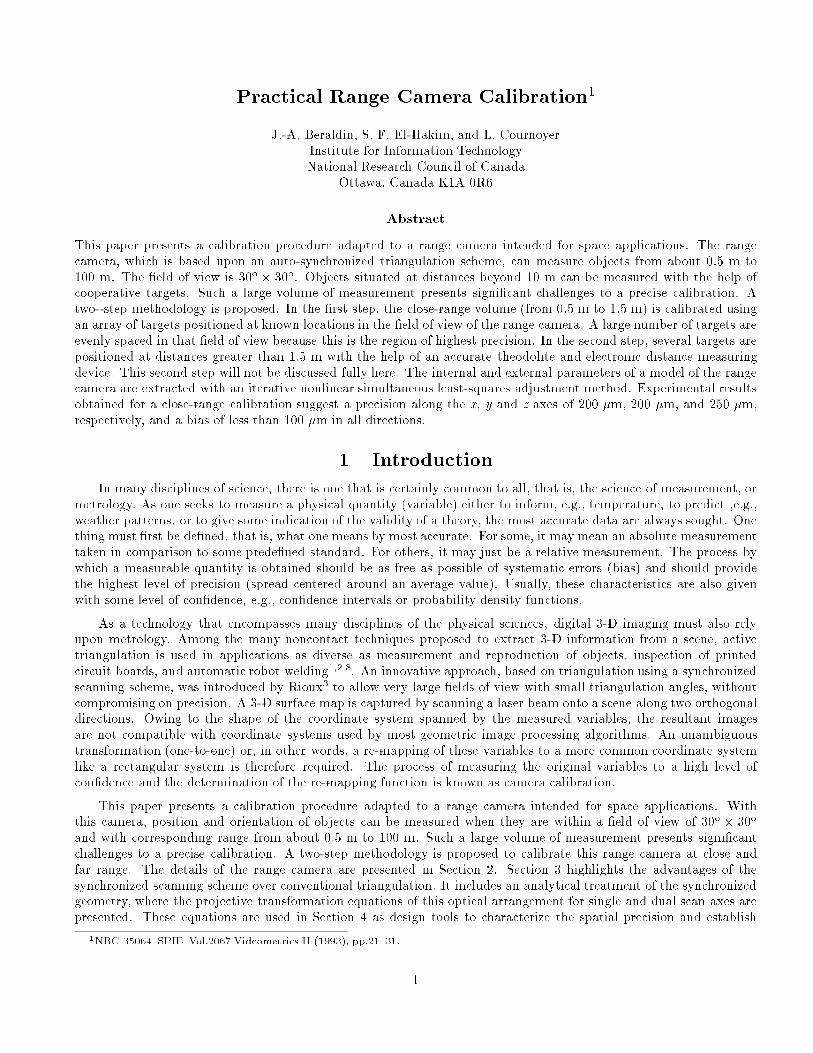
The raster mode is used primarily for the measurement of registered range and intensity information of largestationary objects . Figure 2 shows a shaded image of a quarter-scale model (at the National Research Council) of thecargo bay of the Space Shuttle Orbiter. The scale model measures 4.33 m by 1.42 m by 0.6 m. It was digitized to aresolution of 2048 4096.
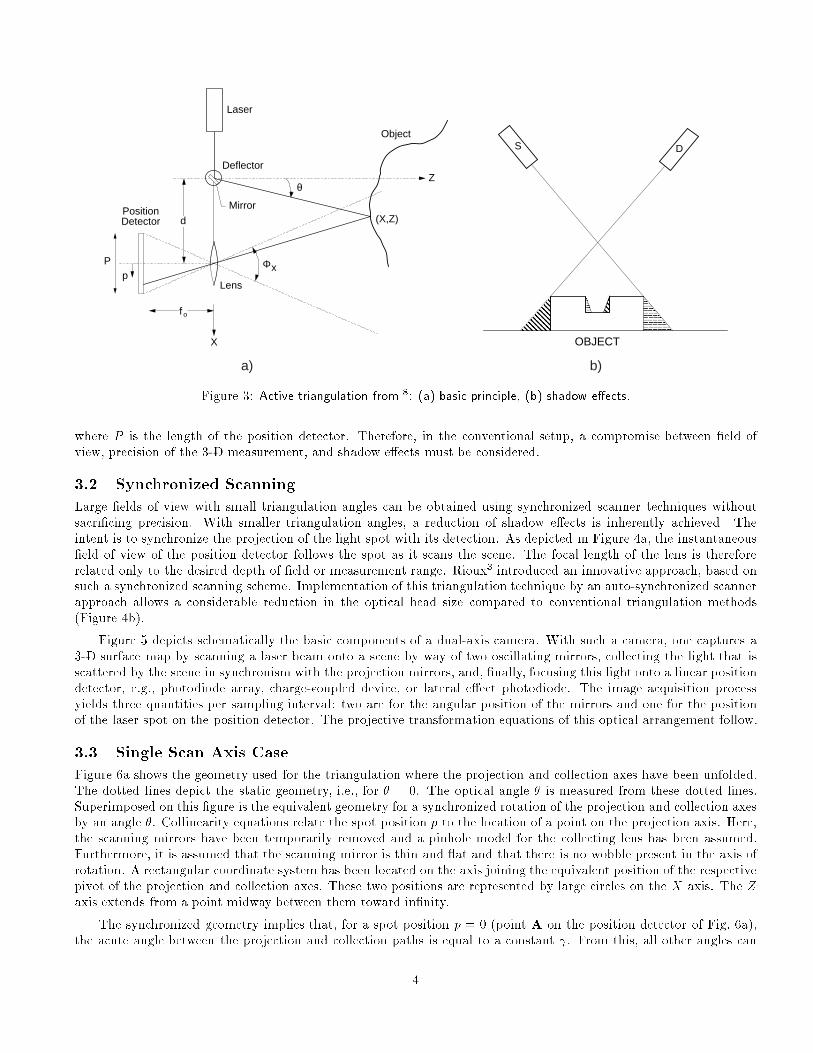
The basic geometrical principle of optical triangulation is shown in Figure 3a. The light beam generated by the laser isde ected by a mirror and scanned on the object. A camera, composed of a lens and a position sensitive photodetector,
2
�
z
z p
p
x
x
0
0
0
0
2
0
0
0
x; z
zd f
p f �
x z �
p � df
f
z � p
�z
f d�
� p z
f dd
d
P
f
Shaded image of scaled model of cargo bay.Figure 2:
measures the location of the image of the illuminated point on the object. By simple trigonometry, the coordinateof the illuminated point on the object in a rectangular coordinate system is calculated. From Figure 3a,
=+ tan( )
(1)
and= tan( ) (2)
where is the position of the imaged spot on the position detector, is the de ection angle of the laser beam, is theseparation between the lens and the laser source, and is the e�ective distance between the position detector and thelens. is related to the focal length of the lens.
To show some of the limitations of this triangulation method, let us approximate the standard deviation of theerror in , , as a function of only. The law of propagation of errors gives
= (3)
where is the standard deviation of the error in the measurement of . The error in the estimate of is thereforeinversely proportional to both the separation between the laser and the position detector and the e�ective positionof the lens, but directly proportional to the square of the distance. Unfortunately, and cannot be made as largeas desired. is limited mainly by the mechanical structure of the optical setup and by shadow e�ects. As seen inFigure 3b, must be kept small to minimize these e�ects.
In the conventional triangulation geometry, the �eld of view � of the sensor, where the light beam can be scannedover the whole �eld of view, is given approximately by
� 2 arctan(2
) (4)
3
Laser
Object
Deflector
PositionDetector
Pp
X
Z
Lens
d
Mirror(X,Z)
θ
Φx
fo
S D
OBJECT
a) b)
A
8
3
P
� �
� p
X Z
p
3.2 Synchronized Scanning
3.3 Single Scan Axis Case
Active triangulation from : (a) basic principle, (b) shadow e�ects.Figure 3:
where is the length of the position detector. Therefore, in the conventional setup, a compromise between �eld ofview, precision of the 3-D measurement, and shadow e�ects must be considered.
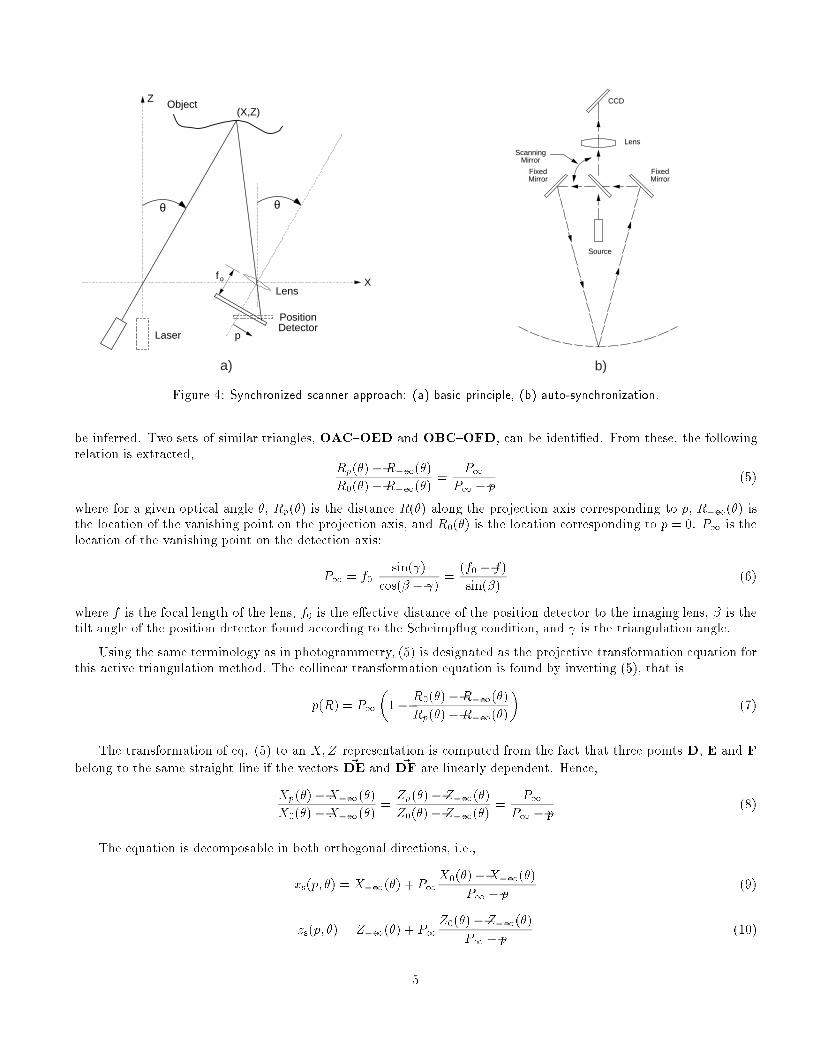
Large �elds of view with small triangulation angles can be obtained using synchronized scanner techniques withoutsacri�cing precision. With smaller triangulation angles, a reduction of shadow e�ects is inherently achieved. Theintent is to synchronize the projection of the light spot with its detection. As depicted in Figure 4a, the instantaneous�eld of view of the position detector follows the spot as it scans the scene. The focal length of the lens is thereforerelated only to the desired depth of �eld or measurement range. Rioux introduced an innovative approach, based onsuch a synchronized scanning scheme. Implementation of this triangulation technique by an auto-synchronized scannerapproach allows a considerable reduction in the optical head size compared to conventional triangulation methods(Figure 4b).
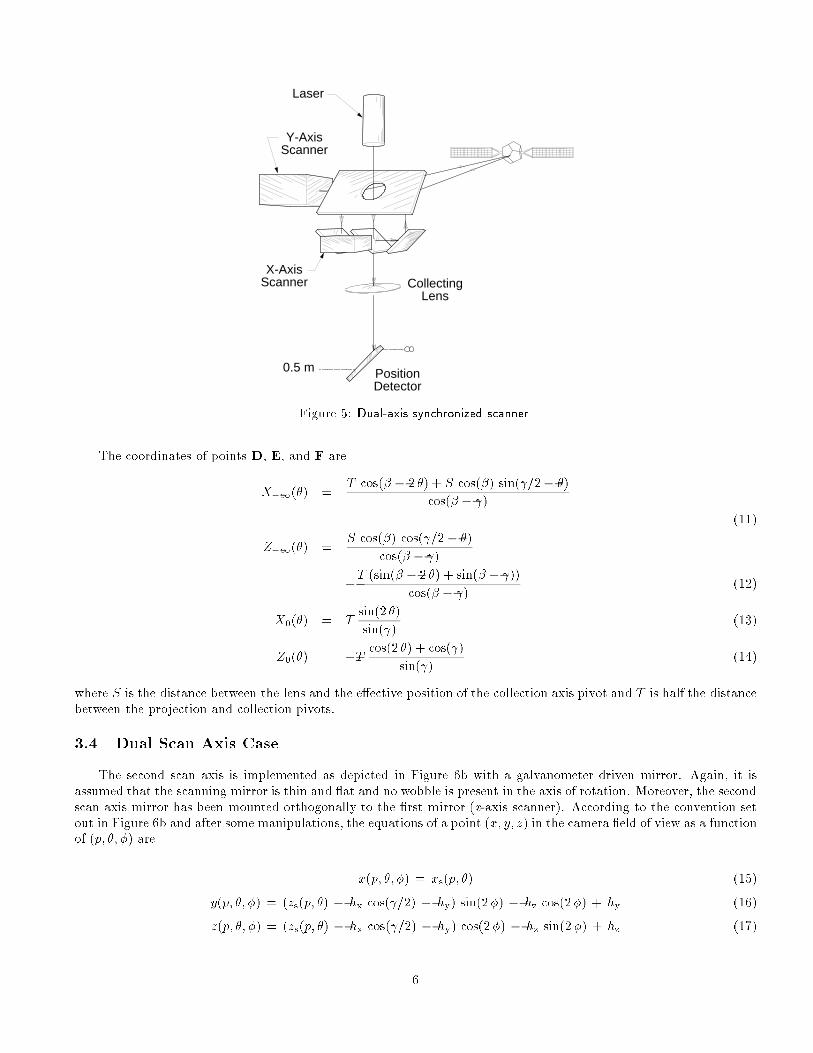
Figure 5 depicts schematically the basic components of a dual-axis camera. With such a camera, one captures a3-D surface map by scanning a laser beam onto a scene by way of two oscillating mirrors, collecting the light that isscattered by the scene in synchronism with the projection mirrors, and, �nally, focusing this light onto a linear positiondetector, e.g., photodiode array, charge-coupled device, or lateral e�ect photodiode. The image acquisition processyields three quantities per sampling interval: two are for the angular position of the mirrors and one for the positionof the laser spot on the position detector. The projective transformation equations of this optical arrangement follow.
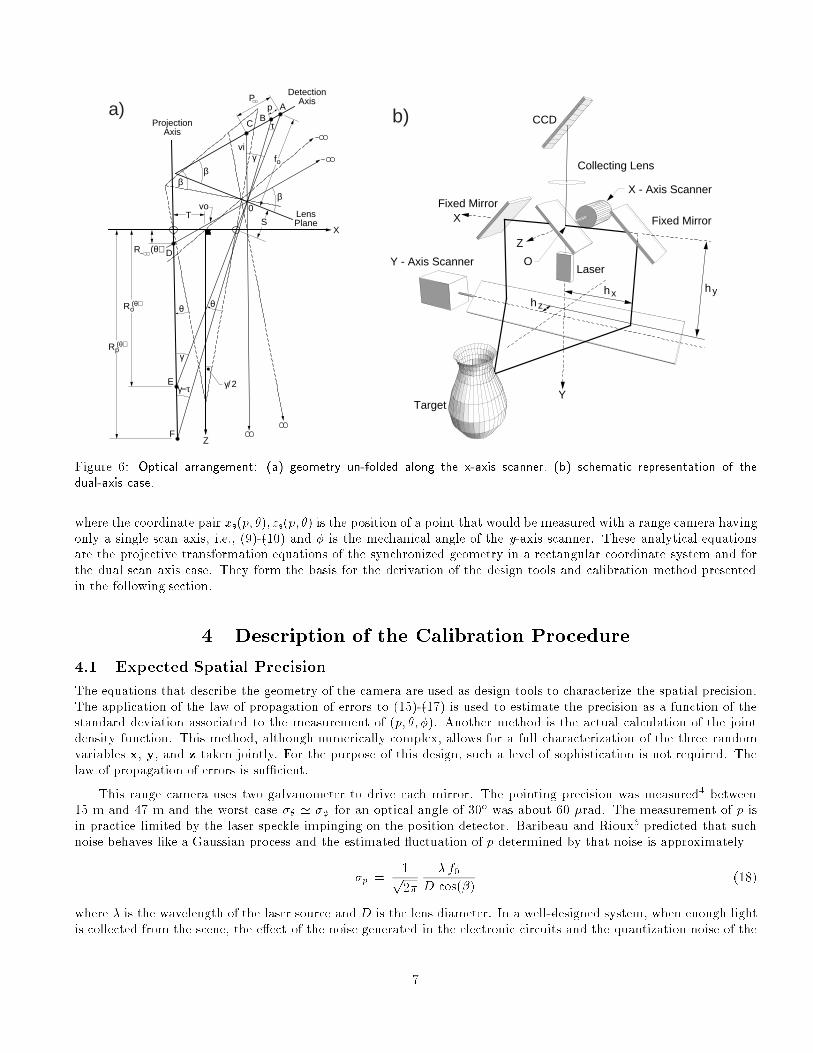
Figure 6a shows the geometry used for the triangulation where the projection and collection axes have been unfolded.The dotted lines depict the static geometry, i.e., for = 0. The optical angle is measured from these dotted lines.Superimposed on this �gure is the equivalent geometry for a synchronized rotation of the projection and collection axesby an angle . Collinearity equations relate the spot position to the location of a point on the projection axis. Here,the scanning mirrors have been temporarily removed and a pinhole model for the collecting lens has been assumed.Furthermore, it is assumed that the scanning mirror is thin and at and that there is no wobble present in the axis ofrotation. A rectangular coordinate system has been located on the axis joining the equivalent position of the respectivepivot of the projection and collection axes. These two positions are represented by large circles on the axis. Theaxis extends from a point midway between them toward in�nity.
The synchronized geometry implies that, for a spot position = 0 (point on the position detector of Fig. 6a),the acute angle between the projection and collection paths is equal to a constant . From this, all other angles can
4
θ θ
ObjectZ
Laser
PositionDetector
Lens
(X,Z)
p
Xfo
a)
CCD
Lens
FixedMirror
ScanningMirror
Source
FixedMirror
b)
� �
p
p
p
p p
0
0
00
0
0
0 0
s0
s0
�� �
��
� ��
��
�� �
��
��
OAC OED OBC OFD
D E F
DE DF
�1
�1
1
1
�1
1
1
1
�1
�1
�1
�1
�1
�1
1
1
�1 1
�1
1
�1 1
�1
1
Synchronized scanner approach: (a) basic principle, (b) auto-synchronization.
R � R �
R � R �
P
P p
� R � R � p R �R � p P
P f
�
f f
�
f f �
p R PR � R �
R � R �
X;Z~ ~
X � X �
X � X �
Z � Z �
Z � Z �
P
P p
x p; � X � PX � X �
P p
z p; � Z � PZ � Z �
P p
Figure 4:
be inferred. Two sets of similar triangles, { and { , can be identi�ed. From these, the followingrelation is extracted,
( ) ( )
( ) ( )= (5)
where for a given optical angle , ( ) is the distance ( ) along the projection axis corresponding to , ( ) isthe location of the vanishing point on the projection axis, and ( ) is the location corresponding to = 0. is thelocation of the vanishing point on the detection axis:
=sin( )
cos( )=
( )
sin( )(6)
where is the focal length of the lens, is the e�ective distance of the position detector to the imaging lens, is thetilt angle of the position detector found according to the Scheimp ug condition, and is the triangulation angle.
Using the same terminology as in photogrammetry, (5) is designated as the projective transformation equation forthis active triangulation method. The collinear transformation equation is found by inverting (5), that is
( ) = 1( ) ( )
( ) ( )(7)
The transformation of eq. (5) to an representation is computed from the fact that three points , and
belong to the same straight line if the vectors and are linearly dependent. Hence,
( ) ( )
( ) ( )=
( ) ( )
( ) ( )= (8)
The equation is decomposable in both orthogonal directions, i.e.,
( ) = ( ) +( ) ( )
(9)
( ) = ( ) +( ) ( )
(10)
5
0.5 m PositionDetector
Laser
Y-AxisScanner
X-AxisScanner Collecting
Lens
x
D E F
�1
�1
0
0
s
s x y z y
s x y z z
� ��
��
� � ��
�
� � �� � �
3.4 Dual Scan Axis Case
Dual-axis synchronized scanner.
X �T � � S � = �
�
Z �S � = �
�
T � � �
�
X � T�
Z � T�
S T
x; y; zp; �; �
x p; �; � x p; �
y p; �; � z p; � h = h � h � h
z p; �; � z p; � h = h � h � h
Figure 5:
The coordinates of points , , and are
( ) =cos( 2 ) + cos( ) sin( 2 )
cos( )
(11)
( ) =cos( ) cos( 2 )
cos( )
(sin( 2 ) + sin( ))
cos( )(12)
( ) =sin(2 )
sin( )(13)
( ) =cos(2 ) + cos( )
sin( )(14)
where is the distance between the lens and the e�ective position of the collection axis pivot and is half the distancebetween the projection and collection pivots.
The second scan axis is implemented as depicted in Figure 6b with a galvanometer driven mirror. Again, it isassumed that the scanning mirror is thin and at and no wobble is present in the axis of rotation. Moreover, the secondscan axis mirror has been mounted orthogonally to the �rst mirror ( -axis scanner). According to the convention setout in Figure 6b and after some manipulations, the equations of a point ( ) in the camera �eld of view as a functionof ( ) are
( ) = ( ) (15)
( ) = ( ( ) cos( 2) ) sin(2 ) cos(2 ) + (16)
( ) = ( ( ) cos( 2) ) cos(2 ) sin(2 ) + (17)
6
CB
p
γ
γ−τ
vo
vi
P
ββ
β
τ
DetectionAxis
ProjectionAxis
fo
0S
LensPlane
Z
Rp(θ)
γ
θ θ
γ/2
T
A
D
E
F
Ro(θ)
R (θ)
X
a)
Target
CCD
Laser
Fixed Mirror
Y - Axis Scanner
Fixed Mirror
Collecting Lens
Z
O
Y
X
X - Axis Scanner
hyhxhz
b)
y
'
p
� �
p
x y z
s s
4
o
6
0
4.1 Expected Spatial Precision
x p; � ; z p; ��
p; �; �
� � � p
p
��
� f
D �
� D
4 Description of the Calibration Procedure
Optical arrangement: (a) geometry un-folded along the x-axis scanner, (b) schematic representation of thedual-axis case.Figure 6:
where the coordinate pair ( ) ( ) is the position of a point that would be measured with a range camera havingonly a single scan axis, i.e., (9)-(10) and is the mechanical angle of the -axis scanner. These analytical equationsare the projective transformation equations of the synchronized geometry in a rectangular coordinate system and forthe dual scan axis case. They form the basis for the derivation of the design tools and calibration method presentedin the following section.
The equations that describe the geometry of the camera are used as design tools to characterize the spatial precision.The application of the law of propagation of errors to (15)-(17) is used to estimate the precision as a function of thestandard deviation associated to the measurement of ( ). Another method is the actual calculation of the jointdensity function. This method, although numerically complex, allows for a full characterization of the three randomvariables , , and taken jointly. For the purpose of this design, such a level of sophistication is not required. Thelaw of propagation of errors is su�cient.
This range camera uses two galvanometer to drive each mirror. The pointing precision was measured between15 m and 47 m and the worst case for an optical angle of 30 was about 60 rad. The measurement of isin practice limited by the laser speckle impinging on the position detector. Baribeau and Rioux predicted that suchnoise behaves like a Gaussian process and the estimated uctuation of determined by that noise is approximately
=1
2 cos( )(18)
where is the wavelength of the laser source and is the lens diameter. In a well-designed system, when enough lightis collected from the scene, the e�ect of the noise generated in the electronic circuits and the quantization noise of the
7
0.4 0.6 0.8 1.0 1.2 1.4 1.60.0
0.1
0.2
0.3
0.4
0.5
0.6
0.7
0.8
Exp
ecte
d P
reci
sion
(m
m) σz
σy
σx
Distance from Range Camera along Z axis (m) Distance from Range Camera along Z axis (m)
Exp
ecte
d P
reci
sion
σz
(mm
)
1 10 1000.1
1
10
100
1000
a) b)
p
'
'
'
'
�
et al.
� � � � � �
� � � � � �
� � � � � �
� � p
p
x y z
x p � �
y p � �
z p � �
p � �
z
4.2 Proposed Calibration Method
2 2 2
2
2
2
2
2
2
2
2
2
2
2
2
2
2
2
2
2
2
2
2
2
2 2 2
5
3
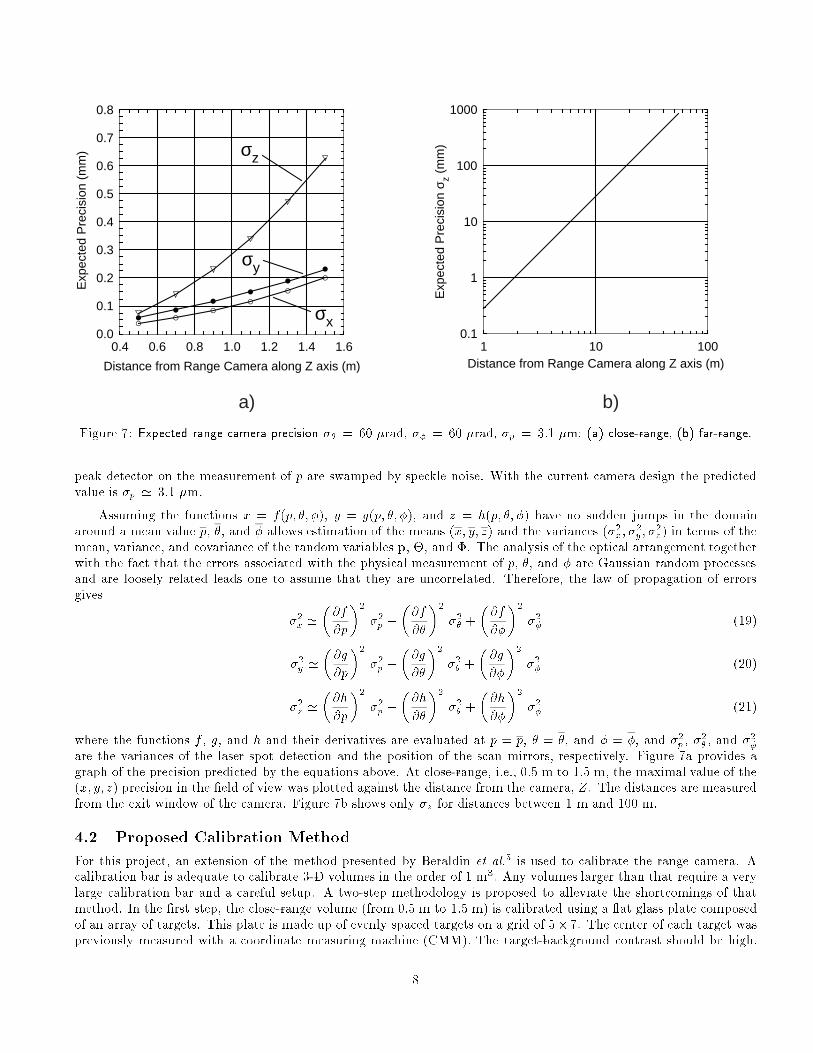
Expected range camera precision , , m: (a) close-range, (b) far-range.� � � � � : �
p� : �
x f p; �; � y g p; �; � z h p; �; �p � � x; y; z � ; � ; �
p � �
�@f
@p�
@f
@��
@f
@��
�@g
@p�
@g
@��
@g
@��
�@h
@p�
@h
@��
@h
@��
f g h p p � � � � � � �
x; y; z Z�
Figure 7: = 60 rad = 60 rad = 3 1
peak detector on the measurement of are swamped by speckle noise. With the current camera design the predictedvalue is 3 1 m.
Assuming the functions = ( ), = ( ), and = ( ) have no sudden jumps in the domainaround a mean value , , and allows estimation of the means ( ) and the variances ( ) in terms of themean, variance, and covariance of the random variables , �, and �. The analysis of the optical arrangement togetherwith the fact that the errors associated with the physical measurement of , , and are Gaussian random processesand are loosely related leads one to assume that they are uncorrelated. Therefore, the law of propagation of errorsgives
+ + (19)
+ + (20)
+ + (21)
where the functions , , and and their derivatives are evaluated at = , = , and = , and , , andare the variances of the laser spot detection and the position of the scan mirrors, respectively. Figure 7a provides agraph of the precision predicted by the equations above. At close-range, i.e., 0.5 m to 1.5 m, the maximal value of the( ) precision in the �eld of view was plotted against the distance from the camera, . The distances are measuredfrom the exit window of the camera. Figure 7b shows only for distances between 1 m and 100 m.
For this project, an extension of the method presented by Beraldin is used to calibrate the range camera. Acalibration bar is adequate to calibrate 3-D volumes in the order of 1 m . Any volumes larger than that require a verylarge calibration bar and a careful setup. A two-step methodology is proposed to alleviate the shortcomings of thatmethod. In the �rst step, the close-range volume (from 0.5 m to 1.5 m) is calibrated using a at glass plate composedof an array of targets. This plate is made up of evenly spaced targets on a grid of 5 7. The center of each target waspreviously measured with a coordinate measuring machine (CMM). The target-background contrast should be high.
8
�
�
7
o o
p; �; �
p; �; �� � p
�
:
5 Accuracy Assessment
Resolution
bias
precision
accuracy
5.1 De�nitions
5.2 Close-Range Calibration and Evaluation
The target array is positioned at known locations in the �eld of view of the range camera using a precise linear stage.Here, a large number of targets is used in this region because it is where the camera has its highest range precision.In the second step, it is proposed to use a smaller number of targets (the number of targets is a�ected by the numberof parameters in the model) positioned at distances greater than 1.5 m with the help of an accurate theodolite andelectronic distance measuring device. Beyond 10 m, these instruments have angular and distance measuring accuracies10 times better than this range camera though they have very low measurement rate compared to the 18 000 samplesper second of the present system. Once the registered range and intensity images have been acquired for all the targets,the edges of those targets are extracted to sub-pixel accuracy using a moment preserving algorithm. The center of eachtarget (in terms of the coordinates ( )) is then determined by �tting an ellipse to the edge points. An iterativenonlinear simultaneous least-squares adjustment method extracts the internal and external parameters of the cameramodel, i.e., (15)-(17).
To remove most residual systematic errors from the calibration, distortion parameters on ( ) were includedin the model. Equations (15)-(17) require that and be in angular units and in unit of length. Unfortunately,this is not the case. The angular position of the mirrors are given as an output number from an analog-to-digitalconverter located on the galvanometer controller card. The laser spot position is an interpolated pixel number. Third-order polynomials are included in the model for the mapping of these dimensionless quantities to the proper variables.Twenty parameters must be solved for in the current range camera model.
To establish standardized measures for vision systems performance, terminology for accuracy must be clearlyde�ned. Ideally, a vision system intended for metrology should provide the distribution of repeated measurementstaken on well-known objects and �ducial marks, the operating conditions, all pertinent system parameters, and thespeci�c targeted application. Moreover, the vision system should yield dimensional measurements that have symmetricerror distributions, free of systematic errors and artifacts. Considering that the requirements and speci�cations varygreatly from one application to another, characterizing a vision system becomes a non-trivial task . For the purposeof this experiment, the terms resolution, bias, precision, and accuracy will be de�ned and used in the context of digitalrange imaging. No attempt has been made to fully characterize the error distributions.
is the smallest spatial interval that can be displayed. With this range camera, the resolutions of thescanning axes and the spot position detection are each 16 bits. System is de�ned as the di�erence between themean of the measurement and the true value of some �ducial mark. The true value of a measurement is, however,unknown and the best estimate one could obtain is from using a superior system. Measurements provided by a well-accepted gauging technique such as a CMM serves as a base for comparison. The term is de�ned as the degreeof conformity among a set of observations of the same quantity. The spread or dispersion of the measurement of thatquantity is an indication of precision. When the distribution of the measurements behaves like a Gaussian distribution,the standard deviation is used as a measure of precision. For , both bias and precision must be given asmeasure of system metric performance. No attempt should be made to combine the two numbers into a single number.Obviously, environmental parameters like temperature, atmospheric pressure, humidity, and mechanical stability mustbe speci�ed. In this experiment, the accuracy was estimated and veri�ed at a temperature of 25 C 0 5 C.
The results for a close-range calibration are reported here. The second step in the calibration procedure will be discussedin a separate paper. The �eld of view of the camera was digitized to a resolution of 512 512. The calibration wasperformed by positioning the target array 0.7 m and 1.1 m from the camera. Forty targets or control points were usedfor the solution (the minimum being seven). The extracted parameters for the model were then applied to the rawdata (both range and intensity) obtained for the same target array located at three other locations: 0.9 m, 1.3 m, and1.5 m. Note that the last two positions of the array are essentially extrapolated data. Positions 1.3 m and 1.5 m couldnot be used in the solution because the targets were too small. This target array was not speci�cally designed for thisrange camera. Future calibrations will not be hindered by these limitations.
9
p
x y z
6 Discussion
z : z :z : � ; � ; �
p; �; �x; y
x yz
z
z �
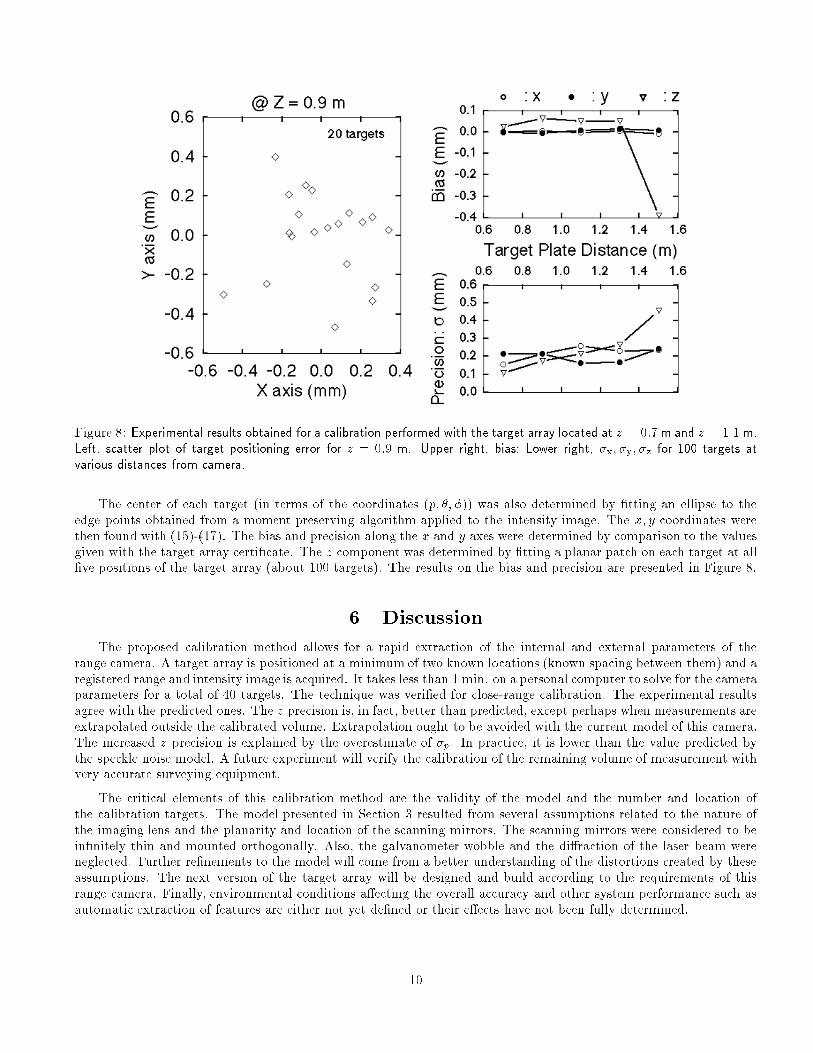
Experimental results obtained for a calibration performed with the target array located at m and m.Left, scatter plot of target positioning error for m. Upper right, bias; Lower right, for 100 targets atvarious distances from camera.
Figure 8: = 0 7 = 1 1= 0 9
The center of each target (in terms of the coordinates ( )) was also determined by �tting an ellipse to theedge points obtained from a moment preserving algorithm applied to the intensity image. The coordinates werethen found with (15)-(17). The bias and precision along the and axes were determined by comparison to the valuesgiven with the target array certi�cate. The component was determined by �tting a planar patch on each target at all�ve positions of the target array (about 100 targets). The results on the bias and precision are presented in Figure 8.
The proposed calibration method allows for a rapid extraction of the internal and external parameters of therange camera. A target array is positioned at a minimum of two known locations (known spacing between them) and aregistered range and intensity image is acquired. It takes less than 1 min. on a personal computer to solve for the cameraparameters for a total of 40 targets. The technique was veri�ed for close-range calibration. The experimental resultsagree with the predicted ones. The precision is, in fact, better than predicted, except perhaps when measurements areextrapolated outside the calibrated volume. Extrapolation ought to be avoided with the current model of this camera.The increased precision is explained by the overestimate of . In practice, it is lower than the value predicted bythe speckle noise model. A future experiment will verify the calibration of the remaining volume of measurement withvery accurate surveying equipment.
The critical elements of this calibration method are the validity of the model and the number and location ofthe calibration targets. The model presented in Section 3 resulted from several assumptions related to the nature ofthe imaging lens and the planarity and location of the scanning mirrors. The scanning mirrors were considered to bein�nitely thin and mounted orthogonally. Also, the galvanometer wobble and the di�raction of the laser beam wereneglected. Further re�nements to the model will come from a better understanding of the distortions created by theseassumptions. The next version of the target array will be designed and build according to the requirements of thisrange camera. Finally, environmental conditions a�ecting the overall accuracy and other system performance such asautomatic extraction of features are either not yet de�ned or their e�ects have not been fully determined.
10
x; y z � � ��
7 Conclusion
8 Acknowledgements
References
This paper introduced a new method for the calibration of a range camera intended for space applications. A modelbased on the collinearity principle is derived for the synchronized geometry. It is used to extract the internal andexternal parameters of the range camera with an iterative nonlinear simultaneous least-squares adjustment method.An assessment of the precision and accuracy of this range camera and the proposed calibration method were conductedin a �eld of view located within a range of 0.5 m to 1.5 m. Experimental results obtained for a close range calibrationsuggest a precision along the and axes of 200 m, 200 m, and 250 m, respectively, and a bias of less than100 m in all directions. These results are satisfactory for the intended application of this range camera. Although alaser range �nder based upon the synchronized scanner approach was considered, other active triangulation geometrieswith di�erent requirements can be accommodated by a similar analysis and calibration procedure.
The evaluation of the performance of vision systems for metrology is challenging since it is concerned with allaspects of evaluation, i.e., image quality and detection success, and also involves the understanding of all systemparameters and how they interact to produce certain results. Rigorous range camera calibration is essential for visionapplications, if one wants to speed up the transition of vision systems from laboratory to the space environment orto the factory oor where accurate measurement is required. An important factor is the lack of reliable methods forpredicting the performance of a proposed solution for a given application. It is also very di�cult to model or predictthe performance without a near perfect and stable calibration process.
The authors wish to thank the Canadian Space Agency for their support along the course of this project. The authorswish to express their gratitude to P. Boulanger who provided the segmentation routines used to evaluate the cameraperformance and P. Amirault for the technical illustrations. Finally, the authors wish to thank E. Kidd for her help inpreparing the text.
[1] M. Rioux, \Applications of Digital 3-D Imaging," Canadian Conference on Electrical and Computer Engineering.,Ottawa, Sept. 4{6, 37.3.1{37.3.10 (1990).
[2] P.J. Besl, \Range Imaging Sensors," Mach. Vision Applic., 1, 127{152 (1988).
[3] M. Rioux, \Laser Range Finder based on Synchronized Scanners," Appl. Opt., 23, 3837{3844 (1984).
[4] F. Blais, J.-A. Beraldin, M. Rioux, R.A. Couvillon, and S.G. MacLean, \Development of a Real-Time TrackingLaser Range Scanner for Space Applications," Workshop on Computer Vision for Space Applications, Antibes,France, Sept. 22{24 (1993) In Press.
[5] J.-A. Beraldin, R. Baribeau, M. Rioux, F. Blais, and G. Godin, \Model-Based Calibration of a Range Camera",Proc. of 11th IAPR Int. Conf. on Pattern Recognition, The Hague, The Netherlands, Aug. 30{Sept. 3, 163{167,(1992).
[6] R. Baribeau and M. Rioux, \In uence of Speckle on Laser Range Finders," Appl. Opt., 30, 2873{2878 (1991).
[7] S.F. El-Hakim, \Application and Performance Evaluation of a Vision-based Automated Measurement System,"Videometrics, SPIE Proceedings, Vol. 1820, 181{195 (1992).
[8] F. Blais, M. Rioux and J.-A. Beraldin, \Practical Considerations for a Design of a High Precision 3-D LaserScanner System," SPIE Proceedings, Vol. 959, 225{246 (1988).
11