Embed Size (px)
Citation preview

196
The Condor 112(2):196–212 The Cooper Ornithological Society 2010
The Condor, Vol. 112, Number 2, pages 196–212. ISSN 0010-5422, electronic ISSN 1938-5422. 2010 by The Cooper Ornithological Society. All rights reserved. Please direct all requests for permission to photocopy or reproduce article content through the University of California Press’s Rights and Permissions website, http://www.ucpressjournals.com/reprintInfo.asp. DOI: 10.1525/cond.2010.080113
Resumen. El Hakalau Forest National Wildlife Refuge se estableció para proteger a las aves de bosque nativas de Hawái, particularmente a las especies amenazadas. El manejo para restaurar el bosque en este refugio consis-tió principalmente en remover ungulados asilvestrados, controlar plantas exóticas invasoras y reforestar áreas que antes estaban como pastizales. Para evaluar los efectos de este mejoramiento del hábitat para las aves de bosque, estimamos su densidad anualmente mediante muestreos de distancia y examinamos las tendencias poblacionales de paserinos nativos y exóticos a lo largo de los 21 años transcurridos desde el establecimiento del refugio. Evalu-amos las tendencias de largo plazo y las trayectorias recientes de corto plazo en tres áreas de estudio: (1) pastiza-les reforestados, (2) bosques abiertos fuertemente ramoneados en recuperación y (3) bosques cerrados con poco ramoneo que se encontraban relativamente intactos. Tres especies de aves nativas y dos de aves exóticas habían colonizado el pastizal reforestado y estaban aumentando. En el bosque abierto, las densidades de las ocho especies nativas estuvieron estables o en aumento. En general, las tendencias de largo plazo de las aves exóticas también mostraron estabilidad o incremento de las poblaciones. Sin embargo, de modo preocupante, durante los nueve años más recientes las trayectorias de las especies nativas en el bosque abierto fueron decrecientes o inciertas, pero en el pastizal reforestado en general tendieron a aumentar. El bosque cerrado fue censado sólo en los nueve años más recientes y allí las trayectorias de las especies nativas fueron variadas. En general, las poblaciones tienden a estar estables o a aumentar en el largo plazo en Hakalau, lo que contrasta con las disminuciones observadas en la ma-yoría de las demás áreas de Hawái en el mismo período. Sin embargo, los resultados mixtos más recientes podrían indicar la aparición de problemas en esta área de importancia para las aves.
POPUlATION TRENDS OF FOREST BIRDS AT HAkAlAU FOREST NATIONAl WIlDlIFE REFUgE, HAWAI‘I
Tendencias Poblacionales de Aves de Bosque en Hakalau Forest National Wildlife Refuge, Hawái
Richard J. Camp et al.Trends of Forest Birds at Hakalau, Hawai‘i
Abstract. The Hakalau Forest National Wildlife Refuge was established to protect native Hawaiian forest birds, particularly endangered species. Management for forest restoration on the refuge has consisted mainly of re-moving feral ungulates, controlling invasive alien plants, and reforesting former pastures. To assess effects of this habitat improvement for forest birds, we estimated density annually by distance sampling and examined popula-tion trends for native and alien passerines over the 21 years since the refuge was established. We examined long-term trends and recent short-term trajectories in three study areas: (1) reforested pastureland, (2) heavily grazed open forest that was recovering, and (3) lightly grazed closed forest that was relatively intact. Three species of native birds and two species of alien birds had colonized the reforested pasture and were increasing. In the open forest, densities of all eight native species were either stable or increasing. long-term trends for alien birds were also generally stable or increasing. Worryingly, however, during the most recent 9 years, in the open forest tra-jectories of native species were decreasing or inconclusive, but in the reforested pasture they generally increased. The closed forest was surveyed in only the most recent 9 years, and trajectories of native species there were mixed. Overall, long-term population trends in Hakalau are stable or increasing, contrasting with declines in most other areas of Hawai‘i over the same period. However, more recent mixed results may indicate emergent problems for this important bird area.
4E-mail: [email protected] address: P. O. Box 420, Volcano, HI 96785.6Current address: P. O. Box 40, Pepe’ekeo, HI 96783.7Current address: Department of Environmental Studies, University of New England, 11 Hills Beach Road, Biddeford, ME 04005.
0000
19December2008
21October2009
© The Cooper Ornithological Society, 20102010
RichaRd J. camp1,4, Thane K. pRaTT2,5, p. maRcos GoRResen1, John J. JeffRey3,6, and BeThany L. WoodWoRTh2,7
1Hawai‘i Cooperative Studies Unit, University of Hawai‘i at Hilo, Pacific Aquaculture and Coastal Resources Center, P. O. Box 44, Hawai‘i National Park, HI 96718
2U.S. Geological Survey, Pacific Island Ecosystems Research Center, P. O. Box 44, Hawai‘i National Park, HI 96718
3U.S. Fish and Wildlife Service, Hakalau Forest National Wildlife Refuge, 60 Nowelo St., Suite 100, Hilo, HI 96720
Manuscript received 19 December 2008; accepted 21 October 2009.
Key words: bird counts, Hakalau Forest National Wildlife Refuge, Hawai‘i, Hawaiian forest birds, point-transect sampling, population trends.
02_MS080113.indd 196 5/17/10 4:47:39 PM
TRENDS OF FOREST BIRDS AT HAkAlAU, HAWAI‘I 197
INTRODUCTION
It is widely recognized that native Hawaiian birds are greatly imperiled (Birdlife International 2000, Scott et al. 2001, Pratt et al. 2009). Naturalists from the 1890s through 1950s wit-nessed declining populations, contracting species’ ranges, and a great many extinctions (Banko and Banko 2009). Even in the modern period of conservation activity in the Hawaiian Islands, population trends for most species have been down-ward, with perhaps as many as 10 extinctions from 1977 to 2004 (Scott and kepler 1985, gorresen et al. 2009). Despite some successes in Hawaiian seabird and waterbird conserva-tion (Birdlife International 2000), reversing declines in for-est birds has been particularly challenging owing to continued deterioration of habitat and the harmful effects of invasive alien species (Price et al. 2009).
Comprehensive surveys from 1976 to 1981 by Scott et al. (1986)—the Hawai‘i Forest Bird Survey or HFBS—provided the first quantitative estimates of Hawaiian forest bird popu-lations. These authors established that the majority of native land birds survived mainly at high elevations above the limits of avian diseases, the mosquito vectors that transmit them, and other factors resulting in habitat deterioration and deple-tion of food resources. Recovery planning has depended on
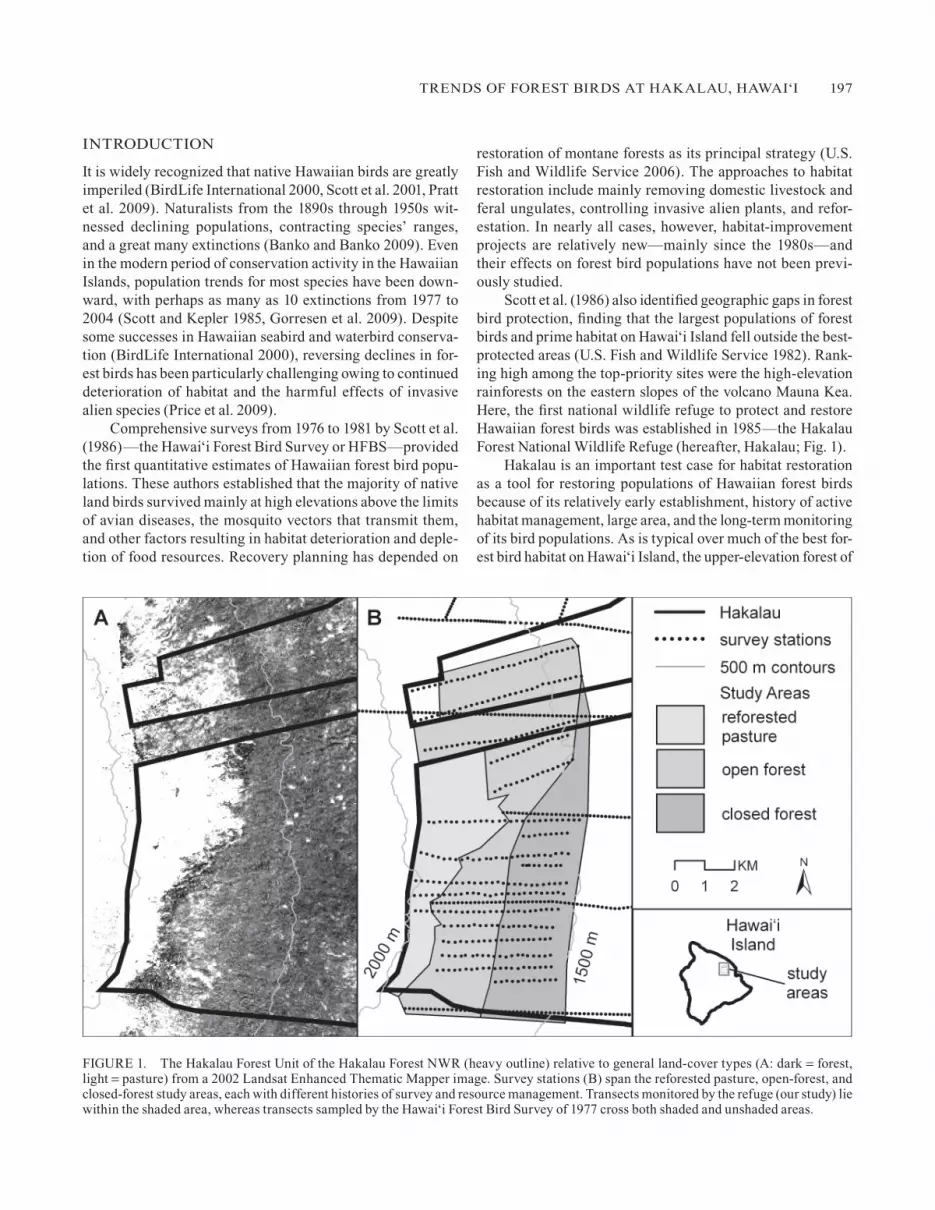
FIgURE 1. The Hakalau Forest Unit of the Hakalau Forest NWR (heavy outline) relative to general land-cover types (A: dark = forest, light = pasture) from a 2002 landsat Enhanced Thematic Mapper image. Survey stations (B) span the reforested pasture, open-forest, and closed-forest study areas, each with different histories of survey and resource management. Transects monitored by the refuge (our study) lie within the shaded area, whereas transects sampled by the Hawai‘i Forest Bird Survey of 1977 cross both shaded and unshaded areas.
restoration of montane forests as its principal strategy (U.S. Fish and Wildlife Service 2006). The approaches to habitat restoration include mainly removing domestic livestock and feral ungulates, controlling invasive alien plants, and refor-estation. In nearly all cases, however, habitat-improvement projects are relatively new—mainly since the 1980s—and their effects on forest bird populations have not been previ-ously studied.
Scott et al. (1986) also identified geographic gaps in forest bird protection, finding that the largest populations of forest birds and prime habitat on Hawai‘i Island fell outside the best-protected areas (U.S. Fish and Wildlife Service 1982). Rank-ing high among the top-priority sites were the high-elevation rainforests on the eastern slopes of the volcano Mauna kea. Here, the first national wildlife refuge to protect and restore Hawaiian forest birds was established in 1985—the Hakalau Forest National Wildlife Refuge (hereafter, Hakalau; Fig. 1).
Hakalau is an important test case for habitat restoration as a tool for restoring populations of Hawaiian forest birds because of its relatively early establishment, history of active habitat management, large area, and the long-term monitoring of its bird populations. As is typical over much of the best for-est bird habitat on Hawai‘i Island, the upper-elevation forest of
02_MS080113.indd 197 5/17/10 4:47:44 PM

198 RICHARD J. CAMP eT aL.
koa (Acacia koa) and ‘o-hi‘a-lehua (Metrosideros polymorpha) in the area that is now the refuge was converted to cattle pasture in the 1800s, leading to replacement of forest by non-native grassland (Scott et al. 1986). An additional environmental stressor to forest health has been the feral pig (Sus scrofa), which damages the forest understory, spreads alien plants, and creates mosquito habitat (laPointe et al. 2009, Price et al. 2009). The eradication of feral cattle (Bos taurus) and pigs has been a primary management goal at Hakalau (U.S. Fish and Wildlife Service 1996), and to date about 4800 ha of the refuge is now ungulate free or nearly so (Maxfield 1998, Hess et al. 2006). Control of four species of invasive weeds has also been undertaken at Hakalau. Finally and importantly, to accelerate habitat recovery in open pastures, refuge staff and volunteers have planted 2000 ha with seedlings of native trees, mainly koa (Hakalau Forest National Wildlife Refuge [NWR], unpubl. data).
Detecting and interpreting trends in bird populations and their response to management are important components of assessing conservation actions at Hakalau. Since 1987 birds have been surveyed annually there in reforested pasture and formerly grazed open forest between 1300 and 2100 m. Sur-veys in these two areas sample about 35% (5500 ha) of the ref-uge. An additional 1100 ha in relatively intact closed forest has been surveyed annually since 1999. Such long-term datasets of population densities are useful for describing baseline vari-ability in populations, detecting biologically relevant changes, and revealing population responses to management (Camp et al. 2009b). Thus, the frequent and long-term monitoring of forest birds at Hakalau offers one of the best opportunities to examine the outcome of forest restoration for these birds in Hawai‘i.
The purpose of this study is to appraise changes in forest bird populations in light of habitat restoration. Because native bird populations are decreasing at many locations on Hawai‘i Island (gorresen et al. 2009), we ask the question: Are native bird populations stable or increasing at Hakalau? Although a causal relationship between habitat restoration and changes in the bird populations cannot be identified from these data, it is reasonable to expect that the habitat changes underway at the refuge influence bird trends and could halt or reverse popu-lation declines. We examine this expectation by comparing trends in native birds within Hakalau to trends in populations outside the refuge under different practices of forest and un-gulate management.
METHODS
STUDy AREA
The 15 390-ha Hakalau Forest NWR (19° 51′ N, 155° 18′ W) on the windward slope of Mauna kea is the largest protected and actively managed area of mid- to high-elevation rain forest on the island of Hawai‘i and in the state of Hawai‘i (Fig. 1). Mean daily air temperature averages 15° C with an
annual variation of <5° C, and annual rainfall averages 2500 mm with a maximum of about 6100 mm (Juvik and Juvik 1998). The montane forest at middle elevations (600–1900 m) is dominated by native ‘o-hi‘a and koa/‘o-hi‘a, whereas at the highest elevations (>1900 m) it consists of open grassland, rel-ict mature koa trees, and recently planted forest (Fig. 1). Non-native plants may be found in native forest at all elevations, the most injurious species being various pasture grasses, gorse (Ulex europaeus), blackberry (Rubus argutus), banana poka (Passiflora tarminiana), and holly (Ilex aquifolium).
For purposes of analysis, we divided the refuge into three study areas that reflect the history of management and moni-toring at Hakalau (Fig. 1): (1) the pasture study area at 1650–2000 m elevation was deforested grassland at the beginning of the study. The area was gradually reforested mainly by planting, so that by the end of the study period it was cov-ered mostly by stands of koa trees as much as 20 years old. This study area has been surveyed intermittently since 1987 with 35 stations (area = 1314 ha). Because fewer than 30 sta-tions were sampled in 1992, 1993, 1994, 1995, and 1997, we did not use survey data from those years in our analyses of the pasture study area. (2) The open-forest study area, eleva-tion 1400–1920 m (area = 3373 ha), was once heavily grazed. Most regeneration has proceeded with recruitment from the forest itself rather than by planting. The vegetation is not uni-form, and the northeastern portion has a more complex and denser structure (canopy, understory, and ground cover) than the southwestern portion. This area has been surveyed since 1987, longer than the closed-forest study area, averaging 277 stations. (3) last, the closed-forest study area, the least modi-fied by grazing, has been surveyed only since 1999 with 197 stations (area = 1998 ha). The ecological significance of this study area to the refuge’s management is that, because of its lower overall elevation (1400–1700 m), declines in native birds due to avian disease might be expected to appear there first (van Riper and Scott 2001). Note that the reforested pasture and open-forest study areas have been managed and moni-tored for a longer time (1987–present) than has the closed-forest study area (1999–present).
BIRD SPECIES
We estimated the density and population trends of eight na-tive and four introduced species. Only a small portion—11 species—of the refuge’s original avifauna survives. The miss-ing component includes as many as 13 historically known species that could once have occurred on the refuge, but these are now either extinct or extirpated from the area that is now the refuge, together with an unknown number of species that disappeared before Western contact in the late 18th century (Banko and Banko 2009). Densities of native birds decline at lower elevations, and several species are essentially absent from the lowest elevations of the refuge. Our survey meth-ods (see below) were effective at sampling the refuge’s eight
02_MS080113.indd 198 5/17/10 4:47:45 PM

TRENDS OF FOREST BIRDS AT HAkAlAU, HAWAI‘I 199
extant forest passerines but were not suitable for estimating densities of the ‘Io (Hawaiian Hawk; Buteo solitarius), Pueo (Short-eared Owl; Asio flammeus), and Ne-ne- (Hawaiian goose; Branta sandvicensis), and data for those species are not presented here.
The eight native species sampled are the Hawai‘i ‘Ele-paio (Chasiempis s. sandwichensis), a monarch flycatcher (Monarchidae), the ‘O
-ma‘o (Myadestes obscurus), a thrush
(Turdidae), and six Hawaiian honeycreepers (Fringillidae: Drepanidinae), the ‘Akiapo-la-‘au (Hemignathus munroi), Hawai‘i ‘Amakihi (Hemignathus virens), Hawai‘i Creeper (Oreomystis mana), Hawai‘i ‘A- kepa (Loxops c. coccineus), ‘I‘iwi (Vestiaria coccinea), and ‘Apapane (Himatione san-guinea). The ‘Akiapo-la-‘au, Hawai‘i Creeper, and Hawai‘i ‘A- kepa are listed as endangered by the U.S. Fish and Wild-life Service and the state of Hawai‘i, and the refuge encom-passes a core portion of their ranges (U.S. Fish and Wildlife Service 2006, gorresen et al. 2009). In addition, 16 species of introduced birds now occupy the refuge, but only four of these have invaded the forest and exist in densities that can be read-ily tracked: the Red-billed leiothrix (Timaliidae; Leiothrix lutea), Japanese White-eye (Zosteropidae; Zosterops japoni-cus), Northern Cardinal (Cardinalidae; Cardinalis cardina-lis), and House Finch (Fringillidae; Carpodacus mexicanus).
BIRD SAMPlINg
In 1977 the HFBS sampled what is now the refuge along three transects spaced about 3 km apart with 95 stations at 134-m intervals (Scott et al. 1986). Soon after establishment of the refuge, in 1986, a new series of 11 transects was laid out and later expanded to a total of 15 transects, with a range of 196 to 343 stations surveyed across the refuge. Annual bird sampling commenced in 1987. To assure the stations’ independence, distances between them varied from 150 to 250 m (Reynolds et al. 1980, Scott et al. 1986). All surveys have followed the same point-transect sampling procedures initiated by Scott et al. (1986). (Here we use the more current term point-transect sampling rather than the term variable circular plot count used by Scott et al. 1986.)
Before the surveys observers were trained in distance es-timation and bird vocalizations, thereby minimizing variabil-ity among observers and standardizing for local conditions (kepler and Scott 1981). Observers recorded the detection type (heard, seen, or both) and horizontal distance from the station’s center point to individual birds detected during an 8-min count. Birds only flying over or through the survey area were excluded. Both males and females singing and calling were recorded, although the sex of individuals was not noted. Most of the birds encountered were adults because counts were timed during the breeding season (see below) and most juveniles had not yet fledged.
Observers also recorded cloud cover, rain, wind, gust, and time of day at each station. Sampling was typically conducted
between dawn and 11:00 and halted when rain, wind, or gust exceeded prescribed levels (light rain and wind level 3 on the Beaufort scale). We included weather variables and time of day as covariates in the analyses to account for possible differ-ences in the detection probabilities due to the conditions when the count was conducted, as explained later.
The detectability of forest birds varies through the year because of changes in vocal activity associated with breeding (Best 1981) and because birds may move in or out of the study area in response to phenology of food resources (Simon et al. 2002). To minimize biases associated with differences in sam-pling periods, we restricted density estimates to the breeding season only. The original 1977 HFBS was conducted in July, a month when birds’ breeding has generally finished and many nectarivorous birds have dispersed in search of flowers (Scott et al. 1986; Ralph and Fancy 1994, 1995). Since the HFBS, from 1987 to 2007, annual surveys were conducted mainly during March and April to correspond with the breeding sea-son of most species. Because of this disparity in the months sampled, and the great difference in number and location of stations sampled, we excluded the 1977 HFBS data from our trend analyses.
DENSITy ESTIMATION
Point-transect methods, a form of distance sampling, are used to correct abundance estimates for individuals that go unde-tected. This correction is accomplished by modeling a species-specific detection function and calculating a probability of detection, which is subsequently used to estimate bird density (Buckland et al. 2001). Robust estimates rely upon the critical assumptions that all birds are detected with certainty at the station’s center point, birds are detected prior to any respon-sive movement, and distances are measured without error. Buckland et al. (2001, 2004) described distance-sampling procedures and analyses in detail.
We estimated density only for species for which we had detections sufficient to characterize detectability adequately (Appendix 1; Buckland et al. 2001:241). We did not estimate species-specific densities for strata in which <50 individuals were detected. Species-specific density estimates (birds ha−1) were calculated from point-transect data with program DIS-TANCE, version 5.0, release 2 (Thomas et al. 2005). Stations were usually counted only once during an annual survey, but when counted more than once, survey effort was adjusted by the number of times the station was counted.
Candidate models for the detection function were limited to half-normal and hazard-rate detection functions with ex-pansion series of order two (Buckland et al. 2001:361, 365; half-normal was paired with cosine and Hermite polyno-mial adjustments, and hazard-rate was paired with cosine and simple polynomial adjustments). The uniform detection function was not considered because covariates cannot be modeled. To improve the models’ precision, we incorporated
02_MS080113.indd 199 5/17/10 4:47:45 PM

200 RICHARD J. CAMP eT aL.
sampling covariates in the multiple-covariate distance- sampling (MCDS) engine of DISTANCE (Marques and Buckland 2004, Thomas et al. 2005). Covariates included cloud cover, rain, wind, gust, observer, time of detection, strata (reforested pasture, open forest, or closed forest study area), month, and year of survey. All covariates were treated as factors, except year was treated as both a factor and a con-tinuous covariate. Assessing year as a factor covariate allowed for detection probability to be calculated for each survey in-dependently, whereas assessing year as a continuous covari-ate allowed us to determine if the detection rate varied with time (see below). Each detectability model in the candidate set was fit to data pooled across strata and time (year) for each species, and the model selected was that with the lowest sec-ond-order Akaike’s information criterion corrected for small sample sizes (AICc) and where the proportion of variance in the model due to variability in the detection function was less than 70% (Buckland et al. 2001, Burnham and Anderson 2002; k. Burnham, pers. comm.; Appendices 1 and 2). Be-cause there was considerable spatial variation in the counts, we set an upper limit of 70% of the variation in density to be attributed to the detection function. Data were truncated at a distance where detection probability was <10%. This pro-cedure facilitates modeling by deleting outliers and reduc-ing the number of parameters needed to modify the detection function. Species-specific densities by year and stratum were estimated from the global detection function with the post-filtering approach (see below), and variances and confidence intervals were derived by bootstrap methods in DISTANCE from 999 iterations (Thomas et al. 2005).
A concern when birds are monitored over a long period is that successional changes in the vegetation may affect bird detectability and thereby influence measurement of density and trend. Over the past two decades of habitat management at the refuge, the forest has become increasingly dense and complex. We therefore assumed that detection probabilities, p̂i, may vary through time and be survey specific. Using the open-forest stratum, where there has been considerable un-derstory regrowth and native birds are relatively abundant, we tested for changes in bird detectability by estimating the posterior probability of a trend within a Bayesian framework (see Trend Detection below). We used a 10% change in detec-tion probability over 25 years as the threshold for defining the ecological relevance of a trend in detectability. An alternative approach is to include year as a continuous covariate to assess evidence for a trend in detection rates through time. For all species, however, year as a continuous covariate was strongly correlated with other model parameters, so its inclusion in the models should be avoided (see Marques et al. 2007).
The observed pattern of annual variability in the detec-tion probabilities contributed to our decision to estimate den-sities from year-specific data instead of approaches that pool data for many years. Densities are typically calculated from
global models that assume constant detection probabilities ( p̂•). This practice artificially reduces between-year variabil-ity in density estimates, which in turn overestimates the confi-dence of trend assessments. An alternative approach is to fit a global model to the whole data set and then apply this model to the individual survey data, i.e., “post-filtering.” This approach utilizes the entire data set to determine the best-fit detection function similar to the global modeling approach. However, it differs from the global modeling approach by allowing detec-tion probabilities to vary by survey. The third approach is to model detection functions, probabilities, and densities sepa-rately for each survey. However, the small numbers of obser-vations typical of rare species frequently cause models to fail. We found no evidence that mean densities generated by the three approaches differed (Camp et al. 2009a). Therefore, we chose the post-filtering approach to estimate densities because it uses the entire data set to model observations and allows the detection probabilities to vary by survey.
TREND DETECTION
We defined population trend as the long-term overall pattern in abundance over time. A long-term trend may be composed of short-term fluctuations or trajectories that vary over time and that may persist for only a few years. Relying on short-term trajectories to describe population patterns can be mis-leading when extrapolated; however, short-term trajectories can also be illuminating, especially as they may indicate the start of a shift in the long-term trend. We assessed long-term trends in bird density in the open-forest and pasture study ar-eas over 21 years (1987–2007). We also calculated short-term trajectories for each of the three strata over 9 years (1999–2007) when these tracts were concurrently surveyed.
We assessed change in populations by estimating trends within a Bayesian framework. The Bayesian approach pro-vides an intuitive assessment of the trend, and the method is particularly useful for distinguishing between ecologically negligible and meaningful trends (Wade 2000, Camp et al. 2008). In contrast, conventional trend analysis is unable to pro-vide conclusive evidence that a trend is near or at zero, nor can it distinguish such from actual trends masked by the effects of high variance in statistically nonsignificant outcomes.
We ran a log-link regression model in WinBUgS (lunn et al. 2000) from program R (version 2.7.0; R Foundation for Statistical Computing) to calculate the distribution of the posterior probabilities of the slope (b̂). The parameter α describes the density at time t = 0 (i.e., intercept), b is the rate of change (i.e., slope) with each unit increase in time t, and τ equals variance−1 (i.e., precision). The parameters α and b were given uninformative normal priors, and an un-informative gamma prior was given for τ. An uninforma-tive prior distribution was chosen to restrict the posterior distribution to the likelihood. The trends were centered on the year 1997 for the period 1987–2007, and on 2002 for the
02_MS080113.indd 200 5/17/10 4:47:46 PM

TRENDS OF FOREST BIRDS AT HAkAlAU, HAWAI‘I 201
period 1999–2007. The model parameters were estimated from 50 000 iterations for each of three chains (i.e., model runs) after the first 2000 iterations were discarded (a “burn-in” pe-riod). The three chains were pooled (150 000 total samples) to calculate the posterior distribution. Diagnostics demonstrated that the log-linear regressions of bird trends met all model assumptions.
We used a population change of 25% over 25 years as the threshold for defining the ecological relevance of a trend. The Breeding Bird Survey uses a 50% change over 25 years to as-sess trends (Peterjohn et al. 1995), but we felt this criterion was not sensitive enough to detect trends in endangered species. We defined a trend as an ecologically meaningful decrease when the slope exceeded the lower threshold (b̂ < −0.0119), as an increase when the slope surpassed the upper threshold (b̂ > 0.0093), and as negligible when the slope fell within the threshold levels (−0.0119 ≤ b̂ ≤ 0.0093) (Camp et al. 2008).
We interpret the likelihood of a trend with four catego-ries of evidence derived from the posterior odds (also called Bayes factors): very weak, weak, strong, or very strong (Wade 2000). We defined the categories on the basis of the following limits of posterior probability (P): very weak if P < 0.1, weak if 0.1 ≤ P < 0.7, strong if 0.7 ≤ P < 0.9, and very strong if P ≥ 0.9. In cases where the posterior odds provide weak evidence among all three trend categories (i.e., decreasing, negligible, and increasing), we interpret the trend to be inconclusive (re-ferred to as “no consensus” by Crome et al. 1996). We con-clude that a population was stable if evidence of a negligible trend was strong or very strong. We interpret trends as stable to increasing or stable to decreasing in cases where the pos-terior odds provided weak evidence for both the negligible category and either the increasing or decreasing category and provided very weak evidence for the remaining category. The R code to assess population trends is available from the au-thors by request.
RESUlTS
TRENDS IN DENSITIES
In the reforested pasture study area, the Hawai‘i ‘Amakihi, ‘I‘iwi, ‘Apapane, Japanese White-eye, and House Finch showed strong or very strong evidence of long-term increase, their den-sities more than doubling over the 21-year period (Table 1, Fig. 2; detection probabilities and annual bird densities are in Camp et al. 2009a). Notably, numbers of the Hawai‘i ‘Amakihi and Japanese White-eye increased many-fold. Recent short-term trajectories (1999–2007) for forest birds in the reforested pasture study area were mixed. Again, evidence of increase in the densities of the Hawai‘i ‘Amakihi and Japanese White-eye was very strong , while House Finch densities decreased, and short-term trajectories for the ‘I‘iwi and ‘Apapane were incon-clusive. Visual comparison of Figures 2 and 3 shows that by the end of the study Hawai‘i ‘Amakihi densities in the reforested
pasture were still less than in the open forest but similar to those in the closed forest, whereas Japanese White-eye and House Finch densities were greater than in either the open forest or the closed forest. Densities of the ‘I‘iwi and ‘Apapane in the reforested pasture were much less than in the open forest and closed forest. Although all three of the endangered species—the ‘Akiapo-la-‘au, Hawai‘i Creeper, and Hawai‘i ‘A- kepa—have been observed using reforested pasture, trends for these species could not be determined because of the in-sufficient numbers of detections (<10 detections per species over the 21-year period; see Appendix 1).
One of the most significant and positive findings of this study was that within the open-forest study area, densities of the Hawai‘i ‘Elepaio, ‘Akiapo-la-‘au, and Hawai‘i Creeper have increased over the 21-year period (Table 1, Fig. 3). That is, each of those species’ densities showed a long-term trend of its population increasing by 31%, 125%, and 39%, respectively. Another positive finding was evidence for stable to increasing long-term trends for the Hawai‘i ‘A- kepa and ‘O
-ma‘o during
the same period. Moreover, we detected very strong evidence of stable trends for Hawai‘i ‘Amakihi, ‘I‘iwi, and ‘Apapane (Table 1, Fig. 3). Thus, long-term trends for all native species were found to have either remained stable or increased in the open-forest study area over the 21-year period.
In addition to long-term trends, we examined shorter-term (1999–2007) trajectories in the open-forest and closed-forest study areas. In the open forest, the short-term trajectory was a decline for all of the native birds except the ‘O
-ma‘o, for
which it was stable, and the ‘Akiapo-la-‘au and Hawai‘i Creeper, for which it was inconclusive (Table 1, Fig. 3). In the closed-forest study area, sampled only since 1999, densities of the Hawai‘i Creeper and Hawai‘i ‘A- kepa showed evidence of in-crease, whereas those of the ‘I‘iwi and ‘Apapane were stable to decreasing. Trajectories for the ‘O
-ma‘o, Hawai‘i ‘Amakihi,
and ‘Akiapo-la-‘au were declines, and that of the Hawai‘i ‘Elepaio was inconclusive.
For the introduced birds in the open-forest study area, the long-term trends of the Red-billed leiothrix and Japanese White-eye over the 21-year period were stable, and that of the Northern Cardinal was stable to declining (Table 1, Fig. 3). House Finch densities decreased during the 21-year period. During the recent 9-year period short-term trajectories were a decline for the Red-billed leiothrix in both the open forest and closed forest and for the Northern Cardinal and House Finch in the open forest; in the closed forest numbers of the latter two species were too low for trends to be detected. From 1999 to 2007 the Japanese White-eye was stable to increas-ing in the open-forest study area and increasing in the closed-forest study area. Thus, the Japanese White-eye was the only alien species whose density at the refuge increased overall, and this increase was observed both as a long-term trend in the reforested pasture and as recent short-term trajectories in all three habitats.
02_MS080113.indd 201 5/17/10 4:47:47 PM
202 RICHARD J. CAMP eT aL.
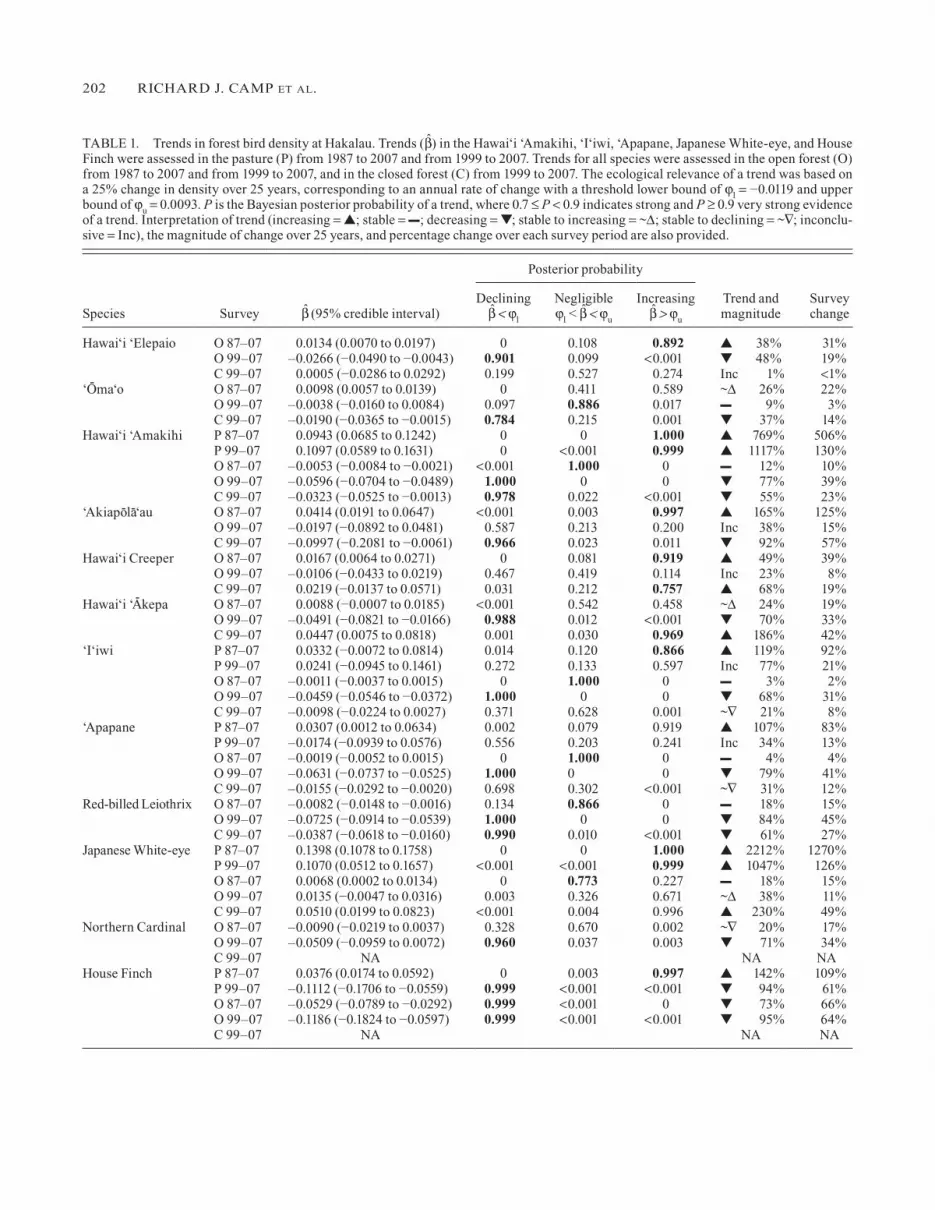
TABlE 1. Trends in forest bird density at Hakalau. Trends (b̂) in the Hawai‘i ‘Amakihi, ‘I‘iwi, ‘Apapane, Japanese White-eye, and House Finch were assessed in the pasture (P) from 1987 to 2007 and from 1999 to 2007. Trends for all species were assessed in the open forest (O) from 1987 to 2007 and from 1999 to 2007, and in the closed forest (C) from 1999 to 2007. The ecological relevance of a trend was based on a 25% change in density over 25 years, corresponding to an annual rate of change with a threshold lower bound of ϕl = −0.0119 and upper bound of ϕu = 0.0093. P is the Bayesian posterior probability of a trend, where 0.7 ≤ P < 0.9 indicates strong and P ≥ 0.9 very strong evidence of a trend. Interpretation of trend (increasing = ▲; stable = –; decreasing = ▼; stable to increasing = ~∆; stable to declining = ~∇; inconclu-sive = Inc), the magnitude of change over 25 years, and percentage change over each survey period are also provided.
Posterior probability
Species Survey b̂ (95% credible interval)Declining
b̂ < ϕl
Negligible ϕl < b̂ < ϕu
Increasing b̂ > ϕu
Trend and magnitude
Survey change
Hawai‘i ‘Elepaio O 87–07 0.0134 (0.0070 to 0.0197) 0 0.108 0.892 ▲ 38% 31%O 99–07 –0.0266 (−0.0490 to −0.0043) 0.901 0.099 <0.001 ▼ 48% 19%C 99–07 0.0005 (−0.0286 to 0.0292) 0.199 0.527 0.274 Inc 1% <1%
‘O-
ma‘o O 87–07 0.0098 (0.0057 to 0.0139) 0 0.411 0.589 ~∆ 26% 22%O 99–07 –0.0038 (−0.0160 to 0.0084) 0.097 0.886 0.017 – 9% 3%C 99–07 –0.0190 (−0.0365 to −0.0015) 0.784 0.215 0.001 ▼ 37% 14%
Hawai‘i ‘Amakihi P 87–07 0.0943 (0.0685 to 0.1242) 0 0 1.000 ▲ 769% 506%P 99–07 0.1097 (0.0589 to 0.1631) 0 <0.001 0.999 ▲ 1117% 130%O 87–07 –0.0053 (−0.0084 to −0.0021) <0.001 1.000 0 – 12% 10%O 99–07 –0.0596 (−0.0704 to −0.0489) 1.000 0 0 ▼ 77% 39%C 99–07 –0.0323 (−0.0525 to −0.0013) 0.978 0.022 <0.001 ▼ 55% 23%
‘Akiapo-la-‘au O 87–07 0.0414 (0.0191 to 0.0647) <0.001 0.003 0.997 ▲ 165% 125%O 99–07 –0.0197 (−0.0892 to 0.0481) 0.587 0.213 0.200 Inc 38% 15%C 99–07 –0.0997 (−0.2081 to −0.0061) 0.966 0.023 0.011 ▼ 92% 57%
Hawai‘i Creeper O 87–07 0.0167 (0.0064 to 0.0271) 0 0.081 0.919 ▲ 49% 39%O 99–07 –0.0106 (−0.0433 to 0.0219) 0.467 0.419 0.114 Inc 23% 8%C 99–07 0.0219 (−0.0137 to 0.0571) 0.031 0.212 0.757 ▲ 68% 19%
Hawai‘i ‘A-kepa O 87–07 0.0088 (−0.0007 to 0.0185) <0.001 0.542 0.458 ~∆ 24% 19%
O 99–07 –0.0491 (−0.0821 to −0.0166) 0.988 0.012 <0.001 ▼ 70% 33%C 99–07 0.0447 (0.0075 to 0.0818) 0.001 0.030 0.969 ▲ 186% 42%
‘I‘iwi P 87–07 0.0332 (−0.0072 to 0.0814) 0.014 0.120 0.866 ▲ 119% 92%P 99–07 0.0241 (−0.0945 to 0.1461) 0.272 0.133 0.597 Inc 77% 21%O 87–07 –0.0011 (−0.0037 to 0.0015) 0 1.000 0 – 3% 2%O 99–07 –0.0459 (−0.0546 to −0.0372) 1.000 0 0 ▼ 68% 31%C 99–07 –0.0098 (−0.0224 to 0.0027) 0.371 0.628 0.001 ~∇ 21% 8%
‘Apapane P 87–07 0.0307 (0.0012 to 0.0634) 0.002 0.079 0.919 ▲ 107% 83%P 99–07 –0.0174 (−0.0939 to 0.0576) 0.556 0.203 0.241 Inc 34% 13%O 87–07 –0.0019 (−0.0052 to 0.0015) 0 1.000 0 – 4% 4%O 99–07 –0.0631 (−0.0737 to −0.0525) 1.000 0 0 ▼ 79% 41%C 99–07 –0.0155 (−0.0292 to −0.0020) 0.698 0.302 <0.001 ~∇ 31% 12%
Red-billed leiothrix O 87–07 –0.0082 (−0.0148 to −0.0016) 0.134 0.866 0 – 18% 15%O 99–07 –0.0725 (−0.0914 to −0.0539) 1.000 0 0 ▼ 84% 45%C 99–07 –0.0387 (−0.0618 to −0.0160) 0.990 0.010 <0.001 ▼ 61% 27%
Japanese White-eye P 87–07 0.1398 (0.1078 to 0.1758) 0 0 1.000 ▲ 2212% 1270%P 99–07 0.1070 (0.0512 to 0.1657) <0.001 <0.001 0.999 ▲ 1047% 126%O 87–07 0.0068 (0.0002 to 0.0134) 0 0.773 0.227 – 18% 15%O 99–07 0.0135 (−0.0047 to 0.0316) 0.003 0.326 0.671 ~∆ 38% 11%C 99–07 0.0510 (0.0199 to 0.0823) <0.001 0.004 0.996 ▲ 230% 49%
Northern Cardinal O 87–07 –0.0090 (−0.0219 to 0.0037) 0.328 0.670 0.002 ~∇ 20% 17%O 99–07 –0.0509 (−0.0959 to 0.0072) 0.960 0.037 0.003 ▼ 71% 34%C 99–07 NA NA NA
House Finch P 87–07 0.0376 (0.0174 to 0.0592) 0 0.003 0.997 ▲ 142% 109%P 99–07 –0.1112 (−0.1706 to −0.0559) 0.999 <0.001 <0.001 ▼ 94% 61%O 87–07 –0.0529 (−0.0789 to −0.0292) 0.999 <0.001 0 ▼ 73% 66%O 99–07 –0.1186 (−0.1824 to −0.0597) 0.999 <0.001 <0.001 ▼ 95% 64%C 99–07 NA NA NA
02_MS080113.indd 202 5/17/10 4:47:49 PM
TRENDS OF FOREST BIRDS AT HAkAlAU, HAWAI‘I 203
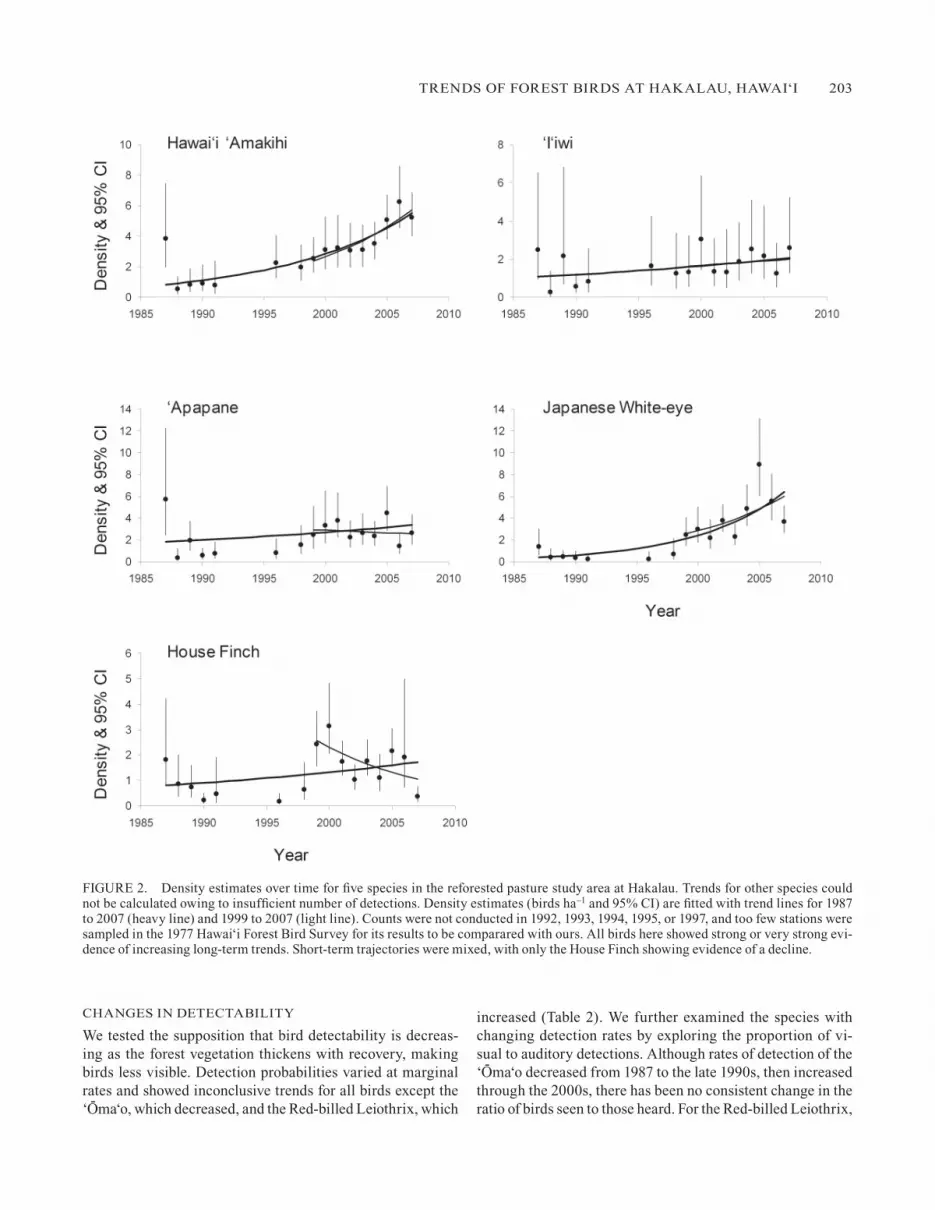
FIgURE 2. Density estimates over time for five species in the reforested pasture study area at Hakalau. Trends for other species could not be calculated owing to insufficient number of detections. Density estimates (birds ha–1 and 95% CI) are fitted with trend lines for 1987 to 2007 (heavy line) and 1999 to 2007 (light line). Counts were not conducted in 1992, 1993, 1994, 1995, or 1997, and too few stations were sampled in the 1977 Hawai‘i Forest Bird Survey for its results to be comparared with ours. All birds here showed strong or very strong evi-dence of increasing long-term trends. Short-term trajectories were mixed, with only the House Finch showing evidence of a decline.
CHANgES IN DETECTABIlITy
We tested the supposition that bird detectability is decreas-ing as the forest vegetation thickens with recovery, making birds less visible. Detection probabilities varied at marginal rates and showed inconclusive trends for all birds except the ‘O
-ma‘o, which decreased, and the Red-billed leiothrix, which
increased (Table 2). We further examined the species with changing detection rates by exploring the proportion of vi-sual to auditory detections. Although rates of detection of the ‘O
-ma‘o decreased from 1987 to the late 1990s, then increased
through the 2000s, there has been no consistent change in the ratio of birds seen to those heard. For the Red-billed leiothrix,
02_MS080113.indd 203 5/17/10 4:47:53 PM

204 RICHARD J. CAMP eT aL.
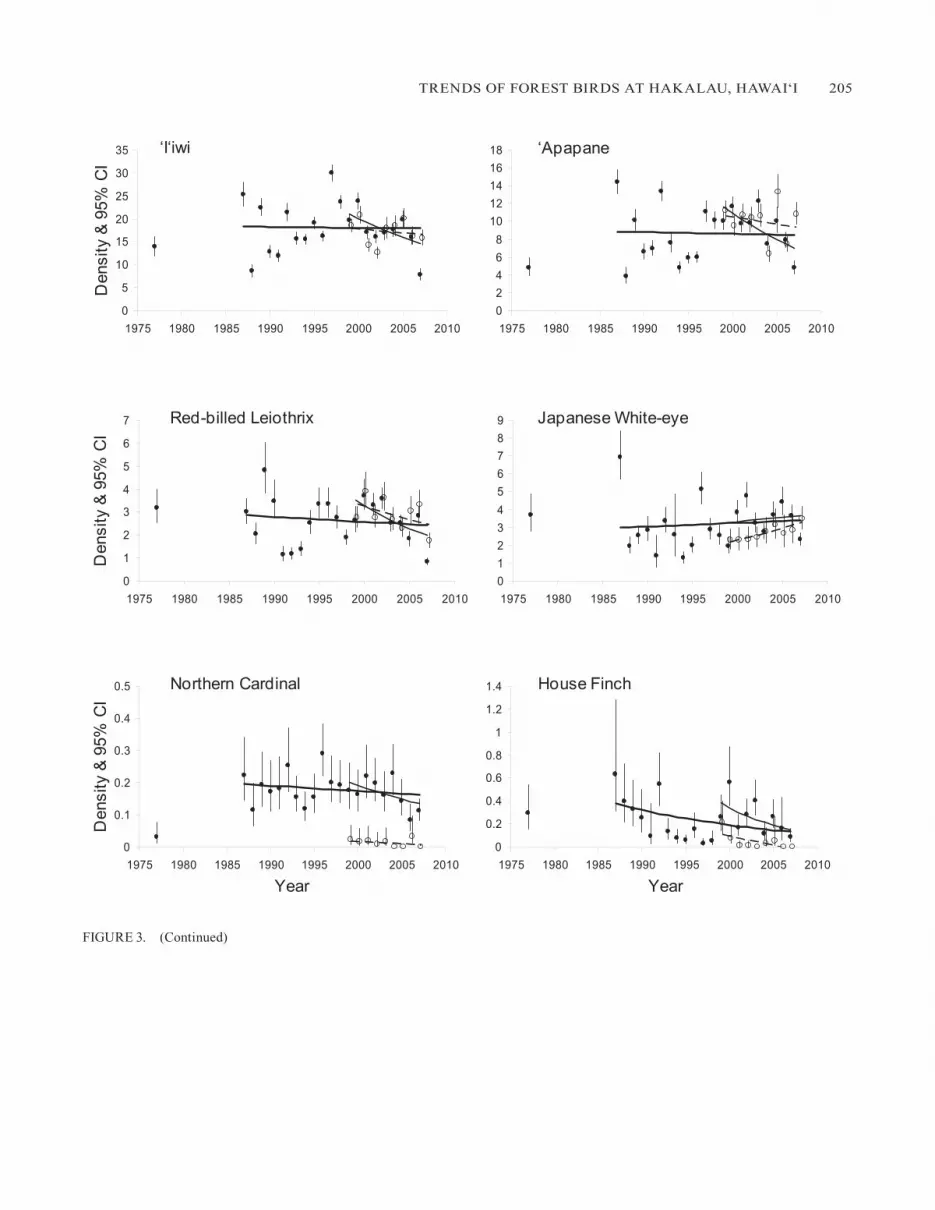
FIgURE 3. Density estimates over time for the eight native and four alien bird species in the open-forest and closed-forest study areas at Hakalau. Density estimates (birds ha–1 and 95% CI) in the open-forest study area (filled circles) are fitted with trend lines for 1987–2007 (heavy line) and 1999–2007 (light line) and in the closed-forest study area (unfilled circles) for 1999–2007 (dashed line). Data for the closed-forest study area are available only for the short-term analysis. Densities from the 1977 Hawai‘i Forest Bird Survey are presented for refer-ence and are not included in the trend analyses. In the open-forest study area, in the full data set (1987–2007), long-term population trends were negligible in all native species except the Hawai‘i ‘Elepaio, ‘Akiapo-la-‘au, and Hawai‘i Creeper, which showed strong evidence of in-crease. In the open-forest study area, long-term trends were stable for all alien species except the House Finch, which showed evidence of a decrease. During the last 9 years, however, the short-term trajectories of most species, both native and alien, were in decline.
Year Year
02_MS080113.indd 204 5/17/10 4:47:55 PM
TRENDS OF FOREST BIRDS AT HAkAlAU, HAWAI‘I 205
FIgURE 3. (Continued)
02_MS080113.indd 205 5/17/10 4:47:57 PM
206 RICHARD J. CAMP eT aL.
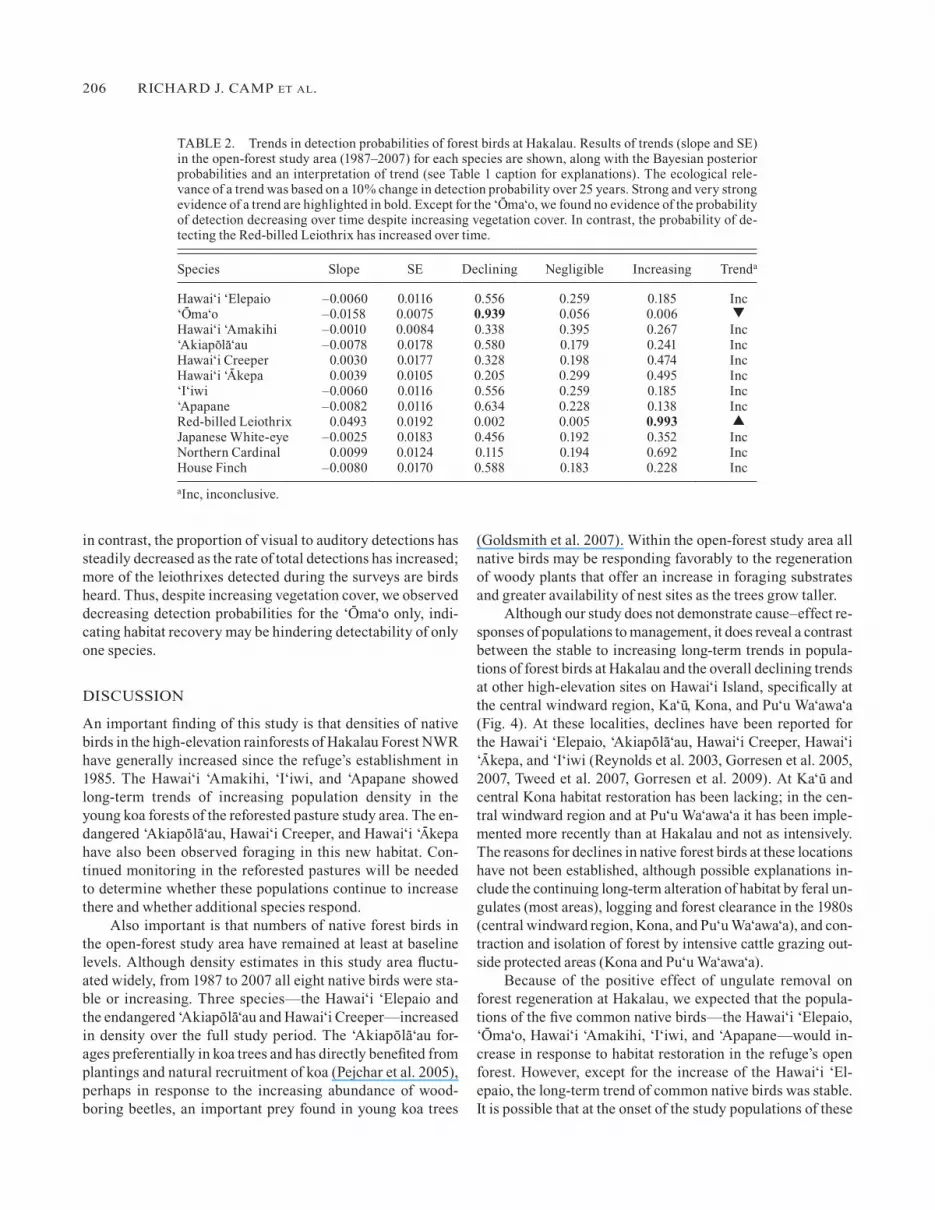
TABlE 2. Trends in detection probabilities of forest birds at Hakalau. Results of trends (slope and SE) in the open-forest study area (1987–2007) for each species are shown, along with the Bayesian posterior probabilities and an interpretation of trend (see Table 1 caption for explanations). The ecological rele-vance of a trend was based on a 10% change in detection probability over 25 years. Strong and very strong evidence of a trend are highlighted in bold. Except for the ‘O
-ma‘o, we found no evidence of the probability
of detection decreasing over time despite increasing vegetation cover. In contrast, the probability of de-tecting the Red-billed leiothrix has increased over time.
Species Slope SE Declining Negligible Increasing Trenda
Hawai‘i ‘Elepaio –0.0060 0.0116 0.556 0.259 0.185 Inc‘O
-ma‘o –0.0158 0.0075 0.939 0.056 0.006 ▼
Hawai‘i ‘Amakihi –0.0010 0.0084 0.338 0.395 0.267 Inc‘Akiapo-la-‘au –0.0078 0.0178 0.580 0.179 0.241 IncHawai‘i Creeper 0.0030 0.0177 0.328 0.198 0.474 IncHawai‘i ‘A
-kepa 0.0039 0.0105 0.205 0.299 0.495 Inc
‘I‘iwi –0.0060 0.0116 0.556 0.259 0.185 Inc‘Apapane –0.0082 0.0116 0.634 0.228 0.138 IncRed-billed leiothrix 0.0493 0.0192 0.002 0.005 0.993 ▲Japanese White-eye –0.0025 0.0183 0.456 0.192 0.352 IncNorthern Cardinal 0.0099 0.0124 0.115 0.194 0.692 IncHouse Finch –0.0080 0.0170 0.588 0.183 0.228 Inc
aInc, inconclusive.
in contrast, the proportion of visual to auditory detections has steadily decreased as the rate of total detections has increased; more of the leiothrixes detected during the surveys are birds heard. Thus, despite increasing vegetation cover, we observed decreasing detection probabilities for the ‘O
-ma‘o only, indi-
cating habitat recovery may be hindering detectability of only one species.
DISCUSSION
An important finding of this study is that densities of native birds in the high-elevation rainforests of Hakalau Forest NWR have generally increased since the refuge’s establishment in 1985. The Hawai‘i ‘Amakihi, ‘I‘iwi, and ‘Apapane showed long-term trends of increasing population density in the young koa forests of the reforested pasture study area. The en-dangered ‘Akiapo-la-‘au, Hawai‘i Creeper, and Hawai‘i ‘A-kepa have also been observed foraging in this new habitat. Con-tinued monitoring in the reforested pastures will be needed to determine whether these populations continue to increase there and whether additional species respond.
Also important is that numbers of native forest birds in the open-forest study area have remained at least at baseline levels. Although density estimates in this study area fluctu-ated widely, from 1987 to 2007 all eight native birds were sta-ble or increasing. Three species—the Hawai‘i ‘Elepaio and the endangered ‘Akiapo-la-‘au and Hawai‘i Creeper—increased in density over the full study period. The ‘Akiapo- la-‘au for-ages preferentially in koa trees and has directly benefited from plantings and natural recruitment of koa (Pejchar et al. 2005), perhaps in response to the increasing abundance of wood-boring beetles, an important prey found in young koa trees
(goldsmith et al. 2007). Within the open-forest study area all native birds may be responding favorably to the regeneration of woody plants that offer an increase in foraging substrates and greater availability of nest sites as the trees grow taller.
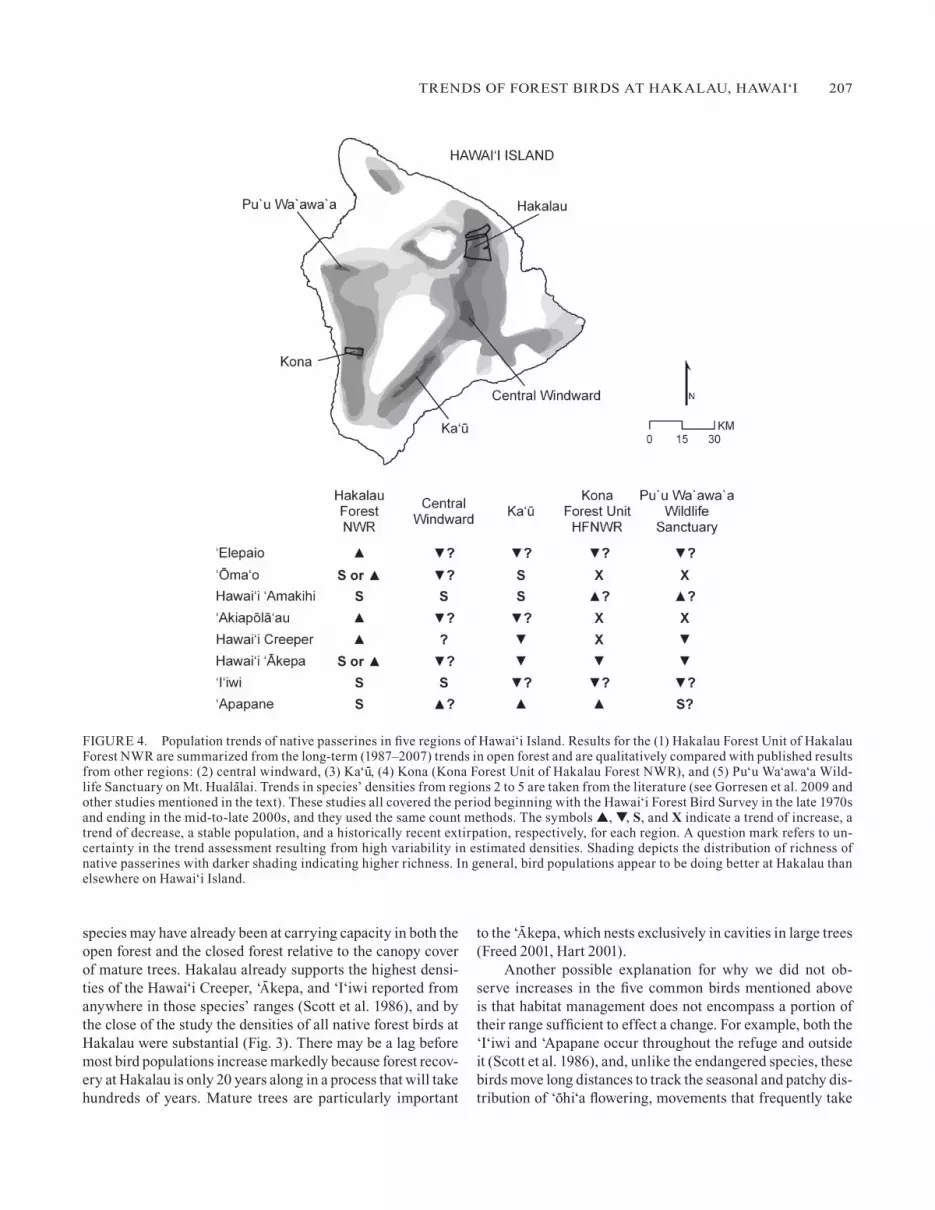
Although our study does not demonstrate cause–effect re-sponses of populations to management, it does reveal a contrast between the stable to increasing long-term trends in popula-tions of forest birds at Hakalau and the overall declining trends at other high-elevation sites on Hawai‘i Island, specifically at the central windward region, ka‘u-, kona, and Pu‘u Wa‘awa‘a (Fig. 4). At these localities, declines have been reported for the Hawai‘i ‘Elepaio, ‘Akiapo-la-‘au, Hawai‘i Creeper, Hawai‘i ‘A- kepa, and ‘I‘iwi (Reynolds et al. 2003, gorresen et al. 2005, 2007, Tweed et al. 2007, gorresen et al. 2009). At ka‘u- and central kona habitat restoration has been lacking; in the cen-tral windward region and at Pu‘u Wa‘awa‘a it has been imple-mented more recently than at Hakalau and not as intensively. The reasons for declines in native forest birds at these locations have not been established, although possible explanations in-clude the continuing long-term alteration of habitat by feral un-gulates (most areas), logging and forest clearance in the 1980s (central windward region, kona, and Pu‘u Wa‘awa‘a), and con-traction and isolation of forest by intensive cattle grazing out-side protected areas (kona and Pu‘u Wa‘awa‘a).
Because of the positive effect of ungulate removal on forest regeneration at Hakalau, we expected that the popula-tions of the five common native birds—the Hawai‘i ‘Elepaio, ‘O
-ma‘o, Hawai‘i ‘Amakihi, ‘I‘iwi, and ‘Apapane—would in-
crease in response to habitat restoration in the refuge’s open forest. However, except for the increase of the Hawai‘i ‘El-epaio, the long-term trend of common native birds was stable. It is possible that at the onset of the study populations of these
02_MS080113.indd 206 5/17/10 4:47:58 PM
TRENDS OF FOREST BIRDS AT HAkAlAU, HAWAI‘I 207
FIgURE 4. Population trends of native passerines in five regions of Hawai‘i Island. Results for the (1) Hakalau Forest Unit of Hakalau Forest NWR are summarized from the long-term (1987–2007) trends in open forest and are qualitatively compared with published results from other regions: (2) central windward, (3) ka‘u-, (4) kona (kona Forest Unit of Hakalau Forest NWR), and (5) Pu‘u Wa‘awa‘a Wild-life Sanctuary on Mt. Huala-lai. Trends in species’ densities from regions 2 to 5 are taken from the literature (see gorresen et al. 2009 and other studies mentioned in the text). These studies all covered the period beginning with the Hawai‘i Forest Bird Survey in the late 1970s and ending in the mid-to-late 2000s, and they used the same count methods. The symbols ▲, ▼, S, and X indicate a trend of increase, a trend of decrease, a stable population, and a historically recent extirpation, respectively, for each region. A question mark refers to un-certainty in the trend assessment resulting from high variability in estimated densities. Shading depicts the distribution of richness of native passerines with darker shading indicating higher richness. In general, bird populations appear to be doing better at Hakalau than elsewhere on Hawai‘i Island.
species may have already been at carrying capacity in both the open forest and the closed forest relative to the canopy cover of mature trees. Hakalau already supports the highest densi-ties of the Hawai‘i Creeper, ‘A- kepa, and ‘I‘iwi reported from anywhere in those species’ ranges (Scott et al. 1986), and by the close of the study the densities of all native forest birds at Hakalau were substantial (Fig. 3). There may be a lag before most bird populations increase markedly because forest recov-ery at Hakalau is only 20 years along in a process that will take hundreds of years. Mature trees are particularly important
to the ‘A- kepa, which nests exclusively in cavities in large trees (Freed 2001, Hart 2001).
Another possible explanation for why we did not ob-serve increases in the five common birds mentioned above is that habitat management does not encompass a portion of their range sufficient to effect a change. For example, both the ‘I‘iwi and ‘Apapane occur throughout the refuge and outside it (Scott et al. 1986), and, unlike the endangered species, these birds move long distances to track the seasonal and patchy dis-tribution of ‘o-hi‘a flowering, movements that frequently take
02_MS080113.indd 207 5/17/10 4:48:02 PM

208 RICHARD J. CAMP eT aL.
them outside managed areas (Fancy and Ralph 1997, 1998). It is possible that limiting factors operating at larger geographic scales, such as an upslope expansion of avian diseases (Ben-ning et al. 2002, Freed et al. 2005), might be counteracting the local benefits of forest restoration for these and other wide-spread species.
A final concern is the recent decline in bird density ap-parent in the short-term (9-year) trajectories of five native spe-cies in the recovering open-forest study area and three native species in the relatively intact closed-forest study area. If the near-term trajectories continue downward, it will not be long before the long-term trends of some species in the open for-est turn negative. One explanation for the change in the recent short-term trajectories is that the birds may be responding to fluctuations or longer-term changes in climate. long-term changes include an overall warming trend (giambelluca et al. 2008) and an altitudinal lowering and strengthening of the inversion layer that could be reducing rainfall at Hakalau (giambelluca and luke 2007).
Apparent recent declines might also be the result of an increase in one or more established threats, such as upslope expansion of mosquitoes and avian disease or population growth by competing alien birds. Transmission of avian ma-laria (Plasmodium relictum) and avian poxvirus is forecast to increase with the upslope movement of mosquitoes in a warm-ing climate (Benning et al. 2002, Atkinson and laPointe 2009, laPointe et al. 2009). Both diseases are certainly pres-ent at Hakalau, although infrequent at the higher elevations considered in our study (VanderWerf 2001, Freed et al. 2005). Evidence of an increase in two other threats—competition with the Japanese White-eye and ectoparasitism—has been recently reported from the southwestern portion of Hakalau (Freed et al. 2008a, b).
last, methodological issues may also be contributing to the recent short-term trajectories. Earlier, we raised a potentially important point that the obvious increase in vegetation struc-ture and density could interfere with counts and violate the as-sumption that count conditions remain constant. Although we found statistical evidence for declining detection probabilities for only one species, the ‘O
-ma‘o. Nevertheless, it is the impres-
sion of bird counters at Hakalau that the birds are increasingly difficult to see in both the open forest and closed forest because of the thick undergrowth.
Ultimately, continued annual monitoring and updated analyses may reveal more conclusive patterns in population trends as the refuge’s forest regenerates and the birds have ad-ditional time to respond to forest recovery, unless existing or new threats increase and override the benefits of improved habitat. The results of forest restoration and bird monitoring at Hakalau Forest NWR will be watched closely by all involved in the recovery of Hawaiian forest birds. Many similar restora-tion projects involving tens of thousands of hectares of formerly
grazed lands and degraded forest have been started by conser-vation agencies in Hawai‘i (Price et al. 2009).
Interpreting the results of bird monitoring at Hakalau will be an important next step in understanding the direc-tion of forest birds’ recovery on managed lands at the ref-uge and elsewhere in the islands. Monitoring birds outside the refuge as well as inside would allow for comparison of these populations at a landscape scale. Research comparing habitat use and demographic response in forests under dif-ferent regimes of management would yield information on the mechanisms driving bird trends at the refuge. Finally, new ways other than the current practices of forest restora-tion could be found to increase bird populations at Hakalau; these might include the large-scale planting of ‘o-hi‘a-lehua and other codominant trees and the control of rats. To ad-dress such issues, it is particularly important that future res-toration be carried out with experimental designs that cast these efforts in an adaptive management framework provid-ing feedback to managers.
ACkNOWlEDgMENTS
Analyses of the bird-monitoring data from Hakalau were con-ducted by the Hawai‘i Forest Bird Interagency Database Project of the U.S. geological Survey—Pacific Island Ecosystems Research Center (PIERC) with collaboration from the Pacific Islands Office of the U.S. Fish and Wildlife Service and State of Hawai‘i Divi-sion of Forestry and Wildlife. We especially thank the managers and field biologists who collected the data and worked so hard to maintain a core group of trained count ers. The manuscript was improved by comments from S. Conant, H. Freifeld, D. leonard, S. Matsuoka, l. Mehrhoff, E. VanderWerf, and two anonymous reviewers. We also thank the numerous interns that assisted with the preparation of data described here. The study was funded by the Pacific Islands Office of the U.S. Fish and Wildlife Service and by PIERC. Any use of trade, product, or firm names in this publica-tion is for descriptive purposes only and does not imply endorse-ment by the U.S. government.
lITERATURE CITED
aTKinson, c. T., and d. a. LapoinTe. 2009. Ecology and patho-genicity of avian malaria and pox, p. 234–252. In T. K. Pratt, C. T. Atkinson, P. Banko, J. Jacobi, and B. l. Woodworth [eds.], Conservation biology of Hawaiian forest birds: implications for island avifauna. yale University Press, New Haven, CT.
BanKo, W. e., and p. c. BanKo. 2009. Historic decline and extinc-tion, p. 25–58. In T. k. Pratt, C. T. Atkinson, P. Banko, J. Jacobi, and B. l. Woodworth [eds.], Conservation biology of Hawaiian forest birds: implications for island avifauna. yale University Press, New Haven, CT.
BenninG, T. L., d. a. LapoinTe, c. T. aTKinson, and p. m. ViTouseK. 2002. Interactions of climate change with biological invasions and land use in Hawaii: modeling the fate of endemic birds using a geographic information system. Proceedings of the National Academy of Sciences 99:14246–14249.
BesT, L. B. 1981. Seasonal changes in detection of individual bird species. Studies in Avian Biology 6:252–261.
02_MS080113.indd 208 5/17/10 4:48:03 PM

TRENDS OF FOREST BIRDS AT HAkAlAU, HAWAI‘I 209
BiRdLife inTeRnaTionaL. 2000. Threatened birds of the world. lynx Edicions, Barcelona.
BucKLand, s. T., d. R. andeRson, K. p. BuRnham, J. L. LaaKe, d. L. BoRcheRs, and L. Thomas. 2001. Introduction to dis-tance sampling: estimating abundance of biological populations. Oxford University Press, Oxford, Uk.
BucKLand, s. T., d. R. andeRson, K. p. BuRnham, J. L. LaaKe, d. L. BoRcheRs, and L. Thomas [eds.]. 2004. Advanced distance sampling. Oxford University Press, Oxford, Uk.
BuRnham, K. p., and d. R. andeRson. 2002. Model selection and multimodel inference: a practical information-theoretic approach, 2nd ed. Springer-Verlag, New york.
camp, R. J., T. K. pRaTT, p. m. GoRResen, J. J. JeffRey, and B. L. WoodWoRTh. [onLine]. 2009a. Passerine bird trends at Hakalau Forest National Wildlife Refuge. Hawaii Cooperative Studies Unit Technical Report HCSU-011, University of Hawai‘i at Hilo. <http://www.uhh.hawaii.edu/hcsu/publications.php> (20 March 2009).
camp, R. J., m. h. ReynoLds, B. L. WoodWoRTh, T. K. pRaTT, and p. m. GoRResen. 2009b. Monitoring Hawaiian forest birds, p. 83–107. In T. k. Pratt, C. T. Atkinson, P. Banko, J. Jacobi, and B. l. Woodworth [eds.], Conservation biology of Hawaiian for-est birds: implications for island avifauna. yale University Press, New Haven, CT.
camp, R. J., n. e. seaVy, p. m. GoRResen, and m. h. ReynoLds. 2008. A statistical test to show negligible trend: comment. Ecol-ogy 89:1469–1472.
cRome, f. h., m. R. homas, and L. a. mooRe. 1996. A novel Bayes-ian approach to assessing impacts of rain forest logging. Ecologi-cal Applications 6:1104–1123.
fancy, s. G., and c. J. RaLph. 1997. ‘Apapane (Himatione san-guinea), no.296. In a. Poole and F. gill [eds.], The birds of North America. Academy of Natural Sciences, Philadelphia.
fancy, s. G., and c. J. RaLph. 1998. ‘I‘iwi (Vestiaria coccinea), no. 327. In A. Poole and F. gill [eds.], The birds of North America. Birds of North America, Philadelphia.
fReed, L. a. 2001. Significance of old-growth forest to the Hawai‘i ‘A-kepa. Studies in Avian Biology 22:173–184.
fReed, L. a., R. L. cann, m. L. Goff, W. a. KunTz, and G. R. BodneR. 2005. Increase in avian malaria at upper elevations in Hawai‘i. Condor 107:753–764.
fReed, L. a., R. L. cann, and G. R. BodneR. 2008a. Incipient extinction of a major population of the Hawaii Akepa owing to introduced species. Evolutionary Ecology Research 10:931–965.
fReed, L. a., m. c. medieRos, and G. R. BodneR. 2008b. Explo-sive increase in ectoparasites in Hawaiian forest birds. Journal of Parasitology 94:1009–1021.
GiamBeLLuca, T. W., h. f. diaz, and m. s. a. LuKe. 2008. Secular temperature changes in Hawai‘i. geophysical Research letters 35, l12702, doi:10.1029/2008glO34377.
GiamBeLLuca, T. W., and m. s. a. LuKe. 2007. Climate change in Hawai‘i’s mountains. Mountain Views 1:13–18.
GoLdsmiTh, s., h. GiLLespie, and c. WeaTheRBy. 2007. Restoration of Hawaiian montane wet forest: endemic long-horned beetle (Cer-ambycidae: Plagithmysus) in koa (Fabaceae: Acacia koa) planta-tions and in intact forest. Southwestern Naturalist 52:356–363.
GoRResen, m. p., R. J. camp, and T. K. pRaTT. 2007. Forest bird dis-tribution, density and trends in the ka‘u- region of Hawai‘i Island. U.S. geological Survey Open-File Report 2007-1076.
GoRResen, m. p., R. J. camp, T. K. pRaTT, and B. L. WoodWoRTh. 2005. Status of forest birds in the Central Windward Region of Hawai‘i Island. U.S. geological Survey Open-File Report 2005-1441.
GoRResen, p. m., R. J. camp, m. h. ReynoLds, T. K. pRaTT, and B. L. WoodWoRTh. 2009. Status and trends of native Hawaiian songbirds, p. 108–136. In T. K. Pratt, C. T. Atkinson, P. Banko, J. Jacobi, and B. l. Woodworth [eds.], Conservation biology of Hawaiian forest birds: implications for island avifauna. yale Uni-versity Press, New Haven, CT.
haRT, p. J. 2001. Demographic comparisons between high and low density populations of Hawai‘i ‘A
-kepa. Studies in Avian Biology
22:185–193.hess, s. c., J. J. JeffRey, d. L. BaLL, and L. BaBich. 2006. Efficacy
of feral pig removals at Hakalau Forest National Wildlife Ref-uge, Hawai‘i. Transactions of the Western Section of the Wildlife Society 42:53–67.
JuViK, s. p., and J. o. JuViK [eds.]. 1998. Atlas of Hawai‘i, 3rd ed. University of Hawai‘i Press, Honolulu, HI.
KepLeR, c. B., and J. m. scoTT. 1981. Reducing bird count vari-ability by training observers. Studies in Avian Biology 6:366–371.
LapoinTe, d. a., c. T. aTKinson, and s. i. JaRVi. 2009. Manag-ing disease, p. 405–424. In T. k. Pratt, C. T. Atkinson, P. Banko, J. Jacobi, and B. l. Woodworth [eds.], Conservation biology of Hawaiian forest birds: implications for island avifauna. yale Uni-versity Press, New Haven, CT.
Lunn, d. J., a. Thomas, n. BesT, and d. spieGeLhaLTeR. [onLine]. 2000. WinBUgS—a Bayesian modeling framework: concepts, structure, and extensibility. Statistics and Computing 10:325–337. <http://www.mrc-bsu.cam.ac.uk/bugs> (1 December 2006).
maRques, f. f. c., and s. T. BucKLand. 2004. Covariate models for the detection function, p. 31–47. In S. T. Buckland, D. R. Ander-son, k. P. Burnham, J. l. laake, D. l. Borchers, and l. Thomas [eds.], Advanced distance sampling: estimating abundance of biological populations. Oxford University Press, Oxford, Uk.
maRques, T. a., L. Thomas, s. G. fancy, and s. T. BucKLand. 2007. Improving estimates of bird density using multiple-covariate sampling. Auk 124:1229–1243.
maxfieLd, B. 1998. Hakalau Forest National Wildlife Refuge. Endangered Species Bulletin 23:26–27.
peJchaR, L., K. d. hoLL, and J. L. LocKWood. 2005. Hawaiian hon-eycreeper home-range size varies with habitat: implications for native Acacia koa forestry. Ecological Applications 15:1053–1061.
peTeRJohn, B. G., J. R. saueR, and W. a. LinK. 1995. The 1994 and 1995 summary of the North American Breeding Bird Survey. Bird Populations 3:48–66.
pRaTT, T. K., c. T. aTKinson, p. c. BanKo, J. d. JacoBi, and B. L. WoodWoRTh [eds.] 2009. Conservation biology of Hawaiian for-est birds: implications for island avifauna. yale University Press, New Haven, CT.
pRice, J. p., J. d. JacoBi, L. W. pRaTT, f. K. WaRshaueR, and c. W. smiTh. 2009. Protecting forest bird populations across land-scapes, p. 381–404. In T. k. Pratt, C. T. Atkinson, P. Banko, J. Jacobi, and B. l. Woodworth [eds.], Conservation biology of Hawaiian forest birds: implications for island avifauna. yale Uni-versity Press, New Haven, CT.
RaLph, c. J., and s. G. fancy. 1994. Timing of breeding and molt in six species of Hawaiian honeycreepers. Condor 96:151–161.
RaLph, c. J., and s. G. fancy. 1995. Demography and movements of Apapane and Iiwi in Hawaii. Condor 97:729–742.
ReynoLds, m. h., R. J. camp, B. m. B. nieLsen, and J. d. JacoBi. 2003. Evidence of change in a low elevation forest bird com-munity of Hawai‘i since 1979. Bird Conservation International 13:175–187.
02_MS080113.indd 209 5/17/10 4:48:04 PM

210 RICHARD J. CAMP eT aL.
ReynoLds, R. T., J. m. scoTT, and R. a. nussBaum. 1980. A vari-able circular-plot method for estimating bird numbers. Condor 82:309–313.
scoTT. J. m., s. conanT, and c. Van RipeR iii [eds.]. 2001. Evolu-tion, ecology, conservation, and management of Hawaiian birds: a vanishing avifauna. Studies in Avian Biology 22.
scoTT. J. m., and c. B. KepLeR. 1985. Distribution and abundance of Hawaiian native birds: a status report, p. 43–70. In S.A. Temple [ed.], Bird conservation 2. University of Wisconsin Press, Madi-son, WI.
scoTT, J. m., s. mounTainspRinG, f. L. Ramsey, and c. B. KepLeR. 1986. Forest bird communities of the Hawaiian Islands: their dynamics, ecology, and conservation. Studies in Avian Biology 9.
simon, J. c., T. K. pRaTT, K. e. BeRLin, J. R. KoWaLsKy, s. G. fancy, and J. s. haTfieLd. 2002. Temporal variation in bird counts within a Hawaiian rainforest. Condor 104:469–481.
Thomas, L., J. L. LaaKe, s. sTRindBeRG, f. f. c. maRques, s. T. BucKLand, d. L. BoRcheRs, d. R. andeRson, K. p. BuRnham, s. L. hedLey, J. h. poLLaRd, J. R. B. Bishop and T. a. maRques. [onLine]. 2005. Distance 5.0. Release 2. Research Unit for Wildlife
Population Assessment, University of St. Andrews, Uk. <http://www.ruwpa.st-and.ac.uk/distance/> (11 September 2006)
TWeed, e., p. m. GoRResen, R. J. camp, T. K. pRaTT, and p. J. haRT. 2007. Forest bird inventory of the kahuku Unit of Hawai‘i Volca-noes National Park. Pacific Cooperative Studies Unit Technical Report 143.
U. S. fish and WiLdLife seRVice. 1982. The Hawaii forest bird recovery plan. U.S. Fish and Wildlife Service, Portland, OR.
U. S. fish and WiLdLife seRVice. 1996. Feral ungulate management plan. U.S. Fish and Wildlife Service, Portland, OR.
U. S. fish and WiLdLife seRVice. 2006. Revised recovery plan for Hawaiian forest birds. U.S. Fish and Wildlife Service, Portland, OR.
VandeRWeRf, e. a. 2001. Distribution and potential impacts of avian poxlike lesions in ‘Elepaio at Hakalau Forest National Wildlife Refuge. Studies in Avian Biology 22:247–253.
Van RipeR, c. iii, and J. m. scoTT. 2001. limiting factors affecting Hawaiian native birds. Studies in Avian Biology 22:221–233.
Wade, p. R. 2000. Bayesian methods in conservation biology. Con-servation Biology 14:1308–1316.
Species Pasture Open forest Closed forest Model
Hawai‘i ‘Elepaio 27 3262 871 HN + OBS‘O
-ma‘o 26 7853 1649 HR + yEAR(f)
Hawai‘i ‘Amakihi 571 15 619 1651 HN + yEAR(f)‘Akiapo-la-‘au 8 335 115 HRHawai‘i Creeper 4 1926 730 HR + COS(1) + yEAR(f)Hawai‘i ‘A
-kepa 1 2346 710 HR + OBS
‘I‘iwi 323 23 346 4333 HN + OBS‘Apapane 586 17 783 3866 HR + OBSRed-billed leiothrix 44 6275 1514 HR + COS(2) + yEAR(f)Japanese White-eye 448 3881 698 HR + S-P(2) + OBSNorthern Cardinal 115 879 13 HN + ClOUDHouse Finch 904 896 29 HR + yEAR(f)
appendix 1. Numbers of detections, by study area, and the best-fit detection-function model of each species used to calculate population densities. AICc statistics for the full set of detection-function models are provided in Appendix 2. Models included half-normal (HN) and hazard-rate (HR) key detection functions and with cosine (COS) and simple polynomial (S-P) series expan-sions. The number of series-expansion adjustment terms is provided in parentheses. Covariates included the variables cloud cover (ClOUD) and observer (OBS) and survey year [yEAR(f)] treated as factors.
02_MS080113.indd 210 5/17/10 4:48:04 PM
TRENDS OF FOREST BIRDS AT HAkAlAU, HAWAI‘I 211
Species Modela Kb log Lc ∆AICcd wi
e
Hawai‘i HN + OBS 4 –14350.80 0 0.9325 ‘Elepaio HN + yEAR(f) 22 –14335.29 5.25 0.0675
HN + MONTH 5 –14362.60 25.60 0HN + TIME 11 –14376.02 64.50 0HN + gUST 4 –14383.17 64.73 0HN 1 –14387.40 67.18 0HN + WIND 5 –14383.57 67.54 0HN + RAIN 4 –14385.46 69.31 0HN + ClOUD 12 –14380.07 74.61 0HRfHN + COSg
HN + H-Ph
HR + COSg
HR + S-Pi
HN + yEAR(c)j
HN + STRATAk
‘O-ma‘o HR + yEAR(f) 23 –57455.23 0 1.0000
HR + OBS 4 –57605.76 263.00 0HR + WIND 6 –57650.05 355.60 0HR + MONTH 7 –57672.80 403.10 0HR + gUST 7 –57694.81 447.10 0HR + RAIN 6 –57708.53 472.60 0HR + TIME 11 –57708.18 481.90 0HR + ClOUD 13 –57706.58 482.70 0HR 2 –57718.16 483.80 0HN + H-P 2 –57743.02 533.50 0HN 1 –57832.76 711.00 0HR + COSg
HN + COSj
HR + S-Pk
HR + yEAR(c)j
HR + STRATAj
Hawai‘i ‘Amakihi
HN + yEAR(f) 22 –89403.99 0 1.0000HN + OBS 5 –89500.08 158.20 0HN + MONTH 6 –89635.72 376.30 0HN + STRATA 4 –89621.63 399.30 0HN + ClOUD 12 –89627.39 426.80 0HN + WIND 6 –89638.05 436.10 0HN + TIME 13 –89635.72 445.50 0HN + RAIN 5 –89652.43 462.90 0HN + gUST 6 –89666.87 493.70 0HN 1 –89675.11 500.20 0HR 2 –89711.00 574.00 0HN + COSg
HN + H-Pj
HR + COSg
HR + S-Pg
HN + yEAR(c)j
‘Akiapo-la-‘au HR 2 –3126.66 0 0.4642HR + WIND 3 –3126.70 2.10 0.1624HR + TIME 3 –3126.78 2.27 0.1492HR + RAIN 3 –3126.79 2.29 0.1477HR + OBS 5 –3126.49 5.74 0.0263HR + STRATA 5 –3126.62 6.00 0.0231HR + ClOUD 5 –3126.63 6.01 0.0230HR + MONTH 7 –3126.32 9.48 0.0041HNg
HN + COSh
HN + H-Ph
HR + COSg
HR + S-Pi
HR + gUSTi
HR + yEAR(f)k
HR + yEAR(c)j
Hawai‘i Creeper
HR + COS(1) + yEAR(f)
24 –14148.17 0 1.0000
HR + COS(1) 3 –14203.94 69.21 0HN 1 –14208.42 74.16 0
Species Modela Kb log Lc ∆AICcd wi
e
Hawai‘i Creeper (cont.)
HR 2 –14234.05 127.41 0HR + COS(1) + MONTH
7 –14234.26 137.87 0
HR + COS(1) + OBS
6 –14235.29 137.91 0
HR + COS(1) + gUST
6 –14235.29 137.92 0
HR + COS(1) + RAIN
6 –14235.37 138.08 0
HR + COS(1) + WIND
7 –14235.12 139.58 0
HR + COS(1) + TIME
11 –14235.17 147.73 0
HR + COS(1) + ClOUD
14 –14235.19 153.81 0
HN + COSh
HN + H-Pk
HR + S-Pi
HR + COS(1) + yEAR(c)j
HR + COS(1) + STRATAj
Hawai‘i ‘A
-kepa
HR + OBS 5 –14377.89 0 0.9992HR + yEAR(f) 23 –14366.88 14.27 0.0008HR 2 –14415.42 69.05 0HR + MONTH 6 –14413.59 73.41 0HR + gUST 5 –14415.88 75.97 0HR + RAIN 5 –14416.49 77.19 0HR + WIND 6 –14416.11 78.44 0HR + TIME 12 –14415.19 88.67 0HR + ClOUD 13 –14415.99 92.28 0HN 1 –14442.26 120.73 0HN + H-Pj
HR + S-Pj
HR + COSg
HN + COSg
HR + yEAR(c)j
HR + STRATAj
‘I‘iwi HN + OBS 59 –144023.50 0 1.0000HN + yEAR(f) 22 –144649.10 1177.20 0HN + MONTH 6 –145039.70 1926.20 0HN + WIND 5 –145068.50 1981.80 0HN + ClOUD 12 –145086.70 2032.40 0HN + RAIN 5 –145106.80 2058.50 0HN + gUST 6 –145145.60 2138.10 0HN + TIME 11 –145147.30 2151.60 0HN 1 –145162.40 2161.70 0HR + S-P 4 –145165.00 2172.80 0HR 2 –145323.10 2485.10 0HN + H-Pg
HN + COSg
HR + COSg
HN + yEAR(c)j
HN + STRATAk
‘Apapane HR + OBS 55 –118294.50 0 1.0000HR + yEAR(f) 23 –118408.30 163.50 0HR + MONTH 7 –119033.60 1382.20 0HR 2 –119088.10 1481.10 0HR + ClOUD 13 –119109.80 1546.50 0HR + WIND 6 –119135.90 1584.70 0HN 1 –119166.30 1635.40 0HR + STRATA 5 –119213.90 1738.60 0HR + RAIN 6 –119213.90 1740.60 0HR + gUST 7 –119213.90 1742.60 0HR + TIME 12 –119213.90 1752.70 0HN + COSg
HN + H-Pj
HR + COSg
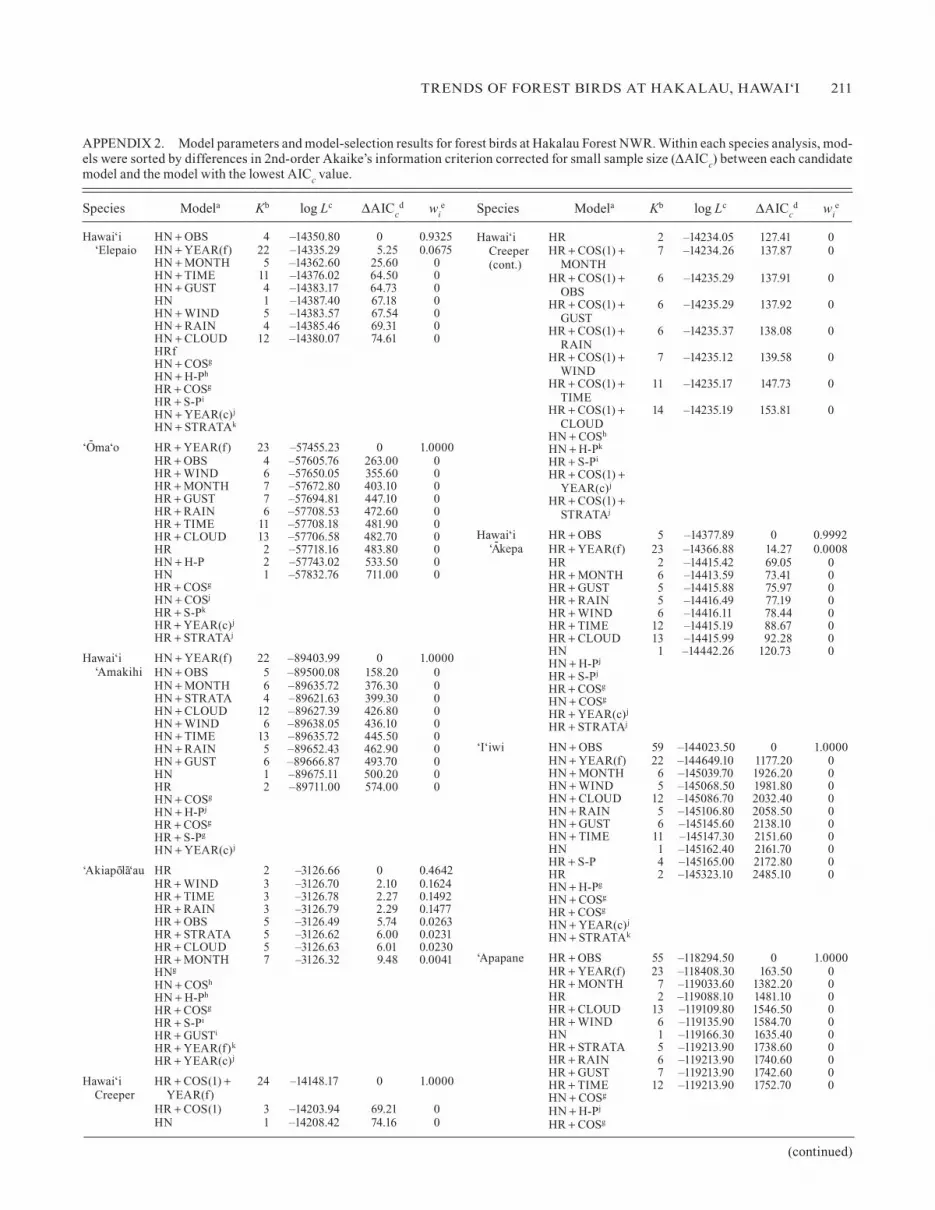
APPENDIX 2. Model parameters and model-selection results for forest birds at Hakalau Forest NWR. Within each species analysis, mod-els were sorted by differences in 2nd-order Akaike’s information criterion corrected for small sample size (∆AICc) between each candidate model and the model with the lowest AICc value.
(continued)
02_MS080113.indd 211 5/17/10 4:48:06 PM
212 RICHARD J. CAMP eT aL.
Species Modela Kb log Lc ∆AICcd wi
e
Japanese White- eye (cont.)
HR + S-P(2) + gUST
9 –34130.06 280.00 0
HN 1 –34154.16 312.17 0HR 2 –34158.18 322.21 0HN + COSg
HN + H-Pj
HR + COSg
HR + S-P(2) + yEAR(c)j
HR + S-P(2) + STRATAj
Northern Cardinal
HN + ClOUD 5 –6739.03 0 0.8723HN + STRATA 4 –6742.14 4.21 0.1063HN + yEAR(f) 22 –6725.41 7.42 0.0214HN + RAIN 4 –6751.09 22.11 0HN + WIND 4 –6753.44 26.81 0HN + MONTH 6 –6753.02 30.01 0HN + OBS 3 –6760.15 38.24 0HN + TIME 8 –6756.89 41.78 0HN + gUST 3 –6767.54 53.01 0HN 1 –6774.06 62.03 0HR 2 –6785.24 86.39 0HN + COSh
HN + H-Ph
HR + COSg
HR + S-Pg
HN + yEAR(c)k
House Finch
HR + yEAR(f) 23 –9045.82 0 1.0000HR + TIME 9 –9075.23 30.36 0HR + WIND 6 –9082.88 39.61 0HR + OBS 4 –9089.68 49.19 0HR + MONTH 6 –9090.06 53.98 0HR + ClOUD 6 –9094.22 62.29 0HR + RAIN 5 –9100.90 73.64 0HR + gUST 4 –9109.80 89.42 0HR 2 –9112.48 90.78 0HN 1 –9132.15 128.11 0HN + COSh
HN + H-Ph
HR + COSh
HR + S-Ph
HR + yEAR(c)j
HR + STRATAk
Species Modela Kb log Lc ∆AICcd wi
e
‘Apapane (cont.)
HR + S-Pk
HR + yEAR(c)j
Red-billed leiothrix
HR + COS(2) + yEAR(f)
25 –44462.42 0 1.0000
HR + COS(2) + MONTH
9 –44509.49 62.02 0
HR + COS(2) + ClOUD
15 –44514.72 84.52 0
HR + COS(2) + OBS
6 –44531.06 99.16 0
HR + COS(2) 4 –44534.76 102.55 0HR + COS(2) + RAIN
8 –44531.81 104.66 0
HR + COS(2) + WIND
9 –44531.57 106.19 0
HR + COS(2) + gUST
9 –44532.80 108.65 0
HR + COS(2) + TIME
13 –44529.14 109.33 0
HN 1 –44559.73 146.49 0HR 2 –44618.32 265.67 0HN + COSg
HN + H-Pj
HR + S-Pi
HR + COS(2) + yEAR(c)j
HR + COS(2) + STRATAj
Japanese White- eye
HR + S-P(2) + OBS
6 –33993.07 0 1.0000
HR + S-P(2) + yEAR(f)
25 –34030.92 113.85 0
HR + S-P(2) + MONTH
9 –34069.13 158.15 0
HR + S-P(2) + WIND
9 –34091.36 202.59 0
HR + S-P(2) + ClOUD
15 –34101.41 234.74 0
HR + S-P(2) + RAIN
8 –34113.61 245.09 0
HR + S-P(2) + TIME
17 –34112.38 260.70 0
HR + S-P(2) 4 –34127.04 264.21 0
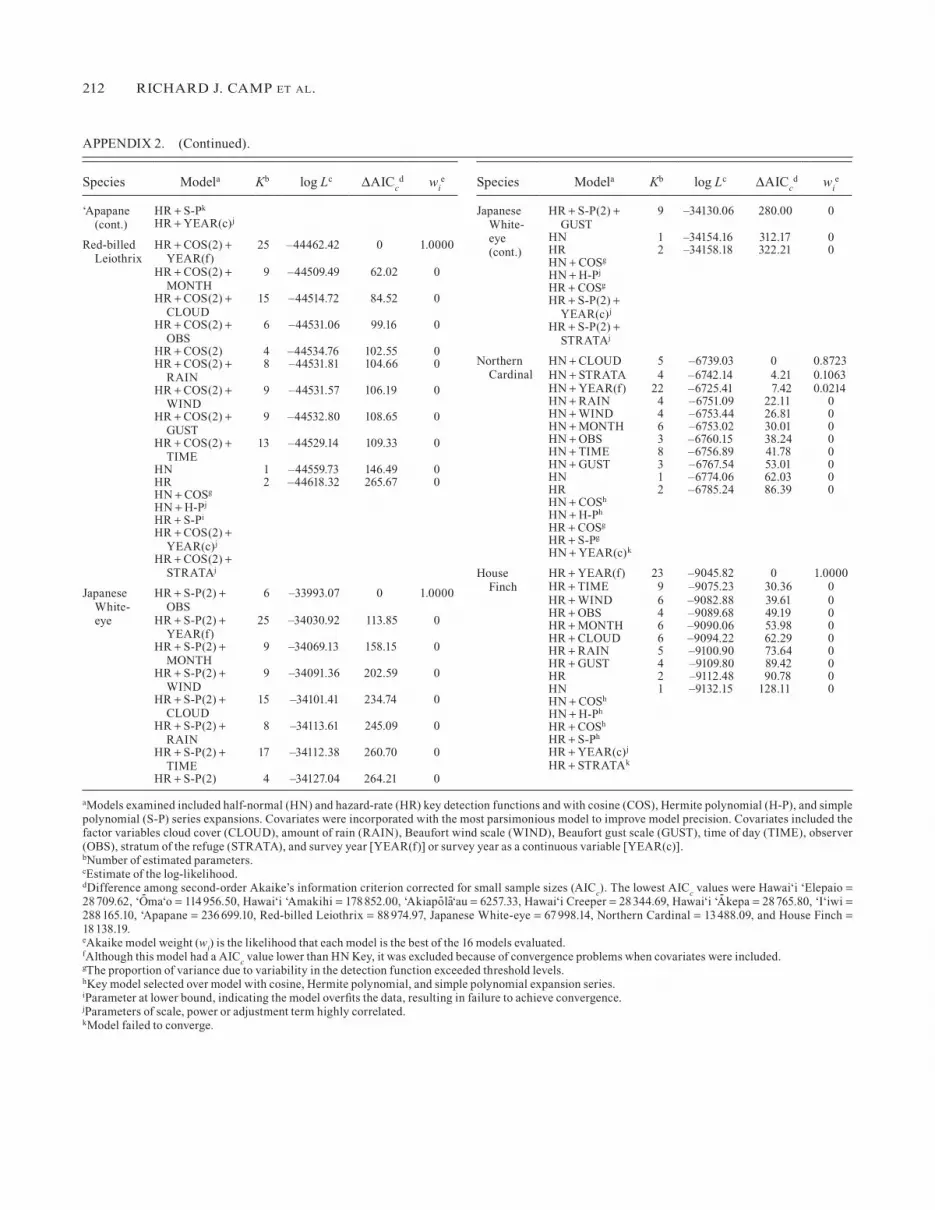
aModels examined included half-normal (HN) and hazard-rate (HR) key detection functions and with cosine (COS), Hermite polynomial (H-P), and simple polynomial (S-P) series expansions. Covariates were incorporated with the most parsimonious model to improve model precision. Covariates included the factor variables cloud cover (ClOUD), amount of rain (RAIN), Beaufort wind scale (WIND), Beaufort gust scale (gUST), time of day (TIME), observer (OBS), stratum of the refuge (STRATA), and survey year [yEAR(f)] or survey year as a continuous variable [yEAR(c)].bNumber of estimated parameters.cEstimate of the log-likelihood.dDifference among second-order Akaike’s information criterion corrected for small sample sizes (AICc). The lowest AICc values were Hawai‘i ‘Elepaio = 28 709.62, ‘O
-ma‘o = 114 956.50, Hawai‘i ‘Amakihi = 178 852.00, ‘Akiapo-la-‘au = 6257.33, Hawai‘i Creeper = 28 344.69, Hawai‘i ‘A
-kepa = 28 765.80, ‘I‘iwi =
288 165.10, ‘Apapane = 236 699.10, Red-billed leiothrix = 88 974.97, Japanese White-eye = 67 998.14, Northern Cardinal = 13 488.09, and House Finch = 18 138.19.eAkaike model weight (wi) is the likelihood that each model is the best of the 16 models evaluated.fAlthough this model had a AICc value lower than HN key, it was excluded because of convergence problems when covariates were included.gThe proportion of variance due to variability in the detection function exceeded threshold levels.hkey model selected over model with cosine, Hermite polynomial, and simple polynomial expansion series.iParameter at lower bound, indicating the model overfits the data, resulting in failure to achieve convergence.jParameters of scale, power or adjustment term highly correlated.kModel failed to converge.
APPENDIX 2. (Continued).
02_MS080113.indd 212 5/17/10 4:48:07 PM


