Embed Size (px)
Citation preview

Bioinformatic analysis and design
of haloalkane dehalogenases Doctoral dissertation
Mgr. Eva Chovancová
Supervisor: Prof. Mgr. Jiří Damborský, Dr. Brno 2011


Bibliographic entry
Author: Mgr. Eva Chovancová
Faculty of Science, Masaryk University Department of Experimental Biology and Research Centre for Toxic Compounds in the Environment
Title of dissertation: Bioinformatic analysis and design of haloalkane dehalogenases
Degree program: Chemistry
Field of study: Environmental Chemistry
Supervisor: Prof. Mgr. Jiří Damborský, Dr.
Year of defense: 2011
Keywords: bioinformatics; evolution; enzyme; rational design, substrate specificity; tunnel; haloalkane dehalogenase


Bibliografický záznam
Autor: Mgr. Eva Chovancová
Přírodovědecká fakulta, Masarykova univerzita Ústav experimentální biologie a Centrum pro výzkum toxických látek v prostředí
Název disertační práce: Bioinformatická analýza a design halogenalkandehalogenas
Studijní program: Chemie
Studijní obor: Chemie životního prostředí
Školitel: Prof. Mgr. Jiří Damborský, Dr.
Rok obhajoby: 2011
Klíčová slova: bioinformatika; evoluce; enzym; racionální design; substrátová specificita; tunel; halogenalkandehalogenasa


Mým rodičům

To strive, to seek,
to find, and not to yield. Alfred Lord Tennyson, Ulysses
© Eva Chovancová, Masaryk University, 2011

ACKNOWLEDGEMENTS
Velmi děkuji prof. Jiřímu Damborskému za příležitost pracovat v jeho skupině, za cenné odborné rady, za vše, co pro mě v průběhu studia udělal a co mě naučil, za možnost věnovat se tomu, co mě baví a rozvíjet své dovednosti. Velmi děkuji taktéž za vstřícnost a podporu v těžších chvílích. I would like to thank Janusz Bujnicki and Janek Kosinski for showing me the beauty of bioinformatics. I also thank all, mostly former, members of the Laboratory of Bioinformatics and Protein Engineering of the International Institute of Molecular and Cell Biology in Warsaw, especially Agnieszka Obarska-Kosinska, for their friendliness and help. Děkuji kolegům z Laboratoře interakce člověka s počítačem z Fakulty informatiky MU, zejména Petrovi Benešovi a Báře Kozlíkové, za zajímavou spolupráci. Děkuji všem současným i minulým členům Loschmidtových laboratoří, se kterými jsem se v průběhu studia setkala, za vždy a všude přítomnou přátelskou atmosféru. Velmi děkuji Tondovi, že byl dokonalým studentem i učitelem, za trpělivost, vstřícnost a za to, že přivádí k životu naše nápady. Děkuji Petrovi Jr. za usnadnění příchodu do nové skupiny, děkuji Tomášovi a Petrovi Sr. za neuvěřitelné zážitky v průběhu prvních let doktorátu, děkuji Táně za snad nikdy neutuchající přátelství, trpělivost a podporu, děkuji Honzovi a Zoře za úžasné diskuze, i když u každého trochu jiného typu, a samozřejmě také děkuji velkému Guru za to, že je pro nás všechny nedostižným vzorem a inspirací, zdrojem moudra a letité zkušenosti,... Velmi děkuji svým rodičům, Vaškovi, bratrovi a přátelům za lásku, podporu a vše, co pro mě kdy udělali a ještě udělají...

ABBREVIATIONS
3D three-dimensional AIC Akaike information criterion CSA Catalytic Site Atlas EBI European Bioinformatics Institute HLD haloalkane dehalogenase MD molecular dynamics ML maximum-likelihood MP maximum-parsimony MSA multiple sequence alignment NCBI National Center for Biotechnology Information NJ neighbor-joining nr non-redundant PC principal component PCA principal component analysis PDB Protein Data Bank PDBe Protein Data Bank in Europe PDBj Protein Data Bank Japan PIR Protein Information Resource PSSM position-specific score matrix RCSB Research Collaboratory for Structural Bioinformatics SCOP Structural Classification of Proteins SD steepest descent SSG substrate specificity group TCP 1,2,3-trichloropropane UniProtKB UniProt Knowledgebase UPGMA unweighted pair group method using arithmetic average VDW van der Waals wwPDB worldwide Protein Data Bank

Contents
CONTENTS
Abstract .................................................................................................................................... 13
Abstrakt .................................................................................................................................... 14
Motivation ................................................................................................................................ 15
Introduction .............................................................................................................................. 17 1 Bioinformatics ..................................................................................................................... 17
1.1 Biological databases .................................................................................................... 17 1.2 Protein sequence analysis ........................................................................................... 18 1.3 Phylogenetic analysis .................................................................................................. 20 1.4 Protein structure analysis ........................................................................................... 23
2 Haloalkane dehalogenases .................................................................................................. 25 2.1 Introduction ................................................................................................................ 25 2.2 Structure ..................................................................................................................... 26 2.3 Evolution ..................................................................................................................... 29 2.4 Substrate specificity .................................................................................................... 31 2.5 Rational design of haloalkane dehalogenases ............................................................ 32
Synopsis of results .................................................................................................................... 43
Chapter 1
Phylogenetic analysis of haloalkane dehalogenases ................................................................. 47
Chapter 1S Supplementary information for Phylogenetic analysis of haloalkane dehalogenases ............. 67
Chapter 2 Substrate specificity of haloalkane dehalogenases .................................................................. 77
Chapter 2S Supplementary information for Substrate specificity of haloalkane dehalogenases ............... 97
Chapter 3 CAVER 3.0: A tool for effective analysis of tunnels in dynamic protein structures................. 109
Chapter 3S Supplementary information for CAVER 3.0 ............................................................................. 125
Chapter 4 HotSpot Wizard: A web server for identification of hot spots in protein engineering ........... 139
Appendices ............................................................................................................................. 152 A1 Description of selected databases and methods............................................................ 152 A2 Curriculum Vitae ............................................................................................................. 172 A3 List of Publications .......................................................................................................... 174


Abstract
13
ABSTRACT
Haloalkane dehalogenases are broad-specificity enzymes catalyzing the hydrolysis of numerous halogenated hydrocarbons, including environmental pollutants. The aim of this Thesis was to: (i) extend the knowledge about this environmentally important family of enzymes by information about the evolutionary and functional relationships among its members and (ii) develop two bioinformatics tools facilitating the rational design of enzymes with improved catalytic properties. Phylogenetic analysis suggested subdivision of haloalkane dehalogenases into three subfamilies, of which one comprised exclusively putative members. A novel type of the catalytic pentad composition was predicted for this new subfamily. The main evolutionary events of haloalkane dehalogenases, i.e., the repositioning of the catalytic pentad residues and the change of the composition of the cap domain, were elucidated. The N-terminal part of the cap domain and the access tunnels were proposed as important sites for the adaptation of haloalkane dehalogenases to the new substrates. The established phylogenetic classification enables effective identification of new putative family members in the sequence databases. The follow-up study investigated the possibility to use the phylogenetic classification also for prediction of the substrate specificity of putative haloalkane dehalogenases. Comparison of the substrate specificity profiles of nine haloalkane dehalogenases with the phylogenetic data revealed that such extrapolation is not possible for these enzymes. Additionally, this study defined substrates suitable for routine screening for the haloalkane dehalogenase activity and confirmed that the active site cavity and the access tunnels are important, yet not the only determinants of haloalkane dehalogenase substrate specificity. To facilitate the analysis of the access tunnels in haloalkane dehalogenases as well as other proteins, a new version of the CAVER software was developed. CAVER 3.0 enables systematic analysis of tunnels in molecular dynamics simulations, which is essential for assessing the reliability of identified tunnels or identification of tunnel gating mechanisms. Modification of the size, shape and physico-chemical properties of the access tunnels and the active site cavity represents a common protein engineering strategy for construction of enzymes with improved activity, enantioselectivity or novel substrate specificity. This strategy was extended by the procedure estimating mutability of individual residues and implemented into the web server HotSpot Wizard. HotSpot Wizard integrates structural, functional and evolutionary information obtained from several databases and tools and selects positions suitable for engineering of enzyme catalytic properties. Comparison of the identified hot-spots with the literature data confirmed that the mutagenesis targeting the hot-spot positions leads to modulation of the catalytic properties of enzymes and provides a higher proportion of viable variants than the random mutagenesis.

Abstrakt
14
ABSTRAKT
Halogenalkandehalogenasy jsou enzymy se širokou substrátovou specificitou, které katalyzují hydrolytický rozklad řady halogenovaných uhlovodíků, včetně významných polutantů životního prostředí. Cílem této práce bylo: (i) rozšířit dosavadní znalosti o halogenalkandehalogenasach o informace týkající se evolučních a funkčních vztahů mezi jednotlivými členy této rodiny a (ii) vyvinout dva bioinformatické nástroje pro racionální design enzymů s vylepšenými katalytickými vlastnostmi. Na základě fylogenetické analýzy byla rodina halogenalkandehalogenas rozdělena do tří podrodin, z nichž jedna nebyla dosud v literatuře pospána. Pro tuto podrodinu byl předpovězen nový typ katalytické pentády. Studie dále zmapovala hlavní evoluční události, které vedly k vývoji současných halogenalkandehalogenas, a to změnu katalytických reziduí a přestavbu víčkové domény. Jako oblast důležitá pro adaptaci halogenalkandehalogenas k novým substrátům byla předpovězena N-koncová část víčkové domény a také přístupové tunely. Fylogenetická klasifikace, která byla zavedena v této studii, umožňuje rychlou a přesnou identifikaci nových členů rodiny v sekvenčních databázích. Cílem navazujícího projektu bylo zjistit, zda je možné využít fylogenetickou klasifikaci pro předpověď substrátové specificity nových halogenalkandehalogenas. Na základě porovnání evolučních a funkčních příbuzností devíti halogenalkandehalogenas se ukázalo, že extrapolace funkčních vlastností není pro tyto enzymy možná. Studie rovněž umožnila nalézt vhodné substráty pro testování aktivity nových halogenalkandehalogenas a potvrdila důležitý vliv dutiny aktivního místa a přístupových tunelů na substrátovou specificitu těchto enzymů. V rámci této disertační práce byla dále vyvinuta nová verze programu CAVER pro analýzu přístupových tunelů v proteinech. CAVER 3.0 nově umožňuje systematickou analýzu tunelů v dynamických systémech. Informace o dynamickém chování tunelů jsou totiž klíčové jak pro vyhodnocení biologické relevance identifikovaných tunelů, tak pro studium mechanizmů řídících otevírání a zavírání tunelů. Cílem mnoha experimentů proteinového inženýrství je vytvoření enzymů s vylepšenou aktivitou, enantioselektivitou či novou substrátovou specificitou. Pro tyto účely se často využívá modifikace velikosti, tvaru a fyzikálně-chemických vlastností přístupových tunelů a dutiny aktivního místa. Tato strategie byla rozšířena o odhad mutability jednotlivých pozic proteinu a implementována do webového nástroje HotSpot Wizard. HotSpot Wizard integruje strukturní, funkční a evoluční informace z řady bioinformatických databází a nástrojů a na základě těchto informací vybírá pozice vhodné pro inženýrství katalytických vlastností enzymu. Porovnání s publikovanými daty potvrdilo, že mutageneze zacílená do míst identifikovaných nástrojem HotSpot Wizard vede ke změně katalytických vlastností enzymů a poskytuje větší podíl funkčních variant než mutageneze náhodná.

Motivation
15
MOTIVATION
Enzymes from the protein family of haloalkane dehalogenases are involved in the degradation of numerous halogenated compounds, which opens up the possibility of their application in bioremediations or monitoring of halogenated pollutants in contaminated environments. High ecological importance of this family motivates the research efforts towards the understanding of structure-function relationships of these enzymes and construction of haloalkane dehalogenases with improved catalytic properties. In addition to the laboratory experiments, a wealth of information about the structure-function relationships of enzymes can be obtained by the computer modeling or the bioinformatic techniques. This Thesis is focused on the bioinformatic analysis of the haloalkane dehalogenase family and development of new bioinformatic tools for structural analysis of enzymes and rational design of improved catalysts.
The objectives of the Ph.D. project:
1. Reconstruction of the evolutionary history of haloalkane dehalogenases. 2. Systematic analysis of the substrate specificity of haloalkane dehalogenases. 3. Development of a computational tool for the analysis of tunnels in dynamic protein
structures. 4. Development of a computational tool for the selection of hot-spot positions for
engineering of enzyme catalytic properties.

Introduction
16

Bioinformatics
17
INTRODUCTION
1 Bioinformatics
Bioinformatics is an interdisciplinary research field at the intersection of biology and informatics [1]. In the broadest sense, bioinformatics can be defined as any application of information technology to the management and analysis of biological data [2], while other definitions restrict the focus of bioinformatics only to the management and analysis of the data related to the biological macromolecules. The main goal of bioinformatics is to make sense of a large amount of available biological data in order to better understand living systems and their functioning at the molecular level [1].
The field of bioinformatics encompasses two main areas: (i) the development of computational tools and databases and (ii) application of these tools on biological problems. Both areas are highly complementary to each other. Easy-to-use computational tools and wealth of information accessible in public databases represent the foundation of all sequence, structural and functional analyses. The analyses in turn often produce new data to be stored and highlight challenges for the further development of both computational tools and databases [1].
Bioinformatic analyses include tasks such as biological database searches, prediction and analysis of three-dimensional (3D) structures, comparison and classification of sequences and structures, analysis of sequence conservation, motif and pattern discovery, reconstruction of evolutionary relationships, assembly, comparison and annotation of genomes, prediction of genes, analysis of gene expression and regulation, prediction of pairwise molecular interactions and interaction networks, prediction of subcellular localization or reconstruction of metabolic pathway [1]. This introduction chapter aims to provide a brief overview of the bioinformatic approaches that were used to study haloalkane dehalogenases in the Chapter 1 and Chapter 2 and/or utilized for development of novel bioinformatic tools described in the Chapter 3 and Chapter 4. The detailed description of individual databases and methods is provided in the Appendix.
1.1 Biological databases
Biological databases contain all possible kinds of information related to biomacromolecules—sequences, structures, classifications, localizations, sequence motifs, expression patterns, etc. Since hundreds of different databases are currently publically available, an important step of bioinformatic analysis is to select a proper database. A comprehensive collection of links to selected biological databases is maintained and annually updated by the Nucleic Acids Research journal and is available at http://oxfordjournals.org/nar/database/a/ [3].
The first-choice for obtaining the protein sequence data is usually one of the large public protein sequence databases—the UniProt Knowledgebase [4] or the non-redundant protein database of the National Center for Biotechnology Information (NCBI) [5]. Considering 3D

Introduction
18
protein structures, the central resource is the worldwide Protein Data Bank (wwPDB) [6]. Two most widely used systems for classification of protein structures are those of the Structural Classification of Proteins (SCOP) [7] and Class, Architecture, Topology and Homologous (CATH) [8] databases, providing information about similarities and relationships of individual structures. Many databases are focused on specific aspects of protein function, e.g., the Catalytic Site Atlas [9], MACiE [10] or EzCatDB [11] databases specialized in enzyme catalytic residues and reaction mechanisms, Protein Mutant Database [12], ProTherm [13] or UniProt Knowledgebase, providing information about effects of mutations on protein function and stability, or BRENDA database, representing a comprehensive collection of information about enzymes [14].
1.2 Protein sequence analysis
1.2.1 Identification of protein sequences
Information stored in the sequence databases can be accessed using text-based or sequence-based queries. The NCBI Entrez system [15] and EBI Sequence Retrieval System [16] represent the most popular interfaces for the text-based retrieval of information from biological databases. These two integration systems enable a simultaneous search of multiple databases [1]. The main limitation of the text-based search is associated with the common problem of all automatically maintained databases—incorrect, incomplete or unexpected annotations of entries. Due to this problem, some entries of interest may be missed and, on the other hand, false positive hits may occur in the search results. To minimize the false negative results, one should try several keywords, including all possible synonyms used for a given protein or more general keywords. The usage of too general keywords, on the other hand, increases the number of false positive hits.
Sequence similarity searches compare the query sequence with all individual sequences in a database, returning the most closely related sequences as hits. Similarity searches are more sensitive and selective than the text-based searches, and are essential parts in most bioinformatic analyses [1]. The most widely used tools for database similarity searches are BLAST [17], FASTA [18] and more accurate profile-based methods PSI-BLAST [17], HMMER [19] or a recently developed HHblits, which provides fast searches with improved sensitivity to selectivity ratio compared to PSI-BLAST or HMMER [20]. Sequence similarity searches are not sensitive to annotation errors and therefore are clearly a good choice if one wants to identify all members of some protein family or any other group of evolutionary related sequences. If the evolutionary relatedness is not an issue, the combination of the text-based searches with the sequence similarity searches will provide desired results. Similarly to the text-based searches, also the results of the sequence similarity searches may contain false positive hits, only this time they represent sequences from closely evolutionary related groups.

Bioinformatics
19
1.2.2 Clustering of sequences
Sequence datasets obtained by database searches usually contain many redundant sequences (sequences highly similar to other sequence in the dataset) as well as sequences that actually belong to distinct protein families. Redundant sequences can be removed either manually or using some of available methods [21], e.g., CD-HIT [22], Decrease Redundancy [23] or PISCES [24]. The selection of the genuine members of the target protein family is a more complex task. The CLANS [25] program provides an elegant solution to this problem by visualization of the complex relationships among sequences in the 3D space. Besides the rapid and reliable classification of sequences, this kind of analysis also provides information about relationships among individual sequences groups, which can be used, e.g., for identification of outgroup sequences for rooting of phylogenetic tree. Alternatively to the CLANS analysis, one can construct multiple sequence alignment of the whole dataset and only then select members of the target family, or proceed even to the phylogenetic reconstruction and define family members based on the phylogenetic tree. However, these approaches are quite laborious and, in contrast to the CLANS, become less accurate with an increasing number of sequences [25].
1.2.3 Multiple sequence alignment
Comparison and further analyses of sets of homologous sequences is not possible without construction of a multiple sequence alignment (MSA) [26]. The MSA establishes residue-residue correspondence among sequences—residues presumably derived from a common ancestor are aligned in the same column of MSA [27]. The main applications of MSA include phylogenetic analysis, prediction of function, identification of important residues, regions and characteristic patterns, construction of profiles for database searches and detection of conserved domains, or prediction of secondary and tertiary structures [28,29]. Many programs for construction of MSAs are available. Clustal W/Clustal X are the best known and therefore probably still the most commonly used. However, some more recent methods, e.g., MUSCLE [30,31], MAFFT [32], ProbCons [33], T-COFFEE [34] or Clustal Omega [35] provide more accurate alignments.
The quality of MSA is crucial for the quality of results in all application areas. Most notably, incorrect alignments may lead to incorrect assignment of protein function, to errors in predicted secondary and tertiary structures as well as to systematic errors in the phylogenetic tree [1,36]. Since the automatically generated MSAs usually contain misaligned regions, they should always be refined manually, e.g., using the BioEdit sequence editor [37], which represents one of the most popular software for editing and analysis of MSAs [1].

Introduction
20
1.3 Phylogenetic analysis
Phylogenetic analysis reconstructs evolutionary history of individual protein families or other groups of related sequences. It provides more detailed and accurate information about protein relationships than MSA or clustering techniques. The first step is selection of the molecular markers to be used for the reconstruction. In majority of cases, protein sequence data are preferred over nucleotide sequences, as they are relatively more conserved, not biased by different codon usages in different organisms and for most current methods also more informative. Nevertheless, nucleotide sequences can still represent a better choice in some cases, e.g., if one wants to study evolution of nearly identical proteins or trace evolutionary pressure. Assuming the availability of MSA of selected protein sequences (see 1.2.1-1.2.3), the procedure of phylogenetic tree reconstruction typically involves three steps: (i) selection of evolutionary model; (ii) calculation of phylogenetic tree; and (iii) evaluation of tree topology [1].
Besides the already mentioned reconstruction of evolutionary history, applications of phylogenetics in the protein research include rapid classification of new sequences, assessment of homology, prediction of protein function, identification of useful proteins, prediction of protein interactions, analysis of evolutionary events, reconstruction of ancestral genes or estimation of evolutionary conservation [1,38-43].
1.3.1 Selection of evolutionary model
The selection of appropriate evolutionary model is an important step in distance-based and likelihood-based phylogenetic reconstructions, enabling to take into account multiple substitution events and different rates of evolution among different amino acid positions [1]. Evolutionary models usually involve three types of parameters: (i) exchangeability parameters; (ii) frequency parameters; and (iii) rate heterogeneity parameters [44]. Amino acid exchangeability parameters estimate probability of amino acids to be substituted one for another and are reported in so called substitution matrices. The amino acid substitution matrices are mostly empirical, calculated based on large datasets of protein sequences [45]. The most commonly used matrices include the Dayhoff matrix [46], JTT matrix [47], mtREV matrix [48], cpREV [49], WAG matrix [50] or the more recent LG matrix [51]. The amino acid frequency parameters describe the frequencies of individual amino acids averaged over the alignment and, upon substitution, these parameters make certain amino acids more likely to occur than others [44]. Mutation rates may be considerably different at different amino acid positions. This so called rate heterogeneity can be modeled using a gamma distribution of rates across sequence positions [52,53]. The shape of gamma distribution is controlled by the parameter α [44]. Other parameters for modeling of the rate heterogeneity include the parameter estimating a proportion of invariable amino acid positions [54] or parameters assigning specific rates of substitution to individual sequence regions [44,55]. The most widely used methods for the selection of the best-fitting amino acid model of evolution are ProtTest [45,56] and ModelGenerator [57].

Bioinformatics
21
1.3.2 Calculation of phylogenetic tree
Currently, there are two main classes of methods for calculation of phylogenetic trees: (i) distance-based methods and (ii) character-based methods. Distance-based methods first estimate pairwise distances, i.e., dissimilarities, between sequences in MSA. Unless all sequences are highly similar, the distances should be corrected using an appropriate evolutionary model accounting for multiple changes at a single position and rate heterogeneity among sites. Computed distance matrix is then used to calculate phylogenetic tree [1,58]. The widely used tree-building algorithms include an unweighted pair group method using arithmetic average (UPGMA), neighbor-joining (NJ) [59] or BIONJ [60], which are also frequently used for estimation of initial guiding trees in MSA or maximum-likelihood phylogenetic methods. The distance-based phylogenetic reconstructions are available in a variety of programs, e.g., Vannila [61], PAUP*[62] or PHYLIP [63]. The general advantage of distance-based methods is their computational efficiency. On the other hand, the main disadvantage is the loss of evolutionary information upon conversion of MSA to the distance matrix [1,44].
In contrast to the distance-based algorithms, the character-based methods use directly information about individual sequence characters. They include the maximum-parsimony (MP) and maximum-likelihood (ML) methods. The MP approach selects the tree that requires the fewest evolutionary changes to explain the provided MSA. To make sure that the most parsimonious tree will be found, one would have to conduct either an exhaustive search, i.e., test all possible tree topologies, or branch-and-bound search [64], which excludes some obviously bad trees from consideration [1,58]. However, both approaches are too computationally demanding and therefore different heuristic strategies are being used instead. Using the heuristics searching, one can get fast, but not necessarily optimal results [1,58]. The main disadvantage of MP is that it does not employ evolutionary models to correct for rate heterogeneity among sites or multiple changes at one position. Consequently, this approach may work quite well if the number of changes per position is small, i.e., for analysis of similar sequences, while for more dissimilar sequences with multiple mutations per site, the MP approach often fails as the true evolutionary tree is often not the one with the least number of changes [1,44]. Furthermore, MP is sensitive to the long-branch attraction artifact (a methodological artifact in which two or more rapidly evolving lineages with long branches are grouped together in a tree, regardless of their true evolutionary relationships) [1,44,65]. The best-known programs enabling MP reconstructions are PAUP*[62] and PHYLIP [63].
The ML methods search for the ML tree, i.e., the tree which renders the provided MSA most plausible, given the selected evolutionary model. ML methods employ complex evolutionary models to calculate the tree likelihood for different combinations of tree topology, branch lengths and also values of evolutionary parameters. ML thus enables simultaneous estimation of the phylogenetic tree and model parameters [44]. The ML methods are generally considered to be the most rigorous and accurate methods for phylogenetic inference. However, due to their exhaustive nature, they are also the most

Introduction
22
computationally demanding [1,44,66]. Heuristic, rather than exhaustive, searches for the ML tree are therefore widely applied to overcome this problem [1,44]. Additionally, one can also use faster alternative likelihood-based methods, like quartet puzzling [67] or Bayesian inference [68]. Similarly to MP, the heuristic and alternative approaches does not guarantee finding of an optimal tree [1,58,68]. A large number of programs for ML reconstructions are currently available including the well-known PAML package [69,70] as well as variety of fast methods such as PhyML [71,72], RAxML [73], IQPNNI [74] or TREEFINDER [75]. The Bayesian approach is implemented in MrBayes [68] or BEAST [76] programs.
It is important to note that majority of methods provide trees without indication of the root (node representing the common ancestor of all sequences in the dataset) [1]. Without the knowledge of the root, one knows the relative relationships among sequences, but has no information about the direction of evolution, which is needed for the full interpretation of the tree. Two most commonly used approaches for rooting of the tree are (i) outgroup rooting and (ii) midpoint rooting. The outgroup rooting uses so called outgroup sequences—a group of related, but clearly distinct, sequences to the sequences under the consideration. The outgroup sequences are then added to the original (ingroup) sequences and phylogenetic reconstruction is performed for the whole dataset. The root of the reconstructed tree is on the edge connecting outgroup and ingroup sequences. Consequently, the node of the ingroup sequences located on this edge represents the probable root of the original tree. It is very important to select outgroup sequences that are clearly distinct but not too distant from the ingroup sequences [1]. Preferably, the number of outgroup sequences should be comparable to the number of ingroup sequences. Groups of sequences fulfilling such criteria can be effectively identified by CLANS (see 2.2.2.). If no good outgroup is available, the midpoint rooting can be used. This approach selects the branches of the two most divergent sequences and assigns the root in the middle of these two branches. However, this approach assumes similar evolutionary rates in different sequences, which is usually not the case [1].
1.3.3 Evaluation of tree topology
It is a good practice to use at least two principally different methods for the tree reconstruction as well as alternative MSAs and/or alternative settings of evolutionary model to get an idea about reliability and robustness of obtained results. Besides that, statistical tests for evaluation of the tree topology or testing of different phylogenetic hypotheses are available. The statistical confidence of the tree topology is most commonly estimated using the bootstrapping or jackknifing re-sampling techniques [1]. The likelihood-ratio test of Shimodaira and Hasegawa [77] or the test of Kishino and Hasegawa [78] can be used for comparison of competing tree topologies, distinguishing whether one of the topology is significantly better than the other [1,44]. The four-cluster likelihood mapping implemented in the TREE-PUZZLE package [67,79], as well as four-cluster analysis implemented in the Phyltest program [80], enable comparison of alternative hypotheses on the relationship among the user-defined sequence groups.

Bioinformatics
23
1.3.4 Analysis of evolutionary conservation
The assumption behind the analysis of sequence conservation is that amino acids essential for maintaining structural or functional properties of a protein tend to be conserved over evolution. The analysis of conservation of individual amino acid positions in MSA may thus be used for prediction of sites important for enzyme catalytic activity, ligand binding, protein interactions, etc. [81]. Knowledge of functional residues and/or information about their conservation level can also be used to guide the drug design or mutagenesis studies [81-83, Chapter 4]. Many different conservation scoring systems exist [84], including well-known WebLogo [85,86] or more sophisticated methods using the evolutionary information like Rate4Site [40], ConSurf [39,87] and Evolutionary trace [88,89].
1.4 Protein structure analysis
1.4.1 Identification of protein structures
All experimentally determined protein 3D structures that are publically available can be accessed by searching the wwPDB database. This can be done by the text-based or sequence-based queries via the wwPDB search interface. Additionally, it is also possible to search the wwPDB, or derived databases like SCOP, using the 3D structure similarity searches available via the third-party servers. Since the 3D structures are more conserved than sequences, the structure similarity searches are able to reliably detect more distant homologs than sequence similarity searches. The core of the structure similarity search is the algorithm for structural alignment. Besides the database searches, the structural alignments are used for routine comparison of structures, structural classifications or evaluation of structure prediction methods by comparing the theoretically predicted and experimentally determined structures [1]. The commonly used structure comparison and/or search tools are Dali [90,91], FATCAT [92,93], LGA [94], PDBeFold [95] and CE-MC [96].
1.4.2 Comparative structure modeling
Knowledge of the 3D structure provides invaluable information about the protein of interest. Unfortunately, the 3D structure was experimentally determined only for a small fraction of known sequences. If the experimental structure is not available, one can build a structure model by computational methods [97]. Currently, the most accurate predictions are provided by the comparative (or homology) modeling. Comparative modeling makes use of the fact that two proteins with similar sequences are likely to have very similar 3D structures, and hence, predicts the 3D structure of a target protein based on the structures of closely related proteins (so called templates). Comparative modeling can be divided into four main steps: (i) identification of at least one template structure (also referred as a fold assignment); (ii) alignment of the target and template sequences; (iii) construction of a model based on the alignment with the chosen template(s); and (iv) evaluation of the model [98].
For the identification of suitable templates, one can use standard sequence similarity search tools such as BLAST or FASTA or more sensitive profile-based searching tools like PSI-BLAST, HMMER, FFAS [99] and HHblits. If no template can be reliably identified by the

Introduction
24
sequence or profile-based methods, one can search for the best fitting structure to a target sequence by threading methods, e.g., FUGUE [100], GenTHREADER [101] or pro-sp3-TASSER [102]. If two or more possible templates are identified, the following criteria are usually used to select the final template for construction of the homology model: (i) sequence identity between the template and target protein; (ii) the resolution of the template structure; or (iii) a portion of conserved residues of interest (e.g., binding site residues). Alternatively, it is also possible to use several templates and create a combined model [103,104]. The identification and selection of suitable templates is greatly facilitated by the structure prediction meta-servers providing a gateway to several different fold assignment methods, e.g., GeneSilico meta-server [105] or BioInfoBank Meta Server [106].
The target-template alignments provided by the fold-assignment methods should be refined, optimally based on the MSA or the alignments obtained from multiple tools. The quality of the alignment is crucial as it determines the quality of the final model [98]. The reliability of alignment decreases with decreasing similarity of the target and template sequences; the rule of thumb says that, for an accurate model, the sequence identity between the template and target should be at least 30 % [1].
The most widely used tools for building of the homology model based on the target-template alignment include MODELLER [97,103], SWISS-MODEL [107,108] or 3D-JIGSAW [109]. The constructed model is evaluated, typically using the methods for verification of the compatibility between the target sequence and modeled structure, e.g., VERIFY3D [110], ANOLEA [111] or PROSAII [112]. Additionally, PROCHECK [113] or WHATCHECK [114] methods can be used for verification of the proper stereochemistry of the model [98]. The COLORADO3D server integrates several evaluation methods and maps their results on the protein structure, thus facilitating assessment of the model quality [115]. If the model assessment methods indicate incorrectly modeled regions, a given region of the target-template alignment should be refined and a new model constructed and evaluated. By such iterative approach, the reliability of the final model can be substantially improved [98].
1.4.3 Analysis of protein pockets, cavities, pores and tunnels
Protein structures contain many specific structural features, including surface clefts, pockets, protrusions, pores (also referred as channels), tunnels or cavities. These features have often functional relevance—they represent enzyme active sites, binding or interaction sites as well as pathways for migration of ions or molecules through the protein [116-124]. Identification and characterization of such structural features is therefore important for understanding of structure-function relationships of proteins. Obtained knowledge can be used for drug design and mutagenesis studies [82,116,125-127]. A number of geometry-based methods are available for the detection of pockets and cavities [116], e.g., VOIDOO [128], CASTp [129,130], POCKET [131] and PASS [132], as well as for the analysis of protein tunnels and pores, e.g., CAVER [133, Chapter 3], MOLE [134] and MolAxis [135,136].

Haloalkane Dehalogenases
25
2 Haloalkane dehalogenases
2.1 Introduction
Haloalkane dehalogenases (HLDs; EC 3.8.5.1) catalyze the hydrolytic cleavage of carbon-halogen bond in a wide range of chlorinated, brominated and iodinated compounds [137-140]. The substrates of HLDs include a variety of toxic pollutants [141-143], e.g., 1,2-dichloroethane, 1,2,3-trichloropropane or β-hexachlorocyclohexane [141-143], highlighting the environmental importance of these enzymes. Consequently, HLDs have a great application potential in bioremediation or detection of halogenated compounds in the environment [144-151]. Other potential practical applications of HLDs include biocatalysis, detoxification of warfare agents, protein production or cell imaging [137,152-154]. Besides that, HLDs represent a good model system for the investigation of structure-function relationships of enzymes.
The HLD family can be divided into three subfamilies [Chapter 1] and currently comprises sixteen experimentally confirmed HLDs (Table 1) and more than 250 putative members accessible in sequence databases. While experimentally confirmed HLDs are exclusively of bacterial origin, putative HLD from the eukaryotic organism Strongylocentrotus purpuratus was identified by the comparative sequence analysis [Chapter 1]. Sources of the characterized HLDs include bacterial strains isolated from contaminated environment [155-157] as well as marine bacteria [158-160], animal pathogens [161,162], plant symbionts [163] or plant parasites [164].
Table 1 Experimentally characterized HLDs
Subfamily Enzymea Organism Accession No.
b PDB-ID
c Ref.
HLD-I DhlA Xanthobacter autotrophicus GJ10 AAA88691 1B6G [155] DhmA Mycobacterium avium N85 CAC41377 - [161] DmbB Mycobacterium tuberculosis 5033/66 CAH04660 - [162] DppA Plesiocystis pacifica SIR-1 ZP_01908831 2XT0 [160]
HLD-II DatA Agrobacterium tumefaciens C58 BAJ23993 - [164] DbeA Bradyrhizobium elkanii USDA94 BAJ23986 - -d DbjA Bradyrhizobium japonicum USDA110 BAC46352 3AFI [163] DhaA Rhodococcus rhodochrous NCIMB 13064 P0A3G2 1CQW [157] DmbA Mycobacterium tuberculosis 5033/66 CAH04659 2QVB [162] DmlA Mesorhizobium loti MAFF303099 NP_106032 - [163] DmsA Mycobacterium smegmatis ATCC700084 AAL17946 - -d Jann2620 Jannaschia sp. CCS1 YP_510562 - [159] LinB Sphingobium japonicum UT26 BAA03443 1MJ5 [165] Sav4779 Streptomyces avermitilis MA-4680 NP_825956 - [159]
HLD-III DmbC Mycobacterium tuberculosis 5033/66 CAM90599 - [158] DrbA Rhodopirellula baltica SH1 CAM90600 - [158]
aRepresentatives of individual enzymes (enzyme variants with >90 % protein sequence identity to the representative are not shown); baccession number to the NCBI protein sequence database; cPDB-ID code of the best-resolution structure of a given enzyme; dunpublished data

Introduction
26
HLDs isolated from bacteria inhabiting contaminated soil are known to be involved in metabolic pathways for utilization of halogenated compounds [155,156,166], however, the biological function of most HLDs remains unknown. The catalytic mechanism of HLDs involves five residues of the so called catalytic pentad—a nucleophile (Asp), a base (His), a catalytic acid (Asp or Glu) and two halide-stabilizing residues (Trp-Trp or Trp-Asn). The dehalogenation reaction is initiated after binding of the substrate to the active site. The halogenated carbon atom of the substrate is attacked by the carboxylate oxygen of the nucleophile, which leads to the displacement of the halide ion from the substrate (Figure 1). This process is facilitated by the two halide-stabilizing residues, which binds the leaving halide. The formed alkyl-enzyme intermediate is subsequently hydrolyzed by a water molecule that is activated by the catalytic base. The positive charge that develops on the catalytic base during this process is stabilized by the catalytic acid. The three products of reaction, i.e., an alcohol, a halide and a proton, are released and another reaction cycle may start after entering of a new water molecule [167,168].
Figure 1 General scheme of the reaction mechanism of HLDs. Adapted from [159].
2.2 Structure
To date, the experimental 3D structures have been determined for six HLDs (Table 1). Based on the SCOP classification, HLDs structurally belong to the superfamily of α/β-hydrolases. The structure of HLDs consists of two domains: (i) the α/β-hydrolase core domain (also called the main domain) and (ii) the helical cap domain (Figure 2A). The main domain is remarkably conserved among all members of the α/β-hydrolase superfamily. It is composed of an eight-stranded mostly parallel β-sheet flanked by α-helices and provides a stable scaffold for the main catalytic residues. The cap domain of HLDs contains four or five helices (Figure 2B) and is inserted into the main domain after the β-strand 6 [169-173].

Haloalkane Dehalogenases
27
Figure 2 Tertiary structure of HLDs. (A) The main and the cap domain are shown as a light gray and dark gray cartoon, respectively. Locations of the catalytic pentad residues are indicated by blue spheres. (B) Two different compositions of the cap domain in HLDs. The main difference is highlighted by a red color. (C) The cross-section of the HLD structure with a detail of the active site cavity (1) and main access tunnel (2). The catalytic pentad residues and the substrate are highlighted by blue and orange sticks, respectively. Figure was prepared in PyMOL v1.4.

Introduction
28
The active site of HLDs is buried inside the structure in a cavity located at the interface of the cap and main domain (Figure 2C). With the exception of polar residues of the catalytic pentad, the active site cavity is formed by hydrophobic residues, providing a suitable micro-environment for the catalytic reaction. The cavity is connected with the bulk solvent by the tunnels representing transport pathways (Figure 2C). Tunnels mediate the access of substrates and water molecules to the active site and egress of reaction products and thus play an important role in the reaction cycle of HLDs [82,121,125,133,168,174,175]. The size, shape, dynamics and amino acid composition of the active site cavity and access tunnels significantly influence catalytic properties of enzymes. Residues lining the active site cavity and the tunnels hence represent common targets of the protein engineering experiments [82,125,176-180].
The active site cavities differ among members of the HLDs. To date, the largest and most open cavity was found in the DbjA and DmbA enzymes, while the smallest and the most occluded one in DhlA [138]. The small cavity of DhlA possibly reflects the adaptation of this enzyme to the small substrate 1,2-dichloroethane [168,174,181]. Concerning the tunnels, the best analyzed HLD is DhaA, which was studied using classical and random acceleration molecular dynamics simulations [121,182]. This way, five different transport pathways for the release of products and/or exchange of water solvent were identified: p1, p2a, p2b, p2c and p3 (Figure 3). The p1 pathway, corresponding to the main tunnel observed in the crystal structure of DhaA, was found to be the dominant transport pathway of DhaA, followed by the p2b and p2a pathways [121]. Based on the analysis of crystal structures, these tunnels are anticipated to be a dominant transport pathway also in other HLDs [82,133]. Due to the internal protein dynamics, individual tunnels may change significantly over time [119,183-185]. Therefore, dynamical systems, rather than a single static structure, must be analyzed to get more reliable information about tunnel characteristics [119,121,182,183,185,186]. The development of a new tool facilitating the analysis of tunnel dynamics is described in the Chapter 3.
Figure 3 Tunnels identified in the DhaA enzyme using classical and random acceleration molecular dynamics simulations. Individual tunnels are represented by the surface: p1 (blue), p2a (green), p2b (yellow), p2c (red) and p3 (magenta). Adapted from [121].

Haloalkane Dehalogenases
29
2.3 Evolution
HLDs share common structural features with enzymes from the α/β-hydrolase superfamily, which represent one of the largest group of structurally related enzymes with distinct catalytic functions [170,187]. The comparative analysis of structures and sequences of α/β-hydrolases described in the Chapter 1 revealed that the closest evolutionary relatives of HLDs are the cytosolic epoxide hydrolases, fluoroacetate dehalogenases, perhydrolases, carbon–carbon bond hydrolases and various carboxylic ester hydrolases (Figure 4). All these enzymes employ nucleophilic hydrolysis mediated by a nucleophile-His-acid catalytic triad [170]. The sister-group relationship of HLDs with epoxide hydrolase and fluoroacetate dehalogenase clade was proposed based on their structural and sequence similarities and the fact that only these families possess Asp as the catalytic nucleophile; Ser or Cys is employed in other α/β-hydrolase families [Chapter 1].
Figure 4 Comparison of the catalytic activities of HLDs and their closest evolutionary relatives. Adapted from [170].
Based on the phylogenetic analysis of both experimentally confirmed and putative HLDs
from sequence databases, the HLD family was classified into three subfamilies: HLD-I, HLD-II and HLD-III. The subfamilies HLD-I and HLD-III were predicted to be the sister-groups [Chapter 1]. To date, the HLD-II subfamily is by far the best characterized, comprising ten out of the sixteen biochemically characterized HLDs and four determined structures (Table 1).

Introduction
30
Each subfamily maintains its specific composition of the catalytic pentad (Figure nucleophile Asp, the catalytic base His and one halideamong all subfamilies, while both the type and spatial location of the casecond halide-stabilizing residue varies among subfamilies. Based on the tree and sequences of related protein families, the ancestral catalytic pentad of HLDs was predicted to comprise Asp-His-Asp+Asn-Trp (Figure characteristic is the absence of the second cap domain helix (helix α5') in the HLDThis helix was most likely lost after the separation of the HLD5). This reconstruction of the cap domain may be connected with the change of the halidestabilizing residue from Asn to Trp, facilitating the proper orientatfunction [Chapter 1].
Figure 5 Probable evolution of the catalytic pentad and cap domain within the HLD family. The common ancestor is indicated at the root of the tree (A). The catalytic pentad is composed of the catalytic triad of a nucleophile-base-acid and a pair of halide-stabilizing residues. Evolution lead to the change of the catalytic acid, from Asp to Glu, along the branch towards the ancestor of HLDchange of the halide-stabilizing residue, from Asn to Trp, along the branch from the common ancestor oHLD-I and HLD-III subfamilies (A13) towards the ancestor of HLDdomain resulted in the deletion of the second cap domain helix α5' in the HLDoccurred along the same branch as the change of halide-stabilizing residue, from A13 to A1.
In addition to the investigation of the evolutionary history of HLDs, the evolutionary
methods were used to analyze evolutionary rates at individual amino acidRelatively high rates of evolution detected in the N-reflect the importance of this region for the adaptive evolution of HLDsregion is known for its influence on the substrate specificity and enantioselectivity of HLDs and was also shown to be the most flexible part of HLD structures by displaying concerted
Each subfamily maintains its specific composition of the catalytic pentad (Figure 5). The c base His and one halide-stabilizing residue Trp are conserved
among all subfamilies, while both the type and spatial location of the catalytic acid and stabilizing residue varies among subfamilies. Based on the HLD phylogenetic
uences of related protein families, the ancestral catalytic pentad of HLDs was Trp (Figure 5). Another important subfamily
absence of the second cap domain helix (helix α5') in the HLD-I members. the separation of the HLD-I and HLD-III subfamilies (Figure
This reconstruction of the cap domain may be connected with the change of the halide-stabilizing residue from Asn to Trp, facilitating the proper orientation of Trp to fulfill its
Probable evolution of the catalytic pentad and cap domain within the HLD family. The common ancestor is indicated at the root of the tree (A). The catalytic pentad is composed of the catalytic triad of
ing residues. Evolution lead to the change of the catalytic acid, from Asp to Glu, along the branch towards the ancestor of HLD-II subfamily (A2) and the
stabilizing residue, from Asn to Trp, along the branch from the common ancestor of III subfamilies (A13) towards the ancestor of HLD-I subfamily (A1). Evolution of the cap
domain resulted in the deletion of the second cap domain helix α5' in the HLD-I subfamily. This deletion stabilizing residue, from A13 to A1.
In addition to the investigation of the evolutionary history of HLDs, the evolutionary-based methods were used to analyze evolutionary rates at individual amino acid positions.
-terminal part of the cap domain probably reflect the importance of this region for the adaptive evolution of HLDs [Chapter 1]. This region is known for its influence on the substrate specificity and enantioselectivity of HLDs
lso shown to be the most flexible part of HLD structures by displaying concerted

functionally relevant motions [137,175,188,189]for accommodation of relatively long insertionswithin sequences of HLDs are located in this region, including two experimentally characterized members—DhlA (10 amino acid insertion) and DbjA (11 amino acid insertion) [Chapter 1]. In both these enzymes, the insertion influences the architecturesite cavity and the access tunnels and consequently their catalytic properties
The insertion in DhlA harbors two short tandem sequence repeats and additional substitutions (Figure 6). The mutations were attributed to the rethe conversion of the synthetic compound 1,2in the environment since its release to the biosphere in 1922. The connection between the DhlA insertion and the adaptation towards 1,2laboratory experiment. The hypothetical DhlA precursor was constructed and subjected to the in vitro laboratory mutagenesis, mimicking natural evolution of the cap domain. While the DhlA precursor was inactive with 1,2-dichloroethane, some of the evolved mutants carrying repeats in the N-terminal part of the cap domain possessed the 1,2dehalogenase activity [181,190].
Another example of the HLD adaptation to a new compound through a short evolutionary pathway represents LinBMI from Sphingobium
S. japonicum UT26. These two enzymes differ only by seven amino acids, nevertheless, they have distinct catalytic properties. The LinBMI
cyclohexanol (an intermediate of the β-hexachlorocyclohexane degradation) to 2,3,5,6tetrachlorocyclohexane-1,4-diol, while the LinBto the two residues of the active site cavity often sufficient to evolve HLD to a new substrate enable fast adaptation of the host organisms to changes in living environments [82,125,143,181]
Figure 6 Evolution of DhlA activity towards 1,2-dichloroethane. The NDhlA contains two short tandem sequence repeats (arrows), which might be signs of recent adaptation to this xenobiotic compound. Adapted from [190].
2.4 Substrate specificity
HLDs have broad substrate specificity. They catalyze conversion of a wide range of substrates, including chlorinated, brominated and iodinated alkanes, cycloalkanes, alkenes, alcohols, esters, carboxylic acids, ethers, epoxides, nitriles and amides as well as the rates of conversion of individual substrates are different in different HLDs [140,163,191]. Throughout time, the multivariate statistical analysis was repeatedly used to
Haloalkane Dehalogenases
31
[137,175,188,189]. This region seems to be particularly suitable for accommodation of relatively long insertions—most of the unique long insertions found within sequences of HLDs are located in this region, including two experimentally
amino acid insertion) and DbjA (11 amino acid insertion) . In both these enzymes, the insertion influences the architecture of their active
site cavity and the access tunnels and consequently their catalytic properties [137,168,174]. The insertion in DhlA harbors two short tandem sequence repeats and additional
substitutions (Figure 6). The mutations were attributed to the recent adaptation of DhlA to the conversion of the synthetic compound 1,2-dichloroethane, which has only been present in the environment since its release to the biosphere in 1922. The connection between the DhlA insertion and the adaptation towards 1,2-dichloroethane was investigated in the laboratory experiment. The hypothetical DhlA precursor was constructed and subjected to
laboratory mutagenesis, mimicking natural evolution of the cap domain. While the chloroethane, some of the evolved mutants carrying
terminal part of the cap domain possessed the 1,2-dichloroethane
Another example of the HLD adaptation to a new compound through a short evolutionary Sphingobium sp. MI1205, a variant of the LinB enzyme from
UT26. These two enzymes differ only by seven amino acids, nevertheless, they
MI is capable to convert 2,3,4,5,6-pentachloro-hexachlorocyclohexane degradation) to 2,3,5,6-
diol, while the LinBUT is not. The dominant effect was attributed to the two residues of the active site cavity [143]. The fact, that only a few mutations are often sufficient to evolve HLD to a new substrate enable fast adaptation of the host
[82,125,143,181].
dichloroethane. The N-terminal part of the cap domain of DhlA contains two short tandem sequence repeats (arrows), which might be signs of recent adaptation
specificity. They catalyze conversion of a wide range of substrates, including chlorinated, brominated and iodinated alkanes, cycloalkanes, alkenes, alcohols, esters, carboxylic acids, ethers, epoxides, nitriles and amides [137-140]. The substrate range as well as the rates of conversion of individual substrates are different in different HLDs
. Throughout time, the multivariate statistical analysis was repeatedly used to

Introduction
32
classify HLDs based on their similarities in substrate specificities [140,163,192,193]. The most recent and also the most extensive systematic comparison of HLD substrate specificities is described in the Chapter 2. This classification is based on the relative preferences of nine different HLDs for thirty representative substrates. The analyzed enzymes were divided into four substrate specificity groups (SSGs): (i) SSG-I comprising the catalytically robust enzymes DbjA, DhaA, DhlA and LinB; (ii) SSG-II with the DmbA enzyme differing from others by a high preference for 2-iodobutane, 1-chloro-2-(2-chloroethoxy)ethane and chloro-cyclopentane; (iii) SSG-III with the DrbA enzyme characterized by extremely low or zero activity towards all of the tested compounds and relatively high preference for 1-chlorbutane; and (iv) SSG-IV comprising the DbeA, DatA and DmbC enzymes with preference for terminally substituted brominated and iodinated propanes and butanes. The most general substrates (from a given test set) converted by most HLDs are 1-bromobutane, 1-iodopropane, 1-iodobutane, 1,2-dibromoethane and 4-bromobutanenitrile [Chapter 2].
The substrate specificity of HLDs is influenced by the architecture of the active site cavity and the cap domain modulating the anatomy of access tunnels [82,170,174,189, Chapter 2]. Other determinants of the substrate specificity of HLDs may include distribution of charges on the protein surface [194], protein solvation [195] or protein dynamics [121]. Only one or few mutations in the specificity-determining region is sufficient to change the preference of a given HLD to particular substrates [82,125,143,181,189]. Consequently, it is not possible to predict the substrate specificity of a putative HLD solely based on its evolutionary relatedness to the biochemically characterized HLDs [Chapter 2].
2.5 Rational design of haloalkane dehalogenases
A wealth of available knowledge concerning the structure and function of HLDs provides a theoretical framework for the rational design of HLD variants with improved catalytic properties [138]. Mutations targeting the residues that mediate the substrate binding, transition-state stabilization or product release, i.e., the residues located in the active site cavity or access tunnels, have a better chance to produce enzyme variants with novel catalytic properties than mutations localized in other parts of the protein structure [176,177,196]. These residues are therefore typically selected as hot-spots for engineering of enzyme catalytic properties [82,125,176-180].
Holloway et al. designed four single-point mutants of DhlA with enlarged active site cavity with the aim to expand the substrate range of this enzyme. In each mutant, one of the bulky residues lining the active site cavity was replaced by Ala. Two of the four constructed mutant variants (164A and D170A) showed increased specific activity against the larger substrates than the wild type [197]. In another study, Chaloupková et al. combined structural and evolutionary information and identified Leu177 as one of the most important determinants of the substrate specificity of LinB [82]. This residue was selected because: (i) the side-chain of Leu177 points towards the narrowest part of the main access tunnel (Figure 7), indicating its possible importance for the exchange of ligands; and (ii) the position 177 was the most variable of all cavity and main tunnel residues based on the MSA of the HLD family, suggesting

Haloalkane Dehalogenases
33
its high tolerance to mutations and possible importance for adaptation of LinB to the new substrates. All 19 possible amino acids were introduced to this position by the side-directed mutagenesis. Out of the 19 constructed mutants, 15 represented active protein variants, confirming that the position 177 is highly tolerant to introduction of different amino acid residues. Statistical multivariate analysis of activity data with 12 halogenated substrates revealed that individual mutant variants differ in their substrate specificity profiles. This study showed that important determinants of enzyme catalytic properties can be deduced by a combination of structural and evolutionary analysis and also suggested that evolutionary variability of a position may possibly serve as a useful indicator of its tolerance to the amino acid substitutions [82]. Consequently, this strategy can be used for the rational selection of suitable positions for engineering of enzyme activity, enantioselectivity or substrate specificity. This strategy has been implemented in the software tool HotSpot Wizard, which enables an automatic identification of mutagenesis hot spots. The development of HotSpot Wizard is described in the Chapter 4.
Figure 7 Cross-section of the LinB structure with highlighted position 177 (red) located at the mouth of the main access tunnel. The wild type (Leu) and two mutant variants (Trp and Thr) are shown. Figure was prepared in PyMOL v1.4.
Two studies focused on engineering of the DhaA enzyme employed the semi-rational
approach. Los et al. constructed the DhaA H272F mutant capable of binding the synthetic ligand composed of a chloroalkane linker and a fluorescent dye [154]. To improve the binding rate of the ligand, the rational design, used for the selection of suitable amino acid positions, was combined with the site-saturation mutagenesis and the high-throughput screening. Several enzyme variants with significantly improved binding were identified. The best mutant with a four order of magnitude improved binding rate carried the substitution in the active site cavity (Y273L) and two substitutions in the access tunnels (K175M and C176G) [154]. Pavlová et al. attempted to construct the DhaA enzyme with improved conversion of the toxic, recalcitrant environmental pollutant 1,2,3-trichloropropane (TCP) [125]. The random acceleration molecular dynamics was initially employed to identify the key residues for the release of TCP reaction products from the active site of DhaA, selecting five positions lining the access tunnels of DhaA (I135, W141, C176, V245 and L246). The mutability of these
Introduction
34
selected positions was assessed based on the MSA of the HLD family. The known DhaA mutant C176Y+Y273F with the 3.5 fold higher activity towards TCP than the wild type [198] and the triple mutant W141F+C176Y+Y273F were then used as templates for focused directed evolution, subjecting the positions I135, V245 and L246 to simultaneous saturation mutagenesis. The screening of 5,000 variants against TCP provided 25 unique mutants with improved activities towards TCP. The best mutant (I135F+C176Y+ V245F+L246+Y273F) showed 32-times higher activity than the wild type [125].
Additionally to the above mentioned studies, many computer-assisted protein engineering experiments of HLDs were focused on verification of predicted catalytic residues and elucidation of the catalytic mechanism of HLDs [163,199-203].
References
[1] J. Xiong, Essential Bioinformatics, Cambridge University Press, New York, 2006. [2] T. Attwood, D. Parry-Smith, Introduction to Bioinformatics, Benjamin Cummings,
Harlow, 2001. [3] M. Y. Galperin, G. R. Cochrane, Nucleic Acids Res 2011, 39, D1-6. [4] M. Magrane, Uniprot Consortium, Database 2011, bar009. [5] E. W. Sayers, T. Barrett, D. A. Benson, E. Bolton, S. H. Bryant, K. Canese, V. Chetvernin,
D. M. Church, M. DiCuccio, S. Federhen, M. Feolo, I. M. Fingerman, L. Y. Geer, W. Helmberg, Y. Kapustin, D. Landsman, D. J. Lipman, Z. Lu, T. L. Madden, T. Madej, D. R. Maglott, A. Marchler-Bauer, V. Miller, I. Mizrachi, J. Ostell, A. Panchenko, L. Phan, K. D. Pruitt, G. D. Schuler, E. Sequeira, S. T. Sherry, M. Shumway, K. Sirotkin, D. Slotta, A. Souvorov, G. Starchenko, T. A. Tatusova, L. Wagner, Y. Wang, W. J. Wilbur, E. Yaschenko, J. Ye, Nucleic Acids Res 2011, 39, D38-51.
[6] H. Berman, K. Henrick, H. Nakamura, J. L. Markley, Nucleic Acids Res 2007, 35, D301-303.
[7] A. Andreeva, D. Howorth, J. M. Chandonia, S. E. Brenner, T. J. P. Hubbard, C. Chothia, A. G. Murzin, Nucleic Acids Res 2008, 36, D419-425.
[8] M. Knudsen, C. Wiuf, Hum Genomics 2010, 4, 207-212. [9] C. T. Porter, G. J. Bartlett, J. M. Thornton, Nucleic Acids Res 2004, 32, D129-133. [10] G. L. Holliday, D. E. Almonacid, G. J. Bartlett, N. M. O’Boyle, J. W. Torrance, P. Murray-
Rust, J. B. O. Mitchell, J. M. Thornton, Nucleic Acids Res 2007, 35, D515-520. [11] N. Nagano, Nucleic Acids Res 2005, 33, D407-412. [12] T. Kawabata, M. Ota, K. Nishikawa, Nucleic Acids Res 1999, 27, 355-357. [13] K. A. Bava, M. M. Gromiha, H. Uedaira, K. Kitajima, A. Sarai, Nucleic Acids Res 2004,
32, D120-121. [14] M. Scheer, A. Grote, A. Chang, I. Schomburg, C. Munaretto, M. Rother, C. Söhngen, M.
Stelzer, J. Thiele, D. Schomburg, Nucleic Acids Res 2011, 39, D670-676. [15] G. Gibney, A. D. Baxevanis, Curr Protoc Bioinformatics 2011, Chapter 1, Unit 1.3. [16] E. M. Zdobnov, R. Lopez, R. Apweiler, T. Etzold, Bioinformatics 2002, 18, 1149-1150.

References
35
[17] S. F. Altschul, T. L. Madden, A. A. Schäffer, J. Zhang, Z. Zhang, W. Miller, D. J. Lipman, Nucleic Acids Res 1997, 25, 3389-3402.
[18] D. W. Mount, CSH Protoc 2007, doi:10.1101/pdb.top16. [19] S. R. Eddy, Genome Inform 2009, 23, 205-211. [20] J. Söding, M. Remmert, Curr Opin Struct Biol 2011, 21, 404-411. [21] K. Sikic, O. Carugo, Bioinformation 2010, 5, 234-239. [22] Y. Huang, B. Niu, Y. Gao, L. Fu, W. Li, Bioinformatics 2010, 26, 680-682. [23] E. Gasteiger, A. Gattiker, C. Hoogland, I. Ivanyi, R. D. Appel, A. Bairoch, Nucleic Acids
Res 2003, 31, 3784-3788. [24] G. Wang, R. L. Dunbrack Jr, Bioinformatics 2003, 19, 1589-1591. [25] T. Frickey, A. Lupas, Bioinformatics 2004, 20, 3702-3704. [26] I. M. Wallace, G. Blackshields, D. G. Higgins, Curr Opin Struct Biol 2005, 15, 261-266. [27] J. Pevsner, Bioinformatics and Functional Genomics, Wiley-Liss, Hoboken, 2003. [28] J. Pei, Curr Opin Struct Biol 2008, 18, 382-386. [29] C. Kemena, C. Notredame, Bioinformatics 2009, 25, 2455-2465. [30] R. C. Edgar, Nucleic Acids Res 2004, 32, 1792-1797. [31] R. C. Edgar, BMC Bioinformatics 2004, 5, 113. [32] K. Katoh, K. Misawa, K. Kuma, T. Miyata, Nucleic Acids Res 2002, 30, 3059-3066. [33] C. B. Do, M. S. P. Mahabhashyam, M. Brudno, S. Batzoglou, Genome Res 2005, 15,
330-340. [34] C. Notredame, D. G. Higgins, J. Heringa, J Mol Biol 2000, 302, 205-217. [35] F. Sievers, A. Wilm, D. Dineen, T. J. Gibson, K. Karplus, W. Li, R. Lopez, H. McWilliam,
M. Remmert, J. Söding, J. D. Thompson, D. G. Higgins, In preparation.
[36] K. M. Wong, M. A. Suchard, J. P. Huelsenbeck, Science 2008, 319, 473-476. [37] T. A. Hall, Nucleic Acids Symp Ser 1994, 41, 95-98. [38] N. Krishnamurthy, K. Sjölander, Curr Protoc Bioinformatics 2005, Chapter 6, Unit 6.9. [39] H. Ashkenazy, E. Erez, E. Martz, T. Pupko, N. Ben-Tal, Nucleic Acids Res 2010, 38,
W529-533. [40] T. Pupko, R. E. Bell, I. Mayrose, F. Glaser, N. Ben-Tal, Bioinformatics 2002, 18 Suppl 1,
S71-77. [41] A. Stern, A. Doron-Faigenboim, E. Erez, E. Martz, E. Bacharach, T. Pupko, Nucleic Acids
Res 2007, 35, W506-511. [42] M. J. Harms, J. W. Thornton, Curr Opin Struct Biol 2010, 20, 360-366. [43] J. W. Thornton, R. DeSalle, Annu Rev Genomics Hum Genet 2000, 1, 41-73. [44] S. Whelan, P. Liò, N. Goldman, Trends Genet 2001, 17, 262-272. [45] F. Abascal, R. Zardoya, D. Posada, Bioinformatics 2005, 21, 2104-2105. [46] M. O. Dayhoff, R. M. Schwartz, B. C. Orcutt, A Model of Evolutionary Change in
Proteins, in Atlas of Protein Sequence and Structure (Ed.: M. O. Dayhoff), National Biomedical Research Foundation, Washington, DC, 1978, pp. 345–351.
[47] D. T. Jones, W. R. Taylor, J. M. Thornton, Comput Appl Biosci 1992, 8, 275-282. [48] J. Adachi, M. Hasegawa, J Mol Evol 1996, 42, 459-468. [49] J. Adachi, P. J. Waddell, W. Martin, M. Hasegawa, J Mol Evol 2000, 50, 348-358.

Introduction
36
[50] S. Whelan, N. Goldman, Mol Biol Evol 2001, 18, 691-699. [51] S. Q. Le, O. Gascuel, Mol Biol Evol 2008, 25, 1307-1320. [52] Z. Yang, Mol Biol Evol 1993, 10, 1396-1401. [53] Z. Yang, Trends Ecol Evol 1996, 11, 367-372. [54] J. H. Reeves, J Mol Evol 1992, 35, 17-31. [55] Z. Yang, J Mol Evol 1996, 42, 587-596. [56] D. Darriba, G. L. Taboada, R. Doallo, D. Posada, Bioinformatics 2011, 27, 1164-1165. [57] T. M. Keane, C. J. Creevey, M. M. Pentony, T. J. Naughton, J. O. Mclnerney, BMC Evol
Biol 2006, 6, 29. [58] M. Holder, P. O. Lewis, Nat Rev Genet 2003, 4, 275-284. [59] N. Saitou, M. Nei, Mol Biol Evol 1987, 4, 406-425. [60] O. Gascuel, Mol Biol Evol 1997, 14, 685-695. [61] A. Drummond, K. Strimmer, Bioinformatics 2001, 17, 662-663. [62] J. C. Wilgenbusch, D. Swofford, Curr Protoc Bioinformatics 2003, Chapter 6, Unit 6.4. [63] J. D. Retief, Methods Mol Biol 2000, 132, 243-258. [64] M. D. Hendy, D. Penny, Math Biosci 1982, 59, 277–290. [65] J. Bergsten, Cladistics 2005, 21, 163-193. [66] S. Guindon, J. F. Dufayard, V. Lefort, M. Anisimova, W. Hordijk, O. Gascuel, Syst Biol
2010, 59, 307-321. [67] H. A. Schmidt, A. von Haeseler, Curr Protoc Bioinformatics 2007, Chapter 6, Unit 6.6. [68] F. Ronquist, J. P. Huelsenbeck, Bioinformatics 2003, 19, 1572-1574. [69] Z. Yang, Comput Appl Biosci 1997, 13, 555-556. [70] Z. Yang, Mol Biol Evol 2007, 24, 1586-1591. [71] S. Guindon, O. Gascuel, Syst Biol 2003, 52, 696-704. [72] S. Guindon, F. Delsuc, J. F. Dufayard, O. Gascuel, Methods Mol Biol 2009, 537,
113-137. [73] A. Stamatakis, Bioinformatics 2006, 22, 2688-2690. [74] L. S. Vinh, A. von Haeseler, Mol Biol Evol 2004, 21, 1565-1571. [75] G. Jobb, A. von Haeseler, K. Strimmer, BMC Evol Biol 2004, 4, 18. [76] A. J. Drummond, A. Rambaut, BMC Evol Biol 2007, 7, 214. [77] H. Shimodaira, M. Hasegawa, Mol Biol Evol 1999, 16, 1114-1116. [78] H. Kishino, M. Hasegawa, J Mol Evol 1989, 29, 170-179. [79] K. Strimmer, A. von Haeseler, Proc Natl Acad Sci USA 1997, 94, 6815-6819. [80] A. Rzhetsky, S. Kumar, M. Nei, Mol Biol Evol 1995, 12, 163-167. [81] S. W. Zhang, Y. L. Zhang, Q. Pan, Y. M. Cheng, K. C. Chou, Amino Acids 2008, 35,
495-501. [82] R. Chaloupková, J. Sýkorová, Z. Prokop, A. Jesenská, M. Monincová, M. Pavlová, M.
Tsuda, Y. Nagata, J. Damborský, J Biol Chem 2003, 278, 52622-52628. [83] C. Fattorusso, S. Gemma, S. Butini, P. Huleatt, B. Catalanotti, M. Persico, M. De
Angelis, I. Fiorini, V. Nacci, A. Ramunno, M. Rodriquez, G. Greco, E. Novellino, A. Bergamini, S. Marini, M. Coletta, G. Maga, S. Spadari, G. Campiani, J Med Chem 2005, 48, 7153-7165.

References
37
[84] W. S. J. Valdar, Proteins 2002, 48, 227-241. [85] T. D. Schneider, R. M. Stephens, Nucleic Acids Res 1990, 18, 6097-6100. [86] G. E. Crooks, G. Hon, J. M. Chandonia, S. E. Brenner, Genome Res 2004, 14, 1188-1190. [87] F. Glaser, T. Pupko, I. Paz, R. E. Bell, D. Bechor-Shental, E. Martz, N. Ben-Tal,
Bioinformatics 2003, 19, 163-164. [88] O. Lichtarge, M. E. Sowa, Curr Opin Struct Biol 2002, 12, 21-27. [89] I. Mihalek, I. Res, O. Lichtarge, Bioinformatics 2006, 22, 1656-1657. [90] L. Holm, C. Sander, J Mol Biol 1993, 233, 123-138. [91] L. Holm, P. Rosenström, Nucleic Acids Res 2010, 38, W545-549. [92] Y. Ye, A. Godzik, Bioinformatics 2003, 19 Suppl 2, ii246-255. [93] Y. Ye, A. Godzik, Nucleic Acids Res 2004, 32, W582-585. [94] A. Zemla, Nucleic Acids Res 2003, 31, 3370-3374. [95] E. Krissinel, K. Henrick, Acta Crystallogr D Biol Crystallogr 2004, 60, 2256-2268. [96] I. N. Shindyalov, P. E. Bourne, Protein Eng 1998, 11, 739-747. [97] N. Eswar, D. Eramian, B. Webb, M. Y. Shen, A. Sali, Methods Mol Biol 2008, 426,
145-159. [98] N. Eswar, B. Webb, M. A. Marti-Renom, M. S. Madhusudhan, D. Eramian, M. Y. Shen,
U. Pieper, A. Sali, Curr Protoc Protein Sci 2007, Chapter 2, Unit 2.9. [99] L. Jaroszewski, L. Rychlewski, Z. Li, W. Li, A. Godzik, Nucleic Acids Res 2005, 33,
W284-288. [100] J. Shi, T. L. Blundell, K. Mizuguchi, J Mol Biol 2001, 310, 243-257. [101] D. T. Jones, J Mol Biol 1999, 287, 797-815. [102] H. Zhou, J. Skolnick, Biophys J 2009, 96, 2119-2127. [103] A. Sali, T. L. Blundell, J Mol Biol 1993, 234, 779-815. [104] J. Kosinski, I. A. Cymerman, M. Feder, M. A. Kurowski, J. M. Sasin, J. M. Bujnicki,
Proteins 2003, 53 Suppl 6, 369-379. [105] M. A. Kurowski, J. M. Bujnicki, Nucleic Acids Res 2003, 31, 3305-3307. [106] K. Ginalski, A. Elofsson, D. Fischer, L. Rychlewski, Bioinformatics 2003, 19, 1015-1018. [107] T. Schwede, J. Kopp, N. Guex, M. C. Peitsch, Nucleic Acids Res 2003, 31, 3381-3385. [108] N. Guex, M. C. Peitsch, T. Schwede, Electrophoresis 2009, 30 Suppl 1, S162-173. [109] P. A. Bates, L. A. Kelley, R. M. MacCallum, M. J. Sternberg, Proteins 2001, Suppl 5,
39-46. [110] R. Lüthy, J. U. Bowie, D. Eisenberg, Nature 1992, 356, 83-85. [111] F. Melo, D. Devos, E. Depiereux, E. Feytmans, Proc Int Conf Intell Syst Mol Biol 1997, 5,
187-190. [112] M. J. Sippl, Proteins 1993, 17, 355-362. [113] R. A. Laskowski, M. W. Macarthur, D. S. Moss, J. M. Thornton, J Appl Crystallogr 1993,
26, 283–291. [114] R. W. Hooft, G. Vriend, C. Sander, E. E. Abola, Nature 1996, 381, 272. [115] J. M. Sasin, J. M. Bujnicki, Nucleic Acids Res 2004, 32, W586-589. [116] A. T. R. Laurie, R. M. Jackson, Curr Protein Pept Sci 2006, 7, 395-406. [117] J. Janin, C. Chothia, J Biol Chem 1990, 265, 16027-16030.

Introduction
38
[118] D. Rhodes, S. K. Burley, Curr Opin Struct Biol 2000, 10, 75-77. [119] F. M. Ho, Photosyn Res 2008, 98, 503-522. [120] V. Cojocaru, P. J. Winn, R. C. Wade, Biochim Biophys Acta 2007, 1770, 390-401. [121] M. Klvana, M. Pavlova, T. Koudelakova, R. Chaloupkova, P. Dvorak, Z. Prokop, A.
Stsiapanava, M. Kuty, I. Kuta-Smatanova, J. Dohnalek, P. Kulhanek, R. C. Wade, J. Damborsky, J Mol Biol 2009, 392, 1339-1356.
[122] F. M. Raushel, J. B. Thoden, H. M. Holden, Acc Chem Res 2003, 36, 539-548. [123] E. Gouaux, R. Mackinnon, Science 2005, 310, 1461-1465. [124] R. MacKinnon, FEBS Lett 2003, 555, 62-65. [125] M. Pavlova, M. Klvana, Z. Prokop, R. Chaloupkova, P. Banas, M. Otyepka, R. C. Wade,
M. Tsuda, Y. Nagata, J. Damborsky, Nat Chem Biol 2009, 5, 727-733. [126] T. A. Nguyen, M. Tychopoulos, F. Bichat, C. Zimmermann, J. P. Flinois, M. Diry, E.
Ahlberg, M. Delaforge, L. Corcos, P. Beaune, P. Dansette, F. André, I. de Waziers, Mol
Pharmacol 2008, 73, 1122-1133. [127] J. Damborský, M. Petrek, P. Banás, M. Otyepka, Biotechnol J 2007, 2, 62-67. [128] G. J. Kleywegt, T. A. Jones, Acta Crystallogr D Biol Crystallogr 1994, 50, 178-185. [129] T. A. Binkowski, S. Naghibzadeh, J. Liang, Nucleic Acids Res 2003, 31, 3352-3355. [130] J. Dundas, Z. Ouyang, J. Tseng, A. Binkowski, Y. Turpaz, J. Liang, Nucleic Acids Res 2006,
34, W116-118. [131] D. G. Levitt, L. J. Banaszak, J Mol Graph 1992, 10, 229-234. [132] G. P. Brady Jr, P. F. Stouten, J Comput Aided Mol Des 2000, 14, 383-401. [133] M. Petrek, M. Otyepka, P. Banás, P. Kosinová, J. Koca, J. Damborský, BMC
Bioinformatics 2006, 7, 316. [134] M. Petrek, P. Kosinová, J. Koca, M. Otyepka, Structure 2007, 15, 1357-1363. [135] E. Yaffe, D. Fishelovitch, H. J. Wolfson, D. Halperin, R. Nussinov, Proteins 2008, 73, 72-
86. [136] E. Yaffe, D. Fishelovitch, H. J. Wolfson, D. Halperin, R. Nussinov, Nucleic Acids Res
2008, 36, W210-215. [137] Z. Prokop, Y. Sato, J. Brezovsky, T. Mozga, R. Chaloupkova, T. Koudelakova, P. Jerabek,
V. Stepankova, R. Natsume, J. G. E. van Leeuwen, D. B. Janssen, J. Florian, Y. Nagata, T. Senda, J. Damborsky, Angew Chem Int Ed Engl 2010, 49, 6111-6115.
[138] J. Damborsky, R. Chaloupkova, M. Pavlova, E. Chovancova, J. Brezovsky, Structure-Function Relationships and Engineering of Haloalkane Dehalogenases, in Handbook of
Hydrocarbon and Lipid Microbiology (Ed.: K.N. Timmis), Springer-Verlag, Berlin, Heidelberg, 2010, pp. 1081-1098.
[139] J. P. Schanstra, J. Kingma, D. B. Janssen, J Biol Chem 1996, 271, 14747-14753. [140] J. Damborský, E. Rorije, A. Jesenská, Y. Nagata, G. Klopman, W. J. Peijnenburg, Environ
Toxicol Chem 2001, 20, 2681-2689. [141] D. B. Janssen, F. Pries, J. van der Ploeg, B. Kazemier, P. Terpstra, B. Witholt, J Bacteriol
1989, 171, 6791-6799. [142] T. Bosma, E. Kruizinga, E. J. de Bruin, G. J. Poelarends, D. B. Janssen, Appl Environ
Microbiol 1999, 65, 4575-4581.

References
39
[143] M. Ito, Z. Prokop, M. Klvana, Y. Otsubo, M. Tsuda, J. Damborský, Y. Nagata, Arch
Microbiol 2007, 188, 313-325. [144] G. Stucki, M. Thueer, Environ Sci Technol 1995, 29, 2339-2345. [145] L. M. Freitas dos Santos, A. G. Livingston, Water Res 1995, 29, 179-194. [146] B. Erable, I. Goubet, A. Seltana, T. Maugard, J Environ Manage 2009, 90, 2841-2844. [147] E. Uchida, T. Ouchi, Y. Suzuki, T. Yoshida, H. Habe, I. Yamaguchi, T. Omori, H. Nojiri,
Environ Sci Technol 2005, 39, 7671-7677. [148] G. L. Mena-Benitez, F. Gandia-Herrero, S. Graham, T. R. Larson, S. J. McQueen-Mason,
C. E. French, E. L. Rylott, N. C. Bruce, Plant Physiol 2008, 147, 1192-1198. [149] D. W. Campbell, C. Müller, K. F. Reardon, Biotechnol Lett 2006, 28, 883-887. [150] H. Naested, M. Fennema, L. Hao, M. Andersen, D. B. Janssen, J. Mundy, Plant J 1999,
18, 571-576. [151] S. Bidmanova, R. Chaloupkova, J. Damborsky, Z. Prokop, Anal Bioanal Chem 2010, 398,
1891-1898. [152] Z. Prokop, F. Oplustil, J. DeFrank, J. Damborský, Biotechnol J 2006, 1, 1370-1380. [153] R. F. Ohana, L. P. Encell, K. Zhao, D. Simpson, M. R. Slater, M. Urh, K. V. Wood, Protein
Expr Purif 2009, 68, 110-120. [154] G. V. Los, L. P. Encell, M. G. McDougall, D. D. Hartzell, N. Karassina, C. Zimprich, M. G.
Wood, R. Learish, R. F. Ohana, M. Urh, D. Simpson, J. Mendez, K. Zimmerman, P. Otto, G. Vidugiris, J. Zhu, A. Darzins, D. H. Klaubert, R. F. Bulleit, K. V. Wood, ACS Chem Biol 2008, 3, 373-382.
[155] S. Keuning, D. B. Janssen, B. Witholt, J Bacteriol 1985, 163, 635-639. [156] Y. Nagata, T. Nariya, R. Ohtomo, M. Fukuda, K. Yano, M. Takagi, J Bacteriol 1993, 175,
6403-6410. [157] A. N. Kulakova, M. J. Larkin, L. A. Kulakov, Microbiology 1997, 143, 109-115. [158] A. Jesenská, M. Monincová, T. Koudeláková, K. Hasan, R. Chaloupková, Z. Prokop, A.
Geerlof, J. Damborsky, Appl Environ Microbiol 2009, 75, 5157-5160. [159] W. Y. Chan, M. Wong, J. Guthrie, A. V. Savchenko, A. F. Yakunin, E. F. Pai, E. A.
Edwards, Microb Biotechnol 2010, 3, 107-120. [160] M. Hesseler, X. Bogdanović, A. Hidalgo, J. Berenguer, G. J. Palm, W. Hinrichs, U. T.
Bornscheuer, Appl Microbiol Biotechnol 2011, 91, 1049-1060. [161] A. Jesenská, M. Bartos, V. Czerneková, I. Rychlík, I. Pavlík, J. Damborský, Appl Environ
Microbiol 2002, 68, 3724-3730. [162] A. Jesenská, M. Pavlová, M. Strouhal, R. Chaloupková, I. Tesínská, M. Monincová, Z.
Prokop, M. Bartos, I. Pavlík, I. Rychlík, P. Möbius, Y. Nagata, J. Damborsky, Appl
Environ Microbiol 2005, 71, 6736-6745. [163] Y. Sato, M. Monincová, R. Chaloupková, Z. Prokop, Y. Ohtsubo, K. Minamisawa, M.
Tsuda, J. Damborsky, Y. Nagata, Appl Environ Microbiol 2005, 71, 4372-4379. [164] K. Hasan, A. Fortova, T. Koudelakova, R. Chaloupkova, M. Ishitsuka, Y. Nagata, J.
Damborsky, Z. Prokop, Appl Environ Microbiol 2011, 77, 1881-1884. [165] Y. Nagata, K. Hynková, J. Damborský, M. Takagi, Protein Expr Purif 1999, 17, 299-304.

Introduction
40
[166] H. Curragh, O. Flynn, M. J. Larkin, T. M. Stafford, J. T. Hamilton, D. B. Harper, Microbiology 1994, 140, 1433-1442.
[167] D. B. Janssen, Curr Opin Chem Biol 2004, 8, 150-159. [168] J. Damborský, J. Koca, Protein Eng 1999, 12, 989-998. [169] D. L. Ollis, E. Cheah, M. Cygler, B. Dijkstra, F. Frolow, S. M. Franken, M. Harel, S. J.
Remington, I. Silman, J. Schrag, Protein Eng 1992, 5, 197-211. [170] M. Holmquist, Curr Protein Pept Sci 2000, 1, 209-235. [171] Z. Qian, C. J. Fields, Y. Yu, S. Lutz, Biotechnol J 2007, 2, 192-200. [172] S. M. Franken, H. J. Rozeboom, K. H. Kalk, B. W. Dijkstra, EMBO J 1991, 10, 1297-1302. [173] J. Newman, T. S. Peat, R. Richard, L. Kan, P. E. Swanson, J. A. Affholter, I. H. Holmes, J.
F. Schindler, C. J. Unkefer, T. C. Terwilliger, Biochemistry 1999, 38, 16105-16114. [174] J. Marek, J. Vévodová, I. K. Smatanová, Y. Nagata, L. A. Svensson, J. Newman, M.
Takagi, J. Damborský, Biochemistry 2000, 39, 14082-14086. [175] M. Otyepka, J. Damborský, Protein Sci 2002, 11, 1206-1217. [176] R. A. Chica, N. Doucet, J. N. Pelletier, Curr Opin Biotechnol 2005, 16, 378-384. [177] K. L. Morley, R. J. Kazlauskas, Trends Biotechnol 2005, 23, 231-237. [178] M. Zamocky, C. Herzog, L. M. Nykyri, F. Koller, FEBS Lett 1995, 367, 241-245. [179] M. Kotik, V. Stepánek, P. Kyslík, H. Maresová, J Biotechnol 2007, 132, 8-15. [180] P. Chelikani, X. Carpena, I. Fita, P. C. Loewen, J Biol Chem 2003, 278, 31290-31296. [181] M. G. Pikkemaat, D. B. Janssen, Nucleic Acids Res 2002, 30, e35. [182] W. Li, J. Shen, G. Liu, Y. Tang, T. Hoshino, Proteins 2011, 79, 271-281. [183] T. Shen, K. Tai, R. H. Henchman, J. A. McCammon, Acc Chem Res 2002, 35, 332-340. [184] P. Arroyo-Mañez, D. E. Bikiel, L. Boechi, L. Capece, S. Di Lella, D. A. Estrin, M. A. Martí,
D. M. Moreno, A. D. Nadra, A. A. Petruk, Biochim Biophys Acta 2011, 1814, 1054-1064. [185] M. Karplus, J. A. McCammon, Nat Struct Biol 2002, 9, 646-652. [186] M. Otyepka, J. Skopalík, E. Anzenbacherová, P. Anzenbacher, Biochim Biophys Acta
2007, 1770, 376-389. [187] P. D. Carr, D. L. Ollis, Protein Pept Lett 2009, 16, 1137-1148. [188] J. Kmunícek, S. Luengo, F. Gago, A. R. Ortiz, R. C. Wade, J. Damborský, Biochemistry
2001, 40, 8905-8917. [189] F. Pries, A. J. van den Wijngaard, R. Bos, M. Pentenga, D. B. Janssen, J Biol Chem 1994,
269, 17490-17494. [190] D. B. Janssen, I. J. T. Dinkla, G. J. Poelarends, P. Terpstra, Environ Microbiol 2005, 7,
1868-1882. [191] J. Kmunícek, K. Hynková, T. Jedlicka, Y. Nagata, A. Negri, F. Gago, R. C. Wade, J.
Damborský, Biochemistry 2005, 44, 3390-3401. [192] J. Damborsky, M. G. Nyandoroh, M. Nĕmec, I. Holoubek, A. T. Bull, D. J. Hardman,
Biotechnol Appl Biochem 1997, 26, 19-25. [193] Y. Nagata, K. Miyauchi, J. Damborsky, K. Manova, A. Ansorgova, M. Takagi, Appl
Environ Microbiol 1997, 63, 3707-3710. [194] A. J. Russell, A. R. Fersht, Nature 1987, 328, 496-500. [195] N. Ota, D. A. Agard, Protein Sci 2001, 10, 1403-1414.

References
41
[196] S. Park, K. L. Morley, G. P. Horsman, M. Holmquist, K. Hult, R. J. Kazlauskas, Chem Biol 2005, 12, 45-54.
[197] P. Holloway, K. L. Knoke, J. T. Trevors, H. Lee, Biotechnol Bioeng 1998, 59, 520-523. [198] T. Bosma, J. Damborský, G. Stucki, D. B. Janssen, Appl Environ Microbiol 2002, 68,
3582-3587. [199] F. Pries, J. Kingma, M. Pentenga, G. van Pouderoyen, C. M. Jeronimus-Stratingh, A. P.
Bruins, D. B. Janssen, Biochemistry 1994, 33, 1242-1247. [200] F. Pries, J. Kingma, G. H. Krooshof, C. M. Jeronimus-Stratingh, A. P. Bruins, D. B.
Janssen, J Biol Chem 1995, 270, 10405-10411. [201] G. H. Krooshof, E. M. Kwant, J. Damborský, J. Koca, D. B. Janssen, Biochemistry 1997,
36, 9571-9580. [202] K. Hynková, Y. Nagata, M. Takagi, J. Damborský, FEBS Lett 1999, 446, 177-181. [203] M. Pavlová, M. Klvana, A. Jesenská, Z. Prokop, H. Konecná, T. Sato, M. Tsuda, Y.
Nagata, J. Damborský, J Struct Biol 2007, 157, 384-392.

42

Synopsis of Results
43
SYNOPSIS OF RESULTS
The results are composed of four original papers:
1. Chovancová, E., Kosinski, J., Bujnicki, J. M., Damborský, J. (2007). Phylogenetic analysis of haloalkane dehalogenases. Proteins 67: 305-316.
2. Chovancová, E.*, Koudeláková, T.*, Brezovský, J., Monincová, M., Fořtová, A., Jarkovský, J., Damborský, J. (2011). Substrate specificity of haloalkane dehalogenases. Biochemical Journal 435: 345-354.
3. Chovancová, E.*, Pavelka, A.*, Beneš, P.*, Medek, P., Brezovský, J., Kozlíková, B., Gora, A., Šustr, V., Klvaňa, M., Strnad, O., Biedermannová, L., Sochor, J., Damborský, J. (2011). CAVER 3.0: A tool for effective analysis of tunnels in dynamic protein structures. In preparation
4. Chovancová, E.*, Pavelka, A*, Damborský, J. (2009). HotSpot Wizard: A web server for identification of hot spots in protein engineering. Nucleic Acids Research 37: W376-383.
* These authors contributed equally to this work
Contribution to the papers:
1. comparative structure and sequence analysis, phylogenetic analysis, analysis of residue conservation, contribution to homology modeling, interpretation of data, writing most of the paper
2. phylogenetic analysis, interpretation of data, writing part of the paper 3. design of the application, testing, analysis of tunnels in molecular dynamic
simulations, writing most of the paper 4. design and testing of the application, implementation of conservation analysis,
validation of mutability concept, preparation of examples, writing part of the documentation, writing most of the paper

44
The Chapter 1 describes the phylogenetic analysis of HLDs performed to assess relationships within the HLD family members and to establish an objective classification of these enzymes. The analysis of 3,442 protein sequences obtained from database searches revealed that the closest evolutionary relatives of HLDs are the cytosolic epoxide hydrolases and fluoroacetate dehalogenases. The HLD family comprised 12 experimentally characterized and 32 putative members, including the first putative HLD from the eukaryotic organism. HLDs were classified into three subfamilies: HLD-I, HLD-II and HLD-III. The HLD-III subfamily comprised exclusively putative members and its relevance was investigated in a follow-up study, confirming the dehalogenase activity for two HLD-III members. The proposed classification of HLDs was supported by a unique composition of the catalytic pentad, observed for each of the tree subfamilies. We found that the HLD-III subfamily possesses a novel type of the catalytic pentad, Asp-His-Asp+Asn-Trp, and the same type of the catalytic pentad was also predicted for the HLD ancestor. Interestingly, the HLD-I subfamily, which has a different architecture of the cap domain than other two subfamilies, was predicted to be a sister-group of HLD-III, indicating that the cap domain reconstruction had occurred after the divergence of these two subfamilies. We proposed that this event had been connected with the change of the halide-stabilizing residue in HLD-I from Asn located in the main domain to the cap domain Trp. Evolutionary analysis was further used to assess the evolutionary conservation of individual amino acid positions of HLDs. The residues located in the N-terminal part of the cap domain and several residues lining the access tunnels were found to be frequently replaced during evolution, suggesting possible importance of these sites for the adaptation of HLDs to the new substrates.
The established phylogenetic classification of the HLD family provided the necessary framework for effective identification of new family members in the sequence databases. In the subsequent study (Chapter 2), we investigated whether the evolutionary information can also be used for prediction of the substrate specificity of putative HLDs. For this purpose, nine wild-type HLDs characterized with a set of 30 halogenated compounds were classified based on their similarities in the substrate specificity profiles. The HLD family was divided into four substrate specificity groups. The comparison of the results with phylogenetic data revealed that the substrate specificity classification of HLDs does not reflect evolution of the family and therefore cannot be simply deduced based on the established phylogenetic classification. We proposed that the observed incongruence between both classifications may reflect a certain ‘plasticity’ of HLDs, enabling them to quickly evolve the activity towards new substrates and thereby adapt to changing environments. Since the range of substrates converted by different HLDs often differs, we also attempted to define a set of substrates suitable for a routine screening of HLD activity. The selected set comprised 1-bromobutane, 1-iodopropane, 1-iodobutane, 1,2-dibromoethane and 4-bromobutanenitrile, all of which represented relatively good substrates for the nine analyzed HLDs. We further focused on the analysis of the HLD substrate specificity determinants. Structural and functional comparisons of the wild-type and mutant HLDs confirmed the anticipated importance of the active site cavity and the main access tunnel. However, it also revealed that they are not the only factors influencing the substrate specificity of HLDs. The additional factors important for the substrate specificity

Synopsis of Results
45
of HLDs may include distribution of surface charges, protein solvation, protein dynamics and auxiliary access tunnels.
To facilitate the analysis of auxiliary tunnels, a new version of the CAVER software has been developed (Chapter 3). Similarly to its predecessor, CAVER 3.0 is an approximate method for a rapid geometry-based calculation of tunnels in protein structures. While the identification of the main tunnels usually does not represent a serious problem, analysis of the molecular dynamics simulations is often essential to assess the biological relevance of other calculated tunnels, possibly representing the auxiliary transport pathways. We therefore designed CAVER 3.0 specifically for the analysis of tunnels in the dynamical systems. We have implemented new algorithms for effective calculation and clustering of tunnels for this purpose. The CAVER 3.0 output provides all necessary information to analyze the time evolution of individual tunnels, including the scripts for opening of the results in structure visualization software, information about the tunnel characteristics, amino acid composition and tunnel profiles. To demonstrate the capabilities of CAVER 3.0, we used this tool to analyze tunnels in the molecular dynamics simulation of the DhaA enzyme. All previously proposed transport pathways of DhaA, including both the main and auxiliary tunnels, could be reliably identified by CAVER 3.0. We further showed that the analysis of the static structures may easily lead to overlooking of relevant auxiliary tunnels and/or identification of tunnels which relevancy is disputable. Additionally, a detailed investigation of the dynamics of the DhaA main tunnel suggested the second mechanism for its gating. Since the corresponding gate is opened in all three crystal structures of DhaA, this mechanism could not be identified without employing the analysis of the dynamical system.
The Chapter 1 and Chapter 2 as well as many other previous studies demonstrated significant effect of the active site cavity and access tunnels on catalytic properties of enzymes. The residues located in these regions represent common hot-spots for the protein engineering experiments. To facilitate the identification of such hot-spot positions, we have developed a web server HotSpot Wizard (Chapter 4). The common protein engineering strategy was in HotSpot Wizard extended by estimation of mutability of individual amino acid positions based on their evolutionary conservation. Several bioinformatics databases and tools have been integrated into HotSpot Wizard, including: (i) tools for identification of residues lining the active site cavity and access tunnels; (ii) databases providing information about the catalytic residues and residue annotations; and (iii) tools for identification of homologous sequences and estimation of evolutionary conservation of individual amino acid positions. The identified hot-spot positions are ordered by estimated mutability and accompanied by information about their conservation level, potential structural and functional importance, available mutagenesis data and existing sequence variants. Results are mapped on the structure and can be displayed in the web browser or downloaded to the local computer. To validate the implemented strategy, we further compared the hot-spot positions identified by HotSpot Wizard with mutations extracted from a database of mutants and the primary literature. This comparison confirmed that the mutagenesis targeting the hot spot positions leads to changes in catalytic properties of enzymes and provides significantly higher proportion of viable variants than the random mutagenesis.

Chapter 1
46

47
1
Phylogenetic analysis of
haloalkane dehalogenases
Eva Chovancová, Jan Kosinski,
Janusz M. Bujnicki and Jiří Damborský
Proteins 67: 305-316 (2007)

Chapter 1
48
Abstract
Haloalkane dehalogenases (HLDs) are enzymes that catalyze the cleavage of carbon–halogen bonds by a hydrolytic mechanism. Although comparative biochemical analyses have been published, no classification system has been proposed for HLDs, to date, that reconciles their phylogenetic and functional relationships. In the study presented here, we have analyzed all sequences and structures of genuine HLDs and their homologs detectable by database searches. Phylogenetic analyses revealed that the HLD family can be divided into three subfamilies denoted HLD-I, HLD-II, and HLD-III, of which HLD-I and HLD-III are predicted to be sister-groups. A mismatch between the HLD protein tree and the tree of species, as well as the presence of more than one HLD gene in a few genomes, suggest that horizontal gene transfers, and perhaps also multiple gene duplications and losses have been involved in the evolution of this family. Most of the biochemically characterized HLDs are found in the HLD-II subfamily. The dehalogenating activity of two members of the newly identified HLD-III subfamily has only recently been confirmed, in a study motivated by this phylogenetic analysis. A novel type of the catalytic pentad (Asp-His-Asp+Asn-Trp) was predicted for members of the HLD-III subfamily. Calculation of the evolutionary rates and lineage-specific innovations revealed a common conserved core as well as a set of residues that characterizes each HLD subfamily. The N-terminal part of the cap domain is one of the most variable regions within the whole family as well as within individual subfamilies, and serves as a preferential site for the location of relatively long insertions. The highest variability of discrete sites was observed among residues that are structural components of the access channels. Mutations at these sites modify the anatomy of the channels, which are important for the exchange of ligands between the buried active site and the bulk solvent, thus creating a structural basis for the molecular evolution of new substrate specificities. Our analysis sheds light on the evolutionary history of HLDs and provides a structural framework for designing enzymes with new specificities.
Introduction
Haloalkane dehalogenases (HLDs) are enzymes that catalyze the hydrolytic cleavage of carbon–halogen bonds, yielding a primary alcohol, a proton, and a halide (EC 3.8.1.5). To date, HLD activity has been experimentally confirmed in only about a dozen different proteins. HLDs have broad substrate specificities, which nevertheless differ between individual members of the family. These enzymes are able to convert a wide spectrum of substrates including halogenated alkanes, cycloalkanes, alkenes, ethers, alcohols, ketones, and cyclic dienes. Several HLDs have been shown to be involved in biodegradation pathways of important environmental pollutants [1–10]. Furthermore, these enzymes have also been found to be present in pathogenic bacteria [11,12] and rhizobial bacteria [13], where their function remains unknown.
Structurally HLDs belong to the α/β-hydrolase superfamily [14–17]. The three-dimensional structure of three HLDs has been solved, revealing two common domains: the α/β-hydrolase
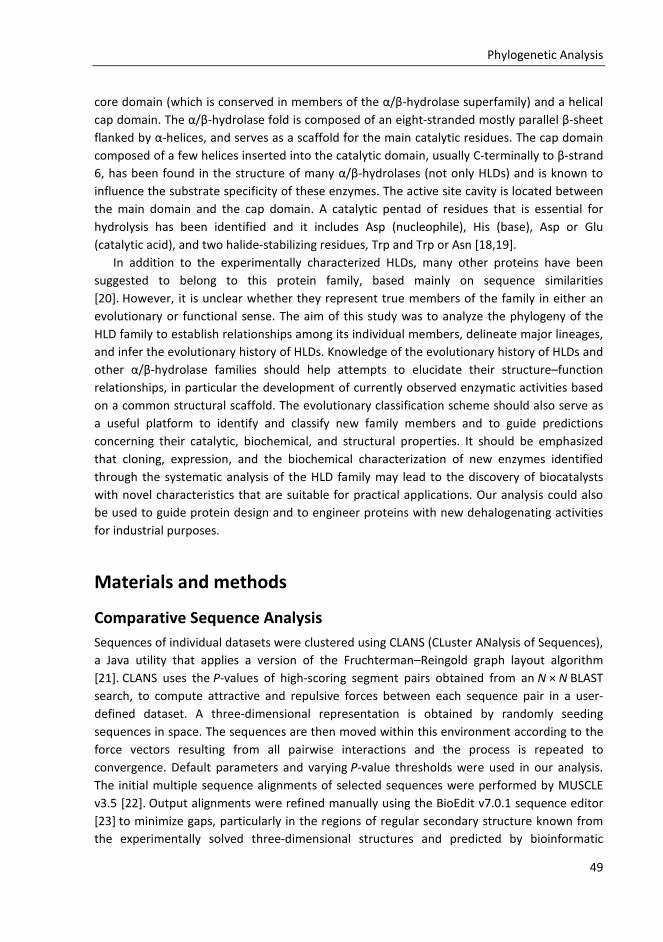
Phylogenetic Analysis
49
core domain (which is conserved in members of the α/β-hydrolase superfamily) and a helical cap domain. The α/β-hydrolase fold is composed of an eight-stranded mostly parallel β-sheet flanked by α-helices, and serves as a scaffold for the main catalytic residues. The cap domain composed of a few helices inserted into the catalytic domain, usually C-terminally to β-strand 6, has been found in the structure of many α/β-hydrolases (not only HLDs) and is known to influence the substrate specificity of these enzymes. The active site cavity is located between the main domain and the cap domain. A catalytic pentad of residues that is essential for hydrolysis has been identified and it includes Asp (nucleophile), His (base), Asp or Glu (catalytic acid), and two halide-stabilizing residues, Trp and Trp or Asn [18,19].
In addition to the experimentally characterized HLDs, many other proteins have been suggested to belong to this protein family, based mainly on sequence similarities [20]. However, it is unclear whether they represent true members of the family in either an evolutionary or functional sense. The aim of this study was to analyze the phylogeny of the HLD family to establish relationships among its individual members, delineate major lineages, and infer the evolutionary history of HLDs. Knowledge of the evolutionary history of HLDs and other α/β-hydrolase families should help attempts to elucidate their structure–function relationships, in particular the development of currently observed enzymatic activities based on a common structural scaffold. The evolutionary classification scheme should also serve as a useful platform to identify and classify new family members and to guide predictions concerning their catalytic, biochemical, and structural properties. It should be emphasized that cloning, expression, and the biochemical characterization of new enzymes identified through the systematic analysis of the HLD family may lead to the discovery of biocatalysts with novel characteristics that are suitable for practical applications. Our analysis could also be used to guide protein design and to engineer proteins with new dehalogenating activities for industrial purposes.
Materials and methods
Comparative Sequence Analysis
Sequences of individual datasets were clustered using CLANS (CLuster ANalysis of Sequences), a Java utility that applies a version of the Fruchterman–Reingold graph layout algorithm [21]. CLANS uses the P-values of high-scoring segment pairs obtained from an N × N BLAST search, to compute attractive and repulsive forces between each sequence pair in a user-defined dataset. A three-dimensional representation is obtained by randomly seeding sequences in space. The sequences are then moved within this environment according to the force vectors resulting from all pairwise interactions and the process is repeated to convergence. Default parameters and varying P-value thresholds were used in our analysis. The initial multiple sequence alignments of selected sequences were performed by MUSCLE v3.5 [22]. Output alignments were refined manually using the BioEdit v7.0.1 sequence editor [23] to minimize gaps, particularly in the regions of regular secondary structure known from the experimentally solved three-dimensional structures and predicted by bioinformatic

Chapter 1
50
methods (see below). Partial or engineered sequences, sequences with incomplete catalytic triad, as well as poorly aligned regions of proteins lacking sufficient conservation, were excluded from further analyses.
Phylogenetic Analysis
Multiple sequence alignments were used for the selection of suitable evolutionary models and parameters by PROTTEST [24] and then for phylogenetic reconstructions by the maximum likelihood (ML) and neighbor-joining (NJ) methods. The ML analysis was performed by PHYML [25] using the WAG model of amino acid substitution [26] and was based on the preliminary NJ tree generated by BIONJ [27]. Distance matrices for the NJ inferences [28] were generated by the MLDIST program of the VANILLA v1.2 package [29] according to the WAG model. Confidence levels of output trees were estimated by bootstrapping the data 1000 times. The resulting phylogenetic trees were rooted either by introducing outgroup sequences or by midpoint rooting. In the case of the whole HLD family, three different outgroups identified by cluster analysis were used, and thus phylogenetic trees were calculated for three different datasets. Each dataset included HLD sequences and sequences from one of the outgroups. Four-cluster likelihood mapping analysis [30] implemented in the TREE-PUZZLE v5.2 package [31] and four-cluster analysis [32] by the PHYLTEST program [33] were used to test the tree topologies obtained from the phylogenetic analyses.
Analysis of Residue Conservation
Multiple sequence alignment was used to estimate the level of conservation of individual sites in HLDs. Normalized evolutionary rates for each amino acid site of the alignment were calculated by the CONSURF 3.0 server [34] according to the WAG model of evolution [26]. The evolutionary rates were further used to identify regions with significantly higher or lower level of conservation. For this purpose, a statistical test was performed by a simulation in which the mean conservation of each defined region of the sequence was compared with the mean conservation of 10,000,000 different randomly generated sets of residues of the same size. Regions ranging in size from 2 to 9 residues were analyzed. Two null hypotheses were tested for each such region: the mean evolutionary rate of the analyzed region consisting of n
residues is either not higher (first hypothesis) or not lower (second hypothesis) than the mean evolutionary rate of the random set of n residues drawn without replacement from the set of all residues. Subsequently, for each region, a P-value expressing the support for the null hypothesis was calculated from the equation: P = tc/t, where tc indicates the number of times that the mean evolutionary rate of the analyzed region was not higher (or not lower) than the mean of the random set, and t indicates the total number of iterations (here 10,000,000). An arbitrary selected cut-off of 5% was used. If the P-value was lower, the null hypothesis was rejected and the given region was regarded as significantly less (or more) conserved than could be expected by chance. Regions of different lengths were analyzed and a majority consensus was mapped onto the protein surface. These analyses were performed both for the entire HLD family and, separately, for each subfamily.

Phylogenetic Analysis
51
Homology Modeling
Secondary structure prediction and tertiary fold-recognition was carried out via the GeneSilico meta-server gateway [35]. Secondary structure was predicted using PSIPRED [36], PROFsec [37], PROF [38], SABLE [39], JNET [40], JUFO [41], and SAM-T02 [42]. Solvent accessibility for individual residues was predicted with SABLE [39] and JPRED [43]. Fold-recognition analysis (alignment of the query sequence to known protein structures) was carried out using FFAS03 [44], SAM-T02 [42], 3DPSSM [45], BIOINBGU [46], FUGUE [47], mGenTHREADER [48], and SPARKS [49]. The fold-recognition alignments reported by these methods were compared, evaluated, and ranked by the Pcons server [50]. Accordingly, fold-recognition alignments to the structures of highly scored templates were used as starting points for homology modeling using the FRankenstein's monster approach [51], as described previously [52]. The first set of models were built with MODELLER [53], based on unrefined FR alignments. The quality of local structure in these preliminary models was assessed by VERIFY3D [54] via the COLORADO3D server [55]. All these models were superimposed and a hybrid model was constructed from fragments conserved in more than 50% of models, while the nonconsensus regions were built from fragments with the highest local VERIFY3D scores. The hybrid model was not refined directly, but superimposed onto the template structures to recreate the sequence alignment, which was then used to build a new model. This new model was re-evaluated using VERIFY3D to identify segments of secondary structure with poor scores (segments that exhibited consensus in the first step or good scores in the second step were not modified in subsequent steps). For each of the nonconsensus and poorly scored regions, a number of alternative models were built by locally shifting target-template alignments. The models were evaluated again and the best scoring segments were recombined and then the whole procedure of structural recombination, regeneration, and modification of alignments, model building, and evaluation was iterated until the score could not be significantly improved.
Results
Sequence Database Searches and Clustering of α/β-Hydrolases and
Haloalkane Dehalogenases
Sequences of α/β-hydrolases for which experimentally solved three-dimensional structures are available were obtained from SCOP [56]. In addition, 14 putative α/β-hydrolases were identified by DALI [57] and Fatcat [58] searches of the protein data bank (PDB) [59] and added to the dataset. Redundant sequences were discarded and the final dataset included 115 sequences of α/β-hydrolases with known three-dimensional structure (Supplementary Table S1). Sequences of this dataset were clustered using CLANS to identify α/β-hydrolase families that are closely related to HLDs and to separate them confidently from other α/β-hydrolases (data not shown). The sequences of HLDs and their closest homologs with a known structure were used as queries (Supplementary Table S1) for the PSI-BLAST searches [60] of the nr

Chapter 1
52
database run until convergence with an e-value threshold of 10−10, to identify all members with no known structure. Sequences with more than 90% identity were removed using the ExPASy tool for decreasing redundancy (http://www.expasy.org/tools/redundancy/), yielding a final set of 3442 proteins.
Cluster analysis of the 3442 sequences of α/β-hydrolases with sequence similarity to HLDs was carried out with CLANS using the stringent P-value threshold of 10−25. This revealed the subdivision of this set into several clusters. Haloalkane dehalogenases were localized toward the edge of the largest cluster composed of over 1300 sequences. Biochemically characterized proteins of this cluster include HLDs, various carboxylic ester hydrolases [carboxylesterases, arylesterases, methylesterases, lipases, enol-lactone hydrolases, dihydrocoumarin hydrolases, poly(3-hydroxyalkanoate) depolymerases], fluoroacetate dehalogenases, cytosolic epoxide hydrolases, luciferases, perhydrolases, and carbon–carbon bond hydrolases (see Figure 1). Inter-relationships among all sequences within this cluster were investigated by varying the P-value threshold for “attraction” between individual sequences. The final set, considered hereafter as the HLD family, comprised 44 sequences. Three clusters were finally identified as being the most closely related to HLDs: two families currently lacking experimentally characterized proteins (outgroup-I and outgroup-II) and the family of cytosolic epoxide hydrolases and fluoroacetate dehalogenases (outgroup-III). These three families were later used as alternative outgroups for rooting the phylogenetic tree of the HLD family.
Figure 1 Cluster analysis of a subset of sequences obtained from PSI-BLAST searches, performed at a cutoff P-value of 1e-25. Biochemically characterized proteins are colored: haloalkane dehalogenases (HLDs) in red, cytosolic epoxide hydrolases in orange, fluoroacetate dehalogenases in yellow, perhydrolases in violet, carbon carbon bond hydrolases in green and carboxylic ester hydrolases in blue. Sequences of outgroup I (OUT-I), outgroup II (OUT-II) and outgroup III (OUT-III) were used for rooting haloalkane dehalogenase phylogenetic trees.

Phylogenetic Analysis
53
Phylogenetic Analysis of Haloalkane Dehalogenases
The phylogenetic trees of HLDs were inferred from the maximum likelihood and neighbor-joining analyses (see Materials and Methods section for details). The topology of the trees agreed with the results of clustering, implying that the HLD family should be subdivided into three main subfamilies, termed as HLD-I, HLD-II, and HLD-III. In analyses employing three different outgroups, the root of the tree was placed within the branch connecting the HLD-II subfamily with the rest of the family (see Figure 2). Similar results were obtained by midpoint-rooting of the tree. Four-cluster likelihood mapping employing HLD-I, HLD-II, and HLD-III and either of the outgroup families provided further support for this scenario and revealed preferential grouping of the HLD-I and HLD-III subfamilies. The branching pattern of HLD-II and HLD-III grouped together against HLD-I obtained only low support. However, it was not possible to completely rule out a third hypothesis suggesting a sister-group relationship between the HLD-I and HLD-II subfamilies. The results of four-cluster analysis agreed with the four-cluster likelihood mapping in that the topologies corresponding to sister-group relationships of HLD-I with HLD-III, or HLD-I with HLD-II, were not significantly different. Thus, both alternative positions of the root are indicated in the phylogenetic tree of HLDs (see Figure 3).
Figure 2 Results of the outgroup analysis represented by schema of HLD phylogenetic trees indicating inter-relationships among individual HLD subfamilies (HLD-I, HLD-II, and HLD-III). Outgroup analysis was performed using three alternative outgroups (OUT-I, OUT-II, and OUT-III) and phylogenetic trees were calculated by neighbor-joining (A) and maximum-likelihood (B) methods. Numbers above branches indicate bootstrap support values for given sister-group relationships.

Chapter 1
54
Figure 3 Phylogenetic tree of haloalkane dehalogenases calculated by the maximum likelihood method. Bootstrap support values obtained from both neighbor-joining and maximum likelihood reconstructions are depicted above branches. Values that were not higher than 50% for any of the methods used are not shown. The tree is rooted based on the results of outgroup analysis and its probable root is indicated by the solid arrow. An alternative root position is indicated by the dotted arrow. The subdivision of the haloalkane dehalogenase family into three subfamilies (HLD-I, HLD-II, and HLD-III) is indicated.

Phylogenetic Analysis
55
All three subfamilies include experimentally characterized HLDs. The HLD-I subfamily segregates into two subgroups. This subdivision is also apparent from the sequence alignment (Supplementary Figure S1). Subgroup IA includes the experimentally confirmed haloalkane dehalogenase, DhlA, from Xanthobacter autotrophicus [1], while subgroup IB is represented by the mycobacterial dehalogenases DmbB from Mycobacterium bovis and M. tuberculosis [12] and DhmA from M. avium [20]. The HLD-II subfamily includes the following experimentally characterized haloalkane dehalogenases: LinB from Sphingobium japonicum [61], DmbA from M. bovis and M. tuberculosis [12], DmsA from M. smegmatis (unpublished data), DhaA from Rhodococcus sp. [7], DatA from Agrobacterium tumefaciens (Nagata, personal communication), DbjA from Bradyrhizobium japonicum [13], DmlA from Mesorhizobium loti [13], and surprisingly, an enzyme with luciferase activity. Luciferase from the sea pansy, Renilla reniformis [62], clearly falls into a well-defined cluster together with LinB, DmbA, DmsA, a protein from an environmental sample, and proteins from the purple sea urchin, Strongylocentrotus purpuratus. The HLD-III subfamily currently includes two proteins that have been empirically shown to possess low dehalogenating activity, i.e., DmbC from M. bovis and M. tuberculosis, and DrbA from Rhodopirellula baltica (unpublished data). We note that the HLD-III subfamily is not as well-defined as HLD-I and HLD-II. This is primarily due to the uncertain position of DmbC and three putative proteins from Jannaschia sp., Nocardia farcinica, and Burkholderia cenocepacia within the tree of HLDs. In most of the trees, these proteins group together with the HLD-III subfamily. However, this grouping had relatively low statistical support. Also, the sequence alignment in certain regions indicates significant differences between these proteins and other members of the HLD-III subfamily. The characteristics of all three subfamilies are summarized in Table 1.
Sequence and Structure Comparisons
Three available experimental structures of HLDs were compared; those of DhlA (PDB-ID 1EDE [63]), DhaA (PDB-ID 1BN6 [64]), and LinB (PDB-ID 1IZ7 [65]). HLD-I and HLD-II subfamilies differ mainly in the cap domain. The second helix in the cap domain (α5′), which is common to HLD-II subfamily members (Figure 4A,B) and can also be predicted for HLD-III members, is not present in the structure of the HLD-I protein DhlA (Figure 4C). Moreover, the spatial arrangement of helices α4 and α5 is different in the cap domains of DhlA and HLD-II enzymes. In addition, enzymes from different HLD subfamilies exhibit structural divergence in the loop regions that connect the cap to the main domain, and in the C-terminal part of the main domain. Analysis of the multiple sequence alignment also reveals differences within subfamilies. For example, DbjA exhibits an 11 residue-long insertion in the N-terminus of the cap domain that is not present in other proteins from the HLD-II subfamily. In the sequence of DhlA, a long insertion of 10 amino acids is situated in an analogous region. Furthermore, two very long insertions, of 34 and 24 residues, are present in the sequence of a HLD-I subfamily member, uncbac-67906508, obtained from an environmental sample. The former is localized in the N-terminus of the cap domain, while the latter follows helix α5.

Table 1 List of experimentally characterized haloalkane dehalogenases
Subfamily Protein Organism GI number Substrates Catal. pentad Reference
HLD-I
DhlA Xanthobacter autotrophicus 442872 Small, terminally halogenated
Asp-His-Asp Trp -Trp
[1] DhmA Mycobacterium avium 41408155
[12] DmbB Mycobacterium tuberculosis 15609433
[12]
HLD-II
LinB Sphingobium japonicum 4521186 Larger, β-substituted
Asp-His-Glu Asn-Trp
[61] DmbA Mycobacterium tuberculosis 13882401 [12] DmsA Mycobacterium smegmatis 16508080 UD
DhaA Rhodococcus sp. 7245711 [7]
DbjA Bradyrhizobium japonicum 27349338
[13] DmlA Mesorhizobium loti 13474464 [13]
DatA Agrobacterium tumefaciens 16119878 PC
HLD-III DrbA Rhodopirellula baltica 32476333
Unknown Asp-His-Asp Asn-Trp UD
DmbC Mycobacterium tuberculosis 15608970 UD
UD, unpublished data; PC, Y. Nagata, personal communication.
ClCl
ClCl
Br
Br
Cl
ClO
Cl
ClCl
Br
BrBr
OH
Br
O
Cl

Phylogenetic Analysis
57
Figure 4 Structures of three haloalkane dehalogenases determined by protein crystallography. DhaA (A) and LinB (B) proteins are representatives of subfamily HLD-II, whereas DhlA (C) belongs to the subfamily HLD-I. The main structural differences discussed in this paper are highlighted, namely, helix α5′ lost in HLD-I, the differently arranged helices α4 and α5 and the connections of the main and cap domains.
Different compositions of the catalytic pentad were identified for each of the HLD
subfamilies (see Figure 5). However, three residues of the pentad are identical in all subfamilies and thus would be expected to fulfill identical functions, allowing us to extrapolate our knowledge of the catalytic mechanism to the HLD-III subfamily; i.e. nucleophile—Asp (D108 of LinB), catalytic base—His (H272 of LinB), and one of the halide stabilizing residues—Trp (W109 of LinB). HLDs possess two types of catalytic acid, Asp and Glu [18]. In the HLD-I subfamily, the catalytic acid, Asp, is located in the loop following β-strand 7 (D260 of DhlA), whereas HLD-II subfamily members contain a Glu in the loop following β-strand 6 (E132 of LinB). Based on the sequence alignment, the Asp corresponding to the catalytic acid of the HLD-I subfamily was identified and predicted to fulfill this function in the HLD-III subfamily. Similarly, HLDs differ both in the type and location of one halide-stabilizing residue [18]. HLD-I members employ Trp (W175 of DhlA) located in helix α4, whereas HLD-II members use Asn (N38 of LinB) located in the loop following β-strand 3. In the sequences of all HLD-III subfamily members, we also found Asn in the position corresponding to the HLD-II-like halide-stabilizing Asn. Moreover, in some HLD-III members, we found a Trp residue corresponding to the halide-stabilizing amino acid in HLD-I members.
The conservation profile in Figure 6A shows that the α/β core is the most conserved region of the HLDs, and surface residues are the least conserved. Regions having the highest sequence variability were found in the N-terminal part of the cap domain and in all three helices within the C-terminal region of the main domain (Figure 6B). Nine residues are fully conserved in all analyzed sequences. The catalytic base (H272 of LinB) and the catalytic nucleophile (D108 of LinB), a Gly that participates in stabilizing the catalytic water (G37 of LinB) and a His located N-terminally to this residue (H36 of LinB). Four conserved residues are located within a highly conserved loop following β-strand 4: (G65, G67, D62, and S69 of LinB). The last fully conserved residue is a nucleophile +2 Gly (G110 of LinB). Some of the most variable positions include three sites within the N-terminal main domain (A5, G54, and G99 of

Chapter 1
58
LinB), five cap domain sites (F143, Q146, E161, Q172, and E184 of LinB), two sites located in helix α8 (D226 and S232 of LinB), two in helix α9 (R254 and D255 of LinB), and finally eight positions within the C-terminal domain (A285, A288, and R291-A296 of LinB) (Figure 6C). Identical analyses of conservation were performed for each subfamily (Figure 6D).
Figure 5 The topological arrangement of secondary structure elements in individual haloalkane dehalogenase subfamilies (HLD-I, HLD-II, and HLD-III). Positions of catalytic pentad residues are indicated by symbols. Nucleophile, catalytic base, and one halide-stabilizing residue are conserved among all subfamilies (gray), whereas the catalytic acid and second halide-stabilizing residue differ among subfamilies (black).

Phylogenetic Analysis
59
Figure 6 Conservation profiles of the haloalkane dehalogenase family. Highly conserved regions are colored in blue, highly variable in red. The LinB structure was used as a representative of the entire family (A–C). (A) Conservation was assigned by the CONSURF server. (B) Regions of the highest conservation and the highest variability in haloalkane dehalogenase sequences as indicated by the statistical test. (C) The twenty most conserved and the most variable sites within haloalkane dehalogenase family. (D) Conservation profiles of individual haloalkane dehalogenase subfamilies (HLD-I, HLD-II, and HLD-III). Experimentally determined structures of DhlA, LinB, and a homology model of DrbA enzymes were used as representatives of subfamilies, HLD-I, HLD-II, and HLD-III, respectively.
Discussion
There are currently a dozen known members of the HLD family with experimentally confirmed dehalogenase activity. Traditionally, HLDs were classified according to their substrate specificity [66]. At least four different classes of HLDs have been proposed, namely DhlA, LinB, and DhaA enzymes [18,67] and, more recently, the DbjA enzyme [13]. However, such classification is problematic due to insufficient biochemical characterization of the majority of

Chapter 1
60
HLDs. Therefore, we decided to adopt a phylogenetic approach to assess relationships within the HLD family and to establish an objective classification of these enzymes.
To find the root of a HLD phylogenetic tree and establish the direction of evolutionary changes, it was first necessary to find sequences closely related to HLDs that could be used as an outgroup. We clustered HLDs and their homologs using the criterion of pairwise sequence similarity to delineate the “core” HLD family as well as the most closely related, but clearly distinct, protein families. Of the three such families we identified, only one includes experimentally characterized proteins, the epoxide hydrolases and fluoroacetate dehalogenases, while the other two comprise only uncharacterized proteins. This distribution of proteins in the sequence space provides support for the hypothesis that HLDs, together with epoxide hydrolase and fluoroacetate dehalogenase families, have a common ancestor that diverged from other α/β-hydrolases. Not only do these enzymes share significant structural similarities, but of all 363 experimentally characterized α/β-hydrolases included in this study, only these possess Asp as the catalytic nucleophile, suggesting that this residue is the synapomorphy of the haloalkane dehalogenase/epoxide hydrolase/fluoroacetate dehalogenase clade.
Both outgroup-I and outgroup-II only include putative proteins identified in genome sequencing projects. While for outgroup-I the catalytic triad is preserved and consequently these proteins could potentially serve as hydrolases, the catalytic nucleophile is replaced by Gly in all members of outgroup-II. A homology model was constructed for a representative member of this group to identify whether another residue could potentially compensate for this change. However, the candidate residues Asp/Ser/Cys were not found in a suitable position in the presumptive active site. Sequence conservation within outgroup-II, as well as between this group and other sequences in our dataset, suggests that these proteins are not degenerate and do exhibit a conserved ligand-binding and perhaps catalytic activity. However, they either catalyze a reaction other than hydrolysis or they employ a completely different reaction mechanism. It is also possible that they may serve as receptors or transporters.
Based on our phylogenetic analyses, we propose that the HLD family should be divided into three subfamilies. Previous classifications based on substrate specificities suggested at least four classes. However, three of these former classes (DhaA, LinB, and DbjA) belong to the same subfamily delineated in this work (HLD-II). The other previous specificity class (DhlA) falls within part of the HLD-I subfamily. DhlA has very different substrate specificity from HLD-II proteins, being active with smaller substrates (Table 1). The proposed HLD-III subfamily was not included in previous classifications as no experimentally characterized protein was available for this subfamily. However, experiments ongoing in our laboratory have confirmed that the DrbA and DmbC enzymes have weak dehalogenating activity (unpublished data). Differences in substrate specificity of HLDs are attributed to differences in composition, geometry and size of the active site, the halide-stabilizing residues, and in the entrance channels connecting the active site with the protein surface [65].
Crystal structures are available for DhlA [63] from the HLD-I subfamily, and for DhaA [64] and LinB [65] from the HLD-II subfamily. There is currently no structure available for the

Phylogenetic Analysis
61
HLD-III subfamily, however, some information about the composition of these proteins can be deduced from the sequence alignment and homology models. Similarly to HLD-II members, the presence of the α5′ helix in the cap domain was predicted for the HLD-III subfamily. Both alternative positions of the root in the phylogenetic tree of HLDs support the presence of α5′ helix in the ancestor of HLDs (Figure 7A). We therefore propose that the HLD-I subfamily has lost the α5′ helix, rather than that both the HLD-II and HLD-III subfamilies independently acquired it. The different spatial arrangement and high sequence divergence of helices α4 and α5 in HLD subfamilies may be a consequence of the α5′ helix loss. The helix loss hypothesis is further supported by the composition of the cap domain of epoxide hydrolases, the closest relatives of HLDs with a known structure in which the helix is also present. Based on the alignment, the presence of the α5′ helix is also suggested for two experimentally uncharacterized outgroups, providing further support for the presence of this helix in the ancestor of HLDs. The cap domain and a uteroglobin-like structure composed of four helices have been previously proposed to have a common origin [68, 69].
Figure 7 Evolution of the cap domain (A) and the catalytic pentad (B) within the haloalkane dehalogenase family. The tree is rooted based on the results of outgroup analysis and its probable root is indicated by the solid arrow. An alternative root position is indicated by the dotted arrow. The region of helix α5′ lost in the HLD-I subfamily is highlighted. The catalytic pentad is composed of the catalytic triad of a nucleophile-base-catalytic acid and a pair of halide-stabilizing residues. The nucleophile, catalytic base and one halide-stabilizing residue are conserved among all subfamilies (gray), whereas the catalytic acid and second halide-stabilizing residue differ among subfamilies (black).
To date, two different catalytic pentads have been proposed for haloalkane
dehalogenases [18]: Asp-His-Asp+Trp-Trp for the HLD-I subfamily and Asp-His-Glu+Asn-Trp for the HLD-II subfamily. In this study, we have identified a new subfamily of HLDs with a novel catalytic pentad composed of Asp-His-Asp+Asn-Trp (Figure 7B). Other authors have hypothesized that repositioning of a catalytic acid from β-strand 6 (Glu of HLD-II) to the β-strand 7 (Asp of HLD-I) occurred during the molecular adaptation of HLDs to the substrate 1,2-dichloroethane [70]. For HLD-III, we have found Asp in a position corresponding to that in

Chapter 1
62
HLD-I, but Glu, characteristic of HLD-II, was not present. It appears that the repositioning of a catalytic acid occurred just after the evolutionary separation of the HLD-II subfamily from the ancestor of HLD-I and HLD-III. It therefore seems unlikely that repositioning of the catalytic acid has been an adaptation to dehalogenation of 1,2-dichloroethane, which was unknown in nature until the industrial revolution and the repositioning must have occurred much earlier. Moreover, members of outgroup-I, outgroup-II, and some proteins of outgroup-III also contain a catalytic acid identical to that of HLD-I and HLD-III. This suggests that the ancestor of HLDs probably had a catalytic acid in the position following β-strand 7. All members of the HLD-III subfamily contain Asn in their sequence at the site corresponding to the halide-stabilizing Asn of HLD-II. Moreover, some proteins of this subfamily also have a Trp corresponding to the halide-stabilizing Trp present in the HLD-I subfamily. However, the spatial location of this residue is different from that seen in HLD-I members due to the presence of the α5′ helix in the HLD-III cap domain. Therefore, it is probably not correctly oriented to fulfill a halide-stabilization function in this subfamily. Also, the functionality of the Trp could be dependent on the loss of the α5′ helix within the cap domain of the HLD-I subfamily, leading to repositioning of its side-chain in space.
To assess the importance of individual amino acid residues within the HLD family as a whole, we analyzed sequence conservation by calculating their respective evolutionary rates. High conservation of a particular site usually indicates its importance for maintaining structural or functional properties of the protein. As expected, both β-strands in the protein core and the loops carrying catalytic residues are highly conserved among HLDs. In addition to the catalytic loops, a loop following β-strand 4 was also found to be strongly conserved, but the reason for this remains unclear. The precise determination of highly variable sites was complicated by ambiguities in the alignment of variable regions. Nevertheless, it is important to delineate variable residues in the region involved in substrate binding, since high mutability may also be a result of selection pressure on variants with potentially new substrate specificities. Such variable positions are particularly suitable targets for protein engineering by site-directed mutagenesis. In HLDs, three highly variable sites, corresponding to F143, Q146, and Q172 of LinB, form the walls of the access channels. It has been shown that replacement of channel residues can effectively change the size of the channel and substrate specificity of the haloalkane dehalogenase from S. japonicum UT26 [71]. Sites corresponding to R254 and D255 of LinB are located on the protein surface close to the entrance of the channel. We speculate that the high variability of these five positions reflects the adaptation of HLDs to different substrates by modifying the channel size, shape, and location.
In addition to the variability of individual residues, we also considered the variability of entire protein segments. The N-terminal part of the cap domain and all three helices in the C-terminus of the main domain were found to be among the most variable parts of HLDs. The high variability of the last C-terminal helix is not surprising as it is located at the very end of the sequence, which is not involved in functionally important interactions, and its conservation is, therefore, not essential. The other two C-terminal helices participate in the formation of the surface close to the entrance to the channel leading to the active site. However, it is unclear whether they participate in substrate binding or if their variability is in
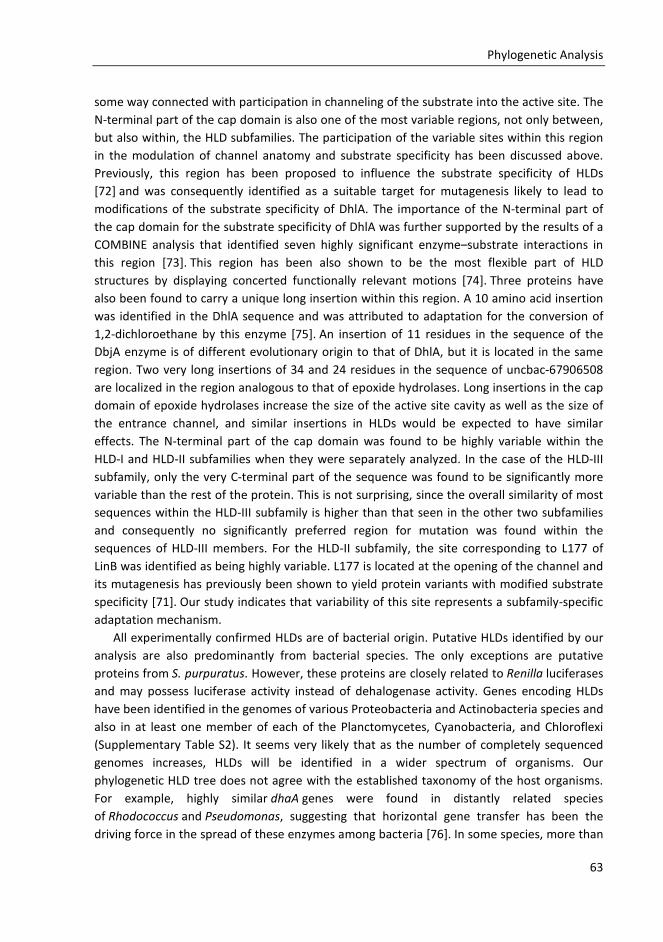
Phylogenetic Analysis
63
some way connected with participation in channeling of the substrate into the active site. The N-terminal part of the cap domain is also one of the most variable regions, not only between, but also within, the HLD subfamilies. The participation of the variable sites within this region in the modulation of channel anatomy and substrate specificity has been discussed above. Previously, this region has been proposed to influence the substrate specificity of HLDs [72] and was consequently identified as a suitable target for mutagenesis likely to lead to modifications of the substrate specificity of DhlA. The importance of the N-terminal part of the cap domain for the substrate specificity of DhlA was further supported by the results of a COMBINE analysis that identified seven highly significant enzyme–substrate interactions in this region [73]. This region has been also shown to be the most flexible part of HLD structures by displaying concerted functionally relevant motions [74]. Three proteins have also been found to carry a unique long insertion within this region. A 10 amino acid insertion was identified in the DhlA sequence and was attributed to adaptation for the conversion of 1,2-dichloroethane by this enzyme [75]. An insertion of 11 residues in the sequence of the DbjA enzyme is of different evolutionary origin to that of DhlA, but it is located in the same region. Two very long insertions of 34 and 24 residues in the sequence of uncbac-67906508 are localized in the region analogous to that of epoxide hydrolases. Long insertions in the cap domain of epoxide hydrolases increase the size of the active site cavity as well as the size of the entrance channel, and similar insertions in HLDs would be expected to have similar effects. The N-terminal part of the cap domain was found to be highly variable within the HLD-I and HLD-II subfamilies when they were separately analyzed. In the case of the HLD-III subfamily, only the very C-terminal part of the sequence was found to be significantly more variable than the rest of the protein. This is not surprising, since the overall similarity of most sequences within the HLD-III subfamily is higher than that seen in the other two subfamilies and consequently no significantly preferred region for mutation was found within the sequences of HLD-III members. For the HLD-II subfamily, the site corresponding to L177 of LinB was identified as being highly variable. L177 is located at the opening of the channel and its mutagenesis has previously been shown to yield protein variants with modified substrate specificity [71]. Our study indicates that variability of this site represents a subfamily-specific adaptation mechanism.
All experimentally confirmed HLDs are of bacterial origin. Putative HLDs identified by our analysis are also predominantly from bacterial species. The only exceptions are putative proteins from S. purpuratus. However, these proteins are closely related to Renilla luciferases and may possess luciferase activity instead of dehalogenase activity. Genes encoding HLDs have been identified in the genomes of various Proteobacteria and Actinobacteria species and also in at least one member of each of the Planctomycetes, Cyanobacteria, and Chloroflexi (Supplementary Table S2). It seems very likely that as the number of completely sequenced genomes increases, HLDs will be identified in a wider spectrum of organisms. Our phylogenetic HLD tree does not agree with the established taxonomy of the host organisms. For example, highly similar dhaA genes were found in distantly related species of Rhodococcus and Pseudomonas, suggesting that horizontal gene transfer has been the driving force in the spread of these enzymes among bacteria [76]. In some species, more than

Chapter 1
64
one putative dehalogenase gene was identified. For example, Shewanella frigidimarina carries two putative HLD genes belonging to the HLD-I subfamily that exhibit 77% sequence identity, indicating that some divergence has already occurred since duplication. This suggests that paralogization, potentially followed by subfunctionalization and adaptation to different substrates, have also played roles in the evolution of HLDs. Interestingly, S. frigidimarina also possesses an additional putative HLD of subfamily HLD-III. Jannaschia sp. possesses two putative HLD genes, each belonging to a different subfamily, HLD-II and HLD-III. M.
tuberculosis has even three different HLDs with confirmed dehalogenating activity, namely, DmbA, DmbB, and DmbC from subfamilies HLD-II, HLD-I, and HLD-III, respectively. Thus, the presence of multiple dehalogenases in several bacteria has probably arisen from a combination of duplications and independent horizontal gene transfers. It is important to note that the physiological function of HLDs in most of the bacteria analyzed in this work is not currently understood. This phylogenetic study should provide a useful framework for, and stimulate, both comparative biochemical analyses and further efforts to elucidate the function of HLDs in the natural environment of their hosts.
References
[1] S. Keuning, D. B. Janssen, B. Witholt, J Bacteriol 1985, 163, 635-639. [2] T. Yokota, T. Omori, T. Kodama, J Bacteriol 1987, 169, 4049-4054. [3] R. Scholtz, T. Leisinger, F. Suter, A. M. Cook, J Bacteriol 1987, 169, 5016-5021. [4] Y. Nagata, K. Miyauchi, J. Damborsky, K. Manova, A. Ansorgova, M. Takagi, Appl
Environ Microbiol 1997, 63, 3707-3710. [5] D. B. Janssen, J. Gerritse, J. Brackman, C. Kalk, D. Jager, B. Witholt, Eur J
Biochem 1988, 171, 67-72. [6] P. J. Sallis, S. J. Armfield, A. T. Bull, D. J. Hardman, J Gen Microbiol 1990, 136, 115-
120. [7] A. N. Kulakova, M. J. Larkin, L. A. Kulakov, Microbiology 1997, 143, 109-115. [8] G. J. Poelarends, M. Wilkens, M. J. Larkin, Appl Environ Microbiol 1998, 64, 2931-
2936. [9] G. J. Poelarends, J Bacteriol 1999, 181, 2050-2058. [10] R. Kumari, S. Subudhi, M. Suar, G. Dhingra, V. Raina, C. Dogra, S. Lal, Appl Environ
Microbiol 2002, 68, 6021-6028. [11] A. Jesenska, I. Sedlacek, J. Damborsky, Appl Environ Microbiol 2000, 66, 219-222. [12] A. Jesenska, M. Pavlova, M. Strouhal, R. Chaloupkova, I. Tesinska, M. Monincova, Z.
Prokop, M. Bartos, I. Pavlik, I. Rychlik, P. Mobius, Y. Nagata, J. Damborsky, Appl
Environ Microbiol 2005, 71, 6736-6745. [13] Y. Sato, M. Monincova, R. Chaloupkova, Z. Prokop, Y. Ohtsubo, K. Minamisawa, M.
Tsuda, J. Damborsky, Y. Nagata, Appl Environ Microbiol 2005, 71, 4372-4379. [14] T. D. H. Bugg, Bioorg Chem 2004, 32, 367-375. [15] M. Holmquist, Curr Protein Pept Sci 2000, 1, 209-235.

Phylogenetic Analysis
65
[16] M. Nardini, B. W. Dijkstra, Curr Opin Struct Biol 1999, 9, 732-737. [17] D. L. Ollis, E. Cheah, M. Cygler, B. Dijkstra, F. Frolow, S. M. Franken, M. Harel, S. J.
Remington, I. Silman, J. Schrag, J. L. Sussman, K. H. G. Verschueren, A. Goldman, Protein Eng Des Sel 1992, 5, 197-211.
[18] J. Damborsky, J. Koca, Protein Eng Des Sel 1999, 12, 989-998. [19] D. B. Janssen, Curr Opin Chem Biol 2004, 8, 150-159. [20] A. Jesenska, M. Bartos, V. Czernekova, I. Rychlik, I. Pavlik, J. Damborsky, Appl Environ
Microbiol 2002, 68, 3724-3730. [21] T. Frickey, A. Lupas, Bioinformatics 2004, 20, 3702-3704. [22] R. C. Edgar, Nucleic Acids Res 2004, 32, 1792-1797. [23] T. A. Hall, Nucleic Acids Symp Ser 1999, 41, 95-98. [24] F. Abascal, R. Zardoya, D. Posada, Bioinformatics 2005, 21, 2104-2105. [25] S. Guindon, O. Gascuel, Syst Biol 2003, 52, 696-704. [26] S. Whelan, N. Goldman, Mol Biol Evol 2001, 18, 691-699. [27] O. Gascuel, Mol Biol Evol 1997, 14, 685-695. [28] N. Saitou, M. Nei, Mol Biol Evol 1987, 4, 406-425. [29] A. Drummond, K. Strimmer, Bioinformatics 2001, 17, 662-663. [30] K. Strimmer, Proc Natl Acad Sci USA 1997, 94, 6815-6819. [31] H. A. Schmidt, K. Strimmer, M. Vingron, Bioinformatics 2002, 18, 502-504. [32] A. Rzhetsky, S. Kumar, M. Nei, Mol Biol Evol 1995, 12, 163-167. [33] S. Kumar, PHYLTEST: a program for testing phylogenetic hypotheses, Version 2.0.
University Park, PA: Pennsylvania State University, 1996. [34] M. Landau, I. Mayrose, Y. Rosenberg, F. Glaser, E. Martz, T. Pupko, Nucleic Acids
Res 2005, 33, W299-W302. [35] M. A. Kurowski, J. M. Bujnicki, Nucleic Acids Res 2003, 31, 3305-3307. [36] L. J. McGuffin, K. Bryson, D. T. Jones, Bioinformatics 2000, 16, 404-405. [37] B. Rost, G. Yachdav, J. F. Liu, Nucleic Acids Res 2004, 32, W321-W326. [38] M. Ouali, R. D. King, Protein Sci 2000, 9, 1162-1176. [39] R. Adamczak, A. Porollo, J. Meller, Proteins 2004, 56, 753-767. [40] J. A. Cuff, G. J. Barton, Proteins 2000, 40, 502-511. [41] J. Meiler, D. Baker, Proc Natl Acad Sci USA 2003, 100, 12105-12110. [42] K. Karplus, R. Karchin, J. Draper, J. Casper, Proteins 2003, 53, 491-496. [43] J. A. Cuff, M. E. Clamp, A. S. Siddiqui, M. Finlay, G. J. Barton, Bioinformatics 1998, 14,
892-893. [44] L. Jaroszewski, L. Rychlewski, A. Godzik, Protein Sci 2000, 9, 1487-1496. [45] L. A. Kelley, J Mol Biol 2000, 299, 499-520. [46] D. Fischer, Pac Symp Biocomput 2000, 119, 119-130. [47] J. Y. Shi, T. L. Blundell, K. Mizuguchi, J Mol Biol 2001, 310, 243-257. [48] D. T. Jones, J Mol Biol 1999, 287, 797-815. [49] H. Y. Zhou, Y. Q. Zhou, Proteins 2004, 55, 1005-1013. [50] J. Lundstrom, L. Rychlewski, J. Bujnicki, A. Elofsson, Protein Sci 2001, 10, 2354-2362.

Chapter 1
66
[51] J. Kosinski, I. A. Cymerman, M. Feder, M. A. Kurowski, J. M. Sasin, J. M. Bujnicki, Proteins 2003, 53, 369-379.
[52] M. Feder, J. M. Bujnicki, BMC Genomics 2005, 6, 21. [53] A. S. Fiser, A. Sali, Methods Enzymol 2003, 374, 461-491. [54] R. Luthy, J. U. Bowie, D. Eisenberg, Nature 1992, 356, 83-85. [55] J. M. Sasin, J. M. Bujnicki, Nucleic Acids Res 2004, 32, W586-W589. [56] A. G. Murzin, S. E. Brenner, T. Hubbard, C. Chothia, J Mol Biol 1995, 247, 536-540. [57] L. Holm, C. Sander, J Mol Biol 1993, 233, 123-138. [58] Y. Z. Ye, A. Godzik, Nucleic Acids Res 2004, 32, W582-W585. [59] H. M. Berman, J. Westbrook, Z. Feng, G. Gilliland, T. N. Bhat, H. Weissig, I. N.
Shindyalov, P. E. Bourne, Nucleic Acids Res 2000, 28, 235-242. [60] S. F. Altschul, T. L. Madden, Nucleic Acids Res 1997, 25, 3389-3402. [61] Y. Nagata, T. Nariya, R. Ohtomo, M. Fukuda, K. Yano, M. Takagi, J Bacteriol 1993, 175,
6403-6410. [62] W. W. Lorenz, R. O. McCann, M. Longiaru, M. J. Cormier, Proc Natl Acad Sci
USA 1991, 88, 4438-4442. [63] K. H. G. Verschueren, J. Kingma, H. J. Rozeboom, K. H. Kalk, D. B. Janssen, B. W.
Dijkstra, Biochemistry 1993, 32, 9031-9037. [64] J. Newman, T. S. Peat, R. Richard, L. Kan, P. E. Swanson, J. A. Affholter, I. H. Holmes, J.
F. Schindler, C. J. Unkefer, T. C. Terwilliger, Biochemistry 1999, 38, 16105-16114. [65] J. Marek, J. Vevodova, Biochemistry 2000, 39, 14082-14086. [66] J. Damborsky, M. G. Nyandoroh, M. Nemec, I. Holoubek, A. T. Bull, D. J. Hardman,
Biotechnol Appl Biochem 1997, 26, 19-25. [67] J. Damborsky, E. Rorije, A. Jesenska, Y. Nagata, G. Klopman, W. J. G. M. Peijnenburg,
Environ Toxicol Chem 2001, 20, 2681-2689. [68] I. Callebaut, A. Poupon, R. Bally, J. P. Demaret, D. Housset, J. Delettre, P. Hossenlopp,
J. P. Mornon, Ann N Y Acad Sci 2000, 923, 90-112. [69] R. B. Russell, M. J. E. Sternberg, Protein Eng Des Sel 1997, 10, 333-338. [70] G. H. Krooshof, E. M. Kwant, J. Damborsky, J. Koca, D. B. Janssen, Biochemistry 1997,
36, 9571-9580. [71] R. Chaloupkova, J. Sykorova, Z. Prokop, A. Jesenska, M. Monincova, M. Pavlova, M.
Tsuda, Y. Nagata, J. Damborsky, J Biol Chem 2003, 278, 52622-52628. [72] F. Pries, J Biol Chem 1994, 269, 17490-17494. [73] J. Kmunicek, S. Luengo, F. Gago, A. R. Ortiz, R. C. Wade, J. Damborsky, Biochemistry
2001, 40, 8905-8917. [74] M. Otyepka, J. Damborsky, Protein Sci 2002, 11, 1206-1217. [75] M. G. Pikkemaat, D. B. Janssen, Nucleic Acids Res 2002, 30, E35. [76] G. J. Poelarends, L. A. Kulakov, M. J. Larkin, J Bacteriol 2000, 182, 2191-2199.

67
1S
Phylogenetic analysis of
haloalkane dehalogenases
Supplementary information
Eva Chovancová, Jan Kosinski, Janusz M. Bujnicki and Jiří Damborský
Proteins 67: 305-316 (2007)
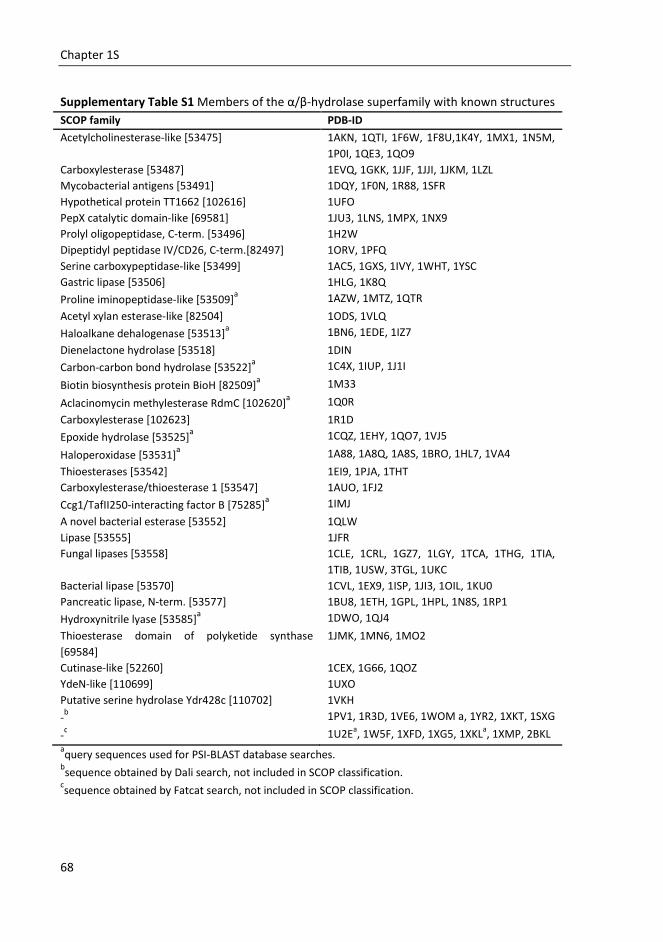
Chapter 1S
68
Supplementary Table S1 Members of the α/β-hydrolase superfamily with known structures SCOP family PDB-ID
Acetylcholinesterase-like [53475] 1AKN, 1QTI, 1F6W, 1F8U,1K4Y, 1MX1, 1N5M, 1P0I, 1QE3, 1QO9
Carboxylesterase [53487] 1EVQ, 1GKK, 1JJF, 1JJI, 1JKM, 1LZL Mycobacterial antigens [53491] 1DQY, 1F0N, 1R88, 1SFR Hypothetical protein TT1662 [102616] 1UFO PepX catalytic domain-like [69581] 1JU3, 1LNS, 1MPX, 1NX9 Prolyl oligopeptidase, C-term. [53496] 1H2W Dipeptidyl peptidase IV/CD26, C-term.[82497] 1ORV, 1PFQ Serine carboxypeptidase-like [53499] 1AC5, 1GXS, 1IVY, 1WHT, 1YSC Gastric lipase [53506] 1HLG, 1K8Q
Proline iminopeptidase-like [53509]a 1AZW, 1MTZ, 1QTR
Acetyl xylan esterase-like [82504] 1ODS, 1VLQ
Haloalkane dehalogenase [53513]a 1BN6, 1EDE, 1IZ7
Dienelactone hydrolase [53518] 1DIN
Carbon-carbon bond hydrolase [53522]a 1C4X, 1IUP, 1J1I
Biotin biosynthesis protein BioH [82509]a 1M33
Aclacinomycin methylesterase RdmC [102620]a 1Q0R
Carboxylesterase [102623] 1R1D
Epoxide hydrolase [53525]a 1CQZ, 1EHY, 1QO7, 1VJ5
Haloperoxidase [53531]a 1A88, 1A8Q, 1A8S, 1BRO, 1HL7, 1VA4
Thioesterases [53542] 1EI9, 1PJA, 1THT Carboxylesterase/thioesterase 1 [53547] 1AUO, 1FJ2
Ccg1/TafII250-interacting factor B [75285]a 1IMJ
A novel bacterial esterase [53552] 1QLW Lipase [53555] 1JFR Fungal lipases [53558] 1CLE, 1CRL, 1GZ7, 1LGY, 1TCA, 1THG, 1TIA,
1TIB, 1USW, 3TGL, 1UKC Bacterial lipase [53570] 1CVL, 1EX9, 1ISP, 1JI3, 1OIL, 1KU0 Pancreatic lipase, N-term. [53577] 1BU8, 1ETH, 1GPL, 1HPL, 1N8S, 1RP1
Hydroxynitrile lyase [53585]a 1DWO, 1QJ4
Thioesterase domain of polyketide synthase [69584]
1JMK, 1MN6, 1MO2
Cutinase-like [52260] 1CEX, 1G66, 1QOZ YdeN-like [110699] 1UXO Putative serine hydrolase Ydr428c [110702] 1VKH
-b 1PV1, 1R3D, 1VE6, 1WOM a, 1YR2, 1XKT, 1SXG
-c 1U2Ea, 1W5F, 1XFD, 1XG5, 1XKLa, 1XMP, 2BKL aquery sequences used for PSI-BLAST database searches.
bsequence obtained by Dali search, not included in SCOP classification. csequence obtained by Fatcat search, not included in SCOP classification.

Phylogenetic Analysis - Supplementary Information
69
Supplementary Table S2 List of haloalkane dehalogenase family members obtained by PSI-BLAST searches
Subfamily Organism Strain GI number Abbreviation
HLD-II
Mycobacterium smegmatis ATCC 700084 16508080 Mycsme-16508080 (DmsA) Mycobacterium tuberculosis CDC1551 13882401 Myctub-13882401 (DmbA) Mycobacterium tuberculosis H37Rv 57117001 -a Mycobacterium tuberculosis F11 76783587 -a Mycobacterium bovis 5033/66 50470553 -a Mycobacterium bovis MU11 50399582 -a Mycobacterium bovis AF2122/97 31619357 -a Sphingobium japonicum UT26 4521186 Sphjap-4521186 (LinB) Sphingobium indicum B90A 78499751 -a Sphingobium francense Sp+ 59799356 -a uncultured bacterium - 40062609 uncbac-40062609 Renilla reniformis - 84399 Renren-84399 (Luc) Renilla muelleri - 12621062 -a Strongylocentrotus purpuratus - 72160391 Strpur-72160391 Strongylocentrotus purpuratus - 72149468 Strpur-72149468 Strongylocentrotus purpuratus - 72149470 -a Strongylocentrotus purpuratus - 72067650 -a Streptomyces avermitilis MA-4680 29831322 Strave-29831322 Agrobacterium tumefaciens C58b 16119878 Agrtum-16119878 (DatA) Agrobacterium tumefaciens C58c 17939197 -a Mesorhizobium loti MAFF303099 13474464 Meslot-13474464 (DmlA) Bradyrhizobium japonicum USDA 110 27349338 Brajap-27349338 (DbjA) Rhodococcus sp. TDTM0003 7245711 Rhosp-7245711 (DhaA) Rhodococcus rhodochrous NCIMB 13064 61222634 -a Pseudomonas pavonaceae 170 6689030 -a Mycobacterium sp. GP1 28558101 -a Coxiella burnetii RSA 493 29654528 -d Jannaschia sp. CCS1 68181465 Jansp-68181465 Lyngbya majuscula 19L 50082962 Lynmaj-50082962
HLD-I
Erythrobacter litoralis HTCC2594 61101637 Erylit-61101637 Xanthobacter autotrophicus GJ10 442872 Xanaut-442872 (DhlA) Xanthobacter flavus UE15 6137395 -a Polaromonas sp. JS666 54031620 Polsp-54031620 Mycobacterium avium K-10 41408155 Mycavi-41408155 (DhmA) Mycobacterium avium N85 14422311 -a Mycobacterium tuberculosis H37Rv 15609433 Myctub-15609433 (DmbB) Mycobacterium tuberculosis CDC1551 13882048 -a Mycobacterium tuberculosis F11 76783831 -a Mycobacterium bovis AF2122/97 31619067 -a Mycobacterium bovis 5033 /66 50470555 -a Mycobacterium avium K-10 41406443 Mycavi-41406443 Marinobacter aquaeolei VT8 77955285 -d uncultured bacterium - 67906508 uncbac-67906508 Caulobacter crescentus CB15 16125427 Caucre-16125427 Pseudoalteromonas atlantica T6c 76794738 Pseatl-76794738 Psychrobacter cryohalolentis K5 71362578 Psycry-71362578 Shewanella frigidimarina NCIMB 400 69952184 Shefri-69952184 Shewanella frigidimarina NCIMB 400 69950247 Shefri-69950247
anot analyzed: sequence more then 90% identical to another sequence in the dataset, bisolate Cereon, cisolate U. Washington, dnot analyzed: sequence lacks catalytic nucleophile.

Chapter 1S
70
Supplementary Table S2 List of haloalkane dehalogenase family members obtained by PSI-BLAST searches (continuation)
SubfamilyOrganism Strain GI number Abbreviation
HLD-III
Jannaschia sp. CCS1 68183968 Jansp-68183968 Nocardia farcinica IFM 10152 54024592 Nocfar-54024592 Mycobacterium tuberculosis H37Rv 15608970 Myctub-15608970 (DmbC) Mycobacterium tuberculosis CDC1551 13881532 -a Mycobacterium tuberculosis F11 76784350 -a Mycobacterium bovis AF2122/97 31618614 -a Burkholderia cenocepacia HI2424 67663651 Burcen-67663651 Burkholderia cenocepacia AU 1054 67658893 -a Burkholderia sp. 383 78062699 -a Rhodopirellula baltica SH 1 32476333 Rhobal-32476333 (DrbA) Desulfotalea psychrophila LSv54 51246484 Despsy-51246484 Chloroflexus aurantiacus J-10-fl 53795006 Chlaur-53795006 Xylella fastidiosa 95a5c 15838559 Xylfas-15838559 Xylella fastidiosa Temecula-1 28198741 -a Xylella fastidiosa Ann-1 52856730 -a Xylella fastidiosa Dixon 53800283 -a Xylella fastidiosa Ann-1 71899343 -a Xanthomonas axonopodis 306 21241009 Xanaxo-21241009 Xanthomonas campestris ATCC 33913 21229694 -a Xanthomonas campestris 8004 66571903 -a Xanthomonas campestris 85-10 78045797 -a Xanthomonas oryzae KACC10331 58583836 -a Desulfuromonas acetoxidans DSM 684 68178012 Desace-68178012 Pelobacter propionicus DSM 2379 71837478 Pelpro-71837478 Shewanella amazonensis SB2B 68547118 Sheama-68547118 Shewanella sp. PV-4 78368128 Shesp-78368128 Colwellia psychrerythraea 34H 71279056 Colpsy-71279056 Photobacterium profundum SS9 54308656 Phopro-54308656 Shewanella oneidensis MR-1 24373310 Sheone-24373310 Shewanella baltica OS155 68540485 -a Shewanella putrefaciens CN-32 77812889 -a Shewanella sp. ANA-3 78685560 -a Shewanella sp. MR-7 78689424 -a Shewanella sp. MR-4 82405605 -a Shewanella denitrificans OS217 69156531 Sheden-69156531 Shewanella frigidimarina NCIMB 400 69949450 Shefri-69949450
anot analyzed: sequence more then 90% identical to another sequence in the dataset.

Mycsme-16508080(DmsA) -------------------------------------------- MPGSE- PYGRLQYREI N----- GKRMAYI DE----------- A-- RGD----- AI VFQHGNPSSSY 42 Myctub-13882401(DmbA) ------------------------------------------ MTAFGVE- PYGQPKYLEI A----- GKRMAYI DE----------- G-- KGD----- AI VFQHGNPTSSY 44 Sphjap-4521186(LinB) ------------------------------------------- MSLGAK- PFGEKKFI EI K----- GRRMAYI DE----------- G-- TGD----- PIL FQHGNPTSSY 43 uncbac-40062609 ----------------------------------------- MNEKASSE- FNYEKKYLEI F----- GKKMAYVDK----------- G-- QGD----- PTVFLHGNPTSSY 45 Renren-84399(Luc) ------------------------------ MTSKVYDPEQRKRMITGPQ- WWARCKQMNVL----- DSFI NYYDS----------- EKHAEN----- AVI FLHGNAASSY 58 Strpur-72160391 MAFRSI GRLQTVVGHLQYGPASSGQLVARPAAAMGSRNQSTI PLVTADE- WWGKCKKVDVL----- GEKMSYYDSDP--------- QNSSSK---- HAVVFLHGNPTSSY 91 Strpur-72149468 --------------------------------- MASRNQSAI PLVTADE- WWGKCKKVDVL----- GSKMSYYDSDP--------- QNRSGK---- HTVVFLHGNPTSSY 58 Strave-29831322 --------------------------------------------------- --- MPVQHIL ----- DSTMYHRES----------- GT-- GV----- PI VFLHGNPTSSY 33 Agrtum-16119878(DatA) --------------------------------- MKEHRHMTEKSPHSAF- GDGAKAYDMPAF---- GLQI HTVEH----------- G-- SGA----- PI VFLHGNPTSSY 54 Meslot-13474464(DmlA) -------------------------------------- MSSKANPPQPVATAPKRSQI PIL ----- DSTMSYVEA----------- G- ASGP----- TVLFLHGNPTSSH 50 Brajap-27349338(DbjA) --------------------------------------------- MSKPI EI E- I RRAPVL----- GSSMAYRET----------- GAQDAP----- VVLFLHGNPTSSH 43 Rhosp-7245711(DhaA) ------------------------------------------ MSEI GTGFPFD- PHYVEVL----- GERMHYVDV----------- GPRDGT----- PVLFLHGNPTSSY 46 Jansp-68181465 ------------- MKRI RALATAATLAAGLAMPVAAQDTGGAQQPI SAEFPFE- LQTVEVL----- GSNMAYVDT----------- G-- DGP----- VVLFI HGNPTSSY 73 Lynmaj-50082962 --- MSQKLLMSRRATFAAGTAGLVAVAAGVPVAGRAQSQPPLQLPI SSEFPFA- KRTVEVE----- GATI AYVDE----------- G-- SGQ----- PVLFLHGNPTSSY 83 Erylit-61101637 -------------------------------- MTEALRTPDEAFAEVPDYPFA- PHYVDDLPG- YEGLRVHYI DEPG------ AEDGPEAGK----- TFLCLHGQPSWSF 65 Xanaut-442872(DhlA) -------------------------------- MINAI RTPDQRFSNLDQYPFS- PNYLDDLPG- YPGLRAHYLDE----------- GNSDAE---- DVFLCLHGEPTWSY 61 Polsp-54031620 ------------------- ADKREKFRLNHPLRDDALRTPDAAFDDLPGYPWP- PRYVSDLPA- LDGLRMHYLDEGE--------- GGPGGL----- TYLCLHGNPAWSY 75 Mycavi-41408155(DhmA) --------------------------------- MHVLRTPDSRFENLEDYPFV- AHYLDVTARDTRPLRMHYLDE----------- GPI DGP----- PI VLLHGEPTWSY 60 Myctub-15609433(DmbB) --------------------------------- MDVLRTPDSRFEHLVGYPFA- PHYVDVTAGDTQPLRMHYVDE----------- GPGDGP----- PI VLLHGEPTWSY 60 Mycavi-41406443 --------------------------------- MHTLRTPDDRFHTVPDFPYP- PRYCEVSDDDGGALRVAWVED----------- GPAGAD----- PVLMLHGEPSWSY 60 uncbac-67906508 --------------------------------- MEIL RTPDKYFENLKDYPFN- PQYTNI SAADGTEI RI HHI DE----------- GPKDGP----- ILL AMHGQPVWSY 60 Caucre-16125427 --------------------------------- MDVLRTPDERFEGLADWSFA- PHYTEVTDADGTALRI HHVDE----------- GPKDQR----- PILLM HGEPSWAY 60 Pseatl-76794738 --------------------------------- MQYLRTSDDCFEGLSGYSFA- PHYI EVDDFEGGNLRMHYLDE----------- GSKEGE----- VVLMLHGEPSWSY 60 Psycry-71362578 --------------------------------- MKIL RTPDSRFANLPDYNFD- PHYLMVDDSEDSELRVHYLDE----------- GPRDAD----- PVLLLHGEPSWCY 60 Shefri-69952184 --------------------------------- MEFLRTDDSFFANLPDYQFT- AHYLTVDDTEGGELRVHYLDE----------- GPKDAA----- PILL LHGEPTWSF 60 Shefri-69950247 --------------------------------- MEFLRTDDSYFVNLPGYPFT- PNYLLVDDTEGGQLRI HYLDE----------- GDKDAE----- PILL LHGEPSWSF 60 Jansp-68183968 ------------------------- MTGVFDAAHGRAQATVARLGI GAEYRFA- HHFAHTP----- MGTMHYVDE----------- GT-- GD----- PVLLLHGNPTWSY 61 Nocfar-54024592 -------------------------------------- MQI TFVPDATLYPFA- SRWFDSSV---- G- RVHYI DE----------- G-- AGP----- TIL FCHGAPAWSF 48 Myctub-15608970(DmbC) -------------------------------------- MSI DFTPDPQLYPFE- SRWFDSSR---- G- RI HYVDE----------- G-- TGP----- PILL CHGNPTWSF 48 Burcen-67663651 -------------------------------------- MIRSDATFDGTFPFA- PHFDDAS----- GFRMHYVDE----------- GPRDGE----- I VLCLHGEPTWGY 50 Rhobal-32476333(DrbA) ------------------------ MSCRLSSNRRGSSKLAAMTNLASDLFPHP- SSELSI D----- GHTLRYI DTAASSDI PSSAVGSSDGE---- PTFLCVHGNPTWSF 76 Despsy-51246484 --------------------------------------------- MFTEYPFQ- SNYFEI G----- GQRLHYVDE----------- GH-- GP----- VI VLVHGNPTWSF 41 Chlaur-53795006 ----------------------------------- MVIHTEVPAPI RALFPFH- VHEYALPA---- G- VMRYVDE----------- GS-- GT----- PVVLLHGNPTWSF 51 Xylfas-15838559 -------------------------------------------- MSYHDYPFL- SQCFEVRP---- GI RMRYLDE----------- GPRDAA----- VVVMLHGNPSWSY 45 Xanaxo-21241009 -------------------------------------------- MNYPGYPFP- PKRLEVRP---- GVAMSYLDE----------- GPRDGE----- VVVMLHGNPSWSY 45 Desace-68178012 -------------------------------------------- MVKRLLPFQ- GNTLTLAN---- NLRYHYLDK----------- GQ-- GD----- PVVMVHGNPSWCY 43 Pelpro-71837478 ---------------------------------------- MVSDPLKRHYPFQ- SHHLDLD----- GLAYHYLDE----------- GS-- GP----- AVVMLHGNPSWSF 46 Sheama-68547118 --------------------------------------- MDNHKMLDSLLPFK- RRFFNHG----- GHNI HFI DE----------- GPE- GDVAPKGTVVMVHGNPSWTL 53 Shesp-78368128 -------------------------------------------- MLDSLFPI K- RNYLDRN----- GHKLQYVNE----------- GQ-- GE----- PVVMVHGNPSWSF 42 Colpsy-71279056 -------------------------------- MSDTMSKSMLENKLTKLFPFT- RNFI NRN----- GHQYHYVNE----------- GQ-- GS----- PVVMVHGNPSWSF 54 Phopro-54308656 -------------------------------------------- MLDTLFPFK- RNFLSRN----- GHKLHYVNE----------- GQ-- GE----- PVVMVHGNPSWSF 42 Sheone-24373310 -------------------------------------------- MLDTLLPFK- RHFLSRN----- GNKLHYI NE----------- GQ-- GE----- PVVMVHGNPSWSF 42 Sheden-69156531 -------------------------------------------- MLDTLLPFK- SHFLSRN----- GQQLHYLNE----------- GE-- GE----- AVVMVHGNPSWSY 42 Shefri-69949450 -------------------------------------------- MLDNLLPFK- SHYLDRN----- GNKLHYI NE----------- GQ-- GE----- PVVMVHGNPSWSY 42
β1’ β1 β2 β3 Sphjap-4521186(ss) EEE EEEEEE EEEEE HH Rhosp-7245711(ss) EEEEE EEEEEEEE EEEE HH Xanaut-442872(ss) EE HHHH EEE EEEEEE EEEE HH
HLD-II
HLD-I
HLD-III

Mycsme-16508080(DmsA) LWRNVLPHTEGLG- RLVACDLIGMGASDKLDGSGP---- DSYHYHENRDYLFAL- WDALDLGD-- RVTLVLHDWGGALGFDWANRHRDRVAGI VHMETVS--- VPME--- 138 Myctub-13882401(DmbA) LWRNIMPHLEGLG- RLVACDLIGMGASDKLSPSGP---- DRYSYGEQRDFLFAL- WDALDLGD-- HVVLVLHDWGSALGFDWANQHRDRVQGI AFMEAIV --- TPMT--- 140 Sphjap-4521186(LinB) LWRNIMPHCAGLG- RLI ACDLIGMGDSDKLDPSGP---- ERYAYAEHRDYLDAL- WEALDLGD-- RVVLVVHDWGSALGFDWARRHRERVQGI AYMEAI A--- MPI E--- 139 uncbac-40062609 LWRNIMPYAEEAG- RI I APDLIGMGDSEKLENSGP---- DSYTFQEHAKYLYKL- FEELELD--- NVNLVI HDWGSALGFNWTRLNPEKVKSI TYMEAIV --- GPI E--- 140 Renren-84399(Luc) LWRHVVPHI EPVA- RCI I PDLIGMGKSGK- SGNG------ SYRLLDHYKYLTAW- FELLNLPK-- KII FVGHDWGACLAFHYSYEHQDKI KAI VHAESVV--- DVI E--- 151 Strpur-72160391 LWRNVMPQVEPI A- RCLAPDLIGQGRSNKLAN------- HSYRFVDHYRYLSAW- FDSVNLPE-- KVCI VCHDWGSGLGFHWCNEHRDRI EGLI HMESVV--- APVP--- 184 Strpur-72149468 LWRNVIP QVEPI A- RCLAPDLIGMGRSDKLASR------- SYRFLDHYRYLSAW- FDALKLPE-- KI TVVCHDWGSALGFHWCNEHRGRLEAI VHMEGVY--- QPMT--- 151 Strave-29831322 LWRDVMPAV- GSG- RLLAPDLIGMGESGKPAL-------- DYTFADHARYLDAW- FDALDLR--- DVI LVGHDWGGALAFDWAARHPHRVRGI AFTETIV --- KPMA--- 123 Agrtum-16119878(DatA) LWRHI FRRLHGHG- RLLAVDLIGYGQSSKPDI -------- EYTLENQQRYVDAW- FDALDLR--- NVTLVLQDYGAAFGLNWASRNPDRVRAVAFFEPVL--- RNI D--- 145 Meslot-13474464(DmlA) I WRNI IP HVAPFG- RCI APDLIGYGQSGKPDI -------- DYRFFDHVRYLDAF- LDALDI R--- DVLLVAQDWGTALAFHLAARRPQRVLGLAFMEFI ---- RPFE--- 140 Brajap-27349338(DbjA) I WRNIL PLVSPVA- HCI APDLIGFGQSGKPDI -------- AYRFFDHVRYLDAF- I EQRGVT--- SAYLVAQDWGTALAFHLAARRPDFVRGLAFMEFI ---- RPMP--- 133 Rhosp-7245711(DhaA) LWRNI IP HVAPSH- RCI APDLIGMGKSDKPDL-------- DYFFDDHVRYLDAF- I EALGLEE--- VVLVI HDWGSALGFHWAKRNPERVKGI ACMEFI ---- RPI P--- 136 Jansp-68181465 LWRNVIP HVAEDH- RAI AI DLIGMGASDKPDI -------- DYTFQDHYAHLEGF- I DALELT--- DI TLVLHDWGGGLGTYYAANNSDNVRAI AMMEAAAPPALPI P--- 167 Lynmaj-50082962 LWRNI IP YVVAAGYRAVAPDLIGMGDSAKPDI -------- EYRLQDHVAYMDGF- I DALGLD--- DMVLVI HDWGSVIG MRHARLNPDRVAAVAFMEALVPPALPMP--- 178 Erylit-61101637 LYRKMIP VFTAAGGRAVAPDLLGFGKSDKPVDD------ ETYTYNFHRGMLI AF- I EKLDLT--- SI TLVCQDWGGIL GLGIV PDMADRFERLIVMNTAI ---- PI ---- 157 Xanaut-442872(DhlA) LYRKMIP VFAESGARVI APDFFGFGKSDKPVDE------ EDYTFEFHRNFLLAL- I ERLDLR--- NI TLVVQDWGGFLGLTLPMADPSRFKRLIIM NACL---- MT---- 153 Polsp-54031620 LYRKMIP VFLQAGHRVVAPDLIGFGKSDKPKKD------ SFHSFGVHRQI LLEL- VDRLDLQ--- NVVLVVQDWGGLLGLTLPMVAPLRYKGLLVMNTML---- AT---- 167 Mycavi-41408155(DhmA) LYRTMI TPLTDAGNRVLAPDLIGFGRSDKPSRI ------ EDYSYQRHVDWVVSW- FEHLNLS--- DVTLFVQDWGSLIG LRI AAEQPDRVGRLVVANGFL---- PT---- 152 Myctub-15609433(DmbB) LYRTMIP PLSAAGHRVLAPDLIGFGRSDKPTRI ------ EDYTYLRHVEWVTSW- FENLDLH--- DVTLFVQDWGSLIG LRI AAEHGDRI ARLVVANGFL---- PA---- 152 Mycavi-41406443 LYRKMIP VLAGAGHRVVCPDLVGFGRSDKPTRR------ EDHSYARHVEWMRALAFDVLDLH--- NVTLVGQDWGGLIG LRLAAEHPERFARLVVANTGL---- PN---- 153 uncbac-67906508 LYARMIP YLTKAGI RVI APDLVGYGKSDKPAAR------ EDYSYQNQVDWMGAW- LTKNDFK--- NLTFFGQDWGGLIG LRMVAADPDRFI KI AMGNTGL---- PYN--- 153 Caucre-16125427 LYRKVI AELVAKGHRVVAPDLVGFGRSDKPAKR------ TDYTYERHVAWMSAW- LEQNDLK--- DIV LFCQDWGGLIG LRLVAAFPERFSAVVVSNTGL---- PI ---- 152 Pseatl-76794738 LYRDMI KPI ADKGYRVI APDLIGFGRSDKPTQR------ CDYTYQRHLDWI RNI - LTQLNLK--- QVTLVCQDWGGLLGLRLVAEHPELFARVLAANTML---- PT---- 152 Psycry-71362578 LYRKMIP I LTAAGHRVI APDLPGFGRSDKPASR------ TDYTYQRHVNWMQSV- LDQLDLN--- NI TLFCQDWGGLIG LRLVAENPDRFARVAAGNTML---- PT---- 152 Shefri-69952184 LYRKMIP I LVKAGHRVI APDLIGFGRSDKPTKR------ HDYTYQRHVDWMKSF- MLQLI LT--- DI TLVCQDWGGLIG LRLAAEESERFARI VCANTML---- PT---- 152 Shefri-69950247 LYRKMIP I LVEAGYRVI VPDI IG FGRSDKPSKR------ SDYTYQRHVDWMKSF- VLQLELT--- NI TLVCQDWGGLIG LRMAAEDI PRYTGI VAANTML---- PT---- 152 Jansp-68183968 LYRKFIP ALAQTH- RVI APDHIG FGLSDKPEAEG------ DYTLDAHI QNLEAL- VQQLDLT--- NI TLVMQDWGGPIG LGMAARHPARI KALVVMKTFGFY- PPI D--- 156 Nocfar-54024592 LYRRIV RALRDRF- RCVAVDHLGFGLSERPTG------- FGYTVAEHTAVLGEL- I DHLRLE--- DFVVMGHDWGGPIG LGAAGARADRVRGVVLGNTAL----- WP--- 138 Myctub-15608970(DmbC) LYRDI I VALRDRF- RCVAPDYLGFGLSERPSG------- FGYQI DEHARVI GEF- VDHLGLD--- RYLSMGQDWGGPI SMAVAVERADRVRGVVLGNTWF----- WP--- 138 Burcen-67663651 LFRHLVTALSPTY- RVVVPDHMGFGKSATPQD------- RSYWLQDHI DNLERF- VLAHDLD--- RI TLVMHDFGGPVGMGLAARHPDRI RRI VSANGPTP-- FGQTDLA 146 Rhobal-32476333(DrbA) YYRRI I ERYGKQQ- RVI AVDHIG CGRSDKPSEDE----- FPYTMAAHRDNLI RL- VDELDLK--- NVI LI AHDWGGAIG LSAMHARRDRLAGI GLLNTAA--- FPPP--- 170 Despsy-51246484 YYRRVI SLLSKTH- RI I AVDHMGCGLSDKPQD------- YSYTLQTHRQNLFQL- LEHLQI E--- KYSLVVHDWGGAIG VGCAAFAPERVEKLVVLNTAA--- FRST--- 133 Chlaur-53795006 FYRRLIP LLRTQR- RVI APDHLGCGLSDKPQH------- YRYSLVNHI ANLESL- LTWLDVG--- PVDLVVHDWGGAIG MGWAVRHPDLVRRI VVLNTAA--- FLSP--- 143 Xylfas-15838559 YWRHLVAALRDGY- RCI VPDHIG MGLSDKPGDAPGVVPRYDYTLQSRVDDLDAL- LRHVGI DDVTPLTLAVHDWGGMIG FGWALAHAVQVRRLVMTNTAV--- FPMP--- 147 Xanaxo-21241009 LWRHLVSGLSDRY- RCI VPDHIG MGLSDKPDDAPDAQPRYDYTLQSRVDDLDTL- LRHLGI TG-- PVTLAVHDWGGMIG FGWALSHHAQVKRLVI TNTAA--- FPLP--- 145 Desace-68178012 YYRHLAVALSASH- RVI VPDHIG CGLSDKPDDS----- RYRYTLEQRI ADLETL- LDHLQI KE-- NI TLVVHDWGGMIG MAYATRYPERI KRCVVLNTGA--- FHLP--- 138 Pelpro-71837478 YYRNLVRELSASY- RCI VPDHIG CGLSDKPGDER----- YDYTLARRVQDLERL- LDHLAI RD-- NI TLVVHDWGGMIG MAYAVAHPRAI RRLVVMNTAA--- FQLP--- 141 Sheama-68547118 YYRNLI RALKGEY- RCI AMDNVGCGLSDKPDDS----- RYHYTLTSRI GDLEAL- LASLNVTE-- KVTLVVHDWGGMIG MGWATKYPDAI ERLVIL NTAA--- FHLP--- 148 Shesp-78368128 YYRNLVTALSPNH- QCI VPDHIG CGLSDKPDDAG----- YDYTLKNRI DDLEAL- LDHLEVKE-- KI TLIV HDWGGMIG MGYAARHPERI KKI VVLNTGA--- FHLP--- 137 Colpsy-71279056 YYRNLVSQLSKSH- QCI VPDHIG CGLSDKPDDDG----- YDYTLANRI DDLEAL- LEHLDVKE-- NI TLVVHDWGGMIG MGYAARHPERI KRLVIL NTGA--- FHLP--- 149 Phopro-54308656 YYRNLVTELSQNH- QCI VPDHIG CGLSDKPDDAG----- YDYTLKNRI DDLEAL- LEHLEVRE-- NI TLVVHDWGGMIG MGYAARYPDRI KRLVIL NTGA--- FHLP--- 137 Sheone-24373310 YYRNLVSALKDTH- QCI VPDHIG CGLSDKPDDSG----- YDYTLKNRI DDLEAL- LDSLNVKE-- NI TLVVHDWGGMIG MGYAARYPERI KRLVIL NTGA--- FHLP--- 137 Sheden-69156531 YYRNLVAELKGEY- QCI VPDHIG CGLSDKPDDPQ----- YDYTLKSRI DDLEAL- LEHVEVRE-- NI TLVLHDWGGMIG MGFAARHPERI KRLVLLNTAA--- FHLP--- 137 Shefri-69949450 YYRNLVSALSDKH- QCI VPDHIG CGLSDKPDDPQ----- YDYTLKNRI DDLEAL- LDSLDVKQ-- NI TLVVHDWGGMIG MGFAARHPERI KRI VCLNTAA--- FHLP--- 137
α1 β4 β5’ α2 β5 α3 β6 Sphjap-4521186(ss) HH HHHH EEEEE HHHHHHHHHHH HHH EEEEEEHHHHHHHHHHHHH HHHEEEEEEEEE Rhosp-7245711(ss) HH HHHH EEEE HHHHHHHHHHH HHH EEEEEEEHHHHHHHHHHHH HHHEEEEEEEEE Xanaut-442872(ss) HH HHHHHH EEEEE EE H HH HHHHHHHHHHH HHH EEEEE HHHHHH HHH HHHEEEEEEE
HLD-II
HLD-I
HLD-III

Mycsme-16508080(DmsA) ------ WDDFP--------------------------------- DEVAQMFRGLRSP----- QGEEMVLENNAFI EGVLPS- IVMRT----------------------- 180 Myctub-13882401(DmbA) ------ WADWPP--------------------------------- AVRGVFQGFRSP----- QGEPMALEHNI FVERVLPG- AIL RQ----------------------- 182 Sphjap-4521186(LinB) ------ WADFP--------------------------------- EQDRDLFQAFRS----- QAGEELVLQDNVFVEQVLPG- LIL RP----------------------- 181 uncbac-40062609 ----- SWEDWP--------------------------------- ENARNI FQGFRS----- EDGEELVLEKNI FVERIL AG- DGA------------------------- 181 Renren-84399(Luc) ----- SWDEWP--------------------------------- DI EEDI ALI - KS----- EEGEKMVLENNFFVETMLPS- KIMRK----------------------- 193 Strpur-72160391 ----- GWDRFP--------------------------------- DMAKDFFQVLRS----- EAGDDLVLQKNYFI ELLLPR- AIMRE----------------------- 227 Strpur-72149468 ------ WDI FP--------------------------------- DSMRDI FLALRS----- DEGEEMILKKNMFI ETIL PL- ATKRK----------------------- 193 Strave-29831322 ------ WAEFP--------------------------------- EGGRELFRAI KTR---- GVGESMILDDNAFI EQGLPG- SSATA----------------------- 166 Agrtum-16119878(DatA) ----- SVDLSP--------------------------------- EFVTRRAKL- RQP---- GEGEI FVQQENRFLTELFPW- FFLTP----------------------- 188 Meslot-13474464(DmlA) ----- RWEDFHQR------------------------------- PQAREMFKALRTP---- GVGEKLVLEDNVFVEKVLPA- SVLRA----------------------- 186 Brajap-27349338(DbjA) ----- TWQDFHHTEVAEEQDHA---------------------- EAARAVFRKFRTP---- GEGEAMILEANAFVERVLPG- GIV RK----------------------- 188 Rhosp-7245711(DhaA) ----- TWDEWP--------------------------------- EFARETFQAFRTA---- DVGRELII DQNAFI EGVLPK- CVVRP----------------------- 180 Jansp-68181465 ----- DWAMVAD-------------------------------- QQTRETFQAFRDP---- VMGPQIIL EQNGFVEGLLPA- TIL RT----------------------- 212 Lynmaj-50082962 ----- SYEAMGP--------------------------------- QLGPLFRDLRTA---- DVGEKMVLDGNFFVETIL PEMGVVRS----------------------- 223 Erylit-61101637 ----- GESPGP----------------------------------- GFEAWKAFNRS------------ QPNMDVAGLFKR- GTPD------------------------ 190 Xanaut-442872(DhlA) ----- DPVTQPAFSAFVTQPA------------------------ DGFTAWKYDLVT------------ PSDLRLDQFMKR- WAPT------------------------ 197 Polsp-54031620 ----- SDVPLS---------------------------------- PGFRAWREMCAK------------ NPDFDVARLFAR- GNPQ------------------------ 201 Mycavi-41408155(DhmA) ----- AQRRTP---------------------------------- PAFYAWRAFARY------------ SPVLPAGRIV SV- GTVRR----------------------- 187 Myctub-15609433(DmbB) ----- AQGRTP---------------------------------- LPFYVWRAFARY------------ SPVLPAGRLVNF- GTVHR----------------------- 187 Mycavi-41406443 ----- GDQPMA---------------------------------- DVWWRFREAI TS------------ APQLNI GAFVQG- GCRRR----------------------- 188 uncbac-67906508 ----- PDVPQEVI DEI KAFRASNKKI NFFTMAKNI SKMDKSKHFATKFMYWQKFSWE------------ SKNMPI GFLNSM- QMEDKLAKSKVKAYVHLLFQGLGLEKLS 245 Caucre-16125427 ----- GVGKS----------------------------------- EGFEAWLNFSQN------------ TPELPVGFIL NG- GTARD----------------------- 186 Pseatl-76794738 ----- GDHPPG---------------------------------- EAFMKWRAFSQE------------ VPEFPVAGII KG- ATVTA----------------------- 187 Psycry-71362578 ----- GDHDLG---------------------------------- EGFRKWQQFSQE------------ I PQFHVGGTI KS- GTVTK----------------------- 187 Shefri-69952184 ----- GDHPPG---------------------------------- EAFTKWRQFSQD------------ VAI FPTGNLI NS- ACVST----------------------- 187 Shefri-69950247 ----- GDEETN---------------------------------- DAFMKWFNYSQE------------ SVDFPAGQMING- ASVSD----------------------- 187 Jansp-68183968 ----- GVDPDK--------------------------------- LKLPPPLLMMRAK---- GI GDFLVRRLGFFERQVMTM- ATATK----------------------- 200 Nocfar-54024592 ----- I DALAN---------------------------------- RVFSVVMSSRP----- LQRRIL EH-- NFLI DRVLL-- AELRG----------------------- 177 Myctub-15608970(DmbC) ----- ADTLAM---------------------------------- KAFSRVMSSPP----- VQYAIL RR-- NFFVERLI PA- GTEHR----------------------- 178 Burcen-67663651 ERLTANGREAP------------------------------------ WFQWIM- RAAADGTLETVLGQLGFNIL STLKLNG- FENHA----------------------- 195 Rhobal-32476333(DrbA) -------- YMP------------------------------------ QRI AAC- RMP---- VLGTPAVRGLNLFARAAVTM- AMSRT----------------------- 207 Despsy-51246484 -------- HI P------------------------------------ LRI SLC- RAP---- LFGEYLVRGLNGFAWPASFM- AVQKR----------------------- 170 Chlaur-53795006 -------- HVP------------------------------------ LRI AAG- KLP---- RLGEWAI RQLNAFAI AATTM- AVTRP----------------------- 180 Xylfas-15838559 ----- TSKKMP------------------------------------ WQI ALG- RDW---- RFGEWMVRGLNAFALGAAWL- GVETR----------------------- 187 Xanaxo-21241009 ----- AEKPMP------------------------------------ WQI AMG- RHW---- RPGEWFI RTFNAFSSGASWF- GVSRR----------------------- 185 Desace-68178012 ----- PSKPLP------------------------------------ KALKLC- RDS---- KLGAFLVRGFNAFSRGAAWV- GCKI N----------------------- 178 Pelpro-71837478 ----- PGKPFP------------------------------------ LALRI C- RDT---- RLGSLLVRGFNAFSLAASFV- GCKRN----------------------- 181 Sheama-68547118 ----- ATKPLP------------------------------------ LRLKI C- RDT---- WLGTLLVRGFNAFAGLASVI - GCKRN----------------------- 188 Shesp-78368128 ----- EAKPFP------------------------------------ WALWI C- RNT---- LLGTVLVRGFNAFSSI ASYV- GVKRA----------------------- 177 Colpsy-71279056 ----- KAKKLP------------------------------------ PALWLG- RNT---- FVGAALVRGFNAFSSVASYI - GVKRK----------------------- 189 Phopro-54308656 ----- DTKPFP------------------------------------ WALWI C- RNT---- LLGTGLVRGFNAFSSI ASYI - GVKRK----------------------- 177 Sheone-24373310 ----- DTKPLP------------------------------------- ALWI C- RNT---- LLGTVLVRGFNAFSSI ASYV- GVKRQ----------------------- 176 Sheden-69156531 ----- QSKPFP------------------------------------ WALWI C- RET---- FLGTLLVRGFNAFSAAASYV- GVKRK----------------------- 177 Shefri-69949450 ----- KTKPFP------------------------------------ WALWI C- RET---- LLGTLLVRGLNAFSSAASYV- GVKRK----------------------- 177
α4’ α4 α5’ α5 Sphjap-4521186(ss) HHH HHHHHHHHHH HHHHH HHHH HHHH Rhosp-7245711(ss) HHH HHHHHHHHHH HHHHHH HHHH HHHH Xanaut-442872(ss) HHHH HHHHHHHHH HHHHHHH H
HLD-I
HLD-III
HLD-II

Mycsme-16508080(DmsA) - LSEEEMIHYRRPFLNAGEDRRPTLSWPRDVPL- AGEPAEVVAVI EDFGEWLATS--- DI PKLFI RADPG-- VI QG- KQRIL DIV RSWPN--- QTEI TV-- PGTHFLQED 277 Myctub-13882401(DmbA) - LSDEEMNHYRRPFVNGGEDRRPTLSWPRNLPI - DGEPAEVVALVNEYRSWLEET--- DMPKLFI NAEPG-- AII T-- GRI RDYVRSWPN--- QTEI TV-- PGVHFVQED 278 Sphjap-4521186(LinB) - LSEAEMAAYREPFLAAGEARRPTLSWPRQIP I - AGTPADVVAI ARDYAGWLSES--- PI PKLFI NAEPG-- ALTT-- GRMRDFCRTWPN--- QTEI TV-- AGAHFI QED 277 uncbac-40062609 - LTEAEMKTYMKPFQNPGEDRRPTLTWPRQIP I - AGEPGEVVKI ASDYESFLAES--- NI PKLFI NADPG-- SILV -- GKQRERARLWPN--- QKEVAV-- KGGHFI QEI 277 Renren-84399(Luc) - LEPEEFAAYLEPFKEKGEVRRPTLSWPREIP LVKGGKPDVVQIV RNYNAYLRAS-- DDLPKMFI ESDPG-- FFS--- NAIV EGAKKFPN--- TEFVKV-- KGLHFSQED 290 Strpur-72160391 - LRPEEMDAYREPFKNPGEDRRPTLTWPREIP I KGDGPDDVI AI ASSYNAWLKESA-- DLPKLYI HAKPG-- FFS--- EGI KKGI ANWPN--- QKTVES-- EGLHFLQED 324 Strpur-72149468 - LRQEEMDAYREPFKNPGEDRRPLLTFPRQIP I QGEGPEETVAIV TAYHAWI KGT-- EDLPKFRIL PTPG-- LFS--- EWGTGI TKDWPN--- HKVVQV-- EGSHFFQED 290 Strave-29831322 - LTEGDLDVYRKPYPTR- ESRLPLLRWPRSMPL- GGEPADVVARI EAYDRWLKAS-- VDVPKLLLTFAPGPGAMMH- EGIV AWCAANI AG--- LEI EHSEAVAGHHTPED 267 Agrtum-16119878(DatA) - LAPEDLRQYQTPFPTP- HSRKAIL AGPRNLPV- DGEPASTVAFLEQAVNWLNTS--- DTPKLLLTFKPG-- FLLT- DAIL KWSQVTI RN--- LEI EAAG- AGI HFVQEE 285 Meslot-13474464(DmlA) - MSDDEMDVYRAPFPTP- QSRKPVLRLPREMPI - EGQPADVAAI SAHDHRALRLS--- TYPKLLFAGDPG-- ALI G- PQAAREFAAGLKN--- CSFI NLG- PGAHYLQED 283 Brajap-27349338(DbjA) - LGDEEMAPYRTPFPTP- ESRRPVLAFPRELPI - AGEPADVYEALQSAHAALAAS--- SYPKLLFTGEPG-- ALVS- PEFAERFAASLTR--- CALI RLG- AGLHYLQED 285 Rhosp-7245711(DhaA) - LTEVEMDHYREPFLKP- VDREPLWRFPNEIP I - AGEPANIV ALVEAYMNWLHQS--- PVPKLLFWGTPG-- VLI P- PAEAARLAESLPN--- CKTVDI G- PGLHYLQED 277 Jansp-68181465 - LSDAEMDAYRAPFPTP- ESRQPVLMWPNEIP I - EGTPARNVTVMEEVAAWLTTS--- EQPKLIL YASPG-- LI WS- PEVADFAARTFNN--- TEARFVG- AGI HFI QED 309 Lynmaj-50082962 - LSEAEMAAYRAPFPTR- QSRLPTLQWPREVPI - GGEPAFAEAEVLKNGEWLMAS--- PI PKLLFHAEPG-- ALAP- KPVVDYLSENVPN--- LEVRFVG- AGTHFLQED 320 Erylit-61101637 - LTDAEAAAYGAPFPDQ- RYKAGVRRFPELVPVSPEMQGV-- EEGKRAREFWANE-- WSGKSFMAI GMQD-- PVLG- PPAMRGLQKQI RGC-- PDPMEVP- DGGHFVQE- 287 Xanaut-442872(DhlA) - LTEAEASAYAAPFPDT- SYQAGVRKFPKMVAQ- RDQACI -- DI STEAI SFWQND-- WNGQTFMAI GMKD-- KLLG- PDVMYPMKALI NGC-- PEPLEI A- DAGHFVQE- 293 Polsp-54031620 - MSPDECAAYNAPFPDK- GHRAALRAFPLMVPESECADGA-- AI SREAREFWQSR-- WTGQTLMAVGAQD-- PVLG- LPVMRALQGII RGC-- DAPLVLE- QAGHFVQE- 298 Mycavi-41408155(DhmA) - VSSKVRAGYDAPFPDK- TYQAGARAFPQLVPTSPADPAI -- PANRKAWEALGR--- WEKPFLAI FGARD-- PIL G-- HADSPLI KHI PGAAGQPHARI -- NASHFI QED 284 Myctub-15609433(DmbB) - VPAGVRAGYDAPFPDK- TYQAGARAFPRLVPTSPDDPAV-- PANRAAWEALGR--- WDKPFLAI FGYRD-- PIL G-- QADGPLI KHI PGAAGQPHARI -- KASHFI QED 284 Mycavi-41406443 - LSDAERAGYDAPFPSD- EYCAGPRAMPTLVPTSPEDPAA-- AANKAAWAKLAV--- SPTPMLVAFSDSD-- PI TG-- PMAAI FQREMRGAQGI DHPLI R- GAGHFLQED 286 uncbac-67906508 PFSTDLI KAYEAPFPDP- SYKMGPRAMPSQVPSI PDQSL--- EAQRKAREFFRT--- SNMPFLSVFAGND-- PVTN-- GI EKDVLKMAPNAI SAPHI ---- GGGHFFQWT 340 Caucre-16125427 - LSDAERSAYDAPFPDE- SYKEGARI FPALVPI TPEHASV-- EENKAAWAVLET--- FDKPFVTAFSDAD-- PI TR-- GGEAMFLARVPGTKNVAHTTL-- KGGHFVQED 283 Pseatl-76794738 - LSTDVLNAYDAPFPTE- AHKAGVRQFPLLVPATTDDPQT-- QNNRKAWQVLQQ--- FNKPFI TAFSDSD-- PVTA-- GGDKIMQKLI PGTQGQSHTTI T- QGGHFLQED 285 Psycry-71362578 - LSQAVI DAYNAPFPDE- SYKEGARQFPLLVPSTPDDPAS-- ENNRAAWI ELSK--- WTKPFI TLFSDSD-- PVTA-- GGDRIMQKII PGTKGQAHTTI A- NGGHFLQED 285 Shefri-69952184 - LTVEII AAYDAPFPDE- RYKEGARQFPLLVPI TPDDPAA-- DKNRAAWKVLNQ--- WKKPFLTVFSDSD-- PI TA-- GGDALMQKLI PGTKGQKHTTIV - AAGHFLQED 285 Shefri-69950247 - LSDDVI AAYDAPFPDE- TYKTGAREFPLLVPI TPDDPAT-- LKNRAAWKVLSQ--- WNKPFLTAFSDSD-- PI TA-- GGDKMMQEII PGTKGQKHTTIV - NAGHYLQEE 285 Jansp-68183968 - RKGPSKRAYRDI FRTY- AERAGVMAFPRMIP ANTGHPAAQ- ILMQETGPYI DQF--- DGPAHI FWGMKD-- PLI P- VGALTAWKKRLPQ--- AGVTEFA- TARHYLQDD 297 Nocfar-54024592 VLTKAEADHYRGVQPTP- AARRGLAVMPGQI RAAR------- PLLEELARKVPERL- GDKPTLAVWGMRD-- VVFRPSACLPRVRAMFGDL-- EVVELS-- GARHFVQEH 272 Myctub-15608970(DmbC) - PSSAVMAHYRAVQPNA- AARRGVAEMPKQI LAAR------- PLLARLAREVPATL- GTKPTLLI WGMKD-- VAFRPKTII PRLSATFPDH-- VLVELP-- NAKHFI QED 272 Burcen-67663651 II ADTWI AAYGAPFAQP- ADCLGAI GWARGFA-- AGAH---- RFEEPDAAALRAI -- RGKPALAI WGDAD- RTLGT- EHFLPLFTALFPSA-- PI ERLA-- GVGHYCFED 290 Rhobal-32476333(DrbA) KMKPDVAAGLLAPYDNW- KNRVAI DRFVRDIP LNDSHPTM-- KTLRQLESDLPDL-- ASLPI SLI WGMKD-- WCFR- PECLRRFQSVWPDA-- EVTELA-- TTGHYVI ED 305 Despsy-51246484 - LSKEVVAGYLAPYSNW- EKRVAVYGFVHDIP LNSAHPSY-- GTLVEVERGLEALVARQVPTLIL WGGKD-- FCFN- DHFYRQWCERVPYA-- EKVYYE-- NGGHYIL ED 269 Chlaur-53795006 - LPAAVREGYLWPYRTF- ADRI AI ARFVQDIP LHPGHPTW-- PVVDAI DRELVHL-- RDKPVRI FWGGRD-- WCFD- DRFLAGWLHRFPSA-- HVTRLD-- DAGHYVLED 277 Xylfas-15838559 - LPRAVRRAYLAPYNSW- ANRI SII RFMQDIP CGPGDRAW-- PLLEATGKALPDF-- ADRPVFI GWGMQD-- IV FD- HHCLDEFRAALPGA-- QVQVFA-- DAGHYVLED 284 Xanaxo-21241009 - MPADVRRAYVAPYNNW- RNRI STI RFMQDIP LSPADQGW-- SLLERSAQALPAF-- ADRPAFI AWGLRD-- I CFD- KHFLAGFRRALPQA-- EVTAFN-- DANHYVLED 282 Desace-68178012 PMPPALRAAYMAPYNTW- NNRI ATLRFVQDIP LDPSDRAY-- AEVSRVADNLHLL-- VDKPMFI GWGEKD-- FVFD- HHFLAEWQKRFPNA-- QYHTWP-- RGGHYIL ED 276 Pelpro-71837478 PLSRELRRLYRLPYGSW- NDRI ATLRFVQDIP LKPGDRGF-- DLVNSVDRGLDQF-- RDLPLLLVWGERD-- FVFD- RHFLAEWRRRFPQA-- EVHSYA-- DAGHYIL ED 279 Sheama-68547118 PMNAEMRRAYVAPFNSW- ANRI STLRFVQDIP LKPGDTAW-- DEVSRI EQSLAQF-- TRVPTLI CWGLKD-- FVFD- RHFLTVWQEKLPQA-- EVHAFE-- DCGHYIL ED 286 Shesp-78368128 PMPKAI REAYVAPFNSW- ANRI STLRFVQDIP LKPGDRNY-- ELVSEI SEKLNQF-- NQLPMMICWGLKD-- FVFD- KHFLDEWKRRFPEA-- EVHEFA-- DCGHYIL ED 275 Colpsy-71279056 PMSKEVREAYVAPFNSW- TNRI STLRFI QDIP LKI GDRNY-- QLVSDI SDNLAQF-- KKI PMLI CWGLKD-- FVFD- RHFLDEWQHRFPDA-- QVHAFD-- DCGHYIL ED 287 Phopro-54308656 PMSPEVRKAYVSPFNSW- ANRI STLRFVQDIP LRKGDRNY-- ELVSEI AASLPKF-- SHVPTLI CFGLKD-- FVFD- KHFLAVWREKMPHA-- TVHEFE-- DCGHYIL ED 275 Sheone-24373310 PMSKYI REAYVAPFNSW- ANRI STLRFVQDIP LKPGDRNY-- QLVSDI AASLPKF-- AKVPTLI CWGLQD-- FVFD- KHFLVKWREHMPHA-- QVHEFA-- DCGHYIL ED 274 Sheden-69156531 PMDNAVREAYVAPFNSW- TNRI STLRFVQDIP LKPSDRNY-- QLVSDI ADSLSQF-- KQTPALI CFGMQD-- FVFD- KHFLQEWRRRLPNA-- KVHEFA-- DCGHYIL ED 275 Shefri-69949450 PMSKEVREAYVAPFDSW- KNRI STLRFVQDIP LKPGDRNY-- DLVTSI GDSLSEF-- AEVPTLI CFGLQD-- FVFD- KYFLEEWRQRMPHA-- TVHEFA-- DCGHYIL ED 275
α6 α7 α8 β7 α9 β8 Sphjap-4521186(ss) HHHHHHHHHHH HHHHHHHHHHHH HHHHHHHHHHHHHHHH EEEEEEEE HHHHHHH EEEEEE EE HHH Rhosp-7245711(ss) HHHHHHHHHHH H HHHHHHHHHHHH HHHHHHHHHHHHHHHH EEEEEEEE HHHHHHHHHH EEEEEEE EE HHH Xanaut-442872(ss) HHHHHHHH H HH HHHHHHHHHHH HHHH HHHHHHHHHHHH EEEEEEE HHHHHHHHHH EEE HHH
HLD-I
HLD-II
HLD-III

Mycsme-16508080(DmsA) SADQI GEAI ASFVREI RAGDNLHREAAPEMNSAS 311 Myctub-13882401(DmbA) SPEEI GAAI AQFVRRLRSAAGV------------ 300 Sphjap-4521186(LinB) SPDEI GAAI AAFVRRLRPA--------------- 296 uncbac-40062609 SPHEI GDHLKGFLASLD----------------- 294 Renren-84399(Luc) APDEMGKYI KSFVERVLKNEQ------------- 311 Strpur-72160391 SPI QI GDHVKDFLSALYK---------------- 342 Strpur-72149468 SPI QTGDYI KEFLSSI FK---------------- 308 Strave-29831322 QPVLI ARAI SAWADRLGLRLS------------- 288 Agrtum-16119878(DatA) QPETI ARLLDAWLTRI AGN--------------- 304 Meslot-13474464(DmlA) HADAI GRAI ASWLPEVVLANQTDELA-------- 309 Brajap-27349338(DbjA) HADAI GRSVAGWI AGI EAVRPQLAA--------- 310 Rhosp-7245711(DhaA) NPDLI GSEI ARWLPGLA----------------- 294 Jansp-68181465 QPEAI GRNLSDWLRDRVTRGN------------- 330 Lynmaj-50082962 HPHLI GQGI ADWLRRNKPHAS------------- 341 Erylit-61101637 KGEGI ARAALESFAA------------------- 302 Xanaut-442872(DhlA) FGEQVAREALKHFAETE----------------- 310 Polsp-54031620 HGEPI ARHAVGFFKR------------------- 313 Mycavi-41408155(DhmA) RGPELAERI LSWQQALL----------------- 301 Myctub-15609433(DmbB) SGTELAERMLSWQQAT------------------ 300 Mycavi-41406443 AGAELAGHI VEFLRR------------------- 301 uncbac-67906508 KAELLSNVLI KFI KE------------------- 355 Caucre-16125427 SPVEI AALLDGLVAGLPQA--------------- 302 Pseatl-76794738 QPQQLAKVLLQFI NDNPI STD------------- 306 Psycry-71362578 QGEKVAKLLVQFI HDNPR---------------- 303 Shefri-69952184 KGEVLADVVVNFI ADNR----------------- 302 Shefri-69950247 QGEVLAKVI VNFI ADNR----------------- 302 Jansp-68183968 VPDQLI PELVEFLNRDV----------------- 314 Nocfar-54024592 EPDAI AVAI TERFS-------------------- 286 Myctub-15608970(DmbC) APDRI AAAI I ERFG-------------------- 286 Burcen-67663651 APDAI AARI ADFI RTTG----------------- 307 Rhobal-32476333(DrbA) SPEETLAAI DSLLARVKERI GAA----------- 328 Despsy-51246484 EFADI APRLERFFTVCEE---------------- 287 Chlaur-53795006 ASAEMIALLAHWLLSE------------------ 293 Xylfas-15838559 KSSVLVPAI RAFLDAHP----------------- 301 Xanaxo-21241009 KHEVLVPAI RAFLERNPL---------------- 300 Desace-68178012 VGDELI PLI CRFI QETK----------------- 293 Pelpro-71837478 MKDEVVPI I SAFLKRTE----------------- 296 Sheama-68547118 ASDEVI AHI ERFVAASAPAEALAS---------- 310 Shesp-78368128 ASDEVVAQVQQFMAR------------------- 290 Colpsy-71279056 ASDEVVPLI ENFLKTSETKLA------------- 308 Phopro-54308656 ASDEVVPLI SDFMKMPLATDNKPSEADL------ 303 Sheone-24373310 ASDEVI THI KHFMTETETL--------------- 293 Sheden-69156531 APDEVI GLVKDFLTGTESEKTH------------ 297 Shefri-69949450 ASDEVI GLI KDFI AKN------------------ 291
α10 Sphjap-4521186(ss) HHHHHHHHHHHHHHH Rhosp-7245711(ss) HHHHHHHHHHHHHHH Xanaut-442872(ss) HHHHHHHHHHHHHH
Supplementary Figure S1 Multiple sequence alignment of 44 members of the haloalkane dehalogenase family. Three haloalkane dehalogenase subfamilies are indicated, HLD-I, HLD-II and HLD-III. Amino acids are colored according to their physico-chemical properties (negatively charged, red; positively charged, blue; polar, magenta; hydrophobic, green). Residues conserved in >50% of sequences are shaded. Catalytic pentad residues are indicated by symbols above the alignment. The nucleophile Asp (gray circle), catalytic base His (gray square) and one halide-stabilizing Trp residue (gray asterisk) are conserved among all subfamilies. The catalytic acid of the HLD-II subfamily Glu (black triangle) follows β-strand 6, the catalytic acid of subfamilies HLD-I and HLD-III Asp (blue triangle) follows β-strand 7, the second halide-stabilizing residue of HLD-II and HLD-III subfamilies Asn (red cross) is located in the N-terminal part of the main domain, and the second halide-stabilizing residue in HLD-I subfamily Trp (orange cross) in the N-terminal part of the cap domain. Information regarding the arrangement of the secondary structure elements, helices (H), and sheets (E) was derived from the haloalkane dehalogenases with experimentally determined 3D structures: LinB, DhaA and DhlA.
HLD-III
HLD-I
HLD-II

Chapter 2
76
77
2
Substrate specificity of
haloalkane dehalogenases
Eva Chovancová*, Táňa Koudeláková*,
Jan Brezovský, Marta Monincová, Andrea Fořtová, Jiří Jarkovský and Jiří Damborský
*These authors contributed equally to this work
Biochemical Journal 435: 345-354 (2011)

Chapter 2
78
Abstract
An enzyme's substrate specificity is one of its most important characteristics. The quantitative comparison of broad-specificity enzymes requires the selection of a homogenous set of substrates for experimental testing, determination of substrate-specificity data, and analysis using multivariate statistics. We describe a systematic analysis of the substrate specificities of nine wild-type and four engineered haloalkane dehalogenases. The enzymes were characterized experimentally using a set of 30 substrates selected using statistical experimental design from a set of nearly 200 halogenated compounds. Analysis of the activity data showed that the most universally useful substrates in the assessment of haloalkane dehalogenase activity are 1-bromobutane, 1-iodopropane, 1-iodobutane, 1,2-dibromoethane and 4-bromobutanenitrile. Functional relationships among the enzymes were explored using principal component analysis. Analysis of the untransformed specific activity data revealed that the overall activity of wild-type haloalkane dehalogenases decreases in the following order: LinB∼DbjA > DhlA∼DhaA∼DbeA∼DmbA > DatA∼DmbC∼DrbA. After transforming the data, we were able to classify haloalkane dehalogenases into four substrate-specificity groups (SSGs). These functional groups are clearly distinct from the evolutionary subfamilies, suggesting that phylogenetic analysis cannot be used to predict the substrate specificity of individual haloalkane dehalogenases. Structural and functional comparisons of wild-type and mutant enzymes revealed that the architecture of the active site and the main access tunnel significantly influences the substrate specificity of these enzymes, but is not its only determinant. The identification of other structural determinants of the substrate specificity remains a challenge for further research on haloalkane dehalogenases.
Introduction
Enzymes are biological catalysts that are essential components of every biological system and are valuable in biotechnology. The key functional characteristics of an enzyme are its catalytic activity towards different substrates and its substrate specificity, i.e. the range of substrates it can convert. As such, the identification of enzymes that efficiently catalyze new chemical reactions or display novel substrate specificities is of great scientific and practical interest. The traditional way of isolating novel biocatalysts is a time-consuming multistep process involving enrichment of organisms from a natural resource, construction of a genomic library, cloning of the library into a host organism, screening for appropriate activity, protein purification and biochemical characterization. This process has been greatly accelerated by the development of new techniques in molecular biology and bioinformatics, including high-throughput techniques for screening mutant and metagenomic libraries, methods for the in silico identification of potential targets using sequence database searches and bioinformatics tools, and various novel approaches to protein engineering [1,2].
Haloalkane dehalogenases (HLDs, EC 3.8.1.5) are enzymes that catalyze hydrolytic cleavage of the carbon-halogen bond in a wide range of halogenated compounds. They have a number of potential practical applications, including roles in industrial biocatalysis [3,4],

Substrate Specificity
79
bioremediation [5], detoxification [6], biosensing [7] and molecular imaging [8]. The properties of several HLDs have been improved by directed evolution [9-12]. A substantial body of knowledge concerning the structure and function of HLDs also allows construction of modified enzymes by rational design [4,13,14].
Structurally, HLDs belong to the α/β-hydrolase fold superfamily. Their active site is buried in the predominantly hydrophobic cavity at the interface of the α/β-hydrolase core domain and the helical cap domain, and is connected to the bulk solvent by access tunnels [4,15-18]. The active-site residues that are essential for catalysis are referred to as the catalytic pentad, and comprise a nucleophilic aspartate, a basic histidine, an aspartic or glutamic acid moiety that serves as a general acid, and either two tryptophan residues or a tryptophan-asparagine pair that serve to stabilize the leaving halide ion [19]. The HLD family currently includes 14 distinct enzymes with experimentally confirmed dehalogenation activity [20-27]. An analysis of the sequences and structures of these HLDs and their homologs divided the family into three phylogenetic subfamilies, HLD-I, HLD-II and HLD-III, which differ mainly in the composition of the catalytic pentad and cap domain [19].
To date, HLDs have been isolated from bacterial strains originating from the soil [23,24,27,28], sea water [22,27], obligatory animal pathogens [20,21], plant symbionts [26] and plant parasites [29]. Although the biological function of many HLDs remains unknown, those that were isolated from bacteria inhabiting contaminated soil are known to be involved in metabolic pathways that enable the host organisms to utilize halogenated compounds as carbon sources [23,28,30]. HLDs catalyze the hydrolysis of chlorinated, brominated and iodinated alkanes, alkenes, cycloalkanes, alcohols, carboxylic acids, esters, ethers, epoxides, amides and nitriles [4,31,32] and are thus broad-specificity enzymes, exhibiting miscellaneous activity across a wide range of substrate classes. The substrate specificity of HLDs can be described in terms of a quantitative profile of their specific activities with respect to a set of specific substrates. Quantitative comparisons of such specificity profiles can be used to identify appropriate catalysts for practical applications and to further our understanding of the relationships between the enzymes in terms of their function, structure and evolution.
The present study focused on the comparison and classification of the substrate specificities of nine members of the HLD family. A functional classification of the HLDs was carried out using principal component (PC) analysis (PCA) and the classification thus derived was compared with one derived on the basis of the enzymes’ evolutionary relationships. The purpose of this comparison was to see whether the substrate specificity of individual HLDs reflects the evolution of the family and thus could be predicted from established phylogenetic classifications. Factors influencing the substrate specificity of HLDs were assessed by structural and functional comparison of wild-type and mutant enzymes. This study also identifies 'universal' substrates converted by all of the enzymes examined as well as 'preferred' and 'characteristic' substrates for individual substrate specificity groups (SSGs). Such knowledge will be useful for the selection of appropriate biocatalysts for specific biotechnological applications and the development of platforms for screening HLD activity in different hosts, environments, or in vitro samples.

Chapter 2
80
Experimental
Materials
All halogenated compounds used were of at least 95% purity, and were purchased from Sigma-Aldrich (St. Louis, USA).
Preparation of enzymes and activity assay
The wild-type HLDs examined were: DatA from Agrobacterium tumefaciens C58 [29], DbeA from Bradyrhizobium elkanii USDA94 [Prudnikova, T., et al., in preparation], DbjA from Bradyrhizobium japonicum USDA110 [26], DhaA from Rhodococcus rhodochrous NCIMB 13064 [24], DhlA from Xanthobacter autotrophicus GJ10 [23], DmbA [21] and DmbC [22] from Mycobacterium bovis 5033/66, DrbA from Rhodopirellula baltica SH1 [22] and LinB from Sphingobium japonicum UT26 [25] (Supplementary Table S1). Mutant enzymes were constructed by rational design or focused directed evolution and include DbeA1 and DbeA2, which carry the insertions Val-Ala-Glu-Glu-Gln-Asp-His-Ala-Glu between residues 142 and 143 and Glu-Val-Ala-Glu-Glu-Gln-Asp-His-Ala between residues 141 and 142, respectively
[Chaloupková, R., et al., in preparation]; DbjA∆, from which the His140-Thr-Glu-Val-Ala-Glu-Glu146 residues were deleted [4]; and DhaA31, which incorporates the substitions Ile135Phe, Cys176Tyr, Val245Phe, Leu246Ile, Tyr273Phe [11] (Supplementary Table S2). His-tagged enzymes were heterogeneously expressed in Escherichia coli or Mycobacterium smegmatis strains using appropriate vectors and purified to homogeneity using immobilized metal affinity chromatography as described elsewhere [11,13,21,22,26]. The specific activities of HLDs towards the set of 30 halogenated substrates were taken from previous studies [11,22,29, Prudnikova, T., et al., in preparation] or determined under the conditions used in those studies for DbjA, DhaA, DhlA, DmbA and LinB (Supplementary Table S3). Enzyme concentration was estimated using Bradford reagent (Sigma-Aldrich, St. Louis, USA) with BSA as a standard. Specific activity was measured using reagents containing mercuric thiocyanate and ferric ammonium sulfate; the halide ions released during the dehalogenase reaction were quantified by an end-point spectrophotometric measurement [33]. Reactions were carried out in 100 mM glycine buffer (pH 8.6) in 25 cm3 Microflasks closed by Mininert valves (Alltech, Deerfield, IL, U.S.A.) at 37 °C. The initial experimental concentration of the halogenated substrates in the reaction mixture was established on gas chromatograph GC Trace 2000 (Thermo Fisher Scientific, Waltham, USA) equipped with flame ionization detector and capillary column DB-FFAP 30 m × 0.25 mm × 0.25 µm (J&W Scientific, Folsom, USA) (Supplementary Table S3). Samples were periodically withdrawn with a 1 cm3 syringe (Hamilton, Reno, USA) during 40 min measurement after the initiation of the reaction by the addition of an enzyme. All withdrawn samples were immediately mixed with 35% nitric acid to stop the reaction. The reagents with mercuric thiocyanate and ferric ammonium sulfate were subsequently added to the collected samples and absorbance of the final mixture was measured in a microtiter plate at 460 nm by Sunrise spectrophotometer (Tecan, Männedorf, Switzerland). Spontaneous hydrolysis of substrates in buffer was tested in the abiotic control.

Substrate Specificity
81
The specific activities were quantified by an initial linear slope of the increasing halide concentration plotted against the time after the subtraction of spontaneous hydrolysis. The kinetic constants of all nine wild-type HLDs towards 1-chlorobutane (4) or 1-iodobutane (29) were collected from the literature or measured as described in the Supplementary information (Supplementary Table S4).
Statistical analyses
A matrix containing the activity data for the nine wild-type HLDs towards 30 substrates (Supplementary Tables S3 and S5) was analyzed by PCA to uncover relationships between individual HLDs (cases) and their substrates (variables). PCA of the data matrix X allows it to be expressed as the product of two new matrices plus a noise matrix of residuals: X = TP’ + E [34,35]. The score matrix T (nine HLDs × 30 substrates) summarizes the X-variables, the loading matrix P’ (number of PCs × 30 substrates) shows the influence of individual variables on the projection model and the residual matrix E (nine HLDs × 30 substrates) quantifies the differences between the original values and the projections. The underlying principles of PCA can be visualised by considering its geometrical interpretation [35,36]. It is impossible to imagine nine points, representing the activity of individual HLDs, distributed in thirty-dimensional space. PCA projects these points onto a lower-dimensional subspace, and establishes a reduced set of new orthogonal co-ordinates called PCs. PCs are fitted to points in multi-dimensional space by the least squares method, such that the first PC is aligned in the direction of maximum variance in the data set, the second is aligned in the direction of the maximum remaining variance and so on. The co-ordinate values of individual cases in the new co-ordinate system are called scores (t), and the projection of the data points onto the two-dimensional plain defined by any two PCs is called a score plot. The cosines of the angles between a given PC and the axes defined by the original variables are called loadings (p), and they represent the contributions of the original variables to a particular PC. PCA was conducted using the Statistica 8.0 software package (StatSoft, Tulsa, USA). Two PCAs were performed. In the first, the raw data concerning individual enzymes’ specific activities towards particular substrates were used as the primary input data. In the second, the raw data were log-transformed and weighted relative to the individual enzyme’s activity towards other substrates prior to analysis, in order to better discern individual enzymes’ specificity profiles. Thus: (i) each specific activity value was incremented by 1 unit to avoid logarithmic transformation of zero values; (ii) the log of this new value was taken; and (iii) this log value was then divided by the sum of all the log values for that particular enzyme to give a log-transformed, weighted measure of that enzyme’s activity towards that specific substrate relative to its activity towards all of the other substrates considered. These transformed data were used to identify enzymes with interesting or unusual specificity profiles, without regard to their overall specific activity. The score plots obtained from the analysis of these log-transformed data were used to classify the HLDs into SSGs; substrates that were important in defining individual groups were identified from the loading plots. The co-ordinates of individual enzymes in the space defined by the biologically significant PCs arising from this analysis were used to calculate a matrix of Euclidean distances. This matrix was in turn used
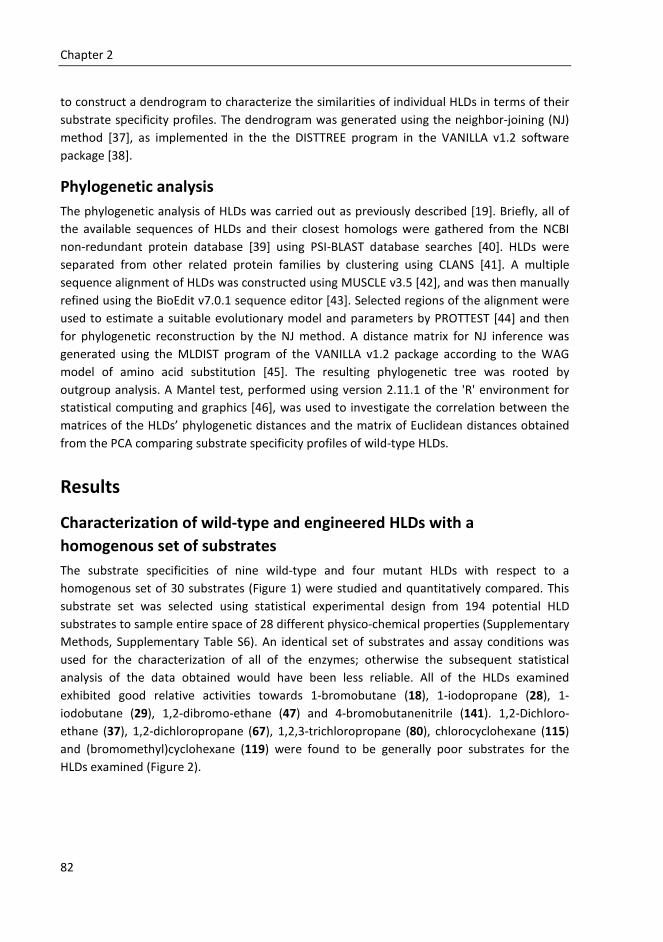
Chapter 2
82
to construct a dendrogram to characterize the similarities of individual HLDs in terms of their substrate specificity profiles. The dendrogram was generated using the neighbor-joining (NJ) method [37], as implemented in the the DISTTREE program in the VANILLA v1.2 software package [38].
Phylogenetic analysis
The phylogenetic analysis of HLDs was carried out as previously described [19]. Briefly, all of the available sequences of HLDs and their closest homologs were gathered from the NCBI non-redundant protein database [39] using PSI-BLAST database searches [40]. HLDs were separated from other related protein families by clustering using CLANS [41]. A multiple sequence alignment of HLDs was constructed using MUSCLE v3.5 [42], and was then manually refined using the BioEdit v7.0.1 sequence editor [43]. Selected regions of the alignment were used to estimate a suitable evolutionary model and parameters by PROTTEST [44] and then for phylogenetic reconstruction by the NJ method. A distance matrix for NJ inference was generated using the MLDIST program of the VANILLA v1.2 package according to the WAG model of amino acid substitution [45]. The resulting phylogenetic tree was rooted by outgroup analysis. A Mantel test, performed using version 2.11.1 of the 'R' environment for statistical computing and graphics [46], was used to investigate the correlation between the matrices of the HLDs’ phylogenetic distances and the matrix of Euclidean distances obtained from the PCA comparing substrate specificity profiles of wild-type HLDs.
Results
Characterization of wild-type and engineered HLDs with a
homogenous set of substrates
The substrate specificities of nine wild-type and four mutant HLDs with respect to a homogenous set of 30 substrates (Figure 1) were studied and quantitatively compared. This substrate set was selected using statistical experimental design from 194 potential HLD substrates to sample entire space of 28 different physico-chemical properties (Supplementary Methods, Supplementary Table S6). An identical set of substrates and assay conditions was used for the characterization of all of the enzymes; otherwise the subsequent statistical analysis of the data obtained would have been less reliable. All of the HLDs examined exhibited good relative activities towards 1-bromobutane (18), 1-iodopropane (28), 1-iodobutane (29), 1,2-dibromo-ethane (47) and 4-bromobutanenitrile (141). 1,2-Dichloro-ethane (37), 1,2-dichloropropane (67), 1,2,3-trichloropropane (80), chlorocyclohexane (115) and (bromomethyl)cyclohexane (119) were found to be generally poor substrates for the HLDs examined (Figure 2).

Substrate Specificity
83
Figure 1 The set of thirty substrates used to test the substrate specificity of the HLDs.
Figure 2 Substrate specificity profiles of HLDs. Transformation of the primary data suppressed the differences in the enzymes’ absolute activities and allowed comparison of the HLDs’ substrate specificity profiles. Color coding corresponds to individual substrate specificity groups: red corresponds to SSG-I, yellow to SSG-II, green to SSG-III, and blue to SSG-IV. The values higher than 0.2 are depicted by truncated cones for the clarity.

Chapter 2
84
Functional classification of wild-type HLDs
The matrix of the HLDs’ untransformed specific activities towards the various substrates was subjected to analysis using PCA. Three biologically significant PCs were identified, which together accounted for 79% of the variance in the primary dataset (Supplementary Table S7). PC1 ranked the enzymes according to the magnitude of their overall activity towards the tested substrates: LinB∼DbjA > DhlA∼DhaA∼DbeA∼DmbA > DatA∼DmbC∼DrbA (Supplementary Figure S1). LinB and DbjA were generally the most active of the HLDs analyzed; their specific activities were two to three orders of magnitude greater than those of DmbC and DrbA. PC2 and PC3 further separated the HLDs; specifically, these components identified three enzymes with unique specific activities towards several substrates (Supplementary Figure S2). DmbA exhibits high activity towards 2-iodobutane (64), 1-chloro-2-(2-chloroethoxy) ethane (111) and chlorocyclopentane (138). DbjA exhibits exceptionally high activity towards 2-bromo-1-chloropropane (76) and chlorocyclopentane (138), and also catalyzes the dehalogenation of the highly resistant substrates 1,2-dichloropropane (67) and 1,2,3-trichloropropane (80). DhlA possesses exceptional activity towards the chlorinated substrates 1,2-dichloroethane (37) and 1,3-dichloropropane (38).
Analysis of the untransformed data revealed that enzymes with similar overall activities can nevertheless have divergent activity profiles; similarities in the magnitude of two enzymes’ overall activities can obscure interesting and potentially useful differences in their reactivity towards specific substrates. In such cases, data pre-treatment methods can be used to facilitate interpretation of datasets by emphasizing biologically relevant information [47]. To this end, the activity data were log-transformed and weighted as described in the Experimental section, in order to minimize complications arising from differences in the enzymes’ absolute catalytic proficiency and to emphasize the differences in their specificity profiles (Figure 3, Supplementary Table S5). The top three biologically significant PCs from this second model accounted for 62% of the variance in the transformed dataset (Supplementary Table S7). PCs quantify how individual HLDs act with all 30 tested substrates, resulting in the clusters of HLDs with similar specificity profiles. On the basis of the model, the HLDs were divided into four SSGs (Figure 3A, left-hand panel): (i) SSG-I comprising DbjA, DhaA, DhlA and LinB, (ii) SSG-II containing DmbA, (iii) SSG-III containing DrbA and (iv) SSG-IV comprising DatA, DbeA and DmbC. This classification of the HLDs was primarily due to differences in their position along PC1 and PC2 (Figure 3A, left-hand panel); the classification of DrbA and DmbA into separate groups was justified by the difference in their position along PC3 (Supplementary Figure S3A). HLDs in the same SSG exhibited common substrate preferences that differentiated them from HLDs in other groups (Table 1 and Figure 3, left-hand panel). HLDs in SSG-I are characterized primarily by their catalytic robustness. Their activity can be detected towards most of the tested substrates. All members are active towards at least one of poorly degradable compounds: 1,2-dichloroethane (37), 1,2-dichloropropane (67), 1,2,3-tri-chloropropane (80) and chlorocyclohexane (115). Enzymes in SSG-II, SSG-III and SSG-IV are more selective for specific halogenated compounds, differentiating them from other SSGs. The substrate-specificity profile of SSG-II is similar to SSG-I, as obvious for example from good

Substrate Specificity
85
conversion of 1,2-dibromoethane (47) and 1-bromo-2-chloroethane (137). On the other hand, the substrate specificity of SSG-II is unique due to good activity towards otherwise not preferred substrates and inactivity towards 1,3-diiodopropane (54). DrbA from SSG-III possesses extremely low or zero activity towards all tested compounds. Unique preference for 1-chlorobutane (4) and inactivity with otherwise good substrates are SSG-III characteristics. SSG-IV is mainly characterized by preference for terminally substituted brominated and iodinated propanes and butanes.
Figure 3 PCA of the transformed specific activity data. (A) Clustering of HLDs based on their activity with tested substrates in t1/t2 score plots. t1 and t2 are the PC scores of individual HLDs in the plane defined by PC1 and PC2. Depicted score plots are the two-dimensional windows into thirty-dimensional space explaining 47% and 46% data variance in the transformed datasets, respectively. Wild-type HLDs (left-hand panel) were divided into four SSGs: SSG-I (in red), SSG-II (in yellow), SSG-III (in green) and SSG-IV (in blue). Clusters are depicted by gray ovals. Analysis of merged data for both wild-type and mutant enzymes (right-hand panel) reveals that the specific activities of mutant HLDs were altered, but the mutants were clustered within the same SSGs as their 'parent' enzymes. Arrows indicate changes in substrate specificity caused by mutations. (B) Distribution of variables in p1/p2 loading plots corresponding to t1/t2 in (A). p1 and p2 are the PC loadings of corresponding variables (relative activities with particular substrates). The values quantify contributions of individual variables to given PCs. The variables contributing similar information are grouped together. The variables localized further from the origin possess the stronger effect on PC than the variables localized closer to the origin of the plot. Comparison of a score and a loading plot enables identification of variables (relative activities with particular substrates) responsible for clustering of enzymes.

Chapter 2
86
Table 1 Characteristics of the HLD SSGs
SSG:
Enzyme Converted
substrates Substrates characterizing SSG Preferred substrates
SSG-I:
DbjA DhaA DhlA LinB
26—29 NA
1,2-dibromoethane (47) 1,3-dibromopropane (48) 1-bromo-3-chloropropane (52) 1-bromo-2-chloroethane (137) 4-bromobutanenitrile (141)
SSG-II:
DmbA 23
↑↑↑↑ 2-iodobutane (64) ↑↑↑↑ 1-chloro-2-(2-chloroethoxy)ethane (111) ↑↑↑↑ chlorocyclopentane (138) ↓↓↓↓ 1-bromohexane (20) ↓↓↓↓ 1-iodohexane (31) ↓↓↓↓ 1,2-dibromopropane (72) ×××× 1,3-diiodopropane (54)
2-iodobutane (64) 1-chloro-2-(2-chloroethoxy)ethane (111)
SSG-III:
DrbA 17
↑↑↑↑ 1-chlorobutane (4) ×××× 1,3-dibromopropane (48) ×××× 1-bromo-3-chloropropane (52) ×××× 1,2,3-tribromopropane (154)
1-chlorobutane (4) 1-iodobutane (29) 1,3-diiodopropane (54) 2,3-dichloroprop-1-ene (225)
SSG-IV:
DatA DbeA DmbC
21—25 ↑↑↑↑ 1-bromobutane (18) ↑↑↑↑ 1,3-dibromopropane (48) ↓↓↓↓ 1-bromo-2-chloroethane (137) ↓↓↓↓ 2,3-dichloroprop-1-ene (225)
1-bromobutane (18) 1-iodopropane (28) 1,3-dibromopropane (48) 1-bromo-3-chloropropane (52)
'Substrates characterizing SSG' are compounds important for defining the specified SSG. 'Preferred substrates' are compounds converted at high relative rates by the members of the specified SSG under the described conditions. NA, not applicable; ↑↑↑↑, high relative activity; ↓↓↓↓, low relative activity; ××××, no activity under the conditions used.
Functional classification of mutant HLDs
In addition to the wild-type enzymes, four mutants (DbeA1, DbeA2, DbjA∆ and DhaA31; see Supplementary Table S5) were examined. The incorporation of these enzymes’ specificity data generated a new PCA model, whose top three biologically-significant PCs accounted for 58% of the total variance in the dataset (Supplementary Table S7). The incorporation of the data on the mutant enzymes did not affect the proposed functional classification of the HLDs (Figure 3A, right-hand panel), demonstrating the robustness of the model constructed for the wild-type enzymes. The engineered HLDs were found to cluster in the same SSG as their 'parent' enzymes.
The most pronounced difference between a mutant and its 'parent' in terms of substrate specificity was observed with DhaA31. Relative to DhaA, DhaA31 exhibits decreased relative activity towards longer substrates such as 1-bromohexane (20), 1-iodohexane (31) and

Substrate Specificity
87
increased relative activity towards 2-iodobutane (64), 1,2-dibromopropane (72) and 1,2,3-trichloro-propane (80). Compared with DbjA, DbjA∆ exhibited a loss of activity towards 2-iodobutane (64) and decreased relative activity towards 2-bromo-1-chloro-propane (76). However, it also exhibited a gain of activity towards 1,2-dibromo-3-chloropropane (155) and enhanced relative activity towards 1,3-diiodopropane (54), 1,2-dibromopropane (72) and 1-bromo-2-chloroethane (137). Relative to the 'parent' enzyme, the DbeA1 and DbeA2 mutants exhibited improved relative activity towards 1-bromobutane (18), 1-bromo-hexane (20) and 1,3-dibromopropane (48), and reduced relative activity towards 3-chloro-2-methylprop-1-ene (209), 1,5-dichloropentane (40), 2-iodo-butane (64), and 1,3-diiodopropane (54), which was the best substrate for the 'parent' DbeA.
Comparison of functional and evolutionary classifications of HLDs
The examined dataset included representatives of all three HLD phylogenetic subfamilies. The HLD-I subfamily was represented by a single enzyme, DhlA. The HLD-II subfamily was represented by six enzymes (DatA, DbeA, DbjA, DhaA, DmbA and LinB), while the HLD-III subfamily was represented by DmbC and DrbA. DbeA and DbjA have a protein sequence identity of 71% and are thus the most closely related pair of enzymes in the dataset, followed by DmbA and LinB, which show 68% protein sequence identity (Supplementary Table S8). On the other hand, the DbjA-DrbA and DhlA-DmbA pairs both have mutual protein sequence identities of 19%, and are thus the most dissimilar pairs of enzymes in the dataset.
A comparison of the phylogenetic tree with the substrate specificity dendrogram revealed that members of the same phylogenetic subfamily are spread across different SSGs (Figure 4). DhlA from the HLD-I subfamily is in SSG-I, along with the HLD-II subfamily members DbjA, DhaA and LinB. DmbA did not cluster together with its close relative LinB; instead, it forms a separate cluster, SSG-II. The other two HLD-II members, DbeA and DatA, are in SSG-IV together with DmbC from the HLD-III subfamily; the second representative of HLD-III, DrbA, is in its own specificity group, SSG-III. The Mantel test further confirmed the absence of a statistically significant correlation between the enzymes’ evolutionary relationships and their substrate specificity profiles (rs = – 0.286; P = 0.915).
Discussion
The biochemical characterization of nine HLDs with a set of 30 halogenated substrates, followed by multivariate statistical analysis, phylogenetic inference and structural comparisons, allowed us to investigate the relation-ships between the structure, function and evolution of this broad-specificity family of enzymes. The analysis of the substrate preferences of individual wild-type HLDs revealed that 1-bromobutane (18), 1-iodopropane (28), 1-iodobutane (29), 1,2-dibromoethane (47) and 4-bromobutanenitrile (141) are good substrates for all nine enzymes. These 'universal' substrates are suitable for screening or biochemical characterization of putative HLDs.

Chapter 2
88
Figure 4 Comparison of evolutionary and substrate specificity relationships of nine wild-type haloalkane dehalogenases. (A) The phylogenetic tree indicates that the HLDs are subdivided into three phylogenetic subfamilies: HLD-I, HLD-II and HLD-III. Individual subfamilies are shown in gray. (B) The dendrogram indicates that the HLDs can be classified into four SSGs: SSG-I, SSG-II, SSG-III and SSG-IV.
Substrate specificities of individual HLDs
PCA carried out with untransformed data ranked the enzymes according to their absolute activities along PC1. LinB and DbjA possess the highest activities of all the analyzed HLDs, and are thus the most suitable family members for mechanistic studies [4,13] and biotechnological applications [4-7]. At the other end of the spectrum, DatA, and especially DmbC and DrbA, have very low specific activities towards most of the tested substrates. In the case of DrbA and DmbC, this may be related to the unique composition of their catalytic pentad, Asp-His-Asp+Asn-Trp, [19] or their highly oligomeric structures [22]. Their low activity values may also reflect incompatibility with the selected class of substrates. Nonetheless, DrbA, which originates from a marine organism, exhibited good catalytic efficiency and high relative activity towards 1-iodobutane (29) [22] (Supplementary Tables S4 and S5); this compound is produced by marine algae, along with other iodinated compounds [48]. The low activity of DatA may be due to its unusual active site, in which a tyrosine residue takes the place of the tryptophan residue located next to the nucleophile. This tryptophan residue is typically involved in stabilizing the leaving halide in HLDs and is highly conserved in other members of the HLD family [19]. To date, DatA is the only characterized HLD to feature this exchange.
The distribution of HLDs along PC2 and PC3 highlighted certain unique functional properties of individual enzymes, such as the ability to convert resistant organic compounds or high activity towards specific substrates. Knowledge of these important catalytic properties is useful when selecting HLDs for use as biocatalysts or biosensing components. Relative to other HLDs, DhlA possesses a uniquely high activity towards 1,2-dichloroethane (37). DhlA is

Substrate Specificity
89
naturally produced by 1,2-dichloroethane-degrading micro-organisms [23], which have already been used successfully in a full-scale groundwater treatment plant [5]. DbjA is the only characterized HLD to exhibit significant activity towards the persistent compound 1,2-dichloropropane (67) (Supplementary Table S3). DhaA and DbjA can also convert the highly toxic environmental pollutant 1,2,3-trichloropropane (80), albeit at a slow rate (Supplementary Table S3). Enzymes having at least some activity towards a target compound can be further optimized by protein engineering [9]; the catalytic efficiency of DhaA towards 1,2,3-trichloropropane (80) has recently been improved by a factor of 26 by means of directed evolution [11], resulting in an efficient catalyst for biotechnological applications.
Functional and evolutionary classifications of HLDs
To examine the similarities and differences in the substrate specificities of the wild-type and mutant enzymes, the raw data were subjected to a transformation to suppress the obfuscating effects of the different absolute activities of individual enzymes. The wild-type HLDs were divided into four SSGs; SSG-I consisted of DbjA, DhaA, DhlA and LinB. It has been suggested in previous studies [26,49,50] that these enzymes belong in different specificity classes; our analysis suggests that the previously observed differences between the members of this group are relatively insignificant if one considers a broader range of enzymes and substrates. The common feature of the SSG-I enzymes is their catalytic robustness. In particular, the SSG-I members exhibited measurable activity towards most of the chlorinated compounds, suggesting that these HLDs can effectively stabilize a chloride leaving group. Kinetic analysis with 1-chlorobutane (4) revealed that SSG-I enzymes also exhibit higher turnover numbers than other tested HLDs (Supplementary Table S4). The highest specific activities observed with this group of enzymes were obtained with brominated ethanes and propanes. This is consistent with earlier studies, which showed that dibrominated compounds having low lowest unoccupied molecular orbital energies are efficiently and rapidly dehalogenated by HLDs [32,51,52].
Three SSG-I members, DbjA, DhaA and LinB, belong to the HLD-II subfamily. Notably, the substrate specificity profiles of these three enzymes are more similar to that of DhlA from the HLD-I subfamily than to those of the other three HLD-II members in the dataset, namely DmbA (which we classified into SSG-II), DatA, and DbeA (both classified into SSG-IV). The fact that DbeA and DmbA enzymes were not classified into SSG-I alongside their close evolutionary relatives DbjA and LinB demonstrates that a close evolutionary relationship between two HLDs does not necessarily imply that they will have similar activity and specificity profiles. At the time of writing, only 14 members of the HLD family have been experimentally characterized and shown to be dehalogenation-competent. However, a recent sequence database search and bioinformatics analysis identified more than 200 putative members of this family [Chovancova, E., unpublished work].
These results indicate that it is not possible to predict the substrate specificity of putative HLDs solely on the basis of sequence similarities with experimentally characterized family members. This observation is in correspondence with previous observations that a subtle change in the key active-site residues can lead to modulation or even a switch of enzyme

Chapter 2
90
substrate specificity [53,54]. Several mutants of LinB carrying a single point substitution at the opening of the access tunnel have been reported to have modified activities towards various halogenated substrates [13]. Similarly, a few mutations in the specificity-determining regions of HLDs have led to changes in substrate specificity during laboratory [55] and natural [56] evolution. We speculate that the incongruence between the phylogenetic and functional classifications of HLDs reflects a certain 'plasticity' of these enzymes. This would enable the host organisms to quickly evolve the capacity to convert novel substrates, which is essential for the adaptation of bacteria to various living environments. Statistical analysis of the merged data set of the wild-type and mutant dehalogenases demonstrated that developed PCA model can be used for classification of characterized members of the HLD family (Supplementary Figure S3). The prediction of the specificity group can be made for any newly isolated HLD with determined specificity profile using the protocols described in the Experimental section.
Structural determinants of substrate specificity in HLDs
We have previously proposed that the substrate specificity of individual HLDs is influenced by the architecture of their active-site cavities and the anatomy of their access tunnels [11,13,17,51,57,58]. The active-site cavities of DbjA [4] and LinB [17] are the largest of all HLDs whose structure is known, and both enzymes do indeed perform well with bigger substrates such as mono-halogenated butanes, pentanes, hexanes, cyclopentanes and cyclohexanes. The large active sites are also consistent with these enzymes’ very broad substrate specificity. The cavities of DhaA [16] and DmbA [18] are smaller and therefore cannot accommodate so readily these larger substrates. The smallest and most occluded active-site cavity is that of DhlA [15,59]; it is optimized for its 'natural' substrate, 1,2-dichloroethane (37). Notably, this enzyme shows enhanced activity towards other small substrates [59]. The key role of the access tunnels in controlling the specificity of HLDs was strikingly demonstrated in a recent directed evolution experiment which sought to improve the activity of DhaA towards 1,2,3-trichloropropane (80) [11]. A DhaA31 mutant carrying five substitutions in its access tunnels was prepared; this increased the occlusion of its active site, restricting the access of water molecules to the active site. In turn, the exclusion of water enhances the stability of the activated complex, enhancing the activity of the mutant towards halogenated ethanes and propanes. However, the mutant also exhibits decreased activity towards longer haloalkanes such as hexanes, presumably due to the steric hindrance between the alkyl chains of substrates and the large hydrophobic residues introduced in the access tunnels.
Comparative analysis of closely related HLDs provided further insight into the structural determinants of their substrate specificity. DmbA exhibits 68% sequence identity with LinB, but despite this these two enzymes were classified into different SSGs. While their catalytic residues are positioned identically [17,18], there are significant differences in the anatomies of their active-site cavities and main access tunnels, which might be responsible for the observed differences in substrate specificity (Figure 5A). DbeA and DbjA exhibit 71% sequence identity and provide a second example of a pair of closely related enzymes with different

Substrate Specificity
91
kinetic properties and substrate specificities (Supplementary Tables S4 and S3). Compared to DbeA, DbjA carries an insertion of nine amino acids between the main and cap domains [4]. A structural comparison of the two enzymes revealed that their active-site cavities and main access tunnels are structurally similar; the main structural difference lies in the conformational behavior of His139, which is located in close proximity to the insertion (Figure 5B). His139 adopts two alternative conformations in DbjA [4], but only one conformation in DbeA [Prudnikova, T., et al., in preparation]. The role of the conformational behavior of His139 in controlling the enzyme's specificity was probed using the deletion mutant DbjA∆. His139 adopts only one conformation in DbjA∆, resembling that observed in DbeA (Figure 5C). However, the mutant DbjA∆ retains the substrate specificity of DbjA, demonstrating that His139 does not play an essential role in controlling substrate specificity. This conclusion was further supported by an experiment using two mutants of DbeA, DbeA1 and DbeA2. These mutants were constructed to mimic the active site and the main access tunnel of DbjA [Chaloupková, R., et al., in preparation]. As was the case with DbjA∆, their substrate specificity profiles were more similar to their 'parent' enzyme, DbeA, than to the target protein DbjA.
By comparing wild-type and mutant HLDs, we were able to address an intriguing question, namely, whether it is possible to interconvert the substrate specificity of two HLDs by modifying their active-site cavities and main access tunnels. Even when the mutants had identical active-site and main tunnel residues with those observed in the target enzyme, switches in the mutants’ substrate specificity were not detected. The mutants all exhibited similar substrate specificity to their respective 'parent' enzymes, and were classified into the same SSGs as their 'parents' by PCA, indicating that our mutations did not target one or more of the the key determinants of HLD substrate specificity. Thus, the interconversion of substrate specificity remains one of the challenges for the rational design of HLDs. In addition to re-engineering of the active site and the main access tunnel, it may also be necessary to modify auxiliary access tunnels or tunnel openings [60], the distribution of charges on the protein’s surface [61,62], protein solvation [14], or protein dynamics [63].
Acknowledgements
We thank Tomáš Mozga and Radka Chaloupková (Masaryk University, Brno, Czech Republic), Pavlína Řezáčová (Institute of Molecular Genetics of the Academy of Sciences of the Czech Republic, Prague, Czech Republic), Tatyana Prudnikova and Ivana Kuta-Smatanová (Institute of Systems Biology and Ecology of the Academy of Sciences of the Czech Republic, Nove Hrady, Czech Republic) for providing their unpublished data for analysis, and Hana Moskalíková (Enantis Ltd., Brno, Czech Republic) for her help with the measurement of catalytic constants. This work was supported by the Ministry of Education, Youth and Sports of the Czech Republic [grant no. LC06010, MSM0021622412, MSM0021622413 and CZ.1.05/2.1.00/01.0001] (to T. K., J. J., J. B. and A. F. respectively)] and the Grant Agency of the Czech Academy of Sciences [grant number IAA401630901] (to J. D.) is also gratefully acknowledged.
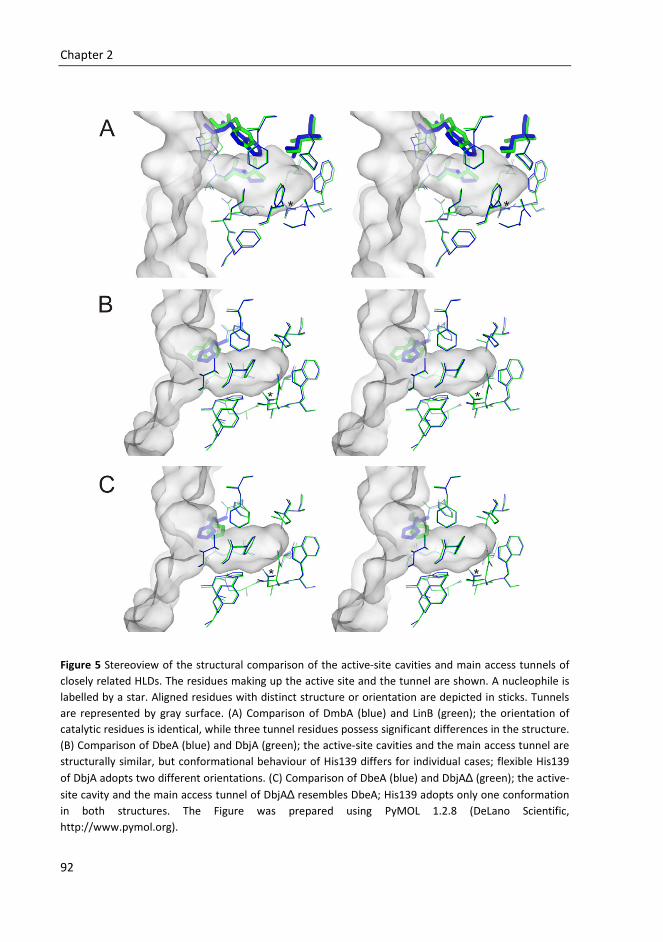
Chapter 2
92
Figure 5 Stereoview of the structural comparison of the active-site cavities and main access tunnels of closely related HLDs. The residues making up the active site and the tunnel are shown. A nucleophile is labelled by a star. Aligned residues with distinct structure or orientation are depicted in sticks. Tunnels are represented by gray surface. (A) Comparison of DmbA (blue) and LinB (green); the orientation of catalytic residues is identical, while three tunnel residues possess significant differences in the structure. (B) Comparison of DbeA (blue) and DbjA (green); the active-site cavities and the main access tunnel are structurally similar, but conformational behaviour of His139 differs for individual cases; flexible His139 of DbjA adopts two different orientations. (C) Comparison of DbeA (blue) and DbjA∆ (green); the active-site cavity and the main access tunnel of DbjA∆ resembles DbeA; His139 adopts only one conformation in both structures. The Figure was prepared using PyMOL 1.2.8 (DeLano Scientific, http://www.pymol.org).

Substrate Specificity
93
Author Contribution
T. K. determined activities of DhaA and DhlA, carried out PCA, interpreted the data and contributed to writing the manuscript. E. C. conducted phylogenetic analysis, interpreted the data and contributed to writing the manuscript. J. B. interpreted the data, conducted computer modeling and contributed to writing the manuscript. M. M. selected the set of substrates for testing, and determined activities and kinetic constants of DbjA and DmbA. A. F. determined activities of LinB. J. J. designed transformation of the primary data set, carried out the Mantel test and interpreted the data. J. D. designed the concept of the project, calculated molecular descriptors, interpreted the data and contributed to writing the manuscript.
References
[1] U. T. Bornscheuer, Adv Biochem Eng Biotechnol 2005, 100, 181-203. [2] J. C. Whisstock, A. M. Lesk, Q Rev Biophys 2003, 36, 307-340. [3] P. Swanson, Curr Opin Biotechnol 1999, 10, 365-369. [4] Z. Prokop, Y. Sato, J. Brezovsky, T. Mozga, R. Chaloupkova, T. Koudelakova, P.
Jerabek, V. Stepankova, R. Natsume, J. G. E. van Leeuwen, D. B. Janssen, J. Florian, Y. Nagata, T. Senda, J. Damborsky, Angew Chem Int Ed 2010, 49, 6111-6115.
[5] G. Stucki, M. Thuer, Environ Sci Technol 1995, 29, 2339-2345. [6] Z. Prokop, F. Oplustil, J. DeFrank, J. Damborsky, Biotechnol J 2006, 1, 1370-1380. [7] S. Bidmanova, R. Chaloupkova, J. Damborsky, Z. Prokop, Anal Bioanal Chem 2010,
398, 1891-1898. [8] G. Los, L. Encell, M. McDougall, D. Hartzell, N. Karassina, C. Zimprich, M. Wood, R.
Learish, R. Ohane, M. Urh, D. Simpson, J. Mendez, K. Zimmerman, P. Otto, G. Vidugiris, J. Zhu, A. Darzins, D. Klaubert, R. Bulleit, K. Wood, ACS Chem Biol 2008, 3, 373-382.
[9] T. Bosma, J. Damborsky, G. Stucki, D. Janssen, Appl Environ Microbiol 2002, 68, 3582-3587.
[10] K. Gray, T. Richardson, K. Kretz, J. Short, F. Bartnek, R. Knowles, L. Kan, P. Swanson, D. Robertson, Adv Synth Catal 2001, 343, 607-617.
[11] M. Pavlova, M. Klvana, Z. Prokop, R. Chaloupkova, P. Banas, M. Otyepka, R. C. Wade, M. Tsuda, Y. Nagata, J. Damborsky, Nat Chem Biol 2009, 5, 727-733.
[12] M. G. Pikkemaat, D. B. Janssen, Nucleic Acids Res 2002, 30, E35-35. [13] R. Chaloupkova, J. Sykorova, Z. Prokop, A. Jesenska, M. Monincova, M. Pavlova, M.
Tsuda, Y. Nagata, J. Damborsky, J Biol Chem 2003, 278, 52622-52628. [14] M. Klvana, M. Pavlova, T. Koudelakova, R. Chaloupkova, P. Dvorak, Z. Prokop, A.
Stsiapanava, M. Kuty, I. Kuta-Smatanova, J. Dohnalek, P. Kulhanek, R. C. Wade, J. Damborsky, J Mol Biol 2009, 392, 1339-1356.
[15] K. H. Verschueren, F. Seljée, H. J. Rozeboom, K. H. Kalk, B. W. Dijkstra, Nature 1993, 363, 693-698.
[16] J. Newman, T. S. Peat, R. Richard, L. Kan, P. E. Swanson, J. A. Affholter, I. H. Holmes, J. F. Schindler, C. J. Unkefer, T. C. Terwilliger, Biochemistry 1999, 38, 16105-16114.

Chapter 2
94
[17] J. Marek, J. Vevodova, I. K. Smatanova, Y. Nagata, L. A. Svensson, J. Newman, M. Takagi, J. Damborsky, Biochemistry 2000, 39, 14082-14086.
[18] P. A. Mazumdar, J. C. Hulecki, M. M. Cherney, C. R. Garen, M. N. G. James, Biochim
Biophys Acta 2008, 1784, 351-362. [19] E. Chovancova, J. Kosinski, J. M. Bujnicki, J. Damborsky, Proteins 2007, 67, 305-316. [20] A. Jesenska, M. Bartos, V. Czernekova, I. Rychlik, I. Pavlik, J. Damborsky, Appl Environ
Microbiol 2002, 68, 3724-3730. [21] A. Jesenska, M. Pavlova, M. Strouhal, R. Chaloupkova, I. Tesinska, M. Monincova, Z.
Prokop, M. Bartos, I. Pavlik, I. Rychlik, P. Möbius, Y. Nagata, J. Damborsky, Appl
Environ Microbiol 2005, 71, 6736-6745. [22] A. Jesenska, M. Monincova, T. Koudelakova, K. Hasan, R. Chaloupkova, Z. Prokop, A.
Geerlof, J. Damborsky, Appl Environ Microbiol 2009, 75, 5157-5160. [23] S. Keuning, D. B. Janssen, B. Witholt, J Bacteriol 1985, 163, 635-639. [24] A. N. Kulakova, M. J. Larkin, L. A. Kulakov, Microbiology 1997, 143, 109-115. [25] Y. Nagata, K. Hynkova, J. Damborsky, M. Takagi, Protein Expr Purif 1999, 17, 299-304. [26] Y. Sato, M. Monincova, R. Chaloupkova, Z. Prokop, Y. Ohtsubo, K. Minamisawa, M.
Tsuda, J. Damborsky, Y. Nagata, Appl Environ Microbiol 2005, 71, 4372-4379. [27] W. Y. Chan, M. Wong, J. Guthrie, A. V. Savchenko, A. F. Yakunin, E. F. Pai, E. A.
Edwards, Microb Biotechnol 2010, 3, 107-120. [28] Y. Nagata, T. Nariya, R. Ohtomo, M. Fukuda, K. Yano, M. Takagi, J Bacteriol 1993, 175,
6403-6410. [29] K. Hasan, A. Fortova, T. Koudelakova, R. Chaloupkova, M. Ishitsuka, Y. Nagata, J.
Damborsky, Z. Prokop, Appl Environ Microbiol 2011, 77, 1881-1884. [30] H. Curragh, O. Flynn, M. J. Larkin, T. M. Stafford, J. T. Hamilton, D. B. Harper,
Microbiology 1994, 140, 1433-1442. [31] J. Damborsky, E. Rorije, A. Jesenska, Y. Nagata, G. Klopman, W. J. Peijnenburg,
Environ Toxicol Chem 2001, 20, 2681-2689. [32] J. P. Schanstra, J. Kingma, D. B. Janssen, J Biol Chem 1996, 271, 14747-14753. [33] I. Iwasaki, S. Utsumi, T. Ozawa, Bull Chem Soc Jpn 1952, 25, 226-226. [34] L. Eriksson, H. Antti, J. Gottfries, E. Holmes, E. Johansson, F. Lindgren, I. Long, T.
Lundstedt, J. Trygg, S. Wold, Anal Bioanal Chem 2004, 380, 419-429. [35] S. Wold, K. Esbensen, P. Geladi, Chemometr Intell Lab 1987, 2, 37-52. [36] L. Eriksson, E. Johansson, N. Kettaneh-Wold, S. Wold, Introduction to Multi- and
Megavariate Data Analysis Using Projection Methods (PCA & PLS), Umetrics, Umea, 1999.
[37] N. Saitou, M. Nei, Mol Biol Evol 1987, 4, 406-425. [38] A. Drummond, K. Strimmer, Bioinformatics 2001, 17, 662-663. [39] E. W. Sayers, T. Barrett, D. A. Benson, S. H. Bryant, K. Canese, V. Chetvernin, D. M.
Church, M. DiCuccio, R. Edgar, S. Federhen, M. Feolo, L. Y. Geer, W. Helmberg, Y. Kapustin, D. Landsman, D. J. Lipman, T. L. Madden, D. R. Maglott, V. Miller, I. Mizrachi, J. Ostell, K. D. Pruitt, G. D. Schuler, E. Sequeira, S. T. Sherry, M. Shumway, K. Sirotkin, A. Souvorov, G. Starchenko, T. A. Tatusova, L. Wagner, E. Yaschenko, J. Ye, Nucleic Acids Res 2009, 37, D5-D15.
[40] S. F. Altschul, T. L. Madden, A. A. Schäffer, J. Zhang, Z. Zhang, W. Miller, D. J. Lipman, Nucleic Acids Res 1997, 25, 3389-3402.

Substrate Specificity
95
[41] T. Frickey, A. Lupas, Bioinformatics 2004, 20, 3702-3704. [42] R. C. Edgar, Nucleic Acids Res 2004, 32, 1792-1797. [43] T. Hall, Nucleic Acids Symp Ser 1999, 41, 95-98. [44] F. Abascal, R. Zardoya, D. Posada, Bioinformatics 2005, 21, 2104-2105. [45] S. Whelan, N. Goldman, Mol Biol Evol 2001, 18, 691-699. [46] K. Hornik, F. Leisch, Comp Stat 2005, 20, 197-202. [47] R. A. van den Berg, H. C. J. Hoefsloot, J. A. Westerhuis, A. K. Smilde, M. J. van der
Werf, BMC Genomics 2006, 7, 142. [48] G. W. Gribble, Chemosphere 2003, 52, 289-297. [49] J. Damborsky, M. G. Nyandoroh, M. Nemec, I. Holoubek, A. T. Bull, D. J. Hardman,
Biotechnol Appl Biochem 1997, 26, 19-25. [50] Y. Nagata, K. Miyauchi, J. Damborsky, K. Manova, A. Ansorgova, M. Takagi, Appl
Environ Microbiol 1997, 63, 3707-3710. [51] J. Kmunicek, K. Hynkova, T. Jedlicka, Y. Nagata, A. Negri, F. Gago, R. C. Wade, J.
Damborsky, Biochemistry 2005, 44, 3390-3401. [52] T. Bosma, M. G. Pikkemaat, J. Kingma, J. Dijk, D. B. Janssen, Biochemistry 2003, 42,
8047-8053. [53] T. M. Penning, J. M. Jez, Chem Rev 2001, 101, 3027-3046. [54] K. L. Morley, R. J. Kazlauskas, Trends Biotechnol 2005, 23, 231-237. [55] F. Pries, A. J. van den Wijngaard, R. Bos, M. Pentenga, D. B. Janssen, J Biol Chem
1994, 269, 17490-17494. [56] M. Ito, Z. Prokop, M. Klvana, Y. Otsubo, M. Tsuda, J. Damborsky, Y. Nagata, Arch
Microbiol 2007, 188, 313-325. [57] M. Silberstein, J. Damborsky, S. Vajda, Biochemistry 2007, 46, 9239-9249. [58] J. Damborsky, J. Brezovsky, Curr Opin Chem Biol 2009, 13, 26-34. [59] J. Kmunicek, S. Luengo, F. Gago, A. R. Ortiz, R. C. Wade, J. Damborsky, Biochemistry
2001, 40, 8905-8917. [60] M. Petrek, M. Otyepka, P. Banás, P. Kosinová, J. Koca, J. Damborský, BMC
Bioinformatics 2006, 7, 316. [61] A. J. Russell, A. R. Fersht, Nature 1987, 328, 496-500. [62] A. de Kreij, B. van den Burg, G. Venema, G. Vriend, V. G. H. Eijsink, J. E. Nielsen, J Biol
Chem 2002, 277, 15432 -15438. [63] N. Ota, D. A. Agard, Protein Sci 2001, 10, 1403-1414.

Chapter 2S
96

97
2S
Substrate specificity of
haloalkane dehalogenases
Supplementary information
Eva Chovancová*, Táňa Koudeláková*, Jan Brezovský, Marta Monincová, Andrea Fořtová, Jiří Jarkovský and Jiří Damborský
*These authors contributed equally to this work
Biochemical Journal 435: 345-354 (2011)

Chapter 2S
98
Supplementary experimental
Selection of halogenated compounds
The compiled list of potential substrates consisted of 194 halogenated compounds, including chloro-, bromo-, and iodoalkanes; saturated and non-saturated species; mono-, di- and tri-halogenated species; and alcohols, ethers, carboxylic acids, amino and cyano compounds. Compounds, which are known to not be viable substrates for haloalkane dehalogenases (namely species halogenated at sp
2 carbons, species bearing multiple halides on a single carbon, fluorinated species, and aryl halides) were excluded from the list, as were compounds having unsuitable physico-chemical properties (low solubility in water, extreme volatility, boiling points lower than 37 °C and quick spontaneous hydrolysis). After this pre-selection process, a set of 109 compounds remained for use in experimental design.
Multivariate characterization and definition of design variables
The structures of 109 halogenated substrates were built using the molecular modeling package Insight II, version 95 (Accelrys, San Diego, USA), and then refined by molecular mechanics optimization. Full energy minimization of the structures was achieved using the Gaussian '98 quantum chemistry software package (Gaussian, Wallingford, USA). Molecular descriptors for multivariate characterization were calculated using TSAR coupled with VAMP, version 3.1 (Oxford Molecular, Oxford, Great Britain). The set of 24 calculated descriptors was complemented by four physico-chemical properties compiled from the Sigma-Aldrich handbook (Supplementary Table S6).
Selection of the set of 30 halogenated compounds for experimental
testing
PCA [1] was applied to a dataset containing 109 halogenated compounds and 28 physicochemical descriptors (independent variables). The data were centred and scaled to unit variance prior to PCA. Four latent variables (scores) that summarize the original variables in the data matrix were constructed and used as principal properties for the 24 factorial design. PCA resulted in the selection of 30 substrates for experimental testing. This final training set of 30 substrates exhibited maximal variability in terms of the substrates’ physicochemical properties.

Substrate Specificity - Supplementary Information
99
Supplementary Figure S1 p1 loading and t1 score plots from the PCA of the untransformed specific activity data. (A) p1 loading plot for the substrates corresponding to the score plot t1 (B). p1 shows the loadings of PC1; higher value suggests more significant impact of the variable on PC1. PC1 is influenced by activities with majority of tested substrates and individual enzymes are therefore distributed according to their overall activity along PC1 in t1 score plot. (B) t1 score plot shows the scores of individual HLDs along PC1. HLDs are ordered according to their overall activity: DrbA, DmbC and DatA < DmbA, DbeA, DhaA and DhlA < DbjA and LinB.
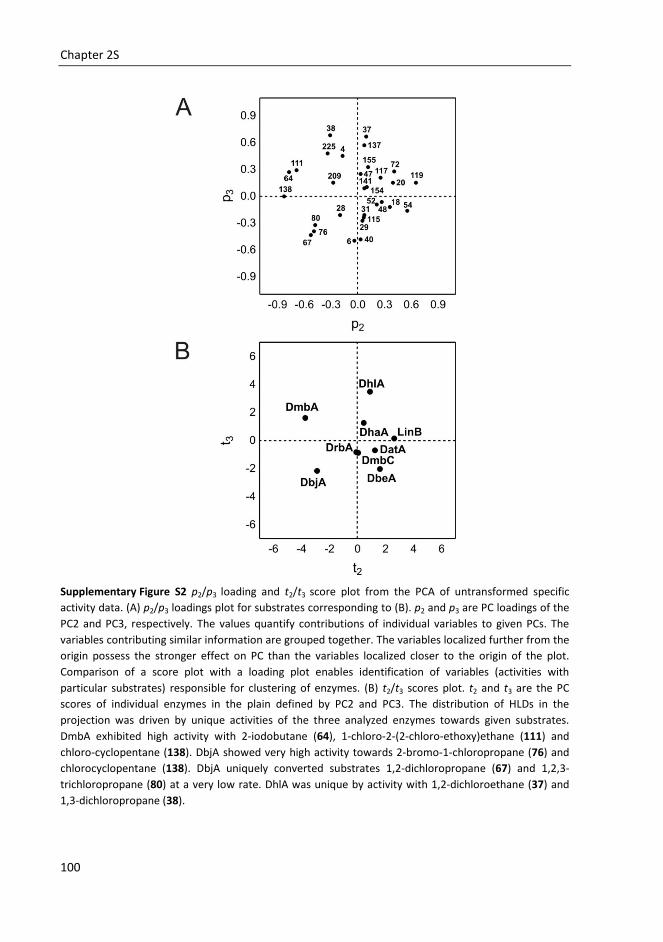
Chapter 2S
100
Supplementary Figure S2 p2/p3 loading and t2/t3 score plot from the PCA of untransformed specific activity data. (A) p2/p3 loadings plot for substrates corresponding to (B). p2 and p3 are PC loadings of the PC2 and PC3, respectively. The values quantify contributions of individual variables to given PCs. The variables contributing similar information are grouped together. The variables localized further from the origin possess the stronger effect on PC than the variables localized closer to the origin of the plot. Comparison of a score plot with a loading plot enables identification of variables (activities with particular substrates) responsible for clustering of enzymes. (B) t2/t3 scores plot. t2 and t3 are the PC scores of individual enzymes in the plain defined by PC2 and PC3. The distribution of HLDs in the projection was driven by unique activities of the three analyzed enzymes towards given substrates. DmbA exhibited high activity with 2-iodobutane (64), 1-chloro-2-(2-chloro-ethoxy)ethane (111) and chloro-cyclopentane (138). DbjA showed very high activity towards 2-bromo-1-chloropropane (76) and chlorocyclopentane (138). DbjA uniquely converted substrates 1,2-dichloropropane (67) and 1,2,3-trichloropropane (80) at a very low rate. DhlA was unique by activity with 1,2-dichloroethane (37) and 1,3-dichloropropane (38).

Substrate Specificity - Supplementary Information
101
Supplementary Figure S3 t1/t2/t3 score plots from the PCA of transformed specific activity data. The distribution of HLDs in the projections was driven by their specificity profiles towards thirty substrates. t1, t2 and t3 are the scores of individual HLDs in the space defined by PC1, PC2 and PC3. (A) Wild-type HLDs were clustered into four SSGs. The scores of PC3 support the separation of DmbA and DrbA into separate groups. (B) The wild-type enzymes were clustered to the same substrate specificity groups even in the analysis of the merged dataset of wild-type and mutant HLDs. Constructed model is sufficiently robust for classification of newly characterized enzymes.

Chapter 2S
102
Supplementary Table S1 Wild-type HLDs included in the analysis
Enzyme
GenBank
accession
number
Source organism Type of organism PDB-ID Ref.
DatA Q8U671 Agrobacterium
tumefaciens C58 G-, plant pathogen, soil bacterium
NA [2]a
DbeA BAJ23986 Bradyrhizobium
elkanii USDA94 G-, N2-fixing soil bacterium
NA IPa
DbjA NP_767727 Bradyrhizobium
japonicum USDA110 G-, N2-fixing soil bacterium
3A2M [3]a, [4]b
DhaA P0A3G2 Rhodococcus
rhodochrous NCIMB 13064
G+, soil bacterium degrading 1-chlorobutane
1CQW [5]a, [6]b
DhlA P22643 Xanthobacter
autotrophicus GJ10
G-, N2-fixing soil bacterium degrading 1,2-dichloroethane
1EDE [7]a, [8]b
DmbA AAK46969 Mycobacterium
bovis 5033/66 G+, animal pathogen 2QVB [9]a, [10]b
DmbC NP_216349 Mycobacterium
bovis 5033/66 G+, animal pathogen NA [11]a
DrbA NP_869327 Rhodopirellula
baltica SH1 Marine bacterium NA [11]a
LinB BAA03443 Sphingobium
japonicum UT26 G-, soil bacterium degrading lindane
1CV2 [12]a, [13]b
aBiochemical characterization; bStructural characterization; G+, Gram-positive; G-, Gram-negative; NA, structure not available; IP, Prudnikova, T., et al., in preparation.
Supplementary Table S2 Engineered HLDs included in the analysis
Mutant Mutations Parent enzyme Approach PDB-ID Ref.
DbeA1 Insertion between residues 142 and 143: VAEEQDHAE
DbeA Rational design NAa IP
DbeA2 Insertion between residues 141 and 142: EVAEEQDHA
DbeA Rational design NAa IP
DbjAΔ Deletion H140TEVAEE146 DbjA Rational design 3A2L [4]
DhaA31 I135F, C176Y, V245F, L246I, Y273F
DhaA
Focused directed evolution
NAa
[14]
NA, structure not available; IP, Chaloupková, R., et al., in preparation.

Supplementary Table S3 Specific activities of DbjA, DhaA, DhlA, DmbA and LinBa
No. Substrates [S0] (mM) Specific activity (nmol s-1 mg-1)
DbjA DhaA DhlA DmbA LinB
4 1-chlorobutane 3.8 ± 0.31 13.3 ± 2.62 12.8 ± 1.07 11.7 ± 1.17 17.1 ± 3.88 23.1 ± 0.51 6 1-chlorohexane 0.9 ± 0.12 37.0 ± 2.10 6.5 ± 1.61 1.3 ± 0.09 2.9 ± 0.66 27.0 ± 0.33
18 1-bromobutane 7.0 ± 0.35 29.7 ± 2.62 11.6 ± 0.45 19.9 ± 2.38 6.6 ± 0.55 48.9 ± 3.25 20 1-bromohexane 4.2 ± 0.49 24.5 ± 2.28 13.9 ± 1.40 29.2 ± 2.07 1.8 ± 0.18 29.3 ± 0.77 28 1-iodopropane 3.3 ± 0.33 75.0 ± 5.46 22.8 ± 1.03 14.1 ± 0.27 31.8 ± 0.97 66.5 ± 4.27 29 1-iodobutane 1.5 ± 0.75 56.0 ± 3.32 14.8 ± 0.32 13.6 ± 1.64 7.9 ± 1.02 56.5 ± 4.04 31 1-iodohexane 0.4 ± 0.07 45.7 ± 0.73 12.0 ± 1.98 13.9 ± 0.56 2.9 ± 0.24 46.0 ± 0.37 37 1,2-dichloroethane 10.9 ± 0.11 8.4 ± 3.21 1.1 ± 0.16 66.7 ± 3.18 ND ND 38 1,3-dichloropropane 9.5 ± 0.15 32.3 ± 2.64 21.8 ± 0.48 50.4 ± 0.85 28.3 ± 3.15 20.4 ± 0.15 40 1,5-dichloropentane 4.9 ± 1.32 33.4 ± 0.75 8.6 ± 1.68 2.1 ± 0.15 5.7 ± 0.37 28.8 ± 0.97 47 1,2-dibromoethane 12.1 ± 2.49 92.8 ± 5.34 64.8 ± 2.27 64.3 ± 2.60 41.9 ± 7.73 133.4 ± 8.25 48 1,3-dibromopropane 3.7 ± 1.04 69.7 ± 3.39 20.0 ± 0.91 45.1 ± 1.03 9.3 ± 0.07 92.5 ± 2.85 52 1-bromo-3-chloropropane 7.6 ± 0.59 67.0 ± 6.29 22.2 ± 0.35 38.4 ± 1.36 15.8 ± 0.05 86.0 ± 3.36 54 1,3-diiodopropane 1.0 ± 0.09 44.4 ± 0.63 39.1 ± 2.48 28.6 ± 1.11 ND 47.9 ± 5.63 64 2-iodobutane 1.8 ± 0.20 33.9 ± 0.10 7.0 ± 0.97 4.0 ± 0.45 154.4 ± 6.49 10.1 ± 1.16 67 1,2-dichloropropane 8.4 ± 0.03 3.5 ± 0.67 ND ND ND ND 72 1,2-dibromopropane 4.9 ± 1.98 19.7 ± 1.11 36.5 ± 1.40 23.6 ± 1.21 0.6 ± 0.07 62.5 ± 1.60 76 2-bromo-1-chloropropane 5.6 ± 2.09 419.7 ± 41.63 19.5 ± 1.68 17.6 ± 0.62 18.5 ± 3.34 59.9 ± 2.08 80 1,2,3-trichloropropane 8.5 ± 0.16 4.5 ± 0.04 1.8 ± 0.38 ND ND ND
111 1-chloro-2-(2-chloroethoxy)ethane 5.3 ± 0.84 16.3 ± 0.72 9.1 ± 0.89 ND 87.5 ± 5.55 17.7 ± 0.06 115 Chlorocyclohexane 2.2 ± 0.42 5.7 ± 0.50 0.7 ± 0.13 ND ND 7.4 ± 0.33 117 Bromocyclohexane 1.3 ± 0.51 15.0 ± 1.50 2.3 ± 0.14 17.2 ± 1.57 3.1 ± 0.09 24.9 ± 0.36 119 (bromomethyl)cyclohexane 0.3 ± 0.06 ND 2.3 ± 0.35 3.7 ± 0.47 ND 8.5 ± 0.13 137 1-bromo-2-chloroethane 8.0 ± 0.00 49.3 ± 4.56 74.9 ± 3.69 72.5 ± 3.22 45.2 ± 0.66 94.0 ± 2.22 138 Chlorocyclopentane 1.7 ± 0.10 22.3 ± 0.09 5.3 ± 0.49 2.9 ± 0.40 22.7 ± 0.46 5.9 ± 0.76 141 4-bromobutanenitrile 10.4 ± 0.50 77.3 ± 2.32 39.6 ± 1.29 63.3 ± 0.13 7.9 ± 0.69 57.8 ± 2.76 154 1,2,3-tribromopropane 1.0 ± 0.55 40.4 ± 5.84 49.7 ± 3.25 5.9 ± 0.51 29.9 ± 3.30 93.6 ± 2.28 155 1,2-dibromo-3-chloropropane 2.8 ± 0.23 ND 45.1 ± 0.73 5.7 ± 0.49 ND ND 209 3-chloro-2-methylprop-1-ene 4.0 ± 0.50 57.2 ± 0.75 15.5 ± 1.70 38.0 ± 2.32 19.9 ± 2.44 35.1 ± 2.70 225 2,3-dichloroprop-1-ene 2.7 ± 1.19 53.6 ± 4.12 23.9 ± 1.48 62.3 ± 1.53 22.5 ± 2.34 15.5 ± 0.73
Reaction mixtures were prepared by dissolving 10 µl of substrate (purity ≥95%) in 10 ml of 100 mM glycine buffer (pH 8.6). The mixtures were incubated in 25 ml Microflasks closed by Mininert Valves at 37 °C in a shaking bath for 30 min. Initial concentration of the substrates were determined for the samples withdrawn at time 0 min by GC. The values from at least duplicate measurements are given together with the SD. a1-chlorobutane or 1-iodobutane assayed at different concentrations (Supplementary Table S4), ND , activity not detected under used conditions; SD, standard deviation.

Chapter 2S
104
Supplementary Table S4 Kinetic parameters for HLDs
Enzyme Substrate Km (mM) kcat (s-1
) kcat/Km (mM-1
.s-1
) Reference
DatA 1-Iodobutane 0.04a 0.55b 13.75 This study
DbeA 1-Chlorobutane 3.23 0.17 0.05 IP
DbjA 1-Chlorobutane 4.02c 1.40d 0.35 This study
DhaA 1-Chlorobutane 0.40 0.86 2.15 [15]
DhlA 1-Chlorobutane 2.20 1.50 0.68 [16]
DmbA 1-Chlorobutane 1.56e 0.60f 0.38 This study
DmbC 1-Iodobutane 0.02 0.08 4.00 [11]
DrbA 1-Iodobutane 0.06 0.13 2.17 [11]
LinB 1-Chlorobutane 0.14 0.98 7.00 [17]
Michaelis-Menten kinetic constants were determined as described in the Experimental section. The initial activity measurements were carried out at nine different substrate concentrations. The highest substrate concentration was used as the abiotic control. The initial substrate concentration was determined by GC. The kinetic constants Km and kcat were calculated using a non-linear fitting in the program Origin version 6.1 (OriginLab, Northampton, MA, USA). aSE 0.012 mM, bSE 0.035 s-1, cSE 1.830 mM, dSE 0.415 s-1, eSE 0.359 mM, fSE 0.048 s-1, Abbreviations: IP, Prudnikova, T, et al., unpublished work; SE, standard error of the fit.

Supplementary Table S5 Transformed specific activity data for nine wild-type and four engineered HLDs
No. Substrates Wild-type enzymes Engineered enzymes
DatA DbeA DbjA DhaA DhlA DmbA DmbC DrbA LinB DbeA1 DbeA2 DbjAΔ DhaA31
4 1-chlorobutane 0.0025 0.0023 0.0100 0.0214 0.0166 0.0300 0.0053 0.1029 0.0197 0.0014 0.0013 0.0062 0.0087 6 1-chlorohexane 0.0068 0.0494 0.0275 0.0108 0.0018 0.0052 0.0053 0.0455 0.0229 0.0305 0.0326 0.0350 0.0014
18 1-bromobutane 0.0702 0.0694 0.0222 0.0194 0.0282 0.0116 0.0527 0.0286 0.0412 0.1214 0.1569 0.0357 0.0187 20 1-bromohexane 0.1280 0.0414 0.0183 0.0232 0.0411 0.0032 0.0422 0.0641 0.0249 0.0941 0.1155 0.0256 0.0041 28 1-iodopropane 0.0591 0.0641 0.0547 0.0379 0.0200 0.0553 0.0948 0.0506 0.0555 0.0754 0.0770 0.0235 0.0369 29 1-iodobutane 0.0480 0.0552 0.0412 0.0248 0.0194 0.0140 0.1106 0.1789 0.0474 0.0727 0.0578 0.0171 0.0161 31 1-iodohexane 0.0292 0.0365 0.0338 0.0201 0.0197 0.0051 0.0105 0.0337 0.0388 0.0492 0.0587 0.0133 0.0032 37 1,2-dichloroethane 0.0025 0.0000 0.0063 0.0018 0.0923 0.0000 0.0000 0.0000 0.0000 0.0000 0.0000 0.0000 0.0010 38 1,3-dichloropropane 0.0007 0.0000 0.0240 0.0363 0.0703 0.0493 0.0005 0.0000 0.0174 0.0000 0.0000 0.0103 0.0407 40 1,5-dichloropentane 0.0412 0.0579 0.0248 0.0144 0.0029 0.0101 0.0026 0.0000 0.0244 0.0312 0.0260 0.0171 0.0026 47 1,2-dibromoethane 0.0249 0.0239 0.0671 0.1057 0.0890 0.0726 0.0369 0.0348 0.1080 0.0404 0.0397 0.1298 0.1280 48 1,3-dibromopropane 0.1972 0.0830 0.0509 0.0334 0.0631 0.0164 0.2156 0.0000 0.0763 0.1440 0.1466 0.1240 0.0274 52 1-bromo-3-chloropropane 0.1474 0.0965 0.0490 0.0370 0.0538 0.0278 0.0632 0.0000 0.0712 0.1071 0.0996 0.0747 0.0327 54 1,3-diiodopropane 0.0489 0.2097 0.0106 0.0646 0.0403 0.0000 0.2890 0.1267 0.0403 0.1064 0.0862 0.0690 0.0235 64 2-iodobutane 0.0000 0.0041 0.0252 0.0117 0.0058 0.2539 0.0000 0.0098 0.0087 0.0000 0.0000 0.0000 0.0328 67 1,2-dichloropropane 0.0000 0.0000 0.0026 0.0000 0.0000 0.0000 0.0000 0.0000 0.0000 0.0000 0.0000 0.0000 0.0006 72 1,2-dibromopropane 0.0155 0.0077 0.0148 0.0604 0.0333 0.0010 0.0105 0.0523 0.0523 0.0083 0.0067 0.0481 0.1056 76 2-bromo-1-chloropropane 0.0052 0.0032 0.2650 0.0324 0.0250 0.0325 0.0211 0.0321 0.0502 0.0043 0.0049 0.0273 0.0886 80 1,2,3-trichloropropane 0.0000 0.0000 0.0034 0.0031 0.0000 0.0000 0.0000 0.0000 0.0000 0.0000 0.0000 0.0000 0.0210
111 1-chloro-2-(2-chloroethoxy)ethane 0.0000 0.0028 0.0122 0.0153 0.0000 0.1484 0.0000 0.0000 0.0151 0.0019 0.0000 0.0042 0.0141 115 chlorocyclohexane 0.0000 0.0000 0.0043 0.0012 0.0000 0.0000 0.0000 0.0000 0.0064 0.0000 0.0000 0.0011 0.0003 117 bromocyclohexane 0.0215 0.0127 0.0113 0.0038 0.0244 0.0054 0.0000 0.0091 0.0212 0.0076 0.0058 0.0096 0.0076 119 (bromomethyl)cyclohexane 0.0779 0.0027 0.0000 0.0038 0.0053 0.0000 0.0038 0.0000 0.0073 0.0036 0.0018 0.0000 0.0024 137 1-bromo-2-chloroethane 0.0189 0.0221 0.0364 0.1216 0.1000 0.0782 0.0048 0.0590 0.0774 0.0187 0.0135 0.1125 0.1289 138 chlorocyclopentane 0.0082 0.0077 0.0166 0.0089 0.0041 0.0398 0.0000 0.0000 0.0050 0.0036 0.0081 0.0069 0.0074 141 4-bromobutanenitrile 0.0197 0.0957 0.0563 0.0654 0.0877 0.0139 0.0192 0.0708 0.0485 0.0619 0.0459 0.0878 0.0356 154 1,2,3-tribromopropane 0.0120 0.0140 0.0300 0.0817 0.0085 0.0522 0.0096 0.0000 0.0772 0.0032 0.0031 0.0488 0.1008 155 1,2-dibromo-3-chloropropane 0.0070 0.0059 0.0000 0.0742 0.0081 0.0000 0.0019 0.0035 0.0000 0.0022 0.0027 0.0398 0.0859 209 3-chloro-2-methylprop-1-ene 0.0076 0.0262 0.0420 0.0259 0.0532 0.0349 0.0000 0.0000 0.0297 0.0051 0.0054 0.0218 0.0134 225 2,3-dichloroprop-1-ene 0.0000 0.0059 0.0395 0.0397 0.0863 0.0393 0.0000 0.0977 0.0133 0.0058 0.0040 0.0110 0.0101
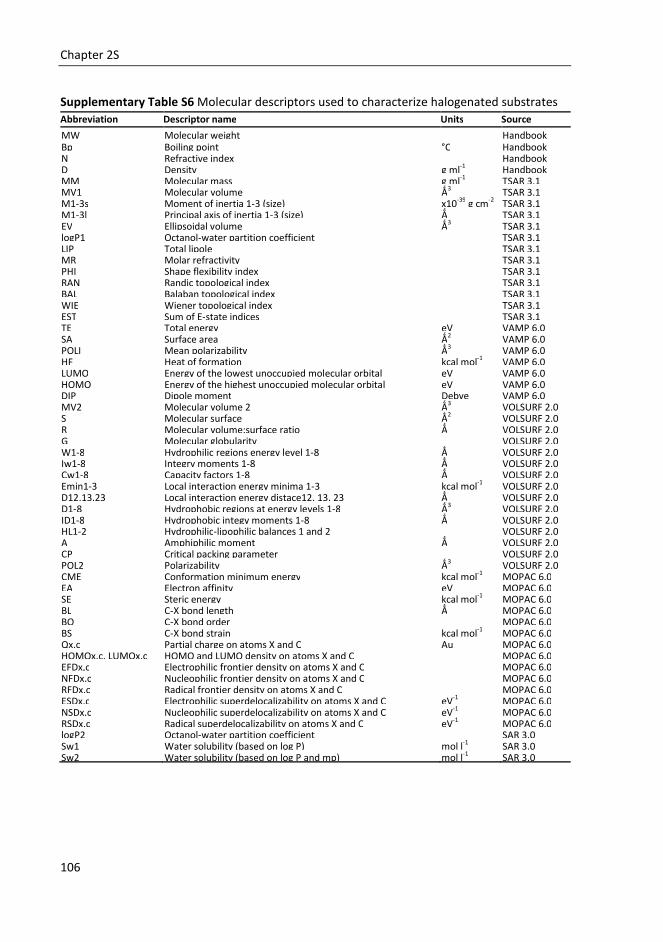
Chapter 2S
106
Supplementary Table S6 Molecular descriptors used to characterize halogenated substrates Abbreviation Descriptor name Units Source
MW Molecular weight Handbook Bp Boiling point °C Handbook N Refractive index Handbook D Density g ml-1 Handbook MM Molecular mass g ml-1 TSAR 3.1 MV1 Molecular volume Ǻ3 TSAR 3.1 M1-3s Moment of inertia 1-3 (size) x10-39 g cm-2 TSAR 3.1 M1-3l Principal axis of inertia 1-3 (size) Ǻ TSAR 3.1 EV Ellipsoidal volume Ǻ3 TSAR 3.1 logP1 Octanol-water partition coefficient TSAR 3.1 LIP Total lipole TSAR 3.1 MR Molar refractivity TSAR 3.1 PHI Shape flexibility index TSAR 3.1 RAN Randic topological index TSAR 3.1 BAL Balaban topological index TSAR 3.1 WIE Wiener topological index TSAR 3.1 EST Sum of E-state indices TSAR 3.1 TE Total energy eV VAMP 6.0 SA Surface area Ǻ2 VAMP 6.0 POLI Mean polarizability Ǻ3 VAMP 6.0 HF Heat of formation kcal mol-1 VAMP 6.0 LUMO Energy of the lowest unoccupied molecular orbital eV VAMP 6.0 HOMO Energy of the highest unoccupied molecular orbital eV VAMP 6.0 DIP Dipole moment Debye VAMP 6.0 MV2 Molecular volume 2 Ǻ3 VOLSURF 2.0 S Molecular surface Ǻ2 VOLSURF 2.0 R Molecular volume:surface ratio Ǻ VOLSURF 2.0 G Molecular globularity VOLSURF 2.0 W1-8 Hydrophilic regions energy level 1-8 Ǻ VOLSURF 2.0 Iw1-8 Integry moments 1-8 Ǻ VOLSURF 2.0 Cw1-8 Capacity factors 1-8 Ǻ VOLSURF 2.0 Emin1-3 Local interaction energy minima 1-3 kcal mol-1 VOLSURF 2.0 D12,13,23 Local interaction energy distace12, 13, 23 Ǻ VOLSURF 2.0 D1-8 Hydrophobic regions at energy levels 1-8 Ǻ3 VOLSURF 2.0 ID1-8 Hydrophobic integy moments 1-8 Ǻ VOLSURF 2.0 HL1-2 Hydrophilic-lipophilic balances 1 and 2 VOLSURF 2.0 A Amphiphilic moment Ǻ VOLSURF 2.0 CP Critical packing parameter VOLSURF 2.0 POL2 Polarizability Ǻ3 VOLSURF 2.0 CME Conformation minimum energy kcal mol-1 MOPAC 6.0 EA Electron affinity eV MOPAC 6.0 SE Steric energy kcal mol-1 MOPAC 6.0 BL C-X bond length Ǻ MOPAC 6.0 BO C-X bond order MOPAC 6.0 BS C-X bond strain kcal mol-1 MOPAC 6.0 Qx,c Partial charge on atoms X and C Au MOPAC 6.0 HOMOx,c, LUMOx,c HOMO and LUMO density on atoms X and C MOPAC 6.0 EFDx,c Electrophilic frontier density on atoms X and C MOPAC 6.0 NFDx,c Nucleophilic frontier density on atoms X and C MOPAC 6.0 RFDx,c Radical frontier density on atoms X and C MOPAC 6.0 ESDx,c Electrophilic superdelocalizability on atoms X and C eV-1 MOPAC 6.0 NSDx,c Nucleophilic superdelocalizability on atoms X and C eV-1 MOPAC 6.0 RSDx,c Radical superdelocalizability on atoms X and C eV-1 MOPAC 6.0 logP2 Octanol-water partition coefficient SAR 3.0 Sw1 Water solubility (based on log P) mol l-1 SAR 3.0 Sw2 Water solubility (based on log P and mp) mol l-1 SAR 3.0

Substrate Specificity - Supplementary Information
107
Supplementary Table S7 Detailed parameters of PCA
PCA Data Dataset Explained variance (%)
Total PC1 PC2 PC3
1 untransformed wt 79 54 14 11
2a transformed wt 62 30 17 15
2b transformed wt + mt 58 33 13 12
wt, wild-type HLDs; mt, mutant HLDs.
Supplementary Table S8 Protein sequence identity matrix of nine wild-type HLDs
Enzyme DatA DbeA DbjA DhaA DhlA DmbA DmbC DrbA LinB
DatA 100 32 31 35 20 34 21 22 34
DbeA - 100 71 47 21 39 21 20 41
DbjA - - 100 47 20 36 22 19 37
DhaA - - - 100 24 43 26 22 48
DhlA - - - - 100 19 20 21 21
DmbA - - - - - 100 24 25 68
DmbC - - - - - - 100 25 25
DrbA - - - - - - - 100 24
LinB - - - - - - - - 100
Sequence identities are given as percentages.
References
[1] S. Wold, K. Esbensen, P. Geladi, Chemometr Intell Lab 1987, 2, 37-52. [2] K. Hasan, A. Fortova, T. Koudelakova, R. Chaloupkova, M. Ishitsuka, Y. Nagata, J.
Damborsky, Z. Prokop, Appl Environ Microbiol 2011, 77, 1881-1884. [3] Y. Sato, M. Monincova, R. Chaloupkova, Z. Prokop, Y. Ohtsubo, K. Minamisawa, M.
Tsuda, J. Damborsky, Y. Nagata, Appl Environ Microbiol 2005, 71, 4372-4379. [4] Z. Prokop, Y. Sato, J. Brezovsky, T. Mozga, R. Chaloupkova, T. Koudelakova, P.
Jerabek, V. Stepankova, R. Natsume, J. G. E. van Leeuwen, D. B. Janssen, J. Florian, Y. Nagata, T. Senda, J. Damborsky, Angew Chem Int Ed 2010, 49, 6111-6115.
[5] A. N. Kulakova, M. J. Larkin, L. A. Kulakov, Microbiology 1997, 143, 109-115. [6] J. Newman, T. S. Peat, R. Richard, L. Kan, P. E. Swanson, J. A. Affholter, I. H. Holmes,
J. F. Schindler, C. J. Unkefer, T. C. Terwilliger, Biochemistry 1999, 38, 16105-16114. [7] S. Keuning, D. B. Janssen, B. Witholt, J Bacteriol 1985, 163, 635-639. [8] K. H. Verschueren, S. M. Franken, H. J. Rozeboom, K. H. Kalk, B. W. Dijkstra, J Mol
Biol 1993, 232, 856-872.

Chapter 2S
108
[9] A. Jesenska, M. Pavlova, M. Strouhal, R. Chaloupkova, I. Tesinska, M. Monincova, Z. Prokop, M. Bartos, I. Pavlik, I. Rychlik, P. Möbius, Y. Nagata, J. Damborsky, Appl
Environ Microbiol 2005, 71, 6736-6745. [10] P. A. Mazumdar, J. C. Hulecki, M. M. Cherney, C. R. Garen, M. N. G. James, Biochim
Biophys Acta 2008, 1784, 351-362. [11] A. Jesenska, M. Monincova, T. Koudelakova, K. Hasan, R. Chaloupkova, Z. Prokop, A.
Geerlof, J. Damborsky, Appl Environ Microbiol 2009, 75, 5157-5160. [12] Y. Nagata, K. Hynkova, J. Damborsky, M. Takagi, Protein Expr Purif 1999, 17, 299-304. [13] J. Marek, J. Vevodova, I. K. Smatanova, Y. Nagata, L. A. Svensson, J. Newman, M.
Takagi, J. Damborsky, Biochemistry 2000, 39, 14082-14086. [14] M. Pavlova, M. Klvana, Z. Prokop, R. Chaloupkova, P. Banas, M. Otyepka, R. C. Wade,
M. Tsuda, Y. Nagata, J. Damborsky, Nat Chem Biol 2009, 5, 727-733. [15] J. F. Schindler, P. A. Naranjo, D. A. Honaberger, C. H. Chang, J. R. Brainard, L. A.
Vanderberg, C. J. Unkefer, Biochemistry 1999, 38, 5772-5778. [16] J. P. Schanstra, J. Kingma, D. B. Janssen, J Biol Chem 1996, 271, 14747-14753. [17] K. Hynkova, Y. Nagata, M. Takagi, J. Damborsky, FEBS Lett 1999, 446, 177-181.

109
3
CAVER 3.0: A tool for effective analysis of
tunnels in dynamic protein structures
Eva Chovancová*, Antonín Pavelka*, Petr Beneš*, Petr
Medek, Jan Brezovský, Barbora Kozlíková, Artur Gora, Vilém Šustr, Martin Klvaňa, Ondřej Strnad, Lada Biedermannová, Jiří Sochor and Jiří Damborský
*These authors contributed equally to this work
In preparation

Chapter 3
110

CAVER 3.0
111

Chapter 3
112

CAVER 3.0
113

Chapter 3
114

CAVER 3.0
115

Chapter 3
116

CAVER 3.0
117

Chapter 3
118

CAVER 3.0
119

Chapter 3
120

CAVER 3.0
121

Chapter 3
122

CAVER 3.0
123

Chapter 3
124

125
3S
CAVER 3.0: A tool for effective analysis of
tunnels in dynamic protein structures
Supplementary information
Eva Chovancová*, Antonín Pavelka*, Petr Beneš*, Petr Medek, Jan Brezovský, Barbora Kozlíková, Artur Gora,
Vilém Šustr, Martin Klvaňa, Ondřej Strnad, Lada Biedermannová, Jiří Sochor and Jiří Damborský
*These authors contributed equally to this work
In preparation

Chapter 3S
126

CAVER 3.0 - Supplementary Information
127

Chapter 3S
128

CAVER 3.0 - Supplementary Information
129

Chapter 3S
130

CAVER 3.0 - Supplementary Information
131

Chapter 3S
132

CAVER 3.0 - Supplementary Information
133

Chapter 3S
134

CAVER 3.0 - Supplementary Information
135

Chapter 3S
136

CAVER 3.0 - Supplementary Information
137

Chapter 3S
138

139
4
HotSpot Wizard:
A web server for identification of
hot spots in protein engineering
Eva Chovancová*, Antonín Pavelka* and Jiří Damborský
*These authors contributed equally to this work
Nucleic Acids Research 37: W376-383 (2009)

Chapter 4
140
Abstract
HotSpot Wizard is a web server for automatic identification of ‘hot spots’ for engineering of substrate specificity, activity or enantioselectivity of enzymes and for annotation of protein structures. The web server implements the protein engineering protocol, which targets evolutionarily variable amino acid positions located in the active site or lining the access tunnels. The ‘hot spots’ for mutagenesis are selected through the integration of structural, functional and evolutionary information obtained from: (i) the databases RCSB PDB, UniProt, PDBSWS, Catalytic Site Atlas and nr NCBI and (ii) the tools CASTp, CAVER, BLAST, CD-HIT, MUSCLE and Rate4Site. The protein structure and e-mail address are the only obligatory inputs for the calculation. In the output, HotSpot Wizard lists annotated residues ordered by estimated mutability. The results of the analysis are mapped on the enzyme structure and visualized in the web browser using Jmol. The HotSpot Wizard server should be useful for protein engineers interested in exploring the structure of their favourite protein and for the design of mutations in site-directed mutagenesis and focused directed evolution experiments. HotSpot Wizard is available at http://loschmidt.chemi.muni.cz/hotspotwizard/.
Introduction
Protein engineering represents a powerful approach for production of useful enzymes [1,2]. Directed evolution and rational protein design are two distinct technologies currently used in protein engineering. While directed evolution randomly modifies the residues throughout the entire protein structure, the rational protein design and focused directed evolution targets only selected residues, called ‘hot spots’. Modification of ‘hot spots’ often leads to desired changes in protein properties and significantly reduces the number of mutants that must be biochemically characterized to discover an interesting variant [3,4].
The functional amino acid residues that mediate the substrate binding, transition-state stabilization or product release, i.e. the residues located in the active sites and lining the access tunnels, are frequently selected as ‘hot spots’ for modification of enzyme catalytic properties [4–12]. However, some functional residues may be indispensable for catalysis and their replacement leads to complete loss of enzyme function. Information about the evolutionary conservation of individual residues can serve as a useful indicator for their mutability. Mutagenesis targeting the functional residues located in highly variable positions is an effective strategy for altering catalytic properties with reduced risk of losing a catalytic activity [9].
This strategy is implemented in HotSpot Wizard, which automatically identifies the functional residues for engineering of catalytic properties and estimates their mutability. For this purpose, HotSpot Wizard integrates several bioinformatics databases and computational tools. Structural analyses are conducted to identify the residues that potentially come into contact with the substrates or products. The mutability of individual amino acid residues is derived from their conservation level. Higher mutability implies a better chance that the amino acid replacement will not compromise the enzyme function. HotSpot Wizard assigns all

HotSpot Wizard
141
functional residues with high mutability as ‘hot spots’. HotSpot Wizard results, including the annotated structure, sequence and summary tables of ‘hot spots’, functional residues, pockets and tunnels, can be interactively visualized in the web browser or downloaded to a local computer. For individual residues, information about their mutability, structural location, functional role and annotations are provided.
A variety of computational tools has been developed to assist rational design of proteins and recently reviewed [13]. Novelty of HotSpot Wizard lies in a tight integration of functional, evolutionary and structural information. This integration enables automation of the protein engineering protocol and makes our tool accessible to wider scientific community.
Methods
Flow chart of the HotSpot Wizard is depicted in the Figure 1. HotSpot Wizard works with a PDB file, which is either downloaded from the RCSB PDB [14] or provided by the user. The PDBSWS database [15] is used to identify UniProt entries [16] corresponding to individual PDB chains. If the structure is provided by the user, corresponding entries in UniProt and RCSB PDB are identified by the BLAST sequence search [17]. The UniProt entries are retrieved by the WSDbfetch web service [18]. Residue annotations are extracted from the UniProt fields ‘Active site’, ‘Binding site’, ‘Mutagenesis’ and ‘Natural variant’ to determine amino acid residues indispensable for enzymatic function and to collect available information about mutagenesis experiments and naturally occurring variants. PDBSWS is then used for the second time to map the indexes of extracted UniProt annotations to the corresponding PDB residues. The JAligner pairwise alignment tool (http://jaligner.sourceforge.net/) is used to map the annotations to the structures provided by the user. Information about catalytic residues is also downloaded from the Catalytic Site Atlas [19]. The catalytic residues are assigned to the individual catalytic sites according to the Catalytic Site Atlas and their spatial proximity. In the next step, HotSpot Wizard searches for residues located in the active site pockets and access tunnels. CASTp [20] is used to find all pockets present in the query structure and was selected because it offers online, fast and reliable computation of pockets and precise measurements of their volumes and areas of their respective surfaces. Among the calculated pockets, the active site pockets are selected using the information about the catalytic residues and the volume of individual pockets. For each identified active site, a center of mass for the catalytic residues is computed, where unitary weight is assigned to each residue. In the next step, another point is calculated where (i) a sphere circumscribed around this point intersects no atom in a protein structure and (ii) the distance between this point and the center is minimal, which ensures its positioning within the space occupied by the substrate molecule. The CAVER [21,22] calculation is then performed to automatically identify tunnels connecting this point with the outside solvent.
In the final step of the HotSpot Wizard protocol, the BLAST search against the non-redundant database at NCBI [23]) is performed to gather protein sequences similar to the query. Sequences are clustered by CD-HIT [24] and representatives of the clusters aligned using MUSCLE [25]). Both tools were chosen for their ability to process large datasets within a

Chapter 4
142
short time period with required accuracy. The multiple sequence alignment is used for estimating the site-specific conservation scores. For this purpose, the approach exploiting the information about evolution of the analyzed sequences was selected. Evolutionary rates of individual amino acid positions are estimated by the empirical Bayesian method [26] as implemented in the Rate4Site program [27]. The evolutionary rates are converted to the ConSurf conservation scale [28], which is then used to assign mutability to individual residues of the query enzyme. Users are notified about the finished calculation by an e-mail containing the results of the calculation in a text file and a link to relevant web pages.
Figure 1 Flow chart of the HotSpot Wizard calculation. The input is either a PDB code or a protein structure in PDB format. The output is an annotated structure. The ‘hot spots’ for mutagenesis are selected through the integration of structural, functional and evolutionary information obtained from the bioinformatics databases (database symbol) and the tools (computational tool symbol).
Description of the server
Input
HotSpot Wizard requires a structure of the query protein, provided as a PDB code or a PDB file, and an e-mail address as the only obligatory inputs. Additionally, a number of optional settings are available to control the calculation. The user may specify protein chains of interest. By default, the application attempts to extract information about the biologically relevant molecule from the PDB file. If this information is not available, the first chain of the PDB file is used for the calculation. Another option enables the selection of the resource for annotation of the catalytic residues or the manual input of the catalytic residues. Two parameters can be set for the calculation of tunnels: (i) the minimal tunnel radius specifying the minimal tunnel width (default 1.4 Å) and (ii) the minimal starting radius specifying the required free space around the tunnel starting point (default 1.6 Å). The calculation of

HotSpot Wizard
143
evolutionary conservation is, by default, conducted on the dataset obtained by the BLAST search. The appropriate setting of the E-value (default 1E–12) enables the user to perform the analysis on enzymes with desired similarities or function. The user can also change the maximum number of sequences to be analyzed (default 50) and thus potentially increase the accuracy of the evolutionary rate estimation. However, demand on calculation time grows with increasing number of sequences, and it is currently not recommended to analyze more than 100 sequences at once. Results of the conservation analysis are stored on the server for 3 months. If a new job with identical parameters is submitted during this period, the precalculated results are used instead of conducting the conservation analysis. The usage of precalculated results may be disabled. Users can also upload their own multiple sequence alignment and the phylogenetic tree. Users interested only in the structural annotation or some specific analysis may skip the conservation analysis as it is the most time-consuming part of the HotSpot Wizard calculation.
Output
The ‘Job’ panel appears when the calculation is finished and enables navigation through the obtained results. The results may be accessed either by an interactive web application called the ‘Results Browser’ (Figure 2) or downloaded to a local computer. Moreover, the ‘Job’ panel provides links to the external databases and servers with further information about the query protein.
Residue annotations
For each residue, information about its mutability, potential function (catalytic, located in the active site or access tunnel), available mutagenesis data, existing sequence variants and amino acids occurring at the corresponding position of the sequence alignment is provided. The mutability of individual sites, which estimates the tolerance of a given position to amino acid replacement, is derived from evolutionary conservation. The mutability scale ranges from 1 (low mutability) to 9 (high mutability). For visualization purposes, mutability is converted to a color scale ranging from blue (low mutability) to red (high mutability). The color scale is additionally extended by the violet, pink and ivory colors to indicate catalytic residues, residues with unreliable assignment and residues with missing information about evolutionary conservation, respectively. It is important to note that low mutability of a particular position does ‘not’ necessarily mean that the corresponding residue is immutable. However, the residues at such positions are often essential for maintaining structural or functional properties of an enzyme and should not be mutated without careful consideration of the potential effects of these mutations. To prevent mutagenesis at the sites indispensable for a function, catalytic residues are assigned as immutable.
Summary tables The main output of the HotSpot Wizard application is summarized in the ‘Mutagenesis Hot Spots’ table, listing the residues assigned as ‘hot spots’, based on their high mutability (6–9) and structural location. ‘Hot spots’ are ordered by their mutability, starting with the most mutable ones, and accompanied by the residue annotations. For some proteins, only very few

Chapter 4
144
‘hot spots’ are identified by HotSpot Wizard, because functional residues of the protein are highly conserved. The users are encouraged to use the ‘Functional residues’ table to see annotations for all active site and tunnel residues identified in the query structure. However, selecting the targets for mutagenesis from this table increases a risk of producing inactive mutants, especially when the positions with low mutability are targeted. The ‘Functional residues’ table is also useful for users who want to select their own ‘hot spots’ based on other criteria than mutability. The ‘All Residues’ and ‘All Residues by Mutability’ tables provide information about each individual residue of the query enzyme.
Figure 2 Graphic interface of the HotSpot Wizard results. (A) The ‘Results Browser’ includes the embedded Jmol applet enabling visualization of the annotated structure, ligands and identified tunnels. ‘Hot spots’ and functional residues are highlighted and colored according to their estimated mutability. The ‘Results Browser’ further offers the ‘Job’ panel enabling navigation through the results, ‘Control’ panel providing basic operations for manipulating the structure, annotated sequence and summary tables of ‘hot spots’, functional residues, all residues, active sites, pockets and tunnels. (B) The mutability color scale is defined in the ‘Color coding’ panel. (C) The ‘Sequence’ panel is interactively interconnected with all other sections of the ‘Results Browser’. (D) The output is summarized in the ‘Mutagenesis Hot Spots’ table listing all identified ‘hot spots’ ordered by their mutability. For individual residues, information about their mutability, structural location, functional role and annotations are provided.

HotSpot Wizard
145
Annotated structure
HotSpot Wizard results are mapped on the enzyme structure and are visualized directly in the web browser using the Jmol applet (http://jmol.sourceforge.net/). Besides the enzyme structure, ligands and identified tunnels may be displayed as well. The default visualization highlights the ‘hot spots’ and the functional residues. The residue annotations may be invoked by positioning the mouse cursor over a given residue in the Jmol applet. Users can select predefined groups of residues and change their coloring and visualization styles using the ‘Controls’ panel. The Jmol applet is interactively interconnected with all other sections of the ‘Results Browser’ also enabling selection from the ‘Sequence’ panel and the summary tables.
Annotated sequence The panel ‘Sequence’ displays the annotated sequence of the query enzyme. Its functionality comprises selections of residues and displaying the residue annotations. The coloring of the sequence is synchronized with the structure and the summary tables.
Results for download
The results may be downloaded to a local computer all in one package or as individual files. The package includes the summary tables in a text format for direct reading or software parsing, the original outputs obtained from individual servers and databases, and the Python script enabling visualization and analysis of the HotSpot Wizard results in PyMOL (http://pymol.sourceforge.net/).
Limitations
HotSpot Wizard processes information from databases and computational tools in a highly automated manner. A specification of the query protein structure is the only required input information. Tight integration of individual components in the HotSpot Wizard workflow may result in the propagation of incorrect results from one tool to the remaining components of the cascade. (i) Currently, the most critical step of the protocol is the assignment of the catalytic residues. Information about the catalytic residues is used to avoid mutagenesis at the residues critical for the enzyme function, but also for the assignment of the active site pocket and the starting point for the calculation of tunnels. If catalytic residues are not found in databases either for the query sequence or for homologous sequences, users must specify this information manually. Otherwise, the pocket with the largest volume will be assumed to contain the active site and no tunnels will be computed. (ii) The identification of the active site pocket is another critical step of the computation. Surface residues can be incorrectly assigned as part of the active site pocket. This sometimes happens at the interface of two subunits forming a very large pocket. Exclusion of one of the chains is a simple solution to this problem. Miss-assignment of the residues of the active site pocket happens also for proteins carrying large open depressions at the protein surface, which has to be recognized by the user, and these residues should not be considered for mutagenesis experiments. (iii) Finally, the sequence databases might not contain a sufficient number of homologous sequences for

Chapter 4
146
some of the proteins and their mutability thus cannot be calculated. In such cases, HotSpot Wizard lists the functional residues without mutability scores.
Examples
The ‘hot spot’ residues identified computationally by HotSpot Wizard were compared with the mutations extracted from the Protein Mutant Database [29] and the primary literature for four different proteins: (i) haloalkane dehalogenase, (ii) phosphotriesterase, (iii) 1,3-1,4-ß-D-glucan 4-glucanohydrolase and (iv) ß-lactamase.
Haloalkane dehalogenase
Haloalkane dehalogenase DhaA from Rhodococcus sp. catalyzes hydrolytic dehalogenation of a broad range of halogenated aliphatic hydrocarbons. The structure of the DhaA enzyme was specified by the PDB code 1BN6 [30]. In further text, the numbering from the PDB file is used, while 11 residues need to be subtracted to obtain the numbering used in the literature. HotSpot Wizard identified 17 reliable ‘hot spots’ (mutability range 6–9) lining 1 active site pocket and 2 tunnels: F142, R144, I146, P147, E151, W152, F155, A156, T159, V183, K186, C187, E234, H241, V256, P259, E262 (Figure 3). Kretz et al. performed saturation mutagenesis of the entire dhaA gene and constructed its mutability map [31]. While one third of the residues of DhaA could not be replaced without compromising enzyme activity according to the experiments of Kretz et al., all but one ‘hot spots’ identified by HotSpot Wizard, were able to accommodate a wide range of mutations. The only exception is the residue F142 located just next to the catalytic residue E141. It is well known that the mutations introduced to the regions closest to the catalytic residues are tricky as they can disrupt the geometry of the transition state and lead to loss of enzyme activity. In another project, error-prone PCR was used for the introduction of random mutations to the DhaA structure by Gray et al. [32] and Bosma et al. [33]. The biochemical screening of 10,000 variants against toxic environmental pollutant 1,2,3-trichloropropane (TCP) provided two double-point mutants C187Y+Y284F [33] and G14D+C187F [32], respectively, showing 3.5 times and 4 times higher activities with TCP than the wild-type enzyme. These two variants obtained independently in the directed evolution experiments carry the mutation in the position C187. HotSpot Wizard identified the position C187 as the ‘hot spot’ due to its location at the tunnel opening and high mutability. Pavlova et al. (manuscript submitted) used rational design and selected five positions lining the access tunnels: I146, W152, C187, V256 and L257. The mutant of Bosma et al. (C187Y and Y284F) and the triple mutant (W152F, C187Y and Y284F) were used as templates for focused directed evolution, subjecting the positions I146, V256 and L257 to a simultaneous saturation mutagenesis. The screening of 5,000 variants against TCP provided 25 unique mutants with higher activities towards TCP; the best mutant showing 32 times higher activity than the wild type. Out of the five positions rationally selected in this study, four positions were also identified as ‘hot spots’ by HotSpot Wizard.

HotSpot Wizard
147
Figure 3 Comparison of the results from HotSpot Wizard with the experimental data. HotSpot Wizard identified seventeen ‘hot spots’ (balls) lining the active site pocket of the enzyme DhaA (PDB code 1BN6) and its two tunnels (tubes). All identified ‘hot spots’ could accommodate a wide range of mutations in the gene saturation experiment, except F142 (blue ball), which is adjacent to the catalytic residue. Four predicted ‘hot spots’ (red balls) were verified experimentally in three independent directed evolution experiments, showing a key role of these residues for the catalytic activity of DhaA. The picture was prepared in PyMOL using the Python script generated by the HotSpot Wizard server.
Phosphotriesterase
Phosphotriesterase from Pseudomonas diminuta catalyzes the hydrolysis of a variety of organophosphates, including the widely used insecticide paraoxon and the chemical warfare agent sarin. The crystal structure of the phosphotriesterase homodimer, PDB code 1I0D [34], was analyzed and nine reliably assigned ‘hot spots’ were identified: G60, L136, R139, S205, D235, A270, L271, L272, F306. The data from mutagenesis experiments were found for 4 of these residues: G60, L136, L271 and F306. Gopal et al. [35] rationally designed eight mutants, including L136Y, L271Y, F306A and F306Y, intending to enhance activity towards a chemical warfare agent VX [O-ethyl S-(2-diiso-propyl aminoethyl) methylphosphonothioate] and five other organophosphorus compounds. L136Y was the only mutation under study that leads to an increased relative activity towards VX. Five mutants, including L136Y and F306Y, displayed increased activity towards demeton-S-methyl. In another study, improvements of the catalysis of insecticide DFP up to one order of magnitude were obtained with the mutants F306Y and F306H [36]. Systematic alanine-scanning of phosphotriesterase binding pocket,

Chapter 4
148
including residues G60, L271 and F306, was carried out to elucidate structural determinants of stereoselectivity and overall reactivity of this enzyme with different substrates [37]. Substitution G60A lead to a dramatic enhancement of the chiral preference for the SP-enantiomers, increasing the enantioselectivity for several chiral substrates, e.g. from 21 to >>100 for p-nitrophenyl ethyl phenyl phosphate [6]. Substitutions in L271 and F306 did not improve stereoselectivity, while the catalytic rates were decreased relative to those of the wild-type enzyme for most of the tested substrates [37].
1,3-1,4-ß-D-Glucan 4-glucanohydrolase
1,3-1,4-ß-D-Glucan 4-glucanohydrolase (1,3-1,4-ß-glucanase) from Bacillus licheniformis is an endoglycosidase that cleaves ß-glucans containing mixed ß-1,3- and ß-1,4- linkages. The structure of 1,3-1,4-ß-glucanase was specified by the PDB code 1GBG [38]. In further text, the numbering from the PDB file is used, while 29 residues needs to be added to obtain the numbering used in the literature. HotSpot Wizard identified 5 reliable ‘hot spots’: Y24, N28, M29, T69, V189. Three of them, Y24, N28 and M29, are described in the experimental study of Pons et al. [39]. Pons et al. conducted alanine-scanning mutagenesis of the major loop (residues 22–38) of 1,3-1,4-ß-glucanase to investigate its role in substrate binding. The substitution M29A resulted in a 3.4-fold increase in kcat/Km towards the substrate 4-methylumbelliferyl 3-O-ß-cellobiosyl-ß-D-glucopyranoside, while the catalytic efficiency of other mutants decreased.
ß-Lactamase
The class C ß-lactamase from Enterobacter cloacae P99 confers resistance to broad-spectrum ß-lactam antibiotics by cleaving the amide bond in the ß-lactam ring. The HotSpot Wizard calculation using the PDB code 1BLS (chain A) of the ß-lactamase structure [40] suggested 7 reliable ‘hot spots’: M215, S264, T282, E285, S289, L293, L296. The 21 amino acid residues of the active site pocket of the ß-lactamase, including ‘hot spots’ S289 and L293, were systematically randomized to identify the determinants of catalysis for the important antibiotic ceftazidime [41]. A diverse set of substitutions was found at positions corresponding to S289 and L293 among the mutants selected for ceftazidime resistance, indicating that these residues are not essential for the binding or hydrolysis of this antibiotic. Although not critical for the function, the position L293 was shown to be important for the substrate specificity of this enzyme. Vakulenko et al. [42] conducted PCR mutagenesis, followed by the selection for cefepime resistance and obtained a mutant carrying the single-point substitution L293P. Compared to the wild-type ß-lactamase, the catalytic efficiencies of the L293P mutant were increased 27- and 11-fold for cefepime and ceftazidime, respectively. In the next step, 14 additional substitutions were introduced to the position L293 by site-directed mutagenesis. More than half of the mutants conferred increased resistances towards cefepime and ceftazidime.

HotSpot Wizard
149
Validation
The effectivity of mutagenesis targeting highly variable positions was assessed by comparing HotSpot Wizard results with the data obtained from the systematic mutagenesis studies: (i) 3,315 mutants of lactose repressor [43], (ii) 1,930 mutants of T4 lysozyme [44], (iii) 676 mutants of barnase [45] and (iv) 364 mutants of HIV reverse transcriptase [29,46]. The individual mutagenesis studies differed in the activity assays and in the classification of the effects. Therefore, these data sets are not directly comparable and had to be evaluated independently. For each data set, those mutations which lead to the protein variants with very low or no activity, were assigned as deleterious. The proportion of deleterious mutations in the positions assigned as highly mutable by HotSpot Wizard, i.e. with the mutability grades from 6 to 9, were compared with proportion of deleterious mutations in the entire protein structure. Calculated ratio of deleterious mutations in the mutable positions versus in the entire protein structure were: (i) 2.7% versus 25.3% for lactose repressor, (ii) 1% versus 9.1% for T4 lysozyme, (iii) 0.4% versus 4.8% for barnase and (iv) 3.9% versus 30.7% for HIV reverse transcriptase. These results demonstrate that mutagenesis targeting the ‘hot spot’ positions identified by HotSpot Wizard provides significantly higher proportion of viable variants than blind mutagenesis. Detailed information on all presented examples can be downloaded from http://loschmidt.chemi.muni.cz/hotspotwizard/data.
Conclusions and outlook
The development of the HotSpot Wizard server was motivated by a growing demand for comprehensive tools assisting protein engineers with the rational design of enzymes. The primary use of HotSpot Wizard is the identification of ‘hot spots’ for the site-directed mutagenesis or focused directed evolution experiments. Mutagenesis targeting the ‘hot spots’ found by HotSpot Wizard should increase the yield of active mutants with altered catalytic properties. Alternatively, HotSpot Wizard can be used for the annotation of protein structures. HotSpot Wizard automates a protein engineering protocol by the integration of several bioinformatics databases and computational tools and saves the user's time. Minimal demands on input information make this web server potentially useful for the users with no prior knowledge of structural or bioinformatics analyses. We are currently integrating additional features to HotSpot Wizard, e.g. a visualization of the residue solvent accessibility and volumes of pockets. We also aim to improve the estimation of mutability by including additional factors into the calculation of the prioritization function.
Funding
Czech Ministry of Education, Youth and Sport [LC06010 to E.C., MSM0021622412 to J.D.]; the Grant Agency of the Czech Republic [201/07/0927 to J.D.]; and the Grant Agency of the Czech Academy of Sciences [IAA401630901 to J.D.]. Funding for open access charge: LC06010 and MSM0021622412.

Chapter 4
150
Acknowledgements
We would like to express our thanks to the authors of the tools used by HotSpot Wizard and to Peter Lisak (Brno University of Technology) for the LLWS utility enabling a simple HTTP access to software installed on Linux. Access to the METACentrum supercomputing facilities provided under the research intent MSM6383917201 is highly appreciated.
References
[1] U. T. Bornscheuer, M. Pohl, Curr Opin Chem Biol 2001, 5, 137-143. [2] J. A. Brannigan, A. J. Wilkinson, Nat Rev Mol Cell Biol 2002, 3, 964-970. [3] R. Chen, Trends Biotechnol 2001, 19, 13-14. [4] R. A. Chica, N. Doucet, J. N. Pelletier, Curr Opin Biotechnol 2005, 16, 378-384. [5] S. Park, K. L. Morley, G. P. Horsman, M. Holmquist, K. Hult, R. J. Kazlauskas, Chem
Biol 2005, 12, 45-54. [6] K. L. Morley, R. J. Kazlauskas, Trends Biotechnol 2005, 23, 231-237. [7] M. Zamocky, C. Herzog, L. M. Nykyri, F. Koller, FEBS Lett 1995, 367, 241-245. [8] J. Schmitt, S. Brocca, R. D. Schmid, J. Pleiss, Protein Eng 2002, 15, 595-601. [9] R. Chaloupkova, J. Sykorova, Z. Prokop, A. Jesenska, M. Monincova, M. Pavlova, M.
Tsuda, Y. Nagata, J. Damborsky, J Biol Chem 2003, 278, 52622-52628. [10] R. Fedorov, R. Vasan, D. K. Ghosh, I. Schlichting, Proc Natl Acad Sci USA 2004, 101,
5892-5897. [11] M. Kotik, V. Stepanek, P. Kyslik, H. Maresova, J Biotechnol 2007, 132, 8-15. [12] R. Feingersch, J. Shainsky, T. K. Wood, A. Fishman, Appl Environ Microbiol 2008, 74,
1555-1566. [13] J. Damborsky, J. Brezovsky, Curr Opin Chem Biol 2009, 13, 26-34. [14] H. M. Berman, J. Westbrook, Z. Feng, G. Gilliland, T. N. Bhat, H. Weissig, I. N.
Shindyalov, P. E. Bourne, Nucleic Acids Res 2000, 28, 235-242. [15] A. C. R. Martin, Bioinformatics 2005, 21, 4297-4301. [16] R. Apweiler, A. Bairoch, C. H. Wu, W. C. Barker, B. Boeckmann, S. Ferro, E. Gasteiger,
H. Huang, R. Lopez, M. Magrane, M. J. Martin, D. A. Natale, C. O'Donovan, N. Redaschi, L. L. Yeh, Nucleic Acids Res 2004, 32, D115-D119.
[17] S. F. Altschul, T. L. Madden, A. A. Schaffer, J. Zhang, Z. Zhang, W. Miller, D. J. Lipman, Nucleic Acids Res 1997, 25, 3389-3402.
[18] A. Labarga, F. Valentin, M. Anderson, R. Lopez, Nucleic Acids Res 2007, 35, W6-W11. [19] C. T. Porter, G. J. Bartlett, J. M. Thornton, Nucleic Acids Res 2004, 32, D129-D133. [20] J. Dundas, Z. Ouyang, J. Tseng, A. Binkowski, Y. Turpaz, J. Liang, Nucleic Acids
Res 2006, 34, W116-W118. [21] M. Petrek, M. Otyepka, P. Banas, P. Kosinova, J. Koca, J. Damborsky, BMC
Bioinformatics 2006, 7, 316. [22] P. Medek, P. Benes, J. Sochor, Computer Graphics and Imaging 2008, 2008, 5.

HotSpot Wizard
151
[23] E. W. Sayers, T. Barrett, D. A. Benson, S. H. Bryant, K. Canese, V. Chetvernin, D. M. Church, M. DiCuccio, R. Edgar, S. Federhen, M. Feolo, L. Y. Geer, W. Helmberg, Y. Kapustin, D. Landsman, D. J. Lipman, T. L. Madden, D. R. Maglott, V. Miller, I. Mizrachi, J. Ostell, K. D. Pruitt, G. D. Schuler, E. Sequeira, S. T. Sherry, M. Shumway, K. Sirotkin, A. Souvorov, G. Starchenko, T. A. Tatusova, L. Wagner, E. Yaschenko, J. Ye, Nucleic Acids Res 2009, 37, D5-D15.
[24] W. Li, A. Godzik, Bioinformatics 2006, 22, 1658-1659. [25] R. C. Edgar, BMC Bioinformatics 2004, 5, 113. [26] I. Mayrose, D. Graur, N. Ben-Tal, T. Pupko, Mol Biol Evol 2004, 21, 1781-1791. [27] T. Pupko, R. E. Bell, I. Mayrose, F. Glaser, N. Ben-Tal, Bioinformatics 2002, 18, S71-77. [28] M. Landau, I. Mayrose, Y. Rosenberg, F. Glaser, E. Martz, T. Pupko, N. Ben-Tal, Nucleic
Acids Res 2005, 33, W299-W302. [29] T. Kawabata, M. Ota, K. Nishikawa, Nucleic Acids Res 1999, 27, 355-357. [30] J. Newman, T. S. Peat, R. Richard, L. Kan, P. E. Swanson, J. A. Affholter, I. H. Holmes, J.
F. Schindler, C. J. Unkefer, T. C. Terwilliger, Structure 1999, 38, 16105-16114. [31] K. A. Kretz, T. H. Richardson, K. A. Gray, D. E. Robertson, X. Tan, J. M. Short, Methods
Enzymol 2004, 388, 3-11. [32] K. A. Gray, T. H. Richardson, K. Kretz, J. M. Short, F. Bartnek, R. Knowles, L. Kan, P. E.
Swanson, D. E. Robertson, Adv Synth Catal 2001, 343, 607-617. [33] T. Bosma, J. Damborsky, G. Stucki, D. B. Janssen, Appl Environ Microbiol 2002, 68,
3582-3587. [34] M. M. Benning, H. Shim, F. M. Raushel, H. M. Holden, Biochemistry 2001, 40, 2712-
2722. [35] S. Gopal, V. Rastogi, W. Ashman, W. Mulbry, Biochem Biophys Res Commun 2000,
279, 516-519. [36] L. M. Watkins, H. J. Mahoney, J. K. McCulloch, F. M. Raushel, J Biol Chem 1997, 272,
25596-25601. [37] M. Chen-Goodspeed, M. A. Sogorb, F. Wu, S. B. Hong, F. M. Raushel, Biochemistry
2001, 40, 1325-1331. [38] M. Hahn, J. Pons, A. Planas, E. Querol, U. Heinemann, FEBS Lett 1995, 374, 221-224. [39] J. Pons, E. Querol, A. Planas, J Biol Chem 1997, 272, 13006-13012. [40] E. Lobkovsky, E. M. Billings, P. C. Moews, J. Rahil, R. F. Pratt, J. R. Knox, Biochemistry
1994, 33, 6762-6772. [41] Z. Zhang, Y. Yu, J. M. Musser, T. Palzkill, J Biol Chem 2001, 276, 46568-46574. [42] S. B. Vakulenko, D. Golemi, B. Geryk, M. Suvorov, J. R. Knox, S. Mobashery, S. A.
Lerner, Antimicrob Agents Chemother 2002, 46, 1966-1970. [43] P. Markiewicz, L. G. Kleina, C. Cruz, S. Ehret, J. H. Miller, J Mol Biol 1994, 240, 421-
433. [44] D. Rennell, S. E. Bouvier, L. W. Hardy, A. R. Poteete, J Mol Biol 1991, 222, 67-88. [45] D. D. Axe, N. W. Foster, A. R. Fersht, Biochemistry 1998, 37, 7157-7166. [46] J. A. Wrobel, S. F. Chao, M. J. Conrad, J. D. Merker, R. Swanstrom, G. J. Pielak, C. A.
Hutchison, Proc Natl Acad Sci USA 1998, 95, 638-645.

Appendix A1
152
APPENDICES
A1 Description of selected databases and methods
This section provides the detailed description of individual databases and methods that were used to study haloalkane dehalogenases (Chapter 1 and Chapter 2) or utilized for the development of novel bioinformatic tools (Chapter 3 and Chapter 4).
A1.1 Biological databases
UniProt Knowledgebase
UniProt Knowledgebase (UniProtKB) is a database of protein sequences and functional information. It is maintained by the UniProt Consortium including groups from the European Bioinformatics Institute (EBI), the Swiss Institute of Bioinformatics and the Protein Information Resource (PIR). The UniProtKB has two sections: (i) UniProtKB/Swiss-Prot, representing manually curated database with high-quality annotations and (ii) UniProtKB/TrEMBL with automatically annotated entries [1]. The majority of the UniProtKB sequences are derived by the translation of coding sequences from the European Nucleotide Archive [2], the DNA Data Bank of Japan [3] and the GenBank [4].
As of 2011_08 release, the UniProtKB contains more than 17 million entries with 531,473 entries in UniProtKB/Swiss-Prot. The database is updated and distributed every four weeks [1]. The data are freely available at www.uniprot.org and can be accessed by the text or sequence similarity searches. Besides the protein sequence, each entry also provides information related to protein function and structure, protein interactions, post-translational modifications, classifications, biological ontologies, sequence features like active or binding sites, natural variants of amino acids, known effects of mutations as well as literature references and cross-references to a multitude of different databases. An important feature of the UniProtKB is the indication of the quality of annotations [1].
Non-redundat database of NCBI The non-redundant (nr) database of NCBI is a non-redundant collection of sequences derived by the conceptual translation of coding regions from GenBank along with protein sequences from the NCBI Reference Sequence database [5], UniProtKB/Swiss-Prot, worldwide Protein Data Bank [6], PIR and the Protein Research Foundation, excluding environmental samples from whole genome shotgun projects [7]. As of April 2011, it contains nearly 15 million sequences. The database is updated on daily basis. The nr is the default database of NCBI for the protein BLAST and PSI-BLAST searches [7,8]. The nr database pre-formatted for BLAST searches can be freely downloaded from ftp://ftp.ncbi.nlm.nih.gov/blast/db/ or searched via the NCBI BLAST interface at http://blast.ncbi.nlm.nih.gov/Blast.cgi.

Description of Databases and Methods
153
Worldwide Protein Data Bank
The worldwide Protein Data Bank (wwPDB) represents a central repository for experimentally determined 3D structures of biological macromolecules [9,6,10]. The wwPDB is a joint initiative of four organizations—the Research Collaboratory for Structural Bioinformatics (RCSB) [11,12], the Protein Data Bank in Europe (PDBe) [13], the Protein Data Bank Japan (PDBj) [14] and the BioMagResBank [15]—which share responsibilities in deposition, processing and distribution of data. Each centre also maintains its own services and integrates a variety of tools for visualization and analysis of structures [6,13]. Structural data are stored in three different standardized formats: (i) the PDB file format; (ii) the PDB exchange format following the mmCIF syntax; and (iii) the PDBML format [6,10,16].
As of August 2011, the wwPDB contains almost 75,000 entries, majority of which represent protein structures and have been determined by X-ray crystallography. The database is updated every week. At the time of the deposition, each structure is provided with a four-character PDB-ID, which serves as its unique identifier. The access to the data is free and publicly available from the RCSB PDB site at http://pdb.rcsb.org, PDBe site at http://www.ebi.ac.uk/pdbe/ or PDBj site at http://www.pdbj.org/. All three sites can be searched using both text-based and sequence-based queries. In addition to the 3D coordinate data, each entry also provides information about ligands, source organism, sequence and experimental details, classifications, links to related structures, literature references and cross-references to a number of different databases.
PDBSWS The PDBSWS database provides mapping between amino acid residues from wwPDB entries and residues from UniProtKB entries. The database is automatically maintained. The mapping can be freely downloaded or queried using PDB-ID, UniProtKB accession or UniProtKB/SwissProt identifier via the web interface at http://bioinf.org.uk/pdbsws/ [17].
SCOP The SCOP database provides classifications of proteins with known 3D structure according to their evolutionary and structural relationships. The unit of SCOP classification is a protein domain. The classification hierarchy comprises several levels: Species, Protein, Family, Superfamily, Fold and Class. The Species level contains different forms of the same protein, all from one organism, while the Protein groups structures of the same protein originating from different organisms or different protein isoforms from the same organism. Each SCOP Family contains proteins with similar sequences. Families with similar structures but low sequence similarity are grouped into Superfamilies. Structurally similar Superfamilies with different characteristic features form Folds, which are further grouped into Classes, mostly based on the similarity in the secondary structure content and organization [18,19].
The latest SCOP release (v1.75, June 2009) contains 110,800 domains corresponding to the 38,221 wwPDB entries. New entries that are highly similar to some other domain are classified automatically. The remaining proteins are curated manually. The SCOP database is freely available at http://scop.mrc-lmb.cam.ac.uk/scop/. The entries can be accessed using a keyword search or by browsing the classification hierarchy, or using a structural or sequence

Appendix A1
154
searches provided by the third-party servers. In addition to the information about classification, each entry contains links to different databases and interactive molecular viewers. Besides the official SCOP release, the SCOP developmental version (pre-SCOP), providing an earlier access to newly classified data, is available at http://www.mrc-lmb.cam.ac.uk/agm/pre-scop/ [19].
Catalytic Site Atlas
The Catalytic Site Atlas (CSA) database provides information about active sites and catalytic residues in enzymes with experimentally determined 3D structure. It defines catalytic residues as residues directly involved in some aspect of the enzyme reaction. The CSA contains two types of entries: (i) original entries annotated manually based on the information extracted from the primary literature and (ii) homologous entries annotated based on the sequence similarity (PSI-BLAST alignment) to one of the original entries [20].
The database was last updated on January 2010 and this release contains close to 27,000 entries, including 968 entries derived from literature. The database can be queried by enzyme EC number, PDB-ID or UniProtKB/Swiss-Prot identifier [20]. The CSA entry contains information about catalytic residues and their function, links to related CSA entries, cross-references to different databases and, for original entries, also additional notes on enzyme function and reaction mechanism. Each entry is provided with a clear indication of its origin, i.e., whether it is original or homologous entry [20]. The CSA is freely accessible at http://www.ebi.ac.uk /thornton-srv/databases/CSA/.
Protein mutant database
The Protein mutant database is a collection of protein mutant data, including both natural and artificial mutants of various proteins [21,22]. The data are derived from the scientific literature. The last release from March 2007 contains information on functional, structural or stability effects of nearly 218,873 different mutations extracted from more than 45,000 articles. The database is freely accessible at http://pmd.ddbj.nig.ac.jp/~pmd/ and can be searched using the text-based or sequence-based queries. Each entry corresponds to one article and may contain information about different protein mutants. The entry includes a brief description of a protein, information about the paper and cross-references to the PubMed [7], wwPDB, UniProtKB/Swiss-Prot and PIR databases. For each mutant, the position and type of the mutation is specified and effects of mutation on protein structure, activity, stability or expression are explained and/or described in relative terms [22].
A1.2 Protein sequence analysis
PSI-BLAST PSI-BLAST is a widely used tool for sequence similarity searching of protein databases. Its algorithm is based on the BLAST method [8]. BLAST uses a heuristics to compare the query sequence with individual database sequences and identifies regions of local alignments. The alignments with the statistical significance higher than the user-specified threshold are reported [23,24]. In the first step of PSI-BLAST, the standard protein-protein BLAST search (the search of the protein sequence database based on the protein sequence query) is
Description of Databases and Methods
155
performed to obtain initial similarity hits. The hits with significant similarities to the query are used to build a MSA, which is in turn converted to a profile—position-specific score matrix (PSSM). For each position of the MSA, the PSSM provides for each amino acid a score which reflects the probability that a given amino acid occurs at a given position of the MSA. The constructed PSSM is used as both the query and scoring system for the second round of database searches. This way, additional sequences may be identified. The newly identified significant hits are added to the MSA, which is used to construct a new PSSM for the next round of searching. This procedure is repeated for a specified number of iterations or until no new sequences can be found. The main advantage of PSI-BLAST over the corresponding BLAST method is a higher sensitivity, which improves the detection of distant homologs [8,23,24].
PSI-BLAST is freely available online at different sites, including the NCBI site at http://ncbi.nlm.nih.gov/BLAST or the EBI site at http://www.ebi.ac.uk/Tools/sss/psiblast/. It may also be downloaded as a part of the BLAST package at ftp://ftp.ncbi.nlm.nih.gov/blast/. As input, users have to specify the query sequence and select the target sequence database. Many optional settings are available, including specification of the number of PSI-BLAST iterations, setting of thresholds defining statistically significant hits and hits to be included to the PSSM, the number of hits to be reported, selection of substitution matrix, etc. PSI-BLAST provides a list of identified hits and reports their local alignments with the query after each iteration. The hits are ordered based on the E-value, i.e., the number of alignments with the score equal or better than the observed one that are expected to be seen purely by a chance, searching a given database. The E-value thus represents a measure of the statistical significance of the match between the hit and query. Users may interactively change predefined criteria for inclusion of sequences to the PSSM as well as specify sequences they want to download [23,24].
CD-HIT
CD-HIT is a tool for fast clustering and comparison of large biological sequence datasets. It is based on a greedy incremental clustering supplemented by the short word filtering algorithm [25,26]. First, all sequences are sorted based on their length and the longest sequence of the dataset is selected as a representative of the first cluster. In next steps, each remaining sequence is compared to the existing cluster representatives. If the identity between a given sequence and some representative is above the user-defined threshold, the sequence is grouped into this cluster. Otherwise, it becomes a representative of a new cluster. The sequence identity is determined based on a pairwise sequence alignment. To avoid this time consuming step, the short word filtering algorithm is applied. Short word filtering is based on the fact that sequences of a certain level of identity should share some minimum number of identical short substrings, called words. The short word filtering thus enables to determine if the identity between the sequence and cluster representative is below a selected threshold without constructing sequence alignment [25-27]. Recently, a new version of CD-HIT with improved accuracy, scalability and flexibility was released [27].
The program can be freely downloaded from http://www.bioinformatics.org/cd-hit/. Newly, it is also available as a web server at http://weizhong-lab.ucsd.edu/cdhit_suite/,

Appendix A1
156
where users can cluster or compare their own datasets as well as download the wwPDB, UniProtKB/Swiss-Prot or NCBI nr databases pre-clustered at different identity levels [27]. As an input, users provide a set of unaligned sequences and specify clustering parameters, most importantly the clustering identity level. The outputs include a set of representative sequences and file with information about subdivision of the dataset into clusters.
CLANS
CLANS is a program for visualization of pairwise sequence similarities in large datasets of sequences [28]. In the first step, each sequence of the analyzed dataset is compared to all other sequences using the BLAST search [8]. For each pair of sequences, P-values of the best local alignments are used to set attraction forces between these sequences, so that the two most similar sequences have the highest attraction value [28]. The BLAST P-values refers to the probability that a local alignment with a given or better score would occur purely by a chance [24]. A modified version of the Fruchterman–Reingold graph layout algorithm [29] is then used to generate a graph in which sequences are represented as vertices and BLAST local alignments, providing attraction forces, as edges connecting these vertices. Individual sequences are randomly seeded in either two- or three-dimensional space. A mild force is applied between all sequences to prevent their eventual collision. Sequences are then moved iteratively according to their total force vector until convergence. The convergence is achieved by gradual decreasing the distance by which individual sequences can move in each round [28].
CLANS can be freely downloaded at http://www.eb.tuebingen.mpg.de/departments/1-protein-evolution/software/clans and is also accessible online via the MPI Bioinformatics Toolkit [30] at http://toolkit.tuebingen.mpg.de/clans. As an input, users can provide unaligned set of sequences or pre-computed matrix of attraction values. CLANS can be therefore used for visualization of any kind of pairwise similarities. The users can control calculation by a number of different parameters. Most importantly, the P-value threshold defines which edges (attraction forces) will be ignored during calculation—all edges with P-values worse than specified are ignored. Varying of this threshold can lead to a disaggregation of previously compact groups or merging of the previously divided clusters together [28].
MUSCLE
MUSCLE is a program for construction of MSA [31,32]. It implements very fast and accurate progressive alignment algorithm which enables to make high-quality MSA for hundreds or thousands of sequences [33]. The MUSCLE algorithm consists of three main stages: (i) draft progressive; (ii) improved progressive; and (iii) refinement (Figure A1). In the draft progressive stage, MUSCLE first calculates for each pair of sequences the number of common short sub-sequences (known as k-mers, k-tuples or words) and based on that creates a rough guiding tree by UPGMA method. The initial guiding tree is used to construct an initial MSA by progressive alignment of the sequences. During this procedure, a pairwise alignment is constructed at each node of the tree, progressing from the top of the tree towards its root. The sequence-sequence alignment is created at the top nodes and individual nodes are then represented by an alignment profile. The profile is then used to construct pairwise alignment

Description of Databases and Methods
157
with either another sequence or another node profile at deeper nodes of the tree. In the improved progressive stage, the initial MSA is used to compute a distance matrix for building a new guiding tree. The old and new trees are compared, the subgroups that differ are re-aligned and a new tree is built. The procedure of tree comparisons and re-alignments is repeated until topology of old and new trees agrees or for a specified number of iterations. In the refinement stage, a guiding tree is split into two sub-trees by deleting a selected edge of the tree. Based on the current MSA, a profile is constructed for each of the two sub-trees and a new MSA is constructed by re-aligning these two profiles. If the score of the new MSA is higher than the old one, the new MSA is kept otherwise is discarded. All possible sub-trees are successively tried within one iteration. The calculation continues until convergence or for a specified number of iterations.
MUSCLE is freely available as a stand-alone application at http://drive5.com/muscle/ and is also accessible online, e.g., via the EBI tools at http://www.ebi.ac.uk/Tools/msa/muscle/. Users may choose either a traditional alignment and provide one set of unaligned sequences, or a profile-profile alignment and submit two sets of aligned sequences. Several parameters are available to control the quality of the MSA or the running time. The constructed MSA can be provided in several different formats.
Figure A1 Schematic representation of the MUSCLE algorithm. The algorithm can be divided into three main stages: draft progressive (A), improved progressive (B) and refinement (C). Adapted from [31].

Appendix A1
158
A1.3 Phylogenetic analysis
ProtTest
ProtTest is a tool for the selection of the most appropriate evolutionary model for a provided MSA [34,35]. The current version implements twelve empirical substitution matrices, e.g., WAG [36], LG [37], JTT [38], Blosum62 [39] and mtREV [40] and additionally also parameters assuming invariability of a fraction of amino acid positions, different rates of evolution over different positions and amino acid frequencies observed in the dataset. Given a protein alignment and a tree topology, ProtTest calculates the likelihood under each of the 112 candidate models and estimates model parameters using modified PhyML algorithm [41]. The best model of evolution for a given protein alignment is selected based on the Akaike information criterion (AIC), ensuring balance between accuracy and simplicity of the model [42]. The model with the lowest AIC is expected to be the closest to the true among the set of used candidate models [34]. For small sample sizes, the corrected AIC [43] or the Bayesian information criterion [44] should be used instead of the AIC [34]. ProtTest is freely available both as a web server and stand-alone application at http://darwin.uvigo.es/software/prottest.html. Users have to submit the MSA and optionally may also upload own phylogenetic tree. The output includes likelihoods and estimated parameters for all tested models, ranking of models based on the selected criterion and information about relative importance of individual parameters [34].
WAG matrix The WAG substitution matrix represents an empirical model of amino acid replacements. It was calculated by an approximate maximum-likelihood method using a set of 3,905 amino acid sequences of globular proteins from 182 different protein families [36]. The WAG matrix is implemented in the model selection programs ProtTest [34,35] and ModelGenerator [45] as well as in a large scale of standard phylogenetic packages [41,46-49].
Vanilla Vanilla is a collection of programs for phylogenetic analyses written using the Phylogenetic analysis library [50]. The Vanilla package includes programs for reformatting and modifying MSA, comparison of phylogenetic trees, simulating datasets along phylogenetic trees, calculation of ML branch lengths or sequence distance matrices. The MLDIST, representing one of the implemented programs, provides the ML estimates of pairwise sequence distances. For this purpose, MLDIST incorporates a number of substitution matrices, the gamma distribution modeling rate heterogeneity across sites, as well as frequency parameters. Based on the computed distance matrix, MLDIST enables to construct phylogenetic trees using the NJ [51] or UPGMA methods [50].
The Vanilla package is freely available for download at http://strimmerlab.org/software/ vanilla/index.html. As an input, MLDIST requires a MSA and optionally specification of evolutionary model parameters. The essential outputs include a phylogenetic tree, a distance matrix, information about branch lengths and a summary of calculation settings.

Description of Databases and Methods
159
PhyML
PhyML is a widely used program for phylogenetic reconstructions based on the ML principle. It implements very fast, yet accurate algorithm, which enables to build phylogenetic trees from even large datasets and complete the calculation in a reasonable time [24,41]. In the first step, the starting tree is constructed using the BIONJ method [52]. The starting tree topology and branch lengths are then simultaneously and iteratively optimized using a simple hill-climbing algorithm based on the nearest neighbor interchange (Figure A2) [41]. The tree likelihood increases by each iteration and usually only a few iterations are needed to found an optimal tree. PhyML implements several models of evolution including substitution matrices as well as frequency and rate heterogeneity parameters [41]. The recent version, PhyML 3.0, introduces new algorithm for tree optimization and a fast approximate likelihood ratio test to compute the support of individual tree branches [53].
PhyML is freely available both for a download and as a web server at http://www.atgc-montpellier.fr/phyml/. As an input, users have to provide MSA and optionally may also upload own starting tree. Additionally, they may specify parameters of evolutionary model and select tree optimization method. The outputs include the estimated ML tree and file listing used parameters of evolutionary model as well as other calculation settings.
Figure A2 The nearest-neighbor interchange algorithm applied on one internal branch (red line) of the tree. The internal branch defines relationship among four subtrees (a, b, c, d). For a given internal branch, the algorithm creates two alternative trees by swapping a subtree on one side of the branch with a subtree on the other side. Two such rearrangements are possible for each internal branch. Adapted from [54].
Non-parametric bootstrapping
The non-parametric bootstrapping [55] estimates the statistical confidence of the tree topology by analyzing the amount of support provided by a given MSA to each node in the tree [56]. The first step of the bootstrap procedure is a creation of a set of new MSAs. This is done by a random replacement of certain columns of the original MSA by other randomly chosen columns. Consequently, certain columns are present multiple times in the new MSA, while other columns from the original MSA are not present at all. A phylogenetic tree is then

Appendix A1
160
constructed for each new MSA and all calculated trees are combined into a consensus tree. For each node (grouping of sequences) of the consensus tree, the bootstrap support is calculated as the percentage of times a given sequence grouping appeared in the bootstrap trees. The bootstrap values are mapped on the tree and indicate homogeneity with which individual groups of sequences are supported as monophyletic groups by the original MSA [24,56,57]. It is important to note that bootstrapping does not test the correctness of the inferred phylogenetic tree, it just indicates consistency and stability of individual parts of the tree [24,56]. Thus, even high bootstrap values do not rule out the possibility that the tree is biased or completely wrong due to the usage of unrealistic evolutionary model, unusually accelerated evolutionary rates or other systematic errors [24]. The non-parametric bootstrap analysis is available in most phylogenetic packages.
TREE-PUZZLE TREE-PUZZLE is a program package for phylogenetic analyses based on the ML principle. It implements a fast tree search algorithm called quartet puzzling [58]. In the first step of the algorithm, all sequences of the dataset are divided into many subsets of four sequences (quartets), and for each of such subsets, an optimal ML tree is found. In the next step, all obtained quartet trees are combined into one consensual tree [24]. TREE-PUZZLE implements a variety of evolutionary models including substitution matrices and parameters to model rate heterogeneity among sites and amino acid frequencies [58]. It provides methods for reconstruction, comparison and evaluation of phylogenetic trees as well as likelihood-mapping, which enable to estimate the quartet support for relationships among user-defined clusters of sequences. For this purpose, users have to divide the sequence dataset into 2-4 clusters; most commonly four clusters are analyzed. The quartet puzzling algorithm is then used to estimate likelihood of each of the three possible tree topologies for a quartet. For each quartet, the likelihood value of each tree topology is weighted by the sum of all three likelihoods. The likelihood weights are then used as the barycentric coordinates to plot the point, representing a given quartet, on the equilateral triangle in which each vertex represents one of the possible topologies (Figure A3A). The closer this point is to some vertex, the more likelihoods favor a corresponding tree topology over the other two. By plotting the points for all reconstructed quartets, likelihood mapping provides information which of the possible tree topologies is most supported (Figure A3B) [58,59]. Besides the cluster analyses, the likelihood mapping can also be used to visualize amount of phylogenetic information in the dataset [48,58,59]
TREE-PUZZLE is freely available for download at http://www.tree-puzzle.de/. For the four-cluster likelihood mapping analysis, users have to provide MSA and define four groups of sequences. Optionally, they can also specify evolutionary model and methods for estimation of parameters. The outputs include illustrations of the distribution of individual quartet points in triangles divided into three and seven areas. The triangle with three areas indicates the tree topology that would be obtained by the ML tree reconstruction, while the second triangle distinguish three regions for the fully resolved quartets, three regions for the partially resolved quartets and one, central, region for the unresolved quartets (Figure A3B) [58,59].

Description of Databases and Methods
161
Figure A3 Schematic representation of the four-cluster likelihood mapping. The triangle vertices with coordinates (1,0,0), (0,1,0) and (0,0,1) correspond to the three alternative topologies of the tree (T1, T2, T3). (A) For each quartet, weighted likelihoods (p1, p2 and p3) of the three alternative tree topologies are used as barycentric coordinates to map the point P, representing a given quartet, on the equilateral triangle. (B) Results of the four-cluster likelihood mapping divided into seven regions: 90.4 % of quartets were mapped into the region corresponding to the T3 topology, while only 6.4 % and 0.9 % of the quartets supports the T2 and T1 topology, respectively. 1.8 % of quartets were only partially resolved and 0.5 % of quartets mapped to the central region were unresolved. Adapted from [59].
Phyltest
Phyltest is a program for statistical tests of phylogenetic hypotheses. It implements the four-cluster analysis [60], interior branch test [61], estimation of average distances within and between different sequence clusters, relative rate tests and estimation of the divergence time [Kumar, S., unpublished]. The four-cluster analysis uses the minimum evolution method, which, based on the sequence distance matrix, searches for a tree with the smallest sum of branch lengths [61]. Phyltest provides a simple statistical test for comparison of three alternative hypotheses on the relationships among four monophyletic sequence groups defined by users. The algorithm does not need any information regarding the topologies within individual clusters since these do not influence inferences of relationships among clusters. This fact significantly reduces the complexity of calculations. In the first step, the distance matrix is calculated from the provided set of sequences. Subsequently, branch lengths and their variances are estimated by the least squares method for each of the three alternative tree topologies, each corresponding to one hypothesis of inter-group relationships. The last step is the pairwise comparison of the sums of branch lengths estimated for individual topologies and calculation of the statistical significance of observed

Appendix A1
162
differences using the two-tailed normal deviate test [60] [Kumar, S., unpublished]. The potential disadvantage of Phyltest is that it provides only limited set of evolutionary models.
The Phyltest program is freely available for download at https://homes.bio.psu.edu/ people/faculty/nei/lab/software.htm. Users have to provide a MSA in a specific format with indicated subdivision of sequences into monophyletic groups. The output file provides information about statistical significance of differences between each pair of alternative topologies.
Rate4Site
Rate4Site estimates the relative rate of evolution of individual positions in protein sequences [62,63]. For this purpose, Rate4Site makes use of likelihood methods and several evolutionary models. In the first step, the MSA of the target sequence and its homologs is converted to the ML distance matrix. The distance matrix is used to build the NJ phylogenetic tree. Based on the reconstructed phylogenetic tree, the site-specific evolutionary rates are calculated for each position (column) of the MSA using the empirical Bayesian or ML algorithm [63]. The inferred site-specific rates are presented as normalized conservation scores and indicate how fast a given position evolves compared to the average rate of all positions [62,63]. The main advantage of Rate4Site over many other methods for calculation of conservation scores is that it considers the phylogenetic relationships of analyzed sequences and the stochastic process underlying their evolution. Consequently, Rate4Site is able to distinguish genuine sequence conservation from conservation due to the short evolutionary time [64].
Rate4Site is freely available for download at http://tau.ac.il/~itaymay/cp/rate4site.html or as a part of the ConSurf server at http://consurf.tau.ac.il/. Users provide MSA and optionally also own phylogenetic tree. Additionally, they may choose between ML and Bayesian methods, specify evolutionary model and branch-lengths optimization procedure. The output includes information about normalized conservation scores for each position of the target sequence and for Bayesian inference also the confidence intervals for the site-specific rate estimates.
ConSurf
The ConSurf web server calculates the level of evolutionary conservation of individual positions of a protein and maps this information onto its 3D structure. The evolutionary conservation visualized in the structural context facilitates identification of structurally and functionally important regions of a given protein [65,66]. The conservation of individual sites is calculated using the Rate4Site program [62,63]. In the first step, the server extracts sequence from the provided protein structure and identifies its homologs in the UniProtKB/Swiss-Prot database using the PSI-BLAST search. Obtained dataset is then aligned using CLUSTALW and the MSA is used as an input for the Rate4Site program. The Rate4Site program estimates the phylogenetic tree by NJ algorithm and position-specific conservation scores by Bayesian or ML algorithm. The normalized conservation scores obtained from the Rate4Site are then converted into a discrete scale of nine grades and mapped on the query 3D structure [66]. The server was recently upgraded and currently enables to select from

Description of Databases and Methods
163
several sequence databases and MSA building programs, provides more substitution matrices and possibility to filter out redundant or unrelated sequences [64].
ConSurf is freely available at http://consurf.tau.ac.il/. As an input, users provide the query structure in the PDB format or alternatively only the sequence file. In the latter case, the evolutionary scores will be just calculated and not mapped. Optionally, users may upload own MSA and phylogenetic tree and specify the calculation parameters like the substitution matrix or the likelihood method for estimation of evolutionary conservation. The results mapped onto the query structure can be visualized directly in the web browser. The other essential outputs include scripts for visualization of results in different structure visualization programs, calculated MSA and phylogenetic tree and the file providing for each position information about the normalized conservation scores and grades, confidence intervals of estimations (for the Bayesian method) and amino acids found in a given column of MSA [64,66].
A1.4 Protein structure analysis
Dali Dali is a web server for pairwise structure comparison and structure database searches [67,68]. The Dali alignment algorithm calculates for both analyzed structures intramolecular distances between Cα atoms of all their residues. The two generated distance matrices, each representing one protein, are then moved relative to each other to find maximum overlaps between them. For this purpose, each matrix is decomposed into smaller submatrices. This procedure enables to find similar patterns of intramolecular distances, i.e., local similarities between the two structures. Identified local similarities are subsequently combined into alignments using the heuristic branch-and-bound search. The high-scoring alignments are further refined using a Monte Carlo optimization procedure [24,67,69]. Comparison of the query structure with all structures in the wwPDB using the standard Dali procedure may take a long time. To speed-up the database searches, fast methods such as BLAST or GTG sequence motifs [70] are used to find potential homologs of the query and the DALI alignment is constructed only for the best hits. If a strong match is found this way, the query structure only needs to be compared with the structural neighbors of the strong match. Otherwise, the query structure must be compared against all structures in PDB90 (wwPDB clustered at 90% identity level) [68,71].
The DALI server is freely available at http://ekhidna.biocenter.helsinki.fi/dali_server/. Users can either submit two structures and calculate their similarity or specify the query structure for the database search. Additionally, users can access the database of the pre-computed structural neighborhoods and alignments, which are available for most proteins from the wwPDB. The essential output of the database search is a list of structural neighbors and their corresponding alignment with the query [68]. Hits are ranked by the Z-score, representing the statistical significance of the observed similarity, i.e., the number of standard deviations by which the obtained score differs from the average score derived from the database background distribution [24]. Structural alignments of selected hits can be interactively visualized in the web browser or analyzed as MSAs. The pairwise comparison server returns the structural alignment of the analyzed proteins [68].

Appendix A1
164
FATCAT
FATCAT is a web server for pairwise comparison of protein structures and database searches for similar structures [72]. It implements a flexible protein structure alignment algorithm which allows internal rearrangements in the structures during the alignment procedure [73]. In the first step, FATCAT identifies a set of local matches (fragments that can be aligned) between the two structures. Dynamic programming is then used to find an optimal way to connect these local matches and produce structural alignment. During this process, twists and gaps can be introduced between two consecutive matches, if they substantially improve the superposition of the structures. The produced alignment is then refined using several post-processing steps, including removal of unnecessary twists or introduction of new twists improving the overall structural alignment [72,73].
The FATCAT web server is freely available at http://fatcat.burnham.org/. For the pairwise alignment, users have to provide two protein structures in the PDB format. The output includes the alignment of the two structures and information about the statistical significance of their similarity provided as a P-value, which reflects the chance of getting the same or better similarity when comparing two random structures. The structural alignment can be visualized in the web browser or downloaded in the PDB format. For the database search, users provide one query structure and select the database to be searched (wwPDB or SCOP databases clustered at different levels). The server returns a list of similar structures ranked by the P-values and pairwise alignments between each structure and the query [72].
GeneSilico meta-server GeneSilico meta-server represents a gateway to many structure prediction methods [74]. The current components of the GeneSilico meta-server include tools for: (i) identification of conserved domains—HmmPfam [75,76] and HHSearchCDD [77,78]; (ii) secondary structure prediction—PSIPRED [79], Jnet [80] and Prof [81]; (iii) prediction of domain composition—DOMAC [82], Scooby [83] and GlobPlot [84]; (iv) identification of transmembrane helices—TOPCONS [85], Phobius [86] and OCTOPUS [87]; (v) prediction of disordered regions—POODLE-S [88], IUPred [89] and DisEMBL [90]; (vi) prediction of coiled coils—COILS [91], Parcoil [92] and Ncoils [93]; (vii) prediction of protein-DNA and protein-RNA interactions—BindN+ [94], NAPS [95] and RNABindR [96]; (viii) prediction of solvent accessibility of residues—SABLE [97], Jnet [80] and ACCpro [98]; and (ix) fold recognition—pro-sp3-TASSER [88], Phyre [99] and FUGUE [100]. Note that the GeneSilico meta-server integrates many other tools that are not listed above. The GeneSilico meta-server is freely available for academic users at https://genesilico.pl/meta2. Users can submit a protein sequence or MSA. Results of all methods are presented in a unified way. For most categories, also the consensus prediction (a combined prediction of all methods from a given category) is reported. The fold recognition methods provide alignments of the query sequence to identified templates, which can be directly used for building of homology models [74]. For each alignment, a crude 3D model of the query is automatically generated and evaluated by the by the SCWRL [101] and VERIFY3D method [102], respectively. To select potentially best query-template alignments,

Description of Databases and Methods
165
results of the fold recognition methods can be evaluated and ranked by the Pcons5 consensus predictor server [74,103].
MODELLER MODELLER is a program for comparative protein structure modeling [104-106]. Besides the construction of homology models, MODELLER can also be used for additional tasks, including fold recognition, alignment of protein sequences or model evaluation. Models are built using the method of modeling by satisfaction of spatial restraints. First, the model building algorithm generates many different restrains on the structure of the target sequence [105,106]. These include: (i) homology-based restraints on the distances and dihedral angles derived based on the alignment of the target sequence with template structures; (ii) stereochemical restrains such as bond lengths, bond angles, solvent accessibility or atom density preferences, obtained from the CHARMM22 molecular mechanics force-field [107]; (iii) statistical preferences for dihedral angles and nonbonded atom-atom contacts, extracted from representatives of known protein structures; and (iv) optional manually specified restraints obtained from analyses of hydrophobicity, site-directed mutagenesis, fluorescence spectroscopy, etc. [105,106]. The final 3D model is then derived by minimizing the violations of all the defined restraints. For this purpose, the spatial restraints are expressed as probability density functions and are combined into an objective function. The objective function is subsequently optimized using the methods of conjugate gradients and molecular dynamics with simulated annealing [105,106,108].
MODELLER is freely available for academic users at http://salilab.org/modeller/. It is also available as a web server at different sites, e.g., as a part of the GeneSilico Toolkit at https://genesilico.pl/toolkit/unimod?method=Modeller. The typical input is the alignment of the target sequence to one or more templates and the 3D structure of the templates. Several optional parameters are available to adjust the model building procedure, for instance, specification of the number of models to be built or level of model refinements. The most important outputs are the 3D model of the target protein containing all non-hydrogen atoms and the log file providing information about the calculation procedure, warnings, errors or violated restraints in the final model [105,106].
COLORADO3D
COLORADO3D is a web server for mapping of results of different protein structure analyses on the 3D structures. It integrates methods for identification of buried residues, estimation of sequence conservations and evaluation of protein 3D models [109]. The protein structure validations can be conducted using four different third-party programs—ANOLEA [110], PROSAII [111], PROVE [112] or VERIFY3D. PROVE evaluates the quality of structure based on the deviations of the atomic volumes from the standard values [112], while VERIFY3D, PROSAII and ANOLEA verifies the models by evaluation of the environment of individual residues in a model with respect to the environments found in the high resolution crystal structures [109]. In VERIFY3D, each residue position in the 3D structure is first characterized by its environment—by the local secondary structure, area of the residue that is buried and the fraction of the side-chain area covered by polar atoms. The compatibility of a given

Appendix A1
166
residue with its environment is then evaluated based on the known statistical preferences of individual amino acids for individual environments [102]. To assess the compatibility of each amino acid residue with the local 3D structure, COLORADO3D by default averages the VERIFY3D scores in a window of five residues [109].
COLORADO3D is freely available for academic users at http://asia.genesilico.pl/ colorado3d. As an input, users have to provide a structure in the PDB format and select the type of analysis. Conservation analyses additionally require a MSA. Results of individual analyses are converted to the blue-to-red color scale and are mapped on the provided structure using the B-factor column of the PDB file. Results thus can be displayed in any structure viewer which enables coloring of proteins by B-factors [109].
CASTp CASTp is an online tool for locating and measuring of pockets and cavities in the 3D structures of proteins [113,114]. CASTp is based on computational geometry methods including Delaunay triangulation, alpha shape and discrete flow theory. In the first steps, the molecular surface of a protein is defined by the probe sphere and structure is approximated by the convex hull. In the next step, the Voronoi diagram [115] is constructed and the Delaunay triangulation of the convex hull is subsequently derived by mapping from the Voronoi diagram. The alpha shape representation of the molecule is then obtained by repeated mapping of the Voronoi diagram but, this time, excluding all Voronoi vertices and edges that are completely outside the molecule. Comparison of the Delaunay triangulation and the alpha shape enables to identify the so called empty triangles, i.e., the Delaunay triangles that are not part of the alpha shape. Pockets, surface depressions and interior cavities are then identified as collections of such empty triangles. Cavities are identified as an empty space that is not accessible to the solvent probe, while the discrete-flow method is used to distinguish pockets and surface depressions [116]. The volume and area of each pocket and cavity is measured analytically using the solvent accessible surface model [117] and molecular surface model [113,118].
CASTp is freely available as a plugin for PyMOL visualization software [119] and as a web server at http://sts.bioengr.uic.edu/castp. Users have to provide a protein structure and specify the radius of the probe sphere. Calculated pockets and cavities can be loaded in PyMOL or interactively visualized in the web browser. Additional outputs include information about the volume and area of individual pockets and cavities, list of all their lining atoms and, if available, also the information about biologically important residues of a given pocket or cavity, derived from the wwPDB, Online Mendelian Inheritance in Man [120,121] and UniProtKB/Swiss-Prot databases [114].
CAVER CAVER is a program for a rapid and automated identification of tunnels, channels or pores in biological macromolecules or inorganic materials [122,123]. The algorithm performs a skeleton search based on a grid constructed over the molecule. In the first step, the protein is modeled on a discrete 3D grid space. The convex hull approximation of the protein surface is then used to distinguish the protein interior from the protein surrounding and the interior

Description of Databases and Methods
167
grid nodes that do not overlap with protein body are searched, i.e., nodes located within an empty space of protein cavities or tunnels. For this purpose, the respective grid nodes are evaluated using a cost function, assigning “higher costs” to nodes located closer to protein atoms. The Dijkstra's algorithm [124] is used to find the lowest-cost paths between the user-defined starting point and protein surrounding [122,123]. CAVER 1.0 can be used for analysis of static crystal structures as well as structure assemblies from molecular dynamics simulations or NMR experiments [122]. However, the application of CAVER 1.0 for automatic analysis of tunnels in dynamical systems is quite limited. CAVER 1.0 does not implement any algorithm for clustering of identified tunnels and consequently, users have to assign correspondence between tunnels from different snapshots manually. The other limitations of CAVER 1.0 are large demands on processor time and memory and calculation errors due to the used grid approximation [125]. To overcome these limitations, the new version of CAVER was recently developed [Chapter 3]. The new version was specifically designed for analysis of large assemblies of structures. It implements a new algorithm for tunnel calculation based on the Voronoi diagram [115] and provides algorithms enabling high-quality tunnel clustering [Chapter 3].
CAVER is freely available as a PyMOL plugin or command-line application at http://www.caver.cz/. Users have to provide a structure or a set of aligned structures in the PDB format and specify calculation starting point. They may also specify a number of additional parameters to adjust the calculation based on their needs. The calculated tunnels approximated by a sequence of spheres can be visualized in PyMOL or VMD [126] using the automatically generated scripts. Additional outputs include summaries and characteristics (e.g., bottleneck radius, mean radius and length) of individual tunnels, tunnel profiles, list of tunnel-lining atoms and residues or bottleneck-residues.
A1.5 References
[1] M. Magrane, Uniprot Consortium, Database 2011, bar009. [2] R. Leinonen, R. Akhtar, E. Birney, L. Bower, A. Cerdeno-Tárraga, Y. Cheng, I. Cleland,
N. Faruque, N. Goodgame, R. Gibson, G. Hoad, M. Jang, N. Pakseresht, S. Plaister, R. Radhakrishnan, K. Reddy, S. Sobhany, P. Ten Hoopen, R. Vaughan, V. Zalunin, G. Cochrane, Nucleic Acids Res 2011, 39, D28-31.
[3] E. Kaminuma, J. Mashima, Y. Kodama, T. Gojobori, O. Ogasawara, K. Okubo, T. Takagi, Y. Nakamura, Nucleic Acids Res 2010, 38, D33-38.
[4] D. A. Benson, I. Karsch-Mizrachi, D. J. Lipman, J. Ostell, E. W. Sayers, Nucleic Acids Res 2011, 39, D32-37.
[5] K. D. Pruitt, T. Tatusova, W. Klimke, D. R. Maglott, Nucleic Acids Res 2009, 37, D32-D36.
[6] H. Berman, K. Henrick, H. Nakamura, J. L. Markley, Nucleic Acids Res 2007, 35, D301-303.
[7] E. W. Sayers, T. Barrett, D. A. Benson, E. Bolton, S. H. Bryant, K. Canese, V. Chetvernin, D. M. Church, M. DiCuccio, S. Federhen, M. Feolo, I. M. Fingerman, L. Y. Geer, W. Helmberg, Y. Kapustin, D. Landsman, D. J. Lipman, Z. Lu, T. L. Madden, T. Madej, D. R. Maglott, A. Marchler-Bauer, V. Miller, I. Mizrachi, J. Ostell, A.

Appendix A1
168
Panchenko, L. Phan, K. D. Pruitt, G. D. Schuler, E. Sequeira, S. T. Sherry, M. Shumway, K. Sirotkin, D. Slotta, A. Souvorov, G. Starchenko, T. A. Tatusova, L. Wagner, Y. Wang, W. J. Wilbur, E. Yaschenko, J. Ye, Nucleic Acids Res 2011, 39, D38-51.
[8] S. F. Altschul, T. L. Madden, A. A. Schäffer, J. Zhang, Z. Zhang, W. Miller, D. J. Lipman, Nucleic Acids Res 1997, 25, 3389-3402.
[9] H. Berman, K. Henrick, H. Nakamura, Nat Struct Biol 2003, 10, 980. [10] S. Dutta, K. Burkhardt, J. Young, G. J. Swaminathan, T. Matsuura, K. Henrick, H.
Nakamura, H. M. Berman, Mol Biotechnol 2009, 42, 1-13. [11] H. M. Berman, Acta Crystallogr, A, Found Crystallogr 2008, 64, 88-95. [12] P. W. Rose, B. Beran, C. Bi, W. F. Bluhm, D. Dimitropoulos, D. S. Goodsell, A. Prlic, M.
Quesada, G. B. Quinn, J. D. Westbrook, J. Young, B. Yukich, C. Zardecki, H. M. Berman, P. E. Bourne, Nucleic Acids Res 2011, 39, D392-401.
[13] S. Velankar, Y. Alhroub, A. Alili, C. Best, H. C. Boutselakis, S. Caboche, M. J. Conroy, J. M. Dana, G. van Ginkel, A. Golovin, S. P. Gore, A. Gutmanas, P. Haslam, M. Hirshberg, M. John, I. Lagerstedt, S. Mir, L. E. Newman, T. J. Oldfield, C. J. Penkett, J. Pineda-Castillo, L. Rinaldi, G. Sahni, G. Sawka, S. Sen, R. Slowley, A. W. Sousa da Silva, A. Suarez-Uruena, G. J. Swaminathan, M. F. Symmons, W. F. Vranken, M. Wainwright, G. J. Kleywegt, Nucleic Acids Res 2011, 39, D402-410.
[14] D. M. Standley, A. R. Kinjo, K. Kinoshita, H. Nakamura, Brief Bioinformatics 2008, 9, 276-285.
[15] E. L. Ulrich, H. Akutsu, J. F. Doreleijers, Y. Harano, Y. E. Ioannidis, J. Lin, M. Livny, S. Mading, D. Maziuk, Z. Miller, E. Nakatani, C. F. Schulte, D. E. Tolmie, R. Kent Wenger, H. Yao, J. L. Markley, Nucleic Acids Res 2008, 36, D402-408.
[16] J. Westbrook, N. Ito, H. Nakamura, K. Henrick, H. M. Berman, Bioinformatics 2005, 21, 988-992.
[17] A. C. R. Martin, Bioinformatics 2005, 21, 4297-4301. [18] A. Andreeva, D. Howorth, S. E. Brenner, T. J. P. Hubbard, C. Chothia, A. G. Murzin,
Nucleic Acids Res 2004, 32, D226-229. [19] A. Andreeva, D. Howorth, J. M. Chandonia, S. E. Brenner, T. J. P. Hubbard, C. Chothia,
A. G. Murzin, Nucleic Acids Res 2008, 36, D419-425. [20] C. T. Porter, G. J. Bartlett, J. M. Thornton, Nucleic Acids Res 2004, 32, D129-133. [21] K. Nishikawa, S. Ishino, H. Takenaka, N. Norioka, T. Hirai, T. Yao, Y. Seto, Protein Eng
1994, 7, 733. [22] T. Kawabata, M. Ota, K. Nishikawa, Nucleic Acids Res 1999, 27, 355-357. [23] M. Bhagwat, L. Aravind, Methods Mol Biol 2007, 395, 177-186. [24] J. Xiong, Essential Bioinformatics, Cambridge University Press, New York, 2006. [25] W. Li, L. Jaroszewski, A. Godzik, Protein Eng 2002, 15, 643-649. [26] W. Li, L. Jaroszewski, A. Godzik, Bioinformatics 2001, 17, 282-283. [27] Y. Huang, B. Niu, Y. Gao, L. Fu, W. Li, Bioinformatics 2010, 26, 680-682. [28] T. Frickey, A. Lupas, Bioinformatics 2004, 20, 3702-3704. [29] T. M. J. Fruchterman, E. M. Reingold, Software Pract Exper 1991, 21, 1129-1164. [30] A. Biegert, C. Mayer, M. Remmert, J. Söding, A. N. Lupas, Nucleic Acids Res 2006, 34,
W335-339. [31] R. C. Edgar, Nucleic Acids Res 2004, 32, 1792-1797. [32] R. C. Edgar, BMC Bioinformatics 2004, 5, 113. [33] I. M. Wallace, G. Blackshields, D. G. Higgins, Curr Opin Struct Biol 2005, 15, 261-266.

Description of Databases and Methods
169
[34] F. Abascal, R. Zardoya, D. Posada, Bioinformatics 2005, 21, 2104-2105. [35] D. Darriba, G. L. Taboada, R. Doallo, D. Posada, Bioinformatics 2011, 27, 1164-1165. [36] S. Whelan, N. Goldman, Mol Biol Evol 2001, 18, 691-699. [37] S. Q. Le, O. Gascuel, Mol Biol Evol 2008, 25, 1307-1320. [38] D. T. Jones, W. R. Taylor, J. M. Thornton, Comput Appl Biosci 1992, 8, 275-282. [39] S. Henikoff, J. G. Henikoff, Proc Natl Acad Sci USA 1992, 89, 10915-10919. [40] J. Adachi, M. Hasegawa, J Mol Evol 1996, 42, 459-468. [41] S. Guindon, O. Gascuel, Syst Biol 2003, 52, 696-704. [42] H. Akaike, Proceedings of 2nd International Symposium on Information Theory, 1973,
Budapest, Hungary, 267-281. [43] N. Sugiura, Commun Stat A-Theor 1978, 7, 13-26. [44] G. Schwarz, Ann Stat 1978, 6, 461-464. [45] T. M. Keane, C. J. Creevey, M. M. Pentony, T. J. Naughton, J. O. Mclnerney, BMC Evol
Biol 2006, 6, 29. [46] F. Ronquist, J. P. Huelsenbeck, Bioinformatics 2003, 19, 1572-1574. [47] Z. Yang, Mol Biol Evol 2007, 24, 1586-1591. [48] H. A. Schmidt, A. von Haeseler, Curr Protoc Bioinformatics 2007, Chapter 6, Unit 6.6. [49] W. Delport, A. F. Y. Poon, S. D. W. Frost, S. L. Kosakovsky Pond, Bioinformatics 2010,
26, 2455-2457. [50] A. Drummond, K. Strimmer, Bioinformatics 2001, 17, 662-663. [51] N. Saitou, M. Nei, Mol Biol Evol 1987, 4, 406-425. [52] O. Gascuel, Mol Biol Evol 1997, 14, 685-695. [53] S. Guindon, J. F. Dufayard, V. Lefort, M. Anisimova, W. Hordijk, O. Gascuel, Syst Biol
2010, 59, 307-321. [54] Z. Yang, Computational Molecular Evolution, Oxford University Press, New York,
2006. [55] J. Felsenstein, Evolution 1985, 39, 783–791. [56] M. Holder, P. O. Lewis, Nat Rev Genet 2003, 4, 275-284. [57] S. Whelan, P. Liò, N. Goldman, Trends Genet 2001, 17, 262-272. [58] H. A. Schmidt, K. Strimmer, M. Vingron, A. von Haeseler, Bioinformatics 2002, 18,
502-504. [59] K. Strimmer, A. von Haeseler, Proc Natl Acad Sci USA 1997, 94, 6815-6819. [60] A. Rzhetsky, S. Kumar, M. Nei, Mol Biol Evol 1995, 12, 163-167. [61] A. Rzhetsky, M. Nei, Mol Biol Evol 1992, 9, 945-967. [62] T. Pupko, R. E. Bell, I. Mayrose, F. Glaser, N. Ben-Tal, Bioinformatics 2002, 18 Suppl 1,
S71-77. [63] I. Mayrose, D. Graur, N. Ben-Tal, T. Pupko, Mol Biol Evol 2004, 21, 1781-1791. [64] H. Ashkenazy, E. Erez, E. Martz, T. Pupko, N. Ben-Tal, Nucleic Acids Res 2010, 38,
W529-533. [65] F. Glaser, T. Pupko, I. Paz, R. E. Bell, D. Bechor-Shental, E. Martz, N. Ben-Tal,
Bioinformatics 2003, 19, 163-164. [66] M. Landau, I. Mayrose, Y. Rosenberg, F. Glaser, E. Martz, T. Pupko, N. Ben-Tal, Nucleic
Acids Res 2005, 33, W299-302. [67] L. Holm, J. Park, Bioinformatics 2000, 16, 566-567. [68] L. Holm, P. Rosenström, Nucleic Acids Res 2010, 38, W545-549. [69] L. Holm, C. Sander, J Mol Biol 1993, 233, 123-138.

Appendix A1
170
[70] A. Heger, S. Mallick, C. Wilton, L. Holm, Bioinformatics 2007, 23, 2361-2367. [71] L. Holm, S. Kääriäinen, P. Rosenström, A. Schenkel, Bioinformatics 2008, 24,
2780-2781. [72] Y. Ye, A. Godzik, Nucleic Acids Res 2004, 32, W582-585. [73] Y. Ye, A. Godzik, Bioinformatics 2003, 19 Suppl 2, ii246-255. [74] M. A. Kurowski, J. M. Bujnicki, Nucleic Acids Res 2003, 31, 3305-3307. [75] S. R. Eddy, Genome Inform 2009, 23, 205-211. [76] P. Coggill, R. D. Finn, A. Bateman, Curr Protoc Bioinformatics 2008, Chapter 2,
Unit 2.5. [77] J. Söding, Bioinformatics 2005, 21, 951-960. [78] A. Marchler-Bauer, S. Lu, J. B. Anderson, F. Chitsaz, M. K. Derbyshire, C. DeWeese-
Scott, J. H. Fong, L. Y. Geer, R. C. Geer, N. R. Gonzales, M. Gwadz, D. I. Hurwitz, J. D. Jackson, Z. Ke, C. J. Lanczycki, F. Lu, G. H. Marchler, M. Mullokandov, M. V. Omelchenko, C. L. Robertson, J. S. Song, N. Thanki, R. A. Yamashita, D. Zhang, N. Zhang, C. Zheng, S. H. Bryant, Nucleic Acids Res 2011, 39, D225-229.
[79] D. T. Jones, J Mol Biol 1999, 292, 195-202. [80] C. Cole, J. D. Barber, G. J. Barton, Nucleic Acids Res 2008, 36, W197-201. [81] M. Ouali, R. D. King, Protein Sci 2000, 9, 1162-1176. [82] J. Cheng, Nucleic Acids Res 2007, 35, W354-356. [83] R. A. George, K. Lin, J. Heringa, Nucleic Acids Res 2005, 33, W160-163. [84] R. Linding, R. B. Russell, V. Neduva, T. J. Gibson, Nucleic Acids Res 2003, 31,
3701-3708. [85] A. Bernsel, H. Viklund, A. Hennerdal, A. Elofsson, Nucleic Acids Res 2009, 37,
W465-468. [86] L. Käll, A. Krogh, E. L. L. Sonnhammer, Nucleic Acids Res 2007, 35, W429-432. [87] H. Viklund, A. Elofsson, Bioinformatics 2008, 24, 1662-1668. [88] H. Zhou, J. Skolnick, Biophys J 2009, 96, 2119-2127. [89] Z. Dosztányi, V. Csizmok, P. Tompa, I. Simon, Bioinformatics 2005, 21, 3433-3434. [90] R. Linding, L. J. Jensen, F. Diella, P. Bork, T. J. Gibson, R. B. Russell, Structure 2003, 11,
1453-1459. [91] A. Lupas, M. Van Dyke, J. Stock, Science 1991, 252, 1162-1164. [92] B. Berger, D. B. Wilson, E. Wolf, T. Tonchev, M. Milla, P. S. Kim, Proc Natl Acad Sci
USA 1995, 92, 8259-8263. [93] A. Lupas, Meth Enzymol 1996, 266, 513-525. [94] L. Wang, C. Huang, M. Q. Yang, J. Y. Yang, BMC Syst Biol 2010, 4 Suppl 1, S3. [95] M. B. Carson, R. Langlois, H. Lu, Nucleic Acids Res 2010, 38, W431-435. [96] M. Terribilini, J. D. Sander, J.-H. Lee, P. Zaback, R. L. Jernigan, V. Honavar, D. Dobbs,
Nucleic Acids Res 2007, 35, W578-584. [97] R. Adamczak, A. Porollo, J. Meller, Proteins 2004, 56, 753-767. [98] G. Pollastri, P. Baldi, P. Fariselli, R. Casadio, Proteins 2002, 47, 142-153. [99] L. A. Kelley, M. J. E. Sternberg, Nat Protoc 2009, 4, 363-371. [100] J. Shi, T. L. Blundell, K. Mizuguchi, J Mol Biol 2001, 310, 243-257. [101] R. L. Dunbrack Jr, Proteins 1999, Suppl 3, 81-87. [102] R. Lüthy, J. U. Bowie, D. Eisenberg, Nature 1992, 356, 83-85. [103] B. Wallner, A. Elofsson, Bioinformatics 2005, 21, 4248-4254. [104] A. Sali, T. L. Blundell, J Mol Biol 1993, 234, 779-815.

Description of Databases and Methods
171
[105] N. Eswar, B. Webb, M. A. Marti-Renom, M. S. Madhusudhan, D. Eramian, M. Y. Shen, U. Pieper, A. Sali, Curr Protoc Protein Sci 2007, Chapter 2, Unit 2.9.
[106] N. Eswar, D. Eramian, B. Webb, M. Y. Shen, A. Sali, Methods Mol Biol 2008, 426, 145-159.
[107] A. D. MacKerell, D. Bashford, Bellott, R. L. Dunbrack, J. D. Evanseck, M. J. Field, S. Fischer, J. Gao, H. Guo, S. Ha, D. Joseph-McCarthy, L. Kuchnir, K. Kuczera, F. T. K. Lau, C. Mattos, S. Michnick, T. Ngo, D. T. Nguyen, B. Prodhom, W. E. Reiher, B. Roux, M. Schlenkrich, J. C. Smith, R. Stote, J. Straub, M. Watanabe, J. Wiórkiewicz-Kuczera, D. Yin, M. Karplus, J Phys Chem B 1998, 102, 3586-3616.
[108] G. M. Clore, A. T. Brünger, M. Karplus, A. M. Gronenborn, J Mol Biol 1986, 191, 523-551.
[109] J. M. Sasin, J. M. Bujnicki, Nucleic Acids Res 2004, 32, W586-589. [110] F. Melo, D. Devos, E. Depiereux, E. Feytmans, Proc Int Conf Intell Syst Mol Biol 1997,
5, 187-190. [111] M. J. Sippl, Proteins 1993, 17, 355-362. [112] J. Pontius, J. Richelle, S. J. Wodak, J Mol Biol 1996, 264, 121-136. [113] T. A. Binkowski, S. Naghibzadeh, J. Liang, Nucleic Acids Res 2003, 31, 3352-3355. [114] J. Dundas, Z. Ouyang, J. Tseng, A. Binkowski, Y. Turpaz, J. Liang, Nucleic Acids Res
2006, 34, W116-118. [115] F. Aurenhammer, ACM Comput Surv 1991, 23, 345-405. [116] J. Liang, H. Edelsbrunner, C. Woodward, Protein Sci 1998, 7, 1884-1897. [117] B. Lee, F. M. Richards, J Mol Biol 1971, 55, 379-400. [118] M. L. Connolly, J Appl Crystallogr 1983, 16, 548-558. [119] The PyMOL Molecular Graphics System, Version 1.4, Schrödinger, LLC. [120] A. Hamosh, A. F. Scott, J. S. Amberger, C. A. Bocchini, V. A. McKusick, Nucleic Acids
Res 2005, 33, D514-517. [121] J. Amberger, C. Bocchini, A. Hamosh, Hum Mutat 2011, 32, 564-567. [122] M. Petrek, M. Otyepka, P. Banás, P. Kosinová, J. Koca, J. Damborský, BMC
Bioinformatics 2006, 7, 316. [123] J. Damborský, M. Petrek, P. Banás, M. Otyepka, Biotechnol J 2007, 2, 62-67. [124] E. W. Dijkstra, Numer Math 1959, 1, 269-271. [125] M. Petrek, P. Kosinová, J. Koca, M. Otyepka, Structure 2007, 15, 1357-1363. [126] W. Humphrey, A. Dalke, K. Schulten, J Mol Graph 1996, 14, 33-38, 27-28.

Appendix A2
172
A2 Curriculum Vitae
Person Identification
Name: Eva Chovancová Date and place of birth: July 22, 1980 in Uherské Hradiště, Czech Republic Nationality: Czech
Affiliation and Address
Loschmidt Laboratories Department of Experimental Biology and Research Centre for Toxic Compounds in the Environment Faculty of Science, Masaryk University Kamenice 5/A13, 625 00 Brno, Czech Republic Email: [email protected]
Education and Academic Qualifications
2004: M.Sc. in Molecular Biology and Genetics, Faculty of Science, Masaryk University, Brno, Czech Republic
Employment Summary
2009-present: Department of Experimental Biology, Faculty of Science, Masaryk University, Brno, Czech Republic
2006-2008: National Centre for Biomolecular Research, Faculty of Science, Masaryk University, Brno, Czech Republic
Pedagogical Activities
2005-present: Bioinformatics - practice 2010: 1st Summer School of Protein Engineering 2008: 4th International Summer School on Computational Biology 2007: 3rd International Summer School on Computational Biology
Academic Stays
11/2005: CEMBM, International Institute of Molecular and Cell Biology, Warsaw, Poland 4/2005: EMBO Fellowship, International Institute of Molecular and Cell Biology, Warsaw, Poland 3-4/2003: Austria Grant, Institute of Cancer Research, University of Vienna, Vienna, Austria

Curriculum Vitae
173
Practical Courses
02/2010: Programmatic Access to Biological Databases (Perl), Hinxton, United Kingdom 03/2005: Molecular Phylogenetic Reconstruction Course, Tuebingen, Germany 09/2004: Summer School of Theoretical and Computational Chemistry, Prague, Czech Republic
Membership in Scientific Communities
member of the Czech Free & Open Bioinformatic Association member of the Czech Society for Biochemistry and Molecular Biology
Research Interests
bioinformatics, molecular phylogenetics, protein evolution, protein stability, rational design, development of computational tools for protein engineering
Award
2009: Award of the Dean of the Faculty of Science, Masaryk University

Appendix A3
174
A3 List of Publications
• Chovancová, E., Kosinski, J., Bujnicki, J. M., Damborský, J. (2007). Phylogenetic Analysis
of Haloalkane Dehalogenases. Proteins: 67, 305-316.
• Chovancová, E.*, Pavelka, A*, Damborský, J. (2009). HotSpot Wizard: A Web Server for Identification of Hot Spots in Protein Engineering. Nucleic Acids Research: 37, W376-383.
• Damborský, J., Chaloupková, R., Pavlová, M., Chovancová, E., Brezovský, J. (2010). Structure-Function Relationships and Engineering of Haloalkane Dehalogenases. In Kenneth, N.T., (Ed.), Handbook of Hydrocarbon and Lipid Microbiology. Springer-Verlag, Berlin, Heidelberg, pp. 1081-1098.
• Chovancová, E.*, Koudeláková, T.*, Brezovský, J., Monincová, M., Fořtová, A., Jarkovský, J., Damborský, J. (2011). Substrate Specificity of Haloalkane Dehalogenases. Biochemical Journal 435: 345-354.
• Brezovský, J., Chovancová, E., Gora, A., Pavelka A., Biedermannová L., Damborský, J. (2011). Review: Software Tools for Identification, Visualization and Analysis of Protein Tunnels and Channels. Submitted.
* These authors contributed equally to this work