Embed Size (px)
Citation preview

RESEARCH PAPER
Phase Separation of an IgG1 Antibody Solution under a LowIonic Strength Condition
Hirotaka Nishi & Makoto Miyajima & Hiroaki Nakagami & Masanori Noda & Susumu Uchiyama & Kiichi Fukui
Received: 5 November 2009 /Accepted: 12 March 2010 /Published online: 17 April 2010# Springer Science+Business Media, LLC 2010
ABSTRACTPurpose Phase separation of monoclonal antibody A (MAb A)solution and its relation to protein self-association are studied.Methods A phase diagram of MAb A and its dependence onionic strength and pH were investigated. The protein self-associations were characterized by dynamic light scattering(DLS), analytical ultracentrifugation analysis (AUC) and viscositymeasurement.Results MAb A solution with a clear appearance in an isotonicionic strength condition turned opalescent in a low ionic strengthcondition, followed by liquid-liquid phase separation (LLPS) intolight and heavy phases. The protein concentrations of the twophases were dependent on the ionic strength and pH. The twophases became reversibly miscible when the ionic strength ortemperature was increased. DLS and AUC showed that MAb Aunder a low ionic strength condition self-associates at a proteinconcentration above the critical concentration of 16.5 mg/mL.The viscosity of the heavy phase was high and dependent on theshear rate. These results indicate that attractive protein-proteininteraction in the heavy phase induces LLPS.Conclusions LLPS was induced in MAb A solution in a lowionic strength condition due to reversible protein self-
association mediated mainly by attractive electrostatic interac-tion among the MAb A molecules in the heavy phase.
KEY WORDS low ionic strength condition . monoclonalantibody . opalescence . phase separation . self-association
INTRODUCTION
Humanized monoclonal antibodies (hMAbs) have becomemajor pharmaceutical products in the treatment of a numberof major diseases such as cancer, infectious diseases, allergies,autoimmune diseases, cardiovascular diseases and inflam-mation. However, mainly due to the poor bioavailability ofMAbs via the oral route, the majority of approved MAbs arelimited to parenteral routes of administration, and patientsare forced to bear frequent and chronic administration at aclinic. The development of an alternative delivery route isrequired to improve patient convenience and compliance.Subcutaneous (SC) administration is the preferred routebecause SC administration finishes in a shorter time than IVinfusion, and self-administration by patients at home is alsopossible. For SC administration, a high MAb concentrationsolution is necessary because a large dose (100∼200 mg) isrequired for treatment, and the injection volume is limited(<1.5 mL) (1).
The development of a high MAb concentration formu-lation is very challenging because the behavior of highlyconcentrated MAb solution is quite different from that ofan ideal dilute solution. Generally, proteins in highlyconcentrated solutions tend to self-associate due to molec-ular crowding and the high probability of intermolecularcollisions (1-4). The non-ideality observed in the highlyconcentrated protein solutions is related to protein self-association, which can affect properties such as proteinaggregation (4), viscosity (5, 6) and appearance. The
Electronic Supplementary Material The online version of this article(doi:10.1007/s11095-010-0125-7) contains supplementary material,which is available to authorized users.
H. Nishi :M. Miyajima :H. NakagamiFormulation Technology Research Laboratories( Daiichi Sankyo Co., Ltd.1-12-1 ShinomiyaHiratsuka, Kanagawa 254-0014, Japan
H. Nishi :M. Noda : S. Uchiyama : K. Fukui (*)Department of Biotechnology, Graduate School of EngineeringOsaka University2-1 YamadaokaSuita, Osaka 565-0871, Japane-mail: [email protected]
Pharm Res (2010) 27:1348–1360DOI 10.1007/s11095-010-0125-7

significant contributors in protein self-association arehydrogen bonding, excluded volume effects (2), electrostaticinteraction (5), van der Waals interaction (7) and hydro-phobic interaction (8).
From a pharmaceutical perspective, the prevention ofMAb aggregation is most important because some MAbsform reversible or irreversible aggregates (9, 10), which couldimpact the therapeutic effect, pharmacokinetics or immuno-genicity of the protein drug (11, 12). Protein aggregates canhave a non-native conformation, and this structural changemay affect the immunogenicity of the protein. Reversibleaggregates (9) observed in some MAbs are likely related tosome diseases, such as cryoglobulinemia, macroglobuline-mia, systemic autoimmune disease and hepatitis C virusinfection. In these diseases, reversible aggregation and/orself-association of monoclonal serum immunoglobulinsknown as cryoglobulins have been observed and are believedto be associated with pathogenesis. Cryoglobulins areimmunoglobulins, most frequently IgG or IgM, which showunusual behavior upon cooling. Cryoglobulins precipitateand form a condensed phase below 37°C reversibly (13).Self-association among the Fab portions of IgG might beresponsible for the precipitation of cryoglobulins (14).
The high viscosity of MAb solution impairs its suitabilityfor administration by injection (1, 5). If the viscosity of thehigh concentration solution is sufficiently high, the solutioncan not be withdrawn and expelled using the 26 or 27gauge needles used for SC administration. Recent studiesusing static and dynamic light scattering (7, 15-17),analytical ultracentrifugation (3, 5), rheometry (5, 6, 18-21),membrane osmometry (17) and zeta potential measurement(7, 16, 17) have revealed the origin of the high viscosity ofMAb solution at a high concentration, especially theirrelationship to noncovalent reversible self-association.Although the exact mechanism is still unknown, reversibleself-association driven by electrostatic interaction (5), charge-dipole and dipole-dipole interactions (7, 17) among the Fabportions of IgG (22) is reported to be a major cause of thehigh viscosity of MAb solution at high concentrations(>100 mg/mL). Non-covalent reversible self-association ofMAb may also cause an opalescent appearance of highlyconcentrated MAb solutions (16, 23). Interestingly, hypothet-ical liquid-liquid phase separation was presented based on theprotein concentration dependence of the turbidity. However,liquid-liquid phase separation has not been observed (16).
The addition of precipitating agents, such as non-ionicpolymers into a binary protein-water mixture, can inducephase separation (24). Widely known as Asakura andOosawa’s depletion model (25), the addition of non-ionicpolymer causes an overlap of excluded shells and drives theunbalanced osmotic force, which makes attractive protein-protein interaction. Protein salting-out in a condition ofhigh salt concentration is also known to induce phase
separation. The addition of high concentrations of saltreduces the repulsive electrostatic interactions and inducesprotein self-association, which is associated with proteinprecipitation and crystallization (26-28).
As described above, the characterization of protein self-association is important not only to develop new medicaltreatments for diseases, but also to develop a formulationsuitable for biopharmaceuticals at a high concentration. Inthis report, we describe the unusual behavior of a binarymonoclonal antibody A (MAb A)-salt water mixture whichwas not observed with several other antibodies, includingcommercially available ones. MAb A solution at a higherconcentration has an opalescent appearance in a low ionicstrength condition and is separated into two phases: light andheavy. The turbidity of the solution with opalescent appear-ance is much greater than that expected from the Rayleighscattering of macromolecules at a higher concentration.Additionally, it disappears reversibly by increasing the ionicstrength or increasing the temperature to the point where nophase separation occurs. We also describe the relationshipbetween the phase separation and protein self-association.
MATERIALS AND METHODS
Materials
The humanized monoclonal antibody A (IgG1 subclass,MAb A) used in this investigation to target Fas ligand wasproduced in a mouse myeloma (NS0) cell line and washighly purified at Daiichi Sankyo Co., Ltd., Tokyo, Japan(29). The theoretical isoelectric point (pI) of the antibody is6.5. The protein concentration of the MAb A stock solutionwas 3.51 mg/mL in 10 mM sodium phosphate buffer,140 mM sodium chloride, 0.01% polysorbate 80, pH7.4.
Sucrose, sodium chloride and polysorbate 80 werepurchased from Merck KGaA (Darmstadt, Germany),Wako Pure Chemical Industries Ltd. (Osaka, Japan) andCRODA International Plc. (East Yorkshire, UK), respec-tively, as the excipient materials for formulation.
Sample Preparation
MAb A stock solution was concentrated up to 165 mg/mLusing tangential flow filtration (TFF) equipment (PelliconXL ultrafiltration device MWCO 30 kDa, MilliporeCorporation, Billerica, MA, USA), and then the solutionwas extensively dialyzed against the buffer with the desiredionic strength and pH. All the buffers were composed of5 mM sodium phosphate, 5% (w/v) sucrose, and differentconcentrations of sodium chloride. Polysorbate 80 concen-tration in MAb A stock solution was quantified usingDragendorff’s reagent by the calibration curve produced
Phase Separation of an IgG1 Antibody Solution 1349
using the standard solution containing 0, 0.002, 0.005,0.008 and 0.01% (w/v) of polysorbate 80.
Protein Concentration Measurement
The protein concentration was mainly determined by theUV absorbance at 280 nm using a UV-1600PC (ShimadzuCorporation, Osaka, Japan). In the case that an amount ofsample was insufficient for the UV absorbance measure-ment, the protein concentration was determined by aBicinchoninic acid (BCA) protein assay using bovine serumalbumin (BSA) as a standard (Thermo Fisher Scientific Inc.,Rockford, IL, USA). When MAb A was used as a standard,the slope of the calibration curve was larger than thatproduced by using BSA as a standard. The ratio of theslopes was 1.396. The value of the concentration deter-mined by the BCA protein assay was divided by thenumber 1.396 to convert it into the MAb A concentration.
Phase Behavior Experiments
The phase diagram of MAb A was determined as afunction of the protein concentration (30). The samplesprepared as described in the “Sample Preparation” sectionwere incubated at 5°C, 15°C, 25°C, 30°C, 40°C and 50°Cfor 3 days for a liquid-liquid phase separation (LLPS).Sodium chloride concentration was varied from 5 to40 mM to examine the effect of the sodium chlorideconcentration. The pH was varied from 5.0 to 7.0 toexamine the effect of the pH. After the phase separation,the protein concentrations in the light and heavy phaseswere determined by BCA protein assay and were changedto UV-based protein concentrations as described in the“Protein Concentration Measurement” section. All thealiquots of each phase were diluted with saline to makehomogeneous and clear solutions for a reliable determina-tion of the protein concentrations. The MAb A solutiondiluted with saline has a clear appearance and hasabsorption below 0.005 at 320 nm. The protein concen-tration was plotted against the temperature.
Reversibility of LLPS and the Influence of LLPSon the Antibody Properties
Reversibility of LLPS was assessed by changing the ionicstrength and pH of the solution. The change in ionicstrength and pH was carried out using extensive dialysis ofthe antibody solution. Concentrated antibody solution(approximately 25 mg/mL) in isotonic ionic strength buffer(10 mM sodium phosphate, 140 mM sodium chloride, pH7.4) was first dialyzed against low ionic strength buffer(5 mM sodium phosphate, 5% sucrose, pH 5.5) at 5°C toinduce LLPS. After confirmation of LLPS in a dialysis tube
by visual inspection, antibody solution under LLPS wasdialyzed in the same dialysis tube against the isotonic ionicstrength buffer. This was performed to observe whether thelight and heavy phases disappeared and whether thesolution recovered in a homogeneous and clear state.
The influence of LLPS on the properties of MAb A wascarefully checked by characterizing MAb A in the isotonicionic strength buffer before and after LLPS. The solutionswere filtered through sterile 0.22 μm Millex GV Duraporemembrane filters (Millipore Corporation, Billerica, MA,USA) before measurement.
Turbidity Measurement
Concentrated antibody solution (approximately 160 mg/mL)in isotonic ionic strength buffer (10 mM sodium phosphate,140 mM sodium chloride, pH7.4) was dialyzed against lowionic strength buffer (5 mM sodium phosphate, 20 mMsodium chloride, 5% sucrose, pH5.5). After the determina-tion of the protein concentration by UV absorbance at280 nm, this MAb A solution was diluted with the same lowionic strength buffer (5 mM sodium phosphate, 20 mMsodium chloride, 5% sucrose, pH5.5) to prepare the samplein the concentration range from 1.5 to 165 mg/mL by serialdilution at a dilution factor of 1.01 to 5.04.
The turbidity of the MAb A solution was measured in13 mm glass (culture) tubes (Thermo Fisher Scientific Inc.,Rockford, IL, USA) using a HACH 2100AN turbidimeter(Hach Company, Loveland, CO, USA) at 25°C and 40°C.Since the turbidimeter was calibrated using 25 mm standardglass tubes, the observed turbidities using 13 mm glass tubesrequired conversion using a correlation factor. The correla-tion factor was determined experimentally. Standard for-mazin solutions with 20, 100, 200 and 400 FNU (FormazinNephelometry Units) were prepared by serial dilution offormazin turbidity standard 4,000 FNU solution. Theturbidity of these standard solutions was measured usingboth 13 mm and 25 mm glass tubes. The correlation factorwas estimated as 1.97 from the slope of the value in the25 mm tubes to the value in the 13 mm tubes.
Dynamic Light Scattering (DLS)
The hydrodynamic diameter of MAb A was measured at25°C in triplicate using a NicompTM 380 ZLS, PSSNicomp particle sizing system equipped with a 50 mWDPSS laser (λ=532 nm) as the light source (Particle SizingSystems Inc., Santa Barbara, CA, USA). Dynamic lightscattering was determined at a scattering angle of 90°, and atime-dependent fluctuation in the scattering intensity wasobserved. The dynamic information of the molecule wasderived from an autocorrelation of the intensity trace recordedduring the experiment. The mean diameter was determined in
1350 Nishi et al.

the volume-weighted Gaussian fit mode, and the size distribu-tion by intensity was determined in the volume-weightedNICOMP fit mode. All the buffers were filtered through sterile0.22 μm Millex GV Durapore membrane filters (MilliporeCorporation) before measurement. The measurements ofMAb A, which underwent LLPS, were performed within10 min after homogenizing the coexisting phase.
Analytical Ultracentrifugation-SedimentationVelocity (AUC-SV)
The distributions of MAb A under a low ionic strengthcondition (5 mM sodium phosphate and 10 mM sodiumchloride, pH5.5) and isotonic ionic strength conditions(5 mM sodium phosphate and 140 mM sodium chloride,pH5.5) were analyzed using the AUC-SV method. AUC-SV experiments were performed using Proteomelab XL-IAnalytical Ultracentrifuge (Beckman-Coulter, Fullerton,CA). Samples of 25 mg/mL were measured. Runs werecarried out at 12,000 rpm or 40,000 rpm at a temperatureof 20.0°C using 3 mm charcoal epon double sectorcenterpieces and four-hole An60 Ti analytical rotorequilibrated to 20.0°C. The evolution of the resultingconcentration gradient was monitored with Rayleighinterference detection optics. At least 300 scans werecollected between 6.00 and 7.25 cm from the center ofthe rotation axis. All SV raw data were analyzed by thecontinuous C(s) distribution model using the softwareprogram SEDFIT11.71 (33). The position of the meniscusand frictional ratio (f/f0) was set to vary as fittedparameters, and time-invariant (TI) noise and radian-invariant (RI) noise were removed. Additional parameterfor the analysis that included partial specific volumes(0.728 cm3/g), buffer density (ρ=0.99979 g/cm3 for a lowionic strength condition and ρ=1.00516 g/cm3 for anisotonic ionic strength condition) and viscosity (η=1.0067centipoises for low ionic strength condition and η=1.0180centipoises for isotonic ionic condition) was calculated usingthe SEDNTERP program. A resolution of 200 incrementsbetween 0 and 30 S was entered, and maximum entropyregularization was used (p=0.68).
Viscosity Measurement
The viscosity of the protein sample was measured usingViscometer/Rheometer-on-a-Chip (VROC) (RheoSenseInc., San Ramon, CA, USA) at ambient temperature andPhysica MCR 301 cone/plate rheometer (Anton PaarGmbH, Graz, Austria) at 25°C.
VROC consists of a rectangular slit formed of glass and apressure sensor array and provides shear rate-dependentviscosity accurately with a small amount of sample for bothNewtonian and non-Newtonian fluids (31, 32). Approximate-
ly 1 mL of MAb A solution loaded into a syringe flowedthrough the slit at various flow rates using a syringe pump.The pressure was plotted as a function of the position, andthe wall shear stress (τ) was calculated from the slope of thisplot. The viscosity was calculated from the τ value.
Physica MCR 301 cone/plate rheometer was equippedwith a spindle model CP50-0.5, and approximately 1 mL ofsamples was loaded on the measuring plate. The temperaturewas controlled at 25°C via a peltier element, and a solventtrap was used to prevent solvent evaporation. The viscositywas measured over a range from 0.01 to 10,000 (s−1) toevaluate the shear rate.
Newtonian and non-Newtonian behavior of the fluidscan be determined from the shear rate dependence of theviscosity.
Size-Exclusion Chromatography (SEC)
The distribution of intact protein, soluble aggregate andfragments of MAb A was determined using size exclusionchromatography (SEC). An LC-10Avp high performanceliquid chromatography (HPLC) system (Shimadzu Corpo-ration) was used with a Protein KW-803 column (ShowaDenko K.K., Tokyo, Japan) at a flow rate of 0.5 mL/minusing 30 mM sodium phosphate buffer containing 300 mMsodium chloride, pH6.7 as the mobile phase. A 200 μgsample of protein was injected onto the column and wasdetected at an absorbance of 280 nm.
Ion-Exchange Chromatography (IEC)
The amount of intact IgG and its acidic variants werequantitatively determined by cation-exchange chromatog-raphy (IEC) using a ProPac WCX-10 column (DionexCorporation, Sunnyvale, CA, USA) at a flow rate of0.5 mL/min. The separation of variously charged specieswas achieved through an NaCl gradient. Mobile phase Awas 10 mM sodium phosphate buffer at pH 7.0, andmobile phase B was 10 mM sodium phosphate buffercontaining 1.0 M sodium chloride at pH7.0. The mobilephase mixture varied from 6% initially to 9% at 34 min, upto 50% from 34 min to 45 min and finally back to 6% from45 min to 60 min. One-hundred μg of protein was injectedonto the column and detected at an absorbance of 280 nm.
Enzyme-Linked Immunosorbent Assay (ELISA)
A 96-well Nunc-Immuno plate (Nalge Nunc InternationalK.K., Tokyo, Japan) was coated with the target protein,stored overnight at 4°C and blocked with diluted ImmunoBlock (Dainippon Sumitomo Pharma Co., Ltd., Osaka,Japan), followed by washing with rinse solution three times.Then MAb A and horseradish peroxidase-labeled goat anti-
Phase Separation of an IgG1 Antibody Solution 1351
human IgGκ antibody (Bethyl Laboratories, Inc., Mont-gomery, TX, USA) were added to the plate, followed byincubation for 1 h at ambient temperature. After washingfour times, o-Phenylenediamine (OPD) (Wako Pure Chem-ical Industries Ltd.) solution and hydrogen peroxide (WakoPure Chemical Industries Ltd.) were added and incubatedfor 30 min. The enzymatic reaction was stopped by addingdiluted sulfuric acid (Wako Pure Chemical Industries Ltd.),and the UV absorbance at 492 nm was measured with aGENIOS multi-plate reader (Tecan Japan Co., Ltd.,Kanagawa, Japan). The calibration curve was determinedwith the MAb A standard solution at the concentration of 0,4, 8, 12, 16 and 20 ng/mL. The ratio of ELISA-basedprotein concentration to total protein concentration wasevaluated as the binding ability of MAb A to the targetchimera protein, which is composed of human Fas ligandconjugated with Fc (human Fas-Xa-Fcγ1).
RESULTS
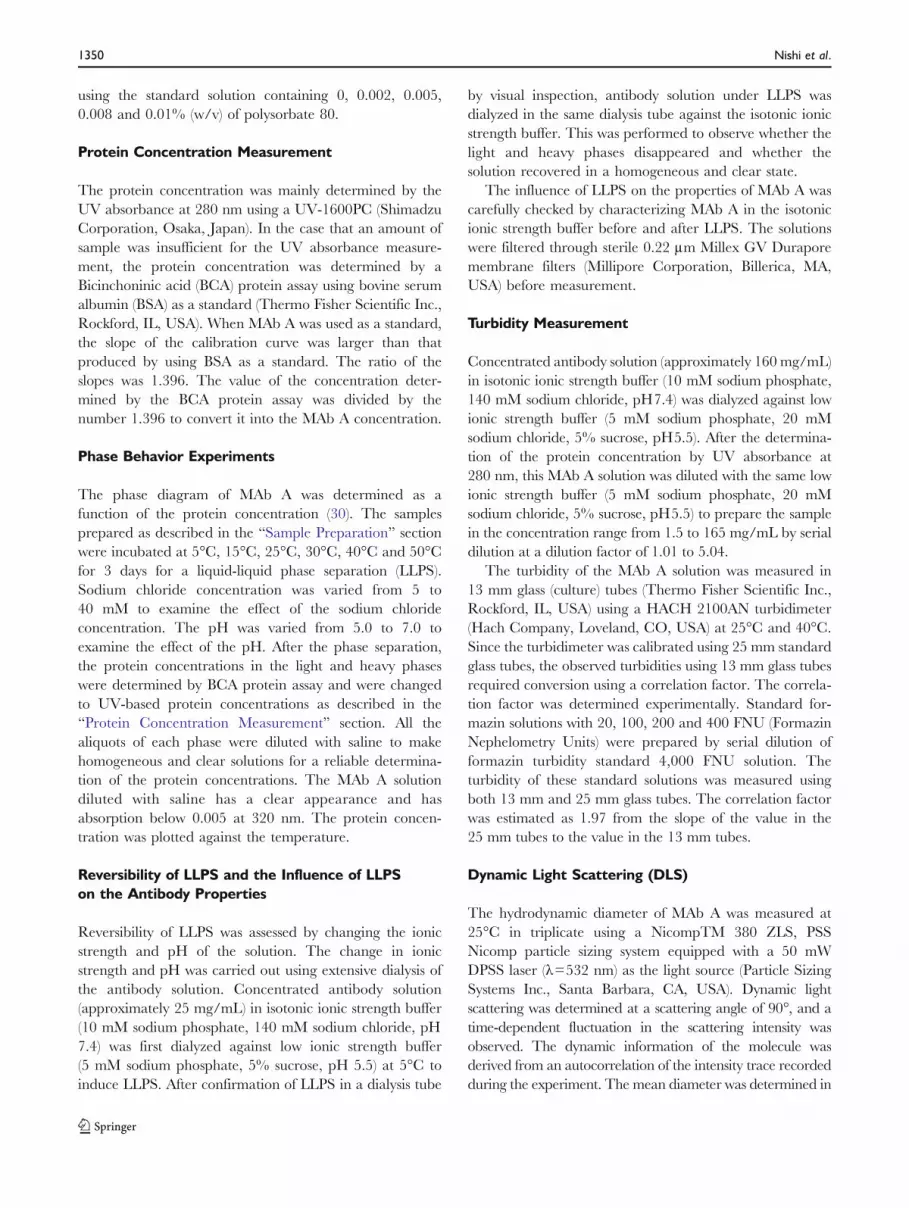
The solution pH and ionic strength have a significant effecton the solution behavior of MAb A, as well as on itsphysical and chemical stabilities. To evaluate the effect, thesolution condition was exchanged by dialysis from anisotonic ionic strength condition (10 mM sodium phos-phate, 140 mM sodium chloride, pH7.2) to a low ionicstrength condition (5 mM sodium phosphate, 10 mMsodium chloride, 5% sucrose, pH5.5). Even though MAbA solution of 2.25 mg/mL has a clear appearance atambient temperature (≈2 FNU), it gradually becomesopalescent at 5°C (≈80 FNU) (Fig. 1). This opalescent
solution at 5°C became clear reversibly at ambienttemperature. A similar behavior of the highly concentratedlysozyme solution was previously reported (34, 35). Thisphenomenon of MAb A solution was not observed in anisotonic ionic strength condition. At a higher concentration(107.22 mg/mL), the opalescent and homogeneous MAb Asolution separated into two phases in a lower ionic strengthcondition (5 mM sodium phosphate, 10 mM sodiumchloride, 5% sucrose, pH5.5) at ambient temperature.Fig. 2 shows the time-dependent change in its appearancein a glass vial. After storage at ambient temperature for upto 2 days, the solution gradually separated into two phases,and finally the coexisting phase appeared, and liquid-liquidinterface could be observed (Fig. 2d). The upper phase andthe lower phase were named light and heavy phases,respectively. The protein concentration measured in eachphase showed that MAb A was highly concentrated in theheavy phase, while it has a lower concentration in the lightphase, as will be described later. These results indicate thata binary MAb A-salt water mixture undergoes LLPS in lowionic strength buffer, as shown in Fig. 2. Although MAb Astock solution (165 mg/mL) contained 0.08% of polysor-bate 80, polysorbate 80 concentrations up to 0.1% (w/v)have no impact on the MAb A concentrations in the lightand heavy phases after phase separation at 25°C (Fig. S1).Therefore, it can be concluded that the presence ofpolysorbate 80 below 0.1% (w/v) has no effect on theLLPS of MAb A. In the following experiments, polysorbate80 concentrations were not controlled but were below0.08% (w/v).
Fig. 3 shows the phase diagram of the binary MAb A-saltwater mixture determined experimentally at 5 mM sodiumphosphate, 5% sucrose, pH5.5 in the presence of 5, 10, 20and 40 mM sodium chloride. The protein concentrations inthe light and heavy phases were bounded by binodalcurves. These binodal curves represent the protein concen-trations of the coexisting phase as a function of thetemperature. Fig. 3 also shows the effect of the sodiumchloride concentration. The upper consolute temperatureof the binary MAb A-salt water mixture depends on thesodium chloride concentration. LLPS was observed from5°C to 50°C at a sodium chloride concentration of 5 and10 mM. However, at a sodium chloride concentration of20 mM, LLPS was not observed above 40°C. At a sodiumchloride concentration of 40 mM, LLPS was observed atonly 5°C. These results indicated that increasing thesodium chloride concentration vertically shifts the criticaltemperature downwards.
In order to confirm that the current LLPS is anequilibrium process, phase separation experiments wereperformed at different MAb A initial concentrations at 5°Cand 25°C. MAb A solutions of 65, 32.5, 16.25 and8.13 mg/mL in a buffer of 10 mM sodium phosphate,
Fig. 1 Visual appearance of MAb A solution at 2.25 mg/mL in low ionicstrength buffer of 5 mM sodium phosphate, 10 mM sodium chloride, 5%sucrose, pH5.5. a: at ambient temperature, b: at 5°C.
1352 Nishi et al.

140 mM sodium chloride, pH7.4 were dialyzed against lowionic strength buffer of 5 mM sodium phosphate, 10 mMsodium chloride, 5% sucrose, pH5.5 and induced LLPS. Asshown in Fig. 4, the protein concentrations of the light andheavy phases were constant regardless of the initial proteinconcentration before phase separation, leading to adifferent volume in each phase (Fig. S2). These resultsindicate that LLPS is an equilibrium process, and the initialconcentration has no effect on the final concentrations ofeach phase. The protein concentrations were 1.69 mg/mLfor the light phase and 215 mg/mL for the heavy phase at5°C, and 10.7 mg/mL for the light phase and 136 mg/mLfor the heavy phase at 25°C. These concentration valuesare nearly the same as those determined from the binodalcurve shown in Fig. 3.
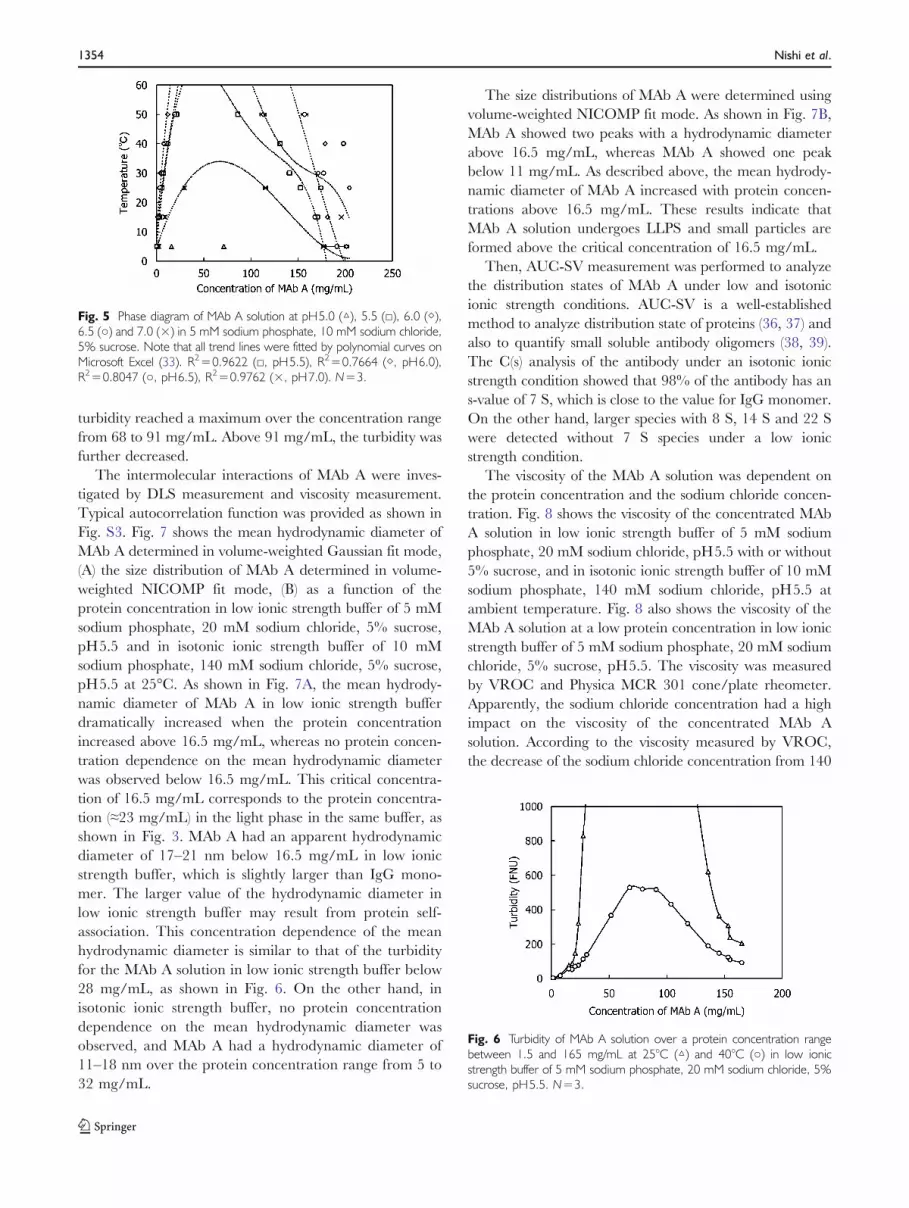
The effect of pH on the phase diagram of the binaryMAb A-salt water mixture was also examined. Fig. 5 showsthe pH dependence of the phase diagram in 5 mM sodiumphosphate, 10 mM sodium chloride, 5% sucrose. Theupper consolute temperature of MAb A-salt water mixturedepends on the solution pH. At pH6.5, which corresponds
to the theoretical pI of the protein (pI: between 6.55 and7.35), the area under the binodal curve was the largest.
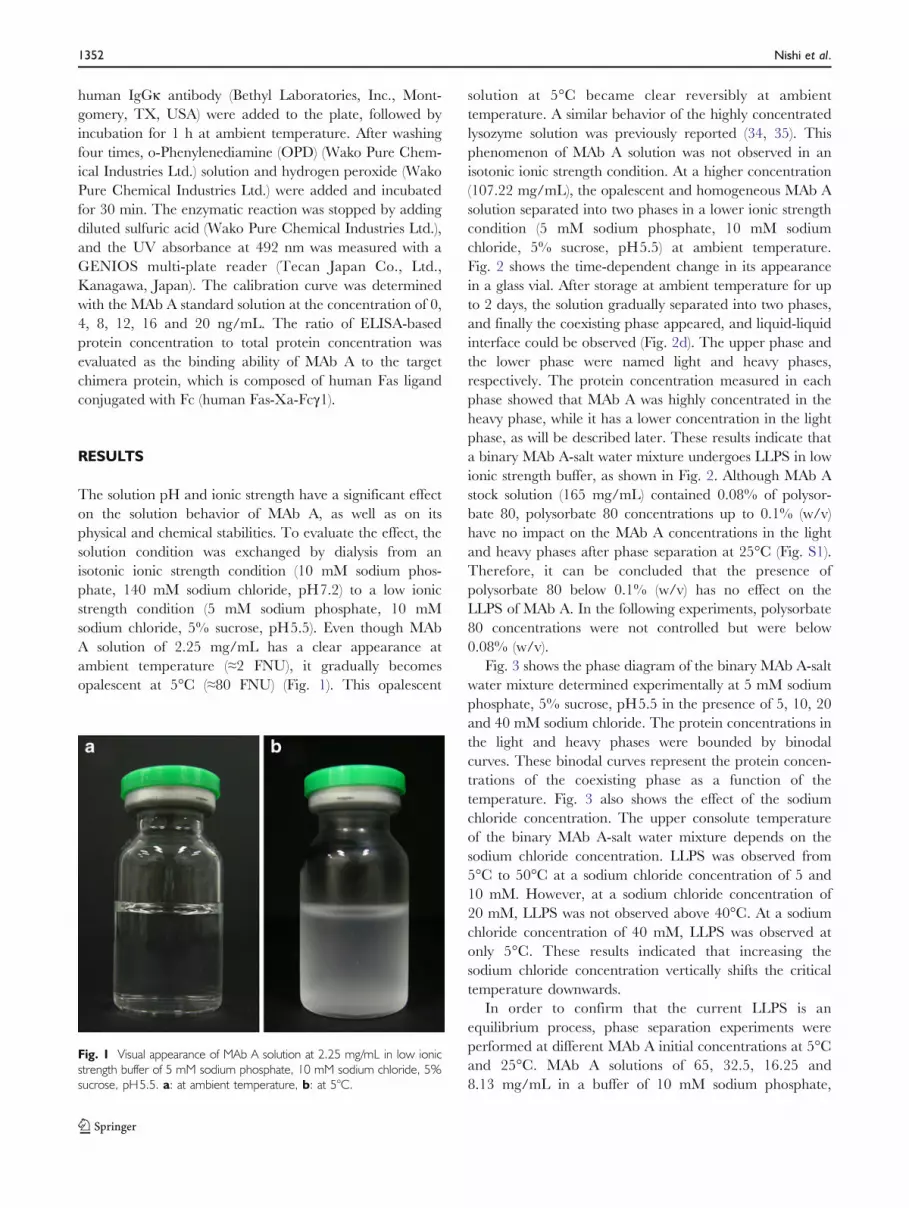
As can be expected from the result shown in Fig. 3, MAbA is completely miscible when its concentration in thebinary mixture with water solvent containing 5 mM sodiumphosphate, 20 mM sodium chloride, 5% sucrose (pH5.5) isless than 22.6 mg/mL or more than 135 mg/mL at 25°C.On the other hand, over the concentration range between22.6 and 135 mg/mL at the same temperature, the MAb Asolution is expected to separate into two phases. Fig. 6shows the turbidity of the MAb A solution as a function ofthe protein concentrations at 25°C and 40°C. As shownin Fig. 6, in the concentration range between 1.5 and28 mg/mL, the turbidity of the MAb A solution in lowionic strength buffer at 25°C dramatically increased whenthe protein concentration increased above 20 mg/mL. Onthe other hand, the turbidity increased linearly withconcentrations in the concentration range between 1.5and 20 mg/mL. In the concentration range between 30and 118 mg/mL, the turbidity at 25°C was very high andbeyond the upper limit of determination. At 40°C, the
Fig. 2 Time course of visualappearance of MAb A solution at107.22 mg/mL in low ionicstrength buffer of 5 mM sodiumphosphate, 10 mM sodium chlo-ride, 5% sucrose, pH5.5 at am-bient temperature after a: 0 min,b: 5 min, c: 20 min, d: 2 days.
Fig. 3 Phase diagram of MAb A solution at 5 mM (△), 10 mM (□),20 mM (◇) and 40 mM (○) of sodium chloride in 5 mM sodiumphosphate, 5% sucrose, pH5.5. Note that all trend lines were fitted bypolynomial curves on Microsoft Excel (33). R2=0.9721 (△, 5 mM), R2=0.9622 (□, 10 mM), R2=0.9748 (◇, 20 mM). N=3.
Fig. 4 Effect of the initial MAb A concentration before phase separationon the protein concentrations of the light phase at 5°C (○) and 25°C (●),and of the heavy phase at 5°C (△) and 25°C (▲) in low ionic strengthbuffer of 5 mM sodium phosphate, 10 mM sodium chloride, 5% sucrose,pH5.5. N=3.
Phase Separation of an IgG1 Antibody Solution 1353
turbidity reached a maximum over the concentration rangefrom 68 to 91 mg/mL. Above 91 mg/mL, the turbidity wasfurther decreased.
The intermolecular interactions of MAb A were inves-tigated by DLS measurement and viscosity measurement.Typical autocorrelation function was provided as shown inFig. S3. Fig. 7 shows the mean hydrodynamic diameter ofMAb A determined in volume-weighted Gaussian fit mode,(A) the size distribution of MAb A determined in volume-weighted NICOMP fit mode, (B) as a function of theprotein concentration in low ionic strength buffer of 5 mMsodium phosphate, 20 mM sodium chloride, 5% sucrose,pH5.5 and in isotonic ionic strength buffer of 10 mMsodium phosphate, 140 mM sodium chloride, 5% sucrose,pH5.5 at 25°C. As shown in Fig. 7A, the mean hydrody-namic diameter of MAb A in low ionic strength bufferdramatically increased when the protein concentrationincreased above 16.5 mg/mL, whereas no protein concen-tration dependence on the mean hydrodynamic diameterwas observed below 16.5 mg/mL. This critical concentra-tion of 16.5 mg/mL corresponds to the protein concentra-tion (≈23 mg/mL) in the light phase in the same buffer, asshown in Fig. 3. MAb A had an apparent hydrodynamicdiameter of 17–21 nm below 16.5 mg/mL in low ionicstrength buffer, which is slightly larger than IgG mono-mer. The larger value of the hydrodynamic diameter inlow ionic strength buffer may result from protein self-association. This concentration dependence of the meanhydrodynamic diameter is similar to that of the turbidityfor the MAb A solution in low ionic strength buffer below28 mg/mL, as shown in Fig. 6. On the other hand, inisotonic ionic strength buffer, no protein concentrationdependence on the mean hydrodynamic diameter wasobserved, and MAb A had a hydrodynamic diameter of11–18 nm over the protein concentration range from 5 to32 mg/mL.
The size distributions of MAb A were determined usingvolume-weighted NICOMP fit mode. As shown in Fig. 7B,MAb A showed two peaks with a hydrodynamic diameterabove 16.5 mg/mL, whereas MAb A showed one peakbelow 11 mg/mL. As described above, the mean hydrody-namic diameter of MAb A increased with protein concen-trations above 16.5 mg/mL. These results indicate thatMAb A solution undergoes LLPS and small particles areformed above the critical concentration of 16.5 mg/mL.
Then, AUC-SV measurement was performed to analyzethe distribution states of MAb A under low and isotonicionic strength conditions. AUC-SV is a well-establishedmethod to analyze distribution state of proteins (36, 37) andalso to quantify small soluble antibody oligomers (38, 39).The C(s) analysis of the antibody under an isotonic ionicstrength condition showed that 98% of the antibody has ans-value of 7 S, which is close to the value for IgG monomer.On the other hand, larger species with 8 S, 14 S and 22 Swere detected without 7 S species under a low ionicstrength condition.
The viscosity of the MAb A solution was dependent onthe protein concentration and the sodium chloride concen-tration. Fig. 8 shows the viscosity of the concentrated MAbA solution in low ionic strength buffer of 5 mM sodiumphosphate, 20 mM sodium chloride, pH5.5 with or without5% sucrose, and in isotonic ionic strength buffer of 10 mMsodium phosphate, 140 mM sodium chloride, pH5.5 atambient temperature. Fig. 8 also shows the viscosity of theMAb A solution at a low protein concentration in low ionicstrength buffer of 5 mM sodium phosphate, 20 mM sodiumchloride, 5% sucrose, pH5.5. The viscosity was measuredby VROC and Physica MCR 301 cone/plate rheometer.Apparently, the sodium chloride concentration had a highimpact on the viscosity of the concentrated MAb Asolution. According to the viscosity measured by VROC,the decrease of the sodium chloride concentration from 140
Fig. 6 Turbidity of MAb A solution over a protein concentration rangebetween 1.5 and 165 mg/mL at 25°C (△) and 40°C (○) in low ionicstrength buffer of 5 mM sodium phosphate, 20 mM sodium chloride, 5%sucrose, pH5.5. N=3.
Fig. 5 Phase diagram of MAb A solution at pH5.0 (△), 5.5 (□), 6.0 (◇),6.5 (○) and 7.0 (×) in 5 mM sodium phosphate, 10 mM sodium chloride,5% sucrose. Note that all trend lines were fitted by polynomial curves onMicrosoft Excel (33). R2=0.9622 (□, pH5.5), R2=0.7664 (◇, pH6.0),R2=0.8047 (○, pH6.5), R2=0.9762 (×, pH7.0). N=3.
1354 Nishi et al.

to 20 mM raised the viscosity of the solution from 6.5 to 41(cP) at the shear rate of 2,000 (s−1). On the other hand,sucrose had little effect on the viscosity, and the viscosity ofthe heavy phase with or without sucrose had almost thesame viscosity. Interestingly, the viscosity of the concentrat-ed MAb A solution in low ionic strength buffer wasdependent on the shear rate, and the increase of the shearrate resulted in the decrease of the viscosity, which is atypical behavior of a non-Newtonian fluid. Though thenon-Newtonian behavior of a monoclonal antibody isunusual, it was reported by Liu et al. (5).
In order to evaluate the shear rate dependence of theviscosity over a wide range, Physica MCR 301 cone/platerheometer was used. As shown in Fig. 8, the viscosity of thehighly concentrated MAb A solution in low ionic strengthbuffer of 5 mM sodium phosphate, 20 mM sodiumchloride, pH5.5 with or without sucrose showed apparentshear rate dependence at a shear rate below 1 (s−1), and theviscosity decreased with an increase of shear rate. Sucrosehad some effect on the viscosity at low shear rate. At a shearrate around 10–10,000 (s−1), slight shear rate dependencewas also observed. Sodium chloride concentration depen-dence of the viscosity was also observed when cone/platerheometer was used. The decrease of the sodium chlorideconcentration from 140 to 20 mM raised the viscosity of thesolution from 5.5 to 55 (cP) at the shear rate above 10 (s−1).At the shear rate below 0.1 and 3.8 (s−1) in measuring theviscosity of highly concentrated MAb A solution in isotonicionic strength buffer and of low concentration MAb Asolution in low ionic strength buffer, respectively, thetorque was too small to measure the viscosity accurately.In the case of the MAb A solution at a low proteinconcentration in low ionic strength buffer, the viscosity wasindependent of the shear rate.
In order to evaluate the effects of LLPS on the stabilityof MAb A, size exclusion chromatography (SEC), ion-exchange chromatography (IEC) and ELISA measurementwere performed. The results are summarized in Table I,where the aggregate contents, area % of the acidic variantpeaks and binding ability are provided. SEC chromato-gram is shown in Fig. S4. The binding ability was evaluatedby the ratio between the ELISA-based concentration andthe total protein concentration. As described in the“Materials and Methods” section, aliquots of MAb A
�Fig. 7 (a) Mean hydrodynamic diameter of MAb A at 25°C that wasdetermined in a volume-weighted Gaussian fit mode over a proteinconcentration range between 2.6 and 33 mg/mL in low ionic strengthbuffer of 5 mM sodium phosphate, 20 mM sodium chloride, 5% sucrose,pH5.5 (○); and a protein concentration range between 5.4 and 32 mg/mLin isotonic ionic strength buffer of 5 mM sodium phosphate, 140 mMsodium chloride, 5% sucrose, pH5.5 (△). (b) Hydrodynamic diameter ofMAb A at 25°C that was determined in a volume-weighted NICOMP fitmode over a protein concentration range between 2.6 and 33 mg/mL inlow ionic strength buffer of 5 mM sodium phosphate, 20 mM sodiumchloride, 5% sucrose, pH5.5. The inset is the size distribution of MAb Ain the same buffer at 16.5 mg/mL under LLPS (blue line) and after removalof a heavy phase (green line). The red line shows the size distribution of aMAb A monomer. The hydrodynamic diameter of MAb A observed asone or two peaks in the DLS measurement was plotted as a MAb Amonomer (△) at approximately 23 nm, and self-associated MAb A (○) atapproximately 190 nm. The value of the hydrodynamic diameter of MAbA monomer under LLPS was measured after removal of the heavy phase.N=3. (c) C(s) Sedimentation coefficient distribution obtained from AUC-SV experiments for 25 mg/mL MAb A solution under an isotonic ionstrength condition (solid line) and a low ion strength condition (dashedline).
Phase Separation of an IgG1 Antibody Solution 1355

solution were taken as samples before and after LLPS. Theaggregate content of the MAb A solution after LLPS didnot increase, even though MAb A was concentrated once tomore than 160 mg/mL during LLPS. Instead, the proteinaggregate decreased slightly after phase separation. For onereason, dialysis may have some effects, such as adsorptionof aggregates on the dialysis membrane. The area % of theacidic variant peak did not change during LLPS either. Thebinding ability was almost 100%. These results indicatethat the intrinsic properties (monomer content, chemicalcomposition and the binding ability) of MAb A aremaintained after LLPS.
DISCUSSION
The scope of this study was to investigate the phasebehavior of MAb A solution. The phase behavior ofmonoclonal antibody has been of interest mainly from thepoint of view of protein crystallization (26-28). In recentstudies, it has been pointed out that the crystallizationprocess of protein is affected by LLPS. During thecrystallization process, nucleation occurs mostly via LLPSand crystal growth. The so-called “crystallization slot” is therestrictive slot in which the second virial coefficient isnegative (40, 41).
Protein phase behavior is also related to diseases such ascryoglobulinemia and cataracts. In cryoglobulinemia, pre-cipitates of cryoglobulin composed of IgG and/or IgMform a condensed phase upon cooling below 37°Creversibly in a low ionic strength condition, which is
believed to be related to the disease (13). We found thatclear and homogeneous MAb A solution in an isotonicionic strength condition separated into two phases in a lowionic strength condition. Furthermore, the two phasesbecame miscible by buffer exchange to isotonic ionicstrength buffer or by increasing the solution temperature(Figs. 1 and 2). This phase behavior of MAb A solution isvery similar to that of cryoglobulin; therefore, MAb A canbe a model molecule of cryoglobulin (13, 14). In cataracts,the interaction between crystallin, an important eye lensprotein, and minor constituents, such as cytoskeletalproteins and intermediate filaments, is modified with aging,and phase separation for eye crystallin is induced (42). Inprevious studies, a binary lysozyme-salt water mixtureshowed opacity upon cooling from 25°C to 12°C, and aresemblance to eye crystallin was noted (34, 35). Recently,Cromwell et al. reported the phase separations of an IgGmonoclonal antibody (43, 44). Salinas et al. also suggestedthe phase separations of an IgG monoclonal antibody,although they did not observe obvious phase separation.The phase behavior of MAb A solution, which has a clearappearance at ambient temperature and turns opalescent at5°C, is similar to the behavior of these proteins. Except forthese proteins, no phase separation has been observed for aprotein-salt water mixture. It is notable that the MAb Asolution underwent LLPS without precipitating agents, suchas polyethylene glycol (PEG). In addition, in this research, asolution that was not clear (>3 NTU) was described as asolution with an opalescent appearance. Meanwhile, theturbidity corresponded to the nephelometric turbidity andwas used for the quantitative expression of the solution withan opalescent appearance.
The phase behavior of MAb A solution can besummarized in a phase diagram (Figs. 3 and 5). The phasediagram was investigated by changing the temperature,ionic strength and pH when LLPS was induced. MAb Aexhibited a UCST (upper critical solution temperature)-type phase diagram at every sodium chloride concentrationin which the protein concentration in the light phaseincreased and the protein concentration in the heavy phasedecreased when the temperature becomes higher (Fig. 3). Asimilar observation was previously reported for a ternary
Fig. 8 Viscosity of MAb A solution and its dependence on the shear ratewere measured by using VROC or Physica MCR 301 cone/platerheometer. Open symbols show the viscosity obtained by VROC. Closedsymbols show the viscosity obtained by Physica MCR 301 cone/platerheometer: at a protein concentration of 147 (□), 155 (■), 8.8 (◇) and 8.3(◆) mg/mL in low ionic strength buffer of 5 mM sodium phosphate,20 mM sodium chloride, 5% sucrose, pH5.5; 156 (△) and 159 (▲) mg/mL in low ionic strength buffer of 5 mM sodium phosphate, 20 mMsodium chloride, pH5.5; and 130 (○) and 133 (●) mg/mL in isotonic ionicstrength buffer of 10 mM sodium phosphate, 140 mM sodium chloride,pH5.5.
Table I Summary of the Quality Evaluation Before LLPS and AfterRedissolution of the Coexisting Phase
Aggregate Acidic variant peakarea
Bindingabilitya
Before LLPS 2.88±0.1% 18.64% 98%
After redissolution 2.58±0.2% 18.91% 98%
a The ratio of ELISA-based protein concentration to total protein concentrationwas evaluated as the binding ability of MAb A to the target protein.
1356 Nishi et al.

IgG-PEG–water mixture, where a cloud point measure-ment was performed (30). The upper consolute tempera-ture of the MAb A-salt water mixture depended on thesodium chloride concentration and pH (Figs. 3 and 5). Itwas highest in a low ionic strength condition and near pI ofthe protein. These observations indicate that electrostaticinteraction plays a major role in inducing LLPS.
In order to understand the phase behavior in detail,phase separation was induced in MAb A solutions atvarious protein concentrations. The protein concentrationsof the two phases were constant even when the initialprotein concentrations of the solution before LLPS weredifferent (Fig. 4). These results suggest that this phenome-non is in fact LLPS. The concentration dependence of theturbidity of MAb A solution as a function of the proteinconcentrations at 25°C and 40°C are shown in Fig. 6.Although turbidity has almost the same meaning asopalescence, here, turbidity was defined as nephelometricturbidity. Nephelometric turbidity measurements detectRayleigh scatter, which is expected to change linearly withconcentration in the absence of protein self-association (23).As shown in Fig. 6, the turbidity of the MAb A solution inlow ionic strength buffer dramatically increased when theprotein concentration increased above the critical concen-tration of 20 mg/mL, whereas the turbidity increasedlinearly below 20 mg/mL. Although the turbidity alsoincreases in the presence of aggregation, the turbidity of theMAb A solution in low ionic strength buffer reached amaximum and then was decreased further. These resultsindicate that the increase of turbidity is not due to protein(irreversible) aggregation, but due to LLPS. Inside thebinodal curve, just after dispersing the heavy phase in thelight phase, the heavy phase exists as small particles andscatters the light. Therefore, the high Rayleigh scatterresults in the dramatic increase of the turbidity above thecritical concentration of 20 mg/mL.
The mean hydrodynamic diameter of MAb A in lowionic strength buffer increased when the protein concen-tration increased above 16.5 mg/mL, while its proteinconcentration dependence was not observed below16.5 mg/mL. This increase in the mean hydrodynamicdiameter with protein concentrations above 16.5 mg/mL issimilar to the concentration dependence of the turbidity,which dramatically increased when the protein concentra-tion increased above 20 mg/mL. Sukumar et al. alsoobserved a protein concentration-dependent increase inthe mean hydrodynamic diameter of IgG1, where thesolution had an opalescent appearance at 5°C (23). Thehydrodynamic diameter of MAb A with 17–21 nm below16.5 mg/mL corresponds to the value of IgG monomer.These results suggest that the protein self-associationbehavior changes around the critical concentration of16.5 mg/mL. Considering that the protein concentration
in the light phase is close to the critical concentration, theprotein self-association is insignificant in the light phase,and MAb A homogeneously exists as a monomer. On theother hand, in the heavy phase, attractive intermolecularinteractions play a major role in inducing LLPS. Theprotein-protein attractive interaction is also supported bythe appearance of an additional peak at approximately190 nm in the DLS measurement (Fig. 7B).
Consistent with the result from DLS measurement,AUC-SV analysis indicated self-association of the antibodyunder low ionic strength condition. The solution concen-tration measured (25 mg/mL) is considered to be higher forthe accurate analysis under a non-ideal effect; however, itcan be concluded that the majority of the antibody underlow ionic strength self-associates with the s-value between8 S–22 S, which is larger than that under the isotonic ionicstrength (7 S). It should be noted that the antibodyoligomers with 22 S can be estimated as a hexamer,assuming that the oligomer has the same frictional ratio as amonomer ( f/f0=1.5) and that oligomers or aggregates thathave a higher s-value than 25 S are absent under a lowionic strength condition.
Thus, both the DLS and AUC results indicate theattractive intermolecular interactions among MAb Amolecules under a low ionic strength condition.
Dependence of ionic strength and pH dependence onthe viscosity of monoclonal antibody solutions has beeninvestigated by other groups. It was described that theviscosity of monoclonal antibody solutions was highest at pIat a low ionic strength condition (5, 7, 17). Electrostaticinteraction and charge-dipole and dipole-dipole interac-tions were suggested to play major roles in protein self-association. The viscosity of the MAb A solution was alsohighly dependent on the sodium chloride concentration,and a decrease of the sodium chloride concentration raisedviscosity (Fig. 8). This result indicates that MAb A self-associates in a low ionic strength condition (7). Further-more, the viscosity of the heavy phase in low ionic strengthbuffer with or without 5% sucrose was dependent on theshear rate (Fig. 8). Shear rate-dependent behavior ofviscosity is a characteristic feature of non-Newtonian fluidsand occurs when several micro-structural species that aremade of large and elongated aggregates exist (5). Therefore,these results support the idea that self-association of MAb Amediated mainly by attractive electrostatic interactionamong the MAb A molecules in the heavy phase isresponsible for inducing LLPS. The viscosity of the lightphase in low ionic strength buffer was independent of theshear rate (Fig. 8). Compared with the value measured byusing Physica MCR 301 cone/plate rheometer, VROCshowed lower viscosity than Physica MCR 301 cone/platerheometer for non-Newtonian fluid samples. Differentshear stress originating from two different measuring
Phase Separation of an IgG1 Antibody Solution 1357

methods may cause a difference in the viscosity of non-Newtonian solutions.
LLPS can be applied to the purification of monoclonalantibodies or the manufacturing of a liquid high concen-tration formulation. So far, these processes have usuallybeen performed with precipitating agents such as PEG,polyvinylsulfonic acid (PVS), polyacrylic acid (PAA) andpolystyrenesulfonic acid (PSS). These macromolecules arerequired to be subsequently removed (45, 46). However, inthe case of antibodies having LLPS properties as MAb Adoes, the purification and concentration steps can becompleted without using precipitating agents. It is possibleto dilute the MAb solution with water or low ionic strengthbuffer and also cool the solution in a large scale. Therefore,purifying and concentrating the MAb solution can beachieved easily in the manufacturing process. For thesepurposes, the quality of the antibodies should be preservedduring LLPS. In fact, our present study shows that LLPS ofMAb A can produce a highly concentrated phase withoutchanging its physical and chemical properties, and bindingability (Table I). No formation of an insoluble precipitationwas observed during LLPS as confirmed by the turbiditymeasurement after adjusting the solution to an isotonicionic condition, and by the absence of pellets aftercentrifugation at 20,000 g for 30 min. The recovery ofMAb A after LLPS was approximately 100%. These resultsfurther demonstrate the usefulness of LLPS for antibodypurification and concentration.
In Fig. 9, we proposed the pathway for LLPS induced ina binary MAb A-salt water mixture at a low ionic strengthcondition. Inside the binodal curve, small particles ofweakly associated antibodies were formed and graduallygrew to large particles. Since the density of an antibody is
larger (1.3–1.4 kg/L) (23) than water, particles with a largerpartial concentration of antibody form the lower part of theLLPS. Such cluster formation in a protein solution is highlyinteresting from the viewpoint of understanding variousdisease processes and producing photonic crystals (47),although the theoretical background for a high concentra-tion solution having a non-ideal behavior is still underdevelopment.
CONCLUSIONS
Binary MAb A-salt water mixture underwent LLPS in lowionic strength buffer without a third component, i.e.,precipitating agents. The two phases of the MAb A solutionbecame reversibly miscible by increasing the ionic strengthor increasing the temperature. The phase diagram and itsdependence on the salt concentration and pH indicate thatelectrostatic interaction plays a major role in inducingLLPS. Above the critical concentration of 16.5 mg/mL,which corresponds to the protein concentration in the lightphase, the mean hydrodynamic diameter of MAb Aincreased with the protein concentration only in a lowionic strength condition. This result is supported by the factthat MAb A self-associates to form oligomers from theAUC-SV analysis. The viscosity of the concentrated MAbA solution was highly dependent on the ionic strength. Theheavy phase had high viscosity in a shear rate-dependentmanner, which is characteristic of a non-Newtonian fluid.These results indicate that attractive self-association in theheavy phase is responsible for inducing LLPS. The physical,chemical and immunological properties of MAb A wereunaffected by LLPS. LLPS observed in a binary MAb A-
Fig. 9 Time course of LLPSinduced in a binary MAb A-saltwater mixture in a low ionicstrength condition.
1358 Nishi et al.

salt water mixture can be used not only to understanddisease processes, but also to develop novel processes inbiopharmaceuticals.
ACKNOWLEDGEMENTS
We would like to thank Mr. Yuichi Shinozaki and Ms.Tazuko Watanabe (Anton Paar Japan K.K.) for theviscosity measurements.
REFERENCES
1. Shire SJ, Shahrokh Z, Liu J. Challenges in the development ofhigh protein concentration formulations. J Pharm Sci.2004;93:1390–402.
2. Minton AP. Molecular crowding: analysis of effects of highconcentrations of inert consolutes on biochemical equilibria andrates in terms of volume exclusion. Methods Enzymol.1998;295:127–49.
3. Jiménez M, Rivas G, Minton AP. Quantitative characterization ofweak self-association in concentrated solutions of immunoglobulinG via the measurement of sedimentation equilibrium and osmoticpressure. Biochemistry. 2007;46:8373–8.
4. Demeule B, Lawrence MJ, Drake AF, Gurny R, Arvinte T.Characterization of protein aggregation: the case of a thera-peutic immnoglobulin. Biochem Biophys Acta. 2007;1774:146–53.
5. Liu J, Nguyen MDH, Andya JD, Shire SJ. Reversible self-association increases the viscosity of a concentrated monoclonalantibody in aqueous solution. J Pharm Sci. 2005;94:1928–40.
6. Saluja A, Badkar AV, Zeng DL, Nema S, Kalonia DS.Application of high-frequency rheology measurements for analyz-ing protein-protein interactions in high concentration solutionsusing a model antibody (IgG2). J Pharm Sci. 2006;95:1967–83.
7. Chari R, Jerath K, Badkar AV, Kalonia DS. Long- and short-range electrostatic interactions affect the rheology of highlyconcentrated antibody solutions. Pharm Res. 2010;26:2607–18.
8. Saluja A, Kalonia DS. Nature and consequences of protein-protein interactions in high protein concentration solutions. Int JPharm. 2008;358:1–15.
9. Cromwell MEM, Felten C, Flores H, Liu J, Shire SJ. Self-association of therapeutic proteins: Implications for productdevelopment. In: Murphy RM, Tsai AM, editors. Misbehavingproteins: protein misfolding, aggregation, and stability, New York:Springer; 2006. pp 313–330.
10. Cleland JL, Powell MF, Shire SJ. The development of stableprotein formulations: a close look at protein aggregation,deamidation and oxidation. Crit Rev Ther Drug Carr Syst.1993;10:307–77.
11. Braun A, Kwee L, Labow MA, Alsenz J. Protein aggregates seemto play a key role among the parameters influencing theantigenicity of interferon alpha (INF-alpha) in normal andtransgenic mice. Pharm Res. 1997;14:1472–8.
12. Hermeling S, Crommelin DJ, Schellekens H, Jiskoot W.Structure-immunogenicity relationships of therapeutic proteins.Pharm Res. 2004;21:897–903.
13. Robert D, Barelli S, Crettaz D, Bart PA, Schifferli JA, Betticher Det al. Clinical proteomics: study of a cryogel. Proteomics.2006;6:3958–60.
14. Yagi H, Takahashi N, Yamaguchi Y, Kato K. Temperature-dependent isologous Fab-Fab interaction that mediates cryocrys-
tallization of a monoclonal immunoglobulin G. Mol Immunol.2004;41:1211–5.
15. Narayanan J, Liu XY. Protein interactions in undersaturated andsupersaturated solutions: a study using light and X-ray scattering.Biophys J. 2003;84:523–32.
16. Salinas BA, Sathish HA, Bishop SM, Harn N, Carpenter JF,Randolph TW. Understanding and modulating opalescence andviscosity in a monoclonal antibody formulation. J Pharm Sci.2010;99:82–93.
17. Yadav S, Liu J, Shire SJ, Kalonia DS. Specific interactions in highconcentration antibody solutions resulting in high viscosity. JPharm Sci. 2010;99:1151–68.
18. Saluja A, Badkar AV, Zeng DL, Nema S, Kalonia DS. Ultrasonicstorage modulus as a novel parameter for analyzing protein-protein interactions in high protein concentration solutions:correlation with static and dynamic light scattering measurements.Biophys J. 2007;92:234–44.
19. Saluja A, Kalonia DS. Application of ultrasonic shear rheometerto characterize rheological properties of high concentrationsolutions at microliter volume. J Pharm Sci. 2005;94:1161–8.
20. Saluja A, Badkar AV, Zeng DL, Kalonia DS. Ultrasonic rheologyof a monoclonal antibody (IgG2) solution: implications for physicalstability of proteins in high concentration formulations. J PharmSci. 2007;96:3181–95.
21. Patel AR, Kerwin BA, Kanapuram SR. Viscoelastic character-ization of high concentration antibody formulations using quartzcrystal microbalance with dissipation monitoring. J Pharm Sci.2009;98:3108–16.
22. Kanai S, Liu J, Patapoff TW, Shire SJ. Reversible self-associationof a concentrated monoclonal antibody solution mediated by Fab-Fab interaction that impacts solution viscosity. J Pharm Sci.2008;97:4219–27.
23. Sukumar M, Doyle BL, Combs JL, Pekar AH. Opalescentappearance of an IgG1 antibody at high concentrations and itsrelationship to noncovalent association. Pharm Res.2004;21:1087–93.
24. Annunziata O, Asherie N, Lomakin A, Pande J, Ogun O,Benedek GB. Effect of polyethylene glycol on the liquid-liquidphase transition in aqueous protein solutions. Proc Natl Acad SciUSA. 2002;99:14165–70.
25. Asakura S, Oosawa F. On interactions between two bodiesimmersed in a solution of macromolecules. J Chem Phys.1954;22:1255–6.
26. Jion AI, Goh LT, Oh SKW. Crystallization of IgG1 by mappingits liquid-liquid phase separation curve. Biotech Bioeng.2006;95:911–8.
27. Ahamed T, Esteban BNA, Ottens M, van Dedem GW, van derWielen LA, Bisschops MAT et al. Phase behavior of an intactmonoclonal antibody. Biophy J. 2007;93:610–9.
28. Dumets AC, Chockla AM, Kaler EW, Lenhoff AM. Protein phasebehavior in aqueous solutions: crystallization, liquid-liquid phaseseparation, gels, and aggregates. Biophys J. 2008;94:570–83.
29. Haruyama H, Ito S, Miyadai K, Takahashi T, Kawaida R,Takayama T et al. Humanization of the mouse anti-Fas antibodyHFE7A and crystal structure of the humanized HFE7A Fabfragment. Biol Pharm Bull. 2002;25:1537–45.
30. Thomson JA, Schurtenberger P, Thurston GM, Benedek GB.Binary liquid phase separation and critical phenomena in aprotein/water solution. Proc Natl Acad Sci USA. 1987;84:7079–83.
31. Baek SG, Magda JJ. Monolithic rheometer plate fabricated usingsilicon micromachining technology and containing miniaturepressure sensors for N1 and N2 measurements. J Rheology.2003;47:1249–60.
32. Pipe C, Kim NJ, McKinley G. Microfluidic Rheometery on aChip. 2007 4th AERC, Italy
Phase Separation of an IgG1 Antibody Solution 1359

33. Schuck P. Size distribution analysis of macromolecules bysedimentation velocity ultracentrifugation and Lamm equationmodeling. Biophys J. 2000;78:1606–19.
34. Tanaka T, Ishimoto C. Phase separation of a protein-water mixturein cold cataract in the young rat lens. Science. 1977;197:1010–2.
35. Ishimoto C, Tanaka T. Critical behavior of a binary mixture ofprotein and salt water. Phys Rev Lett. 1977;39:474–7.
36. Kato K, Sautes-Fridman C, Yamada W, Kobayashi K, UchiyamaS, Kim H et al. Structural basis of the interaction between IgGand Fcγ receptors. J Mol Biol. 2000;295:213–24.
37. Oda M, Uchiyama S, Noda M, Nishi Y, Koga M, Mayanagi M etal. Effects of antibody affinity and antigen valence on molecularforms of immune complexes. Mol Immunol. 2009;47:352–64.
38. Liu J, Andya JD, Shire SJ. A critical review of analyticalultracentrifugation and field flow fractionation methods formeasuring protein aggregation. AAPS J. 2006;8:E580–9.
39. Pekar A, Sukumar M. Quantitation of aggregates in therapeuticproteins using sedimentation velocity analytical ultracentrifuga-tion: practical considerations that affect precision and accuracy.Anal Biochem. 2007;367:225–37.
40. George A, Wilson WW. Predicting protein crystallization from adilute solution property. Acta Crystallogr A. 1994;D50:61–365.
41. George A, Chiang Y, Guo B, Arabshahi A, Cai Z, Wilson WW.Second virial coefficient as predictor in protein crystal growth.Methods Enzymol. 1997;276:100–10.
42. Clark JI, Clark JM. Lens cytoplasmic phase separation. Int RevCytol. 2000;192:171–87.
43. Cromwell MEM, Carpenter JF, Scherer T, Randolph TW.Opalescence in antibody formulations is a solution criticalphenomenon. Abstracts of Papers. 2008 236th ACS NationalMeeting, Philadelphia, PA, United States.
44. Cromwell MEM. Implications of phase separation on pharma-ceutical development. 2009 AAPS National Biotechnology Con-ference, Seattle, WA, United States.
45. McDonald P, Victa C, Carter-Franklin JN, Fahrner R. Selectiveantibody precipitation using polyelectlyte: A novel approach tothe purification of monoclonal antibodies. Biotech Bioeng.2009;102:1141–51.
46. Matheus S, Friess W, Schwartz D, Mahler HC. Liquid highconcentration IgG1 antibody formulations by precipitation. JPharm Sci. 2009;98:3043–57.
47. Strandner A, Sedgwick H, Cardinaux F, Poon WCK, EgelhaafSU, Schurtenberger P. Equilibrium cluster formation in concen-trated protein solutions and colloids. Nature. 2004;432:492–5.
1360 Nishi et al.


![Magnetic ionic plastic crystal: choline[FeCl4]](https://img.dokumen.tips/doc/110x75/6333cdfe7a687b71aa08630b/magnetic-ionic-plastic-crystal-cholinefecl4.jpg)


