Embed Size (px)
Citation preview

IOP PUBLISHING JOURNAL OF PHYSICS: CONDENSED MATTER
J. Phys.: Condens. Matter 20 (2008) 205103 (9pp) doi:10.1088/0953-8984/20/20/205103
Phase separation, crystallization andpolyamorphism in the Y2O3–Al2O3 systemLawrie B Skinner1, Adrian C Barnes1, Philip S Salmon2 andWilson A Crichton3
1 H H Wills Physics Laboratory, Royal Fort, Tyndall Avenue, Bristol BS8 1TL, UK2 Department of Physics, University of Bath, Bath BA2 7AY, UK3 European Synchrotron Radiation Facility, 6 rue Jules Horowitz, BP 220, Grenoble Cedex,F-38043, France
E-mail: [email protected]
Received 14 February 2008Published 17 April 2008Online at stacks.iop.org/JPhysCM/20/205103
AbstractA detailed study of glass formation from aerodynamically levitated liquids in the(Y2O3)x(Al2O3)1−x system for the composition range 0.21 � x � 0.41 was undertaken byusing pyrometric, optical imaging and x-ray diffraction methods. Homogeneous and clearsingle-phase glasses were produced over the composition range 0.27 � x � 0.33. ForY2O3-rich compositions (0.33 � x � 0.375), cloudy materials were produced which containinclusions of crystalline yttrium aluminium garnet (YAG) of diameter up to 40 μm in a glassymatrix. For Y2O3-poor compositions around x = 0.24, cloudy materials were also produced,but it was not possible to deduce whether this resulted from (i) sub-micron inclusions of anano-crystalline or glassy material in a glassy matrix or (ii) a glass formed by spinodaldecomposition. For x = 0.21, however, the sample cloudiness results from crystallization intoat least two phases comprising yttrium aluminium perovskite and alumina. The associatedpyrometric cooling curve shows slow recalescence events with a continuous and slow evolutionof excess heat which contrasts with the sharp recalescence events observed for thecrystallization of YAG at compositions near x = 0.375. The materials that are the most likelycandidates for demonstrating homogeneous nucleation of a second liquid phase occur aroundx = 0.25, which corresponds to the limit for formation of a continuous random network ofcorner-shared AlO4 tetrahedra.
(Some figures in this article are in colour only in the electronic version)
1. Introduction
The (Y2O3)x(Al2O3)1−x (yttria–alumina) system has attractedattention in recent years following the report by Aasland andMcMillan (1994) on the glasses formed by bulk quenchingliquids in the composition range 0.24 � x � 0.32. Inthis work liquid (Y2O3)x(Al2O3)1−x samples were held inthe iridium wire furnace of a hot-stage microscope and werequenched at different rates by rapidly reducing the furnacepower and controlling the flow of nitrogen gas. The samplesthus produced were reported to comprise glassy inclusions in aglassy matrix of higher density, and evidence from microprobeanalysis led to the conclusion that the matrix and inclusionswere of identical compositions and therefore correspond to thehigh-density amorphous (HDA) and low-density amorphous
(LDA) forms of the same material. Since these inclusionsbegan to form in the supercooled state, it was suggested that theobserved behaviour is evidence for the existence of a liquid–liquid phase transition (Mishima and Stanley 1998) in thesupercooled state. A recent summary of polyamorphism in the(Y2O3)x(Al2O3)1−x system, which includes a description ofwork on mechanical separation of the LDA and HDA phases,is given elsewhere (McMillan et al 2003).
However, in a separate study by Nagashio and Kuribayashi(2002), glassy samples of (Y2O3)x(Al2O3)1−x were producedby using a contactless aero-acoustic levitation and laserheating system. The levitated samples were quenched inthe surrounding dry oxygen gas atmosphere after the laserwas switched off or, to increase the cooling rate, they weresplat quenched between a pair of stainless-steel or copper
0953-8984/08/205103+09$30.00 © 2008 IOP Publishing Ltd Printed in the UK1
J. Phys.: Condens. Matter 20 (2008) 205103 L B Skinner et al
anvils. The samples were studied optically, by differentialthermal analysis and by micro-focus x-ray diffraction, and verydifferent behaviour was observed to that reported by Aaslandand McMillan (1994). For gas quenched samples with 0.25 �x < 0.325 single-phase glasses could only be obtained, andfor similarly quenched samples with 0.325 � x � 0.375small yttrium aluminium garnet (Y3Al5O12 garnet or YAG)crystalline inclusions were found in a bulk glassy matrix. Byvery rapid quenching using anvils, it was possible to producesingle-phase bulk glasses over the entire composition range0.25 � x � 0.375. It was concluded that there is noevidence for polyamorphic samples, in direct contrast and incontradiction to the behaviour observed by McMillan et al(2003).
In the present work we have studied the properties ofliquid and glassy (Y2O3)x(Al2O3)1−x for the compositionrange 0.21 � x � 0.41 by using an aerodynamic levitationand laser heating system to melt and quench the samples.In particular, we have monitored crystallization and glassformation by fast pyrometric studies of the liquid as it isquenched. In addition, we have examined the structure ofthe quenched materials by optical microscopy and high-energyx-ray diffraction.
2. Experimental method
An aerodynamic levitation and laser heating system, suppliedby Containerless Research Inc. (Evanston, IL, USA), wasused to study (Y2O3)x(Al2O3)1−x liquids and glasses overthe composition range 0.21 � x � 0.41. The apparatuswas modified to include a fast sampling (100 Hz) pyrometer(model ISQ5 from IMPAC, Frankfurt-am-Main, Germany)used in single-wavelength (0.9 μm) mode and direct computercontrol of the CO2 laser output. This system allows thesample temperature to be monitored synchronously with theapplied laser power. Since the emissivity of a sample changeson crystallization or vitrification, we have not applied anemissivity correction to the recorded temperature. This leads toan underestimate of the sample temperature by approximately30 ◦C, as evaluated by using an emissivity value of 0.92for molten yttria–alumina (Nordine et al 2000). Controlledreduction of the applied laser power allows the sample to becooled at well defined rates. In the absence of any changesin emissivity or phase transitions, the sample temperaturedecreases monotonically with a broadly black-body behaviour.Phase transitions such as nucleation and growth give rise toan evolution of excess heat from the sample and lead to acharacteristic rise and decay of the temperature over and abovethat predicted by black-body cooling.
The samples were prepared from 99.99% purity metaloxides (Al2O3 and Y2O3) purchased from Sigma-Aldrich andRE acton, respectively. Before use, all of the metal oxidepowders were heated in air to 800 ◦C in a muffle furnace forat least 2 h in order to remove any adsorbed water. To obtainoptimum control over the sample composition, the pure oxideswere first formed into small spheres on a copper laser hearth.A sample of the required composition was then obtained byfusing weight-matched beads on the copper hearth. Final
mixing and equilibration of the sample took place in situ onthe aerodynamic levitator. In this way the error in the samplecomposition, δx , could be estimated by comparing the massof the final sample to the masses of the starting spheres, and avalue δx < 0.005 was obtained. The levitated samples wereheated with the laser beam impinging directly onto the top.Cooling by the levitation gas results in a temperature gradientof approximately 50 ◦C between the top and bottom of thesample.
Glasses were produced from liquids levitated on a pureargon (99.999%) gas stream by first heating the samples toa temperature at least 200 ◦C above the measured meltingtemperature, maintaining this temperature for �60 s, and thencontrolling the rate at which the laser power was reduced.This procedure was used in order to avoid errors associatedwith the variation in quoted values for the melting temperature(Caslavsky and Viechnicki 1980, Cockayne 1985) and toexceed the critical temperature needed to ensure that anyremnants of YAG seeding crystals are removed from the melt(Gervais et al 1992, 1997). For a sample with a typical mass of25 mg, the fastest quench rate was obtained by instantaneouslycutting the laser power to zero, and this corresponds to acooling rate of �300 ◦C s−1 at 1200 ◦C. Slower quenchrates could be produced by using a computer-controlled lineardecrease of the laser power. In all cases the laser power andpyrometric temperature were recorded synchronously.
Quenched spheres of (Y2O3)x(Al2O3)1−x were obtainedover the composition range 0.21 � x � 0.41. High-energyx-ray diffraction experiments with an incident wavelength of0.173 A (the rhenium K edge) were undertaken using the ID27diffractometer at the European Synchrotron Radiation Facility(ESRF) with a charge-coupled device (CCD) detector. Themeasurements were made in transmission mode on polisheddisks of �1 mm thickness prepared from the quenched spheres.Data of high statistical precision were accumulated over arange 1.35 � Q � 23 A
−1, where Q denotes the scattering
vector (Fischer et al 2006).For the optical microscopy experiments the samples were
polished into optically flat discs of approximately 2.5 mmdiameter and thickness less than 1 mm by using a fine diamondpolisher. Optical images were recorded by using a phasecontrast microscope (Zeiss-Autophot) with both crossed anduncrossed polarizers and parallel light.
3. Results
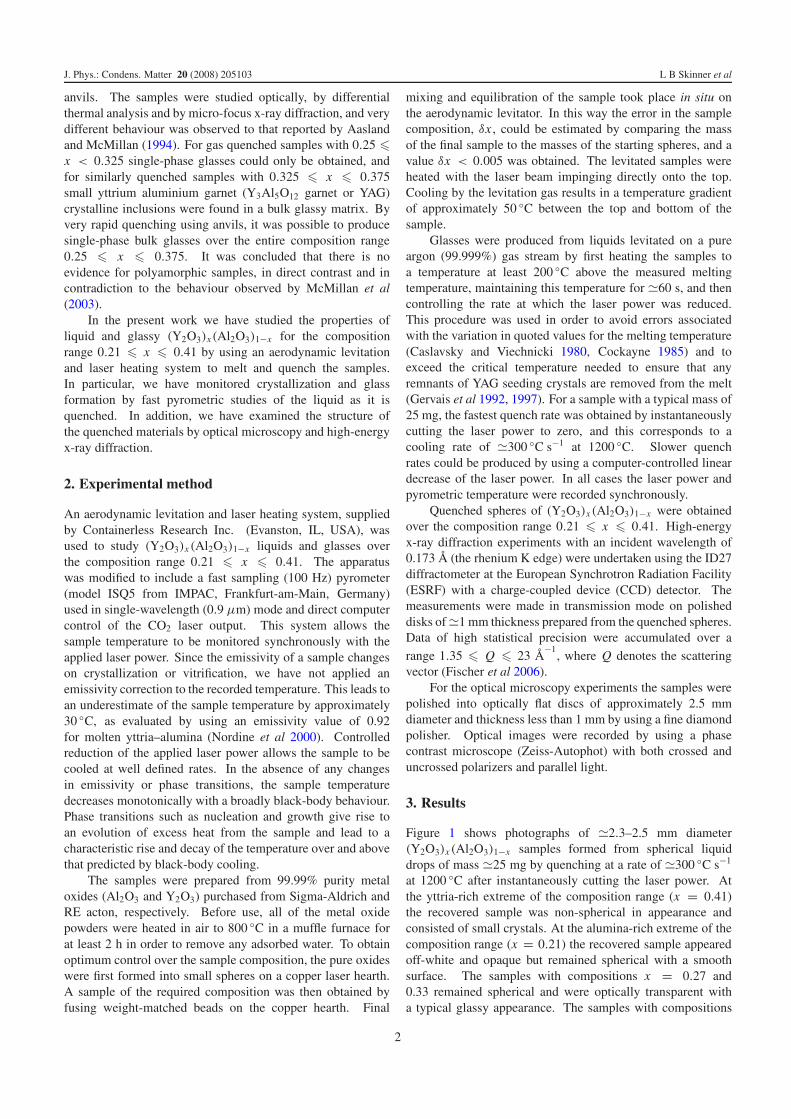
Figure 1 shows photographs of �2.3–2.5 mm diameter(Y2O3)x(Al2O3)1−x samples formed from spherical liquiddrops of mass �25 mg by quenching at a rate of �300 ◦C s−1
at 1200 ◦C after instantaneously cutting the laser power. Atthe yttria-rich extreme of the composition range (x = 0.41)the recovered sample was non-spherical in appearance andconsisted of small crystals. At the alumina-rich extreme of thecomposition range (x = 0.21) the recovered sample appearedoff-white and opaque but remained spherical with a smoothsurface. The samples with compositions x = 0.27 and0.33 remained spherical and were optically transparent witha typical glassy appearance. The samples with compositions
2
J. Phys.: Condens. Matter 20 (2008) 205103 L B Skinner et al
Figure 1. Photographs of �2.3–2.5 mm diameter solid samples of(Y2O3)x (Al2O3)1−x produced on the aerodynamic levitator. Thelabels correspond to the following compositions: AY21 (x = 0.21),AY24 (x = 0.24), AY27 (x = 0.27), AY33 (x = 0.33), AY37.5(x = 0.375) and AY41 (x = 0.41).
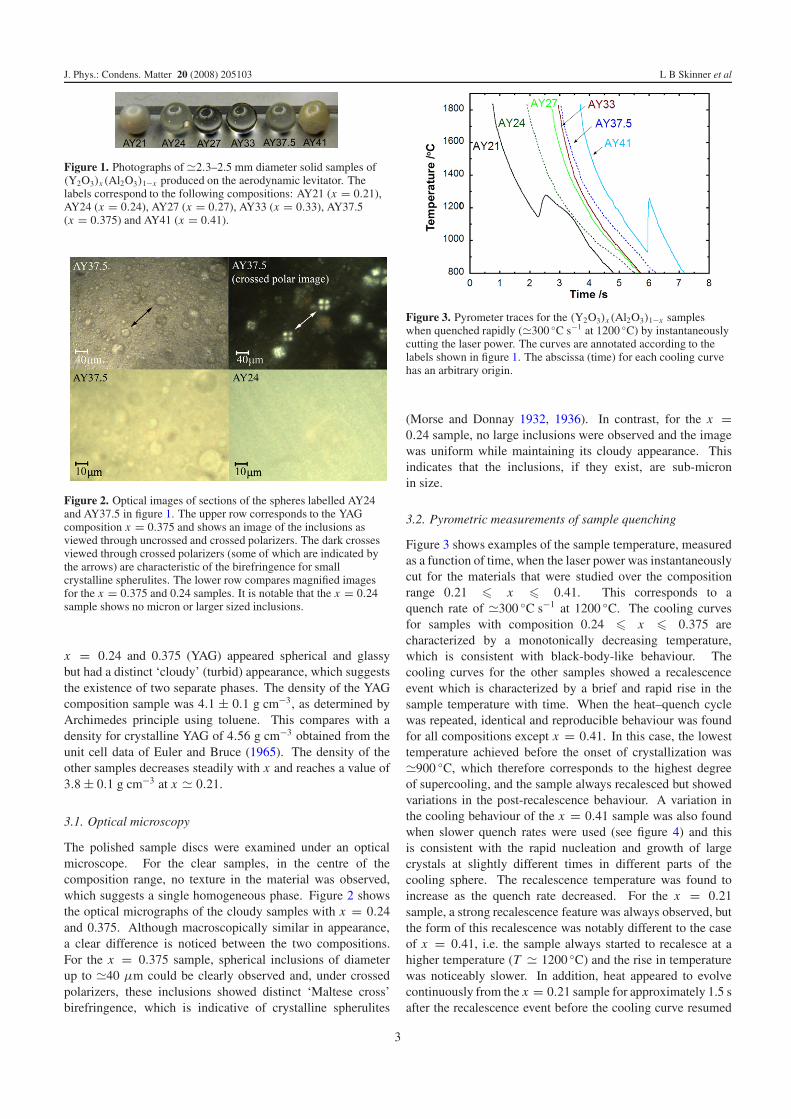
Figure 2. Optical images of sections of the spheres labelled AY24and AY37.5 in figure 1. The upper row corresponds to the YAGcomposition x = 0.375 and shows an image of the inclusions asviewed through uncrossed and crossed polarizers. The dark crossesviewed through crossed polarizers (some of which are indicated bythe arrows) are characteristic of the birefringence for smallcrystalline spherulites. The lower row compares magnified imagesfor the x = 0.375 and 0.24 samples. It is notable that the x = 0.24sample shows no micron or larger sized inclusions.
x = 0.24 and 0.375 (YAG) appeared spherical and glassybut had a distinct ‘cloudy’ (turbid) appearance, which suggeststhe existence of two separate phases. The density of the YAGcomposition sample was 4.1 ± 0.1 g cm−3, as determined byArchimedes principle using toluene. This compares with adensity for crystalline YAG of 4.56 g cm−3 obtained from theunit cell data of Euler and Bruce (1965). The density of theother samples decreases steadily with x and reaches a value of3.8 ± 0.1 g cm−3 at x � 0.21.
3.1. Optical microscopy
The polished sample discs were examined under an opticalmicroscope. For the clear samples, in the centre of thecomposition range, no texture in the material was observed,which suggests a single homogeneous phase. Figure 2 showsthe optical micrographs of the cloudy samples with x = 0.24and 0.375. Although macroscopically similar in appearance,a clear difference is noticed between the two compositions.For the x = 0.375 sample, spherical inclusions of diameterup to �40 μm could be clearly observed and, under crossedpolarizers, these inclusions showed distinct ‘Maltese cross’birefringence, which is indicative of crystalline spherulites
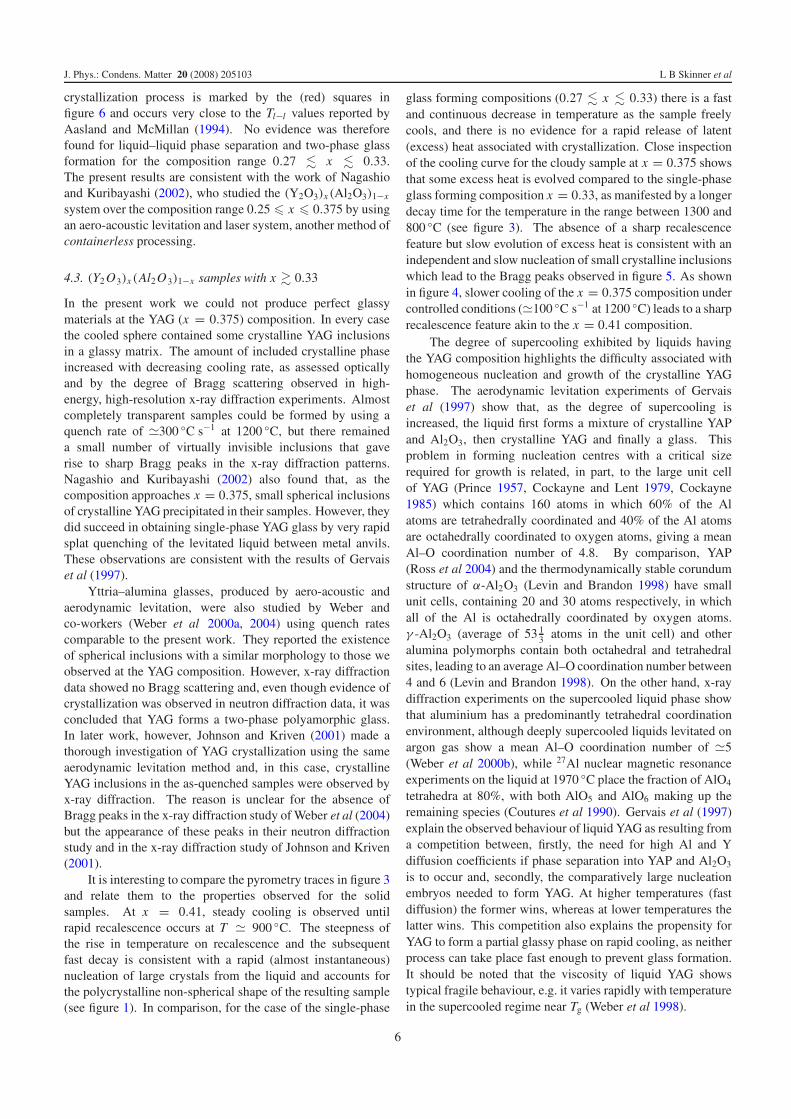
Figure 3. Pyrometer traces for the (Y2O3)x (Al2O3)1−x sampleswhen quenched rapidly (�300 ◦C s−1 at 1200 ◦C) by instantaneouslycutting the laser power. The curves are annotated according to thelabels shown in figure 1. The abscissa (time) for each cooling curvehas an arbitrary origin.
(Morse and Donnay 1932, 1936). In contrast, for the x =0.24 sample, no large inclusions were observed and the imagewas uniform while maintaining its cloudy appearance. Thisindicates that the inclusions, if they exist, are sub-micronin size.
3.2. Pyrometric measurements of sample quenching
Figure 3 shows examples of the sample temperature, measuredas a function of time, when the laser power was instantaneouslycut for the materials that were studied over the compositionrange 0.21 � x � 0.41. This corresponds to aquench rate of �300 ◦C s−1 at 1200 ◦C. The cooling curvesfor samples with composition 0.24 � x � 0.375 arecharacterized by a monotonically decreasing temperature,which is consistent with black-body-like behaviour. Thecooling curves for the other samples showed a recalescenceevent which is characterized by a brief and rapid rise in thesample temperature with time. When the heat–quench cyclewas repeated, identical and reproducible behaviour was foundfor all compositions except x = 0.41. In this case, the lowesttemperature achieved before the onset of crystallization was�900 ◦C, which therefore corresponds to the highest degreeof supercooling, and the sample always recalesced but showedvariations in the post-recalescence behaviour. A variation inthe cooling behaviour of the x = 0.41 sample was also foundwhen slower quench rates were used (see figure 4) and thisis consistent with the rapid nucleation and growth of largecrystals at slightly different times in different parts of thecooling sphere. The recalescence temperature was found toincrease as the quench rate decreased. For the x = 0.21sample, a strong recalescence feature was always observed, butthe form of this recalescence was notably different to the caseof x = 0.41, i.e. the sample always started to recalesce at ahigher temperature (T � 1200 ◦C) and the rise in temperaturewas noticeably slower. In addition, heat appeared to evolvecontinuously from the x = 0.21 sample for approximately 1.5 safter the recalescence event before the cooling curve resumed
3

J. Phys.: Condens. Matter 20 (2008) 205103 L B Skinner et al
Figure 4. Pyrometer traces for several of the (Y2O3)x (Al2O3)1−x
samples when cooled slowly (�100 ◦C s−1 at 1200 ◦C) under lasercontrol. The curves marked AY41A, AY41B and AY41C allcorrespond to the same sample but to the cooling stages of differentheating/cooling cycles. The abscissa (time) for each cooling curvehas an arbitrary origin.
a characteristic black-body shape. Again, the recalescencetemperature increased as the quench rate was decreased.
3.3. High-energy x-ray diffraction
Figure 5 shows the x-ray diffraction patterns measured usingthe ID27 diffractometer for rapidly quenched samples ofdiameter �2.3–2.5 mm with compositions x = 0.21, 0.24,0.30 and 0.375. The powder diffraction patterns for crystallineYAG (x = 0.375) (Prince 1957, Fletcher et al 1996) andyttrium aluminium perovskite (YAP corresponding to x =0.50) (Ross et al 2004) are also shown. The cloudy sample atthe YAG composition is a glass-ceramic with partly amorphousand partly crystalline components. Comparison with thediffraction pattern for crystalline YAG shows that the smallinclusions observed by optical microscopy (see figure 2)correspond to spherical YAG crystals embedded in a glassymatrix. Separate diffraction measurements (not illustrated)of YAG composition samples quenched at different ratesshow that the Bragg peak intensity increases with cloudiness.In comparison, the diffraction pattern for the clear x =0.30 sample shows no evidence of Bragg diffraction and isconsistent with a single glassy phase. At first sight, thediffraction pattern for the cloudy x = 0.24 sample also appearsto be characteristic of a pure glass. For example, there isno strong Bragg peak on the high-Q side of the principlediffraction peak at �2.2 A
−1, as observed in the diffraction
pattern for the x = 0.375 sample, and no sharp Bragg peaksappear elsewhere. However, when compared to the x =0.3 sample, the diffraction pattern appears more structured,especially with regard to the bumps observed at Q-values of∼3.1 and ∼4.5 A
−1. These do not appear to correspond to any
of the Bragg peaks for YAG or YAP, and it is possible that theyresult from the formation of a second glassy phase of differentstructure, as suggested by the sample cloudiness. However,from the diffraction pattern alone it is difficult to ascertainwhether this second component is a true glass or whether it is
Figure 5. The high-energy x-ray diffraction patterns measured usingtransmission geometry for several of the (Y2O3)x (Al2O3)1−x spheresshown in figure 1. In (a), the diffraction patterns for the x = 0.24,0.30 and 0.375 samples are compared with the powder diffractionpattern for pure crystalline YAG (lowest curve). In (b), the diffractionpattern for the x = 0.21 sample is compared with the powderdiffraction pattern for pure crystalline YAP (lowest curve). Thecurves are displaced vertically for clarity of presentation.
an unknown crystalline phase with Bragg peaks that are highlybroadened due to particle size effects. The latter hypothesis isconsistent with the optical microscopy measurements (figure 2)which show that any inclusions must be of size �1 μm.An alternative explanation is that the cloudiness arises fromspinodal decomposition of the liquid before it passes throughthe glass transition. Finally, the diffraction pattern for thex = 0.21 sample is dominated by the Bragg peaks from YAP.The second phase (or phases) could not be unambiguouslyidentified, although there is evidence for crystalline Al2O3 butno evidence for the other intermediate crystalline compoundsof the Y2O3–Al2O3 pseudo-binary system, namely Y3Al5O12
and Y4Al2O9 (Cockayne 1985). The sample compositionindicates the formation of a material containing crystallineYAP and Al2O3 in the ratio 1:1.38.
4. Discussion
4.1. Equilibrium and metastable phase diagrams for theyttria–alumina system
The phase diagram and crystallization behaviour of the yttria–alumina system has been the subject of considerable study,reflecting the importance of YAG as a host for rare-earth
4

J. Phys.: Condens. Matter 20 (2008) 205103 L B Skinner et al
ions in laser and other optical applications (Yoder and Keith1951, Cockayne and Lent 1979, Caslavsky and Viechnicki1980, Cockayne 1985, Gervais et al 1997). The equilibriumphase diagram shows the formation of three stable crystallinecompounds between the Y2O3 and Al2O3 end members,namely Y3Al5O12 (YAG), YAlO3 (YAP) and Y4Al2O9, whichis sometimes called yttrium aluminium monoclinic (or YAM).The melting point of YAG is reported to be in the rangefrom 1940 ◦C (Caslavsky and Viechnicki 1980) to 1970 ◦C(Cockayne 1985). In experiments, the compounds that areactually formed on cooling liquid Y2O3–Al2O3 mixtures isdependent inter alia on the temperature from which the meltis quenched and on the quench rate. For example, moderatesupercooling at the YAG (x = 0.375) composition favoursthe formation of crystalline YAP and Al2O3, rather than YAG,in the absence of YAG seeding (Cockayne and Lent 1979).The corresponding metastable phase diagram, as reported byCaslavsky and Viechnicki (1980) and Cockayne (1985), showsa supercooled liquid state in the range 0.20 � x � 0.45 whichis bounded by a metastable melting curve with a eutectic inthe range 0.23 � x � 0.28 and the absence of any stableYAG phase (see figure 6). Faster quench rates, leading toliquids with an increased degree of supercooling, are madeaccessible by aerodynamic levitation methods. The resultsobtained for the x = 0.375 composition by Gervais et al(1997) show that, as the degree of supercooling is increased,the liquid first forms a mixture of crystalline YAP and Al2O3,then crystalline YAG and finally a glass (which crystallizesto form YAG on reheating to �980 ◦C). Similar observationswere made by Gervais et al (1997) for a range of compositionsabout x = 0.375.
4.2. Glass formation for (Y2 O3)x(Al2O3)1−x with0.25 � x � 0.33
Aasland and McMillan (1994) investigated the yttria–aluminasystem, including the glass forming region, by using aniridium wire furnace and optical microscopy. They concludedthat, on quenching liquids in the composition range 0.24 �x � 0.32, a second liquid phase spontaneously forms in thesupercooled regime, which leads to samples comprising twoglassy phases with identical composition but different density.The nucleation temperature of the second liquid phase, Tl−l ,was observed to be at �1220 ◦C for x = 0.24 and at �1150 ◦Cfor x = 0.32, and is represented by the dash–dot–dot curvein figure 6. The glass transition temperature Tg was estimatedto be 1150 ◦C for all of the glass forming compositions andis represented by the dotted curve in figure 6. The lack ofsensitivity of Tg to composition is supported by the work ofNagashio and Kuribayashi (2002). Aasland and McMillan(1994) assumed that the locus of crystallization temperaturesfor the deeply supercooled liquid Tcryst (dash–dot curve infigure 6) has the same form as the metastable melting curve.The glass forming region corresponds to the temperature rangewhere Tg > Tcryst.
The samples produced in the present work by thecontactless aerodynamic levitation technique show ratherdifferent behaviour. In particular, it was possible to produce
Figure 6. The equilibrium (solid curves) and metastable (dashedcurves) phase diagrams for the (Y2O3)x (Al2O3)1−x system for0 � x � 0.5, as adapted from Caslavsky and Viechnicki (1980) andCockayne (1985). The Al2O3, YAG and YAP compositions areindicated. It should be noted that the position of the metastableeutectic at �0.27 is slightly different to that indicated by Aaslandand McMillan (1994) at �0.25 (the mean of the values reported byCaslavsky and Viechnicki (1980) and Cockayne and Lent (1979)).According to Aasland and McMillan (1994), Tg is given by thehorizontal dotted line, the solid circles show the two phase glassforming compositions, the open diamonds show the compositionswhere glass formation does not occur, the v-shaped dash–dot curvegives the crystallization temperature of the deeply supercooledliquid, Tcryst, and the dash–dot–dot curve gives the liquid–liquidtransition temperature, Tl−l , where a second liquid phase wasobserved to nucleate. Note that Tcryst was assumed by Aasland andMcMillan (1994) to have the same form as the metastable meltingcurve, so the position of the metastable eutectic would be shifted tox � 0.27, according to the metastable phase diagram of Cockayne(1985). The dark grey region for 0.27 � x � 0.33 and the light greyregion for 0.33 � x � 0.375 mark the composition ranges where itwas possible, in the present work, to produce either single-phaseglasses or glasses containing crystalline YAG inclusions,respectively. The (red) triangles show the crystallizationtemperatures found in the present work for the samples preparedusing a quench rate of �300 ◦C s−1 at 1200 ◦C. The (red) squaresshow the crystallization temperatures observed in the present work atthe lower quench rate of �40 ◦C s−1 at 1200 ◦C which was requiredin order to crystallize the good glass forming sample at x = 0.3.
only single-phase glasses for the compositions x = 0.27(which is near to the eutectic in the metastable phase diagramof figure 6) and x = 0.33, even when the quench ratewas reduced by controlled laser cooling. This reductioneventually led to the observation of recalescence and sampleshaving a high degree of crystallinity. The onset of this
5
J. Phys.: Condens. Matter 20 (2008) 205103 L B Skinner et al
crystallization process is marked by the (red) squares infigure 6 and occurs very close to the Tl−l values reported byAasland and McMillan (1994). No evidence was thereforefound for liquid–liquid phase separation and two-phase glassformation for the composition range 0.27 � x � 0.33.The present results are consistent with the work of Nagashioand Kuribayashi (2002), who studied the (Y2O3)x(Al2O3)1−x
system over the composition range 0.25 � x � 0.375 by usingan aero-acoustic levitation and laser system, another method ofcontainerless processing.
4.3. (Y2 O3)x(Al2O3)1−x samples with x � 0.33
In the present work we could not produce perfect glassymaterials at the YAG (x = 0.375) composition. In every casethe cooled sphere contained some crystalline YAG inclusionsin a glassy matrix. The amount of included crystalline phaseincreased with decreasing cooling rate, as assessed opticallyand by the degree of Bragg scattering observed in high-energy, high-resolution x-ray diffraction experiments. Almostcompletely transparent samples could be formed by using aquench rate of �300 ◦C s−1 at 1200 ◦C, but there remaineda small number of virtually invisible inclusions that gaverise to sharp Bragg peaks in the x-ray diffraction patterns.Nagashio and Kuribayashi (2002) also found that, as thecomposition approaches x = 0.375, small spherical inclusionsof crystalline YAG precipitated in their samples. However, theydid succeed in obtaining single-phase YAG glass by very rapidsplat quenching of the levitated liquid between metal anvils.These observations are consistent with the results of Gervaiset al (1997).
Yttria–alumina glasses, produced by aero-acoustic andaerodynamic levitation, were also studied by Weber andco-workers (Weber et al 2000a, 2004) using quench ratescomparable to the present work. They reported the existenceof spherical inclusions with a similar morphology to those weobserved at the YAG composition. However, x-ray diffractiondata showed no Bragg scattering and, even though evidence ofcrystallization was observed in neutron diffraction data, it wasconcluded that YAG forms a two-phase polyamorphic glass.In later work, however, Johnson and Kriven (2001) made athorough investigation of YAG crystallization using the sameaerodynamic levitation method and, in this case, crystallineYAG inclusions in the as-quenched samples were observed byx-ray diffraction. The reason is unclear for the absence ofBragg peaks in the x-ray diffraction study of Weber et al (2004)but the appearance of these peaks in their neutron diffractionstudy and in the x-ray diffraction study of Johnson and Kriven(2001).
It is interesting to compare the pyrometry traces in figure 3and relate them to the properties observed for the solidsamples. At x = 0.41, steady cooling is observed untilrapid recalescence occurs at T � 900 ◦C. The steepness ofthe rise in temperature on recalescence and the subsequentfast decay is consistent with a rapid (almost instantaneous)nucleation of large crystals from the liquid and accounts forthe polycrystalline non-spherical shape of the resulting sample(see figure 1). In comparison, for the case of the single-phase
glass forming compositions (0.27 � x � 0.33) there is a fastand continuous decrease in temperature as the sample freelycools, and there is no evidence for a rapid release of latent(excess) heat associated with crystallization. Close inspectionof the cooling curve for the cloudy sample at x = 0.375 showsthat some excess heat is evolved compared to the single-phaseglass forming composition x = 0.33, as manifested by a longerdecay time for the temperature in the range between 1300 and800 ◦C (see figure 3). The absence of a sharp recalescencefeature but slow evolution of excess heat is consistent with anindependent and slow nucleation of small crystalline inclusionswhich lead to the Bragg peaks observed in figure 5. As shownin figure 4, slower cooling of the x = 0.375 composition undercontrolled conditions (�100 ◦C s−1 at 1200 ◦C) leads to a sharprecalescence feature akin to the x = 0.41 composition.
The degree of supercooling exhibited by liquids havingthe YAG composition highlights the difficulty associated withhomogeneous nucleation and growth of the crystalline YAGphase. The aerodynamic levitation experiments of Gervaiset al (1997) show that, as the degree of supercooling isincreased, the liquid first forms a mixture of crystalline YAPand Al2O3, then crystalline YAG and finally a glass. Thisproblem in forming nucleation centres with a critical sizerequired for growth is related, in part, to the large unit cellof YAG (Prince 1957, Cockayne and Lent 1979, Cockayne1985) which contains 160 atoms in which 60% of the Alatoms are tetrahedrally coordinated and 40% of the Al atomsare octahedrally coordinated to oxygen atoms, giving a meanAl–O coordination number of 4.8. By comparison, YAP(Ross et al 2004) and the thermodynamically stable corundumstructure of α-Al2O3 (Levin and Brandon 1998) have smallunit cells, containing 20 and 30 atoms respectively, in whichall of the Al is octahedrally coordinated by oxygen atoms.γ -Al2O3 (average of 53 1
3 atoms in the unit cell) and otheralumina polymorphs contain both octahedral and tetrahedralsites, leading to an average Al–O coordination number between4 and 6 (Levin and Brandon 1998). On the other hand, x-raydiffraction experiments on the supercooled liquid phase showthat aluminium has a predominantly tetrahedral coordinationenvironment, although deeply supercooled liquids levitated onargon gas show a mean Al–O coordination number of �5(Weber et al 2000b), while 27Al nuclear magnetic resonanceexperiments on the liquid at 1970 ◦C place the fraction of AlO4
tetrahedra at 80%, with both AlO5 and AlO6 making up theremaining species (Coutures et al 1990). Gervais et al (1997)explain the observed behaviour of liquid YAG as resulting froma competition between, firstly, the need for high Al and Ydiffusion coefficients if phase separation into YAP and Al2O3
is to occur and, secondly, the comparatively large nucleationembryos needed to form YAG. At higher temperatures (fastdiffusion) the former wins, whereas at lower temperatures thelatter wins. This competition also explains the propensity forYAG to form a partial glassy phase on rapid cooling, as neitherprocess can take place fast enough to prevent glass formation.It should be noted that the viscosity of liquid YAG showstypical fragile behaviour, e.g. it varies rapidly with temperaturein the supercooled regime near Tg (Weber et al 1998).
6

J. Phys.: Condens. Matter 20 (2008) 205103 L B Skinner et al
4.4. (Y2 O3)x(Al2O3)1−x samples with x � 0.24
In the present work, the character of the cloudy samples at thex = 0.24 composition is substantially different to that seenfor compositions approaching YAG. For example, the opticalimages of figure 2 show that any inclusions are sub-micronin size and the x-ray diffraction pattern of figure 5 showsno obvious Bragg peaks. However, it is not possible to usethis diffraction pattern to establish unambiguously whether theobserved additional structure is due to (i) a second glassy phaseof different density but the same composition that arises fromliquid–liquid phase separation, (ii) a second glassy phase ofdifferent composition that arises from spinodal decomposition,or (iii) a large number of sub-micron nano-crystals which giveBragg peaks with considerable particle size broadening. Allof these scenarios could lead to the distinct sample cloudinessthat we observe at this composition.
As the composition is reduced from x = 0.24 to 0.20,the ability to form bulk glassy samples becomes increasinglydifficult (Aasland and McMillan 1994, Wilding et al 2005)and, for the levitation system used in the present work,crystallization always takes place at x = 0.21 for a sample sizeof ∼2.3–2.5 mm diameter. The corresponding x-ray diffractiondata, which are shown in figure 5, indicate the formationof a multiphase crystalline material comprising YAP but notYAG. This observation is consistent with the metastable phasediagram of figure 6, which shows a eutectic at x � 0.27 withAl2O3 and YAP endpoints.
Again, it is interesting to compare the pyrometry tracesin figure 3 and relate them to the properties observed forthe solid samples. Close inspection of the cooling curvefor the cloudy x = 0.24 sample shows that some excessheat is evolved, compared to the single-phase glass formingcompositions, which is manifested by a longer decay timefor the temperature in the range between 1300 and 800 ◦C.However, the x-ray diffraction data of figure 5 do not enablea clear distinction to be made between the scenarios wherethere is (i) a slow nucleation and growth of small crystallineinclusions or (ii) the formation of a second liquid or glassyphase. By comparison, at the x = 0.21 composition a strongrecalescence phenomenon is observed, but its character is verydifferent from that seen for x = 0.41. Instead, the rise intemperature takes place over a period of �0.5 s and there isa steady evolution of excess heat for �1.5 s before the sampleresumes black-body cooling. As shown in figure 4, this generalbehaviour is repeated if a sample is cooled more slowly undercontrolled conditions. When the quench rate of the x = 0.24sample is reduced, the appearance of the cooling curve issimilar to that for x = 0.21. The nucleation and growthtime for YAP and Al2O3 is therefore much longer than thecorresponding time for YAG near the x = 0.375 composition.For the YAG composition, Gervais et al (1997) observed theformation of YAP and alumina under slow quench conditionsbut the recalescence feature remained sharp.
4.5. Does polyamorphism exist for the (Y2 O3)x(Al2O3)1−x
system?
For the composition range 0.25 � x � 0.33 there areclear distinctions to be made between the results presented
by Aasland and McMillan (1994) and those presented in thepresent work and by Nagashio and Kuribayashi (2002). Inthe former case, two phase glasses were formed at all of thecompositions and the use of an iridium wire furnace leads tothe possibility of inhomogeneous nucleation caused by the meltinteracting with the container walls (Aasland and McMillan1994). In the latter case, however, the use of levitation methodsleads to a suppression of heterogeneous nucleation and a regionof homogeneous single-phase glass formation was found. Theliquid–liquid phase transition line reported by Aasland andMcMillan (1994) occurs at temperatures that are comparableto those found in this work for the onset of crystallization (seefigure 6). The existence and mechanism for the occurrenceof a liquid–liquid phase transition for the composition range0.25 � x � 0.33 is therefore debatable. For instance, atwhat stage would a second phase stop being classified as aglass that has formed from a dynamically arrested metastableliquid–liquid phase transition and start being classified as anembryonic crystal?
In the more recent work of McMillan and co-workers(Wilding and McMillan 2001, Wilding et al 2002a, 2002b,McMillan et al 2003, Wilson and McMillan 2004, McMillanet al 2007) it is reported that large (micron-sized) regionsof isolated HDA (high-density) and LDA (low-density)polyamorphs can be produced by quenching appropriateY2O3–Al2O3 liquids. In a revised sample procedure, the tip ofa rod of the chosen composition produced by sol–gel methodsis heated in an image furnace so that a liquid droplet, in contactwith the solid, is allowed to form. On further heating, thisdroplet detaches from the rod, whereupon it is allowed tofall through a platinum grid (to reduce particle size) and thenquenched into water. By comparison with the LDA phase,the HDA phase is reported to have a mass density that is 4%higher and a glass transition temperature Tg that is lower. Thefavoured composition range for these two-phase glasses is nowgiven as 0.20 � x � 0.24 and not at the higher yttria contentsof the original work. It is also claimed (McMillan et al 2003)that similar materials can be produced by roller quenching,although the precise methods are not stated.
Although we have not been able to produce samplescontaining such clearly isolated regions by using levitationmethods, the revised composition range for the formation oftwo-phase glasses is not inconsistent with the observationsthat we have made for compositions close to x = 0.24, asmanifested by the cloudiness of the samples (see figure 1)and the additional structure observed in the x-ray diffractionpattern compared to x = 0.30 (see figure 5). Nevertheless,the discrepancies between the results suggest that, in the non-levitation procedures, different processes take place such asheterogeneous nucleation from centres that remain in the liquidas it detaches from the solid rod or which form as the liquidmakes contact with the platinum grid or quenching rollers.
It is notable that the cloudy x = 0.24 sample shown infigure 1 also has a large hole in its interior. Similar holes werenot observed in any of the homogeneous single-phase glassesproduced in the present work, but they were observed in cloudysamples made by Weber et al (2000a) using levitation methods.The holes are attributed to sample shrinkage on cooling and
7

J. Phys.: Condens. Matter 20 (2008) 205103 L B Skinner et al
suggest that regions of the liquid are subjected to considerabletension (negative pressure) as a precursor to void formation.As a result, the interior of the liquid will become mechanicallyunstable, due to the significant internal pressure gradients thataccompany differential rates of cooling and solidification, andit is possible that these instabilities lead to different regionswhich favour the formation of HDA and LDA material asthe supercooled liquid solidifies. It is therefore plausible thatthe stability limit (Speedy 1982), percolation and liquid–liquidphase transition hypotheses, outlined by Mishima and Stanley(1998) in relation to the formation of HDA and LDA water,have relevance to the formation of glasses in the Y2O3–Al2O3
system. It could also be surmised that similar tension in theliquid, on dropping through a platinum grid or onto quenchingrollers, could also be present when forming the HDA and LDAmaterial observed by McMillan et al (2007).
The (Y2O3)x(Al2O3)1−x system clearly merits furtherinvestigation in order to elucidate the precise conditions(temperature, pressure, quench rate) that promote theformation of two-phase glasses. In this context it is interestingto note that the neutron and x-ray diffraction work of Wildingand co-workers (Wilding et al 2002a, 2005) show that thestructure of glasses formed for both the x = 0.25 and 0.20compositions is dominated by tetrahedral AlO4 conformations,although the diffraction patterns for x = 0.20 showed Braggpeaks that were attributed to partial crystallization of the LDAphase. Analysis of our diffraction data (which is limited bythe available Q-range of 1.35 � Q � 23 A
−1) gives an Al–
O coordination number of 4.1 ± 0.2 for 0.24 � x � 0.375and confirms this tendency for tetrahedral coordination in theglass. Also, the x = 0.25 composition corresponds to anAl:O ratio of 1:2, which enables the possibility of forming acontinuous random network of corner-shared AlO4 tetrahedra,should the aluminium be exclusively four-fold coordinated byoxygen atoms. To explore the 0.24 � x � 0.27 compositionrange further, we have carefully fabricated a series of sampleswith x increasing in 0.005 steps by using the levitation methoddescribed in this paper. It was found that the samples formedfor x < 0.25 were always cloudy and similar in form tothe x = 0.24 sample shown in figure 1. In contrast, it waspossible to make clear glassy samples for all compositions withx � 0.255. For x = 0.25, the samples sometimes appearedclear and sometimes cloudy, a variation that could be explainedby the difficulty of obtaining precise sample compositions andquenching conditions. Hence, single-phase glass formationappears to occur for x � 0.25, where a network of corner-shared AlO4 tetrahedra can be maintained, provided thatthese structural motifs contain non-bridging oxygen atoms.However, for compositions of x � 0.25, where cloudy samplesalways form, the maintenance of a tetrahedral network requiresan oxygen coordination number greater than two or edge-sharing conformations. Questions that need to be addressedwith regard to glass formation in this system therefore includethe composition dependence of the aluminium and yttriumcoordination environments and the diffusion coefficients ofthese species in both the liquid, supercooled liquid and glassystates, especially in the region around x = 0.25.
5. Conclusions
We have undertaken a study of glass formation fromaerodynamically levitated liquids in the (Y2O3)x(Al2O3)1−x
system by using pyrometric, optical imaging and x-raydiffraction methods. The optimum glass formation regionoccurs for the composition range 0.25 � x � 0.33. Atthe extremes of this range the materials show an increasingtendency to phase separate. For the Y2O3-rich compositions(0.33 � x � 0.375), we conclude that there is a glassy matrixin which small (�40 μm) crystallites of yttrium aluminiumgarnet (YAG) nucleate. With very rapid quenching methodsit is possible to produce a single-phase glass at the YAG(x = 0.375) composition (Nagashio and Kuribayashi 2002).For compositions just less than x = 0.25, the nucleationprocesses taking place in the liquid appear to be slow andcomplex and give rise to microscopic density or compositionalfluctuations that cause cloudiness. In order to resolve someof the discrepancies observed in the properties of liquid,supercooled liquid and glassy (Y2O3)x(Al2O3)1−x , a furthersystematic and detailed study of the structure and dynamicsof this system is required, especially around the x = 0.25composition.
Acknowledgments
We would like to thank Martin Wilding for helpful discussionsduring the preparation of this manuscript and Jeff Odell forassistance in using the phase contrast microscope. LawrieSkinner thanks the UK Engineering and Physical SciencesResearch Council (EPSRC) for the award of a DoctoralTraining Award. We would also like to acknowledge use ofthe EPSRC Chemical Database Service at Daresbury.
References
Aasland S and McMillan P F 1994 Nature 369 633Caslavsky J L and Viechnicki D J 1980 J. Mater. Sci. 15 1709Cockayne B 1985 J. Less-Common Met. 114 199Cockayne B and Lent B 1979 J. Cryst. Growth 46 371Coutures J P, Massiot D, Bessada C, Echegut P, Rifflet J C and
Taulelle F 1990 C. R. Acad. Sci. Paris 310 1041Euler F and Bruce J A 1965 Acta Crystallogr. 19 971Fischer H E, Barnes A C and Salmon P S 2006 Rep. Prog. Phys.
69 233Fletcher D A, McMeeking R F and Parkin D 1996 J. Chem. Inf.
Comput. Sci. 36 746Gervais M, Le Floch S, Gautier N, Massiot D and Coutures J P 1997
Mater. Sci. Eng. B 45 108Gervais M, Le Floch S, Rifflet J C, Coutures J and Coutures J P 1992
J. Am. Ceram. Soc. 75 3166Johnson B R and Kriven W M 2001 J. Mater. Res. 16 1795Levin I and Brandon D 1998 J. Am. Ceram. Soc. 81 1995McMillan P F, Wilson M and Wilding M C 2003 J. Phys.: Condens.
Matter 15 6105McMillan P F, Wilson M, Wilding M C, Daisenberger D,
Mezouar M and Greaves G N 2007 J. Phys.: Condens. Matter19 415101
Mishima O and Stanley H E 1998 Nature 396 329Morse H W and Donnay J D H 1932 Am. J. Sci. 23 440Morse H W and Donnay J D H 1936 Am. Mineral. 21 391
8

J. Phys.: Condens. Matter 20 (2008) 205103 L B Skinner et al
Nagashio K and Kuribayashi K 2002 J. Am. Ceram. Soc. 85 2353Nordine P C, Weber J K R and Abadie J G 2000 Pure Appl. Chem.
72 2127Prince E 1957 Acta Crystallogr. 10 787Ross N L, Zhao J and Angel R J 2004 J. Solid State Chem. 177 1276Speedy R J 1982 J. Phys. Chem. 86 982Weber J K R, Abadie J G, Hixson A D, Nordine P C and
Jerman G A 2000a J. Am. Ceram. Soc. 83 1868Weber J K R, Benmore C J, Siewenie J, Urquidi J and Key T S 2004
Phys. Chem. Chem. Phys. 6 2480Weber J K R, Felten J J, Cho B and Nordine P C 1998 Nature
393 769
Weber J K R, Krishnan S, Ansell S, Hixson A D andNordine P C 2000b Phys. Rev. Lett. 84 3622
Wilding M C, Benmore C J and McMillan P F 2002a J. Non-Cryst.Solids 297 143
Wilding M C and McMillan P F 2001 J. Non-Cryst. Solids293–295 357
Wilding M C, McMillan P F and Navrotsky A 2002b Physica A314 379
Wilding M C, Wilson M and McMillan P F 2005 Phil. Trans. R. Soc.A 363 589
Wilson M and McMillan P F 2004 Phys. Rev. B 69 054206Yoder H S and Keith M L 1951 Am. Mineral. 36 519
9


![Poly[bis(μ 6 -benzene-1,3,5-tricarboxylato-κ 7 O 1 , O 1′ : O 1′ : O 3 : O 3′ : O 5 : O 5′ )tetrakis(dimethylformamide-κ O )trimagnesium(II)]](https://img.dokumen.tips/doc/110x75/6350df58b4766da83b036275/polybism-6-benzene-135-tricarboxylato-k-7-o-1-o-1-o-1-o-3-o.jpg)
![MIXED-LIGANDS μ 3 -OXO TRINUCLEAR CARBOXYLATES [Fe 3 O(CH 2 BrCOO) 1.5 (CH 2 ClCOO) 4.5 (H 2 O) 3 ]Br 0.75 Cl 0.25 5H 2 O and [Fe 3 O(BrCH 2 COO) 6 (H 2 O) 3 ] NO 3 ⋅2.63H 2 O](https://img.dokumen.tips/doc/110x75/63595dbb10f2bd48220e26b6/mixed-ligands-m-3-oxo-trinuclear-carboxylates-fe-3-och-2-brcoo-15-ch-2-clcoo.jpg)

![O[sub 3]-based atomic layer deposition of hexagonal La[sub 2]O[sub 3] films on Si(100) and Ge(100) substrates](https://img.dokumen.tips/doc/110x75/6351ea929ff726561f09372f/osub-3-based-atomic-layer-deposition-of-hexagonal-lasub-2osub-3-films-on-si100.jpg)
![Structural and Luminescence Properties of Gd[sub 2]O[sub 3]:Eu[sup 3+] and Y[sub 3]Al[sub 5]O[sub 12]:Ce[sup 3+] Phosphor Particles Synthesized via Aerosol](https://img.dokumen.tips/doc/110x75/631e927b0ff042c6110c6b5f/structural-and-luminescence-properties-of-gdsub-2osub-3eusup-3-and-ysub.jpg)
![Nucleation of Ga[sub 2]O[sub 3] nanocrystals in the K[sub 2]O–Ga[sub 2]O[sub 3]–SiO[sub 2] glass system](https://img.dokumen.tips/doc/110x75/6337300a20d9c9602f0b2f7c/nucleation-of-gasub-2osub-3-nanocrystals-in-the-ksub-2ogasub-2osub-3siosub.jpg)

![A new type of glycolipid, 1-[α-mannopyranosyl-(1α-3)-(6-O-acyl-α-mannopyranosyl)]-3-O-acylglycerol, from Arthrobacter atrocyaneus](https://img.dokumen.tips/doc/110x75/636047f0fa7cd8ab3f0d3549/a-new-type-of-glycolipid-1-mannopyranosyl-1-3-6-o-acyl-mannopyranosyl-3-o-acylglycerol.jpg)


