Embed Size (px)
Citation preview
High-pressure x-ray scattering and computer simulation studies of density-inducedpolyamorphism in silicon
Dominik Daisenberger,1 Mark Wilson,1 Paul F. McMillan,1,2,* and Raul Quesada Cabrera1
1Department of Chemistry and Materials Chemistry Centre, Christopher Ingold Laboratories, University College London,20 Gordon Street, London WC1H 0AJ, United Kingdom
2Royal Institution of Great Britain, Davy-Faraday Research Laboratory, 21 Albemarle Street, London W1X 4BS, United Kingdom
Martin C. WildingInstitute of Mathematics and Physical Sciences, University of Wales at Aberystwyth, Ceredigion, SY23 3BZ, United Kingdom
Denis MachonLaboratoire de Physique de la Matière Condensée et Nanostructures (UMR CNRS 5586) Université Claude Bernard Lyon1,
43 Bvd du 11 Novembre 1918, F-69622 Villeurbanne, Cedex, France�Received 6 March 2007; published 28 June 2007�
A low- to high-density pressure-driven phase transition in amorphous silicon is investigated by synchrotronx-ray diffraction in the diamond anvil cell. Complementary atomistic molecular dynamics computer simula-tions provide insight into the underlying structural transformations and allow us to interpret the structurefactors obtained from experiment. During compression the form of the scattering function S�Q� changesabruptly at 13.5 GPa, indicating significant structural rearrangement in the amorphous solid. In particular, thefirst peak in S�Q� shifts to larger Q values. The changes are correlated with the occurrence of a low- tohigh-density �LDA-HDA� polyamorphic transition observed previously using Raman scattering and electricalconductivity measurements. The data are analyzed to provide real space �pair distribution function� informa-tion. The experimental data are compared with results from molecular dynamics �MD� simulations using amodified Stillinger-Weber many-body potential energy function in order to extract structural information on thedensified amorphous material. We deduce that the polyamorphic transition involves an abrupt increase in theproportion of 5- and 6-coordinate Si atoms. The overall structure of the HDA polyamorph can be related to thatof the LDA form by creation of highly-coordinated “defects” within the tetrahedrally-bonded LDA network.However classical and quantum MD simulations indicate that an even higher density amorphous state mightexist, based on structures that resemble the densely-packed metallic polymorphs of crystalline Si.
DOI: 10.1103/PhysRevB.75.224118 PACS number�s�: 64.60.�i, 61.43.Dq
I. INTRODUCTION
Silicon, in both its crystalline and amorphous forms, pro-vides a system of fundamental technological importance. Asa result, a detailed understanding of the structural and ther-modynamic behavior of this system over a wide range oftemperature and pressure conditions is necessary if criticalapplications are to be fully exploited. Studies carried out athigh pressure and high temperature have revealed remark-able changes in the structure and physical properties of sili-con, in its crystalline, liquid and solid amorphous states as afunction of the density.
The crystalline material undergoes extensive polymor-phism during compression, leading to series of metallicphases in which the Si atoms are present in octahedral, oreven higher, coordination environments.1,2 Liquid silicon atambient pressure has metallic character and it possesseshigher density than either the semiconducting �diamond�crystal or solid amorphous �a-Si� semiconducting forms ofthe element, that are usually prepared by chemical or physi-cal vapor deposition methods.3,4 Recently, a solid statechemical approach to synthesis of bulk a-Si has beendescribed,5 and that method was used to prepare the samplesused in this study.
As a consequence of the density contrast between thecrystalline polymorph and the liquid phase, diamond-
structured Si-I exhibits a negative melting slope, dTm /dP,between P=1 atm to 11 GPa.6 That observation has led toanalysis of the crystalline melting relations using variousversions of the “two-state” model for the liquid structure.7–9
In such models, “low-” �i.e., four-coordinate� and “high-density” structural domains are presumed to coexist in themelt, and their relative proportion changes as a function ofthe density. At high pressures, the high-coordinate speciespredominate so that the melt density is greater than that ofthe underlying tetrahedrally-bonded crystal and dTm /dP isnegative. As the pressure is decreased, the proportion offour-coordinate states increases so that the normal volumerelations between crystal and liquid are obtained, and thedTm /dP relation should attain a positive slope. Extension ofthe crystal-liquid phase relations into the negative pressure�i.e., tensile� regime using various theoretical models orcomputer simulations indicates that a maximum should occurin the melting curve at P�−2 to −4 GPa.8,10–13
At a sufficiently low temperature, that is modeled to liebelow the melting line in the supercooled liquid regime, ther-modynamic analyses using the two-state or two-domainmodels predict that the supercooled two-state liquid shouldencounter a critical point, followed by a line of first-orderdensity-driven liquid-liquid phase transitions occurring be-tween distinct low- �LDL� and high-density �HDL� super-
PHYSICAL REVIEW B 75, 224118 �2007�
1098-0121/2007/75�22�/224118�11� ©2007 The American Physical Society224118-1

cooled liquid phases �Fig. 1�.7–10,14 It is difficult to directlystudy the LDL-HDL phase transition experimentally in thesupercooled liquid, because of the extreme rapidity of crys-tallization occurring in the metastable high-T , P regime.Nevertheless, in situ high-temperature x-ray scattering ex-periments on liquid-Si show a change in the structure factor,S�Q�, and an associated drop in the coordination numberfrom �6.5 to �5.5 during supercooling at atmosphericpressure.15,16 However, rapid crystallization occurs beforeany liquid-liquid transition is observed �similar behavior isobserved for l-Ge �Ref. 17��. As the temperature is lowered,it is expected that each of the LDL and HDL phases willencounter their respective glass transformations, belowwhich they will become nonergodic LDA and HDA amor-phous solids. Although these are not true phases in internalthermodynamic equilibrium, their transformations may beconsidered to map on to the LDL-HDL polyamorphic liquid-liquid phase transition, assuming some similarity betweenthe configurational energy landscapes of LDA-LDL andHDA-HDL polymorphs. Fast time-scale �ion hammering�techniques18 predict a glass transition temperature for theLDL phase, Tg
L, at T�800–950 K �when extrapolated to“normal” cooling rates19�. The corresponding HDL glasstransition temperature is, as yet, unknown. However, MDsimulations predict such a transition at Tg
H�1027 K.11 Thepressure dependence of both glass transition temperatures isunknown.
The two-state model of the liquid state in silicon is sup-ported by classical and ab initio molecular dynamics �MD�simulations11,20,21 and x-ray scattering experiments on Si�and Ge� as a function of the temperature at ambient
pressure,15,22,23 as well as MD simulations at high pressureand temperature.24–26 Figure 1 shows a region of the siliconphase diagram highlighting the stable thermodynamic transi-tions �generated using a Stillinger-Weber potential model27�along with the metastable LDA and HDA fields calculatedfrom a two-state model using values for the respective en-thalpy, entropy and volume changes of �H=23.24 kJ mol−1,�S=22.0 J mol−1 K−1 and �V=−1.2�10−6 m3. MDsimulations have determined the critical temperature as T�1060 K �Ref. 11� which fixes the energy mixing parameteras W=17.625 kJ mol−1. Both the �-Sn �Si-II� and simplehexagonal �Si-V� polymorphs have stability fields within theexperimentally-accessed pressure range. The two-state modelpredicts a room temperature LDA to HDA pressure-drivenphase transition at p�13.7 GPa.
The first evidence for a semiconductor-metal transition ina-Si was provided by Minomura,28 from electrical conductiv-ity measurements carried out in a large-volume press. It wasobserved that at P�10 GPa the resistance dropped by aboutfive orders of magnitude. Upon decompression to belowP�2–4 GPa, the conductivity of the sample returned to itsoriginal value. X-ray examination of the sample followingthe decompression and recovery to ambient conditionsshowed that it was fully amorphous. It was suggested that astructural or phase transformation had occurred in the amor-phous state, between semiconducting and metallic varietiesof the amorphous solid element.29 The disadvantage of theseexperiments was that the sample could not be examined insitu, and so any metastable structural or phase transforma-tions including crystallization or reamorphization could notbe observed and their possible contributions to the electricalbehavior detected. In a later study of a-Si and a-Ge in a largevolume apparatus using synchrotron radiation to penetratethe sample assembly and record x-ray diffraction patterns insitu at high pressure, it was shown that the amorphous semi-conductors crystallized into their metallic �-Sn structuredpolymorph above P=8–10 GPa, and that the crystallinehigh-pressure phase subsequently reamorphized into thesemiconducting state during decompression.30 It was thusconcluded that the resistance change observed in the earlierstudies was not due to a transformation within the amor-phous material, but to pressure-induced crystallization fol-lowed by reamorphization during recovery of the sample toambient conditions. That result appeared to be confirmed byamorphous diffraction experiments in a diamond anvil cell�DAC�.31 a-Ge and a-Ge:H samples were investigated up to10 GPa by laboratory x-ray scattering. At ambient pressure,first and second amorphous diffraction peaks �the FDP andSDP respectively� in S�Q� were observed at 2.0 and 3.5 Å−1.Upon pressurization, the SDP remained essentially un-changed in position, but the FDP moved to larger Q valuesand its width decreased.31 Above 6.2 GPa, Bragg peaks dueto crystallization of the �-Sn structured phase were presentin the diffraction pattern. Some crystalline material was alsopresent in the sample recovered to ambient conditions.
The HDA metallic form of a-Si was first identified follow-ing high-pressure amorphization experiments on porous sili-con ��-Si�,10 prepared by electrolytic methods32 and it wascompressed in a DAC and studied by optical spectroscopy toinvestigate changes in the bandgap with pressure. Above
0 5 10 15
p (GPa)0
500
1000
1500
2000
T(K
)
Metallic liquid
Diamond
β-SnHDALDA
High density
spin.2
spin.1
Tg
L
Expt. + MD
HgT
sh.
FIG. 1. �Color online� The predicted phase diagram for silicon.The crystal/liquid stability fields are obtained from a combinationof molecular dynamics simulation �Ref. 13� and experiment �Refs.2 and 47� and show the presence of both the high pressure �-Sn�Si-II� and simple hexagonal �Si-V� polymorphs within the presentexperimental pressure range. The metastable LDA/HDA transitionline and the two spinodal lines are obtained using a two-state modelas described in the text. Also shown are the respective LDL andHDL glass transition temperatures obtained from experiment �Ref.18� and simulation. �Ref. 11� The arrow indicates the transitionprobed by the combination of simulation and experiment in thepresent work.
DAISENBERGER et al. PHYSICAL REVIEW B 75, 224118 �2007�
224118-2

P=14–16 GPa, it was noted that the sample became blackand reflective to visible light and that Raman scattering spec-tra indicated an amorphous structure. The pressure-inducedamorphization �PIA� was confirmed by energy-dispersivesynchrotron x-ray diffraction.10 The Raman spectrum ob-tained at high pressure was quite different from that of theusual LDA form of silicon observed at ambient pressure, andit was concluded that HDA had been formed during PIA.During decompression, the HDA polyamorph was observedto back-transform to LDA below P�5 GPa, with no evi-dence for crystallization.10
Recently, we conducted a high pressure study of thedensity-driven polyamorphic transformation between LDAand HDA-Si forms at ambient temperature using Ramanspectroscopy and electrical conductivity measurements in theDAC.12 The sample used was prepared in bulk form by asolid-state chemical metathesis method using Zintl phaseNaSi as a starting material.5 The LDA-HDA transition wasobserved as a dramatic change in the vibrational density ofstates �VDOS�, as probed by Raman scattering, between P=14–15 GPa. The characteristic Si-Si stretching and defor-mation modes of the tetrahedrally-coordinated amorphousnetwork were replaced by features concentrated in the lowerfrequency range, consistent with transformation to a struc-ture with higher average coordination. This was confirmedby molecular dynamics simulations of the VDOS using amany-body Stillinger-Weber potential.12,27 There was no evi-dence for crystallization in the Raman spectra obtained dur-ing compression while the appearance of the sample changedacross the LDA-HDA transition. The LDA sample loadedinto the DAC was a pressed powder of the amorphous semi-conductor and exhibited minimal reflection of visible lightduring optical illumination. Above the pressure-driven tran-sition, the HDA polyamorph appeared highly reflective, com-parable with that of the metallic gasket used to contain thesample in the DAC.12 Electrical conductivity experimentscarried out in the DAC showed a large resistance drop asso-ciated with the LDA-HDA transformation, analogous to thatobserved in the crystalline state during the diamond-structured �Si-I� to �-Sn �Si-II� semiconductor-metaltransition1 and so we concluded that the HDA polyamorph ofa-Si has metallic character. The polyamorphic transformationwas found to be reversible upon release of the pressure, withconsiderable hysteresis as expected for a transition that cor-responds to an underlying first-order density-driven liquid-liquid phase transition. During most decompression runs theobserved Raman spectra exhibited no evidence for crystalli-zation, especially if a critical region between 12–9 GPa wasbypassed rapidly.12 However, in some runs, partial recrystal-lization into a �-Sn structure was observed. That result isdiscussed further below, in the context of our present resultsusing x-ray amorphous diffraction to study the LDA-HDAtransition. During the previous study, we concluded that �a� areversible LDA-HDA transformation in a-Si did exist; �b� theHDA polyamorph had a metallic character and it containedSi species in a higher average coordination than fourfold, incontrast to the LDA form that is semiconducting and essen-tially tetrahedrally coordinated; �c� the large hysteresis ob-served for the HDA-LDA transformation during decompres-sion indicated its likely association with a predicted density-
driven first-order liquid-liquid transition occurring in thesupercooled liquid state, observed below the glass transfor-mation range in the amorphous solid state at T=300 K. Sucha thermodynamic phase transition has also been predictedfrom MD simulations11 �Fig. 1�.
In the present study, we have used synchrotron-basedamorphous x-ray scattering using angle-dispersive tech-niques, combined with MD simulations of the amorphousstructure factor and radial distribution functions, to investi-gate the polyamorphism in a-Si as a function of pressure.
II. EXPERIMENTAL METHODS AND DATAANALYSIS
A. Diamond anvil cell x-ray amorphous scattering
1. Experimental details
With the development of intense highly-collimated x-raybeams available at synchrotron sources it has become pos-sible to measure the weak x-ray scattering from noncrystal-line, low Z materials at high pressure.33,34 Energy dispersivex-ray diffraction �EDXRD� techniques have usually beenemployed in combination with careful spatial filtering of thescattered radiation in experiments involving large volumepresses.35,36 The technique has also been applied to studyamorphous materials in the diamond anvil cell �DAC� at highpressure.34 The EDXRD method involves passing a poly-chromatic “white” beam through the sample and collectingthe data at several diffraction angles �2��. The intensity mustbe normalized to the spectrum of the incident radiation, thatis determined by the source and optics. A major challenge insuch studies is to take proper account of the large back-ground signals generated by the pressure vessel.37 Angle dis-persive �ADXRD� methods, in which a monochromatic inci-dent x-ray beam is used, are being increasingly applied inhigh pressure studies of crystalline as well as amorphousmaterials, in the DAC as well as large volume presses. TheADXRD technique is combined with multichannel collima-tors �for large volume press ecperiments� and image plate orCCD camera detectors to obtain more direct and accurateintensity information.37,38
For high pressure amorphous x-ray scattering studies inthe DAC, the main corrections to the data involve removal ofthe background scattering contributions from the diamondanvils.33,39 This background scattering consists of Comptonscattering and thermal diffuse scattering contributions, aswell as Bragg diffraction from the diamond windows. TheBragg diffraction appears as well-defined spots in the two-dimensional 2D data sets, that can be readily masked duringintegration around the Laue rings to yield the amorphousdiffraction intensity. Both the Compton scattering and ther-mal diffuse scattering contributions from diamond can beevaluated and subtracted from the data by performing abackground measurement in the DAC mounted in the beamwith the same orientation, but with no sample present.
Experimental factors that limit amorphous diffraction ex-periments in the DAC include the sample volume relative tothe diameter and intensity of the collimated incident beamthat is necessary to obtain a useful signal in the allocated
HIGH-PRESSURE X-RAY SCATTERING AND COMPUTER… PHYSICAL REVIEW B 75, 224118 �2007�
224118-3
time; these parameters also determine the maximum pressurethat can be attained in the experiment. Another considerationfor amorphous diffraction studies is to obtain as large a Qrange as possible for subsequent data analysis: that is deter-mined by the opening angle of the DAC on the data collec-tion side. Using light-element diamond seats �e.g., Be� canalleviate part of this problem. In our work we used a gas-operated membrane DAC �Ref. 40� with an opening angle of30° �2�=15° �, with x-ray transparent Be seats for the dia-mond anvils to optimize the available scattering angle range.We used 2 mm diamond anvils with 650 �m culets in theseexperiments. The sample chamber was defined by a 300 �mhole drilled in a Re gasket. Re was chosen partly for itsmechanical strength so that the gasket hole would not col-lapse during the experiment. The initial sample thicknesswas 90 �m. The DAC parameters were chosen to achieveuseful amorphous scattering data from the low Z sample �a-Si� within the available beamtime at the synchrotron station,to pressures into the 20 GPa range where the polyamorphictransition is expected to occur.
No pressure transmitting medium was added into thesample chamber, to avoid having to subtract an additionalsignal from the measured data, and to maximize the scatteredintensity from the sample. From laboratory Raman experi-ments carried out prior to the synchrotron run, we deter-mined that the absence of a pressure-transmitting mediumdid not affect the LDA-HDA transition observed by electricalconductivity measurements or Raman scattering in the a-Simaterial. Likewise, we did not add a pressure calibrant suchas ruby to the sample chamber, to avoid having to subtractBragg diffraction signals from the ruby crystals from theamorphous scattering data. In laboratory experiments carriedout prior to the synchrotron run, we used ruby fluorescenceto calibrate the pressure achieved inside the cell relative tothe gas membrane pressure, that enabled us to determine thepressure during the x-ray scattering experiments.
During amorphous diffraction studies it is important toobtain as large a Q range as possible within the obtainedS�Q� scattering data set, to minimize truncation errors in itsFourier transform to obtain the radial distribution functiong�r�. For a given DAC geometry, the accessible Q range isexpanded by using high energy x-rays available at third-generation synchrotron sources. In the present work datawere collected at the ID-15A station of the ESRF using52 keV x-rays, resulting in the maximum momentum trans-fer of Qmax=11 Å−1 ��=0.238 431 Å� observed in these ex-periments �Fig. 2�. The sample used here was H-free a-Siprepared by a solid-state metathesis reaction from Zintlphase NaSi. The structural state and chemical composition ofthat material has been described previously.5 We reduced thebeam size to 0.1�0.1 mm, exposure times varied between1–3 min �to avoid detector saturation� and data were col-lected over multiple exposures to improve the counting sta-tistics. The angle dispersive x-ray scattering data were re-corded as Laue rings using a MAR3450 on-line scanningimage-plate detector. 2D scattering data were transformed tointegrated I�Q� plots using Fit-2D software, which alsoimplements a polarization correction.41 Background spectrawere collected using the same beam size and exposure times,
after removal of the sample and replacing the cell in thebeam path in the same orientation.
2. Data analysis
The experimental scattering data were analyzed using thefollowing procedure. The total experimentally measured in-tensity, Imeas�Q�, contains various contributions from thesample and the background �Fig. 2�
Imeas�Q� = T�Q�Isamp�Q� + sIbkgd�Q� .
Here, T�Q� and s are the DAC transmission and backgroundscale factors; Ibkgd�Q� is the measured empty-cell back-ground. The scale factor is not unity due to variations inbeam intensity during the course of an experiment. By intro-ducing a normalization factor N the total scattering from thesample, Isamp�Q�, is expressed as a sum of coherent Icoh�Q�,and incoherent scattering, Iincoh�Q�
NIsamp�Q� = Icoh�Q� + Iincoh�Q� .
The incoherent scattering contribution can be computedanalytically42 and N is found using the Krogh-Moe-Normanmethod43,44
N =
− 2�2n0Z2 + �0
Qmax
��f2�Q� + Iincoh�Q���Q2��dQ
�0
Qmax
�Isamp�Q��dQ
.
Here n0 is the average number density, Z is the atomic num-ber and f�Q� is the atomic form factor. The structure factor isobtained by
FIG. 2. The analysis of the raw x-ray diffraction data to give thefinal structure factor. The example shown is for the experimentalx-ray data taken at the lowest pressure studied on the compressioncycle. The raw x-ray scattering data �Imeas� obtained in the diamondanvil cell at the ID-15A station at the ESRF using 52 keV x-rays istreated as described in the text. The figure shows the backgroundsignal �Ibkgd� obtained from the same station under the same condi-tions in the absence of the sample, which is combined with Imeas. togive the unnormalized sample scattering �Isamp�. The normalizedsample scattering �NIsamp� is decomposed into the Compton scatter-ing �IIncoh� and coherent scattering �Icoh� contributions from whichthe final structure factor, S�Q� is obtained.
DAISENBERGER et al. PHYSICAL REVIEW B 75, 224118 �2007�
224118-4

S�Q� =1
f2�Q��NIsamp�Q� − Iincoh�Q�� =
Icoh�Q�f2�Q�
.
The real-space distribution function, g�r�, is the Fouriertransform of S�Q�
g�r� = 1 +1
2n0�2r�
0
Qmax
Q�S�Q� − 1�sin�rQ�dQ
which is exact for Qmax=. However, all experimentally de-termined S�Q� functions have a finite Qmax, that can lead tounphysical oscillations appearing in the real space distribu-tion functions following the Fourier transformation proce-dure. In the present case, Qmax=11 Å−1; the effects of finitewindow size on g�r� are discussed below. For normalizationand subsequent g�r� calculation from the experimental datathe number density of a-Si at ambient conditions was used.45
It has been shown previously that the density has only aminimal effect on the positions of the peaks in both S�Q��through the normalization procedure� and g�r�.39
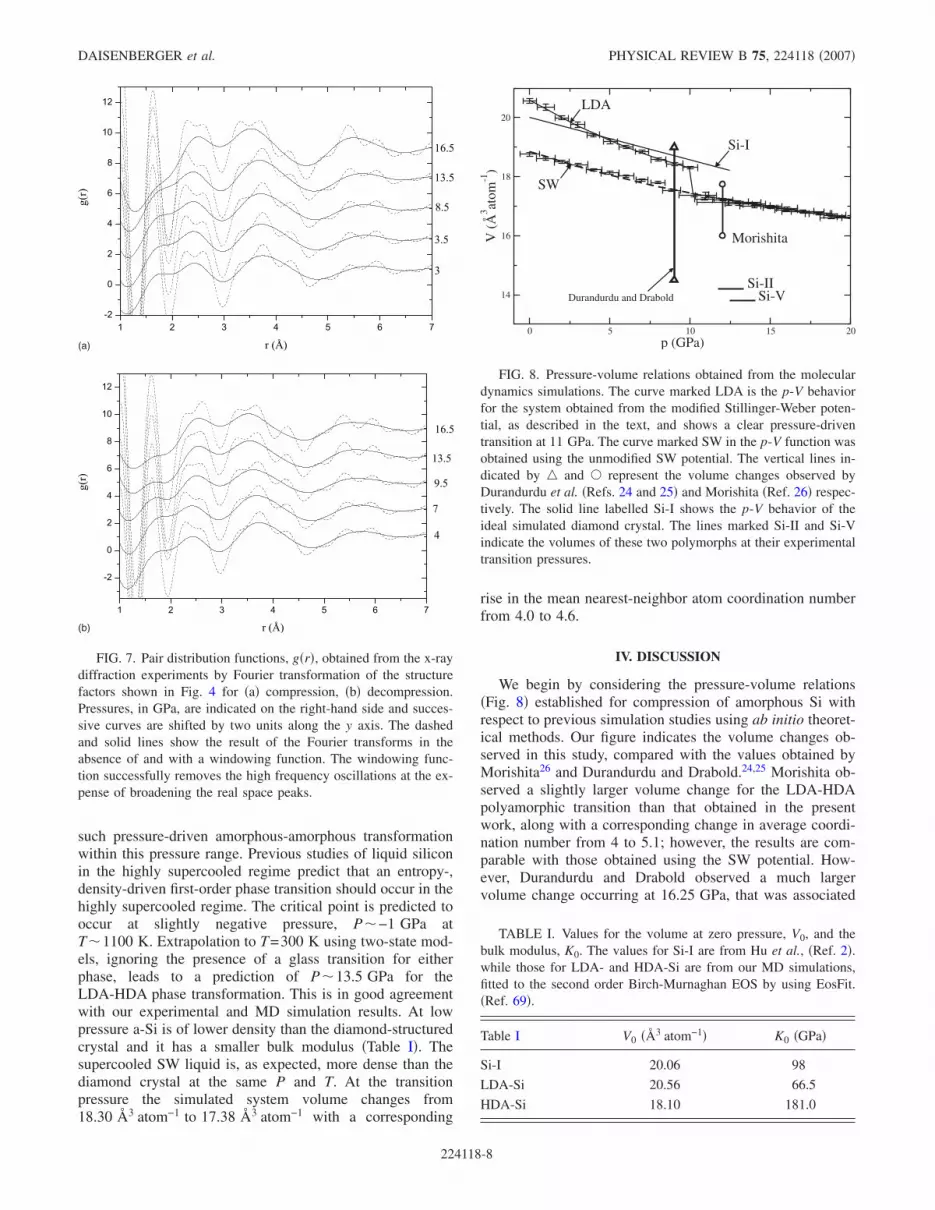
In Figs. 3�a� and 3�b�, we show the raw data �Imeas� ob-tained during a typical compression to P�16.5 GPa andsubsequent decompression. Above �10 GPa partial crystal-lization of the sample into the �-Sn �Si-II� polymorph oc-curs, as evidenced by the emergence of Bragg peaks. Al-though crystallization of phases including Si-XI �Refs. 46and 47� and simple hexagonal Si-V �Ref. 2� phases are ex-pected within this pressure range, the crystalline diffractiondata were best indexed to Si-II �Fig. 3�. The implications ofsuch metastable crystallization are discussed below. The Ra-man spectrum of Si-II has previously been measured up to16.4 GPa.48 We also observed the appearance of Si-II in ourRaman studies during certain decompression experiments,while we were investigating the LDA-HDA transition.12
However, the crystalline signal from Bragg peaks of Si-IIonly makes a small contribution to the overall x-ray signal,that remains dominated by the scattering from a-Si through-out most of the pressure range. Analyzing the relative areasunder the crystalline Bragg features vs. the amorphous scat-tering intensity yields a maximum contribution of �30% forthe highest pressure data sets. We can reconcile the observa-tion that no Si-II signals were detected by laboratory Ramanscattering carried out for the sample prior to the synchrotronrun by the fact that the micro-Raman experiments probesmall spatially defined regions �e.g., 5–10 �m� mainly at thesample surface, whereas the x-ray studies investigate the en-tire sample volume. In order to focus our attention on the�dominant� amorphous structure, the Bragg peaks of crystal-line Si-II were removed from the raw data prior to furtheranalysis �Fig. 4�. It is obvious from the data presented in Fig.3 that changes in the amorphous scattering data, especiallythe position of the first diffraction peak �FDP�, and its inten-sity relative to the second amorphous scattering features�SDP�, are unaffected by the occurrence of the Bragg peaks.The Bragg peaks were subtracted from the data sets by eye.The removal of the first Bragg peak near S�Q�=2.5 Å−1 �cor-responding to the �200� reflection of Si-II� was straightfor-ward. The removal of the second Bragg peak �the �220� re-flection of Si-II� that occurred close to the amorphous SDP at
�3.7 Å−1 was more problematic. A procedure was adoptedin which the Bragg peak intensity was estimated relative tothe �200� feature, and then removed from the amorphousscattering data using a linear baseline function.
B. Molecular dynamics computer simulation
Complementary MD computer simulations were per-formed using a Stillinger-Weber �SW� three-body atomisticpotential.27 Constant temperature and pressure �NpT en-semble� were imposed using Nosé-Hoover thermostats andbarostats.49–51 Runs of 310 ns were performed on a system of216 atoms at 300 K with the pressure ramped by 1 GPa ev-
2 3 4 5 6 7 8 9 10 11
Intensity(arb.units)
Q (Å-1)
3
3.58.5
13.5
16.5
200
220 301 400 420
2 3 4 5 6 7 8 9 10 11
Intensity(arb.units)
Q (Å-1)
16.513.5
9.574
(a)
(b)
FIG. 3. The raw x-ray scattering functions, Imeas�Q�, for the �a�compression and �b� decompression cycles. The diamond anvil cellpressures �in GPa� are indicated on the right-hand side. Each suc-cessive pressure data set is shifted along the y axis for clarity. TheBragg peaks, which emerge at the highest pressure in the compres-sion cycle are indicated by the dashed lines in the uppermost dataset and are indexed as showing the presence of the �-Sn �Si-II�polymorph. The change in position of the first diffraction peak isvisible in the raw data and is not affected by the presence of Braggpeaks at the highest pressure. In the decompression cycle the Braggpeaks gradually disappear as the pressure is reduced indicative ofthe reamorphization of the Si-II structure.
HIGH-PRESSURE X-RAY SCATTERING AND COMPUTER… PHYSICAL REVIEW B 75, 224118 �2007�
224118-5

ery 10 ns. The initial �zero pressure� amorphous configura-tion was obtained using a modified version of the SWpotential.52 Rapid cooling from the melt employing the origi-nal potential function results in an overcoordinated, higherdensity, amorphous structure, commonly referred to as “SWglass.”52 In the method developed by Luedtke andLandman,52 weighting of the SW three-body term is in-creased during cooling from the melt to enhance the degreeof tetrahedral order with respect to the liquid structure. Thisresults in an amorphous structure, that is appropriately lessdense than the diamond-structured crystal �i.e., Si-I�, and thatis dominated by tetrahedrally-coordinated sites but that con-tains of the order of 5.0% three-coordinate and 3.2% five-coordinate species, respectively. The experimentally deter-mined density of annealed amorphous silicon is �1.8%lower than that of Si-I due to the presence of such micro-scopic defects.45 It is possible to obtain analogous configu-
rations using the unmodified SW potential, with much slowercooling rates from the liquid state.53
The S�Q� and g�r� functions can be obtained directly fromthe MD simulation results. The S�Q� is defined byS�Q�= A*�Q�A�Q�, where the A�Q�= 1
�N�i=1
N eiQri are theFourier components whereas g�r� is readily obtained fromthe distribution of pair separations. The g�r� and S�Q� of a-Siobtained using the modified SW potential agree very wellwith experimental data obtained at ambient pressure andtemperature.54,55 Other potential models, such as the environ-ment dependent interaction potential �EDIP�, have also beendeveloped for amorphous silicon.56,57 However, although thecorrect low density form of a-Si can be obtained from themelt, the EDIP-liquid is less dense than the crystal and itsaverage coordination is too low.58 The SW potential on theother hand gives the correct �higher� density of the liquidwith respect to the crystal it and has been used successfullyto investigate a wide range of system behavior, includingmodelling the liquid-liquid transition in supercooled liquidsilicon,11,12 and studying the relative stability and melting ofclathrate phases.13 We chose to continue our studies using theSW potential in the present work, both to interpret the S�Q�data, and to place the results in the context of the metastablephase diagram �Fig. 1�.
III. RESULTS
In Fig. 4�a� we show the static structure factors for a-Siobtained during experimental compression. The S�Q� func-tion is dominated by two main features; the FDP at 2.18 Å−1,and the SDP at 3.63 Å−1. As the pressure is increased to�13 GPa there is a slight change in the position of the FDP�from 2.18 to 2.23 Å−1� consistent with a slight densificationupon pressurization. The relative intensities of the two peaksremains approximately constant on densification. Above13.5 GPa there is a dramatic change in the structure factor.The FDP becomes more intense than the SDP and it shiftsabruptly to larger Q �2.48 Å−1� �Fig. 5�.
During sample decompression the FDP and SDP showreversible behavior with some hysteresis �Fig. 4�b��. Be-tween 16.5 and 13.5 GPa the FDP is still the most intensefeature and it shifts very slightly to lower Q. At 9.5 GPa theintensities of the two features are about equal and the FDP isat 2.33 Å−1. After decompressing further to 4 GPa the SDP isonce more the most intense feature and the FDP has shiftedback to 2.18 Å−1. We also note that the Bragg peaks for �-Sncrystallites �Si-II phase� that emerged during compressionabove 13.5 GPa, disappeared at low pressure �Fig. 3�.
In Fig. 6�a� we show the series of S�Q� functions for a-Sicalculated from the MD simulations as a function of pres-sure. As the pressure is increased between 0–10 GPa theFDP shifts from 2.06–2.19 Å−1 and there is almost nochange in the relative intensities of the first two peaks.Above 11 GPa there is a rapid reversal in the relative inten-sities of the FDP and SDP, and the FDP moves to 2.38 Å−1.The results obtained from the MD simulations show thesame changes over the same pressure range as those ob-served experimentally. To emphasize the similarity of the
2 3 4 5 6 7 8 9 10 11
0
2
4
6
8
10
S(Q)
Q (Å-1)
3
3.58.513.516.5
0 1 2 3 4 5 6 7 8 9 10 11
0
1
2
3
4
5
6
7
8
9
S(Q)
Q (Å-1)
16.5
13.5
9.5
7
4
(a)
(b)
FIG. 4. Structure factors, S�Q�, obtained from x-ray diffractionexperiments in the DAC at 300 K. Pressures �in GPa� are indicatedon the right-hand side for �a� compression and �b� decompression.Successive functions are shifted by one unit along the y axis. Asignificant shift in the position of the first diffraction peak is ob-served at high pressure with a corresponding reverse shift onsample decompression.
DAISENBERGER et al. PHYSICAL REVIEW B 75, 224118 �2007�
224118-6

structure factors obtained from experiment and the MDsimulation, Fig. 6�a� also shows the respective low pressure�p�3 GPa� experimental scattering functions. At low pres-sure the FDP is less intense than the SDP, in agreement withprevious studies at ambient pressure54,59,60 and simulationresults.
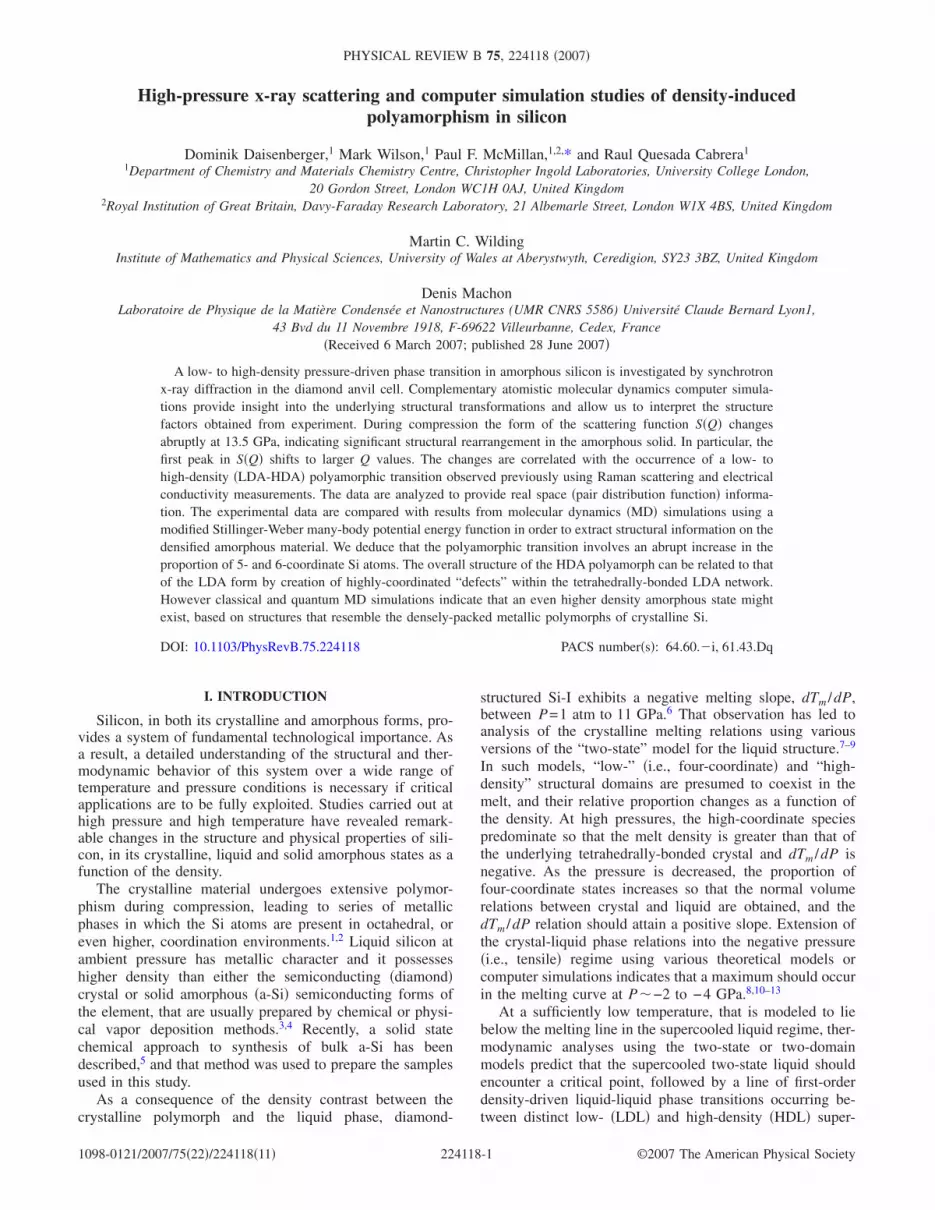
Figure 7�a� shows the radial distribution functions calcu-lated by Fourier transformation of the experimental structurefactors obtained during sample compression. The Fouriertransforms of the raw data are shown as dashed lines andthey exhibit significant high frequency oscillations whosewavelength is due to the truncation of the experimental re-ciprocal space data. The functions obtained by employingBlackman windows are shown as the solid lines. The win-dowing function successfully removes the high frequencyoscillations; however, the resulting real space functions be-come broadened. However, the main features and changes inthe g�r� function remain unaffected. Between pressures of 3and 13.5 GPa, the pair distribution functions show primaryfeatures at 2.36 Å and 3.83 Å associated with Si-Si bondingand next-nearest neighbor Si…Si interactions, indicative ofthe local tetrahedral coordination geometry. At high pressure�16.5 GPa�, the second peak shifts to a shorter separation of�3.40 Å whereas the first peak shifts to slightly longer sepa-ration. This indicates the formation of high coordinate Sispecies. The reverse behavior is observed during decompres-sion �Fig. 7�b��. The real space data displays the same hys-teresis as the S�Q� data so that there is little change in thepeak positions between 16.5 and 9.5 GPa. As the pressure islowered below 9.5 GPa the first peak moves back to shorterseparation and the second peak shifts to 3.72 Å.
Figure 6�b� shows the analogous pair distribution func-tions obtained directly from the MD simulations. The abilityto generate these functions from a priori knowledge of theatom positions means that the MD data do not suffer fromthe truncation effects observed for the experimental data.These functions exhibit analogous changes to the experimen-
tal compression data sets, and �in turn validating the reliabil-ity of our experimental analysis�. At low pressure the g�r�functions display the same two main peaks, along with aweak shoulder on the short-separation side of the secondpeak ��3.30 �. As the pressure is increased, the nearest-neighbor peaks initially shifts to shorter distances and theshoulder on the second peak increases slightly in intensity. Athigh pressures this shoulder becomes the main feature of thesecond peak with a corresponding shift of the first peak ing�r� to longer separations.
Making a direct link between the experimental data andthe MD simulation results means that the simulations can beused to investigate other properties of the densified amor-phous system. In Fig. 8, we show the p-V curves obtainedfrom the MD simulations. There is a dramatic change insystem volume at around 10.5 GPa, that corresponds to theLDA to HDA polyamorphic transformation. It is of interestthat the amorphous system produced using the SW potentialin the absence of the enhanced three-body term shows no
FIG. 5. The position of the first diffraction peak �FDP, squares�and second diffraction peak �SDP, circles� in the structure factors�Figs. 4 and 6�a�� as function of pressure on compression. Theexperimental and simulation results are shown as filled and opensymbols respectively.
(a)
(b)
FIG. 6. �a� Structure factors and, �b� pair distribution functions,obtained from simulation as a function of pressure. The simulationcell pressures are indicated, in GPa, on the right-hand side. In bothcases successive functions are shifted by one unit along the y axisfor clarity. In �a� the structure factor obtained from DAC compres-sion experiment at 3 GPa is shown as a dashed line, shifted downby two units on the y axis, showing the similarity with the structurefactors obtained from MD simulation.
HIGH-PRESSURE X-RAY SCATTERING AND COMPUTER… PHYSICAL REVIEW B 75, 224118 �2007�
224118-7
such pressure-driven amorphous-amorphous transformationwithin this pressure range. Previous studies of liquid siliconin the highly supercooled regime predict that an entropy-,density-driven first-order phase transition should occur in thehighly supercooled regime. The critical point is predicted tooccur at slightly negative pressure, P�−1 GPa atT�1100 K. Extrapolation to T=300 K using two-state mod-els, ignoring the presence of a glass transition for eitherphase, leads to a prediction of P�13.5 GPa for theLDA-HDA phase transformation. This is in good agreementwith our experimental and MD simulation results. At lowpressure a-Si is of lower density than the diamond-structuredcrystal and it has a smaller bulk modulus �Table I�. Thesupercooled SW liquid is, as expected, more dense than thediamond crystal at the same P and T. At the transitionpressure the simulated system volume changes from18.30 Å3 atom−1 to 17.38 Å3 atom−1 with a corresponding
rise in the mean nearest-neighbor atom coordination numberfrom 4.0 to 4.6.
IV. DISCUSSION
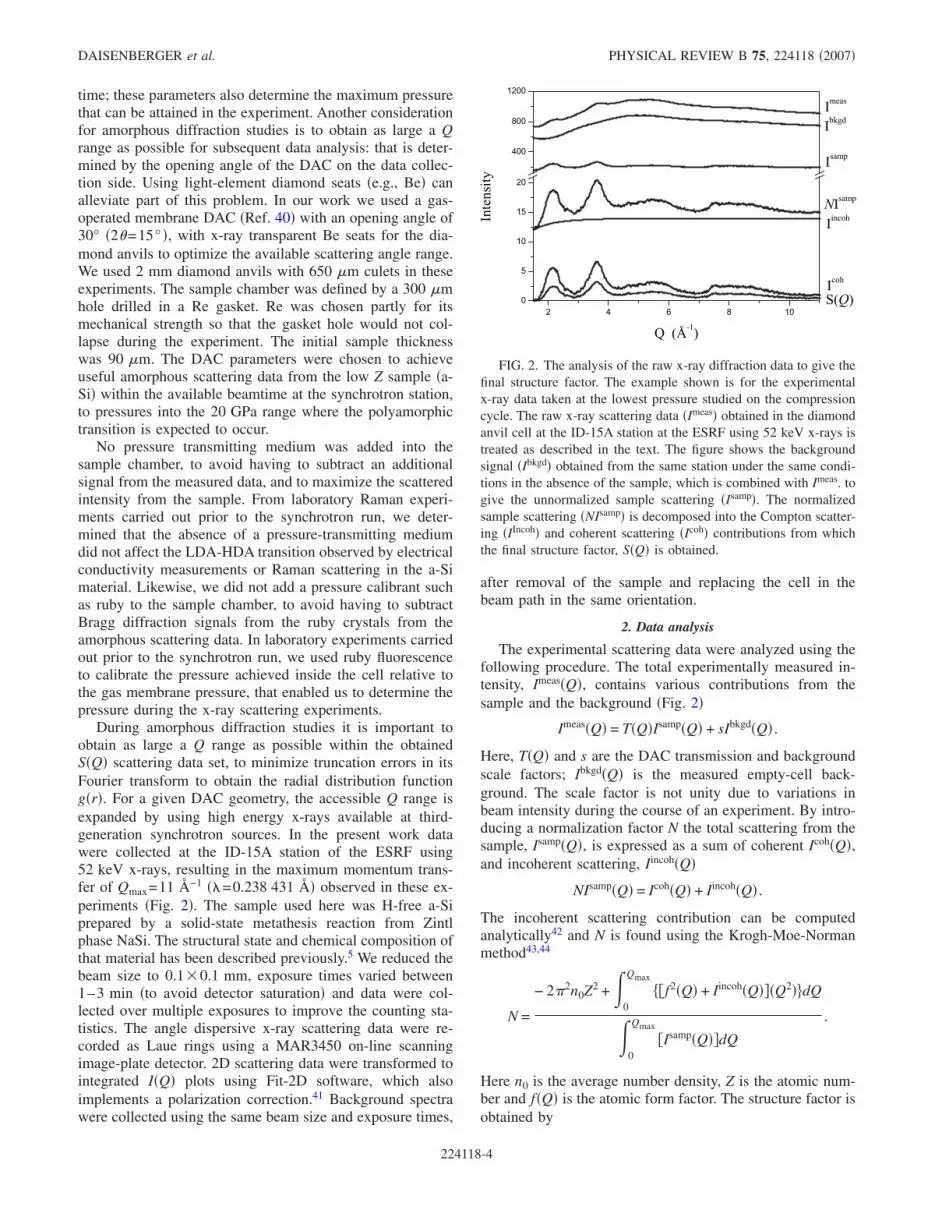
We begin by considering the pressure-volume relations�Fig. 8� established for compression of amorphous Si withrespect to previous simulation studies using ab initio theoret-ical methods. Our figure indicates the volume changes ob-served in this study, compared with the values obtained byMorishita26 and Durandurdu and Drabold.24,25 Morishita ob-served a slightly larger volume change for the LDA-HDApolyamorphic transition than that obtained in the presentwork, along with a corresponding change in average coordi-nation number from 4 to 5.1; however, the results are com-parable with those obtained using the SW potential. How-ever, Durandurdu and Drabold observed a much largervolume change occurring at 16.25 GPa, that was associated
TABLE I. Values for the volume at zero pressure, V0, and thebulk modulus, K0. The values for Si-I are from Hu et al., �Ref. 2�.while those for LDA- and HDA-Si are from our MD simulations,fitted to the second order Birch-Murnaghan EOS by using EosFit.�Ref. 69�.
Table I V0 �Å3 atom−1� K0 �GPa�
Si-I 20.06 98
LDA-Si 20.56 66.5
HDA-Si 18.10 181.0
(a)
(b)
FIG. 7. Pair distribution functions, g�r�, obtained from the x-raydiffraction experiments by Fourier transformation of the structurefactors shown in Fig. 4 for �a� compression, �b� decompression.Pressures, in GPa, are indicated on the right-hand side and succes-sive curves are shifted by two units along the y axis. The dashedand solid lines show the result of the Fourier transforms in theabsence of and with a windowing function. The windowing func-tion successfully removes the high frequency oscillations at the ex-pense of broadening the real space peaks.
0 5 10 15 20p (GPa)
14
16
18
20
V(Å
3 atom
-1)
Si-I
Si-IISi-V
Morishita
Durandurdu and Drabold
LDA
SW
FIG. 8. Pressure-volume relations obtained from the moleculardynamics simulations. The curve marked LDA is the p-V behaviorfor the system obtained from the modified Stillinger-Weber poten-tial, as described in the text, and shows a clear pressure-driventransition at 11 GPa. The curve marked SW in the p-V function wasobtained using the unmodified SW potential. The vertical lines in-dicated by � and � represent the volume changes observed byDurandurdu et al. �Refs. 24 and 25� and Morishita �Ref. 26� respec-tively. The solid line labelled Si-I shows the p-V behavior of theideal simulated diamond crystal. The lines marked Si-II and Si-Vindicate the volumes of these two polymorphs at their experimentaltransition pressures.
DAISENBERGER et al. PHYSICAL REVIEW B 75, 224118 �2007�
224118-8

with a change in average coordination number from 4 to �9.The significance of that result is discussed below.
The structure of the LDA form of a-Si sample at lowpressure is based on an essentially ideal tetrahedrally-coordinated network, containing very few over- or under-coordinated defects. The HDA structure described here, andalso that observed by Morishita, can be understood in termsof highly-coordinated defects generated within the LDA tet-rahedral network. The mean atom coordination number isincreased to above four by the presence of five- or six-coordinated atoms that occupy defect sites between the tet-rahedra. Figure 9 shows molecular graphics “snapshots” ofan LDA and HDA configuration with the Si sites colouredaccording to coordination environment. The HDA phase con-tains a significantly higher fraction of five-coordinate “de-fect” sites when compared to the LDA. The concentration ofthese defects is, therefore, directly related to both the meancoordination number and the volume collapse observed atthe transition pressure. In this picture, the differences in vol-ume change and average coordination observed between theSW result and those obtained by Morishita reflect a slightlysmaller defect concentration within the LDA structure.
Such a defect picture of the amorphous structure is sup-ported by both x-ray diffraction and MD studies on the su-percooled liquid at high temperature which show changes inthe relative FDP and SDP intensities in S�Q� analogous tothose seen here as a function of pressure. These intensitychanges correspond to a decrease in defect concentration asthe liquid is cooled to �1460 K, just above the predictedliquid-liquid transition.15 Supercooled liquid germanium alsodisplays such a decrease in the average coordination numberand a corresponding increase in the relative amount of tetra-hedral bonding.17,61 High pressure, room temperature XASexperiments on a-Ge show a partially reversible transition toa HDA form, with an associated increase in average coordi-nation number to 4.5.62
The larger volume change and significantly higher aver-age coordination number observed in the ab initio simula-tions of Durandurdu and Drabold for both a-Si and a-Ge,might be indicative of the emergence of a “very high densityamorphous” �VHDA� state. Such behavior would be analo-gous to that observed for amorphous H2O, for which thestructural and thermodynamic implications of the relation-ships between LDA-HDA-VHDA forms are currenty underdiscussion.63–66 In the case of a-H2O, a model based on co-ordination defects within a tetrahedral network structure has
been proposed to describe the HDA polyamorph with respectto LDA, and a higher-density structure is projected forVHDA.66
There is significant evidence both from simulation andexperimental studies that the LDA/HDA transformationmaps on to a genuinely first order phase transition in thesupercooled liquid state. However, it is not clear that thesame would hold true for the HDA/VHDA transformation.One possibility is that there is such a first order HDA/VHDAphase transition with an associated phase boundary and anadditional critical point in the system. One alternative possi-bility is that the transition from an HDA-like to a VHDA-likeconfiguration is continuous and is therefore associated with agradual increase in the number of filled defect sites as thepressure is increased. Another possibility is that there existsan series of VHDA-like phases, each characterized by a dif-ferent concentration of defect sites, perhaps separated fromeach other by a series of phase boundaries with associatedcritical points.
Considering the present work in association with previoustheoretical studies, one possibility is that the differentsimulation approaches are accessing alternative HDA vsVHDA-like states. Such differences could be determined byquite subtle aspects of the underlying simulation methodolo-gies. For example, factors including system size and, in par-ticular, the simulated compression rates �and, indeed, the pre-cise details of the manner in which the pressure is applied�might be expected to be significant. These possibilities mustbe tested in future work by systematically varying the simu-lation conditions.
Our data for a-Si do not yet allow us to test the VHDAhypothesis experimentally. However, the density-drivenpolyamorphism can be understood by reference to analogouscrystal phase transitions.2 Figure 8 highlights the densities ofthe high pressure �-Sn �Si-II� and simple hexagonal �Si-V�structured phases, which contain six- and eight-coordinatedatoms, respectively. The crystal densities are typical of thoseobserved in the amorphous state from the ab initio simula-tions and, as a result, we might expect the local coordinationenvironments associated with the VHDA phase to resemblethe local �high� coordination environments displayed bythese high pressure crystals.
VHDA forms have already been proposed for both amor-phous silicon and germanium based on the application ofhigh pressure to the respective liquids.64 Funamori andTsuji36 noted a change in the liquid phase structure of siliconbetween 8 and 14 GPa to give a system whose local coordi-nation environment was suggested to be similar to that of thesimple hexagonal crystal. Similarly, Koga et al.demonstrated67 how application of high pressure to liquidgermanium resulted in an increase in the average coordina-tion number to �7.
Apart from the results for a-Si, the experimental S�Q�data presented here also show the crystalline phase Si-IIforming outside its normal stability field, i.e., in a highlymetastable regime, followed by reamorphization during de-compression to ambient pressure. From high pressure x-raydiffraction experiments, Si-II is normally observed to formfrom Si-I in a pressure range between 10.3 to 14 GPa,47
whereas other crystalline polymorphs �Si-XI, Si-V� are ob-
FIG. 9. Moelcular graphics “snapshots” of typical LDA �left�and HDA �right� configurations. Four and five-coordinate Si atomsare shown as the light and dark shaded circles respectively, high-lighting the greater number of these five-coordinate “defect” sits inthe HDA configuration.
HIGH-PRESSURE X-RAY SCATTERING AND COMPUTER… PHYSICAL REVIEW B 75, 224118 �2007�
224118-9
served to crystallize above these pressures.46 Similarly, dur-ing decompression, Si-II is usually observed to persist downto 6.2 GPa. Further decompression results in metastabletransformation to two further crystalline polymorphs �Si-XII,Si-III�.68 In the data presented here, on compression Si-IIforms at above P�8.5 GPa and persists to at least 16.5 GPa.On decompression, the presence of Si-II is recorded down to4 GPa, at which point it reamorphizes into LDA-Si. Duringour previous Raman spectroscopic investigations of theLDA-HDA transformation and its reversal during decom-pression, we also observed similar metastable formation andreamorphization of Si-II during the decompression part ofthe cycle, when the sample was decompressed slowly withinthe 12–9 GPa range.12 Those data showed the emergence ofSi-II at P�15 GPa, and subsequent reamorphization below7.5 GPa �Fig. 10�. Previously, the Raman spectrum of Si-IIhas been recorded up to 16.4 GPa.48 Other compression ex-periments on LDA-Si have also shown the formation andpersistence of Si-II at high pressure, outside its normal phasefield, and that the crystals subsequently reamorphized duringdecompression.28,30 At low temperature, Si-II formed fromcompression of Si-I has been shown to transform to LDA-Siduring decompression.6
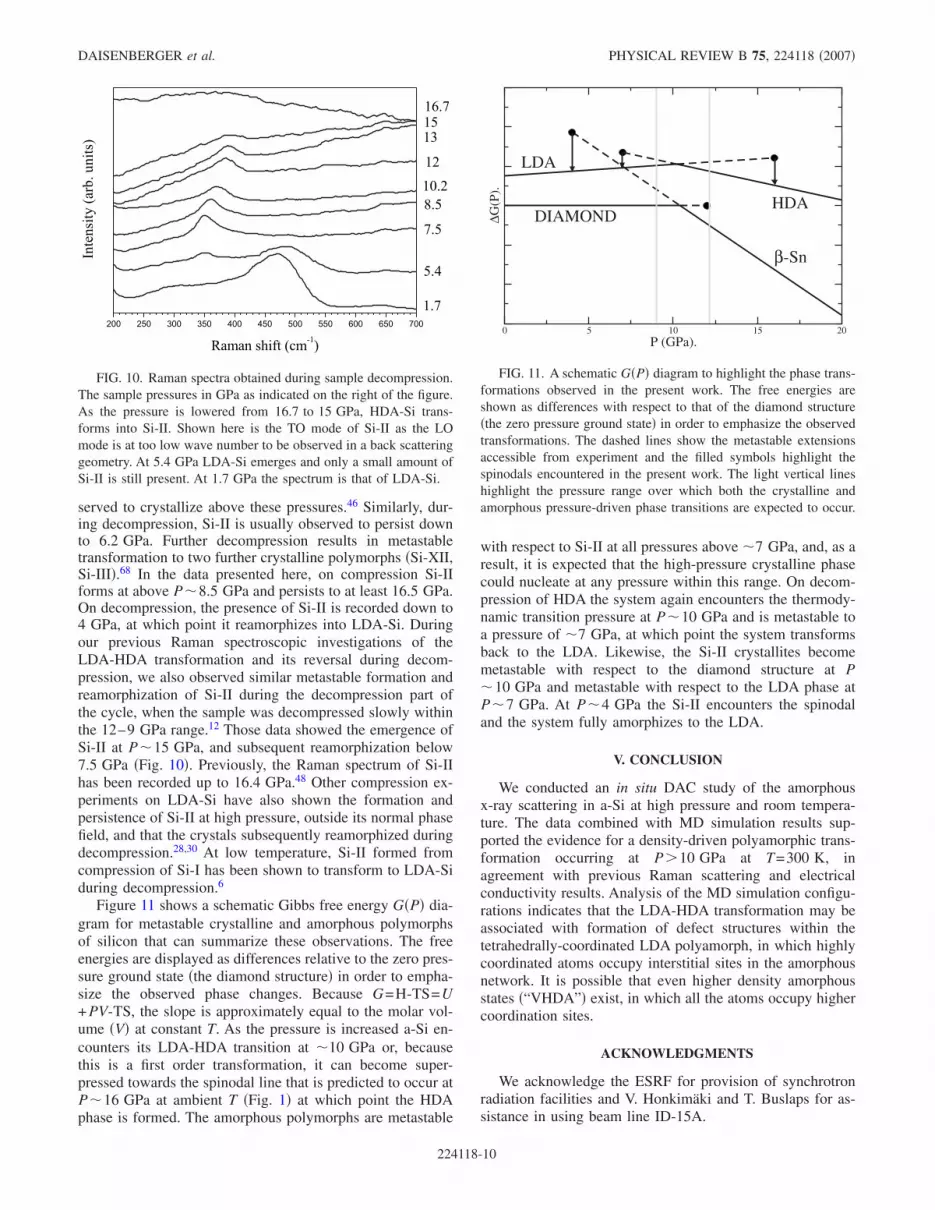
Figure 11 shows a schematic Gibbs free energy G�P� dia-gram for metastable crystalline and amorphous polymorphsof silicon that can summarize these observations. The freeenergies are displayed as differences relative to the zero pres-sure ground state �the diamond structure� in order to empha-size the observed phase changes. Because G=H-TS=U+ PV-TS, the slope is approximately equal to the molar vol-ume �V� at constant T. As the pressure is increased a-Si en-counters its LDA-HDA transition at �10 GPa or, becausethis is a first order transformation, it can become super-pressed towards the spinodal line that is predicted to occur atP�16 GPa at ambient T �Fig. 1� at which point the HDAphase is formed. The amorphous polymorphs are metastable
with respect to Si-II at all pressures above �7 GPa, and, as aresult, it is expected that the high-pressure crystalline phasecould nucleate at any pressure within this range. On decom-pression of HDA the system again encounters the thermody-namic transition pressure at P�10 GPa and is metastable toa pressure of �7 GPa, at which point the system transformsback to the LDA. Likewise, the Si-II crystallites becomemetastable with respect to the diamond structure at P�10 GPa and metastable with respect to the LDA phase atP�7 GPa. At P�4 GPa the Si-II encounters the spinodaland the system fully amorphizes to the LDA.
V. CONCLUSION
We conducted an in situ DAC study of the amorphousx-ray scattering in a-Si at high pressure and room tempera-ture. The data combined with MD simulation results sup-ported the evidence for a density-driven polyamorphic trans-formation occurring at P10 GPa at T=300 K, inagreement with previous Raman scattering and electricalconductivity results. Analysis of the MD simulation configu-rations indicates that the LDA-HDA transformation may beassociated with formation of defect structures within thetetrahedrally-coordinated LDA polyamorph, in which highlycoordinated atoms occupy interstitial sites in the amorphousnetwork. It is possible that even higher density amorphousstates �“VHDA”� exist, in which all the atoms occupy highercoordination sites.
ACKNOWLEDGMENTS
We acknowledge the ESRF for provision of synchrotronradiation facilities and V. Honkimäki and T. Buslaps for as-sistance in using beam line ID-15A.
FIG. 10. Raman spectra obtained during sample decompression.The sample pressures in GPa as indicated on the right of the figure.As the pressure is lowered from 16.7 to 15 GPa, HDA-Si trans-forms into Si-II. Shown here is the TO mode of Si-II as the LOmode is at too low wave number to be observed in a back scatteringgeometry. At 5.4 GPa LDA-Si emerges and only a small amount ofSi-II is still present. At 1.7 GPa the spectrum is that of LDA-Si.
0 5 10 15 20P (GPa).
∆G(P
).
DIAMOND
β-Sn
HDA
LDA
FIG. 11. A schematic G�P� diagram to highlight the phase trans-formations observed in the present work. The free energies areshown as differences with respect to that of the diamond structure�the zero pressure ground state� in order to emphasize the observedtransformations. The dashed lines show the metastable extensionsaccessible from experiment and the filled symbols highlight thespinodals encountered in the present work. The light vertical lineshighlight the pressure range over which both the crystalline andamorphous pressure-driven phase transitions are expected to occur.
DAISENBERGER et al. PHYSICAL REVIEW B 75, 224118 �2007�
224118-10

*Author to whom correspondence should be addressed. Electronicaddress: [email protected]
1 J. C. Jamieson, Science 139, 762 �1963�.2 J. Z. Hu, L. D. Merkle, C. S. Menoni, and I. L. Spain, Phys. Rev.
B 34, 4679 �1986�.3 S. Roorda, K. Laaziri, and S. C. Gujrathi, Nucl. Instrum. Methods
Phys. Res. B 148, 360 �1999�.4 W. F. v. d. Weg, A. J. M. Berntsen, F. W. Saris, and A. Polman,
Mater. Chem. Phys. 46, 140 �1996�.5 P. F. McMillan, J. Gryko, C. Bull, R. Arledge, A. J. Kenyon, and
B. A. Cressey, J. Solid State Chem. 178, 937 �2005�.6 V. V. Brazhkin, A. G. Lyapin, S. V. Popova, and R. N. Voloshin,
Phys. Rev. B 51, 7549 �1995�.7 E. Rapoport, J. Chem. Phys. 46, 2891 �1967�.8 E. G. Ponyatovsky and O. I. Barkalov, Mater. Sci. Rep. 8, 147
�1992�.9 C. T. Moynihan and C. A. Angell, J. Non-Cryst. Solids 274, 1
�2000�.10 S. K. Deb, M. Wilding, M. Somayazulu, and P. F. McMillan,
Nature �London� 414, 528 �2001�.11 S. Sastry and C. A. Angell, Nat. Mater. 2, 739 �2003�.12 P. F. McMillan, M. Wilson, D. Daisenberger, and D. Machon,
Nat. Mater. 4, 680 �2005�.13 M. Wilson and P. F. McMillan, Phys. Rev. Lett. 90, 135703
�2003�.14 L. I. Aptekar, Sov. Phys. Dokl. 24, 993 �1979�.15 N. Jakse, L. Hennet, D. L. Price, S. Krishnan, T. Key, E. Artacho,
B. Glorieux, A. Pasturel, and M. Saboungi, Appl. Phys. Lett. 83,4734 �2003�.
16 S. Ansell, S. Krishnan, J. J. Felten, and D. L. Price, J. Phys.:Condens. Matter 10, L73 �1998�.
17 A. Filipponi and A. DiCicco, Phys. Rev. B 51, 12322 �1995�.18 A. Hedler, S. L. Klaumünzer, and W. Wesch, Nat. Mater. 3, 804
�2004�.19 P. F. McMillan, Nat. Mater. 3, 755 �2004�.20 C. R. Miranda and A. Antonelli, J. Chem. Phys. 120, 11672
�2004�.21 P. Keblinski, M. Z. Bazant, R. K. Dash, and M. M. Treacy, Phys.
Rev. B 66, 064104 �2002�.22 M. Davidović, M. Stojić, and D. J. Jović, J. Phys. C 16, 2053
�1983�.23 P. S. Salmon, J. Phys. F: Met. Phys. 18, 2345 �1988�.24 M. Durandurdu and D. A. Drabold, Phys. Rev. B 64, 014101
�2001�.25 M. Durandurdu and D. A. Drabold, Phys. Rev. B 67, 212101
�2003�.26 T. Morishita, Phys. Rev. Lett. 93, 055503 �2004�.27 F. H. Stillinger and T. A. Weber, Phys. Rev. B 31, 5262 �1985�.28 S. Minomura, High Pressure and Low-Temperature Physics �Ple-
num, New York, 1978�.29 O. Shimomura, S. Minomura, N. Sakai, K. Asaumi, K. Tamura, J.
Fukushima, and H. Endo, Philos. Mag. 29, 547 �1974�.30 M. Imai, T. Mitamura, K. Yaoita, and K. Tsuji, High Press. Res.
15, 167 �1996�.31 K. Tanaka, Phys. Rev. B 43, 4302 �1991�.32 Y. H. Xie et al., Phys. Rev. B 49, 5386 �1994�.33 J. H. Eggert, G. Weck, P. Loubeyre, and M. Mezouar, Phys. Rev.
B 65, 174105 �2002�.34 C. Meade, R. J. Hemley, and H. K. Mao, Phys. Rev. Lett. 69,
1387 �1992�.
35 Y. Katayama, T. Mizutani, W. Utsumi, O. Shimomura, M. Ya-makata, and K. Funakoshi, Nature �London� 403, 170 �2000�.
36 N. Funamori and K. Tsuji, Phys. Rev. Lett. 88, 255508 �2002�.37 W. A. Crichton, M. Mezouar, T. Grande, S. Stolen, and A.
Grzechnik, Nature �London� 414, 622 �2001�.38 K. Yaoita, Y. Katayama, K. Tsuji, T. Kikegawa, and O. Shimo-
mura, Rev. Sci. Instrum. 68, 2106 �1997�.39 G. Shen, V. Prakapenka, M. L. Rivers, and S. R. Sutton, Rev. Sci.
Instrum. 74, 3021 �2003�.40 Diacell-Bragg-�G�*, EasyLab, formerly DIACELL.41 A. Hammersley, O. Svensson, M. Hanfland, A. Fitch, and D.
Häusermann, High Press. Res. 14, 235 �1996�.42 V. H. Smith, A. J. Thakkar, and D. C. Chapman, Acta Crystallogr.
A31, 391 �1975�.43 J. Krogh-Moe, Acta Crystallogr. 9, 951 �1956�.44 N. Norman, Acta Crystallogr. 10, 370 �1957�.45 J. S. Custer, M. O. Thompson, D. C. Jacobson, J. M. Poate, S.
Roorda, W. C. Sinke, and F. Spaepen, Appl. Phys. Lett. 64, 437�1994�.
46 M. I. McMahon, R. J. Nelmes, N. G. Wright, and D. R. Allan,Phys. Rev. B 50, 739 �1994�.
47 G. A. Voronin, C. Pantea, T. W. Zerda, L. Wang, and Y. Zhao,Phys. Rev. B 68, 020102�R� �2003�.
48 H. Olijnyk, Phys. Rev. Lett. 68, 2232 �1992�.49 S. Nosé, Mol. Phys. 52, 255 �1984�.50 S. Nosé, J. Chem. Phys. 81, 511 �1984�.51 G. J. Martyna, D. J. Tobias, and M. L. Klein, J. Chem. Phys. 101,
4177 �1992�.52 W. D. Luedtke and U. Landman, Phys. Rev. B 37, 4656 �1988�.53 W. D. Luedtke and U. Landman, Phys. Rev. B 40, 1164 �1989�.54 K. Laaziri, S. Kycia, S. Roorda, M. Chicoine, J. L. Robertson, J.
Wang, and S. C. Moss, Phys. Rev. Lett. 82, 3460 �1999�.55 S. Kugler, L. Pusztai, L. Rosta, P. Chieux, and R. Bellissent,
Phys. Rev. B 48, 7685 �1993�.56 R. Biswas and D. R. Hamann, Phys. Rev. Lett. 55, 2001 �1985�.57 R. Biswas, G. S. Grest, and C. M. Soukoulis, Phys. Rev. B 36,
7437 �1987�.58 J. F. Justo, M. Z. Bazant, E. Kaxiras, V. V. Bulatov, and S. Yip,
Phys. Rev. B 58, 2539 �1998�.59 J. Fortner and J. S. Lannin, Phys. Rev. B 39, 5527 �1989�.60 S. Kugler, G. Molnár, G. Petö, E. Zsoldos, L. Rosta, A. Menelle,
and R. Bellissent, Phys. Rev. B 40, 8030 �1989�.61 G. Kresse and J. Hafner, Phys. Rev. B 49, 14251 �1994�.62 E. Principi, A. DiCicco, F. Decremps, A. Polian, S. DePanfilis,
and A. Filipponi, Phys. Rev. B 69, 201201�R� �2004�.63 R. J. Nelmes, J. S. Loveday, T. Strässle, C. L. Bull, M. Guthrie,
G. Hamel, and S. Klotz, Nat. Phys. 2, 414 �2006�.64 C. J. Benmore, R. T. Hart, Q. Mei, D. L. Price, J. Yarger, C. A.
Tulk, and D. D. Klug, Phys. Rev. B 72, 132201 �2005�.65 T. Loerting, W. Schustereder, K. Winkel, C. G. Salzmann, I.
Kohl, and E. Mayer, Phys. Rev. Lett. 96, 025702 �2006�.66 T. Loerting and N. Giovambattista, J. Phys.: Condens. Matter 18,
R919 �2006�.67 J. Koga, H. Okumura, K. Nishio, T. Yamaguchi, and F. Yonezawa,
Phys. Rev. B 66, 064211 �2002�.68 R. O. Piltz, J. R. Maclean, S. J. Clark, G. J. Ackland, P. D. Hatton,
and J. Crain, Phys. Rev. B 52, 4072 �1995�.69 R. J. Angel, Equations of state, in High-pressure, high tempera-
ture crystal chemistry, edited by R. M. Hazen and R. T. Downs,Rev. Mineral. Geochem. 41, �2001�.
HIGH-PRESSURE X-RAY SCATTERING AND COMPUTER… PHYSICAL REVIEW B 75, 224118 �2007�
224118-11


