Embed Size (px)
Citation preview
Infrared spectra of (CH3)2O and(CH3)2O þ H2O at low temperature
L. Schriver-Mazzuolia,b,*, J.M. Coangaa, A. Schrivera, P. Ehrenfreundc
aLaboratoire de Physique Moleculaire et Applications, Unite Propre du CNRS, Universite Pierre et Marie Curie,
Tour 13, Case 76, 4 Place Jussieu, 75252 Paris Cedex 05, FrancebLaboratoire d’Etude des Nuisances Atmospheriques et de Leurs Effets, Universite Paris Nord,
IUP Ville et Sante, Rue de la Convention, Bobigny 93017, FrancecLeiden Observatory, P.O. Box 9513, 2300 Leiden, RA, The Netherlands
Received 20 February 2002; received in revised form 16 April 2002; accepted 16 April 2002
Abstract
Fourier transform infrared reflection spectroscopy (incidence angle of 58) was used to characterize thin films of dimethyl ether
(DME) and of mixtures containing water and DME between 10 and 160 K under a pressure of 10�7 mbar. Solid DME has two
solid phases: an amorphous phase which is obtained below 65 K and a crystalline phase >65 K. From 90 K, DME begins to
sublimate with surface binding energy of 20 � 2 kJ mol�1. Vibrational spectrum of DME trapped in water ice remains nearly
unchanged from 30 to 120 K. Between 120 and 130 K, a large part of DME is released and strong changes in the frequencies and
the profile of the absorptions of DME are observed. This behavior suggests the formation of clathrate hydrate. Below 120 K, the
trapped DME is hydrogen-bonded to water molecules.
# 2002 Elsevier Science B.V. All rights reserved.
Keywords: Infrared spectroscopy; Interstellar molecules; Ices; Laboratory studies
1. Introduction
The search for the solid dimethyl ether (DME)
features in the IR spectra of interstellar clouds requires
laboratory data. Observations at radio, millimeter, sub-
millimeter, and infrared wavelengths have led to the
discovery of well over a hundred different molecules in
interstellar clouds and circumstellar shells. Many of
these are organic species of considerable complexity,
with HC11N [1] and diethyl ether [2] being the largest
detected so far. Despite their relatively low abundances,
the variety and complexity of organic compounds
currently detected in space indicates an active chem-
istry and ubiquitous distribution [3].
A large part of the molecular complexity found in
these regions is due to gas–grain interactions. Radio-
astronomical molecular line surveys of well-known
sources, such as the dense star-forming cores in the
Orion and Sagittarius molecular clouds, show the
signature of DME [4–6]. The sources mentioned
above are examples of so-called ‘‘hot cores’’, dense
(106 cm3), hot (�200 K) regions in the immediate
vicinity of massive protostars. The high abundances
of many molecular species found in hot cores cannot be
explained by gas-phase chemistry and one must invoke
molecule formation on catalytic icy grain surfaces [3]
Vibrational Spectroscopy 30 (2002) 245–257
* Corresponding author. Tel.: þ33-1-4427-4475;
fax: þ33-1-4427-7033.
E-mail address: [email protected] (L. Schriver-Mazzuoli).
0924-2031/02/$ – see front matter # 2002 Elsevier Science B.V. All rights reserved.
PII: S 0 9 2 4 - 2 0 3 1 ( 0 2 ) 0 0 0 4 5 - 0
during the cold dark cloud phase of these cores. Heating
by the newly formed protostar and/or energetic pro-
cesses such as outflows producing shock waves lead
to evaporation of the grain mantles into the gas, which
is followed by gas-phase reactions. Pathways to the
formation of larger molecules include alkyl-cation
transfer [7]. For example, infrared observations of ices
towards embedded protostars have been extensively
revisited with the infrared space observatory (ISO) [8].
Currently, the largest molecule detected in interstellar
ices is methanol. In order to identify larger molecules
residing on interstellar grains, laboratory data are
of crucial importance. DME is a molecule with C2v
symmetry and its rotational transitions have been
extensively studied in the laboratory [9]. Also the IR
spectrum of DME has been investigated 30 years ago
([10,11] and references therein). However, no study has
examined ice mixtures of DME, and hence, spectral
properties of the DME fundamentals in ice are not
known. In the present work, we report an infrared
spectroscopic study of mixed films containing water
and DME with a particular attention to temperature
effects between 10 and 170 K. Prior to this study
spectra of pure DME at the same temperature have
also been recorded and the surface binding energy
of DME has been determined. Vibrational spectra of
interstellar ice analogs have been the object of numer-
ous investigations [12–15]. Temperature effects in band
shape and positions of the (OH) absorption related to
structural differences with our experimental device
have been recently described [16].
2. Experimental
The experiments were performed using a rotatable
closed cycle helium refrigerator (Air Product, Displex
202 A), which was pumped continuously (10�7 mbar
background pressure range). Thin films of ice or DME
or H2O–DME mixtures were supported inside upon a
thermostated gold side of a substrate cube. The tem-
perature of the metal substrate (10–170 K) was control-
led by a silicon diode (Scientific Instruments 9600-1).
Water was de-ionized, triply distilled, and then
degassed by freeze–thaw cycles under vacuum before
use. Water layers were grown from water vapor via a
capillary connected to pulsed dosing system, which
provides pulses of gas during 2 ms at a frequency of one
pulse per 2 s leading to a deposition rate of about
2 � 10�3 mmol h�1. DME (from UCAR) was con-
densed at 30 K with helium as carrier gas. The initial
mixture was prepared in a 1 l glass bulb on a vacuum
line. The ratio DME/He was typically 1/25 with a total
pressure of Helium of 150 Torr. Gas was deposited via
a capillary with a rate of 3 mmol h�1. The deposition
nozzle parameters were 1 mm inner diameter and a
distance of 20 mm from the cold substrate. Mixed films
of H2O/DME were prepared with the same method.
Typical ice film thickness were less than 500 nm. The
infrared measurements (from 5000 to 400 cm�1) were
made in reflection absorption geometry with an inci-
dence angle of 58 to the surface normal using a Bruker
113v spectrometer. Spectra were recorded at 0.5 cm�1
nominal resolution from co-addition of 100 interfero-
grams. Temperature was slowly increased (2 K min�1)
then stabilized at the desired value.
3. Results and discussion
3.1. Pure DME ice
Vibrational spectra at 90 K of films of crystalline
DME including deuterated species have been described
in detail 30 years ago [17]. It was suggested that the two
methyl groups were not equivalent in a site of symmetry
lower than C2v with at least four molecules in the unit
shell. Fig. 1 shows in the fundamental regions typical
spectra of a thin film of DME deposited at 11 K then
annealed at 60, 70 and 90 K. From 93 K, DME begins
to sublimate. A strong difference is observed between
spectra recorded below 60 K and spectra recorded
above 70 K which are comparable to those described
in [17]. This behavior provides evidence for the exis-
tence of two phases of DME: an amorphous phase at
low temperature and a more ordering phase which
appears from 65 K. Condensation at 90 K was also
carried out in order to investigate the effect of deposi-
tion temperature on the DME fundamentals. Resulting
spectra were similar to those obtained after annealing
of amorphous DME condensed at 30 K. Positions, full
width at half maximum (FWHM) and relative inten-
sities of the fundamental bands of DME at 11 and 90 K
are summarized in Table 1.
In the amorphous phase, the n(CH3) region is
characterized by two distinct single bands at 2986.8
246 L. Schriver-Mazzuoli et al. / Vibrational Spectroscopy 30 (2002) 245–257

and 2814.0 cm�1 separated by three overlapped
absorptions at 2920.5, 2883.8 and 2866.6 cm�1, the
two later corresponding to overtone or combination
bands of CH3 deformation modes in Fermi resonance
with fundamentals at higher frequency. When going
from amorphous phase to crystalline phase, the
absorption pattern narrows and the two single bands
split into two doublets measured at 2990.0–2984.8 and
2822.4–2814.0 cm�1. This splitting could be due to
the existence of two types of molecule in the unit cell
or to the non-equivalence of the two methyl group in
the same molecule as suggested in [17].
In the deformation region, the spectrum of crystalline
DME is very complex as compared to the spectrum of
the amorphous phase. The broad band observed at
1458.4 cm�1 with a weak shoulder at 1480 cm�1 at
11 K splits into 10 narrow bands above 65 K, the two
more intense features being located at 1481.9 and
1467.7 cm�1. In fact six bands are expected in this
region for the two CH3 groups (4das(CH3), 2ds(CH3)).
Additional features can be due to molecules in non-
equivalent positions and orientations or to 18O and 13C
satellites lines. As a matter of fact, in solid SO2, for
several vibrational modes, the relative integrated inten-
sity absorption coefficients of the 34SO2 isotopic bands
in regard to the bands of natural species is high and not
in good agreement with the natural abundance of 34S
[18]. The minor isotope species are diluted in the solid
main isotope and can be less coupled with crystal
vibrations due to their different mass [19].
Fig. 1. Vibrational spectrum of solid DME recorded at: (a) 11 K; (b) 60 K; (c) 70 K; (d) 90 K.
L. Schriver-Mazzuoli et al. / Vibrational Spectroscopy 30 (2002) 245–257 247

Smaller changes between the two phases are seen in
the rocking mode regions. The three broad bands
located at 1247.1, 1159.3, 1088.5 cm�1 in the amor-
phous phase, and assigned to the r(CH3)(A1), and to
the two r(CH3) coupled with the n(COC), respectively,
narrow by a factor of 4 and blue shift weakly (about
2 cm�1) in the crystalline phase. The two weak satel-
lites at 1158.5. and 1083.3 cm�1 are due to isotopic
species (13C). The r(CH3)(B2) appears as a very weak
feature at 1179 cm�1 and the r(CH3)(A2) expected
about 1148 cm�1 is not observed.
At last, the n(COC) mode is characterized by a band
at 916 cm�1 with a FWHM of 10.5 cm�1 in the
amorphous phase. It narrows by a factor of 6.5 and
splits into three overlapped components at 917.5,
916.4 and 913.1 cm�1 with a weak feature at
907.5 cm�1 due to isotopic DME, (13C) in the crystal-
line phase at 90 K.
Dependence on the band positions with tempera-
ture was accurately examined. No change was
observed between 10 and 60 K for the amorphous
DME. Very weak shifts were measured for crystal-
Table 1
Frequencies in cm�1, relative optical density, FWHM in cm�1, of fundamental absorptions of DME at 11 and 90 K
Amorphous DME (11 K) Crystalline DME (90 K) Assignment
n OD FWHM n OD FWHM
2986.8 0.3 23 2990.0 0.3 5 n0sðCH3Þ2984.8 0.3 5
2920.5 04 –a 2924.5 0.2 25 naðCH3Þ2903.0 sh 2dðCH3Þ
2883.8 0.3 –a 2887.1 0.4 9
2866.6 sh –a 2871.9 0.2 10
2814.0 1 12 2822.4 0.8 3 nsðCH3Þ2814.0 0.4 3
1480.1 sh 1481.9 0.1 2.5 dðCH3Þ1458.4 0.1 24 1474.2 0.02
1467.7 0.2 2
1460.1 0.07
1457.1 0.05
1452.9 0.04
1447.2 0.03
1443.3 0.02
1429.1 0.006
1247.1 0.04 11.5 1249.3 0.05 rðCH3Þ1179.0 0.02
1159.3 0.4 8 1161.8 0.6 3 nðCOCÞ þ rðCH3Þðb1Þ1158.5 sh 13C
1088.5 0.4 8 1090.2 1 1
1083.3 0.06 13C
1072.7 18O
916.4 0.15 10 917.5 sh n(COC)
916.4 0.25 1.5
913.1 0.1
907.6 0.02 13C
sh: shoulder.a These bands are overlapped with a total FWHM of 85 cm�1.
248 L. Schriver-Mazzuoli et al. / Vibrational Spectroscopy 30 (2002) 245–257
line DME between 70 and 100 K. Bands located at
1482, 1468 cm�1 at 70 K were red-shifted with a
Dn/DT of �0.04 and �0.025 cm�1 K�1, respectively.
Bands located at 1160, 1090 and 916 cm�1 shifted
towards the blue with a Dn/DT of þ0.018, þ0.007
and þ0.01 cm�1 K�1, respectively. In the n(CH3)
region, the two components of each doublet shifted
with an inverse sign, the higher component with a
Dn/DT of �0.025 cm�1 K�1 and the lower com-
ponents with a Dn/DT about of þ0.04 and
þ0.02 cm�1 K�1.
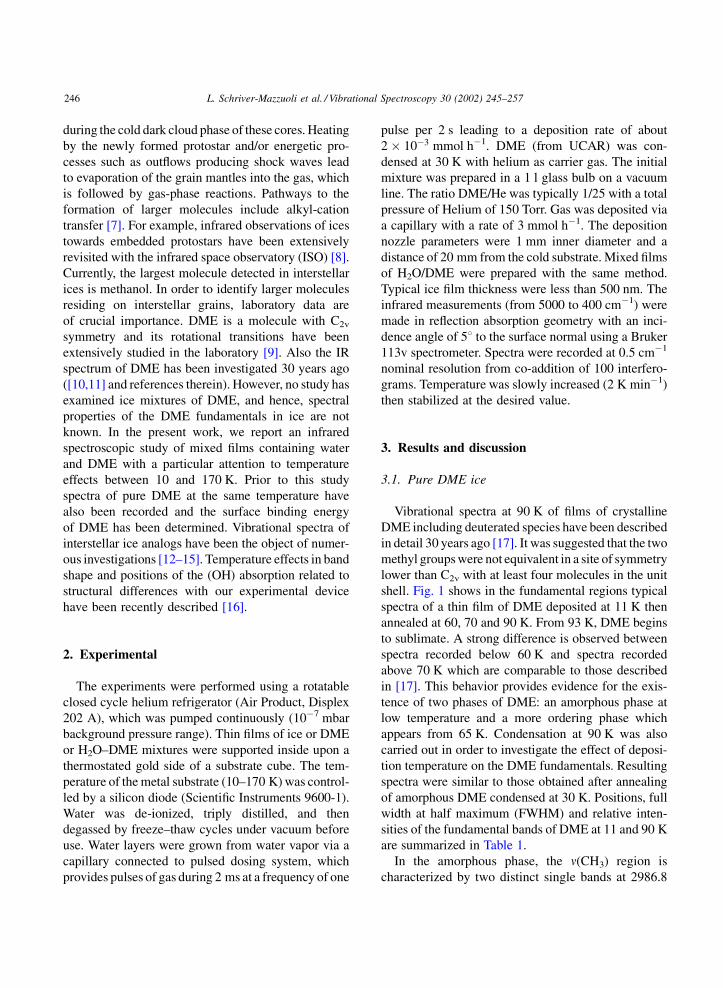
In addition to the fundamental bands of DME, two
weak absorptions (optical density ðODÞ ¼ 0:012) were
observed at 2075.3 and 2002 cm�1 in the previous
films deposited at 30 K. They narrow by a factor of
6 above 65 K and the former one splits into three
overlapped components. These bands can be assigned
to the combinations of the rocking modes (1159.3 and
1088.5 cm�1) with the n(COC) mode at 916.4 cm�1,
respectively. In order to observe other combination
or overtones bands in the 4500–3600 cm�1 region, we
have recorded the spectrum of a thicker sample at
different temperatures. As shown in the Fig. 2A,
numerous weak bands appear. Their intensity are very
weak in regard to those located between 2100 and
2000 cm�1 which are displayed Fig. 2B for the same
sample. The Table 2 summarizes the observed fre-
quencies. On the basis of changes in the spectrum
Fig. 2. (A) Absorptions of a film of DME in the 4500–3650 cm�1 and (B) 2100–1980 cm�1 regions: (a) 30 K; (b) 70 K.
Table 2
Frequencies in cm�1 of additional bands observed between 4450–3700 and 2100–1990 cm�1
30 K 70 K Tentative assignment
4427.0 4440.5–4415.2 n0sðCH3 þ dðCH3ÞÞ4353.1 4365.7 naðCH3Þ þ dðCH3Þ4244.1 4254–4242.7–4230.0 nsðCH3Þ þ dðCH3Þ4152.7 4150.2–4143.6 naðCH3Þ þ rðCH3Þ4091 4105 n0sðCH3Þ þ ðnðCOCÞ; rðCH3ÞÞ4056 4059.4 n0sðCH3Þ þ ðnðCOCÞ; rðCH3ÞÞ4023 4028.4
3976.6 3983.3–3975.0 naðCH3Þ þ ðnðCOCÞ; rðCH3ÞÞ3906.0 3910.9–3901.2 nsðCH3Þ þ ðnðCOCÞ; rðCH3ÞÞ3734.0 3738–3730 nsðCH3Þ þ ðnðCOCÞ; rðCH3ÞÞ2075.3 2090.4–2075.0–2071 ðnðCOCÞ; rðCH3ÞÞ þ nðCOCÞ2002 2000 ðnðCOCÞ; rðCH3ÞÞ þ nðCOCÞ
L. Schriver-Mazzuoli et al. / Vibrational Spectroscopy 30 (2002) 245–257 249

between the amorphous and the crystalline phases, a
tentative assignment has been given.
In order to derive the surface binding energy of
DME in our experimental conditions, kinetic studies
of the sublimation of crystalline DME were performed
at 94, 96, 98, 100 and 102 K. Several experiments
were done. In each experiment, pure DME was deposi-
ted near the temperature to be studied then the spectra
were recorded at the chosen temperature at different
times. The concentration of DME which remains at
each time was monitored by the measurement of the
integrated intensity of different absorptions of DME.
Fig. 3A shows plots of the integrated intensity of the
1090.2 cm�1 band versus time at some different tem-
peratures. As it can be seen, a zero order is found as
expected for a three-dimensional phase. For presenta-
tion, curves have been translated at the same origin.
Slope of the curves does not give the absolute rate
constant k which is dependent on the absorption
coefficient of the band of DME monitoring the kinetic
loss of DME. However, variation of ln k versus reci-
procal temperature leads to activation energy from the
Arrhenius law. As shown in Fig. 3B, the logarithm of
the sublimation rates varies linearly with reciprocal
temperature and the activation energy for sublimation
of neat crystalline DME was deduced from the slope
of such a plot. Ea,sub related to the enthalpy of sub-
limation was found to be 20 � 2 kJ mol�1.
3.2. Proton affinity of DME
The proton affinity of DME has been found of about
803 kJ mol�1 indicating that hydrogen bonds stronger
than in the water dimer can be formed between DME
and water for which proton affinity is of about
685 kJ mol�1. In nitrogen matrices, three complexes
(H2O)m(DME)n (m ¼ n ¼ 1; m ¼ 1, n ¼ 2; m ¼ 2,
n ¼ 1) have been spectroscopically identified from
shifts in the infrared absorptions of water sub-mole-
cule [20]. The 1:1 complex, HOH DME is charac-
terized by strongly decoupled oscillators, an
unperturbed one absorbing at 3700 cm�1 and an other
one perturbed with a frequency close to 3510 cm�1. In
the 1:2 complex, B H–O–H B in which the water
molecule keeps it C2v symmetry, n3 is measured at
3592 cm�1 and n1 at 3520 cm�1.
The 2:1 complex is characterized by two bands at
3520 and 3425 cm�1 corresponding to two perturbed
OH of water molecules. Vibrational spectrum of DME
sub-molecule in the complex was not reported. In
order to examine spectrum of DME molecule com-
plexed by water molecules, we have recorded some
nitrogen matrix spectra of DME co-deposited with an
Fig. 3. (A) Kinetic curves for pure DME desorption at 93, 97 and 100 K. The integrated intensity of the DME absorption at 1088 cm�1 is
plotted vs. time for each temperature. (B) Arrhenius plots of ln k vs. 1/T.
250 L. Schriver-Mazzuoli et al. / Vibrational Spectroscopy 30 (2002) 245–257
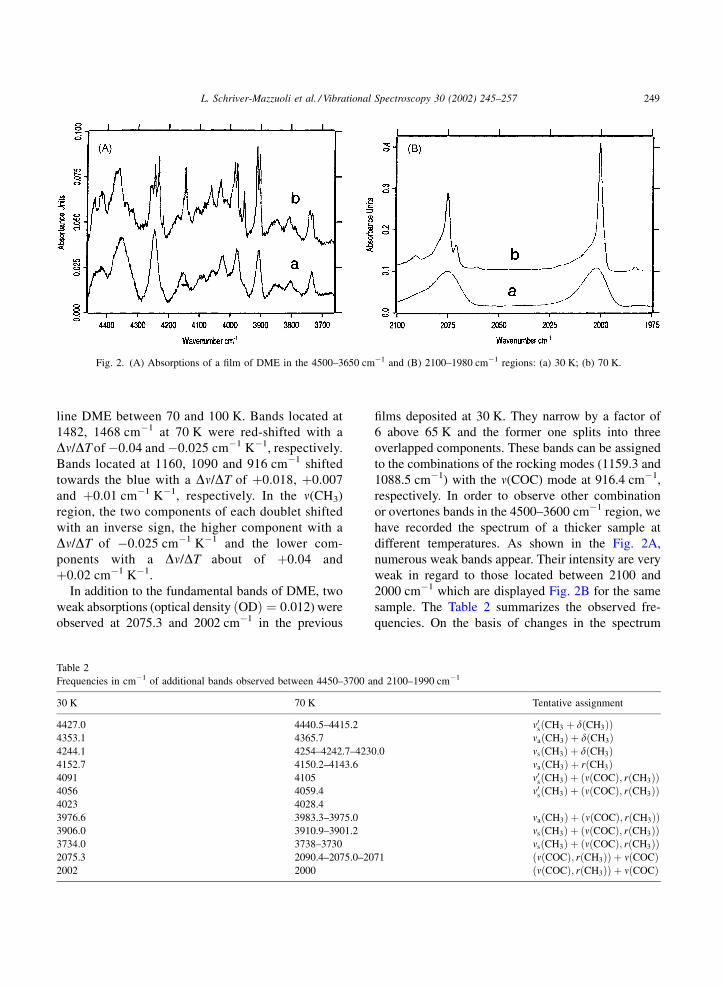
excess of water at 17 K in a single jet deposition
(DME/H2O/N2 ¼ 1/20/1000). Fig. 4 compares the
spectrum obtained with that of isolated DME in
nitrogen without water. As can be seen, addition of
an excess of water gives rise to new DME absorptions
in almost all the fundamental regions. Positions of
bands characterizing DME isolated in nitrogen and
those of DME perturbed by water molecules are
summarized in Table 3. In the n(CH3) region new
bands are blue-shifted by about 8–9 cm�1 from fun-
damental bands of DME, while the rocking modes
coupled with the n(COC) mode are red-shifted. The
stronger red shift was found for the n(COC) band
which is shifted by 7 cm�1 and appears as a doublet.
3.3. Interaction of DME with ice surfaces
Before studying the spectral properties of mixed
(DME þ H2O) films we have recorded the spectrum of
a water ice film first deposited at 11 K then exposed to
DME vapor. Difference spectrum between the water
film spectrum and that of water film recovered by
Fig. 4. FTIR spectra in the 3020–2800, 1275–1050 and 945–900 cm�1 spectral DME regions of: (a) DME/N2, 1/5000; (b) DME/H2O/N2,
1/20/5000. All spectra are recorded at 11 K after deposition at 17 K.
L. Schriver-Mazzuoli et al. / Vibrational Spectroscopy 30 (2002) 245–257 251

some layers of DME did not reveal new bands in the
n(OH) region of ice and in the DME fundamental
regions. DME fundamentals were qualitatively similar
to the spectrum of pure solid obtained at this tem-
perature. This observation in particular in the n(OH)
region of water ice is puzzling because as previously
reported earlier, DME has a great proton affinity and
hydrogen bond between the first layer of DME with
the free OH of ice surface are expected. Two explana-
tions can be thought of. First, the perturbed dangling
bands (free water OH oscillator bands) are perhaps too
weak to be observed. Generally, such bands are
observed when the impurity is trapped in the micro-
pores of amorphous ice which has a high coverage of
free OH surface groups compared to crystalline ice
surface. [21,22]. Thus, coverage of DME in the pores
could be negligible, an assumption supported by the
study of a sandwich H2O/DME/H2O which was kept at
90 K during 12 h. No migration of DME in the water
lattice was observed. However, an alternative expla-
nation is that the absence of perturbed free water OH
in our spectrum may be due to an orientation effect. In
our device, because of the surface dipole selection
rule, only the transversal mode (TO) can be excited. If
the dangling perturbed OH band is nearly perpendi-
cular to the metal surface, the intensity of the OH
stretch would be strongly reduced.
3.4. Mixed DME/H2O films
Mixed films were obtained mainly by co-depositing
through two inlets of DME and H2O diluted in He as
carrier gas. Some experiments were also made by
depositing through one inlet a gaseous mixture of
DME and water in helium. They led to the same
Table 3
Absorption band frequencies in cm�1 of DME and DME in
interaction with water molecules in nitrogen matrices
DME/N2 DME/N2/H2O Assignment
2997.8–2994.8–2991.3 3001.4 n0sðCH3Þ2937.1–2934.4 2942.6 2dðCH3Þ2922.0 2929.6 naðCH3Þ2908.6 2913.0 2dðCH3Þ2890.8–2887.1 2896.4
2872–2869 2875.7
2822.0–2818.1 2830.0 nsðCH3Þ1476.1 1478.4 dðCH3Þ1459.5–1456.1 1460.7–1457.6
1245.2 1249.5 rðCH3Þ1168.7 1167.2 sh nðCOCÞ þ rðCH3Þðb1Þ1096.5 1092.9
925.2 919.1–916.9 n(COC)
Fig. 5. Evolution with the temperature of vibrational spectra of films of DME containing water: (A) initial gas ratio DME/H2O, 10/1—(a)
30 K; (b) 50 K; (c) 61 K; (d) 63 K. (B) Initial gas ratio DME/H2O, 4/1: (a) 30 K; (b) 52 K; (c) 70 K; (d) 74 K; (e) 78 K.
252 L. Schriver-Mazzuoli et al. / Vibrational Spectroscopy 30 (2002) 245–257

results. Several initial ratios of H2O and DME were
studied as H2O/DME ¼ 1/100, 1/10, 1/4, 5/1 and 10/1.
3.4.1. Mixtures rich in DME
Fig. 5A (trace a) shows the spectrum of a film rich in
DME by co-depositing at 30 K of DME and H2O with
a H2O/DME ratio of 1/10. Spectrum of DME with
traces of water (<1/100) was similar. In the n(OH)
region two relative narrow bands appear at 3537 and
3473 cm�1 with in the d(OH) region a weak feature at
1664 cm�1. With temperature increase no change in
intensity and position is observed till 65 K. At 65 K,
when transformation of amorphous DME to crystal-
line DME occurs, the three bands disappear. These
bands can be assigned to an aggregate (H2O)(DME)2.
When the water concentration in DME is increased
(DME/H2O ¼ 4/1) four absorptions are observed at
3534, 3474, 3417 and 3296 cm�1 in the n(OH) region
(Fig. 5B) as well as two bands at 1664 and 1640 cm�1
in the d(OH) region. Some small changes are observed
in the DME spectrum. The n(CH3) absorptions are
blue-shifted by 1.6 cm�1 and a shoulder at 2939 cm�1
appears on the high side of the 2921 cm�1 absorption.
The rocking mode at 1090.2 cm�1 broadens and is
red-shifted by 1.5 cm�1, while a shoulder at 910 cm�1
appears on the low side of the n(COC) band. When the
film is annealed at 78 K, crystalline DME is formed
and its spectrum is similar to that observed for cry-
stalline DME without water. In the water region, the
3534 cm�1 band disappears as well as the 1640 cm�1
absorption. We observe a broad band with three sub-
maxima at 3469, 3380 and 3264 cm�1 and an absorp-
tion at 1670 cm�1 characteristic of water ice. These
observations suggest that upon heating some water
molecules can diffuse through the DME matrix to
form larger aggregates besides the DME–H2O clus-
ters. Monomers, and dimers of isolated water mole-
cules are observed at higher frequencies compared to
multimers and polymeric water ice [23]. The shift
towards lower frequencies of the water OH stretching
features shown in Fig. 5B, indicates the restructuring
of H2O ice.
3.5. Mixture with excess of water
Fig. 6 (trace a) shows in two DME spectral regions a
typical spectrum of a mixed film (H2O/DME ¼ 10)
deposited at 30 K with He as carrier gas. Vibrational
spectrum is qualitatively comparable to that of pure
amorphous DME. Bands are broad non-structured, but
shifted from those of amorphous DME in particular in
the n(CH3) and in the n(COC) regions as illustrated in
the Fig. 7. The n(CH3) absorptions are blue-shifted by
about 7–20 cm�1 and the n(COC) band is red-shifted
by 6 cm�1. The rocking band at 1086 cm�1 is broa-
dened and presents a shoulder at 1071 cm�1. Such a
behavior is comparable to that observed in nitrogen
matrix when excess of water was deposited with
Fig. 6. Spectral changes with temperature in DME spectral regions after condensation at 30 K of a H2O/DME mixture rich in water
(H2O/DME ¼ 10/1): after deposition at 30 K (a); after annealing at different temperatures, T (K): 110 (b); 120 (c); 130 (d); 140 (e); 150 (f).
L. Schriver-Mazzuoli et al. / Vibrational Spectroscopy 30 (2002) 245–257 253

DME. Furthermore, the relative intensities of bands in
the n(CH3) region and <1200 cm�1 are different of
those observed in pure amorphous DME. In water ice,
the most intense absorptions are the two rocking bands
at 1161 and 1086 cm�1.
After deposition the mixed film was annealed at
different temperatures at a rate of 1 K min�1. Evolu-
tion of the spectrum with temperature is also shown in
Fig. 6 (traces b–f). Between 30 and 110 K, shapes and
positions of the bands remain the same. No partial
crystallization of DME is observed indicating that
DME is well diluted in the water amorphous phase.
Between 120 and 130 K, a strong change occurs.
Bands narrow and strongly shift as summarized in
Table 4 which compares the frequencies of DME
trapped in water ice <120 K and frequencies of
DME after annealing at 130 K. In parallel, a loss of
DME is observed. At 130 K, 60% of initial DME is
lost and at 150 K, 18% of initial DME remains.
However, no change in the frequency is observed
between 130 and 150 K. Above 160 K, DME disap-
pears as a result of the complete evaporation during
ice crystallization. The Fig. 8 shows the temperature
dependence of frequencies of the 2826 and 1086 cm�1
bands as well that of the FWHM and the integrated
intensity of the 2826 cm�1 absorption. The marked
band shapes and positions observed between 120
and 130 K is the result of the progressive transforma-
tion of low density amorphous ice Ial in a third
amorphous ice form Iar and in cubic ice Ic above
130 K as probed by the evolution of water n(OH)
band. A complete evaporation of DME is observed
at 160 K when water crystallization is achieved. The
release of volatile species trapped in ice which probes
the gradual transformation of water ice structure, has
been shown by various techniques [24–28]. The
trapped species escape from ice mixture mainly in
two temperature ranges: the first one lies between 30
and 80 K, that corresponds to the transformation of Iah
into Ial and the progressive collapse of the pores, the
second one is roughly between 120 and 140 K, that
corresponds to the transformation of Ial into Iar þ Ic.
The rearrangement of water molecules opens some
blocked channels and results in loss of trapped species.
In the case of DME, the non-evolution of DME
spectrum between 30 and 110 K is the indication
that DME, as expected, is not trapped in the pores
of amorphous ices. Furthermore, the significant fre-
quency shift and the strong change in the shape of the
bands observed for DME in the 120–130 K tempera-
ture range, which is not typical for other species, is
Fig. 7. Comparison of spectra of amorphous pure DME (a) and of DME trapped in ice (b).
Table 4
Frequencies in cm�1 of fundamental absorptions of DME trapped
in excess of water ice
30 K 110 K 130 K Assignment
2995.6 (0.2) 2996.7 3006.0 n0sðCH3Þ2942.5 (0.3) 2940.9 2932.6–2919.4 naðCH3Þ2892.9 (0.2) 2891.7 2884.8 2dðCH3Þ2870.4 (0.1) 2870.4 2868.0
2826.0 (0.4) 2826.0 2816.7–2811.4 nsðCH3Þ1478.1 (0.15) 1476.3 1474.1 dðCH3Þ1458.2 (0.3) 1456.5 1456.5
1250.6 (0.2) 1250.6 1246.7 rðCH3Þ1176.5 (0.15) 1174.5 –
1161.4 (1) 1161.4 1168.4 nðCOCÞ; rðCH3Þðb1; a1Þ1086.2 (1) 1086.6 1096.3
910.4 (0.6) 910.4 – n(COC)
254 L. Schriver-Mazzuoli et al. / Vibrational Spectroscopy 30 (2002) 245–257

difficult to explain. It could be suggested the formation
of a clathrate hydrate of DME. Clathrate hydrates of
some ethers were shown to form in the course of co-
deposition of water vapor mixtures with guest ether
species [29]. The latter, being incorporated in the
clathrate structure, are characterized by a very specific
spectrum with respect to their solution in other phases
of an ether. The DME–H2O bonding is comparable in
strength to water–water bonding and DME can break
the H-bonds of ice and reorder ice to form an hydrate
Fig. 8. Temperature dependence on frequencies of the 2826 and 1086 cm�1 bands and on integrated intensities and FWHM of the 2826 cm�1
absorption.
L. Schriver-Mazzuoli et al. / Vibrational Spectroscopy 30 (2002) 245–257 255
clathrate. Thus, the spectrum of DME in water ice at
140 K may correspond to an intermediate absorbate,
and hence, the observed DME frequencies in ice at
this temperature are not representative of DME in the
evenly averaged water molecules environment.
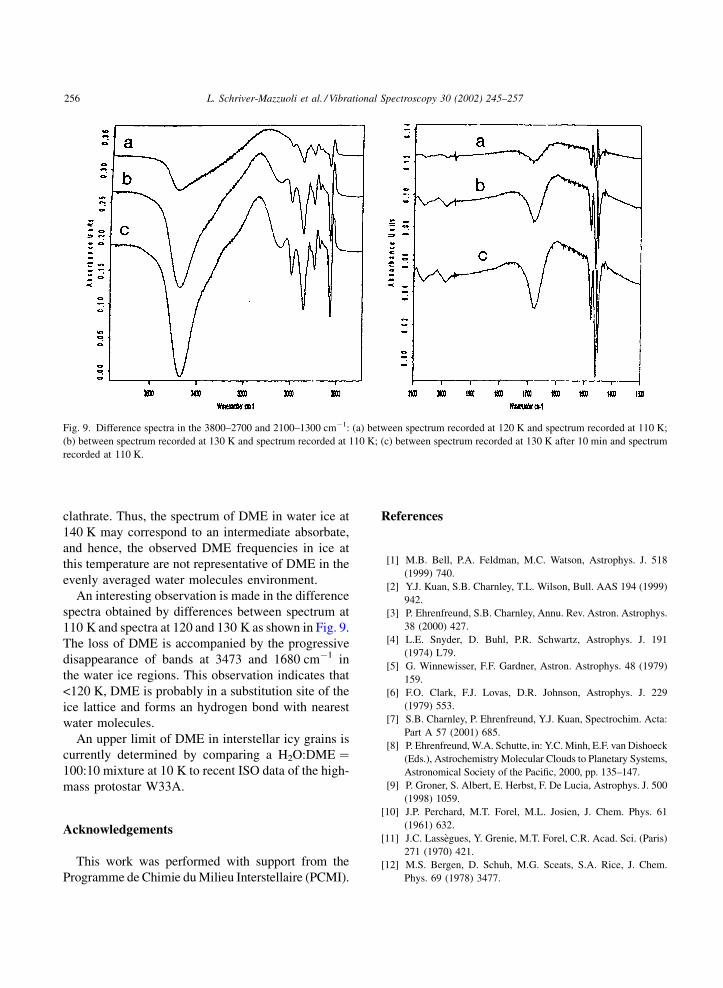
An interesting observation is made in the difference
spectra obtained by differences between spectrum at
110 K and spectra at 120 and 130 K as shown in Fig. 9.
The loss of DME is accompanied by the progressive
disappearance of bands at 3473 and 1680 cm�1 in
the water ice regions. This observation indicates that
<120 K, DME is probably in a substitution site of the
ice lattice and forms an hydrogen bond with nearest
water molecules.
An upper limit of DME in interstellar icy grains is
currently determined by comparing a H2O:DME ¼100:10 mixture at 10 K to recent ISO data of the high-
mass protostar W33A.
Acknowledgements
This work was performed with support from the
Programme de Chimie du Milieu Interstellaire (PCMI).
References
[1] M.B. Bell, P.A. Feldman, M.C. Watson, Astrophys. J. 518
(1999) 740.
[2] Y.J. Kuan, S.B. Charnley, T.L. Wilson, Bull. AAS 194 (1999)
942.
[3] P. Ehrenfreund, S.B. Charnley, Annu. Rev. Astron. Astrophys.
38 (2000) 427.
[4] L.E. Snyder, D. Buhl, P.R. Schwartz, Astrophys. J. 191
(1974) L79.
[5] G. Winnewisser, F.F. Gardner, Astron. Astrophys. 48 (1979)
159.
[6] F.O. Clark, F.J. Lovas, D.R. Johnson, Astrophys. J. 229
(1979) 553.
[7] S.B. Charnley, P. Ehrenfreund, Y.J. Kuan, Spectrochim. Acta:
Part A 57 (2001) 685.
[8] P. Ehrenfreund, W.A. Schutte, in: Y.C. Minh, E.F. van Dishoeck
(Eds.), Astrochemistry Molecular Clouds to Planetary Systems,
Astronomical Society of the Pacific, 2000, pp. 135–147.
[9] P. Groner, S. Albert, E. Herbst, F. De Lucia, Astrophys. J. 500
(1998) 1059.
[10] J.P. Perchard, M.T. Forel, M.L. Josien, J. Chem. Phys. 61
(1961) 632.
[11] J.C. Lassegues, Y. Grenie, M.T. Forel, C.R. Acad. Sci. (Paris)
271 (1970) 421.
[12] M.S. Bergen, D. Schuh, M.G. Sceats, S.A. Rice, J. Chem.
Phys. 69 (1978) 3477.
Fig. 9. Difference spectra in the 3800–2700 and 2100–1300 cm�1: (a) between spectrum recorded at 120 K and spectrum recorded at 110 K;
(b) between spectrum recorded at 130 K and spectrum recorded at 110 K; (c) between spectrum recorded at 130 K after 10 min and spectrum
recorded at 110 K.
256 L. Schriver-Mazzuoli et al. / Vibrational Spectroscopy 30 (2002) 245–257
[13] W. Hagen, A.G.G.M. Tielens, J.M. Greenberg, Chem. Phys.
56 (1981) 367.
[14] A. Givan, A. Loewenschuss, C.J. Nielsen, J. Phys. Chem. B
101 (1997) 8696.
[15] P. Jenniskens, D.F. Blake, Science 265 (1994) 753.
[16] L. Schriver-Mazzuoli, A. Schriver, A. Hallou, J. Mol. Struct.
554 (2000) 289.
[17] A. Allan, J.P. Perchard, M.L. Josien, Spectrochim. Acta 27A
(1971) 1409.
[18] E. Quirico, B. Schmitt, R. Bini, P.R. Salvi, Planet. Space Sci.
44 (1996) 976.
[19] B. Schmitt, C. De Bergh, M. Festou (Eds.), Solar System
Ices, Vol. 22, Astrophysics and Space Science Library,
Kluwer Academic Publishers, Dordrecht, 1998.
[20] L. Schriver-Mazzuoli, A. Burneau, J.P. Perchard, J. Chim.
Phys. 82 (1985) 10.
[21] M.A. Zondlo, T.B. Onasch, M.S. Warhawsky, M.A. Tolbert,
P. Arentz, M.S. Robinson, J. Phys. Chem. 101 (1987) 10887.
[22] J.E. Schaff, J.T. Roberts, J. Phys. Chem. 98 (1994) 6900.
[23] P. Ehrenfreund et al., Astron. Astrophys. 312 (1996) 263.
[24] D. Lauper, E. Kochavi, A. Bar-Nun, Phys. Rev. B 36 (1987)
9219.
[25] A. Kouchi, J. Cryst. Growth 99 (1990) 1220.
[26] A. Givan, A. Loewenschuss, C.J. Nielsen, Vibrat. Spectrosc.
12 (1996) 1.
[27] H. Chaabouni, L. Schriver-Mazzuoli, A. Schriver, J. Phys.
Chem. A 104 (2000) 6962.
[28] H. Chaabouni, L. Schriver-Mazzuoli, A. Schriver, Low
Temp. Phys. 26 (2000) 712.
[29] H.H. Richardson, P.J. Wooldridge, J.P. Devlin, J. Chem. Phys.
83 (1985) 4387.
L. Schriver-Mazzuoli et al. / Vibrational Spectroscopy 30 (2002) 245–257 257

![Silver(I) diaquamagnesium catena -borodiphosphate(V) monohydrate, AgMg(H 2 O) 2 [BP 2 O 8 ]·H 2 O](https://img.dokumen.tips/doc/110x75/6357b376debc1859f603efeb/silveri-diaquamagnesium-catena-borodiphosphatev-monohydrate-agmgh-2-o-2.jpg)


![MIXED-LIGANDS μ 3 -OXO TRINUCLEAR CARBOXYLATES [Fe 3 O(CH 2 BrCOO) 1.5 (CH 2 ClCOO) 4.5 (H 2 O) 3 ]Br 0.75 Cl 0.25 5H 2 O and [Fe 3 O(BrCH 2 COO) 6 (H 2 O) 3 ] NO 3 ⋅2.63H 2 O](https://img.dokumen.tips/doc/110x75/63595dbb10f2bd48220e26b6/mixed-ligands-m-3-oxo-trinuclear-carboxylates-fe-3-och-2-brcoo-15-ch-2-clcoo.jpg)


