Embed Size (px)
Citation preview

Edited by
Personalized Medicine in Epidemics
Rutger A. MiddelburgPrinted Edition of the Special Issue Published in
Journal of Personalized Medicine
www.mdpi.com/journal/jpm

Personalized Medicine in Epidemics

Personalized Medicine in Epidemics
Editor
Rutger A. Middelburg
MDPI Basel Beijing Wuhan Barcelona Belgrade Manchester Tokyo Cluj Tianjin
Editor
Rutger A. Middelburg
LUMC
Leiden,
The Netherlands
Editorial Office
MDPI
St. Alban-Anlage 66
4052 Basel, Switzerland
This is a reprint of articles from the Special Issue published online in the open access journal
Journal of Personalized Medicine (ISSN 2075-4426) (available at: www.mdpi.com/journal/jpm/
special issues/Personalized Epidemics).
For citation purposes, cite each article independently as indicated on the article page online and as
indicated below:
LastName, A.A.; LastName, B.B.; LastName, C.C. Article Title. Journal Name Year, Volume Number,
Page Range.
ISBN 978-3-0365-4208-9 (Hbk)
ISBN 978-3-0365-4207-2 (PDF)
© 2022 by the authors. Articles in this book are Open Access and distributed under the Creative
Commons Attribution (CC BY) license, which allows users to download, copy and build upon
published articles, as long as the author and publisher are properly credited, which ensures maximum
dissemination and a wider impact of our publications.
The book as a whole is distributed by MDPI under the terms and conditions of the Creative Commons
license CC BY-NC-ND.
Contents
About the Editor . . . . . . . . . . . . . . . . . . . . . . . . . . . . . . . . . . . . . . . . . . . . . . vii
Preface to ”Personalized Medicine in Epidemics” . . . . . . . . . . . . . . . . . . . . . . . . . . . ix
Rutger A. MiddelburgPersonalized Medicine in EpidemicsReprinted from: 2022, 12, 583, doi:10.3390/jpm12040583 . . . . . . . . . . . . . . . . . . . . . . . 1
Joaquın Dopazo, Douglas Maya-Miles, Federico Garcıa, Nicola Lorusso, Miguel AngelCalleja and Marıa Jesus Pareja et al.Implementing Personalized Medicine in COVID-19 in Andalusia: An Opportunity to Transformthe Healthcare SystemReprinted from: 2021, 11, 475, doi:10.3390/jpm11060475 . . . . . . . . . . . . . . . . . . . . . . . 3
Anca Andreea Boboc, Carmen Nicoleta Novac, Maria Teodora Ilie, Mara Ioana Ies, anu, FeliciaGalos, and Mihaela Balgradean et al.The Impact of SARS-CoV-2 Pandemic on the New Cases of T1DM in Children. A Single-CentreCohort StudyReprinted from: 2021, 11, 551, doi:10.3390/jpm11060551 . . . . . . . . . . . . . . . . . . . . . . . 19
Michael Leutner, Nils Haug, Luise Bellach, Elma Dervic, Alexander Kautzky and PeterKlimek et al.Risk of Typical Diabetes-Associated Complications in Different Clusters of Diabetic Patients:Analysis of Nine Risk FactorsReprinted from: 2021, 11, 328, doi:10.3390/jpm11050328 . . . . . . . . . . . . . . . . . . . . . . . 31
Xiaoni Meng, Manshu Song, Marija Vilaj, Jerko Stambuk, Mamatyusupu Dolikun and JieZhang et al.Glycosylation of IgG Associates with Hypertension and Type 2 Diabetes Mellitus Comorbidityin the Chinese Muslim Ethnic Minorities and the Han ChineseReprinted from: 2021, 11, 614, doi:10.3390/jpm11070614 . . . . . . . . . . . . . . . . . . . . . . . 41
Hiba Bawadi, Manal Kassab, Abdel Hadi Zanabili and Reema TayyemIdentification of Adolescents with Adiposities and Elevated Blood Pressure andImplementation of Preventive Measures Warrants the Use of Multiple Clinical AssessmentToolsReprinted from: 2021, 11, 873, doi:10.3390/jpm11090873 . . . . . . . . . . . . . . . . . . . . . . . 61
Po-Ya Chang, Yu-Wei Chang, Yuh-Feng Lin and Hueng-Chuen FanSex-Specific Association of Uric Acid and Kidney Function Decline in TaiwanReprinted from: 2021, 11, 415, doi:10.3390/jpm11050415 . . . . . . . . . . . . . . . . . . . . . . . 71
Yu-Fen Tsai, Yi-Chang Liu, Ching-I Yang, Tzer-Ming Chuang, Ya-Lun Ke and Tsung-Jang Yehet al.Poor Prognosis of Diffuse Large B-Cell Lymphoma with Hepatitis C InfectionReprinted from: 2021, 11, 844, doi:10.3390/jpm11090844 . . . . . . . . . . . . . . . . . . . . . . . 85
Bumhee Yang, Hayoung Choi, Sun Hye Shin, Youlim Kim, Ji-Yong Moon and Hye Yun Parket al.Association of Ventilatory Disorders with Respiratory Symptoms, Physical Activity, andQuality of Life in Subjects with Prior Tuberculosis: A National Database Study in KoreaReprinted from: 2021, 11, 678, doi:10.3390/jpm11070678 . . . . . . . . . . . . . . . . . . . . . . . 99
v
Fu-Zong Wu, Yun-Ju Wu, Chi-Shen Chen and Shu-Ching YangImpact of Smoking Status on Lung Cancer Characteristics and Mortality Rates betweenScreened and Non-Screened Lung Cancer Cohorts: Real-World Knowledge Translationand EducationReprinted from: 2022, 12, 26, doi:10.3390/jpm12010026 . . . . . . . . . . . . . . . . . . . . . . . . 111
Szu-Yu Hsiao, Ping-Ho Chen, Shan-Shan Huang, Cheng-Wei Yen, Shun-Te Huang andShu-Yuan Yin et al.Dental Treatment Needs and Related Risk Factors among School Children with Special Needsin TaiwanReprinted from: 2021, 11, 452, doi:10.3390/jpm11060452 . . . . . . . . . . . . . . . . . . . . . . . 121
Hsiu-Yueh Liu, Jen-Hao Chen, Kun-Jung Hsu, Ching-Teng Yao, Ping-Ho Chen and Szu-YuHsiao et al.Decreased Tongue Pressure Associated with Aging, Chewing and Swallowing Difficulties ofCommunity-Dwelling Older Adults in TaiwanReprinted from: 2021, 11, 653, doi:10.3390/jpm11070653 . . . . . . . . . . . . . . . . . . . . . . . 133
vi

About the Editor
Rutger A. Middelburg
Rutger Middelburg achieved a PhD in Epidemiology at the department of Clinical Epidemiology
of the Leiden University Medical Center. He has since spent over a decade researching clinical
transfusion medicine and advocating the personalization of medicine. Since 2020, he has worked
at the department of Public Health and Primary Care of the Leiden University Medical Center and as
an editor at the Dutch drug bulletin (a member of the International Society of Drug Bulletins).
vii

Preface to ”Personalized Medicine in Epidemics”
The only good medicine is personalized medicine. There is no “one size fits all“in the vastly
divergent landscape formed by the endless numbers of unique patients that need to be treated.
No two patients are the same; thus, neither is the optimal treatment for two different patients ever
completely identical. Therefore, a good doctor needs to try to always maximize the personalization
of the practiced medicine. At the same time, the medical world is continuously challenged by new
epidemics. The SARS-CoV-2 pandemic is an obvious example. Possibly less obvious, but no less
important, the epidemic of obesity and its associated morbidities also continues to impact all aspects
of medicine. Even lesser epidemics such as seasonal flu or lung cancer all impact our ability to
personalize the treatments offered to patients.
Therefore, this reprint explores the impact of epidemics of all kinds on the personalization
of medicine. With eleven high-quality scientific studies on this subject, this book represents an
important compilation for medical doctors and researchers alike. The broad overview offered in this
reprint is by no way meant to be exhaustive, but rather to provide examples from diverse fields of
medicine, thereby emphasizing the importance of the subject for all.
Rutger A. Middelburg
Editor
ix

Citation: Middelburg, R.A.
Personalized Medicine in Epidemics.
J. Pers. Med. 2022, 12, 583. https://
doi.org/10.3390/jpm12040583
Received: 1 April 2022
Accepted: 2 April 2022
Published: 5 April 2022
Publisher’s Note: MDPI stays neutral
with regard to jurisdictional claims in
published maps and institutional affil-
iations.
Copyright: © 2022 by the author.
Licensee MDPI, Basel, Switzerland.
This article is an open access article
distributed under the terms and
conditions of the Creative Commons
Attribution (CC BY) license (https://
creativecommons.org/licenses/by/
4.0/).
Journal of
Personalized
Medicine
Editorial
Personalized Medicine in EpidemicsRutger A. Middelburg
Department of Public Health and Primary Care, Leiden University Medical Center,2300 RC Leiden, The Netherlands; [email protected]
Before you lies the Special Issue “Personalized Medicine in Epidemics”. As we statedin our call for papers, we were looking for papers which make a novel contribution towardsoptimizing the personalization of medicine during epidemics. In this context, we aimed toinclude papers covering all kinds of epidemics, whether big or small, and whether infectiousor non-infectious in nature. Personalized medicine is important in all fields of medicine,and all epidemics influence our ability to practice personalized medicine—not only forthose suffering from the epidemic disease itself, but also for those with other diseases,which tend to get less attention as a major epidemic unfolds. This broadly inclusive viewof the role of personalized medicine during epidemics has led to the inclusion of elevenhigh quality papers, on a wide range of topics within this Special Issue.
Dopazo et al. [1] review opportunities and challenges of personalized medicine in thecontext of the COVID-19 pandemic. Boboc et al. [2] were more specific in their approach, byreporting on their experience with diabetes mellitus type 1 in children during the COVID-19pandemic. Besides an increased incidence, they also report important differences in patientcharacteristics between a pre-pandemic control group and the cases occurring duringthe pandemic.
Sticking with diabetes, Leutner et al. [3] report on different risk profiles and individualrisk factors that predispose diabetic patients (predominantly type 2) to a whole range ofdiabetic complications. They further differentiated these associations between men andwomen. Meng et al. [4] report on the role of IgG N-glycan profiles in the prediction ofprogression from either isolated diabetes mellitus type 2 or isolated hypertension to acombination of diabetes mellitus type 2, hypertension, and diabetic comorbidity. Theyfurther differentiated these associations between different Chinese ethnic groups.
Bawadi et al. [5] investigated the relationship between different measures for abdom-inal fat and hypertension in adolescent males. Chang et al. [6] studied the associationof serum urate concentrations with progression of kidney disease. They show a clearassociation for women, but not for men, suggesting different clinical strategies could bewarranted for men and women.
Returning to infectious diseases, Tsai et al. [7] show that hepatitis C infection is associ-ated with worse outcomes for diffuse large B-cell lymphoma, suggesting that direct-actingantiviral agents might help improve prognosis for this group of patients. Yang et al. [8]found that tuberculosis survivors who experience lasting ventilatory function disorders aremore likely to also experience more respiratory symptoms, more limitations in physicalactivity, and a worse decline in quality of life.
Wu et al. [9] associated lung cancer prognosis with mode of detection (i.e., screendetected or non-screen detected), smoking status, and several other potential risk factorsfor poor outcome. For non-smokers, the screened status was one of the predictors, whileit was not for smokers. Further, the probability of lung cancer being screen detected wasmuch higher in non-smokers. Since smokers are also less likely to engage in screening, theauthors suggest smokers’ prognosis might be improved by more effectively motivatingthem to participate in screening programs.
1
J. Pers. Med. 2022, 12, 583
Finally, Hsiao et al. [10] identified several modifiable predictors of dental problems inchildren with disabilities, and Liu et al. [11] demonstrate that tongue pressure decline canbe used as an indicator for chewing and swallowing problems in older adults.
Together, these eleven papers demonstrate the wide variety of epidemics in whichpersonalization of medicine is affected. As personalization of medicine is important in allfields of medicine, so are all fields of medicine affected by epidemics. We therefore, after thesuccessful completion of this first Special Issue on “Personalized Medicine in Epidemics”,now open our second Special Issue on this topic “Personalized Medicine in Epidemics 2.0”for submissions.
Funding: This research received no external funding.
Conflicts of Interest: The author declares no conflict of interest.
References1. Dopazo, J.; Maya-Miles, D.; García, F.; Lorusso, N.; Calleja, M.Á.; Pareja, M.J.; López-Miranda, J.; Rodríguez-Baño, J.; Padillo, J.;
Túnez, I.; et al. Implementing Personalized Medicine in COVID-19 in Andalusia: An Opportunity to Transform the HealthcareSystem. J. Pers. Med. 2021, 11, 475. [CrossRef]
2. Boboc, A.A.; Novac, C.N.; Ilie, M.T.; Ies, anu, M.I.; Galos, , F.; Bălgrădean, M.; Berghea, E.C.; Ionescu, M.D. The Impact of SARS-CoV-2 Pandemic on the New Cases of T1DM in Children. A Single-Centre Cohort Study. J. Pers. Med. 2021, 11, 551. [CrossRef][PubMed]
3. Leutner, M.; Haug, N.; Bellach, L.; Dervic, E.; Kautzky, A.; Klimek, P.; Kautzky-Willer, A. Risk of Typical Diabetes-AssociatedComplications in Different Clusters of Diabetic Patients: Analysis of Nine Risk Factors. J. Pers. Med. 2021, 11, 328. [CrossRef][PubMed]
4. Meng, X.; Song, M.; Vilaj, M.; Štambuk, J.; Dolikun, M.; Zhang, J.; Liu, D.; Wang, H.; Zhang, X.; Zhang, J.; et al. Glycosylation ofIgG Associates with Hypertension and Type 2 Diabetes Mellitus Comorbidity in the Chinese Muslim Ethnic Minorities and theHan Chinese. J. Pers. Med. 2021, 11, 614. [CrossRef] [PubMed]
5. Bawadi, H.; Kassab, M.; Zanabili, A.H.; Tayyem, R. Identification of Adolescents with Adiposities and Elevated Blood Pressureand Implementation of Preventive Measures Warrants the Use of Multiple Clinical Assessment Tools. J. Pers. Med. 2021, 11, 873.[CrossRef] [PubMed]
6. Chang, P.-Y.; Chang, Y.-W.; Lin, Y.-F.; Fan, H.-C. Sex-Specific Association of Uric Acid and Kidney Function Decline in Taiwan.J. Pers. Med. 2021, 11, 415. [CrossRef] [PubMed]
7. Tsai, Y.-F.; Liu, Y.-C.; Yang, C.-I.; Chuang, T.-M.; Ke, Y.-L.; Yeh, T.-J.; Gau, Y.-C.; Du, J.-S.; Wang, H.-C.; Cho, S.-F.; et al. PoorPrognosis of Diffuse Large B-Cell Lymphoma with Hepatitis C Infection. J. Pers. Med. 2021, 11, 844. [CrossRef] [PubMed]
8. Yang, B.; Choi, H.; Shin, S.H.; Kim, Y.; Moon, J.-Y.; Park, H.Y.; Lee, H. Association of Ventilatory Disorders with RespiratorySymptoms, Physical Activity, and Quality of Life in Subjects with Prior Tuberculosis: A National Database Study in Korea. J. Pers.Med. 2021, 11, 678. [CrossRef] [PubMed]
9. Wu, F.-Z.; Wu, Y.-J.; Chen, C.-S.; Yang, S.-C. Impact of Smoking Status on Lung Cancer Characteristics and Mortality Ratesbetween Screened and Non-Screened Lung Cancer Cohorts: Real-World Knowledge Translation and Education. J. Pers. Med.2022, 12, 26. [CrossRef] [PubMed]
10. Hsiao, S.-Y.; Chen, P.-H.; Huang, S.-S.; Yen, C.-W.; Huang, S.-T.; Yin, S.-Y.; Liu, H.-Y. Dental Treatment Needs and Related RiskFactors among School Children with Special Needs in Taiwan. J. Pers. Med. 2021, 11, 452. [CrossRef] [PubMed]
11. Liu, H.-Y.; Chen, J.-H.; Hsu, K.-J.; Yao, C.-T.; Chen, P.-H.; Hsiao, S.-Y.; Lin, C.-L. Decreased Tongue Pressure Associated withAging, Chewing and Swallowing Difficulties of Community-Dwelling Older Adults in Taiwan. J. Pers. Med. 2021, 11, 653.[CrossRef] [PubMed]
2
Journal of
Personalized
Medicine
Review
Implementing Personalized Medicine in COVID-19 inAndalusia: An Opportunity to Transform the Healthcare System
Joaquín Dopazo 1,2,3 , Douglas Maya-Miles 4,5, Federico García 1,6,7 , Nicola Lorusso 1,8 ,Miguel Ángel Calleja 1,9, María Jesús Pareja 1,10, José López-Miranda 1,11,12,13, Jesús Rodríguez-Baño 1,4,14,15,Javier Padillo 1,4,16,17, Isaac Túnez 1,11,12,18,19,* and Manuel Romero-Gómez 1,4,5,15,20,*
Citation: Dopazo, J.; Maya-Miles, D.;
García, F.; Lorusso, N.; Calleja, M.Á.;
Pareja, M.J.; López-Miranda, J.;
Rodríguez-Baño, J.; Padillo, J.; Túnez,
I.; et al. Implementing Personalized
Medicine in COVID-19 in Andalusia:
An Opportunity to Transform the
Healthcare System. J. Pers. Med. 2021,
11, 475. https://doi.org/10.3390/
jpm11060475
Academic Editor: Rutger
A. Middelburg
Received: 22 April 2021
Accepted: 21 May 2021
Published: 26 May 2021
Publisher’s Note: MDPI stays neutral
with regard to jurisdictional claims in
published maps and institutional affil-
iations.
Copyright: © 2021 by the authors.
Licensee MDPI, Basel, Switzerland.
This article is an open access article
distributed under the terms and
conditions of the Creative Commons
Attribution (CC BY) license (https://
creativecommons.org/licenses/by/
4.0/).
1 GT MP Covid-19. SGIDIS, Consejería de Salud y Familias, Junta de Andalucía, Spain;[email protected] (J.D.); [email protected] (F.G.);[email protected] (N.L.); [email protected] (M.Á.C.);[email protected] (M.J.P.); [email protected] (J.L.-M.); [email protected] (J.R.-B.);[email protected] (J.P.)
2 Área de Bioinformática, Fundación progreso y Salud, Junta de Andalucía, 41013 Sevilla, Spain3 Centro de Investigación Biomédica en Red de Enfermedades Raras (CIBERER), 28029 Madrid, Spain4 Instituto de Biomedicina de Sevilla (HUVR/HUVM/CSIC/US), 41013 Sevilla, Spain; [email protected] Centro de Investigación Biomédica en Red de Enfermedades Hepáticas y Digestivas (CIBEREHD),
28029 Madrid, Spain6 Servicio de Microbiología, Hospital Universitario San Cecilio, 18016 Granada, Spain7 Instituto de Investigación Biosanitaria IBS, 18012 Granada, Spain8 Dirección General de Salud Pública, Consejería de Salud y Familias, Junta de Andalucía, Spain9 Servicio de Farmacia, Hospital Universitario Virgen Macarena, 41009 Sevilla, Spain10 Hospital Universitario de Valme, 41014 Sevilla, Spain11 Servicio de Medicina Interna, Hospital Universitario Reina Sofía, 14004 Córdoba, Spain12 Instituto Maimónides de Investigación Biomédica de Córdoba (IMIBIC), 14004 Córdoba, Spain13 Departamento de Ciencias Médicas y Quirúrgicas, Universidad de Córdoba, 14071 Córdoba, Spain14 Unidad Clínica de Enfermedades Infecciosas y Microbiología, Hospital Universitario Virgen Macarena,
41009 Sevilla, Spain15 Departamento de Medicina, Universidad de Sevilla, 41009 Sevilla, Spain16 Departamento de Cirugía, Universidad de Sevilla, 41009 Sevilla, Spain17 Servicio de Cirugía General y Digestiva, Hospital Universitario Virgen del Rocío, 41013 Sevilla, Spain18 Departamento de Bioquímica, Universidad de Córdoba, 14071 Córdoba, Spain19 Secretaría General de Investigación, Desarrollo e Innovación en Salud, Consejería de Salud y Familias de la
Junta de Andalucía, 41020 Sevilla, Spain20 Servicio de Aparato Digestivo, Hospital Universitario Virgen del Rocío, 41013 Sevilla, Spain* Correspondence: [email protected] (I.T.); [email protected] (M.R.-G.)
Abstract: The COVID-19 pandemic represents an unprecedented opportunity to exploit the advan-tages of personalized medicine for the prevention, diagnosis, treatment, surveillance and manage-ment of a new challenge in public health. COVID-19 infection is highly variable, ranging fromasymptomatic infections to severe, life-threatening manifestations. Personalized medicine can play akey role in elucidating individual susceptibility to the infection as well as inter-individual variabilityin clinical course, prognosis and response to treatment. Integrating personalized medicine intoclinical practice can also transform health care by enabling the design of preventive and therapeuticstrategies tailored to individual profiles, improving the detection of outbreaks or defining trans-mission patterns at an increasingly local level. SARS-CoV2 genome sequencing, together with theassessment of specific patient genetic variants, will support clinical decision-makers and ultimatelybetter ways to fight this disease. Additionally, it would facilitate a better stratification and selection ofpatients for clinical trials, thus increasing the likelihood of obtaining positive results. Lastly, defininga national strategy to implement in clinical practice all available tools of personalized medicine inCOVID-19 could be challenging but linked to a positive transformation of the health care system. Inthis review, we provide an update of the achievements, promises, and challenges of personalizedmedicine in the fight against COVID-19 from susceptibility to natural history and response to therapy,as well as from surveillance to control measures and vaccination. We also discuss strategies to
3
J. Pers. Med. 2021, 11, 475
facilitate the adoption of this new paradigm for medical and public health measures during and afterthe pandemic in health care systems.
Keywords: personalized medicine; precision medicine; Covid-19; SARS CoV2; epidemiology; hostgenetics; viral genome
1. Introduction
Policymakers, health care leaders and physicians should improve our response tothe SARS-CoV-2 pandemic by promoting interdisciplinary collaboration and moving themain research and innovation milestones to clinical practice. The management of thispandemic has been a great challenge addressing health care delivery in stressful conditionsdue to inadequate capacity, supply shortages, redesigning care, being more transversal andfocused on the patient and the virus, thinking in a few days on open intensive care unitsdistributed throughout the campus and managed by several specialties. Innovation andresearch on COVID-19 required an adaptive process to be translated to clinicians as fast aspossible when usefulness was supported in evidence-based medicine. Complex adaptivesystems that operate in unpredictable environments should be replaced. Personalizedmedicine implementation in clinical practice requires a multidisciplinary approach puttingtogether people working on genome sequences, bioinformatics, geneticists or microbiolo-gists and physicians in charge of the patients as well as the management of big-data (BD).A well-defined circuit is mandatory together with a multidisciplinary group able to meetfrequently to solve complex clinical situations as severe COVID-19. Precision medicineand beyond, P4 medicine, including predictive, personalized, preventive and participatorymedicine, could find the correct scenario in this pandemic. The Andalusian RegionalGovernment allowed us to put together a large population-based health database togetherwith human genomics and viral sequencing to be addressed by Artificial Intelligence (AI)methods to develop robust algorithms able to predict not just the natural history andprogression of the disease but also antiviral therapy response [1] and immune response tovaccination [2].
2. Impact of Human Genome on COVID-19
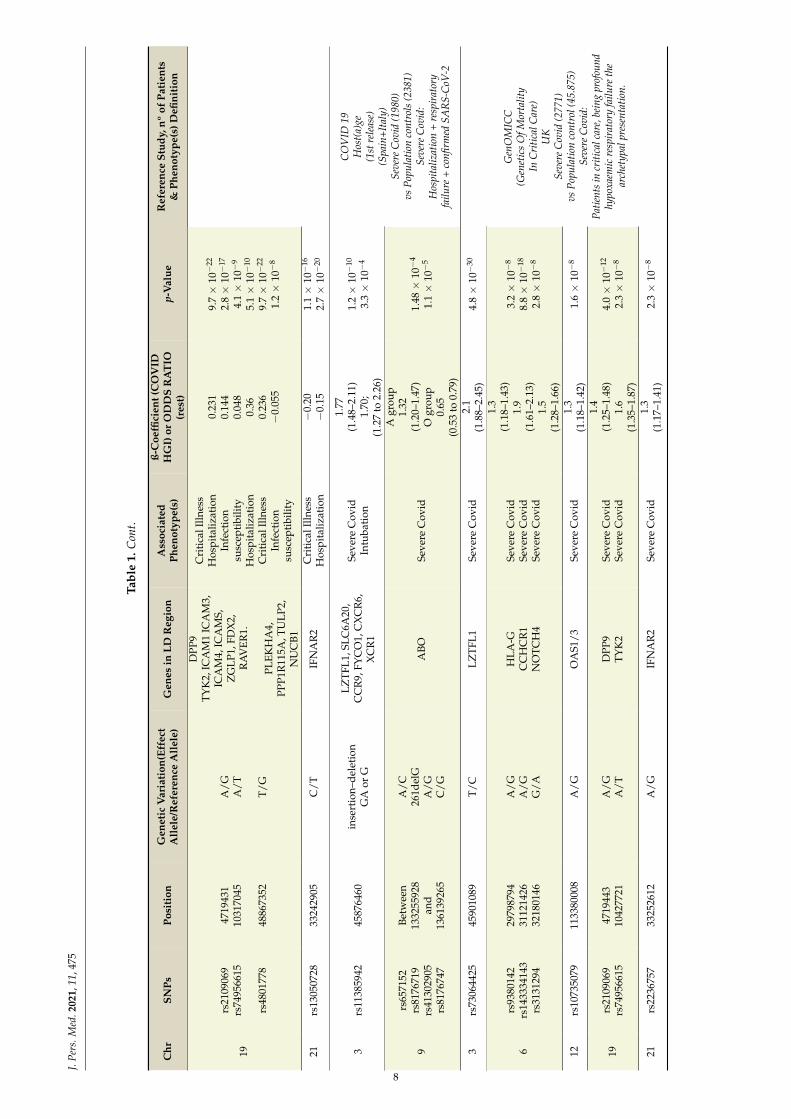
The clinical course in patients with COVID-19 has been reported as highly heteroge-neous. While most people will experience a mild or asymptomatic course, some othersmay develop progressive and life-threatening bilateral pneumonia and acute respiratorydistress syndrome (ARDS). Identifying which patients are at risk to progress to a severeform could reduce the burden of COVID-19, which is currently overloading many healthcare systems around the world. Factors contributing to disease severity include anthro-pometric factors (e.g., age, gender, BMI), comorbidities (e.g., hypertension, diabetes) andunhealthy habits (e.g., smoking) [3]. Host genetics studies in COVID-19 have reportedgenomic variations associated with disease severity in chromosomes 1 (1q22.1), 2 (2p21.1),3 (3p21.1–3), 6 (6p21.1), 8 (8q24.13), 9 (9q34.1–2), 12 (12q24.1–2), 17 (17q21.3), 19 (19p13.1–3)and 21 (21q21–q22) as well as in specific loci that have been manually selected [4–8]. TheCOVID Host Genetics Initiative has set up one of the largest communities that are currentlygenerating, sharing and analyzing data to learn the genetic determinants of COVID-19susceptibility, severity and outcomes. This initiative, which has currently released its fifthdata freeze, including data from 46 studies across 19 countries worldwide and analysislooking for genetic determinants of severity (+6000 death or intubated patients vs +1.4 Mcontrols), hospitalization (+13,000 hospitalized patients vs +2 M controls) and infection(≈ 50 K infected patients vs +1.7 M controls), is currently setting up a platform in whichresearchers will be able to explore the genetic variations that have a deeper impact in SARSCoV-2 infection and severity [9]. An overview of some of the strongest genetic associationsdescribed so far for COVID-19 infection and severity, along with some potential gene
4
J. Pers. Med. 2021, 11, 475
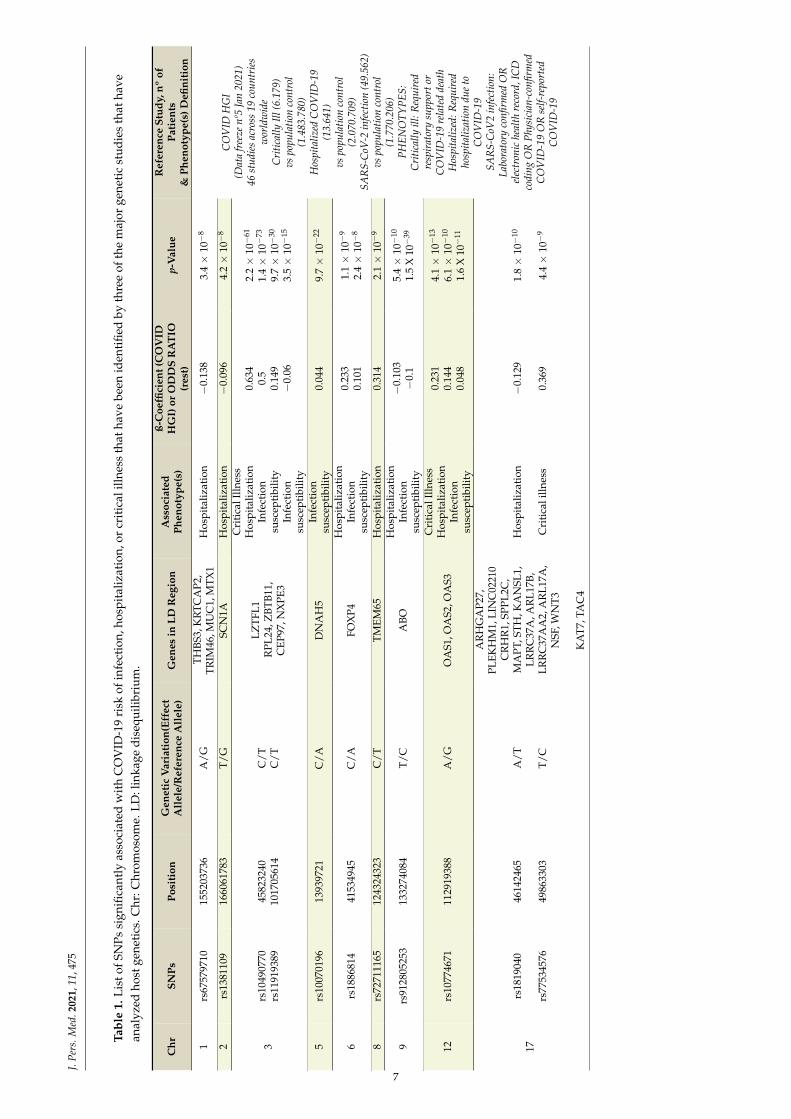
candidates, is shown in Table 1. Chromosome 3 genetic variation in the 3p21 locus is thegenetic variant that has shown the strongest association in terms of reproducibility to bothCOVID-19 infection and severity. This region, which is thought to be present in around 30%of people in South Asia and 8% in Europe, has been shown to increase between 1.5- and2-times approximately an infected person’s odds of developing severe COVID-19 [4,7,10].Carriers of rs10490770, an SNP strongly linked to this chromosome region have increasedthe odds of several COVID-19 complications, including severe respiratory failure (oddsratio [OR] 2·0, 95%CI 1·6–2·6), venous thromboembolism (OR 1·7, 95%CI 1·2–2·4), andhepatic injury (OR 1·6, 95%CI 1·2–2·0) and higher odds of death or severe respiratory fail-ure, which are especially relevant in patients ≤60 years (OR 2.6, 95%CI 1.8–3.9) comparedto those >60 years (OR 1.5 (95%CI 1.3–1.9, interaction p-value = 0·04) [11]. rs11385942,another SNP strongly associated with this genetic variation, has shown no association tobiomarkers of systemic inflammation, including the C-reactive protein, ferritin, IL-6 andcirculating neutrophils and lymphocytes but has been recently associated to increasedamounts of the enhanced complement activation, both with C5a and terminal complementcomplex [12,13]. The 3p21.31 locus contains 17 known protein-coding genes, includingSLC6A20, LZTFL1, CCR9, FYCO1, CXCR6, XCR1, CCR1, CCR3, CCR2 and CCR5. Noneof them seems to have a straightforward connection to SARS-CoV-2 infection or severityto date, besides maybe SLC6A20, which is a transporter regulated by the main SARS-CoV-2 receptor ACE2. However, there are some indirect connections that might be worthhighlighting. CCR2 encodes a C-C type chemokine receptor for a chemokine (CCL2) thatmediates monocyte chemotaxis. Its expression has recently shown a strong associationwith the 3p21.31 severe COVID-19-risk variant in certain CD4+ memory T cell subsetsand classical monocytes. Patients with severe COVID-19 illness have increased CCR2expression in circulating monocytes as well as very high levels of CCR2 ligand (CCL2)in bronchoalveolar lavage fluid, leading to the hypothesis that excessive recruitment ofCCR2-expressing monocytes may drive pathogenic lung inflammation in COVID-19 [14,15].LZTFL1/BBS17 is a member of the Bardet-Biedl syndrome (BBS) and encodes a proteininvolved in protein trafficking to primary cilia. Mutations in LZTFL1 have been reportedin human BBS patients, which develop a wide range of pathologies, including obesity,which is so far one of the comorbidities with a stronger link to both COVID-19 infectionand severity. It has been recently shown that the deletion of LZTFL1 can cause pleiotropicdefects in mice, including obesity. Interestingly, this work links obesity to the expressionof LZTFL1 in the brain and demonstrates that the loss of this protein specifically in thebrain can lead to leptin resistance [16]. SARS-CoV-2 has been shown to be able to infectthe epithelial cells of the gastrointestinal glands of the stomach, duodenum and rectumof COVID-19 patients. The continuous positive detection of SARS-CoV-2 viral RNA instools suggests that viral particles can be secreted by gastrointestinal cells infected withthe virus, and two recent works have proven the ability of this virus to infect human andbat enterocytes in vitro [17–19]. CCR9 is a small intestinal chemokine homing receptornormally found on most mucosal T cells in the gastrointestinal tract, and that has beenlinked to celiac disease [20] It has been recently shown that the CCR9-CCL25 axis in micepromotes the development of a Th1 population with features of TRM cell that regulatesthe local immune environment and that CCR9 can exert a protective response againstinfections in the gastrointestinal tract [21]. CCR9 expression has also been observed ininflammatory cells that are recruited to the lungs and in peripheral blood eosinophils ofasthmatic subjects and can be upregulated by stimulation with proinflammatory mediatorsin human eosinophils-derived cell lines [22]. FYCO1 plays a role in microtubule plusend-directed transport of autophagic vesicles through interactions with the small GTPaseRab7. Although the molecular mechanism of SARS-CoV2 virus infection and spread in thebody is not yet disclosed, studies on other beta-coronaviruses show that, upon cell infec-tion, these viruses inhibit macroautophagy/autophagy flux and cause the accumulationof autophagosomes. RNA viruses such as HBV and HCV also modify the autophagy ma-chinery to favor viral replication, translation and propagation. [23] Experiments performed
5
J. Pers. Med. 2021, 11, 475
in hepatocyte cell lines have shown that HCV infection causes inhibition of ras-relatedprotein Rab-7 (Rab7)-dependent endosome–lysosome fusion and promotes the cleavage ofthe Rab7 adaptor protein RILP (Rab interacting lysosomal protein). This cleavage allowschanging the location of this protein to the cell periphery, promoting the export of viralparticles outside the cell [24]. XCR1 is a chemokine receptor for XCL1 (Lymphotactin orLptn). This chemokine is produced predominantly by NK and CD8+ T cells and plays akey role in the tissue-specific recruitment of T lymphocytes [25]. Nasal co-administrationof XCL1 and a protein antigen enhances antigen-specific antibody responses both in bloodplasma and in mucosal secretions. Lptn as adjuvant-induced antigen-specific CD4+ Th1-and Th2- type cells and IgG1 > IgG2a = IgG2b = IgG3 antibody subclasses [26]. Viralmacrophage inflammatory protein-II, a viral protein that inhibits C class chemokines, hasbeen shown to be a potent antagonist able to block the signaling of the XCR1 receptor [27],and the TAT protein of HIV can strongly increase the expression of XCL1 in several celltypes [28].
6
J.Pe
rs.M
ed.2
021,
11,4
75
Tabl
e1.
Lis
tofS
NPs
sign
ifica
ntly
asso
ciat
edw
ith
CO
VID
-19
risk
ofin
fect
ion,
hosp
ital
izat
ion,
orcr
itic
alill
ness
that
have
been
iden
tifie
dby
thre
eof
the
maj
orge
neti
cst
udie
sth
atha
vean
alyz
edho
stge
neti
cs.C
hr:C
hrom
osom
e.LD
:lin
kage
dise
quili
briu
m.
Chr
SNPs
Posi
tion
Gen
etic
Var
iati
on(E
ffec
tA
llel
e/R
efer
ence
All
ele)
Gen
esin
LDR
egio
nA
ssoc
iate
dPh
enot
ype(
s)
ß-C
oeffi
cien
t(C
OV
IDH
GI)
orO
DD
SR
AT
IO(r
est)
p-V
alue
Ref
eren
ceSt
udy,
nºof
Pati
ents
&Ph
enot
ype(
s)D
efini
tion
1rs
6757
9710
1552
0373
6A
/GTH
BS3,
KR
TCA
P2,
TRIM
46,M
UC
1,M
TX1
Hos
pita
lizat
ion
−0.
138
3.4×
10−
8
CO
VID
HG
I(D
ata
free
zenº
5Ja
n20
21)
46st
udie
sac
ross
19co
untr
ies
wor
ldw
ide
Cri
tical
lyIll
(6.1
79)
vspo
pula
tion
cont
rol
(1.4
83.7
80)
Hos
pita
lized
CO
VID
-19
(13.
641)
vspo
pula
tion
cont
rol
(2.0
70.7
09)
SAR
S-C
oV-2
infe
ctio
n(4
9.56
2)vs
popu
latio
nco
ntro
l(1
.770
.206
)PH
ENO
TYPE
S:C
ritic
ally
ill:R
equi
red
resp
irat
ory
supp
orto
rC
OV
ID-1
9re
late
dde
ath
Hos
pita
lized
:Req
uire
dho
spita
lizat
ion
due
toC
OV
ID-1
9SA
RS-
CoV
2in
fect
ion:
Labo
rato
ryco
nfirm
edO
Rel
ectr
onic
heal
thre
cord
,IC
Dco
ding
OR
Phys
icia
n-co
nfirm
edC
OV
ID-1
9O
Rse
lf-re
port
edC
OV
ID-1
9
2rs
1381
109
1660
6178
3T
/GSC
N1A
Hos
pita
lizat
ion
−0.
096
4.2×
10−
8
3rs
1049
0770
rs11
9193
8945
8232
4010
1705
614
C/T
C/T
LZTF
L1R
PL24
,ZBT
B11,
CEP
97,N
XPE
3
Cri
tica
lIlln
ess
Hos
pita
lizat
ion
Infe
ctio
nsu
scep
tibi
lity
Infe
ctio
nsu
scep
tibi
lity
0.63
40.
50.
149
−0.
06
2.2×
10−
61
1.4×
10−
73
9.7×
10−
30
3.5×
10−
15
5rs
1007
0196
1393
9721
C/A
DN
AH
5In
fect
ion
susc
epti
bilit
y0.
044
9.7×
10−
22
6rs
1886
814
4153
4945
C/A
FOX
P4H
ospi
taliz
atio
nIn
fect
ion
susc
epti
bilit
y
0.23
30.
101
1.1×
10−
9
2.4×
10−
8
8rs
7271
1165
1243
2432
3C
/TTM
EM65
Hos
pita
lizat
ion
0.31
42.
1×
10−
9
9rs
9128
0525
313
3274
084
T/C
ABO
Hos
pita
lizat
ion
Infe
ctio
nsu
scep
tibi
lity
−0.
103
−0.
15.
4×
10−
10
1.5
X10
−39
12rs
1077
4671
1129
1938
8A
/GO
AS1
,OA
S2,O
AS3
Cri
tica
lIlln
ess
Hos
pita
lizat
ion
Infe
ctio
nsu
scep
tibi
lity
0.23
10.
144
0.04
8
4.1×
10−
13
6.1×
10−
10
1.6
X10
−11
17rs
1819
040
rs77
5345
76
4614
2465
4986
3303
A/T
T/C
AR
HG
AP2
7,PL
EKH
M1,
LIN
C02
210
CR
HR
1,SP
PL2C
,M
APT
,STH
,KA
NSL
1,LR
RC
37A
,AR
L17B
,LR
RC
37A
A2,
AR
L17A
,N
SF,W
NT3
KA
T7,T
AC
4
Hos
pita
lizat
ion
Cri
tica
lilln
ess
−0.
129
0.36
9
1.8×
10−
10
4.4×
10−
9
7
J.Pe
rs.M
ed.2
021,
11,4
75
Tabl
e1.
Con
t.
Chr
SNPs
Posi
tion
Gen
etic
Var
iati
on(E
ffec
tA
llel
e/R
efer
ence
All
ele)
Gen
esin
LDR
egio
nA
ssoc
iate
dPh
enot
ype(
s)
ß-C
oeffi
cien
t(C
OV
IDH
GI)
orO
DD
SR
AT
IO(r
est)
p-V
alue
Ref
eren
ceSt
udy,
nºof
Pati
ents
&Ph
enot
ype(
s)D
efini
tion
19
rs21
0906
9rs
7495
6615
rs48
0177
8
4719
431
1031
7045
4886
7352
A/G
A/T
T/G
DPP
9TY
K2,
ICA
M1
ICA
M3,
ICA
M4,
ICA
MS,
ZG
LP1,
FDX
2,R
AV
ER1.
PLEK
HA
4,PP
P1R
115A
,TU
LP2,
NU
CB1
Cri
tica
lIlln
ess
Hos
pita
lizat
ion
Infe
ctio
nsu
scep
tibi
lity
Hos
pita
lizat
ion
Cri
tica
lIlln
ess
Infe
ctio
nsu
scep
tibi
lity
0.23
10.
144
0.04
80.
360.
236
−0.
055
9.7×
10−
22
2.8×
10−
17
4.1×
10−
9
5.1×
10−
10
9.7×
10−
22
1.2×
10−
8
21rs
1305
0728
3324
2905
C/T
IFN
AR
2C
riti
calI
llnes
sH
ospi
taliz
atio
n−
0.20
−0.
151.
1×
10−
16
2.7×
10−
20
3rs
1138
5942
4587
6460
inse
rtio
n–de
leti
onG
Aor
G
LZTF
L1,S
LC6A
20,
CC
R9,
FYC
O1,
CX
CR
6,X
CR
1
Seve
reC
ovid
Intu
bati
on
1.77
(1.4
8–2.
11)
1.70
;(1
.27
to2.
26)
1.2×
10−
10
3.3×
10−
4
CO
VID
19H
ost(
a)ge
(1st
rele
ase)
(Spa
in+I
taly
)Se
vere
Cov
id(1
980)
vsPo
pula
tion
cont
rols
(238
1)Se
vere
Cov
id:
Hos
pita
lizat
ion
+re
spir
ator
yfa
ilure
+co
nfirm
edSA
RS-
CoV
-2
9
rs65
7152
rs81
7671
9rs
4130
2905
rs81
7674
7
Betw
een
1332
5592
8an
d13
6139
265
A/C
261d
elG
A/G
C/G
ABO
Seve
reC
ovid
Agr
oup
1.32
(1.2
0–1.
47)
Ogr
oup
0.65
(0.5
3to
0.79
)
1.48
×10
−4
1.1×
10−
5
3rs
7306
4425
4590
1089
T/C
LZTF
L1Se
vere
Cov
id2.
1(1
.88–
2.45
)4.
8×
10−
30
Gen
OM
ICC
(Gen
etic
sO
fMor
talit
yIn
Cri
tical
Car
e)U
KSe
vere
Cov
id(2
771)
vsPo
pula
tion
cont
rol(
45.8
75)
Seve
reC
ovid
:Pa
tient
sin
criti
calc
are,
bein
gpr
ofou
ndhy
poxa
emic
resp
irat
ory
failu
reth
ear
chet
ypal
pres
enta
tion.
6rs
9380
142
rs14
3334
143
rs31
3129
4
2979
8794
3112
1426
3218
0146
A/G
A/G
G/A
HLA
-GC
CH
CR
1N
OTC
H4
Seve
reC
ovid
Seve
reC
ovid
Seve
reC
ovid
1.3
(1.1
8–1.
43)
1.9
(1.6
1–2.
13)
1.5
(1.2
8–1.
66)
3.2×
10−
8
8.8×
10−
18
2.8×
10−
8
12rs
1073
5079
1133
8000
8A
/GO
AS1
/3Se
vere
Cov
id1.
3(1
.18–
1.42
)1.
6×
10−
8
19rs
2109
069
rs74
9566
1547
1944
310
4277
21A
/GA
/TD
PP9
TYK
2Se
vere
Cov
idSe
vere
Cov
id
1.4
(1.2
5–1.
48)
1.6
(1.3
5–1.
87)
4.0×
10−
12
2.3×
10−
8
21rs
2236
757
3325
2612
A/G
IFN
AR
2Se
vere
Cov
id1.
3(1
.17–
1.41
)2.
3×
10−
8
8
J. Pers. Med. 2021, 11, 475
3. Role of Viral Genetic Variants in Covid-19
Coronaviruses (CoVs) are positive ssRNA viruses, non-fragmented, 26–32 kb belong-ing to the coronaviridae family. At least four types have been described (α, β, γ and δ).Alpha and beta are pathogenic to mammalians, including humans. Until now, they havebeen associated with respiratory diseases—α: HCoV-229E and HCoV-NL63 and β: HCoV-OC43, HCoV-HKU1, SARS-CoV-1, MERS-CoV and SARS-CoV-2. The virus did infectand replicate in the cell-expressing ACE-2 receptors. Infection is diagnosed by RT-PCRdetecting at least two of these four genes (envelope, spike, nucleocapsid or RNA-dependentRNA polymerase) [29]. The enormous international effort in SARS-CoV-2 sequencing andthe subsequent data sharing in sequence databases, along with the popularization of theinteractive epidemiological map viewer Nexstrain [30], has uncovered a huge variabilityspectrum in the viral sequences reported, which are estimated to accumulate nucleotidemutations at a rate of about 1–2 mutations per month [31]. As new sequences cumulated,an increasing number of studies started to describe mutations with an apparent impacton increased infectivity of the virus, such as the well-known D614G variant in the spikeprotein, or even on increased mortality [32]. Additionally, mutations in the spike have beenassociated with mABs evasion, which implies a potential risk for vaccine effectivity [33].Beyond the spike protein, mutations in other proteins, such as the RNA-dependent-RNApolymerase, can reduce the copy fidelity that could result in resistance to antiviral treat-ments [34] On the other hand, mutations present at the receptor-binding site of the spikeprotein apparently cause reduced infectivity [33]. ORF8 deletion has also been associ-ated with a milder clinical infection and less post-infection inflammation [35]. Actually,it has been suggested that superspreading events seem to be driving the SARS-CoV-2pandemic evolution [36]. Moreover, sometimes a more drastic evolutionary event canoccur, such as the recently described transmission between humans and mink, and back tohumans [37], which triggered a preventive systematic mink slaughter in Denmark becauseof the presence of variants in the spike protein that might compromise the effectivity ofa vaccine [38]. Another case of a new SARS-CoV-2 variant with an unexpectedly largenumber of mutations in several proteins is the new lineage, B.1.1.7, described in the UK,which is apparently associated with higher transmission rates and mortality [39], or themore recent strains B.1.351 from South Africa and B.1.1.28.1 from Brazil.
The potential effect of many of these mutations has been questioned as speculativeand often based on a small number of cases with no much clinical information associated,which casts serious doubts on their actual significance [40]. However, there is an obviousscenario where viral mutations are known to have a potential effect: resistance to antiviraltreatments. A noticeable example is remdesivir, an antiviral agent developed against theEbola virus with demonstrated in vitro activity against SARS-CoV-2. In vitro studies havelinked some drug-resistance variants, mainly amino acid changes on RNA-dependentRNA-polymerase (corresponding to residues F480; V557; F480 + V553; F480 + V557), withreduced susceptibility to remdesivir (between 2.4- and 6-fold changes). In clinical cases,some emergent variants promoting drug resistance, mainly in the RNA-dependent RNA-polymerase region (D484Y), as a therapeutic target of the drug, have been reported inpatients receiving remdesivir [41–43]. Indeed, new variants are continuously emergingevery day and may affect drug binding sites and, consequently, may bear the potentialto promote drug resistance or escape to current vaccines. Therefore, the benefit of com-bined genomic and epidemiological analysis for the investigation of health-care-associatedCOVID-19 seems apparent, as has recently been reported, enabling the detection of cryptictransmission events and identify opportunities for early interventions.
4. Genetic Epidemiology of COVID-19
In recent years, the European Center for Disease Prevention and Control (ECDC) haspublished several documents informing about both the roadmap for and state of the art onthe current situation of the integration of microbiological data in Public Health surveillanceand proposing the need to implement molecular typing and genomic sequencing data for
9
J. Pers. Med. 2021, 11, 475
outbreak surveillance and control [44,45]. The use of genomic surveillance and moleculartyping in public health surveillance involves the availability of complementary informationto the epidemiological survey and identification of contacts (allowing traceability of thetransmission chain). It allows knowing if the cases belong almost unequivocally to thesame exposition or transmission line. Using this technique, exposures to a common sourcecan quickly and easily be identified, as demonstrated in the recently reported UK SARS-CoV-2 variant [46]. The creation of a regional geographic database allows to know whichpathogens are endemic and which are imported and the identification of new clades,strains or variants that are imported. The analysis of genetic data with phylodynamicmethods allows making inferences about the characteristics of the individuals involved inthe transmission of the infection and about how contact patterns and the dynamics of riskbehaviors affect the flow of transmission through a population [39]. Thus, epidemiologicalsurveillance has to monitor for abrupt changes in rates of transmission or disease severityas part of a systematic process of identifying, response and assessing the impact of variants.A recent example has been the emergence and rapid spread of the above-mentioned newSARS-CoV-2 B.1.1.7 variant with multiple spike protein changes and mutations in othergenomic regions associated with higher transmissibility [46].
Although retrospective incorporation has made it possible at the local level to securethe data that had been identified by epidemiologists through surveys when the virussequencing of confirmed cases has to be carried out faster, the pathways of infection havebeen prospectively traced, and chains of transmission have been precisely identified, atthe hospital level [44,45,47–49]. Technological advances in the classification of pathogensaccording to the genomic sequence propel us into a new era of massive availability ofgenomic data at increasingly reduced costs. This information applied to current surveillancesystems allows the pathogen causing an infection to be more accurately discriminated,improves the detection of outbreaks and circumscribes the scope and impact of theseoutbreaks as it allows defining transmission patterns at an increasingly local level. SARS-CoV-2 sequencing has also proven to be useful for studying reinfection. The first case ofSARS-CoV-2 reinfection was reported on 24 August 2020 in a Hong Kong citizen re-infectedwhile travelling in Europe. A few other COVID-19 reinfections have been publishedor deposited in repositories; however, as diagnosing reinfection requires whole-genomesequencing strategies to evaluate the differences between the first and the second strainand samples from both episodes may not be available, it is suspected that reinfection maybe a more frequent event than reported.
Another important aspect of genomic surveillance of SARS-CoV-2 is related to vac-cination. An effective vaccine should consider the natural variation of the pathogen inorder to provide protection with coverage as extensive as possible. The evolution of virusesby mutating epitopes to escape from different pressures has been demonstrated in vitroin the presence of monoclonal antibodies [50] and also in clinical trials [51]. Additionally,some cases of viruses that evade the immune response elicited by vaccines have beendescribed [52,53]. As expected, SARS-CoV-2 can escape in vitro from neutralizing anti-bodies against the spike protein [54]. However, the recent report of the escape in vitrofrom a neutralizing COVID-19 convalescent plasma with only three mutations [55], isa serious warning that cannot be ignored and points to the convenience of surveillancethat considers immune aspects. The use of immunogenomics, bioinformatics and systemsbiology helps to understand the basis of interindividual responses to vaccines, both interms of acquired immunity and adverse effects. The application of these concepts opensthe door to the possibility of quantifying and predicting the protective immune responseinduced by vaccines according to the genomic signature, both of the microorganism andof the vaccine recipient itself [56]. In fact, a bioinformatic approach has recently beendescribed that can predict candidate targets for immune responses to SARS-CoV-2 [57],providing crucial information for understanding human immune responses to this virusand for evaluating vaccine candidates [58]. In fact, these predictions, based on ArtificialIntelligence (AI) methodologies [59], allows understanding the individual responses of
10
J. Pers. Med. 2021, 11, 475
patients against the virus [60]. Thus, genomic surveillance and patient screening of riskvariants need to be considered for personalized approaches to SARS-CoV-2 vaccinationand to prevent possible future vaccine failures [61].
5. Data Science in Health Data Sheet from Large Populations: An Opportunityfor COVID-19
Recent estimates suggest that, while more than 50 years were needed to duplicateall the medical knowledge by 1950, only 70 days were necessary for this increase by theend of 2020 [62], thus providing an idea of the real dimension of current clinical BD andtheir amazing growing pace. This increasing volume of data poses growing challengesfor its management, but at the same time, offers an invaluable opportunity for discovery.In fact, the secondary use of stored clinical data is gaining importance progressivelyand provides a solid substrate for an increasing number of real-world evidence (RWE)studies [63]. Additionally, in parallel to the growth of clinical data repositories, the field ofAI has recently experienced a remarkable development, particularly in the case of clinicalapplications [64]. The AI is starting to integrate into many aspects of medicine with theperspective of optimizing processes, diagnostic procedures and treatments, as well ashelping to reduce medical errors [65].
It is worth noting that, despite the short time since the first COVID-19 outbreak, theactivity in the development of applications for the retrospective analysis of electronic healthrecords (EHR) by means of artificial intelligence (AI) applied to different aspects of thepandemic is remarkable [66]. With a rapidly growing amount of data available, predictorsfor different endpoints are being proposed based on different clinical data, that includea medical image [67], clinical text data [68] or, in general, clinical data contained in theEHRs [69]. One of the strengths of AI is its ability to “learn” how individual EHR variables(potential risk factors) can be used and combined among them to produce personalized riskpredictions. While conventional approximations (e.g., Cox proportional hazards model)cannot properly combine heterogeneous data from different natures and often incompleteEHRs, modern AI techniques, based on supervised learning, can efficiently learn from sucha complex variable dataset and generate risk predictors, as well as update their predictionsas data evolve with time [70].
Beyond clinical data from EHRs, the abundance of genomic data in public databases,as well as international initiatives to rapidly increase the biological knowledge on theviral infection process, such as the COVID-19 disease map [71], is fostering innovativeapplications of AI in the field of drug repurposing [72]. It has recently been demonstratedthat a combination of AI methods and mathematical models of the COVID-19 disease map2
has been able of predicting all targeted drugs for COVID-19 treatment currently in clinicaltrials [73], opening the door to a new era in which AI-based in silico studies will becomemainstream. AI may also help in the design of new randomized trials by selecting the mostappropriate subpopulations for testing specific drugs according to the best fitted a-prioryhypothesis based on the mechanisms of action of the drugs.
6. Ethics, Data Science and Data Sharing in the Times of COVID-19
Sharing data and results arising from public research projects promotes scientificprogress. This concept, widely accepted among research communities, funding bodies,and regulatory agencies, has acquired an unprecedented dimension during the COVID-19pandemic. The scientific and medical communities have both put in enormous effort topromote data sharing as fast as possible in order to advance our knowledge during the pan-demic and design more effective ways to fight it back. Huge efforts have been performedto identify biological and non-biological factors behind the enormous heterogeneity ofCOVID-19 outcomes and to design strategies able to improve the standard of care givento patients. Sharing clinical and genomic data can improve research efficiency, especiallyin the genetics field, where the number of samples required to achieve enough statisticalpower is high. The analysis and re-use of large datasets also allow performing studies thatintegrate better genomic and phenomic variations, increasing research translationality and
11
J. Pers. Med. 2021, 11, 475
reproducibility. Last but not least, it ensures transparency of previous studies while maxi-mizing the utility of existing datasets. Several public resources have been set in place toaccess genomic data. 1000 Genomes Project [74], dbGaP [75], European Genome-phenomeArchive [76] or the NHGRI AnVIL [77], a US cloud environment for the analysis of largegenomic and related datasets, are some examples of databases that have provided servicesfor the archiving and distribution of genetic and phenotypic data resulting from biomedicalresearch projects during this pandemic.
Big data genomic and phenomic databases are necessary to promote personalizedmedicine but imply certain risks and challenges that need to be taken into considerationthat can be roughly grouped into three main categories: issues associated with privacy,the occurrence of incidental findings and challenges associated with the safe managementand sharing of genomic data. Researchers need to ensure that patients are well-informedabout the benefits and potential risks of data sharing while educating participants aboutthe importance of sample donation as the main pillar of scientific and medical progress.A great example is depicted in some sentences included in the 1000 Genomes Projectconsent template: "there may be new ways of linking information back to you that we cannotforesee now. [...] We believe that the benefits of learning more about human genetic variationand how it relates to health and disease outweigh the current and potential future risks, butthis is something that you must judge for yourself." Strategies to ensure patient privacy gofrom oversampling (recruiting more individuals than the final number to be included) tonot collecting personal data besides sex. Aggregating data, such as allele frequency orallele-presence information, is another strategy that allows protecting participant privacyand also simplifies data sharing and storage. Genomic and phenomic databases usuallyincorporate controlled-access mechanisms to protect the privacy and confidentiality ofresearch participants, limiting and/or restricting access to personal information. Implementtechnology safeguards to prevent unauthorized access, use, or disclosure of confidentialand private data is a common feature of most of them. Data at EGA, for example, iscollected from individuals that authorize data release only for specific research use, andstrict protocols govern how information is managed, stored and distributed. EGA databasescontain several measures to ensure the security of data, including a regular risk assessmentand mitigation, audit logs, cryptography and communication security, among others [76].IT security has become especially relevant with the transition from locked filing cabinets todigital databases, which bring enormous opportunities for big data analysis but also havean additional set of risks that need to be taken into account. NHGRI AnVIL, for example,uses NIST 800-53 Rev 4 security controls at the Moderate baseline and NIST 800-53 privacycontrols documented, security protocols similar to those established in the industry [77].
The COVID-19 Host Genetics Initiative represents a good example of a huge world-wide effort made for COVID-19 genetic and phenotypic data sharing (+160 registeredstudies +19 countries). This initiative allows submitting individual-level data that includesgenetic and clinical phenotype data and also study summary statistics. Individual-leveldata is shared via the European Genome-phenome Archive (EGA) or via NHGRI AnVIL(US studies). Researchers are allowed to download the metanalysis summary statisticsas they are released by the consortia and also have a genome browser that allows themto explore all genetic variations found associated with infection and/or disease severity.Researchers can also apply for study-specific summary statistics and can also requestaccess to the initiative’s data deposited on EGA and AnVIL via their respective Data AccessCommittee, which is composed of the PIs of the studies that have deposited the data (EGA)or managed directly by the NIH (AnVIL). Several genetic studies from Spain, includingsome launched from Andalusia, are currently contributing with data and samples to thisinitiative, which is currently working together with the EGA and with the ELIXIR networkto establish the EGA Federation network and ensure that data from all countries can bedeposited within all national jurisdictions [78].
12
J. Pers. Med. 2021, 11, 475
7. Translating Personalized Medicine into Clinical Practice: The Andalusian Experience
Andalusia, located in the south of Spain and with 8.5 million inhabitants, is the thirdmost populated region in Europe, and it is larger than half of the countries of the Euro-pean Union. Remarkably, Andalusia has the whole population under a unique universalelectronic health record, thus forming the largest resource of this kind in the EuropeanUnion. Under this scenario, all the decisions and strategies taken around this huge clinicaldatabase acquire enormous relevance. Since 2001, the data recorded by the AndalusianPublic Health System (SSPA) are systematically uploaded to the Population Health Base(BPS), making it one of the largest repositories of highly detailed clinical data in the world(with over 13 million registries) [79]. BPS constitutes a unique and privileged environmentto carry out large-scale RWE studies. Actually, one of the BPS missions is facilitating thediscovery of new biomedical knowledge by means secondary use of clinical data [80],paying special attention to the evaluation of impact in personal data protection [81].
The Andalusian SARS-CoV-2 genomic surveillance project [82] set the ground forthe implementation of a clinical circuit for controlling the COVID-19 pandemic as well asother potential future emergent viruses. This project engaged the 16 main tertiary hospitalsin Andalusia, along with three research centers with genome sequencing facilities (IBIS,Genyo and CABIMER) and the Bioinformatics Area of the Progress and Health Foundationin a circuit of genomic data production. In parallel, the COVID-19 registries from PublicHealth and the BPS provide ongoing and retrospective clinical data, respectively, to theBioinformatics Area, where the data are linked to the genomic data in a circuit of genomicdata interpretation. Bioinformatics then provide (i) to the microbiologists at hospitals withinformation on the lineage, clade and relevant mutations in the virus; (ii) to Public Healthwith epidemiological data; (iii) to BPS with the viral sequences for further secondary clinicaldata studies; (iv) to the research community with the viral genome sequences through theEuropean Nucleotide Archive (ENA).
The Andalusian Health Research and Innovation Strategy 2020–2023, presented on2 September 2020, focused on the improvement of the wellbeing of citizens in the frame-work of Horizon Europe 2027, including a response to the impact of the challenges of theSARS-CoV2 pandemic. The Regional Health Ministry has been working and collaboratingon different initiatives for some time: (a) To promote Digital Clinical records (Diraya®),integrating all the information on people into a Single Health Record and facilitating accessto all the services and provisions of the health system, ensuring that all the relevant infor-mation is structured. As opposed to systems that merely assemble records, the design of theapplications in Diraya shared tables, codes and catalogues; (b) To create the BioinformaticsResearch Area [82], on 14 June 2016, to improve the technological support of personalizedmedicine, genomics and clinical genetics programs in the SSPA; (c) To create, by resolu-tion of the management direction of the Andalusian Health Service 11 March 2018, theinformation system called BPS of the Andalusian Public Health System, which integratesclinical and epidemiological data from each patient; (d) The resolution of 9 March 2018, ofthe Public Business Entity Red.es, by which the Agreement with the Andalusian HealthService is published for the application of Information and Communication Technologiesin the management of chronicity and continuity of care in the SSPA; (e) On 27 June 2019,at the meeting of the board of the Progress and Health Foundation (FPS), the creation ofthe B-D Area in Health of Andalusia was approved as an area integrated into the FPSin order to provide the SSPA of a platform of powerful, safe and data analysis tools ori-ented to health results and the optimization of healthcare processes based on personalizedmedicine; (f) During the last quarter of 2020, the coordination of the information andcommunication technologies (ICT) strategy of the SSPA was promoted; (g) The promotionof research on COVID19 in Andalusia, as of December 6, the number of research studiesrelated to COVID-19, presented and/or evaluated in our Research Ethics Committees inAndalusia has been 277, with participation in 24 clinical trials addressing all the spectrumof COVID-19 from epidemiology, diagnosis, biomarkers, genetics (as a contributing studyof the COVID-HGI), therapeutic interventions and vaccination. Some of them granted
13
J. Pers. Med. 2021, 11, 475
under the specific support for financing research, development and innovation (R+D+i)in COVID-19; (h) The Ministry of Health and Families, through its General Secretariat forResearch, Development and Innovation in Health, has also set up three working groups:(1) prospective studies on the evolution of the pandemic; (2) personalized medicine inCovid-19; and (3) supplement and nutritional intervention against the SARS-Cov2 virus.
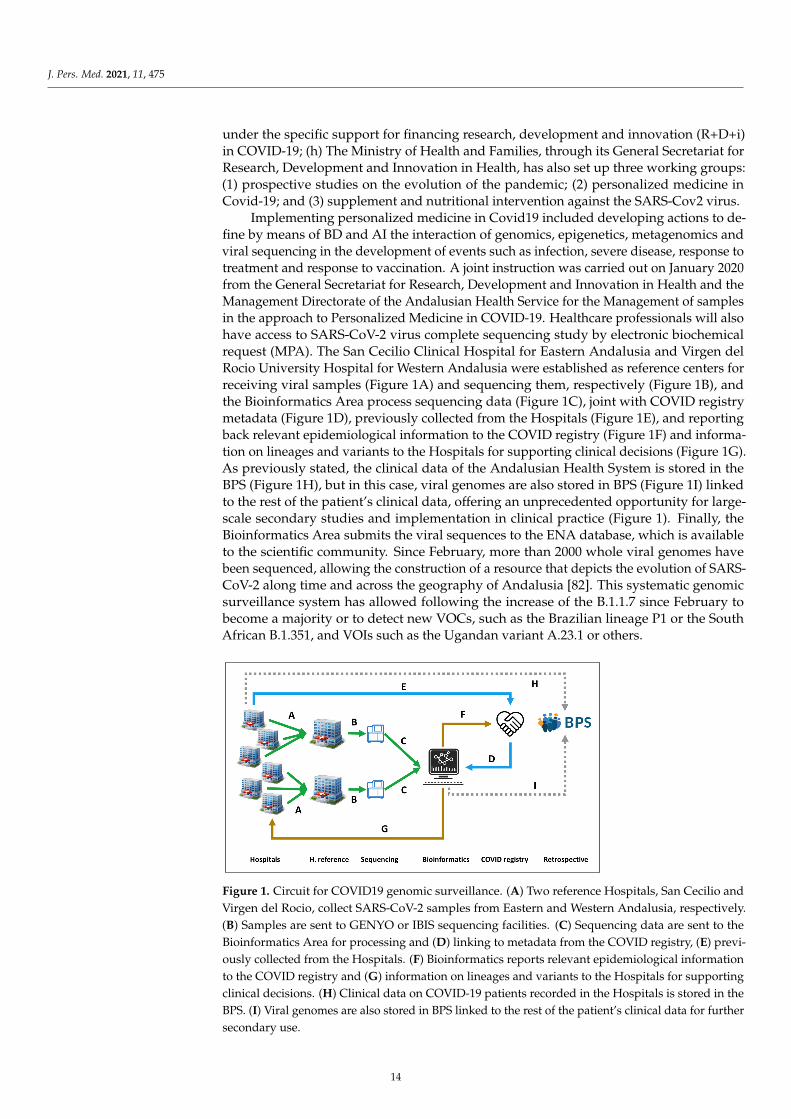
Implementing personalized medicine in Covid19 included developing actions to de-fine by means of BD and AI the interaction of genomics, epigenetics, metagenomics andviral sequencing in the development of events such as infection, severe disease, response totreatment and response to vaccination. A joint instruction was carried out on January 2020from the General Secretariat for Research, Development and Innovation in Health and theManagement Directorate of the Andalusian Health Service for the Management of samplesin the approach to Personalized Medicine in COVID-19. Healthcare professionals will alsohave access to SARS-CoV-2 virus complete sequencing study by electronic biochemicalrequest (MPA). The San Cecilio Clinical Hospital for Eastern Andalusia and Virgen delRocio University Hospital for Western Andalusia were established as reference centers forreceiving viral samples (Figure 1A) and sequencing them, respectively (Figure 1B), andthe Bioinformatics Area process sequencing data (Figure 1C), joint with COVID registrymetadata (Figure 1D), previously collected from the Hospitals (Figure 1E), and reportingback relevant epidemiological information to the COVID registry (Figure 1F) and informa-tion on lineages and variants to the Hospitals for supporting clinical decisions (Figure 1G).As previously stated, the clinical data of the Andalusian Health System is stored in theBPS (Figure 1H), but in this case, viral genomes are also stored in BPS (Figure 1I) linkedto the rest of the patient’s clinical data, offering an unprecedented opportunity for large-scale secondary studies and implementation in clinical practice (Figure 1). Finally, theBioinformatics Area submits the viral sequences to the ENA database, which is availableto the scientific community. Since February, more than 2000 whole viral genomes havebeen sequenced, allowing the construction of a resource that depicts the evolution of SARS-CoV-2 along time and across the geography of Andalusia [82]. This systematic genomicsurveillance system has allowed following the increase of the B.1.1.7 since February tobecome a majority or to detect new VOCs, such as the Brazilian lineage P1 or the SouthAfrican B.1.351, and VOIs such as the Ugandan variant A.23.1 or others.J. Pers. Med. 2021, 11, x FOR PEER REVIEW 13 of 17
Figure 1. Circuit for COVID19 genomic surveillance. (A) Two reference Hospitals, San Cecilio and Virgen del Rocio, collect
SARS-CoV-2 samples from Eastern and Western Andalusia, respectively. (B) Samples are sent to GENYO or IBIS sequenc-
ing facilities. (C) Sequencing data are sent to the Bioinformatics Area for processing and (D) linking to metadata from the
COVID registry, (E) previously collected from the Hospitals. (F) Bioinformatics reports relevant epidemiological infor-
mation to the COVID registry and (G) information on lineages and variants to the Hospitals for supporting clinical deci-
sions. (H) Clinical data on COVID-19 patients recorded in the Hospitals is stored in the BPS. (I) Viral genomes are also
stored in BPS linked to the rest of the patient’s clinical data for further secondary use.
8. Concluding Remarks
The pandemic has pushed us to a new scenario promoting association and relation-
ship between governments and the scientific community at the same time that emerged
multidisciplinary teams to take care of this complex disease together with telemedicine to
guarantee health care keeping at home. Deep sequencing, bioinformatic area and clini-
cians working on personalized medicine could help to better understand the interaction
between the virus and the host. These tools should be available for physicians able to in-
clude in their everyday decision-making process. The increasing need for personalized
medicine supported by scientific and objective data, big data and AI systems to create
algorithms based on individual variables (genomic), the host and the guest (pathogen and
patient subject). Public and private investment for the generation and transfer of
knowledge could support the development of high-quality translational and collaborative
research to face a threatening situation similar to this terrible pandemic.
Author Contributions: Conception and design: J.D., D.M.-M., I.T., M.R.-G.; Analysis & interpreta-
tion; All authors contributed; Writing the article: J.D., D.M.-M., M.R.-G., I.T.; Critical revision &
modifications: All authors contributed; Data collection: All authors contributed; Funding: All au-
thors contributed. Literature search: All authors contributed; Figures, tables: D.M.-M., J.D. All au-
thors have read and agreed to the published version of the manuscript.
Funding: The authors included in this review have received funding for two COVID-19 projects
(COVID GWAs, Premed COVID-19) from the Consejería de Salud y Familias of the Andalusian
Government. DMM`s contract is supported by the Andalussian government (Proyectos Estraté-
gicos Fondos Feder PE-0451-2018).
Figure 1. Circuit for COVID19 genomic surveillance. (A) Two reference Hospitals, San Cecilio andVirgen del Rocio, collect SARS-CoV-2 samples from Eastern and Western Andalusia, respectively.(B) Samples are sent to GENYO or IBIS sequencing facilities. (C) Sequencing data are sent to theBioinformatics Area for processing and (D) linking to metadata from the COVID registry, (E) previ-ously collected from the Hospitals. (F) Bioinformatics reports relevant epidemiological informationto the COVID registry and (G) information on lineages and variants to the Hospitals for supportingclinical decisions. (H) Clinical data on COVID-19 patients recorded in the Hospitals is stored in theBPS. (I) Viral genomes are also stored in BPS linked to the rest of the patient’s clinical data for furthersecondary use.
14
J. Pers. Med. 2021, 11, 475
8. Concluding Remarks
The pandemic has pushed us to a new scenario promoting association and relation-ship between governments and the scientific community at the same time that emergedmultidisciplinary teams to take care of this complex disease together with telemedicine toguarantee health care keeping at home. Deep sequencing, bioinformatic area and cliniciansworking on personalized medicine could help to better understand the interaction betweenthe virus and the host. These tools should be available for physicians able to include intheir everyday decision-making process. The increasing need for personalized medicinesupported by scientific and objective data, big data and AI systems to create algorithmsbased on individual variables (genomic), the host and the guest (pathogen and patientsubject). Public and private investment for the generation and transfer of knowledge couldsupport the development of high-quality translational and collaborative research to face athreatening situation similar to this terrible pandemic.
Author Contributions: Conception and design: J.D., D.M.-M., I.T., M.R.-G.; Analysis & interpre-tation; All authors contributed; Writing the article: J.D., D.M.-M., M.R.-G., I.T.; Critical revision& modifications: All authors contributed; Data collection: All authors contributed; Funding: Allauthors contributed. Literature search: All authors contributed; Figures, tables: D.M.-M., J.D. Allauthors have read and agreed to the published version of the manuscript.
Funding: The authors included in this review have received funding for two COVID-19 projects(COVID GWAs, Premed COVID-19) from the Consejería de Salud y Familias of the AndalusianGovernment. DMM‘s contract is supported by the Andalussian government (Proyectos EstratégicosFondos Feder PE-0451-2018).
Institutional Review Board Statement: The circuit for COVID-19 genomic surveillance (PremedCovid) is being conducted according to the guidelines of the Declaration of Helsinki, and has beenreviewed and approved by the Andalusian Ethics Biomedicine Committee (ethics id: 1954-N-20).
Informed Consent Statement: Not applicable.
Data Availability Statement: Not applicable.
Acknowledgments: We acknowledge all members of the “Grupo de Trabajo en Medicina Personal-izada contra el COVID-19 de Andalucía.”
Conflicts of Interest: The authors declare no conflict of interest. The funders had no role in thedesign of the study, the writing of the manuscript or in the decision to publish it.
References1. Loucera, C.; Esteban-Medina, M.; Rian, K.; Falco, M.M.; Dopazo, J.; Peña-Chilet, M. Drug repurposing for COVID-19 using
machine learning and mechanistic models of signal transduction circuits related to SARS-CoV-2 infection. Signal Transduct. Target.Ther. 2020, 5, 290. [CrossRef]
2. Friedman, J.M.; Jones, K.L.; Carey, J.C. Exome Sequencing as Part of a Multidisciplinary Approach to Diagnosis-Reply. JAMA2020, 324, 2445–2446. [CrossRef]
3. Wolff, D.; Nee, S.; Hickey, N.S.; Marschollek, M. Risk factors for Covid-19 severity and fatality: A structured literature review.Infection 2021, 49, 15–28. [CrossRef]
4. Severe Covid-19 GWAS Group; Ellinghaus, D.; Degenhardt, F.; Bujanda, L.; Buti, M.; Albillos, A.; Invernizzi, P.; Fernández, J.;Prati, D.; Baselli, G.; et al. Genomewide Association Study of Severe Covid-19 with Respiratory Failure. N. Engl. J. Med. 2020, 383,1522–1534. [CrossRef]
5. Shelton, J.F.; Shastri, A.J.; Ye, C.; Weldon, C.H.; Filshtein-Sonmez, T.; Coker, D.; Symons, A.; Esparza-Gordillo, J.; 23andMeCOVID-19 Team; Aslibekyan, S.; et al. Trans-ethnic analysis reveals genetic and non-genetic associations with COVID-19susceptibility and severity. Nat. Genet. 2021. [CrossRef]
6. Roberts, G.H.L.; Park, D.S.; Coignet, M.V.; McCurdy, S.R.; Knight, S.C.; Partha, R.; Rhead, B.; Zhang, M.; Berkowitz, N.;Ancestry DNA Science Team; et al. Ancestry DNA COVID-19 Host Genetic Study Identifies Three Novel Loci. Available online:https://www.medrxiv.org/content/10.1101/2020.10.06.20205864v1 (accessed on 19 May 2021).
7. Pairo-Castineira, E.; Clohisey, S.; Klaric, L.; Bretherick, A.D.; Rawlik, K.; Pasko, D.; Walker, S.; Parkinson, N.; Fourman, M.H.;Russell, C.D.; et al. Genetic mechanisms of critical illness in Covid-19. Nature 2020. [CrossRef]
15
J. Pers. Med. 2021, 11, 475
8. Horowitz, J.E.; Kosmicki, J.A.; Damask, A.; Sharma, D.; Roberts, G.H.L.; Justice, A.E.; Banerjee, N.; Coignet, M.V.; Yadav, A.;Leader, J.B. Common genetic variants identify therapeutic targets for COVID-19 and individuals at high risk of severe disease.MedRxiv 2020. [CrossRef]
9. The COVID-19 Host Genetics Initiative; Ganna, A. Mapping the human genetic architecture of COVID-19 by worldwidemeta-analysis. medRxiv 2021. [CrossRef]
10. Zeberg, H.; Pääbo, S. The major genetic risk factor for severe COVID-19 is inherited from Neanderthals. Nature 2020, 587, 610–612.[CrossRef] [PubMed]
11. Nakanishi, T.; Pigazzini, S.; Degenhardt, F.; Cordioli, M.; Butler-Laporte, G.; Maya-Miles, D.; Nafría-Jiménez, B.; Bouysran, Y.;Niemi, M.; Palom, A.; et al. Age-dependent impact of the major common genetic risk factor for COVID-19 on severity andmortality. medRxiv 2021. [CrossRef]
12. Bianco, C.; Baselli, G.; Malvestiti, F.; Santoro, L.; Pelusi, S.; Manunta, M. Genetic insight into COVID-19-related liver injury. LiverInt. 2020. [CrossRef]
13. Valenti, L.; Griffini, S.; Lamorte, G.; Grovetti, E.; Uceda Renteria, S.C.; Malvestiti, F.; Scudeller, L.; Bandera, A.; Peyvandi, F.; Prati,D.; et al. Chromosome 3 cluster rs11385942 variant links complement activation with severe COVID-19. J. Autoimmun. 2021,117, 102595. [CrossRef]
14. Schmiedel, B.J.; Chandra, V.; Rocha, J.; Gonzalez-Colin, C.; Bhattacharyya, S.; Madrigal, A.; Ottensmeier, C.H.; Ay, F.; Vijayanand, P.COVID-19 Genetic Risk Variants Are Associated with Expression of Multiple Genes in Diverse IMMUNE cell Types. bioRxiv 2020.[CrossRef]
15. Szabo, P.A.; Dogra, P.; Gray, J.I.; Wells, S.B.; Connors, T.J.; Weisberg, S.P.; Krupska, I.; Matsumoto, R.; Poon, M.M.L.; Idzikowski,E.; et al. Analysis of respiratory and systemic immune responses in COVID-19 reveals mechanisms of disease pathogenesis.medRxiv 2020. [CrossRef]
16. Wei, Q.; Gu, Y.-F.; Zhang, Q.-J.; Yu, H.; Peng, Y.; Williams, K.W.; Wang, R.; Yu, K.; Liu, T.; Liu, Z.-P. Lztfl1/BBS17 controls energyhomeostasis by regulating the leptin signaling in the hypothalamic neurons. J. Mol. Cell Biol. 2018, 10, 402–410. [CrossRef][PubMed]
17. Xiao, F.; Tang, M.; Zheng, X.; Liu, Y.; Li, X.; Shan, H. Evidence for Gastrointestinal Infection of SARS-CoV-2. Gastroenterology 2020,158, 1831–1833.e3. [CrossRef] [PubMed]
18. Lamers, M.M.; Beumer, J.; Van Der Vaart, J.; Knoops, K.; Puschhof, J.; Breugem, T.I.; Ravelli, R.B.G.; Van Schayck, J.P.; Mykytyn,A.Z.; Duimel, H.Q.; et al. SARS-CoV-2 productively infects human gut enterocytes. Science 2020, 369, 50–54. [CrossRef] [PubMed]
19. Zhou, J.; Li, C.; Liu, X.; Chiu, M.C.; Zhao, X.; Wang, D.; Wei, Y.; Lee, A.; Zhang, A.J.; Chu, H.; et al. Infection of bat and humanintestinal organoids by SARS-CoV-2. Nat. Med. 2020, 26, 1077–1083. [CrossRef]
20. Olaussen, R.W.; Karlsson, M.R.; Lundin, K.E.; Jahnsen, J.; Brandtzaeg, P.; Farstad, I.N. Reduced chemokine receptor 9 onintraepithelial lymphocytes in celiac disease suggests persistent epithelial activation. Gastroenterology 2007, 132, 2371–2382.[CrossRef] [PubMed]
21. Fu, H.; Jangani, M.; Parmar, A.; Wang, G.; Coe, D.; Spear, S.; Sandrock, I.; Capasso, M.; Coles, M.; Cornish, G.; et al. A Subsetof CCL25-Induced Gut-Homing T Cells Affects Intestinal Immunity to Infection and Cancer. Front. Immunol. 2019, 10, 271.[CrossRef]
22. López-Pacheco, C.; Soldevila, G.; Du Pont, G.; Hernández-Pando, R.; García-Zepeda, E.A. CCR9 Is a Key Regulator of EarlyPhases of Allergic Airway Inflammation. Mediat. Inflamm. 2016, 2016, 3635809. [CrossRef] [PubMed]
23. Khan, M.; Imam, H.; Siddiqui, A. Subversion of cellular autophagy during virus infection: Insights from hepatitis B and hepatitisC viruses. Liver Res. 2018, 2, 146–156. [CrossRef]
24. Wozniak, A.L.; Long, A.; Jones-Jamtgaard, K.N.; Weinman, S.A. Hepatitis C virus promotes virion secretion through cleavage ofthe Rab7 adaptor protein RILP. Proc. Natl. Acad. Sci. USA 2016, 113, 12484–12489. [CrossRef]
25. Boyaka, P.N.; McGhee, J.R.; Czerkinsky, C.; Mestecky, J. Mucosal Vaccines: An Overview. Mucosal Immunol. 2005, 855–874.[CrossRef]
26. Lillard, J.W., Jr.; Boyaka, P.N.; Hedrick, J.A.; Zlotnik, A.; McGhee, J.R. Lymphotactin acts as an innate mucosal adjuvant. J.Immunol. 1999, 162, 1959–1965. [PubMed]
27. Shan, L.; Qiao, X.; Oldham, E.; Catron, D.; Kaminski, H.; Lundell, D.; Zlotnik, A.; Gustafson, E.; Hedrick, J.A. Identification ofviral macrophage inflammatory protein (vMIP)-II as a ligand for GPR5/XCR1. Biochem. Biophys. Res. Commun. 2000, 268, 938–941.[CrossRef]
28. Kim, B.O.; Liu, Y.; Zhou, B.Y.; He, J.J. Induction of C chemokine XCL1 (lymphotactin/single C motif-1 alpha/activation-induced,T cell-derived and chemokine-related cytokine) expression by HIV-1 Tat protein. J. Immunol. 2004, 172, 1888–1895. [CrossRef]
29. Uddin, M.; Mustafa, F.; Rizvi, T.A.; Loney, T.; Suwaidi, H.A.; Al-Marzouqi, A.H.H.; Eldin, A.K.; Alsabeeha, N.; Adrian, T.E.;Stefanini, C.; et al. SARS-CoV-2/COVID-19: Viral Genomics, Epidemiology, Vaccines, and Therapeutic Interventions. Viruses2020, 12, 526. [CrossRef]
30. Hadfield, J.; Megill, C.; Bell, S.M.; Huddleston, J.; Potter, B.; Callender, C.; Sagulenko, P.; Bedford, T.; Neher, R.A. Nextstrain:Real-time tracking of pathogen evolution. Bioinformatics 2018, 34, 4121–4123. [CrossRef] [PubMed]
31. Duchene, S.; Featherstone, L.; Haritopoulou-Sinanidou, M.; Rambaut, A.; Lemey, P.; Baele, G. Temporal signal and the phylody-namic threshold of SARS-CoV-2. Virus Evol. 2020, 6, veaa061. [CrossRef]
16
J. Pers. Med. 2021, 11, 475
32. Toyoshima, Y.; Nemoto, K.; Matsumoto, S.; Nakamura, Y.; Kiyotani, K. SARS-CoV-2 genomic variations associated with mortalityrate of COVID-19. J. Hum. Genet. 2020, 65, 1075–1082. [CrossRef] [PubMed]
33. Li, Q.; Wu, J.; Nie, J.; Zhang, L.; Hao, H.; Liu, S.; Zhao, C.; Zhang, Q.; Liu, H.; Nie, L.; et al. The impact of mutations in SARS-CoV-2spike on viral infectivity and antigenicity. Cell 2020, 182, 1284–1294.e9. [CrossRef] [PubMed]
34. Pachetti, M.; Marini, B.; Benedetti, F.; Giudici, F.; Mauro, E.; Storici, P.; Masciovecchio, C.; Angeletti, S.; Ciccozzi, M.; Gallo, R.C.;et al. Emerging SARS-CoV-2 mutation hot spots include a novel RNA-dependent-RNA polymerase variant. J. Transl. Med. 2020,18, 1–9. [CrossRef]
35. Young, B.E.; Fong, S.W.; Chan, Y.H.; Mak, T.M.; Ang, L.W.; Anderson, D.E.; Lee, C.Y.; Amrun, S.N.; Lee, B.; Goh, Y.S.; et al. Effectsof a major deletion in the SARS-CoV-2 genome on the severity of infection and the inflammatory response: An observationalcohort study. Lancet 2020, 396, 603–611. [CrossRef]
36. Popa, A.; Genger, J.W.; Nicholson, M.D.; Penz, T.; Schmid, D.; Aberle, S.W.; Agerer, B.; Lercher, A.; Endler, L.; Colaço, H.;et al. Genomic epidemiology of superspreading events in Austria reveals mutational dynamics and transmission properties ofSARS-CoV-2. Sci. Transl. Med. 2020, 12. [CrossRef] [PubMed]
37. Oude Munnink, B.B.; Sikkema, R.S.; Nieuwenhuijse, D.F.; Molenaar, R.J.; Munger, E.; Molenkamp, R.; van der Spek, A.; Tolsma,P.; Rietveld, A.; Brouwer, M.; et al. Transmission of SARS-CoV-2 on mink farms between humans and mink and back to humans.Science 2021, 371, 172–177. [CrossRef]
38. McCarthy, K.R.; Rennick, L.J.; Nambulli, S.; Robinson-McCarthy, L.R.; Bain, W.G.; Haidar, G.; Duprex, W.P. Recurrent deletions inthe SARS-CoV-2 spike glycoprotein drive antibody escape. Science 2021, 371, 1139–1142. [CrossRef]
39. Davies, N.G.; Jarvis, C.I.; CMMID COVID-19 Working Group; Edmunds, W.J.; Jewell, N.P.; Diaz-Ordaz, K.; Keogh, R.H. Increasedmortality in community-tested cases of SARS-CoV-2 lineage B.1.1.7. Nature 2021. [CrossRef]
40. Van Dorp, L.; Richard, D.; Tan, C.; Shaw, L.; Acman, M.; Balloux, F. No evidence for increased transmissibility from recurrentmutations in SARS-CoV-2. Nat. Commun. 2020, 11, 1–8. [CrossRef]
41. Sheahan, T.P.; Sims, A.C.; Leist, S.R.; Schäfer, A.; Won, J.; Brown, A.J.; Montgomery, S.A.; Hogg, A.; Babusis, D.; Clarke, M.O.; et al.Comparative therapeutic efficacy of remdesivir and combination lopinavir, ritonavir, and interferon beta against MERS-CoV. Nat.Commun. 2020, 11, 1–14. [CrossRef] [PubMed]
42. Agostini, M.L.; Andres, E.L.; Sims, A.C.; Graham, R.L.; Sheahan, T.P.; Lu, X.; Smith, E.C.; Case, J.B.; Feng, J.Y.; Jordan, R.; et al.Coronavirus susceptibility to the antiviral remdesivir (GS-5734) is mediated by the viral polymerase and the proofreadingexoribonuclease. MBio 2018, 9, e00221-18. [CrossRef] [PubMed]
43. Martinot, M.; Jary, A.; Fafi-Kremer, S.; Leducq, V.; Delagreverie, H.; Garnier, M.; Pacanowski, J.; Mékinian, A.; Pirenne, F.;Tiberghien, P.; et al. Remdesivir failure with SARS-CoV-2 RNA-dependent RNA-polymerase mutation in a B-cell immunodeficientpatient with protracted Covid-19. Clin. Infect. Dis. 2020. [CrossRef]
44. European Centre for Disease Prevention and Control. ECDC Strategic Framework for the Integration of Molecular and Ge-nomic Typing into European Surveillance and Multi-Country Outbreak Investigations. Available online: https://www.ecdc.europa.eu/en/publications-data/ecdc-strategic-framework-integration-molecular-and-genomic-typing-european (accessed on31 December 2020).
45. Expert Opinion on Whole Genome Sequencing for Public Health Surveillance. Available online: https://www.ecdc.europa.eu/en/publications-data/expert-opinion-whole-genome-sequencing-public-health-surveillance (accessed on 31 December 2020).
46. Report 42—Transmission of SARS-CoV-2 Lineage B.1.1.7 in England: Insights from Linking Epidemiological and Genetic Data.2020. Available online: https://www.imperial.ac.uk/mrc-global-infectious-disease-analysis/covid-19/report-42-sars-cov-2-variant/ (accessed on 2 January 2021).
47. The PIRASOA Programme. 2014. Available online: http://pirasoa.iavante.es/ (accessed on 4 January 2021).48. SIEGA (Integrated System for Genomic Epidemiology in Andalusia). 2020. Available online: http://clinbioinfosspa.es/projects/
siega/ (accessed on 4 January 2021).49. The Andalusian SARS-CoV-2 Genomic Surveillance Project. 2020. Available online: http://clinbioinfosspa.es/projects/covseq/
(accessed on 4 January 2021).50. Mas, V.; Nair, H.; Campbell, H.; Melero, J.A.; Williams, T.C. Antigenic and sequence variability of the human respiratory syncytial
virus F glycoprotein compared to related viruses in a comprehensive dataset. Vaccine 2018, 36, 6660–6673. [CrossRef] [PubMed]51. Simões, E.A.F.; Forleo-Neto, E.; Geba, G.P.; Kamal, M.; Yang, F.; Cicirello, H.; Houghton, M.R.; Rideman, R.; Zhao, Q.; Benvin, S.L.;
et al. Suptavumab for the prevention of medically attended respiratory syncytial virus infection in preterm infants. Clin. Infect.Dis. 2020. [CrossRef]
52. Romanò, L.; Paladini, S.; Galli, C.; Raimondo, G.; Pollicino, T.; Zanetti, A.R. Hepatitis B vaccination: Are escape mutant viruses amatter of concern? Human Vaccines Immunother. 2015, 1, 53–57. [CrossRef]
53. Ali, H.; Donovan, B.; Wand, H.; Read, T.R.; Regan, D.G.; Grulich, A.E.; Fairley, C.K.; Guy, R.J. Genital warts in young Australiansfive years into national human papillomavirus vaccination programme: National surveillance data. Br. Med. J. 2013, 346, f2032.[CrossRef]
54. Weisblum, Y.; Schmidt, F.; Zhang, F.; DaSilva, J.; Poston, D.; Lorenzi, J.C.; Muecksch, F.; Rutkowska, M.; Hoffmann, H.H.;Michailidis, E. Escape from neutralizing antibodies by SARS-CoV-2 spike protein variants. eLife 2020, 9, e61312. [CrossRef][PubMed]
17
J. Pers. Med. 2021, 11, 475
55. Andreano, E.; Piccini, G.; Licastro, D.; Casalino, L.; Johnson, N.V.; Paciello, I.; Monego, S.D.; Pantano, E.; Manganaro, N.; Manenti,A. SARS-CoV-2 escape in vitro from a highly neutralizing COVID-19 convalescent plasma. bioRxiv 2020. (Preprint). [CrossRef]
56. Poland, G.A.; Ovsyannikova, I.G.; Kennedy, R.B. Personalized vaccinology: A review. Vaccine 2018, 36, 5350–5357. [CrossRef][PubMed]
57. Grifoni, A.; Sidney, J.; Zhang, Y.; Scheuermann, R.H.; Peters, B.; Sette, A. A sequence homology and bioinformatic approach canpredict candidate targets for immune responses to SARS-CoV-2. Cell Host Microbe 2020, 27, 671–680.e2. [CrossRef]
58. Kiyotani, K.; Toyoshima, Y.; Nemoto, K.; Nakamura, Y. Bioinformatic prediction of potential T cell epitopes for SARS-Cov-2. J.Human Genet. 2020, 65, 569–575. [CrossRef] [PubMed]
59. Nguyen, A.; David, J.K.; Maden, S.K.; Wood, M.A.; Weeder, B.R.; Nellore, A.; Thompson, R.F. Human leukocyte antigensusceptibility map for SARS-CoV-2. J. Virol. 2020, 94, e00510–e00520. [CrossRef]
60. Barquera, R.; Collen, E.; Di, D.; Buhler, S.; Teixeira, J.; Llamas, B.; Nunes, J.M.; Sanchez-Mazas, A. Binding affinities of 438 HLAproteins to complete proteomes of seven pandemic viruses and distributions of strongest and weakest HLA peptide binders inpopulations worldwide. HLA 2020, 96, 277–298. [CrossRef] [PubMed]
61. Omersel, J.; Karas Kuželicki, N. Vaccinomics and Adversomics in the Era of Precision Medicine: A Review Based on HBV, MMR,HPV, and COVID-19 Vaccines. J. Clin. Med. 2020, 9, 3561. [CrossRef]
62. Densen, P. Challenges and opportunities facing medical education. Trans. Am. Clin. Climatol. Assoc. 2011, 122, 48–58. [PubMed]63. Sherman, R.E.; Anderson, S.A.; Dal Pan, G.J.; Gray, G.W.; Gross, T.; Hunter, N.L.; LaVange, L.; Marinac-Dabic, D.; Marks, P.W.;
Robb, M.A.; et al. Real-World Evidence—What Is It and What Can It Tell Us? N. Engl. J. Med. 2016, 375, 2293–2297. [CrossRef][PubMed]
64. Topol, E.J. High-performance medicine: The convergence of human and artificial intelligence. Nat. Med. 2019, 25, 44–56.[CrossRef]
65. Rajkomar, A.; Dean, J.; Kohane, I. Machine learning in medicine. N. Engl. J. Med. 2019, 380, 1347–1358. [CrossRef]66. van der Schaar, M.; Alaa, A.M.; Floto, A.; Gimson, A.; Scholtes, S.; Wood, A.; McKinney, E.; Jarrett, D.; Lio, P.; Ercole, A. How
artificial intelligence and machine learning can help healthcare systems respond to COVID-19. Mach Learn 2020, 110, 1–14.[CrossRef]
67. Martini, K.; Blüthgen, C.; Walter, J.E.; Messerli, M.; Nguyen-Kim, T.D.L.; Frauenfelder, T. Accuracy of Conventional and MachineLearning Enhanced Chest Radiography for the Assessment of COVID-19 Pneumonia: Intra-Individual Comparison with CT. J.Clin. Med. 2020, 9, 3576. [CrossRef]
68. Khanday, A.M.U.D.; Rabani, S.T.; Khan, Q.R.; Rouf, N.; Din, M.M.U. Machine learning based approaches for detecting COVID-19using clinical text data. Int. J. Inf. Technol. 2020, 12, 731–739. [CrossRef]
69. Yan, L.; Zhang, H.; Goncalves, J.; Xiao, Y.; Wang, M.; Guo, Y.; Sun, C.; Tang, X.; Jin, L.; Zhang, M.; et al. Prediction of survival forsevere Covid-19 patients with three clinical features: Development of a machine learning-based prognostic model with clinicaldata in Wuhan. medRxiv 2020. [CrossRef]
70. Alaa, A.M.; van der Schaar, M. Autoprognosis: Automated clinical prognostic modeling via bayesian optimization with structuredkernel learning. arXiv 2018, arXiv:180207207.
71. Ostaszewski, M.; Mazein, A.; Gillespie, M.E.; Kuperstein, I.; Niarakis, A.; Hermjakob, H.; Pico, A.R.; Willighagen, E.L.; Evelo,C.T.; Hasenauer, J.; et al. COVID-19 Disease Map, building a computational repository of SARS-CoV-2 virus-host interactionmechanisms. Sci. Data 2020, 7, 136. [CrossRef] [PubMed]
72. Harrison, C. Coronavirus puts drug repurposing on the fast track. Nat. Biotechnol. 2020, 38, 379–381. [CrossRef]73. Fragkou, P.C.; Belhadi, D.; Peiffer-Smadja, N.; Moschopoulos, C.D.; Lescure, F.X.; Janocha, H.; Karofylakis, E.; Yazdanpanah, Y.;
Mentré, F.; Skevaki, C.; et al. Review of trials currently testing treatment and prevention of COVID-19. Clin. Microbiol. Infect.2020, 26, 988–998. [CrossRef]
74. The 1000 Genomes Project. Available online: http://www.internationalgenome.org/ (accessed on 10 May 2021).75. dbGaP. Available online: https://www.ncbi.nlm.nih.gov/gap (accessed on 10 May 2021).76. The European Genome-Phenome Archive EGA. Available online: https://www.ebi.ac.uk/ega/home (accessed on 10 May 2021).77. NHGRI AnVIL. Available online: https://anvilproject.org/ (accessed on 10 May 2021).78. COVID-19 HGI: How to Share Data. Available online: https://www.covid19hg.org/data-sharing/ (accessed on 12 May 2021).79. Muñoyerro-Muñiz, D.; Goicoechea-Salazar, J.; García-León, F.; Laguna-Tellez, A.; Larrocha-Mata, D.; Cardero-Rivas, M. Health
record linkage: Andalusian health population database. Gaceta Sanitaria 2019, 34, 105–113. [CrossRef]80. BPS and Research. Andalusian Health Population Database (Base Poblacional de Salud), 2020. Available online: https://www.
sspa.juntadeandalucia.es/servicioandaluzdesalud/sites/default/files/sincfiles/wsas-mediamediafile_sasdocumento/2019/BPS_Investigaci%C3%B3n.pdf (accessed on 3 January 2021).
81. García-León, F.; Villegas-Portero, R.; Goicoechea-Salazar, J.; Muñoyerro-Muñiz, D.; Dopazo, J. Impact assessment on dataprotection in research projects. Gaceta Sanitaria 2020, 34, 521–523. [CrossRef]
82. Clinical Bioinformatics Area. Progress and Health Foundation, 2017. Available online: http://clinbioinfosspa.es/projects/covseq/indexEng.html (accessed on 3 April 2021).
18
Journal of
Personalized
Medicine
Article
The Impact of SARS-CoV-2 Pandemic on the New Cases ofT1DM in Children. A Single-Centre Cohort Study
Anca Andreea Boboc 1,†, Carmen Nicoleta Novac 1,†, Maria Teodora Ilie 1,† , Mara Ioana Ies, anu 1,†,Felicia Galos, 1,2,†, Mihaela Bălgrădean 1,2,† , Elena Camelia Berghea 1,2,*,† and Marcela Daniela Ionescu 1,2,†
Citation: Boboc, A.A.; Novac, C.N.;
Ilie, M.T.; Ies, anu, M.I.; Galos, , F.;
Balgradean, M.; Berghea, E.C.;
Ionescu, M.D. The Impact of
SARS-CoV-2 Pandemic on the New
Cases of T1DM in Children. A
Single-Centre Cohort Study. J. Pers.
Med. 2021, 11, 551. https://doi.org/
10.3390/jpm11060551
Academic Editor: Rutger
A. Middelburg
Received: 10 May 2021
Accepted: 11 June 2021
Published: 13 June 2021
Publisher’s Note: MDPI stays neutral
with regard to jurisdictional claims in
published maps and institutional affil-
iations.
Copyright: © 2021 by the authors.
Licensee MDPI, Basel, Switzerland.
This article is an open access article
distributed under the terms and
conditions of the Creative Commons
Attribution (CC BY) license (https://
creativecommons.org/licenses/by/
4.0/).
1 Marie Curie Emergency Children’s Hospital, 041451 Bucharest, Romania; [email protected] (A.A.B.);[email protected] (C.N.N.); [email protected] (M.T.I.);[email protected] (M.I.I.); [email protected] (F.G.); [email protected] (M.B.);[email protected] (M.D.I.)
2 Department of Pediatrics, Carol Davila University of Medicine and Pharmacy, 020021 Bucharest, Romania* Correspondence: [email protected]† All authors contributed equally.
Abstract: Type 1 diabetes mellitus (T1DM) represents one of the most frequent chronic illnessesaffecting children. The early diagnosis of this disease is crucial, as it plays a key role in preventingthe development of a life-threatening acute complication: diabetic ketoacidosis. The etiopathogeneticrole of viral infections has long been suggested and emerging data are pointing towards a complexbidirectional relationship between diabetes and COVID-19. The aim of this study is to assess theimpact of the COVID-19 pandemic on the incidence and severity of new T1DM cases in children inRomania. We analyzed the differences between a group of 312 patients diagnosed with T1DM inthe period 2003–2019 and a group of 147 children diagnosed during the pandemic. The data wereinvestigated using statistical analysis of a series of relevant variables. The total number of newlydiagnosed T1DM increased by 30.08% in the period March 2020–February 2021 compared to theprevious years. The patients in the pandemic group had a higher mean age at the onset of T1DM,were less frequently living in an urban area, and presented a higher mean value of HbA1c. Diabeticketoacidosis at the onset of T1DM was 67.40% more frequent, and a higher percentage of thesepatients presented with a severe form. The duration of T1DM symptoms did not differ significantlybetween the two groups. A number of 8 patients associated SARS-CoV-2 infection at the time ofT1DM diagnosis.
Keywords: early diagnosis; type 1 diabetes mellitus; children; COVID-19; epidemics; diabeticketoacidosis
1. Introduction
Type 1 diabetes mellitus (T1DM) is a metabolic disease characterized by the autoimmune-mediated destruction of the pancreatic β-cells that leads to a deficit in the production ofinsulin with various repercussions on the intermediary metabolism. T1DM represents oneof the most frequent chronic illnesses in pediatric population and has shown a continuouslyincreasing incidence over the last decades [1]. The most frequent clinical manifestations ofT1DM are weight loss, polyuria, and polydipsia; therefore, the rapid recognition of thesesymptoms plays a key role in making an early diagnosis and thus avoiding the progressiontowards diabetic ketoacidosis (DKA). DKA is a life-threatening acute complication thatcan be associated with the onset of T1DM. The incidence of DKA varies widely from onegeographic region to another, ranging from 15% to 70% in Europe and North America [2].
The specific etiopathogenetic mechanisms involved in the development of T1DMare not completely understood so far, but they are known to entail a complex interactionbetween the genome, metabolic processes, immune system characteristics, environmentalfactors, and microbiome [3]. Among the environmental factors, viral infections have long
19
J. Pers. Med. 2021, 11, 551
been considered triggers of the autoimmune process leading to the development of T1DM.Various mechanisms could explain the role that viral infections play in promoting theonset of T1DM in children. In patients with a predisposing background of genetic andimmunological factors, the exposure to certain viruses might accelerate the final processesleading to the onset of the disease [4].
COVID-19 is a highly infectious respiratory disease determined by SARS-CoV-2 thatspread rapidly across the world, having been declared a pandemic on 11 March 2020. Inchildren, the disease has a milder course, being asymptomatic in many cases and having amortality rate of 0.18% in patients hospitalized for COVID-19 [5]. In Romania, the first caseof SARS-CoV-2 infection was reported on 26 February 2020. On 28 February 2021, the totalnumber of confirmed cases exceeded 800,000 (41.77 per 1 million people, a prevalence thatmade the country rank 24th in the world by the number of infections). Over 40,000 (5%) ofthese infections were reported among children [6].
Although extensive evidence has been gathered since the beginning of the COVID-19pandemic about the complex bidirectional relation between SARS-CoV-2 infection anddiabetes, data regarding T1DM specifically remain sparse. A multicentre study reportedan 80% increase in new T1DM cases in children, some of these patients having a confirmedhistory of SARS-CoV-2 infection [7]. Several studies reported a significant increase in thefrequency of DKA present at the diagnosis of T1DM, with a higher percentage of the severeform of this metabolic complication [7–12]. It was hypothesized that an explanation for thisphenomenon is the delay in the presentation of these patients caused by the parents’ fear ofaccessing the healthcare system [9,10]. However, reports from the United Kingdom showeda short duration of symptoms in the majority of children newly diagnosed with T1DM [7].More information about the complex interactions between T1DM and COVID-19 wasgathered due to a study which showed that SARS-CoV-2 is able to infect cultured humanpancreatic islets and replicate inside these cells, altering the subcellular morphology andthe response to glycemic variations [13]. The pancreatic endocrine cells strongly express theangiotensin converting enzyme 2 (ACE2) receptor, a main binding site for SARS-CoV-2 [14].
Another possible mechanism that could play a role in the observed increased numberof patients with T1DM and other autoimmune disorders during the pandemic could bethe decreased vitamin D levels, a possible consequence of strict lockdown measures withpeople spending significantly less time outside. Vitamin D, due to its immunomodulatoryproperties, shows multiple beneficial effects in T1DM [15]. This idea is supported by astudy reporting that 2000 UI cholecalciferol per day reduced T1DM incidence by 78% [16].Moreover, the decision of the Finish authorities to fortify dietary milk products with vitaminD had led to a decrease in the number of T1DM cases [16]. From another point of view, thecapacity of vitamin D to enhance the immune system might ensure a protective effect fromdeveloping severe forms of SARS-CoV-2 infection and reduce the risk of contracting thedisease [17].
The aims of this study were to assess a possible increase in the number of T1DM newcases in children from Bucharest and the surrounding areas during the COVID-19 pandemic,compared to previous years, to analyze the differences in patient and disease characteristicsbetween the pre-pandemic and pandemic periods and to evaluate predictors (includingpresentation time) of DKA associated with the onset of the disease and DKA severity.
2. Materials and Methods2.1. Study Population
We performed an observational retrospective cohort study that included pediatricpatients with T1DM from Marie Curie Emergency Children’s Hospital, Bucharest. Ourinstitution is a reference centre for pediatric T1DM, all the new cases from Bucharest andthe south-east region of Romania (approximately one quarter of the 3,895,000 children inRomania are living here) being managed here. In order to analyze the temporary evolutionof newly diagnosed pediatric T1DM cases, we extracted from the electronic hospital registry
20
J. Pers. Med. 2021, 11, 551
the numbers of all new T1DM cases diagnosed in patients younger than 18 years old, foreach month of 2018, 2019, and 2020. Patients with other types of diabetes were excluded.
In order to further assess patients and disease differences between children diag-nosed during (March 2020–February 2021; pandemic group) and before the COVID-19pandemic (2003–2019; pre-pandemic group), we split the study sample into 2 groups. Thepre-pandemic group included patients under 18 years old, diagnosed with T1DM, withextensive follow-up and complete and easily available medical records. The pandemicgroup included all the children diagnosed with T1DM in the period mentioned before;thus, the follow-up criteria being impossible to apply considering the recent onset.
2.2. Patients and Disease Characteristics
The data were collected from the digital and paper-based medical records of thehospital. For each patient, we gathered the following information: age at the onset of T1DM,gender, living area, glycosylated hemoglobin (HbA1c) levels, pH, and duration of T1DMspecific symptomatology. The diagnosis of T1DM was made on the following criteria:fasting plasma glucose levels higher than 126 mg/dL or symptoms of hyperglycemia(polyuria, polydipsia, unexplained weight loss) with a random plasma glucose level≥200 mg/dL or 2-h plasma glucose ≥200 mg/dL during an oral glucose tolerance test.
The pH was determined at the time of presentation, and a level lower than 7.3 was de-fined as DKA. The degree of severity of DKA was classified according to 2018 InternationalSociety for Paediatric and Adolescent Diabetes (ISPAD) guidelines: mild DKA (pH < 7.3),moderate DKA (pH < 7.2), severe DKA (pH < 7.1).
HbA1c was measured through an immunoturbidimetric method (DCCT standard-ized: Diabetes Control and Complications Trial and NGSP certificated: National Glycohe-moglobin Standardization Program). The normal levels were 4.8–6.4%.
2.3. Statistical Analyses
Patients and disease characteristics were reported as absolute and relative frequenciesfor categorical variables, medians, and interquartile ranges (IQR) for non-normally dis-tributed continuous variables and means and standard deviations for normally distributedcontinuous variables. Tests of normality were conducted with the Kolmogorov-Smirnovand Shapiro-Wilks tests. The variables were reported for the overall study sample, andseparately, according to the time of diagnosis (pre-pandemic/pandemic group), accordingto DKA presence and DKA severity. Differences between the groups were tested usingχ2 statistics for categorical variables, Wilcoxon or Kruskal-Wallis rank sum tests for non-normally distributed continuous variables, and t-tests or ANOVA for normally distributedcontinuous variables. The eight cases that presented SARS-CoV-2 infection at the time ofT1DM diagnosis were described separately based on multiple variables.
Logistic regression was performed to determine the effects of patient characteristicsand time of presentation (independent variables) on the likelihood of DKA being presentat the time of T1DM diagnosis (dependent variable). Proportional odds logistic regressionwas performed to assess effects on the likelihood of increased DKA severity (3-level orderedvariable) for the subset of patients presenting DKA. Univariable and multivariable analyseswere conducted for both outcomes. Patients’ characteristics were included in multivariableanalysis, regardless of their significance in univariable analysis, in order to estimate theindependent effect of time of presentation on the outcomes.
Furthermore, to address selection bias induced by the selection of patients in thepre-pandemic group, the analyses were repeated on a propensity score-matched dataset.Propensity scores for being diagnosed during or before the pandemic period were esti-mated with logistic regression, using all baseline measured characteristics. Patients werematched using 1:1 greedy nearest neighbor matching without replacement. The balanceof individual characteristics between the pandemic and pre-pandemic groups, before andafter matching, was assessed using standardized mean differences (SMD). In the matcheddataset, containing patients with similar characteristics, the effects of time of presenta-
21
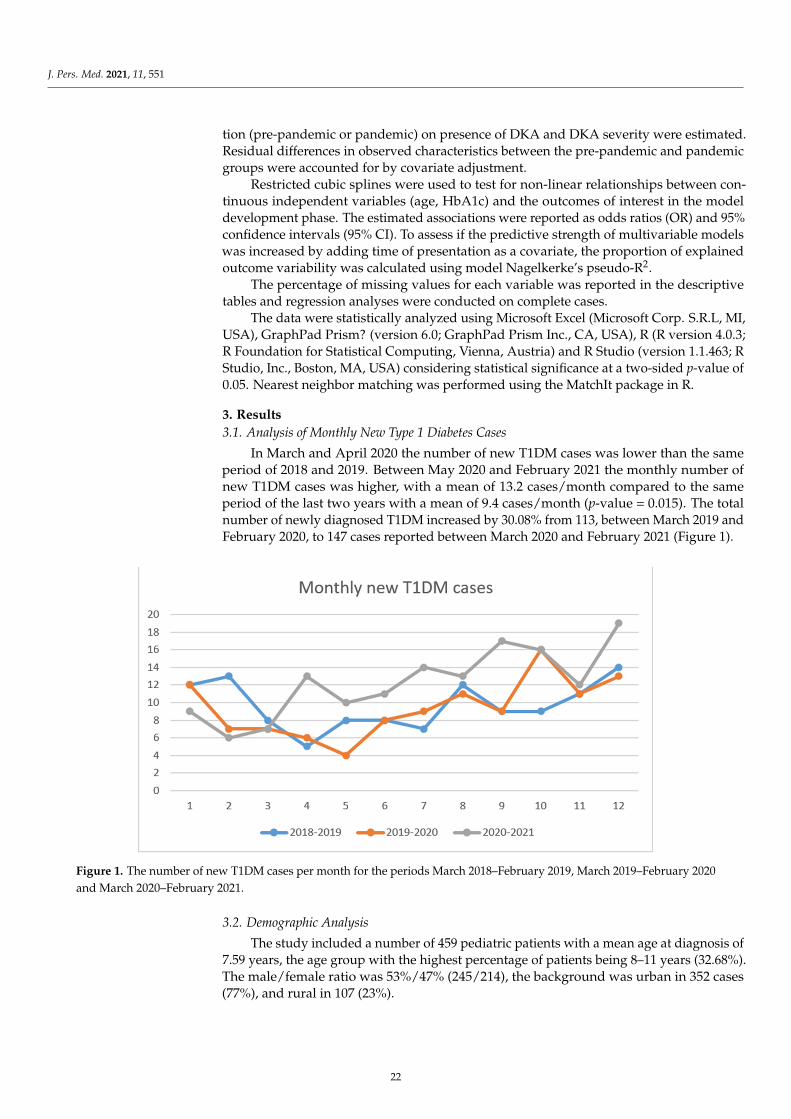
J. Pers. Med. 2021, 11, 551
tion (pre-pandemic or pandemic) on presence of DKA and DKA severity were estimated.Residual differences in observed characteristics between the pre-pandemic and pandemicgroups were accounted for by covariate adjustment.
Restricted cubic splines were used to test for non-linear relationships between con-tinuous independent variables (age, HbA1c) and the outcomes of interest in the modeldevelopment phase. The estimated associations were reported as odds ratios (OR) and 95%confidence intervals (95% CI). To assess if the predictive strength of multivariable modelswas increased by adding time of presentation as a covariate, the proportion of explainedoutcome variability was calculated using model Nagelkerke’s pseudo-R2.
The percentage of missing values for each variable was reported in the descriptivetables and regression analyses were conducted on complete cases.
The data were statistically analyzed using Microsoft Excel (Microsoft Corp. S.R.L, MI,USA), GraphPad Prism? (version 6.0; GraphPad Prism Inc., CA, USA), R (R version 4.0.3;R Foundation for Statistical Computing, Vienna, Austria) and R Studio (version 1.1.463; RStudio, Inc., Boston, MA, USA) considering statistical significance at a two-sided p-value of0.05. Nearest neighbor matching was performed using the MatchIt package in R.
3. Results3.1. Analysis of Monthly New Type 1 Diabetes Cases
In March and April 2020 the number of new T1DM cases was lower than the sameperiod of 2018 and 2019. Between May 2020 and February 2021 the monthly number ofnew T1DM cases was higher, with a mean of 13.2 cases/month compared to the sameperiod of the last two years with a mean of 9.4 cases/month (p-value = 0.015). The totalnumber of newly diagnosed T1DM increased by 30.08% from 113, between March 2019 andFebruary 2020, to 147 cases reported between March 2020 and February 2021 (Figure 1).
J. Pers. Med. 2021, 11, x FOR PEER REVIEW 4 of 13
Furthermore, to address selection bias induced by the selection of patients in the pre-pandemic group, the analyses were repeated on a propensity score-matched dataset. Pro-pensity scores for being diagnosed during or before the pandemic period were estimated with logistic regression, using all baseline measured characteristics. Patients were matched using 1:1 greedy nearest neighbor matching without replacement. The balance of individual characteristics between the pandemic and pre-pandemic groups, before and after matching, was assessed using standardized mean differences (SMD). In the matched dataset, containing patients with similar characteristics, the effects of time of presentation (pre-pandemic or pandemic) on presence of DKA and DKA severity were estimated. Re-sidual differences in observed characteristics between the pre-pandemic and pandemic groups were accounted for by covariate adjustment.
Restricted cubic splines were used to test for non-linear relationships between con-tinuous independent variables (age, HbA1c) and the outcomes of interest in the model development phase. The estimated associations were reported as odds ratios (OR) and 95% confidence intervals (95% CI). To assess if the predictive strength of multivariable models was increased by adding time of presentation as a covariate, the proportion of explained outcome variability was calculated using model Nagelkerke’s pseudo-R2.
The percentage of missing values for each variable was reported in the descriptive tables and regression analyses were conducted on complete cases.
The data were statistically analyzed using Microsoft Excel ( Microsoft Corp. S.R.L, Michigan, USA), GraphPad Prism? (version 6.0; GraphPad Prism Inc., California, USA), (; ), R (R version 4.0.3; R Foundation for Statistical Computing, Vienna, Austria) and R Stu-dio (version 1.1.463; R Studio, Inc., Boston, Massachusetts, USA) considering statistical significance at a two-sided p-value of 0.05. Nearest neighbor matching was performed using the MatchIt package in R.
3. Results 3.1. Analysis of Monthly New Type 1 Diabetes Cases
In March and April 2020 the number of new T1DM cases was lower than the same period of 2018 and 2019. Between May 2020 and February 2021 the monthly number of new T1DM cases was higher, with a mean of 13.2 cases/month compared to the same pe-riod of the last two years with a mean of 9.4 cases/month (p-value = 0.015). The total num-ber of newly diagnosed T1DM increased by 30.08% from 113, between March 2019 and February 2020, to 147 cases reported between March 2020 and February 2021 (Figure 1).
Figure 1. The number of new T1DM cases per month for the periods March 2018–February 2019, March 2019–February 2020and March 2020–February 2021.
3.2. Demographic Analysis
The study included a number of 459 pediatric patients with a mean age at diagnosis of7.59 years, the age group with the highest percentage of patients being 8–11 years (32.68%).The male/female ratio was 53%/47% (245/214), the background was urban in 352 cases(77%), and rural in 107 (23%).
22
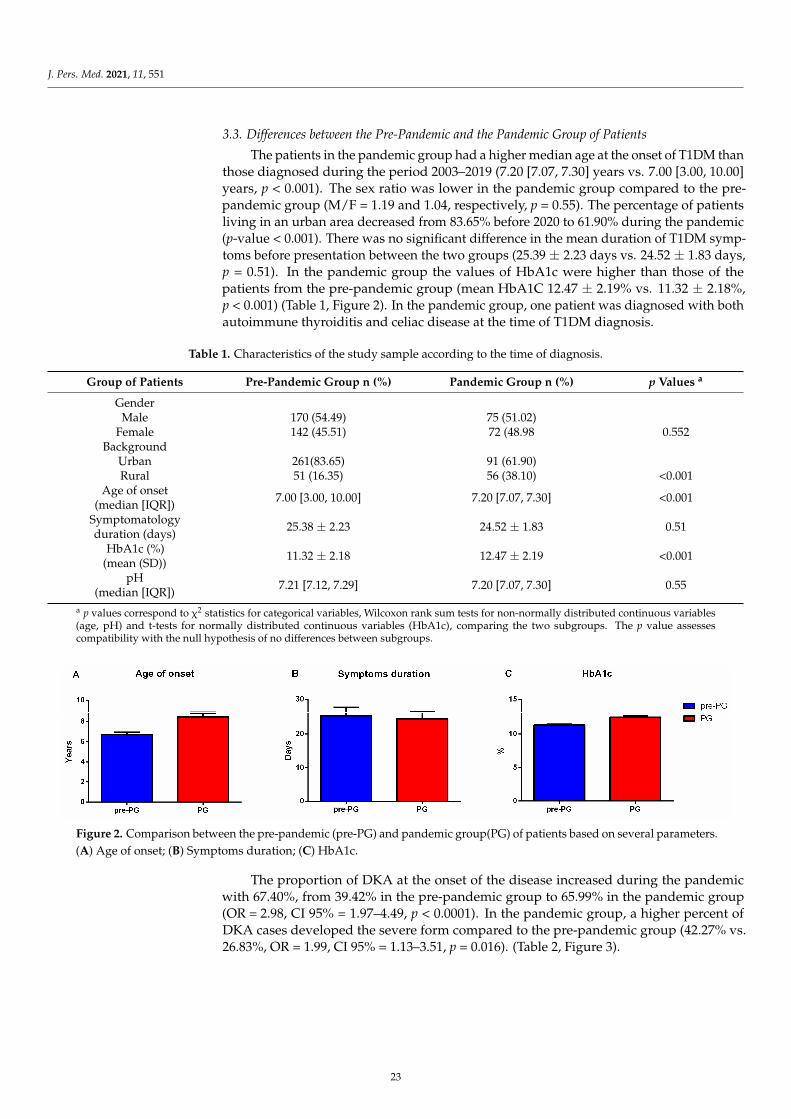
J. Pers. Med. 2021, 11, 551
3.3. Differences between the Pre-Pandemic and the Pandemic Group of Patients
The patients in the pandemic group had a higher median age at the onset of T1DM thanthose diagnosed during the period 2003–2019 (7.20 [7.07, 7.30] years vs. 7.00 [3.00, 10.00]years, p < 0.001). The sex ratio was lower in the pandemic group compared to the pre-pandemic group (M/F = 1.19 and 1.04, respectively, p = 0.55). The percentage of patientsliving in an urban area decreased from 83.65% before 2020 to 61.90% during the pandemic(p-value < 0.001). There was no significant difference in the mean duration of T1DM symp-toms before presentation between the two groups (25.39 ± 2.23 days vs. 24.52 ± 1.83 days,p = 0.51). In the pandemic group the values of HbA1c were higher than those of thepatients from the pre-pandemic group (mean HbA1C 12.47 ± 2.19% vs. 11.32 ± 2.18%,p < 0.001) (Table 1, Figure 2). In the pandemic group, one patient was diagnosed with bothautoimmune thyroiditis and celiac disease at the time of T1DM diagnosis.
Table 1. Characteristics of the study sample according to the time of diagnosis.
Group of Patients Pre-Pandemic Group n (%) Pandemic Group n (%) p Values a
GenderMale 170 (54.49) 75 (51.02)
Female 142 (45.51) 72 (48.98 0.552Background
Urban 261(83.65) 91 (61.90)Rural 51 (16.35) 56 (38.10) <0.001
Age of onset(median [IQR]) 7.00 [3.00, 10.00] 7.20 [7.07, 7.30] <0.001
Symptomatologyduration (days) 25.38 ± 2.23 24.52 ± 1.83 0.51
HbA1c (%)(mean (SD)) 11.32 ± 2.18 12.47 ± 2.19 <0.001
pH(median [IQR]) 7.21 [7.12, 7.29] 7.20 [7.07, 7.30] 0.55
a p values correspond to χ2 statistics for categorical variables, Wilcoxon rank sum tests for non-normally distributed continuous variables(age, pH) and t-tests for normally distributed continuous variables (HbA1c), comparing the two subgroups. The p value assessescompatibility with the null hypothesis of no differences between subgroups.
J. Pers. Med. 2021, 11, x FOR PEER REVIEW 5 of 13
Figure 1. The number of new T1DM cases per month for the periods March 2018–February 2019, March 2019–February 2020 and March 2020–February 2021.
3.2. Demographic Analysis The study included a number of 459 pediatric patients with a mean age at diagnosis
of 7.59 years, the age group with the highest percentage of patients being 8–11 years (32.68%). The male/female ratio was 53%/47% (245/214), the background was urban in 352 cases (77%), and rural in 107 (23%).
3.3. Differences between the Pre-Pandemic and the Pandemic Group of Patients The patients in the pandemic group had a higher median age at the onset of T1DM
than those diagnosed during the period 2003–2019 (7.20 [7.07, 7.30] years vs. 7.00 [3.00, 10.00] years, p < 0.001). The sex ratio was lower in the pandemic group compared to the pre-pandemic group (M/F = 1.19 and 1.04, respectively, p = 0.55). The percentage of pa-tients living in an urban area decreased from 83.65% before 2020 to 61.90% during the pandemic (p-value < 0.001). There was no significant difference in the mean duration of T1DM symptoms before presentation between the two groups (25.39 ± 2.23 days vs. 24.52 ± 1.83 days, p = 0.51). In the pandemic group the values of HbA1c were higher than those of the patients from the pre-pandemic group (mean HbA1C 12.47 ± 2.19% vs. 11.32 ± 2.18%, p < 0.001) (Table 1, Figure 2). In the pandemic group, one patient was diagnosed with both autoimmune thyroiditis and celiac disease at the time of T1DM diagnosis.
Table 1. Characteristics of the study sample according to the time of diagnosis.
Group of Patients Pre-Pandemic Group n (%)
Pandemic Group n (%) p Values a
Gender Male 170 (54.49) 75 (51.02)
Female 142 (45.51) 72 (48.98 0.552 Background
Urban 261(83.65) 91 (61.90) Rural 51 (16.35) 56 (38.10) <0.001
Age of onset (median [IQR])
7.00 [3.00, 10.00] 7.20 [7.07, 7.30] <0.001
Symptomatology duration (days)
25.38 ± 2.23 24.52 ± 1.83 0.51
HbA1c (%) (mean (SD))
11.32 ± 2.18 12.47 ± 2.19 <0.001
pH (median [IQR])
7.21 [7.12, 7.29] 7.20 [7.07, 7.30] 0.55
a p values correspond to χ2 statistics for categorical variables, Wilcoxon rank sum tests for non-normally distributed continuous variables (age, pH) and t-tests for normally distributed continu-ous variables (HbA1c), comparing the two subgroups. The p value assesses compatibility with the null hypothesis of no differences between subgroups.
Figure 2. Comparison between the pre-pandemic (pre-PG) and pandemic group(PG) of patients based on several parameters.(A) Age of onset; (B) Symptoms duration; (C) HbA1c.
The proportion of DKA at the onset of the disease increased during the pandemicwith 67.40%, from 39.42% in the pre-pandemic group to 65.99% in the pandemic group(OR = 2.98, CI 95% = 1.97–4.49, p < 0.0001). In the pandemic group, a higher percent ofDKA cases developed the severe form compared to the pre-pandemic group (42.27% vs.26.83%, OR = 1.99, CI 95% = 1.13–3.51, p = 0.016). (Table 2, Figure 3).
23
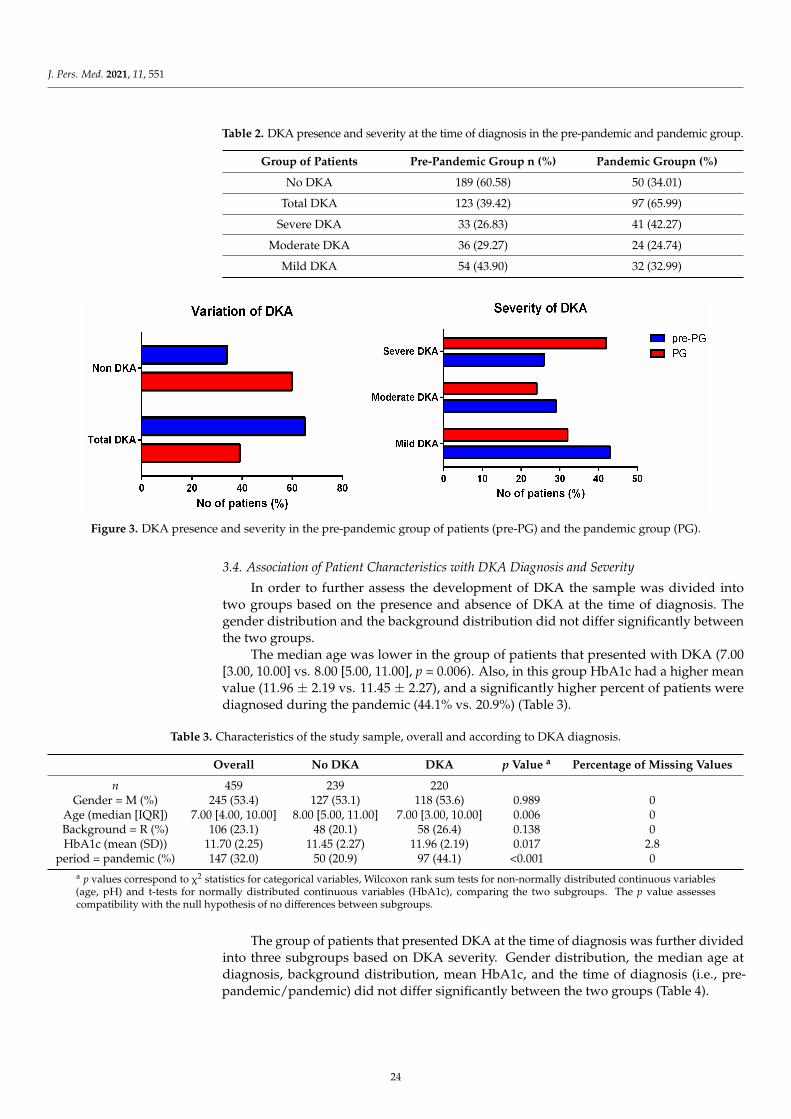
J. Pers. Med. 2021, 11, 551
Table 2. DKA presence and severity at the time of diagnosis in the pre-pandemic and pandemic group.
Group of Patients Pre-Pandemic Group n (%) Pandemic Groupn (%)
No DKA 189 (60.58) 50 (34.01)
Total DKA 123 (39.42) 97 (65.99)
Severe DKA 33 (26.83) 41 (42.27)
Moderate DKA 36 (29.27) 24 (24.74)
Mild DKA 54 (43.90) 32 (32.99)
J. Pers. Med. 2021, 11, x FOR PEER REVIEW 6 of 13
Figure 2. Comparison between the pre-pandemic (pre-PG) and pandemic group(PG) of patients based on several param-eters. (A) Age of onset; (B) Symptoms duration; (C) HbA1c.
The proportion of DKA at the onset of the disease increased during the pandemic with 67.40%, from 39.42% in the pre-pandemic group to 65.99% in the pandemic group (OR = 2.98, CI 95% = 1.97–4.49, p < 0.0001). In the pandemic group, a higher percent of DKA cases developed the severe form compared to the pre-pandemic group (42.27% vs. 26.83%, OR = 1.99, CI 95% = 1.13–3.51, p = 0.016). (Table 2, Figure 3).
Table 2. DKA presence and severity at the time of diagnosis in the pre-pandemic and pandemic group.
Group of Patients Pre-Pandemic Group n (%)
Pandemic Group n (%)
No DKA 189 (60.58) 50 (34.01) Total DKA 123 (39.42) 97 (65.99)
Severe DKA 33 (26.83) 41 (42.27) Moderate DKA 36 (29.27) 24 (24.74)
Mild DKA 54 (43.90) 32 (32.99)
Figure 3. DKA presence and severity in the pre-pandemic group of patients (pre-PG) and the pandemic group (PG).
3.4. Association of Patient Characteristics with DKA Diagnosis and Severity In order to further assess the development of DKA the sample was divided into two
groups based on the presence and absence of DKA at the time of diagnosis. The gender distribution and the background distribution did not differ significantly between the two groups.
The median age was lower in the group of patients that presented with DKA (7.00 [3.00, 10.00] vs. 8.00 [5.00, 11.00], p = 0.006). Also, in this group HbA1c had a higher mean value (11.96 ± 2.19 vs. 11.45 ± 2.27), and a significantly higher percent of patients were diagnosed during the pandemic (44.1% vs. 20.9%) (Table 3).
Figure 3. DKA presence and severity in the pre-pandemic group of patients (pre-PG) and the pandemic group (PG).
3.4. Association of Patient Characteristics with DKA Diagnosis and Severity
In order to further assess the development of DKA the sample was divided intotwo groups based on the presence and absence of DKA at the time of diagnosis. Thegender distribution and the background distribution did not differ significantly betweenthe two groups.
The median age was lower in the group of patients that presented with DKA (7.00[3.00, 10.00] vs. 8.00 [5.00, 11.00], p = 0.006). Also, in this group HbA1c had a higher meanvalue (11.96 ± 2.19 vs. 11.45 ± 2.27), and a significantly higher percent of patients werediagnosed during the pandemic (44.1% vs. 20.9%) (Table 3).
Table 3. Characteristics of the study sample, overall and according to DKA diagnosis.
Overall No DKA DKA p Value a Percentage of Missing Values
n 459 239 220Gender = M (%) 245 (53.4) 127 (53.1) 118 (53.6) 0.989 0
Age (median [IQR]) 7.00 [4.00, 10.00] 8.00 [5.00, 11.00] 7.00 [3.00, 10.00] 0.006 0Background = R (%) 106 (23.1) 48 (20.1) 58 (26.4) 0.138 0HbA1c (mean (SD)) 11.70 (2.25) 11.45 (2.27) 11.96 (2.19) 0.017 2.8
period = pandemic (%) 147 (32.0) 50 (20.9) 97 (44.1) <0.001 0a p values correspond to χ2 statistics for categorical variables, Wilcoxon rank sum tests for non-normally distributed continuous variables(age, pH) and t-tests for normally distributed continuous variables (HbA1c), comparing the two subgroups. The p value assessescompatibility with the null hypothesis of no differences between subgroups.
The group of patients that presented DKA at the time of diagnosis was further dividedinto three subgroups based on DKA severity. Gender distribution, the median age atdiagnosis, background distribution, mean HbA1c, and the time of diagnosis (i.e., pre-pandemic/pandemic) did not differ significantly between the two groups (Table 4).
24
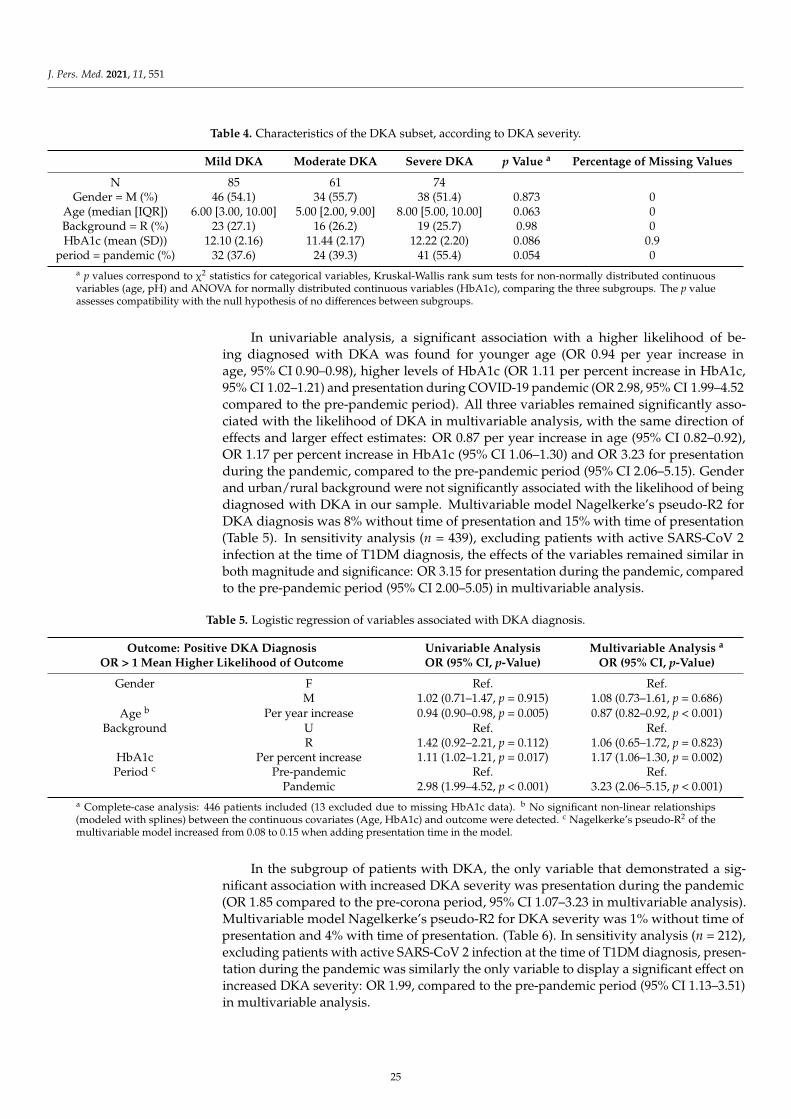
J. Pers. Med. 2021, 11, 551
Table 4. Characteristics of the DKA subset, according to DKA severity.
Mild DKA Moderate DKA Severe DKA p Value a Percentage of Missing Values
N 85 61 74Gender = M (%) 46 (54.1) 34 (55.7) 38 (51.4) 0.873 0
Age (median [IQR]) 6.00 [3.00, 10.00] 5.00 [2.00, 9.00] 8.00 [5.00, 10.00] 0.063 0Background = R (%) 23 (27.1) 16 (26.2) 19 (25.7) 0.98 0HbA1c (mean (SD)) 12.10 (2.16) 11.44 (2.17) 12.22 (2.20) 0.086 0.9
period = pandemic (%) 32 (37.6) 24 (39.3) 41 (55.4) 0.054 0a p values correspond to χ2 statistics for categorical variables, Kruskal-Wallis rank sum tests for non-normally distributed continuousvariables (age, pH) and ANOVA for normally distributed continuous variables (HbA1c), comparing the three subgroups. The p valueassesses compatibility with the null hypothesis of no differences between subgroups.
In univariable analysis, a significant association with a higher likelihood of be-ing diagnosed with DKA was found for younger age (OR 0.94 per year increase inage, 95% CI 0.90–0.98), higher levels of HbA1c (OR 1.11 per percent increase in HbA1c,95% CI 1.02–1.21) and presentation during COVID-19 pandemic (OR 2.98, 95% CI 1.99–4.52compared to the pre-pandemic period). All three variables remained significantly asso-ciated with the likelihood of DKA in multivariable analysis, with the same direction ofeffects and larger effect estimates: OR 0.87 per year increase in age (95% CI 0.82–0.92),OR 1.17 per percent increase in HbA1c (95% CI 1.06–1.30) and OR 3.23 for presentationduring the pandemic, compared to the pre-pandemic period (95% CI 2.06–5.15). Genderand urban/rural background were not significantly associated with the likelihood of beingdiagnosed with DKA in our sample. Multivariable model Nagelkerke’s pseudo-R2 forDKA diagnosis was 8% without time of presentation and 15% with time of presentation(Table 5). In sensitivity analysis (n = 439), excluding patients with active SARS-CoV 2infection at the time of T1DM diagnosis, the effects of the variables remained similar inboth magnitude and significance: OR 3.15 for presentation during the pandemic, comparedto the pre-pandemic period (95% CI 2.00–5.05) in multivariable analysis.
Table 5. Logistic regression of variables associated with DKA diagnosis.
Outcome: Positive DKA DiagnosisOR > 1 Mean Higher Likelihood of Outcome
Univariable AnalysisOR (95% CI, p-Value)
Multivariable Analysis a
OR (95% CI, p-Value)
Gender F Ref. Ref.M 1.02 (0.71–1.47, p = 0.915) 1.08 (0.73–1.61, p = 0.686)
Age b Per year increase 0.94 (0.90–0.98, p = 0.005) 0.87 (0.82–0.92, p < 0.001)Background U Ref. Ref.
R 1.42 (0.92–2.21, p = 0.112) 1.06 (0.65–1.72, p = 0.823)HbA1c Per percent increase 1.11 (1.02–1.21, p = 0.017) 1.17 (1.06–1.30, p = 0.002)Period c Pre-pandemic Ref. Ref.
Pandemic 2.98 (1.99–4.52, p < 0.001) 3.23 (2.06–5.15, p < 0.001)a Complete-case analysis: 446 patients included (13 excluded due to missing HbA1c data). b No significant non-linear relationships(modeled with splines) between the continuous covariates (Age, HbA1c) and outcome were detected. c Nagelkerke’s pseudo-R2 of themultivariable model increased from 0.08 to 0.15 when adding presentation time in the model.
In the subgroup of patients with DKA, the only variable that demonstrated a sig-nificant association with increased DKA severity was presentation during the pandemic(OR 1.85 compared to the pre-corona period, 95% CI 1.07–3.23 in multivariable analysis).Multivariable model Nagelkerke’s pseudo-R2 for DKA severity was 1% without time ofpresentation and 4% with time of presentation. (Table 6). In sensitivity analysis (n = 212),excluding patients with active SARS-CoV 2 infection at the time of T1DM diagnosis, presen-tation during the pandemic was similarly the only variable to display a significant effect onincreased DKA severity: OR 1.99, compared to the pre-pandemic period (95% CI 1.13–3.51)in multivariable analysis.
25
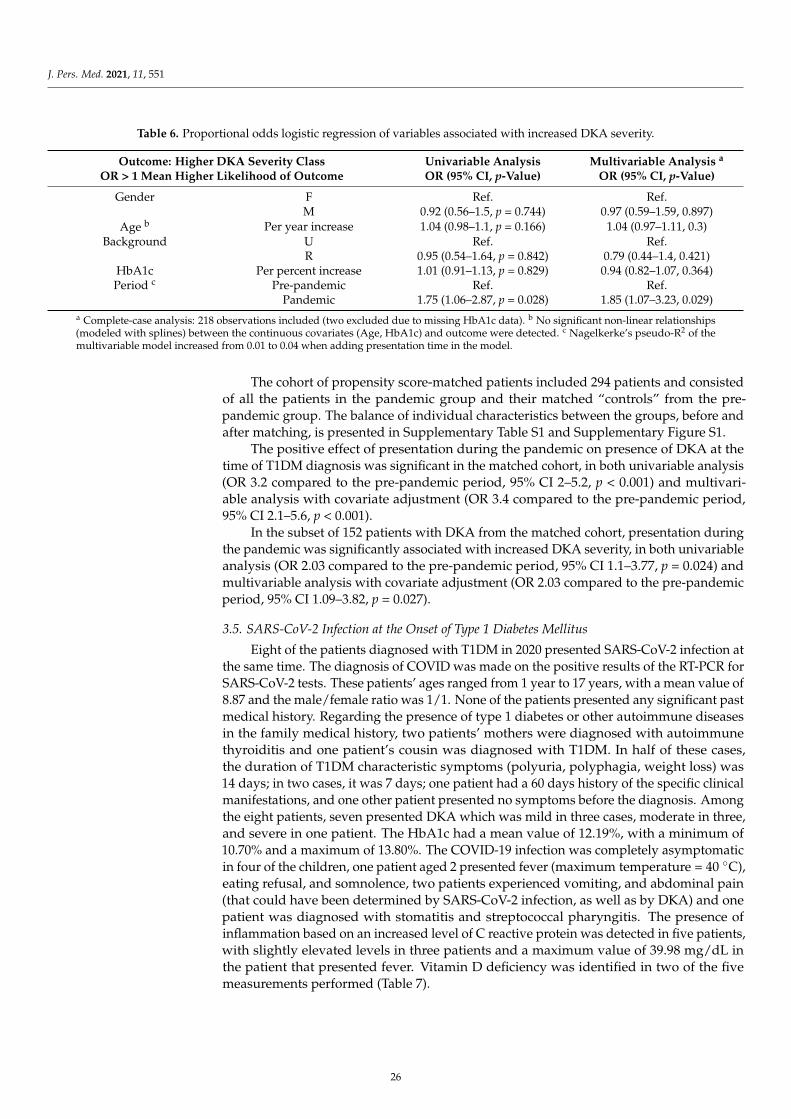
J. Pers. Med. 2021, 11, 551
Table 6. Proportional odds logistic regression of variables associated with increased DKA severity.
Outcome: Higher DKA Severity ClassOR > 1 Mean Higher Likelihood of Outcome
Univariable AnalysisOR (95% CI, p-Value)
Multivariable Analysis a
OR (95% CI, p-Value)
Gender F Ref. Ref.M 0.92 (0.56–1.5, p = 0.744) 0.97 (0.59–1.59, 0.897)
Age b Per year increase 1.04 (0.98–1.1, p = 0.166) 1.04 (0.97–1.11, 0.3)Background U Ref. Ref.
R 0.95 (0.54–1.64, p = 0.842) 0.79 (0.44–1.4, 0.421)HbA1c Per percent increase 1.01 (0.91–1.13, p = 0.829) 0.94 (0.82–1.07, 0.364)Period c Pre-pandemic Ref. Ref.
Pandemic 1.75 (1.06–2.87, p = 0.028) 1.85 (1.07–3.23, 0.029)a Complete-case analysis: 218 observations included (two excluded due to missing HbA1c data). b No significant non-linear relationships(modeled with splines) between the continuous covariates (Age, HbA1c) and outcome were detected. c Nagelkerke’s pseudo-R2 of themultivariable model increased from 0.01 to 0.04 when adding presentation time in the model.
The cohort of propensity score-matched patients included 294 patients and consistedof all the patients in the pandemic group and their matched “controls” from the pre-pandemic group. The balance of individual characteristics between the groups, before andafter matching, is presented in Supplementary Table S1 and Supplementary Figure S1.
The positive effect of presentation during the pandemic on presence of DKA at thetime of T1DM diagnosis was significant in the matched cohort, in both univariable analysis(OR 3.2 compared to the pre-pandemic period, 95% CI 2–5.2, p < 0.001) and multivari-able analysis with covariate adjustment (OR 3.4 compared to the pre-pandemic period,95% CI 2.1–5.6, p < 0.001).
In the subset of 152 patients with DKA from the matched cohort, presentation duringthe pandemic was significantly associated with increased DKA severity, in both univariableanalysis (OR 2.03 compared to the pre-pandemic period, 95% CI 1.1–3.77, p = 0.024) andmultivariable analysis with covariate adjustment (OR 2.03 compared to the pre-pandemicperiod, 95% CI 1.09–3.82, p = 0.027).
3.5. SARS-CoV-2 Infection at the Onset of Type 1 Diabetes Mellitus
Eight of the patients diagnosed with T1DM in 2020 presented SARS-CoV-2 infection atthe same time. The diagnosis of COVID was made on the positive results of the RT-PCR forSARS-CoV-2 tests. These patients’ ages ranged from 1 year to 17 years, with a mean value of8.87 and the male/female ratio was 1/1. None of the patients presented any significant pastmedical history. Regarding the presence of type 1 diabetes or other autoimmune diseasesin the family medical history, two patients’ mothers were diagnosed with autoimmunethyroiditis and one patient’s cousin was diagnosed with T1DM. In half of these cases,the duration of T1DM characteristic symptoms (polyuria, polyphagia, weight loss) was14 days; in two cases, it was 7 days; one patient had a 60 days history of the specific clinicalmanifestations, and one other patient presented no symptoms before the diagnosis. Amongthe eight patients, seven presented DKA which was mild in three cases, moderate in three,and severe in one patient. The HbA1c had a mean value of 12.19%, with a minimum of10.70% and a maximum of 13.80%. The COVID-19 infection was completely asymptomaticin four of the children, one patient aged 2 presented fever (maximum temperature = 40 ◦C),eating refusal, and somnolence, two patients experienced vomiting, and abdominal pain(that could have been determined by SARS-CoV-2 infection, as well as by DKA) and onepatient was diagnosed with stomatitis and streptococcal pharyngitis. The presence ofinflammation based on an increased level of C reactive protein was detected in five patients,with slightly elevated levels in three patients and a maximum value of 39.98 mg/dL inthe patient that presented fever. Vitamin D deficiency was identified in two of the fivemeasurements performed (Table 7).
26
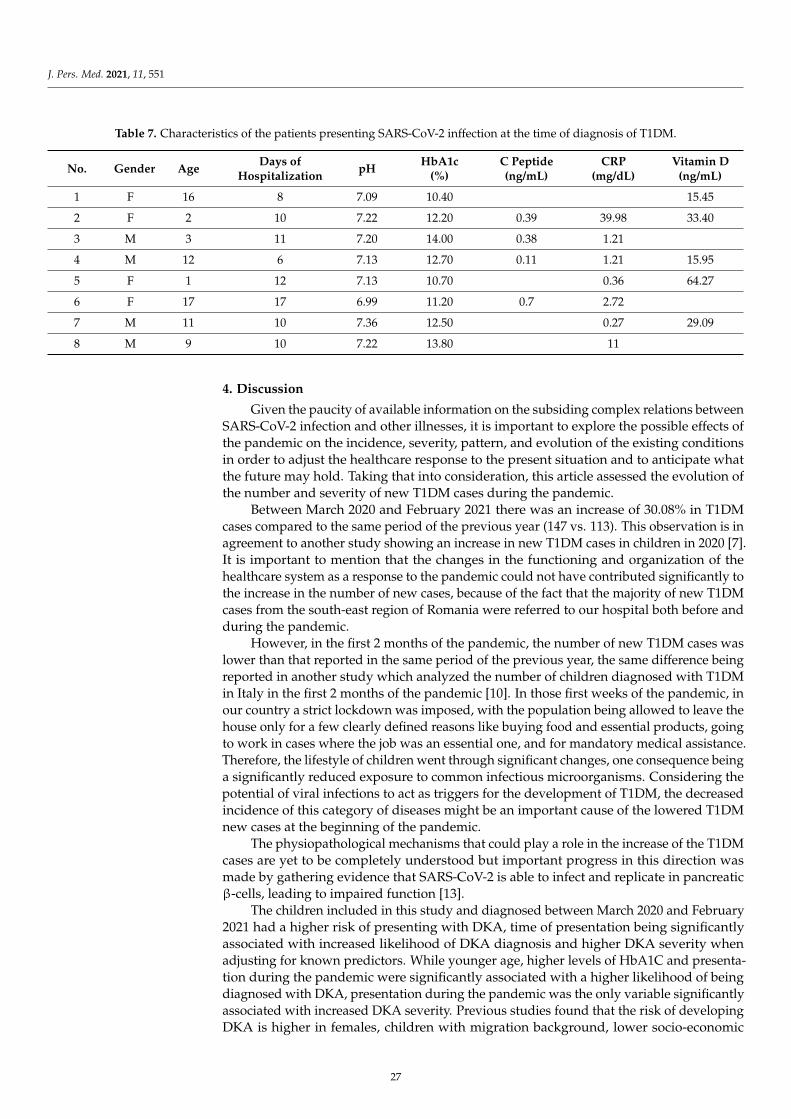
J. Pers. Med. 2021, 11, 551
Table 7. Characteristics of the patients presenting SARS-CoV-2 inffection at the time of diagnosis of T1DM.
No. Gender Age Days ofHospitalization pH HbA1c
(%)C Peptide(ng/mL)
CRP(mg/dL)
Vitamin D(ng/mL)
1 F 16 8 7.09 10.40 15.45
2 F 2 10 7.22 12.20 0.39 39.98 33.40
3 M 3 11 7.20 14.00 0.38 1.21
4 M 12 6 7.13 12.70 0.11 1.21 15.95
5 F 1 12 7.13 10.70 0.36 64.27
6 F 17 17 6.99 11.20 0.7 2.72
7 M 11 10 7.36 12.50 0.27 29.09
8 M 9 10 7.22 13.80 11
4. Discussion
Given the paucity of available information on the subsiding complex relations betweenSARS-CoV-2 infection and other illnesses, it is important to explore the possible effects ofthe pandemic on the incidence, severity, pattern, and evolution of the existing conditionsin order to adjust the healthcare response to the present situation and to anticipate whatthe future may hold. Taking that into consideration, this article assessed the evolution ofthe number and severity of new T1DM cases during the pandemic.
Between March 2020 and February 2021 there was an increase of 30.08% in T1DMcases compared to the same period of the previous year (147 vs. 113). This observation is inagreement to another study showing an increase in new T1DM cases in children in 2020 [7].It is important to mention that the changes in the functioning and organization of thehealthcare system as a response to the pandemic could not have contributed significantly tothe increase in the number of new cases, because of the fact that the majority of new T1DMcases from the south-east region of Romania were referred to our hospital both before andduring the pandemic.
However, in the first 2 months of the pandemic, the number of new T1DM cases waslower than that reported in the same period of the previous year, the same difference beingreported in another study which analyzed the number of children diagnosed with T1DMin Italy in the first 2 months of the pandemic [10]. In those first weeks of the pandemic, inour country a strict lockdown was imposed, with the population being allowed to leave thehouse only for a few clearly defined reasons like buying food and essential products, goingto work in cases where the job was an essential one, and for mandatory medical assistance.Therefore, the lifestyle of children went through significant changes, one consequence beinga significantly reduced exposure to common infectious microorganisms. Considering thepotential of viral infections to act as triggers for the development of T1DM, the decreasedincidence of this category of diseases might be an important cause of the lowered T1DMnew cases at the beginning of the pandemic.
The physiopathological mechanisms that could play a role in the increase of the T1DMcases are yet to be completely understood but important progress in this direction wasmade by gathering evidence that SARS-CoV-2 is able to infect and replicate in pancreaticβ-cells, leading to impaired function [13].
The children included in this study and diagnosed between March 2020 and February2021 had a higher risk of presenting with DKA, time of presentation being significantlyassociated with increased likelihood of DKA diagnosis and higher DKA severity whenadjusting for known predictors. While younger age, higher levels of HbA1C and presenta-tion during the pandemic were significantly associated with a higher likelihood of beingdiagnosed with DKA, presentation during the pandemic was the only variable significantlyassociated with increased DKA severity. Previous studies found that the risk of developingDKA is higher in females, children with migration background, lower socio-economic
27
J. Pers. Med. 2021, 11, 551
status, children under 3 years old, early teenage years, patients without any first-degreerelatives with T1DM and delayed diagnosis [18–20].
The addition of time of presentation to the multivariable explanatory model resultedin increased predictive performance, as reflected by a 2-fold increase in Nagelkerke’spseudo-R2 for the DKA diagnosis model and a 4-fold increase for the DKA severity model.However, the absolute proportions of explained variability are relatively low even whenincluding time of presentation, which indicates poor predictability of the outcomes giventhe variables we have considered. Although the purpose of this analysis is effect estimationrather than prediction, weak [18] predictive performance might indicate that other impor-tant predictors of outcome exist, which we did not consider in our analysis. The strongeffect we have identified for time of presentation could be confounded by such an importantunobserved predictor, and as such our results should be interpreted with caution.
An increase in DKA frequency and severity has been prior reported in other coun-tries [7–12]. As DKA is a life-threatening condition that requires complex management,sometimes possible only in an intensive care unit, the increased frequency of this metaboliccomplication could lead to extensive pressure on an already overwhelmed healthcaresystem. On the other hand, pointing out that an increase in the incidence of a chronicpediatric disease might be one of the consequences of SARS-CoV-2 exposure might changethe paradigm that children are not remarkably affected by the pandemic.
The duration of symptoms did not differ significantly during the pandemic comparedto the previous years, this observation supporting the fact that an early diagnosis was madein these cases and being in contradiction with the hypotheses suggesting that the increasein the DKA frequency is caused by a delay in the diagnosis of T1DM [9,10]. A multicentrestudy performed in the United Kingdom also reported a short duration of symptoms inthe majority of children [7].
Another interesting observation was that the mean age at diagnosis was higher in thepandemic group. Considering that it has long been recognized that DKA is more frequentin children of younger ages at the onset of T1DM [2], an increase in DKA frequency wouldbe expected to associate a lower mean age of the patients.
One limitation of this study is represented by the fact that the pre-pandemic groupincluded only the children that were under observation in our hospital during the evolutionof T1DM and not all the cases diagnosed, while the pandemic group included all childrendiagnosed with T1DM in our hospital during the pandemic. This has been addressed inthe effect estimation analysis for presence of DKA and DKA severity by using a propensityscore matched cohort, in which every patient diagnosed in the pandemic period wasmatched to a patient diagnosed in the pre-pandemic period. In the matched cohort, theeffect of presentation during the pandemic remained significantly associated with bothhigher likelihood of DKA at diagnosis and higher DKA severity. Another limitation isthat the SARS-CoV-2 specific antibodies were not available for the new cases of T1DM.Additionally, the duration of symptoms might be insufficiently accurate as the informationwas gathered from the patients’ parents or guardians. The main strength of this study,on the other hand, is represented by the large sample used: a relatively high numberof patients were included in the analysis. Moreover, all patients included in the studywere diagnosed with T1DM in the same hospital and all the blood tests referenced wereperformed in the same laboratory, which ensures consistency.
As explained at the beginning of this paper, it is highly necessary to further investigatethe relation between the increase in the number of cases and severity of T1DM cases inchildren and SARS-CoV-2 infection. More data supporting this link could be gatheredby analyzing the presence of SARS-CoV-2 antibodies as evidence of previous infection inchildren newly diagnosed with T1DM.
28
J. Pers. Med. 2021, 11, 551
5. Conclusions
Considering the fact that T1DM is one of the most frequent chronic pediatric illnessesand that its main acute complication, DKA is a life-threatening condition, it is importantto analyze the repercussions that the new global pandemic might determine. BetweenMarch and February 2020, in Bucharest (Romania) and the surrounding areas there wasa 30.08% increase in the total number of new T1DM cases in children. The patients thatpresented during the pandemic had a lower mean age, higher values of HbA1c, and wereliving more frequently in a rural area compared to the previous years. The number ofdiabetic ketoacidosis presentations also showed an increase during the pandemic, patientsdiagnosed after March 2020 having a significantly higher risk of developing DKA, whenadjusting for other predictors. Moreover, a higher percentage of children presented asevere form of this metabolic complication. In the subgroup of patients that presentedwith DKA, the time of diagnosis (i.e., during the pandemic) was the only variable thatshowed a significant association with increased severity. These findings are supportingthe idea that an increase in the incidence and severity of T1DM in children could be oneof the consequences of COVID-19 pandemic. The duration of T1DM symptoms did notdiffer significantly between the pandemic and the pre-pandemic group; therefore, a delayin the presentation is unlikely to have been the main cause of the increased number of DKApresentations. Among the patients with the T1DM onset during the pandemic, 8 of themalso presented SARS-CoV2 infection at the time of diagnosis.
Taking all these results into consideration we believe that further investigations areneeded in order to discover other possible particular characteristics of T1DM cases diag-nosed during the pandemic. Also, we are taking into consideration that a prospectivecohort study including these patients could bring relevant additional data.
Supplementary Materials: The following are available online at https://www.mdpi.com/article/10.3390/jpm11060551/s1, Figure S1: title, Table S1: title, Video S1: title.
Author Contributions: Conceptualization, A.A.B., C.N.N., M.T.I., F.G., M.B., E.C.B. and M.D.I.; Datacuration, A.A.B., C.N.N., M.T.I., M.I.I., F.G. and E.C.B.; Formal analysis, A.A.B., M.T.I., M.I.I. andM.B.; Investigation, A.A.B., C.N.N., M.T.I. and F.G.; Methodology, A.A.B., C.N.N., M.T.I., M.B., E.C.B.and M.D.I.; Project administration, M.B., E.C.B. and M.D.I.; Resources, E.C.B. and M.D.I.; Software,M.T.I. and M.I.I.; Supervision, A.A.B., C.N.N., F.G., M.B., E.C.B. and M.D.I.; Validation, F.G., M.B.,E.C.B. and M.D.I.; Visualization, A.A.B., C.N.N., M.T.I., F.G., M.B. and M.D.I.; Writing—original draft,A.A.B., C.N.N., M.T.I., M.I.I., E.C.B. and M.D.I.; Writing—review & editing, A.A.B., C.N.N., M.T.I.,M.B., E.C.B. and M.D.I. All authors have read and agreed to the published version of the manuscript.
Funding: This research received no external funding.
Institutional Review Board Statement: The research was approved by the Ethics Committee of“Marie Curie” Emergency Children’s Hospital.
Informed Consent Statement: Informed consent was obtained from all the patients included in the study.
Data Availability Statement: Not applicable.
Conflicts of Interest: The authors declare no conflict of interest.
References1. Couper, J.J.; Haller, M.J.; Greenbaum, C.J.; Ziegler, A.-G.; Wherrett, D.K.; Knip, M.; Craig, M.E. ISPAD Clinical Practice Consensus
Guidelines 2018: Stages of type 1 diabetes in children and adolescents. Pediatr. Diabetes 2018, 19, 20–27. [CrossRef] [PubMed]2. Wolfsdorf, J.I.; Glaser, N.; Agus, M.; Fritsch, M.; Hanas, R.; Rewers, A.; Sperling, M.A.; Codner, E. ISPAD Clinical Practice
Consensus Guidelines 2018: Diabetic ketoacidosis and the hyperglycemic hyperosmolar state. Pediatr. Diabetes 2018, 19, 155–177.[CrossRef] [PubMed]
3. DiMeglio, L.A.; Evans-Molina, C.; A Oram, R. Type 1 diabetes. Lancet 2018, 391, 2449–2462. [CrossRef]4. Filippi, C.M.; Von Herrath, M.G. Viral Trigger for Type 1 Diabetes: Pros and Cons. Diabetes 2008, 57, 2863–2871. [CrossRef]
[PubMed]5. Patel, N.A. Pediatric COVID-19: Systematic review of the literature. Am. J. Otolaryngol. 2020, 41, 102573. [CrossRef] [PubMed]6. Date la zi, COVID-19. Available online: https://datelazi.ro (accessed on 9 May 2021).
29
J. Pers. Med. 2021, 11, 551
7. Unsworth, R.; Wallace, S.; Oliver, N.S.; Yeung, S.; Kshirsagar, A.; Naidu, H.; Kwong, R.M.W.; Kumar, P.; Logan, K.M. New-OnsetType 1 Diabetes in Children During COVID-19: Multicenter Regional Findings in the U.K. Diabetes Care 2020, 43, e170–e171.[CrossRef] [PubMed]
8. Kamrath, C.; Mönkemöller, K.; Biester, T.; Rohrer, T.R.; Warncke, K.; Hammersen, J.; Holl, R.W. Ketoacidosis in Childrenand Adolescents With Newly Diagnosed Type 1 Diabetes During the COVID-19 Pandemic in Germany. JAMA 2020, 324, 801.[CrossRef] [PubMed]
9. Lawrence, C.; Seckold, R.; Smart, C.; King, B.R.; Howley, P.; Feltrin, R.; Smith, T.A.; Roy, R.; Lopez, P. Increased paediatricpresentations of severe diabetic ketoacidosis in an Australian tertiary centre during the COVID-19 pandemic. Diabet. Med. 2021,38, e14417. [CrossRef] [PubMed]
10. Rabbone, I.; Schiaffini, R.; Cherubini, V.; Maffeis, C.; Scaramuzza, A. Has COVID-19 Delayed the Diagnosis and Worsened thePresentation of Type 1 Diabetes in Children? Diabetes Care 2020, 43, 2870–2872. [CrossRef] [PubMed]
11. Basatemur, E.; Jones, A.; Peters, M.; Ramnarayan, P. Paediatric critical care referrals of children with diabetic ketoacidosis duringthe COVID-19 pandemic. Arch. Dis. Child. 2021, 106, e21. [CrossRef] [PubMed]
12. Dzygało, K.; Nowaczyk, J.; Szwilling, A.; Kowalska, A. Increased frequency of severe diabetic ketoacidosis at type 1 diabetesonset among children during COVID-19 pandemic lockdown: An observational cohort study. Pediatr. Endocrinol. Diabetes Metab.2020, 26, 167–175. [CrossRef] [PubMed]
13. Müller, J.A.; Groß, R.; Conzelmann, C.; Krüger, J.; Merle, U.; Steinhart, J.; Weil, T.; Koepke, L.; Bozzo, C.P.; Read, C.; et al.SARS-CoV-2 infects and replicates in cells of the human endocrine and exocrine pancreas. Nat. Metab. 2021, 3, 149–165. [CrossRef][PubMed]
14. Yang, J.-K.; Lin, S.-S.; Ji, X.-J.; Guo, L.-M. Binding of SARS coronavirus to its receptor damages islets and causes acute diabetes.Acta Diabetol. 2009, 47, 193–199. [CrossRef] [PubMed]
15. Aljabri, K.S.; Bokhari, S.A.; Khan, M.J. Glycemic changes after vitamin D supplementation in patients with type 1 diabetesmellitus and vitamin D deficiency. Ann. Saudi Med. 2010, 30, 454–458. [CrossRef] [PubMed]
16. Papadimitriou, D.T. The Big Vitamin D Mistake. J. Prev. Med. Public Heal. 2017, 50, 278–281. [CrossRef] [PubMed]17. Papadimitriou, D.T.; Vassaras, A.K.; Holick, M.F. Association between population vitamin D status and SARS-CoV-2 related
serious-critical illness and deaths: An ecological integrative approach. World J. Virol. 2021, 10, 111–129. [CrossRef] [PubMed]18. Fritsch, M.; Rosenbauer, J.; Schober, E.; Neu, A.; Placzek, K.; Holl, R.W. Predictors of diabetic ketoacidosis in children and
adolescents with type 1 diabetes. Experience from a large multicentre database. Pediatr. Diabetes 2011, 12, 307–312. [CrossRef][PubMed]
19. Vicinanza, A.; Messaaoui, A.; Tenoutasse, S.; Dorchy, H. Diabetic ketoacidosis in children newly diagnosed with type 1 diabetesmellitus: Role of demographic, clinical, and biochemical features along with genetic and immunological markers as risk factors.A 20-year experience in a tertiary Belgian center. Pediatr. Diabetes 2019, 20, 584–593. [CrossRef] [PubMed]
20. Raghupathy, P. Diabetic ketoacidosis in children and adolescents. Indian J. Endocrinol. Metab. 2015, 19, S55–S57. [CrossRef][PubMed]
30
Journal of
Personalized
Medicine
Article
Risk of Typical Diabetes-Associated Complications in DifferentClusters of Diabetic Patients: Analysis of Nine Risk Factors
Michael Leutner 1,†, Nils Haug 2,3,† , Luise Bellach 1 , Elma Dervic 2,3 , Alexander Kautzky 4, Peter Klimek 2,3
and Alexandra Kautzky-Willer 1,5,*
Citation: Leutner, M.; Haug, N.;
Bellach, L.; Dervic, E.; Kautzky, A.;
Klimek, P.; Kautzky-Willer, A. Risk of
Typical Diabetes-Associated
Complications in Different Clusters of
Diabetic Patients: Analysis of Nine
Risk Factors. J. Pers. Med. 2021, 11,
328. https://doi.org/10.3390/
jpm11050328
Academic Editors: George Patrinos
and Rutger A. Middelburg
Received: 18 March 2021
Accepted: 15 April 2021
Published: 22 April 2021
Publisher’s Note: MDPI stays neutral
with regard to jurisdictional claims in
published maps and institutional affil-
iations.
Copyright: © 2021 by the authors.
Licensee MDPI, Basel, Switzerland.
This article is an open access article
distributed under the terms and
conditions of the Creative Commons
Attribution (CC BY) license (https://
creativecommons.org/licenses/by/
4.0/).
1 Department of Internal Medicine III, Clinical Division of Endocrinology and Metabolism,Medical University of Vienna, Waehringer Guertel 18-20, A-1090 Vienna, Austria;[email protected] (M.L.); [email protected] (L.B.)
2 Section for Science of Complex Systems, CeMSIIS, Medical University of Vienna, Spitalgasse 23,A-1090 Vienna, Austria; [email protected] (N.H.); [email protected] (E.D.);[email protected] (P.K.)
3 Complexity Science Hub Vienna, Josefstaedter Straße 39, 1080 Vienna, Austria4 Department of Psychiatry and Psychotherapy, Medical University of Vienna, Waehringer Guertel 18-20,
A-1090 Vienna, Austria; [email protected] Gender Institute, A-3571 Gars am Kamp, Austria* Correspondence: [email protected]; Tel.: +43-1-40400-43120† Equally contribution.
Abstract: Objectives: Diabetic patients are often diagnosed with several comorbidities. The aim ofthe present study was to investigate the relationship between different combinations of risk factorsand complications in diabetic patients. Research design and methods: We used a longitudinal,population-wide dataset of patients with hospital diagnoses and identified all patients (n = 195,575)receiving a diagnosis of diabetes in the observation period from 2003–2014. We defined nine ICD-10-codes as risk factors and 16 ICD-10 codes as complications. Using a computational algorithm, cohortpatients were assigned to clusters based on the risk factors they were diagnosed with. The clusterswere defined so that the patients assigned to them developed similar complications. Complicationrisk was quantified in terms of relative risk (RR) compared with healthy control patients. Results:We identified five clusters associated with an increased risk of complications. A combined diagnosisof arterial hypertension (aHTN) and dyslipidemia was shared by all clusters and expressed a baselineof increased risk. Additional diagnosis of (1) smoking, (2) depression, (3) liver disease, or (4) obesitymade up the other four clusters and further increased the risk of complications. Cluster 9 (aHTN,dyslipidemia and depression) represented diabetic patients at high risk of angina pectoris “AP” (RR:7.35, CI: 6.74–8.01), kidney disease (RR: 3.18, CI: 3.04–3.32), polyneuropathy (RR: 4.80, CI: 4.23–5.45),and stroke (RR: 4.32, CI: 3.95–4.71), whereas cluster 10 (aHTN, dyslipidemia and smoking) identifiedpatients with the highest risk of AP (RR: 10.10, CI: 9.28–10.98), atherosclerosis (RR: 4.07, CI: 3.84–4.31),and loss of extremities (RR: 4.21, CI: 1.5–11.84) compared to the controls. Conclusions: A comorbidityof aHTN and dyslipidemia was shown to be associated with diabetic complications across all risk-clusters. This effect was amplified by a combination with either depression, smoking, obesity,or non-specific liver disease.
Keywords: diabetes mellitus; cluster analyses; risk factors; micro- and macrovascular disease
1. Background
The prevalence of diabetes mellitus is constantly increasing, making this disease aglobal health problem. Efficient diabetes management is necessary in order to decrease therisk of both micro- and macrovascular complications such as cardiovascular diseases ordiabetic nephropathy [1], especially when patients are also diagnosed with other comor-bidities such as hypertension or depression [2,3]. Data from large trials conducted in recent
31
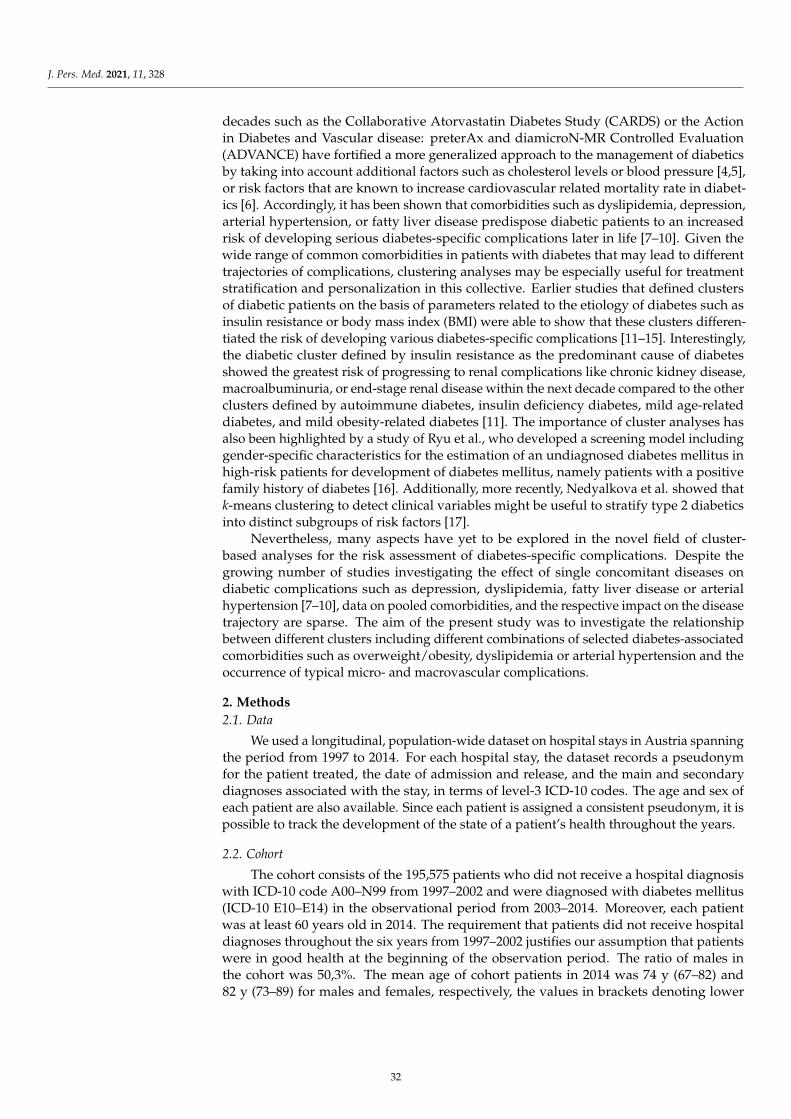
J. Pers. Med. 2021, 11, 328
decades such as the Collaborative Atorvastatin Diabetes Study (CARDS) or the Actionin Diabetes and Vascular disease: preterAx and diamicroN-MR Controlled Evaluation(ADVANCE) have fortified a more generalized approach to the management of diabeticsby taking into account additional factors such as cholesterol levels or blood pressure [4,5],or risk factors that are known to increase cardiovascular related mortality rate in diabet-ics [6]. Accordingly, it has been shown that comorbidities such as dyslipidemia, depression,arterial hypertension, or fatty liver disease predispose diabetic patients to an increasedrisk of developing serious diabetes-specific complications later in life [7–10]. Given thewide range of common comorbidities in patients with diabetes that may lead to differenttrajectories of complications, clustering analyses may be especially useful for treatmentstratification and personalization in this collective. Earlier studies that defined clustersof diabetic patients on the basis of parameters related to the etiology of diabetes such asinsulin resistance or body mass index (BMI) were able to show that these clusters differen-tiated the risk of developing various diabetes-specific complications [11–15]. Interestingly,the diabetic cluster defined by insulin resistance as the predominant cause of diabetesshowed the greatest risk of progressing to renal complications like chronic kidney disease,macroalbuminuria, or end-stage renal disease within the next decade compared to the otherclusters defined by autoimmune diabetes, insulin deficiency diabetes, mild age-relateddiabetes, and mild obesity-related diabetes [11]. The importance of cluster analyses hasalso been highlighted by a study of Ryu et al., who developed a screening model includinggender-specific characteristics for the estimation of an undiagnosed diabetes mellitus inhigh-risk patients for development of diabetes mellitus, namely patients with a positivefamily history of diabetes [16]. Additionally, more recently, Nedyalkova et al. showed thatk-means clustering to detect clinical variables might be useful to stratify type 2 diabeticsinto distinct subgroups of risk factors [17].
Nevertheless, many aspects have yet to be explored in the novel field of cluster-based analyses for the risk assessment of diabetes-specific complications. Despite thegrowing number of studies investigating the effect of single concomitant diseases ondiabetic complications such as depression, dyslipidemia, fatty liver disease or arterialhypertension [7–10], data on pooled comorbidities, and the respective impact on the diseasetrajectory are sparse. The aim of the present study was to investigate the relationshipbetween different clusters including different combinations of selected diabetes-associatedcomorbidities such as overweight/obesity, dyslipidemia or arterial hypertension and theoccurrence of typical micro- and macrovascular complications.
2. Methods2.1. Data
We used a longitudinal, population-wide dataset on hospital stays in Austria spanningthe period from 1997 to 2014. For each hospital stay, the dataset records a pseudonymfor the patient treated, the date of admission and release, and the main and secondarydiagnoses associated with the stay, in terms of level-3 ICD-10 codes. The age and sex ofeach patient are also available. Since each patient is assigned a consistent pseudonym, it ispossible to track the development of the state of a patient’s health throughout the years.
2.2. Cohort
The cohort consists of the 195,575 patients who did not receive a hospital diagnosiswith ICD-10 code A00–N99 from 1997–2002 and were diagnosed with diabetes mellitus(ICD-10 E10–E14) in the observational period from 2003–2014. Moreover, each patientwas at least 60 years old in 2014. The requirement that patients did not receive hospitaldiagnoses throughout the six years from 1997–2002 justifies our assumption that patientswere in good health at the beginning of the observation period. The ratio of males inthe cohort was 50,3%. The mean age of cohort patients in 2014 was 74 y (67–82) and82 y (73–89) for males and females, respectively, the values in brackets denoting lower
32
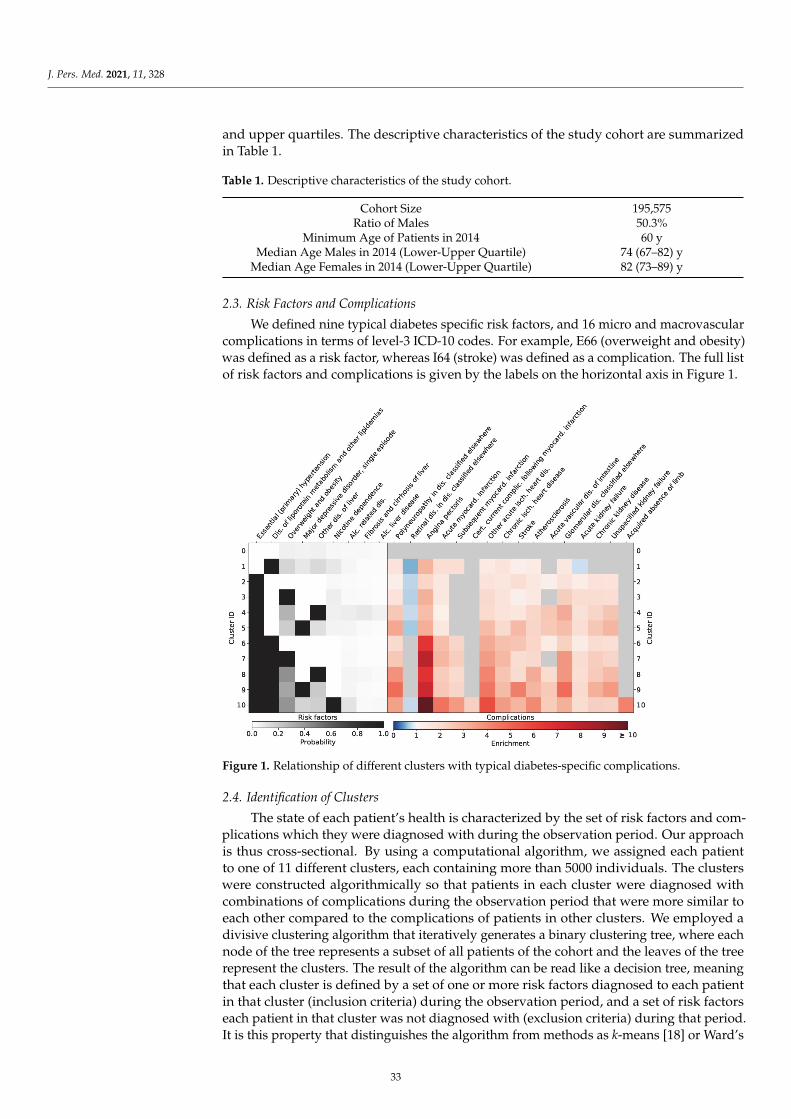
J. Pers. Med. 2021, 11, 328
and upper quartiles. The descriptive characteristics of the study cohort are summarizedin Table 1.
Table 1. Descriptive characteristics of the study cohort.
Cohort Size 195,575Ratio of Males 50.3%
Minimum Age of Patients in 2014 60 yMedian Age Males in 2014 (Lower-Upper Quartile) 74 (67–82) y
Median Age Females in 2014 (Lower-Upper Quartile) 82 (73–89) y
2.3. Risk Factors and Complications
We defined nine typical diabetes specific risk factors, and 16 micro and macrovascularcomplications in terms of level-3 ICD-10 codes. For example, E66 (overweight and obesity)was defined as a risk factor, whereas I64 (stroke) was defined as a complication. The full listof risk factors and complications is given by the labels on the horizontal axis in Figure 1.
Figure 1. Relationship of different clusters with typical diabetes-specific complications.
2.4. Identification of Clusters
The state of each patient’s health is characterized by the set of risk factors and com-plications which they were diagnosed with during the observation period. Our approachis thus cross-sectional. By using a computational algorithm, we assigned each patientto one of 11 different clusters, each containing more than 5000 individuals. The clusterswere constructed algorithmically so that patients in each cluster were diagnosed withcombinations of complications during the observation period that were more similar toeach other compared to the complications of patients in other clusters. We employed adivisive clustering algorithm that iteratively generates a binary clustering tree, where eachnode of the tree represents a subset of all patients of the cohort and the leaves of the treerepresent the clusters. The result of the algorithm can be read like a decision tree, meaningthat each cluster is defined by a set of one or more risk factors diagnosed to each patientin that cluster (inclusion criteria) during the observation period, and a set of risk factorseach patient in that cluster was not diagnosed with (exclusion criteria) during that period.It is this property that distinguishes the algorithm from methods as k-means [18] or Ward’s
33
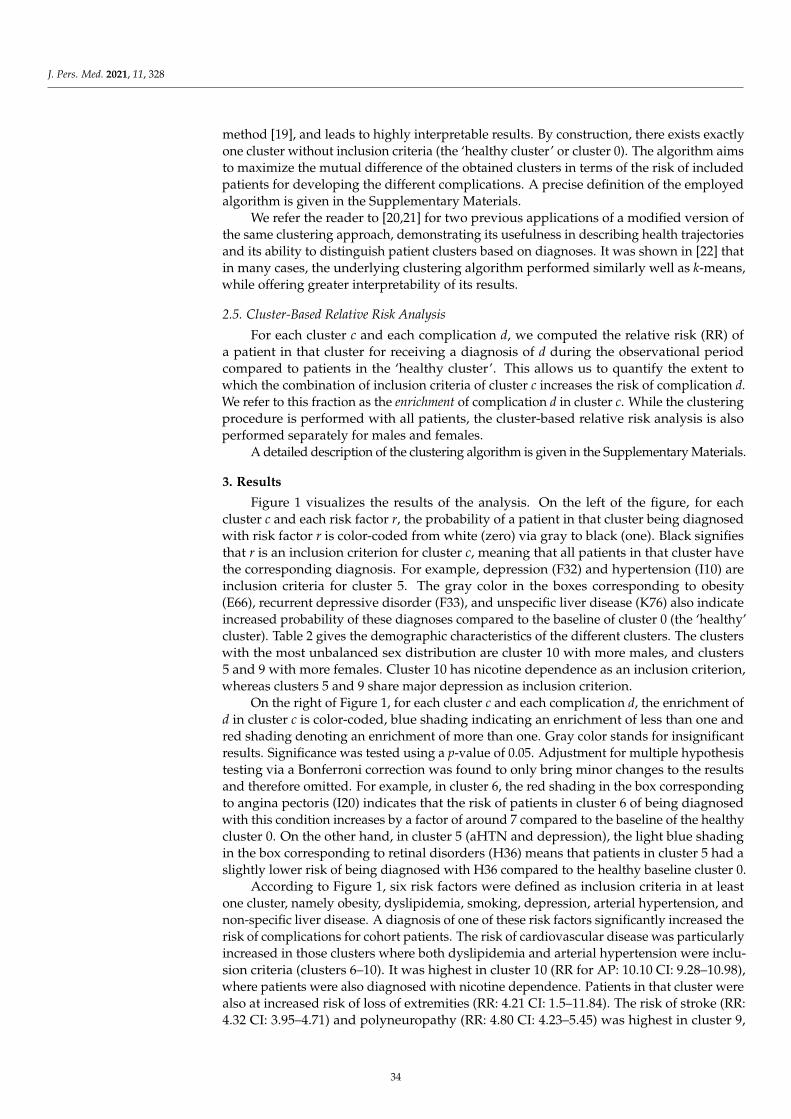
J. Pers. Med. 2021, 11, 328
method [19], and leads to highly interpretable results. By construction, there exists exactlyone cluster without inclusion criteria (the ‘healthy cluster’ or cluster 0). The algorithm aimsto maximize the mutual difference of the obtained clusters in terms of the risk of includedpatients for developing the different complications. A precise definition of the employedalgorithm is given in the Supplementary Materials.
We refer the reader to [20,21] for two previous applications of a modified version ofthe same clustering approach, demonstrating its usefulness in describing health trajectoriesand its ability to distinguish patient clusters based on diagnoses. It was shown in [22] thatin many cases, the underlying clustering algorithm performed similarly well as k-means,while offering greater interpretability of its results.
2.5. Cluster-Based Relative Risk Analysis
For each cluster c and each complication d, we computed the relative risk (RR) ofa patient in that cluster for receiving a diagnosis of d during the observational periodcompared to patients in the ‘healthy cluster’. This allows us to quantify the extent towhich the combination of inclusion criteria of cluster c increases the risk of complication d.We refer to this fraction as the enrichment of complication d in cluster c. While the clusteringprocedure is performed with all patients, the cluster-based relative risk analysis is alsoperformed separately for males and females.
A detailed description of the clustering algorithm is given in the Supplementary Materials.
3. Results
Figure 1 visualizes the results of the analysis. On the left of the figure, for eachcluster c and each risk factor r, the probability of a patient in that cluster being diagnosedwith risk factor r is color-coded from white (zero) via gray to black (one). Black signifiesthat r is an inclusion criterion for cluster c, meaning that all patients in that cluster havethe corresponding diagnosis. For example, depression (F32) and hypertension (I10) areinclusion criteria for cluster 5. The gray color in the boxes corresponding to obesity(E66), recurrent depressive disorder (F33), and unspecific liver disease (K76) also indicateincreased probability of these diagnoses compared to the baseline of cluster 0 (the ‘healthy’cluster). Table 2 gives the demographic characteristics of the different clusters. The clusterswith the most unbalanced sex distribution are cluster 10 with more males, and clusters5 and 9 with more females. Cluster 10 has nicotine dependence as an inclusion criterion,whereas clusters 5 and 9 share major depression as inclusion criterion.
On the right of Figure 1, for each cluster c and each complication d, the enrichment ofd in cluster c is color-coded, blue shading indicating an enrichment of less than one andred shading denoting an enrichment of more than one. Gray color stands for insignificantresults. Significance was tested using a p-value of 0.05. Adjustment for multiple hypothesistesting via a Bonferroni correction was found to only bring minor changes to the resultsand therefore omitted. For example, in cluster 6, the red shading in the box correspondingto angina pectoris (I20) indicates that the risk of patients in cluster 6 of being diagnosedwith this condition increases by a factor of around 7 compared to the baseline of the healthycluster 0. On the other hand, in cluster 5 (aHTN and depression), the light blue shadingin the box corresponding to retinal disorders (H36) means that patients in cluster 5 had aslightly lower risk of being diagnosed with H36 compared to the healthy baseline cluster 0.
According to Figure 1, six risk factors were defined as inclusion criteria in at leastone cluster, namely obesity, dyslipidemia, smoking, depression, arterial hypertension, andnon-specific liver disease. A diagnosis of one of these risk factors significantly increased therisk of complications for cohort patients. The risk of cardiovascular disease was particularlyincreased in those clusters where both dyslipidemia and arterial hypertension were inclu-sion criteria (clusters 6–10). It was highest in cluster 10 (RR for AP: 10.10 CI: 9.28–10.98),where patients were also diagnosed with nicotine dependence. Patients in that cluster werealso at increased risk of loss of extremities (RR: 4.21 CI: 1.5–11.84). The risk of stroke (RR:4.32 CI: 3.95–4.71) and polyneuropathy (RR: 4.80 CI: 4.23–5.45) was highest in cluster 9,
34
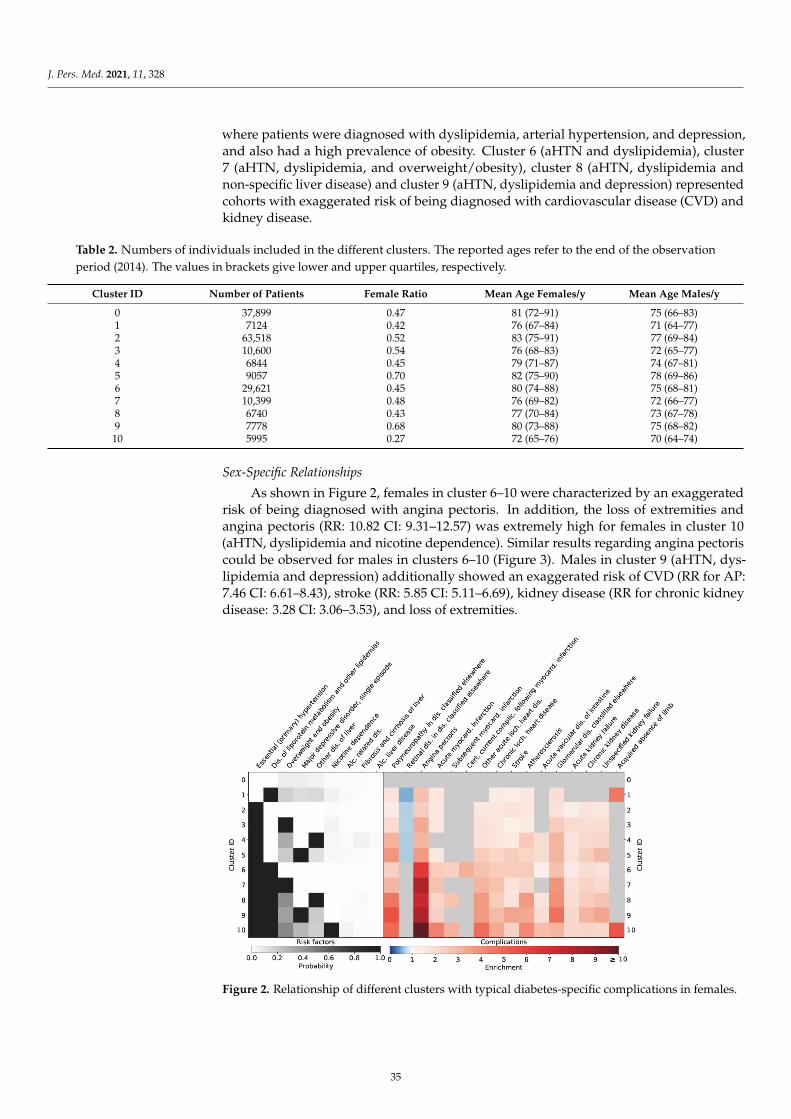
J. Pers. Med. 2021, 11, 328
where patients were diagnosed with dyslipidemia, arterial hypertension, and depression,and also had a high prevalence of obesity. Cluster 6 (aHTN and dyslipidemia), cluster7 (aHTN, dyslipidemia, and overweight/obesity), cluster 8 (aHTN, dyslipidemia andnon-specific liver disease) and cluster 9 (aHTN, dyslipidemia and depression) representedcohorts with exaggerated risk of being diagnosed with cardiovascular disease (CVD) andkidney disease.
Table 2. Numbers of individuals included in the different clusters. The reported ages refer to the end of the observationperiod (2014). The values in brackets give lower and upper quartiles, respectively.
Cluster ID Number of Patients Female Ratio Mean Age Females/y Mean Age Males/y
0 37,899 0.47 81 (72–91) 75 (66–83)1 7124 0.42 76 (67–84) 71 (64–77)2 63,518 0.52 83 (75–91) 77 (69–84)3 10,600 0.54 76 (68–83) 72 (65–77)4 6844 0.45 79 (71–87) 74 (67–81)5 9057 0.70 82 (75–90) 78 (69–86)6 29,621 0.45 80 (74–88) 75 (68–81)7 10,399 0.48 76 (69–82) 72 (66–77)8 6740 0.43 77 (70–84) 73 (67–78)9 7778 0.68 80 (73–88) 75 (68–82)10 5995 0.27 72 (65–76) 70 (64–74)
Sex-Specific Relationships
As shown in Figure 2, females in cluster 6–10 were characterized by an exaggeratedrisk of being diagnosed with angina pectoris. In addition, the loss of extremities andangina pectoris (RR: 10.82 CI: 9.31–12.57) was extremely high for females in cluster 10(aHTN, dyslipidemia and nicotine dependence). Similar results regarding angina pectoriscould be observed for males in clusters 6–10 (Figure 3). Males in cluster 9 (aHTN, dys-lipidemia and depression) additionally showed an exaggerated risk of CVD (RR for AP:7.46 CI: 6.61–8.43), stroke (RR: 5.85 CI: 5.11–6.69), kidney disease (RR for chronic kidneydisease: 3.28 CI: 3.06–3.53), and loss of extremities.
Figure 2. Relationship of different clusters with typical diabetes-specific complications in females.
35
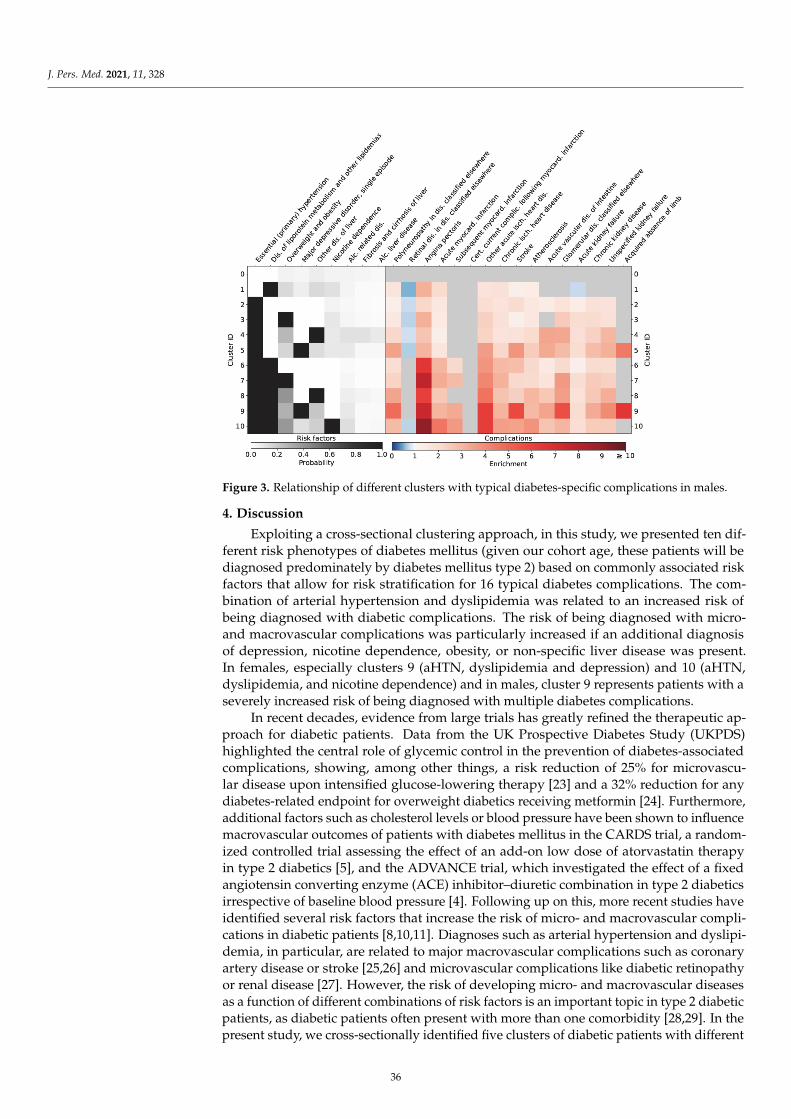
J. Pers. Med. 2021, 11, 328
Figure 3. Relationship of different clusters with typical diabetes-specific complications in males.
4. Discussion
Exploiting a cross-sectional clustering approach, in this study, we presented ten dif-ferent risk phenotypes of diabetes mellitus (given our cohort age, these patients will bediagnosed predominately by diabetes mellitus type 2) based on commonly associated riskfactors that allow for risk stratification for 16 typical diabetes complications. The com-bination of arterial hypertension and dyslipidemia was related to an increased risk ofbeing diagnosed with diabetic complications. The risk of being diagnosed with micro-and macrovascular complications was particularly increased if an additional diagnosisof depression, nicotine dependence, obesity, or non-specific liver disease was present.In females, especially clusters 9 (aHTN, dyslipidemia and depression) and 10 (aHTN,dyslipidemia, and nicotine dependence) and in males, cluster 9 represents patients with aseverely increased risk of being diagnosed with multiple diabetes complications.
In recent decades, evidence from large trials has greatly refined the therapeutic ap-proach for diabetic patients. Data from the UK Prospective Diabetes Study (UKPDS)highlighted the central role of glycemic control in the prevention of diabetes-associatedcomplications, showing, among other things, a risk reduction of 25% for microvascu-lar disease upon intensified glucose-lowering therapy [23] and a 32% reduction for anydiabetes-related endpoint for overweight diabetics receiving metformin [24]. Furthermore,additional factors such as cholesterol levels or blood pressure have been shown to influencemacrovascular outcomes of patients with diabetes mellitus in the CARDS trial, a random-ized controlled trial assessing the effect of an add-on low dose of atorvastatin therapyin type 2 diabetics [5], and the ADVANCE trial, which investigated the effect of a fixedangiotensin converting enzyme (ACE) inhibitor–diuretic combination in type 2 diabeticsirrespective of baseline blood pressure [4]. Following up on this, more recent studies haveidentified several risk factors that increase the risk of micro- and macrovascular compli-cations in diabetic patients [8,10,11]. Diagnoses such as arterial hypertension and dyslipi-demia, in particular, are related to major macrovascular complications such as coronaryartery disease or stroke [25,26] and microvascular complications like diabetic retinopathyor renal disease [27]. However, the risk of developing micro- and macrovascular diseasesas a function of different combinations of risk factors is an important topic in type 2 diabeticpatients, as diabetic patients often present with more than one comorbidity [28,29]. In thepresent study, we cross-sectionally identified five clusters of diabetic patients with different
36
J. Pers. Med. 2021, 11, 328
combinations of common comorbidities of diabetes, each of them showing an exaggeratedrisk of being diagnosed with micro- and macrovascular diabetic complications. Thesefive clusters share the diagnoses of dyslipidemia and arterial hypertension as inclusioncriteria, alongside combinations of smoking, depression, obesity, or non-specific liver dis-ease. An increased risk of being diagnosed with micro- and macrovascular complicationscould be observed in the subgroup of diabetic patients with arterial hypertension anddyslipidemia, who also had a positive history of smoking. In this specific cluster, therewas an increased risk of being diagnosed with CVD, atherosclerosis, and amputation ofthe legs. In a sex-specific analysis, a close relationship between smoking and diagnosis ofangina pectoris and amputation of the legs in women could be observed. Smoking hasbeen associated with an increased risk of glycemic progression in diabetics [30] as well aswith an increased risk of macrovascular complications, especially peripheral artery disease,coronary artery disease [31], and diabetic foot ulcerations findings [32], which are superim-posable with the risk characteristics of subgroup “cluster 10”. The underrepresentationof affections of the retina in nicotine-dependent diabetic patients is in accordance witha study by Cai et al., who noted a decreased risk of diabetic retinopathy and prolifera-tive diabetic retinopathy [33]. Nevertheless, our results highlight that the combinationof arterial hypertension, dyslipidemia, and smoking defines a specific cohort at a majorrisk of being diagnosed with diabetic complications. Next to that, cluster 9, characterizedby type 2 diabetic patients diagnosed with arterial hypertension, dyslipidemia, and addi-tional depression, also showed a close relationship to macro- and microvascular disease.Hence, men in this cluster were particularly at increased risk, especially of leg amputations.To date, co-occurrence of depression and type 2 diabetes has been identified as a major riskfactor for chronic kidney disease, coronary heart disease, stroke, and increased all-causemortality in a retrospective analysis investigating 933,211 patients. Although patients withdepression were younger and had a higher estimated glomerular filtration rate (eGFR)than diabetics without depression in the study by Novak et al., they were characterizedby a higher rate of comorbidities [8]. Accordingly, in the present study, we could showthat the combination of depression with aHTN and dyslipidemia is especially related to anincreased risk of being diagnosed with typical diabetes-specific complications. One possi-ble explanation for the elevated risk of complications in depressed diabetic patients couldbe deficient glycemic control, as patients with depression are characterized by a worseglycemic profile compared to type 2 diabetic patients without depression [34]. The thirdhigh-risk cluster in the present study, cluster 8, comprised type 2 diabetic patients witha predominant co-occurrence of aHTN and dyslipidemia additional to the diagnosis ofnon-specific liver disease such as non-alcoholic fatty liver disease (NAFLD). NAFLD isin general closely related to metabolic disorders like diabetes mellitus and the respectivecomplications. Evidence points to a crosstalk between inflamed abdominal fatty tissueand the liver, combined with a state of gut microbial dysbiosis accompanied by intestinalbarrier dysfunction, leading to systemic inflammation, which consequently constitutes adriving factor in the development of vascular complication in diabetic patients [35]. Cluster7 is defined by type 2 diabetic patients with arterial hypertension, dyslipidemia, and obe-sity. To date, several cluster analyses have reported an increased risk of diabetes-specificcomplications in type 2 diabetic patients suffering from obesity [13,36].
In this study, we clustered cross-sectionally, and hence one limitation is that causalrelationships cannot be evaluated. A further limitation of the present study is that we didnot have access to 4-point ICD codes that would have allowed analysis of the combinationsof the underlying diseases with comorbidities. Nor did we have access to data on laboratoryparameters, anthropometric parameters, or prescribed medications. A further limitation isthat we defined our cohort with the ICD-codes E10–E14, which also includes diagnosis ofdiabetes mellitus type 1. However, given our cohort age, the diagnoses of the patients inthe present study will be dominated by patients with diabetes mellitus type 2. Additionally,we cannot draw conclusions as to whether adequate diabetes therapy is related to changesin the risk of complications. Another limitation is that we had no access to data on lifestyle
37
J. Pers. Med. 2021, 11, 328
habits such as physical activity and nutritional data, which are closely related to thedevelopment of insulin resistance and diabetes mellitus [37].
5. Conclusions
In conclusion, our results demonstrate that the combination of arterial hypertensionand dyslipidemia is especially associated with an elevated risk of diabetes-associatedcomplications. Furthermore, an additional diagnosis of one of the following diseases,namely depression, obesity, non-specific liver disease, or the habit of smoking dramaticallyaggravates the risk of being diagnosed with micro- or macrovascular diseases in a diabeticpatient collective. Therefore, patients who present with the unfavorable combinations ofrisk factors defined by these five clusters should be screened regularly and an intensifiedtreatment and observation regimen may be implemented in the management algorithmof type 2 diabetes mellitus. In particular, the increasing prevalence of smoking in womenin recent years [38] calls for better smoking cessation programs. Additionally, the closerelationship between depression and typical diabetic complications already demonstratedby earlier work and shown to be even more pronounced in males in the present studycalls for regular screening programs for depression in all diabetic patients, allowing forestablishment of appropriate treatment [39]. However, prospective clinical studies would benecessary to further investigate the relationship between different risk factor combinationsand the development of diabetes-specific outcomes.
Supplementary Materials: Supplementary information is available online at https://www.mdpi.com/article/10.3390/jpm11050328/s1.
Author Contributions: Study design: M.L., N.H., P.K. and A.K.-W. Conceived the analytical method:N.H. Implemented the cluster analysis and produced the figures with assistance by E.D. Manuscriptwriting: M.L. and N.H. Contributed to the introduction and the discussion: L.B., E.D., A.K., P.K. andA.K.-W. All authors read, reviewed, and approved the final manuscript. A.K.-W. is the guarantor ofthis work. All authors have read and agreed to the published version of the manuscript.
Funding: The present study was funded by the Vienna Science and Technology Fund (MA16-045).
Institutional Review Board Statement: The study was conducted according to the guidelines ofthe Declaration of Helsinki, and approved by the Ethics Committee of the Medical University ofVienna (Nr.:1020/2020).
Informed Consent Statement: Not applicable.
Data Availability Statement: Data were provided by the Federal Ministry for Health of Austria.
Conflicts of Interest: There are no conflict of interest associated with the manuscript and the authorshave nothing to disclose.
References1. Zheng, Y.; Ley, S.H.; Hu, F.B. Global aetiology and epidemiology of type 2 diabetes mellitus and its complications.
Nat. Rev. Endocrinol. 2018, 14, 88–98. [CrossRef]2. Alonso-Morán, E.; Orueta, J.F.; Esteban, J.I.F.; Axpe, J.M.A.; González, M.L.M.; Polanco, N.T.; Loiola, P.E.; Gaztambide, S.;
Nuño-Solinís, R. Multimorbidity in people with type 2 diabetes in the Basque Country (Spain): Prevalence, comorbidity clustersand comparison with other chronic patients. Eur. J. Intern. Med. 2015, 26, 197–202. [CrossRef] [PubMed]
3. Khan, A.; Uddin, S.; Srinivasan, U. Comorbidity network for chronic disease: A novel approach to understand type 2 diabetesprogression. Int. J. Med. Inform. 2018, 115, 1–9. [CrossRef] [PubMed]
4. Patel, A.; ADVANCE Collaborative Group. Effects of a fixed combination of perindopril and indapamide on macrovascular andmicrovascular outcomes in patients with type 2 diabetes mellitus (the ADVANCE trial): A randomised controlled trial. Lancet2007, 370, 829–840. [CrossRef]
5. Colhoun, H.M.; Betteridge, D.J.; Durrington, P.N.; A Hitman, G.; Neil, H.A.W.; Livingstone, S.J.; Thomason, M.J.; Mackness, M.I.;Charlton-Menys, V.; Fuller, J.H. Primary prevention of cardiovascular disease with atorvastatin in type 2 diabetes in the Collabora-tive Atorvastatin Diabetes Study (CARDS): Multicentre randomised placebo-controlled trial. Lancet 2004, 364, 685–696. [CrossRef]
6. Stamler, J.; Vaccaro, O.; Neaton, J.D.; Wentworth, D. The multiple risk factor intervention trial research group diabetes, other riskfactors, and 12-yr cardiovascular mortality for men screened in the multiple risk factor intervention Trial. Diabetes Care 1993, 16,434–444. [CrossRef] [PubMed]
38
J. Pers. Med. 2021, 11, 328
7. Kearney, P.M.; Blackwell, L.; Collins, R.; Keech, A.; Simes, J.; Peto, R.; Armitage, J.; Baigent, C. Efficacy of cholesterol-loweringtherapy in 18,686 people with diabetes in 14 randomised trials of statins: A meta-analysis. Lancet 2008, 371, 117–125. [PubMed]
8. Novak, M.; Mucsi, I.; Rhee, C.M.; Streja, E.; Lu, J.L.; Kalantar-Zadeh, K.; Molnar, M.Z.; Kovesdy, C.P. Increased risk of incidentchronic kidney disease, cardiovascular disease, and mortality in patients with diabetes with comorbid depression. Diabetes Care2016, 39, 1940–1947. [CrossRef]
9. Wild, S.H.; Walker, J.J.; Morling, J.R.; McAllister, D.A.; Colhoun, H.M.; Farran, B.; McGurnaghan, S.; McCrimmon, R.; Read, S.H.;Sattar, N.; et al. Cardiovascular disease, cancer, and mortality among people with type 2 diabetes and alcoholic or nonalcoholicfatty liver disease hospital admission. Diabetes Care 2018, 41, 341–347. [CrossRef]
10. Wong, T.Y.; Cheung, C.M.; Larsen, M.; Sharma, S.; Simó, R. Diabetic retinopathy. Nat. Rev. Dis. Primers. 2016, 2, 16012. [CrossRef]11. Ahlqvist, E.; Storm, P.; Käräjämäki, A.; Martinell, M.; Dorkhan, M.; Carlsson, A.; Vikman, P.; Prasad, R.B.; Almgren, P.; Wessman,
Y.; et al. Novel subgroups of adult-onset diabetes and their association with outcomes: A data-driven cluster analysis of sixvariables. Lancet Diabetes Endocrinol. 2018, 6, 361–369. [CrossRef]
12. Dennis, J.M.; Shields, B.M.; E Henley, W.; Jones, A.G.; Hattersley, A.T. Disease progression and treatment response in data-drivensubgroups of type 2 diabetes compared with models based on simple clinical features: An analysis using clinical trial data.Lancet Diabetes Endocrinol. 2019, 7, 442–451. [CrossRef]
13. Kahkoska, A.R.; Geybels, M.S.; Klein, K.R.; Kreiner, F.F.; Marx, N.; Nauck, M.A.; Pratley, R.E.; Wolthers, B.O.; Buse, J.B. Validationof distinct type 2 diabetes clusters and their association with diabetes complications in the DEVOTE, LEADER and SUSTAIN -6cardiovascular outcomes trials. Diabetes Obes. Metab. 2020, 22, 1537–1547. [CrossRef]
14. Tanabe, H.; Saito, H.; Kudo, A.; Machii, N.; Hirai, H.; Maimaituxun, G.; Tanaka, K.; Masuzaki, H.; Watanabe, T.; Asahi, K.; et al.Factors associated with risk of diabetic complications in novel cluster-based diabetes subgroups: A Japanese retrospective cohortstudy. J. Clin. Med. 2020, 9, 2083. [CrossRef]
15. Zaharia, O.P.; Strassburger, K.; Strom, A.; Bönhof, G.J.; Karusheva, Y.; Antoniou, S.; Bódis, K.; Markgraf, D.F.; Burkart, V.; Müssig,K.; et al. Risk of diabetes-associated diseases in subgroups of patients with recent-onset diabetes: A 5-year follow-up study.Lancet Diabetes Endocrinol. 2019, 7, 684–694. [CrossRef]
16. Ryu, K.S.; Kang, H.Y.J.; Lee, S.; Park, H.W.; You, N.Y.; Kim, J.H.; Hwangbo, Y.; Choi, K.S.; Cha, H.S. Screening model for estimatingundiagnosed diabetes among people with a family history of diabetes mellitus: A KNHANES-based study. Int. J. Environ. Res.Public Health 2020, 17, 8903. [CrossRef]
17. Nedyalkova, M.; Madurga, S.; Simeonov, V. Combinatorial k-means clustering as a machine learning tool applied to diabetesmellitus type 2. Int. J. Environ. Res. Public Health 2021, 18, 1919. [CrossRef] [PubMed]
18. MacQueen, J. Some methods for classification and analysis of multivariate observations. In Proceedings of the 5th BerkeleySymposium on Mathematical Statistics and Probability, Berkeley, CA, USA, 1 January 1967; University of California Press:Berkeley, CA, USA, 1967; pp. 281–297.
19. Ward, J.J. Hierarchical grouping to optimize an objective function. J. Am. Stat. Assoc. 1963, 58, 236–244. [CrossRef]20. Haug, N.; Deischinger, C.; Gyimesi, M.; Kautzky-Willer, A.; Thurner, S.; Klimek, P. High-risk multimorbidity patterns on the road
to cardiovascular mortality. BMC Med. 2020, 18, 44. [CrossRef] [PubMed]21. Haug, N.; Sorger, J.; Gisinger, T.; Gyimesi, M.; Kautzky-Willer, A.; Thurner, S.; Klimek, P. Decompression of multimorbidity along
the disease trajectories of diabetes mellitus patients. Front. Physiol. 2021, 11, 612604. [CrossRef]22. Chavent, M.; Lechevallier, Y.; Briant, O. DIVCLUS-T: A monothetic divisive hierarchical clustering method. Comput. Stat.
Data Anal. 2007, 52, 687–701. [CrossRef]23. Group UPDSU. Intensive blood-glucose control with sulphonylureas or insulin compared with conventional treatment and risk
of complications in patients with type 2 diabetes (UKPDS 33). UK Prospective Diabetes Study (UKPDS) Group. Lancet 1998,352, 837–853. [CrossRef]
24. UK Prospective Diabetes Study (UKPDS) Group. Effect of intensive blood-glucose control with metformin on complications inoverweight patients with type 2 diabetes (UKPDS 34). Lancet 1998, 352, 854–865. [CrossRef]
25. Baigent, C.; Keech, A.C.; Kearney, P.M.; Blackwell, L.; Buck, G.; Pollicino, C.; Kirby, A.; Sourjina, T.; Peto, R.; Collins, R.; et al.Efficacy and safety of cholesterol-lowering treatment: Prospective meta-analysis of data from 90 056 participants in 14 randomisedtrials of statins. Lancet 2005, 366, 1267–1278.
26. Scott, R.S.; Obrien, R.T.; Fulcher, G.; Pardy, C.; Demden, M.C.; Tse, D.; Taskinen, M.-R.; Ehnholm, C.; Keech, A.C. Effectsof fenofibrate treatment on cardiovascular disease risk in 9,795 individuals with type 2 diabetes and various componentsof the metabolic syndrome: The fenofibrate intervention and event lowering in diabetes (FIELD) study. Diabetes Care 2008,32, 493–498. [CrossRef]
27. Raman, R.; Gupta, A.; Krishna, S.; Kulothungan, V.; Sharma, T. Prevalence and risk factors for diabetic microvascular complicationsin newly diagnosed type II diabetes mellitus. Sankara Nethralaya Diabetic Retinopathy Epidemiology And Molecular GeneticStudy (SN-DREAMS, report 27). J. Diabetes Complicat. 2012, 26, 123–128. [CrossRef]
28. Nowakowska, M.; Zghebi, S.S.; Ashcroft, D.M.; Buchan, I.; Chew-Graham, C.; Holt, T.; Mallen, C.; Van Marwijk, H.; Peek, N.;Perera-Salazar, R.; et al. The comorbidity burden of type 2 diabetes mellitus: Patterns, clusters and predictions from a largeEnglish primary care cohort. BMC Med. 2019, 17, 145. [CrossRef]
29. Piette, J.D.; Kerr, E.A. The impact of comorbid chronic conditions on diabetes care. Diabetes Care 2006, 29, 725–731. [CrossRef]
39
J. Pers. Med. 2021, 11, 328
30. Jiang, G.; Luk, A.O.; Tam, C.H.T.; Lau, E.S.; Ozaki, R.; Chow, E.Y.K.; Kong, A.P.S.; Lim, C.K.P.; Lee, K.F.; Siu, S.C.; et al. Obesity,clinical, and genetic predictors for glycemic progression in Chinese patients with type 2 diabetes: A cohort study using the HongKong Diabetes Register and Hong Kong Diabetes Biobank. PLoS Med. 2020, 17, e1003209. [CrossRef]
31. Zhu, P.; Pan, X.-F.; Sheng, L.; Chen, H.; Pan, A. Cigarette smoking, diabetes, and diabetes complications: Call for urgent action.Curr. Diabetes Rep. 2017, 17, 78. [CrossRef]
32. Zhang, P.; Lu, J.; Jing, Y.; Tang, S.; Zhu, D.; Bi, Y. Global epidemiology of diabetic foot ulceration: A systematic review andmeta-analysis. Ann. Med. 2017, 49, 106–116. [CrossRef] [PubMed]
33. Cai, X.; Chen, Y.; Yang, W.; Gao, X.; Han, X.; Ji, L. The association of smoking and risk of diabetic retinopathy in patients withtype 1 and type 2 diabetes: A meta-analysis. Endocrine 2018, 62, 299–306. [CrossRef] [PubMed]
34. Petrak, F.; Baumeister, H.; Skinner, T.C.; Brown, A.; Holt, R.I.G. Depression and diabetes: Treatment and health-care delivery.Lancet Diabetes Endocrinol. 2015, 3, 472–485. [CrossRef]
35. Targher, G.; Lonardo, A.; Byrne, C.D. Nonalcoholic fatty liver disease and chronic vascular complications of diabetes mellitus.Nat. Rev. Endocrinol. 2018, 14, 99–114. [CrossRef]
36. Anjana, R.M.; Baskar, V.; Nair, A.T.N.; Jebarani, S.; Siddiqui, M.K.; Pradeepa, R.; Unnikrishnan, R.; Palmer, C.; Pearson, E.;Mohan, V. Novel subgroups of type 2 diabetes and their association with microvascular outcomes in an Asian Indian population:A data-driven cluster analysis: The INSPIRED study. BMJ Open Diabetes Res. Care 2020, 8, e001506. [CrossRef]
37. Kanellakis, S.; Mavrogianni, C.; Karatzi, K.; Lindstrom, J.; Cardon, G.; Iotova, V.; Wikström, K.; Shadid, S.; Moreno, L.A.; Tsochev,K.; et al. Development and validation of two self-reported tools for insulin resistance and hypertension risk assessment in aeuropean cohort: The Feel4Diabetes-study. Nutrients 2020, 12, 960. [CrossRef]
38. Dorner, T.E.; Brath, H.; Kautzky-Willer, A. Sex-specific trends in smoking prevalence over seven years in different Austrianpopulations: Results of a time-series cross-sectional analysis. BMJ Open 2020, 10, e035235. [CrossRef]
39. Kautzky-Willer, A.; Harreiter, J.; Pacini, G. Sex and gender differences in risk, pathophysiology and complications of type 2diabetes mellitus. Endocr. Rev. 2016, 37, 278–316. [CrossRef]
40
Journal of
Personalized
Medicine
Article
Glycosylation of IgG Associates with Hypertension and Type 2Diabetes Mellitus Comorbidity in the Chinese Muslim EthnicMinorities and the Han Chinese
Xiaoni Meng 1 , Manshu Song 1,2,* , Marija Vilaj 3, Jerko Štambuk 3, Mamatyusupu Dolikun 4, Jie Zhang 1,Di Liu 1, Hao Wang 5 , Xiaoyu Zhang 1, Jinxia Zhang 1, Weijie Cao 1, Ana Momcilovic 3,Irena Trbojevic-Akmacic 3 , Xingang Li 2,6 , Deqiang Zheng 1, Lijuan Wu 1, Xiuhua Guo 1, Youxin Wang 1,2 ,Gordan Lauc 3,7 and Wei Wang 1,2,6
Citation: Meng, X.; Song, M.; Vilaj,
M.; Štambuk, J.; Dolikun, M.; Zhang,
J.; Liu, D.; Wang, H.; Zhang, X.;
Zhang, J.; et al. Glycosylation of IgG
Associates with Hypertension and
Type 2 Diabetes Mellitus Comorbidity
in the Chinese Muslim Ethnic
Minorities and the Han Chinese. J.
Pers. Med. 2021, 11, 614. https://
doi.org/10.3390/jpm11070614
Academic Editor: Rutger
A. Middelburg
Received: 7 May 2021
Accepted: 21 June 2021
Published: 29 June 2021
Publisher’s Note: MDPI stays neutral
with regard to jurisdictional claims in
published maps and institutional affil-
iations.
Copyright: © 2021 by the authors.
Licensee MDPI, Basel, Switzerland.
This article is an open access article
distributed under the terms and
conditions of the Creative Commons
Attribution (CC BY) license (https://
creativecommons.org/licenses/by/
4.0/).
1 Beijing Key Laboratory of Clinical Epidemiology, School of Public Health, Capital Medical University,Beijing 100069, China; [email protected] (X.M.); [email protected] (J.Z.);[email protected] (D.L.); [email protected] (X.Z.); [email protected] (J.Z.); [email protected] (W.C.);[email protected] (D.Z.); [email protected] (L.W.); [email protected] (X.G.);[email protected] (Y.W.); [email protected] (W.W.)
2 School of Medical and Health Sciences, Edith Cowan University, Perth, WA 6027, Australia;[email protected]
3 Genos Glycoscience Research Laboratory, 10000 Zagreb, Croatia; [email protected] (M.V.);[email protected] (J.Š.); [email protected] (A.M.); [email protected] (I.T.-A.);[email protected] (G.L.)
4 College of the Life Sciences and Technology, Xinjiang University, Urumqi 830046, China;[email protected]
5 Department of Clinical Epidemiology and Evidence-Based Medicine,National Clinical Research Center for Digestive Disease, Beijing Friendship Hospital,Capital Medical University, Beijing 100050, China; [email protected]
6 Centre for Precision Health, Edith Cowan University, Perth, WA 6027, Australia7 Faculty of Pharmacy and Biochemistry, University of Zagreb, 10000 Zagreb, Croatia* Correspondence: [email protected]
Abstract: Objectives: Hypertension and type 2 diabetes mellitus comorbidity (HDC) is common,which confers a higher risk of cardiovascular disease than the presence of either condition alone.Describing the underlying glycomic changes of immunoglobulin G (IgG) that predispose individualsto HDC may help develop novel protective immune-targeted and anti-inflammatory therapies. There-fore, we investigated glycosylation changes of IgG associated with HDC. Methods: The IgG N-glycanprofiles of 883 plasma samples from the three northwestern Chinese Muslim ethnic minorities andthe Han Chinese were analyzed by ultra-performance liquid chromatography instrument. Results:We found that 12 and six IgG N-glycan traits showed significant associations with HDC in theChinese Muslim ethnic minorities and the Han Chinese, respectively, after adjustment for potentialconfounders and false discovery rate. Adding the IgG N-glycan traits to the baseline models, the areaunder the receiver operating characteristic curves (AUCs) of the combined models differentiatingHDC from hypertension (HTN), type 2 diabetes mellitus (T2DM), and healthy individuals were0.717, 0.747, and 0.786 in the pooled samples of Chinese Muslim ethnic minorities, and 0.828, 0.689,and 0.901 in the Han Chinese, respectively, showing improved discriminating performance thanboth the baseline models and the glycan-based models. Conclusion: Altered IgG N-glycan profileswere shown to associate with HDC, suggesting the involvement of inflammatory processes of IgGglycosylation. The alterations of IgG N-glycome, illustrated here for the first time in HDC, demon-strate a biomarker potential, which may shed light on future studies investigating their potential formonitoring or preventing the progression from HTN or T2DM towards HDC.
Keywords: hypertension and type 2 diabetes mellitus comorbidity; IgG; N-glycosylation; biomarkers
41
J. Pers. Med. 2021, 11, 614
1. Introduction
Hypertension (HTN) is one of the leading modifiable risk factors for morbidity andmortality of cardiovascular disease (CVD) worldwide [1]. Likewise, type 2 diabetes melli-tus (T2DM) has become one of the global disease burdens [2]. HTN and T2DM are closelyinterlinked due to similar risk factors including obesity, dyslipidemia, insulin resistance,endothelial dysfunction, vascular inflammation, atherosclerosis, and sequential inappro-priate activation of renin-angiotensin system, etc. [3,4]. Previous studies have shown thathypertension is at least twice as frequent in patients with diabetes compared with thosewho do not have diabetes [5]. Accordingly, a considerable portion of the world populationundergoes coexistent T2DM and HTN, which increases the risk of CVD and renal failurein individuals [6]. Compared with the normotensive non-diabetic individuals, patientswith HTN and T2DM comorbidity (HDC) have a four-fold increased risk of CVD [7]. Thenumber of patients diagnosed with HTN and T2DM comorbidity (HDC) is on the rise,resulting in increased medical expenses and resource utilization [8]. Thus, further studiesof biomarkers for monitoring and preventing the progression from HTN or T2DM towardsHDC are timely and called for.
The glycan attachment to individual proteins is driven by specific enzymes and playsan indispensable role in almost all physiological processes [9]. In general, N-glycome con-structed in healthy individuals is fairly stable but can vary due to pathological conditions,especially during inflammation [10]. Altered glycosylation pathways can have significanteffects on protein structure and function that occur during the transition from healthyto diseased states. Due to the absence of the genetic template and the lack of stringencywithin the biosynthetic pathway, the glycan structures of individuals are influenced by theintricate interplay of genetic polymorphisms and environmental factors [11]. Therefore, it iswarranted to elucidate the role of altered glycome composition in the pathogenic immuneresponse and to analyze the possibility of using N-glycosylation as a latent predictor forthe development of multifactorial diseases, such as HDC.
As the most abundant antibody in human blood, immunoglobulin G (IgG) regulatessystemic inflammation balance at multiple levels, and its function is largely influencedby glycosylation. It has been shown that the pro- and anti-inflammatory activities of IgGcould no longer be demonstrated if N-glycans are completely removed [12]. Aberrant IgGN-glycosylation has also been demonstrated to be involved in the pathogenesis such asaging [13], HTN [14], and T2DM [15,16], which are relevant risk factors contributing toHDC. These observations make us speculate that changes of IgG N-glycosylation maybe related to the pathogenesis of HDC by regulating inflammation. Understanding theunderlying altered IgG N-glycosylation profiles that predispose individuals to HDC mayhelp to develop novel protective immune-targeted and anti-inflammatory therapies and/orprevention approaches. However, the associations between IgG N-glycans and HDC havenot been described in current literature.
There are 55 officially recognized ethnic minority groups within China in addition toHan majority (which constitute about 91.9% of the total population). The population sizeof Han Chinese and Chinese ethnic minorities are 1286.3 and 125.5 million, respectively(according to the seventh national census statistics of China conducted in 2020). Thegenetic background, culture, socioeconomic conditions, climate, geographical features,lifestyle, and dietary habit are substantially different between Han Chinese and other ethnicminorities. The Kirgiz (KGZ), Tajik (TJK), and Uygur (UIG) are three Chinese Muslimethnic minorities, with a total population size of 11.94 million, inhabiting the XinjiangUygur Autonomous Region, the northwestern frontier of China, for generations, withoutintermarry with other ethnic groups [17]. These Chinese Muslim minorities share relativelysimilar lifestyles, diet-related habits, living environment, culture, and genetic backgrounds,thereby are well-defined isolated populations with substantial ancestry contribution fromWestern Eurasian people [18,19]. The prevalence of HTN and T2DM in the northwesternChinese minority populations is on the rise and relatively higher than that in the HanChinese, the majority ethnic group in China [20,21]. Investigating the IgG N-glycan profiles
42
J. Pers. Med. 2021, 11, 614
of ethnic groups with different prevalence of HTN and T2DM could shed light on thepotential population-specific and/or general IgG N-glycan patterns and their relevance tothe pathogenesis of HDC.
In this study, we investigated the changes in IgG N-glycosylation profiles associatedwith HDC and their biomarker potential for distinguishing HDC from HTN, T2DM, andhealthy individuals in the aforementioned populations. This work could further increaseour understanding of HDC pathophysiology and may shed light on future studies investi-gating their potential for monitoring or preventing the progression from HTN or T2DMtowards HDC.
2. Materials and Methods2.1. Subjects
The participants from the three northwestern Chinese ethnic minorities (KGZ, TJK, andUIG) were recruited, and their demographic characteristics (gender, age, ethnicity, levelsof education, occupation, and urban/rural residence) and anthropometric measurements(height, weight, body mass index [BMI], and blood pressure), as well as blood samples, werecollected. All the Muslim participants were recruited from the isolated underdevelopedrural areas (Halajun town, Tagan town, and Minfeng town) of Xinjiang, China, wherethe respective Muslim minority “exclusively” inhabit for generations without co-residentHan or other ethnic groups, with either primary or secondary education. The occupationsof all the UIG participants were farmers and of all the KGZ and TJK participants wereherdsmen. A total of 484 samples from 165 KGZ, 146 TJK, and 173 UIG were included inthis study, composed of 67 HDC, 183 HTN, 51 T2DM, and 183 healthy individuals (medianages for the four health condition groups: 63, 59, 54, and 51 years). The participants met thefollowing inclusion criteria: (1) Over 18 years old; (2) self-reported the KGZ, TJK, or UIGethnicity without intermarriage history with other ethnic groups within at least the pastthree generations. Individuals were excluded based on the following criteria: (1) Pregnantor lactating women; (2) history of severe hepatic, nephritic and autoimmune disease; and(3) diagnosis of diseases of mental illness or infectious disease.
In this study, a total of 399 Han Chinese participants from a community-based surveyin Beijing were also included, composed of 72 HDC, 112 HTN, 50 T2DM, and 165 healthycontrols (median ages for the four health condition groups: 66, 49, 54, and 46 years).The demographic characteristics, anthropometric measurements, and blood samples ofHan Chinese population were collected in a cross-sectional study conducted in 2012, asdescribed previously [13].
All 883 participants included in this study have signed written informed consent.The study was approved by the local community leaders and the Ethics Committee ofCapital Medical University, Beijing, China (No. 2015SY21 and 2009SY16) and adhered tothe principles of the Declaration of Helsinki.
2.2. Diagnostic Criteria
HTN was defined as an average systolic blood pressure (SBP)≥ 140 mmHg and/or anaverage diastolic blood pressure (DBP) ≥ 90 mmHg, according to the Chinese guidelinesfor the prevention and treatment of HTN in adults [22]. Peripheral blood samples ofthe participants for analyses of biochemical indicators (fasting plasma glucose and bloodlipids) and IgG N-glycan profiles were collected using EDTA anti-coagulated tube after anovernight fast. The diagnosis of T2DM was based on fasting blood glucose≥ 7.0 mmol/L inthis study, according to World Health Organization (WHO) Criteria [23]. HDC was definedas the co-existence of HTN and T2DM [24]. Dyslipidemia was defined as total cholesterol(TC) ≥ 6.2 mmol/L, triglycerides (TG) ≥ 2.3 mmol/L, low-density lipoprotein choles-terol (LDL) ≥ 4.1 mmol/L, or high-density lipoprotein cholesterol (HDL) < 1.0 mmol/L,according to the Guidelines for Prevention and Treatment of Dyslipidemia in Adults inChina [25].
43
J. Pers. Med. 2021, 11, 614
2.3. Analysis of IgG N-glycosylation
IgG was isolated from plasma samples from all participants using 96-well proteinG monolithic plates, and N-linked glycans were released and labeled as described previ-ously [26]. In brief, the isolated IgG was eluted from protein G with 1 mL of 0.1 M formicacid and instantly neutralized with 1 M ammonium bicarbonate. Then, IgG N-glycanswere released using PNGase F, labeled with 2-aminobenzamide and purified with 96%acetonitrile and ultrapure water to remove proteins, salts and excess of reagents fromdeglycosylation and fluorescent labeling reaction. In the end, IgG N-glycans were analyzedby hydrophilic interaction liquid chromatography (HILIC) using ultra-performance liquidchromatography (UPLC) instrument as described previously [27].
In total, 24 chromatographic peaks, (i.e., IgG glycan peaks (GPs, GP1–GP24)) weremeasured and the amount of glycans in each peak was expressed as percentage of totalintegrated area [15], and the detailed structures of the N-glycan peaks were shown inTable S1. The 54 derived glycan traits (DGs, DG1–DG54) were calculated from the directlymeasured GPs [28]. These DGs were used to describe the relative abundance of galacto-sylation, sialylation, bisecting N-acetylglucosamine (GlcNAc), and core fucosylation. Toremove the experimental variation from measurements, normalization and batch correctionwere conducted on the UPLC measured glycan data [29]. Therefore, the measurementswere comparable across all samples.
2.4. Statistical Analysis
Based on our previous publications, in which the correlation coefficients of the re-lationship between the sialylated glycans (i.e., IgG 4 G1S (that is, Galactose and Sialicacid) and monosialylated glycan, respectively) and SBP in the Chinese Muslim ethnicminority (Kazakh) and the Han Chinese were of a similar magnitude: −0.373 and −0.372,respectively [30,31]. With 75% power and a 0.05 two-sided significance level, the re-quired sample size is estimated to be 48 participants for each of the four health condi-tion groups (i.e., HDC, HTN, T2DM, and healthy individuals) using StatsToDo (http://www.statstodo.com/SSizCorr_Pgm.php; accessed on 9 October 2020). The data fromthe three Chinese Muslim ethnic minorities with similar genetic and environmental back-grounds were pooled together for the statistical analysis, given that the sample size of therespective four health condition groups of the individual Chinese Muslim ethnic minorityis insufficient.
Normality distributions of all glycan traits were double-checked by using the Kolmogorov–Smirnov test and Shapiro–Wilk test. When the continuous variable conformed to the normalitydistribution, means together with standard deviations were used in descriptive statistics.Otherwise, medians together with the interquartile ranges were used. The Chi-square testwas applied to investigate the differences in categorical variables. Since the majority of theIgG N-glycan traits were not normally distributed, the Kruskal–Wallis test was conducted todetermine the differences of directly measured and derived IgG N-glycan traits among theHDC, HTN, T2DM, and healthy controls.
The IgG glycosylation features of HDC may combine the IgG glycosylation fea-tures of both HTN and T2DM, thus a Venn diagram was constructed to illustrate sharedIgG N-glycan features between the four health condition groups using online software(http://bioinformatics.psb.ugent.be/webtools/Venn/; accessed on 17 April 2021). The as-sociations between HDC and IgG N-glycan traits were assessed through logistic regressionanalysis, with the IgG N-glycan traits as independent variables, adjusted for potentialconfounders (i.e., age, gender, ethnicity, BMI, and dyslipidemia). Given the potentialinternal associations among IgG N-glycan traits, which could induce multicollinearity inthe statistical models, the least absolute shrinkage and selection operator (LASSO) methodwas conducted to reduce dimension before constructing the logistic regression models.
To evaluate differences in IgG N-glycan traits of different health conditions in the threeChinese Muslim minorities pooled samples and Han Chinese samples, the IgG N-glycantraits screened by the LASSO method were included to construct logistic regression models
44
J. Pers. Med. 2021, 11, 614
for HDC versus HTN, HDC versus T2DM, and HDC versus healthy controls, respectively.Three types of logistic classification models were applied: (1) The baseline models includedage, gender, ethnicity, BMI, and dyslipidemia as the covariates; (2) the glycan-basedmodels included the screened IgG N-glycan traits as the covariates; and (3) the combinedmodels incorporated the screened IgG N-glycan traits on top of the covariates includedin the baseline models. The prediction error of the five-fold cross-validation procedurewas used to assess the performance of the discriminant models (R package “boot”) [32].The discriminant ability of the models in delineating the HDC from the HTN, T2DM,and healthy individuals was evaluated by receiver operating characteristic (ROC) curveanalysis (R package “pROC”).
Data were analyzed and visualized using SAS (Version 9.4) and R packages (Ver-sion 4.0.4). For the logistic regression analysis, the Benjamini–Hochberg procedure wasused to control the false discovery rate (FDR) [33]. All analyses were two-sided, andstatistical significance was set at p < 0.05. Bonferroni adjustment was used for multiplecomparisons among the four health condition groups to control familywise error rate(FWER) in a very stringent criterion and to compute the adjusted p values by directly adjustthe significance level as α′ = α/m (i.e., the number of simultaneously tested hypotheses).Thus, p < 0.05/6 (0.0083) was considered to be statistical significance in the comparativeanalysis of demographic and biochemical characteristics, and the levels of IgG N-glycansbetween the groups.
3. Results3.1. Demographic and Biochemical Characteristics
A total of 883 participants (484 Chinese Muslim minorities and 399 Han Chinese) wereanalyzed in this study. Demographic and biochemical characteristics of the HDC, HTN,T2DM, and healthy individuals for the Chinese Muslim ethnic minorities and those for theHan Chinese are shown separately (Table S2) and pooled together in Table 1. In the poolingof the Chinese Muslim ethnic minorities, the age significantly differed in HDC comparedto T2DM and healthy controls, and the SBP and DBP were significantly higher in the HDCgroup than those in both T2DM and healthy individuals, and the FBG was higher in theHDC than that in both the HTN and healthy individuals. In the Han Chinese individuals,the age, gender, BMI, SBP, DBP, TC, TG, LDL, FBG, and dyslipidemia significantly differedamong the four health condition groups (i.e., HDC, HTN, T2DM, and healthy controls).
45
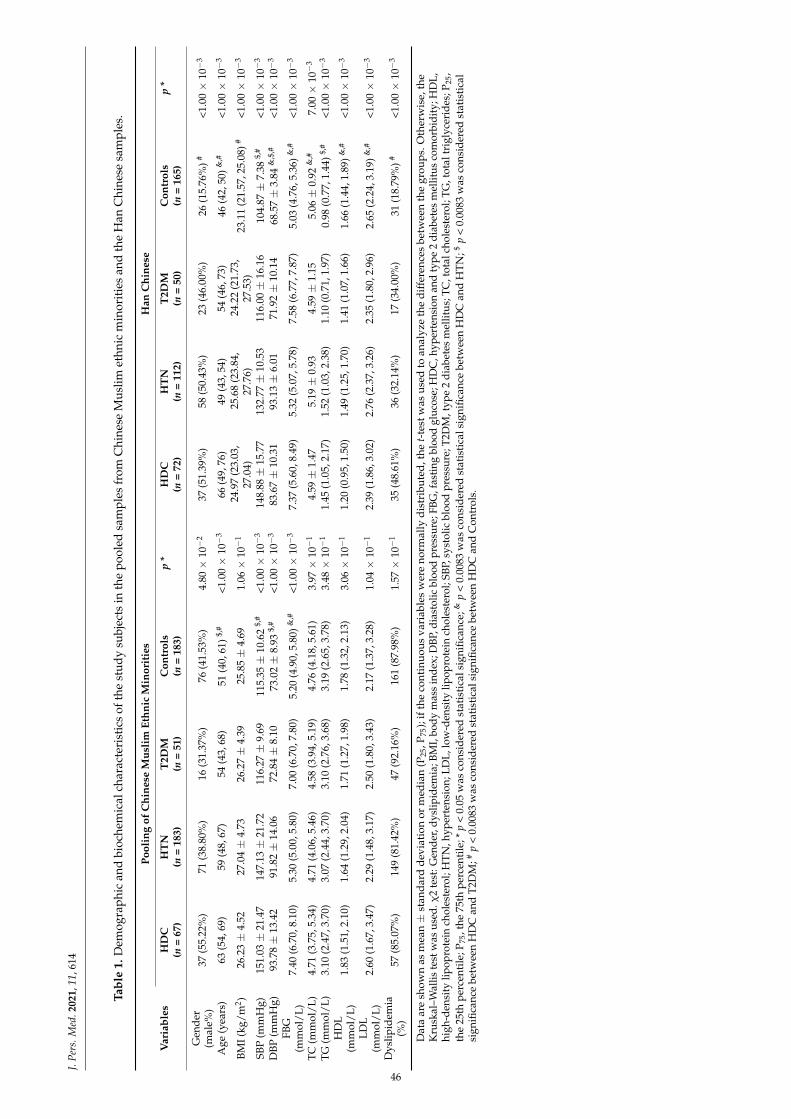
J.Pe
rs.M
ed.2
021,
11,6
14
Tabl
e1.
Dem
ogra
phic
and
bioc
hem
ical
char
acte
rist
ics
ofth
est
udy
subj
ects
inth
epo
oled
sam
ples
from
Chi
nese
Mus
limet
hnic
min
orit
ies
and
the
Han
Chi
nese
sam
ples
.
Pool
ing
ofC
hine
seM
usli
mEt
hnic
Min
orit
ies
Han
Chi
nese
Var
iabl
esH
DC
HT
NT
2DM
Con
trol
sp
*H
DC
HT
NT
2DM
Con
trol
sp
*(n
=67
)(n
=18
3)(n
=51
)(n
=18
3)(n
=72
)(n
=11
2)(n
=50
)(n
=16
5)
Gen
der
(mal
e%)
37(5
5.22
%)
71(3
8.80
%)
16(3
1.37
%)
76(4
1.53
%)
4.80×
10−
237
(51.
39%
)58
(50.
43%
)23
(46.
00%
)26
(15.
76%
)#<1
.00×
10−
3
Age
(yea
rs)
63(5
4,69
)59
(48,
67)
54(4
3,68
)51
(40,
61)$,
#<1
.00×
10−
366
(49,
76)
49(4
3,54
)54
(46,
73)
46(4
2,50
)&,#
<1.0
0×
10−
3
BMI(
kg/m
2 )26
.23±
4.52
27.0
4±
4.73
26.2
7±
4.39
25.8
5±
4.69
1.06×
10−
124
.97
(23.
03,
27.0
4)25
.68
(23.
84,
27.7
6)24
.22
(21.
73,
27.5
3)23
.11
(21.
57,2
5.08
)#<1
.00×
10−
3
SBP
(mm
Hg)
151.
03±
21.4
714
7.13±
21.7
211
6.27±
9.69
115.
35±
10.6
2$,
#<1
.00×
10−
314
8.88±
15.7
713
2.77±
10.5
311
6.00±
16.1
610
4.87±
7.38
$,#
<1.0
0×
10−
3
DBP
(mm
Hg)
93.7
8±
13.4
291
.82±
14.0
672
.84±
8.10
73.0
2±
8.93
$,#
<1.0
0×
10−
383
.67±
10.3
193
.13±
6.01
71.9
2±
10.1
468
.57±
3.84
&,$
,#<1
.00×
10−
3
FBG
(mm
ol/L
)7.
40(6
.70,
8.10
)5.
30(5
.00,
5.80
)7.
00(6
.70,
7.80
)5.
20(4
.90,
5.80
)&,#
<1.0
0×
10−
37.
37(5
.60,
8.49
)5.
32(5
.07,
5.78
)7.
58(6
.77,
7.87
)5.
03(4
.76,
5.36
)&,#
<1.0
0×
10−
3
TC(m
mol
/L)
4.71
(3.7
5,5.
34)
4.71
(4.0
6,5.
46)
4.58
(3.9
4,5.
19)
4.76
(4.1
8,5.
61)
3.97×
10−
14.
59±
1.47
5.19±
0.93
4.59±
1.15
5.06±
0.92
&,#
7.00×
10−
3
TG(m
mol
/L)
3.10
(2.4
7,3.
70)
3.07
(2.4
4,3.
70)
3.10
(2.7
6,3.
68)
3.19
(2.6
5,3.
78)
3.48×
10−
11.
45(1
.05,
2.17
)1.
52(1
.03,
2.38
)1.
10(0
.71,
1.97
)0.
98(0
.77,
1.44
)$,#
<1.0
0×
10−
3
HD
L(m
mol
/L)
1.83
(1.5
1,2.
10)
1.64
(1.2
9,2.
04)
1.71
(1.2
7,1.
98)
1.78
(1.3
2,2.
13)
3.06×
10−
11.
20(0
.95,
1.50
)1.
49(1
.25,
1.70
)1.
41(1
.07,
1.66
)1.
66(1
.44,
1.89
)&,#
<1.0
0×
10−
3
LDL
(mm
ol/L
)2.
60(1
.67,
3.47
)2.
29(1
.48,
3.17
)2.
50(1
.80,
3.43
)2.
17(1
.37,
3.28
)1.
04×
10−
12.
39(1
.86,
3.02
)2.
76(2
.37,
3.26
)2.
35(1
.80,
2.96
)2.
65(2
.24,
3.19
)&,#
<1.0
0×
10−
3
Dys
lipid
emia
(%)
57(8
5.07
%)
149
(81.
42%
)47
(92.
16%
)16
1(8
7.98
%)
1.57×
10−
135
(48.
61%
)36
(32.
14%
)17
(34.
00%
)31
(18.
79%
)#<1
.00×
10−
3
Dat
aar
esh
own
asm
ean±
stan
dar
dd
evia
tion
orm
edia
n(P
25,P
75);
ifth
eco
ntin
uou
sva
riab
les
wer
eno
rmal
lyd
istr
ibu
ted
,the
t-te
stw
asu
sed
toan
alyz
eth
ed
iffe
renc
esbe
twee
nth
egr
oups
.Oth
erw
ise,
the
Kru
skal
–Wal
liste
stw
asus
ed.χ
2te
st:G
ende
r,dy
slip
idem
ia;B
MI,
body
mas
sin
dex;
DBP
,dia
stol
icbl
ood
pres
sure
;FBG
,fas
ting
bloo
dgl
ucos
e;H
DC
,hyp
erte
nsio
nan
dty
pe2
diab
etes
mel
litus
com
orbi
dity
;HD
L,hi
gh-d
ensi
tylip
opro
tein
chol
este
rol;
HTN
,hyp
erte
nsio
n;LD
L,lo
w-d
ensi
tylip
opro
tein
chol
este
rol;
SBP,
syst
olic
bloo
dpr
essu
re;T
2DM
,typ
e2
diab
etes
mel
litus
;TC
,tot
alch
oles
tero
l;TG
,tot
altr
igly
ceri
des;
P 25,
the
25th
perc
enti
le;P
75,t
he75
thpe
rcen
tile
;*p
<0.
05w
asco
nsid
ered
stat
isti
cals
igni
fican
ce;&
p<
0.00
83w
asco
nsid
ered
stat
isti
cals
igni
fican
cebe
twee
nH
DC
and
HT
N;$
p<
0.00
83w
asco
nsid
ered
stat
isti
cal
sign
ifica
nce
betw
een
HD
Can
dT2
DM
;#p
<0.
0083
was
cons
ider
edst
atis
tica
lsig
nific
ance
betw
een
HD
Can
dC
ontr
ols.
46
J. Pers. Med. 2021, 11, 614
3.2. The Association of IgG N-Glycans with HDC
IgG N-glycome composition (i.e., GPs and DGs) was analyzed in all samples. Out ofthe total 78 glycan traits, 56 and 62 glycan traits were found to be abnormally distributed(pKolmogorov–Smirnov < 0.05 and pShapiro–Wilk < 0.05) in the pooled samples from the threeChinese Muslim ethnic minorities and those from Han Chinese, respectively (Table S3).The differences of directly measured and derived glycan compositions among HDC, HTN,T2DM, and healthy controls for the Chinese Muslim ethnic minorities and the Han Chi-nese, respectively, were shown in Figure 1 and Table S3. We found the increased relativeabundance of GP4 (FA2), GP6 (FA2B), and GP11 (FA2[3]BG1) and the reduced relativeabundance of GP14 (FA2G2), GP18 (FA2G2S1), and GP20 (FA2FG2S1) in the HDC groupcompared with the other three health condition groups (i.e., HTN, T2DM, and healthyindividuals), with similar trends in the Chinese Muslim ethnic minorities and the HanChinese (Figure 1).
Table S4 and its accompanying Venn Diagrams (Figure 2) displays and illustratesrespectively, the results of the logistic regression analysis of IgG N-glycans after adjustmentfor potential confounders (i.e., age, gender, ethnicity, BMI, and dyslipidemia), and sharedand unique IgG glycan features between the different health conditions. Noteworthily,12 (i.e., 7 in HDC versus HTN, 3 in HDC versus T2DM, and 2 in HDC versus Controls)and 6 (i.e., 3 in HDC versus HTN, 2 in HDC versus T2DM, and 1 in HDC versus Controls)IgG N-glycan traits were found to be significantly different between four health conditiongroups within the three Chinese Muslim minorities pooled samples and Han Chinesesamples, respectively, after controlling the aforementioned confounders and FDR, in theHDC pairwise comparison with the three health condition groups (i.e., HDC versus HTN,HDC versus T2DM, and HDC versus healthy individuals) (Table S4 and Figure 3). Toelaborate further, it was found that within the pooled samples from the three ChineseMuslim minorities, seven glycan traits (increased relative abundance of GP5 [M5], GP6[FA2B], and DG54 [BG2n/(FG2n + FBG2n)] as well as reduced relative abundance ofGP16 [FA2G1S1], GP18 [FA2G2S1], DG3 [FGS/(F + FG + FGS)], and DG24 [GP8n]) weresignificant differences between HDC and HTN (p < 0.05). Three glycan traits (increasedrelative abundance of GP5 and reduced relative abundance of GP16 and GP18) weresignificant differences between HDC and T2DM (p < 0.05). In addition, two glycan traits(GP5 and GP6), with increased relative abundance, were significantly different betweenHDC and healthy controls (p < 0.05).
For the pooling of three Chinese Muslim ethnic minorities, we found that one sharedglycan trait—GP5, containing high mannose glycan (M5) in the HDC, was significantlyhigher than those in the other three healthy condition groups (i.e., HTN, T2DM, and healthyindividuals). Additionally, two shared glycan traits (GP16 and GP18), containing core-fucosylated galactosylated glycans with sialic acid (FA2G1S1 and FA2G2S1, respectively),were observed in lower levels in the HDC compared with HTN and T2DM, and a core-fucosylated agalactosylated glycan containing bisecting GlcNAc eluting in GP6 (FA2B)was observed in higher levels in the HDC than those in the HTN and healthy individuals(Figure 3 and Table S4).
Similarly, for the Han Chinese, in comparisons between HDC and the other threehealthy condition groups (i.e., HTN, T2DM, and healthy controls), one shared glycan trait(GP20 [FA2FG2S1]) containing core-fucosylated digalactosylated glycan with sialic acid ofreduced relative abundance was of statistical significance. The relative abundance of DG2(FBGS/(FBG + FBGS)) and DG53 (FG2n/(BG2n + FBG2n)) in the HDC were significantlyhigher than those in the HTN. Additionally, the increased relative abundance of GP24(FA2BG2S2) containing sialylation of fucosylated galactosylated structures with bisectingGlcNAc was found in the HDC compared with the T2DM (Figure 3 and Table S4).
47
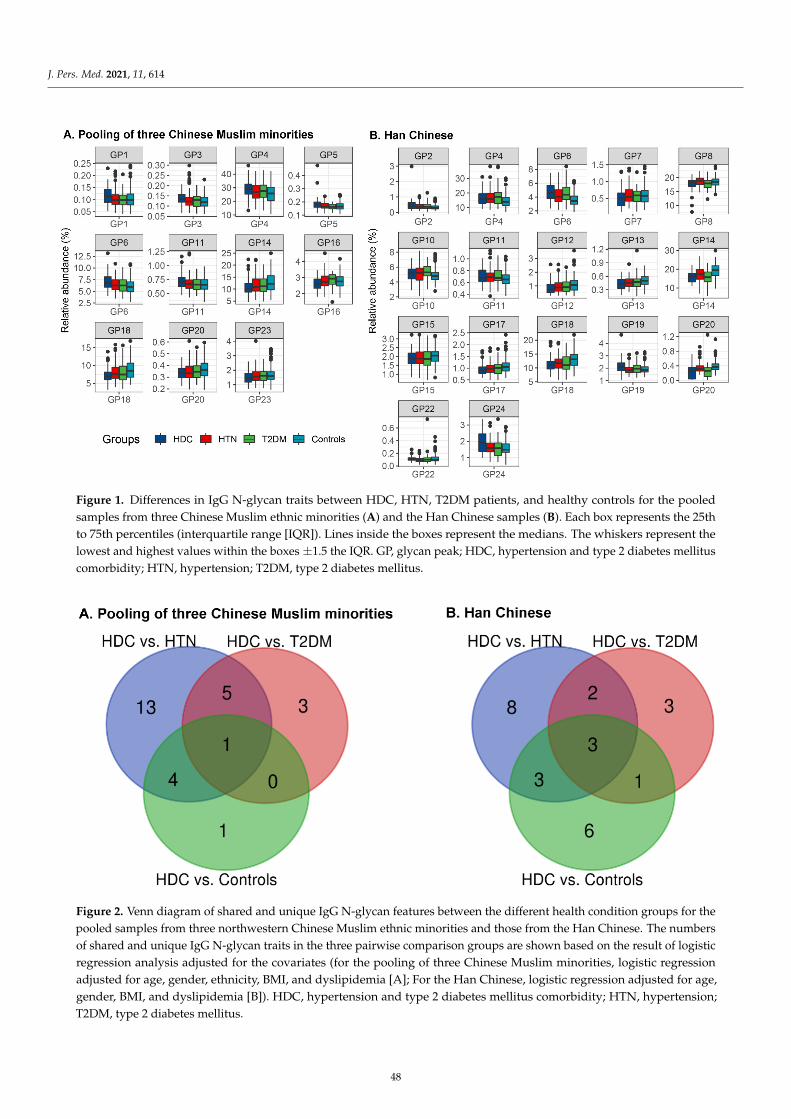
J. Pers. Med. 2021, 11, 614
J. Pers. Med. 2021, 11, x FOR PEER REVIEW 7 of 19
3.2. The Association of IgG N-Glycans with HDC IgG N-glycome composition (i.e., GPs and DGs) was analyzed in all samples. Out of
the total 78 glycan traits, 56 and 62 glycan traits were found to be abnormally distributed (pKolmogorov–Smirnov < 0.05 and pShapiro–Wilk < 0.05) in the pooled samples from the three Chinese Muslim ethnic minorities and those from Han Chinese, respectively (Table S3). The dif-ferences of directly measured and derived glycan compositions among HDC, HTN, T2DM, and healthy controls for the Chinese Muslim ethnic minorities and the Han Chi-nese, respectively, were shown in Figure 1 and Table S3. We found the increased relative abundance of GP4 (FA2), GP6 (FA2B), and GP11 (FA2[3]BG1) and the reduced relative abundance of GP14 (FA2G2), GP18 (FA2G2S1), and GP20 (FA2FG2S1) in the HDC group compared with the other three health condition groups (i.e., HTN, T2DM, and healthy individuals), with similar trends in the Chinese Muslim ethnic minorities and the Han Chinese (Figure 1).
Figure 1. Differences in IgG N-glycan traits between HDC, HTN, T2DM patients, and healthy controls for the pooled samples from three Chinese Muslim ethnic minorities (A) and the Han Chinese samples (B).
Each box represents the 25th to 75th percentiles (interquartile range [IQR]). Lines inside the boxes represent the medians. The whiskers represent the lowest and highest values within the boxes ± 1.5 the IQR.
GP, glycan peak; HDC, hypertension and type 2 diabetes mellitus comorbidity; HTN, hyper-tension; T2DM, type 2 diabetes mellitus
Table S4 and its accompanying Venn Diagrams (Figure 2) displays and illustrates respectively, the results of the logistic regression analysis of IgG N-glycans after adjust-ment for potential confounders (i.e., age, gender, ethnicity, BMI, and dyslipidemia), and shared and unique IgG glycan features between the different health conditions. Notewor-thily, 12 (i.e., 7 in HDC versus HTN, 3 in HDC versus T2DM, and 2 in HDC versus Con-trols) and 6 (i.e., 3 in HDC versus HTN, 2 in HDC versus T2DM, and 1 in HDC versus Controls) IgG N-glycan traits were found to be significantly different between four health condition groups within the three Chinese Muslim minorities pooled samples and Han Chinese samples, respectively, after controlling the aforementioned confounders and FDR, in the HDC pairwise comparison with the three health condition groups (i.e., HDC
Figure 1. Differences in IgG N-glycan traits between HDC, HTN, T2DM patients, and healthy controls for the pooledsamples from three Chinese Muslim ethnic minorities (A) and the Han Chinese samples (B). Each box represents the 25thto 75th percentiles (interquartile range [IQR]). Lines inside the boxes represent the medians. The whiskers represent thelowest and highest values within the boxes ±1.5 the IQR. GP, glycan peak; HDC, hypertension and type 2 diabetes mellituscomorbidity; HTN, hypertension; T2DM, type 2 diabetes mellitus.
J. Pers. Med. 2021, 11, x FOR PEER REVIEW 8 of 19
versus HTN, HDC versus T2DM, and HDC versus healthy individuals) (Table S4 and Fig-ure 3). To elaborate further, it was found that within the pooled samples from the three Chinese Muslim minorities, seven glycan traits (increased relative abundance of GP5 [M5], GP6 [FA2B], and DG54 [BG2n/(FG2n + FBG2n)] as well as reduced relative abundance of GP16 [FA2G1S1], GP18 [FA2G2S1], DG3 [FGS/(F + FG + FGS)], and DG24 [GP8n]) were significant differences between HDC and HTN (p < 0.05). Three glycan traits (increased relative abundance of GP5 and reduced relative abundance of GP16 and GP18) were sig-nificant differences between HDC and T2DM (p < 0.05). In addition, two glycan traits (GP5 and GP6), with increased relative abundance, were significantly different between HDC and healthy controls (p < 0.05).
Figure 2. Venn diagram of shared and unique IgG N-glycan features between the different health condition groups for the pooled samples from three northwestern Chinese Muslim ethnic minorities and those from the Han Chinese.
The numbers of shared and unique IgG N-glycan traits in the three pairwise comparison groups are shown based on the result of logistic regression analysis adjusted for the covariates (for the pooling of three Chinese Muslim minorities, logistic regression adjusted for age, gender, ethnic-ity, BMI, and dyslipidemia [A]; For the Han Chinese, logistic regression adjusted for age, gender, BMI, and dyslipidemia [B]).
HDC, hypertension and type 2 diabetes mellitus comorbidity; HTN, hypertension; T2DM, type 2 diabetes mellitus.
Figure 2. Venn diagram of shared and unique IgG N-glycan features between the different health condition groups for thepooled samples from three northwestern Chinese Muslim ethnic minorities and those from the Han Chinese. The numbersof shared and unique IgG N-glycan traits in the three pairwise comparison groups are shown based on the result of logisticregression analysis adjusted for the covariates (for the pooling of three Chinese Muslim minorities, logistic regressionadjusted for age, gender, ethnicity, BMI, and dyslipidemia [A]; For the Han Chinese, logistic regression adjusted for age,gender, BMI, and dyslipidemia [B]). HDC, hypertension and type 2 diabetes mellitus comorbidity; HTN, hypertension;T2DM, type 2 diabetes mellitus.
48
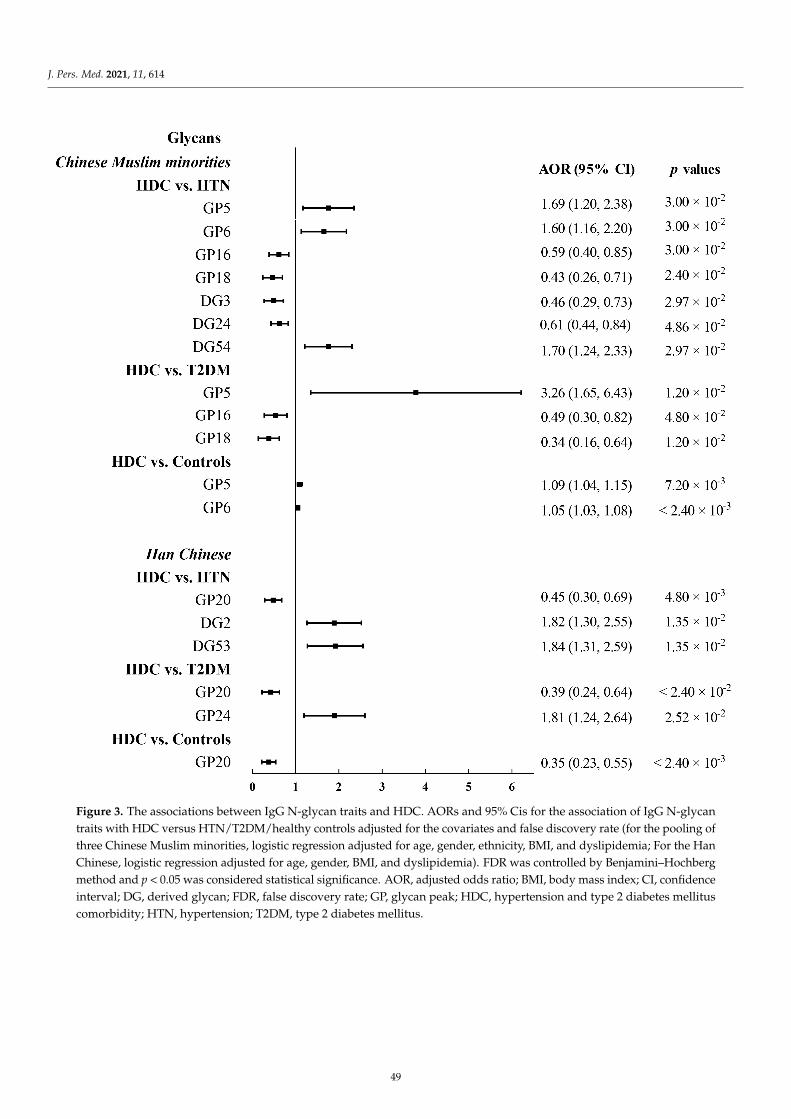
J. Pers. Med. 2021, 11, 614J. Pers. Med. 2021, 11, x FOR PEER REVIEW 9 of 19
Figure 3. The associations between IgG N-glycan traits and HDC.
AORs and 95% Cis for the association of IgG N-glycan traits with HDC versus HTN/T2DM/healthy controls adjusted for the covariates and false discovery rate (for the pooling of three Chinese Muslim minorities, logistic regression adjusted for age, gender, ethnicity, BMI, and dyslipidemia; For the Han Chinese, logistic regression adjusted for age, gender, BMI, and dyslipidemia).
FDR was controlled by Benjamini–Hochberg method and p < 0.05 was considered statistical significance.
AOR, adjusted odds ratio; BMI, body mass index; CI, confidence interval; DG, derived glycan; FDR, false discovery rate; GP, glycan peak; HDC, hypertension and type 2 diabetes mellitus comor-bidity; HTN, hypertension; T2DM, type 2 diabetes mellitus.
For the pooling of three Chinese Muslim ethnic minorities, we found that one shared glycan trait—GP5, containing high mannose glycan (M5) in the HDC, was significantly higher than those in the other three healthy condition groups (i.e., HTN, T2DM, and
Figure 3. The associations between IgG N-glycan traits and HDC. AORs and 95% Cis for the association of IgG N-glycantraits with HDC versus HTN/T2DM/healthy controls adjusted for the covariates and false discovery rate (for the pooling ofthree Chinese Muslim minorities, logistic regression adjusted for age, gender, ethnicity, BMI, and dyslipidemia; For the HanChinese, logistic regression adjusted for age, gender, BMI, and dyslipidemia). FDR was controlled by Benjamini–Hochbergmethod and p < 0.05 was considered statistical significance. AOR, adjusted odds ratio; BMI, body mass index; CI, confidenceinterval; DG, derived glycan; FDR, false discovery rate; GP, glycan peak; HDC, hypertension and type 2 diabetes mellituscomorbidity; HTN, hypertension; T2DM, type 2 diabetes mellitus.
49
J. Pers. Med. 2021, 11, 614
3.3. The Comparison of IgG N-Glycans between the Chinese Muslim Ethnic Minorities PooledSamples and the Han Chinese Samples
We observed the increased relative abundance of sialylated glycans (i.e., GP24, DG2,and DG53) in the Han Chinese with HDC (HDC versus HTN or T2DM), while a reducedtrend (i.e., GP16, GP18, and DG3) was presented in the Chinese Muslim ethnic minoritiespooled samples with HDC (HDC versus HTN or T2DM). The HDC-associated changesin the sialylated glycans showed different trends between the Chinese Muslim ethnicminorities and the Han Chinese as a consequence of the presence or absence of bisectingGlcNAc in these sialylated glycans in the different ethnic groups.
Although the logistic regression analyses suggested that directly measured and de-rived IgG N-glycans between the three Chinese Muslim ethnic minorities and the HanChinese in the three pairwise comparison groups (i.e., HDC versus HTN, HDC versusT2DM, and HDC versus healthy controls) did not share similarities in their results, wefound that their respective results all presented low levels of core-fucosylation and galacto-sylation (i.e., GP16, GP18, and GP20), as well as high levels of bisecting GlcNAc (i.e., GP6,DG54, GP24, and DG53) in the three Chinese Muslim ethnic minorities with HDC and alsoin the Han Chinese with HDC (Figure 3 and Table S4).
3.4. Development of the Classification Models and Discrimination of HDC
Three types of logistic classification models (i.e., baseline models, glycan-based models,and combined models) were constructed for distinguishing HDC from HTN, T2DM, andhealthy individuals, and were trained and evaluated by the five-fold cross-validationprocedure and ROC curve analysis (Figure 4 and Table 2). The detailed information on thecovariates included in the logistic classification models was shown in Table 2. Specifically,in the pooling of three Chinese Muslim ethnic minorities, the AUCs of the glycan-basedmodels discriminating HDC from HTN and T2DM were 0.678 and 0.715, respectively,showing limited improved discriminative performance than the baseline models. However,the AUC of the glycan-based model discriminating HDC from healthy controls was lowerthan that of the baseline model (difference between AUCs, 0.093, p = 3.97× 10⁻²). A similartrend was observed in the Han Chinese for discriminating HDC from healthy controls(difference between AUCs, 0.115, p = 9.56 × 10⁻³) (Table S5).
Adding both IgG N-glycan and baseline traits to the combined models, the AUCs ofthe combined models differentiating HDC from HTN, T2DM, and healthy controls were0.717, 0.747, and 0.786 in the pooling of three Chinese Muslim ethnic minorities, and 0.828,0.689, and 0.901 in the Han Chinese, respectively (Table 2). The AUCs showed modestimprovement in the combined models compared to the baseline models, with incrementsof 0.064 (p = 4.18 × 10⁻²) for HDC versus HTN, 0.065 (p = 8.66 × 10⁻²) for HDC versusT2DM, and 0.015 (p = 2.45 × 10⁻¹) for HDC versus healthy controls, in the pooling of threeChinese Muslim ethnic minorities; and with increments of 0.064 (p = 2.22 × 10⁻²) for HDCvs. HTN, 0.080 (p = 8.99 × 10⁻²) for HDC vs. T2DM, and 0.030 (p = 2.73 × 10⁻¹) for HDCvs. healthy controls, in the Han Chinese (Table S5). The discriminative performances ofthe combined models were shown to be superior to the baseline models. Although notall the AUCs of the combined models are statistically different from the baseline models,the addition of glycan variables into the baseline models can increase the discriminativepower of the models. It suggests that IgG N-glycans could reinforce the discriminativepotential of models. Additionally, all but the combined model discriminating HDC fromHTN (Chinese Muslim ethnic minorities) showed lower prediction error than the baselineand glycan-based models in five-fold cross-validation (Table 2).
50
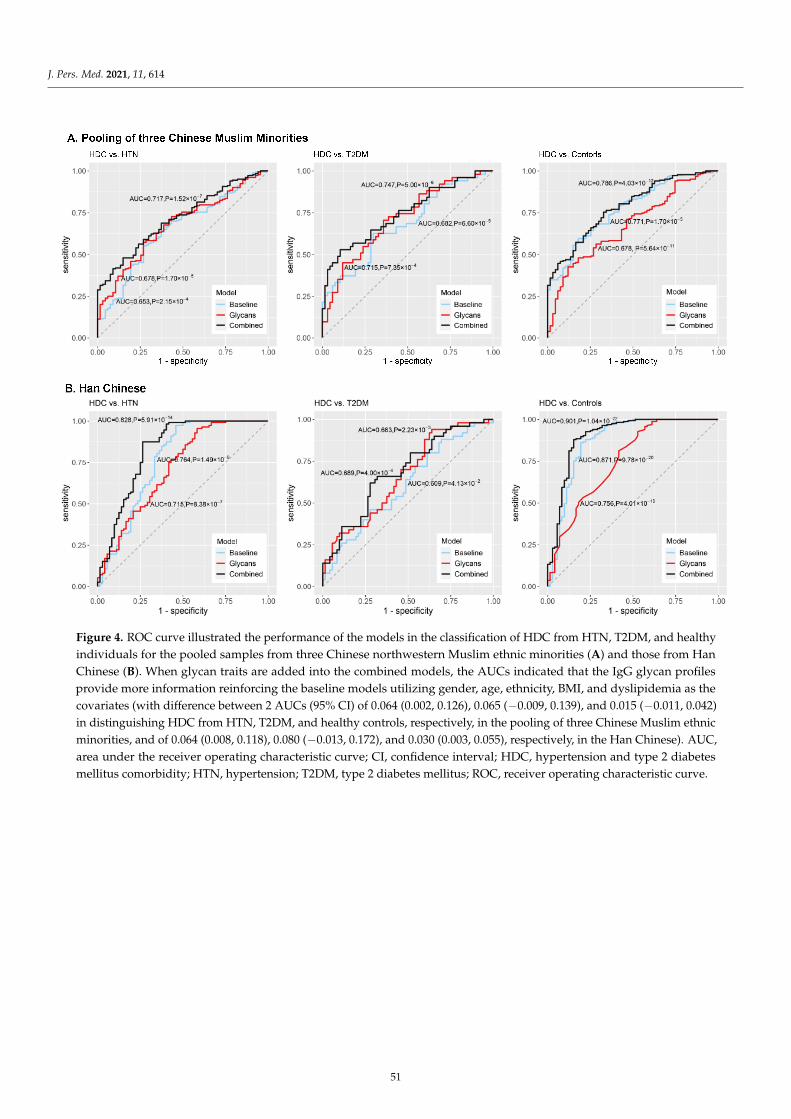
J. Pers. Med. 2021, 11, 614J. Pers. Med. 2021, 11, x FOR PEER REVIEW 12 of 19
Figure 4. ROC curve illustrated the performance of the models in the classification of HDC from HTN, T2DM, and healthy individuals for the pooled samples from three Chinese northwestern Muslim ethnic minorities (A) and those from Han Chinese (B).
When glycan traits are added into the combined models, the AUCs indicated that the IgG glycan profiles provide more information reinforcing the baseline models utilizing gender, age, ethnicity, BMI, and dyslipidemia as the covariates (with difference between 2 AUCs (95% CI) of 0.064 (0.002, 0.126), 0.065 (−0.009, 0.139), and 0.015 (−0.011, 0.042) in distinguishing HDC from HTN, T2DM, and healthy controls, respectively, in the pooling of three Chinese Muslim ethnic minorities, and of 0.064 (0.008, 0.118), 0.080 (−0.013, 0.172), and 0.030 (0.003, 0.055), respectively, in the Han Chinese).
AUC, area under the receiver operating characteristic curve; CI, confidence interval; HDC, hypertension and type 2 diabetes mellitus comorbidity; HTN, hypertension; T2DM, type 2 diabetes mellitus; ROC, receiver operating characteristic curve.
Adding both IgG N-glycan and baseline traits to the combined models, the AUCs of the combined models differentiating HDC from HTN, T2DM, and healthy controls were 0.717, 0.747, and 0.786 in the pooling of three Chinese Muslim ethnic minorities, and 0.828, 0.689, and 0.901 in the Han Chinese, respectively (Table 2). The AUCs showed modest improvement in the combined models compared to the baseline models, with increments of 0.064 (p = 4.18 × 10⁻²) for HDC versus HTN, 0.065 (p = 8.66 × 10⁻²) for HDC versus T2DM, and 0.015 (p = 2.45 × 10⁻¹) for HDC versus healthy controls, in the pooling of three Chinese Muslim ethnic minorities; and with increments of 0.064 (p = 2.22 × 10⁻²) for HDC vs. HTN, 0.080 (p = 8.99 × 10⁻²) for HDC vs. T2DM, and 0.030 (p = 2.73 × 10⁻¹) for HDC vs. healthy controls, in the Han Chinese (Table S5). The discriminative performances of the combined models were shown to be superior to the baseline models. Although not all the AUCs of
Figure 4. ROC curve illustrated the performance of the models in the classification of HDC from HTN, T2DM, and healthyindividuals for the pooled samples from three Chinese northwestern Muslim ethnic minorities (A) and those from HanChinese (B). When glycan traits are added into the combined models, the AUCs indicated that the IgG glycan profilesprovide more information reinforcing the baseline models utilizing gender, age, ethnicity, BMI, and dyslipidemia as thecovariates (with difference between 2 AUCs (95% CI) of 0.064 (0.002, 0.126), 0.065 (−0.009, 0.139), and 0.015 (−0.011, 0.042)in distinguishing HDC from HTN, T2DM, and healthy controls, respectively, in the pooling of three Chinese Muslim ethnicminorities, and of 0.064 (0.008, 0.118), 0.080 (−0.013, 0.172), and 0.030 (0.003, 0.055), respectively, in the Han Chinese). AUC,area under the receiver operating characteristic curve; CI, confidence interval; HDC, hypertension and type 2 diabetesmellitus comorbidity; HTN, hypertension; T2DM, type 2 diabetes mellitus; ROC, receiver operating characteristic curve.
51
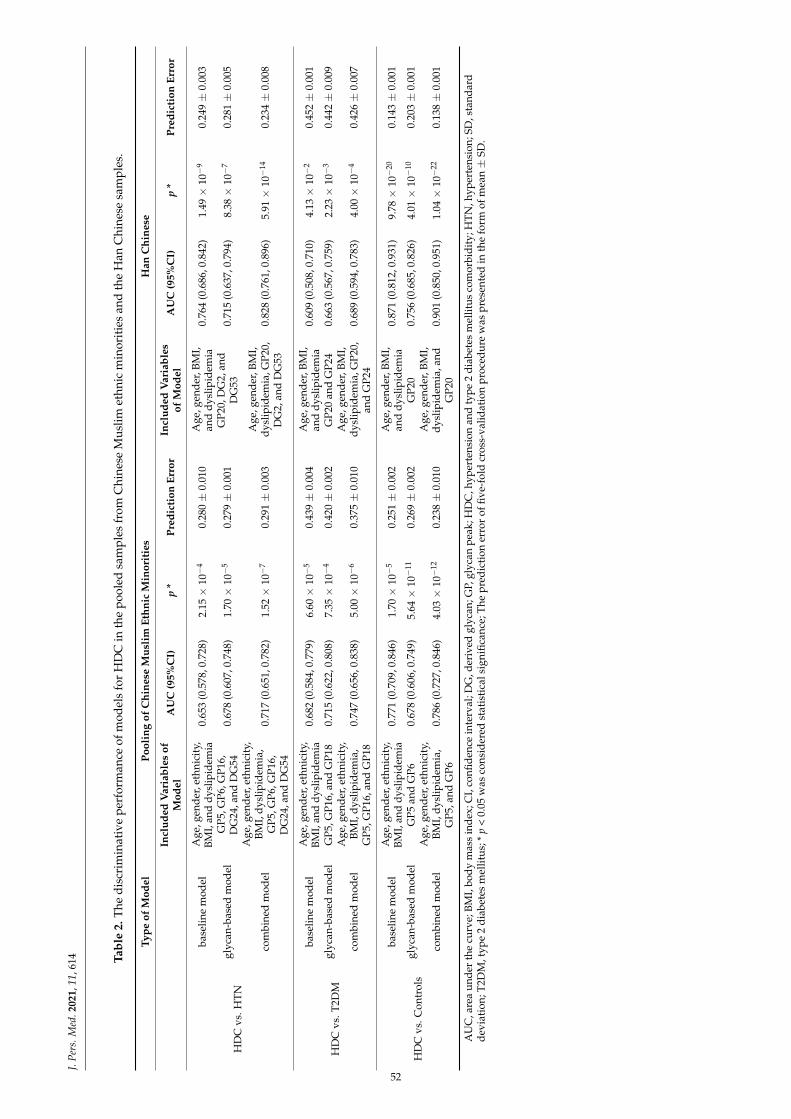
J.Pe
rs.M
ed.2
021,
11,6
14 Tabl
e2.
The
disc
rim
inat
ive
perf
orm
ance
ofm
odel
sfo
rH
DC
inth
epo
oled
sam
ples
from
Chi
nese
Mus
limet
hnic
min
orit
ies
and
the
Han
Chi
nese
sam
ples
.
Type
ofM
odel
Pool
ing
ofC
hine
seM
usli
mEt
hnic
Min
orit
ies
Han
Chi
nese
Incl
uded
Var
iabl
esof
Mod
elA
UC
(95%
CI)
p*
Pred
icti
onEr
ror
Incl
uded
Var
iabl
esof
Mod
elA
UC
(95%
CI)
p*
Pred
icti
onEr
ror
HD
Cvs
.HTN
base
line
mod
elA
ge,g
ende
r,et
hnic
ity,
BMI,
and
dysl
ipid
emia
0.65
3(0
.578
,0.7
28)
2.15×
10−
40.
280±
0.01
0A
ge,g
ende
r,BM
I,an
ddy
slip
idem
ia0.
764
(0.6
86,0
.842
)1.
49×
10−
90.
249±
0.00
3
glyc
an-b
ased
mod
elG
P5,G
P6,G
P16,
DG
24,a
ndD
G54
0.67
8(0
.607
,0.7
48)
1.70×
10−
50.
279±
0.00
1G
P20,
DG
2,an
dD
G53
0.71
5(0
.637
,0.7
94)
8.38×
10−
70.
281±
0.00
5
com
bine
dm
odel
Age
,gen
der,
ethn
icit
y,BM
I,dy
slip
idem
ia,
GP5
,GP6
,GP1
6,D
G24
,and
DG
54
0.71
7(0
.651
,0.7
82)
1.52×
10−
70.
291±
0.00
3A
ge,g
ende
r,BM
I,dy
slip
idem
ia,G
P20,
DG
2,an
dD
G53
0.82
8(0
.761
,0.8
96)
5.91×
10−
140.
234±
0.00
8
HD
Cvs
.T2D
M
base
line
mod
elA
ge,g
ende
r,et
hnic
ity,
BMI,
and
dysl
ipid
emia
0.68
2(0
.584
,0.7
79)
6.60×
10−
50.
439±
0.00
4A
ge,g
ende
r,BM
I,an
ddy
slip
idem
ia0.
609
(0.5
08,0
.710
)4.
13×
10−
20.
452±
0.00
1
glyc
an-b
ased
mod
elG
P5,G
P16,
and
GP1
80.
715
(0.6
22,0
.808
)7.
35×
10−
40.
420±
0.00
2G
P20
and
GP2
40.
663
(0.5
67,0
.759
)2.
23×
10−
30.
442±
0.00
9
com
bine
dm
odel
Age
,gen
der,
ethn
icit
y,BM
I,dy
slip
idem
ia,
GP5
,GP1
6,an
dG
P18
0.74
7(0
.656
,0.8
38)
5.00×
10−
60.
375±
0.01
0A
ge,g
ende
r,BM
I,dy
slip
idem
ia,G
P20,
and
GP2
40.
689
(0.5
94,0
.783
)4.
00×
10−
40.
426±
0.00
7
HD
Cvs
.Con
trol
s
base
line
mod
elA
ge,g
ende
r,et
hnic
ity,
BMI,
and
dysl
ipid
emia
0.77
1(0
.709
,0.8
46)
1.70×
10−
50.
251±
0.00
2A
ge,g
ende
r,BM
I,an
ddy
slip
idem
ia0.
871
(0.8
12,0
.931
)9.
78×
10−
200.
143±
0.00
1
glyc
an-b
ased
mod
elG
P5an
dG
P60.
678
(0.6
06,0
.749
)5.
64×
10−
110.
269±
0.00
2G
P20
0.75
6(0
.685
,0.8
26)
4.01×
10−
100.
203±
0.00
1
com
bine
dm
odel
Age
,gen
der,
ethn
icit
y,BM
I,dy
slip
idem
ia,
GP5
,and
GP6
0.78
6(0
.727
,0.8
46)
4.03×
10−
120.
238±
0.01
0A
ge,g
ende
r,BM
I,dy
slip
idem
ia,a
ndG
P20
0.90
1(0
.850
,0.9
51)
1.04×
10−
220.
138±
0.00
1
AU
C,a
rea
unde
rth
ecu
rve;
BMI,
body
mas
sin
dex;
CI,
confi
denc
ein
terv
al;D
G,d
eriv
edgl
ycan
;GP,
glyc
anpe
ak;H
DC
,hyp
erte
nsio
nan
dty
pe2
diab
etes
mel
litus
com
orbi
dity
;HTN
,hyp
erte
nsio
n;SD
,sta
ndar
dde
viat
ion;
T2D
M,t
ype
2di
abet
esm
ellit
us;*
p<
0.05
was
cons
ider
edst
atis
tica
lsig
nific
ance
;The
pred
icti
oner
ror
offiv
e-fo
ldcr
oss-
valid
atio
npr
oced
ure
was
pres
ente
din
the
form
ofm
ean±
SD.
52
J. Pers. Med. 2021, 11, 614
4. Discussion
To the best of our knowledge, this is the first investigation on the association anddiscriminative potential of IgG N-glycan traits in HDC versus HTN, T2DM, and healthyindividuals in the pooling of three Chinese Muslim ethnic minorities (KGZ, TJK, and UIG),inhabiting the northwestern frontier of China, as well as the Han Chinese population.
HTN and T2DM are common comorbidities that are multifactorial diseases driven bymany common pathogenic factors, including modifiable risk factors (obesity, dyslipidemia,insulin resistance, endothelial dysfunction, vascular inflammation, atherosclerosis, andsequential inappropriate activation of renin-angiotensin system, etc.) [3,4], environmentalfactors, and genetic predisposition [4,34]. IgG contains complex-type biantennary N-glycanstructures, which activate or inhibit IgG Fcγ receptors (FcγRs) by altering the bindingaffinity of IgG, thereby decisively affecting effector functions of IgG [35]. The pro- andanti-inflammatory actions of IgG are modulated by the specific N-glycan residues includinggalactose, fucose, sialic acid, and bisecting GlcNAc [9,36,37]. Cumulative evidence indi-cates that the alteration of terminal modification in IgG N-glycan plays a vital role in theanti- or pro-inflammatory process. Previous studies reported that aberrant glycosylation ofIgG (low levels of sialylation and core fucosylation, as well as the high level of bisectingGlcNAc) have been demonstrated to be involved in a range of specific health conditionsrelated to HDC, including aging, obesity, HTN, T2DM, dyslipidemia, and metabolic syn-drome [13,14,31,32,38–40]. In the present study, the altered IgG N-glycosylation profilewas also observed in the HDC patients, further suggesting that IgG N-glycome patternsare associated with the progression of inflammatory disorders, such as HDC, via inflam-matory signaling. These findings present a situation where the role of IgG glycans in thepathogenesis of HDC extends beyond just a reflection of changes stemming from the onsetof disease, but rather perhaps has some contribution towards influencing pathogenesisitself resulting from the altered inflammatory actions of IgG.
In this study, the higher level of GP5 (M5) and GP6 (FA2B), and the lower levelsof GP16 (FA2G1S1) and GP18 (FA2G2S1) were found to be the population-specific IgGN-glycomic changes with statistical significance (p < 0.05) for the pooled samples from threeChinese Muslim ethnic minorities with HDC; and the lower level of GP20 (FA2FG2S1) wereobserved to be unique to the Han Chinese with HDC. In the pooled samples from the threeChinese Muslim ethnic minorities, HDC patients presented increased core-fucosylationwith bisecting GlcNAc of IgG (GP6 and DG54), but decreased sialylation (GP16, GP18,and DG3) and monogalactosylated (GP16) and digalactosylated (GP18) core-fucosylatedglycans without bisecting GlcNAc of IgG, when compared with HTN patients. In com-parison with T2DM patients, HDC patients showed decreased galactosylation, sialylation,and core-fucosylation without bisecting GlcNAc of IgG (GP16 and GP18), but increasedmannose structures of IgG (GP5). Additionally, compared to healthy individuals, HDCpatients presented increased core-fucosylation with bisecting GlcNAc (GP6) and mannosestructures of IgG (GP5). In the Han Chinese, the lower level of core-fucosylated galactosy-lated glycan containing sialic acid of IgG (GP20) was observed in the HDC compared withHTN/T2DM/healthy individuals, while sialylated glycans (reduced relative abundance ofGP20 and increased relative abundance of GP24 [FA2BG2S2], DG2 [FBGS/(FBG + FBGS)],and DG53 [FG2n/(BG2n + FBG2n)]) presented inconsistent trends in HDC patients. Specifi-cally, the common characteristic of these HDC-associated sialylated glycans is the presenceof bisecting N-GlcNAc, and the increase of this structural feature in HDC outweighed theeffects of a decrease in sialylation, which is in agreement with the alterations of sialyationobserved in the study on systemic lupus erythematosus [29].
Fucosylation plays key roles in the function of IgG and highly fucosylated IgG showsa reduced magnitude of antibody-dependent cellular cytotoxicity (ADCC), which is a resultof IgG-subclass IgG1 binding to each of the different Fc receptors [41]. Bisecting GlcNAcis the central branch of N-glycans, which is biosynthesized by the glycosyltransferaseGnT-III encoded by the MGAT3 gene [42]. The presence of bisecting GlcNAc in N-glycanscould suppress various terminal modifications (fucosylation, sialylation, and others) of N-
53
J. Pers. Med. 2021, 11, 614
glycans [42], affecting the structure of glycans exerting noteworthy effects on inflammatoryresponses or immune function. IgG carrying glycans with bisecting GlcNAc was reportedto have pronouncedly increased affinity to FcγRIIIa leading to an enhancement in ADCC,whereas fucosylation without bisecting GlcNAc of IgG can reduce ADCC [37]. Previousstudies showed that such increased fucosylation with bisecting GlcNAc was associated withT2DM [15]. We also observed similarly increased fucosylation in structures with bisectingGlcNAc (GP6), and decreased fucosylation in structures without bisecting GlcNAc (GP16,GP18, and GP20) in the HDC patients, compared with HTN and T2DM patients. Theincreased fucosylation in structures with bisecting GlcNAc of IgG N-glycans could lead tothe pro-inflammatory status of the body [37], thereby contributing to the progression ofHTN or T2DM towards HDC. Thus, the present results indicate that the individuals withhigher levels of fucosylated structures with bisecting GlcNAc of IgG may increase the riskfor HDC, and that pathophysiological states of individuals with HDC are conditioned on achronic inflammatory process.
The level of galactosylation has an essential impact on the inflammatory activities ofIgG; lack of galactosylation was shown to associate with the pro-inflammatory autoimmuneresponses through activation of the complement cascade [43]. The down-regulation ofgalactosyltransferase activity in plasma cells and the activation of complement cascadeswere identified as potential mechanisms for the changes in IgG galactosylation [43]. Asa modulator of inflammatory activity, high galactosylation of IgG Fc N-glycan promotesthe association of the inhibitory receptor FcγRIIb and the lectin-like receptor dectin-1,which blocks the pro-inflammatory effector functions of C5aR and CXCR2, and enhancesthe anti-inflammatory activity of antigen-specific IgG1 immune complexes [44]. Previousstudies have suggested that the decrease in galactosylation of IgG N-glycans play potentialroles in the development and progression of chronic pro-inflammatory diseases, includingHTN, T2DM, and dementia [14–16,45], which are in agreement with the alterations ofIgG N-glycosylation patterns observed in the HDC patients in the present study. Thedecreased IgG galactosylation found in HDC presented a similar pattern found in theprevious studies and thus our finding further supports the hypothesis that a decrease ingalactosylation is a general feature of multiple chronic diseases associated with decreasedanti-inflammatory/immunosuppressive potential of circulating IgG.
Besides fucosylation and galactosylation, sialylation mediates partly the inflammatoryfunction of IgG. IgG shows different pro- and anti-inflammatory potentials on the basisof different Fcγ receptors that IgG preferentially binds to, and the affinity of the receptordepends on the composition of the glycans attached to the 297 asparagine [46]. Theaddition of sialic acid to IgG can decrease its affinity for FcγRIII, thereby reducing thedegree of ADCC, converting its function from pro- to anti-inflammatory [47]. In the twocomparison groups (HDC versus HTN, HDC versus T2DM), we observed that patients withHDC showed a significant decrease in sialylation (GP16, GP18, and GP20), indicating thatsialylation is correlated with HDC through decreasing adaptive pro-inflammatory actionsof IgG. However, sialylation with bisecting GlcNAc showed the reduced relative abundancein HDC patients, which was consistent with the suppression of core fucosylation expressiondue to the presence of bisecting GlcNAc. Bisecting GlcNAc inhibits the biosynthesis andmodification of sialic acid of terminal epitopes in N-glycans, which results in the relativeabundance of sialylation (GP16, GP18, GP20, GP24, DG2, DG3, and DG53) presentinginconsistent trends in HDC patients. Additionally, we found the decrease of GPs containinggalactosylated sialylated glycan structures (GP16, GP18, and GP20) in HDC patients. Sinceterminal sialic acid residues are covalently attached to galactosylated glycans, the decreaseof galactosylated sialylation could be a consequence of a decrease in galactosylation [48],which could provide a plausible explanation for the phenomenon of the co-directionalchanges of sialylation and galactosylation shown in the HDC patients. It is worthwhile toinvestigate the potential of the level of sialylation and galactosylation of IgG for monitoringthe progression from HTN or T2DM towards HDC. Thus, future prospective cohort studiesare called for to explore if there is a stepwise decrease trend in levels of sialylation and
54
J. Pers. Med. 2021, 11, 614
galactosylation of IgG during progression from healthy individuals to HTN or T2DM andthen to HDC.
Among the different Chinese ethnic minorities, the similarities and differences inthe glycosylation patterns were found in both the HTN and T2DM patients, comparedwith the HDC patients, suggesting that those individuals who have developed T2DMor HTN do not show consistent alterations of IgG N-glycans. More work is required onunderstanding alterations of IgG N-glycans in HTN or T2DM individuals to see if theiralterations over time show an inclination towards HDC. Such IgG N-glycans profiling willhelp to contribute towards developing potential glycan biosignatures for monitoring theprogression from HTN or T2DM towards HDC.
The AUCs of the combined models, based on the glycan traits and the baselinecharacteristics, demonstrate higher discriminative performance to help discern betweenHDC, HTN, T2DM, and healthy individuals than the models based on either the glycantraits or the baseline characteristics alone. IgG N-glycan profiles reflect the integrativeeffects of genetic, metabolic, and environmental factors, contributing significantly towardstheir discriminative potential [11]. Although the addition of glycan traits to the baselinemodels did not substantially improve the discrimination in all the combined models,the glycan based models constructed based on IgG N-glycans alone displayed enoughdiscrimination power and all the combined models showed improved discriminationperformance. These results suggest that IgG N-glycan profiles may contribute significantlyto much of the combined risk of these characteristics, where dynamic and population-specific IgG N-glycomic changes can serve as functional effectors of the disease potentiallyincreasing the diagnostic accuracy for complex diseases. The IgG N-glycosylation profilesassociated with HDC described in this study may thus help to shed light on future studiesinvestigating their biomarker potential for personalized monitoring and prevention of theprogression from HTN or T2DM towards HDC.
The strength of this study is that we evaluated IgG N-glycomes in relation to HDC andexplored similarities and differences in the IgG N-glycosylation profiles for the first time,particularly in different Chinese ethnic groups, including the Chinese Muslim minorities.The alterations of IgG N-glycosylation in HDC patients found in this study suggest atheoretical foundation and present practical direction for future studies to further elaboratethe association of IgG glycosylation with HDC. These suggestions are, however, builtupon the constraints of this study. Firstly, due to the small sample size of HDC in eachethnic minority in the present study, it is unfeasible to analyze the association of IgGN-glycans with HDC in each of the Muslim minorities separately. Consequently, thesame health condition groups from the three Chinese Muslim ethnic minorities werepooled together for the analysis. Furthermore, the Han subjects included in the studywere not co-resident in the Xinjiang Autonomous Region since the Muslim minoritieswere recruited from the isolated rural areas in Xinjiang, where the respective Muslimminority “exclusively” inhabit for generations without co-resident Han or other ethnicgroups. Additionally, it is difficult to match the Han subjects with the Muslim minoritiesin terms of their profile of demographic variables due to the relatively small sample sizeof the respective health condition group of the Muslim minorities. To compensate forthe potential impact of unmatched demographic variables on the results, we adjustedthe potential confounding factors in the logistic regression analyses. Thirdly, the case-control nature of the present study was not able to provide the information about acausal relationship between the altered IgG glycosylation and the progression of HDC.A previous study reported that the polymorphisms at six loci (i.e., FUT8, FUT6/FUT3,HNF1A, MGAT5, B3GAT1, and SLC9A9) affect plasma levels of N-glycans [49], which couldbe used as the instrumental variables for future Mendelian randomization (MR) studiesinvestigating the causal relationship between the altered IgG glycosylation and HDC.Fourthly, the information on medical treatment of the patients with HTN and/or T2DMwas not completely collected. Consequently, the potential impact of medical treatment forHTN and/or T2DM on the associations between HDC and IgG glycans was unable to be
55
J. Pers. Med. 2021, 11, 614
addressed in this current study. Lastly, only the five-fold cross-validation of the model isperformed, external validation of model performance is still needed in further studies.
In the current study, the IgG N-glycans were analyzed by HILIC-UPLC method, whichis a profiling method for total IgG N-glycosylation. The detailed differences between theglycosylation profiles of the individual IgG subclasses associated with HDC remain to beinvestigated, which would be performed in our coming study. Future prospective stud-ies with larger samples in multiracial populations and/or MR studies examining causalinference are warranted to validate the potential of IgG N-glycosylation biomarkers forpersonalized monitoring and prevention of HDC. Clinical exploitation of IgG N-glycanbiomarkers will be facilitated by the existing broad application in clinical laboratoriesof UPLC. This study shows the potential clinical application of N-glycans as dynamicbiomarkers (e.g., of routine diagnostic and prophylactic test for HDC patients). Future lon-gitudinal and prospective studies would provide a better understanding of the transitionfrom HTN or T2DM to HDC and allow us to generate glycan-based markers for use inearlier detection of the risk of progression towards HDC. As such, healthy lifestyle interven-tion and therapeutic decision-making could be delivered timely for the HDC prophylaxisfrom the perspectives of predictive, preventive and personalized/precision medicine.
5. Conclusions
This study presents conclusive examples of population-specific N-glycosylation of IgGassociated with HDC in three northwestern Chinese Muslim ethnic minorities the KGZ,TJK, and UIG, as well as a Han Chinese population, respectively. These findings offer anopportunity to understand how IgG N-glycosylation profiles may be developed as potentialbiomarkers indicative of pro- or anti-inflammatory states shared by HTN, T2DM, and HDC.Further prospective follow-up studies exploring the onset of HDC using glycomics areexpected to provide a more comprehensive understanding of specific glycomic biomarkersthat may serve as tools for personalized monitoring or to help prevent the progressionfrom HTN or T2DM towards HDC.
Supplementary Materials: The following are available online at https://www.mdpi.com/article/10.3390/jpm11070614/s1, Supplementary Table S1: The structures of 24 directly measured IgG glycanpeaks by UPLC, Supplementary Table S2: Demographic and biochemical characteristics of the studysubjects in the four Chinese ethnic groups: Kirgiz, Tajik, Uygur, and Han, Supplementary Table S3:The description of IgG glycome composition and the levels of IgG glycan traits in the HDC, HTN,T2DM patients, and healthy controls for the pooled samples from Chinese Muslim ethnic minoritiesand the Han Chinese samples, Supplementary Table S4: The associations of IgG N-glycan traits withHDC vs. HTN/T2DM/healthy individuals for the pooled samples from Chinese Muslim ethnicminorities and the Han Chinese samples, Supplementary Table S5: The differences of AUC betweenthree type of models.
Author Contributions: Conceptualization, M.S., Y.W., G.L. and W.W.; data curation, W.C., D.Z. andX.G.; investigation, M.D., X.Z. and J.Z. (Jinxia Zhang); methodology, X.M., M.V., J.Š., J.Z. (Jie Zhang),H.W., A.M. and I.T.-A.; software, D.L., X.L. and L.W.; supervision, M.S., G.L. and W.W.; visualization,X.M.; writing—original draft, X.M., M.S.; writing—review and editing, M.S., H.W., I.T.-A., X.L., Y.W.and W.W. All authors have read and agreed to the published version of the manuscript.
Funding: This study was supported by the National Natural Science Foundation of China (81573215,31460285, and 81673247), and the China-Australian Collaborative Grant (NSFC 81561128020-NHMRCAPP1112767). Genos has received funding from European Commission FP7 grants MIMOmics (contract#305280), HTP-GlycoMet (contract #324400) and PainOmics (contract #602736), and H2020 grants GlySign(contract #722095), GlyCoCan (contract #676412), SYSCID (contract #733100), and IMforFuture (contract#721815), as well as funding from the European Structural and Investments funds for projects “Newgeneration of high throughput glycoanalytical services (contract #KK.01.2.1.01.0003) and “CroatianNational Centre of Research Excellence in Personalized Healthcare” (contract#KK.01.1.1.01.0010).
Institutional Review Board Statement: The study was approved by the local community leadersand the Ethics Committee of Capital Medical University, Beijing, China (No. 2015SY21 and 2009SY16)and adhered to the principles of the Declaration of Helsinki.
56
J. Pers. Med. 2021, 11, 614
Informed Consent Statement: Informed consent was obtained from all participants included inthis study.
Data Availability Statement: The data presented in this study are available on request from thecorresponding author. The data are not publicly available due to privacy restrictions.
Acknowledgments: The authors thank the directors and relevant staff of relevant Health Bureausfor their support for recruiting the Kirgiz, Tajik, and Uygur participants, and these volunteers andcommunity leaders for their participation and support.
Conflicts of Interest: Gordan Lauc is the founder and owner of Genos Ltd., Zagreb, Croatia, aprivate research organization that specializes in high-throughput glycomic analysis and has severalpatents in this field. Ana Momcilovic, Irena Trbojevic-Akmacic, Jerko Štambuk, and Marija Vilaj areemployees of Genos Ltd., Zagreb, Croatia.
Abbreviations
AUC area under the receiver operating characteristic curveBMI body mass indexCI confidence intervalCVD cardiovascular diseaseDBP diastolic blood pressureDG derived glycanFBG fasting blood glucoseGP glycan peakHDC hypertension and type 2 diabetes mellitus comorbidityHDL high-density lipoprotein cholesterolHILIC hydrophilic interaction liquid chromatographyHTN hypertensionIgG immunoglobulin GLDL low-density lipoprotein cholesterolOR odds ratioROC receiver operating characteristicSBP systolic blood pressureT2DM type 2 diabetes mellitusTC total cholesterolTG triglyceridesUPLC ultra-performance liquid chromatography
References1. Forouzanfar, M.H.; Alexander, L.; Anderson, H.R.; Bachman, V.F.; Biryukov, S.; Brauer, M.; Burnett, R.; Casey, D.; Coates, M.M.;
Cohen, A.; et al. Global, regional, and national comparative risk assessment of 79 behavioural, environmental and occupational,and metabolic risks or clusters of risks in 188 countries, 1990–2013: A systematic analysis for the Global Burden of Disease Study2013. Lancet 2015, 386, 2287–2323. [CrossRef]
2. Koye, D.N.; Magliano, D.J.; Nelson, R.G.; Pavkov, M.E. The Global Epidemiology of Diabetes and Kidney Disease. Adv. ChronicKidney Dis. 2018, 25, 121–132. [CrossRef]
3. Petrie, J.R.; Guzik, T.J.; Touyz, R.M. Diabetes, Hypertension, and Cardiovascular Disease: Clinical Insights and VascularMechanisms. Can. J. Cardiol. 2018, 34, 575–584. [CrossRef] [PubMed]
4. Pavlou, D.I.; Paschou, S.A.; Anagnostis, P.; Spartalis, M.; Spartalis, E.; Vryonidou, A.; Tentolouris, N.; Siasos, G. Hypertension inpatients with type 2 diabetes mellitus: Targets and management. Maturitas 2018, 112, 71–77. [CrossRef]
5. Gillespie, C.D.; Hurvitz, K.A. Prevalence of hypertension and controlled hypertension–United States, 2007–2010. MMWR Suppl.2013, 62, 144–148.
6. Weir, M.R. Diabetes and hypertension: Blood pressure control and consequences. Am. J. Hypertens. 1999, 12, 170S–178S. [CrossRef]7. Hu, G.; Jousilahti, P.; Tuomilehto, J. Joint effects of history of hypertension at baseline and type 2 diabetes at baseline and during
follow-up on the risk of coronary heart disease. Eur. Heart J. 2007, 28, 3059–3066. [CrossRef] [PubMed]8. Eaddy, M.T.; Shah, M.; Lunacsek, O.; Stanford, R.H. The burden of illness of hypertension and comorbid diabetes. Curr. Med. Res.
Opin. 2008, 24, 2501–2507. [CrossRef]9. Kristic, J.; Lauc, G. Ubiquitous Importance of Protein Glycosylation. Methods Mol. Biol. 2017, 1503, 1–12. [PubMed]10. Gornik, O.; Wagner, J.; Pucic, M.; Knezevic, A.; Redzic, I.; Lauc, G. Stability of N-glycan profiles in human plasma. Glycobiology
2009, 19, 1547–1553. [CrossRef] [PubMed]
57
J. Pers. Med. 2021, 11, 614
11. Zoldoš, V.; Horvat, T.; Lauc, G. Glycomics meets genomics, epigenomics and other high throughput omics for system biologystudies. Curr. Opin. Chem. Biol. 2013, 17, 34–40. [CrossRef]
12. Arnold, J.N.; Wormald, M.R.; Sim, R.B.; Rudd, P.M.; Dwek, R.A. The impact of glycosylation on the biological function andstructure of human immunoglobulins. Annu. Rev. Immunol. 2007, 25, 21–50. [CrossRef]
13. Yu, X.; Wang, Y.; Kristic, J.; Dong, J.; Chu, X.; Ge, S.; Wang, H.; Fang, H.; Gao, Q.; Liu, D.; et al. Profiling IgG N-glycans as potentialbiomarker of chronological and biological ages: A community-based study in a Han Chinese population. Medicine 2016, 95, e4112.[CrossRef]
14. Liu, J.N.; Dolikun, M.; Stambuk, J.; Trbojevic-Akmacic, I.; Zhang, J.; Wang, H.; Zheng, D.Q.; Zhang, X.Y.; Peng, H.L.; Zhao, Z.Y.;et al. The association between subclass-specific IgG Fc N-glycosylation profiles and hypertension in the Uygur, Kazak, Kirgiz,and Tajik populations. J. Hum. Hypertens. 2018, 32, 555–563. [CrossRef]
15. Lemmers, R.F.H.; Vilaj, M.; Urda, D.; Agakov, F.; Šimurina, M.; Klaric, L.; Rudan, I.; Campbell, H.; Hayward, C.; Wilson, J.F.; et al.IgG glycan patterns are associated with type 2 diabetes in independent European populations. Biochim. Biophys. Acta Gen. Subj.2017, 1861, 2240–2249. [CrossRef] [PubMed]
16. Reily, C.; Stewart, T.J.; Renfrow, M.B.; Novak, J. Glycosylation in health and disease. Nat. Rev. Nephrol. 2019, 15, 346–366.[CrossRef] [PubMed]
17. Ding, Z.; Wang, Y.; Bili, K.; Guli, N.; Tian, Z.; Gan, X.; Tuerxun, G.; Liu, L.; Liu, C.; Bai, W.; et al. Population by Nationality in MainYears. In Xinjiang Statistic Yearbook-2019; Gao, W., Han, R., Eds.; China Statistics Press: Beijing, China, 2019; Volume 3, pp. 90–91.
18. Yao, H.B.; Wang, C.C.; Tao, X.; Shang, L.; Wen, S.Q.; Zhu, B.; Kang, L.; Jin, L.; Li, H. Genetic evidence for an East Asian origin ofChinese Muslim populations Dongxiang and Hui. Sci. Rep. 2016, 6, 38656. [CrossRef] [PubMed]
19. Wang, W.; Wise, C.; Baric, T.; Black, M.L.; Bittles, A.H. The origins and genetic structure of three co-resident Chinese Muslimpopulations: The Salar, Bo’an and Dongxiang. Hum. Genet. 2003, 113, 244–252. [CrossRef]
20. Wang, L.; Li, N.; Heizhati, M.; Yao, X.; Duiyimuhan, G.; Zhou, K.; Cao, M.; Wang, M.; Hu, J.; Zhang, D. Prevalence, Awareness,Treatment, and Control and Related Factors of Hypertension in Multiethnic Agriculture, Stock-Raising, and Urban Xinjiang,Northwest China: A Cross-Sectional Screening for 47,000 Adults. Int. J. Hypertens. 2019, 2019, 3576853. [CrossRef]
21. Wang, L.; Tao, Y.; Xie, Z.; Ran, X.; Zhang, M.; Wang, Y.; Luo, X.; Hu, M.; Gen, W.; Wufuer, H.; et al. Prevalence of metabolicsyndrome, insulin resistance, impaired fasting blood glucose, and dyslipidemia in Uygur and Kazak populations. J. Clin.Hypertens. 2010, 12, 741–745. [CrossRef]
22. Lu, J.; Lu, Y.; Wang, X.; Li, X.; Linderman, G.C.; Wu, C.; Cheng, X.; Mu, L.; Zhang, H.; Liu, J.; et al. Prevalence, awareness,treatment, and control of hypertension in China: Data from 1·7 million adults in a population-based screening study (ChinaPEACE Million Persons Project). Lancet 2017, 390, 2549–2558. [CrossRef]
23. Alberti, K.G.; Zimmet, P.Z. Definition, diagnosis and classification of diabetes mellitus and its complications. Part 1: Diagnosisand classification of diabetes mellitus provisional report of a WHO consultation. Diabet. Med. 1998, 15, 539–553. [CrossRef]
24. Okosun, I.S.; Chandra, K.M.; Choi, S.; Christman, J.; Dever, G.E.; Prewitt, T.E. Hypertension and type 2 diabetes comorbidity inadults in the United States: Risk of overall and regional adiposity. Obes. Res. 2001, 9, 1–9. [CrossRef]
25. Zhu, J.; Gao, R.; Zhao, S.; Lu, G.; Zhao, D.; Li, J. Guidelines for the prevention and treatment of dyslipidemia in Chinese adults(Revised Edition 2016). J. Chin. Circ. 2016, 31, 937–953.
26. Trbojevic-Akmacic, I.; Ugrina, I.; Lauc, G. Comparative Analysis and Validation of Different Steps in Glycomics Studies. MethodsEnzymol. 2017, 586, 37–55. [PubMed]
27. Pucic-Bakovic, M. High-Throughput Analysis of the IgG N-Glycome by UPLC-FLR. Methods Mol. Biol. 2017, 1503, 21–29.28. Pucic, M.; Knezevic, A.; Vidic, J.; Adamczyk, B.; Novokmet, M.; Polasek, O.; Gornik, O.; Supraha-Goreta, S.; Wormald, M.R.;
Redzic, I.; et al. High throughput isolation and glycosylation analysis of IgG-variability and heritability of the IgG glycome inthree isolated human populations. Mol. Cell. Proteom. 2011, 10, M111.010090. [CrossRef] [PubMed]
29. Vuckovic, F.; Krištic, J.; Gudelj, I.; Teruel, M.; Keser, T.; Pezer, M.; Pucic-Bakovic, M.; Štambuk, J.; Trbojevic-Akmacic, I.; Barrios, C.;et al. Association of systemic lupus erythematosus with decreased immunosuppressive potential of the IgG glycome. ArthritisRheumatol. 2015, 67, 2978–2989. [CrossRef]
30. Gao, Q.; Dolikun, M.; Stambuk, J.; Wang, H.; Zhao, F.; Yiliham, N.; Wang, Y.; Trbojevic-Akmacic, I.; Zhang, J.; Fang, H.; et al.Immunoglobulin G N-Glycans as Potential Postgenomic Biomarkers for Hypertension in the Kazakh Population. Omics 2017, 21,380–389. [CrossRef] [PubMed]
31. Lu, J.P.; Knezevic, A.; Wang, Y.X.; Rudan, I.; Campbell, H.; Zou, Z.K.; Lan, J.; Lai, Q.X.; Wu, J.J.; He, Y.; et al. Screening novelbiomarkers for metabolic syndrome by profiling human plasma N-glycans in Chinese Han and Croatian populations. J. ProteomeRes. 2011, 10, 4959–4969. [CrossRef]
32. Liu, J.; Dolikun, M.; Štambuk, J.; Trbojevic-Akmacic, I.; Zhang, J.; Zhang, J.; Wang, H.; Meng, X.; Razdorov, G.; Menon, D.; et al.Glycomics for Type 2 Diabetes Biomarker Discovery: Promise of Immunoglobulin G Subclass-Specific Fragment CrystallizableN-glycosylation in the Uyghur Population. Omics 2019, 23, 640–648. [CrossRef]
33. Glickman, M.E.; Rao, S.R.; Schultz, M.R. False discovery rate control is a recommended alternative to Bonferroni-type adjustmentsin health studies. J. Clin. Epidemiol. 2014, 67, 850–857. [CrossRef]
34. Lastra, G.; Syed, S.; Kurukulasuriya, L.R.; Manrique, C.; Sowers, J.R. Type 2 diabetes mellitus and hypertension: An update.Endocrinol. Metab. Clin. N. Am. 2014, 43, 103–122. [CrossRef]
58
J. Pers. Med. 2021, 11, 614
35. Maverakis, E.; Kim, K.; Shimoda, M.; Gershwin, M.E.; Patel, F.; Wilken, R.; Raychaudhuri, S.; Ruhaak, L.R.; Lebrilla, C.B. Glycansin the immune system and The Altered Glycan Theory of Autoimmunity: A critical review. J. Autoimmun. 2015, 57, 1–13.[CrossRef] [PubMed]
36. Raju, T.S. Terminal sugars of Fc glycans influence antibody effector functions of IgGs. Curr. Opin. Immunol. 2008, 20, 471–478.[CrossRef]
37. Shinkawa, T.; Nakamura, K.; Yamane, N.; Shoji-Hosaka, E.; Kanda, Y.; Sakurada, M.; Uchida, K.; Anazawa, H.; Satoh, M.;Yamasaki, M.; et al. The absence of fucose but not the presence of galactose or bisecting N-acetylglucosamine of human IgG1complex-type oligosaccharides shows the critical role of enhancing antibody-dependent cellular cytotoxicity. J. Biol. Chem. 2003,278, 3466–3473. [CrossRef]
38. Liu, D.; Chu, X.; Wang, H.; Dong, J.; Ge, S.Q.; Zhao, Z.Y.; Peng, H.L.; Sun, M.; Wu, L.J.; Song, M.S.; et al. The changes ofimmunoglobulin G N-glycosylation in blood lipids and dyslipidaemia. J. Transl. Med. 2018, 16, 235. [CrossRef] [PubMed]
39. Liu, D.; Li, Q.; Dong, J.; Li, D.; Xu, X.; Xing, W.; Zhang, X.; Cao, W.; Hou, H.; Wang, H.; et al. The Association Between NormalBMI With Central Adiposity and Proinflammatory Potential Immunoglobulin G N-Glycosylation. Diabetes Metab. Syndr. Obes.2019, 12, 2373–2385. [CrossRef] [PubMed]
40. Wang, Y.; Klaric, L.; Yu, X.; Thaqi, K.; Dong, J.; Novokmet, M.; Wilson, J.; Polasek, O.; Liu, Y.; Krištic, J.; et al. The AssociationBetween Glycosylation of Immunoglobulin G and Hypertension: A Multiple Ethnic Cross-Sectional Study. Medicine 2016,95, e3379. [CrossRef]
41. Vidarsson, G.; Dekkers, G.; Rispens, T. IgG subclasses and allotypes: From structure to effector functions. Front. Immunol. 2014,5, 520. [CrossRef]
42. Nakano, M.; Mishra, S.K.; Tokoro, Y.; Sato, K.; Nakajima, K.; Yamaguchi, Y.; Taniguchi, N.; Kizuka, Y. Bisecting GlcNAc Is aGeneral Suppressor of Terminal Modification of N-glycan. Mol. Cell. Proteom. 2019, 18, 2044–2057. [CrossRef] [PubMed]
43. Mihai, S.; Nimmerjahn, F. The role of Fc receptors and complement in autoimmunity. Autoimmun. Rev. 2013, 12, 657–660.[CrossRef] [PubMed]
44. Karsten, C.M.; Pandey, M.K.; Figge, J.; Kilchenstein, R.; Taylor, P.R.; Rosas, M.; McDonald, J.U.; Orr, S.J.; Berger, M.; Petzold, D.;et al. Anti-inflammatory activity of IgG1 mediated by Fc galactosylation and association of FcγRIIB and dectin-1. Nat. Med. 2012,18, 1401–1406. [CrossRef] [PubMed]
45. Zhang, X.; Yuan, H.; Lyu, J.; Meng, X.; Tian, Q.; Li, Y.; Zhang, J.; Xu, X.; Su, J.; Hou, H.; et al. Association of dementia withimmunoglobulin G N-glycans in a Chinese Han Population. NPJ Aging Mech. Dis. 2021, 7, 3. [CrossRef]
46. Kemna, M.J.; Plomp, R.; van Paassen, P.; Koeleman, C.A.M.; Jansen, B.C.; Damoiseaux, J.; Cohen Tervaert, J.W.; Wuhrer, M.Galactosylation and Sialylation Levels of IgG Predict Relapse in Patients with PR3-ANCA Associated Vasculitis. EBioMedicine2017, 17, 108–118. [CrossRef]
47. Kaneko, Y.; Nimmerjahn, F.; Ravetch, J.V. Anti-inflammatory activity of immunoglobulin G resulting from Fc sialylation. Science2006, 313, 670–673. [CrossRef]
48. Hassinen, A.; Pujol, F.M.; Kokkonen, N.; Pieters, C.; Kihlström, M.; Korhonen, K.; Kellokumpu, S. Functional organization ofGolgi N- and O-glycosylation pathways involves pH-dependent complex formation that is impaired in cancer cells. J. Biol. Chem.2011, 286, 38329–38340. [CrossRef]
49. Huffman, J.E.; Knezevic, A.; Vitart, V.; Kattla, J.; Adamczyk, B.; Novokmet, M.; Igl, W.; Pucic, M.; Zgaga, L.; Johannson, Å.; et al.Polymorphisms in B3GAT1, SLC9A9 and MGAT5 are associated with variation within the human plasma N-glycome of 3533European adults. Hum. Mol. Genet. 2011, 20, 5000–5011. [CrossRef]
59

Journal of
Personalized
Medicine
Article
Identification of Adolescents with Adiposities and ElevatedBlood Pressure and Implementation of Preventive MeasuresWarrants the Use of Multiple Clinical Assessment Tools
Hiba Bawadi 1 , Manal Kassab 2 , Abdel Hadi Zanabili 3 and Reema Tayyem 1,*
Citation: Bawadi, H.; Kassab,
M.; Zanabili, A.H.; Tayyem, R.
Identification of Adolescents with
Adiposities and Elevated Blood
Pressure and Implementation of
Preventive Measures Warrants the
Use of Multiple Clinical Assessment
Tools. J. Pers. Med. 2021, 11, 873.
https://doi.org/10.3390/jpm11090873
Academic Editor: Francesco Masedu
Received: 17 June 2021
Accepted: 23 August 2021
Published: 31 August 2021
Publisher’s Note: MDPI stays neutral
with regard to jurisdictional claims in
published maps and institutional affil-
iations.
Copyright: © 2021 by the authors.
Licensee MDPI, Basel, Switzerland.
This article is an open access article
distributed under the terms and
conditions of the Creative Commons
Attribution (CC BY) license (https://
creativecommons.org/licenses/by/
4.0/).
1 Department of Health Sciences, Qatar University, Doha P.O. Box 2713, Qatar; [email protected] Faculty of Nursing, Jordan University of Science & Technology (JUST), P.O. Box 3030, Irbid 22110, Jordan;
[email protected] Department of Nutrition and Food Technology, Jordan University of Science and Technology, P.O. Box 3030,
Irbid 22110, Jordan; [email protected]* Correspondence: [email protected]; Tel.: +974-3030-8344 or +974-4403-7505
Abstract: Abstract: BackgroundThe burden of abdominal adiposity has increased globally, whichis recognized as a key condition for the development of obesity-related disorders among youth,including type 2 diabetes, cardiovascular disease, and hypertension. High blood pressure (BP)and cardiovascular diseases increase the rates of premature mortality and morbidity substantially.Aims: to investigate the relation between abdominal adiposity and elevated BP among adolescentmales in Jordan. Methods: Nationally representative sample of male adolescents was selected usingmulti-cluster sampling technique. Study sample included 1035 adolescent males aged 12 to 17 years.Multiple indicators were used to assess adiposity including waist circumference (WC) and totalbody fat (TF), truncal fat (TrF), and visceral fat (VF). Systolic blood pressure was measured to assesshypertension. Results: After adjusting for age, smoking status, and physical activity, the odds ofhaving stage two hypertension increased 6, 7, and 8 times for adolescents who were on 90th percentileor above for Trf, VF, and WC, respectively. Conclusion: Elevated BP was significantly associatedwith total and abdominal adiposity among adolescent males in Jordan. Use of multiple clinicalassessment tools is essential to assess abdominal obesity among adolescents.
Keywords: abdominal adiposity; adolescents; blood pressure; obesity; Jordan; boys
1. Introduction
Obesity is considered the most serious future-health threatening problem amongchildren and adolescents. In Jordan, about 17.3% of children and adolescents were over-weight, and 15.7% were obese, as documented by Zayed and colleagues (2016) [1]. Recentresearch indicates that abdominal or central obesity is a more robust predictor for severaldebilitating and deadly chronic diseases than overall adiposity [2,3]. Besides being con-sidered an important predictor of adult obesity, abdominal obesity among children andadolescents is also linked to several life threatening diseases, including cardiovasculardiseases, diabetes, orthopaedic problems, cancers, metabolic syndrome, and high bloodpressure [4–7]. Obesity does this through a variety of pathways, some as straightforwardas the mechanical stress of carrying extra pounds and some involving multipart alterationsin both hormones and cellular metabolism [8].
In the last decade, elevated BP increased among children and adolescents [9]. Adoles-cents with elevated BP can develop several chronic diseases and body organ damage [10,11].Children with high BMI are more prone to have elevated BP [12]. Premature mortalityis attributed to elevated BP by increasing the incidence of cardiovascular disease [13].Prevention of childhood obesity initiates reduction in BP which leads to substantial pre-vention of cardiovascular disease [14]. Several studies supported the association between
61
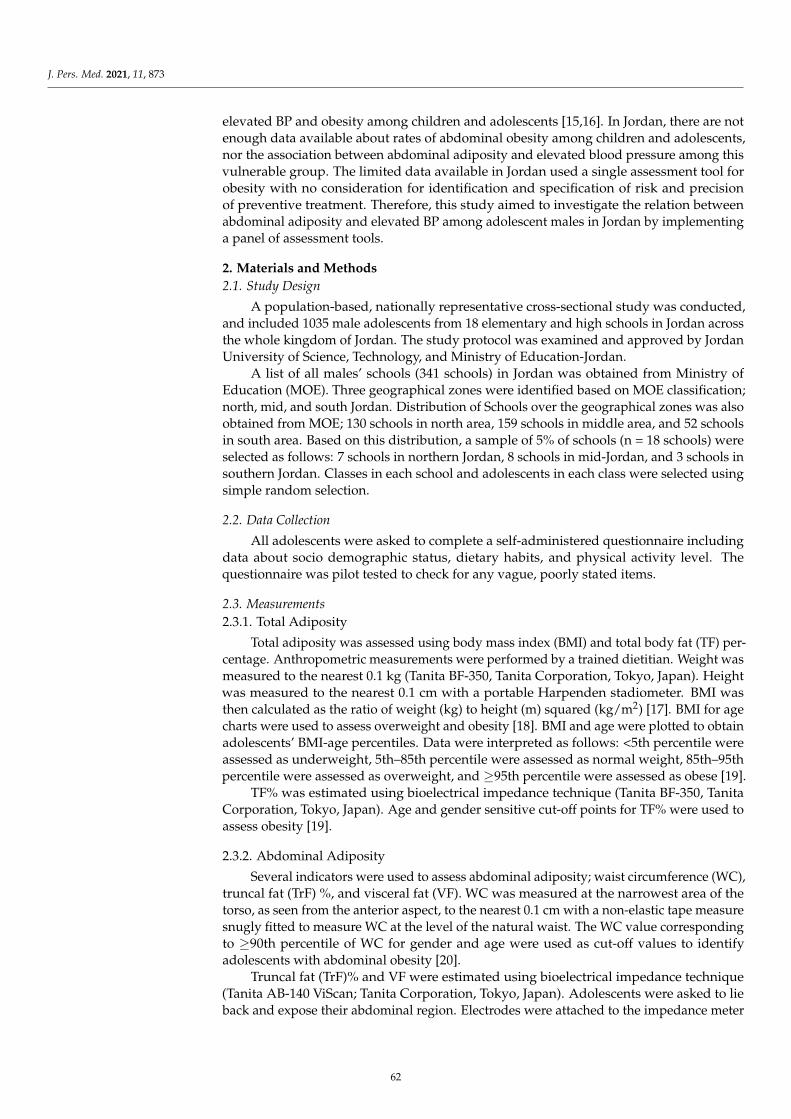
J. Pers. Med. 2021, 11, 873
elevated BP and obesity among children and adolescents [15,16]. In Jordan, there are notenough data available about rates of abdominal obesity among children and adolescents,nor the association between abdominal adiposity and elevated blood pressure among thisvulnerable group. The limited data available in Jordan used a single assessment tool forobesity with no consideration for identification and specification of risk and precisionof preventive treatment. Therefore, this study aimed to investigate the relation betweenabdominal adiposity and elevated BP among adolescent males in Jordan by implementinga panel of assessment tools.
2. Materials and Methods2.1. Study Design
A population-based, nationally representative cross-sectional study was conducted,and included 1035 male adolescents from 18 elementary and high schools in Jordan acrossthe whole kingdom of Jordan. The study protocol was examined and approved by JordanUniversity of Science, Technology, and Ministry of Education-Jordan.
A list of all males’ schools (341 schools) in Jordan was obtained from Ministry ofEducation (MOE). Three geographical zones were identified based on MOE classification;north, mid, and south Jordan. Distribution of Schools over the geographical zones was alsoobtained from MOE; 130 schools in north area, 159 schools in middle area, and 52 schoolsin south area. Based on this distribution, a sample of 5% of schools (n = 18 schools) wereselected as follows: 7 schools in northern Jordan, 8 schools in mid-Jordan, and 3 schools insouthern Jordan. Classes in each school and adolescents in each class were selected usingsimple random selection.
2.2. Data Collection
All adolescents were asked to complete a self-administered questionnaire includingdata about socio demographic status, dietary habits, and physical activity level. Thequestionnaire was pilot tested to check for any vague, poorly stated items.
2.3. Measurements2.3.1. Total Adiposity
Total adiposity was assessed using body mass index (BMI) and total body fat (TF) per-centage. Anthropometric measurements were performed by a trained dietitian. Weight wasmeasured to the nearest 0.1 kg (Tanita BF-350, Tanita Corporation, Tokyo, Japan). Heightwas measured to the nearest 0.1 cm with a portable Harpenden stadiometer. BMI wasthen calculated as the ratio of weight (kg) to height (m) squared (kg/m2) [17]. BMI for agecharts were used to assess overweight and obesity [18]. BMI and age were plotted to obtainadolescents’ BMI-age percentiles. Data were interpreted as follows: <5th percentile wereassessed as underweight, 5th–85th percentile were assessed as normal weight, 85th–95thpercentile were assessed as overweight, and ≥95th percentile were assessed as obese [19].
TF% was estimated using bioelectrical impedance technique (Tanita BF-350, TanitaCorporation, Tokyo, Japan). Age and gender sensitive cut-off points for TF% were used toassess obesity [19].
2.3.2. Abdominal Adiposity
Several indicators were used to assess abdominal adiposity; waist circumference (WC),truncal fat (TrF) %, and visceral fat (VF). WC was measured at the narrowest area of thetorso, as seen from the anterior aspect, to the nearest 0.1 cm with a non-elastic tape measuresnugly fitted to measure WC at the level of the natural waist. The WC value correspondingto ≥90th percentile of WC for gender and age were used as cut-off values to identifyadolescents with abdominal obesity [20].
Truncal fat (TrF)% and VF were estimated using bioelectrical impedance technique(Tanita AB-140 ViScan; Tanita Corporation, Tokyo, Japan). Adolescents were asked to lieback and expose their abdominal region. Electrodes were attached to the impedance meter
62
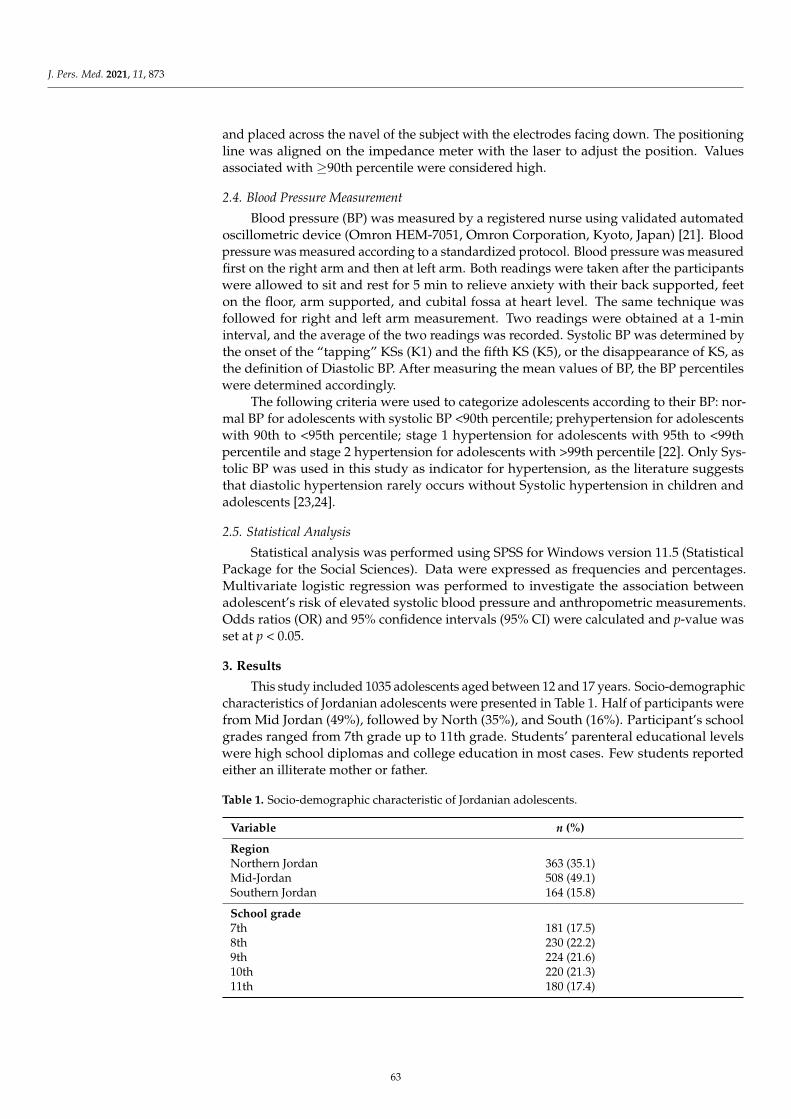
J. Pers. Med. 2021, 11, 873
and placed across the navel of the subject with the electrodes facing down. The positioningline was aligned on the impedance meter with the laser to adjust the position. Valuesassociated with ≥90th percentile were considered high.
2.4. Blood Pressure Measurement
Blood pressure (BP) was measured by a registered nurse using validated automatedoscillometric device (Omron HEM-7051, Omron Corporation, Kyoto, Japan) [21]. Bloodpressure was measured according to a standardized protocol. Blood pressure was measuredfirst on the right arm and then at left arm. Both readings were taken after the participantswere allowed to sit and rest for 5 min to relieve anxiety with their back supported, feeton the floor, arm supported, and cubital fossa at heart level. The same technique wasfollowed for right and left arm measurement. Two readings were obtained at a 1-mininterval, and the average of the two readings was recorded. Systolic BP was determined bythe onset of the “tapping” KSs (K1) and the fifth KS (K5), or the disappearance of KS, asthe definition of Diastolic BP. After measuring the mean values of BP, the BP percentileswere determined accordingly.
The following criteria were used to categorize adolescents according to their BP: nor-mal BP for adolescents with systolic BP <90th percentile; prehypertension for adolescentswith 90th to <95th percentile; stage 1 hypertension for adolescents with 95th to <99thpercentile and stage 2 hypertension for adolescents with >99th percentile [22]. Only Sys-tolic BP was used in this study as indicator for hypertension, as the literature suggeststhat diastolic hypertension rarely occurs without Systolic hypertension in children andadolescents [23,24].
2.5. Statistical Analysis
Statistical analysis was performed using SPSS for Windows version 11.5 (StatisticalPackage for the Social Sciences). Data were expressed as frequencies and percentages.Multivariate logistic regression was performed to investigate the association betweenadolescent’s risk of elevated systolic blood pressure and anthropometric measurements.Odds ratios (OR) and 95% confidence intervals (95% CI) were calculated and p-value wasset at p < 0.05.
3. Results
This study included 1035 adolescents aged between 12 and 17 years. Socio-demographiccharacteristics of Jordanian adolescents were presented in Table 1. Half of participants werefrom Mid Jordan (49%), followed by North (35%), and South (16%). Participant’s schoolgrades ranged from 7th grade up to 11th grade. Students’ parenteral educational levelswere high school diplomas and college education in most cases. Few students reportedeither an illiterate mother or father.
Table 1. Socio-demographic characteristic of Jordanian adolescents.
Variable n (%)
RegionNorthern Jordan 363 (35.1)Mid-Jordan 508 (49.1)Southern Jordan 164 (15.8)
School grade7th 181 (17.5)8th 230 (22.2)9th 224 (21.6)10th 220 (21.3)11th 180 (17.4)
63
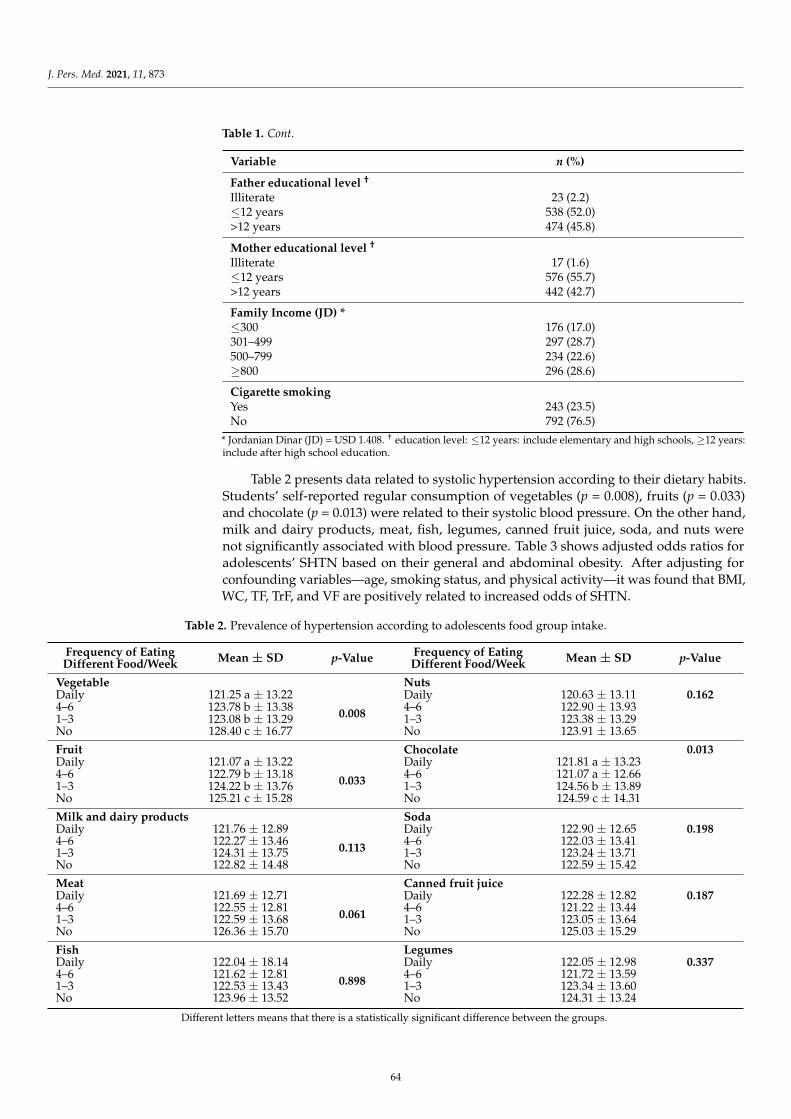
J. Pers. Med. 2021, 11, 873
Table 1. Cont.
Variable n (%)
Father educational level †
Illiterate 23 (2.2)≤12 years 538 (52.0)>12 years 474 (45.8)
Mother educational level †
Illiterate 17 (1.6)≤12 years 576 (55.7)>12 years 442 (42.7)
Family Income (JD) *≤300 176 (17.0)301–499 297 (28.7)500–799 234 (22.6)≥800 296 (28.6)
Cigarette smokingYes 243 (23.5)No 792 (76.5)
* Jordanian Dinar (JD) = USD 1.408. † education level: ≤12 years: include elementary and high schools, ≥12 years:include after high school education.
Table 2 presents data related to systolic hypertension according to their dietary habits.Students’ self-reported regular consumption of vegetables (p = 0.008), fruits (p = 0.033)and chocolate (p = 0.013) were related to their systolic blood pressure. On the other hand,milk and dairy products, meat, fish, legumes, canned fruit juice, soda, and nuts werenot significantly associated with blood pressure. Table 3 shows adjusted odds ratios foradolescents’ SHTN based on their general and abdominal obesity. After adjusting forconfounding variables—age, smoking status, and physical activity—it was found that BMI,WC, TF, TrF, and VF are positively related to increased odds of SHTN.
Table 2. Prevalence of hypertension according to adolescents food group intake.
Frequency of EatingDifferent Food/Week Mean ± SD p-Value Frequency of Eating
Different Food/Week Mean ± SD p-Value
Vegetable NutsDaily 121.25 a ± 13.22
0.008
Daily 120.63 ± 13.11 0.1624–6 123.78 b ± 13.38 4–6 122.90 ± 13.931–3 123.08 b ± 13.29 1–3 123.38 ± 13.29No 128.40 c ± 16.77 No 123.91 ± 13.65
Fruit Chocolate 0.013Daily 121.07 a ± 13.22
0.033
Daily 121.81 a ± 13.234–6 122.79 b ± 13.18 4–6 121.07 a ± 12.661–3 124.22 b ± 13.76 1–3 124.56 b ± 13.89No 125.21 c ± 15.28 No 124.59 c ± 14.31
Milk and dairy products SodaDaily 121.76 ± 12.89
0.113
Daily 122.90 ± 12.65 0.1984–6 122.27 ± 13.46 4–6 122.03 ± 13.411–3 124.31 ± 13.75 1–3 123.24 ± 13.71No 122.82 ± 14.48 No 122.59 ± 15.42
Meat Canned fruit juiceDaily 121.69 ± 12.71
0.061
Daily 122.28 ± 12.82 0.1874–6 122.55 ± 12.81 4–6 121.22 ± 13.441–3 122.59 ± 13.68 1–3 123.05 ± 13.64No 126.36 ± 15.70 No 125.03 ± 15.29
Fish LegumesDaily 122.04 ± 18.14
0.898
Daily 122.05 ± 12.98 0.3374–6 121.62 ± 12.81 4–6 121.72 ± 13.591–3 122.53 ± 13.43 1–3 123.34 ± 13.60No 123.96 ± 13.52 No 124.31 ± 13.24
Different letters means that there is a statistically significant difference between the groups.
64
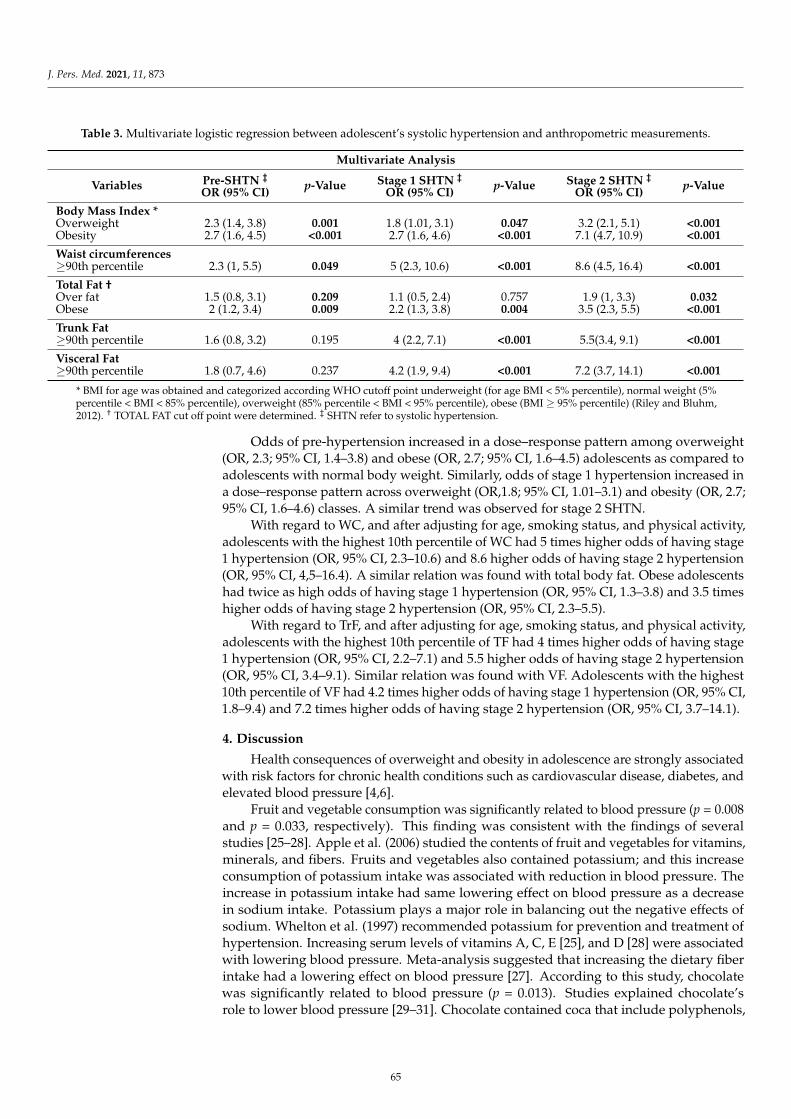
J. Pers. Med. 2021, 11, 873
Table 3. Multivariate logistic regression between adolescent’s systolic hypertension and anthropometric measurements.
Multivariate Analysis
Variables Pre-SHTN ‡
OR (95% CI) p-Value Stage 1 SHTN ‡
OR (95% CI) p-Value Stage 2 SHTN ‡
OR (95% CI) p-Value
Body Mass Index *Overweight 2.3 (1.4, 3.8) 0.001 1.8 (1.01, 3.1) 0.047 3.2 (2.1, 5.1) <0.001Obesity 2.7 (1.6, 4.5) <0.001 2.7 (1.6, 4.6) <0.001 7.1 (4.7, 10.9) <0.001
Waist circumferences≥90th percentile 2.3 (1, 5.5) 0.049 5 (2.3, 10.6) <0.001 8.6 (4.5, 16.4) <0.001
Total Fat †Over fat 1.5 (0.8, 3.1) 0.209 1.1 (0.5, 2.4) 0.757 1.9 (1, 3.3) 0.032Obese 2 (1.2, 3.4) 0.009 2.2 (1.3, 3.8) 0.004 3.5 (2.3, 5.5) <0.001
Trunk Fat≥90th percentile 1.6 (0.8, 3.2) 0.195 4 (2.2, 7.1) <0.001 5.5(3.4, 9.1) <0.001
Visceral Fat≥90th percentile 1.8 (0.7, 4.6) 0.237 4.2 (1.9, 9.4) <0.001 7.2 (3.7, 14.1) <0.001
* BMI for age was obtained and categorized according WHO cutoff point underweight (for age BMI < 5% percentile), normal weight (5%percentile < BMI < 85% percentile), overweight (85% percentile < BMI < 95% percentile), obese (BMI ≥ 95% percentile) (Riley and Bluhm,2012). † TOTAL FAT cut off point were determined. ‡ SHTN refer to systolic hypertension.
Odds of pre-hypertension increased in a dose–response pattern among overweight(OR, 2.3; 95% CI, 1.4–3.8) and obese (OR, 2.7; 95% CI, 1.6–4.5) adolescents as compared toadolescents with normal body weight. Similarly, odds of stage 1 hypertension increased ina dose–response pattern across overweight (OR,1.8; 95% CI, 1.01–3.1) and obesity (OR, 2.7;95% CI, 1.6–4.6) classes. A similar trend was observed for stage 2 SHTN.
With regard to WC, and after adjusting for age, smoking status, and physical activity,adolescents with the highest 10th percentile of WC had 5 times higher odds of having stage1 hypertension (OR, 95% CI, 2.3–10.6) and 8.6 higher odds of having stage 2 hypertension(OR, 95% CI, 4,5–16.4). A similar relation was found with total body fat. Obese adolescentshad twice as high odds of having stage 1 hypertension (OR, 95% CI, 1.3–3.8) and 3.5 timeshigher odds of having stage 2 hypertension (OR, 95% CI, 2.3–5.5).
With regard to TrF, and after adjusting for age, smoking status, and physical activity,adolescents with the highest 10th percentile of TF had 4 times higher odds of having stage1 hypertension (OR, 95% CI, 2.2–7.1) and 5.5 higher odds of having stage 2 hypertension(OR, 95% CI, 3.4–9.1). Similar relation was found with VF. Adolescents with the highest10th percentile of VF had 4.2 times higher odds of having stage 1 hypertension (OR, 95% CI,1.8–9.4) and 7.2 times higher odds of having stage 2 hypertension (OR, 95% CI, 3.7–14.1).
4. Discussion
Health consequences of overweight and obesity in adolescence are strongly associatedwith risk factors for chronic health conditions such as cardiovascular disease, diabetes, andelevated blood pressure [4,6].
Fruit and vegetable consumption was significantly related to blood pressure (p = 0.008and p = 0.033, respectively). This finding was consistent with the findings of severalstudies [25–28]. Apple et al. (2006) studied the contents of fruit and vegetables for vitamins,minerals, and fibers. Fruits and vegetables also contained potassium; and this increaseconsumption of potassium intake was associated with reduction in blood pressure. Theincrease in potassium intake had same lowering effect on blood pressure as a decreasein sodium intake. Potassium plays a major role in balancing out the negative effects ofsodium. Whelton et al. (1997) recommended potassium for prevention and treatment ofhypertension. Increasing serum levels of vitamins A, C, E [25], and D [28] were associatedwith lowering blood pressure. Meta-analysis suggested that increasing the dietary fiberintake had a lowering effect on blood pressure [27]. According to this study, chocolatewas significantly related to blood pressure (p = 0.013). Studies explained chocolate’srole to lower blood pressure [29–31]. Chocolate contained coca that include polyphenols,
65
J. Pers. Med. 2021, 11, 873
especially flavones. Strong effects of flavones on blood pressure as a vasodilator wereapplied by increasing the formation of endothelial nitric oxide.
Findings of the current study are in line with previously published studies suggestingthat obesity is an independent risk factor for early hypertension [4,6,23,24]. Abdominaladiposity showed stronger association that between fatness and the risks of stage 1 andstage 2 systolic hypertension among study participants. Risks increased up to 8 times withabdominal adiposity indicators. Our findings were similar to those reported by Pausovaet al. (2012) and Pazin et al. (2020), where an association was found between adolescentsabdominal adiposity and high BP, especially among in boys [32,33].
The relationship between abdominal adiposity and elevated blood pressure is notfully explained yet. However, researchers linked abdominal adiposity to elevated bloodpressure via insulin resistance and related inflammation [8,24,34–37]. Abdominal adipositystimulates the state of insulin resistance and the inflammatory process [38]. Inflammationleads several changes vascular endothelial function, which in turn leads to the developmentof hypertension [39]. Visceral fat that accumulates around individual internal organsdecreases body sensitivity to insulin, which contributes to oxidative stress, inflammation,vascular endothelial dysfunction, and hypertension [35,37].
Landsberg et al. (2013) explained that the pathophysiology of fat accumulation in theabdominal region led to an increase in BP through the stimulation of insulin resistance,increasing central nervous system activity, renin-angiotensin-aldosterone system activity,angiotensinogen from intra-abdominal adipocytes, aldosterone production, and the renalsodium reabsorption [40]. High adiposity can lead to adiposopathy in adolescence, withassociated increases in inflammation and oxidative stress, changes in adipokines andendocrinopathy [39]. This manifests as cardio-metabolic risk factors in similar patternsto those in noted in obese adults [5]. Both obesity and cardio-metabolic risk factors havebeen shown to be associated with vascular changes indicative of early hypertension,atherosclerosis, as well as ventricular hypertrophy, dilation, and dysfunction [8,24].
Ke and colleagues (2018) clarified that high BP is being induced by VF due to highlevels of free fatty acids excretion in liver via portal circulation after lipogenesis andlipolysis activity, gluconeogenesis, lipid synthesis, and insulin resistance [41]. This elevatedamount of free fatty acids will induce hypertension and eventually atherosclerosis [42,43].
Many studies revealed that applying different anthropometric assessment methodsis essential to evaluate body weight status accurately [44–47]. Body composition can beassessed at the molecular, cellular, and tissue levels using several different methods [44,46].Specific limitations of anthropometry in the obese are obvious. These limitations includethe inability to distinguish subcutaneous fat from visceral adipose tissue, which is helpfulto assess disease risk [47] and accuracy may be lowered in the severely obese, due todifficulties finding the actual waistline or drooping abdominal fat can interfere with hipmeasurement [46]. Therefore, no single measurement is recommended to assess the bodycomposition of obese people. Yet, each modality has benefits and drawbacks [46].
This study has several strengths, including the representation of the sample to theJordanian adolescent males and multiple tools used to operationalize adiposity. However,the study is limited as it did not include intensive dietary data which were not to feasiblein the school setting, especially with all the measurements being performed.
In conclusion, excess fat, especially abdominal fat, is associated with increased riskof systolic hypertension among adolescent males. The physiological relation betweenobesity and hypertension could not attribute to a single factor. It is critical to use multipleclinical assessment tools for obesity to optimizes identification of adolescents at risk; hencepreventive measures can be timely considered. Findings of this study must be taken withhigh level of importance to prevent early hypertension and associated cardiovasculardiseases risk later in adulthood.
66
J. Pers. Med. 2021, 11, 873
Author Contributions: H.B.: proposal writing, data analysis, data interpretation, and writingmanuscript. M.K.: data interpretation and writing manuscript. A.H.Z.: data collection and writingmanuscript. R.T.: data interpretation and writing manuscript. All authors have read and agreed tothe published version of the manuscript.
Funding: This research was funded by the Deanship of Research in Jordan University of Science andTechnology (project No. 2014/97).
Institutional Review Board Statement: This study was conducted according to the guidelines laiddown in the Declaration of Helsinki and all procedures involving research study participants wereapproved by the IRB at Ministry of Education. IRB Approval number was 3/10/21299.
Informed Consent Statement: Written informed consent was obtained from all subjects/parents.
Acknowledgments: Authors would like to thank Fawzieh Hammad for her help in the data entryand analysis.
Conflicts of Interest: The authors declare no conflict of interest.
References1. Zayed, A.A.; Beano, A.M.; Haddadin, F.I.; Radwan, S.S.; Allauzy, S.A.; Alkhayyat, M.M.; Al-Dahabrah, Z.A.; Al-Hasan, Y.G.;
Yousef, A.-M.F. Prevalence of short stature, underweight, overweight, and obesity among school children in Jordan. BMC PublicHealth 2016, 16, 1040. [CrossRef]
2. Tchernof, A.; Després, J.-P. Pathophysiology of human visceral obesity: An update. Physiol. Rev. 2013. [CrossRef]3. Wang, S.; Ren, J. Obesity paradox in aging: From prevalence to pathophysiology. Progress Cardiovasc. Dis. 2018, 61, 182–189.
[CrossRef]4. Albuquerque, D.; Nóbrega, C.; Samouda, H.; Manco, L. Assessment of obesity and abdominal obesity among Portuguese children.
Acta Med. Portuguesa 2012, 25, 169–173.5. Bendor, C.D.; Bardugo, A.; Pinhas-Hamiel, O.; Afek, A.; Twig, G. Cardiovascular morbidity, diabetes and cancer risk among
children and adolescents with severe obesity. Cardiovasc. Diabetol. 2020, 19, 79. [CrossRef]6. Branca, F.; Nikogosian, H.; Lobstein, T. The Challenge Obesity in the WHO European Region and the Strategies for Response: Summary;
World Health Organization: Geneva, Switzerland, 2007.7. Güngör, N.K. Overweight and obesity in children and adolescents. J. Clin. Res. Pediatr. Endocrinol. 2014, 6, 129. [CrossRef]
[PubMed]8. Chait, A.; den Hartigh, L.J. Adipose tissue distribution, inflammation and its metabolic consequences, including diabetes and
cardiovascular disease. Front. Cardiovasc. Med. 2020, 7, 22. [CrossRef]9. Prastowo, N.A.; Haryono, I.R. Elevated blood pressure and its relationship with bodyweight and anthropometric measurements
among 8–11-year-old Indonesian school children. J. Public Health Res. 2020, 9, 1723. [CrossRef]10. Lande, M.B.; Carson, N.L.; Roy, J.; Meagher, C.C. Effects of childhood primary hypertension on carotid intima media thickness: A
matched controlled study. Hypertension 2006, 48, 40–44. [CrossRef] [PubMed]11. Must, A.; Jacques, P.F.; Dallal, G.E.; Bajema, C.J.; Dietz, W.H. Long-term morbidity and mortality of overweight adolescents: A
follow-up of the Harvard Growth Study of 1922 to 1935. N. Engl. J. Med. 1992, 327, 1350–1355. [CrossRef] [PubMed]12. Freedman, D.S.; Mei, Z.; Srinivasan, S.R.; Berenson, G.S.; Dietz, W.H. Cardiovascular risk factors and excess adiposity among
overweight children and adolescents: The Bogalusa Heart Study. J. Pediatr. 2007, 150, 12–17. [CrossRef] [PubMed]13. Stamler, J.; Stamler, R.; Neaton, J.D. Blood pressure, systolic and diastolic, and cardiovascular risks: US population data. Arch. Int.
Med. 1993, 153, 598–615. [CrossRef]14. Freedman, D.S.; Dietz, W.H.; Srinivasan, S.R.; Berenson, G.S. The relation of overweight to cardiovascular risk factors among
children and adolescents: The Bogalusa Heart Study. Pediatrics 1999, 103, 1175–1182. [CrossRef] [PubMed]15. Genovesi, S.; Giussani, M.; Pieruzzi, F.; Vigorita, F.; Arcovio, C.; Cavuto, S.; Stella, A. Results of blood pressure screening in a
population of school-aged children in the province of Milan: Role of overweight. J. Hypertens. 2005, 23, 493–497. [CrossRef]16. Wang, M.; Kelishadi, R.; Khadilkar, A.; Hong, Y.M.; Nawarycz, T.; Krzywinska-Wiewiorowska, M.; Aounallah-Skhiri, H.; Motlagh,
M.E.; Kim, H.S.; Khadilkar, V. Body mass index percentiles and elevated blood pressure among children and adolescents. J.Human Hypertens. 2020, 34, 319–325. [CrossRef] [PubMed]
17. Lohman, T.G.; Roche, A.F.; Martorell, R. Anthropometric Standardization Reference Manual; Human Kinetics Books: Champaign, IL,USA, 1988.
18. Jebb, S.; McCarthy, D.; Fry, T.; Prentice, A. New body fat reference curves for children. Int. J. Obes. 2006, 30, A156–A157.19. Siegel, M.J.; Hildebolt, C.F.; Bae, K.T.; Hong, C.; White, N.H. Total and intraabdominal fat distribution in preadolescents and
adolescents: Measurement with MR imaging. Radiology 2007, 242, 846–856. [CrossRef]
67
J. Pers. Med. 2021, 11, 873
20. Pandit, D.S.; Khadilkar, A.V.; Chiplonkar, S.A.; Khadilkar, V.V.; Kinare, A.S. Arterial stiffness in obese children: Role of adiposityand physical activity. Indian J. Endocrinol. Metabol. 2014, 18, 70.
21. Umer, A.; Kelley, G.A.; Cottrell, L.E.; Giacobbi, P.; Innes, K.E.; Lilly, C.L. Childhood obesity and adult cardiovascular disease riskfactors: A systematic review with meta-analysis. BMC Public Health 2017, 17, 683. [CrossRef]
22. Kelishadi, R.; Heshmat, R.; Ardalan, G.; Qorbani, M.; Taslimi, M.; Poursafa, P.; Keramatian, K.; Taheri, M.; Motlagh, M.-E. Firstreport on simplified diagnostic criteria for pre-hypertension and hypertension in a national sample of adolescents from theMiddle East and North Africa: The CASPIAN-III study. J. Pediatr. 2014, 90, 85–91. [CrossRef] [PubMed]
23. Alp, H.; Karaarslan, S.; Eklioglu, B.S.; Atabek, M.E.; Altın, H.; Baysal, T. Association between nonalcoholic fatty liver disease andcardiovascular risk in obese children and adolescents. Canadian J. Cardiol. 2013, 29, 1118–1125. [CrossRef]
24. Gupta, P.P.; Fonarow, G.C.; Horwich, T.B. Obesity and the obesity paradox in heart failure. Canadian J. Cardiol. 2015, 31, 195–202.[CrossRef]
25. Appel, L.J.; Brands, M.W.; Daniels, S.R.; Karanja, N.; Elmer, P.J.; Sacks, F.M. Dietary approaches to prevent and treat hypertension:A scientific statement from the American Heart Association. Hypertension 2006, 47, 296–308. [CrossRef] [PubMed]
26. Whelton, P.K.; He, J.; Cutler, J.A.; Brancati, F.L.; Appel, L.J.; Follmann, D.; Klag, M.J. Effects of oral potassium on blood pressure:Meta-analysis of randomized controlled clinical trials. JAMA 1997, 277, 1624–1632. [CrossRef] [PubMed]
27. Whelton, S.P.; Hyre, A.D.; Pedersen, B.; Yi, Y.; Whelton, P.K.; He, J. Effect of dietary fiber intake on blood pressure: A meta-analysisof randomized, controlled clinical trials. LWW 2005, 2005, 475–481. [CrossRef] [PubMed]
28. Witham, M.D.; Nadir, M.A.; Struthers, A.D. Effect of vitamin D on blood pressure: A systematic review and meta-analysis. J.Hypertens. 2009, 27, 1948–1954. [CrossRef]
29. Fisher, N.D.; Hollenberg, N.K. Aging and vascular responses to flavanol-rich cocoa. J. Hypertens. 2006, 24, 1575–1580. [CrossRef]30. Karim, M.; McCormick, K.; Kappagoda, C.T. Effects of cocoa extracts on endothelium-dependent relaxation. J. Nutr. 2000, 130,
2105S–2108S. [CrossRef]31. Taubert, D.; Roesen, R.; Schömig, E. Effect of cocoa and tea intake on blood pressure: A meta-analysis. Arch. Int. Med. 2007, 167,
626–634. [CrossRef]32. Pausova, Z.; Mahboubi, A.; Abrahamowicz, M.; Leonard, G.T.; Perron, M.; Richer, L.; Veillette, S.; Gaudet, D.; Paus, T. Sex
differences in the contributions of visceral and total body fat to blood pressure in adolescence. Hypertension 2012, 59, 572–579.[CrossRef]
33. Pazin, D.C.; da Luz Kaestner, T.L.; Olandoski, M.; Baena, C.P.; de Azevedo Abreu, G.; Kuschnir, M.C.C.; Bloch, K.V.; Faria-Neto,J.R. Association Between Abdominal Waist Circumference and Blood Pressure In Brazilian Adolescents With Normal Body MassIndex: Waist circumference and blood pressure in Adolescents. Glob. Heart 2020, 15. [CrossRef]
34. Poirier, P.; Giles, T.D.; Bray, G.A.; Hong, Y.; Stern, J.S.; Pi-Sunyer, F.X.; Eckel, R.H. Obesity and cardiovascular disease: Pathophysi-ology, evaluation, and effect of weight loss: An update of the 1997 American Heart Association Scientific Statement on Obesityand Heart Disease from the Obesity Committee of the Council on Nutrition, Physical Activity, and Metabolism. Circulation 2006,113, 898–918.
35. Reddy, P.; Lent-Schochet, D.; Ramakrishnan, N.; McLaughlin, M.; Jialal, I. Metabolic syndrome is an inflammatory disorder: Aconspiracy between adipose tissue and phagocytes. Clin. Chim. Acta 2019, 496, 35–44. [CrossRef] [PubMed]
36. Tsioufis, C.; Kordalis, A.; Flessas, D.; Anastasopoulos, I.; Tsiachris, D.; Papademetriou, V.; Stefanadis, C. Pathophysiology ofresistant hypertension: The role of sympathetic nervous system. Int. J. Hypertens. 2011, 2011. [CrossRef] [PubMed]
37. Zhou, Y.; Li, H.; Xia, N. The Interplay Between Adipose Tissue and Vasculature: Role of Oxidative Stress in Obesity. Front.Cardiovasc. Med. 2021, 8, 131. [CrossRef]
38. Xu, H.; Barnes, G.T.; Yang, Q.; Tan, G.; Yang, D.; Chou, C.J.; Sole, J.; Nichols, A.; Ross, J.S.; Tartaglia, L.A. Chronic inflammation infat plays a crucial role in the development of obesity-related insulin resistance. J. Clin. Investig. 2003, 112, 1821–1830. [CrossRef][PubMed]
39. Dinh, Q.N.; Drummond, G.R.; Sobey, C.G.; Chrissobolis, S. Roles of inflammation, oxidative stress, and vascular dysfunction inhypertension. BioMed Res. Int. 2014, 2014. [CrossRef]
40. Landsberg, L.; Aronne, L.J.; Beilin, L.J.; Burke, V.; Igel, L.I.; Lloyd-Jones, D.; Sowers, J. Obesity-related hypertension: Pathogenesis,cardiovascular risk, and treatment—A position paper of the The Obesity Society and the American Society of Hypertension.Obesity 2013, 21, 8–24. [CrossRef] [PubMed]
41. Ke, C.; Zhu, X.; Zhang, Y.; Shen, Y. Metabolomic characterization of hypertension and dyslipidemia. Metabolomics 2018, 14, 117.[CrossRef]
42. Artwohl, M.; Roden, M.; Waldhäusl, W.; Freudenthaler, A.; Baumgartner-Parzer, S.M. Free fatty acids trigger apoptosis andinhibit cell cycle progression in human vascular endothelial cells. FASEB J. 2004, 18, 146–148. [CrossRef]
43. Boden, G.; She, P.; Mozzoli, M.; Cheung, P.; Gumireddy, K.; Reddy, P.; Xiang, X.; Luo, Z.; Ruderman, N. Free fatty acids produceinsulin resistance and activate the proinflammatory nuclear factor-κB pathway in rat liver. Diabetes 2005, 54, 3458–3465. [CrossRef][PubMed]
44. Baumgartner, R.N.; Ross, R.; Heymsfield, S.B. Does adipose tissue influence bioelectric impedance in obese men and women? J.Appl. Physiol. 1998, 84, 257–262. [CrossRef] [PubMed]
68

J. Pers. Med. 2021, 11, 873
45. Beechy, L.; Galpern, J.; Petrone, A.; Das, S.K. Assessment tools in obesity—Psychological measures, diet, activity, and bodycomposition. Physiol. Behav. 2012, 107, 154–171. [CrossRef]
46. Das, S.K. Body composition measurement in severe obesity. Curr. Opin. Clin. Nutr. Metab. Care 2005, 8, 602–606. [CrossRef]47. Duren, D.L.; Sherwood, R.J.; Czerwinski, S.A.; Lee, M.; Choh, A.C.; Siervogel, R.M.; Chumlea, W.C. Body composition methods:
Comparisons and interpretation. J. Diabetes Sci. Technol. 2008, 2, 1139–1146. [CrossRef] [PubMed]
69

Journal of
Personalized
Medicine
Article
Sex-Specific Association of Uric Acid and Kidney FunctionDecline in Taiwan
Po-Ya Chang 1,* , Yu-Wei Chang 2, Yuh-Feng Lin 3 and Hueng-Chuen Fan 4
Citation: Chang, P.-Y.; Chang, Y.-W.;
Lin, Y.-F.; Fan, H.-C. Sex-Specific
Association of Uric Acid and Kidney
Function Decline in Taiwan. J. Pers.
Med. 2021, 11, 415. https://
doi.org/10.3390/jpm11050415
Academic Editor: Rutger
A. Middelburg
Received: 31 March 2021
Accepted: 12 May 2021
Published: 15 May 2021
Publisher’s Note: MDPI stays neutral
with regard to jurisdictional claims in
published maps and institutional affil-
iations.
Copyright: © 2021 by the authors.
Licensee MDPI, Basel, Switzerland.
This article is an open access article
distributed under the terms and
conditions of the Creative Commons
Attribution (CC BY) license (https://
creativecommons.org/licenses/by/
4.0/).
1 Department of Leisure Industry and Health Promotion, National Taipei University of Nursing and HealthSciences, Taipei 112, Taiwan
2 Department of Business Management, National Taichung University of Science and Technology,Taichung City 404, Taiwan; [email protected]
3 Graduate Institute of Clinical Medicine, Taipei Medical University, Taipei 110, Taiwan; [email protected] Department of Pediatrics, Tungs’ Taichung Metroharbor Hospital, Taichung 435, Taiwan;
[email protected]* Correspondence: [email protected]; Tel.:+886-2-28227101 (ext. 3678)
Abstract: An elevated serum urate concentration is associated with kidney damage. Men’s uric acidlevels are usually higher than women’s. However, postmenopausal women have a higher risk of goutthan men, and comorbidities are also higher than in men. This study examined the sex differences inthe relationship between hyperuricemia and renal progression in early chronic kidney disease (CKD)and non-CKD, and further examined the incidence of CKD in non-CKD populations among patientsover 50 years of age. We analyzed 1856 women and 1852 men participating in the epidemiology andrisk factors surveillance of the CKD database. Women showed a significantly higher risk of renalprogression and CKD than men within the hyperuricemia group. After adjusting covariates, women,but not men resulted in an hazard ratio (HR) for developing renal progression (HR = 1.12; 95% CI1.01–1.24 in women and HR = 1.03; 95% CI 0.93–1.13 in men) and CKD (HR = 1.11; 95% CI 1.01–1.22in women and HR = 0.95; 95% CI 0.85–1.05 in men) for each 1 mg/dL increase in serum urate levels.The association between serum urate levels and renal progression was stronger in women. Given theprevalence and impact of kidney disease, factors that impede optimal renal function management inwomen and men must be identified to provide tailored treatment recommendations.
Keywords: hyperuricemia; sex; renal progression; chronic kidney disease
1. Introduction
Uric acid is the final product of the breakdown of an exogenous pool of purines andendogenous purine metabolism [1], and most uric acid is excreted via the kidneys [2].Elevated serum urate concentrations are associated with gout [3], diabetes mellitus [4,5],hypertension [6,7], metabolic syndrome [8] and cardiovascular mortality [9,10]. A meta-analysis of 1,134,073 participants showed a positive dose-response association betweenuric acid levels and cardiovascular disease mortality risk [11]. Hyperuricemia is commonin chronic kidney disease (CKD) patients [12], and several studies have also shown arelationship between serum urate levels and kidney damage [13–16]. Urate-loweringtherapy statistically significantly improved estimated glomerular filtration rate (eGFR) andserum creatinine and serum creatinine [17], and reduced the incidence of kidney failureevents [18]. Uric acid crystallizations induce endothelial dysfunction [19,20], systemicinflammation [21], oxidative stress, and renin-angiotensin-aldosterone system activity [22],which may provide a pathogenic mechanism for chronic urate nephropathy.
Previous evidence has suggested that there are sex differences in uric acid levels; menhave a higher uric acid level than women [23], and men have a higher prevalence of goutthan women [24]. Sex differences decline with increasing age, but men still far exceedwomen in the prevalence of gout, even in older populations [24]. Age-related factors
71
J. Pers. Med. 2021, 11, 415
and hormone are also associated with uric acid levels [25]. Premenopausal women havelower levels of uric acid than men or postmenopausal women because estrogens stimulatekidney clearance, secretion and reabsorption [25,26]. However, there is evidence thatpostmenopausal women are at higher risk of gout than men [27]. Moreover, women withhyperuricemia had more comorbidities than men with hyperuricemia. Women with highuric acid levels had a higher risk of developing metabolic syndrome [28], diabetes [29,30],hypertension [7], coronary artery disease [31,32], and cardiovascular events [9,23] thanmen. Sex differences have appeared in the physiological regulation of urate homeostasis.Estrogen may play an important role in the regulation of the expression or activity ofurate transporters [33].
In addition, the effects of uric acid on renal function are sex-specific. Both high and lowuric acid levels increase the risk of developing chronic kidney disease (CKD) in men, whileonly high levels are a risk factor in women [34]. A historic cohort study in Japan indicatedthat uric acid levels greater than 6.0 mg/dL are associated with kidney impairment inmen with mild kidney dysfunction [13]. However, a screened study conducted in Japanshowed that higher uric acid levels increase the risk of developing ESRD in women but notin men [35].
Sex-specificity exists in renal progression in patients with early CKD [36,37]. In fact,whether the incidence of CKD and renal progression differ between postmenopausalwomen and men with hyperuricemia is unclear. Early detection of loss of kidney functionand early treatment can decrease the risk of complications [38], prevent disease progres-sion and prevent high medical costs in later stages [39]. Therefore, we investigated sexdifferences in the relationship between hyperuricemia and renal progression in early CKDand non-CKD populations, and further examined the incidence of CKD in non-CKDpopulations among patients over 50 years of age.
2. Materials and Methods2.1. Study Population
A cohort based on the Epidemiology and Risk Factors Surveillance of CKD databasewas recruited from 14 medical centers and community in Taiwan, namely Tri-Service Gen-eral Hospital, Taipei Medical University Hospital, Shuang Ho Hospital, Taipei Chang GungMemorial Hospital of the C.G.M.F., Cardinal Tien Hospital, E-DA Hospital, National ChengKung University Hospital, China Medical University Hospital, Show Chwan MemorialHospital, Changhua Christian Hospital, Taipei Veterans General Hospital, Kaohsiung Med-ical University Chung-Ho Memorial Hospital, Kaohsiung Municipal Siaogang Hospital,and Kaohsiung Chang Gung Memorial Hospital from October 2008 to February 2016. Atotal of 10,823 participants aged ≥18 years who had at least two serum creatinine mea-surements were recruited in this study. For this study, we excluded patients according tothe following criteria: renal function could not be assessed, the follow-up periods wereless than 12 months, missing data on uric acid or younger than 50 years of age. In total,6085 patients were enrolled, with 1728, 1980 and 2377 having non-CKD, early CKD and lateCKD, respectively. In the present study, we examined the risk factors for renal progressionin subjects with non-CKD and early CKD, as well as the incidence of CKD in subjects withnon-CKD (Figure 1).
72
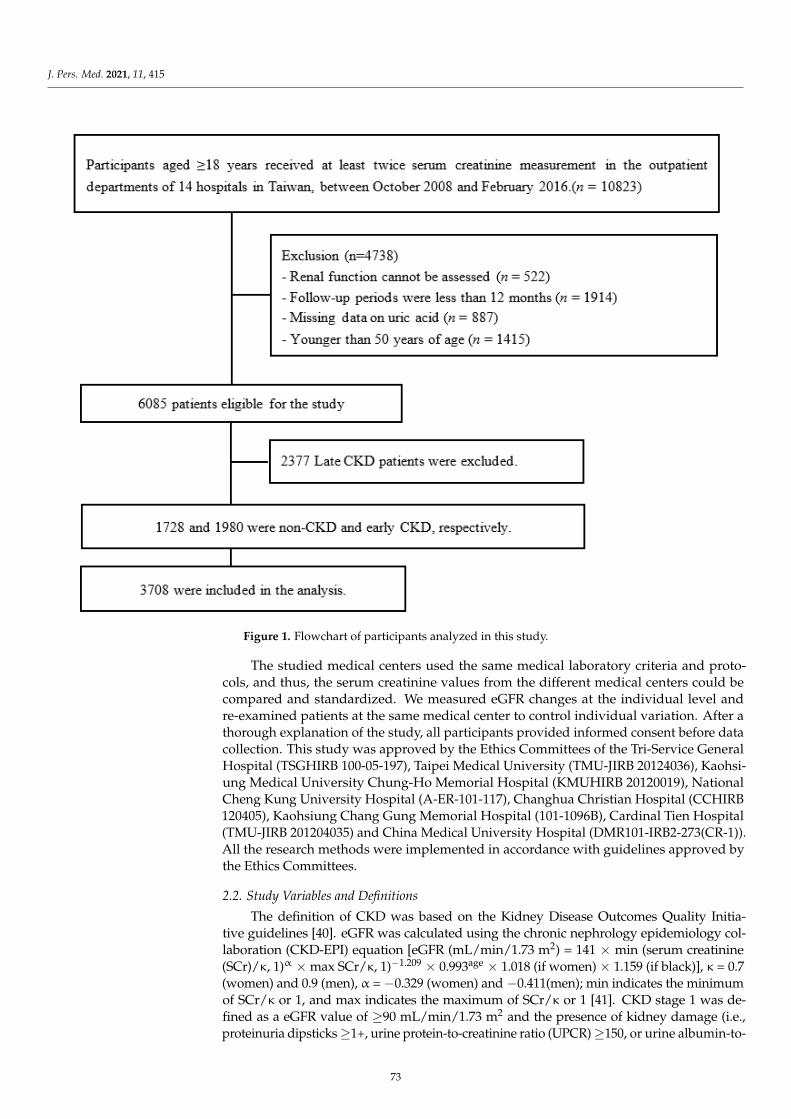
J. Pers. Med. 2021, 11, 415J. Pers. Med. 2021, 11, 415 3 of 13
Figure 1. Flowchart of participants analyzed in this study.
The studied medical centers used the same medical laboratory criteria and protocols,
and thus, the serum creatinine values from the different medical centers could be com-
pared and standardized. We measured eGFR changes at the individual level and re-ex-
amined patients at the same medical center to control individual variation. After a thor-
ough explanation of the study, all participants provided informed consent before data
collection. This study was approved by the Ethics Committees of the Tri-Service General
Hospital (TSGHIRB 100-05-197), Taipei Medical University (TMU-JIRB 20124036),
Kaohsiung Medical University Chung-Ho Memorial Hospital (KMUHIRB 20120019), Na-
tional Cheng Kung University Hospital (A-ER-101-117), Changhua Christian Hospital
(CCHIRB 120405), Kaohsiung Chang Gung Memorial Hospital (101-1096B), Cardinal Tien
Hospital (TMU-JIRB 201204035) and China Medical University Hospital (DMR101-IRB2-
273(CR-1)). All the research methods were implemented in accordance with guidelines
approved by the Ethics Committees.
2.2. Study Variables and Definitions
The definition of CKD was based on the Kidney Disease Outcomes Quality Initiative
guidelines [40]. eGFR was calculated using the chronic nephrology epidemiology collab-
oration (CKD-EPI) equation [eGFR (mL/min/1.73 m2) = 141 × min (serum creatinine
(SCr)/κ, 1)α × max SCr/κ, 1)−1.209 × 0.993age × 1.018 (if women) × 1.159 (if black)], κ = 0.7
(women) and 0.9 (men), α = −0.329 (women) and −0.411(men); min indicates the minimum
of SCr/κ or 1, and max indicates the maximum of SCr/κ or 1 [41]. CKD stage 1 was defined
Figure 1. Flowchart of participants analyzed in this study.
The studied medical centers used the same medical laboratory criteria and proto-cols, and thus, the serum creatinine values from the different medical centers could becompared and standardized. We measured eGFR changes at the individual level andre-examined patients at the same medical center to control individual variation. After athorough explanation of the study, all participants provided informed consent before datacollection. This study was approved by the Ethics Committees of the Tri-Service GeneralHospital (TSGHIRB 100-05-197), Taipei Medical University (TMU-JIRB 20124036), Kaohsi-ung Medical University Chung-Ho Memorial Hospital (KMUHIRB 20120019), NationalCheng Kung University Hospital (A-ER-101-117), Changhua Christian Hospital (CCHIRB120405), Kaohsiung Chang Gung Memorial Hospital (101-1096B), Cardinal Tien Hospital(TMU-JIRB 201204035) and China Medical University Hospital (DMR101-IRB2-273(CR-1)).All the research methods were implemented in accordance with guidelines approved bythe Ethics Committees.
2.2. Study Variables and Definitions
The definition of CKD was based on the Kidney Disease Outcomes Quality Initia-tive guidelines [40]. eGFR was calculated using the chronic nephrology epidemiology col-laboration (CKD-EPI) equation [eGFR (mL/min/1.73 m2) = 141 × min (serum creatinine(SCr)/κ, 1)α × max SCr/κ, 1)−1.209 × 0.993age × 1.018 (if women) × 1.159 (if black)], κ = 0.7(women) and 0.9 (men), α = −0.329 (women) and −0.411(men); min indicates the minimumof SCr/κ or 1, and max indicates the maximum of SCr/κ or 1 [41]. CKD stage 1 was de-fined as a eGFR value of ≥90 mL/min/1.73 m2 and the presence of kidney damage (i.e.,proteinuria dipsticks ≥1+, urine protein-to-creatinine ratio (UPCR) ≥150, or urine albumin-to-
73
J. Pers. Med. 2021, 11, 415
creatinine ratio (UACR) ≥ 30); CKD stage 2 was defined as eGFR = 60–89 mL/min/1.73 m2
and the presence of kidney damage (i.e., proteinuria dipsticks ≥1+, urine protein-to-creatinine ratio (UPCR) ≥150, or urine albumin-to-creatinine ratio (UACR) ≥30); CKDstage 3a was defined as eGFR = 45–59 mL/min/1.73 m2; CKD stage 3b was defined aseGFR = 30–44 mL/min/1.73 m2; CKD stage 4 was defined as eGFR = 15–29 mL/min/1.73 m2;and CKD stage 5 was defined as eGFR <15 mL/min/1.73 m2 [42]. CKD stages 1, 2, and 3areferred to patients with early CKD, whereas CKD stages 3b, 4, and 5 referred to patients withlate CKD.
According to the baseline eGFR, renal progression was defined as an eGFR that wasreduced by more than 25% [43]. Non-CKD patients were followed up from the baselinemeasurement of renal function to the development of renal progression and CKD, orthe end of the study period. Early CKD patients were followed up from the baselinemeasurement of renal function to the development of renal progression, or the end of thestudy period. The patients were censored at the end of the follow-up period.
Uric acid status was classified as the absence of hyperuricemia (serum urate concen-tration values of <7.0 mg/dL for men and <6.0 mg/dL for women) or the presence ofhyperuricemia (serum urate concentration values of ≥7.0 mg/dL for men and ≥6.0 mg/dLfor women) [44,45].
Sociodemographic characteristics, comorbidities, and health-related behaviors, includ-ing age, sex, hypertension, diabetes mellitus, dyslipidemia, CKD, gout, stroke, cigarettesmoking, and alcohol consumption, were obtained at baseline using a structured question-naire. Serum urate levels and physical examination variables, including height, weight,body mass index (BMI), serum creatinine, baseline eGFR, systolic blood pressure (SBP),diastolic blood pressure (DBP), fasting glucose, and total cholesterol, were obtained viamedical chart review. Cigarette smoking was divided into never smoking, current smoker(had smoked at least 100 cigarettes in the lifetime and is currently smoking cigarettes) orformer smoker (had smoked at least 100 cigarettes in the lifetime but had quit smoking atthe time of the interview) [46,47]. Alcohol consumption was divided into current alcoholconsumers versus participants who never consumed alcohol.
2.3. Statistical Analysis
To determine the significant differences between women and men, participants wereexamined using the chi-square test and Student’s t test for categorical and continuousvariables, respectively. The incidence density method was used to estimate the uric acidstatus and sex-specific incidence rates of renal progression and CKD. Multivariate Coxproportional hazards analysis was used to estimate the hazard ratio (HR) and 95% confi-dence interval (CI) of the risk of renal progression and CKD associated with sex. Covariatesincluded age, CKD, hypertension, diabetes mellitus, dyslipidemia, gout, stroke, BMI, serumcreatinine, cigarette smoking, and alcohol consumption.
To induce a similar distribution of covariates between women and men, we used theinverse probability of treatment weighting (IPTW) analysis method, where the weight wasthe inverse (i.e., reciprocal) of the propensity scores [48]. To assess the balance of baselinecovariates between women and men, we applied absolute standardized mean differences.In addition, the value of the absolute standardized mean difference was required to belower than 10% between the sexes, indicating negligible differences among the covariates.In addition, the value of the absolute standardized mean difference was less than 10%between sexes, indicating negligible differences among the potential confounders [49]. Therisks of renal progression and CKD among the groups of women and men were comparedusing Cox proportional hazards regression with IPTW. In order to compare the results ofpremenopausal and postmenopausal women, we further analyzed the sex differences inthe relationship between hyperuricemia and renal progression and the incidence of CKDamong patients before 50 years of age. Analyses were performed using SAS software (SASInstitute), version 9.4.
74
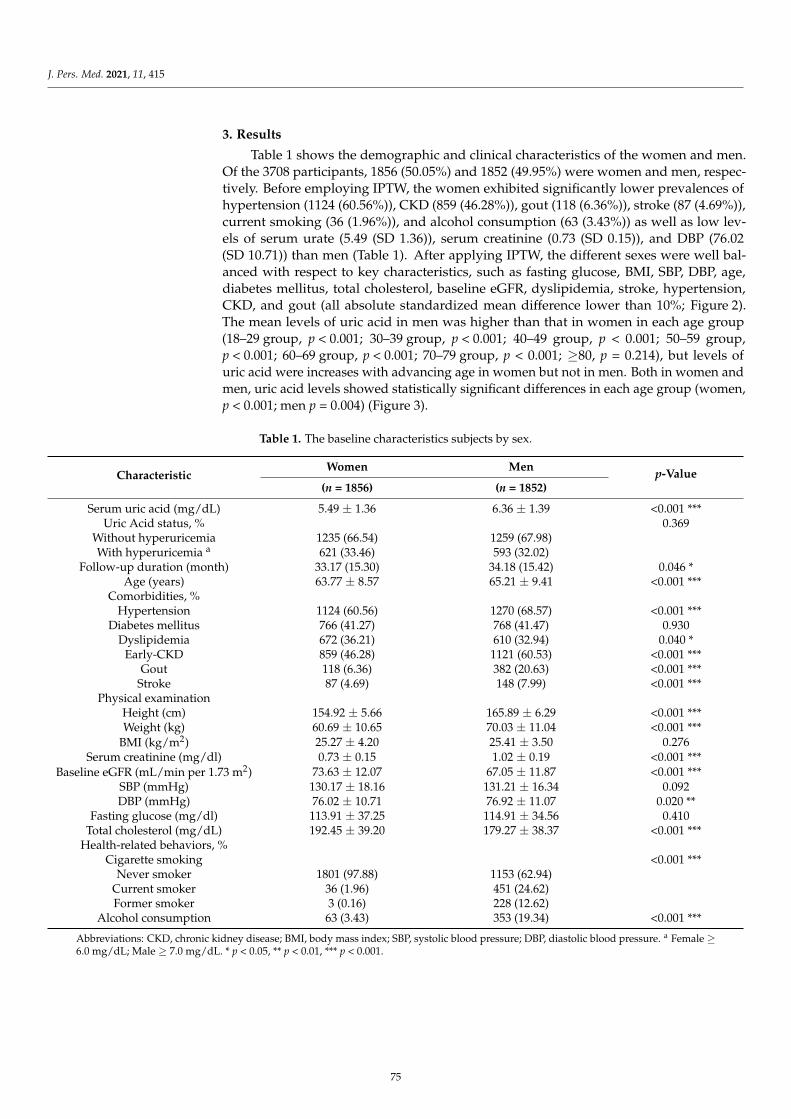
J. Pers. Med. 2021, 11, 415
3. Results
Table 1 shows the demographic and clinical characteristics of the women and men.Of the 3708 participants, 1856 (50.05%) and 1852 (49.95%) were women and men, respec-tively. Before employing IPTW, the women exhibited significantly lower prevalences ofhypertension (1124 (60.56%)), CKD (859 (46.28%)), gout (118 (6.36%)), stroke (87 (4.69%)),current smoking (36 (1.96%)), and alcohol consumption (63 (3.43%)) as well as low lev-els of serum urate (5.49 (SD 1.36)), serum creatinine (0.73 (SD 0.15)), and DBP (76.02(SD 10.71)) than men (Table 1). After applying IPTW, the different sexes were well bal-anced with respect to key characteristics, such as fasting glucose, BMI, SBP, DBP, age,diabetes mellitus, total cholesterol, baseline eGFR, dyslipidemia, stroke, hypertension,CKD, and gout (all absolute standardized mean difference lower than 10%; Figure 2).The mean levels of uric acid in men was higher than that in women in each age group(18–29 group, p < 0.001; 30–39 group, p < 0.001; 40–49 group, p < 0.001; 50–59 group,p < 0.001; 60–69 group, p < 0.001; 70–79 group, p < 0.001; ≥80, p = 0.214), but levels ofuric acid were increases with advancing age in women but not in men. Both in women andmen, uric acid levels showed statistically significant differences in each age group (women,p < 0.001; men p = 0.004) (Figure 3).
Table 1. The baseline characteristics subjects by sex.
CharacteristicWomen Men p-Value
(n = 1856) (n = 1852)
Serum uric acid (mg/dL) 5.49 ± 1.36 6.36 ± 1.39 <0.001 ***Uric Acid status, % 0.369
Without hyperuricemia 1235 (66.54) 1259 (67.98)With hyperuricemia a 621 (33.46) 593 (32.02)
Follow-up duration (month) 33.17 (15.30) 34.18 (15.42) 0.046 *Age (years) 63.77 ± 8.57 65.21 ± 9.41 <0.001 ***
Comorbidities, %Hypertension 1124 (60.56) 1270 (68.57) <0.001 ***
Diabetes mellitus 766 (41.27) 768 (41.47) 0.930Dyslipidemia 672 (36.21) 610 (32.94) 0.040 *
Early-CKD 859 (46.28) 1121 (60.53) <0.001 ***Gout 118 (6.36) 382 (20.63) <0.001 ***
Stroke 87 (4.69) 148 (7.99) <0.001 ***Physical examination
Height (cm) 154.92 ± 5.66 165.89 ± 6.29 <0.001 ***Weight (kg) 60.69 ± 10.65 70.03 ± 11.04 <0.001 ***
BMI (kg/m2) 25.27 ± 4.20 25.41 ± 3.50 0.276Serum creatinine (mg/dl) 0.73 ± 0.15 1.02 ± 0.19 <0.001 ***
Baseline eGFR (mL/min per 1.73 m2) 73.63 ± 12.07 67.05 ± 11.87 <0.001 ***SBP (mmHg) 130.17 ± 18.16 131.21 ± 16.34 0.092DBP (mmHg) 76.02 ± 10.71 76.92 ± 11.07 0.020 **
Fasting glucose (mg/dl) 113.91 ± 37.25 114.91 ± 34.56 0.410Total cholesterol (mg/dL) 192.45 ± 39.20 179.27 ± 38.37 <0.001 ***
Health-related behaviors, %Cigarette smoking <0.001 ***
Never smoker 1801 (97.88) 1153 (62.94)Current smoker 36 (1.96) 451 (24.62)Former smoker 3 (0.16) 228 (12.62)
Alcohol consumption 63 (3.43) 353 (19.34) <0.001 ***
Abbreviations: CKD, chronic kidney disease; BMI, body mass index; SBP, systolic blood pressure; DBP, diastolic blood pressure. a Female ≥6.0 mg/dL; Male ≥ 7.0 mg/dL. * p < 0.05, ** p < 0.01, *** p < 0.001.
75
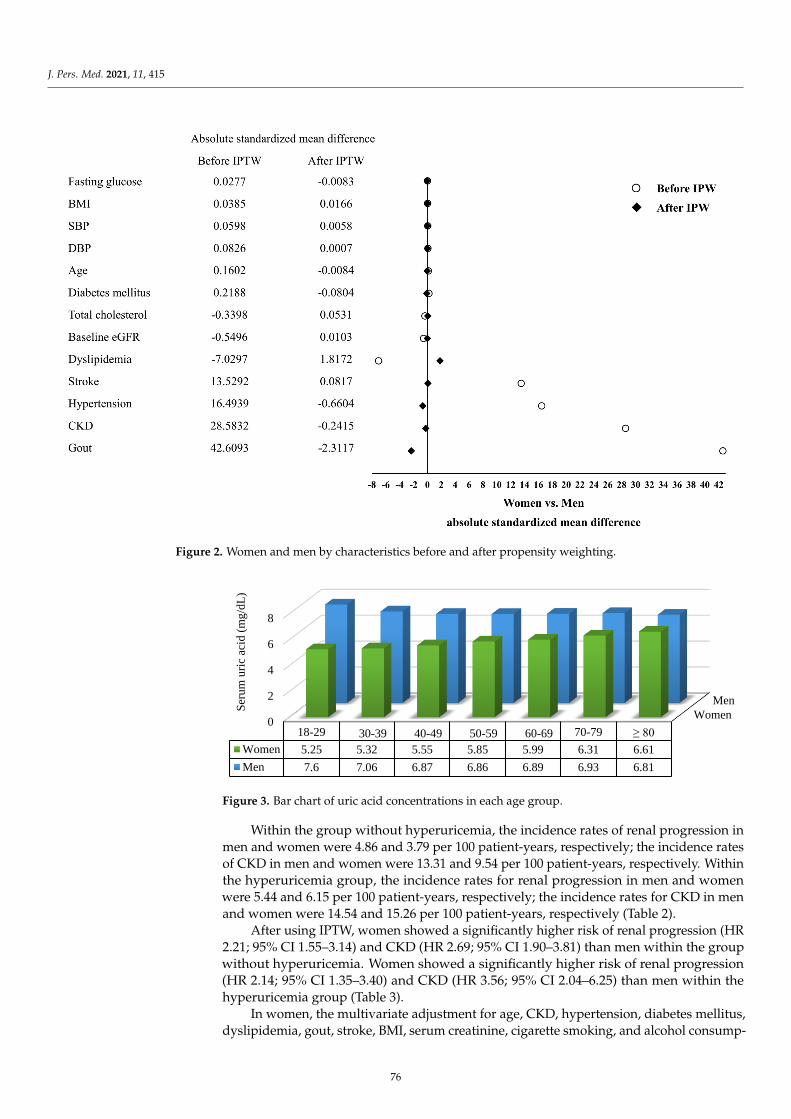
J. Pers. Med. 2021, 11, 415
J. Pers. Med. 2021, 11, 415 6 of 13
Alcohol consumption 63 (3.43) 353 (19.34) <0.001 ***
Abbreviations: CKD, chronic kidney disease; BMI, body mass index; SBP, systolic blood pressure; DBP, diastolic blood
pressure. a Female ≥ 6.0 mg/dL; Male ≥ 7.0 mg/dL. * p < 0.05, ** p < 0.01, *** p < 0.001.
Figure 2. Women and men by characteristics before and after propensity weighting.
Figure 3. Bar chart of uric acid concentrations in each age group.
Within the group without hyperuricemia, the incidence rates of renal progression in
men and women were 4.86 and 3.79 per 100 patient-years, respectively; the incidence rates
of CKD in men and women were 13.31 and 9.54 per 100 patient-years, respectively. Within
the hyperuricemia group, the incidence rates for renal progression in men and women
Women
Men
0
2
4
6
8
18-29 30-39 40-49 50-59 60-69 70-79 ≥ 80
Women 5.25 5.32 5.55 5.85 5.99 6.31 6.61
Men 7.6 7.06 6.87 6.86 6.89 6.93 6.81
Ser
um
uri
c ac
id (
mg
/dL
)
Figure 2. Women and men by characteristics before and after propensity weighting.
J. Pers. Med. 2021, 11, 415 6 of 13
Alcohol consumption 63 (3.43) 353 (19.34) <0.001 ***
Abbreviations: CKD, chronic kidney disease; BMI, body mass index; SBP, systolic blood pressure; DBP, diastolic blood
pressure. a Female ≥ 6.0 mg/dL; Male ≥ 7.0 mg/dL. * p < 0.05, ** p < 0.01, *** p < 0.001.
Figure 2. Women and men by characteristics before and after propensity weighting.
Figure 3. Bar chart of uric acid concentrations in each age group.
Within the group without hyperuricemia, the incidence rates of renal progression in
men and women were 4.86 and 3.79 per 100 patient-years, respectively; the incidence rates
of CKD in men and women were 13.31 and 9.54 per 100 patient-years, respectively. Within
the hyperuricemia group, the incidence rates for renal progression in men and women
Women
Men
0
2
4
6
8
18-29 30-39 40-49 50-59 60-69 70-79 ≥ 80
Women 5.25 5.32 5.55 5.85 5.99 6.31 6.61
Men 7.6 7.06 6.87 6.86 6.89 6.93 6.81
Ser
um
uri
c ac
id (
mg
/dL
)
Figure 3. Bar chart of uric acid concentrations in each age group.
Within the group without hyperuricemia, the incidence rates of renal progression inmen and women were 4.86 and 3.79 per 100 patient-years, respectively; the incidence ratesof CKD in men and women were 13.31 and 9.54 per 100 patient-years, respectively. Withinthe hyperuricemia group, the incidence rates for renal progression in men and womenwere 5.44 and 6.15 per 100 patient-years, respectively; the incidence rates for CKD in menand women were 14.54 and 15.26 per 100 patient-years, respectively (Table 2).
After using IPTW, women showed a significantly higher risk of renal progression (HR2.21; 95% CI 1.55–3.14) and CKD (HR 2.69; 95% CI 1.90–3.81) than men within the groupwithout hyperuricemia. Women showed a significantly higher risk of renal progression(HR 2.14; 95% CI 1.35–3.40) and CKD (HR 3.56; 95% CI 2.04–6.25) than men within thehyperuricemia group (Table 3).
In women, the multivariate adjustment for age, CKD, hypertension, diabetes mellitus,dyslipidemia, gout, stroke, BMI, serum creatinine, cigarette smoking, and alcohol consump-
76
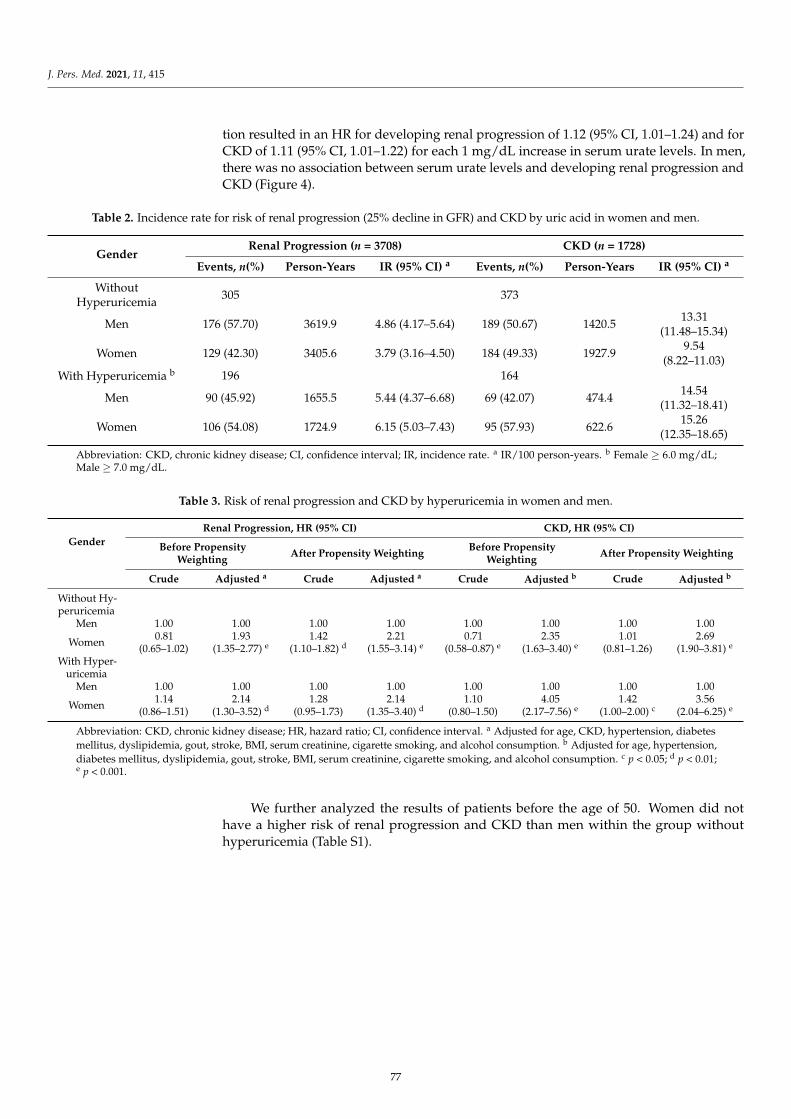
J. Pers. Med. 2021, 11, 415
tion resulted in an HR for developing renal progression of 1.12 (95% CI, 1.01–1.24) and forCKD of 1.11 (95% CI, 1.01–1.22) for each 1 mg/dL increase in serum urate levels. In men,there was no association between serum urate levels and developing renal progression andCKD (Figure 4).
Table 2. Incidence rate for risk of renal progression (25% decline in GFR) and CKD by uric acid in women and men.
GenderRenal Progression (n = 3708) CKD (n = 1728)
Events, n(%) Person-Years IR (95% CI) a Events, n(%) Person-Years IR (95% CI) a
WithoutHyperuricemia 305 373
Men 176 (57.70) 3619.9 4.86 (4.17–5.64) 189 (50.67) 1420.5 13.31(11.48–15.34)
Women 129 (42.30) 3405.6 3.79 (3.16–4.50) 184 (49.33) 1927.9 9.54(8.22–11.03)
With Hyperuricemia b 196 164
Men 90 (45.92) 1655.5 5.44 (4.37–6.68) 69 (42.07) 474.4 14.54(11.32–18.41)
Women 106 (54.08) 1724.9 6.15 (5.03–7.43) 95 (57.93) 622.6 15.26(12.35–18.65)
Abbreviation: CKD, chronic kidney disease; CI, confidence interval; IR, incidence rate. a IR/100 person-years. b Female ≥ 6.0 mg/dL;Male ≥ 7.0 mg/dL.
Table 3. Risk of renal progression and CKD by hyperuricemia in women and men.
GenderRenal Progression, HR (95% CI) CKD, HR (95% CI)
Before PropensityWeighting After Propensity Weighting Before Propensity
Weighting After Propensity Weighting
Crude Adjusted a Crude Adjusted a Crude Adjusted b Crude Adjusted b
Without Hy-peruricemia
Men 1.00 1.00 1.00 1.00 1.00 1.00 1.00 1.00
Women 0.81(0.65–1.02)
1.93(1.35–2.77) e
1.42(1.10–1.82) d
2.21(1.55–3.14) e
0.71(0.58–0.87) e
2.35(1.63–3.40) e
1.01(0.81–1.26)
2.69(1.90–3.81) e
With Hyper-uricemia
Men 1.00 1.00 1.00 1.00 1.00 1.00 1.00 1.00
Women 1.14(0.86–1.51)
2.14(1.30–3.52) d
1.28(0.95–1.73)
2.14(1.35–3.40) d
1.10(0.80–1.50)
4.05(2.17–7.56) e
1.42(1.00–2.00) c
3.56(2.04–6.25) e
Abbreviation: CKD, chronic kidney disease; HR, hazard ratio; CI, confidence interval. a Adjusted for age, CKD, hypertension, diabetesmellitus, dyslipidemia, gout, stroke, BMI, serum creatinine, cigarette smoking, and alcohol consumption. b Adjusted for age, hypertension,diabetes mellitus, dyslipidemia, gout, stroke, BMI, serum creatinine, cigarette smoking, and alcohol consumption. c p < 0.05; d p < 0.01;e p < 0.001.
We further analyzed the results of patients before the age of 50. Women did nothave a higher risk of renal progression and CKD than men within the group withouthyperuricemia (Table S1).
77
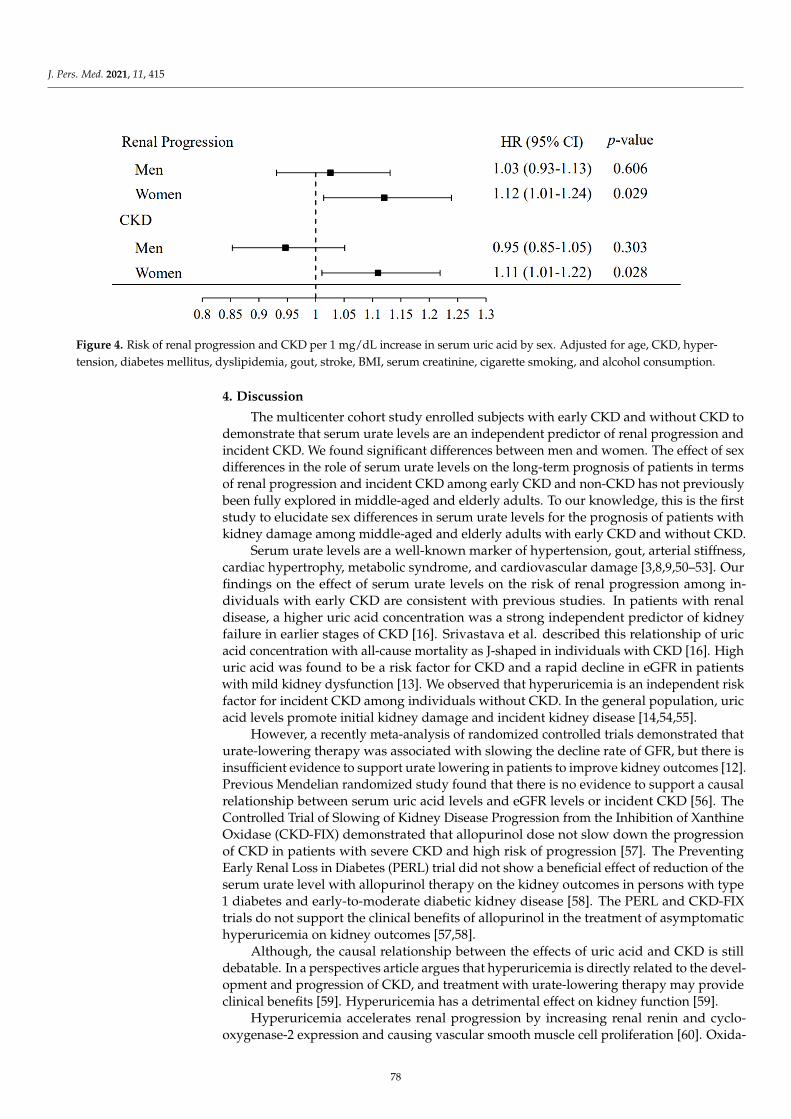
J. Pers. Med. 2021, 11, 415J. Pers. Med. 2021, 11, 415 8 of 13
Figure 4. Risk of renal progression and CKD per 1 mg/dL increase in serum uric acid by sex. Adjusted for age, CKD,
hypertension, diabetes mellitus, dyslipidemia, gout, stroke, BMI, serum creatinine, cigarette smoking, and alcohol con-
sumption.
4. Discussion
The multicenter cohort study enrolled subjects with early CKD and without CKD to
demonstrate that serum urate levels are an independent predictor of renal progression
and incident CKD. We found significant differences between men and women. The effect
of sex differences in the role of serum urate levels on the long-term prognosis of patients
in terms of renal progression and incident CKD among early CKD and non-CKD has not
previously been fully explored in middle-aged and elderly adults. To our knowledge, this
is the first study to elucidate sex differences in serum urate levels for the prognosis of
patients with kidney damage among middle-aged and elderly adults with early CKD and
without CKD.
Serum urate levels are a well-known marker of hypertension, gout, arterial stiffness,
cardiac hypertrophy, metabolic syndrome, and cardiovascular damage [3,8,9,50–53]. Our
findings on the effect of serum urate levels on the risk of renal progression among indi-
viduals with early CKD are consistent with previous studies. In patients with renal dis-
ease, a higher uric acid concentration was a strong independent predictor of kidney failure
in earlier stages of CKD [16]. Srivastava et al. described this relationship of uric acid con-
centration with all-cause mortality as J-shaped in individuals with CKD [16]. High uric
acid was found to be a risk factor for CKD and a rapid decline in eGFR in patients with
mild kidney dysfunction [13]. We observed that hyperuricemia is an independent risk
factor for incident CKD among individuals without CKD. In the general population, uric
acid levels promote initial kidney damage and incident kidney disease [14,54,55].
However, a recently meta-analysis of randomized controlled trials demonstrated that
urate-lowering therapy was associated with slowing the decline rate of GFR, but there is
insufficient evidence to support urate lowering in patients to improve kidney outcomes
[12]. Previous Mendelian randomized study found that there is no evidence to support a
causal relationship between serum uric acid levels and eGFR levels or incident CKD [56].
The Controlled Trial of Slowing of Kidney Disease Progression from the Inhibition of Xan-
thine Oxidase (CKD-FIX) demonstrated that allopurinol dose not slow down the progres-
sion of CKD in patients with severe CKD and high risk of progression [57]. The Preventing
Early Renal Loss in Diabetes (PERL) trial did not show a beneficial effect of reduction of
the serum urate level with allopurinol therapy on the kidney outcomes in persons with
type 1 diabetes and early-to-moderate diabetic kidney disease [58]. The PERL and CKD-
FIX trials do not support the clinical benefits of allopurinol in the treatment of asympto-
matic hyperuricemia on kidney outcomes [57,58].
Although, the causal relationship between the effects of uric acid and CKD is still
debatable. In a perspectives article argues that hyperuricemia is directly related to the
development and progression of CKD, and treatment with urate-lowering therapy may
Figure 4. Risk of renal progression and CKD per 1 mg/dL increase in serum uric acid by sex. Adjusted for age, CKD, hyper-tension, diabetes mellitus, dyslipidemia, gout, stroke, BMI, serum creatinine, cigarette smoking, and alcohol consumption.
4. Discussion
The multicenter cohort study enrolled subjects with early CKD and without CKD todemonstrate that serum urate levels are an independent predictor of renal progression andincident CKD. We found significant differences between men and women. The effect of sexdifferences in the role of serum urate levels on the long-term prognosis of patients in termsof renal progression and incident CKD among early CKD and non-CKD has not previouslybeen fully explored in middle-aged and elderly adults. To our knowledge, this is the firststudy to elucidate sex differences in serum urate levels for the prognosis of patients withkidney damage among middle-aged and elderly adults with early CKD and without CKD.
Serum urate levels are a well-known marker of hypertension, gout, arterial stiffness,cardiac hypertrophy, metabolic syndrome, and cardiovascular damage [3,8,9,50–53]. Ourfindings on the effect of serum urate levels on the risk of renal progression among in-dividuals with early CKD are consistent with previous studies. In patients with renaldisease, a higher uric acid concentration was a strong independent predictor of kidneyfailure in earlier stages of CKD [16]. Srivastava et al. described this relationship of uricacid concentration with all-cause mortality as J-shaped in individuals with CKD [16]. Highuric acid was found to be a risk factor for CKD and a rapid decline in eGFR in patientswith mild kidney dysfunction [13]. We observed that hyperuricemia is an independent riskfactor for incident CKD among individuals without CKD. In the general population, uricacid levels promote initial kidney damage and incident kidney disease [14,54,55].
However, a recently meta-analysis of randomized controlled trials demonstrated thaturate-lowering therapy was associated with slowing the decline rate of GFR, but there isinsufficient evidence to support urate lowering in patients to improve kidney outcomes [12].Previous Mendelian randomized study found that there is no evidence to support a causalrelationship between serum uric acid levels and eGFR levels or incident CKD [56]. TheControlled Trial of Slowing of Kidney Disease Progression from the Inhibition of XanthineOxidase (CKD-FIX) demonstrated that allopurinol dose not slow down the progressionof CKD in patients with severe CKD and high risk of progression [57]. The PreventingEarly Renal Loss in Diabetes (PERL) trial did not show a beneficial effect of reduction of theserum urate level with allopurinol therapy on the kidney outcomes in persons with type1 diabetes and early-to-moderate diabetic kidney disease [58]. The PERL and CKD-FIXtrials do not support the clinical benefits of allopurinol in the treatment of asymptomatichyperuricemia on kidney outcomes [57,58].
Although, the causal relationship between the effects of uric acid and CKD is stilldebatable. In a perspectives article argues that hyperuricemia is directly related to the devel-opment and progression of CKD, and treatment with urate-lowering therapy may provideclinical benefits [59]. Hyperuricemia has a detrimental effect on kidney function [59].
Hyperuricemia accelerates renal progression by increasing renal renin and cyclo-oxygenase-2 expression and causing vascular smooth muscle cell proliferation [60]. Oxida-
78
J. Pers. Med. 2021, 11, 415
tive stress plays an important pathophysiological role in renal progression [22]. Further-more, impaired kidney clearance is responsible for increased uric acid concentrations [16].
There are sex differences in hypertension and cardiovascular events in patients withhigh serum urate levels, and the rates in female patients are significantly higher than thosein males [9,61]. The present study demonstrated that sex differences in the associationbetween uric acid level and renal progression and incident CKD were stronger in womenthan in men. A previous study in Okinawa, Japan also found a significant associationbetween uric acid and renal failure requiring renal replacement in women, but no significantassociation was observed in men [35].
It is well known that men have higher uric acid levels than women. Our findings alsoshowed that men had higher levels of uric acid than women in each age group; however,we found that uric acid levels increased with advancing age in women but not in men.Women before the age of 50 did not have a higher risk of renal progression and CKD thanmen. Uric acid levels increase with age, and after menopause, the levels roughly equalthe levels in men in later years [62]. A previous study in Japan showed that women uricacid levels increased until the age of 70 years or older as a result of changes in hormonesaccompanying menopause [63]. This finding provides a potential explanation for whywomen have a higher risk of kidney damage than men.
Young women have higher levels of estrogen, which can promote renal uric acidexcretion and reduce uric acid levels [26,64]. The Third National Health and NutritionExamination Survey reported that postmenopausal women receiving hormone replacementtherapy may have reduced uric acid levels [25]. Further investigations are encouraged toinvestigate the mechanism by which hyperuricemic women have a higher risk of reducedrenal function than men among elderly populations.
Our findings indicate that young men aged 18–29 and 30–39 have higher serum uratelevels and decrease with age, while the opposite is the case in women. If young peopleaged 18–40 have normal kidney function and they develop hyperuricemia, the most likelyclinical indication is genetic variants in urate transporters, such as SLC2A9 [65], rather thanunderlying chronic kidney disease. Additionally, there is extensive evidence that variantsin ABCG2 cause hyperuricemia in young people [66–68]. Thus, predicting whether thesepatients develop CKD or whether hyperuricemia contributes to CKD progression laterin life is impossible due to genetic components and environmental factors as previouslydescribed in a study in Taiwan [69]. Therefore, in this study, the sex-specific relationshipbetween hyperuricemia and renal progression was studied, with a focus on patients over50 years of age.
In addition, we found that younger women with hyperuricemia have a higher riskof kidney deterioration than men with hyperuricemia. A study of a military cohort ofyoung individuals also found that the association between hyperuricemia and raised bloodpressure was stronger in women than in men [70]. One possible explanation for the sexdifference is that women with hyperuricemia may have higher levels of xanthine oxidaseactivity and reactive oxygen species productions than men, leading to more severe renalvascular inflammation in women than in men [71,72].
This study has several advantages. First, we had a large cohort that recruited patientsfrom multiple centers throughout Taiwan. Second, we provided sex-specific data showinga difference in the relationship between hyperuricemia and renal progression. Third, thisstudy used well-trained interviewers to collect data on demographic characteristics andhealth-related behaviors face to face. Finally, in order to reduce the effects of confoundingin observational study, we used the IPTW analysis method to induce similar covariatedistribution between women and men.
However, our study has some limitations. First, this research may have potentialselection bias because our patients were voluntarily recruited. Second, certain test resultsmay be underestimated due to the use of structured questionnaires to collect clinicaldisease data. Third, this study does not contain information on potential factors, includingmenopausal age and hormone replacement therapy. Fourth, this study uses structured
79
J. Pers. Med. 2021, 11, 415
questionnaires to collect alcohol consumption data, but does not include daily alcoholconsumption. Therefore, it is difficult to accurately analyze the possible relationshipbetween alcohol consumption with hyperuricemia and renal decline. Therefore, thesefactors should be considered in future research.
5. Conclusions
Given the prevalence and impact of kidney disease, factors that impede optimal renalfunction management in women and men must be identified to provide tailored treatmentrecommendations. Elevated serum urate levels are a strong risk factor for developingkidney disease. Therefore, our results suggest that individuals, especially postmenopausalwomen, with higher uric acid levels are at increased risk of developing renal progressionand incident CKD.
Supplementary Materials: The following are available online at https://www.mdpi.com/article/10.3390/jpm11050415/s1, Table S1: Risk of renal progression and CKD by hyperuricemia in youngerwomen and men (Less than 50 years old).
Author Contributions: Conceptualization, P.-Y.C.; methodology, P.-Y.C.; software, P.-Y.C.; validation,Y.-W.C. and Y.-F.L.; formal analysis, P.-Y.C.; investigation, P.-Y.C. and Y.-F.L.; writing—original draftpreparation, P.-Y.C. and Y.-W.C.; writing—review and editing, P.-Y.C.; supervision, Y.-F.L. and H.-C.F.;funding acquisition, Y.-F.L. and H.-C.F. All authors have read and agree to the published version ofthe manuscript.
Funding: This study was funded by a grant from the Health Promotion Administration, Ministry ofHealth and Welfare, Taiwan, Republic of China (DOH101-HP-1103, DOH102-HP-1103, MOHW103-HPA-H-114-134101, MOHW104-HPA-H-114-134101); National Taipei University of Nursing andHealth Sciences (109ntunhs-NT-02).
Institutional Review Board Statement: This study was approved by the Ethics Committees of Tri-Service General Hospital (TSGHIRB 100-05-197), Taipei Medical University (TMU-JIRB 20124036),Kaohsiung Medical University Chung-Ho Memorial Hospital (KMUHIRB 20120019), National ChengKung University Hospital (A-ER-101-117), Changhua Christian Hospital (CCHIRB 120405), Kaoh-siung Chang Gung Memorial Hospital (101-1096B), Cardinal Tien Hospital (TMU-JIRB 201204035)and China Medical University Hospital (DMR101-IRB2-273(CR-1)). All research methods wereimplemented in accordance with guidelines approved by the Ethics Committees.
Informed Consent Statement: Informed consent was obtained from all subjects involved in the study.
Data Availability Statement: The data are not publicly available due to subject’s privacy.
Conflicts of Interest: The authors declare that there is no duality of interest associated withthis manuscript.
References1. Maiuolo, J.; Oppedisano, F.; Gratteri, S.; Muscoli, C.; Mollace, V. Regulation of uric acid metabolism and excretion. Int. J. Cardiol.
2016, 213, 8–14. [CrossRef] [PubMed]2. Lipkowitz, M.S. Regulation of uric acid excretion by the kidney. Curr. Rheumatol. Rep. 2012, 14, 179–188. [CrossRef] [PubMed]3. Shiozawa, A.; Szabo, S.M.; Bolzani, A.; Cheung, A.; Choi, H.K. Serum Uric Acid and the Risk of Incident and Recurrent Gout:
A Systematic Review. J. Rheumatol. 2017, 44, 388–396. [CrossRef]4. Dehghan, A.; van Hoek, M.; Sijbrands, E.J.G.; Hofman, A.; Witteman, J.C.M. High Serum Uric Acid as a Novel Risk Factor for
Type 2 Diabetes. Diabetes Care 2008, 31, 361–362. [CrossRef] [PubMed]5. Juraschek, S.P.; McAdams-Demarco, M.; Miller, E.R.; Gelber, A.C.; Maynard, J.W.; Pankow, J.S.; Young, H.; Coresh, J.; Selvin,
E. Temporal relationship between uric acid concentration and risk of diabetes in a community-based study population. Am. J.Epidemiol. 2014, 179, 684–691. [CrossRef]
6. Sundstrom, J.; Sullivan, L.; D’Agostino, R.B.; Levy, D.; Kannel, W.B.; Vasan, R.S. Relations of serum uric acid to longitudinalblood pressure tracking and hypertension incidence. Hypertension 2005, 45, 28–33. [CrossRef] [PubMed]
7. Kuwabara, M.; Hisatome, I.; Niwa, K.; Hara, S.; Roncal-Jimenez, C.A.; Bjornstad, P.; Nakagawa, T.; Andres-Hernando, A.; Sato, Y.;Jensen, T.; et al. Uric Acid Is a Strong Risk Marker for Developing Hypertension from Prehypertension: A 5-Year Japanese CohortStudy. Hypertension 2018, 71, 78–86. [CrossRef]
80
J. Pers. Med. 2021, 11, 415
8. Al-Daghri, N.M.; Al-Attas, O.S.; Wani, K.; Sabico, S.; Alokail, M.S. Serum Uric Acid to Creatinine Ratio and Risk of MetabolicSyndrome in Saudi Type 2 Diabetic Patients. Sci. Rep. 2017, 7, 12104. [CrossRef] [PubMed]
9. Fang, J.; Alderman, M.H. Serum uric acid and cardiovascular mortality the NHANES I epidemiologic follow-up study, 1971–1992.National Health and Nutrition Examination Survey. JAMA 2000, 283, 2404–2410. [CrossRef]
10. Feig, D.I.; Kang, D.H.; Johnson, R.J. Uric acid and cardiovascular risk. N. Engl. J. Med. 2008, 359, 1811–1821. [CrossRef]11. Rahimi-Sakak, F.; Maroofi, M.; Rahmani, J.; Bellissimo, N.; Hekmatdoost, A. Serum uric acid and risk of cardiovascular mortality:
A systematic review and dose-response meta-analysis of cohort studies of over a million participants. BMC Cardiovasc. Disord.2019, 19, 218. [CrossRef] [PubMed]
12. Chen, Q.; Wang, Z.; Zhou, J.; Chen, Z.; Li, Y.; Li, S.; Zhao, H.; Badve, S.V.; Lv, J. Effect of Urate-Lowering Therapy on Cardiovascularand Kidney Outcomes: A Systematic Review and Meta-Analysis. Clin. J. Am. Soc. Nephrol. 2020, 15, 1576–1586. [CrossRef][PubMed]
13. Toyama, T.; Furuichi, K.; Shimizu, M.; Hara, A.; Iwata, Y.; Sakai, N.; Perkovic, V.; Kobayashi, M.; Mano, T.; Kaneko, S.; et al.Relationship between Serum Uric Acid Levels and Chronic Kidney Disease in a Japanese Cohort with Normal or Mildly ReducedKidney Function. PLoS ONE 2015, 10, e0137449. [CrossRef] [PubMed]
14. Obermayr, R.P.; Temml, C.; Gutjahr, G.; Knechtelsdorfer, M.; Oberbauer, R.; Klauser-Braun, R. Elevated uric acid increases the riskfor kidney disease. J. Am. Soc. Nephrol. 2008, 19, 2407–2413. [CrossRef]
15. Ahola, A.J.; Sandholm, N.; Forsblom, C.; Harjutsalo, V.; Dahlström, E.; Groop, P.-H.; FinnDiane Study Group. The serum uricacid concentration is not causally linked to diabetic nephropathy in type 1 diabetes. Kidney Int. 2017, 91, 1178–1185. [CrossRef][PubMed]
16. Srivastava, A.; Kaze, A.D.; McMullan, C.J.; Isakova, T.; Waikar, S.S. Uric Acid and the Risks of Kidney Failure and Death inIndividuals With CKD. Am. J. Kidney Dis. Off. J. Natl. Kidney Found. 2018, 71, 362–370. [CrossRef]
17. Kanji, T.; Gandhi, M.; Clase, C.M.; Yang, R. Urate lowering therapy to improve renal outcomes in patients with chronic kidneydisease: Systematic review and meta-analysis. BMC Nephrol. 2015, 16, 58. [CrossRef]
18. Su, X.; Xu, B.; Yan, B.; Qiao, X.; Wang, L. Effects of uric acid-lowering therapy in patients with chronic kidney disease: A meta-analysis. PLoS ONE 2017, 12, e0187550. [CrossRef]
19. Khosla, U.M.; Zharikov, S.; Finch, J.L.; Nakagawa, T.; Roncal, C.; Mu, W.; Krotova, K.; Block, E.R.; Prabhakar, S.; Johnson, R.J.Hyperuricemia induces endothelial dysfunction. Kidney Int. 2005, 67, 1739–1742. [CrossRef] [PubMed]
20. Cai, W.; Duan, X.-M.; Liu, Y.; Yu, J.; Tang, Y.-L.; Liu, Z.-L.; Jiang, S.; Zhang, C.-P.; Liu, J.-Y.; Xu, J.-X. Uric Acid Induces EndothelialDysfunction by Activating the HMGB1/RAGE Signaling Pathway. BioMed Res. Int. 2017, 2017, 4391920. [CrossRef]
21. Zhou, Y.; Fang, L.; Jiang, L.; Wen, P.; Cao, H.; He, W.; Dai, C.; Yang, J. Uric acid induces renal inflammation via activating tubularNF-kappaB signaling pathway. PLoS ONE 2012, 7, e39738.
22. Yu, M.A.; Sanchez-Lozada, L.G.; Johnson, R.J.; Kang, D.H. Oxidative stress with an activation of the renin-angiotensin systemin human vascular endothelial cells as a novel mechanism of uric acid-induced endothelial dysfunction. J. Hypertens. 2010, 28,1234–1242. [CrossRef]
23. Barbieri, L.; Verdoia, M.; Schaffer, A.; Marino, P.; Suryapranata, H.; De Luca, G. Impact of sex on uric acid levels and itsrelationship with the extent of coronary artery disease: A single-centre study. Atherosclerosis 2015, 241, 241–248. [CrossRef][PubMed]
24. Singh, J.A. Racial and gender disparities among patients with gout. Curr. Rheumatol. Rep. 2013, 15, 307. [CrossRef] [PubMed]25. Hak, A.E.; Choi, H.K. Menopause, postmenopausal hormone use and serum uric acid levels in US women–the Third National
Health and Nutrition Examination Survey. Arthritis Res. Ther. 2008, 10, R116. [CrossRef] [PubMed]26. Yahyaoui, R.; Esteva, I.; Haro-Mora, J.J.; Almaraz, M.C.; Morcillo, S.; Rojo-Martinez, G.; Martinez, J.; Gomez-Zumaquero, J.M.;
Gonzalez, I.; Hernando, V.; et al. Effect of long-term administration of cross-sex hormone therapy on serum and urinary uric acidin transsexual persons. J. Clin. Endocrinol. Metab. 2008, 93, 2230–2233. [CrossRef]
27. Puig, J.G.; Michan, A.D.; Jimenez, M.L.; Perez de Ayala, C.; Mateos, F.A.; Capitan, C.F.; de Miguel, E.; Gijon, J.B. Female gout.Clinical spectrum and uric acid metabolism. Arch. Intern. Med. 1991, 151, 726–732. [CrossRef] [PubMed]
28. Yadav, D.; Lee, E.S.; Kim, H.M.; Choi, E.; Lee, E.Y.; Lim, J.S.; Ahn, S.V.; Koh, S.B.; Chung, C.H. Prospective study of serum uricacid levels and incident metabolic syndrome in a Korean rural cohort. Atherosclerosis 2015, 241, 271–277. [CrossRef] [PubMed]
29. Kivity, S.; Kopel, E.; Steinlauf, S.; Segev, S.; Sidi, Y.; Olchovsky, D. The association between serum uric acid and diabetes mellitusis stronger in women. J. Women Health 2013, 22, 782–789. [CrossRef] [PubMed]
30. Kuwabara, M.; Niwa, K.; Hisatome, I.; Nakagawa, T.; Roncal-Jimenez, C.A.; Andres-Hernando, A.; Bjornstad, P.; Jensen, T.;Sato, Y.; Milagres, T.; et al. Asymptomatic Hyperuricemia Without Comorbidities Predicts Cardiometabolic Diseases: Five-YearJapanese Cohort Study. Hypertension 2017, 69, 1036–1044. [CrossRef] [PubMed]
31. Wingrove, C.S.; Walton, C.; Stevenson, J.C. The effect of menopause on serum uric acid levels in non-obese healthy women.Metabolism Clin. Exp. 1998, 47, 435–438. [CrossRef]
32. Lan, M.; Liu, B.; He, Q. Evaluation of the association between hyperuricemia and coronary artery disease: A STROBE-compliantarticle. Medicine 2018, 97, e12926. [CrossRef] [PubMed]
33. Halperin Kuhns, V.L.; Woodward, O.M. Sex Differences in Urate Handling. Int. J. Mol. Sci. 2020, 21, 4269. [CrossRef] [PubMed]
81
J. Pers. Med. 2021, 11, 415
34. Mun, K.H.; Yu, G.I.; Choi, B.Y.; Kim, M.K.; Shin, M.H.; Shin, D.H. Effect of Uric Acid on the Development of Chronic KidneyDisease: The Korean Multi-Rural Communities Cohort Study. J. Prev. Med. Public Health Yebang Uihakhoe Chi 2018, 51, 248–256.[CrossRef] [PubMed]
35. Iseki, K.; Ikemiya, Y.; Inoue, T.; Iseki, C.; Kinjo, K.; Takishita, S. Significance of hyperuricemia as a risk factor for developing ESRDin a screened cohort. Am. J. Kidney Dis. Off. J. Natl. Kidney Found. 2004, 44, 642–650. [CrossRef]
36. Chang, P.Y.; Chien, L.N.; Lin, Y.F.; Wu, M.S.; Chiu, W.T.; Chiou, H.Y. Risk factors of gender for renal progression in patients withearly chronic kidney disease. Medicine 2016, 95, e4203. [CrossRef]
37. Okada, K.; Yanai, M.; Takeuchi, K.; Matsuyama, K.; Nitta, K.; Hayashi, K.; Takahashi, S. Sex differences in the prevalence,progression, and improvement of chronic kidney disease. Kidney Blood Press. Res. 2014, 39, 279–288. [CrossRef]
38. Fink, H.A.; Ishani, A.; Taylor, B.C.; Greer, N.L.; MacDonald, R.; Rossini, D.; Sadiq, S.; Lankireddy, S.; Kane, R.L.; Wilt, T.J. AHRQComparative Effectiveness Reviews Chronic Kidney Disease Stages 1-3: Screening, Monitoring, and Treatment. In Chronic KidneyDisease Stages 1–3: Screening, Monitoring, and Treatment; Agency for Healthcare Research and Quality: Rockville, MD, USA, 2012.
39. Honeycutt, A.A.; Segel, J.E.; Zhuo, X.; Hoerger, T.J.; Imai, K.; Williams, D. Medical costs of CKD in the Medicare population.J. Am. Soc. Nephrol. 2013, 24, 1478–1483. [CrossRef]
40. National Kidney Foundation. K/DOQI clinical practice guidelines for chronic kidney disease: Evaluation, classification, andstratification. Am. J. Kidney Dis. Off. J. Natl. Kidney Found. 2002, 39 (Suppl. 1), S1–S266.
41. Levey, A.S.; Stevens, L.A.; Schmid, C.H.; Zhang, Y.L.; Castro, A.F.; Feldman, H.I.; Kusek, J.W.; Eggers, P.; Van Lente, F.; Greene,T.; et al. A new equation to estimate glomerular filtration rate. Ann. Intern. Med. 2009, 150, 604–612. [CrossRef]
42. Levey, A.S.; Coresh, J. Chronic kidney disease. Lancet 2012, 379, 165–180. [CrossRef]43. Levin, A. Kidney Disease: Improving Global Outcomes (KDIGO) CKD Work Group. KDIGOKCW; KDIGO 2012 clinical practice
guideline for the evaluation and management of chronic kidney disease. Kidney Int. Suppl. 2013, 3, 1–150.44. Chang, H.Y.; Tung, C.W.; Lee, P.H.; Lei, C.C.; Hsu, Y.C.; Chang, H.H.; Yang, H.F.; Lu, L.C.; Jong, M.C.; Chen, C.Y.; et al.
Hyperuricemia as an independent risk factor of chronic kidney disease in middle-aged and elderly population. Am. J. Med. Sci.2010, 339, 509–515. [CrossRef] [PubMed]
45. Ali, N.; Perveen, R.; Rahman, S.; Mahmood, S.; Rahman, S.; Islam, S.; Haque, T.; Sumon, A.H.; Kathak, R.R.; Molla, N.H.; et al.Prevalence of hyperuricemia and the relationship between serum uric acid and obesity: A study on Bangladeshi adults. PLoSONE 2018, 13, e0206850. [CrossRef]
46. Vupputuri, S.; Sandler, D.P. Lifestyle risk factors and chronic kidney disease. Ann. Epidemiol. 2003, 13, 712–720. [CrossRef]47. Henley, S.J.; Asman, K.; Momin, B.; Gallaway, M.S.; Culp, M.B.; Ragan, K.R.; Richards, T.B.; Babb, S. Smoking cessation behaviors
among older, U.S. adults. Prev. Med. Rep. 2019, 16, 100978. [CrossRef] [PubMed]48. Austin, P.C.; Stuart, E.A. Moving towards best practice when using inverse probability of treatment weighting (IPTW) using the
propensity score to estimate causal treatment effects in observational studies. Stat. Med. 2015, 34, 3661–3679. [CrossRef]49. Austin, P.C. The use of propensity score methods with survival or time-to-event outcomes: Reporting measures of effect similar
to those used in randomized experiments. Stat. Med. 2014, 33, 1242–1258. [CrossRef] [PubMed]50. Viazzi, F.; Parodi, D.; Leoncini, G.; Parodi, A.; Falqui, V.; Ratto, E.; Vettoretti, S.; Bezante, G.P.; Del Sette, M.; Deferrari, G.; et al.
Serum uric acid and target organ damage in primary hypertension. Hypertension 2005, 45, 991–996. [CrossRef]51. Canepa, M.; Viazzi, F.; Strait, J.B.; Ameri, P.; Pontremoli, R.; Brunelli, C.; Studenski, S.; Ferrucci, L.; Lakatta, E.G.; AlGhatrif, M.
Longitudinal Association Between Serum Uric Acid and Arterial Stiffness: Results From the Baltimore Longitudinal Study ofAging. Hypertension 2017, 69, 228–235. [CrossRef]
52. Yoshitomi, R.; Fukui, A.; Nakayama, M.; Ura, Y.; Ikeda, H.; Oniki, H.; Tsuchihashi, T.; Tsuruya, K.; Kitazono, T. Sex differences inthe association between serum uric acid levels and cardiac hypertrophy in patients with chronic kidney disease. Hypertens. Res.Off. J. Jpn. Soc. Hypertens. 2014, 37, 246–252. [CrossRef]
53. Dalbeth, N.; Merriman, T.R.; Stamp, L.K. Gout. Lancet 2016, 388, 2039–2052. [CrossRef]54. Heinig, M.; Johnson, R.J. Role of uric acid in hypertension, renal disease, and metabolic syndrome. Clevel. Clin. J. Med. 2006, 73,
1059–1064. [CrossRef] [PubMed]55. Weiner, D.E.; Tighiouart, H.; Elsayed, E.F.; Griffith, J.L.; Salem, D.N.; Levey, A.S. Uric acid and incident kidney disease in the
community. J. Am. Soc. Nephrol. 2008, 19, 1204–1211. [CrossRef]56. Jordan, D.M.; Choi, H.K.; Verbanck, M.; Topless, R.; Won, H.H.; Nadkarni, G.; Merriman, T.R.; Do, R. No causal effects of serum
urate levels on the risk of chronic kidney disease: A Mendelian randomization study. PLoS Med. 2019, 16, e1002725. [CrossRef][PubMed]
57. Badve, S.V.; Pascoe, E.M.; Tiku, A.; Boudville, N.; Brown, F.G.; Cass, A.; Clarke, P.; Dalbeth, N.; Day, R.O.; de Zoysa, J.R.; et al.Effects of Allopurinol on the Progression of Chronic Kidney Disease. N. Engl. J. Med. 2020, 382, 2504–2513. [CrossRef] [PubMed]
58. Doria, A.; Galecki, A.T.; Spino, C.; Pop-Busui, R.; Cherney, D.Z.; Lingvay, I.; Parsa, A.; Rossing, P.; Sigal, R.J.; Afkarian, M.; et al.Serum Urate Lowering with Allopurinol and Kidney Function in Type 1 Diabetes. N. Engl. J. Med. 2020, 382, 2493–2503. [CrossRef]
59. Sato, Y.; Feig, D.I.; Stack, A.G.; Kang, D.H.; Lanaspa, M.A.; Ejaz, A.A.; Sánchez-Lozada, L.G.; Kuwabara, M.; Borghi, C.; Johnson,R.J. The case for uric acid-lowering treatment in patients with hyperuricaemia and CKD. Nat. Rev. Nephrol. 2019, 15, 767–775.[CrossRef]
82
J. Pers. Med. 2021, 11, 415
60. Johnson, R.J.; Segal, M.S.; Srinivas, T.; Ejaz, A.; Mu, W.; Roncal, C.; Sanchez-Lozada, L.G.; Gersch, M.; Rodriguez-Iturbe, B.; Kang,D.H.; et al. Essential hypertension, progressive renal disease, and uric acid: A pathogenetic link? J. Am. Soc. Nephrol. 2005, 16,1909–1919. [CrossRef]
61. Zhang, W.; Sun, K.; Yang, Y.; Zhang, H.; Hu, F.B.; Hui, R. Plasma uric acid and hypertension in a Chinese community: Prospectivestudy and metaanalysis. Clin. Chem. 2009, 55, 2026–2034. [CrossRef]
62. Gaffo, A.L.; Saag, K.G. Serum urate, menopause, and postmenopausal hormone use: From eminence to evidence-based medicine.Arthritis Res. Ther. 2008, 10, 120. [CrossRef] [PubMed]
63. Akizuki, S. Serum uric acid levels among thirty-four thousand people in Japan. Ann. Rheum. Dis. 1982, 41, 272–274. [CrossRef]64. Mumford, S.L.; Dasharathy, S.S.; Pollack, A.Z.; Perkins, N.J.; Mattison, D.R.; Cole, S.R.; Wactawski-Wende, J.; Schisterman, E.F.
Serum uric acid in relation to endogenous reproductive hormones during the menstrual cycle: Findings from the BioCycle study.Hum. Reprod. 2013, 28, 1853–1862. [CrossRef] [PubMed]
65. Hollis-Moffatt, J.E.; Xu, X.; Dalbeth, N.; Merriman, M.E.; Topless, R.; Waddell, C.; Gow, P.J.; Harrison, A.A.; Highton, J.; Jones,P.B.; et al. Role of the urate transporter SLC2A9 gene in susceptibility to gout in New Zealand Maori, Pacific Island, and Caucasiancase-control sample sets. Arthritis Rheum. 2009, 60, 3485–3492. [CrossRef]
66. Ichida, K.; Matsuo, H.; Takada, T.; Nakayama, A.; Murakami, K.; Shimizu, T.; Yamanashi, Y.; Kasuga, H.; Nakashima, H.;Nakamura, T.; et al. Decreased extra-renal urate excretion is a common cause of hyperuricemia. Nat. Commun. 2012, 3, 764.[CrossRef] [PubMed]
67. Matsuo, H.; Nakayama, A.; Sakiyama, M.; Chiba, T.; Shimizu, S.; Kawamura, Y.; Nakashima, H.; Nakamura, T.; Takada, Y.;Oikawa, Y.; et al. ABCG2 dysfunction causes hyperuricemia due to both renal urate underexcretion and renal urate overload. Sci.Rep. 2014, 4, 3755. [CrossRef] [PubMed]
68. Tin, A.; Marten, J.; Halperin Kuhns, V.L.; Li, Y.; Wuttke, M.; Kirsten, H.; Sieber, K.B.; Qiu, C.; Gorski, M.; Yu, Z.; et al. Target genes,variants, tissues and transcriptional pathways influencing human serum urate levels. Nat. Genet. 2019, 51, 1459–1474. [PubMed]
69. Chang, H.Y.; Pan, W.H.; Yeh, W.T.; Tsai, K.S. Hyperuricemia and gout in Taiwan: Results from the Nutritional and Health Surveyin Taiwan (1993–1996). J. Rheumatol. 2001, 28, 1640–1646.
70. Lin, Y.K.; Lin, Y.P.; Lee, J.T.; Lin, C.S.; Wu, T.J.; Tsai, K.Z.; Su, F.Y.; Kwon, Y.; Hoshide, S.; Lin, G.M. Sex-specific association ofhyperuricemia with cardiometabolic abnormalities in a military cohort: The CHIEF study. Medicine 2020, 99, e19535. [CrossRef]
71. Kang, D.H.; Park, S.K.; Lee, I.K.; Johnson, R.J. Uric acid-induced C-reactive protein expression: Implication on cell proliferationand nitric oxide production of human vascular cells. J. Am. Soc. Nephrol. 2005, 16, 3553–3562. [CrossRef] [PubMed]
72. Bove, M.; Cicero, A.F.; Veronesi, M.; Borghi, C. An evidence-based review on urate-lowering treatments: Implications for optimaltreatment of chronic hyperuricemia. Vasc. Health Risk Manag. 2017, 13, 23–28. [CrossRef]
83

Journal of
Personalized
Medicine
Article
Poor Prognosis of Diffuse Large B-Cell Lymphoma withHepatitis C Infection
Yu-Fen Tsai 1,2, Yi-Chang Liu 3,4, Ching-I Yang 3,5, Tzer-Ming Chuang 3 , Ya-Lun Ke 3, Tsung-Jang Yeh 3 ,Yuh-Ching Gau 3, Jeng-Shiun Du 3 , Hui-Ching Wang 3,4 , Shih-Feng Cho 3,4, Chin-Mu Hsu 3 , Pey-Fang Wu 6,Ching-I Huang 4,6, Chung-Feng Huang 4,6, Ming-Lung Yu 4,6 , Chia-Yen Dai 4,6 and Hui-Hua Hsiao 3,4,7,8,*
Citation: Tsai, Y.-F.; Liu, Y.-C.; Yang,
C.-I.; Chuang, T.-M.; Ke, Y.-L.; Yeh,
T.-J.; Gau, Y.-C.; Du, J.-S.; Wang, H.-C.;
Cho, S.-F.; et al. Poor Prognosis of
Diffuse Large B-Cell Lymphoma with
Hepatitis C Infection. J. Pers. Med.
2021, 11, 844. https://doi.org/
10.3390/jpm11090844
Academic Editor: Stephen Opat
Received: 9 July 2021
Accepted: 25 August 2021
Published: 27 August 2021
Publisher’s Note: MDPI stays neutral
with regard to jurisdictional claims in
published maps and institutional affil-
iations.
Copyright: © 2021 by the authors.
Licensee MDPI, Basel, Switzerland.
This article is an open access article
distributed under the terms and
conditions of the Creative Commons
Attribution (CC BY) license (https://
creativecommons.org/licenses/by/
4.0/).
1 Department of Hematology & Oncology, E-Da Cancer Hospital, Kaohsiung 824, Taiwan;[email protected]
2 School of Chinese Medicine for Post Baccalaureate, College of Medicine, I-Shou University,Kaohsiung 824, Taiwan
3 Division of Hematology and Oncology, Department of Internal Medicine,Kaohsiung Medical University Hospital, Kaohsiung 807, Taiwan; [email protected] (Y.-C.L.);[email protected] (C.-I.Y.); [email protected] (T.-M.C.); [email protected] (Y.-L.K.);[email protected] (T.-J.Y.); [email protected] (Y.-C.G.); [email protected] (J.-S.D.);[email protected] (H.-C.W.); [email protected] (S.-F.C.); [email protected] (C.-M.H.)
4 Faculty of Medicine, Kaohsiung Medical University, Kaohsiung 807, Taiwan; [email protected] (C.-I.H.);[email protected] (C.-F.H.); [email protected] (M.-L.Y.); [email protected] (C.-Y.D.)
5 Specialist Nurse and Surgical Nurse Practitioner Office, Kaohsiung Medical University Hospital,Kaohsiung Medical University, Kaohsiung 807, Taiwan
6 Division of Hepatobiliary Ward, Department of Internal Medicine, Kaohsiung Medical University Hospital,Kaohsiung 807, Taiwan; [email protected]
7 Center for Liquid Biopsy, Kaohsiung Medical University, Kaohsiung 807, Taiwan8 Cancer Center, Kaohsiung Medical University Hospital, Kaohsiung Medical University,
Kaohsiung 807, Taiwan* Correspondence: [email protected]; Tel.: +886-7-3121101 (ext. 6110)
Abstract: Background: Hepatitis C virus (HCV) in diffuse large B-cell lymphoma (DLBCL) is asso-ciated with a higher prevalence and distinctive clinical characteristics and outcomes. Methods: Aretrospective analysis of adult DLBCL patients from 2011 to 2015 was studied. Results: A total of206 adult DLBCL were enrolled with 22 (10.7%) HCV-positive patients. Compared to HCV-negativepatients, the HCV-positive group had a poor performance status (p = 0.011), lower platelet count(p = 0.029), and higher spleen and liver involvement incidences (liver involvement, p = 0.027, spleeninvolvement, p = 0.026), and they received fewer cycles of chemotherapy significantly due to mor-bidity and mortality (p = 0.048). Overall survival was shorter in HCV-positive DLBCL (25.3 monthsin HCV-positive vs. not reached (NR), p = 0.049). With multivariate analysis, poor performancestatus (p < 0.001), advanced stage (p < 0.001), less chemotherapy cycles (p < 0.001), and the presenceof liver toxicity (p = 0.001) contributed to poor OS in DLBCL. Among HCV-positive DLBCL, theseverity of liver fibrosis was the main risk factor related to death. Conclusion: Inferior survival ofHCV-positive DLBCL was observed and associated with poor performance status, higher numbers ofcomplications, and intolerance of treatment, leading to fewer therapy. Therefore, anti-HCV therapy,such as direct-acting antiviral agents, might benefit these patients in the future.
Keywords: hepatitis C virus; diffuse large B-cell lymphoma; survival; fibrosis; performance status;liver toxicity
1. Introduction
Hepatitis C virus (HCV) infection is one of the major causes of chronic liver diseasearound the world with a prevalence rate of around 3% [1]. In addition to hepatic func-tion, various extrahepatic manifestations, including vasculitis, glomerulonephrisis, and awide range of lymphoproliferative disorders, have been associated with HCV infections,
85
J. Pers. Med. 2021, 11, 844
resulting in further morbidities and mortalities [2,3]. HCV infection are also associatedwith B-cell non-Hodgkin lymphoma (NHL) with distinct clinical presentation and out-come, especially in diffuse large B-cell lymphoma (DLBCL) and marginal zone lymphoma(MZL) in recent epidemiological studies [4–9]. Due to the fact that direct anti-HCV ther-apy induces hematologic response in indolent NHL patients with HCV infection, HCVinfection has been linked to NHL, and front-line therapy of asymptomatic indolent NHLsis recommended [10,11]. DLBCL, the most common NHL, is an aggressive type of NHLwith specific genetic features and clinical presentations [12]. Although HCV-positive DLB-CLs display specific clinical features and outcomes, the optimal treatment and timing ofanti-HCV therapy in aggressive lymphoma is still uncertain [1,13–16]. Previous reportsshowed that HCV-positive patients with DLBCL exhibited worse overall survival (OS), andthe incidence of severe hepatic toxicity in HCV-positive patients was significantly higherthan that of HCV-negative patients [13,17]. However, all these studies only included smallnumbers of HCV-positive patients, and not all studies regarding HCV infection and DLBCLshowed consistent results.
In addition, the seroprevalence of anti-HCV antigen in Taiwan is around 1 to 5.4% inthe general population [18–20], and a retrospective study that investigated the associationof HCV and lymphoma in southern Taiwan by Chuang et al. displayed that the incidenceof HCV infection among lymphoma patients was significantly higher than that in healthycontrols (11.0% vs. 1.8%, p < 0.001) [21]. The differences of HCV infection in NHL patientsreflect geographic differences in HCV epidemiology [1,22,23]. The purpose of this studyis to analyze clinicopathological characteristics, tolerance to chemotherapy, and clinicaloutcomes of DLBCL patients between HCV-positive and HCV-negative groups in order todetermine the impact of HCV infection in this population.
2. Materials and Methods2.1. Study Population
In this retrospective observational study, newly diagnosed DLBCL patients who weremanaged at Kaohsiung Medical University Hospital between January 2011 and December2015 were enrolled. Clinical characteristics, including patients’ demographics, baselinelaboratory and biochemical data, hepatitis virus serology including hepatitis B virus (HBV)and HCV, and FIB (fibrosis)-4 index were collected and analyzed from medical records.Lymphoma was treated according to the treatment guideline in the hospital. The study wasapproved by the Institutional Review Board of Kaohsiung Medical University Hospital(KMUHIRB-E(I)-20210119).
2.2. Risk Groups and Outcomes
Patients were categorized as HCV-positive or HCV-negative groups based on thepresence or absence of anti-HCV antibody. Since the interferon-free direct-acting antiviralagent (DAA) regimens were added to the reimbursement list in Taiwan for HCV treatmentin 2017, patients were only followed until 2017 to eliminate the confounding factor of DAAtreatment. All HCV-positive patients in this study did not receive interferon-free DAA priorto or during chemotherapy. All DLBCL patients with HBsAg-positive received antiviralagents for HBV prophylaxis. Performance status was evaluated by Eastern CooperativeOncology Group (ECOG) scale [24]. The FIB-4 index was used to assess the severity ofliver fibrosis as it is considered to be a useful fibrosis scoring system in HCV. A cutoff of>3.25 had a positive predictive value of 65% and a specificity of 97% to predict advancedfibrosis [25,26]. In Taiwan, liver cirrhosis was diagnosed by the image, either sonographyor computed tomography or by FIB-4 index ≥ 6.5. The international prognostic index(IPI) score divided patients into four groups: low, low-intermediate, high-intermediate,and high for risk stratification [27], and the revised international prognostic index (R-IPI)classified patients into three groups: very good, good, and poor [28], which was calculatedand used for analysis. The treatment response was evaluated by computed tomography(CT) or positron emission tomography–computed tomography (PET-CT) every 3–6 months
86
J. Pers. Med. 2021, 11, 844
according to response criteria [29]. The first time of treatment response evaluation wasat the time after 3–4 courses of chemoimmunotherapy. The liver toxicity was calculatedby the common terminology criteria for adverse events (CTACE), version 4. Progression-free survival (PFS) was defined as the length of time from the date of diagnosis to thedate of progression or death. Overall survival (OS) was defined as the length of timefrom the date of diagnosis to the last date of follow-up or death. Liver function wasmonitored during every course of treatment during chemotherapy and around every3 months after chemotherapy.
2.3. Statistical Analysis
Patient characteristics between HCV-positive and HCV-negative groups were ana-lyzed using descriptive statistics and are presented as frequencies, percentages, and meanswith standard deviations. Student’s t-test or nonparametric statistics were utilized to testfor statistically significant differences in continuous variables, whereas the chi-square orFisher’s exact test was used for categorical variables. OS and PFS was estimated usingthe Kaplan–Meier method. Variables with a p-value of less than 0.05 in the univariateanalysis of overall survival were subsequently subjected to multivariate analysis using aCox regression model. A two-tailed p-value < 0.05 was considered statistically significant.
3. Results3.1. Baseline Characteristics
A total of 206 DLBCL patients were enrolled in the study. Among them, twenty-two (10.7%) were HCV-positive. The characteristics at the time of diagnosis are listed inTable 1. Compared to HCV-negative patients, HCV-positive patients seemed to have asignificantly lower platelet count (186.7 ± 68.8 × 10³/µL vs. 236.2 ± 102.9 × 10³/µL,p = 0.029) and a trend of older age (mean age 67.23 ± 17.13 vs. 61.24 ± 15.27, p = 0.088).HCV-negative patients had better performance status compared to HCV-positive patients(p = 0.011). Higher spleen and liver involvement rates were observed in HCV-positivepatients compared to HCV-negative (liver involvement: 18.2% in HCV-positive vs. 4.3%in HCV-negative, p = 0.027, spleen involvement: 31.8% in HCV-positive vs. 13.6% inHCV-negative, p = 0.026). More HCV-positive patients had elevated aminotransferasecompared to HCV-negative population, however, not to a statistical significant degree(31.8% vs. 16.3%, p = 0.073). There were no significant differences on sex, B symptoms, bonemarrow involvement, IPI score, R-IPI score, HBsAg status, white blood cell (WBC) count,hemoglobin, albumin, lactate dehydrogenase (LDH) levels, alanine aminotransferase (GPT)levels, Beta-2 macroglobulin levels, and the percentage of receiving treatment betweentwo groups.
3.2. Response to Therapy and Outcomes
Patients were managed by guidelines according to clinical status. Most (92.9%) ofthe HCV-negative patients and 86.4% of the HCV-positive patients received treatmentrespectively without statistical difference (p = 0.388) with most of them (74.3% in HCV-negative, 68.4% in HCV-positive) receiving an R-CHOP (rituximab, cyclophosphamide,daunorubicin, oncovin, and prednisolone) regimen. The details of the chemotherapyregimen were presented in Table 2, and there was no significant difference in treatmentregimen between the HCV-positive and HCV-negative population. The HCV-positivepopulation received fewer cycles of chemotherapy compared with HCV-negative patients(mean cycles of chemotherapy: 4.8 ± 3.5 in HCV-positive vs. 6.3 ± 3.4 in HCV-negative,p = 0.048) (Table 2). A lower evaluation of treatment response during the follow-up periodwas found in HCV-positive patients compared to the HCV-negative patient group (31.8% inHCV positive vs. 14.7% in HCV-negative, p = 0.041). Among these HCV-positive patientswho were unable to be evaluated, four of seven patients received limited treatment withthree of them receiving only one cycle of chemotherapy due to early mortality from sepsis
87
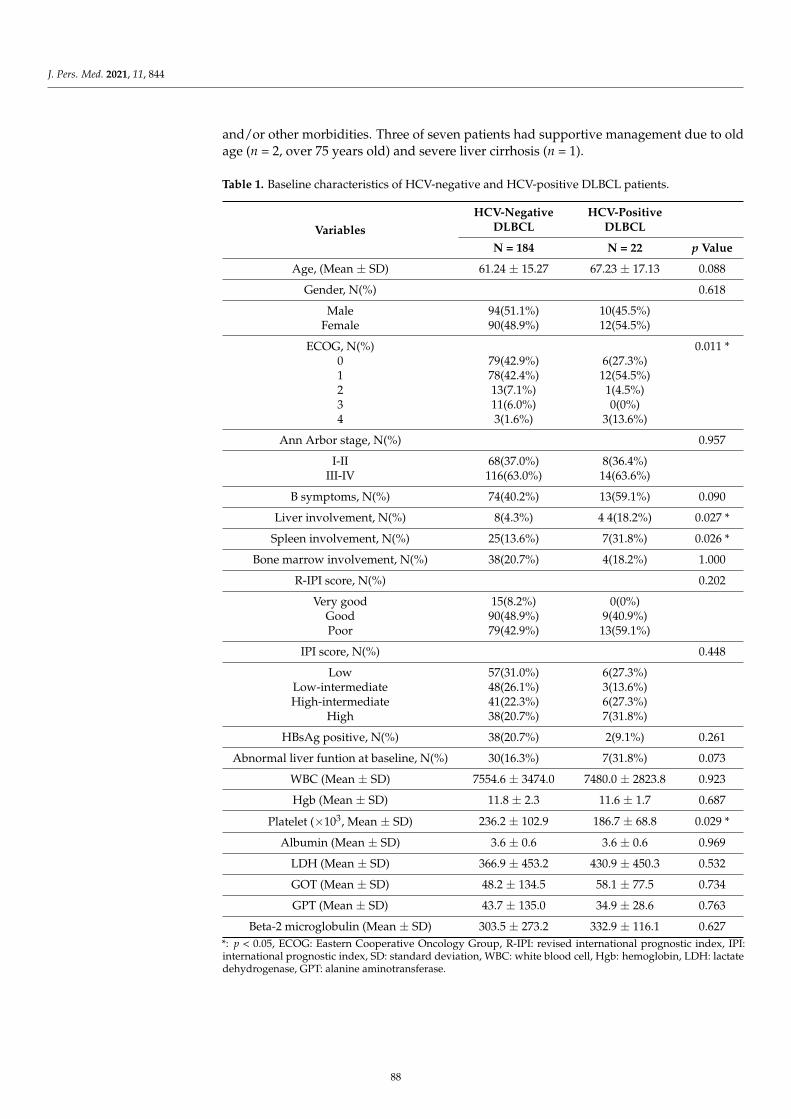
J. Pers. Med. 2021, 11, 844
and/or other morbidities. Three of seven patients had supportive management due to oldage (n = 2, over 75 years old) and severe liver cirrhosis (n = 1).
Table 1. Baseline characteristics of HCV-negative and HCV-positive DLBCL patients.
VariablesHCV-Negative
DLBCLHCV-Positive
DLBCL
N = 184 N = 22 p Value
Age, (Mean ± SD) 61.24 ± 15.27 67.23 ± 17.13 0.088
Gender, N(%) 0.618
Male 94(51.1%) 10(45.5%)Female 90(48.9%) 12(54.5%)
ECOG, N(%) 0.011 *0 79(42.9%) 6(27.3%)1 78(42.4%) 12(54.5%)2 13(7.1%) 1(4.5%)3 11(6.0%) 0(0%)4 3(1.6%) 3(13.6%)
Ann Arbor stage, N(%) 0.957
I-II 68(37.0%) 8(36.4%)III-IV 116(63.0%) 14(63.6%)
B symptoms, N(%) 74(40.2%) 13(59.1%) 0.090
Liver involvement, N(%) 8(4.3%) 4 4(18.2%) 0.027 *
Spleen involvement, N(%) 25(13.6%) 7(31.8%) 0.026 *
Bone marrow involvement, N(%) 38(20.7%) 4(18.2%) 1.000
R-IPI score, N(%) 0.202
Very good 15(8.2%) 0(0%)Good 90(48.9%) 9(40.9%)Poor 79(42.9%) 13(59.1%)
IPI score, N(%) 0.448
Low 57(31.0%) 6(27.3%)Low-intermediate 48(26.1%) 3(13.6%)High-intermediate 41(22.3%) 6(27.3%)
High 38(20.7%) 7(31.8%)
HBsAg positive, N(%) 38(20.7%) 2(9.1%) 0.261
Abnormal liver funtion at baseline, N(%) 30(16.3%) 7(31.8%) 0.073
WBC (Mean ± SD) 7554.6 ± 3474.0 7480.0 ± 2823.8 0.923
Hgb (Mean ± SD) 11.8 ± 2.3 11.6 ± 1.7 0.687
Platelet (×103, Mean ± SD) 236.2 ± 102.9 186.7 ± 68.8 0.029 *
Albumin (Mean ± SD) 3.6 ± 0.6 3.6 ± 0.6 0.969
LDH (Mean ± SD) 366.9 ± 453.2 430.9 ± 450.3 0.532
GOT (Mean ± SD) 48.2 ± 134.5 58.1 ± 77.5 0.734
GPT (Mean ± SD) 43.7 ± 135.0 34.9 ± 28.6 0.763
Beta-2 microglobulin (Mean ± SD) 303.5 ± 273.2 332.9 ± 116.1 0.627*: p < 0.05, ECOG: Eastern Cooperative Oncology Group, R-IPI: revised international prognostic index, IPI:international prognostic index, SD: standard deviation, WBC: white blood cell, Hgb: hemoglobin, LDH: lactatedehydrogenase, GPT: alanine aminotransferase.
88
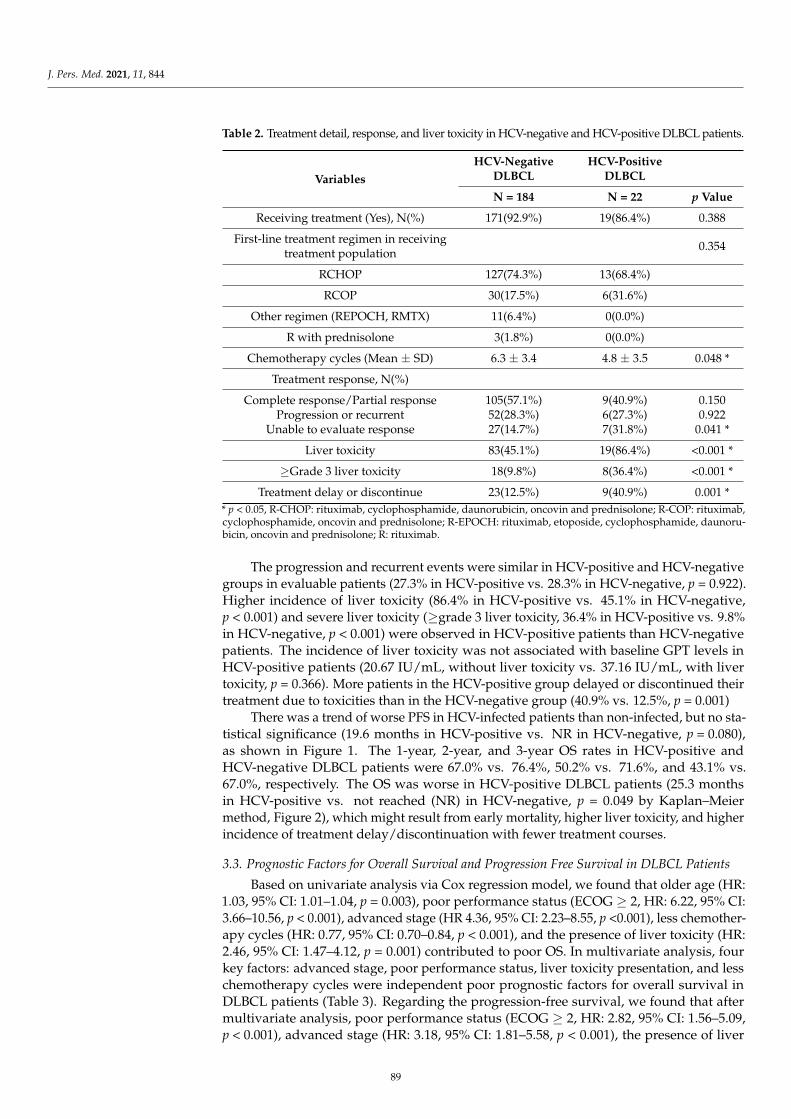
J. Pers. Med. 2021, 11, 844
Table 2. Treatment detail, response, and liver toxicity in HCV-negative and HCV-positive DLBCL patients.
VariablesHCV-Negative
DLBCLHCV-Positive
DLBCL
N = 184 N = 22 p Value
Receiving treatment (Yes), N(%) 171(92.9%) 19(86.4%) 0.388
First-line treatment regimen in receivingtreatment population 0.354
RCHOP 127(74.3%) 13(68.4%)
RCOP 30(17.5%) 6(31.6%)
Other regimen (REPOCH, RMTX) 11(6.4%) 0(0.0%)
R with prednisolone 3(1.8%) 0(0.0%)
Chemotherapy cycles (Mean ± SD) 6.3 ± 3.4 4.8 ± 3.5 0.048 *
Treatment response, N(%)
Complete response/Partial response 105(57.1%) 9(40.9%) 0.150Progression or recurrent 52(28.3%) 6(27.3%) 0.922
Unable to evaluate response 27(14.7%) 7(31.8%) 0.041 *
Liver toxicity 83(45.1%) 19(86.4%) <0.001 *
≥Grade 3 liver toxicity 18(9.8%) 8(36.4%) <0.001 *
Treatment delay or discontinue 23(12.5%) 9(40.9%) 0.001 ** p < 0.05, R-CHOP: rituximab, cyclophosphamide, daunorubicin, oncovin and prednisolone; R-COP: rituximab,cyclophosphamide, oncovin and prednisolone; R-EPOCH: rituximab, etoposide, cyclophosphamide, daunoru-bicin, oncovin and prednisolone; R: rituximab.
The progression and recurrent events were similar in HCV-positive and HCV-negativegroups in evaluable patients (27.3% in HCV-positive vs. 28.3% in HCV-negative, p = 0.922).Higher incidence of liver toxicity (86.4% in HCV-positive vs. 45.1% in HCV-negative,p < 0.001) and severe liver toxicity (≥grade 3 liver toxicity, 36.4% in HCV-positive vs. 9.8%in HCV-negative, p < 0.001) were observed in HCV-positive patients than HCV-negativepatients. The incidence of liver toxicity was not associated with baseline GPT levels inHCV-positive patients (20.67 IU/mL, without liver toxicity vs. 37.16 IU/mL, with livertoxicity, p = 0.366). More patients in the HCV-positive group delayed or discontinued theirtreatment due to toxicities than in the HCV-negative group (40.9% vs. 12.5%, p = 0.001)
There was a trend of worse PFS in HCV-infected patients than non-infected, but no sta-tistical significance (19.6 months in HCV-positive vs. NR in HCV-negative, p = 0.080),as shown in Figure 1. The 1-year, 2-year, and 3-year OS rates in HCV-positive andHCV-negative DLBCL patients were 67.0% vs. 76.4%, 50.2% vs. 71.6%, and 43.1% vs.67.0%, respectively. The OS was worse in HCV-positive DLBCL patients (25.3 monthsin HCV-positive vs. not reached (NR) in HCV-negative, p = 0.049 by Kaplan–Meiermethod, Figure 2), which might result from early mortality, higher liver toxicity, and higherincidence of treatment delay/discontinuation with fewer treatment courses.
3.3. Prognostic Factors for Overall Survival and Progression Free Survival in DLBCL Patients
Based on univariate analysis via Cox regression model, we found that older age (HR:1.03, 95% CI: 1.01–1.04, p = 0.003), poor performance status (ECOG ≥ 2, HR: 6.22, 95% CI:3.66–10.56, p < 0.001), advanced stage (HR 4.36, 95% CI: 2.23–8.55, p <0.001), less chemother-apy cycles (HR: 0.77, 95% CI: 0.70–0.84, p < 0.001), and the presence of liver toxicity (HR:2.46, 95% CI: 1.47–4.12, p = 0.001) contributed to poor OS. In multivariate analysis, fourkey factors: advanced stage, poor performance status, liver toxicity presentation, and lesschemotherapy cycles were independent poor prognostic factors for overall survival inDLBCL patients (Table 3). Regarding the progression-free survival, we found that aftermultivariate analysis, poor performance status (ECOG ≥ 2, HR: 2.82, 95% CI: 1.56–5.09,p < 0.001), advanced stage (HR: 3.18, 95% CI: 1.81–5.58, p < 0.001), the presence of liver
89
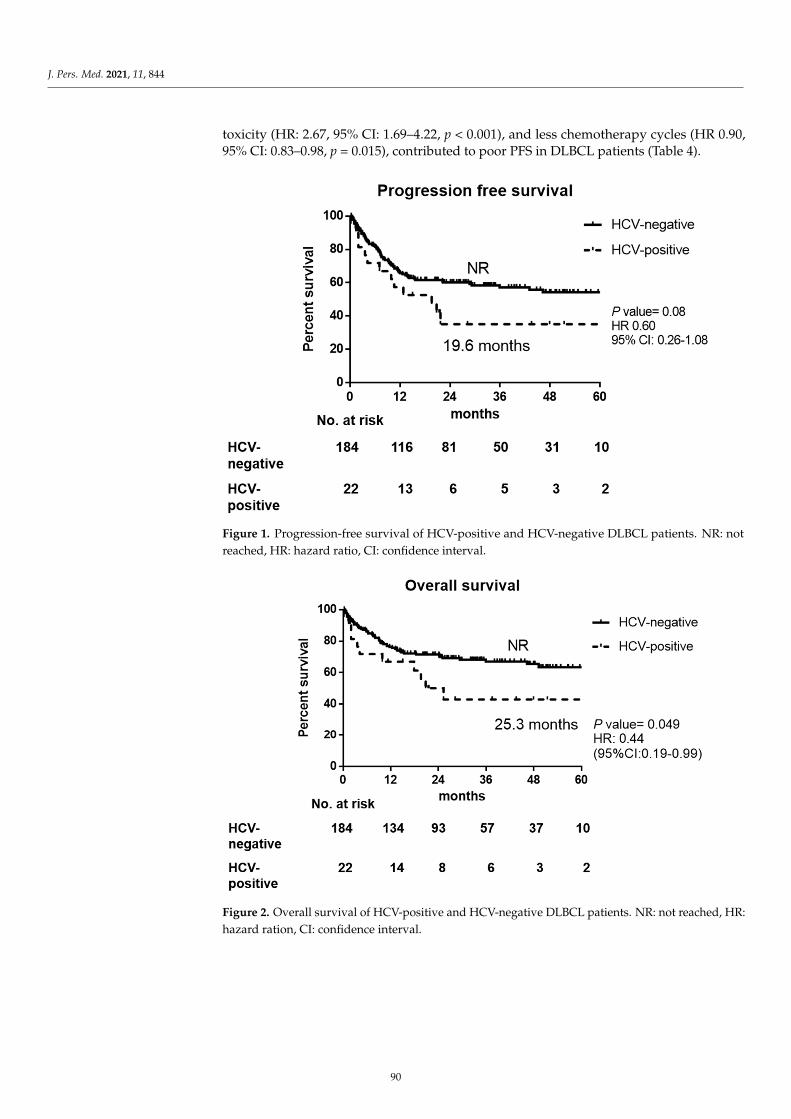
J. Pers. Med. 2021, 11, 844
toxicity (HR: 2.67, 95% CI: 1.69–4.22, p < 0.001), and less chemotherapy cycles (HR 0.90,95% CI: 0.83–0.98, p = 0.015), contributed to poor PFS in DLBCL patients (Table 4).
J. Pers. Med. 2021, 11, x FOR PEER REVIEW 6 of 13
Figure 1. Progression-free survival of HCV-positive and HCV-negative DLBCL patients. NR: not reached, HR: hazard ratio, CI: confidence interval.
Figure 2. Overall survival of HCV-positive and HCV-negative DLBCL patients. NR: not reached, HR: hazard ration, CI: confidence interval.
3.3. Prognostic Factors for Overall Survival and Progression Free Survival in DLBCL Patients Based on univariate analysis via Cox regression model, we found that older age (HR:
1.03, 95% CI: 1.01–1.04, p = 0.003), poor performance status (ECOG ≥ 2, HR: 6.22, 95% CI: 3.66–10.56, p < 0.001), advanced stage (HR 4.36, 95% CI: 2.23–8.55, p <0.001), less chemo-therapy cycles (HR: 0.77, 95% CI: 0.70–0.84, p < 0.001), and the presence of liver toxicity (HR: 2.46, 95% CI: 1.47–4.12, p = 0.001) contributed to poor OS. In multivariate analysis, four key factors: advanced stage, poor performance status, liver toxicity presentation, and
Figure 1. Progression-free survival of HCV-positive and HCV-negative DLBCL patients. NR: notreached, HR: hazard ratio, CI: confidence interval.
J. Pers. Med. 2021, 11, x FOR PEER REVIEW 6 of 13
Figure 1. Progression-free survival of HCV-positive and HCV-negative DLBCL patients. NR: not reached, HR: hazard ratio, CI: confidence interval.
Figure 2. Overall survival of HCV-positive and HCV-negative DLBCL patients. NR: not reached, HR: hazard ration, CI: confidence interval.
3.3. Prognostic Factors for Overall Survival and Progression Free Survival in DLBCL Patients Based on univariate analysis via Cox regression model, we found that older age (HR:
1.03, 95% CI: 1.01–1.04, p = 0.003), poor performance status (ECOG ≥ 2, HR: 6.22, 95% CI: 3.66–10.56, p < 0.001), advanced stage (HR 4.36, 95% CI: 2.23–8.55, p <0.001), less chemo-therapy cycles (HR: 0.77, 95% CI: 0.70–0.84, p < 0.001), and the presence of liver toxicity (HR: 2.46, 95% CI: 1.47–4.12, p = 0.001) contributed to poor OS. In multivariate analysis, four key factors: advanced stage, poor performance status, liver toxicity presentation, and
Figure 2. Overall survival of HCV-positive and HCV-negative DLBCL patients. NR: not reached, HR:hazard ration, CI: confidence interval.
90
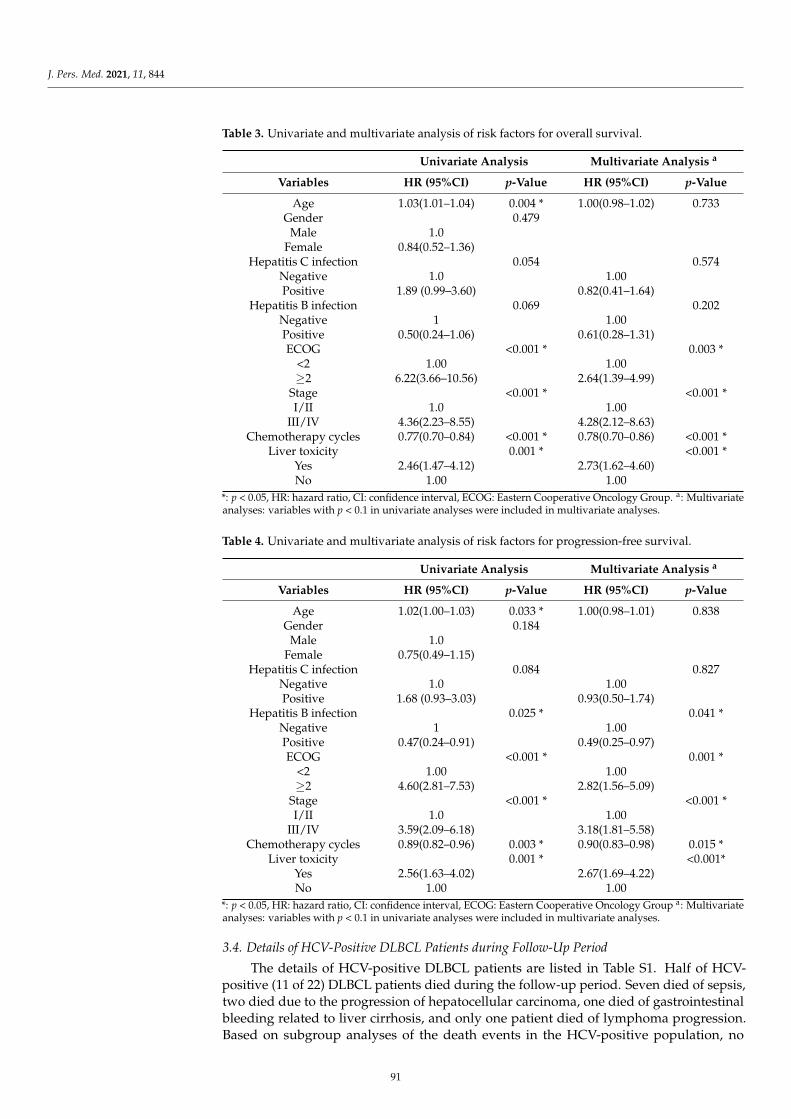
J. Pers. Med. 2021, 11, 844
Table 3. Univariate and multivariate analysis of risk factors for overall survival.
Univariate Analysis Multivariate Analysis a
Variables HR (95%CI) p-Value HR (95%CI) p-Value
Age 1.03(1.01–1.04) 0.004 * 1.00(0.98–1.02) 0.733Gender 0.479
Male 1.0Female 0.84(0.52–1.36)
Hepatitis C infection 0.054 0.574Negative 1.0 1.00Positive 1.89 (0.99–3.60) 0.82(0.41–1.64)
Hepatitis B infection 0.069 0.202Negative 1 1.00Positive 0.50(0.24–1.06) 0.61(0.28–1.31)ECOG <0.001 * 0.003 *
<2 1.00 1.00≥2 6.22(3.66–10.56) 2.64(1.39–4.99)
Stage <0.001 * <0.001 *I/II 1.0 1.00
III/IV 4.36(2.23–8.55) 4.28(2.12–8.63)Chemotherapy cycles 0.77(0.70–0.84) <0.001 * 0.78(0.70–0.86) <0.001 *
Liver toxicity 0.001 * <0.001 *Yes 2.46(1.47–4.12) 2.73(1.62–4.60)No 1.00 1.00
*: p < 0.05, HR: hazard ratio, CI: confidence interval, ECOG: Eastern Cooperative Oncology Group. a: Multivariateanalyses: variables with p < 0.1 in univariate analyses were included in multivariate analyses.
Table 4. Univariate and multivariate analysis of risk factors for progression-free survival.
Univariate Analysis Multivariate Analysis a
Variables HR (95%CI) p-Value HR (95%CI) p-Value
Age 1.02(1.00–1.03) 0.033 * 1.00(0.98–1.01) 0.838Gender 0.184
Male 1.0Female 0.75(0.49–1.15)
Hepatitis C infection 0.084 0.827Negative 1.0 1.00Positive 1.68 (0.93–3.03) 0.93(0.50–1.74)
Hepatitis B infection 0.025 * 0.041 *Negative 1 1.00Positive 0.47(0.24–0.91) 0.49(0.25–0.97)ECOG <0.001 * 0.001 *
<2 1.00 1.00≥2 4.60(2.81–7.53) 2.82(1.56–5.09)
Stage <0.001 * <0.001 *I/II 1.0 1.00
III/IV 3.59(2.09–6.18) 3.18(1.81–5.58)Chemotherapy cycles 0.89(0.82–0.96) 0.003 * 0.90(0.83–0.98) 0.015 *
Liver toxicity 0.001 * <0.001*Yes 2.56(1.63–4.02) 2.67(1.69–4.22)No 1.00 1.00
*: p < 0.05, HR: hazard ratio, CI: confidence interval, ECOG: Eastern Cooperative Oncology Group a: Multivariateanalyses: variables with p < 0.1 in univariate analyses were included in multivariate analyses.
3.4. Details of HCV-Positive DLBCL Patients during Follow-Up Period
The details of HCV-positive DLBCL patients are listed in Table S1. Half of HCV-positive (11 of 22) DLBCL patients died during the follow-up period. Seven died of sepsis,two died due to the progression of hepatocellular carcinoma, one died of gastrointestinalbleeding related to liver cirrhosis, and only one patient died of lymphoma progression.Based on subgroup analyses of the death events in the HCV-positive population, no
91
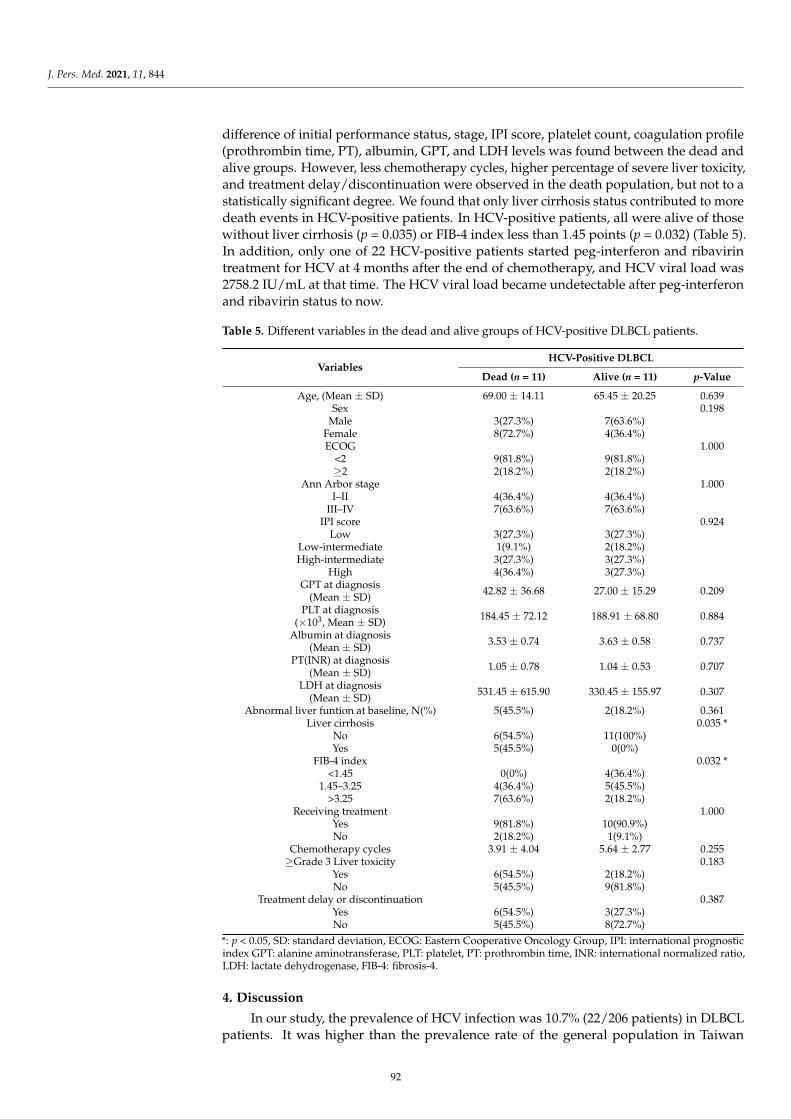
J. Pers. Med. 2021, 11, 844
difference of initial performance status, stage, IPI score, platelet count, coagulation profile(prothrombin time, PT), albumin, GPT, and LDH levels was found between the dead andalive groups. However, less chemotherapy cycles, higher percentage of severe liver toxicity,and treatment delay/discontinuation were observed in the death population, but not to astatistically significant degree. We found that only liver cirrhosis status contributed to moredeath events in HCV-positive patients. In HCV-positive patients, all were alive of thosewithout liver cirrhosis (p = 0.035) or FIB-4 index less than 1.45 points (p = 0.032) (Table 5).In addition, only one of 22 HCV-positive patients started peg-interferon and ribavirintreatment for HCV at 4 months after the end of chemotherapy, and HCV viral load was2758.2 IU/mL at that time. The HCV viral load became undetectable after peg-interferonand ribavirin status to now.
Table 5. Different variables in the dead and alive groups of HCV-positive DLBCL patients.
VariablesHCV-Positive DLBCL
Dead (n = 11) Alive (n = 11) p-Value
Age, (Mean ± SD) 69.00 ± 14.11 65.45 ± 20.25 0.639Sex 0.198
Male 3(27.3%) 7(63.6%)Female 8(72.7%) 4(36.4%)ECOG 1.000
<2 9(81.8%) 9(81.8%)≥2 2(18.2%) 2(18.2%)
Ann Arbor stage 1.000I–II 4(36.4%) 4(36.4%)
III–IV 7(63.6%) 7(63.6%)IPI score 0.924
Low 3(27.3%) 3(27.3%)Low-intermediate 1(9.1%) 2(18.2%)High-intermediate 3(27.3%) 3(27.3%)
High 4(36.4%) 3(27.3%)GPT at diagnosis
(Mean ± SD) 42.82 ± 36.68 27.00 ± 15.29 0.209
PLT at diagnosis(×103, Mean ± SD) 184.45 ± 72.12 188.91 ± 68.80 0.884
Albumin at diagnosis(Mean ± SD) 3.53 ± 0.74 3.63 ± 0.58 0.737
PT(INR) at diagnosis(Mean ± SD) 1.05 ± 0.78 1.04 ± 0.53 0.707
LDH at diagnosis(Mean ± SD) 531.45 ± 615.90 330.45 ± 155.97 0.307
Abnormal liver funtion at baseline, N(%) 5(45.5%) 2(18.2%) 0.361Liver cirrhosis 0.035 *
No 6(54.5%) 11(100%)Yes 5(45.5%) 0(0%)
FIB-4 index 0.032 *<1.45 0(0%) 4(36.4%)
1.45–3.25 4(36.4%) 5(45.5%)>3.25 7(63.6%) 2(18.2%)
Receiving treatment 1.000Yes 9(81.8%) 10(90.9%)No 2(18.2%) 1(9.1%)
Chemotherapy cycles 3.91 ± 4.04 5.64 ± 2.77 0.255≥Grade 3 Liver toxicity 0.183
Yes 6(54.5%) 2(18.2%)No 5(45.5%) 9(81.8%)
Treatment delay or discontinuation 0.387Yes 6(54.5%) 3(27.3%)No 5(45.5%) 8(72.7%)
*: p < 0.05, SD: standard deviation, ECOG: Eastern Cooperative Oncology Group, IPI: international prognosticindex GPT: alanine aminotransferase, PLT: platelet, PT: prothrombin time, INR: international normalized ratio,LDH: lactate dehydrogenase, FIB-4: fibrosis-4.
4. Discussion
In our study, the prevalence of HCV infection was 10.7% (22/206 patients) in DLBCLpatients. It was higher than the prevalence rate of the general population in Taiwan
92
J. Pers. Med. 2021, 11, 844
at 4.4% (6904/157,720) of anti-HCV positive [30]. There have been some hypotheticalmodels to describe the possible pathologic role of HCV infection in aggressive B-celllymphoma. The direct transformation mechanism is one kind of hypothesis accounting forHCV-associated lymphomagenesis. In vitro, the infection of B-cell lines with HCV leadsto somatic mutations of several oncogenes and tumor-suppressor genes such as p53, beta-catenin, and Bcl6 [31]. On the contrary, some studies support the role of HCV as an indirecttransformation agent by chronically stimulating B-cell immunologic response and finallyleading to lymphoma. Polyclonal or monoclonal B-cell proliferation can be detected in theblood or bone marrow of HCV patients and is associated with mixed cryoglobulinemia typeII. The risk of lymphoma in patients with HCV-associated cryoglobulinemia is estimated tobe 35 times higher than that in the general population [32]. All these theories are proposedto explain the high prevalence of HCV infection in lymphoma patients.
In previous retrospective studies, HCV-infected DLBCL patients shared distinctiveclinical features. A higher percentage of HCV-positive DLBCL cases were associated withold age (> or =60) than HCV-negative DLBCL cases at diagnosis [14,33]. HCV-positivepatients had more frequent extra-nodal involvement [13,33] and more frequent elevatedlactate dehydrogenase (LDH) levels than other patients [13]. In our studies, we foundthat HCV-positive DLBCL patients had poorer performance status, lower platelet count,and higher probability of liver and spleen involvement than HCV-negative patients. Interms of OS and PFS, the influence of HCV infection on survival in DLBCL patients re-mains controversial. Studies conducted by Ennishi et al. reported a similar outcome inHCV-positive DLBCL patients compared to HCV-negative (3-year OS 75% in HCV-positivevs. 84% in HCV-negative, p = 0.07) [17]. On the contrary, two other studies presented aninferior outcome in HCV-positive patients [16,34]. Chen et al. found that three independentfactors predicted a dismal OS: lower albumin level (<3 g/dL vs. ≥3 g/dL; HR = 13.21, 95%CI = 2.69–64.98, p = 0.001), presence of HCV infection (HCV-positive vs. HCV-negative;HR = 9.75, 95% CI = 1.97–48.34, p = 0.005), and poor IPI risk (high-intermediate or high vs.low-intermediate or low; HR = 5.56, 95% CI = 1.17–26.55, p = 0.031) [34]. The FondazioneItaliana Linfomi has conducted a multicenter retrospective study to explore a new prog-nostic system for HCV-associated DLBCL. Therefore, the HCV Prognostic Score, based onperformance status, albumin level, and HCV-RNA viral load, was therefore introduced asa useful tool to predict the outcome of HCV-associated DLBCL [16].
In our study, we found that an inferior overall survival was observed in HCV-positivepatients by the Kaplan–Meier method. However, after multivariate analysis, HCV infectionstatus was not the key risk factor for overall survival. Instead, advanced stage, poorperformance status, liver toxicity presentation, and less chemotherapy cycles were themain risk factors that predicted overall survival and progression-free survival. A higherpercentage of HCV-positive patients’ treatment response was unable to be evaluated duringthe follow-up period (31.8% in HCV-positive vs. 14.7% in HCV-negative, p = 0.041). Nearlyhalf (42.9%, three of seven) of them did not receive any treatment due to elderly agewith poor performance status and severe liver cirrhosis; the rest of the patients receivedtreatment of no more than two cycles with no possible follow-up image due to sepsis-related death. This highlighted the ability of HCV co-morbidity to hamper treatmentcompleteness. The number of chemotherapy cycles was a major predictive factor for OSand HCV-positive patients; fewer chemotherapy cycles resulted in poor survival in theHCV-positive group. The phenomenon was also observed by Dlouhy et al., who presentedhigher number of complications and early deaths in HCV-positive DLBCL patients [33].
Regarding the HCV-positive DLBCL population, we found that liver cirrhosis wasthe main factor related to death events. Unlike the whole DLBCL population, age, stage,and performance status carried no vital role in predicting survival in HCV-positive DLBCLpatients. Although fewer chemotherapy cycles, higher percentage of severe liver toxicity,and treatment delay/discontinuation were observed among those patients that died, thedifference was not statistically significant compared to those who remained alive. Whilethese findings highlighted the influence of the severity of liver cirrhosis for HCV-positive
93
J. Pers. Med. 2021, 11, 844
DLBCL patients, the small sample size might limit the statistical findings. This resulthighlighted that the severity of cirrhosis was the major factor to determine survival inHCV-positive DLBCL patients and also contributed to high complications and early deathsin HCV-positive DLBCL patients.
We found higher liver toxicity and higher ≥ grade 3 liver toxicity in HCV-positivepopulation, and the incidence of liver toxicity was not associated with initial GPT levels.One patient (4.5%, one of 22 HCV-positive) received peg-interferon and ribavirin treatmentfor high HCV RNA levels after chemoimmunotherapy. Since we did not have the com-prehensive data of HCV viral load, it was difficult to be conclude as a HCV reactivationin our study. The increased risk of liver toxicity in the HCV-positive population wasconsistent with other studies. In a Japanese multicenter retrospective study of 553 DLBCLpatients, HCV RNA levels significantly increased in the HCV-positive patients duringimmunochemotherapy, and more grade 3–4 hepatic toxicity (27%) was observed in pa-tients with HCV-positive patients than HCV-negative patients (3%) [17]. In another Italianretrospective study of 156 HCV-positive DLBCL patients, they found that 85% of patientscompleted their therapeutic program without any interruption or dosage reduction andfive patients (4%) had to discontinue chemotherapy due to severe hepatic function impair-ment (toxicity grade 3–4) [35]. These studies revealed that without initial liver dysfunction,HCV-positive patients experience a similar outcome compared to HCV-negative patientswhen treated with chemotherapy or immunotherapy [36]. Therefore, careful monitoring ofhepatic function and viral load is suggested during the therapy, especially for those withinitial liver dysfunction patients.
Some studies showed that DAA treatment could reverse the liver inflammation, fi-brosis, and decrease the complications of compensated liver cirrhosis in chronic hepatitisC [37–39]. From the observation report of Occhipinti et al., seven DLBCL patients with HCVinfection received different DAA regimens concurrently with immunochemotherapy [40].All patients completed their scheduled treatment with no liver toxicity occurrence. Thus,the concomitant administration of DAA and immunochemotherapy for HCV-positiveDLBCL seems safe and may prevent immunochemotherapy-induced liver toxicity. Furtherprospective studies are warranted to identify if concurrent DAA therapy with chemoim-munotherapy in HCV-positive DLBCL patients can lead to survival benefit, especially forthose with advanced fibrosis.
There were some limitations in this study. First, our study was a retrospective studywith limited numbers of HCV patients, which limits the scope of our conclusion. Secondly,HCV viral load was not routinely checked during 2011–2015. Therefore, we did not havethe comprehensive data of HCV viral load in all HCV-positive patients. Thus, we onlyused the anti-HCV positivity as criteria for being HCV-positive. Thirdly, some patientshad a shortened course of therapy due to mortalities, which hinders proper responseevaluations, especially in HCV-positive patients. However, this study presents real-worlddata of clinical characteristics and outcomes of HCV-positive DLBCL patients before theintroduction of DAA treatment and provided the association of HCV and DLBCL.
5. Conclusions
In our study, DLBCL patients have a higher prevalence (10.7%) of HCV infection thanthe general population in our area. Clinically, HCV-positive DLBCL patients had poorperformance status, lower platelet count, higher probability of spleen and liver involvement,and received less chemotherapy cycles due to morbidity and mortality. With multivariateanalysis, stage, performance status, liver toxicity presentation, and chemotherapy cycleswere found to be the major factors for the OS and PFS in DLBCL patients. Inferior survivalof HCV-positive DLBCL was contributed by poor performance status, higher numbers ofcomplications, and intolerance of treatment, leading to fewer therapy. Severity of liverfibrosis was the main factor related to death in the HCV-positive population. As such,anti-HCV therapy such as direct-acting antiviral agents might benefit such patients in thefuture to improve outcomes.
94
J. Pers. Med. 2021, 11, 844
Supplementary Materials: The following are available online at https://www.mdpi.com/article/10.3390/jpm11090844/s1, Table S1: the details of HCV-positive DLBCL patients.
Author Contributions: Conceptualization, Y.-F.T., H.-H.H., Y.-C.L. and C.-I.Y.; methodology, Y.-F.T.,C.-I.Y. and P.-F.W.; validation, C.-I.H., C.-F.H., M.-L.Y. and C.-Y.D.; resources, T.-J.Y., Y.-C.G., J.-S.D.,H.-C.W., S.-F.C., Y.-F.T., H.-H.H. and Y.-C.L.; data curation, T.-M.C. and Y.-L.K.; writing—originaldraft preparation, Y.-F.T. and H.-H.H.; writing—review and editing, Y.-F.T., H.-H.H. and C.-M.H.;supervision, P.-F.W., C.-I.H., C.-F.H., M.-L.Y. and C.-Y.D.; project administration, Y.-F.T. and H.-H.H.All authors have read and agreed to the published version of the manuscript.
Funding: This study was supported by a grant from the Kaohsiung Medical University Hospital(KMUH108-8R24 and KMUH109-9R19) and Ministry of Health and Welfare (MOHW110-TDU-B-212-124006).
Institutional Review Board Statement: The study was conducted according to the guidelines ofthe Declaration of Helsinki, and approved by the Institutional Review Board of Kaohsiung MedicalUniversity Hospital (KMUHIRB-E(I)-20210119).
Informed Consent Statement: Not applicable.
Data Availability Statement: The data used in the present study are available from the correspondingauthor upon reasonable request.
Conflicts of Interest: The authors declare no conflict of interest.
References1. Defrancesco, I.; Zerbi, C.; Rattotti, S.; Merli, M.; Bruno, R.; Paulli, M.; Arcaini, L. HCV infection and non-Hodgkin lymphomas:
An evolving story. Clin. Exp. Med. 2020, 20, 321–328. [CrossRef] [PubMed]2. Negro, F.; Forton, D.; Craxi, A.; Sulkowski, M.S.; Feld, J.J.; Manns, M.P. Extrahepatic morbidity and mortality of chronic hepatitis
C. Gastroenterology 2015, 149, 1345–1360. [CrossRef]3. Dammacco, F.; Lauletta, G.; Russi, S.; Leone, P.; Tucci, M.; Manno, C.; Monaco, S.; Ferrari, S.; Vacca, A.; Racanelli, V. Clinical
practice: Hepatitis C virus infection, cryoglobulinemia and cryoglobulinemic vasculitis. Clin. Exp. Med. 2019, 19, 1–21. [CrossRef][PubMed]
4. Spinelli, J.J.; Lai, A.S.; Krajden, M.; Andonov, A.; Gascoyne, R.D.; Connors, J.M.; Brooks-Wilson, A.R.; Gallagher, R.P. Hepatitis Cvirus and risk of non-Hodgkin lymphoma in British Columbia, Canada. Int. J. Cancer 2008, 122, 630–633. [CrossRef] [PubMed]
5. de Sanjose, S.; Benavente, Y.; Vajdic, C.M.; Engels, E.A.; Morton, L.M.; Bracci, P.M.; Spinelli, J.J.; Zheng, T.; Zhang, Y.; Franceschi,S.; et al. Hepatitis C and non-Hodgkin lymphoma among 4784 cases and 6269 controls from the International LymphomaEpidemiology Consortium. Clin. Gastroenterol. Hepatol. 2008, 6, 451–458. [CrossRef] [PubMed]
6. Viswanatha, D.S.; Dogan, A. Hepatitis C virus and lymphoma. J. Clin. Pathol. 2007, 60, 1378–1383. [CrossRef] [PubMed]7. Mihaila, R.G. Hepatitis C virus—associated B cell non-Hodgkin’s lymphoma. World J. Gastroenterol. 2016, 22, 6214–6223.
[CrossRef]8. Suarez, F.; Lortholary, O.; Hermine, O.; Lecuit, M. Infection-associated lymphomas derived from marginal zone B cells: A model
of antigen-driven lymphoproliferation. Blood 2006, 107, 3034–3044. [CrossRef]9. Provencio, M.; Sanchez, A.; Bonilla, F.; Espana, P. Association between hepatitis C virus and non-Hodgkin’s lymphomas. J. Clin.
Oncol. 2006, 24, 3513. [CrossRef]10. Zignego, A.L.; Ramos-Casals, M.; Ferri, C.; Saadoun, D.; Arcaini, L.; Roccatello, D.; Antonelli, A.; Desbois, A.C.; Comarmond, C.;
Gragnani, L.; et al. International therapeutic guidelines for patients with HCV-related extrahepatic disorders. A multidisciplinaryexpert statement. Autoimmun. Rev. 2017, 16, 523–541. [CrossRef]
11. Arcaini, L.; Bruno, R. Hepatitis C virus infection and antiviral treatment in marginal zone lymphomas. Curr. Clin. Pharm. 2010, 5,74–81. [CrossRef]
12. Sehn, L.H.; Salles, G. Diffuse Large B-Cell Lymphoma. N. Engl. J. Med. 2021, 384, 842–858. [CrossRef] [PubMed]13. Besson, C.; Canioni, D.; Lepage, E.; Pol, S.; Morel, P.; Lederlin, P.; Van Hoof, A.; Tilly, H.; Gaulard, P.; Coiffier, B.; et al.
Characteristics and outcome of diffuse large B-cell lymphoma in hepatitis C virus-positive patients in LNH 93 and LNH 98Groupe d’Etude des Lymphomes de l’Adulte programs. J. Clin. Oncol. 2006, 24, 953–960. [CrossRef] [PubMed]
14. Park, B.B.; Kim, J.S.; Lee, Y.Y.; Kang, H.J.; Ryoo, B.Y.; Kang, J.H.; Kim, H.Y.; Kim, B.S.; Oh, S.Y.; Kwon, H.C.; et al. Clinicalcharacteristics and outcome for hepatitis C virus-positive diffuse large B-cell lymphoma. Leuk. Lymphoma 2008, 49, 88–94.[CrossRef]
15. Visco, C.; Finotto, S. Hepatitis C virus and diffuse large B-cell lymphoma: Pathogenesis, behavior and treatment. World J.Gastroenterol. 2014, 20, 11054–11061. [CrossRef]
16. Merli, M.; Visco, C.; Spina, M.; Luminari, S.; Ferretti, V.V.; Gotti, M.; Rattotti, S.; Fiaccadori, V.; Rusconi, C.; Targhetta, C.; et al.Outcome prediction of diffuse large B-cell lymphomas associated with hepatitis C virus infection: A study on behalf of theFondazione Italiana Linfomi. Haematologica 2014, 99, 489–496. [CrossRef] [PubMed]
95
J. Pers. Med. 2021, 11, 844
17. Ennishi, D.; Maeda, Y.; Niitsu, N.; Kojima, M.; Izutsu, K.; Takizawa, J.; Kusumoto, S.; Okamoto, M.; Yokoyama, M.; Takamatsu,Y.; et al. Hepatic toxicity and prognosis in hepatitis C virus-infected patients with diffuse large B-cell lymphoma treated withrituximab-containing chemotherapy regimens: A Japanese multicenter analysis. Blood 2010, 116, 5119–5125. [CrossRef]
18. Sun, C.A.; Chen, H.C.; Lu, C.F.; You, S.L.; Mau, Y.C.; Ho, M.S.; Lin, S.H.; Chen, C.J. Transmission of hepatitis C virus in Taiwan:Prevalence and risk factors based on a nationwide survey. J. Med. Virol. 1999, 59, 290–296. [CrossRef]
19. Chen, Y.Y.; Chen, C.L.; Chen, J.W.; Hsu, N.T.; Wei, S.T.; Hou, S.M.; Lu, S.N.; Chen, P.J. Secular Trends and Geographic Maps ofHepatitis C Virus Infection among 4 Million Blood Donors in Taiwan from 1999 to 2017. Hepatol. Commun. 2020, 4, 1193–1205.[CrossRef] [PubMed]
20. Sun, C.A.; Chen, H.C.; Lu, S.N.; Chen, C.J.; Lu, C.F.; You, S.L.; Lin, S.H. Persistent hyperendemicity of hepatitis C virus infectionin Taiwan: The important role of iatrogenic risk factors. J. Med. Virol. 2001, 65, 30–34. [CrossRef] [PubMed]
21. Chuang, S.-S.; Liao, Y.-L.; Chang, S.-T.; Hsieh, Y.-C.; Kuo, S.-Y.; Lu, C.-L.; Hwang, W.-S.; Lin, I.-H.; Tsao, C.-J.; Huang, W.-T.Hepatitis C virus infection is significantly associated with malignant lymphoma in Taiwan, particularly with nodal and splenicmarginal zone lymphomas. J. Clin. Pathol. 2010, 63, 595–598. [CrossRef] [PubMed]
22. Mele, A.; Pulsoni, A.; Bianco, E.; Musto, P.; Szklo, A.; Sanpaolo, M.G.; Iannitto, E.; De Renzo, A.; Martino, B.; Liso, V.; et al.Hepatitis C virus and B-cell non-Hodgkin lymphomas: An Italian multicenter case-control study. Blood 2003, 102, 996–999.[CrossRef] [PubMed]
23. Giannoulis, E.; Economopoulos, T.; Mandraveli, K.; Giannoulis, K.; Nikolaides, C.; Zervou, E.; Papageorgiou, E.; Zoulas, D.;Tourkantonis, A.; Giannopoulos, G.; et al. The prevalence of hepatitis C and hepatitis G virus infection in patients with Bcell non-Hodgkin lymphomas in Greece: A Hellenic Cooperative Oncology Group Study. Acta Haematol. 2004, 112, 189–193.[CrossRef] [PubMed]
24. Oken, M.M.; Creech, R.H.; Tormey, D.C.; Horton, J.; Davis, T.E.; McFadden, E.T.; Carbone, P.P. Toxicity and response criteria ofthe Eastern Cooperative Oncology Group. Am. J. Clin. Oncol. 1982, 5, 649–655. [CrossRef]
25. Vallet-Pichard, A.; Mallet, V.; Nalpas, B.; Verkarre, V.; Nalpas, A.; Dhalluin-Venier, V.; Fontaine, H.; Pol, S. FIB-4: An inexpensiveand accurate marker of fibrosis in HCV infection. comparison with liver biopsy and fibrotest. Hepatology 2007, 46, 32–36.[CrossRef]
26. Sterling, R.K.; Lissen, E.; Clumeck, N.; Sola, R.; Correa, M.C.; Montaner, J.; Sulkowski, M.S.; Torriani, F.J.; Dieterich, D.T.; Thomas,D.L.; et al. Development of a simple noninvasive index to predict significant fibrosis in patients with HIV/HCV coinfection.Hepatology 2006, 43, 1317–1325. [CrossRef]
27. The International Non-Hodgkin’s Lymphoma Prognostic Factors Project. A Predictive Model for Aggressive Non-Hodgkin’sLymphoma. N. Engl. J. Med. 1993, 329, 987–994. [CrossRef]
28. Sehn, L.H.; Berry, B.; Chhanabhai, M.; Fitzgerald, C.; Gill, K.; Hoskins, P.; Klasa, R.; Savage, K.J.; Shenkier, T.; Sutherland, J.; et al.The revised International Prognostic Index (R-IPI) is a better predictor of outcome than the standard IPI for patients with diffuselarge B-cell lymphoma treated with R-CHOP. Blood 2007, 109, 1857–1861. [CrossRef]
29. Cheson, B.D.; Fisher, R.I.; Barrington, S.F.; Cavalli, F.; Schwartz, L.H.; Zucca, E.; Lister, T.A. Recommendations for initialevaluation, staging, and response assessment of Hodgkin and non-Hodgkin lymphoma: The Lugano classification. J. Clin. Oncol.2014, 32, 3059–3068. [CrossRef]
30. Chen, C.-H.; Yang, P.-M.; Huang, G.-T.; Lee, H.-S.; Sung, J.-L.; Sheu, J.-C. Estimation of Seroprevalence of Hepatitis B Virus andHepatitis C Virus in Taiwan from a Large-scale Survey of Free Hepatitis Screening Participants. J. Formos. Med. Assoc. 2007, 106,148–155. [CrossRef]
31. Machida, K.; Cheng, K.T.; Sung, V.M.; Shimodaira, S.; Lindsay, K.L.; Levine, A.M.; Lai, M.Y.; Lai, M.M. Hepatitis C virus inducesa mutator phenotype: Enhanced mutations of immunoglobulin and protooncogenes. Proc. Natl. Acad. Sci. USA 2004, 101,4262–4267. [CrossRef] [PubMed]
32. Saadoun, D.; Landau, D.A.; Calabrese, L.H.; Cacoub, P.P. Hepatitis C-associated mixed cryoglobulinaemia: A crossroad betweenautoimmunity and lymphoproliferation. Rheumatology 2007, 46, 1234–1242. [CrossRef] [PubMed]
33. Dlouhy, I.; Torrente, M.; Lens, S.; Rovira, J.; Magnano, L.; Giné, E.; Delgado, J.; Balagué, O.; Martínez, A.; Campo, E.; et al.Clinico-biological characteristics and outcome of hepatitis C virus-positive patients with diffuse large B-cell lymphoma treatedwith immunochemotherapy. Ann. Hematol. 2017, 96, 405–410. [CrossRef]
34. Chen, Y.Y.; Huang, C.E.; Liang, F.W.; Lu, C.H.; Chen, P.T.; Lee, K.D.; Chen, C.C. Prognostic impact of hepatitis C virus infectionin patients with diffuse large B-cell lymphoma treated with immunochemotherapy in the context of a novel prognostic index.Cancer Epidemiol. 2015, 39, 382–387. [CrossRef]
35. Visco, C.; Arcaini, L.; Brusamolino, E.; Burcheri, S.; Ambrosetti, A.; Merli, M.; Bonoldi, E.; Chilosi, M.; Viglio, A.; Lazzarino,M.; et al. Distinctive natural history in hepatitis C virus positive diffuse large B-cell lymphoma: Analysis of 156 patients fromnorthern Italy. Ann. Oncol. 2006, 17, 1434–1440. [CrossRef]
36. Nooka, A.; Shenoy, P.J.; Sinha, R.; Lonial, S.; Flowers, C.R. Hepatitis C reactivation in patients who have diffuse large B-celllymphoma treated with rituximab: A case report and review of literature. Clin. Lymphoma Myeloma Leuk. 2011, 11, 379–384.[CrossRef]
37. Krassenburg, L.A.P.; Maan, R.; Ramji, A.; Manns, M.P.; Cornberg, M.; Wedemeyer, H.; de Knegt, R.J.; Hansen, B.E.; Janssen,H.L.A.; de Man, R.A.; et al. Clinical outcomes following DAA therapy in patients with HCV-related cirrhosis depend on diseaseseverity. J. Hepatol. 2021, 74, 1053–1063. [CrossRef]
96

J. Pers. Med. 2021, 11, 844
38. Hsu, W.F.; Lai, H.C.; Su, W.P.; Lin, C.H.; Chuang, P.H.; Chen, S.H.; Chen, H.Y.; Wang, H.W.; Huang, G.T.; Peng, C.Y. Rapid declineof noninvasive fibrosis index values in patients with hepatitis C receiving treatment with direct-acting antiviral agents. BMCGastroenterol. 2019, 19, 63. [CrossRef]
39. Cheng, C.H.; Chu, C.Y.; Chen, H.L.; Lin, I.T.; Wu, C.H.; Lee, Y.K.; Hu, P.J.; Bair, M.J. Direct-acting antiviral therapy of chronichepatitis C improves liver fibrosis, assessed by histological examination and laboratory markers. J. Med. Assoc. 2021, 120,1259–1268. [CrossRef]
40. Occhipinti, V.; Farina, L.; Vigano, M.; Capecchi, M.; Labanca, S.; Fanetti, I.; Corradini, P.; Rumi, M. Concomitant therapy withdirect-acting antivirals and chemoimmunotherapy in HCV-associated diffuse large B-cell lymphoma. Dig. Liver Dis. 2019, 51,719–723. [CrossRef] [PubMed]
97

Journal of
Personalized
Medicine
Article
Association of Ventilatory Disorders with RespiratorySymptoms, Physical Activity, and Quality of Life in Subjectswith Prior Tuberculosis: A National Database Study in Korea
Bumhee Yang 1,†, Hayoung Choi 2,† , Sun Hye Shin 3, Youlim Kim 4,5, Ji-Yong Moon 6, Hye Yun Park 3,*,‡
and Hyun Lee 6,*,‡
Citation: Yang, B.; Choi, H.; Shin,
S.H.; Kim, Y.; Moon, J.-Y.; Park, H.Y.;
Lee, H. Association of Ventilatory
Disorders with Respiratory Symptoms,
Physical Activity, and Quality of Life
in Subjects with Prior Tuberculosis: A
National Database Study in Korea. J.
Pers. Med. 2021, 11, 678. https://
doi.org/10.3390/jpm11070678
Academic Editors: Rutger
A. Middelburg and José Carmelo
Adsuar Sala
Received: 9 June 2021
Accepted: 16 July 2021
Published: 19 July 2021
Publisher’s Note: MDPI stays neutral
with regard to jurisdictional claims in
published maps and institutional affil-
iations.
Copyright: © 2021 by the authors.
Licensee MDPI, Basel, Switzerland.
This article is an open access article
distributed under the terms and
conditions of the Creative Commons
Attribution (CC BY) license (https://
creativecommons.org/licenses/by/
4.0/).
1 Division of Pulmonary and Critical Care Medicine, Department of Internal Medicine,Chungbuk National University Hospital, Chungbuk National University College of Medicine,Cheongju 28644, Korea; [email protected]
2 Division of Pulmonary, Allergy, and Critical Care Medicine, Department of Internal Medicine,Hallym University Kangnam Sacred Heart Hospital, Hallym University College of Medicine,Seoul 07441, Korea; [email protected]
3 Division of Pulmonary and Critical Care Medicine, Department of Medicine, Samsung Medical Center,Sungkyunkwan University School of Medicine, Seoul 06351, Korea; [email protected]
4 Division of Pulmonary, Allergy, and Critical Care Medicine, Department of Internal Medicine,Hallym University Chuncheon Sacred Heart Hospital, Chuncheon 24252, Korea; [email protected]
5 Lung Research Institute, Hallym University College of Medicine, Chuncheon 24252, Korea6 Division of Pulmonary Medicine and Allergy, Department of Internal Medicine,
Hanyang University College of Medicine, Seoul 04763, Korea; [email protected]* Correspondence: [email protected] (H.Y.P.); [email protected] (H.L.)† B.Y. and H.C. contributed equally to this work.‡ H.Y.P. and H.L. contributed equally to this work.
Abstract: Tuberculosis (TB) survivors experience post-TB lung damage and ventilatory functiondisorders. However, the proportions of obstructive and restrictive ventilatory disorders as wellas normal ventilation among subjects with prior TB are unknown. In addition, the impacts ofventilatory disorder and its severity on respiratory symptoms, physical activity limitations, and thequality of life in subjects with prior TB remain unclear. Subjects who participated in the KoreanNational Health and Nutritional Examination Survey 2007–2016 were enrolled in this study. Weevaluated the impact of each ventilatory disorder and its severity on respiratory symptoms, physicalactivity limitations, and quality of life (measured by the EuroQoL five dimensions questionnaire[EQ-5D] index values) in subjects with prior TB. Among 1466 subjects with prior TB, 29% and16% had obstructive ventilatory disorders and restrictive ventilatory disorders, respectively. Mildand moderate obstructive ventilatory disorders were not associated with respiratory symptoms,physical activity limitations, or EQ-5D index value compared with normal ventilation; however,severe obstructive ventilatory disorders were associated with more respiratory symptoms (adjustedodds ratio [aOR] = 13.62, 95% confidence interval [CI] = 4.64–39.99), more physical activity limitation(aOR = 218.58, 95% CI = 26.82–1781.12), and decreased EQ-5D index (adjusted coefficient = −0.06,95% CI = (−0.12–−0.10) compared with normal ventilation. Mild restrictive ventilatory disorderswere associated with more respiratory symptoms (aOR = 2.10, 95% CI = 1.07–4.14) compared withnormal ventilation, while moderate (aOR = 5.71, 95% CI = 1.14–28.62) and severe restrictive ventilatorydisorders (aOR = 9.17, 95% CI = 1.02–82.22) were associated with physical activity limitation comparedwith normal ventilation. In conclusion, among subjects with prior TB, 29% and 16% developedobstructive and restrictive ventilatory disorders, respectively. Severe obstructive ventilatory disorderwas associated with more respiratory symptoms, more physical activity limitation, and poorerquality of life, while severe restrictive ventilatory disorder was associated with more physicalactivity limitations.
Keywords: tuberculosis; pulmonary function; respiratory symptoms; quality of life
99
J. Pers. Med. 2021, 11, 678
1. Introduction
Tuberculosis (TB) is the leading cause of death from a single epidemic disease world-wide [1]. Since recognition of TB as a deadly communicable disease, the mortality rate hasdecreased, and 85% of patients treated for their first episode of TB survive with treatmentsuccess (cure or completion) [1,2]. Despite the improved survival rate, approximately50% of TB survivors experience post-TB lung damage and ventilatory disorders [3–5].Depending on the severity of post-TB lung damage, they show various clinical courses,including no respiratory symptoms, dyspnea, or impaired quality of life (QoL) [6,7].
The ventilatory disorders of subjects with prior TB comprise obstructive and restric-tive patterns [8]. Obstructive ventilatory disorder, which appears as airflow limitationon pulmonary function tests, is the most well-known form of lung damage after TB treat-ment [5,8]. Post-TB lung damage, including cavity, bronchiectasis, or distorted airway,can cause obstructive ventilatory disorder, which can lead to dyspnea, chronic obstructivepulmonary disease, and reduced exercise capacity [9,10]. Although obstructive disorderhas been recognized as post-TB lung damage, restrictive ventilatory disorder is also foundin subjects with prior TB and can lead to dyspnea or chest pain [11]. The restrictive patternhas been suggested to be a consequence of excessive fibrosis, fibrotic bands, or bronchovas-cular distortion in the process of post-TB lung repair [12]. The proportions of obstructiveand restrictive ventilatory disorders as well as normal ventilation among subjects withprior TB remain unclear. Additionally, the impacts of ventilatory defects and severity ofdefects on respiratory symptoms, physical limitations, and QoL in subjects with prior TBhave not been investigated.
This study sought to determine the composition of ventilatory defects among subjectswith prior TB using a nationally representative database in South Korea. Furthermore, thisstudy investigated the impact of each ventilatory disorder and its severity on respiratorysymptoms, physical activity limitations, and QoL among subjects with prior TB.
2. Material and Methods2.1. Study Population
We used the data from the 2007–2016 Korea National Health and Nutrition Examina-tion Survey (NHANES), a nationally representative health survey collected by the KoreanMinistry of Health and Welfare. Health-related questionnaires, health examinations, andspirometry results were used in this study. Previous pulmonary TB was defined based onformal reading of a chest X-ray or a history of physician diagnosed pulmonary TB. We clas-sified subjects with prior TB into three groups according to spirometric pattern (Figure 1).The study protocol was approved by the Institutional Review Board of Chungbuk NationalUniversity Hospital (application no. 2021-01-041).
100
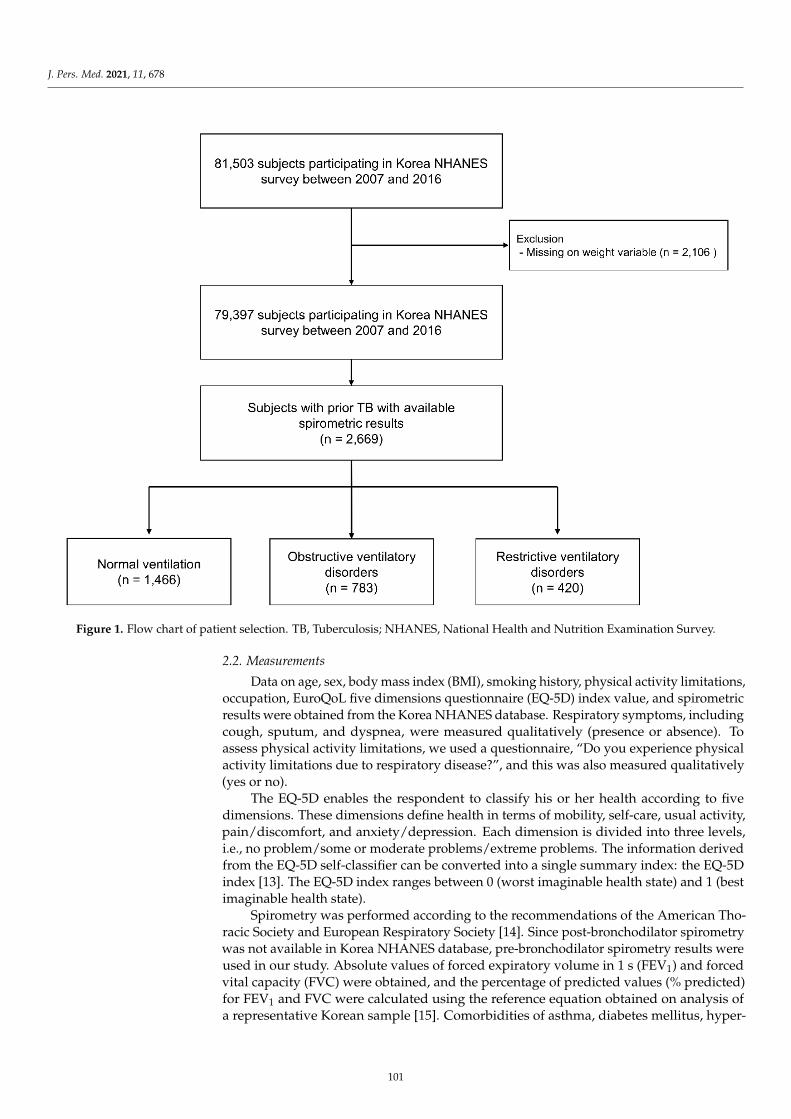
J. Pers. Med. 2021, 11, 678J. Pers. Med. 2021, 11, x FOR PEER REVIEW 3 of 11
Figure 1. Flow chart of patient selection. TB, Tuberculosis; NHANES, National Health and Nutrition Examination Survey.
2.2. Measurements Data on age, sex, body mass index (BMI), smoking history, physical activity limita-
tions, occupation, EuroQoL five dimensions questionnaire (EQ-5D) index value, and spi-rometric results were obtained from the Korea NHANES database. Respiratory symp-toms, including cough, sputum, and dyspnea, were measured qualitatively (presence or absence). To assess physical activity limitations, we used a questionnaire, “Do you expe-rience physical activity limitations due to respiratory disease?”, and this was also meas-ured qualitatively (yes or no).
The EQ-5D enables the respondent to classify his or her health according to five di-mensions. These dimensions define health in terms of mobility, self-care, usual activity, pain/discomfort, and anxiety/depression. Each dimension is divided into three levels, i.e., no problem/some or moderate problems/extreme problems. The information derived from the EQ-5D self-classifier can be converted into a single summary index: the EQ-5D index [13]. The EQ-5D index ranges between 0 (worst imaginable health state) and 1 (best imaginable health state).
Spirometry was performed according to the recommendations of the American Tho-racic Society and European Respiratory Society [14]. Since post-bronchodilator spirometry was not available in Korea NHANES database, pre-bronchodilator spirometry results were used in our study. Absolute values of forced expiratory volume in 1 s (FEV1) and forced vital capacity (FVC) were obtained, and the percentage of predicted values (% pre-dicted) for FEV1 and FVC were calculated using the reference equation obtained on anal-ysis of a representative Korean sample [15]. Comorbidities of asthma, diabetes mellitus, hypertension, dyslipidemia, cardiovascular disease, osteoporosis, osteoarthritis or rheu-matoid arthritis, and depression were self-reported based on previous physician diagno-sis [16].
2.3. Definitions of Ventilatory Disorder
Figure 1. Flow chart of patient selection. TB, Tuberculosis; NHANES, National Health and Nutrition Examination Survey.
2.2. Measurements
Data on age, sex, body mass index (BMI), smoking history, physical activity limitations,occupation, EuroQoL five dimensions questionnaire (EQ-5D) index value, and spirometricresults were obtained from the Korea NHANES database. Respiratory symptoms, includingcough, sputum, and dyspnea, were measured qualitatively (presence or absence). Toassess physical activity limitations, we used a questionnaire, “Do you experience physicalactivity limitations due to respiratory disease?”, and this was also measured qualitatively(yes or no).
The EQ-5D enables the respondent to classify his or her health according to fivedimensions. These dimensions define health in terms of mobility, self-care, usual activity,pain/discomfort, and anxiety/depression. Each dimension is divided into three levels,i.e., no problem/some or moderate problems/extreme problems. The information derivedfrom the EQ-5D self-classifier can be converted into a single summary index: the EQ-5Dindex [13]. The EQ-5D index ranges between 0 (worst imaginable health state) and 1 (bestimaginable health state).
Spirometry was performed according to the recommendations of the American Tho-racic Society and European Respiratory Society [14]. Since post-bronchodilator spirometrywas not available in Korea NHANES database, pre-bronchodilator spirometry results wereused in our study. Absolute values of forced expiratory volume in 1 s (FEV1) and forcedvital capacity (FVC) were obtained, and the percentage of predicted values (% predicted)for FEV1 and FVC were calculated using the reference equation obtained on analysis ofa representative Korean sample [15]. Comorbidities of asthma, diabetes mellitus, hyper-
101
J. Pers. Med. 2021, 11, 678
tension, dyslipidemia, cardiovascular disease, osteoporosis, osteoarthritis or rheumatoidarthritis, and depression were self-reported based on previous physician diagnosis [16].
2.3. Definitions of Ventilatory Disorder
Normal ventilation was defined as pre-bronchodilator FEV1/FVC ≥ 0.70 andFVC ≥ 80% predicted. Obstructive ventilatory disorder was defined as pre-bronchodilatorFEV1/FVC < 0.70 [17]. For cases with obstructive ventilatory disorder, FEV1 ≥ 80%predicted, FEV1 of 50–79% predicted, and FEV1 < 50% predicted were classified asmild, moderate, and severe, respectively. Restrictive ventilatory disorder was defined asFEV1/FVC ≥ 0.7 and FVC < 80% predicted. For cases with restrictive ventilatory disorder,FVC ≥ 70% predicted, FVC of 60–69% predicted, and FVC < 60% predicted were classifiedas mild, moderate, and severe, respectively [18,19].
2.4. Outcomes
We compared respiratory symptoms, physical activity limitations due to respiratorydiseases (hereafter physical activity limitations), and QoL (measured using the EQ-5D in-dex) between subjects with prior TB with different ventilatory disorders. We also analyzedthe impacts of ventilatory disorder severity on respiratory symptoms, physical activitylimitations, and QoL in subjects with prior TB.
2.5. Statistical Analysis
All analysis was performed using survey commands in STATA 15.1 version (Stat-aCorp LP, College Station, TX, USA) to account for the complex sampling design andsurvey weights. For each variable, we calculated prevalence and 95% confidence interval(CI) by group.
The associations between ventilatory disorders and respiratory symptoms (cough,sputum, or dyspnea) and physical activity limitations were analyzed using logistic regres-sion analysis: Multivariable analysis was adjusted for age (categorized as ≥65 years or not),sex, BMI, smoking amount (pack-years), education level (categorized as high school or lessvs. college or above), and family income (categorized as low vs. high). Linear regressionanalysis was performed to assess the association between ventilatory disorders and EQ-5Dindex scores: Multivariable analysis was adjusted for covariates as mentioned above.
A two-sided p value < 0.05 was considered significant. To account for multiple com-parisons, post hoc Bonferroni correction was applied (normal ventilation vs. obstructiveventilatory disorder, normal ventilation vs. restrictive ventilatory disorder, and obstruc-tive ventilatory disorder vs. restrictive ventilatory disorder), in which a p value of 0.05corresponds to 0.017 (0.05/3).
3. Results3.1. Baseline Characteristics
As shown in Table 1, the post-TB patient group included 1466 patients (54.9%) withnormal ventilation, 783 patients (29.3%) with obstructive ventilatory disorders, and 420 pa-tients (15.8%) with restrictive ventilatory disorders. The mean ages of subjects with normalventilation, obstructive ventilatory disorders, and restrictive ventilatory disorders were53.4, 64.4, and 59.6 years, respectively (p < 0.001). The proportion of males was highest insubjects with obstructive ventilatory disorders, followed by those with restrictive ventila-tory disorders and those with normal ventilation (76.2%, 52.0%, and 49.5%, respectively,p < 0.001). The subjects with obstructive ventilatory disorders had a lower BMI than thosewith normal ventilation or restrictive ventilatory disorders (22.8 kg/m2, 23.7 kg/m2, and23.8 kg/m2, respectively, p < 0.001). The subjects with obstructive ventilatory disordershad higher rates of current or ex-smoking than those with normal ventilation or restrictiveventilatory disorders (71.8%, 44.5%, and 39.4%, respectively, p < 0.001). The proportionof subjects with low family income was highest among obstructive ventilatory disorders,followed by restrictive ventilatory disorders, and normal ventilation (68.3%, 55.9%, and
102
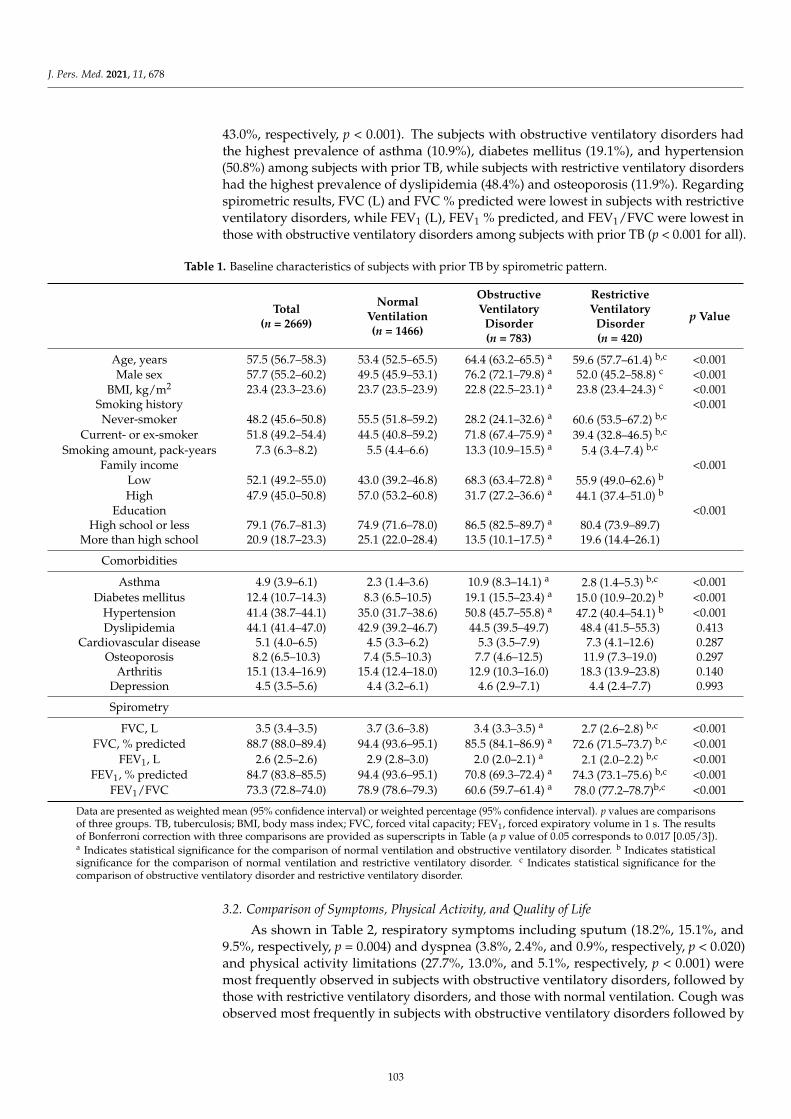
J. Pers. Med. 2021, 11, 678
43.0%, respectively, p < 0.001). The subjects with obstructive ventilatory disorders hadthe highest prevalence of asthma (10.9%), diabetes mellitus (19.1%), and hypertension(50.8%) among subjects with prior TB, while subjects with restrictive ventilatory disordershad the highest prevalence of dyslipidemia (48.4%) and osteoporosis (11.9%). Regardingspirometric results, FVC (L) and FVC % predicted were lowest in subjects with restrictiveventilatory disorders, while FEV1 (L), FEV1 % predicted, and FEV1/FVC were lowest inthose with obstructive ventilatory disorders among subjects with prior TB (p < 0.001 for all).
Table 1. Baseline characteristics of subjects with prior TB by spirometric pattern.
Total(n = 2669)
NormalVentilation(n = 1466)
ObstructiveVentilatory
Disorder(n = 783)
RestrictiveVentilatory
Disorder(n = 420)
p Value
Age, years 57.5 (56.7–58.3) 53.4 (52.5–65.5) 64.4 (63.2–65.5) a 59.6 (57.7–61.4) b,c <0.001Male sex 57.7 (55.2–60.2) 49.5 (45.9–53.1) 76.2 (72.1–79.8) a 52.0 (45.2–58.8) c <0.001
BMI, kg/m2 23.4 (23.3–23.6) 23.7 (23.5–23.9) 22.8 (22.5–23.1) a 23.8 (23.4–24.3) c <0.001Smoking history <0.001Never-smoker 48.2 (45.6–50.8) 55.5 (51.8–59.2) 28.2 (24.1–32.6) a 60.6 (53.5–67.2) b,c
Current- or ex-smoker 51.8 (49.2–54.4) 44.5 (40.8–59.2) 71.8 (67.4–75.9) a 39.4 (32.8–46.5) b,c
Smoking amount, pack-years 7.3 (6.3–8.2) 5.5 (4.4–6.6) 13.3 (10.9–15.5) a 5.4 (3.4–7.4) b,c
Family income <0.001Low 52.1 (49.2–55.0) 43.0 (39.2–46.8) 68.3 (63.4–72.8) a 55.9 (49.0–62.6) b
High 47.9 (45.0–50.8) 57.0 (53.2–60.8) 31.7 (27.2–36.6) a 44.1 (37.4–51.0) b
Education <0.001High school or less 79.1 (76.7–81.3) 74.9 (71.6–78.0) 86.5 (82.5–89.7) a 80.4 (73.9–89.7)
More than high school 20.9 (18.7–23.3) 25.1 (22.0–28.4) 13.5 (10.1–17.5) a 19.6 (14.4–26.1)
Comorbidities
Asthma 4.9 (3.9–6.1) 2.3 (1.4–3.6) 10.9 (8.3–14.1) a 2.8 (1.4–5.3) b,c <0.001Diabetes mellitus 12.4 (10.7–14.3) 8.3 (6.5–10.5) 19.1 (15.5–23.4) a 15.0 (10.9–20.2) b <0.001
Hypertension 41.4 (38.7–44.1) 35.0 (31.7–38.6) 50.8 (45.7–55.8) a 47.2 (40.4–54.1) b <0.001Dyslipidemia 44.1 (41.4–47.0) 42.9 (39.2–46.7) 44.5 (39.5–49.7) 48.4 (41.5–55.3) 0.413
Cardiovascular disease 5.1 (4.0–6.5) 4.5 (3.3–6.2) 5.3 (3.5–7.9) 7.3 (4.1–12.6) 0.287Osteoporosis 8.2 (6.5–10.3) 7.4 (5.5–10.3) 7.7 (4.6–12.5) 11.9 (7.3–19.0) 0.297
Arthritis 15.1 (13.4–16.9) 15.4 (12.4–18.0) 12.9 (10.3–16.0) 18.3 (13.9–23.8) 0.140Depression 4.5 (3.5–5.6) 4.4 (3.2–6.1) 4.6 (2.9–7.1) 4.4 (2.4–7.7) 0.993
Spirometry
FVC, L 3.5 (3.4–3.5) 3.7 (3.6–3.8) 3.4 (3.3–3.5) a 2.7 (2.6–2.8) b,c <0.001FVC, % predicted 88.7 (88.0–89.4) 94.4 (93.6–95.1) 85.5 (84.1–86.9) a 72.6 (71.5–73.7) b,c <0.001
FEV1, L 2.6 (2.5–2.6) 2.9 (2.8–3.0) 2.0 (2.0–2.1) a 2.1 (2.0–2.2) b,c <0.001FEV1, % predicted 84.7 (83.8–85.5) 94.4 (93.6–95.1) 70.8 (69.3–72.4) a 74.3 (73.1–75.6) b,c <0.001
FEV1/FVC 73.3 (72.8–74.0) 78.9 (78.6–79.3) 60.6 (59.7–61.4) a 78.0 (77.2–78.7)b,c <0.001
Data are presented as weighted mean (95% confidence interval) or weighted percentage (95% confidence interval). p values are comparisonsof three groups. TB, tuberculosis; BMI, body mass index; FVC, forced vital capacity; FEV1, forced expiratory volume in 1 s. The resultsof Bonferroni correction with three comparisons are provided as superscripts in Table (a p value of 0.05 corresponds to 0.017 [0.05/3]).a Indicates statistical significance for the comparison of normal ventilation and obstructive ventilatory disorder. b Indicates statisticalsignificance for the comparison of normal ventilation and restrictive ventilatory disorder. c Indicates statistical significance for thecomparison of obstructive ventilatory disorder and restrictive ventilatory disorder.
3.2. Comparison of Symptoms, Physical Activity, and Quality of Life
As shown in Table 2, respiratory symptoms including sputum (18.2%, 15.1%, and9.5%, respectively, p = 0.004) and dyspnea (3.8%, 2.4%, and 0.9%, respectively, p < 0.020)and physical activity limitations (27.7%, 13.0%, and 5.1%, respectively, p < 0.001) weremost frequently observed in subjects with obstructive ventilatory disorders, followed bythose with restrictive ventilatory disorders, and those with normal ventilation. Cough wasobserved most frequently in subjects with obstructive ventilatory disorders followed by
103
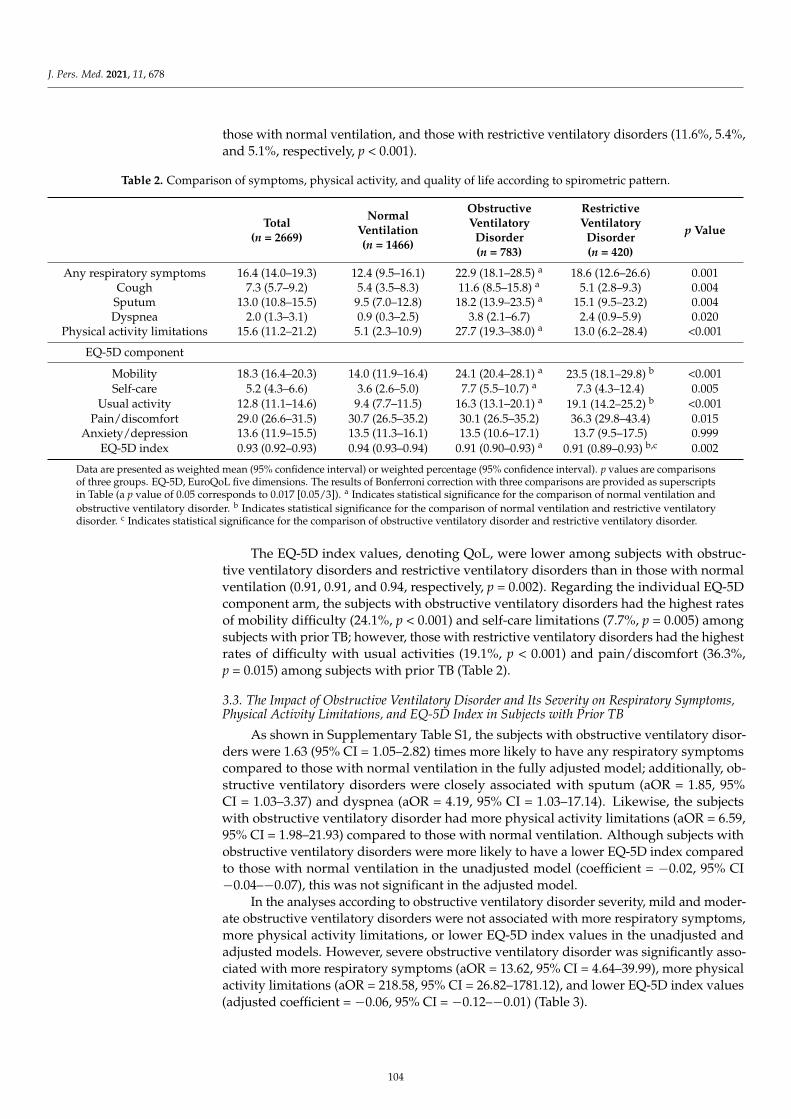
J. Pers. Med. 2021, 11, 678
those with normal ventilation, and those with restrictive ventilatory disorders (11.6%, 5.4%,and 5.1%, respectively, p < 0.001).
Table 2. Comparison of symptoms, physical activity, and quality of life according to spirometric pattern.
Total(n = 2669)
NormalVentilation(n = 1466)
ObstructiveVentilatory
Disorder(n = 783)
RestrictiveVentilatory
Disorder(n = 420)
p Value
Any respiratory symptoms 16.4 (14.0–19.3) 12.4 (9.5–16.1) 22.9 (18.1–28.5) a 18.6 (12.6–26.6) 0.001Cough 7.3 (5.7–9.2) 5.4 (3.5–8.3) 11.6 (8.5–15.8) a 5.1 (2.8–9.3) 0.004
Sputum 13.0 (10.8–15.5) 9.5 (7.0–12.8) 18.2 (13.9–23.5) a 15.1 (9.5–23.2) 0.004Dyspnea 2.0 (1.3–3.1) 0.9 (0.3–2.5) 3.8 (2.1–6.7) 2.4 (0.9–5.9) 0.020
Physical activity limitations 15.6 (11.2–21.2) 5.1 (2.3–10.9) 27.7 (19.3–38.0) a 13.0 (6.2–28.4) <0.001
EQ-5D component
Mobility 18.3 (16.4–20.3) 14.0 (11.9–16.4) 24.1 (20.4–28.1) a 23.5 (18.1–29.8) b <0.001Self-care 5.2 (4.3–6.6) 3.6 (2.6–5.0) 7.7 (5.5–10.7) a 7.3 (4.3–12.4) 0.005
Usual activity 12.8 (11.1–14.6) 9.4 (7.7–11.5) 16.3 (13.1–20.1) a 19.1 (14.2–25.2) b <0.001Pain/discomfort 29.0 (26.6–31.5) 30.7 (26.5–35.2) 30.1 (26.5–35.2) 36.3 (29.8–43.4) 0.015
Anxiety/depression 13.6 (11.9–15.5) 13.5 (11.3–16.1) 13.5 (10.6–17.1) 13.7 (9.5–17.5) 0.999EQ-5D index 0.93 (0.92–0.93) 0.94 (0.93–0.94) 0.91 (0.90–0.93) a 0.91 (0.89–0.93) b,c 0.002
Data are presented as weighted mean (95% confidence interval) or weighted percentage (95% confidence interval). p values are comparisonsof three groups. EQ-5D, EuroQoL five dimensions. The results of Bonferroni correction with three comparisons are provided as superscriptsin Table (a p value of 0.05 corresponds to 0.017 [0.05/3]). a Indicates statistical significance for the comparison of normal ventilation andobstructive ventilatory disorder. b Indicates statistical significance for the comparison of normal ventilation and restrictive ventilatorydisorder. c Indicates statistical significance for the comparison of obstructive ventilatory disorder and restrictive ventilatory disorder.
The EQ-5D index values, denoting QoL, were lower among subjects with obstruc-tive ventilatory disorders and restrictive ventilatory disorders than in those with normalventilation (0.91, 0.91, and 0.94, respectively, p = 0.002). Regarding the individual EQ-5Dcomponent arm, the subjects with obstructive ventilatory disorders had the highest ratesof mobility difficulty (24.1%, p < 0.001) and self-care limitations (7.7%, p = 0.005) amongsubjects with prior TB; however, those with restrictive ventilatory disorders had the highestrates of difficulty with usual activities (19.1%, p < 0.001) and pain/discomfort (36.3%,p = 0.015) among subjects with prior TB (Table 2).
3.3. The Impact of Obstructive Ventilatory Disorder and Its Severity on Respiratory Symptoms,Physical Activity Limitations, and EQ-5D Index in Subjects with Prior TB
As shown in Supplementary Table S1, the subjects with obstructive ventilatory disor-ders were 1.63 (95% CI = 1.05–2.82) times more likely to have any respiratory symptomscompared to those with normal ventilation in the fully adjusted model; additionally, ob-structive ventilatory disorders were closely associated with sputum (aOR = 1.85, 95%CI = 1.03–3.37) and dyspnea (aOR = 4.19, 95% CI = 1.03–17.14). Likewise, the subjectswith obstructive ventilatory disorder had more physical activity limitations (aOR = 6.59,95% CI = 1.98–21.93) compared to those with normal ventilation. Although subjects withobstructive ventilatory disorders were more likely to have a lower EQ-5D index comparedto those with normal ventilation in the unadjusted model (coefficient = −0.02, 95% CI−0.04–−0.07), this was not significant in the adjusted model.
In the analyses according to obstructive ventilatory disorder severity, mild and moder-ate obstructive ventilatory disorders were not associated with more respiratory symptoms,more physical activity limitations, or lower EQ-5D index values in the unadjusted andadjusted models. However, severe obstructive ventilatory disorder was significantly asso-ciated with more respiratory symptoms (aOR = 13.62, 95% CI = 4.64–39.99), more physicalactivity limitations (aOR = 218.58, 95% CI = 26.82–1781.12), and lower EQ-5D index values(adjusted coefficient = −0.06, 95% CI = −0.12–−0.01) (Table 3).
104
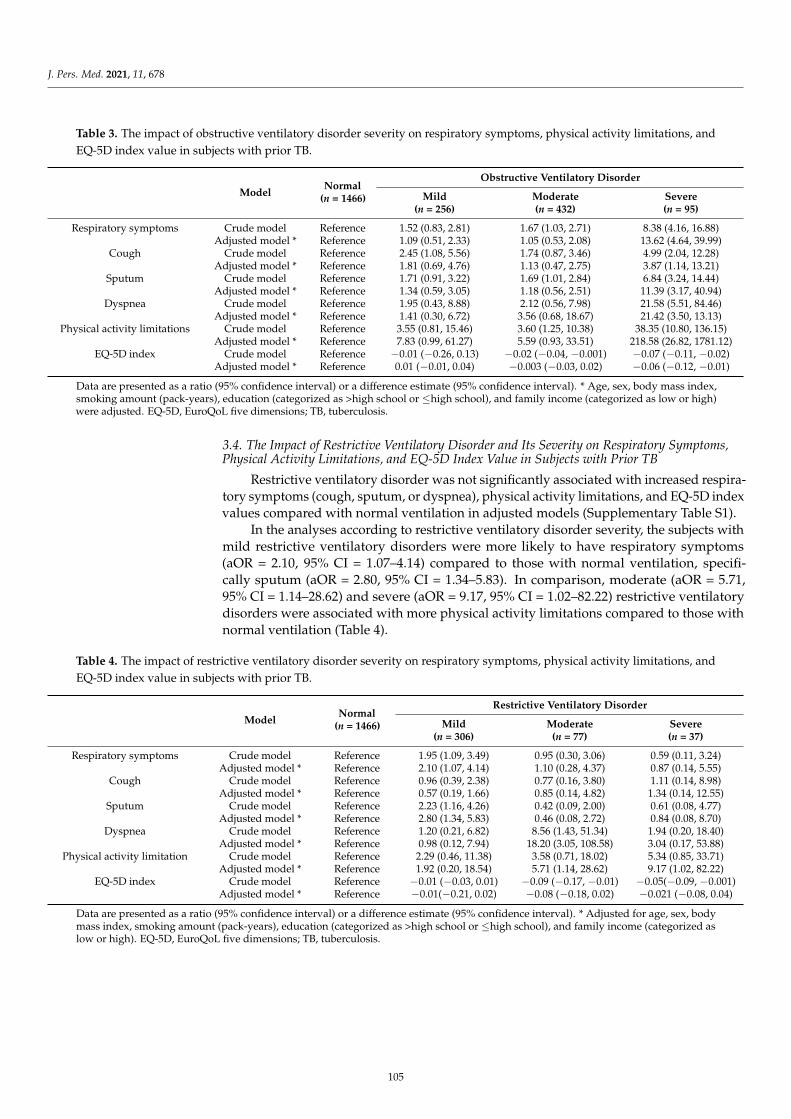
J. Pers. Med. 2021, 11, 678
Table 3. The impact of obstructive ventilatory disorder severity on respiratory symptoms, physical activity limitations, andEQ-5D index value in subjects with prior TB.
ModelNormal
(n = 1466)
Obstructive Ventilatory Disorder
Mild(n = 256)
Moderate(n = 432)
Severe(n = 95)
Respiratory symptoms Crude model Reference 1.52 (0.83, 2.81) 1.67 (1.03, 2.71) 8.38 (4.16, 16.88)Adjusted model * Reference 1.09 (0.51, 2.33) 1.05 (0.53, 2.08) 13.62 (4.64, 39.99)
Cough Crude model Reference 2.45 (1.08, 5.56) 1.74 (0.87, 3.46) 4.99 (2.04, 12.28)Adjusted model * Reference 1.81 (0.69, 4.76) 1.13 (0.47, 2.75) 3.87 (1.14, 13.21)
Sputum Crude model Reference 1.71 (0.91, 3.22) 1.69 (1.01, 2.84) 6.84 (3.24, 14.44)Adjusted model * Reference 1.34 (0.59, 3.05) 1.18 (0.56, 2.51) 11.39 (3.17, 40.94)
Dyspnea Crude model Reference 1.95 (0.43, 8.88) 2.12 (0.56, 7.98) 21.58 (5.51, 84.46)Adjusted model * Reference 1.41 (0.30, 6.72) 3.56 (0.68, 18.67) 21.42 (3.50, 13.13)
Physical activity limitations Crude model Reference 3.55 (0.81, 15.46) 3.60 (1.25, 10.38) 38.35 (10.80, 136.15)Adjusted model * Reference 7.83 (0.99, 61.27) 5.59 (0.93, 33.51) 218.58 (26.82, 1781.12)
EQ-5D index Crude model Reference −0.01 (−0.26, 0.13) −0.02 (−0.04, −0.001) −0.07 (−0.11, −0.02)Adjusted model * Reference 0.01 (−0.01, 0.04) −0.003 (−0.03, 0.02) −0.06 (−0.12, −0.01)
Data are presented as a ratio (95% confidence interval) or a difference estimate (95% confidence interval). * Age, sex, body mass index,smoking amount (pack-years), education (categorized as >high school or ≤high school), and family income (categorized as low or high)were adjusted. EQ-5D, EuroQoL five dimensions; TB, tuberculosis.
3.4. The Impact of Restrictive Ventilatory Disorder and Its Severity on Respiratory Symptoms,Physical Activity Limitations, and EQ-5D Index Value in Subjects with Prior TB
Restrictive ventilatory disorder was not significantly associated with increased respira-tory symptoms (cough, sputum, or dyspnea), physical activity limitations, and EQ-5D indexvalues compared with normal ventilation in adjusted models (Supplementary Table S1).
In the analyses according to restrictive ventilatory disorder severity, the subjects withmild restrictive ventilatory disorders were more likely to have respiratory symptoms(aOR = 2.10, 95% CI = 1.07–4.14) compared to those with normal ventilation, specifi-cally sputum (aOR = 2.80, 95% CI = 1.34–5.83). In comparison, moderate (aOR = 5.71,95% CI = 1.14–28.62) and severe (aOR = 9.17, 95% CI = 1.02–82.22) restrictive ventilatorydisorders were associated with more physical activity limitations compared to those withnormal ventilation (Table 4).
Table 4. The impact of restrictive ventilatory disorder severity on respiratory symptoms, physical activity limitations, andEQ-5D index value in subjects with prior TB.
ModelNormal
(n = 1466)
Restrictive Ventilatory Disorder
Mild(n = 306)
Moderate(n = 77)
Severe(n = 37)
Respiratory symptoms Crude model Reference 1.95 (1.09, 3.49) 0.95 (0.30, 3.06) 0.59 (0.11, 3.24)Adjusted model * Reference 2.10 (1.07, 4.14) 1.10 (0.28, 4.37) 0.87 (0.14, 5.55)
Cough Crude model Reference 0.96 (0.39, 2.38) 0.77 (0.16, 3.80) 1.11 (0.14, 8.98)Adjusted model * Reference 0.57 (0.19, 1.66) 0.85 (0.14, 4.82) 1.34 (0.14, 12.55)
Sputum Crude model Reference 2.23 (1.16, 4.26) 0.42 (0.09, 2.00) 0.61 (0.08, 4.77)Adjusted model * Reference 2.80 (1.34, 5.83) 0.46 (0.08, 2.72) 0.84 (0.08, 8.70)
Dyspnea Crude model Reference 1.20 (0.21, 6.82) 8.56 (1.43, 51.34) 1.94 (0.20, 18.40)Adjusted model * Reference 0.98 (0.12, 7.94) 18.20 (3.05, 108.58) 3.04 (0.17, 53.88)
Physical activity limitation Crude model Reference 2.29 (0.46, 11.38) 3.58 (0.71, 18.02) 5.34 (0.85, 33.71)Adjusted model * Reference 1.92 (0.20, 18.54) 5.71 (1.14, 28.62) 9.17 (1.02, 82.22)
EQ-5D index Crude model Reference −0.01 (−0.03, 0.01) −0.09 (−0.17, −0.01) −0.05(−0.09, −0.001)Adjusted model * Reference −0.01(−0.21, 0.02) −0.08 (−0.18, 0.02) −0.021 (−0.08, 0.04)
Data are presented as a ratio (95% confidence interval) or a difference estimate (95% confidence interval). * Adjusted for age, sex, bodymass index, smoking amount (pack-years), education (categorized as >high school or ≤high school), and family income (categorized aslow or high). EQ-5D, EuroQoL five dimensions; TB, tuberculosis.
105
J. Pers. Med. 2021, 11, 678
4. Discussion
To the best of our knowledge, this is the first study evaluating respiratory symptoms,physical activity limitations, and QoL according to ventilatory disorder type and severityin subjects with prior TB. Among subjects with prior TB, approximately 29% and 16%developed obstructive and restrictive ventilatory disorders, respectively. Severe obstructiveventilatory disorders were associated with more respiratory symptoms, more physicalactivity limitations, and poorer quality of life. Severe restrictive ventilatory disorder wasassociated with more physical activity limitations.
TB survivors frequently experience structural and functional lung sequelae that varyin severity [7]. For example, approximately 24–35% of TB survivors experience obstructiveventilatory disorders [20–22]. In agreement with previous reports, 29% of the subjectswith prior TB in this study had obstructive ventilatory disorders. Thus, developmentof obstructive ventilatory disorders can cause a concerning health-related burden in TBsurvivors. Subjects with prior TB also can experience restrictive ventilatory disorders.Post-TB survivors often show a fibrotic pattern on chest imaging due to the sequelae ofpulmonary TB including destruction of lung parenchyma [23]. Restrictive ventilatorydisorders occur in subjects with prior TB due to volume loss, lung scarring with reductionof pulmonary compliance, and an increase in elastic retraction pressure [24,25]. In contrastto the literature on obstructive ventilatory disorders, only a few studies have describedrestrictive ventilatory disorders, and the prevalence was reported to be 31–42% amongTB survivors [26,27]. The small number of patients in these studies (n = 107 and n = 33)limited the study findings [26,27]. Thus, our study had the advantage of confirming thesefindings with a larger number of subjects using a nationwide database.
As shown in previous studies [20,28], clinical factors associated with poorer QoL (e.g.,old age, male sex, smoking history, lower BMI, and lower education level) were morecommon in subjects with prior TB with obstructive ventilatory disorders than in thosewith normal ventilation. Approximately 72% of subjects with prior TB with obstructiveventilatory disorders in this study were current or ex-smokers. In line with this finding,smoking is a well-established factor associated with obstructive ventilatory disordersin subjects with prior TB [20]. However, little is known as to whether development ofobstructive ventilatory disorders associated with higher symptomatic burdens in post-TBsurvivors, as most previous studies focused on the presence of obstructive ventilatorydisorders and their severity after TB treatment [5,11,29]. From this perspective, our studyhas confirmed that the development of severe obstructive ventilatory disorders is associatedwith more respiratory symptoms, more physical activity limitations, and poorer QoLcompared to patients with normal ventilation; however, these findings were not significantin patients with mild-to-moderate obstructive ventilatory disorders. These results indicatethat regular health check-ups with pulmonary function measurement is necessary aftercompletion of TB treatment to detect obstructive ventilatory disorders early and provideappropriate treatment to prevent further lung function impairment. Recent studies alsosupport this suggestion in showing clinical improvement after bronchodilator treatment inTB-destroyed lung patients with obstructive ventilatory disorder [30,31].
Despite the prevalence of restrictive ventilatory disorders after TB, to the best ofour knowledge, no studies have evaluated the association between restrictive ventilatorydisorder and respiratory symptoms, physical activity limitations, and QoL in TB survivors.Our study revealed that respiratory symptoms and QoL were not significantly affected byrestrictive ventilatory disorders in subjects with prior TB, while physical activity limitationswere significant in subjects with prior TB with moderate-to-severe restrictive ventilatorydisorders. Restrictive ventilatory disorders might be an underappreciated cause of func-tional impairments and respiratory symptoms [32,33]. One study showed that 35.4% ofsubjects with restrictive ventilatory disorders reported at least one chronic respiratorysymptom [33]. One reason why our study results contrast with previous findings mightbe that most subjects with restrictive ventilatory disorders in our study had a mild degreeof restrictive abnormality; thus, the number of subjects with moderate-to-severe restric-
106
J. Pers. Med. 2021, 11, 678
tive ventilator disorders was relatively small. Accumulating evidence has shown thatrestrictive ventilatory disorders are related to physical activity limitations, which is in linewith our study results [34,35]. The significant association of moderate-to-severe restrictiveventilatory disorders with physical activity limitations, but not with respiratory symp-toms, suggests that restrictive ventilatory disorders influence physical activity limitationsthrough mechanisms that are at least partly independent of respiratory symptoms. De-creased lung or chest wall compliance and increased elastic work of breathing might be onemechanism underlying physical activity limitations in patients with advanced restrictiveventilatory disorders [36].
This study has several limitations. First, this study was performed among a representa-tive sample of Koreans. Thus, our data might not be generalizable to other ethnic groups orpopulations. Second, obstructive ventilatory disorders were defined by pre-bronchodilatorspirometric results. This might lead to overestimation of the prevalence of obstructiveventilatory disorders; however, our estimates were similar to previous studies [20]. Third,the relatively small number of subjects with prior TB with moderate-to-severe restrictiveventilatory disorders might lead to statistical nonsignificance when analyzing the impactof ventilatory disorder severity on respiratory symptoms or QoL. Fourth, because thisretrospective study used the Korea NHANES database that had been established beforewe designed this study, power calculations for sample size could not be performed duringthe design phase of the study. Fifth, there is a possibility that some subjects already hadventilatory disorders before Mycobacterium tuberculosis infection; however, in the KoreaNHANES database, spirometry results before TB were not available. Sixth, as the KoreaNHANES database does not provide some important clinical information that can affectrespiratory symptoms and quality of life, such as medication use or exacerbation history,we could not adjust for these factors.
5. Conclusions
Among TB survivors, 29% had obstructive ventilatory disorders and 16% had re-strictive ventilatory disorders. Severe obstructive ventilatory disorders were associatedwith an increased health-related burden, including more respiratory symptoms, morephysical activity limitations, and poorer QoL, while severe restrictive ventilatory disorderswere associated with more physical activity limitations. Further research is needed toestablish strategies for early diagnosis and adequate treatment of ventilatory disorders inTB survivors.
Supplementary Materials: The following are available online at https://www.mdpi.com/article/10.3390/jpm11070678/s1, Table S1: The impact of obstructive and restrictive ventilatory disorderson respiratory symptoms, physical activity limitations, and EQ-5D index values in subjects withprior TB.
Author Contributions: Conceptualization, H.Y.P. and H.L.; data curation, B.Y., H.C., and Y.K.; formalanalysis, B.Y. and H.C.; funding acquisition, B.Y.; H.C., H.Y.P. and H.L.; methodology, J.-Y.M., H.Y.P.and H.L.; supervision, H.Y.P. and H.L.; visualization, B.Y. and S.H.S.; H.C., H.Y.P. and H.L.; writing—original draft, B.Y.; H.C., H.Y.P. and H.L.; writing—review and editing, All authors have read andagreed to the published version of the manuscript.
Funding: This work was supported by a National Research Foundation of Korea (NRF) grantfunded by the Ministry of Science, Information, and Communications Technologies (MSIT) (No.2020R1F1A1070468 and No. 2021M3E5D1A0101517621 to HL) and by the Korea Medical DeviceDevelopment Fund grant funded by the Korean government (Ministry of Science and ICT, Ministryof Trade, Industry and Energy, the Ministry of Health and Welfare, the Ministry of Food and DrugSafety) (Project Number: KMDF_PR_20200901_0214-2021-03 to HL).
Institutional Review Board Statement: The study protocol was approved by the Institutional ReviewBoard of Chungbuk National University Hospital (application no. 2021-01-041).
Informed Consent Statement: Not applicable.
107
J. Pers. Med. 2021, 11, 678
Data Availability Statement: The data presented in this study are available on request from thecorresponding author.
Conflicts of Interest: The authors have no conflict of interest to declare.
References1. World Health Organization. Global Tuberculosis Report 2020: Executive Summary; WHO: Geneva, Switzerland, 2020.2. Meghji, J.; Lesosky, M.; Joekes, E.; Banda, P.; Rylance, J.; Gordon, S.; Jacob, J.; Zonderland, H.; MacPherson, P.; Corbett, E.L.; et al.
Patient outcomes associated with post-tuberculosis lung damage in Malawi: A prospective cohort study. Thorax 2020, 75, 269–278.[CrossRef] [PubMed]
3. Hnizdo, E.; Singh, T.; Churchyard, G. Chronic pulmonary function impairment caused by initial and recurrent pulmonarytuberculosis following treatment. Thorax 2000, 55, 32–38. [CrossRef]
4. Plit, M.L.; Anderson, R.; Van Rensburg, C.E.; Page-Shipp, L.; Blott, J.A.; Fresen, J.L.; Feldman, C. Influence of antimicrobialchemotherapy on spirometric parameters and pro-inflammatory indices in severe pulmonary tuberculosis. Eur. Respir. J. 1998, 12,351–356. [CrossRef] [PubMed]
5. Ross, J.; Ehrlich, R.I.; Hnizdo, E.; White, N.; Churchyard, G.J. Excess lung function decline in gold miners following pulmonarytuberculosis. Thorax 2010, 65, 1010–1015. [CrossRef] [PubMed]
6. Maguire, G.P.; Anstey, N.M.; Ardian, M.; Waramori, G.; Tjitra, E.; Kenangalem, E.; Handojo, T.; Kelly, P.M. Pulmonary tuberculosis,impaired lung function, disability and quality of life in a high-burden setting. Int. J. Tuberc. Lung Dis. 2009, 13, 1500–1506.[PubMed]
7. Pasipanodya, J.G.; McNabb, S.J.; Hilsenrath, P.; Bae, S.; Lykens, K.; Vecino, E.; Munguia, G.; Miller, T.L.; Drewyer, G.; Weis, S.E.Pulmonary impairment after tuberculosis and its contribution to TB burden. BMC Public Health 2010, 10, 259. [CrossRef]
8. Ravimohan, S.; Kornfeld, H.; Weissman, D.; Bisson, G.P. Tuberculosis and lung damage: From epidemiology to pathophysiology.Eur. Respir. Rev. 2018, 27. [CrossRef]
9. Rhee, C.K.; Yoo, K.H.; Lee, J.H.; Park, M.J.; Kim, W.J.; Park, Y.B.; Hwang, Y.I.; Kim, Y.S.; Jung, J.Y.; Moon, J.Y.; et al. Clinicalcharacteristics of patients with tuberculosis-destroyed lung. Int. J. Tuberc. Lung Dis. 2013, 17, 67–75. [CrossRef]
10. Ralph, A.P.; Kenangalem, E.; Waramori, G.; Pontororing, G.J.; Sandjaja; Tjitra, E.; Maguire, G.P.; Kelly, P.M.; Anstey, N.M. Highmorbidity during treatment and residual pulmonary disability in pulmonary tuberculosis: Under-recognised phenomena. PLoSONE 2013, 8, e80302. [CrossRef]
11. Ehrlich, R.I.; Adams, S.; Baatjies, R.; Jeebhay, M.F. Chronic airflow obstruction and respiratory symptoms following tuberculosis:A review of South African studies. Int. J. Tuberc. Lung Dis. 2011, 15, 886–891. [CrossRef] [PubMed]
12. Manji, M.; Shayo, G.; Mamuya, S.; Mpembeni, R.; Jusabani, A.; Mugusi, F. Lung functions among patients with pulmonarytuberculosis in Dar es Salaam—A cross-sectional study. BMC Pulm. Med. 2016, 16, 58. [CrossRef]
13. Rabin, R.; de Charro, F. EQ-5D: A measure of health status from the EuroQol Group. Ann. Med. 2001, 33, 337–343. [CrossRef]14. Miller, M.R.; Hankinson, J.; Brusasco, V.; Burgos, F.; Casaburi, R.; Coates, A.; Crapo, R.; Enright, P.v.; Van der Grinten, C.;
Gustafsson, P. Standardisation of spirometry. Eur. Respir. J. 2005, 26, 319–338. [CrossRef]15. Choi, J.K.; Paek, D.; Lee, J.O. Normal predictive values of spirometry in Korean population. Tuberc. Respir. Dis. 2005, 58, 230–242.
[CrossRef]16. Lee, H.; Shin, S.H.; Gu, S.; Zhao, D.; Kang, D.; Joi, Y.R.; Suh, G.Y.; Pastor-Barriuso, R.; Guallar, E.; Cho, J.; et al. Racial differences in
comorbidity profile among patients with chronic obstructive pulmonary disease. BMC Med. 2018, 16, 178. [CrossRef] [PubMed]17. Lange, P.; Celli, B.; Agustí, A.; Boje Jensen, G.; Divo, M.; Faner, R.; Guerra, S.; Marott, J.L.; Martinez, F.D.; Martinez-Camblor,
P.; et al. Lung-Function Trajectories Leading to Chronic Obstructive Pulmonary Disease. N. Engl. J. Med. 2015, 373, 111–122.[CrossRef] [PubMed]
18. Rabe, K.F.; Hurd, S.; Anzueto, A.; Barnes, P.J.; Buist, S.A.; Calverley, P.; Fukuchi, Y.; Jenkins, C.; Rodriguez-Roisin, R.; van Weel, C.;et al. Global strategy for the diagnosis, management, and prevention of chronic obstructive pulmonary disease: GOLD executivesummary. Am. J. Respir. Crit. Care Med. 2007, 176, 532–555. [CrossRef]
19. Sim, Y.S.; Lee, J.H.; Lee, W.Y.; Suh, D.I.; Oh, Y.M.; Yoon, J.S.; Lee, J.H.; Cho, J.H.; Kwon, C.S.; Chang, J.H. Spirometry andBronchodilator Test. Tuberc. Respir. Dis. 2017, 80, 105–112. [CrossRef] [PubMed]
20. Jung, J.W.; Choi, J.C.; Shin, J.W.; Kim, J.Y.; Choi, B.W.; Park, I.W. Pulmonary Impairment in Tuberculosis Survivors: The KoreanNational Health and Nutrition Examination Survey 2008–2012. PLoS ONE 2015, 10, e0141230. [CrossRef] [PubMed]
21. Lam, K.B.; Jiang, C.Q.; Jordan, R.E.; Miller, M.R.; Zhang, W.S.; Cheng, K.K.; Lam, T.H.; Adab, P. Prior TB, smoking, and airflowobstruction: A cross-sectional analysis of the Guangzhou Biobank Cohort Study. Chest 2010, 137, 593–600. [CrossRef]
22. Snider, G.L.; Doctor, L.; Demas, T.A.; Shaw, A.R. Obstructive airway disease in patients with treated pulmonary tuberculosis. Am.Rev. Respir. Dis. 1971, 103, 625–640. [CrossRef] [PubMed]
23. Pasipanodya, J.G.; Vecino, E.; Miller, T.L.; Munguia, G.; Drewyer, G.; Fernandez, M.; Slocum, P.; Weis, S.E. Non-hispanic whiteshave higher risk for pulmonary impairment from pulmonary tuberculosis. BMC Public Health 2012, 12, 119. [CrossRef] [PubMed]
24. Di Naso, F.C.; Pereira, J.S.; Schuh, S.J.; Unis, G. Functional evaluation in patients with pulmonary tuberculosis sequelae. Rev. Port.Pneumol. 2011, 17, 216–221. [CrossRef]
25. Miguel-Reyes, J.L.; Gochicoa-Rangel, L.; Pérez-Padilla, R.; Torre-Bouscoulet, L. Functional respiratory assessment in interstitiallung disease. Rev. Investig. Clin. 2015, 67, 5–14.
108
J. Pers. Med. 2021, 11, 678
26. Pasipanodya, J.G.; Miller, T.L.; Vecino, M.; Munguia, G.; Garmon, R.; Bae, S.; Drewyer, G.; Weis, S.E. Pulmonary impairment aftertuberculosis. Chest 2007, 131, 1817–1824. [CrossRef]
27. De Vallière, S.; Barker, R.D. Residual lung damage after completion of treatment for multidrug-resistant tuberculosis. Int. J. Tuberc.Lung Dis. 2004, 8, 767–771.
28. Gandhi, K.; Gupta, S.; Singla, R. Risk factors associated with development of pulmonary impairment after tuberculosis. Indian J.Tuberc. 2016, 63, 34–38. [CrossRef] [PubMed]
29. Willcox, P.A.; Ferguson, A.D. Chronic obstructive airways disease following treated pulmonary tuberculosis. Respir. Med. 1989,83, 195–198. [CrossRef]
30. Kim, C.-J.; Yoon, H.-K.; Park, M.-J.; Yoo, K.-H.; Jung, K.-S.; Park, J.-W.; Lim, S.Y.; Shim, J.J.; Lee, Y.C.; Kim, Y.-S.; et al. Inhaledindacaterol for the treatment of COPD patients with destroyed lung by tuberculosis and moderate-to-severe airflow limitation:Results from the randomized INFINITY study. Int. J. Chronic Obstruct. Pulmon. Dis. 2017, 12, 1589–1596. [CrossRef]
31. Kim, H.C.; Kim, T.H.; Kim, Y.-J.; Rhee, C.K.; Oh, Y.-M. Effect of tiotropium inhaler use on mortality in patients with tuberculousdestroyed lung: Based on linkage between hospital and nationwide health insurance claims data in South Korea. Respir. Res.2019, 20, 85. [CrossRef] [PubMed]
32. Godfrey, M.S.; Jankowich, M.D. The Vital Capacity Is Vital: Epidemiology and Clinical Significance of the Restrictive SpirometryPattern. Chest 2016, 149, 238–251. [CrossRef] [PubMed]
33. Mannino, D.M.; Doherty, D.E.; Sonia Buist, A. Global Initiative on Obstructive Lung Disease (GOLD) classification of lung diseaseand mortality: Findings from the Atherosclerosis Risk in Communities (ARIC) study. Respir. Med. 2006, 100, 115–122. [CrossRef]
34. Chung, S.J.; Kim, H.I.; Yang, B.; Kim, T.; Sim, Y.S.; Kang, H.K.; Kim, S.H.; Yoon, H.J.; Choi, H.; Lee, H. Impact of the severity ofrestrictive spirometric pattern on nutrition, physical activity, and quality of life: Results from a nationally representative database.Sci. Rep. 2020, 10, 19672. [CrossRef] [PubMed]
35. Guerra, S.; Sherrill, D.L.; Venker, C.; Ceccato, C.M.; Halonen, M.; Martinez, F.D. Morbidity and mortality associated with therestrictive spirometric pattern: A longitudinal study. Thorax 2010, 65, 499–504. [CrossRef]
36. Nonato, N.L.; Nascimento, O.A.; Padilla, R.P.; de Oca, M.M.; Tálamo, C.; Valdivia, G.; Lisboa, C.; López, M.V.; Celli, B.; Menezes,A.M.; et al. Occurrence of respiratory symptoms in persons with restrictive ventilatory impairment compared with persons withchronic obstructive pulmonary disease: The PLATINO study. Chronic Respir. Dis. 2015, 12, 264–273. [CrossRef] [PubMed]
109

Citation: Wu, F.-Z.; Wu, Y.-J.;
Chen, C.-S.; Yang, S.-C. Impact of
Smoking Status on Lung Cancer
Characteristics and Mortality Rates
between Screened and Non-Screened
Lung Cancer Cohorts: Real-World
Knowledge Translation and
Education. J. Pers. Med. 2022, 12, 26.
https://doi.org/10.3390/jpm
12010026
Academic Editor: Rutger A.
Middelburg
Received: 19 October 2021
Accepted: 15 November 2021
Published: 2 January 2022
Publisher’s Note: MDPI stays neutral
with regard to jurisdictional claims in
published maps and institutional affil-
iations.
Copyright: © 2022 by the authors.
Licensee MDPI, Basel, Switzerland.
This article is an open access article
distributed under the terms and
conditions of the Creative Commons
Attribution (CC BY) license (https://
creativecommons.org/licenses/by/
4.0/).
Journal of
Personalized
Medicine
Article
Impact of Smoking Status on Lung Cancer Characteristics andMortality Rates between Screened and Non-Screened LungCancer Cohorts: Real-World Knowledge Translationand EducationFu-Zong Wu 1,2,3,4,5 , Yun-Ju Wu 2, Chi-Shen Chen 6 and Shu-Ching Yang 1,*
1 Institute of Education, National Sun Yat-sen University, 70, Lien-Hai Road, Kaohsiung 80424, Taiwan;[email protected]
2 Department of Radiology, Kaohsiung Veterans General Hospital, Kaohsiung 81362, Taiwan;[email protected]
3 Department of Medical Research and Education, Kaohsiung Veterans General Hospital,Kaohsiung 81362, Taiwan
4 Faculty of Medicine, School of Medicine, National Yang Ming Chiao Tung University, Taipei 11221, Taiwan5 Faculty of Clinical Medicine, National Yang Ming Chiao Tung University, Taipei 11221, Taiwan6 Physical Examination Center, Kaohsiung Veterans General Hospital, Kaohsiung 81362, Taiwan;
[email protected]* Correspondence: [email protected]
Abstract: This was a retrospective hospital-based cohort study of participants diagnosed with lungcancer in the lung cancer register database, and our goal was to evaluate the impact of smoking andscreening status on lung cancer characteristics and clinical outcomes. According to the hospital-basedlung cancer register database, a total of 2883 lung cancers were diagnosed in 2883 patients betweenJanuary 2007 and September 2017, which were divided into four groups according to smoking andscreening status. A comparison was performed in terms of clinical characteristics and outcomes oflung cancer between the four groups. For non-smokers, age, gender, screened status, tumor size,targeted therapy, and curative surgery were independent prognostic factors of overall survival forlung cancer subjects. However, screened status and gender were not significant prognostic factors forlung cancer survival in smokers with lung cancer. For the non-smoker group, about 4.9% of lungcancer subjects (N = 81) were detected by screening. However, only 0.97% of lung cancer subjects(N = 12) were detected by screening in smokers. This could be attributed to smokers’ negativeattitudes and low socioeconomic status preventing LDCT lung cancer screening. In summary, ourreal-world data suggest that effectively encouraging smokers to be more willing to participate inlung cancer screening programs with screening allowance and educational training in the future is animportant issue.
Keywords: lung cancer screening; smoking; willingness to screen; education
1. Introduction
Lung cancer is the most common cause of cancer-related death among both menand women worldwide in recent years, and about 70% of lung cancers are diagnosed atan advanced stage with poor survival outcomes [1–3]. Recent systematic reviews andmeta-analyses across 31 randomized control trials (RCTs) have demonstrated the pro-longed, substantial survival benefit of low-dose computed tomography (LDCT) for lungcancer screening in high-risk heavy smokers, with a 20% reduction in lung-cancer-specificmortality compared with the control group [4].
In recent years, several previous studies have emphasized the importance of a lungcancer screening program in the population with a high prevalence of non-smoking-related
111
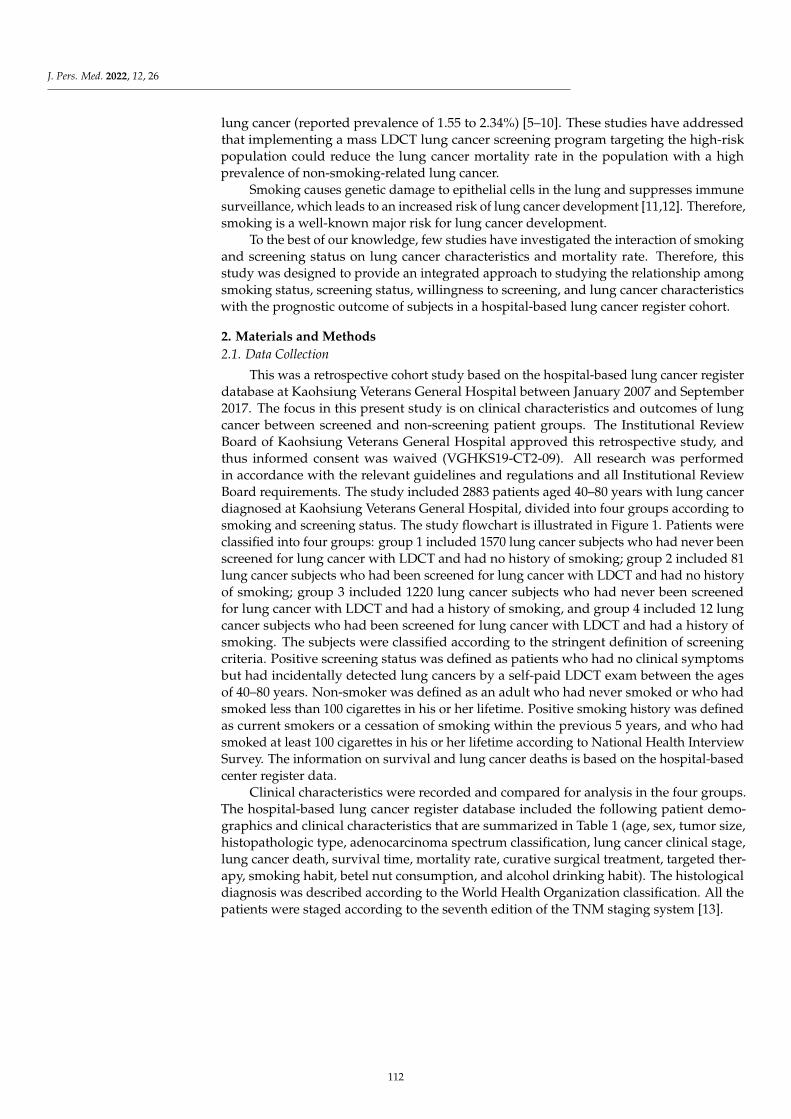
J. Pers. Med. 2022, 12, 26
lung cancer (reported prevalence of 1.55 to 2.34%) [5–10]. These studies have addressedthat implementing a mass LDCT lung cancer screening program targeting the high-riskpopulation could reduce the lung cancer mortality rate in the population with a highprevalence of non-smoking-related lung cancer.
Smoking causes genetic damage to epithelial cells in the lung and suppresses immunesurveillance, which leads to an increased risk of lung cancer development [11,12]. Therefore,smoking is a well-known major risk for lung cancer development.
To the best of our knowledge, few studies have investigated the interaction of smokingand screening status on lung cancer characteristics and mortality rate. Therefore, thisstudy was designed to provide an integrated approach to studying the relationship amongsmoking status, screening status, willingness to screening, and lung cancer characteristicswith the prognostic outcome of subjects in a hospital-based lung cancer register cohort.
2. Materials and Methods2.1. Data Collection
This was a retrospective cohort study based on the hospital-based lung cancer registerdatabase at Kaohsiung Veterans General Hospital between January 2007 and September2017. The focus in this present study is on clinical characteristics and outcomes of lungcancer between screened and non-screening patient groups. The Institutional ReviewBoard of Kaohsiung Veterans General Hospital approved this retrospective study, andthus informed consent was waived (VGHKS19-CT2-09). All research was performedin accordance with the relevant guidelines and regulations and all Institutional ReviewBoard requirements. The study included 2883 patients aged 40–80 years with lung cancerdiagnosed at Kaohsiung Veterans General Hospital, divided into four groups according tosmoking and screening status. The study flowchart is illustrated in Figure 1. Patients wereclassified into four groups: group 1 included 1570 lung cancer subjects who had never beenscreened for lung cancer with LDCT and had no history of smoking; group 2 included 81lung cancer subjects who had been screened for lung cancer with LDCT and had no historyof smoking; group 3 included 1220 lung cancer subjects who had never been screenedfor lung cancer with LDCT and had a history of smoking, and group 4 included 12 lungcancer subjects who had been screened for lung cancer with LDCT and had a history ofsmoking. The subjects were classified according to the stringent definition of screeningcriteria. Positive screening status was defined as patients who had no clinical symptomsbut had incidentally detected lung cancers by a self-paid LDCT exam between the agesof 40–80 years. Non-smoker was defined as an adult who had never smoked or who hadsmoked less than 100 cigarettes in his or her lifetime. Positive smoking history was definedas current smokers or a cessation of smoking within the previous 5 years, and who hadsmoked at least 100 cigarettes in his or her lifetime according to National Health InterviewSurvey. The information on survival and lung cancer deaths is based on the hospital-basedcenter register data.
Clinical characteristics were recorded and compared for analysis in the four groups.The hospital-based lung cancer register database included the following patient demo-graphics and clinical characteristics that are summarized in Table 1 (age, sex, tumor size,histopathologic type, adenocarcinoma spectrum classification, lung cancer clinical stage,lung cancer death, survival time, mortality rate, curative surgical treatment, targeted ther-apy, smoking habit, betel nut consumption, and alcohol drinking habit). The histologicaldiagnosis was described according to the World Health Organization classification. All thepatients were staged according to the seventh edition of the TNM staging system [13].
112
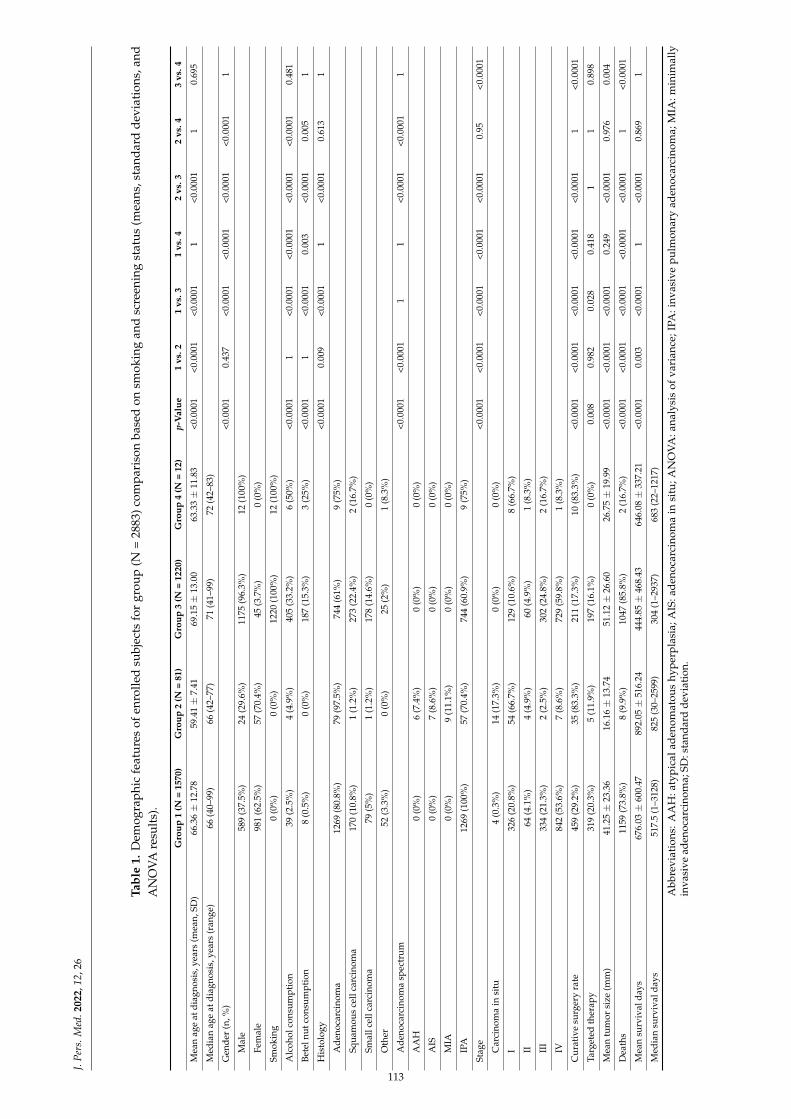
J.Pe
rs.M
ed.2
022,
12,2
6
Tabl
e1.
Dem
ogra
phi
cfe
atu
res
ofen
rolle
dsu
bjec
tsfo
rgr
oup
(N=
2883
)com
par
ison
base
don
smok
ing
and
scre
enin
gst
atu
s(m
eans
,sta
ndar
dd
evia
tion
s,an
dA
NO
VAre
sult
s).
Gro
up1
(N=
1570
)G
roup
2(N
=81
)G
roup
3(N
=12
20)
Gro
up4
(N=
12)
p-V
alue
1vs
.21
vs.3
1vs
.42
vs.3
2vs
.43
vs.4
Mea
nag
eat
diag
nosi
s,ye
ars
(mea
n,SD
)66
.36±
12.7
859
.41±
7.41
69.1
5±
13.0
063
.33±
11.8
3<0
.000
1<0
.000
1<0
.000
11
<0.0
001
10.
695
Med
ian
age
atdi
agno
sis,
year
s(r
ange
)66
(40–
99)
66(4
2–77
)71
(41–
99)
72(4
2–83
)
Gen
der
(n,%
)<0
.000
10.
437
<0.0
001
<0.0
001
<0.0
001
<0.0
001
1
Mal
e58
9(3
7.5%
)24
(29.
6%)
1175
(96.
3%)
12(1
00%
)
Fem
ale
981
(62.
5%)
57(7
0.4%
)45
(3.7
%)
0(0
%)
Smok
ing
0(0
%)
0(0
%)
1220
(100
%)
12(1
00%
)
Alc
ohol
cons
umpt
ion
39(2
.5%
)4
(4.9
%)
405
(33.
2%)
6(5
0%)
<0.0
001
1<0
.000
1<0
.000
1<0
.000
1<0
.000
10.
481
Bete
lnut
cons
umpt
ion
8(0
.5%
)0
(0%
)18
7(1
5.3%
)3
(25%
)<0
.000
11
<0.0
001
0.00
3<0
.000
10.
005
1
His
tolo
gy<0
.000
10.
009
<0.0
001
1<0
.000
10.
613
1
Ade
noca
rcin
oma
1269
(80.
8%)
79(9
7.5%
)74
4(6
1%)
9(7
5%)
Squa
mou
sce
llca
rcin
oma
170
(10.
8%)
1(1
.2%
)27
3(2
2.4%
)2
(16.
7%)
Smal
lcel
lcar
cino
ma
79(5
%)
1(1
.2%
)17
8(1
4.6%
)0
(0%
)
Oth
er52
(3.3
%)
0(0
%)
25(2
%)
1(8
.3%
)
Ade
noca
rcin
oma
spec
trum
<0.0
001
<0.0
001
11
<0.0
001
<0.0
001
1
AA
H0
(0%
)6
(7.4
%)
0(0
%)
0(0
%)
AIS
0(0
%)
7(8
.6%
)0
(0%
)0
(0%
)
MIA
0(0
%)
9(1
1.1%
)0
(0%
)0
(0%
)
IPA
1269
(100
%)
57(7
0.4%
)74
4(6
0.9%
)9
(75%
)
Stag
e<0
.000
1<0
.000
1<0
.000
1<0
.000
1<0
.000
10.
95<0
.000
1
Car
cino
ma
insi
tu4
(0.3
%)
14(1
7.3%
)0
(0%
)0
(0%
)
I32
6(2
0.8%
)54
(66.
7%)
129
(10.
6%)
8(6
6.7%
)
II64
(4.1
%)
4(4
.9%
)60
(4.9
%)
1(8
.3%
)
III
334
(21.
3%)
2(2
.5%
)30
2(2
4.8%
)2
(16.
7%)
IV84
2(5
3.6%
)7
(8.6
%)
729
(59.
8%)
1(8
.3%
)
Cur
ativ
esu
rger
yra
te45
9(2
9.2%
)35
(83.
3%)
211
(17.
3%)
10(8
3.3%
)<0
.000
1<0
.000
1<0
.000
1<0
.000
1<0
.000
11
<0.0
001
Targ
eted
ther
apy
319
(20.
3%)
5(1
1.9%
)19
7(1
6.1%
)0
(0%
)0.
008
0.98
20.
028
0.41
81
10.
898
Mea
ntu
mor
size
(mm
)41
.25±
23.3
616
.16±
13.7
451
.12±
26.6
026
.75±
19.9
9<0
.000
1<0
.000
1<0
.000
10.
249
<0.0
001
0.97
60.
004
Dea
ths
1159
(73.
8%)
8(9
.9%
)10
47(8
5.8%
)2
(16.
7%)
<0.0
001
<0.0
001
<0.0
001
<0.0
001
<0.0
001
1<0
.000
1
Mea
nsu
rviv
alda
ys67
6.03
±60
0.47
892.
05±
516.
2444
4.85
±46
8.43
646.
08±
337.
21<0
.000
10.
003
<0.0
001
1<0
.000
10.
869
1
Med
ian
surv
ival
days
517.
5(1
–312
8)82
5(3
0–25
99)
304
(1–2
937)
683
(22–
1217
)
Abb
revi
atio
ns:
AA
H:a
typ
ical
aden
omat
ous
hyp
erp
lasi
a;A
IS:a
den
ocar
cino
ma
insi
tu;A
NO
VA
:ana
lysi
sof
vari
ance
;IPA
:inv
asiv
ep
ulm
onar
yad
enoc
arci
nom
a;M
IA:m
inim
ally
inva
sive
aden
ocar
cino
ma;
SD:s
tand
ard
devi
atio
n.
113
J. Pers. Med. 2022, 12, 26J. Pers. Med. 2021, 11, x FOR PEER REVIEW 3 of 10
Figure 1. Flowchart of patient recruitment. Patients were classified into four groups according to smoking and screening status.
Table 1. Demographic features of enrolled subjects for group (N = 2883) comparison based on smoking and screening status (means, standard deviations, and ANOVA results).
Group 1 (N = 1570)
Group 2 (N = 81)
Group 3 (N = 1220)
Group 4 (N = 12)
p-Value 1 vs. 2 1 vs. 3 1 vs. 4 2 vs. 3 2 vs. 4 3 vs.
4 Mean age at diagnosis, years (mean, SD)
66.36 ± 12.78 59.41 ± 7.41 69.15 ± 13.00 63.33 ± 11.83 <0.0001 <0.0001 <0.0001 1 <0.0001 1 0.695
Median age at diagnosis, years (range)
66 (40–99) 66 (42–77) 71 (41–99) 72 (42–83)
Gender (n, %) <0.0001 0.437 <0.0001 <0.0001 <0.0001 <0.0001 1 Male 589 (37.5%) 24 (29.6%) 1175 (96.3%) 12 (100%) Female 981 (62.5%) 57 (70.4%) 45 (3.7%) 0 (0%)
Smoking 0 (0%) 0 (0%) 1220 (100%) 12 (100%) Alcohol consumption 39 (2.5%) 4 (4.9%) 405 (33.2%) 6 (50%) <0.0001 1 <0.0001 <0.0001 <0.0001 <0.0001 0.481 Betel nut consumption 8 (0.5%) 0 (0%) 187 (15.3%) 3 (25%) <0.0001 1 <0.0001 0.003 <0.0001 0.005 1 Histology <0.0001 0.009 <0.0001 1 <0.0001 0.613 1
Adenocarcinoma 1269 (80.8%) 79 (97.5%) 744 (61%) 9 (75%) Squamous cell carcinoma 170 (10.8%) 1 (1.2%) 273 (22.4%) 2 (16.7%) Small cell carcinoma 79 (5%) 1 (1.2%) 178 (14.6%) 0 (0%) Other 52 (3.3%) 0 (0%) 25 (2%) 1 (8.3%)
Adenocarcinoma spectrum <0.0001 <0.0001 1 1 <0.0001 <0.0001 1 AAH 0 (0%) 6 (7.4%) 0 (0%) 0 (0%) AIS 0 (0%) 7 (8.6%) 0 (0%) 0 (0%) MIA 0 (0%) 9 (11.1%) 0 (0%) 0 (0%) IPA 1269 (100%) 57 (70.4%) 744 (60.9%) 9 (75%)
Stage <0.0001 <0.0001 <0.0001 <0.0001 <0.0001 0.95 <0.00
01 Carcinoma in situ 4 (0.3%) 14 (17.3%) 0 (0%) 0 (0%) I 326 (20.8%) 54 (66.7%) 129 (10.6%) 8 (66.7%) II 64 (4.1%) 4 (4.9%) 60 (4.9%) 1 (8.3%) III 334 (21.3%) 2 (2.5%) 302 (24.8%) 2 (16.7%) IV 842 (53.6%) 7 (8.6%) 729 (59.8%) 1 (8.3%)
Curative surgery rate 459 (29.2%) 35 (83.3%) 211 (17.3%) 10 (83.3%) <0.0001 <0.0001 <0.0001 <0.0001 <0.0001 1 <0.00
01 Targeted therapy 319 (20.3%) 5 (11.9%) 197 (16.1%) 0 (0%) 0.008 0.982 0.028 0.418 1 1 0.898 Mean tumor size (mm) 41.25 ± 23.36 16.16 ± 13.74 51.12 ± 26.60 26.75 ± 19.99 <0.0001 <0.0001 <0.0001 0.249 <0.0001 0.976 0.004
Deaths 1159 (73.8%) 8 (9.9%) 1047 (85.8%) 2 (16.7%) <0.0001 <0.0001 <0.0001 <0.0001 <0.0001 1 <0.00
01
Mean survival days 676.03 ± 600.47 892.05 ± 516.24
444.85 ± 468.43 646.08 ± 337.21
<0.0001 0.003 <0.0001 1 <0.0001 0.869 1
Figure 1. Flowchart of patient recruitment. Patients were classified into four groups according tosmoking and screening status.
2.2. Statistical Analysis
The patient demographics and clinical characteristics are expressed as mean ± stan-dard deviation (SD) or median (interquartile range, IQR) and frequency (%) for group com-parison. Multiple group comparisons were completed by analysis of variance (ANOVA)for normally distributed data and Kruskal–Wallis test for skewed data. We used the Kol-mogorov test to assess the normality assumption in analysis of variance. We used thepost hoc Bonferroni test to analyze the differences between each group. Cox regressionanalysis was performed to calculate and compare the survival rate between screened andnon-screening groups in smokers and non-smokers. The proportional hazards assumptionrefers to the fact that the hazard functions are multiplicatively related. A multivariateanalysis was used to estimate the hazard ratios (HRs) based on the Cox regression model,adjusted for age, gender, smoking, alcohol consumption, betel nut consumption, tumor size,curative surgery, targeted therapy, histology, and screening status. All statistical analyseswere performed with SPSS 18.0 for Windows (SPSS Inc, Chicago, IL). A p-value of 0.05 wasregarded as significant.
3. Results
The baseline characteristics of lung cancer subjects classified into four groups accordingto the screened and smoking status are shown in Table 1. There were statistically significantdifferences across the four groups for the clinical characteristics and outcomes demonstratedby one-way ANOVA. Bonferroni post hoc test results (inter-group comparison) are alsoshown in Table 1.
3.1. Non-Smokers in Two-Group Comparison
For non-smokers, the general characteristics and outcomes of the lung cancer subjectsbetween the screened and non-screened groups are summarized in Supplemental Table S1.Table 2 summarizes the mortality and survival analysis according to screened and non-screened status for non-smokers. For non-smokers, patients in the screened group hadlower overall mortality than those in the non-screened group. One- and five-year mortalityrates increased significantly from the screened group to the non-screened group (p < 0.001for all). The mean survival time for the screened group was 892.05 ± 516.24 days (median825 days), and the mean survival for the non-screened group was 676.03 ± 600.47 days(median 517.5 days).
114
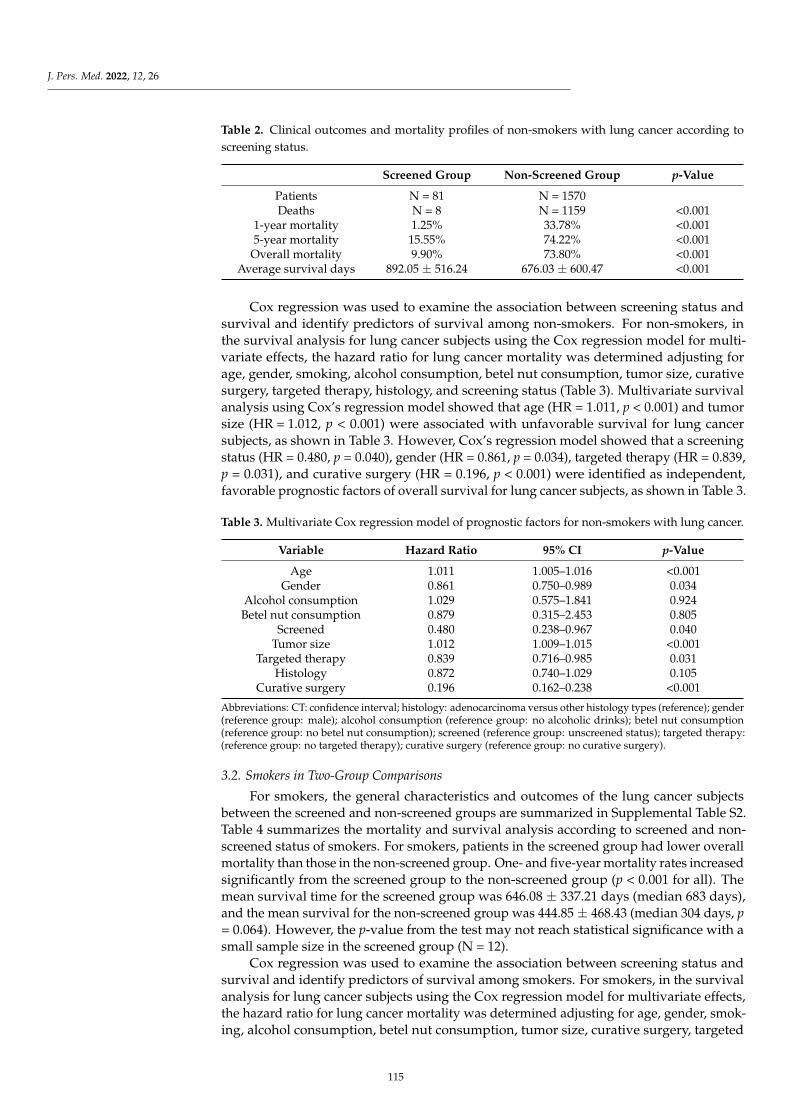
J. Pers. Med. 2022, 12, 26
Table 2. Clinical outcomes and mortality profiles of non-smokers with lung cancer according toscreening status.
Screened Group Non-Screened Group p-Value
Patients N = 81 N = 1570Deaths N = 8 N = 1159 <0.001
1-year mortality 1.25% 33.78% <0.0015-year mortality 15.55% 74.22% <0.001
Overall mortality 9.90% 73.80% <0.001Average survival days 892.05 ± 516.24 676.03 ± 600.47 <0.001
Cox regression was used to examine the association between screening status andsurvival and identify predictors of survival among non-smokers. For non-smokers, inthe survival analysis for lung cancer subjects using the Cox regression model for multi-variate effects, the hazard ratio for lung cancer mortality was determined adjusting forage, gender, smoking, alcohol consumption, betel nut consumption, tumor size, curativesurgery, targeted therapy, histology, and screening status (Table 3). Multivariate survivalanalysis using Cox’s regression model showed that age (HR = 1.011, p < 0.001) and tumorsize (HR = 1.012, p < 0.001) were associated with unfavorable survival for lung cancersubjects, as shown in Table 3. However, Cox’s regression model showed that a screeningstatus (HR = 0.480, p = 0.040), gender (HR = 0.861, p = 0.034), targeted therapy (HR = 0.839,p = 0.031), and curative surgery (HR = 0.196, p < 0.001) were identified as independent,favorable prognostic factors of overall survival for lung cancer subjects, as shown in Table 3.
Table 3. Multivariate Cox regression model of prognostic factors for non-smokers with lung cancer.
Variable Hazard Ratio 95% CI p-Value
Age 1.011 1.005–1.016 <0.001Gender 0.861 0.750–0.989 0.034
Alcohol consumption 1.029 0.575–1.841 0.924Betel nut consumption 0.879 0.315–2.453 0.805
Screened 0.480 0.238–0.967 0.040Tumor size 1.012 1.009–1.015 <0.001
Targeted therapy 0.839 0.716–0.985 0.031Histology 0.872 0.740–1.029 0.105
Curative surgery 0.196 0.162–0.238 <0.001
Abbreviations: CT: confidence interval; histology: adenocarcinoma versus other histology types (reference); gender(reference group: male); alcohol consumption (reference group: no alcoholic drinks); betel nut consumption(reference group: no betel nut consumption); screened (reference group: unscreened status); targeted therapy:(reference group: no targeted therapy); curative surgery (reference group: no curative surgery).
3.2. Smokers in Two-Group Comparisons
For smokers, the general characteristics and outcomes of the lung cancer subjectsbetween the screened and non-screened groups are summarized in Supplemental Table S2.Table 4 summarizes the mortality and survival analysis according to screened and non-screened status of smokers. For smokers, patients in the screened group had lower overallmortality than those in the non-screened group. One- and five-year mortality rates increasedsignificantly from the screened group to the non-screened group (p < 0.001 for all). Themean survival time for the screened group was 646.08 ± 337.21 days (median 683 days),and the mean survival for the non-screened group was 444.85 ± 468.43 (median 304 days, p= 0.064). However, the p-value from the test may not reach statistical significance with asmall sample size in the screened group (N = 12).
Cox regression was used to examine the association between screening status andsurvival and identify predictors of survival among smokers. For smokers, in the survivalanalysis for lung cancer subjects using the Cox regression model for multivariate effects,the hazard ratio for lung cancer mortality was determined adjusting for age, gender, smok-ing, alcohol consumption, betel nut consumption, tumor size, curative surgery, targeted
115
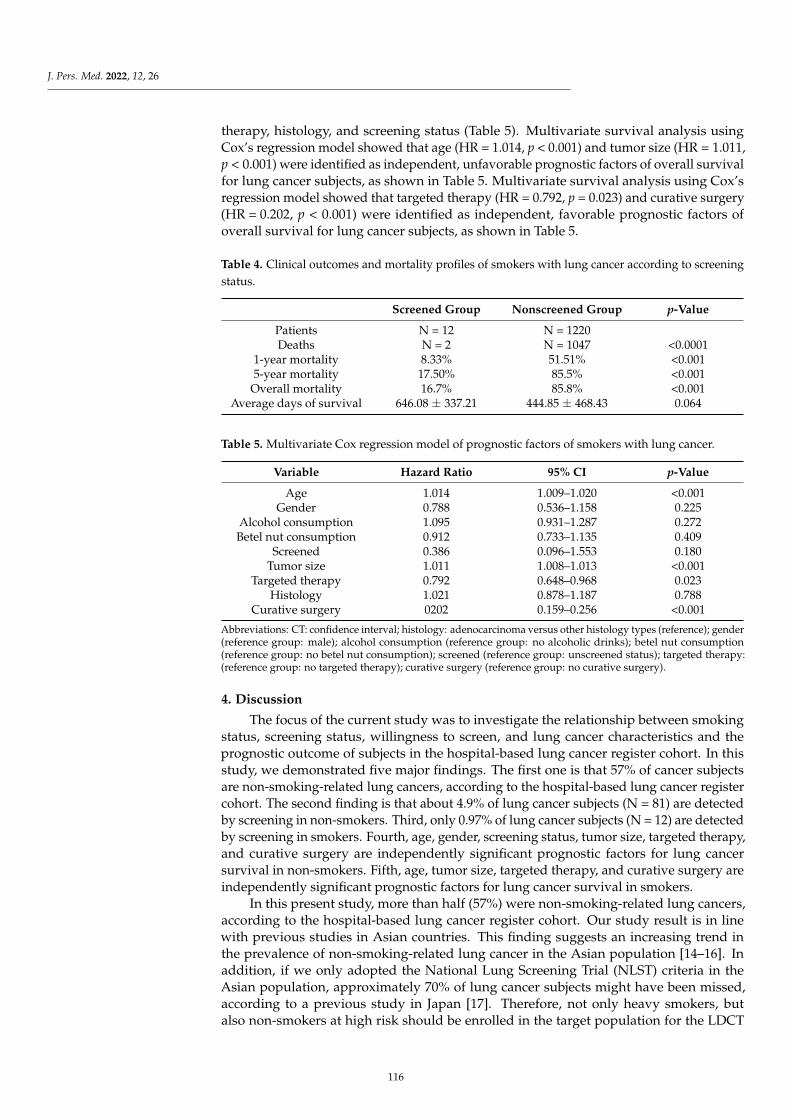
J. Pers. Med. 2022, 12, 26
therapy, histology, and screening status (Table 5). Multivariate survival analysis usingCox’s regression model showed that age (HR = 1.014, p < 0.001) and tumor size (HR = 1.011,p < 0.001) were identified as independent, unfavorable prognostic factors of overall survivalfor lung cancer subjects, as shown in Table 5. Multivariate survival analysis using Cox’sregression model showed that targeted therapy (HR = 0.792, p = 0.023) and curative surgery(HR = 0.202, p < 0.001) were identified as independent, favorable prognostic factors ofoverall survival for lung cancer subjects, as shown in Table 5.
Table 4. Clinical outcomes and mortality profiles of smokers with lung cancer according to screeningstatus.
Screened Group Nonscreened Group p-Value
Patients N = 12 N = 1220Deaths N = 2 N = 1047 <0.0001
1-year mortality 8.33% 51.51% <0.0015-year mortality 17.50% 85.5% <0.001
Overall mortality 16.7% 85.8% <0.001Average days of survival 646.08 ± 337.21 444.85 ± 468.43 0.064
Table 5. Multivariate Cox regression model of prognostic factors of smokers with lung cancer.
Variable Hazard Ratio 95% CI p-Value
Age 1.014 1.009–1.020 <0.001Gender 0.788 0.536–1.158 0.225
Alcohol consumption 1.095 0.931–1.287 0.272Betel nut consumption 0.912 0.733–1.135 0.409
Screened 0.386 0.096–1.553 0.180Tumor size 1.011 1.008–1.013 <0.001
Targeted therapy 0.792 0.648–0.968 0.023Histology 1.021 0.878–1.187 0.788
Curative surgery 0202 0.159–0.256 <0.001
Abbreviations: CT: confidence interval; histology: adenocarcinoma versus other histology types (reference); gender(reference group: male); alcohol consumption (reference group: no alcoholic drinks); betel nut consumption(reference group: no betel nut consumption); screened (reference group: unscreened status); targeted therapy:(reference group: no targeted therapy); curative surgery (reference group: no curative surgery).
4. Discussion
The focus of the current study was to investigate the relationship between smokingstatus, screening status, willingness to screen, and lung cancer characteristics and theprognostic outcome of subjects in the hospital-based lung cancer register cohort. In thisstudy, we demonstrated five major findings. The first one is that 57% of cancer subjectsare non-smoking-related lung cancers, according to the hospital-based lung cancer registercohort. The second finding is that about 4.9% of lung cancer subjects (N = 81) are detectedby screening in non-smokers. Third, only 0.97% of lung cancer subjects (N = 12) are detectedby screening in smokers. Fourth, age, gender, screening status, tumor size, targeted therapy,and curative surgery are independently significant prognostic factors for lung cancersurvival in non-smokers. Fifth, age, tumor size, targeted therapy, and curative surgery areindependently significant prognostic factors for lung cancer survival in smokers.
In this present study, more than half (57%) were non-smoking-related lung cancers,according to the hospital-based lung cancer register cohort. Our study result is in linewith previous studies in Asian countries. This finding suggests an increasing trend inthe prevalence of non-smoking-related lung cancer in the Asian population [14–16]. Inaddition, if we only adopted the National Lung Screening Trial (NLST) criteria in theAsian population, approximately 70% of lung cancer subjects might have been missed,according to a previous study in Japan [17]. Therefore, not only heavy smokers, butalso non-smokers at high risk should be enrolled in the target population for the LDCT
116
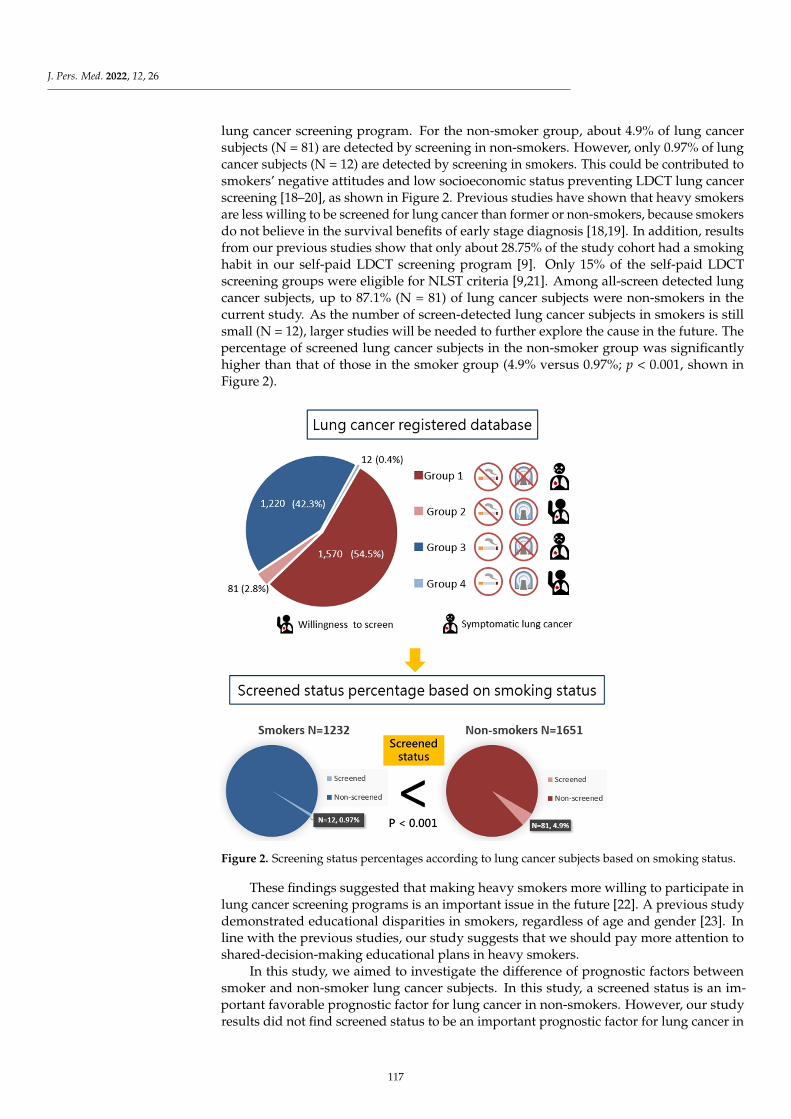
J. Pers. Med. 2022, 12, 26
lung cancer screening program. For the non-smoker group, about 4.9% of lung cancersubjects (N = 81) are detected by screening in non-smokers. However, only 0.97% of lungcancer subjects (N = 12) are detected by screening in smokers. This could be contributed tosmokers’ negative attitudes and low socioeconomic status preventing LDCT lung cancerscreening [18–20], as shown in Figure 2. Previous studies have shown that heavy smokersare less willing to be screened for lung cancer than former or non-smokers, because smokersdo not believe in the survival benefits of early stage diagnosis [18,19]. In addition, resultsfrom our previous studies show that only about 28.75% of the study cohort had a smokinghabit in our self-paid LDCT screening program [9]. Only 15% of the self-paid LDCTscreening groups were eligible for NLST criteria [9,21]. Among all-screen detected lungcancer subjects, up to 87.1% (N = 81) of lung cancer subjects were non-smokers in thecurrent study. As the number of screen-detected lung cancer subjects in smokers is stillsmall (N = 12), larger studies will be needed to further explore the cause in the future. Thepercentage of screened lung cancer subjects in the non-smoker group was significantlyhigher than that of those in the smoker group (4.9% versus 0.97%; p < 0.001, shown inFigure 2).
J. Pers. Med. 2021, 11, x FOR PEER REVIEW 7 of 10
smokers do not believe in the survival benefits of early stage diagnosis [18,19]. In addi-tion, results from our previous studies show that only about 28.75% of the study cohort had a smoking habit in our self-paid LDCT screening program [9]. Only 15% of the self-paid LDCT screening groups were eligible for NLST criteria [9,21]. Among all-screen detected lung cancer subjects, up to 87.1% (N = 81) of lung cancer subjects were non-smokers in the current study. As the number of screen-detected lung cancer subjects in smokers is still small (N = 12), larger studies will be needed to further explore the cause in the future. The percentage of screened lung cancer subjects in the non-smoker group was significantly higher than that of those in the smoker group (4.9% versus 0.97%; p < 0.001, shown in Figure 2).
Figure 2. Screening status percentages according to lung cancer subjects based on smoking status.
These findings suggested that making heavy smokers more willing to participate in lung cancer screening programs is an important issue in the future [22]. A previous study demonstrated educational disparities in smokers, regardless of age and gender [23]. In line with the previous studies, our study suggests that we should pay more attention to shared-decision-making educational plans in heavy smokers.
In this study, we aimed to investigate the difference of prognostic factors between smoker and non-smoker lung cancer subjects. In this study, a screened status is an im-portant favorable prognostic factor for lung cancer in non-smokers. However, our study results did not find screened status to be an important prognostic factor for lung cancer in smokers. Recent studies have demonstrated that low-dose computed tomography lung cancer screening trials have revealed a reduction in lung cancer mortality in sub-jects with a smoking history [24,25]. In our study, only 0.97% of lung cancer subjects (N = 12) were detected by screening in smokers. The rate is much lower than that of non-smoking lung cancer patients participating in lung cancer screening, as shown in Figure 2. These findings suggest that increasing smokers’ participation in lung cancer
Figure 2. Screening status percentages according to lung cancer subjects based on smoking status.
These findings suggested that making heavy smokers more willing to participate inlung cancer screening programs is an important issue in the future [22]. A previous studydemonstrated educational disparities in smokers, regardless of age and gender [23]. Inline with the previous studies, our study suggests that we should pay more attention toshared-decision-making educational plans in heavy smokers.
In this study, we aimed to investigate the difference of prognostic factors betweensmoker and non-smoker lung cancer subjects. In this study, a screened status is an im-portant favorable prognostic factor for lung cancer in non-smokers. However, our studyresults did not find screened status to be an important prognostic factor for lung cancer in
117
J. Pers. Med. 2022, 12, 26
smokers. Recent studies have demonstrated that low-dose computed tomography lungcancer screening trials have revealed a reduction in lung cancer mortality in subjects witha smoking history [24,25]. In our study, only 0.97% of lung cancer subjects (N = 12) weredetected by screening in smokers. The rate is much lower than that of non-smoking lungcancer patients participating in lung cancer screening, as shown in Figure 2. These findingssuggest that increasing smokers’ participation in lung cancer screening will improve lungcancer survival. However, several studies have shown that smokers are less likely toparticipate in lung cancer screening programs due to their low socioeconomic status or lowwillingness to screen [18–20]. As a result, the self-paid lung cancer screening program inthis study has difficulty achieving significant effects in smokers. Through policy subsidiesand shared-decision-making educational practices, barriers can be overcome, and the rate ofsmokers receiving lung cancer screening can be effectively increased. Therefore, screeningcan gradually reduce the lung cancer mortality of smokers in the real world.
In the non-smoking group, we found that female gender was a favorable prognosticfactor predicting better survival. This could be due to the different biologic mechanisms oflung cancer that depend upon smoking status [26,27]. Previous studies have demonstrateda high prevalence of non-smoking-related lung cancer in the Asian population in thescreening program, especially in women, usually manifesting with persistent subsolidnodules with indolent behavior [9,28,29]. In addition, about 30% of screen-detected lungcancer subjects met the diagnostic criteria for multiple primary lung cancers, accordingto previous studies [30,31]. However, these non-smoking lung cancer subjects have abetter prognostic outcome of lung cancer. On the other hand, screening may also causeoverdiagnosis and overtreatment during the screening process [32,33]. To maximize thebenefit of LDCT screening and minimize the potential harm in over-diagnosis and over-management among non-smokers, a lung-cancer-risk-prediction algorithm with shareddecision-making plans for indeterminate pulmonary nodule management is mandatoryfor a successful LDCT lung cancer screening program [34,35]. For smokers, effectivelyencouraging smokers to be more willing to participate in lung cancer screening programswith screening allowances and educational training programs (quitting smoking) in thefuture is an important issue. Promoting a personalized lung cancer screening programrequires the support of government policies, primary care physicians, and public educationfor the incorporation of patient lung cancer risk, preferences, and socioeconomic status toresolve the complex trade-offs in the screening process.
This study benefits from real-world data through the prolonged implementation ofthe self-paid LDCT lung cancer screening program in this hospital-based cohort. This studydescribes why and how more non-smokers (especially women) could benefit from beingdiagnosed with lung cancer at an early stage. However, there are three major limitationsin this study that could be addressed in future research. First, this study did not exploredifferences in attitudes and behavior towards screening for lung cancer between smokersand non-smokers. Real-world data from this study show that the smoking group hada very low proportion (0.97%) of lung cancer detected by screening, and only 12 peoplewere diagnosed in this group (group 4). Our data also indirectly reflect smokers’ negativeattitudes and behavior towards participating in lung cancer screening. This finding issupported by previous studies that described that heavy smokers are less willing to bescreened for lung cancer than former smokers or smokers [18,19]. Second, our self-paid,screened population may not represent the screening population eligible for NLST criteria.Therefore, the study result may not be generalized to the population at other institutions orwith other demographics. Third, potential residual confounding in this study lowers thecertainty of the evidence.
5. Conclusions
In summary, this study aimed at investigating the different impacts of smoking andscreening status on lung cancer characteristics and mortality rates. For non-smokers, femalegender and screened status are two independent, important, and favorable prognostic
118
J. Pers. Med. 2022, 12, 26
factors for lung cancer survival. However, these findings could not be demonstratedin smokers, which may be due to limited numbers of lung cancer subjects classified assmokers who have a negative attitude and low socioeconomic status preventing LDCTlung cancer screening. Effectively encouraging smokers to be more willing to participate ingovernment-subsidized lung cancer screening programs in the future is an important issue.
Supplementary Materials: The following are available online at https://www.mdpi.com/article/10.3390/jpm12010026/s1, Table S1: Clinical characteristics of 1651 non-smokers with lung canceraccording to screening status, Table S2: Clinical characteristics of 1232 smokers with lung canceraccording to screening status.
Author Contributions: Conceptualization, F.-Z.W. and S.-C.Y.; methodology, F.-Z.W.; software,F.-Z.W. and Y.-J.W.; formal analysis, F.-Z.W. and Y.-J.W.; investigation, F.-Z.W. and Y.-J.W.; writing—original draft preparation, F.-Z.W. and S.-C.Y.; writing—review and editing, F.-Z.W.; visualization,F.-Z.W., Y.-J.W. and C.-S.C.; supervision, F.-Z.W. All authors have read and agreed to the publishedversion of the manuscript.
Funding: This study was supported by grants from the Kaohsiung Veterans General Hospital,KSVGH110-120, KSVGH111-108, KSVGH111-D02-3, Taiwan, R.O.C, MOST 109-2314-B-075B-006-,MOST 110-2314-B-075B-008-.
Informed Consent Statement: Informed consent was waived due to the retrospective study design.
Data Availability Statement: The data presented in this study are available on request from thecorresponding author.
Acknowledgments: We thank all doctors who responded to our screening and investigation. Thisstudy is based in part on data from the Cancer Registry Database provided by the Cancer Center ofthe Kaohsiung Veterans General Hospital.
Conflicts of Interest: All authors have declared no conflict of interest.
References1. De Groot, P.M.; Wu, C.C.; Carter, B.W.; Munden, R.F. The epidemiology of lung cancer. Transl. Lung Cancer Res. 2018, 7, 220–233.
[CrossRef]2. Wang, B.-Y.; Huang, J.-Y.; Cheng, C.-Y.; Lin, C.-H.; Ko, J.-L.; Liaw, Y.-P. Lung Cancer and Prognosis in Taiwan: A Population-Based
Cancer Registry. J. Thorac. Oncol. 2013, 8, 1128–1135. [CrossRef] [PubMed]3. Lin, H.T.; Liu, F.C.; Wu, C.Y.; Kuo, C.F.; Lan, W.C.; Yu, H.P. Epidemiology and Survival Outcomes of Lung Cancer: A Population-
Based Study. Biom. Res. Int. 2019, 2019, 8148156. [CrossRef]4. Rota, M.; Pizzato, M.; La Vecchia, C.; Boffetta, P. Efficacy of lung cancer screening appears to increase with prolonged intervention:
Results from the MILD trial and a meta-analysis. Ann. Oncol. 2019, 30, 1040–1043. [CrossRef]5. Wu, F.-Z.; Huang, Y.-L.; Wu, Y.-J.; Tang, E.-K.; Wu, M.-T.; Chen, C.-S.; Lin, Y.-P. Prognostic effect of implementation of the mass
low-dose computed tomography lung cancer screening program: A hospital-based cohort study. Eur. J. Cancer Prev. 2020, 29,445–451. [CrossRef] [PubMed]
6. Wu, F.Z.; Kuo, P.L.; Huang, Y.L.; Tang, E.K.; Chen, C.S.; Wu, M.T.; Lin, Y.P. Differences in lung cancer characteristics and mortalityrate between screened and non-screened cohorts. Sci. Rep. 2019, 9, 19386. [CrossRef]
7. Nawa, T.; Fukui, K.; Nakayama, T.; Sagawa, M.; Nakagawa, T.; Ichimura, H.; Mizoue, T. A population-based cohort study toevaluate the effectiveness of lung cancer screening using low-dose CT in Hitachi city, Japan. Jpn. J. Clin. Oncol. 2019, 49, 130–136.[CrossRef]
8. Nawa, T.; Nakagawa, T.; Mizoue, T.; Kusano, S.; Chonan, T.; Hayashihara, K.; Suito, T.; Endo, K. A decrease in lung cancermortality following the introduction of low-dose chest CT screening in Hitachi, Japan. Lung Cancer 2012, 78, 225–228. [CrossRef]
9. Wu, F.-Z.; Huang, Y.-L.; Wu, C.C.; Tang, E.-K.; Chen, C.-S.; Mar, G.-Y.; Yen, Y.; Wu, M.-T. Assessment of Selection Criteria forLow-Dose Lung Screening CT Among Asian Ethnic Groups in Taiwan: From Mass Screening to Specific Risk-Based Screening forNon-Smoker Lung Cancer. Clin. Lung Cancer 2016, 17, e45–e56. [CrossRef]
10. Hung, Y.-C.; Tang, E.-K.; Wu, Y.-J.; Chang, C.-J.; Wu, F.-Z. Impact of low-dose computed tomography for lung cancer screening onlung cancer surgical volume: The urgent need in health workforce education and training. Medicine 2021, 100, e26901. [CrossRef][PubMed]
11. Hays, L.E.; Zodrow, D.M.; Yates, J.E.; Deffebach, M.E.; Jacoby, D.B.; Olson, S.B.; Pankow, J.F.; Bagby, G.C. Cigarette smoke inducesgenetic instability in airway epithelial cells by suppressing FANCD2 expression. Br. J. Cancer. 2008, 98, 1653–1661. [CrossRef][PubMed]
119
J. Pers. Med. 2022, 12, 26
12. Spira, A.; Beane, J.; Shah, V.; Liu, G.; Schembri, F.; Yang, X.; Palma, J.; Brody, J.S. Effects of cigarette smoke on the human airwayepithelial cell transcriptome. Proc. Natl. Acad. Sci. USA 2004, 101, 10143–10148. [CrossRef] [PubMed]
13. UyBico, S.J.; Wu, C.C.; Suh, R.D.; Le, N.H.; Brown, K.; Krishnam, M.S. Lung Cancer Staging Essentials: The New TNM StagingSystem and Potential Imaging Pitfalls. RadioGraphics 2010, 30, 1163–1181. [CrossRef]
14. Thun, M.J.; Hannan, L.M.; Adams-Campbell, L.L.; Boffetta, P.; Buring, J.E.; Feskanich, D.; Flanders, W.D.; Jee, S.H.; Katanoda, K.;Kolonel, L.N.; et al. Lung cancer occurrence in never-smokers: An analysis of 13 cohorts and 22 cancer registry studies. PLoS Med.2008, 5, e185. [CrossRef] [PubMed]
15. Zhou, F.; Zhou, C. Lung cancer in never smokers—the East Asian experience. Transl. Lung Cancer Res. 2018, 7, 450–463. [CrossRef]16. Yano, T.; Miura, N.; Takenaka, T.; Haro, A.; Okazaki, H.; Ohba, T.; Kouso, H.; Kometani, T.; Shoji, F.; Maehara, Y. Never-smoking
nonsmall cell lung cancer as a separate entity. Cancer 2008, 113, 1012–1018. [CrossRef]17. Kakinuma, R.; Muramatsu, Y.; Asamura, H.; Watanabe, S.-i.; Kusumoto, M.; Tsuchida, T.; Kaneko, M.; Tsuta, K.; Maeshima, A.M.;
Ishii, G.; et al. Low-dose CT lung cancer screening in never-smokers and smokers: Results of an eight-year observational study.Transl. Lung Cancer Res. 2020, 9, 10–22. [CrossRef]
18. Silvestri, G.A.; Nietert, P.J.; Zoller, J.; Carter, C.; Bradford, D. Attitudes towards screening for lung cancer among smokers andtheir non-smoking counterparts. Thorax 2007, 62, 126. [CrossRef]
19. Quaife, S.L.; Vrinten, C.; Ruparel, M.; Janes, S.M.; Beeken, R.J.; Waller, J.; McEwen, A. Smokers’ interest in a lung cancer screeningprogramme: A national survey in England. BMC Cancer 2018, 18, 497. [CrossRef]
20. Castro, S.; Sosa, E.; Lozano, V.; Akhtar, A.; Love, K.; Duffels, J.; Raz, D.J.; Kim, J.Y.; Sun, V.; Erhunmwunsee, L. The impactof income and education on lung cancer screening utilization, eligibility, and outcomes: A narrative review of socioeconomicdisparities in lung cancer screening. J. Thorac. Dis. 2021, 13, 3745–3757. [CrossRef]
21. Wu, Y.-J.; Tseng, J.-H.; Liang, C.-H.; Tang, E.-K.; Wu, F.-Z. The fate of subsolid nodule: Predictable or unpredictable? J. Thorac. Dis.2020, 12, 1118–1120. [CrossRef]
22. Heffner, J.L.; Krebs, P.; Johnson, H.; Greene, P.A.; Klein, D.E.; Feemster, L.C.; Slatore, C.G.; Au, D.H.; Zeliadt, S.B. Smokers’Inaccurate Beliefs about the Benefits of Lung Cancer Screening. Ann. Am. Thorac. Soc. 2018, 15, 1110–1113. [CrossRef]
23. Tomioka, K.; Kurumatani, N.; Saeki, K. The Association Between Education and Smoking Prevalence, Independent of Occupation:A Nationally Representative Survey in Japan. J. Epidemiol. 2020, 30, 136–142. [CrossRef]
24. Reduced Lung-Cancer Mortality with Low-Dose Computed Tomographic Screening. N. Engl. J. Med. 2011, 365, 395–409.[CrossRef] [PubMed]
25. de Koning, H.J.; van der Aalst, C.M.; de Jong, P.A.; Scholten, E.T.; Nackaerts, K.; Heuvelmans, M.A.; Lammers, J.J.; Weenink, C.;Yousaf-Khan, U.; Horeweg, N.; et al. Reduced Lung-Cancer Mortality with Volume CT Screening in a Randomized Trial. N. Engl.J. Med. 2020, 382, 503–513. [CrossRef] [PubMed]
26. Clement-Duchene, C.; Vignaud, J.M.; Stoufflet, A.; Bertrand, O.; Gislard, A.; Thiberville, L.; Grosdidier, G.; Martinet, Y.; Benichou,J.; Hainaut, P.; et al. Characteristics of never smoker lung cancer including environmental and occupational risk factors. LungCancer 2010, 67, 144–150. [CrossRef] [PubMed]
27. Smolle, E.; Pichler, M. Non-Smoking-Associated Lung Cancer: A distinct Entity in Terms of Tumor Biology, Patient Characteristicsand Impact of Hereditary Cancer Predisposition. Cancers 2019, 11, 204. [CrossRef]
28. Hsu, H.T.; Tang, E.K.; Wu, M.T.; Wu, C.C.; Liang, C.H.; Chen, C.S.; Mar, G.Y.; Lai, R.S.; Wang, J.C.; Wu, C.L.; et al. ModifiedLung-RADS Improves Performance of Screening LDCT in a Population with High Prevalence of Non-smoking-related LungCancer. Acad. Radiol. 2018, 25, 1240–1251. [CrossRef]
29. Tang, E.-K.; Chen, C.-S.; Wu, C.C.; Wu, M.-T.; Yang, T.-L.; Liang, H.-L.; Hsu, H.-T.; Wu, F.-Z. Natural History of PersistentPulmonary Subsolid Nodules: Long-Term Observation of Different Interval Growth. Heart Lung Circ. 2019, 28, 1747–1754.[CrossRef]
30. Lin, K.-F.; Wu, H.-F.; Huang, W.-C.; Tang, P.-L.; Wu, M.-T.; Wu, F.-Z. Propensity score analysis of lung cancer risk in a populationwith high prevalence of non-smoking related lung cancer. BMC Pulm. Med. 2017, 17, 120. [CrossRef]
31. van Rens, M.T.M.; Zanen, P.; Brutel de la Rivière, A.; Elbers, H.R.J.; van Swieten, H.A.; van den Bosch, J.M.M. Survival inSynchronous vs Single Lung Cancer: Upstaging Better Reflects Prognosis. CHEST 2000, 118, 952–958. [CrossRef] [PubMed]
32. Kauczor, H.-U.; von Stackelberg, O. Subsolid Lung Nodules: Potential for Overdiagnosis. Radiology 2019, 293, 449–450. [CrossRef][PubMed]
33. Silva, M.; Prokop, M.; Jacobs, C.; Capretti, G.; Sverzellati, N.; Ciompi, F.; van Ginneken, B.; Schaefer-Prokop, C.M.; Galeone,C.; Marchianò, A.; et al. Long-Term Active Surveillance of Screening Detected Subsolid Nodules is a Safe Strategy to ReduceOvertreatment. J. Thorac. Oncol. 2018, 13, 1454–1463. [CrossRef]
34. Wu, F.-Z.; Kuo, P.-L.; Wu, C.C.; Wu, M.-T. The impact of patients’ preferences on the decision of low-dose computed tomographylung cancer screening. Transl Lung Cancer Res. 2018, 7, S236–S238. [CrossRef] [PubMed]
35. Caverly, T. Selecting the best candidates for lung cancer screening. JAMA Intern. Med. 2015, 175, 898–900. [CrossRef] [PubMed]
120
Journal of
Personalized
Medicine
Article
Dental Treatment Needs and Related Risk Factors amongSchool Children with Special Needs in Taiwan
Szu-Yu Hsiao 1,2, Ping-Ho Chen 2 , Shan-Shan Huang 1, Cheng-Wei Yen 1, Shun-Te Huang 1,3, Shu-Yuan Yin 4
and Hsiu-Yueh Liu 3,5,*
Citation: Hsiao, S.-Y.; Chen, P.-H.;
Huang, S.-S.; Yen, C.-W.; Huang, S.-T.;
Yin, S.-Y.; Liu, H.-Y. Dental Treatment
Needs and Related Risk Factors
among School Children with Special
Needs in Taiwan. J. Pers. Med. 2021,
11, 452. https://doi.org/10.3390/
jpm11060452
Academic Editor: Rutger
A. Middelburg
Received: 17 April 2021
Accepted: 21 May 2021
Published: 23 May 2021
Publisher’s Note: MDPI stays neutral
with regard to jurisdictional claims in
published maps and institutional affil-
iations.
Copyright: © 2021 by the authors.
Licensee MDPI, Basel, Switzerland.
This article is an open access article
distributed under the terms and
conditions of the Creative Commons
Attribution (CC BY) license (https://
creativecommons.org/licenses/by/
4.0/).
1 Division of Pediatric Dentistry and Special Needs Dentistry, Department of Dentistry, Kaohsiung MedicalUniversity Hospital, Kaohsiung 807377, Taiwan; [email protected] (S.-Y.H.);[email protected] (S.-S.H.); [email protected] (C.-W.Y.); [email protected] (S.-T.H.)
2 School of Dentistry, College of Dental Medicine, Kaohsiung Medical University, Kaohsiung 807378, Taiwan;[email protected]
3 Department of Oral Hygiene, College of Dental Medicine, Kaohsiung Medical University,Kaohsiung 807378, Taiwan
4 Department of Nursing, Fooyin University, Kaohsiung 831301, Taiwan; [email protected] Department of Medical Research, Kaohsiung Medical University Hospital, Kaohsiung Medical University,
Kaohsiung 807377, Taiwan* Correspondence: [email protected]; Tel.: +886-7-3121101x2209x64; Fax: +886-7-3210637
Abstract: The purpose of this study was to assess dental treatment needs (TNs) and related risk factorsof children with disabilities (CD). This cross-sectional study recruited 484 CD, 6 to 12 years of age,from 10 special education schools in Taiwan. Dental status and TNs were examined and evaluatedby well-trained dentists and based on the criteria set by the World Health Organization (1997). Theresults indicated that 61.78% required restorative dental treatment due to their dental caries. Onaverage, each participant had 2.72 teeth that required treatment, and 6.38 surfaces required restoration.One-quarter of the participants (24.79%) required 1- or 2-surface restoration, and one out of three(36.98%) had more complex TNs (including 3 or more surfaces to be filled, pulp care, extraction,and more specialized care). The significant risk factors associated with restorative TNs among CDwere those whose parents had lower socioeconomic status, frequent sweets intake, insufficient tooth-brushing ability, and poor oral health. Most of the CD had extensive unmet TNs for their caries andrequired complex treatment to recover the function of their teeth. Encouraging parents/caregivers totake their children for dental treatment, promoting awareness of the importance of dental hygiene,giving assistance to brushing their teeth after eating, and controlling and/or modifying sweet diethabits are necessary to reduce CD’s dental caries, especially those with lower socioeconomic statusparents/caregivers.
Keywords: disability; children; oral health; caries; dental treatment
1. Introduction
People with disabilities usually suffer from a significantly higher prevalence of poordental hygiene, plaque accumulation, dental caries, gingivitis, and periodontal diseasethan the ordinary population, and it gets worse with increasing age [1–6]. The top threemedical care departments most frequently visited by people with intelligence disabilitiesin Taiwan are internal medicine (24.4%), psychiatry (16.7%), and dentistry (13.8%), asopposed to surgery, family medicine, and obstetrics and gynecology, which are utilizedmainly by the general population [7]. People with disabilities have higher dental treatmentneeds (TNs) caused by secondary conditions as opposed to the general population, whoseek and receive healthcare services regularly. According to Healthy People 2010 in theUSA, secondary conditions refer to the problems related to medical, social, emotional,family, or community problems that a person with a primary disabling condition mayencounter in his/her life [8]. It often aggravates and/or lessens their life quality in terms
121
J. Pers. Med. 2021, 11, 452
of physical, psychosocial, and social functions and increases the burden of health careon their parents, family members, or other caregivers with limited resources. Koritsas &Iacono reported that people with disabilities experienced an average of 11.3 secondaryconditions (including medical complications, psychiatric disorders, environmental andquality-of-life issues, and difficulties with access to medical care/centers) during their de-velopment [9]. Secondary conditions often cause significant limitations, including readingdifficulties, communication, physical fitness–conditioning, personal hygiene–appearance,weight, dental and oral hygiene, and memory problems [9]. Dental and oral hygiene is oneof the significant limitations which is caused by secondary conditions.
A previous study reported that the greatest unmet health needs of people with disabili-ties are unmet dental treatment [10]. Studies have shown that children with disabilities (CD)usually receive less restorative care compared to the general population [11–15]. Peoplewith disabilities cannot express their physical discomfort properly because of their physical,intellectual, and psychological barriers. Long-term neglect of TNs, with increasing severityand complexity of oral diseases, leads to delay of time-sensitive, necessary treatment [16].A previous study reported that only 32.37% of decayed teeth received restorative treatmentamong 6- to 12-year-old CD, and it was significantly lower than the ordinary population(47.72%) in Taiwan [17–19]. It reveals that the dental TNs for those children are unmet.
Dental treatment is a basic component of rehabilitation for CD, and it is difficult fordentists to perform [20]. The majority of children with special needs can be adequatelytreated using non-pharmacologic behavior management such as the tell-show-do tech-nique [14,21]. Disabled people who have extensive and severe dental problems veryoften cannot cooperate well during the dental treatment process, and the treatment hasto be performed by pharmacological behavior management techniques such as nitrousoxide/oxygen sedation, oral sedation. or general anesthesia (GA) to achieve higher qualitytreatment [14,22,23]. In order to avoid oral diseases’ worsening and to provide CD witheffective dental treatment services, it is helpful to provide appropriate baseline informationregarding trends in unmet needs and related risk factors so as to make proper decisions toimprove the oral health status of CD. Thus, the present study was carried out in an attemptto determine the unmet dental TNs and related factors of children with various disabilitiesin primary schools for CD in Taiwan.
2. Method2.1. Study Design and Sample Characteristics
This cross-sectional study recruited 484 children, aged from 6 to 12 years old (meanage = 9.47 ± 2.06 years old), from 10 out of 18 special education primary schools inTaiwan. According to the definition of the Physically and Mentally Disabled CitizensProtection Act [24], people with disabilities refers to those who are limited or restricted fromengagement in ordinary living activities and participation in society. All the participantshave been evaluated by a committee composed of professionals from medicine, social work,special education, and employment counseling. After evaluation, they receive certificatesthat prove their classification and severity of disabilities after the processes of evaluationand assessment.
The CD were categorized according to their disability certificates in this study, whichincluded vision disability (VD); hearing, voice or speech mechanism disability (HVD);intellectual disability (ID); and multiple disabilities (MD). MD means at least two or moretypes of impairment. The participants of this study included the certified MD childrenwith ID and at least one or more co-occurring conditions. These conditions included visiondisability, hearing mechanism disability, limb disability, etc.
2.2. Ethical Approval
This study was conducted according to the guidelines of the Declaration of Helsinkiand approved by the Institutional Review Board of Kaohsiung Medical University Hospital(Protocol number: KMUH-IRB-950125). The study purpose, procedures, and contents of
122
J. Pers. Med. 2021, 11, 452
the survey were explained to the parents or guardians of all CD, and written consent wasobtained from parents or guardians who agreed to allow their children to participate.
2.3. Data Collection2.3.1. Oral Examination
Examination of the oral health status of study participants was carried out using adisposable dental mirror (Prosperity Island Medical Dressing Co, Ltd., Changhua, Taiwan),a standard dental explorer (CP-11.5B6, Hu-Freidy, Chicago, IL, USA), and a flashlight, andwith the help of nursing staff in the classroom, lobby, auditorium, or other open space of theschools. An oral examination of the oral health status of study participants was performedin accordance with the methods and criteria of the World Health Organization [25], carriedout by six well-trained dentists (S.-T.H., S.-Y.H., C.-Y.J., B.-M.C., C.-C.C.,R.-C.T.) who wereevaluated prior to the survey by a senior dentist (gold standard: S.T.H.) with abundantclinical experience, and achieved acceptable reliability and inter-examiner agreementwith a Kappa score between 0.80 and 0.84 (0.81, 0.84, 0.80, 0.80, and 0.82) between eachtwo dentists.
The oral examination and records were determined on the basis of a maximum of20–28 teeth for primary, mixed, or permanent dentition up to 12 years old. Unmet dentalTNs were evaluated using dmt + DMT and dms + DMS indices to record numerically thenumber of unmet dental treatment teeth and surfaces. The dmt + DMT index is a sum ofdecayed teeth number (dt + DT) and missing teeth number (mt + MT) of mixed dentition.The dms + DMS index is a sum of decayed teeth surfaces (ds + DS) and missing surfaces(dm + DM) of mixed dentition. These two indices provide the consequences of untreatedcaries and present an aggregate value of current dental TNs.
Plaque and gingivitis indices were evaluated on 6 indicative surfaces (buccal sideof 4 teeth and lingual side of 2 teeth) with the naked eye and a CPI explorer (CP-11.5B6,Hu-Freidy, Chicago, IL, USA). The 4 buccal surfaces selected for inspection were from2 posterior teeth (tooth numbers 55 or 17/16 and 65 or 26/27) and 2 anterior teeth (toothnumbers 51 or 11 and 71 or 31). The 2 lingual surfaces selected for inspection were from2 posterior teeth of the mandible (tooth numbers 85 or 47/46 and 75 or 36/37). The valueof the poorest surface situation prevailed.
Plaque index (PI) was assessed according to criteria modified from Greene and Ver-million [26] and marked as: 0 = no plaque; 1 = plaque covering not more than one-thirdof the exposed tooth surface; 2 = plaque covering more than one-third, but not more thantwo-thirds, of the exposed tooth surface; and 3 = plaque covering more than two-thirdsof the exposed tooth surface. The tooth surface with the worst plaque of six teeth wasrecorded as a whole-mouth oral hygiene score for each participant. Gingivitis index (GI)was assessed by inspection of the following and tendency toward spontaneously bleedingcriteria: 0 = healthy; 1 = mild gingivitis—no bleeding on probing; 2 = moderate gingivitis—bleeding on probing; 3 = severe gingivitis—ulceration [27]. The most-inflamed gingivalsurface of six teeth was identified as a whole gingivitis severity score for each partici-pant. The PI and GI were classified into yes (score ≥ 1) and no (score = 0) for statisticalanalysis, respectively.
The dental TNs of each child were categorized as simple, moderate, and complex basedon the following criteria [12,28]: simple = child had no caries and required no restorativetreatment, but required assistance with oral hygiene and preventive treatment such as oralhygiene instruction (OHI), scaling, application of topical fluoride, and/or fissure sealants;moderate = one or more teeth caries and required one and/or two surface restorations;complex = one or more teeth caries and required three or four surface restorations/stainlesssteel crowns, endodontic therapy/crown, extraction, and/or prosthodontics.
2.3.2. Questionnaire
The self-report questionnaire was completed by the parents or guardians of the par-ticipants. The questionnaire consisted of close-ended items and was constructed in three
123
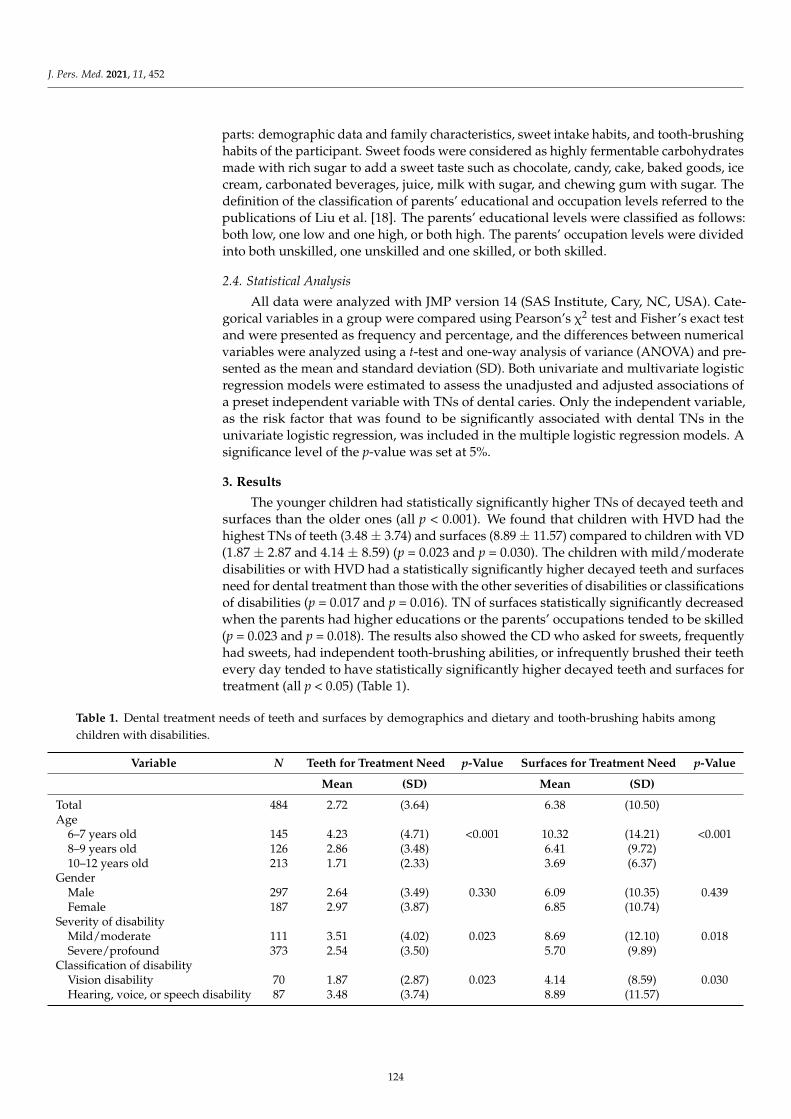
J. Pers. Med. 2021, 11, 452
parts: demographic data and family characteristics, sweet intake habits, and tooth-brushinghabits of the participant. Sweet foods were considered as highly fermentable carbohydratesmade with rich sugar to add a sweet taste such as chocolate, candy, cake, baked goods, icecream, carbonated beverages, juice, milk with sugar, and chewing gum with sugar. Thedefinition of the classification of parents’ educational and occupation levels referred to thepublications of Liu et al. [18]. The parents’ educational levels were classified as follows:both low, one low and one high, or both high. The parents’ occupation levels were dividedinto both unskilled, one unskilled and one skilled, or both skilled.
2.4. Statistical Analysis
All data were analyzed with JMP version 14 (SAS Institute, Cary, NC, USA). Cate-gorical variables in a group were compared using Pearson’s χ2 test and Fisher’s exact testand were presented as frequency and percentage, and the differences between numericalvariables were analyzed using a t-test and one-way analysis of variance (ANOVA) and pre-sented as the mean and standard deviation (SD). Both univariate and multivariate logisticregression models were estimated to assess the unadjusted and adjusted associations ofa preset independent variable with TNs of dental caries. Only the independent variable,as the risk factor that was found to be significantly associated with dental TNs in theunivariate logistic regression, was included in the multiple logistic regression models. Asignificance level of the p-value was set at 5%.
3. Results
The younger children had statistically significantly higher TNs of decayed teeth andsurfaces than the older ones (all p < 0.001). We found that children with HVD had thehighest TNs of teeth (3.48 ± 3.74) and surfaces (8.89 ± 11.57) compared to children with VD(1.87 ± 2.87 and 4.14 ± 8.59) (p = 0.023 and p = 0.030). The children with mild/moderatedisabilities or with HVD had a statistically significantly higher decayed teeth and surfacesneed for dental treatment than those with the other severities of disabilities or classificationsof disabilities (p = 0.017 and p = 0.016). TN of surfaces statistically significantly decreasedwhen the parents had higher educations or the parents’ occupations tended to be skilled(p = 0.023 and p = 0.018). The results also showed the CD who asked for sweets, frequentlyhad sweets, had independent tooth-brushing abilities, or infrequently brushed their teethevery day tended to have statistically significantly higher decayed teeth and surfaces fortreatment (all p < 0.05) (Table 1).
Table 1. Dental treatment needs of teeth and surfaces by demographics and dietary and tooth-brushing habits amongchildren with disabilities.
Variable N Teeth for Treatment Need p-Value Surfaces for Treatment Need p-Value
Mean (SD) Mean (SD)
Total 484 2.72 (3.64) 6.38 (10.50)Age
6–7 years old 145 4.23 (4.71) <0.001 10.32 (14.21) <0.0018–9 years old 126 2.86 (3.48) 6.41 (9.72)10–12 years old 213 1.71 (2.33) 3.69 (6.37)
GenderMale 297 2.64 (3.49) 0.330 6.09 (10.35) 0.439Female 187 2.97 (3.87) 6.85 (10.74)
Severity of disabilityMild/moderate 111 3.51 (4.02) 0.023 8.69 (12.10) 0.018Severe/profound 373 2.54 (3.50) 5.70 (9.89)
Classification of disabilityVision disability 70 1.87 (2.87) 0.023 4.14 (8.59) 0.030Hearing, voice, or speech disability 87 3.48 (3.74) 8.89 (11.57)
124
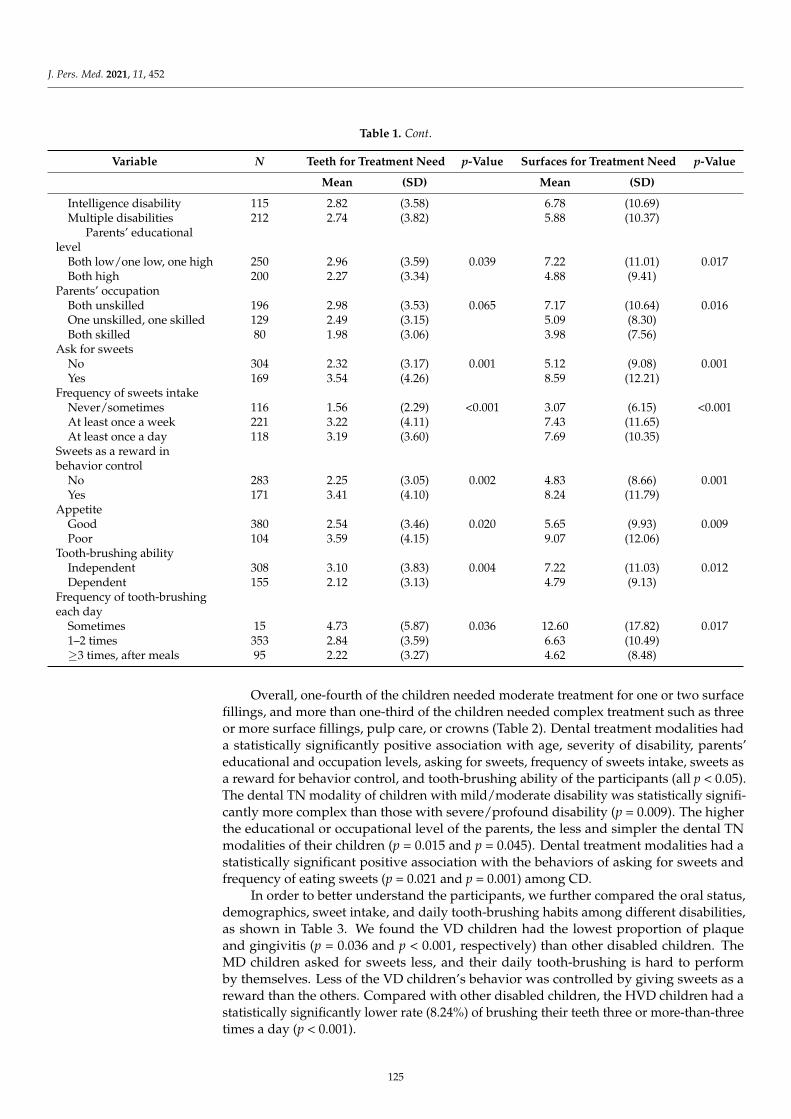
J. Pers. Med. 2021, 11, 452
Table 1. Cont.
Variable N Teeth for Treatment Need p-Value Surfaces for Treatment Need p-Value
Mean (SD) Mean (SD)
Intelligence disability 115 2.82 (3.58) 6.78 (10.69)Multiple disabilities 212 2.74 (3.82) 5.88 (10.37)
Parents’ educationallevel
Both low/one low, one high 250 2.96 (3.59) 0.039 7.22 (11.01) 0.017Both high 200 2.27 (3.34) 4.88 (9.41)
Parents’ occupationBoth unskilled 196 2.98 (3.53) 0.065 7.17 (10.64) 0.016One unskilled, one skilled 129 2.49 (3.15) 5.09 (8.30)Both skilled 80 1.98 (3.06) 3.98 (7.56)
Ask for sweetsNo 304 2.32 (3.17) 0.001 5.12 (9.08) 0.001Yes 169 3.54 (4.26) 8.59 (12.21)
Frequency of sweets intakeNever/sometimes 116 1.56 (2.29) <0.001 3.07 (6.15) <0.001At least once a week 221 3.22 (4.11) 7.43 (11.65)At least once a day 118 3.19 (3.60) 7.69 (10.35)
Sweets as a reward inbehavior control
No 283 2.25 (3.05) 0.002 4.83 (8.66) 0.001Yes 171 3.41 (4.10) 8.24 (11.79)
AppetiteGood 380 2.54 (3.46) 0.020 5.65 (9.93) 0.009Poor 104 3.59 (4.15) 9.07 (12.06)
Tooth-brushing abilityIndependent 308 3.10 (3.83) 0.004 7.22 (11.03) 0.012Dependent 155 2.12 (3.13) 4.79 (9.13)
Frequency of tooth-brushingeach day
Sometimes 15 4.73 (5.87) 0.036 12.60 (17.82) 0.0171–2 times 353 2.84 (3.59) 6.63 (10.49)≥3 times, after meals 95 2.22 (3.27) 4.62 (8.48)
Overall, one-fourth of the children needed moderate treatment for one or two surfacefillings, and more than one-third of the children needed complex treatment such as threeor more surface fillings, pulp care, or crowns (Table 2). Dental treatment modalities hada statistically significantly positive association with age, severity of disability, parents’educational and occupation levels, asking for sweets, frequency of sweets intake, sweets asa reward for behavior control, and tooth-brushing ability of the participants (all p < 0.05).The dental TN modality of children with mild/moderate disability was statistically signifi-cantly more complex than those with severe/profound disability (p = 0.009). The higherthe educational or occupational level of the parents, the less and simpler the dental TNmodalities of their children (p = 0.015 and p = 0.045). Dental treatment modalities had astatistically significant positive association with the behaviors of asking for sweets andfrequency of eating sweets (p = 0.021 and p = 0.001) among CD.
In order to better understand the participants, we further compared the oral status,demographics, sweet intake, and daily tooth-brushing habits among different disabilities,as shown in Table 3. We found the VD children had the lowest proportion of plaqueand gingivitis (p = 0.036 and p < 0.001, respectively) than other disabled children. TheMD children asked for sweets less, and their daily tooth-brushing is hard to performby themselves. Less of the VD children’s behavior was controlled by giving sweets as areward than the others. Compared with other disabled children, the HVD children had astatistically significantly lower rate (8.24%) of brushing their teeth three or more-than-threetimes a day (p < 0.001).
125
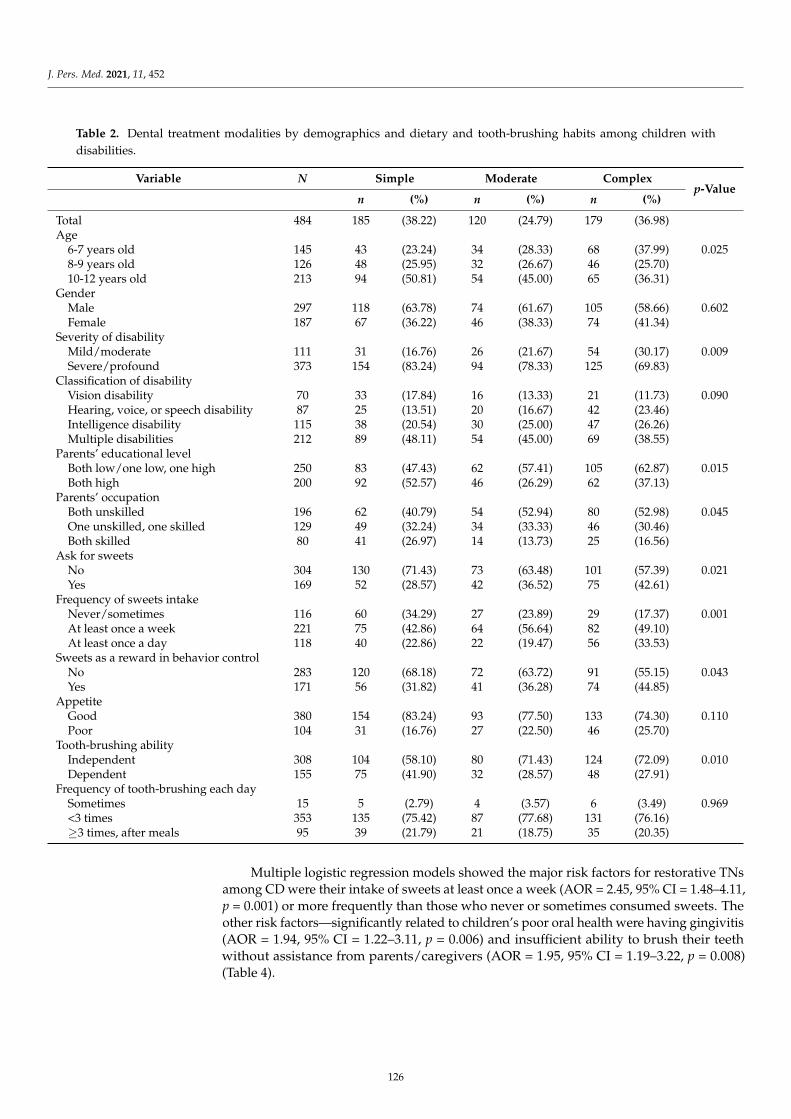
J. Pers. Med. 2021, 11, 452
Table 2. Dental treatment modalities by demographics and dietary and tooth-brushing habits among children withdisabilities.
Variable N Simple Moderate Complexp-Value
n (%) n (%) n (%)
Total 484 185 (38.22) 120 (24.79) 179 (36.98)Age
6-7 years old 145 43 (23.24) 34 (28.33) 68 (37.99) 0.0258-9 years old 126 48 (25.95) 32 (26.67) 46 (25.70)10-12 years old 213 94 (50.81) 54 (45.00) 65 (36.31)
GenderMale 297 118 (63.78) 74 (61.67) 105 (58.66) 0.602Female 187 67 (36.22) 46 (38.33) 74 (41.34)
Severity of disabilityMild/moderate 111 31 (16.76) 26 (21.67) 54 (30.17) 0.009Severe/profound 373 154 (83.24) 94 (78.33) 125 (69.83)
Classification of disabilityVision disability 70 33 (17.84) 16 (13.33) 21 (11.73) 0.090Hearing, voice, or speech disability 87 25 (13.51) 20 (16.67) 42 (23.46)Intelligence disability 115 38 (20.54) 30 (25.00) 47 (26.26)Multiple disabilities 212 89 (48.11) 54 (45.00) 69 (38.55)
Parents’ educational levelBoth low/one low, one high 250 83 (47.43) 62 (57.41) 105 (62.87) 0.015Both high 200 92 (52.57) 46 (26.29) 62 (37.13)
Parents’ occupationBoth unskilled 196 62 (40.79) 54 (52.94) 80 (52.98) 0.045One unskilled, one skilled 129 49 (32.24) 34 (33.33) 46 (30.46)Both skilled 80 41 (26.97) 14 (13.73) 25 (16.56)
Ask for sweetsNo 304 130 (71.43) 73 (63.48) 101 (57.39) 0.021Yes 169 52 (28.57) 42 (36.52) 75 (42.61)
Frequency of sweets intakeNever/sometimes 116 60 (34.29) 27 (23.89) 29 (17.37) 0.001At least once a week 221 75 (42.86) 64 (56.64) 82 (49.10)At least once a day 118 40 (22.86) 22 (19.47) 56 (33.53)
Sweets as a reward in behavior controlNo 283 120 (68.18) 72 (63.72) 91 (55.15) 0.043Yes 171 56 (31.82) 41 (36.28) 74 (44.85)
AppetiteGood 380 154 (83.24) 93 (77.50) 133 (74.30) 0.110Poor 104 31 (16.76) 27 (22.50) 46 (25.70)
Tooth-brushing abilityIndependent 308 104 (58.10) 80 (71.43) 124 (72.09) 0.010Dependent 155 75 (41.90) 32 (28.57) 48 (27.91)
Frequency of tooth-brushing each daySometimes 15 5 (2.79) 4 (3.57) 6 (3.49) 0.969<3 times 353 135 (75.42) 87 (77.68) 131 (76.16)≥3 times, after meals 95 39 (21.79) 21 (18.75) 35 (20.35)
Multiple logistic regression models showed the major risk factors for restorative TNsamong CD were their intake of sweets at least once a week (AOR = 2.45, 95% CI = 1.48–4.11,p = 0.001) or more frequently than those who never or sometimes consumed sweets. Theother risk factors—significantly related to children’s poor oral health were having gingivitis(AOR = 1.94, 95% CI = 1.22–3.11, p = 0.006) and insufficient ability to brush their teethwithout assistance from parents/caregivers (AOR = 1.95, 95% CI = 1.19–3.22, p = 0.008)(Table 4).
126
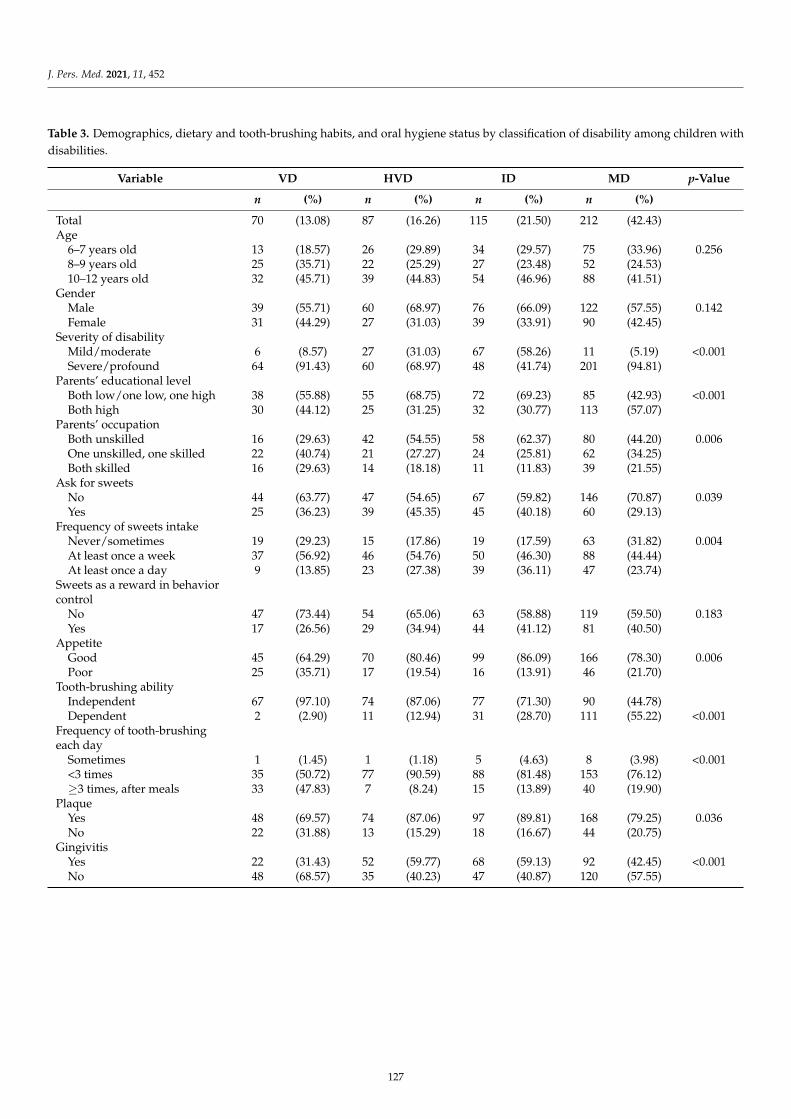
J. Pers. Med. 2021, 11, 452
Table 3. Demographics, dietary and tooth-brushing habits, and oral hygiene status by classification of disability among children withdisabilities.
Variable VD HVD ID MD p-Value
n (%) n (%) n (%) n (%)
Total 70 (13.08) 87 (16.26) 115 (21.50) 212 (42.43)Age
6–7 years old 13 (18.57) 26 (29.89) 34 (29.57) 75 (33.96) 0.2568–9 years old 25 (35.71) 22 (25.29) 27 (23.48) 52 (24.53)10–12 years old 32 (45.71) 39 (44.83) 54 (46.96) 88 (41.51)
GenderMale 39 (55.71) 60 (68.97) 76 (66.09) 122 (57.55) 0.142Female 31 (44.29) 27 (31.03) 39 (33.91) 90 (42.45)
Severity of disabilityMild/moderate 6 (8.57) 27 (31.03) 67 (58.26) 11 (5.19) <0.001Severe/profound 64 (91.43) 60 (68.97) 48 (41.74) 201 (94.81)
Parents’ educational levelBoth low/one low, one high 38 (55.88) 55 (68.75) 72 (69.23) 85 (42.93) <0.001Both high 30 (44.12) 25 (31.25) 32 (30.77) 113 (57.07)
Parents’ occupationBoth unskilled 16 (29.63) 42 (54.55) 58 (62.37) 80 (44.20) 0.006One unskilled, one skilled 22 (40.74) 21 (27.27) 24 (25.81) 62 (34.25)Both skilled 16 (29.63) 14 (18.18) 11 (11.83) 39 (21.55)
Ask for sweetsNo 44 (63.77) 47 (54.65) 67 (59.82) 146 (70.87) 0.039Yes 25 (36.23) 39 (45.35) 45 (40.18) 60 (29.13)
Frequency of sweets intakeNever/sometimes 19 (29.23) 15 (17.86) 19 (17.59) 63 (31.82) 0.004At least once a week 37 (56.92) 46 (54.76) 50 (46.30) 88 (44.44)At least once a day 9 (13.85) 23 (27.38) 39 (36.11) 47 (23.74)
Sweets as a reward in behaviorcontrol
No 47 (73.44) 54 (65.06) 63 (58.88) 119 (59.50) 0.183Yes 17 (26.56) 29 (34.94) 44 (41.12) 81 (40.50)
AppetiteGood 45 (64.29) 70 (80.46) 99 (86.09) 166 (78.30) 0.006Poor 25 (35.71) 17 (19.54) 16 (13.91) 46 (21.70)
Tooth-brushing abilityIndependent 67 (97.10) 74 (87.06) 77 (71.30) 90 (44.78)Dependent 2 (2.90) 11 (12.94) 31 (28.70) 111 (55.22) <0.001
Frequency of tooth-brushingeach day
Sometimes 1 (1.45) 1 (1.18) 5 (4.63) 8 (3.98) <0.001<3 times 35 (50.72) 77 (90.59) 88 (81.48) 153 (76.12)≥3 times, after meals 33 (47.83) 7 (8.24) 15 (13.89) 40 (19.90)
PlaqueYes 48 (69.57) 74 (87.06) 97 (89.81) 168 (79.25) 0.036No 22 (31.88) 13 (15.29) 18 (16.67) 44 (20.75)
GingivitisYes 22 (31.43) 52 (59.77) 68 (59.13) 92 (42.45) <0.001No 48 (68.57) 35 (40.23) 47 (40.87) 120 (57.55)
127
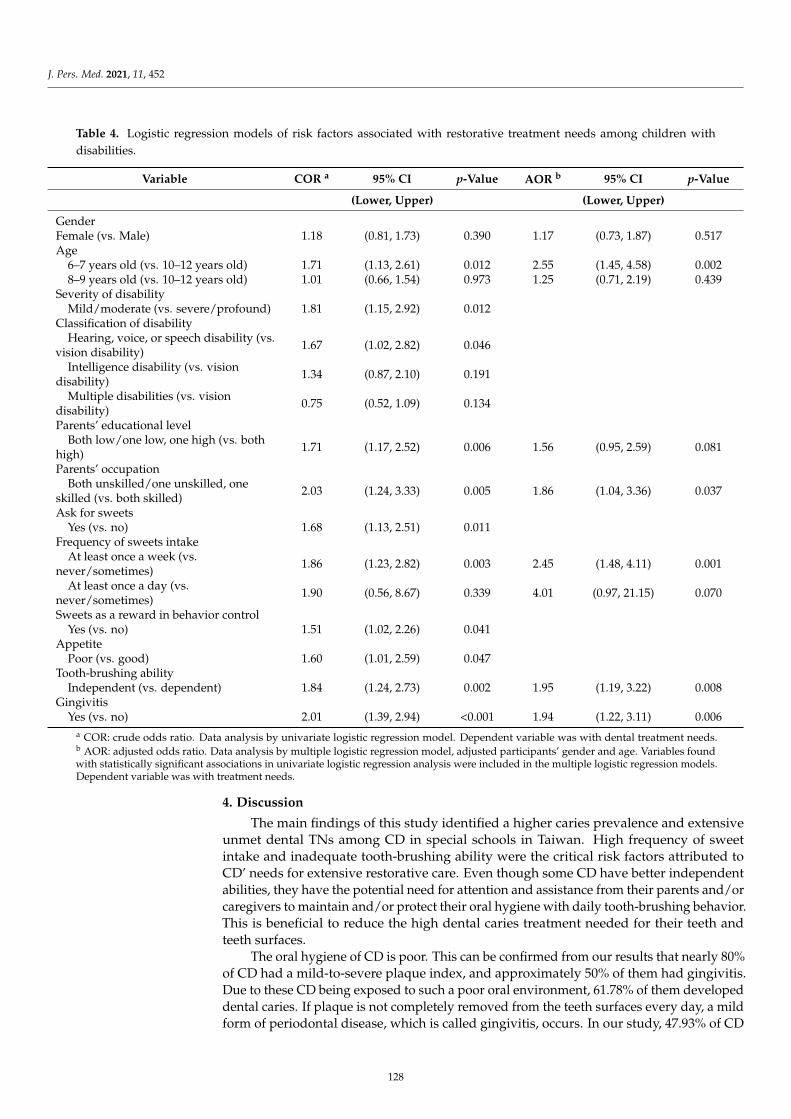
J. Pers. Med. 2021, 11, 452
Table 4. Logistic regression models of risk factors associated with restorative treatment needs among children withdisabilities.
Variable COR a 95% CI p-Value AOR b 95% CI p-Value
(Lower, Upper) (Lower, Upper)
GenderFemale (vs. Male) 1.18 (0.81, 1.73) 0.390 1.17 (0.73, 1.87) 0.517Age
6–7 years old (vs. 10–12 years old) 1.71 (1.13, 2.61) 0.012 2.55 (1.45, 4.58) 0.0028–9 years old (vs. 10–12 years old) 1.01 (0.66, 1.54) 0.973 1.25 (0.71, 2.19) 0.439
Severity of disabilityMild/moderate (vs. severe/profound) 1.81 (1.15, 2.92) 0.012
Classification of disabilityHearing, voice, or speech disability (vs.
vision disability) 1.67 (1.02, 2.82) 0.046
Intelligence disability (vs. visiondisability) 1.34 (0.87, 2.10) 0.191
Multiple disabilities (vs. visiondisability) 0.75 (0.52, 1.09) 0.134
Parents’ educational levelBoth low/one low, one high (vs. both
high) 1.71 (1.17, 2.52) 0.006 1.56 (0.95, 2.59) 0.081
Parents’ occupationBoth unskilled/one unskilled, one
skilled (vs. both skilled) 2.03 (1.24, 3.33) 0.005 1.86 (1.04, 3.36) 0.037
Ask for sweetsYes (vs. no) 1.68 (1.13, 2.51) 0.011
Frequency of sweets intakeAt least once a week (vs.
never/sometimes) 1.86 (1.23, 2.82) 0.003 2.45 (1.48, 4.11) 0.001
At least once a day (vs.never/sometimes) 1.90 (0.56, 8.67) 0.339 4.01 (0.97, 21.15) 0.070
Sweets as a reward in behavior controlYes (vs. no) 1.51 (1.02, 2.26) 0.041
AppetitePoor (vs. good) 1.60 (1.01, 2.59) 0.047
Tooth-brushing abilityIndependent (vs. dependent) 1.84 (1.24, 2.73) 0.002 1.95 (1.19, 3.22) 0.008
GingivitisYes (vs. no) 2.01 (1.39, 2.94) <0.001 1.94 (1.22, 3.11) 0.006
a COR: crude odds ratio. Data analysis by univariate logistic regression model. Dependent variable was with dental treatment needs.b AOR: adjusted odds ratio. Data analysis by multiple logistic regression model, adjusted participants’ gender and age. Variables foundwith statistically significant associations in univariate logistic regression analysis were included in the multiple logistic regression models.Dependent variable was with treatment needs.
4. Discussion
The main findings of this study identified a higher caries prevalence and extensiveunmet dental TNs among CD in special schools in Taiwan. High frequency of sweetintake and inadequate tooth-brushing ability were the critical risk factors attributed toCD’ needs for extensive restorative care. Even though some CD have better independentabilities, they have the potential need for attention and assistance from their parents and/orcaregivers to maintain and/or protect their oral hygiene with daily tooth-brushing behavior.This is beneficial to reduce the high dental caries treatment needed for their teeth andteeth surfaces.
The oral hygiene of CD is poor. This can be confirmed from our results that nearly 80%of CD had a mild-to-severe plaque index, and approximately 50% of them had gingivitis.Due to these CD being exposed to such a poor oral environment, 61.78% of them developeddental caries. If plaque is not completely removed from the teeth surfaces every day, a mildform of periodontal disease, which is called gingivitis, occurs. In our study, 47.93% of CD
128
J. Pers. Med. 2021, 11, 452
had inflammation and bleeding of the gums. This results make us more convinced thatpoor oral hygiene will affect subsequent oral diseases such as dental decay and gingivitis,which is consistent with previous findings [12,18,28]. However, good oral hygiene canbe achieved via regular removal of plaque by thorough tooth-brushing every day. If theplaque declines, tooth decay and gingivitis will simultaneously diminish.
Dental caries remains a primary health problem among CD. Unmet decayed andmissing teeth in 6–12-year-old Taiwanese CD, with a mean age of 9.47 years old, havedecreased, with the mean caries experience index declining from 3.36 teeth (72.77%) in2005 [17] to 2.72 teeth (61.78%) in our study (2021). The same index in 9-year-old childrenalso declined from 2.70 (73.55%) in 2007 to 2.66 (47.09%) in 2012 [17,29] among the ordinarypopulation. The decreasing value of caries experience index among CD (10.99%) in ourstudy was less than in those without disabilities (26.46%) [17,29]. In comparison with otherstudies, the caries prevalence in this study (61.78%) is higher than the result in Australia(56%) but lower than that in Iran (73.6%) [12,28]. The studies of 5–16-year-old CD inAustralia and Iran reported less unmet dental treatment teeth (1.53 and 2.09), which washalf to two-thirds of our findings (2.75) [12,28]. Furthermore, we compared the treatmentmodalities and found the CD in the present study had a higher need of complex treatment(36.64%) than the CD in the Australian (21%) and Iranian (25.1%) studies [12,28]. FewerCD had caries lesions in the present study than in Iran, but they needed more complexdental treatment. It appeared that the CD in our study tended to have more severe toothcaries and required higher dental TNs than CD from other countries [28].
The moderate and complex dental TNs among CD were unmet in this study. Most ofthe patients receiving dental treatment under GA were people with special needs [14,21,30],especially when the patient needed to have extensive and complicated treatment [31].The most common treatments (extraction, restoration, and pulp therapy) under GA overthe past 10 years in Taiwan are related to a high proportion of multiple dental caries(86.4%) [32,33]. Our result is consistent with other studies, wherein children who need tobe treated under GA usually have a higher unmet decayed teeth treatment of more than10 teeth [32,33]. There were two-thirds (59.87%) out of 36.98% of our participants whomight need to be treated under GA due to their uncooperative behavior in specialist clinicsor regional hospitals that have critical care facilities. If the CD receive their first dentaltreatment as early as possible, they can achieve more effective dental rehabilitation [32].
There was a clear negative correlation between decayed teeth and surfaces for complexrestorative TNs and severity of disability. This observation is in line with previous studiesthat children with profound disabilities acquire partial or complete assistance from othersas it pertains to maintaining their oral health due to lack of adequate manual dexterityability [12,22]. However, this is not always true, according to our findings. Our resultsshowed the complex restorative TNs in HVD (71.26%) were higher than MD (58.02%) andVD (52.86%), which was also contrary to the results of a study in Saudi Arabia [34]. Thestudies of 5–16-year-old children with HVD in Saudi Arabia had restorative TN of 66.02%,which was lower than MD and VD (76.93% and 74.29%) in the present study. In this study,the HVD and VD children had the better capability to learn oral hygiene skills and takecare of themselves in comparison with other groups. However, HVD children had ordinalvision and tended to be more susceptible to the allure of various sweets than VD children.The HVD children also had a better independent ability to access, buy, and obtain sweetsby themselves than other disability groups. If HVD children do not perform the positivebehavior of cleaning their teeth after sweets under supervision by parents/caregivers, it islikely to result in the repercussions of increasing the risk of more caries teeth and surfacesand higher restorative TNs.
Obstacles blocking these participants from achieving lower TNs in this study areimproper sweet habits and inadequate tooth-brushing behavior. Manual dexterity is not aguarantee of better oral health and lower TNs among CD. The effectiveness of brushingis limited if CD receive less brushing assistance or supervision when they brush theirteeth [18,34–36]. The higher the education level the parents/caregivers had, the more
129
J. Pers. Med. 2021, 11, 452
aware they were about how to sufficiently complete the oral care needs of the CD [18,36,37].If parents have higher occupation levels, they will have the sufficient financial capacity totake care of their children’s oral hygiene to reach better oral health and decrease dentalTNs [36,37]. However, the negative effect of caries TNs among CD from frequent sweets in-take is superior to that from insufficient tooth-brushing ability [38]. The results of our studyshowed that frequent tooth-brushing could minimize the severity and prevalence of TN.The consumption of sweets in small amounts, along with other fermentable carbohydratesconsumed frequently. will increase the caries risk and TNs, rather than large amountseaten occasionally. Sweet limits, not only controlling the frequency, but also advisingto give healthy or low-carcinogenic alternative foods such as fresh fruit and vegetablesand/or low-carcinogenic foods by parents/caregivers contributed to a lower prevalence ofuntreated dental caries and TN rates among CD [39].
Before treatment, how to prevent and decrease the number and severity of TNs isimportant. Our study showed that tooth-brushing can, in part, diminish the associationbetween giving sweets as a reward in behavior control, asking for sweets, and frequencyof sweets intake on dental decay outcome in CDs [38]. Sticky foods with sugar and/orfermentable carbohydrates can stay in the oral environment for longer periods, thusincreasing the potential and risk for tooth decay. Similar to ordinary children, having theirchildren brush their teeth at least twice a day is deeply associated with parents’/caregivers’self-efficacy or confidence [40]. More frequent tooth-brushing might compensate for theinadequate tooth-brushing ability of children, as seen in previous studies [18]. To addressthe high TNs among CD in the present study, we need to provide promotion coursesto encourage the parents/caregivers with lower educational levels, especially those inunskilled occupation levels, to implement effective preventive measures such as brushingafter eating and correctly choosing healthy snacks for their children.
There are several limitations to the present study. One is that we have difficultyconcluding regarding the causation between dental TNs and related risk factors by self-reported questionnaires, as is the case in most observational cross-sectional studies. Second,the observations were assessed outside the dental clinic, with limited accessibility anddifficulties for patients’ handling. Third, a small number of parents/caregivers mightanswer questions in such a way as to meet social expectations and thus cause answerbias. In addition, we collected the data from special schools, not including bedridden andhomebound groups; therefore, our results may underestimate the real consideration of alldisability groups and reflect the status of school CD. However, our findings may help tobetter understand the TNs of CD and propose some measures to improve their oral care.
5. Conclusions
The present findings illustrate TNs with an enormous need for restorative treatment,concentrated on 61.78% of CD. Improper sweet habits and inadequate tooth-brushing abilitywere found in the risk factors for having the highest odds of requiring restorative treatment.Study results reveal that oral problems among these children do not get much attentionfrom their parents/caregivers, especially those with lower education or occupation levels. Itis imperative to encourage low-educational-level parents/caregivers to take their childrenfor dental treatment, teach them why and how to brush teeth after eating, and help themmodify the sweet intake habits of their children to decrease their children’s caries andimprove their children’s oral health.
Author Contributions: Conceptualization, S.-Y.H. and H.-Y.L.; methodology, P.-H.C. and S.-T.H.;software, P.-H.C.; validation, H.-Y.L.; formal analysis, S.-S.H. and C.-W.Y.; investigation, S.-Y.H.and S.-T.H.; data curation, S.-S.H. and C.-W.Y.; writing—original draft preparation, S.-Y.H. andS.-Y.Y.; writing—review and editing, H.-Y.L.; visualization, S.-Y.Y.; supervision, H.-Y.L.; projectadministration, H.-Y.L. The authors have confirmed that all authors meet the International Journalof Personalized Medicine criteria for authorship credit, as follows: (1) substantial contributions toconception and design, acquisition of data, or analysis and interpretation of data; (2) drafting the
130
J. Pers. Med. 2021, 11, 452
article or revising it critically for important intellectual content; and (3) final approval of the versionto be published. All authors have read and agreed to the published version of the manuscript.
Funding: This research was funded by the Bureau of Health Promotion, Department of Health, Taiwan.
Informed Consent Statement: The study was conducted according to the guidelines of the Declara-tion of Helsinki and approved by the Institutional Review Board of Kaohsiung Medical UniversityHospital (KMUH-IRB-950125). The participants’ legal representatives provided written informedconsent for the participants’ involvement in the study.
Acknowledgments: The authors gratefully acknowledge the dentists from Tomlin children’s dentalclinic and Dada clinics, nurses of special schools, children, and their parents for conducting oralexaminations, cordial help, participation, and cooperation, respectively. We would like to expressour sincere gratitude to the administrators and staff of the facilities for people with disabilities fortheir support and assistance, and to all the wonderful children with disabilities for their generousparticipation.
Conflicts of Interest: The authors declare no conflict of interest.
References1. Scott, A.; March, L.; Stokes, M.L. A survey of oral health in a population of adults with developmental disabilities: Comparison
with a national oral health survey of the general population. Aust. Dent. J. 1998, 43, 257–261. [CrossRef] [PubMed]2. Tonge, B.; Einfeld, S. The trajectory of psychiatric disorders in young people with intellectual disabilities. Aust. N. Z. J. Psychiatry
2000, 34, 80–84. [CrossRef]3. Lopez-Perez, R.; Borges-Yanez, S.A.; Jimenez-Garcia, G.; Maupome, G. Oral hygiene, gingivitis, and periodontitis in persons with
Down syndrome. Spec. Care Dent. 2002, 22, 214–220. [CrossRef] [PubMed]4. Salles, P.S.; Tannure, P.N.; Oliveira, C.A.; Souza, I.P.; Portela, M.B.; Castro, G.F. Dental needs and management of children with
special health care needs according to type of disability. J. Dent. Child. (Chic) 2012, 79, 165–169.5. Petrovic, B.B.; Peric, T.O.; Markovic, D.L.; Bajkin, B.B.; Petrovic, D.; Blagojevic, D.B.; Vujkov, S. Unmet oral health needs among
persons with intellectual disability. Res. Dev. Disabil. 2016, 59, 370–377. [CrossRef] [PubMed]6. Zhou, N.; Wong, H.; Wen, Y.; McGrath, C. Efficacy of caries and gingivitis prevention strategies among children and adolescents
with intellectual disabilities: A systematic review and meta-analysis. J. Intellect. Disabil. Res. 2019, 63, 507–518. [CrossRef][PubMed]
7. Li, C.W.; Yen, C.F.; Loh, C.H.; Lee, T.N.; Lin, J.D. Medical Care and Affected Factors among People with Intellectual Disabilities inTaiwan: Outpatient Utilization in 2001. J. Disabil. Res. 2005, 3, 5–17.
8. US Department of Health and Human Services. Healthy People 2010, 2nd ed.; US Government Printing Office: Washington, DC,USA, 2000.
9. Koritsas, S.; Iacono, T. Secondary conditions in people with developmental disability. Am. J. Intellect. Dev. Disabil. 2011, 116,36–47. [CrossRef]
10. Hennequin, M.; Faulks, D.; Roux, D. Accuracy of estimation of dental treatment need in special care patients. J. Dent. 2000, 28,131–136. [CrossRef]
11. Cumella, S.; Ransford, N.; Lyons, J.; Burnham, H. Needs for oral care among people with intellectual disability not in contact withCommunity Dental Services. J. Intellect. Disabil. Res. 2000, 44, 45–52. [CrossRef] [PubMed]
12. Desai, M.; Messer, L.B.; Calache, H. A study of the dental treatment needs of children with disabilities in Melbourne, Australia.Aust. Dent. J. 2001, 46, 41–50. [CrossRef] [PubMed]
13. Bradley, C.; McAlister, T. The oral health of children with Down syndrome in Ireland. Spec. Care Dent. 2004, 24, 55–60. [CrossRef][PubMed]
14. Lee, P.Y.; Chou, M.Y.; Chen, Y.L.; Chen, L.P.; Wang, C.J.; Huang, W.H. Comprehensive dental treatment under general anesthesiain healthy and disabled children. Chang Gung Med. J. 2009, 32, 636–642.
15. Huang, S.T.; Hurng, S.J.; Liu, H.Y.; Chen, C.C.; Hu, W.C.; Tai, Y.C.; Hsiao, S.Y. The oral health status and treatment needs ofinstitutionalized children with cerebral palsy in Taiwan. J. Dent. Sci. 2010, 5, 75–89. [CrossRef]
16. Weng, R.H.; Kung, P.T.; Tsai, W.C.; Chiang, H.H.; Chiu, L.T. The use of fluoride varnish and its determining factors amongchildren with disability in Taiwan. Res. Dev. Disabil. 2011, 32, 583–592. [CrossRef] [PubMed]
17. Ministry of Health and Welfare. Oral Health Survey of Children and Adolescents in Taiwan (2003–2005). Available online:https://dep.mohw.gov.tw/DOMHAOH/cp-486-1917-107.html (accessed on 18 March 2021).
18. Liu, H.Y.; Chen, C.C.; Hu, W.C.; Tang, R.C.; Chen, C.C.; Tsai, C.C.; Huang, S.T. The impact of dietary and tooth-brushing habits todental caries of special school children with disability. Res. Dev. Disabil. 2010, 31, 1160–1169. [CrossRef]
19. Liu, H.Y.; Hung, H.C.; Hsiao, S.Y.; Chen, H.S.; Yen, Y.Y.; Huang, S.T.; Chen, C.C.; Chen, P.H.; Chen, C.C.; Lin, P.C.; et al. Impact of24-month fluoride tablet program on children with disabilities in a non-fluoridated country. Res. Dev. Disabil. 2013, 34, 2598–2605.[CrossRef] [PubMed]
131
J. Pers. Med. 2021, 11, 452
20. Waldman, H.B.; Perlman, S.P. Disability and rehabilitation: Do we ever think about needed dental care? A case study: The USA.Disabil. Rehabil. 2010, 32, 947–951. [CrossRef]
21. Sari, M.; Ozmen, B.; Koyuturk, A.; Tokay, U. A retrospective comparison of dental treatment under general anesthesia on childrenwith and without mental disabilities. Niger. J. Clin. Pract. 2014, 17, 361–365. [CrossRef]
22. Liu, H.Y.; Huang, S.T.; Hsuao, S.Y.; Chen, C.C.; Hu, W.C.; Yen, Y.Y. Dental caries associated with dietary and toothbrushing habitsof 6-to 12-year-old mentally retarded children in Taiwan. J. Dent. Sci. 2009, 4, 61–74. [CrossRef]
23. Petrovic, B.; Markovic, D.; Peric, T. Evaluating the population with intellectual disability unable to comply with routine dentaltreatment using the International Classification of Functioning, Disability and Health. Disabil. Rehabil. 2011, 33, 1746–1754.[CrossRef] [PubMed]
24. Physically and Mentally Disabled Citizens Protection Act. Available online: https://law.moj.gov.tw/Eng/LawClass/LawAll.aspx?PCode=D0050046 (accessed on 18 March 2021).
25. World Health Organization. Oral Health Surveys-Basic Methods, 4th ed.; World Health Organization: Geneva, Switzerland, 1997.26. Greene, J.C.; Vermillion, J.R. The simplified oral hygiene index. J. Am. Dent. Assoc. 1964, 68, 7–13. [CrossRef] [PubMed]27. Löe, H. The Gingival Index, the Plaque Index and the Retention Index Systems. J. Periodontol. 1967, 38, 610–616. [CrossRef]28. Ajami, B.A.; Shabzendedar, M.; Rezay, Y.A.; Asgary, M. Dental treatment needs of children with disabilities. J. Dent. Res. Dent.
Clin. Dent. Prospects 2007, 1, 93–98.29. Ministry of Health and Welfare. Oral Health Survey of Children and Adolescents in Taiwan (2010–2013). Available online:
https://dep.mohw.gov.tw/DOMHAOH/cp-486-1917-107.html (accessed on 18 March 2021).30. Wang, Y.C.; Lin, I.H.; Huang, C.H.; Fan, S.Z. Dental anesthesia for patients with special needs. Acta Anaesthesiol. Taiwanica 2012,
50, 122–125. [CrossRef]31. Chen, Y.P.; Hsieh, C.Y.; Hsu, W.T.; Wu, F.Y.; Shih, W.Y. A 10-year trend of dental treatments under general anesthesia of children
in Taipei Veterans General Hospital. J. Chin. Med. Assoc. 2017, 80, 262–268. [CrossRef]32. Chen, C.Y.; Chen, Y.W.; Tsai, T.P.; Shih, W.Y. Oral health status of children with special health care needs receiving dental treatment
under general anesthesia at the dental clinic of Taipei Veterans General Hospital in Taiwan. J. Chin. Med. Assoc. 2014, 77, 198–202.[CrossRef]
33. Al-Qahtani, Z.; Wyne, A.H. Caries experience and oral hygiene status of blind, deaf and mentally retarded female children inRiyadh, Saudi Arabia. Odontostomatol. Trop. 2004, 27, 37–40.
34. Chiwata, K.; Takeda, F. Daily living activities and oral condition among care facility residents with severe intellectual disabilities.Comparative analyses between residents receiving tooth-brushing assistance and those not receiving tooth-brushing assistance.Nihon Koshu Eisei Zasshi 2007, 54, 387–398.
35. Martens, L.; Marks, L.; Goffin, G.; Gizani, S.; Vinckier, F.; Declerck, D. Oral hygiene in 12-year-old disabled children in Flanders,Belgium, related to manual dexterity. Community Dent. Oral Epidemiol. 2000, 28, 73–80. [CrossRef]
36. Jaber, M.A. Dental caries experience, oral health status and treatment needs of dental patients with autism. J. Appl. Oral Sci. 2011,19, 212–217. [CrossRef] [PubMed]
37. Liu, H.Y.; Chen, J.R.; Hsiao, S.Y.; Huang, S.T. Caregivers’ oral health knowledge, attitude and behavior toward their children withdisabilities. J. Dent. Sci. 2017, 12, 388–395. [CrossRef]
38. Skafida, V.; Chambers, S. Positive association between sugar consumption and dental decay prevalence independent of oralhygiene in pre-school children: A longitudinal prospective study. J. Public Health 2017, 40, e275–e283. [CrossRef] [PubMed]
39. Bonotto, D.V.; Montes, G.R.; Ferreira, F.M.; da Silva Assunção, L.R.; Fraiz, F.C. Association of parental attitudes at mealtime andsnack limits with the prevalence of untreated dental caries among preschool children. Appetite 2017, 108, 450–455. [CrossRef][PubMed]
40. Phanthavong, S.; Nonaka, D.; Phonaphone, T.; Kanda, K.; Sombouaphan, P.; Wake, N.; Sayavong, S.; Nakasone, T.; Phongsavath,K.; Arasaki, A. Oral health behavior of children and guardians’ beliefs about children’s dental caries in Vientiane, Lao People’sDemocratic Republic (Lao PDR). PLoS ONE 2019, 14, e0211257. [CrossRef]
132
Journal of
Personalized
Medicine
Article
Decreased Tongue Pressure Associated with Aging, Chewingand Swallowing Difficulties of Community-Dwelling OlderAdults in Taiwan
Hsiu-Yueh Liu 1,2 , Jen-Hao Chen 3,4, Kun-Jung Hsu 3,5,6 , Ching-Teng Yao 7 , Ping-Ho Chen 3,8 ,Szu-Yu Hsiao 3,9 and Chun-Li Lin 10,*
Citation: Liu, H.-Y.; Chen, J.-H.;
Hsu, K.-J.; Yao, C.-T.; Chen, P.-H.;
Hsiao, S.-Y.; Lin, C.-L. Decreased
Tongue Pressure Associated with
Aging, Chewing and Swallowing
Difficulties of Community-Dwelling
Older Adults in Taiwan. J. Pers. Med.
2021, 11, 653. https://doi.org/
10.3390/jpm11070653
Academic Editor: Rutger
A. Middelburg
Received: 17 June 2021
Accepted: 9 July 2021
Published: 11 July 2021
Publisher’s Note: MDPI stays neutral
with regard to jurisdictional claims in
published maps and institutional affil-
iations.
Copyright: © 2021 by the authors.
Licensee MDPI, Basel, Switzerland.
This article is an open access article
distributed under the terms and
conditions of the Creative Commons
Attribution (CC BY) license (https://
creativecommons.org/licenses/by/
4.0/).
1 Department of Oral Hygiene, College of Dental Medicine, Kaohsiung Medical University,Kaohsiung 80708, Taiwan; [email protected]
2 Department of Medical Research, Kaohsiung Medical University Hospital, Kaohsiung Medical University,Kaohsiung 80708, Taiwan
3 School of Dentistry, College of Dental Medicine, Kaohsiung Medical University, Kaohsiung 80708, Taiwan;[email protected] (J.-H.C.); [email protected] (K.-J.H.); [email protected] (P.-H.C.);[email protected] (S.-Y.H.)
4 Division of Prosthodontics, Department of Dentistry, Kaohsiung Medical University Hospital,Kaohsiung 80708, Taiwan
5 Department of Family Dentistry, Kaohsiung Medical University Hospital, Kaohsiung 80708, Taiwan6 Department of Dentistry, Kaohsiung Municipal Ta-Tung Hospital, Kaohsiung 80145, Taiwan7 Master Program of Long-Term Care in Aging, Kaohsiung Medical University,
Kaohsiung 80708, Taiwan; [email protected] Cancer Center, Kaohsiung Medical University Hospital, Kaohsiung 80708, Taiwan9 Division of Pediatric Dentistry and Special Needs Dentistry, Department of Dentistry, Kaohsiung Medical
University Hospital, Kaohsiung 807377, Taiwan10 Department of Biomedical Engineering, National Yang-Ming Chiao-Tung University, Hsinchu 30010, Taiwan* Correspondence: [email protected]
Abstract: Personalized tongue pressure (TP) training focuses on improving swallowing. This studyaims to establish the TP values of different age levels and compare changes between differentswallowing status among community-dwelling elders. In this cross-sectional study, 1000 participants,aged 60 years old and above, were recruited from community care centers. All participants wereclassified into non chewing and/or swallowing difficulties (NCSD) and with chewing and/orswallowing difficulties (CSD) groups and their diseases and dieting status were recorded using astructured questionnaire. A disposable oral probe was used to measure TP by asking participants tocompress it against the hard palate with maximum voluntary effort. Among 1000 elders, 63.10% hadCSD and their TP (from 31.76 to 18.20 kPa) was lower than the NCSD group (from 33.56 to 24.51 kPa).Both groups showed the same tendency for TP decline with increasing age. Decline of TP makes CSDelderly have a poor appetite, eat a soft or liquid diet, and take longer to eat a meal (all p < 0.050). Thesecondary risk factor dominating TP decline for NCSD and CSD elders is having an education levelless than primary school and an abnormal eating assessment, respectively. Our results demonstratedthat TP decline has a significant relationship with age changes. Education level and an abnormaleating assessment score are closely associated with TP decline. A series of TP values can be used as areference indicator of personalized medicine during the aging process among community-dwellingolder adults.
Keywords: tongue pressure; aging; epidemics; community; elderly
1. Introduction
Taiwan’s accelerated rate of aging issues have become an imperative topic in thecountry’s long-term care policy and practice [1,2]. In response to the challenge of the rapidlygrowing older population, the new policy of long-term care, called LTC 2.0, was launched,
133
J. Pers. Med. 2021, 11, 653
planned, developed, and implemented in 2017 to prevent and delay the functional declineof the community-dwelling older population [3]. Aging has been confirmed to increasethe decline of swallowing function by several studies [4–9]. Decreasing motor functionin the lips, muscle strength and tongue pressure (TP), and loss of taste and smell withage increases and raises swallowing time, worsens swallowing performance, and impairsswallowing function [10]. A previous study in Taiwan found that 21.8% of the community’selderly in Taiwan aged 65–95 years old tended to choke at least three times a week duringeating, and 12.8% of the study population were assessed as having swallowing disorders [8].Based on this proportion, it is reasonable to estimate that approximately 480,000 eldersin Taiwan have swallowing disorders. Swallowing disorders and/or difficulties reducethe willingness and ability to eat food or drink liquids they once loved, causes nutritionalimbalance, weight loss, dehydration, and also increases the risk of and mortality fromaspiration pneumonia in the elderly [9].
The aging process sees diminished muscle mass, a decline in muscle strength, andcauses frailty and sarcopenia. As for most muscle groups, muscle reduction also occursin the tongue muscles. Tongue muscle loss reflects tongue muscle strength [11,12]. Theperformance of tongue strength is considered the main driving force for moving the bolusduring the chewing and swallowing of food. Swallowing efficacy and safety may worsendue to muscle fatigue and weakness of the swallowing-related tongue muscles as a result ofrepetitive swallowing during a long meal time over 30 min [10,13]. Due to the developmentand progress of science, the strength of the tongue muscle can be measured via a mechanicalpressure device exerted by the tongue against the hard palate. These devices provide anobjective method of assessing tongue strength for community screening and physicalresearch investigation [14,15]. A meta-analysis conducted by Adams et al. reportedaverage TP decreased by about 8–9 kPa from young to old adults overall [16]. Anotheranalysis further reported that mean TP value ranges of healthy individuals ascertained byJMS (JMS TPM-01/02, JMS Co., Ltd., Hiroshima, Japan) [17] were significantly higher inhealthy individuals less than 60 years (37.5 kPa to 41.1 kPa) relative to those 60 years orolder (29.4 kPa to 31.1 kPa) [18].
Over the past three decades, tongue muscle strength has been used as a useful indicatorto evaluate the physically frail, the eating and swallowing ability of the elderly, to screenpatients with or without penetration, aspiration, or residue during eating, and assistpatients (such as those with stroke, Parkinson’s disease, and amyotrophic lateral sclerosis)with management targeted therapy goals or disease progression [13–15,19,20]. PersonalizedTP training is a new focus for improve swallowing. TP training or rehabilitation therapyat home is feasible, and it may become a new focus of personal precision medicine inthe future. However, a large-scale TP database of older adults is currently unavailable inTaiwan. Moreover, the TP database may vary by country, subjects, and age groups. Beforeusing TP to achieve personal swallowing precision medicine, it is necessary to establish adatabase of TP values among community-dwelling elderly. Therefore, this study aims toestablish the TP values of different age levels among the community-dwelling elderly, andcompare the TP changes between the elderly with different chewing and/or swallowingdifficulties (CSD) status. These TP values of different age levels and CSD status may beused as an effective indicator for screening the changes of tongue function of the elderlyand be an optimal treatment goal for patients with chewing and/or swallowing difficulties.
2. Methods2.1. Study Design and Population2.1.1. Study Design
This observational cross-sectional study was carried out from October 2019 to Novem-ber 2020. Community-dwelling older adults residing in Kaohsiung, Taiwan were enrolledin this study. The study adopted a multi-stage stratified cluster sampling design. Thesampling probability is based on the probability proportional to size, with the communitycare centers as the sampling unit. First, Kaohsiung City has 38 districts stratified into
134
J. Pers. Med. 2021, 11, 653
seven clusters based on the urbanization stratification of townships in Taiwan [21]. Wemerged the first and second clusters into urban areas (8 districts with 92 care centers), thirdand fourth clusters into town areas (9 districts with 89 care centers), and fifth to seventhclusters into rural areas (21 districts with 112 care centers). Second, 38 community carecenters were randomly selected from 293 community care centers based on the populationprobability of older adults (60 years old or above), which were 47.76% (19 care centers),31.39% (11 care centers) and 20.65% (7 care centers) of the 3 district clusters, respectively.Third, we recruited the eligible older adults from each selected community care center.A total of 1000 participants were recruited from urban areas (n = 463), new town areas(n = 339), and rural areas (n = 198).
2.1.2. Sample Size
The sample size calculation considered the population of 616,280 older adults living inthe city. We wanted to identify the sample size for a larger population and used the Slovin orYamane formulas [22]. This formula, based on Krejcie and Morgan’s recommendation [23],used 0.50 as an estimate of the population proportion to maximize variance, which willalso produce the maximum sample size. With the population size of 616,280 older adults,at 95% confidence level and 5% margin of error, this resulted in our minimal sample size of384 participants. We selected double the number of older adults necessary for research andconsidered 30% drop-out rate (as the rejection). Finally, the theoretical sample size in thisdesignated study was at least 998 after original calculation. The actual sample size wasadjusted to 1000 for further grouping and implementation. This study successfully recruited1000 older adults (aged from 60 to 95 years old; 215 males, mean age of 74.75 ± 7.51 years;785 females, mean age: 72.86 ± 7.58 years).
2.1.3. Sample Selection and Randomization
The participants enrolled in this study (1) were equal to or older than 60 years; (2) hadno craniofacial deformities or syndromes, no neuromuscular diseases, no history of head orneck cancer, had not undergone radiation therapy, and had no underlying neuromusculardiseases that were known as diseases that affect tongue strength. The exclusion criteria forthe participants were (1) cognitively not fit for understanding and communication; (2) thecoexistence of cognitive problems that affect language understanding, their inability tocomplete the tasks or the chance they may disrupt accurate TP measurement, and otherproblems that may impair the test.
2.1.4. Ethical Approval
Ethical approval was obtained from the Human Experiment and Ethics Commit-tees of Kaohsiung Medical University (Protocol number: KMUHIRB-F(I)-20190104). Allprocedures performed were in accordance with the ethical standards of the institutionaland/or national research committee, and with the 1964 Helsinki Declaration and its lateramendments or comparable ethical standards. Prior to oral examination and oral functionevaluation, the purpose and content of the study protocol was thoroughly explained tothe participants by the principal investigator. After agreeing to participate in the study, allparticipants signed a written informed consent.
2.2. Data Collection Methods2.2.1. Questionnaire Interview and Swallowing Assessment
A structured questionnaire was used to collect data on basic demographic characteris-tics (i.e., age, sex, education level), and diet status (i.e., type of diet and duration of mealtime) referred to in the publication of Liu et al. [24]. Questionnaire data were collected bythoroughly trained interviewers using Mandarin or Taiwanese during face-to-face inter-views in accordance with standard protocol. All interviewers participated in a 120-mintraining course on the standard process and data collection criteria to prevent informationbias during interviews.
135
J. Pers. Med. 2021, 11, 653
Swallowing difficulty screening used a self-administered questionnaire, called theEating Assessment Tool (EAT-10) [25]. This self-administered tool is widely used to assessswallowing difficulty. According to the suggestion of EAT-10 normative data, a participantwho scored 3 or more points on the EAT-10 was considered as having swallowing diffi-culty [25,26]. Each participant was also screened using the repetitive saliva swallowingtest (RSST) within 30 s [27]. The RSST is a safe and simple screening test for functionalswallowing difficulty. A participant who swallowed their saliva less than 3 times during30 s of test was considered as having swallowing difficulty [27].
2.2.2. Oral Examination
The oral examination of all study participants was performed by three well-trained andcalibrated senior dentists according to the guidelines of the World Health Organization [28].Intra-examiner reliability tests of tooth decay were carried out on these dentists duringthe oral data collection. The kappa coefficient was 0.81 for intra-examiner agreement. Theparticipant’s oral health examinations were performed in a group activity room in thecare centers between 9.00 a.m. and 11.00 a.m. under natural light using disposable dentalmirrors and CPI explorers, without radiographs.
Information was collected on the kind of denture and the condition of natural teeth,which included the caries status, location, and number. The dentist counted the number offunctional natural teeth (FNT), fixed artificial teeth (FAT), removable artificial teeth (RAT),and functional teeth (FT) [29,30]. All examinations excluded third molars. Remainingnatural teeth, teeth that were sound, decayed, filled, or filled but decayed were regarded asFT. Teeth with grade III mobility, residual roots, or extensive crown destruction (i.e., morethan three-fourths of the clinical crown destroyed) were excluded. FAT was defined as fixedartificial teeth, including abutment teeth, pontics, and implant-supported prostheses. FATwith grade III mobility were excluded. RAT was regarded as artificial teeth on removabledentures being worn during the dental examination. FT included FNT, FAT, and RAT. Thetotal number of FT ranged from 0 to 28. The participants with more teeth was helpful forassessment of TP [11,26,31]. According to the number of FT, participants were classifiedinto 0–9, 10–19, and ≥20 teeth groups to analyze the relationship between FT and TP [11].
2.2.3. Tongue Pressure Measurement
A wireless TP measurement device (OCPT-168, Shi-Heng Technology Co., Ltd., Taipei,Taiwan) was used to assess TP [32]. The device is a personal use device which consistsof a disposable position mouthpiece and a pressure transducer (Figure 1a). During thetest, the participant sits with foot support, keeps head upright, and eyes on a horizontaltarget (Figure 1b). A mouthpiece is used for each participant. The TP mouthpiece is placedbehind the central incisor along the central groove of the tongue blade. The participantis asked to press their tongue against the hard palate as hard as possible for 5 s and amaximum TP is obtained on the digital screen of the device. Each participant was tested3 times with 30-s rest interval in between. The obtained maximum value was recordedas maximum TP of each participant. For the data analysis, participants’ TP less than themedian value (27 kPa) was considered as decreased TP.
136
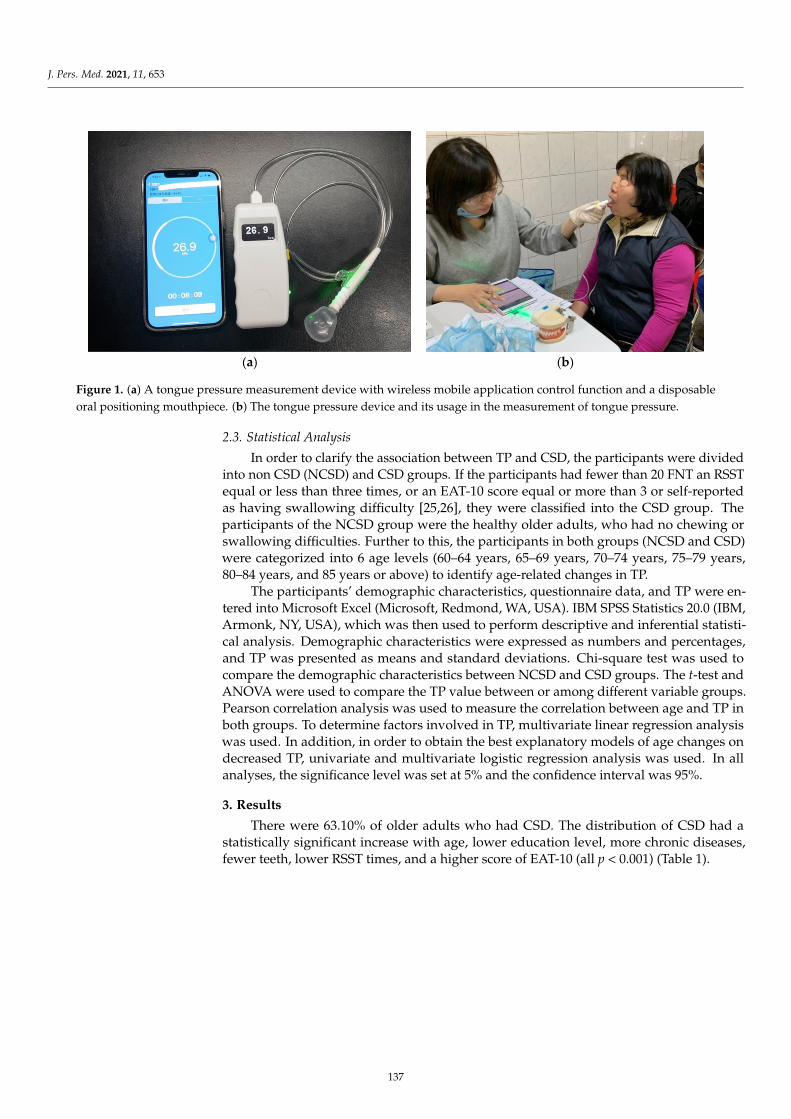
J. Pers. Med. 2021, 11, 653J. Pers. Med. 2021, 11, x FOR PEER REVIEW 7 of 18
(a) (b)
Figure 1. (a) A tongue pressure measurement device with wireless mobile application control function and a disposable oral positioning mouthpiece. (b) The tongue pressure device and its usage in the measurement of tongue pressure.
2.3. Statistical Analysis In order to clarify the association between TP and CSD, the participants were di-
vided into non CSD (NCSD) and CSD groups. If the participants had fewer than 20 FNT an RSST equal or less than three times, or an EAT-10 score equal or more than 3 or self-reported as having swallowing difficulty [25,26], they were classified into the CSD group. The participants of the NCSD group were the healthy older adults, who had no chewing or swallowing difficulties. Further to this, the participants in both groups (NCSD and CSD) were categorized into 6 age levels (60–64 years, 65–69 years, 70–74 years, 75–79 years, 80–84 years, and 85 years or above) to identify age-related changes in TP.
The participants’ demographic characteristics, questionnaire data, and TP were en-tered into Microsoft Excel (Microsoft, Redmond, WA, USA). IBM SPSS Statistics 20.0 (IBM, Armonk, NY, USA), which was then used to perform descriptive and inferential statistical analysis. Demographic characteristics were expressed as numbers and percent-ages, and TP was presented as means and standard deviations. Chi-square test was used to compare the demographic characteristics between NCSD and CSD groups. The t-test and ANOVA were used to compare the TP value between or among different variable groups. Pearson correlation analysis was used to measure the correlation between age and TP in both groups. To determine factors involved in TP, multivariate linear regression analysis was used. In addition, in order to obtain the best explanatory models of age changes on decreased TP, univariate and multivariate logistic regression analysis was used. In all analyses, the significance level was set at 5% and the confidence interval was 95%.
3. Results There were 63.10% of older adults who had CSD. The distribution of CSD had a sta-
tistically significant increase with age, lower education level, more chronic diseases, fewer teeth, lower RSST times, and a higher score of EAT-10 (all p < 0.001) (Table 1).
Figure 1. (a) A tongue pressure measurement device with wireless mobile application control function and a disposableoral positioning mouthpiece. (b) The tongue pressure device and its usage in the measurement of tongue pressure.
2.3. Statistical Analysis
In order to clarify the association between TP and CSD, the participants were dividedinto non CSD (NCSD) and CSD groups. If the participants had fewer than 20 FNT an RSSTequal or less than three times, or an EAT-10 score equal or more than 3 or self-reportedas having swallowing difficulty [25,26], they were classified into the CSD group. Theparticipants of the NCSD group were the healthy older adults, who had no chewing orswallowing difficulties. Further to this, the participants in both groups (NCSD and CSD)were categorized into 6 age levels (60–64 years, 65–69 years, 70–74 years, 75–79 years,80–84 years, and 85 years or above) to identify age-related changes in TP.
The participants’ demographic characteristics, questionnaire data, and TP were en-tered into Microsoft Excel (Microsoft, Redmond, WA, USA). IBM SPSS Statistics 20.0 (IBM,Armonk, NY, USA), which was then used to perform descriptive and inferential statisti-cal analysis. Demographic characteristics were expressed as numbers and percentages,and TP was presented as means and standard deviations. Chi-square test was used tocompare the demographic characteristics between NCSD and CSD groups. The t-test andANOVA were used to compare the TP value between or among different variable groups.Pearson correlation analysis was used to measure the correlation between age and TP inboth groups. To determine factors involved in TP, multivariate linear regression analysiswas used. In addition, in order to obtain the best explanatory models of age changes ondecreased TP, univariate and multivariate logistic regression analysis was used. In allanalyses, the significance level was set at 5% and the confidence interval was 95%.
3. Results
There were 63.10% of older adults who had CSD. The distribution of CSD had astatistically significant increase with age, lower education level, more chronic diseases,fewer teeth, lower RSST times, and a higher score of EAT-10 (all p < 0.001) (Table 1).
137
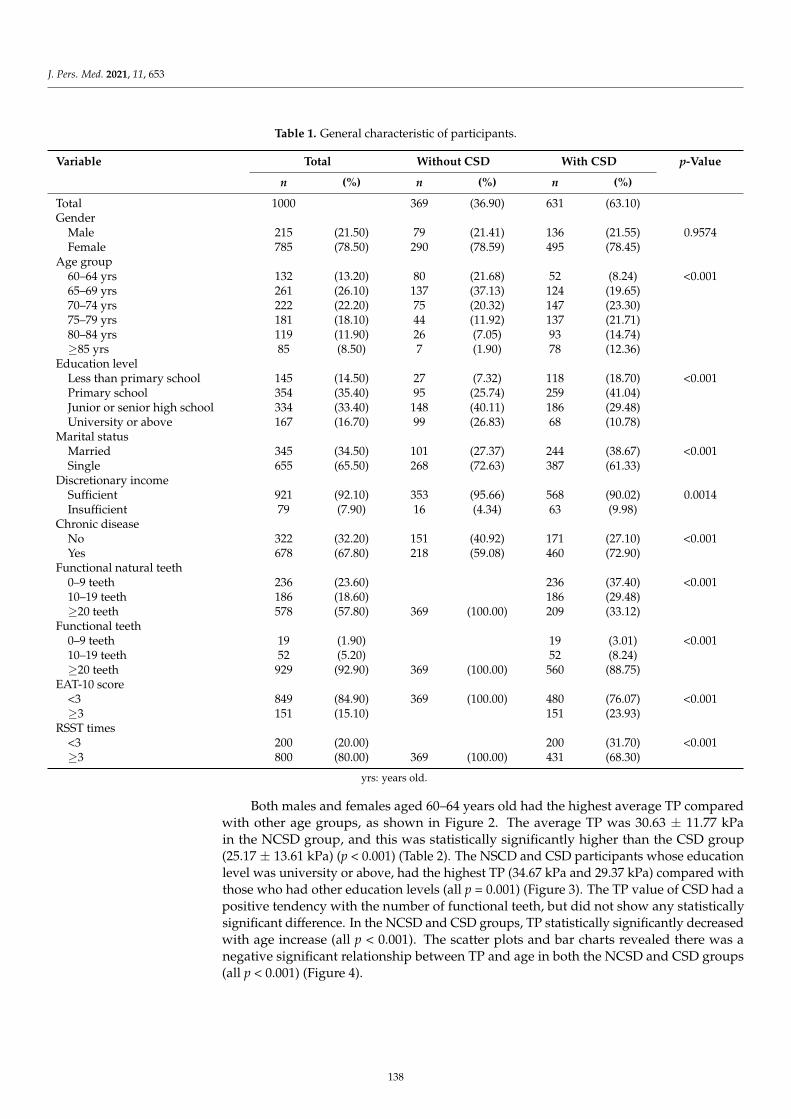
J. Pers. Med. 2021, 11, 653
Table 1. General characteristic of participants.
Variable Total Without CSD With CSD p-Value
n (%) n (%) n (%)
Total 1000 369 (36.90) 631 (63.10)Gender
Male 215 (21.50) 79 (21.41) 136 (21.55) 0.9574Female 785 (78.50) 290 (78.59) 495 (78.45)
Age group60–64 yrs 132 (13.20) 80 (21.68) 52 (8.24) <0.00165–69 yrs 261 (26.10) 137 (37.13) 124 (19.65)70–74 yrs 222 (22.20) 75 (20.32) 147 (23.30)75–79 yrs 181 (18.10) 44 (11.92) 137 (21.71)80–84 yrs 119 (11.90) 26 (7.05) 93 (14.74)≥85 yrs 85 (8.50) 7 (1.90) 78 (12.36)
Education levelLess than primary school 145 (14.50) 27 (7.32) 118 (18.70) <0.001Primary school 354 (35.40) 95 (25.74) 259 (41.04)Junior or senior high school 334 (33.40) 148 (40.11) 186 (29.48)University or above 167 (16.70) 99 (26.83) 68 (10.78)
Marital statusMarried 345 (34.50) 101 (27.37) 244 (38.67) <0.001Single 655 (65.50) 268 (72.63) 387 (61.33)
Discretionary incomeSufficient 921 (92.10) 353 (95.66) 568 (90.02) 0.0014Insufficient 79 (7.90) 16 (4.34) 63 (9.98)
Chronic diseaseNo 322 (32.20) 151 (40.92) 171 (27.10) <0.001Yes 678 (67.80) 218 (59.08) 460 (72.90)
Functional natural teeth0–9 teeth 236 (23.60) 236 (37.40) <0.00110–19 teeth 186 (18.60) 186 (29.48)≥20 teeth 578 (57.80) 369 (100.00) 209 (33.12)
Functional teeth0–9 teeth 19 (1.90) 19 (3.01) <0.00110–19 teeth 52 (5.20) 52 (8.24)≥20 teeth 929 (92.90) 369 (100.00) 560 (88.75)
EAT-10 score<3 849 (84.90) 369 (100.00) 480 (76.07) <0.001≥3 151 (15.10) 151 (23.93)
RSST times<3 200 (20.00) 200 (31.70) <0.001≥3 800 (80.00) 369 (100.00) 431 (68.30)
yrs: years old.
Both males and females aged 60–64 years old had the highest average TP comparedwith other age groups, as shown in Figure 2. The average TP was 30.63 ± 11.77 kPain the NCSD group, and this was statistically significantly higher than the CSD group(25.17 ± 13.61 kPa) (p < 0.001) (Table 2). The NSCD and CSD participants whose educationlevel was university or above, had the highest TP (34.67 kPa and 29.37 kPa) compared withthose who had other education levels (all p = 0.001) (Figure 3). The TP value of CSD had apositive tendency with the number of functional teeth, but did not show any statisticallysignificant difference. In the NCSD and CSD groups, TP statistically significantly decreasedwith age increase (all p < 0.001). The scatter plots and bar charts revealed there was anegative significant relationship between TP and age in both the NCSD and CSD groups(all p < 0.001) (Figure 4).
138
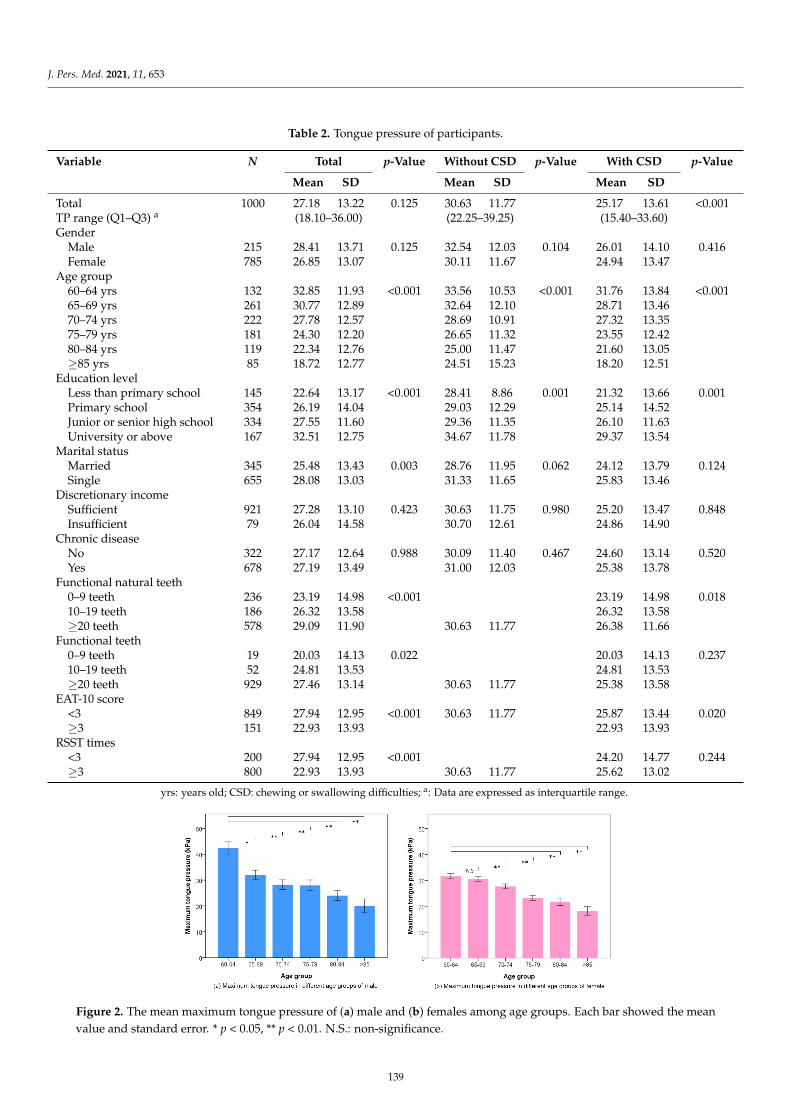
J. Pers. Med. 2021, 11, 653
Table 2. Tongue pressure of participants.
Variable N Total p-Value Without CSD p-Value With CSD p-Value
Mean SD Mean SD Mean SD
Total 1000 27.18 13.22 0.125 30.63 11.77 25.17 13.61 <0.001TP range (Q1–Q3) a (18.10–36.00) (22.25–39.25) (15.40–33.60)Gender
Male 215 28.41 13.71 0.125 32.54 12.03 0.104 26.01 14.10 0.416Female 785 26.85 13.07 30.11 11.67 24.94 13.47
Age group60–64 yrs 132 32.85 11.93 <0.001 33.56 10.53 <0.001 31.76 13.84 <0.00165–69 yrs 261 30.77 12.89 32.64 12.10 28.71 13.4670–74 yrs 222 27.78 12.57 28.69 10.91 27.32 13.3575–79 yrs 181 24.30 12.20 26.65 11.32 23.55 12.4280–84 yrs 119 22.34 12.76 25.00 11.47 21.60 13.05≥85 yrs 85 18.72 12.77 24.51 15.23 18.20 12.51
Education levelLess than primary school 145 22.64 13.17 <0.001 28.41 8.86 0.001 21.32 13.66 0.001Primary school 354 26.19 14.04 29.03 12.29 25.14 14.52Junior or senior high school 334 27.55 11.60 29.36 11.35 26.10 11.63University or above 167 32.51 12.75 34.67 11.78 29.37 13.54
Marital statusMarried 345 25.48 13.43 0.003 28.76 11.95 0.062 24.12 13.79 0.124Single 655 28.08 13.03 31.33 11.65 25.83 13.46
Discretionary incomeSufficient 921 27.28 13.10 0.423 30.63 11.75 0.980 25.20 13.47 0.848Insufficient 79 26.04 14.58 30.70 12.61 24.86 14.90
Chronic diseaseNo 322 27.17 12.64 0.988 30.09 11.40 0.467 24.60 13.14 0.520Yes 678 27.19 13.49 31.00 12.03 25.38 13.78
Functional natural teeth0–9 teeth 236 23.19 14.98 <0.001 23.19 14.98 0.01810–19 teeth 186 26.32 13.58 26.32 13.58≥20 teeth 578 29.09 11.90 30.63 11.77 26.38 11.66
Functional teeth0–9 teeth 19 20.03 14.13 0.022 20.03 14.13 0.23710–19 teeth 52 24.81 13.53 24.81 13.53≥20 teeth 929 27.46 13.14 30.63 11.77 25.38 13.58
EAT-10 score<3 849 27.94 12.95 <0.001 30.63 11.77 25.87 13.44 0.020≥3 151 22.93 13.93 22.93 13.93
RSST times<3 200 27.94 12.95 <0.001 24.20 14.77 0.244≥3 800 22.93 13.93 30.63 11.77 25.62 13.02
yrs: years old; CSD: chewing or swallowing difficulties; a: Data are expressed as interquartile range.
Figure 2. The mean maximum tongue pressure of (a) male and (b) females among age groups. Each bar showed the meanvalue and standard error. * p < 0.05, ** p < 0.01. N.S.: non-significance.
139
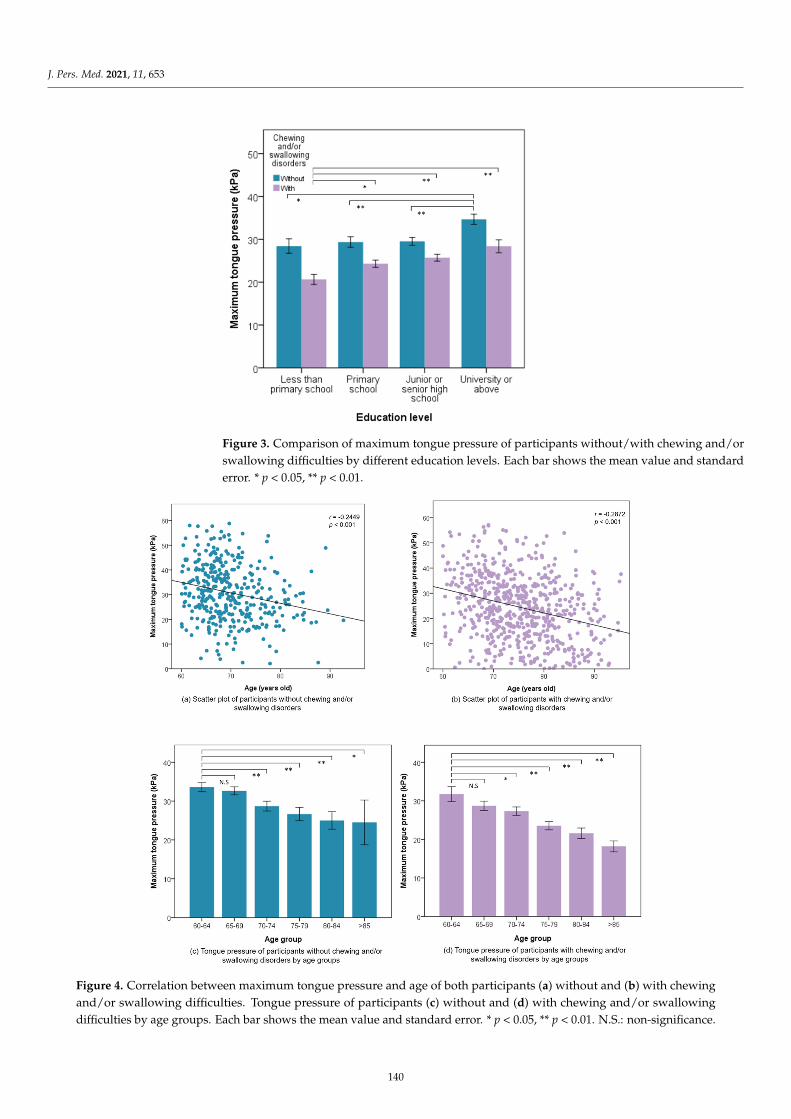
J. Pers. Med. 2021, 11, 653
J. Pers. Med. 2021, 11, x FOR PEER REVIEW 10 of 18
≥3 151 22.93 13.93 22.93 13.93 RSST times
<3 200 27.94 12.95 <0.001 24.20 14.77 0.244 ≥3 800 22.93 13.93 30.63 11.77 25.62 13.02
yrs: years old; CSD: chewing or swallowing difficulties; a: Data are expressed as interquartile range.
Figure 3. Comparison of maximum tongue pressure of participants without/with chewing and/or swallowing difficulties by different education levels. Each bar shows the mean value and standard error. * p < 0.05, ** p < 0.01.
Figure 3. Comparison of maximum tongue pressure of participants without/with chewing and/orswallowing difficulties by different education levels. Each bar shows the mean value and standarderror. * p < 0.05, ** p < 0.01.
J. Pers. Med. 2021, 11, x FOR PEER REVIEW 11 of 18
Figure 4. Correlation between maximum tongue pressure and age of both participants (a) without and (b) with chewing and/or swallowing difficulties. Tongue pressure of participants (c) without and (d) with chewing and/or swallowing dif-ficulties by age groups. Each bar shows the mean value and standard error. * p < 0.05, ** p < 0.01. N.S.: non-significance.
In order to better understand the participants, we further compared the dietary hab-its between the NCSD and CSD groups, as shown in Table 3. Higher TP values of CSD participants had a statistically significant benefit with their independent ability to eat, var-ious types of diet, and shorter duration of meal time (all p < 0.050) while eating a meal. As TP decreased, CSD participants obviously felt that they needed to take longer to eat a meal than before (p = 0.006).
Figure 4. Correlation between maximum tongue pressure and age of both participants (a) without and (b) with chewingand/or swallowing difficulties. Tongue pressure of participants (c) without and (d) with chewing and/or swallowingdifficulties by age groups. Each bar shows the mean value and standard error. * p < 0.05, ** p < 0.01. N.S.: non-significance.
140
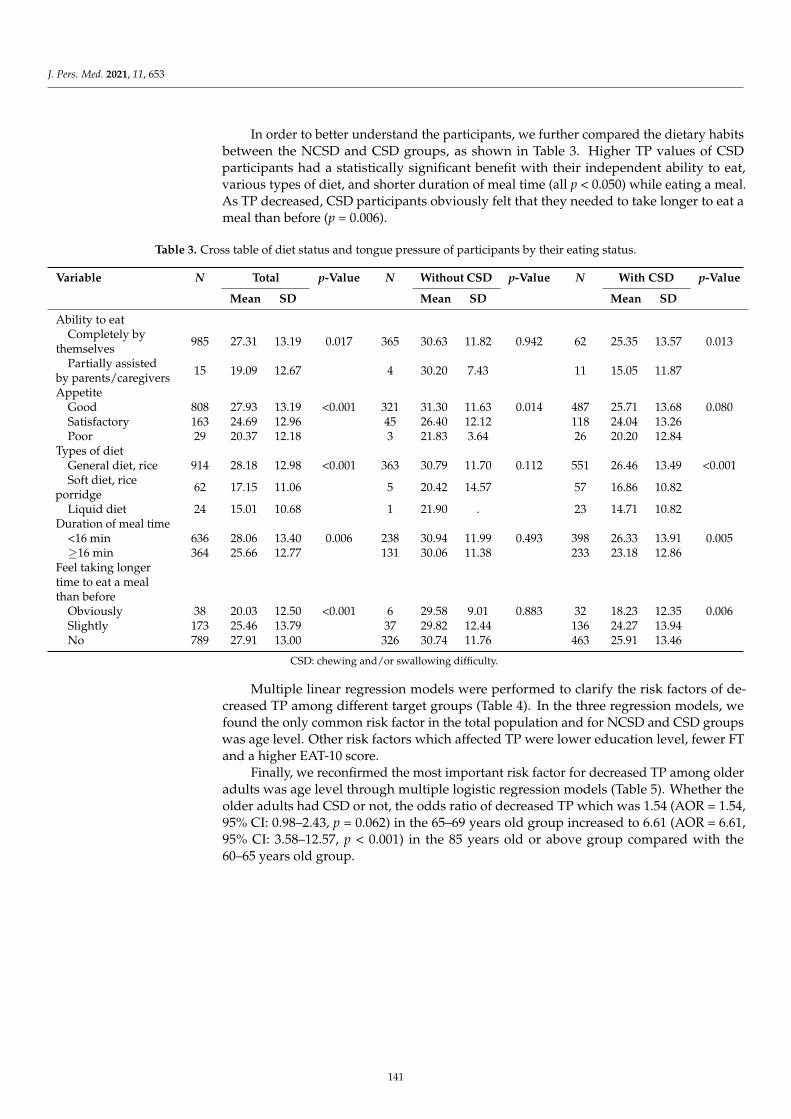
J. Pers. Med. 2021, 11, 653
In order to better understand the participants, we further compared the dietary habitsbetween the NCSD and CSD groups, as shown in Table 3. Higher TP values of CSDparticipants had a statistically significant benefit with their independent ability to eat,various types of diet, and shorter duration of meal time (all p < 0.050) while eating a meal.As TP decreased, CSD participants obviously felt that they needed to take longer to eat ameal than before (p = 0.006).
Table 3. Cross table of diet status and tongue pressure of participants by their eating status.
Variable N Total p-Value N Without CSD p-Value N With CSD p-Value
Mean SD Mean SD Mean SD
Ability to eatCompletely by
themselves 985 27.31 13.19 0.017 365 30.63 11.82 0.942 62 25.35 13.57 0.013
Partially assistedby parents/caregivers 15 19.09 12.67 4 30.20 7.43 11 15.05 11.87
AppetiteGood 808 27.93 13.19 <0.001 321 31.30 11.63 0.014 487 25.71 13.68 0.080Satisfactory 163 24.69 12.96 45 26.40 12.12 118 24.04 13.26Poor 29 20.37 12.18 3 21.83 3.64 26 20.20 12.84
Types of dietGeneral diet, rice 914 28.18 12.98 <0.001 363 30.79 11.70 0.112 551 26.46 13.49 <0.001Soft diet, rice
porridge 62 17.15 11.06 5 20.42 14.57 57 16.86 10.82
Liquid diet 24 15.01 10.68 1 21.90 . 23 14.71 10.82Duration of meal time
<16 min 636 28.06 13.40 0.006 238 30.94 11.99 0.493 398 26.33 13.91 0.005≥16 min 364 25.66 12.77 131 30.06 11.38 233 23.18 12.86
Feel taking longertime to eat a mealthan before
Obviously 38 20.03 12.50 <0.001 6 29.58 9.01 0.883 32 18.23 12.35 0.006Slightly 173 25.46 13.79 37 29.82 12.44 136 24.27 13.94No 789 27.91 13.00 326 30.74 11.76 463 25.91 13.46
CSD: chewing and/or swallowing difficulty.
Multiple linear regression models were performed to clarify the risk factors of de-creased TP among different target groups (Table 4). In the three regression models, wefound the only common risk factor in the total population and for NCSD and CSD groupswas age level. Other risk factors which affected TP were lower education level, fewer FTand a higher EAT-10 score.
Finally, we reconfirmed the most important risk factor for decreased TP among olderadults was age level through multiple logistic regression models (Table 5). Whether theolder adults had CSD or not, the odds ratio of decreased TP which was 1.54 (AOR = 1.54,95% CI: 0.98–2.43, p = 0.062) in the 65–69 years old group increased to 6.61 (AOR = 6.61,95% CI: 3.58–12.57, p < 0.001) in the 85 years old or above group compared with the60–65 years old group.
141
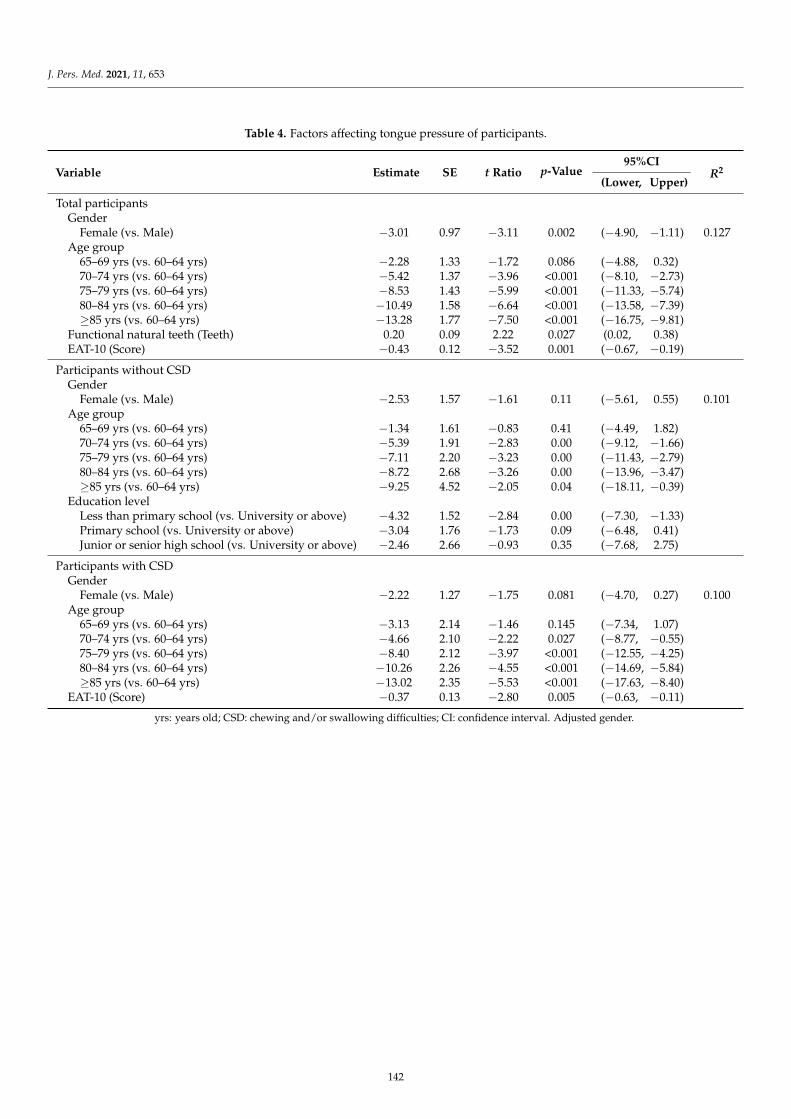
J. Pers. Med. 2021, 11, 653
Table 4. Factors affecting tongue pressure of participants.
Variable Estimate SE t Ratio p-Value95%CI
R2(Lower, Upper)
Total participantsGender
Female (vs. Male) −3.01 0.97 −3.11 0.002 (−4.90, −1.11) 0.127Age group
65–69 yrs (vs. 60–64 yrs) −2.28 1.33 −1.72 0.086 (−4.88, 0.32)70–74 yrs (vs. 60–64 yrs) −5.42 1.37 −3.96 <0.001 (−8.10, −2.73)75–79 yrs (vs. 60–64 yrs) −8.53 1.43 −5.99 <0.001 (−11.33, −5.74)80–84 yrs (vs. 60–64 yrs) −10.49 1.58 −6.64 <0.001 (−13.58, −7.39)≥85 yrs (vs. 60–64 yrs) −13.28 1.77 −7.50 <0.001 (−16.75, −9.81)
Functional natural teeth (Teeth) 0.20 0.09 2.22 0.027 (0.02, 0.38)EAT-10 (Score) −0.43 0.12 −3.52 0.001 (−0.67, −0.19)
Participants without CSDGender
Female (vs. Male) −2.53 1.57 −1.61 0.11 (−5.61, 0.55) 0.101Age group
65–69 yrs (vs. 60–64 yrs) −1.34 1.61 −0.83 0.41 (−4.49, 1.82)70–74 yrs (vs. 60–64 yrs) −5.39 1.91 −2.83 0.00 (−9.12, −1.66)75–79 yrs (vs. 60–64 yrs) −7.11 2.20 −3.23 0.00 (−11.43, −2.79)80–84 yrs (vs. 60–64 yrs) −8.72 2.68 −3.26 0.00 (−13.96, −3.47)≥85 yrs (vs. 60–64 yrs) −9.25 4.52 −2.05 0.04 (−18.11, −0.39)
Education levelLess than primary school (vs. University or above) −4.32 1.52 −2.84 0.00 (−7.30, −1.33)Primary school (vs. University or above) −3.04 1.76 −1.73 0.09 (−6.48, 0.41)Junior or senior high school (vs. University or above) −2.46 2.66 −0.93 0.35 (−7.68, 2.75)
Participants with CSDGender
Female (vs. Male) −2.22 1.27 −1.75 0.081 (−4.70, 0.27) 0.100Age group
65–69 yrs (vs. 60–64 yrs) −3.13 2.14 −1.46 0.145 (−7.34, 1.07)70–74 yrs (vs. 60–64 yrs) −4.66 2.10 −2.22 0.027 (−8.77, −0.55)75–79 yrs (vs. 60–64 yrs) −8.40 2.12 −3.97 <0.001 (−12.55, −4.25)80–84 yrs (vs. 60–64 yrs) −10.26 2.26 −4.55 <0.001 (−14.69, −5.84)≥85 yrs (vs. 60–64 yrs) −13.02 2.35 −5.53 <0.001 (−17.63, −8.40)
EAT-10 (Score) −0.37 0.13 −2.80 0.005 (−0.63, −0.11)
yrs: years old; CSD: chewing and/or swallowing difficulties; CI: confidence interval. Adjusted gender.
142
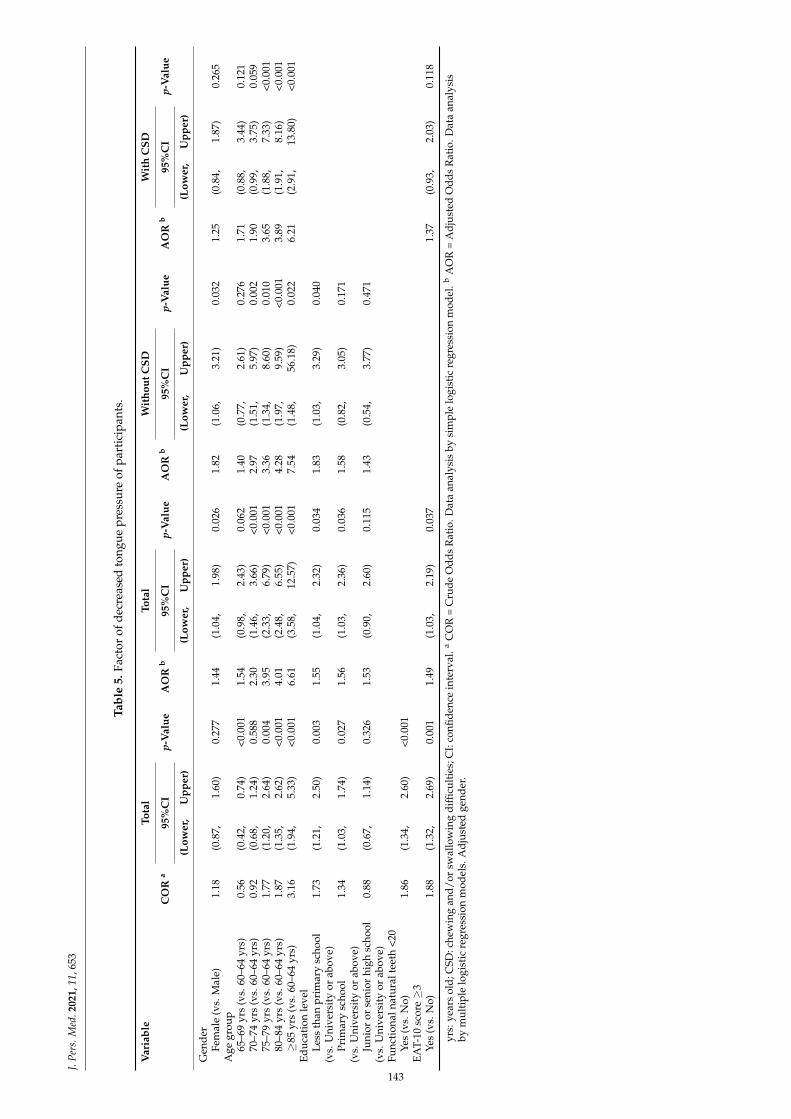
J.Pe
rs.M
ed.2
021,
11,6
53
Tabl
e5.
Fact
orof
decr
ease
dto
ngue
pres
sure
ofpa
rtic
ipan
ts.
Var
iabl
eTo
tal
Tota
lW
itho
utC
SDW
ith
CSD
CO
Ra
95%
CI
p-V
alue
AO
Rb
95%
CI
p-V
alue
AO
Rb
95%
CI
p-V
alue
AO
Rb
95%
CI
p-V
alue
(Low
er,
Upp
er)
(Low
er,
Upp
er)
(Low
er,
Upp
er)
(Low
er,
Upp
er)
Gen
der
Fem
ale
(vs.
Mal
e)1.
18(0
.87,
1.60
)0.
277
1.44
(1.0
4,1.
98)
0.02
61.
82(1
.06,
3.21
)0.
032
1.25
(0.8
4,1.
87)
0.26
5A
gegr
oup
65–6
9yr
s(v
s.60
–64
yrs)
0.56
(0.4
2,0.
74)
<0.0
011.
54(0
.98,
2.43
)0.
062
1.40
(0.7
7,2.
61)
0.27
61.
71(0
.88,
3.44
)0.
121
70–7
4yr
s(v
s.60
–64
yrs)
0.92
(0.6
8,1.
24)
0.58
82.
30(1
.46,
3.66
)<0
.001
2.97
(1.5
1,5.
97)
0.00
21.
90(0
.99,
3.75
)0.
059
75–7
9yr
s(v
s.60
–64
yrs)
1.77
(1.2
0,2.
64)
0.00
43.
95(2
.33,
6.79
)<0
.001
3.36
(1.3
4,8.
60)
0.01
03.
65(1
.88,
7.33
)<0
.001
80–8
4yr
s(v
s.60
–64
yrs)
1.87
(1.3
5,2.
62)
<0.0
014.
01(2
.48,
6.55
)<0
.001
4.28
(1.9
7,9.
59)
<0.0
013.
89(1
.91,
8.16
)<0
.001
≥85
yrs
(vs.
60–6
4yr
s)3.
16(1
.94,
5.33
)<0
.001
6.61
(3.5
8,12
.57)
<0.0
017.
54(1
.48,
56.1
8)0.
022
6.21
(2.9
1,13
.80)
<0.0
01Ed
ucat
ion
leve
lLe
ssth
anpr
imar
ysc
hool
(vs.
Uni
vers
ity
orab
ove)
1.73
(1.2
1,2.
50)
0.00
31.
55(1
.04,
2.32
)0.
034
1.83
(1.0
3,3.
29)
0.04
0
Prim
ary
scho
ol(v
s.U
nive
rsit
yor
abov
e)1.
34(1
.03,
1.74
)0.
027
1.56
(1.0
3,2.
36)
0.03
61.
58(0
.82,
3.05
)0.
171
Juni
oror
seni
orhi
ghsc
hool
(vs.
Uni
vers
ity
orab
ove)
0.88
(0.6
7,1.
14)
0.32
61.
53(0
.90,
2.60
)0.
115
1.43
(0.5
4,3.
77)
0.47
1
Func
tion
alna
tura
ltee
th<2
0Ye
s(v
s.N
o)1.
86(1
.34,
2.60
)<0
.001
EAT-
10sc
ore≥
3Ye
s(v
s.N
o)1.
88(1
.32,
2.69
)0.
001
1.49
(1.0
3,2.
19)
0.03
71.
37(0
.93,
2.03
)0.
118
yrs:
year
sol
d;C
SD:c
hew
ing
and/
orsw
allo
win
gdi
fficu
lties
;CI:
confi
denc
ein
terv
al.a
CO
R=
Cru
deO
dds
Rat
io.D
ata
anal
ysis
bysi
mpl
elo
gist
icre
gres
sion
mod
el.b
AO
R=
Adj
uste
dO
dds
Rat
io.D
ata
anal
ysis
bym
ulti
ple
logi
stic
regr
essi
onm
odel
s.A
djus
ted
gend
er.
143
J. Pers. Med. 2021, 11, 653
4. Discussion
Personalized TP training or rehabilitation therapy is a new measure to improveswallowing with a basis of customized design. In the present study, we successfullyestablished a large amount of TP data in NCSD (healthy) and CSD adults over the ageof 60 by a quantitative method. The results of this study show evidence that TP declinesare in parallel for NSCD and CSD adults at every 5-year increase in age. But the TP ofCSD adults saw an accelerated decline from 60 years old (31.76 kPa) until 85 years orolder (18.20 kPa) than NCSD adults (33.56 kPa and 24.51 kPa). Furthermore, this studyestablished the standard and normal reference ranges of TP values at 60 years (31.47 kPa),70 years (26.22 kPa), and 80 years and above (20.83 kPa) of overall participants. If an elder’sTP value is less than 30 kPa, 25 kPa, and 20 kPa, respectively, he or she may have CSD.These three TP values can also be used as reference indicators for community screening,clinical diagnosis, and treatment effectiveness of CSD. In the future, the elderly can refer tothe TP values currently found under parameters such as age, gender, education level, CSDstatus, etc., to set personalized training goals for rehabilitation.
Besides the 60–64 and 75–79 years old groups, there was no difference in TP valuesbetween genders of most age groups in the present study, as seen in several previousstudies [6,17,33,34]. The TP values in males was rather gradual with a slightly higher value(within 2.5 kPa) than in females in most age groups. A research reviewed numerous studiesand concluded that the impact of TP in healthy older adults between different gendersonly exists in the participants who are less than 60 years old [18]. From the present studyresults, we can clearly see that the TP of male older adults at 60–64 years and 75–79 yearsare significantly higher than females. This may because the height of a male’s anteriortongue have already decreases by their sixties [34]. Then, a man may experience greaterloss of total muscle mass at this time, accompanied with a rapid decline in muscle strengthat age 75 or older, until they finally reach the same level of pressure as females [5,17].
This study clearly demonstrates that TP decreased with natural aging in older adults.Past studies showed that mean TP values in healthy individuals at an age less than 60 yearswas 39.3 kPa, which was higher than those at age 60 years or above (30.3 kPa) [18]. Fur-thermore, we compared our TP values with several studies of similar age composition.These studies included the participants’ age between 60 years to 95 years and the mean ageof participants was between 70–75 years. We found that our mean TP conducted by TPwireless application (30.63 kPa) was similar with previous studies which were conductedusing JMS (29.5 kPa to 31.8 kPa) [15,17,18,35,36]. This result confirmed that our TP datahave high reference value. Hara et al. reported that the TP values of healthy people in theirforties, fifties, sixties, seventies, and eighties were 36.48 kPa, 34.59 kPa, 33.16 kPa, 29.92 kPa,and 23.60 kPa, respectively [37]. From the above data, we observed that the TP values in60–64 year olds was lower than those less than 60 years old. We also observed that ourTP value for 60–64 year olds (33.56 kPa) was very close to the relevant study of Hara et al.(33.16 kPa). We confirmed that this study’s results provide quantitative evidence of theage-related changes in TP during the aging process.
CSD is another risk factor of rapid TP decline under natural aging. From 75 years ofage, TP continued to rapidly decrease with larger differences with increasing age betweenthe NCSD and CSD groups until the later stage of aging. We observed that the TP declinerate from 60–64 years old to 80 years old or older of CSD (42.70%) participants were1.5 times that of NCSD participants (26.97%). Wang et al. reported that swallowingfunction decreases significantly above the age of 75 years old in Taiwan [8], supportingthe results of the present study. However, the former TP studies showed no evidence ofindependent differences in CSD attributable to age due to only a small sample size of theelderly group evaluated or a lack of clear health conditions of the participants [6,18,38]. Wecollected chronic disease, teeth number, swallowing, and eating status of each participantthrough a large sample size and excluded the relationship between diseases and TP duringdata analysis. Unquestionably, CSD accelerates the decline rate of TP. The study provides asupplement to explore the interaction between age and swallowing difficulty in TP.
144
J. Pers. Med. 2021, 11, 653
This study observed that decreased TP strongly affects the eating status of CSD. Theelderly who have swallowing difficulties commonly encounter swallowing muscle fatigue,longer mealtimes, low food consumption, and malnutrition, supporting the results of thepresent study [36,39]. A series of negative effects during the eating process may originatefrom weak TP. A low TP makes normal swallowing hard to achieve. As noted in previousstudies, the percentage of maximum TP used during swallowing in older adults was 53.8%,which was higher than young adults at 38.8%. This could be regarded as an indispensablecompensatory mechanism to complete safe swallowing [7] because posterior TP is neededto generate propulsion to transfer solid bolus into the pharynx [12]. Based on the currentfindings, order adults with CSD had lower TP than those without CSD and a decreasingTP is linked to CSD. This finding reveals that a lack of adequate tongue muscle strength isone of the eating disorders in older adults with CSD.
There are some limitations that need to be noted for the current study. First, wecannot well observe the impact of disease on TP because those who were actively willingto participate in this study may tend to be healthier than those who did not participate.Due to an inability to reach the complete population of elderly, the results of the currentstudy may be overestimated. Second, the presence of fewer males than females may elicitselection bias. However, the number of each age group in this study were larger than inprevious studies, and we believe that the results of the study can compensate for part ofthe sample bias.
5. Conclusions
TP decline is prevalent among community-dwelling older adults, and aging is themajor factor in TP decrease in parallel with ordinary and CSD adults. Older adults withCSD have an accelerated decrease in their TP, especially when they are 75 years old orabove. This study successfully established a series of TP values in NCSD (from 33.56 to24.51 kPa) and CSD (from 31.76 to 18.20 kPa) in Taiwan and suggests that TP can be usedas a reference indicator of aging progression among community-dwelling older adults.The authors have confirmed that all authors meet the Journal of Personalized Medicinecriteria for authorship credit, as follows: (1) substantial contributions to conception andde-sign, acquisition of data, or analysis and interpretation of data; (2) drafting the article orrevising it critically for important intellectual content; and (3) final approval of the versionto be published.
Author Contributions: Conceptualization, H.-Y.L., C.-T.Y. and C.-L.L.; methodology, H.-Y.L.; soft-ware, H.-Y.L.; validation, P.-H.C.; formal analysis, K.-J.H.; investigation, H.-Y.L., J.-H.C., K.-J.H. andC.-T.Y.; resources, H.-Y.L.; data curation, J.-H.C. and C.-L.L.; writing—original draft preparation,J.-H.C., K.-J.H. and S.-Y.H.; writing—review and editing, H.-Y.L. and C.-L.L.; visualization, C.-T.Y.and P.-H.C.; supervision, C.-L.L.; project administration, H.-Y.L. and C.-L.L. All authors have readand agreed to the published version of the manuscript.
Funding: This research was funded by the Ministry of Science and Technology, Taiwan (grantnumber: MOST108-2218-E- 010-005/MOST109-2224-E- 010-001).
Data Availability Statement: Not applicable.
Conflicts of Interest: The authors declare no potential conflict of interest with respect to the research,authorship, and/or publication of this article.
References1. Lin, Y.Y.; Huang, C.S. Aging in Taiwan: Building a Society for Active Aging and Aging in Place. Gerontologist 2016, 56, 176–183.
[CrossRef] [PubMed]2. National Development Council. Population Projections for the R.O.C. (Taiwan): 2020~2070. Available online: https://www.ndc.
gov.tw/en/cp.aspx?n=2E5DCB04C64512CC (accessed on 18 May 2021).3. Hsu, H.C.; Chen, C.F. LTC 2.0: The 2017 reform of home- and community-based long-term care in Taiwan. Health Policy
2019, 123, 912–916. [CrossRef] [PubMed]
145
J. Pers. Med. 2021, 11, 653
4. Tamine, K.; Ono, T.; Hori, K.; Kondoh, J.; Hamanaka, S.; Maeda, Y. Age-related changes in tongue pressure during swallowing. J.Dent. Res. 2010, 89, 1097–1101. [CrossRef] [PubMed]
5. Castell, M.V.; Sánchez, M.; Julián, R.; Queipo, R.; Martín, S.; Otero, Á. Frailty prevalence and slow walking speed in persons age65 and older: Implications for primary care. BMC Fam. Pract. 2013, 14, 86. [CrossRef]
6. Fei, T.; Polacco, R.C.; Hori, S.E.; Molfenter, S.M.; Peladeau-Pigeon, M.; Tsang, C.; Steele, C.M. Age-related differences intongue-palate pressures for strength and swallowing tasks. Dysphagia 2013, 28, 575–581. [CrossRef]
7. Park, J.S.; Oh, D.H.; Chang, M. Comparison of maximal tongue strength and tongue strength used during swallowing in relationto age in healthy adults. J. Phys. Ther. Sci. 2016, 28, 442–445. [CrossRef]
8. Wang, T.G.; Chen, S.Y.; Lian, Y.N.; Huang, S.F. Swallowing Disorder in the Elderly of a Taipei Community. J. Formos. Med. Assoc.2001, 5, 523–529.
9. Lin, L.C.; Wu, S.C.; Chen, H.S.; Wang, T.G.; Chen, M.Y. Prevalence of impaired swallowing in institutionalized older people inTaiwan. J. Am. Geriatr. Soc. 2002, 50, 1118–1123. [CrossRef]
10. Hiramatsu, T.; Kataoka, H.; Osaki, M.; Hagino, H. Effect of aging on oral and swallowing function after meal consumption. Clin.Interv. Aging 2015, 10, 229–235.
11. Hara, K.; Tohara, H.; Kenichiro, K.; Yamaguchi, K.; Ariya, C.; Yoshimi, K.; Nakane, A.; Minakuchi, S. Association between tonguemuscle strength and masticatory muscle strength. J. Oral Rehabil. 2019, 46, 134–139. [CrossRef]
12. Nicosia, M.A.; Hind, J.A.; Roecker, E.B.; Carnes, M.; Doyle, J.; Dengel, G.A.; Robbins, J. Age effects on the temporal evolution ofisometric and swallowing pressure. J. Gerontol. A Biol. Sci. Med. Sci. 2000, 55, 634–640. [CrossRef]
13. Pizzorni, N.; Ginocchio, D.; Bianchi, F.; Feroldi, S.; Vedrodyova, M.; Mora, G.; Schindler, A. Association between maximumtongue pressure and swallowing safety and efficacy in amyotrophic lateral sclerosis. Neurogastroenterol. Motil. 2020, 32, e13859.[CrossRef]
14. Higa, C.; Mori, T.; Hiraoka, A.; Takeda, C.; Kuroki, A.; Yoshikawa, M.; Yoshida, M.; Tsuga, K. Five-year change in maximumtongue pressure and physical function in community-dwelling elderly adults. J. Dent. Sci. 2020, 15, 265–269. [CrossRef] [PubMed]
15. Yamanashi, H.; Shimizu, Y.; Higashi, M.; Koyamatsu, J.; Sato, S.; Nagayoshi, M.; Kadota, K.; Kawashiri, S.; Tamai, M.; Takamura, N.Validity of maximum isometric tongue pressure as a screening test for physical frailty: Cross-sectional study of Japanesecommunity-dwelling older adults. Geriatr. Gerontol. Int. 2018, 18, 240–249. [CrossRef] [PubMed]
16. Adams, V.; Mathisen, B.; Baines, S.; Lazarus, C.; Callister, R. A systematic review and meta-analysis of measurements of tongueand hand strength and endurance using the Iowa Oral Performance Instrument (IOPI). Dysphagia 2013, 28, 350–369. [CrossRef]
17. Utanohara, Y.; Hayashi, R.; Yoshikawa, M.; Yoshida, M.; Tsuga, K.; Akagawa, Y. Standard values of maximum tongue pressuretaken using newly developed disposable tongue pressure measurement device. Dysphagia 2008, 23, 286. [CrossRef]
18. Arakawa, I.; Igarashi, K.; Imamura, Y.; Müller, F.; Abou-Ayash, S.; Schimmel, M. Variability in tongue pressure among elderly andyoung healthy cohorts: A systematic review and meta-analysis. J. Oral Rehabil. 2021, 48, 430–448. [CrossRef] [PubMed]
19. Fujishima, I.; Fujiu-Kurachi, M.; Arai, H.; Hyodo, M.; Kagaya, H.; Maeda, K.; Mori, T.; Nishioka, S.; Oshima, F.; Ogawa, S.Sarcopenia and dysphagia: Position paper by four professional organizations. Geriatr. Gerontol. Int. 2019, 19, 91–97. [CrossRef]
20. Luchesi, K.F.; Kitamura, S.; Mourão, L.F. Management of dysphagia in Parkinson’s disease and amyotrophic lateral sclerosis.Codas 2013, 25, 358–364. [CrossRef]
21. Center for Survey Research, Research Center for Humanities and Social Sciences, Academia Sinica. The Typology of Townshipsin Taiwan 2014. Available online: https://survey.sinica.edu.tw/research/document/01_2_2014.pdf (accessed on 18 May 2021).
22. Adam, A.M. Sample size determination in survey research. J. Sci. Res. Rep. 2020, 26, 90–97. [CrossRef]23. Krejcie, R.V.; Morgan, D.W. Determining sample size for research activities. Educ. Psychol. Meas. 1970, 30, 607–610. [CrossRef]24. Liu, H.Y.; Chen, C.C.; Hu, W.C.; Tang, R.C.; Chen, C.C.; Tsai, C.C.; Huang, S.T. The impact of dietary and tooth-brushing habits to
dental caries of special school children with disability. Res. Dev. Disabil. 2010, 31, 1160–1169. [CrossRef] [PubMed]25. Belafsky, P.C.; Mouadeb, D.A.; Rees, C.J.; Pryor, J.C.; Postma, G.N.; Allen, J.; Leonard, R.J. Validity and reliability of the Eating
Assessment Tool (EAT-10). Ann. Otol. Rhinol. Laryngol. 2008, 117, 919–924. [CrossRef] [PubMed]26. Minakuchi, S.; Tsuga, K.; Ikebe, K.; Ueda, T.; Tamura, F.; Nagao, K.; Furuya, J.; Matsuo, K.; Yamamoto, K.; Kanazawa, M.; et al.
Oral hypofunction in the older population: Position paper of the Japanese Society of Gerodontology in 2016. Gerodontology 2018,35, 317–324. [CrossRef] [PubMed]
27. Oguchi, K.; Saitoh, E.; Mizuno, M.; Baba, M.; Okui, M.; Suzuki, M. The repetitive saliva swallowing test (RSST) as a screening testof functional dysphagia. (1). Normal values of RSST. Jpn. J. Rehabil. Med. 2000, 37, 375–382. [CrossRef]
28. World Health Organization. Oral Health Surveys-Basic Methods, 5th ed.; World Health Organization: Geneva, Switzerland, 2013.29. Hsu, K.J.; Lee, H.E.; Wu, Y.M.; Lan, S.J.; Huang, S.T.; Yen, Y.Y. Masticatory factors as predictors of oral health-related quality of
life among elderly people in Kaohsiung City, Taiwan. Qual. Life Res. 2014, 23, 1395–1405. [CrossRef]30. Maekawa, K.; Ikeuchi, T.; Shinkai, S.; Hirano, H.; Ryu, M.; Tamaki, K.; Yatani, H.; Kuboki, T.; Kimura-Ono, A.; Kikutani, T.; et al.
Number of functional teeth more strongly predicts all-cause mortality than number of present teeth in Japanese older adults.Geriatr. Gerontol. Int. 2020, 20, 607–614. [CrossRef] [PubMed]
31. Suma, S.; Naito, M.; Wakai, K.; Naito, T.; Kojima, M.; Umemura, O.; Yokota, M.; Hanada, N.; Kawamura, T. Tooth loss andpneumonia mortality: A cohort study of Japanese dentists. PLoS ONE 2018, 13, e0195813. [CrossRef]
146
J. Pers. Med. 2021, 11, 653
32. Liu, H.Y.; Chen, C.H.; Kuo, C.H.; Feng, M.C.; Chen, J.H.; Wang, H.W.; Chen, K.C.; Lin, C.L. A Novel Tongue Pressure MeasurementInstrument with Wireless Mobile Application Control Function and Disposable Positioning Mouthpiece. Diagnostics (Basel) 2021,11, 489. [CrossRef]
33. Junior, H.V.M.; Tavares, J.C.; Magalhães, A.A.B.; Galvão, H.C.; Ferreira, M.A.F. Characterization of tongue pressure in the elderly.Audiol. Commun. Res. 2014, 19, 375–379.
34. Vanderwegen, J.; Guns, C.; Van Nuffelen, G.; Elen, R.; De Bodt, M. The influence of age, sex, bulb position, visual feedback, andthe order of testing on maximum anterior and posterior tongue strength and endurance in healthy Belgian adults. Dysphagia2013, 28, 159–166. [CrossRef] [PubMed]
35. Morita, K.; Tsuka, H.; Kato, K.; Mori, T.; Nishimura, R.; Yoshida, M.; Tsuga, K. Factors related to masticatory performance inhealthy elderly individuals. J. Prosthodont. Res. 2018, 62, 432–435. [CrossRef] [PubMed]
36. Satake, A.; Kobayashi, W.; Tamura, Y.; Oyama, T.; Fukuta, H.; Inui, A.; Sawada, K.; Ihara, K.; Noguchi, T.; Murashita, K. Effects oforal environment on frailty: Particular relevance of tongue pressure. Clin. Interv. Aging 2019, 14, 1643. [CrossRef]
37. Hara, K.; Tohara, H.; Kobayashi, K.; Yamaguchi, K.; Yoshimi, K.; Nakane, A.; Minakuchi, S. Age-related declines in the swallowingmuscle strength of men and women aged 20–89 years: A cross-sectional study on tongue pressure and jaw-opening force in 980subjects. Arch. Gerontol. Geriatr. 2018, 78, 64–70. [CrossRef]
38. Van Ravenhorst-Bell, H.A.; Mefferd, A.S.; Coufal, K.L.; Scudder, R.; Patterson, J. Tongue strength and endurance: Comparison inactive and non-active young and older adults. Int. J. Speech Lang. Pathol. 2017, 19, 77–86. [CrossRef]
39. Namasivayam, A.M.; Steele, C.M.; Keller, H. The effect of tongue strength on meal consumption in long term care. Clin. Nutr.2016, 35, 1078–1083. [CrossRef] [PubMed]
147


MDPISt. Alban-Anlage 66
4052 BaselSwitzerland
Tel. +41 61 683 77 34Fax +41 61 302 89 18
www.mdpi.com
Journal of Personalized Medicine Editorial OfficeE-mail: [email protected]
www.mdpi.com/journal/jpm


MDPI St. Alban-Anlage 66 4052 Basel Switzerland
Tel: +41 61 683 77 34 Fax: +41 61 302 89 18
www.mdpi.com ISBN 978-3-0365-4207-2


