Embed Size (px)
Citation preview

SJIF Impact Factor 2021: 8.013| ISI I.F.Value:1.241| Journal DOI: 10.36713/epra2016 ISSN: 2455-7838(Online)
EPRA International Journal of Research and Development (IJRD) Volume: 6 | Issue: 7 | July 2021 - Peer Reviewed Journal
2021 EPRA IJRD | Journal DOI: https://doi.org/10.36713/epra2016 | www.eprajournals.com |526 |
PERSONALIZED INSTRUCTIONAL VIDEOS AS INTERVENTION MATERIALS IN GRADE 8 ON THE
LEAST LEARNED COMPETENCIES IN ALGEBRA
Rachelle Mae C. Noriel Faculty, Balian Integrated National High School
ABSTRACT
This study entitled “Personalized Instructional Videos as Intervention Materials in Grade 8 on the Least
Learned Competencies in Algebra” attempted to answer the questions: (1) What is the level of Personalized
Instructional Videos in terms of: Objectives, Content, Presentation, Evaluation? (2) What is the level of students’
performance in Mathematics 8 on least learned competencies in Algebra in terms of: Pre-Test and Post-Test? (3)
Is there significant difference between the students’ performance in Mathematics 8 on least learned competencies
in Algebra in terms of Pre-Test and Post-Test? (4) Is there a significant effect of the personalized instructional
videos on the students’ performance in Mathematics 8 on the least learned competencies in Algebra in terms of
Post-Test?
The research designs used were the Descriptive method to determine the effectiveness of the personalized
instructional videos on the students’ performance in the least learned competencies in Algebra. The non-
probability sampling technique specifically purposive sampling technique was used to determine the respondents in
this study. The Grade 8 students composed of 398 population and only 30 students were selected as the
experimental group based on their availability of gadgets and their accessibility in Internet.
The mean, standard deviation, frequency, and percentage are used to determine the level of personalized
instructional videos to identify the level on the students’ performance in the least learned competencies. T-Test was
used as statistical treatment to determine the significant difference on the pre-test and post-test scores and Multiple
Regression for the significant effect of personalized instructional videos on the students’ performance in the least
learned competencies.
Findings revealed in this study: (1) The level of personalized instructional videos implied Very High; (2) The
level of personalized instructional videos in students’ performance in the least learned competencies showed that
there was improvement from low mastery to average mastery; (3) The difference between the students’ performance
in terms of pre-test and post-test that there are significant; (4) The effect of the personalized instructional videos
revealed that there was no significant effect on the students’ performance.
Based on the results and conclusions, the following recommendations were highlighted: Teachers want to make
their own instructional videos may use the familiar medium of instruction and shows mastery of content using
different platforms in delivering; The students may use the instructional videos in conducive learning
environment with availability of gadgets and accessibility of internet that most of use nowadays even in modular
distance learning; The administration, the teaching-learning Mathematics in this time of pandemic may help the
learners within blended learning; The future researcher, the personalized instructional videos may be localized and
suitable for the learners and presentable to the way more facilitating, stimulating and exciting for the learners to be
enthusiastic and eager to learn; Similar studies on the use of the learning material as intervention not just only in
Mathematics but also in other subject areas may be conducted and the use of other variables aside from those
considered in the study.
KEYWORDS: Personalized instructional videos, intervention materials, least learned competencies in Algebra

SJIF Impact Factor 2021: 8.013| ISI I.F.Value:1.241| Journal DOI: 10.36713/epra2016 ISSN: 2455-7838(Online)
EPRA International Journal of Research and Development (IJRD) Volume: 6 | Issue: 7 | July 2021 - Peer Reviewed Journal
2021 EPRA IJRD | Journal DOI: https://doi.org/10.36713/epra2016 | www.eprajournals.com |527 |
INTRODUCTION Amidst the current situation of the society due
to the existence of the pandemic CoViD-19 affecting
not only the Philippines but all the countries around
the world learning delivery system has become an
issue that should be addressed as we move towards
fighting the pandemic. Every institution adopts
different learning modalities such as e-Learning,
modular and blended distance learning to bridge the
education for every learner. Though these learning
modalities have been slowly becoming part of the
medium of instruction in the Philippine education,
challenges have been evident on the use of these
modalities especially in Mathematics areas.
Each institution may decide what modalities
and suitable in their areas, depending on the
capabilities and availabilities of learners, and
especially the modalities to be chosen. In the modular
learning delivery, learners study through printed
materials and teachers communicate to them through
messaging. There would be uncertain misconceptions
in the content. Anxieties and fears arise to not
motivate the learners. Math teachers might fail in
developing the students toward the twin goals of the
K-12 Math – critical thinking and problem solving.
Thus, the DepEd gives instruction to conduct
intervention to cope with these problems.
From this reason, the researcher decided to
use the Personalized
Instructional Videos as an intervention
material on the least learned competencies in Algebra
Mathematics 8 with the topic of Linear Inequality
and the System of Linear Inequality in two variables
as learned in the researchers’ collected data from
learner’s test. The researcher wanted to remediate
that situation through personalized instructional
videos to help the learners cope with Mathematics
and develop their skills in the subjects through
guiding them in content-based and procedural way
with personal instruction.
RESEARCH METHODOLOGY The study is about the use of personalized
instructional videos as intervention materials in
Grade 8 on the least learned competencies in
Algebra. The Grade 8 students composed of 398
population and only 30 students were selected as the
experimental group were used the researcher made
materials and assess the materials.
Sampling Techniques
The researcher has used the non-probability
sampling technique specifically purposive sampling
technique was used to determine the respondents in
this study based on their availability of gadgets and
their accessibility in Internet.
Data Gathering Procedure
A letter of request will be submitted to the
Schools Division Superintendent, through the
Division Education Program Secondary to seek
permission to conduct the study. Immediately after
the approval, with permission of School Principals,
schedules in conducting remediation used the
researcher made materials which is the personalized
instructional videos as intervention materials in the
least learned competencies in algebra, then the post-
test assessment and questionnaires to the
acceptability of the materials. Data are going to
tabulate, analyze and compute applying the needed
statistical treatment.
Research Procedure
A permit is secured from the office of the
Schools Division Superintendent and School
Principal of chosen school before the conduct of the
study. The proponent will undergo the difficult stages
and then monitored the development until the
completion of the study.
Research Instrument
The data for the study are going to gather by
means of a conducting the Mathematical test and
questionnaire. A researcher-made Mathematical test
and questionnaire is also employed as a part of the
instrument in gathering the data.
The Mathematical test aims to determine
difference from pre-test and post-test results and
effectiveness of the personalized instructional videos
in the least learned competencies in algebra.
The questionnaire aims to determine the
level of acceptability of researcher made materials
which the personalized instructional videos. It
composed of the parts of intervention materials in
terms of objectives, content, presentation and
evaluation.
SJIF Impact Factor 2021: 8.013| ISI I.F.Value:1.241| Journal DOI: 10.36713/epra2016 ISSN: 2455-7838(Online)
EPRA International Journal of Research and Development (IJRD) Volume: 6 | Issue: 7 | July 2021 - Peer Reviewed Journal
2021 EPRA IJRD | Journal DOI: https://doi.org/10.36713/epra2016 | www.eprajournals.com |528 |
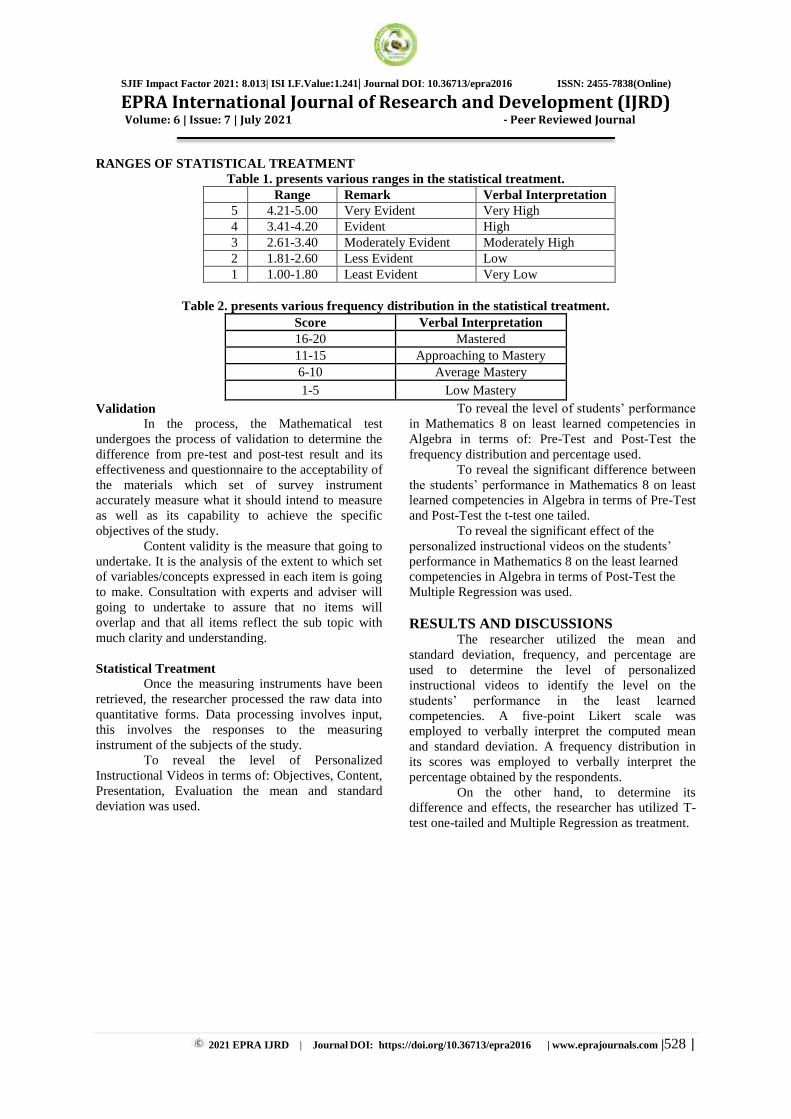
RANGES OF STATISTICAL TREATMENT
Table 1. presents various ranges in the statistical treatment.
Range Remark Verbal Interpretation
5 4.21-5.00 Very Evident Very High
4 3.41-4.20 Evident High
3 2.61-3.40 Moderately Evident Moderately High
2 1.81-2.60 Less Evident Low
1 1.00-1.80 Least Evident Very Low
Table 2. presents various frequency distribution in the statistical treatment.
Score Verbal Interpretation
16-20 Mastered
11-15 Approaching to Mastery
6-10 Average Mastery
1-5 Low Mastery
Validation
In the process, the Mathematical test
undergoes the process of validation to determine the
difference from pre-test and post-test result and its
effectiveness and questionnaire to the acceptability of
the materials which set of survey instrument
accurately measure what it should intend to measure
as well as its capability to achieve the specific
objectives of the study.
Content validity is the measure that going to
undertake. It is the analysis of the extent to which set
of variables/concepts expressed in each item is going
to make. Consultation with experts and adviser will
going to undertake to assure that no items will
overlap and that all items reflect the sub topic with
much clarity and understanding.
Statistical Treatment
Once the measuring instruments have been
retrieved, the researcher processed the raw data into
quantitative forms. Data processing involves input,
this involves the responses to the measuring
instrument of the subjects of the study.
To reveal the level of Personalized
Instructional Videos in terms of: Objectives, Content,
Presentation, Evaluation the mean and standard
deviation was used.
To reveal the level of students’ performance
in Mathematics 8 on least learned competencies in
Algebra in terms of: Pre-Test and Post-Test the
frequency distribution and percentage used.
To reveal the significant difference between
the students’ performance in Mathematics 8 on least
learned competencies in Algebra in terms of Pre-Test
and Post-Test the t-test one tailed.
To reveal the significant effect of the
personalized instructional videos on the students’
performance in Mathematics 8 on the least learned
competencies in Algebra in terms of Post-Test the
Multiple Regression was used.
RESULTS AND DISCUSSIONS The researcher utilized the mean and
standard deviation, frequency, and percentage are
used to determine the level of personalized
instructional videos to identify the level on the
students’ performance in the least learned
competencies. A five-point Likert scale was
employed to verbally interpret the computed mean
and standard deviation. A frequency distribution in
its scores was employed to verbally interpret the
percentage obtained by the respondents.
On the other hand, to determine its
difference and effects, the researcher has utilized T-
test one-tailed and Multiple Regression as treatment.

SJIF Impact Factor 2021: 8.013| ISI I.F.Value:1.241| Journal DOI: 10.36713/epra2016 ISSN: 2455-7838(Online)
EPRA International Journal of Research and Development (IJRD) Volume: 6 | Issue: 7 | July 2021 - Peer Reviewed Journal
2021 EPRA IJRD | Journal DOI: https://doi.org/10.36713/epra2016 | www.eprajournals.com |529 |
Supplemental Material on Operation on Integers
Table 1. Level of Personalized Instructional Videos in Terms of Objectives
Statement Mean Standard
Deviation Remarks
1. Each lesson in the video presentation is
accompanied by specific objectives 4.37 0.490 Very Evident
2. The aims and objectives of the video
presentation are attainable and measurable. 4.17 0.699 Evident
3. The objectives are stated in behavioral
terms. 4.03 0.850 Evident
4. The words used in objectives are clear and
easily understood. 4.50 0.777 Very Evident
5. The objectives are in line with the
competencies set by the DepEd under in the
pandemic situation.
4.37 0.490 Very Evident
Overall Mean/ SD 4.29 0.686 Very High
Legend:
Point Range Remark Verbal Interpretation
5 4.20-5.00 Very Evident Very High
4 3.60-4.19 Evident High
3 2.40-3.59 Moderately Evident Moderately High
2 1.80-2.39 Less Evident Low
1 1.00-1.79 Least Evident Very Low
The (OM=4.29 SD=0.686), which was
verbally interpreted as Very High, indicated level of
personalized instructional materials in terms of
objectives. This implied that the respondents noticed
that the objectives of the personalized instructional
videos were attainable and in line with the
competencies set by the DepEd under the pandemic
situation achieved the results of (M=4.37,
SD=0.490), (M=4.17, SD=0.699), (M=4.03,
SD=0.850), (M=4.50, SD=0.777) and (M=4.37,
SD=0.490), respectively.
Kirubhakaran (2021) mentioned writing
effective learning objectives is a necessary skill in
academic medicine. Learning objectives are clearly
written, specific statements of observable learner
behavior or action that can be measured upon
completion of educational activity. They are the
foundation for instructional alignment whereby the
learning objectives, assessment tools, and
instructional methods mutually support the desired
learning outcome. In addition, any materials should
align with those goals to help to reach the desire-
learning outcome.
Table 2. Level of Personalized Instructional Videos in Terms of Content
Statement Mean Standard
Deviation Remarks
1. Lesson content was consistent with the lesson
objectives (MELCS). 4.50 0.509 Very Evident
2. The content arranged in a clear, logical and orderly
manner. 4.23 0.679 Very Evident
3. The content is suitable to the level of the learners. 4.03 0.850 Evident
4. The video presentation contents are complete to cover
the whole course. 4.67 0.479 Very Evident
5. The video presentation’s content was intellectually
stimulating. 4.03 0.890 High
Overall Mean/SD 4.29 0.735 Very High
Legend:
Point Range Remark Verbal Interpretation
5 4.20-5.00 Very Evident Very High
4 3.60-4.19 Evident High
3 2.40-3.59 Moderately Evident Moderately High
2 1.80-2.39 Less Evident Low
1 1.00-1.79 Least Evident Very Low
SJIF Impact Factor 2021: 8.013| ISI I.F.Value:1.241| Journal DOI: 10.36713/epra2016 ISSN: 2455-7838(Online)
EPRA International Journal of Research and Development (IJRD) Volume: 6 | Issue: 7 | July 2021 - Peer Reviewed Journal
2021 EPRA IJRD | Journal DOI: https://doi.org/10.36713/epra2016 | www.eprajournals.com |530 |
Based on the result (OM=4.29 SD=0.735),
which was verbally interpreted as Very High,
indicated on level of personalized instructional
materials in terms of content. This inferred that the
respondents noticed that the content of the
personalized instructional videos was aligned with
the objectives and organized in a stimulating way to
deliver the instruction achieved the results of
(M=4.50, SD=0.509), (M=4.23, SD=0.679),
(M=4.03, SD=0.850), (M=4.67, SD=0.479) and
(M=4.03, SD=0.890), respectively.
According to Abunda (2020) who cited the
work of Koehler and Mishra (2006), ―Quality
teaching requires developing a nuanced
understanding of the complex relationship between
technology, content, and pedagogy, and using this
understanding to develop appropriate, context-
specific strategies and representations‖. According to
C. S. Chai, J. H. L. Koh, C-C. Tsai (2010), a teacher
who aims to achieve a successful technology
integration in the teaching—and learning process
needs to consider all these interrelated components
other than just a sole subject matter, pedagogy, or
technology expert. Preparing preservice teachers for
ICT-based classroom instruction attracts more
attention for many teacher educations institutes. As
21st century educators’ education amidst of
phenomenal situations of education, it proven that
those skills should be possessed by the teachers to
pursue quality in teaching under challenging
circumstances.
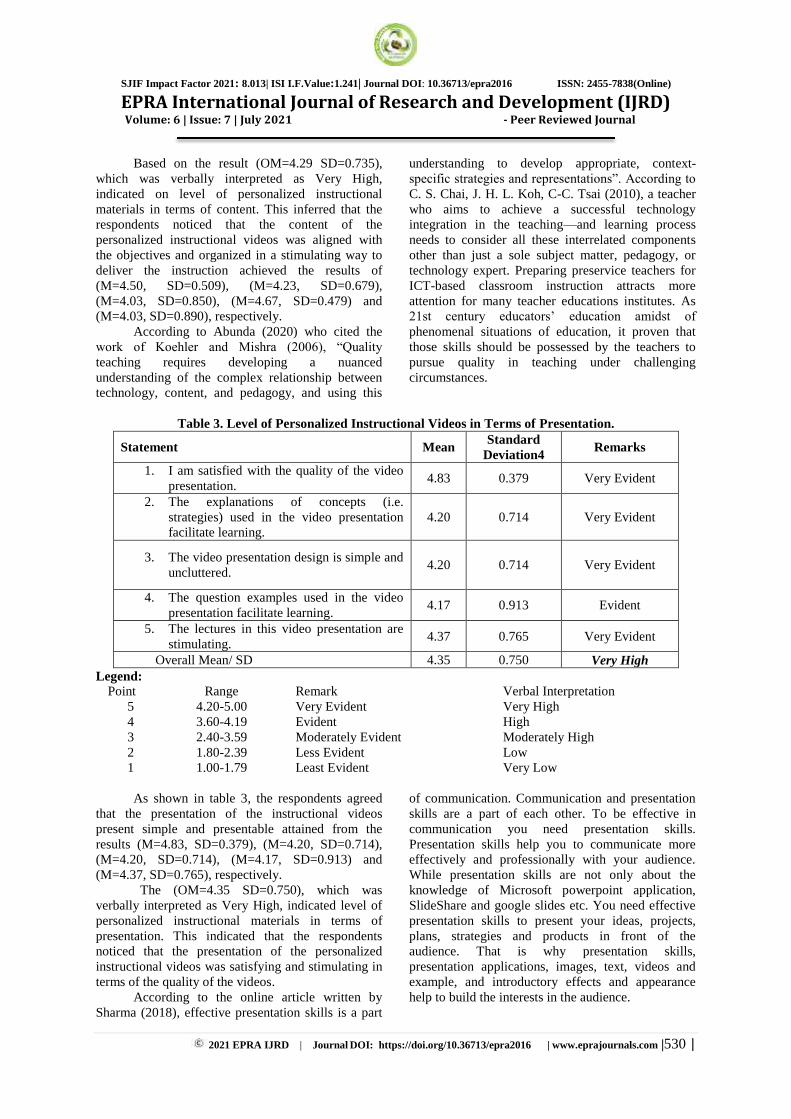
Table 3. Level of Personalized Instructional Videos in Terms of Presentation.
Statement Mean Standard
Deviation4 Remarks
1. I am satisfied with the quality of the video
presentation. 4.83 0.379 Very Evident
2. The explanations of concepts (i.e.
strategies) used in the video presentation
facilitate learning.
4.20 0.714 Very Evident
3. The video presentation design is simple and
uncluttered. 4.20 0.714 Very Evident
4. The question examples used in the video
presentation facilitate learning. 4.17 0.913 Evident
5. The lectures in this video presentation are
stimulating. 4.37 0.765 Very Evident
Overall Mean/ SD 4.35 0.750 Very High
Legend:
Point Range Remark Verbal Interpretation
5 4.20-5.00 Very Evident Very High
4 3.60-4.19 Evident High
3 2.40-3.59 Moderately Evident Moderately High
2 1.80-2.39 Less Evident Low
1 1.00-1.79 Least Evident Very Low
As shown in table 3, the respondents agreed
that the presentation of the instructional videos
present simple and presentable attained from the
results (M=4.83, SD=0.379), (M=4.20, SD=0.714),
(M=4.20, SD=0.714), (M=4.17, SD=0.913) and
(M=4.37, SD=0.765), respectively.
The (OM=4.35 SD=0.750), which was
verbally interpreted as Very High, indicated level of
personalized instructional materials in terms of
presentation. This indicated that the respondents
noticed that the presentation of the personalized
instructional videos was satisfying and stimulating in
terms of the quality of the videos.
According to the online article written by
Sharma (2018), effective presentation skills is a part
of communication. Communication and presentation
skills are a part of each other. To be effective in
communication you need presentation skills.
Presentation skills help you to communicate more
effectively and professionally with your audience.
While presentation skills are not only about the
knowledge of Microsoft powerpoint application,
SlideShare and google slides etc. You need effective
presentation skills to present your ideas, projects,
plans, strategies and products in front of the
audience. That is why presentation skills,
presentation applications, images, text, videos and
example, and introductory effects and appearance
help to build the interests in the audience.

SJIF Impact Factor 2021: 8.013| ISI I.F.Value:1.241| Journal DOI: 10.36713/epra2016 ISSN: 2455-7838(Online)
EPRA International Journal of Research and Development (IJRD) Volume: 6 | Issue: 7 | July 2021 - Peer Reviewed Journal
2021 EPRA IJRD | Journal DOI: https://doi.org/10.36713/epra2016 | www.eprajournals.com |531 |
Table 4. Level of Personalized Instructional Videos in terms of Evaluation.
Statement Mean Standard
Deviation4 Remarks
1. The video presentation improve the
general analytic skills of the learners. 4.70 0.466 Very Evident
2. The teaching on this video presentation is
sufficient to enhance the student’s
knowledge.
4.03 0.850 Evident
3. The lectures in this video presentation are
in general informative. 4.50 0.777 Very Evident
4. The academic expectations on this video
presentation are appropriate with the
desired learners.
4.37 0.765 Very Evident
5. The learning outcomes for this video
presentation were made clear and
attainable.
4.33 0.758 Very Evident
Overall Mean/ SD 4.39 0.755 Very High
Legend:
Point Range Remark Verbal Interpretation
5 4.20-5.00 Very Evident Very High
4 3.60-4.19 Evident High
3 2.40-3.59 Moderately Evident Moderately High
2 1.80-2.39 Less Evident Low
1 1.00-1.79 Least Evident Very Low
The data above reveal that the personalized
instructional videos the learning outcomes were
attainable and informative garnered the result of
(M=4.70, SD=0.466), (M=4.03, SD=0. 850),
(M=4.50, SD=0.777), (M=4.37, SD=0.765) and
(M=4.33, SD=0.758), respectively.
The (OM=4.39 SD=0.755) with a verbal
interpretation of Very High indicated level of
personalized instructional materials in terms of
evaluation. This showed that the respondents noticed
that the evaluation of the personalized instructional
videos were used to improve the analytical skills and
provide general information sufficient in the learners’
knowledge.
According to the works of Rao and Ramesh
(2021), Test Items or Assessment Items are used to
assess the student’s acquisition of the competencies.
Test Items or Assessment Items identify both at the
competency and at sub-competency levels. They can
be either written test items (such as quizzes and
problems) or performance test items (such as projects
and group discussions). These are tagged with the
competency/sub-competency they address, the type
(written or performance), maximum marks, answer
key wherever possible, duration of answering, etc. As
stated earlier, the test items must pedagogically
aligned with the competency they address. Therefore,
test items must be tagged with the competency,
which they address. This is what evaluation means,
materials used to gather information intend to
measure if those competencies are attained after the
instruction.
Level of Students’ Performance in Mathematics 8 in the Least Learned Competencies in Algebra
Table 5. Level of Students’ Performance in Mathematics 8 on the Least Learned Competencies in Algebra
in terms of Pre-Test.
Score Frequency
(f)
Percentage
(%) Verbal Interpretation
16-20 0 0% Mastered
11-15 0 0% Approaching to Mastery
6-10 9 30.00% Average Mastery
1-5 21 70.00% Low Mastery
Total 30 100%
M = 4. 67 SD = 2.02
SJIF Impact Factor 2021: 8.013| ISI I.F.Value:1.241| Journal DOI: 10.36713/epra2016 ISSN: 2455-7838(Online)
EPRA International Journal of Research and Development (IJRD) Volume: 6 | Issue: 7 | July 2021 - Peer Reviewed Journal
2021 EPRA IJRD | Journal DOI: https://doi.org/10.36713/epra2016 | www.eprajournals.com |532 |
Students' Performance in
Mathematics 8 on the
Least Learned
Competencies in Algebra
Mean SDMean
Differencet-value p-value
Verbal
Interpretation
Pre Test 4.67 2.02
Post Test 8.7 1.644.03 1.699 0.000 Siginificant
Table 5 showed the level of students’
performance in Mathematics 8 in the least learned
competencies in Algebra. In this study, referred to the
pre-test which got (M=4.67 SD= 2.02), the
percentage that got 1-5 scores was 70 % which was
verbally interpreted as Low Mastery. The percentage
that got 6-10 scores is 30% which was verbally
interpreted as Average Mastery. And the percentage
for the scores of 11-15 was 0% which verbally was
interpreted as Approaching to Mastery and got the
score of 16-20 was 0% which verbally interpreted as
Mastered.
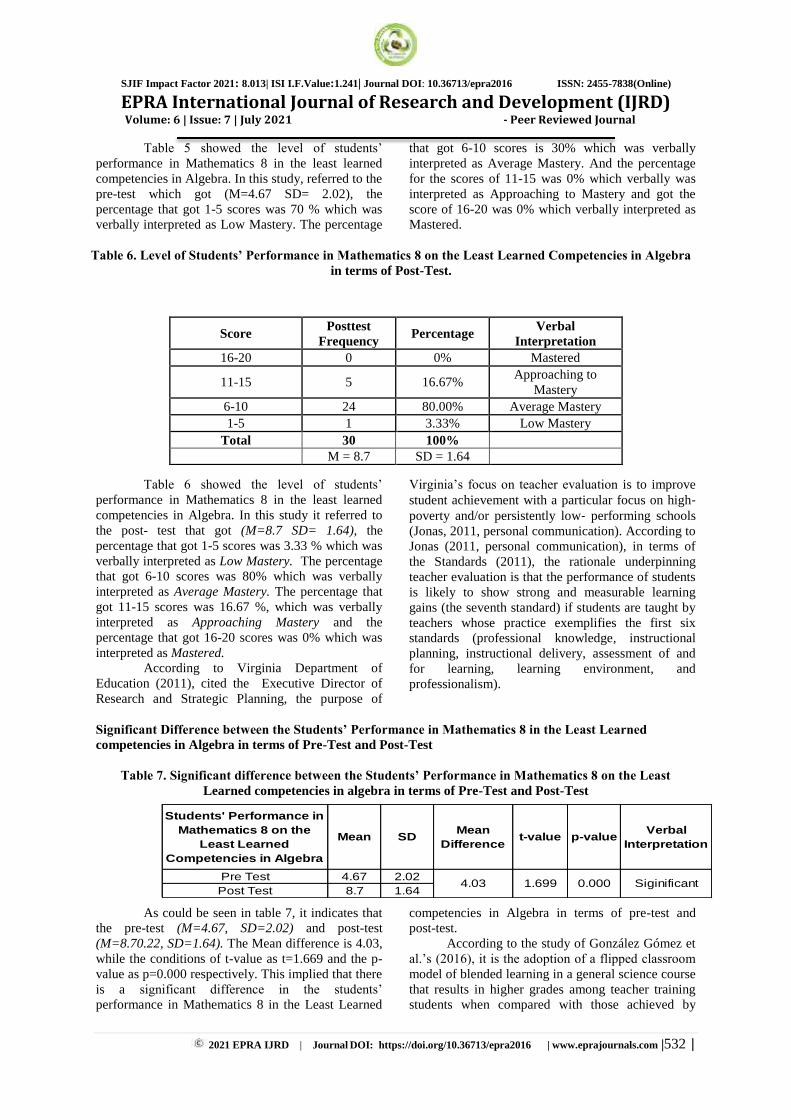
Table 6. Level of Students’ Performance in Mathematics 8 on the Least Learned Competencies in Algebra
in terms of Post-Test.
Table 6 showed the level of students’
performance in Mathematics 8 in the least learned
competencies in Algebra. In this study it referred to
the post- test that got (M=8.7 SD= 1.64), the
percentage that got 1-5 scores was 3.33 % which was
verbally interpreted as Low Mastery. The percentage
that got 6-10 scores was 80% which was verbally
interpreted as Average Mastery. The percentage that
got 11-15 scores was 16.67 %, which was verbally
interpreted as Approaching Mastery and the
percentage that got 16-20 scores was 0% which was
interpreted as Mastered.
According to Virginia Department of
Education (2011), cited the Executive Director of
Research and Strategic Planning, the purpose of
Virginia’s focus on teacher evaluation is to improve
student achievement with a particular focus on high‐poverty and/or persistently low‐ performing schools
(Jonas, 2011, personal communication). According to
Jonas (2011, personal communication), in terms of
the Standards (2011), the rationale underpinning
teacher evaluation is that the performance of students
is likely to show strong and measurable learning
gains (the seventh standard) if students are taught by
teachers whose practice exemplifies the first six
standards (professional knowledge, instructional
planning, instructional delivery, assessment of and
for learning, learning environment, and
professionalism).
Significant Difference between the Students’ Performance in Mathematics 8 in the Least Learned
competencies in Algebra in terms of Pre-Test and Post-Test
Table 7. Significant difference between the Students’ Performance in Mathematics 8 on the Least
Learned competencies in algebra in terms of Pre-Test and Post-Test
As could be seen in table 7, it indicates that
the pre-test (M=4.67, SD=2.02) and post-test
(M=8.70.22, SD=1.64). The Mean difference is 4.03,
while the conditions of t-value as t=1.669 and the p-
value as p=0.000 respectively. This implied that there
is a significant difference in the students’
performance in Mathematics 8 in the Least Learned
competencies in Algebra in terms of pre-test and
post-test.
According to the study of González Gómez et
al.’s (2016), it is the adoption of a flipped classroom
model of blended learning in a general science course
that results in higher grades among teacher training
students when compared with those achieved by
Score Posttest
Frequency Percentage
Verbal
Interpretation
16-20 0 0% Mastered
11-15 5 16.67% Approaching to
Mastery
6-10 24 80.00% Average Mastery
1-5 1 3.33% Low Mastery
Total 30 100%
M = 8.7 SD = 1.64

SJIF Impact Factor 2021: 8.013| ISI I.F.Value:1.241| Journal DOI: 10.36713/epra2016 ISSN: 2455-7838(Online)
EPRA International Journal of Research and Development (IJRD) Volume: 6 | Issue: 7 | July 2021 - Peer Reviewed Journal
2021 EPRA IJRD | Journal DOI: https://doi.org/10.36713/epra2016 | www.eprajournals.com |533 |
students following a traditional classroom setting.
Though Israel (2015) or Potter (2015) mentions no
specific predictor, the former still observes modest
positive impacts on students’ learning outcome
resulting from the adoption of the blended format. As
adaptation of the researcher, the aim study of
instructional videos intervention is to increase the
student performance from the modular distance
learning.
Significant Effect of the Personalized Instructional Videos in the Students’ Performance in Mathematics
8 on the Least Learned Competencies in Algebra in terms of Post-Test
Table 8. Significant Effect of the Personalized Instructional Videos in the Students’ Performance in
Mathematics 8 on the Least Learned Competencies in Algebra in terms of Post-Test
Personalized Instructional
Videos in the Students’
Performance in
Mathematics 8 on the
Least Learned
Competencies in Algebra
Coefficient t-value p-value Verbal
Interpretation
Objectives 0.1713 0.7649 0.4507 Not Significant
Content 0.3475 1.2462 0.223 Not Significant
Presentation 0.2524 1.3838 0.1773 Not Significant
Evaluation 0.3191 1.6110 0.1184 Not Significant
In table 8 showed the result of the analysis
that there is a significant effect of the Personalized
Instructional Videos in terms of Objectives; Content;
Presentation; and Evaluation on the Students’
Performance in Mathematics 8 on Least Learned
Competencies in Algebra in terms of Post-Test, with
coefficient of 0.1713, 0.3475, -0.2524, and 0.3191
with t-value of 0.7649, 1.2462, 1.3838, and 1.6110
respectively.
This indicated that there was not significant
of the personalized instructional videos in the
students’ performance in Mathematics 8 on the Least
Learned competencies in Algebra in terms of Post-
Test.
To support this study the researcher cited the
study of Obagah and Brisibe (2017), entitled ―The
Effectiveness of Instructional Videos in Enhancing
Learning Experience of Architecture Students in
Design and Drawing Courses: A Case Study of
Rivers State University, Port-Harcourt‖, the
effectiveness of the use of instructional video in
design and drawing courses is very evident. While,
the effect of the use of instructional videos and
projector assisted teaching of design and drawing
was also a welcome experience by the students based
on their response to the test instrument. This result
agrees with the findings of earlier studies by Brecht,
et al. (2008) also noting that students use the video
lectures to (a) understand concepts and problems
presented in the classroom lectures, (b) do
homework, (c) prepare for weekly exams, and (d)
receive instructor-quality tutoring assistance. In the
survey, it stated that the number of students using and
help by the videos for these purposes was statistically
significant in all cases. It concluded that video
lectures are substantially appealing to many students
and perceived as effective for learning.
FINDINGS Based on the results of the study, the following
conclusions hereby presented:
1. The level of personalized instructional
videos in terms of objectives, content,
presentation and evaluation the respondents
implied Very High.
2. The level of personalized instructional
videos in students’ performance in the least
learned competencies in Algebra showed
that there was improvement from low
mastery to average mastery.
3. The difference between the students’
performance in Mathematics 8 in the least
learned competencies in Algebra there are
significant
4. The effect of the personalized instructional
videos in terms of objectives; content;
presentation; and evaluation on the students’
performance in Mathematics 8 in least
learned competencies in Algebra revealed
that there was no significant effect on the
students’ performance.
CONCLUSIONS Based on the results of the study, the following
conclusions hereby presented:
The difference between the students’
performance in mathematics 8 on the least learned
competencies in algebra in terms of pre-test and post-
test was Significant. Therefore, it indicate that there
is significant difference between the students’

SJIF Impact Factor 2021: 8.013| ISI I.F.Value:1.241| Journal DOI: 10.36713/epra2016 ISSN: 2455-7838(Online)
EPRA International Journal of Research and Development (IJRD) Volume: 6 | Issue: 7 | July 2021 - Peer Reviewed Journal
2021 EPRA IJRD | Journal DOI: https://doi.org/10.36713/epra2016 | www.eprajournals.com |534 |
performance in mathematics 8 on the least learned
competencies in terms of pre-test and post-test.
The effect of the personalized instructional
videos in terms of objectives; content; presentation;
and evaluation on the students’ performance in
mathematics 8 on least learned competencies in
algebra in terms of post-test was Not Significant.
Therefore, the null hypothesis indicating that there is
a significant effect of the personalized instructional
videos in the students’ performance in Mathematics 8
on the least learned competencies in Algebra hereby
rejected. Rejected of the null hypothesis shows that
there were no significant effect of the personalized
instructional videos in the students’ performance in
Mathematics 8 on the least learned competencies in
Algebra.
RECOMMENDATIONS The following were the recommendations based on
the above findings.
1. Teachers want to make their own
instructional videos and improve the
objectives, contents, presentations and
evaluations may use the familiar medium in
delivering the instruction and keep the
students to practice their reading and
comprehension skills, Higher Order
Thinking Skills (HOTS) questions, and
lastly show the mastery of content and its
pedagogical approach even in digital form of
teaching to attain the twin goals in Math
were student be critical thinker and problem
solver.
2. The students may use the instructional
videos in appropriate time, schedule and
activities that allotted in conducting the
lesson proper, in conducive learning
environment and the availability of gadgets
and stable internet connection to be more
effective in their studies and improve their
performance in Math.
3. For administration, the teaching-learning
mathematics in this time of pandemic or
phenomenal situation may help the learners
within blended learning associates with
available printed materials. Also, allocate
the period of the lesson proper in its suitable
span of teaching and learning of students.
4. For future researcher, the personalized
instructional videos the objectives, contents,
presentations and evaluations may be
localized and suitable for the learners and
presentable to the way more facilitating,
stimulating and exciting for the learners to
be enthusiastic and eager to learn, and may
use Higher Order Thinking Skills (HOTS)
questions to aim the twin goals in Math:
Critical thinker and Problem Solver.
5. Similar studies on the use of the learning
material as intervention not just only in
Mathematics but also in other subject areas
may be conducted and the use of other
variables aside from those considered in the
study.
REFERENCES 1. Alvarez, A., Jr. (2020). The Phenomenon of
Learning at a Distance Through Emergency
Remote Teaching Amidst the Pandemic Crisis,
Asian Journal of Distance Education: 15 pp. 144-
153 (11).
2. Anderson L.W., Krathwohl D.R., Airasian P.W.,
Cruikshank K.A., Mayer R.E., Pintrich P.R.,
Raths J. and Wittrock M.C. (Editors) (2001): A
Taxonomy for Learning, Teaching, and
Assessing: A Revision of Blooms Taxonomy of
Educational Objectives, Longman, 2001
3. Black, K. (2010). “Business Statistics:
Contemporary Decision Making”, 6th edition,
John Wiley & Sons, Retrieved on June 22, 2021,
https://research-methodology.net/sampling-in-
primary-data-collection/purposive-sampling/.
4. Bonk, C. J., & Graham, C. R. (2006). The
Handbook of Blended Learning Environments:
Global Perspectives, Local Designs. San
Francisco, CA: Jossey‐Bass/Pfeiffer.
5. Darling‐Hammond, L., & Bransford, J. (2005).
Preparing Teachers for a Changing World: What
Teachers Should Learn and Be able to Do. San
Francisco, CA: Jossey‐ Bass.
6. Garcia, Carlito D. (2013). “Measuring and
Evaluating Learning Outcomes: A Textbook in
Assessment in Learning, 1 7 2 2nd Edition”.
Books Atbp. Publishing Corp. 707 Tiaga Corner
Kasipagan Streets, Barangka Drive,
Mandaluyong City.
7. Manurung, Konder et al (2017). “Designing
Instructional Materials” Konder Manurung.
Palu: Untad Press, 2017 UNTAD Press Jl.
Soekarno Hatta KM. 9 Palu Sulawesi Tengah.
8. M. J. Koehler, P. Mishra (2006). Technological
Pedagogical Content Knowledge: A Framework
for Teacher Knowledge. Teachers College
Record, Vol. 108, No. 6, pp. 1017 – 1054, 2006.
9. Redding, S. (2013). Through the Student‟s Eyes:
A Perspective on Personalized Learning.
Philadelphia, PA: Temple University (Center on
Innovations in Learning).
10. Robert M. Branch and Tonia A. Dousay
(2015). "Survey of Instructional Design
Models," Association for Educational
Communications and Technology (AECT), 2015.
11. Sandler, S. (2012). People v. „Personalization‟:
Retaining the Human Element in the High-tech
Era of Education. Education Week, 31(22), 20–
22.

SJIF Impact Factor 2021: 8.013| ISI I.F.Value:1.241| Journal DOI: 10.36713/epra2016 ISSN: 2455-7838(Online)
EPRA International Journal of Research and Development (IJRD) Volume: 6 | Issue: 7 | July 2021 - Peer Reviewed Journal
2021 EPRA IJRD | Journal DOI: https://doi.org/10.36713/epra2016 | www.eprajournals.com |535 |
12. Shinkfield, A. J., & Stufflebeam, D. L. (1995).
Teacher Evaluation: Guide to Effective Practices.
Boston, MA: Kluwer Academic.
13. Venacio, Dr. Ardales B. (2008). “Basic Concepts
and Methods in Research 3rd Edition 2008”
Educational Publishing House 526-528 United
Nations Avenues Ermita, Manila.
14. Whitcomb, J. A. (2003). Learning and Pedagogy
in Initial Teacher Preparation. In I. B. Weiner,
(Ed.), Handbook of Psychology (Vol. 7, pp.
533–556). Hoboken, NJ: Wiley.
15. Agurin, L.A.C. (2011). “Effect of Module
Instruction on Program Writing in the
Performance of Selected Secondary School
Students in Linga National High School, Pila
Laguna A.Y. 2010-2011”. Unpublished
Undergraduate Thesis, Laguna State Polytechnic
University, Sta. Cruz, Laguna.
16. Mecija, M.B (2013). “Performance of Fourth
Year Students in Solving Word Problems in
Mathematics”. Unpublished MAED, Masteral
Thesis, Laguna State Polytechnic University,
Santa Cruz, Laguna.
17. Noriel, R.M.C (2014). The Effect of Using
Tangram on the Performance in Geometry of
Selected Grade 7 Students of Suba National High
School Majayjay, Laguna. (Unpublished
Bachelor‟s Degree Thesis, Laguna State
Polytechnic University, Sta. Cruz, Laguna).
18. Pascual, M.S.M (2012). “Correlation of
Techniques of Solving Mathematical Problems in
Right Triangles and the Average of Problem
Solving Skills of First Year Biology Students of
Laguna State Polytechnic University Main
Campus, Sta. Cruz, Laguna.” Unpublished
Undergraduate Thesis, Laguna State Polytechnic
University Sta. Cruz, Laguna.
19. Solpico M.L. (February 2013). “The
Effectiveness of Tutorial Classes on the
Performance In Statistics of Third Year Low
Achieveing Learners of Buenavista National High
School. (Annex): Magdalena, Laguna, S.Y. 2011-
2012.” Unpublished Undergraduate Thesis,
Laguna State Polytechnic University Sta. Cruz,
Laguna.
20. Villanueva, J.L (2013). “Double Exposure
Application and the Performance in Mathematics
of Selected Grade 7 Students of Southville I
National High School Cabuyao, Laguna. ”
21. Valverde, K.G.S. (March 2011). “Acceptability of
Module on Commonly Used Figures of Speech.”
Unpublished Undergraduate Thesis, Laguna
State Polytechnic University Sta. Cruz, Laguna.
Unpublished Masteral thesis, Laguna State
Polytechnic University Santa Cruz, Laguna.
22. Abunda, A.N (2020). "Cross-sectional Study on
Technological Pedagogical Content Knowledge
(TPACK) of Mathematics Teachers," Universal
Journal of Educational Research, Vol. 8, No.
12A, pp. 7651 - 7659, 2020. DOI:
10.13189/ujer.2020.082551.
23. Amani K. H. A., Alotaibi, G. and Ibrahim, O.
(2020). Institutional Academic Assessment and
Effectiveness in Higher Education: Saudi Arabia Case
Study 2020, Research & Practice in Assessment Vol.
(15), Issue (2)
24. Bautista, R.G. (2012) The Effects of Personalized
Instruction on the Academic Achievement of
Students in Physics (International Journal of Arts
and Sciences ISSN: 1994-6934)
25. Blomberg, G., Sherin, M. G., Renkl, A.,
Glogger, I., & Seidel, T. (2014). Understanding
video as a tool for teacher education:
Investigating instructional strategies to promote
reflection. Instructional Science, 42(3), 443–
463.
26. Capuno R., Demetrio R., et al. (2019).
Facilitating Learning Mathematics Through the
Use of Instructional Media, International
Electronic Journal of Mathematics Education e-
ISSN: 1306-3030. 2019, Vol. 14, No. 3, 677-688
https://doi.org/10.29333/iejme/5785.
27. Cheng, G., and Chau, J., (2016). Exploring the
Relationships Between Learning Styles, Online
Participation, Learning Achievement and Course
Satisfaction: An Empirical Study of a Blended
Learning Course. British Journal of Educational
Technology, 47(2), pp. 257–278.
https://doi.org/10.1111/bjet.12243
28. Chigeza, P. and Halbert, K., (2014). Navigating
E-Learning and Blended Learning for Pre-
service Teachers: Redesigning for Engagement,
Access and Efficiency. Australian Journal of
Teacher Education, 39(11), pp. 133–146.
https://doi.org/10.14221/ajte.204v39n11.8
29. Chiu, T.K.F., Jong, M.S.Y., & Mok, I.A.C. (2020).
Does Learner Expertise Matter when Designing
Emotional Multimedia for Learners of Primary
School Mathematics? Educational Technology
Research and Development,68, 2305–2320.
https://doi.org/10.1007/s11423- 020-09775-
30. Chai, C.S., Koh, J.H.L, Tsai C-C. (2010).
Facilitating Preservice Teachers‟ Development
of Technological, Pedagogical and Content
Knowledge (TPACK). Educational Technology &
Society, Vol. 13, No. 4, pp. 63-73, 2010
31. Dabbagh A. and Safaei A. (2019). “Comparative
Textbook Evaluation: Representation of Learning
Objectives in Locally and Internationally
Published ELT Textbooks”, Issues in Language
Teaching (ILT), Vol. 8, No. 1, 249-277, June
2019
32. Dangle YR.P, Sumaoang J. D., (2020). The
Implementation of Modular Distance Learning
in the Philippine Secondary Public Schools.
Proceedings of The 3rd International Conference
on Academic Research in Science, Technology
and Engineering, Dublin Republic, of Ireland
November 27-29, 2020. [email protected]
33. Doabler, T.; Fien, H. (2013). Explicit
Mathematics Instruction: What teachers can do
for teaching students with mathematics
difficulties. Interv. Sch. Clin. 2013, 48, 276–285.
34. Donaldson, M. L. (2010). No More Valentines.
Educational Leadership, 67(8), 54‐58.
35. Dumigsi M.P and Cabrella J.J.B (2019).
Effectiveness of Strategic Intervention Material in
Mathematics as Remediation for Grade 9

SJIF Impact Factor 2021: 8.013| ISI I.F.Value:1.241| Journal DOI: 10.36713/epra2016 ISSN: 2455-7838(Online)
EPRA International Journal of Research and Development (IJRD) Volume: 6 | Issue: 7 | July 2021 - Peer Reviewed Journal
2021 EPRA IJRD | Journal DOI: https://doi.org/10.36713/epra2016 | www.eprajournals.com |536 |
Students in Solving Problems Involving
Quadratic Functions. Asian Journal of Education
and Social Studies 5(1): 1-10, 2019; Article
no.AJESS.50794 ISSN: 2581-6268
36. Esra O.C and İsmail F.A. (2021). Analysis of
English Lesson Broadcasts During Emergency
Remote Teaching from Pedagogical,
Instructional And Technical Aspects,
International Journal of Education, Technology
and Science 1(2) (2021) 71–87.
globets.org/journal
37. Fancher, E.L (2013). Comparison of Methods of
Analysis for Pretest and Posttest Data, Published
Masteral Thesis B.B.A. University of Georgia,
2010.
https://getd.libs.uga.edu/pdfs/fancher_emily_l_20
1308_ms.pdf.
38. Fajarini, B.E. Soetjipto, and F. Hanurawan,
“Developing a social studies module by using
problem based learning (PBL) with Scaffolding
for the seventh grade students in a junior high
scholl in Malang,” Indonesia Education, 6(1),
62-69, 2016.
39. González-Gómez, D., Jeong, J. S., Rodríguez, D.
A. and Cañada-Cañada, F., (2016). Performance
and Perception in the Flipped Learning Model:
An Initial Approach to Evaluate the Effectiveness
of a New Teaching Methodology in a General
Science Classroom. Journal of Science and
Education Technology, 25(3), pp. 450-459.
40. Gray, J. A., and Diloreto, M., (2016). The Effects
of Student Engagement, Student Satisfaction, and
Perceived Learning in Online Learning
Environments. International Journal of
Educational Leadership Preparation, 11(1).
41. Heinerichs, S., Pazzaglia, G., and Gilboy, M. B.,
(2016). Using Flipped Classroom Components in
Blended Courses to Maximize Student Learning,
11(1), pp. 54–57. https://doi.org/10.4085/110154
42. Joksimovic, S., Gaševic, D., Kovanovic, V.,
Riecke, B. E. and. Hatala, M., (2015). Social
presence in online discussions as a process
predictor of academic performance. Journal of
Computer Assisted Learning, 31(6), pp. 638–654.
43. Kelly, S. (2012). Understanding teacher effects:
Market versus process models of educaƟonal
improvement. In S. Kelly (Ed.), Assessing teacher
quality: Understanding teacher effects on
instrucƟon and achievement (pp. 7‐32). New
York, NY: Teachers College Press.
44. Khogali, H.A (2021), Assessment for the
Evaluation of E-Learning and Teaching by the
Quality Matter Standards Post COVID-19,
Modern Applied Science; Vol. 15, No. 4; 2021
ISSN 1913-1844 E-ISSN 1913-1852 Published by
Canadian Center of Science and Education.
45. Koh, J.H.L (2017), Designing and integrating
reusable learning objects for meaningful
learning: Cases from a graduate programme,
National Institute of Education, Nanyang
Technological University, Singapore,
Australasian Journal of Educational Technology,
2017, 33(5).
46. Kumar, P., Saxena, C. & Baber, H. Learner-
content interaction in e-learning- the moderating
role of perceived harm of COVID-19 in assessing
the satisfaction of learners. Smart Learn.
Environ. 8, 5 (2021).
https://doi.org/10.1186/s40561-021-00149-8.
47. Lee, J., (2014). An Exploratory Study of Effective
Online Learning: Assessing Satisfaction Levels of
Graduate Students of Mathematics Education
Associated with Human and Design Factors of an
Online Course. The International Review of
Research in Open and Distance Learning, 15(1).
48. Madaki, A; Nkom, J.S. and Yaya, F.B.. (2021). "A
review of benefits and challenges of e-learning in
tertiary institutions" JEAPP Online Journal: Vol.
1: Issue 1, Article 020. Available at:
http://independent.academia.edu/leagueofresearc
hers.
49. Malik, T.G and Alam, R. (2020). Comparative
Analysis Between Pretest/Post-Test Model and
Post-Test-only Model in Achieving the Learning
Outcomes, Pak J Ophthalmol 2019, Vol.
35,No.1,https://www.researchgate.net/publication
/338478816_Comparative_Analysis_Between_Pr
e-_testPost-Test_Model_and_Post-Test-
only_Model_in_Achieving_the_Learning_Outco
mes.
50. Martín-Rodríguez, Ó., Fernández-Molina, J. C.,
Montero-Alonso, M. Á., and González-Gómez, F.,
2015. The main components of satisfaction with
e-learning. Technology, Pedagogy and
Education, 24(2), pp. 267–277.
https://doi.org/10.1080/1475939X.2014.888370.
51. Meddaugh, M. F. (2010). Planning and
assessment in higher education: Demonstrating
institutional effectiveness. New York, NY: Jossey-
Bass.
52. Mitchell, R. N., & Marin, K. A. (2015).
Examining the use of a structured analysis
framework to support prospective teacher
noticing. Journal of Mathematics Teacher
Education, 18(6), 551–575.
53. Mitchell K. M. W. & Manzo W.R (2018). The
Purpose and Perception of Learning Objectives,
Journal of political science education, Volume
14, 2018 - Issue 4 pp. 456-472,
https://www.tandfonline.com/doi/abs/10.1080/15
512169.2018.1433542
54. Moore, R. L. (2014). Importance of developing
community in distance education courses.
TechTrends, 58(2), 20–24.
55. M. J. Koehler, P. Mishra. Technological
Pedagogical Content Knowledge: A framework
for teacher knowledge. Teachers College Record,
Vol. 108, No. 6, pp. 1017 – 1054, 2006.
56. M. Goos (2010). Using technology to support
effective mathematics teaching and learning:
What counts? Australian Council for Educational
Research Conference Proceedings, pp. 67 – 70,
2010.
57. Obagah, R.R and Brisibe W.G, (2017). entitled
“The Effectiveness of Instructional Videos in
Enhancing Learning Experience of Architecture
Students in Design and Drawing Courses: A

SJIF Impact Factor 2021: 8.013| ISI I.F.Value:1.241| Journal DOI: 10.36713/epra2016 ISSN: 2455-7838(Online)
EPRA International Journal of Research and Development (IJRD) Volume: 6 | Issue: 7 | July 2021 - Peer Reviewed Journal
2021 EPRA IJRD | Journal DOI: https://doi.org/10.36713/epra2016 | www.eprajournals.com |537 |
Case Study of Rivers State University, Port-
Harcourt”, International Journal of Education
and Research Vol. 5 No. 11 November 2017.
58. Ogbeiwi O. (2017). Why written objectives need
to be really SMART, British Journal of Health
Care Management 23(7):324-336 DOI:
10.12968/bjhc.2017.23.7.324, July 2017.
59. Olsson, M., Mozelius, P. and Collin, J., (2016).
Visualisation and Gamification of e-Learning and
Programming Education. Electronic Journal of
e-Learning, 13(6), pp. 441-454.
60. O'Neill M. (2018). What Is the Difference
Between Goals and Objectives: Examples of an
Actionable Business Planning Process, August
29, 2018,
https://www.samewave.com/posts/goals-and-
objectives-how-to-use-s-m-a-r-t-goal-planning-
in-2019
61. Ozkan, S., & Koseler, R. (2009). Multi-
dimensional students‟ evaluation of e-learning
systems in the higher education context: An
empirical investigation. Computers & Education,
53(4), 1285–1296.
doi:10.1016/j.compedu.2009.06.011.
62. Peterson, K. D. (2004). Research on school
teacher evaluaƟon. NASSP BulleƟn, 88(639),
60‐79.
63. Ryan, S., Kaufman, J., Greenhouse, J., Joel; She,
R. and Shi, J., (2016). The Effectiveness of
Blended Online Learning Courses at the
Community College Level. Community College
Journal of Research and Practice, 40(4), pp. 285-
298.
64. Rivers, B. A. A., Richardson, J. T. E., and Price,
L., 2014. Promoting Reflection in synchronous
Virtual Learning Spaces: Tertiary Distance
Tutors‟ Conceptions. The International Review of
Research in Open and Distributed Learning,
15(3).
65. Reardon M. (2013), A Review of Literature on
Teaching Evaluation, MERC Publication 2013,
http://scholarscompass.vcu.edu/merc_pubs.
66. Robert L. M. and Brian P. F. ( 2018), “Distance
Education and Technology Infrastructure:
Strategies and Opportunities”,
Doi: 10.1007/978-3-319-61780-0_7, Leading and
Managing e-learning pp. 87-100
https://www.academia.edu/35320135/Distance_E
ducation_and_Technology_Infrastructure_Strate
gies_and_Opportunities.
67. Schalich, Marion E.(2015). "Analysis of Pre-Test
and Post-Test Performance of Students in a
Learning Center Model at the Elementary School
Level" (2015). Graduate Master's Theses,
Capstones, and Culminating Projects. 181.
https://doi.org/10.33015/dominican.edu/2015.edu
.08.
68. Santagata, R., & Angelici, G. (2010). Studying
the impact of the lesson analysis framework on
preservice teachers‟ abilities to reflect on
videos of classroom teaching. Journal of
Teacher Education, 61(4), 339–349.
69. Simpson, A., Vondrová, N., & Žalská, J. (2017).
Sources of shifts in pre-service teachers‟
patterns of attention: The roles of teaching
experience and of observational
experience. Journal of Mathematics Teacher
Education. Advance online
publication. https://doi.org/10.1007/s10857-
017-9370-6.
70. Shivaraju, P.T., Vinaya G.M.M (2017).
“Evaluating the effectiveness of pre- and Post-
Test model of learning in a medical school”
Madhav K Savkar Department of Pharmacology,
Adichunchanagiri Institute of Medical Sciences,
Mandya, Karnataka, India Correspondence to:
Padmanabha Thiruganahalli Shivaraju, E-mail:
[email protected] Received: April 20,
2017; Accepted: May 02, 2017
71. Stroud, N. D. (2015). Transitioning from a
Traditional School Setting to a Montessori
Learning Environment (Doctoral dissertation,
Texas Christian University). Retrieved
fromhttps://repository.tcu.edu/bitstream/handle/1
16099117/8350/Stroud_tcu_0229D_10558.pdf.
72. Sridharan, B., Deng, H., & Corbitt, B. (2010).
Critical success factors in e-learning ecosystems:
a qualitative study. Journal of Systems and
Information Technology, 12(4), 263-288.
https://doi.org/10.1108/13287261011095798.
73. Southard, S., Meddaugh, J., and France-Harris,
A., 2015. Can SPOC (self-paced online course)
live long and prosper? A comparison study of a
new species of online course delivery. Online
Journal of Distance Learning Administration,
18(2), 8.
74. Suparman, Siti Nursolekah (2019). Design Of
Mathematics Learning Module Based On
Problem Based Learning To Improve Critical
Thinking Ability Students INTERNATIONAL
JOURNAL OF SCIENTIFIC & TECHNOLOGY
RESEARCH VOLUME 8, ISSUE 12,
DECEMBER 2019 ISSN 2277-8616 2608
IJSTR©2019 www.ijstr.org.
75. Tomas, L., Lasen, M., Field, E. and Skamp, K.,
(2015). Promoting online students‟ engagement
and learning in science and sustainability
preservice teacher education. Australian Journal
of Teacher Education, 40(11), pp. 78–107.
https://doi.org/10.14221/ajte.2015v40n11.5.
76. Tambouris, E., Zotou, M. and Tarabanis, K.,
(2014). Towards designing cognitively-enriched
project-oriented courses within a blended
problem-based learning context. 19(1), pp. 61-86.
77. Virginia Department of Education. (2011).
Guidelines for uniform performance standards
and evaluation criteria for teachers. Richmond,
VA: Author. Retrieved from
hƩp://www.doe.virginia.gov/
teaching/performance_evaluaƟon/
guidelines_ups_eval_criteria_teachers.pdf.
78. Virginia Department of Education. (2011). The
research base for the uniform performance
standards for teachers. Richmond, VA: Author.
Retrieved from
hƩp://www.doe.virginia.gov/teaching/
performance_evaluation/
research_base_ups_teachers.pdf

SJIF Impact Factor 2021: 8.013| ISI I.F.Value:1.241| Journal DOI: 10.36713/epra2016 ISSN: 2455-7838(Online)
EPRA International Journal of Research and Development (IJRD) Volume: 6 | Issue: 7 | July 2021 - Peer Reviewed Journal
2021 EPRA IJRD | Journal DOI: https://doi.org/10.36713/epra2016 | www.eprajournals.com |538 |
79. von Frank, V. (2011). Measurement makeover.
Journal of Staff Development, 32(6), 32‐39.
80. https://scholarscompass.vcu.edu/cgi/viewcontent.
cgi?article=1013&context=merc_pubs&fbclid=I
wAR2Ug4XWwXkP7bbHzfg0nd4yfBP3aODGDQ
Qv1fCfPI-y1ei5jvnzYM2jAY0.
81. Voskoglou. M (2019), “Comparing Teaching
Methods of Mathematics at University Level”,
School of Technological Applications, Graduate
Technological Educational Institute of Western
Greece, 26334 Patras, Greece;
[email protected], Received: 14 June 2019;
Accepted: 28 July 2019; Published: 1 August
2019.
82. Watson, W. R., & Watson, S. L. (2016).
Personalized instruction. In C.M. Reigeluth & B.
Beatty (Eds.), Instructional-Design Theories and
Models (Vol. 4)(pp. 93-120). New York: Taylor &
Francis.
83. Weisberg, D., Sexton, S., Mulhern, J., & Keeling,
D. (2009). The widget effect. Santa Cruz, CA:
The New Teacher Project.
84. Vondrová, N. (2018), “The Effect of a Video-
Based Intervention on the Knowledge-Based
Reasoning of Future Mathematics Teachers”,
Invited Lectures from the 13th International
Congress on Mathematical Education pp 699-
717, January 2018.
85. Berry T. (2008), “Pre-Test Assessment”,
American Journal of Business Education – Third
Quarter 2008 Volume 1, Number 1 retrieved June
13, 2021 http://www.njppp.com/fulltext/28-
1492680142.pdf.
86. Birbaum, (1997-2013) “Performace – Based
Teaching and Assessment”
http://clickit.ort.org.il/files/upl/192089623/85159
800 doc.
87. Buck, Shannon (June 02, 2014). “How to
improve Education”
www.ehow.com/how_6556719_improve-
education.html.
88. Busljeta, R. (2013). Effective Use of Teaching
and Learning Resources. Czech-Polish Historical
and Pedagogical Journal, 5(2), 55-69. Retrieved
June 27, 2019 from
https://www.ped.muni.cz/cphpjournal/520132/06.
pdf \.
89. Castro, R.V, Moor, A.M, et.al (2015). From
Learning Objects to Language Learning Objects,
International Journal of Computer-Assisted
Language Learning and Teaching 3(2):82-
96,DOI:10.4018/ijcallt.2013040105
https://www.researchgate.net/publication/275997
575_From_Learning_Objects_to_Language_Lea
rning_Objects.
90. Department of Education (2020). DM No. 067, s.
2020 https://www.deped.gov.ph/covid-
19/covid19-memoranda/.
91. Dy L. (2011). Teaching mathematics through
Strategic Intervention Materials (SIM); 2011.
(Retrieved January 9, 2015) Dumigsi and
Cabrella; AJESS, 5(1): 1-10, 2019; Article
no.AJESS.50794
Available:http://jhody.hubpages.coom/hub/.
92. Gordillo, A., Barra, E., & Quemada, J. (2014).
Towards a Learning Object pedagogical quality
metric based on the LORI evaluation model.
Proceedings of the 2014 IEEE Frontiers in
Education Conference (FIE), Madrid-Spain, 1-8.
https://doi.org/10.1109/FIE.2014.7044499
93. Kirubhakaran, J. (2021). Developing Learning
Objectives Related
Assessment.https://www.researchgate.net/publica
tion/348266873_DEVELOPING_LEARNING_O
BJECTIVES_RELATED_ASSESSMENT
94. Kuehn, P.R. (2021). Function and Importance of
Pre and Post-Tests,
https://owlcation.com/academia/PrePost-Test-A-
Diagnostic-Tool-For-More-Effective-Teaching-
of-EFL-Students.
95. Lifesnadir (2013). “What is Pre-Test and Post-
Test”, http”//wiki.answers.com/Q/What_is_Pre-
Test_and-Post-Test&altQ=What_is_Pre-Test.
96. Nortvig A.M, Petersen A.K and Balle S.H (2017).
A Literature Review of the Factors Influencing E-
Learning and Blended Learning in Relation to
Learning Outcome, Student Satisfaction and
Engagement, pp. 6
https://files.eric.ed.gov/fulltext/EJ1175336.pdf?fb
clid=IwAR0R5nYTEQj5of4jdAjOG3u0xm4AGng
JK0I9CBEGvESdJgxLks597JUe98Q.
97. Quinones, M. T. (2020, July 3). DepEd clarifies
blended, distance learning modalities for SY
2020- 2021. Philippine Information Agency.
https://pia.gov.ph/news/articles/1046619.
98. Rao N.J. and Ramesh V. M (2021), Defining
Competencies of a Course as per Standards
International Institute of Information Technology,
Electronics City.
Bangalore560100https://www.academia.edu/431
3540/Defining_competencies_of_a_course_as_pe
r_standards, retrieved June 13, 2021.
99. Sharma V.K (2018), “Importance of presentation
skills – Effective Communication” December 10,
2018,
https://www.klientsolutech.com/importance-of-
presentation-skills/.
100. Treasury, Alberta (1996) Retrieved 2020,
“Measuring Performance: A Reference Guide,
September 1996” http://www.oag.ab.ca or
http://education.alberta.ca/media/442973/Perfor
manceMeasurementinEducation.pdf.
101. Witt. E., OlowaT & Lill. I (2021), Teaching
Project Risk Management in a BIM-Enabled
Learning Environment, DOI: 10.1007/978-3-030-
68201-
9_49https://www.researchgate.net/publication/35
0046877_Evaluating_Construction_Education_I
nterventions.
102. Wolf, M. (2010). Innovate to education: System
[re]design for personalized learning. A report
from the 2010 symposium. Washington, DC:
Software & Information Industry Association.
Retrieved 2020 from http://siia.net/pli/
presentations/PerLearnPaper.pdf.
SJIF Impact Factor 2021: 8.013| ISI I.F.Value:1.241| Journal DOI: 10.36713/epra2016 ISSN: 2455-7838(Online)
EPRA International Journal of Research and Development (IJRD) Volume: 6 | Issue: 7 | July 2021 - Peer Reviewed Journal
2021 EPRA IJRD | Journal DOI: https://doi.org/10.36713/epra2016 | www.eprajournals.com |539 |
103. UNESCO-IBE (2013). Glossary of curriculum
terminology. UNESCO International Bureau of
Education Available online
at: http://www.ibe.unesco.org/fileadmin/user_upl
oad/Publications/IBE_GlossaryC
urriculumTerminology2013_eng.pdf. Accessed 13
Feb 2021.


