Embed Size (px)
Citation preview

Accepted Manuscript
Performance evaluation of indirect evaporative cooling using whole-building
hygrothermal simulations
Marijke Steeman, Arnold Janssens, Michel De Paepe
PII: S1359-4311(09)00056-8
DOI: 10.1016/j.applthermaleng.2009.02.004
Reference: ATE 2738
To appear in: Applied Thermal Engineering
Received Date: 17 July 2008
Revised Date: 5 January 2009
Accepted Date: 8 February 2009
Please cite this article as: M. Steeman, A. Janssens, M.D. Paepe, Performance evaluation of indirect evaporative
cooling using whole-building hygrothermal simulations, Applied Thermal Engineering (2009), doi: 10.1016/
j.applthermaleng.2009.02.004
This is a PDF file of an unedited manuscript that has been accepted for publication. As a service to our customers
we are providing this early version of the manuscript. The manuscript will undergo copyediting, typesetting, and
review of the resulting proof before it is published in its final form. Please note that during the production process
errors may be discovered which could affect the content, and all legal disclaimers that apply to the journal pertain.

ACCEPTED MANUSCRIPT
1
Performance evaluation of indirect evaporative
cooling using whole-building hygrothermal
simulations
Marijke Steeman*
Ghent University, Department of Architecture & Urban Planning,
Jozef Plateaustraat 22, B-9000 Gent, Belgium
Tel +3292643752 / Fax +3292644185 / Email: [email protected]
* Corresponding author
Arnold Janssens
Ghent University, Department of Architecture & Urban Planning,
Jozef Plateaustraat 22, B-9000 Gent, Belgium
Michel De Paepe
Ghent University, Department of Flow, Heat and Combustion Mechanics,
Sint - Pietersnieuwstraat 41, B-9000 Gent, Belgium
Abstract
In an indirect evaporative cooling (IEC) installation the return air is cooled by adiabatic
humidification. In an air/air heat exchanger this air cools down the supply air. This paper presents
a simulation methodology focusing on the interaction between the thermal performance of an
IEC system and the heat and moisture balance of the building where it is applied. The thermal
effectiveness of an IEC system is first studied by measurements. It was found that the

ACCEPTED MANUSCRIPT
2
effectiveness is independent of the air inlet conditions. In the second part the influence of the
ventilation rate, the indoor moisture production and the moisture buffering capacity on the
thermal performance were evaluated using dynamic calculations with the multizone building
simulation program TRNSYS. Increasing the indoor moisture production and lowering the
ventilation rate both reduce the thermal performance of the system. Hygroscopic materials may
ameliorate the applicability of IEC.
Keywords
Indirect evaporative cooling, indoor humidity, thermal performance, effectiveness, dynamic
simulations
1.Introduction
During the last decades, the need for cooling of buildings has increased. A 30% rise in worldwide
sold air conditioners is noted from 2000 to 2004 and is expected to increase to 63% till 2008 [1].
The main drawback of these systems is their large energy use and their contribution to the
emission of greenhouse gases. Contrary to air conditioning, passive cooling techniques may
provide cooling with more limited environmental impact. However, the indoor temperature and
humidity are free floating when applying passive cooling techniques, which limits their
applicability.
Evaporative cooling is a passive technique in which the dry bulb temperature of air is lowered by
evaporation of water. Two types of evaporative cooling systems can be distinguished. In a direct
evaporative cooling installation (DEC) the supply air to the building is humidified. In an indirect
evaporative cooling system (IEC) a secondary air flow is cooled by adiabatic humidification using
sprayed water. In an air to air heat exchanger this air cools down the supply air to the building.
Fresh outdoor air or building return air can be used as secondary air. The advantage of indirect

ACCEPTED MANUSCRIPT
3
evaporative cooling is that in contrast to direct evaporative cooling, the vapour content of the
supply air is not increased. This will lead to a more comfortable indoor climate and fewer
moisture problems in the indoor environment are expected.
Indirect evaporative cooling performs best in dry hot areas but also has good potential in most
locations in Europe because of the moderate humidity during summer. [2] investigates the
potential of direct and indirect evaporative cooling for different types of climates. An evaluation
procedure is presented which shows that the cooling demand can often be satisfied completely
combining direct and indirect evaporative cooling.
When return air is used as secondary air, water is evaporated and heat is withdrawn from the air
due to latent heat transfer. As a result the return air is cooled. At the same time the supply air is
cooled indirectly by sensible heat transport through the heat exchanger walls. The wet bulb
temperature of the return air is a measure for the maximum vapour content of the return air at
adiabatic saturation, which corresponds to the lowest possible temperature to which the return
air may theoretically be cooled. The IEC-effectiveness can be defined by the ratio of the actual
temperature reduction in the supply air realized by an IEC system to the maximum possible
temperature change, which is given by the temperature difference between the dry bulb of the
outdoor air and the wet bulb of the return air entering the heat exchanger [3], see Eq. 1:
IEC-effectiveness: 1,,1,
2,1,
wbrs
ss
(1)
The IEC-effectiveness is mainly characterized by the heat transfer surface, the air flow rate
through the heat exchanger and ratio between the supply and return air flow rate. Depending on
the geometry of the heat exchanger and the primary and secondary mass flow rates the
effectiveness may range from 40 to 80% according to ASHRAE [3].

ACCEPTED MANUSCRIPT
4
The aim of this paper is to clarify the interaction between the indoor humidity and the thermal
performance of an indirect evaporative cooling system where the return air is used as secondary
air. A recent international research project in the framework of the International Energy Agency
(IEA/ECBCS) entitled “Whole Building Heat, Air and Moisture response (MOIST-ENG) was
started in 2003 and dealt with the need to develop improved models to evaluate the integral
performance of the whole building, considering the presence of moisture within porous elements
[4-6]. In the frame of this international project several researchers focused on the interaction
between HVAC systems and the indoor moisture balance, which may be significant especially in
buildings with high hygroscopic contents e.g. museums and libraries. Despite of the importance
of taking into account moisture buffering in the evaluation of HVAC systems, only few
publications were found in literature: Catalina et al. [7] noted that neglecting the moisture
buffering capacity of the indoor environment penalises the evaluation of radiant cooling panels.
The authors showed that hygroscopic materials decrease the risk of condensation on the surface
of the ceiling and improve the overall performance of the system. Maalouf et al. [8] looked at the
effect of taking into account coupled heat and moisture transport through the building envelope
on the performance and operation of a desiccant cooling system. Variations in the COP of the
system up to 6% were noted between a model taking into account the humidity transport in the
walls and one neglecting it. Recently, Woloszyn et al. [9] studied the effect of combining a
relative-humidity-sensitive ventilation (RHS) system with indoor moisture buffering materials. By
means of Heat, Air and Moisture transfer models the performance of different strategies was
analysed in terms of indoor air quality and energy efficiency. The results demonstrated that
RHS-ventilation is able to reduce the building energy demand and confirmed that hygroscopic
materials are able to damp the humidity variations in the indoor climate. In a recent study
Barbosa and Mendes performed a combined simulation of a HVAC system with a whole –
building hygrothermal model [10]. In the simulated case study, disregarding moisture may lead to

ACCEPTED MANUSCRIPT
5
oversizing the HVAC system by 13% and underestimating the cooling energy consumption by
4%. Osayintola et al. estimated the effect of hygroscopic materials on the energy consumption in
buildings [11]. They showed the possibility to reduce the heating and cooling energy
consumption respectively up to 5% and 30% when applying hygroscopic materials combined
with a well-controlled HVAC-system.
So far no research was found on the interaction between the thermal performance of an indirect
evaporative cooling system and the building moisture balance. In this paper first an integrated
simulation approach is given. The necessary parameters to the model are defined by means of
measurements. Next, the potential of IEC-systems to improve the thermal comfort in a typical
application in Belgium is investigated using dynamic simulations with TRNSYS [12].
2.Simulation methodology
2.1 Coupling approach
As the performance of the installation depends on wet bulb temperature of the return air, the
indoor temperature obtained using IEC is defined both by the room heat and moisture balance.
Typically the moisture balance includes convective vapour transfer by infiltration and ventilation
air Minf/vent, moisture gains Mgain (e.g. by human activity), water vapour exchange with
hygroscopic materials Mbuff, moisture gains or removals due to humidifying or dehumidifying
systems Mde/hum and convective vapour transfer between zones Mcoupl (Eq.2).
dt
dVMMMMMMM v
kkcoupldehumhumbuffgain
kkvent
,,inf (2)
Due to the uncertainty of many parameters related to moisture buffering water vapour exchange
with porous materials is often difficult to assess. As a result building energy simulation (BES)
programs such as TRNSYS use simplified models to predict the relative humidity [13]. In this
approach a lumped model is used in which the moisture capacity of walls, furniture and room air
ACCEPTED MANUSCRIPT
6
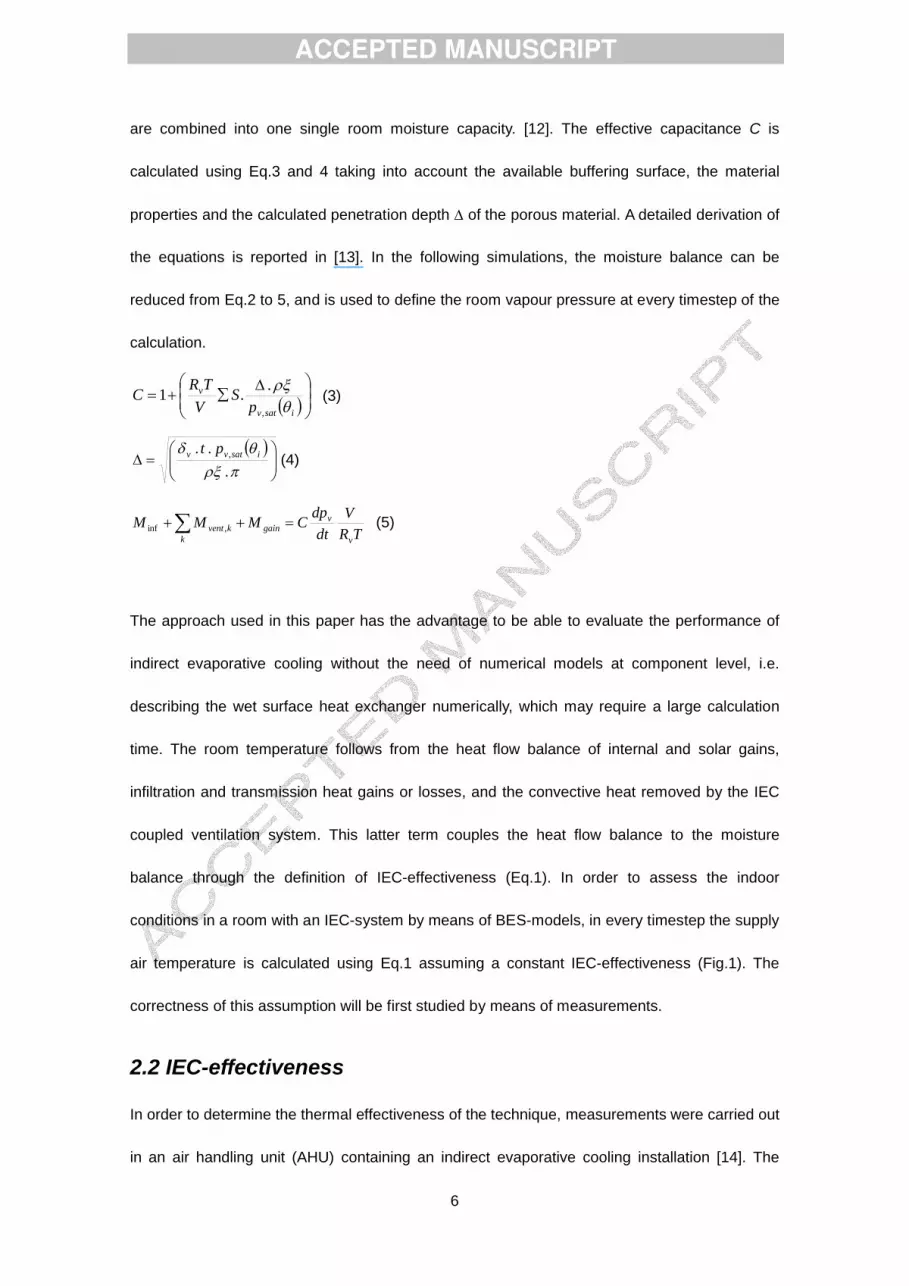
are combined into one single room moisture capacity. [12]. The effective capacitance C is
calculated using Eq.3 and 4 taking into account the available buffering surface, the material
properties and the calculated penetration depth of the porous material. A detailed derivation of
the equations is reported in [13]. In the following simulations, the moisture balance can be
reduced from Eq.2 to 5, and is used to define the room vapour pressure at every timestep of the
calculation.
isatv
v
pS
V
TRC
,
..1 (3)
.
.. , isatvv pt(4)
TR
V
dt
dpCMMM
v
vgain
kkvent ,inf (5)
The approach used in this paper has the advantage to be able to evaluate the performance of
indirect evaporative cooling without the need of numerical models at component level, i.e.
describing the wet surface heat exchanger numerically, which may require a large calculation
time. The room temperature follows from the heat flow balance of internal and solar gains,
infiltration and transmission heat gains or losses, and the convective heat removed by the IEC
coupled ventilation system. This latter term couples the heat flow balance to the moisture
balance through the definition of IEC-effectiveness (Eq.1). In order to assess the indoor
conditions in a room with an IEC-system by means of BES-models, in every timestep the supply
air temperature is calculated using Eq.1 assuming a constant IEC-effectiveness (Fig.1). The
correctness of this assumption will be first studied by means of measurements.
2.2 IEC-effectiveness
In order to determine the thermal effectiveness of the technique, measurements were carried out
in an air handling unit (AHU) containing an indirect evaporative cooling installation [14]. The

ACCEPTED MANUSCRIPT
7
evaporative cooling system consists of a double cross flow heat exchanger in polypropylene
(Fig.2). Nozzles located upstream of the heat exchanger are wetting the return air in the first part
of the heat exchanger. The water is collected in the sump below the heat exchanger and
recirculated. Every five minutes temperature and relative humidity in the supply and return air
before and behind the heat exchanger were measured [15].
In fig.3 the difference between the dry bulb temperature of the supply air and the wet bulb
temperature of the return air is plotted on the x-axis, the temperature drop in the supply air
obtained using IEC is shown on the y-axis. According to Eq.1, the IEC-effectiveness is given by
the slope of the plotted data and could be derived by means of linear regression. The
measurements show that the performance of an IEC system is independent of the inlet
conditions of temperature and relative humidity of both outdoor air and return air. Measured
values of the IEC-effectiveness from different installations are given in table1. Note that these
values are substantially higher than the values mentioned in the introduction which is caused by
the specific design of the double heat exchanger.
2.3 Control strategy
A good control strategy is essential to make the technique perform well. Therefore the control
criteria should be carefully chosen to ensure that the evaporative cooling is working properly as
long as a cooling demand is present, and no heating of the supply air is occurring e.g. during
colder days. Therefore the different stages in which the AHU may operate are included in the
simulation model:
A. During occupancy hours
a. setii , : V.
= min.
V
b. setii , : V.
= max.
V
i. Ce 18 and Cwbie 2, : wbisss ,1,1,2, (IEC)

ACCEPTED MANUSCRIPT
8
ii. Ce 18 or Cwbie 2, : 1,2, ss (Free cooling)
B. Outside occupancy hours
a. setii , : V.
= max.
V : 1,2, ss (Free night cooling)
The air flow rate for hygienic ventilation rate min.
V is calculated to meet the minimal ventilation
requirements for a medium indoor air quality (IDA 2) [16]. Because IEC is often combined with
free (night) cooling, a maximum ventilation capacity max.
V based on conventional cooling load
calculations may lead to oversizing of the AHU. Therefore the maximum ventilation capacity can
be determined by preliminary simulations.
During the following dynamic simulations the maximum ventilation rate max.
V is constant. Some
additional heating of the supply air due to the supply fan was not taken into account. In figure 4 a
typical temperature course is given for a summer day in the base case simulation (see 3.1).
3.Parametric study
In this part the interaction between the moisture balance and the thermal comfort is studied
making use of a typical application in the Belgian climate.
3.1 Modelling strategy
As a case study, a generic room is analysed with a typical geometry of an office or a health care
room. The room has a floor surface of 15m², a height of 2.8m with a west facing façade
containing a window a 3m². Only the west oriented wall is an external wall, all the other
boundaries are adiabatic. No lowered ceiling or raised floor is used. Construction details and
material properties are given in table 2. The infiltration rate is 0.4 ach.
In the base case model the room is occupied during the office hours (08-17h) by one person
having a sensible heat production of 65W and a moisture production of 0.07kg/h [17]. The same

ACCEPTED MANUSCRIPT
9
occupancy schedule was applied to all days in the simulation period. Internal gains due to one
personal computer (140W) and lights (10W/m²) are introduced. The total buffering capacity of the
room was five times the capacity of the indoor air (C=5), corresponding to 55m² plastered wall.
Simulations were run over an entire year using a 15-minute time step assuming that besides the
IEC there was no other cooling device present. Solar gains are taken into account, no
sunshading was present. An extreme warm weather data set, i.e. outdoor temperatures
occurring once every 10year, for Uccle (Belgium) was created using Meteonorm. This program
constructs the synthetic hourly weather data based on the climatological normals of 1961-1990
for a specific location [18].
During winter the indoor temperature setpoint is 20°C. Based on the measured values of the
IEC-effectiveness in section 2.2, a constant IEC-effectiveness equal to 85% was chosen in the
model. The hygienic ventilation rate min.
V for one person is 36m³/h (0.85 ach). In order to see
the influence of the night cooling on the thermal comfort, the operation of the AHU with and
without night cooling is compared for different max.
V . Fig.5 compares the number of (weighted)
temperature excess hours for an AHU with and without night cooling and shows that night
cooling has an important influence on the thermal comfort realized in the building. Some first
simulations showed that in the base case max.
V = 3ach (125m³/h) yields to a good thermal
comfort.
3.2 Sensitivity analysis
As the thermal performance of indirect evaporative cooling is influenced by the moisture balance
of the room, a sensitivity analysis was performed by changing the parameters from the base
case, which influence the indoor humidity (Eq.5): the maximum ventilation rate max.
V , the indoor
moisture production Mgain and the amount of moisture buffering capacity C which is available in

ACCEPTED MANUSCRIPT
10
the room.
The (weighted) temperature excess hours above 26°C were used as a performance indicator for
thermal summer comfort [19]. The amount of time during which the operative temperature
exceeds 26°C is multiplied with the temperature difference, in this way the extent of temperature
excess is taken into account. Similar to the GTO-method [20] the maximum number of
temperature excess hours during one year has been set to 100h as a criterion for good thermal
comfort. The number of temperature excess hours is calculated for the cases with and without
IEC. In the latter free cooling with outdoor air is available if there is a cooling demand. The
difference in temperature excess hours gives an indication of the thermal comfort improvement
which can be realized using IEC. Furthermore the operation time of the IEC system during one
year is derived. It gives an indication of the interaction between the operation of IEC and the
indoor moisture balance.
a. Maximum ventilation rate max.
V
First the maximum ventilation rate max.
V is varied. Fig.6 shows that the number of temperature
excess hours decreases while increasing the maximum ventilation rate. With higher air flow rates,
the operation time for the IEC increases. A high air flow rate causes more moisture to be
removed from the room, which lowers the average indoor wet bulb temperature and thus
increases the amount of time during which the control conditions for IEC are satisfied.
Additionally the influence of free cooling increases due to the higher ventilation rate. Compared
to the case with only free cooling, use of IEC is able to improve the comfort by about 25% if
max.
V = 60m³/h, and by about 95% if max.
V = 250m³/h, based on the calculated temperature
excess hours at both air flow rates.

ACCEPTED MANUSCRIPT
11
b. Moisture production Mgain
Increasing the indoor moisture production Mgain has a large influence on the moisture balance of
the room and therefore on the thermal performance of IEC. Depending on the number of people
and their activity level, the indoor moisture gains in the room may increase. Apart from loads
from occupants other gains such as bathing, washing etc. may be introduced. Fig.7 shows that
with higher moisture production Mgain the number of temperature excess hours increases from
67h at 0.07kg/h to 150h at 1.5kg/h, thus approaching the number of temperature excess hours in
case the IEC is not in operation. Because of the high indoor humidity, a smaller temperature
decrease can be realized in the supply air, which results in a larger number of temperature
excess hours. If the indoor air humidity rises, the operation time decreases because the control
conditions for IEC are less often fulfilled.
c. Moisture buffering capacity C
Moisture buffering is able to contribute to a more comfortable indoor climate since it dampens out
humidity variations [10,11]. Different variations on the base case were simulated: if the walls and
ceiling are vapour tight and no other hygroscopic materials are present the effective capacitance
is equal to one. In the second variation the moisture buffer capacity from the base case is
doubled.
Fig.8 demonstrates that the number of temperature excess hours decreases with a higher
moisture buffering capacity. If the moisture buffering capacity increases, the indoor humidity
peaks are damped out and the number of operation hours slightly increases because the control
conditions for IEC are more often satisfied. Furthermore, the influence of the moisture buffering
capacity on the temperature excess hours is smaller with a higher maximum ventilation rate. In
this case less moisture is available to be absorbed and released by the hygroscopic surfaces in
the room.

ACCEPTED MANUSCRIPT
12
4.Conclusion
An integrated simulation methodology of the building with its indirect evaporative cooling
installation is necessary in order to take into account both heat and mass balance in building
calculations. In this way it is possible to study the interaction between the thermal performance of
an indirect evaporative cooling system and the moisture balance of a room.
The IEC-effectiveness was studied using measurements in an AHU containing an indirect
evaporative cooling system. It was found that the thermal effectiveness is independent of the
inlet conditions of the outdoor and return air.
Next, the interaction between the moisture balance and the thermal comfort was investigated for
a typical application in the Belgian climate. The indoor comfort and operation time increase with
high ventilation rates as they are favourable to help remove heat and moisture from the building.
Furthermore the results showed that the thermal comfort decreases with increasing indoor
moisture production indoor and thus higher wet bulb temperature. The amount of moisture
buffering material determines how much the relative humidity variations are damped and
therefore also directly affects the wet bulb temperature of the return air. The influence of the
moisture buffering capacity is limited compared to the ventilation rate and the moisture
production.
5.Nomenclature
C Effective capacitance [-]
g Solar admittance factor [-]
Mgain Indoor moisture production [kg/s]
pv Vapour pressure [Pa]
Rv Gas constant for water vapour [J/kgK]

ACCEPTED MANUSCRIPT
13
RH Relative humidity [%]
t Period of cyclic humidity variation [s]
S Moisture buffering surface [m²]
T Absolute temperature [K]
V Volume [m³]
V.
Ventilation rate [m³/h]
IEC-effectiveness [%]
v Vapour permeability [kg/Pams]
Penetration depth [m]
Temperature [°C]
v Vapour concentration [kg/m³]
Specific moisture capacity [kg/m³]
Subscripts
s supply air
r return air
1 air stream entering heat exchanger
2 air stream leaving heat exchanger
i indoor
e outdoor
wb wet bulb temperature
sat saturation
set setpoint
Acknowledgements
This PhD research is established with the financial support of the Flemish Institute for the

ACCEPTED MANUSCRIPT
14
Promotion and Innovation by Science and Technology in Flanders (IWT-SB/51283/Steeman).
References
[1] JRAIA - The Japan refrigeration and air conditioning industry association. Estimate of world
demand for air conditioners 2000-2008. http://www.jraia.or.jp/frameset_english.html.
[2] Lazzarin M. Introduction of a simple diagram-based method for analyzing evaporative cooling.
Applied Thermal Engineering 27 (2007) 2011-2025.
[3] ASHRAE. Chapter 51: Evaporative Cooling Applications. In: Fundamentals Handbook: HVAC
Applications. American Society of Heating, Refrigerating and Air Conditioning Engineers. Atlanta,
USA, 2003.
[4] Hens H. Annex 41. Whole Building Heat, Air and Moisture Response (MOIST-ENG). ECBCS
News 38 (2003) 1-3. (www.ecbcs.org/annexes/annex41.htm)
[5] Simonson CJ, Salonvaara M, Ojanen T. The effects of structures on indoor humidity –
possibility to improve comfort and perceived air quality. Indoor Air 12 (2002) 243-251.
[6] Svennberg K, Hedegaard L, Rode C. Moisture buffer performance of a fully furnished room,
ASHRAE Special Publications. Proceedings of Buildings IX Conference, 2004.
[7] Catalina T, Woloszyn M, Virgone J. Impact of moisture buffering on energy performance of
cooling ceilings. Annex 41 meeting Lyon, 2006.
[8] Maalouf C, Wurtz E, Mendonça KC, Mora L. Parametric analysis of a desiccant cooling
system: effect of hygrothermal interactions with building envelope – part1. Annex41 meeting,
Trondheim, 2005.
[9] Woloszyn M, Kalamees T, Abadie MO, Steeman M, Kalagasidis AS. The effect of combining a
relative-humidity-sensitive ventilation system with the moisture-buffering capacity of materials on
indoor climate and energy efficiency of building. Building and Environment (2008) doi:
10.1016/j.buildenv.2008.04.017 (article in press).
ACCEPTED MANUSCRIPT
15
[10] Barbosa RM, Mendes N. Combined simulation of central HVAC systems with a
whole-building hygrothermal model. Energy and Buildings (2007) doi
10.1016/j.enbuild.2007.02.022 (article in press).
[11] Osanyintola OF, Simonson CJ. Moisture buffering of hygroscopic building materials:
experimental facilities and energy impact. Energy and Buildings 38 (2006) 1270-1282.
[12] SEL, TRANSSOLAR, CSTB, TESS. Trnsys 16: A TRanSient SYstem Simulation program.
University of Wisconsin, Madison, USA, 2004.
[13] Janssens A, De Paepe M. Effect of moisture inertia models on the predicted indoor humidity
in a room. Proceedings of the 26th AIVC Conference, Brussels, 2005.
[14] Menerga Klimatechnologie. www.menerga.de
[15] Steeman M, Janssens A, De Paepe M. Performance evaluation of indirect evaporative
cooling by means of measurements and dynamic simulations. Proceedings of the Sixth
International Conference on Indoor Air Quality, Ventilation and Energy Conservation in Buildings
(IAQVEC). Sendai, Japan, 2007, 1403-1410.
[16] CEN EN 13779. Ventilation for non-residential buildings – performance requirements for
ventilation and room-conditioning systems. Brussels, Belgium, 2004.
[17] Harriman L, Brundrett G, Kittler R. Humidity control design guide for commercial and
institutional buildings. American Society of Heating, Refrigerating and Air Conditioning Engineers,
Artlanta, USA, 2001.
[18] Meteotest. Meteonorm: global meteorological database for engineers, planners and
education, Version5.0. Bern, Switzerland, 2003.
[19] prEN 15251 Criteria for the indoor environment including thermal, indoor air quality, light and
noise. CEN, Brussels, 2005.
[20] van der Linden K, Boerstra AC et. al. Thermal indoor climate building performance
characterized by human comfort response. Energy and Buildings 34 (2002) 737-744.

ACCEPTED MANUSCRIPT
16
Figure 1: Scheme of the simulation methodology in TRNSYS
Figure 2: Operation of studied AHU with indirect evaporative cooling
Figure 3: Measured effectiveness in an AHU with indirect evaporative cooling (summer 2006)
Figure 4: Typical daily temperature course in the base case simulation
Figure 5: Comparison of (weighted) temperature excess hours above 26°C for an AHU with (-◊-)
and without (-□-) night cooling
Figure 6: Influence of the maximum ventilation rate max.
V on the (weighted) temperature excess
hours above 26°C with IEC (-◊-), the (weighted) temperature excess hours above 26°C without
IEC (-□-) and the operation time (-○-).(Mgain = 0.07kg/h, C=5)
Figure 7: Influence of moisture production Mgain on the (weighted) temperature excess hours
above 26°C with IEC (-◊-), the (weighted) temperature excess hours above 26°C without IEC
(-□-) and the operation time (-○-). ( max.
V =125m³/h, C=5)
Figure 8: Influence of the effective capacitance C on the (weighted) temperature excess hours
above 26°C with IEC if max.
V =125m³/h (-◊-) and if max.
V =250m³/h (-x-); operation time if
max.
V =125m³/h (-○-) and if max.
V =250m³/h (-□-). (Mgain = 0.07kg/h)

ACCEPTED MANUSCRIPT
17
Table 1: Measured values of IEC-effectiveness
Table 2: Construction details and material properties of the generic room

ACCEPTED MANUSCRIPT
Fig.1

ACCEPTED MANUSCRIPT
Fig.2

ACCEPTED MANUSCRIPT
Fig.3

ACCEPTED MANUSCRIPT
Fig.4

ACCEPTED MANUSCRIPT
Fig.5

ACCEPTED MANUSCRIPT
Fig.6

ACCEPTED MANUSCRIPT
Fig.7

ACCEPTED MANUSCRIPT
Fig.8

ACCEPTED MANUSCRIPT
Vmax (m³/h) Heat exchangersurface (m²)
(%) r²
°1 2000 500 95 0.99°2 4300 500 80 0.96°3 6900 500 77 0.96°4 7100 380 82.5 0.99
Table1

ACCEPTED MANUSCRIPT
Construction Materials d (m) (W/mK) (kg/m³)
Exterior wall(heavy)
Exterior bricks 0.09 0.5 1250Air layer 0.02 R=0.14m²K/W /EPS 0.08 0.034 35Interior brick 0.14 0.5 1250Plaster 0.01 0.35 1200
Interior wall(heavy)
Plaster 0.01 0.35 1200Brick 0.09 0.5 1250Plaster 0.01 0.35 1200
FloorFinishing carpet 0.005 0.061 200Light concrete 0.07 0.23 750(Heavy) concrete 0.10 1.7 2200
Ceiling(Heavy) concrete 0.10 1.7 2200Plaster 0.01 0.35 1200
WindowUglass (W/m²K) g (-) Uframe (W/m²K)
6/16/6 Argon gold 1.3 0.212 2.27
Table2


