Embed Size (px)
Citation preview
The Eco-Cool:
Porous Concrete
Evaporative Cooler McGill University
Winter, 2019
BREE 495 Design III
Final Design Report
Submitted to Prof. Chandra Madramootoo
Nayna Ahmed
Sarah Mitchell
April 9, 2019
Abstract
The Eco-Cool, an evaporative cooling storage unit made of porous concrete with an
integrated plant system, is presented for the design project. This product uses an alternative
approach to the refrigeration of legumes, fruits and beverages to minimize the negative
environmental footprint from carbon and chemical emissions of the refrigeration industry. The unit
will be chemical and electrical free and will operate on the theory of evaporative cooling.
1
Table of Contents
1. Introduction .................................................................................................................................. 3
1.1 Problem Statement ............................................................................................................ 3
2. Literature Review ......................................................................................................................... 5
2.1 Evaporative Cooling .............................................................................................................. 5
2.1.1 Theory & Optimization ................................................................................................... 5
2.1.2 Expected Functionality ................................................................................................... 6
2.2 Existing Design Alternatives & Patents ................................................................................. 7
2.2.1 Traditional Root Cellar ................................................................................................... 7
2.2.2 Zeer Pot ........................................................................................................................... 8
2.2.3 MittiCool Clay Refrigerator ............................................................................................ 9
2.2.4 Portable Evaporative Cooling Unit ................................................................................. 9
2.2.5 Traditional Fridge ........................................................................................................... 9
2.2 Applicable Standards....................................................................................................... 10
2.3.1 Food Storage Requirements .......................................................................................... 10
3. Approach & Initial Design ......................................................................................................... 11
3.1 Design Criteria ..................................................................................................................... 11
3.2 Material Options .................................................................................................................. 11
3.3 Initial Design Details ........................................................................................................... 12
3.3.1 Detailed Rendering ....................................................................................................... 13
3.3.2 Features Meeting Design Criteria ................................................................................. 14
3.3.3 Initial Plan Drawing ...................................................................................................... 15
4. Design Testing & Modifications ................................................................................................ 16
4.1 Testing of Existing Concrete Blocks ................................................................................... 16
4.1.1 Description & Methods ................................................................................................. 16
4.1.2 Results & Discussion .................................................................................................... 17
4.2 Formulation & Testing of New Concrete Blocks ................................................................ 17
4.2.1 Initial Testing Plan ........................................................................................................ 19
4.2.2 Challenges ..................................................................................................................... 20
4.2.3 Final Testing Plan ......................................................................................................... 21
4.2.4 Results & Discussion ............................................................................................... 22
4.3 Formulation & Testing of Final Prototype ........................................................................... 24
4.3.1 Prototype Creation ........................................................................................................ 25
2
4.3.2 Preparation for Testing .................................................................................................. 28
4.3.3 Observations & Challenges ........................................................................................... 29
4.3.4 Results & Discussion .................................................................................................... 30
5. Recommendations & Final Design ............................................................................................ 33
5.1 Recommendations ................................................................................................................ 33
5.2 Final Design Assembly ........................................................................................................ 34
5.3 User Manual ......................................................................................................................... 34
5.4 Economic Analysis .............................................................................................................. 36
5.4.1 Initial Costs ................................................................................................................... 37
5.4.2 Yearly Costs & Savings ................................................................................................ 37
5.4.3 Cost-Benefit Breakdown ............................................................................................... 38
5.4.4 Emerging Markets ......................................................................................................... 38
6. Conclusions ................................................................................................................................ 39
Acknowledgements ........................................................................................................................ 40
Appendix A – Risk Factor Matrix .............................................................................................. 40
Appendix B – Materials Life Cycle Assessment ....................................................................... 41
Appendix C – Materials Pugh Chart .......................................................................................... 43
Appendix D – Design Dimensions Calculations ........................................................................ 43
Appendix E – Final Data Summary ........................................................................................... 44
References ...................................................................................................................................... 45
3
1. Introduction
1.1 Problem Statement
The global refrigeration industry is a significant player in environmental issues, especially due
to its size. The industry has approximately 3 billion units of operations worldwide in refrigeration,
air-conditioning, and heat pump systems (IIR, 2015). To minimize the harmful environmental
effects of domestic refrigeration, a cooling storage unit without chemicals or electricity will be
designed by our team made of senior undergraduate students in Bioresource engineering at McGill
University.
1.2 Background
Currently, chlorofluorocarbons (CFCs) are found in many refrigerants, and while they are not
toxic compounds, they deplete the ozone layer and have a negative global environmental impact.
The production and consumption of CFCs was banned in developed countries on January 1, 1996
by the Montreal Protocol, however the recent replacement to CFCs - hydrofluorocarbons (HCFCs)
- also deplete the ozone layer. As such the Montreal Protocol plans to ban HCFCs in developed
countries in 2030 and in 2040 for developing countries. 461 million tons of CO2 emissions per year
are from domestic refrigerators and “20% of global warming effects of refrigeration are due to
direct emissions of fluorocarbons” and other chemical reagents (IIR, 2015). There is clearly a need
for a chemical-free replacement.
Furthermore, according to the International Institute of Refrigeration (2015), the refrigeration
sector and its related electricity consumption and usage accounts for 17.2% of electrical
consumption worldwide; and North America consumes the most in comparison to other world
regions at approximately 2,697 kWh/year/capita (IIR, 2015). Overconsumption of electricity
creates economic costs on society and contributes to climate change.
While domestic refrigeration does aid in decreasing food waste, due to the ozone depleting
chemical substances in refrigerants, its energy requirements, and its emissions of greenhouse gases,
the refrigeration industry has a negative impact on the environment. As such, a chemical and
electricity-free cooler, functioning on the premise of evaporative cooling, has been designed and
tested in this project. This design has been named “The Eco-Cool”.
4
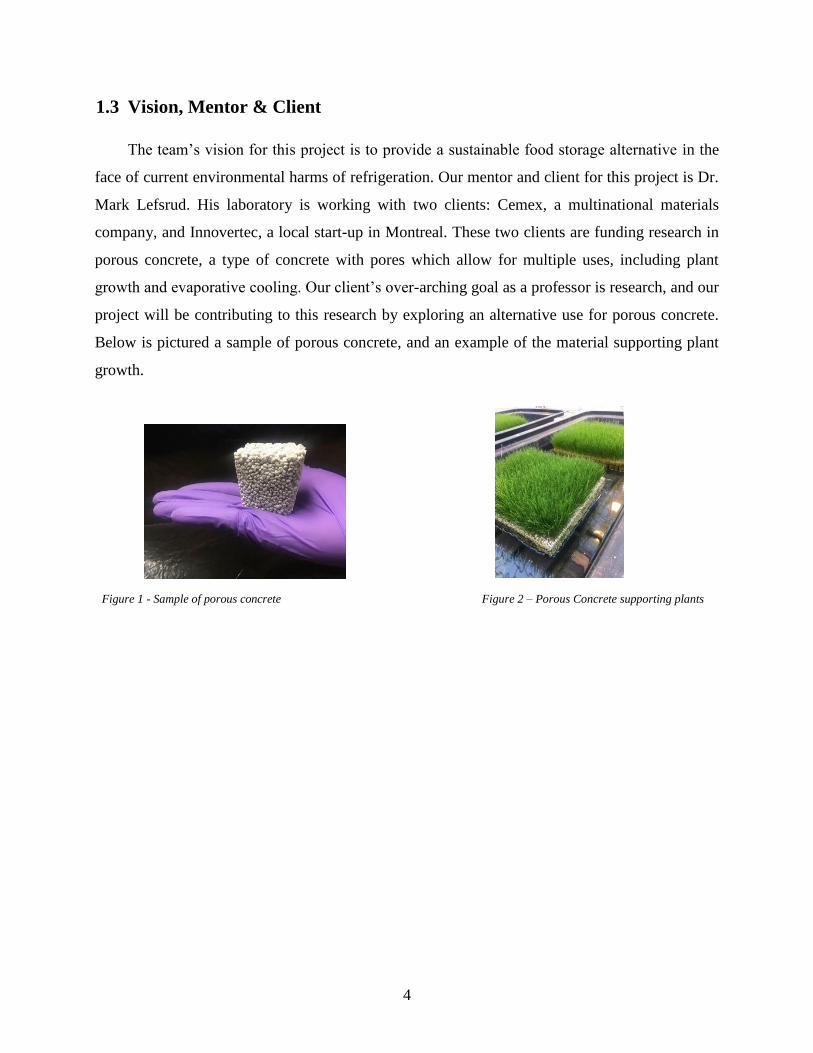
1.3 Vision, Mentor & Client
The team’s vision for this project is to provide a sustainable food storage alternative in the
face of current environmental harms of refrigeration. Our mentor and client for this project is Dr.
Mark Lefsrud. His laboratory is working with two clients: Cemex, a multinational materials
company, and Innovertec, a local start-up in Montreal. These two clients are funding research in
porous concrete, a type of concrete with pores which allow for multiple uses, including plant
growth and evaporative cooling. Our client’s over-arching goal as a professor is research, and our
project will be contributing to this research by exploring an alternative use for porous concrete.
Below is pictured a sample of porous concrete, and an example of the material supporting plant
growth.
Figure 1 - Sample of porous concrete Figure 2 – Porous Concrete supporting plants
5
2. Literature Review
2.1 Evaporative Cooling
2.1.1 Theory & Optimization
The Eco-Cool functions on the premise of evaporative cooling. Latent heat is the energy
used when liquid particles change phase to gas particles, without a change in temperature. The
evaporation of water (the change from liquid to gas) draws energy from the surroundings to provide
this latent heat, resulting in a temperature decrease of the surroundings. This decrease in
surrounding temperature is thus named evaporative cooling. “The faster the rate of evaporation,
the greater cooling” (Odesola and Onyebuchi, 2009).
As the evaporation of water draws heat energy from its surroundings, this heat is transferred
through convection. Convection is the transfer of energy between a surface and a bulk moving
fluid and comprises of both conduction and bulk fluid motion (Engineering ToolBox, 2003a). Heat
transferred through convection is given through the following equation:
�̇�𝑐𝑜𝑛𝑣 = ℎ𝐴(𝑇𝑠 − 𝑇∞)
Equation 1 – Convective Heat Transfer
where
�̇�𝑐𝑜𝑛𝑣 = heat transferred through convection (W)
ℎ = convection heat transfer coefficient (W m-2 K-1)
𝐴 = area of the surface over which convection is occurring (m2)
𝑇𝑠= temperature at the surface (K)
𝑇∞ = ambient air temperature (K)
The convection heat transfer coefficient h is calculated as a function of volume, surface area, and
characteristics of the flow around the body (density, velocity, dynamic viscosity and specific heat).
Additionally, the capacity for the surrounding air’s ability to uptake water particles is a
function of the air’s relative humidity. Relative humidity is a measure of the air’s saturation with
water particles. When the air is more saturated, relative humidity is higher, and the air has less
capacity to take on additional moisture. When the air is less saturated, relative humidity is lower,
and the air has more capacity to take on additional moisture, thus evaporative cooling is more
effective. In our case, air with lower relative humidity is preferred (Odesola and Onyebuchi, 2009).
6
Evaporative cooling is thus affected by the following factors
Relative Humidity of the surrounding air: more humid air will be able to hold less water and
thus less cooling is possible
Wind Speed of the surrounding air: air with more movement allows for more convective heat
transfer and thus more cooling
Surface Area of cooler: All heat transfer is in some way a function of area. Gustafsson and
Simon (2016) found when an evaporative cooler pot was hung in the air, increased cooling
resulted due to the increased surface area.
Wall Thickness of cooler: convective heat transfer coefficient h is a function of volume
through which heat transfer must occur. Furthermore, studies on similar designs show an
increase in cooling when the wall thickness is decreased.
2.1.2 Expected Functionality
The Psychrometric Chart provides the relationship between wet bulb temperature, dry bulb
temperature, and relative humidity of air. The wet bulb temperature is the theoretical lowest
possible temperature that can be achieved through evaporative cooling and occurs when air is
100% saturated with water. Given an ambient air’s relative humidity and dry bulb temperature (i.e.
actual air temperature), the Psychrometric Chart will show the wet bulb temperature. In this
manner, it is possible to see the maximum cooling effect possible (Engineering ToolBox, 2004).
Cooling efficiency is the effectiveness of the evaporative cooler, and is given by the following
equation
𝜂 =𝑇𝐷𝐵𝑂 − 𝑇𝐷𝐵𝐼
𝑇𝐷𝐵𝑂 − 𝑇𝑊𝐵𝑂
Equation 2 – Cooling Efficiency
where
𝜂 = Cooling efficiency (%)
𝑇𝐷𝐵𝑂 = Dry-bulb temperature outside the evaporative cooler
𝑇𝐷𝐵𝐼 = Dry-bulb temperature inside the evaporative cooler
𝑇𝑊𝐵𝑂= Wet-bulb temperature outside the evaporative cooler
7
Thus, at 100% efficiency the lowest temperature achievable from evaporative cooling depends
on the surrounding temperature and relative humidity. According to Statistics Canada (2012), most
Canadians keep their indoor temperature to 20-22 oC during the day, and 16-18 oC at night. Health
Canada (2015) recommends keeping relative humidity (RH) between 30%-50% (50% in summer
and 30% in colder weather). The lowest possible temperature that could be achieved from
evaporative cooling is equal to the wet bulb temperature and will change with seasons. The results
from the Psychrometric Calculator (2018) are:
RH 50%, Ambient Temp 22 oC (summer conditions) Lowest Temperature: 15.43 oC
RH 40%, Ambient Temp 20 oC (average conditions) Lowest Temperature: 12.36 oC
RH 30%, Ambient Temp 16 oC (winter conditions) Lowest Temperature: 7.97 oC
These calculations provide an estimate target inner temperature of 8 - 16 oC.
2.2 Existing Design Alternatives & Patents
The following is designed to provide a broad overview of cold food storage options
available, from the lowest cost and least technologically advanced to the most expensive but most
effective options.
2.2.1 Traditional Root Cellar
On the cheapest end of the scale is the traditional root cellar. This is a structure at least
partially underground used for the storage of vegetables, fruits, nuts and other foods. Best practices
involve keeping the cellar beneath the frost line (around four feet down) which is the point at
which the soil will not freeze during the winter. The scale of the root cellar depends on the user’s
discretion; some may be lined with bricks, but dirt-floored or insulated basement rooms also work.
For longer lasting crops, it is important the cellar is kept at high humidity (90 – 95%) which can
be achieved by sprinkling water on a dirt floor. Additionally, ventilation is important to remove
odours and ethylene gas. Aeration can be induced by including an intake of air lower down and an
outlet further up (since hot air rises). The optimal temperature for a root cellar is around 0 - 4 oC
but can very between 4 - 10 oC due to cellar depth (M. Bubel and Bubel, 1991). The root cellar is
less convenient to access than other options and can cause intrusive building, but will last a very
long time and can be made relatively cheaply (a plan design by Bubel and Bubel (1991) was $164
in 1974, or $875 by today’s standards (“Inflation Calculator,” 2018).
8
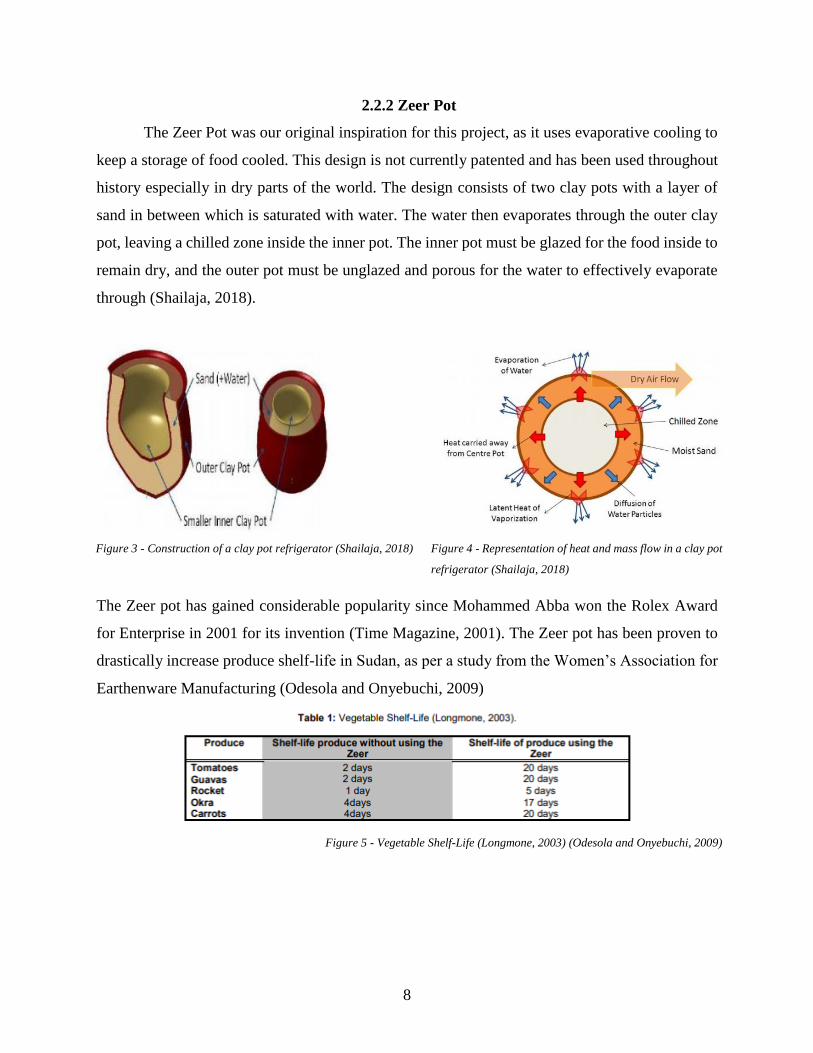
2.2.2 Zeer Pot
The Zeer Pot was our original inspiration for this project, as it uses evaporative cooling to
keep a storage of food cooled. This design is not currently patented and has been used throughout
history especially in dry parts of the world. The design consists of two clay pots with a layer of
sand in between which is saturated with water. The water then evaporates through the outer clay
pot, leaving a chilled zone inside the inner pot. The inner pot must be glazed for the food inside to
remain dry, and the outer pot must be unglazed and porous for the water to effectively evaporate
through (Shailaja, 2018).
Figure 3 - Construction of a clay pot refrigerator (Shailaja, 2018) Figure 4 - Representation of heat and mass flow in a clay pot
refrigerator (Shailaja, 2018)
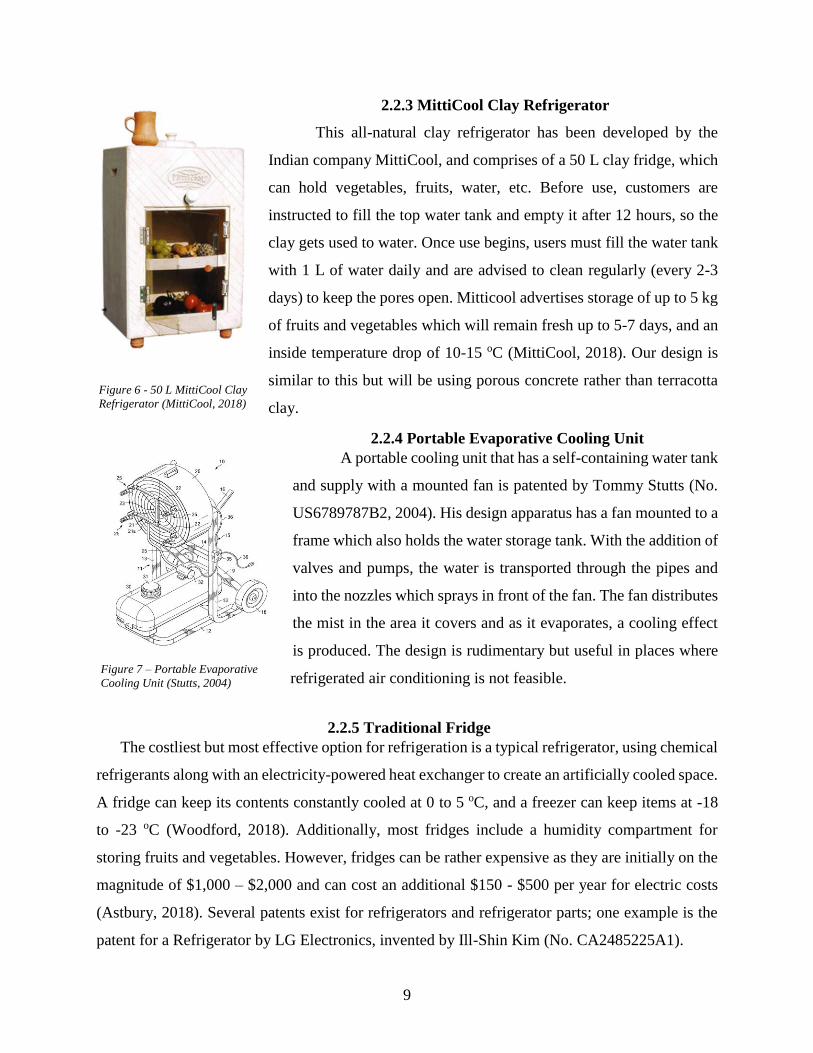
The Zeer pot has gained considerable popularity since Mohammed Abba won the Rolex Award
for Enterprise in 2001 for its invention (Time Magazine, 2001). The Zeer pot has been proven to
drastically increase produce shelf-life in Sudan, as per a study from the Women’s Association for
Earthenware Manufacturing (Odesola and Onyebuchi, 2009)
Figure 5 - Vegetable Shelf-Life (Longmone, 2003) (Odesola and Onyebuchi, 2009)
9
2.2.3 MittiCool Clay Refrigerator
This all-natural clay refrigerator has been developed by the
Indian company MittiCool, and comprises of a 50 L clay fridge, which
can hold vegetables, fruits, water, etc. Before use, customers are
instructed to fill the top water tank and empty it after 12 hours, so the
clay gets used to water. Once use begins, users must fill the water tank
with 1 L of water daily and are advised to clean regularly (every 2-3
days) to keep the pores open. Mitticool advertises storage of up to 5 kg
of fruits and vegetables which will remain fresh up to 5-7 days, and an
inside temperature drop of 10-15 oC (MittiCool, 2018). Our design is
similar to this but will be using porous concrete rather than terracotta
clay.
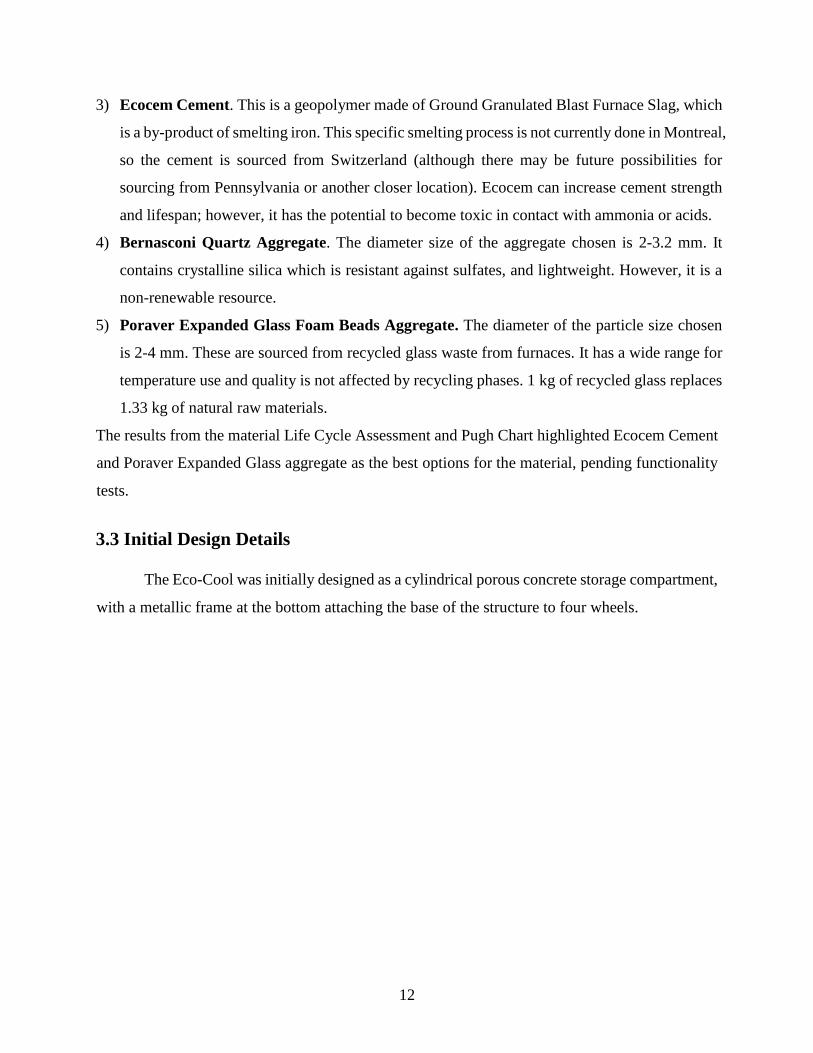
2.2.4 Portable Evaporative Cooling Unit
A portable cooling unit that has a self-containing water tank
and supply with a mounted fan is patented by Tommy Stutts (No.
US6789787B2, 2004). His design apparatus has a fan mounted to a
frame which also holds the water storage tank. With the addition of
valves and pumps, the water is transported through the pipes and
into the nozzles which sprays in front of the fan. The fan distributes
the mist in the area it covers and as it evaporates, a cooling effect
is produced. The design is rudimentary but useful in places where
refrigerated air conditioning is not feasible.
2.2.5 Traditional Fridge
The costliest but most effective option for refrigeration is a typical refrigerator, using chemical
refrigerants along with an electricity-powered heat exchanger to create an artificially cooled space.
A fridge can keep its contents constantly cooled at 0 to 5 oC, and a freezer can keep items at -18
to -23 oC (Woodford, 2018). Additionally, most fridges include a humidity compartment for
storing fruits and vegetables. However, fridges can be rather expensive as they are initially on the
magnitude of $1,000 – $2,000 and can cost an additional $150 - $500 per year for electric costs
(Astbury, 2018). Several patents exist for refrigerators and refrigerator parts; one example is the
patent for a Refrigerator by LG Electronics, invented by Ill-Shin Kim (No. CA2485225A1).
Figure 6 - 50 L MittiCool Clay
Refrigerator (MittiCool, 2018)
Figure 7 – Portable Evaporative
Cooling Unit (Stutts, 2004)

10
2.2 Applicable Standards
2.3.1 Food Storage Requirements
As our design will be concerned with the safe guarding of food, it is important to study
storage requirements as food items must be stored at specific temperatures to prevent bacterial
growth and remain preserved for an optimal time period. Fresh meat, leftovers, eggs, dairy
products, vegetables and fruits, and liquids can be stored at 4 °C; and less than 0 °C is typical for
storing frozen meat, vegetables or fruit. Dry storage units such as ground level, underground root
cellars, or wine cellars have a temperature range of 10 °C – 19 °C and humidity levels between
60-70% (USDA, 2016).
11
3. Approach & Initial Design
3.1 Design Criteria
The following have been established after consultation with our client, Mark Lefsrud, as
important criteria to consider when designing the Eco-Cool for indoor home use. These criteria
were used to establish the initial design.
1. High Ease of Use & Installation
2. High Functionality
3. High Safety (Risk Factor Matrix found in Appendix A)
4. Low Environmental Footprint
5. Low Cost
6. High Aesthetic
7. Convenient Size
3.2 Material Options
Before construction of the sample prototypes began, 5 material options were compared
through a Life Cycle Assessment (found in Appendix B) and Pugh Chart (found in Appendix C) to
determine which among them best met the design criteria.
Past Materials
1) Saturated sand. This is the “wall material” (i.e. material through which evaporative cooling
is occurring) that would be found in a typical Zeer pot-in-pot system, so we have selected it for
comparison to give a baseline. The reason for sand to be considered is because it is a powerful
insulator and adds bulk strength to the design; however, it is a non-renewable resource.
Porous Concrete Options
Since we will be creating the concrete, we must research options for both cement (binding
agents) and aggregates. The following materials are based on the options available from Dr.
Mark Lefsrud’s lab.
2) Portland cement. This is the typical cement used in the industry. The product has different
chemical compositions and concentrations based on the manufacturer’s processes and formula
(Ca, Si, Al, and Fe). It has a fast setting time, however, and has a high amount of CO2 emissions.
12
3) Ecocem Cement. This is a geopolymer made of Ground Granulated Blast Furnace Slag, which
is a by-product of smelting iron. This specific smelting process is not currently done in Montreal,
so the cement is sourced from Switzerland (although there may be future possibilities for
sourcing from Pennsylvania or another closer location). Ecocem can increase cement strength
and lifespan; however, it has the potential to become toxic in contact with ammonia or acids.
4) Bernasconi Quartz Aggregate. The diameter size of the aggregate chosen is 2-3.2 mm. It
contains crystalline silica which is resistant against sulfates, and lightweight. However, it is a
non-renewable resource.
5) Poraver Expanded Glass Foam Beads Aggregate. The diameter of the particle size chosen
is 2-4 mm. These are sourced from recycled glass waste from furnaces. It has a wide range for
temperature use and quality is not affected by recycling phases. 1 kg of recycled glass replaces
1.33 kg of natural raw materials.
The results from the material Life Cycle Assessment and Pugh Chart highlighted Ecocem Cement
and Poraver Expanded Glass aggregate as the best options for the material, pending functionality
tests.
3.3 Initial Design Details
The Eco-Cool was initially designed as a cylindrical porous concrete storage compartment,
with a metallic frame at the bottom attaching the base of the structure to four wheels.
13
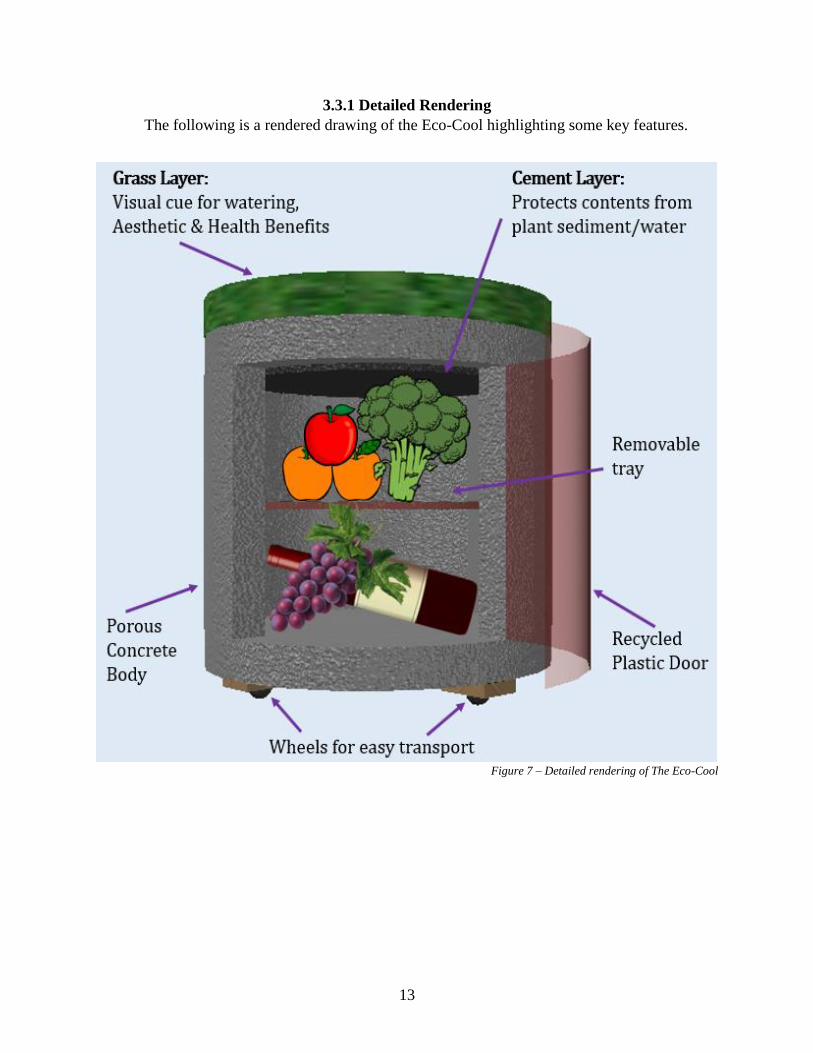
3.3.1 Detailed Rendering
The following is a rendered drawing of the Eco-Cool highlighting some key features.
Figure 7 – Detailed rendering of The Eco-Cool
14
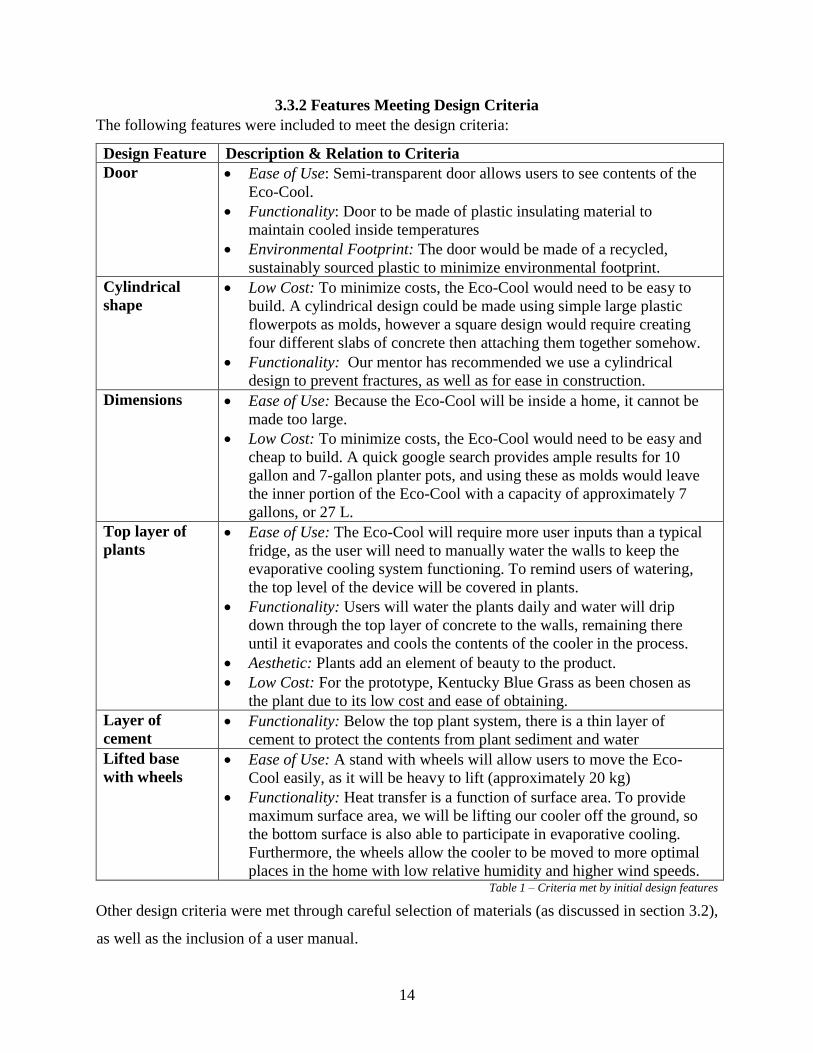
3.3.2 Features Meeting Design Criteria
The following features were included to meet the design criteria:
Design Feature Description & Relation to Criteria
Door Ease of Use: Semi-transparent door allows users to see contents of the
Eco-Cool.
Functionality: Door to be made of plastic insulating material to
maintain cooled inside temperatures
Environmental Footprint: The door would be made of a recycled,
sustainably sourced plastic to minimize environmental footprint.
Cylindrical
shape Low Cost: To minimize costs, the Eco-Cool would need to be easy to
build. A cylindrical design could be made using simple large plastic
flowerpots as molds, however a square design would require creating
four different slabs of concrete then attaching them together somehow.
Functionality: Our mentor has recommended we use a cylindrical
design to prevent fractures, as well as for ease in construction.
Dimensions Ease of Use: Because the Eco-Cool will be inside a home, it cannot be
made too large.
Low Cost: To minimize costs, the Eco-Cool would need to be easy and
cheap to build. A quick google search provides ample results for 10
gallon and 7-gallon planter pots, and using these as molds would leave
the inner portion of the Eco-Cool with a capacity of approximately 7
gallons, or 27 L.
Top layer of
plants Ease of Use: The Eco-Cool will require more user inputs than a typical
fridge, as the user will need to manually water the walls to keep the
evaporative cooling system functioning. To remind users of watering,
the top level of the device will be covered in plants.
Functionality: Users will water the plants daily and water will drip
down through the top layer of concrete to the walls, remaining there
until it evaporates and cools the contents of the cooler in the process.
Aesthetic: Plants add an element of beauty to the product.
Low Cost: For the prototype, Kentucky Blue Grass as been chosen as
the plant due to its low cost and ease of obtaining.
Layer of
cement Functionality: Below the top plant system, there is a thin layer of
cement to protect the contents from plant sediment and water
Lifted base
with wheels Ease of Use: A stand with wheels will allow users to move the Eco-
Cool easily, as it will be heavy to lift (approximately 20 kg)
Functionality: Heat transfer is a function of surface area. To provide
maximum surface area, we will be lifting our cooler off the ground, so
the bottom surface is also able to participate in evaporative cooling.
Furthermore, the wheels allow the cooler to be moved to more optimal
places in the home with low relative humidity and higher wind speeds. Table 1 – Criteria met by initial design features
Other design criteria were met through careful selection of materials (as discussed in section 3.2),
as well as the inclusion of a user manual.
15
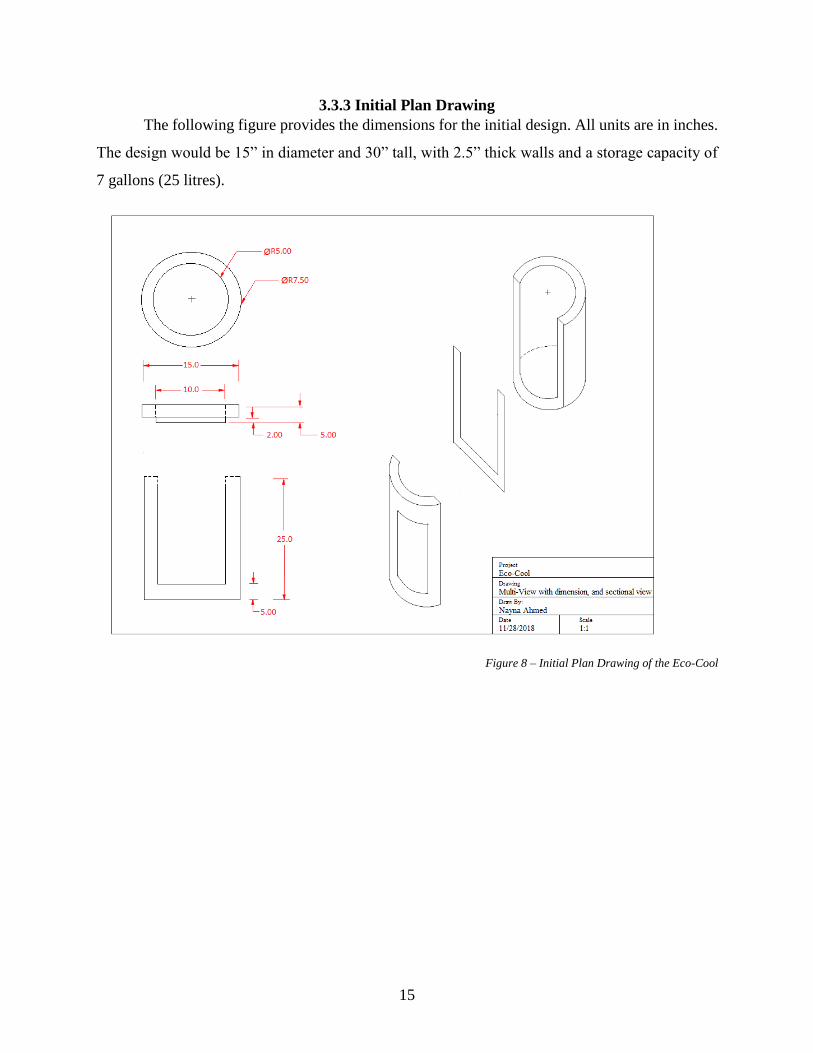
3.3.3 Initial Plan Drawing
The following figure provides the dimensions for the initial design. All units are in inches.
The design would be 15” in diameter and 30” tall, with 2.5” thick walls and a storage capacity of
7 gallons (25 litres).
Figure 8 – Initial Plan Drawing of the Eco-Cool
16
4. Design Testing & Modifications
The testing plan was designed to narrow down which specific combination of aggregate
and cement options available in the lab would be most optimal for the final product. The testing
plan included three stages of experimentation. An initial test to measure the water holding capacity
of existing porous concrete blocks helped narrow down cement and aggregate combinations for
producing the next samples. The secondary test included creating small samples with different
formulation in more than one replicate and conducting another water field capacity test, along with
measuring temperature and relative humidity inside the samples. This would provide more data in
selecting the better performing concrete sample and test its formulation on a larger scale for the
third experimentation.
4.1 Testing of Existing Concrete Blocks
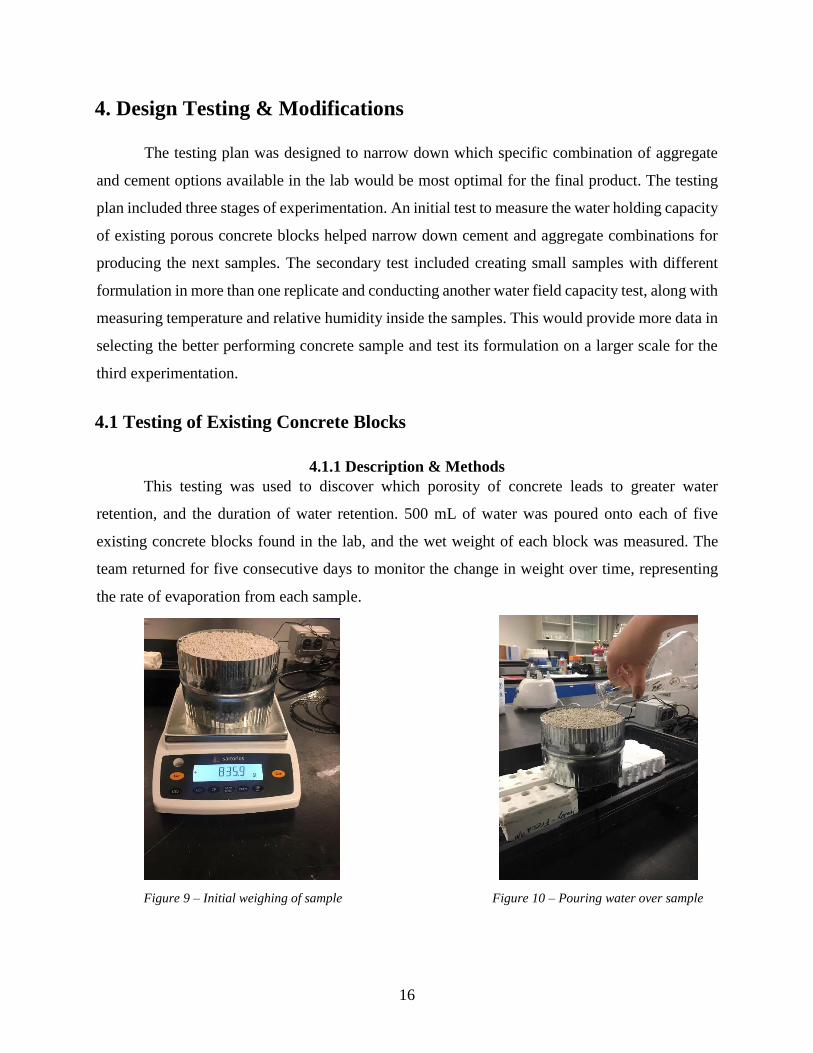
4.1.1 Description & Methods
This testing was used to discover which porosity of concrete leads to greater water
retention, and the duration of water retention. 500 mL of water was poured onto each of five
existing concrete blocks found in the lab, and the wet weight of each block was measured. The
team returned for five consecutive days to monitor the change in weight over time, representing
the rate of evaporation from each sample.
Figure 9 – Initial weighing of sample Figure 10 – Pouring water over sample
17
4.1.2 Results & Discussion
Results were analyzed to highlight which samples held the most water initially from the
500 mL, and which samples held the highest moisture content over five days. Five-day moisture
content was calculated as follows:
5 − 𝑑𝑎𝑦 𝑀𝑜𝑖𝑠𝑡𝑢𝑟𝑒 𝐶𝑜𝑛𝑡𝑒𝑛𝑡 [%] = 𝑊𝑒𝑡 𝑊𝑒𝑖𝑔ℎ𝑡𝐷𝑎𝑦 5 − 𝐷𝑟𝑦 𝑊𝑒𝑖𝑔ℎ𝑡𝐷𝑎𝑦 1
𝐷𝑟𝑦 𝑊𝑒𝑖𝑔ℎ𝑡𝐷𝑎𝑦 1 [
𝑔
𝑔]
Equation 3 – 5-day moisture content
Results as follows:
Sample 1 Sample 2 Sample 3 Sample 4 Sample 5
Aggregate EGB Quartz Quartz Quartz Quartz
Cement Ecocem Ecocem Ecocem Ecocem Ecocem
Actual Porosity 46 39 36 45 30
Initial Water Held (a) 131 136 160 122 167
5-day Moisture Content (b) 5.9% 1.1% 2.0% 0.7% 1.8%
EGB: Expanded Glass Foam Beads (a) Volume (mL) assuming 0.9982 g/mL at 20 o C (b) Percent moisture after 5 days. Moisture content on a DRY basis (w-d/d)
Table 2 – Results from initial testing of existing concrete blocks
From these results, it was found that concrete with a Quartz aggregate and lower porosity
had more initial water retention, however the Expanded Glass Foam Beads aggregate had a greater
water retention over the 5-day period.
4.2 Formulation & Testing of New Concrete Blocks
In the second phase of testing, we poured small
versions of the Eco-Cool using smaller store-bought
planter pots as molds. These structures were made of
combinations of different aggregates and cements. The
varieties of concrete to be poured were selected based
on availability in the lab and results from the Life Cycle
Assessment and Pugh Chart for material options. Only
two prototypes made of quartz were to be poured,
despite quartz’s high performance in the initial testing
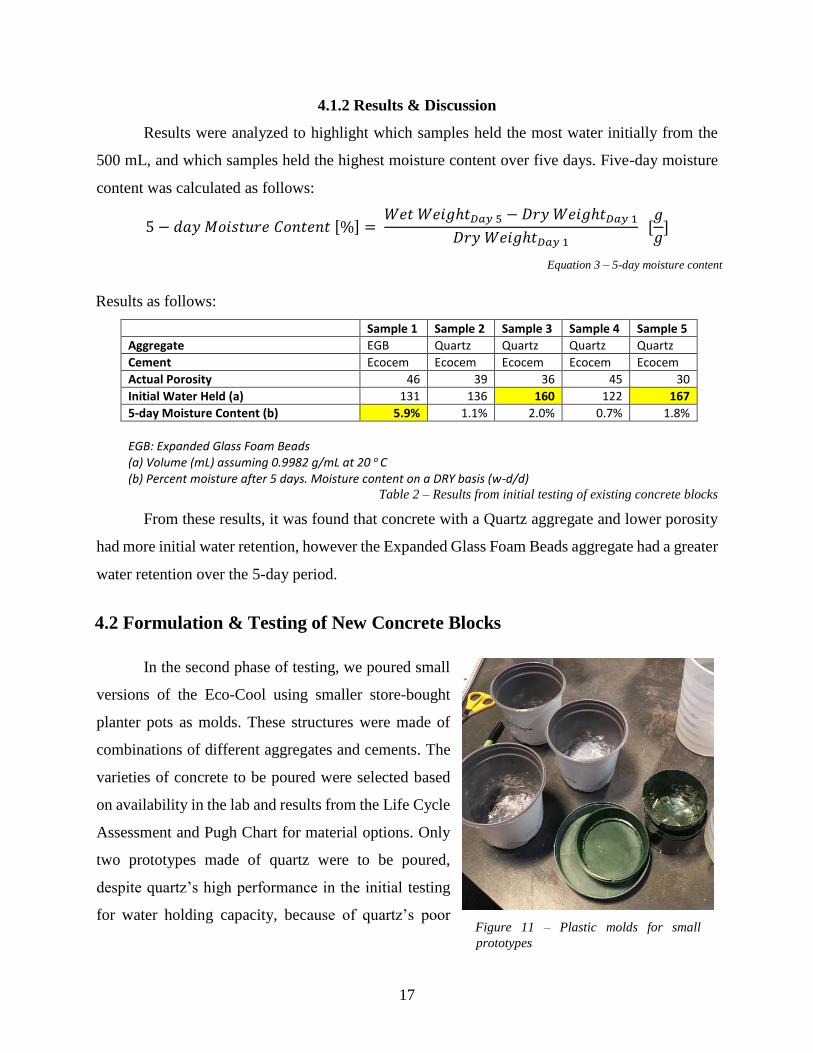
for water holding capacity, because of quartz’s poor Figure 11 – Plastic molds for small
prototypes
18
performance in other criteria, such as environmental footprint and weight.
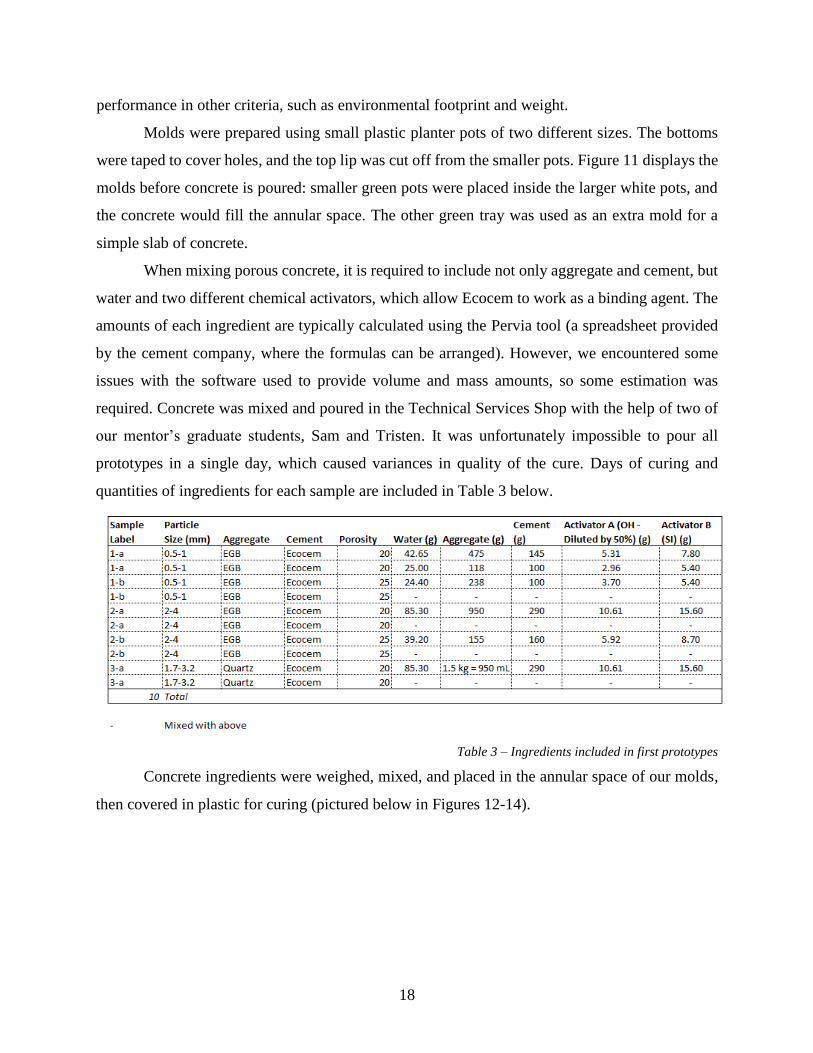
Molds were prepared using small plastic planter pots of two different sizes. The bottoms
were taped to cover holes, and the top lip was cut off from the smaller pots. Figure 11 displays the
molds before concrete is poured: smaller green pots were placed inside the larger white pots, and
the concrete would fill the annular space. The other green tray was used as an extra mold for a
simple slab of concrete.
When mixing porous concrete, it is required to include not only aggregate and cement, but
water and two different chemical activators, which allow Ecocem to work as a binding agent. The
amounts of each ingredient are typically calculated using the Pervia tool (a spreadsheet provided
by the cement company, where the formulas can be arranged). However, we encountered some
issues with the software used to provide volume and mass amounts, so some estimation was
required. Concrete was mixed and poured in the Technical Services Shop with the help of two of
our mentor’s graduate students, Sam and Tristen. It was unfortunately impossible to pour all
prototypes in a single day, which caused variances in quality of the cure. Days of curing and
quantities of ingredients for each sample are included in Table 3 below.
Table 3 – Ingredients included in first prototypes
Concrete ingredients were weighed, mixed, and placed in the annular space of our molds,
then covered in plastic for curing (pictured below in Figures 12-14).
19
Figure 12 – Weighing EGB and
Cement in the shop
Figure 13 – Mixing of concrete
occurred in large plastic buckets
Figure 14 – Concrete placed in
molds
4.2.1 Initial Testing Plan
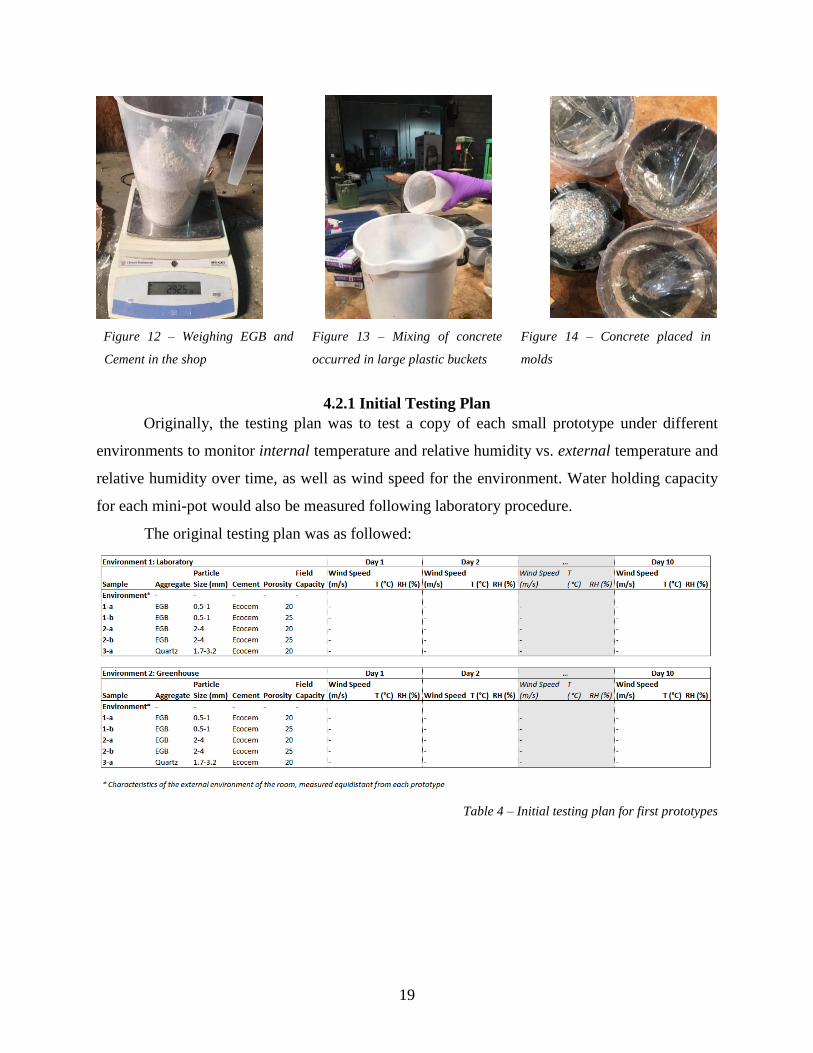
Originally, the testing plan was to test a copy of each small prototype under different
environments to monitor internal temperature and relative humidity vs. external temperature and
relative humidity over time, as well as wind speed for the environment. Water holding capacity
for each mini-pot would also be measured following laboratory procedure.
The original testing plan was as followed:
Table 4 – Initial testing plan for first prototypes
20
4.2.2 Challenges
Material Related
Initially, there were challenges in calculating the correct amount of each ingredient
required since the Pervia Tool was optimized for quartz aggregate and was not stabilized for EGB
aggregate yet. Ingredients were thus added as necessary during mixing to make the mixture the
correct consistency and wetness.
Pouring the concrete and using plastic plant pots as molds was more difficult than expected,
as the concrete was thick and needed to be placed into the annular space. Rather than pouring the
concrete in the annular space, we poured some concrete in the larger pots and used the smaller
planter pots to create the cylindrical hollow shape desired. This resulted in non-uniform wall and
base thicknesses.
For optimal curing, the concrete should be sealed in a completely air-tight manner and
placed in a warm environment. For our curing, there were challenges in creating a completely air-
tight seal, as well as maintaining warm temperatures since the prototypes were left in the shop
during the end of January.
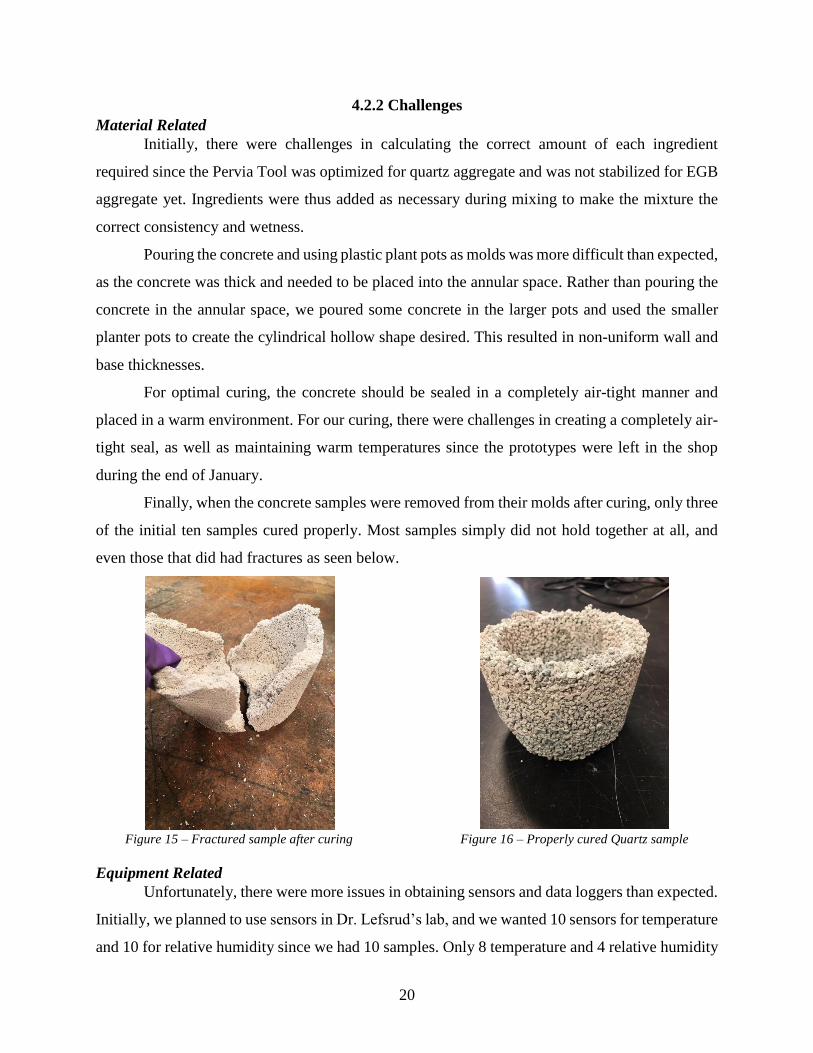
Finally, when the concrete samples were removed from their molds after curing, only three
of the initial ten samples cured properly. Most samples simply did not hold together at all, and
even those that did had fractures as seen below.
Figure 15 – Fractured sample after curing Figure 16 – Properly cured Quartz sample
Equipment Related
Unfortunately, there were more issues in obtaining sensors and data loggers than expected.
Initially, we planned to use sensors in Dr. Lefsrud’s lab, and we wanted 10 sensors for temperature
and 10 for relative humidity since we had 10 samples. Only 8 temperature and 4 relative humidity

21
sensors were available. Additionally, the data-logger (pictured below) had unknown issues and
was not monitoring.
Figure 17 – Data logger in the lab
The team then spoke with another graduate student (Dave) with whom Sarah worked on a
project for her Instrumentation & Control class in the Fall semester. Dave still had sensors and
Arduino code from the project they worked on and agreed to help the team set these up for use in
the Eco-Cool project. These sensors would work with an Arduino breadboard and code, and record
data to an SD card. Once supplies were obtained, the sensors were gathered and connected to the
computer. The Arduino code records data at a user-specified time interval and creates a time stamp
at the time of recording. Data is recorded to the SD card which is then uploaded to a computer in
the form of an Excel spreadsheet. During the initial test of the code and sensors they worked well,
and data for temperature and RH were obtained at correct time intervals. However, we removed
some of the wires since there were too many, and it stopped working (data was not being retrieved
properly). Dave was unable to find a solution to the problem, and since the team members have
limited coding and robotics knowledge, they sought external help. Unfortunately, nobody was able
to help us in the limited time frame.
4.2.3 Final Testing Plan
The difficulty and complications in locating sensors, and the poor results from the concrete
curing of samples necessitated drastic cuts to the original testing plan. The final testing plan
comprised of the following test:
ASTM C1585-13: Standard Test Method for Measurement of Rate of Absorption of Water by
Hydraulic Cement Concretes (ASTM, 2013)
22
This method was used to test the four concrete samples that at least somewhat properly cured. The
procedure was as follows
1. Measure the dry weight of each sample. Fill a container with water and record water level.
2. Immerse the sample in the water and record the water level (this represents the volume of
the sample). Leave sample in water for 5 minutes.
3. Remove sample from water and allow to drip off excess water inside the container. Record
water level (this represents the volume of water absorbed by the concrete)
4. Towel dry the sample in an upside-down orientation for two minutes. Record wet weight of
sample.
The procedure was completed again two days later.
4.2.4 Results & Discussion
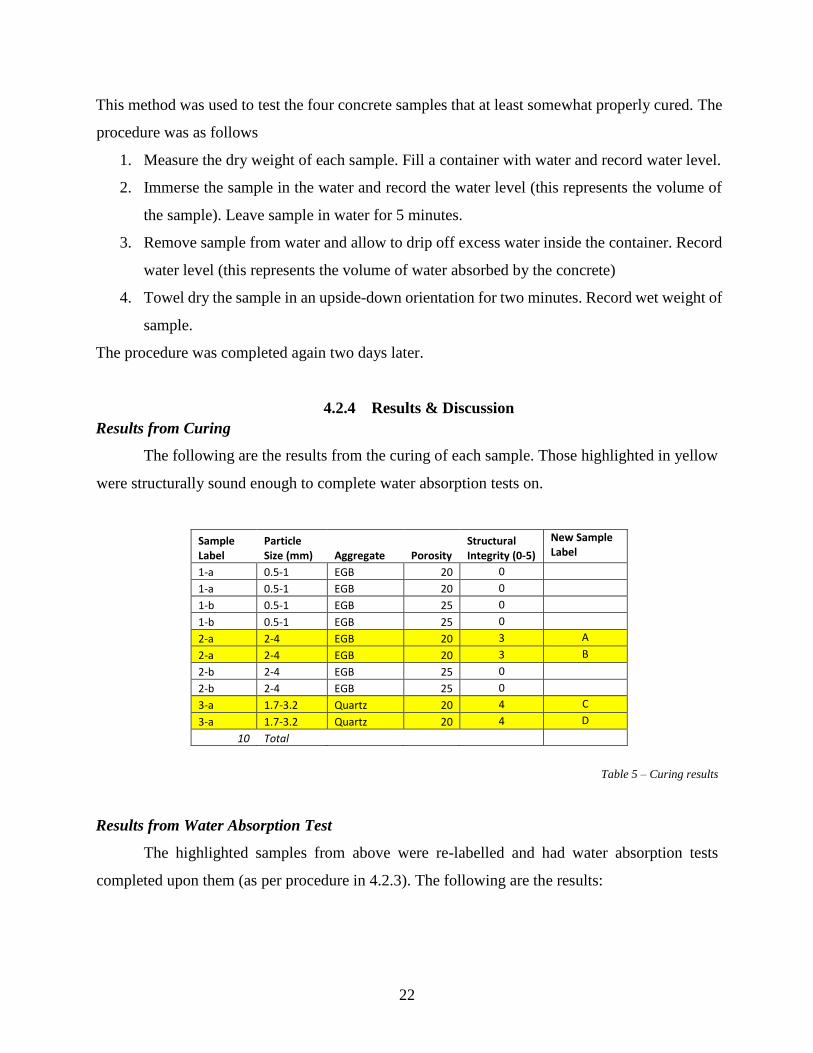
Results from Curing
The following are the results from the curing of each sample. Those highlighted in yellow
were structurally sound enough to complete water absorption tests on.
Sample Label
Particle Size (mm) Aggregate Porosity
Structural Integrity (0-5)
New Sample Label
1-a 0.5-1 EGB 20 0
1-a 0.5-1 EGB 20 0
1-b 0.5-1 EGB 25 0
1-b 0.5-1 EGB 25 0
2-a 2-4 EGB 20 3 A
2-a 2-4 EGB 20 3 B
2-b 2-4 EGB 25 0
2-b 2-4 EGB 25 0
3-a 1.7-3.2 Quartz 20 4 C
3-a 1.7-3.2 Quartz 20 4 D
10 Total
Table 5 – Curing results
Results from Water Absorption Test
The highlighted samples from above were re-labelled and had water absorption tests
completed upon them (as per procedure in 4.2.3). The following are the results:
23
Test One: February 19, 2019 Test Two: February 21, 2019
Sample
Dry Weight (g)
Volume of Sample (mL)
Water Volume Initially Retained (mL)
Wet Weight (g)
Dry Weight (g)
Volume of Sample (mL)
Water Volume Initially Retained (mL)
Wet Weight (g)
A 112.8 160 20 128.9 113.2 140 20 135.1
B 48.7 80 20 55.4 48.6 60 10 59.5
C 572.5 240 40 605.8 579.2 220 40 610.8
D 502.4 200 40 530.7 505.9 210 10 534.3
Table 6 – Water absorption test
These results were then used to highlight which sample on average was able to hold the most water
(per volume of sample), and which sample retained the most water over the two-day period. These
were calculated as follows:
𝐴𝑣𝑒𝑟𝑎𝑔𝑒 𝐼𝑛𝑖𝑡𝑖𝑎𝑙 𝑊𝑎𝑡𝑒𝑟 𝑅𝑒𝑡𝑒𝑛𝑡𝑖𝑜𝑛 [%] =∑
𝑉𝑜𝑙𝑢𝑚𝑒 𝑜𝑓 𝑊𝑎𝑡𝑒𝑟 𝐼𝑛𝑖𝑡𝑖𝑎𝑙𝑙𝑦 𝑅𝑒𝑡𝑎𝑖𝑛𝑒𝑑𝑉𝑜𝑙𝑢𝑚𝑒 𝑜𝑓 𝑆𝑎𝑚𝑝𝑙𝑒
2 [
𝑚𝐿
𝑚𝐿]
Equation 4 – Average initial water retention
2 − 𝑑𝑎𝑦 𝑊𝑎𝑡𝑒𝑟 𝑅𝑒𝑡𝑒𝑛𝑡𝑖𝑜𝑛 [%] = 𝐷𝑟𝑦 𝑊𝑒𝑖𝑔ℎ𝑡𝐷𝑎𝑦 2 − 𝑊𝑒𝑡 𝑊𝑒𝑖𝑔ℎ𝑡𝐷𝑎𝑦 1
𝑊𝑒𝑡 𝑊𝑒𝑖𝑔ℎ𝑡𝐷𝑎𝑦 1 [
𝑔
𝑔]
Equation 5 – 2-day water retention
Results from these calculations were as follows
Sample
Average Initial Water Retention
2-day Water Retention
A 13% 12.2%
B 21% 12.3%
C 17% 4.4%
D 12% 4.7%
Average 16% 8.4%
Table 7 – Results from second testing
Discussion
The failed curing of 6 of the 10 samples signified the need to re-evaluate our final prototype
design. After discussions with two graduate students (Tristan and Sam), it appeared they had
corrected the formula to include more binding agent and as such we used this corrected formula
for the final prototype. They also advised the final prototype to have much thicker walls, since one
24
cause of the failed curing was how thin the walls were. Furthermore, it was decided to use paper
molds moving forward for ease of mold removal.
The final results for average initial water retention and 2-day water retention for the four
tested samples demonstrated that there was not very much variance between then Quartz and
Expanded Glass Bead concretes for certain parameters. The initial water retention varied from 12-
21% per volume of sample. The 2-day water retention was higher for the Expanded Glass samples
A & B, however overall all samples returned to within 15% of their original weight after two days,
implicating that the final Eco-Cool design will need to be watered at least every day. Moving
forward, it would be difficult to use the porosity variances anyways due to the limited capacity for
manipulating the concrete recipes. As per our Life Cycle Assessment and the aforementioned
results, we built our final prototype with Expanded Glass Beads aggregate.
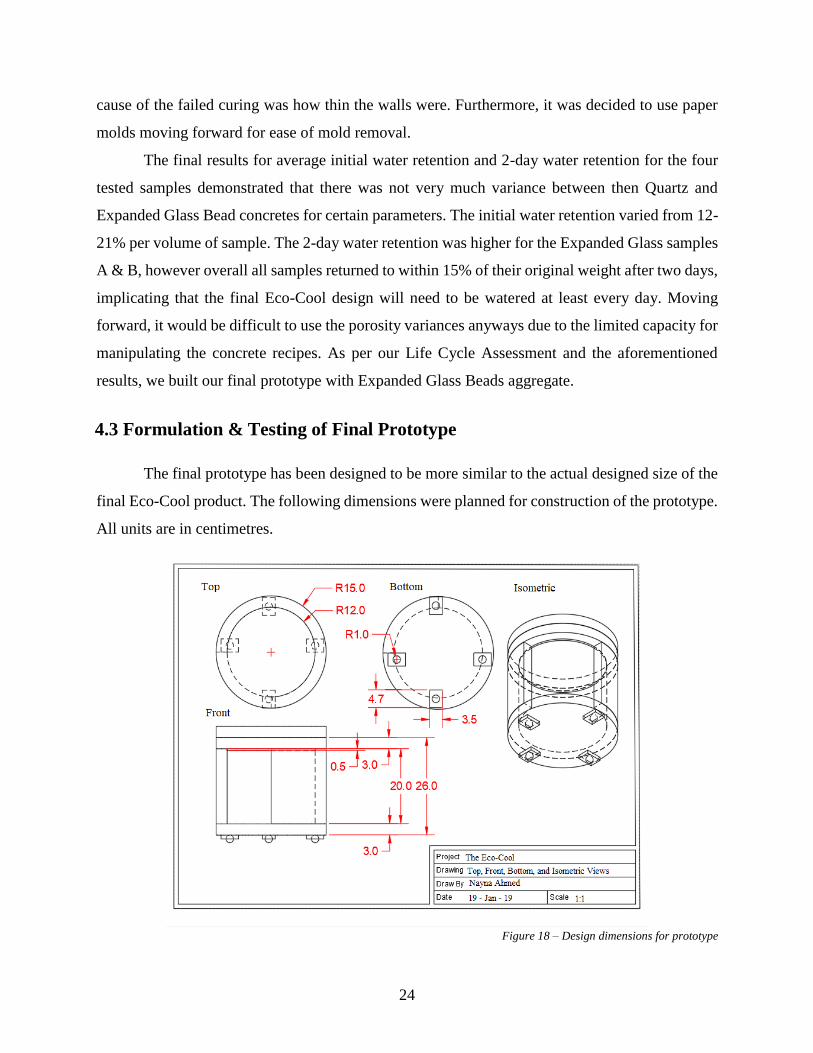
4.3 Formulation & Testing of Final Prototype
The final prototype has been designed to be more similar to the actual designed size of the
final Eco-Cool product. The following dimensions were planned for construction of the prototype.
All units are in centimetres.
Figure 18 – Design dimensions for prototype
25
4.3.1 Prototype Creation
Mold Creation
Despite having initially bought large plastic planter pots from Canadian Tire as molds for
the final prototype, after the difficulty in removing the plastic from the small concrete samples
post-curing it was decided to switch to a paper mold. Several options exist for cardboard “sonar”
tubes which are used in industry to pour columns of concrete. The team located 8” and 12”
diameter tubes at a nearby Rona which would serve well as molds for the final Eco-Cool. However,
at the store it became apparent it would be impossible to purchase only the necessary 3 feet of 12”
and 8” tube, as the store required us to purchase all 12 feet of tubing which was very unnecessary
and would cost $100. So, the team decided to instead construct their own molds out of poster
board. 10 pieces of poster board were bought at Dollarama, as well as a stand with wheels from
Canadian Tire.
The team constructed the molds using poster board, concrete and tape. Each mold used 5
layers of poster board to increase strength, and the insides were lined with clear tape to prevent
concrete from sticking to the mold. The outer two layers of poster board included 2” long flaps cut
along the bottom segment to fold and tape down to the cardboard base. Three molds were made:
one for the body of the prototype, one for the lid and one for the base. During construction, several
adjustments were made to simplify the concrete structure and prevent complications in curing. It
was decided the door would be removed, and users would simply remove the lid to access the
contents of the cooler. Additionally, it was decided to do three separate pours instead of attempting
to pour the base and the body in one pour. After the first curing process, it was apparent that
simpler structures cured better, and as such we greatly simplified our final prototype. Adjustments
were also made to the initial design dimensions from Figure 18. Final dimensions are as follows:
o Body inner cylinder: 6” diameter, 14” height
o Body outer cylinder: 12” diameter, 14” height
o Lid cylinder: 12” diameter, 4” height
o Base cylinder: 12” diameter, 4” height
The following pictures display the three molds that were created.
26
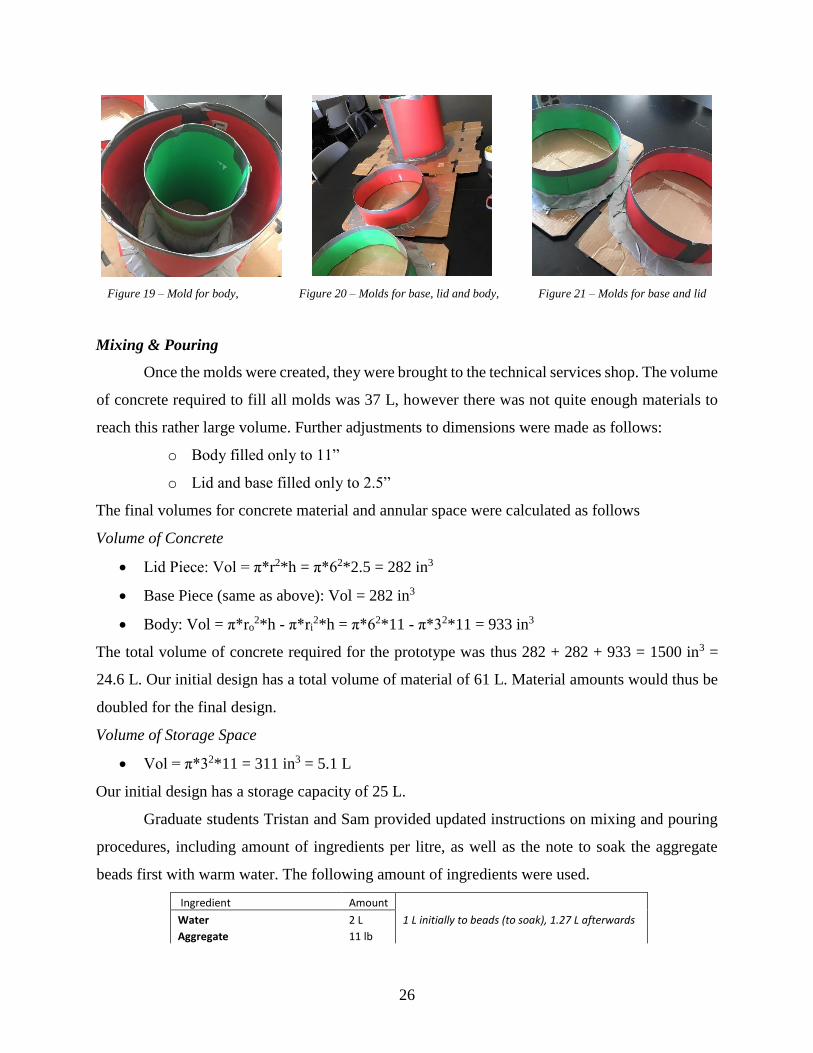
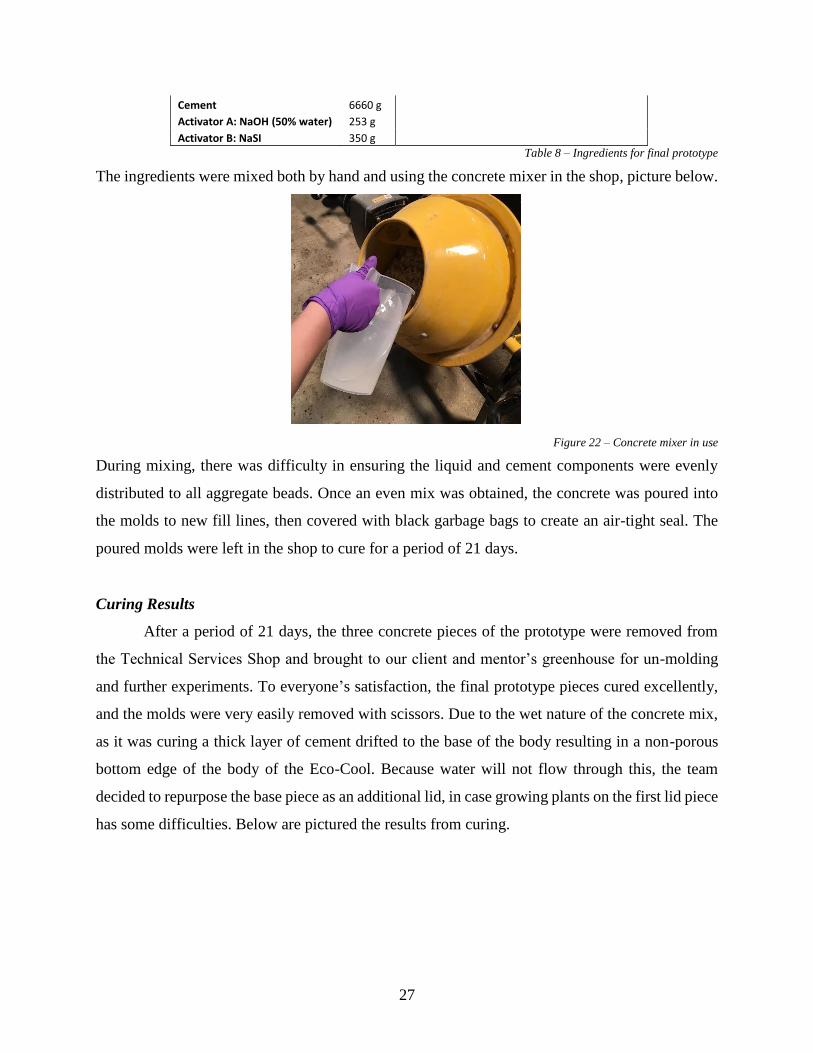
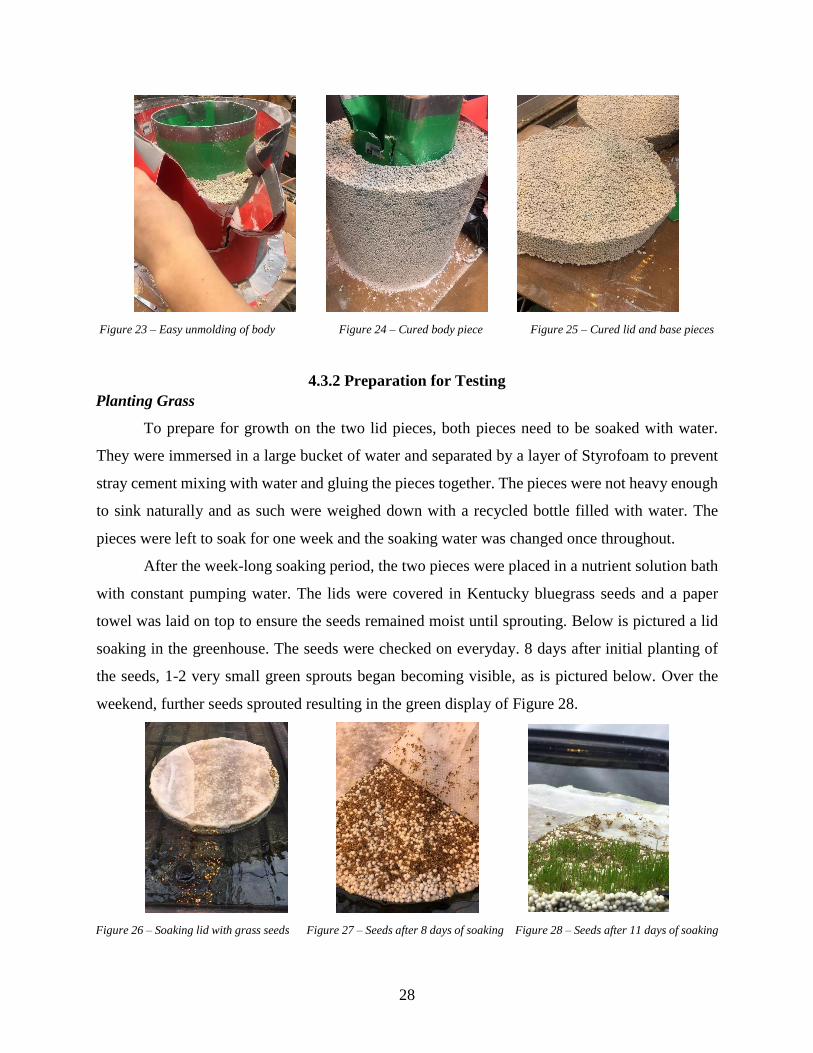
Figure 19 – Mold for body, Figure 20 – Molds for base, lid and body, Figure 21 – Molds for base and lid
Mixing & Pouring
Once the molds were created, they were brought to the technical services shop. The volume
of concrete required to fill all molds was 37 L, however there was not quite enough materials to
reach this rather large volume. Further adjustments to dimensions were made as follows:
o Body filled only to 11”
o Lid and base filled only to 2.5”
The final volumes for concrete material and annular space were calculated as follows
Volume of Concrete
Lid Piece: Vol = π*r2*h = π*62*2.5 = 282 in3
Base Piece (same as above): Vol = 282 in3
Body: Vol = π*ro2*h - π*ri
2*h = π*62*11 - π*32*11 = 933 in3
The total volume of concrete required for the prototype was thus 282 + 282 + 933 = 1500 in3 =
24.6 L. Our initial design has a total volume of material of 61 L. Material amounts would thus be
doubled for the final design.
Volume of Storage Space
Vol = π*32*11 = 311 in3 = 5.1 L
Our initial design has a storage capacity of 25 L.
Graduate students Tristan and Sam provided updated instructions on mixing and pouring
procedures, including amount of ingredients per litre, as well as the note to soak the aggregate
beads first with warm water. The following amount of ingredients were used.
Ingredient Amount Water 2 L 1 L initially to beads (to soak), 1.27 L afterwards
Aggregate 11 lb
27
Cement 6660 g
Activator A: NaOH (50% water) 253 g
Activator B: NaSI 350 g Table 8 – Ingredients for final prototype
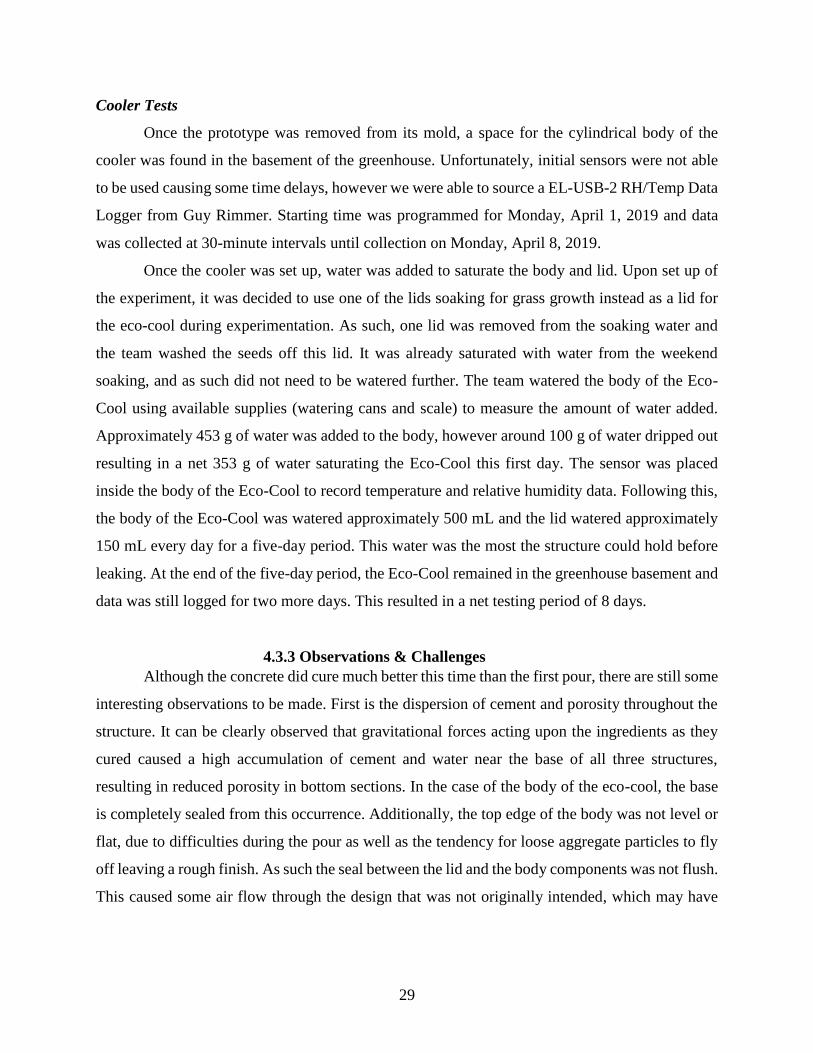
The ingredients were mixed both by hand and using the concrete mixer in the shop, picture below.
Figure 22 – Concrete mixer in use
During mixing, there was difficulty in ensuring the liquid and cement components were evenly
distributed to all aggregate beads. Once an even mix was obtained, the concrete was poured into
the molds to new fill lines, then covered with black garbage bags to create an air-tight seal. The
poured molds were left in the shop to cure for a period of 21 days.
Curing Results
After a period of 21 days, the three concrete pieces of the prototype were removed from
the Technical Services Shop and brought to our client and mentor’s greenhouse for un-molding
and further experiments. To everyone’s satisfaction, the final prototype pieces cured excellently,
and the molds were very easily removed with scissors. Due to the wet nature of the concrete mix,
as it was curing a thick layer of cement drifted to the base of the body resulting in a non-porous
bottom edge of the body of the Eco-Cool. Because water will not flow through this, the team
decided to repurpose the base piece as an additional lid, in case growing plants on the first lid piece
has some difficulties. Below are pictured the results from curing.
28
Figure 23 – Easy unmolding of body Figure 24 – Cured body piece Figure 25 – Cured lid and base pieces
4.3.2 Preparation for Testing
Planting Grass
To prepare for growth on the two lid pieces, both pieces need to be soaked with water.
They were immersed in a large bucket of water and separated by a layer of Styrofoam to prevent
stray cement mixing with water and gluing the pieces together. The pieces were not heavy enough
to sink naturally and as such were weighed down with a recycled bottle filled with water. The
pieces were left to soak for one week and the soaking water was changed once throughout.
After the week-long soaking period, the two pieces were placed in a nutrient solution bath
with constant pumping water. The lids were covered in Kentucky bluegrass seeds and a paper
towel was laid on top to ensure the seeds remained moist until sprouting. Below is pictured a lid
soaking in the greenhouse. The seeds were checked on everyday. 8 days after initial planting of
the seeds, 1-2 very small green sprouts began becoming visible, as is pictured below. Over the
weekend, further seeds sprouted resulting in the green display of Figure 28.
Figure 26 – Soaking lid with grass seeds Figure 27 – Seeds after 8 days of soaking Figure 28 – Seeds after 11 days of soaking
29
Cooler Tests
Once the prototype was removed from its mold, a space for the cylindrical body of the
cooler was found in the basement of the greenhouse. Unfortunately, initial sensors were not able
to be used causing some time delays, however we were able to source a EL-USB-2 RH/Temp Data
Logger from Guy Rimmer. Starting time was programmed for Monday, April 1, 2019 and data
was collected at 30-minute intervals until collection on Monday, April 8, 2019.
Once the cooler was set up, water was added to saturate the body and lid. Upon set up of
the experiment, it was decided to use one of the lids soaking for grass growth instead as a lid for
the eco-cool during experimentation. As such, one lid was removed from the soaking water and
the team washed the seeds off this lid. It was already saturated with water from the weekend
soaking, and as such did not need to be watered further. The team watered the body of the Eco-
Cool using available supplies (watering cans and scale) to measure the amount of water added.
Approximately 453 g of water was added to the body, however around 100 g of water dripped out
resulting in a net 353 g of water saturating the Eco-Cool this first day. The sensor was placed
inside the body of the Eco-Cool to record temperature and relative humidity data. Following this,
the body of the Eco-Cool was watered approximately 500 mL and the lid watered approximately
150 mL every day for a five-day period. This water was the most the structure could hold before
leaking. At the end of the five-day period, the Eco-Cool remained in the greenhouse basement and
data was still logged for two more days. This resulted in a net testing period of 8 days.
4.3.3 Observations & Challenges
Although the concrete did cure much better this time than the first pour, there are still some
interesting observations to be made. First is the dispersion of cement and porosity throughout the
structure. It can be clearly observed that gravitational forces acting upon the ingredients as they
cured caused a high accumulation of cement and water near the base of all three structures,
resulting in reduced porosity in bottom sections. In the case of the body of the eco-cool, the base
is completely sealed from this occurrence. Additionally, the top edge of the body was not level or
flat, due to difficulties during the pour as well as the tendency for loose aggregate particles to fly
off leaving a rough finish. As such the seal between the lid and the body components was not flush.
This caused some air flow through the design that was not originally intended, which may have
30
caused errors in the collected data. The molds used to create the lid and the body pieces were also
of slightly different circular dimensions, again resulting in a slightly off-skew layering.
During watering of the concrete pieces, it was interesting to note the direct colour change
of the structure as water saturated its pores and coated aggregate particles. Every day of watering
the structure appeared completely dry once again, implying the user could water the structure at
least once each day if not twice.
There were difficulties in pouring the water over the lid because of the smooth layer of
cement in some parts and decreased porosity. This caused water to flow horizontally across the
concrete rather than down vertically. In the case of the body, since we were pouring water atop the
rougher more porous edge, this was less of an issue. For both segments, we did encounter the
problem of adding more water that the structure could handle, which caused water to leak.
Due to the slight difference in circle shapes of each piece and the gradient of the body, it
was not feasible to keep the lid on the body of the Eco-Cool during watering and only water the
lid. Since this was a fundamental part of our initial design (i.e. having users water only the top part
of the design and water trickle naturally down), many further adjustments would be necessary.
For the grass sprouting, there was an issue with the pump one day which caused the vessel
in which the lid was resting to completely drain of water. Thankfully the paper towel cover
remained moist, and the team quickly refilled the vessel with water manually, however this may
have caused the issues with the sprouting time.
4.3.4 Results & Discussion
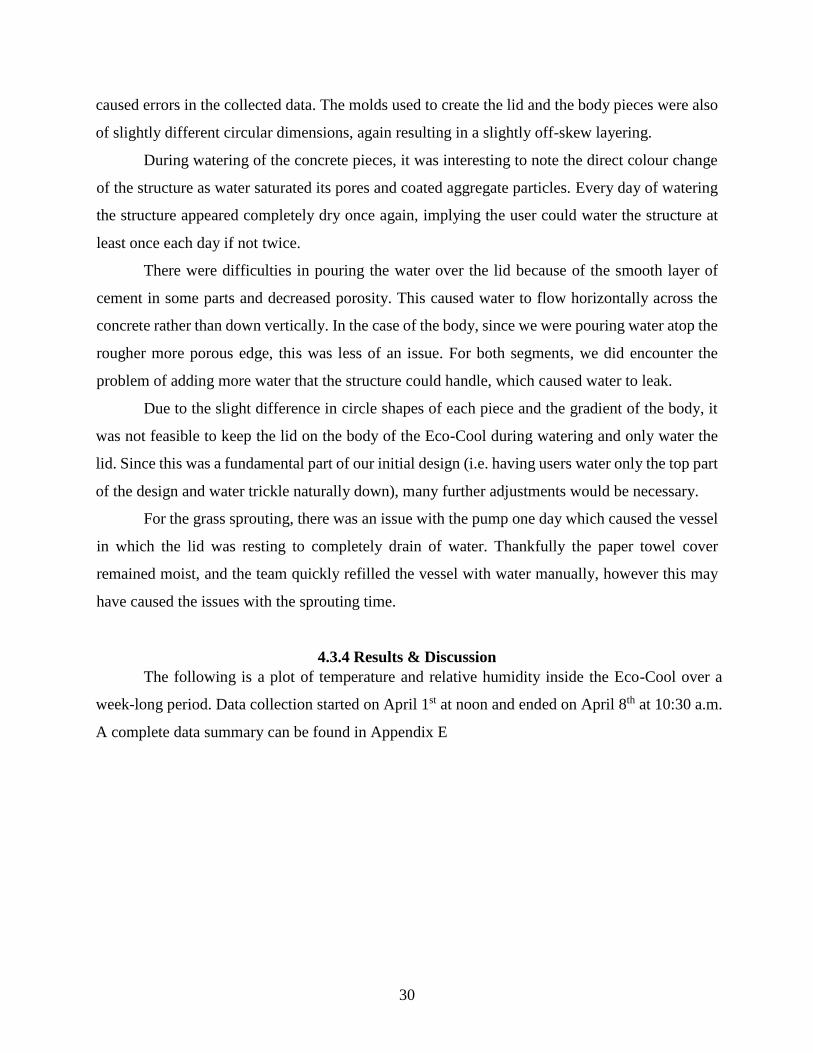
The following is a plot of temperature and relative humidity inside the Eco-Cool over a
week-long period. Data collection started on April 1st at noon and ended on April 8th at 10:30 a.m.
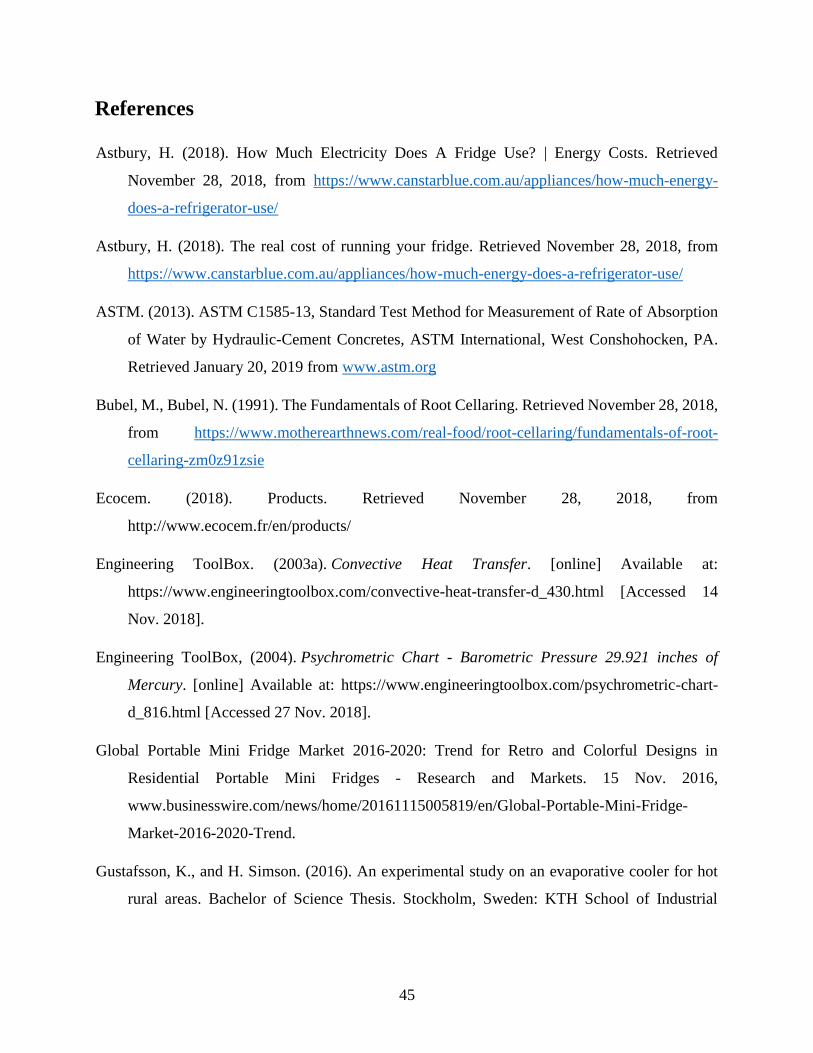
A complete data summary can be found in Appendix E
31
Figure 29 – Plot of temperature and relative humidity inside the Eco-Cool
The results show a sudden increase in temperature every day when water was added. This
is because as the lid was removed, external warmer air was able to travel into the unit. Successfully,
every watering moment did cause a drop-in temperature. This drop occurred over a span of on
average 2.1 hours, and the decreased temperature lasted on average 10.6 hours. On April 2nd
(second day of watering), the Eco-Cool maintained a temperature of 17.5 °C for 7 hours after
watering (2:30 p.m.) and increased to 18.0 °C at 9:00 p.m. (from Excel worksheet). It reached a
maximum of 19.5 °C the next day before watering, which then went back down to 17.0 °C, and
maintained it for another 7 hours before it starts to rise in temperature.
The lowest temperature achieved was 16.0 °C on April 4th. This was maintained for 5 hours.
On average, the Eco-Cool reached a minimum temperature of 16.7 °C after watering, which is
almost a 5 °C decrease from the surrounding room temperature.
Water was not added to the Eco-Cool after April 6th which is why there were no temperature
fluctuations between April 7th and 8th. The maximum temperature was reached during this 2-day
dry period when the Eco-Cool reached the room temperature of the greenhouse, 21.5 °C. It took
more than 2 full days (48.5 hours) for the Eco-Cool to reach this room temperature.

32
Relative humidity fluctuation was very minimal. The average RH was 84%, which is
relatively high compared to the average indoor humidity of a Canadian home. The high RH may
also have caused less cooling than would be possible in a room with lower humidity.
Since it is possible to have the Eco-Cool reach and maintain a temperature of 16°C in a
greenhouse basement, it may be possible to reach the 14°C target under a normal air movement
room. Further developments in creating an air tight seal, as well as improved watering conditions,
may be able to decrease this temperature further.
33
5. Recommendations & Final Design
As demonstrated through the challenges encountered throughout the testing phases, further
research and testing is critical for optimal concrete mixing as well as for quantities and frequencies
of watering for the final product. Through the encountered challenges, the team has decided to scale
back the complexity of the final design. The door will be removed, and instead the lid will be left
removable to access the contents. Additionally, if further tests prove it is impossible to water the
lid and have the body of the Eco-Cool be watered and saturated in the same process, this design
provides the option to remove the lid, water the body, then place the lid back on the Eco-Cool and
water the plants. The lid will still have the thin layer of cement on the centre of its bottom layer to
prevent sediment from falling through and have plants growing on its top. Additionally, this option
provides the possibility for users to switch out different lids with different plants species on them,
allowing them to, for example, have the roof of the Eco-Cool be grass one day and flowers the next.
Removing the door element will slightly decrease the user-friendliness, since now users
will not be able to clearly see the contents of the Eco-Cool. However, the difficulties encountered
in pouring the concrete necessitate creating a slightly simpler design. Removing the door also
removes the need for an annular door space within the mold, or the need to knock out a space for
the door after curing. This simplicity will reduce costs incurred in developing elaborate molds, as
well as increase structural integrity of the design.
5.1 Recommendations
Paired with the aforementioned slight modification to the design is the necessity for further
testing and trials. As the porous concrete material is relatively new, it is imperative that further
testing be completed to develop a confident formula of ingredients and amounts to create the ideal
concrete mixture for the structure. Molds and concrete pouring must be further developed to ensure
uniformity of shapes, as well as create flat and level edges. Using paper lined with tape as a mold
material is highly recommended as it has proved the most successful for post-curing removal.
Further testing and trials are recommended to calculate the exact amount of water to be
poured upon the Eco-Cool surface, as well as the method of its application. A key finding from the
testing of the prototype was that segments of walls would become saturated very quickly and cause
leaking of water before the entire structure was saturated. As for the placement of the Eco-Cool, it
34
is recommended to place the final design upon its wheeled trolley on another collection bucket, in
case of this excess water leaking through.
Pending the completion of these recommendations, the design can be slightly adjusted for
an optimal solution. This final design will be different in creation process and maintenance than its
prototype, however the components of the design will be almost identical to the initial design.
5.2 Final Design Assembly
Once determined, the established formula of the concrete will be produced in mixers and
the Eco-Cool will be built with a single pour. The side walls and bottom of the cooler will be
poured first into the mold in the shape of the Eco-Cool without a top cover. Four wheels with small
rectangular wood plates will be placed in the curing cement at four symmetric edges on the bottom
of the body. The top lid will be left to cured as a separate entity and a thin layer cement will be
added to the centre of the bottom edge of this lid. Additionally, since the plants will go on the top
lid it will need to be soaked in water separately from the body, to allow seeds to germinate on the
lid. During manufacturing once seeds begin growing, they will be watered daily with 250 mL of
Hoagland Solution for one week, before being delivered to the user’s home. Once in the home, the
final product will be placed on top of a water-absorbing mat in the case of water leakage. The user
will water the grass with 250 mL of Hoagland Solution twice per week to ensure healthy plants.
5.3 User Manual
The user manual will be available with every purchase of the Eco-Cool. The specifications
are provided as shown below:
Product Introduction:
Thank you for purchasing the Eco-Cool: Evaporative Porous Concrete Cooler! This mini
natural cooler will help lower your carbon footprint by reducing chemical refrigerant and
electrical usage. It will also make your home literally greener with aesthetic plants. Before
setting up the Eco-Cool at your place of living, please read this manual in detail and for
future reference.
Safety Warnings:
Read all safety warnings before use.
Use this product only for its intended purpose.
35
Keep nutrient solution away from contact and away from children.
Store away the nutrient solution in a cool dry place away from light until needed for use.
The Eco-Cool does not have user serviceable components. Do not disassemble.
Inspect product before use. If product appears damaged in any manner, discontinue use and
contact the provider for discarding product, or within warranty for replacement.
Specifications:
Model: The Eco-Cool. Version 1A.
Product size: diameter: 15”, height: 30”
Internal space: diameter: 10”, height 20”
Wall thickness: 2.5’’
Product weight: 20kg
Carrying capacity: 7 U.S liquid gallons; 25 L
Temperature Range: 16°C - 19°C
Nutrient Solution: Hoagland powder – 50g
Contents:
1. Eco-Cool Unit
2. Plant seeds
3. Nutrient Solution
4. Attached Wheels
Installation:
The Eco-Cool is ideally situated in an air movement area with low relative humidity. If the
Eco-Cool is purchased without germinated plants, then see the application direction of the
plant seed with its nutrient solution.
Recommended Products:
Vegetables and fruits only. No meat or seafood.
Usage:
Eco-Cool:
1. Water the top layer according to the plant’s water requirement needs.
2. Use the inside to store fresh produce - can store up to 5kg.
3. Produce keeps fresh up to 5-7 days.
4. Use a soft sponge to clean Eco-Cool every 5 days to ensure pores remain open.
Nutrient Solution:
1. To create solution, use 1.65g of Hoagland powder per litre of water.
2. Before and during germination (one-week period) use 250 mL of solution to water the
lid every day.
36
3. After complete germination, start only using solution twice a week to water the system.
FAQ:
1. Will I need to water the Eco-Cool every day?
Yes, must administer 500mL of water at least once a day. Water is required for evaporative
cooling, and plants' survival.
2. Can the Eco-Cool be placed anywhere?
No, the Eco-Cool is for indoors, and needs to be in a dry area with possible air movement.
3. How can I change my plants?
All previous plant materials need to be removed from the lid of the Eco-Cool. The lid will
then need to be soaked with the nutrient solution Eco-Cool provides with its purchase. The
seeds can be put on the lid and wait for germination.
4. How long can I store fresh produce?
Fresh produce, fruits and vegetables can last up to 4-5 days.
Limited Warranty:
Purchase of an Eco-Cool comes with a warranty of one year.
Support:
Contact us:
If you have any trouble using the Eco-Cool or any other questions, do not hesitate to send
us an email at [email protected]. We will do our best to help you. We reply within 48
hours.
5.4 Economic Analysis
Our economic analysis has been completed from the vantage point of a potential buyer, to
demonstrate the initial cost they would need to spend to purchase one Eco-Cool, and the savings
which would be incurred over time.
37
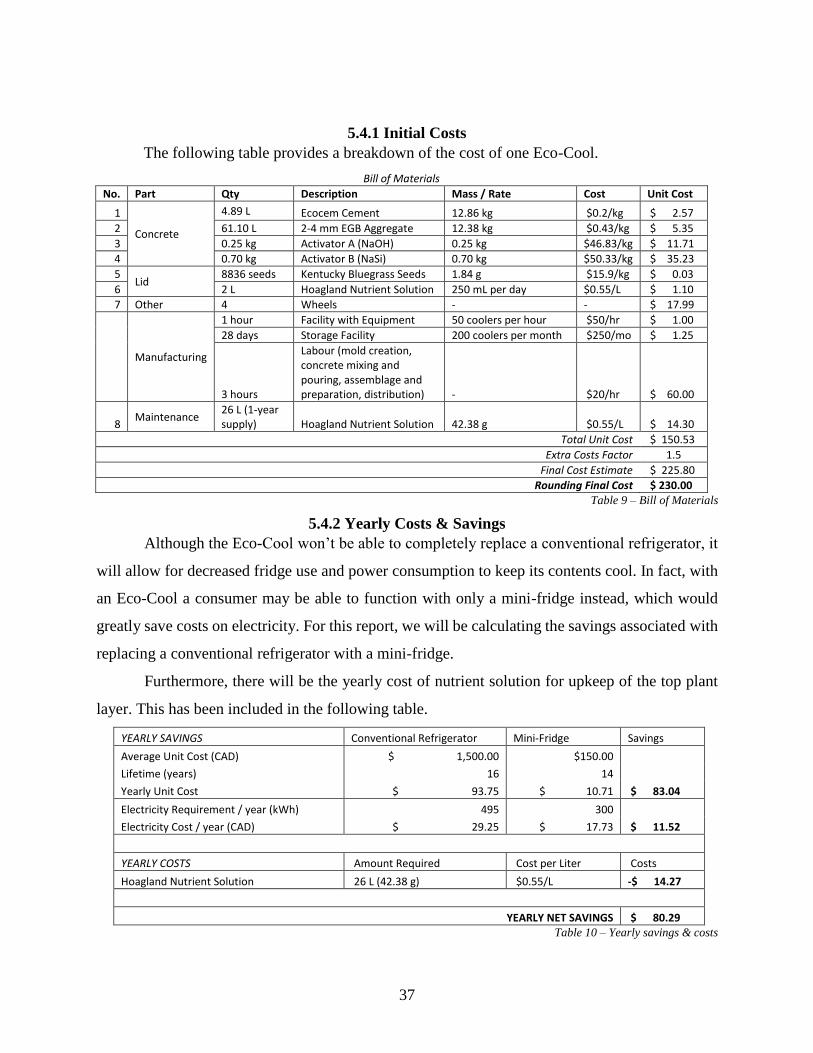
5.4.1 Initial Costs
The following table provides a breakdown of the cost of one Eco-Cool.
Bill of Materials
No. Part Qty Description Mass / Rate Cost Unit Cost
1
Concrete
4.89 L Ecocem Cement 12.86 kg $0.2/kg $ 2.57
2 61.10 L 2-4 mm EGB Aggregate 12.38 kg $0.43/kg $ 5.35
3 0.25 kg Activator A (NaOH) 0.25 kg $46.83/kg $ 11.71
4 0.70 kg Activator B (NaSi) 0.70 kg $50.33/kg $ 35.23
5 Lid
8836 seeds Kentucky Bluegrass Seeds 1.84 g $15.9/kg $ 0.03
6 2 L Hoagland Nutrient Solution 250 mL per day $0.55/L $ 1.10
7 Other 4 Wheels - - $ 17.99
Manufacturing
1 hour Facility with Equipment 50 coolers per hour $50/hr $ 1.00
28 days Storage Facility 200 coolers per month $250/mo $ 1.25
3 hours
Labour (mold creation, concrete mixing and pouring, assemblage and preparation, distribution) - $20/hr $ 60.00
8 Maintenance
26 L (1-year supply) Hoagland Nutrient Solution 42.38 g $0.55/L $ 14.30
Total Unit Cost $ 150.53
Extra Costs Factor 1.5
Final Cost Estimate $ 225.80
Rounding Final Cost $ 230.00
Table 9 – Bill of Materials
5.4.2 Yearly Costs & Savings
Although the Eco-Cool won’t be able to completely replace a conventional refrigerator, it
will allow for decreased fridge use and power consumption to keep its contents cool. In fact, with
an Eco-Cool a consumer may be able to function with only a mini-fridge instead, which would
greatly save costs on electricity. For this report, we will be calculating the savings associated with
replacing a conventional refrigerator with a mini-fridge.
Furthermore, there will be the yearly cost of nutrient solution for upkeep of the top plant
layer. This has been included in the following table.
YEARLY SAVINGS Conventional Refrigerator Mini-Fridge Savings
Average Unit Cost (CAD) $ 1,500.00 $150.00
Lifetime (years) 16 14
Yearly Unit Cost $ 93.75 $ 10.71 $ 83.04
Electricity Requirement / year (kWh) 495 300
Electricity Cost / year (CAD) $ 29.25 $ 17.73 $ 11.52
YEARLY COSTS Amount Required Cost per Liter Costs
Hoagland Nutrient Solution 26 L (42.38 g) $0.55/L -$ 14.27
YEARLY NET SAVINGS $ 80.29 Table 10 – Yearly savings & costs
38
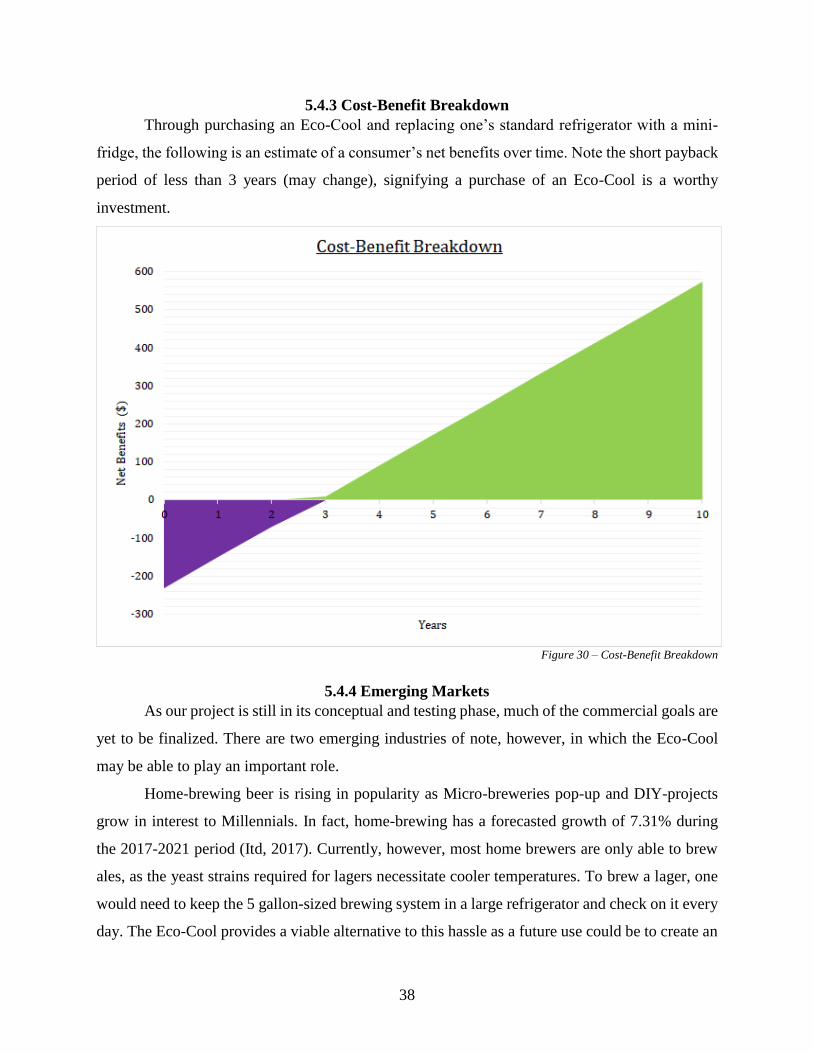
5.4.3 Cost-Benefit Breakdown
Through purchasing an Eco-Cool and replacing one’s standard refrigerator with a mini-
fridge, the following is an estimate of a consumer’s net benefits over time. Note the short payback
period of less than 3 years (may change), signifying a purchase of an Eco-Cool is a worthy
investment.
Figure 30 – Cost-Benefit Breakdown
5.4.4 Emerging Markets
As our project is still in its conceptual and testing phase, much of the commercial goals are
yet to be finalized. There are two emerging industries of note, however, in which the Eco-Cool
may be able to play an important role.
Home-brewing beer is rising in popularity as Micro-breweries pop-up and DIY-projects
grow in interest to Millennials. In fact, home-brewing has a forecasted growth of 7.31% during
the 2017-2021 period (Itd, 2017). Currently, however, most home brewers are only able to brew
ales, as the yeast strains required for lagers necessitate cooler temperatures. To brew a lager, one
would need to keep the 5 gallon-sized brewing system in a large refrigerator and check on it every
day. The Eco-Cool provides a viable alternative to this hassle as a future use could be to create an
39
Eco-Cool Home Brewing Kit, in which the brewing vessel would be inside the Eco-Cool and
would be cooled down to temperatures the yeast desires, using the evaporative cooling technology.
Furthermore, home brewers are already required to check on the status of their beer daily, so
adding the daily watering of the Eco-Cool would cause no additional disturbance.
Another emerging market is in the cosmetics industry, as make-up mini-fridges grow in
popularity especially in Eastern Asia and Europe. In fact, the global portable mini-fridge market
is expected to grow at 4.15% in 2016-2020 (Businesswire, 2016). This trend is due to consumers’
desire to keep their makeup cool which provides a longer shelf life, therapeutic effects, and a better
texture (Kong, 2014). According to dermatologists, the optimal temperature for cosmetics is
around 10 oC (Nedelcheva, 2018) which could fit nicely in line with the inner temperature of the
Eco-Cool.
As global trends shift, we strongly believe in the viability for the Eco-Cool to replace not
only current, but future market needs. This electricity- and chemical-free storage device represents
a sustainable alternative in cooled storage, addressing the current concerns and growing legislation
surrounding the refrigeration industry.
6. Conclusions
The growing concern and legislation countering current refrigeration chemicals indicate
the need for a viable alternative in cooled food storage. The Eco-Cool is designed to be one such
alternative: a cooled food storage device without the use of electricity or chemicals. Users will
water the concrete roof and walls daily and through evaporative cooling, a cooled space will be
created inside to keep fruits, vegetables and beverages fresh. The roof of the cooler will include a
plant system with grass to provide aesthetic and a visual cue for watering. Material options include
sustainably-sourced Ecocem Cement and Poraver Expanded Glass Foam Bead aggregate, which
have a small ecological footprint compared to Portland cement, quartz aggregate, and regular
refrigerant chemicals. Safety in design is imperative, and the final product will include a user
manual to ensure food spoilage does not occur. Economically, the Eco-Cool will provide
significant savings to users as it will be able to somewhat replace costly refrigerators. The Eco-
Cool represents a holistic approach to the green market.
40
Acknowledgements
We gratefully thank Dr. Lefsrud for his mentorship and provisioning materials, laboratory
space, and greenhouse accommodations. We also would like to thank Mr. Rimmer for supplying
sensors. Senior colleague, Tristan Chauvin-Bosse was a great help throughout the project with
knowledgeable comments, advice, and supervision; Samuel Bilodeau for his comments as well,
and David Leroux for sensor help. We also thank Dr. Madramootoo for his instructions and
specifications for the design project.
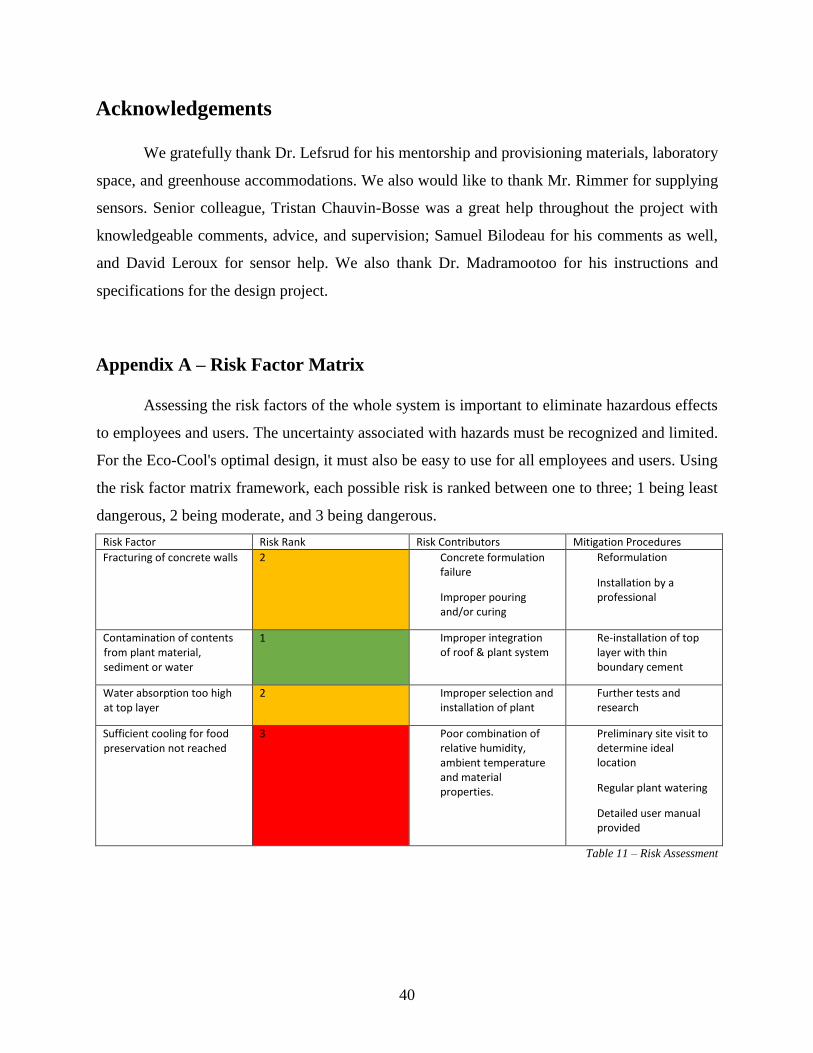
Appendix A – Risk Factor Matrix
Assessing the risk factors of the whole system is important to eliminate hazardous effects
to employees and users. The uncertainty associated with hazards must be recognized and limited.
For the Eco-Cool's optimal design, it must also be easy to use for all employees and users. Using
the risk factor matrix framework, each possible risk is ranked between one to three; 1 being least
dangerous, 2 being moderate, and 3 being dangerous.
Risk Factor Risk Rank Risk Contributors Mitigation Procedures
Fracturing of concrete walls 2 Concrete formulation failure
Improper pouring and/or curing
Reformulation
Installation by a professional
Contamination of contents from plant material, sediment or water
1 Improper integration of roof & plant system
Re-installation of top layer with thin boundary cement
Water absorption too high at top layer
2 Improper selection and installation of plant
Further tests and research
Sufficient cooling for food preservation not reached
3 Poor combination of relative humidity, ambient temperature and material properties.
Preliminary site visit to determine ideal location
Regular plant watering
Detailed user manual provided
Table 11 – Risk Assessment
41
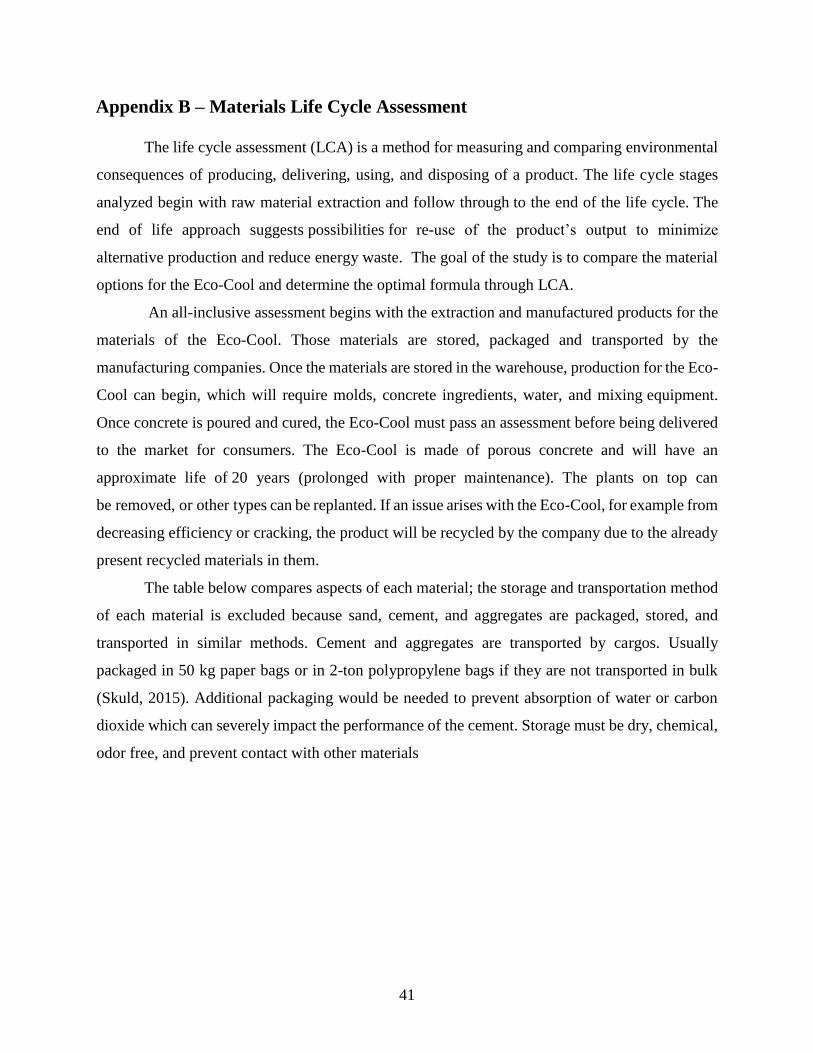
Appendix B – Materials Life Cycle Assessment
The life cycle assessment (LCA) is a method for measuring and comparing environmental
consequences of producing, delivering, using, and disposing of a product. The life cycle stages
analyzed begin with raw material extraction and follow through to the end of the life cycle. The
end of life approach suggests possibilities for re-use of the product’s output to minimize
alternative production and reduce energy waste. The goal of the study is to compare the material
options for the Eco-Cool and determine the optimal formula through LCA.
An all-inclusive assessment begins with the extraction and manufactured products for the
materials of the Eco-Cool. Those materials are stored, packaged and transported by the
manufacturing companies. Once the materials are stored in the warehouse, production for the Eco-
Cool can begin, which will require molds, concrete ingredients, water, and mixing equipment.
Once concrete is poured and cured, the Eco-Cool must pass an assessment before being delivered
to the market for consumers. The Eco-Cool is made of porous concrete and will have an
approximate life of 20 years (prolonged with proper maintenance). The plants on top can
be removed, or other types can be replanted. If an issue arises with the Eco-Cool, for example from
decreasing efficiency or cracking, the product will be recycled by the company due to the already
present recycled materials in them.
The table below compares aspects of each material; the storage and transportation method
of each material is excluded because sand, cement, and aggregates are packaged, stored, and
transported in similar methods. Cement and aggregates are transported by cargos. Usually
packaged in 50 kg paper bags or in 2-ton polypropylene bags if they are not transported in bulk
(Skuld, 2015). Additional packaging would be needed to prevent absorption of water or carbon
dioxide which can severely impact the performance of the cement. Storage must be dry, chemical,
odor free, and prevent contact with other materials
42
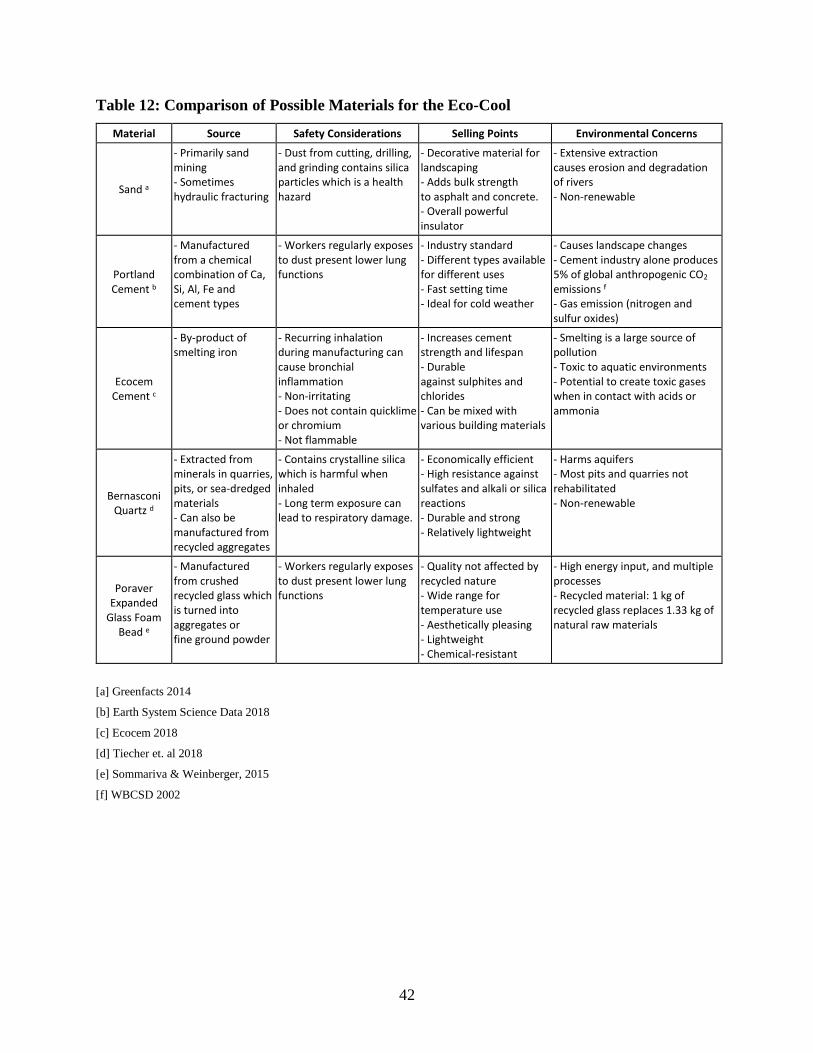
Table 12: Comparison of Possible Materials for the Eco-Cool
Material Source Safety Considerations Selling Points Environmental Concerns
Sand a
- Primarily sand mining - Sometimes hydraulic fracturing
- Dust from cutting, drilling, and grinding contains silica particles which is a health hazard
- Decorative material for landscaping - Adds bulk strength to asphalt and concrete. - Overall powerful insulator
- Extensive extraction causes erosion and degradation of rivers - Non-renewable
Portland Cement b
- Manufactured from a chemical combination of Ca, Si, Al, Fe and cement types
- Workers regularly exposes to dust present lower lung functions
- Industry standard - Different types available for different uses - Fast setting time - Ideal for cold weather
- Causes landscape changes - Cement industry alone produces 5% of global anthropogenic CO2 emissions f - Gas emission (nitrogen and sulfur oxides)
Ecocem Cement c
- By-product of smelting iron
- Recurring inhalation during manufacturing can cause bronchial inflammation - Non-irritating - Does not contain quicklime or chromium - Not flammable
- Increases cement strength and lifespan - Durable against sulphites and chlorides - Can be mixed with various building materials
- Smelting is a large source of pollution - Toxic to aquatic environments - Potential to create toxic gases when in contact with acids or ammonia
Bernasconi Quartz d
- Extracted from minerals in quarries, pits, or sea-dredged materials - Can also be manufactured from recycled aggregates
- Contains crystalline silica which is harmful when inhaled - Long term exposure can lead to respiratory damage.
- Economically efficient - High resistance against sulfates and alkali or silica reactions - Durable and strong - Relatively lightweight
- Harms aquifers - Most pits and quarries not rehabilitated - Non-renewable
Poraver Expanded
Glass Foam Bead e
- Manufactured from crushed recycled glass which is turned into aggregates or fine ground powder
- Workers regularly exposes to dust present lower lung functions
- Quality not affected by recycled nature - Wide range for temperature use - Aesthetically pleasing - Lightweight - Chemical-resistant
- High energy input, and multiple processes - Recycled material: 1 kg of recycled glass replaces 1.33 kg of natural raw materials
[a] Greenfacts 2014
[b] Earth System Science Data 2018
[c] Ecocem 2018
[d] Tiecher et. al 2018
[e] Sommariva & Weinberger, 2015
[f] WBCSD 2002
43
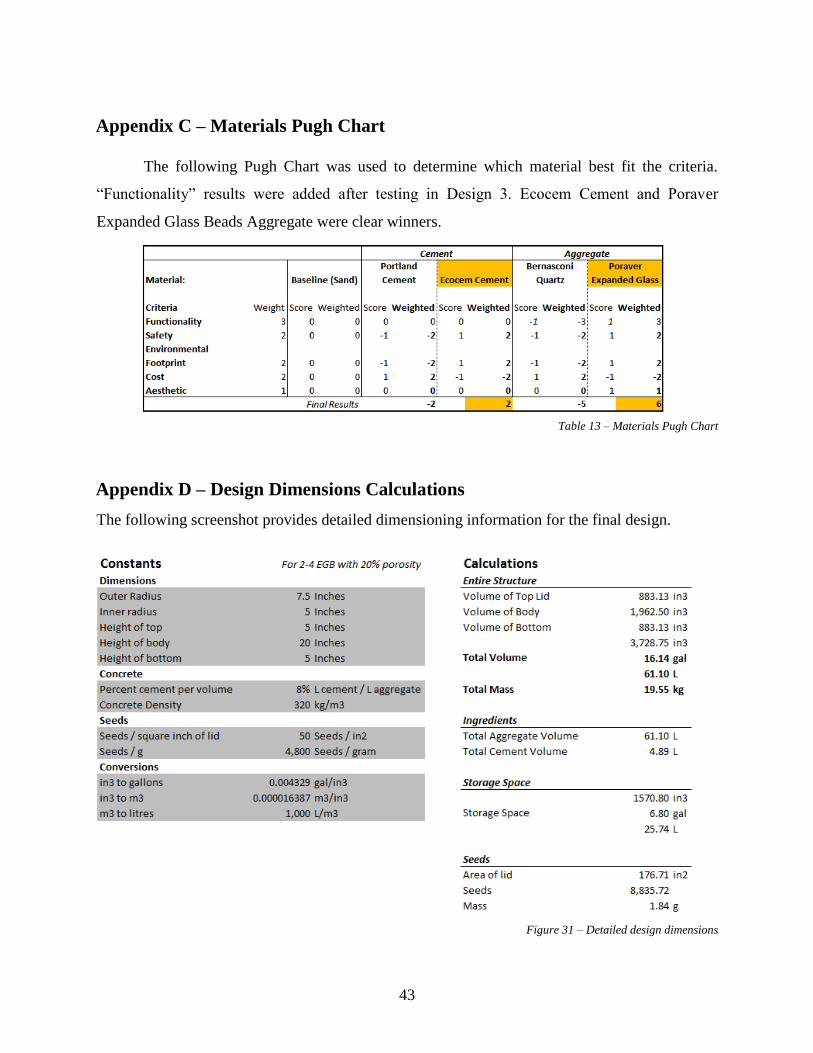
Appendix C – Materials Pugh Chart
The following Pugh Chart was used to determine which material best fit the criteria.
“Functionality” results were added after testing in Design 3. Ecocem Cement and Poraver
Expanded Glass Beads Aggregate were clear winners.
Table 13 – Materials Pugh Chart
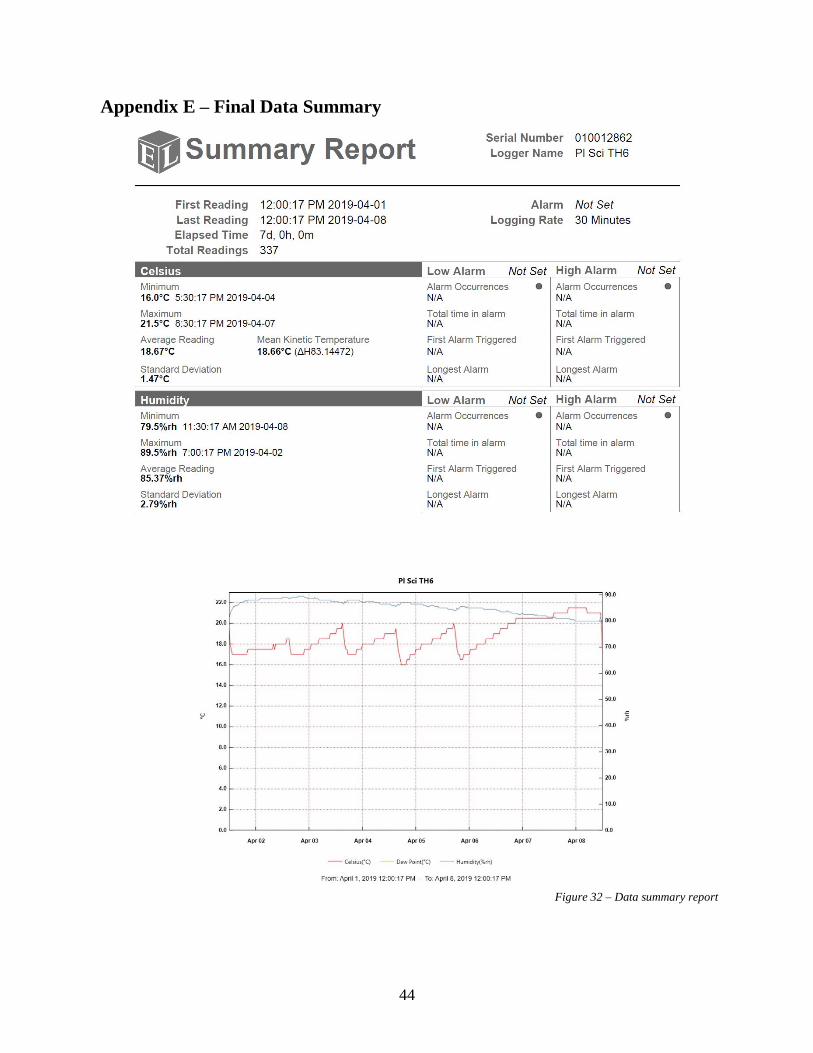
Appendix D – Design Dimensions Calculations
The following screenshot provides detailed dimensioning information for the final design.
Figure 31 – Detailed design dimensions
44
Appendix E – Final Data Summary
Figure 32 – Data summary report
45
References
Astbury, H. (2018). How Much Electricity Does A Fridge Use? | Energy Costs. Retrieved
November 28, 2018, from https://www.canstarblue.com.au/appliances/how-much-energy-
does-a-refrigerator-use/
Astbury, H. (2018). The real cost of running your fridge. Retrieved November 28, 2018, from
https://www.canstarblue.com.au/appliances/how-much-energy-does-a-refrigerator-use/
ASTM. (2013). ASTM C1585-13, Standard Test Method for Measurement of Rate of Absorption
of Water by Hydraulic-Cement Concretes, ASTM International, West Conshohocken, PA.
Retrieved January 20, 2019 from www.astm.org
Bubel, M., Bubel, N. (1991). The Fundamentals of Root Cellaring. Retrieved November 28, 2018,
from https://www.motherearthnews.com/real-food/root-cellaring/fundamentals-of-root-
cellaring-zm0z91zsie
Ecocem. (2018). Products. Retrieved November 28, 2018, from
http://www.ecocem.fr/en/products/
Engineering ToolBox. (2003a). Convective Heat Transfer. [online] Available at:
https://www.engineeringtoolbox.com/convective-heat-transfer-d_430.html [Accessed 14
Nov. 2018].
Engineering ToolBox, (2004). Psychrometric Chart - Barometric Pressure 29.921 inches of
Mercury. [online] Available at: https://www.engineeringtoolbox.com/psychrometric-chart-
d_816.html [Accessed 27 Nov. 2018].
Global Portable Mini Fridge Market 2016-2020: Trend for Retro and Colorful Designs in
Residential Portable Mini Fridges - Research and Markets. 15 Nov. 2016,
www.businesswire.com/news/home/20161115005819/en/Global-Portable-Mini-Fridge-
Market-2016-2020-Trend.
Gustafsson, K., and H. Simson. (2016). An experimental study on an evaporative cooler for hot
rural areas. Bachelor of Science Thesis. Stockholm, Sweden: KTH School of Industrial
46
Engineering an Management, Energy Technology. http://www.diva-
portal.org/smash/get/diva2:952001/FULLTEXT01.pdf
Health Canada. (2015). Temperature and humidity variations. Retrieved April 8, 2019, from
https://www.caaquebec.com/en/at-home/guides/your-healthy-home-guide/temperature-and-
humidity-variations/
Inflation Calculator. Value of $164 in Today’s Dollars, by Year. (2018). Retrieved November 28,
2018, from https://www.saving.org/inflation/inflation.php?amount=164
ltd, Research and Markets. “Global Home Beer Brewing Machine Market 2017-2021.” Research
and Markets - Market Research Reports - Welcome,
www.researchandmarkets.com/reports/4420440/global-home-beer-brewing-machine-
market-2017-2021#pos-0.
Keep Food Safe! Food Safety Basics. (2016). Retrieved April 8, 2019, from
https://www.fsis.usda.gov/wps/portal/fsis/topics/food-safety-education/get-answers/food-
safety-fact-sheets/safe-food-handling/keep-food-safe-food-safety-basics/ct_index
Kim, Ill-Shin. (2011). No. CA2485225A1. Retrieved from
https://patents.google.com/patent/CA2485225A1/en:Method
Kong, Joyce. (2014, October 17) “Do You Really Need A Refrigerator For… Makeup?”
Refinery29, www.refinery29.com/en-us/makeup-refrigerators#slide-1.
MittiCool Clay Refrigerator. (2018). Retrieved November 28, 2018, from
https://mitticool.com/products/mitticool-clay-refrigerator50-liter/
Nedelcheva, Kalina. “Refrigerated Beauty Boxes : Storage for Cosmetics.” TrendHunter.com,
TREND HUNTER Inc., 11 June 2018, www.trendhunter.com/trends/storage-for-cosmetics.
Odesola, I.F. and O. Onyebuchi. (2009). “A Review of Porous Evaporative Cooling for the
Preservation of Fruits and Vegetables”. Pacific Journal of Science and Technology.
10(2):935- 941.
Psychrometric Calculator. (2018). Retrieved November 28, 2018, from
https://www.kwangu.com/work/psychrometric.htm
47
Scientific Facts on The mining of sand, a non-renewable resource. (n.d.). Retrieved November 15,
2018, from https://www.greenfacts.org/en/sand-extraction/index.htm
Shailaja, M. (2018). Study of Effect on Cooling Rate in Clay Pot Refrigerator by Experimental
Investigations. International Journal of Computer & Mathematical Sciences, 7(1), 24–29.
Sommariva, L., Weinberger, K. (2015005). Energy and natural resources saving in the production
of expanded glass granules. Chemical Engineering Transactions, 2437–2442.
https://doi.org/10.3303/CET1543407
Statistics Canada. (2012). Controlling the Temperature in Canadian Homes. Retrieved November
28, 2018, from https://www150.statcan.gc.ca/n1/pub/16-001-m/2008006/5212652-eng.htm
Stutts, Tommy. (2002). No. US6789787B2. Retrieved from
https://patents.google.com/patent/US6789787B2/en#patentCitations
Tiecher, F., Florindo, R., Vieira, G., Gomes, M., Dal Molin, D., Lermen, R. (2018). Influence of
the Quartz Deformation Structures for the Occurrence of the Alkali–Silica
Reaction. Materials, 11(9), 1692. https://doi.org/10.3390/ma11091692
Time Magazine (2001). Best Inventions of 2001. Time. Retrieved from
http://content.time.com/time/specials/packages/article/0,28804,1936165_1936254_1936632
,00.htm
The Role of Refrigeration in the Global Economy. IIR. (2015). Retrieved November 14, 2018,
from http://www.iifiir.org/userfiles/file/publications/notes/NoteTech_29_EN.pdf
WBCSD. The Cement Sustainability Initiative: Our agenda for action. (2002, June 1) World
Business Council for Sustainable Development.
Woodford, C. (2018, October 20). Refrigerators. Retrieved November 28, 2018, from
https://www.explainthatstuff.com/refrigerator.html


