Embed Size (px)
Citation preview
672
Abstract
Defective fuel is defi ned as a breach in the con-tainment of a fuel element, resulting in gaseous fi ssion products release and/or uranium material loss into the primary heat transport system. During spreading throughout the primary circuit, some ra-dioactive material deposits on circuit components, becoming a source of high gamma radiation fi eld, with potential radiological impact on personnel ex-posure during operation or maintenance activities. Although rare, fuel defects have always been an important issue for CANDU plants operation.
At Cernavoda Nuclear Power Plant, which currently operates two CANDU-6 units, policies and procedures in use clearly state the expecta-tion that nuclear fuel should be designed, manu-factured, stored, handled and operated in a man-ner appropriate to avoid failures. Consequently, a strategy for achieving high standards for fuel per-formance is currently implemented with the aim to achieve failure-free fuel operation. It addresses the main aspects of the surveillance process re-quired to achieve a good fuel performance:
● preliminary inspections on fresh fuel bundles prior their loading into the core,
● core monitoring to detect and localize suspect defective bundles in the core,
● specifi c procedures for discharging the sus-pect defective bundles from the core,
● performing “root-cause” analyses to deter-mine failure mechanisms,
● feedback to the fuel manufacturer to improve the nuclear fuel quality.
The present paper reviews the main steps and ac-tions taken at Cernavoda Nuclear Power Plant for improving fuel performance and achieving a zero-failure target.
1. Introduction
Cernavoda Nuclear Power Plant is operating two CANDU-6 reactors. The fi rst unit was com-missioned in 1996 and, the second, in 2007. The CANDU-6 reactor is a cylindrical horizontal
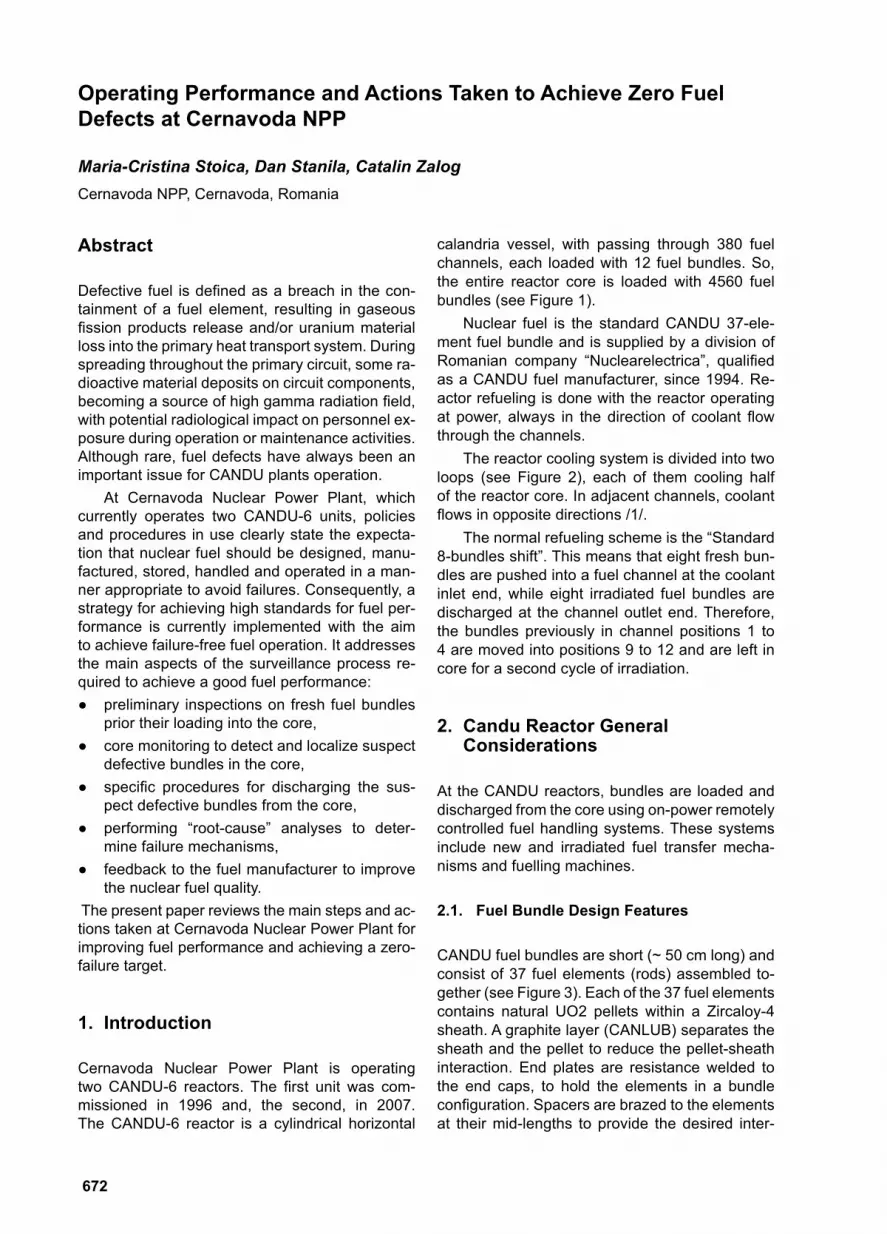
calandria vessel, with passing through 380 fuel channels, each loaded with 12 fuel bundles. So, the entire reactor core is loaded with 4560 fuel bundles (see Figure 1).
Nuclear fuel is the standard CANDU 37-ele-ment fuel bundle and is supplied by a division of Romanian company “Nuclearelectrica”, qualifi ed as a CANDU fuel manufacturer, since 1994. Re-actor refueling is done with the reactor operating at power, always in the direction of coolant fl ow through the channels.
The reactor cooling system is divided into two loops (see Figure 2), each of them cooling half of the reactor core. In adjacent channels, coolant fl ows in opposite directions /1/.
The normal refueling scheme is the “Standard 8-bundles shift”. This means that eight fresh bun-dles are pushed into a fuel channel at the coolant inlet end, while eight irradiated fuel bundles are discharged at the channel outlet end. Therefore, the bundles previously in channel positions 1 to 4 are moved into positions 9 to 12 and are left in core for a second cycle of irradiation.
2. Candu Reactor General Considerations
At the CANDU reactors, bundles are loaded and discharged from the core using on-power remotely controlled fuel handling systems. These systems include new and irradiated fuel transfer mecha-nisms and fuelling machines.
2.1. Fuel Bundle Design Features
CANDU fuel bundles are short (~ 50 cm long) and consist of 37 fuel elements (rods) assembled to-gether (see Figure 3). Each of the 37 fuel elements contains natural UO2 pellets within a Zircaloy-4 sheath. A graphite layer (CANLUB) separates the sheath and the pellet to reduce the pellet-sheath interaction. End plates are resistance welded to the end caps, to hold the elements in a bundle confi guration. Spacers are brazed to the elements at their mid-lengths to provide the desired inter-
Operating Performance and Actions Taken to Achieve Zero Fuel Defects at Cernavoda NPP
Maria-Cristina Stoica, Dan Stanila, Catalin ZalogCernavoda NPP, Cernavoda, Romania
673
element separation. The bundle is spaced from the pressure tube by bearing pads brazed near the ends and at the middle of the outer elements. The fi ller metal used for brazing is beryllium.
3. Defect Types
Before loading into fueling machines, the fresh bundles are visually inspected. If bundles show any unconformities, they are stored on quarantine pallets and send back to the manufacturer /8/.
The fuel defects due to manufacturing cause in a CANDU reactor include:
● Incomplete end-cap welds, ● Primary hydriding (excess Hydrogen gas with-
in the fuel element), ● Fretting through the sheath from end-cap weld fl ashings,
● Crevice corrosion (brazing defect).Another defect type is due to operational causes and includes:
● Sheath fretting due to debris from the coolant, ● Mechanical damage due to abnormal han-
dling/fueling, ● Wear between spacer pads.
Design related defects: ● Stress Corrosion Cracking (SCC) due to pow-
er ramps associated with normal operation, ● Fission gas overpressure, ● Circumferential End-Cap cracks /2/.
4. Systems Used for Defect Fuel Detection and Localization
4.1. Gaseous Fission Products Monitoring System (GFP)
The GFP Monitoring system is designed to moni-tor continuously the Primary Heat Transport System (PHTS) for the activity concentrations of Kr-88, I-131, Xe-133, Xe-135 and for the gross gamma activity. The measured values are trans-mitted to the station Digital Control Computers (DCC) to be displayed at Control Room Operator demand.
The system consists of two sample lines, each corresponding to half of the PHTS fuel chan-nels. In each of these lines, the coolant sample is passed along the front of a gamma spectroscope (Germanium pure) that measures the concentra-
tion of the four mentioned isotopes (see Figure 4).The GFP Monitor is able to determine which of
the two PHTS loops is likely to contain the fuel fail-ure. The sample transit time is around 15 minutes, allowing the unwanted short-lived isotopes to be removed by radioactive decay. During normal op-eration, the system measures both samples lines at the same time. When operators observe an in-crease in activity, they use a handswitch to direct the fl ow from one PHTS loop into both sample holders (this handswich has four positions: OFF, BOTH, CIRCUIT 1 and CIRCUIT 2).
The GFP system helps to determine: ● the number of defected fuel elements in the
core, ● the condition of defects at power, ● the time of defect deterioration and of uranium
release to the coolant, ● the level of tramp Uranium in the coolant.
In a defected fuel element, the fi ssion products move to the fuel-to-sheath gap where they can be-come trapped or migrate to the defect hole and escape to the coolant.
During normal operation, iodine is effi ciently removed from primary circuit by the ion-exchange columns of the purifi cation system. As this system usually works continuously, the iodine activity con-centration in coolant is normally very low. Due to a higher mobility in liquid water than in steam, it es-capes in large quantities from defective elements after a sudden reactor shutdown or a reduction in operating pressure or temperature in fuel cooling circuit. Thus, the iodine activity measured by GFP system in coolant has a spike. Consequently, if an iodine spike occurs after a reactor shut-down, it is a clear evidence that at least one fuel defect ex-ists inside the core.
Unlike iodine, noble gases are chemically inert and escape from defected fuel even through very small holes, providing an early indication of fuel failure. Generally, the release rate of noble gases through the defect hole depends on failed element power. For small defects, the release is slow, be-ing restricted by the hole size and a large fraction of the short-lived isotopes decay before release. Therefore, the ratio between coolant activity con-centration of Xe-133 (half-life of 5.3 d) and Kr-88 (half-life of 2.8 h) measured in coolant can provide information if the release is slow or fast. (For a slow releasing defect, this ratio is greater than 80 and, for a fast releasing one, it is between 12 and 15). Xe-133 has the highest cumulative yield and fractional release of all noble gases. Therefore, it is the best indicator for estimating the number of in-core defected elements.

674
Based on operating experience, a slow re-leasing defect in a fuel element operating at 40 kW/m will account for 5 to 20 MBq/kg of Xe-133 activity in coolant. (For a fast releasing defect, its activity concentration increases in coolant with more than 35 MBq/kg). Figure 6 shows the activity concentration response to a fuel defect occurred at Cernavoda NPP.
The measured coolant activities are affected by the presence of Uranium contamination inside the core. Tramp Uranium is mainly released from large defects, but it also may be present in small quantities as a contaminant on the surface of fresh fuel bundles. Once in core, it will tend to deposit on fuel surface downstream the fuel defect or on inner wall of the pressure tube. While in the core, tramp Uranium will undergo fi ssion and it remains active for a long time, becoming the main source of the background signal for the fi ssion products monitored by the GFP system.
The quantity of tramp Uranium present in core can be estimated based on coolant activities mea-sured while the core is free of fuel defects and the activity concentrations are at equilibrium. It is esti-mated that one gram of tramp Uranium distributed uniformly inside a CANDU-6 core has a contribu-tion of about 0.8 MBq/kg to the Xe-133 activity measured in coolant and the Xe-133/Kr-88 activity concentration ratio is between 2 and 3.
On the other hand, the GFP system indication is compared with the Chemical Lab analysis. Grab Samples are taken and measured by the Chemi-cal Lab every week. This process is implemented as a back-up verifi cation, to eliminate any doubt on the presence of fuel defect in core /3/.
4.2. Delayed Neutrons Monitoring System
For fuel defects localization, Cernavoda NPP uses the Delayed Neutron system (DN) which measures the activity of delayed neutrons emitted from short-lived fi ssion products, such as I-137 (24.5 s half-life), Br-87 (55.65 s half-life) and Cs-141 (24.84 s half-life) on coolant samples taken from the outlet feeder of each fuel channel. On each side of the reactor, sample lines (taken from half of the core channels) are collected in tanks located in two rooms (one quarter from Loop #1 and one quarter from Loop #2, respectively) and connected to sample coils arranged in two-layer array inside a water fi lled tank that serves as moderator. The sample coils wind around dry well tubes. Each dry well has two sample coils, one on top to the other. A computer-controlled carriage moves six BF3 counters above the water tank and
lowers the detectors into sample coil dry wells. To minimize interferences, the neighboring detectors take measurements one inside an upper coil and the other inside a lower coil (see Figure 5). The length and diameter of sample lines are designed such as the coolant transit time from a channel to its sample coil is around 45-50 seconds. This delay is required to reduce interferences of the photo-neutrons produced by interaction between heavy water and gamma radiation emitted from N-16 and N-17 decay.
At CANDU-6 reactors, a full core scan is per-formed in about 3-4 hours. At Cernavoda NPP this is done routinely. The normal frequency is one full core scan every week but, when a fuel defect oc-curs, the frequency is increased to twice per week or more, as required. A database with the count rate measured on each core channel is continu-ously updated. For each core channel, a discrimi-nation ratio is defi ned as the ratio between the count rate measured from that channel and the average of the count rates from all channels from the same cooling loop measured by the same DN detector (a group of 15 or 16 channels). The chan-nel is considered to be “suspect” of containing a fuel defect when its current discrimination ratio deviates by more than 2 sigmas from its “histori-cal” value, i.e. the average of the values recorded at that channel within the past period (usually, within the last few months, up to one year). See Figure 9.
Figure 7 shows the DN signal response for a “suspect” channel. Usually, “suspect” channels are monitored for a period of time prior to decide their refueling to discharge defective fuel. Within this period, information provided by the DN sys-tem is correlated with data provided by GFP sys-tem to diagnose the defect status. A fast release of large quantities of fi ssion products is an indica-tion of a large defect at a fuel element operating at high power. Such defects may quickly deteriorate and, eventually, release tramp Uranium. To avoid the risk of PHTS long term contamination, the suspect channel must be refueled with high prior-ity. On the other side, a small defect that releases only small quantities of fi ssion products may be tolerated for a while inside the core. Usually, small defects which allow the ingress of a small quantity of coolant inside the fuel-to-sheath gap need sev-eral weeks prior a secondary hydriding damage. It is not uncommon that a pinhole defect to release noble gases (and hence, to be detected by the GFP system), but almost no halogens. Such de-fects are diffi cult to locate by the DN system prior the fuel element fails due to secondary hydriding damage /4/.

675
5. Fuel Defects Removal Confi rmation
During a normal refueling, eight of the twelve bun-dles present in a channel are replaced with fresh fuel. Therefore, when a channel is refueled to re-move a fuel defect, it is important to have a meth-od to confi rm that defected bundle was indeed un-loaded from the core. If left behind, in a low power position, near the channel end, the defect might be diffi cult to detect by DN system and it might re-lease Uranium, contaminating the primary circuit.
There are various techniques to confi rm that the defective bundles were discharged from the core.
5.1. Single Channel Monitoring with DN Sys-tem During Suspect Channel Refueling
During a channel refueling, the fuel bundles are loaded/unloaded in pairs. As the pair containing the fuel defect moves towards the channel outlet, the DN signal follows the power profi le along the channel. Eventually, it drops and stabilizes at a certain level when defected bundle is transferred onto the Fuelling Machine (FM) magazine. By correlating the DN signal trend with the refueling sequence, the pair containing the defect can be identifi ed.
5.2. Monitoring the Signal from Alarm Area Gamma Monitor (AAGM) Unit Located Near the Drain Tank of the Fuelling Ma-chine while Bundles are Transferred to the Pool
After the FM disconnects from the fuel channel, pressure and water level inside FM are lowered to allow the transfer of irradiated fuel to the pool. If a defective bundle is present inside one of the FM magazines, it releases fi ssion products and activ-ity level within the FM cooling circuit will increase until the pair of bundles containing the defect is transferred to the pool. Figure 8 shows how the AAGM unit located near the FM drain tank re-sponds during the transfer of a defective bundle located in the second pair transferred.
5.3. Monitoring the Signal from AAGM Unit Located in the FM Room while Irradiated Bundles are Transferred to the Pool
During the short period in air, irradiated fuel heats-up and, if defective, residual amounts of fi ssion
products are released, remaining air borne after the transfer of the defective bundle. Consequent-ly, the background activity measured within the Fueling Machine room increases after the pair containing a defective bundle is transferred to the pool. Figure 8 shows the trends during the defec-tive fuel transfer to the pool. In this case, the de-fect was confi rmed on one of the bundles from the second pair transferred.
5.4. Visual Inspection of Fuel Bundles in the Spent Fuel Bay within a Few Days after Discharge from the Core
This activity requires special tools for underwater visual inspection. The main parts are: a telescope with a digital camera mounted on it and a mecha-nism to manipulate the irradiated bundle under-water.
Unfortunately, only elements located on the outer ring can be inspected. Even if on the out-er ring no defects are detected, traces of fi ssion products released from an failed inner ring could appear. This is a indication that the bundle visual examined is defective.
6. Cernavoda NPP Defects Experience
During the fi rst two years of commercial opera-tion, Unit 1 recorded only 12 fuel defects. Other 2 defects were identifi ed within the next two years. This rate is typical for a unit in its early period of operation. Despite efforts made during commis-sioning to clean the PHTS, it is not uncommon that a small amount of debris to remain in the coolant and cause fuel defects during the early stage of plant operation.
Since at that time, there were no tools avail-able at Cernavoda for visual inspection of dis-charged fuel in the Spent Fuel Bay, no further in-vestigation were possible. Most likely, the cause of those defects was debris fretting.
After that initial period, at Unit #1 followed a period of more than 6.5 years with no fuel defects. The activity of all isotopes measured in coolant has decreased close to the system detection limit (below 0.5 MBq/kg) and no spikes were recorded after reactor shutdowns or other power maneu-vers.
In spring 2007, there was evidence that a fuel failure has occurred inside the core. The Xe-133 activity increased in the coolant and, soon a “sus-

676
pect” channel was identifi ed with the DN system.In June 2007, the “suspect” channel was refu-
eled with the standard “8-bundle shift” but, during the bundles transfer to the pool, the AAGM units did not confi rm that fuel defect was discharged. It was concluded that the defect was still in core. This hypothesis was supported by the trend of DN signal from the “suspect” channel which contin-ued to increase (see Figure 9). The defect was discharged at mid-September, when the channel was fueled with other 4 bundles. The defective bundle was identifi ed on the pair of bundles in ini-tial positions 3 and 4, and moved to positions 11 and 12 after the fi rst attempt.
Two defects were unloaded from Unit #1 core in 2008 and seven in 2009.
The period of excellent fuel performance at Unit#1 ended when Unit #2 reached full power for the fi rst time in September 2007. After one month of operation Unit #2 was shutdown for a two-week outage. After the reactor shutdown, the coolant activity had a spike of around 4 MBq/kg for I-131 and, of around 10MBq/kg, for Xe-133, indicating the presence of at least one defect inside the re-actor core. Unfortunately, during the fi rst months after commissioning, the DN and GFP systems had many operational problems (GFP readings were noisy, some DN counters failed and had to be replaced). This prevented gathering data nec-essary for an early location of fuel defects. Be-sides, as defects occurred very early in the plant life, there was no historical reference available to compare the DN signal from the channels. Un-der these circumstances, priority was given to the channels with a high DN signal and a fast in-creasing trend. After few refueling operations per-formed, it became evident that a systematic fuel failure problem existed and the refueling rate of suspect channels was increased.
At the beginning of 2008, for the fi rst time, the refueling of a channel with a very high DN signal and, probably, releasing uranium did not confi rm a defect. Moreover, the channel DN signal did not respond during refueling. However, it was decided to proceed with a second visit for discharge the last four bundles left in the channel. As, again, the defect did not confi rm, it was concluded that the channel sampling coil was mistakenly connected to the sample line from other channel.
During the following three month, defects re-moval continued at a rate lower and lower. Conse-quently, the Xe-133 activity in coolant decreased to around 1.5 MBq/kg. In the second half of 2008, only one fuel defect was identifi ed.
Routinely, the reactor core GFP count rate
and fi ssion products activity are monitored as per procedures. Every two weeks, the operators per-form the DN scan and data acquisitions routine. Based on these data, the trends are prepared and interpreted to identify possible in-core fuel de-fects. When a defect suspicion exists, the routine is executed more frequently.
Most fi ssion products are trapped within the fuel pellet matrix and only a small fraction passes to the gap between pellet and fuel clad. At high power (when pellet temperature exceeds 10000C), noble gases have an increased mobility and eas-ily escape from pellets into the gap and then (if a clad defect exists) into the coolant. Iodines also escapes from pellets, but under steady operating conditions tend to deposit on fuel element inter-nal surfaces. If a fuel defect exists, coolant can enter inside the defective element and dissolve soluble fi ssion products (including Iodines). Under transient conditions (caused by a sudden change in power, temperature or pressure) this coolant is expelled from defective fuel elements and Iodines escape into PHTS in a high burst. If the break size is large enough, Uranium can also be released.
The main concern regarding operation with defective fuel is the high gamma radiation fi eld around the PHT system components, which in-creases occupational exposure during plant op-eration and outages. Therefore, defective fuel has to be removed from the core as soon as possible. However, we must be aware that there will be al-ways a delay between the moment when the fuel becomes defective and the moment when defec-tive bundle is unloaded from the core. Depending of the situation, this delay may range between few days and few weeks.
In some unusual situations, many fuel failures occur at the same time and the Xe-133 activity level can increase excessively. Continued opera-tion under these circumstances might lead to deg-radation of existing defects and/or an increased Uranium release. Also, there is a potential risk that in case of a large power transient (like a reactor shutdown) initiated from these conditions, the io-dine activity in PHT to spike and exceed the regu-latory limit of 500 MBq/kg.
In order to reduce this risk, the reactor power must be decreased to bring the fuel pellets tem-perature below 10000C and most of the fi ssion products to remain trapped inside the fuel pellets.
When the Xe-133 activity in coolant exceeds 200 MBq/kg, as per procedure, the operator shall begin derating the reactor power in increments of 5%FP, at a rate not higher than 1%FP per hour. After each 5%FP reduction, the power must be

677
kept constant for a while until the Xe-133 activity falls below 200 MBq/kg or is at least declining. If the reactor power has been decreased to 80%FP and Xe-133 activity is still increasing or exceeds 240 MBq/kg, the reactor shutdown shall be con-sidered.
Reactor operation shall continue at a reduced power level, for performing DN scans and refuel-ing the channels suspect to contain defective fuel. Power increase shall be considered only after all suspect defective fuel has been unloaded from the core and the Xe-133 activity is steady or declining. This will be performed in increments of 5%FP, at a rate no higher than 1%FP/hour. After each step of 5%FP increase, the rector power must be held constant for a while and the Xe-133 trend must be monitored. If the Xe-133 activity in coolant is increasing and tends to exceed 200 MBq/kg, the power increase shall be discontinued and a DN scan shall be performed to locate defective fuel. If suspect channels are identifi ed, they must be re-fueled before resuming the power increase. (The power increase is not allowed if the Xe-133 activ-ity is not steady or declining) /2/.
7. Root Cause Analysis
Due to the large number of fuel defects occurred at Unit #2 in a relatively short time, an investiga-tion was initiated to determine the cause and to take corrective actions.
Investigation started with the underwater visu-al inspection of 102 suspect bundles discharged from Unit 2 core between October 2007 and May 2008.
The results of the inspection showed that de-fects due to debris fretting were distributed in both loops. No case of debris caught on endplates or end-caps was identifi ed but it was one case of a bundle with a piece of debris wedged between fuel elements. Although the source of debris was not identifi ed, the fretting marks observed on fuel sheaths suggest that debris particles were large enough (1-2 mm) to get wedged between fuel ele-ments or between the fuel elements and pressure tube. Also, there was evidence that some particles were trapped downstream of the bearing pads, which is unusual. It is not clear how they could get there after the fuel loading, unless they were stacked since fuel manual loading into the core.
Based on experience, the fretting by debris was responsible for most failures. The fuel defects would be preferentially located in channels that are more likely to collect debris in the PHTS. Fuel
channels in this category would have inlet feeders connected along the bottom of the inlet header or near HTS pump outlet lines, where pieces of de-bris are more likely to be found (see Figure 10).
It was studied also the radial distribution of failures over the bundle outer ring. Conclusion was that defective elements were located espe-cially towards the bottom of the bundle, with the highest frequency on fuel elements, on both sides of the four element bearing pads that support the bundle on pressure tube. This suggests that de-bris particles were dense enough to settle even under the high coolant fl ow conditions in the chan-nel and that fretting damage was caused by ele-ment vibration against a debris particle.
Most manufacturing defects were produced by bad end-cap welds. However, it cannot be completely eliminate the excess hydrogen gas as a cause of some defects. Some fuel elements had hydride blisters along the sheath, but only few bundles had elements with hydride blowouts. These were discharged from the core after the de-fective elements operated long enough at power and exceeded a burnup of around 40 MWd/kgU.
Manufacturing defects were distributed in both cooling loops with a higher frequency in channels from the upper region of the core row (E and F). A statistics on failed bundles due to manufacturing causes revealed that most of these bundles were produced during the summer of 2006 and, all the others been produced at least one year earlier. The fuel bundles manufactured in 2006 were the last delivered to the plant. Since the storage racks were almost full, many pallets containing this fuel were stored on the new fuel room fl oor. When the manual fuel loading started, this fuel was loaded on rows E and F. From a total of 1340 bundles from this lot, loaded with the fi rst charge, 53 were discharged with confi rmed defective fuel ele-ments.
8. Measures Taken to Achieve the Zero Defects Target
During the fi rst year of Unit #1 operation (1997), a number of 12 (twelve) fuel defects were dis-charged. This is a normal situation for a young CANDU Power Plant, due to the higher probability to accumulate debris into PHTS, during the com-missioning activities.
This fact was proved later, after the fuel chan-nels cleaned-up by the refueling process and de-bris retention in the strainers. A root-cause analy-sis couldn’t be performed because, by that time,

678
the technical means for defective fuel inspection were not available.
The long period that followed (about 7 years) with no fuel defect supplied a consistent argument to consider that the fi rst defects were caused by the debris left in the PHTS during commissioning.
In 2007, after Unit #2 was put in service, an excursion of defects occurred at both units. It was suggested a fabrication problem, especially for the fuel produced in 2006. The suspicion was plausible as the manufacturer reorganized the fabrication process to increase production.
Therefore, actions were taken to investigate and determinate the cause which conducted to the fuel deterioration and to implement adequate corrective measures.
Two sets of visual underwater inspection tools were purchased, one for each unit, and the per-sonnel was trained to operate them. Unfortunate-ly, the underwater inspection is not fully effective, because just the outer ring of fuel elements can be visual inspected. For many defective bundles, the failures were proved to be caused by the de-bris present in the coolant. This failure mechanism was indicated by the traces left on the sheath due to interaction with foreign particles carried by the coolant and, sometimes blocked between fuel ele-ments.
Beside operation-induced failures, the under-water visual inspection leads to the conclusion that some fuel defects were caused by manufac-turing issues.
Consequently, an audit was organized at the manufacturer. The audit team, with participation from both the NPP and the manufacturer, focused its investigation on fabrication and quality inspec-tions activities. There were identifi ed signifi cant changes in production and quality inspection plan-ning, in staff organization, in equipment and tech-nology supply, in procurement activities, changes that could lead to fuel failures during in-core ir-radiation.
During the audit, verifi cations were performed on fuel element cladding received at the manufac-turer site to check its quality.
Because, during underwater visual inspection of the fuel bundles suspect of defect, unconform-able end-cap welds were identifi ed, special atten-tion was paid to the end-cap welding process.
Acceptance criteria were verifi ed for: ● End Cap Machining, ● End Cap Cleaning, ● CANLUB Coating and Curing,
● Chamfering and Tube Cleaning, were met.The investigation showed that the end-cap weld-ing process was performed within the acceptance criteria.
Investigation was performed also from the point of view of human error. It was proved that the staff involved in the end-cap weld process had more than 10 years of experience while fuel bun-dles suspect of failure due to end-cap weld uncon-formity were not produced during certain shifts or from certain welding machines.
The only unconformity found in the end-cap welding process was the misalignment found, at one of the welding machines, during the “end-cap weld peel failure test”. The audit team recom-mended that all fuel bundles produced during the period of unconformity should be quarantined at the plant and shipped back to the manufacturer.
Part of the corrective action program, recom-mended by the Root-Cause Report, was the issue of the “Fuel Surveillance Program at Cernavoda NPP” procedure. This procedure emphasize the on-site nuclear fuel surveillance starting with re-ception until its discharge from the reactor core and store in the Spent Fuel Bay.
This document states the main stages to be followed for maintaining fuel performance:
● Fresh fuel inspection, during reception, ● Inspection before loading the fresh bundles
into the reactor core, ● Reactor core monitoring for fuel defects de-
tection and localization, ● Monitoring of channels suspect of containing
defective fuel bundles, ● Monitoring of underwater visual inspection of
the suspect fuel bundles discharged from re-actor core,
● Root-Cause Analysis on failure mechanism.Beside the audit at the manufacturer and conse-quent actions taken, investigations were also per-formed at the power plant and adequate actions were taken.
The main cause of operating-induce failures is given by the debris carried through the PHTS. To diminish the effect of this failure mechanism, an extensive process of cleaning of the cooling circuit was implemented:
● For an extended period, additional strainers were mounted within the PHTS;
● Procedures for identifi cation, collection and analysis of macroscopic particles deposition on the fuelling machine head, spent fuel ladle, fuel bundle trays and within spent fuel bay;

679
● Procedures were issued for the coolant chem-ical control (results and data records being presented in an annual report);
“Foreign Material Exclusion Area” was declared for zone with high risk of contamination of PHTS with foreign materials.
The cleanliness achieved in the PHTS, after the mentioned action taken, is confi rmed by the lack of corrosion or oxidation traces on fuel ele-ment sheaths, rent evident during underwater vi-sual inspections.
Even if the number of fuel defects recorded a consistent decrease, special attention is paid for clarifying the failure mechanisms. Consequently, it was decided to send suspect bundles for Post Irradiation Examination (PIE).
Until now, two fuel bundles were examined in the hot cell. They were subject to both destructive and non-destructive examinations.
For one bundle it was discovered a micro-structural defect in the sheath material, thus a fail-ure precursor unidentifi ed by the Zircaloy tubes manufacturer.
For the other bundle, the examinations proved that “debris fretting” caused the sheath failure.
From 2010, the number of fuel defects signifi -cantly decreased (an average of one defect/year).
It shows that measures taken set the plant on the right track to achieve the “zero-defects” target.
9. Conclusions
Since commissioning, both Cernavoda NPP units experienced fuel defects during operation.
Two main failure causes were identifi ed: ● Manufacturing (inadequate end plug-sheath
weld), ● Operating (debris fretting).
Historically, plant experience and technical means of investigation constantly improved:
● In the early stage of Unit #1 operation, the lack of investigation means, prevented the plant from identifying neither the defect type, nor the defect cause.
● After Unit #2 commissioning, due to the de-fect excursion during the early stage of op-eration, measures taken such as technical audit at the fuel manufacturer , purchasing of
Underwater Inspection Tools, PIE for suspect bundles, allowed identifi cation of defect types and causes.
In conclusion measures taken led to a consistent decrease of the fuel failure frequency.
● At Unit #1, over 19 years of operations, out of 100958 irradiated bundles, a number of 29 fuel defects were recorded, equivalent to a failure rate of 0.029%.
● At Unit #2, over 8 years of operation, out of 43180 irradiated bundles, a number of 67 fuel defects were recorded, equivalent to failure rate of 0.155%.
Regarding the fuel in-core operation, note that: ● All discharged fuel bundles were mechanically
sound (no occurrence of fl ow blockage or cor-rosion fl ow),
● No occurrence of incidents related to the Fuel-ling Machine to fuel interface,
● High quality of coolant chemistry (no corrosion on discharged fuel bundles).
Both in fuel manufacturing and in plant operation, consistent and signifi cant efforts are done the keep the high standards needed to achieve the “zero-defects” target.
References
[1] Fuel Design Manual, 81-37000-DM-000, Rev. 1, January 1995
[2] S. Livingstone – SOTAR, Chapter 2.1 “Defect Root Causes”, COG-08-2075, Rev. 0, February 2009
[3] Gaseous Fission Product Monitor Design Manual, 79-63103-DM-000, Rev. 0, 88-04-20
[4] Failed Fuel Location System Design Description, 79-63105-DD-000, Rev. 1, 79-11-01
[5] A. Manzer, P. Valliant, E. Suk, J. Pyoli – Root Cause Investigation of Fuel Failures at Cernavoda 2, 82-37000-RCA-001, April 2008
[6] M. Mincu etc – Examinarea post-iradiere a fascicu-lului #GK964F1 iradiat in Unitatea 2 de la CNE Cer-navoda, Raport Nr. 10107, Octombrie 2013
[7] M. Mincu etc - Examinarea post-iradiere a fascicu-lului #HE386F1 iradiat in Unitatea 2 de la CNE Cer-navoda, Raport Nr. 10490, Noiembrie 2014
[8] D. Stanila – Program supraveghere performan-te combustibil nuclear la CNE Cernavoda, SI-01365-T014, Rev. 1, Decembrie 2011.

680
Figures
Figure 1. CANDU 6 reactor assembly1. Calandria2. Calandria End Shield3. Shut-off and Control Rods4. Poison Injection5. Fuel Channel Assemblies6. Feeder Pipes7. Vault
Figure 2. The heat transport system separated in two loops

681
Figure 3. Fuel Bundle Components
Figure 4. A schematic diagram of the gaseous fi ssion product monitoring system in Candu-6
Figure 5. a schematic diagram of a scanning room for the delayed neutron system in a CANDU-6 reactor

682
Figure 6. Specifi c activity in coolant during defect
Figure 7. DN count rate for channel L05 Excurtion at unit #2

683
Figure 8. AAGM trend at L05 defective fuel discharge
Figure 9. DN discrimination ratio evolution for channel L05

684
01 02 03 04 05 06 07 08 09 10 11 12 13 14 15 16 17 18 19 20 21 22
A A
B B
C C
D D
E E
F F
G G
H H
J J
K K
L L
M M
N N
O O
P P
Q Q
R R
S S
T T
U U
V V
W W
Loop #2 Loop #1
Figure 10. Channels susceptible to collect debris
Figure 11. Defects number at unit #1 and unit #2

685
Figure 12. Defect on bundle # GK964F1 Figure 13. Defect on bundle #HE386F1