Embed Size (px)
Citation preview
Vol. 4, No. 3 International Journal of Business and Management
70
On the Added Value of Firm Valuation by Financial Experts
Dan Elnathan
School of Business
The College of Management
Rishon Lezion 75190, Israel
E-mail: [email protected]
Ilanit Gavious (Corresponding author)
Guilford Glazer School of Business and Management
Ben-Gurion University
PO Box 653, Beer-Sheva 84105, Israel
Tel: 972-8-6477538 E-mail: [email protected]
Shmuel Hauser
ONO Academic College and Guilford Glazer School of Business and Management
104 ZAAL st., Kiryat ONO 55000, Israel
E-mail: [email protected]
The authors thank Roni Amichai, Simon Beninga, Oded Sarig, seminar participants at the ISA, Ramy Elitzur, Gus De Franco, Phil Shane, Sanjai Bhagat, Gitit Gur-Gershgoren and seminar participants at the University of Colorado, Boulder, for their helpful comments.
Abstract
This paper is motivated by the recent concern raised by the SEC and other Securities Commissions around the Globe
that financial analysts are not impartial. The question addressed is whether expert valuations provide unbiased
information to shareholders and other stakeholders, and contribute to full disclosure. We examine the added value of
expert valuations and their relationship to insider holdings based on a unique sample of 44 closely held companies listed
on the TASE that were appraised by financial experts for transactions outside of the Exchange. These valuations are
part of the full disclosure requirements in the case of extraordinary transactions. Each expert valuation is assessed on
the basis of pre- and post-valuation data. Our key findings are: (1) expert valuations are 29% higher than market values
and significantly affected by insider holdings; (2) there is a systematic upward bias in cash flow and cost of capital
figures projected by experts; (3) expert valuations are not impartial; while they are supposed to provide an independent
expert opinion, they are in fact biased towards majority shareholders who hired them to value the firm; (4) in the
short-run investors respond cautiously to expert valuation; in the long-run, however, the over-valuation appears to be
followed by destruction of value that is related to the firm's ownership structure.
Keywords: Insider holdings, Firm valuation, Financial experts, Insiders
1. Introduction
A recent IOSCO (International Organization of Securities Commissions) press release notes that securities analysts play
an important role in global markets by helping investors make sense about information of publicly traded companies.
However, these securities analysts are frequently "sell-side" analysts and therefore were criticized in many countries
because conflict of interests can potentially bias their research and recommendations. According to Jensen (2005), in
many cases when managers chose to defend unjustified overvaluation of their firm they ended up destroying part or all
of the core value of the firm. (Note 1)
International Journal of Business and Management March, 2009
71
Valuation of companies represent the “state of the art” in modern finance and accounting because of the need to resolve
theoretical and empirical problems related to the analysis of financial statements, estimation of the cost of capital and
prediction of future cash flows. Extant research does not thoroughly examine the whole range of factors that influence
the valuation results (see, e.g., Bowers, 2002). In this paper we use a unique sample of 44 closely held firms listed on the
Tel Aviv Stock Exchange (TASE) that were valuated by financial experts and for which a comprehensive data set was
carefully gathered. (Note 2)
The purpose of the paper is to examine the added value of expert valuations of companies that were performed in the
course of transactions such as mergers, acquisitions and private placements. In such cases, the Israel Securities
Authority (ISA - Israeli SEC) requires a full disclosure of the transaction including a justification for the price of
transaction to take place if it differs from market price. Customarily, majority shareholders that are on the sell or buy
side of the transaction commission an expert valuation to justify the transaction price. The need for such non-routine
expert valuations is often argued to be driven by management’s perception that full disclosure (argued by some to
simply be sophisticated data manipulation) of the procedure underlying the transaction would justify the price agreed
upon for the transaction. Also, it appears that management considers the expert valuation as a hedge against possible
litigation by outside shareholders. Both arguments rely on an implicit assumption that the experts performing such
valuations are impartial, have superior information, and possess better capabilities to interpret it. These assumptions are
examined in the study.
We question the benefits of such valuations of firms as part of the full disclosure requirements in the case of
extraordinary transactions, under the notion of an efficient market hypothesis. (Note 3) Following the concern raised by
IOSCO, the main hypothesis raised in this study is that these experts are not impartial; while they are supposed to
provide an independent expert opinion, they seem to be, in fact, biased towards majority shareholders who hired them to
value the firm.
The study expands on the existing literature. Its principal contributions lie in the comprehensive examination of a broad
range of factors that influence the valuation results, including insider holdings and specific factors that characterize the
company being valuated. For that purpose, each of the 44 firm valuations was examined meticulously, including use of
alternative valuation methods and a retroactive analysis based on actual data, using the Discounted Cash Flows (DCF)
method.
The paper proceeds as follows. Section 2 contains our literature review and Section 3 outlines the research design. In
Section 4 we present the data. The first important finding is that, on average, expert valuations of companies are 29%
higher than their stock market values.
In Section 5, we examine the hypothesis that the discrepancy between expert valuation and market value depends
mainly on insider holdings. We also examine whether the discrepancy is influenced by the identity of the parties
involved in the transaction, expert's reputation, the sector in which the company operates, firm size, share's liquidity and
market trend. The main finding is that the discrepancy is primarily influenced by insider holdings and by the identity of
the party to the transaction that commissioned the valuation.
In Section 6, we examine the hypothesis that the added value of expert valuations lies in their ability to obtain the
required information (including inside information) from the company, and use it competently in their valuations. Our
tests include reconstruction of expert valuations, where we employ the DCF method ex-post, using the realized cash
flows and cost of capital for years subsequent to the valuation date. This allows us to test directly the forecasting errors
experts made in their prediction of the company’s future cash flows and cost of capital. The main findings are: (1) a
systematic upward bias in the experts’ estimated cash flows and cost of capital; and (2) on average, the value obtained
by the experts was about 50% higher than ex-post value calculated based on realized cash flows and cost of capital.
These results reject the hypothesis that experts possess superior information or capabilities to interpret it. On the other
hand, the findings seem to support the claim that the added value of valuations for outside shareholders is limited, and
that such valuations are intended mainly to appraise the value of the firm for the majority shareholders involved in the
transaction. Thus, expert valuations do not seem to provide public shareholders and other stakeholders with unbiased
information that contributes to full disclosure of such transactions as per ISA requirements. Based on these findings, we
consider the observed price premium (29% divergence) to be “control premium”. This conclusion gains further support
in Section 7.
In Section 7, we examine the impact of expert valuations on share prices. Despite the 29% discrepancy between
companies’ expert valuations and their market value, on average, share prices did not change on the days surrounding
the publication of valuation results. We find, however, that the change in share price depends on the size of the
discrepancy and on share’s liquidity, suggesting that outside investors react cautiously to the valuation results. This may
indicate that outside investors are aware of the fact that the added value reflects primarily control premium. We also
find support to Jensen's (2005) claim that unjustified overvaluation of firms contributes to the destruction of their values
in the long-run.
Vol. 4, No. 3 International Journal of Business and Management
72
Summary and conclusions are presented in Section 8. The various findings are consistent with the findings of DeAngelo
(1990), and of other studies, that transactions such as takeovers, mergers and acquisitions are generally made at a price
different from the prevailing market price. The findings cast doubt on the objectivity of financial experts and therefore
on the benefits of expert valuations as part of the full disclosure requirements.
2. Literature review
Many of the studies dealing with the valuation of companies relate to routine valuations of companies whose shares are
traded on the exchange (e.g., O’Brien, 1998; De Bondet and Thaler, 1990; Lim, 2001). These valuations are performed
regularly by "sell-side" analysts employed by investment banks as part of their services to clients. Unlike these studies,
we focus on expert valuations commissioned by interested parties (buyers or sellers) as part of the process required for
execution of transactions that take place outside the exchange.
Additional studies focus on several important aspects of valuations such as the role of accounting data (e.g., Givoly and
Hayn, 2000; Barth et al., 1998; Francis and Schipper, 1999); models for equity evaluation (e.g., Ohlson, 1995; Ang and
Liu, 2001); the use of multiples (Liu et al., 2002); and governance structure premium (e.g., Smith and Amoako-Ado,
1995; Hauser and Lauterbach, 2004). Many of these issues have been addressed in DeAngelo (1990). She investigates
the discrepancy between the market value of companies and their intrinsic value in corporate control transactions. The
latter usually takes place according to a value significantly different from market value (e.g., Comment and Jarrell, 1987;
DeAngelo et al., 1984). DeAngelo (1990) finds that corporate control transactions have premiums of 50%+ above
pre-offer stock price. Brigham and Gapenski (1996), for comparison, report average premium of about 30% (20%) in
hostile tender offers (friendly mergers). They also report buyouts with premiums ranging from 60% to over 100%.
According to DeAngelo (1990), a company's market value differs from its intrinsic value because the former is based on
market assessment of managers’ inside information, and not on the actual inside information that managers have; hence
the need for independent expert valuations. However, according to DeAngelo (1990) there is a snag. Some claim that
these experts are “rubber stamps” to a price already determined by the company's directors.
The methods used to value public companies include discounted cash flows (DCF), multiples of market price to
accounting information, net asset value, and market value based on comparable transactions. According to DeAngelo
(1990), despite its prominence in the finance literature, the DCF method is not the only one that is being used because it
has several weaknesses. The main weakness lies in the method’s sensitivity to assumptions regarding future profitability
and the cost of capital. In their valuations, the experts may assign a greater weight to management’s (relative to their
own) estimates of future cash flows and cost of capital. DeAngelo argues that in order to increase the objectivity of their
valuations, financial experts are supposed to base their analyses also on data obtained from external sources and avoid
using a single valuation method. Specifically, she examines which valuation methods were used by four different
experts who provided fairness opinions for corporate control transactions. She finds significant discrepancies between
values obtained according to different methods of valuation, and that the results of DCF are highly sensitive to the
assumptions regarding the terminal value. These issues are being examined here. The paper expands on DeAngelo’s
1990 study and others. It contributes to the literature by systematically examining a whole range of factors that
influence the experts and their valuation results, as well as exploring the added value of these expert valuations.
3. Research methodology
In the first phase of the study, we examine the effect of a broad range of factors on the discrepancy between the
company’s expert valuation and its market value. We employ specific factors that characterize the valuated company
(size, industry, corporate governance), factors related to the transaction for which an expert valuation was
commissioned (type of transaction, transaction with insiders vs. transaction with outsiders), factors related to the expert
valuation itself (valuation method, expert's reputation), and market factors (market trends). We then seek to investigate
whether the demand for expert valuations of closely held companies stems from the need to value the control premium
for the majority shareholders involved in the transaction. To that end, we perform Theil’s analysis of variance by
forming two groups of variables: (1) corporate governance (represented by the percentage holdings of insiders and a
dummy variable for transactions with current insiders); (2) firm's-specifics variables that characterize the company, the
transaction and the market at time of transaction – valuation method, industry sector, size, market trend, trading volume
and expert's reputation.
In the second phase of the study, we move to explore whether the discrepancy between expert valuations and market
values derives also from the superior ability of experts to obtain information and use it competently. We estimate
experts' prediction errors based on the differences between predicted and realized free cash flows (FCF) and cost of
capital for each company during the five years following the expert valuation. Then, we use these figures to compare
the value obtained by the expert to that obtained by reconstruction of the companies’ value using DCF method.
Calculation of realized FCF for each of the five years subsequent to the expert valuation is shown in Appendix. Starting
in the sixth year we estimate a normalized level of FCF that would grow at a constant rate to perpetuity. (Note 4)
International Journal of Business and Management March, 2009
73
The normalized level of FCF is determined based on four different alternatives: (1) FCF in the fifth year; (2) average
FCF in the fourth and the fifth year; (3) average FCF in the third, fourth and fifth year (4) average FCF in all five years.
All FCFs used to calculate the normalized level of free cash flows are adjusted as follows: cash flows from discontinued
operations are deducted; investments in fixed assets are adjusted to the amount of depreciation and amortization in those
years; and investments in working capital are adjusted to the long-term growth rate. (Note 5) The realized cost of capital
was estimated based on the Capital Assets Pricing Model (CAPM), as CAPM is the model used by the experts in their
valuations. (Note 6)
Weights of equity and debt for the calculation of cost of capital are based on the company’s average capital structure
during the five years following the disclosure of the expert valuation. Systematic risk was estimated using the market
model in three ways: (1) estimate of industry versus the market; (2) assuming that = 1; and (3) estimate of the
company’s versus the market. In addition, we used the cost of capital employed by the expert in his valuation. was
estimated based on share prices and the corresponding share indices, in the five years following publication date of the
expert valuation. Discounting the firm’s free cash flows at the firm’s cost of capital results in the firm’s value of
operation (the enterprise value). To obtain the equity value we added the firm’s non-operating assets and deducted its
financial liabilities, as valuated by the experts. (Note 7)
The third stage of the analysis investigates whether and how investors in the stock market are influenced by expert
valuations. We use an event study methodology to examine investors’ response to the publication of expert valuation
reports. We estimate the abnormal returns using the market model, mtiiitit RR , where itR is the rate of
return on day t for firm i, mtR is the rate of return on day t of the market index, and it is the abnormal return for
firm i on day t. and are estimated using transaction data for the 210 trading days up to 30 days prior to the
announcement day of the transaction for which the expert valuation was commissioned. In order to examine the effect
of expert valuation on share prices around the time the valuation was publicized (“Day 0”), we calculated the average
abnormal return and the average cumulative abnormal return for the period starting 30 days preceding the date of
publication and ending 30 days following that date. We also examine to what extent the abnormal returns are influenced
by the publication of expert valuation reports and the degree of share liquidity. The range of 30 days preceding
publication was determined because during the process of preparing the reports of the prospective transactions and
expert valuations to the ISA and the TASE, corrections and clarifications are frequently required before it is released to
the public. Thus it is expected that if such influence on share prices exists, it will be present during the period directly
preceding the publication. Finally, from a long-term perspective, we calculate abnormal returns in the 3 years that
followed the date the expert valuation was published. To test the hypothesis raised by Jensen (2005) that there are
agency costs attached to firms that are substantially overvalued, we examine the effect of ownership structure (insider
holdings) on the extent of market value destruction throughout the years subsequent the expert valuation.
4. Data
The sample includes all 44 valuations that were performed by financial experts for firms whose shares have been
acquired during the period of 1991 through 1999. Specifically, these valuations were related to 23 mergers and
acquisitions and 21 private placements. The data include the documented valuations submitted by the valuator to the
person or body who commissioned it. The documents generally contain all the details needed for the valuation: the
company's industrial sector; the purpose of the valuation (the transaction for which the valuation was commissioned);
the parties involved in the transaction and the nature of their relationship prior to and after the transaction; whether the
transaction is with majority shareholders; and, who commissioned the valuation (buyer or seller). We also include a
variable to indicate the expert’s reputation, proxied by a dummy variable that equals ‘1’ if the valuation was performed
by one of three experts that together performed over 50% of the valuations in the sample, and at least three valuations
each. The dummy variable equals ‘0’ if it was performed by an expert that provided no more than two valuations in the
sample. In addition, we examine the assumptions, analyses and forecasts employed by the experts in their valuations;
the method or methods of valuation employed and the values obtained according to each method; the final value that
was determined for the company and the method or methods selected to determine it; and sensitivity tests of the results
obtained.
We also draw information from the financial statements published by the companies, starting from the year in which the
valuation took place and continuing in each of the five following years. These figures serve to estimate, ex post, the
forecasting errors made by the experts.
The market value and trading volume of the companies’ shares are extracted from trading guides published by the
TASE and the ISA. Missing data is taken from Predicta Ltd. Market value and trading volume are calculated on the
basis of the average share price and shares' trading volume, during the 90 trading days prior to the date of valuation. To
test the robustness of the results we also estimate market price based on the five days preceding the valuation date.
In order to identify the exact date on which the results of the expert valuations were disclosed to the public, we
collected the immediate reports submitted by the companies to the TASE, the ISA and the press regarding the
Vol. 4, No. 3 International Journal of Business and Management
74
transaction for which the valuations were commissioned. These reports are required by law and have to be filed with the
authorities immediately following significant events concerning the transactions. This information was found at the
TASE library and from the database in the Yif’at Capital Disk Co.
Finally, we used the ISA database of daily share prices, general share index and the sector index of the valuated
company, starting a year prior to publication of valuation results and ending five years following that date. These
figures are used for the event study to examine investors’ response to the valuation results, and for estimating, ex post,
the experts' forecasting errors of firms' cost of capital.
Insert Table 1
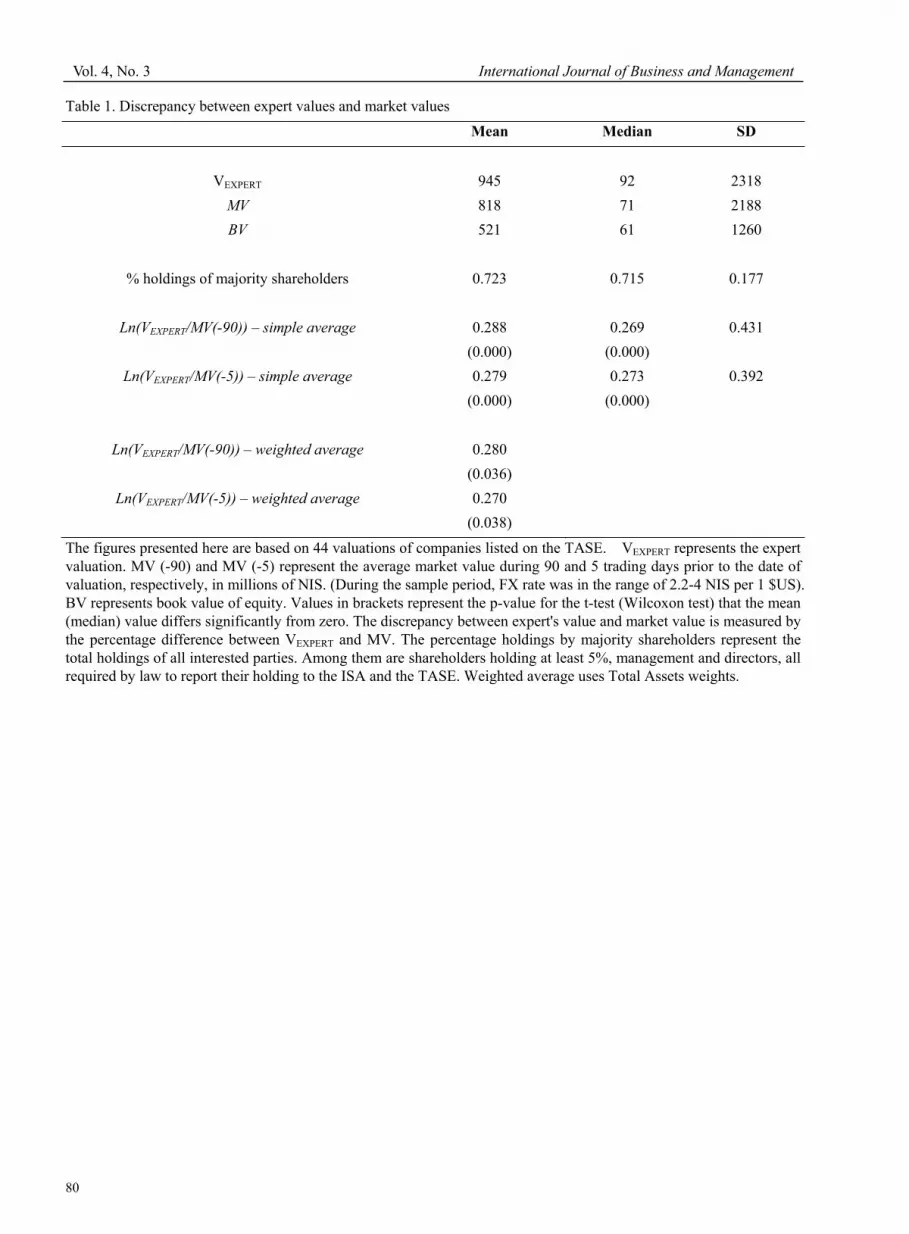
Table 1 describes the results of the expert valuations in the sample. The main finding is that the value of companies as
calculated by the experts is 29% higher than their market value (MV(-90)). This result does not change when market
value is estimated on the basis of average share prices during the five days prior to publication date of the valuation
results (MV(-5)). The difference between MV(-90) and MV(-5) is insignificant (p-value=0.963). (Note 8)
We also calculate a weighted average of the discrepancy between expert valuations and market values, using size (total
assets) weights. Remarkably, the result remains unchanged (a 28% discrepancy). We point out that in only 23% of the
cases, the expert valuation was lower than the market value of the company. Specifically, we find that in 34 cases,
expert valuations were 46.0% higher than firms' market values, on average, compared with 10 cases in which expert
valuations were 29.8% lower than firms' market values. Of the latter 10 cases, 9 were commissioned by insiders-buyers.
It should also be emphasized that in almost all of the 44 transactions, the actual price of the deal was identical to that of
the expert valuations. More specifically, in 43 out of the 44 expert valuations, the transaction price was equal to the
expert valuation. In one case, the transaction price was 6.5% lower than the expert valuation (57 compared with 61
millions of NIS). Hence, these valuations were the ending point when they were reported to the public, rather than the
starting point, for the negotiations between the parties selling and those buying. In other words, since the expert
valuation is meant to provide justification for the transaction price, his preliminary valuation is, in fact, indirectly part of
the negotiations and he or the parties involved may change their final valuation prior to reporting it to the public. This
finding was also observed by DeAngelo (1990) who argued that financial experts rely too heavily on the information
gathered from insiders. (Note 9)
In the following section we shall examine the factors that influence the valuation results, including the effect of insider
holdings and specific factors related to the valuated company.
5. Factors that may influence the discrepancy between companies’ expert valuation and market value
In this section we examine the hypothesis that the discrepancy between the company’s expert valuation and its market
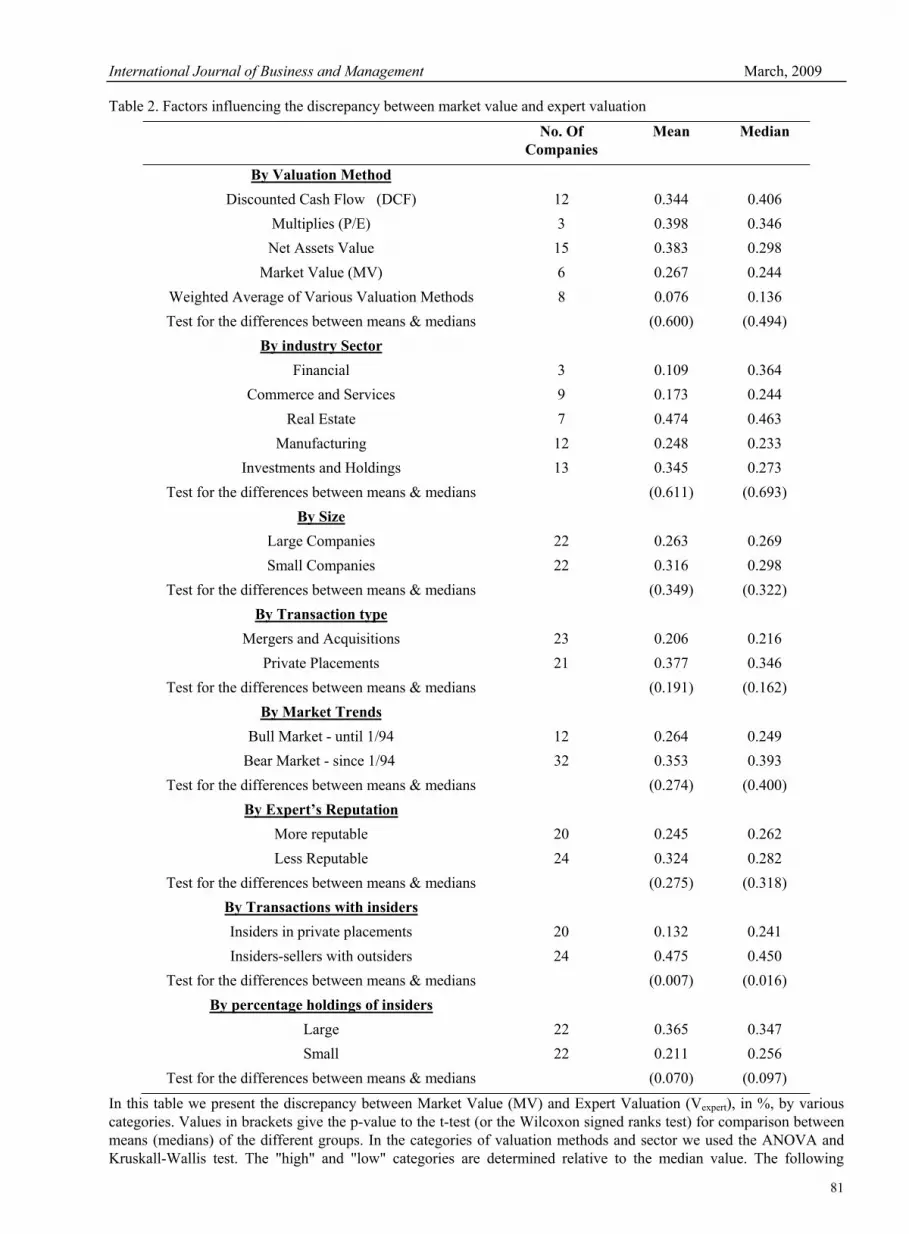
value is a function of specific factors that characterize the valuated company, including insider holdings. Table 2
presents the results.
Insert Table 2
The first finding is that the discrepancy between expert valuation and market value does not depend on the valuation
method used by the expert, the industrial sector in which the company operates, expert's reputation, size of the company,
transaction type or market trends. Notably, when we differentiated between the results of valuations that relied on a
single method (DCF, net asset value, comparable transactions of other firms, or multiples), and the results of valuations
that were obtained from averaging the results of several methods, the discrepancies in the latter were significantly lower
(p-value=0.081, not tabulated) than those obtained by a single method. This finding is consistent with DeAngelo's (1990)
claim that experts' objectivity requires them to rely on more than one method in their valuations.
When relating valuation results to market trends, the differences – though insignificant – indicate that the discrepancy
between expert valuation and market value is larger (smaller) when the market is trending downwards (upwards). We
also analyze the results according to the expert's reputation. Although there is no statistically significant difference
between the results, we find that for the more reputable experts, the discrepancy in the valuations was lower (24%)
relative to the group of 13 experts who performed a total of 24 valuations (32%). A possible explanation is the tendency
of the former to base their valuations on more than one method whereas the latter usually do with one.
The most important finding concerns the influence of insider holdings on the discrepancy between expert valuation and
market values. The results indicate that in companies where the holdings of majority shareholders are relatively high
(higher than the median), the discrepancy between expert valuation and market values is approximately 37%, compared
with 21% in companies where the holdings of majority shareholders is relatively low (p-value=0.07). This finding raises
the possibility that the need for expert valuation stems from the need to appraise the firm's value for the majority
shareholders involved in the transaction, and as such, these valuations are not intended for outsiders; i.e., outsiders
should not be affected by the expert valuations in their decision making. We shall see below that share prices did not
increase in response to the experts' upward estimated value suggesting that the added value of the expert valuations is in
International Journal of Business and Management March, 2009
75
appraising the premium of control that is not necessarily reflected in the price observed in the market. Thus, investors in
the market seem to realize that the valuations are aimed at the majority shareholders that are involved in the transactions.
This explanation gains further support from the fact that the bias in expert valuations is greater in transactions involving
insiders-sellers with outsiders than in transactions involving private placements to insiders-buyers. In transactions with
insiders-buyers the bias was (13.2%) and significantly lower (p-value=0.045) than in transactions involving
insiders-sellers (47.5%). This finding is mainly affected by who commissioned the valuation. It appears that smaller
bias in transactions involving private placements to insiders is when these insiders-buyers commissioned the valuation
and the larger bias in transactions involving insiders-sellers with outsiders is when the insiders-sellers commissioned the
expert valuation. (Note 10) These findings also support DeAngelo’s (1990) claim that financial experts rely too heavily
on the information gathered from those insiders.
At this stage, we further examine the hypothesis that the demand for expert valuations of closely held companies stems
from the need to value the control premium for the majority shareholders involved in the transaction. This premium
reflects, inter alia, the additional value that majority shareholders are willing to pay for the ability to control the
company’s activities (Hauser and Lauterbach (2004)). In such cases, an expert valuation is required if share prices in the
market do not include the control premium. The market value may include control premium if investors consider the
possibility of future contests for control that may lead to a demand for their voting rights by the parties interested in
acquiring control of the company. According to Smith and Amoako-Ado (1995), the higher the probability investors
attribute to such event, the higher the control premium embedded in the shares’ market price. In Israel, because of the
prevailing concentrated insider holdings of closely held firms, there are almost no such contests for control and
therefore the control premium finds expression only in transactions with insiders (Hauser and Lauterbach (2004)) and in
transactions with outsiders who acquire control of the company.
To estimate the overall impact of insider holdings together with other variables that characterize the company under
valuation, we perform Theil’s analysis of variance by forming two groups of variables. Insider holdings are represented
by the percentage holdings of insiders and a dummy variable for transactions with current insiders, which is assigned
the value of 1 when the transaction was with an insider on the buy-side and 0 otherwise. In the second group we include
firm's-specifics variables that characterize the company and the transaction - valuation method, industry sector, size,
market trend, trading volume and expert's reputation.
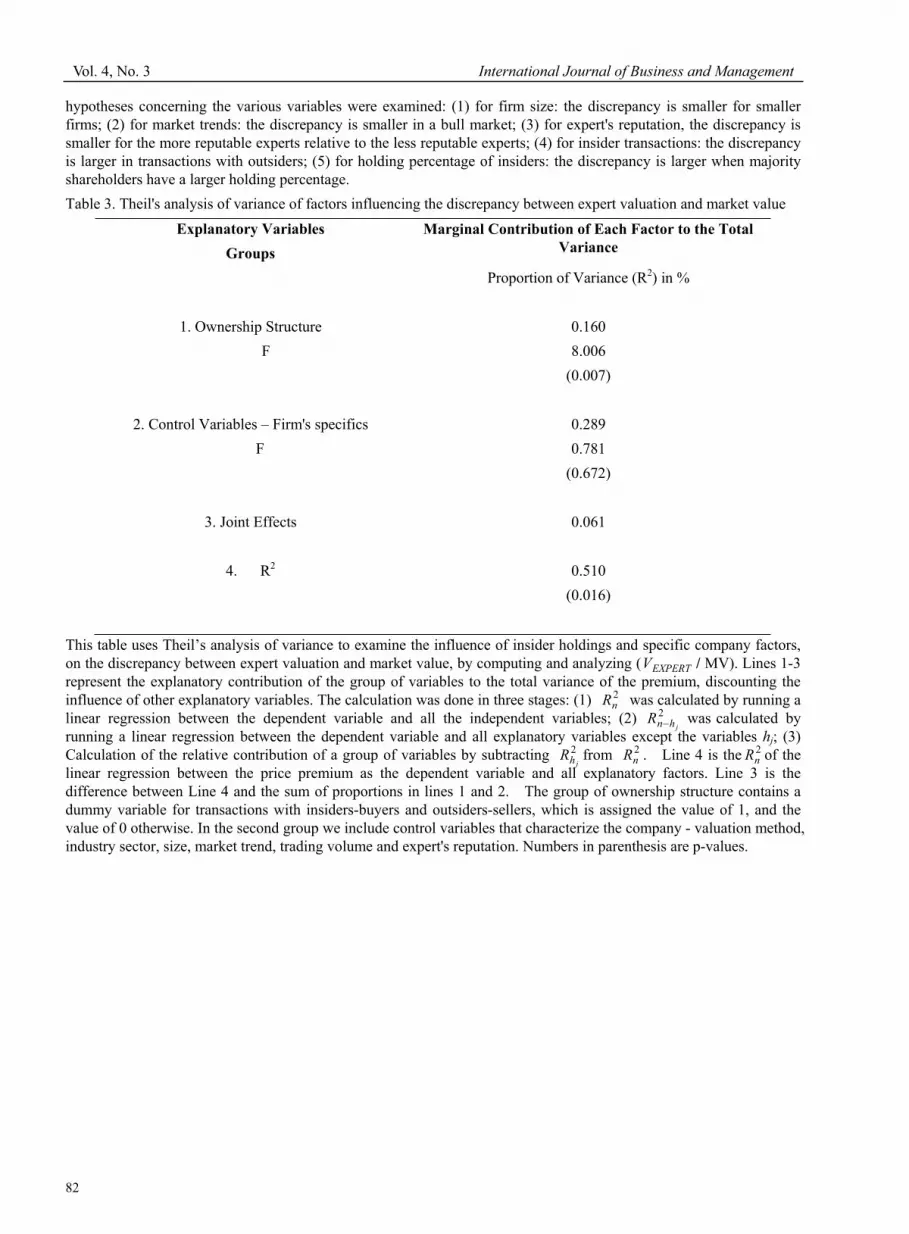
Insert Table 3
The results, presented in Table 3, indicate that the discrepancy between expert values and market values is significantly
affected by insider holdings. We find that this discrepancy is smaller for insiders-buyers. As a robustness check, we
repeat the Theil's analysis without grouping the control variables. In this setting of multivariate framework the relative
importance of the key individual variables is assessed, as these variables may not be independent. The results obtained
are qualitatively the same.
The findings are consistent with the assumption that share prices in the market reflect their value to the marginal
investor, who trades on the exchange but who is not involved in any other aspect of the firm’s activity. The results also
correspond to the findings of Hauser and Lauterbach (2004) that the value of voting rights derives mainly from their
value to majority shareholders. We tend to conclude, therefore, that expert valuations are primarily intended for
majority shareholders and not for outside shareholders. This finding gains further support in the following sections.
6. Does the added value of the experts derive from their superior information about companies?
In this section, we examine the hypothesis that the discrepancy between expert valuations and market values derives
also from the superior ability of experts to obtain information and use it competently. According to DeAngelo (1990)
this discrepancy may be due to the difference between market expectations and management expectations regarding
future cash flows. Hence, the added value of expert valuators depends to a large extent on their ability to gain complete
access to inside information from the company and to use it efficiently.
We estimate experts' prediction errors based on the differences between predicted and realized free cash flows and cost
of capital for each company during the five years following the expert valuation. Then, we use these figures to compare
the value obtained by the expert to that obtained by reconstruction of the companies’ value using DCF method.
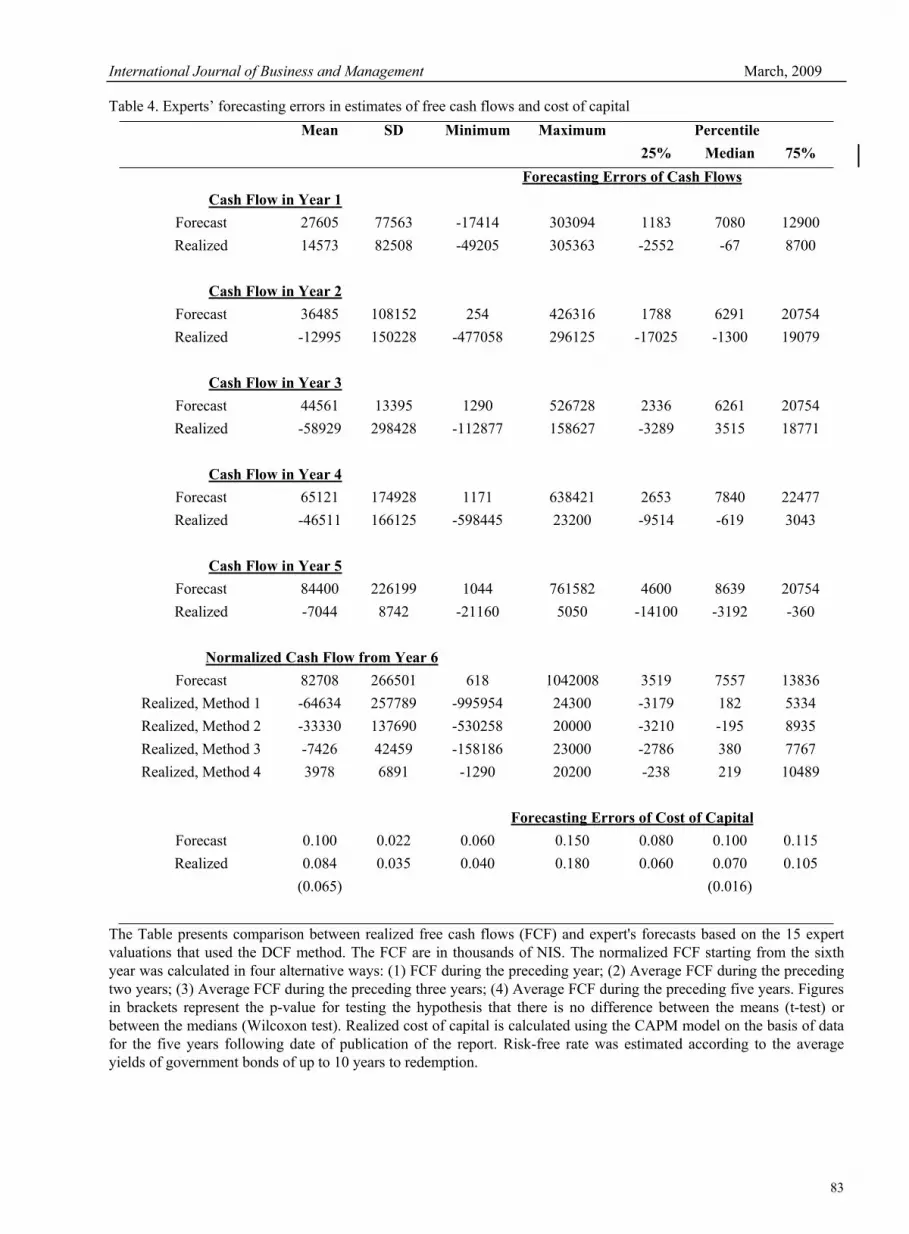
Insert Table 4
Table 4 presents the forecasting errors of cash flows and cost of capital, based on a partial sample of 15 expert
valuations that used the DCF method. The results show that the cash flow estimates have an upward bias compared to
the actual figures. In all years, the realized cash flows were consistently smaller than those estimated by the experts.
Specifically, about 50% of the companies valuated had negative cash flows, compared to the forecasted positive cash
flows, indicating a systematic bias in the forecasts. It is possible, however, that the results simply indicate that the
experts do not have an advantage over other investors in obtaining or utilizing more efficiently the information
disclosed to the public. It should also be noted here that one seemingly drawback of this analysis is the fact that it relies
Vol. 4, No. 3 International Journal of Business and Management
76
on relatively small number of observations and that the entire market was surprised by the poor ex-post performance.
We argue that overwhelming evidence that in practically all years the cash flows were biased upwards shadows this
drawback of our analysis, particularly when combined with the all other results reported in the paper.
The results of Table 4 also show that forecasted cost of capital is biased upward. (Note 11) The bias in the cost of
capital estimate may reflect the ambiguity with which the experts regard their own forecasts. However, since expert
valuations were higher than market values, we shall see below that the influence of the upward bias in cash flow
estimates was dominant.
We turn now to calculating the realized value of all 44 companies in the sample at the time the expert’s valuation was
published. The valuations were reconstructed for each company on the basis of the realized cash flows and cost of
capital (VREALIZED). The results of these valuations were compared to the expert valuations (VEXPERT). Table 5 displays
the results.
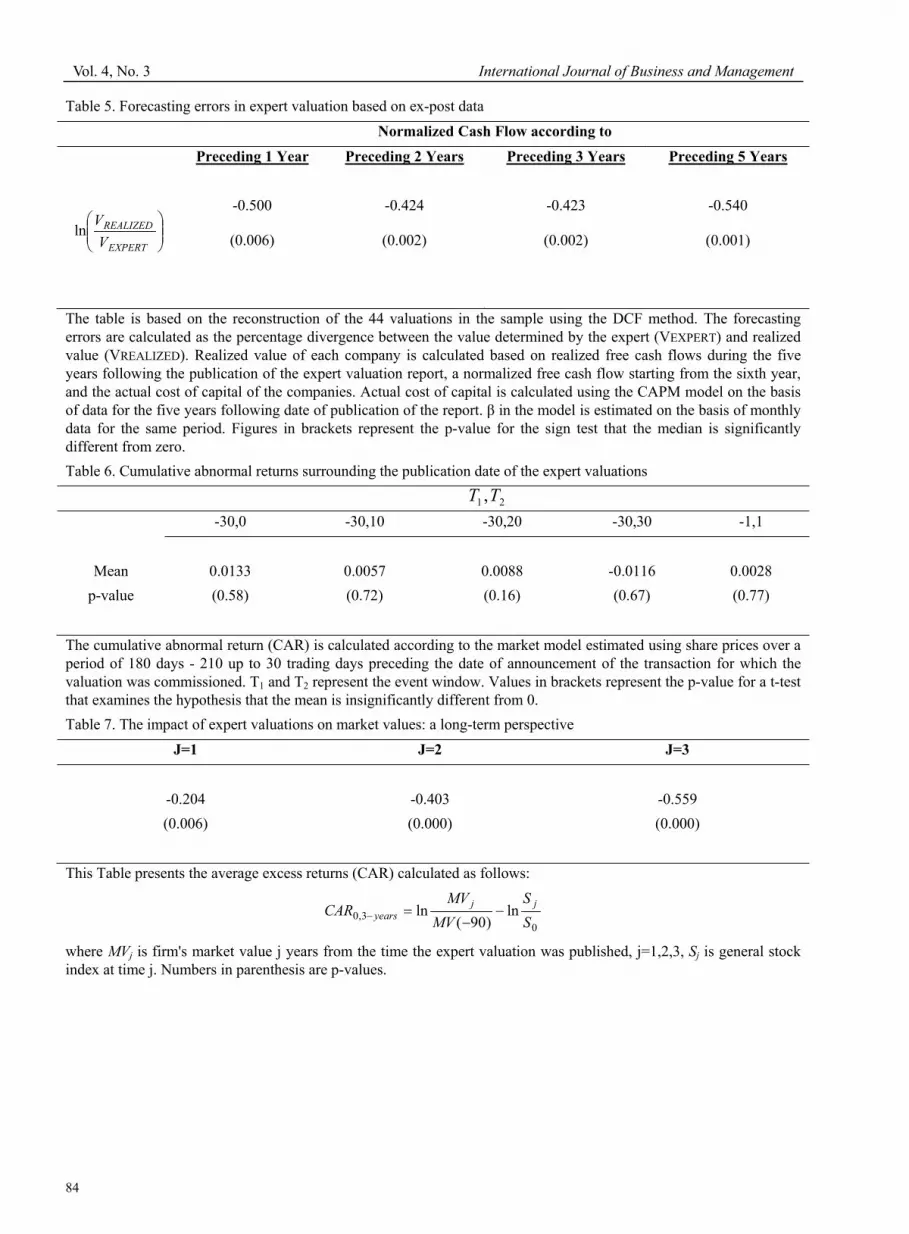
Insert Table 5
We find that the realized value is about 50% lower than the value of the companies as calculated by the experts.
Specifically, more than half of the companies had negative cash flows in the five years subsequent to the expert
valuation. In these cases we assigned zero to the company’s value. The results reject DeAngelo’s (1990) hypothesis that
the discrepancy between expert valuation and market value can be explained by the superior information that the
experts possess and their ability to use it competently. These findings cast doubt on either the experts' objectivity or
their superior ability in appraising the value of public firms.
7. The impact of expert valuations on share prices
7.1 A Short-Term Perspective
Are investors in the stock market influenced by expert valuations? If DeAngelo (1990) is correct in claiming that there
is a discrepancy between the expectations of the market and those of management, than share prices are expected to
change if investors recognize the superior ability of the experts to forecast companies’ future cash flows and cost of
capital.
Insert Table 6
Table 6 displays cumulative abnormal returns (CAR) surrounding the publication date of the expert valuations. We find
that CAR is insignificantly different from zero indicating that, on average, investors did not respond to information
revealed when expert valuations were disclosed to the market, in spite of the 29% divergence between the expert
valuation and the market values of the companies. This finding is consistent with the findings presented earlier. They
may be regarded as another piece of evidence to support the hypothesis that the expert valuations are aimed at
estimating the control premium for the majority shareholders involved in the transaction. As such, they are not intended
for outside shareholders, those not part of the control group, who limit their investment decisions to trading on the
exchange. Our finding that there was no significant change in share prices around the time of publication of expert
valuations, combined with the finding of a systematic upward bias in the expert valuations – and with the experts' bias
being particularly towards majority shareholders who hired them to value the firm – seem to suggest that the outside
shareholders recognize that expert valuations are of limited importance to them since they are aimed at the parties
involved in the transactions. This leads us to conclude that the above mentioned discrepancy may be interpreted as
“control premium”.
In order to test whether share prices are influenced by the size and direction of the discrepancies between expert
valuation and market values, and the degree of share liquidity (Amihud and Mendelsohn, 1987), we estimated the
following regression equation:
173.02R (1)
(p-value) (0.081) (0.003) (0.032)
Equation (1) reveals, as expected, that the cumulative abnormal return is higher when the discrepancy between expert
valuation and market value is greater, and the liquidity of the stock is lower. Indeed, we find that when discrepancy
between expert valuation and market value exceeds 29%, CAR (-30, 30) =5.21% compared with CAR (-30, 30)
=-7.86% when this discrepancy is lower than 29% (the difference is significant at 0.02 level). The influence of liquidity
on share price is related, inter alia, to the possibility that for thinly traded shares, whose market value may not reflect
their “true” economic value, investors attribute greater importance to expert valuations. (Note 12)
VolumeMV
VCAR EXPERT 0084.001658.00534.0)30,30(
International Journal of Business and Management March, 2009
77
7.2 A Long-Term Perspective
In this subsection we test the hypothesis raised by Jensen (2005) that there are agency costs attached to firms that are
substantially overvalued since managers may fail to deliver the performance required to support that value. In such
cases, market disappointment results in firm's value destruction. According to Jensen (2005) the problem lies, to a large
extent, in the insider holdings system. To test this hypothesis we estimated the change in market values over the years.
In Table 7, we present evidence that supports the hypothesis. Market values appear to decline by over 50% in the 3
years that followed the date the expert valuation was published. Prior studies on long-run underperformance for mergers
and acquisitions document either negative or insignificant long-term abnormal returns (see, for example, Loughran and
Vijh, 1997; Sudarsanam and Mahate, 2003; Conn et al., 2005; Alexandritis et al., 2006). Whereas the lowest returns
documented in these studies reach around -20% three years from the time of transaction, in our study negative abnormal
returns for the same period reach around -56%. We conclude that our finding of long-term underperformance is only
partially related to the underperformance effect typical to transactions such as mergers and acquisitions. Notably, most
of the underperformance presented in Table 7 seems to be related to value destruction that is explained by agency costs
attached to overvalued firms (Jensen, 2005).
We also estimated a regression model to examine the effect of ownership structure on the extent of market value
destruction. We find,
HoldingsInsiderCAR years _963.0258.13,0 087.02R (2)
(p-value) (0.011) (0.052)
where, , is the percentage change in market values minus the general share index
return in the 3 years that followed the publication of the valuation. The positive coefficient seems to suggest that the
more closely-held is the firm, the lower is the value destruction (higher CAR). However, given that in most of our
sample firms (40/44), insiders hold more than 50% of the firm's equity, the results suggest that in firms in which
insiders holdings are in the lower 50%, the value destruction is higher. One possible explanation is that the interests of
insiders who have a higher (lower) percentage of holdings are more (less) aligned with those of outside shareholders. In
the former firms, insiders have higher control but their motivation to expropriate firm's assets is lower than in the latter
firms since they represent the vast majority of shareholders. Indeed, we find that in the 22 firms with the highest
holdings of insiders, 85% on average, CAR0,3-years=-38.5%, whereas in the other 22 firms, in which insiders' holdings
were 59%, CAR0,3-years=-73.4%, on average. Hence, it appears that insider holdings have significant effect on firms'
value destruction.
Insert Table 7
8. Summary and conclusions
The difficulty in valuating companies stems from the need to deal with conceptual and empirical issues that relate to
financial statements’ analysis, expectations regarding the companies’ profitability, and their cost of capital. In this study
we examine the added value of expert valuations of closely-held companies whose shares are listed on the TASE and
whose insider holdings is typical to most firms listed in European and Asian exchanges, and small firms in the US. The
empirical work is based on a comprehensive data set of 44 companies that were valuated for transactions carried out
outside the exchange. Each expert valuation was thoroughly examined, including the use of alternative methods to those
employed by the experts, and by post factum reconstruction of the data.
The principal findings are that the discrepancy between expert valuations and market values is 29% and that insider
holdings are the dominant factor explaining this discrepancy. The discrepancy does not depend on the valuation method
and the industry sector of the company. We also find that despite the size of the discrepancy, on the average, share
prices did not change significantly following the publication of expert valuation results. These findings correspond to
the findings of DeAngelo(1990) that in corporate control transactions, share prices agreed upon for the transactions
usually differ from the market price of the company. The results gain farther support from the ex-post analysis of
valuations, where we find that the experts systematically bias upwards their estimates of future cash flows and cost of
capital. We also find that the ex-post values of the companies valuated were 50% lower than the value determined in the
expert valuation. The fact that there is no significant change in share prices around the time of publication of expert
valuation results, combined with the finding of a systematic upward bias in the expert’s valuation, seem to suggest that
in the short-run outside investors recognize that expert valuations are of limited importance to them since they are
0
ln)90(
3ln3,0
S
jS
MV
yearsMV
yearsCAR
Vol. 4, No. 3 International Journal of Business and Management
78
aimed at the parties involved in the transactions. In the long-run, however, we find that firms that were overvalued by
experts, lost on average over 50% of their values supporting Jensen's argument that when managers cannot deliver the
performance required to justify firms' value, disappointed investors appear to destruct firms' value. These findings cast
doubt on the ability of experts to be objective and therefore on the benefits of expert valuations as part of the full
disclosure requirements.
References
Alexandridis, G., Antoniou, A., & Zhao, H. (2006). Valuation effect of institutional ownership: the case of corporate takeovers. European Financial Management, 12 (3).
Amihud, Y., & Mendelson, H. (1987). Trading Mechanisms and Stock returns: An Empirical Investigation, Journal of Finance, 42, 533-553.
Ang, A., & Liu, J. (2001). A General Affine Earnings Valuation Model. Review of Accounting Studies, 6 (4), 397-425.
Barth, M.E., Beaver, W.H., & Landsman, W.R. (1998). Relative Valuation Roles of Equity Book Value and Net Income as a Function of Financial Health. Journal of Accounting and Economics, 25, 1-34.
Benninga S. Z., & Sarig O.H. (1997). Corporate Finance: A Valuation Approach. McGraw- Hill.
Bowers, H.M. (2002). Fairness Opinions and the Business Judgment Rule: An Empirical Investigation of Target Firms. Northwestern University Law Review, 96 (2), 567-578.
Brigham, E.F., & Gapenski, L.C. (1996). Intermediate Financial Management. (5th ed.). The Dryden Press, Orlando, Florida.
Comment, R., & Jarrell, G.A. (1987). Two-Tier and Negotiated Tender Offers: The Imprisonment of the Free-Riding Shareholder. Journal of Financial Economics, (December), 283-310.
Conn, C., Cosh, A., Guest, P., & Hughes, A. (2005). The impact on UK acquirers of domestic, cross border, public and private acquisitions. Journal of Business Finance and Accounting, 32, 815–870.
De Bondt, W.F.M., & Thaler R.H. (1990). Do Security Analysts Overreact? American Economic Review, 80 (May), 52-7.
DeAngelo, H., DeAngelo, L., & Rice, E.M. (1984). Going Private: Minority Freezeouts and Stockholder Wealth. Journal of Law and Economics, (October), 367-401.
DeAngelo, L.E. (1990). Equity Valuation and Corporate Control. The Accounting Review, (January), 93-112.
Francis, J., & Schipper, K. (1999). Have Financial Statements Lost Their Relevance? Journal of Accounting Research, 37, 319-352.
Givoly, D., & Hayn, C. (2000). The Changing Time-Series Properties of Earnings, Cash Flows and Accruals: Has Financial Reporting Become More Conservative? Journal of Accounting and Economics, (29), 287-320.
Hauser, S., & Lauterbach, B. (2004). The Value of Voting Rights to Majority Shareholders: Evidence from Dual Class Stock Unifications. Review of Financial Studies, 17 (4), 1167-1184.
Jensen, S.C. (2005). Agency Costs of Overvalued Equity. Financial Management, 34 (1), 5-19.
Kaplan, S.N., & Ruback, R.S. (1995). The Valuation of Cash flows Forecasts: An Empirical Analysis. Journal of Finance, 50 (4), 1059-1093.
Lim, T. (2001). Rationality and Analysts’ Forecast Bias. Journal of Finance, LVI (1), 369-385.
Liu, J., Nissim, D. & Thomas, J. (2002). Equity Valuation Using Multiples. Journal of Accounting Research, 40 (1), 135-172.
Loughran, T., & Vijh, A.M. (1997). Do long term shareholders benefit from corporate acquisitions? Journal of Finance,52, 1759–1790.
O`Brien, P.C. (1998). Analysts’ Forecasts as Earnings Expectations. Journal of Accounting and Economics, 10, 53-58.
Ohlson, J. A. (1995). Earnings, Book Value and Dividends in Security Valuation. Contemporary Accounting Research,11, 661-687.
Smith, B., & Amoako-Ado, B. (1995). Relative Prices of Dual Class Shares. Journal of Financial and Quantitative Analysis, 30, 223-239.
Sougiannis, T., & Yaekura, T. (2001). The Accuracy and Bias of Equity Values Inferred From Analysts’ Earnings Forecasts. Journal of Accounting, Auditing and Finance, 16 (Fall), 331-362.
Sudarsanam, S., & Mahate, A.A. (2003). Glamour acquirers, method of payment and post-acquisition performance: the UK evidence. Journal of Business Finance and Accounting, 30, 299–341.
International Journal of Business and Management March, 2009
79
Notes
Note 1. In announcing the publication of the principles for addressing analyst conflict of interests, US SEC
commissioner, Roel C. Campos, stated: "IOSCO members understand that investor confidence is fundamental to strong,
healthy financial markets. When investors come to believe that analysts offering supposedly independent research are
really little more than marketers for investment bank, this confidence suffers."
Note 2. The sample represents a norm in most countries since many small firms in the US, and most publicly traded
firms outside of US, are closely held by a small group of majority shareholders.
Note 3. In 2001, the ISA considered prohibiting the use of expert valuations in such cases but did not apply it
eventually.
Note 4. The normalized level of FCF is needed for calculation of a firm's terminal value. We conduct sensitivity
analyses for the firms' expected growth rate for perpetuity using various growth rates from 0% to 4% (see Sougiannis
and Yaekura (2001)). We report here only the results based on 2% growth. The results are essentially the same when
other growth rates are used.
Note 5. The normalized flow of investments in fixed assets is supposed to be at least as large as the depreciation and
amortization expenses (See Kaplan and Ruback, 1995). Also, the investment in working capital should be adjusted to
the growth rate to perpetuity, which is typically lower than the growth rate during the years for which the estimation is
carried out. We test and find that using actual free cash flows, without adjusting to investments in fixed assets and
working capital, (but instead assuming that the investment amounts in the years following the expert valuation are
representative), does not change the results qualitatively.
Note 6. See Beninga and Sarig (1997), pp. 297-301.
Note 7. The value of non-operating assets and financial liabilities can theoretically be estimated using discounted cash
flows, but typically the non-operating assets are estimated using their market (realization) value and financial liabilities
are estimated using their book value. We do not calculate the economic value of the financial liabilities, but rely on the
expert valuation, since we do not have the detailed maturity dates of the liabilities for the sample companies. Additional
adjustments to the realized equity value include deduction of the value of minority interests and a discount for holdings
companies. The discount for holdings companies is taken based on the discount rate estimated by the experts. The value
of minority interests is calculated as follows. In case that the subsidiary company was (not) separately evaluated by the
experts, we calculate the value of minority interests as the product of the minority's percentage holdings and the expert
value (market value) of the subsidiary company. In case that the subsidiary company is neither traded on the exchange
nor it was evaluated by the experts, we estimate its value based on an average of the values obtained by multiplying the
company's reported earnings before extraordinary items (book value of equity) by the earnings (book value) multiple in
its industrial sector.
Note 8. The date of publication was on average 50 days following the announcement of the up-coming transaction. This
may explain why both MV(-90) and MV(-5) include investors’ response to the transaction itself.
Note 9. It should be noted that whenever an extraordinary transaction is considered, the ISA requires a full disclosure on
the nature of the transaction and the way the price was determined. As a result, in all such transactions, in practice, at
least one of the parties involved hires an expert to provide a valuation that justifies the transaction price. Usually that
party will be an interested party (holding at least 5% of the company's shares). Since the ISA examines the expert
valuation, and often times makes comments on that valuation which may actually lead to changes in the valuation, the
transaction price agreed upon by the parties is reported to the public together with the final valuation. As a result,
almost always the transaction price will be in line with the expert's valuation. Since the expert valuation is meant to
provide justification for the transaction price, he is, in fact, indirectly part of the negotiations. In fact, often he will be
invited to the ISA together with the selling and buying parties to respond directly to the inquiries of the ISA officials.
Hence, the valuation made by the expert is an important benchmark for the transaction price that will eventually be
agreed upon by the parties involved. Notably, since the ISA may address questions to the expert and may consider
asking for another expert's opinion, the expert is supposed to be committed to an objective valuation. This "objective"
valuation is the subject of investigation in this paper. In rare cases, these valuations are not reported to the public, if the
expert valuation did not justify the transaction price and the deal was called off by the parties involved.
Note 10. Outsiders commissioned only 9 valuations.
Note 11. The results do not change qualitatively when we estimate the cost of capital in other ways, among them:
estimating against industry index or assuming that 1,0 .
Note 12. We examined the possibility that other variables representing company characteristics also influence share
prices, and did not find such influence.
Vol. 4, No. 3 International Journal of Business and Management
80
Table 1. Discrepancy between expert values and market values
Mean Median SD
VEXPERT 945 92 2318
MV 818 71 2188
BV 521 61 1260
% holdings of majority shareholders 0.723 0.715 0.177
Ln(VEXPERT/MV(-90)) – simple average 0.288 0.269 0.431
)0.000( )0.000(
Ln(VEXPERT/MV(-5)) – simple average 0.279 0.273 0.392
)0.000( )0.000(
Ln(VEXPERT/MV(-90)) – weighted average 0.280
)0.036(
Ln(VEXPERT/MV(-5)) – weighted average 0.270
)0.038(
The figures presented here are based on 44 valuations of companies listed on the TASE. VEXPERT represents the expert
valuation. MV (-90) and MV (-5) represent the average market value during 90 and 5 trading days prior to the date of
valuation, respectively, in millions of NIS. (During the sample period, FX rate was in the range of 2.2-4 NIS per 1 $US).
BV represents book value of equity. Values in brackets represent the p-value for the t-test (Wilcoxon test) that the mean
(median) value differs significantly from zero. The discrepancy between expert's value and market value is measured by
the percentage difference between VEXPERT and MV. The percentage holdings by majority shareholders represent the
total holdings of all interested parties. Among them are shareholders holding at least 5%, management and directors, all
required by law to report their holding to the ISA and the TASE. Weighted average uses Total Assets weights.
International Journal of Business and Management March, 2009
81
Table 2. Factors influencing the discrepancy between market value and expert valuation
No. Of
Companies
Mean Median
By Valuation Method
Discounted Cash Flow (DCF) 12 0.344 0.406
Multiplies (P/E) 3 0.398 0.346
Net Assets Value 15 0.383 0.298
Market Value (MV) 6 0.267 0.244
Weighted Average of Various Valuation Methods 8 0.076 0.136
Test for the differences between means & medians )0.600( )0.494(
By industry Sector
Financial 3 0.109 0.364
Commerce and Services 9 0.173 0.244
Real Estate 7 0.474 0.463
Manufacturing 12 0.248 0.233
Investments and Holdings 13 0.345 0.273
Test for the differences between means & medians )0.611( )0.693(
By Size
Large Companies 22 0.263 0.269
Small Companies 22 0.316 0.298
Test for the differences between means & medians )0.349( )0.322(
By Transaction type
Mergers and Acquisitions 23 0.206 0.216
Private Placements 21 0.377 0.346
Test for the differences between means & medians )0.191( )0.162(
By Market Trends
Bull Market - until 1/94 12 0.264 0.249
Bear Market - since 1/94 32 0.353 0.393
Test for the differences between means & medians )0.274( )0.400(
By Expert’s Reputation
More reputable 20 0.245 0.262
Less Reputable 24 0.324 0.282
Test for the differences between means & medians )0.275( )0.318(
By Transactions with insiders
Insiders in private placements 20 0.132 0.241
Insiders-sellers with outsiders 24 0.475 0.450
Test for the differences between means & medians )0.007( )0.016(
By percentage holdings of insiders
Large 22 0.365 0.347
Small 22 0.211 0.256
Test for the differences between means & medians )0.070( )0.097(
In this table we present the discrepancy between Market Value (MV) and Expert Valuation (Vexpert), in %, by various
categories. Values in brackets give the p-value to the t-test (or the Wilcoxon signed ranks test) for comparison between
means (medians) of the different groups. In the categories of valuation methods and sector we used the ANOVA and
Kruskall-Wallis test. The "high" and "low" categories are determined relative to the median value. The following
Vol. 4, No. 3 International Journal of Business and Management
82
hypotheses concerning the various variables were examined: (1) for firm size: the discrepancy is smaller for smaller
firms; (2) for market trends: the discrepancy is smaller in a bull market; (3) for expert's reputation, the discrepancy is
smaller for the more reputable experts relative to the less reputable experts; (4) for insider transactions: the discrepancy
is larger in transactions with outsiders; (5) for holding percentage of insiders: the discrepancy is larger when majority
shareholders have a larger holding percentage.
Table 3. Theil's analysis of variance of factors influencing the discrepancy between expert valuation and market value
Explanatory Variables
Groups
Marginal Contribution of Each Factor to the Total
Variance
Proportion of Variance (R2) in %
1. Ownership Structure 0.160
F 8.006
(0.007)
2. Control Variables – Firm's specifics 0.289
F 0.781
(0.672)
3. Joint Effects 0.061
4. R2 0.510
(0.016)
This table uses Theil’s analysis of variance to examine the influence of insider holdings and specific company factors,
on the discrepancy between expert valuation and market value, by computing and analyzing ( EXPERTV / MV). Lines 1-3
represent the explanatory contribution of the group of variables to the total variance of the premium, discounting the
influence of other explanatory variables. The calculation was done in three stages: (1) 2nR was calculated by running a
linear regression between the dependent variable and all the independent variables; (2) 2
jhnR was calculated by
running a linear regression between the dependent variable and all explanatory variables except the variables hj; (3)
Calculation of the relative contribution of a group of variables by subtracting 2
jhR from 2nR . Line 4 is the 2
nR of the
linear regression between the price premium as the dependent variable and all explanatory factors. Line 3 is the
difference between Line 4 and the sum of proportions in lines 1 and 2. The group of ownership structure contains a
dummy variable for transactions with insiders-buyers and outsiders-sellers, which is assigned the value of 1, and the
value of 0 otherwise. In the second group we include control variables that characterize the company - valuation method,
industry sector, size, market trend, trading volume and expert's reputation. Numbers in parenthesis are p-values.
International Journal of Business and Management March, 2009
83
Table 4. Experts’ forecasting errors in estimates of free cash flows and cost of capital
Mean SD Minimum Maximum Percentile
25% Median 75%
Forecasting Errors of Cash Flows
Cash Flow in Year 1
Forecast 27605 77563 -17414 303094 1183 7080 12900
Realized 14573 82508 -49205 305363 -2552 -67 8700
Cash Flow in Year 2
Forecast 36485 108152 254 426316 1788 6291 20754
Realized -12995 150228 -477058 296125 -17025 -1300 19079
Cash Flow in Year 3
Forecast 44561 13395 1290 526728 2336 6261 20754
Realized -58929 298428 -112877 158627 -3289 3515 18771
Cash Flow in Year 4
Forecast 65121 174928 1171 638421 2653 7840 22477
Realized -46511 166125 -598445 23200 -9514 -619 3043
Cash Flow in Year 5
Forecast 84400 226199 1044 761582 4600 8639 20754
Realized -7044 8742 -21160 5050 -14100 -3192 -360
Normalized Cash Flow from Year 6
Forecast 82708 266501 618 1042008 3519 7557 13836
Realized, Method 1 -64634 257789 -995954 24300 -3179 182 5334
Realized, Method 2 -33330 137690 -530258 20000 -3210 -195 8935
Realized, Method 3 -7426 42459 -158186 23000 -2786 380 7767
Realized, Method 4 3978 6891 -1290 20200 -238 219 10489
Forecasting Errors of Cost of Capital
Forecast 0.100 0.022 0.060 0.150 0.080 0.100 0.115
Realized 0.084 0.035 0.040 0.180 0.060 0.070 0.105
(0.065) (0.016)
The Table presents comparison between realized free cash flows (FCF) and expert's forecasts based on the 15 expert
valuations that used the DCF method. The FCF are in thousands of NIS. The normalized FCF starting from the sixth
year was calculated in four alternative ways: (1) FCF during the preceding year; (2) Average FCF during the preceding
two years; (3) Average FCF during the preceding three years; (4) Average FCF during the preceding five years. Figures
in brackets represent the p-value for testing the hypothesis that there is no difference between the means (t-test) or
between the medians (Wilcoxon test). Realized cost of capital is calculated using the CAPM model on the basis of data
for the five years following date of publication of the report. Risk-free rate was estimated according to the average
yields of government bonds of up to 10 years to redemption.
Vol. 4, No. 3 International Journal of Business and Management
84
Table 5. Forecasting errors in expert valuation based on ex-post data
Normalized Cash Flow according to
arPreceding 1 Ye Preceding 2 Years Preceding 3 Years Preceding 5 Years
EXPERT
REALIZED
V
Vln
-0.500 -0.424 -0.423 -0.540
(0.006) (0.002) (0.002) (0.001)
The table is based on the reconstruction of the 44 valuations in the sample using the DCF method. The forecasting
errors are calculated as the percentage divergence between the value determined by the expert (VEXPERT) and realized
value (VREALIZED). Realized value of each company is calculated based on realized free cash flows during the five
years following the publication of the expert valuation report, a normalized free cash flow starting from the sixth year,
and the actual cost of capital of the companies. Actual cost of capital is calculated using the CAPM model on the basis
of data for the five years following date of publication of the report. in the model is estimated on the basis of monthly
data for the same period. Figures in brackets represent the p-value for the sign test that the median is significantly
different from zero.
Table 6. Cumulative abnormal returns surrounding the publication date of the expert valuations
21 ,TT
-30,0 -30,10 -30,20 -30,30 -1,1
Mean 0.0133 0.0057 0.0088 0.0116- 0.0028
p-value )0.58( )0.72( )0.16( )0.67( )0.77(
The cumulative abnormal return (CAR) is calculated according to the market model estimated using share prices over a
period of 180 days - 210 up to 30 trading days preceding the date of announcement of the transaction for which the
valuation was commissioned. T1 and T2 represent the event window. Values in brackets represent the p-value for a t-test
that examines the hypothesis that the mean is insignificantly different from 0.
Table 7. The impact of expert valuations on market values: a long-term perspective
J=1 J=2 J=3
-0.204 -0.403 -0.559
(0.006) (0.000) (0.000)
This Table presents the average excess returns (CAR) calculated as follows:
03,0 ln
)90(ln
S
S
MV
MVCAR
jjyears
where MVj is firm's market value j years from the time the expert valuation was published, j=1,2,3, Sj is general stock
index at time j. Numbers in parenthesis are p-values.
International Journal of Business and Management March, 2009
85
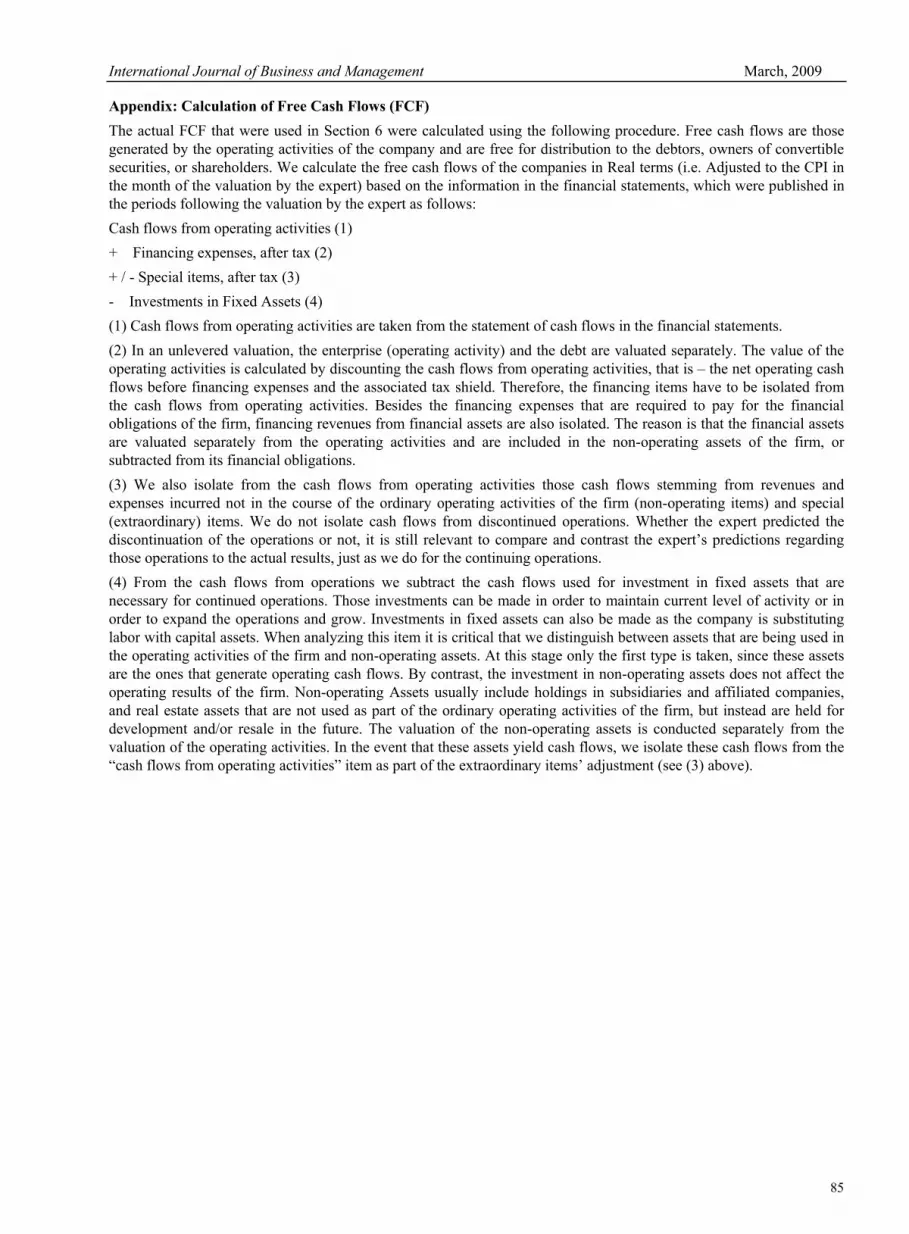
Appendix: Calculation of Free Cash Flows (FCF)
The actual FCF that were used in Section 6 were calculated using the following procedure. Free cash flows are those
generated by the operating activities of the company and are free for distribution to the debtors, owners of convertible
securities, or shareholders. We calculate the free cash flows of the companies in Real terms (i.e. Adjusted to the CPI in
the month of the valuation by the expert) based on the information in the financial statements, which were published in
the periods following the valuation by the expert as follows:
Cash flows from operating activities (1)
+ Financing expenses, after tax (2)
+ / - Special items, after tax (3)
- Investments in Fixed Assets (4)
(1) Cash flows from operating activities are taken from the statement of cash flows in the financial statements.
(2) In an unlevered valuation, the enterprise (operating activity) and the debt are valuated separately. The value of the
operating activities is calculated by discounting the cash flows from operating activities, that is – the net operating cash
flows before financing expenses and the associated tax shield. Therefore, the financing items have to be isolated from
the cash flows from operating activities. Besides the financing expenses that are required to pay for the financial
obligations of the firm, financing revenues from financial assets are also isolated. The reason is that the financial assets
are valuated separately from the operating activities and are included in the non-operating assets of the firm, or
subtracted from its financial obligations.
(3) We also isolate from the cash flows from operating activities those cash flows stemming from revenues and
expenses incurred not in the course of the ordinary operating activities of the firm (non-operating items) and special
(extraordinary) items. We do not isolate cash flows from discontinued operations. Whether the expert predicted the
discontinuation of the operations or not, it is still relevant to compare and contrast the expert’s predictions regarding
those operations to the actual results, just as we do for the continuing operations.
(4) From the cash flows from operations we subtract the cash flows used for investment in fixed assets that are
necessary for continued operations. Those investments can be made in order to maintain current level of activity or in
order to expand the operations and grow. Investments in fixed assets can also be made as the company is substituting
labor with capital assets. When analyzing this item it is critical that we distinguish between assets that are being used in
the operating activities of the firm and non-operating assets. At this stage only the first type is taken, since these assets
are the ones that generate operating cash flows. By contrast, the investment in non-operating assets does not affect the
operating results of the firm. Non-operating Assets usually include holdings in subsidiaries and affiliated companies,
and real estate assets that are not used as part of the ordinary operating activities of the firm, but instead are held for
development and/or resale in the future. The valuation of the non-operating assets is conducted separately from the
valuation of the operating activities. In the event that these assets yield cash flows, we isolate these cash flows from the
“cash flows from operating activities” item as part of the extraordinary items’ adjustment (see (3) above).