Embed Size (px)
Citation preview
1
Survey of Extra-Low Frequency and
Very-Low Frequency Magnetic Fields
in Cell Culture Incubators
Dong Su, Paul Héroux InVitroPlus Laboratory, Department of Surgery, Royal Victoria Hospital, Montreal,
Canada.
Corresponding author:
Paul Héroux, PhD
1110 Pine Ave West, Room 307
Montreal, PQ, Canada
H3A 1A3
E-mail: [email protected]
http://www.invitroplus.mcgill.ca/
Abstract
A typical cell culture CO2 incubator was probed in detail to document the pattern of 60-Hz
magnetic fields (MFs) inside the unit, as well as the ability of the incubator to attenuate
environmental MFs. Subsequently, a survey of 46 cell culture incubators was performed. The
survey measured MFs outside and inside the incubators, the frequency spectrum between 5
and 2000 Hz, and variations over time of the 60-Hz MF. Our measurements show an uneven
spatial distribution, reflecting electronic and electrical components hidden within the walls.
Attenuation of environmental MFs varied between 18 % and 33 %, signalling easy
penetration into the units. MF levels, frequency spectra and variations over time were very
different from one unit to the next. All 46 incubators surveyed had an average field greater
than 0.2 µT; among them, 39 (85 %) had an average field greater than 1 µT. There is
substantial work to be done in improving control over the MF environment of in vitro
experiments in bio-medicine, particularly if they involve cancer cells.
Keywords: Magnetic Fields, ELF, VLF, Cell Culture, Incubator, Survey
2
1 Introduction
1.1 Purpose of the Survey
In vitro experiments are essential tools in modern toxicology, biology, and medicine. To
insure meaningful in vitro experiments, it is necessary to tightly control the
micro-environment inside incubators, for example, temperature, humidity, CO2, and even O2.
The aim is to provide a good simulation of the in vivo environment, and to achieve reliable
and reproducible results. However, one important factor has been overlooked for a long time
by nearly all incubator manufacturers and bioscience researchers: the Magnetic Fields (MFs)
within incubators, mostly generated by heating elements and control circuits.
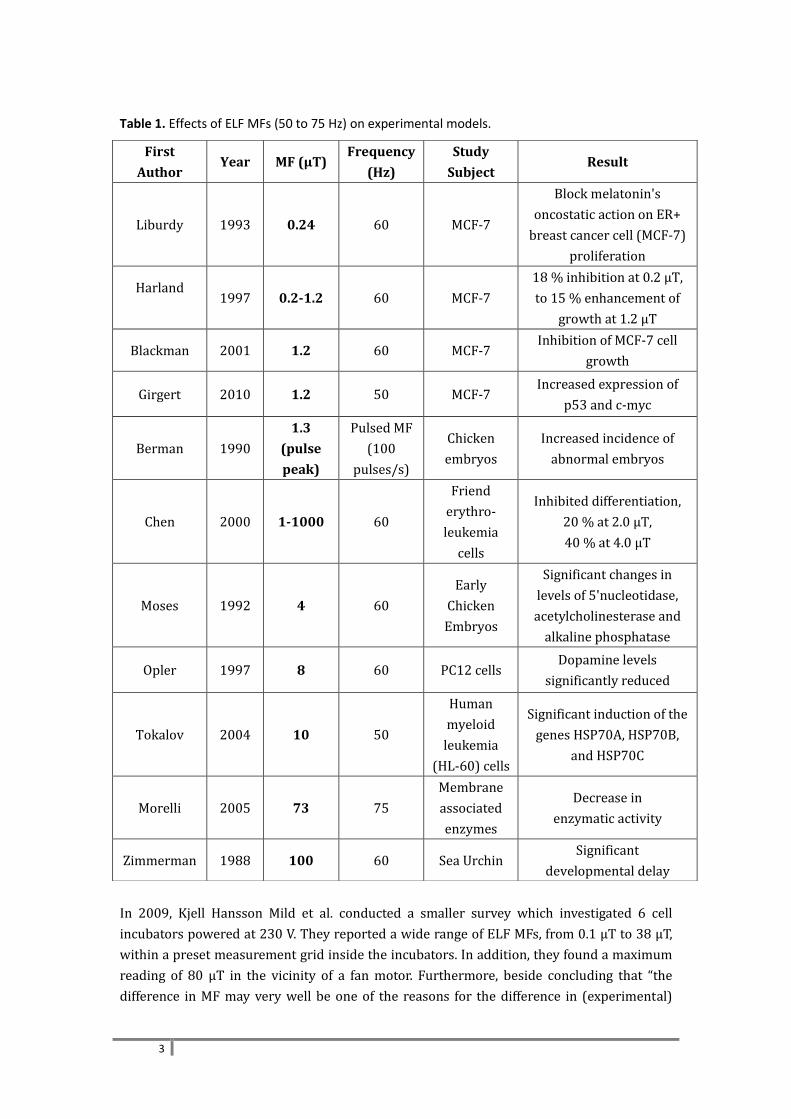
Over the past two decades, many studies have revealed that MFs significantly affect cellular
gene expression, growth and differentiation. Various cells, mostly cancer cells or chicken
embryos, were used to conduct these experiments. Table 1 lists, according to ascending MFs,
a number of such published findings.
Even though Table 1 is not an exhaustive list of publications on the biological effects of MFs,
it shows clearly the reproducibility of some findings. For example, perturbations of the
growth of MCF-7, a breast cancer cell line isolated in 1970 from a 69-year-old Caucasian
woman, were confirmed by three different authors (Liburdy (1993), Harland (1997), and
Blackman (2001)) in the range of 0.24 µT to 1.2 µT. Moreover, a fourth author, Girgert
(2010), confirmed that MCF-7’s gene expression was altered by MFs in the same intensity
range. It should also be pointed out that beside this direct evidences from cell biology,
several epidemiology studies have provided positive correlations between exposure to MFs
and elevated risks of cancers. IARC stated that “Extremely low-frequency MFs are possibly
carcinogenic to humans (Group 2B)” in its 2002 summary report. It is therefore reasonable
to deduce that MFs influence biological materials.
In 2012, Li and Héroux reported that 5 cancer cells lines lost chromosomes after exposure to
Extra-Low-Frequency (ELF) MFs within the range of 0.025 to 5 µT for 6 days. Further, they
proposed that the underlying biological mechanism for this phenomenon is related to "an
alteration in the structure of water that impedes the flux of protons in ATP Synthase
channels.".
Although many researchers have pointed to significant impacts of MFs on the results of in
vitro experiments, this critical issue has been overlooked by both incubator manufacturers
and the large majority of bioscience researchers. This oversight will at the very least
introduce extra variations in experimental outcomes performed in incubators with
uncontrolled MFs. The situation is particularly dire in that MFs vary not only from one unit to
the next, but also at different locations within the same incubator.
3
Table 1. Effects of ELF MFs (50 to 75 Hz) on experimental models.
In 2009, Kjell Hansson Mild et al. conducted a smaller survey which investigated 6 cell
incubators powered at 230 V. They reported a wide range of ELF MFs, from 0.1 µT to 38 µT,
within a preset measurement grid inside the incubators. In addition, they found a maximum
reading of 80 µT in the vicinity of a fan motor. Furthermore, beside concluding that “the
difference in MF may very well be one of the reasons for the difference in (experimental)
First
Author Year MF (µT)
Frequency
(Hz)
Study
Subject Result
Liburdy 1993 0.24 60 MCF-7
Block melatonin's
oncostatic action on ER+
breast cancer cell (MCF-7)
proliferation
Harland
1997 0.2-1.2 60 MCF-7
18 % inhibition at 0.2 µT,
to 15 % enhancement of
growth at 1.2 µT
Blackman 2001 1.2 60 MCF-7 Inhibition of MCF-7 cell
growth
Girgert 2010 1.2 50 MCF-7 Increased expression of
p53 and c-myc
Berman 1990
1.3
(pulse
peak)
Pulsed MF
(100
pulses/s)
Chicken
embryos
Increased incidence of
abnormal embryos
Chen 2000 1-1000 60
Friend
erythro-
leukemia
cells
Inhibited differentiation,
20 % at 2.0 µT,
40 % at 4.0 µT
Moses 1992 4 60
Early
Chicken
Embryos
Significant changes in
levels of 5'nucleotidase,
acetylcholinesterase and
alkaline phosphatase
Opler 1997 8 60 PC12 cells Dopamine levels
significantly reduced
Tokalov 2004 10 50
Human
myeloid
leukemia
(HL-60) cells
Significant induction of the
genes HSP70A, HSP70B,
and HSP70C
Morelli 2005 73 75
Membrane
associated
enzymes
Decrease in
enzymatic activity
Zimmerman 1988 100 60 Sea Urchin Significant
developmental delay
4
outcome”, they pointed out that in North America, where incubators are operated at 110 V,
the situation would be worse, since the current is roughly doubled.
Following these observations, it seemed important to provide a clear picture of MFs inside
incubators operated in North America, and to make incubator manufacturers and users
aware of this issue.
To reach these goals, we conducted a study, followed by a survey, which focused on
Extra-Low Frequency and Very Low Frequency MFs, and the following items.
Average MF in various incubators.
Spatial distribution of MFs within incubators.
MF variations over time inside incubators.
Ability of incubators to attenuate environmental MFs.
Influence of background MFs in laboratories on conditions inside the units.
Ways to minimize the impact of MFs on experiments.
1.2 Types of Incubators
Generally, incubators can be assigned into 3 classes: CO2 incubators, general purpose
incubators (non-CO2 incubators), and incubator shakers.
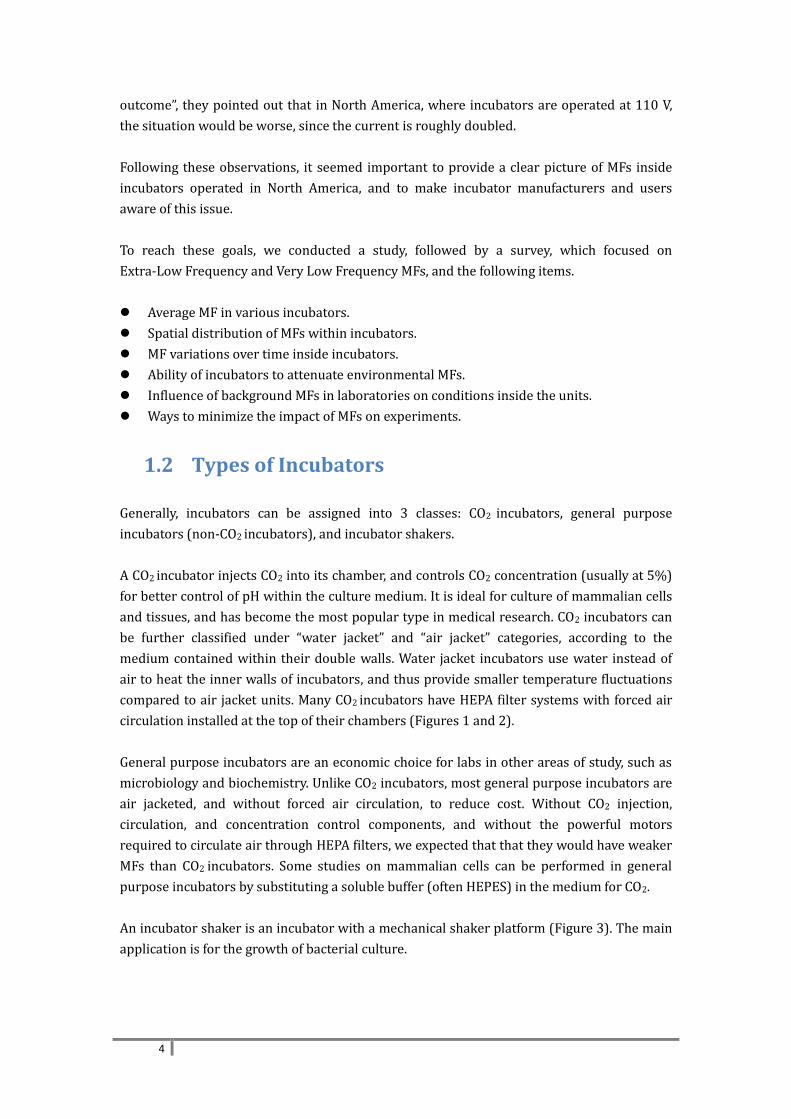
A CO2 incubator injects CO2 into its chamber, and controls CO2 concentration (usually at 5%)
for better control of pH within the culture medium. It is ideal for culture of mammalian cells
and tissues, and has become the most popular type in medical research. CO2 incubators can
be further classified under “water jacket” and “air jacket” categories, according to the
medium contained within their double walls. Water jacket incubators use water instead of
air to heat the inner walls of incubators, and thus provide smaller temperature fluctuations
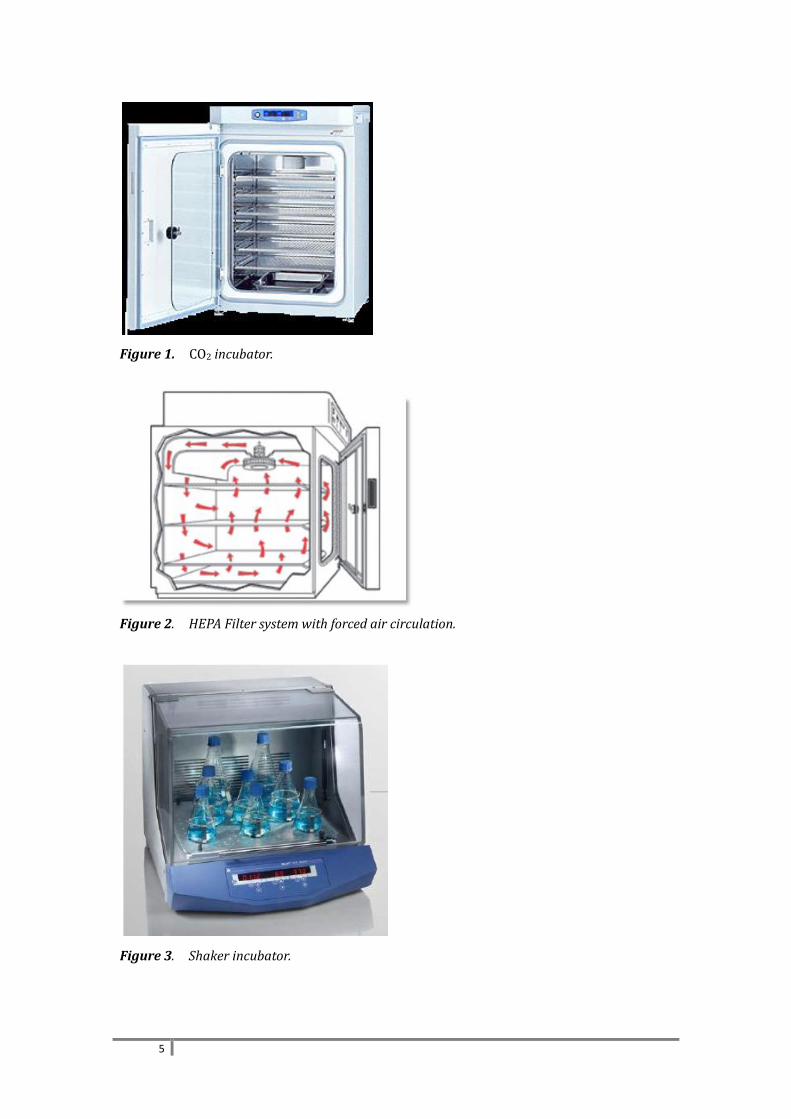
compared to air jacket units. Many CO2 incubators have HEPA filter systems with forced air
circulation installed at the top of their chambers (Figures 1 and 2).
General purpose incubators are an economic choice for labs in other areas of study, such as
microbiology and biochemistry. Unlike CO2 incubators, most general purpose incubators are
air jacketed, and without forced air circulation, to reduce cost. Without CO2 injection,
circulation, and concentration control components, and without the powerful motors
required to circulate air through HEPA filters, we expected that that they would have weaker
MFs than CO2 incubators. Some studies on mammalian cells can be performed in general
purpose incubators by substituting a soluble buffer (often HEPES) in the medium for CO2.
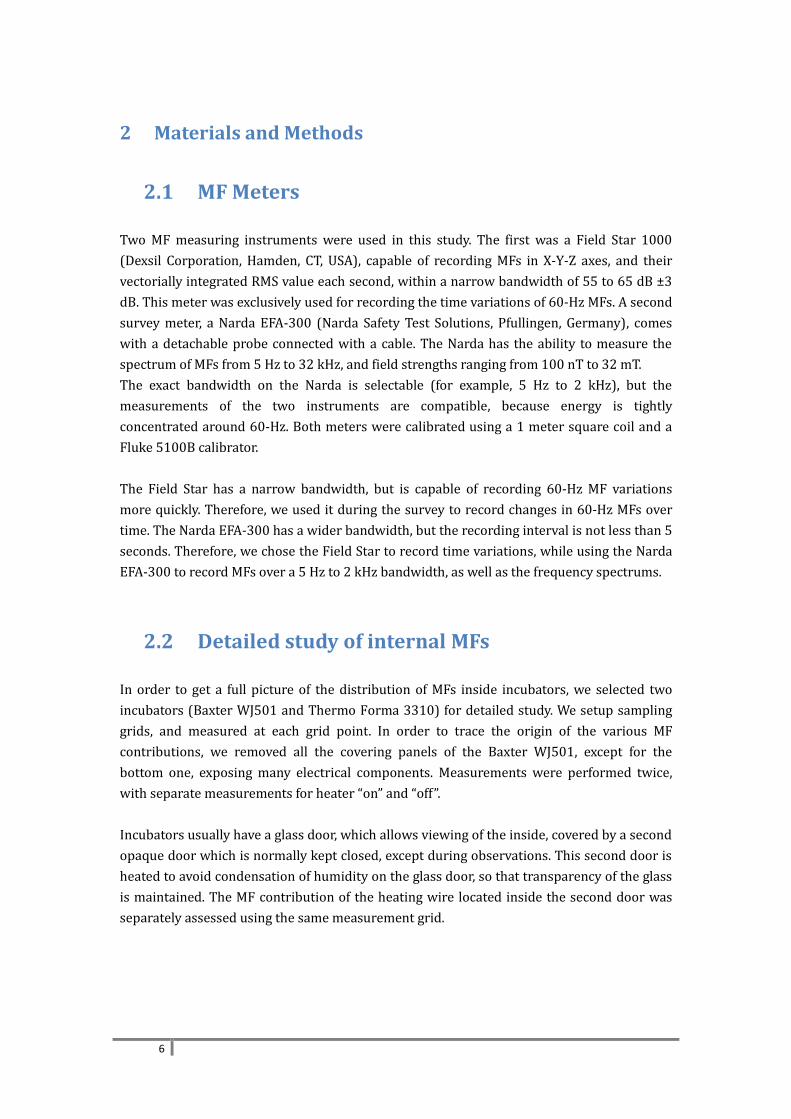
An incubator shaker is an incubator with a mechanical shaker platform (Figure 3). The main
application is for the growth of bacterial culture.
5
Figure 1. CO2 incubator.
Figure 2. HEPA Filter system with forced air circulation.
Figure 3. Shaker incubator.
6
2 Materials and Methods
2.1 MF Meters
Two MF measuring instruments were used in this study. The first was a Field Star 1000
(Dexsil Corporation, Hamden, CT, USA), capable of recording MFs in X-Y-Z axes, and their
vectorially integrated RMS value each second, within a narrow bandwidth of 55 to 65 dB ±3
dB. This meter was exclusively used for recording the time variations of 60-Hz MFs. A second
survey meter, a Narda EFA-300 (Narda Safety Test Solutions, Pfullingen, Germany), comes
with a detachable probe connected with a cable. The Narda has the ability to measure the
spectrum of MFs from 5 Hz to 32 kHz, and field strengths ranging from 100 nT to 32 mT.
The exact bandwidth on the Narda is selectable (for example, 5 Hz to 2 kHz), but the
measurements of the two instruments are compatible, because energy is tightly
concentrated around 60-Hz. Both meters were calibrated using a 1 meter square coil and a
Fluke 5100B calibrator.
The Field Star has a narrow bandwidth, but is capable of recording 60-Hz MF variations
more quickly. Therefore, we used it during the survey to record changes in 60-Hz MFs over
time. The Narda EFA-300 has a wider bandwidth, but the recording interval is not less than 5
seconds. Therefore, we chose the Field Star to record time variations, while using the Narda
EFA-300 to record MFs over a 5 Hz to 2 kHz bandwidth, as well as the frequency spectrums.
2.2 Detailed study of internal MFs
In order to get a full picture of the distribution of MFs inside incubators, we selected two
incubators (Baxter WJ501 and Thermo Forma 3310) for detailed study. We setup sampling
grids, and measured at each grid point. In order to trace the origin of the various MF
contributions, we removed all the covering panels of the Baxter WJ501, except for the
bottom one, exposing many electrical components. Measurements were performed twice,
with separate measurements for heater “on” and “off”.
Incubators usually have a glass door, which allows viewing of the inside, covered by a second
opaque door which is normally kept closed, except during observations. This second door is
heated to avoid condensation of humidity on the glass door, so that transparency of the glass
is maintained. The MF contribution of the heating wire located inside the second door was
separately assessed using the same measurement grid.
7
2.3 MF Attenuation by Incubator Walls
To measure the Baxter WJ501’s (exterior dimensions of 74 by 64 by 74 cm) ability to
attenuate environmental MFs, we constructed a 238 cm X 238 cm square coil, and used it to
apply a controlled external MF around the unit. The coil was successively placed in 3
different orthogonal directions, to allow measurement of the attenuation of MFs oriented
from top to bottom (Z), door to back (Y), and side to side (X). Because current cannot
circulate across the door opening, even when the door is closed, it is not expected that
attenuations will be the same in all field orientations. These attenuation measurements are
difficult to perform, due to the space necessary to setup the coils, and to the difficulty and
safety concerns involved in positioning a heavy water jacketed incubator within the
magnetic coils. Even a relatively small incubator weighs about 200 kg, when water-loaded.
Although we provide in this document measurements of attenuation for one incubator only,
we feel that this single measurement is representative, based on the fact that most
incubators have similar stainless steel double-wall construction. This type of measurement
has never been performed before. The Narda EFA-300 was used for these measurements.
2.3.1 Z-axis
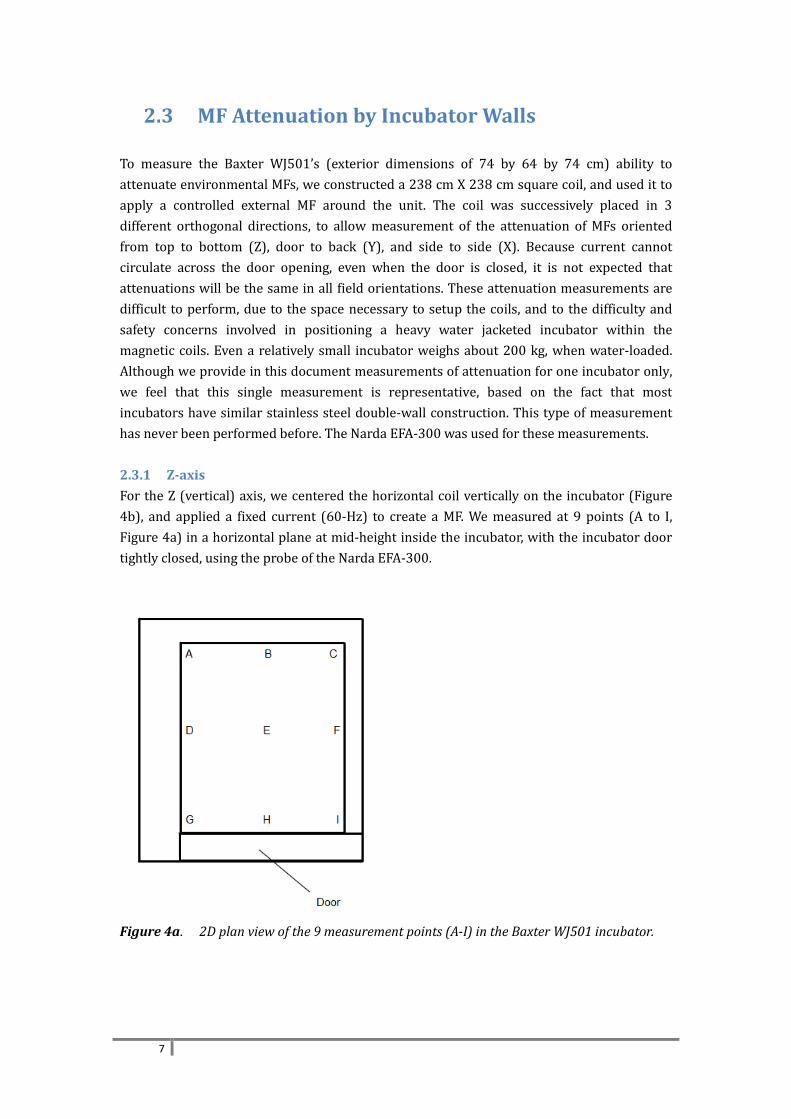
For the Z (vertical) axis, we centered the horizontal coil vertically on the incubator (Figure
4b), and applied a fixed current (60-Hz) to create a MF. We measured at 9 points (A to I,
Figure 4a) in a horizontal plane at mid-height inside the incubator, with the incubator door
tightly closed, using the probe of the Narda EFA-300.
Figure 4a. 2D plan view of the 9 measurement points (A-I) in the Baxter WJ501 incubator.
8
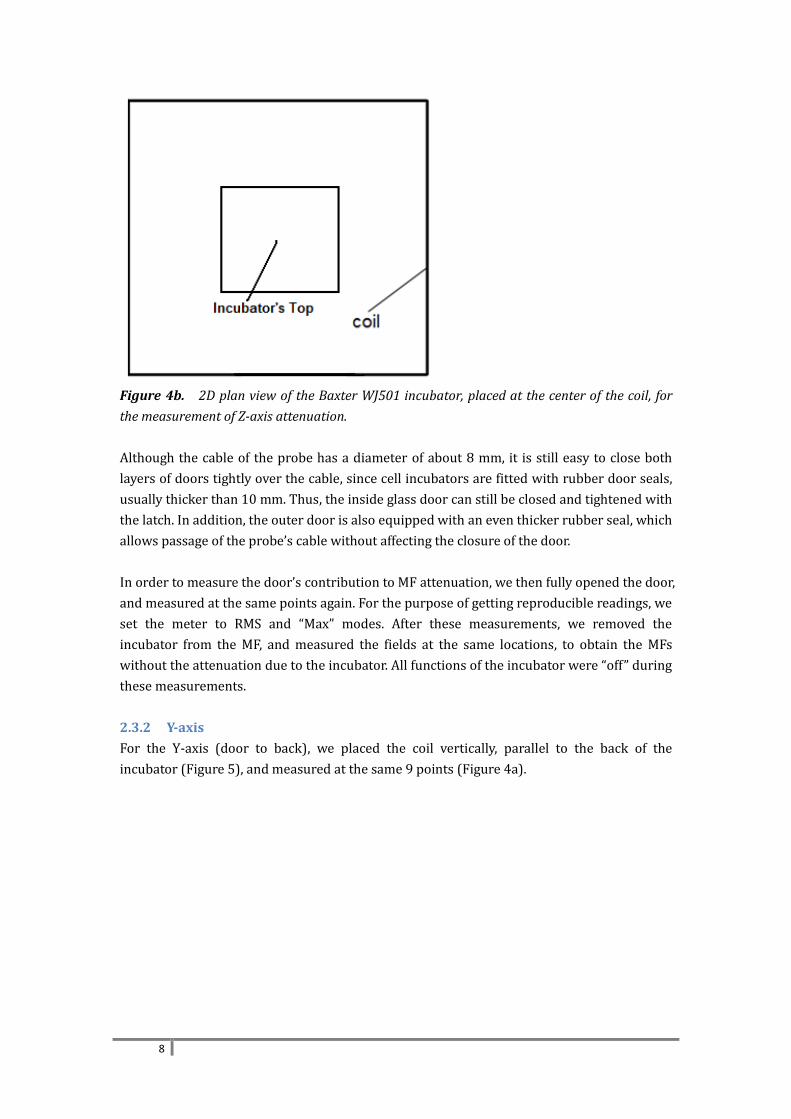
Figure 4b. 2D plan view of the Baxter WJ501 incubator, placed at the center of the coil, for
the measurement of Z-axis attenuation.
Although the cable of the probe has a diameter of about 8 mm, it is still easy to close both
layers of doors tightly over the cable, since cell incubators are fitted with rubber door seals,
usually thicker than 10 mm. Thus, the inside glass door can still be closed and tightened with
the latch. In addition, the outer door is also equipped with an even thicker rubber seal, which
allows passage of the probe’s cable without affecting the closure of the door.
In order to measure the door’s contribution to MF attenuation, we then fully opened the door,
and measured at the same points again. For the purpose of getting reproducible readings, we
set the meter to RMS and “Max” modes. After these measurements, we removed the
incubator from the MF, and measured the fields at the same locations, to obtain the MFs
without the attenuation due to the incubator. All functions of the incubator were “off” during
these measurements.
2.3.2 Y-axis
For the Y-axis (door to back), we placed the coil vertically, parallel to the back of the
incubator (Figure 5), and measured at the same 9 points (Figure 4a).

9
Figure 5. Square MF coil placed parallel to the back of the incubator.
Left: 3D front view. Right: 2D side view.
2.3.3 X-axis
For the X-axis (side to side), we placed the coil vertically, parallel to the sides of the incubator
(Figure 6), and measured the same points (Figure 4a).
Figure 6. 3D front view of the square MF coil placed parallel to the side walls of the
incubator.

10
2.4 MF Survey Procedures
Having completed these measurements (2.2 and 2.3), we performed our main survey,
conducted in 14 different departments of the Royal Victoria Hospital and McGill University
laboratories (Faculties of Medicine and Biology, Cancer Research Center). 87 incubators were
indentified, and 46 of them were measured. Since the units surveyed were actively in use, the
following procedures take into account encumbrances due to the presence of other pieces of
laboratory equipment around the incubators, and of positioning of culture vessels within
incubators. The measurements were performed with the Narda EFA-300, except for 2.4.2e.
2.4.1. MF Measurements Outside the Incubators
a) Measure the MF in front of the centre of the incubator’s door, at a distance of 1
meter; measurement time is 1 minute, using RMS Max mode at 60-Hz.
b) Measure the 60-Hz MF at the left, right, and back, at a distance of 1 meter of the
respective centers on the external surfaces of the incubator. If there is any other
electrical device within 1 meter, measure at 50 cm. When the space between two
units is less than 50 cm, measure at midway between the incubator and the
device.
2.4.2 MF Measurements Inside the Incubators
a) All the measurements use Max mode, measurement times are at least 1 minute
after the reading stabilizes, in order to catch the peak value (when the heater is
on). If there are fewer than 3 layers of shelves installed in the incubator, measure
at height/4, height/2, and 3x height/4. For each height, measure at 5 cm from the
left wall, at the mid-point, and at 5 cm from the right wall.
c) If there are 3 or more layers of shelves inside the incubator, measure at the
shelves closest to the height/4, height/2, and 3x height/4. For each shelf, measure
at 5 cm from the left wall, middle point, and 5 cm from the right wall.
d) At the center point of the incubator, record the MF’s frequency spectrum, using
the Narda EFA-300’s Vect Max mode.
e) At the center point of the incubator, using the Field Star 1000, record the MF
(60-Hz) at each second for a duration of 5 minutes, or the time for 10 cycles of
heater “on” and “off”, whichever is longer.
f) For incubator shakers, measure the 3 columns of the tray: left, middle, and right
columns. At each column, measure at 3 different points: front, middle and rear
holders. Frequency spectrum and time variations of MFs are also recorded, as in
steps d) and e).
11
3 Results
We define 3 incubator axes to report our MF vector measurements: “X-axis” from left to right,
“Y-axis” from front to back, and “Z-axis” from bottom to top. For each axis, we plotted the
Narda readings from grids at a series of fixed heights. The vectorially integrated MFs (RMS of
combined X-Y-Z) are also reported.
The Field Star 1000 logged X-Y-Z MF components, as well as the integrated values, while
recording MFs over time (section 3.2.2.6).
3.1 Detailed MF Measurements
One of the incubators available for detailed measurements (Baxter) could be disassembled to
localize the electrically powered components, while the second one (Forma) was a larger
unit that we used for comparison.
3.1.1 MFs inside the Baxter Incubator
We made the following measurements in the Baxter WJ501 incubator,
3.1.1.1 MFs along X-axis
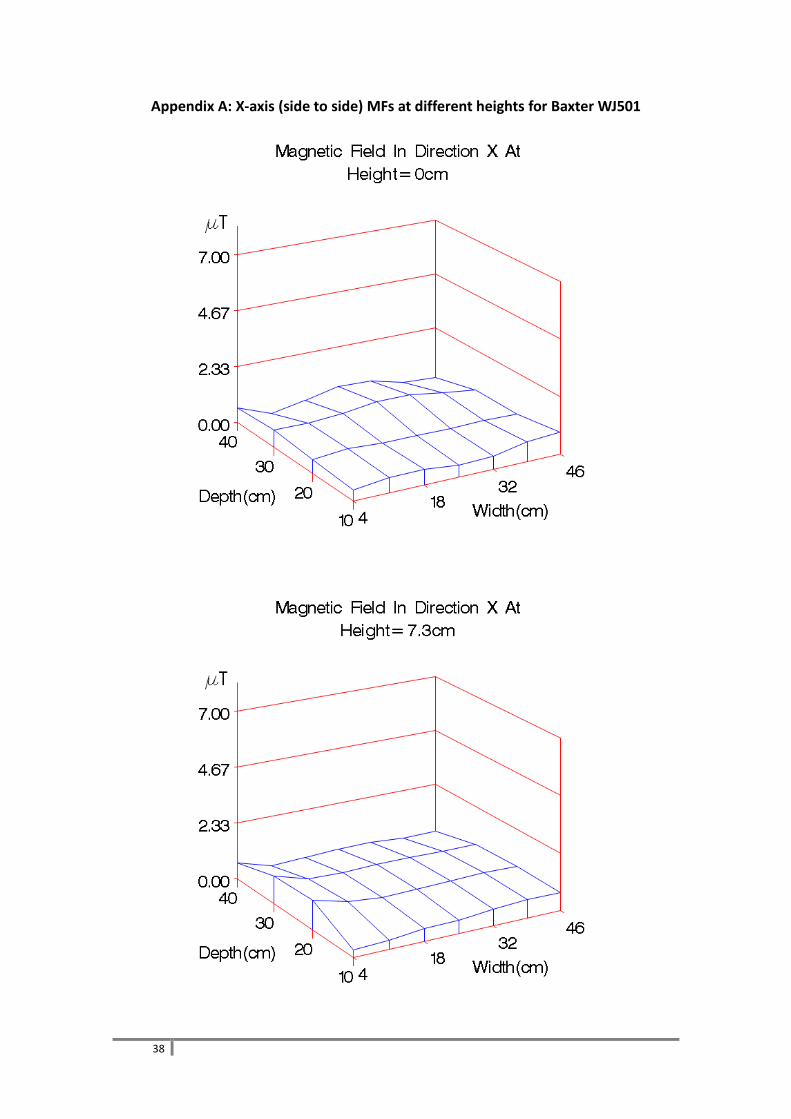
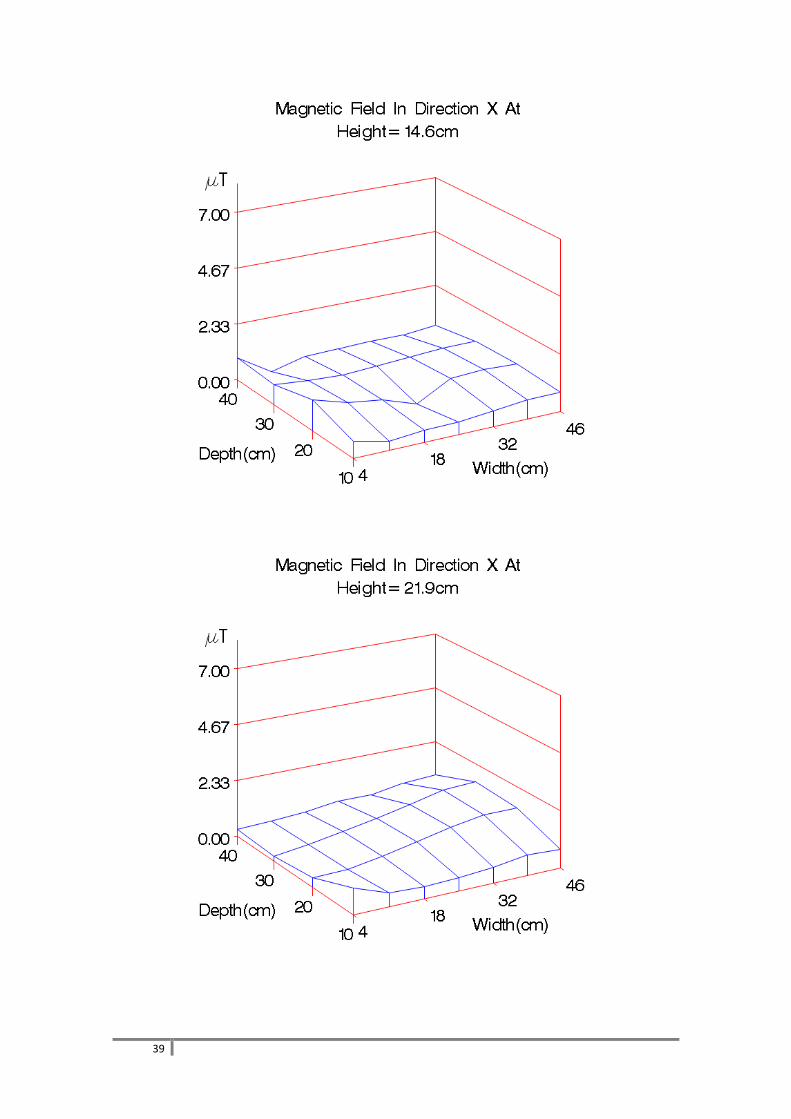
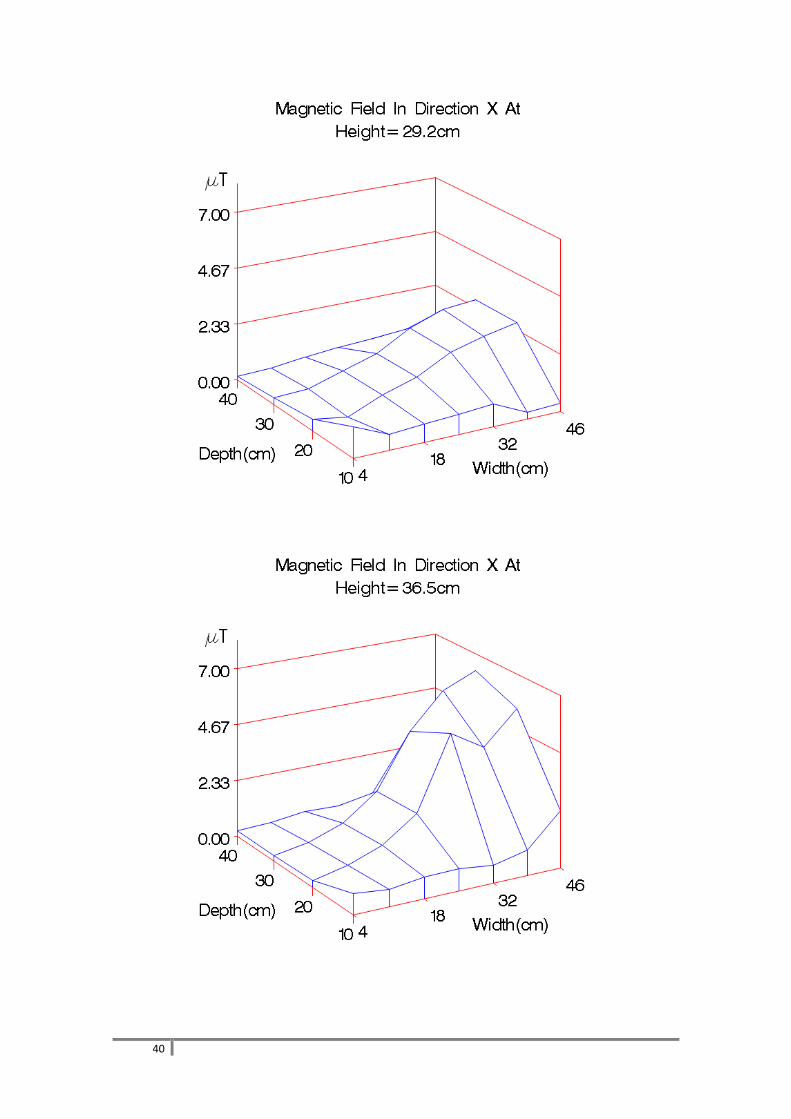
MFs along the X-axis (left to right) increase along height (Z axis), as can be seen from the
summary statistics in Table 2, and the plots in Appendix A.
Table 2. Mean, minimum, maximum, and standard deviation of MFs along the X-axis at different heights inside the Baxter WJ501.
Height from Bottom (Z, cm)
MFs along the X-axis (µT)
Mean Min Max Std Dev
0 0.61 0.07 1.00 0.22
7.3 0.63 0.25 1.20 0.25
14.6 0.67 0.04 1.24 0.26
21.9 0.77 0.21 1.56 0.39
29.2 0.99 0.14 2.64 0.80
36.5 1.84 0.24 6.20 1.9
3.1.1.2 MFs along Y-axis
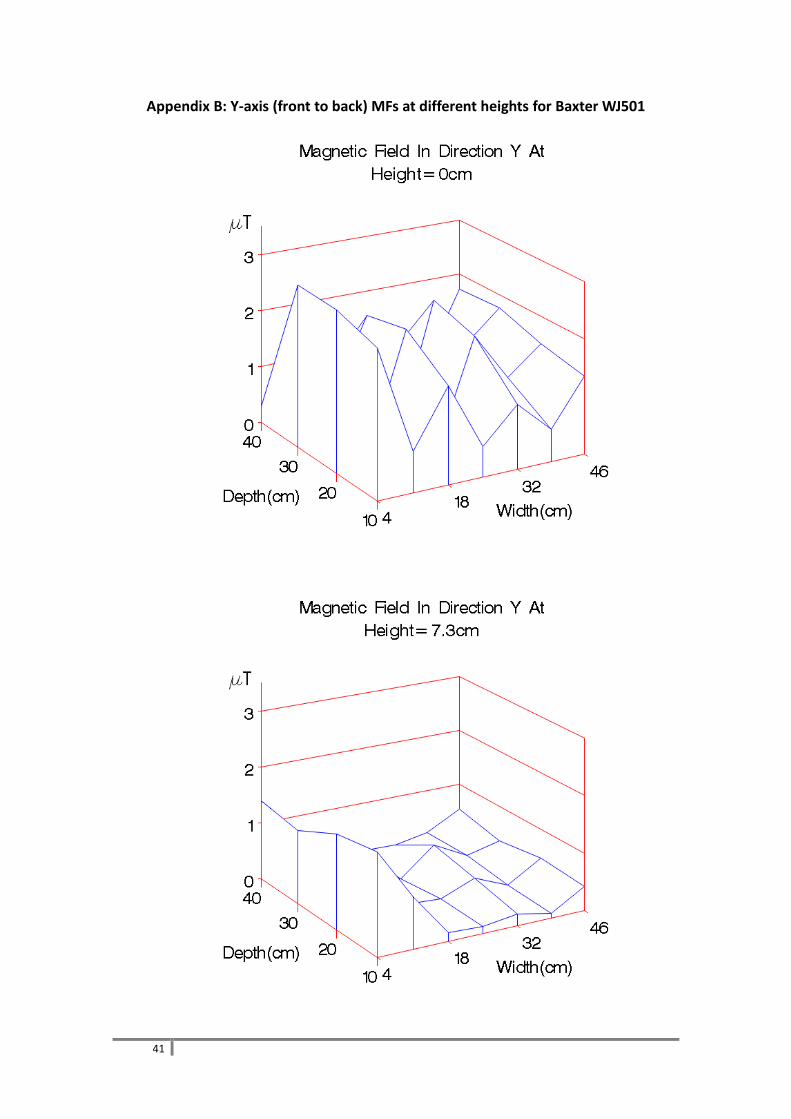
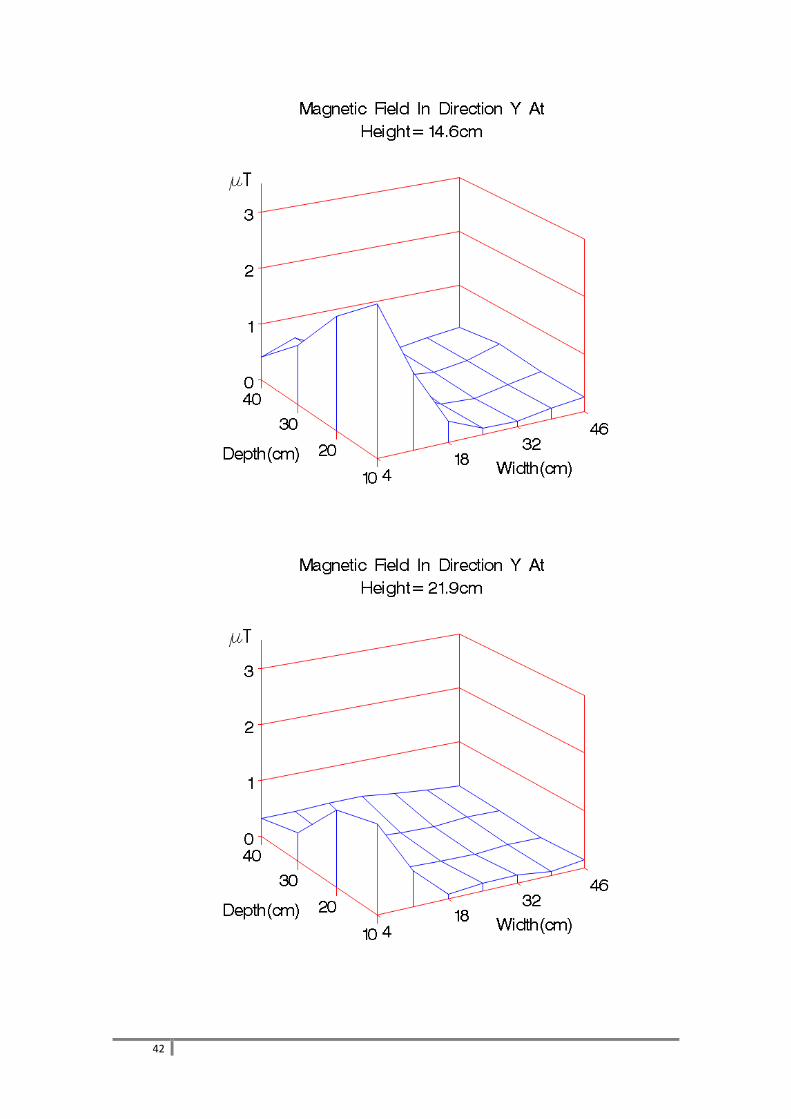
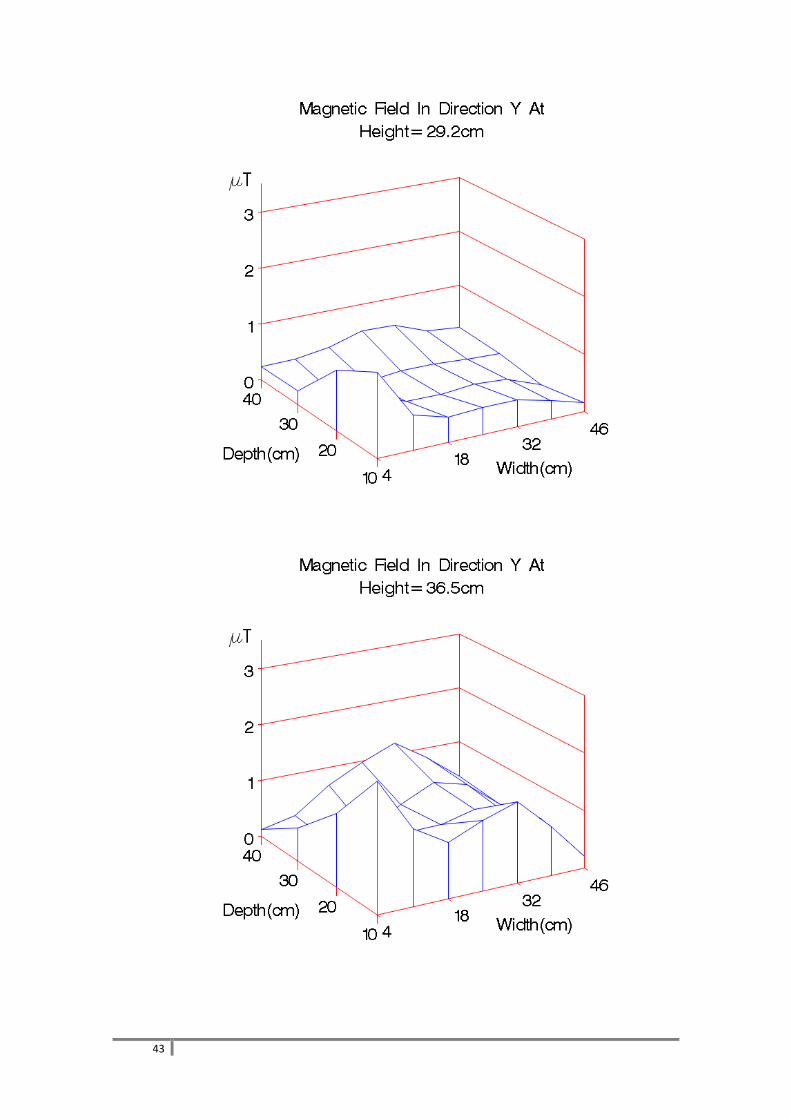
MFs along the Y-axis (front to back), from Table 3 and the plots in Appendix B, showed the
following.
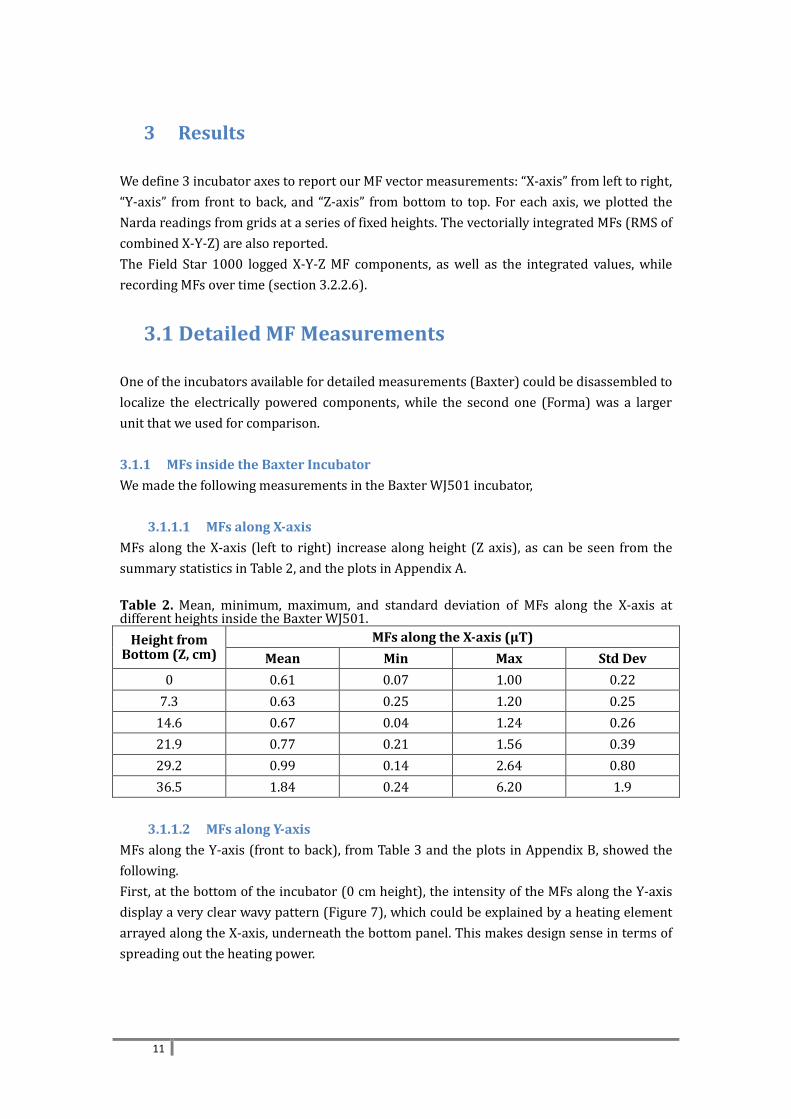
First, at the bottom of the incubator (0 cm height), the intensity of the MFs along the Y-axis
display a very clear wavy pattern (Figure 7), which could be explained by a heating element
arrayed along the X-axis, underneath the bottom panel. This makes design sense in terms of
spreading out the heating power.
12
Figure 7. Wavy MF pattern at the bottom of Baxter WJ501.
Second, we noted that as we moved towards the top of the incubator, the average MF along
the Y-axis initially decreased, and then increased (Table 3). This was mainly caused by an air
circulation motor, which is located at the left rear top of the incubator.
Table 3. Mean, minimum, maximum, and standard deviation of MFs along the Y-axis at different heights inside the Baxter WJ501.
Height from Bottom (Z, cm)
MFs along the Y-axis (µT)
Mean Min Max Std Dev
0 1.24 0.05 2.84 0.82
7.3 0.51 0.06 1.76 0.49
14.6 0.48 0.04 2.58 0.61
21.9 0.30 0.06 1.52 0.35
29.2 0.36 0.03 1.44 0.29
36.5 0.77 0.13 2.24 0.46
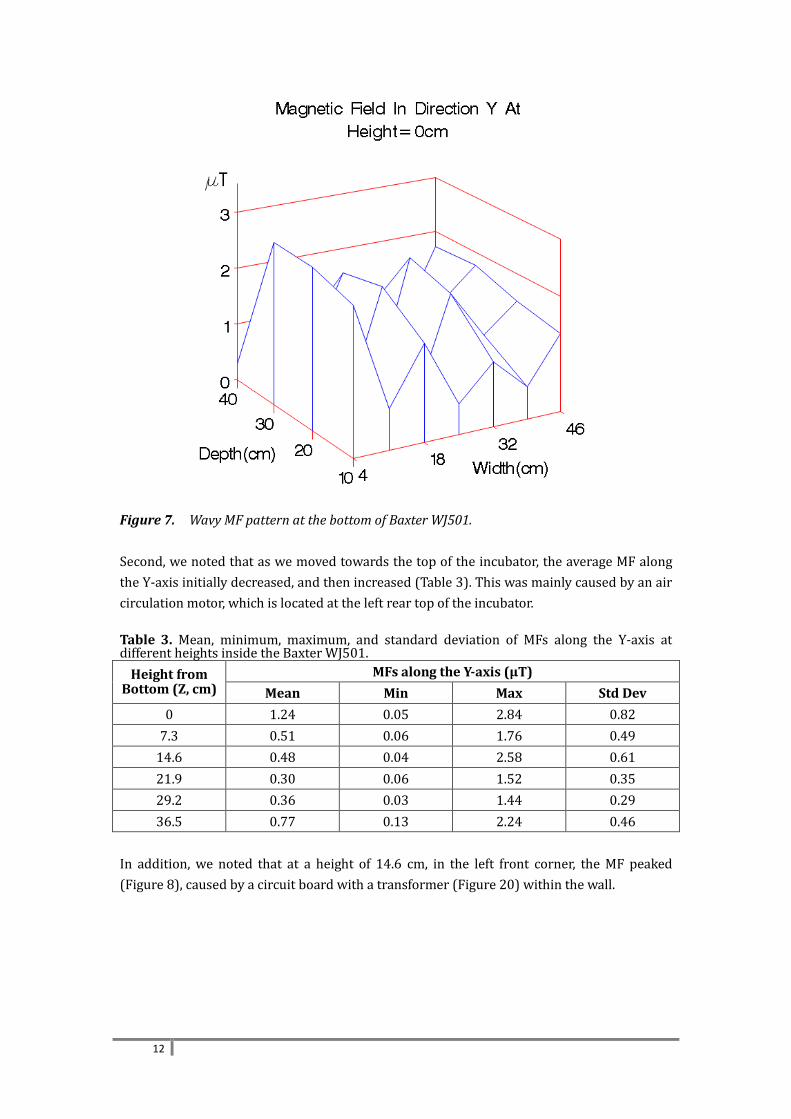
In addition, we noted that at a height of 14.6 cm, in the left front corner, the MF peaked
(Figure 8), caused by a circuit board with a transformer (Figure 20) within the wall.
13
Figure 8. MF along the X-axis peaked near a Transformer.
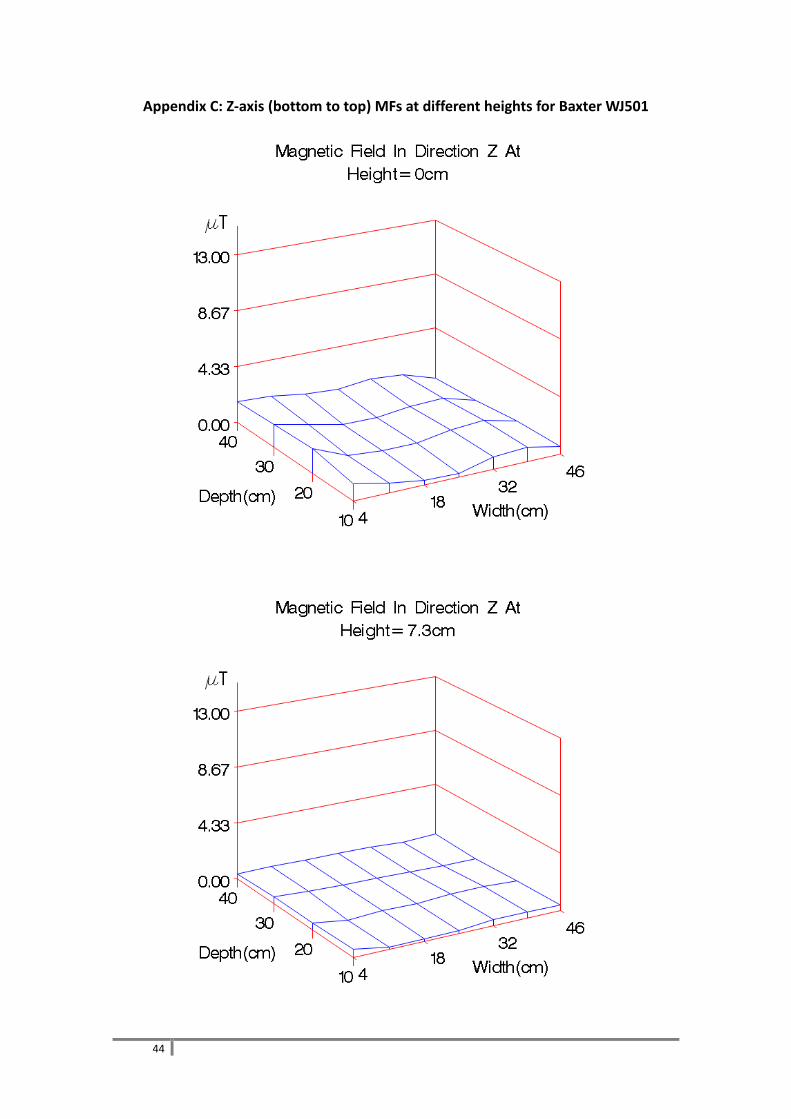
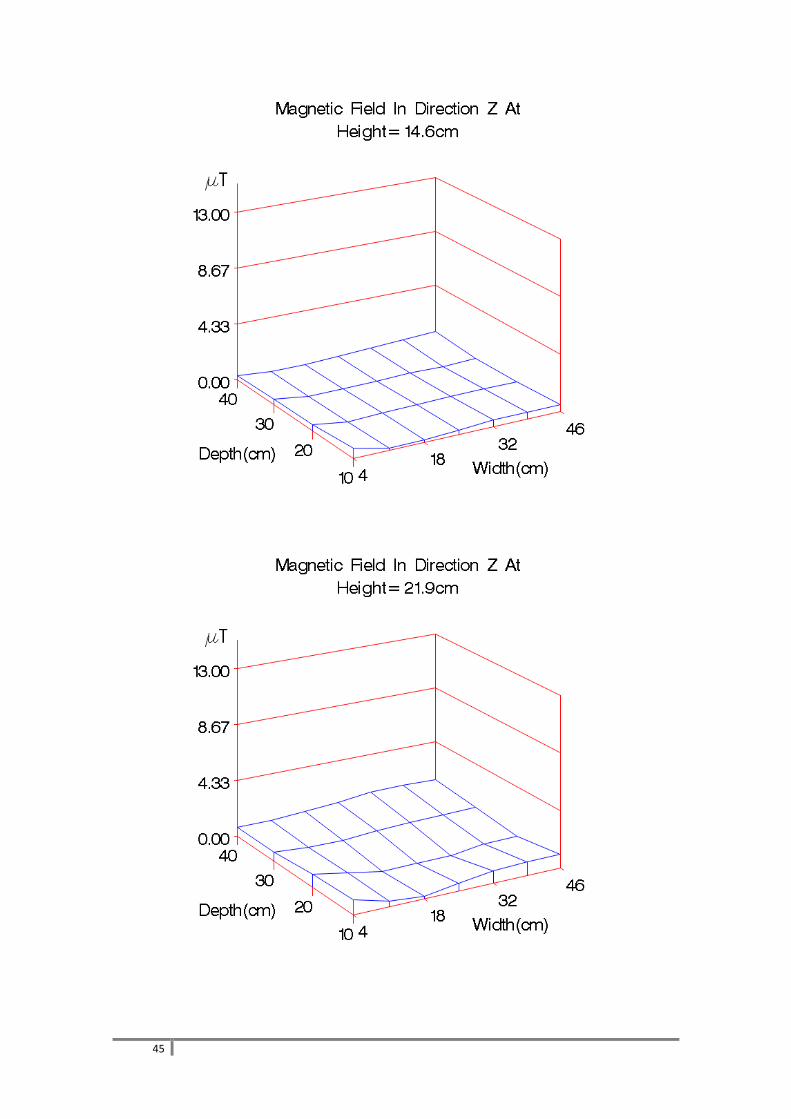
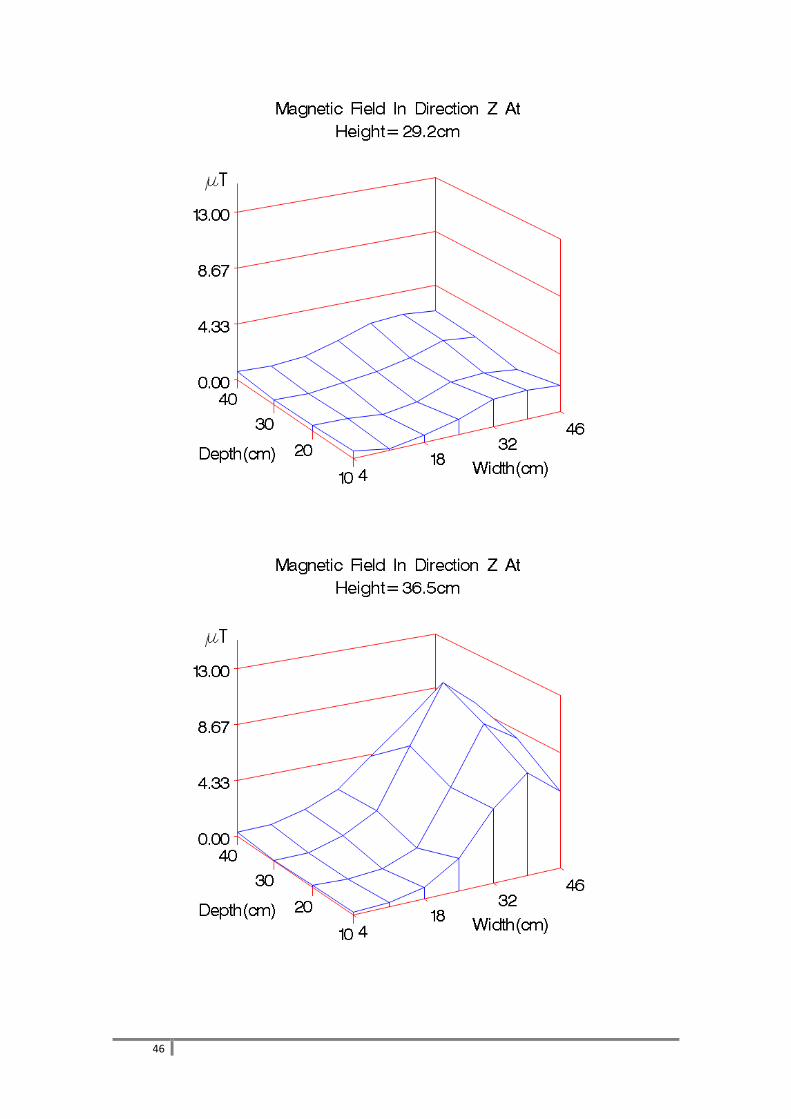
3.1.1.3 MFs along Z-axis
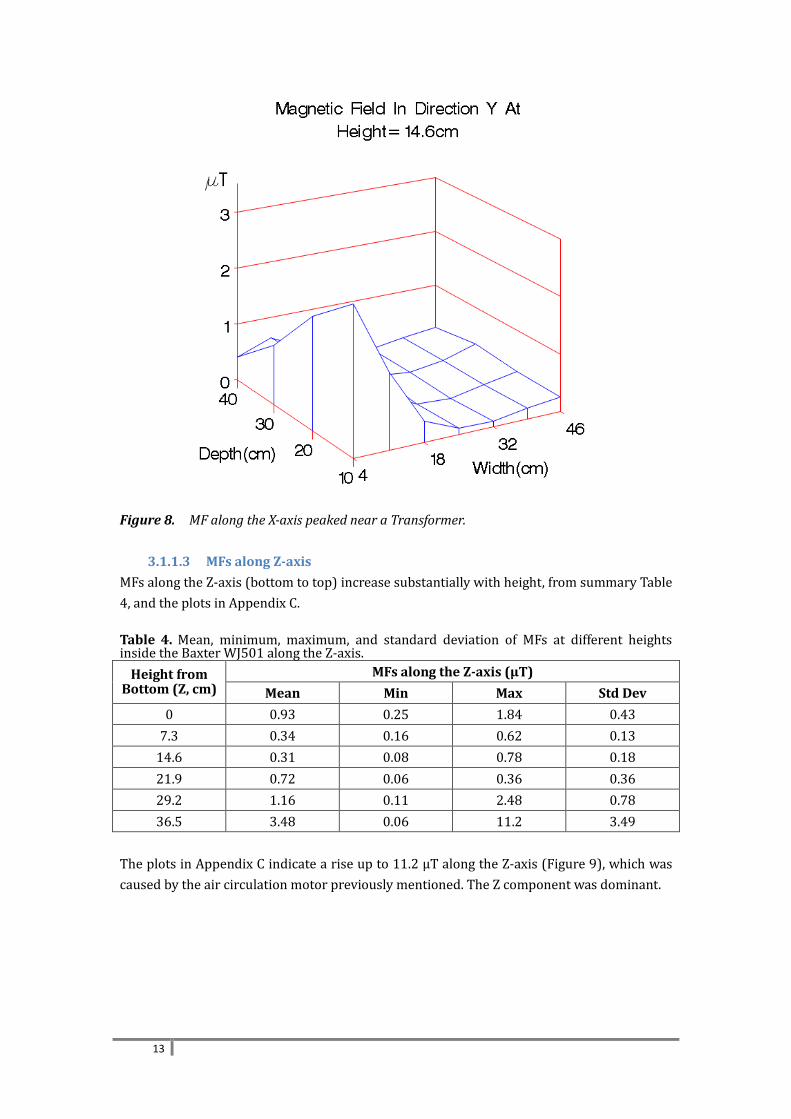
MFs along the Z-axis (bottom to top) increase substantially with height, from summary Table
4, and the plots in Appendix C.
Table 4. Mean, minimum, maximum, and standard deviation of MFs at different heights inside the Baxter WJ501 along the Z-axis.
Height from Bottom (Z, cm)
MFs along the Z-axis (µT)
Mean Min Max Std Dev
0 0.93 0.25 1.84 0.43
7.3 0.34 0.16 0.62 0.13
14.6 0.31 0.08 0.78 0.18
21.9 0.72 0.06 0.36 0.36
29.2 1.16 0.11 2.48 0.78
36.5 3.48 0.06 11.2 3.49
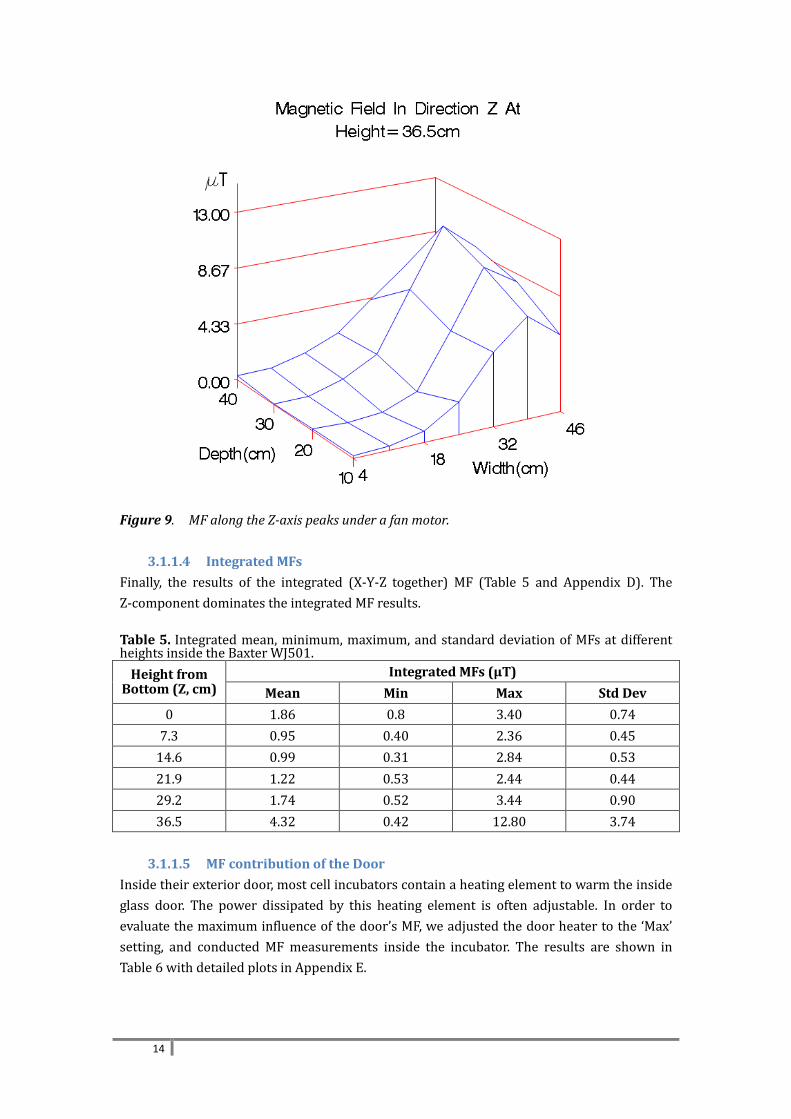
The plots in Appendix C indicate a rise up to 11.2 µT along the Z-axis (Figure 9), which was
caused by the air circulation motor previously mentioned. The Z component was dominant.
14
Figure 9. MF along the Z-axis peaks under a fan motor.
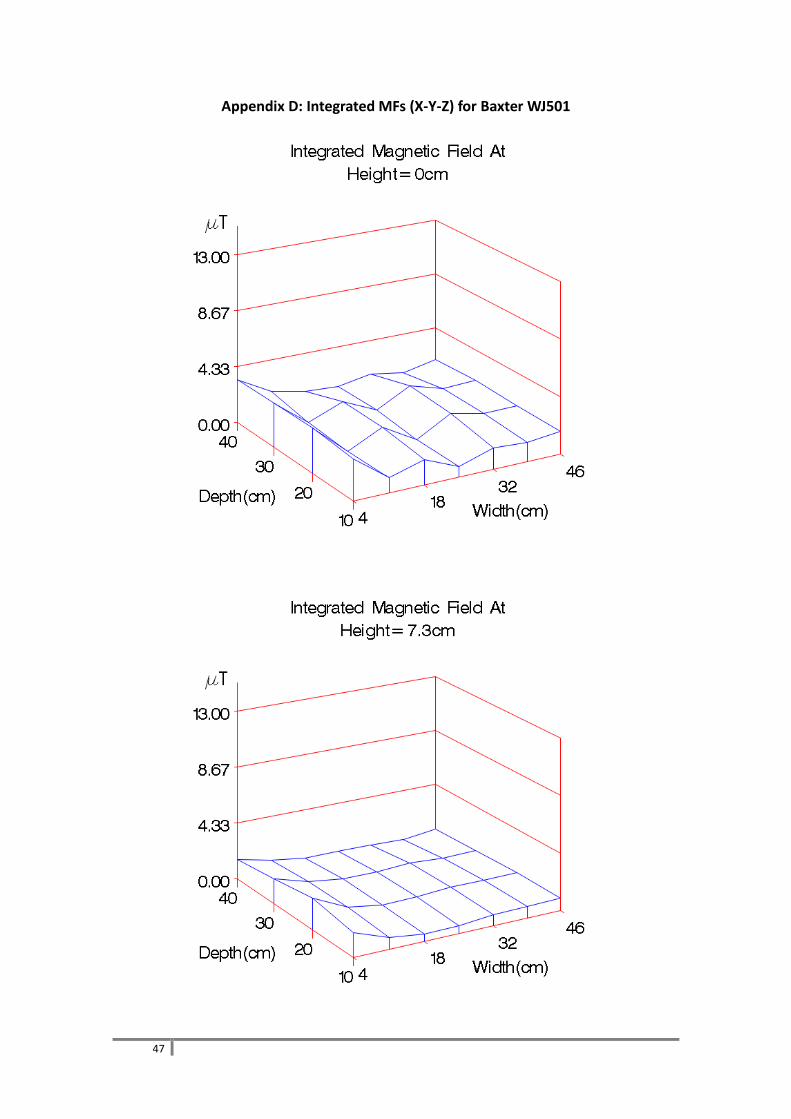
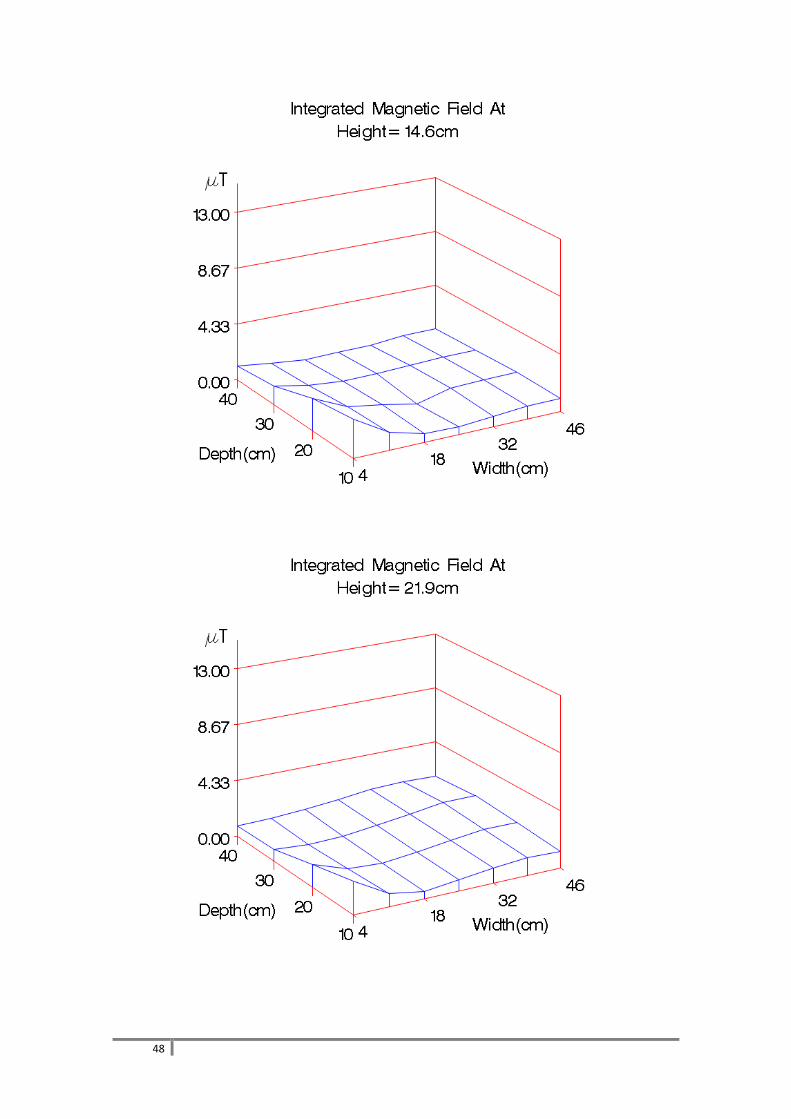
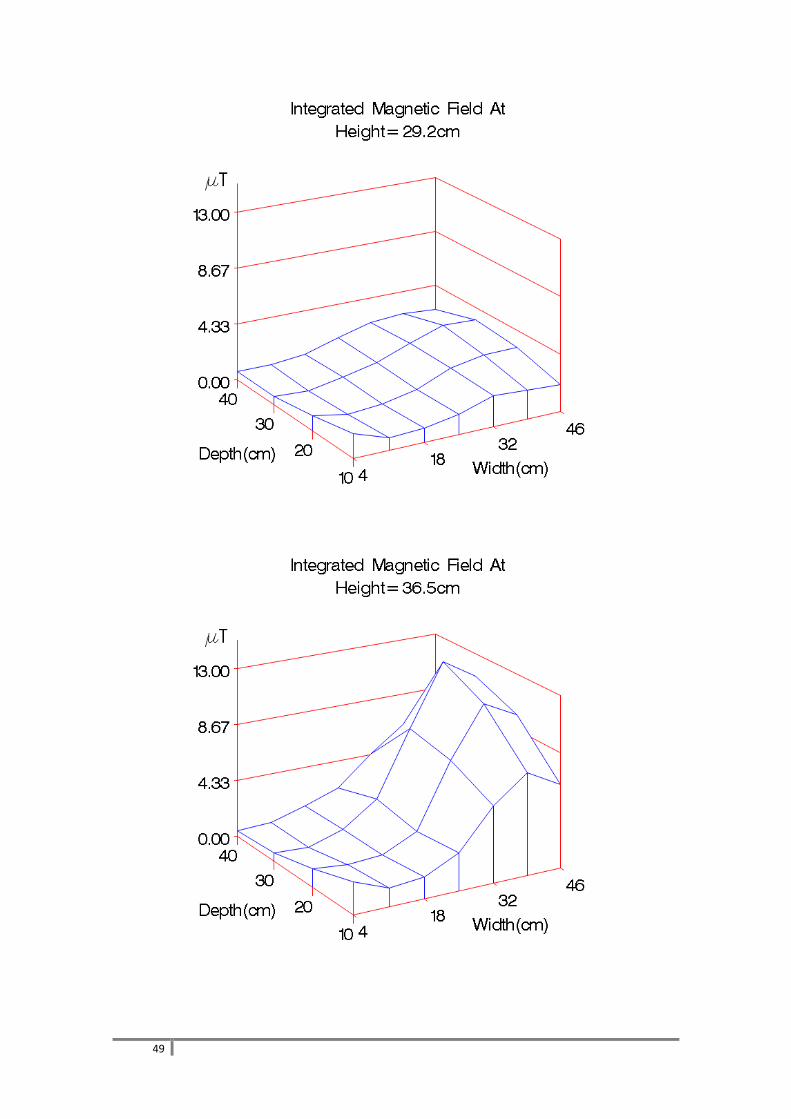
3.1.1.4 Integrated MFs
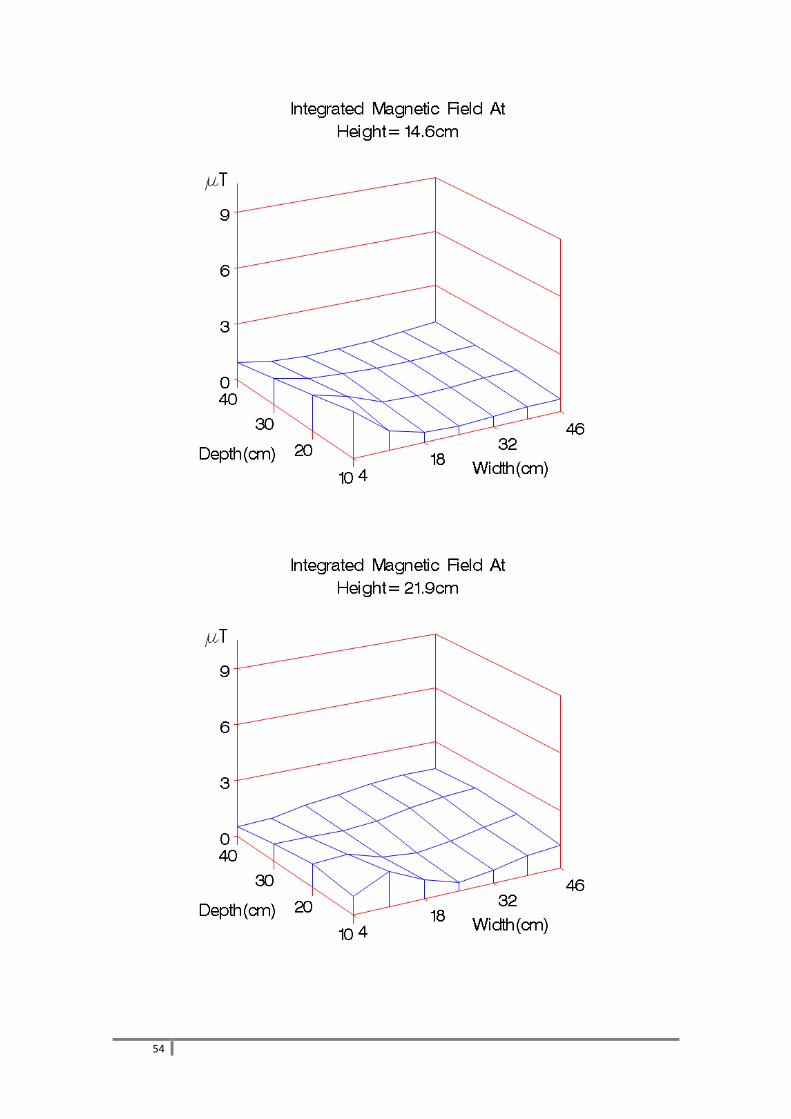
Finally, the results of the integrated (X-Y-Z together) MF (Table 5 and Appendix D). The
Z-component dominates the integrated MF results.
Table 5. Integrated mean, minimum, maximum, and standard deviation of MFs at different heights inside the Baxter WJ501.
Height from Bottom (Z, cm)
Integrated MFs (µT)
Mean Min Max Std Dev
0 1.86 0.8 3.40 0.74
7.3 0.95 0.40 2.36 0.45
14.6 0.99 0.31 2.84 0.53
21.9 1.22 0.53 2.44 0.44
29.2 1.74 0.52 3.44 0.90
36.5 4.32 0.42 12.80 3.74
3.1.1.5 MF contribution of the Door
Inside their exterior door, most cell incubators contain a heating element to warm the inside
glass door. The power dissipated by this heating element is often adjustable. In order to
evaluate the maximum influence of the door’s MF, we adjusted the door heater to the ‘Max’
setting, and conducted MF measurements inside the incubator. The results are shown in
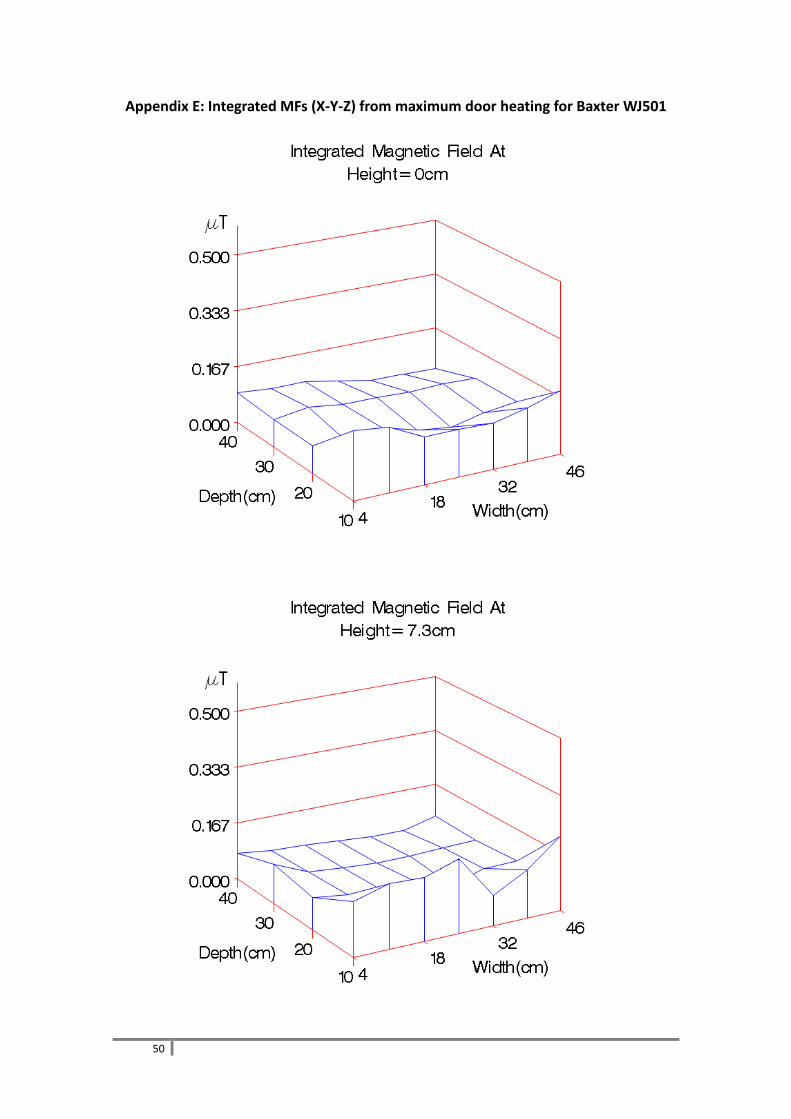
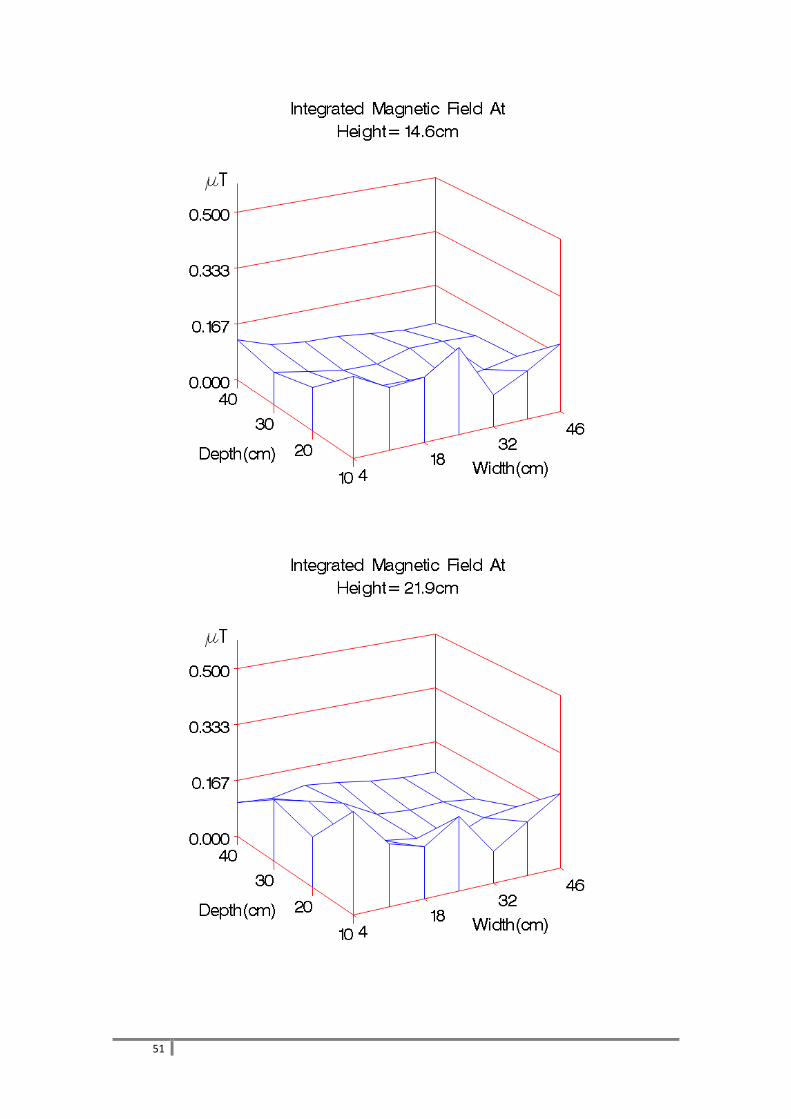
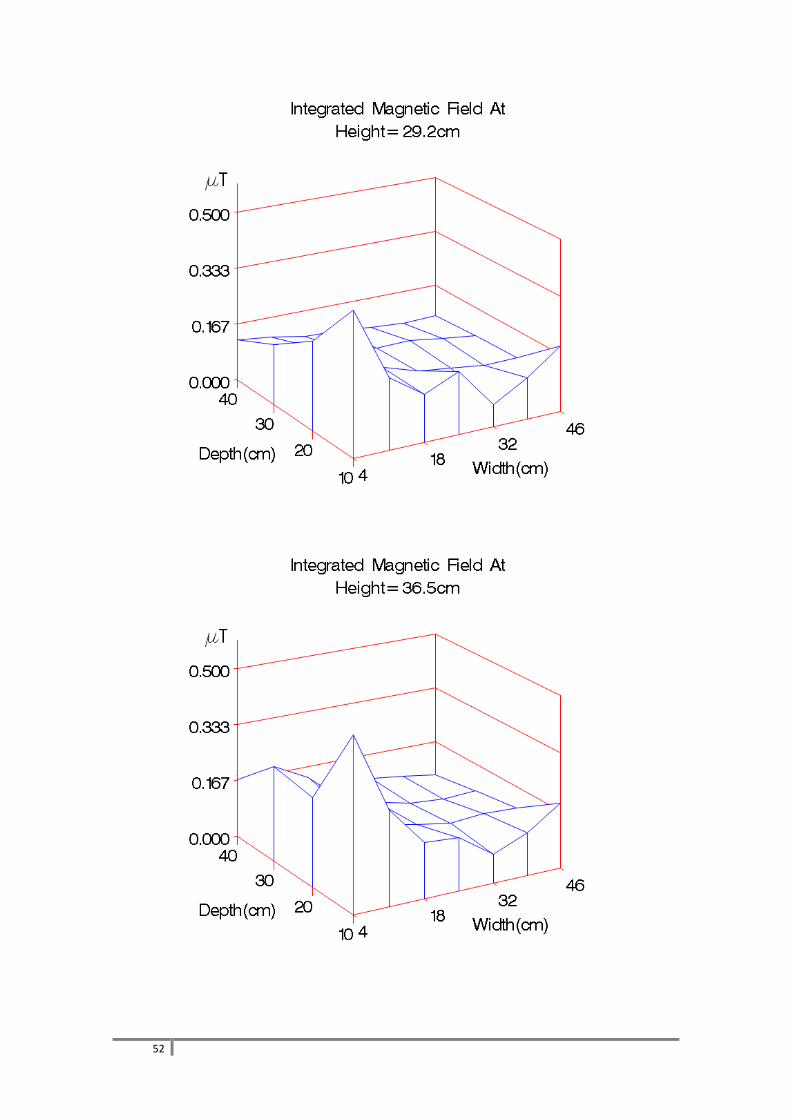
Table 6 with detailed plots in Appendix E.
15
Table 6. Mean, minimum, maximum, and standard deviation of MFs with maximum door heating at different heights inside the Baxter WJ501.
Height from Bottom (Z, cm)
Integrated MFs (µT)
Mean Min Max Std Dev
0 0.09 0.04 0.20 0.04
7.3 0.09 0.04 0.22 0.05
14.6 0.10 0.05 0.25 0.05
21.9 0.12 0.06 0.29 0.06
29.2 0.13 0.06 0.41 0.07
36.5 0.15 0.06 0.56 0.10
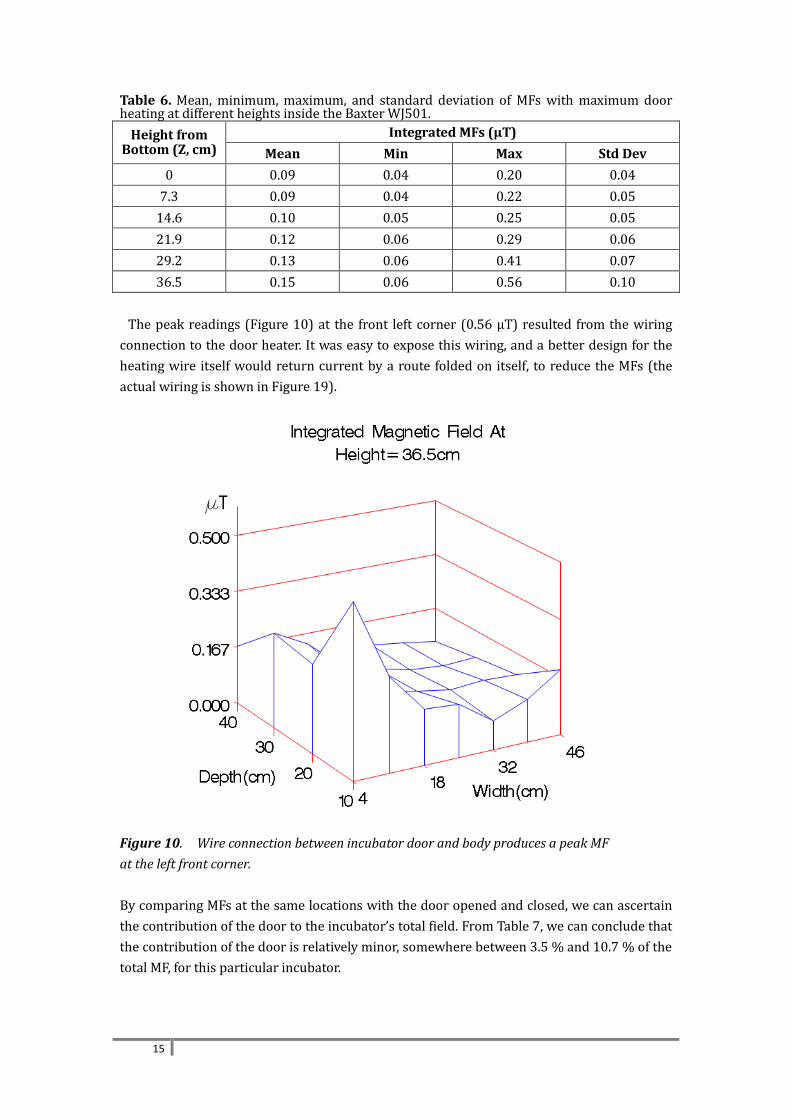
The peak readings (Figure 10) at the front left corner (0.56 µT) resulted from the wiring
connection to the door heater. It was easy to expose this wiring, and a better design for the
heating wire itself would return current by a route folded on itself, to reduce the MFs (the
actual wiring is shown in Figure 19).
Figure 10. Wire connection between incubator door and body produces a peak MF
at the left front corner.
By comparing MFs at the same locations with the door opened and closed, we can ascertain
the contribution of the door to the incubator’s total field. From Table 7, we can conclude that
the contribution of the door is relatively minor, somewhere between 3.5 % and 10.7 % of the
total MF, for this particular incubator.
16
Table 7. Door Contribution to the MF at different heights inside the Baxter WJ501.
Height (Z, cm) Mean with Door
open (µT) Mean with Door
closed (µT) Door Contribution
0 0.094 1.86 5.05%
7.3 0.092 0.954 10.7%
14.6 0.104 0.986 10.5%
21.9 0.120 1.224 9.80%
29.2 0.133 1.737 7.66%
36.5 0.153 4.323 3.5%
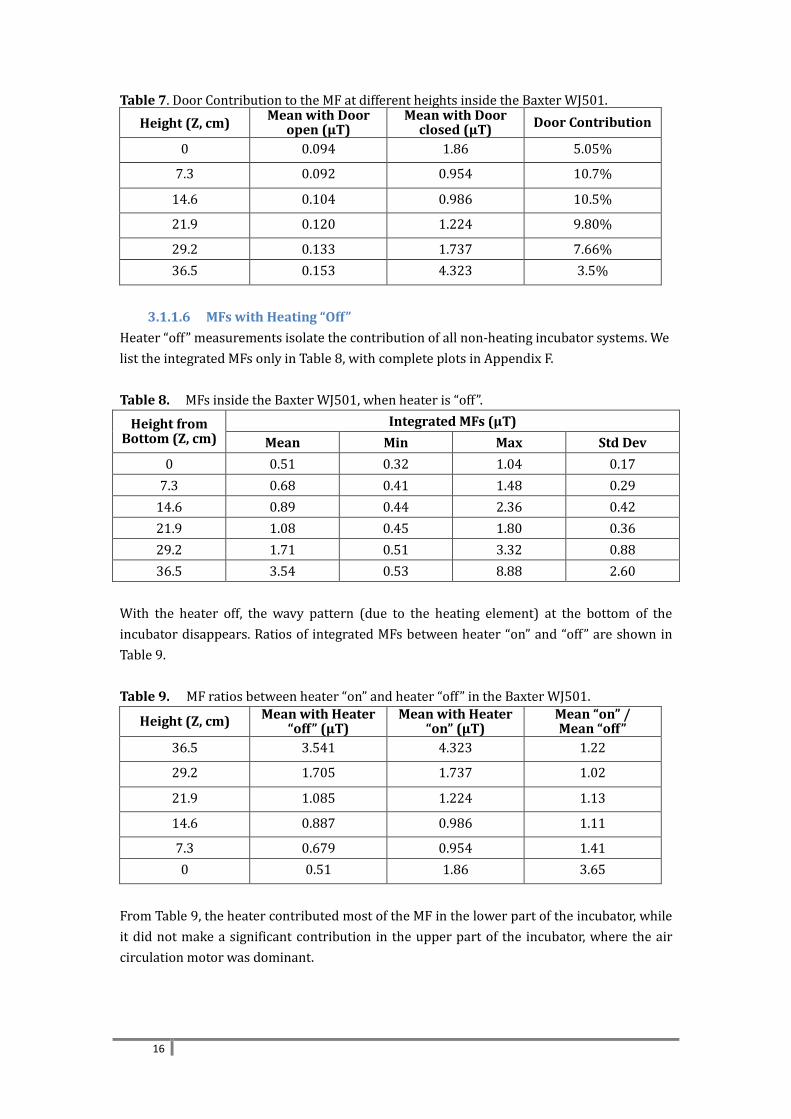
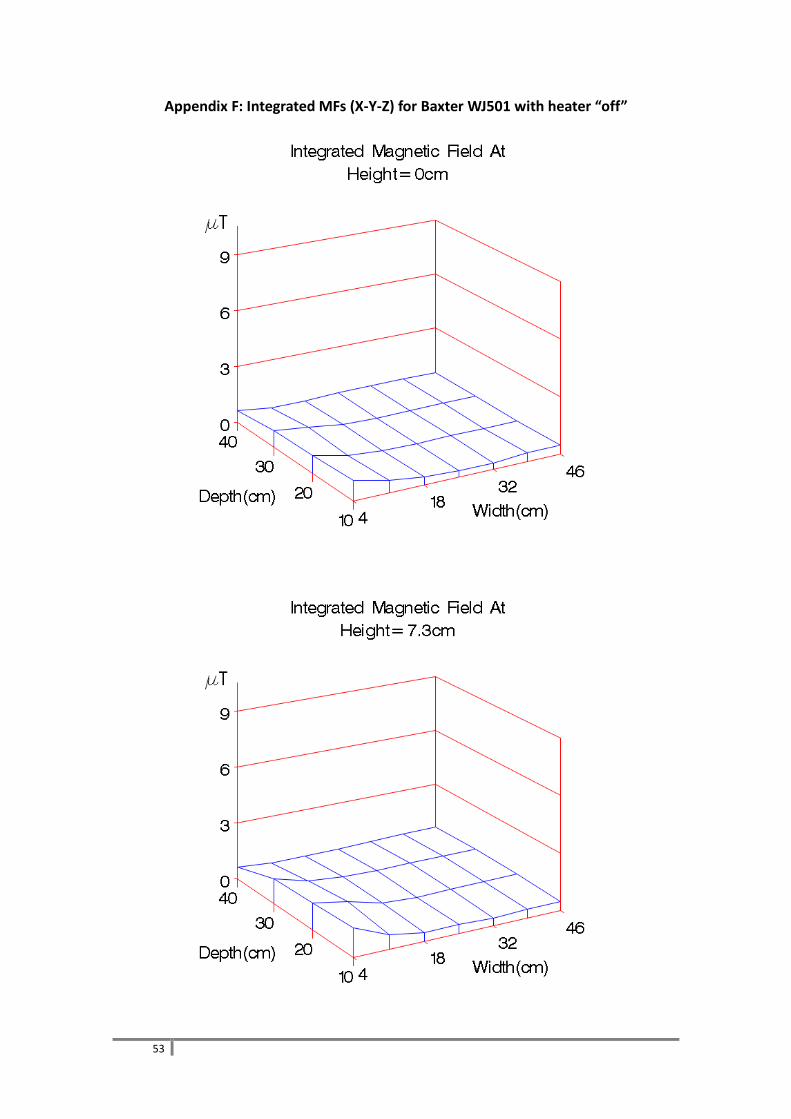
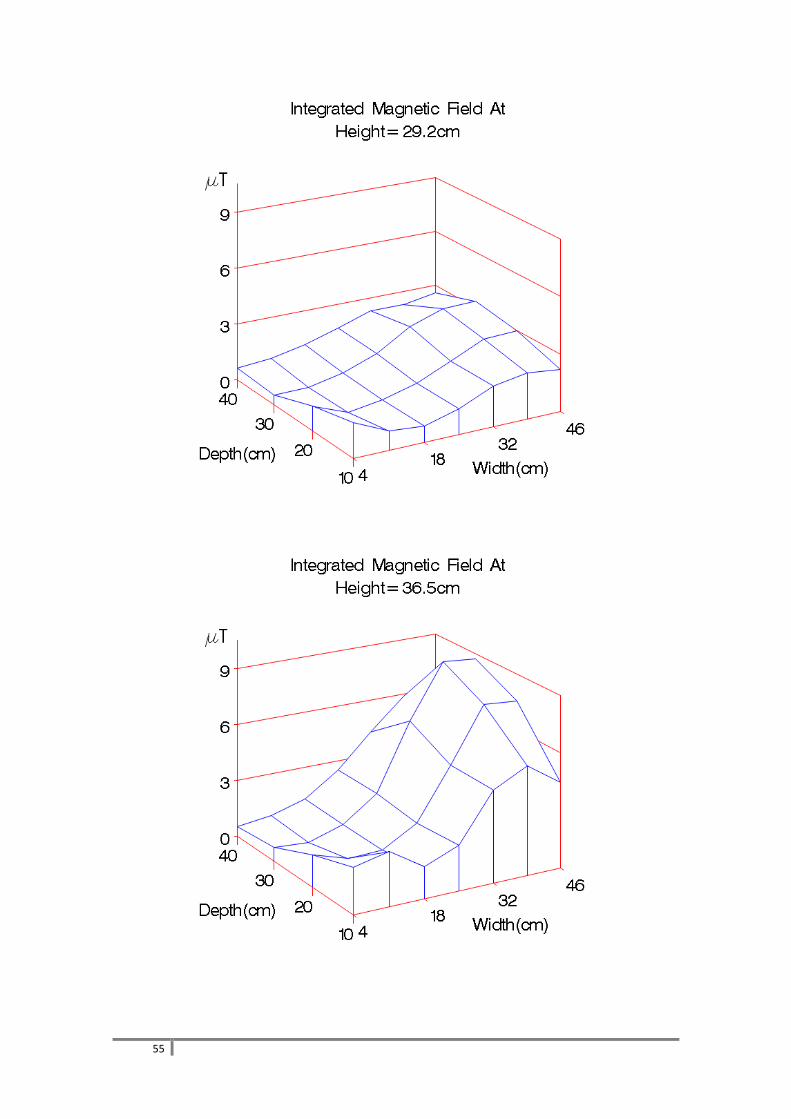
3.1.1.6 MFs with Heating “Off”
Heater “off” measurements isolate the contribution of all non-heating incubator systems. We
list the integrated MFs only in Table 8, with complete plots in Appendix F.
Table 8. MFs inside the Baxter WJ501, when heater is “off”.
Height from Bottom (Z, cm)
Integrated MFs (µT)
Mean Min Max Std Dev
0 0.51 0.32 1.04 0.17
7.3 0.68 0.41 1.48 0.29
14.6 0.89 0.44 2.36 0.42
21.9 1.08 0.45 1.80 0.36
29.2 1.71 0.51 3.32 0.88
36.5 3.54 0.53 8.88 2.60
With the heater off, the wavy pattern (due to the heating element) at the bottom of the
incubator disappears. Ratios of integrated MFs between heater “on” and “off” are shown in
Table 9.
Table 9. MF ratios between heater “on” and heater “off” in the Baxter WJ501.
Height (Z, cm) Mean with Heater
“off” (µT) Mean with Heater
“on” (µT) Mean “on” / Mean “off”
36.5 3.541 4.323 1.22
29.2 1.705 1.737 1.02
21.9 1.085 1.224 1.13
14.6 0.887 0.986 1.11
7.3 0.679 0.954 1.41
0 0.51 1.86 3.65
From Table 9, the heater contributed most of the MF in the lower part of the incubator, while
it did not make a significant contribution in the upper part of the incubator, where the air
circulation motor was dominant.
17
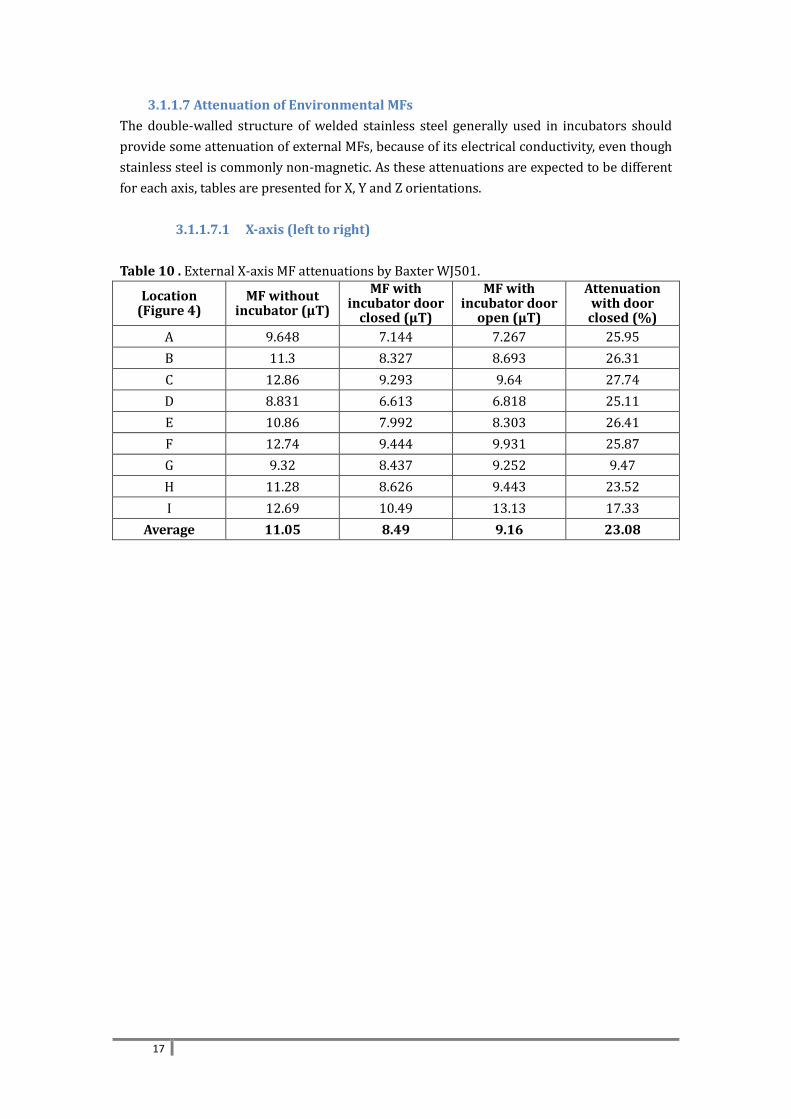
3.1.1.7 Attenuation of Environmental MFs
The double-walled structure of welded stainless steel generally used in incubators should
provide some attenuation of external MFs, because of its electrical conductivity, even though
stainless steel is commonly non-magnetic. As these attenuations are expected to be different
for each axis, tables are presented for X, Y and Z orientations.
3.1.1.7.1 X-axis (left to right)
Table 10 . External X-axis MF attenuations by Baxter WJ501.
Location (Figure 4)
MF without incubator (μT)
MF with incubator door
closed (μT)
MF with incubator door
open (μT)
Attenuation with door
closed (%)
A 9.648 7.144 7.267 25.95
B 11.3 8.327 8.693 26.31
C 12.86 9.293 9.64 27.74
D 8.831 6.613 6.818 25.11
E 10.86 7.992 8.303 26.41
F 12.74 9.444 9.931 25.87
G 9.32 8.437 9.252 9.47
H 11.28 8.626 9.443 23.52
I 12.69 10.49 13.13 17.33
Average 11.05 8.49 9.16 23.08
18
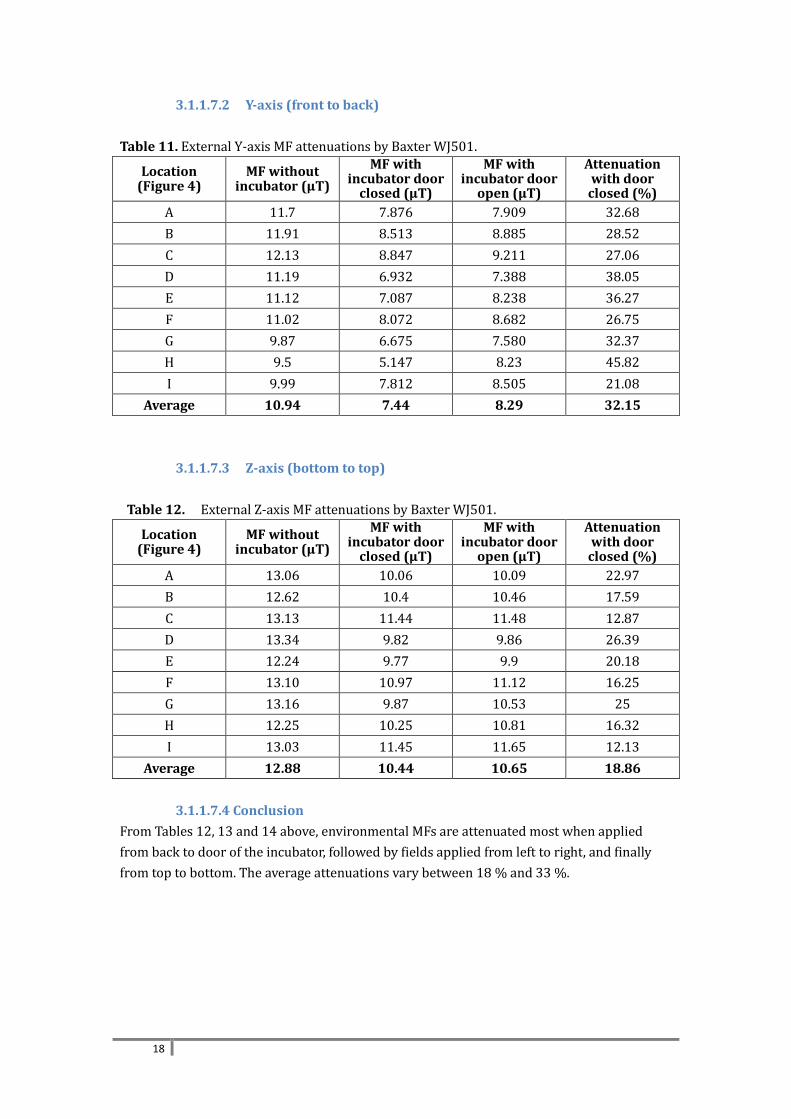
3.1.1.7.2 Y-axis (front to back)
Table 11. External Y-axis MF attenuations by Baxter WJ501.
Location (Figure 4)
MF without incubator (μT)
MF with incubator door
closed (μT)
MF with incubator door
open (μT)
Attenuation with door
closed (%)
A 11.7 7.876 7.909 32.68
B 11.91 8.513 8.885 28.52
C 12.13 8.847 9.211 27.06
D 11.19 6.932 7.388 38.05
E 11.12 7.087 8.238 36.27
F 11.02 8.072 8.682 26.75
G 9.87 6.675 7.580 32.37
H 9.5 5.147 8.23 45.82
I 9.99 7.812 8.505 21.08
Average 10.94 7.44 8.29 32.15
3.1.1.7.3 Z-axis (bottom to top)
Table 12. External Z-axis MF attenuations by Baxter WJ501.
Location (Figure 4)
MF without incubator (μT)
MF with incubator door
closed (μT)
MF with incubator door
open (μT)
Attenuation with door
closed (%)
A 13.06 10.06 10.09 22.97
B 12.62 10.4 10.46 17.59
C 13.13 11.44 11.48 12.87
D 13.34 9.82 9.86 26.39
E 12.24 9.77 9.9 20.18
F 13.10 10.97 11.12 16.25
G 13.16 9.87 10.53 25
H 12.25 10.25 10.81 16.32
I 13.03 11.45 11.65 12.13
Average 12.88 10.44 10.65 18.86
3.1.1.7.4 Conclusion
From Tables 12, 13 and 14 above, environmental MFs are attenuated most when applied
from back to door of the incubator, followed by fields applied from left to right, and finally
from top to bottom. The average attenuations vary between 18 % and 33 %.
19
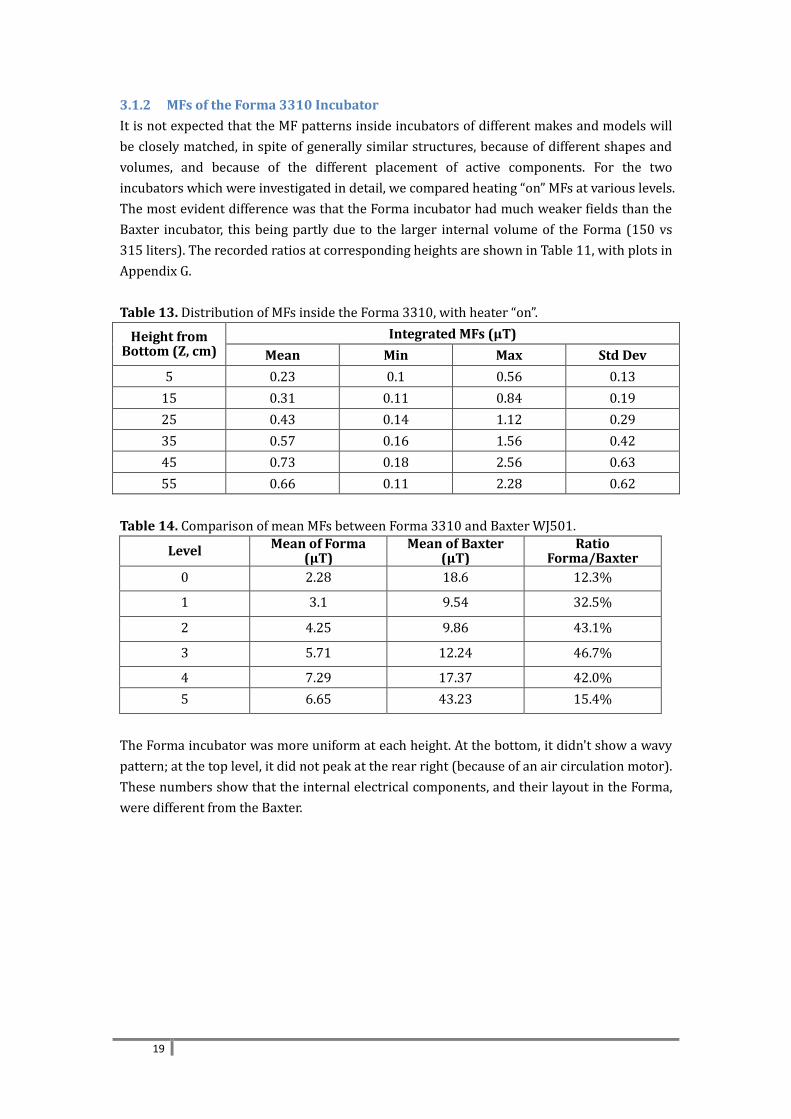
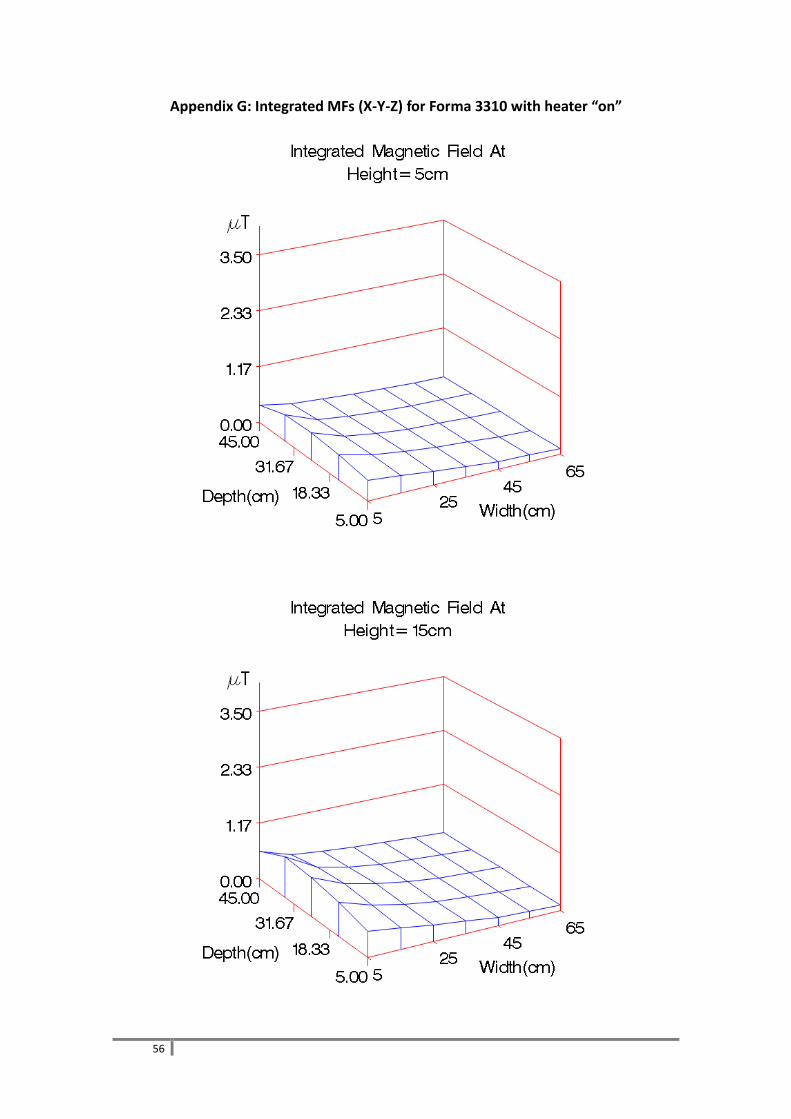
3.1.2 MFs of the Forma 3310 Incubator
It is not expected that the MF patterns inside incubators of different makes and models will
be closely matched, in spite of generally similar structures, because of different shapes and
volumes, and because of the different placement of active components. For the two
incubators which were investigated in detail, we compared heating “on” MFs at various levels.
The most evident difference was that the Forma incubator had much weaker fields than the
Baxter incubator, this being partly due to the larger internal volume of the Forma (150 vs
315 liters). The recorded ratios at corresponding heights are shown in Table 11, with plots in
Appendix G.
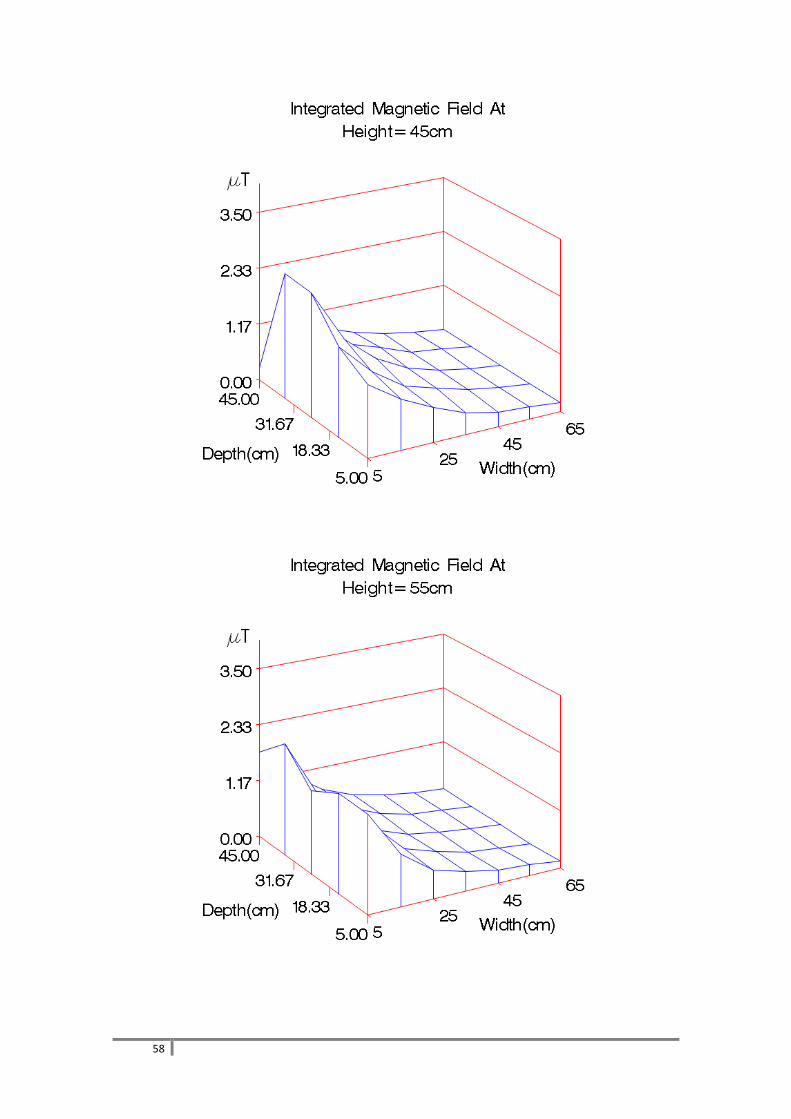
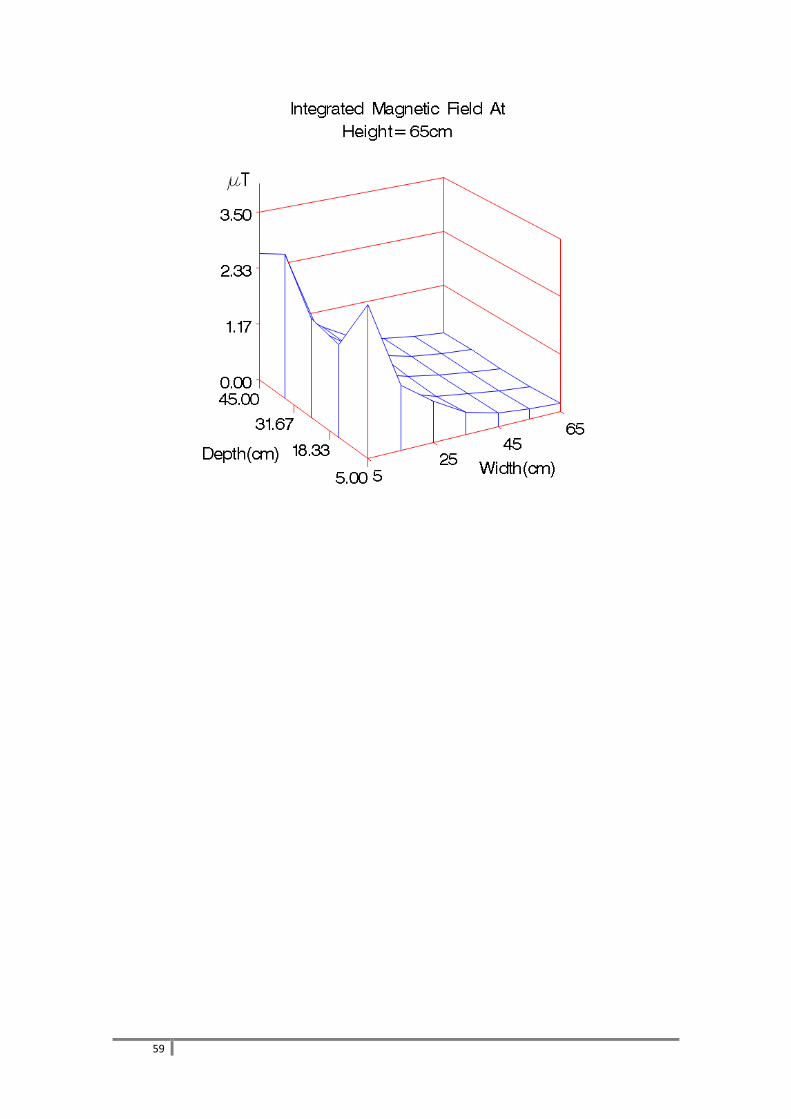
Table 13. Distribution of MFs inside the Forma 3310, with heater “on”.
Height from Bottom (Z, cm)
Integrated MFs (µT)
Mean Min Max Std Dev
5 0.23 0.1 0.56 0.13
15 0.31 0.11 0.84 0.19
25 0.43 0.14 1.12 0.29
35 0.57 0.16 1.56 0.42
45 0.73 0.18 2.56 0.63
55 0.66 0.11 2.28 0.62
Table 14. Comparison of mean MFs between Forma 3310 and Baxter WJ501.
Level Mean of Forma
(µT) Mean of Baxter
(µT) Ratio
Forma/Baxter
0 2.28 18.6 12.3%
1 3.1 9.54 32.5%
2 4.25 9.86 43.1%
3 5.71 12.24 46.7%
4 7.29 17.37 42.0%
5 6.65 43.23 15.4%
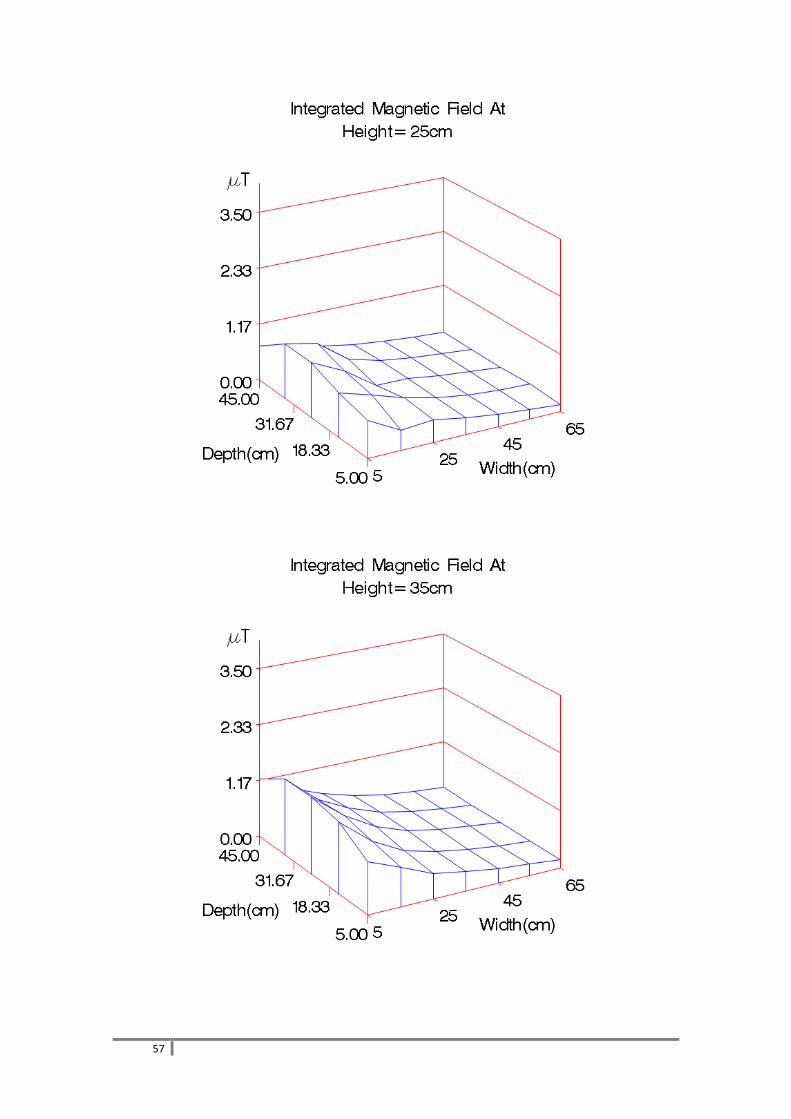
The Forma incubator was more uniform at each height. At the bottom, it didn't show a wavy
pattern; at the top level, it did not peak at the rear right (because of an air circulation motor).
These numbers show that the internal electrical components, and their layout in the Forma,
were different from the Baxter.
20
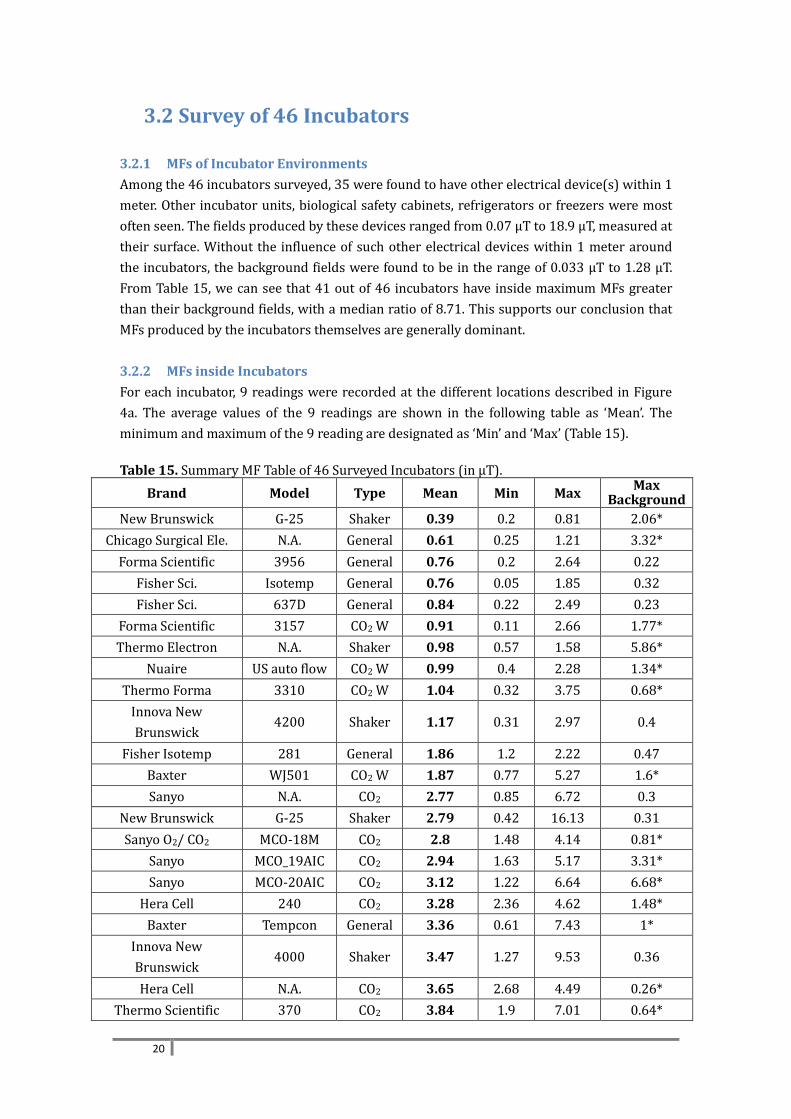
3.2 Survey of 46 Incubators
3.2.1 MFs of Incubator Environments
Among the 46 incubators surveyed, 35 were found to have other electrical device(s) within 1
meter. Other incubator units, biological safety cabinets, refrigerators or freezers were most
often seen. The fields produced by these devices ranged from 0.07 μT to 18.9 μT, measured at
their surface. Without the influence of such other electrical devices within 1 meter around
the incubators, the background fields were found to be in the range of 0.033 μT to 1.28 μT.
From Table 15, we can see that 41 out of 46 incubators have inside maximum MFs greater
than their background fields, with a median ratio of 8.71. This supports our conclusion that
MFs produced by the incubators themselves are generally dominant.
3.2.2 MFs inside Incubators
For each incubator, 9 readings were recorded at the different locations described in Figure
4a. The average values of the 9 readings are shown in the following table as ‘Mean’. The
minimum and maximum of the 9 reading are designated as ‘Min’ and ‘Max’ (Table 15).
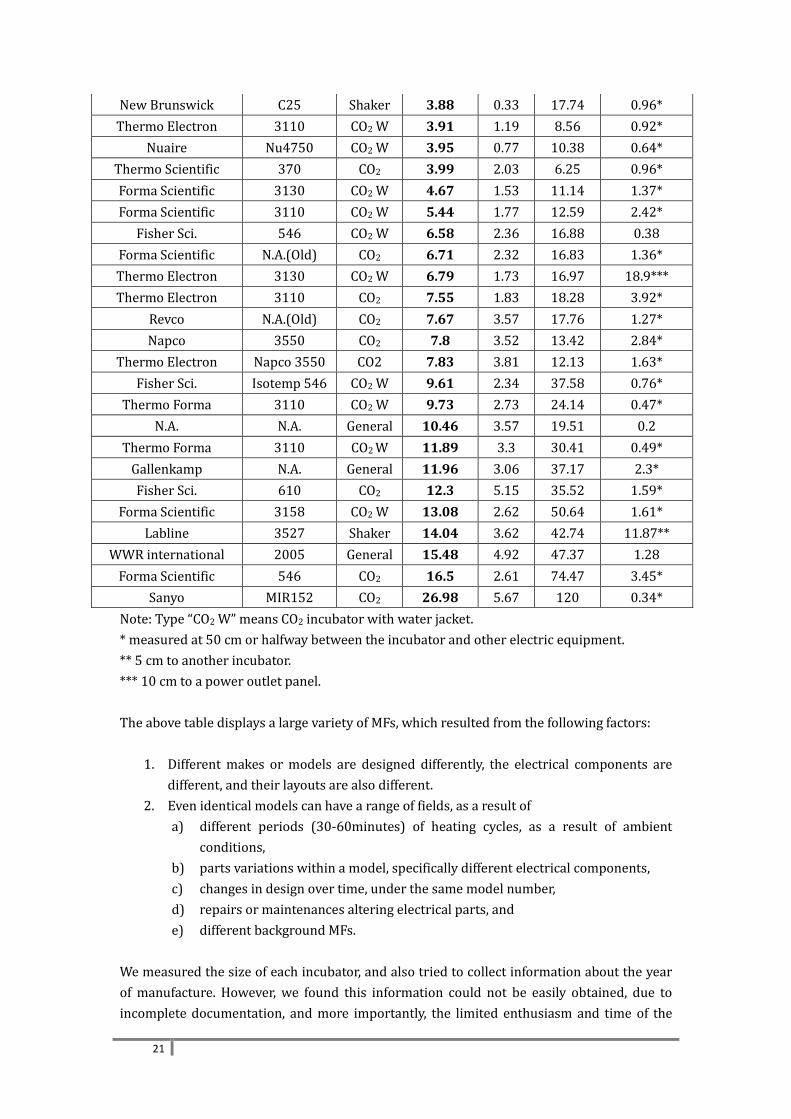
Table 15. Summary MF Table of 46 Surveyed Incubators (in μT).
Brand Model Type Mean Min Max Max
Background
New Brunswick G-25 Shaker 0.39 0.2 0.81 2.06*
Chicago Surgical Ele. N.A. General 0.61 0.25 1.21 3.32*
Forma Scientific 3956 General 0.76 0.2 2.64 0.22
Fisher Sci. Isotemp General 0.76 0.05 1.85 0.32
Fisher Sci. 637D General 0.84 0.22 2.49 0.23
Forma Scientific 3157 CO2 W 0.91 0.11 2.66 1.77*
Thermo Electron N.A. Shaker 0.98 0.57 1.58 5.86*
Nuaire US auto flow CO2 W 0.99 0.4 2.28 1.34*
Thermo Forma 3310 CO2 W 1.04 0.32 3.75 0.68*
Innova New
Brunswick 4200 Shaker 1.17 0.31 2.97 0.4
Fisher Isotemp 281 General 1.86 1.2 2.22 0.47
Baxter WJ501 CO2 W 1.87 0.77 5.27 1.6*
Sanyo N.A. CO2 2.77 0.85 6.72 0.3
New Brunswick G-25 Shaker 2.79 0.42 16.13 0.31
Sanyo O2/ CO2 MCO-18M CO2 2.8 1.48 4.14 0.81*
Sanyo MCO_19AIC CO2 2.94 1.63 5.17 3.31*
Sanyo MCO-20AIC CO2 3.12 1.22 6.64 6.68*
Hera Cell 240 CO2 3.28 2.36 4.62 1.48*
Baxter Tempcon General 3.36 0.61 7.43 1*
Innova New
Brunswick 4000 Shaker 3.47 1.27 9.53 0.36
Hera Cell N.A. CO2 3.65 2.68 4.49 0.26*
Thermo Scientific 370 CO2 3.84 1.9 7.01 0.64*
21
New Brunswick C25 Shaker 3.88 0.33 17.74 0.96*
Thermo Electron 3110 CO2 W 3.91 1.19 8.56 0.92*
Nuaire Nu4750 CO2 W 3.95 0.77 10.38 0.64*
Thermo Scientific 370 CO2 3.99 2.03 6.25 0.96*
Forma Scientific 3130 CO2 W 4.67 1.53 11.14 1.37*
Forma Scientific 3110 CO2 W 5.44 1.77 12.59 2.42*
Fisher Sci. 546 CO2 W 6.58 2.36 16.88 0.38
Forma Scientific N.A.(Old) CO2 6.71 2.32 16.83 1.36*
Thermo Electron 3130 CO2 W 6.79 1.73 16.97 18.9***
Thermo Electron 3110 CO2 7.55 1.83 18.28 3.92*
Revco N.A.(Old) CO2 7.67 3.57 17.76 1.27*
Napco 3550 CO2 7.8 3.52 13.42 2.84*
Thermo Electron Napco 3550 CO2 7.83 3.81 12.13 1.63*
Fisher Sci. Isotemp 546 CO2 W 9.61 2.34 37.58 0.76*
Thermo Forma 3110 CO2 W 9.73 2.73 24.14 0.47*
N.A. N.A. General 10.46 3.57 19.51 0.2
Thermo Forma 3110 CO2 W 11.89 3.3 30.41 0.49*
Gallenkamp N.A. General 11.96 3.06 37.17 2.3*
Fisher Sci. 610 CO2 12.3 5.15 35.52 1.59*
Forma Scientific 3158 CO2 W 13.08 2.62 50.64 1.61*
Labline 3527 Shaker 14.04 3.62 42.74 11.87**
WWR international 2005 General 15.48 4.92 47.37 1.28
Forma Scientific 546 CO2 16.5 2.61 74.47 3.45*
Sanyo MIR152 CO2 26.98 5.67 120 0.34*
Note: Type “CO2 W” means CO2 incubator with water jacket.
* measured at 50 cm or halfway between the incubator and other electric equipment.
** 5 cm to another incubator.
*** 10 cm to a power outlet panel.
The above table displays a large variety of MFs, which resulted from the following factors:
1. Different makes or models are designed differently, the electrical components are
different, and their layouts are also different.
2. Even identical models can have a range of fields, as a result of
a) different periods (30-60minutes) of heating cycles, as a result of ambient
conditions,
b) parts variations within a model, specifically different electrical components,
c) changes in design over time, under the same model number,
d) repairs or maintenances altering electrical parts, and
e) different background MFs.
We measured the size of each incubator, and also tried to collect information about the year
of manufacture. However, we found this information could not be easily obtained, due to
incomplete documentation, and more importantly, the limited enthusiasm and time of the
22
busy incubator users. It is not feasible to move heavy incubators, while they are in use, to
access the chassis plates. It was not possible to produce a regression between MFs and date
of manufacture.
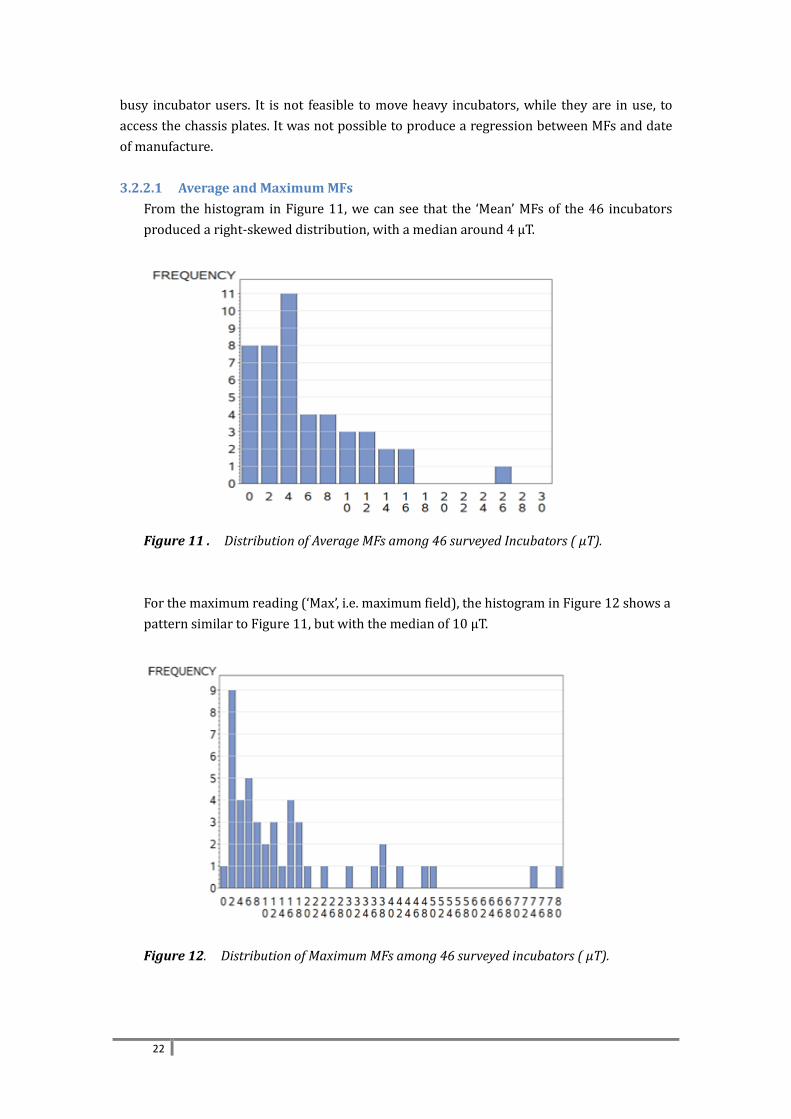
3.2.2.1 Average and Maximum MFs
From the histogram in Figure 11, we can see that the ‘Mean’ MFs of the 46 incubators
produced a right-skewed distribution, with a median around 4 μT.
Figure 11 . Distribution of Average MFs among 46 surveyed Incubators ( µT).
For the maximum reading (‘Max’, i.e. maximum field), the histogram in Figure 12 shows a
pattern similar to Figure 11, but with the median of 10 μT.
Figure 12. Distribution of Maximum MFs among 46 surveyed incubators ( µT).
23
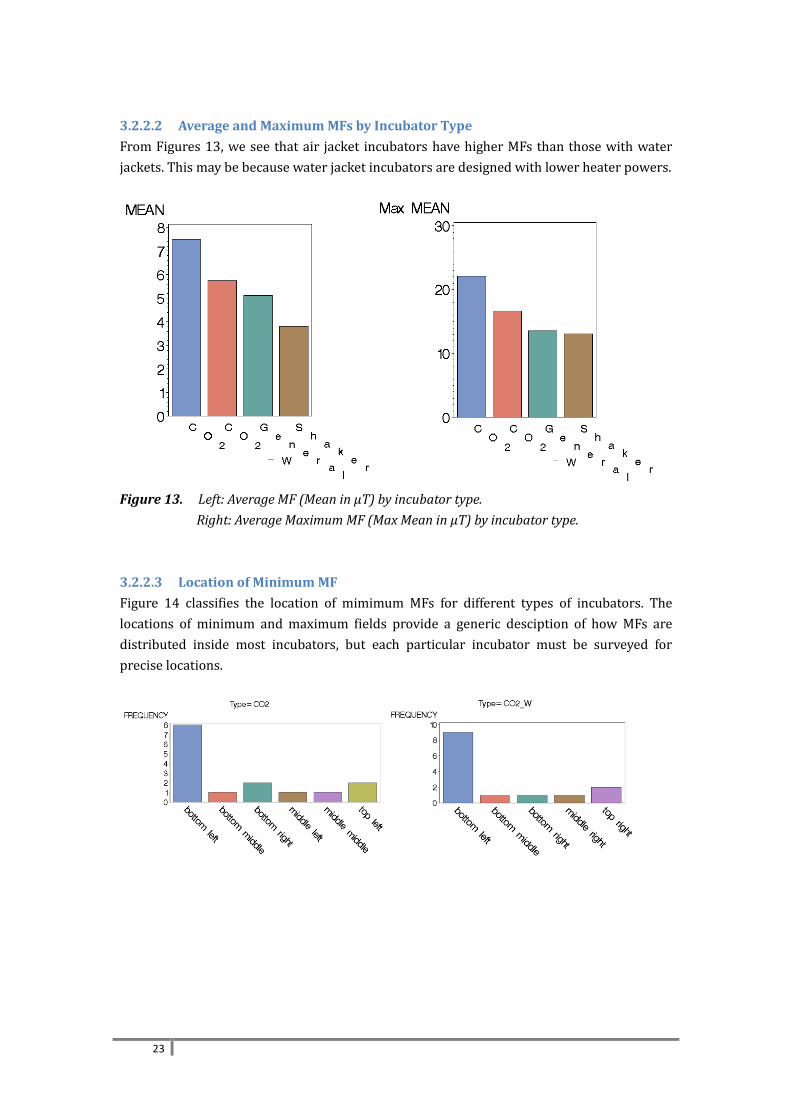
3.2.2.2 Average and Maximum MFs by Incubator Type
From Figures 13, we see that air jacket incubators have higher MFs than those with water
jackets. This may be because water jacket incubators are designed with lower heater powers.
Figure 13. Left: Average MF (Mean in µT) by incubator type.
Right: Average Maximum MF (Max Mean in µT) by incubator type.
3.2.2.3 Location of Minimum MF
Figure 14 classifies the location of mimimum MFs for different types of incubators. The
locations of minimum and maximum fields provide a generic desciption of how MFs are
distributed inside most incubators, but each particular incubator must be surveyed for
precise locations.
24
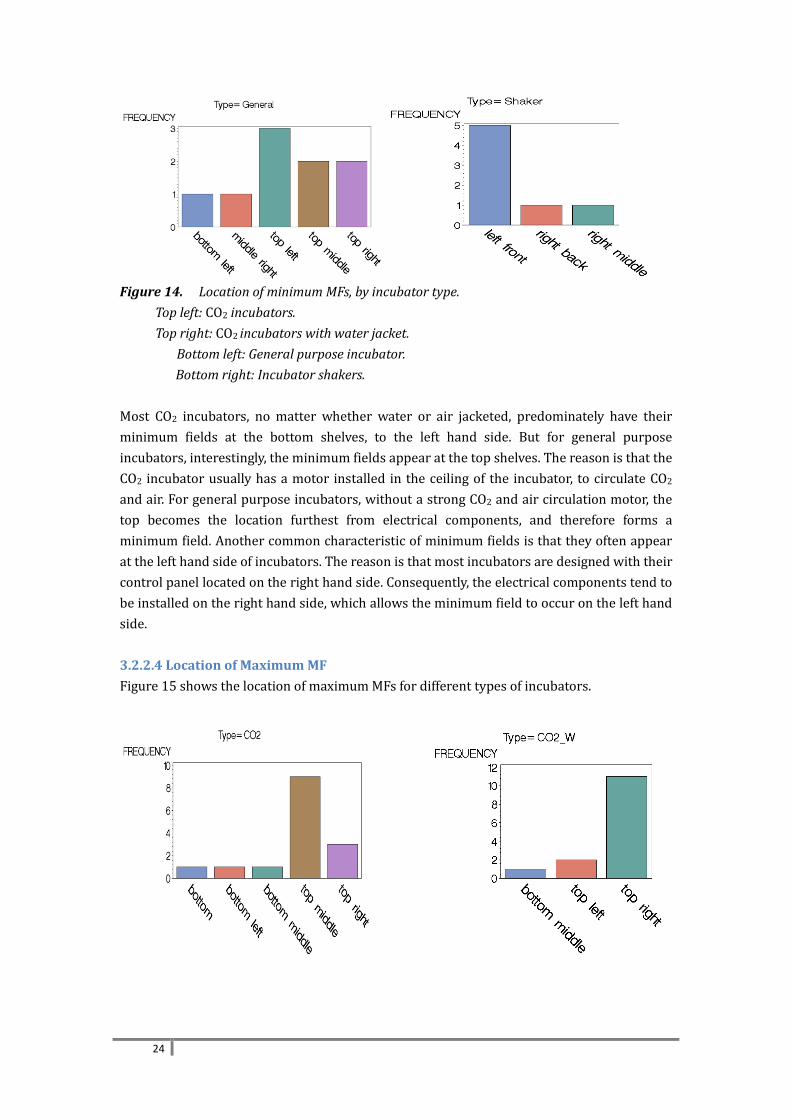
Figure 14. Location of minimum MFs, by incubator type.
Top left: CO2 incubators.
Top right: CO2 incubators with water jacket.
Bottom left: General purpose incubator.
Bottom right: Incubator shakers.
Most CO2 incubators, no matter whether water or air jacketed, predominately have their
minimum fields at the bottom shelves, to the left hand side. But for general purpose
incubators, interestingly, the minimum fields appear at the top shelves. The reason is that the
CO2 incubator usually has a motor installed in the ceiling of the incubator, to circulate CO2
and air. For general purpose incubators, without a strong CO2 and air circulation motor, the
top becomes the location furthest from electrical components, and therefore forms a
minimum field. Another common characteristic of minimum fields is that they often appear
at the left hand side of incubators. The reason is that most incubators are designed with their
control panel located on the right hand side. Consequently, the electrical components tend to
be installed on the right hand side, which allows the minimum field to occur on the left hand
side.
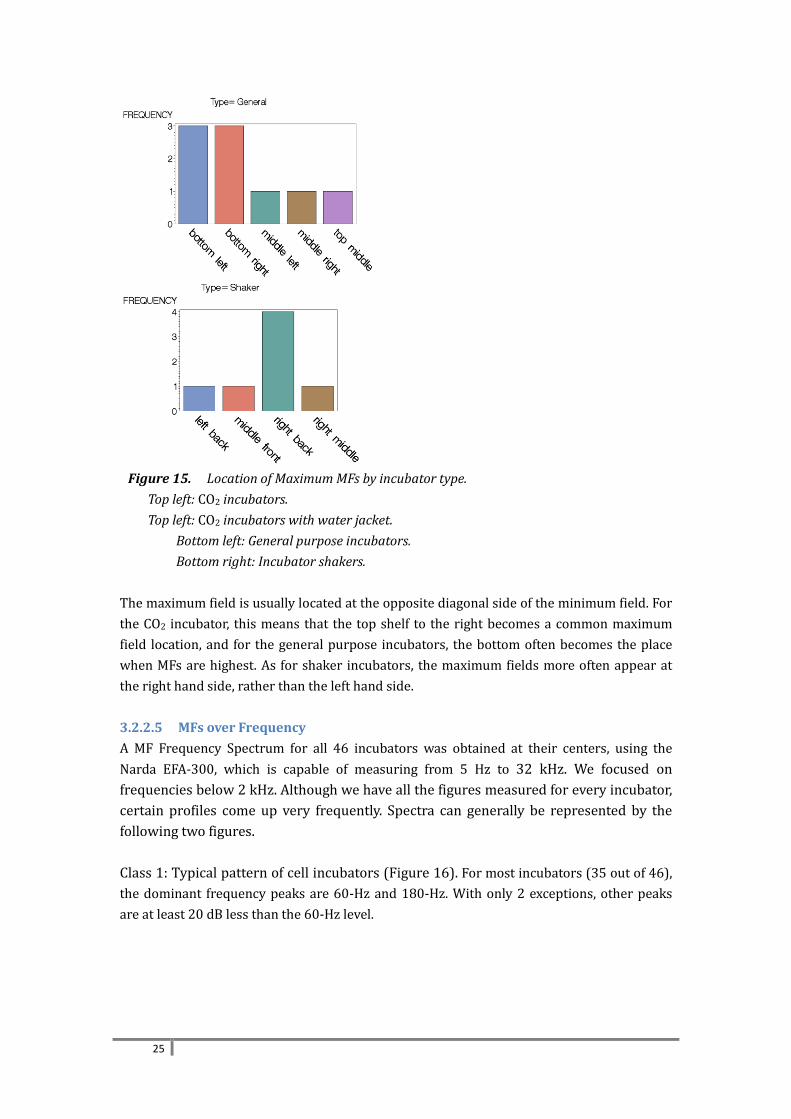
3.2.2.4 Location of Maximum MF
Figure 15 shows the location of maximum MFs for different types of incubators.
25
Figure 15. Location of Maximum MFs by incubator type.
Top left: CO2 incubators.
Top left: CO2 incubators with water jacket.
Bottom left: General purpose incubators.
Bottom right: Incubator shakers.
The maximum field is usually located at the opposite diagonal side of the minimum field. For
the CO2 incubator, this means that the top shelf to the right becomes a common maximum
field location, and for the general purpose incubators, the bottom often becomes the place
when MFs are highest. As for shaker incubators, the maximum fields more often appear at
the right hand side, rather than the left hand side.
3.2.2.5 MFs over Frequency
A MF Frequency Spectrum for all 46 incubators was obtained at their centers, using the
Narda EFA-300, which is capable of measuring from 5 Hz to 32 kHz. We focused on
frequencies below 2 kHz. Although we have all the figures measured for every incubator,
certain profiles come up very frequently. Spectra can generally be represented by the
following two figures.
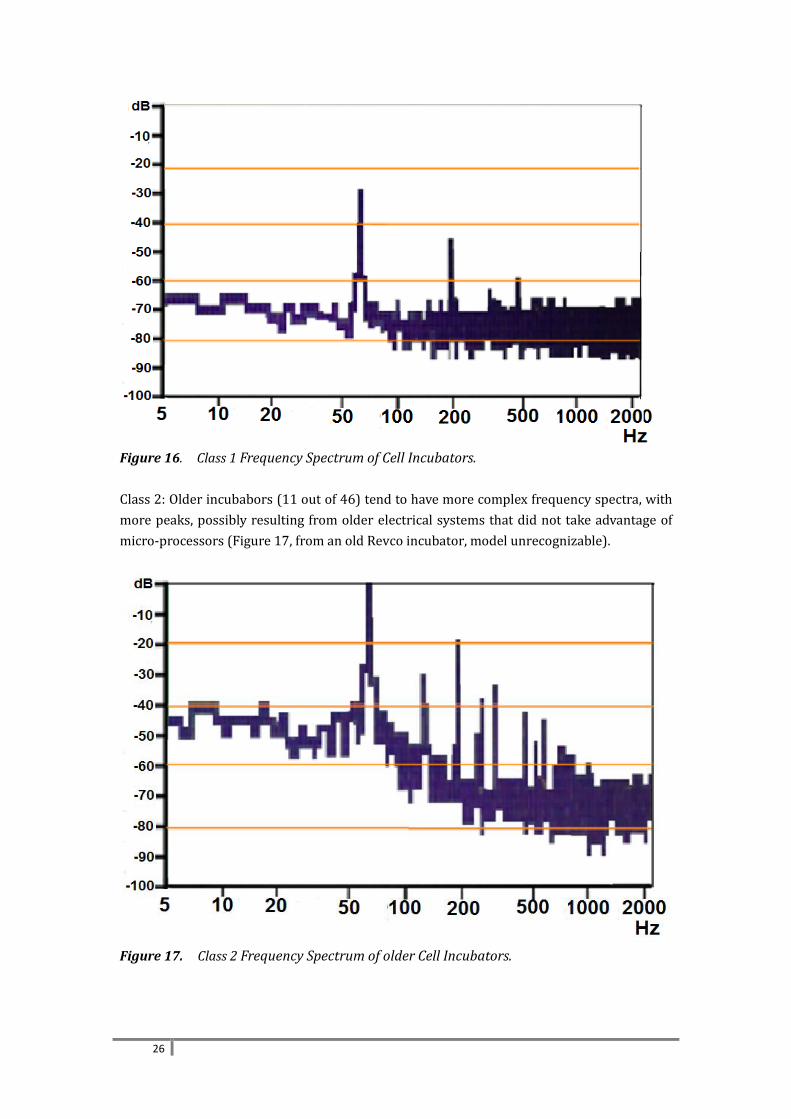
Class 1: Typical pattern of cell incubators (Figure 16). For most incubators (35 out of 46),
the dominant frequency peaks are 60-Hz and 180-Hz. With only 2 exceptions, other peaks
are at least 20 dB less than the 60-Hz level.
26
Figure 16. Class 1 Frequency Spectrum of Cell Incubators.
Class 2: Older incubabors (11 out of 46) tend to have more complex frequency spectra, with
more peaks, possibly resulting from older electrical systems that did not take advantage of
micro-processors (Figure 17, from an old Revco incubator, model unrecognizable).
Figure 17. Class 2 Frequency Spectrum of older Cell Incubators.

27
To sum up, althought there are some frequencies other than 60-Hz inside incubators, they
are generally much weaker (20 dB less) than 60-Hz. This means the field contribued by
frequencies other than 60-Hz should be
where P0 : energy related to 60-Hz
P1 : energy related to the second peak, which is 20 dB less than
From the above calculation, we can see that the contribution of frequencies other than 60-Hz
are negligible compared with 60-Hz, and should therefore be of sencondary concern.
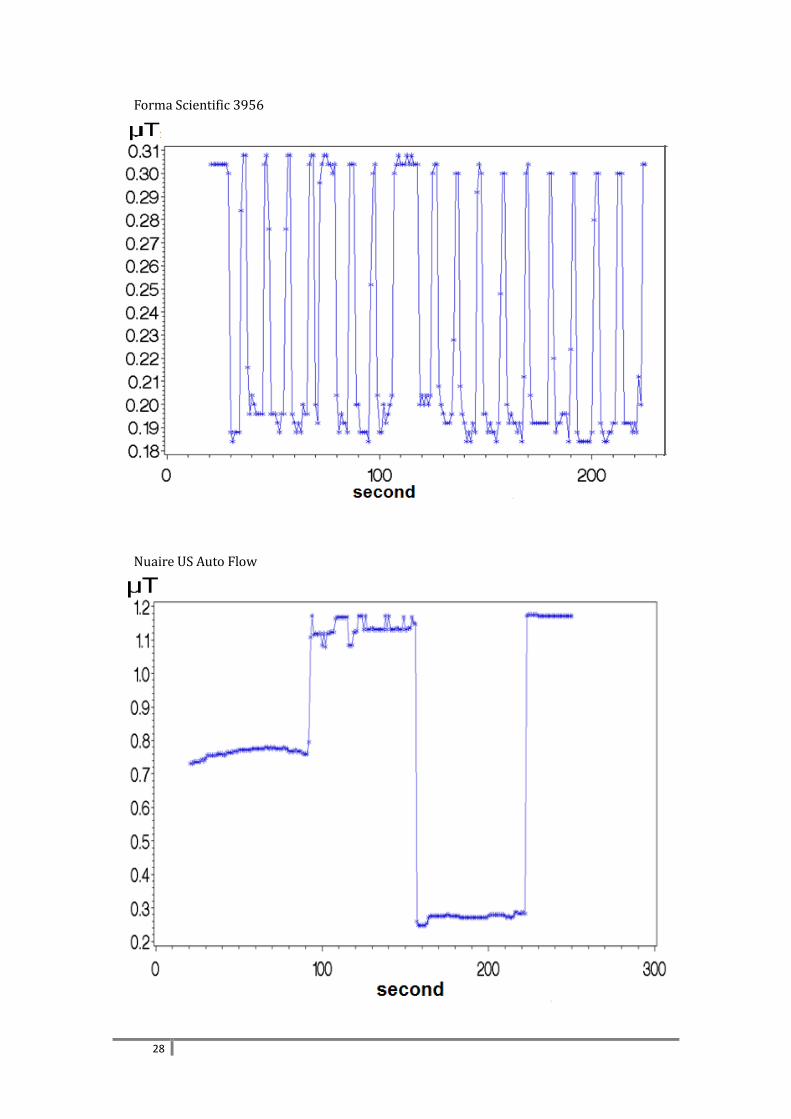
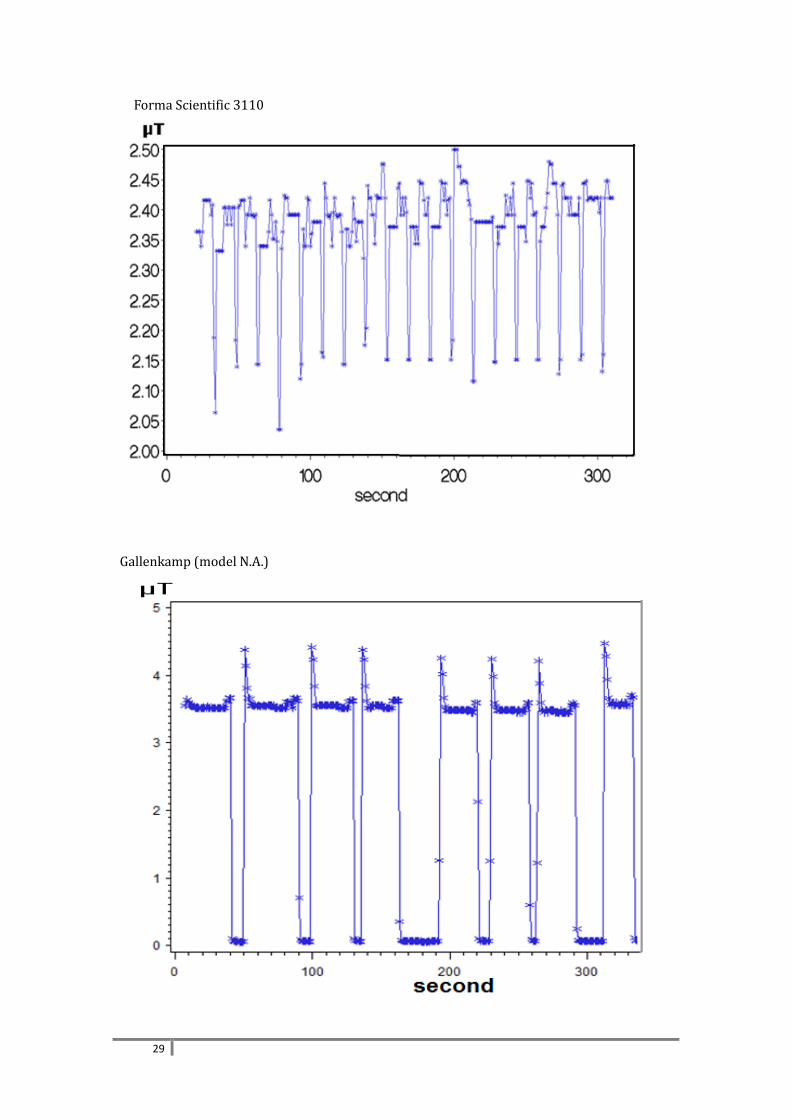
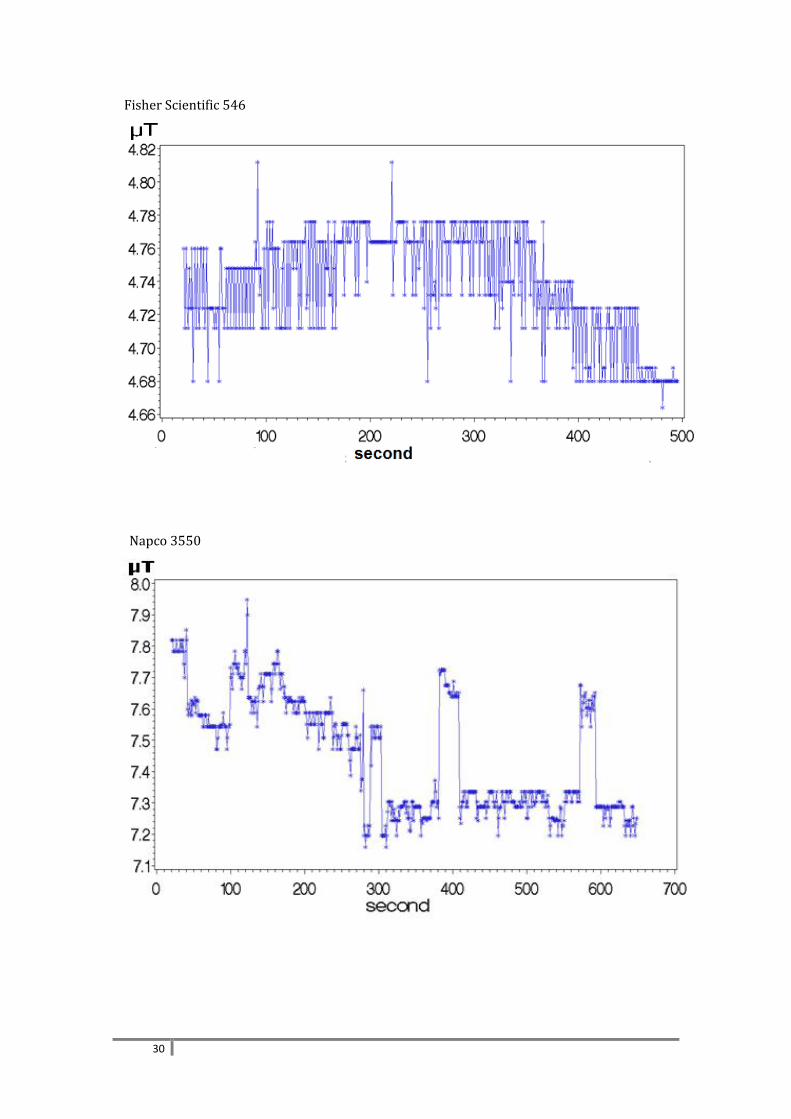
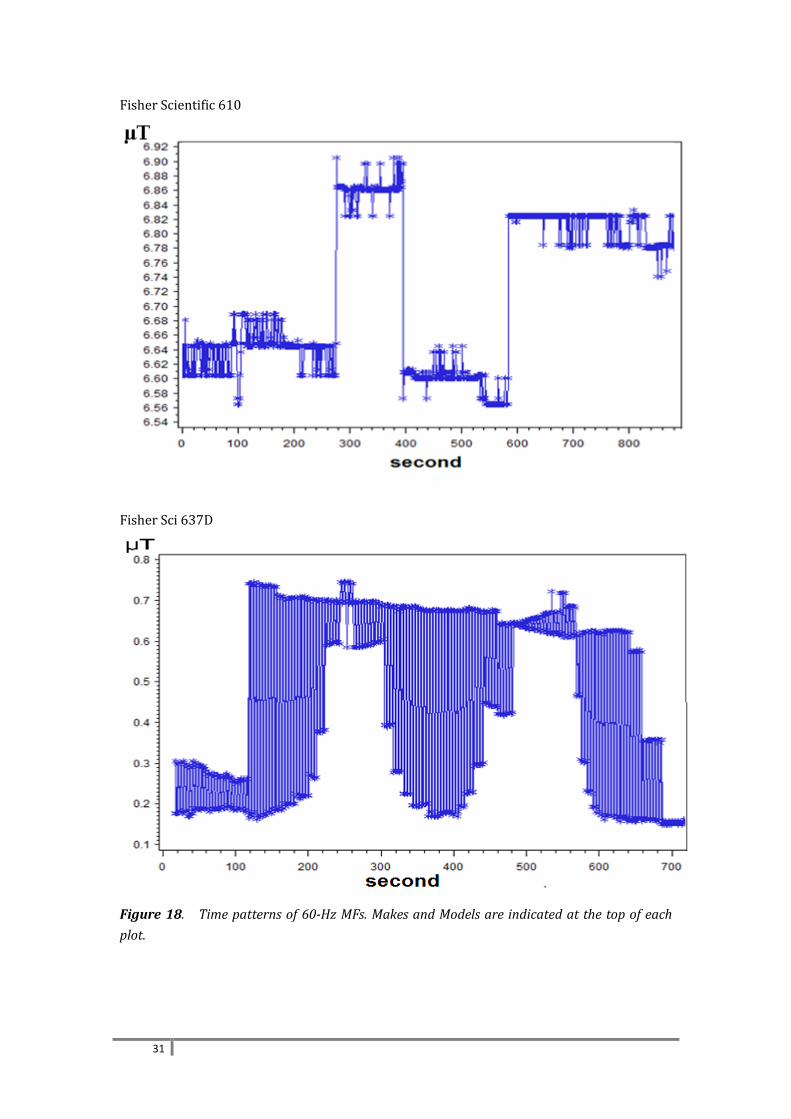
3.2.2.6 MFs over Time
The Field Star 1000 measured 60-Hz MFs each second at the center points of all 46
incubators. The minimum recording time was 240 seconds.
MFs fluctuate over time, mainly due to the heater’s on-off cycle. However, for CO2 incubators,
the CO2 injection control relay and the electromagnetic valve’s openings and closings also
contributed to the fluctuations. Surprisingly, the patterns of the fluctuations are highly
variable. Some of typical results are posted in Figure 18.
It should be noted that some studies (Berman et al. (1991), Lohmann et al. (2000), Guerkov
et al. (2001), Selvamurugan et al. (2007), Schwartz et al.(2008), Sun et al. (2009 ) and Chen
et al (2010)) reported that pulsed MFs have significant effects on various cells. Therefore, the
changes in MFs which we observed, which are similar to pulsed fields, may be of concern.
28
Forma Scientific 3956
Nuaire US Auto Flow
29
Forma Scientific 3110
Gallenkamp (model N.A.)
30
Fisher Scientific 546
Napco 3550
31
Fisher Scientific 610
Fisher Sci 637D
Figure 18. Time patterns of 60-Hz MFs. Makes and Models are indicated at the top of each
plot.

32
4 Discussion
4.1 Incubator MFs and precise In Vitro work
Among the 46 incubators surveyed, the lowest MF was 0.39 μT. According to Li and Héroux,
transferring cells from extremely low fields (~ 0.004 µT) to 0.025 μT can cause cancer cells
to lose chromosomes, and changes in the MF as small as to 0.01 μT can induce the same
effect. Other observers, although they probably started from less well defined baseline MFs,
reported effects on cells under MF exposures as low as 0.2 μT (Table 1), substantially less
than 0.39 µT. Therefore, our survey results should serve as an alert to bioscience researchers
and incubator manufacturers.
Li and Héroux have also reported effects of static MFs, but these effects became detectable
only under very low levels of ELF MFs. This survey did not compile static MFs.
4.2 Users are Unaware
A second finding of this survey is that many incubator users are unaware of the existence of
MFs inside their incubators, nor do they realize that MFs play a role in their experiments. We
found that many incubator operators like to place their culture vessels on the top shelf, and
even stack them high. This may reflect a belief that heating elements are placed at the
bottom, coupled with ignorance of the high MFs associated with air circulation ventilators.
According to our survey, the top shelf is usually the place where maximum MFs are found.
4.3 Manufacturers are Unaware
One may wonder if new incubators have weaker fields than older ones, reflecting a positive
evolution in equipment design. Unfortunately, we cannot answer this question formally,
because during our survey, the information about the year of make of incubators was often
inaccessible. But our impression, from correlating observed field values with apparent
equipment age, is that incubator engineering is, today, blind to the requirements of serious
environmental controls. Rather manufacturers aim at providing more electrically-based
conveniences, increasing the complexity of the electro-magnetic incubator environment.
Consequently, we draw the conclusion that incubator manufacturers are not making
progress in minimizing or controlling the MFs of their products.
4.4 Control Measures for Users
What should the conscientious operator do, in the absence of re-designed equipment?
Our suggestions are as follows.
33
A. When placing cell cultures in incubators, choose the lowest field location within the unit,
and use that location repeatedly for a coherent experimental series. This particular control
measure is already part of the routine of many experienced cell culture technicians. Avoid
using the maximum field regions. The most prominent effect of MFs on cancer cells
(Karyotype Contraction) appears to be related to the time-weighted-average of the MF (Li
and Héroux, 2012).
B. Since incubator walls only weakly attenuate external fields, choose the location of an
incubator carefully, so that the MF environment is as weak and constant as possible
(preferably below 0.1 µT, i.e. half of 0.2µT). Cells in a constant MF seem to adapt to a fixed
value over time (Li and Héroux, 2012).
B. Do not place two or more incubators together without a minimum clearance of 20 cm,
to avoid cross-incubator interference.
C. Insure that no occasional source of MFs is activated or brought in proximity to the
incubator during culture growth.
4.5 Control Measures for Manufacturers
Abating MFs inside incubators through shielding or active MF compensation would be
expensive. However, simple controls of the various MF sources can be economically
implemented .
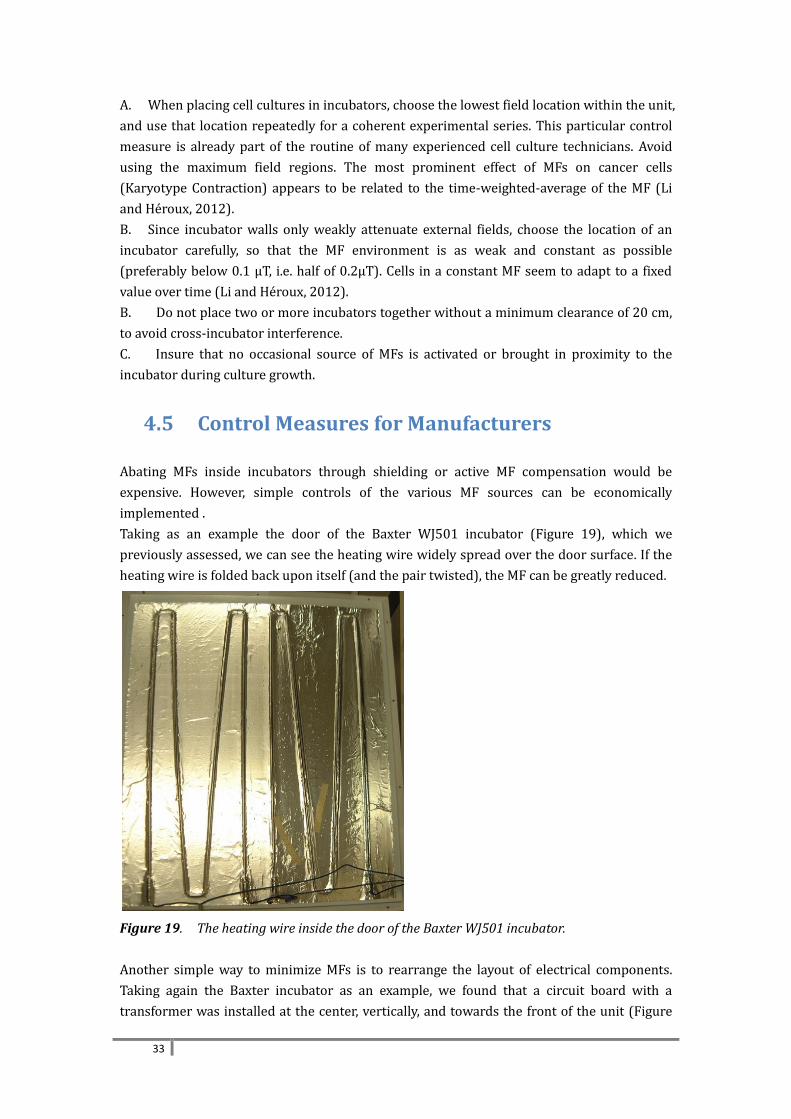
Taking as an example the door of the Baxter WJ501 incubator (Figure 19), which we
previously assessed, we can see the heating wire widely spread over the door surface. If the
heating wire is folded back upon itself (and the pair twisted), the MF can be greatly reduced.
Figure 19. The heating wire inside the door of the Baxter WJ501 incubator.
Another simple way to minimize MFs is to rearrange the layout of electrical components.
Taking again the Baxter incubator as an example, we found that a circuit board with a
transformer was installed at the center, vertically, and towards the front of the unit (Figure
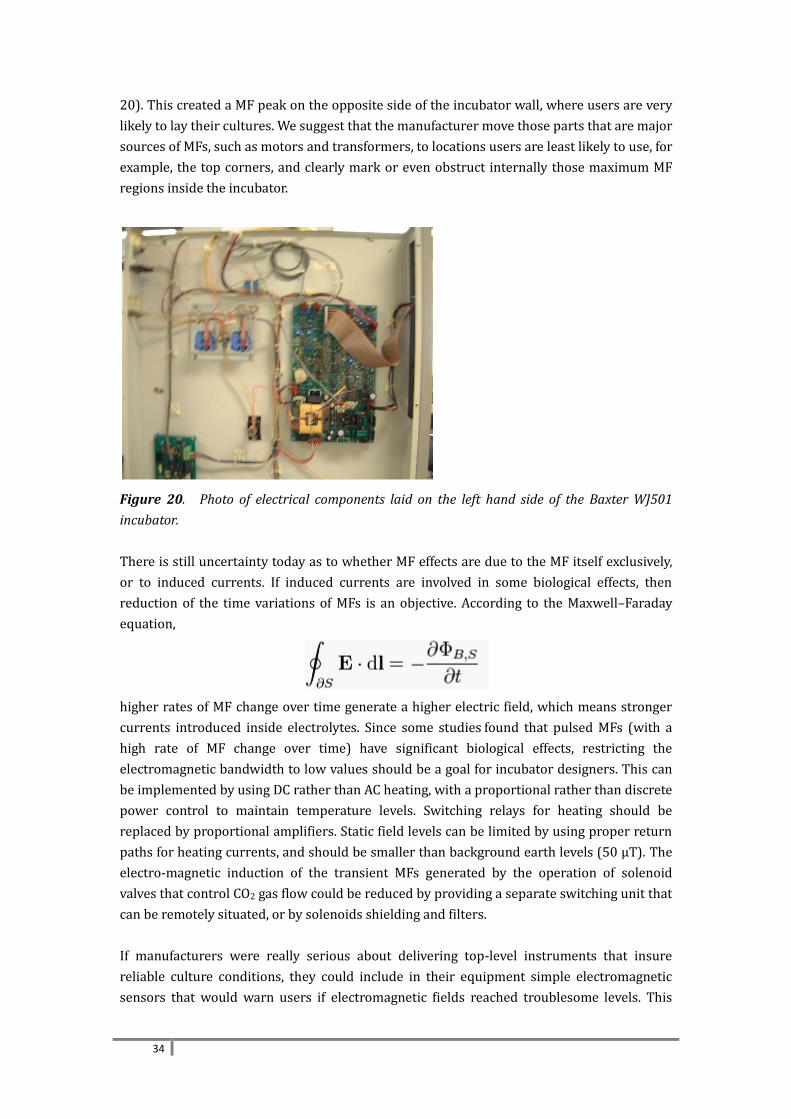
34
20). This created a MF peak on the opposite side of the incubator wall, where users are very
likely to lay their cultures. We suggest that the manufacturer move those parts that are major
sources of MFs, such as motors and transformers, to locations users are least likely to use, for
example, the top corners, and clearly mark or even obstruct internally those maximum MF
regions inside the incubator.
Figure 20. Photo of electrical components laid on the left hand side of the Baxter WJ501
incubator.
There is still uncertainty today as to whether MF effects are due to the MF itself exclusively,
or to induced currents. If induced currents are involved in some biological effects, then
reduction of the time variations of MFs is an objective. According to the Maxwell–Faraday
equation,
higher rates of MF change over time generate a higher electric field, which means stronger
currents introduced inside electrolytes. Since some studies found that pulsed MFs (with a
high rate of MF change over time) have significant biological effects, restricting the
electromagnetic bandwidth to low values should be a goal for incubator designers. This can
be implemented by using DC rather than AC heating, with a proportional rather than discrete
power control to maintain temperature levels. Switching relays for heating should be
replaced by proportional amplifiers. Static field levels can be limited by using proper return
paths for heating currents, and should be smaller than background earth levels (50 µT). The
electro-magnetic induction of the transient MFs generated by the operation of solenoid
valves that control CO2 gas flow could be reduced by providing a separate switching unit that
can be remotely situated, or by solenoids shielding and filters.
If manufacturers were really serious about delivering top-level instruments that insure
reliable culture conditions, they could include in their equipment simple electromagnetic
sensors that would warn users if electromagnetic fields reached troublesome levels. This
35
could be built using tri-axial magnetic sensors coupled to analog or digital vector integration
feeding a threshold detection circuit, and finally an alarm.
5 Conclusion
All incubators surveyed were found to have average ELF MFs higher than 0.39 µT, high
variability within their useable space, as well as high variability over time. Since there is
evidence that ELF MFs influence cell cultures and other experimental models, and since
we have been able to demonstrate that currently used incubators expose their contents
to significant levels of such fields, manufacturers of incubators, and researchers using
such devices should endeavor to control ELF MFs to the lowest levels achievable in their
experiments in order to prevent their influence on scientific results.
6 Acknowledgements
We thank Michel Bourdages and Duc Hai of Institut de Recherche d’Hydro-Québec for
supplying the Narda EFA-300 for the purposes of this survey. We thank Dr. Ying Li for
reviewing the document.
References
Blackman CF, Benane SG, House DE. 2001. The influence of 1.2 μT, 60-Hz MFs on melatonin-
and tamoxifen-induced inhibition of MCF-7 cell growth. Bioelectromagnetics. 22:122-128.
Berman E, Chacon L, House D et al. 1991. Development of chicken embryos in a pulsed MF.
Bioelectromagnetics;12(4):259.
Chen J, He HC, Xia QJ, Huang LQ, Hu YJ, He EQ. 2010. Effects of Pulsed ElectroMFs on the
mRNA Expression of RANK and CAII in Ovariectomized Rat Osteoclast-Like Cell. Connective
Tissue Research, 51-1, Feb. 1-7(7)
Chen G, Upham BL, Sun W, Chang CC, Rothwell EJ, Chen KM, Yamasaki H, and Trosko JE. 2000.
Effect of electroMF exposure on chemically induced differentiation of friend erythroleukemia
cells. Environ Health Perspect. 108: 967-72.
Girgert R, Hanf V, Emons G, Gründker C. 2010. Signal Transduction of the Melatonin
Receptor MT1 is Disrupted in Breast Cancer Cells by ElectroMFs. Bioelectromagnetics.
31:237- 245.
Guerkov HH, Lohmann CH, Liu Y, et al. 2001. Pulsed electroMFs increase growth factor
release by nonunion cells. Clin Orthop Rel Res 384:265-279.
Harland JD, Liburdy RP. 1997. Environmental MFs inhibit the antiproliferative action of
tamoxifen and melatonin in a human breast cancer cell line. Bioelectromagnetics.
18(8):555-562.
Incubator Selection Tailored To Lab Requirements:
http://www.shellab.com/news/whitepapers/incubator-selection-tailored-to-lab-requireme
nts/

36
Mild KH, Wilén J, Mattsson MO, Simko M. 2009. Background ELF MFs in incubators: a factor
of importance in cell culture work. Cell Biology International . 33: 755-757.
Li Y, Héroux P. 2012. Extra-Low-Frequency MFs alter Cancer Cells through Metabolic
Restriction. http://arxiv.org/abs/1209.5754v1
Liburdy RP, Sloma TR, Sokolic R, Yaswen P. 1993. ELF MFs, breast cancer, and melatonin:
60-Hz fields block melatonin's oncostatic action on ER+ breast cancer cell proliferation. J
Pineal Res . 14(2):89-97.
Sun LY, Hsieh DK, Yu TC, Chiu HT, Lu SF, Luo GH, Kuo TK, Lee OK, and Chiou TW. 2009
Effect of Pulsed ElectroMF on the Proliferation and Differentiation Potential of Human Bone
Marrow Mesenchymal Stem Cells. Bioelectromagnetics 30:251-260.
Lohmann CH, Schwartz Z, Hummert TW, et al. 2000. Pulsed electroMF stimulation of MG36
osteoblast-like cells affects differentiation and local factor production. J Orthop Res.
Jul;18(4):637-46.
Opler M, Rukenstein A, Coté L, Goodman R. 1997. Reduced dopamine levels in PC12 cells
exposed to low frequency electroMFs Bioelectrochemistry and Bioenergetics. 42(2):
235-239.
Morelli A, Ravera S, Panfoli I, Pepe IM. 2005. Effects of extremely low frequency electroMFs
on membrane-associated enzymes. Arch Biochem Biophys. 441(2):191-8.
Moses GC, Martin AH. 1992. Effects of Extremely Low-Frequency ElectroMFs on Three
Plasma Membrane-Associated Enzymes in Early Chicken Embryos. Biochem Int.
28(4):659-64.
Schwartz Z, Simon BJ, Duran MA, Barabino G, Chaudhri R. Boyan BD. 2008. Pulsed
electroMFs enhance BMP-2 dependent osteoblastic differentiation of human mesenchymal
stem cells. 26- 9: 1250–1255, September 2008.
Selvamurugan N, Kwok S, Vasilov Ay, Jefcoat SC, Nicola C. 2007. Partridge Effects of BMP-2
and Pulsed ElectroMF (PEMF) on Rat Primary Osteoblastic Cell. Proliferation and Gene
Expression. J Orthop Res (Published online in Wiley InterScience
(www.interscience.wiley.com). DOI 10.1002/jor.20409)
Tokalov SV, Gutzeit HO. 2004. Weak electroMFs (50 Hz) elicit a stress response in human
cells. Environ Res. 94(2):145-51.
World Health Organization, International Agency For Research On Cancer, IARC. Monographs
on the Evaluation of Carcinogenic Risks to Humans. Volume 80.
Zimmerman S, Zimmerman AM, Winters WD, Cameron IL. 1990. Influence of 60-Hz MFs on
sea urchin development, Bioelectromagnetics. 11(1): 37–45.

37
Appendices
A Plots of X-axis MF (Baxter WJ501)
B Plots of Y-axis MF (Baxter WJ501)
C Plots of z-axis MF (Baxter WJ501)
D Plots of integrated MF (Baxter WJ501)
E Plots of MF produced from the door heater of Baxter WJ501
F Plots of integrated MF (heater off, Baxter WJ501 )
G Plots of MF of Forma 3310 (heater on)
38
Appendix A: X-axis (side to side) MFs at different heights for Baxter WJ501
39
40
41
Appendix B: Y-axis (front to back) MFs at different heights for Baxter WJ501
42
43
44
Appendix C: Z-axis (bottom to top) MFs at different heights for Baxter WJ501
45
46
47
Appendix D: Integrated MFs (X-Y-Z) for Baxter WJ501
48
49
50
Appendix E: Integrated MFs (X-Y-Z) from maximum door heating for Baxter WJ501
51
52
53
Appendix F: Integrated MFs (X-Y-Z) for Baxter WJ501 with heater “off”
54
55
56
Appendix G: Integrated MFs (X-Y-Z) for Forma 3310 with heater “on”
57
58
59