Embed Size (px)
Citation preview

Paper
INCREASED OCCUPATIONAL RADIATION DOSES: NUCLEAR FUEL CYCLE
Andre Bouville* and Victor Kryuchkov†
AbstractVThe increased occupational doses resulting from theChernobyl nuclear reactor accident that occurred in Ukrainein April 1986, the reactor accident of Fukushima that took placein Japan in March 2011, and the early operations of the MayakProduction Association in Russia in the 1940s and 1950s arepresented and discussed. For comparison purposes, the occu-pational doses due to the other two major reactor accidents(Windscale in the United Kingdom in 1957 and ThreeMile Islandin theUnited States in 1979) and to themain plutonium-producingfacility in the United States (HanfordWorks) are also covered butin less detail. Both for the Chernobyl nuclear reactor accident andthe routine operations at Mayak, the considerable efforts made toreconstruct individual doses from external irradiation to a largenumber of workers revealed that the recorded doses had beenoverestimated by a factor of about two.
Introduction of Increased Occupational Exposures: NuclearIndustry Workers. (Video 1:32, http://links.lww.com/HP/A21)Health Phys. 106(2):259Y271; 2014
Key words: National Council on Radiation Protection and
Measurements; accidents, nuclear; Chernobyl; occupational safety
INTRODUCTION
HUNDREDS IF not thousands of radiation accidents haveoccurred in nuclear facilities, as well as in industrial,medical, research, and academic facilities, that make use ofsealed radioactive sources or of machine-generated radi-ation. A detailed survey of accidents ‘‘whereby exposure toradioactive material affected workers or members of thepublic in a fashion that results in acute (i.e., deterministic)health effects’’ was conducted by the United NationsScientific Committee on the Effects of Atomic Radiation(UNSCEAR 2011a), and the medical management of such
types of radiation accidents was described extensively byGusev et al. (2001). This paper will present and discussthe increased occupational doses that were received as aconsequence of severe reactor accidents, defined as thosethat resulted in irreparable damages to the plant (Windscalein the United Kingdom in 1957; Three Mile Island in theUnited States in 1979; Chernobyl in the former SovietUnion in 1986; Fukushima in Japan in 2011). The facilitiesof the ‘‘military’’ fuel cycle Ei.e., the reactors used for theproduction of plutonium and the plants involved in theprocessing of plutonium (Hanford in the United States andMayak in the former Soviet Union)^ have been consideredas well, even though the increased doses that were receivedin the early years of operation in the late 1940s and early1950s at Mayak were not due to accidents but to theconduct of routine operations.
External doses to workers are usually derived fromthe reading or processing of personnel dosimeters. Overthe course of the years, the external doses have beenreported in terms of exposure, absorbed dose, or doseequivalent. For regulatory practices, the operating princi-ple is to estimate the dose conservatively in order to pro-tect the worker. However, when the doses are to be usedin the framework of epidemiologic studies, care must betaken to ensure that unbiased estimates of individual doseare obtained. In that respect, considerable efforts have beenmade to evaluate the validity of the reported doses result-ing from the Chernobyl nuclear reactor accident and fromthe early operations of the Mayak Production Association(MPA). In this paper, the doses recorded for regulatorypractice are presented in terms of dose equivalent (sievert ormillisievert); when the doses are used for epidemiologicpurposes, they are presented in terms of absorbed dose(gray or milligray).
Substantial internal doses were also received by someof the workers at Mayak, as well as those involved inemergency and cleanup activities related to the Chernobyland Fukushima accidents. The internal occupational dosesare estimated retrospectively and are derived from theanalysis of the available environmental and bioassaymeasurements. Based on the experience of Mayak andChernobyl, the assessment of the internal doses improvesgradually with time and takes a number of years to be
www.health-physics.com 259
*National Cancer Institute (retired), 9609 Medical Drive, Room7E590, MSC 9778, Rockville, MD 20850; †Federal Medical Bio-logical Agency, Burnasyan Federal Medical Biophysical Center, 46Zhivopisnaya Street, 123182, Moscow, Russia.
The authors declare no conflicts of interest.For correspondence contact: Andre Bouville, 9609 Medical
Drive, Room 7E590, MSC 9778, Rockville, MD 20850, or email [email protected].
Supplemental Digital Content is available in the HTML and PDFversions of this article on the journal’s Web site (www.health-physics.com).
(Manuscript accepted 5 November 2013)0017-9078/14/0Copyright * 2014 Health Physics Society
DOI: 10.1097/HP.0000000000000066
Copyright © 2013 Health Physics Society. Unauthorized reproduction of this article is prohibited.

implemented satisfactorily. In this paper, the internal dosesare expressed in terms of absorbed dose (gray or milligray),except for Fukushima, where the use of effective dosesseemed to be more appropriate.
Following a brief summary of the average annualoccupational doses that have been reported worldwide forroutine operations in facilities of the nuclear fuel cycle,a detailed presentation of the increased exposures amongthe workers involved in early operations of plutonium-producing facilities and in the emergency and mitigatingactivities related to the four major nuclear reactor acci-dents will be made, and the efforts made to improve thedose estimates for the purposes of epidemiologic studieswill be described.
AVERAGE ANNUAL DOSES TO WORKERSDUE TO ROUTINE OPERATION OF THE
NUCLEAR FUEL CYCLE
Doses to workers in the whole range of facilities andactivities involving radiation exposure have been com-piled and presented in a number of reports, notably by theNational Council on Radiation Protection and Measure-ments (NCRP 1989) and UNSCEAR (1993, 2010). Forepidemiologic purposes, occupational doses covering alarge number of reactor workers were collected and an-alyzed also (Cardis et al. 2007; Thierry-Chef et al. 2007).In an ongoing study, Boice (2012) is collecting andanalyzing the dosimetric information for about one millionU.S. workers who were exposed to radiation in facilities ofvarious types or a as a result of work in contaminated areas.
With regard to the nuclear fuel cycle, which includesthe facilities that are covered in this paper, UNSCEARhas reported information periodically on the number ofworkers involved worldwide in each component of thenuclear fuel cycle and on the related average annual ef-fective doses. The results for two time periods (1975Y1979and 2000Y2002) are presented in Table 1 (UNSCEAR 2010).The number of workers in uranium mining and mill-ing decreased from one time period to the other, while
the number of workers involved in reactor operations in-creased and the workers in other components of the nu-clear fuel cycle were relatively constant. The averageannual effective doses during the 1975Y1979 time periodwere G5 mSv in uranium enrichment, fuel fabrication,and reactor operation, and between 5Y10 mSv in uraniummining, uranium milling, and fuel reprocessing; duringthe 2000Y2002 time period, average annual effectivedoses had decreased to G2 mSv in all components of thenuclear fuel cycle.
INCREASED EXPOSURES DURING ROUTINEOPERATION: EARLY YEARS
At the beginning of the nuclear era in the 1940s,nuclear energy was developed for military purposes. Itwas deemed interesting to present the occupational dosesat two sites with very similar activities: Hanford in theUnited States and Mayak in the former Soviet Union.
The Hanford site, located in south-central WashingtonState, was selected in 1943 for the production of pluto-nium and other nuclear materials in support of the WorldWar II effort. Reactor operation started in 1944. Over sev-eral years, nine nuclear reactors were constructed for theproduction of plutonium (Shipler et al. 1996), which wasused first for the Trinity nuclear weapons test of July 1945.A few thousand workers were monitored for radiation atthe Hanford site during the mid- and late-1940s. The per-sonnel dosimetry program at Hanford has been describedand evaluated in detail by Wilson et al. (1990). The pre-dominant source of exposure, which was external irradia-tion from high-energy photons (9100 keV), was judged tohave been measured adequately for all years of operation.From1944Y1957, a filmbadge dosimeterwas used. In 1957,a multi-element film badge dosimeter was introduced.This led to a significant improvement in measurement oflow-energy photons, the dose from which had previouslybeen underestimated. In 1972, the film badges were re-placed with thermo-luminescent dosimeters, thus allow-ing for the estimation of the neutron doses, which hadalso been underestimated until that time.
Following the detonation of nuclear weapons by theUnited States in 1945, large efforts were undertaken bythe former Soviet Union to develop their own nuclearweapons technology. The MPA, which is located in theSouthern Urals, was the first industrial complex in theformer Soviet Union that was built for the production ofplutonium. The initial industrial complex included nuclearreactors, a radiochemical plant for separation of plutoniumfrom irradiated fuel, and a plutonium production plant(Vasilenko et al. 2007). The construction of the first reac-tor began in 1945 and became operational in 1948. Theconstruction of the chemical processing plant began in
Table 1. Variation with time of the numbers of workers worldwidein the components of the nuclear fuel cycle and of the average annualeffective doses (UNSCEAR 2010).
Monitored workers(thousands)
Average annualeffective dose (mSv)
1975Y1979 2000Y2002 1975Y1979 2000Y2002
Uranium mining 240 12 5.5 1.9Uranium milling 12 3 10 1.1Uranium enrichment 11 18 0.5 0.1Fuel fabrication 20 20 1.8 1.6Reactor operation 150 437 4.1 1.0Fuel reprocessing 78 76 7.1 0.9
260 Health Physics February 2014, Volume 106, Number 2
www.health-physics.com
Copyright © 2013 Health Physics Society. Unauthorized reproduction of this article is prohibited.

1946, and plutonium ready for use in nuclear weaponswas available in 1949. Approximately 20,000 workers wereexposed to radiation in the early years of operation. Oc-cupational doses were due to external irradiation, mainlyfrom photons, and internal irradiation arising from intakesof plutonium. External exposures were monitored by meansof film badges, which were without filters from 1948Y1953and not suitable for appropriately measuring photons withenergies below 400 keV. A compensating filter (0.75 mmof lead) was added to the film badges to measure externaldoses from 1954Y1960. In 1961, a 0.5-mm aluminum filterwas added to the lead filter (Romanov et al. 2002).
Estimates of annual effective doses from externalirradiation to workers at the Hanford Works (Buschbomand Gilbert 1993) and at MPA (Romanov et al. 2002;Vasilenko et al. 2007) are shown in Table 2 and in Fig. 1.For comparison purposes, it was assumed that the reporteddoses, which were expressed as whole-body penetratingdoses (Hanford) and tissue-equivalent dose in free air(MPA), are approximately equal to the effective doses.The differences in the magnitude of the average annualeffective doses from external irradiation at the HanfordWorks and at MPA are striking. Annual doses at the HanfordWorks were generally G5 mSv, and there were only threeworkers with annual doses 950 mSv during the early years:one in 1947 with an annual effective dose of 60 mSv,another one in 1951 with a dose of 55 mSv, and the thirdone in 1954 with an annual dose of 144 mSv. By contrast,at MPA, the average annual effective dose was È1,000mSv or so around 1950 and did not decrease to 10 mSv
until 1970. Reasons for these high doses from externalirradiation at MPA include:
1. the fact that reactor, chemical processing, and pluto-nium chemical-metallurgical facility technologies wereemerging rapidly;
2. there were limitations in MPA resources and capabil-ities to protect workers; and
3. there was poor understanding of the consequences ofrelatively high occupational radiation doses.
It is worth noting that important efforts have beenmade during the last 20 y to reconstruct the doses to theMPAworkers, resulting in a database called ‘‘Doses-2005’’(Vasilenko et al. 2007). It is now established that theinitial doses shown in Table 2 and Fig. 1 were mostly over-estimated when the film badges without filtration wereused during 1948Y1953, in some areas by a factor of 2.8.With regard to the Hanford Works, it seems that the re-corded doses are biased to some extent but that they arereasonably adequate for the purposes of epidemiologicstudies (Gilbert and Fix 1995).
Another important feature of the working situationat MPA is the high internal doses that were received as aresult of plutonium intakes. Cumulative organ doses toworkers were calculated using the Doses-2005 internaldosimetry model (Vasilenko et al. 2007). As expected,the greatest cumulative doses were estimated for the lung(mean of 205 mGy, median of 23.5 mGy, 53 workers withcumulative doses 9500 mGy), liver (mean of 284 mGy,median of 42.2 mGy, 77 workers with cumulative doses9500 mGy), and bone surface (mean of 1040 mGy, me-dian of 156 mGy, 243 workers with cumulative doses9500 mGy).
Table 2. Variation with time of the average annual effective doses(millisievert) from external irradiation to workers of the HanfordWorks (Buschbom andGilbert 1993) and ofMPA [based onRomanovet al. (2002) and on Vasilenko et al. (2007)].
MPA
YearHanfordWorks
Reactorfacilitya
Radiochemicalplanta
Plutoniumfacilityb
1944 0.591945 2.251946 1.391947 0.791948 0.48 2001949 0.65 950 400 101950 0.90 300 950 1701951 0.95 190 1020 2301952 1.41 150 650 1301953 2.19 200 300 901954 1.88 90 190 401955 2.12 95 2101960 3.18 29 1701965 6.99 40 201970 3.20 14 16
aFrom Fig. 3 in Romanov et al. (2002).bFrom Fig. 1 in Vasilenko et al. (2007).
Fig. 1. Variation with time of the average annual effectivedoses from external irradiation to workers of the Hanford Works(Buschbom and Gilbert 1993) and of MPA Ebased on Romanov et al.(2002) and on Vasilenko et al. (2007)^.
261Increased occupational doses c A. BOUVILLE AND V. KRYUCHKOV
www.health-physics.com
Copyright © 2013 Health Physics Society. Unauthorized reproduction of this article is prohibited.

REACTOR ACCIDENTS
Four major nuclear reactor accidents, which resultedin irreparable damages to the plant, occurred in four dif-ferent countries: the United Kingdom in 1957 (Windscale),the United States in 1979 (Three Mile Island), the formerSoviet Union in 1986 (Chernobyl), and Japan in 2011(Fukushima). In each case, the type of reactor was dif-ferent, and the main cause of the accident was, to someextent, different.
Windscale accidentThe Windscale reactors, also called ‘‘Piles,’’ used
uranium metal as fuel, were moderated by graphite, andwere air-cooled. Their main purpose was the productionof plutonium for the U.K. atomic weapons program. Theheat produced by nuclear fission was not used to generateelectricity. Pile No. 1, on which the accident happened,was operational in October 1950 (Wakeford 2007). Sincethe potential energy stored in the graphite (the Wignerenergy) needed to be released in a controlled manner,anneals were organized periodically. Unfortunately, dur-ing the ninth anneal, a fire broke out in the reactor coreon 10 October 1957 and resulted in a partial core melt-down (Arnold 2007).
Within the framework of an epidemiologic study,McGheoghegan and Binks (2000) collected the recordedexternal doses relative to the 471 workers who were in-volved in fire activities. For October 1957, the median ofthe recorded dose was 4.5 mSv, while the 95th percentilewas 16 mSv, and the maximum dose was 44 mSv. Overa 3-mo period encompassing the time of the accident,14 workers received a dose 930 mSv, the highest dosebeing 47 mSv. No information could be found in theopen literature on the occupational exposures relatedspecifically to the cleanup activities.
Three Mile Island accidentUnit 2 of the Three Mile Island reactor was a
pressurized-water reactor with an installed capacity of906 MWof electricity. It had started operating in December1978. An accident occurred on 28 March 1979, with fail-ures in the non-nuclear secondary system, followed by astuck-open relief valve in the primary system, which al-lowed loss of coolant to occur and resulted in melting atleast 45% of the reactor core.
Detailed information on the occupational doses re-lated to the accident and to the cleanup of the damagedreactor could not be found in the open literature. Occu-pational external doses, which were reported together forthe workers of Units 1 and 2 until 1985, show for 1979 anaverage of 3.5 mSv among the 3,975 workers with mea-surable doses and a maximum dose of 45 mSv (Table 3).Because the containment of the reactor had held up,there was no urgency to clean up the reactor. After 6 y
of preparation, defueling began in October 1985, anddecontamination activities took place until December1993. About 1,000 workers were involved in those op-erations. The reported average annual external doses forthe workers with measurable doses over the 1979Y1993time period are presented in Table 3; they were a fewmillisievert each year during that time period.
Chernobyl nuclear reactor accidentThe reactor was a graphite-moderated, light water-
cooled system known as RBMK-1000. With an installedelectrical generating capacity of 1,000 MW, it was used toproduce electricity for commercial purposes; it had startedoperating in December 1983. The accident occurred on 26April 1986 during a low-power engineering test of Unit 4.Improper, unstable operation of the reactor, which haddesign flaws, allowed an uncontrollable power surge tooccur, resulting in successive steam explosions, whichdestroyed the reactor and part of the building in whichthe reactor core was housed (UNSCEAR 1988, 2000,2011b). It is the most severe accident that has ever oc-curred in the nuclear power industry.
With regard to occupational exposure, a distinction ismade between the emergency workers, including thepersons whowere on the site during the day of the accident,and the recovery operation workers, who performed avariety of tasks at the site and in the 30-km zone sur-rounding the site from 1986Y1990. Among the emergencyworkers, who included 374 reactor staff, 69 firemen, 113guards, and 10 medical staff, two workers died in theimmediate aftermath and 134 reactor staff and firemensuffered from acute radiation sickness (ARS) (Mettler et al.2007; UNSCEAR 2011b). The distribution of the external
Table 3. Variation with time of the average annual doses fromexternal irradiation to workers exposed as a result of the Three MileIsland accident [based on NRC (1984) and on Radiation ExposureInformation and Reporting System data.]a
YearbNumber of workerswith measurable dose
Highest dose(mSv)
Average dose(mSv)
1979 3,975 45 3.51980 2,328 21 1.71981 2,103 21 1.81982 2,123 42 4.71983 1,592 27 7.31984 1,079 6.41985 1,890 4.51986 1,497 6.11987 1,378 7.11988 1,247 7.41989 1,014 6.31990 484 2.81991 153 2.41992 315 5.01993 167 2.0
aData provided by D. Hagemeyer, Oak Ridge, TN: Oak Ridge AssociatedUniversities.bUnits 1 and 2 of the Three Mile Island reactor reported together until 1985and separately from 1986 onwards.
262 Health Physics February 2014, Volume 106, Number 2
www.health-physics.com
Copyright © 2013 Health Physics Society. Unauthorized reproduction of this article is prohibited.

doses received by the workers with ARS and their out-comes are shown in Table 4. The external whole-bodydoses that are presented in Table 4 are based on biologi-cal measurements and clinical symptoms, as the dosime-ters worn by the reactor personnel were all overexposed,and the firemen were not equipped with dosimeters. Theexternal whole-body doses ranged from 0.8Y16 Gy; mostof the 28 ARS victims who died within a few monthsafter the accident had received doses between 6.5 and16 Gy. The skin doses resulting from beta exposures mayhave been much higher than the external whole-bodydoses; an evaluation of the skin doses for eight patientsshowed that the skin doses ranged from 10Y30 times theexternal whole-body doses (Barabanova and Osanov 1990).On the other hand, the internal doses, based on whole-bodycounting and bioassay measurements performed while thepatients were under treatment, were found generally to bemuch smaller than the external whole-body doses (Mettleret al. 2007; UNSCEAR 2000).
Following the acute emergency phase of the acci-dent, È530,000 recovery operation workers were calledfrom 1986 to 1990 to carry out a variety of tasks, includ-ing the decontamination of the reactor block and of thereactor site, and the construction of the entombment ofthe reactor (known as object Shelter, sarcophagus, andUkrytie) (UNSCEAR 2011b). The enormous scale ofthe problems that had to be faced necessitated a massiveengagement of several ministries of the former SovietUnion, most notably the Ministry of Defense, the Mini-stry of Atomic Energy, and the Ministry of MediumMachinery. The numbers of recovery operation workersdecreased from year to year, from È300,000 in 1986 toÈ6,000 in 1990. Altogether, È200,000 recovery operationworkers were from Ukraine; È200,000 also from Russia;È100,000 fromBelarus; andÈ5,000 from each of the Balticcountries (Estonia, Latvia, and Lithuania). The time spentby the workers on the site was extremely variable but wasgenerally less than a year. The dosimetry of the recoveryoperation workers, also called cleanup workers or liquida-tors, proved to be very challenging, in part because of thevery large number of workers originating from a varietyof organizations. The ‘‘official’’ doses presented in Table 5are based on doses that were recorded for about half of
the recovery operation workers, using the assumption thatthe mean doses obtained for the workers with recordeddoses apply to the entire population of workers. Therecorded doses, which represent external irradiation fromphotons only, were usually obtained by means of one ofthree methods:
1. reading of a personal dosimeter;2. group dosimetry: assignment of the same dose to a
group of workers performing a given task, based onthe reading of a personal dosimeter worn by a memberof the group (in some cases, no member of the group,in which case the dose was assigned on the basis ofprevious experience); or
3. group estimation: crude time-and-motion analysis(measurements of gamma-radiation levels were madeat various points of the reactor site, and the dose wasestimated as a function of the locations where workwas to be done and of the time spent at those locations)(Pitkevitch et al. 1997; UNSCEAR 2000).
As shown in Table 5, the annual averages of the of-ficially recorded external whole-body doses decreasedfrom 146 mGy in 1986 to 96 mGy in 1987 and 43 mGy in1988 and remained approximately stable in 1989 (41mGy)and 1990 (47 mGy); the average annual official externalwhole-body dose over the 1986Y1990 time period was117 mGy. Neither the external doses to the skin nor tothe lens of the eye that were due to beta exposure nor theinternal doses due to intakes of radionuclides were recorded.
The extent to which the officially recorded whole-body doses are valid has been discussed in many publi-cations (e.g., Ilyin et al. 1995; Pitkevitch et al. 1997;Auvinen et al. 1998; UNSCEAR 2000; Chumak 2007;Kryuchkov et al. 2012), mainly in relation to their use-fulness in epidemiologic studies. The quality of the do-simetry depends to a large extent on the worker categoryand on the way in which his or her dose was estimated.As a result of the broad variety of the tasks related toChernobyl activities, the population of the recovery op-eration workers was very heterogeneous. From the pointof view of exposure conditions and dosimetric monitor-ing, the population of recovery operation workers can bedivided into the following categories (Chumak 2007;Kryuchkov et al. 2012), presented in Fig. 2 in terms ofpercentages of the total number of workers. It should benoted that the numbers of workers given below for eachcategory are taken from Kryuchkov et al. (2012) and maynot be in complete agreement with those found in otherpublications (e.g., UNSCEAR 2011b); they give, however,a good idea of the population size of each category ofrecovery operation workers:
Table 4. Emergency workers of the Chernobyl nuclear reactoraccident with ARS (UNSCEAR 2010).
Degree ofseverity
Dose range(Gy)
Number ofworkers
Number ofdeaths
Mild 0.8Y2.1 41 0Moderate 2.2Y4.1 50 1Severe 4.2Y6.4 22 7Very severe 6.5Y16 21 20
Total 134 28
263Increased occupational doses c A. BOUVILLE AND V. KRYUCHKOV
www.health-physics.com
Copyright © 2013 Health Physics Society. Unauthorized reproduction of this article is prohibited.

& Witnesses and victims of the accident (È2,000): the per-sonnel of the Chernobyl Nuclear Power Plant (ChNPP)and of other organizations, who were at the site atthe time of the accident or arrived at the site be-fore 30 April 1986. This category includes the emer-gency workers previously discussed. Doses during theperiod of exposure were not recorded for those workers.The official doses, when available, are based on clinicaland biological monitoring performed while the workerswere hospitalized;
& Early liquidators (È21,600): civilian and military work-ers, who were used to decontaminate the site and the30 km zone between 27 April and 31 May 1986. Aconsequence of the chaotic situation at the ChNPPsite during the few weeks following the accident wasthat all information related to reading personal dosim-eters until mid-May 1986 was either inadequate or lost.The official doses, when available, were based on aconservatively applied time-and-motion analysis;
& ChNPP personnel (2,358 in 1986; 4,498 in 1987):professional atomic workers, charged with the controlof operations in Unit 4 and the operation of Units 1, 2,and 3. Good quality dosimetric monitoring was estab-lished in mid-May 1986. However, all dose recordsrelated to MayYJune 1986, presumably the period ofhighest radiation doses, were lost and were never re-covered. Personnel who started their work after June1986 have adequate personal dosimetry;
& Sent to ChNPP (È2,000 in 1986; 3,458 in 1987): per-sonnel temporally assigned to ChNPP from other nu-clear power plants. The dosimetry system was identicalto that for the ChNPP personnel;
& Sent to the 30 km zone (31,000 in 1986; 32,000 in1987): the most diverse category of workers, who wereinvolved in Chernobyl cleanup activities on a task-oriented basis and who visited the 30 km zone onlyfor the duration of their mission; to this category be-long, for instance, drivers who delivered equipmentand supplies, specialists who were engaged to solvespecific technological problems, as well as all kinds ofinspectors and representatives of authorities, researchinstitutes, etc. The dosimetric monitoring system dependedon the task to be performed and was very uneven;
& AC-605 (21,500 in 1986; 5,376 in 1987): the personnel ofAdministration of Construction (AC) No.605 Especializedenterprise of the Ministry of Medium Machinery, whichwas established for the purpose of construction of thesarcophagus (‘‘Object Ukrytie’’)^. Except for the periodbefore mid-June 1986, the dosimetric management ofthat category of workers was performed adequately bymeans of personal dosimeters;
& Ukrytie personnel (several hundreds in 1990): person-nel monitoring the sarcophagus. Dosimetric monitoringwas controlled by the ChNPP dosimetry service (per-sonal dosimeters);
& IAE personnel (3,521 in 1988): personnel of theKurchatov Institute of Atomic Energy (IAE) and ofother organizations, involved in various activities in-side the sarcophagus. The dosimetric monitoring ofFig. 2. Categories of recovery operation workers (percent).
Table 5. Numbers of recovery operation workers and external dosesa (millisievert) to these workers as officially recorded innational registries (based on UNSCEAR 2011b).
Ukraine Russia Belarus Lithuania Latvia Estonia All countries
1986 186 149 60 144 146 109 1461987 127 89 28 108 106 111 961988 57 35 20 43 31 32 431989 49 34 20 50 45 45 411990 51 39 V 28 55 V 47Average dose 151 107 51 109 117 44 117Number of workers 229,219 188,174 91,000 6,960 6,065 4,832 526,250b
aThe external dose is expressed in millisievert for reasons of convenience. In fact, the quantity measured was, in many cases, exposure. It isassumed that these external doses are representative of the whole-body doses.bThe total includes 1,074 recovery operation workers with unknown year of exposure and five 1991 workers.
264 Health Physics February 2014, Volume 106, Number 2
www.health-physics.com
Copyright © 2013 Health Physics Society. Unauthorized reproduction of this article is prohibited.

that category of workers is similar to that of the AC-605personnel, and, therefore, of high quality;
& Military workers (61,762 in 1986; 63,751 in 1987): themost numerous category of recovery operation workers,involved in most of the decontamination activities(including manual removal of reactor debris from theroofs of ChNPP in SeptemberYOctober 1986 andJanuaryYFebruary 1987), as well as the demolition ofabandoned villages, transportation of contaminatedmaterials, etc. The military had its own dosimetric mon-itoring system, where each unit of battalion level had itsown radiation protection officer who kept the dose re-cords and conducted liaison with the dosimetrists onthe spot. Due to lack of adequate personal dosimeters(wartime dosimeters had a sensitivity threshold ofÈ100 mSv) and because of numerous cases of misuseof the dosimeters, the group dosimetry and the group-estimation methods were used for dose assignment toall team members, often numbering several dozen.Both methods were applied in a conservative manner(e.g., overestimated the doses);
& ‘‘Combinat’’ personnel (6,281 in 1987): civilian staffpermanently employed to perform and supervise alloffsite activities within the 30 km zone (e.g., activitiesnot related to the recovery and operation of the ChNPPitself ), including mainly radiation monitoring, han-dling of radioactive waste, decontamination, and lifesupporting infrastructure within the 30 km zone. Be-cause of organizational problems, the dosimetric moni-toring of that category of workers was largely notconducted in 1986 and part of 1987. The quality andcompleteness of the dosimetric information regard-ing the ‘‘Combinat’’ personnel and the visitors to the30 km zone became adequate in mid-1987; and
& Belarusian workers (È24,000 in 1986; È28,000 in1987): civilian personnel who worked in the Belarusianpart of the 30 km zone. Only 9% of the Belarusianworkers have official recorded doses.
In summary, the population of recovery operationworkers was extremely heterogeneous, with durations ofexposure that could vary from hours to years, locationsof work with very low to very high radiation levels, andactivities varying from manual removal of reactor debristo working as a cook or in an office. Also, many types ofdosimeters (Fig. 3) were used, because the workers camefrom a number of organizations with their own dosimetricmonitoring systems with little coordination. The qualityof the official recorded doses was relatively low in 1986because the authorities were not prepared to monitor avery large number of workers, but it improved with timeand was adequate after mid-1987. Unfortunately, the
highest doses were received during the first year follow-ing the accident.
A number of risk projections and epidemiologicstudies have been devoted to the risk of leukemia amongrecovery operation workers (e.g., Ivanov 2007; Kesminieneet al. 2008; Romanenko et al. 2008). The case controlstudies sponsored by the International Agency For Re-search on Cancer (Kesminiene et al. 2008) and by theNational Cancer Institute (Romanenko et al. 2008) re-quired the estimation of individual bone marrow dosesfor all study subjects. Because external doses are notavailable for about half of the recovery operation workers,and because of doubts regarding the quality of the exter-nal doses for some categories of workers, it was decidednot to rely on the official recorded doses and to developa method of dose estimation that could be applied to allstudy subjects, whether dead or alive, irrespective of theirradiation exposure. The method of dose estimation thatwas selected for the case control studies sponsored by theInternational Agency For Research on Cancer and by theNational Cancer Institute is a sophisticated time-and-motion analysis called RADRUE, which is an acronymfor Realistic Analytical Dose Reconstruction with Un-certainty Estimates (Kryuchkov et al. 2009). Briefly,
Fig. 3. Primary dosimeters used by the recovery operation workers.
265Increased occupational doses c A. BOUVILLE AND V. KRYUCHKOV
www.health-physics.com
Copyright © 2013 Health Physics Society. Unauthorized reproduction of this article is prohibited.
results of exposure rate and nuclide deposition measure-ments were embedded in RADRUE and were used to deriveexposure rates at places where liquidators lived and workedand thus to calculate external dose to bone marrow accord-ing to the liquidators’ itineraries. Liquidators’ routes werereconstructed by dosimetry experts familiar with the orga-nization and conditions of work in the 30-km zone basedon information obtained through a study questionnaire(Kryuchkov et al. 2009).
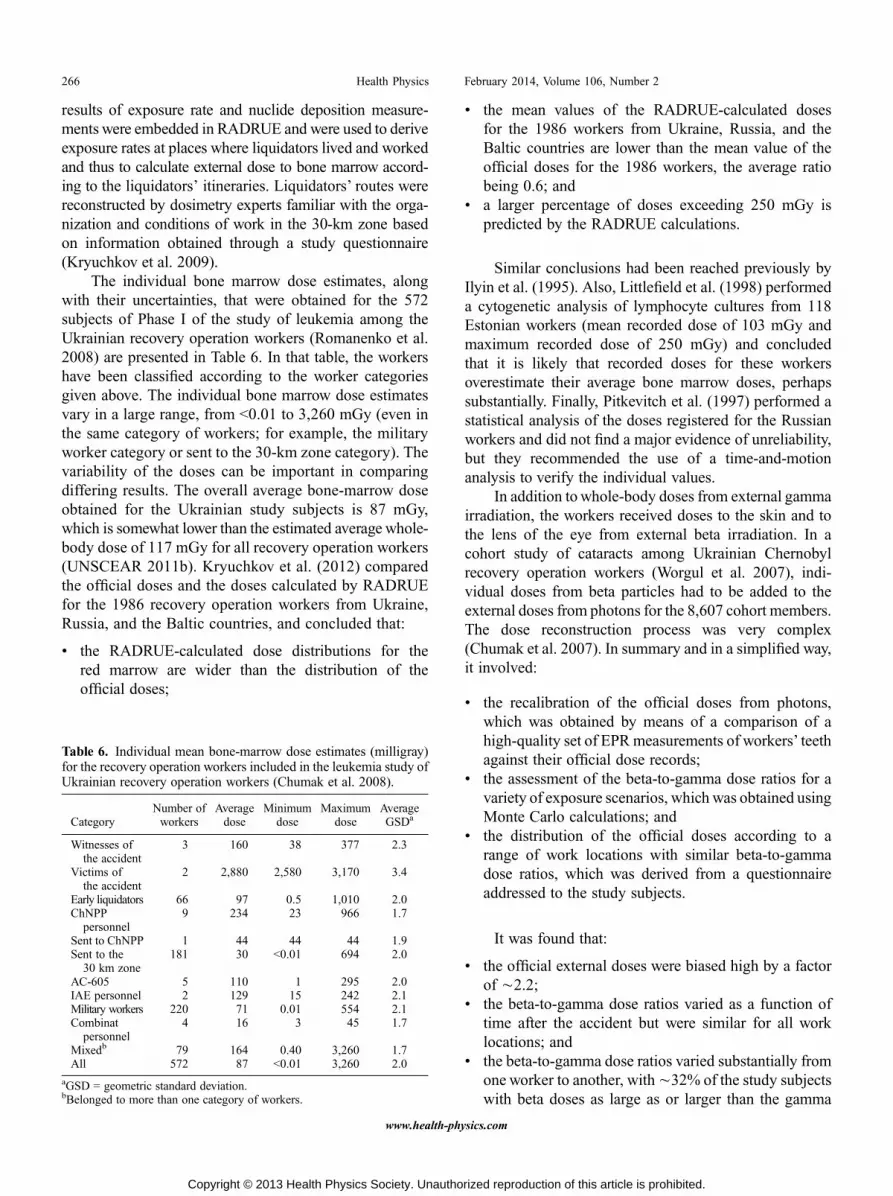
The individual bone marrow dose estimates, alongwith their uncertainties, that were obtained for the 572subjects of Phase I of the study of leukemia among theUkrainian recovery operation workers (Romanenko et al.2008) are presented in Table 6. In that table, the workershave been classified according to the worker categoriesgiven above. The individual bone marrow dose estimatesvary in a large range, from G0.01 to 3,260 mGy (even inthe same category of workers; for example, the militaryworker category or sent to the 30-km zone category). Thevariability of the doses can be important in comparingdiffering results. The overall average bone-marrow doseobtained for the Ukrainian study subjects is 87 mGy,which is somewhat lower than the estimated average whole-body dose of 117 mGy for all recovery operation workers(UNSCEAR 2011b). Kryuchkov et al. (2012) comparedthe official doses and the doses calculated by RADRUEfor the 1986 recovery operation workers from Ukraine,Russia, and the Baltic countries, and concluded that:
& the RADRUE-calculated dose distributions for thered marrow are wider than the distribution of theofficial doses;
& the mean values of the RADRUE-calculated dosesfor the 1986 workers from Ukraine, Russia, and theBaltic countries are lower than the mean value of theofficial doses for the 1986 workers, the average ratiobeing 0.6; and
& a larger percentage of doses exceeding 250 mGy ispredicted by the RADRUE calculations.
Similar conclusions had been reached previously byIlyin et al. (1995). Also, Littlefield et al. (1998) performeda cytogenetic analysis of lymphocyte cultures from 118Estonian workers (mean recorded dose of 103 mGy andmaximum recorded dose of 250 mGy) and concludedthat it is likely that recorded doses for these workersoverestimate their average bone marrow doses, perhapssubstantially. Finally, Pitkevitch et al. (1997) performed astatistical analysis of the doses registered for the Russianworkers and did not find a major evidence of unreliability,but they recommended the use of a time-and-motionanalysis to verify the individual values.
In addition towhole-body doses from external gammairradiation, the workers received doses to the skin and tothe lens of the eye from external beta irradiation. In acohort study of cataracts among Ukrainian Chernobylrecovery operation workers (Worgul et al. 2007), indi-vidual doses from beta particles had to be added to theexternal doses from photons for the 8,607 cohort members.The dose reconstruction process was very complex(Chumak et al. 2007). In summary and in a simplified way,it involved:
& the recalibration of the official doses from photons,which was obtained by means of a comparison of ahigh-quality set of EPRmeasurements of workers’ teethagainst their official dose records;
& the assessment of the beta-to-gamma dose ratios for avariety of exposure scenarios, which was obtained usingMonte Carlo calculations; and
& the distribution of the official doses according to arange of work locations with similar beta-to-gammadose ratios, which was derived from a questionnaireaddressed to the study subjects.
It was found that:
& the official external doses were biased high by a factorof È2.2;
& the beta-to-gamma dose ratios varied as a function oftime after the accident but were similar for all worklocations; and
& the beta-to-gamma dose ratios varied substantially fromone worker to another, withÈ32% of the study subjectswith beta doses as large as or larger than the gamma
Table 6. Individual mean bone-marrow dose estimates (milligray)for the recovery operation workers included in the leukemia study ofUkrainian recovery operation workers (Chumak et al. 2008).
CategoryNumber ofworkers
Averagedose
Minimumdose
Maximumdose
AverageGSDa
Witnesses ofthe accident
3 160 38 377 2.3
Victims ofthe accident
2 2,880 2,580 3,170 3.4
Early liquidators 66 97 0.5 1,010 2.0ChNPP
personnel9 234 23 966 1.7
Sent to ChNPP 1 44 44 44 1.9Sent to the
30 km zone181 30 G0.01 694 2.0
AC-605 5 110 1 295 2.0IAE personnel 2 129 15 242 2.1Military workers 220 71 0.01 554 2.1Combinat
personnel4 16 3 45 1.7
Mixedb 79 164 0.40 3,260 1.7All 572 87 G0.01 3,260 2.0
aGSD = geometric standard deviation.bBelonged to more than one category of workers.
266 Health Physics February 2014, Volume 106, Number 2
www.health-physics.com
Copyright © 2013 Health Physics Society. Unauthorized reproduction of this article is prohibited.

doses and È56% with beta doses less than half as largeas the gamma doses (Chumak et al. 2007).
The overall distribution of the total doses (beta +gamma) is presented in Table 7. The median dose to thelens of the eye was estimated to be in the range from100Y200 mGy, while È200 subjects had estimated dosesexceeding 700 mGy.
Because of the abundance of 131I and of shorter-livedradioiodines in the environment of the reactor during theaccident, the workers who were on the site during the firstfew weeks after the accident may have received substantialthyroid doses from internal irradiation. Kesminiene et al.(2012) performed a case-control study among 530 workersfrom Belarus, Russia, Estonia, Latvia, and Lithuania withthe objective of evaluating more precisely the relation-ship between the dose to the adult thyroid from both ex-ternal irradiation and internally incorporated 131I and riskof thyroid cancer. For each study subject, individual dosesto the thyroid were reconstructed by considering the fol-lowing pathways of exposure: (1) external irradiation fromgamma-emitting radionuclides; and (2) internal irradia-tion arising from the intake of 131I via inhalation of con-taminated air or ingestion of contaminated foodstuffs.To estimate the external doses received by the workersduring their cleanupmissions, the RADRUEmethod, whichhad been selected for the leukemia studies (Kesminieneet al. 2008; Romanenko et al. 2008), was also used. Themain difficulty resided in the estimation of the thyroiddoses resulting from intakes of 131I. Internal doses due toinhalation intake of 131I during the period of work as aliquidator were calculated for six study subjects whoworked on the ChNPP site during the first few weeks af-ter the accident. The approach was based on the data onconcentration of 131I in air in settlements in the 30-kmzone (Prohl et al. 2000) and was validated by measure-ments of the dose rate near the neck taken in 30AprilY5May1986 in a group of 624 early liquidators who were notstudy subjects. In addition to the dose received duringtheir work, Belarusian workers who were residents ofcontaminated settlements of the Gomel and Mogilev ob-lasts and were returning home every evening or after
weekly shift work may also have received substantial doseto the thyroid from 131I through consumption of locallyproduced contaminated milk and/or vegetables. The so-called ‘‘residential’’ doses from intakes of 131I were esti-mated up to 20 June 1986, whereas those from externalirradiation were estimated for the entire period of workas a liquidator. Residential doses were not calculated forRussian and Baltic workers, as they are thought to haveconsumed foodstuffs that were produced in and impor-ted from non-contaminated areas. The estimated thyroiddoses from external and internal irradiation are presentedin Table 8. The average external dose received by theBelarusian subjects, who worked away from the reactorsite in the Belarusian part of the 30-km zone, is muchsmaller than that received by the Russian and the Balticsubjects, whoworked at the ChNPP site. On the other hand,the average internal dose received by the Belarusian sub-jects was much higher than those due to the Russian andthe Baltic subjects, because the Belarusian subjects con-sumed locally produced milk and/or leafy vegetables thatwere contaminated with 131I.
Fukushima accidentThe Fukushima-Daiichi Nuclear Power Station (FDNPS)
of the Tokyo Electric Power Company (TEPCO) consistedof six units of boiling-water reactors, with a total powergenerating capacityof 4,700MWof electricity.Unit 1 startedoperating in 1971, Unit 2 in 1974, Unit 3 in 1976, Units 4and 5 in 1978, and Unit 6 in 1979. On 11 March 2011, an
Table 7. Distribution of the lens of the eye dose (milligray) amongthe Ukrainian Chernobyl recovery operation workers enrolled in thecataract study (Worgul et al. 2007).
Dose range (mGy) Number of subjects
0 Y 49 1,30050 Y 99 1,550100 Y 199 3,776200 Y 399 1,431400 Y 699 364700+ 186All 8,607
Table 8. Arithmetic means, medians and ranges of estimated externaldoses, internal doses from 131I to the thyroid, and total doses (milligray)for the recovery operation workers included in the thyroid study bycountry and by case/control status (based on Kesminiene et al. 2012).
External dose Internal dose Total dose
BelarusNumber of workers 420 412 420Arithmetic mean 17 183 191Median 6.5 63 68Range 0.11Y454 0.2Y3253 0.24Y3307
Russian FederationNumber of workers 77 1 77Arithmetic mean 101 73 102Median 63 73 69Range 0.13Y507 73 0.13Y507
Baltic countriesNumber of workers 33 0 33Arithmetic mean 79 V 79Median 55 V 55Range 1.9Y488 V 1.9Y488
All countriesNumber of workers 530 413 530Arithmetic mean 33 182 171Median 10 63 68Range 0.11Y507 0.18Y3253 0.13Y3307
267Increased occupational doses c A. BOUVILLE AND V. KRYUCHKOV
www.health-physics.com
Copyright © 2013 Health Physics Society. Unauthorized reproduction of this article is prohibited.

earthquake of magnitude 9.0, the largest ever recorded inJapan, occurred along the Japan Trench. The earthquakecreated a series of tsunami waves that struck the east coastof Japan. The earthquake and the tsunamis knocked outthe power supply to the FDNPS and, consequently, themeans to control and cool the reactor. In the days that fol-lowed, reactor meltdown and hydrogen gas explosions re-sulted in serious damage to the facility (WHO 2013).
Similarly to the Chernobyl nuclear reactor accident,occupational exposure to radiation of the FDNPS workersincluded external irradiation from radiation sourceswithin the damaged reactor and radioactive material de-posited in the workplace, and internal irradiation frominhalation of radioactive material. The assessment ofthe radiation doses is under the responsibility of TEPCO.Doses from external irradiation were mainly monitoredusing alarm personal detectors that were changed everyday. However, because there was a shortage of monitor-ing equipment at the early stage of emergency response,groups of workers were provided with a single personaldosimeter, and the resulting measurements were takento be representative of the external doses received by allmembers of the group (WHO 2013). Once monitor-ing equipment was available for all workers, external doseassessment was based on the alarm personal detectormeasurements. The distribution of the monthly effectivedoses from external irradiation received by the TEPCOworkers and their contractors in March and April 2011is presented in Table 9 (TEPCO 2011). The external ef-fective doses are found to be, on average, lower in Aprilthan in March by a factor of about three for the TEPCOworkers and two for the contractors. The average doses inMarch 2011 were 19 mSv for the TEPCO workers and6 mSv for the contractors, while the maximum dose was200 mSv for both the TEPCO workers and the contrac-tors. It is worth noting that other categories of workerswho may have been exposed to radiation during the re-sponse to the accident (e.g., rescue workers, firemen,policemen, etc.) are not included in Table 9 (WHO 2013).
The internal dose assessment was based on in vivomeasurements performed with whole-body counters(WBCs). The Japan Atomic Energy Agency and theNational Institute of Radiological Sciences cooperatedwith TEPCO to assess the occupational doses during thefirst few months after the accident (Kurihara et al. 2012;Nakano et al. 2012; Takada et al. 2012). The initial screeningwas performed using WBCs equipped with plastic scintil-lators. In a second step, WBCs with sodium iodide scintil-lators were used to identify the radionuclides present inthe body of workers with a predicted internal dose 920mSv.Finally, WBCs with germanium semiconductor detectorswere used for more precise measurements on workers withpredicted internal doses 9250 mSv (WHO 2013). The dis-tribution of estimated internal effective doses is shownin Table 10 (WHO 2013). Among the population of 23,000workers that was considered, only 12 TEPCO workersand no contractors were found with estimated effectivedoses 9100 mSv. TEPCO concluded that workers withthe highest internal doses were those working in a centralcontrol room; for these workers, 131I was by far the majorcontributor to the internal dose. Consequently, the thyroiddoses are very high for those workers and are estimated tobe 910 Gy for two workers and in the range from 2Y10 Gyfor the other 10 (WHO 2013). Because of the short physi-cal half-life of 131I (È1 wk), practically all of the thyroiddoses had been delivered by the end of April 2011.
The cumulative effective doses from external andinternal irradiation to the È25,000 Fukushima workers(TEPCO and contractors) that were involved in mitigationactivities during the time period fromMarch 2011 throughDecember 2012 are presented in Table 11 (TEPCO 2011).Although many more contractors than TEPCO workershad been involved in mitigation activities up to the end of2012, the TEPCO workers received most of the effectivedoses 9100 mSv (161 versus 20 for the contractors). Theaverage effective dose was 25 mSv among the TEPCOworkers and 10 mSv among the contractors. A comparisonof the effective dose estimates presented in Table 11 on
Table 9. Distribution of monthly effective doses (millisievert) from external irradiation to Fukushima workers: March2011 and April 2011 (TEPCO 2011).
Effective doserange (mSv)
TEPCO workers Contractors Total
March 2011 April 2011 March 2011 April 2011 March 2011 April 2011
0 Y 10 689 1,397 1,553 3,479 2,242 4,87610 Y 20 560 173 323 485 883 65820 Y 50 274 58 146 234 420 19350 Y 100 108 1 95 24 163 25100 Y 250 26 0 11 0 37 09250 0 0 0 0 0 0All 1,657 1,629 2,088 4,123 3,745 5,752Maximum 182 60 199 85 199 85Average 19 6 9 5 14 5
268 Health Physics February 2014, Volume 106, Number 2
www.health-physics.com
Copyright © 2013 Health Physics Society. Unauthorized reproduction of this article is prohibited.
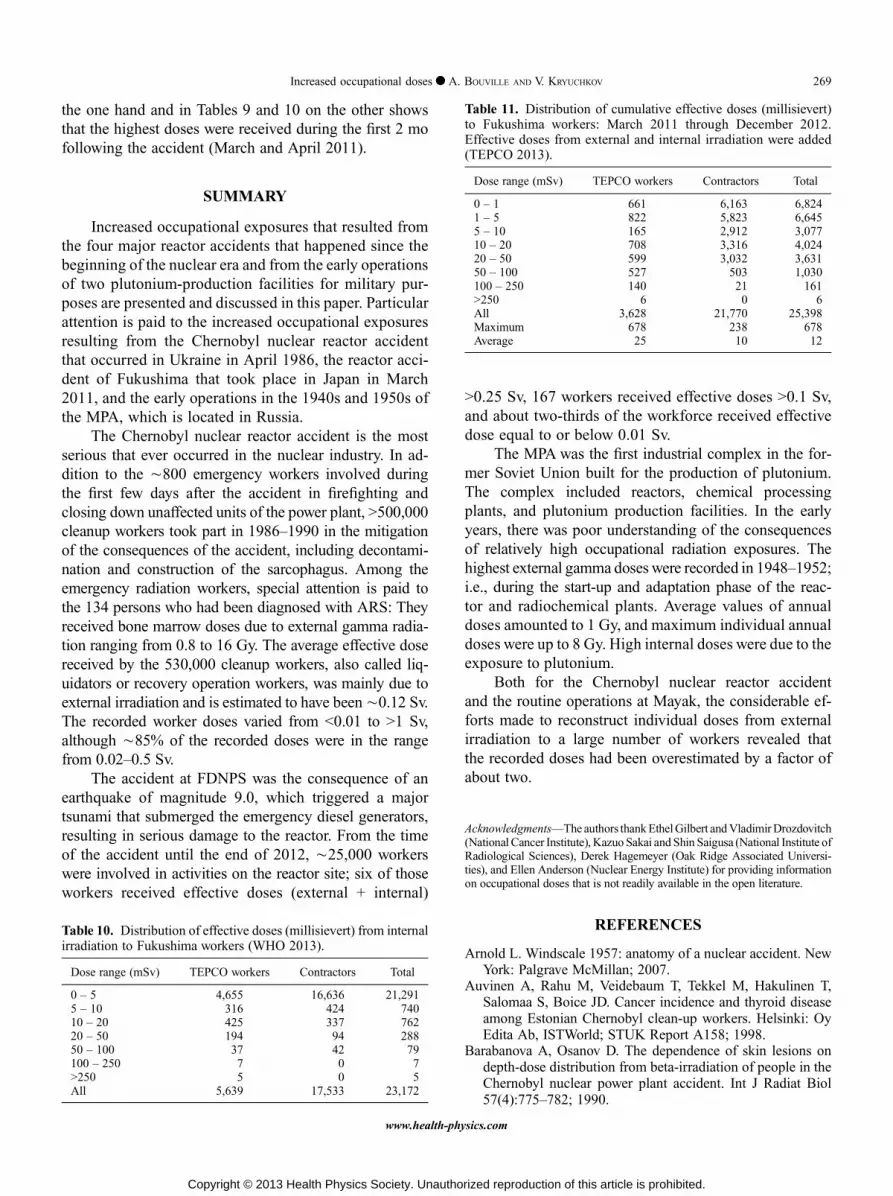
the one hand and in Tables 9 and 10 on the other showsthat the highest doses were received during the first 2 mofollowing the accident (March and April 2011).
SUMMARY
Increased occupational exposures that resulted fromthe four major reactor accidents that happened since thebeginning of the nuclear era and from the early operationsof two plutonium-production facilities for military pur-poses are presented and discussed in this paper. Particularattention is paid to the increased occupational exposuresresulting from the Chernobyl nuclear reactor accidentthat occurred in Ukraine in April 1986, the reactor acci-dent of Fukushima that took place in Japan in March2011, and the early operations in the 1940s and 1950s ofthe MPA, which is located in Russia.
The Chernobyl nuclear reactor accident is the mostserious that ever occurred in the nuclear industry. In ad-dition to the È800 emergency workers involved duringthe first few days after the accident in firefighting andclosing down unaffected units of the power plant, 9500,000cleanup workers took part in 1986Y1990 in the mitigationof the consequences of the accident, including decontami-nation and construction of the sarcophagus. Among theemergency radiation workers, special attention is paid tothe 134 persons who had been diagnosed with ARS: Theyreceived bone marrow doses due to external gamma radia-tion ranging from 0.8 to 16 Gy. The average effective dosereceived by the 530,000 cleanup workers, also called liq-uidators or recovery operation workers, was mainly due toexternal irradiation and is estimated to have beenÈ0.12 Sv.The recorded worker doses varied from G0.01 to 91 Sv,although È85% of the recorded doses were in the rangefrom 0.02Y0.5 Sv.
The accident at FDNPS was the consequence of anearthquake of magnitude 9.0, which triggered a majortsunami that submerged the emergency diesel generators,resulting in serious damage to the reactor. From the timeof the accident until the end of 2012, È25,000 workerswere involved in activities on the reactor site; six of thoseworkers received effective doses (external + internal)
90.25 Sv, 167 workers received effective doses 90.1 Sv,and about two-thirds of the workforce received effectivedose equal to or below 0.01 Sv.
The MPA was the first industrial complex in the for-mer Soviet Union built for the production of plutonium.The complex included reactors, chemical processingplants, and plutonium production facilities. In the earlyyears, there was poor understanding of the consequencesof relatively high occupational radiation exposures. Thehighest external gamma doses were recorded in 1948Y1952;i.e., during the start-up and adaptation phase of the reac-tor and radiochemical plants. Average values of annualdoses amounted to 1 Gy, and maximum individual annualdoses were up to 8 Gy. High internal doses were due to theexposure to plutonium.
Both for the Chernobyl nuclear reactor accidentand the routine operations at Mayak, the considerable ef-forts made to reconstruct individual doses from externalirradiation to a large number of workers revealed thatthe recorded doses had been overestimated by a factor ofabout two.
AcknowledgmentsVThe authors thankEthelGilbert andVladimirDrozdovitch(National Cancer Institute), Kazuo Sakai and Shin Saigusa (National Institute ofRadiological Sciences), Derek Hagemeyer (Oak Ridge Associated Universi-ties), and Ellen Anderson (Nuclear Energy Institute) for providing informationon occupational doses that is not readily available in the open literature.
REFERENCES
Arnold L. Windscale 1957: anatomy of a nuclear accident. NewYork: Palgrave McMillan; 2007.
Auvinen A, Rahu M, Veidebaum T, Tekkel M, Hakulinen T,Salomaa S, Boice JD. Cancer incidence and thyroid diseaseamong Estonian Chernobyl clean-up workers. Helsinki: OyEdita Ab, ISTWorld; STUK Report A158; 1998.
Barabanova A, Osanov D. The dependence of skin lesions ondepth-dose distribution from beta-irradiation of people in theChernobyl nuclear power plant accident. Int J Radiat Biol57(4):775Y782; 1990.
Table 10. Distribution of effective doses (millisievert) from internalirradiation to Fukushima workers (WHO 2013).
Dose range (mSv) TEPCO workers Contractors Total
0 Y 5 4,655 16,636 21,2915 Y 10 316 424 74010 Y 20 425 337 76220 Y 50 194 94 28850 Y 100 37 42 79100 Y 250 7 0 79250 5 0 5All 5,639 17,533 23,172
Table 11. Distribution of cumulative effective doses (millisievert)to Fukushima workers: March 2011 through December 2012.Effective doses from external and internal irradiation were added(TEPCO 2013).
Dose range (mSv) TEPCO workers Contractors Total
0 Y 1 661 6,163 6,8241 Y 5 822 5,823 6,6455 Y 10 165 2,912 3,07710 Y 20 708 3,316 4,02420 Y 50 599 3,032 3,63150 Y 100 527 503 1,030100 Y 250 140 21 1619250 6 0 6All 3,628 21,770 25,398Maximum 678 238 678Average 25 10 12
269Increased occupational doses c A. BOUVILLE AND V. KRYUCHKOV
www.health-physics.com
Copyright © 2013 Health Physics Society. Unauthorized reproduction of this article is prohibited.

Boice JD Jr. The Boice report #6 Y a study of one million U.S.radiation workers and veterans: a new NCRP initiative (DOEGrant Awarded September 2012). Health PhysNewsNovember:1Y10; 2012.
Buschbom RL, Gilbert ES. Summary of recorded external ra-diation doses for Hanford workers 1944Y1989. Richland, WA:Pacific Northwest Laboratory Report PNL-8909 AD-902; 1993.
Cardis E, Vrijheid M, Blettner M, Gilbert E, Hakama M, Hill C,Howe G, Kaldor J, Muirhead CR, Veress K. The 15-countrycollaborative study of cancer risk among radiation workers inthe nuclear industry: estimates of radiation-related cancerrisks. Radiat Res 167:396Y416; 2007.
Chumak VV. Physical dosimetry of Chernobyl cleanup workers.Health Phys 93:452Y461; 2007.
Chumak VV, Worgul BV, Kundiyev YI, Sergiyenko NM, VittePM, Medvedovsky C, Bakhanova EV, Junk AK, KyrychenkoOY,MusijachenkoNV, SholomSV, Shylo SA,Vitte OP, Xu S,Xue X, Shore RE. Dosimetry for a study of low-dose radi-ation cataracts among Chernobyl clean-up workers. RadiatRes 167:606Y614; 2007.
Chumak VV, Romanenko A, Voilleque PG, Bakhanova EV,Gudzenko N, Hatch M, Zablotska LB, Golovanov IA,Luckyanov N, Sholom SV, Kryuchkov VP, Bouville A. TheUkrainian-American study of leukemia and related disordersamong Chornobyl cleanup workers from Ukraine: II. estima-tion of bone-marrow doses. Radiat Res 170:698Y710; 2008.
Gavrilin Y, Khrouch V, Shinkarev S, Drozdovitch V, Minenko V,Shemiakina E, Ulanovsky A, Bouville A, Anspaugh L,Voilleque P, Luckyanov N. Individual thyroid dose estimationfor a case-control study of Chernobyl-related thyroid canceramong children of Belarus-Part I: 131I, short-lived radioiodines(132I, 133I, 135I), and short-lived radiotelluriums (131mTe and132Te). Health Phys 86:565Y585; 2004.
Gilbert ES, Fix JJ. Accounting for bias in dose estimates inanalyses of data from nuclear worker mortality studies. HealthPhys 68:450Y460; 1995.
Gusev IA, Guskova AK,Mettler FA, eds. Medical management ofradiation accidents. Boca Raton, FL: CRC Press LLC; 2001.
Ilyin LA, Kryuchkov VP, Osanov DP, Pavlov DP. Exposure levelsfor participants of emergency clean-up after Chernobyl ac-cident in 1986, 1987 and verification of dosimetric data. RadBiol Radiat Ecol 35:803Y828; 1995.
Ivanov VK. Late cancer and non-cancer risks among Chernobylemergency workers of Russia. Health Phys 93:470Y479; 2007.
Kesminiene A, Evrard AS, Ivanov VK,Malakhova IV, Kurtiniatis J,Stengrevics A, Tekkel M, Anspaugh L, Bouville A, ChekinS, Chumak VV, Drozdovitch V, Gapanovich V, Golovanov I,Hubert P, Illichev SV, Khayt MS, Krjuchkov VP, Maceika E,Maksyoutov M, Mirkhaidarov AK, Polyakov S, ShchukinaN, Tenet V, Tserekhovich TI, Tsykalo A, Tukov A, Cardis E.Leukemia and non-Hodgkin lymphoma risk among Chernobylliquidators. Radiat Res 170:721Y735; 2008.
KesminieneA, EvrardAS, IvanovVK,Malakhova IV, KurtinaitiseJ, Stengrevics A, Tekkel M, Chekin S, Drozdovitch V, GavrilinY, Golovanov I, Kryuchkov VP, Maceika E,Mirkhaidarov AK,Polyakov S, Tenet V, Tukov AR, Byrnes G, Cardis E. Risk ofthyroid cancer among Chernobyl liquidators. Radiat Res178:425Y436; 2012.
Kryuchkov V, Chumak V, Maceika E, Anspaugh LR, Cardis E,Bakhanova E, Golovanov I, Drozdovitch V, Luckyanov N,Kesminiene A, Voilleque P, Bouville A. RADRUE method forreconstruction of external photon doses for Chernobyl liqui-dators in epidemiological studies. Health Phys 97:275Y298; 2009.
Kryuchkov VP, Kochetkov OA, Tovijanov AG. Mitigation ofaccident consequences at Chernobyl NPP: radiation and do-simetry issues. Moscow: Izdat; 2012.
KuriharaO,KanaiK,NakagawaT, TakadaC,MomoseT, Furuta S.Direct measurements of employees involved in the FukushimaDaiichi Nuclear Power Station for internal dose estimates:JAEA’s experiences. In: Proceedings of the 1st NIRS sympo-sium on reconstruction of early internal dose in the TEPCOFukushima Daiichi Nuclear Power Station accident. Chiba:National Institute of Radiological Sciences; 2012: 13Y25.
Littlefield GL, McFee AF, Salomaa SI, Tucker JD, Inskip PD,Sayer AM, Lindholm C, Makinen S, Mustonen R, SorensenK, Tekkel M, Veidebaum T, Auvinen A, Boice JD Jr. Dorecorded doses overestimate true doses received by Chernobylcleanup workers? Results of cytogenetic analyses of Estonianworkers by fluorescence in situ hybridization. Radiat Res 150:237Y249; 1998.
McGheoghegan D, Binks K. Mortality and cancer registrationexperience of the Sellafield employees known to have beeninvolved in the 1957 Windscale accident. J Radiol Prot20:261Y274; 2000.
Mettler FA, Gus’kova AK, Gusev I. Health effects in those withacute radiation sickness from the Chernobyl accident. HealthPhys 93:462Y469; 2007.
Nakano T, Kim E, Akahane K, Tominaga T, Tatsuzaki H,Kurihara O, Sugiura N. Direct measurements for highly-exposed TEPCO workers and NIRS first responders in-volved in the Fukushima NPS accident. In: Proceedings ofthe 1st NIRS symposium on reconstruction of early internaldose in the TEPCO Fukushima Daiichi Nuclear Power Stationaccident. Chiba: National Institute of Radiological Sciences;2012: 27Y34.
NCRP. Exposure of the U.S. population from occupational ra-diation. Bethesda, MD: National Council on Radiation Pro-tection and Measurements; NCRP Report No. 101; 1989.
PitkevitchVA, IvanovVK,TsybAF,MaksyutovMA,MatiashVA,Shchukina NV. Exposure levels for persons involved in re-covery operations after the Chernobyl accident. Radiat EnvironBiophys 36:149Y160; 1997.
Prohl G,MeckbachR,MuckK,Likhtarev I, KovganL,ChumakV,Golikov V. Reconstruction of the doses to the populationevacuated from the 30-km zone around the Chernobyl reactor.Munich: GSF-National Research Center for EnvironmentalHealth; Report No. 07/00; 2000.
Romanenko A, Finch S, Hatch M, Lubin J, Bebeshko VG,Bazyka D, Gudzenko N, Dyagil I, Reiss R, Bouville A,Chumak V, Trotsiuk N, Babkina NG, Belayev Y, Masnyk I, RonE, Howe GR, Zablotska LB. The Ukrainian-American studyof leukemia and related disorders among Chornobyl cleanupworkers from Ukraine: III. radiation risks. Radiat Res 170:711Y720; 2008.
Romanov SA, Vasilenko EK, Khokhryakov VF. Studies onthe Mayak nuclear workers. Radiat Environ Biophys 41:23Y28; 2002.
Shipler DB, Napier BA, Farris WT, Freshley MD. Hanford Envi-ronmental Dose Reconstruction ProjectVan overview. HealthPhys 71:532Y544; 1996.
Takada C, Kurihara O, Kanai K, Nakagawa T, Tsujimara N,Momose T. Results of whole-body counting for JAEA staffmembers engaged in the emergency radiological monitoringfor the Fukushima nuclear disaster. In: Proceedings of the 1stNIRS symposiumon reconstruction of early internal dose in theTEPCO Fukushima Daiichi Nuclear Power Station accident.Chiba: National Institute of Radiological Sciences; 2012: 3Y11.
270 Health Physics February 2014, Volume 106, Number 2
www.health-physics.com
Copyright © 2013 Health Physics Society. Unauthorized reproduction of this article is prohibited.

TEPCO. Enhancing controls of internal exposures at FukushimaDaiichi Nuclear Power Station. Tokyo: Tokyo Electric PowerCompany; 2011. Available at www.tepco.co.jp/en/press/corp.com/release/betu11_e/images/110831e13.pdf.Accessed6August2013.
TEPCO. Exposure dose distribution. Tokyo: Tokyo ElectricPower Company; 2013. Available at http://www.tepco.co.jp/en/press/corp.com/release/betu13_e/images/130131e1001.pdf.Accessed 6 August 2013.
Thierry-Chef I, Marshall M, Fix J, Bermann F, Gilbert ES,Hacker C, Heinmiller B,MurrayW, Ohshima S, Cardis E. The15-country collaborative study of cancer risk among radiationworkers in the nuclear industry: study of errors in dosimetry.Radiat Res 167:380Y395; 2007.
UNSCEAR. Sources, effects and risks of ionizing radiation.United Nations Scientific Committee on the Effects ofAtomic Radiation 1988 report. Annex D. Exposures from theChernobyl accident. New York: United Nations; 1988.
UNSCEAR. Sources and effects of ionizing radiation. UnitedNations Scientific Committee on the Effects of Atomic Ra-diation 1993 report. Annex D. Occupational radiation expo-sures. New York: United Nations; 1993.
UNSCEAR. Sources and effects of ionizing radiation. United Na-tions Scientific Committee on the Effects of Atomic Radiation2000 Report. Volume II: effects. Annex J. Exposures and effectsof the Chernobyl accident. New York: United Nations; 2000.
UNSCEAR. Sources and effects of ionizing radiation. UnitedNations Scientific Committee on the Effects of Atomic Ra-diation 2008 Report. Volume I: sources. Annex B. Exposuresof the public and workers from various sources of radiation.New York: United Nations; 2010.
UNSCEAR. Sources and Effects of Ionizing Radiation. UnitedNations Scientific Committee on the Effects of Atomic Radi-ation 2008 report. Volume II: effects. Annex D. Health effectsdue to radiation from the Chernobyl accident. New York:United Nations; 2011a.
UNSCEAR. Sources and Effects of Ionizing Radiation. UnitedNations Scientific Committee on the Effects of Atomic Ra-diation 2008 report. Volume II: effects. Annex C. Radiationexposures in accidents. New York: United Nations; 2011b.
U.S. Nuclear Regulatory Commission. Programmatic environmen-tal impact statement related to decontamination and disposalof radioactive wastes resulting from March 28, 1979 acci-dent Three Mile Island Nuclear Station, unit 2. Washington,DC: U.S. Nuclear Regulatory Commission; NUREG-0683Supplement No. 1; 1984.
Vasilenko EK, Khokhryakov VF, Miller SC, Fix JJ, Eckerman K,Choe DO,GorelovM,KhokhryakovVV,KnyasevV,KrahenbuhlMP, Scherplez RI, Smetanin M, Suslova K, Vostrotin V.Mayak worker dosimetry study: an overview. Health Phys93:190Y216; 2007.
Wakeford R. The Windscale reactor accidentV50 years on.J Radiol Prot 27:211Y215; 2007.
WHO. Health risk assessment from the nuclear accident afterthe 2011 Great East Japan earthquake and tsunami based on apreliminary dose estimation. Geneva: World Health Organi-zation; 2013.
Wilson RH, Fix JJ, Baumgartner WV, Nichols LL. Descriptionand evaluation of the Hanford personnel dosimeter programfrom 1944 through 1989. Richland, WA: Pacific NorthwestLaboratory; Report PNL-7447; 1990.
Worgul BV, Kundiyev YI, Sergiyenko NM, Chumak VV, Vitte PM,Medvedosky C, Bakhanova EV, Junk AK, Kyrychenko OY,Musijachenko NV, Shylo SA, Vitte OP, Xu S, Xue X, Shore RE.Cataracts among Chernobyl clean-up workers: implicationsregarding permissible eye exposures. Radiat Res 167:233Y243; 2007.
¡¡
271Increased occupational doses c A. BOUVILLE AND V. KRYUCHKOV
www.health-physics.com
Copyright © 2013 Health Physics Society. Unauthorized reproduction of this article is prohibited.