Embed Size (px)
Citation preview
PREPARING FUTURE SPATIAL DECISION MAKERS: USING SELF-INSTRUCTION AND GIS TO IMPROVE MAP SKILLS IN THE CLASSROOM1
LORRAINE INNESi AND CLARE VANDER WILLIGENii
ABSTRACT
The national Departments of Education and Land Affairs are addressing the development of spatial competence in South Africa. There is a looming shortage of geography teachers due in part to the growth in the geospatial information industry. A self-instruction, computer-assisted programme, delivered on a GIS platform has been developed to teach map analysis, a component of spatial competence. The results of the trials indicate that participants’ confidence increased and their map analysis scores improved after using the programme. While the gender and age of this population sample, drawn from a variety of state and private schools, had little bearing on the outcome of their post-intervention map analysis test scores, speaking a language at home that is different to the language of instruction (in this case, English) had a slightly negative impact on results. Taking an IT elective at school had little influence on their map analysis scores but taking Mathematics and Science along with Geography had a positive impact on spatial competence. Easy access to computers combined with a positive attitude to maps and GIS was associated with improved scores.
Key words: spatial competence; map skills; map analysis; self-instruction; computer-assisted learning; GIS.
Introduction
Problems with map skills at school level have received attention over many years in many countries (Gerber and Wilson, 1984; Sandford, 1989; Wiegand, 2006 and many others). In South Africa the map skills dilemma has been examined from many angles (Magi, 1981; Ndlwana, 1991; Smit, 1994; Sekete, 1995; Innes, 1998; Liebenberg, 1998; Tshibalo, 2002 and Clarke, 2003). The burgeoning of spatial information technologies and the important role of spatial information in a wide range of endeavours has prompted the National Research Council (NRC) of America to focus attention on spatial thinking and on how to teach young people to understand concepts of space, how that space is represented and how to use both in reasoning and decision making (NRC, 2006).
The aim of this investigation is to assess the effectiveness of a computer-assisted,
GIS-based, self-instruction programme that has been developed to improve map analysis skills at secondary school. The objectives are firstly to ascertain whether participants’ performance improved both overall and on each of eight specific map analysis skills while using the programme. The secondary objective is to identify which characteristics of the sample population influenced their map analysis performance so as to ascertain which learners, under which conditions, may benefit from the introduction of such a programme.
Spatial competence at school level in South Africa
Two state departments are fostering the spatial competence (map skills) of learners at school in South Africa – the Department of Land Affairs (DLA) and the Department of Education (DoE). Within the DLA, the Chief Directorate of Surveys and Mapping (CDSM) is legislated as the national mapping organisation of South Arica. In 1997 CDSM launched the MapAware project to “develop and enhance the mapping skills of South Africans, both young learners and adults alike” (DLA, 2000, 67). Map use training workshops are offered to improve spatial competence in the workplace for a
1 Paper initially presented at the GDEST 2008 Conference, 17 -19 March in Cape Town
1
range of employees, especially educators (Innes and Engel, 2001) and officials working on land reform projects (Engel, 2002). Another aim of the MapAware project is to place a local topographic map sheet on the wall of every senior geography classroom in the country (Clarke, 1998).
Apart from supplying local topographic map sheets to schools, on CDSM’s 80th
anniversary in October 2000, two thousand MapTrix Kits (Innes, 2000) were donated to the Minister of Education for distribution to under-resourced schools (Tickner, 2000). These paper-based kits of self-instruction materials contain 52 work cards with different topographic map extracts plus lessons and exercises that can be used to improve topographic map reading skills.
Outcomes Based Education (OBE) has been adopted by the national Department
of Education in South Africa and linked to a National Qualifications Framework (NQF) which was passed into law as the South African Qualifications Authority (SAQA) Act No. 58 of 1995. Wolfe (1995) outlines the importance of identifying measurable outcomes in the form of specific competencies. The DoE has the chief role to play in fostering spatial competence through the teaching of Geography at schools. Their responsibility is focused at two levels. The General Education and Training (GET) band caters for learners in the 7th, 8th and 9th years of schooling (Grades). When the GET Curriculum for OBE was introduced in 2000, many objections to the composition of the Human and Social Sciences Learning Area were raised. These concerns lead to an extensive revision (DoE, 2002) and later the implementation of the Revised National Curriculum Statement (RNCS) in 2005. Now History and Geography are equally represented in the Social Sciences Learning Area which is a compulsory curriculum component for all learners. In the GET examination at the end of Grade 9, learners are required to display competence in reading, analysing and interpreting local maps. The 1:50 000 topographic map sheets produced by CDSM are the only standardised local maps available for all areas of South Africa. The policy framework is thus in place to provide for the development and examination of spatial competence for all who reach the end of the General Education and Training band.
At the start of the Further Education and Training (FET) band, learners in Grade
10 elect at least six subjects which they take forward for three years in preparation for the FET Certificate in Grade 12. This school leavers’ qualification is historically referred to as the matriculation examination or Matric. Geography is one of many electives. The examination comprises two papers; one a theory paper and the other examines practical geographical skills and techniques and focuses on the use of aerial photographs, topographic and orthophoto maps. This paper now includes geographic information systems (GIS) which will be examined at matric level for the first time in December 2008 (DoE, 2008).
Devising an education policy and implementing an education policy are far from
the same thing (Fullan, 1995). While the Department of Land Affairs is making maps and in-service teacher training available, the shortage of new geography teachers in the
2
Department of Education “is an issue that should be investigated at greater depth and one which should call for urgent action” (Fairhurst et al., 2003, 88).
Much research has been conducted internationally into the use of information and
communication technology (ICT) to support geography teaching at school, for example, to keep it relevant to the world beyond the classroom (Gerber and Lidstone, 1996) and to stimulate young geography learners to undertake ‘real world’ investigations (Wiegand, 2006) yet, Donert in 2006 still decried the slow uptake of ICT in the geography departments of European Higher Education Institutions. In South Africa a group of teacher trainers promote the use of digital video discs (DVD’s) in training pre-service geography teachers so that they can “enable learners to gather and synthesise information using ICT, a skill needed for the growing technology-based work place” (de Sousa et al., 2006, 141). Van der Westhuizen and Richter (2006) promote DVD use in geography classrooms because they can combine text, audio, photographs, animations and video footage while still providing a cost effective answer to technology in education requirements in developing countries where connectivity for all cannot yet be guaranteed.
Moving from using ICT in secondary school geography classrooms generally to
using GIS in particular, research has been conducted across seven European countries (Kankaanrinta et al., 2006) as well as individual investigations in Germany (Herzig, 2006) and Holland (van der Schee), all involving internet connectivity. GIS use at high school has also been investigated in Japan (Ida, 2006) and Australia (Maguire, 2006; West, 2006). In the majority of reports the advantages of active and self-directed learning are stressed as well as the opportunities for learners to develop decision making skills based on responsible attitudes to the environment and citizenship.
Although no published research on using GIS at school level in South Africa has
come to hand yet, Ashwell (2007) is evaluating the use of GIS by the local youth for biodiversity mapping and monitoring in Cape Town’s urban nature reserves and Simon Taylor is looking at policy matters related to implementing GIS in schools (pers. comm.). Although some provincial education authorities are less enthusiastic than others, the benefit of GIS has been described by Andrew Isaacs, Deputy Chief Education Specialist for Geography in the Western Cape Education Department as “technology that saves teachers and learners time on measuring and recording so they can spend more time on analysis and evaluation” (quoted in Jones, 2006, 16).
The inclusion of GIS in the geography curriculum has elicited widely different
reactions from teachers - from outright panic to keen optimism. At schools where geography teachers have neither computer facilities (nor relevant skills), a move has been made to drop Geography from the subject options offered at the school (Neuhoff, pers. comm.). At the other end of the scale are the comparatively small number of well-resourced private schools with enthusiastic geography teachers trained in information technology (IT) who have relished the challenge and have engaged their learners in practical GIS activities related to school land management and other real world issues (Taylor, pers. comm.). The majority of teachers between these two extremes do the best they can with limited resources and little training. Although some provincial education
3
departments, such as the Western Cape, are making great strides in the provision of IT hardware and software for use by teachers and learners (van Wyk, 2006), in other provinces teachers are lucky if they have access to the school’s only personal computer for limited time periods in the staffroom (personal discussions with teachers in South Africa’s northern provinces). A study of the distribution of ICT in schools throws light on the uneven distribution of computer facilities between South Africa’s nine provinces (Lundall and Howell, 2000) which is similar to that conducted in Namibia by Matengu (2006) who found significant disparities between the core and periphery areas.
Co-operative learning is a methodology that Tshibalo (2002) proposes, which
may help side-step the geography teacher shortage and place responsibility for developing map skills in the hands of learners themselves. Another way to address both the lack of trained geography teachers and the introduction into the geography curriculum of new technology such as GIS may be to use a computer-assisted, GIS-based, self-instruction programme on DVD, at least in those places where the technology is available but internet connections are not.
Materials and methods
This paper reports on one facet of an action research project (Huysamen, 1994) which uses an experimental approach (Francis, 1997) to address the problem of poor spatial competence levels in South African secondary schools. Two intervention instruments were developed and trialled by learners under four different trial conditions using the test-intervention-test method (Cohen and Manion, 1985).
A self-instruction package offers a route to improving skills in a situation where
there are insufficient skilled instructors and/or a lack of materials available for practising skills. For a self-instruction programme to be effective, a clear hierarchy of concepts and skills must be identified so that the learner is introduced to foundation concepts and associated skills first. Entry level tasks are practiced to a point where learners display competence and then more advanced tasks can be introduced (Gagné and Briggs, 1974). Three levels of map skills have been identified as map reading, map analysis and map interpretation (Innes, 1998). While the second level, map analysis, is the focus of attention in this investigation, acceptable map reading ability first had to be demonstrated. The self-instruction programme for map reading
In order to teach map reading, a firm geographic concept base is required to understand the geographic terminology and processes that are evidenced on a topographic map. Four equally important foundation concepts are developed using the MapTrix Kit (Innes, 2000) namely Urban Settlement, Rural Settlement, Landscape and Transport. The range of 96 words and symbols used on the 1:50 000 topographic map series are divided between these four concept areas. The odd numbered, even numbered and picture cards in the four suits of a deck of playing cards are used to structure the 12 Geography lessons in the programme (three each on the concept areas named above). The 52 playing cards are used to identify 52 work cards with map reading exercises using different extracts of
4
the 1:50 000 topographic map series and 52 answer cards used for self-assessment. A national opinion survey conducted after the distribution of the free MapTrix Kits found that both teachers’ and learners’ attitudes to the paper-based learning programme were favourable and that the learners’ map reading skills improved while using the programme (Innes, 2002). This paper-based self-instruction programme for map reading has been converted to a computer-assisted map reading game by Eltanin Aerospace Academy (www.eltanin.co.za). The prototype of this game was used to improve the skills of participants with poor map reading abilities in preparation for the map analysis intervention. The self-instruction programme for map analysis
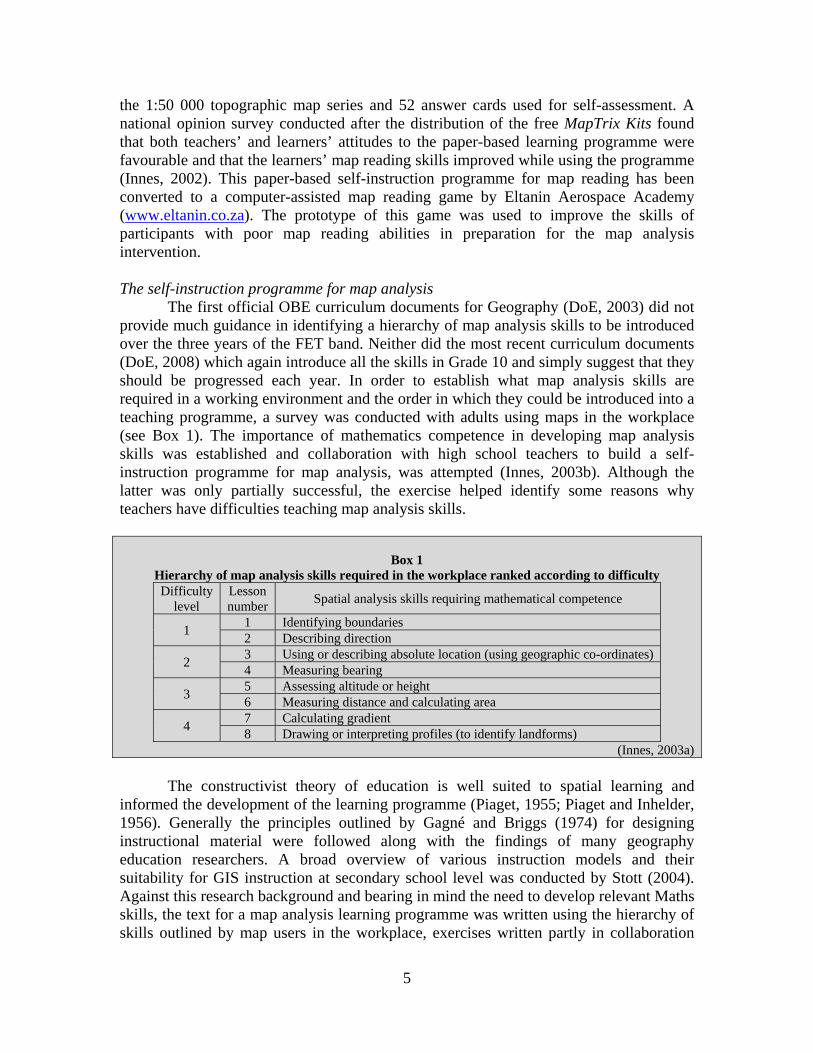
The first official OBE curriculum documents for Geography (DoE, 2003) did not provide much guidance in identifying a hierarchy of map analysis skills to be introduced over the three years of the FET band. Neither did the most recent curriculum documents (DoE, 2008) which again introduce all the skills in Grade 10 and simply suggest that they should be progressed each year. In order to establish what map analysis skills are required in a working environment and the order in which they could be introduced into a teaching programme, a survey was conducted with adults using maps in the workplace (see Box 1). The importance of mathematics competence in developing map analysis skills was established and collaboration with high school teachers to build a self-instruction programme for map analysis, was attempted (Innes, 2003b). Although the latter was only partially successful, the exercise helped identify some reasons why teachers have difficulties teaching map analysis skills.
Box 1
Hierarchy of map analysis skills required in the workplace ranked according to difficulty Difficulty
level Lesson number Spatial analysis skills requiring mathematical competence
1 1 Identifying boundaries 2 Describing direction
2 3 Using or describing absolute location (using geographic co-ordinates) 4 Measuring bearing
3 5 Assessing altitude or height 6 Measuring distance and calculating area
4 7 Calculating gradient 8 Drawing or interpreting profiles (to identify landforms)
(Innes, 2003a)
The constructivist theory of education is well suited to spatial learning and informed the development of the learning programme (Piaget, 1955; Piaget and Inhelder, 1956). Generally the principles outlined by Gagné and Briggs (1974) for designing instructional material were followed along with the findings of many geography education researchers. A broad overview of various instruction models and their suitability for GIS instruction at secondary school level was conducted by Stott (2004). Against this research background and bearing in mind the need to develop relevant Maths skills, the text for a map analysis learning programme was written using the hierarchy of skills outlined by map users in the workplace, exercises written partly in collaboration
5
with practising high school geography teachers and updated extracts of the topographic maps selected for the MapTrix Kit (Innes, 2000).
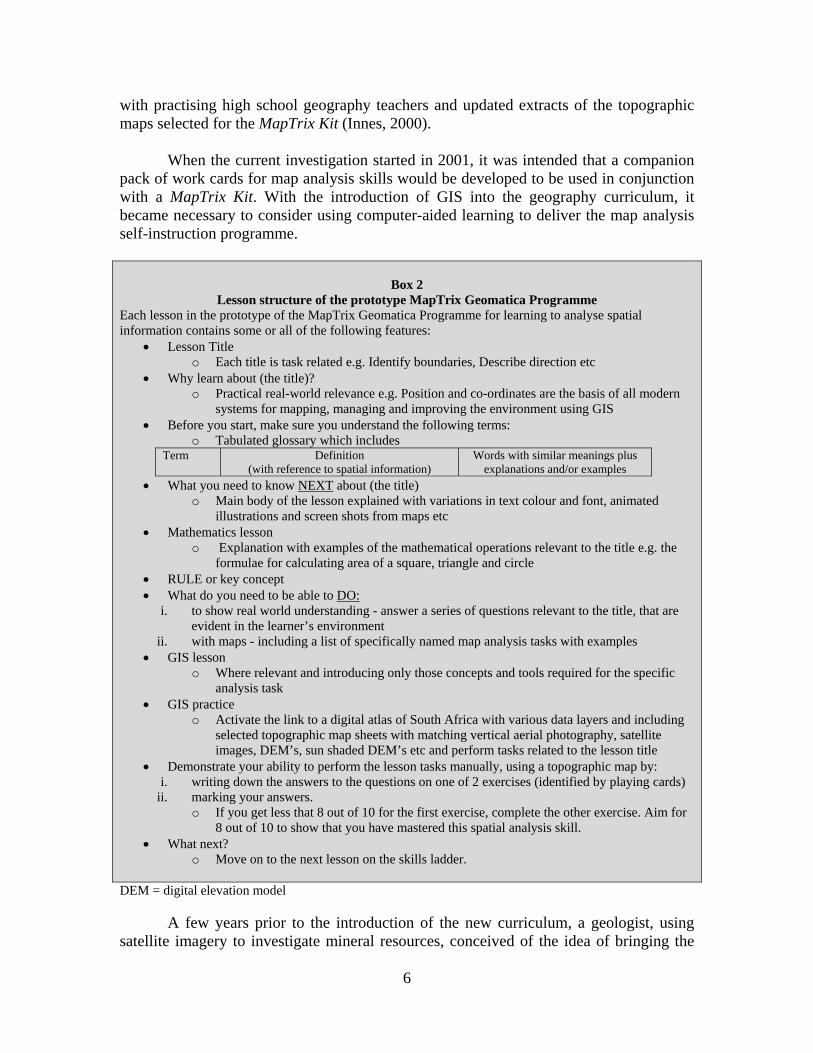
When the current investigation started in 2001, it was intended that a companion
pack of work cards for map analysis skills would be developed to be used in conjunction with a MapTrix Kit. With the introduction of GIS into the geography curriculum, it became necessary to consider using computer-aided learning to deliver the map analysis self-instruction programme.
Box 2 Lesson structure of the prototype MapTrix Geomatica Programme
Each lesson in the prototype of the MapTrix Geomatica Programme for learning to analyse spatial information contains some or all of the following features:
• Lesson Title o Each title is task related e.g. Identify boundaries, Describe direction etc
• Why learn about (the title)? o Practical real-world relevance e.g. Position and co-ordinates are the basis of all modern
systems for mapping, managing and improving the environment using GIS • Before you start, make sure you understand the following terms:
o Tabulated glossary which includes Term Definition
(with reference to spatial information) Words with similar meanings plus
explanations and/or examples • What you need to know NEXT about (the title)
o Main body of the lesson explained with variations in text colour and font, animated illustrations and screen shots from maps etc
• Mathematics lesson o Explanation with examples of the mathematical operations relevant to the title e.g. the
formulae for calculating area of a square, triangle and circle • RULE or key concept • What do you need to be able to DO:
i. to show real world understanding - answer a series of questions relevant to the title, that are evident in the learner’s environment
ii. with maps - including a list of specifically named map analysis tasks with examples • GIS lesson
o Where relevant and introducing only those concepts and tools required for the specific analysis task
• GIS practice o Activate the link to a digital atlas of South Africa with various data layers and including
selected topographic map sheets with matching vertical aerial photography, satellite images, DEM’s, sun shaded DEM’s etc and perform tasks related to the lesson title
• Demonstrate your ability to perform the lesson tasks manually, using a topographic map by: i. writing down the answers to the questions on one of 2 exercises (identified by playing cards)
ii. marking your answers. o If you get less that 8 out of 10 for the first exercise, complete the other exercise. Aim for
8 out of 10 to show that you have mastered this spatial analysis skill. • What next?
o Move on to the next lesson on the skills ladder. DEM = digital elevation model
A few years prior to the introduction of the new curriculum, a geologist, using satellite imagery to investigate mineral resources, conceived of the idea of bringing the
6
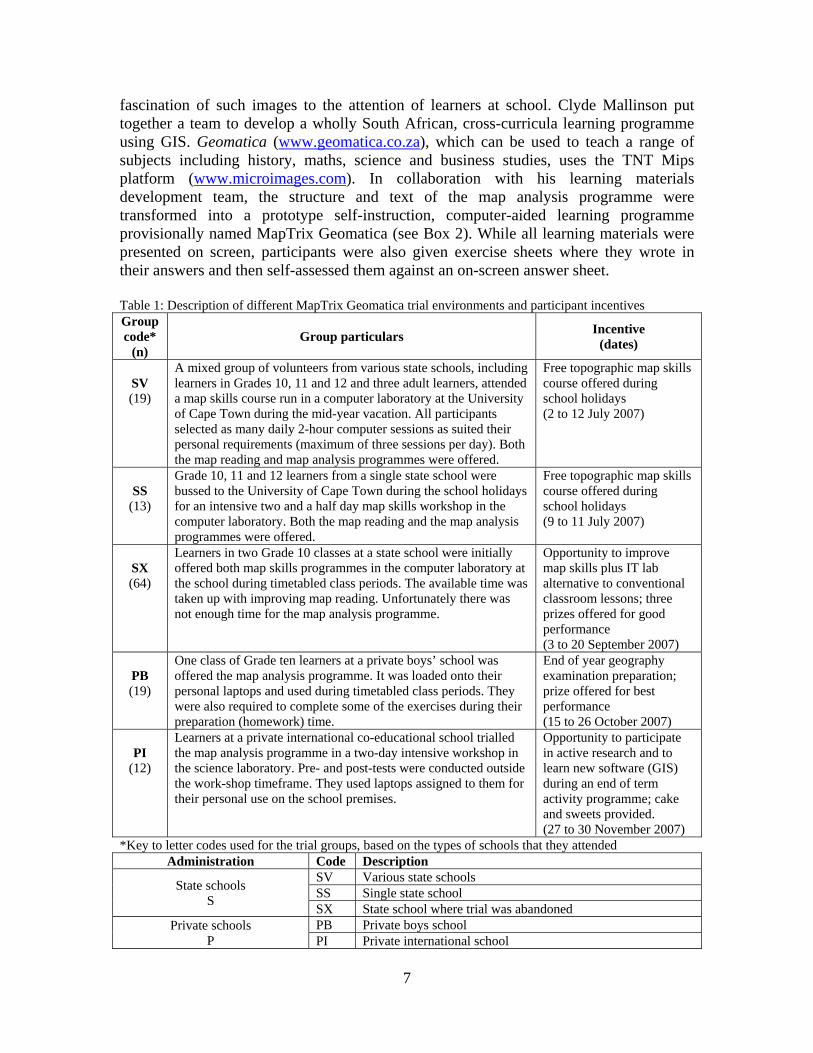
fascination of such images to the attention of learners at school. Clyde Mallinson put together a team to develop a wholly South African, cross-curricula learning programme using GIS. Geomatica (www.geomatica.co.za), which can be used to teach a range of subjects including history, maths, science and business studies, uses the TNT Mips platform (www.microimages.com). In collaboration with his learning materials development team, the structure and text of the map analysis programme were transformed into a prototype self-instruction, computer-aided learning programme provisionally named MapTrix Geomatica (see Box 2). While all learning materials were presented on screen, participants were also given exercise sheets where they wrote in their answers and then self-assessed them against an on-screen answer sheet. Table 1: Description of different MapTrix Geomatica trial environments and participant incentives Group code*
(n) Group particulars Incentive
(dates)
SV (19)
A mixed group of volunteers from various state schools, including learners in Grades 10, 11 and 12 and three adult learners, attended a map skills course run in a computer laboratory at the University of Cape Town during the mid-year vacation. All participants selected as many daily 2-hour computer sessions as suited their personal requirements (maximum of three sessions per day). Both the map reading and map analysis programmes were offered.
Free topographic map skills course offered during school holidays (2 to 12 July 2007)
SS
(13)
Grade 10, 11 and 12 learners from a single state school were bussed to the University of Cape Town during the school holidays for an intensive two and a half day map skills workshop in the computer laboratory. Both the map reading and the map analysis programmes were offered.
Free topographic map skills course offered during school holidays (9 to 11 July 2007)
SX (64)
Learners in two Grade 10 classes at a state school were initially offered both map skills programmes in the computer laboratory at the school during timetabled class periods. The available time was taken up with improving map reading. Unfortunately there was not enough time for the map analysis programme.
Opportunity to improve map skills plus IT lab alternative to conventional classroom lessons; three prizes offered for good performance (3 to 20 September 2007)
PB (19)
One class of Grade ten learners at a private boys’ school was offered the map analysis programme. It was loaded onto their personal laptops and used during timetabled class periods. They were also required to complete some of the exercises during their preparation (homework) time.
End of year geography examination preparation; prize offered for best performance (15 to 26 October 2007)
PI
(12)
Learners at a private international co-educational school trialled the map analysis programme in a two-day intensive workshop in the science laboratory. Pre- and post-tests were conducted outside the work-shop timeframe. They used laptops assigned to them for their personal use on the school premises.
Opportunity to participate in active research and to learn new software (GIS) during an end of term activity programme; cake and sweets provided. (27 to 30 November 2007)
*Key to letter codes used for the trial groups, based on the types of schools that they attended Administration Code Description
State schools S
SV Various state schools SS Single state school SX State school where trial was abandoned
Private schools P
PB Private boys school PI Private international school
7
Sample population
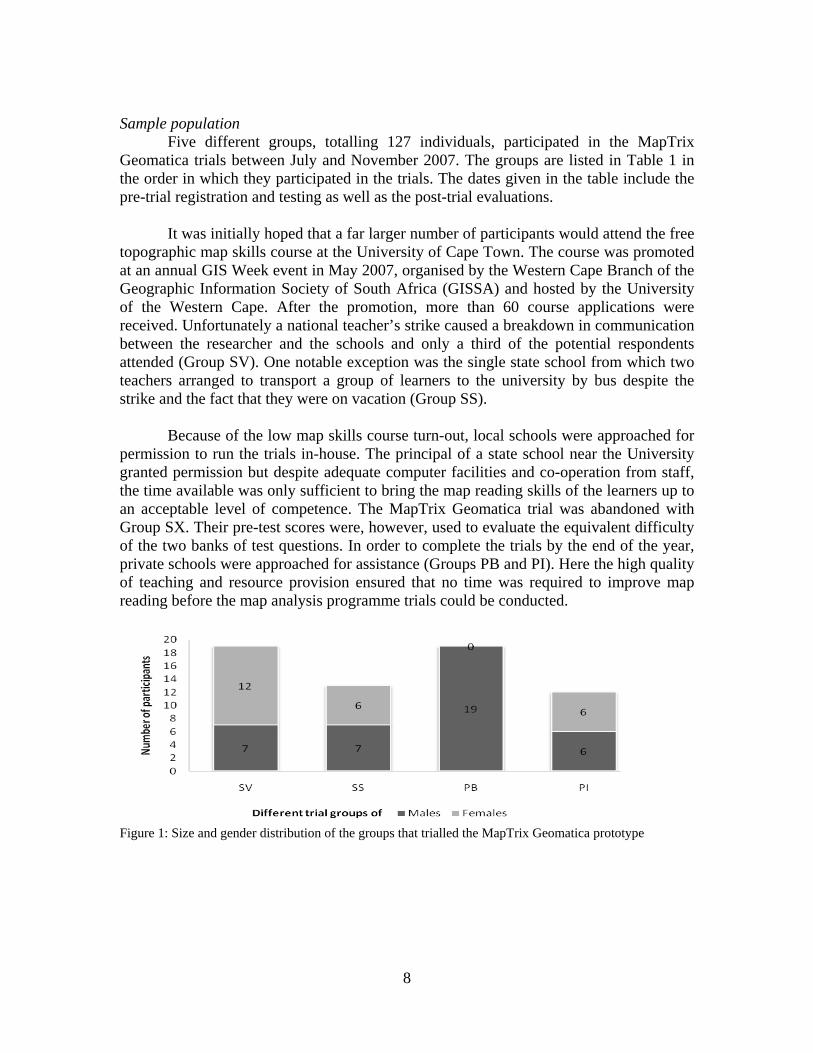
Five different groups, totalling 127 individuals, participated in the MapTrix Geomatica trials between July and November 2007. The groups are listed in Table 1 in the order in which they participated in the trials. The dates given in the table include the pre-trial registration and testing as well as the post-trial evaluations.
It was initially hoped that a far larger number of participants would attend the free topographic map skills course at the University of Cape Town. The course was promoted at an annual GIS Week event in May 2007, organised by the Western Cape Branch of the Geographic Information Society of South Africa (GISSA) and hosted by the University of the Western Cape. After the promotion, more than 60 course applications were received. Unfortunately a national teacher’s strike caused a breakdown in communication between the researcher and the schools and only a third of the potential respondents attended (Group SV). One notable exception was the single state school from which two teachers arranged to transport a group of learners to the university by bus despite the strike and the fact that they were on vacation (Group SS).
Because of the low map skills course turn-out, local schools were approached for
permission to run the trials in-house. The principal of a state school near the University granted permission but despite adequate computer facilities and co-operation from staff, the time available was only sufficient to bring the map reading skills of the learners up to an acceptable level of competence. The MapTrix Geomatica trial was abandoned with Group SX. Their pre-test scores were, however, used to evaluate the equivalent difficulty of the two banks of test questions. In order to complete the trials by the end of the year, private schools were approached for assistance (Groups PB and PI). Here the high quality of teaching and resource provision ensured that no time was required to improve map reading before the map analysis programme trials could be conducted.
Figure 1: Size and gender distribution of the groups that trialled the MapTrix Geomatica prototype
8
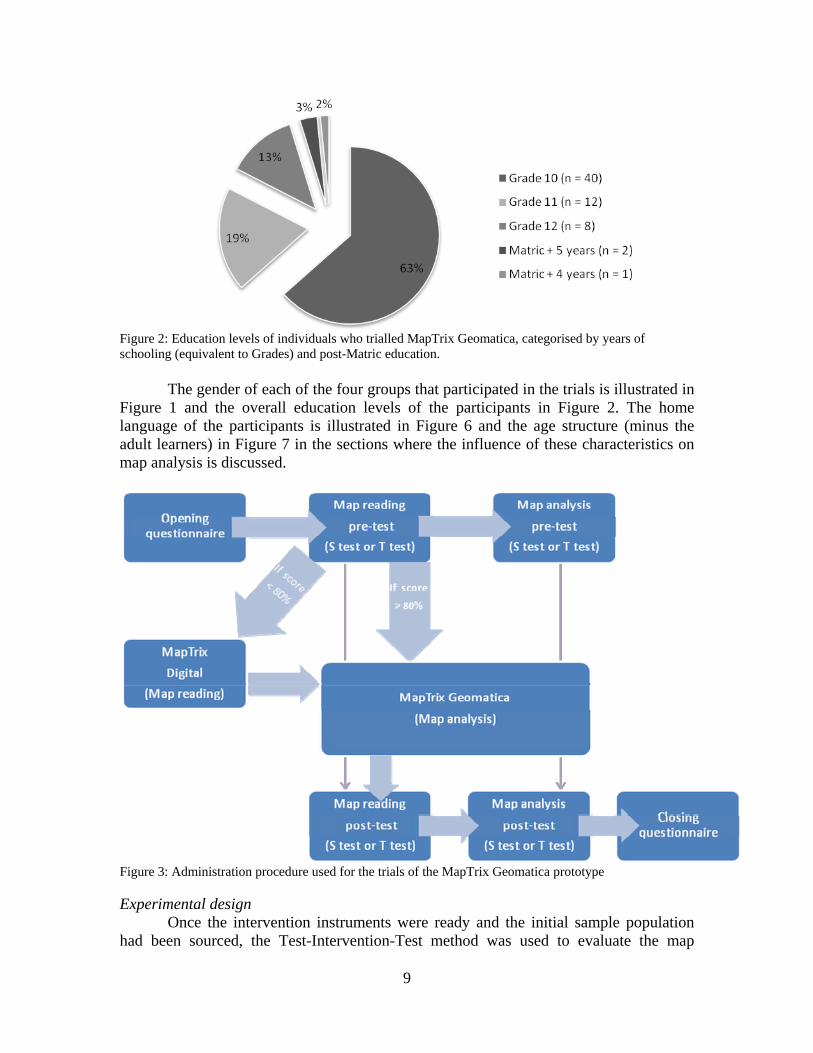
Figure 2: Education levels of individuals who trialled MapTrix Geomatica, categorised by years of schooling (equivalent to Grades) and post-Matric education.
The gender of each of the four groups that participated in the trials is illustrated in Figure 1 and the overall education levels of the participants in Figure 2. The home language of the participants is illustrated in Figure 6 and the age structure (minus the adult learners) in Figure 7 in the sections where the influence of these characteristics on map analysis is discussed.
Figure 3: Administration procedure used for the trials of the MapTrix Geomatica prototype Experimental design
Once the intervention instruments were ready and the initial sample population had been sourced, the Test-Intervention-Test method was used to evaluate the map
9
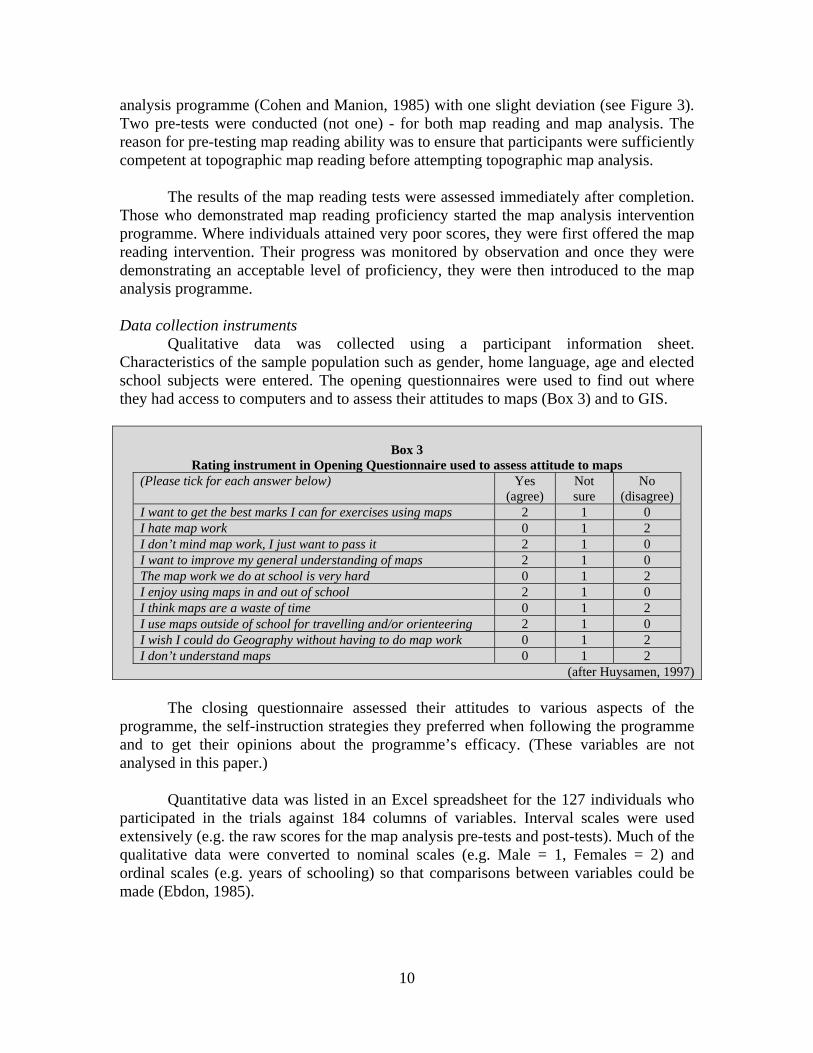
analysis programme (Cohen and Manion, 1985) with one slight deviation (see Figure 3). Two pre-tests were conducted (not one) - for both map reading and map analysis. The reason for pre-testing map reading ability was to ensure that participants were sufficiently competent at topographic map reading before attempting topographic map analysis.
The results of the map reading tests were assessed immediately after completion. Those who demonstrated map reading proficiency started the map analysis intervention programme. Where individuals attained very poor scores, they were first offered the map reading intervention. Their progress was monitored by observation and once they were demonstrating an acceptable level of proficiency, they were then introduced to the map analysis programme. Data collection instruments
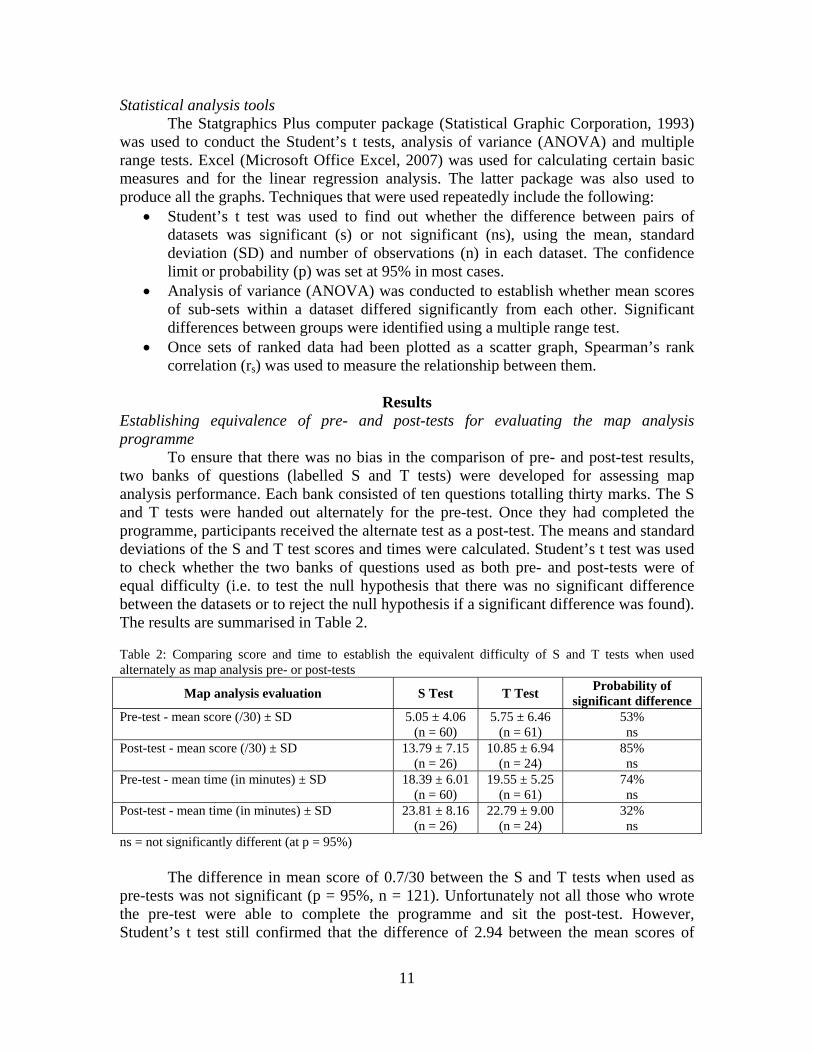
Qualitative data was collected using a participant information sheet. Characteristics of the sample population such as gender, home language, age and elected school subjects were entered. The opening questionnaires were used to find out where they had access to computers and to assess their attitudes to maps (Box 3) and to GIS.
Box 3
Rating instrument in Opening Questionnaire used to assess attitude to maps (Please tick for each answer below) Yes
(agree) Not sure
No (disagree)
I want to get the best marks I can for exercises using maps 2 1 0 I hate map work 0 1 2 I don’t mind map work, I just want to pass it 2 1 0 I want to improve my general understanding of maps 2 1 0 The map work we do at school is very hard 0 1 2 I enjoy using maps in and out of school 2 1 0 I think maps are a waste of time 0 1 2 I use maps outside of school for travelling and/or orienteering 2 1 0 I wish I could do Geography without having to do map work 0 1 2 I don’t understand maps 0 1 2
(after Huysamen, 1997)
The closing questionnaire assessed their attitudes to various aspects of the programme, the self-instruction strategies they preferred when following the programme and to get their opinions about the programme’s efficacy. (These variables are not analysed in this paper.)
Quantitative data was listed in an Excel spreadsheet for the 127 individuals who
participated in the trials against 184 columns of variables. Interval scales were used extensively (e.g. the raw scores for the map analysis pre-tests and post-tests). Much of the qualitative data were converted to nominal scales (e.g. Male = 1, Females = 2) and ordinal scales (e.g. years of schooling) so that comparisons between variables could be made (Ebdon, 1985).
10
Statistical analysis tools The Statgraphics Plus computer package (Statistical Graphic Corporation, 1993)
was used to conduct the Student’s t tests, analysis of variance (ANOVA) and multiple range tests. Excel (Microsoft Office Excel, 2007) was used for calculating certain basic measures and for the linear regression analysis. The latter package was also used to produce all the graphs. Techniques that were used repeatedly include the following:
• Student’s t test was used to find out whether the difference between pairs of datasets was significant (s) or not significant (ns), using the mean, standard deviation (SD) and number of observations (n) in each dataset. The confidence limit or probability (p) was set at 95% in most cases.
• Analysis of variance (ANOVA) was conducted to establish whether mean scores of sub-sets within a dataset differed significantly from each other. Significant differences between groups were identified using a multiple range test.
• Once sets of ranked data had been plotted as a scatter graph, Spearman’s rank correlation (rs) was used to measure the relationship between them.
Results
Establishing equivalence of pre- and post-tests for evaluating the map analysis programme
To ensure that there was no bias in the comparison of pre- and post-test results, two banks of questions (labelled S and T tests) were developed for assessing map analysis performance. Each bank consisted of ten questions totalling thirty marks. The S and T tests were handed out alternately for the pre-test. Once they had completed the programme, participants received the alternate test as a post-test. The means and standard deviations of the S and T test scores and times were calculated. Student’s t test was used to check whether the two banks of questions used as both pre- and post-tests were of equal difficulty (i.e. to test the null hypothesis that there was no significant difference between the datasets or to reject the null hypothesis if a significant difference was found). The results are summarised in Table 2. Table 2: Comparing score and time to establish the equivalent difficulty of S and T tests when used alternately as map analysis pre- or post-tests
Map analysis evaluation S Test T Test Probability of significant difference
Pre-test - mean score (/30) ± SD 5.05 ± 4.06 (n = 60)
5.75 ± 6.46 (n = 61)
53% ns
Post-test - mean score (/30) ± SD 13.79 ± 7.15 (n = 26)
10.85 ± 6.94 (n = 24)
85% ns
Pre-test - mean time (in minutes) ± SD 18.39 ± 6.01 (n = 60)
19.55 ± 5.25 (n = 61)
74% ns
Post-test - mean time (in minutes) ± SD 23.81 ± 8.16 (n = 26)
22.79 ± 9.00 (n = 24)
32% ns
ns = not significantly different (at p = 95%)
The difference in mean score of 0.7/30 between the S and T tests when used as pre-tests was not significant (p = 95%, n = 121). Unfortunately not all those who wrote the pre-test were able to complete the programme and sit the post-test. However, Student’s t test still confirmed that the difference of 2.94 between the mean scores of
11
those who sat the S and T tests as post-tests was not significantly different either (p = 95%, n = 50).
Time taken to complete the tests was used as a further validation of the
equivalence of the two banks of questions in the S and T tests. The small differences in the times taken to complete the S and T tests (1.16 minutes on pre-test and 1.02 minutes on the post-test) were also not significant. The chance of bias in the assessment instrument has been eliminated by using two equivalent tests alternately as pre- and post-tests. Comparing the pre- and post-intervention map analysis performance of trial groups
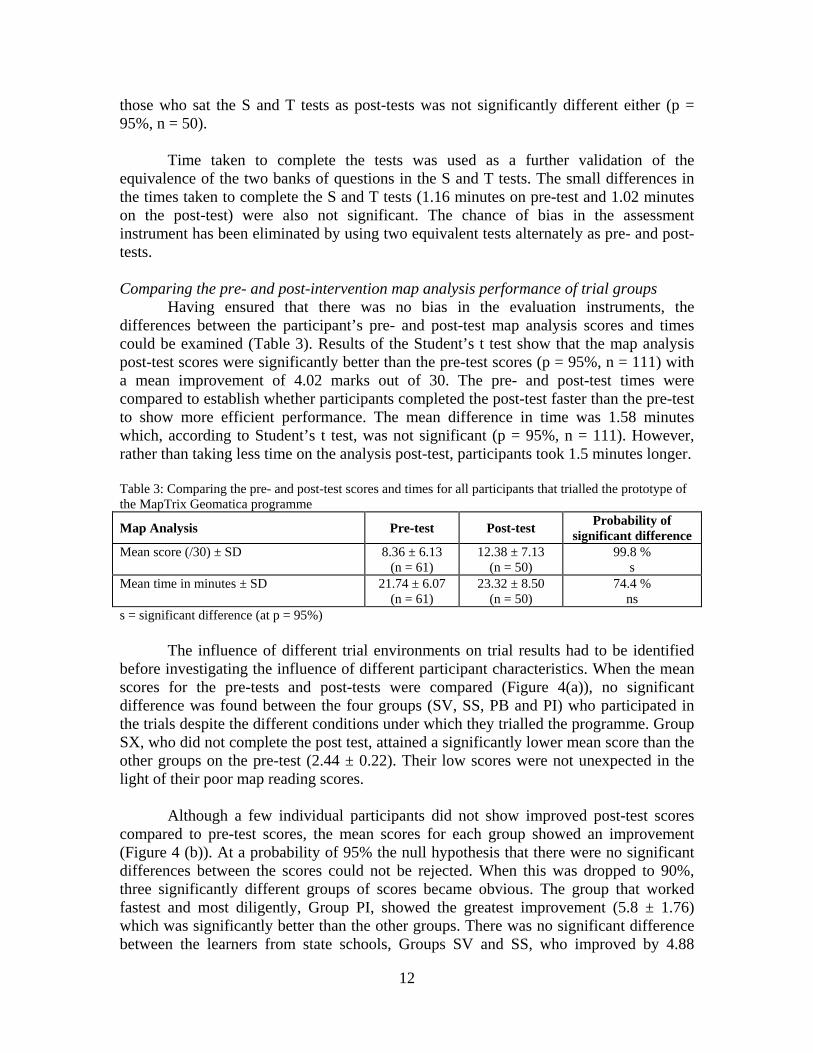
Having ensured that there was no bias in the evaluation instruments, the differences between the participant’s pre- and post-test map analysis scores and times could be examined (Table 3). Results of the Student’s t test show that the map analysis post-test scores were significantly better than the pre-test scores (p = 95%, n = 111) with a mean improvement of 4.02 marks out of 30. The pre- and post-test times were compared to establish whether participants completed the post-test faster than the pre-test to show more efficient performance. The mean difference in time was 1.58 minutes which, according to Student’s t test, was not significant (p = 95%, n = 111). However, rather than taking less time on the analysis post-test, participants took 1.5 minutes longer. Table 3: Comparing the pre- and post-test scores and times for all participants that trialled the prototype of the MapTrix Geomatica programme
Map Analysis Pre-test Post-test Probability of significant difference
Mean score (/30) ± SD 8.36 ± 6.13 (n = 61)
12.38 ± 7.13 (n = 50)
99.8 % s
Mean time in minutes ± SD 21.74 ± 6.07 (n = 61)
23.32 ± 8.50 (n = 50)
74.4 % ns
s = significant difference (at p = 95%)
The influence of different trial environments on trial results had to be identified before investigating the influence of different participant characteristics. When the mean scores for the pre-tests and post-tests were compared (Figure 4(a)), no significant difference was found between the four groups (SV, SS, PB and PI) who participated in the trials despite the different conditions under which they trialled the programme. Group SX, who did not complete the post test, attained a significantly lower mean score than the other groups on the pre-test (2.44 ± 0.22). Their low scores were not unexpected in the light of their poor map reading scores.
Although a few individual participants did not show improved post-test scores
compared to pre-test scores, the mean scores for each group showed an improvement (Figure 4 (b)). At a probability of 95% the null hypothesis that there were no significant differences between the scores could not be rejected. When this was dropped to 90%, three significantly different groups of scores became obvious. The group that worked fastest and most diligently, Group PI, showed the greatest improvement (5.8 ± 1.76) which was significantly better than the other groups. There was no significant difference between the learners from state schools, Groups SV and SS, who improved by 4.88
12
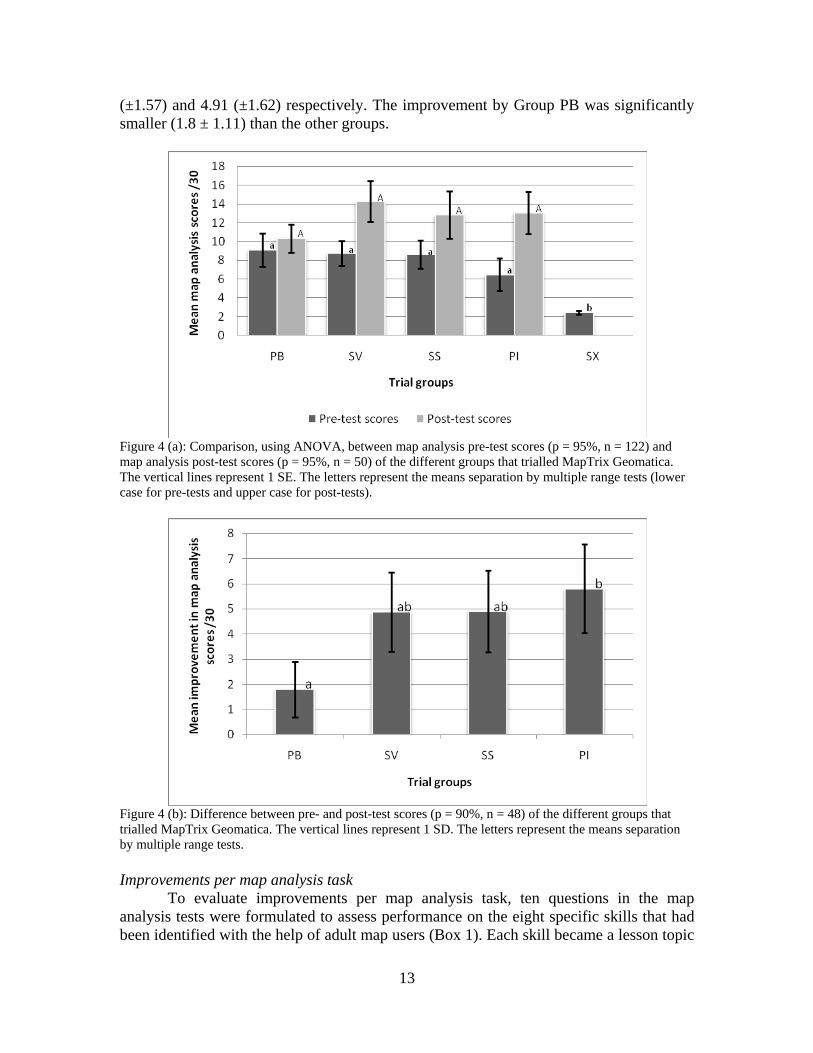
(±1.57) and 4.91 (±1.62) respectively. The improvement by Group PB was significantly smaller (1.8 ± 1.11) than the other groups.
Figure 4 (a): Comparison, using ANOVA, between map analysis pre-test scores (p = 95%, n = 122) and map analysis post-test scores (p = 95%, n = 50) of the different groups that trialled MapTrix Geomatica. The vertical lines represent 1 SE. The letters represent the means separation by multiple range tests (lower case for pre-tests and upper case for post-tests).
Figure 4 (b): Difference between pre- and post-test scores (p = 90%, n = 48) of the different groups that trialled MapTrix Geomatica. The vertical lines represent 1 SD. The letters represent the means separation by multiple range tests. Improvements per map analysis task
To evaluate improvements per map analysis task, ten questions in the map analysis tests were formulated to assess performance on the eight specific skills that had been identified with the help of adult map users (Box 1). Each skill became a lesson topic
13
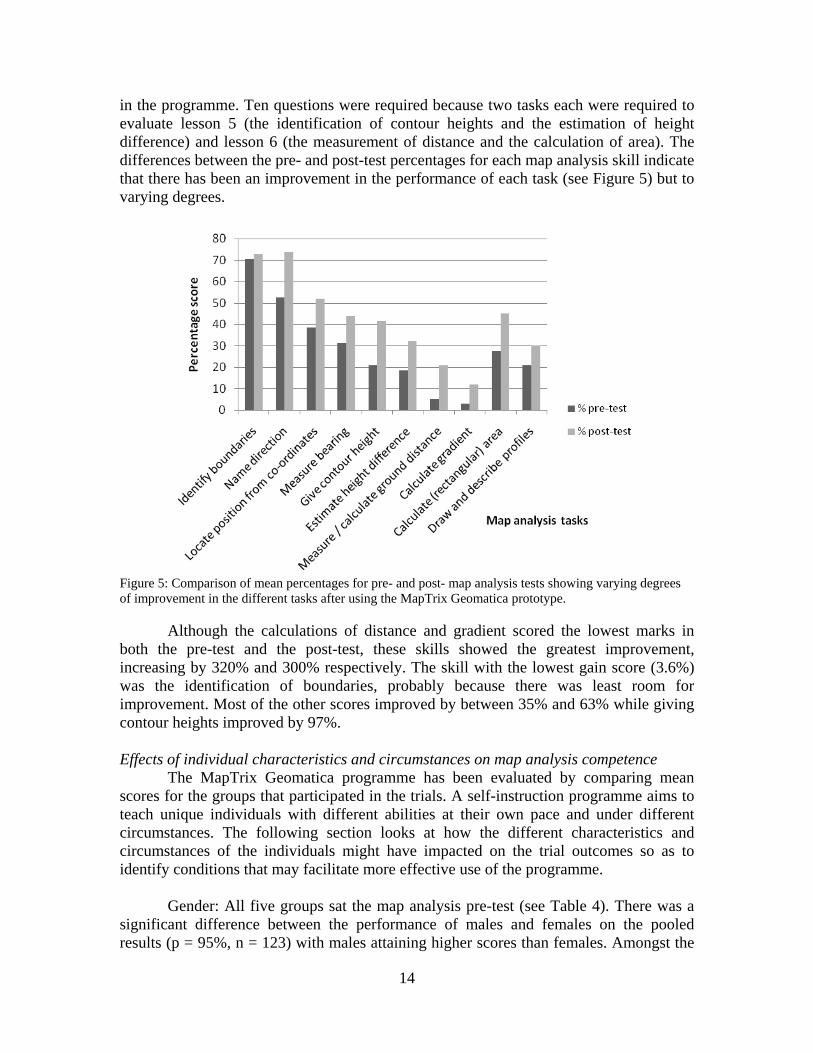
in the programme. Ten questions were required because two tasks each were required to evaluate lesson 5 (the identification of contour heights and the estimation of height difference) and lesson 6 (the measurement of distance and the calculation of area). The differences between the pre- and post-test percentages for each map analysis skill indicate that there has been an improvement in the performance of each task (see Figure 5) but to varying degrees.
Figure 5: Comparison of mean percentages for pre- and post- map analysis tests showing varying degrees of improvement in the different tasks after using the MapTrix Geomatica prototype.
Although the calculations of distance and gradient scored the lowest marks in both the pre-test and the post-test, these skills showed the greatest improvement, increasing by 320% and 300% respectively. The skill with the lowest gain score (3.6%) was the identification of boundaries, probably because there was least room for improvement. Most of the other scores improved by between 35% and 63% while giving contour heights improved by 97%. Effects of individual characteristics and circumstances on map analysis competence
The MapTrix Geomatica programme has been evaluated by comparing mean scores for the groups that participated in the trials. A self-instruction programme aims to teach unique individuals with different abilities at their own pace and under different circumstances. The following section looks at how the different characteristics and circumstances of the individuals might have impacted on the trial outcomes so as to identify conditions that may facilitate more effective use of the programme.
Gender: All five groups sat the map analysis pre-test (see Table 4). There was a
significant difference between the performance of males and females on the pooled results (p = 95%, n = 123) with males attaining higher scores than females. Amongst the
14
four groups that trialled MapTrix Geomatica, males attained higher pre-test scores than females but the difference falls just short of being statistically significant (p = 95%, n = 61). There was no significant difference between the post-test scores of males and females who completed the map analysis programme although males had a slightly higher mean score than females. There was also no significant difference between the mean improvement in performance between males and females (p = 95%, n = 50). Table 4: Comparing scores of male and female participants who trialled MapTrix Geomatica
Map Analysis Male mean (/30) ± SD
Female mean (/30) ± SD
Probability of significant difference
Pre-test scores (all participants) 6.42 ± 0.75
(n = 67) 4.18 ± 0.53
(n = 56) 97.89 %
s Pre-test scores of those who completed the programme
9.55 ± 1.09 (n = 37)
6.52 ± 1 (n = 24)
94.15 % ns
Post-test scores of those who completed the programme
13.29 ± 1.24 (n = 34)
10.44 ± 1.7 (n = 16)
81.05 % ns
Mean improvement (difference between pre- and post-test scores)
4.14 ± 0.89 (n = 34)
3.72 ± 1.41 (n = 16)
20.31 % ns
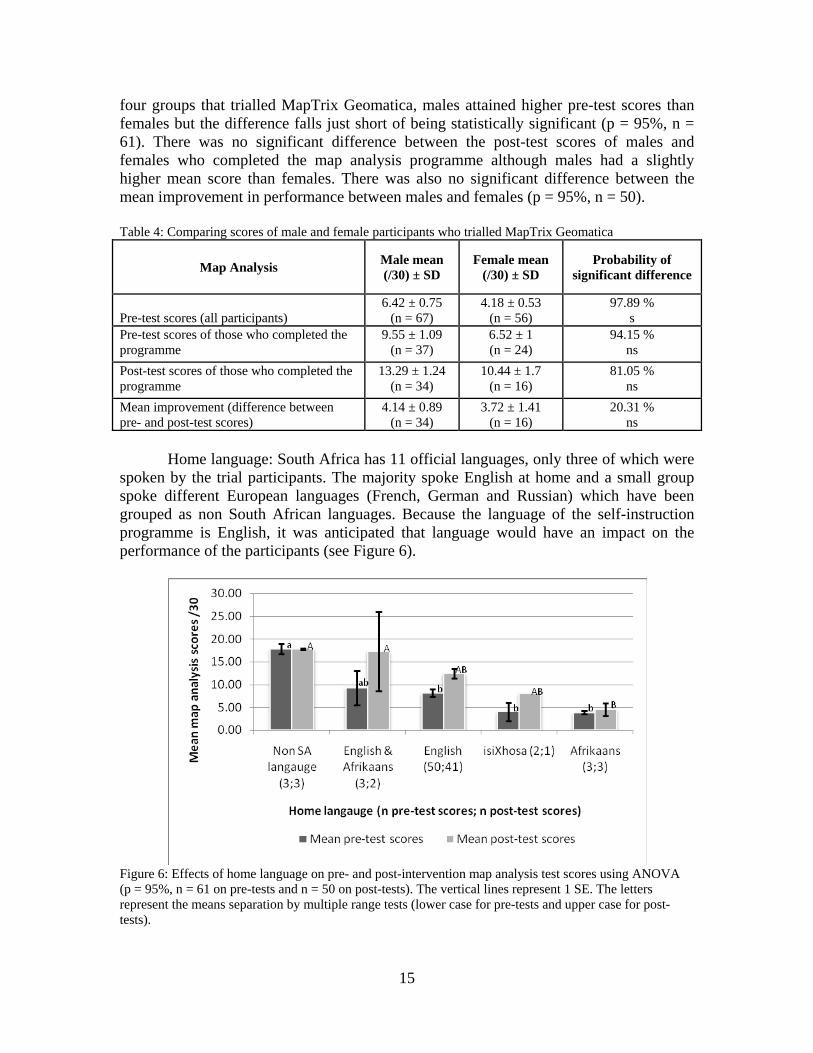
Home language: South Africa has 11 official languages, only three of which were
spoken by the trial participants. The majority spoke English at home and a small group spoke different European languages (French, German and Russian) which have been grouped as non South African languages. Because the language of the self-instruction programme is English, it was anticipated that language would have an impact on the performance of the participants (see Figure 6).
Figure 6: Effects of home language on pre- and post-intervention map analysis test scores using ANOVA (p = 95%, n = 61 on pre-tests and n = 50 on post-tests). The vertical lines represent 1 SE. The letters represent the means separation by multiple range tests (lower case for pre-tests and upper case for post-tests).
15
In the pre-test, the non South African (SA) language speakers attained the highest mean score which was significantly different to the rest of the participants. The score of the English & Afrikaans home language speakers was not significantly different from any of the other groups. There was no significant difference between the mean scores of the majority, who spoke only English at home and the two, who spoke isiXhosa, nor the three Afrikaans home language speakers. The scores were all disappointingly low considering that topographic map skills are a requirement of the Social Sciences learning area in the Revised National Curriculum Statement (RNCS) for the GET phase. The majority of these learners, being in Grade 10 (see Figure 2), would have completed this phase at the end of Grade 9 the previous year.
On the post-test all participants, except the non SA language speakers, showed
improved mean scores. The participants who had the most improved scores were those who spoke English & Afrikaans giving them results not significantly different from the non SA language group. The improved post-test mean score of those who spoke English at home, was not significantly different from the single isiXhosa speaker. The mean post-test score of the Afrikaans speakers was significantly less than the two most improved groups. The translation of the programme bears further discussion.
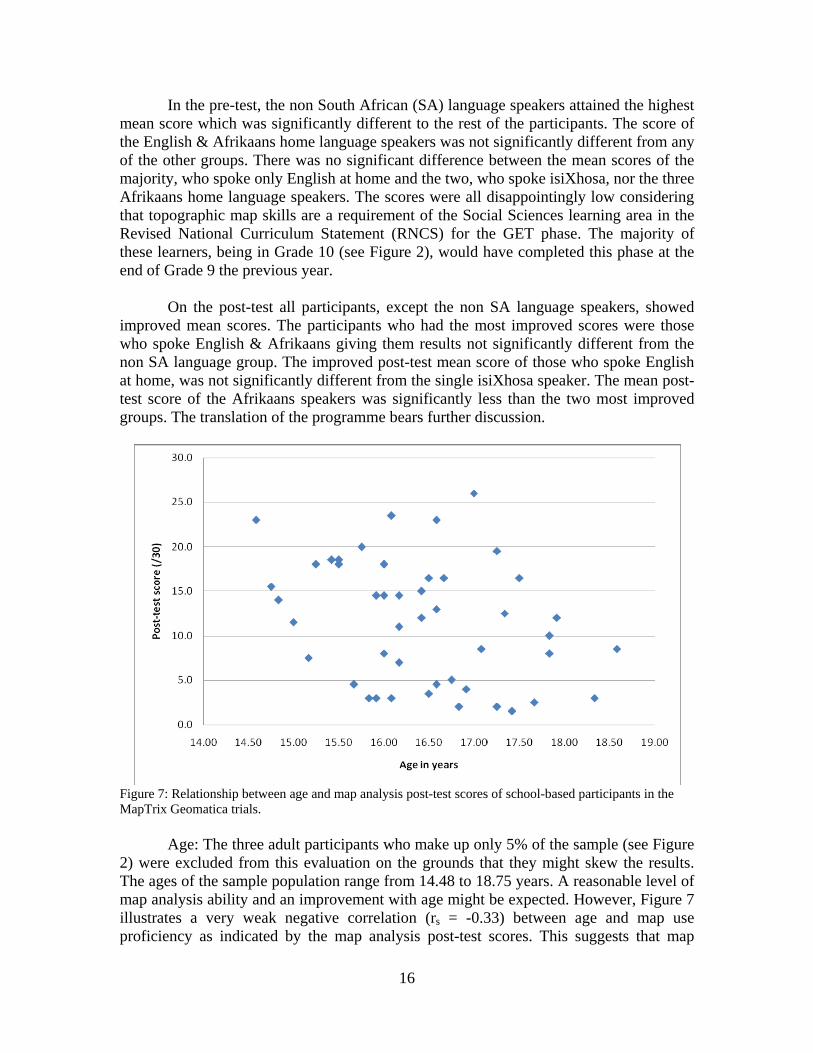
Figure 7: Relationship between age and map analysis post-test scores of school-based participants in the MapTrix Geomatica trials.
Age: The three adult participants who make up only 5% of the sample (see Figure 2) were excluded from this evaluation on the grounds that they might skew the results. The ages of the sample population range from 14.48 to 18.75 years. A reasonable level of map analysis ability and an improvement with age might be expected. However, Figure 7 illustrates a very weak negative correlation (rs = -0.33) between age and map use proficiency as indicated by the map analysis post-test scores. This suggests that map
16
users in the sample population do not demonstrate improvement with age, but rather that the older participants performed less well than the younger participants.
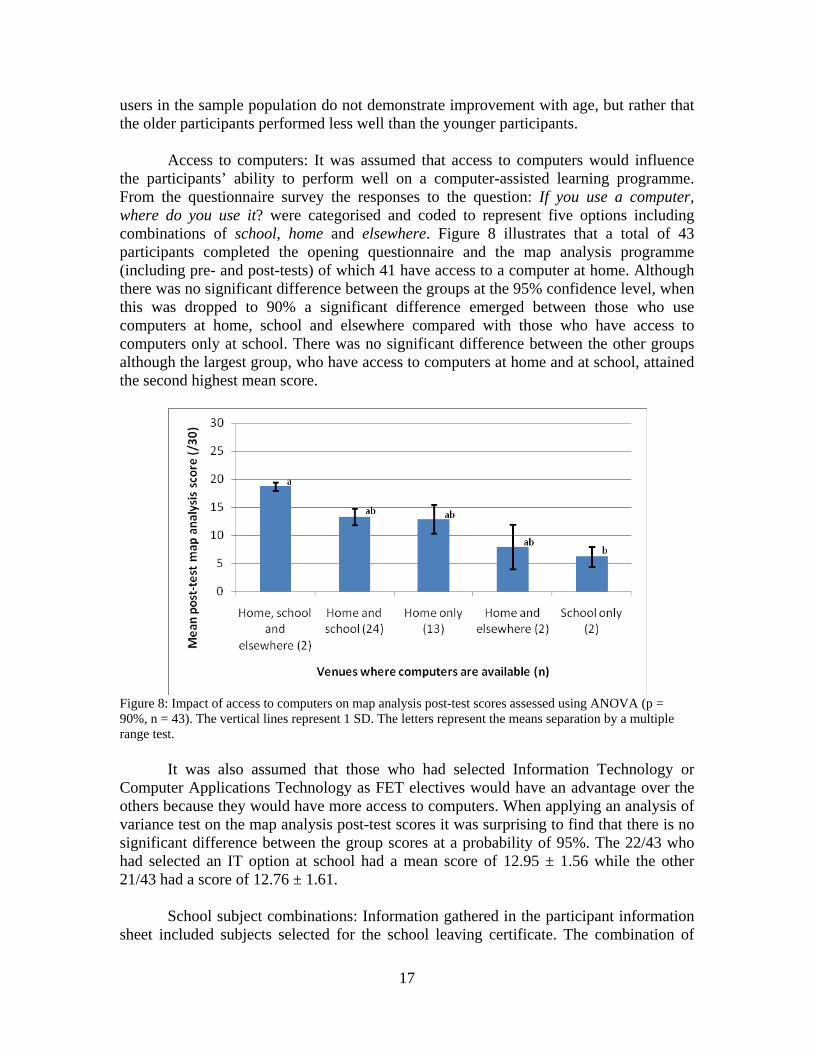
Access to computers: It was assumed that access to computers would influence the participants’ ability to perform well on a computer-assisted learning programme. From the questionnaire survey the responses to the question: If you use a computer, where do you use it? were categorised and coded to represent five options including combinations of school, home and elsewhere. Figure 8 illustrates that a total of 43 participants completed the opening questionnaire and the map analysis programme (including pre- and post-tests) of which 41 have access to a computer at home. Although there was no significant difference between the groups at the 95% confidence level, when this was dropped to 90% a significant difference emerged between those who use computers at home, school and elsewhere compared with those who have access to computers only at school. There was no significant difference between the other groups although the largest group, who have access to computers at home and at school, attained the second highest mean score.
Figure 8: Impact of access to computers on map analysis post-test scores assessed using ANOVA (p = 90%, n = 43). The vertical lines represent 1 SD. The letters represent the means separation by a multiple range test.
It was also assumed that those who had selected Information Technology or Computer Applications Technology as FET electives would have an advantage over the others because they would have more access to computers. When applying an analysis of variance test on the map analysis post-test scores it was surprising to find that there is no significant difference between the group scores at a probability of 95%. The 22/43 who had selected an IT option at school had a mean score of 12.95 ± 1.56 while the other 21/43 had a score of 12.76 ± 1.61.
School subject combinations: Information gathered in the participant information
sheet included subjects selected for the school leaving certificate. The combination of
17
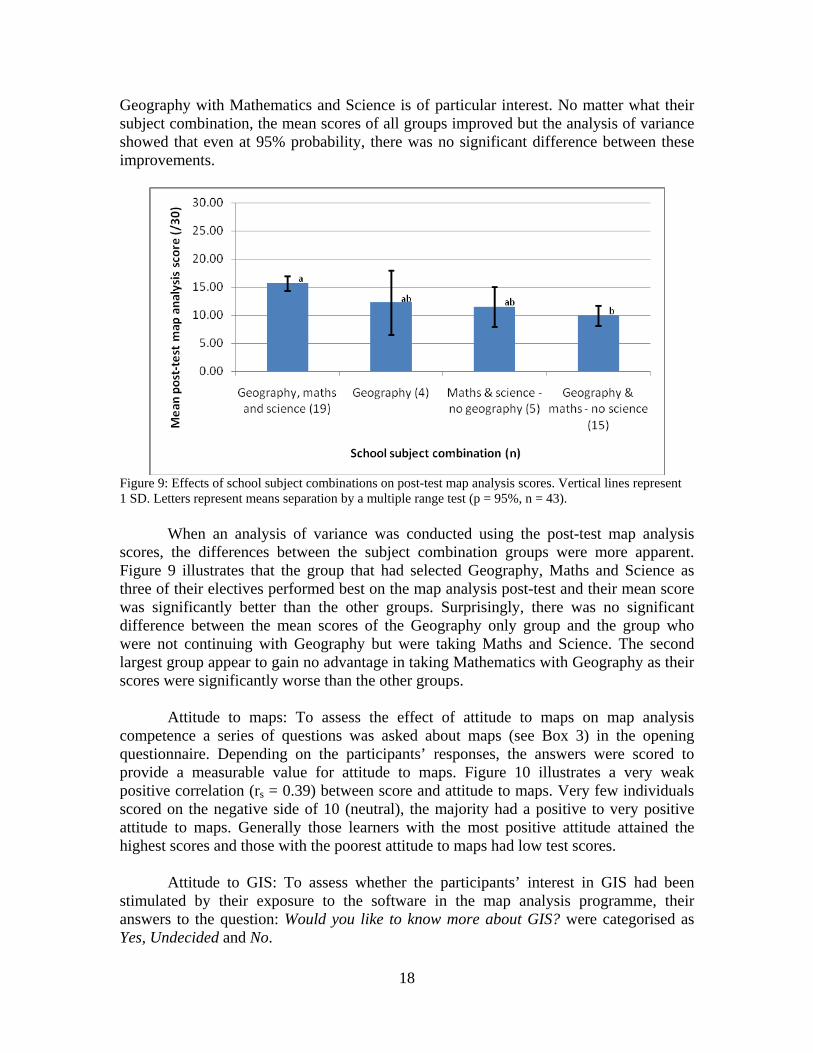
Geography with Mathematics and Science is of particular interest. No matter what their subject combination, the mean scores of all groups improved but the analysis of variance showed that even at 95% probability, there was no significant difference between these improvements.
Figure 9: Effects of school subject combinations on post-test map analysis scores. Vertical lines represent 1 SD. Letters represent means separation by a multiple range test (p = 95%, n = 43).
When an analysis of variance was conducted using the post-test map analysis scores, the differences between the subject combination groups were more apparent. Figure 9 illustrates that the group that had selected Geography, Maths and Science as three of their electives performed best on the map analysis post-test and their mean score was significantly better than the other groups. Surprisingly, there was no significant difference between the mean scores of the Geography only group and the group who were not continuing with Geography but were taking Maths and Science. The second largest group appear to gain no advantage in taking Mathematics with Geography as their scores were significantly worse than the other groups.
Attitude to maps: To assess the effect of attitude to maps on map analysis competence a series of questions was asked about maps (see Box 3) in the opening questionnaire. Depending on the participants’ responses, the answers were scored to provide a measurable value for attitude to maps. Figure 10 illustrates a very weak positive correlation (rs = 0.39) between score and attitude to maps. Very few individuals scored on the negative side of 10 (neutral), the majority had a positive to very positive attitude to maps. Generally those learners with the most positive attitude attained the highest scores and those with the poorest attitude to maps had low test scores.
Attitude to GIS: To assess whether the participants’ interest in GIS had been
stimulated by their exposure to the software in the map analysis programme, their answers to the question: Would you like to know more about GIS? were categorised as Yes, Undecided and No.
18
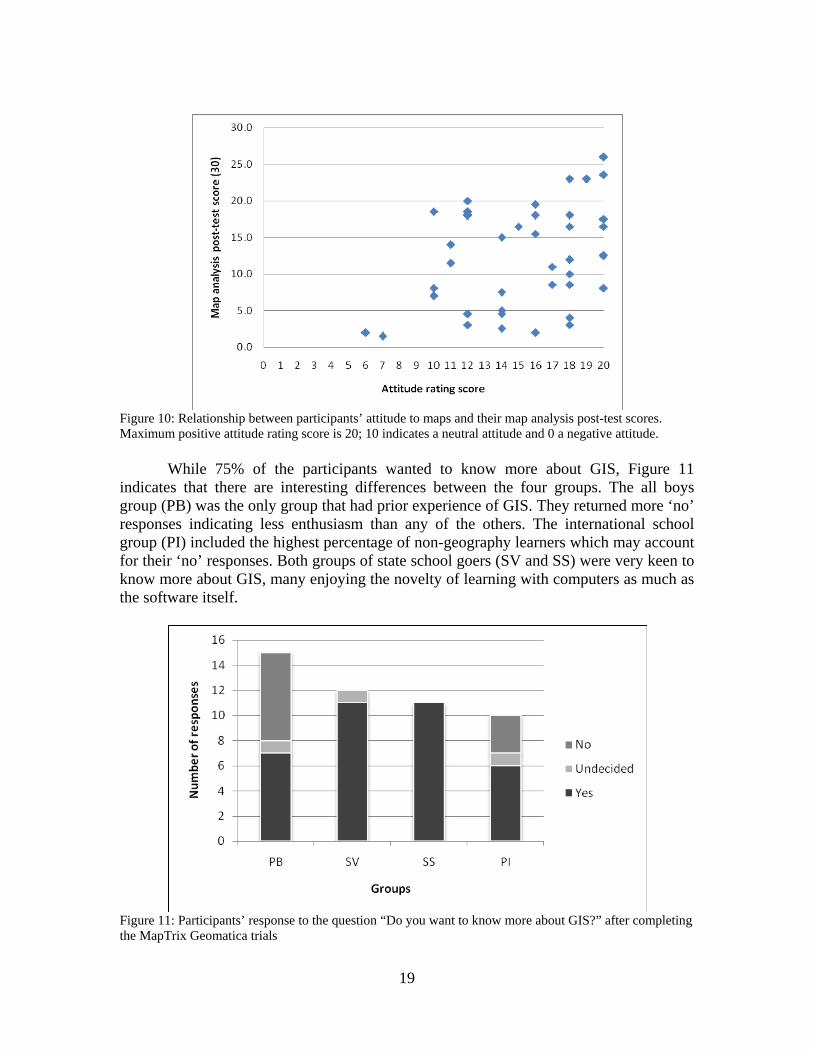
Figure 10: Relationship between participants’ attitude to maps and their map analysis post-test scores. Maximum positive attitude rating score is 20; 10 indicates a neutral attitude and 0 a negative attitude.
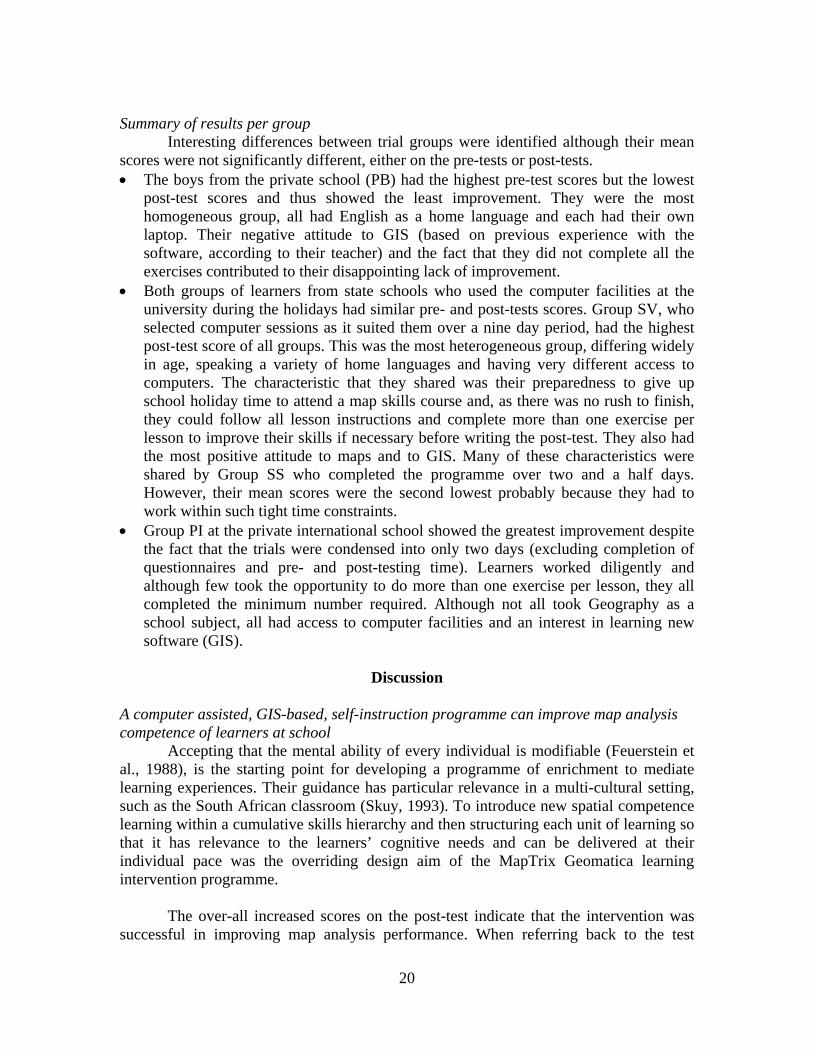
While 75% of the participants wanted to know more about GIS, Figure 11 indicates that there are interesting differences between the four groups. The all boys group (PB) was the only group that had prior experience of GIS. They returned more ‘no’ responses indicating less enthusiasm than any of the others. The international school group (PI) included the highest percentage of non-geography learners which may account for their ‘no’ responses. Both groups of state school goers (SV and SS) were very keen to know more about GIS, many enjoying the novelty of learning with computers as much as the software itself.
Figure 11: Participants’ response to the question “Do you want to know more about GIS?” after completing the MapTrix Geomatica trials
19
Summary of results per group
Interesting differences between trial groups were identified although their mean scores were not significantly different, either on the pre-tests or post-tests. • The boys from the private school (PB) had the highest pre-test scores but the lowest
post-test scores and thus showed the least improvement. They were the most homogeneous group, all had English as a home language and each had their own laptop. Their negative attitude to GIS (based on previous experience with the software, according to their teacher) and the fact that they did not complete all the exercises contributed to their disappointing lack of improvement.
• Both groups of learners from state schools who used the computer facilities at the university during the holidays had similar pre- and post-tests scores. Group SV, who selected computer sessions as it suited them over a nine day period, had the highest post-test score of all groups. This was the most heterogeneous group, differing widely in age, speaking a variety of home languages and having very different access to computers. The characteristic that they shared was their preparedness to give up school holiday time to attend a map skills course and, as there was no rush to finish, they could follow all lesson instructions and complete more than one exercise per lesson to improve their skills if necessary before writing the post-test. They also had the most positive attitude to maps and to GIS. Many of these characteristics were shared by Group SS who completed the programme over two and a half days. However, their mean scores were the second lowest probably because they had to work within such tight time constraints.
• Group PI at the private international school showed the greatest improvement despite the fact that the trials were condensed into only two days (excluding completion of questionnaires and pre- and post-testing time). Learners worked diligently and although few took the opportunity to do more than one exercise per lesson, they all completed the minimum number required. Although not all took Geography as a school subject, all had access to computer facilities and an interest in learning new software (GIS).
Discussion
A computer assisted, GIS-based, self-instruction programme can improve map analysis competence of learners at school
Accepting that the mental ability of every individual is modifiable (Feuerstein et al., 1988), is the starting point for developing a programme of enrichment to mediate learning experiences. Their guidance has particular relevance in a multi-cultural setting, such as the South African classroom (Skuy, 1993). To introduce new spatial competence learning within a cumulative skills hierarchy and then structuring each unit of learning so that it has relevance to the learners’ cognitive needs and can be delivered at their individual pace was the overriding design aim of the MapTrix Geomatica learning intervention programme.
The over-all increased scores on the post-test indicate that the intervention was
successful in improving map analysis performance. When referring back to the test
20
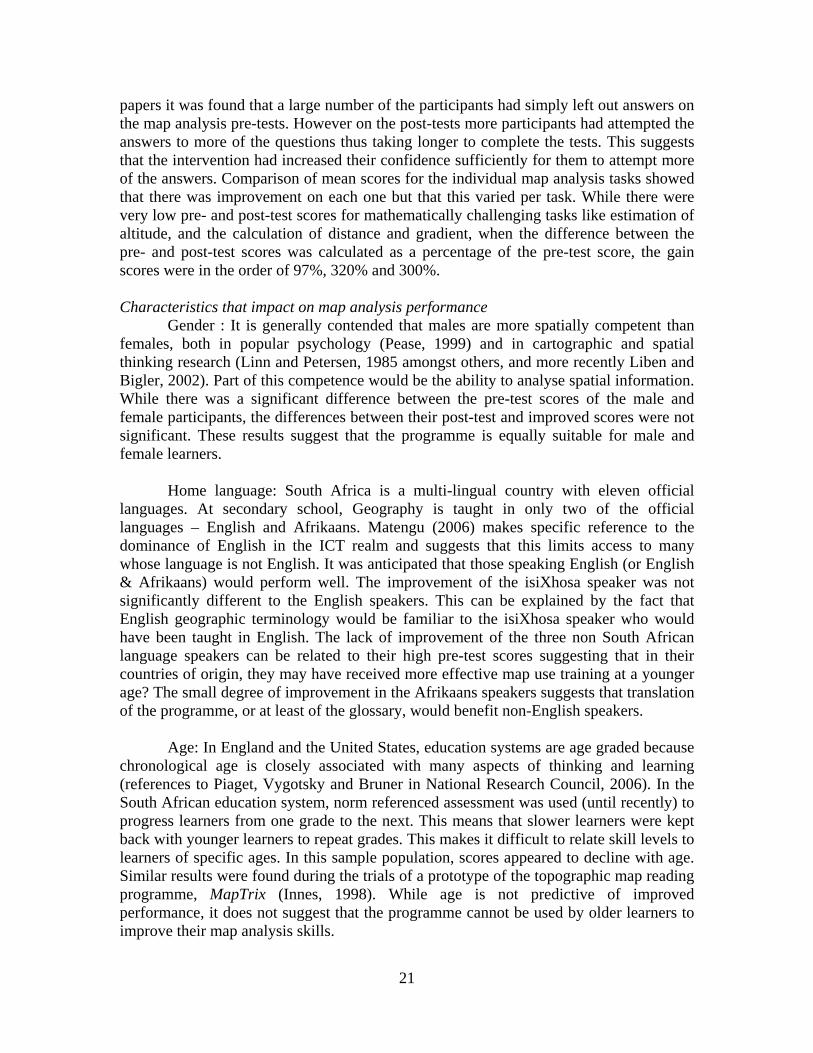
papers it was found that a large number of the participants had simply left out answers on the map analysis pre-tests. However on the post-tests more participants had attempted the answers to more of the questions thus taking longer to complete the tests. This suggests that the intervention had increased their confidence sufficiently for them to attempt more of the answers. Comparison of mean scores for the individual map analysis tasks showed that there was improvement on each one but that this varied per task. While there were very low pre- and post-test scores for mathematically challenging tasks like estimation of altitude, and the calculation of distance and gradient, when the difference between the pre- and post-test scores was calculated as a percentage of the pre-test score, the gain scores were in the order of 97%, 320% and 300%. Characteristics that impact on map analysis performance
Gender : It is generally contended that males are more spatially competent than females, both in popular psychology (Pease, 1999) and in cartographic and spatial thinking research (Linn and Petersen, 1985 amongst others, and more recently Liben and Bigler, 2002). Part of this competence would be the ability to analyse spatial information. While there was a significant difference between the pre-test scores of the male and female participants, the differences between their post-test and improved scores were not significant. These results suggest that the programme is equally suitable for male and female learners.
Home language: South Africa is a multi-lingual country with eleven official
languages. At secondary school, Geography is taught in only two of the official languages – English and Afrikaans. Matengu (2006) makes specific reference to the dominance of English in the ICT realm and suggests that this limits access to many whose language is not English. It was anticipated that those speaking English (or English & Afrikaans) would perform well. The improvement of the isiXhosa speaker was not significantly different to the English speakers. This can be explained by the fact that English geographic terminology would be familiar to the isiXhosa speaker who would have been taught in English. The lack of improvement of the three non South African language speakers can be related to their high pre-test scores suggesting that in their countries of origin, they may have received more effective map use training at a younger age? The small degree of improvement in the Afrikaans speakers suggests that translation of the programme, or at least of the glossary, would benefit non-English speakers.
Age: In England and the United States, education systems are age graded because
chronological age is closely associated with many aspects of thinking and learning (references to Piaget, Vygotsky and Bruner in National Research Council, 2006). In the South African education system, norm referenced assessment was used (until recently) to progress learners from one grade to the next. This means that slower learners were kept back with younger learners to repeat grades. This makes it difficult to relate skill levels to learners of specific ages. In this sample population, scores appeared to decline with age. Similar results were found during the trials of a prototype of the topographic map reading programme, MapTrix (Innes, 1998). While age is not predictive of improved performance, it does not suggest that the programme cannot be used by older learners to improve their map analysis skills.
21
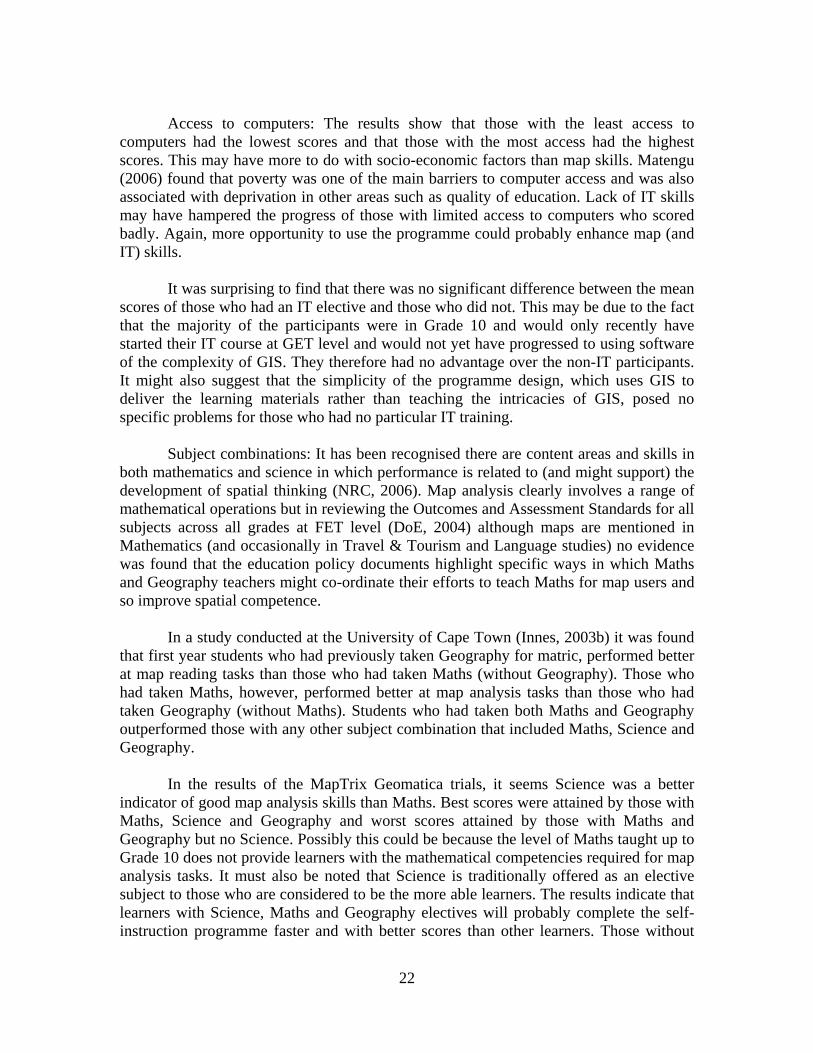
Access to computers: The results show that those with the least access to
computers had the lowest scores and that those with the most access had the highest scores. This may have more to do with socio-economic factors than map skills. Matengu (2006) found that poverty was one of the main barriers to computer access and was also associated with deprivation in other areas such as quality of education. Lack of IT skills may have hampered the progress of those with limited access to computers who scored badly. Again, more opportunity to use the programme could probably enhance map (and IT) skills.
It was surprising to find that there was no significant difference between the mean
scores of those who had an IT elective and those who did not. This may be due to the fact that the majority of the participants were in Grade 10 and would only recently have started their IT course at GET level and would not yet have progressed to using software of the complexity of GIS. They therefore had no advantage over the non-IT participants. It might also suggest that the simplicity of the programme design, which uses GIS to deliver the learning materials rather than teaching the intricacies of GIS, posed no specific problems for those who had no particular IT training.
Subject combinations: It has been recognised there are content areas and skills in both mathematics and science in which performance is related to (and might support) the development of spatial thinking (NRC, 2006). Map analysis clearly involves a range of mathematical operations but in reviewing the Outcomes and Assessment Standards for all subjects across all grades at FET level (DoE, 2004) although maps are mentioned in Mathematics (and occasionally in Travel & Tourism and Language studies) no evidence was found that the education policy documents highlight specific ways in which Maths and Geography teachers might co-ordinate their efforts to teach Maths for map users and so improve spatial competence.
In a study conducted at the University of Cape Town (Innes, 2003b) it was found
that first year students who had previously taken Geography for matric, performed better at map reading tasks than those who had taken Maths (without Geography). Those who had taken Maths, however, performed better at map analysis tasks than those who had taken Geography (without Maths). Students who had taken both Maths and Geography outperformed those with any other subject combination that included Maths, Science and Geography.
In the results of the MapTrix Geomatica trials, it seems Science was a better
indicator of good map analysis skills than Maths. Best scores were attained by those with Maths, Science and Geography and worst scores attained by those with Maths and Geography but no Science. Possibly this could be because the level of Maths taught up to Grade 10 does not provide learners with the mathematical competencies required for map analysis tasks. It must also be noted that Science is traditionally offered as an elective subject to those who are considered to be the more able learners. The results indicate that learners with Science, Maths and Geography electives will probably complete the self-instruction programme faster and with better scores than other learners. Those without
22
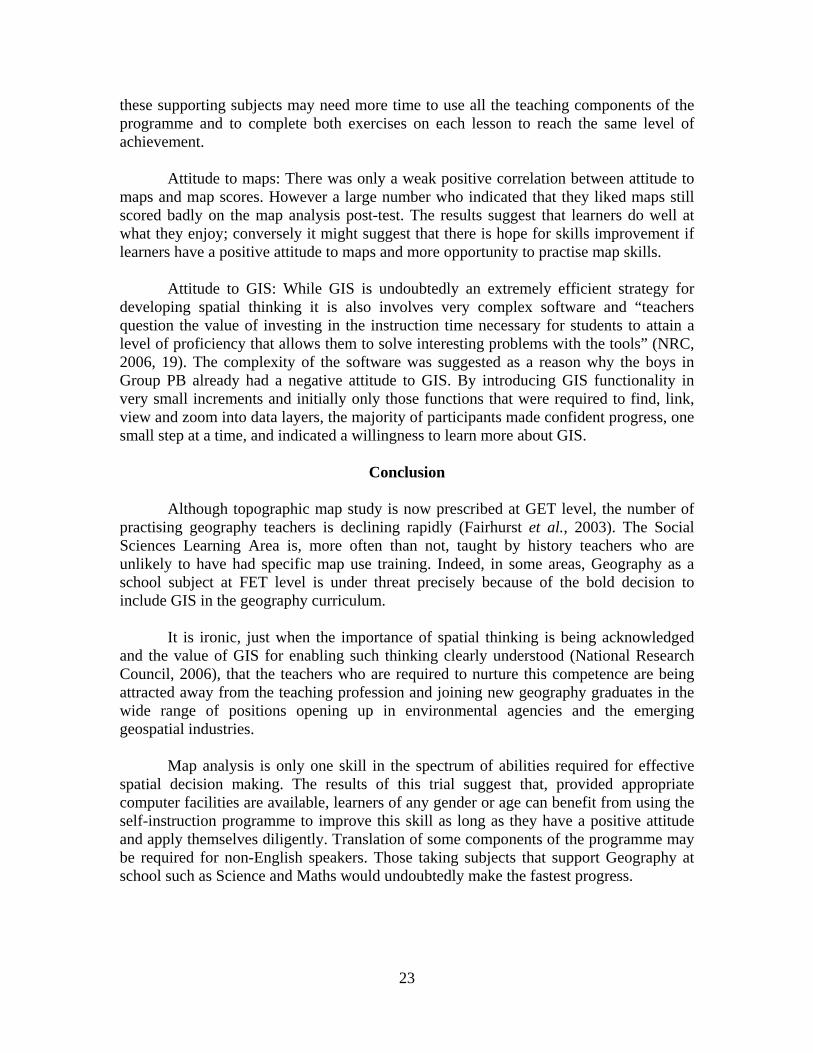
these supporting subjects may need more time to use all the teaching components of the programme and to complete both exercises on each lesson to reach the same level of achievement.
Attitude to maps: There was only a weak positive correlation between attitude to maps and map scores. However a large number who indicated that they liked maps still scored badly on the map analysis post-test. The results suggest that learners do well at what they enjoy; conversely it might suggest that there is hope for skills improvement if learners have a positive attitude to maps and more opportunity to practise map skills.
Attitude to GIS: While GIS is undoubtedly an extremely efficient strategy for
developing spatial thinking it is also involves very complex software and “teachers question the value of investing in the instruction time necessary for students to attain a level of proficiency that allows them to solve interesting problems with the tools” (NRC, 2006, 19). The complexity of the software was suggested as a reason why the boys in Group PB already had a negative attitude to GIS. By introducing GIS functionality in very small increments and initially only those functions that were required to find, link, view and zoom into data layers, the majority of participants made confident progress, one small step at a time, and indicated a willingness to learn more about GIS.
Conclusion
Although topographic map study is now prescribed at GET level, the number of
practising geography teachers is declining rapidly (Fairhurst et al., 2003). The Social Sciences Learning Area is, more often than not, taught by history teachers who are unlikely to have had specific map use training. Indeed, in some areas, Geography as a school subject at FET level is under threat precisely because of the bold decision to include GIS in the geography curriculum.
It is ironic, just when the importance of spatial thinking is being acknowledged
and the value of GIS for enabling such thinking clearly understood (National Research Council, 2006), that the teachers who are required to nurture this competence are being attracted away from the teaching profession and joining new geography graduates in the wide range of positions opening up in environmental agencies and the emerging geospatial industries.
Map analysis is only one skill in the spectrum of abilities required for effective
spatial decision making. The results of this trial suggest that, provided appropriate computer facilities are available, learners of any gender or age can benefit from using the self-instruction programme to improve this skill as long as they have a positive attitude and apply themselves diligently. Translation of some components of the programme may be required for non-English speakers. Those taking subjects that support Geography at school such as Science and Maths would undoubtedly make the fastest progress.
23
Acknowledgements: The value of personal communication in the past with the Sandra Neuhoff, examiner responsible
for the matric Geography Practical Paper in the Free State and Simon Taylor, Head of Geography at Hilton College, KwaZulu-Natal is acknowledged. Geomatica made the development of a computer-assisted, self-instruction, map analysis programme possible; to Clyde Mallinson and each staff member especially Debbie Stott and Caryll Tyson – deepest thanks. Thanks to all the trial participants, the various institutions that gave me access to their learners and/or IT facilities and to their staff for their invaluable help. Sincere gratitude goes to Lynne McEwan for her help during the initial trial and to Banele Dube for invaluable technical assistance. Abbreviations (other than those used for statistics which are explained in the relevant sections) CDSM Chief Directorate of Surveys and
Mapping ICT Information and Communication
Technology DEM Digital Elevation Model Matric Matriculation exemption or school
leaving examination DLA Department of Land Affairs NQF National Qualifications Framework DoE Department of Education NRC National Research Council (of America) FET Further Education and Training OBE Outcomes Based Education GET General Education and Training RNCS Revised National Curriculum Statement GIS Geographic Information Systems SAQA South African Qualifications Authority IT Information Technology S and T
tests arbitrary labels assigned to two banks of questions used alternately as both pre- and post-tests
REFERENCES
Ashwell, A., 2007: Youth, GIS and urban nature, report tabled during a Geography Teacher’s Seminar at
GIS Week at the University of the Western Cape, Cape Town. Clarke, D. G., 1998: Free maps for secondary schools, Landinfo, 5(1), 5 Clarke, D. G., 2003: Are you functionally map literate? Proceedings of the 21st International Cartographic
Conference (ICC), Durban, South Africa. Cohen, L. and Manion, L. 1985 (2nd ed.): Research Methods in Education, Croom Helm, London. Department of Education, 2002: Revised National Curriculum Statement Grades R-9 (Schools) Policy,
Department of Education, Pretoria. Department of Education, 2003: National Curriculum Statement Grades 10-12 (General) Geography,
Department of Education, Pretoria. Department of Education, 2004: Learning Outcomes and Assessment Standards Grades 10-12 (General)
Department of Education, Pretoria. Department of Education, 2008: National Curriculum Statement Grades 10-12 (General) Learning
Programme Guidelines for Geography, Department of Education, Pretoria. Department of Land Affairs, 2000: The Chief Directorate: Surveys and Mapping, 80 Years of surveying
and Mapping South Africa, Department of Land Affairs, Media Production Unit, Pretoria. de Sousa, L. O., Richter, B. W. and Nel, C., 2006: The integration of digital video discs (DVD’s) and
multimedia in training pre-service geography teachers, in K. Purnell, J. Lidstone and S. Hodgson, (eds) Proceedings of the International Geographical Union Commission on Geographical
24
Education Symposium, IGU CGE and Royal Geographical Society of Queensland, QUT Publications, 140-145.
Donert, K., 2006: The use of ICT and eLearning in Geography: HERODOT perspectives in European
higher education, in K. Purnell, J. Lidstone and S. Hodgson, (eds) Proceedings of the International Geographical Union Commission on Geographical Education Symposium, IGU CGE and Royal Geographical Society of Queensland, QUT Publications,146-154.
Ebdon, D., 1985: Statistics in Geography, Basil Blackwell. Oxford. Engel, B. P., 2002: No land reform without spatial information, paper presented at the Regional Conference
of the IGU (International Geographical Union), Durban, South Africa. Fairhurst, U. J., Davies, R. J., Fox, R. C., Goldschagg, P., Ramutsindela, M., Bob, U. and Khosa, M. M.,
2003: Geography: the state of the discipline in South Africa (2000-2001), The South African Geographical Journal, 85(2), 81-89.
Francis, H., 1997: The research process in N. Graves and V. Varma (eds) Working for a Doctorate,
Routledge, London, 18-34. Feuerstein, R., Rand, Y. and Rynders, J. E., 1988: Don’t Accept me As I Am: Helping “Retarded” People
to Excel, Plenum, New York. Fullan, M., 1995: Change Forces, Falmer Press, London. Gagné, R. M. and Briggs, L. J., 1974: Principles of Instructional Design, Holt, Rinehart and Winston, New
York. Gerber, R. and Wilson, P., 1984: Maps in the classroom, in J. Fein, R. Gerber and P. Wilson (eds) The
Geography Teacher’s Guide to the Classroom, Macmillan, Sydney, 146-157. Gerber, R. and Lidstone, J., 1996: Reflecting on developments and directions in geographical education in
R. Gerber and J. Lidstone (eds) Developments and Directions in Geographical Education, Channel View, Clevedon, 1-11.
Herzig, R., 2006: Problems of GIS didactics for general school in Germany, in K. Purnell, J. Lidstone and
S. Hodgson, (eds) Proceedings of the International Geographical Union Commission on Geographical Education Symposium, IGU CGE and Royal Geographical Society of Queensland, QUT Publications, 206-211.
Huysamen, G. K., 1994: Methodology for the Social and Behavioural Sciences, Southern, Halfway House,
South Africa. Ida, Y., 2006: The meaning of geography education using GIS in Japanese junior high schools, in K.
Purnell, J. Lidstone and S. Hodgson, (eds) Proceedings of the International Geographical Union Commission on Geographical Education Symposium, IGU CGE and Royal Geographical Society of Queensland, QUT Publications, 217-220.
Innes, L. M., 1998: Learning to read the South African 1:50 000 topographic map: the development of a
self-instruction method, unpublished M.Ed. dissertation submitted to the Faculty of Education, University of the Witwatersrand, Johannesburg.
Innes, L. M., 2000: MapTrix: a self-instruction programme for learning to read the 1:50 000 Topographic
Map of South Africa (generally referred to as the MapTrix Kit), Juta, Cape Town.
25
Innes, L. M., 2002: Evaluating learning materials for map reading, paper presented at the Regional Conference of the IGU (International Geographical Union), Durban, South Africa.
Innes, L. M., 2003a: Maths for map users, paper presented at 21st ICA (International Cartographic
Association) Conference, Durban, South Africa. Innes, L. M., 2003b: The impact of school mathematics and geography teaching on topographic map use
performance, paper presented at the 5th biennial SSAG (Society of South African Geographers) Conference, Bloemfontein, South Africa.
Innes, L. M., 2005: Identifying spatial competence outcomes for South African Secondary Schools, paper
presented at ICC 2005, A Coruña, Spain. Innes, L. M. and Engel, B. P., 2001: The role of the national mapping organisation in map literacy
education and training, paper presented at the 4th biennial SSAG (Society of South African Geographers) Conference, Goudini Spa, South Africa.
Jones, M, 2006: Geographical Information Systems - mapping abstract phenomena in Khanya, Education
Through Technology, 9 (16-19) Picasso Headline, Cape Town. Kankaanrinta, I., Komulainen, E. and Houtsonen, L., 2006: Geographical Information Systems in schools
and self-rated Multiple Intelligences, in K. Purnell, J. Lidstone and S. Hodgson, (eds) Proceedings of the International Geographical Union Commission on Geographical Education Symposium, IGU CGE and Royal Geographical Society of Queensland, QUT Publications, 233-237.
Liebenberg, E. C., 1998: Teaching map use in a multicultural environment, South African Geographical
Journal, 80(2), 111-117. Liben, L. S. and Bigler, R. S., 2002: The developmental course of gender differentiation: conceptualizing
measuring and evaluating constructs and pathways, Monographs of the Society for Research in Child Development, 67(2), 1-147.
Linn, M. C. and Petersen, A. C., 1986: A meta-analysis of gender differences in spatial ability: implications
for mathematics and science achievement, in J. S. Hyde and M. C. Linn, eds, The Psychology of Gender: Advances Through Meta-analysis, 67-101, John Hopkins University Press, Baltimore.
Lundall, P. And Howell, C., 2000: Computers in schools: A national survey of Information Communication
Technology in South African schools, Education Policy Unit, University of the Western Cape and the International Development Research Centre, Cape Town.
Magi, L. M., 1981: Black university geography students’ perception of school geography and the
geography teacher, South African Geographer, 9(2), 145-153. Maguire, M., 2006: Spatial Technologies in Schools (STiS) and the spatial industry in Queensland – “It
Takes a Whole Village to Raise a Child” (African Proverb), in K. Purnell, J. Lidstone and S. Hodgson, (eds) Proceedings of the International Geographical Union Commission on Geographical Education Symposium, IGU CGE and Royal Geographical Society of Queensland, QUT Publications, 297-302.
Matengu, K. K., 2006: Adoption of ICT at Schools in Core and Periphery Settings of Namibia: Exploring
Innovation, Technology Policy and Development Issues, Geowissenschaft Shaker Verlag, Aachen. National Research Council, 2006: Learning to Think Spatially: GIS as a Support System in the K-12
Curriculum, National Academy of Sciences, Washington.
26
27
Ndlwana, M., 1991: A critical analysis of problems encountered by senior secondary school pupils in the reading and interpretation of 1:50 000 topographical maps and aerial photographs with special reference to Black pupils in Transkei, unpublished M.Ed. thesis, Rhodes University, Grahamstown, South Africa.
Pease, A. and B., 1999: Why Men Don’t Listen and Women Can’t Read Maps, Pease Training International,
Mona Vale, Australia. Piaget, J., 1955: The Child’s Construction of Reality, Routledge and Kegan Paul, London. Piaget, J and Inhelder, B., 1956: The Child’s Construction of Space, Routledge and Kegan Paul, London. Sandford, H. A., 1989: School-based research into pupil's mapwork difficulties and their solution, in R. Gerber
and J. Lidstone (eds.) Developing Skills in Geographical Education, International Geographical Union, Brisbane, 333-338.
Sekete, P. G. I., 1995: An investigation into problems with topographic map comprehension by first year
college of education students in North West (Province), unpublished Master of Science research report, University of the Witwatersrand, Johannesburg.
Skuy, M., (ed.) 1993: Illustrating Feuerstein’s Instrumental Enrichment Programme Working Manual,
Cognitive Research Programme, Division of Specialised Education, University of Witwatersrand, Johannesburg.
Smit, T. 1994: The reading of topographical maps – an elementary model for secondary schools, paper
presented at the IGU Conference (September 1994), Prague and published in Geographiedidaktishe Forschungen, 25.
Stott, D., 2004: A framework for evaluating instructional design models resulting in a model for designing and
developing computer based learning tools with GIS technologies, unpublished Master of Education thesis, Rhodes University, Grahamstown.
Tickner, P., 2000: South Africa’s National Mapping Organisation celebrates 80 years of service excellence,
International Cartographic Association Newsletter, December, 2000, 3-4. Tshibalo, A. E., 2002: Cooperative learning as a strategy to improve the teaching of mapwork to Grade 11
and 12 Geography learners in Region 3 (Limpopo Province): a case study conducted at Ramaano Mbulaheni In-service Training Centre, poster presented at 21st International Cartographic Conference, Durban, South Africa.
van der Schee, J., 2006: EduGIS - a challenge for geography teaching, in K. Purnell, J. Lidstone and S.
Hodgson, (eds) Proceedings of the International Geographical Union Commission on Geographical Education Symposium, IGU CGE and Royal Geographical Society of Queensland, QUT Publications, 452-456.
van der Westhuizen, C. P. and Richter, B. W., 2006: The DVD as ICT-variant for geography teaching and learning, in K. Purnell, J. Lidstone and S. Hodgson, (eds) Proceedings of the International Geographical Union Commission on Geographical Education Symposium, IGU CGE and Royal Geographical Society of Queensland, QUT Publications, 457-462.
van Wyk, K., 2006: Unlocking the computer room in Khanya, Education Through Technology, 9 (6-7)
Picasso Headline, Cape Town. Wiegand, P., 2006: Learning and Teaching with Maps, Routledge, London. Wolf, A., 1995: Competence-Based Assessment, Open University Press, Philadelphia.
28
i LORRAINE INNES Department of Environmental and Geographical Science
University of Cape Town Email: [email protected]
ii CLARE VANDER WILLIGEN
Examinations Officer International School of Hout Bay
Email: [email protected]


