Embed Size (px)
Citation preview
NEWS RELEASE
NIDEC CORPORATION
FOR IMMEDIATE RELEASE
Contact:Hiroshi ToribaExecutive Director, Nidec CorporationInvestor Relations & Public Relations & [email protected]
INTERIM FINANCIAL STATEMENTS (U.S. GAAP)
(U.S. GAAP) RESULTS FOR THE NINE MONTHS ENDED DECEMBER 31,2003(FROM APRIL 1, 2003 TO DECEMBER 31, 2003)CONSOLIDATEDReleased on February 27, 2004
1
NIDEC CORPORATION338 Kuzetonoshiro-cho, Minami-ku,
Kyoto 601-8205 Japan
CONSOLIDATED FINANCIAL RESULTSFOR THE NINE MONTHS
ENDED DECEMBER 31, 2003(U.S. GAAP, unaudited)
CONSOLIDATED STATEMENTS OF INCOME
Yen in millionsU.S. dollarsin thousands
(except per share amounts)For the three months ended December 31,
2002 2003 2003Net sales ¥59,430 ¥64,281 $600,028Operating income 5,113 6,646 62,037Income before provision for income taxes 3,733 5,658 52,814Net income 2,733 3,042 28,395Per share dataNet income
- Basic ¥42.99 ¥47.29 $0.44- Diluted ¥40.89 ¥44.80 $0.42
For the nine months ended December 31,2002 2003 2003
Net sales ¥174,766 ¥183,321 $1,711,201Operating income 13,326 17,972 167,759Income before provision for income taxes 8,994 15,227 142,136Net income 7,745 11,444 106,823Per share dataNet income
- Basic ¥121.84 ¥179.22 $1.67- Diluted ¥115.92 ¥172.42 $1.61
CONSOLIDATED BALANCE SHEETS
2003March 31 December 31 December 31,
Current assets ¥121,313 ¥126,778 $1,183,403Investments 34,375 54,646 510,090Property, plant, equipment and others 102,244 103,967 970,476
Total assets 257,932 285,391 2,663,969Current liabilities 133,175 125,127 1,167,992Long-term liabilities 27,092 54,352 507,346Minority interest in consolidated subsidiaries 9,108 6,931 64,697Shareholders’ equity 88,557 98,981 923,934
Total liabilities and shareholders’ equity ¥257,932 ¥285,391 $2,663,969
2
This report contains forward-looking statements that are based on our current expectations,assumptions, estimates and projections about our business, our industry and capital markets around theworld. These forward-looking statements are subject to various risks and uncertainties. Generally, theseforward-looking statements can be identified by the use of forward-looking terminology such as “may,”“will,” “expect,” “anticipate,” “estimate,” “plan” or similar words. These statements discuss futureexpectations, identify strategies, contain projections of results of operations or of our financial condition,or state other forward-looking information. Known and unknown risks, uncertainties and other factorscould cause the actual results to differ materially from those contained in any forward-looking statement.We cannot promise that our expectations expressed in these forward-looking statements will turn out tobe correct. Our actual results could be materially different from and worse than our expectations as aresult of certain factors, including, but not limited to (i) our ability to design, develop, mass produce andwin acceptance of our products, particularly those that use fluid dynamic bearing motor technology,which are offered in highly competitive markets characterized by continual new products introductionand rapid technological development, (ii) general economic conditions in the computer, informationtechnology and related product markets, particularly in the level of consumer spending, (iii) exchangerate fluctuations, particularly between the Japanese yen and the U.S. dollar and other currencies in whichwe make significant sales or in which our assets and liabilities are denominated, (iv) our ability toacquire and successfully integrate companies with complementary technologies and product lines, and(v) adverse changes in laws, regulations or economic policies in any of the countries where we havemanufacturing operations, especially China.
As used in this document, references to “we,” ”our” and “us” are to Nidec Corporation and,except as the context otherwise requires, its consolidated subsidiaries; “U.S. dollar” or “$” means thelawful currency of the United States of America, and “yen” or “¥” means the lawful currency of Japan;and “U.S. GAAP” means accounting principles generally accepted in the United States, and “JapaneseGAAP” means accounting principles generally accepted in Japan.
Results of Operations — The Nine Months Ended December 31, 2003 Compared to the NineMonths Ended December 31, 2002
Net Sales
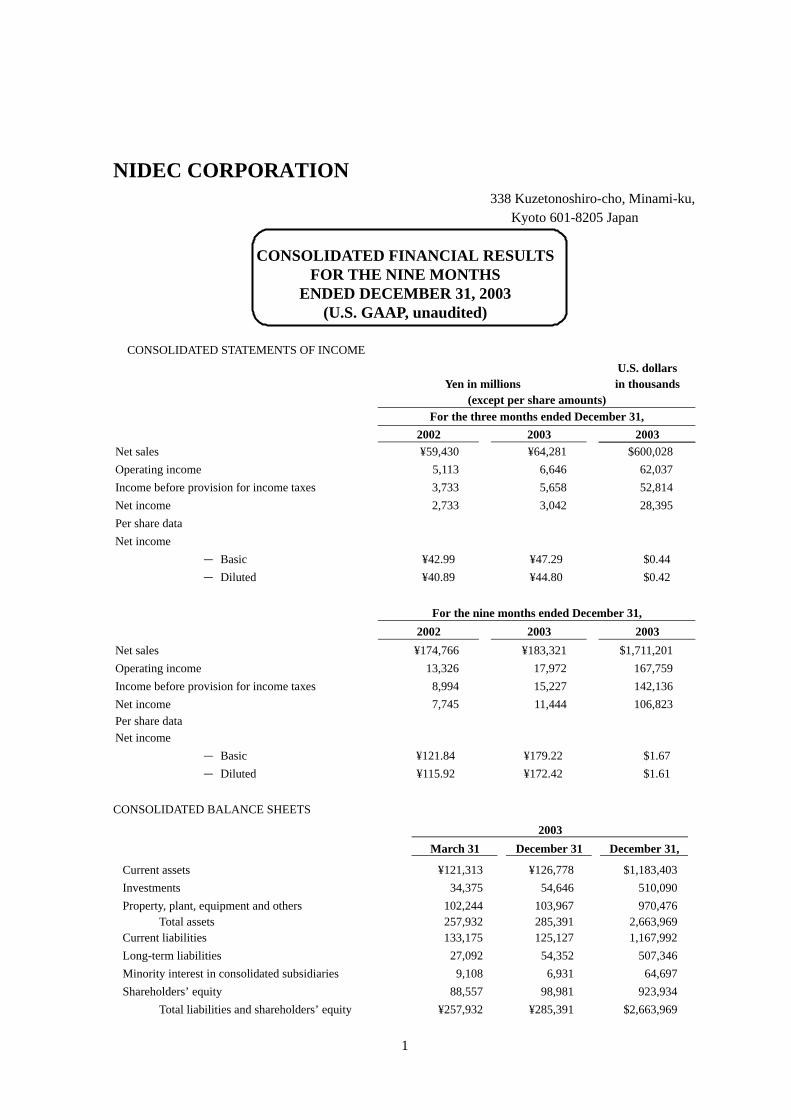
Our net sales increased ¥4,851 million, or 8.2%, from ¥59,430 million for the three monthsended December 31, 2002 to ¥64,281 million for the three months ended December 31, 2003. This wasprimarily due to an increase in net sales of hard disc drives spindle motors, other small precisionbrushless DC motors, machinery and other products. Our gross profit ratio increased from 19.3% for thethree months ended December 31, 2002 to 22.2% for the three months ended December 31, 2003.
Our net sales increased ¥8,555 million, or 4.9%, from ¥174,766 million for the nine monthsended December 31, 2002 to ¥183,321 million for the nine months ended December 31, 2003. Ourgross profit ratio increased from18.9% for the nine months ended December 31, 2002 to 21.8% for thenine months ended December 31, 2003.
3
Net sales of our hard disk drives spindle motors increased ¥2,436 million, or 9.4%, from¥26,040 million for the three months ended December 31, 2002 to ¥28,476 million for the three monthsended December 31, 2003. The increase was primarily due to a 25.0% increase in unit shipments whichwere partially offset by a modest decline in unit prices and the yen’s appreciation. A remarkable factorduring this term was the over 70% increase in unit shipments of spindle motors for 2.5-inch, 1.8-inchand other smaller hard disk drives. Net sales of hard disk drives spindle motors accounted for 43.8% ofour total net sales for the three months ended December 31, 2002 and 44.3% for the three months endedDecember 31, 2003. Net sales of fluid dynamic bearing motors accounted for 58.7% of total net sales ofhard disk drives spindle motors for the three months ended December 31, 2002 and 77.5% for the threemonths ended December 31, 2003. This was due to a sharp increase in demand for fluid dynamicbearing motors which is rapidly replacing demand for conventional ball bearing motors. Conventionalball bearing motors have come up against technological limitations in fulfilling market needs, also, thisincrease in net sales of fluid dynamic bearing motors was mainly due to a successful shift to massproduction at our overseas factories.
Net sales of our hard disk drive spindle motors increased 5,475 million, or 7.5%, from¥73,261 million for the nine months ended December 31, 2002 to ¥78,736 million for the nine monthsended December 31, 2003. Net sales of hard disk drive spindle motors accounted for 41.9% of total netsales for the nine months ended December 31, 2002 and 42.9% of total net sales for the nine monthsended December 31, 2003.
Net sales of other small precision brushless DC motors increased ¥2,086 million, or 31.4%,from ¥6,653 million for the three months ended December 31, 2002 to ¥8,739 million for the threemonths ended December 31, 2003. This increase resulted from sales growth in brushless DC motorsmainly used for DVD drives, CD-R drives and CD-R/W drives. Sales volume of these motors increasedby approximately 48% compared to the three months ended December 31, 2002. Net sales of othersmall precision brushless DC motors accounted for 11.2% of total net sales for the three months endedDecember 31, 2002 and 13.5% for the three months ended December 31, 2003.
Net sales of other small precision brushless DC motors increased ¥4,488 million, or 23.6%,from ¥19,001 million for the nine months ended December 31, 2002 to ¥23,489 million for the ninemonths ended December 31, 2003. Net sales from other small precision brushless DC motors accountedfor 10.9% of total net sales for the nine months ended December 31, 2002 and 12.8% for the ninemonths ended December 31, 2003.
Net sales of brushless DC fans decreased ¥549 million, or 8.2%, from ¥6,662 million for thethree months ended December 31, 2002 to ¥6,113 million for the three months ended December 31,2003. This was primarily due to a decrease in the unit sales price, and declining sales volume due to acontinuing decline in demand for game machines and Micro Processing Unit cooling units. Thisslowdown in demand has been lingering since the latter half of the previous fiscal year. The sluggishdemand and increasingly fierce market competition has brought down the selling prices. Net sales ofbrushless DC fans accounted for 11.2% of total net sales for the three months ended December 31, 2002and 9.5% for the three months ended December 31, 2003.
4
Net sales of brushless DC fans decreased ¥2,250 million, or 10.1%, from ¥22,212 million forthe nine months ended December 31, 2002 to ¥19,962 million for the nine months ended December 31,2003. Net sales from brushless DC fans accounted for 12.7% of total net sales for the nine monthsended December 31, 2002 and 10.9% for the nine months ended December 31, 2003.
Net sales of mid-size motors decreased 1,317 million, or 14.9%, from ¥8,864 million for thethree months ended December 31, 2002 to ¥7,547 million for the three months ended December 31,2003. During this period we discontinued our prior practice of selling some mid-size motors togetherwith electronic control units purchased from a third party supplier for use in hydraulic power steeringsystems and began selling these mid-size motors separately. As a consequence, both our sales and costof sales declined in respect of the amounts related to the electronic control units. Net sales of mid-sizemotors accounted for 14.9% of total net sales for the three months ended December 31, 2002 and 11.7%for the three months ended December 31, 2003.
Net sales of mid-size motors decreased 3,614 million, or 13.0%, from ¥27,825 million for thenine months ended December 31, 2002 to ¥24,211 million for the nine months ended December 31,2003. Net sales of mid-size motors accounted for 15.9% of total net sales for the nine months endedDecember 31, 2002 and 13.2% for the nine months ended December 31, 2003.
Net sales of machinery increased ¥1,080 million, or 18.8%, from ¥5,745 million for the threemonths ended December 31, 2002 to ¥6,825 million for the three months ended December 31, 2003.This increase was primarily due to growth in unit shipments of precision presses manufactured byNidec-Kyori Corporation, gear reducers manufactured by Nidec-Shimpo Corporation and die bonders(factory automation components) manufactured by Nidec-Machinery Corporation. Net sales ofmachinery accounted for 9.7% of total net sales for the three months ended December 31, 2002 and10.6% for the three months ended December 31, 2003.
Net sales of machinery increased ¥2,506 million, or 15.1%, from ¥16,650 million for the ninemonths ended December 31, 2002 to ¥19,156 million for the nine months ended December 31, 2003.Net sales of machinery accounted for 9.5% of total net sales for the nine months ended December 31,2002 and 10.4% for the nine months ended December 31, 2003.
Net sales of other products increased ¥1,032 million, or 22.7%, from ¥4,551 million for thethree months ended December 31, 2002 to ¥5,583 million for the three months ended December 31,2003. During this period, sales of automobile components manufactured by Nidec Tosok Corporationand encoders manufactured by Nidec Nemicon Corporation increased. Net sales of other productsaccounted for 7.7% of total net sales for the three months ended December 31, 2002 and 8.7% for thethree months ended December 31, 2003.
Net sales of other products increased ¥1,739 million, or 13.1%, from ¥13,264 million for thenine months ended December 31, 2002 to ¥15,003 million for the nine months ended December 31,2003. Net sales of other products accounted for 7.6% of total net sales for the nine months endedDecember31,2002 and 8.2% for the nine months ended December 31, 2003.
5
Cost of Products Sold
Our cost of products sold increased ¥2,862 million, or 6.0%, from ¥47,950 million for thethree months ended December 31, 2002 to ¥50,812 million for the three months ended December 31,2003. As a percentage of net sales, cost of sales decreased from 80.7% to 79.0%. This decrease wasprimarily due to increased efficiencies of scale through an expansion in the production of fluid dynamicbearing motors mainly undertaken by factories in the Southeast Asia, and a change in the sales practiceof mid-size motors for automobiles, whereby electronic controls units were not sold together with mid-size motors for automobiles as described in "Net Sales" above. The cost of products sold increased 1.7%from ¥141,671 million for the nine months ended December 31, 2002 to ¥144,094 million for the ninemonths ended December 31, 2003.
Selling, General and Administrative Expenses
Our selling, general and administrative expenses increased ¥27 million, or 0.6%, from ¥4,673million for the three months ended December 31, 2002 to ¥4,700 million for the three months endedDecember 31, 2003. The increases in selling, general and administrative expenses resulted fromincreases in sales, personnel expenses for an expanded workforce and depreciation costs of tangiblefixed assets incurred from the establishment of a new headquarter building. As a percentage of net sales,selling, general and administrative expenses decreased from 7.9% for the three months ended December31, 2002 to 7.3% for the three months ended December 31, 2003. Our selling, general andadministrative expenses increased 5.4% from ¥14,710 million for the nine months ended December 31,2002 to ¥15,505 million for the nine months ended December 31, 2003.
Research and Development Expenses
Our research and development expenses increased ¥429 million, or 25.3%, from ¥1,694million for the three months ended December 31, 2002 to ¥2,123 million for the three months endedDecember 31, 2003. This increase was mainly due to an increase in our research and developmentefforts with respect to fluid dynamic bearing motors and mid-size motors for automobile steeringsystems. As a percentage of net sales, research and development expenses increased from 2.9 % for thethree months ended December 31, 2002 to 3.3% for the three months ended December 31, 2003. Ourresearch and development expenses increased 13.7% from ¥5,059 million for the nine months endedDecember 31, 2002 to ¥5,750 million for the nine months ended December 31, 2003.
6
Operating Income
As a result of the foregoing factors, our operating income increased ¥1,533 million, or 30.0%,from ¥5,113 million for the three months ended December 31, 2002 to ¥6,646 million for the threemonths ended December 31, 2003. As a percentage of net sales, operating income increased from 8.6%for the three months ended December 31, 2002 to 10.3% for the three months ended December 31, 2003.Our operating income increased 34.9% from ¥13,326 million for the nine months ended December 31,2002 to ¥17,972 million for the nine months ended December 31, 2003.
Other Income (Expenses)
Other expenses decreased ¥392 million from ¥1,380 million for the three months endedDecember 31, 2002 to ¥988 million for the three months ended December 31, 2003. Other expensesdecreased ¥1,587 million from ¥4,332 million for the nine months ended December 31, 2002 to ¥2,745million for the nine months ended December 31, 2003.
Interest and dividend income decreased from ¥80 million for the three months endedDecember 31, 2002 to ¥52 million for the three months ended December 31, 2003. This was mainly dueto a decreased average balance of our foreign currency deposits and lower interest rates. Interest anddividend income decreased from ¥289 million for the nine months ended December 31, 2002 to ¥176million for the nine months ended December 31, 2003. Interest expenses also decreased from ¥220million for the three months ended December 31, 2002 to ¥173 million for the three months endedDecember 31, 2003. The decreases mainly derived from the refinancing of long-term loans with lowerinterest rates and due to the issuance of zero-coupon bonds as an alternative to bank loans. Interestexpense decreased from ¥718 million for the nine months ended December 31, 2002 to ¥586 million forthe nine months ended December 31, 2003.
Foreign exchange losses increased ¥625 million from ¥510 million for the three months endedDecember 31, 2002 to ¥1,135 million for the three months ended December 31, 2003. This wasprincipally due to an increase in the average balance of our foreign currency denominated assetscompared to December 31, 2002 and a further appreciation in the average value of the yen againstrelevant foreign currencies during the three months ended December 31, 2003. The exchange differencerecorded for the nine months slightly exceeded the year-ago level. For the nine months ended December31, 2003, we recorded a net foreign exchange loss of ¥2,812 million as compared to ¥3,587 million forthe nine months ended December 31, 2002.
Income before Provision for Income Taxes
As a result of the foregoing factors, our income before provision for income taxes increased¥1,925 million, or 51.6%, from ¥3,733 million for the three months ended December 31, 2002 to ¥5,658million for the three months ended December 31, 2003. Our income before provision for income taxesincreased 69.3% from ¥8,994 million for the nine months ended December 31, 2002 to ¥15,227 millionfor the nine months ended December 31, 2003.
7
Provision for Income Taxes
Our provision for income taxes increased ¥605 million, or 51.0%, from ¥1,187 million for thethree months ended December 31, 2002 to ¥1,792 million for the three months ended December 31,2003 due to the increase in the income before provision for income taxes.
Our provision for income taxes increased 112.7% from ¥1,711 million for the nine monthsended December 31, 2002 to ¥3,639 million for the nine months ended December 31, 2003. Ourestimated effective income tax rate increased from 19.0% for the nine months ended December 31, 2002to 23.9% for the nine months ended December 31, 2003 mainly due to a decrease in tax benefits offoreign subsidiaries. (*) See Note 6 to the unaudited interim consolidated financial statements. The taxbenefit in foreign subsidiaries decreased as a percentage of income mainly due to an increase in incomebefore provision for income taxes. Tax on undistributed earnings decreased mainly due to a decrease individends from overseas subsidiaries and an increase in income before provision for income taxes.Other increased mainly due to a decrease in tax deductions taken in fiscal 2004 with respect to impairedinvestment securities.
Minority Interest in Income of Consolidated Subsidiaries
For the three months ended December 31, 2003, minority interest in income of ourconsolidated subsidiaries was ¥408 million as compared to ¥224 million for the three months endedDecember 31, 2002. For the nine months ended December 31, 2003, minority interest in income of ourconsolidated subsidiaries was ¥981 million as compared to ¥549 million for the nine months endedDecember 31, 2002.
Equity in Net (Income)/Losses of Affiliated Companies
Equity in net income of our affiliated companies decreased ¥827 million from ¥411 millionfor the three months ended December 31, 2002 to a negative ¥416 million for the three months endedDecember 31, 2003. The decrease reflected a ¥950 million loss deriving from the impact of the financialresults of Sankyo Seiki Mfg. Co., Ltd. for the three months ended December 31, 2003. Sankyo SeikiMfg. Co., Ltd. became an equity-method affiliate of Nidec Corporation in October 2003. Equity in netincome of our affiliated companies decreased ¥174 million from ¥1,011 million for the nine monthsended December 31, 2002 to ¥837 million for the nine months ended December 31, 2003.
Net Income
As a result of the foregoing factors, our net income increased ¥309 million, or 11.3%, from¥2,733 million for the three months ended December 31, 2002 to ¥3,042 million for the three monthsended December 31, 2003. Our net income increased from ¥7,745 million for the nine months endedDecember 31, 2002 to ¥11,444 million for the nine months ended December 31, 2003.
8
Segment Information
Based on the applicable criteria set forth in Statement of Financial Accounting Standards No.131, “Disclosures about Segments of an Enterprise and Related Information,” we have nine reportableoperating segments on which we report in our consolidated financial statements. These reportablesegments are each a separate legal entity. One of them is Nidec Corporation, and the others are eight ofNidec’s consolidated subsidiaries: Nidec Singapore Pte. Ltd., Nidec Electronics (Thailand) Co., Ltd.,Nidec Philippines Corporation, Nidec America Corporation, Nidec Power Motor Corporation, Nidec(Dalian) Limited, Nidec Shibaura Corporation and Nidec Tosok Corporation.
We evaluate our financial performance based on segmental profit and loss, which consists ofsales and operating revenues less operating expenses. Segmental profit or loss is determined using theaccounting principles in the segment’s country of domicile. Nidec Corporation, Nidec Power MotorCorporation, Nidec Shibaura Corporation and Nidec Tosok Corporation apply Japanese GAAP, NidecSingapore Corporation applies Singaporean accounting principles, Nidec Electronics (Thailand) Co.,Ltd. applies Thai accounting principles, Nidec Philippines Corporation applies Philippine accountingprinciples, Nidec America Corporation applies U.S. GAAP, and Nidec (Dalian) Limited applies Chineseaccounting principles. Therefore our segmental data has not been prepared under U.S. GAAP on a basisthat is consistent with our consolidated financial statements or on any other single basis that isconsistent between segments. While there are several differences between U.S. GAAP and theunderlying accounting principles used by the eight operating segments other than Nidec AmericaCorporation, the principal differences that affect segmental operating profit or loss are accounting forpension and severance costs, directors’ bonuses and leases. We believe that the monthly segmentalinformation is available on a timely basis and that it is sufficiently accurate at the segment profit andloss level for us to manage our business.
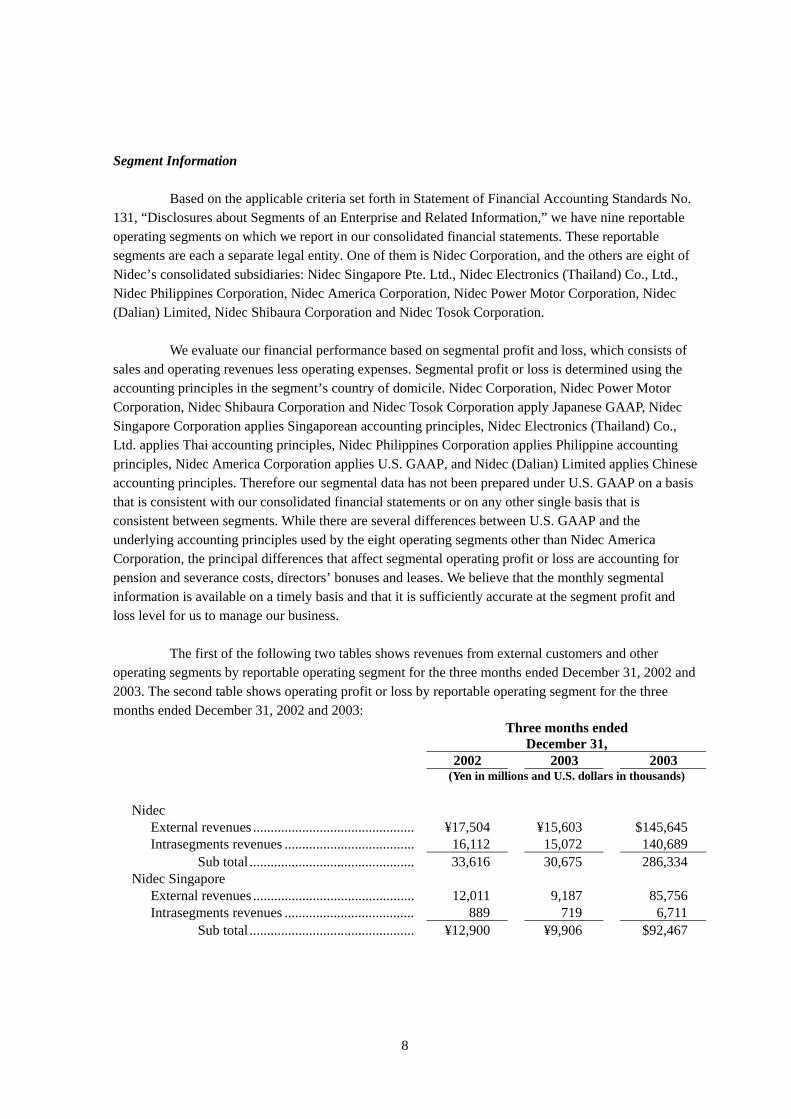
The first of the following two tables shows revenues from external customers and otheroperating segments by reportable operating segment for the three months ended December 31, 2002 and2003. The second table shows operating profit or loss by reportable operating segment for the threemonths ended December 31, 2002 and 2003:
Three months endedDecember 31,
2002 2003 2003(Yen in millions and U.S. dollars in thousands)
NidecExternal revenues .............................................. ¥17,504 ¥15,603 $145,645Intrasegments revenues ..................................... 16,112 15,072 140,689
Sub total ............................................... 33,616 30,675 286,334Nidec Singapore
External revenues .............................................. 12,011 9,187 85,756Intrasegments revenues ..................................... 889 719 6,711
Sub total ............................................... ¥12,900 ¥9,906 $92,467
9
Three months endedDecember 31,
2002 2003 2003(Yen in millions and U.S. dollars in thousands)
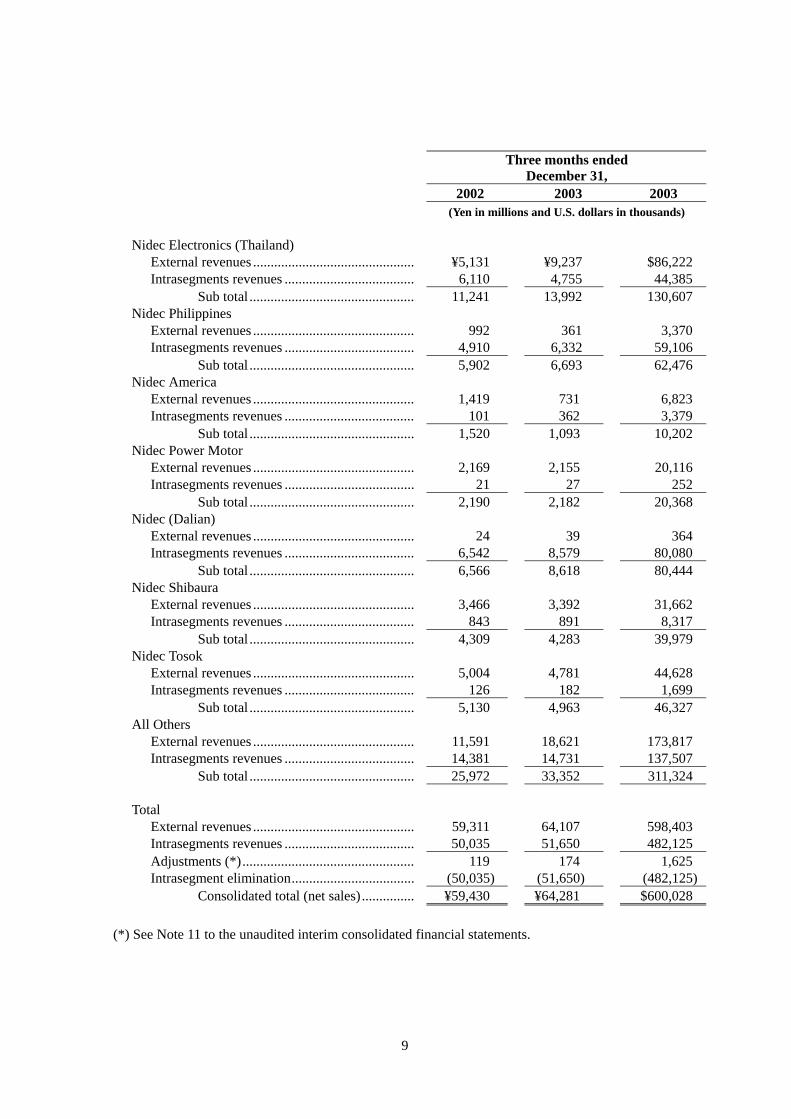
Nidec Electronics (Thailand)External revenues .............................................. ¥5,131 ¥9,237 $86,222Intrasegments revenues ..................................... 6,110 4,755 44,385
Sub total ............................................... 11,241 13,992 130,607Nidec Philippines
External revenues .............................................. 992 361 3,370Intrasegments revenues ..................................... 4,910 6,332 59,106
Sub total ............................................... 5,902 6,693 62,476Nidec America
External revenues .............................................. 1,419 731 6,823Intrasegments revenues ..................................... 101 362 3,379
Sub total ............................................... 1,520 1,093 10,202Nidec Power Motor
External revenues .............................................. 2,169 2,155 20,116Intrasegments revenues ..................................... 21 27 252
Sub total ............................................... 2,190 2,182 20,368Nidec (Dalian)
External revenues .............................................. 24 39 364Intrasegments revenues ..................................... 6,542 8,579 80,080
Sub total ............................................... 6,566 8,618 80,444Nidec Shibaura
External revenues .............................................. 3,466 3,392 31,662Intrasegments revenues ..................................... 843 891 8,317
Sub total ............................................... 4,309 4,283 39,979Nidec Tosok
External revenues .............................................. 5,004 4,781 44,628Intrasegments revenues ..................................... 126 182 1,699
Sub total ............................................... 5,130 4,963 46,327All Others
External revenues .............................................. 11,591 18,621 173,817Intrasegments revenues ..................................... 14,381 14,731 137,507
Sub total ............................................... 25,972 33,352 311,324
TotalExternal revenues .............................................. 59,311 64,107 598,403Intrasegments revenues ..................................... 50,035 51,650 482,125Adjustments (*)................................................. 119 174 1,625Intrasegment elimination................................... (50,035) (51,650) (482,125)
Consolidated total (net sales)............... ¥59,430 ¥64,281 $600,028
(*) See Note 11 to the unaudited interim consolidated financial statements.
10
Three months endedDecember 31,
2002 2003 2003
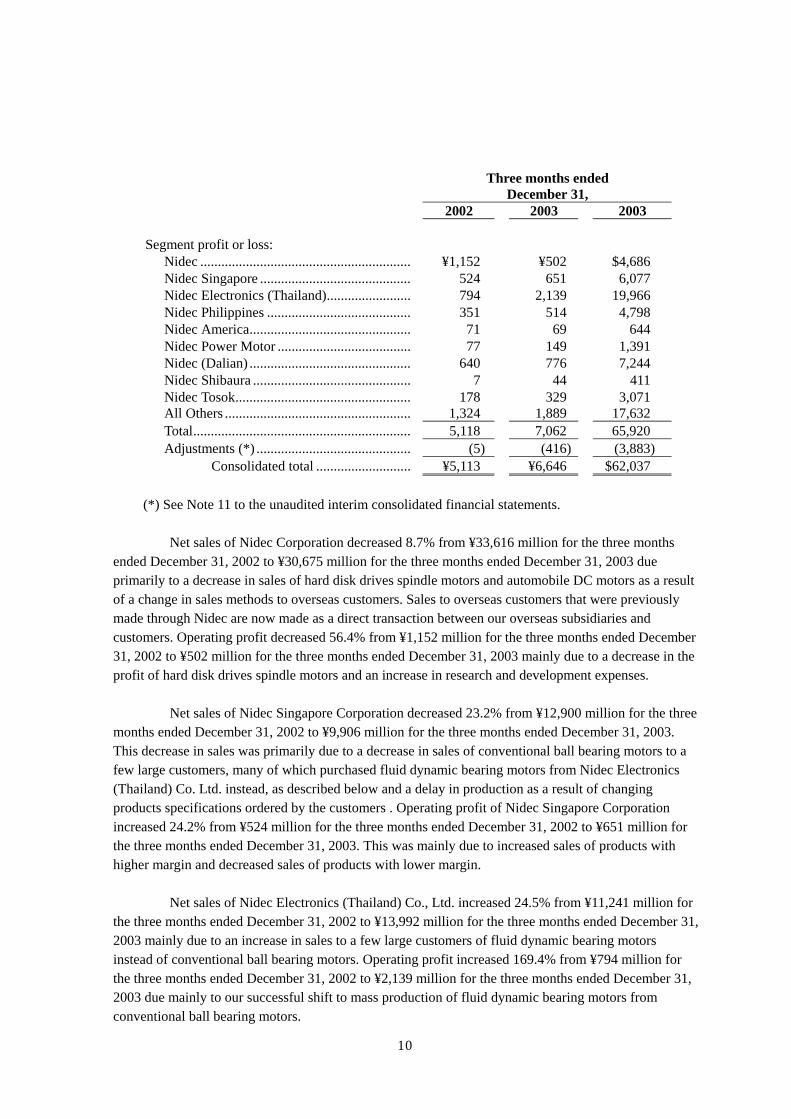
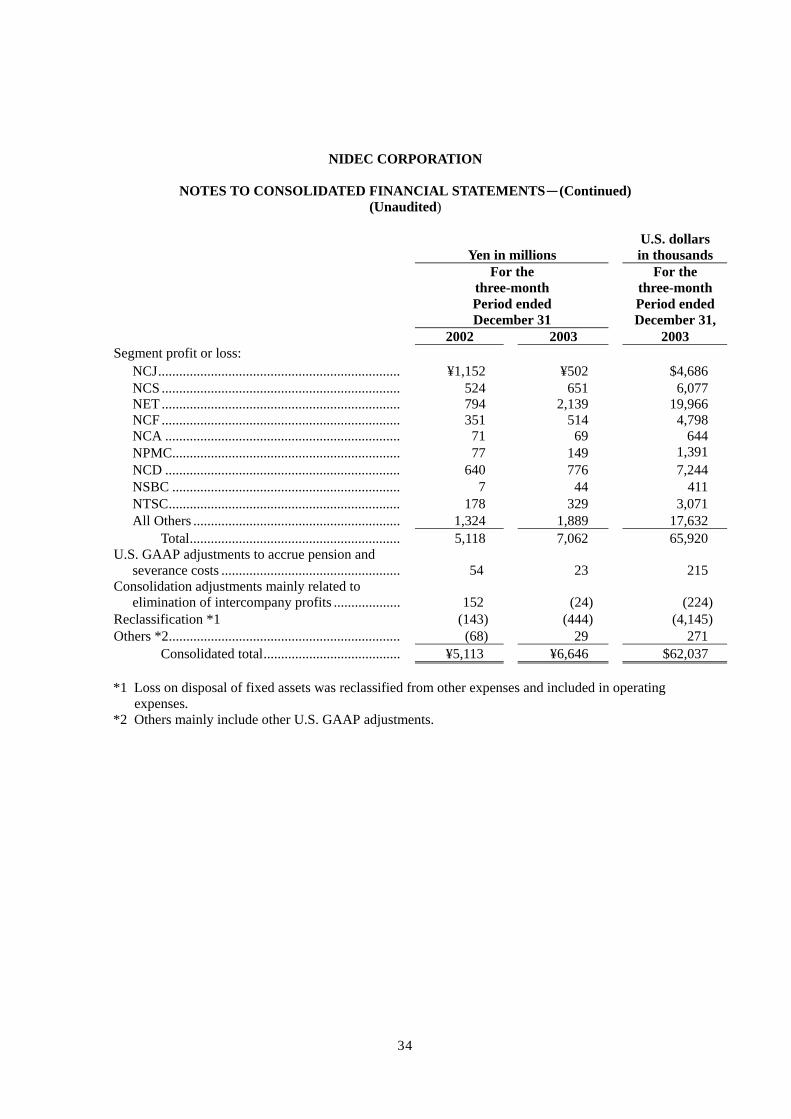
Segment profit or loss:Nidec ............................................................ ¥1,152 ¥502 $4,686Nidec Singapore ........................................... 524 651 6,077Nidec Electronics (Thailand)........................ 794 2,139 19,966Nidec Philippines ......................................... 351 514 4,798Nidec America.............................................. 71 69 644Nidec Power Motor ...................................... 77 149 1,391Nidec (Dalian) .............................................. 640 776 7,244Nidec Shibaura ............................................. 7 44 411Nidec Tosok.................................................. 178 329 3,071All Others ..................................................... 1,324 1,889 17,632Total.............................................................. 5,118 7,062 65,920Adjustments (*) ............................................ (5) (416) (3,883)
Consolidated total ........................... ¥5,113 ¥6,646 $62,037
(*) See Note 11 to the unaudited interim consolidated financial statements.
Net sales of Nidec Corporation decreased 8.7% from ¥33,616 million for the three monthsended December 31, 2002 to ¥30,675 million for the three months ended December 31, 2003 dueprimarily to a decrease in sales of hard disk drives spindle motors and automobile DC motors as a resultof a change in sales methods to overseas customers. Sales to overseas customers that were previouslymade through Nidec are now made as a direct transaction between our overseas subsidiaries andcustomers. Operating profit decreased 56.4% from ¥1,152 million for the three months ended December31, 2002 to ¥502 million for the three months ended December 31, 2003 mainly due to a decrease in theprofit of hard disk drives spindle motors and an increase in research and development expenses.
Net sales of Nidec Singapore Corporation decreased 23.2% from ¥12,900 million for the threemonths ended December 31, 2002 to ¥9,906 million for the three months ended December 31, 2003.This decrease in sales was primarily due to a decrease in sales of conventional ball bearing motors to afew large customers, many of which purchased fluid dynamic bearing motors from Nidec Electronics(Thailand) Co. Ltd. instead, as described below and a delay in production as a result of changingproducts specifications ordered by the customers . Operating profit of Nidec Singapore Corporationincreased 24.2% from ¥524 million for the three months ended December 31, 2002 to ¥651 million forthe three months ended December 31, 2003. This was mainly due to increased sales of products withhigher margin and decreased sales of products with lower margin.
Net sales of Nidec Electronics (Thailand) Co., Ltd. increased 24.5% from ¥11,241 million forthe three months ended December 31, 2002 to ¥13,992 million for the three months ended December 31,2003 mainly due to an increase in sales to a few large customers of fluid dynamic bearing motorsinstead of conventional ball bearing motors. Operating profit increased 169.4% from ¥794 million forthe three months ended December 31, 2002 to ¥2,139 million for the three months ended December 31,2003 due mainly to our successful shift to mass production of fluid dynamic bearing motors fromconventional ball bearing motors.
11
Net sales of Nidec Philippines Corporation increased 13.4% from ¥5,902 million for the threemonths ended December 31, 2002 to ¥6,693 million for the three months ended December 31, 2003,mainly due to increased demand for the fluid dynamic bearing motors. A shift to mass production offluid dynamic bearing motors was successful, and its gross margins were improved by sales of thesemotors. As a result, operating profit of Nidec Philippines Corporation increased 46.4% from ¥351million for the three months ended December 31, 2002 to ¥514 million for the three months endedDecember 31, 2003.
Net sales of Nidec America Corporation decreased 28.1% from ¥1,520 million for the threemonths ended December 31, 2002 to ¥1,093 million for the three months ended December 31, 2003,mainly due to a decrease in sales of fan motors used in microprocessor cooling units. The operatingprofit of Nidec America Corporation decreased 2.8% from ¥71 million for the three months endedDecember 31, 2002 to ¥69 million for the three months ended December 31, 2003. This was mainly dueto an increase in the sales margin of fan motors.
Net sales of Nidec Power Motor Corporation decreased 0.4% from ¥2,190 million for thethree months ended December 31, 2002 to ¥2,182 million for the three months ended December 31,2003 mainly due to a decrease in the sales price of AC motors for industrial use. The operating profit ofNidec Power Motor Corporation increased 93.5% from ¥77 million for the three months endedDecember 31, 2002 to ¥149 million for the three months ended December 31, 2003. This was mainlydue to the successful production shift to the overseas.
Net sales of Nidec (Dalian) Limited increased 31.3% from ¥6,566 million for the threemonths ended December 31, 2002 to ¥8,618 million for the three months ended December 31, 2003mainly due to an increase in volume sales of slim-type DC motors for personal computer DVD use.Operating profit increased 21.3% from ¥640 million for the three months ended December 31, 2002 to¥ 776 million for the three months ended December 31, 2003 due mainly to an increase in the sales ofDC motors .
Net sales of Nidec Shibaura Corporation decreased 0.6% from ¥4,309 million for the threemonths ended December 31, 2002 to ¥4,283 million for the three months ended December 31, 2003,mainly due to a decrease in sales of home electric appliance motors. The operating profit increased from¥7 million for the three months ended December 31, 2002 to ¥ 44 million for the three months endedDecember 31, 2003.
Net sales of Nidec Tosok Corporation decreased 3.3% from ¥5,130 million for the threemonths ended December 31, 2002 to ¥4,963 million for the three months ended December 31, 2003mainly due to a decrease in sales of semiconductor fabrication equipment. Operating profit increased84.8% from ¥178 million for the three months ended December 31, 2002 to ¥329 million for the threemonths ended December 31, 2003 due mainly to an increase in the automobile parts margin as a resultof the successful production shift to Vietnam.
12
In our All Others segment, net sales increased 28.4% from ¥25,972 million for the threemonths ended December 31, 2002 to ¥33,352 million for the three months ended December 31, 2003.Operating profit also increased 42.7% from ¥1,324 million for the three months ended December 31,2002 to ¥1,889 million for the three months ended December 31, 2003. This was mainly due to anincrease in sales and operating profit of Nidec (Zhejiang) Corporation and Nidec (Dongguan)Corporation which are located in China.
Liquidity and Capital Resources
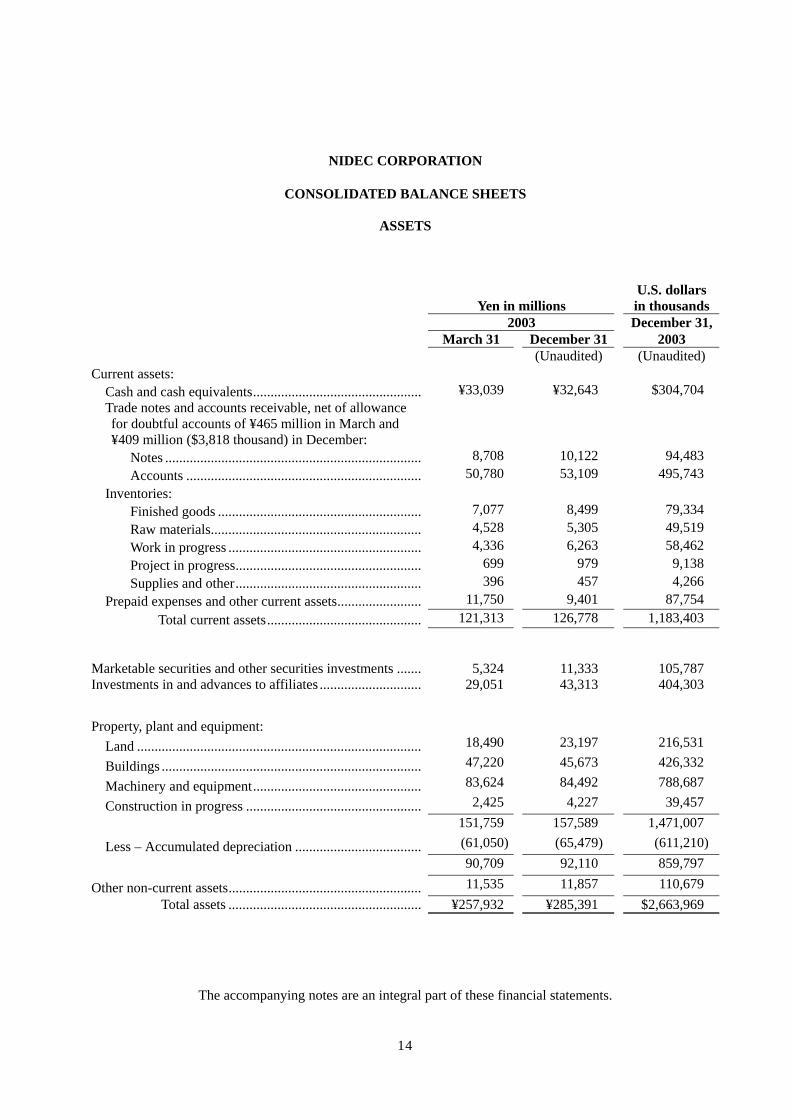
During the nine months ended December 31, 2003, our total assets increased ¥27,459 million,or 10.6%, to ¥285,391 million. Total investments and other assets increased ¥20,271 million, or 59.0%,to ¥54,646 million mainly due to investment in shares of Sankyo Seiki Mfg. Co., Ltd. (“Sankyo”) andthe purchase of securities that Sankyo had held. Inventories, trade accounts receivable and trade notesreceivable increased ¥4,467 million, ¥2,329 million and ¥1,414 million, respectively, mainly due to anincrease in sales.
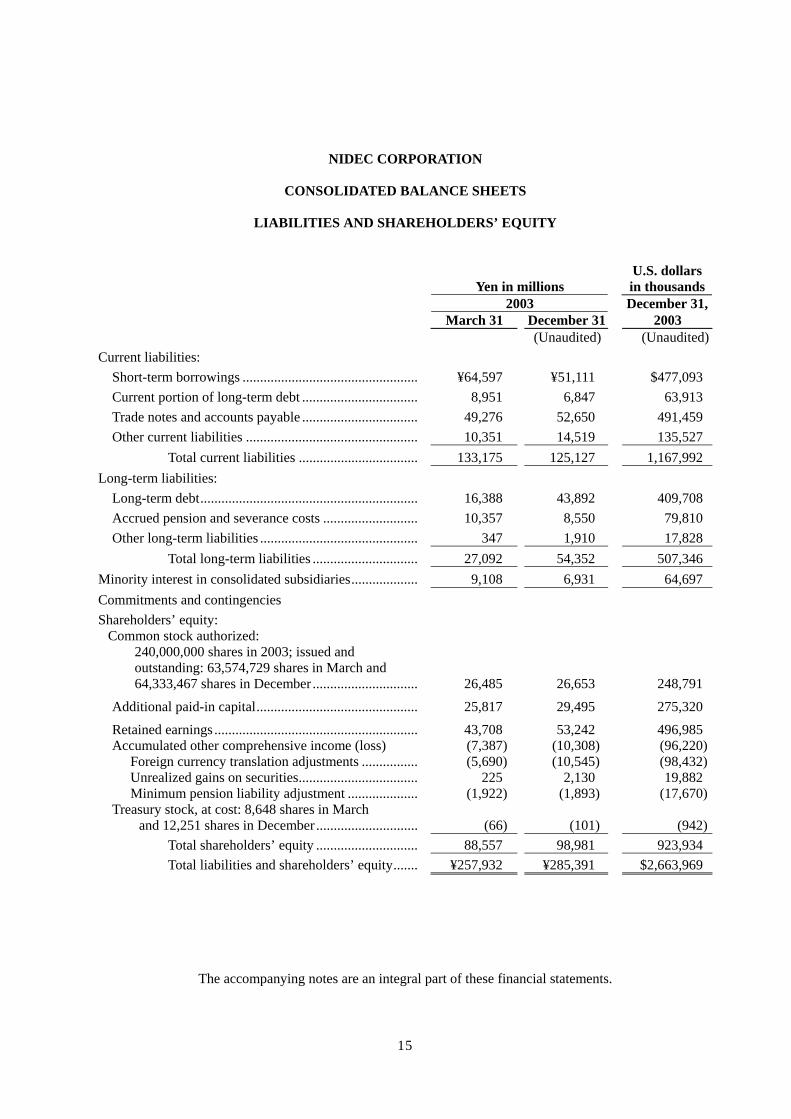
During the nine months ended December 31, 2003, our total liabilities increased ¥19,212million, or 12.0%, to ¥179,479 million. This increase was mainly due to increases in long-term debts of¥27,504 million and other current liabilities of ¥4,168 million mainly through accounts payable toSankyo for purchase of land. On the other hand, short-term borrowings decreased ¥13,486.
During the nine months ended December 31, 2003, our working capital increased ¥13,513million from a negative ¥11,862 million to ¥1,651 million. This increase was mainly due to a decreasein short-term borrowings.
During the nine months ended December 31, 2003, total shareholders’ equity increased¥10,424 million, or 11.8%, to ¥98,981 million. This increase was mainly due to increases in retainedearnings of ¥9,534 million offset by dividends paid of ¥1,910 million and 582,990 new shares issuedupon shares exchange with Nidec-Shimpo Corporation of ¥3,510 million. The ratio of stockholders’equity to total assets increased from 34.3% as of March 31, 2003 to 34.7% as of December 31, 2003.
13
Cash Flows
Net cash provided by operating activities increased ¥7,624 million from ¥13,784 million forthe nine months ended December 31, 2002 to ¥21,408 million for the nine months ended December 31,2003 mainly due to increases in net income of ¥3,699 million and accounts payable to Sankyo forpurchase of land at ¥3,710 million included in “Other” of the consolidated statements of cash flows.
Net cash used in investing activities increased ¥13,482 million from ¥18,052 million for thenine months ended December 31, 2002 to ¥31,534 million for the nine months ended December 31,2003 mainly due to an increase in investments in and advances to affiliates of ¥13,893 million. Thisincludes ¥12,485 million for our investment in Sankyo Seiki Mfg. Co, Ltd. in October 2003.
As a result of these factors, our net cash flow (the difference between cash provided byoperating activities and cash used in investing activities) decreased ¥5,858 million from negative ¥4,268million for the nine months ended December 31, 2002 to negative ¥10,126 million for the nine monthsended December 31, 2003.
Net cash provided by financing activities increased ¥17,890 million from a negative ¥6,136million for the nine months ended December 31, 2002 to ¥11,754 million for the nine months endedDecember 31, 2003. This increase was mainly due to proceeds from issuance of yen denominated zerocoupon convertible bonds with stock acquisition rights of ¥30,872 million (maturity date; October 17,2008) and a decrease in short-term borrowings of ¥11,447 million. The face value of the bonds was¥30,000 million and the issue price was 103.00% of the face value. Concerning stock acquisition rights,the conversion price per share is ¥13,905 and convertible shares are 2,222,222.
As a result of the foregoing factors and the effect of exchange rate changes, our totaloutstanding balance of cash and cash equivalents decreased ¥396 million from ¥33,039 million as ofMarch 31, 2003 to ¥32,643 million as of December 31, 2003.
14
NIDEC CORPORATION
CONSOLIDATED BALANCE SHEETS
ASSETS
Yen in millionsU.S. dollarsin thousands
2003 December 31,March 31 December 31 2003
(Unaudited) (Unaudited)Current assets:
Cash and cash equivalents................................................ ¥33,039 ¥32,643 $304,704Trade notes and accounts receivable, net of allowancefor doubtful accounts of ¥465 million in March and¥409 million ($3,818 thousand) in December:
Notes ......................................................................... 8,708 10,122 94,483Accounts ................................................................... 50,780 53,109 495,743
Inventories:Finished goods .......................................................... 7,077 8,499 79,334Raw materials............................................................ 4,528 5,305 49,519Work in progress ....................................................... 4,336 6,263 58,462Project in progress..................................................... 699 979 9,138Supplies and other..................................................... 396 457 4,266
Prepaid expenses and other current assets........................ 11,750 9,401 87,754Total current assets............................................ 121,313 126,778 1,183,403
Marketable securities and other securities investments ....... 5,324 11,333 105,787Investments in and advances to affiliates ............................. 29,051 43,313 404,303
Property, plant and equipment:Land ................................................................................. 18,490 23,197 216,531
Buildings .......................................................................... 47,220 45,673 426,332
Machinery and equipment................................................ 83,624 84,492 788,687
Construction in progress .................................................. 2,425 4,227 39,457151,759 157,589 1,471,007
Less – Accumulated depreciation .................................... (61,050) (65,479) (611,210)90,709 92,110 859,797
Other non-current assets....................................................... 11,535 11,857 110,679Total assets ....................................................... ¥257,932 ¥285,391 $2,663,969
The accompanying notes are an integral part of these financial statements.
15
NIDEC CORPORATION
CONSOLIDATED BALANCE SHEETS
LIABILITIES AND SHAREHOLDERS’ EQUITY
Yen in millionsU.S. dollarsin thousands
2003 December 31,March 31 December 31 2003
(Unaudited) (Unaudited)Current liabilities:
Short-term borrowings .................................................. ¥64,597 ¥51,111 $477,093Current portion of long-term debt ................................. 8,951 6,847 63,913Trade notes and accounts payable ................................. 49,276 52,650 491,459Other current liabilities ................................................. 10,351 14,519 135,527
Total current liabilities .................................. 133,175 125,127 1,167,992Long-term liabilities:
Long-term debt.............................................................. 16,388 43,892 409,708Accrued pension and severance costs ........................... 10,357 8,550 79,810Other long-term liabilities ............................................. 347 1,910 17,828
Total long-term liabilities .............................. 27,092 54,352 507,346Minority interest in consolidated subsidiaries................... 9,108 6,931 64,697Commitments and contingenciesShareholders’ equity:
Common stock authorized:240,000,000 shares in 2003; issued andoutstanding: 63,574,729 shares in March and64,333,467 shares in December .............................. 26,485 26,653 248,791
Additional paid-in capital.............................................. 25,817 29,495 275,320
Retained earnings .......................................................... 43,708 53,242 496,985Accumulated other comprehensive income (loss) (7,387) (10,308) (96,220)
Foreign currency translation adjustments ................ (5,690) (10,545) (98,432)Unrealized gains on securities.................................. 225 2,130 19,882Minimum pension liability adjustment .................... (1,922) (1,893) (17,670)
Treasury stock, at cost: 8,648 shares in Marchand 12,251 shares in December ............................. (66) (101) (942)
Total shareholders’ equity ............................. 88,557 98,981 923,934Total liabilities and shareholders’ equity....... ¥257,932 ¥285,391 $2,663,969
The accompanying notes are an integral part of these financial statements.
16
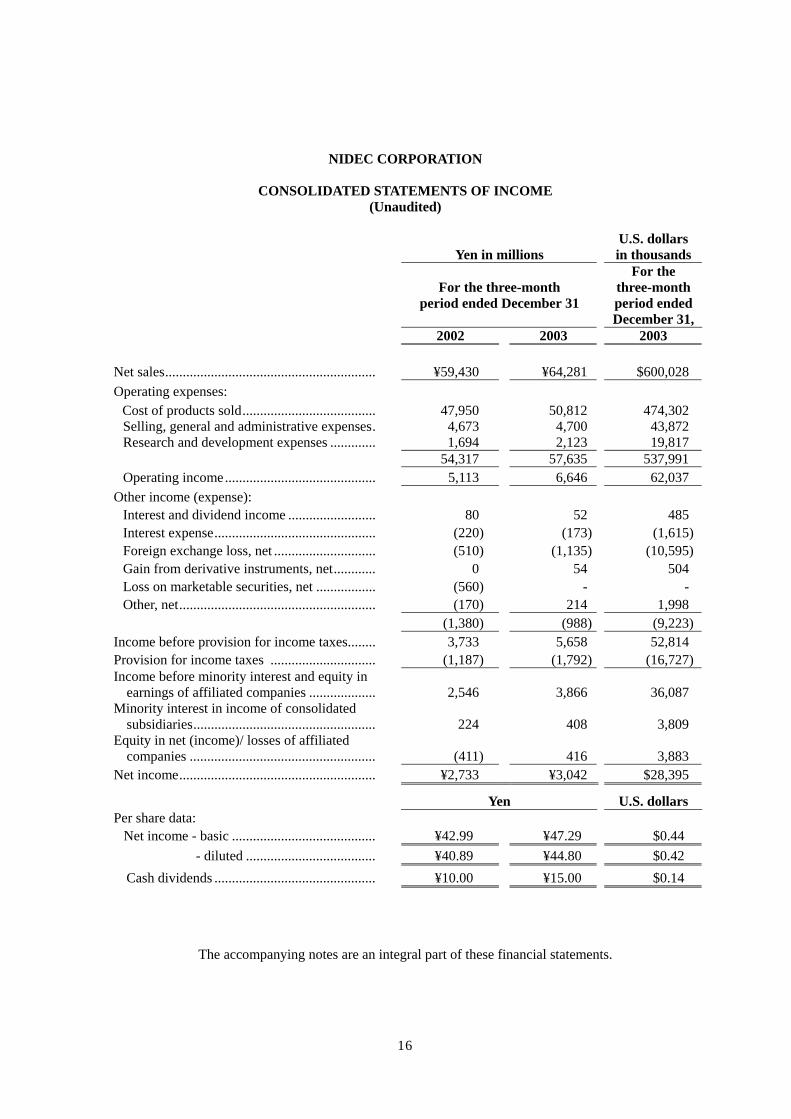
NIDEC CORPORATION
CONSOLIDATED STATEMENTS OF INCOME(Unaudited)
Yen in millionsU.S. dollarsin thousands
For the three-monthperiod ended December 31
For thethree-monthperiod endedDecember 31,
2002 2003 2003
Net sales............................................................ ¥59,430 ¥64,281 $600,028Operating expenses:
Cost of products sold...................................... 47,950 50,812 474,302Selling, general and administrative expenses. 4,673 4,700 43,872Research and development expenses ............. 1,694 2,123 19,817
54,317 57,635 537,991Operating income........................................... 5,113 6,646 62,037
Other income (expense):Interest and dividend income ......................... 80 52 485Interest expense.............................................. (220) (173) (1,615)Foreign exchange loss, net ............................. (510) (1,135) (10,595)Gain from derivative instruments, net............ 0 54 504Loss on marketable securities, net ................. (560) - -Other, net........................................................ (170) 214 1,998
(1,380) (988) (9,223)Income before provision for income taxes........ 3,733 5,658 52,814Provision for income taxes .............................. (1,187) (1,792) (16,727)Income before minority interest and equity in
earnings of affiliated companies ................... 2,546 3,866 36,087Minority interest in income of consolidated
subsidiaries.................................................... 224 408 3,809Equity in net (income)/ losses of affiliated
companies ..................................................... (411) 416 3,883Net income........................................................ ¥2,733 ¥3,042 $28,395
Yen U.S. dollarsPer share data:
Net income - basic ......................................... ¥42.99 ¥47.29 $0.44- diluted ..................................... ¥40.89 ¥44.80 $0.42
Cash dividends .............................................. ¥10.00 ¥15.00 $0.14
The accompanying notes are an integral part of these financial statements.
17
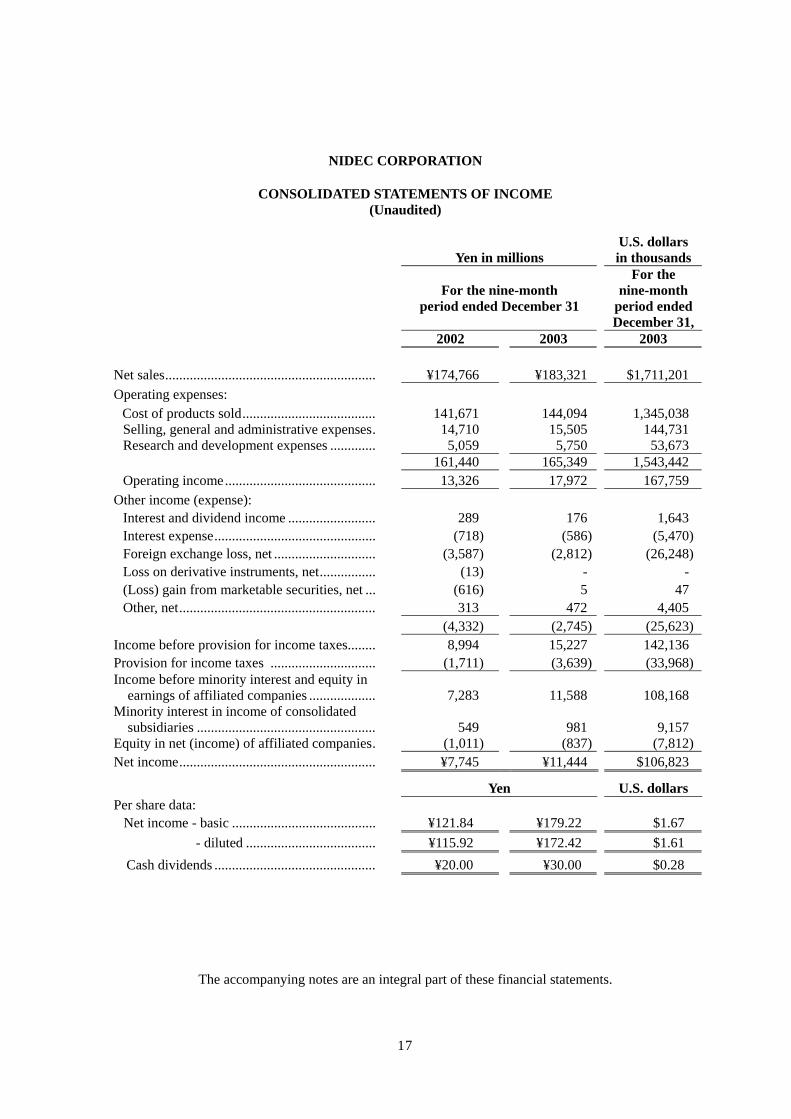
NIDEC CORPORATION
CONSOLIDATED STATEMENTS OF INCOME(Unaudited)
Yen in millionsU.S. dollarsin thousands
For the nine-monthperiod ended December 31
For thenine-month
period endedDecember 31,
2002 2003 2003
Net sales............................................................ ¥174,766 ¥183,321 $1,711,201Operating expenses:
Cost of products sold...................................... 141,671 144,094 1,345,038Selling, general and administrative expenses. 14,710 15,505 144,731Research and development expenses ............. 5,059 5,750 53,673
161,440 165,349 1,543,442Operating income........................................... 13,326 17,972 167,759
Other income (expense):Interest and dividend income ......................... 289 176 1,643Interest expense.............................................. (718) (586) (5,470)Foreign exchange loss, net ............................. (3,587) (2,812) (26,248)Loss on derivative instruments, net................ (13) - -(Loss) gain from marketable securities, net ... (616) 5 47Other, net........................................................ 313 472 4,405
(4,332) (2,745) (25,623)Income before provision for income taxes........ 8,994 15,227 142,136Provision for income taxes .............................. (1,711) (3,639) (33,968)Income before minority interest and equity in
earnings of affiliated companies ................... 7,283 11,588 108,168Minority interest in income of consolidated
subsidiaries ................................................... 549 981 9,157Equity in net (income) of affiliated companies. (1,011) (837) (7,812)Net income........................................................ ¥7,745 ¥11,444 $106,823
Yen U.S. dollarsPer share data:
Net income - basic ......................................... ¥121.84 ¥179.22 $1.67- diluted ..................................... ¥115.92 ¥172.42 $1.61
Cash dividends .............................................. ¥20.00 ¥30.00 $0.28
The accompanying notes are an integral part of these financial statements.
18
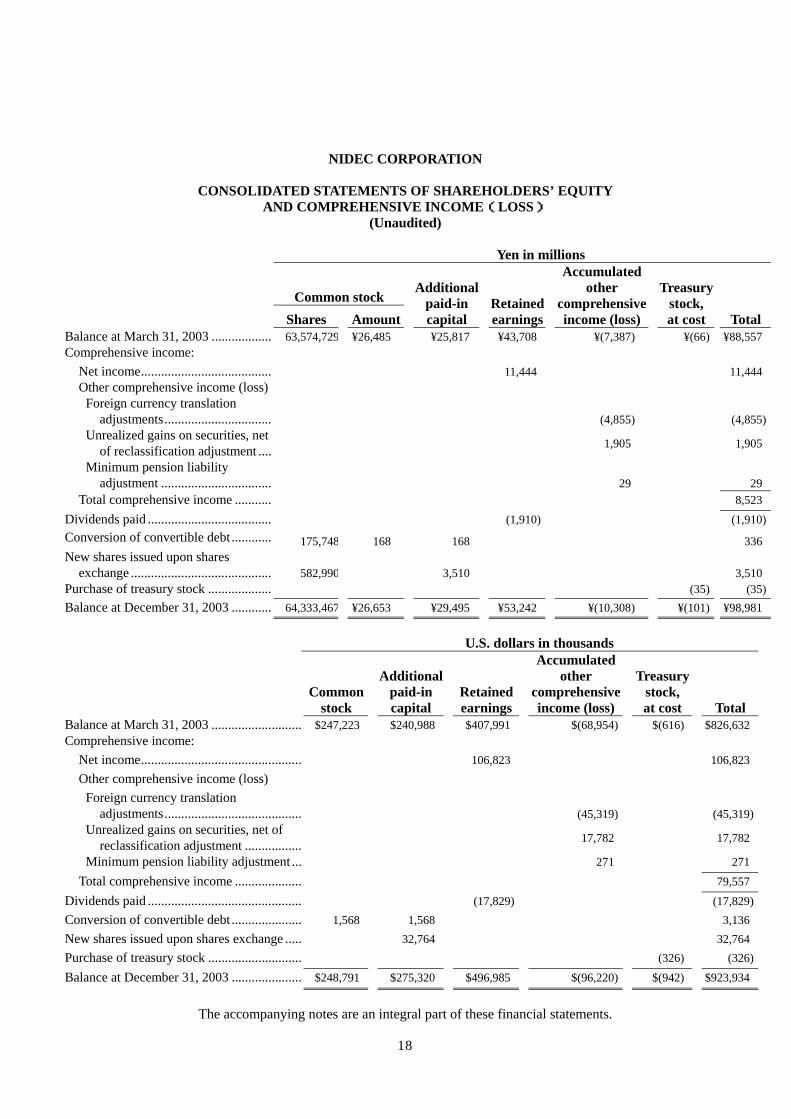
NIDEC CORPORATION
CONSOLIDATED STATEMENTS OF SHAREHOLDERS’ EQUITYAND COMPREHENSIVE INCOME(LOSS)
(Unaudited)
Yen in millions
Common stockShares Amount
Additionalpaid-incapital
Retainedearnings
Accumulatedother
comprehensiveincome (loss)
Treasurystock,at cost Total
Balance at March 31, 2003 .................. 63,574,729 ¥26,485 ¥25,817 ¥43,708 ¥(7,387) ¥(66) ¥88,557Comprehensive income:
Net income....................................... 11,444 11,444Other comprehensive income (loss)
Foreign currency translationadjustments................................ (4,855) (4,855)
Unrealized gains on securities, netof reclassification adjustment .... 1,905 1,905
Minimum pension liabilityadjustment ................................. 29 29
Total comprehensive income ........... 8,523Dividends paid ..................................... (1,910) (1,910)Conversion of convertible debt ............ 175,748 168 168 336New shares issued upon shares
exchange .......................................... 582,990 3,510 3,510Purchase of treasury stock ................... (35) (35)Balance at December 31, 2003 ............ 64,333,467 ¥26,653 ¥29,495 ¥53,242 ¥(10,308) ¥(101) ¥98,981
U.S. dollars in thousands
Commonstock
Additionalpaid-incapital
Retainedearnings
Accumulatedother
comprehensiveincome (loss)
Treasurystock,at cost Total
Balance at March 31, 2003 ........................... $247,223 $240,988 $407,991 $(68,954) $(616) $826,632Comprehensive income:
Net income................................................ 106,823 106,823Other comprehensive income (loss)
Foreign currency translationadjustments......................................... (45,319) (45,319)
Unrealized gains on securities, net ofreclassification adjustment ................. 17,782 17,782
Minimum pension liability adjustment ... 271 271
Total comprehensive income .................... 79,557
Dividends paid .............................................. (17,829) (17,829)Conversion of convertible debt ..................... 1,568 1,568 3,136New shares issued upon shares exchange ..... 32,764 32,764Purchase of treasury stock ............................ (326) (326)
Balance at December 31, 2003 ..................... $248,791 $275,320 $496,985 $(96,220) $(942) $923,934
The accompanying notes are an integral part of these financial statements.
19
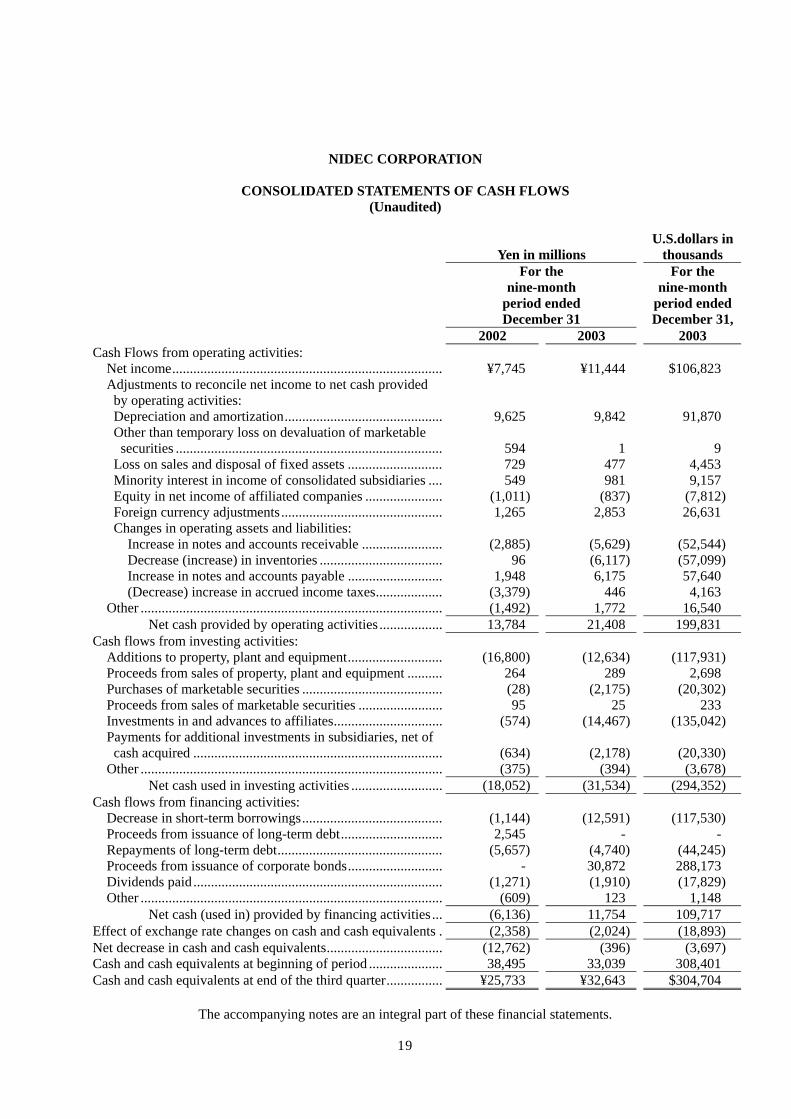
NIDEC CORPORATION
CONSOLIDATED STATEMENTS OF CASH FLOWS(Unaudited)
Yen in millionsU.S.dollars in
thousandsFor the
nine-monthperiod endedDecember 31
For thenine-month
period endedDecember 31,
2002 2003 2003Cash Flows from operating activities:
Net income............................................................................. ¥7,745 ¥11,444 $106,823Adjustments to reconcile net income to net cash provided
by operating activities:Depreciation and amortization............................................. 9,625 9,842 91,870Other than temporary loss on devaluation of marketablesecurities ............................................................................ 594 1 9
Loss on sales and disposal of fixed assets ........................... 729 477 4,453Minority interest in income of consolidated subsidiaries .... 549 981 9,157Equity in net income of affiliated companies ...................... (1,011) (837) (7,812)Foreign currency adjustments.............................................. 1,265 2,853 26,631Changes in operating assets and liabilities:
Increase in notes and accounts receivable ....................... (2,885) (5,629) (52,544)Decrease (increase) in inventories ................................... 96 (6,117) (57,099)Increase in notes and accounts payable ........................... 1,948 6,175 57,640(Decrease) increase in accrued income taxes................... (3,379) 446 4,163
Other ...................................................................................... (1,492) 1,772 16,540Net cash provided by operating activities .................. 13,784 21,408 199,831
Cash flows from investing activities:Additions to property, plant and equipment........................... (16,800) (12,634) (117,931)Proceeds from sales of property, plant and equipment .......... 264 289 2,698Purchases of marketable securities ........................................ (28) (2,175) (20,302)Proceeds from sales of marketable securities ........................ 95 25 233Investments in and advances to affiliates............................... (574) (14,467) (135,042)Payments for additional investments in subsidiaries, net of
cash acquired ....................................................................... (634) (2,178) (20,330)Other ...................................................................................... (375) (394) (3,678)
Net cash used in investing activities .......................... (18,052) (31,534) (294,352)Cash flows from financing activities:
Decrease in short-term borrowings........................................ (1,144) (12,591) (117,530)Proceeds from issuance of long-term debt............................. 2,545 - -Repayments of long-term debt............................................... (5,657) (4,740) (44,245)Proceeds from issuance of corporate bonds........................... - 30,872 288,173Dividends paid ....................................................................... (1,271) (1,910) (17,829)Other ...................................................................................... (609) 123 1,148
Net cash (used in) provided by financing activities ... (6,136) 11,754 109,717Effect of exchange rate changes on cash and cash equivalents . (2,358) (2,024) (18,893)Net decrease in cash and cash equivalents................................. (12,762) (396) (3,697)Cash and cash equivalents at beginning of period ..................... 38,495 33,039 308,401Cash and cash equivalents at end of the third quarter................ ¥25,733 ¥32,643 $304,704
The accompanying notes are an integral part of these financial statements.
20
NIDEC CORPORATION
NOTES TO CONSOLIDATED FINANCIAL STATEMENTS(Unaudited)
1. Basis of preparation:
The accompanying interim condensed consolidated financial statements of NIDECCORPORATION (“NIDEC”) have been prepared in accordance with accounting principles generallyaccepted in the United States. The interim condensed consolidated financial statements are unauditedbut include all adjustments, consisting of only normal recurring adjustments, which the Companyconsiders necessary for a fair presentation of the consolidated financial position and the consolidatedresults of its operations and cash flows. Results for the nine months ended December 31, 2003 are notnecessarily indicative of results that may be expected for the full year.
U.S. dollar amounts are included solely for the convenience of readers at the rate of ¥107.13 =US$1, the approximate current exchange rate at December 31, 2003.
Certain reclassifications in the consolidated statements of income and the consolidatedstatements of cash flows for the nine-month period ended December 31, 2002, have been made toconform to the presentation used for the nine-month period ended December 31, 2003.
Newly adopted accounting standards -
NIDEC follows the disclosure-only provisions of SFAS No. 148 - “Accounting for Stock-Based Compensation - Transition and Disclosure - an amendment of FASB Statement No. 123” and haselected to apply APB No. 25 in accounting for its stock-based compensation plans. No compensationexpense is recognized on the grant date, since at that date, the option price equals the market price of theunderlying common stock. See Note 8 for a summary of the pro forma effects on reported net incomeand net income per share for the nine-month period ended December 31, 2003 based on the fair value ofoptions and shares granted as prescribed by SFAS No. 148.
In January 2003, the FASB issued FASB Interpretation No. 46 (“FIN 46”), “Consolidation ofVariable Interest Entities, an Interpretation of ARB No. 51.” FIN 46 requires certain variable interestentities to be consolidated by the primary beneficiary of the entity if the equity investors in the entity donot have the characteristics of a controlling financial interest or do not have sufficient equity at risk forthe entity to finance its activities without additional subordinated financial support from other parties.FIN 46 is effective for all new variable interest entities created or acquired after January 31, 2003. Forvariable interest entities created or acquired prior to February 1, 2003, the provisions of FIN 46 areeffective for NIDEC on July 1, 2003. NIDEC has completed its evaluation of the impact of FIN 46 andhas not identified any variable interest entities which would require consolidation as a result ofimplementing the new standard.
21
NIDEC CORPORATION
NOTES TO CONSOLIDATED FINANCIAL STATEMENTS-(Continued)(Unaudited)
In November 2002, the FASB issued EITF Issue No. 00-21, “Accounting for RevenueArrangements with Multiple Deliverables”. EITF Issue No. 00-21 provides guidance on when and howto account for arrangements that involve the delivery or performance of multiple products, servicesand/or rights to use assets. The provisions of EITF Issue No.00-21 applied to revenue arrangementsentered into in fiscal periods beginning after June 15, 2003. Adoption of this standard did not have amaterial impact on its results of operations and financial position.
In April 2003, the FASB issued SFAS No.149, “Amendment of Statement 133 on DerivativeInstruments and Hedging Activities”. This statement amends and clarifies financial accounting andreporting for derivative instruments, including derivative instruments embedded in other contracts andfor hedging activities under SFAS No. 133. The adoption of SFAS No. 149 did not have an impact onNIDEC’s results of operations and financial position.
In May 2003, the FASB issued SFAS No. 150, “Accounting for Certain Financial Instrumentswith Characteristics of both Liabilities and Equity”. SFAS No. 150 establishes standards for how certainfinancial instruments with characteristics of both liabilities and equity shall be classified and measured.This statement is effective for financial instruments entered into or modified after May 31, 2003, andotherwise is effective at the beginning of the first interim period beginning after June 15,2003. Theadoption of SFAS No.150 did not have a significant impact on NIDEC’s results of operations andfinancial position.
22
NIDEC CORPORATION
NOTES TO CONSOLIDATED FINANCIAL STATEMENTS-(Continued)(Unaudited)
2. Acquisitions
On October 1, 2003, NIDEC issued 582,990 shares of its common stock in exchange forcommon stock of Nidec Shimpo Corporation, making Nidec Shimpo Corporation a wholly ownedsubsidiary of NIDEC.
The share were issued to Nidec Shimpo Corporation’s shareholders of record as of September30, 2003, in an amount equal to 0.060 shares per share of Nidec-Shimpo’s common stock. However, noshares were allotted to the shares of Nidec-Shimpo’s common stock already held by NIDEC. Thenumber of shares of Nidec-Shimpo’s common stock transferred to NIDEC through the share exchangeamounted to 9,716,516 shares. The number was reached by subtracting 10,284,000 shares of Nidec-Shimpo’s common stock held by NIDEC from 20,000,516 total outstanding shares of Nidec-Shimpo’scommon stock.
On September 30, 2003, NIDEC acquired 39.8% of the stock of Sankyo Seiki Mfg. Co., Ltd.(“Sankyo”). Under the terms of the agreement, Sankyo issued 57,800,000 shares to NIDEC on October1, 2003. NIDEC consolidated Sankyo group by adopting the equity method for the three months endedDecember, 31, 2003. The purchase price was based on a price of ¥239.42 per share, the average closingprice of Sankyo’s common stock on the Tokyo Stock Exchange during the six months from February 5,2003 to August 4, 2003, with a 9.78% discount. As a result, the total outstanding shares of commonstock of Sankyo was 145,111,591 shares, including 87,311,591 shares currently outstanding, 39.8% ofwhich was held by NIDEC. Sankyo develops ,manufactures and sells products relating to fluid dynamicbearing motors, micro motors, optical pick-up units, automated teller machines, home appliances,factory automation systems and others. As a member of the NIDEC Group, Sankyo will pursuesynergies with Nidec and its subsidiaries in various areas.
23
NIDEC CORPORATION
NOTES TO CONSOLIDATED FINANCIAL STATEMENTS-(Continued)(Unaudited)
3. Goodwill and other intangible assets
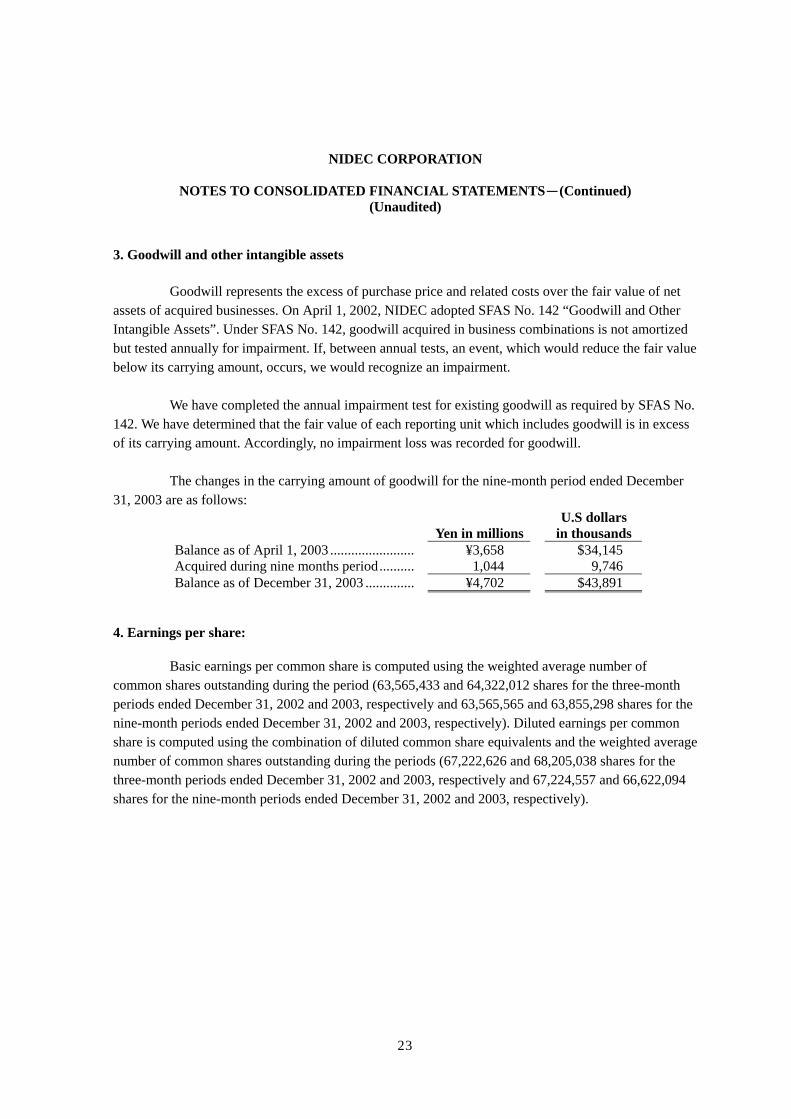
Goodwill represents the excess of purchase price and related costs over the fair value of netassets of acquired businesses. On April 1, 2002, NIDEC adopted SFAS No. 142 “Goodwill and OtherIntangible Assets”. Under SFAS No. 142, goodwill acquired in business combinations is not amortizedbut tested annually for impairment. If, between annual tests, an event, which would reduce the fair valuebelow its carrying amount, occurs, we would recognize an impairment.
We have completed the annual impairment test for existing goodwill as required by SFAS No.142. We have determined that the fair value of each reporting unit which includes goodwill is in excessof its carrying amount. Accordingly, no impairment loss was recorded for goodwill.
The changes in the carrying amount of goodwill for the nine-month period ended December31, 2003 are as follows:
Yen in millionsU.S dollars
in thousandsBalance as of April 1, 2003 ........................ ¥3,658 $34,145Acquired during nine months period.......... 1,044 9,746Balance as of December 31, 2003 .............. ¥4,702 $43,891
4. Earnings per share:
Basic earnings per common share is computed using the weighted average number ofcommon shares outstanding during the period (63,565,433 and 64,322,012 shares for the three-monthperiods ended December 31, 2002 and 2003, respectively and 63,565,565 and 63,855,298 shares for thenine-month periods ended December 31, 2002 and 2003, respectively). Diluted earnings per commonshare is computed using the combination of diluted common share equivalents and the weighted averagenumber of common shares outstanding during the periods (67,222,626 and 68,205,038 shares for thethree-month periods ended December 31, 2002 and 2003, respectively and 67,224,557 and 66,622,094shares for the nine-month periods ended December 31, 2002 and 2003, respectively).
24
NIDEC CORPORATION
NOTES TO CONSOLIDATED FINANCIAL STATEMENTS-(Continued)(Unaudited)
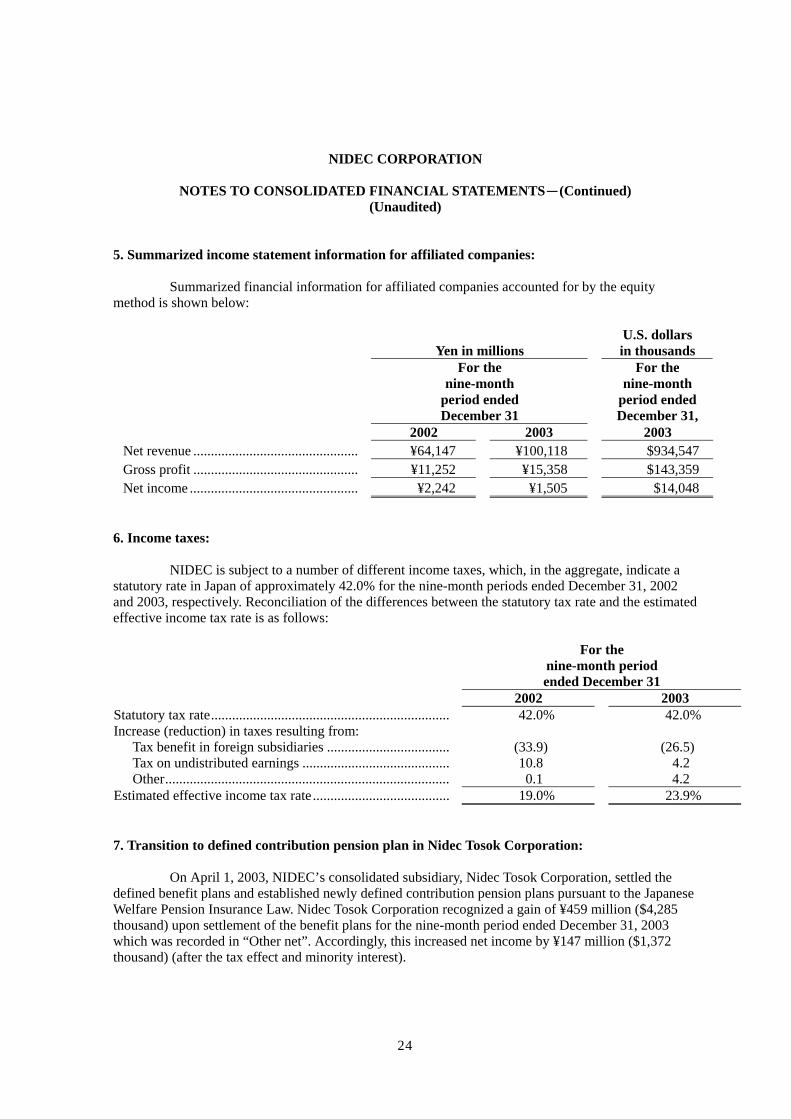
5. Summarized income statement information for affiliated companies:
Summarized financial information for affiliated companies accounted for by the equitymethod is shown below:
Yen in millionsU.S. dollarsin thousands
For thenine-month
period endedDecember 31
For thenine-month
period endedDecember 31,
2002 2003 2003Net revenue ............................................... ¥64,147 ¥100,118 $934,547Gross profit ............................................... ¥11,252 ¥15,358 $143,359Net income ................................................ ¥2,242 ¥1,505 $14,048
6. Income taxes:
NIDEC is subject to a number of different income taxes, which, in the aggregate, indicate astatutory rate in Japan of approximately 42.0% for the nine-month periods ended December 31, 2002and 2003, respectively. Reconciliation of the differences between the statutory tax rate and the estimatedeffective income tax rate is as follows:
For thenine-month periodended December 31
2002 2003Statutory tax rate.................................................................... 42.0% 42.0%Increase (reduction) in taxes resulting from:
Tax benefit in foreign subsidiaries ................................... (33.9) (26.5)Tax on undistributed earnings .......................................... 10.8 4.2Other................................................................................. 0.1 4.2
Estimated effective income tax rate....................................... 19.0% 23.9%
7. Transition to defined contribution pension plan in Nidec Tosok Corporation:
On April 1, 2003, NIDEC’s consolidated subsidiary, Nidec Tosok Corporation, settled thedefined benefit plans and established newly defined contribution pension plans pursuant to the JapaneseWelfare Pension Insurance Law. Nidec Tosok Corporation recognized a gain of ¥459 million ($4,285thousand) upon settlement of the benefit plans for the nine-month period ended December 31, 2003which was recorded in “Other net”. Accordingly, this increased net income by ¥147 million ($1,372thousand) (after the tax effect and minority interest).
25
NIDEC CORPORATION
NOTES TO CONSOLIDATED FINANCIAL STATEMENTS-(Continued)(Unaudited)
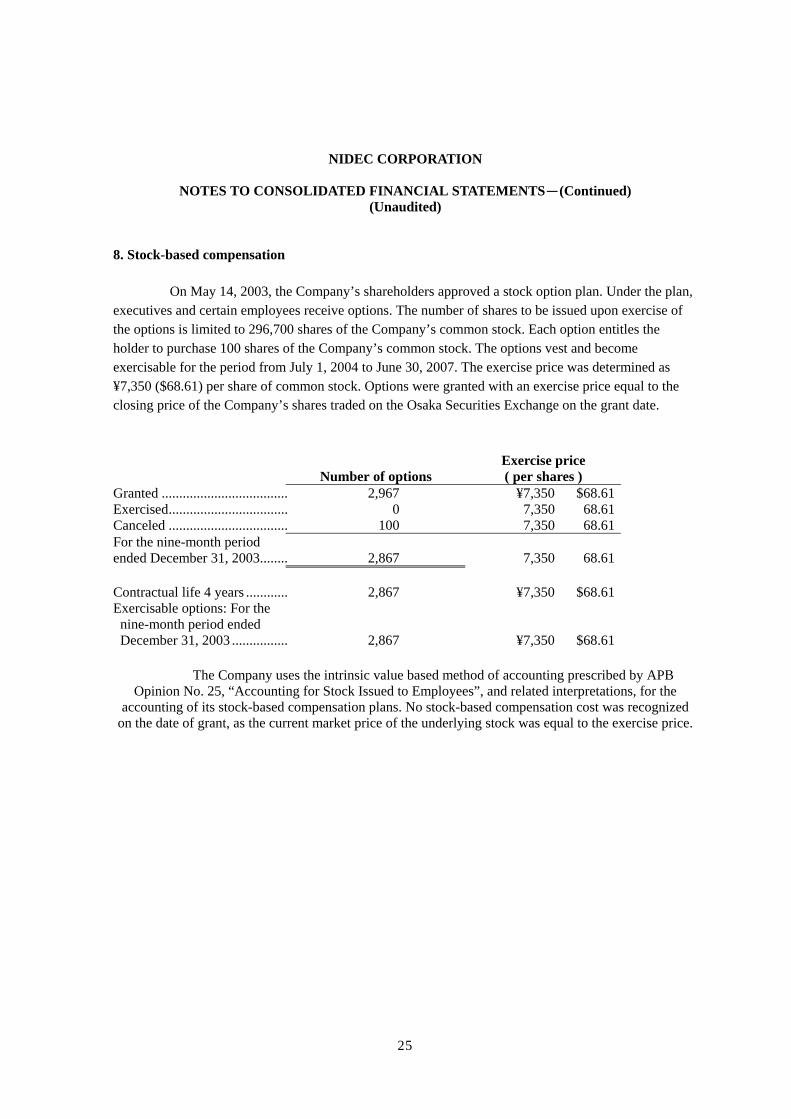
8. Stock-based compensation
On May 14, 2003, the Company’s shareholders approved a stock option plan. Under the plan,executives and certain employees receive options. The number of shares to be issued upon exercise ofthe options is limited to 296,700 shares of the Company’s common stock. Each option entitles theholder to purchase 100 shares of the Company’s common stock. The options vest and becomeexercisable for the period from July 1, 2004 to June 30, 2007. The exercise price was determined as¥7,350 ($68.61) per share of common stock. Options were granted with an exercise price equal to theclosing price of the Company’s shares traded on the Osaka Securities Exchange on the grant date.
Number of optionsExercise price( per shares )
Granted .................................... 2,967 ¥7,350 $68.61Exercised.................................. 0 7,350 68.61Canceled .................................. 100 7,350 68.61For the nine-month periodended December 31, 2003........ 2,867 7,350 68.61
Contractual life 4 years ............ 2,867 ¥7,350 $68.61Exercisable options: For the
nine-month period endedDecember 31, 2003 ................ 2,867 ¥7,350 $68.61
The Company uses the intrinsic value based method of accounting prescribed by APBOpinion No. 25, “Accounting for Stock Issued to Employees”, and related interpretations, for the
accounting of its stock-based compensation plans. No stock-based compensation cost was recognizedon the date of grant, as the current market price of the underlying stock was equal to the exercise price.
26
NIDEC CORPORATION
NOTES TO CONSOLIDATED FINANCIAL STATEMENTS-(Continued)(Unaudited)
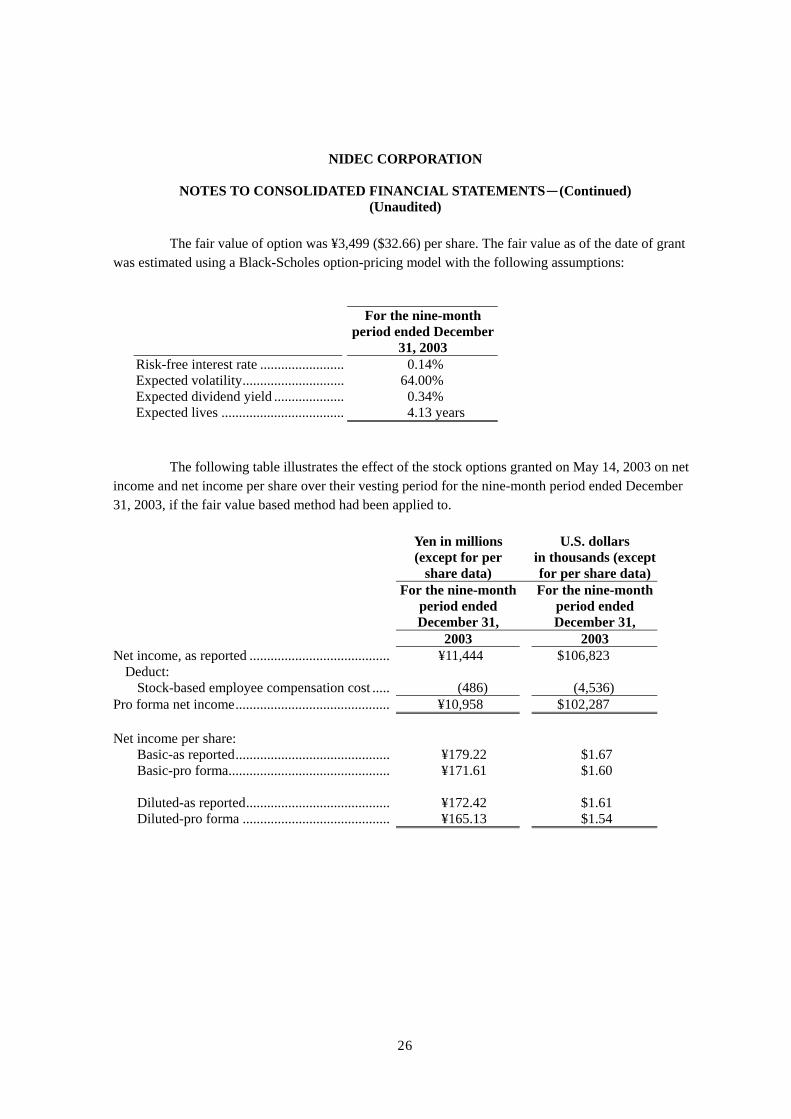
The fair value of option was ¥3,499 ($32.66) per share. The fair value as of the date of grantwas estimated using a Black-Scholes option-pricing model with the following assumptions:
For the nine-monthperiod ended December
31, 2003Risk-free interest rate ........................ 0.14%Expected volatility............................. 64.00%Expected dividend yield .................... 0.34%Expected lives ................................... 4.13 years
The following table illustrates the effect of the stock options granted on May 14, 2003 on netincome and net income per share over their vesting period for the nine-month period ended December31, 2003, if the fair value based method had been applied to.
Yen in millions(except for per
share data)
U.S. dollarsin thousands (exceptfor per share data)
For the nine-monthperiod endedDecember 31,
For the nine-monthperiod endedDecember 31,
2003 2003Net income, as reported ........................................ ¥11,444 $106,823
Deduct:Stock-based employee compensation cost ..... (486) (4,536)
Pro forma net income............................................ ¥10,958 $102,287
Net income per share:Basic-as reported............................................ ¥179.22 $1.67Basic-pro forma.............................................. ¥171.61 $1.60
Diluted-as reported......................................... ¥172.42 $1.61Diluted-pro forma .......................................... ¥165.13 $1.54

27
NIDEC CORPORATION
NOTES TO CONSOLIDATED FINANCIAL STATEMENTS-(Continued)(Unaudited)
9. Comprehensive income
NIDEC’s total comprehensive income (loss) for the nine-month period ended December 31,2002 and 2003, respectively, was as follows:
Yen in millionsU.S. dollarsin thousands
For thenine-month
period endedDecember 31
For thenine-month
period endedDecember 31,
2002 2003 2003Net income................................................................... ¥7,745 ¥11,444 $106,823
Other comprehensive income (loss):Foreign currency translation adjustments............... (4,358) (4,855) (45,319)Unrealized gains on securities, net of
reclassification adjustment................................... (303) 1,905 17,782Minimum pension liability adjustment................... - 29 271
(4,661) (2,921) (27,266)Total comprehensive income ....................... ¥3,084 ¥8,523 $79,557
28
NIDEC CORPORATION
NOTES TO CONSOLIDATED FINANCIAL STATEMENTS-(Continued)(Unaudited)
10. Contingencies:
Contingent liabilities for guarantees given in the ordinary course of business amounted toapproximately ¥147 million ($1,372 thousand) on December 31, 2003. These contingent liabilitiesprimarily relate to NIDEC’s guarantee of affiliated companies’ borrowings from banks. On April 2002,NIDEC’s consolidated subsidiary, Nidec Tosok Corporation, agreed to guarantee loans payable byOkaya Seiken Corporation, a subcontractor of Nidec Tosok Corporation, totaling ¥120 million ($1,120thousand) in order to provide funds for Okaya’s manufacturing facilities in Vietnam.
The Company received notice from Matsushita Electric Industrial Co., Ltd. (“Matsushita”)claiming that small precision brushless DC motors manufactured by the Company infringe one ofMatsushita’s patents relating to neodymium magnets and this matter through negotiation. Accordingly,the Company filed a motion with the Japanese Patent Office on November 16, 2001 seeking adeclaratory judgment that the patent is invalid on several grounds, the primary one being that theinvention is obvious in view of prior art.
On June 25, 2003, the Japanese Patent Office judged that the patent was invalid, and onAugust 16, 2003, Matsushita filed a suit with the Tokyo High Court against the Company contesting theJapanese Patent Office’s judgement. On December 22, 2003, the Tokyo High Court handed down ajudgement in favor of the Company and affirmed the Japanese Patent Office’s judgement that the patentwas invalid. On January 9, 2004, Matsushita did not make an appeal against the judgement of the court.Therefore the judgement of the court and the invalidity of the patent of Matsushita were settled.
29
NIDEC CORPORATION
NOTES TO CONSOLIDATED FINANCIAL STATEMENTS-(Continued)(Unaudited)
11. Segment data:
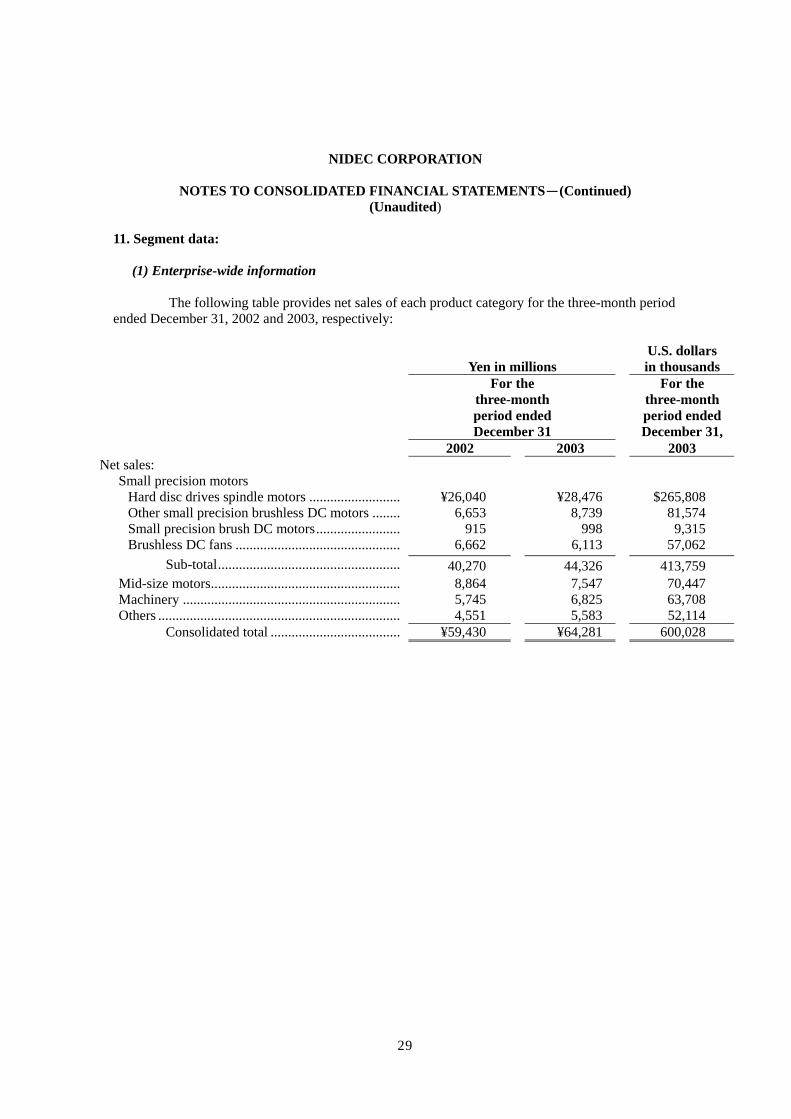
(1) Enterprise-wide information
The following table provides net sales of each product category for the three-month periodended December 31, 2002 and 2003, respectively:
Yen in millionsU.S. dollarsin thousands
For thethree-monthperiod endedDecember 31
For thethree-monthperiod endedDecember 31,
2002 2003 2003Net sales:
Small precision motorsHard disc drives spindle motors .......................... ¥26,040 ¥28,476 $265,808Other small precision brushless DC motors ........ 6,653 8,739 81,574Small precision brush DC motors........................ 915 998 9,315Brushless DC fans ............................................... 6,662 6,113 57,062
Sub-total.................................................... 40,270 44,326 413,759Mid-size motors...................................................... 8,864 7,547 70,447Machinery .............................................................. 5,745 6,825 63,708Others ..................................................................... 4,551 5,583 52,114
Consolidated total ..................................... ¥59,430 ¥64,281 600,028
30
NIDEC CORPORATION
NOTES TO CONSOLIDATED FINANCIAL STATEMENTS-(Continued)(Unaudited)
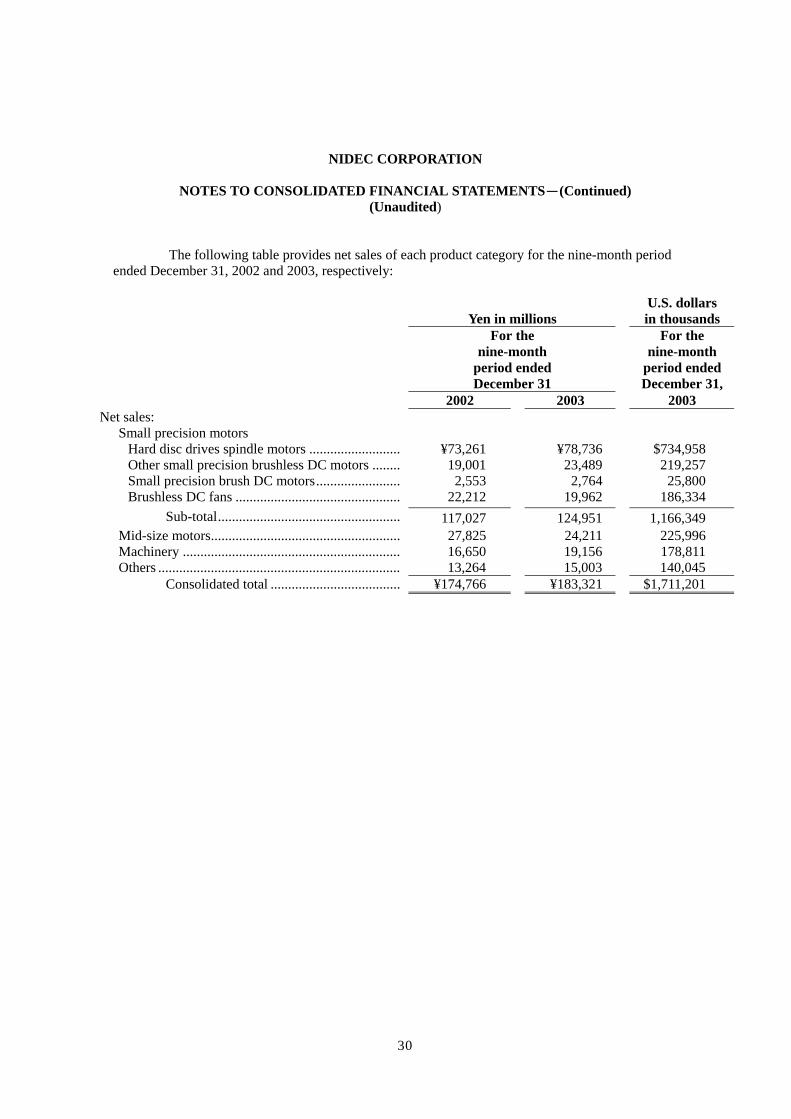
The following table provides net sales of each product category for the nine-month periodended December 31, 2002 and 2003, respectively:
Yen in millionsU.S. dollarsin thousands
For thenine-month
period endedDecember 31
For thenine-month
period endedDecember 31,
2002 2003 2003Net sales:
Small precision motorsHard disc drives spindle motors .......................... ¥73,261 ¥78,736 $734,958Other small precision brushless DC motors ........ 19,001 23,489 219,257Small precision brush DC motors........................ 2,553 2,764 25,800Brushless DC fans ............................................... 22,212 19,962 186,334
Sub-total.................................................... 117,027 124,951 1,166,349Mid-size motors...................................................... 27,825 24,211 225,996Machinery .............................................................. 16,650 19,156 178,811Others ..................................................................... 13,264 15,003 140,045
Consolidated total ..................................... ¥174,766 ¥183,321 $1,711,201
31
NIDEC CORPORATION
NOTES TO CONSOLIDATED FINANCIAL STATEMENTS-(Continued)(Unaudited)
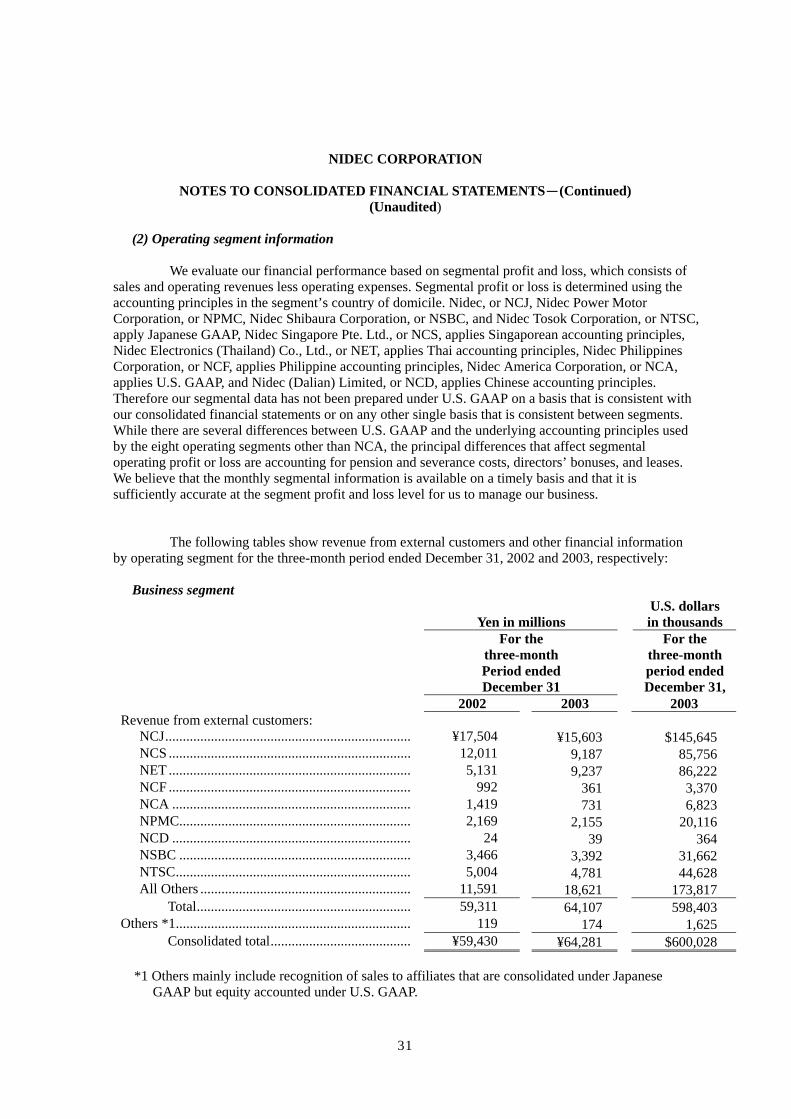
(2) Operating segment information
We evaluate our financial performance based on segmental profit and loss, which consists ofsales and operating revenues less operating expenses. Segmental profit or loss is determined using theaccounting principles in the segment’s country of domicile. Nidec, or NCJ, Nidec Power MotorCorporation, or NPMC, Nidec Shibaura Corporation, or NSBC, and Nidec Tosok Corporation, or NTSC,apply Japanese GAAP, Nidec Singapore Pte. Ltd., or NCS, applies Singaporean accounting principles,Nidec Electronics (Thailand) Co., Ltd., or NET, applies Thai accounting principles, Nidec PhilippinesCorporation, or NCF, applies Philippine accounting principles, Nidec America Corporation, or NCA,applies U.S. GAAP, and Nidec (Dalian) Limited, or NCD, applies Chinese accounting principles.Therefore our segmental data has not been prepared under U.S. GAAP on a basis that is consistent withour consolidated financial statements or on any other single basis that is consistent between segments.While there are several differences between U.S. GAAP and the underlying accounting principles usedby the eight operating segments other than NCA, the principal differences that affect segmentaloperating profit or loss are accounting for pension and severance costs, directors’ bonuses, and leases.We believe that the monthly segmental information is available on a timely basis and that it issufficiently accurate at the segment profit and loss level for us to manage our business.
The following tables show revenue from external customers and other financial informationby operating segment for the three-month period ended December 31, 2002 and 2003, respectively:
Business segment
Yen in millionsU.S. dollarsin thousands
For thethree-monthPeriod endedDecember 31
For thethree-monthperiod endedDecember 31,
2002 2003 2003Revenue from external customers:
NCJ...................................................................... ¥17,504 ¥15,603 $145,645NCS ..................................................................... 12,011 9,187 85,756NET ..................................................................... 5,131 9,237 86,222NCF ..................................................................... 992 361 3,370NCA .................................................................... 1,419 731 6,823NPMC.................................................................. 2,169 2,155 20,116NCD .................................................................... 24 39 364NSBC .................................................................. 3,466 3,392 31,662NTSC................................................................... 5,004 4,781 44,628All Others ............................................................ 11,591 18,621 173,817
Total............................................................. 59,311 64,107 598,403Others *1................................................................... 119 174 1,625
Consolidated total........................................ ¥59,430 ¥64,281 $600,028
*1 Others mainly include recognition of sales to affiliates that are consolidated under JapaneseGAAP but equity accounted under U.S. GAAP.
32
NIDEC CORPORATION
NOTES TO CONSOLIDATED FINANCIAL STATEMENTS-(Continued)(Unaudited)
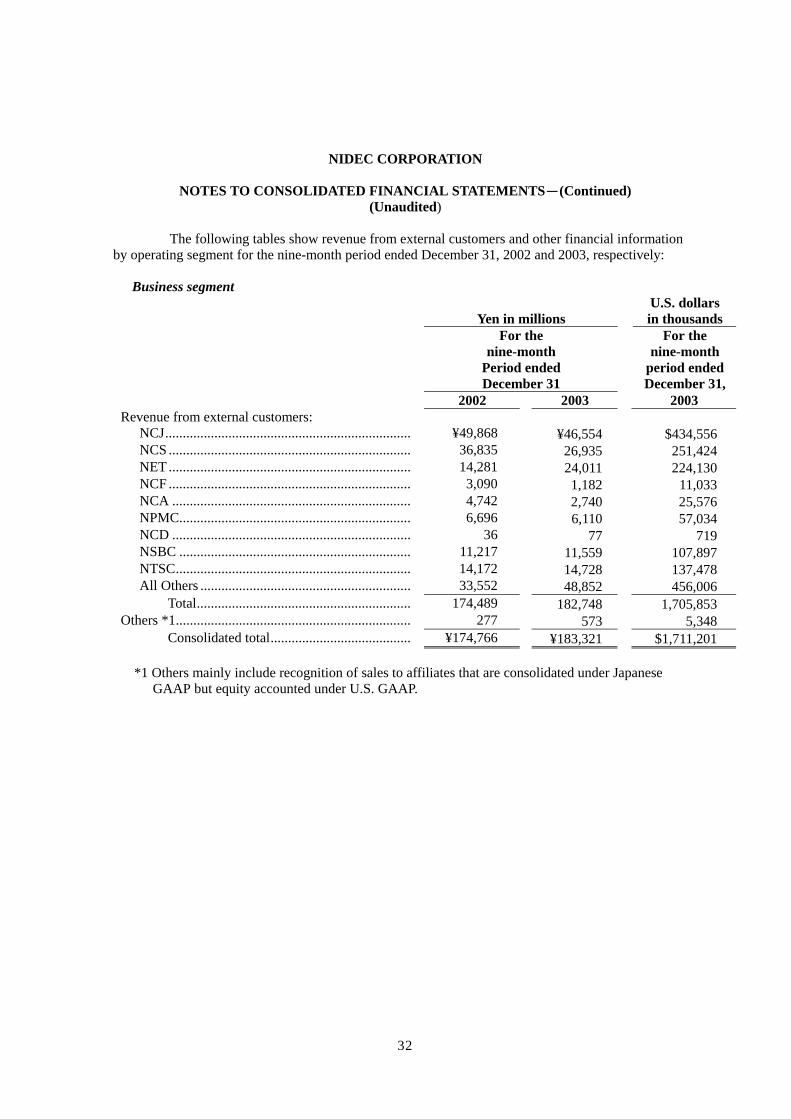
The following tables show revenue from external customers and other financial informationby operating segment for the nine-month period ended December 31, 2002 and 2003, respectively:
Business segment
Yen in millionsU.S. dollarsin thousands
For thenine-month
Period endedDecember 31
For thenine-month
period endedDecember 31,
2002 2003 2003Revenue from external customers:
NCJ...................................................................... ¥49,868 ¥46,554 $434,556NCS ..................................................................... 36,835 26,935 251,424NET ..................................................................... 14,281 24,011 224,130NCF ..................................................................... 3,090 1,182 11,033NCA .................................................................... 4,742 2,740 25,576NPMC.................................................................. 6,696 6,110 57,034NCD .................................................................... 36 77 719NSBC .................................................................. 11,217 11,559 107,897NTSC................................................................... 14,172 14,728 137,478All Others ............................................................ 33,552 48,852 456,006
Total............................................................. 174,489 182,748 1,705,853Others *1................................................................... 277 573 5,348
Consolidated total........................................ ¥174,766 ¥183,321 $1,711,201
*1 Others mainly include recognition of sales to affiliates that are consolidated under JapaneseGAAP but equity accounted under U.S. GAAP.
33
NIDEC CORPORATION
NOTES TO CONSOLIDATED FINANCIAL STATEMENTS-(Continued)(Unaudited)
Yen in millionsU.S. dollarsin thousands
For thethree-monthperiod endedDecember 31
For thethree-monthperiod endedDecember 31,
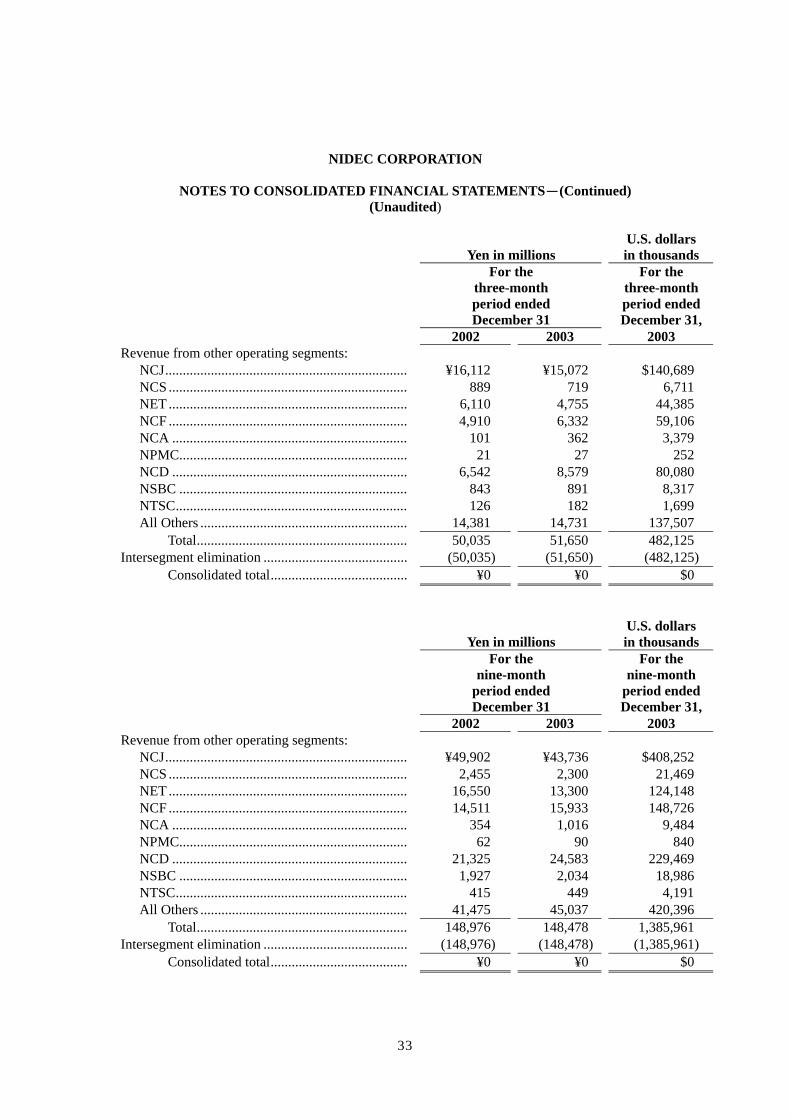
2002 2003 2003Revenue from other operating segments:
NCJ..................................................................... ¥16,112 ¥15,072 $140,689NCS .................................................................... 889 719 6,711NET .................................................................... 6,110 4,755 44,385NCF .................................................................... 4,910 6,332 59,106NCA ................................................................... 101 362 3,379NPMC................................................................. 21 27 252NCD ................................................................... 6,542 8,579 80,080NSBC ................................................................. 843 891 8,317NTSC.................................................................. 126 182 1,699All Others ........................................................... 14,381 14,731 137,507
Total............................................................ 50,035 51,650 482,125Intersegment elimination ......................................... (50,035) (51,650) (482,125)
Consolidated total....................................... ¥0 ¥0 $0
Yen in millionsU.S. dollarsin thousands
For thenine-month
period endedDecember 31
For thenine-month
period endedDecember 31,
2002 2003 2003Revenue from other operating segments:
NCJ..................................................................... ¥49,902 ¥43,736 $408,252NCS .................................................................... 2,455 2,300 21,469NET .................................................................... 16,550 13,300 124,148NCF .................................................................... 14,511 15,933 148,726NCA ................................................................... 354 1,016 9,484NPMC................................................................. 62 90 840NCD ................................................................... 21,325 24,583 229,469NSBC ................................................................. 1,927 2,034 18,986NTSC.................................................................. 415 449 4,191All Others ........................................................... 41,475 45,037 420,396
Total............................................................ 148,976 148,478 1,385,961Intersegment elimination ......................................... (148,976) (148,478) (1,385,961)
Consolidated total....................................... ¥0 ¥0 $0
34
NIDEC CORPORATION
NOTES TO CONSOLIDATED FINANCIAL STATEMENTS-(Continued)(Unaudited)
Yen in millions
U.S. dollarsin thousands
For thethree-monthPeriod endedDecember 31
For thethree-monthPeriod endedDecember 31,
2002 2003 2003Segment profit or loss:
NCJ..................................................................... ¥1,152 ¥502 $4,686NCS .................................................................... 524 651 6,077NET .................................................................... 794 2,139 19,966NCF .................................................................... 351 514 4,798NCA ................................................................... 71 69 644NPMC................................................................. 77 149 1,391NCD ................................................................... 640 776 7,244NSBC ................................................................. 7 44 411NTSC.................................................................. 178 329 3,071All Others ........................................................... 1,324 1,889 17,632
Total............................................................ 5,118 7,062 65,920U.S. GAAP adjustments to accrue pension and
severance costs ................................................... 54 23 215Consolidation adjustments mainly related to
elimination of intercompany profits ................... 152 (24) (224)Reclassification *1 (143) (444) (4,145)Others *2.................................................................. (68) 29 271
Consolidated total....................................... ¥5,113 ¥6,646 $62,037
*1 Loss on disposal of fixed assets was reclassified from other expenses and included in operatingexpenses.
*2 Others mainly include other U.S. GAAP adjustments.

35
NIDEC CORPORATION
NOTES TO CONSOLIDATED FINANCIAL STATEMENTS-(Continued)(Unaudited)
Yen in millions
U.S. dollarsin thousands
For thenine-month
Period endedDecember 31
For thenine-month
Period endedDecember 31,
2002 2003 2003Segment profit or loss:
NCJ..................................................................... ¥3,636 ¥1,148 $10,716NCS .................................................................... 1,510 1,644 15,346NET .................................................................... 1,885 5,977 55,792NCF .................................................................... 867 1,095 10,221NCA ................................................................... 148 148 1,381NPMC................................................................. 269 262 2,446NCD ................................................................... 2,446 2,179 20,340NSBC ................................................................. (262) 468 4,369NTSC.................................................................. 445 974 9,092All Others ........................................................... 2,953 5,241 48,921
Total............................................................ 13,897 19,136 178,624U.S. GAAP adjustments to accrue pension and
severance costs ................................................... 157 66 616Consolidation adjustments mainly related to
elimination of intercompany profits ................... (187) (349) (3,258)Reclassification *1 (686) (1,289) (12,032)Others *2.................................................................. 145 408 3,809
Consolidated total....................................... ¥13,326 ¥17,972 $167,759
*1 Loss on disposal of fixed assets was reclassified from other expenses and included in operatingexpenses.
*2 Others mainly include other U.S. GAAP adjustments.
36
NIDEC CORPORATION
NOTES TO CONSOLIDATED FINANCIAL STATEMENTS-(Continued)(Unaudited)
12. Subsequent events:
On January 26, 2004, the Company obtained approval to transfer the obligation for benefitsrelated to future employee service to the Japanese Government. The obligation relates to a portion of thegovernmental welfare pension program established under the Japanese Welfare Pension Insurance Law.The Company is also in the process of transferring the obligation for past services but has not receivedapproval. Nidec Copal Corporation, an affiliated company, is also in the process of transferring itsobligation for benefits for past services. When approval is received and the plan assets are transferred inamount sufficient to settle the transferred obligations, the plan will be accounted for as settled with gainor loss recognition under EITF Issue No. 03-2, “Accounting for the Transfer to the JapaneseGovernment of the Substitutional Portion of Employee Pension Fund Liabilities”. EITF Issue No. 03-2provides guidance on when and how to account for arrangements that involve the separation andtransfer of the substitutional portion to the government.
As of February 2, 2004, the Company has purchased 871,000 shares of common stock in oneof its equity method consolidated subsidiaries, Nidec Copal Electronics Corporation (“Nidec CopalElectronics”), whose shares are listed on the Second Section of Tokyo Stock Exchange. As a result, totalnumber of shares held by the Company is 8,289,000 shares.
On December 8, 2003, the Company held a meeting of its board of directors and resolved topurchase newly issued shares of common stock (“Shares”) in Sankyo Seiki Mfg. Co., Ltd. (“Sankyo”)to make Sankyo its consolidated subsidiary under the Japanese GAAP (the “Share Purchase”). OnFebruary 13, 2004, the Company purchased 4,728,000 shares of common stock in one of its equitymethod subsidiaries, Sankyo, whose shares are listed on the First Section of Tokyo Stock. As a result,total number of Sankyo shares held by the Company is 92,028,000 shares.


