Embed Size (px)
Citation preview
ARTICLE IN PRESS
Journal of Biomechanics 41 (2008) 2821–2828
Contents lists available at ScienceDirect
journal homepage: www.elsevier.com/locate/jbiomech
Journal of Biomechanics
0021-92
doi:10.1
� Corr
E-m
www.JBiomech.com
Neuromuscular neutral zones response to cyclic lumbar flexion
Deborah Solomonow a,b, Bradley Davidson a, Bing He Zhou a, Yun Lu a,Vikas Patel a, Moshe Solomonow a,�
a Musculoskeletal Disorders Research Laboratory, Bioengineering Division, Department of Orthopaedic Surgery, Health Sciences Center, University of Colorado, Denver,
12800 E. 19th Avenue, P.O. Box 6511, Aurora, CO 80045, USAb Division of Engineering, Colorado School of Mines, Golden, CO 80401,USA
a r t i c l e i n f o
Article history:
Accepted 10 July 2008The in vivo lumbar spine of the anaesthetized feline was subjected to passive cyclic anterior
flexion–extension at 0.25 Hz and 40 N peak load for cumulative 60 min duration. Displacement (or
Keywords:
Spine
Lumbar
Stability
Muscles
EMG
90/$ - see front matter & 2008 Elsevier Ltd. A
016/j.jbiomech.2008.07.010
esponding author. Tel.: +1303 724 0383; fax:
ail address: [email protected] (M
a b s t r a c t
displacement neuromuscular neutral zones—DNNZ) and tension (or tension neuromuscular neutral
zones—TNNZ) at which reflexive EMG activity from the multifidi muscles was initiated and terminated
were recorded, for single-test cycles, before and for 7 h after cyclic loading. Displacement and tension
NNZs increased significantly after loading. The displacement NNZs decreased exponentially to near
baseline by the 7th hour of rest. The tension NNZs, however, decreased to below the baseline by the 2nd
to 3rd hour after loading and continued decreasing into the 7th hour. Peak EMG significantly decreased
(49–57%) to below the baseline immediately after loading and then exponentially increased, exceeding
the baseline by the 2nd to 3rd hour and reaching 33–59% above baseline by the 7th hour. EMG median
frequency decreased after loading and then exceeded the baseline after the 3rd hour, indicating initial
de-recruitment, followed by recruitment of new motor units. These findings suggest that the lumbar
spine was exposed to instability for 2–3 h after cyclic loading, due to concurrent laxity of the viscoelastic
tissues and deficient muscular activity. A delayed neuromuscular compensation mechanism was found
to exist, triggering the musculature significantly earlier and at higher magnitude than baseline, while
the viscoelastic tissues were still lax. Thus, it is suggested that prolonged cyclic loading may
compromise lumbar stability during the immediate 2–3 h post-loading, increasing the risk of injury.
& 2008 Elsevier Ltd. All rights reserved.
1. Introduction
Spinal stability is a complex issue, the full extent of which isnot fully delineated (Adams, 2007). One component of thestructural stability of the intervertebral joints is composed ofthe effects of the viscoelastic properties of the ligaments, discsand facet capsules. When vertebrae are displaced relative to eachother, the various viscoelastic tissues deform and generate tensionexpressed as resistance to destabilizing motion. This passiveproperty of the viscoelastic tissues is minimal for small perturba-tions about the neutral position and sharply increases for largerdisplacements. Panjabi (1996, 1992) designated the range of smallperturbation where the viscoelastic tissues are minimally engagedas neutral zones (NZ) within which the spine is inherently stable.
Another important component of spine stability is thecontribution of the muscles and their motor control (Panjabi,1996; Reeves et al., 2007; Adams, 2007). Recently, (Eversull et al.,2001; Solomonow et al., 2001) described the neuromuscular
ll rights reserved.
+1303 724 0394.
. Solomonow).
neutral zones (NNZ), where passive intervertebral motion above acertain displacement or a load above a certain magnitude, triggersthe reflexive activation of the musculature to preserve thestability (Stubbs et al., 1998; Solomonow et al., 1998). Under suchdefinition, initiation of muscular activity at a higher displacement(Displacement NNZ) or higher tension (Tension NNZ) than normalis indicative of a decrease or deficiency in stability, as moremotion is performed without the protection of the musculature.Conversely, decrease in the displacement or tension level, or lowerdisplacement or tension NNZ, is indicative of increased stability.To date, it was shown that the NNZ during flexion are smaller thanduring extension and that the NNZ display a gradual decreaseconcurrent with EMG increase as the velocity of spinal flexio-n–extension increases.
Cyclic/repetitive sports and occupational activities were shownto trigger high rates of musculoskeletal disorders when performedover long periods (Marras, 2000; Silverstein et al., 1986; Punnettet al., 1991; Hoogendoorn et al., 2000). The epidemiology wasrecently confirmed biomechanically and physiologically in in vivo
models (Navar et al., 2006; Le et al., 2007; Hoops et al., 2007) andin humans (Granata et al., 2005, 1999; Olson et al., 2004, 2006, inpress; Shin and Mirka, 2007; Li et al., 2007; Dickey et al., 2003;
ARTICLE IN PRESS
D. Solomonow et al. / Journal of Biomechanics 41 (2008) 2821–28282822
Karajcarski and Wells, 2006). Prolonged periods of exposure tocyclic lumbar loading were shown to develop substantial laxity/creep in the viscoelastic tissues and in turn, significant changes inthe activation pattern of the spinal musculature. A disorderconsisting of spasms, temporary attenuation of muscle activityfollowed by hyperexcitability was observed. It is expected thatcyclic activity of the lumbar spine may also elicit pronouncedchanges in the NNZ and elicit pronounced changes in spinalstability.
We hypothesize that 60 min of cyclic lumbar loading at amoderate load will cause significant enlargement of the NNZ,immediately after loading and that several hours of rest will berequired to restore normal NNZ. We further predict thatpronounced changes may be observed in the EMG amplitudeand its motor control when comparing it before and after cyclicloading.
Such information can afford new insights into the changes inthe motor control responsible for the stability of the lumbar spineafter cyclic work, the potential for injury and development of ameans for its prevention, as well as baseline data for design of safework scheduling.
2. Methods
2.1. Preparation
Seven adult cats, with an average weight of 3.9570.37 kg, were used in this
study. They were anesthetized with 60 mg/kg chloralose, according to a protocol
approved by the Institutional Animal Care and Use Committee. A superficial skin
incision overlying the lumbar spine was made to expose the dorso-lumbar fascia,
and an S-shaped stainless steel hook made of 1.5-mm-diameter rod was applied
around the supraspinous ligament between L4 and L5. The preparation was then
positioned in a rigid stainless steel frame and the lumbar spine was isolated by
means of two external fixators, which were applied to the L1 and L7 posterior
process, respectively. The external fixation was intended to limit the elicited
flexion to the lumbar spine and to prevent interaction of thoracic and sacral and/or
pelvic structures, but not to prevent any motion.
2.2. Instrumentation
Three pairs of stainless steel fine wire EMG electrodes (interelectrode distance:
3–4 mm) were inserted into the right L3–4, L4–5 and L5–6 multifidus muscles
L1 L2 L3 L
R1 R2 RN-1
P1 P2 P3
rp1 rp2 rp3
Load / Rest PeriodPre-Load
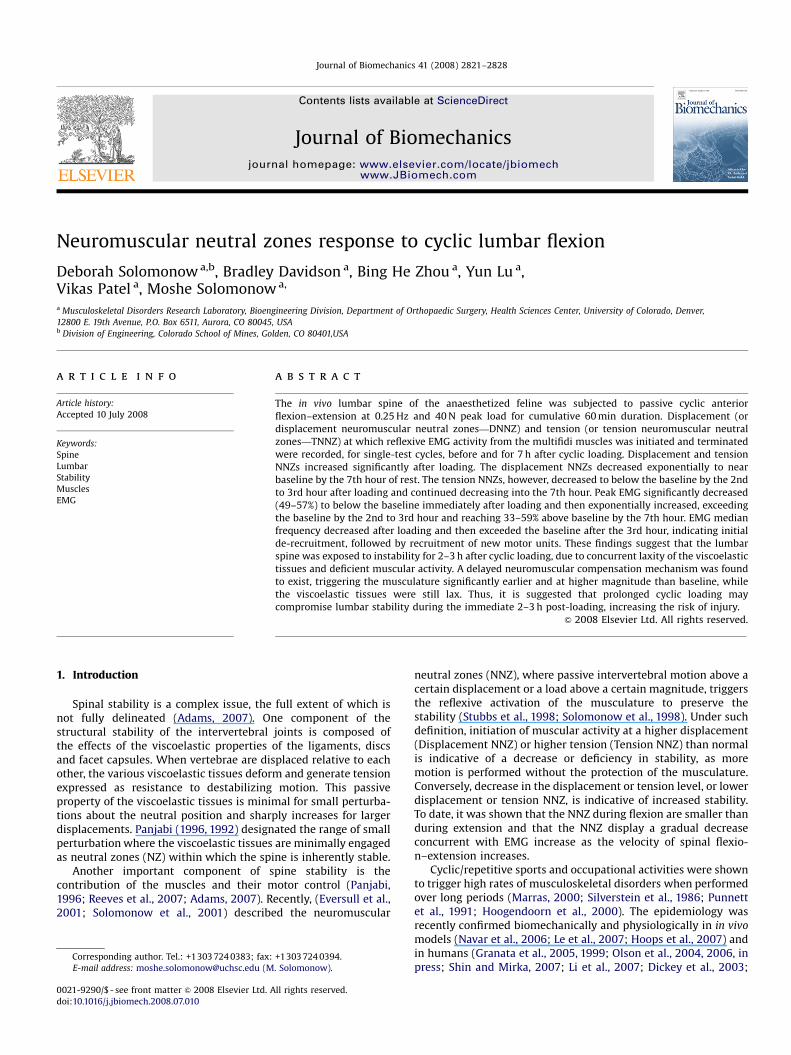
Rest Periods During Recovery: r0 = 10 min, r1 = 20
ri = 60 min for i = 3
(Note: Time Base not to Scale)
Rest Periods During Pre-Load: rp1, rp2, rp3 = 10 min
Loading Periods: L1, L2, ..., LN = 40 N @f for 10 mi
Rest Periods During Loading: R1, R2, ... RN-1 = 10
Single-CycleTests During Recovery Period: T1, T2,
f = 0.25 HzPre-Load Cycles: P1, P2, P3 = 40 N @f
# of Loading Periods: N = 6
Fig. 1. Loading sequence schema
6–8 mm laterally from the posterior spinal processes. A ground electrode was
inserted into the gluteus muscle. Each electrode pair constituted the input to a
differential EMG amplifier with a 110 dB common mode rejection ratio, a gain of up
to 200,000 and a band-pass filter in the range of 6–500 Hz. The EMG was recorded
with a sampling rate of 1000 Hz, and it was continuously monitored on an
oscilloscope. The S-shaped stainless steel hook inserted around the L4�5
supraspinous ligament was connected to the crosshead of the Bionix 858 material
testing system (MTS, Minneapolis, MN), in which a load cell was located. The load
was applied through the MTS actuator with a computer-controlled loading system
and monitored continuously along with the vertical displacement of the actuator.
The load cell and displacement outputs of the Bionix 858 MTS were also sampled
into the computer at 1000 Hz, along with the EMG signals.
Under such loading condition, the lumbar spine underwent anterior flex-
ion–extension while straining the supraspinous, intraspinous and posterior
longitudinal ligaments as well as the ligamentum flavum, facet capsule and
dorso-lumbar fascia. The discs in the lumbar spine were also deformed, expanding
in their dorsal aspects while narrowing in their ventral aspects during the flexion
phase. Overall, the neuromuscular response represents the reflexive activation of
several lumbar viscoelastic components similar to those active during flexion–
extension.
2.3. Protocol
A pre-load of 1 N was applied just prior to each single period of cyclic loading
in order to produce a standard baseline across all preparations. Initially, single
cycles of 40 N peak load at 0.25 Hz were applied with a 10 min rest at no load
between each cycle. This phase was performed to establish the normal NZ before
cyclic loading. Following, a set of six 10 min cyclic loading periods at 40 N peak,
each followed by 10 min rest was applied for a cumulative cyclic loading period of
60 min. The following recovery phase consisted of 7 h of rest at no load, during
which single-test cycles of 40 N peak load at 0.25 Hz were applied. The single
cycles were applied at 10, 30 and 60 min after the cyclic loading phase terminated,
and then once at every hour. Overall, 9 test cycles were applied during the 7 h
recovery period. Fig. 1 shows the schematic representation of the cyclic loading
with the single-cycle tests before and after. EMG, load and displacement were
recorded throughout the protocol.
2.4. Data analysis
The analysis considered the recorded EMG, vertical displacement and cyclic
load applied to the supraspinous ligament during the three pre-loading cycles and
the nine cycles during the recovery period. Each cycle was analyzed in a 5 s
window including 0.5 s before and 0.5 s after the 4 s cycle (0.25 Hz). EMG threshold
analysis was performed as follows: The first 500 ms of each EMG record, which
was before the initiation of movement by the actuator, was used as a benchmark
for baseline EMG signal level. The mean absolute value (MAV) of this baseline was
calculated: the signal recorded from each lumbar level was full wave rectified and
N
7 Hours Recovery Period
min, r2 = 30 min,
to 8
n
min
... Tn = 40 N @f
r0 r1 r2 r3 r4 r5 r8
T1 T2 T3 T4 T5 T6 T9
tic and protocol parameters.
ARTICLE IN PRESS
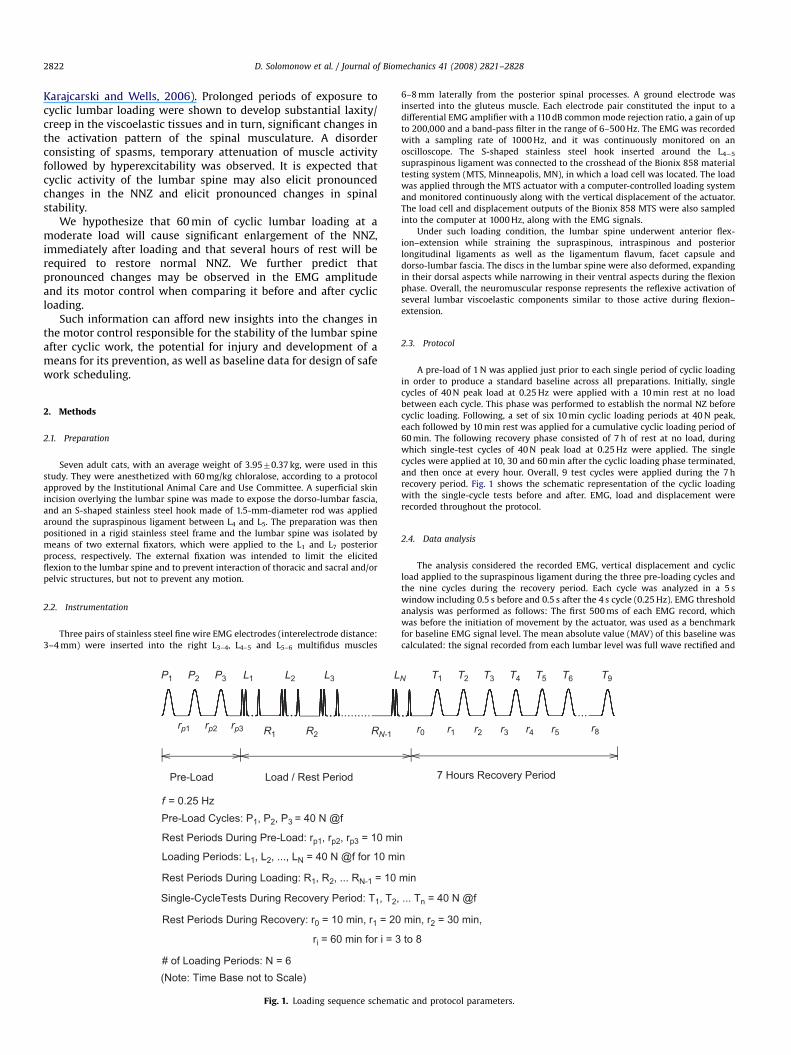
Fig. 2. Typical recording of raw EMG from L-3/4, L-4/5 and L-5/6, and corresponding tension and displacement vs. time during entire loading sequence.
D. Solomonow et al. / Journal of Biomechanics 41 (2008) 2821–2828 2823
smoothed with a 200 ms moving average filter (every 10 points) to yield the EMG
MAV. The filter was centered on the window under consideration in order to
prevent any time lags from affecting the data. After the initial 0.5 s period, any
point along the absolute value (full wave rectified) of the EMG during the given
cycle that exceeded three times the baseline MAV was denoted as the threshold of
activity in that channel. The corresponding tension and displacement values
during the stretch phase (increasing load) of the cycle were recorded as the tension
neuromuscular neutral zone (TNNZ) and displacement neuromuscular neutral
zone (DNNZ) DNNZ threshold values for that particular trial and lumbar level.
Similarly, as the EMG dropped below the three times baseline MAV threshold in
the release phase (decreasing load) of the cycle, the corresponding tension and
displacement were recorded as the TNNZ and DNNZ thresholds of cessation of
activity. This automatic procedure was visually supervised to ensure that any
unexpected signal artifacts were not detected as thresholds. Furthermore, in cases
where the EMG traces included spasms along the baseline, or the EMG discharge
during the flexion–extension was below three times the baseline (for example, see
Fig. 2, L-3/4 level, 110–170 min interval), the thresholds were determined visually.
The DNNZ and TNNZ from corresponding cycles during the recovery period for
each of the preparations were pooled across lumbar level, and the mean (7SD)
were calculated and plotted as a function of time. The DNNZ and TNNZ of the three
cycles applied before cyclic loading was initiated were averaged for each
preparation to yield a mean and SD, and then pooled with those of the other
preparations to use as the pre-loading NNZ baselines.
The peak MAV (PMAV) of the first three cycles recorded before cyclic loading
was used as a normalization value for the PMAV recorded in the test cycles of the
same preparation during the 7 h recovery period. A single-peak value was
determined for each cycle. The normalized values of all the preparations were
pooled, and the mean (7SD) was calculated and plotted as normalized PMAV vs.
time (Fig. 6) to assess whether the contraction level increased or decreased
because of cyclic loading.
EMG median frequency (MF) was found for each single-cycle test in order to
identify changes in motor unit recruitment (Solomonow et al., 1990). A 500 ms
window, centered at the peak load of each cycle, within which EMG was
approximated as a stationary signal, was zero-padded on both sides. A Tukey
window was applied to the zero-padded data, the power spectral density of the
signal in this window was found via the fast Fourier transform, and the MF, defined
as the frequency that divides the area under the power spectral density in half, was
calculated. The MF values of all corresponding time points and lumbar levels were
pooled and plotted as mean MF vs. recovery time with the mean of the pre-loading
MF as baseline.
2.5. Statistics
Since multifidus segments are not innervated from multiple roots (MacIntosh
et al., 1986), the data was divided into three lumbar levels (L-3/4, L-4/5, L-5/6) for
statistical analyses. The DNNZ, TNNZ and PMAV data were visually inspected for
normality. If a distribution did not appear normal, an appropriate data
transformation was applied. Two-way repeated measures ANOVAs were used to
test for differences in the stretch and relaxation phases and changes over time of
the DNNZ and TNNZ. The independent variables included time (pre-cyclic loading,
recovery times) and loading phase (stretch, relaxation). All higher order factorial
terms were included in the statistical models to test for interaction of the
independent variables. One-way repeated measures ANOVAs were used to test for
changes over time in the EMG-based variables. The independent variables included
time (pre-cyclic loading, recovery times) and the dependent variables were
normalized PMAV and median frequency. Upon determining a significant
interaction or main effect, pair-wise comparisons were performed using a
Student’s t -test. Level of significance for all tests was set as p ¼ 0.05.
2.6. Modeling
The mean7SD values of the DNNZ, TNNZ, PMAV and MF during recovery for
each lumbar level were fit with exponential-based models, as they represent the
classical response of viscoelastic tissues (Solomonow et al., 2000).
The time-course of the DNNZ thresholds during the stretch phase and
relaxation phase of the test cycles during the recovery period were described by
DISPðtÞ ¼ D0 þ ðt � trÞDLðe�ðt�tr=t1 ÞÞ þ DMðe
�ðt�tr=t2 ÞÞ ftj120ptp530g (1)
where D0 is the intercept of the displacement (mm), DL affects the rise amplitude
(mm/s), DM is the amplitude of the decay dominating the end of the recovery
period (mm), (t�tr)DL(exp(�(t�tr/t1))) allows for a transient rise at the beginning
of the recovery period; t1 affects the rates of rise and fall (s); t2 is the exponential
time constant of the decay that dominates the end of the recovery period (min).
As noted above, the model was evaluated from the time point of 120–530 min,
which constitutes the 7 h of recovery post-static loading.
The time-course of the TNNZ thresholds during the stretch phase and
relaxation phase of the test cycles during the recovery period were described by
TENðtÞ ¼ T0 þ ðt � trÞTLðe�ðt�tr=t3 ÞÞ þ TMðe
�ðt�tr=t4 ÞÞ ftj120ptp530g (2)
where T0 is the intercept of the tension (N); TL affects the rise amplitude (N/s); TM
is the amplitude of the decay dominating the end of the recovery period(N);
(t�tr)TL(exp(�(t�tr/t3))) allows for a transient rise at the beginning of the
recovery period; t3 affects the rates of rise and fall (s); t4 is the exponential time
constant of the decay that dominates the end of the recovery period (min).
The time course of the PMAV during the recovery period were described by
PMAVðtÞ ¼
P0 þ PLðe�ðt�tr=t5ÞÞ þ PMð1� e�ðt�tr=t6 ÞÞ; totd
P0 þ PLðe�ðt�tr=t5ÞÞ þ PMð1� e�ðt�tr=t6 ÞÞ
þðt � tdÞPHðe�ðt�td=t7 ÞÞ; tXtd
ftj120ptp530g
8><>:
(3)
where P0 is the intercept of the PMAV; PL is the amplitude of the exponential
decay; PM is the amplitude of the exponential increase; t is time measured since
the beginning of the experiment (min); t5, t6 are exponential time constants
(min); tr is the time of the first recovery measurement (120 min);
(t�td)PHexp(�(t�td/t7)) is the hyperexcitability term. This term has a delayed
onset during the recovery period and is equal to zero when totd.
The model for the time course of the MF data was described by the equations
below:
MFðtÞ ¼
F0 þ FLðe�ðt�tr=t8 ÞÞ þ FMð1� e�ðt�tr=t9 ÞÞ; totd
F0 þ FLðe�ðt�tr=t8 ÞÞ þ FMð1� e�ðt�tr=t9 ÞÞ
þðt � tdÞFHðe�ðt�td=t10 ÞÞ; tXtd
ftj120ptp530g
8><>:
(4)
ARTICLE IN PRESS
D. Solomonow et al. / Journal of Biomechanics 41 (2008) 2821–28282824
where F0 is the intercept of the peak MF (Hz); FL is the amplitude of exponential
decay dominating beginning of recovery period (Hz); FM is the amplitude of
exponential increase following decay in beginning of recovery period (Hz); tr is the
time of first recovery measurement (120 min); td is the time of onset of
hyperexcitability (min); t8 is the exponential time constant of exponential decay
dominating beginning of recovery period (min); t9 is the exponential time
constant of exponential increase following decay in beginning of recovery period
(min); t10 is the exponential time constant of hyperexcitability term dominating
end of recovery period (min); FL(exp(�(t�tr/t8))) Allows for exponential decay
dominating beginning of recovery period; FM(1�exp(�(t�tr/t9))) Allows for
exponential increase following decay in beginning of recovery period;
(t�td)FH(exp(�(t�td/t10))). Hyperexcitability term with delayed onset dominating
end of recovery period (equal to zero when toTd).
Levenberg–Marquardt nonlinear regression algorithms were used to generate
the best-fit models, optimizing for the regression coefficient.
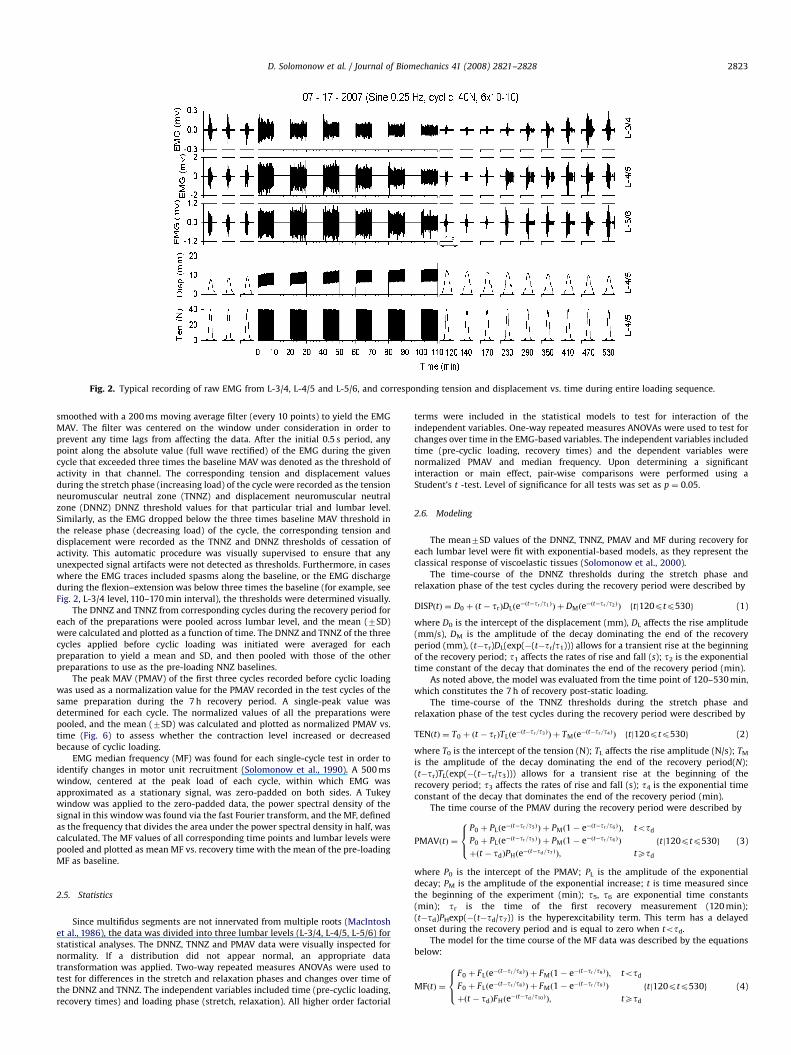
Fig. 3. Typical recording of EMG from L-3/4, L-4/5 and L-5/6 with superimposed
MAV and arrows indicating initiation and cessation NNZ thresholds, and
corresponding tension and displacement vs. time during single loading cycle.
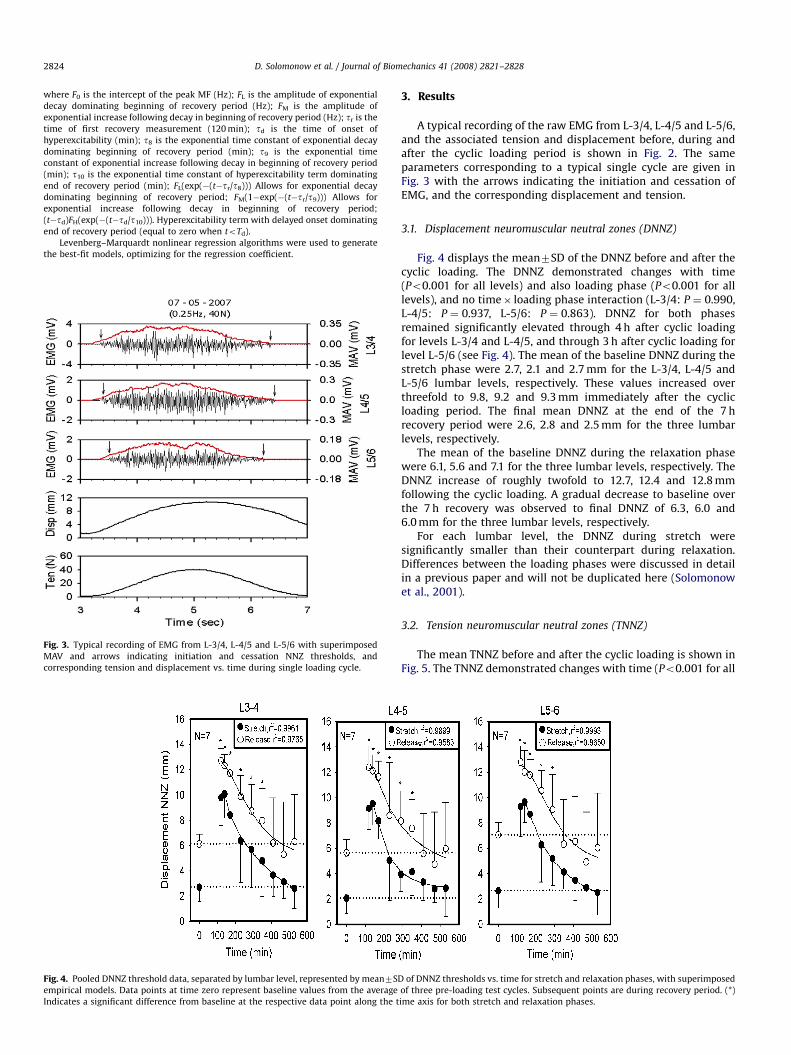
Fig. 4. Pooled DNNZ threshold data, separated by lumbar level, represented by mean7SD
empirical models. Data points at time zero represent baseline values from the average
Indicates a significant difference from baseline at the respective data point along the t
3. Results
A typical recording of the raw EMG from L-3/4, L-4/5 and L-5/6,and the associated tension and displacement before, during andafter the cyclic loading period is shown in Fig. 2. The sameparameters corresponding to a typical single cycle are given inFig. 3 with the arrows indicating the initiation and cessation ofEMG, and the corresponding displacement and tension.
3.1. Displacement neuromuscular neutral zones (DNNZ)
Fig. 4 displays the mean7SD of the DNNZ before and after thecyclic loading. The DNNZ demonstrated changes with time(Po0.001 for all levels) and also loading phase (Po0.001 for alllevels), and no time� loading phase interaction (L-3/4: P ¼ 0.990,L-4/5: P ¼ 0.937, L-5/6: P ¼ 0.863). DNNZ for both phasesremained significantly elevated through 4 h after cyclic loadingfor levels L-3/4 and L-4/5, and through 3 h after cyclic loading forlevel L-5/6 (see Fig. 4). The mean of the baseline DNNZ during thestretch phase were 2.7, 2.1 and 2.7 mm for the L-3/4, L-4/5 andL-5/6 lumbar levels, respectively. These values increased overthreefold to 9.8, 9.2 and 9.3 mm immediately after the cyclicloading period. The final mean DNNZ at the end of the 7 hrecovery period were 2.6, 2.8 and 2.5 mm for the three lumbarlevels, respectively.
The mean of the baseline DNNZ during the relaxation phasewere 6.1, 5.6 and 7.1 for the three lumbar levels, respectively. TheDNNZ increase of roughly twofold to 12.7, 12.4 and 12.8 mmfollowing the cyclic loading. A gradual decrease to baseline overthe 7 h recovery was observed to final DNNZ of 6.3, 6.0 and6.0 mm for the three lumbar levels, respectively.
For each lumbar level, the DNNZ during stretch weresignificantly smaller than their counterpart during relaxation.Differences between the loading phases were discussed in detailin a previous paper and will not be duplicated here (Solomonowet al., 2001).
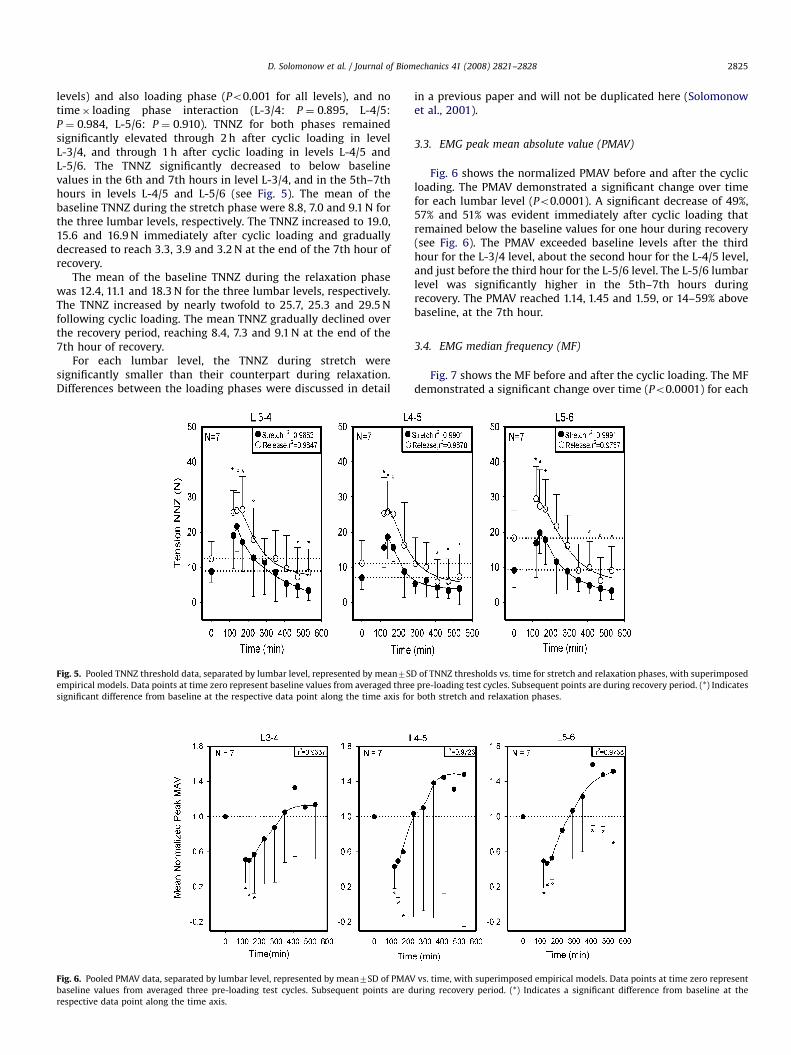
3.2. Tension neuromuscular neutral zones (TNNZ)
The mean TNNZ before and after the cyclic loading is shown inFig. 5. The TNNZ demonstrated changes with time (Po0.001 for all
of DNNZ thresholds vs. time for stretch and relaxation phases, with superimposed
of three pre-loading test cycles. Subsequent points are during recovery period. (*)
ime axis for both stretch and relaxation phases.
ARTICLE IN PRESS
D. Solomonow et al. / Journal of Biomechanics 41 (2008) 2821–2828 2825
levels) and also loading phase (Po0.001 for all levels), and notime� loading phase interaction (L-3/4: P ¼ 0.895, L-4/5:P ¼ 0.984, L-5/6: P ¼ 0.910). TNNZ for both phases remainedsignificantly elevated through 2 h after cyclic loading in levelL-3/4, and through 1 h after cyclic loading in levels L-4/5 andL-5/6. The TNNZ significantly decreased to below baselinevalues in the 6th and 7th hours in level L-3/4, and in the 5th–7thhours in levels L-4/5 and L-5/6 (see Fig. 5). The mean of thebaseline TNNZ during the stretch phase were 8.8, 7.0 and 9.1 N forthe three lumbar levels, respectively. The TNNZ increased to 19.0,15.6 and 16.9 N immediately after cyclic loading and graduallydecreased to reach 3.3, 3.9 and 3.2 N at the end of the 7th hour ofrecovery.
The mean of the baseline TNNZ during the relaxation phasewas 12.4, 11.1 and 18.3 N for the three lumbar levels, respectively.The TNNZ increased by nearly twofold to 25.7, 25.3 and 29.5 Nfollowing cyclic loading. The mean TNNZ gradually declined overthe recovery period, reaching 8.4, 7.3 and 9.1 N at the end of the7th hour of recovery.
For each lumbar level, the TNNZ during stretch weresignificantly smaller than their counterpart during relaxation.Differences between the loading phases were discussed in detail
Fig. 5. Pooled TNNZ threshold data, separated by lumbar level, represented by mean7SD
empirical models. Data points at time zero represent baseline values from averaged three
significant difference from baseline at the respective data point along the time axis for
Fig. 6. Pooled PMAV data, separated by lumbar level, represented by mean7SD of PMAV
baseline values from averaged three pre-loading test cycles. Subsequent points are d
respective data point along the time axis.
in a previous paper and will not be duplicated here (Solomonowet al., 2001).
3.3. EMG peak mean absolute value (PMAV)
Fig. 6 shows the normalized PMAV before and after the cyclicloading. The PMAV demonstrated a significant change over timefor each lumbar level (Po0.0001). A significant decrease of 49%,57% and 51% was evident immediately after cyclic loading thatremained below the baseline values for one hour during recovery(see Fig. 6). The PMAV exceeded baseline levels after the thirdhour for the L-3/4 level, about the second hour for the L-4/5 level,and just before the third hour for the L-5/6 level. The L-5/6 lumbarlevel was significantly higher in the 5th–7th hours duringrecovery. The PMAV reached 1.14, 1.45 and 1.59, or 14–59% abovebaseline, at the 7th hour.
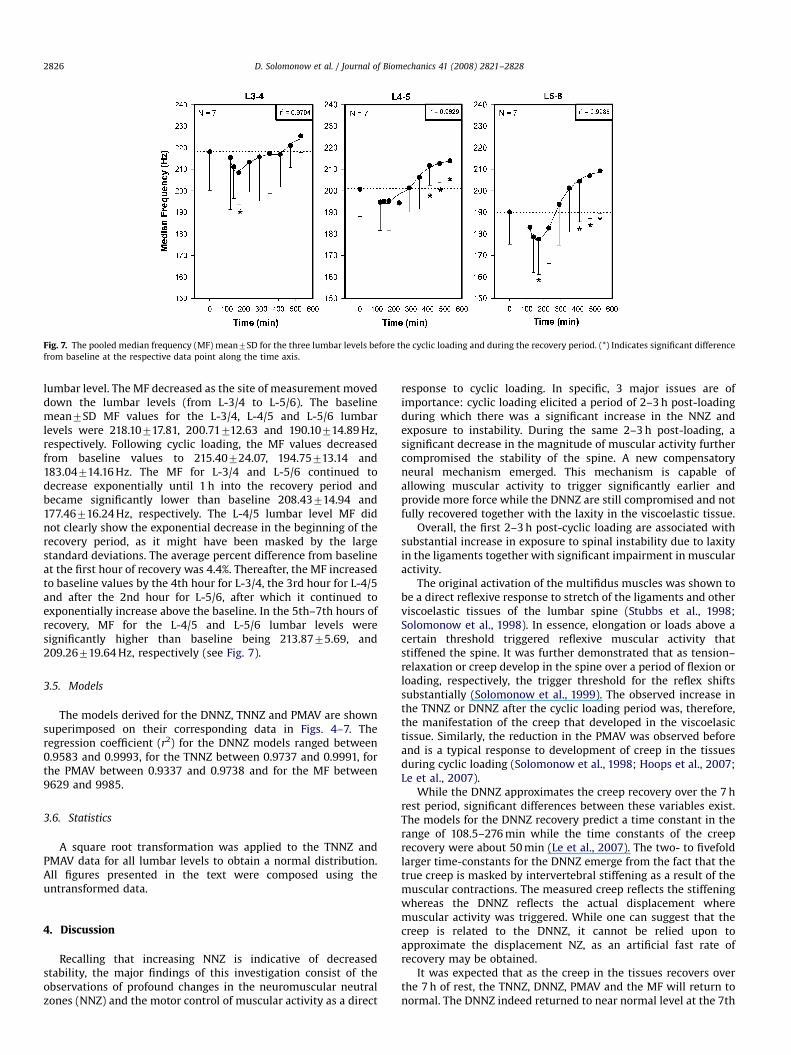
3.4. EMG median frequency (MF)
Fig. 7 shows the MF before and after the cyclic loading. The MFdemonstrated a significant change over time (Po0.0001) for each
of TNNZ thresholds vs. time for stretch and relaxation phases, with superimposed
pre-loading test cycles. Subsequent points are during recovery period. (*) Indicates
both stretch and relaxation phases.
vs. time, with superimposed empirical models. Data points at time zero represent
uring recovery period. (*) Indicates a significant difference from baseline at the
ARTICLE IN PRESS
Fig. 7. The pooled median frequency (MF) mean7SD for the three lumbar levels before the cyclic loading and during the recovery period. (*) Indicates significant difference
from baseline at the respective data point along the time axis.
D. Solomonow et al. / Journal of Biomechanics 41 (2008) 2821–28282826
lumbar level. The MF decreased as the site of measurement moveddown the lumbar levels (from L-3/4 to L-5/6). The baselinemean7SD MF values for the L-3/4, L-4/5 and L-5/6 lumbarlevels were 218.10717.81, 200.71712.63 and 190.10714.89 Hz,respectively. Following cyclic loading, the MF values decreasedfrom baseline values to 215.40724.07, 194.75713.14 and183.04714.16 Hz. The MF for L-3/4 and L-5/6 continued todecrease exponentially until 1 h into the recovery period andbecame significantly lower than baseline 208.43714.94 and177.46716.24 Hz, respectively. The L-4/5 lumbar level MF didnot clearly show the exponential decrease in the beginning of therecovery period, as it might have been masked by the largestandard deviations. The average percent difference from baselineat the first hour of recovery was 4.4%. Thereafter, the MF increasedto baseline values by the 4th hour for L-3/4, the 3rd hour for L-4/5and after the 2nd hour for L-5/6, after which it continued toexponentially increase above the baseline. In the 5th–7th hours ofrecovery, MF for the L-4/5 and L-5/6 lumbar levels weresignificantly higher than baseline being 213.8775.69, and209.26719.64 Hz, respectively (see Fig. 7).
3.5. Models
The models derived for the DNNZ, TNNZ and PMAV are shownsuperimposed on their corresponding data in Figs. 4–7. Theregression coefficient (r2) for the DNNZ models ranged between0.9583 and 0.9993, for the TNNZ between 0.9737 and 0.9991, forthe PMAV between 0.9337 and 0.9738 and for the MF between9629 and 9985.
3.6. Statistics
A square root transformation was applied to the TNNZ andPMAV data for all lumbar levels to obtain a normal distribution.All figures presented in the text were composed using theuntransformed data.
4. Discussion
Recalling that increasing NNZ is indicative of decreasedstability, the major findings of this investigation consist of theobservations of profound changes in the neuromuscular neutralzones (NNZ) and the motor control of muscular activity as a direct
response to cyclic loading. In specific, 3 major issues are ofimportance: cyclic loading elicited a period of 2–3 h post-loadingduring which there was a significant increase in the NNZ andexposure to instability. During the same 2–3 h post-loading, asignificant decrease in the magnitude of muscular activity furthercompromised the stability of the spine. A new compensatoryneural mechanism emerged. This mechanism is capable ofallowing muscular activity to trigger significantly earlier andprovide more force while the DNNZ are still compromised and notfully recovered together with the laxity in the viscoelastic tissue.
Overall, the first 2–3 h post-cyclic loading are associated withsubstantial increase in exposure to spinal instability due to laxityin the ligaments together with significant impairment in muscularactivity.
The original activation of the multifidus muscles was shown tobe a direct reflexive response to stretch of the ligaments and otherviscoelastic tissues of the lumbar spine (Stubbs et al., 1998;Solomonow et al., 1998). In essence, elongation or loads above acertain threshold triggered reflexive muscular activity thatstiffened the spine. It was further demonstrated that as tension–relaxation or creep develop in the spine over a period of flexion orloading, respectively, the trigger threshold for the reflex shiftssubstantially (Solomonow et al., 1999). The observed increase inthe TNNZ or DNNZ after the cyclic loading period was, therefore,the manifestation of the creep that developed in the viscoelasictissue. Similarly, the reduction in the PMAV was observed beforeand is a typical response to development of creep in the tissuesduring cyclic loading (Solomonow et al., 1998; Hoops et al., 2007;Le et al., 2007).
While the DNNZ approximates the creep recovery over the 7 hrest period, significant differences between these variables exist.The models for the DNNZ recovery predict a time constant in therange of 108.5–276 min while the time constants of the creeprecovery were about 50 min (Le et al., 2007). The two- to fivefoldlarger time-constants for the DNNZ emerge from the fact that thetrue creep is masked by intervertebral stiffening as a result of themuscular contractions. The measured creep reflects the stiffeningwhereas the DNNZ reflects the actual displacement wheremuscular activity was triggered. While one can suggest that thecreep is related to the DNNZ, it cannot be relied upon toapproximate the displacement NZ, as an artificial fast rate ofrecovery may be obtained.
It was expected that as the creep in the tissues recovers overthe 7 h of rest, the TNNZ, DNNZ, PMAV and the MF will return tonormal. The DNNZ indeed returned to near normal level at the 7th
ARTICLE IN PRESS
D. Solomonow et al. / Journal of Biomechanics 41 (2008) 2821–2828 2827
hour of recovery, yet the behavior of the TNNZ, PMAV and the MFwas completely different. Muscular activity was triggered at lowerthan baseline tension and at a higher level of activation after 2–3 hof rest. The TNNZ continued to decrease below baseline and thePMAV continued to increase above baseline with rest, reachingsaturation near the 6th–7th hour. The MF pattern followed that ofthe PMAV, increasing after the first 2–3 h of recovery andindicating that recruitment of larger motor units is taking place.
The models developed expose the link between the TNNZ,PMAV and MF: activation by the same source. The dominant timeconstant from mid to end of recovery of the three variables werenearly overlapping; TNNZ, T4, ranged from 100 to 280 min, T7 forthe PMAV ranged from 170 to 400 min and T10 of the MF rangedfrom 171 to 321 min. Essentially, the motor control activation ofthe compensatory mechanism recruited additional, larger motorunits after the 3rd hour of recovery, increasing the averageconduction velocity and therefore the MF of the EMG. This wasmanifested by the corresponding increase of the EMG amplitude,expressed by the PMAV, as well as by the corresponding earlyincrease in the tension, reflected by the TNNZ. Further confirma-tion that a single compensatory motor control triggered the TNNZ,PMAV and MF could be obtained from the Td associated with thecorresponding models. The Td values ranged from 224 to 294 min,indicating that the compensatory motor control was initiated andaffected all the above parameter simultaneously. Furthermore, thebehavior of the TNNZ, PMAV and MF trends could not beexplained by a simple ligamento-muscular reflex, as the viscoe-lastic tissues were still substantially lax by the 2nd or 3rd and upto the 7th hour of recovery. Increasing PMAV and MF withdecreasing TNNZ would require tightening of the viscoelastictissues above their baseline to elicit such an increase as a reflexiveresponse. Based on the observations above, it is becomingapparent that a different, compensatory neural control mode isactivated 2–3 h after cyclic loading.
The different neural control modes could be associated withthe clinical finding that tissue damage and the associated painresults in spasms, elevated muscular activity and joint stiffness(Pedersen et al., 1956; van Dieen et al., 2003). The work of Wooet al. (1981, 1982) demonstrated that cyclic creep of viscoelastictissues within the physiologic range is associated with micro-damage in the collagen fibrils. The viscoelastic tissue could beconsidered damaged in this experiment as it was exposed to60 min of cumulative cyclic loading. This neural control mode,therefore, may be triggered by the tissue damage and theassociated pain mechanism.
The micro-damage in the viscoelastic tissues could beclassified as sub-clinical for such physiological loads and dis-placements, yet was shown in humans to result in stiffening of thespine for several hours after the work was completed (Granataand Marras, 2000). Similarly, Olson et al. (2004, 2006), Li et al.(2007), Shin and Mirka (2007), Granata et al. (2005), Dickey et al.(2003) found that such significant changes in muscular activityoccur after moderate and mild cyclic loading in humans. Inessence, these complementary findings validate that the observa-tions made in this project, using an in vivo cat model, are also seenin humans subjected to similar loading conditions, and that mildloading dose duration can trigger such muscular responses.
In conclusion, a period of cyclic loading significantly increasedthe tension and displacement NZ while decreasing peak muscularactivity in the 2–3 h immediately after the work. This suggeststhat the lumbar spine is exposed to significant reduction instability control in that period. A compensatory neural controlmechanism is triggered by the 3rd hour post-cycling loading, andsignificantly enhanced the magnitude and timing of the muscularcontributions while allowing the viscoelastic tissues to recoverfrom the imposed creep for several hours longer.
Conflict of interest statement
There is no conflict of interest regarding the publication of thispaper.
Acknowledgment
This work was supported by Grant R01-OH-007622 from theNational Institute of Occupational Safety and Health.
References
Adams, M., 2007. Spine stability: the six blind men and the elephant. ClinicalBiomechanics 22, 486.
Dickey, J., McNorton, S., Potvin, J., 2003. Repeated spinal flexion modulates theflexion-relaxation phenomenon. Clinical Biomechanics 18, 783–789.
Eversull, E., Solomonow, M., Bing He Zhou, E.E., et al., 2001. Neuromuscular neutralzones sensitivity to lumbar displacement rate. Clinical Biomechanics 16,102–113.
Granata, K.P., Marras, W.S., 2000. Cost-benefit of muscle co-contraction inprotecting against spinal instability. Spine 25, 1398–1404.
Granata, K., Marras, W., Davis, K., 1999. Variation in spinal load and trunk dynamicsduring repeated lifting exertions. Clinical Biomechanics 14, 367–375.
Granata, K.P., Rogers, E., Moorhouse, K., 2005. Effects of static flexion-relaxation onparaspinal reflex behavior. Clinical Biomechanics 20, 16–24.
Hoogendoorn, W.E., Bongers, P.M., de Vet, H.C., et al., 2000. Flexion and rotation ofthe trunk and lifting at work are risk factors for low back pain: results of aprospective cohort study. Spine 25, 3087–3092.
Hoops, H., Zhou, B., Lu, Y., Solomonow, M., Patel, V., 2007. Short rest between cyclicflexion periods is a risk factor for lumbar disorder. Clinical Biomechanics 22,745–757.
Karajcarski, S., Wells, R., 2006. The time variation pattern of mechanical exposureand the reporting of low back pain. Theoretical Issues in Ergonomic Science,1–27.
Le, P., Solomonow, M., Zhou, B., Lu, Y., Patel, V., 2007. Cyclic load magnitude is a riskfactor for accumulative low back disorder. Journal of Occupational andEnvironmental Medicine 49, 375–387.
Li, L., Patel, N., Solomonow, D., Le, P., Hoops, H., Gerhardt, D., Johnson, K., Zhou, B.,Lu, Y., Solomonow, M., 2007. Neuromuscular response to cyclic lumbartwisting. Human Factors 49, 820–829.
MacIntosh, J., Valencia, F., Bogduk, N., Munro, R., 1986. The morphology of thehuman lumbar multifidus. Clinical Biomechanics 1, 196–204.
Marras, W.S., 2000. Occupational low back disorder causation and control.Ergonomics 43, 880–902.
Navar, D., Zhou, B., Lu, Y., Solomonow, M., 2006. High repetition of cyclic loading isa risk factor for lumbar disorders. Muscle and Nerve 34, 614–622.
Olson, M.W., Li, L., Solomonow, M., Interaction of viscoelastic tissue compliancewith lumbar muscles during passive cyclic flexion–extension. Journal ofElectromyography and Kinesiology, in press.
Olson, M.W., Li, L., Solomonow, M., 2004. Flexion-relaxation response to cycliclumbar flexion. Clinical Biomechanics 19, 769–776.
Olson, M., Solomonow, M., Li, L., 2006. Flexion-relaxation response to gravity.Journal of Biomechanics 39, 2545–2554.
Panjabi, M.M., 1992. The stabilizing system of the spine. 2. Neutral zone andinstability hypothesis. Journal of Spinal Disorders 5, 390–397.
Panjabi, M.M., 1996. Low back pain and spinal stability. In: Weinstein, J.N., Gordon,S.L. (Eds.), Low Back Pain: A Scientific and Clinical Overview. AmericanAcademy of Orthopedic Surgeons, Rosemont, IL, pp. 367–384.
Pedersen, H., Blunk, C., Gardner, E., 1956. The anatomy of lumbosacral posteriorrami and meningeal branches of spinal nerves. Journal of Bone and JointSurgery(A) 38, 377–391.
Punnett, L., Fine, L.J., Keyserling, W.M., et al., 1991. Back disorders and nonneutraltrunk postures of automobile assembly workers. Scandinavian Journal of Work,Environment and Health 17, 337–346.
Reeves, N.P., Narendra, K.S., Cholewicki, J., 2007. Spine stability: the six blind menand the elephant. Clinical Biomechanics 22, 266–274.
Shin, G., Mirka, G., 2007. An in-vivo assessment of the low back response toprolonged flexion: interplay between active and passive tissues. ClinicalBiomechanics 22, 965–971.
Silverstein, B.A., Fine, L.J., Armstrong, T.J., 1986. Hand wrist cumulative traumadisorders in industry. British Journal of Industrial Medicine 43,779–784.
Solomonow, M., Baten, C., Smit, J., Baratta, R.V., Hermens, H., D’Ambrosia, R., Shoji,H., 1990. EMG power spectra frequencies associated with motor unitrecruitment strategies. J Appl Physiology 68, 1177–1185.
Solomonow, M., Zhou, B., Harris, M., Lu, Y., Baratta, R., 1998. The ligament–mus-cular stabilizing system of the spine. Spine 23, 2552–2562.
Solomonow, M., Zhou, B.H., Baratta, R.V., et al., 1999. Biomechanics of increasedexposure to lumbar injury caused by cyclic loading: Part 1. Loss of reflexivemuscular stabilization. Spine 24, 2426–2434.

ARTICLE IN PRESS
D. Solomonow et al. / Journal of Biomechanics 41 (2008) 2821–28282828
Solomonow, M., Zhou, B., Baratta, R., Lu, Y., Zhu, M., Harris, M., 2000. Bi-exponentialrecovery model of lumbar viscoelastic laxity and reflexive muscular activity afterprolonged cyclic loading. Clinical Biomechanics 15, 167–175.
Solomonow, M., Eversull, E., He Zhou, B., et al., 2001. Neuromuscular neutral zonesassociated with viscoelastic hysteresis during cyclic lumbar flexion. Spine 26,E314–E324.
Stubbs, M., Harris, M., Solomonow, M., Zhou, B., Lu, Y., Baratta, R., 1998. Theligamento-muscular protective reflex in the lumbar Spine. Journal of Electro-myography and Kinesiology 8, 197–204.
van Dieen, J.H., Selen, L.P., Cholewicki, J., 2003. Trunk muscle activation in low-backpain patients, an analysis of the literature. Journal of Electromyography andKinesiology 13, 333–351.
Woo, S., Gomez, M., Amiel, D., Akeson, W., 1981. The effect of exercise on thebiomechanical and biochemical properties of swine digital flexor tendon.Journal of Biomechanical Engineering 103, 51–56.
Woo, S., Gomez, M., Woo, Y., Akeson, W., 1982. Mechanical properties of tendonsand ligaments; the relationships of exercise in tissue remodeling. Biorheology19, 379–408.


