Embed Size (px)
Citation preview
HIGHLIGHTED TOPIC Neural Control of Movement
Longer static flexion duration elicits a neuromuscular disorderin the lumbar spine
Rebecca LaBry, Paola Sbriccoli, Bing-He Zhou, and Moshe SolomonowOccupational Medicine Research Center, Bioengineering Laboratory, Department of OrthopaedicSurgery, Louisiana State University Health Sciences Center, New Orleans, Louisiana 70112
Submitted 7 November 2003; accepted in final form 20 January 2004
LaBry, Rebecca, Paola Sbriccoli, Bing-He Zhou, and MosheSolomonow.Longer static flexion duration elicits a neuromusculardisorder in the lumbar spine. J Appl Physiol 96: 2005–2015, 2004.First published January 23, 2004; 10.1152/japplphysiol.01190.2003.—The objective of this study was to assess the impact of twosequential long, static, anterior lumbar flexions on the development ofa neuromuscular disorder and to compare it with previously obtaineddata from a series of short static flexion periods of the same cumu-lative time (Sbriccoli P, Solomonow M, Zhou BH, Baratta RV, Lu Y,Zhu MP, and Burger EL, Muscle Nerve 29: 300–308, 2004). Staticflexions with loads of 20, 40, and 60 N were applied to the lumbarspine over two 30-min periods with a 10-min rest in between. Thereflex EMG activity from the multifidus muscles and supraspinousligament displacement (creep) was recorded during the flexion peri-ods. Creep and EMG were also monitored over 7 h of rest followingthe work-rest-work cycle. It was found that the creep that developedin the first 30-min flexion period did not recover completely duringthe following 10 min of rest, giving rise to a large cumulative creepat the end of the work-rest-work session. Spasms were frequently seenwithin the EMG during the static flexion. Initial and delayed hyper-excitabilities were observed in all of the preparations at any of thethree loads explored during the 7-h rest period. ANOVA revealed asignificant effect of time (P � 0.0001) on the postloading data. Largerloads elicited larger magnitudes of the initial and delayed hyperexcit-abilities, yet were not statistically different. It was concluded that the3:1 work-to-rest duration ratio resulted in a neuromuscular disorder,regardless of the load magnitude. The conclusions are reinforced inview of the results from a previous study using 60 min of flexionoverall but at 1:1 work-to-rest ratio in which only the highest loadelicited a delayed hyperexcitability (Sbriccoli et al., Muscle Nerve 29:300–308, 2004). An optimal dose-to-duration ratio needs to be estab-lished to limit, attenuate, or prevent the adverse effects of static loadon the lumbar spine while considering the loading duration as a majorrisk factor.
electromyography; muscle; lumbar; spine; disorder
CUMULATIVE TRAUMA DISORDER (CTD) is subjectively character-ized by joint pain, limited range of motion, and weakness(inability to generate forces or sustain loads within the physi-ological range). In the spine, objective diagnostic proceduresfail to identify vertebral fractures, herniated disk, facet jointimpingement, or stenosis within the canal, and so forth. Theepidemiological literature demonstrates that workers exposed
to static, cyclic, and vibratory occupational activities for ex-tended periods of time develop CTD (8, 19, 24). The epide-miology goes on to demonstrate additional correlations to theduration and magnitude of loads developed in such activitiesand the number of repetitions of the activity within a given day.Physiological and biomechanical experimental validation ofthe disorder and its dependence of the various risk factors, aswell as the tissues involved, is lacking.
Overall, it seems that a dose-duration formula may exist thatmay predict the relationships between CTD and the magnitudeof loads developed within the joint tissues, the duration overwhich the loads were applied, and the number of repetitionsthat such load over time was executed (6). Intuitively, a restperiod between sequential episodes of load sustained over timemay also play a prominent role in the development or preven-tion of CTD. Similarly, the overall period, in months or years,that a worker was exposed to such activity may also beincorporated as a major component of any dose-duration for-mula (15, 16).
Our laboratory’s initial research related to this issue devel-oped a feline model that could be used to gain new insights onthe biomechanics and physiology of CTD in the lumbar spine(2, 21, 28, 30, 32). So far, it was shown that passive static orcyclic flexion of the lumbar spine subjected to 10- to 20-minload resulted in the development of substantial creep in theviscoelastic tissues (ligaments, disks, facet capsule, dorsolum-bar fascia, etc.) during the flexion period and only partialrecovery of the creep over 7 h of following rest. The electro-myographic (EMG) manifestations of the flexion consisted ofa five-component neuromuscular disorder (26, 27). Exponen-tially decreasing reflexive EMG was present during the flexionperiod with randomly appearing spasms. During the following7-h rest, short-loading tests of 2 s revealed initial (during the1st h) and delayed (3–7 h into the rest) long-term hyperexcit-abilities. A slow exponential recovery of the EMG to itsnormal level was also present throughout the 7 h of rest.Pathological analysis of the lumbar supraspinous ligamentsrevealed that an acute inflammation gradually developed in thetissue, peaking in the 6–7 h of rest, as evidenced by as much as100 times higher neutrophil density than in controls (26). Thedata demonstrated that the delayed hyperexcitability and theincrease in neutrophil density were developing in parallel,suggesting that this hyperexcitability is the manifestation of the
Address for reprint requests and other correspondence: M. Solomonow,Occupational Medicine Research Center, Bioengineering Laboratory, Dept.of Orthopaedic Surgery, Louisiana State Univ. Health Sciences Center,2025 Gravier St., Suite 400, New Orleans, LA 70112 (E-mail:[email protected]).
The costs of publication of this article were defrayed in part by the paymentof page charges. The article must therefore be hereby marked “advertisement”in accordance with 18 U.S.C. Section 1734 solely to indicate this fact.
J Appl Physiol 96: 2005–2015, 2004.First published January 23, 2004; 10.1152/japplphysiol.01190.2003.
8750-7587/04 $5.00 Copyright © 2004 the American Physiological Societyhttp://www.jap.org 2005
by 10.220.33.3 on Septem
ber 2, 2016http://jap.physiology.org/
Dow
nloaded from
acute inflammation. It is conceivable that the ongoing presenceof acute inflammation in the spinal viscoelastic tissues willeventually become a chronic inflammation and result in thetissues’ degeneration as well as deterioration of its mechanicalproperties, displaying the CTD signs of limited range ofmotion, weakness, and pain (12, 15, 16).
Additional insights regarding CTD and its risk factors dem-onstrated that larger loads and more repetitions are associatedwith a significant increase in initial and delayed hyperexcit-ability and, therefore, acute inflammation (21, 22). Low loadsand fewer repetitions do not elicit the delayed hyperexcitabilityand/or inflammatory response when a schedule of 10-min workand 10-min rest was repeated three and six times but waspresent for nine times (22).
It is of interest to gain insight on the role of various durationsof load application as a risk factor for the development ofdelayed hyperexcitability and/or acute inflammation and,therefore, CTD in the long term. Because data relating thedevelopment of the neuromuscular disorder to a schedule of10-min work and 10-min rest repeated six times (for a cumu-lative work time of 60 min) are available for three loadsspanning the physiological range (20, 40, and 60 N) (21), adifferent schedule could be explored for comparison. A sched-ule of two 30-min work spaced by a 10-min rest, for example,will also allow a cumulative work time of 60 min, yet with alonger continuous exposure to the load and less rest.
It is hypothesized that passive spinal flexion with loadswithin the physiological range applied for two periods of 30min with a 10-min rest interval will elicit a neuromusculardisorder with a prominent delayed hyperexcitability and thatlarger load magnitudes will further contribute to the severity ofthe hyperexcitability. The additional insight gained from suchinformation may have sufficient impact on defining the array ofrisk factors of CTD and the design of work schedules that limit,attenuate, or prevent the disorder.
METHODS
Preparation. Twenty adult cats, 1–2 yr old, with average weight of4.51 kg, were used in this study. Cats were anesthetized with 60mg/kg chloralose, according to a protocol approved by the Institu-tional Animal Care and Use Committee. The skin overlying thelumbar spine was dissected to expose the lumbar fascia, and anS-shaped stainless steel hook made of 1.5-mm-diameter rod wasapplied around the supraspinous ligament between L4 and L5. Thepreparation was then positioned in a rigid stainless steel frame andfixed for subsequent EMG electrode insertion. Preparations weredivided into three experimental groups, each subjected to a differentload: 20 N (n � 6) for the first group, 40 N (n � 7) for the secondgroup, and 60 N (n � 7) for the third group.
Instrumentation. The lumbar spine was isolated by means of twoexternal fixators, which were applied to the L1 and L7 posteriorprocess, respectively. The external fixation was intended to limit theelicited flexion to the lumbar spine and to prevent interaction ofthoracic and sacral and/or pelvic structures but not to prevent anymotion.
Three pairs of fine stainless steel wire EMG electrodes (interelec-trode distance: 3–4 mm) were inserted in the right L3-L4, L4-L5, andL5-L6 multifidus muscles 8 mm laterally from the posterior spinalprocesses. A ground electrode was inserted into the gluteus muscle.Each electrode pair constituted the input to a differential EMGamplifier with a 110-dB common mode rejection ratio, a gain of up to200,000, and a band-pass filter in the range of 6–500 Hz. The EMGwas recorded with a sampling rate of 1,000 Hz, and it was continu-
ously monitored on an oscilloscope. The S-shaped stainless steel hookinserted around the L4-L5 supraspinous ligament was connected to thecrosshead of the Bionix 858 Material Testing System (MTS, Minne-apolis, MN), in which a load cell was located. The load was appliedthrough the MTS actuator with a computer-controlled loading system.The vertical displacement of the actuator was also monitored contin-uously. The load cell and displacement outputs of the Bionix 858MTS were sampled into the computer along with the EMG signals.
Protocol. The three experimental groups were subjected to the pro-tocol described below. A pretension of 1 N was applied to the supraspi-nous ligament to standardize the initial conditions in all of the differentpreparations (4). For each experimental group, a different constant load(20, 40, or 60 N) was applied to the lumbar spine via the S-shapedstainless steel hook. These different loads were chosen because theycovered the range between minimum (just above the reflex excitationthreshold load of the ligament) and maximum physiological strain, aspreviously described (2, 30). The tension level was maintained constantduring a 30-min loading period, followed by 10-min rest and by a second30-min loading period. The EMG signal, the vertical displacement, andthe load were recorded continuously during the loading periods. Nine 8-sloading tests were performed during the following 7 h of recovery. Eachgroup was loaded during the recovery with the same load used in the two30-s tests (see Fig. 1). This was obtained by a linear increase in tensionover 6 s followed by 2 s of constant load. The linear increase in load over6 s was used to avoid possible damage to the ligaments due to a suddenor fast stretch (17).
A 6-s ramp to the respective load of each of the three experimentalgroups was also applied in the initial loading of the 30-min workingperiods.
The same protocol was used for the three different loads (20, 40,and 60 N), and each preparation was subjected to only one load. TheEMG, load, and supraspinous ligament displacement data were thenstored in the computer for subsequent analysis.
Data analysis. The analysis of the EMG, vertical displacement, andthe static load applied to the supraspinous ligament was performedover 1.5-s epochs. During the two 30-min constant loads, the analysiswas performed at the very beginning of the loading period and thenevery 20 s for each 30-min static load. During the recovery phase, theanalysis was performed over the 2-s constant-load phase following the6-s ramp. To be confident that the load was fully applied, the first 0.5 sof the constant-load phase (2-s length) was discarded, and the analysiswas performed over the following 1.5 s. Each EMG sample wasintegrated over the 1.5-s epoch and normalized with respect to theintegrated EMG computed for the first window of the first 30-minconstant load to obtain the normalized integrated EMG (NIEMG). Foreach experimental group, all of the corresponding NIEMG data werepooled together, and the mean and SD values were computed andplotted on NIEMG vs. time for each of the muscles of the three lumbarlevels investigated. The displacement data were normalized to thedisplacement recorded at the beginning of the first 30-min loadingperiod. Then the corresponding normalized displacement data of eachof the experimental groups (20, 40, and 60 N) were pooled together asmeans (�SD) and plotted as normalized displacement vs. time.
Model. The model considered is based on our laboratory’s previouswork in which continuous 20-min static load was followed by a 7-hrecovery period (27, 29, 31). To convert the equations to describe aseries of work periods spaced by rest periods, two new time compo-nents are defined. Tw is the time period over which work (or load) wasperformed (or applied) by (to) the spine, which was 30 min in thisstudy. TR is the period of rest between the two work periods (Tw), 10min in this study. The equation describing the NIEMG behaviorduring each of the work periods is rewritten as
NIEMG(t) � Ane��t�n�TW�TR)]
Tn1 � �n�1�TW�nTR
n(TW�TR)� NIEMG0n (1)
where NIEMG(t) is the NIEMG as a function of time t; NIEMG0 isthe steady-state amplitude of the NIEMG; An is the amplitude of the
2006 STATIC FLEXION AND LUMBAR NEUROMUSCULAR DISORDER
J Appl Physiol • VOL 96 • MAY 2004 • www.jap.org
by 10.220.33.3 on Septem
ber 2, 2016http://jap.physiology.org/
Dow
nloaded from
exponential component of the NIEMG; and Tn1 is the time constant ofthe exponential component.
It was assumed that A and NIEMG0 are not constant throughout thework-rest session, i.e., A and NIEMG0 are changing from one workperiod to the next. It was also assumed that T1 might not be the samefor the two work periods.
Because this study employs only a 10-min rest, the first transientcomponent of the recovery equation will be dominant, and thesteady-state component contribution as well as the delayed hyperex-citability term can be neglected. During the rest period, therefore, theequation is modified as follows
NIEMG(t) � {t � [�n � 1�TW � nTR]}
� Bne �t���n�1�TW�nTR]
Tn2 � �n�1��TW�TR)�n�1�TW�nTR
� NIEMG0n (2)
where Bn is the amplitude of the exponential component of theNIEMG during recovery, and Tn2 is the time constant of the expo-nential.
The equation describing the development of displacement (Disp)(and indirect creep in the viscoelastic tissues) during the two workperiods spaced by a rest period is given by
Disp(t) � �D0n � DLn1 � e��t�n�TW�TR)]
Tn5 � � �n�1�TW�nTR
n�TW�TR) (3)
where D0n is the elastic component of amplitude; DLn is the viscoelas-tic component amplitude; and Tn5 is the time constant of the creepduring flexion.
Tn5, D0n and DLn were assumed to be variables. The recovery of thedisplacement during the rest period is described by
Disp(t) � D0n � Rn � �DLn � Rn�e�
t���n�1�TW � nTR]Tn6 � �n�1��TW�TR)
�n�1)TW�nTR(4)
where Rn is the residual creep at the end of each rest session, and Tn6 isthe time constant governing the recovery of creep in each rest session.
The long-term 7-h recovery after the work-rest-work session wasmodeled by the original equation for long-term recovery (2, 27).
Once the means � SD of the experimental data were calculated,attempts were made to generate the best-fit models described above byusing the Marquardt-Levenberg nonlinear regression algorithm. Insome cases, the algorithm failed to converge satisfactorily; in thesecases, initial or final values were determined by sequential recursiveiteration, optimizing for regression coefficient.
To test for the effect of the three protocols adopted (20, 40, and 60N) on the NIEMG and displacement data at the three lumbar levelsexplored (L3-L4, L4-L5, and L5-L6), a Fisher’s post hoc test wasadopted. Furthermore, a two-way ANOVA was performed to assessthe effect of time postloading and load magnitude on the recovery ofthe NIEMG and the displacement. Significance was set at 0.05 for allstatistical tests.
RESULTS
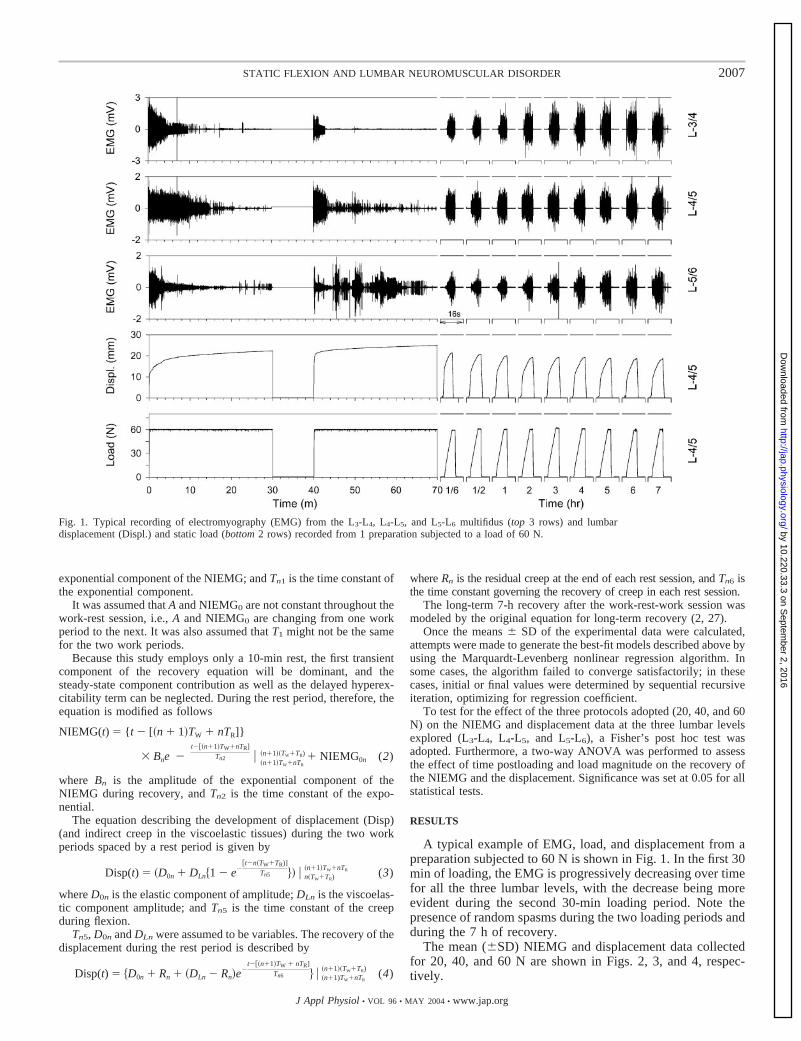
A typical example of EMG, load, and displacement from apreparation subjected to 60 N is shown in Fig. 1. In the first 30min of loading, the EMG is progressively decreasing over timefor all the three lumbar levels, with the decrease being moreevident during the second 30-min loading period. Note thepresence of random spasms during the two loading periods andduring the 7 h of recovery.
The mean (�SD) NIEMG and displacement data collectedfor 20, 40, and 60 N are shown in Figs. 2, 3, and 4, respec-tively.
Fig. 1. Typical recording of electromyography (EMG) from the L3-L4, L4-L5, and L5-L6 multifidus (top 3 rows) and lumbardisplacement (Displ.) and static load (bottom 2 rows) recorded from 1 preparation subjected to a load of 60 N.
2007STATIC FLEXION AND LUMBAR NEUROMUSCULAR DISORDER
J Appl Physiol • VOL 96 • MAY 2004 • www.jap.org
by 10.220.33.3 on Septem
ber 2, 2016http://jap.physiology.org/
Dow
nloaded from
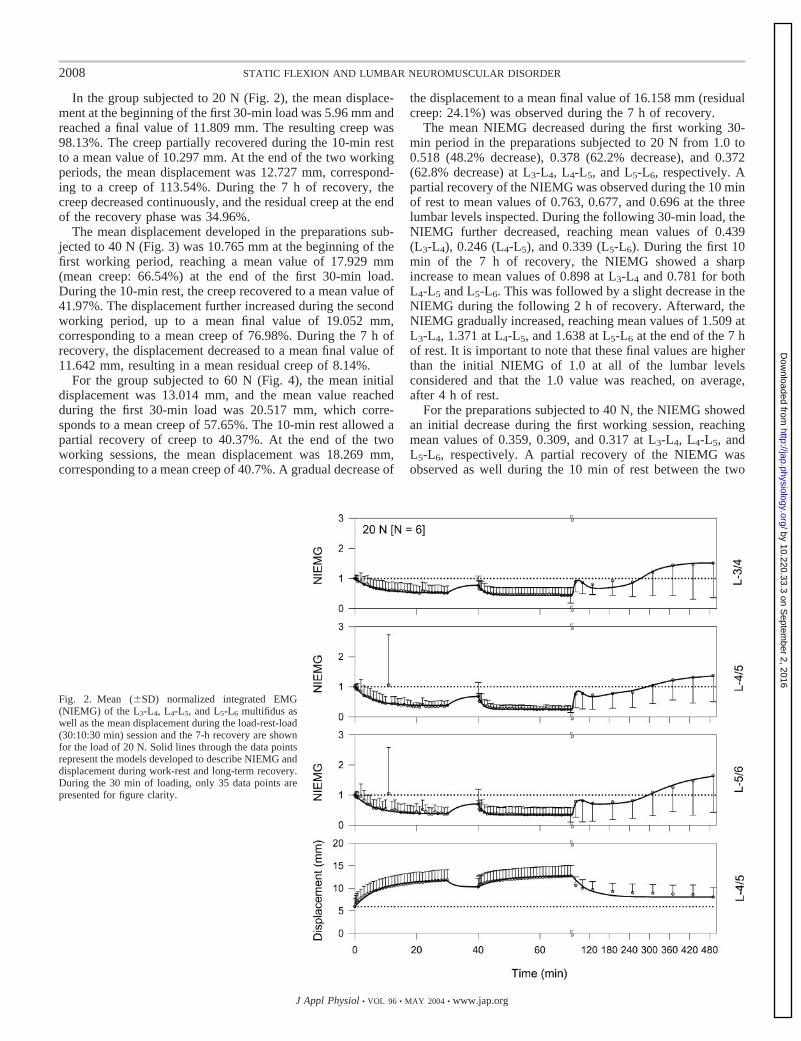
In the group subjected to 20 N (Fig. 2), the mean displace-ment at the beginning of the first 30-min load was 5.96 mm andreached a final value of 11.809 mm. The resulting creep was98.13%. The creep partially recovered during the 10-min restto a mean value of 10.297 mm. At the end of the two workingperiods, the mean displacement was 12.727 mm, correspond-ing to a creep of 113.54%. During the 7 h of recovery, thecreep decreased continuously, and the residual creep at the endof the recovery phase was 34.96%.
The mean displacement developed in the preparations sub-jected to 40 N (Fig. 3) was 10.765 mm at the beginning of thefirst working period, reaching a mean value of 17.929 mm(mean creep: 66.54%) at the end of the first 30-min load.During the 10-min rest, the creep recovered to a mean value of41.97%. The displacement further increased during the secondworking period, up to a mean final value of 19.052 mm,corresponding to a mean creep of 76.98%. During the 7 h ofrecovery, the displacement decreased to a mean final value of11.642 mm, resulting in a mean residual creep of 8.14%.
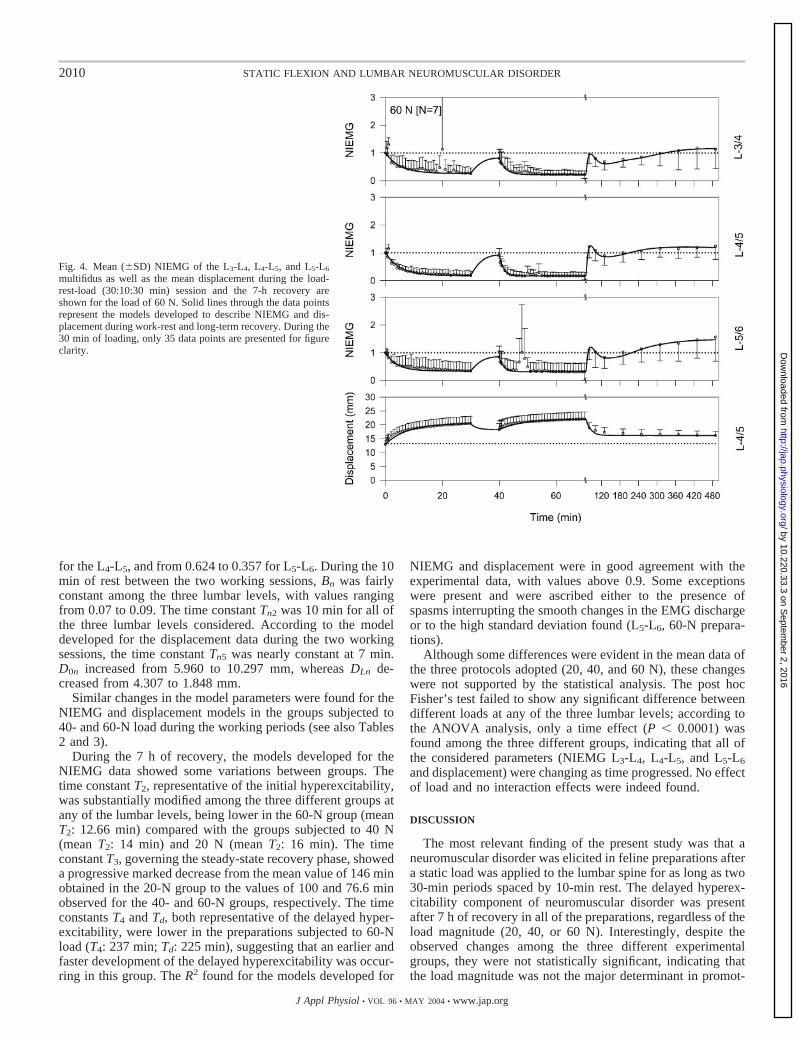
For the group subjected to 60 N (Fig. 4), the mean initialdisplacement was 13.014 mm, and the mean value reachedduring the first 30-min load was 20.517 mm, which corre-sponds to a mean creep of 57.65%. The 10-min rest allowed apartial recovery of creep to 40.37%. At the end of the twoworking sessions, the mean displacement was 18.269 mm,corresponding to a mean creep of 40.7%. A gradual decrease of
the displacement to a mean final value of 16.158 mm (residualcreep: 24.1%) was observed during the 7 h of recovery.
The mean NIEMG decreased during the first working 30-min period in the preparations subjected to 20 N from 1.0 to0.518 (48.2% decrease), 0.378 (62.2% decrease), and 0.372(62.8% decrease) at L3-L4, L4-L5, and L5-L6, respectively. Apartial recovery of the NIEMG was observed during the 10 minof rest to mean values of 0.763, 0.677, and 0.696 at the threelumbar levels inspected. During the following 30-min load, theNIEMG further decreased, reaching mean values of 0.439(L3-L4), 0.246 (L4-L5), and 0.339 (L5-L6). During the first 10min of the 7 h of recovery, the NIEMG showed a sharpincrease to mean values of 0.898 at L3-L4 and 0.781 for bothL4-L5 and L5-L6. This was followed by a slight decrease in theNIEMG during the following 2 h of recovery. Afterward, theNIEMG gradually increased, reaching mean values of 1.509 atL3-L4, 1.371 at L4-L5, and 1.638 at L5-L6 at the end of the 7 hof rest. It is important to note that these final values are higherthan the initial NIEMG of 1.0 at all of the lumbar levelsconsidered and that the 1.0 value was reached, on average,after 4 h of rest.
For the preparations subjected to 40 N, the NIEMG showedan initial decrease during the first working session, reachingmean values of 0.359, 0.309, and 0.317 at L3-L4, L4-L5, andL5-L6, respectively. A partial recovery of the NIEMG wasobserved as well during the 10 min of rest between the two
Fig. 2. Mean (�SD) normalized integrated EMG(NIEMG) of the L3-L4, L4-L5, and L5-L6 multifidus aswell as the mean displacement during the load-rest-load(30:10:30 min) session and the 7-h recovery are shownfor the load of 20 N. Solid lines through the data pointsrepresent the models developed to describe NIEMG anddisplacement during work-rest and long-term recovery.During the 30 min of loading, only 35 data points arepresented for figure clarity.
2008 STATIC FLEXION AND LUMBAR NEUROMUSCULAR DISORDER
J Appl Physiol • VOL 96 • MAY 2004 • www.jap.org
by 10.220.33.3 on Septem
ber 2, 2016http://jap.physiology.org/
Dow
nloaded from
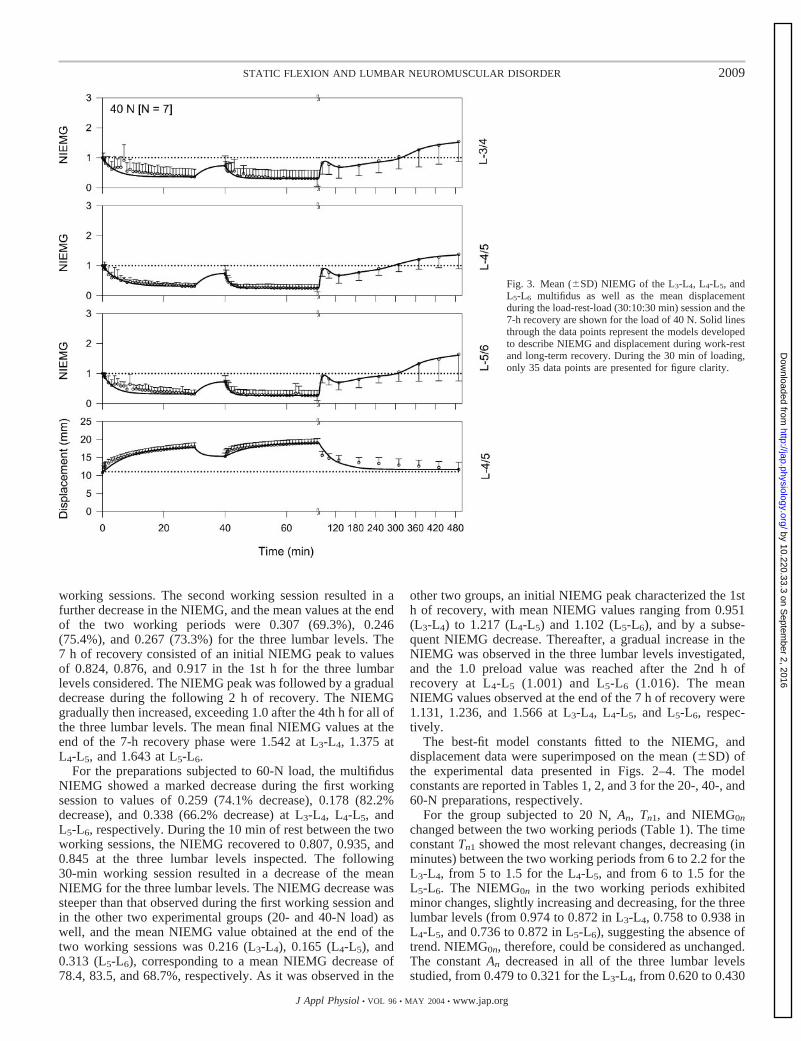
working sessions. The second working session resulted in afurther decrease in the NIEMG, and the mean values at the endof the two working periods were 0.307 (69.3%), 0.246(75.4%), and 0.267 (73.3%) for the three lumbar levels. The7 h of recovery consisted of an initial NIEMG peak to valuesof 0.824, 0.876, and 0.917 in the 1st h for the three lumbarlevels considered. The NIEMG peak was followed by a gradualdecrease during the following 2 h of recovery. The NIEMGgradually then increased, exceeding 1.0 after the 4th h for all ofthe three lumbar levels. The mean final NIEMG values at theend of the 7-h recovery phase were 1.542 at L3-L4, 1.375 atL4-L5, and 1.643 at L5-L6.
For the preparations subjected to 60-N load, the multifidusNIEMG showed a marked decrease during the first workingsession to values of 0.259 (74.1% decrease), 0.178 (82.2%decrease), and 0.338 (66.2% decrease) at L3-L4, L4-L5, andL5-L6, respectively. During the 10 min of rest between the twoworking sessions, the NIEMG recovered to 0.807, 0.935, and0.845 at the three lumbar levels inspected. The following30-min working session resulted in a decrease of the meanNIEMG for the three lumbar levels. The NIEMG decrease wassteeper than that observed during the first working session andin the other two experimental groups (20- and 40-N load) aswell, and the mean NIEMG value obtained at the end of thetwo working sessions was 0.216 (L3-L4), 0.165 (L4-L5), and0.313 (L5-L6), corresponding to a mean NIEMG decrease of78.4, 83.5, and 68.7%, respectively. As it was observed in the
other two groups, an initial NIEMG peak characterized the 1sth of recovery, with mean NIEMG values ranging from 0.951(L3-L4) to 1.217 (L4-L5) and 1.102 (L5-L6), and by a subse-quent NIEMG decrease. Thereafter, a gradual increase in theNIEMG was observed in the three lumbar levels investigated,and the 1.0 preload value was reached after the 2nd h ofrecovery at L4-L5 (1.001) and L5-L6 (1.016). The meanNIEMG values observed at the end of the 7 h of recovery were1.131, 1.236, and 1.566 at L3-L4, L4-L5, and L5-L6, respec-tively.
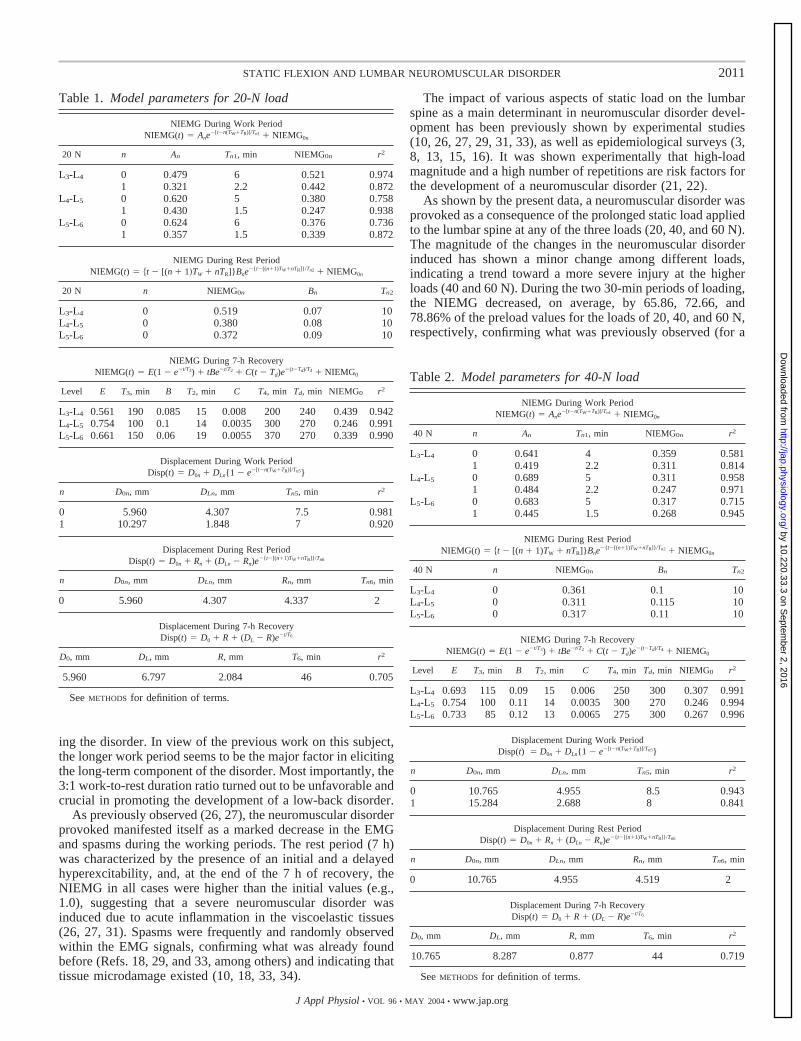
The best-fit model constants fitted to the NIEMG, anddisplacement data were superimposed on the mean (�SD) ofthe experimental data presented in Figs. 2–4. The modelconstants are reported in Tables 1, 2, and 3 for the 20-, 40-, and60-N preparations, respectively.
For the group subjected to 20 N, An, Tn1, and NIEMG0n
changed between the two working periods (Table 1). The timeconstant Tn1 showed the most relevant changes, decreasing (inminutes) between the two working periods from 6 to 2.2 for theL3-L4, from 5 to 1.5 for the L4-L5, and from 6 to 1.5 for theL5-L6. The NIEMG0n in the two working periods exhibitedminor changes, slightly increasing and decreasing, for the threelumbar levels (from 0.974 to 0.872 in L3-L4, 0.758 to 0.938 inL4-L5, and 0.736 to 0.872 in L5-L6), suggesting the absence oftrend. NIEMG0n, therefore, could be considered as unchanged.The constant An decreased in all of the three lumbar levelsstudied, from 0.479 to 0.321 for the L3-L4, from 0.620 to 0.430
Fig. 3. Mean (�SD) NIEMG of the L3-L4, L4-L5, andL5-L6 multifidus as well as the mean displacementduring the load-rest-load (30:10:30 min) session and the7-h recovery are shown for the load of 40 N. Solid linesthrough the data points represent the models developedto describe NIEMG and displacement during work-restand long-term recovery. During the 30 min of loading,only 35 data points are presented for figure clarity.
2009STATIC FLEXION AND LUMBAR NEUROMUSCULAR DISORDER
J Appl Physiol • VOL 96 • MAY 2004 • www.jap.org
by 10.220.33.3 on Septem
ber 2, 2016http://jap.physiology.org/
Dow
nloaded from
for the L4-L5, and from 0.624 to 0.357 for L5-L6. During the 10min of rest between the two working sessions, Bn was fairlyconstant among the three lumbar levels, with values rangingfrom 0.07 to 0.09. The time constant Tn2 was 10 min for all ofthe three lumbar levels considered. According to the modeldeveloped for the displacement data during the two workingsessions, the time constant Tn5 was nearly constant at 7 min.D0n increased from 5.960 to 10.297 mm, whereas DLn de-creased from 4.307 to 1.848 mm.
Similar changes in the model parameters were found for theNIEMG and displacement models in the groups subjected to40- and 60-N load during the working periods (see also Tables2 and 3).
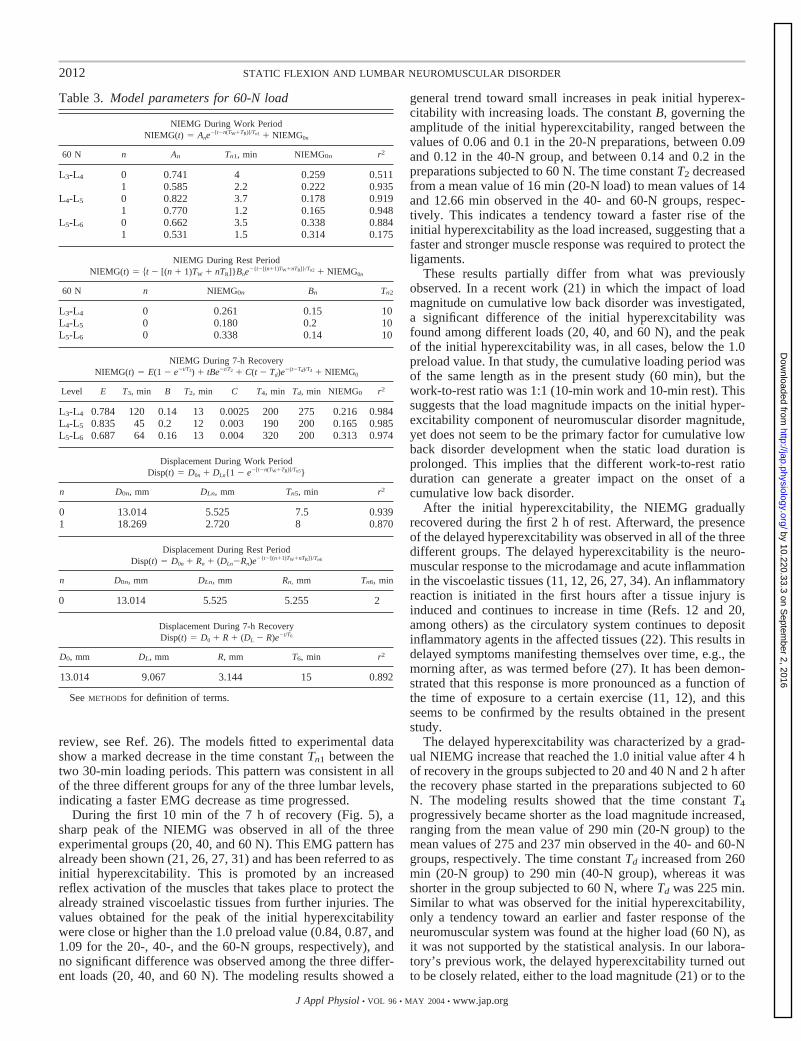
During the 7 h of recovery, the models developed for theNIEMG data showed some variations between groups. Thetime constant T2, representative of the initial hyperexcitability,was substantially modified among the three different groups atany of the lumbar levels, being lower in the 60-N group (meanT2: 12.66 min) compared with the groups subjected to 40 N(mean T2: 14 min) and 20 N (mean T2: 16 min). The timeconstant T3, governing the steady-state recovery phase, showeda progressive marked decrease from the mean value of 146 minobtained in the 20-N group to the values of 100 and 76.6 minobserved for the 40- and 60-N groups, respectively. The timeconstants T4 and Td, both representative of the delayed hyper-excitability, were lower in the preparations subjected to 60-Nload (T4: 237 min; Td: 225 min), suggesting that an earlier andfaster development of the delayed hyperexcitability was occur-ring in this group. The R2 found for the models developed for
NIEMG and displacement were in good agreement with theexperimental data, with values above 0.9. Some exceptionswere present and were ascribed either to the presence ofspasms interrupting the smooth changes in the EMG dischargeor to the high standard deviation found (L5-L6, 60-N prepara-tions).
Although some differences were evident in the mean data ofthe three protocols adopted (20, 40, and 60 N), these changeswere not supported by the statistical analysis. The post hocFisher’s test failed to show any significant difference betweendifferent loads at any of the three lumbar levels; according tothe ANOVA analysis, only a time effect (P � 0.0001) wasfound among the three different groups, indicating that all ofthe considered parameters (NIEMG L3-L4, L4-L5, and L5-L6
and displacement) were changing as time progressed. No effectof load and no interaction effects were indeed found.
DISCUSSION
The most relevant finding of the present study was that aneuromuscular disorder was elicited in feline preparations aftera static load was applied to the lumbar spine for as long as two30-min periods spaced by 10-min rest. The delayed hyperex-citability component of neuromuscular disorder was presentafter 7 h of recovery in all of the preparations, regardless of theload magnitude (20, 40, or 60 N). Interestingly, despite theobserved changes among the three different experimentalgroups, they were not statistically significant, indicating thatthe load magnitude was not the major determinant in promot-
Fig. 4. Mean (�SD) NIEMG of the L3-L4, L4-L5, and L5-L6
multifidus as well as the mean displacement during the load-rest-load (30:10:30 min) session and the 7-h recovery areshown for the load of 60 N. Solid lines through the data pointsrepresent the models developed to describe NIEMG and dis-placement during work-rest and long-term recovery. During the30 min of loading, only 35 data points are presented for figureclarity.
2010 STATIC FLEXION AND LUMBAR NEUROMUSCULAR DISORDER
J Appl Physiol • VOL 96 • MAY 2004 • www.jap.org
by 10.220.33.3 on Septem
ber 2, 2016http://jap.physiology.org/
Dow
nloaded from
ing the disorder. In view of the previous work on this subject,the longer work period seems to be the major factor in elicitingthe long-term component of the disorder. Most importantly, the3:1 work-to-rest duration ratio turned out to be unfavorable andcrucial in promoting the development of a low-back disorder.
As previously observed (26, 27), the neuromuscular disorderprovoked manifested itself as a marked decrease in the EMGand spasms during the working periods. The rest period (7 h)was characterized by the presence of an initial and a delayedhyperexcitability, and, at the end of the 7 h of recovery, theNIEMG in all cases were higher than the initial values (e.g.,1.0), suggesting that a severe neuromuscular disorder wasinduced due to acute inflammation in the viscoelastic tissues(26, 27, 31). Spasms were frequently and randomly observedwithin the EMG signals, confirming what was already foundbefore (Refs. 18, 29, and 33, among others) and indicating thattissue microdamage existed (10, 18, 33, 34).
The impact of various aspects of static load on the lumbarspine as a main determinant in neuromuscular disorder devel-opment has been previously shown by experimental studies(10, 26, 27, 29, 31, 33), as well as epidemiological surveys (3,8, 13, 15, 16). It was shown experimentally that high-loadmagnitude and a high number of repetitions are risk factors forthe development of a neuromuscular disorder (21, 22).
As shown by the present data, a neuromuscular disorder wasprovoked as a consequence of the prolonged static load appliedto the lumbar spine at any of the three loads (20, 40, and 60 N).The magnitude of the changes in the neuromuscular disorderinduced has shown a minor change among different loads,indicating a trend toward a more severe injury at the higherloads (40 and 60 N). During the two 30-min periods of loading,the NIEMG decreased, on average, by 65.86, 72.66, and78.86% of the preload values for the loads of 20, 40, and 60 N,respectively, confirming what was previously observed (for a
Table 2. Model parameters for 40-N load
NIEMG During Work PeriodNIEMG(t) � Ane
�[t�n(TW�TR)]/Tn1 � NIEMG0n
40 N n An Tn1, min NIEMG0n r2
L3-L4 0 0.641 4 0.359 0.5811 0.419 2.2 0.311 0.814
L4-L5 0 0.689 5 0.311 0.9581 0.484 2.2 0.247 0.971
L5-L6 0 0.683 5 0.317 0.7151 0.445 1.5 0.268 0.945
NIEMG During Rest PeriodNIEMG(t) � t � [(n � 1)TW � nTR]}Bne
�{t�[(n�1)TW�nTR]}/Tn2 � NIEMG0n
40 N n NIEMG0n Bn Tn2
L3-L4 0 0.361 0.1 10L4-L5 0 0.311 0.115 10L5-L6 0 0.317 0.11 10
NIEMG During 7-h RecoveryNIEMG(t) � E(1 � e�t/T3) � tBe�t/T2 � C(t � Td)e
�(t�Td)/T4 � NIEMG0
Level E T3, min B T2, min C T4, min Td, min NIEMG0 r2
L3-L4 0.693 115 0.09 15 0.006 250 300 0.307 0.991L4-L5 0.754 100 0.11 14 0.0035 300 270 0.246 0.994L5-L6 0.733 85 0.12 13 0.0065 275 300 0.267 0.996
Displacement During Work PeriodDisp(t) � D0n � DLn{1 � e�[t�n(TW�TR)]/Tn5}
n D0n, mm DLn, mm Tn5, min r2
0 10.765 4.955 8.5 0.9431 15.284 2.688 8 0.841
Displacement During Rest PeriodDisp(t) � D0n � Rn � (DLn � Rn)e
�{t�[(n�1)TW�nTR]}/Tn6
n D0n, mm DLn, mm Rn, mm Tn6, min
0 10.765 4.955 4.519 2
Displacement During 7-h RecoveryDisp(t) � D0 � R � (DL � R)e�t/T6
D0, mm DL, mm R, mm T6, min r2
10.765 8.287 0.877 44 0.719
See METHODS for definition of terms.
Table 1. Model parameters for 20-N load
NIEMG During Work PeriodNIEMG(t) � Ane
�[t�n(TW�TR)]/Tn1 � NIEMG0n
20 N n An Tn1, min NIEMG0n r2
L3-L4 0 0.479 6 0.521 0.9741 0.321 2.2 0.442 0.872
L4-L5 0 0.620 5 0.380 0.7581 0.430 1.5 0.247 0.938
L5-L6 0 0.624 6 0.376 0.7361 0.357 1.5 0.339 0.872
NIEMG During Rest PeriodNIEMG(t) � t � [(n � 1�TW � nTR]}Bne
�{t�[(n�1)TW�nTR]}/Tn2 � NIEMG0n
20 N n NIEMG0n Bn Tn2
L3-L4 0 0.519 0.07 10L4-L5 0 0.380 0.08 10L5-L6 0 0.372 0.09 10
NIEMG During 7-h RecoveryNIEMG(t) � E(1 � e�t/T3) � tBe�t/T2 � C(t � Td)e
�(t�Td)/T4 � NIEMG0
Level E T3, min B T2, min C T4, min Td, min NIEMG0 r2
L3-L4 0.561 190 0.085 15 0.008 200 240 0.439 0.942L4-L5 0.754 100 0.1 14 0.0035 300 270 0.246 0.991L5-L6 0.661 150 0.06 19 0.0055 370 270 0.339 0.990
Displacement During Work PeriodDisp(t) � D0n � DLn{1 � e�[t�n(TW�TR)]/Tn5}
n D0n, mm DLn, mm Tn5, min r2
0 5.960 4.307 7.5 0.9811 10.297 1.848 7 0.920
Displacement During Rest PeriodDisp(t) � D0n � Rn � (DLn � Rn)e
�{t�[(n�1)TW�nTR]}/Tn6
n D0n, mm DLn, mm Rn, mm Tn6, min
0 5.960 4.307 4.337 2
Displacement During 7-h RecoveryDisp(t) � D0 � R � (DL � R)e�t/T6
D0, mm DL, mm R, mm T6, min r2
5.960 6.797 2.084 46 0.705
See METHODS for definition of terms.
2011STATIC FLEXION AND LUMBAR NEUROMUSCULAR DISORDER
J Appl Physiol • VOL 96 • MAY 2004 • www.jap.org
by 10.220.33.3 on Septem
ber 2, 2016http://jap.physiology.org/
Dow
nloaded from
review, see Ref. 26). The models fitted to experimental datashow a marked decrease in the time constant Tn1 between thetwo 30-min loading periods. This pattern was consistent in allof the three different groups for any of the three lumbar levels,indicating a faster EMG decrease as time progressed.
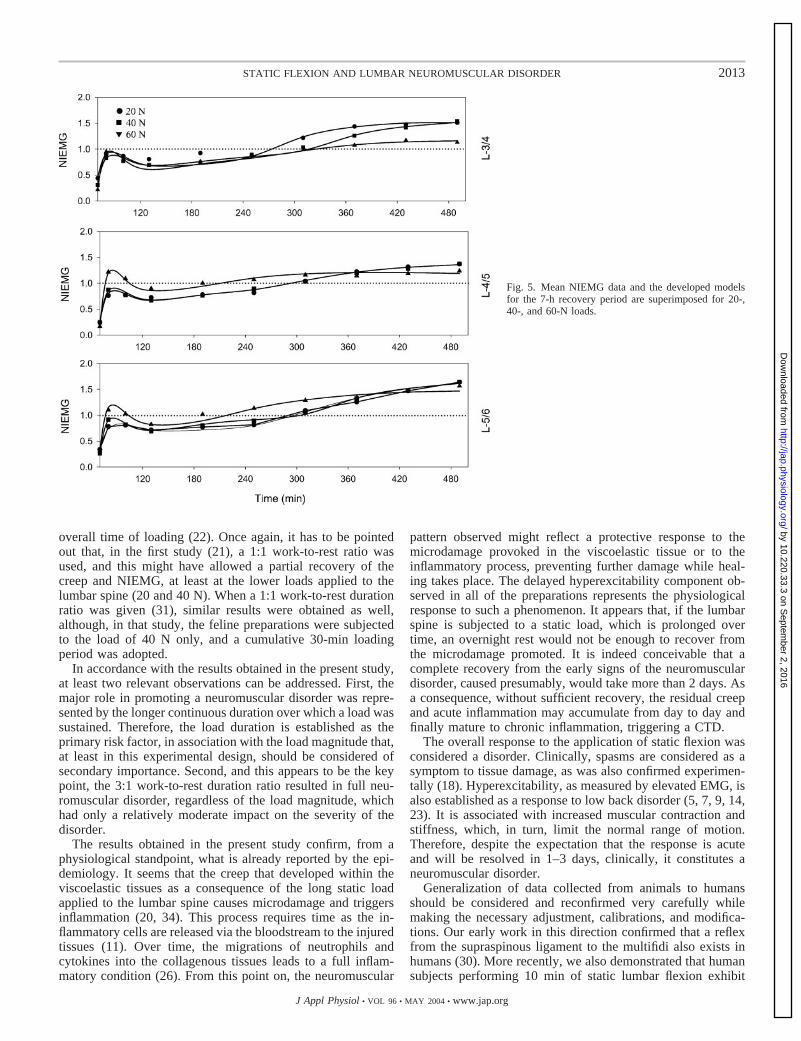
During the first 10 min of the 7 h of recovery (Fig. 5), asharp peak of the NIEMG was observed in all of the threeexperimental groups (20, 40, and 60 N). This EMG pattern hasalready been shown (21, 26, 27, 31) and has been referred to asinitial hyperexcitability. This is promoted by an increasedreflex activation of the muscles that takes place to protect thealready strained viscoelastic tissues from further injuries. Thevalues obtained for the peak of the initial hyperexcitabilitywere close or higher than the 1.0 preload value (0.84, 0.87, and1.09 for the 20-, 40-, and the 60-N groups, respectively), andno significant difference was observed among the three differ-ent loads (20, 40, and 60 N). The modeling results showed a
general trend toward small increases in peak initial hyperex-citability with increasing loads. The constant B, governing theamplitude of the initial hyperexcitability, ranged between thevalues of 0.06 and 0.1 in the 20-N preparations, between 0.09and 0.12 in the 40-N group, and between 0.14 and 0.2 in thepreparations subjected to 60 N. The time constant T2 decreasedfrom a mean value of 16 min (20-N load) to mean values of 14and 12.66 min observed in the 40- and 60-N groups, respec-tively. This indicates a tendency toward a faster rise of theinitial hyperexcitability as the load increased, suggesting that afaster and stronger muscle response was required to protect theligaments.
These results partially differ from what was previouslyobserved. In a recent work (21) in which the impact of loadmagnitude on cumulative low back disorder was investigated,a significant difference of the initial hyperexcitability wasfound among different loads (20, 40, and 60 N), and the peakof the initial hyperexcitability was, in all cases, below the 1.0preload value. In that study, the cumulative loading period wasof the same length as in the present study (60 min), but thework-to-rest ratio was 1:1 (10-min work and 10-min rest). Thissuggests that the load magnitude impacts on the initial hyper-excitability component of neuromuscular disorder magnitude,yet does not seem to be the primary factor for cumulative lowback disorder development when the static load duration isprolonged. This implies that the different work-to-rest ratioduration can generate a greater impact on the onset of acumulative low back disorder.
After the initial hyperexcitability, the NIEMG graduallyrecovered during the first 2 h of rest. Afterward, the presenceof the delayed hyperexcitability was observed in all of the threedifferent groups. The delayed hyperexcitability is the neuro-muscular response to the microdamage and acute inflammationin the viscoelastic tissues (11, 12, 26, 27, 34). An inflammatoryreaction is initiated in the first hours after a tissue injury isinduced and continues to increase in time (Refs. 12 and 20,among others) as the circulatory system continues to depositinflammatory agents in the affected tissues (22). This results indelayed symptoms manifesting themselves over time, e.g., themorning after, as was termed before (27). It has been demon-strated that this response is more pronounced as a function ofthe time of exposure to a certain exercise (11, 12), and thisseems to be confirmed by the results obtained in the presentstudy.
The delayed hyperexcitability was characterized by a grad-ual NIEMG increase that reached the 1.0 initial value after 4 hof recovery in the groups subjected to 20 and 40 N and 2 h afterthe recovery phase started in the preparations subjected to 60N. The modeling results showed that the time constant T4
progressively became shorter as the load magnitude increased,ranging from the mean value of 290 min (20-N group) to themean values of 275 and 237 min observed in the 40- and 60-Ngroups, respectively. The time constant Td increased from 260min (20-N group) to 290 min (40-N group), whereas it wasshorter in the group subjected to 60 N, where Td was 225 min.Similar to what was observed for the initial hyperexcitability,only a tendency toward an earlier and faster response of theneuromuscular system was found at the higher load (60 N), asit was not supported by the statistical analysis. In our labora-tory’s previous work, the delayed hyperexcitability turned outto be closely related, either to the load magnitude (21) or to the
Table 3. Model parameters for 60-N load
NIEMG During Work PeriodNIEMG(t) � Ane
�[t�n(TW�TR)]/Tn1 � NIEMG0n
60 N n An Tn1, min NIEMG0n r2
L3-L4 0 0.741 4 0.259 0.5111 0.585 2.2 0.222 0.935
L4-L5 0 0.822 3.7 0.178 0.9191 0.770 1.2 0.165 0.948
L5-L6 0 0.662 3.5 0.338 0.8841 0.531 1.5 0.314 0.175
NIEMG During Rest PeriodNIEMG(t) � t � [(n � 1)TW � nTR]}Bne
�{t�[(n�1)TW�nTR]}/Tn2 � NIEMG0n
60 N n NIEMG0n Bn Tn2
L3-L4 0 0.261 0.15 10L4-L5 0 0.180 0.2 10L5-L6 0 0.338 0.14 10
NIEMG During 7-h RecoveryNIEMG(t) � E(1 � e�t/T3) � tBe�t/T2 � C(t � Td)e
�(t�Td)/T4 � NIEMG0
Level E T3, min B T2, min C T4, min Td, min NIEMG0 r2
L3-L4 0.784 120 0.14 13 0.0025 200 275 0.216 0.984L4-L5 0.835 45 0.2 12 0.003 190 200 0.165 0.985L5-L6 0.687 64 0.16 13 0.004 320 200 0.313 0.974
Displacement During Work PeriodDisp(t) � D0n � DLn{1 � e�[t�n(TW�TR)]/Tn5}
n D0n, mm DLn, mm Tn5, min r2
0 13.014 5.525 7.5 0.9391 18.269 2.720 8 0.870
Displacement During Rest PeriodDisp(t) � D0n � Rn � (DLn�Rn)e
�{t�[(n�1)TW�nTR]}/Tn6
n D0n, mm DLn, mm Rn, mm Tn6, min
0 13.014 5.525 5.255 2
Displacement During 7-h RecoveryDisp(t) � D0 � R � (DL � R)e�t/T6
D0, mm DL, mm R, mm T6, min r2
13.014 9.067 3.144 15 0.892
See METHODS for definition of terms.
2012 STATIC FLEXION AND LUMBAR NEUROMUSCULAR DISORDER
J Appl Physiol • VOL 96 • MAY 2004 • www.jap.org
by 10.220.33.3 on Septem
ber 2, 2016http://jap.physiology.org/
Dow
nloaded from
overall time of loading (22). Once again, it has to be pointedout that, in the first study (21), a 1:1 work-to-rest ratio wasused, and this might have allowed a partial recovery of thecreep and NIEMG, at least at the lower loads applied to thelumbar spine (20 and 40 N). When a 1:1 work-to-rest durationratio was given (31), similar results were obtained as well,although, in that study, the feline preparations were subjectedto the load of 40 N only, and a cumulative 30-min loadingperiod was adopted.
In accordance with the results obtained in the present study,at least two relevant observations can be addressed. First, themajor role in promoting a neuromuscular disorder was repre-sented by the longer continuous duration over which a load wassustained. Therefore, the load duration is established as theprimary risk factor, in association with the load magnitude that,at least in this experimental design, should be considered ofsecondary importance. Second, and this appears to be the keypoint, the 3:1 work-to-rest duration ratio resulted in full neu-romuscular disorder, regardless of the load magnitude, whichhad only a relatively moderate impact on the severity of thedisorder.
The results obtained in the present study confirm, from aphysiological standpoint, what is already reported by the epi-demiology. It seems that the creep that developed within theviscoelastic tissues as a consequence of the long static loadapplied to the lumbar spine causes microdamage and triggersinflammation (20, 34). This process requires time as the in-flammatory cells are released via the bloodstream to the injuredtissues (11). Over time, the migrations of neutrophils andcytokines into the collagenous tissues leads to a full inflam-matory condition (26). From this point on, the neuromuscular
pattern observed might reflect a protective response to themicrodamage provoked in the viscoelastic tissue or to theinflammatory process, preventing further damage while heal-ing takes place. The delayed hyperexcitability component ob-served in all of the preparations represents the physiologicalresponse to such a phenomenon. It appears that, if the lumbarspine is subjected to a static load, which is prolonged overtime, an overnight rest would not be enough to recover fromthe microdamage promoted. It is indeed conceivable that acomplete recovery from the early signs of the neuromusculardisorder, caused presumably, would take more than 2 days. Asa consequence, without sufficient recovery, the residual creepand acute inflammation may accumulate from day to day andfinally mature to chronic inflammation, triggering a CTD.
The overall response to the application of static flexion wasconsidered a disorder. Clinically, spasms are considered as asymptom to tissue damage, as was also confirmed experimen-tally (18). Hyperexcitability, as measured by elevated EMG, isalso established as a response to low back disorder (5, 7, 9, 14,23). It is associated with increased muscular contraction andstiffness, which, in turn, limit the normal range of motion.Therefore, despite the expectation that the response is acuteand will be resolved in 1–3 days, clinically, it constitutes aneuromuscular disorder.
Generalization of data collected from animals to humansshould be considered and reconfirmed very carefully whilemaking the necessary adjustment, calibrations, and modifica-tions. Our early work in this direction confirmed that a reflexfrom the supraspinous ligament to the multifidi also exists inhumans (30). More recently, we also demonstrated that humansubjects performing 10 min of static lumbar flexion exhibit
Fig. 5. Mean NIEMG data and the developed modelsfor the 7-h recovery period are superimposed for 20-,40-, and 60-N loads.
2013STATIC FLEXION AND LUMBAR NEUROMUSCULAR DISORDER
J Appl Physiol • VOL 96 • MAY 2004 • www.jap.org
by 10.220.33.3 on Septem
ber 2, 2016http://jap.physiology.org/
Dow
nloaded from
spasms during the flexion and profound changes in muscularactivity postflexion (25). Furthermore, in an attempt to extendthe findings to ligaments of other joints, we found that 10 minof static loading of the anterior cruciate ligament of humansalso resulted in spasms and postloading hyperexcitability of thequadriceps (1). Ongoing work with human subjects also con-firms that cyclic loading of the spinal and knee ligaments elicitsa neuromuscular disorder. Overall, human subjects seem torespond in a similar mode to that of the feline model whensubjected to static and cyclic loading of ligaments. So far, theinsight gained from the feline model has proved to be valuablefor understanding human responses to similar conditions.
From the clinical standpoint, low back patients present withpain, posterior muscle stiffness, and limited range of motion.Muscle stiffness and the associated elevated EMG are widelyreported in the literature (Refs. 5, 7, 9, 14, 23, and others). It isevident that the increased EMG (or hyperexcitability) that weobserved represents the stiffness associated with higher thannormal muscular force response and the resulting limited rangeof motion. In essence, the responses observed in the felinemodel have some parallelism to clinically established symp-toms as well.
It should be noted that the responses observed in this reportrepresent an acute condition that is expected to be resolved in1–3 days (based on model predictions). CTD, however, willrequire daily repetition of the static flexion for a long period inorder for the condition to be transformed from acute to chronic.
Finally, our laboratory’s recent findings (26) confirm that theS-shaped hook did not elicit an artifactual response due toapplication of force to a localized area of the ligament. Neu-trophils of similar concentration were observed throughout theL4-L5 supraspinous ligament and in the ligaments of one levelabove and below, confirming that the overall tissue strainelicited by the lumbar flexion was the source of the responsewhile excluding the localized strain due to the hook. The factthat lumbar flexion was elicited by loading the L4-L5 supraspi-nous ligament was also confirmed by X-ray records (33). Anisolated control group further demonstrated that the merepresence of the S-shaped hook was not the source of thedisorder (33). We can reasonably conclude that the data pre-sented are the responses of spinal viscoelastic tissues to staticflexion.
In conclusion, two 30-min static loads spaced by a 10-mininterval elicited a cumulative low back disorder that did notrecover after 7 h of rest. Although the impact of load magni-tude cannot be neglected, this was overwhelmed by the effectof longer static loading duration and its distribution (work-to-rest ratio). It can be reasonably argued that the combined effectof load magnitude, duration of loading, number of repetitions,and work-to-rest duration ratio as a whole should be con-sidered as risk factors in CTD development. An optimaldose-to-duration ratio is yet to be determined to limit,attenuate, or prevent the adverse effects of static load on thelumbar spine (6).
GRANTS
This work was supported by National Institute for Occupational Safety andHealth Grants OH-04079 and OH-07622. P. Sbriccoli was a research fellowfrom the University Institute of Motor Sciences of Rome, Italy and wassupported by Louisiana Board of Regents Grant HEF (2000-5)-7.
REFERENCES
1. Chu D, LeBlanc R, D’Ambrosia P, D’Ambrosia R, Baratta RV, andSolomonow M. Neuromuscular disorder in response to anterior cruciateligament creep. Clin Biomech (Bristol, Avon) 18: 222–230, 2003.
2. Claude LN, Solomonow M, Zhou BH, Baratta RV, and Zhu MP.Neuromuscular dysfunction elicited by cyclic lumbar flexion. MuscleNerve 27: 348–358, 2003.
3. Cole MH and Grimshaw PN. Low back pain and lifting: a review ofepidemiology and aetiology. Work 21: 173–184, 2003.
4. Eversull E, Solomonow M, Zhou BH, Baratta RV, and Zhu MP.Neuromuscular neutral zones sensitivity to lumbar displacement rate. ClinBiomech (Bristol, Avon) 16: 102–113, 2001.
5. Fisher A and Chang C. Electromyographic evidence of paraspinalmuscle spasms during sleep in patients with low back pain. Clin J Pain 1:147–154, 1985.
6. Frazer M, Callaghan J, Marras W, and McGill S. Cumulative load:toward the metric for optimal occupational health—a low back example.Human Factors In press.
7. Haig A, Wiesman G, Haugh L, Pope M, and Grober L. Prospectiveevidence for change in paraspinal muscle activity after herniated nucleuspulposus. Spine 18: 926–930, 1993.
8. Hoogendoorn WE, Bongers PM, de Vet HC, Douwes M, Koes BW,Miedema MC, Ariens GA, and Bouter LM. Flexion and rotation of thetrunk and lifting at work are risk factors for low back pain: results of aprospective cohort study. Spine 25: 3087–3092, 2000.
9. Hoyt W, Hunt H, and DePauw M. EMG assessment of chronic low backpain syndrome. J Am Osteopath Assoc 80: 728–730, 1981.
10. Jackson M, Solomonow M, Zhou BH, Baratta RV, and Harris M.Multifidus EMG and tension relaxation recovery after prolonged staticlumbar flexion. Spine 26: 715–723, 2001.
11. Kaway Y, Matsumoto Y, Watanabe K, Yamamoto H, Satoh K,Morata M, Handa M, and Jkeda Y. Hemodynamic forces modulate theeffects of cytokines on fibrinolytic activity of endothelial cells. Blood 87:2314–2321, 1996.
12. Leadbetter W. An introduction to sports induced soft tissue inflammation.In: Sports Induced Inflammation, edited by Leadbetter W, Buckwalter J,and Gordon S. Park-Ridge, IL: AAOS, 1990.
13. Marras W. Occupational low back disorder causation and control. Ergo-nomics 43: 880–902, 2000.
14. Miller D. Comparison of EMG activity in the lumbar paraspinal musclesof subjects with and without chronic low back pain. Phys Ther 65:1347–1354, 1985.
15. National Research Council.Musculoskeletal Disorders and the Work-place: Low Back And Upper Extremities. Panel on MusculoskeletalDisorders and the Workplace, Commission on Behavioral and SocialSciences and Education, National Research Council and Institute ofMedicine. Washington, DC: National Academy, 2001.
16. OSHA. Ergonomics program, Final Rule: 29 CFR Part 1910, Departmentof Labor, Occupational Safety and Health Administration. Inflammation64: 68262–68870, 2000.
17. Panjabi M and Courtney T. High speed subfailure stretch of rabbitanterior cruciate ligament: change in elastic failure and viscoelastic char-acteristics. Clin Biomech (Bristol, Avon) 16: 334–340, 2001.
18. Pedersen H, Blunk C, and Gardner E.The anatomy of lumbosacralposterior rami and meningeal branches of spinal nerves. J Bone Joint Surg38A: 377–391, 1956.
19. Punnett L, Fine L, Keyserling W, Herrin G, and Chaffin D. Backdisorders and nonneutral trunk postures of automobile assembly workers.Scand J Work Environ Health 17: 337–346, 1991.
20. Safran M. Elbow injuries in athletes. Clin Orthop 310: 257–277, 1985.21. Sbriccoli P, Solomonow M, Zhou BH, Baratta RV, Lu Y, Zhu MP, and
Burger EL. Static load magnitude is a risk factor in the development ofcumulative low back disorder. Muscle Nerve 29: 300–308, 2004. Firstpublished January 2, 2004; 10.1002/mus.10531.
22. Sbriccoli P, Yousuf K, Kupershtein I, Solomonow M, Zhou BH, ZhuMP, and Lu Y. Static repetition is a risk factor in the development oflumbar cumulative musculoskeletal disorder. Spine In press.
23. Shivonen T, Partanen J, Hanninen O, and Soimakallio S.Electricbehavior of low back muscles during lumbar pelvic rhythm in low backpain and healthy controls. Arch Phys Med Rehabil 72: 1080–1087, 1991.
24. Silverstein B, Fine L, and Armstrong T. Hand wrist cumulative traumadisorders in industry. Br J Ind Med 43: 779–784, 1986.
2014 STATIC FLEXION AND LUMBAR NEUROMUSCULAR DISORDER
J Appl Physiol • VOL 96 • MAY 2004 • www.jap.org
by 10.220.33.3 on Septem
ber 2, 2016http://jap.physiology.org/
Dow
nloaded from
25. Solomonow M, Baratta RV, Banks A, Freudenberger C, and ZhouBH. Flexion-relaxation response to static lumbar flexion in males andfemales. Clin Biomech (Bristol, Avon) 18: 273–279, 2003.
26. Solomonow M, Baratta RV, Zhou BH, Burger E, Zieske A, andGedalia A. Muscular dysfunction elicited by creep of lumbar viscoelastictissues. J Electromyogr Kinesiol 13: 381–393, 2003.
27. Solomonow M, Hatipkarasulu S, Zhou BH, Baratta RV, and Aghaza-deh F. Biomechanics and electromyography of a common idiopathic lowback disorder. Spine 28: 1235–1248, 2003.
28. Solomonow M, Zhou B, Baratta RV, Lu Y, and Harris M. Biomechan-ics of increased exposure to lumbar injury due to cyclic loading. I. Loss ofreflexive muscular stabilization. Spine 24: 2426–2434, 1999.
29. Solomonow M, Zhou B, Baratta RV, Zhu M, and Lu Y. Neuromusculardisorders associated with static lumbar flexion: a feline model. J Electro-myogr Kinesiol 12: 81–90, 2002.
30. Solomonow M, Zhou B, Harris M, Lu Y, and Baratta RV. Theligamento-muscular stabilizing system of the spine. Spine 23: 2552–2562,1998.
31. Solomonow M, Zhou BH, Baratta RV, and Burger E. Biomechanicsand electromyography of a cumulative lumbar disorder: response to staticflexion. Clin Biomech (Bristol, Avon) 18: 890–898, 2003.
32. Stubbs M, Harris M, Solomonow M, Zhou BH, Lu Y, and Baratta RV.Ligamento-muscular protective reflex in the spine. J Electromyogr Kine-siol 8: 197–204, 1998.
33. Williams M, Solomonow M, Zhou BH, Baratta RV, and Harris M.Multifidus spasms elicited by prolonged lumbar flexion. Spine 22: 2916–2924, 2000.
34. Woo S, Aprelena M, and Hoher J. Tissue mechanics of ligaments andtendons. In: Biomechanics and Ergonomics, edited by Kumar S. Philadel-phia, PA: Taylor & Francis, 1999.
2015STATIC FLEXION AND LUMBAR NEUROMUSCULAR DISORDER
J Appl Physiol • VOL 96 • MAY 2004 • www.jap.org
by 10.220.33.3 on Septem
ber 2, 2016http://jap.physiology.org/
Dow
nloaded from


