Embed Size (px)
Citation preview
Neuroactive hormones and interpersonal trust:
International evidence
Paul J. Zak a,b,c,d,*, Ahlam Fakhar b
a Center for Neuroeconomics Studies, Claremont Graduate University, Claremont, CA 91711-6165, USAb Department of Economics, Claremont Graduate University, Claremont, CA 91711-6165, USAc Neurology Department, Loma Linda University Medical Center, Loma Linda, CA 92350, USA
d Gruter Institute for Law and Behavioral Research, 158 Goya Road, Portola Valley, CA 94028, USA
Received 30 June 2006; accepted 30 June 2006
Abstract
Social attachment is vital for human health and welfare. Recent experimental evidence in humans has
identified the role of neuroactive hormones, especially the peptide oxytocin, in mediating trusting behaviors.
Herein, we test if the endocrinological basis for trust between humans scales up to the country level. Trust
pervades nearly every aspect of our daily lives, yet survey data on trust show substantial variation across
countries. Using 31 measures of biological, social, and environmental factors associated with hormone
levels for a sample of 41 countries, we find that two classes of factors are related to trust: consumption of
plant-based estrogens (phytoestrogens), and the presence of environmental conditions that include measures
of estrogen-like molecules. Our findings provide preliminary evidence that interpersonal trust at the country
level may be related to the intake of neuroactive hormones.
# 2006 Elsevier B.V. All rights reserved.
JEL classification : Q57 Bioeconomics
Keywords: Neuroeconomics; Behavioral economics; Trust; Social affiliation; Neuroendocrinology; Oxytocin;
Phytoestrogens; Xenoestrogens
1. Introduction
Human beings have evolved to attach socially (Mason and Mendoza, 1998; Carter, 1998;
Pedersen, 2004), and attachment is essential for physical and psychological health (Zak et al.,
2005a; Harpham et al., 2004; Lindstrom, 2003). Maternal attachment is necessary for mammalian
http://www.elsevier.com/locate/ehb
Economics and Human Biology 4 (2006) 412–429
* Corresponding author. Tel.: +1 909 621 8788; fax: +1 909 621 8460.
E-mail address: [email protected] (P.J. Zak).
1570-677X/$ – see front matter # 2006 Elsevier B.V. All rights reserved.
doi:10.1016/j.ehb.2006.06.004

offspring survival, while in some species physiologically regulated pair bonding mechanisms
developed to enhance lineage survival. This mammalian attachment system prominently utilizes
the neuroactive hormone oxytocin (Carter and Keverne, 2002; Insel and Young, 2001; Carter, 1998;
Uvnas-Moberg, 1998; Carter et al., 1997a,b; Insel, 1997; Pedersen et al., 1992). In this paper we
examine whether a societal form of attachment, trusting others, is related to endocrine indicators
using cross-country data.
Trust is an important topic to study because it is among the strongest predictors of poverty that
economists have found; poor countries are by-and-large low trust countries (Zak and Knack,
2001; Zak, 2006). When trust is low, too few investments that create new businesses and raise
employment are undertaken. Investments, which occur over time, require a degree of trust in the
party who must fulfill the contract. The general equilibrium model of Zak and Knack (2001)
identifies the kinds of institutional environments which produce high trust. High trust occurs
when formal institutions efficiently enforce contracts, informal institutions facilitate social
relations, per capita incomes are high, and interpersonal heterogeneity is low. Indeed, Zak and
Knack (2001) derive a threshold level of trust that is necessary to produce a positive level of
income growth—countries below this threshold will not achieve positive income growth. The
predictions of this model have been confirmed in extensive empirical tests and have been
replicated by other researchers (Zak and Knack, 2001; Beugelsdijk et al., 2004). While some of
the factors that produce trust can be modified by policy, especially education levels (Knack and
Zak, 2002), it would be useful to know if additional factors affect country-level trust.
The first demonstration of the neuroendocrinological basis for social attachment was the study
of maternal behavior in rats by Pedersen and Prange (1979). Subsequent research demonstrated
the role of oxytocin and the related neurohormone vasopressin in pair bonding by prairie voles
(meadow mice) (Insel and Shapiro, 1992; Carter and Getz, 1993). In addition, oxytocin appears
to stimulate, and be stimulated by positive social interactions (Carter, 1998; Panksepp, 1992).
Oxytocin ‘‘induces a physiological process of ‘social motivation’ that increases the probability of
social interactions’’ (Carter and Keverne, 2002, p. 328).1
Interpersonal trust was among the first issues examined in the new transdisciplinary field of
neuroeconomics. Neuroeconomics dates to the late 1990s in the work by Glimcher, McCabe,
Smith, Zak and their co-workers (Glimcher, 2003; Camerer et al., 2005; McCabe, 2003; Zak,
2005). Recent neuroeconomics experiments with humans have demonstrated that the receipt of
an intentional signal of trust from a stranger is associated with an endogenous release by the brain
of oxytocin (Zak et al., 2004, 2005a). Further, elevated oxytocin levels were strongly associated
with trustworthy behavior (the reciprocation of trust). In a separate experiment, exogenously
manipulating oxytocin levels substantially increased the likelihood that subjects would trust a
stranger with money they had earned (Kosfeld et al., 2005). These experiments offer evidence
that trust between two individuals is facilitated by oxytocin. This paper examines if generalized
trust (the likelihood that two randomly chosen individuals will trust each other in a given
environment) is also associated with levels of neuroactive hormones at the societal level. That is,
we examine if the endocrine–trust relationship scales up to the country level.
Oxytocin is synthesized in the paraventricular nucleus and supraoptic nucleus of the
hypothalamus and is released in pulses into the circulatory system. Oxytocin also circulates
P.J. Zak, A. Fakhar / Economics and Human Biology 4 (2006) 412–429 413
1 Besides parturition and breastfeeding, behaviors that release oxytocin include grooming, massage, immersion in
warm water, vibration, electroacupunture, afferent vagal nerve stimulation, feeding, and sexual climax (Carter and
Altemus, 1997; Uvnas-Moberg, 1997, 1998).
centrally, acting as a neuromodulator (Fliers et al., 1986; Tribollet et al., 1992). In humans, areas
of the brain associated with memory (the diagonal band of Broca and the nucleus basalis of
Meynert) and emotions (the hypothalamus and amygdala) have an accumulation of oxytocin
receptors (Insel, 1997), though oxytocin receptors are distributed throughout the brain (Fliers
et al., 1986). For example, there are collections of oxytocin receptors in the olfactory bulb and
throughout the limbic system (Fernald and White, 2000), regions that process sensory signals
from the environment. The distribution of oxytocin receptors in limbic areas suggests that the
decision to trust another has an emotional component. This is consistent with debriefings of
laboratory subjects who report their decision to trust someone or to be trustworthy is made
quickly and with little introspection.
Animal studies indicate that estrogen facilitates oxytocin uptake by facilitating receptor
binding and increasing the number of oxytocin receptors (Verbalis, 1999). This may partially
explain gender differences in social behaviors and fear avoidance (Carter and Keverne, 2002) as
well as in some trust experiments (Zak et al., 2005b; Croson and Buchan, 1999). Because
oxytocin is highly responsive to estrogen, the latter can serve as an effective proxy for the former.
Reviewing the endocrine-behavioral literature, Carter and Keverne (2002, p. 325) conclude that
‘‘. . . exposure to peptides and steroids may ‘retune’ the nervous system, altering the thresholds for
sociality and aggression’’. As a result, life experiences and environmental conditions may affect the
‘‘set point’’ of oxytocin. For example, exposure to offspring can chronically raise oxytocin levels
(Carter and Keverne, 2002). Other social behaviors may also affect homeostatic oxytocin levels.
The extensive experimental literature showing that oxytocin facilitates pro-social behaviors in
mammals suggests that it is a candidate to explain society-wide trust levels separate from
institutional and economic factors known to affect trust (Zak and Knack, 2001). Specifically, we
hypothesize that human beings living in environments associated with higher levels of oxytocin
and/or estrogen are more likely to report that others in their society are trustworthy.
2. Methods
2.1. Data
Since international data on hormones levels are unavailable, we collected data on factors
correlated with oxytocin levels. Because oxytocin receptors are upregulated by estrogen, our data
collection also included variables correlated with estrogen levels, as well as the presence of
estrogen-like molecules in the environment (xenoestrogens). A total of 31 oxytocin-correlate and
estrogen-correlate data series were collected for 41 countries (the countries for which data on
trust is available). All data series are measured on a per capita basis to correct for differences in
population sizes. Data sources and descriptive statistics for all variables are reported in
Appendix A.
There are several classes of data that are expected to be correlated with oxytocin and
estrogen levels: biological processes that directly impact oxytocin; the frequency of social
interactions; and exposure to estrogen-like molecules in the environment. The biological
effects measured in this study are sex frequency, the fertility rate, the share of females in the
population, and the rate of breastfeeding.2 Social factors proxying the frequency of social
P.J. Zak, A. Fakhar / Economics and Human Biology 4 (2006) 412–429414
2 Because we are measure factors that may affect chronic oxytocin levels, we include the share of females as a measure
of nurturing behaviors that in most societies are performed more by women than men.

interactions are telephone usage, population density, home ownership, percentage of rural
population, and the proportional representation in each country of six major religious groups
(Catholics, Buddhists, Hindus, Jews, Muslims, and Protestants). Religion data is included as
religious events are an important venue for social interactions. In addition, previous research
has shown that socialization is higher in more ‘‘horizontally organized’’ religions (e.g.
Protestantism) relative to more ‘‘hierarchically organized’’ religions (e.g. Catholicism and
Islam) (Putnam, 2000). The biosocial factors in our dataset are expected to raise oxytocin and
therefore to be positively related to trust.
The environmental factors that we measure include average ambient temperature, distance
from the equator, and several measures of organic and synthetic xenoestrogens. Synthetic
estrogens are derived from a number of sources, including pesticides (e.g. herbicides and
insecticides such as dichlorodiphenyltrichloroethane (DDT), endosulfan, and other chlorinated
hydrocarbons), chemical byproducts associated with plastics (e.g. bisphenol A), pharmaceuticals
that enter the ecosystem through waste (e.g. birth control pills, the synthetic estrogen
diethylstilbestrol (DES), estrogen antagonists used to treat osteoporosis (raloxifene) and breast
cancer (tamoxifen), and the histamine antagonist cimetidine), the breakdown of household
products (e.g. detergents and surfactants, especially nonylphenol and octylphenol), and industrial
chemicals (e.g. polychlorinated biphenyls (PCBs)). Synthetic xenoestrogen magnitudes are
included in our dataset through an index of water pollution, a measure of CO2 emissions, and
three indices of air pollution. We also utilize an index of biodiversity as a general measure of the
biological environment. Synthetic xenoestrogens can either mimic the effect of endogenous
estrogen (be an agonist) or inhibit the uptake of estrogen (be an antagonist) depending on their
action at the receptor site (Safe et al., 1998). As a result, their a priori effect on trust is ambiguous.
As for organic estrogens, more than 300 plants have been identified as phytoestrogenic
(Tilgner, 1999). Phytoestrogens are found in many foods, principally soy and other legumes, but
also peas, rye, rice, beans, beef, dates, and tea. We measure the consumption of 14 types of
phytoestrogens by constructing a database of per capita consumption of 28 types of foods (listed
in Appendix A) for each country in our sample. Once the types of food consumed per capita are
determined, the amounts of various types of phytoestrogens consumed are calculated per person
by country using the values in Pillow et al. (1999), Albertazzi et al. (1999), and Mazur (1998).3
Phytoestrogens have been shown to bind to human estrogen receptors (reviewed in Cassidy and
Milligan, 1998; Brzezinski and Debi, 1999) and most are weakly agonistic though some are
estrogen antagonists (Mishra et al., 2003). On balance, agonistic effects likely dominate
antagonistic ones, and we therefore expect that overall phytoestrogen consumption will be
positively related to trust.
The data on trust were obtained from the 1996 World Values Surveys wave (WVS) (Inglehart
et al., 2000).4 The WVS contains data from thousands of respondents from 38 countries, both
developed and less developed. Two additional observations (Greece and Luxembourg) are taken
from the Eurobarometer survey, while another is from a government-sponsored survey in New
Zealand (Gold and Webster, 1990), both of which follow the WVS methodology. The measure we
use to assess trust is the proportion of those in each country who respond affirmatively to the
P.J. Zak, A. Fakhar / Economics and Human Biology 4 (2006) 412–429 415
3 The primary classes of phytoestrogens (phytoestrogens measured) are isoflavones (daidzein, genistein, formononetin,
and biochanin A), coumestans (coumestrol, and total coumestans), sterols (b-sitosterol, campesterol, stigmasterol),
flavonols (myricetin, quercetin and kaempferol), and lignans (secoisolariciresinol, and matairesinol).4 Or the nearest date to this if 1996 was unavailable.
question: ‘‘Generally speaking, would you say that most people can be trusted, or that you can’t
be too careful in dealing with people?’’ This question seeks to capture ‘‘generalized trust’’ which
is whether two randomly selected individuals trust each other. The surveys are done in person
using the native language, and the questions correspond to impressions of the respondents’ own
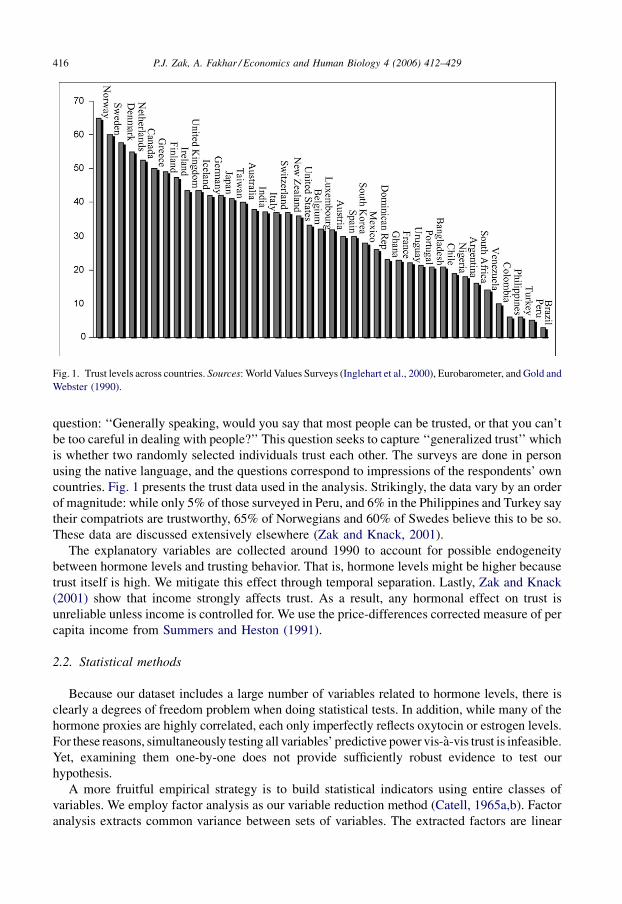
countries. Fig. 1 presents the trust data used in the analysis. Strikingly, the data vary by an order
of magnitude: while only 5% of those surveyed in Peru, and 6% in the Philippines and Turkey say
their compatriots are trustworthy, 65% of Norwegians and 60% of Swedes believe this to be so.
These data are discussed extensively elsewhere (Zak and Knack, 2001).
The explanatory variables are collected around 1990 to account for possible endogeneity
between hormone levels and trusting behavior. That is, hormone levels might be higher because
trust itself is high. We mitigate this effect through temporal separation. Lastly, Zak and Knack
(2001) show that income strongly affects trust. As a result, any hormonal effect on trust is
unreliable unless income is controlled for. We use the price-differences corrected measure of per
capita income from Summers and Heston (1991).
2.2. Statistical methods
Because our dataset includes a large number of variables related to hormone levels, there is
clearly a degrees of freedom problem when doing statistical tests. In addition, while many of the
hormone proxies are highly correlated, each only imperfectly reflects oxytocin or estrogen levels.
For these reasons, simultaneously testing all variables’ predictive power vis-a-vis trust is infeasible.
Yet, examining them one-by-one does not provide sufficiently robust evidence to test our
hypothesis.
A more fruitful empirical strategy is to build statistical indicators using entire classes of
variables. We employ factor analysis as our variable reduction method (Catell, 1965a,b). Factor
analysis extracts common variance between sets of variables. The extracted factors are linear
P.J. Zak, A. Fakhar / Economics and Human Biology 4 (2006) 412–429416
Fig. 1. Trust levels across countries. Sources: World Values Surveys (Inglehart et al., 2000), Eurobarometer, and Gold and
Webster (1990).
combinations of the variables that load on it. That is, a ‘‘factor score’’ substitutes for sets of the
original variables, and in this way can identify the principal classes of factors that affect trust. In
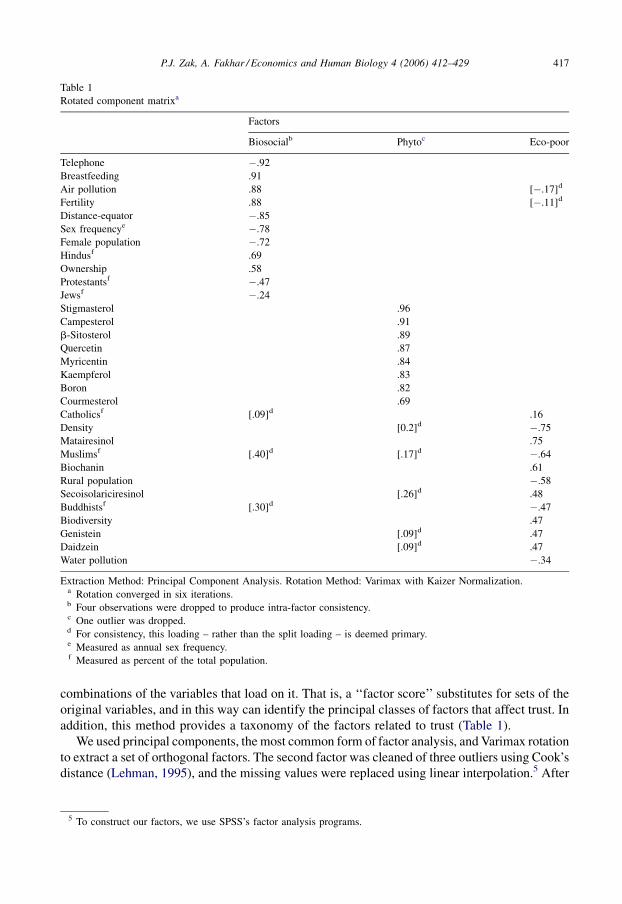
addition, this method provides a taxonomy of the factors related to trust (Table 1).
We used principal components, the most common form of factor analysis, and Varimax rotation
to extract a set of orthogonal factors. The second factor was cleaned of three outliers using Cook’s
distance (Lehman, 1995), and the missing values were replaced using linear interpolation.5 After
P.J. Zak, A. Fakhar / Economics and Human Biology 4 (2006) 412–429 417
Table 1
Rotated component matrixa
Factors
Biosocialb Phytoc Eco-poor
Telephone �.92
Breastfeeding .91
Air pollution .88 [�.17]d
Fertility .88 [�.11]d
Distance-equator �.85
Sex frequencye �.78
Female population �.72
Hindusf .69
Ownership .58
Protestantsf �.47
Jewsf �.24
Stigmasterol .96
Campesterol .91
b-Sitosterol .89
Quercetin .87
Myricentin .84
Kaempferol .83
Boron .82
Courmesterol .69
Catholicsf [.09]d .16
Density [0.2]d �.75
Matairesinol .75
Muslimsf [.40]d [.17]d �.64
Biochanin .61
Rural population �.58
Secoisolariciresinol [.26]d .48
Buddhistsf [.30]d �.47
Biodiversity .47
Genistein [.09]d .47
Daidzein [.09]d .47
Water pollution �.34
Extraction Method: Principal Component Analysis. Rotation Method: Varimax with Kaizer Normalization.a Rotation converged in six iterations.b Four observations were dropped to produce intra-factor consistency.c One outlier was dropped.d For consistency, this loading – rather than the split loading – is deemed primary.e Measured as annual sex frequency.f Measured as percent of the total population.
5 To construct our factors, we use SPSS’s factor analysis programs.
the examination of Catell’s Scree test and the application of Kaizer’s Criterion (Catell, 1965a,b), we
retain three factors and call them, biosocial, phyto and eco-poor, respectively. Details of the factor
construction are presented in Appendix A.
3. Results
The statistical procedure that decomposes variables into common factors reflects the broad
classes of variables discussed above, but imperfectly so. Indeed, the split loadings on some
factors are caused by two aspects of the procedure. First, principal components, based on the
extraction of eigenvalues, share the variance in one variable with other variables. Second, by
construction, Varimax rotation maximizes the loadings on every factor which exacerbates the
tendency to split loadings between factors (Comrey and Lee, 1992). For our analysis, factor
assignments were made based on the largest loadings.
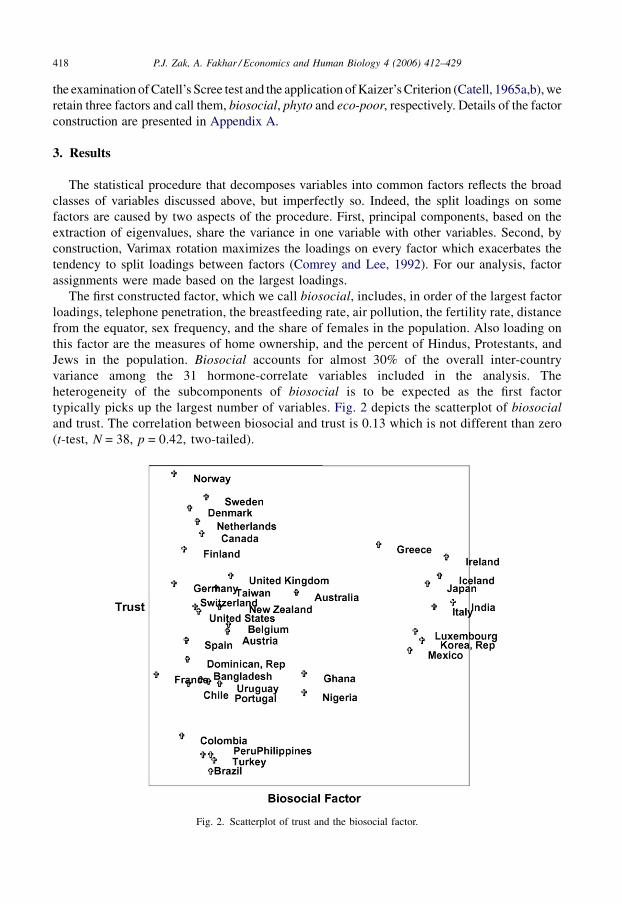
The first constructed factor, which we call biosocial, includes, in order of the largest factor
loadings, telephone penetration, the breastfeeding rate, air pollution, the fertility rate, distance
from the equator, sex frequency, and the share of females in the population. Also loading on
this factor are the measures of home ownership, and the percent of Hindus, Protestants, and
Jews in the population. Biosocial accounts for almost 30% of the overall inter-country
variance among the 31 hormone-correlate variables included in the analysis. The
heterogeneity of the subcomponents of biosocial is to be expected as the first factor
typically picks up the largest number of variables. Fig. 2 depicts the scatterplot of biosocial
and trust. The correlation between biosocial and trust is 0.13 which is not different than zero
(t-test, N = 38, p = 0.42, two-tailed).
P.J. Zak, A. Fakhar / Economics and Human Biology 4 (2006) 412–429418
Fig. 2. Scatterplot of trust and the biosocial factor.
The second factor, phyto, includes eight types of phytoestrogens as primary loadings:
stigmasterol, campesterol, b-sitosterol, quercetin, myricentin, kaempferol, boron, coumestrol.
This factor explains 20% of the total variation among the 31 hormone-correlate variables. The
correlation between phyto and trust is 0.34 and is statistically significant (t-test, N = 34,
p = 0.043, two-tailed). Fig. 3 plots phyto against trust showing the positive relationship.
The third factor, called eco-poor, contains the measures of population characteristics, five
phytoestrogens, and measures of the quality of the natural environment. The factors in eco-
poor, in order of the highest loadings are: population density, the phytoestrogen matairesinol,
the percentage of Muslims, the phytoestrogen biochanin, the percentage of rural population,
the phytoestrogen secoisolariciresinol, the percent of Buddhists, the measure of biodiversity,
the phytoestrogens genistein and daidzein, the index of water pollution, and the proportion of
Catholics. For consistency, this factor also includes fertility and air pollution as secondary
loadings. This factor is heterogeneous, including both ecological conditions as well as
factors associated with poverty such as the proportions of religious groups that tend
to be poorer as well as larger in rural populations. The name eco-poor seeks to denote both
these classes of constituents. This factor explains 12% of the overall variance in the hormone-
correlate factors. The correlation between eco-poor and trust is �0.17, which is not
different than zero (t-test, N = 37, p = 0.31, two-tailed). Fig. 4 shows the negative relationship
between eco-poor and trust.
Table 2 reports a least-squares regression of biosocial, phyto, and eco-poor on trust with per
capita income as a covariate control. Since the extracted factors are orthogonal to each other, we
are able to regress all three factors on trust simultaneously. The three factors and per capita
income explain 70% of the variation in trust.
P.J. Zak, A. Fakhar / Economics and Human Biology 4 (2006) 412–429 419
Fig. 3. Scatterplot of trust and the phyto factor.

Although the coefficient estimate for the biosocial factor is not statistically significant
( p = 0.94, t-test), its positive relationship to trust is consistent with the effect of childcare and
socializing on oxytocin levels. The phyto factor is positive and statistically significantly related to
trust ( p = 0.031, t-test). This finding indicates that one’s diet may affect the quality of social
interactions one has. The third factor, eco-poor, is statistically significant and is negatively
related to trust ( p = 0.038, t-test). The effects of eco-poor appear to operate through measures of
poverty not captured by income, and by estrogen antagonists, presumably driven by the measures
of pollution.
4. Discussion
Our results show that endocrine-correlate measures are related to international levels of
generalized trust. The high degree of explained variation is remarkable given the order of
magnitude of the variation in trust levels and the moderate sample size. The presumed causal
mechanism is either that oxytocin directly raises trust, or does so indirectly by stimulating social
interactions which build trust. The insignificance of the biosocial factor is to be expected with
P.J. Zak, A. Fakhar / Economics and Human Biology 4 (2006) 412–429420
Fig. 4. Scatterplot of trust and the eco-poor Factor.
Table 2
Least-squares regression of the three factors on trust with income as a covariate control
Variables Biosocial factor Phyto factor Eco-poor factor Per capita income Intercept R2 [N]
Trust (S.E.) .116 (1.645) 5.830 (2.560) �5.306 (2.432) 2.645 (.356) 12.227 (3.303) .702 [32]
p-Value .944 .031 .038 .000 .001
factor analysis which biases the first factor to include many variables, resulting in high standard
errors. In particular, biosocial has almost no correlation in the highest trust countries like Norway
and Sweden. This occurred because the variables that load on biosocial for these countries have
little common variance to extract. An inspection of the scatterplot in Fig. 2 shows the weak
correlation between trust and the biosocial factor with the majority of the sample massed about a
biosocial value of zero.
The phyto and eco-poor factors are statistically related to trust even after controlling for
income. This suggests that the social and biological environments affect average levels of trust in
a country.
The evidence does not conclusively demonstrate that neuroactive hormones cause
generalized trust, but is consistent with a growing body of experimental evidence showing that
trust has a neuroendocrinological basis. The results should be viewed as preliminary since we
are extrapolating individual effects from aggregated data. The use of lagged explanatory
variables (and the lack of time series data on explanatory variables) do not permit us to
determine if the impact of environmental conditions causes chronic or temporary effects on
the hormones of interest. We suspect the effects are chronic since food consumption,
population subgroups, and geographic factors are relatively constant over time, as are trust
levels within countries, but additional research is necessary to demonstrate this. The eco-poor
factor is more difficult to interpret than phyto, as it includes greater heterogeneity in its
loadings. Ecological insults such as pollution may raise stress levels (McEwen, 2001),
reducing the likelihood of behaving in a trustworthy manner (Heinrichs et al., 2003). Because
oxytocin down-regulates stress responses, this finding relates social capital physiologically to
health outcomes (Lindstrom, 2003; Harpham et al., 2004). Further, both the biosocial and eco-
poor factors are associated with cultural practices, so the results may be identifying social
factors that indirectly relate culture to trust. Care is therefore required in interpreting our
results.
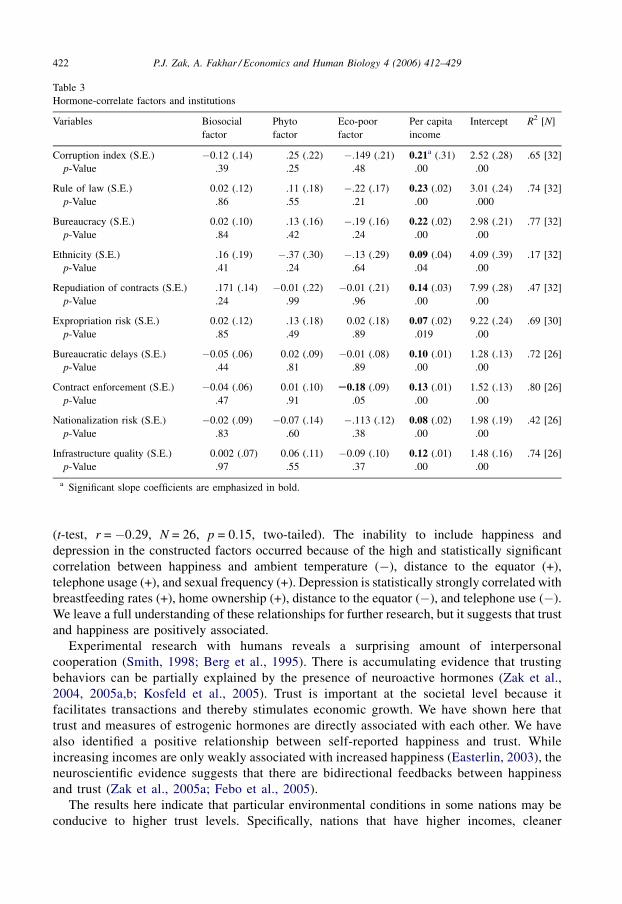
Zak and Knack (2001) and Knack and Zak (2002) identify the role of institutional factors on
trust, e.g. measures of corruption, contract enforcement, infrastructure spending, and unbiased
application of the law. We therefore regressed the three endocrine-correlate factors biosocial,
phyto, and eco-poor, on 10 measures of legal institutions to determine if, for example, the
constructed neuroendocrine factors are associated with weak legal systems (Zak and Knack,
2001). None of the 10 institutional measures reach statistical significance for any of the
endocrine-correlate factors (t-tests; see Table 3). This indicates that endocrine effects may be a
new and independent as explanation for generalized trust, and that these factors affect trust
directly, rather than indirectly.
Uvnas-Moberg (1997, p. 155) writes that ‘‘a causal relationship may exist between
endogenous oxytocin and personality’’. If our finding that interpersonal trust has a
neuroendocrinological basis is correct, then direct measures of emotions would be expected
to be related to trust levels. Cross-country affective measures are difficult to obtain, but the WVS
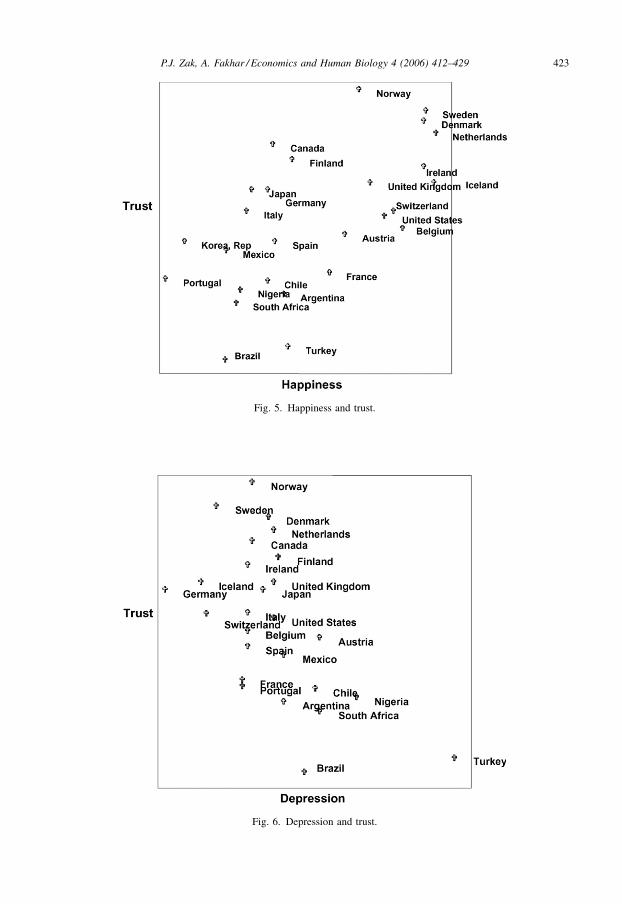
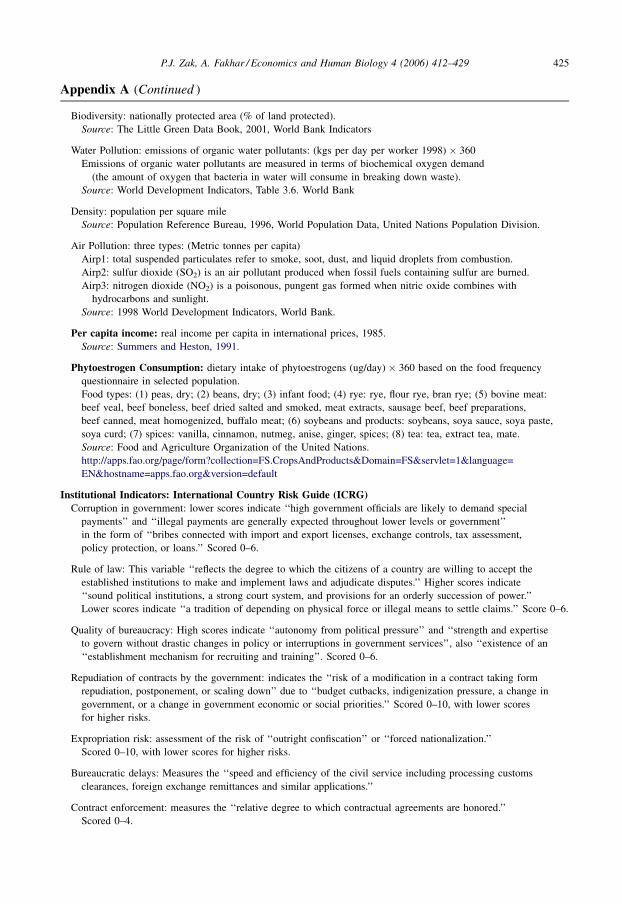
contains data on self-reported happiness and depression. Figs. 5 and 6 plot these affect measures
against trust. Happiness is strongly positively correlated with trust (t-test, N = 27, r = 0.60,
p = 0.001, two-tailed), while depression is significantly negative related to trust (t-test, N = 26,
r = �0.56, p = 0.003, two-tailed). Indeed, running correlations for all the 80 variables in our
initial dataset on trust, we find rates of happiness and depression explain the largest amount of the
variation for trust among all the single variables examined. Interestingly, happiness and
depression were unable to be included in the constructed factors because the factor matrix was
noninvertible, although happiness and depression are not themselves significantly correlated
P.J. Zak, A. Fakhar / Economics and Human Biology 4 (2006) 412–429 421
(t-test, r = �0.29, N = 26, p = 0.15, two-tailed). The inability to include happiness and
depression in the constructed factors occurred because of the high and statistically significant
correlation between happiness and ambient temperature (�), distance to the equator (+),
telephone usage (+), and sexual frequency (+). Depression is statistically strongly correlated with
breastfeeding rates (+), home ownership (+), distance to the equator (�), and telephone use (�).
We leave a full understanding of these relationships for further research, but it suggests that trust
and happiness are positively associated.
Experimental research with humans reveals a surprising amount of interpersonal
cooperation (Smith, 1998; Berg et al., 1995). There is accumulating evidence that trusting
behaviors can be partially explained by the presence of neuroactive hormones (Zak et al.,
2004, 2005a,b; Kosfeld et al., 2005). Trust is important at the societal level because it
facilitates transactions and thereby stimulates economic growth. We have shown here that
trust and measures of estrogenic hormones are directly associated with each other. We have
also identified a positive relationship between self-reported happiness and trust. While
increasing incomes are only weakly associated with increased happiness (Easterlin, 2003), the
neuroscientific evidence suggests that there are bidirectional feedbacks between happiness
and trust (Zak et al., 2005a; Febo et al., 2005).
The results here indicate that particular environmental conditions in some nations may be
conducive to higher trust levels. Specifically, nations that have higher incomes, cleaner
P.J. Zak, A. Fakhar / Economics and Human Biology 4 (2006) 412–429422
Table 3
Hormone-correlate factors and institutions
Variables Biosocial
factor
Phyto
factor
Eco-poor
factor
Per capita
income
Intercept R2 [N]
Corruption index (S.E.) �0.12 (.14) .25 (.22) �.149 (.21) 0.21a (.31) 2.52 (.28) .65 [32]
p-Value .39 .25 .48 .00 .00
Rule of law (S.E.) 0.02 (.12) .11 (.18) �.22 (.17) 0.23 (.02) 3.01 (.24) .74 [32]
p-Value .86 .55 .21 .00 .000
Bureaucracy (S.E.) 0.02 (.10) .13 (.16) �.19 (.16) 0.22 (.02) 2.98 (.21) .77 [32]
p-Value .84 .42 .24 .00 .00
Ethnicity (S.E.) .16 (.19) �.37 (.30) �.13 (.29) 0.09 (.04) 4.09 (.39) .17 [32]
p-Value .41 .24 .64 .04 .00
Repudiation of contracts (S.E.) .171 (.14) �0.01 (.22) �0.01 (.21) 0.14 (.03) 7.99 (.28) .47 [32]
p-Value .24 .99 .96 .00 .00
Expropriation risk (S.E.) 0.02 (.12) .13 (.18) 0.02 (.18) 0.07 (.02) 9.22 (.24) .69 [30]
p-Value .85 .49 .89 .019 .00
Bureaucratic delays (S.E.) �0.05 (.06) 0.02 (.09) �0.01 (.08) 0.10 (.01) 1.28 (.13) .72 [26]
p-Value .44 .81 .89 .00 .00
Contract enforcement (S.E.) �0.04 (.06) 0.01 (.10) S0.18 (.09) 0.13 (.01) 1.52 (.13) .80 [26]
p-Value .47 .91 .05 .00 .00
Nationalization risk (S.E.) �0.02 (.09) �0.07 (.14) �.113 (.12) 0.08 (.02) 1.98 (.19) .42 [26]
p-Value .83 .60 .38 .00 .00
Infrastructure quality (S.E.) 0.002 (.07) 0.06 (.11) �0.09 (.10) 0.12 (.01) 1.48 (.16) .74 [26]
p-Value .97 .55 .37 .00 .00
a Significant slope coefficients are emphasized in bold.
P.J. Zak, A. Fakhar / Economics and Human Biology 4 (2006) 412–429 423
Fig. 5. Happiness and trust.
Fig. 6. Depression and trust.

environments, and that consume more food containing phytoestrogens appear to have higher
levels of generalized trust. This information could be directly used by policy-makers to raise trust
levels, especially in developing countries. It also provides a development rationale for
maintaining a clean environment and for the consumption of healthy foods.
Acknowledgements
We thank the Claremont Institute for Economic Policy Studies and its director Tom
Willett for research support. Helpful comments were provided by the editor of this journal
John Komlos, four anonymous referees, as well as Janet Landa, William T. Matzner, Vera
Morhenn, Cort Pedersen, and Michael Stryker, though they are not responsible for omissions
or errors.
Appendix A. Data sources and descriptive statistics
Data sources
Indicators, description and source
Social indicators:Trust: percentage of respondents who answered yes to the question: ‘‘Generally speaking,
would you say that most people can be trusted or that you can’t be too careful in dealing with people?’’
Source: World Values Survey, 1995–1996.
Ownership: households in occupied housing units, % owner.
Source: United Nations, Human Settlement Statistics Questionnaire 1999.
http://www.unchs.org/habrdd/Statannex_A-4.pdf
Total breastfeeding: percent of breastfed infants.
Exclusive breastfeeding rate (<4 months) + time complementary breastfeeding rate
(6–9 months) + continued breastfeeding rate (12–15 months) + continued breastfeeding rate (20–23 months).
Source: Breastfeeding indicators, UNICEF Global database.
Fertility rate: total births per woman.
Source: World Development Indicators database, World Bank, 1990.
Female population: percentage of total population.
Source: World Development Indicators database, World Bank, 1990.
Rural population: percentage of the total population.
Source: World Development Indicators database, World Bank, 1990.
Sex frequency: respondents from the Global Sex Survey 2002 answering the question:
‘‘How often do you have sex’’.
Source: Durex Global Survey.
www.durex.com/scientific/studies/global/global3.html
Religion variables: International Social Survey Programme.
Source: http://www.issp.org/
Telephone usage: mainlines per 1000 population.
Source: World Bank: World Development Indicators
Eco-poor Indicators:Distance from the equator: in degrees and minutes, of various major cities around the world.
Source: http://geography.about.com/gi/dynamic/offsite.htm?once=true&site=http://www.bcca.org/misc/qib
lih/latlong.html
P.J. Zak, A. Fakhar / Economics and Human Biology 4 (2006) 412–429424
Biodiversity: nationally protected area (% of land protected).
Source: The Little Green Data Book, 2001, World Bank Indicators
Water Pollution: emissions of organic water pollutants: (kgs per day per worker 1998) � 360
Emissions of organic water pollutants are measured in terms of biochemical oxygen demand
(the amount of oxygen that bacteria in water will consume in breaking down waste).
Source: World Development Indicators, Table 3.6. World Bank
Density: population per square mile
Source: Population Reference Bureau, 1996, World Population Data, United Nations Population Division.
Air Pollution: three types: (Metric tonnes per capita)
Airp1: total suspended particulates refer to smoke, soot, dust, and liquid droplets from combustion.
Airp2: sulfur dioxide (SO2) is an air pollutant produced when fossil fuels containing sulfur are burned.
Airp3: nitrogen dioxide (NO2) is a poisonous, pungent gas formed when nitric oxide combines with
hydrocarbons and sunlight.
Source: 1998 World Development Indicators, World Bank.
Per capita income: real income per capita in international prices, 1985.
Source: Summers and Heston, 1991.
Phytoestrogen Consumption: dietary intake of phytoestrogens (ug/day) � 360 based on the food frequency
questionnaire in selected population.
Food types: (1) peas, dry; (2) beans, dry; (3) infant food; (4) rye: rye, flour rye, bran rye; (5) bovine meat:
beef veal, beef boneless, beef dried salted and smoked, meat extracts, sausage beef, beef preparations,
beef canned, meat homogenized, buffalo meat; (6) soybeans and products: soybeans, soya sauce, soya paste,
soya curd; (7) spices: vanilla, cinnamon, nutmeg, anise, ginger, spices; (8) tea: tea, extract tea, mate.
Source: Food and Agriculture Organization of the United Nations.
http://apps.fao.org/page/form?collection=FS.CropsAndProducts&Domain=FS&servlet=1&language=
EN&hostname=apps.fao.org&version=default
Institutional Indicators: International Country Risk Guide (ICRG)Corruption in government: lower scores indicate ‘‘high government officials are likely to demand special
payments’’ and ‘‘illegal payments are generally expected throughout lower levels or government’’
in the form of ‘‘bribes connected with import and export licenses, exchange controls, tax assessment,
policy protection, or loans.’’ Scored 0–6.
Rule of law: This variable ‘‘reflects the degree to which the citizens of a country are willing to accept the
established institutions to make and implement laws and adjudicate disputes.’’ Higher scores indicate
‘‘sound political institutions, a strong court system, and provisions for an orderly succession of power.’’
Lower scores indicate ‘‘a tradition of depending on physical force or illegal means to settle claims.’’ Score 0–6.
Quality of bureaucracy: High scores indicate ‘‘autonomy from political pressure’’ and ‘‘strength and expertise
to govern without drastic changes in policy or interruptions in government services’’, also ‘‘existence of an
‘‘establishment mechanism for recruiting and training’’. Scored 0–6.
Repudiation of contracts by the government: indicates the ‘‘risk of a modification in a contract taking form
repudiation, postponement, or scaling down’’ due to ‘‘budget cutbacks, indigenization pressure, a change in
government, or a change in government economic or social priorities.’’ Scored 0–10, with lower scores
for higher risks.
Expropriation risk: assessment of the risk of ‘‘outright confiscation’’ or ‘‘forced nationalization.’’
Scored 0–10, with lower scores for higher risks.
Bureaucratic delays: Measures the ‘‘speed and efficiency of the civil service including processing customs
clearances, foreign exchange remittances and similar applications.’’
Contract enforcement: measures the ‘‘relative degree to which contractual agreements are honored.’’
Scored 0–4.
P.J. Zak, A. Fakhar / Economics and Human Biology 4 (2006) 412–429 425
Appendix A (Continued )
Nationalization risk: measures risk of ‘‘appropriation for no compensation’’ and ‘‘preferential treatment for
nationals.’’ Scored 0–4, with higher scores for lower risks.
Infrastructure quality: assesses ‘‘facilities for ease of communication between headquarters and the operation, and
within the country,’’ as well as quality of transportation. Scored 0–4, with higher scores for superior quality.
Ethnicity: Index of ethnolinguistic fractionalization, 1960. Measures the probability that two randomly selected
people from a given country will not belong to the same ethnolinguistic group.
Sources: Business Environment Risk International (BERI), http://www.beri.com/brs.htm;
International Country Risk Guide, http://www.icrgonline.com; Sullivan, M. Measuring Global Values.
Greenwood, 1991.
Happiness: Respondents answer the question: ‘‘How many days in the last week did you feel happy?’’.
Source: General Social Survey, 1996
Depression: Respondents answer the question: ‘‘How many days in the last week did you feel sad?
Source: General Social Survey, 1996
Descriptive statistics
Mean S.D.
Trust ( ) 32.02 15.88
Income per capita (*) 7.96 4.87
Fertility ( ) 2.15 .92
Home ownership (&) 62.83 13.77
Density (!) 381.16 478.03
Annual sex frequency (") 124.84 28.82
Breastfeeding (b) 32.12 56.59
Distance from the equator (~) 35.69 16.22
Telephone usage (&) 294.92 211.04
Air pollution (^) 114.87 103.22
Water pollution (y) 367681.41 535831.27
Muslims (^) 8.27 21.48
Catholics (^) 42.70 36.98
Jews (^) 1.64 8.81
Protestants (^) 22.08 26.54
Buddhists (^) 2.25 10.10
Hindus (^) 2.58 13.02
Female population (*) 50.58 .73
Biodiversity (z) 10.01 9.93
Rural population (*) 213.28 239.44
Happiness (k) 3.12 .17
Depression (k) .20 .10
Corruption (|) 4.09 1.31
Rule of Law (|) 4.85 1.25
Bureaucracy (|) 4.68 1.29
Ethnicity (|) 4.90 1.10
Repudiation of contracts (|) 9.20 1.02
Expropriation risk (|) 9.75 .67
Bureaucracy delay (|) 2.06 .56
Contract enforcement (|) 2.58 .72
Nationalization risk (|) 2.63 .56
Infrastructure quality (|) 2.47 .73
P.J. Zak, A. Fakhar / Economics and Human Biology 4 (2006) 412–429426
Appendix A (Continued )
Secoisolariciresinol (€) 34716.69 22438.85
Campesterol (€) 2003.23 1109.44
Biochanin (€) 42530.53 47790.49
Stigmasterol (€) 2065.36 1305.60
Courmestrol (€) 10963.15 18386.50
Genistein (€) 148293.98 572098.72
Daidzein (€) 91530.8 362430.82
Matairesinol (€) 1103.69 1730.20
Myricetin (€) 123171.46 102401.85
b-Sisterol (€) 13591.18 6692.33
Boron (€) 3940079.01 2831384.20
Quercetin (€) 122188.01 178981.32
Kaempferol (€) 73465.92 51866.26
( ) Percentage of respondents who said they trusted most people. * Income real income per capita in 1985 international
prices/1000. ( ) Total births per woman. (&) Percent of home owners in total population. (!) Population per square mile.
(") Frequency of sexual encounters per year. (b ) Percent of breastfed infants. (~) Degrees and minutes. (& )Mainlines
per 1000 population. (^) Metric tonnes of CO2, SO2 and NO2 per capita. (y) (kgs per day per worker 1998) � 360. (z)Percent of land protected. (^) Percent of total population. (* and *) Percentage of total population. (k) Percent of
population which feels happy/depressed. (|) Scores between 0–6 or 0–10. See Appendix A. (€) Dietary intake of
phytoestrogens (ug/day) � 360 based on the food frequency questionnaire in selected population.
References
Albertazzi, P., Pansini, F., Bottazzi, M., Bonaccorsi, G., De Aloysio, D., Morton, M.S., 1999. Dietary soy supplementation
and phytoestrogen levels. Obstet. Gynecol. 94 (2), 229–231.
Berg, J., Dickhaut, J., McCabe, K., 1995. Trust, reciprocity and social history. Games Econ. Behav. 10, 122–142.
Beugelsdijk, S., de Groot, H.L.F., van Schaik, A.B.T.M., 2004. Trust and economic growth: a robustness analysis. Oxford
Econ. Pap. 56, 118–134.
Brzezinski, A., Debi, A., 1999. Phytoestrogens: the ‘‘natural’’ selective estrogen receptor modulators? Eur. J. Obstet.,
Gynecol. Reprod. Biol. 85 (1), 47–51.
Camerer, C., Loewenstein, G., Prelec, D., 2005. Neuroeconomics: how neuroscience can inform economics. J. Econ. Lit.
XLIII, 9–64.
Carter, C.S., 1998. Neuroendocrine perspectives on social attachment and love. Psychoneuroendocrinology 23 (8), 779–
818.
Carter, C.S., Altemus, M., 1997. Integrative functions of lactational hormones in social behavior and stress management.
In: Carter, C.S., Lederhendler, I., Kirkpatrick, B. (Eds.), Integrative Neurobiology of Affiliation. New York Academy
of Sciences, pp. 164–174.
Carter, C.S., Getz, L.L., 1993. Monogamy and the prairie vole: noting the role of oxytocin and vasopressin hormones. Sci.
Am. 268, 100–106.
Carter, C.S., Keverne, E.B., 2002. The neurobiology of social affiliation and pair bonding. In: Pfaff, D., et al. (Eds.),
Hormones, Brain, and Behavior. Academic Press, pp. 299–337.
Carter, C.S., DeVries, C., Taymans, S.E., Roberts, R.L., Williams, J.R., Getz, L.L., 1997a. Peptides, steroids, and pair
bonding. In: Carter, C.S., Lederhendler, I., Kirkpatrick, B. (Eds.), The Integrative Neurobiology of Affiliation. New
York Academy of Sciences, pp. 260–272.
Carter, C.S., Lederhendler, I.I., Kirkpatrick, B. (Eds.), 1997b. The Integrative Neurobiology of Affiliation. New York
Academy of Sciences.
Cassidy, A., Milligan, S., 1998. How significant are environmental estrogens to women? Climacteric 1 (3), 229–242.
Catell, R.B., 1965a. Factor Analysis: an introduction to essentials I. The purpose and underlying models. Biometrika 21,
190–215.
Catell, R.B., 1965b. Factor analysis: an introduction to essentials II. The role of factor analysis in research. Biometrika 21,
405–433.
Comrey, A.L., Lee, H.B., 1992. A First Course in Factor Analysis, second ed. Lawrence Erlbaum Associates, Hillsdale,
NJ.
P.J. Zak, A. Fakhar / Economics and Human Biology 4 (2006) 412–429 427
Appendix A (Continued )

Croson, R., Buchan, N., 1999. Gender and culture: international experimental evidence from trust games. Am. Econ. Rev.
89 (2), 386–391.
Easterlin, R., 2003. Explaining happiness. Proc. Natl. Acad. Sci. USA 100 (19), 11176–11183.
Febo, M., Numan, M., Ferris, C.F., 2005. Functional magnetic resonance imaging shows oxytocin activates brain regions
associated with mother–pup bonding during suckling. J. Neurosci. 25 (50), 11637–11644.
Fernald, R.E., White, S.A., 2000. Social control of brains: from behavior to genes. In: Gazzaniga, M.S. (Ed.), 2002. The
New Cognitive Neurosciences, second ed. MIT Press, Cambridge, (Chapter 82), pp. 1193–1208.
Fliers, E., Guldenaar, S.E., van de Wal, N., Swaab, D.F., 1986. Extrahypothalamic vasopressin and oxytocin in the human
brain; presence of vasopressin cells in the bed nucleus of the stria terminalis. Brain Res. 375 (2), 363–367.
Glimcher, P.W., 2003. Decisions, Uncertainty, and the Brain: The Science of Neuroeconomics. MIT Press.
Gold, H., Webster, A., 1990. New Zealand Values Today. Alpha Publications, Palmerston North, New Zealand.
Harpham, T., Grant, E., Rodriguez, C., 2004. Mental health and social capital in Cali, Colombia. Soc. Sci. Med. 58 (11),
2267–2277.
Heinrichs, M., Baumgartner, T., Kirschbaum, C., Ehlert, U., 2003. Social support and oxytocin interact to suppress
cortisol and subjective responses to psychosocial stress. Biol. Psychiatry 54 (12), 1389–1398.
Inglehart, R., et al., 2000. World values surveys and European values surveys. 1981–1984, 1990–1993, and 1995–1997.
ICPSR Study No. 2790. Inter-University Consortium for Political and Social Research, Institute for Social Research.
Insel, T.R., 1997. A neurobiological basis of social attachment. Am. J. Psychiatry 154 (6), 726–735.
Insel, T.R., Shapiro, L.E., 1992. Oxytocin receptor distribution reflects social organization in monogamous and
polygamous voles. Proc. Natl. Acad. Sci. USA 5981–5985 89(13).
Insel, T.R., Young, L.J., 2001. The neurobiology of attachment. Nat. Rev. Neurosci. 2 (2), 129–135.
Knack, S., Zak, P.J., 2002. Building trust: public policy, interpersonal trust, and economic development. Supreme Court
Econ. Rev. 10, 91–107.
Kosfeld, M., Heinrichs, M., Zak, P.J., Fischbacher, U., Fehr, E., 2005. Oxytocin increases trust in humans. Nature 435 (2),
673–676.
Lehman, R.S., 1995. Statistics in the Behavioral Sciences: A Conceptual Introduction. Brooks Cole Publishing Company.
Lindstrom, M., 2003. Social capital, the miniaturisation of community and self-reported global and psychological health.
Soc. Sci. Med. 59 (3), 595–607.
Mason, W.A., Mendoza, S.P., 1998. Generic aspects of primate attachments: parents, offspring, and mates. Psychoneur-
oendocrinology 23 (8), 765–778.
Mazur, W., 1998. Phytoestrogen content in foods. Bailliere’s Clin. Endocrinol. Metab. 12 (14), 729–742.
McCabe, K., 2003. In: Lynn Nadel (Ed.), Neuroeconomics. Encyclopedia of Cognitive Science. Nature Publishing
Group, Macmillan Publishing, New York, pp. 294–298.
McEwen, B.S., 2001. From molecules to mind; stress, individual differences, and the social environment. Ann. N. Y.
Acad. Sci. 935, 42–49.
Mishra, S.I., Dickerson, V., Najm, W., 2003. Phytoestrogens and breast cancer prevention: what is the evidence? Am. J.
Obstet. Gynecol. 188 (5), S66–S70.
Panksepp, J., 1992. Oxytocin effects on emotional processes: separation distress, social bonding, and relationships to
psychiatric disorders. In: Pedersen, C.A., Caldwell, J.D., Jirikowski, G.F., Insel, T.R. (Eds.), Oxytocin in Maternal,
Sexual, and Social Behaviors. New York Academy of Sciences, pp. 243–252.
Pedersen, C.A., 2004. How love evolved from sex and gave birth to intelligence and human nature. J. Bioecon. 6, 39–63.
Pedersen, C.A., Caldwell, J.D., Jirikowski, G.F., Insel, T.R. (Eds.), 1992. Oxytocin in Maternal, Sexual, and Social
behaviors. New York Academy of Sciences.
Pedersen, C.A., Prange Jr., A.J., 1979. Induction of maternal behavior in virgin rats after intracerebroventricular
administration of oxytocin. Proc. Natl. Acad. Sci. USA 76 (12), 6661–6665.
Pillow, P.C., Duphorne, C.M., Chang, S., Contois, J.H., Strom, S.S., Spitz, M.R., Hursting, S.D., 1999. Development of a
database for assessing dietary phytoestrogen intake. Nutr. Cancer 33 (1), 3–19.
Putnam, R.D., 2000. Bowling Alone: The Collapse and Revival of American Community. Simon and Schuster, New York.
Safe, S., Connor, K., Gaido, K., 1998. Methods for xenoestrogen testing. Toxicol. Lett. 102–103, 665–670.
Smith, V., 1998. The two faces of Adam Smith. Southern Econ. J. 65 (1), 1–19.
Summers, R., Heston, A., 1991. The Penn world tables: an expanded set of international comparisons. Quart. J. Econ. 106,
327–368.
Tilgner, S.N.D., 1999. Herbal Medicine From the Heart of the Earth. Wise Acres.
Tribollet, E., Dubois-Daupin, M., Dreifuss, J.J., Barberis, C., Jard, S., 1992. Oxytocin receptors in the central nervous
system: distribution, development, and species differences. In: Pedersen, C.A., Caldwell, J.D., Jirikowski, G.F., Insel,
T.R. (Eds.), Oxytocin in Maternal, Sexual, and Social Behaviors. New York Academy of Sciences, pp. 29–38.
P.J. Zak, A. Fakhar / Economics and Human Biology 4 (2006) 412–429428
Uvnas-Moberg, K., 1998. Oxytocin may mediate the benefits of positive social interaction and emotions. Psychoneur-
oendocrinology 23 (8), 819–835.
Uvnas-Moberg, K., 1997. Physiological and endocrine effects of social contact. In: Carter, C.S., Lederhendler, I.,
Kirkpatrick, B. (Eds.), The Integrative Neurobiology of Affiliation. New York Academy of Sciences, pp. 146–163.
Verbalis, J., 1999. The brain oxytocin receptor(s)? Front. Neuroendocrinol. 20, 146–156.
Zak, P.J., Kurzban, R., Matzner, W.T., 2005a. Oxytocin is associated with human trustworthiness. Horm. Behav. 48, 522–
527.
Zak, P.J., Borja, K., Matzner, W.T., Kurzban, R., 2005b. The neuroeconomics of distrust: physiologic and behavioral
differences between men and women. Am. Econ. Rev. Pap. Proceed. 95 (2), 360–363.
Zak, P.J., 2005. Neuroeconomics. Philos. Trans. R. Soc. B 359, 1737–1748.
Zak, P.J., Kurzban, R., Matzner, W.T., 2004. The neurobiology of trust. Ann. N. Y. Acad. Sci. 1032, 224–227.
Zak, P.J., 2006. The neuroeconomics of trust. In: Franz, R. (Ed.), Two Minds. Intuition and Analysis in the History of
Economic Thought, Springer, in press.
Zak, P.J., Knack, S., 2001. Trust and growth. Econ. J. 111, 295–321.
P.J. Zak, A. Fakhar / Economics and Human Biology 4 (2006) 412–429 429


