Embed Size (px)
Citation preview
Myostatin Expression, Lymphocyte Population, andPotential Cytokine Production Correlate withPredisposition to High-Fat Diet Induced Obesity in MiceJeri-Anne Lyons1, Jodie S. Haring2, Peggy R. Biga3*
1 Department of Clinical Health Sciences, University of Wisconsin-Milwaukee, Milwaukee, Wisconsin, United States of America, 2 Department of Chemistry and Molecular
Biology, North Dakota State University, Fargo, North Dakota, United States of America, 3 Department of Biological Sciences, North Dakota State University, Fargo, North
Dakota, United States of America
Abstract
A strong relationship exists between increased inflammatory cytokines and muscle insulin resistance in obesity. This studyfocused on identifying a relationship between metabolic propensity and myostatin expression in muscle and spleen cells inresponse to high-fat diet intake. Using a comparative approach, we analyzed the effects of high-fat diet intake on myostatinand follistatin expression, spleen cell composition, and potential cytokine expression in high-fat diet induced obesity(HFDIO) resistant (SWR/J) and susceptible (C57BL/6) mice models. Results demonstrated overall increased myostatinexpression in muscle following high-fat diet intake in HFDIO-susceptible mice, while myostatin expression levels decreasedinitially in muscle from high-fat diet fed resistant mice. In HFDIO-resistant mice, myostatin expression decreased in spleen,while myostatin increased in spleen tissue from HFDIO-susceptible mice. Proinflammatory cytokine (IL-17, IL-1b, and IFNc)potential increased in splenocytes from HFDIO-susceptible mice. In comparison, C57BL/6 mice fed a high-fat diet exhibitedhigher frequencies of CD4+/CD44hi and CD8+/CD44hi cells in the spleen compared to control fed mice. Together, theseresults suggest that susceptibility to high-fat diet induced obesity could be influenced by local myostatin activity in a tissue-specific manner and that splenocytes exhibit differential cytokine production in a strain-dependent manner. This study setsthe stage for future investigations into the interactions between growth, inflammation, and metabolism.
Citation: Lyons J-A, Haring JS, Biga PR (2010) Myostatin Expression, Lymphocyte Population, and Potential Cytokine Production Correlate with Predisposition toHigh-Fat Diet Induced Obesity in Mice. PLoS ONE 5(9): e12928. doi:10.1371/journal.pone.0012928
Editor: Frederic Marion-Poll, INRA - Paris 6 - AgroParisTech, France
Received November 13, 2009; Accepted August 27, 2010; Published September 22, 2010
Copyright: � 2010 Lyons et al. This is an open-access article distributed under the terms of the Creative Commons Attribution License, which permitsunrestricted use, distribution, and reproduction in any medium, provided the original author and source are credited.
Funding: This work was supported by funds to PRB by NIH NCRR COBRE, Center for Protease Research Grant # 2P20RR015566 and ND EPSCoR Grant # EPS-00447679 from NSF. The funders had no role in study design, data collection and analysis, decision to publish, or preparation of the manuscript.
Competing Interests: The authors have declared that no competing interests exist.
* E-mail: [email protected]
Introduction
The pathophysiology of obesity and type 2 diabetes is complex
and is associated with environmental and lifestyle risk factors that
include a sedentary lifestyle and an overweight condition. The
onset of type 2 diabetes can, in most cases, be reversed with
lifestyle changes including diet and exercise. However, the
mechanisms controlling this pathophysiology are unclear. Gluco-
and lipitoxicity are considered to play key roles in the development
of type 2 diabetes [1,2], with the primary molecular defect being
impaired insulin-stimulated glucose transport and decreased
glycogen synthesis in skeletal muscle [3]. Skeletal muscle
represents the most important tissue for maintenance of balanced
glucose homeostasis since it accounts for ,80% of insulin-
stimulated glucose uptake [4]. Muscle is also the predominant
tissue for whole body lipid oxidation, with up to 90% of the energy
requirements at rest being derived from fatty acids [5].
Recently, Zhao et al. [6] demonstrated that disrupting
myostatin (MSTN) function by overexpressing its propeptide
protects against dietary-induced obesity and insulin resistance.
MSTN is a myokine known to negatively regulate muscle growth
and impact body fat accumulation. Myostatin is produced as a
375-amino acid propeptide that is proteolytically cleaved at the
RSRR (263) site to produce the 26-kDa active MSTN [7]. The
resulting prodomain has been shown to inhibit the negative
growth activity of active MSTN [8]. Myostatin-null mice show a
two-fold increase in muscle mass compared to wild-type mice, as
well as a significant suppression of body fat accumulation [9,10].
Similarly, transgenic mice expressing muscle-specific MSTN
propeptide exhibit 20% faster growth and 44% more muscle
mass than wild-type controls, but maintain normal adipose tissue
[6]. In addition, follistatin has been shown to bind and inhibit
MSTN activity [11,12]. Conversely, overexpression of the active
MSTN peptide in muscle results in low muscle weights and
increased fat mass [13], suggesting that processing of MSTN may
play a role in energy partitioning between protein and fat,
counteracting muscle-wasting disorders that are prevalent in many
disease states including diabetes.
A strong link exists between increased inflammatory cytokines,
such as tumor necrosis factor-alpha (TNF-a) and interleukin-6 (IL-
6), and insulin resistance in obese individuals [14]. In response to
high fat intake, a low-grade systemic inflammatory response is seen
along with increased intramyocellular adipose deposition. A
previous study demonstrated that age, intramyocellular lipid,
and TNF-a are the strongest predictors of insulin resistance [15].
However, the mechanisms regulating the interactions between the
PLoS ONE | www.plosone.org 1 September 2010 | Volume 5 | Issue 9 | e12928
inflammatory response and muscle insulin sensitivity are still not
fully elucidated. It has been known for some time that high-fat
diets can generally compromise protective immune responses
[16,17]. Recently, the dysfunction of the innate immune response
to influenza and increased mortality was linked directly to obesity
[18]. It is still unclear where the regulation interactions lie between
metabolic and immune response regulation. The intent of the
current study was to evaluate the interactions between high-fat diet
intake, MSTN expression, and spleen cell population dynamics in
two strains of mice exhibiting differential responses to dietary
intake. To the authors’ knowledge, this is the first report of
differential MSTN expression in different strains of mice, as well as
the first report of MSTN expression in spleen and leukocytes in
mice.
Materials and Methods
Ethics StatementInstitutional Animal Care and Use Committees at both
University of Wisconsin-Milwaukee and North Dakota State
University approved all animal procedures.
Animals and Experimental DesignSix week old mice, SWR/J and C57BL/6 strains, were used for
these experiments (Jackson Laboratories, Bar Harbor, ME).
C57BL/6 mice exhibit a high susceptibility to diet-induced obesity,
type 2 diabetes, and atherosclerosis [19,20]. High-fat, high-simple-
carbohydrate, low-fiber diet produces obesity in C57BL/6J mice as
well as fasting blood glucose levels of greater than 240 mg/dl and
blood insulin levels of greater than 150 microU/ml [20], suggesting
that the C57BL/6J mouse carries a genetic predisposition to
develop non-insulin-dependent (type 2) diabetes. The SWR/J
mouse is resistant to diet-induced obesity and does not exhibit
glucose intolerance associated with obesity [21]. Mice were allowed
to acclimate for a period of two weeks to the facilities, which were
maintained at constant 20uC and 50% humidity with a 12:12 hour
light:dark cycle. Mice were acclimated to the control diets for two
weeks. Each strain of mouse was divided equally into two
experimental groups, which included 1) Control: fed a control diet
(10% kcal fat, Research Diets Inc., D12450B), or 2) High-fat: fed a
high-fat diet (60% kcal fat, Research Diets Inc., D12492). Mice were
fed experimental diets for 12 wk ad libitum, and given free access to
water. Each treatment group of mice was divided and housed in
sub-groups and each experiment was repeated (n = 3/grp, n = 6
total). Individual body weight, whole blood glucose, and average
daily food intake were measured weekly. All mice were fasted for
12 h prior to any biological sampling and were euthanized by CO2
inhalation prior to end-point sampling (cardiac puncture bleed and
tissue collections).
Sample Collection and AnalysisTissue and blood samples were collected at end-point sampling
for further analyses. Spleen and skeletal muscle (pool of
gastrocnemius and soleus) samples were collected and immediately
placed on dry ice until further processing. Blood was collected
from live animals via the saphenous vein (50 ml) or terminal
cardiac puncture (500 ml) for analysis for blood glucose using an
Accu-chek Blood Glucose Meter (Roche Diagnostics). Spleen
samples isolated at the 6-wk sampling period were used for either
RNA isolation (n = 6) or for ex vivo lymphocyte activation (n = 4).
Lymphocyte ActivationT lymphocyte stimulation and activation was performed on
individual spleens isolated from SWR and C57BL/6 mice fed
either a high-fat or control diet for 6 weeks using modifications to
the methods described by Trickett and Kwam [22]. Spleen
samples (n = 4) were homogenized by glass dounce homogenizers
in Hank’s buffered saline to result in a single cell suspension.
Following removal of red blood cells and granulocytes using a
Percol density gradient, mononuclear leukocytes were suspended
in RPMI 1640 medium supplemented with 1% L-glutamine, 1%
Hepes, 1% sodium pyruvate, 1% penicillin and streptomycin, and
0.1% beta-mercaptoethanol (complete RPMI, cRPMI). Single cell
suspensions were incubated with DynaBeads (CD3/CD28 beads,
Invitrogen) to expand and activate T lymphocytes. No difference
in total cell counts was detected between treatment groups
following cell separation. Cells were plated in cRPMI at a density
of 16106/mL and cultured at 37uC, 10% CO2. Aliquots of cell
supernatants (100 mL) were collected at 48, 72, and 96 h.
Supernatants were spun at 3,0006 g for 10 minutes, flash frozen
and stored at 280uC until assayed for cytokine production.
Cellular Composition of Spleen TissuesSpleens were harvested from all groups of mice into RPMI 1640
supplemented with 10% fetal bovine serum (FBS) and 1%
penicillin and streptomycin. Spleens were forced through a mesh
screen to obtain a single cell suspension. Red blood cells were
removed using RBC Lysis Buffer following manufacturer’s
directions (eBioscience). Following two washes with supplemented
RPMI, splenocytes were counted and aliquots of 16106 cells were
made for each staining combination as well as for flow cytometry
compensation controls. Staining was done in labeling buffer (PBS
plus 5% FBS). Antibodies used for staining were: FITC anti-mouse
CD4, PE-Cy5 anti-mouse CD8, FITC anti-mouse CD19, PE anti-
mouse CD44, PE anti-mouse CD25, PE anti-mouse CD69. Cells
were stained for 30 minutes at 4uC in the dark. Following one
wash in labeling buffer, samples were fixed using Cytofix Solution
according to manufacturer’s directions (BD), resuspended in
300 ml labeling buffer, and data were collected on a FACSCalibur
(BD). Data were analyzed using FlowJo (Treestar).
Quantitative Real-Time PCRChanges in genetic expression of myostatin (MSTN), follistatin
(FSTN), and interleukin-6 (IL-6) in muscle and spleen samples were
evaluated by real-time reverse transcription quantitative PCR
(RT-qPCR). Total RNA samples were reverse transcribed using
SuperScript II RNase H- reverse transcriptase (Invitrogen) and
oligo dT primers to obtain first-strand cDNA. First-strand cDNAs
were diluted 1:20 and used as templates for qPCR analysis.
Reactions (25 ml total volume) containing 1 ml diluted template,
150 nM each primer, and 1X Platinum SYBR Green qPCR
SuperMix (Invitrogen) were run in triplicate using the Mx3000P
real-time PCR system (Stratagene) and the following cycling
parameters: 50uC for 5 min; 95uC for 2 min; 40 cycles of 95uC for
15 s, 52uC for 15 s, 72uC for 30 s. No-template controls were run
for all primer pairs and PCR efficiencies were calculated for each
primer pair. Mean cycle threshold values (Ct values) for each
target gene were normalized with mean beta-actin Ct values.
Primer PCR efficiencies were calculated and utilized for PCR
correction for all primer pairs and normalized data were analyzed
using the standard curve quantification method [23].
Myostatin Protein Production AnalysisTotal muscle and spleen MSTN protein levels were detected
using Western ligand blot techniques. Total tissue proteins (10 mg)
were separated on reducing SDS-PAGE gels (8–16% Tris-HCl,
Pierce) and transferred to nitrocellulose membranes (ProTran,
0.45 mm). Myostatin prodomain immunoreactive peptides (MPIPs)
Myostatin and Inflammation
PLoS ONE | www.plosone.org 2 September 2010 | Volume 5 | Issue 9 | e12928
were detected with anti-GDF8/myostatin prodomain antibody (AF-
1539, R&D Systems). Putative pro-myostatin (,50 kDa) and
prodomain (,37 kDa) were detected in muscle, while putative
processed prodomain (,32 and 35 kDa) and further processed
immunoreactive peptides (,15 kDa) were detected in spleen tissue.
Cytokine Expression AnalysisCytokine expression was evaluated in cultured, activated spleen
lymphocyte populations utilizing a commercially available protein
array that recognizes 12 inflammation-related cytokines, including
granulocyte macrophage-colony stimulating factor (GM-CSF),
interferon-c (IFNc), IL-1a, IL-1b, IL-2, IL-4, IL-5, IL-6, IL-10,
IL-12, IL-17, and TNFa. The ExcelArrayTM Mouse Inflammation
Array (82005, ThermoFisher) was utilized to detect the expression
of cytokines by activated splenic lymphocytes isolated from high
fat fed and control animals of both strains of mice. The array is a
multiplex fluorescent sandwich ELISA that contains internal
normalization, standards for quantification, and is optimized for
cell culture supernatants. The assay was performed according to
the recommendations of the manufacturer. Briefly, neat cell
culture supernatants were incubated on the slides for 2 h, and a
streptavidin detection system was utilized to visualize. Visualiza-
tion was conducted two ways to ensure accuracy of detection.
Slides were sent to the manufacturer for slide reading and data
acquisition, while other slides were scanned, analyzed, and data
acquired using the GenePix Array Scanner and software. No
differences were detected between data sets utilizing the two
scanning techniques.
Statistical AnalysisAll RT-qPCR data were analyzed using the standard curve
method where cycle threshold values were compared to standard
curves generated and validated for each primer pair to result in a
relative starting copy number of mRNA. All comparisons within
strains were analyzed by two-way analysis of variance (ANOVA)
with factors being time and treatment using GraphPad Prism
version 5.0c for Mac OS X, GraphPad Software, San Diego
California USA, www.graphpad.com. Bonferroni post-hoc com-
parisons were conducted when overall interactions were significant
(P,0.05) to test for differences between treatment groups at each
sampling time.
All cytokine, weight, and blood glucose data were analyzed
using three-way analysis of variance (StatPlus, AnalystSoft) with
factors being strain, time, and treatment. Pairwise multiple-
comparison tests were conducted by the Holm-Sidak or Tukey-
Kramer method to compare between and within strains only when
main effects were significant. Cell frequencies were analyzed using
two-way analysis of variance with factors being strain and time.
Pairwise comparisons were conducted as previously stated.
Normality of sample distribution was tested by Normal Quantile
Plot (Q-Q Plot), and residuals were plotted against predicted
values to evaluate dependency between the means and variances
and test the assumption of homogeneity of variances. Results were
reported as least square means 6 SE.
Results
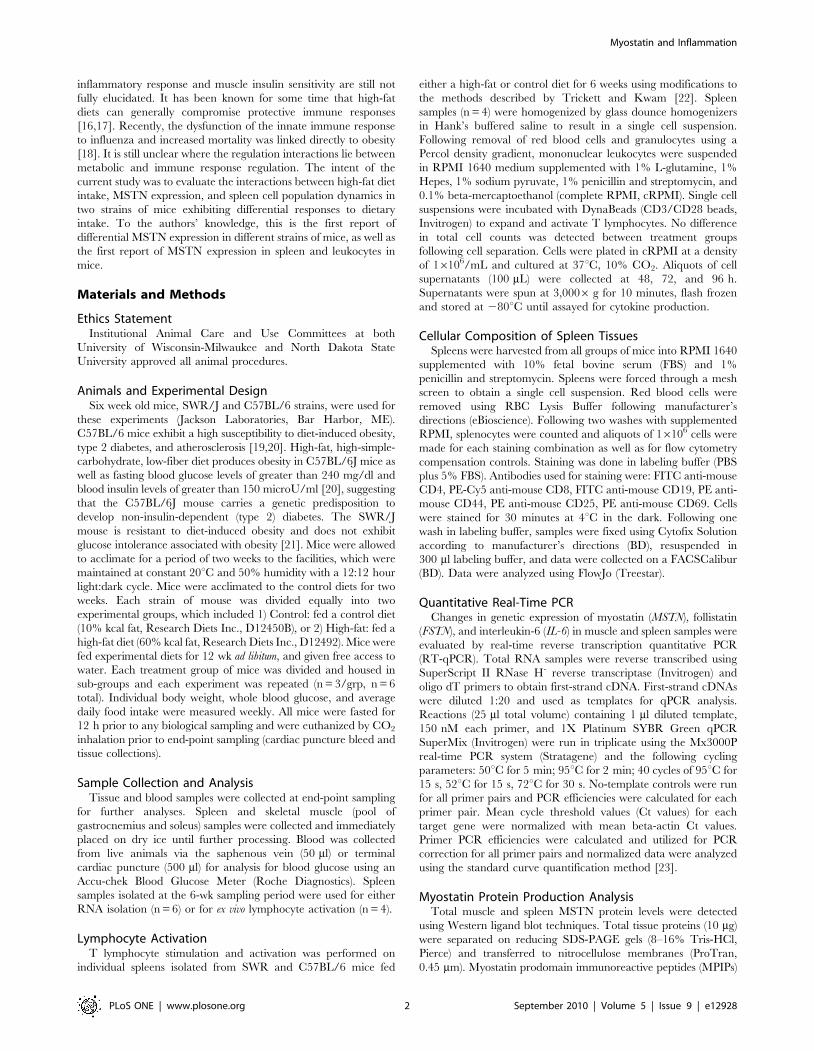
SWR mice are resistant to high-fat diet induced obesityOver the 12-wk feeding trial, C57BL/6 mice fed the high-fat
diet consistently gained weight, while the other treatment groups
failed to exhibit significant weight gain (Fig. 1a). Significant weight
increases were detected as early as 3 weeks on the high-fat diet in
C57BL/6 mice. At 12 wk, the high-fat fed C57BL/6 mice nearly
doubled their weight from wk 1, 43.0360.10 g vs. 24.2560.08 g.
No difference was detected between the control- and high-fat fed
SWR mice throughout the trial. In addition, there was no
difference between SWR mice (control or high-fat) and the control
C57BL/6 group at any time point in the feeding trial.
Consistent with weight changes between the experimental
groups, the C57BL/6 high-fat fed group exhibited increased blood
glucose levels at 3, 6, 9, and 12 wk following dietary intake
(Fig. 1b). Overall, blood glucose levels were elevated 2.45-fold in
C57BL/6 mice fed the high-fat diet compared to mice fed the
control diet (236650 mg/dl compared to 96610 mg/dl). How-
ever, SWR mice fed a high-fat diet did not exhibit elevated blood
glucose levels compared to control group (9467 mg/dl vs.
81614 mg/dl). These levels were significantly lower than the
C57BL/6 high-fat group, but not different from the C57BL/6
mice fed the control diet. In addition, there was no difference
detected in voluntary feed intake between any group of mice
throughout the feeding trial (data not shown).
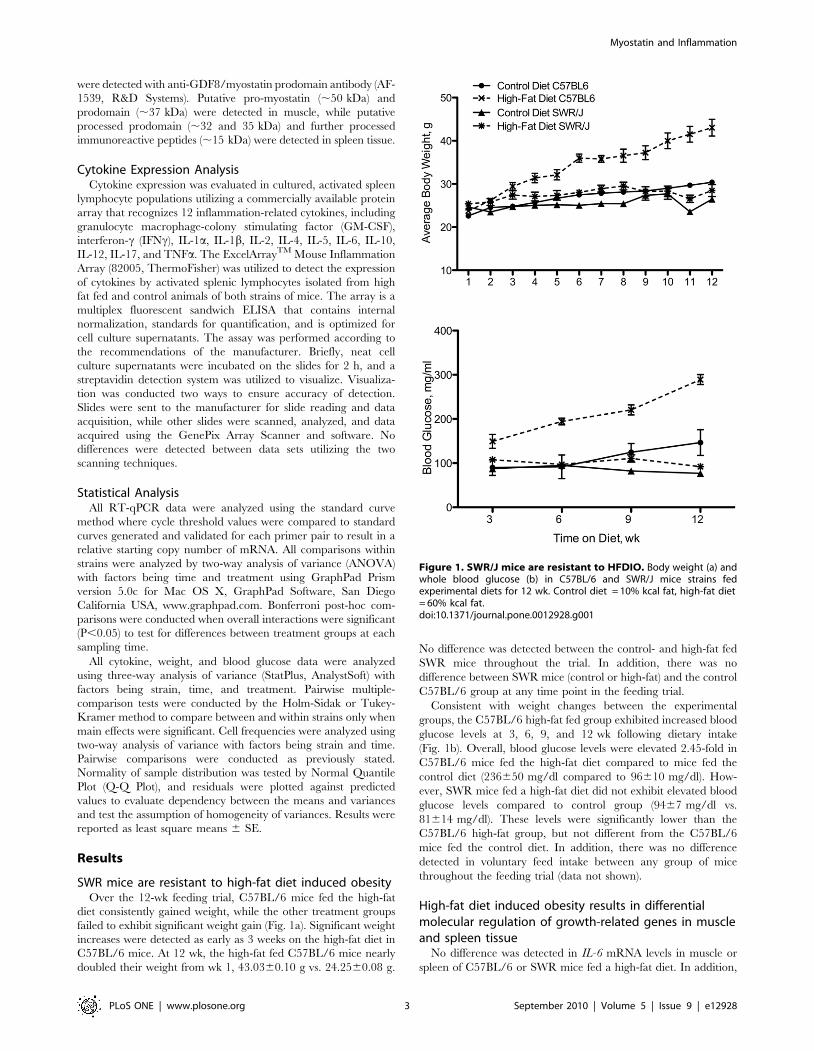
High-fat diet induced obesity results in differentialmolecular regulation of growth-related genes in muscleand spleen tissue
No difference was detected in IL-6 mRNA levels in muscle or
spleen of C57BL/6 or SWR mice fed a high-fat diet. In addition,
Figure 1. SWR/J mice are resistant to HFDIO. Body weight (a) andwhole blood glucose (b) in C57BL/6 and SWR/J mice strains fedexperimental diets for 12 wk. Control diet = 10% kcal fat, high-fat diet= 60% kcal fat.doi:10.1371/journal.pone.0012928.g001
Myostatin and Inflammation
PLoS ONE | www.plosone.org 3 September 2010 | Volume 5 | Issue 9 | e12928
no differences were detected between IL-6 mRNA levels in
C57BL/6 or SWR control fed mice in either tissue. In contrast,
MSTN mRNA levels were increased by high-fat diet intake in
muscle tissue of SWR and C57BL/6 mice after 9 and 12 wk,
respectively (Fig. 2a and 2c). At 3 wk, MSTN mRNA levels were
decreased in SWR muscle while levels increased in C57BL/6
muscle. Levels of MSTN mRNA were higher at 3 and 6 wk, and
lower at 12 wk, in muscle from control SWR mice compared to
control C57BL/6 mice. SWR spleen MSTN mRNA levels
decreased at 6 wk and 9 wk on the high-fat diet (Fig. 2d).
C57BL/6 spleen MSTN levels increased 8.8460.13-fold at 3 wk
on the high-fat diet, with no change detected at 6, 9, or 12 wk
(Fig. 2b). MSTN mRNA levels in spleen of SWR mice fed the high-
fat diet were consistently lower than control fed mice, regardless of
strain. No difference was detected in MSTN mRNA levels between
C57BL/6 or SWR control mice. The presence of myostatin in
whole spleen and isolated leukocytes was confirmed through
traditional RT-PCR (Fig. 2e).
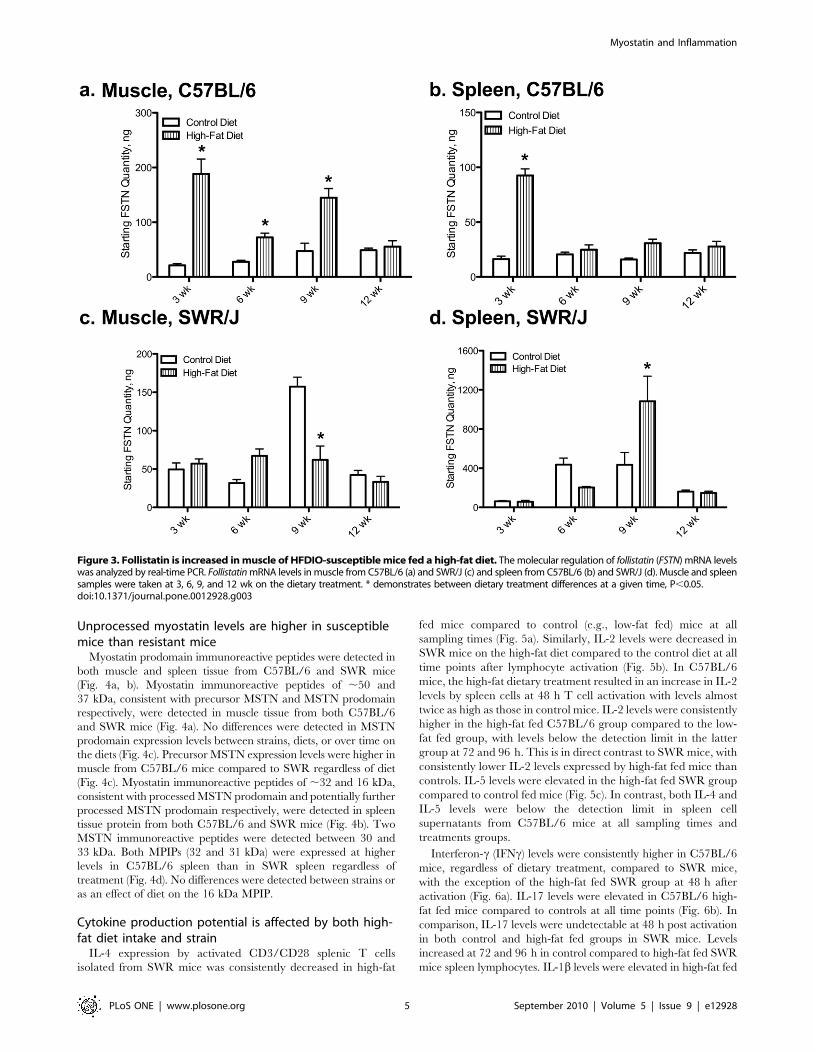
Follistatin levels were similar to MSTN levels in muscle tissue of
C57BL/6 mice, with an increase (Fig. 3a) at 3, 9, and 12 wk.
However, FSTN mRNA levels in muscle of high-fat fed SWR
mice were lower than control fed levels at 9 wk (Fig. 3c). Control
FSTN levels were higher in SWR muscle than C57BL/6 muscle
only at the 9 wk sampling period. In C57BL/6 mice, FSTN
mRNA levels in spleen increased following 3 wk feeding of high-
fat diet compared to control fed animals (92.5068.36 compared
to 16.3462.35 copies, respectively; Fig. 3b). Similarly in SWR
high-fat fed mice, spleen FSTN mRNA levels increased
compared to control fed levels (1084646.56 compared to
434.6618.67), but not until 9 wk on the diet (Fig. 3d). Control
spleen levels of FSTN mRNA were higher in SWR mice at both 6
and 9 wk.
Figure 2. Myostatin is attenuated in spleens of HFDIO-resistant mice fed high fat. Molecular regulation of myostatin (MSTN) mRNA levelsusing quantitative real-time PCR. Myostatin mRNA levels in muscle from C57BL/6 (a) and SWR/J (c) and spleen from C57BL/6 (b) and SWR/J (d). Muscleand spleen samples were taken at 3, 6, 9, and 12 wk on the dietary treatment. (e) RT-PCR analysis of myostatin mRNA expression in different tissuesfor verification. Mar) 100 bp ladder, Spl) whole spleen, Leu) isolated leukocytes (CD3/CD28), mus) pooled skeletal muscle, Adi) adipose tissue, and ntc)no template control. * demonstrates between dietary treatment differences at a given time, P,0.05.doi:10.1371/journal.pone.0012928.g002
Myostatin and Inflammation
PLoS ONE | www.plosone.org 4 September 2010 | Volume 5 | Issue 9 | e12928
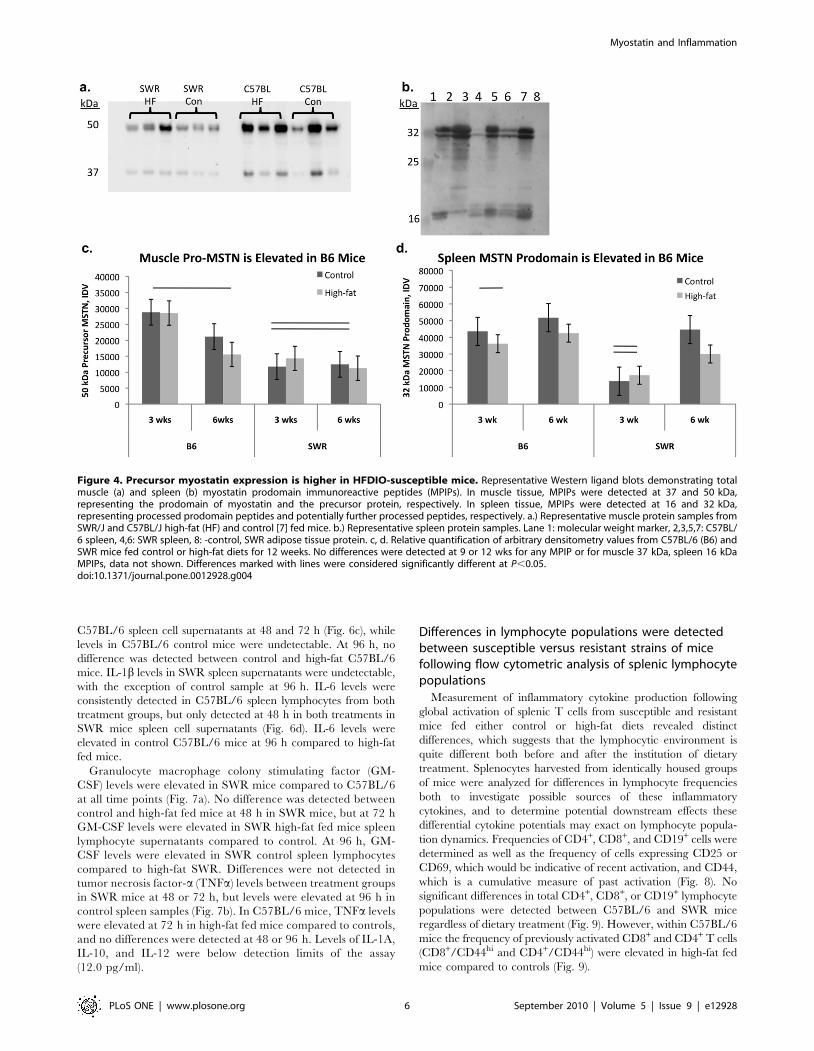
Unprocessed myostatin levels are higher in susceptiblemice than resistant mice
Myostatin prodomain immunoreactive peptides were detected in
both muscle and spleen tissue from C57BL/6 and SWR mice
(Fig. 4a, b). Myostatin immunoreactive peptides of ,50 and
37 kDa, consistent with precursor MSTN and MSTN prodomain
respectively, were detected in muscle tissue from both C57BL/6
and SWR mice (Fig. 4a). No differences were detected in MSTN
prodomain expression levels between strains, diets, or over time on
the diets (Fig. 4c). Precursor MSTN expression levels were higher in
muscle from C57BL/6 mice compared to SWR regardless of diet
(Fig. 4c). Myostatin immunoreactive peptides of ,32 and 16 kDa,
consistent with processed MSTN prodomain and potentially further
processed MSTN prodomain respectively, were detected in spleen
tissue protein from both C57BL/6 and SWR mice (Fig. 4b). Two
MSTN immunoreactive peptides were detected between 30 and
33 kDa. Both MPIPs (32 and 31 kDa) were expressed at higher
levels in C57BL/6 spleen than in SWR spleen regardless of
treatment (Fig. 4d). No differences were detected between strains or
as an effect of diet on the 16 kDa MPIP.
Cytokine production potential is affected by both high-fat diet intake and strain
IL-4 expression by activated CD3/CD28 splenic T cells
isolated from SWR mice was consistently decreased in high-fat
fed mice compared to control (e.g., low-fat fed) mice at all
sampling times (Fig. 5a). Similarly, IL-2 levels were decreased in
SWR mice on the high-fat diet compared to the control diet at all
time points after lymphocyte activation (Fig. 5b). In C57BL/6
mice, the high-fat dietary treatment resulted in an increase in IL-2
levels by spleen cells at 48 h T cell activation with levels almost
twice as high as those in control mice. IL-2 levels were consistently
higher in the high-fat fed C57BL/6 group compared to the low-
fat fed group, with levels below the detection limit in the latter
group at 72 and 96 h. This is in direct contrast to SWR mice, with
consistently lower IL-2 levels expressed by high-fat fed mice than
controls. IL-5 levels were elevated in the high-fat fed SWR group
compared to control fed mice (Fig. 5c). In contrast, both IL-4 and
IL-5 levels were below the detection limit in spleen cell
supernatants from C57BL/6 mice at all sampling times and
treatments groups.
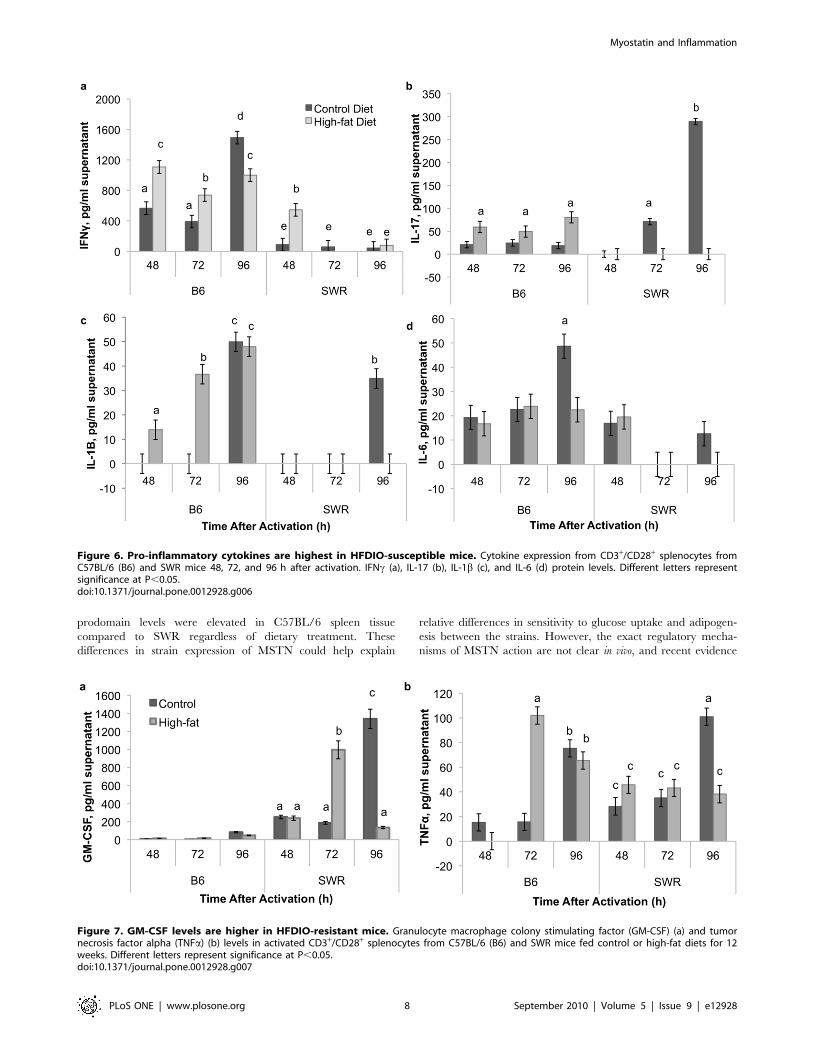
Interferon-c (IFNc) levels were consistently higher in C57BL/6
mice, regardless of dietary treatment, compared to SWR mice,
with the exception of the high-fat fed SWR group at 48 h after
activation (Fig. 6a). IL-17 levels were elevated in C57BL/6 high-
fat fed mice compared to controls at all time points (Fig. 6b). In
comparison, IL-17 levels were undetectable at 48 h post activation
in both control and high-fat fed groups in SWR mice. Levels
increased at 72 and 96 h in control compared to high-fat fed SWR
mice spleen lymphocytes. IL-1b levels were elevated in high-fat fed
Figure 3. Follistatin is increased in muscle of HFDIO-susceptible mice fed a high-fat diet. The molecular regulation of follistatin (FSTN) mRNA levelswas analyzed by real-time PCR. Follistatin mRNA levels in muscle from C57BL/6 (a) and SWR/J (c) and spleen from C57BL/6 (b) and SWR/J (d). Muscle and spleensamples were taken at 3, 6, 9, and 12 wk on the dietary treatment. * demonstrates between dietary treatment differences at a given time, P,0.05.doi:10.1371/journal.pone.0012928.g003
Myostatin and Inflammation
PLoS ONE | www.plosone.org 5 September 2010 | Volume 5 | Issue 9 | e12928
C57BL/6 spleen cell supernatants at 48 and 72 h (Fig. 6c), while
levels in C57BL/6 control mice were undetectable. At 96 h, no
difference was detected between control and high-fat C57BL/6
mice. IL-1b levels in SWR spleen supernatants were undetectable,
with the exception of control sample at 96 h. IL-6 levels were
consistently detected in C57BL/6 spleen lymphocytes from both
treatment groups, but only detected at 48 h in both treatments in
SWR mice spleen cell supernatants (Fig. 6d). IL-6 levels were
elevated in control C57BL/6 mice at 96 h compared to high-fat
fed mice.
Granulocyte macrophage colony stimulating factor (GM-
CSF) levels were elevated in SWR mice compared to C57BL/6
at all time points (Fig. 7a). No difference was detected between
control and high-fat fed mice at 48 h in SWR mice, but at 72 h
GM-CSF levels were elevated in SWR high-fat fed mice spleen
lymphocyte supernatants compared to control. At 96 h, GM-
CSF levels were elevated in SWR control spleen lymphocytes
compared to high-fat SWR. Differences were not detected in
tumor necrosis factor-a (TNFa) levels between treatment groups
in SWR mice at 48 or 72 h, but levels were elevated at 96 h in
control spleen samples (Fig. 7b). In C57BL/6 mice, TNFa levels
were elevated at 72 h in high-fat fed mice compared to controls,
and no differences were detected at 48 or 96 h. Levels of IL-1A,
IL-10, and IL-12 were below detection limits of the assay
(12.0 pg/ml).
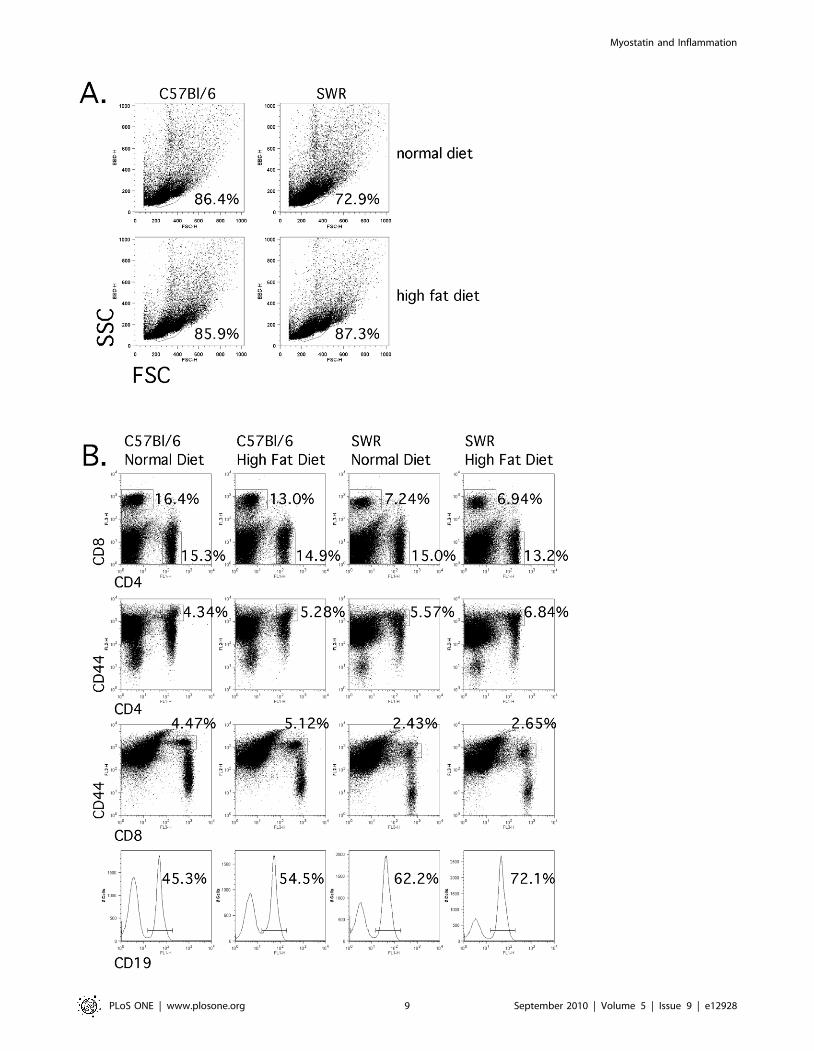
Differences in lymphocyte populations were detectedbetween susceptible versus resistant strains of micefollowing flow cytometric analysis of splenic lymphocytepopulations
Measurement of inflammatory cytokine production following
global activation of splenic T cells from susceptible and resistant
mice fed either control or high-fat diets revealed distinct
differences, which suggests that the lymphocytic environment is
quite different both before and after the institution of dietary
treatment. Splenocytes harvested from identically housed groups
of mice were analyzed for differences in lymphocyte frequencies
both to investigate possible sources of these inflammatory
cytokines, and to determine potential downstream effects these
differential cytokine potentials may exact on lymphocyte popula-
tion dynamics. Frequencies of CD4+, CD8+, and CD19+ cells were
determined as well as the frequency of cells expressing CD25 or
CD69, which would be indicative of recent activation, and CD44,
which is a cumulative measure of past activation (Fig. 8). No
significant differences in total CD4+, CD8+, or CD19+ lymphocyte
populations were detected between C57BL/6 and SWR mice
regardless of dietary treatment (Fig. 9). However, within C57BL/6
mice the frequency of previously activated CD8+ and CD4+ T cells
(CD8+/CD44hi and CD4+/CD44hi) were elevated in high-fat fed
mice compared to controls (Fig. 9).
Figure 4. Precursor myostatin expression is higher in HFDIO-susceptible mice. Representative Western ligand blots demonstrating totalmuscle (a) and spleen (b) myostatin prodomain immunoreactive peptides (MPIPs). In muscle tissue, MPIPs were detected at 37 and 50 kDa,representing the prodomain of myostatin and the precursor protein, respectively. In spleen tissue, MPIPs were detected at 16 and 32 kDa,representing processed prodomain peptides and potentially further processed peptides, respectively. a.) Representative muscle protein samples fromSWR/J and C57BL/J high-fat (HF) and control [7] fed mice. b.) Representative spleen protein samples. Lane 1: molecular weight marker, 2,3,5,7: C57BL/6 spleen, 4,6: SWR spleen, 8: -control, SWR adipose tissue protein. c, d. Relative quantification of arbitrary densitometry values from C57BL/6 (B6) andSWR mice fed control or high-fat diets for 12 weeks. No differences were detected at 9 or 12 wks for any MPIP or for muscle 37 kDa, spleen 16 kDaMPIPs, data not shown. Differences marked with lines were considered significantly different at P,0.05.doi:10.1371/journal.pone.0012928.g004
Myostatin and Inflammation
PLoS ONE | www.plosone.org 6 September 2010 | Volume 5 | Issue 9 | e12928

Discussion
C57BL/6 mice are highly susceptible to high-fat dietinduced obesity, while SWR mice are resistant
As anticipated, C57BL/6 mice are highly susceptible to high-fat
diet induced obesity, with a significant increase in weight seen as
early as three weeks on the diet. Following 12 wk on a high-fat
diet, C57BL/6 mice almost doubled their initial weight. Consistent
with these results, a similar increase in whole blood glucose levels
was detected in C57BL/6 mice on the high-fat diet. In addition,
glucose levels continue to rise in high-fat fed C57BL/6 mice as
time on the diet increases. In contrast, there were no differences
detected in weight or whole blood glucose levels in SWR mice over
the 12-week feeding trial. These data suggest that the SWR strain
of mice is resistant to the body weight and insulin challenges seen
in C57BL/6 mice on a high-fat diet and is consistent with previous
work [24,25].
This is the first report of differential MSTN regulation in a non-
muscle tissue, and specifically expression in isolated leukocytes
from a mammalian species (Fig. 2e). As expected, MSTN levels
were significantly different between strains in response to high-fat
diet intake. Most notable is the dramatic decrease in MSTN levels
in whole spleen tissue of SWR mice in response to a high-fat diet.
Overall levels of MSTN mRNA in control SWR spleen appear
lower than levels detected in C57BL/6 spleen tissue but were not
significantly lower (Fig. 10a), possibly due to the high variability
detected in C57BL/6 control spleen MSTN mRNA levels.
However, in SWR mice fed a high-fat diet MSTN mRNA levels
were consistently lower than levels observed in control SWR or
C57BL/6 mice, suggesting a different regulatory mechanism is
activated in response to high-fat diet intake in HFDIO-resistant
animals. A dramatic increase in spleen MSTN mRNA levels was
detected in C57BL/6 mice with 3 wk of high-fat diet intake and
no differences detected at other sampling times. These results are
intriguing as they are consistent with previous reports of MSTN
knockout mice being resistant to high-fat diet induced obesity
[26,27] as HFDIO-resistant mice in this study exhibit lowered
levels of MSTN expression. However, one difference is that our
study demonstrates a dramatic down-regulation of MSTN in
spleen tissue, with only an initial decrease in MSTN levels in
muscle tissue following 3 wk of high-fat diet intake. Guo and co-
workers demonstrated that removal of myostatin activity in
adipose tissue results in no differences to body composition,
weight gain, glucose or insulin sensitivity, and were not resistant to
HFDIO, suggesting that metabolic changes in skeletal muscle are
required for improved HFDIO-resistance and metabolic handling.
In muscle tissue, MSTN mRNA levels were elevated in C57BL/
6 in response to high-fat diet, as well as in SWR mice following 9
and 12 wk of high-fat diet intake. Interestingly, control levels of
MSTN were higher in muscle from SWR mice compared to
control C57BL/6 mice (Fig. 10b). It is possible that higher levels of
MSTN mRNA in younger SWR mice play an important role in
sensitizing them to metabolic shifts compared to C57BL/6 mice. It
is possible that timing of high-fat diet intake affects the animal’s
ability to handle the excess lipid. In older SWR mice, around 20
weeks of age (respective to the 12 wk sampling time), muscle
MSTN levels are reduced compared to C57BL/6 levels. Myostatin
has been shown to promote adipogenesis in vitro [28,29], and in
this study we demonstrate that in HFDIO-resistant mice increases
in lipid consumption initially decrease MSTN levels in muscle and
spleen tissue with more of an effect in spleen tissue. Taken together
with Guo and co-worker’s results demonstrating that removal of
MSTN activity in muscle is required for HFDIO resistance, we
suggest that MSTN might play a substantial role in metabolic shift
regulation that occurs in muscle cells during increased lipid intake
that results in either increased glucose uptake or increases
intramyocellular lipid accumulation, depending on resistance of
susceptibility. It is also likely that myostatin plays a significant role
in spleen tissue as well.
Different sized immunoreactive peptides were detected between
the two tissues, indicating potential tissue-specific processing of
MSTN. Results indicate that only strain has an effect on MSTN
protein levels and that dietary lipid intake does not have any effect
on MSTN protein processing. In C57BL/6 muscle tissue,
precursor MSTN (,50 kDa) expression levels were higher than
SWR mice with no effect of diet. In addition, processed MSTN
Figure 5. IL-4 levels are attenuated in HFDIO-resistant micewhen fed a high fat diet. Cytokine levels in ex vivo CD3+/CD28+
splenocytes from SWR and C57BL/6 (B6) mice at 48, 72, and 96 h afteractivation. IL-4 (a), IL-2 (b), and IL-5 (c) levels were measured by cytokineexpression array. IL-4 and IL-5 levels were not detectable in C57BL/6mice splenocytes in this assay. * P,0.05.doi:10.1371/journal.pone.0012928.g005
Myostatin and Inflammation
PLoS ONE | www.plosone.org 7 September 2010 | Volume 5 | Issue 9 | e12928
prodomain levels were elevated in C57BL/6 spleen tissue
compared to SWR regardless of dietary treatment. These
differences in strain expression of MSTN could help explain
relative differences in sensitivity to glucose uptake and adipogen-
esis between the strains. However, the exact regulatory mecha-
nisms of MSTN action are not clear in vivo, and recent evidence
Figure 6. Pro-inflammatory cytokines are highest in HFDIO-susceptible mice. Cytokine expression from CD3+/CD28+ splenocytes fromC57BL/6 (B6) and SWR mice 48, 72, and 96 h after activation. IFNc (a), IL-17 (b), IL-1b (c), and IL-6 (d) protein levels. Different letters representsignificance at P,0.05.doi:10.1371/journal.pone.0012928.g006
Figure 7. GM-CSF levels are higher in HFDIO-resistant mice. Granulocyte macrophage colony stimulating factor (GM-CSF) (a) and tumornecrosis factor alpha (TNFa) (b) levels in activated CD3+/CD28+ splenocytes from C57BL/6 (B6) and SWR mice fed control or high-fat diets for 12weeks. Different letters represent significance at P,0.05.doi:10.1371/journal.pone.0012928.g007
Myostatin and Inflammation
PLoS ONE | www.plosone.org 8 September 2010 | Volume 5 | Issue 9 | e12928
Myostatin and Inflammation
PLoS ONE | www.plosone.org 9 September 2010 | Volume 5 | Issue 9 | e12928
indicates that MSTN activity might be sequestered when it is
bound to components of the extracellular matrix [30,31,32]. This
level of activity control makes it difficult to interpret changes, or
lack there of, in steady-state expression of MSTN. However, to
further support the effect of high-fat diet intake on MSTN levels,
changes in follistatin mRNA levels were similar to MSTN levels with
consistent upregulation observed in C57BL/6 in response to lipid
intake. Collectively, these results indicate that MSTN plays a role
in HFDIO susceptibility and resistance and that tissue-specific
expression likely contributes to the role MSTN plays in metabolic
regulation.
Differences in IL-6 expression levels were not different between
dietary treatment groups in muscle or spleen tissue from C57BL/6
or SWR mice. This is interesting because IL-6 levels are known to
increase in circulation in obese and diabetic states [33,34], and IL-
6 is known to regulate glucose homeostasis [35,36]. The lack of
mRNA expression level differences between the strains of mice
suggests that either IL-6 production increases are a result of
adipose IL-6 production, translation rate increases, or post-
transcription modification changes. In addition, not all obese/
diabetic states are IL-6-dependent.
Cytokines are Responsive to Dietary Intake and Strain-Specific Expression
Low-grade inflammation commonly observed with obesity is
thought to play an important role in increasing risk for metabolic
disorder [37,38]. Tissue inflammation following high-fat intake
results from the recruitment and activation of local macrophages
that release inflammatory cytokines that are thought to promote
insulin resistance locally [37,38,39]. Most attention has been paid
to adipose, skeletal muscle, and liver tissue in this regard. In this
project we focus on the changes in cytokine expression potential in
spleen tissue due to the dramatic differences observed in myostatin
expression between HFDIO-resistant and susceptible mice.
Cytokine expression data supports interactions between strain,
diet, and potential immune system regulation. IL-6 is thought to
play an important role in the inflammatory-related pathogenesis of
obesity. Interestingly, no difference was detected in IL-6 levels in
total spleen or muscle from either mouse strain. However, IL-6
protein expression by lymphocytes isolated from low-fat-fed
C57BL/6 mice was elevated following 96 h of activation by
CD3/CD28 stimulation, which results in activation of the total T
lymphocyte population. Interestingly, levels dropped below the
detection limit of the assay in SWR mice 72 and 96 h following
activation in both feeding groups, suggesting a strain-dependent
difference in potential activation response.
IL-4 is a cytokine (prototypically Th2) important for B cell
activation, antibody production, Th2 cell proliferation and
differentiation, as well as in macrophage fusion and myoblast
recruitment and fusion [40,41]. IL-4 is also important in down-
regulating the production of IFNc, a key proinflammatory
cytokine. IL-4 expression was consistently lower in high-fat fed
SWR activated lymphocytes compared to the control fed SWR
group at all sampling times, while expression was undetectable in
C57BL/6 mice at all time-points tested, regardless of diet.
Interestingly, a recent report demonstrated that central IL-4
administration in conjunction with a high-fat diet led to
hypothalamic inflammation and HFDIO [42], indicating a pro-
inflammatory response to IL-4. It is likely that IL-4 functions as
pro- or anti-inflammatory in response to the cellular and
physiological environment.
IL-2 expression potential was similar to that of IL-4, as IL-2 levels
decreased in high-fat diet fed SWR mice compared to control diet
fed mice at all time points. IL-2 is a cytokine known to maintain T
regulatory cells for self/non-self recognition during infection, as well
as stimulate growth, differentiation, and survival of T cells. IL-5,
important in stimulating B cell growth, levels were elevated in SWR
mice compared to C57BL/6 mice regardless of diet. In contrast to
IL-4, IL-5 expression was higher in high-fat fed SWR mice
compared to control fed animals. Together the data reported here
indicate that cytokine expression potential of splenoctyes may play
particularly important roles in the ability of SWR mice to handle an
increased lipid load without increasing weight or lipid deposition or
any apparent pro-inflammatory response.
In contrast to the expression of anti-inflammatory cytokines in
response to high-fat diet in the obesity-resistant SWR animal,
obesity-prone C57BL/6 animals presented with evidence of an
increased inflammatory response resulting from the high-fat diet.
When compared to SWR mice, IFNc levels were consistently
higher in activated T lymphocytes from C57BL/6 mice spleen
regardless of dietary treatment, with the exception of the high-fat
fed SWR group at 48 h after activation. IFNc is a hallmark Th1-
type cytokine that, among its many roles, stimulates inflammation.
Macrophages accumulate in adipose tissue during obesity [43] and
IFNc produced by these macrophages was recently shown to
regulate fat inflammation during obesity [44]. In addition,
evidence suggests that the increase in systemic TNF-a in obesity
is derived from these adipose macrophages, which suggests that
this increase in infiltrated macrophages might represent the cause
or consequence of the low-grade inflammation observed in obesity
[45,46,47,48]. The increased potential of IFNc production by
C57BL/6 activated splenic lymphocytes and potentially macro-
phages, presented here is consistent to the previously described
systemic inflammation regulation.
The most notable differences reported are the strain difference
in response to high-fat diet intake on IL-17 and IL-1b levels, both
cytokines that, along with IFNc, can drive the inflammatory
response. In C57BL/6 mice, high-fat diet increased both cytokines
expression level potential with a time-dependant increase in IL-1blevels. Levels of IL-17 and IL-1b were not detectable in high-fat
fed SWR mice, and only detectable in control mice over time. The
increased IL-1b, IL-17, and IFNc potential levels detected in
C57BL/6 mice fed a high-fat diet were not correlated (P = 0.85),
however a clear strain difference is detected. Thus, the splenic
environment of HFDIO-susceptible (C57BL/6) mice could
contribute to increased systemic inflammation seen in respond to
a high-fat diet, compared to the more protective anti-inflamma-
tory response that is possible in SWR mice.
Lymphocyte populations present in the spleens of SWR and
C57BL/6 mice in both dietary treatment groups were similar with
respect to CD4+ and CD8+ T cell groups, but higher frequencies
of both previously activated CD4+ and CD8+ cells (CD44hi) were
detected in C57BL/6 mice fed a high-fat diet. Interestingly,
CD8+/CD44hi T cells have previously been identified as a potent
source of IFN-c [49,50]. The fact that C57BL/6 mice have a
greater frequency of these cells compared to SWR mice suggests
that they may be a potential source for the increased IFN-cdetected in the cytokine analysis.
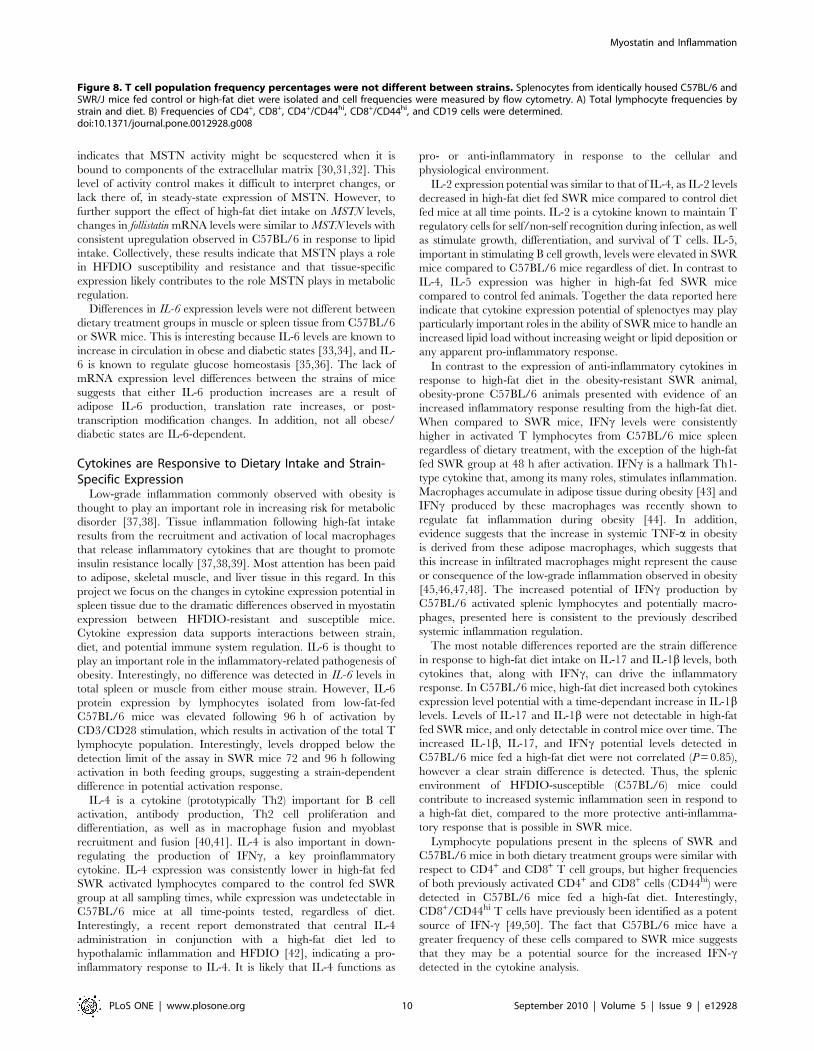
Figure 8. T cell population frequency percentages were not different between strains. Splenocytes from identically housed C57BL/6 andSWR/J mice fed control or high-fat diet were isolated and cell frequencies were measured by flow cytometry. A) Total lymphocyte frequencies bystrain and diet. B) Frequencies of CD4+, CD8+, CD4+/CD44hi, CD8+/CD44hi, and CD19 cells were determined.doi:10.1371/journal.pone.0012928.g008
Myostatin and Inflammation
PLoS ONE | www.plosone.org 10 September 2010 | Volume 5 | Issue 9 | e12928
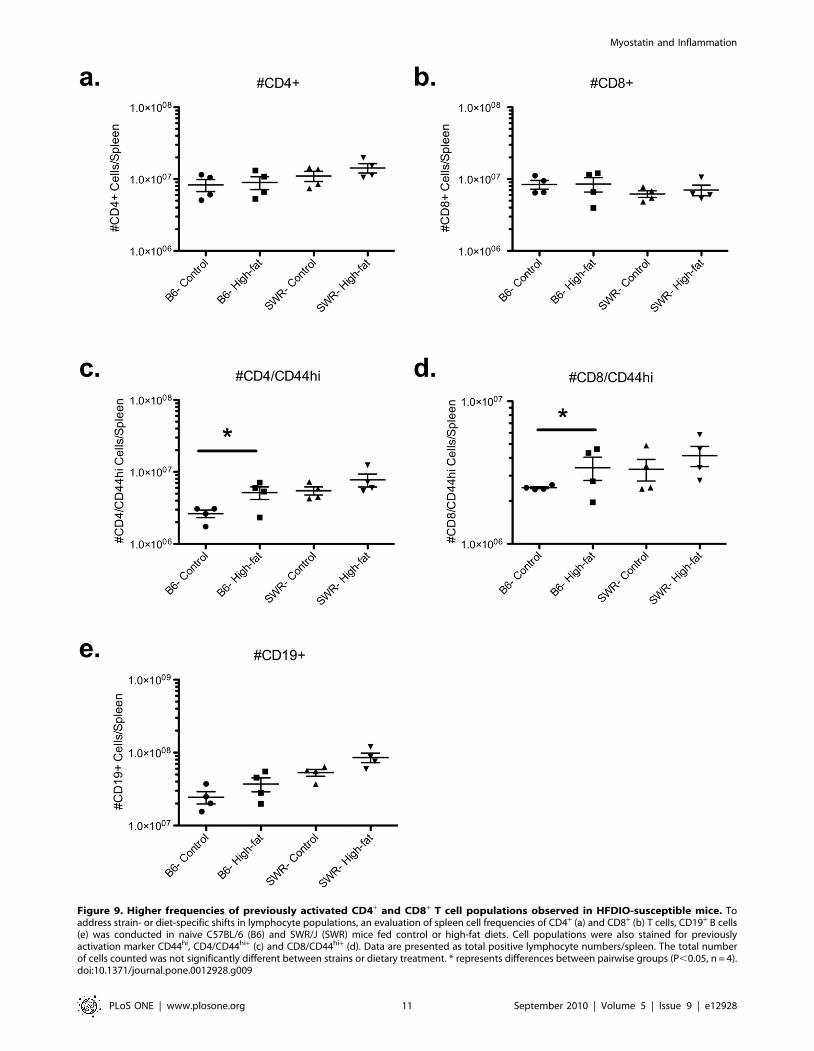
Figure 9. Higher frequencies of previously activated CD4+ and CD8+ T cell populations observed in HFDIO-susceptible mice. Toaddress strain- or diet-specific shifts in lymphocyte populations, an evaluation of spleen cell frequencies of CD4+ (a) and CD8+ (b) T cells, CD19+ B cells(e) was conducted in naive C57BL/6 (B6) and SWR/J (SWR) mice fed control or high-fat diets. Cell populations were also stained for previouslyactivation marker CD44hi, CD4/CD44hi+ (c) and CD8/CD44hi+ (d). Data are presented as total positive lymphocyte numbers/spleen. The total numberof cells counted was not significantly different between strains or dietary treatment. * represents differences between pairwise groups (P,0.05, n = 4).doi:10.1371/journal.pone.0012928.g009
Myostatin and Inflammation
PLoS ONE | www.plosone.org 11 September 2010 | Volume 5 | Issue 9 | e12928
A proinflammatory phenotype is associated with obesity and
insulin resistance [37,38]. Data presented here suggested a genetic
link between diet, myostatin expression, and potential for
generating a proinflammatory response. Consistent with previous
reports of obesity-prone C57BL/6 mice responding to a high-fat
diet with the induction of a proinflammatory response [37,38], this
work demonstrates increased spleen production potential of IFNc,
IL1b, and IL-17. In contrast, obesity-resistant SWR mice
exhibited an increased spleen potential for lymphocytes to produce
greater levels of IL-4 and depressed potential for production of
proinflammatory cytokines.
The results of this study clearly show an interesting link between
susceptibility to high-fat diet induced obesity and myostatin
expression. Myostatin has been shown to regulate adipogenesis
and cell proliferation [29,51] and be regulated by stress [52,53,54].
It is clear that several factors confound the predisposition to
HFDIO, however it is apparent that myostatin plays a role in
regulating cell cycle regulation and metabolism and might be
acting as a sort of regulatory switch for metabolic shifts in a tissue-
specific manner. In HFDIO-resistant mice, myostatin levels are
consistently lower in spleen tissue than in susceptible mice. This
evidence provides further support that myostatin and its activity
are potential therapeutic targets for metabolic regulation. It is
possible that myostatin also serves as a modulator for innate
immune system regulation involved in inflammation progression
as dynamic changes were detected in splenocytes following high-
fat dietary intake. Further investigations are needed to empirically
identify regulatory interactions between metabolic- and inflam-
matory-regulating pathways to better understand the propensity
for diabesity and to provide opportunities for prevention.
Acknowledgments
The authors wish to thank the CPR Core Biology Facility for assistance
and use of facility, Keerti Pakala for assistance in data collection, and Drs.
Jane Schuh and Kendra Greenlee for their review of this manuscript.
Author Contributions
Conceived and designed the experiments: PRB. Performed the experi-
ments: JAL JSH PRB. Analyzed the data: JAL JSH PRB. Contributed
reagents/materials/analysis tools: JAL JSH PRB. Wrote the paper: JAL
JSH PRB.
References
1. Unger RH (2002) Lipotoxic diseases. Annu Rev Med 53: 319–336.
2. Nishikawa T, Edelstein D, Du XL, Yamagishi S, Matsumura T, et al. (2000)
Normalizing mitochondrial superoxide production blocks three pathways of
hyperglycaemic damage. Nature 404(6779): 787–790.
3. Cline GW, Petersen KF, Krssak M, Shen J, Hundal RS, et al. (1999) Impaired
glucose transport as a cause of decreased insulin-stimulated muscle glycogen
synthesis in type 2 diabetes. N Engl J Med 341(4): 240–246.
4. Baron AD, Brechtel G, Wallace P, Edelman SV (1988) Rates and tissue sites of
non-insulin- and insulin-mediated glucose uptake in humans. Am J Physiol 255(6
Pt 1): E769–774.
5. Dagenais GR, Tancredi RG, Zierler KL (1976) Free fatty acid oxidation by
forearm muscle at rest, and evidence for an intramuscular lipid pool in the
human forearm. J Clin Invest 58(2): 421–431.
6. Zhao B, Wall RJ, Yang J (2005) Transgenic expression of myostatin propeptide
prevents diet-induced obesity and insulin resistance. Biochem Biophys Res
Commun 337(1): 248–255.
7. Sharma M, Kambadur R, Matthews KG, Somers WG, Devlin GP, et al. (1999)
Myostatin, a transforming growth factor-beta superfamily member, is expressed
in heart muscle and is upregulated in cardiomyocytes after infarct. J Cell Physiol
180(1): 1–9.
8. Yang J, Ratovitski T, Brady JP, Solomon MB, Wells KD, et al. (2001)
Expression of myostatin pro domain results in muscular transgenic mice. Mol
Reprod Dev 60(3): 351–361.
9. McPherron AC, Lawler AM, Lee SJ (1997) Regulation of skeletal muscle mass in
mice by a new TGF-beta superfamily member. Nature 387(6628): 83–90.
10. McPherron AC, Lee SJ (2002) Suppression of body fat accumulation in
myostatin-deficient mice. J Clin Invest 109(5): 595–601.
11. Amthor H, Nicholas G, McKinnell I, Kemp CF, Sharma M, et al. (2004)
Follistatin complexes Myostatin and antagonises Myostatin-mediated inhibition
of myogenesis. Dev Biol 270(1): 19–30.
12. Hill JJ, Davies MV, Pearson AA, Wang JH, Hewick RM, et al. (2002) The
myostatin propeptide and the follistatin-related gene are inhibitory binding
proteins of myostatin in normal serum. J Biol Chem 277(43): 40735–40741.
13. Reisz-Porszasz S, Bhasin S, Artaza JN, Shen R, Sinha-Hikim I, et al. (2003)
Lower skeletal muscle mass in male transgenic mice with muscle-specific
overexpression of myostatin. Am J Physiol Endocrinol Metab 285(4): E876–888.
14. Guzik TJ, Mangalat D, Korbut R (2006) Adipocytokines - novel link between
inflammation and vascular function? J Physiol Pharmacol 57(4): 505–528.
15. White LJ, Ferguson MA, McCoy SC, Kim HW, Castellano V (2006) Cardiovascular/
non-insulin-dependent diabetes mellitus risk factors and intramyocellular lipid in
healthy subjects: a sex comparison. Metabolism 55(1): 128–134.
16. Gottschlich MM, Mayes T, Khoury JC, Warden GD (1993) Significance of
obesity on nutritional, immunologic, hormonal, and clinical outcome parameters
in burns. J Am Diet Assoc 93(11): 1261–1268.
17. Krishnan EC, Trost L, Aarons S, Jewell WR (1982) Study of function and
maturation of monocytes in morbidly obese individuals. J Surg Res 33(2): 89–97.
Figure 10. Muscle myostatin levels in control fed animals werehigher in HFDIO-resistant mice. Myostatin mRNA levels fromcontrol fed C57BL/6 and SWR/J mice at 3, 6, 9, and 12 weeks of theexperiment from spleen (a) and muscle (b) tissue. * representsdifferences between pairwise groups, P,0.05.doi:10.1371/journal.pone.0012928.g010
Myostatin and Inflammation
PLoS ONE | www.plosone.org 12 September 2010 | Volume 5 | Issue 9 | e12928
18. Smith AG, Sheridan PA, Harp JB, Beck MA (2007) Diet-induced obese mice
have increased mortality and altered immune responses when infected withinfluenza virus. J Nutr 137(5): 1236–1243.
19. Surwit RS, Feinglos MN, Rodin J, Sutherland A, Petro AE, et al. (1995)
Differential effects of fat and sucrose on the development of obesity and diabetesin C57BL/6J and A/J mice. Metabolism 44(5): 645–651.
20. Surwit RS, Kuhn CM, Cochrane C, McCubbin JA, Feinglos MN (1988) Diet-induced type II diabetes in C57BL/6J mice. Diabetes 37(9): 1163–1167.
21. West DB, Boozer CN, Moody DL, Atkinson RL (1992) Dietary obesity in nine
inbred mouse strains. Am J Physiol 262(6 Pt 2): R1025–1032.22. Trickett A, Kwan YL (2003) T cell stimulation and expansion using anti-CD3/
CD28 beads. J Immunol Methods 275(1–2): 251–255.23. Pfaffl M (2001) A new mathematical model for relative quantification in real-
time RT-PCR. Nucleic Acids Res 29: e45.24. Lewis SR, Dym C, Chai C, Singh A, Kest B, et al. (2007) Genetic variance
contributes to ingestive processes: a survey of eleven inbred mouse strains for fat
(Intralipid) intake. Physiol Behav 90(1): 82–94.25. Paigen B (1995) Genetics of responsiveness to high-fat and high-cholesterol diets
in the mouse. Am J Clin Nutr 62(2): 458S–462S.26. Guo T, Jou W, Chanturiya T, Portas J, Gavrilova O, et al. (2009) Myostatin
inhibition in muscle, but not adipose tissue, decreases fat mass and improves
insulin sensitivity. PLoS One 4(3): e4937.27. Hamrick MW, Pennington C, Webb CN, Isales CM (2006) Resistance to body
fat gain in ‘double-muscled’ mice fed a high-fat diet. Int J Obes (Lond) 30(5):868–870.
28. Artaza JN, Bhasin S, Magee TR, Reisz-Porszasz S, Shen R, et al. (2005)Myostatin inhibits myogenesis and promotes adipogenesis in C3H 10T(1/2)
mesenchymal multipotent cells. Endocrinology 146(8): 3547–3557.
29. Feldman BJ, Streeper RS, Farese RV, Jr., Yamamoto KR (2006) Myostatinmodulates adipogenesis to generate adipocytes with favorable metabolic effects.
Proc Natl Acad Sci U S A 103(42): 15675–15680.30. Kishioka Y, Thomas M, Wakamatsu J, Hattori A, Sharma M, et al. (2008)
Decorin enhances the proliferation and differentiation of myogenic cells through
suppressing myostatin activity. J Cell Physiol 215(3): 856–867.31. Miura T, Kishioka Y, Wakamatsu J, Hattori A, Hennebry A, et al. (2006)
Decorin binds myostatin and modulates its activity to muscle cells. BiochemBiophys Res Commun 340(2): 675–680.
32. Zhu J, Li Y, Shen W, Qiao C, Ambrosio F, et al. (2007) Relationships betweentransforming growth factor-beta1, myostatin, and decorin: implications for
skeletal muscle fibrosis. J Biol Chem 282(35): 25852–25863.
33. Carey AL, Bruce CR, Sacchetti M, Anderson MJ, Olsen DB, et al. (2004)Interleukin-6 and tumor necrosis factor-alpha are not increased in patients with
Type 2 diabetes: evidence that plasma interleukin-6 is related to fat mass and notinsulin responsiveness. Diabetologia 47(6): 1029–1037.
34. Lazar MA (2005) How obesity causes diabetes: not a tall tale. Science 307(5708):
373–375.35. Al-Khalili L, Bouzakri K, Glund S, Lonnqvist F, Koistinen HA, et al. (2006)
Signaling specificity of interleukin-6 action on glucose and lipid metabolism inskeletal muscle. Mol Endocrinol 20(12): 3364–3375.
36. Bruce CR, Dyck DJ (2004) Cytokine regulation of skeletal muscle fatty acidmetabolism: effect of interleukin-6 and tumor necrosis factor-alpha. Am J Physiol
Endocrinol Metab 287(4): E616–621.
37. Hotamisligil GS (2006) Inflammation and metabolic disorders. Nature
444(7121): 860–867.
38. Shoelson SE, Lee J, Goldfine AB (2006) Inflammation and insulin resistance.
J Clin Invest 116(7): 1793–1801.
39. Lumeng CN, Bodzin JL, Saltiel AR (2007) Obesity induces a phenotypic switch
in adipose tissue macrophage polarization. J Clin Invest 117(1): 175–184.
40. Horsley V, Jansen KM, Mills ST, Pavlath GK (2003) IL-4 acts as a myoblast
recruitment factor during mammalian muscle growth. Cell 113(4): 483–494.
41. McInnes A, Rennick DM (1988) Interleukin 4 induces cultured monocytes/
macrophages to form giant multinucleated cells. J Exp Med 167(2): 598–611.
42. Oh IS, Thaler JP, Ogimoto K, Wisse BE, Morton GJ, et al. Central
administration of interleukin-4 exacerbates hypothalamic inflammation and
weight gain during high-fat feeding. Am J Physiol Endocrinol Metab 299(1):
E47–53.
43. Weisberg SP, McCann D, Desai M, Rosenbaum M, Leibel RL, et al. (2003)
Obesity is associated with macrophage accumulation in adipose tissue. J Clin
Invest 112(12): 1796–1808.
44. Rocha VZ, Folco EJ, Sukhova G, Shimizu K, Gotsman I, et al. (2008)
Interferon-gamma, a Th1 cytokine, regulates fat inflammation: a role for
adaptive immunity in obesity. Circ Res 103(5): 467–476.
45. Bastard JP, Maachi M, Lagathu C, Kim MJ, Caron M, et al. (2006) Recent
advances in the relationship between obesity, inflammation, and insulin
resistance. Eur Cytokine Netw 17(1): 4–12.
46. Bastard JP, Maachi M, Van Nhieu JT, Jardel C, Bruckert E, et al. (2002)
Adipose tissue IL-6 content correlates with resistance to insulin activation of
glucose uptake both in vivo and in vitro. J Clin Endocrinol Metab 87(5):
2084–2089.
47. Fried SK, Bunkin DA, Greenberg AS (1998) Omental and subcutaneous adipose
tissues of obese subjects release interleukin-6: depot difference and regulation by
glucocorticoid. J Clin Endocrinol Metab 83(3): 847–850.
48. Hotamisligil G, Shargill N, Spiegelman B (1993) Adipose expression of tumor
necrosis factor-alpha: direct role in obesity-linked insulin resistance. Science 259:
87.
49. Berg RE, Crossley E, Murray S, Forman J (2003) Memory CD8+ T cells provide
innate immune protection against Listeria monocytogenes in the absence of
cognate antigen. J Exp Med 198(10): 1583–1593.
50. Berg RE, Crossley E, Murray S, Forman J (2005) Relative contributions of NK
and CD8 T cells to IFN-gamma mediated innate immune protection against
Listeria monocytogenes. J Immunol 175(3): 1751–1757.
51. Thomas M, Langley B, Berry C, Sharma M, Kirk S, et al. (2000) Myostatin, a
negative regulator of muscle growth, functions by inhibiting myoblast
proliferation. J Biol Chem 275(51): 40235–40243.
52. Biga PR, Cain KD, Hardy RW, Schelling GT, Overturf K, et al. (2004) Growth
hormone differentially regulates muscle myostatin1 and -2 and increases
circulating cortisol in rainbow trout (Oncorhynchus mykiss). Gen Comp
Endocrinol 138(1): 32–41.
53. Rodgers BD, Weber GM, Kelley KM, Levine MA (2003) Prolonged fasting and
cortisol reduce myostatin mRNA levels in tilapia larvae; short-term fasting
elevates. Am J Physiol Regul Integr Comp Physiol 284(5): R1277–1286.
54. Willoughby DS (2004) Effects of heavy resistance training on myostatin mRNA
and protein expression. Med Sci Sports Exerc 36(4): 574–582.
Myostatin and Inflammation
PLoS ONE | www.plosone.org 13 September 2010 | Volume 5 | Issue 9 | e12928


