Embed Size (px)
Citation preview
Enteric Microbiome Metabolites Correlate with Responseto Simvastatin TreatmentRima Kaddurah-Daouk1*, Rebecca A. Baillie2, Hongjie Zhu3, Zhao-Bang Zeng3, Michelle M. Wiest4, Uyen
Thao Nguyen5, Katie Wojnoonski7, Steven M. Watkins5, Miles Trupp6, Ronald M. Krauss7*
1 Duke University Medical Center, Durham, North Carolina, United States of America, 2 Rosa and Company, Cupertino, California, United States of America, 3 Department
of Statistics and Bioinformatics Research Center, North Carolina State University, Raleigh, North Carolina, United States of America, 4 Department of Statistics, University of
Idaho, Moscow, Idaho, United States of America, 5 Lipomics Technologies-Tethys Bioscience, West Sacramento, California, United States of America, 6 Bioinformatics
Research Group, AI Center, SRI International, Menlo Park, California, United States of America, 7 Children’s Hospital Oakland Research Institute, Oakland, California, United
States of America
Abstract
Although statins are widely prescribed medications, there remains considerable variability in therapeutic response. Geneticscan explain only part of this variability. Metabolomics is a global biochemical approach that provides powerful tools formapping pathways implicated in disease and in response to treatment. Metabolomics captures net interactions betweengenome, microbiome and the environment. In this study, we used a targeted GC-MS metabolomics platform to measure apanel of metabolites within cholesterol synthesis, dietary sterol absorption, and bile acid formation to determine metabolitesignatures that may predict variation in statin LDL-C lowering efficacy. Measurements were performed in two subsets of thetotal study population in the Cholesterol and Pharmacogenetics (CAP) study: Full Range of Response (FR), and Good andPoor Responders (GPR) were 100 individuals randomly selected from across the entire range of LDL-C responses in CAP. GPRwere 48 individuals, 24 each from the top and bottom 10% of the LDL-C response distribution matched for body massindex, race, and gender. We identified three secondary, bacterial-derived bile acids that contribute to predicting themagnitude of statin-induced LDL-C lowering in good responders. Bile acids and statins share transporters in the liver andintestine; we observed that increased plasma concentration of simvastatin positively correlates with higher levels of severalsecondary bile acids. Genetic analysis of these subjects identified associations between levels of seven bile acids and asingle nucleotide polymorphism (SNP), rs4149056, in the gene encoding the organic anion transporter SLCO1B1. Thesefindings, along with recently published results that the gut microbiome plays an important role in cardiovascular disease,indicate that interactions between genome, gut microbiome and environmental influences should be considered in thestudy and management of cardiovascular disease. Metabolic profiles could provide valuable information about treatmentoutcomes and could contribute to a more personalized approach to therapy.
Citation: Kaddurah-Daouk R, Baillie RA, Zhu H, Zeng Z-B, Wiest MM, et al. (2011) Enteric Microbiome Metabolites Correlate with Response to SimvastatinTreatment. PLoS ONE 6(10): e25482. doi:10.1371/journal.pone.0025482
Editor: Herman Tse, The University of Hong Kong, Hong Kong
Received April 26, 2011; Accepted September 5, 2011; Published October 13, 2011
Copyright: � 2011 Kaddurah-Daouk et al. This is an open-access article distributed under the terms of the Creative Commons Attribution License, which permitsunrestricted use, distribution, and reproduction in any medium, provided the original author and source are credited.
Funding: This work is supported by National Institute of General Medical Sciences grants R24, GM078233, ‘‘The Metabolomics Research Network for DrugResponse Phenotype’’ (RKD, RMK); and U01 HL069757, ‘‘Pharmacogenomics and Risk of Cardiovascular Disease’’ (RMK). The funders had no role in study design,data collection and analysis, decision to publish, or preparation of the manuscript.
Competing Interests: RKD is equity holder in a biotechnology company in the metabolomics domain, and also an inventor on patents in the metabolomicsfield. RKD, RMK, RAB, and SW are inventors on a patent application on statin effects on metabolism. RAB is an employee of Rosa and Company. SW is an employeeof Tethys Bioscience. MT is an employee of SRI International. In none of these cases do these affiliations alter the authors’ adherence to all the PLoS ONE policieson sharing data and materials.
* E-mail: [email protected] (RKD); [email protected] (RMK)
Introduction
Statins are HMG-CoA reductase inhibitors that are widely used
to reduce plasma levels of LDL cholesterol (LDL-C) and the risk
for coronary artery disease (CAD) [1,2,3,4]. However, statins also
have a number of other important biological actions that may
contribute to treatment benefit (e.g,, reducing inflammation) or
adverse events, (e.g., myopathy, increased risk for type 2 diabetes
mellitus [5]. Furthermore, efficacy of statins for lowering LDL-C
and for reducing CAD risk can vary greatly among individuals [6].
For these reasons, identification of pre-treatment metabolic
signatures or ‘‘biomarkers’’ predictive of response would be useful
for targeting this drug to the population that may benefit most
from its use.
Metabolomics brings powerful tools for mapping the metabolic
state of individuals prior to treatment and global biochemical
changes induced by drug treatment [7,8,9,10]. Recently we
reported that baseline metabolic profiles so called metabotypes do
inform about trajectory of response to antidepressants escitalo-
pram and sertraline [7,8]. A new field is evolving called
Pharmacometabolomics (also pharmacometabonomics) for appli-
cations of metabolomics in personalized medicine [10] and where
biochemical data is being used to inform about treatment
outcomes.
While it is well established that response to therapeutics can be
affected by genetic and environmental factors, the enteric
microbiome might also play a role in uncharacterized ways.
Metabolomics provides a unique method to characterize the net
PLoS ONE | www.plosone.org 1 October 2011 | Volume 6 | Issue 10 | e25482
interactions among these contributing factors. Numerous studies,
by members of this group and others, have identified genetic
polymorphisms that contribute to variability in the LDL-C
response to statins [6], but only a small proportion of the variance
has been explained by these factors [11]. Some statins are
administered as inactive precursor drugs that are activated by
endogenous biotransformation pathways, and there is increasing
interest in the role of gut bacteria in the metabolism of drugs [12]
including simvastatin. Metabolomics can capture a unique portrait
of the state and changes of the gut microbiota by direct
measurements of metabolite production [12,13,14]. Recently
several metabolites produced by the gut microbiome were
implicated in cardiovascular disease [15], highlighting for the first
time an important and complementary role that the gut
microbiome plays in cardiovascular health, and indicating the
need to study net interactions between genome, gut microbiome
and the environment.
Given that the primary cellular action of statins is well upstream
of the factors that modulate plasma lipoprotein metabolism, there
are many potential pathways that may act to influence the
magnitude of the statin response. In this study, we sought to
identify metabolites whose plasma levels predict LDL-C lowering
response to statin treatment (simvastatin 40 mg/day) using a
defined metabolomic approach. We measured a targeted panel of
metabolites related to cholesterol metabolism in three known
pathways: cholesterol synthesis, dietary sterol absorption, and bile
acid formation. We detected significant correlations between gut-
derived metabolites and simvastatin response. This supports
further evidence that the genome, the microbiome and diet all
contribute to mechanisms of variation of response to simvastatin.
Results
Pre-treatment levels of metabolites correlated withLDL-C reduction
Two subgroups of subjects were selected from the 944
participants in the Cholesterol and Pharmacogenetics (CAP)
study: 1) 100 individuals randomly selected from and representa-
tive of the entire range of LDL-C response, defined as the
percentage change in LDL cholesterol from pretreatment levels
(full range, FR); and 2) 24 individuals each selected from the top
and bottom 10% tails of the LDL-C response distribution
(total = 48) with matching of individuals from the two tails for
body mass index, race, and gender (Table 1). There was a slightly
lower proportion of men in the GPR than in the FR groups, but
the two groups were similar in age, race, BMI, initial LDL-C,
initial HDL-C, and initial total cholesterol. The two groups cannot
be differentiated using these pretreatment measures.
A. Analysis of Full Range (FR) SamplesUsing a targeted metabolomics platform with which we
evaluated 12 sterols and 14 bile acids, we observed in the
randomly selected (FR) subjects a very strong correlation between
a lower pretreatment level of several endogenous primary and
secondary bile acids—taurocholic acid (TCA), glycocholic acid
(GCA), taurochenodeoxycholic acid (TCDCA), glycochenodeoxy-
cholic acid, (GCDCA) and glycoursodeoxycholic acid (GUDCA)
—and greater response to the LDL lowering effects of simvastatin
(Fig. 1 and Table 2). Bile acids were the only compounds for which
we observed a significant correlation with LDL reductions in this
random sample from the full range of subjects.
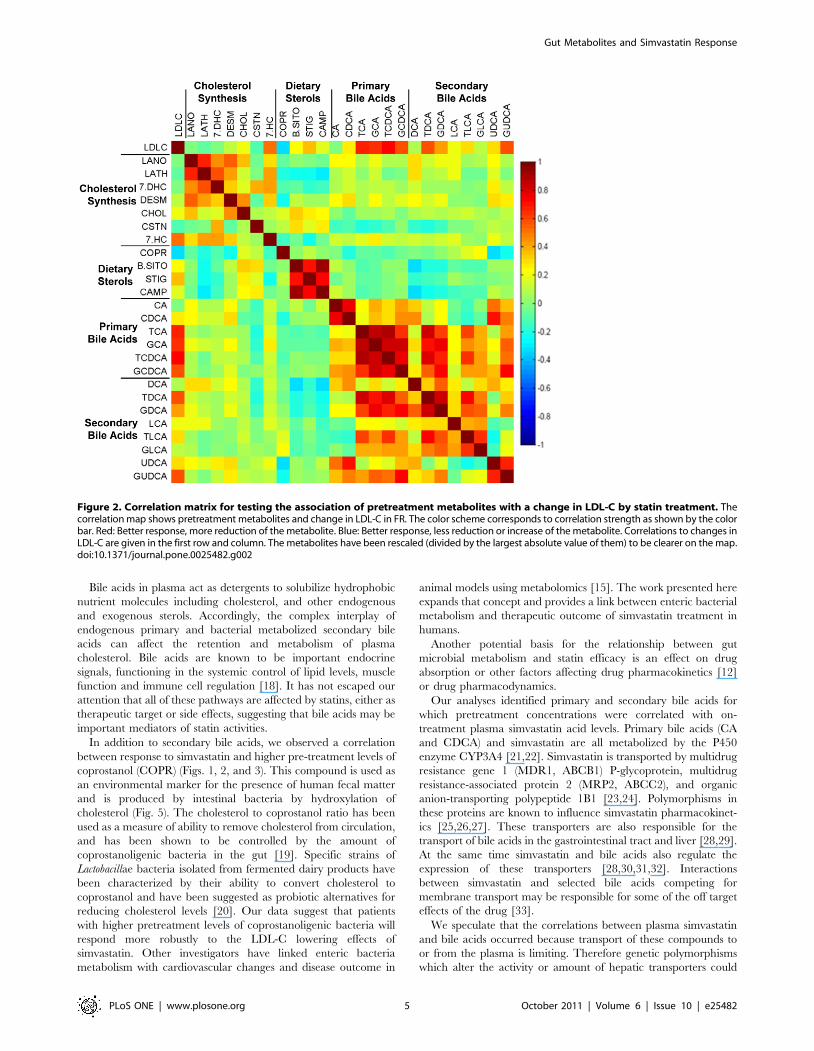
A correlation matrix shows all correlations between the FR
pretreatment metabolites and LDL-C response (Fig. 2). All of the
metabolites within the cholesterol biosynthetic pathway except
cholestanol (CSTN) were positively correlated with each other but
they were not strongly correlated with LDL-C response. The
dietary sterols, b-sitosterol (b-SITO), stigmasterol (STIG), and
campesterol (CAMP) were highly positively correlated with each
other, and were negatively correlated with most cholesterol
biosynthesis metabolites, and bile acids. Coprostanol (COPR)
did not correlate with the other dietary sterols and was negatively
correlated with LDL-C response to statins, while b-SITO, STIG
and CAMP were slightly positively correlated with LDL-C
response. Most bile acids were positively correlated with each
other. The primary bile acids cholic acid (CA) and chenodeoxy-
cholic acid (CDCA) were positively correlated with most other bile
acids except the secondary bile acids lithocholic acid (LCA),
taurolithocholic acid (TLCA), and glycolithocholic acid (GLCA).
A set of primary and secondary bile acids was positively and
significantly correlated with LDL-C.
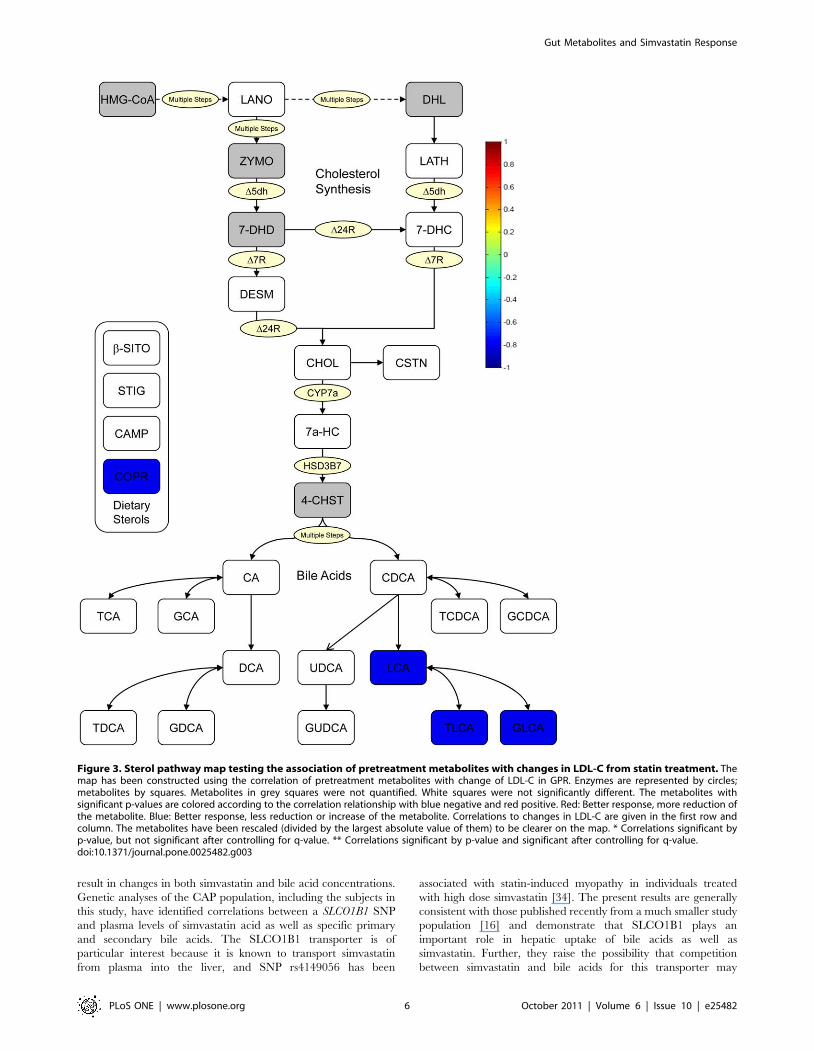
B. Analysis of Good/Poor Responders (GPR)We next evaluated samples from the tails of the spectrum of
LDL-C response, that is, subsets of the best and worst responders
to simvastatin therapy (Fig. 3). As shown in Figure 3 and Table 3,
we observed a strong relationship between the level of reduction in
LDL-C levels and higher pretreatment levels of the secondary bile
Table 1. Demographics of patients included in metabolomics study.
GPR FR
Subjects selected from: Good Responders Poor Responders Full Range Subjects
Total, n 24 24 100
Male, % 33 33 48
Body Mass Index kg/m2 28.566.4 29.165.1 28.565.1
Race % African American 25 29 30
Decrease in LDL-C, % 63.0664.2 7.6269.4 41.4+11.7
Age, y 60.3613.8 53.1612.4 53.6+12.6
Initial LDL-C, mg/dL 133.2631.9 120.1629.6 138.4635.5
Initial HDL-C, mg/dL 58.17615.46 53.66618.57 52.6616.5
Initial Total Cholesterol, mg/dL 219.58639.55 201.75632.71 215.8639.2
Values are mean 6 SD.doi:10.1371/journal.pone.0025482.t001
Gut Metabolites and Simvastatin Response
PLoS ONE | www.plosone.org 2 October 2011 | Volume 6 | Issue 10 | e25482
acids, LCA, TLCA and GLCA, as well as COPR which is
produced in the intestine by enteric bacterial reduction of
endogenous cholesterol.
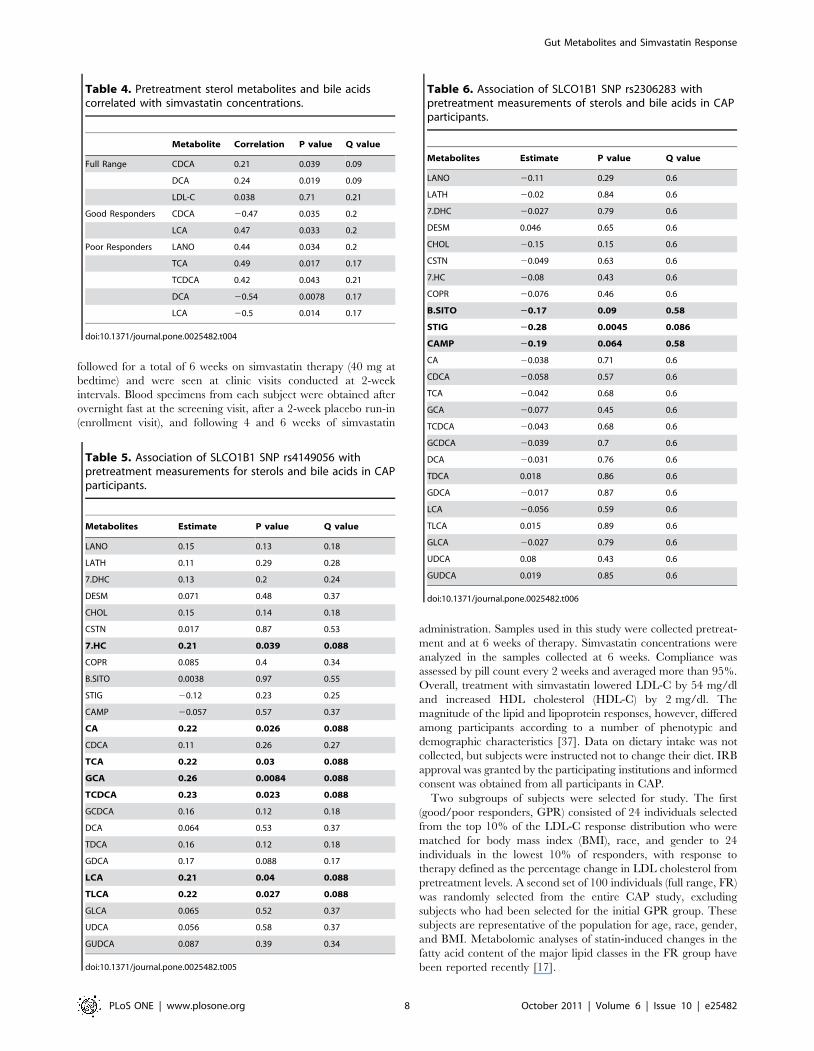
Separate correlation matrices for the good and the poor
responders show all correlations of pretreatment metabolites
within each group (Fig. 4). There were some strong positive
correlations within the cholesterol biosynthesis metabolites, dietary
sterols, and bile acids in both good and poor responders. COPR
had a positive correlation with the dietary sterols in the good
responders and no correlation in the poor responder subjects. Bile
acids were also different between the good and poor responders,
with primary bile acids (TCA, GCA, TCDCA, GCDCA) changing
from no correlation with cholesterol biosynthesis and negative
correlation with dietary sterol metabolites in good responders to a
slightly positive correlation in poor responders. Conversely,
secondary bile acids (deoxycholic acid DCA, taurodeoxycholic acid
Figure 1. Sterol pathway map testing the association of pretreatment metabolites with change of LDL-C by statin treatment. Themap was constructed using a correlation of pretreatment metabolites with change in LDL-C in FR. The color scheme corresponds to correlationstrength as shown by the color bar. Red: Better response, more reduction of the metabolite. Blue: Better response, less reduction or increase of themetabolite. Correlations to change in LDL-C are given in the first row and column. The metabolites are rescaled (divided by the largest absolute valueof them) to be clearer in the map. * Correlations significant by p-value, but not significant after controlling for q-value. ** Correlations significant byp-value and significant after controlling for q-value.doi:10.1371/journal.pone.0025482.g001
Gut Metabolites and Simvastatin Response
PLoS ONE | www.plosone.org 3 October 2011 | Volume 6 | Issue 10 | e25482
TDCA, GDCA, LCA, TLCA, and GLCA) showed a positive
correlation with cholesterol biosynthesis metabolites in good
responders and a negative correlation in the poor responders.
Pre-treatment levels of metabolites correlated withon-treatment simvastatin concentration
Pretreatment concentrations of two bile acids, CDCA and DCA,
were positively correlated with on-treatment plasma simvastatin
acid concentrations in the FR subjects (Table 4). Neither pre- nor
post-treatment level of LDL-C was significantly correlated with
plasma simvastatin concentration in this study (Table 4 and data not
shown) or in the entire CAP study (data not shown).
Several bile acids were correlated with simvastatin acid
concentrations in the good and the poor responders, with borderline
significant q-values (Table 4). These include negative correlations to
CDCA and positive correlations to LCA in good responders; and, in
poor responders, negative correlations to both secondary bile acids
(DCA and LCA) that were positively correlated to simvastatin acid
levels in good and normal range responders.
Pre-treatment levels of several metabolites correlatedwith SLCO1B1 gene polymorphisms
We tested the FR subjects for associations of plasma lipid
metabolites with SNP rs4149056 in the gene encoding the organic
anion transporter SLCO1B1. In the full CAP study population,
this SNP was strongly associated with fasting simvastatin acid
concentration (p,0.0001, r = 0.23, R. Krauss, personal commu-
nication), consistent with earlier observations [16]. We were
interested in determining whether SNP rs4149056 was associated
with levels of sterol/bile acid metabolites whose pre-treatment
concentrations had been correlated with simvastatin LDL
response. Our analysis (Table 5) revealed that seven bile acids
showed nominally significant associations with this SNP, such that
the minor allele was associated with higher plasma levels. These
include two secondary bile acids, LCA and TLCA, which we
identified as markers for greater response to simvastatin lowering
of LDL-C levels in good responders. LDL-C reduction in FR
subjects was also correlated with post simvastatin treatment levels
of LCA and TLCA (data not shown). The minor allele of
rs4149056 was also associated with increased plasma levels of 7a-
hydroxycholesterol, the product of the rate-limiting step in
synthesis of bile acids from cholesterol (Table 5).
We also analyzed a second SLCO1B1 SNP (rs2306283, an
N130D coding variant) that was not associated with plasma
simvastatin acid levels and found a significant correlation only with
plasma stigmasterol concentration (Table 6).
Discussion
Statins lower plasma LDL-C by blocking the activity of HMG-
CoA reductase, thereby decreasing the synthesis of cholesterol
and modifying downstream metabolic pathways. In our previous
study we evaluated over 300 lipid species within eight lipid classes
and found that baseline cholesterol ester and phospholipid
metabolites correlated with LDL-C response to treatment [17].
This study builds on our previous work to investigate sterol
metabolism in more depth and beyond effects on HMG-CoA
reductase. We used a selective analytic platform to assay levels of
sterol metabolites in plasma of participants in a trial of
simvastatin treatment in order to identify biomarkers that
correlate with statin lipid-modifying efficacy. We investigated
metabolite levels from both the best and worst responders as well
as from subjects with a full range of response. Doing so allowed us
to explore and verify the effects of statin treatment in two
population subsets representing a wide range of LDL-C
responses. The FR subset provided an assessment of the
predictors of statin response that is applicable to a wide range
of statin-treated patients. On the other hand, the GPR subset
provided a means to explore the differences in metabolite
predictors of the highest and lowest responses to drug therapy,
although the results may be applicable to only a small subset of
patients who take simvastatin. We identified a positive correlation
between LDL-C response and specific primary and secondary
bile metabolites including TCA, GCA, TCDCA, GCDCA and
GUDCA. In addition, there was a negative correlation in the
GPR group with secondary bile acids produced by intestinal
bacteria. These enteric bacterially produced bile acids included
lithocholic acid (LCA) and the conjugated derivatives glycolitho-
cholic acid (GLCA) and taurolithocholic acid (TLCA). The
observation that different secondary bile acids were inversely
associated with LDL-C response in the two study subsets may
signify differing specific relationships among extreme responders
compared with the remainder of the population.
In this study there were no strong correlations between
pretreatment bile acid metabolites and HDL-C response to
simvastatin (data not shown), which further supports the specificity
of the relationship between the concentration of the bile acid
metabolites and LDL-C response.
Table 2. Pretreatment metabolites that correlate with changeof LDL-C in FR group.
Association with LDL-C change
Metabolic Pathway Metabolite Correlation P value Q value
Sterol Synthesis LANO negative 0.8947 0.6770
LATH negative 0.7464 0.6212
7.DHC negative 0.9341 0.6770
DESM positive 0.6398 0.5749
CHOL positive 0.3984 0.4475
CSTN negative 0.5886 0.5696
7.HC positive 0.0266 0.0683
Dietary Sterols COPR negative 0.1692 0.3041
B.SITO positive 0.3330 0.4275
STIG positive 0.1084 0.2165
CAMP positive 0.4435 0.4688
Primary Bile Acids CA negative 0.9417 0.6770
CDCA positive 0.2342 0.3238
TCA positive 0.0023 0.0207
GCA positive 0.0038 0.0228
TCDCA positive 0.0011 0.0198
GCDCA positive 0.0120 0.0359
Secondary Bile Acids DCA positive 0.7604 0.6212
TDCA positive 0.0110 0.0359
GDCA positive 0.0607 0.1364
LCA positive 0.3651 0.4374
TLCA positive 0.2007 0.3088
GLCA positive 0.6022 0.5696
UDCA positive 0.2062 0.3088
GUDCA positive 0.0097 0.0359
doi:10.1371/journal.pone.0025482.t002
Gut Metabolites and Simvastatin Response
PLoS ONE | www.plosone.org 4 October 2011 | Volume 6 | Issue 10 | e25482
Bile acids in plasma act as detergents to solubilize hydrophobic
nutrient molecules including cholesterol, and other endogenous
and exogenous sterols. Accordingly, the complex interplay of
endogenous primary and bacterial metabolized secondary bile
acids can affect the retention and metabolism of plasma
cholesterol. Bile acids are known to be important endocrine
signals, functioning in the systemic control of lipid levels, muscle
function and immune cell regulation [18]. It has not escaped our
attention that all of these pathways are affected by statins, either as
therapeutic target or side effects, suggesting that bile acids may be
important mediators of statin activities.
In addition to secondary bile acids, we observed a correlation
between response to simvastatin and higher pre-treatment levels of
coprostanol (COPR) (Figs. 1, 2, and 3). This compound is used as
an environmental marker for the presence of human fecal matter
and is produced by intestinal bacteria by hydroxylation of
cholesterol (Fig. 5). The cholesterol to coprostanol ratio has been
used as a measure of ability to remove cholesterol from circulation,
and has been shown to be controlled by the amount of
coprostanoligenic bacteria in the gut [19]. Specific strains of
Lactobacillae bacteria isolated from fermented dairy products have
been characterized by their ability to convert cholesterol to
coprostanol and have been suggested as probiotic alternatives for
reducing cholesterol levels [20]. Our data suggest that patients
with higher pretreatment levels of coprostanoligenic bacteria will
respond more robustly to the LDL-C lowering effects of
simvastatin. Other investigators have linked enteric bacteria
metabolism with cardiovascular changes and disease outcome in
animal models using metabolomics [15]. The work presented here
expands that concept and provides a link between enteric bacterial
metabolism and therapeutic outcome of simvastatin treatment in
humans.
Another potential basis for the relationship between gut
microbial metabolism and statin efficacy is an effect on drug
absorption or other factors affecting drug pharmacokinetics [12]
or drug pharmacodynamics.
Our analyses identified primary and secondary bile acids for
which pretreatment concentrations were correlated with on-
treatment plasma simvastatin acid levels. Primary bile acids (CA
and CDCA) and simvastatin are all metabolized by the P450
enzyme CYP3A4 [21,22]. Simvastatin is transported by multidrug
resistance gene 1 (MDR1, ABCB1) P-glycoprotein, multidrug
resistance-associated protein 2 (MRP2, ABCC2), and organic
anion-transporting polypeptide 1B1 [23,24]. Polymorphisms in
these proteins are known to influence simvastatin pharmacokinet-
ics [25,26,27]. These transporters are also responsible for the
transport of bile acids in the gastrointestinal tract and liver [28,29].
At the same time simvastatin and bile acids also regulate the
expression of these transporters [28,30,31,32]. Interactions
between simvastatin and selected bile acids competing for
membrane transport may be responsible for some of the off target
effects of the drug [33].
We speculate that the correlations between plasma simvastatin
and bile acids occurred because transport of these compounds to
or from the plasma is limiting. Therefore genetic polymorphisms
which alter the activity or amount of hepatic transporters could
Figure 2. Correlation matrix for testing the association of pretreatment metabolites with a change in LDL-C by statin treatment. Thecorrelation map shows pretreatment metabolites and change in LDL-C in FR. The color scheme corresponds to correlation strength as shown by the colorbar. Red: Better response, more reduction of the metabolite. Blue: Better response, less reduction or increase of the metabolite. Correlations to changes inLDL-C are given in the first row and column. The metabolites have been rescaled (divided by the largest absolute value of them) to be clearer on the map.doi:10.1371/journal.pone.0025482.g002
Gut Metabolites and Simvastatin Response
PLoS ONE | www.plosone.org 5 October 2011 | Volume 6 | Issue 10 | e25482
result in changes in both simvastatin and bile acid concentrations.
Genetic analyses of the CAP population, including the subjects in
this study, have identified correlations between a SLCO1B1 SNP
and plasma levels of simvastatin acid as well as specific primary
and secondary bile acids. The SLCO1B1 transporter is of
particular interest because it is known to transport simvastatin
from plasma into the liver, and SNP rs4149056 has been
associated with statin-induced myopathy in individuals treated
with high dose simvastatin [34]. The present results are generally
consistent with those published recently from a much smaller study
population [16] and demonstrate that SLCO1B1 plays an
important role in hepatic uptake of bile acids as well as
simvastatin. Further, they raise the possibility that competition
between simvastatin and bile acids for this transporter may
Figure 3. Sterol pathway map testing the association of pretreatment metabolites with changes in LDL-C from statin treatment. Themap has been constructed using the correlation of pretreatment metabolites with change of LDL-C in GPR. Enzymes are represented by circles;metabolites by squares. Metabolites in grey squares were not quantified. White squares were not significantly different. The metabolites withsignificant p-values are colored according to the correlation relationship with blue negative and red positive. Red: Better response, more reduction ofthe metabolite. Blue: Better response, less reduction or increase of the metabolite. Correlations to changes in LDL-C are given in the first row andcolumn. The metabolites have been rescaled (divided by the largest absolute value of them) to be clearer on the map. * Correlations significant byp-value, but not significant after controlling for q-value. ** Correlations significant by p-value and significant after controlling for q-value.doi:10.1371/journal.pone.0025482.g003
Gut Metabolites and Simvastatin Response
PLoS ONE | www.plosone.org 6 October 2011 | Volume 6 | Issue 10 | e25482
influence both the pharmacokinetics and pharmacodynamics of
simvastatin, and possibly risk of muscle toxicity. It should be
pointed out however that the findings from the present study may
not be applicable to other statins, whose interactions with bile acid
metabolism and transport may differ from those of simvastatin.
The present findings point to the utility of metabolomic surveys
for identifying predictors of clinical response that may have
implications for assessing efficacy of this widely-used class of drugs.
We have observed that the pretreatment levels of bile acids derived
from gut bacteria and nutrient inputs are correlated with response
to simvastatin. It is becoming increasingly clear that gut microbial
symbiots are critical for normal digestion and defense, and also
play an important role in development of disease [15] and in
metabolizing orally ingested therapeutics [12]. There is increasing
recognition that intestinal bacteria can metabolize drugs and alter
an individual’s response to drug treatment depending on specific
bacterial strains present [35]. In an interesting corollary to our
work, Ridlon et al. have suggested that probiotics, by altering
intestinal microflora, can alter the enterohepatic circulation of
secondary bile acids [36]. In addition, Wang et al. recently have
implicated enteric bacteria and phosphatidylcholine metabolism in
the pathogenesis of cardiovascular disease [15]. We suggest that
our findings warrant further evaluation of interactions of specific
markers for gut microbiota and therapeutic response to statins.
Identification of the basis for such interactions may in turn lead to
dietary or other interventions that can improve statin efficacy by
altering gut microflora.
Methods
SubjectsPlasma samples were analyzed from participants in the
Cholesterol and Pharmacogenetics (CAP) study—a trial in which
944 Caucasian and African-American men and women with total
cholesterol levels of 160–400 mg/dL were treated with simvastatin
40 mg/d for 6 weeks. This study was designed to examine genetic
and non-genetic factors affecting the response to simvastatin
therapy in healthy, drug-naı̈ve patients [37]. Participants were
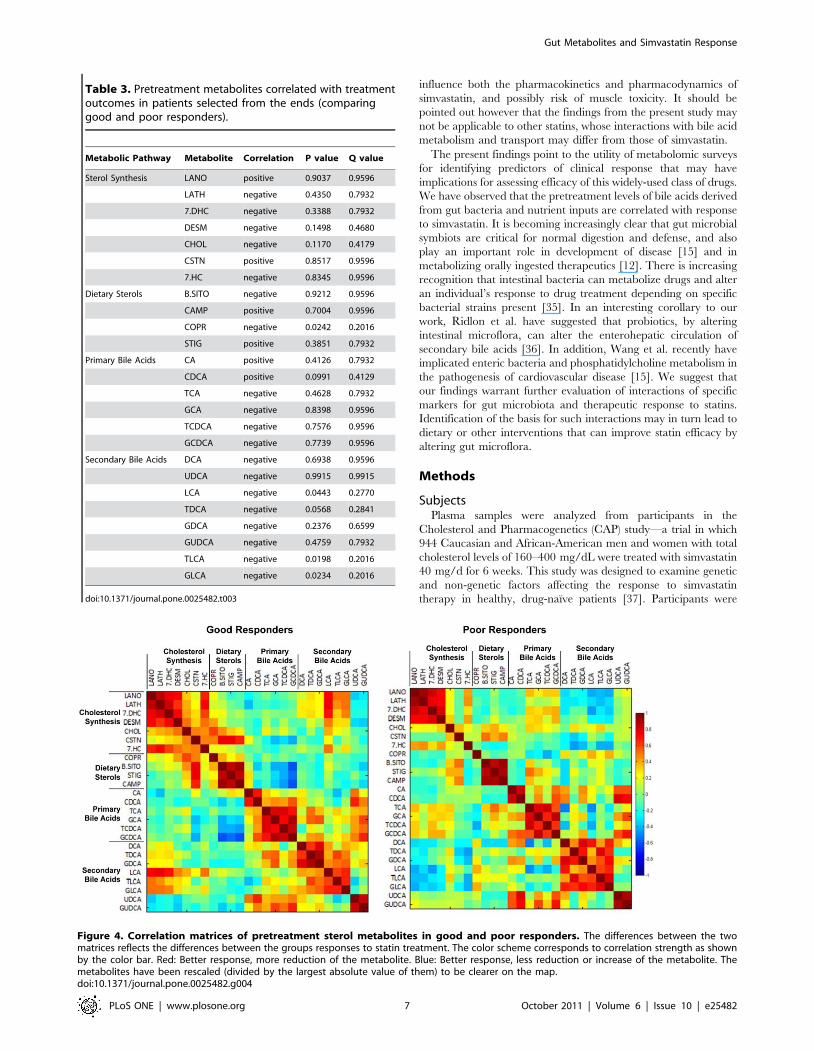
Table 3. Pretreatment metabolites correlated with treatmentoutcomes in patients selected from the ends (comparinggood and poor responders).
Metabolic Pathway Metabolite Correlation P value Q value
Sterol Synthesis LANO positive 0.9037 0.9596
LATH negative 0.4350 0.7932
7.DHC negative 0.3388 0.7932
DESM negative 0.1498 0.4680
CHOL negative 0.1170 0.4179
CSTN positive 0.8517 0.9596
7.HC negative 0.8345 0.9596
Dietary Sterols B.SITO negative 0.9212 0.9596
CAMP positive 0.7004 0.9596
COPR negative 0.0242 0.2016
STIG positive 0.3851 0.7932
Primary Bile Acids CA positive 0.4126 0.7932
CDCA positive 0.0991 0.4129
TCA negative 0.4628 0.7932
GCA negative 0.8398 0.9596
TCDCA negative 0.7576 0.9596
GCDCA negative 0.7739 0.9596
Secondary Bile Acids DCA negative 0.6938 0.9596
UDCA negative 0.9915 0.9915
LCA negative 0.0443 0.2770
TDCA negative 0.0568 0.2841
GDCA negative 0.2376 0.6599
GUDCA negative 0.4759 0.7932
TLCA negative 0.0198 0.2016
GLCA negative 0.0234 0.2016
doi:10.1371/journal.pone.0025482.t003
Figure 4. Correlation matrices of pretreatment sterol metabolites in good and poor responders. The differences between the twomatrices reflects the differences between the groups responses to statin treatment. The color scheme corresponds to correlation strength as shownby the color bar. Red: Better response, more reduction of the metabolite. Blue: Better response, less reduction or increase of the metabolite. Themetabolites have been rescaled (divided by the largest absolute value of them) to be clearer on the map.doi:10.1371/journal.pone.0025482.g004
Gut Metabolites and Simvastatin Response
PLoS ONE | www.plosone.org 7 October 2011 | Volume 6 | Issue 10 | e25482
followed for a total of 6 weeks on simvastatin therapy (40 mg at
bedtime) and were seen at clinic visits conducted at 2-week
intervals. Blood specimens from each subject were obtained after
overnight fast at the screening visit, after a 2-week placebo run-in
(enrollment visit), and following 4 and 6 weeks of simvastatin
administration. Samples used in this study were collected pretreat-
ment and at 6 weeks of therapy. Simvastatin concentrations were
analyzed in the samples collected at 6 weeks. Compliance was
assessed by pill count every 2 weeks and averaged more than 95%.
Overall, treatment with simvastatin lowered LDL-C by 54 mg/dl
and increased HDL cholesterol (HDL-C) by 2 mg/dl. The
magnitude of the lipid and lipoprotein responses, however, differed
among participants according to a number of phenotypic and
demographic characteristics [37]. Data on dietary intake was not
collected, but subjects were instructed not to change their diet. IRB
approval was granted by the participating institutions and informed
consent was obtained from all participants in CAP.
Two subgroups of subjects were selected for study. The first
(good/poor responders, GPR) consisted of 24 individuals selected
from the top 10% of the LDL-C response distribution who were
matched for body mass index (BMI), race, and gender to 24
individuals in the lowest 10% of responders, with response to
therapy defined as the percentage change in LDL cholesterol from
pretreatment levels. A second set of 100 individuals (full range, FR)
was randomly selected from the entire CAP study, excluding
subjects who had been selected for the initial GPR group. These
subjects are representative of the population for age, race, gender,
and BMI. Metabolomic analyses of statin-induced changes in the
fatty acid content of the major lipid classes in the FR group have
been reported recently [17].
Table 4. Pretreatment sterol metabolites and bile acidscorrelated with simvastatin concentrations.
Metabolite Correlation P value Q value
Full Range CDCA 0.21 0.039 0.09
DCA 0.24 0.019 0.09
LDL-C 0.038 0.71 0.21
Good Responders CDCA 20.47 0.035 0.2
LCA 0.47 0.033 0.2
Poor Responders LANO 0.44 0.034 0.2
TCA 0.49 0.017 0.17
TCDCA 0.42 0.043 0.21
DCA 20.54 0.0078 0.17
LCA 20.5 0.014 0.17
doi:10.1371/journal.pone.0025482.t004
Table 5. Association of SLCO1B1 SNP rs4149056 withpretreatment measurements for sterols and bile acids in CAPparticipants.
Metabolites Estimate P value Q value
LANO 0.15 0.13 0.18
LATH 0.11 0.29 0.28
7.DHC 0.13 0.2 0.24
DESM 0.071 0.48 0.37
CHOL 0.15 0.14 0.18
CSTN 0.017 0.87 0.53
7.HC 0.21 0.039 0.088
COPR 0.085 0.4 0.34
B.SITO 0.0038 0.97 0.55
STIG 20.12 0.23 0.25
CAMP 20.057 0.57 0.37
CA 0.22 0.026 0.088
CDCA 0.11 0.26 0.27
TCA 0.22 0.03 0.088
GCA 0.26 0.0084 0.088
TCDCA 0.23 0.023 0.088
GCDCA 0.16 0.12 0.18
DCA 0.064 0.53 0.37
TDCA 0.16 0.12 0.18
GDCA 0.17 0.088 0.17
LCA 0.21 0.04 0.088
TLCA 0.22 0.027 0.088
GLCA 0.065 0.52 0.37
UDCA 0.056 0.58 0.37
GUDCA 0.087 0.39 0.34
doi:10.1371/journal.pone.0025482.t005
Table 6. Association of SLCO1B1 SNP rs2306283 withpretreatment measurements of sterols and bile acids in CAPparticipants.
Metabolites Estimate P value Q value
LANO 20.11 0.29 0.6
LATH 20.02 0.84 0.6
7.DHC 20.027 0.79 0.6
DESM 0.046 0.65 0.6
CHOL 20.15 0.15 0.6
CSTN 20.049 0.63 0.6
7.HC 20.08 0.43 0.6
COPR 20.076 0.46 0.6
B.SITO 20.17 0.09 0.58
STIG 20.28 0.0045 0.086
CAMP 20.19 0.064 0.58
CA 20.038 0.71 0.6
CDCA 20.058 0.57 0.6
TCA 20.042 0.68 0.6
GCA 20.077 0.45 0.6
TCDCA 20.043 0.68 0.6
GCDCA 20.039 0.7 0.6
DCA 20.031 0.76 0.6
TDCA 0.018 0.86 0.6
GDCA 20.017 0.87 0.6
LCA 20.056 0.59 0.6
TLCA 0.015 0.89 0.6
GLCA 20.027 0.79 0.6
UDCA 0.08 0.43 0.6
GUDCA 0.019 0.85 0.6
doi:10.1371/journal.pone.0025482.t006
Gut Metabolites and Simvastatin Response
PLoS ONE | www.plosone.org 8 October 2011 | Volume 6 | Issue 10 | e25482
As shown in Table 1, good responders were slightly but not
significantly older than poor responders, with marginally higher
initial cholesterol, HDL-C, apolipoprotein AI (apoAI), and
apolipoprotein B (apoB) levels The FR group, with the broad
response range, had a slightly higher percentage of men than Group
1, but was matched for race, age, and initial cholesterol levels.
Laboratory measurementsPlasma LDL-C, HDL-C, apoAI and apoB were measured as
described previously (Simon et al., 2006). Lipid extraction, solid-
phase extraction, and capillary gas-liquid chromatography were
used for quantitative analysis of sterols according to the method of
Phillips et al. [38]. The analysis was conducted using an Agilent
5975 GC/MSD. Bile acids were extracted using a sample
preparation involving protein precipitation as described in
Tagliacozzi et al. [39]. Analysis separations were performed by
the Agilent 1200 RRLC (rapid resolution liquid chromatograph)
using a Zorbax 1.8 micron column; bile acids were detected with
the 4000 Qtrap (Applied Biosystems) by monitoring the analytes
under multiple reaction-monitoring mode as described in Burkard
et al. [40]. The following sterols and bile acids were detected and
quantified: campesterol (CAMP), chenodeoxycholic acid (CDCA),
cholestanol (CSTN), 4-cholesten-7a-ol-3-one (4-CHST), choles-
terol, cholic acid (CA), coprostanol (COPR), 7-dehydrocholesterol
(7-DCH), deoxycholic acid (DCA), desmosterol (DESM), glyco-
chenodeoxycholic acid (GCDCA), glycocholic acid (GCA),
glycodeoxycholic acid (GDCA), glycolithocholic acid (GLCA),
glycoursodeoxycholic acid (GUDCA), 7a-hydroxycholesterol (7a-
HC), lanosterol (LANO), lathosterol (LATH), lithocholic acid
(LCA), b-sitosterol (b-SITO), stigmasterol (STIG), taurocheno-
deoxycholic acid (TCDCA), taurocholic acid (TCA), taurodeoxy-
cholic acid (TDCA), taurolithocholic acid (TLCA), and ursodeoxy-
cholic acid (UDCA).
The levels of activated metabolite of simvastatin, simvastatin
acid, were determined by mass spectrometry as described
elsewhere [41]. Analysis of the SLCO1B1 rs4149056 single
nucleotide polymorphism (SNP) was performed by BeadArray
technology (Illumina, San Diego, CA).
Statistical analysesWe tested the correlation of pretreatment metabolites with drug
response. Metabolites were log-transformed before correlation
testing. For FR subjects, Spearman’s correlation coefficient was
used to obtain correlation coefficients between the pretreatment
level of each metabolite with changes in LDL-C or HDL-C.
Because changes in LDL-C and HDL-C are correlated with
pretreatment LDL-C and HDL-C concentrations, respectively, the
changes of these measurements were adjusted for their pretreatment
levels \. Correlations among pretreatment metabolites were
obtained by deriving Spearman’s correlation coefficient between
each pair. For GPR subjects, Wilcoxon rank sum tests were used to
test differences in pretreatment metabolites between good respond-
ers and poor responders. Correlation maps were constructed using
the algorithm in Ayroles et al. [42]. The degree of correlation
between each two metabolites was color-coded. Metabolites were
listed in the order of the pathway maps for sterol metabolism.
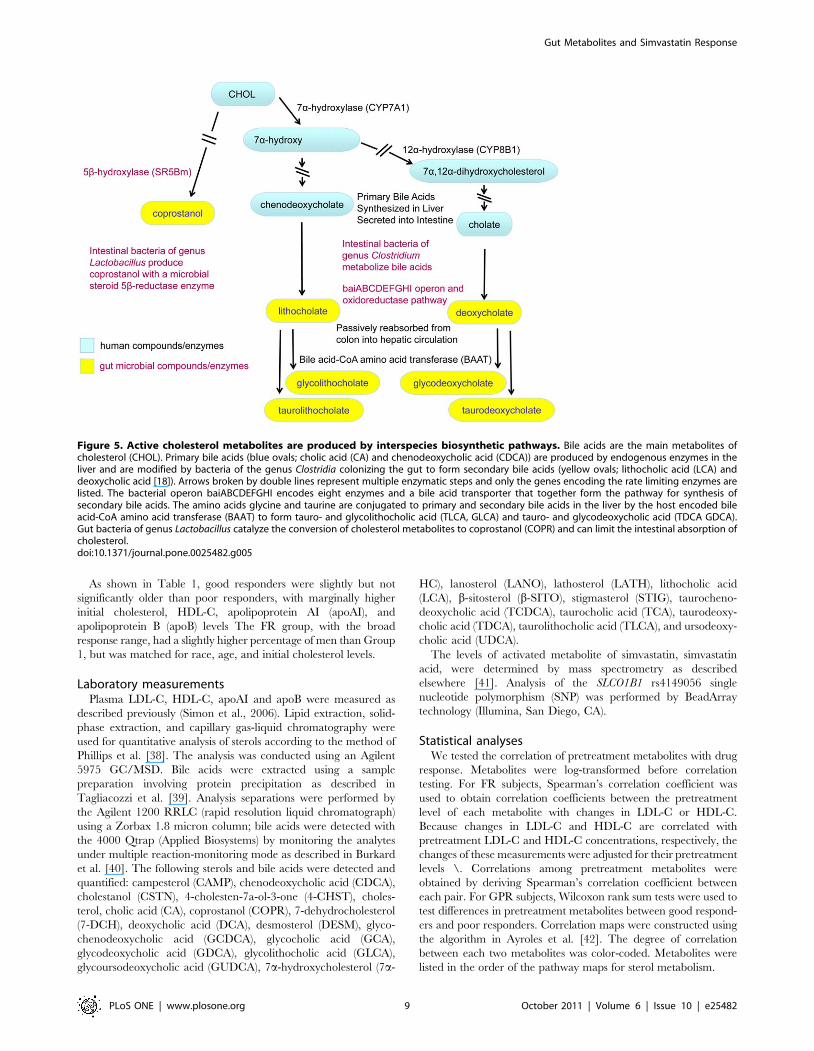
Figure 5. Active cholesterol metabolites are produced by interspecies biosynthetic pathways. Bile acids are the main metabolites ofcholesterol (CHOL). Primary bile acids (blue ovals; cholic acid (CA) and chenodeoxycholic acid (CDCA)) are produced by endogenous enzymes in theliver and are modified by bacteria of the genus Clostridia colonizing the gut to form secondary bile acids (yellow ovals; lithocholic acid (LCA) anddeoxycholic acid [18]). Arrows broken by double lines represent multiple enzymatic steps and only the genes encoding the rate limiting enzymes arelisted. The bacterial operon baiABCDEFGHI encodes eight enzymes and a bile acid transporter that together form the pathway for synthesis ofsecondary bile acids. The amino acids glycine and taurine are conjugated to primary and secondary bile acids in the liver by the host encoded bileacid-CoA amino acid transferase (BAAT) to form tauro- and glycolithocholic acid (TLCA, GLCA) and tauro- and glycodeoxycholic acid (TDCA GDCA).Gut bacteria of genus Lactobacillus catalyze the conversion of cholesterol metabolites to coprostanol (COPR) and can limit the intestinal absorption ofcholesterol.doi:10.1371/journal.pone.0025482.g005
Gut Metabolites and Simvastatin Response
PLoS ONE | www.plosone.org 9 October 2011 | Volume 6 | Issue 10 | e25482
Acknowledgments
We thank Debbie Nickerson, Mark Rieder, and Joshua Smith of the
University of Washington for genotype analysis.
Author Contributions
Conceived and designed the experiments: RKD RMK. Performed the
experiments: MMW UTN SW. Analyzed the data: HZ ZZ KW.
Contributed reagents/materials/analysis tools: MMW UTN SW. Wrote
the paper: RAB MT.
References
1. American Heart Association (2004) Heart Disease and Stroke Statistics - 2004
Update: American Heart Association.
2. Zhou Z, Rahme E, Pilote L (2006) Are statins created equal? Evidence fromrandomized trials of pravastatin, simvastatin, and atorvastatin for cardiovascular
disease prevention. Am Heart J 151: 273–281.3. Ridker PM, Danielson E, Fonseca FA, Genest J, Gotto AM, Jr., et al. (2008)
Rosuvastatin to prevent vascular events in men and women with elevated C-
reactive protein. N Engl J Med 359: 2195–2207.4. Baigent C, Keech A, Kearney PM, Blackwell L, Buck G, et al. (2005) Efficacy
and safety of cholesterol-lowering treatment: prospective meta-analysis of datafrom 90,056 participants in 14 randomised trials of statins. Lancet 366:
1267–1278.5. Ridker PM (2009) The JUPITER trial: results, controversies, and implications
for prevention. Circ Cardiovasc Qual Outcomes 2: 279–285.
6. Barber MJ, Mangravite LM, Hyde CL, Chasman DI, Smith JD, et al. (2010)Genome-wide association of lipid-lowering response to statins in combined study
populations. PLoS ONE 5: e9763.7. Ji Y, Hebbring S, Zhu H, Jenkins GD, Biernacka J, et al. (2011) Glycine and a
glycine dehydrogenase (GLDC) SNP as citalopram/escitalopram response
biomarkers in depression: pharmacometabolomics-informed pharmacoge-nomics. Clin Pharmacol Ther 89: 97–104.
8. Kaddurah-Daouk R, Boyle SH, Matson W, Sharma S, Matson S, et al. (2011)Pretreatment metabotype as a predictor of response to sertraline or placebo in
depressed outpatients: a proof of concept. Transl Psychiatry 1: e26.9. Kaddurah-Daouk R, Krishnan KR (2009) Metabolomics: a global biochemical
approach to the study of central nervous system diseases. Neuropsychopharma-
cology 34: 173–186.10. Kaddurah-Daouk R, Kristal BS, Weinshilboum RM (2008) Metabolomics: a
global biochemical approach to drug response and disease. Annu RevPharmacol Toxicol 48: 653–683.
11. Mangravite LM, Wilke RA, Zhang J, Krauss RM (2008) Pharmacogenomics of
statin response. Curr Opin Mol Ther 10: 555–561.12. Clayton TA, Baker D, Lindon JC, Everett JR, Nicholson JK (2009)
Pharmacometabonomic identification of a significant host-microbiome meta-bolic interaction affecting human drug metabolism. Proc Natl Acad Sci U S A
106: 14728–14733.
13. Wikoff WR, Anfora AT, Liu J, Schultz PG, Lesley SA, et al. (2009)Metabolomics analysis reveals large effects of gut microflora on mammalian
blood metabolites. Proc Natl Acad Sci U S A 106: 3698–3703.14. Kinross JM, Darzi AW, Nicholson JK (2011) Gut microbiome-host interactions
in health and disease. Genome Med 3: 14.15. Wang Z, Klipfell E, Bennett BJ, Koeth R, Levison BS, et al. (2011) Gut flora
metabolism of phosphatidylcholine promotes cardiovascular disease. Nature
472: 57–63.16. Xiang X, Han Y, Neuvonen M, Pasanen MK, Kalliokoski A, et al. (2009) Effect
of SLCO1B1 polymorphism on the plasma concentrations of bile acids and bileacid synthesis marker in humans. Pharmacogenet Genomics 19: 447–457.
17. Kaddurah-Daouk R, Baillie RA, Zhu H, Zeng ZB, Wiest MM, et al. (2010)
Lipidomic analysis of variation in response to simvastatin in the Cholesterol andPharmacogenetics Study. Metabolomics 6: 191–201.
18. Houten SM, Watanabe M, Auwerx J (2006) Endocrine functions of bile acids.Embo J 25: 1419–1425.
19. Veiga P, Juste C, Lepercq P, Saunier K, Beguet F, et al. (2005) Correlationbetween faecal microbial community structure and cholesterol-to-coprostanol
conversion in the human gut. FEMS Microbiol Lett 242: 81–86.
20. Lye HS, Rusul G, Liong MT (2010) Removal of cholesterol by lactobacilli viaincorporation and conversion to coprostanol. J Dairy Sci 93: 1383–1392.
21. Deo AK, Bandiera SM (2008) Identification of human hepatic cytochrome p450enzymes involved in the biotransformation of cholic and chenodeoxycholic acid.
Drug Metab Dispos 36: 1983–1991.
22. Shitara Y, Sugiyama Y (2006) Pharmacokinetic and pharmacodynamicalterations of 3-hydroxy-3-methylglutaryl coenzyme A (HMG-CoA) reductase
inhibitors: drug-drug interactions and interindividual differences in transporterand metabolic enzyme functions. Pharmacol Ther 112: 71–105.
23. Holtzman CW, Wiggins BS, Spinler SA (2006) Role of P-glycoprotein in statin
drug interactions. Pharmacotherapy 26: 1601–1607.
24. Chen C, Mireles RJ, Campbell SD, Lin J, Mills JB, et al. (2005) Differentialinteraction of 3-hydroxy-3-methylglutaryl-coa reductase inhibitors with ABCB1,
ABCC2, and OATP1B1. Drug Metab Dispos 33: 537–546.25. Pasanen MK, Neuvonen M, Neuvonen PJ, Niemi M (2006) SLCO1B1
polymorphism markedly affects the pharmacokinetics of simvastatin acid.
Pharmacogenet Genomics 16: 873–879.26. Chen C, Lin J, Smolarek T, Tremaine L (2007) P-glycoprotein has differential
effects on the disposition of statin acid and lactone forms in mdr1a/b knockoutand wild-type mice. Drug Metab Dispos 35: 1725–1729.
27. Keskitalo JE, Kurkinen KJ, Neuvoneni PJ, Niemi M (2008) ABCB1 haplotypesdifferentially affect the pharmacokinetics of the acid and lactone forms of
simvastatin and atorvastatin. Clin Pharmacol Ther 84: 457–461.
28. Klaassen CD, Aleksunes LM (2010) Xenobiotic, bile acid, and cholesteroltransporters: function and regulation. Pharmacol Rev 62: 1–96.
29. Hsiang B, Zhu Y, Wang Z, Wu Y, Sasseville V, et al. (1999) A novel humanhepatic organic anion transporting polypeptide (OATP2). Identification of a
liver-specific human organic anion transporting polypeptide and identification of
rat and human hydroxymethylglutaryl-CoA reductase inhibitor transporters.J Biol Chem 274: 37161–37168.
30. Gnerre C, Blattler S, Kaufmann MR, Looser R, Meyer UA (2004) Regulation ofCYP3A4 by the bile acid receptor FXR: evidence for functional binding sites in
the CYP3A4 gene. Pharmacogenetics 14: 635–645.31. Rodrigues AC, Curi R, Genvigir FD, Hirata MH, Hirata RD (2009) The
expression of efflux and uptake transporters are regulated by statins in Caco-2
and HepG2 cells. Acta Pharmacol Sin 30: 956–964.32. Yamasaki D, Nakamura T, Okamura N, Kokudai M, Inui N, et al. (2009)
Effects of acid and lactone forms of 3-hydroxy-3-methylglutaryl coenzyme Areductase inhibitors on the induction of MDR1 expression and function in
LS180 cells. Eur J Pharm Sci 37: 126–132.
33. Tazuma S, Kajiyama G, Mizuno T, Yamashita G, Miura H, et al. (1998) Acombination therapy with simvastatin and ursodeoxycholic acid is more effective
for cholesterol gallstone dissolution than is ursodeoxycholic acid monotherapy.J Clin Gastroenterol 26: 287–291.
34. Link E, Parish S, Armitage J, Bowman L, Heath S, et al. (2008) SLCO1B1
variants and statin-induced myopathy–a genomewide study. N Engl J Med 359:789–799.
35. Lindon JC, Holmes E, Nicholson JK (2007) Metabonomics in pharmaceuticalR&D. Febs J 274: 1140–1151.
36. Ridlon JM, Kang DJ, Hylemon PB (2006) Bile salt biotransformations by humanintestinal bacteria. J Lipid Res 47: 241–259.
37. Simon JA, Lin F, Hulley SB, Blanche PJ, Waters D, et al. (2006) Phenotypic
predictors of response to simvastatin therapy among African-Americans andCaucasians: the Cholesterol and Pharmacogenetics (CAP) Study. Am J Cardiol
97: 843–850.38. Phillips KM, Ruggio DM, Bailey JA (1999) Precise quantitative determination of
phytosterols, stanols, and cholesterol metabolites in human serum by capillary
gas-liquid chromatography. J Chromatogr B Biomed Sci Appl 732: 17–29.39. Tagliacozzi D, Mozzi AF, Casetta B, Bertucci P, Bernardini S, et al. (2003)
Quantitative analysis of bile acids in human plasma by liquid chromatography-electrospray tandem mass spectrometry: a simple and rapid one-step method.
Clin Chem Lab Med 41: 1633–1641.40. Burkard I, von Eckardstein A, Rentsch KM (2005) Differentiated quantification
of human bile acids in serum by high-performance liquid chromatography-
tandem mass spectrometry. J Chromatogr B Analyt Technol Biomed Life Sci826: 147–159.
41. Zhao JJ, Xie IH, Yang AY, Roadcap BA, Rogers JD (2000) Quantitation ofsimvastatin and its beta-hydroxy acid in human plasma by liquid-liquid cartridge
extraction and liquid chromatography/tandem mass spectrometry. J Mass
Spectrom 35: 1133–1143.42. Ayroles JF, Carbone MA, Stone EA, Jordan KW, Lyman RF, et al. (2009)
Systems genetics of complex traits in Drosophila melanogaster. Nat Genet 41:299–307.
Gut Metabolites and Simvastatin Response
PLoS ONE | www.plosone.org 10 October 2011 | Volume 6 | Issue 10 | e25482


